Embed Size (px)
Citation preview
UNITED STATESSECURITIES AND EXCHANGE COMMISSION
Washington, D.C. 20549_________________________________
FORM 10-K_________________________________
(MARK ONE)☒ANNUAL REPORT PURSUANT TO SECTION 13 OR 15(d) OF THE SECURITIES EXCHANGE ACT OF 1934For the fiscal year ended June 30, 2020
OR☐TRANSITION REPORT PURSUANT TO SECTION 13 OR 15(d) OF THE SECURITIES EXCHANGE ACT OF 1934FOR THE TRANSITION PERIOD FROM TO
Commission file number 001-34717__________________________
Alpha and Omega Semiconductor Limited(Exact name of Registrant as Specified in its Charter)
Bermuda 77-0553536(State or Other Jurisdiction of Incorporation or Organization) (I.R.S. Employer Identification Number)
Clarendon House, 2 Church StreetHamilton HM 11, Bermuda
(Address of Principal RegisteredOffices including Zip Code)
(408) 830-9742(Registrant's Telephone Number, Including Area Code)
__________________________________________Securities registered pursuant to Section 12(b) of the Act:
Title of each class Trading Symbol(s) Name of each exchange on which registeredCommon Shares, $0.002 par value per share AOSL The NASDAQ Global Select Market
Securities registered pursuant to Section 12(g) of the Act:None
Indicate by check mark if the registrant is a well-known seasoned issuer, as defined in Rule 405 of the Securities Act. Yes ☐ No ☒Indicate by check mark if the registrant is not required to file reports pursuant to Section 13 or Section 15(d) of the Act. Yes ☐ No ☒Indicate by check mark whether the registrant (1) has filed all reports required to be filed by Section 13 or 15(d) of the Securities Exchange Act of 1934 during the
preceding 12 months, (or for such shorter period that the registrant was required to file such reports), and (2) has been subject to such filing requirements for the past90 days. Yes ☒ No ☐
Indicate by check mark whether the registrant has submitted electronically, every Interactive Data File required to be submitted and posted pursuant to Rule 405 ofRegulation S-T (§ 232.405 of this chapter) during the preceding 12 months (or for such shorter period that the registrant was required to submit such files). Yes ☒ No ☐
Indicate by check mark whether the registrant is a large accelerated filer, an accelerated filer, a non-accelerated filer, a smaller reporting company or an emerging growthcompany. See definitions of “large accelerated filer,” “accelerated filer”, “smaller reporting company” and "emerging growth company" in Rule 12b-2 of the Exchange Act.(Check one):
Large accelerated filer ☐ Accelerated filer ☒ Non-accelerated filer ☐
(Do not check if a smaller reporting company) Smaller reporting company ☐ Emerging growth company ☐
If an emerging growth company, indicate by check mark if the registrant has elected not to use the extended transition period for complying with any new or revised
financial accounting standards provided pursuant to Section 13(a) of the Exchange Act. ☐Indicate by check mark whether the registrant has filed a report on and attestation to its management’s assessment of the effectiveness of its internal control over financial
reporting under Section 404(b) of the Sarbanes-Oxley Act (15 U.S.C. 7262(b)) by the registered public accounting firm that prepared or issued its audit report. ☐
Indicate by check mark whether the registrant is a shell company (as defined in Rule 12b-2 of the Exchange Act). Yes ☐ No ☒The aggregate market value of the voting shares held by non-affiliates of the registrant as of December 31, 2019 was approximately $266 million based on the closing price
of the registrant's common share as reported on the NASDAQ Global Select Market on December 31, 2019 (the last business day of the registrant's most recently completedsecond fiscal quarter). The common shares of the registrant held by each executive officer and director and certain affiliated shareholders who beneficially owned 10% or moreof the outstanding common stock of the registrant have been excluded in such calculation as such persons and entities may be deemed to be affiliates of the registrant. Thisdetermination of affiliate status is not necessarily a conclusive determination for other purposes.
There were 25,307,533 shares of the registrant's common shares outstanding as of July 31, 2020.
DOCUMENTS INCORPORATED BY REFERENCE
Portions of the registrant's Proxy Statement for the registrant's 2020 Annual General Meeting of Shareholders are incorporated by reference into Part III of this Form 10-Kto the extent stated herein. The Definitive Proxy Statement is expected to be filed within 120 days of the registrant's fiscal year ended June 30, 2020.

Alpha and Omega Semiconductor LimitedForm 10-K
For the Year Ended June 30, 2020TABLE OF CONTENTS
PagePart I. Item 1. Business 1 Item 1A. Risk Factors 14 Item 1B. Unresolved Staff Comments 37 Item 2. Properties 38 Item 3. Legal Proceedings 39 Item 4. Mine Safety Disclosures 39Part II. 40 Item 5. Market for Registrant's Common Equity, Related Stockholder Matters and Issuer Purchases of Equity Securities 40 Item 6. Selected Financial Data 42 Item 7. Management's Discussion and Analysis of Financial Condition and Results of Operations 44 Item 7A. Quantitative and Qualitative Disclosures About Market Risk 64 Item 8. Financial Statements and Supplementary Data 65 Item 9. Changes in and Disagreements with Accountants on Accounting and Financial Disclosure 65 Item 9A. Controls and Procedures 66 Item 9B. Other Information 68Part III. 69 Item 10. Directors, Executive Officers and Corporate Governance 69 Item 11. Executive Compensation 69 Item 12. Security Ownership of Certain Beneficial Owners and Management and Related Stockholder Matters 69 Item 13. Certain Relationships and Related Transactions, and Director Independence 69 Item 14. Principal Accounting Fees and Services 69Part IV. 70 Item 15. Exhibits and Financial Statement Schedules 70Signatures 125

(This page intentionally left blank.)
PART I
Item 1. Business
Forward Looking Statements
This Annual Report on Form 10-K and the documents incorporated herein by reference contain forward-looking statements within the meaning ofSection 27A of the Securities Act of 1933, as amended, and Section 21E of the Securities Exchange Act of 1934, as amended, which are subject to the “safeharbor” created by those sections. Forward-looking statements are based on our management's beliefs and assumptions and on information currently available toour management. In some cases, you can identify forward-looking statements by terms such as “may,” “will,” “should,” “could,” “intend,” “would,” “expect,”“plan,” “anticipate,” “believe,” “estimate,” “project,” “predict,” “potential” and similar expressions intended to identify forward-looking statements. Thesestatements involve known and unknown risks, uncertainties and other factors, which may cause our actual results, performance, time frames or achievements to bematerially different from any future results, performance, time frames or achievements expressed or implied by the forward-looking statements. We discuss manyof these risks, uncertainties and other factors in this Annual Report on Form 10-K in greater detail in Item 1A.“Risk Factors.” Given these risks, uncertainties andother factors, you should not place undue reliance on these forward-looking statements. Also, these forward-looking statements represent our estimates andassumptions only as of the date of this filing. You should read this Annual Report on Form 10-K in its entirety and with the understanding that our actual futureresults may be materially different from what we expect. We hereby qualify our forward-looking statements by these cautionary statements. Except as required bylaw, we assume no obligation to update these forward-looking statements publicly, or to update the reasons actual results could differ materially from thoseanticipated in these forward-looking statements, even if new information becomes available in the future.
Overview
We are a designer, developer and global supplier of a broad portfolio of power semiconductors. Our portfolio of power semiconductors includesapproximately 2,300 products, and has grown significantly with the introduction of over 160 new products in the fiscal year ended June 30, 2020, and over 200new products in each of the fiscal year ended June 30, 2019 and 2018, respectively. Our teams of scientists and engineers have developed extensive intellectualproperties and technical knowledge that encompass major aspects of power semiconductors, which we believe enables us to introduce and develop innovativeproducts to address the increasingly complex power requirements of advanced electronics. We have an extensive patent portfolio that consists of 823 patents and76 patent applications in the United States as of June 30, 2020. We also have a total of 851 foreign patents, which primarily were based on our research anddevelopment efforts through June 30, 2020. We differentiate ourselves by integrating our expertise in technology, design, and advanced packaging to optimizeproduct performance and cost. Our portfolio of products targets high-volume applications, including portable computers, graphics cards, flat panel TVs, homeappliances, smart phones, battery packs, consumer and industrial motor controls and power supplies for TVs, computers, servers and telecommunicationsequipment.
During the fiscal year ended June 30, 2020, we continued our diversification strategy by developing new silicon and packaging platforms to expand ourserviceable available market, or SAM and offer higher performance products. Our metal-oxide-semiconductor field-effect transistors, or MOSFET, portfolioexpanded significantly across a full range of voltage applications. We also developed new technologies and products designed to penetrate into markets beyond ourMOSFET computing base, including the consumer, communications and industrial markets, IGBTs for the home appliance market, as well as power ICs for thenext generation computing applications.
Our business model leverages global resources, including research and development and manufacturing in the United States and Asia. Our sales and technicalsupport teams are localized in several growing markets. We operate an 8-inch wafer fabrication facility located in Hillsboro, Oregon (the "Oregon fab"), which iscritical for us to accelerate proprietary technology development, new product introduction and improve our financial performance. To meet the market demand forthe more mature high volume products, we also utilize the wafer manufacturing capacity of selected third party foundries. For assembly and test, we primarily relyupon our in-house facilities in China. In addition, we utilize subcontracting partners for industry standard packages. We believe our in-house packaging and testingcapability provides us with a competitive advantage in proprietary packaging technology, product quality, costs and sales cycle time.
On March 29, 2016, we entered into a joint venture contract (the “JV Agreement”) with two investment funds affiliated with the municipalities of Chongqing(the “Chongqing Funds”), pursuant to which we and Chongqing Funds formed a joint venture, (the “JV Company”), for the purpose of constructing a powersemiconductor assembly and test facility and a 12-inch wafer fabrication facility in the Liangjiang New Area of Chongqing, China (the “JV Transaction”). As ofJune 30, 2020, we own 51%, and the Chongqing Funds own 49%, of the equity interest in the JV Company. The JV Company had been ramping
1
up its production of assembly and testing during the fiscal year 2020. The 12-inch wafer fabrication facility commenced its limited mass production in the quarterended September 30, 2019 and continued its ramp in the year ended June 30, 2020. While the JV Company is our consolidated subsidiary for purpose of financialreporting, it operates as an independent and separate legal entity. As a result, the JV Company’s assets and liabilities are generally segregated from our company'sassets and liabilities. For example, the JV Company incurs debt through its own financing and bank loan agreements, and we are not parties to these agreementsand do not provide any guarantee or security for the JV Company’s debt, nor do we have direct access to any cash proceeds borrowed from such loan agreements.
In September 2017, we entered into a license agreement with STMicroelectronics International N.V. (“STMicro”), pursuant to which STMicro granted us aworld-wide, royalty-free and fully-paid license to use its technologies to develop, market and distribute certain digital power multi-phase controller products,which have been previously offered by STMicro. We have been in the process of developing this new digital power business. Our digital power team continues towork with customers in their product designs and is making steady progress on our product roadmap. In July 2020, we shipped our first digital power product.
We were incorporated in Bermuda on September 27, 2000 as an exempted limited liability company. The address of our registered office is ClarendonHouse, 2 Church Street, Hamilton HM 11, Bermuda. The address of our U.S. office is Alpha and Omega Semiconductor Incorporated, 475 Oakmead Parkway,Sunnyvale, CA 94085. Telephone number of our U.S. office is (408) 830-9742. We have incorporated various wholly-owned subsidiaries in different jurisdictions,and a subsidiary (the JV Company) in which we have a controlling interest. Please refer to Exhibit 21.1 to this Form 10-K for a complete list of our subsidiaries.
Our industry
Semiconductors are electronic devices that perform a variety of functions, such as converting or controlling signals, processing data and delivering ormanaging power. With advances in semiconductor technology, the functionality and performance of semiconductors have generally increased over time, while sizeand cost have generally decreased. These advances have led to a proliferation of more complex semiconductors being used in a wide variety of consumer,computing, communications and industrial markets and have contributed to the growth of the semiconductor industry.
Analog semiconductors
The semiconductor industry is segmented into analog and digital. Analog semiconductors process light, sound, motion, radio waves and electrical currentsand voltages. In contrast, digital semiconductors process binary signals represented by a sequence of ones and zeros.
As a result of these fundamental differences, the analog semiconductor industry is distinct from the digital semiconductor industry in terms of the complexityof design and the length of product cycle. Improper interactions between analog circuit elements can potentially render an electronic system inoperable.Experienced engineers engaged in the design process are necessary because computer-aided design cannot fully model the behavior of analog circuitry. Therefore,experienced analog engineers with requisite knowledge are in great demand but short supply worldwide. In addition, analog semiconductors tend to have a longerproduct life cycle because original design manufacturers, or ODMs and original equipment manufacturers, or OEMs typically design the analog portions of asystem to span multiple generations of their products. Once designed into an application, the analog portion is rarely modified because even a slight change to theanalog portion can cause unexpected interactions with other components, resulting in system instability.
Power semiconductors
Power semiconductors are a subset of the analog semiconductor sector with their own set of characteristics unique to system power architecture and function.Power semiconductors transfer, manage and switch electricity to deliver the appropriate amount of voltage or current to a broad range of electronic systems andalso protect electronic systems from damage resulting from excessive or inadvertent electrical charges.
Power semiconductors can be either discrete devices, which typically comprise only a few transistors or diodes, or ICs, which incorporate a greater numberof transistors. The function of power discrete devices is power delivery by switching, transferring or converting electricity. Power transistors comprise the largestsegment of the power discrete device market. Power ICs, sometimes referred to as power management ICs, perform power delivery and power managementfunctions, such as controlling and regulating voltage and current and controlling power discrete devices.
2
The growth of the power semiconductor market in recent years has several key drivers. The proliferation of computer and consumer electronics, such asnotebooks, tablets, smart phones, flat panel displays and portable media players created the need for sophisticated power management to improve power efficiencyand extend battery life. The evolution of these products is characterized by increased functionality, thinner or smaller form factors and decreasing prices. OurPower IC and low voltage (5V-40V) MOSFET products address this market. In the area of AC-DC power supplies for electronic equipment, data centers andservers, the market is characterized by a continuous demand for energy conservation through higher efficiency, which is driving the need for our medium voltage(40V-400V) and high voltage (500V-1000V) MOSFET products. The increased application of power semiconductors to control motors in white goods andindustrial applications, is driving demand for Insulated Gate Bipolar Transistors, or IGBTs. IGBTs are also being used in renewable energy and automotiveapplications.
The evolution toward smaller form factors and complex power requirements in the low voltage areas has driven further integration in power semiconductors,resulting in power ICs that incorporate the functionalities of both power management and power delivery in a single device. Power ICs can be implemented byincorporating all necessary power functions either on one piece of silicon or multiple silicon chips encapsulated into a single device. Additionally, the advancementin semiconductor packaging technology enables increased power density and shrinking form factors.
Power semiconductor suppliers develop and manufacture their products using various approaches which tend to fall across a wide spectrum of balancing costsavings with proprietary technology advantages. At one end of the spectrum are integrated design manufacturers, or IDMs, which own and operate the equipmentused in the manufacturing process and design and manufacture products at their in-house facilities. IDMs exercise full control over the implementation of processtechnologies and have maximum flexibility in setting priorities for their production and delivery schedules. At the other end of the spectrum are completely-outsourced fabless semiconductor companies, which rely entirely on off-the-shelf technologies and processes provided by their manufacturing partners. Thesecompanies seek to reduce or eliminate fixed costs by outsourcing both product manufacturing and development of process technologies to third parties. Our modelseeks to achieve the best balance between technological advancement and cost effectiveness by using a dedicated in-house technology research and developmentteam to drive rapid new product developments, while utilizing both in-house and third-party foundry capacity for our products. This is particularly important in thedevelopment of power semiconductor products due to the unique nature of their technology. While digital technologies are highly standardized in leadingfoundries, power semiconductor technologies tend to be more unique as they seek to accommodate a wider range of voltage applications. Accordingly, third-partyfoundries, which are primarily designed and established for digital technologies, may have limited capabilities when it comes to the development of new powersemiconductor technologies.
Our strategies
Our strategy is to advance our position as a leading designer, developer and global supplier of a broad portfolio of power semiconductors. To accomplish this,we have adopted a strategy that allows us to accelerate the development of our proprietary technology at our in-house fabrication facilities, bring new products tomarket faster, and improve our financial performance in the long run. This model also provides quicker response to our customer demands, enhances relationshipswith strategic customers, and provides flexibility in capacity management and geographic diversification of our wafer supply chain. Our in-house manufacturingcapability allows us to retain a higher level of control over the development and application of our proprietary process technology, thereby reducing certainoperational risks and costs associated with utilizing third-party foundries. We also expect to increase our manufacturing capacity through the JV Transaction,which we believe will also allow us to expand and diversify our markets in China, as well as to accelerate the development of our proprietary process technologyand new product offerings.
Although our largest end-market segment is the personal computing ("PC") market, we have successfully diversified our business by expanding into othermarket segments, including the consumer, communications, power supply and industrial market segments. While we have made progress in our diversification andexpansion into additional applications, we continue to support and grow our PC business by expanding bill-of-material content, gaining market share, andacquiring new customers.
We plan to further expand the breadth of our product portfolio to increase our total bill-of-materials within an electronic system and to address the powerrequirements of additional electronic systems. Our product portfolio currently consists of approximately 2,300 products and we have introduced over 160 newproducts in this past fiscal year. We will continue to leverage our expertise to further increase our product lines, including higher performance power ICs, IGBTsand high, medium and low voltage MOSFETs, in order to broaden our addressable market and improve our margin profile. We are also in the process ofdeveloping a digital power controller and smart power stage product lines based on the technology that we licensed from STMicro. We believe that our increasedproduct offerings will allow us to penetrate new end-market applications and
3
provide us with an important competitive advantage. OEMs and ODMs generally prefer to limit their supplier base to a smaller set of vendors capable of providinga comprehensive menu of products across multiple electronic platforms.
Leverage our power semiconductor expertise to drive new technology platforms
We believe that the ever-increasing demand for power efficiency in power semiconductors requires expertise in and a deep understanding of theinterrelationship among device physics, process technologies, design and packaging. We also believe that engineers with experience and understanding of thesemultiple disciplines are in great demand but short supply. Within this context, we believe that we are well positioned to be a leader in providing total powermanagement solutions because of our extensive pool of experienced scientists and engineers and our strong IP portfolio. Accordingly, we intend to leverage ourexpertise to increase the number of power discrete technology platforms and power IC designs, including future digital power controller products that are currentlyunder development, to expand our product offerings and deliver complete power solutions for our targeted applications. In addition, our ability to develop newtechnology is enhanced by the operation of our own manufacturing facilities in Oregon and Chongqing.
Increase direct relationships and product penetration with OEM and ODM customers
We have developed direct relationships with key OEMs who are responsible for branding, designing and marketing a broad array of electronic products, aswell as ODMs who have traditionally been responsible for manufacturing these products. While OEMs typically focus their design efforts on their flagshipproducts, as the industry has evolved, ODMs are increasingly responsible for designing portions, or entire systems, of the products they manufacture for the OEMs.In addition, several ODMs are beginning to design, manufacture and brand their own proprietary products which they sell directly to consumers. We intend tostrengthen our existing relationships and form new ones with both OEMs and ODMs by aligning our product development efforts with their product requirements,increasing the number of our products used within their systems, and leveraging our relationships to penetrate their other products. In addition, we are refocusingour research and development efforts to respond more directly to market demand by designing and developing new products based on feedback from ourcustomers, which also allows us to reduce time-to-market and sales cycles.
Leverage global business model for cost-effective growth
We intend to continue to leverage our global resources and regional strengths. We will continue to deploy marketing, sales and technical support teams inclose proximity to our end customers. We plan to further expand and align our technical marketing and application support teams along with our sales team tobetter understand and address the needs of our end customers and their end-market applications, in particular for those with the new technology platformsdeveloped in this past year and in the future. This will assist us in identifying and defining new technology trends and products and to help us gain additionaldesign wins. In addition, we have made significant progress in the past fiscal year towards the completion of the manufacturing facilities and commencement ofproduction at the JV Company. We expect the JV Company will, in the long term, reduce the cost of manufacturing our products and accelerate the development ofnew products, while allowing us to gain valuable access to new customers in China.
Our products
To serve the large and diverse analog market for power semiconductors, we have created a broad product portfolio consisting of two major categories: powerdiscretes and power ICs.
Our power discretes products consist primarily of low, medium and high voltage power MOSFETs. Our low voltage MOSFET series is based on ourproprietary silicon and package technologies, with deep application know-how in various market segments. We have precisely defined technology platforms toaddress different requirements from various applications. Our medium voltage MOSFETs provide optimized performance with high efficiency, high robustnessand high reliability, and are widely used in applications such as TV backlighting, telecom power supplies, and industrial applications. We expanded our highvoltage 600V and 700V MOSFET portfolio based on our aMOS5 technology platform to address robust consumer and industrial applications. Our high-voltageportfolio includes our proprietary insulated-gate bipolar transistor ("IGBT") technology, which we provide highly robust and easy-to-use solutions for industrialmotor control and white goods applications. We have also released our first 1200V SiC (Silicon carbide) product based on our new AlphaSiC platform, designed toaddress high efficiency, high density industrial applications such as solar inverters, UPS, and battery management systems.
Our power ICs deliver power as well as control and regulate the power management variables, such as the flow of current and level of voltage. Our DrMOSfamily of products continued to grow as we paired our latest high performance MOSFET
4

silicon with our latest Driver IC technologies. We continued to expand our EZBuck power IC family with products that feature lower on-resistance, less powerconsumption, smaller footprint and thermally enhanced packages. While we derive the majority of our revenue from the sales of power discretes products, sales ofpower ICs continued to gain traction during the past years. Our Type C smart load switch product line has also expanded as it offers reverse blocking capability,designed to protect applications against high voltage exposure.
5
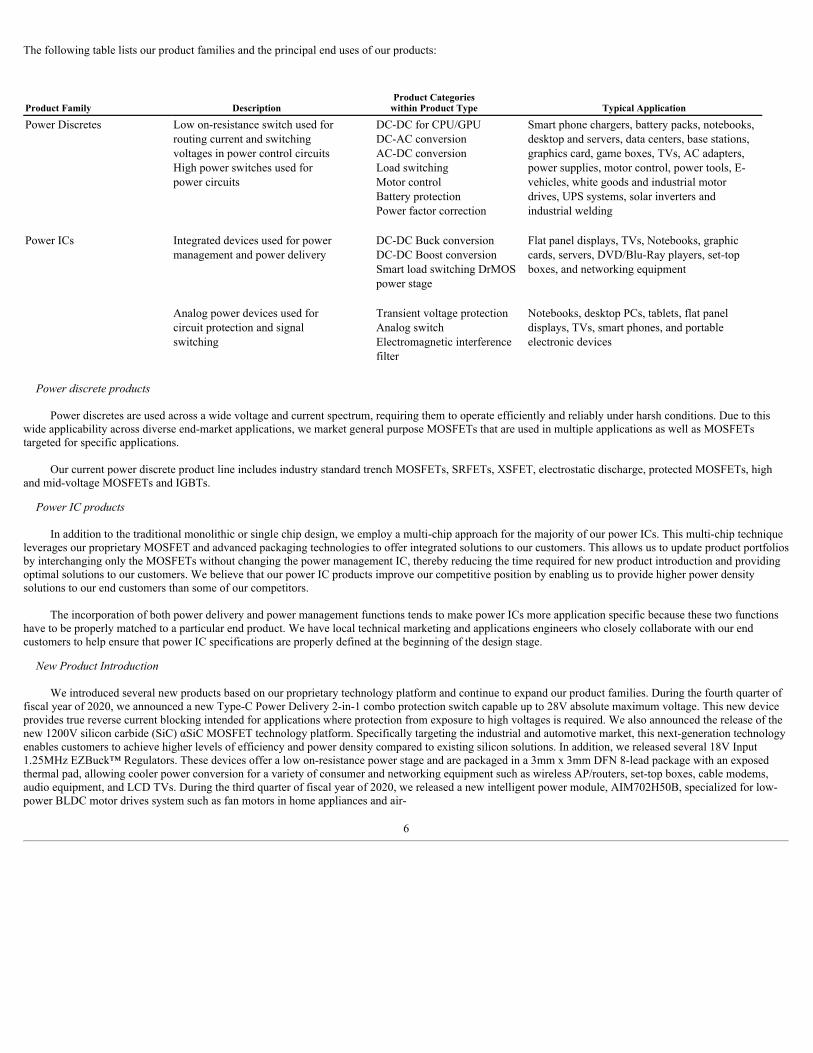
The following table lists our product families and the principal end uses of our products:
Product Family DescriptionProduct Categories
within Product Type Typical Application
Power Discretes Low on-resistance switch used forrouting current and switchingvoltages in power control circuitsHigh power switches used forpower circuits
DC-DC for CPU/GPUDC-AC conversionAC-DC conversionLoad switchingMotor controlBattery protectionPower factor correction
Smart phone chargers, battery packs, notebooks,desktop and servers, data centers, base stations,graphics card, game boxes, TVs, AC adapters,power supplies, motor control, power tools, E-vehicles, white goods and industrial motordrives, UPS systems, solar inverters andindustrial welding
Power ICs Integrated devices used for power
management and power deliveryDC-DC Buck conversionDC-DC Boost conversionSmart load switching DrMOSpower stage
Flat panel displays, TVs, Notebooks, graphiccards, servers, DVD/Blu-Ray players, set-topboxes, and networking equipment
Analog power devices used forcircuit protection and signalswitching
Transient voltage protectionAnalog switchElectromagnetic interferencefilter
Notebooks, desktop PCs, tablets, flat paneldisplays, TVs, smart phones, and portableelectronic devices
Power discrete products
Power discretes are used across a wide voltage and current spectrum, requiring them to operate efficiently and reliably under harsh conditions. Due to thiswide applicability across diverse end-market applications, we market general purpose MOSFETs that are used in multiple applications as well as MOSFETstargeted for specific applications.
Our current power discrete product line includes industry standard trench MOSFETs, SRFETs, XSFET, electrostatic discharge, protected MOSFETs, highand mid-voltage MOSFETs and IGBTs.
Power IC products
In addition to the traditional monolithic or single chip design, we employ a multi-chip approach for the majority of our power ICs. This multi-chip techniqueleverages our proprietary MOSFET and advanced packaging technologies to offer integrated solutions to our customers. This allows us to update product portfoliosby interchanging only the MOSFETs without changing the power management IC, thereby reducing the time required for new product introduction and providingoptimal solutions to our customers. We believe that our power IC products improve our competitive position by enabling us to provide higher power densitysolutions to our end customers than some of our competitors.
The incorporation of both power delivery and power management functions tends to make power ICs more application specific because these two functionshave to be properly matched to a particular end product. We have local technical marketing and applications engineers who closely collaborate with our endcustomers to help ensure that power IC specifications are properly defined at the beginning of the design stage.
New Product Introduction
We introduced several new products based on our proprietary technology platform and continue to expand our product families. During the fourth quarter offiscal year of 2020, we announced a new Type-C Power Delivery 2-in-1 combo protection switch capable up to 28V absolute maximum voltage. This new deviceprovides true reverse current blocking intended for applications where protection from exposure to high voltages is required. We also announced the release of thenew 1200V silicon carbide (SiC) αSiC MOSFET technology platform. Specifically targeting the industrial and automotive market, this next-generation technologyenables customers to achieve higher levels of efficiency and power density compared to existing silicon solutions. In addition, we released several 18V Input1.25MHz EZBuck™ Regulators. These devices offer a low on-resistance power stage and are packaged in a 3mm x 3mm DFN 8-lead package with an exposedthermal pad, allowing cooler power conversion for a variety of consumer and networking equipment such as wireless AP/routers, set-top boxes, cable modems,audio equipment, and LCD TVs. During the third quarter of fiscal year of 2020, we released a new intelligent power module, AIM702H50B, specialized for low-power BLDC motor drives system such as fan motors in home appliances and air-
6
conditioners that require highly compact size with reliable and efficient design allowance. The new IPM7 series consists of advanced super junction MOSFETsdesigned for motor drive and high voltage gate driving ICs with an integrated bootstrap circuit in a new ultra-compact surface mountable package. Also, wereleased 700V and 600V αMOS5™ Super Junction MOSFET families in SMD-type DFN5x6 and DFN8x8 packages. αMOS5 is our latest generation of highvoltage MOSFET, designed to meet the high efficiency and high-density needs for Quick Charger, Adapter, PC Power, Server, Industrial Power, Telecom, andDatacenter applications. During the second quarter of fiscal year of 2020, we introduced the AOZ8621UNI, a series of Transient Voltage Suppressor (TVS) forVBUS protection using the latest high-surge TVS platform. This new series is ideal for USB Type-C Power Delivery, including but not limited to laptops andsmartphones. In addition, we introduced AOZ6682CI and AOZ6683CI which offer high efficiency over the full load range, allowing greener power conversion fora variety of consumer electronics applications such as LCD TVs, set-top boxes, high definition Blu-rayTM Disc Players and Networking terminals. During the firstquarter of fiscal year of 2020, we introduced the “Source Down” in a DFN 5x6 package in combination with a 40V Shield-Gate Technology (AlphaSGT™). Ourinnovative flip-chip know-how achieves the Source Down capability and this packaging technology offers a very low package resistance and inductance. TheAOE66410 is ideally suited to telecommunications applications for secondary rectification, in half bridge configuration for BLDC motor applications, and batterymanagement where paralleling is important. In addition, we introduced the TO-Leadless (TOLL) package in combination with a 60V and 100V Shield-GateTechnology providing the highest current capability in its voltage class. The TOLL package has high current capacity due to our innovative technology, whichutilizes a clip to accommodate the in-rush current. The TOLL packaging technology offers a very low package resistance and inductance due to the clip technologywhen compared to other TO-Leadless packages. This packaging technology uses a standard wire-bonding technology which enables improved EMI performance.
Distributors and customers
We have established direct relationships with key OEMs, including Dell Inc., Hewlett-Packard Company, LG Electronics, Inc. and Samsung Group, most ofwhom we serve through our distributors and ODMs. In addition, based on our historical design win activities, our power semiconductors are also incorporated intoproducts sold to many other leading OEMs.
Through our distributors, we provide products to ODMs who traditionally are contract manufacturers for OEMs. As the industry has evolved, ODMs areincreasingly responsible for designing portions, or entire systems, of the products they manufacture for the OEMs. In addition, several ODMs are beginning todesign, manufacture and brand their own proprietary products, which they sell directly to consumers. Our ODM customers include Compal Electronics, Inc.,Foxconn, Quanta Computer Incorporated, Pegatron, Wistron Corporation and AOC International.
In order to take advantage of the expertise of end-customer fulfillment logistics and shorter payment cycles, we sell most of our products through distributors.In general, under the agreements with our distributors, they have limited rights to return unsold merchandise, subject to time and volume limitations. As of June 30,2020, 2019 and 2018, our two largest distributors were WPG Holdings Limited, or WPG, and Promate Electronic Co. Ltd., or Promate. Sales to WPG and Promateaccounted for 35.5% and 29.3% of our revenue, respectively, for the fiscal year ended June 30, 2020, 36.4% and 28.8% of our revenue, respectively, for the fiscalyear ended June 30, 2019, and 35.2% and 28.3% of our revenue, respectively, for fiscal year ended June 30, 2018, respectively.
Sales and marketing
Our marketing division is responsible for identifying high growth markets and applications where we believe our technology can be effectively deployed. Webelieve that the technical background of our marketing team, including application engineers, helps us better define new products and identify potential endcustomers and geographic and product market opportunities. For example, as part of our market diversification strategy, we have deployed and plan to recruit morefor our new market segments, field application engineers, or FAEs, who provide real-time and local response to our end customers' needs. FAEs work with our endcustomers to understand their requirements and resolve technical problems. FAEs also strive to anticipate future customer needs and facilitate the design-in of ourproducts into the end products of our customers. We believe this strategy increases our share of revenue opportunities within the applications we currently serve, aswell as in new end-market applications.
Our sales team consists of sales personnel, field application engineers, customer service representatives and customer quality engineers who are responsiblefor key accounts. We strategically position our team near our end customers through our offices in Taipei, Hong Kong, Shenzhen, Shanghai, Qingdao, Tokyo,Seoul, Heilbronn, and Sunnyvale, California, complemented by our applications centers in Sunnyvale and Shanghai. In addition, our distributors and salesrepresentatives assist us in our sales and marketing efforts by identifying potential customers, creating additional demand and promoting our products, in whichcase we may pay a sales commission.
7
Our sales cycle varies depending on the types of products and can range from six to eighteen months. In general, our traditional power discrete products inPC and TV applications progress are progressing more rapidly through the design and marketing processes, therefore they generally have shorter sales cycle. Incontrast, our newer Power IC and IGBT products, mostly in the power supply, home appliance and industrial applications, require a more extended design andmarketing timeline and thus have a longer sales cycle. Typically, our sales cycle for all products comprises of the following steps:
• identification of a customer design opportunity;
• qualification of the design opportunity by our FAEs through comparison of the power requirements against our product portfolio;
• provision of a product sample to the end customer to be included in the customer's pre-production model with the goal of being included in the final billof materials; and
• placement by the customer, or through its distributor, of a full production order as the end customer increases to full volume production.
Competition
The power semiconductor industry is characterized by fragmentation with many competitors. We compete with different power semiconductor suppliers,depending on the type of product lines and geographical area. Our key competitors in power discretes and power ICs are primarily headquartered in the UnitedStates, Japan, Europe, China and Taiwan. Our major competitors in power discretes include Infineon Technologies AG, MagnaChip Semiconductor Corporation,ON Semiconductor Corp., STMicroelectronics N.V., Toshiba Corporation, Diodes Incorporated and Vishay Intertechnology, Inc. Our major competitors for ourpower ICs include Global Mixed-mode Technology Inc., Monolithic Power Systems, Inc., ON Semiconductor Corp., Richtek Technology Corp., SemtechCorporation, Texas Instruments Inc. and Vishay Intertechnology, Inc.
Our ability to compete depends on a number of factors, including:
• our success in expanding and diversifying our serviceable markets, and our ability to develop technologies and product solutions for these markets;
• our capability to quickly develop and introduce proprietary technology and best-in-class products;
• the performance and cost-effectiveness of our products relative to that of our competitors;
• our ability and capacity to manufacture, package and deliver products in large volume on a timely basis at a competitive price;
• our success in utilizing new and proprietary technologies to offer products and features previously not available in the marketplace;
• our ability to recruit and retain analog semiconductor designers and application engineers; and
• our ability to protect our intellectual property.
Some of our competitors have longer operating histories, more brand recognition, and significantly greater financial, technical, research and development,sales and marketing, manufacturing and other resources. However, we believe that we can compete effectively through our integrated and innovative technologyplatform and design capabilities, including our strong and extensive patent portfolio, strategic global business model, expanding suites of new products, diversifiedand broad customer base, and excellent on-the-ground support and quick time to market for our products.
Seasonality
As we provide power semiconductors used in consumer electronic products, our business is subject to seasonality. Our sales seasonality is affected by anumber of factors, including global and regional economic conditions as well as the PC market conditions, revenue generated from new products, changes indistributor ordering patterns in response to channel inventory adjustments and end customer demand for our products and fluctuations in consumer purchasepatterns prior to major holiday seasons. Our normal seasonality may be affected by the COVID-19 pandemic and given the uncertainty of the global economicconditions resulting from the pandemic, it is difficult for us to predict to what extent our sales seasonality may change.
8
Backlog
Our sales are made primarily pursuant to standard purchase orders from distributors and direct customers. The amount of backlog to be shipped during anyperiod depends on various factors, and all orders are subject to cancellation or modification, usually with no penalty to customers. The quantities actuallypurchased by customers, as well as shipment schedules, are frequently revised to reflect changes in both the customers' requirements and in manufacturingavailability. Therefore, our backlog at any point in time is not a reliable indicator of our future revenue.
Research and development
Because we view technology as a competitive advantage, we invest significant time and capital in research and development to address the technologyintensive needs of our end customers. Our research and development expenditures for the fiscal years of 2020, 2019 and 2018 were $51.3 million, $46.4 millionand $37.3 million, respectively. Our research and development expenditures primarily consist of salaries, bonuses, benefits, share-based compensation expense,expenses associated with new product prototypes, travel expenses, fees for engineering services provided by outside contractors and consultants, amortization ofsoftware and design tools, depreciation of equipment and overhead costs. We continue to invest in developing new technologies and products utilizing our ownfabrication and packaging facilities as it is critical to our long-term success. We also evaluate appropriate investment levels and stay focused on new productintroductions to improve our competitiveness. We have research and development teams in Silicon Valley (Sunnyvale, California), Oregon, Taipei, Taiwan, andShanghai, China. We believe that these diverse research and development teams enable us to develop leading edge technology platforms and new products. Ourareas of research and development focus include:
Packaging technologies: Consumer demand for smaller and more compact electronic devices with higher power density is driving the need for advancedpackaging technology. Our group of dedicated packaging engineers focuses on smaller form factors, higher power output with efficient heat dissipation and cost-effectiveness. We have invested resources to develop and enhance our proprietary packaging technologies, including the establishment of our in-house packagingand testing facilities. We believe that our efforts to develop innovative packaging technologies will continue to provide new and cost-effective solutions withhigher power density to our customers. During the fiscal year ended June 30, 2020, we continued our diversification strategies by developing new silicon andpackaging platforms to expand our SAM and offer higher performance products.
Process technology and device physics: We focus on specialized process technology in the manufacturing of our products, including vertical DMOS,Shielded Gate Trench, Trench field stop IGBTs, charge-balance high voltage MOSFETs, Schottky Diode and BCDMOS processes. Our process engineers workclosely with our design team to deploy and implement our proprietary manufacturing processes at our Oregon fab, and more recently, at the Chongqingmanufacturing facility under the JV, as well as the third-party foundries that fabricate our wafers. We also expect our 12-inch fab at the JV Company will provideus with enhanced ability to develop and accelerate new process technology for advanced products. To improve our process technology, we continue to develop andenhance our expertise in device physics in order to better understand the physical characteristics of materials and the interactions among these materials during themanufacturing process.
New products and new technology platforms: We also invest significantly in the development of new technology platforms and introduction of new products.Because power management affects all electronic systems, we believe that developing a wide portfolio of products enables us to target new applications in additionto expanding our share of power management needs served within existing applications.
As a technology company, we will continue our significant investment in research and development in our low voltage, medium voltage, and high voltagepower discretes, IGBT and power modules and power ICs by developing new technology platforms and new products that allow for better product performance,more efficient packages and higher levels of integration.
Operations
The manufacture of our products is divided into two major steps: wafer fabrication and packaging and testing.
Wafer fabrication Our Oregon fab allows us to accelerate the development of our technology and products, as well as to provide better service to our customers. We allocate
our wafer production between our in-house facility and third-party foundries, although in the past three years, we have gradually reduced our reliance on third-party foundries and increased allocation of capacity to our Oregon fab. Currently our main third-party foundry is Shanghai Hua Hong Grace Electronic CompanyLimited, ("HHGrace"), or formerly HHNEC, located in Shanghai. HHGrace has been manufacturing wafers for us since 2002. HHGrace
9
manufactured 12.7%, 14.1% and 15.4% of the wafers used in our products for the fiscal years ended June 30, 2020, 2019 and 2018, respectively.
On March 29, 2016, we entered into the JV agreement with two investment funds affiliated with the municipalities of Chongqing for the purpose ofconstructing a power semiconductor packaging, testing and 12-inch wafer fabrication facility in the Liangjiang New Area of Chongqing. The JV Company hadbeen ramping up its production of assembly and testing during the fiscal year 2020. The 12-inch wafer fabrication facility commenced its limited mass productionin the quarter ended September 30, 2019 and continued its ramp in the year ended June 30, 2020. We believe the JV Company will increase and diversify ourcustomer base, particularly in China, and accelerate the development of proprietary process technology.
Packaging and testing
Completed wafers from the foundries are sent to our in-house packaging and testing facilities or to our subcontractors, where the wafers are cut intoindividual die, soldered to lead frames, wired to terminals and then encapsulated in protective packaging. After packaging, all devices are tested in accordance withour specifications and substandard or defective devices are rejected. We have established quality assurance procedures that are intended to control qualitythroughout the manufacturing process, including qualifying new parts for production at each packaging facility, conducting root cause analysis, testing for lots withprocess defects and implementing containment and preventive actions. The final tested products are then shipped to our distributors or customers.
Our in-house and wholly-owned packaging and testing facilities are located in Shanghai, China which handle most of our packaging and testing requirementsfor our products. In addition, the JV Company handles a portion of our packaging and testing requirement. We continuously increase the outsourcing portion of ourpackaging and testing requirements to other contract manufacturers to improve our ability to respond to changes in market demand. Our facilities have thecombined capacity to package and test over 600 million parts per month and have available floor space for new package introductions. We believe our ability topackage and test our products internally represents a strategic advantage as it protects our proprietary packaging technology, increases the rate of new packageintroductions, reduces operating expenses and ultimately improves our profit margins.
Quality assurance
Our quality assurance practices aim to consistently provide our end customers with products that are reliable, durable and free of defects. We strive to do sothrough design for manufacturing, and continuous improvement in our product design and manufacturing and close collaboration with our manufacturing partners.Our manufacturing operations in China and our manufacturing facility in Oregon are certified to the ISO9001 and IATF16949:2016. These Quality ManagementSystem certifications are in recognition of our quality assurance standards. Both ISO9001 and IATF16949:2016 are sets of criteria and procedures established byInternational Organization of Standardization for developing a fundamental quality management system and focusing on continuous improvement, defectprevention and the reduction of variation and waste. Our products are also in compliance with Restrictions on the use of Hazardous Substances, or RoHS 2.0.
We maintain a supplier management and process engineering team in Shanghai that works with our third-party foundries and packaging and testingsubcontractors to monitor the quality of our products, which is designed to ensure that manufacturing of our products is in strict compliance with our processcontrols, monitoring procedures and product requirements. We also conduct periodic reviews and annual audits to ensure supplier performance. For example, weexamine the results of statistical process control systems, implement preventive maintenance, verify the status of quality improvement projects and review deliverytime metrics. In addition, we rate and rank each of our suppliers every quarter based on factors such as their quality and performance. Our facility in Oregonintegrates manufacturing process controls through our manufacturing execution system, coupled with wafer process controls that include monitoring procedures,preventative maintenance, statistical process control, and testing to ensure that finished wafers delivered will meet and exceed quality and reliability requirements.All materials used to manufacture wafers are controlled through a strict qualification process.
Our manufacturing processes use many raw materials, including silicon wafers, gold, copper, molding compound, petroleum and plastic materials andvarious chemicals and gases. We obtain our raw materials and supplies from a large number of sources. Although supplies for raw materials used by us arecurrently adequate, shortages could occur in various essential materials due to interruption of supply or increased demand in the industry.
Intellectual property rights
Intellectual property is a critical component of our business strategy, and we intend to continue to invest in the growth, maintenance and protection of ourintellectual property portfolio. We own significant intellectual property in many aspects of
10
power semiconductor technology, including device physics and structure, wafer processes, circuit designs, packaging, modules and subassemblies. We have alsoentered into intellectual property licensing agreements with other companies, including On Semiconductor Corp. and Giant Semiconductor Corporation, to useselected third-party technology for the development of our products, although we do not believe our business is dependent to any significant degree on anyindividual third-party license agreement. We have a license agreement with STMicroelectronics International N.V. (“STMicro”), pursuant to which STMicrogranted us a world-wide, royalty-free and fully-paid license to use its technologies to develop, market and distribute certain digital multi-phase controller products,which have been offered previously by STMicro. This license agreement allows us to develop a new digital power business that will design and offer a full suite ofadvance digital power controller products.
While we focus our patent efforts in the United States, we file corresponding foreign patent applications in other jurisdictions, such as China and Taiwan,when filing is justified by cost and strategic importance. The patents are increasingly important to remain competitive in our industry, and a strong patent portfoliowill facilitate the entry of our products into new markets. As of June 30, 2020, we had 823 patents issued in the United States, of which 816 were based on ourresearch and development efforts and 7 were acquired, and these patents are set to expire between 2022 and 2039. We also had a total of 851 foreign patents,including 400 Chinese patents, 415 Taiwanese patents, 21 Korean patents, 4 Hong Kong patents, 2 Philippine patents, and 9 Japanese patents as of June 30, 2020.Substantially all of our foreign patents were based on our research and development efforts. These foreign patents will expire in the years between 2023 and 2038.In addition, as of June 30, 2020, we had a total of 221 patent applications, of which 76 patents were pending in the United States, 75 patents were pending inChina, 42 patents were pending in Taiwan and 28 patents were pending in other countries.
As our technologies are deployed in new applications and as we diversify our product portfolio based on new technology platforms, we may be subject tonew potential infringement claims. Patent litigation, if and when instituted against us, could result in substantial costs and a diversion of our management'sattention and resources. However, we are committed to vigorously defending and protecting our investment in our intellectual property. Therefore, the strength ofour intellectual property program, including the breadth and depth of our portfolio, will be critical to our success in the new markets we intend to pursue.
In addition to patent protection, we also rely on a combination of trademark, copyright (including mask work protection), trade secret laws, contractualprovisions and similar laws in other jurisdictions. We also enter into confidentiality and invention assignment agreements with our employees, consultants,suppliers, distributors and customers and seek to control access to, and distribution of, our proprietary information.
Environmental matters
The semiconductor production process, including the semiconductor wafer manufacturing and packaging process, generates air emissions, liquid wastes,waste water and other industrial wastes. We have installed various types of pollution control equipment for the treatment of air emissions and liquid waste andequipment for recycling and treatment of water in our packaging and testing facilities in China and wafer manufacturing facility in Oregon, USA. Waste generatedat our manufacturing facilities, including but not limited to acid waste, alkaline waste, flammable waste, toxic waste, oxide waste and self-igniting waste, iscollected and sorted for proper disposal. Our operations in China are subject to regulation and periodic monitoring by China's State Environmental ProtectionBureau, as well as local environmental protection authorities, including those under the Shanghai Municipal Government, which may in some cases establishstricter standards than those imposed by the State Environmental Protection Bureau. Our operation in Oregon is subject to Oregon Department of EnvironmentalRegulations, Federal Environmental Protection Agency laws and regulations, and local jurisdictional regulations. We believe that we have been in materialcompliance with applicable environmental regulations and standards and have not had a material or adverse effect on our results of operations from complyingwith these regulations.
We have implemented an ISO 14001 environmental management system in our manufacturing facilities in China and Oregon. We also require oursubcontractors, including foundries and assembly houses, to meet ISO14001 standards. We believe that we have adopted pollution control measures for theeffective maintenance of environmental protection standards consistent with the requirements applicable to the semiconductor industry in China and the U.S.
Our products sold in worldwide are subject to RoHS in Electrical and Electronic Equipment, which requires that the products do not contain more thanagreed levels of lead, cadmium, mercury, hexavalent chromium, polybrominated biphenyl and polybrominated diphenyl ether flame retardants. Our manufacturingfacilities in China also obtained QC080000 certification, which is an IECQ Certificate of Conformity Hazardous Substance Process Management for EuropeanDirective 2002/95/EC requirements and a Certificate of Green Partner for Sony Green Partner Program. We avoid using these restricted materials to the extentpossible when we design our products.
11
We are also subject to SEC rules that require diligence, disclosure and reporting on whether certain minerals and metals, known as conflict minerals, used inour products originate from the Democratic Republic of Congo and adjoining countries. As of June 30, 2020, 2019 and 2018, we were in compliance with therelated conflict minerals rule.
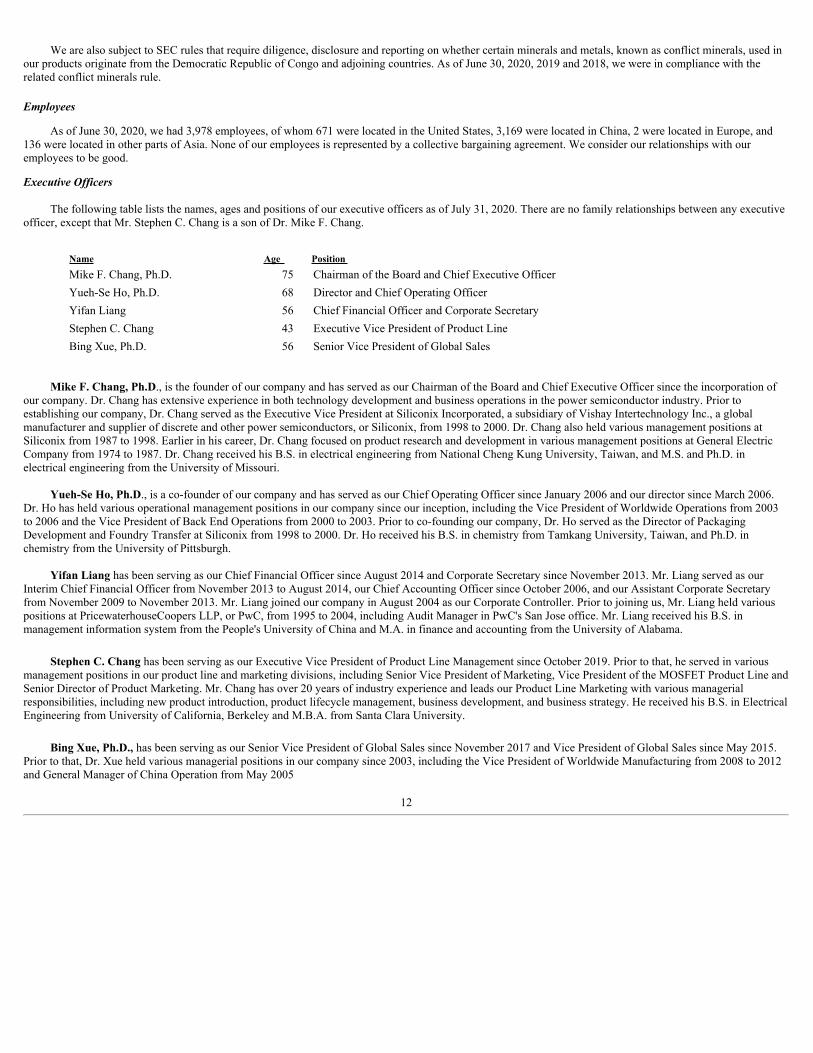
Employees
As of June 30, 2020, we had 3,978 employees, of whom 671 were located in the United States, 3,169 were located in China, 2 were located in Europe, and136 were located in other parts of Asia. None of our employees is represented by a collective bargaining agreement. We consider our relationships with ouremployees to be good.
Executive Officers
The following table lists the names, ages and positions of our executive officers as of July 31, 2020. There are no family relationships between any executiveofficer, except that Mr. Stephen C. Chang is a son of Dr. Mike F. Chang.
Name Age Position Mike F. Chang, Ph.D. 75 Chairman of the Board and Chief Executive OfficerYueh-Se Ho, Ph.D. 68 Director and Chief Operating OfficerYifan Liang 56 Chief Financial Officer and Corporate SecretaryStephen C. Chang 43 Executive Vice President of Product LineBing Xue, Ph.D. 56 Senior Vice President of Global Sales
Mike F. Chang, Ph.D., is the founder of our company and has served as our Chairman of the Board and Chief Executive Officer since the incorporation ofour company. Dr. Chang has extensive experience in both technology development and business operations in the power semiconductor industry. Prior toestablishing our company, Dr. Chang served as the Executive Vice President at Siliconix Incorporated, a subsidiary of Vishay Intertechnology Inc., a globalmanufacturer and supplier of discrete and other power semiconductors, or Siliconix, from 1998 to 2000. Dr. Chang also held various management positions atSiliconix from 1987 to 1998. Earlier in his career, Dr. Chang focused on product research and development in various management positions at General ElectricCompany from 1974 to 1987. Dr. Chang received his B.S. in electrical engineering from National Cheng Kung University, Taiwan, and M.S. and Ph.D. inelectrical engineering from the University of Missouri.
Yueh-Se Ho, Ph.D., is a co-founder of our company and has served as our Chief Operating Officer since January 2006 and our director since March 2006.Dr. Ho has held various operational management positions in our company since our inception, including the Vice President of Worldwide Operations from 2003to 2006 and the Vice President of Back End Operations from 2000 to 2003. Prior to co-founding our company, Dr. Ho served as the Director of PackagingDevelopment and Foundry Transfer at Siliconix from 1998 to 2000. Dr. Ho received his B.S. in chemistry from Tamkang University, Taiwan, and Ph.D. inchemistry from the University of Pittsburgh.
Yifan Liang has been serving as our Chief Financial Officer since August 2014 and Corporate Secretary since November 2013. Mr. Liang served as ourInterim Chief Financial Officer from November 2013 to August 2014, our Chief Accounting Officer since October 2006, and our Assistant Corporate Secretaryfrom November 2009 to November 2013. Mr. Liang joined our company in August 2004 as our Corporate Controller. Prior to joining us, Mr. Liang held variouspositions at PricewaterhouseCoopers LLP, or PwC, from 1995 to 2004, including Audit Manager in PwC's San Jose office. Mr. Liang received his B.S. inmanagement information system from the People's University of China and M.A. in finance and accounting from the University of Alabama.
Stephen C. Chang has been serving as our Executive Vice President of Product Line Management since October 2019. Prior to that, he served in variousmanagement positions in our product line and marketing divisions, including Senior Vice President of Marketing, Vice President of the MOSFET Product Line andSenior Director of Product Marketing. Mr. Chang has over 20 years of industry experience and leads our Product Line Marketing with various managerialresponsibilities, including new product introduction, product lifecycle management, business development, and business strategy. He received his B.S. in ElectricalEngineering from University of California, Berkeley and M.B.A. from Santa Clara University.
Bing Xue, Ph.D., has been serving as our Senior Vice President of Global Sales since November 2017 and Vice President of Global Sales since May 2015.Prior to that, Dr. Xue held various managerial positions in our company since 2003, including the Vice President of Worldwide Manufacturing from 2008 to 2012and General Manager of China Operation from May 2005
12

to December 2007. Prior to joining us, Dr. Xue served as the Director of Engineering in Dowslake microsystem from 2001 to 2003. Dr. Xue received his B.S. inPhysics from Xiamen University, and Ph.D. in Physical Chemistry from University of Pennsylvania.
Available Information
Our filing documents and information with the Securities and Exchange Commission (the "SEC") are available free of charge electronically through ourInternet website, www.aosmd.com. as soon as reasonably practicable after we electronically file such material with, or furnish it to, the SEC. In addition, the SECmaintains a website (www.sec.gov) that contains reports, proxy statements, and other information that we file electronically.
13
Item 1A. Risk Factors
Risks Related to Our Business
Our business operation and financial performance may be adversely affected by the COVID-19 pandemic and related events.
We are subject to risks related to the global pandemic associated with the COVID-19 disease, which has spread globally from China to the U.S. and othercountries where we have operations. Numerous governmental jurisdictions, including the States of California, Oregon and Texas and countries throughout the AsiaPacific region, have imposed “stay-at-home” orders, quarantines, travel bans and similar governmental orders and restrictions to control the spread of COVID-19.Such orders or restrictions have resulted in business closures, work stoppages, slowdowns and delays in commercial activities, unprecedented and widespreadunemployment, disruptions to ports and other shipping infrastructure, border closures, and other travel or health-related restrictions, thereby negatively impactingour customers, suppliers, distributors, employees, offices, and the entire semiconductor ecosystem.
As a result of the COVID-19 pandemic and changing consumer behaviors due to “stay-at-home” restrictions, we have experienced shifting market trends,including an increasing demand in the markets for notebooks, PCs and gaming devices and decreasing demand for mobile phone and industrial related products.While we have recently benefited from the increasing demand of PC related products, there is no guarantee that this trend will continue, and such increasingdemand may discontinue as government authorities relax COVID-19 related restrictions. Furthermore, as the COVID-19 pandemic continues and global economicdownturn and high unemployment persist, consumer spending may slow down substantially, in which case we may experience a significant decline of customerorders for our products, including those designed for PC-related applications, and such decline will adversely affect our financial conditions and results ofoperations. While we are implementing measures to enhance our marketing and sales opportunities, there is no guarantee that such measures will succeed and besufficient to mitigate the rapidly shifting market demand. Furthermore, we are experiencing and may continue to experience supply chain challenges in ourmanufacturing activities as a result of various “stay-at-home” orders. Our JV Company has slowed ramp-up activities, which may cause delay and disruption to ourtimeline to reach full production for the 12” fabrication facility in Chongqing, China.
In addition to the impact on our financial performance and manufacturing process, we are subject to the following risks resulting from the COVID-19pandemic and related events:
• the economic recession and deteriorating financial market in the U.S. and globally resulting from the COVID-19 pandemic may make it more difficult forus to obtain credit and secure debt financing on terms favorable to us, or at all, and we may not be able to comply with financial covenants in our existingcredit agreements or service our existing debt if we do not generate sufficient cash flow from our operations;
• we may encounter difficulties and disruptions in communication and coordination among our employees, partners, customers and others, which mayreduce our productivity and interfere with our ability to serve our customers;
• widespread COVID-19 disease could damage the health of our employees and management team, which may disrupt our business operations;• the value of our common shares may decline significantly as a result of factors outside of our control, such as stock market volatility, which will cause our
shareholders to lose their investment.
The impact of the COVID-19 pandemic is highly uncertain and subject to change. We cannot predict when this pandemic will end and when relatedgovernmental orders and restrictions will be eased or lifted. Any extension or prolonged implementation of these restrictions will further adversely affect ourbusiness, customers and financial results. Even after such orders and restrictions are eased or lifted, the severe economic harm inflicted upon the jurisdictions andareas in which we operate may last for an extended period of time and continue to adversely affect our business and financial performance, and there is noguarantee that we will be able to act quickly and effectively to return to our normal operations.
We may not be able to successfully develop our digital power business.
In September 2017, we entered into a license agreement with STMicro, which allows us to develop and market certain digital power multi-phase controllerproducts and enter into a new market, primarily in the computer server segment. We are in the process of developing this new digital power business and expect toincur significant startup
14
costs, including costs relating to the hiring and compensation of qualified engineers and technical staff; development of marketing and sales infrastructure,particularly in the computer server market; and other research and development and management activities. We do not expect this new business to generatesufficient revenue to offset our costs in the short term, and there is no guarantee that our attempt to develop a profitable digital business will ultimately succeed.The success of our new digital power business depends on a number of factors, including the following:
• competition from other companies with greater resources and experiences and more established reputations in the digital power market;• the availability of and our ability to recruit and attract qualified personnel;• our lack of experience and reputation in the digital power market;• difficulties in designing products acceptable to customers;• legal and regulatory restrictions; and• inadequate sales and marketing capability.
Any one of these factors may negatively impact our ability to create a successful digital power business, which would adversely affect our financialcondition and results of operations.
The decline of personal computing (“PC”) markets may have a material adverse effect on our results of operations.
A significant amount of our revenue is derived from sales of products in the PC markets such as notebooks, motherboards and notebook battery packs. Ourrevenue from the PC markets accounted for approximately 41.1%, 45.9% and 41.6% of our total revenue for the years ended June 30, 2020, 2019 and 2018,respectively. The increasing popularity of smaller, mobile computing devices such as tablets and smart phones with touch interfaces is rapidly changing the PCmarkets both in the United States and abroad. In the past, we experienced a significant reduction in the demand for our products due to the declining PC markets,which had negatively impacted our revenue, profitability and gross margin. While we recently experienced resurgence of demand in the PC market as a result ofthe COVID-19 pandemic and related events, there is no assurance that such trend will continue or that the decline of PC market will not occur again, and if it does,we may not be able to implement measures successfully to mitigate or reduce the negative impact on our financial conditions and results of operations.
Our strategy of diversification into different market segments may not succeed according to our expectations and may expose us to new risks and placesignificant strains on our management, operational, financial and other resources.
As part of the growth strategy to diversify our product portfolio and in response to the rapid decline of the PC markets, we have been developing newtechnologies and products designed to penetrate into other markets and applications, including merchant power supplies, flat panel TVs, smart phones, tablets,gaming consoles, lighting, datacom, telecommunications, home appliances and industrial motor controls. However, there is no guarantee that these diversificationefforts will be successful. As a new entrant to some of these markets, we may face intense competition from existing and more established providers and encounterother unexpected difficulties, any of which may hinder or delay our efforts to achieve success. In addition, our new products may have long design and salescycles, therefore if our diversification efforts fail to keep pace with the declining PC markets, we may not be able to alleviate its negative impact on our results ofoperations.
Our diversification into different market segments may place a significant strain on our management, operational, financial and other resources. To managethis diversification effectively, we will need to take various actions, including:
• enhancing management information systems, including forecasting procedures;• further developing our operating, administrative, financial and accounting systems and controls;• managing our working capital and sources of financing;• maintaining close coordination among our engineering, accounting, finance, marketing, sales and operations organizations;• retaining, training and managing our employee base;• enhancing human resource operations and improving employee hiring and training programs;• realigning our business structure to more effectively allocate and utilize our internal resources;• improving and sustaining our supply chain capability; and• managing both our direct and distribution sales channels in a cost-efficient and competitive manner.
15
Our failure to execute any of the above actions successfully or timely may have an adverse effect on our business and financial results.
Our operating results may fluctuate from period to period due to many factors, which may make it difficult to predict our future performance.
Our periodic operating results may fluctuate as a result of a number of factors, many of which are beyond our control. These factors include, among others:
• a deterioration in general demand for electronic products, particularly the PC market, as a result of global or regional financial crises and associatedmacro-economic slowdowns, and/or the cyclicality of the semiconductor industry;
• a deterioration in business conditions at our distributors and /or end customers;• adverse general economic conditions in the countries where our products are sold or used;• the emergence and growth of markets for products we are currently developing;• our ability to successfully develop, introduce and sell new or enhanced products in a timely manner and the rate at which our new products replace
declining orders for our older products;• the anticipation, announcement or introduction of new or enhanced products by us or our competitors;• changes in the selling prices of our products and in the relative mix in the unit shipments of our products, which have different average selling prices and
profit margins;• the amount and timing of operating costs and capital expenditures, including expenses related to the maintenance and expansion of our business
operations and infrastructure;• the announcement of significant acquisitions, disposition or partnership arrangements;• changes and delays in our JV Transaction;• the ramp-up progress and operation of the JV Company;• changes in the utilization of our in-house manufacturing capacity;• supply and demand dynamics and the resulting price pressure on the products we sell;• the unpredictable volume and timing of orders, deferrals, cancellations and reductions for our products, which may depend on factors such as our end
customers' sales outlook, purchasing patterns and inventory adjustments based on general economic conditions or other factors;• changes in laws and regulations affecting our business operations;
• changes in costs associated with manufacturing of our products, including pricing of wafer, raw materials and assembly services;• announcement of significant share repurchase programs;• our concentration of sales in consumer applications and changes in consumer purchasing patterns and confidence; and• the adoption of new industry standards or changes in our regulatory environment.
Any one or a combination of the above factors and other risk factors described in this section may cause our operating results to fluctuate from period toperiod, making it difficult to predict our future performance. Therefore, comparing our operating results on a period-to-period basis may not be meaningful, andyou should not rely on our past results as an indication of our future performance.
Geopolitical and economic conflicts between United States and China may adversely affect our business
Geopolitical conflicts and tensions between the United States and China have threatened and destabilized trading relationships and economic activitiesbetween the two countries. Because we have significant operations in both countries, such conflicts and tensions may negatively impact our business. At varioustimes during recent years, the United States and China have had disagreements over political and economic issues, including but not limited to, the recentimposition of tariffs by the U.S. on goods imported from China and to the U.S. government's efforts to restrict transfer and sharing of technologies, includingsemiconductor technologies, between the two countries. In addition, the U.S. government may enact new and more restrictive export control regulations that mayreduce our ability to ship and
16
sell products to certain customers in China and Asia and increase our cost to implement additional measures to comply with such new regulations. In addition,disagreements between the United States and China with respect to their political, military or economic policies toward Taiwan may contribute to furthercontroversies. These controversies and trade frictions could have a material adverse effect on our business by, among other things, making it more difficult for usto coordinate our operations between the United States and China causing a reduction in the demand for our products by customers in the United States or Chinaand reducing our profitability due to increasing cost of compliance.
The continuing political and economic conflicts between U.S. and China have resulted in and may continue to cause retaliatory policies from both countries,including a recent executive order issued by the U.S. President eliminating the preferential trade status of Hong Kong in response to China’s action to impose newsecurity measures and regulation on Hong Kong. The order will make it more costly and difficult for U.S. companies to export goods or conduct businesses inHong Kong. While we historically have not relied on the preferential trade status to operate in Hong Kong, there is no guarantee that additional policies, rules orregulations will not be implemented by either the U.S. or China that will negatively impact our ability to maintain our sales and other functions and operations inHong Kong. We also cannot predict what new and additional retaliatory policies and regulations may be implemented by Chinese government in response to U.S.actions, and such policies and regulations may adversely affect our business operations in China and other Asian countries, including our manufacturing and salesand marketing activities.
Our revenue may fluctuate significantly from period to period due to ordering patterns from our distributors and seasonality.
Demand for our products from our end customers fluctuates depending on their sales outlooks and market and economic conditions. Accordingly, ourdistributors place purchase orders with us based on their forecasts of end customer demand. Because these forecasts may not be accurate, channel inventory held atour distributors may fluctuate significantly due to the difference between the forecasts and actual demand. As a result, distributors adjust their purchase ordersplaced with us in response to changing channel inventory levels, as well as their assessment of the latest market demand trends. A significant decrease in ourdistributors' channel inventory in one period may lead to a significant rebuilding of channel inventory in subsequent periods, or vice versa, which may cause ourquarterly revenue and operating results to fluctuate significantly.
In addition, because our power semiconductors are used in consumer electronics products, our revenue is subject to seasonality. Our sales seasonality isaffected by a number of factors, including global and regional economic conditions as well as the PC market conditions, revenue generated from new products,changes in distributor ordering patterns in response to channel inventory adjustments and end customer demand for our products and fluctuations in consumerpurchase patterns prior to major holiday seasons. In recent year, broad fluctuations in the semiconductor markets and the global economic conditions, in particularthe decline of the PC market conditions, have had a more significant impact on our results of operations, than seasonality, and have made it difficult to assess theimpact of seasonal factors on our business. We also expect our normal seasonality cycle be impacted by the COVID-19 pandemic and related events, making itmore difficult to predict and determine a more consistent seasonality trend. See “Risk Factors- Our business operation and financial performance may be adverselyaffected by the COVID-19 pandemic and related events.”
If we are unable to introduce or develop new and enhanced products that meet or are compatible with our customer's product requirements in a timelymanner, it may harm our business, financial position and operating results.
Our success depends upon our ability to develop and introduce new and enhanced products that meet or are compatible with our customer's specifications,performance standards and other product requirements in a timely manner. The development of new and enhanced products involves highly complex processes,and at times we have experienced delays in the introduction of new products. Successful product development and introduction of new products depends on anumber of factors, including the accurate product specification; timely completion of design; achievement of manufacturing yields; timely response to changes incustomers' product requirements; quality and cost-effective production; and effective marketing. Since many of our products are designed for specific applications,we must frequently develop new and enhanced products jointly with our customers. In the past, we have encountered product compatibility issues with a majorOEM that has negatively impacted our financial results, and although we have resolved fully such issues with the OEM, there is no guarantee that the samecompatibility issues will not occur in the future with other OEMs. If we are unable to develop or acquire new products that meet or are compatible with ourcustomer's specification and other product requirements in a timely manner, we may lose revenue or market shares with our customers, which could have amaterial adverse effect on our business, financial position and operating results.
17
We may not win sufficient designs, or our design wins may not generate sufficient revenue for us to maintain or expand our business.
We invest significant resources to compete with other power semiconductor companies to obtain winning competitive bids for our products in selectionprocesses, known as “design wins.” Our effort to obtain design wins may detract us from or delay the completion of other important development projects, impairour relationships with existing end customers and negatively impact sales of products under development. In addition, we cannot be assured that these effortswould result in a design win, that our product would be incorporated into an end customer's initial product design, or that any such design win would lead toproduction orders and generate sufficient revenue. Furthermore, even after we have qualified our products with a customer and made sales, subsequent changes toour products, manufacturing processes or suppliers may require a new qualification process, which may result in delay and excess inventory. If we cannot achievesufficient design wins in the future, or if we fail to generate production orders following design wins, our ability to grow our business and improve our financialresults will be harmed.
Our success depends upon the ability of our OEM end customers to successfully sell products incorporating our products.
The consumer end markets, in particular the PC market, in which our products are used are highly competitive. Our OEM end customers may notsuccessfully sell their products for a variety of reasons, including:
• general global and regional economic conditions;• late introduction or lack of market acceptance of their products;• lack of competitive pricing;• shortage of component supplies;• excess inventory in the sales channels into which our end customers sell their products;• changes in the supply chain; and• changes as a result of regulatory restrictions applicable to China-exported products.
Our success depends on the ability of our OEM end customers to sell their products incorporating our products. In addition, we have expanded our businessmodel to include more OEMs in our direct customer base. The failure of our OEM end customers to achieve or maintain commercial success for any reason couldharm our business, results of operations, and financial condition and prospects.
We are subject to risks associated with operating a fabrication facility in China through our joint venture company, which may not succeed as expected.
In March 2016, we entered into a joint venture contract (the “JV Agreement”) with two investment funds owned by the municipalities of Chongqing, China(the “Chongqing Funds”), pursuant to which we and the Chongqing Funds formed a joint venture (the “JV Company”) for the purpose of constructing a powersemiconductor packaging/testing and wafer fabrication facility. The JV Company had been ramping up its production of assembly and testing during the fiscal year2020. The 12-inch wafer fabrication facility commenced its limited mass production in the quarter ended September 30, 2019 and continued its ramp in the yearended June 30, 2020. While we believe the JV Transaction will enhance our ability to accelerate growth and improve our profitability, there is no guarantee that itwill succeed as we initially expected. We may encounter unanticipated difficulties and obstacles that may delay the JV Company's operation, some of which areoutside of our control. These difficulties may include unexpected costs and delays in transferring our assembly and testing productions to the new facility; inabilityto coordinate and integrate the labor forces; and inability to provide customers with required services.
Even after the JV Company commences operation, we may not fully realize the anticipated benefits of the project, such as cost savings, improvement inworking capital, increased gross margin, revenue and profitability, enhanced market share for our products; and increased diversification of our products andcustomers. The establishment and operation of a new manufacturing facility such as the JV Company involve significant risks and challenges, including, but arenot limited to, the following:
• Inability to gain or sustain sufficient new customers and market shares to offset the additional costs of building and operating a new facility;• Lack of sufficient control over the operation and finances of the joint venture;
18
• Insufficient personnel with requisite expertise and experiences to operate a 12-inch fabrication facility;• High cost and unexpected expenses relating to upgrading and improving the packaging and testing and fabrication facilities;• Inability to fully integrate the joint venture with our existing fabrication facility in Oregon, and inability to fully utilize both fabrication facilities;• Failure of Chongqing Funds to meet its obligations under the JV Agreement;• Difficulties in protecting and enforcing our intellectual property rights;• Difficulties in maintaining international communications and coordination between our locations in the U.S. and China;• Inability to take advantage of the expected tax savings;• Changes or uncertainties in economic, legal, regulatory, social and political conditions in China, and lack of transparency and certainty in the Chinese
regulatory process;• Labor disputes and difficulties in recruiting new employees;• Additional costs and complexity with compliance of local and state regulations of Chongqing; and• New or enhanced U.S. restrictions on the transfer of technology or know-how to the JV Company, and political and economic tension between U.S. and
China that may result in additional limitation on our ability to operate the JV Company.
In addition, we may be subject to the risk of under-utilization of the facilities at the JV Company. The operation of the JV Company’s facilities, including theassembly and testing facilities and the fab, requires significant fixed cost. In order to manage the capacity of the wafer fabrication facility efficiently, we mustperform a forecast of long-term market demand and general economic conditions for our products. Because market conditions may vary significantly andunexpectedly, our forecasts may change significantly at any time, and we may not be able to make timely adjustments to our fabrication capacity in response tothese changes. If our forecast is incorrect or if we are not able to fully utilize the capacities of the facilities at the JV Company, our results of operations will beadversely affected.
In order to fund its capital expenditures and cost of operations, the JV Company has incurred a significant amount of indebtedness from third-party lendersunder several loan and lease financing agreements. Some of the indebtedness is secured by substantially all of the assets of the JV Company. As of June 30, 2020,the total amount of debt outstanding at the JV Company was $140.7 million. The JV Company is required to make interest payments to service such debt. If the JVCompany is not able to generate sufficient cash flow to make interest or principal payments when due, the JV Company may be in default under these loanagreements, which would have an adverse effect on our business operations and financial conditions.
Any of the foregoing risks could materially reduce the expected return of our investment in the JV Transaction and adversely affects our business operations,our financial performance and the trading price of our shares.
The operation of our Oregon fab subjects us to additional risks and the need for additional capital expenditures which may negatively impact our results ofoperations.
The operation of the Oregon fab requires significant fixed manufacturing cost. In order to manage the capacity of the wafer fabrication facility efficiently, wemust perform a forecast of long-term market demand and general economic conditions for our products. Because market conditions may vary significantly andunexpectedly, our forecast may change significantly at any time, and we may not be able to make timely adjustments to our fabrication capacity in response tothese changes. During periods of continued decline in market demand, in particular the decline of the PC market, we may not be able to absorb the excessinventory and additional costs associated with operating the facility at higher capacity, which may adversely affect our operating results. Similarly, during periodsof unexpected increase in customer demand, we may not be able to ramp up production quickly to meet these demands, which may lead to the loss of significantrevenue opportunities. The manufacturing processes of a fabrication facility are complex and subject to interruptions. We may experience production difficulties,including lower manufacturing yields or products that do not meet our or our customers' specifications, and problems in ramping production and installing newequipment. These difficulties could result in delivery delays, quality problems and lost revenue opportunities. Any significant quality problems could also damageour reputation with our customers and distract us from the development of new and enhanced product which may have a significant negative impact on ourfinancial results.
In addition, semiconductor manufacturing has historically required an upgrading of process technology from time to time to remain competitive, as new andenhanced semiconductor processes are developed which permit smaller, more efficient and more powerful semiconductor devices. Accordingly, we may have toincur substantial capital expenditures and install significant production capacity at our in-house fabrication facility to support new technologies and increased
19
production volume, which may cause delay in our ability to deliver new products or negatively impact our results of operations.
Defects and poor performance in our products could result in loss of customers, decreased revenue, unexpected expenses and loss of market share, and we mayface warranty and product liability claims arising from defective products.
Our products are complex and must meet stringent quality requirements. Products as complex as ours may contain undetected errors or defects, especiallywhen first introduced or when new versions are released. Errors, defects or poor performance can arise due to design flaws, defects in raw materials or componentsor manufacturing anomalies, which can affect both the quality and the yield of the product. It can also be potentially dangerous as defective power components, orimproper use of our products by customers, may lead to power overloads, which could result in explosion or fire. As our products become more complex, we facehigher risk of undetected defects, because our testing protocols may not be able to fully test the products under all possible operating conditions. In the past, wehave experienced defects in our products and these products were returned to us and subsequently scrapped or sold at a discount. Any actual or perceived errors,defects or poor performance in our products could result in the replacement or recall of our products, shipment delays, rejection of our products, damage to ourreputation, lost revenue, diversion of our engineering personnel from our product development efforts in order to address or remedy any defects and increases incustomer service and support costs, all of which could have a material adverse effect on our business and operations.
Furthermore, as our products are typically sold at prices much lower than the cost of the equipment or other devices incorporating our products, anydefective, inefficient or poorly performing products, or improper use by customers of power components, may give rise to warranty and product liability claimsagainst us that exceed any revenue or profit we receive from the affected products. Historically, we have received claims from our customers for charges such astheir labor and other costs replacing defective parts, their lost profit, and/or penalty. We could incur significant costs and liabilities if we are sued and if damagesare awarded against us. There is no guarantee that our insurance policies will be available or adequate to protect against such claims. Costs or payments we maymake in connection with warranty and product liability claims or product recalls may adversely affect our financial condition and results of operations.
If we do not forecast demand for our products accurately, we may experience product shortages, delays in product shipment, excess product inventory, ordifficulties in planning expenses, which will adversely affect our business and financial condition.
We manufacture our products according to our estimates of customer demand. This process requires us to make numerous forecasts and assumptions relatingto the demand of our end customers, channel inventory, and general market conditions. Because we sell most of our products to distributors, who in turn sell to ourend customers, we have limited visibility as to end customer demand. Furthermore, we do not have long-term purchase commitments from our distributors or endcustomers, and our sales are generally made by purchase orders that may be cancelled, changed or deferred without notice to us or penalty. As a result, it is difficultto forecast future customer demand to plan our operations.
The utilization of our manufacturing facilities and the provisions for inventory write-downs are important factors in our profitability. If we overestimatedemand for our products, or if purchase orders are canceled or shipments delayed, we may have excess inventory, which may result in adjustments to ourproduction plans. These adjustments to our productions may affect the utilization of our own wafer fabrication and packaging facilities. If we cannot sell certainportion of the excess inventory, it will affect our provisions for inventory write-downs. Our inventory write-down provisions are subject to adjustment based onevents that may not be known at the time the provisions are made, and such adjustments could be material and impact our financial results negatively.
If we underestimate demand, we may not have sufficient inventory to meet end-customer demand, and we may lose market share and damage relationshipswith our distributors and end customers and we may have to forego potential revenue opportunities. Obtaining additional supply in the face of product shortagesmay be costly or impossible, particularly in the short term, which could prevent us from fulfilling orders in a timely manner or at all.
In addition, we plan our operating expenses, including research and development expenses, hiring needs and inventory investments, based in part on ourestimates of customer demand and future revenue. If customer demand or revenue for a particular period is lower than we expect, we may not be able toproportionately reduce our fixed operating expenses for that period, which would harm our operating results.
20
We face intense competition and may not be able to compete effectively which could reduce our revenue and market share.
The power semiconductor industry is highly competitive and fragmented. If we do not compete successfully against current or potential competitors, ourmarket share and revenue may decline. Our main competitors are primarily headquartered in the United States, Japan, Taiwan and Europe. Our major competitorsfor our power discretes include Infineon Technologies AG, MagnaChip Semiconductor Corporation, ON Semiconductor Corp., STMicroelectronics N.V., ToshibaCorporation, Diodes Incorporated and Vishay Intertechnology, Inc. Our major competitors for our power ICs include Global Mixed-mode Technology Inc.,Monolithic Power Systems, Inc., ON Semiconductor Corp., Richtek Technology Corp., Semtech Corporation, Texas Instruments Inc. and Vishay Intertechnology,Inc.
We expect to face competition in the future from our competitors, other manufacturers, designers of semiconductors and start-up semiconductor designcompanies. Many of our competitors have competitive advantages over us, including:
• significantly greater financial, technical, research and development, sales and marketing and other resources, enabling them to invest substantially moreresources than us to respond to the adoption of new or emerging technologies or changes in customer requirements;
• greater brand recognition and longer operating histories;• larger customer bases and longer, more established relationships with distributors or existing or potential end customers, which may provide them with
greater reliability and information regarding future trends and requirements that may not be available to us;• the ability to provide greater incentives to end customers through rebates, and marketing development funds or similar programs;• more product lines, enabling them to bundle their products to offer a broader product portfolio or to integrate power management functionality into other
products that we do not sell;• greater ability and more resources to influence and participate in the regulatory and legislative process for more favorable laws and regulations; and• captive manufacturing facilities, providing them with guaranteed access to manufacturing facilities in times of global semiconductor shortages.
In addition, the semiconductor industry has experienced increased consolidation over the past several years that may adversely affect our competitiveposition. Consolidation among our competitors could lead to a less favorable competitive landscape, capabilities and market share, which could harm our businessand results of operations.
If we are unable to compete effectively for any of the foregoing or other reasons, our business, results of operations, and financial condition and prospectswill be harmed.
We depend partly on third-party semiconductor foundries to manufacture our products and implement our fabrication processes, and any failure to maintainsufficient foundry capacity and control the cost of production could significantly delay our ability to ship our products, damage our relationships withcustomers, reduce our sales and increase expenses.
The allocation of our wafer production between in-house facility and third-party foundries may fluctuate from time to time. We expect to continue to rely inpart on third party foundries to meet our wafer requirements. Although we use several independent foundries, our primary third-party foundry is HHGrace, whichmanufactured 12.7%, 14.1% and 15.4% of the wafers used in our products for the fiscal years ended June 30, 2020, 2019 and 2018, respectively.
We place our purchase orders with foundries based on sales forecasts for our products. If any third-party foundry does not provide competitive pricing or isnot able to meet our required capacity for any reason, we may not be able to obtain the required capacity to manufacture our products timely or efficiently. Fromtime to time, third party suppliers may extend lead-times, limit supplies or increase prices due to capacity constraints or other factors, and we may experience ashortage of capacity on an industry-wide basis that may last for an extended period of time. There are no assurances that we will be able to maintain sufficientcapacity to meet the full demand from our customers, and failure to do so will adversely affect our results of operations. If we cannot maintain sufficient capacityor control pricing with our existing third-party foundries, we may need to increase our own manufacturing capacity, and there is no assurance that we can ramp upthe production of the Oregon fab timely to meet the increased demand. If not, we may need to seek alternative foundries, which may not be available oncommercially reasonable terms, or at all. In addition, the process
21
for qualifying a new foundry is time consuming, difficult and may not be successful, particularly if we cannot integrate our proprietary process technology with theprocess used by the new foundry. Using a foundry with which we have no established relationship could expose us to potentially unfavorable pricing,unsatisfactory quality or insufficient capacity allocation.
In addition, even though we have been transferring more new product developments to our Oregon fab and we expect to increase gradually the utilization ofcapacity at our JV Company as it ramps up production, we still rely on third-party foundries to effectively implement certain of our proprietary technology andprocesses and also require their cooperation in developing new fabrication processes. Any failure to do so may impair our ability to introduce new products and ontime delivery of wafers for our existing products. In order to maintain our profit margins and to meet our customer demand, we need to achieve acceptableproduction yields and timely delivery of silicon wafers. As is common in the semiconductor industry, we have experienced, and may experience from time to time,difficulties in achieving acceptable production yields and timely delivery from third-party foundry vendors. Minute impurities in a silicon wafer can cause asubstantial number of wafers to be rejected or cause numerous die on a wafer to be defective. Low yields often occur during the production of new products, themigration of processes to smaller geometries or the installation and start up of new process technologies.
We face a number of other significant risks associated with outsourcing fabrication, including:
• limited control over delivery schedules, quality assurance and control and production costs;• discretion of foundries to reduce deliveries to us on short notice, allocate capacity to other customers that may be larger or have long-term customer or
preferential arrangements with foundries that we use;• unavailability of, or potential delays in obtaining access to, key process technologies;• limited warranties on wafers or products supplied to us;• damage to equipment and facilities, power outages, equipment or materials shortages that could limit manufacturing yields and capacity at the foundries;• potential unauthorized disclosure or misappropriation of intellectual property, including use of our technology by the foundries to make products for our
competitors;• financial difficulties and insolvency of foundries; and• acquisition of foundries by third parties.
Any of the foregoing risks could delay shipment of our products, result in higher expenses and reduced revenue, damage our relationships with customersand otherwise adversely affect our business and operating results.
Our operation of two wholly-owned packaging and testing facilities are subject to risks that could adversely affect our business and financial results.
We have two wholly-owned packaging and testing facilities located in Shanghai, China that handle most of our packaging and testing requirements. Theoperation of high-volume packaging and testing facilities and implementation of our advanced packaging technology are complex and demand a high degree ofprecision and may require modification to improve yields and product performance. We have committed substantial resources to ensure that our packaging andtesting facilities operate efficiently and successfully, including the acquisition of equipment and raw materials, and training and management of a large number oftechnical personnel and employees. Due to the fixed costs associated with operating our own packaging and testing facilities, if we are unable to utilize our in-house facilities at a desirable level of production, our gross margin and results of operations may be adversely affected. For example, a significant decline in ourmarket share or sales orders may negatively impact our factory utilization and reduce our ability to achieve profitability.
In addition, the operation of our packaging and testing facilities is subject to a number of risks, including the following:
• unavailability of equipment, whether new or previously owned, at acceptable terms and prices;
• facility equipment failure, power outages or other disruptions;• shortage of raw materials, including packaging substrates, copper, gold and molding compound;• failure to maintain quality assurance and remedy defects and impurities;• changes in the packaging requirements of customers; and• our limited experience in operating a high-volume packaging and testing facility.
22
Any of the foregoing risks could adversely affect our capacity to package and test our products, which could delay shipment of our products, result in higherexpenses, reduce revenue, damage our relationships with customers and otherwise adversely affect our business, results of operations, financial condition andprospects.
Our reliance on distributors to sell a substantial portion of our products subjects us to a number of risks.
We sell a substantial portion of our products to distributors, who in turn sell to our end customers. Our distributors typically offer power semiconductorproducts from several different companies, including our direct competitors. The distributors assume collection risk and provide logistical services to endcustomers, including stocking our products. Two distributors, WPG and Promate, collectively accounted for 64.8%, 65.2% and 63.5% of our revenue for the fiscalyears ended June 30, 2020, 2019 and 2018, respectively. Our agreements with Promate and WPG were renewed in July 2017 and are automatically renewed foreach one-year period continuously unless terminated earlier pursuant to the provisions in the agreements. We believe that our success will continue to depend uponthese distributors. Our reliance on distributors subjects us to a number of risks, including:
• write-downs in inventories associated with stock rotation rights and increases in provisions for price adjustments granted to certain distributors;• potential reduction or discontinuation of sales of our products by distributors;• failure to devote resources necessary to sell our products at the prices, in the volumes and within the time frames that we expect;• focusing their sales efforts on products of our competitors;• dependence upon the continued viability and financial resources of these distributors, some of which are small organizations with limited working capital
and all of which depend on general economic conditions and conditions within the semiconductor industry;• dependence on the timeliness and accuracy of shipment forecasts and resale reports from our distributors;• management of relationships with distributors, which can deteriorate as a result of conflicts with efforts to sell directly to our end customers; and• our agreements with distributors which are generally terminable by either party on short notice.
If any significant distributor becomes unable or unwilling to promote and sell our products, or if we are not able to renew our contracts with the distributorson acceptable terms, we may not be able to find a replacement distributor on reasonable terms or at all and our business could be harmed.
We have made and may continue to make strategic acquisitions of other companies, assets or businesses and these acquisitions introduce significant risks anduncertainties, including risks related to integrating the acquired assets or businesses, incurring additional debt, assuming contingent liabilities or diluting ourexisting shareholders.
In order to position ourselves to take advantage of growth opportunities, we have made, and may continue to make, strategic acquisitions, mergers andalliances that involve significant risks and uncertainties. Successful acquisitions and alliances in the semiconductor industry are difficult to accomplish becausethey require, among other things, efficient integration and aligning of product offerings and manufacturing operations and coordination of sales and marketing andresearch and development efforts. The difficulties of integration and alignment may be increased by the necessity of coordinating geographically separatedorganizations, the complexity of the technologies being integrated and aligned and the necessity of integrating personnel with disparate business backgrounds andcombining different corporate cultures. Furthermore, there is no guarantee that we will be able to identify a viable target for strategic acquisition, and we may incursignificant costs and resources in such effort that may not result in a successful acquisition.
In addition, we may also issue equity securities to pay for future acquisitions or alliances, which could be dilutive to existing shareholders. We may also incurdebt or assume contingent liabilities in connection with acquisitions and alliances, which could impose restrictions on our business operations and harm ouroperating results.
If we are unable to obtain raw materials in a timely manner or if the price of raw materials increases significantly, production time and product costs couldincrease, which may adversely affect our business.
Our fabrication and packaging processes depend on raw materials such as silicon wafers, gold, copper, molding compound, petroleum and plastic materialsand various chemicals and gases. From time to time, suppliers may extend
23
lead times, limit supplies or increase prices due to capacity constraints or other factors. If the prices of these raw materials rise significantly, we may be unable topass on the increased cost to our customers. Our results of operations could be adversely affected if we are unable to obtain adequate supplies of raw materials in atimely manner or at reasonable price. In addition, from time to time, we may need to reject raw materials because they do not meet our specifications or thesourcing of such materials do not comply with our conflict mineral policies, resulting in potential delays or declines in output. Furthermore, problems with our rawmaterials may give rise to compatibility or performance issues in our products, which could lead to an increase in customer returns or product warranty claims.Errors or defects may arise from raw materials supplied by third parties that are beyond our detection or control, which could lead to additional customer returns orproduct warranty claims that may adversely affect our business and results of operations.
Our operations may be delayed or interrupted and our business may be adversely affected as a result of our efforts to comply with environmental regulationsapplicable to our in-house wafer manufacturing, packaging and testing facility.
Our in-house manufacturing operations, including wafer manufacturing, packaging and testing, are subject to a variety of environmental regulations relatingto the use, handling, discharge and disposal of toxic or otherwise hazardous materials. See “Item 1. Business - Environmental matters.” Compliance withenvironmental regulations could require us to acquire expensive pollution control equipment or to incur other substantial expenses or investigate and remediatecontamination at our current facilities. Any failure, or any claim that we have failed, to comply with these regulations could cause delays in our production andcapacity expansion and affect our public image, either of which could harm our business. In addition, any failure to comply with these regulations could subject usto substantial fines or other liabilities, result in the suspension of our operating permit, or require us to terminate or adversely modify our in-house manufacturingoperations.
We may not be able to accurately estimate provisions at fiscal period end for price adjustment and stock rotation rights under our agreements with distributors,and our failure to do so may impact our operating results.
We sell a majority of our products to distributors under arrangements allowing price adjustments and returns under stock rotation programs, subject to certainlimitations. As a result, we are required to estimate allowances for price adjustments and stock rotation for our products as inventory at distributors at eachreporting period end. Our ability to reliably estimate these allowances enables us to recognize revenue upon delivery of goods to distributors instead of upon resaleof goods by distributors to end customers.
We estimate the allowance for price adjustment based on factors such as distributor inventory levels, pre-approved future distributor selling prices, distributormargins and demand for our products. Our estimated allowances for price adjustments, which we offset against accounts receivable from distributors, were $30.1million and $24.1 million at June 30, 2020 and 2019, respectively.
Our accruals for stock rotation are estimated based on historical returns and individual distributor agreement, and stock rotation rights, which are recorded asaccrued liabilities on our consolidated balance sheets, are contractually capped based on the terms of each individual distributor agreement. Our estimatedliabilities for stock rotation at June 30, 2020 and 2019 were $3.4 million and $1.9 million, respectively.
Our estimates for these allowances and accruals may be inaccurate. If we subsequently determine that any allowance and accrual based on our estimates isinsufficient, we may be required to increase the size of our allowances and accrual in future periods, which would adversely affect our results of operations andfinancial condition.
We depend on the continuing services of our senior management team and other key personnel, and if we lose a member of our senior management or areunable to successfully retain, recruit and train key personnel, our ability to develop and market our products could be harmed.
Our success depends upon the continuing services of members of our senior management team and various engineering and other technical personnel. Inparticular, our engineers and other sales and technical personnel are critical to our future technological and product innovations. Our industry is characterized byhigh demand and intense competition for talent and the pool of qualified candidates is limited. We have entered into employment agreements with certain seniorexecutives, but we do not have employment agreements with most of our employees. Many of these employees could leave our company with little or no priornotice and would be free to work for a competitor. If one or more of our senior executives or other key personnel are unable or unwilling to continue in theirpresent positions, we may not be able to replace them easily or at all and other senior management may be required to divert attention from
24
other aspects of our business. In addition, we do not have “key person” life insurance policies covering any member of our management team or other keypersonnel. The loss of any of these individuals or our inability to attract or retain qualified personnel, including engineers and others, could adversely affect ourproduct introductions, overall business growth prospects, results of operations and financial condition.
Failure to protect our patents and our other proprietary information could harm our business and competitive position.
Our success depends, in part, on our ability to protect our intellectual property. We rely on a combination of patent, copyright (including mask workprotection), trademark and trade secret laws, as well as nondisclosure agreements, license agreements and other methods to protect our intellectual property rights,which may not be sufficient to protect our intellectual property. As of June 30, 2020, we owned 823 issued U.S. patents expiring between 2022 and 2039 and had76 pending patent applications with the United States Patent and Trademark Office. In addition, we own additional patents and have filed patent applications inseveral jurisdictions outside of the U.S, including China, Taiwan, Japan and Korea.
Our patents and patent applications may not provide meaningful protection from our competitors, and there is no guarantee that patents will be issued fromour patent applications. The status of any patent or patent application involves complex legal and factual determinations and the breadth of a claim is uncertain. Inaddition, our efforts to protect our intellectual property may not succeed due to difficulties and risks associated with:
• policing any unauthorized use of or misappropriation of our intellectual property, which is often difficult and costly and could enable third parties tobenefit from our technologies without paying us;
• others independently developing similar proprietary information and techniques, gaining authorized or unauthorized access to our intellectual propertyrights, disclosing such technology or designing around our patents;
• the possibility that any patent or registered trademark owned by us may not be enforceable or may be invalidated, circumvented or otherwise challengedin one or more countries and the rights granted there under may not provide competitive advantages to us;
• uncertainty as to whether patents will be issued from any of our pending or future patent applications with the scope of the claims sought by us, if at all;and
• intellectual property laws and confidentiality laws may not adequately protect our intellectual property rights, including, for example, in China whereenforcement of China intellectual property-related laws have historically been less effective, primarily because of difficulties in enforcement and lowdamage awards.
We also rely on customary contractual protection with our customers, suppliers, distributors, employees and consultants, and we implement securitymeasures to protect our trade secrets. We cannot assure you that these contractual protections and security measures will not be breached, that we will haveadequate remedies for any such breach or that our suppliers, employees, distributors or consultants will not assert rights to intellectual property arising out of suchcontracts.
In addition, we have a number of third-party patent and intellectual property license agreements, one of which requires us to make ongoing royalty payments.In the future, we may need to obtain additional licenses, renew existing license agreements or otherwise replace existing technology. We are unable to predictwhether these license agreements can be obtained or renewed or the technology can be replaced on acceptable terms, or at all.
Intellectual property disputes could result in lengthy and costly arbitration, litigation or licensing expenses or prevent us from selling our products.
As is typical in the semiconductor industry, we or our customers may receive claims of infringement from time to time or otherwise become aware ofpotentially relevant patents or other intellectual property rights held by other parties that may cover some of our technology, products and services or those of ourend customers. The semiconductor industry is characterized by vigorous protection and pursuit of intellectual property rights which has resulted in protracted andexpensive arbitration and litigation for many companies. Patent litigation has increased in recent years due to increased assertions made by intellectual propertylicensing entities or non-practicing entities and increasing competition and overlap of product functionality in our markets.
25
Any litigation or arbitration regarding patents or other intellectual property could be costly and time consuming and could divert our management and keypersonnel from our business operations. We have in the past and may from time to time in the future become involved in litigation that requires our management tocommit significant resources and time. In addition, as part of our strategy to diversify our serviceable markets, we launched several key product families andtechnologies to enable high efficiency power conversion solutions and we plan to develop and commercialize new products in other power semiconductor markets.Our entry into the commercial markets for high-voltage power semiconductors and other markets as a result of our diversification strategy may subject us toadditional and increased risk of disputes or litigation relating to these products.
Because of the complexity of the technology involved and the uncertainty of litigation generally, any intellectual property arbitration or litigation involvessignificant risks. Any claim of intellectual property infringement against us may require us to:
• incur substantial legal and personnel expenses to defend the claims or to negotiate for a settlement of claims;
• pay substantial damages or settlement to the party claiming infringement;• refrain from further development or sale of our products;• attempt to develop non-infringing technology, which may be expensive and time consuming, if possible at all;• enter into costly royalty or license agreements that might not be available on commercially reasonable terms or at all;• cross-license our technology with a competitor to resolve an infringement claim, which could weaken our ability to compete with that competitor; and• indemnify our distributors, end customers, licensees and others from the costs of and damages of infringement claims by our distributors, end customers,
licensees and others, which could result in substantial expenses for us and damage our business relationships with them.
Any intellectual property claim or litigation could harm our business, results of operations, financial condition and prospects.
The current government investigation and evolving export control regulations may adversely affect our financial performance and business operations.
The U.S. Department of Justice commenced an investigation into the Company’s compliance with export control regulations relating to its businesstransactions with Huawei and its affiliates (“Huawei”), which were added to the “Entity List” by the Department of Commerce (“DOC”) in May 2019. Inconnection with this investigation, DOC requested the Company to suspend shipments of its products to Huawei, and the Company complied with such request.The Company has not shipped any product to Huawei since December 31, 2019. The Company is currently working with DOC to resolve this issue and requestedDOC to grant permission to reinstate shipments to Huawei. To date DOC has not provided us with any timeline or schedule under which DOC will respond to ourrequest. There is no guarantee that DOC will agree to permit us to resume shipment to Huawei on a timely basis, or at all. The DOC’s decision may be influencedby factors beyond our control, such as shifting political dynamics and the macro-economic relationship between the U.S. and China and changes in export controlregulations. Our inability to continue such shipment may negatively impact our revenue and financial performance, particularly if we are not able to acquire newcustomers to offset the loss of shipments to Huawei.
The ongoing government investigations into our export control compliance also subject us to a number of financial and business risks. We expect to incursignificant costs and expenses, including legal fees, in connection with our effort to respond to the government investigation, as well as additional legal fees fordefending securities class actions resulting from public disclosure of the government investigation. Such additional costs will adversely affect our profitability.While the Company has purchased a D&O insurance policy which may reimburse a portion of such fees and expenses, there is no guarantee that such policy willbe sufficient to reduce our costs or that reimbursement can be obtained on a timely basis or at all. Furthermore, the management has diverted its resources and timein response to the investigation, and might not be able to fully engage with the core operation and objectives of our business activities. Finally, while we are fullycooperating with the government in the investigation, we are not able to predict its timing and outcome. In the event that the government decides to bringenforcement action against us, it will result in a material adverse effect on our business operations, our financial conditions and our reputation.
26
We also expect that the U.S. export control regulations to evolve and change in response to the political and economic tension between the U.S. and China,including potential new export control regulations that may impose additional restrictions on our ability to continue to do business with certain customers in Chinaand Asia. If such changes occur, we may be required to reduce shipments to certain Asian customers, adjust our business practices and incur additional costs toimplement new export control compliance procedures, policies and programs, each of which will adversely affect our financial conditions and results of operations.
We may be adversely affected by any disruption in our information technology systems.
Our operations are dependent upon our information technology systems, which encompass all of our major business functions across offices internationally.We rely upon such information technology systems to manage and replenish inventory, complete and track customer orders, coordinate sales activities across all ofour products and services, maintain vital data and information, perform financial and accounting tasks and manage and perform various administrative and humanresources functions. A substantial disruption in our information technology systems for any extended time period (arising from, for example, system capacity limitsfrom unexpected increases in our volume of business, outages or delays in our service) could result in delays in receiving inventory and supplies or filling customerorders and adversely affect our customer service and relationships. Our systems might be damaged or interrupted by natural or man−made events or by computerviruses, physical or electronic break−ins, cyber-attacks and similar disruptions affecting the global Internet. In addition, in the past few years, widespreadransomware attacks in the U.S. and elsewhere have affected many companies. We also experienced such ransomware attacks on our information technologysystem during the past year. While the attacks did not have a material adverse effect on our business operation, they caused temporary disruptions and interferedwith our operations. While we intend to implement additional measures to enhance our security protocol to protect our system, there is no guarantee that futureattacks would be thwarted or prevented. Such attacks could increase our cost of operations and adversely affect our business operations and results of operations.
Global or regional economic, political and social conditions could adversely affect our business and operating results.
External factors such as potential terrorist attacks, acts of war, financial crises, such as the global or regional economic recession, or geopolitical and socialturmoil in those parts of the world that serve as markets for our products could have significant adverse effect on our business and operating results in ways thatcannot presently be predicted. Any future economic downturn or recession in the global economy in general and, in particular, on the economies in China, Taiwanand other countries where we market and sell our products, will have an adverse effect on our results of operations.
Our business operations could be significantly harmed by natural disasters or global epidemics.
We have research and development facilities located in Taiwan and the Silicon Valley in Northern California. Historically, these regions have beenvulnerable to natural disasters and other risks, such as earthquakes, fires and floods, which may disrupt the local economy and pose physical risks to our property.We also have sales offices located in Taiwan and Japan where similar natural disasters and other risks may disrupt the local economy and pose physical risks to ouroperations. We are not currently covered by insurance against business disruption caused by earthquakes. In addition, we currently do not have redundant, multiplesite capacity in the event of a natural disaster or other catastrophic event. In the event of such an occurrence, our business would suffer.
Our business could be adversely affected by natural disasters such as epidemics, outbreaks or other health crisis. An outbreak of avian flu or H1N1 flu in thehuman population, or another similar health crisis, such as the recent COVID-19 pandemic, could adversely affect the economies and financial markets of manycountries, particularly in Asia. Moreover, any related disruptions to transportation or the free movement of persons could hamper our operations and force us toclose our offices temporarily.
The occurrence of any of the foregoing or other natural or man-made disasters could cause damage or disruption to us, our employees, operations,distribution channels, markets and customers, which could result in significant delays in deliveries or substantial shortages of our products and adversely affect ourbusiness results of operations, financial condition or prospects.
27
Our insurance may not cover all losses, including losses resulting from business disruption or product liability claims.
We have limited product liability, business disruption or other business insurance coverage for our operations. In addition, we do not have any businessinsurance coverage for our operations to cover losses that may be caused by litigation or natural disasters. Any occurrence of uncovered loss could harm ourbusiness, results of operations, financial condition and prospects.
Our international operations subject our company to risks not faced by companies without international operations.
We have adopted a global business model under which we maintain significant operations and facilities through our subsidiaries located in the U.S., China,Taiwan and Hong Kong. Our main research and development center is located in Silicon Valley, and our manufacturing and supply chain is located in China. Wealso have sales offices and customers throughout Asia, the U.S. and elsewhere in the world. Our international operations may subject us to the following risks:
• economic and political instability, including trade tension between the U.S. and China;• costs and delays associated with transportations and communications;• coordination of operations through multiple jurisdictions and time zones;• fluctuations in foreign currency exchange rates;• trade restrictions, changes in laws and regulations relating to, amongst other things, import and export tariffs, taxation, environmental regulations, land
use rights and property; and• the laws of, including tax laws, and the policies of the U.S. toward, countries in which we operate.
If we fail to maintain an effective system of internal control over financial reporting, we may not be able to accurately report our financial results or preventfraud.
Our management may conclude that our internal control over financial reporting is not effective. Moreover, even if our management concludes that ourinternal control over financial reporting is effective, our independent registered public accounting firm may decline to issue an opinion as to the effectiveness ofour internal control over financial reporting, or may issue a report that is qualified or adverse. During the course of the initial evaluation of internal control overfinancial reporting, we or our independent registered public accounting firm may identify control deficiencies that we may not be able to remediate prior to the dateof our first assessment of internal control over financial reporting. Our failure to achieve and maintain effective internal control over financial reporting couldresult in the loss of investor confidence in the reliability of our financial statements or prevent fraud, which in turn could harm our business and negatively impactthe trading price of our shares.
We are subject to the risk of increased income taxes and changes in existing tax rules.
We conduct our business in multiple jurisdictions, including Hong Kong, Macau, the U.S., China, Taiwan, South Korea Japan and Germany. The calculationof our tax liabilities involves dealing with uncertainties in the application of complex tax laws and regulations in various taxing jurisdictions. Any of thesejurisdictions may assert that we have unpaid taxes. Our effective tax rate was (1.9)%, (9.4)% and 12.5% for the fiscal years ended June 30, 2020, 2019 and 2018,respectively. Any tax rate changes in the tax jurisdictions in which we operate could result in adjustments to our deferred tax assets, if applicable, which wouldaffect our effective tax rate and results of operations. We base our tax position upon the anticipated nature and conduct of our business and upon our understandingof the tax laws of the various countries in which we have assets or conduct activities. However, our tax position is subject to review and possible challenge by taxauthorities and to possible changes in law, which may have a retroactive effect. In particular, various proposals over the years have been made to change certainU.S. tax laws relating to foreign entities with U.S. connections. In addition, the U.S. government has proposed various other changes to the U.S. international taxsystem, certain of which could adversely impact foreign-based multinational corporate groups, and increased enforcement of U.S. international tax laws. It ispossible that these or other changes in the U.S. tax laws, foreign tax laws, or proposed actions by international bodies such as the Organization of EconomicCooperation and Development (OECD) could significantly increase our U.S. or foreign income tax liability in the future.
In December 2017, the European Union (“EU”) identified certain jurisdictions (including Bermuda and Cayman Islands) which it considered had a taxsystem that facilitated offshore structuring by attracting profits without
28
commensurate economic activity. In order to avoid EU “blacklisting”, both Bermuda and Cayman Islands introduced new legislation in December 2018, whichcame into force on January 1, 2019. These new laws require Bermuda and Cayman companies carrying on one or more “relevant activity” (including: banking,insurance, fund management, financing, leasing, headquarters, shipping, distribution and service center, intellectual property or holding company) to maintain asubstantial economic presence in Bermuda and Cayman Islands in order to comply with the economic substance requirements. Effective from December 31, 2019,we have structured our activities to comply with the new law. However, there is no experience yet as to how the Bermuda and Cayman Islands authorities willinterpret and enforce these new rules. The legislation remains subject to further clarification and, accordingly, there is no guarantee that we will be deemed to becompliant. Furthermore, this legislation may require us to make additional changes to the activities we carry on in Bermuda or Cayman Islands, which couldincrease our costs either directly in those locations or indirectly as a result of increased costs related to moving our operations to other jurisdictions. As a result, weare not able to determine the impact on our operations and net income as of the current period.
In addition, our subsidiaries provide products and services to, and may from time to time undertake certain significant transactions with, us and othersubsidiaries in different jurisdictions. We have adopted transfer pricing arrangements for transactions among our subsidiaries. Related party transactions aregenerally subject to close review by tax authorities, including requirements that transactions be priced at arm's length and be adequately documented. If any taxauthorities were successful in challenging our transfer pricing policies or other tax judgments, our income tax expense may be adversely affected and we could alsobe subject to interest and penalty charges which may harm our business, financial condition and operating results.
Our debt agreements include financial covenants that may limit our ability to pursue business and financial opportunities and subject us to risk of default.
We have entered into debt agreements with certain financial institutions, which generally require us to maintain certain financial covenants that has the effectof limiting our ability to take certain actions, including actions to incur debt, pay dividends, repurchase stock, make certain investments and capital expenditures. These restrictions may limit our ability to pursue business and financial opportunities that are available or beneficial to us in response to changing and competitiveeconomic environment, which may have an adverse effect on our financial conditions. In addition, a breach of any of these financial covenants, if not waived bythe lenders, could trigger an event of default under the debt agreements, which may result in the acceleration of our indebtedness or the loss of our collateral usedto secure such indebtedness.
The imposition of U.S. corporate income tax on our Bermuda parent and non-U.S. subsidiaries could adversely affect our results of operations. We believe that our Bermuda parent and non-U.S. subsidiaries each operate in a manner that they would not be subject to U.S. corporate income tax because
they are not engaged in a trade or business in the United States. Nevertheless, there is a risk that the U.S. Internal Revenue Service may assert that our Bermudaparent and non-U.S. subsidiaries are engaged in a trade or business in the United States. If our Bermuda parent and non-U.S. subsidiaries were characterized asbeing so engaged, we would be subject to U.S. tax at regular corporate rates on our income that is effectively connected with U.S. trade or business, plus anadditional 30% “branch profits” tax on the dividend equivalent amount, which is generally effectively connected income with certain adjustments, deemedwithdrawn from the United States. Any such tax could materially and adversely affect our results of operations.
We may be classified as a passive foreign investment company, which could result in adverse U.S. federal income tax consequences for U.S. holders.
Based on the current and anticipated valuation of our assets and the composition of our income and assets, we do not expect to be considered a passiveforeign investment company, or PFIC, for U.S. federal income tax purposes for the foreseeable future. However, we must make a separate determination for eachtaxable year as to whether we are a PFIC after the close of each taxable year and we cannot assure you that we will not be a PFIC for our 2020 taxable year or anyfuture taxable year. Under current law, a non-U.S. corporation will be considered a PFIC for any taxable year if either (1) at least 75% of its gross income ispassive income or (2) at least 50% of the value of its assets, generally based on an average of the quarterly values of the assets during a taxable year, is attributableto assets that produce or are held for the production of passive income. PFIC status depends on the composition of our assets and income and the value of ourassets, including, among others, a pro rata portion of the income and assets of each subsidiary in which we own, directly or indirectly, at least 25% by value of thesubsidiary's equity interests, from time to time. Because we currently hold and expect to continue to hold a substantial amount of cash or cash equivalents, andbecause the calculation of the value of
29
our assets may be based in part on the value of our common shares, which may fluctuate considerably given that market prices of technology companieshistorically often have been volatile, we may be a PFIC for any taxable year. If we were treated as a PFIC for any taxable year during which a U.S. holder heldcommon shares, certain adverse U.S. federal income tax consequences could apply for such U.S. holder.
The average selling prices of products in our markets have historically decreased rapidly and will likely do so in the future, which could harm our revenue andgross margins.
As is typical in the semiconductor industry, the average selling price of a particular product has historically declined significantly over the life of the product.In the past, we have reduced the average selling prices of our products in anticipation of future competitive pricing pressures, new product introductions by us orour competitors and other factors. We expect that we will have to similarly reduce prices in the future for older generations of products. Reductions in our averageselling prices to one customer could also impact our average selling prices to all customers. A decline in average selling prices would harm our gross margins for aparticular product. If not offset by sales of other products with higher gross margins, our overall gross margins may be adversely affected. Our business, results ofoperations, financial condition and prospects will suffer if we are unable to offset any reductions in our average selling prices by increasing our sales volumes,reducing our costs and developing new or enhanced products on a timely basis, with higher selling prices or gross margins.
We may be adversely affected by the cyclicality of the semiconductor industry.
Our industry is highly cyclical and is characterized by constant and rapid technological change such as the introduction of smart phones and tablets thatcontributed to the decline in the PC market, product obsolescence and price erosion, evolving standards, uncertain product life cycles and wide fluctuations inproduct supply and demand. The industry has, from time to time, experienced significant and sometimes prolonged, downturns, which were often connected withor in anticipation of, maturing product cycles and declines in general economic conditions. These downturns have been characterized by diminished productdemand, production overcapacity, high inventory levels and accelerated erosion of average selling prices. Any future downturns, in particular the PC markets or inany other markets in which we sell our products, may reduce our revenue and result in us having excess inventory. By contrast, any upturn in the semiconductorindustry could result in increased competition for access to limited third-party foundry and packaging and testing capacity, which could prevent us from benefitingfrom such an upturn or reduce our profit margins.
Changes in industry standards, technology, customer requirements and government regulation could limit our ability to sell our products.
The semiconductor industry is characterized by changing demand for new and advanced functions, long design and sales cycles, rapid product obsolescenceand price erosion, intense competition, evolving industry standards and wide fluctuations in product supply and demand. Changes in industry standards, or thedevelopment of new industry standards, or, when applicable, government approval or disapproval of industry standards may make our products obsolete or negatethe cost advantages we believe we have in our products. We may be required to invest significant effort and to incur significant expense to redesign our products inorder to address relevant standards, technological developments, customer requirements or regulations but may not have the financial resources to respond to thesechanges effectively or in a timely manner. Any inability to meet these standards, regulations and requirements could harm our business, results of operations,financial condition and prospects.
Risks Related to Doing Business in China
China's economic, political and social conditions, as well as government policies, could affect our business and growth.
Our financial results have been, and are expected to continue to be, affected by the economy in China. If China’s economy is slowing down, it maynegatively affect our business operation and financial results. The China economy differs from the economies of most developed countries in many respects,including:
• higher level of government involvement;• early stage of development of a market-oriented economy;• rapid growth rate;
30
• higher level of control over foreign currency exchange; and• less efficient allocation of resources.
The Chinese economy has been transitioning from a planned economy to a more market-oriented economy. Although in recent years the China governmenthas implemented measures emphasizing the utilization of market forces for economic reform, the reduction of state ownership of productive assets and theestablishment of corporate governance in business enterprises, the China government continues to retain significant control over the business and productive assetsin China. Any changes in China's government policy or China's political, economic and social conditions, or in relevant laws and regulations, may adversely affectour current or future business, results of operations or financial condition. These changes in government policy may be implemented through various means,including changes in laws and regulations, implementation of anti-inflationary measures, change of basic interest rate, changes in the tax rate or taxation systemand the imposition of additional restrictions on currency conversion and imports. Furthermore, given China's largely export-driven economy, any changes in theeconomies of China's principal trading partners and other export-oriented nations may adversely affect our business, results of operations, financial condition andprospects.
Our ability to successfully expand our business operations in China depends on a number of factors, including macroeconomic and other market conditions,and credit availability from lending institutions. In response to the recent global and Chinese economic recession, the China government has promulgated severalmeasures aimed at expanding credit and stimulating economic growth. We cannot assure you that the various macroeconomic measures, monetary policies andeconomic stimulus package adopted by the China government to guide economic growth will be effective in maintaining or sustaining the growth rate of theChinese economy. If measures adopted by the China government fail to achieve further growth in the Chinese economy, it may adversely affect our growth,business strategies and operating results. In addition, changes in political and social conditions of China may adversely affect our ability to conduct our business inthe region. For example, geopolitical disputes and increased tensions between China and its neighboring countries in which we conduct business could make itmore difficult for us to coordinate and manage our international operations in such countries.
Changes in China's laws, legal protections or government policies on foreign investment in China may harm our business.
Our business and corporate transactions, including our operations through the JV Company, are subject to laws and regulations applicable to foreigninvestment in China as well as laws and regulations applicable to foreign-invested enterprises. These laws and regulations frequently change, and theirinterpretation and enforcement involves uncertainties that could limit the legal protections available to us. Regulations and rules on foreign investments in Chinaimpose restrictions on the means that a foreign investor like us may apply to facilitate corporate transactions we may undertake. In addition, the Chinese legalsystem is based in part on government policies and internal rules, some of which are not published on a timely basis or at all, that may have a retroactive effect. Asa result, we may not be aware of our violation of these policies and rules until sometime after the violation. If any of our past operations are deemed to be non-compliant with Chinese law, we may be subject to penalties and our business and operations may be adversely affected. For instance, under Special AdministrativeMeasures (Negative List) for Foreign Investment Access, some industries are categorized as sectors which are restricted or prohibited for foreign investment. Asthe Negative List is updated every year, there can be no assurance that the China government will not change its policies in a manner that would render part or allof our business to fall within the restricted or prohibited categories. If we cannot obtain approval from relevant authorities to engage in businesses which becomeprohibited or restricted for foreign investors, we may be forced to sell or restructure a business which has become restricted or prohibited for foreign investment.Furthermore, the China government has broad discretion in dealing with violations of laws and regulations, including levying fines, revoking business and otherlicenses and requiring actions necessary for compliance. In particular, licenses and permits issued or granted to us by relevant governmental bodies may be revokedat a later time by higher regulatory bodies. If we are forced to adjust our corporate structure or business as a result of changes in government policy on foreigninvestment or changes in the interpretation and application of existing or new laws, our business, financial condition, results of operations and prospects may beharmed. Moreover, uncertainties in the Chinese legal system may impede our ability to enforce contracts with our business partners, customers and suppliers, orotherwise pursue claims in litigation to recover damages or loss of property, which could adversely affect our business and operations.
31
The continuing potential for new or additional tariffs on imported goods from China could adversely affect our business operations.
The United States entered into what is described as “Phase 1” trade agreement with China on January 15, 2020, which reduces some existing tariffs that hadbeen imposed and defers proposed increases of the tariff rate on an additional $250 billion of Chinese goods from 25% to 30% that had been planned for October15, 2019, and proposed 15% tariffs on an additional $160 billion of a wide range of goods and materials imported from China to be effective December 15, 2019. Under the Phase 1 agreement, existing 25% tariffs previously imposed on $250 billion of Chinese goods will remain in place, while a 15% tariff on another $120billion of Chinese goods has been reduced to 7.5%. These goods, absent exemptions, may include products and applications, including consumer electronics, thatincorporate our power discrete and power IC products. In response, China has imposed tariffs on certain American products, some of which are being reduced aspart of the Phase 1 agreement. China may take additional actions if additional U.S. tariffs are reduced or imposed. On May 8, 2020, the two countries reaffirmedtheir Phrase I trade agreement notwithstanding the COVID-19 pandemic. In view of potential discussions between the Chinese and U.S. governments on a secondphase agreement, for which discussions only among trade negotiators are currently scheduled, the ultimate level of tariffs, the ultimate scope of them, and whetheror how the proposed additional tariffs will impact our business is uncertain. We believe that the imposition of additional tariffs by the U.S. government onproducts incorporating our power semiconductors could deter our customers from purchasing our products originating from China. If so, this would reducedemand for our power semiconductor products or result in pricing adjustments that would lower our gross margin, which could have a material adverse effect onour business and results of operations.
Substantial uncertainties exist with respect to the interpretation and implementation of PRC Foreign Investment Law and how it may impact the viability ofour current corporate structure, corporate governance and business operations.
On March 15, 2019, the National People’s Congress of the PRC promulgated the Foreign Investment Law, which took effect on January 1, 2020, andreplaced the existing laws regulating foreign investment in China, namely, the Sino-foreign Equity Joint Venture Enterprise Law, the Sino-foreign CooperativeJoint Venture Enterprise Law and the Wholly Foreign-invested Enterprise Law, together with their implementation rules and ancillary regulations. The ForeignInvestment Law embodies a PRC regulatory trend to rationalize its foreign investment regulatory regime in line with prevailing international practice and thelegislative efforts to unify the corporate legal requirements for both foreign and domestic investments. The Foreign Investment Law establishes the basicframework for the access, promotion, protection and administration of foreign investments in China in view of investment protection and fair competition. Forexample, treatment of foreign investors on a national level will be no less favorable than the treatment received by domestic investors unless such investments fallwithin a “negative list”. On June 30, 2019, the National Development and Reform Commission and the Ministry of Commerce of the PRC published the SpecialAdministrative Measures for Market Access of Foreign Investment (Negative List), which identifies specific sectors where foreign investors will be subject tospecial administrative measures.
Since the Foreign Investment Law was newly enacted, uncertainties still exist in relation to its interpretation and implementation. For example, the ForeignInvestment Law provides that foreign invested enterprises established according to the existing laws regulating foreign investment may maintain their structure andcorporate governance within a five-year transition period, which means that we may be required to adjust the structure and corporate governance of certain of ourChina subsidiaries in such transition period. Failure to take timely and appropriate measures to cope with any of these or similar regulatory compliance challengescould materially and adversely affect our current corporate structure, corporate governance and business operations.
In addition, under the newly enacted Foreign Investment Law, foreign investors or the foreign invested enterprise should report investment information onthe principle of necessity. Any company found to be non-complaint with such investment information reporting obligation might be potentially subject to fines oradministration liabilities.
Limitations on our ability to transfer funds to our China subsidiaries could adversely affect our ability to expand our operations, make investments that couldbenefit our businesses and otherwise fund and conduct our business.
The transfer of funds from us to our China subsidiaries, either as a shareholder loan or as an increase in registered capital, is subject to registration with orapproval by the China's governmental authorities, including the State Administration of Foreign Exchange, or SAFE, or the relevant examination and approvalauthority. Our subsidiaries may also experience difficulties in converting our capital contributions made in foreign currencies into RMB due to changes in theChina's foreign exchange control policies. Therefore, it may be difficult to change capital expenditure plans once the relevant funds have been remitted from us toour China subsidiaries. These limitations and the difficulties
32
our China subsidiaries may experience on the free flow of funds between us and our China subsidiaries could restrict our ability to act in response to changingmarket situations in a timely manner.
China's currency exchange control and government restrictions on investment repatriation may impact our ability to transfer funds outside of China.
A significant portion of our business is conducted in China where the currency is the Renminbi. Regulations in China permit foreign owned entities to freelyconvert the Renminbi into foreign currency for transactions that fall under the “current account,” which includes trade related receipts and payments, interest anddividends. Accordingly, our Chinese subsidiaries may use Renminbi to purchase foreign exchange for settlement of such “current account” transactions withoutpre-approval. However, pursuant to applicable regulations, foreign‑invested enterprises in China may pay dividends only out of their accumulated profits, if any,determined in accordance with Chinese accounting standards and regulations. In calculating accumulated profits, foreign investment enterprises in China arerequired to allocate at least 10% of their accumulated profits each year, if any, to fund certain reserve funds unless these reserves have reached 50% of theregistered capital of the enterprises.
Other transactions that involve conversion of Renminbi into foreign currency are classified as “capital account” transactions; examples of “capital account”transactions include repatriations of investment by or loans to foreign owners, or direct equity investments in a foreign entity by a China domiciled entity. “Capitalaccount” transactions require prior approval from, or registration with China's State Administration of Foreign Exchange (SAFE) or its provincial branch toconvert a remittance into a foreign currency, such as U.S. dollars, and transmit the foreign currency outside of China.
As a result of these and other restrictions under PRC laws and regulations, our China subsidiaries are restricted in their ability to transfer a portion of their netassets to the parent; such restricted portion amounted to approximately $209.8 million, or 61.4% of our total consolidated net assets attribute to the Company as ofJune 30, 2020. We have no assurance that the relevant Chinese governmental authorities in the future will not limit further or eliminate the ability of our Chinasubsidiaries to purchase foreign currencies and transfer such funds to us to meet our liquidity or other business needs. Any inability to access funds in China, if andwhen needed for use by the Company outside of China, could have a material and adverse effect on our liquidity and our business.
The M&A Rules and certain other PRC regulations establish complex procedures for some acquisitions of Chinese companies by foreign investors, whichcould make it more difficult for us to pursue growth through acquisitions in China.
The Regulations on Mergers and Acquisitions of Domestic Companies by Foreign Investors, or the M&A Rules, adopted by six PRC regulatory agencies inAugust 2006 and amended in 2009, and some other regulations and rules concerning mergers and acquisitions established additional procedures and requirementsthat could make merger and acquisition activities by foreign investors more time consuming and complex, including requirements in some instances that the MOCbe notified in advance of any change-of-control transaction in which a foreign investor takes control of a PRC domestic enterprise. Moreover, the Anti-MonopolyLaw requires that the MOC shall be notified in advance of any concentration of undertaking if certain thresholds are triggered. In addition, the security review rulesissued by the MOC that became effective in September 2011 specify that mergers and acquisitions by foreign investors that raise “national defense and security”concerns and mergers and acquisitions through which foreign investors may acquire de facto control over domestic enterprises that raise “national security”concerns are subject to strict review by the MOC, and the rules prohibit any activities attempting to bypass a security review, including by structuring thetransaction through a proxy or contractual control arrangement. In the future, we may grow our business by acquiring complementary businesses. Complying withthe requirements of the above-mentioned regulations and other relevant rules to complete such transactions could be time consuming, and any required approvalprocesses, including obtaining approval from the MOC or its local counterparts may delay or inhibit our ability to complete such transactions, which could affectour ability to expand our business or maintain our market share.
Our results of operations may be negatively impacted by fluctuations in foreign currency exchange rates between U.S. dollar and Chinese Yuan, or RMB.
While U.S. dollars is our main functional currency and our revenue and a significant portion of our operating expenses are denominated in U.S. dollars, weare required to maintain local currencies, primarily the RMB, in our cash balances in connection with the funding of our overseas operations. As a result, our costsand operating expenses may be exposed to adverse movements in foreign currency exchange rates between the U.S. dollar and RMB. We also do not utilize anyfinancial instruments to hedge or reduce potential losses due to the fluctuation of foreign currency exchange
33
rates. In general, any appreciation of U.S. dollars against a weaker RMB could reduce the value of our cash and cash equivalent balance, which could increase ouroperating expenses and negatively affect our cash flow, income and profitability. The value of RMB against the U.S. dollars may fluctuate and is affected by manyfactors outside of our control, including changes in political and economic conditions, implementation of new monetary policies by the Chinese government andchanges in banking regulations, and there is no guarantee that we will be able to mitigate or recoup any losses due to a significant fluctuation in the U.S.dollar/RMB exchange rates.
PRC labor laws may adversely affect our results of operations.
The PRC government promulgated the Labor Contract Law of the PRC, effective on January 1, 2008, as amended, to govern the establishment ofemployment relationships between employers and employees, and the conclusion, performance, termination of and the amendment to employment contracts. TheLabor Contract Law imposes greater liabilities on employers and significantly affects the cost of an employer’s decision to reduce its workforce. Further, itrequires that certain terminations be based upon seniority and not merit. In the event our subsidiaries decide to significantly change or decrease their workforce inChina, the Labor Contract Law could adversely affect their ability to effect such changes in a manner that is most advantageous to our business or in a timely andcost-effective manner, thus materially and adversely affecting our financial condition and results of operations.
In recent years, compensation in various industries in China has increased and may continue to increase in the future. In order to attract and retain skilledpersonnel, we may need to increase the compensation of our employees. Compensation may, also, increase as inflationary pressure increases in China. In addition,under the Regulations on Paid Annual Leave for Employees, which became effective on January 1, 2008, employees who have served more than one year for aspecific employer are entitled to a paid vacation ranging from 5 to 15 days, depending on length of service. Employees who waive such vacation time at the requestof employers must be compensated for three times their normal salaries for each waived vacation day. This mandated paid-vacation regulation, coupled with thetrend of increasing compensation, may result in increase in our employee-related costs and expenses and decrease in our profit margins.
Relations between Taiwan and China could negatively affect our business, financial condition and operating results and, therefore, the market value of ourcommon shares.
Taiwan has a unique international political status. China does not recognize the sovereignty of Taiwan. Although significant economic and cultural relationshave been established during recent years between Taiwan and China, relations have often been strained. A substantial number of our key customers and some ofour essential sales and engineering personnel are located in Taiwan, and we have a large number of operational personnel and employees located in China.Therefore, factors affecting military, political or economic relationship between China and Taiwan could have an adverse effect on our business, financialcondition and operating results.
Risks Related to Our Corporate Structure and Our Common Shares
Our share price may be volatile and you may be unable to sell your shares at or above the purchase price, if at all.
Limited trading volumes and liquidity of our common shares on the NASDAQ Global Select Market may limit the ability of shareholders to purchase or sellour common shares in the amounts and at the times they wish. In addition, the financial markets in the United States and other countries have experiencedsignificant price and volume fluctuations, and market prices of technology companies have been and continue to be extremely volatile. The trading price of ourcommon shares on The NASDAQ Global Select Market ranged from a low of $5.88 to high of $14.25 from July 1, 2019 to June 30, 2020. At July 31, 2020, thetrading price of our common shares was $10.89. Volatility in the price of our shares may be caused by factors outside our control and may be unrelated ordisproportionate to our operating results.
The market price for our common shares may be volatile and subject to wide fluctuations in response to factors, including:
• actual or anticipated fluctuations in our operating results;• general economic, industry, regional and global market conditions, including the economic conditions of specific market segments for our products,
including the PC markets;• our failure to meet analysts' expectations, including expectation regarding our revenue, gross margin and operating expenses;• changes in financial estimates and outlook by securities research analysts;
34
• our ability to increase our gross margin;• announcements by us or our competitors of new products, acquisitions, strategic partnerships, joint ventures or capital commitments;• announcements of technological or competitive developments;• announcement of acquisition, partnership and major corporate transactions;• regulatory developments in our target markets affecting us, our customers or our competitors;• our ability to enter into new market segments, gain market share, diversify our customer base and successfully secure manufacturing capacity;• announcements regarding intellectual property disputes or litigation involving us or our competitors;• changes in the estimation of the future size and growth rate of our markets;• announcement of significant legal proceedings, litigation or government investigation;• additions or departures of key personnel;• repurchase of shares under our repurchase program;• announcement of sales of our securities by us or by our major shareholders;• general economic or political conditions in China and other countries in Asia; and• other factors.
In the past, securities class action litigation has often been brought against a company following periods of volatility in such company's share price. Thistype of litigation could result in substantial costs and divert our management's attention and resources which could negatively impact our business and financialconditions. See Item 3. Legal Proceeding.
If securities or industry analysts do not publish research or reports about our business, or if they adversely change their recommendations regarding ourcommon shares or if our operating results do not meet their expectations, the trading price of our common shares could decline.
The market price of our common shares is influenced by the research and reports that industry or securities analysts publish about us or our business. There isno guarantee that these analysts will understand our business and results, or that their reports will be accurate or correctly predict our operating results or prospects.If one or more of these analysts cease coverage of our company or fail to publish reports on us regularly, we could lose visibility in the financial markets, which inturn could cause the market price of our common shares or its trading volume to decline. Moreover, if one or more of the analysts who cover our companydowngrade our common shares or if our operating results or prospects do not meet their expectations, the market price of our common shares could declinesignificantly.
Anti-takeover provisions in our bye-laws could make an acquisition of us more difficult and may prevent attempts by our shareholders to replace or remove ourcurrent management.
Certain provisions in our bye-laws may delay or prevent an acquisition of us or a change in our management. In addition, by making it more difficult forshareholders to replace members of our board of directors, these provisions also may frustrate or prevent any attempts by our shareholders to replace or remove ourcurrent management because our board of directors is responsible for appointing the members of our management team. These provisions include:
• the ability of our board of directors to determine the rights, preferences and privileges of our preferred shares and to issue the preferred shares withoutshareholder approval;
• advance notice requirements for election to our board of directors and for proposing matters that can be acted upon at shareholder meetings; and• the requirement to remove directors by a resolution passed by at least two-thirds of the votes cast by the shareholders having a right to attend and vote at
the shareholder meeting.
These provisions could make it more difficult for a third-party to acquire us, even if the third-party's offer may be considered beneficial by manyshareholders. As a result, shareholders may be limited in their ability to obtain a premium for their shares.
35
Insiders have substantial control over us, which could adversely affect the market price of our shares.
Our Chief Executive Officer, certain members of our management and directors, beneficially owned, in the aggregate, approximately 22.0% of ouroutstanding common shares as of June 30, 2020. As a result, these shareholders will be able to exert significant control over all matters requiring shareholderapproval, including the election of directors and approval of significant corporate transactions, such as a merger, consolidation, takeover or other businesscombination involving us. This concentration of ownership may also discourage, delay or prevent a change in control of our company, which could deprive ourshareholders of an opportunity to receive a premium for their shares as part of a sale of our company and may reduce the trading price of our shares. Furthermore,the interests of these insiders could conflict with the interests of our other shareholders and, accordingly, any of them may take actions that favor their owninterests and which may not be in the best interests of our other shareholders. These actions may be taken even if they are opposed by our other shareholders.
We are a Bermuda company and the rights of shareholders under Bermuda law may be different from U.S. laws.
We are a Bermuda limited liability exempted company. As a result, the rights of holders of our common shares will be governed by Bermuda law and ourmemorandum of association and bye-laws. The rights of shareholders under Bermuda law may differ from the rights of shareholders of companies incorporated inother jurisdictions, including the U.S. For example, some of our directors are not residents of the United States, and a substantial portion of our assets are locatedoutside the United States. As a result, it may be difficult for investors to effect service of process on those persons in the U.S. or to enforce in the U.S. judgmentsobtained in U.S. courts against us or those persons based on civil liability provisions of the U.S. securities laws. It is doubtful whether courts in Bermuda willenforce judgments obtained in other jurisdictions, including the U.S., against us or our directors or officers under the securities laws of those jurisdictions orentertain actions in Bermuda against us or our directors or officers under the securities laws of other jurisdictions.
36

Item 1B. Unresolved Staff Comments
None.
37
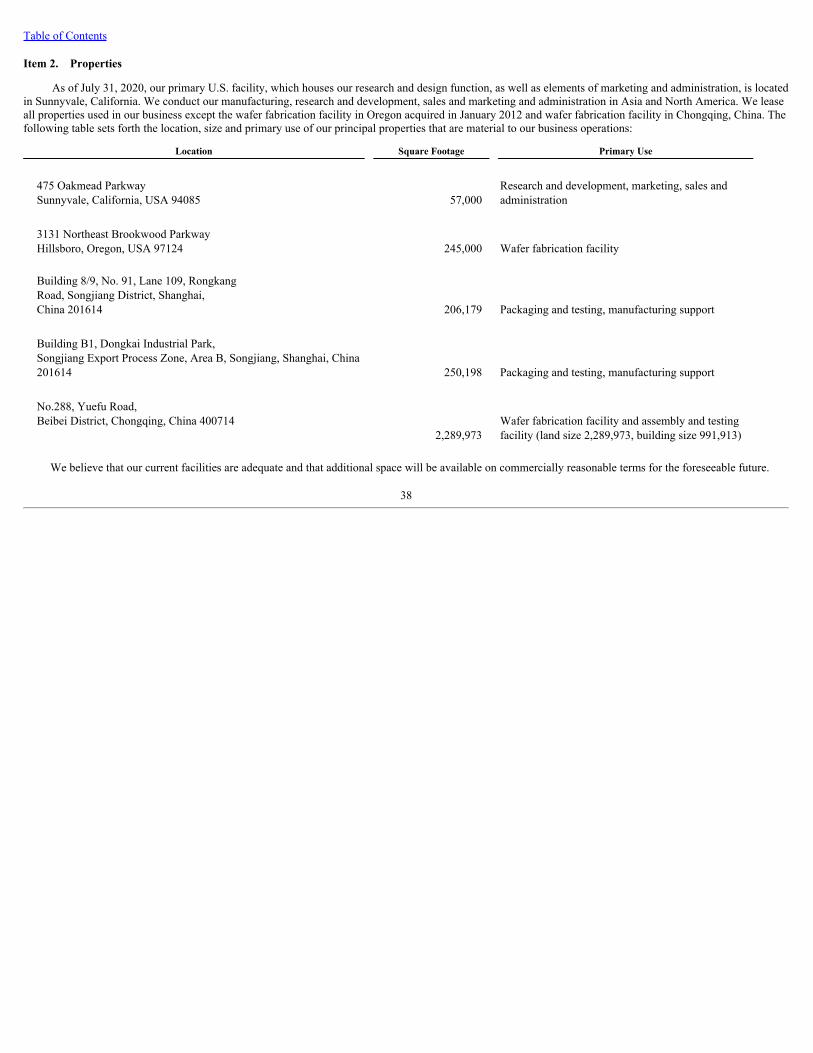
Table of Contents
Item 2. Properties
As of July 31, 2020, our primary U.S. facility, which houses our research and design function, as well as elements of marketing and administration, is locatedin Sunnyvale, California. We conduct our manufacturing, research and development, sales and marketing and administration in Asia and North America. We leaseall properties used in our business except the wafer fabrication facility in Oregon acquired in January 2012 and wafer fabrication facility in Chongqing, China. Thefollowing table sets forth the location, size and primary use of our principal properties that are material to our business operations:
Location Square Footage Primary Use
475 Oakmead ParkwaySunnyvale, California, USA 94085 57,000
Research and development, marketing, sales andadministration
3131 Northeast Brookwood ParkwayHillsboro, Oregon, USA 97124 245,000 Wafer fabrication facility
Building 8/9, No. 91, Lane 109, RongkangRoad, Songjiang District, Shanghai,China 201614 206,179 Packaging and testing, manufacturing support
Building B1, Dongkai Industrial Park,Songjiang Export Process Zone, Area B, Songjiang, Shanghai, China201614 250,198 Packaging and testing, manufacturing support
No.288, Yuefu Road,Beibei District, Chongqing, China 400714
2,289,973 Wafer fabrication facility and assembly and testingfacility (land size 2,289,973, building size 991,913)
We believe that our current facilities are adequate and that additional space will be available on commercially reasonable terms for the foreseeable future.
38
Item 3. Legal Proceedings
As previously disclosed, U.S. Department of Justice (“DOJ”) commenced an investigation into the Company’s compliance with export control regulationsrelating to its business transactions with Huawei and its affiliates (“Huawei”), which were added to the “Entity List” by the Department of Commerce (“DOC”) inMay 2019. The Company is cooperating fully with federal authorities in the investigation. The Company has continued to respond to inquiries and requests fromDOJ for documents and information relating to the investigation, and the matter is currently pending at DOJ. In connection with this investigation, DOC previouslyrequested the Company to suspend shipments of its products to Huawei. The Company complied with such request, and the Company has not shipped any productto Huawei after December 31, 2019. The Company continues to work with DOC to resolve this issue and requested DOC to grant permission to reinstate theCompany’s shipments to Huawei. As part of this process and in response to DOC’s request, the Company provided certain documents and materials relating to theCompany’s supply chain and shipment process to DOC, and DOC is currently reviewing this matter. DOC has not informed the Company of any specific timelineor schedule under which DOC will provide a response to the Company’s request. See “Risk Factor-The current government investigation and evolving exportcontrol regulations may adversely affect our financial performance and business operations” and footnote 13 to the consolidated financial statements of theCompany.
On March 19, 2020, Darryl Gray, a stockholder of the Company (the “Plaintiff”), filed a putative class action complaint in the United States District Court forthe Southern District of New York (the “Gray Action”), alleging that the Company and its management members made material misstatements or omissionsregarding the Company’s business and operations, including its export control practices relating to business transactions with Huawei and its affiliate. The GrayAction asserts claims under Section 10(b) of the Exchange Act against the Company, its Chief Executive Officer and Chief Financial Officer (collectively, theDefendants”), as well as claims under Section 20(a) of the Exchange Act against the Chief Executive Officer and Chief Financial Officer. Among other remedies,the Gray Action seeks to recover compensatory and other damages as well as attorney’s fees and costs.
On May 18, 2020, Plaintiff moved for an order appointing him as Lead Plaintiff pursuant to Section 21D of the Exchange Act and approving Glancy Prongay& Murray LLP as Lead Counsel for the putative class (the “Motion”). On July 1, 2020, the Court entered an order granting the Motion and requiring that: (i) LeadPlaintiff file an amended complaint or designate the current complaint as operative within sixty days; (ii) Defendants answer the complaint or otherwise movewithin sixty days of such filing or designation; (iii) Lead Plaintiff file an opposition, if any, within 45 days; and (iv) Defendants file a reply, if any, forty-five daysthereafter. On August 28, 2020, Plaintiff filed an amended complaint asserting the same claims against the Defendants, and adding the Company’s Executive VicePresident of Product Line as a defendant on both claims. The Company believes the claims in the Gray Action are without merit and intends to vigorously defendthis litigation.
We have in the past, and may from time to time in the future, become involved in legal proceedings arising from the normal course of business activities. The semiconductor industry is characterized by frequent claims and litigation, including claims regarding patent and other intellectual property rights as well asimproper hiring practices. Irrespective of the validity of such claims, we could incur significant costs in the defense thereof or could suffer adverse effects on itsoperations.
Item 4. Mine Safety Disclosures
Not Applicable.
39
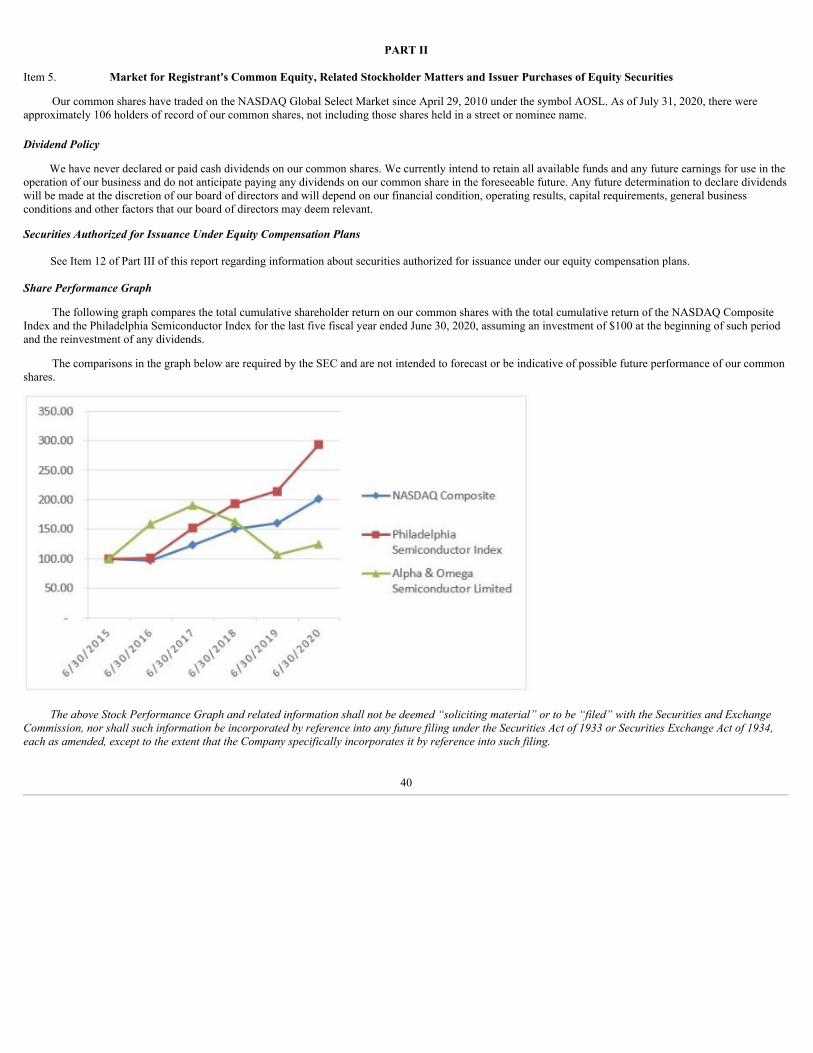
PART II
Item 5. Market for Registrant's Common Equity, Related Stockholder Matters and Issuer Purchases of Equity Securities
Our common shares have traded on the NASDAQ Global Select Market since April 29, 2010 under the symbol AOSL. As of July 31, 2020, there wereapproximately 106 holders of record of our common shares, not including those shares held in a street or nominee name.
Dividend Policy
We have never declared or paid cash dividends on our common shares. We currently intend to retain all available funds and any future earnings for use in theoperation of our business and do not anticipate paying any dividends on our common share in the foreseeable future. Any future determination to declare dividendswill be made at the discretion of our board of directors and will depend on our financial condition, operating results, capital requirements, general businessconditions and other factors that our board of directors may deem relevant.
Securities Authorized for Issuance Under Equity Compensation Plans
See Item 12 of Part III of this report regarding information about securities authorized for issuance under our equity compensation plans.
Share Performance Graph
The following graph compares the total cumulative shareholder return on our common shares with the total cumulative return of the NASDAQ CompositeIndex and the Philadelphia Semiconductor Index for the last five fiscal year ended June 30, 2020, assuming an investment of $100 at the beginning of such periodand the reinvestment of any dividends.
The comparisons in the graph below are required by the SEC and are not intended to forecast or be indicative of possible future performance of our commonshares.
The above Stock Performance Graph and related information shall not be deemed “soliciting material” or to be “filed” with the Securities and Exchange
Commission, nor shall such information be incorporated by reference into any future filing under the Securities Act of 1933 or Securities Exchange Act of 1934,each as amended, except to the extent that the Company specifically incorporates it by reference into such filing.
40

Purchases of Equity Securities by the Issuer and Affiliated Purchasers
In September 2017, the Board of Directors approved a repurchase program (the “Repurchase Program”) that allowed the Company to repurchase its commonshares from the open market pursuant to a pre-established Rule 10b5-1 trading plan or through privately negotiated transactions up to an aggregate of $30.0million. The amount and timing of any repurchases under the Repurchase Program depend on a number of factors, including but not limited to, the trading price,volume and availability of the Company's common shares. There is no guarantee that such repurchases under the Repurchase Program will enhance the value ofour shares. Shares repurchased under this program are accounted for as treasury shares and the total cost of shares repurchased is recorded as a reduction ofshareholders' equity. During the fourth quarter of fiscal year 2020, the Company did not repurchase any shares under the Repurchase Program. As of June 30,2020, we had $13.4 million available under this repurchase program.
41
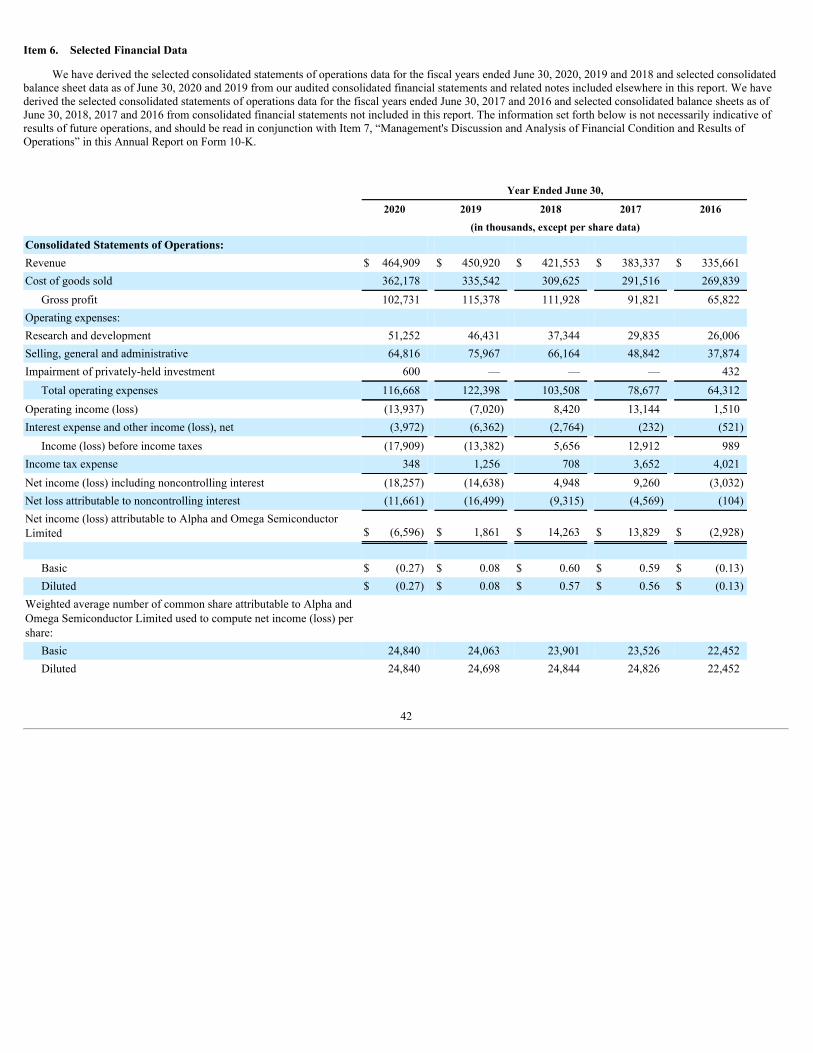
Item 6. Selected Financial Data
We have derived the selected consolidated statements of operations data for the fiscal years ended June 30, 2020, 2019 and 2018 and selected consolidatedbalance sheet data as of June 30, 2020 and 2019 from our audited consolidated financial statements and related notes included elsewhere in this report. We havederived the selected consolidated statements of operations data for the fiscal years ended June 30, 2017 and 2016 and selected consolidated balance sheets as ofJune 30, 2018, 2017 and 2016 from consolidated financial statements not included in this report. The information set forth below is not necessarily indicative ofresults of future operations, and should be read in conjunction with Item 7, “Management's Discussion and Analysis of Financial Condition and Results ofOperations” in this Annual Report on Form 10-K.
Year Ended June 30,
2020 2019 2018 2017 2016
(in thousands, except per share data)
Consolidated Statements of Operations: Revenue $ 464,909 $ 450,920 $ 421,553 $ 383,337 $ 335,661Cost of goods sold 362,178 335,542 309,625 291,516 269,839
Gross profit 102,731 115,378 111,928 91,821 65,822Operating expenses: Research and development 51,252 46,431 37,344 29,835 26,006Selling, general and administrative 64,816 75,967 66,164 48,842 37,874Impairment of privately-held investment 600 — — — 432
Total operating expenses 116,668 122,398 103,508 78,677 64,312Operating income (loss) (13,937) (7,020) 8,420 13,144 1,510Interest expense and other income (loss), net (3,972) (6,362) (2,764) (232) (521)
Income (loss) before income taxes (17,909) (13,382) 5,656 12,912 989Income tax expense 348 1,256 708 3,652 4,021Net income (loss) including noncontrolling interest (18,257) (14,638) 4,948 9,260 (3,032)Net loss attributable to noncontrolling interest (11,661) (16,499) (9,315) (4,569) (104)Net income (loss) attributable to Alpha and Omega SemiconductorLimited $ (6,596) $ 1,861 $ 14,263 $ 13,829 $ (2,928)
Basic $ (0.27) $ 0.08 $ 0.60 $ 0.59 $ (0.13)Diluted $ (0.27) $ 0.08 $ 0.57 $ 0.56 $ (0.13)
Weighted average number of common share attributable to Alpha andOmega Semiconductor Limited used to compute net income (loss) pershare:
Basic 24,840 24,063 23,901 23,526 22,452Diluted 24,840 24,698 24,844 24,826 22,452
42
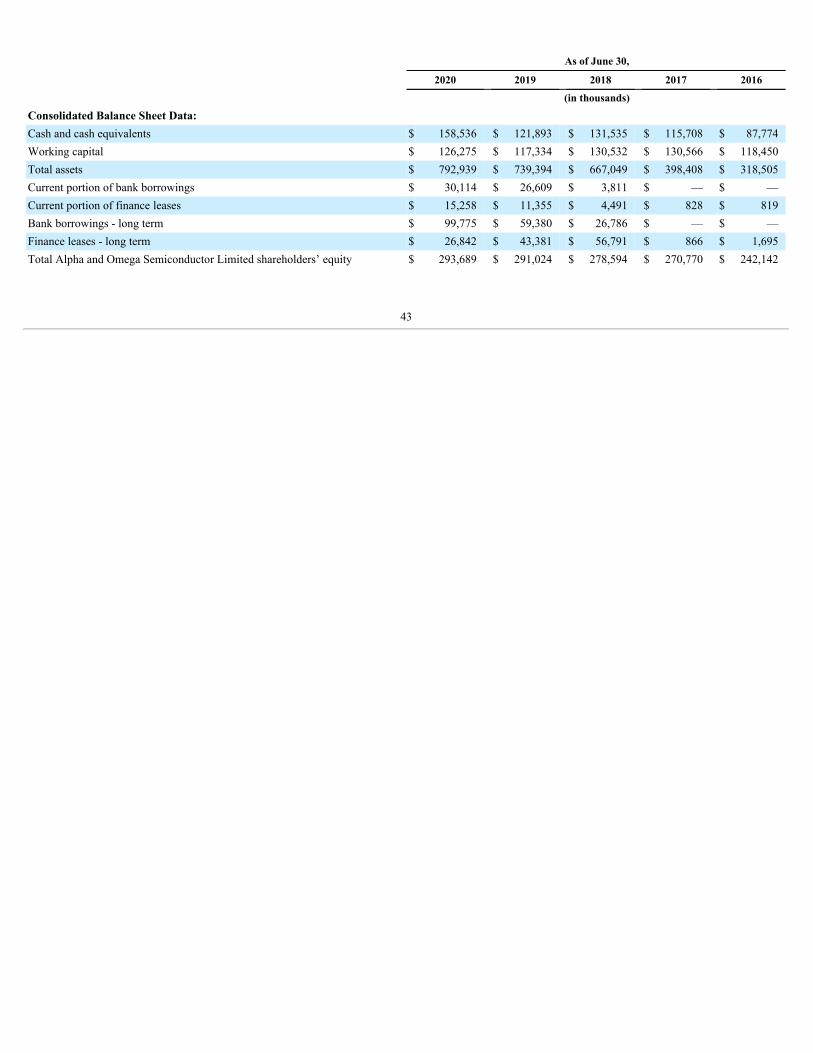
As of June 30,
2020 2019 2018 2017 2016
(in thousands)
Consolidated Balance Sheet Data: Cash and cash equivalents $ 158,536 $ 121,893 $ 131,535 $ 115,708 $ 87,774Working capital $ 126,275 $ 117,334 $ 130,532 $ 130,566 $ 118,450Total assets $ 792,939 $ 739,394 $ 667,049 $ 398,408 $ 318,505Current portion of bank borrowings $ 30,114 $ 26,609 $ 3,811 $ — $ —Current portion of finance leases $ 15,258 $ 11,355 $ 4,491 $ 828 $ 819Bank borrowings - long term $ 99,775 $ 59,380 $ 26,786 $ — $ —Finance leases - long term $ 26,842 $ 43,381 $ 56,791 $ 866 $ 1,695Total Alpha and Omega Semiconductor Limited shareholders’ equity $ 293,689 $ 291,024 $ 278,594 $ 270,770 $ 242,142
43
Item 7. Management's Discussion and Analysis of Financial Condition and Results of Operations
You should read the following discussion of the financial condition and results of our operations in conjunction with our consolidated financial statementsand the notes to those statements included elsewhere in this annual report. Our consolidated financial statements contained in this annual report are prepared inaccordance with U.S. GAAP.
Overview
We are a designer, developer and global supplier of a broad portfolio of power semiconductors. Our portfolio of power semiconductors includesapproximately 2,300 products, and has grown significantly with the introduction of over 160 new products in the fiscal year ended June 30, 2020, and over 200new products in each of the fiscal year ended June 30, 2019 and 2018, respectively. Our teams of scientists and engineers have developed extensive intellectualproperties and technical knowledge that encompass major aspects of power semiconductors, which we believe enables us to introduce and develop innovativeproducts to address the increasingly complex power requirements of advanced electronics. We have an extensive patent portfolio that consists of 823 patents and76 patent applications in the United States as of June 30, 2020. We also have a total of 851 foreign patents, which primarily were based on our research anddevelopment efforts through June 30, 2020. We differentiate ourselves by integrating our expertise in technology, design and advanced manufacturing andpackaging to optimize product performance and cost. Our portfolio of products targets high-volume applications, including portable computers, graphic cards, flatpanel TVs, home appliances, smart phones, battery packs, consumer and industrial motor controls and power supplies for TVs, computers, servers andtelecommunications equipment.
Our business model leverages global resources, including research and development and manufacturing in the United States and Asia. Our sales and technicalsupport teams are localized in several growing markets. We operate an 8-inch wafer fabrication facility located in Hillsboro, Oregon, or the Oregon fab, which iscritical for us to accelerate proprietary technology development, new product introduction and improve our financial performance. To meet the market demand forthe more mature high volume products, we also utilize the wafer manufacturing capacity of selected third party foundries. For assembly and test, we primarily relyupon our in-house facilities in China. In addition, we utilize subcontracting partners for industry standard packages. We believe our in-house packaging and testingcapability provides us with a competitive advantage in proprietary packaging technology, product quality, cost and sales cycle time.
We operate a power semiconductor packaging, testing and wafer fabrication facility in the Liangjiang New Area of Chongqing, China through our jointventure (the “JV Company”) with two investment funds owned by the Municipality of Chongqing (the “Chongqing Funds”), (the “JV Company”). We currentlyown 51%, and the Chongqing Funds own 49%, of the equity interest in the JV Company. The Company’s consolidated financial statements for the fiscal yearsended June 30, 2020, 2019 and 2018 reflect net losses attributable to the non-controlling interest in the JV Company of $11.7 million, $16.5 million and $9.3million, respectively. While the JV Company is our consolidated subsidiary for purpose of financial reporting, it operates as an independent and separate legalentity. As a result, the JV Company’s assets and liabilities are generally segregated from our companies. For example, the JV Company incurs debt through its ownfinancing and bank loan agreements, and our parent company and other subsidiaries are not parties to these agreements and do not provide any guarantee orsecurity for the JV Company’s debt, nor do we have direct access to any cash proceeds borrowed from such loan agreements. As part of our strategic plan, we builtthe JV Company to fulfill growing customer demand. In fact, in the quarter ended June 30, 2020, the JV Company made a major contribution to capturingincreasing demand for our products. Even though the COVID-19 pandemic has slowed its production, we are continuing to make progress. The JV Company hadbeen ramping up its production of assembly and testing during the fiscal year 2020. The 12-inch wafer fabrication facility commenced its limited mass productionin the quarter ended September 30, 2019 and continued its ramp in the year ended June 30, 2020. Importantly, the JV Company achieved a positive EBITDAS inthe fourth quarter of fiscal year 2020. For the quarter ending September 30, 2020, we expect the JV Company to sequentially increase its production of its 12-inchwafer fabrication and assembly and test. Our current goal is to achieve Phase 1 target run rate in the quarter ending September 30, 2021. However, the impact ofthe global COVID-19 pandemic and related economic downturn, intensified geopolitical tensions, logistical difficulties and other factors beyond our control coulddelay our plan. We will continue to monitor and evaluate market conditions closely during this period and react quickly to the changing environment as necessaryto achieve an optimal production level at the JV Company. We expect the joint venture to provide much needed capacity to support our future growth, enhance ourmarket positions in China, and drive improvements in capital expenditures.
On September 5, 2017, we entered into a license agreement with STMicroelectronics International N.V. (“STMicro”), pursuant to which STMicro granted usa world-wide, royalty-free and fully-paid license to use its technologies to develop, market and distribute certain digital multi-phase controller products, whichhave been previously offered by STMicro. As of June 30, 2020, we recorded $16.2 million as intangible assets. We will begin to amortize such intangible assetduring the
44
September 2020 quarter, which is when the technology meets qualification requirements and becomes ready for its intended use in production.
During the fiscal year ended June 30, 2020, we continued our diversification program by developing new silicon and packaging platforms to expand ourserviceable available market, or SAM and offer higher performance products. Our metal-oxide-semiconductor field-effect transistors, or MOSFET, portfolioexpanded significantly across a full range of voltage applications.
Impact of COVID-19 Pandemic to our Business
Our business operations have been impacted by the global COVID-19 pandemic and the resulting economic downturn. Numerous governmental jurisdictions,including the States of California, Oregon and Texas in the U.S. and countries throughout the Asia Pacific region have imposed “stay-at-home” orders, quarantines,travel bans and similar governmental orders and restrictions to control the spread of COVID-19. Such orders and restrictions have resulted in business closures,work stoppages, slowdowns and delays in commercial activities, unprecedented and widespread unemployment, disruptions to ports and other shippinginfrastructure, border closures, and other travel or health-related restrictions, thereby negatively impacting our customers, suppliers, distributors, employees,offices, and the entire semiconductor ecosystem.
As a result of the COVID-19 pandemic and changing consumer behaviors due to various “stay-at-home” restrictions, we have experienced shifting markettrends, including an increasing demand in markets for notebooks, PCs and gaming devices and decreasing demand for mobile phone products. While we haverecently benefited from the increasing demand for PC related products, there is no guarantee that this trend will continue, and such increasing demand maydiscontinue as government authorities relax COVID-19 related restrictions. Furthermore, as the COVID-19 pandemic continues and global economic downturn andhigh unemployment persist, consumer spending in general may slow down substantially, in which case we may experience a significant decline of customer ordersfor our products, including those designed for PC-related applications, and such decline is expected to adversely affect our financial conditions and results ofoperations.
In an effort to protect the health and safety of our employees and to comply with various government and regulatory guidelines, we took proactive actionsfrom the early signs of the COVID-19 outbreak in China to adopt policies and protocols at our locations around the world, including social distancing guidelines,working from home, limiting the number of employees attending meetings, reducing the number of people in our sites at any one time, and suspending employeetravel. As the COVID-19 pandemic reached the U.S., and federal and state authorities imposed “stay-at-home” orders, we have taken similar proactive actions inCalifornia, Oregon and Texas where we have business activities in order to protect the health and safety of our employees, while maintaining our core operations.We expect these measures will result in difficulties and logistical challenges in our business operations, and in some cases, reduce the productivity of ourworkforce and cause disruptions and delays in shipping products to our customers. This may impact our ability to respond quickly and effectively to changingmarket demands as the COVID-19 pandemic continues to cause economic disruption and recession around the globe. In addition, the COVID-19 pandemic andrelated events have slowed the pace of ramp-up activities at the JV Company, and our current goal is to achieve Phase 1 target run rate in the quarter endingSeptember 30, 2021.
We cannot predict the long-term economic impact of the COVID-19 pandemic, but we will continue to actively monitor the situation and may take furtheractions altering our business operations that we determine are in the best interests of our employees, customers, partners, suppliers, and stakeholders, or as requiredby federal, state, or local authorities. The ultimate effects that any such alterations or modifications may have on our business are not clear, including the effects onour customers, employees, and prospects, or on our financial results for the remainder of calendar year 2020.
Other Factors affecting our performance
In addition to the COVID-19 pandemic and related events as described above, our performance is affected by several key factors, including the following:
Costs of JV Company and digital power business: We have incurred an increase in operating expenses due to the additional costs associated with pre-production and production ramp-up activities of the JV Company, as well as the initial startup work to develop and establish our new digital power business, bothof which have had a significant impact on our financial performance. Even though the COVID-19 pandemic has slowed its production, we are making persistentprogress. The JV Company had been ramping up its production of assembly and testing during the fiscal year 2020. The 12-inch wafer fabrication facilitycommenced its limited mass production in the quarter ended September 30, 2019 and continued its ramp in the year ended June 30, 2020. For the quarter endingSeptember 30, 2020, we expect the JV Company to sequentially increase
45
its production of its 12-inch wafer fabrication and assembly and test. The pre-production costs include costs relating to the installation of equipment; performanceof the qualification process; increased demand for electrical power and other utilities; increased headcount as a result of hiring of additional personnel, staff andoperators; and establishment of administrative and management functions and systems. Certain of such pre-production costs could be capitalized under U.S. GAAPaccounting. However, the majority of such pre-production costs and all of the production ramp-up costs cannot be capitalized, and such costs have and maycontinue to have a negative impact on our profitability. We did not incur pre-production costs after July 2019 as the JV Company has commenced limited massproduction.
In addition, we are developing our digital power business based on the STMicro license agreement, which will allow us to design and distribute a full suite ofadvanced low-voltage power IC products. We have incurred and expect to continue to incur additional costs, including costs relating to compensation of qualifiedengineers and technical staff and other research and development and management activities, as we continue to build this new business. In the short term, we willnot be able to generate sufficient amount of revenue from either of these two business initiatives to offset the increased costs, which will likely negatively impactour results of operations.
Manufacturing costs: Our gross margin is affected by a number of factors including our manufacturing costs, utilization of our manufacturing facilities, theproduction mixtures of our sales, pricing of wafers from third party foundries and pricing of semiconductor raw materials. Capacity utilization affects our grossmargin because we have certain fixed costs associated with our packaging and testing facilities at our Oregon fab and our Chongqing fabrication facility operatedby the JV Company. We expect that in the long term our JV Company will reduce our cost of manufacturing. If we are unable to utilize our manufacturingfacilities at a desired level, our gross margin may be adversely affected. In addition, from time to time, we may experience wafer capacity constraints, particularlyat third party foundries, that may prevent us from fully meeting the demand of our customers. While we can mitigate such constraints by increasing and re-allocating capacity at our own fab, we may not be able to do so quickly or at sufficient level, which could adversely affect our financial conditions and results ofoperations.
Erosion and fluctuation of average selling price: Erosion of average selling prices of established products is typical in our industry. Consistent with thishistorical trend, we expect our average selling prices of existing products to decline in the future. However, in the normal course of business, we seek to offset theeffect of declining average selling price by introducing new and higher value products, expanding existing products for new applications and new customers andreducing the manufacturing cost of existing products. These strategies may cause the average selling price of our products to fluctuate significantly from time totime, thereby affecting our financial performance and profitability.
The global, regional economic and PC market conditions: Because our products primarily serve consumer electronic applications, a deterioration of theglobal and regional economic conditions could materially affect our revenue and results of operations. For example, because a significant amount of our revenue isderived from sales of products in the personal computing ("PC") markets, such as notebooks, motherboards and notebook battery packs, a significant decline ordownturn in the PC market can have a material adverse effect on our revenue and results of operations. Our revenue from the PC markets accounted forapproximately 41.1%, 45.9% and 41.6% of our total revenue for the years ended June 30, 2020, 2019 and 2018, respectively. The PC markets have experienced amodest global decline in recent years due to continued growth of demand in tablets and smart phones, worldwide economic conditions and the industry inventorycorrection which had and may continue to have a material impact on the demand for our products. While recently we have experienced an increase of demand inPC market due to the impact of the COVID-19 pandemic, we cannot predict whether and how long this trend will continue. A decline of the PC market may havenegative impact on our revenue, factory utilization, gross margin, our ability to resell excess inventory, and other performance measures. We have executed andcontinue to execute strategies to diversify our product portfolio, penetrate other market segments, including the consumer, communications and industrial markets,and improve gross margins and profit by implementing cost control measures. While making efforts to reduce our reliance on the computing market, we continueto support our computing business and capitalize on the opportunities in this market with a more focused and competitive PC product strategy to gain market share.
Product introductions and customers' product requirements: Our success depends on our ability to introduce products on a timely basis that meet or arecompatible with our customers' specifications and performance requirements. Both factors, timeliness of product introductions and conformance to customers'requirements, are equally important in securing design wins with our customers. As we accelerate the development of new technology platforms, we expect toincrease the pace at which we introduce new products and seek and acquire design wins. Our failure to introduce new products on a timely basis that meetcustomers' specifications and performance requirements, particularly those products with major OEM customers, and our inability to continue to expand ourserviceable markets, could adversely affect our financial performance, including loss of market share. We believe that the JV Transaction will increase anddiversify our customer base, particularly in China, in the long term. However, the ramp-activities and production schedule of our JV Company have been impactedby the COVID-19 pandemic and related events, as discussed above. Even if we are able to ramp up the operation of the JV Company timely, we
46
may not be successful in acquiring a sufficient number of new customers to offset additional costs due to various factors, including but are not limited to,competition from other semiconductor companies in the region, our lack of history and prior relationships with customers as a new entrant, difficulties in executingour joint venture strategies, lack of control over our operations and the general economic conditions in Chongqing and China.
Distributor ordering patterns, customer demand and seasonality: Our distributors place purchase orders with us based on their forecasts of end customerdemand, and this demand may vary significantly depending on the sales outlook and market and economic conditions of end customers. Because these forecastsmay not be accurate, channel inventory held at our distributors may fluctuate significantly, which in turn may prompt distributors to make significant adjustmentsto their purchase orders placed with us. As a result, our revenue and operating results may fluctuate significantly from quarter to quarter. In addition, because ourproducts are used in consumer electronics products, our revenue is subject to seasonality. Our sales seasonality is affected by numerous factors, including globaland regional economic conditions as well as the PC market conditions, revenue generated from new products, changes in distributor ordering patterns in responseto channel inventory adjustments and end customer demand for our products and fluctuations in consumer purchase patterns prior to major holiday seasons. Inrecent periods, broad fluctuations in the semiconductor markets and the global and regional economic conditions, in particular the decline of the PC marketconditions, have had a more significant impact on our results of operations than seasonality. Furthermore, our revenue may be impacted by the level of demandfrom our major customers due to factors outside of our control. If these major customers experience significant decline in the demand of their products, encounterdifficulties or defects in their products, or otherwise fail to execute their sales and marketing strategies successfully, it may adversely affect our revenue and resultsof operations.
Regulatory Development: The U.S. Department of Justice commenced an investigation into the Company’s compliance with export control regulationsrelating to certain business transactions with Huawei and its affiliates (“Huawei”), which were added to the “Entity List” by the Department of Commerce(“DOC”) in May 2019. In connection with this investigation, DOC requested the Company to suspend shipments of its products to Huawei, and the Companycomplied with such request, and the Company has not shipped any product to Huawei after December 31, 2019. The Company is currently working with DOC toresolve this issue and seeks permission to reinstate shipment to Huawei. As of the date of this report, DOC has not provided the Company with any definitivetimeline or schedule for responding to the Company's request. We expect the financial performance will be negatively impacted by the Huawei shipmentinterruption until such time when DOC permits us to continue shipment to Huawei. There is no guarantee that DOC will agree to permit us to resume shipment toHuawei on a timely basis, or at all, and we may not be able to acquire new or additional customers or demand to offset such loss of shipment. Our failure to do sowill negatively impact our revenue and profitability. Furthermore, the Company is expected to incur significant costs and expenses, including legal fees, inconnection with the government investigation, which may reduce our profitability and margin. See “Risk Factor-The current government investigation andevolving export control regulations may adversely affect our financial performance and business operations”.
Principal line items of statements of operations
The following describes the principal line items set forth in our consolidated statements of operations:
Revenue
We generate revenue primarily from the sale of power semiconductors, consisting of power discretes and power ICs. Historically, a majority of our revenuehas been derived from power discrete products. Because our products typically have three-year to five-year life cycles, the rate of new product introduction is animportant driver of revenue growth over time. We believe that expanding the breadth of our product portfolio is important to our business prospects, because itprovides us with an opportunity to increase our total bill-of-materials within an electronic system and to address the power requirements of additional electronicsystems. In addition, a small percentage of our total revenue is generated by providing packaging and testing services to third parties through one of oursubsidiaries.
Our product revenue is reported net of the effect of the estimated stock rotation returns and price adjustments that we expect to provide to our distributors.Stock rotation returns are governed by contract and are limited to a specified percentage of the monetary value of products purchased by the distributor during aspecified period. At our discretion or upon our direct negotiations with the original design manufacturers ("ODMs") or original equipment manufacturers("OEMs"), we may elect to grant special pricing that is below the prices at which we sold our products to the distributors. In these situations, we will grant priceadjustments to the distributors reflecting such special pricing. We estimate the price adjustments for inventory at the distributors based on factors such asdistributor inventory levels, pre-approved future distributor selling prices, distributor margins and demand for our products.
47
Cost of goods sold
Our cost of goods sold primarily consists of costs associated with semiconductor wafers, packaging and testing, personnel, including share-basedcompensation expense, overhead attributable to manufacturing, operations and procurement, and costs associated with yield improvements, capacity utilization,warranty and inventory reserves. As the volume of sales increases, we expect cost of goods sold to increase. We implemented a process to improve our factorycapacity utilization rates by transferring more wafer production to our Oregon fab and reducing our reliance on outside foundries. While our utilization rates cannotbe immune to the market conditions, our goal is to make them less vulnerable to market fluctuations. We believe our market diversification strategy and productgrowth will drive higher volume of manufacturing which will improve our factory utilization rates and gross margin in the long run.
Operating expenses
Our operating expenses consist of research and development, selling, general and administrative expenses and impairment of long-lived assets. We expectour operating expenses as a percentage of revenue to fluctuate from period to period as we continue to exercise cost control measures in response to the decliningPC market as well as align our operating expenses to the revenue level.
Research and development expenses. Our research and development expenses consist primarily of salaries, bonuses, benefits, share-based compensationexpense, expenses associated with new product prototypes, travel expenses, fees for engineering services provided by outside contractors and consultants,amortization of software and design tools, depreciation of equipment and overhead costs. We continue to invest in developing new technologies and productsutilizing our own fabrication and packaging facilities as it is critical to our long-term success. We also evaluate appropriate investment levels and stay focused onnew product introductions to improve our competitiveness. We expect that our research and development expenses will fluctuate from time to time.
Selling, general and administrative expenses. Our selling, general and administrative expenses consist primarily of salaries, bonuses, benefits, share-basedcompensation expense, product promotion costs, occupancy costs, travel expenses, expenses related to sales and marketing activities, amortization of software,depreciation of equipment, maintenance costs and other expenses for general and administrative functions as well as costs for outside professional services,including legal, audit and accounting services. We expect our selling, general and administrative expenses to fluctuate in the near future as we continue to exercisecost control measures.
Impairment of privately-held investment
During fiscal year 2017, we purchased shares of common stock in a privately-held company at a total cost of $0.6 million. We accounted for the investmenton a cost basis. During the fiscal year ended June 30, 2020, we recorded impairment charges of $0.6 million in connection with this investment as we concludedthe impairment to be other-than-temporary.
Income tax expense
We are subject to income taxes in various jurisdictions. Significant judgment and estimates are required in determining our worldwide income tax expense.The calculation of tax liabilities involves dealing with uncertainties in the application of complex tax regulations of different jurisdictions globally. We establishaccruals for potential liabilities and contingencies based on a more likely than not threshold to the recognition and de-recognition of uncertain tax positions. If therecognition threshold is met, the applicable accounting guidance permits us to recognize a tax benefit measured at the largest amount of tax benefit that is morelikely than not to be realized upon settlement with a taxing authority. If the actual tax outcome of such exposures is different from the amounts that were initiallyrecorded, the differences will impact the income tax and deferred tax provisions in the period in which such determination is made. Changes in the location oftaxable income (loss) could result in significant changes in our income tax expense.
We record a valuation allowance against deferred tax assets if it is more likely than not that a portion of the deferred tax assets will not be realized, based onhistorical profitability and our estimate of future taxable income in a particular jurisdiction. Our judgments regarding future taxable income may change due tochanges in market conditions, changes in tax laws, tax planning strategies or other factors. If our assumptions and consequently our estimates change in the future,the deferred tax assets may increase or decrease, resulting in corresponding changes in income tax expense. Our effective tax rate is highly dependent upon thegeographic distribution of our worldwide profits or losses, the tax laws and regulations in each geographical region where we have operations, the availability oftax credits and carry-forwards and the effectiveness of our tax planning strategies.
48

During the quarter ended September 30, 2016, we contributed certain packaging equipment as required by the JV Agreement by transferring the legal title ofsuch equipment to the JV Company. As a result of the transfer, we reduced our deferred tax assets by $6.6 million and recorded a $6.6 million as a prepaid taxasset, which was to be amortized to tax expense over the useful life of the assets. As of June 30, 2017, the prepaid tax asset was amortized down to $5.5 million, ofwhich $1.1 million and $4.4 million were included in prepaid and other current assets and in other long-term assets on our balance sheet, respectively. On July 1,2017, we adopted ASU 2016-16, Intra-Entity Transfers of Assets other than Inventory, which resulted in a de-recognition of a prepaid tax asset of $5.5 millionrelated to the prior period intra-entity asset transfer with the JV Company, with an offsetting reduction to retained earnings. Because the JV Company has a fullvaluation allowance, there was no change to our net deferred tax assets.
U.S. Tax Cuts and Jobs Act, Enacted December 22, 2017
On December 22, 2017, the United States enacted tax reform legislation through the Tax Cuts and Jobs Act (“the Tax Act”), which significantly changes theexisting U.S. tax laws, including, but not limited to, (1) a reduction in the corporate tax rate from 35% to 21%, (2) a shift from a worldwide tax system to aterritorial system, (3) eliminating the corporate alternative minimum tax (AMT) and changing how existing AMT credits can be realized, (4) bonus depreciationthat will allow for full expensing of qualified property, (5) creating a new limitation on deductible interest expense and (6) changing rules related to uses andlimitations of net operating loss carryforwards created in tax years beginning after December 31, 2017.
The SEC staff issued Staff Accounting Bulletin No. 118 ("SAB 118"), which provides guidance on accounting for the tax effects of the Tax Act. SAB 118provides a measurement period that should not extend beyond one year from the Tax Act enactment date for companies to complete the accounting underAccounting Standards Codification Topic 740 ("ASC 740"). In accordance with SAB 118, a company must reflect the income tax effects of those aspects of theTax Act for which the accounting under ASC 740 is complete. To the extent that a company’s accounting for certain income tax effects of the Tax Act isincomplete but it is able to determine a reasonable estimate, it must record a provisional estimate in the financial statements. If a company cannot determine aprovisional estimate to be included in the financial statements, it should continue to apply ASC 740 on the basis of the provisions of the tax law that were in effectimmediately before the enactment of the Tax Act.
In connection with our initial analysis of the impact of the Tax Act, we reported a discrete tax benefit of $2.7 million for the second quarter of fiscal year2018 related to the re-measurement of certain deferred tax assets and liabilities. The $2.7 million tax benefit related to the tax rate re-measurement estimated in thesecond quarter of fiscal year 2018 was reduced downward by $0.2 million in the fourth quarter of fiscal year 2018, to $2.5 million. In addition, we used a 28% U.S.federal tax rate to measure our U.S. federal income tax expense for fiscal year 2018, down from the 34% U.S. federal income tax rate used in first quarter of fiscalyear 2018.
U.S. Coronavirus Aid, Relief and Economic Security Act” (“CARES Act”), Enacted March 27, 2020
On March 27, 2020, the United States enacted the Coronavirus Aid, Relief and Economic Security Act (“the CARES Act”), which made the changes toexisting U.S. tax laws, including, but not limited to, (1) allowing U.S. federal net operating losses originated in the 2018, 2019 or 2020 tax years to be carried backfive years to recover taxes paid based upon taxable income in the prior five years, (2) eliminated the 80% of taxable income limitation on net operating losses forthe 2018, 2019 and 2020 tax years (the 80% limitation will be reinstated for tax years after 2020), (3) accelerating the refund of prior year alternative minimum taxcredits, (4) modifying the bonus depreciation for qualified improvement property and (5) modifying the limitation on deductible interest expense.
As a result of the ability to carryback net operating losses from the June 2018 and June 2019 years to the June 2015 to June 2017 tax years, net operatinglosses which were previously tax-effected using the current 21% U.S. federal tax rate were revalued to the U.S. tax rates in effect for the June 2015 to June 2017tax years due to the ability of receiving tax refunds for the taxes paid in these years. Accordingly, we reported a discrete tax benefit of $1.1 million in the thirdquarter of fiscal year 2020 related to the re-measurement of the net operating losses that could be realized via the new net operating loss carryback provisions.
49
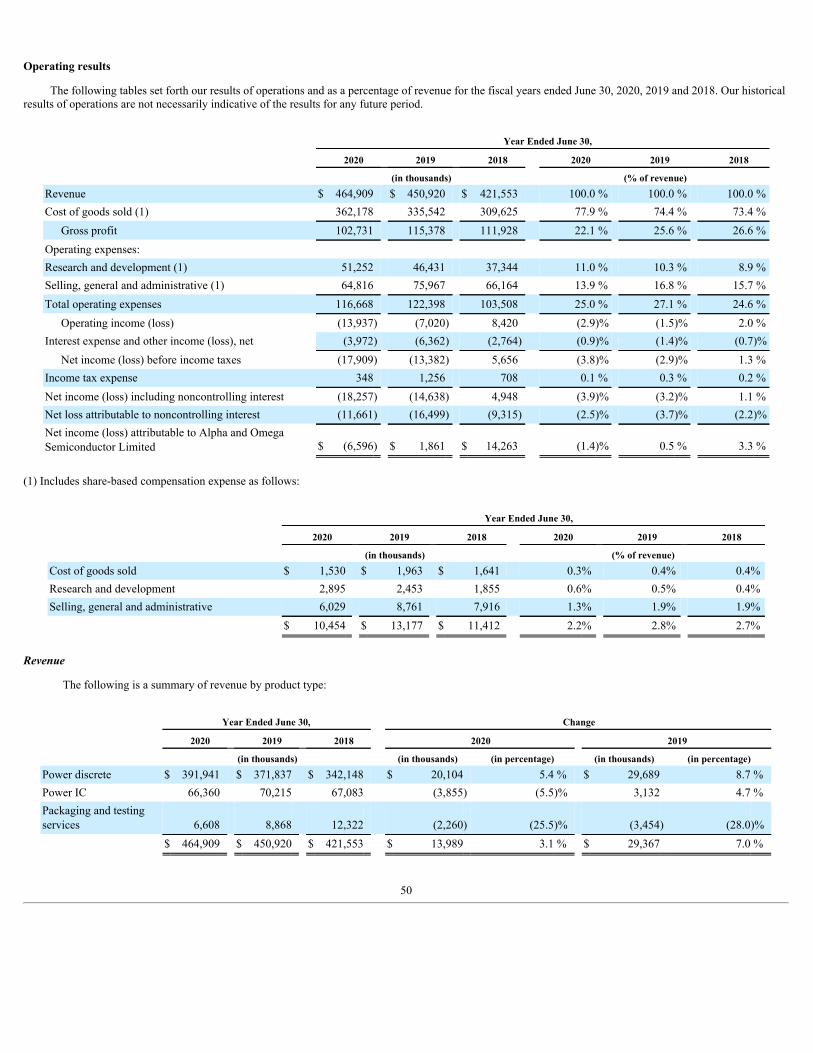
Operating results
The following tables set forth our results of operations and as a percentage of revenue for the fiscal years ended June 30, 2020, 2019 and 2018. Our historicalresults of operations are not necessarily indicative of the results for any future period.
Year Ended June 30,
2020 2019 2018 2020 2019 2018 (in thousands) (% of revenue)Revenue $ 464,909 $ 450,920 $ 421,553 100.0 % 100.0 % 100.0 %Cost of goods sold (1) 362,178 335,542 309,625 77.9 % 74.4 % 73.4 %
Gross profit 102,731 115,378 111,928 22.1 % 25.6 % 26.6 %Operating expenses: Research and development (1) 51,252 46,431 37,344 11.0 % 10.3 % 8.9 %Selling, general and administrative (1) 64,816 75,967 66,164 13.9 % 16.8 % 15.7 %Total operating expenses 116,668 122,398 103,508 25.0 % 27.1 % 24.6 %
Operating income (loss) (13,937) (7,020) 8,420 (2.9)% (1.5)% 2.0 %Interest expense and other income (loss), net (3,972) (6,362) (2,764) (0.9)% (1.4)% (0.7)%
Net income (loss) before income taxes (17,909) (13,382) 5,656 (3.8)% (2.9)% 1.3 %Income tax expense 348 1,256 708 0.1 % 0.3 % 0.2 %Net income (loss) including noncontrolling interest (18,257) (14,638) 4,948 (3.9)% (3.2)% 1.1 %Net loss attributable to noncontrolling interest (11,661) (16,499) (9,315) (2.5)% (3.7)% (2.2)%Net income (loss) attributable to Alpha and OmegaSemiconductor Limited $ (6,596) $ 1,861 $ 14,263 (1.4)% 0.5 % 3.3 %
(1) Includes share-based compensation expense as follows:
Year Ended June 30,
2020 2019 2018 2020 2019 2018 (in thousands) (% of revenue)Cost of goods sold $ 1,530 $ 1,963 $ 1,641 0.3% 0.4% 0.4%Research and development 2,895 2,453 1,855 0.6% 0.5% 0.4%Selling, general and administrative 6,029 8,761 7,916 1.3% 1.9% 1.9%
$ 10,454 $ 13,177 $ 11,412 2.2% 2.8% 2.7%
Revenue
The following is a summary of revenue by product type:
Year Ended June 30, Change
2020 2019 2018 2020 2019 (in thousands) (in thousands) (in percentage) (in thousands) (in percentage)Power discrete $ 391,941 $ 371,837 $ 342,148 $ 20,104 5.4 % $ 29,689 8.7 %Power IC 66,360 70,215 67,083 (3,855) (5.5)% 3,132 4.7 %Packaging and testingservices 6,608 8,868 12,322 (2,260) (25.5)% (3,454) (28.0)%
$ 464,909 $ 450,920 $ 421,553 $ 13,989 3.1 % $ 29,367 7.0 %
50
Fiscal 2020 vs 2019
Total revenue was $464.9 million for fiscal year 2020, an increase of $14.0 million, or 3.1%, as compared to $450.9 million for fiscal year 2019. The increasewas primarily due to an increase of $20.1 million in sales of power discrete products, partially offset by a decrease of $3.9 million in sales of power IC products.The net increase in product sales was primarily due to a 6.0% increase in average selling price as compared to last fiscal year due to a shift in product mix, partiallyoffset by a 2.3% decrease in unit shipments. The decrease in revenue of packaging and testing services for fiscal year 2020 as compared to last fiscal year wasprimarily due to the fluctuation of demand on these services externally. During fiscal year 2020, we accelerated the development of new technology platformswhich allowed us to introduce 48 medium and high voltage MOSFET products, targeting primarily the power supply, as well as 42 low voltage MOSFET productsprimarily for the computing and communication markets. In addition, we introduced 56 Power IC new products for computing applications, communication andconsumer markets.
Fiscal 2019 vs 2018
Total revenue was $450.9 million for fiscal year 2019, an increase of $29.4 million, or 7.0%, as compared to $421.6 million for fiscal year 2018. The increasewas primarily due to an increase of $29.7 million and $3.1 million in sales of power discrete products and in sales of power IC products, respectively. The increasein power discrete and power IC was primarily due to a 18.8% increase in average selling price as compared to last fiscal year due to a shift in product mix, partiallyoffset by a 8.8% decrease in unit shipments. The decrease in revenue of packaging and testing services for fiscal year 2019 as compared to last fiscal year wasprimarily due to decreased demand.
Cost of goods sold and gross profit
Year Ended June 30, Change
2020 2019 2018 2020 2019
(in thousands) (in thousands) (in percentage) (in thousands) (in percentage)Cost of goods sold $ 362,178 $ 335,542 $ 309,625 $ 26,636 7.9 % $ 25,917 8.4% Percentage of revenue 77.9% 74.4% 73.4% Gross profit $ 102,731 $ 115,378 $ 111,928 $ (12,647) (11.0)% $ 3,450 3.1% Percentage of revenue 22.1% 25.6% 26.6%
Fiscal 2020 vs 2019
Cost of goods sold was $362.2 million for fiscal year 2020, an increase of $26.6 million, or 7.9%, as compared to $335.5 million for fiscal year 2019. Theincrease was primarily due to limited mass production in our JV Company and the 3.1% increase of revenue. Gross margin decreased by 3.5 percentage points to22.1% for fiscal year 2020, as compared to 25.6% for fiscal year 2019. The decrease in gross margin was primarily the result of low capacity utilization due to thelimited mass production in our Chongqing joint venture during the fiscal year 2020. We expect our gross margin to continue to fluctuate in the future as a result ofvariations in our product mix, ramp up costs related to our Chongqing joint venture, factory utilization, semiconductor wafer and raw material pricing,manufacturing labor cost and general economic and PC market conditions.
Fiscal 2019 vs 2018
Cost of goods sold was $335.5 million for fiscal year 2019, an increase of $25.9 million, or 8.4%, as compared to $309.6 million for fiscal year 2018. Theincrease was primarily due to the 7.0% increase of revenue and the production ramp up costs related to our Chongqing joint venture. Gross margin decreased by1.0 percentage points to 25.6% for fiscal year 2019, as compared to 26.6% for fiscal year 2018. The decrease in gross margin was primarily due to production rampup costs related to our Chongqing joint venture.
51
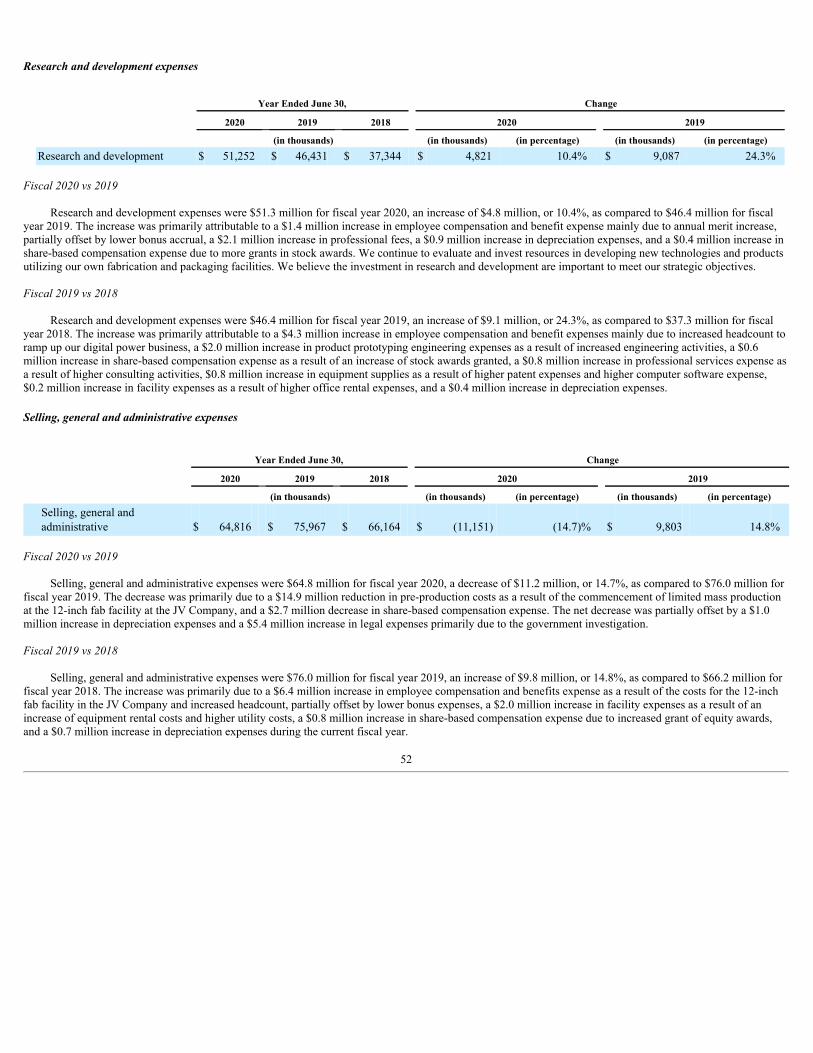
Research and development expenses
Year Ended June 30, Change
2020 2019 2018 2020 2019
(in thousands) (in thousands) (in percentage) (in thousands) (in percentage)Research and development $ 51,252 $ 46,431 $ 37,344 $ 4,821 10.4% $ 9,087 24.3%
Fiscal 2020 vs 2019
Research and development expenses were $51.3 million for fiscal year 2020, an increase of $4.8 million, or 10.4%, as compared to $46.4 million for fiscalyear 2019. The increase was primarily attributable to a $1.4 million increase in employee compensation and benefit expense mainly due to annual merit increase,partially offset by lower bonus accrual, a $2.1 million increase in professional fees, a $0.9 million increase in depreciation expenses, and a $0.4 million increase inshare-based compensation expense due to more grants in stock awards. We continue to evaluate and invest resources in developing new technologies and productsutilizing our own fabrication and packaging facilities. We believe the investment in research and development are important to meet our strategic objectives.
Fiscal 2019 vs 2018
Research and development expenses were $46.4 million for fiscal year 2019, an increase of $9.1 million, or 24.3%, as compared to $37.3 million for fiscalyear 2018. The increase was primarily attributable to a $4.3 million increase in employee compensation and benefit expenses mainly due to increased headcount toramp up our digital power business, a $2.0 million increase in product prototyping engineering expenses as a result of increased engineering activities, a $0.6million increase in share-based compensation expense as a result of an increase of stock awards granted, a $0.8 million increase in professional services expense asa result of higher consulting activities, $0.8 million increase in equipment supplies as a result of higher patent expenses and higher computer software expense,$0.2 million increase in facility expenses as a result of higher office rental expenses, and a $0.4 million increase in depreciation expenses.
Selling, general and administrative expenses
Year Ended June 30, Change
2020 2019 2018 2020 2019
(in thousands) (in thousands) (in percentage) (in thousands) (in percentage)Selling, general andadministrative $ 64,816 $ 75,967 $ 66,164 $ (11,151) (14.7)% $ 9,803 14.8%
Fiscal 2020 vs 2019
Selling, general and administrative expenses were $64.8 million for fiscal year 2020, a decrease of $11.2 million, or 14.7%, as compared to $76.0 million forfiscal year 2019. The decrease was primarily due to a $14.9 million reduction in pre-production costs as a result of the commencement of limited mass productionat the 12-inch fab facility at the JV Company, and a $2.7 million decrease in share-based compensation expense. The net decrease was partially offset by a $1.0million increase in depreciation expenses and a $5.4 million increase in legal expenses primarily due to the government investigation.
Fiscal 2019 vs 2018
Selling, general and administrative expenses were $76.0 million for fiscal year 2019, an increase of $9.8 million, or 14.8%, as compared to $66.2 million forfiscal year 2018. The increase was primarily due to a $6.4 million increase in employee compensation and benefits expense as a result of the costs for the 12-inchfab facility in the JV Company and increased headcount, partially offset by lower bonus expenses, a $2.0 million increase in facility expenses as a result of anincrease of equipment rental costs and higher utility costs, a $0.8 million increase in share-based compensation expense due to increased grant of equity awards,and a $0.7 million increase in depreciation expenses during the current fiscal year.
52
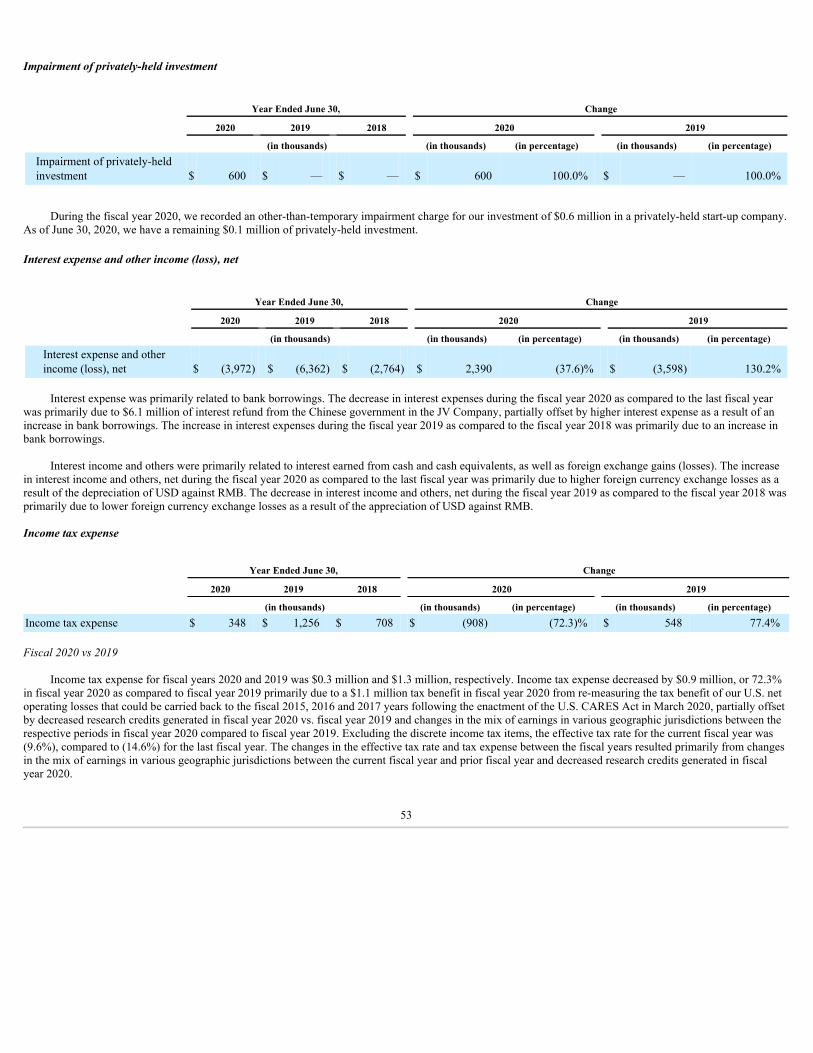
Impairment of privately-held investment
Year Ended June 30, Change
2020 2019 2018 2020 2019
(in thousands) (in thousands) (in percentage) (in thousands) (in percentage)Impairment of privately-heldinvestment $ 600 $ — $ — $ 600 100.0% $ — 100.0%
During the fiscal year 2020, we recorded an other-than-temporary impairment charge for our investment of $0.6 million in a privately-held start-up company.As of June 30, 2020, we have a remaining $0.1 million of privately-held investment.
Interest expense and other income (loss), net
Year Ended June 30, Change
2020 2019 2018 2020 2019
(in thousands) (in thousands) (in percentage) (in thousands) (in percentage)Interest expense and otherincome (loss), net $ (3,972) $ (6,362) $ (2,764) $ 2,390 (37.6)% $ (3,598) 130.2%
Interest expense was primarily related to bank borrowings. The decrease in interest expenses during the fiscal year 2020 as compared to the last fiscal year
was primarily due to $6.1 million of interest refund from the Chinese government in the JV Company, partially offset by higher interest expense as a result of anincrease in bank borrowings. The increase in interest expenses during the fiscal year 2019 as compared to the fiscal year 2018 was primarily due to an increase inbank borrowings.
Interest income and others were primarily related to interest earned from cash and cash equivalents, as well as foreign exchange gains (losses). The increasein interest income and others, net during the fiscal year 2020 as compared to the last fiscal year was primarily due to higher foreign currency exchange losses as aresult of the depreciation of USD against RMB. The decrease in interest income and others, net during the fiscal year 2019 as compared to the fiscal year 2018 wasprimarily due to lower foreign currency exchange losses as a result of the appreciation of USD against RMB.
Income tax expense
Year Ended June 30, Change
2020 2019 2018 2020 2019
(in thousands) (in thousands) (in percentage) (in thousands) (in percentage)Income tax expense $ 348 $ 1,256 $ 708 $ (908) (72.3)% $ 548 77.4%
Fiscal 2020 vs 2019
Income tax expense for fiscal years 2020 and 2019 was $0.3 million and $1.3 million, respectively. Income tax expense decreased by $0.9 million, or 72.3%in fiscal year 2020 as compared to fiscal year 2019 primarily due to a $1.1 million tax benefit in fiscal year 2020 from re-measuring the tax benefit of our U.S. netoperating losses that could be carried back to the fiscal 2015, 2016 and 2017 years following the enactment of the U.S. CARES Act in March 2020, partially offsetby decreased research credits generated in fiscal year 2020 vs. fiscal year 2019 and changes in the mix of earnings in various geographic jurisdictions between therespective periods in fiscal year 2020 compared to fiscal year 2019. Excluding the discrete income tax items, the effective tax rate for the current fiscal year was(9.6%), compared to (14.6%) for the last fiscal year. The changes in the effective tax rate and tax expense between the fiscal years resulted primarily from changesin the mix of earnings in various geographic jurisdictions between the current fiscal year and prior fiscal year and decreased research credits generated in fiscalyear 2020.
53
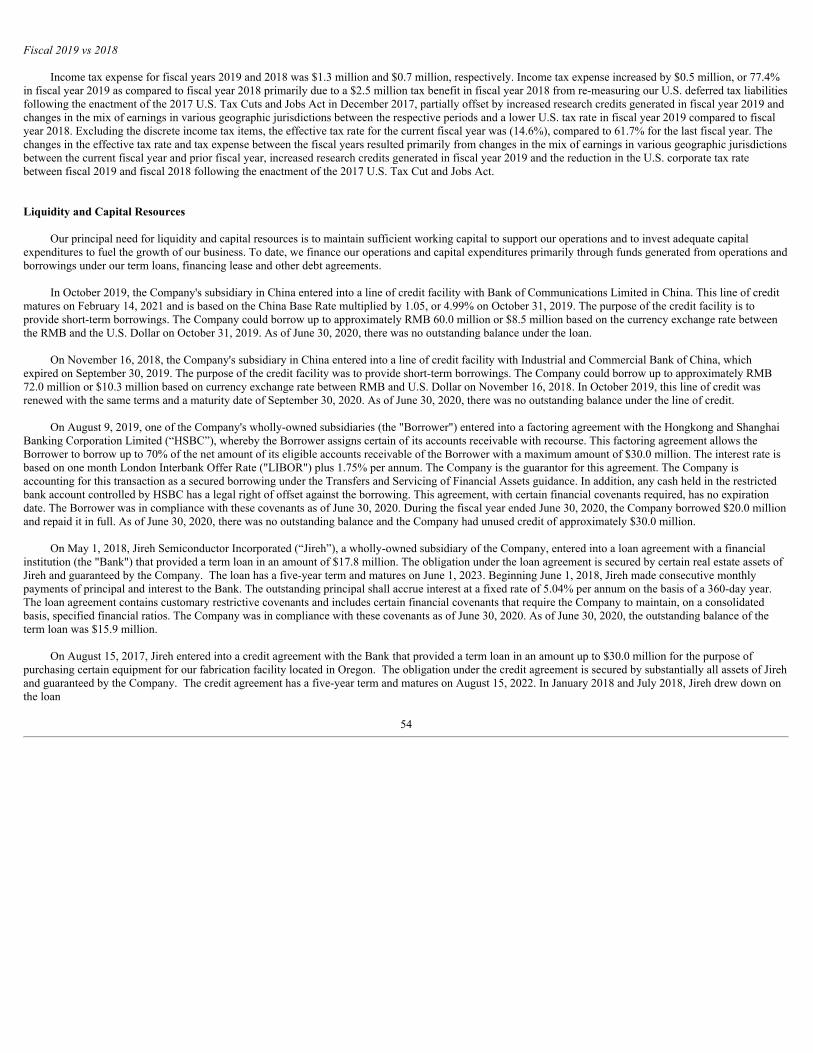
Fiscal 2019 vs 2018
Income tax expense for fiscal years 2019 and 2018 was $1.3 million and $0.7 million, respectively. Income tax expense increased by $0.5 million, or 77.4%in fiscal year 2019 as compared to fiscal year 2018 primarily due to a $2.5 million tax benefit in fiscal year 2018 from re-measuring our U.S. deferred tax liabilitiesfollowing the enactment of the 2017 U.S. Tax Cuts and Jobs Act in December 2017, partially offset by increased research credits generated in fiscal year 2019 andchanges in the mix of earnings in various geographic jurisdictions between the respective periods and a lower U.S. tax rate in fiscal year 2019 compared to fiscalyear 2018. Excluding the discrete income tax items, the effective tax rate for the current fiscal year was (14.6%), compared to 61.7% for the last fiscal year. Thechanges in the effective tax rate and tax expense between the fiscal years resulted primarily from changes in the mix of earnings in various geographic jurisdictionsbetween the current fiscal year and prior fiscal year, increased research credits generated in fiscal year 2019 and the reduction in the U.S. corporate tax ratebetween fiscal 2019 and fiscal 2018 following the enactment of the 2017 U.S. Tax Cut and Jobs Act.
Liquidity and Capital Resources
Our principal need for liquidity and capital resources is to maintain sufficient working capital to support our operations and to invest adequate capitalexpenditures to fuel the growth of our business. To date, we finance our operations and capital expenditures primarily through funds generated from operations andborrowings under our term loans, financing lease and other debt agreements.
In October 2019, the Company's subsidiary in China entered into a line of credit facility with Bank of Communications Limited in China. This line of creditmatures on February 14, 2021 and is based on the China Base Rate multiplied by 1.05, or 4.99% on October 31, 2019. The purpose of the credit facility is toprovide short-term borrowings. The Company could borrow up to approximately RMB 60.0 million or $8.5 million based on the currency exchange rate betweenthe RMB and the U.S. Dollar on October 31, 2019. As of June 30, 2020, there was no outstanding balance under the loan.
On November 16, 2018, the Company's subsidiary in China entered into a line of credit facility with Industrial and Commercial Bank of China, whichexpired on September 30, 2019. The purpose of the credit facility was to provide short-term borrowings. The Company could borrow up to approximately RMB72.0 million or $10.3 million based on currency exchange rate between RMB and U.S. Dollar on November 16, 2018. In October 2019, this line of credit wasrenewed with the same terms and a maturity date of September 30, 2020. As of June 30, 2020, there was no outstanding balance under the line of credit.
On August 9, 2019, one of the Company's wholly-owned subsidiaries (the "Borrower") entered into a factoring agreement with the Hongkong and ShanghaiBanking Corporation Limited (“HSBC”), whereby the Borrower assigns certain of its accounts receivable with recourse. This factoring agreement allows theBorrower to borrow up to 70% of the net amount of its eligible accounts receivable of the Borrower with a maximum amount of $30.0 million. The interest rate isbased on one month London Interbank Offer Rate ("LIBOR") plus 1.75% per annum. The Company is the guarantor for this agreement. The Company isaccounting for this transaction as a secured borrowing under the Transfers and Servicing of Financial Assets guidance. In addition, any cash held in the restrictedbank account controlled by HSBC has a legal right of offset against the borrowing. This agreement, with certain financial covenants required, has no expirationdate. The Borrower was in compliance with these covenants as of June 30, 2020. During the fiscal year ended June 30, 2020, the Company borrowed $20.0 millionand repaid it in full. As of June 30, 2020, there was no outstanding balance and the Company had unused credit of approximately $30.0 million.
On May 1, 2018, Jireh Semiconductor Incorporated (“Jireh”), a wholly-owned subsidiary of the Company, entered into a loan agreement with a financialinstitution (the "Bank") that provided a term loan in an amount of $17.8 million. The obligation under the loan agreement is secured by certain real estate assets ofJireh and guaranteed by the Company. The loan has a five-year term and matures on June 1, 2023. Beginning June 1, 2018, Jireh made consecutive monthlypayments of principal and interest to the Bank. The outstanding principal shall accrue interest at a fixed rate of 5.04% per annum on the basis of a 360-day year.The loan agreement contains customary restrictive covenants and includes certain financial covenants that require the Company to maintain, on a consolidatedbasis, specified financial ratios. The Company was in compliance with these covenants as of June 30, 2020. As of June 30, 2020, the outstanding balance of theterm loan was $15.9 million.
On August 15, 2017, Jireh entered into a credit agreement with the Bank that provided a term loan in an amount up to $30.0 million for the purpose ofpurchasing certain equipment for our fabrication facility located in Oregon. The obligation under the credit agreement is secured by substantially all assets of Jirehand guaranteed by the Company. The credit agreement has a five-year term and matures on August 15, 2022. In January 2018 and July 2018, Jireh drew down onthe loan
54
in the amount of $13.2 million and $16.7 million, respectively. Beginning in October 2018, Jireh is required to pay to the Bank on each payment date, theoutstanding principal amount of the loan in monthly installments. The loan accrues interest based on an adjusted LIBOR as defined in the credit agreement, plusspecified applicable margin in the range of 1.75% to 2.25%, based on the outstanding balance of the loan. The credit agreement contains customary restrictivecovenants and includes certain financial covenants that require the Company to maintain, on a consolidated basis, specified financial ratios and fixed chargecoverage ratio. The Company was in compliance with these covenants as of June 30, 2020. As of June 30, 2020, the outstanding balance of the term loan was $16.8million.
In September 2017, the Board of Directors approved a repurchase program (the “Repurchase Program”) that allowed us to repurchase our common sharesfrom the open market pursuant to a pre-established Rule 10b5-1 trading plan or through privately negotiated transactions up to an aggregate of $30.0 million. Theamount and timing of any repurchases under the Repurchase Program depend on a number of factors, including but not limited to, the trading price, volume,availability of our common shares and the amount of available cash reserve. Shares repurchased under this program are accounted for as treasury shares and thetotal cost of shares repurchased is recorded as a reduction of shareholders' equity. During fiscal year 2020, we did not repurchase any shares pursuant to therepurchase program. During fiscal years 2019 and 2018, we repurchased an aggregate of 111,509 shares and 950,046 shares, respectively, from the open market fora total cost of approximately $1.5 million and $15.1 million, excluding fees and related expenses, at an average price of $13.43 and $15.86 per share, respectively.As of June 30, 2020, we had repurchased an aggregate of 6,784,648 shares for a total cost of $67.3 million, at an average price of $9.92 per share, excluding feesand related expenses, since inception of the program. No repurchased shares have been retired. Of the 6,784,648 repurchased shares, 145,428 shares with aweighted average repurchase price of $10.32 per share, were reissued at an average price of $5.30 per share for option exercises and vested restricted stock units("RSU"). As of June 30, 2020, $13.4 million remain available under the share repurchase program.
On September 5, 2017, we entered into a license agreement with STMicroelectronics International N.V. (“STMicro”), pursuant to which STMicro granted usa world-wide, royalty-free and fully-paid license to use its technologies to develop, market and distribute certain digital multi-phase controller products, whichhave been offered by STMicro. As of June 30, 2020, we recorded $16.2 million of intangible assets related to STMicro. We will begin to amortize such licensefees during the September 2020 quarter, which is when the technology meets qualification requirements and becomes ready for its intended use in production.
The Chinese government imposes certain currency exchange controls on cash transfers out of China. Regulations in China permit foreign owned entities tofreely convert the Renminbi into foreign currency for transactions that fall under the "current account," which includes trade related receipts and payments,interests, and dividend payments. Accordingly, subject to the review and verification of the underlying transaction documents and supporting documents by theaccount banks in China, our Chinese subsidiaries may use Renminbi to purchase foreign exchange currency for settlement of such "current account" transactionswithout the pre-approval from China's State Administration of Foreign Exchange (SAFE) or its provincial branch. Pursuant to applicable regulations, foreign-invested enterprises in China may pay dividends only out of their accumulated profits, if any, determined in accordance with Chinese accounting standards andregulations. In calculating accumulated profits, foreign-invested enterprises in China are required to allocate at least 10% of their profits each year, if any, to fundthe equity reserve account unless the reserve has reached 50% of the registered capital of the enterprises. While SAFE approval is not statutorily required foreligible dividend payments to the foreign parent, in practice, before making the dividend payment, the account bank may seek SAFE's opinion with respect to adividend payment if the payment involves a relatively large amount, which may delay the dividend payment depending on the then overall status of cross-borderpayments and receipts of China.
Transactions that involve conversion of Renminbi into foreign currency in relation to foreign direct investments and provision of debt financings in China areclassified as "capital account" transactions. Examples of "capital account" transactions include repatriations of investments by foreign owners and repayments ofloan principal to foreign lenders. "Capital account" transactions require prior approval from SAFE or its provincial branch or an account bank delegated by SAFEto convert a remittance into a foreign currency, such as U.S. dollars, and transmit the foreign currency outside of China. As a result of this and other restrictionsunder PRC laws and regulations, our China subsidiaries are restricted in their ability to transfer a portion of their net assets to us, and such restriction mayadversely affect our ability to generate sufficient liquidity to fund our operations or other expenditures. As of June 30, 2020 and 2019, such restricted portionamounted to approximately $209.8 million and $209.5 million, or 61.4% and 64.4%, of our total consolidated net assets attributable to the Company, respectively.The increase of restricted net assets was primarily from the JV Company in China.
We believe that our current cash and cash equivalents and cash flows from operations will be sufficient to meet our anticipated cash needs, including working
capital and capital expenditures, for at least the next twelve months. In the long-term, we may require additional capital due to changing business conditions orother future developments, including any
55
investments or acquisitions we may decide to pursue. If our cash is insufficient to meet our needs, we may seek to raise capital through equity or debt financing.The sale of additional equity securities could result in dilution to our shareholders. The incurrence of indebtedness would result in increased debt serviceobligations and may include operating and financial covenants that would restrict our operations. We cannot be certain that any financing will be available in theamounts we need or on terms acceptable to us, if at all.
JV Company Financing Transactions
From time to time the JV Company entered into financing and loan agreements with banks and other third parties to fund capital expenditures and otheroperational expenses in connection with the constructions and ramp-up of the manufacturing facility in Chongqing. The JV Company incurs debt through its ownfinancing agreements, and our parent company and other subsidiaries are not parties to these agreements and do not provide any guarantee or security for JVCompany’s debt, nor do we have direct access to any cash proceeds borrowed from such loan agreements.
On May 9, 2018 (the “Effective Date”), the JV Company entered into a lease finance agreement and a security agreement (the “Agreements”) with YinHaiLeasing Company and China Import/Export Bank (the “Lenders”). Pursuant to the Agreements, the Lenders agree to provide an aggregate of RMB 400.0 million,or $62.8 million based on the currency exchange rate between RMB and U.S. Dollar on the Effective Date, of financing to the JV Company (the “LeaseFinancing”). In exchange for the Lease Financing, the JV Company agrees to transfer title of its assembly and testing equipment to the Lenders, and the Lenderslease such equipment to the JV Company under a five-year lease arrangement, pursuant to which the JV Company makes quarterly lease payments to the Lendersconsisting of principal and interest based on a repayment schedule mutually agreed by the parties. The interest under the Lease Financing is accrued based on theChina Base Rate multiplied by 1.15, or 5.4625% on the Effective Date. Under the Agreements, at the end of the five-year lease term, the Lenders agree to sell suchequipment back to the JV Company for a nominal amount (RMB 1). The JV Company’s obligations under the Lease Financing are secured by the land andbuilding owned by the JV Company (the “Collateral”). The proceeds from the Lease Financing will be used primarily for the acquisition and installation of the 12-inch fabrication equipment and other expenses of the JV Company relating to the completion of the fabrication facility located in Chongqing. The Agreementscontain customary representation, warranties and covenants, including restrictions on the transfer of the Collateral. The Agreements also contain customary eventsof default, including but are not limited to, failure to make payments and breach of material terms under the Agreements. The Agreements include certaincustomary closing conditions, including the payment of deposit by the JV Company. On June 28, 2020, the parties entered into a modification to this agreement,pursuant to which the interest rate was changed to be the five-year loan prime rate in China plus 0.8125%, or 5.4625%. Other terms of this agreement remain thesame. As of June 30, 2020, the outstanding balance of the Lease Financing of 298.0 million RMB (equivalent of $42.1 million based on the currency exchange rateas of June 30, 2020) was recorded under both short-term and long-term finance lease liabilities.
On November 29 and December 4, 2018, the JV Company entered into two, one-year loan agreements with China Merchant Bank and Chongqing LiangJiangNew District China Merchants Group Limited Company in China to provide loans for RMB 80 million and RMB 20 million, respectively, or $14.5 million in totalbased on the currency exchange rate between RMB and U.S. Dollar on December 31, 2018, at varying interest rates. On January 20, 2020, the JV Companyrenewed the loan agreements with the same terms. Interest payments are due monthly and quarterly with the entire principal due not later than January 21, 2021.During the three months ended June 30, 2020, the JV Company repaid the loan in full. As of June 30, 2020, there was no outstanding balance under the loan.
On September 23, 2019, the JV Company entered into a short-term revolving loan agreement with China Everbright bank in China. The JV Company canborrow up to RMB 50.0 million, or $7.1 million based on the currency exchange rate between RMB and U.S. Dollar on September 23, 2019, at varying interestrates, in RMB or USD. Interest payments with the entire principal are due no later than 90 days from each borrowing date. In January and February 2020, the JVCompany borrowed $1.6 million and $5.5 million, respectively, under this loan. During the three months ended June 30, 2020, the JV Company repaid the loan infull. As of June 30, 2020, there was no outstanding balance under the loan.
On March 12, 2019, the JV Company entered into a loan agreement with The Export-Import Bank of China in the aggregate principal amount of RMB 200million (approximately $29.8 million based on currency exchange rate between RMB and U.S. Dollar on March 31, 2019). The loan will mature on February 20,2025. The JV Company drew down RMB 190 million and RMB 10 million in March 2019 and December 2019, respectively. The loan withdraw window expiredon February 28, 2020. The interest is accrued based on the China Base Rate multiplied by 1.1, or 5.39%. The loan requires quarterly interest payments. Theprincipal payments are required to be paid every 6 months over the term of loan commencing in October 2019. This loan is secured by the buildings and certainequipment owned by the JV Company. As a condition of
56
the loan arrangements, 14 million RMB (approximately $2.0 million) of cash is held as restricted cash by the JV Company as a compensating balance at the JVCompany's bank until the principal is paid. On June 24, 2020, a modification of this loan was signed, pursuant to which the interest rate was changed to be basedon the five-year loan prime rate in China plus 0.74%, or 5.39%. Other terms of this loan remain the same. During the three months ended December 31, 2019, theJV Company paid 6.0 million RMB under this agreement. As of June 30, 2020, the outstanding balance of the loan was 194 million RMB (equivalent of $27.4million based on the currency exchange rate as of June 30, 2020).
On March 21, 2019, the JV Company entered into a one-year loan agreement with China Everbright Bank in China to provide a loan for RMB 20 million, or$3.0 million based on currency exchange rate between RMB and U.S. Dollar on March 31, 2019 at fixed interest rate of 5.44% per annum. Interest payments weredue monthly with the entire principal due on March 21, 2020. As of June 30, 2020, there was no outstanding balance under the loan.
In December 2019, the JV Company entered into a loan agreement with China Development Bank in the amount of $24.0 million. The obligation under theloan agreement is secured by certain assets of the JV Company. Beginning December 18, 2020, the JV Company will make consecutive semi-annual payments ofprincipal until December 8, 2024. The interest is accrued based on the LIBOR rate plus 2.8%. The interest is required to be paid on March 21 and September 21each year. As of June 30, 2020, the outstanding balance of the loan was $24.0 million.
On April 15, 2020, the JV Company entered into a one-year loan agreement with China Everbright Bank in China to provide a loan of a maximum of ChineseRenminbi (RMB) 100 million (approximately $14.3 million based on the currency exchange rate between RMB and U.S. Dollar on April 15, 2020) in the amountin RMB or USD. Interest payments are due on the 20th of each month, and the entire principal is due on April 16, 2021. The loan consists of RMB 20 million forworking capital borrowing in Chinese yuan and RMB 80 million for borrowing in US dollars that is collateralized by eligible accounts receivable. During the threemonths ended June 30, 2020, the JV Company borrowed RMB 20 million, or $2.8 million based on the currency exchange rate between RMB and U.S. Dollar, at afixed interest rate of 5.1375% per annum under the working capital loan. The JV Company also borrowed $7.1 million and $1.9 million at a fixed interest rateof 2.7% and 2.8% per annum, respectively, during the same period under the accounts receivable collateralized loan. As of June 30, 2020, the totaloutstanding balance under the loan was $11.8 million.
On April 26, 2020, the JV Company entered into a loan agreement with China Development Bank, Agricultural Bank of China, China Merchants Bank andChongqing Rural Commercial Bank (collectively, "the Banks") in the aggregate principal amount of RMB 250 million, (approximately $35.7 million based on thecurrency exchange rate between RMB and U.S. Dollar on April 26, 2020). The obligation under the loan agreement is secured by certain assets of the JVCompany. Beginning December 18, 2020, the JV Company is required to make consecutive semi-annual payments of principal until December 8, 2024. Interestpayment is due on March 20, June 20, September 20 and December 20 of each year based on China one-year loan prime rate ("LPR") plus 1.3%. The JV Companydrew down RMB 250 million (approximately $35.3 million based on the currency exchange rate between RMB and U.S. Dollar on June 30, 2020) in April 2020.As of June 30, 2020, the outstanding balance of the loan was $35.3 million.
Cash, cash equivalents and restricted cash
As of June 30, 2020 and 2019, we had $162.7 million and $124.3 million of cash, cash equivalents and restricted cash, respectively. Our cash, cashequivalents and restricted cash primarily consisted of cash on hand, restricted cash and short-term bank deposits with original maturities of three months or less. Ofthe $162.7 million and $124.3 million cash and cash equivalents, $120.3 million and $70.6 million, respectively, were deposited with financial institutions outsidethe United States.
57
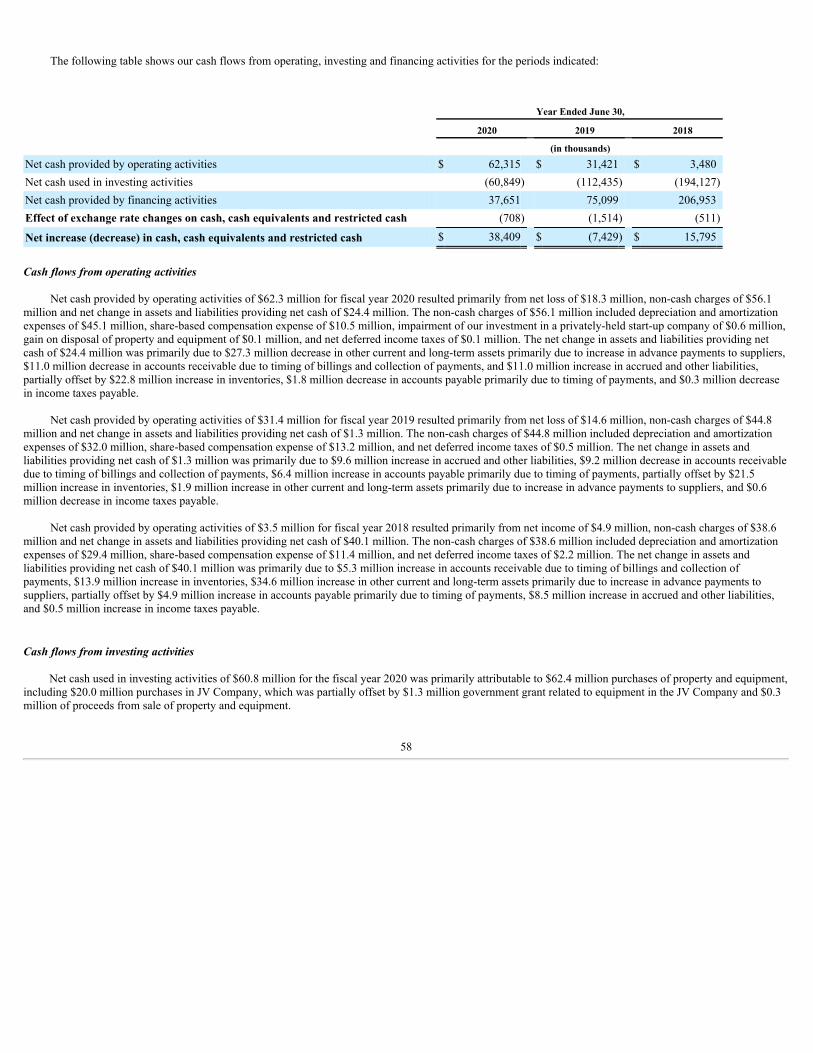
The following table shows our cash flows from operating, investing and financing activities for the periods indicated:
Year Ended June 30,
2020 2019 2018
(in thousands)Net cash provided by operating activities $ 62,315 $ 31,421 $ 3,480Net cash used in investing activities (60,849) (112,435) (194,127)Net cash provided by financing activities 37,651 75,099 206,953Effect of exchange rate changes on cash, cash equivalents and restricted cash (708) (1,514) (511)
Net increase (decrease) in cash, cash equivalents and restricted cash $ 38,409 $ (7,429) $ 15,795
Cash flows from operating activities
Net cash provided by operating activities of $62.3 million for fiscal year 2020 resulted primarily from net loss of $18.3 million, non-cash charges of $56.1million and net change in assets and liabilities providing net cash of $24.4 million. The non-cash charges of $56.1 million included depreciation and amortizationexpenses of $45.1 million, share-based compensation expense of $10.5 million, impairment of our investment in a privately-held start-up company of $0.6 million,gain on disposal of property and equipment of $0.1 million, and net deferred income taxes of $0.1 million. The net change in assets and liabilities providing netcash of $24.4 million was primarily due to $27.3 million decrease in other current and long-term assets primarily due to increase in advance payments to suppliers,$11.0 million decrease in accounts receivable due to timing of billings and collection of payments, and $11.0 million increase in accrued and other liabilities,partially offset by $22.8 million increase in inventories, $1.8 million decrease in accounts payable primarily due to timing of payments, and $0.3 million decreasein income taxes payable.
Net cash provided by operating activities of $31.4 million for fiscal year 2019 resulted primarily from net loss of $14.6 million, non-cash charges of $44.8million and net change in assets and liabilities providing net cash of $1.3 million. The non-cash charges of $44.8 million included depreciation and amortizationexpenses of $32.0 million, share-based compensation expense of $13.2 million, and net deferred income taxes of $0.5 million. The net change in assets andliabilities providing net cash of $1.3 million was primarily due to $9.6 million increase in accrued and other liabilities, $9.2 million decrease in accounts receivabledue to timing of billings and collection of payments, $6.4 million increase in accounts payable primarily due to timing of payments, partially offset by $21.5million increase in inventories, $1.9 million increase in other current and long-term assets primarily due to increase in advance payments to suppliers, and $0.6million decrease in income taxes payable.
Net cash provided by operating activities of $3.5 million for fiscal year 2018 resulted primarily from net income of $4.9 million, non-cash charges of $38.6million and net change in assets and liabilities providing net cash of $40.1 million. The non-cash charges of $38.6 million included depreciation and amortizationexpenses of $29.4 million, share-based compensation expense of $11.4 million, and net deferred income taxes of $2.2 million. The net change in assets andliabilities providing net cash of $40.1 million was primarily due to $5.3 million increase in accounts receivable due to timing of billings and collection ofpayments, $13.9 million increase in inventories, $34.6 million increase in other current and long-term assets primarily due to increase in advance payments tosuppliers, partially offset by $4.9 million increase in accounts payable primarily due to timing of payments, $8.5 million increase in accrued and other liabilities,and $0.5 million increase in income taxes payable.
Cash flows from investing activities
Net cash used in investing activities of $60.8 million for the fiscal year 2020 was primarily attributable to $62.4 million purchases of property and equipment,including $20.0 million purchases in JV Company, which was partially offset by $1.3 million government grant related to equipment in the JV Company and $0.3million of proceeds from sale of property and equipment.
58
Net cash used in investing activities of $112.4 million for the fiscal year 2019 was primarily attributable to $112.1 million purchases of property andequipment, including $76.0 million purchases in JV Company, and $0.4 million purchases of intangible assets.
Net cash used in investing activities of $194.1 million for the fiscal year 2018 was primarily attributable to $177.7 million purchases of property andequipment, including $128.4 million purchases in JV Company, and $16.4 million purchases of intangible assets to develop our digital power business.
Cash flows from financing activities
Net cash provided by financing activities of $37.7 million for the fiscal year 2020 was primarily attributable to $96.2 million of proceeds from borrowings,and $3.4 million of proceeds from exercises of share options and issuance of shares under the ESPP, partially offset by $1.5 million in common shares acquired tosettle withholding tax related to vesting of restricted stock units, $11.0 million in payments of capital lease obligations, and $49.4 million in repayments ofborrowings.
Net cash provided by financing activities of $75.1 million for the fiscal year 2019 was primarily attributable to $24.0 million proceeds from investment byChongqing Funds, $77.9 million of proceeds from borrowings, and $3.0 million of proceeds from exercises of share options and issuance of shares under theESPP, partially offset by $2.0 million in common shares acquired to settle withholding tax related to vesting of restricted stock units, $1.5 million for repurchase ofour common shares under the repurchase program, $4.4 million in payments of capital lease obligations, and $21.9 million in repayments of borrowings.
Net cash provided by financing activities of $207.0 million for the fiscal year 2018 was primarily attributable to $129.0 million proceeds from investment byChongqing Funds, $31.0 million of proceeds from borrowings under our term loans in Jireh, $60.4 million of proceeds from financing lease in the JV Company,and $5.0 million of proceeds from exercises of share options and issuance of shares under the ESPP, partially offset by $2.4 million in common shares acquired tosettle withholding tax related to vesting of restricted stock units, $15.1 million for repurchases of our common shares under the repurchase program, $0.8 million inpayments of capital lease obligations, and $0.1 million in repayments of borrowings.
Contractual Obligations
Our contractual obligations as of June 30, 2020 are as follows:
Payments Due by Period
Less than More than
Total 1 year 1-3 years 3-5years 5 years (in thousands)Bank borrowings $ 131,260 $ 30,616 $ 63,400 $ 37,244 $ —Finance leases 45,608 17,273 28,335 — —Operating leases 43,445 5,695 9,608 7,455 20,687Capital commitments with respect to property and equipment 17,973 17,973 — — —Purchase commitments with respect to inventories and others 43,938 43,938 — — —
Total contractual obligations $ 282,224 $ 115,495 $ 101,343 $ 44,699 $ 20,687
As of June 30, 2020, we had recorded liabilities of $0.8 million for uncertain tax positions and $0.1 million for potential interest and penalties, which are notincluded in the above table because we are unable to reliably estimate the amount of payments in individual years that would be made in connection with theseuncertain tax positions.
Commitments
See Note 13 of the Notes to the Consolidated Financial Statements contained in this Annual Report on Form 10-K for a description of commitments.
59

Off-Balance Sheet Arrangements
As of June 30, 2020, we had no material off-balance sheet arrangements as defined in Item 303(a)(4)(ii) of Regulation S-K.
60
Critical Accounting Policies and Estimates
The preparation of our consolidated financial statements requires us to make estimates, judgments and assumptions that affect the reported amounts of assets,liabilities, revenue and expenses. To the extent there are material differences between these estimates and actual results, our consolidated financial statements willbe affected. On an ongoing basis, we evaluate the estimates, judgments and assumptions including those related to stock rotation returns, price adjustments,allowance for doubtful accounts, inventory reserves, warranty accrual, income taxes, leases, share-based compensation, recoverability of and useful lives forproperty, plant and equipment and intangible assets, as well as economic implications of the COVID-19 pandemic.
Revenue recognition
We determine revenue recognition through the following steps: (1) identification of the contract with a customer; (2) identification of the performanceobligations in the contract; (3) determination of the transaction price; (4) allocation of the transaction price to the performance obligations in the contract; and (5)recognition of revenue when, or as, a performance obligation is satisfied. We recognize revenue when product is shipped to the customer, net of estimated stockrotation returns and price adjustments to certain distributors.
We sell our products primarily to distributors, who in turn sell our products globally to various end customers. Our revenue is net of the effect of theestimated stock rotation returns and price adjustments that we expect to provide to certain distributors. Stock rotation returns are governed by contract and arelimited to a specified percentage of the monetary value of the products purchased by distributors during a specified period. We estimate provision for stock rotationreturns based on historical returns and individual distributor agreements. We also provide special pricing to certain distributors primarily based on volume, toencourage resale of our products. We estimate the expected price adjustments at the time the revenue is recognized based on distributor inventory levels, pre-approved future distributor selling prices, distributor margins and demand for our products. If actual stock rotation returns or price adjustments differ from ourestimates, adjustments may be recorded in the period when such actual information is known. Allowance for price adjustments is recorded against accountsreceivable and provision for stock rotation is recorded in accrued liabilities on the consolidated balance sheets.
Packaging and testing services revenue is recognized upon shipment of serviced products to the customer.
Inventory reserves
We carry inventories at the lower of cost (determined on a first-in, first-out basis) or net realizable value. Cost primarily consists of semiconductor wafersand raw materials, labor, depreciation expenses and other manufacturing expenses and overhead, and packaging and testing fees paid to third parties ifsubcontractors are used. Inventory reserves are made based on our periodic review of inventory quantities on hand as compared with our sales forecasts, historicalusage, aging of inventories, production yield levels and current product selling prices. If actual market conditions are less favorable than those forecasted by us,additional future inventory write-downs may be required that could adversely affect our operating results. Inventory reserves once established are not reversed untilthe related inventory has been sold or scrapped. If actual market conditions are more favorable than expected and the products that have previously been writtendown are sold, our gross margin would be favorably impacted.
Product warranty
We provide a standard one-year warranty for the products from the date of purchase by the end customers. We accrue for estimated warranty costs at the timerevenue is recognized. Our warranty obligation is affected by product failure rates, labor and material costs for replacing defective parts, related freight costs forfailed parts and other quality assurance costs. We monitor our product returns for warranty claims and maintain warranty reserve based on our historicalexperiences and anticipated warranty claims known at the time of estimation. If actual warranty costs differ significantly from our estimates, revisions to theestimated warranty accrual would be required and any such adjustments could be material.
Accounting for income taxes
We are subject to income taxes in a number of jurisdictions. We must make certain estimates and judgments in determining income tax expense for financialstatement purposes. These estimates and judgments occur in the calculation of tax credits, benefits and deductions, and in the calculation of certain tax assets andliabilities which arise from differences in the timing of recognition of revenue and expense for tax and financial statement purposes, as well as interest andpenalties related to uncertain tax positions. There are many transactions and calculations for which the ultimate tax determination is
61
uncertain during the ordinary course of business. We establish accruals for certain tax contingencies based on estimates of whether additional taxes may be due.While the final tax outcome of these matters may differ from the amounts that were initially recorded, such differences will impact the income tax and deferred taxprovisions in the period in which such determination is made. As a result, significant changes to these estimates may result in an increase or decrease to our taxprovision in a subsequent period.
Significant management judgment is also required in determining whether deferred tax assets will be realized in full or in part. When it is more likely thannot that all or some portion of specific deferred tax assets such as net operating losses or foreign tax credit carryforwards will not be realized, a valuation allowancemust be established for the amount of the deferred tax assets that cannot be realized. We consider all available positive and negative evidence on a jurisdiction-by-jurisdiction basis when assessing whether it is more likely than not that deferred tax assets are recoverable. We consider evidence such as our past operatingresults, the existence of cumulative losses in recent years and our forecast of future taxable income. We will maintain a partial valuation allowance equal to thestate research and development credit carryforwards until sufficient positive evidence exists to support reversal of the valuation allowance.
We have not provided for withholding taxes on the undistributed earnings of our foreign subsidiaries because we intend to reinvest such earnings indefinitely.As of June 30, 2020, the cumulative amount of undistributed earnings of our foreign subsidiaries considered permanently reinvested was $159.4 million. Thedetermination of the unrecognized deferred tax liability on these earnings is not practicable. Should we decide to remit this income to the Bermuda parent companyin a future period, our provision for income taxes may increase materially in that period.
The Financial Accounting Standards Board ("FASB") has issued guidance which clarifies the accounting for income taxes by prescribing a minimum
probability threshold that a tax position must meet before a financial statement benefit is recognized. The minimum threshold is defined as a tax position that ismore likely than not to be sustained upon examination by the applicable taxing authority, including resolution of any related appeals or litigation processes, basedon the technical merits of the position. The tax benefit to be recognized is measured as the largest amount of benefit that is greater than fifty percent likely to berealized upon ultimate settlement. The calculation of our tax liabilities involves dealing with uncertainties in the application of complex tax law and regulations ina multitude of jurisdictions. Although the guidance on the accounting for uncertainty in income taxes prescribes the use of a recognition and measurement model,the determination of whether an uncertain tax position has met those thresholds will continue to require significant judgment by management. If the ultimateresolution of tax uncertainties is different from what is currently estimated, a material impact on income tax expense could result.
Our provision for income taxes is subject to volatility and could be adversely impacted by changes in earnings or tax laws and regulations in variousjurisdictions. We are subject to the continuous examination of our income tax returns by the Internal Revenue Service and other tax authorities. We regularly assessthe likelihood of adverse outcomes resulting from these examinations to determine the adequacy of our provision for income taxes. There can be no assurance thatthe outcomes from these continuous examinations will not have an adverse effect on our operating results and financial condition. To the extent that the final taxoutcome of these matters is different than the amounts recorded, such differences will impact the provision for income taxes in the period in which suchdetermination is made. The provision for income taxes includes the impact of changes to reserves, as well as the related net interest and penalties.
Share-based compensation expense
We maintain an equity-settled, share-based compensation plan to grant restricted share units and stock options. We recognize share-based compensationexpense based on the estimated fair value of the awards, using the accelerated attribution method. The fair value of restricted share units is based on the fair valueof the Company's common share on the date of grant. For restricted stock awards subject to market conditions, the fair value of each restricted stock award isestimated at the date of grant using the Monte-Carlo pricing model. Share-based compensation expense is significant to the consolidated financial statements and iscalculated using our best estimates, which involve inherent uncertainties and the application of management's judgment. The Black-Scholes option valuation modelrequires the input of subjective assumptions, including the expected term and stock price volatility. In addition, judgment is also required in estimating the numberof stock-based awards that are expected to be forfeited. Forfeitures are estimated based on historical experience at the time of grant. Changes in estimatedforfeitures are recognized in the period of change and impact the amount of stock compensation expenses to be recognized in future periods, which could bematerial if actual results differ significantly from estimates.
62

Estimated Useful Lives for Property, Plant and Equipment and Intangible Assets
Property, plant and equipment are recorded at cost and are depreciated using the straight-line method over estimated useful lives of the assets. Patents andexclusive technology rights purchased from third parties are amortized on a straight-line basis over their estimated useful lives of three to seven years. Trade nameand customer relationships acquired in a business combination are recognized at fair values at the acquisition date and amortized on a straight-line basis over theirestimated economic lives of three years and four years, respectively.
Recently Issued Accounting Pronouncements
See Note 1 of the Notes to the consolidated financial statements under Item 15 in this Annual Report on Form 10-K for a full description of recent accountingpronouncements, including the expected dates of adoption and estimated effects on results of operations and financial condition.
63
Item 7A. Quantitative and Qualitative Disclosures About Market Risk
Foreign currency risk We and our principal subsidiaries use U.S. dollars as our functional currency because most of the transactions are conducted and settled in U.S. dollars. All of
our revenue and a significant portion of our operating expenses are denominated in U.S. dollars. The functional currency for our in-house packaging and testingfacilities in China is U.S. dollars and a significant portion of our capital expenditures are denominated in U.S. dollars. However, foreign currencies are required tofund our overseas operations, primarily in Taiwan and China. Operating expenses of overseas operations are denominated in their respective local currencies. Inorder to minimize exposure to foreign currencies, we maintained cash and cash equivalent balances in foreign currencies, including Chinese Yuan (“RMB”) asoperating funds for our foreign operating expenses. For our subsidiaries which use the local currency as the functional currency, including the JV Company, theresults and financial position are translated into U.S. dollar using exchange rates at balance sheet dates for assets and liabilities and using average exchange ratesfor income and expenses items. The resulting translation differences are presented as a separate component of accumulated other comprehensive income (loss) andnoncontrolling interest in the consolidated statements of equity. Our management believes that our exposure to foreign currency translation risk is not significantbased on a 10% sensitivity analysis in foreign currencies due to the fact that the net assets denominated in foreign currencies pertaining to foreign operations,principally in Taiwan and China, are not significant to our consolidated net assets.
Interest rate risk
Our interest-bearing assets comprise mainly interest-bearing short-term bank balances. We manage our interest rate risk by placing such balances ininstruments with various short-term maturities. Borrowings expose us to interest rate risk. Borrowings are drawn down after due consideration of market conditionsand expectation of future interest rate movements. As of June 30, 2020, we had $129.9 million outstanding under our loan with the Bank and $42.1 millionoutstanding under our capital leases, which were subject to fluctuations in interest rates. For the year ended June 30, 2020, a hypothetical 10% increase in theinterest rate could result in $0.7 million additional annual interest expense. The hypothetical assumptions made above will be different from what actually occurs inthe future. Furthermore, the computations do not anticipate actions that may be taken by our management should the hypothetical market changes actually occurover time. As a result, actual impacts on our results of operations in the future will differ from those quantified above.
Commodity Price Risk
We are subject to risk from fluctuating market prices of certain commodity raw materials, particularly gold, that are used in our manufacturing process andincorporated into our end products. Supplies for such commodities may from time-to-time become restricted, or general market factors and conditions may affectthe pricing of such commodities. Over the past few years, the price of gold increased significantly and certain of our supply chain partners assess surcharges tocompensate for the rising commodity prices. We have been converting some of our products to use copper wires instead of gold wires. Our results of operationsmay be materially and adversely affected if we have difficulty obtaining these raw materials, the quality of available raw materials deteriorates, or there aresignificant price changes for these raw materials. For periods in which the prices of these raw materials are rising, we may be unable to pass on the increased costto our customers which would result in decreased margins for the products in which they are used and could have a material adverse effect on our net earnings. Wealso may need to record losses for adverse purchase commitments for these materials in periods of declining prices. We do not enter into formal hedgingarrangements to mitigate against commodity risk. We estimate that a 10% increase or decrease in the costs of raw materials subject to commodity price risk, suchas gold, would decrease or increase our current year's net earnings by $0.3 million, assuming that such changes in our costs have no impact on the selling prices ofour products and that we have no pending commitments to purchase metals at fixed prices.
64
Item 8. Financial Statements and Supplementary Data
See Part IV, Item 15 "Exhibits and Financial Statement Schedules" for our consolidated financial statements and the notes and schedules thereto filed as partof this annual report.
Selected Quarterly Consolidated Financial Data
The following tables present our unaudited consolidated financial information for each of the eight quarters in the period ended June 30, 2020. Net income(loss) per share for the four quarters of each fiscal year may not sum to the total for the fiscal year because of difference in the number of shares outstanding duringeach period. The operating results for any quarter should not be relied upon as necessarily indicative of results for any future period. We expect our quarterlyoperating results to fluctuate in future periods due to a variety of reasons, including those discussed in Item 1A. “Risk Factors.”
Quarter Ended
June 30,
2020 March 31,
2020 December 31,
2019 September 30,
2019 (in thousands, except per share data) Revenue $ 122,395 $ 106,852 $ 117,860 $ 117,802 Gross profit $ 28,934 $ 22,459 $ 24,406 $ 26,932 Operating loss $ (1,327) $ (8,619) $ (3,370) $ (621) Net loss including noncontrolling interest $ (1,940) $ (9,886) $ (4,573) $ (1,858) Net loss attributable to noncontrolling interest $ (1,835) $ (3,391) $ (3,568) $ (2,867) Net income (loss) attributable to Alpha and Omega SemiconductorLimited $ (105) $ (6,495) $ (1,005) $ 1,009 Net income (loss) per common share attributable to Alpha andOmega Semiconductor Limited
Basic $ 0.00 $ (0.26) $ (0.04) $ 0.04 Diluted $ 0.00 $ (0.26) $ (0.04) $ 0.04
Quarter Ended
June 30,
2019 March 31,
2019 December 31,
2018 September 30,
2018 (in thousands, except per share data) Revenue $ 111,856 $ 109,067 $ 114,925 $ 115,072 Gross profit $ 27,636 $ 25,629 $ 29,502 $ 32,611 Operating income (loss) $ (958) $ (3,735) $ (3,202) $ 875 Net loss including noncontrolling interest $ (2,235) $ (5,955) $ (5,535) $ (913) Net loss attributable to noncontrolling interest $ (4,780) $ (4,400) $ (3,990) $ (3,329) Net income (loss) attributable to Alpha and Omega SemiconductorLimited $ 2,545 $ (1,555) $ (1,545) $ 2,416 Net income (loss) per common share attributable to Alpha andOmega Semiconductor Limited
Basic $ 0.10 $ (0.06) $ (0.06) $ 0.10 Diluted $ 0.10 $ (0.06) $ (0.06) $ 0.10
Item 9. Changes in and Disagreements with Accountants on Accounting and Financial Disclosure
None
65
Item 9A. Controls and Procedures
Evaluation of Disclosure Controls and Procedures
Our management, with the participation of our Chief Executive Officer and Chief Financial Officer, evaluated the effectiveness of our disclosure controls andprocedures (as defined in Rules 13a-15(e) and 15d-15(e) under the Securities Exchange Act of 1934, as amended, (the “Exchange Act”)), as of the end of theperiod covered by this report. Based on that evaluation, the Chief Executive Officer and Chief Financial Officer concluded that our disclosure controls andprocedures as of June 30, 2020 have been designed and are functioning effectively to provide reasonable assurance that the information required to be disclosed inthe reports that we file or submit under the Exchange Act is recorded, processed, summarized and reported, within the time periods specified in the SEC's rules andforms, and that such information is accumulated and communicated to our management, including our Chief Executive Officer and Chief Financial Officer, orpersons performing similar functions, as appropriate to allow timely decisions regarding required disclosure.
Management's Annual Report on Internal Control over Financial Reporting
Our management, including our Chief Executive Officer and Chief Financial Officer, is responsible for establishing and maintaining adequate internal controlover financial reporting (as defined in Rule 13a-15(f) under the Exchange Act). Our internal control over financial reporting is a process designed to providereasonable assurance regarding the reliability of financial reporting and the preparation of our financial statements for external purposes in accordance withgenerally accepted accounting principles, and includes those policies and procedures that (1) pertain to the maintenance of records that, in reasonable detail,accurately and fairly reflect the transactions and dispositions of our assets; (2) provide reasonable assurance that transactions are recorded to permit preparation offinancial statements in accordance with generally accepted accounting principles, and that our receipts and expenditures are made only in accordance withauthorizations of our management and directors; and (3) provide reasonable assurance regarding prevention or timely detection of unauthorized acquisition, use ordisposition of our assets that could have a material effect on our financial statements.
Our management conducted an assessment of the effectiveness of our internal control over financial reporting based on the criteria set forth in InternalControl - Integrated Framework issued by the Committee of Sponsoring Organizations of the Treadway Commission (2013 framework), as amended from time totime. Based on the assessment, our management has concluded that our internal control over financial reporting was effective as of June 30, 2020 to providereasonable assurance regarding the reliability of financial reporting and the preparation of financial statements in accordance with U.S. GAAP.
The effectiveness of the Company's internal control over financial reporting as of June 30, 2020 has been audited by BDO, USA LLP, an independentregistered public accounting firm, as stated in their report, included on the following page.
Limitation on the Effectiveness of Controls
While our disclosure controls and procedures and internal control over financial reporting are designed to provide reasonable assurance that their respectiveobjectives will be met, we do not expect that our disclosure controls and procedures or our internal control over financial reporting are or will be capable ofpreventing or detecting all errors and all fraud. Any control system, no matter how well designed and operated, can provide only reasonable, not absolute,assurance that the control system's objectives will be met.
Changes in Internal Control Over Financial Reporting
There were no changes in our internal control over financial reporting that occurred during the quarter ended June 30, 2020 that have materially affected orare reasonably likely to materially affect, our internal control over financial reporting.
66
REPORT OF INDEPENDENT REGISTERED PUBLIC ACCOUNTING FIRM
Shareholders and Board of DirectorsAlpha and Omega Semiconductor LimitedSunnyvale, California
Opinion on Internal Control over Financial Reporting
We have audited Alpha and Omega Semiconductor Limited (a Bermuda corporation) and subsidiaries (the “Company’s”) internal control over financial reportingas of June 30, 2020, based on criteria established in Internal Control - Integrated Framework (2013) issued by the Committee of Sponsoring Organizations of theTreadway Commission (the “COSO criteria”). In our opinion, the Company maintained, in all material respects, effective internal control over financial reportingas of June 30, 2020, based on the COSO criteria.
We also have audited, in accordance with the standards of the Public Company Accounting Oversight Board (United States) (“PCAOB”), the consolidated balancesheets of the Company as of June 30, 2020 and 2019, the related consolidated statements of operations, comprehensive income (loss), stockholders’ equity, andcash flows for each of the two years in the period ended June 30, 2020, and the related notes and schedules and our report dated September 2, 2020 expressed anunqualified opinion thereon.
Basis for Opinion
The Company’s management is responsible for maintaining effective internal control over financial reporting and for its assessment of the effectiveness of internalcontrol over financial reporting, included in the accompanying Item 9A. Management’s Report on Internal Control over Financial Reporting. Our responsibility isto express an opinion on the Company’s internal control over financial reporting based on our audit. We are a public accounting firm registered with the PCAOBand are required to be independent with respect to the Company in accordance with U.S. federal securities laws and the applicable rules and regulations of theSecurities and Exchange Commission and the PCAOB.
We conducted our audit of internal control over financial reporting in accordance with the standards of the PCAOB. Those standards require that we plan andperform the audit to obtain reasonable assurance about whether effective internal control over financial reporting was maintained in all material respects. Our auditincluded obtaining an understanding of internal control over financial reporting, assessing the risk that a material weakness exists, and testing and evaluating thedesign and operating effectiveness of internal control based on the assessed risk. Our audit also included performing such other procedures as we considerednecessary in the circumstances. We believe that our audit provides a reasonable basis for our opinion.
Definition and Limitations of Internal Control over Financial Reporting
A company’s internal control over financial reporting is a process designed to provide reasonable assurance regarding the reliability of financial reporting and thepreparation of financial statements for external purposes in accordance with generally accepted accounting principles. A company’s internal control over financialreporting includes those policies and procedures that (1) pertain to the maintenance of records that, in reasonable detail, accurately and fairly reflect thetransactions and dispositions of the assets of the company; (2) provide reasonable assurance that transactions are recorded as necessary to permit preparation offinancial statements in accordance with generally accepted accounting principles, and that receipts and expenditures of the company are being made only inaccordance with authorizations of management and directors of the company; and (3) provide reasonable assurance regarding prevention or timely detection ofunauthorized acquisition, use, or disposition of the company’s assets that could have a material effect on the financial statements.
Because of its inherent limitations, internal control over financial reporting may not prevent or detect misstatements. Also, projections of any evaluation ofeffectiveness to future periods are subject to the risk that controls may become inadequate because of changes in conditions, or that the degree of compliance withthe policies or procedures may deteriorate.
/s/ BDO USA, LLP
San Jose, CaliforniaSeptember 2, 2020
67

Table of Contents
Item 9B. Other Information
None
68
PART III
Certain information required by Part III is omitted from this Annual Report on Form 10-K because we intend to file our definitive proxy statement for ournext annual general meeting of shareholders, pursuant to Regulation 14A of the Securities Exchange Act of 1934, as amended (the “2020 Proxy Statement”), nolater than 120 days after the end of fiscal year 2020, and certain information to be included in the 2020 Proxy Statement is incorporated herein by reference.
Item 10. Directors, Executive Officers and Corporate Governance
The information required by this item concerning our directors, executive officers, Section 16 compliance and corporate governance matters is contained inpart under the caption "Business - Executive Officers" in Part I of this report, and the remainder is incorporated by reference to the information set forth in thesections titled “Election of Directors” and “Section 16(a) Beneficial Ownership Reporting Compliance” in the 2020 Proxy Statement.
Item 11. Executive Compensation
The information required by this item regarding executive compensation is incorporated by reference from the information set forth under the captions“Compensation of Non-Employee Directors” and “Executive Compensation,” in the 2020 Proxy Statement.
Item 12. Security Ownership of Certain Beneficial Owners and Management and Related Stockholder Matters
The information required by this item regarding security ownership of certain beneficial owners and management is incorporated by reference to theinformation set forth in the section titled “Security Ownership of Certain Beneficial Owners and Management” and “Equity Compensation Plan Information” in the2020 Proxy Statement.
Item 13. Certain Relationships and Related Transactions, and Director Independence
The information required by this item regarding related party transactions and director independence is incorporated by reference from the information setforth under the captions “Board of Directors and Committees of the Board", and “Related Party Transactions" in the 2020 Proxy Statement.
Item 14. Principal Accounting Fees and Services
The information required by this item regarding principal accountant fees and services is incorporated by reference from the information set forth under thecaption “Principal Accounting Fees and Services” in the 2020 Proxy Statement.
69
PART IV
Item 15. Exhibits and Financial Statement Schedules
(a) The following documents are filed as part of this annual report:
(1) Consolidated Financial Statements. The index to the consolidated financial statements is below.
Item Page Report of Independent Registered Public Accounting Firm (BDO USA, LLP) 71Report of Independent Registered Public Accounting Firm (Grant Thornton LLP) 72Consolidated Balance Sheets 73Consolidated Statements of Operations 75Consolidated Statements of Comprehensive Income (Loss) 76Consolidated Statements of Equity 77Consolidated Statements of Cash Flows 79Notes to the Consolidated Financial Statements 81
(2) Financial Statement Schedules.
Schedule I - Condensed Financial Information of Registrant 115Schedule II - Valuation and Qualifying accounts 120
(b) Exhibits
The exhibits listed on the accompanying Index to Exhibits in Item 15(b) below are filed as part of, or hereby incorporated by reference into, this AnnualReport on Form 10-K.
70
REPORT OF INDEPENDENT REGISTERED PUBLIC ACCOUNTING FIRM
Shareholders and Board of DirectorsAlpha and Omega Semiconductor LimitedSunnyvale, California
Opinion on the Consolidated Financial Statements
We have audited the accompanying consolidated balance sheets of Alpha and Omega Semiconductor Limited (a Bermuda Corporation) and subsidiaries (the“Company”) as of June 30, 2020 and 2019, the related consolidated statements of operations, comprehensive income (loss), stockholders’ equity, and cash flowsfor each of the two years in the period ended June 30, 2020, and the related notes and schedules (collectively referred to as the “consolidated financial statements”).In our opinion, the consolidated financial statements present fairly, in all material respects, the financial position of the Company at June 30, 2020 and 2019, andthe results of its operations and its cash flows for each of the two years in the period ended June 30, 2020, in conformity with accounting principles generallyaccepted in the United States of America.
We also have audited, in accordance with the standards of the Public Company Accounting Oversight Board (United States) (“PCAOB”), the Company's internalcontrol over financial reporting as of June 30, 2020, based on criteria established in Internal Control - Integrated Framework (2013) issued by the Committee ofSponsoring Organizations of the Treadway Commission (“COSO”) and our report dated September 2, 2020 expressed an unqualified opinion thereon.
Change in Accounting Principle
As discussed in Note 1 to the consolidated financial statements, the Company has changed its accounting method for accounting for leases in fiscal year 2020 dueto the adoption of Topic 842: Leases, using a modified retrospective approach, and changed its method for recognizing revenue in fiscal year 2019 due to theadoption of Topic 606: Revenue from Contracts with Customers.
Basis for Opinion
These consolidated financial statements are the responsibility of the Company’s management. Our responsibility is to express an opinion on the Company’sconsolidated financial statements based on our audits. We are a public accounting firm registered with the PCAOB and are required to be independent with respectto the Company in accordance with the U.S. federal securities laws and the applicable rules and regulations of the Securities and Exchange Commission and thePCAOB.
We conducted our audits in accordance with the standards of the PCAOB. Those standards require that we plan and perform the audit to obtain reasonableassurance about whether the consolidated financial statements are free of material misstatement, whether due to error or fraud.
Our audits included performing procedures to assess the risks of material misstatement of the consolidated financial statements, whether due to error or fraud, andperforming procedures that respond to those risks. Such procedures included examining, on a test basis, evidence regarding the amounts and disclosures in theconsolidated financial statements. Our audits also included evaluating the accounting principles used and significant estimates made by management, as well asevaluating the overall presentation of the consolidated financial statements. We believe that our audits provide a reasonable basis for our opinion.
/s/ BDO USA, LLPWe have served as the Company's auditor since 2018.San Jose, California
September 2, 2020
71
REPORT OF INDEPENDENT REGISTERED PUBLIC ACCOUNTING FIRM
Board of Directors and ShareholdersAlpha and Omega Semiconductor Limited
Opinion on the financial statementsWe have audited the accompanying consolidated balance sheet of Alpha and Omega Semiconductor Limited (a Bermuda corporation) and subsidiaries (the“Company”) as of June 30, 2018 (not presented herein), and the related consolidated statements of operations, comprehensive income (loss), equity, and cash flowsfor the year then ended, and the related notes and schedules (collectively referred to as the “financial statements”). In our opinion, the financial statements presentfairly, in all material respects, the financial position of the Company as of June 30, 2018, and the results of its operations and its cash flows for the year then ended,in conformity with accounting principles generally accepted in the United States of America.
Basis for opinionThese financial statements are the responsibility of the Company’s management. Our responsibility is to express an opinion on the Company’s financial statementsbased on our audit. We are a public accounting firm registered with the Public Company Accounting Oversight Board (United States) (“PCAOB”) and are requiredto be independent with respect to the Company in accordance with the U.S. federal securities laws and the applicable rules and regulations of the Securities andExchange Commission and the PCAOB.
We conducted our audit in accordance with the standards of the PCAOB. Those standards require that we plan and perform the audit to obtain reasonable assuranceabout whether the financial statements are free of material misstatement, whether due to error or fraud.
Our audit included performing procedures to assess the risks of material misstatement of the financial statements, whether due to error or fraud, and performingprocedures that respond to those risks. Such procedures included examining, on a test basis, evidence regarding the amounts and disclosures in the financialstatements. Our audit also included evaluating the accounting principles used and significant estimates made by management, as well as evaluating the overallpresentation of the financial statements. We believe that our audit provides a reasonable basis for our opinion.
/s/ GRANT THORNTON LLP
We served as the Company’s auditor from 2012 to 2018.
San Francisco, California
August 23, 2018
72
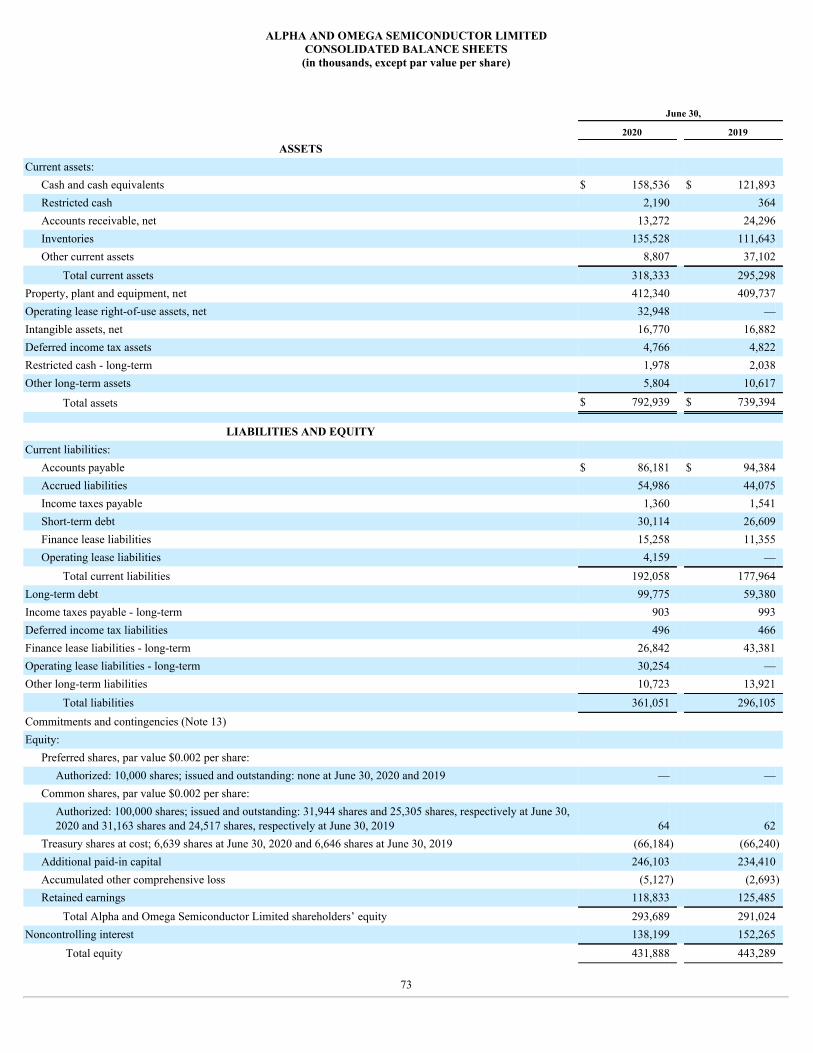
ALPHA AND OMEGA SEMICONDUCTOR LIMITEDCONSOLIDATED BALANCE SHEETS(in thousands, except par value per share)
June 30,
2020 2019
ASSETS Current assets:
Cash and cash equivalents $ 158,536 $ 121,893Restricted cash 2,190 364Accounts receivable, net 13,272 24,296Inventories 135,528 111,643Other current assets 8,807 37,102
Total current assets 318,333 295,298Property, plant and equipment, net 412,340 409,737Operating lease right-of-use assets, net 32,948 —Intangible assets, net 16,770 16,882Deferred income tax assets 4,766 4,822Restricted cash - long-term 1,978 2,038Other long-term assets 5,804 10,617
Total assets $ 792,939 $ 739,394
LIABILITIES AND EQUITY
Current liabilities: Accounts payable $ 86,181 $ 94,384Accrued liabilities 54,986 44,075Income taxes payable 1,360 1,541Short-term debt 30,114 26,609Finance lease liabilities 15,258 11,355Operating lease liabilities 4,159 —
Total current liabilities 192,058 177,964Long-term debt 99,775 59,380Income taxes payable - long-term 903 993Deferred income tax liabilities 496 466Finance lease liabilities - long-term 26,842 43,381Operating lease liabilities - long-term 30,254 —Other long-term liabilities 10,723 13,921
Total liabilities 361,051 296,105Commitments and contingencies (Note 13) Equity:
Preferred shares, par value $0.002 per share: Authorized: 10,000 shares; issued and outstanding: none at June 30, 2020 and 2019 — —
Common shares, par value $0.002 per share: Authorized: 100,000 shares; issued and outstanding: 31,944 shares and 25,305 shares, respectively at June 30,2020 and 31,163 shares and 24,517 shares, respectively at June 30, 2019 64 62
Treasury shares at cost; 6,639 shares at June 30, 2020 and 6,646 shares at June 30, 2019 (66,184) (66,240)Additional paid-in capital 246,103 234,410Accumulated other comprehensive loss (5,127) (2,693)Retained earnings 118,833 125,485
Total Alpha and Omega Semiconductor Limited shareholders’ equity 293,689 291,024Noncontrolling interest 138,199 152,265
Total equity 431,888 443,289
73

Total liabilities and equity $ 792,939 $ 739,394
The accompanying notes are an integral part of these consolidated financial statements.
74
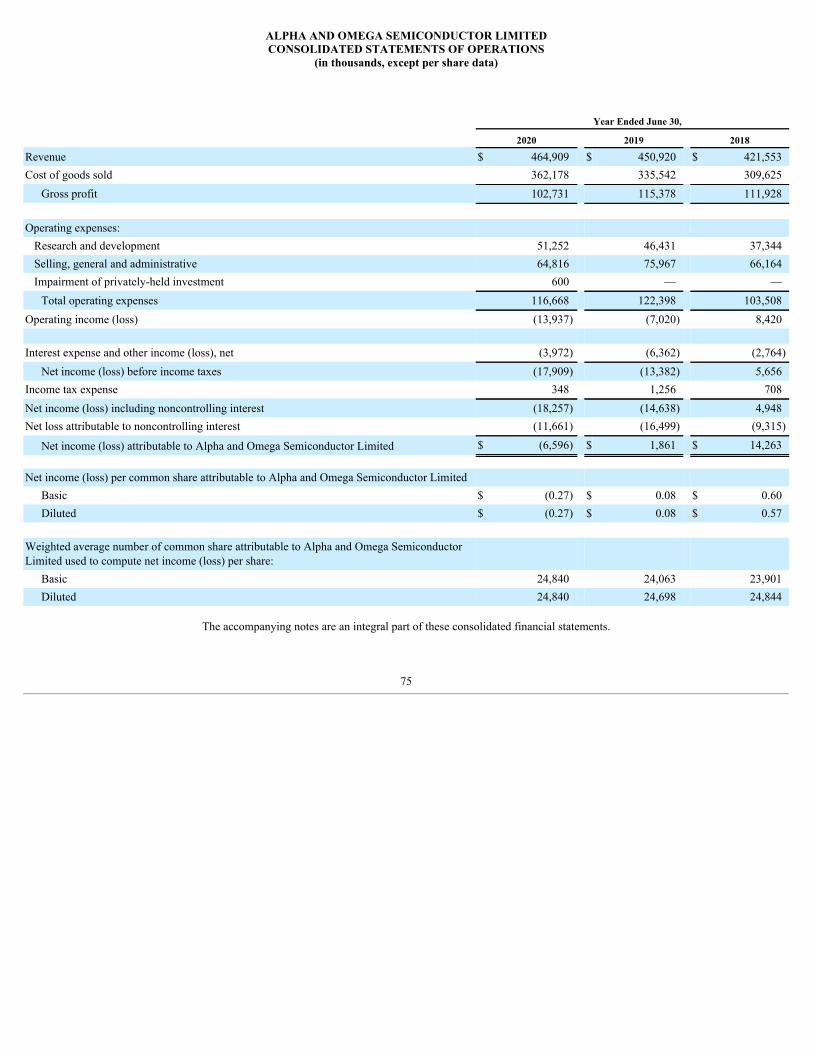
ALPHA AND OMEGA SEMICONDUCTOR LIMITEDCONSOLIDATED STATEMENTS OF OPERATIONS
(in thousands, except per share data)
Year Ended June 30,
2020 2019 2018
Revenue $ 464,909 $ 450,920 $ 421,553Cost of goods sold 362,178 335,542 309,625
Gross profit 102,731 115,378 111,928 Operating expenses:
Research and development 51,252 46,431 37,344Selling, general and administrative 64,816 75,967 66,164Impairment of privately-held investment 600 — —
Total operating expenses 116,668 122,398 103,508Operating income (loss) (13,937) (7,020) 8,420 Interest expense and other income (loss), net (3,972) (6,362) (2,764)
Net income (loss) before income taxes (17,909) (13,382) 5,656Income tax expense 348 1,256 708Net income (loss) including noncontrolling interest (18,257) (14,638) 4,948Net loss attributable to noncontrolling interest (11,661) (16,499) (9,315)
Net income (loss) attributable to Alpha and Omega Semiconductor Limited $ (6,596) $ 1,861 $ 14,263
Net income (loss) per common share attributable to Alpha and Omega Semiconductor Limited
Basic $ (0.27) $ 0.08 $ 0.60Diluted $ (0.27) $ 0.08 $ 0.57
Weighted average number of common share attributable to Alpha and Omega SemiconductorLimited used to compute net income (loss) per share:
Basic 24,840 24,063 23,901Diluted 24,840 24,698 24,844
The accompanying notes are an integral part of these consolidated financial statements.
75
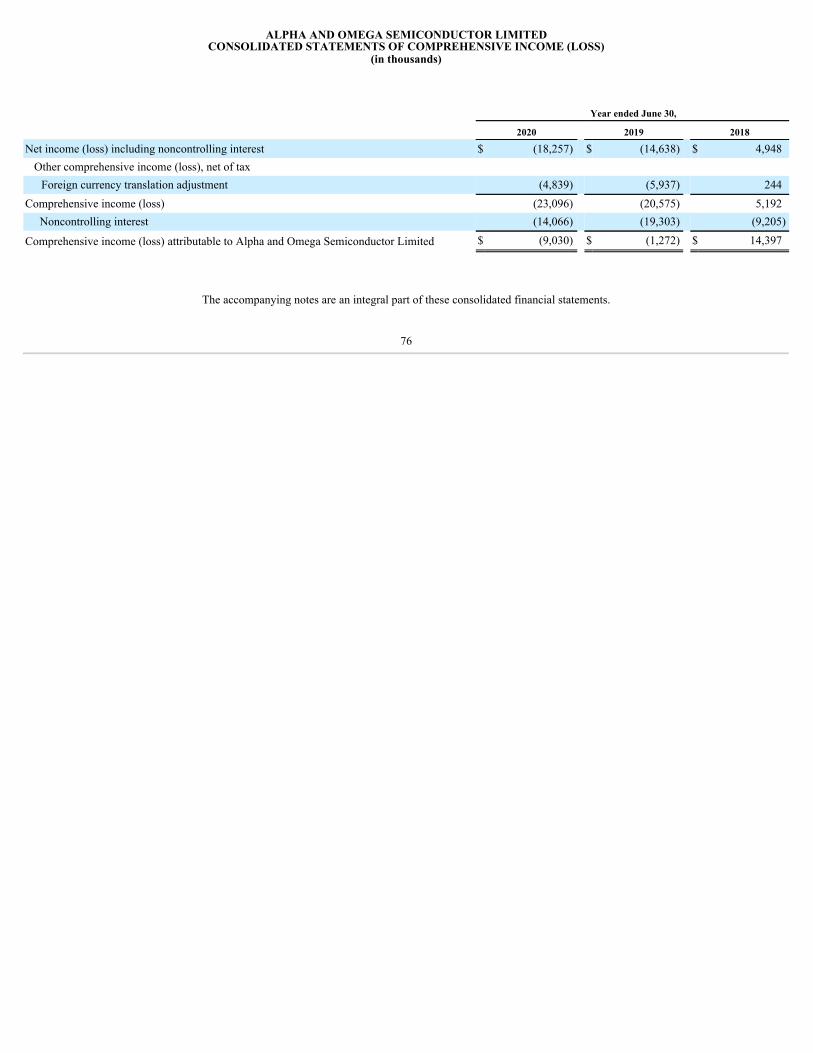
ALPHA AND OMEGA SEMICONDUCTOR LIMITEDCONSOLIDATED STATEMENTS OF COMPREHENSIVE INCOME (LOSS)
(in thousands)
Year ended June 30,
2020 2019 2018
Net income (loss) including noncontrolling interest $ (18,257) $ (14,638) $ 4,948Other comprehensive income (loss), net of tax
Foreign currency translation adjustment (4,839) (5,937) 244Comprehensive income (loss) (23,096) (20,575) 5,192 Noncontrolling interest (14,066) (19,303) (9,205)
Comprehensive income (loss) attributable to Alpha and Omega Semiconductor Limited $ (9,030) $ (1,272) $ 14,397
The accompanying notes are an integral part of these consolidated financial statements.
76
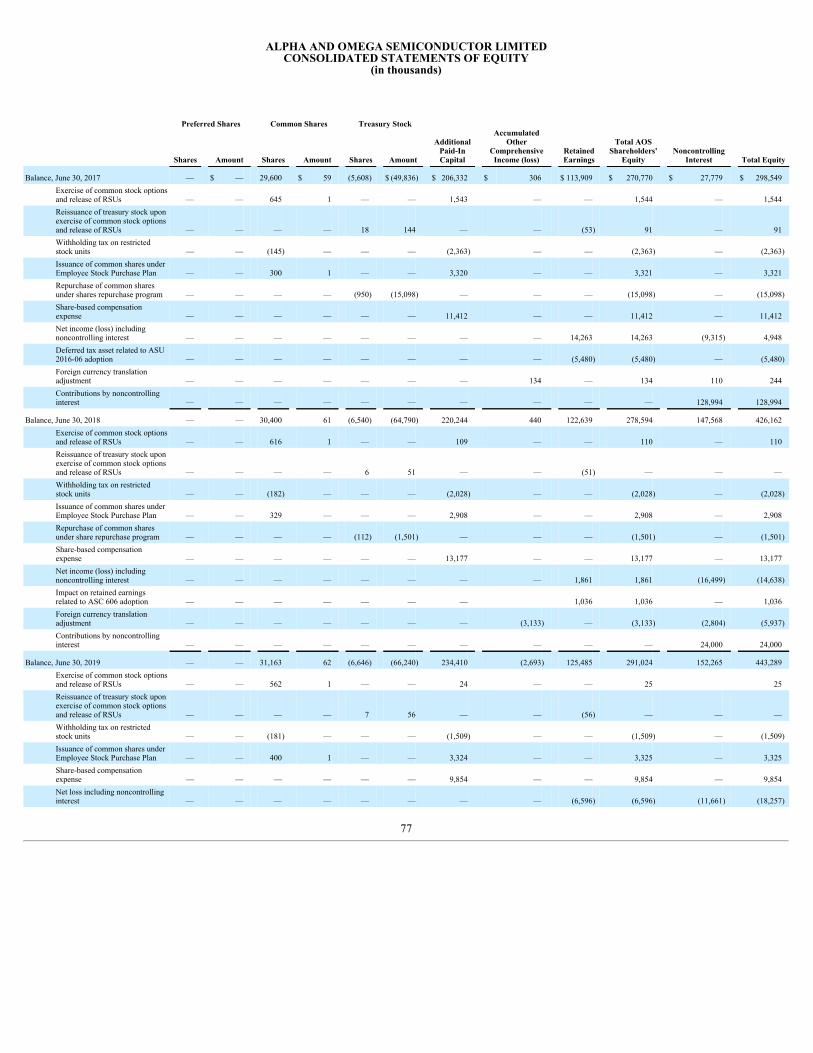
ALPHA AND OMEGA SEMICONDUCTOR LIMITEDCONSOLIDATED STATEMENTS OF EQUITY
(in thousands)
Preferred Shares Common Shares Treasury Stock
AdditionalPaid-InCapital
Accumulated
OtherComprehensive
Income (loss)
RetainedEarnings
Total AOSShareholders'
Equity
NoncontrollingInterest
Total Equity
Shares
Amount Shares
Amount
Shares
Amount
Balance, June 30, 2017 — $ — 29,600 $ 59 (5,608) $ (49,836) $ 206,332 $ 306 $ 113,909 $ 270,770 $ 27,779 $ 298,549Exercise of common stock optionsand release of RSUs — — 645 1 — — 1,543 — — 1,544 — 1,544Reissuance of treasury stock uponexercise of common stock optionsand release of RSUs — — — — 18 144 — — (53) 91 — 91Withholding tax on restrictedstock units — — (145) — — — (2,363) — — (2,363) — (2,363)Issuance of common shares underEmployee Stock Purchase Plan — — 300 1 — — 3,320 — — 3,321 — 3,321Repurchase of common sharesunder shares repurchase program — — — — (950) (15,098) — — — (15,098) — (15,098)Share-based compensationexpense — — — — — — 11,412 — — 11,412 — 11,412Net income (loss) includingnoncontrolling interest — — — — — — — — 14,263 14,263 (9,315) 4,948Deferred tax asset related to ASU2016-06 adoption — — — — — — — — (5,480) (5,480) — (5,480)Foreign currency translationadjustment — — — — — — — 134 — 134 110 244Contributions by noncontrollinginterest — — — — — — — — — — 128,994 128,994
Balance, June 30, 2018 — — 30,400 61 (6,540) (64,790) 220,244 440 122,639 278,594 147,568 426,162Exercise of common stock optionsand release of RSUs — — 616 1 — — 109 — — 110 — 110Reissuance of treasury stock uponexercise of common stock optionsand release of RSUs — — — — 6 51 — — (51) — — —Withholding tax on restrictedstock units — — (182) — — — (2,028) — — (2,028) — (2,028)Issuance of common shares underEmployee Stock Purchase Plan — — 329 — — — 2,908 — — 2,908 — 2,908Repurchase of common sharesunder share repurchase program — — — — (112) (1,501) — — — (1,501) — (1,501)Share-based compensationexpense — — — — — — 13,177 — — 13,177 — 13,177Net income (loss) includingnoncontrolling interest — — — — — — — — 1,861 1,861 (16,499) (14,638)Impact on retained earningsrelated to ASC 606 adoption — — — — — — — 1,036 1,036 — 1,036Foreign currency translationadjustment — — — — — — — (3,133) — (3,133) (2,804) (5,937)Contributions by noncontrollinginterest — — — — — — — — — — 24,000 24,000
Balance, June 30, 2019 — — 31,163 62 (6,646) (66,240) 234,410 (2,693) 125,485 291,024 152,265 443,289Exercise of common stock optionsand release of RSUs — — 562 1 — — 24 — — 25 25Reissuance of treasury stock uponexercise of common stock optionsand release of RSUs — — — — 7 56 — — (56) — — —Withholding tax on restrictedstock units — — (181) — — — (1,509) — — (1,509) — (1,509)Issuance of common shares underEmployee Stock Purchase Plan — — 400 1 — — 3,324 — — 3,325 — 3,325Share-based compensationexpense — — — — — — 9,854 — — 9,854 — 9,854Net loss including noncontrollinginterest — — — — — — — — (6,596) (6,596) (11,661) (18,257)
77

ALPHA AND OMEGA SEMICONDUCTOR LIMITEDCONSOLIDATED STATEMENTS OF EQUITY
(in thousands)
Foreign currency translationadjustment — — — — — — — (2,434) — (2,434) (2,405) (4,839)
Balance, June 30, 2020 — $ — 31,944 $ 64 (6,639) $ (66,184) $ 246,103 $ (5,127) $ 118,833 $ 293,689 $ 138,199 $ 431,888
The accompanying notes are an integral part of these consolidated financial statements.
78
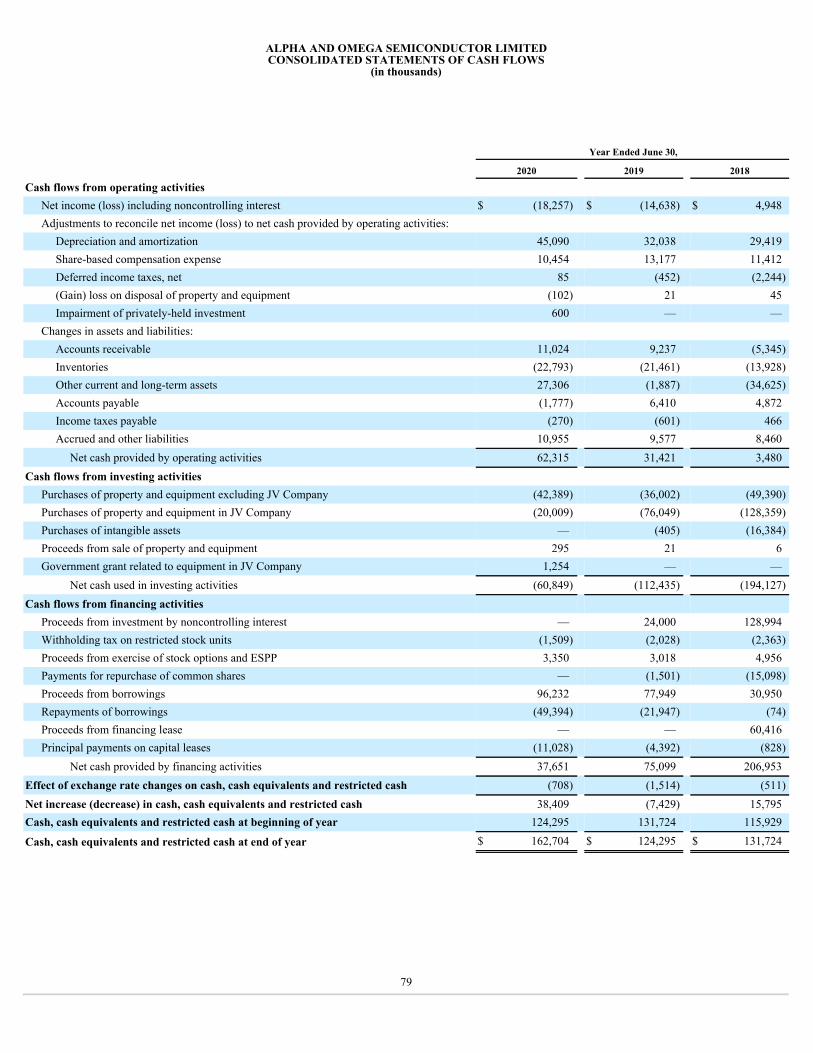
ALPHA AND OMEGA SEMICONDUCTOR LIMITEDCONSOLIDATED STATEMENTS OF CASH FLOWS
(in thousands)
Year Ended June 30,
2020 2019 2018
Cash flows from operating activities Net income (loss) including noncontrolling interest $ (18,257) $ (14,638) $ 4,948Adjustments to reconcile net income (loss) to net cash provided by operating activities:
Depreciation and amortization 45,090 32,038 29,419Share-based compensation expense 10,454 13,177 11,412Deferred income taxes, net 85 (452) (2,244)(Gain) loss on disposal of property and equipment (102) 21 45Impairment of privately-held investment 600 — —
Changes in assets and liabilities: Accounts receivable 11,024 9,237 (5,345)Inventories (22,793) (21,461) (13,928)Other current and long-term assets 27,306 (1,887) (34,625)Accounts payable (1,777) 6,410 4,872Income taxes payable (270) (601) 466Accrued and other liabilities 10,955 9,577 8,460
Net cash provided by operating activities 62,315 31,421 3,480Cash flows from investing activities
Purchases of property and equipment excluding JV Company (42,389) (36,002) (49,390)Purchases of property and equipment in JV Company (20,009) (76,049) (128,359)Purchases of intangible assets — (405) (16,384)Proceeds from sale of property and equipment 295 21 6Government grant related to equipment in JV Company 1,254 — —
Net cash used in investing activities (60,849) (112,435) (194,127)Cash flows from financing activities
Proceeds from investment by noncontrolling interest — 24,000 128,994Withholding tax on restricted stock units (1,509) (2,028) (2,363)Proceeds from exercise of stock options and ESPP 3,350 3,018 4,956Payments for repurchase of common shares — (1,501) (15,098)Proceeds from borrowings 96,232 77,949 30,950Repayments of borrowings (49,394) (21,947) (74)Proceeds from financing lease — — 60,416Principal payments on capital leases (11,028) (4,392) (828)
Net cash provided by financing activities 37,651 75,099 206,953Effect of exchange rate changes on cash, cash equivalents and restricted cash (708) (1,514) (511)Net increase (decrease) in cash, cash equivalents and restricted cash 38,409 (7,429) 15,795Cash, cash equivalents and restricted cash at beginning of year 124,295 131,724 115,929
Cash, cash equivalents and restricted cash at end of year $ 162,704 $ 124,295 $ 131,724
79
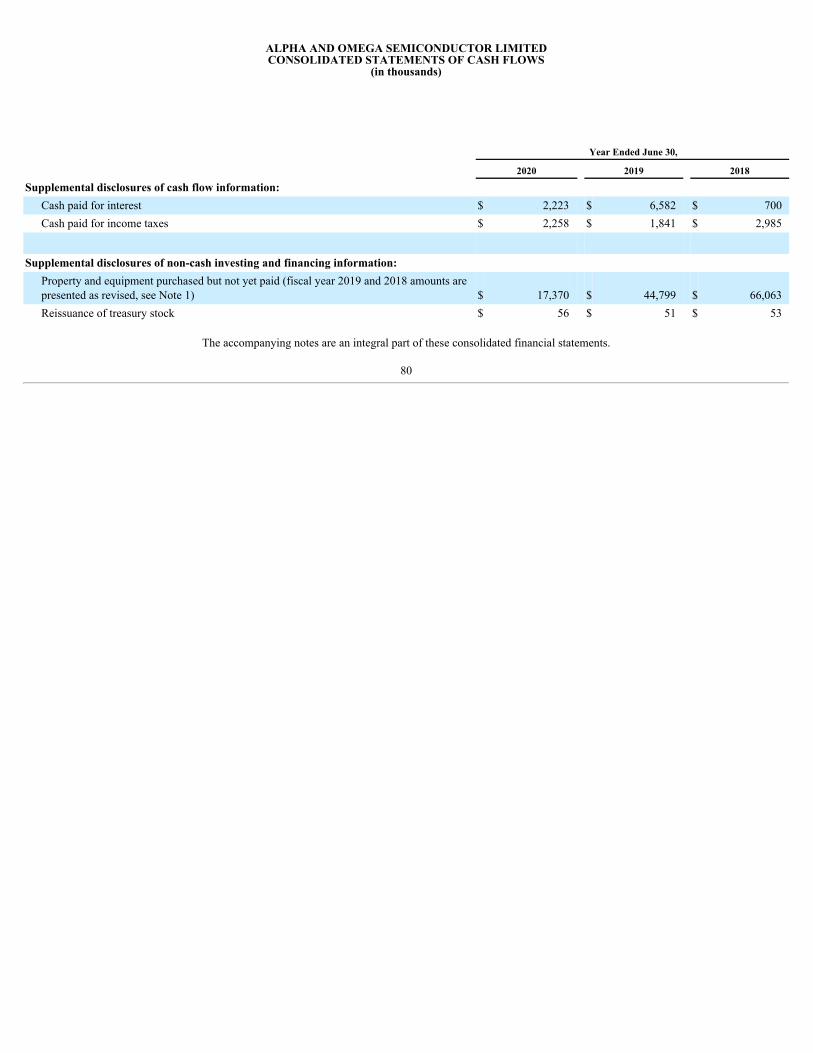
ALPHA AND OMEGA SEMICONDUCTOR LIMITEDCONSOLIDATED STATEMENTS OF CASH FLOWS
(in thousands)
Year Ended June 30,
2020 2019 2018
Supplemental disclosures of cash flow information: Cash paid for interest $ 2,223 $ 6,582 $ 700Cash paid for income taxes $ 2,258 $ 1,841 $ 2,985
Supplemental disclosures of non-cash investing and financing information: Property and equipment purchased but not yet paid (fiscal year 2019 and 2018 amounts arepresented as revised, see Note 1) $ 17,370 $ 44,799 $ 66,063Reissuance of treasury stock $ 56 $ 51 $ 53
The accompanying notes are an integral part of these consolidated financial statements.
80
ALPHA AND OMEGA SEMICONDUCTOR LIMITEDNOTES TO THE CONSOLIDATED FINANCIAL STATEMENTS
1. The Company and Significant Accounting Policies
The Company
Alpha and Omega Semiconductor Limited and its subsidiaries (the “Company”, "AOS", "we" or "us") design, develop and supply a broad range of powersemiconductors. The Company's portfolio of products targets high-volume applications, including personal computers, graphic cards, flat panel TVs, homeappliances, smart phones, battery packs, quick chargers, home appliances, consumer and industrial motor controls and power supplies for TVs, computers, serversand telecommunications equipment. The Company conducts its operations primarily in the United States of America (“USA”), Hong Kong, China, and SouthKorea.
Basis of Preparation
The consolidated financial statements include the accounts of the Company, its wholly-owned subsidiaries, and a subsidiary in which it has a controllinginterest after elimination of inter-company balances and transactions. The consolidated financial statements have been prepared in conformity with accountingprinciples generally accepted in the United States of America ("U.S. GAAP").
During the fiscal year ended June 30, 2020, the Company corrected an immaterial error in the corresponding amount for the fiscal year ended June 30, 2019and 2018 of property and equipment purchased but not yet paid in the supplemental disclosures of non-cash investing and financing information by decreasing theamount by $14.1 million from $58.9 million to $44.8 million and $2.1 million from $68.2 million to $66.1 million, respectively. This disclosure change had noeffect on the consolidated statements of operations and cash flows for the fiscal year ended June 30, 2019 and 2018.
Joint Venture
On March 29, 2016, the Company entered into a joint venture contract (the “JV Agreement”) with two investment funds owned by the Municipality ofChongqing (the “Chongqing Funds”), pursuant to which the Company and the Chongqing Funds formed a joint venture, (the “JV Company”), for the purpose ofconstructing and operating a power semiconductor packaging, testing and 12-inch wafer fabrication facility in the Liangjiang New Area of Chongqing, China (the“JV Transaction”). As of June 30, 2020, the Company owns 51%, and the Chongqing Funds own 49%, of the equity interest in the JV Company. The Joint Ventureis accounted under the provisions of the consolidation guidance since the Company has controlling financial interest. If both parties agree that the termination ofthe JV Company is the best interest of each party or the JV Company is bankrupt or insolvent where either party may terminate early, after paying the debts of theJV Company, the remaining assets of the JV Company shall be paid to the Chongqing Funds to cover the principal of its total paid-in contributions plus interest at10% simple annual rate prior to distributing the balance of the JV Company's assets to the Company. The JV Company had been ramping up its production ofassembly and testing during the fiscal year 2020. The 12-inch wafer fabrication facility commenced its limited mass production in the quarter ended September 30,2019 and continued its ramp in the year ended June 30, 2020.
Certain Significant Risks and Uncertainties Related to Outbreak of Coronavirus Disease 2019 (“COVID-19”)
On March 11, 2020, the World Health Organization characterized the outbreak of the coronavirus disease known as COVID-19 as a global pandemic andrecommended containment and mitigation measures. On March 13, 2020, the United States ("U.S.") declared a national emergency concerning the outbreak, andseveral states and municipalities have declared public health emergencies. Along with these declarations, there have been extraordinary and wide-ranging actionstaken by international, federal, state and local public health and governmental authorities to contain and combat the outbreak and spread of COVID-19 in regionsacross the United States and the world where the Company has operations, including quarantines, and “stay-at-home” orders, closure of all business not deemed"essential", practice of social distancing when engaging in essential activities and similar mandates for many individuals to substantially restrict daily activities andfor many businesses to curtail or cease normal operations. In response to these steps, the Company took proactive actions from the early signs of the COVID-19outbreak in China to adopt policies and protocols at its locations around the world, including social distancing guidelines, working from home, limiting the numberof employees attending meetings, reducing the number of people in our sites at any one time, and suspending employee travel. As the COVID-19 pandemicreached the U.S. and federal and state authorities imposed “stay-at-home” orders, the Company has taken similar proactive actions in California, Oregon and Texas
81
where the Company has business activities in order to protect the health and safety of its employees. The Company has considered the economic implications ofthe COVID-19 pandemic in making critical and significant accounting estimates.
COVID-19 has had a negative impact on business activity across the globe. As a result of the COVID-19 pandemic and the global economic downturn andchanging consumer behaviors due to “stay-at-home” restrictions, the Company has experienced shifting market trends, including an increasing demand in themarkets for notebooks, PCs and gaming devices and decreasing demand for mobile phone and industrial products, as more consumers are staying at and workingfrom home. While the Company has recently benefited from the increasing demand of PC related products, there is no guarantee that this trend will continue, andsuch increasing demand may discontinue as government authorities relax COVID-19 related restrictions. Furthermore, as the COVID-19 pandemic continues andglobal economic downturn and high unemployment persists, consumer spending may slow down substantially, in which case the Company may experience asignificant decline of customer orders for its products, including those designed for PC-related applications, and such decline will adversely affect its financialconditions and results of operations. The extent to which the COVID-19 pandemic may impact the Company's business will depend on future developments whichare uncertain, such as the duration of the outbreak, travel restrictions governmental mandates issued to mitigate the spread of the disease, business closures,economic disruptions, and the effectiveness of actions taken to contain and treat the virus. Accordingly, the COVID-19 pandemic may have a negative impact onthe Company's sales and results of operations, the size and duration of which is difficult to predict. The Company will continue to actively monitor the situationand may take further actions altering its business operations that the Company determines are in the best interests of its employees, customers, partners, suppliers,and stakeholders, or as required by federal, state, or local authorities.
Risks and Uncertainties
The Company is subject to certain risks and uncertainties. The Company believes changes in any of the following areas could have a material adverse effecton the Company's future financial position or results of operations or cash flows: new product development, including market receptiveness, operation of in-housemanufacturing facilities, operation of the JV Company, litigation or claims against the Company based on intellectual property, patent, product regulatory or otherfactors, competition from other products, general economic conditions, the ability to attract and retain qualified employees, the ability to successfully operate jointventure and ultimately to sustain profitable operations, risks associated with doing business in China, and ability to diversify products and develop digital business;the general state of the U.S., China and world economies; the highly cyclical nature of the industries the Company serves; the loss of any of its larger customers;restrictions on the Company’s ability to sell to foreign customers due to trade laws, regulations and requirements; disruptions of the supply chain of componentsneeded for our products; ability to obtain additional financing; inability to meet certain debt covenants; fundamental changes in the technology underlying theCompany’s products; successful and timely completion of product design efforts; and new product design introductions by competitors. Additional risks anduncertainties that the Company is unaware of, or that the Company currently believes are not material, may also become important factors that adversely affect itsbusiness.
The semiconductor industry is characterized by rapid technological change, competition, competitive pricing pressures and cyclical market patterns. TheCompany's financial results are affected by a wide variety of factors, including general economic conditions specific to the semiconductor industry and theCompany's particular market, such as the PC markets, the timely implementation of new products, new manufacturing process technology and the ability tosafeguard patents and intellectual property in a rapidly evolving market. In addition, the semiconductor market has historically been cyclical and subject tosignificant economic downturns. As a result, the Company may experience significant period-to-period fluctuations in operating results due to the factorsmentioned above or other factors.
The Company's business model allocates its wafer manufacturing requirements to both in-house capacity and selected third-party foundries. The Companyalso deploys and implements its proprietary power discrete processes and equipment at third-party foundries to maximize the performance and quality of itsproducts.
The Company's revenue may be impacted by its ability to obtain adequate wafer supplies from third-party foundries and utilize wafer production andpackaging and testing capacity from its in-house facilities. Currently the Company's main third-party foundry is Shanghai Hua Hong Grace Electronic CompanyLimited, or HHGrace, located in Shanghai, China. HHGrace has been manufacturing wafers for the Company since 2002. HHGrace manufactured approximately12.7%, 14.1% and 15.4% of the wafers used in the Company's products for the fiscal years ended June 30, 2020, 2019 and 2018, respectively. Although theCompany believes that its volume of production allows the Company to secure favorable pricing and priority in allocation of capacity in its third-party foundries, ifthe foundries' capacities are constrained due to market demands, HHGrace, together with other foundries from which the Company purchases wafers, may not bewilling or able to satisfy all of the Company's manufacturing requirements on a timely basis and/or at favorable prices. The Company is also subject to the risks ofservice
82
disruptions and raw material shortages by its foundries. Such disruptions, shortages and price increases could harm the Company's operating results. In addition,manufacturing facilities' capacity affects the Company's gross margin because the Company has certain fixed costs associated with its Oregon fab and the JVCompany, as well as in-house packaging and testing facilities. If the Company fails to utilize its manufacturing facilities' capacity at a desirable level, its financialcondition and results of operations will be adversely affected.
Use of Estimates
The preparation of our consolidated financial statements in conformity with U.S. GAAP requires the Company to make estimates, judgments andassumptions that affect the reported amounts of assets, liabilities, revenue and expenses. To the extent there are material differences between these estimates andactual results, the Company's consolidated financial statements will be affected. On an ongoing basis, the Company evaluates the estimates, judgments andassumptions including those related to stock rotation returns, price adjustments, allowance for doubtful accounts, inventory reserves, warranty accrual, incometaxes, leases, share-based compensation, recoverability of and useful lives for property, plant and equipment and intangible assets, as well as economic impacts ofthe COVID-19 pandemic.
Foreign Currency Transactions and Translation
Most of the Company's principal subsidiaries use U.S. dollars as their functional currency because their transactions are primarily conducted and settled inU.S. dollars. All of their revenues and a significant portion of their operating expenses are denominated in U.S. dollars. The functional currencies for theCompany's in-house packaging and testing facilities in China are U.S. dollars, and a majority of their capital expenditures are denominated in U.S. dollars. Foreigncurrency transactions are translated into the functional currencies using the exchange rates prevailing at the dates of the transactions. Foreign exchange gains andlosses, resulting from the settlement of such transactions and from the re-measurement of monetary assets and liabilities denominated in foreign currencies usingexchange rates at balance sheet date and non-monetary assets and liabilities using historical exchange rates, are recognized in the consolidated statements ofoperations.
For the Company's subsidiaries which use the local currency as their functional currency, including the JV Company, their results and financial position aretranslated into U.S. dollars using exchange rates at balance sheet dates for assets and liabilities and using average exchange rates for income and expenses items.The resulting translation differences are presented as a separate component of accumulated other comprehensive income (loss) and noncontrolling interest in theconsolidated statements of equity.
Cash, Cash Equivalents and Restricted Cash
Cash and cash equivalents primarily consist of cash on hand and short-term bank deposits with original maturities of three months or less. Cash equivalentsare highly liquid investments with stated maturities of three months or less as of the dates of purchase. The carrying amounts reported for cash and cash equivalentsare considered to approximate fair values based upon their short maturities.
Cash and cash equivalents are maintained with reputable major financial institutions. If, due to current economic conditions or other factors, one or more ofthe financial institutions with which the Company maintains deposits fails, the Company's cash and cash equivalents may be at risk. Deposits with these banks mayexceed the amount of insurance provided on such deposits; however, these deposits typically may be redeemed upon demand and, therefore, bear minimal risk.
As a condition of the loan arrangements, the Company is required to keep a compensating balance at the issuing bank (see Note 5). In addition, the Companymaintains restricted cash in connection with cash balances temporarily restricted for regular business operations including the possibility of a dispute with avendor. These balances have been excluded from the Company’s cash and cash equivalents balance and are classified as restricted cash in the Company’sconsolidated balance sheets. As of June 30, 2020 and 2019, the amount of restricted cash was $4.2 million and $2.4 million, respectively.
Accounts Receivable, net
The allowance for doubtful accounts is based on assessment of the collectability of accounts receivable from customers. The Company reviews the allowanceby considering factors such as historical collection experience, credit quality, age of the accounts receivable balances and current economic conditions that mayaffect a customer's ability to pay. The Company writes off a receivable and charges against its recorded allowance when it has exhausted its collection effortswithout success.
83
Fair Value Measurements
Fair value is defined as the exchange price that would be received for an asset or paid to transfer a liability (an exit price) in the principal or mostadvantageous market for the asset or liability in an orderly transaction between market participants on the measurement date. Valuation techniques used to measurefair value must maximize the use of observable inputs and minimize the use of unobservable inputs. The fair value hierarchy is based on three levels of inputs, ofwhich the first two are considered observable and the last unobservable, that may be used to measure fair value, which are the following:
• Level 1 - Quoted prices in active markets for identical assets or liabilities.• Level 2 - Inputs other than Level 1 that are observable, either directly or indirectly, such as quoted prices for similar assets or liabilities; quoted prices
in markets that are not active; or other inputs that are observable or can be corroborated by observable market data for substantially the full term of theassets or liabilities.
• Level 3 - Unobservable inputs that are supported by little or no market activity and that are significant to the fair value of the assets or liabilities.
Fair Value of Financial Instruments
The fair value of cash equivalents is based on observable market prices and have been categorized in Level 1 in the fair value hierarchy. Cash equivalentsconsist primarily of short-term bank deposits. The carrying values of financial instruments such as cash and cash equivalents, accounts receivable and accountspayable approximate their carrying values due to their short-term maturities. The carrying value of the company's debt is considered a reasonable estimate of fairvalue which is estimated by considering the current rates available to the Company for debt of the same remaining maturities, structure and terms of the debts.
Inventories
The Company carries inventories at the lower of cost (determined on a first-in, first-out basis) or net realizable value. Cost includes semiconductor wafer andraw materials, labor, depreciation expenses and other manufacturing expenses and overhead, and packaging and testing fees paid to third parties if subcontractorsare used. Inventory reserves are made based on the Company's periodic review of inventory quantities on hand as compared with its sales forecasts, historicalusage, aging of inventories, production yield levels and current product selling prices. If actual market conditions are less favorable than those forecasted bymanagement, additional future inventory write-downs may be required that could adversely affect the Company's operating results. Inventory reserves onceestablished are not reversed until the related inventory has been sold or scrapped.
Property, Plant and Equipment
Property, plant and equipment are stated at historical cost less accumulated depreciation. Historical cost includes expenditures that are directly attributable tothe acquisition of the items and the costs incurred to make the assets ready for their intended use.
Depreciation is provided for on a straight-line basis over the estimated useful lives of the related assets as follows:
Building 20 to 30 yearsManufacturing machinery and equipment 5 to 15 yearsEquipment and tooling 5 yearsComputer hardware and software 3 to 5 yearsOffice furniture and equipment 5 yearsLeasehold and building improvements 2 to 20 yearsLand use rights 50 years
There is no private land ownership in China. Individuals and companies are permitted to acquire land use rights for a specific purpose. In March 2017, the JVCompany received the necessary land use right certificate from the PRC government. The land use rights will expire on November 30, 2066.
Equipment and construction in progress represent equipment received but the necessary installation has not been fully performed or building construction andleasehold improvements have been started but not yet completed. Equipment and
84
construction in progress are stated at cost and transferred to respective asset class when fully completed and ready for their intended use.
Internal-use software development costs are capitalized to the extent that the costs are directly associated with the development of identifiable and uniquesoftware products controlled by the Company that will probably generate economic benefits beyond one year. Costs incurred during the application developmentstage are required to be capitalized. The application development stage is characterized by software design and configuration activities, coding, testing andinstallation. Training costs and maintenance are expensed as incurred, while upgrades and enhancements are capitalized if it is probable that such expenditures willresult in additional functionality. Costs include employee costs incurred and fees paid to outside consultants for the software development and implementation.Internally developed software is amortized over its estimated useful life of three to five years starting from the date when it is ready for its intended use.
Gains and losses on disposals are determined by comparing the proceeds with the carrying amount and are recognized as selling, general and administrativeexpenses in the consolidated statements of operations. Costs of maintenance and repairs that do not improve or extend the lives of the respective assets areexpensed as incurred.
Impairment of Privately-held Investment
During fiscal year 2017, the Company purchased shares of common stock in a privately-held company at a total investment cost of $0.6 million. TheCompany made the investment because it viewed the privately-held company as having strategic technology and a business that would complement the Company'stechnological capabilities and help create an opportunity for the Company to sell its products. The Company accounted for the investment on a cost basis. Duringthe fiscal year ended June 30, 2020, the Company recorded an impairment charge of $0.6 million in connection with this investment as the Company concluded theimpairment to be other-than-temporary.
Government Grants
The Company occasionally receives government grants that provide financial assistance for certain eligible expenditures in China. These grants includereimbursements on interest expense on bank borrowings, payroll tax credits, credit for property, plant and equipment in a particular geographical location,employment credits, , as well as business expansion credits. Government grants are not recognized until there is reasonable assurance that the Company willcomply with the conditions attaching to it, and that the grant will be received. The Company records such grants either as a reduction of the related expense, areduction of the cost of the related asset, or as other income depending upon the nature of the grant. As a result of such grants, during the fiscal year ended June 30,2020, the Company reduced interest expense by $6.1 million, property, plant and equipment by $1.3 million, and operating expenses by $4.7 million. During thefiscal year ended June 30, 2019, the Company reduced interest expenses by $0.3 million. During the fiscal year ended June 30, 2018, the Company reducedproperty, plant and equipment by $3.3 million.
Long-lived Assets
The Company evaluates its long-lived assets for impairment whenever events or changes indicate that the carrying amount of such assets may not berecoverable. Due to the COVID-19 pandemic, the Company assessed the changes in circumstances that occurred during the March and June 2020 quarters. Thesefactors included continued operating losses, a decrease in the Company's share price in February and March of 2020, which reduced its market capitalization,expectation of lower business growth for the coming quarters, increased and prolonged economic and regulatory uncertainty in the global economies, and theexpectation of higher supply chain costs and increased competition. Therefore, the Company performed a recoverability test by comparing the sum of the estimatedundiscounted future cash flows of its long-lived assets to their carrying amount as of June 30, 2020. Some of the more significant assumptions used in theestimated future cash flows involve net sales, cost of goods sold, operating expenses, working capital, capital expenditures, income tax rates, long-term growthrates that appropriately reflect the risks inherent in the future cash flow stream and terminal value. The Company selected the assumptions used in the financialforecasts by referencing to historical data, supplemented by current and anticipated market conditions, estimated product growth rates and management's plans.These estimated future cash flows were consistent with those the Company uses in its internal planning. The result of the recoverability test indicated that the sumof the expected future cash flows (undiscounted and without interest charges) was greater than the carrying amount of the long-lived assets. Therefore, theCompany concluded that the carrying amount of the long-lived assets is recoverable. There was no impairment of long-lived assets for fiscal years 2020, 2019 and2018.
85
Revenue Recognition
As a result of the adoption of the new revenue standard on July 1, 2018, at the beginning of the first quarter of fiscal year 2019, the Company determinesrevenue recognition through the following steps: (1) identification of the contract with a customer; (2) identification of the performance obligations in the contract;(3) determination of the transaction price; (4) allocation of the transaction price to the performance obligations in the contract; and (5) recognition of revenuewhen, or as, a performance obligation is satisfied. The Company recognizes revenue when product is shipped to the customer, net of estimated stock rotationreturns and price adjustments that it expects to provide to certain distributors.
The Company sells its products primarily to distributors, who in turn sell the products globally to various end customers. The Company allows stock rotationreturns from certain distributors. Stock rotation returns are governed by contract and are limited to a specified percentage of the monetary value of productspurchased by distributors during a specified period. The Company records an allowance for stock rotation returns based on historical returns and individualdistributor agreements. The Company also provides special pricing to certain distributors, primarily based on volume, to encourage resale of the Company'sproducts. Allowance for price adjustments is recorded against accounts receivable and the provision for stock rotation rights is included in accrued liabilities on theconsolidated balance sheets.
Packaging and testing services revenue is recognized upon shipment of serviced products to the customer.
Leases
On July 1, 2019, the Company adopted Topic 842, Leases, using the modified retrospective method. Results for reporting periods beginning after July 1,2019 were presented under Topic 842, while prior period amounts were not adjusted and continue to be reported on a historical basis as permitted under Topic 840.
The Company determines if an arrangement is a lease at inception. Operating leases are included in operating lease right-of-use ("ROU") assets, currentoperating lease liabilities and long-term operating lease liabilities on the Company's consolidated balance sheets. Finance leases are included in property, plant andequipment, finance lease liabilities and long-term finance leases liabilities on the consolidated balance sheets.
The Company elected the practical expedient permitted under the transition guidance, which allowed the Company to carryforward its historical leaseclassifications, make an assessment on whether a contract was or contains a lease, and determine initial direct costs for any leases that existed prior to July 1, 2019.The Company elected to combine its lease and non-lease components as a single lease component for all asset classes.
Operating lease ROU assets and operating lease liabilities are recognized based on the present value of the future minimum lease payments over the leaseterm at commencement date. The Company uses an estimate of its incremental borrowing rate based on the information available at the lease commencement date.The operating lease ROU assets also include any lease payments made and exclude lease incentives. Lease terms may include options to extend or terminate thelease when it is reasonably certain that the Company will exercise such options. Operating lease expense is generally recognized on a straight-line basis over thelease term. Variable lease payments are expensed as incurred and are not included within the operating lease ROU asset and lease liability calculation. TheCompany does not record leases on the consolidated balance sheet with a term of one year or less. See Note 6.
Product Warranty
The Company provides a standard one-year warranty for the products from the date of purchase by the end customers. The Company accrues for estimatedwarranty costs at the time revenue is recognized. The Company's warranty obligation is affected by product failure rates, labor and material costs for replacingdefective parts, related freight costs for failed parts and other quality assurance costs. The Company monitors its product returns for warranty claims and maintainswarranty reserves based on historical experiences and anticipated warranty claims known at the time of estimation.
Shipping and Handling Costs
Shipping and handling costs are included in cost of goods sold.
Research and Development
Research and development costs are expensed as incurred.
86
Provision for Income Taxes
Income tax expense or benefit is based on income or loss before taxes. Deferred tax assets and liabilities are recognized principally for the expected taxconsequences of temporary differences between the tax basis of assets and liabilities and their reported amounts.
The Company is subject to income taxes in a number of jurisdictions. Significant judgment is required in determining the worldwide provision for incometaxes. There are many transactions and calculations for which the ultimate tax determination is uncertain during the ordinary course of business. The Companyestablishes accruals for certain tax contingencies based on estimates of whether additional taxes may be due. While the final tax outcome of these matters maydiffer from the amounts that were initially recorded, such differences will impact the income tax and deferred tax provisions in the period in which suchdetermination is made.
Significant management judgment is also required in determining whether deferred tax assets will be realized in full or in part. When it is more likely thannot that all or some portion of specific deferred tax assets such as net operating losses or research and experimentation tax credit carryforwards will not be realized,a valuation allowance must be established for the amount of the deferred tax assets that cannot be realized. The Company considers all available positive andnegative evidence on a jurisdiction-by-jurisdiction basis when assessing whether it is more likely than not that deferred tax assets are recoverable. The Companyconsiders evidence such as our past operating results, the existence of cumulative losses in recent years and our forecast of future taxable income.
The Financial Accounting Standards Board, or FASB, issued guidance which clarifies the accounting for income taxes by prescribing a minimum probabilitythreshold that a tax position must meet before a financial statement benefit is recognized. The minimum threshold is defined as a tax position that is more likelythan not to be sustained upon examination by the applicable taxing authority, including resolution of any related appeals or litigation processes, based on thetechnical merits of the position. The tax benefit to be recognized is measured as the largest amount of benefit that is greater than fifty percent likely to be realizedupon ultimate settlement. Although the guidance on the accounting for uncertainty in income taxes prescribes the use of a recognition and measurement model, thedetermination of whether an uncertain tax position has met those thresholds will continue to require significant judgment by management. If the ultimate resolutionof tax uncertainties is different from what is currently estimated, a material impact on income tax expense could result.
The Company's provision for income taxes is subject to volatility and could be adversely impacted by changes in earnings or tax laws and regulations invarious jurisdictions. The Company is subject to the continuous examination of our income tax returns by the Internal Revenue Service and other tax authorities.The Company regularly assesses the likelihood of adverse outcomes resulting from these examinations to determine the adequacy of our provision for incometaxes. To the extent that the final tax outcome of these matters is different from the amounts recorded, such differences will impact the provision for income taxesin the period in which such determination is made. The provision for income taxes includes the impact of changes to reserves, as well as the related net interest andpenalties.
Share-based Compensation Expense
The Company maintains an equity-settled, share-based compensation plan to grant restricted share units and stock options. The Company recognizes expenserelated to share-based compensation awards that are ultimately expected to vest based on estimated fair values on the date of grant. The fair value of restrictedshare units is based on the fair value of the Company's common share on the date of grant. For restricted stock awards subject to market conditions, the fair valueof each restricted stock award is estimated at the date of grant using the Monte-Carlo pricing model. The fair value of stock options is estimated on the date ofgrant using the Black-Scholes option valuation model. Share-based compensation expense is recognized on the accelerated attribution basis over the requisiteservice period of the award, which generally equals the vesting period.
The Employee Share Purchase Plan (the "ESPP") is accounted for at fair value on the date of grant using the Black-Scholes option valuation model.
Advertising
Advertising expenditures are expensed as incurred. Advertising expense was $0.7 million, $0.6 million and $0.4 million in the fiscal years ended June 30,2020, 2019, and 2018, respectively.
87

Comprehensive Income (Loss)Comprehensive income (loss) is defined as the change in equity of a business enterprise during a period from transactions and other events and
circumstances from non-owner sources. The Company's accumulated other comprehensive income (loss) consists of cumulative foreign currency translationadjustments.
88

Recent Accounting Pronouncements
Recently Issued Accounting Standards not yet adopted
In January 2020, the Financial Accounting Standards Board (FASB) issued Accounting Standards Update (ASU) No. 2020-01, “Investments - EquitySecurities (Topic 321), Investments - Equity Method and Joint Ventures (Topic 323), and Derivatives and Hedging (Topic 815) - Clarifying the Interactionsbetween Topic 321, Topic 323, and Topic 815.” The ASU is based on a consensus of the Emerging Issues Task Force and is expected to increase comparability inaccounting for these transactions. ASU 2016-01 made targeted improvements to accounting for financial instruments, including providing an entity the ability tomeasure certain equity securities without a readily determinable fair value at cost, less any impairment, plus or minus changes resulting from observable pricechanges in orderly transactions for the identical or a similar investment of the same issuer. Among other topics, the amendments clarify that an entity shouldconsider observable transactions that require it to either apply or discontinue the equity method of accounting. For public business entities, the amendments in theASU are effective for fiscal years beginning after December 15, 2020, and interim periods within those fiscal years. The Company does not expect the adoption ofthis guidance will have a material impact on its consolidated financial position, results of operations or cash flows.
In December 2019, the FASB issued ASU No. 2019-12 “Income Taxes (Topic 740): Simplifying the Accounting for Income Taxes ("ASU 2019-12") byremoving certain exceptions to the general principles. The amendments will be effective for fiscal years, and interim periods within those fiscal years, beginningafter December 15, 2020. Early adoption of the amendments is permitted. Depending on the amendment, adoption may be applied on a retrospective, modifiedretrospective or prospective basis. The Company is currently evaluating the impacts of adoption of the new guidance to its consolidated financial statements.
In August 2018, the FASB issued ASU No. 2018-15 “Intangibles - Goodwill and Other - Internal-Use Software (Subtopic 350-40): Customer’s Accountingfor Implementation Costs Incurred in a Cloud Computing Arrangement That Is a Service Contract ("ASU 2018-15”). These amendments align the requirements forcapitalizing implementation costs incurred in a hosting arrangement that is a service contact with the requirements for capitalizing implementation costs incurred todevelop or obtain internal-use software (and hosting arrangements that include an internal-use software license). The accounting for the service element of ahosting arrangement that is a service contract is not affected by these amendments. ASU 2018-15 is effective for annual periods, including interim periods withinthose annual periods, beginning after December 15, 2019. Early adoption is permitted. The Company is currently assessing the impact that adoption of thisguidance will have on its consolidated financial statements.
In August 2018, the FASB issued ASU No. 2018-13, “Fair Value Measurement (Topic 820): Disclosure Framework-Changes to the Disclosure Requirementsfor Fair Value Measurement ("ASU 2018-13”). ASU 2018-13 amends existing fair value measurement disclosure requirements by adding, changing, or removingcertain disclosures. The amendments on changes in unrealized gains and losses, the range and weighted average of significant unobservable inputs used to developLevel 3 fair value measurements, and the narrative description of measurement uncertainty should be applied prospectively for only the most recent interim orannual period presented in the initial fiscal year of adoption. All other amendments should be applied retrospectively to all periods presented upon their effectivedate. ASU No. 2018-13 is effective for fiscal years and interim periods within those fiscal years, beginning after December 15, 2019. The Company does notexpect the adoption of this guidance will have a material impact on its consolidated financial position, results of operations or cash flows.
In June 2016, the FASB issued ASU 2016-13, "Financial Instruments - Credit Losses ("ASU 2016-13"). This accounting standard update changes theaccounting for recognizing impairments of financial assets. Under the update, credit losses for certain types of financial instruments will be estimated based onexpected losses. The update also modifies the impairment models for available-for-sale debt securities and for purchased financial assets with credit deteriorationsince their origination. This update is effective for fiscal years beginning after December 15, 2019, including interim periods within those fiscal years. TheCompany is currently evaluating the impact of this accounting standard update on its Consolidated Financial Statements.
Recently Adopted Accounting Standards
In March 2020, the FASB issued ASU 2020-04, “Reference Rate Reform (Topic 848): Facilitation of the Effects of Reference Rate Reform on FinancialReporting”, which provides optional expedients and exceptions to applying the guidance on contract modifications, hedge accounting, and other transactions, tosimplify the accounting for transitioning from the London Interbank Offered Rate, and other interbank offered rates expected to be discontinued, to alternativereference rates. These amendments are effective for entities as of March 12, 2020 through December 31, 2022. The Company elected to apply
89
the provisions of ASU 2020-04 for its contracts as of June 30, 2020. The adoption of ASU 2020-04 did not have a material impact on its consolidated financialstatements.
In February 2016, the FASB issued ASU 2016-02, Leases (Topic 842). This guidance requires a dual approach for lessee accounting under which a lesseeaccounts for leases as finance leases or operating leases. Both finance and operating leases result in the lessee recognizing a right-of-use asset and a correspondingliability on its balance sheet, with differing methodology for income statement recognition. The Company adopted this standard as of July 1, 2019, using themodified retrospective transition method and recorded a cumulative-effect balance sheet adjustment. As a result of adopting ASU 2016-02 on July 1, 2019, theCompany recognized operating lease right-of-use assets and corresponding operating lease liabilities of approximately $21 million each from existing leases on theCompany's consolidated balance sheet. See Note 6 for further details.
In June 2018, the FASB issued ASU 2018-07, "Compensation -Stock Compensation: Improvement to Nonemployees Share-Based Payment Accounting("ASU 2018-07"), which expands the scope of Topic 718 to include all share-based payment transactions for acquiring goods and services from nonemployees.ASU 2018-07 specifies that Topic 718 applies to all share-based payment transactions in which the grantor acquires goods and services to be used or consumed inits own operations by issuing share-based payment awards. ASU 2018-07 also clarifies that Topic 718 does not apply to share-based payments used to effectivelyprovide (1) financing to the issuer or (2) awards granted in conjunction with selling goods or services to customers as part of a contract accounted for under ASC606. ASU 2018-07 had no material impact on the Company's consolidated financial statements.
90
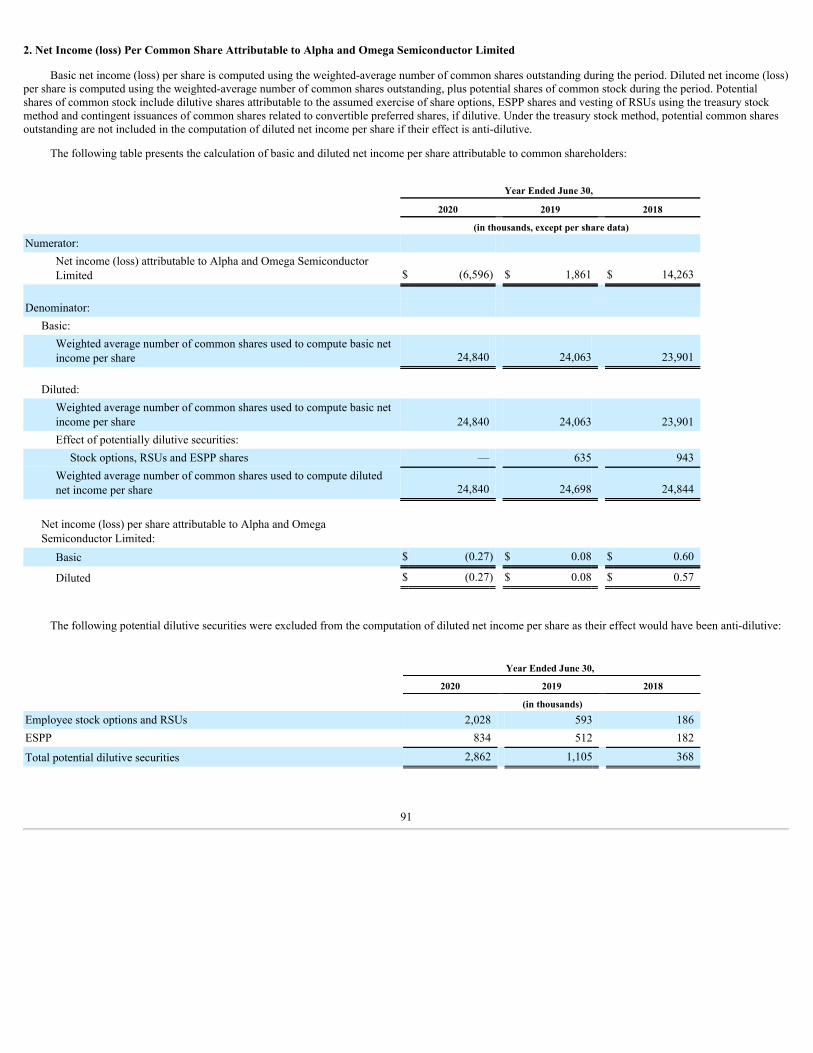
2. Net Income (loss) Per Common Share Attributable to Alpha and Omega Semiconductor Limited
Basic net income (loss) per share is computed using the weighted-average number of common shares outstanding during the period. Diluted net income (loss)per share is computed using the weighted-average number of common shares outstanding, plus potential shares of common stock during the period. Potentialshares of common stock include dilutive shares attributable to the assumed exercise of share options, ESPP shares and vesting of RSUs using the treasury stockmethod and contingent issuances of common shares related to convertible preferred shares, if dilutive. Under the treasury stock method, potential common sharesoutstanding are not included in the computation of diluted net income per share if their effect is anti-dilutive.
The following table presents the calculation of basic and diluted net income per share attributable to common shareholders:
Year Ended June 30,
2020 2019 2018 (in thousands, except per share data)Numerator:
Net income (loss) attributable to Alpha and Omega SemiconductorLimited $ (6,596) $ 1,861 $ 14,263
Denominator:
Basic: Weighted average number of common shares used to compute basic netincome per share 24,840 24,063 23,901
Diluted:
Weighted average number of common shares used to compute basic netincome per share 24,840 24,063 23,901Effect of potentially dilutive securities:
Stock options, RSUs and ESPP shares — 635 943Weighted average number of common shares used to compute dilutednet income per share 24,840 24,698 24,844
Net income (loss) per share attributable to Alpha and OmegaSemiconductor Limited:
Basic $ (0.27) $ 0.08 $ 0.60
Diluted $ (0.27) $ 0.08 $ 0.57
The following potential dilutive securities were excluded from the computation of diluted net income per share as their effect would have been anti-dilutive:
Year Ended June 30, 2020 2019 2018 (in thousands)Employee stock options and RSUs 2,028 593 186ESPP 834 512 182
Total potential dilutive securities 2,862 1,105 368
91
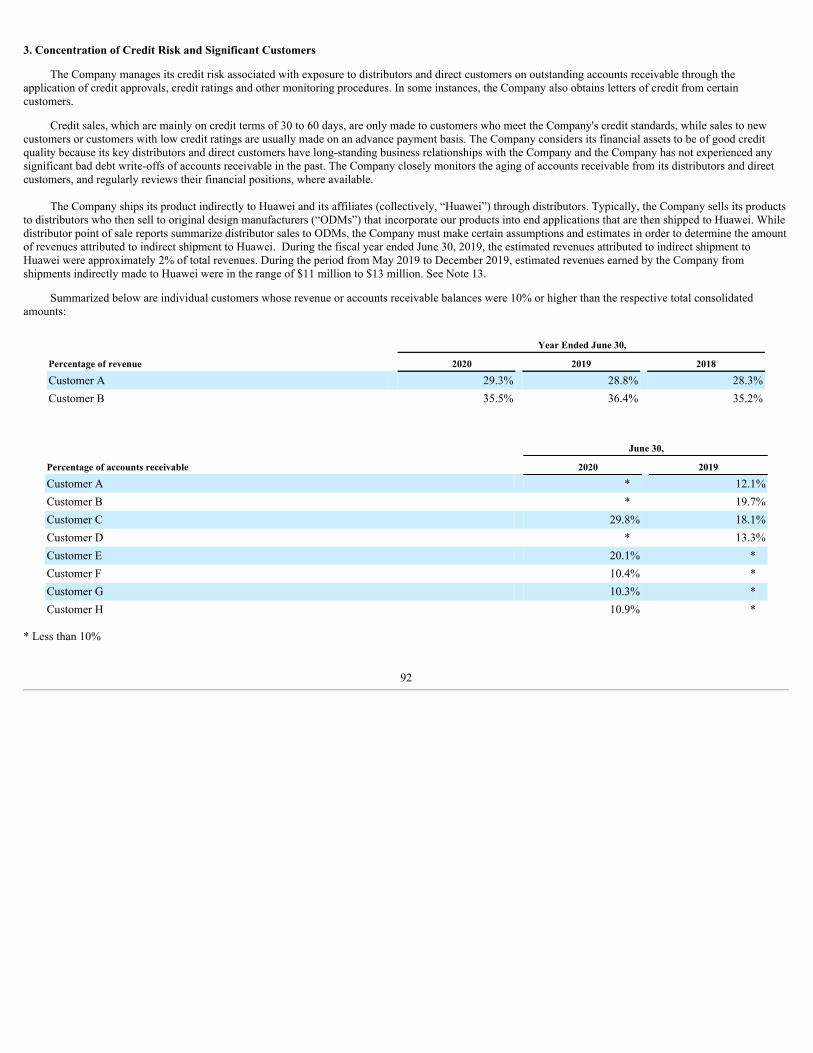
3. Concentration of Credit Risk and Significant Customers
The Company manages its credit risk associated with exposure to distributors and direct customers on outstanding accounts receivable through theapplication of credit approvals, credit ratings and other monitoring procedures. In some instances, the Company also obtains letters of credit from certaincustomers.
Credit sales, which are mainly on credit terms of 30 to 60 days, are only made to customers who meet the Company's credit standards, while sales to newcustomers or customers with low credit ratings are usually made on an advance payment basis. The Company considers its financial assets to be of good creditquality because its key distributors and direct customers have long-standing business relationships with the Company and the Company has not experienced anysignificant bad debt write-offs of accounts receivable in the past. The Company closely monitors the aging of accounts receivable from its distributors and directcustomers, and regularly reviews their financial positions, where available.
The Company ships its product indirectly to Huawei and its affiliates (collectively, “Huawei”) through distributors. Typically, the Company sells its productsto distributors who then sell to original design manufacturers (“ODMs”) that incorporate our products into end applications that are then shipped to Huawei. Whiledistributor point of sale reports summarize distributor sales to ODMs, the Company must make certain assumptions and estimates in order to determine the amountof revenues attributed to indirect shipment to Huawei. During the fiscal year ended June 30, 2019, the estimated revenues attributed to indirect shipment toHuawei were approximately 2% of total revenues. During the period from May 2019 to December 2019, estimated revenues earned by the Company fromshipments indirectly made to Huawei were in the range of $11 million to $13 million. See Note 13.
Summarized below are individual customers whose revenue or accounts receivable balances were 10% or higher than the respective total consolidatedamounts:
Year Ended June 30,
Percentage of revenue 2020 2019 2018
Customer A 29.3% 28.8% 28.3%Customer B 35.5% 36.4% 35.2%
June 30,
Percentage of accounts receivable 2020 2019
Customer A * 12.1%Customer B * 19.7%Customer C 29.8% 18.1%Customer D * 13.3%Customer E 20.1% *Customer F 10.4% *Customer G 10.3% *Customer H 10.9% *
* Less than 10%
92
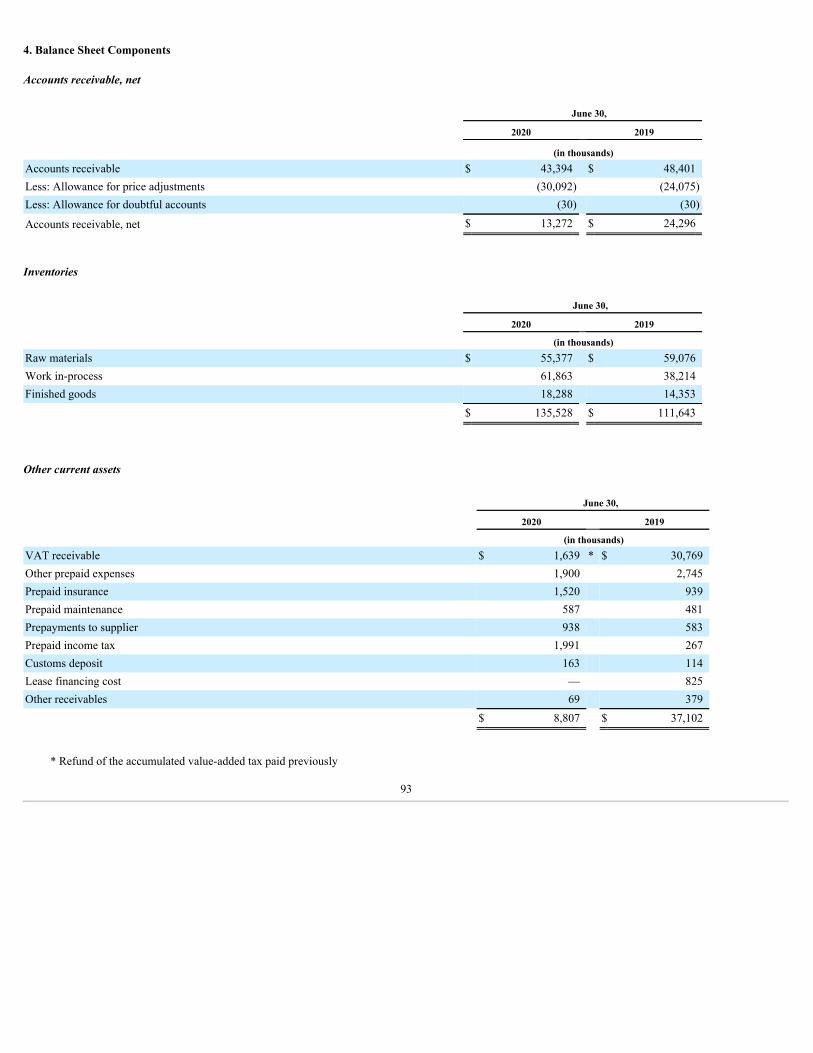
4. Balance Sheet Components
Accounts receivable, net
June 30,
2020 2019
(in thousands)Accounts receivable $ 43,394 $ 48,401Less: Allowance for price adjustments (30,092) (24,075)Less: Allowance for doubtful accounts (30) (30)
Accounts receivable, net $ 13,272 $ 24,296
Inventories
June 30,
2020 2019 (in thousands)Raw materials $ 55,377 $ 59,076Work in-process 61,863 38,214Finished goods 18,288 14,353
$ 135,528 $ 111,643
Other current assets
June 30,
2020 2019 (in thousands)VAT receivable $ 1,639 * $ 30,769Other prepaid expenses 1,900 2,745Prepaid insurance 1,520 939Prepaid maintenance 587 481Prepayments to supplier 938 583Prepaid income tax 1,991 267Customs deposit 163 114Lease financing cost — 825Other receivables 69 379
$ 8,807 $ 37,102
* Refund of the accumulated value-added tax paid previously
93
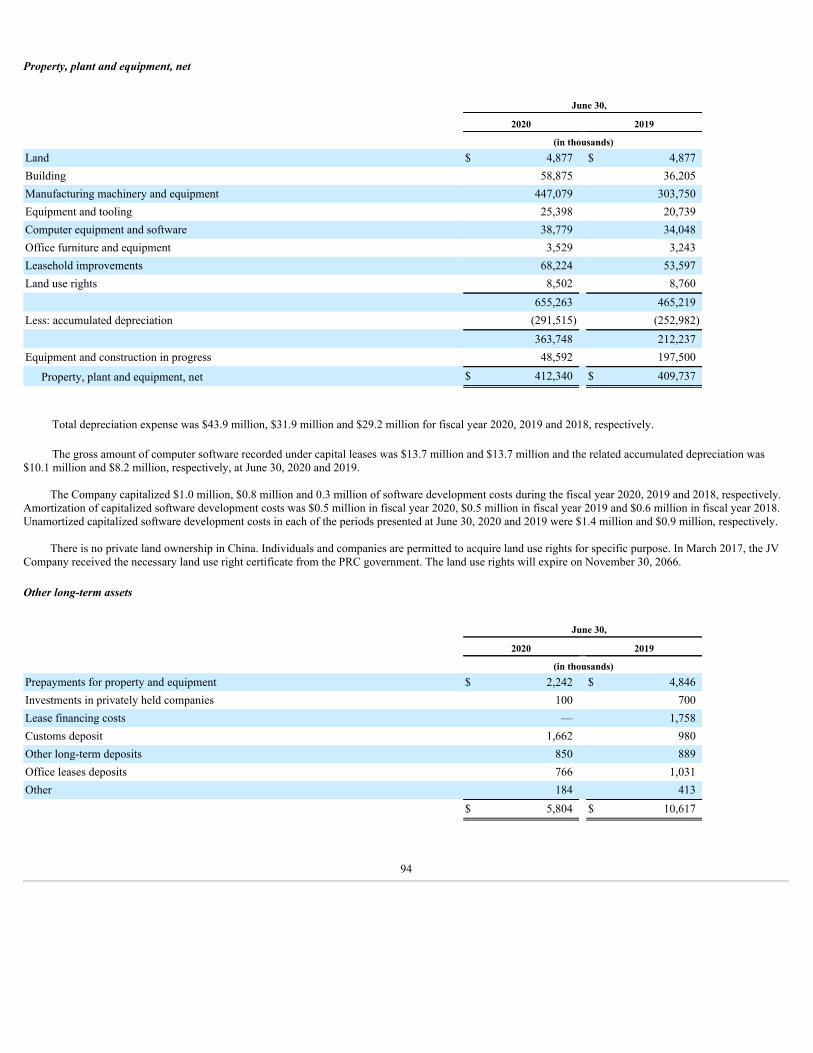
Property, plant and equipment, net
June 30, 2020 2019 (in thousands)Land $ 4,877 $ 4,877Building 58,875 36,205Manufacturing machinery and equipment 447,079 303,750Equipment and tooling 25,398 20,739Computer equipment and software 38,779 34,048Office furniture and equipment 3,529 3,243Leasehold improvements 68,224 53,597Land use rights 8,502 8,760
655,263 465,219Less: accumulated depreciation (291,515) (252,982)
363,748 212,237Equipment and construction in progress 48,592 197,500
Property, plant and equipment, net $ 412,340 $ 409,737
Total depreciation expense was $43.9 million, $31.9 million and $29.2 million for fiscal year 2020, 2019 and 2018, respectively.
The gross amount of computer software recorded under capital leases was $13.7 million and $13.7 million and the related accumulated depreciation was$10.1 million and $8.2 million, respectively, at June 30, 2020 and 2019.
The Company capitalized $1.0 million, $0.8 million and 0.3 million of software development costs during the fiscal year 2020, 2019 and 2018, respectively.Amortization of capitalized software development costs was $0.5 million in fiscal year 2020, $0.5 million in fiscal year 2019 and $0.6 million in fiscal year 2018.Unamortized capitalized software development costs in each of the periods presented at June 30, 2020 and 2019 were $1.4 million and $0.9 million, respectively.
There is no private land ownership in China. Individuals and companies are permitted to acquire land use rights for specific purpose. In March 2017, the JVCompany received the necessary land use right certificate from the PRC government. The land use rights will expire on November 30, 2066.
Other long-term assets
June 30,
2020 2019 (in thousands)Prepayments for property and equipment $ 2,242 $ 4,846Investments in privately held companies 100 700Lease financing costs — 1,758Customs deposit 1,662 980Other long-term deposits 850 889Office leases deposits 766 1,031Other 184 413
$ 5,804 $ 10,617
94
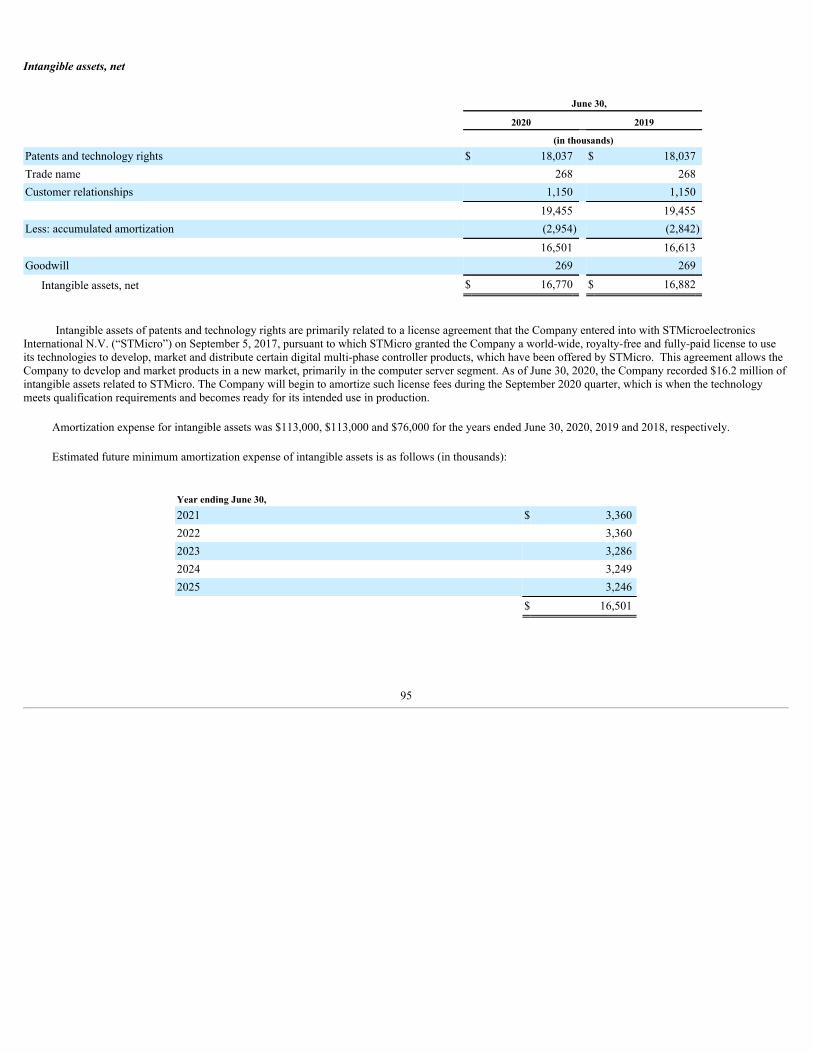
Intangible assets, net
June 30,
2020 2019 (in thousands)Patents and technology rights $ 18,037 $ 18,037Trade name 268 268Customer relationships 1,150 1,150 19,455 19,455Less: accumulated amortization (2,954) (2,842) 16,501 16,613Goodwill 269 269
Intangible assets, net $ 16,770 $ 16,882
Intangible assets of patents and technology rights are primarily related to a license agreement that the Company entered into with STMicroelectronicsInternational N.V. (“STMicro”) on September 5, 2017, pursuant to which STMicro granted the Company a world-wide, royalty-free and fully-paid license to useits technologies to develop, market and distribute certain digital multi-phase controller products, which have been offered by STMicro. This agreement allows theCompany to develop and market products in a new market, primarily in the computer server segment. As of June 30, 2020, the Company recorded $16.2 million ofintangible assets related to STMicro. The Company will begin to amortize such license fees during the September 2020 quarter, which is when the technologymeets qualification requirements and becomes ready for its intended use in production.
Amortization expense for intangible assets was $113,000, $113,000 and $76,000 for the years ended June 30, 2020, 2019 and 2018, respectively.
Estimated future minimum amortization expense of intangible assets is as follows (in thousands):
Year ending June 30, 2021 $ 3,3602022 3,3602023 3,2862024 3,2492025 3,246
$ 16,501
95
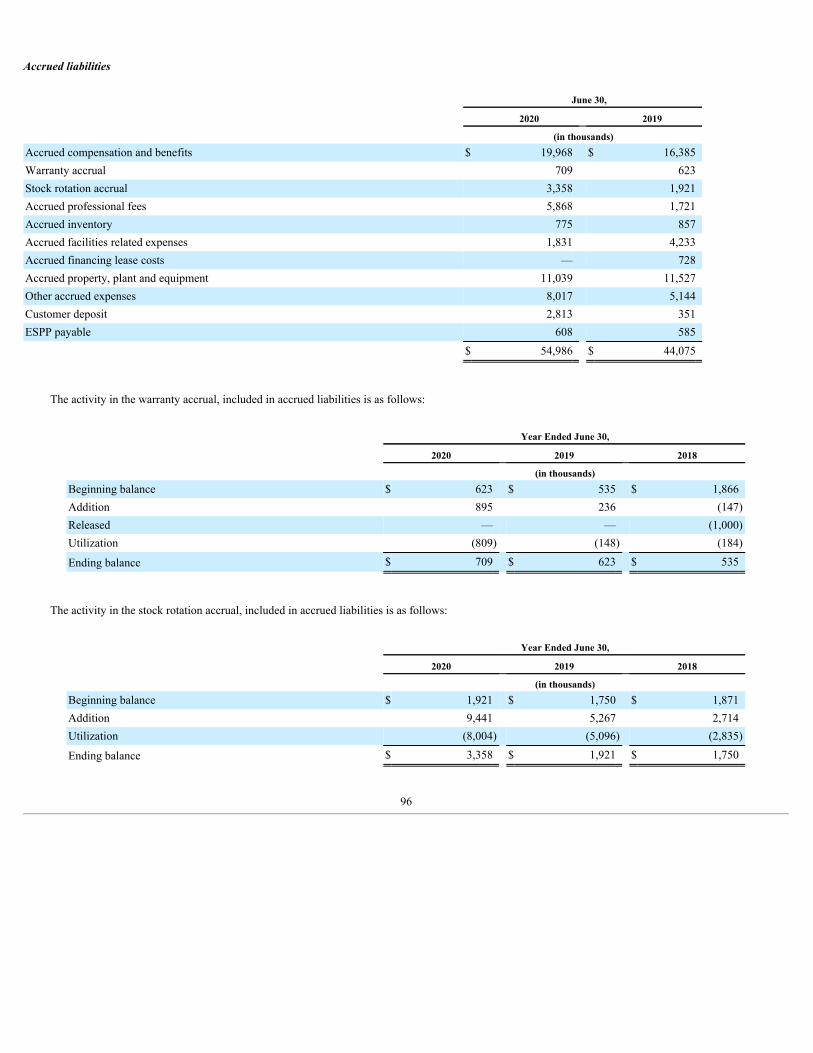
Accrued liabilities
June 30,
2020 2019 (in thousands)Accrued compensation and benefits $ 19,968 $ 16,385Warranty accrual 709 623Stock rotation accrual 3,358 1,921Accrued professional fees 5,868 1,721Accrued inventory 775 857Accrued facilities related expenses 1,831 4,233Accrued financing lease costs — 728Accrued property, plant and equipment 11,039 11,527Other accrued expenses 8,017 5,144Customer deposit 2,813 351ESPP payable 608 585
$ 54,986 $ 44,075
The activity in the warranty accrual, included in accrued liabilities is as follows:
Year Ended June 30,
2020 2019 2018 (in thousands)Beginning balance $ 623 $ 535 $ 1,866Addition 895 236 (147)Released — — (1,000)Utilization (809) (148) (184)
Ending balance $ 709 $ 623 $ 535
The activity in the stock rotation accrual, included in accrued liabilities is as follows:
Year Ended June 30,
2020 2019 2018 (in thousands)Beginning balance $ 1,921 $ 1,750 $ 1,871Addition 9,441 5,267 2,714Utilization (8,004) (5,096) (2,835)
Ending balance $ 3,358 $ 1,921 $ 1,750
96
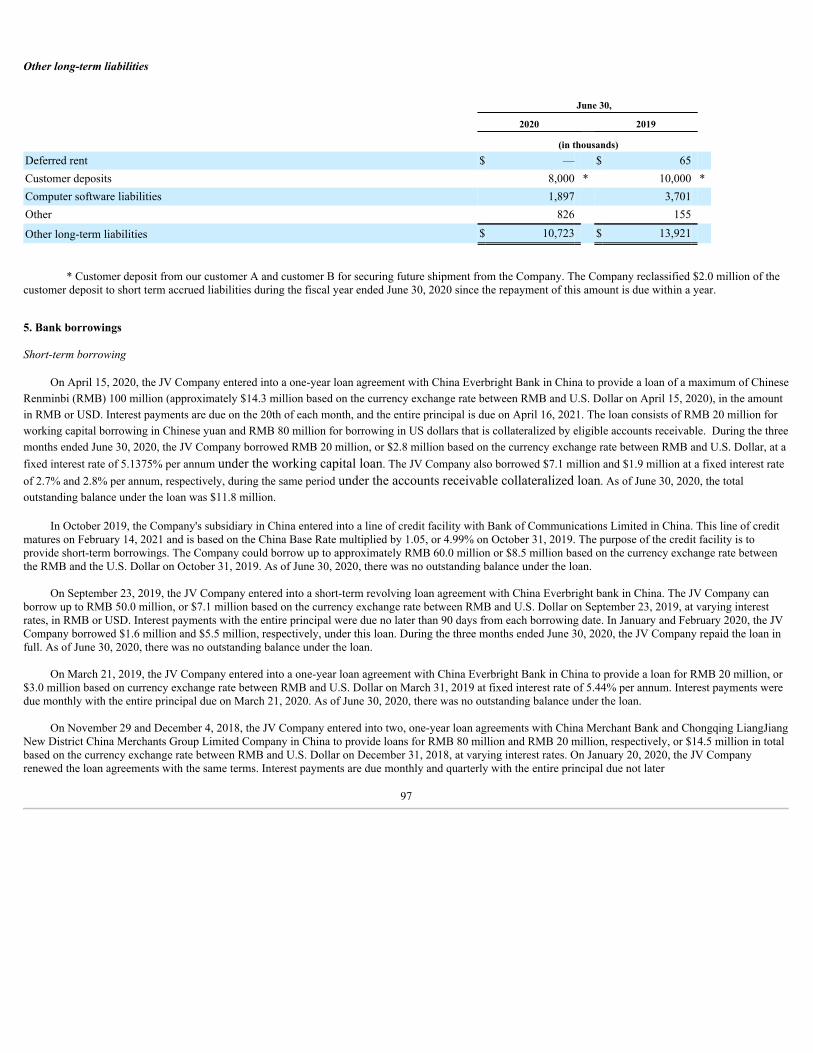
Other long-term liabilities
June 30,
2020 2019
(in thousands) Deferred rent $ — $ 65 Customer deposits 8,000 * 10,000 *Computer software liabilities 1,897 3,701 Other 826 155
Other long-term liabilities $ 10,723 $ 13,921
* Customer deposit from our customer A and customer B for securing future shipment from the Company. The Company reclassified $2.0 million of thecustomer deposit to short term accrued liabilities during the fiscal year ended June 30, 2020 since the repayment of this amount is due within a year.
5. Bank borrowings
Short-term borrowing
On April 15, 2020, the JV Company entered into a one-year loan agreement with China Everbright Bank in China to provide a loan of a maximum of ChineseRenminbi (RMB) 100 million (approximately $14.3 million based on the currency exchange rate between RMB and U.S. Dollar on April 15, 2020), in the amountin RMB or USD. Interest payments are due on the 20th of each month, and the entire principal is due on April 16, 2021. The loan consists of RMB 20 million forworking capital borrowing in Chinese yuan and RMB 80 million for borrowing in US dollars that is collateralized by eligible accounts receivable. During the threemonths ended June 30, 2020, the JV Company borrowed RMB 20 million, or $2.8 million based on the currency exchange rate between RMB and U.S. Dollar, at afixed interest rate of 5.1375% per annum under the working capital loan. The JV Company also borrowed $7.1 million and $1.9 million at a fixed interest rateof 2.7% and 2.8% per annum, respectively, during the same period under the accounts receivable collateralized loan. As of June 30, 2020, the totaloutstanding balance under the loan was $11.8 million.
In October 2019, the Company's subsidiary in China entered into a line of credit facility with Bank of Communications Limited in China. This line of creditmatures on February 14, 2021 and is based on the China Base Rate multiplied by 1.05, or 4.99% on October 31, 2019. The purpose of the credit facility is toprovide short-term borrowings. The Company could borrow up to approximately RMB 60.0 million or $8.5 million based on the currency exchange rate betweenthe RMB and the U.S. Dollar on October 31, 2019. As of June 30, 2020, there was no outstanding balance under the loan.
On September 23, 2019, the JV Company entered into a short-term revolving loan agreement with China Everbright bank in China. The JV Company canborrow up to RMB 50.0 million, or $7.1 million based on the currency exchange rate between RMB and U.S. Dollar on September 23, 2019, at varying interestrates, in RMB or USD. Interest payments with the entire principal were due no later than 90 days from each borrowing date. In January and February 2020, the JVCompany borrowed $1.6 million and $5.5 million, respectively, under this loan. During the three months ended June 30, 2020, the JV Company repaid the loan infull. As of June 30, 2020, there was no outstanding balance under the loan.
On March 21, 2019, the JV Company entered into a one-year loan agreement with China Everbright Bank in China to provide a loan for RMB 20 million, or$3.0 million based on currency exchange rate between RMB and U.S. Dollar on March 31, 2019 at fixed interest rate of 5.44% per annum. Interest payments weredue monthly with the entire principal due on March 21, 2020. As of June 30, 2020, there was no outstanding balance under the loan.
On November 29 and December 4, 2018, the JV Company entered into two, one-year loan agreements with China Merchant Bank and Chongqing LiangJiangNew District China Merchants Group Limited Company in China to provide loans for RMB 80 million and RMB 20 million, respectively, or $14.5 million in totalbased on the currency exchange rate between RMB and U.S. Dollar on December 31, 2018, at varying interest rates. On January 20, 2020, the JV Companyrenewed the loan agreements with the same terms. Interest payments are due monthly and quarterly with the entire principal due not later
97
than January 21, 2021. During the three months ended June 30, 2020, the JV Company repaid the loan in full. As of June 30, 2020, there was no outstandingbalance under the loan.
On November 16, 2018, the Company's subsidiary in China entered into a line of credit facility with Industrial and Commercial Bank of China, whichexpired on September 30, 2019. The purpose of the credit facility was to provide short-term borrowings. The Company could borrow up to approximately RMB72.0 million or $10.3 million based on currency exchange rate between RMB and U.S. Dollar on November 16, 2018. In October 2019, this line of credit wasrenewed with the same terms and a maturity date of September 30, 2020. As of June 30, 2020, there was no outstanding balance under the line of credit.
Accounts Receivable Factoring Agreement
On August 9, 2019, one of the Company's wholly-owned subsidiaries (the "Borrower") entered into a factoring agreement with the Hongkong and ShanghaiBanking Corporation Limited (“HSBC”), whereby the Borrower assigns certain of its accounts receivable with recourse. This factoring agreement allows theBorrower to borrow up to 70% of the net amount of its eligible accounts receivable of the Borrower with a maximum amount of $30.0 million. The interest rate isbased on one month London Interbank Offered Rate ("LIBOR") plus 1.75% per annum. The Company is the guarantor for this agreement. The Company isaccounting for this transaction as a secured borrowing under the Transfers and Servicing of Financial Assets guidance. In addition, any cash held in the restrictedbank account controlled by HSBC has a legal right of offset against the borrowing. This agreement, with certain financial covenants required, has no expirationdate. The Borrower was in compliance with these covenants as of June 30, 2020. During the fiscal year ended June 30, 2020, the Company borrowed $20.0 millionand repaid it in full. As of June 30, 2020, there was no outstanding balance and the Company had unused credit of approximately $30.0 million.
Credit Facilities
On May 9, 2018 (the “Effective Date”), the JV Company entered into a lease finance agreement and a security agreement (the “Agreements”) with YinHaiLeasing Company and China Import/Export Bank (the “Lenders”). Pursuant to the Agreements, the Lenders agree to provide an aggregate of RMB 400.0 million,or $62.8 million based on the currency exchange rate between RMB and U.S. Dollar on the Effective Date, of financing to the JV Company (the “LeaseFinancing”). In exchange for the Lease Financing, the JV Company agrees to transfer title of its assembly and testing equipment to the Lenders, and the Lenderslease such equipment to the JV Company under a five-year lease arrangement, pursuant to which the JV Company makes quarterly lease payments to the Lendersconsisting of principal and interest based on a repayment schedule mutually agreed by the parties. The interest under the Lease Financing is accrued based on theChina Base Rate multiplied by 1.15, or 5.4625% on the Effective Date. Under the Agreements, at the end of the five-year lease term, the Lenders agree to sell suchequipment back to the JV Company for a nominal amount (RMB 1). The JV Company’s obligations under the Lease Financing are secured by the land andbuilding owned by the JV Company (the “Collateral”). The proceeds from the Lease Financing will be used primarily for the acquisition and installation of the 12-inch fabrication equipment and other expenses of the JV Company relating to the completion of the fabrication facility located in Chongqing. The Agreementscontain customary representation, warranties and covenants, including restrictions on the transfer of the Collateral. The Agreements also contain customary eventsof default, including but are not limited to, failure to make payments and breach of material terms under the Agreements. The Agreements include certaincustomary closing conditions, including the payment of deposit by the JV Company. On June 28, 2020, the parties entered into a modification to this agreement,pursuant to which the interest rate was changed to be the five-year loan prime rate in China plus 0.8125%, or 5.4625%. Other terms of this agreement remain thesame. As of June 30, 2020, the outstanding balance of the Lease Financing of 298.0 million RMB (equivalent of $42.1 million based on the currency exchange rateas of June 30, 2020) was recorded under short-term and long-term finance lease liabilities.
See future minimum lease payment table for finance lease liabilities in Note 6.
Long-term debt
On April 26, 2020, the JV Company entered into a loan agreement with China Development Bank, Agricultural Bank of China, China Merchants Bank andChongqing Rural Commercial Bank (collectively, "the Banks") in the aggregate principal amount of RMB 250 million (approximately $35.7 million based on thecurrency exchange rate between RMB and U.S. Dollar on April 26, 2020). The obligation under the loan agreement is secured by certain assets of the JVCompany. Beginning December 18, 2020, the JV Company is required to make consecutive semi-annual payments of principal until December 8, 2024. Interestpayment is due on March 20, June 20, September 20 and December 20 of each year based on China one-year loan prime rate ("LPR") plus 1.3%. The JV Companydrew down RMB 250 million (approximately $35.3 million based on the
98
currency exchange rate between RMB and U.S. Dollar on June 30, 2020) in April 2020. As of June 30, 2020, the outstanding balance of the loan was $35.3million.
In December 2019, the JV Company entered into a loan agreement with China Development Bank in the amount of $24.0 million. The obligation under theloan agreement is secured by certain assets of the JV Company. Beginning December 18, 2020, the JV Company will make consecutive semi-annual payments ofprincipal until December 8, 2024. The interest is accrued based on the LIBOR rate plus 2.8%. The interest is required to be paid on March 21 and September 21each year. As of June 30, 2020, the outstanding balance of the loan was $24.0 million.
On March 12, 2019, the JV Company entered into a loan agreement with The Export-Import Bank of China in the aggregate principal amount of RMB 200million (approximately $29.8 million based on currency exchange rate between RMB and U.S. Dollar on March 31, 2019). The loan will mature on February 20,2025. The JV Company drew down RMB 190 million and RMB 10 million in March 2019 and December 2019, respectively. The loan withdraw window expiredon February 28, 2020. The interest is accrued based on the China Base Rate multiplied by 1.1, or 5.39%. The loan requires quarterly interest payments. Theprincipal payments are required to be paid every 6 months over the term of loan commencing in October 2019. This loan is secured by the buildings and certainequipment owned by the JV Company. As a condition of the loan arrangements, 14 million RMB (approximately $2.0 million) of cash is held as restricted cash bythe JV Company as a compensating balance at the JV Company's bank until the principal is paid. On June 24, 2020, a modification of this loan was signed,pursuant to which the interest rate was changed to be based on the five-year loan prime rate in China plus 0.74%, or 5.39%. Other terms of this loan remain thesame. During the three months ended December 31, 2019, the JV Company paid 6.0 million RMB under this agreement. As of June 30, 2020, the outstandingbalance of the loan was 194 million RMB (equivalent of $27.4 million based on the currency exchange rate as of June 30, 2020).
On May 1, 2018, Jireh Semiconductor Incorporated (“Jireh”), a wholly-owned subsidiary of the Company, entered into a loan agreement with a financialinstitution (the "Bank") that provided a term loan in an amount of $17.8 million. The obligation under the loan agreement is secured by certain real estate assets ofJireh and guaranteed by the Company. The loan has a five-year term and matures on June 1, 2023. Beginning June 1, 2018, Jireh made consecutive monthlypayments of principal and interest to the Bank. The outstanding principal shall accrue interest at a fixed rate of 5.04% per annum on the basis of a 360-day year.The loan agreement contains customary restrictive covenants and includes certain financial covenants that require the Company to maintain, on a consolidatedbasis, specified financial ratios. The Company was in compliance with these covenants as of June 30, 2020. As of June 30, 2020, the outstanding balance of theterm loan was $15.9 million.
On August 15, 2017, Jireh entered into a credit agreement with the Bank that provided a term loan in an amount up to $30.0 million for the purpose ofpurchasing certain equipment for our fabrication facility located in Oregon. The obligation under the credit agreement is secured by substantially all assets of Jirehand guaranteed by the Company. The credit agreement has a five-year term and matures on August 15, 2022. In January 2018 and July 2018, Jireh drew down onthe loan in the amount of $13.2 million and $16.7 million, respectively. Beginning in October 2018, Jireh is required to pay to the Bank on each payment date, theoutstanding principal amount of the loan in monthly installments. The loan accrues interest based on an adjusted London Interbank Offered Rate ("LIBOR") asdefined in the credit agreement, plus specified applicable margin in the range of 1.75% to 2.25%, based on the outstanding balance of the loan. The creditagreement contains customary restrictive covenants and includes certain financial covenants that require the Company to maintain, on a consolidated basis,specified financial ratios and fixed charge coverage ratio. The Company was in compliance with these covenants as of June 30, 2020. As of June 30, 2020, theoutstanding balance of the term loan was $16.8 million.
99
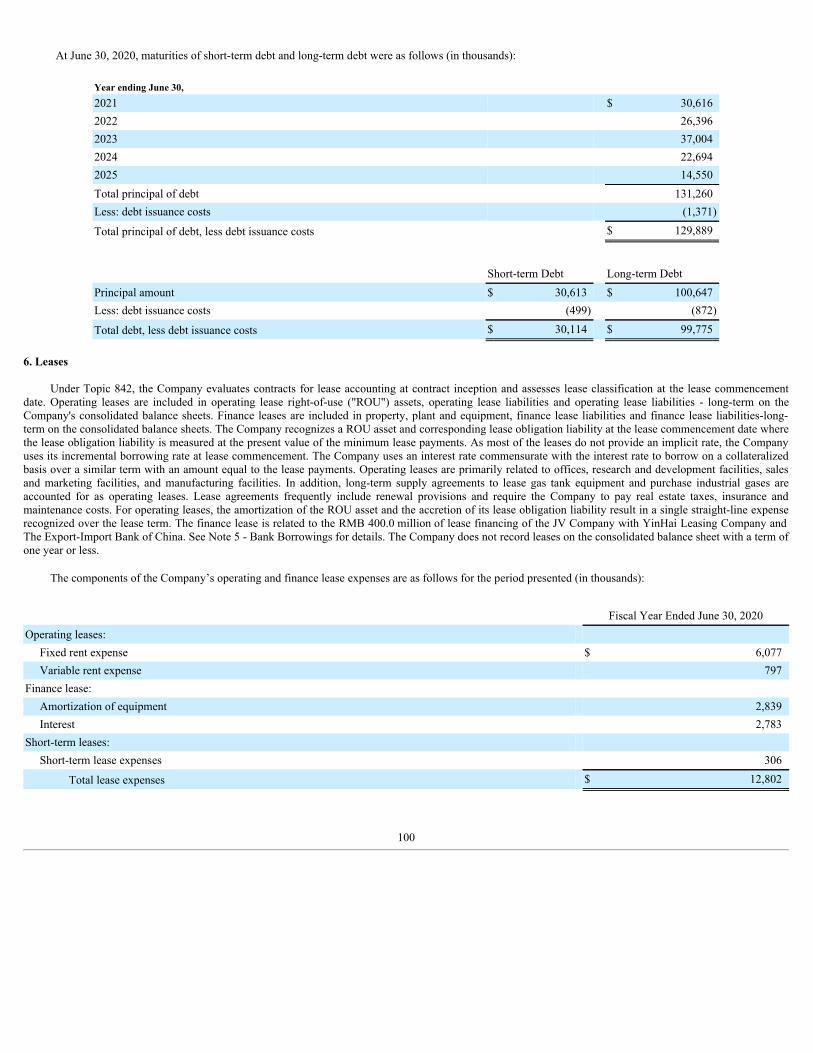
At June 30, 2020, maturities of short-term debt and long-term debt were as follows (in thousands):
Year ending June 30, 2021 $ 30,6162022 26,3962023 37,0042024 22,6942025 14,550Total principal of debt 131,260Less: debt issuance costs (1,371)
Total principal of debt, less debt issuance costs $ 129,889
Short-term Debt Long-term DebtPrincipal amount $ 30,613 $ 100,647Less: debt issuance costs (499) (872)
Total debt, less debt issuance costs $ 30,114 $ 99,775
6. Leases
Under Topic 842, the Company evaluates contracts for lease accounting at contract inception and assesses lease classification at the lease commencementdate. Operating leases are included in operating lease right-of-use ("ROU") assets, operating lease liabilities and operating lease liabilities - long-term on theCompany's consolidated balance sheets. Finance leases are included in property, plant and equipment, finance lease liabilities and finance lease liabilities-long-term on the consolidated balance sheets. The Company recognizes a ROU asset and corresponding lease obligation liability at the lease commencement date wherethe lease obligation liability is measured at the present value of the minimum lease payments. As most of the leases do not provide an implicit rate, the Companyuses its incremental borrowing rate at lease commencement. The Company uses an interest rate commensurate with the interest rate to borrow on a collateralizedbasis over a similar term with an amount equal to the lease payments. Operating leases are primarily related to offices, research and development facilities, salesand marketing facilities, and manufacturing facilities. In addition, long-term supply agreements to lease gas tank equipment and purchase industrial gases areaccounted for as operating leases. Lease agreements frequently include renewal provisions and require the Company to pay real estate taxes, insurance andmaintenance costs. For operating leases, the amortization of the ROU asset and the accretion of its lease obligation liability result in a single straight-line expenserecognized over the lease term. The finance lease is related to the RMB 400.0 million of lease financing of the JV Company with YinHai Leasing Company andThe Export-Import Bank of China. See Note 5 - Bank Borrowings for details. The Company does not record leases on the consolidated balance sheet with a term ofone year or less.
The components of the Company’s operating and finance lease expenses are as follows for the period presented (in thousands):
Fiscal Year Ended June 30, 2020Operating leases: Fixed rent expense $ 6,077 Variable rent expense 797Finance lease: Amortization of equipment 2,839 Interest 2,783Short-term leases: Short-term lease expenses 306
Total lease expenses $ 12,802
100
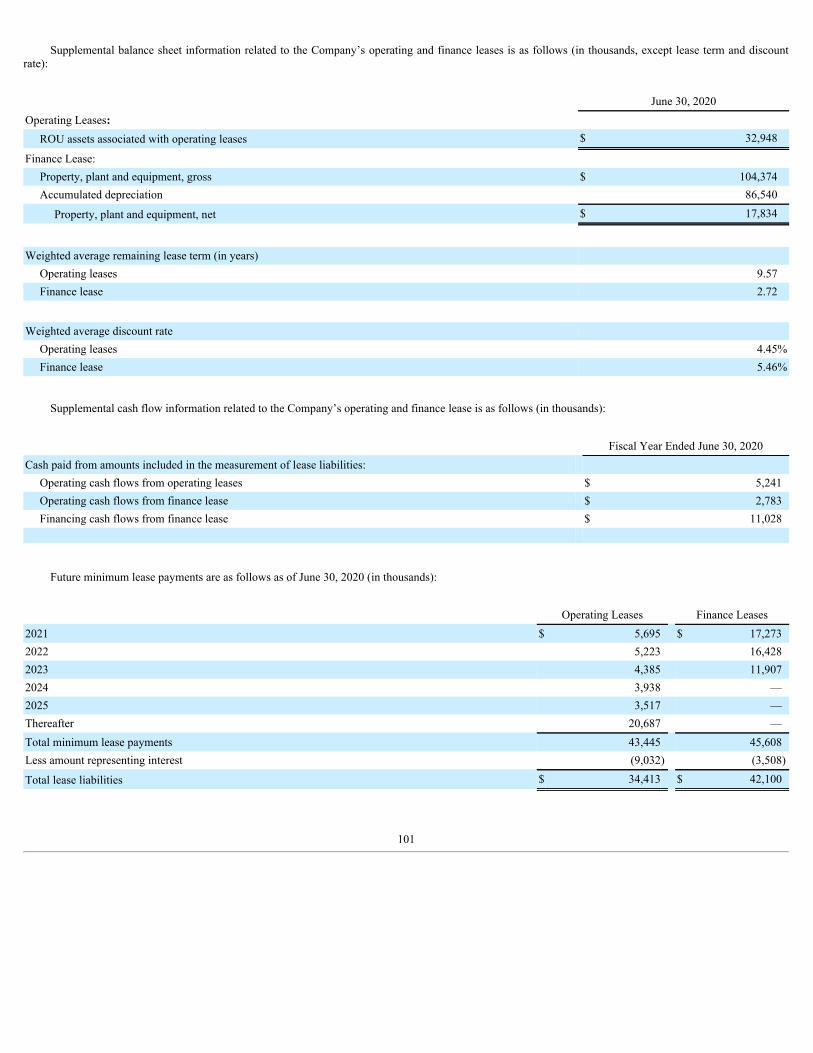
Supplemental balance sheet information related to the Company’s operating and finance leases is as follows (in thousands, except lease term and discountrate):
June 30, 2020Operating Leases: ROU assets associated with operating leases $ 32,948
Finance Lease: Property, plant and equipment, gross $ 104,374 Accumulated depreciation 86,540
Property, plant and equipment, net $ 17,834
Weighted average remaining lease term (in years) Operating leases 9.57 Finance lease 2.72
Weighted average discount rate Operating leases 4.45% Finance lease 5.46%
Supplemental cash flow information related to the Company’s operating and finance lease is as follows (in thousands):
Fiscal Year Ended June 30, 2020Cash paid from amounts included in the measurement of lease liabilities: Operating cash flows from operating leases $ 5,241 Operating cash flows from finance lease $ 2,783 Financing cash flows from finance lease $ 11,028
Future minimum lease payments are as follows as of June 30, 2020 (in thousands):
Operating Leases Finance Leases2021 $ 5,695 $ 17,2732022 5,223 16,4282023 4,385 11,9072024 3,938 —2025 3,517 —Thereafter 20,687 —Total minimum lease payments 43,445 45,608Less amount representing interest (9,032) (3,508)
Total lease liabilities $ 34,413 $ 42,100
101
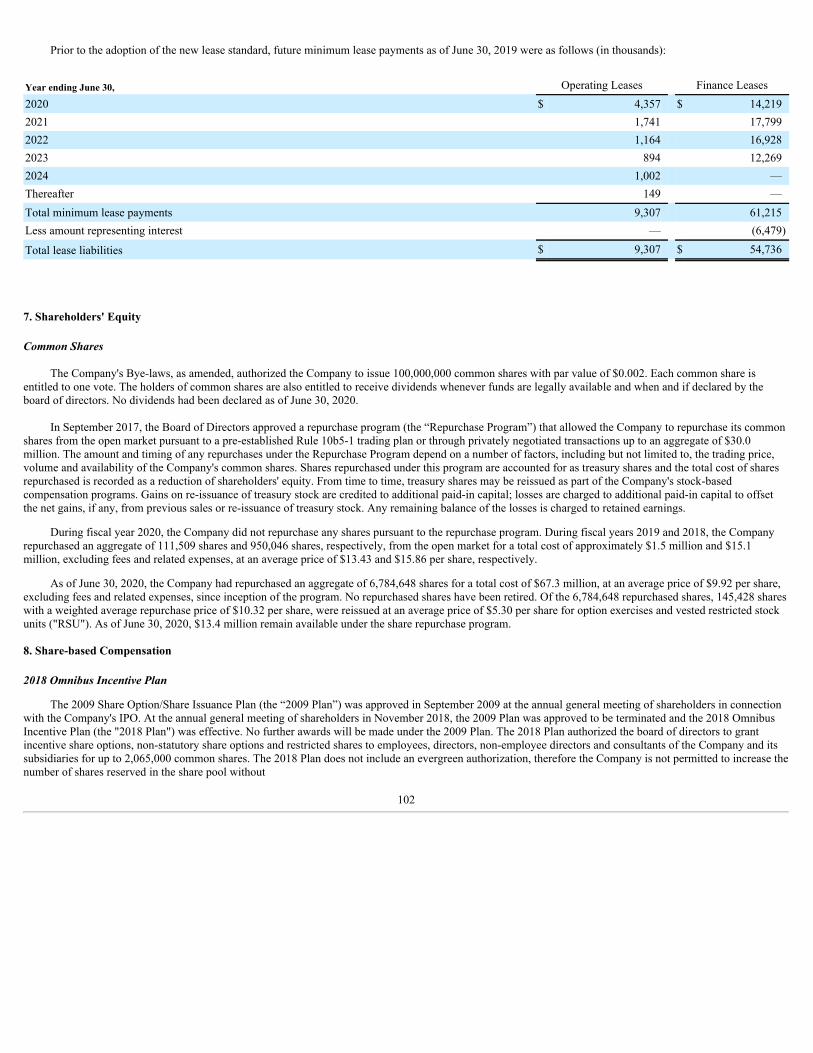
Prior to the adoption of the new lease standard, future minimum lease payments as of June 30, 2019 were as follows (in thousands):
Year ending June 30, Operating Leases Finance Leases2020 $ 4,357 $ 14,2192021 1,741 17,7992022 1,164 16,9282023 894 12,2692024 1,002 —Thereafter 149 —Total minimum lease payments 9,307 61,215Less amount representing interest — (6,479)
Total lease liabilities $ 9,307 $ 54,736
7. Shareholders' Equity
Common Shares
The Company's Bye-laws, as amended, authorized the Company to issue 100,000,000 common shares with par value of $0.002. Each common share isentitled to one vote. The holders of common shares are also entitled to receive dividends whenever funds are legally available and when and if declared by theboard of directors. No dividends had been declared as of June 30, 2020.
In September 2017, the Board of Directors approved a repurchase program (the “Repurchase Program”) that allowed the Company to repurchase its commonshares from the open market pursuant to a pre-established Rule 10b5-1 trading plan or through privately negotiated transactions up to an aggregate of $30.0million. The amount and timing of any repurchases under the Repurchase Program depend on a number of factors, including but not limited to, the trading price,volume and availability of the Company's common shares. Shares repurchased under this program are accounted for as treasury shares and the total cost of sharesrepurchased is recorded as a reduction of shareholders' equity. From time to time, treasury shares may be reissued as part of the Company's stock-basedcompensation programs. Gains on re-issuance of treasury stock are credited to additional paid-in capital; losses are charged to additional paid-in capital to offsetthe net gains, if any, from previous sales or re-issuance of treasury stock. Any remaining balance of the losses is charged to retained earnings.
During fiscal year 2020, the Company did not repurchase any shares pursuant to the repurchase program. During fiscal years 2019 and 2018, the Companyrepurchased an aggregate of 111,509 shares and 950,046 shares, respectively, from the open market for a total cost of approximately $1.5 million and $15.1million, excluding fees and related expenses, at an average price of $13.43 and $15.86 per share, respectively.
As of June 30, 2020, the Company had repurchased an aggregate of 6,784,648 shares for a total cost of $67.3 million, at an average price of $9.92 per share,excluding fees and related expenses, since inception of the program. No repurchased shares have been retired. Of the 6,784,648 repurchased shares, 145,428 shareswith a weighted average repurchase price of $10.32 per share, were reissued at an average price of $5.30 per share for option exercises and vested restricted stockunits ("RSU"). As of June 30, 2020, $13.4 million remain available under the share repurchase program.
8. Share-based Compensation
2018 Omnibus Incentive Plan
The 2009 Share Option/Share Issuance Plan (the “2009 Plan”) was approved in September 2009 at the annual general meeting of shareholders in connectionwith the Company's IPO. At the annual general meeting of shareholders in November 2018, the 2009 Plan was approved to be terminated and the 2018 OmnibusIncentive Plan (the "2018 Plan") was effective. No further awards will be made under the 2009 Plan. The 2018 Plan authorized the board of directors to grantincentive share options, non-statutory share options and restricted shares to employees, directors, non-employee directors and consultants of the Company and itssubsidiaries for up to 2,065,000 common shares. The 2018 Plan does not include an evergreen authorization, therefore the Company is not permitted to increase thenumber of shares reserved in the share pool without
102
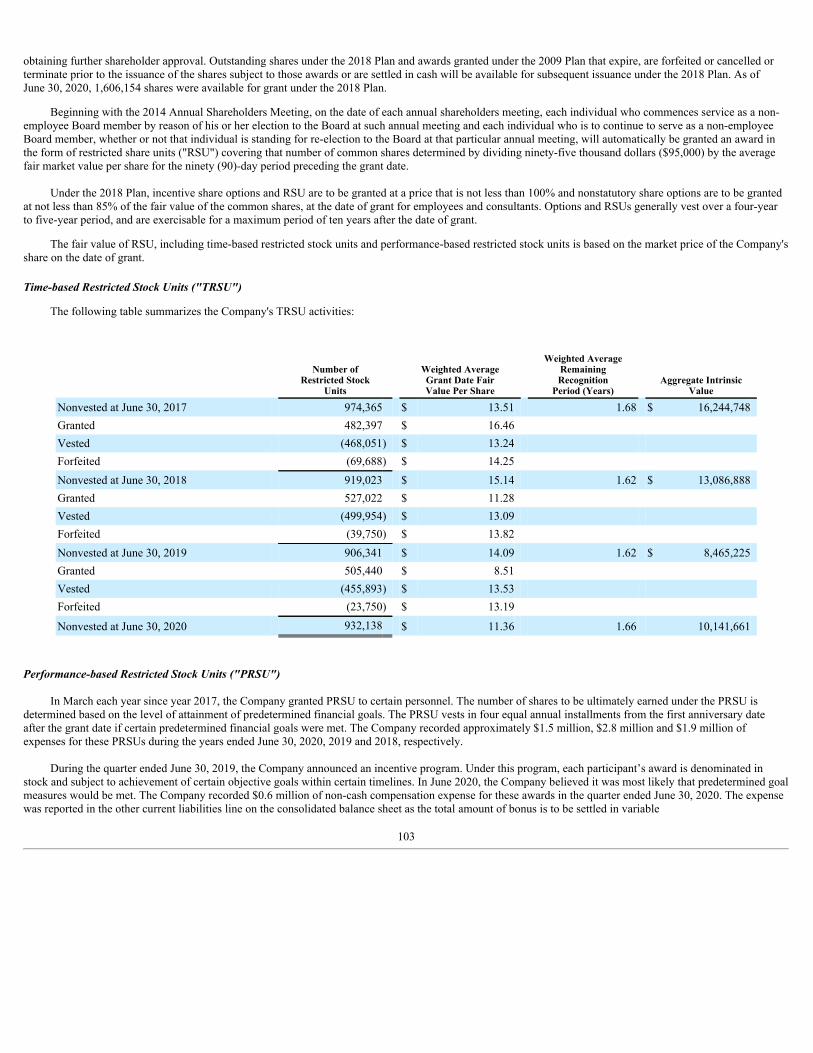
obtaining further shareholder approval. Outstanding shares under the 2018 Plan and awards granted under the 2009 Plan that expire, are forfeited or cancelled orterminate prior to the issuance of the shares subject to those awards or are settled in cash will be available for subsequent issuance under the 2018 Plan. As ofJune 30, 2020, 1,606,154 shares were available for grant under the 2018 Plan.
Beginning with the 2014 Annual Shareholders Meeting, on the date of each annual shareholders meeting, each individual who commences service as a non-employee Board member by reason of his or her election to the Board at such annual meeting and each individual who is to continue to serve as a non-employeeBoard member, whether or not that individual is standing for re-election to the Board at that particular annual meeting, will automatically be granted an award inthe form of restricted share units ("RSU") covering that number of common shares determined by dividing ninety-five thousand dollars ($95,000) by the averagefair market value per share for the ninety (90)-day period preceding the grant date.
Under the 2018 Plan, incentive share options and RSU are to be granted at a price that is not less than 100% and nonstatutory share options are to be grantedat not less than 85% of the fair value of the common shares, at the date of grant for employees and consultants. Options and RSUs generally vest over a four-yearto five-year period, and are exercisable for a maximum period of ten years after the date of grant.
The fair value of RSU, including time-based restricted stock units and performance-based restricted stock units is based on the market price of the Company'sshare on the date of grant.
Time-based Restricted Stock Units ("TRSU")
The following table summarizes the Company's TRSU activities:
Number ofRestricted Stock
Units
Weighted AverageGrant Date FairValue Per Share
Weighted AverageRemainingRecognition
Period (Years) Aggregate Intrinsic
Value
Nonvested at June 30, 2017 974,365 $ 13.51 1.68 $ 16,244,748Granted 482,397 $ 16.46 Vested (468,051) $ 13.24 Forfeited (69,688) $ 14.25 Nonvested at June 30, 2018 919,023 $ 15.14 1.62 $ 13,086,888Granted 527,022 $ 11.28 Vested (499,954) $ 13.09 Forfeited (39,750) $ 13.82 Nonvested at June 30, 2019 906,341 $ 14.09 1.62 $ 8,465,225Granted 505,440 $ 8.51 Vested (455,893) $ 13.53 Forfeited (23,750) $ 13.19
Nonvested at June 30, 2020 932,138 $ 11.36 1.66 10,141,661
Performance-based Restricted Stock Units ("PRSU")
In March each year since year 2017, the Company granted PRSU to certain personnel. The number of shares to be ultimately earned under the PRSU isdetermined based on the level of attainment of predetermined financial goals. The PRSU vests in four equal annual installments from the first anniversary dateafter the grant date if certain predetermined financial goals were met. The Company recorded approximately $1.5 million, $2.8 million and $1.9 million ofexpenses for these PRSUs during the years ended June 30, 2020, 2019 and 2018, respectively.
During the quarter ended June 30, 2019, the Company announced an incentive program. Under this program, each participant’s award is denominated instock and subject to achievement of certain objective goals within certain timelines. In June 2020, the Company believed it was most likely that predetermined goalmeasures would be met. The Company recorded $0.6 million of non-cash compensation expense for these awards in the quarter ended June 30, 2020. The expensewas reported in the other current liabilities line on the consolidated balance sheet as the total amount of bonus is to be settled in variable
103
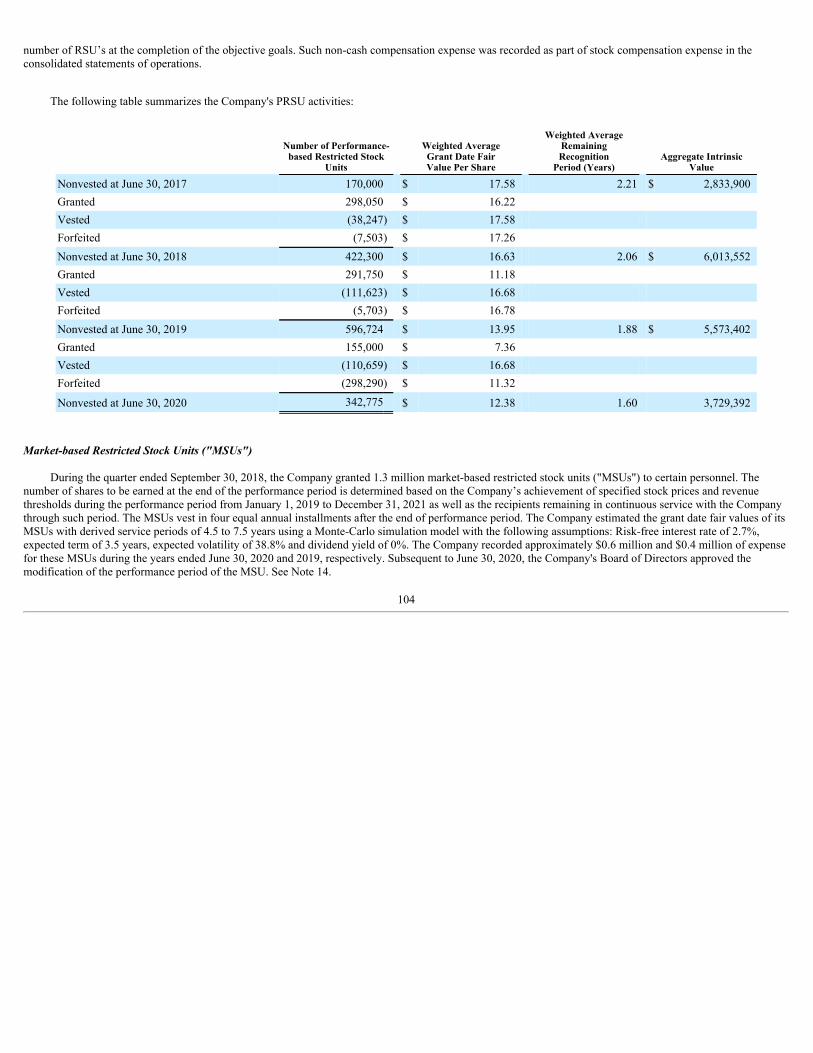
number of RSU’s at the completion of the objective goals. Such non-cash compensation expense was recorded as part of stock compensation expense in theconsolidated statements of operations.
The following table summarizes the Company's PRSU activities:
Number of Performance-based Restricted Stock
Units
Weighted AverageGrant Date FairValue Per Share
Weighted AverageRemainingRecognition
Period (Years) Aggregate Intrinsic
Value
Nonvested at June 30, 2017 170,000 $ 17.58 2.21 $ 2,833,900Granted 298,050 $ 16.22 Vested (38,247) $ 17.58 Forfeited (7,503) $ 17.26 Nonvested at June 30, 2018 422,300 $ 16.63 2.06 $ 6,013,552Granted 291,750 $ 11.18 Vested (111,623) $ 16.68 Forfeited (5,703) $ 16.78 Nonvested at June 30, 2019 596,724 $ 13.95 1.88 $ 5,573,402Granted 155,000 $ 7.36 Vested (110,659) $ 16.68 Forfeited (298,290) $ 11.32
Nonvested at June 30, 2020 342,775 $ 12.38 1.60 3,729,392
Market-based Restricted Stock Units ("MSUs")
During the quarter ended September 30, 2018, the Company granted 1.3 million market-based restricted stock units ("MSUs") to certain personnel. Thenumber of shares to be earned at the end of the performance period is determined based on the Company’s achievement of specified stock prices and revenuethresholds during the performance period from January 1, 2019 to December 31, 2021 as well as the recipients remaining in continuous service with the Companythrough such period. The MSUs vest in four equal annual installments after the end of performance period. The Company estimated the grant date fair values of itsMSUs with derived service periods of 4.5 to 7.5 years using a Monte-Carlo simulation model with the following assumptions: Risk-free interest rate of 2.7%,expected term of 3.5 years, expected volatility of 38.8% and dividend yield of 0%. The Company recorded approximately $0.6 million and $0.4 million of expensefor these MSUs during the years ended June 30, 2020 and 2019, respectively. Subsequent to June 30, 2020, the Company's Board of Directors approved themodification of the performance period of the MSU. See Note 14.
104
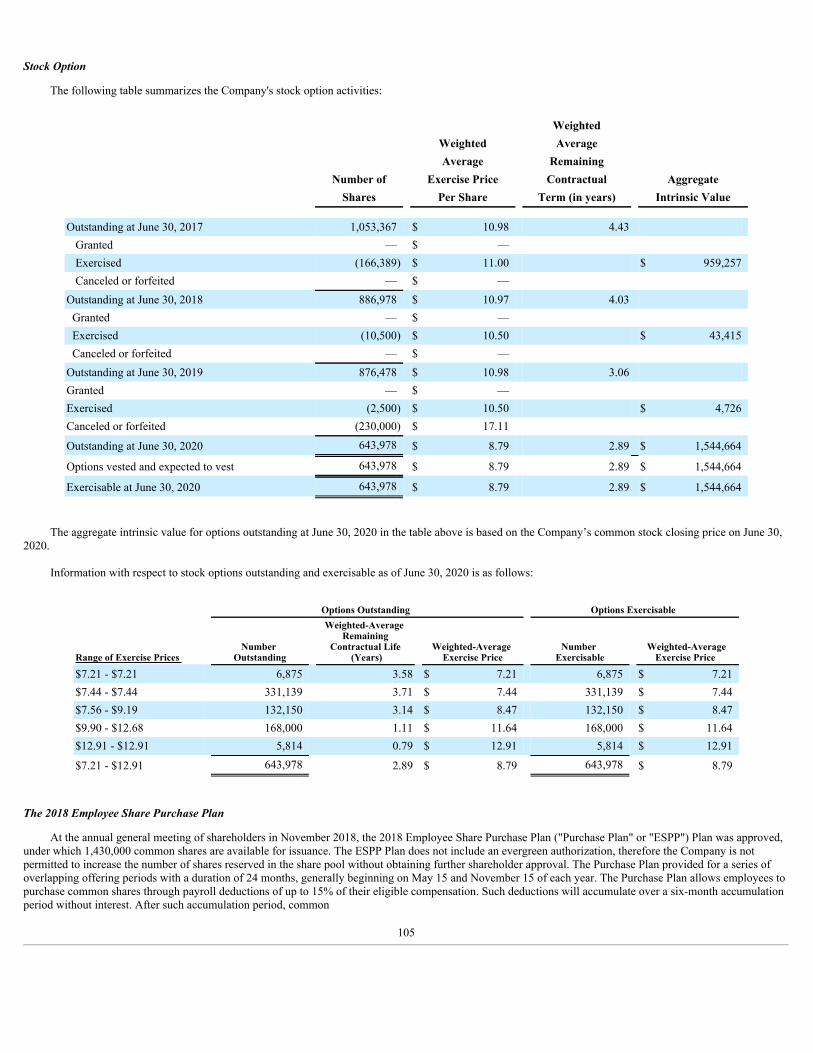
Stock Option
The following table summarizes the Company's stock option activities:
Weighted Weighted Average Average Remaining Number of Exercise Price Contractual Aggregate Shares Per Share Term (in years) Intrinsic Value Outstanding at June 30, 2017 1,053,367 $ 10.98 4.43
Granted — $ — Exercised (166,389) $ 11.00 $ 959,257Canceled or forfeited — $ —
Outstanding at June 30, 2018 886,978 $ 10.97 4.03 Granted — $ — Exercised (10,500) $ 10.50 $ 43,415 Canceled or forfeited — $ — Outstanding at June 30, 2019 876,478 $ 10.98 3.06 Granted — $ — Exercised (2,500) $ 10.50 $ 4,726Canceled or forfeited (230,000) $ 17.11
Outstanding at June 30, 2020 643,978 $ 8.79 2.89 $ 1,544,664
Options vested and expected to vest 643,978 $ 8.79 2.89 $ 1,544,664
Exercisable at June 30, 2020 643,978 $ 8.79 2.89 $ 1,544,664
The aggregate intrinsic value for options outstanding at June 30, 2020 in the table above is based on the Company’s common stock closing price on June 30,2020.
Information with respect to stock options outstanding and exercisable as of June 30, 2020 is as follows:
Options Outstanding Options Exercisable
Range of Exercise Prices Number
Outstanding
Weighted-Average Remaining
Contractual Life (Years)
Weighted-Average Exercise Price
Number Exercisable
Weighted-Average Exercise Price
$7.21 - $7.21 6,875 3.58 $ 7.21 6,875 $ 7.21$7.44 - $7.44 331,139 3.71 $ 7.44 331,139 $ 7.44$7.56 - $9.19 132,150 3.14 $ 8.47 132,150 $ 8.47$9.90 - $12.68 168,000 1.11 $ 11.64 168,000 $ 11.64$12.91 - $12.91 5,814 0.79 $ 12.91 5,814 $ 12.91
$7.21 - $12.91 643,978 2.89 $ 8.79 643,978 $ 8.79
The 2018 Employee Share Purchase Plan
At the annual general meeting of shareholders in November 2018, the 2018 Employee Share Purchase Plan ("Purchase Plan" or "ESPP") Plan was approved,under which 1,430,000 common shares are available for issuance. The ESPP Plan does not include an evergreen authorization, therefore the Company is notpermitted to increase the number of shares reserved in the share pool without obtaining further shareholder approval. The Purchase Plan provided for a series ofoverlapping offering periods with a duration of 24 months, generally beginning on May 15 and November 15 of each year. The Purchase Plan allows employees topurchase common shares through payroll deductions of up to 15% of their eligible compensation. Such deductions will accumulate over a six-month accumulationperiod without interest. After such accumulation period, common
105
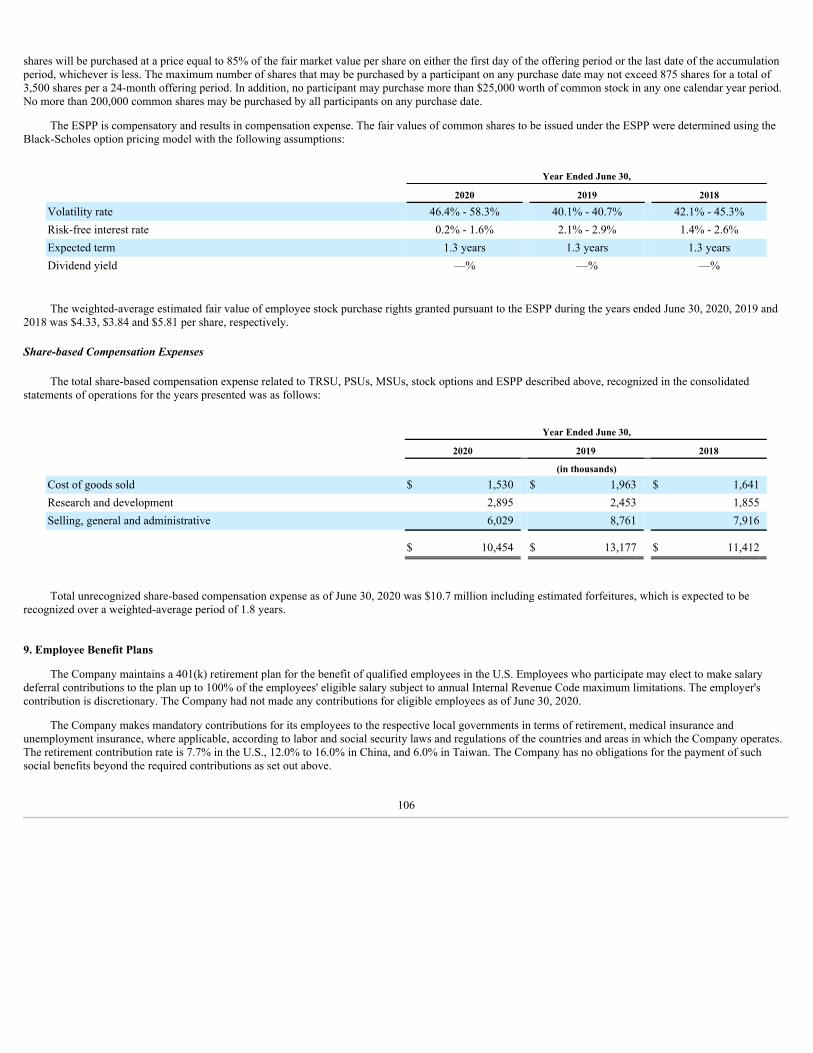
shares will be purchased at a price equal to 85% of the fair market value per share on either the first day of the offering period or the last date of the accumulationperiod, whichever is less. The maximum number of shares that may be purchased by a participant on any purchase date may not exceed 875 shares for a total of3,500 shares per a 24-month offering period. In addition, no participant may purchase more than $25,000 worth of common stock in any one calendar year period.No more than 200,000 common shares may be purchased by all participants on any purchase date.
The ESPP is compensatory and results in compensation expense. The fair values of common shares to be issued under the ESPP were determined using theBlack-Scholes option pricing model with the following assumptions:
Year Ended June 30,
2020 2019 2018
Volatility rate 46.4% - 58.3% 40.1% - 40.7% 42.1% - 45.3%Risk-free interest rate 0.2% - 1.6% 2.1% - 2.9% 1.4% - 2.6%Expected term 1.3 years 1.3 years 1.3 yearsDividend yield —% —% —%
The weighted-average estimated fair value of employee stock purchase rights granted pursuant to the ESPP during the years ended June 30, 2020, 2019 and2018 was $4.33, $3.84 and $5.81 per share, respectively.
Share-based Compensation Expenses
The total share-based compensation expense related to TRSU, PSUs, MSUs, stock options and ESPP described above, recognized in the consolidatedstatements of operations for the years presented was as follows:
Year Ended June 30,
2020 2019 2018 (in thousands)Cost of goods sold $ 1,530 $ 1,963 $ 1,641Research and development 2,895 2,453 1,855Selling, general and administrative 6,029 8,761 7,916 $ 10,454 $ 13,177 $ 11,412
Total unrecognized share-based compensation expense as of June 30, 2020 was $10.7 million including estimated forfeitures, which is expected to berecognized over a weighted-average period of 1.8 years.
9. Employee Benefit Plans
The Company maintains a 401(k) retirement plan for the benefit of qualified employees in the U.S. Employees who participate may elect to make salarydeferral contributions to the plan up to 100% of the employees' eligible salary subject to annual Internal Revenue Code maximum limitations. The employer'scontribution is discretionary. The Company had not made any contributions for eligible employees as of June 30, 2020.
The Company makes mandatory contributions for its employees to the respective local governments in terms of retirement, medical insurance andunemployment insurance, where applicable, according to labor and social security laws and regulations of the countries and areas in which the Company operates.The retirement contribution rate is 7.7% in the U.S., 12.0% to 16.0% in China, and 6.0% in Taiwan. The Company has no obligations for the payment of suchsocial benefits beyond the required contributions as set out above.
106
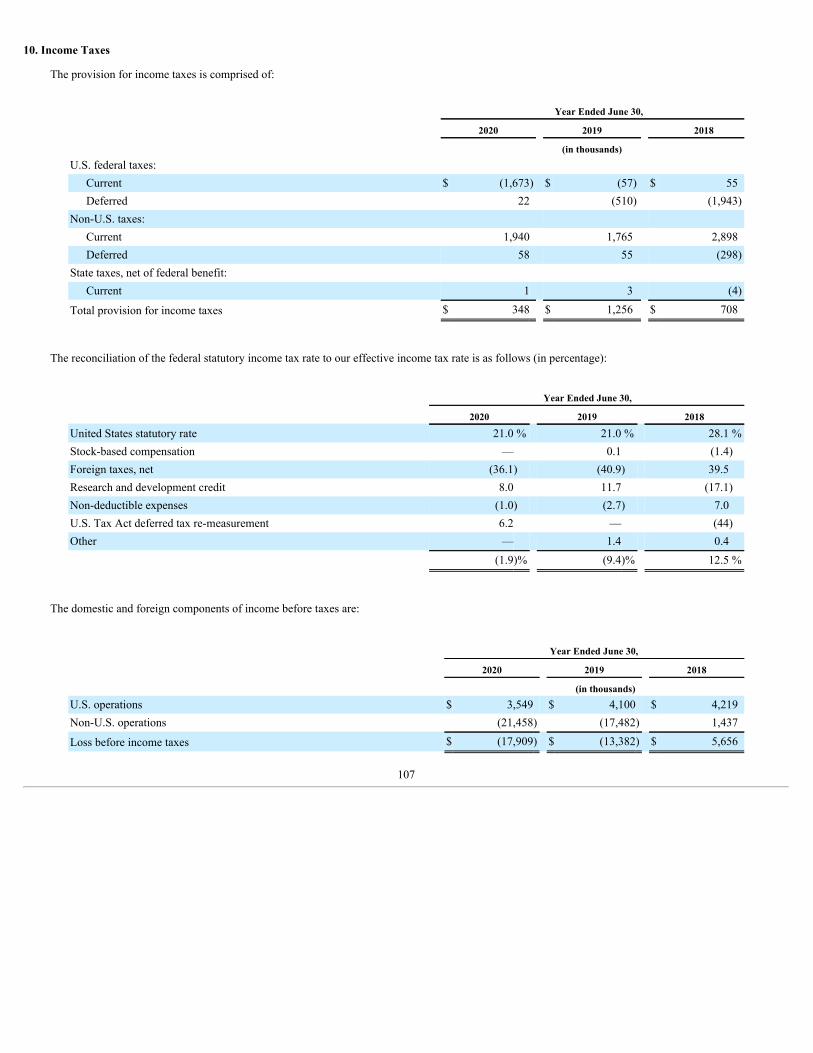
10. Income Taxes
The provision for income taxes is comprised of:
Year Ended June 30,
2020 2019 2018
(in thousands) U.S. federal taxes:
Current $ (1,673) $ (57) $ 55Deferred 22 (510) (1,943)
Non-U.S. taxes: Current 1,940 1,765 2,898Deferred 58 55 (298)
State taxes, net of federal benefit: Current 1 3 (4)
Total provision for income taxes $ 348 $ 1,256 $ 708
The reconciliation of the federal statutory income tax rate to our effective income tax rate is as follows (in percentage):
Year Ended June 30,
2020 2019 2018
United States statutory rate 21.0 % 21.0 % 28.1 %Stock-based compensation — 0.1 (1.4)Foreign taxes, net (36.1) (40.9) 39.5Research and development credit 8.0 11.7 (17.1)Non-deductible expenses (1.0) (2.7) 7.0U.S. Tax Act deferred tax re-measurement 6.2 — (44)Other — 1.4 0.4
(1.9)% (9.4)% 12.5 %
The domestic and foreign components of income before taxes are:
Year Ended June 30,
2020 2019 2018
(in thousands) U.S. operations $ 3,549 $ 4,100 $ 4,219Non-U.S. operations (21,458) (17,482) 1,437
Loss before income taxes $ (17,909) $ (13,382) $ 5,656
107
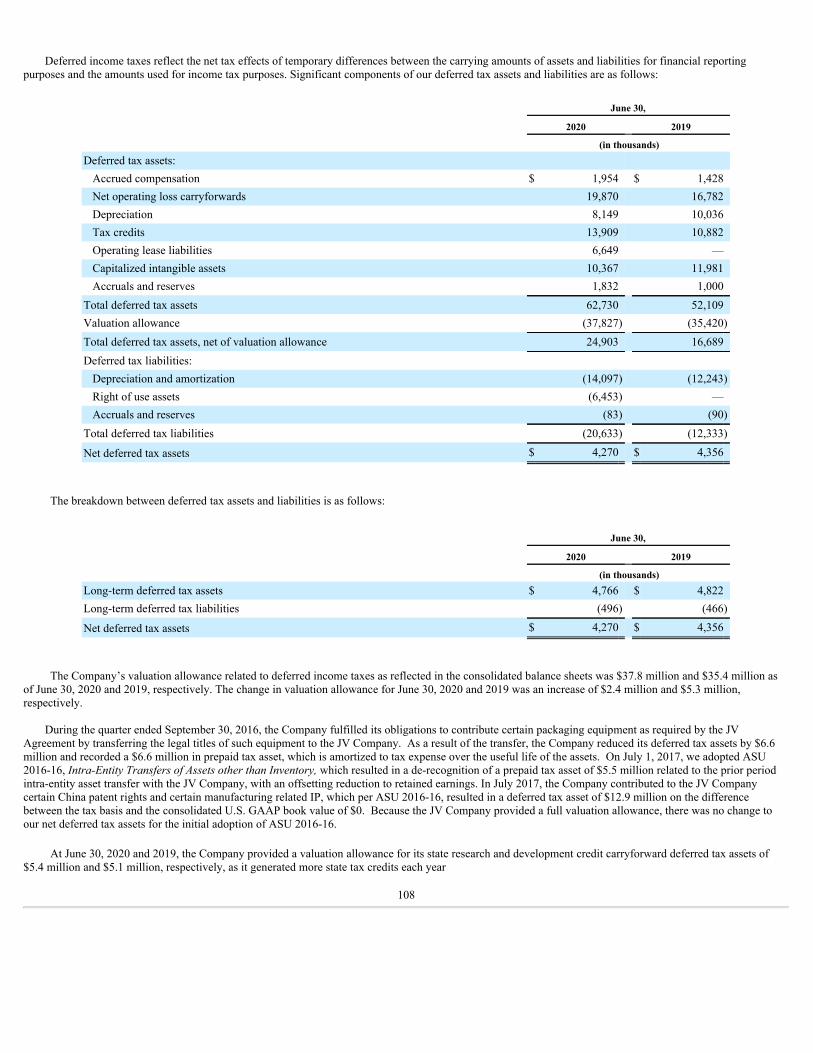
Deferred income taxes reflect the net tax effects of temporary differences between the carrying amounts of assets and liabilities for financial reportingpurposes and the amounts used for income tax purposes. Significant components of our deferred tax assets and liabilities are as follows:
June 30,
2020 2019 (in thousands)Deferred tax assets:
Accrued compensation $ 1,954 $ 1,428Net operating loss carryforwards 19,870 16,782Depreciation 8,149 10,036Tax credits 13,909 10,882Operating lease liabilities 6,649 —Capitalized intangible assets 10,367 11,981Accruals and reserves 1,832 1,000
Total deferred tax assets 62,730 52,109Valuation allowance (37,827) (35,420)Total deferred tax assets, net of valuation allowance 24,903 16,689Deferred tax liabilities:
Depreciation and amortization (14,097) (12,243)Right of use assets (6,453) —Accruals and reserves (83) (90)
Total deferred tax liabilities (20,633) (12,333)
Net deferred tax assets $ 4,270 $ 4,356
The breakdown between deferred tax assets and liabilities is as follows:
June 30,
2020 2019 (in thousands)Long-term deferred tax assets $ 4,766 $ 4,822Long-term deferred tax liabilities (496) (466)
Net deferred tax assets $ 4,270 $ 4,356
The Company’s valuation allowance related to deferred income taxes as reflected in the consolidated balance sheets was $37.8 million and $35.4 million asof June 30, 2020 and 2019, respectively. The change in valuation allowance for June 30, 2020 and 2019 was an increase of $2.4 million and $5.3 million,respectively.
During the quarter ended September 30, 2016, the Company fulfilled its obligations to contribute certain packaging equipment as required by the JVAgreement by transferring the legal titles of such equipment to the JV Company. As a result of the transfer, the Company reduced its deferred tax assets by $6.6million and recorded a $6.6 million in prepaid tax asset, which is amortized to tax expense over the useful life of the assets. On July 1, 2017, we adopted ASU2016-16, Intra-Entity Transfers of Assets other than Inventory, which resulted in a de-recognition of a prepaid tax asset of $5.5 million related to the prior periodintra-entity asset transfer with the JV Company, with an offsetting reduction to retained earnings. In July 2017, the Company contributed to the JV Companycertain China patent rights and certain manufacturing related IP, which per ASU 2016-16, resulted in a deferred tax asset of $12.9 million on the differencebetween the tax basis and the consolidated U.S. GAAP book value of $0. Because the JV Company provided a full valuation allowance, there was no change toour net deferred tax assets for the initial adoption of ASU 2016-16.
At June 30, 2020 and 2019, the Company provided a valuation allowance for its state research and development credit carryforward deferred tax assets of$5.4 million and $5.1 million, respectively, as it generated more state tax credits each year
108
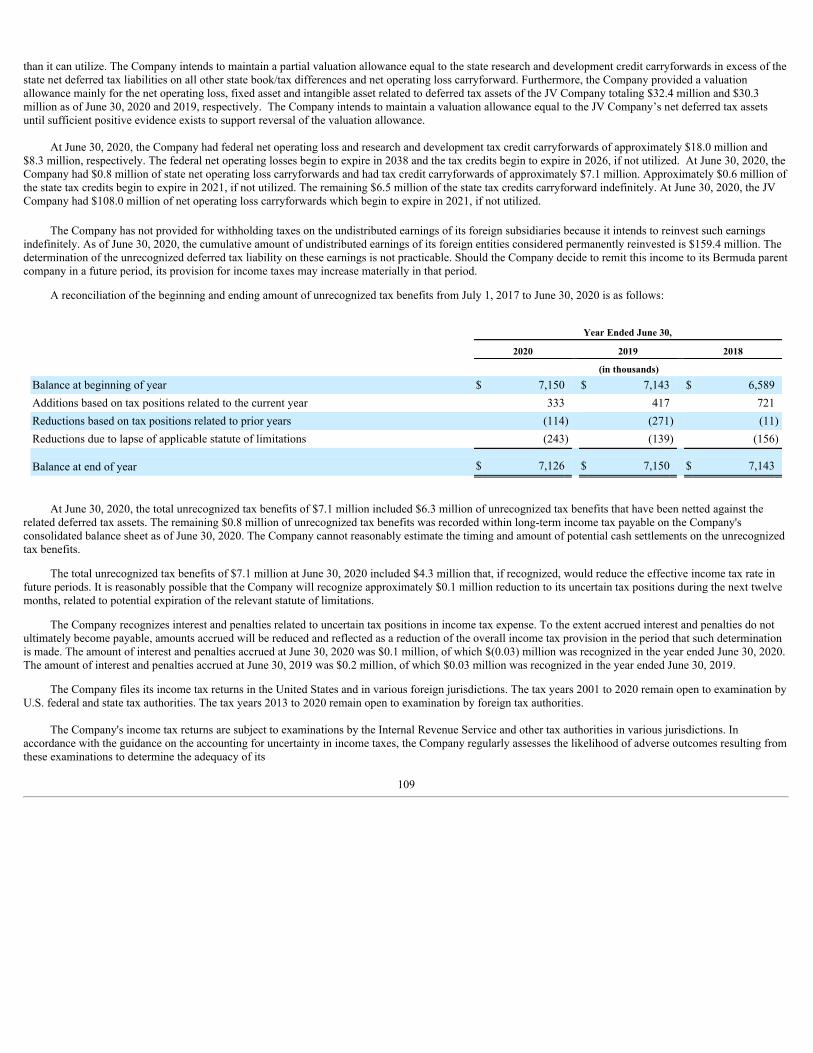
than it can utilize. The Company intends to maintain a partial valuation allowance equal to the state research and development credit carryforwards in excess of thestate net deferred tax liabilities on all other state book/tax differences and net operating loss carryforward. Furthermore, the Company provided a valuationallowance mainly for the net operating loss, fixed asset and intangible asset related to deferred tax assets of the JV Company totaling $32.4 million and $30.3million as of June 30, 2020 and 2019, respectively. The Company intends to maintain a valuation allowance equal to the JV Company’s net deferred tax assetsuntil sufficient positive evidence exists to support reversal of the valuation allowance.
At June 30, 2020, the Company had federal net operating loss and research and development tax credit carryforwards of approximately $18.0 million and$8.3 million, respectively. The federal net operating losses begin to expire in 2038 and the tax credits begin to expire in 2026, if not utilized. At June 30, 2020, theCompany had $0.8 million of state net operating loss carryforwards and had tax credit carryforwards of approximately $7.1 million. Approximately $0.6 million ofthe state tax credits begin to expire in 2021, if not utilized. The remaining $6.5 million of the state tax credits carryforward indefinitely. At June 30, 2020, the JVCompany had $108.0 million of net operating loss carryforwards which begin to expire in 2021, if not utilized.
The Company has not provided for withholding taxes on the undistributed earnings of its foreign subsidiaries because it intends to reinvest such earningsindefinitely. As of June 30, 2020, the cumulative amount of undistributed earnings of its foreign entities considered permanently reinvested is $159.4 million. Thedetermination of the unrecognized deferred tax liability on these earnings is not practicable. Should the Company decide to remit this income to its Bermuda parentcompany in a future period, its provision for income taxes may increase materially in that period.
A reconciliation of the beginning and ending amount of unrecognized tax benefits from July 1, 2017 to June 30, 2020 is as follows:
Year Ended June 30,
2020 2019 2018 (in thousands)Balance at beginning of year $ 7,150 $ 7,143 $ 6,589Additions based on tax positions related to the current year 333 417 721Reductions based on tax positions related to prior years (114) (271) (11)Reductions due to lapse of applicable statute of limitations (243) (139) (156) Balance at end of year $ 7,126 $ 7,150 $ 7,143
At June 30, 2020, the total unrecognized tax benefits of $7.1 million included $6.3 million of unrecognized tax benefits that have been netted against therelated deferred tax assets. The remaining $0.8 million of unrecognized tax benefits was recorded within long-term income tax payable on the Company'sconsolidated balance sheet as of June 30, 2020. The Company cannot reasonably estimate the timing and amount of potential cash settlements on the unrecognizedtax benefits.
The total unrecognized tax benefits of $7.1 million at June 30, 2020 included $4.3 million that, if recognized, would reduce the effective income tax rate infuture periods. It is reasonably possible that the Company will recognize approximately $0.1 million reduction to its uncertain tax positions during the next twelvemonths, related to potential expiration of the relevant statute of limitations.
The Company recognizes interest and penalties related to uncertain tax positions in income tax expense. To the extent accrued interest and penalties do notultimately become payable, amounts accrued will be reduced and reflected as a reduction of the overall income tax provision in the period that such determinationis made. The amount of interest and penalties accrued at June 30, 2020 was $0.1 million, of which $(0.03) million was recognized in the year ended June 30, 2020.The amount of interest and penalties accrued at June 30, 2019 was $0.2 million, of which $0.03 million was recognized in the year ended June 30, 2019.
The Company files its income tax returns in the United States and in various foreign jurisdictions. The tax years 2001 to 2020 remain open to examination byU.S. federal and state tax authorities. The tax years 2013 to 2020 remain open to examination by foreign tax authorities.
The Company's income tax returns are subject to examinations by the Internal Revenue Service and other tax authorities in various jurisdictions. Inaccordance with the guidance on the accounting for uncertainty in income taxes, the Company regularly assesses the likelihood of adverse outcomes resulting fromthese examinations to determine the adequacy of its
109
provision for income taxes. These assessments can require considerable estimates and judgments. If the Company's estimate of income tax liabilities proves to beless than the ultimate assessment, then a further charge to expense would be required. If events occur and the payment of these amounts ultimately proves to beunnecessary, the reversal of the liabilities would result in tax benefits being recognized in the period when the Company determines the liabilities are no longernecessary.
U.S. Tax Cuts and Jobs Act, Enacted December 22, 2017
On December 22, 2017, the United States enacted tax reform legislation through the Tax Cuts and Jobs Act (“the Tax Act”), which significantly changes theexisting U.S. tax laws, including, but not limited to, (1) a reduction in the corporate tax rate from 35% to 21%, (2) a move from a worldwide tax system to aterritorial system, (3) eliminating the corporate alternative minimum tax (AMT) and changing how existing AMT credits can be realized, (4) bonus depreciationthat will allow for full expensing of qualified property, (5) creating a new limitation on deductible interest expense and (6) changing rules related to uses andlimitations of net operating loss carryforwards created in tax years beginning after December 31, 2017.
The SEC staff issued Staff Accounting Bulletin No. 118 ("SAB 118"), which provides guidance on accounting for the tax effects of the Tax Act. SAB 118provides a measurement period that should not extend beyond one year from the Tax Act enactment date for companies to complete the accounting underAccounting Standards Codification Topic 740 ("ASC 740"). In accordance with SAB 118, a company must reflect the income tax effects of those aspects of theTax Act for which the accounting under ASC 740 is complete. To the extent that a company’s accounting for certain income tax effects of the Tax Act isincomplete but it is able to determine a reasonable estimate, it must record a provisional estimate in the financial statements. If a company cannot determine aprovisional estimate to be included in the financial statements, it should continue to apply ASC 740 on the basis of the provisions of the tax law that were in effectimmediately before the enactment of the Tax Act.
In connection with our initial analysis of the impact of the Tax Act, we reported a second quarter of fiscal year 2018 discrete tax benefit of $2.7 millionrelated to the re-measurement of certain deferred tax assets and liabilities. The $2.7 million tax benefit related to the tax rate re-measurement estimated in thesecond quarter of fiscal year 2018 was reduced downward by $0.2 million in the fourth quarter of fiscal year 2018, to $2.5 million. In addition, we used a 28% U.S.federal tax rate to measure our U.S. federal income tax expense for fiscal year 2018, down from the 34% U.S. federal income tax rate used in first quarter of fiscalyear 2018.
U.S. Coronavirus Aid, Relief and Economic Security Act” (“CARES Act”), Enacted March 27, 2020
On March 27, 2020, the United States enacted the Coronavirus Aid, Relief and Economic Security Act (“the CARES Act”), which made the changes toexisting U.S. tax laws, including, but not limited to, (1) allowing U.S. federal net operating losses originated in the 2018, 2019 or 2020 tax years to be carried backfive years to recover taxes paid based upon taxable income in the prior five years, (2) eliminated the 80% of taxable income limitation on net operating losses forthe 2018, 2019 and 2020 tax years (the 80% limitation will be reinstated for tax years after 2020), (3) accelerating the refund of prior year alternative minimum taxcredits, (4) modifying the bonus depreciation for qualified improvement property and (5) modifying the limitation on deductible interest expense.
As a result of the ability to carryback net operating losses from the June 2018 and June 2019 years to the June 2015 to June 2017 tax years, net operatinglosses which were previously tax-effected using the current 21% U.S. federal tax rate were revalued to the U.S. tax rates in effect for the June 2015 to June 2017tax years due to the ability of receiving tax refunds for the taxes paid in these years. Accordingly, we reported a discrete tax benefit of $1.1 million in the thirdquarter of fiscal year 2020 related to the re-measurement of the net operating losses that could be realized via the new net operating loss carryback provisions.
On July 27, 2015, in Altera Corp. v. Commissioner, the U.S. Tax Court issued an opinion related to the treatment of stock-based compensation expense in anintercompany cost-sharing arrangement. In the July 2015 ruling, the Tax Court concluded that the sharing of the cost of employee stock compensation in acompany’s cost-sharing arrangement was invalid under the U.S. Administrative Procedures Act. In June 2019, a panel of the Ninth Circuit of the U.S. Court ofAppeals reversed this decision. In July 2019, Altera petitioned U.S. Court of Appeals for the Ninth Circuit to hold an en banc rehearing of the case. The petitionwas subsequently denied by the Ninth Circuit. Altera appealed the case to the U.S. Supreme Court in February 2020, but the U.S. Supreme Court declined to hearthe case in June 2020, leaving intact the U.S. Court of Appeals for the Ninth Circuit’s decision. AOS has not recorded any benefit related to the Altera CorporationTax Court decision in any period through June 2020. We will continue to monitor ongoing developments and potential impact to our financial statements.
110
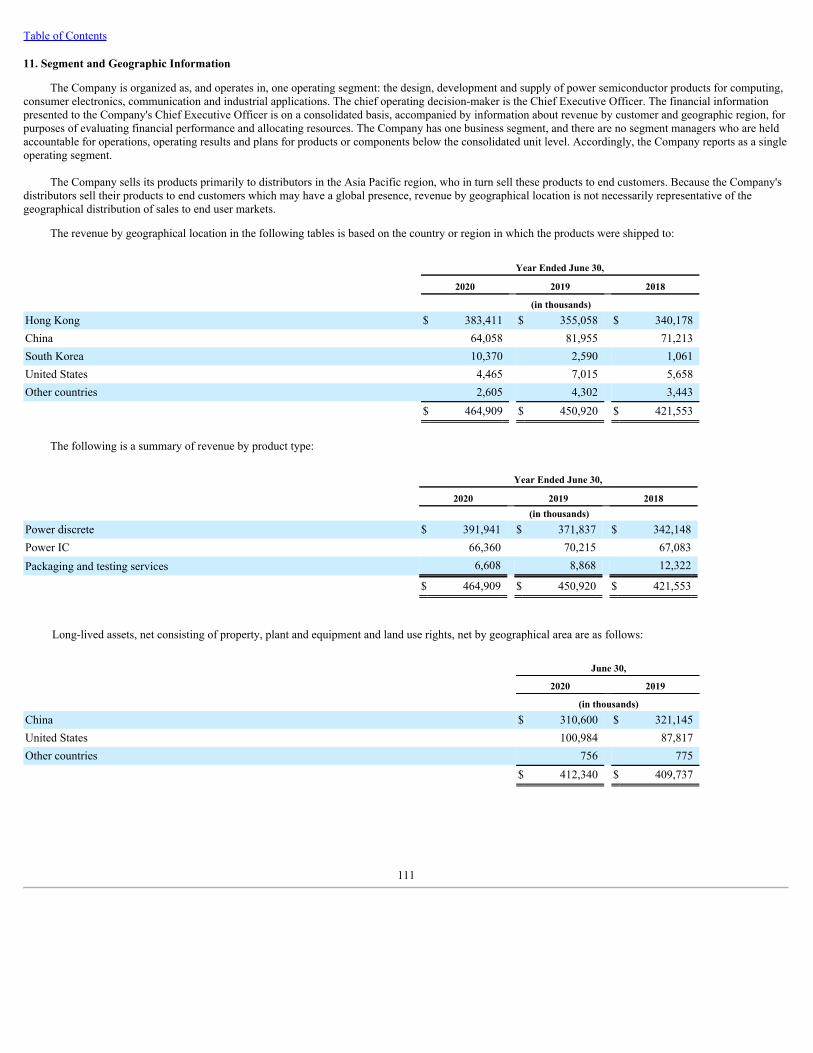
Table of Contents
11. Segment and Geographic Information
The Company is organized as, and operates in, one operating segment: the design, development and supply of power semiconductor products for computing,consumer electronics, communication and industrial applications. The chief operating decision-maker is the Chief Executive Officer. The financial informationpresented to the Company's Chief Executive Officer is on a consolidated basis, accompanied by information about revenue by customer and geographic region, forpurposes of evaluating financial performance and allocating resources. The Company has one business segment, and there are no segment managers who are heldaccountable for operations, operating results and plans for products or components below the consolidated unit level. Accordingly, the Company reports as a singleoperating segment.
The Company sells its products primarily to distributors in the Asia Pacific region, who in turn sell these products to end customers. Because the Company'sdistributors sell their products to end customers which may have a global presence, revenue by geographical location is not necessarily representative of thegeographical distribution of sales to end user markets.
The revenue by geographical location in the following tables is based on the country or region in which the products were shipped to:
Year Ended June 30,
2020 2019 2018 (in thousands)Hong Kong $ 383,411 $ 355,058 $ 340,178China 64,058 81,955 71,213South Korea 10,370 2,590 1,061United States 4,465 7,015 5,658Other countries 2,605 4,302 3,443
$ 464,909 $ 450,920 $ 421,553
The following is a summary of revenue by product type:
Year Ended June 30,
2020 2019 2018 (in thousands)
Power discrete $ 391,941 $ 371,837 $ 342,148Power IC 66,360 70,215 67,083Packaging and testing services 6,608 8,868 12,322
$ 464,909 $ 450,920 $ 421,553
Long-lived assets, net consisting of property, plant and equipment and land use rights, net by geographical area are as follows:
June 30,
2020 2019 (in thousands)China $ 310,600 $ 321,145United States 100,984 87,817Other countries 756 775
$ 412,340 $ 409,737
111
Table of Contents
12. Restricted Net Assets
Laws and regulations in China permit payments of dividends by the Company's subsidiaries in China only out of their retained earnings, if any, asdetermined in accordance with China accounting standards and regulations. Each China subsidiary is also required to set aside at least 10% of its after-tax profit, ifany, based on China accounting standards each year to its statutory reserves until the cumulative amount of such reserves reaches 50% of its registered capital. As aresult of these China laws and regulations, the Company's China subsidiaries are restricted in their abilities to transfer a portion of their net assets to the Company.As of June 30, 2020 and 2019, such restricted portion amounted to approximately $209.8 million and $209.5 million, or 61.4% and 64.4%, of our totalconsolidated net assets attributable to the Company, respectively. As the Company's China subsidiaries are not revenue generating operating units, the Companydoes not expect to repatriate funds in the form of dividends, loans or advances from its China subsidiaries for working capital and other funding purposes.
13. Commitments and Contingencies
Purchase commitments
As of June 30, 2020 and 2019, the Company had approximately $43.9 million and $59.5 million, respectively, of outstanding purchase commitmentsprimarily for purchases of semiconductor raw materials, wafers, spare parts, packaging and testing services and others.
As of June 30, 2020 and 2019, the Company had approximately $18.0 million, and $33.8 million primarily for the JV Company, respectively, of capitalcommitments for the purchase of property and equipment.
Other commitments
See Notes 1, 5 and 6 to the Consolidated Financial Statements contained in this annual Report on Form 10-K for descriptions of commitments including JointVenture, bank borrowings and leases.
Contingencies and indemnities
The Company has in the past, and may from time to time in the future, become involved in legal proceedings arising from the normal course of businessactivities. The semiconductor industry is characterized by frequent claims and litigation, including claims regarding patent and other intellectual property rights aswell as improper hiring practices. Irrespective of the validity of such claims, the Company could incur significant costs in the defense of such claims and sufferadverse effects on its operations.
In December 2019, the U.S. Department of Justice ("DOJ") commenced an investigation into the Company's compliance with export control regulationsrelating to its business transactions with Huawei and its affiliates (“Huawei”), which were added to the “Entity List” maintained by the Department of Commerce(“DOC”) on May 16, 2019. The Company is cooperating fully with federal authorities in the investigation, including responding to requests for documents andinformation from DOJ in connection with the investigation. The Company has maintained an export control compliance program and has been committed tocomply fully with all applicable laws and regulations. In connection with this investigation, DOC requested the Company to suspend shipments of its products toHuawei, and the Company complied with such request, and the Company has not shipped any product to Huawei after December 31, 2019 (see Note 3). TheCompany is currently working with DOC to resolve this issue. Given the case is in still ongoing and neither DOJ nor DOC have provided the Company with anyclear indication of the timing and schedule for the investigation, the Company cannot estimate the reasonably possible loss or range of loss that may occur. Also,the Company is unable to predict the duration, scope, result or related costs of the investigation, although the Company expects to incur additional professional feesas a result of this matter. In addition, the Company is unable to predict what, if any, further action that may be taken by the government in connection with theinvestigation, or what, if any, penalties, sanctions or remedial actions may be sought.
On March 19, 2020, Darryl Gray, a stockholder of the Company (the “Plaintiff”), filed a putative class action complaint in the United States District Court forthe Southern District of New York (the “Gray Action”), alleging that the Company and its management members made material misstatements or omissionsregarding the Company’s business and operations, including its export control practices relating to business transactions with Huawei and its affiliate. The GrayAction asserts claims under Section 10(b) of the Exchange Act against the Company, its Chief Executive Officer and Chief Financial Officer (collectively, theDefendants”), as well as claims under Section 20(a) of the Exchange Act against the Chief Executive Officer and Chief Financial Officer. Among other remedies,the Gray Action seeks to recover compensatory and other damages as well as attorney’s fees and costs.
112
On May 18, 2020, Plaintiff moved for an order appointing him as Lead Plaintiff pursuant to Section 21D of the Exchange Act and approving Glancy Prongay& Murray LLP as Lead Counsel for the putative class (the “Motion”). On July 1, 2020, the Court entered an order granting the Motion and requiring that: (i) LeadPlaintiff file an amended complaint or designate the current complaint as operative within sixty days; (ii) Defendants answer the complaint or otherwise movewithin sixty days of such filing or designation; (iii) Lead Plaintiff file an opposition, if any, within forty-five days; and (iv) Defendants file a reply, if any, forty-five days thereafter. On August 28, 2020, Plaintiff filed an amended complaint asserting the same claims against the Defendants, and adding the Company’sExecutive Vice President of Product Line as a defendant on both claims. The Company believes the claims in the Gray Action are without merit and intends tovigorously defend this litigation. Given the case is in its early stages and still on going, the Company cannot estimate the reasonably possible loss or range of lossthat may occur.
The Company is a party to a variety of agreements that it has contracted with various third parties. Pursuant to these agreements, the Company may beobligated to indemnify another party to such an agreement with respect to certain matters. Typically, these obligations arise in the context of contracts entered intoby the Company, under which the Company customarily agrees to hold the other party harmless against losses arising from a breach of representations andcovenants related to such matters as title to assets sold, certain intellectual property rights, specified environmental matters and certain income taxes. In thesecircumstances, payment by the Company is customarily conditioned on the other party making a claim pursuant to the procedures specified in the particularcontract, which procedures typically allow the Company to challenge the other party's claim. Further, the Company's obligations under these agreements may belimited in time and/or amount, and in some instances, the Company may have recourse against third parties for certain payments made by it under theseagreements. The Company has not historically paid or recorded any material indemnifications, and no accrual was made at June 30, 2020 and 2019.
The Company has agreed to indemnify its directors and certain employees as permitted by law and pursuant to its Bye-laws, and has entered intoindemnification agreements with its directors and executive officers. The Company has not recorded a liability associated with these indemnification arrangements,as it historically has not incurred any material costs associated with such indemnification obligations. Costs associated with such indemnification obligations maybe mitigated by insurance coverage that the Company maintains. However, such insurance may not cover any, or may cover only a portion of, the amounts theCompany may be required to pay. In addition, the Company may not be able to maintain such insurance coverage in the future.
Environmental matters
The Company is subject to various federal, state, local, and foreign laws and regulations governing environmentalmatters, including the use, handling, discharge, and disposal of hazardous materials. The Company believes that it has been in material compliance with applicableenvironmental regulations and standards. Complying with current laws and regulations has not had a material adverse effect on the Company’s financial conditionand results of operations. However, it is possible that additional environmental issues may arise in the future, which the Company cannot currently predict.
113

14. Subsequent Event
On August 31, 2020, the Company’s MSU grant described in Note 8 was modified with the performance period extended through December 31, 2022 and theoriginal four-year time-based service period to commence on January 1, 2023.
114
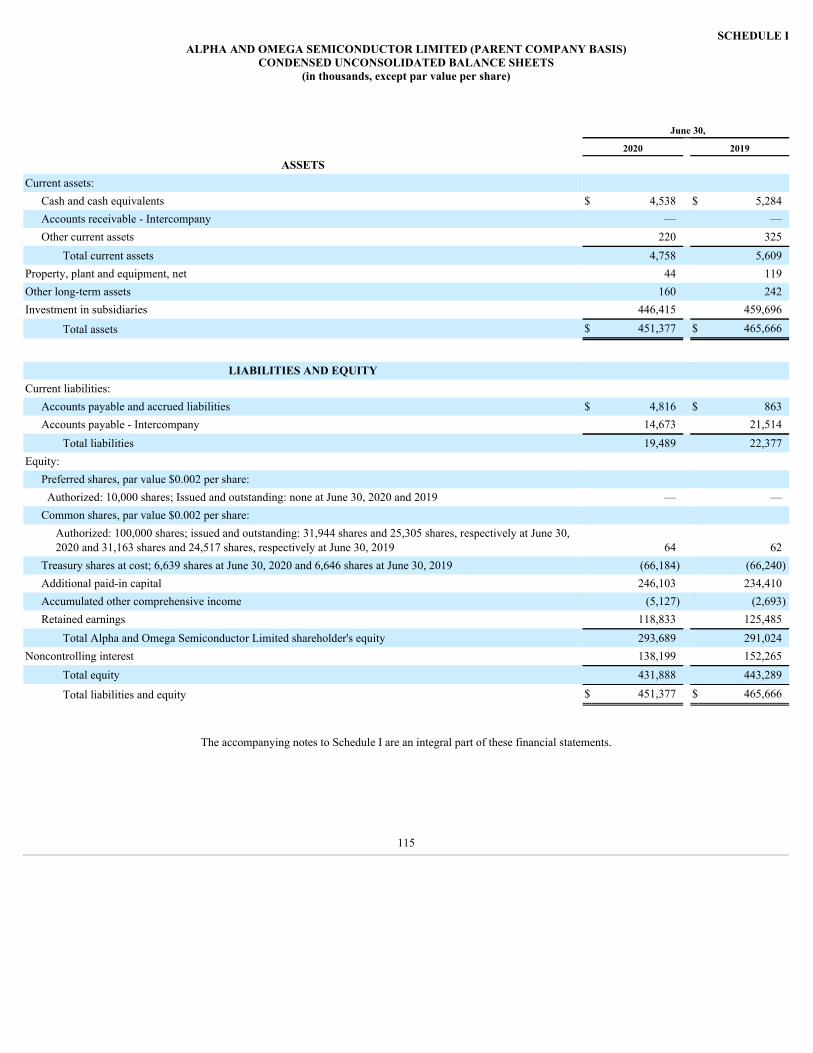
SCHEDULE IALPHA AND OMEGA SEMICONDUCTOR LIMITED (PARENT COMPANY BASIS)
CONDENSED UNCONSOLIDATED BALANCE SHEETS(in thousands, except par value per share)
June 30, 2020 2019
ASSETS Current assets:
Cash and cash equivalents $ 4,538 $ 5,284Accounts receivable - Intercompany — —Other current assets 220 325
Total current assets 4,758 5,609Property, plant and equipment, net 44 119Other long-term assets 160 242Investment in subsidiaries 446,415 459,696
Total assets $ 451,377 $ 465,666
LIABILITIES AND EQUITY Current liabilities:
Accounts payable and accrued liabilities $ 4,816 $ 863Accounts payable - Intercompany 14,673 21,514
Total liabilities 19,489 22,377Equity:
Preferred shares, par value $0.002 per share: Authorized: 10,000 shares; Issued and outstanding: none at June 30, 2020 and 2019 — —Common shares, par value $0.002 per share:
Authorized: 100,000 shares; issued and outstanding: 31,944 shares and 25,305 shares, respectively at June 30,2020 and 31,163 shares and 24,517 shares, respectively at June 30, 2019 64 62
Treasury shares at cost; 6,639 shares at June 30, 2020 and 6,646 shares at June 30, 2019 (66,184) (66,240)Additional paid-in capital 246,103 234,410Accumulated other comprehensive income (5,127) (2,693)Retained earnings 118,833 125,485
Total Alpha and Omega Semiconductor Limited shareholder's equity 293,689 291,024Noncontrolling interest 138,199 152,265
Total equity 431,888 443,289
Total liabilities and equity $ 451,377 $ 465,666
The accompanying notes to Schedule I are an integral part of these financial statements.
115
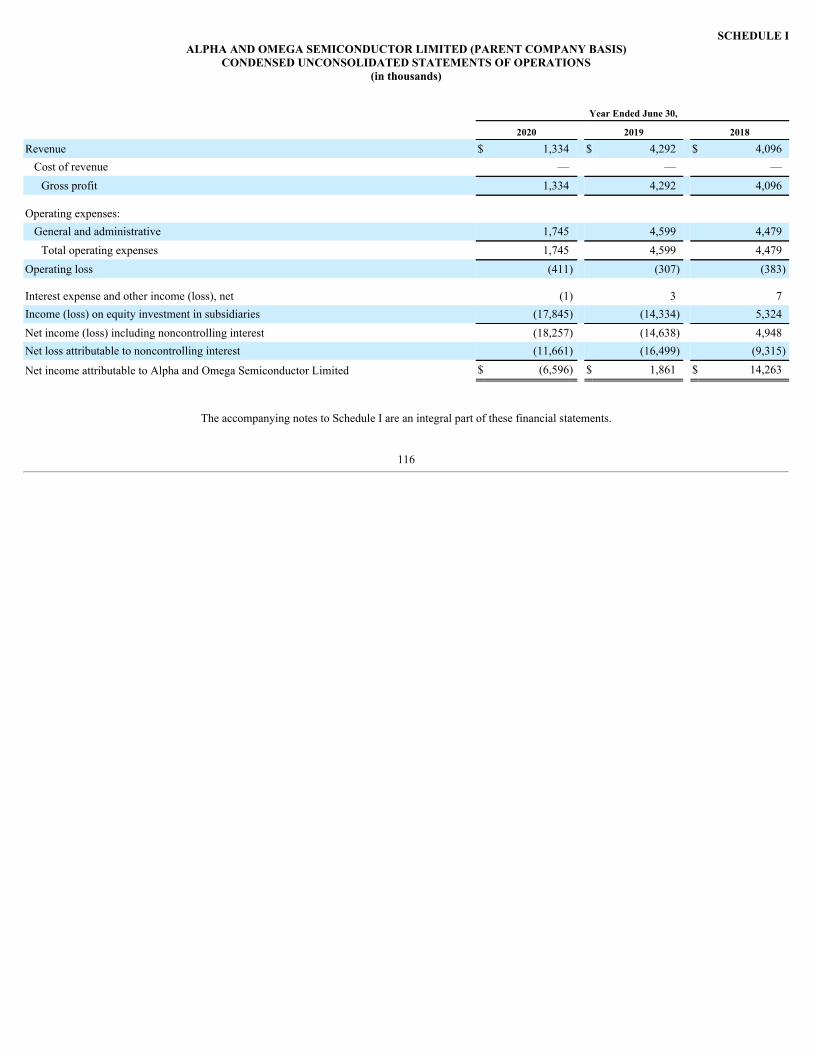
SCHEDULE IALPHA AND OMEGA SEMICONDUCTOR LIMITED (PARENT COMPANY BASIS)
CONDENSED UNCONSOLIDATED STATEMENTS OF OPERATIONS(in thousands)
Year Ended June 30,
2020 2019 2018
Revenue $ 1,334 $ 4,292 $ 4,096Cost of revenue — — —
Gross profit 1,334 4,292 4,096 Operating expenses:
General and administrative 1,745 4,599 4,479Total operating expenses 1,745 4,599 4,479
Operating loss (411) (307) (383) Interest expense and other income (loss), net (1) 3 7Income (loss) on equity investment in subsidiaries (17,845) (14,334) 5,324Net income (loss) including noncontrolling interest (18,257) (14,638) 4,948Net loss attributable to noncontrolling interest (11,661) (16,499) (9,315)
Net income attributable to Alpha and Omega Semiconductor Limited $ (6,596) $ 1,861 $ 14,263
The accompanying notes to Schedule I are an integral part of these financial statements.
116
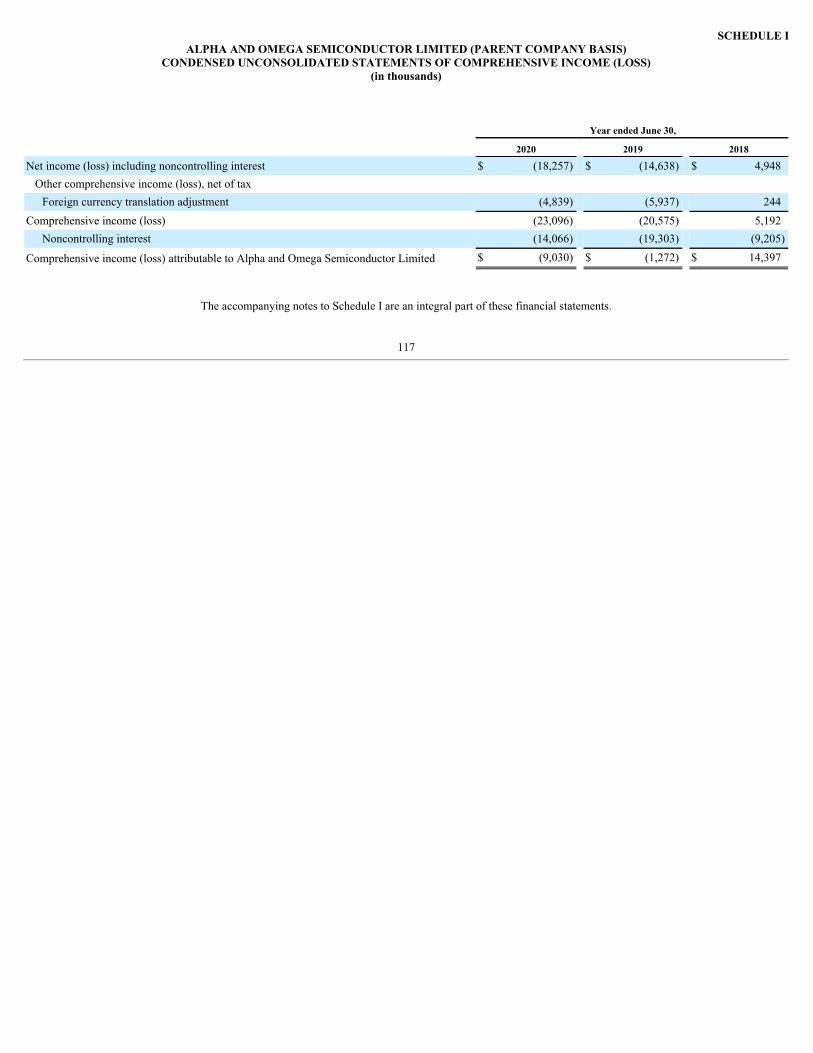
SCHEDULE IALPHA AND OMEGA SEMICONDUCTOR LIMITED (PARENT COMPANY BASIS)
CONDENSED UNCONSOLIDATED STATEMENTS OF COMPREHENSIVE INCOME (LOSS)(in thousands)
Year ended June 30,
2020 2019 2018
Net income (loss) including noncontrolling interest $ (18,257) $ (14,638) $ 4,948Other comprehensive income (loss), net of tax
Foreign currency translation adjustment (4,839) (5,937) 244Comprehensive income (loss) (23,096) (20,575) 5,192
Noncontrolling interest (14,066) (19,303) (9,205)
Comprehensive income (loss) attributable to Alpha and Omega Semiconductor Limited $ (9,030) $ (1,272) $ 14,397
The accompanying notes to Schedule I are an integral part of these financial statements.
117
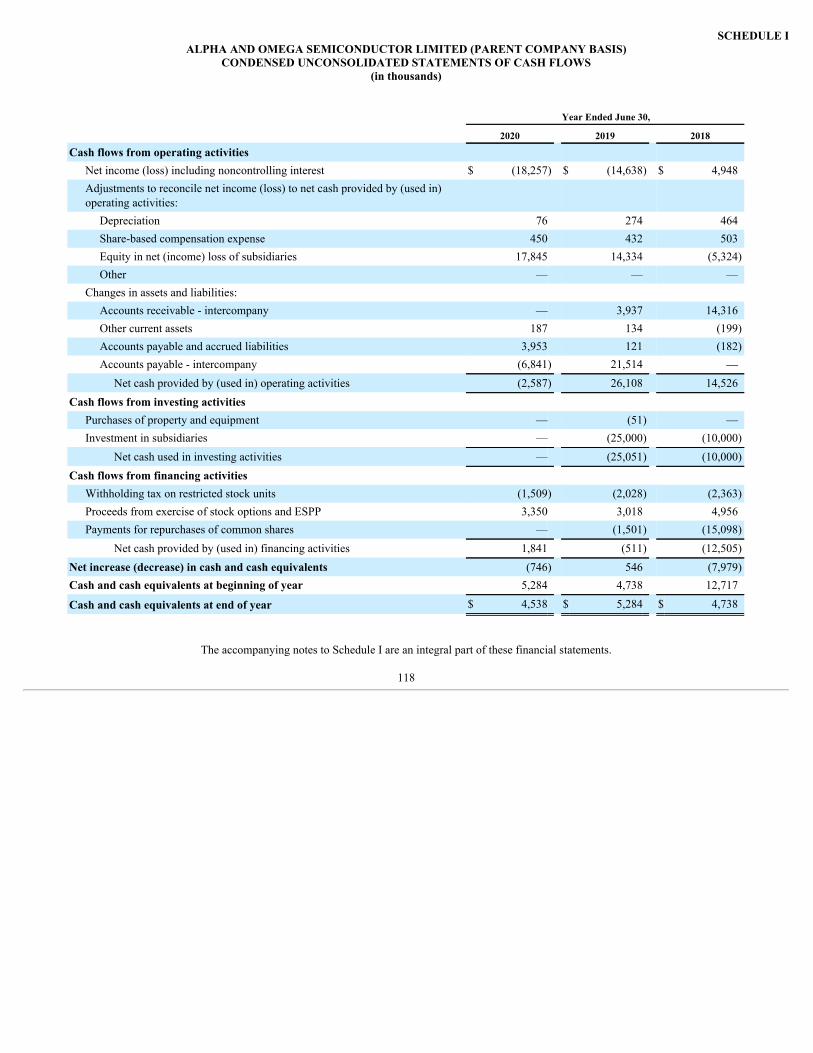
SCHEDULE IALPHA AND OMEGA SEMICONDUCTOR LIMITED (PARENT COMPANY BASIS)
CONDENSED UNCONSOLIDATED STATEMENTS OF CASH FLOWS(in thousands)
Year Ended June 30,
2020 2019 2018
Cash flows from operating activities Net income (loss) including noncontrolling interest $ (18,257) $ (14,638) $ 4,948Adjustments to reconcile net income (loss) to net cash provided by (used in)operating activities:
Depreciation 76 274 464Share-based compensation expense 450 432 503Equity in net (income) loss of subsidiaries 17,845 14,334 (5,324)Other — — —
Changes in assets and liabilities: Accounts receivable - intercompany — 3,937 14,316Other current assets 187 134 (199)Accounts payable and accrued liabilities 3,953 121 (182)Accounts payable - intercompany (6,841) 21,514 —
Net cash provided by (used in) operating activities (2,587) 26,108 14,526Cash flows from investing activities
Purchases of property and equipment — (51) —Investment in subsidiaries — (25,000) (10,000)
Net cash used in investing activities — (25,051) (10,000)Cash flows from financing activities
Withholding tax on restricted stock units (1,509) (2,028) (2,363)Proceeds from exercise of stock options and ESPP 3,350 3,018 4,956Payments for repurchases of common shares — (1,501) (15,098)
Net cash provided by (used in) financing activities 1,841 (511) (12,505)Net increase (decrease) in cash and cash equivalents (746) 546 (7,979)Cash and cash equivalents at beginning of year 5,284 4,738 12,717
Cash and cash equivalents at end of year $ 4,538 $ 5,284 $ 4,738
The accompanying notes to Schedule I are an integral part of these financial statements.
118
ALPHA AND OMEGA SEMICONDUCTOR LIMITED (PARENT COMPANY BASIS)NOTES TO THE CONDENSED UNCONSOLIDATED FINANCIAL STATEMENTS
1. Basis of Presentation
Alpha and Omega Semiconductor Limited is the parent company of all Alpha and Omega Semiconductor subsidiaries. It was incorporated in Bermuda onSeptember 27, 2000 as an exempted limited liability company. The address of its registered office is Clarendon House, 2 Church Street, Hamilton HM 11,Bermuda.
The accompanying condensed parent company financial statements have been prepared in accordance with Rule 12-04, Schedule I of Regulation S-X, as therestricted net assets of its subsidiaries exceed 25% of the consolidated net assets of Alpha and Omega Semiconductor Limited and its subsidiaries (the“Company”).
The parent company records its investment in subsidiaries under the equity method of accounting. Such investment is presented on the balance sheet as"Investment in subsidiaries" and the subsidiaries' net income (loss) are recognized based on the effective shareholding percentage as income on equity investmentin subsidiaries on the statement of operations. Intercompany balances and transactions have not been eliminated. The revenue recorded represents intercompanyadministrative service fees charged by the parent company starting in fiscal year 2013.
Certain information and footnote disclosures normally included in financial statements prepared in accordance with U.S. GAAP have been condensed oromitted. The footnote disclosures contain supplemental information relating to the operations of the Company and, as such, these statements should be read inconjunction with the notes to the consolidated financial statements of the Company.
2. Restricted net assets of subsidiaries
For a discussion of the Company’s restricted net assets of subsidiaries, see Note 12 of the Company’s consolidated financial statements.
3. Commitments and contingencies
For a discussion of the Company’s commitments and contingencies, see Note 13 to the Company’s consolidated financial statements.
119
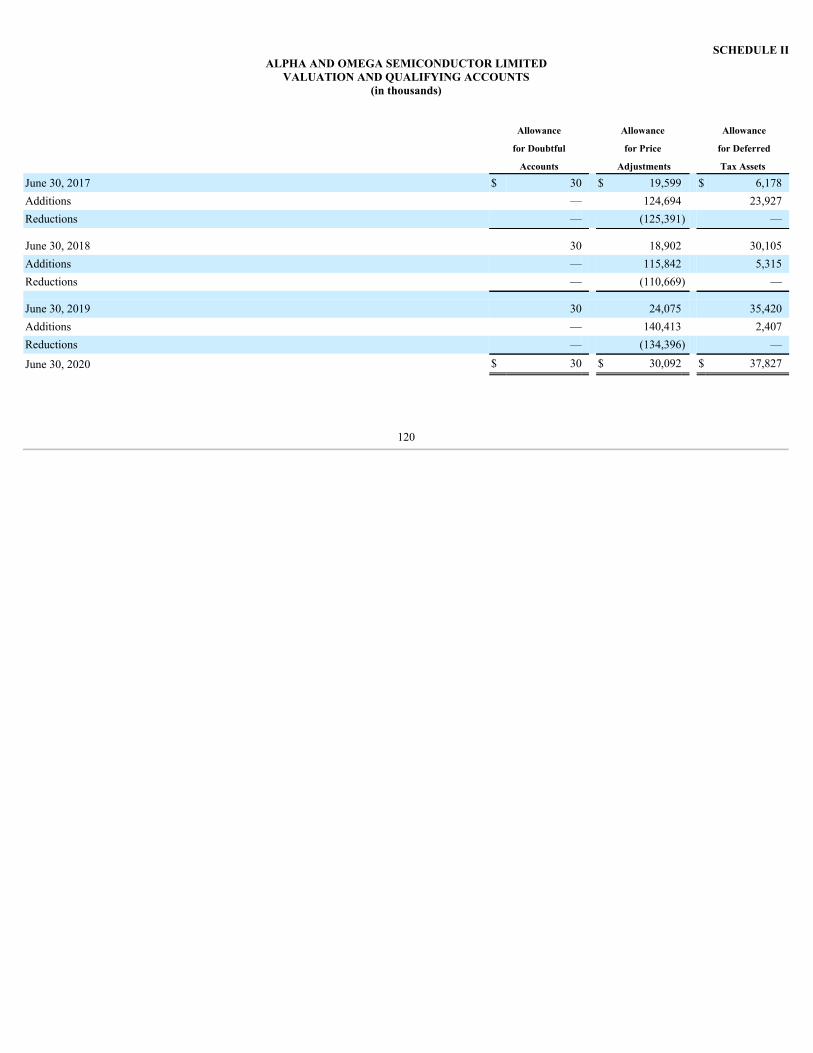
SCHEDULE IIALPHA AND OMEGA SEMICONDUCTOR LIMITED
VALUATION AND QUALIFYING ACCOUNTS(in thousands)
Allowance Allowance Allowance for Doubtful for Price for Deferred Accounts Adjustments Tax Assets
June 30, 2017 $ 30 $ 19,599 $ 6,178Additions — 124,694 23,927Reductions — (125,391) — June 30, 2018 30 18,902 30,105Additions — 115,842 5,315Reductions — (110,669) — June 30, 2019 30 24,075 35,420Additions — 140,413 2,407Reductions — (134,396) —
June 30, 2020 $ 30 $ 30,092 $ 37,827
120
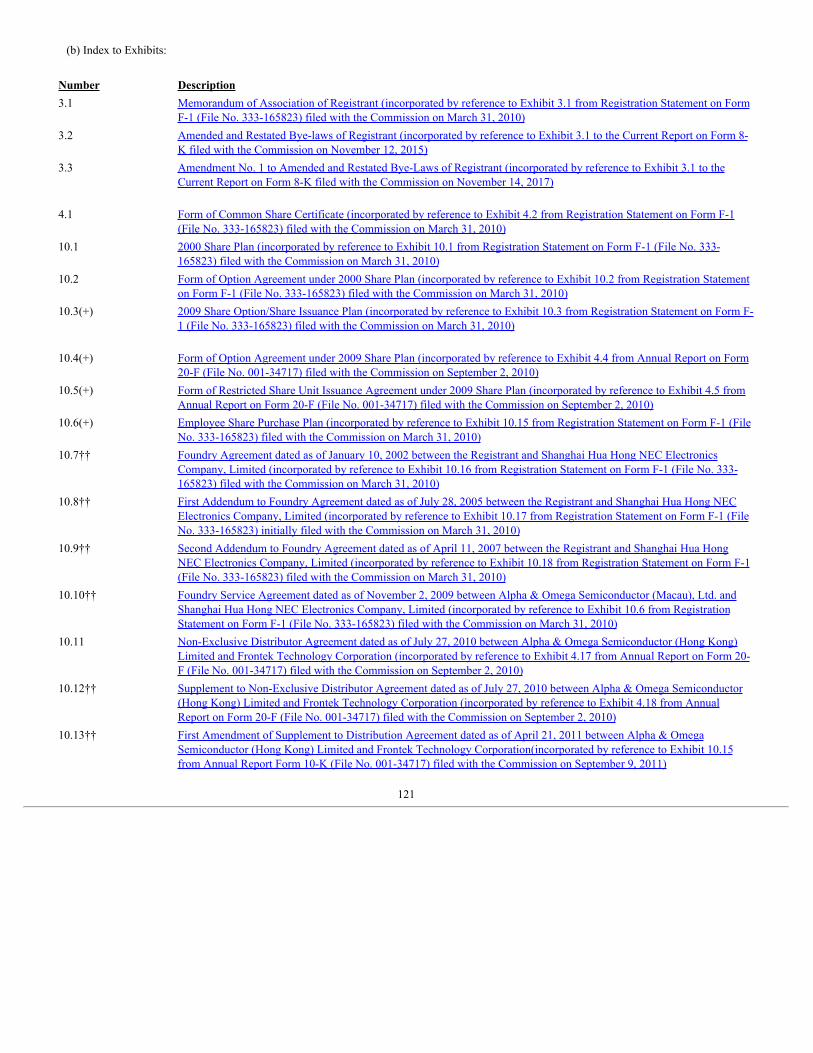
(b) Index to Exhibits:
Number Description3.1 Memorandum of Association of Registrant (incorporated by reference to Exhibit 3.1 from Registration Statement on Form
F-1 (File No. 333-165823) filed with the Commission on March 31, 2010)3.2 Amended and Restated Bye-laws of Registrant (incorporated by reference to Exhibit 3.1 to the Current Report on Form 8-
K filed with the Commission on November 12, 2015)3.3 Amendment No. 1 to Amended and Restated Bye-Laws of Registrant (incorporated by reference to Exhibit 3.1 to the
Current Report on Form 8-K filed with the Commission on November 14, 2017)
4.1 Form of Common Share Certificate (incorporated by reference to Exhibit 4.2 from Registration Statement on Form F-1(File No. 333-165823) filed with the Commission on March 31, 2010)
10.1 2000 Share Plan (incorporated by reference to Exhibit 10.1 from Registration Statement on Form F-1 (File No. 333-165823) filed with the Commission on March 31, 2010)
10.2 Form of Option Agreement under 2000 Share Plan (incorporated by reference to Exhibit 10.2 from Registration Statementon Form F-1 (File No. 333-165823) filed with the Commission on March 31, 2010)
10.3(+) 2009 Share Option/Share Issuance Plan (incorporated by reference to Exhibit 10.3 from Registration Statement on Form F-1 (File No. 333-165823) filed with the Commission on March 31, 2010)
10.4(+) Form of Option Agreement under 2009 Share Plan (incorporated by reference to Exhibit 4.4 from Annual Report on Form20-F (File No. 001-34717) filed with the Commission on September 2, 2010)
10.5(+) Form of Restricted Share Unit Issuance Agreement under 2009 Share Plan (incorporated by reference to Exhibit 4.5 fromAnnual Report on Form 20-F (File No. 001-34717) filed with the Commission on September 2, 2010)
10.6(+) Employee Share Purchase Plan (incorporated by reference to Exhibit 10.15 from Registration Statement on Form F-1 (FileNo. 333-165823) filed with the Commission on March 31, 2010)
10.7†† Foundry Agreement dated as of January 10, 2002 between the Registrant and Shanghai Hua Hong NEC ElectronicsCompany, Limited (incorporated by reference to Exhibit 10.16 from Registration Statement on Form F-1 (File No. 333-165823) filed with the Commission on March 31, 2010)
10.8†† First Addendum to Foundry Agreement dated as of July 28, 2005 between the Registrant and Shanghai Hua Hong NECElectronics Company, Limited (incorporated by reference to Exhibit 10.17 from Registration Statement on Form F-1 (FileNo. 333-165823) initially filed with the Commission on March 31, 2010)
10.9†† Second Addendum to Foundry Agreement dated as of April 11, 2007 between the Registrant and Shanghai Hua HongNEC Electronics Company, Limited (incorporated by reference to Exhibit 10.18 from Registration Statement on Form F-1(File No. 333-165823) filed with the Commission on March 31, 2010)
10.10†† Foundry Service Agreement dated as of November 2, 2009 between Alpha & Omega Semiconductor (Macau), Ltd. andShanghai Hua Hong NEC Electronics Company, Limited (incorporated by reference to Exhibit 10.6 from RegistrationStatement on Form F-1 (File No. 333-165823) filed with the Commission on March 31, 2010)
10.11 Non-Exclusive Distributor Agreement dated as of July 27, 2010 between Alpha & Omega Semiconductor (Hong Kong)Limited and Frontek Technology Corporation (incorporated by reference to Exhibit 4.17 from Annual Report on Form 20-F (File No. 001-34717) filed with the Commission on September 2, 2010)
10.12†† Supplement to Non-Exclusive Distributor Agreement dated as of July 27, 2010 between Alpha & Omega Semiconductor(Hong Kong) Limited and Frontek Technology Corporation (incorporated by reference to Exhibit 4.18 from AnnualReport on Form 20-F (File No. 001-34717) filed with the Commission on September 2, 2010)
10.13†† First Amendment of Supplement to Distribution Agreement dated as of April 21, 2011 between Alpha & OmegaSemiconductor (Hong Kong) Limited and Frontek Technology Corporation(incorporated by reference to Exhibit 10.15from Annual Report Form 10-K (File No. 001-34717) filed with the Commission on September 9, 2011)
121
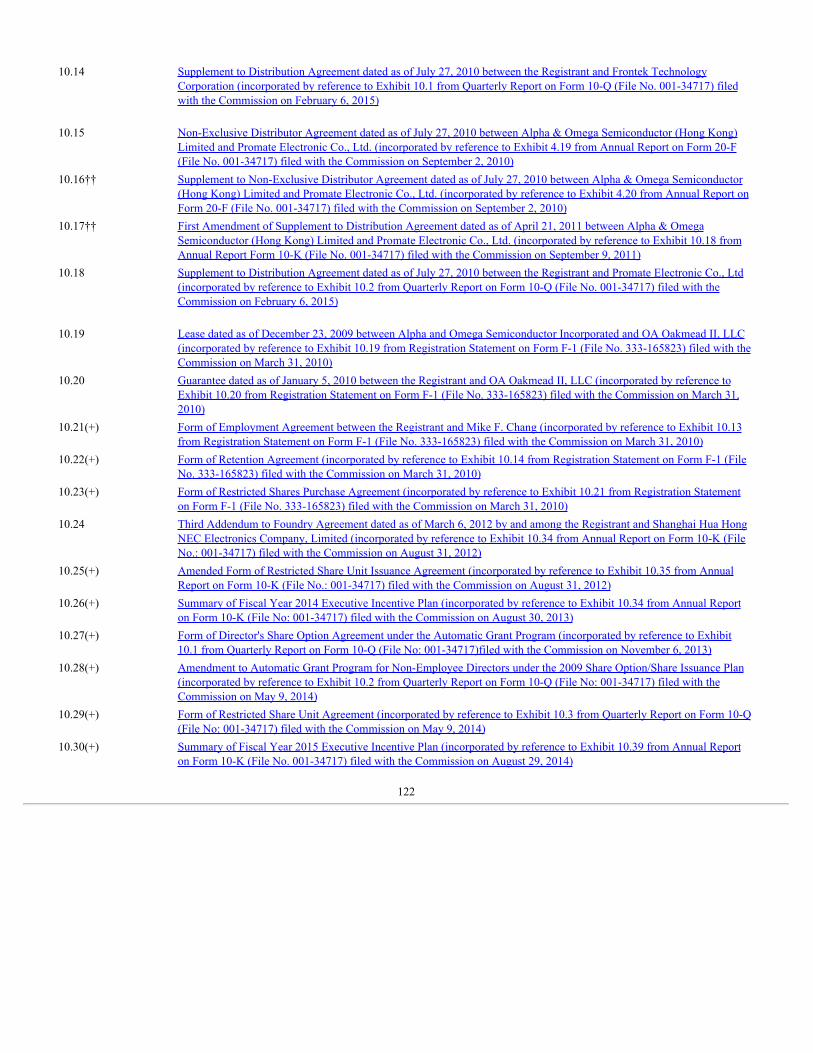
10.14 Supplement to Distribution Agreement dated as of July 27, 2010 between the Registrant and Frontek TechnologyCorporation (incorporated by reference to Exhibit 10.1 from Quarterly Report on Form 10-Q (File No. 001-34717) filedwith the Commission on February 6, 2015)
10.15 Non-Exclusive Distributor Agreement dated as of July 27, 2010 between Alpha & Omega Semiconductor (Hong Kong)Limited and Promate Electronic Co., Ltd. (incorporated by reference to Exhibit 4.19 from Annual Report on Form 20-F(File No. 001-34717) filed with the Commission on September 2, 2010)
10.16†† Supplement to Non-Exclusive Distributor Agreement dated as of July 27, 2010 between Alpha & Omega Semiconductor(Hong Kong) Limited and Promate Electronic Co., Ltd. (incorporated by reference to Exhibit 4.20 from Annual Report onForm 20-F (File No. 001-34717) filed with the Commission on September 2, 2010)
10.17†† First Amendment of Supplement to Distribution Agreement dated as of April 21, 2011 between Alpha & OmegaSemiconductor (Hong Kong) Limited and Promate Electronic Co., Ltd. (incorporated by reference to Exhibit 10.18 fromAnnual Report Form 10-K (File No. 001-34717) filed with the Commission on September 9, 2011)
10.18 Supplement to Distribution Agreement dated as of July 27, 2010 between the Registrant and Promate Electronic Co., Ltd(incorporated by reference to Exhibit 10.2 from Quarterly Report on Form 10-Q (File No. 001-34717) filed with theCommission on February 6, 2015)
10.19 Lease dated as of December 23, 2009 between Alpha and Omega Semiconductor Incorporated and OA Oakmead II, LLC(incorporated by reference to Exhibit 10.19 from Registration Statement on Form F-1 (File No. 333-165823) filed with theCommission on March 31, 2010)
10.20 Guarantee dated as of January 5, 2010 between the Registrant and OA Oakmead II, LLC (incorporated by reference toExhibit 10.20 from Registration Statement on Form F-1 (File No. 333-165823) filed with the Commission on March 31,2010)
10.21(+) Form of Employment Agreement between the Registrant and Mike F. Chang (incorporated by reference to Exhibit 10.13from Registration Statement on Form F-1 (File No. 333-165823) filed with the Commission on March 31, 2010)
10.22(+) Form of Retention Agreement (incorporated by reference to Exhibit 10.14 from Registration Statement on Form F-1 (FileNo. 333-165823) filed with the Commission on March 31, 2010)
10.23(+) Form of Restricted Shares Purchase Agreement (incorporated by reference to Exhibit 10.21 from Registration Statementon Form F-1 (File No. 333-165823) filed with the Commission on March 31, 2010)
10.24 Third Addendum to Foundry Agreement dated as of March 6, 2012 by and among the Registrant and Shanghai Hua HongNEC Electronics Company, Limited (incorporated by reference to Exhibit 10.34 from Annual Report on Form 10-K (FileNo.: 001-34717) filed with the Commission on August 31, 2012)
10.25(+) Amended Form of Restricted Share Unit Issuance Agreement (incorporated by reference to Exhibit 10.35 from AnnualReport on Form 10-K (File No.: 001-34717) filed with the Commission on August 31, 2012)
10.26(+) Summary of Fiscal Year 2014 Executive Incentive Plan (incorporated by reference to Exhibit 10.34 from Annual Reporton Form 10-K (File No: 001-34717) filed with the Commission on August 30, 2013)
10.27(+) Form of Director's Share Option Agreement under the Automatic Grant Program (incorporated by reference to Exhibit10.1 from Quarterly Report on Form 10-Q (File No: 001-34717)filed with the Commission on November 6, 2013)
10.28(+) Amendment to Automatic Grant Program for Non-Employee Directors under the 2009 Share Option/Share Issuance Plan(incorporated by reference to Exhibit 10.2 from Quarterly Report on Form 10-Q (File No: 001-34717) filed with theCommission on May 9, 2014)
10.29(+) Form of Restricted Share Unit Agreement (incorporated by reference to Exhibit 10.3 from Quarterly Report on Form 10-Q(File No: 001-34717) filed with the Commission on May 9, 2014)
10.30(+) Summary of Fiscal Year 2015 Executive Incentive Plan (incorporated by reference to Exhibit 10.39 from Annual Reporton Form 10-K (File No. 001-34717) filed with the Commission on August 29, 2014)
122
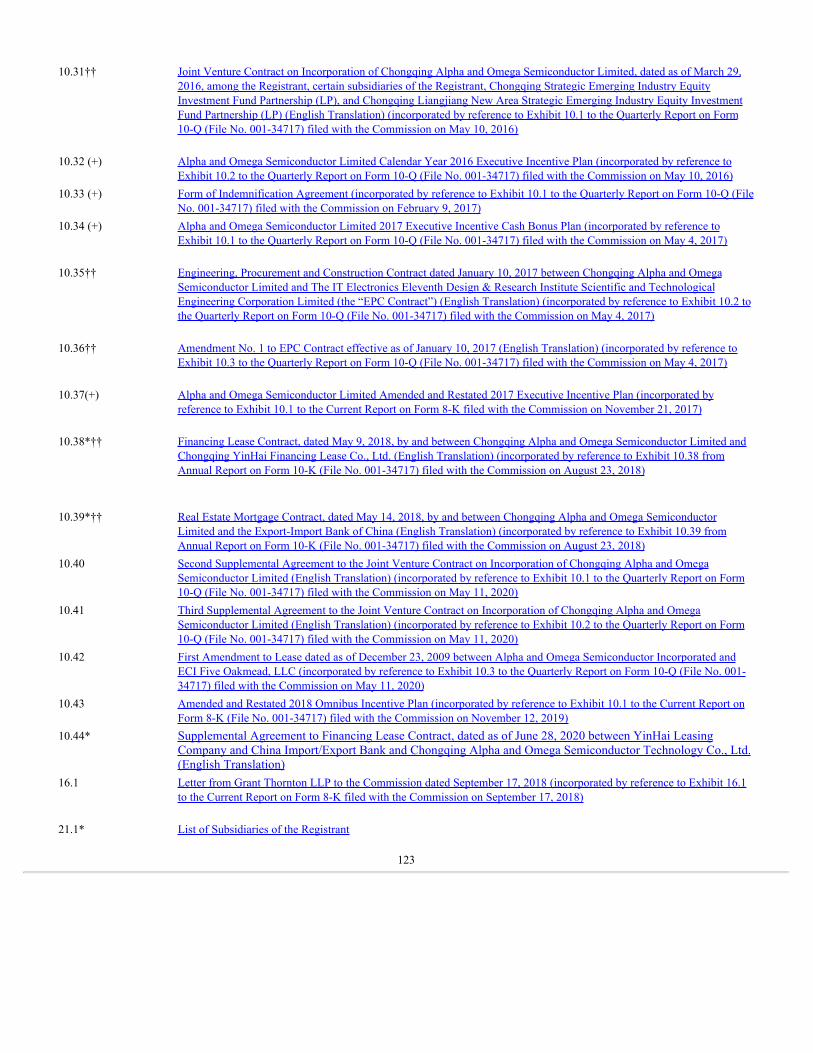
10.31†† Joint Venture Contract on Incorporation of Chongqing Alpha and Omega Semiconductor Limited, dated as of March 29,2016, among the Registrant, certain subsidiaries of the Registrant, Chongqing Strategic Emerging Industry EquityInvestment Fund Partnership (LP), and Chongqing Liangjiang New Area Strategic Emerging Industry Equity InvestmentFund Partnership (LP) (English Translation) (incorporated by reference to Exhibit 10.1 to the Quarterly Report on Form10-Q (File No. 001-34717) filed with the Commission on May 10, 2016)
10.32 (+) Alpha and Omega Semiconductor Limited Calendar Year 2016 Executive Incentive Plan (incorporated by reference toExhibit 10.2 to the Quarterly Report on Form 10-Q (File No. 001-34717) filed with the Commission on May 10, 2016)
10.33 (+) Form of Indemnification Agreement (incorporated by reference to Exhibit 10.1 to the Quarterly Report on Form 10-Q (FileNo. 001-34717) filed with the Commission on February 9, 2017)
10.34 (+) Alpha and Omega Semiconductor Limited 2017 Executive Incentive Cash Bonus Plan (incorporated by reference toExhibit 10.1 to the Quarterly Report on Form 10-Q (File No. 001-34717) filed with the Commission on May 4, 2017)
10.35†† Engineering, Procurement and Construction Contract dated January 10, 2017 between Chongqing Alpha and OmegaSemiconductor Limited and The IT Electronics Eleventh Design & Research Institute Scientific and TechnologicalEngineering Corporation Limited (the “EPC Contract”) (English Translation) (incorporated by reference to Exhibit 10.2 tothe Quarterly Report on Form 10-Q (File No. 001-34717) filed with the Commission on May 4, 2017)
10.36†† Amendment No. 1 to EPC Contract effective as of January 10, 2017 (English Translation) (incorporated by reference toExhibit 10.3 to the Quarterly Report on Form 10-Q (File No. 001-34717) filed with the Commission on May 4, 2017)
10.37(+) Alpha and Omega Semiconductor Limited Amended and Restated 2017 Executive Incentive Plan (incorporated byreference to Exhibit 10.1 to the Current Report on Form 8-K filed with the Commission on November 21, 2017)
10.38*†† Financing Lease Contract, dated May 9, 2018, by and between Chongqing Alpha and Omega Semiconductor Limited andChongqing YinHai Financing Lease Co., Ltd. (English Translation) (incorporated by reference to Exhibit 10.38 fromAnnual Report on Form 10-K (File No. 001-34717) filed with the Commission on August 23, 2018)
10.39*†† Real Estate Mortgage Contract, dated May 14, 2018, by and between Chongqing Alpha and Omega SemiconductorLimited and the Export-Import Bank of China (English Translation) (incorporated by reference to Exhibit 10.39 fromAnnual Report on Form 10-K (File No. 001-34717) filed with the Commission on August 23, 2018)
10.40 Second Supplemental Agreement to the Joint Venture Contract on Incorporation of Chongqing Alpha and OmegaSemiconductor Limited (English Translation) (incorporated by reference to Exhibit 10.1 to the Quarterly Report on Form10-Q (File No. 001-34717) filed with the Commission on May 11, 2020)
10.41 Third Supplemental Agreement to the Joint Venture Contract on Incorporation of Chongqing Alpha and OmegaSemiconductor Limited (English Translation) (incorporated by reference to Exhibit 10.2 to the Quarterly Report on Form10-Q (File No. 001-34717) filed with the Commission on May 11, 2020)
10.42 First Amendment to Lease dated as of December 23, 2009 between Alpha and Omega Semiconductor Incorporated andECI Five Oakmead, LLC (incorporated by reference to Exhibit 10.3 to the Quarterly Report on Form 10-Q (File No. 001-34717) filed with the Commission on May 11, 2020)
10.43 Amended and Restated 2018 Omnibus Incentive Plan (incorporated by reference to Exhibit 10.1 to the Current Report onForm 8-K (File No. 001-34717) filed with the Commission on November 12, 2019)
10.44* Supplemental Agreement to Financing Lease Contract, dated as of June 28, 2020 between YinHai LeasingCompany and China Import/Export Bank and Chongqing Alpha and Omega Semiconductor Technology Co., Ltd.(English Translation)
16.1 Letter from Grant Thornton LLP to the Commission dated September 17, 2018 (incorporated by reference to Exhibit 16.1to the Current Report on Form 8-K filed with the Commission on September 17, 2018)
21.1* List of Subsidiaries of the Registrant
123
23.1* Consent of BDO USA, LLP, independent registered public accounting firm23.2* Consent of Grant Thornton LLP, independent registered public accounting firm
31.1* Certification of Chief Executive Officer required by Rule 13(a)-14(a) under the Exchange Act31.2* Certification of Chief Financial Officer required by Rule 13(a)-14(a) under the Exchange Act32.1* Certification of Chief Executive Officer required by Rule 13a-14(b) under the Exchange Act and Section 1350 of Chapter
63 of Title 18 of the United States Code32.2* Certification of Chief Financial Officer required by Rule 13a-14(b) under the Exchange Act and Section 1350 of Chapter
63 of Title 18 of the United States Code101.INS XBRL Instance101.SCH XBRL Taxonomy Extension Schema101.CAL XBRL Taxonomy Extension Calculation101.DEF XBRL Taxonomy Extension Definition101.LAB XBRL Taxonomy Extension Labels101.PRE XBRL Taxonomy Extension Presentation
* Filed with this Annual Report on Form 10-K.
†† Confidential treatment has been granted for certain information contained in this document pursuant to an order of the Securities and Exchange Commission.Such information has been omitted and filed separately with the Securities and Exchange Commission.
(+) Indicates management contract or compensatory plan or arrangement.
124

SIGNATURES
Pursuant to the requirements of Section 13 or 15(d) of the Securities Exchange Act of 1934, the Registrant has duly caused this report to be signed on itsbehalf by the undersigned, thereunto duly authorized. September 2, 2020
ALPHA AND OMEGA SEMICONDUCTOR LIMITED By: /s/ MIKE F. CHANG Mike F. Chang Chief Executive Officer (Principal Executive Officer)
125
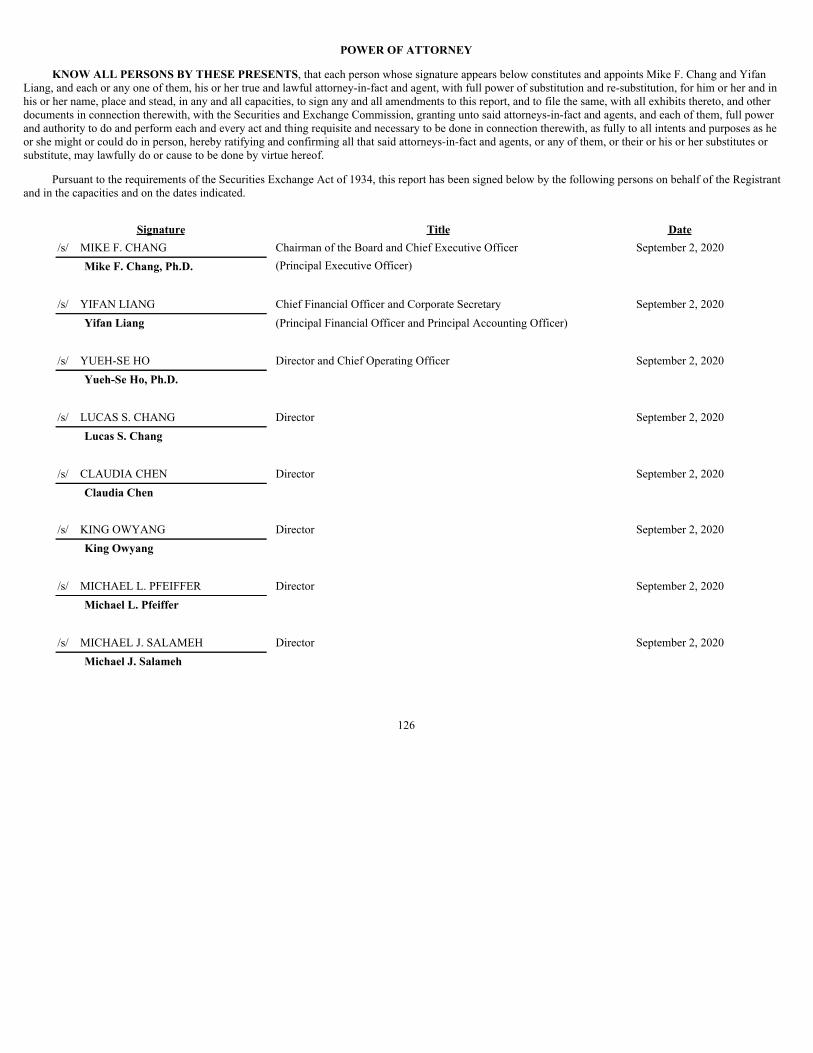
POWER OF ATTORNEY
KNOW ALL PERSONS BY THESE PRESENTS, that each person whose signature appears below constitutes and appoints Mike F. Chang and YifanLiang, and each or any one of them, his or her true and lawful attorney-in-fact and agent, with full power of substitution and re-substitution, for him or her and inhis or her name, place and stead, in any and all capacities, to sign any and all amendments to this report, and to file the same, with all exhibits thereto, and otherdocuments in connection therewith, with the Securities and Exchange Commission, granting unto said attorneys-in-fact and agents, and each of them, full powerand authority to do and perform each and every act and thing requisite and necessary to be done in connection therewith, as fully to all intents and purposes as heor she might or could do in person, hereby ratifying and confirming all that said attorneys-in-fact and agents, or any of them, or their or his or her substitutes orsubstitute, may lawfully do or cause to be done by virtue hereof.
Pursuant to the requirements of the Securities Exchange Act of 1934, this report has been signed below by the following persons on behalf of the Registrantand in the capacities and on the dates indicated.
Signature Title Date/s/ MIKE F. CHANG Chairman of the Board and Chief Executive Officer September 2, 2020
Mike F. Chang, Ph.D. (Principal Executive Officer)
/s/ YIFAN LIANG Chief Financial Officer and Corporate Secretary September 2, 2020Yifan Liang (Principal Financial Officer and Principal Accounting Officer)
/s/ YUEH-SE HO Director and Chief Operating Officer September 2, 2020Yueh-Se Ho, Ph.D.
/s/ LUCAS S. CHANG Director September 2, 2020Lucas S. Chang
/s/ CLAUDIA CHEN Director September 2, 2020Claudia Chen
/s/ KING OWYANG Director September 2, 2020
King Owyang
/s/ MICHAEL L. PFEIFFER Director September 2, 2020Michael L. Pfeiffer
/s/ MICHAEL J. SALAMEH Director September 2, 2020Michael J. Salameh
126
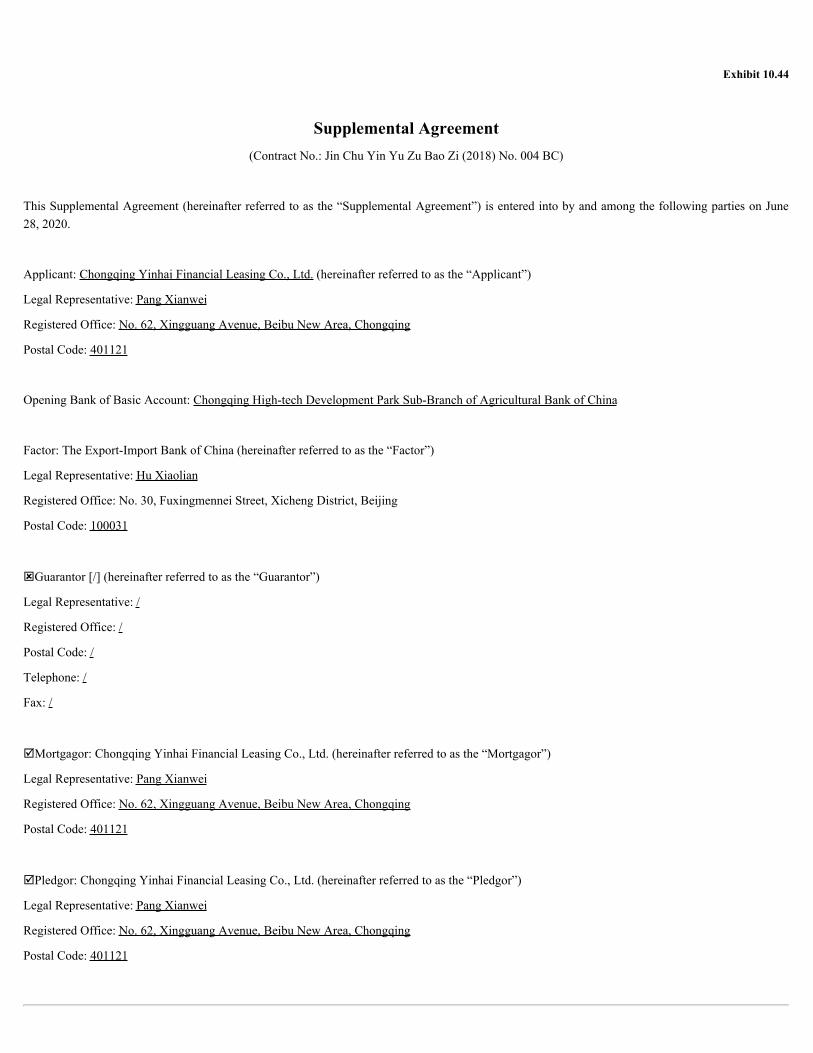
Exhibit 10.44
Supplemental Agreement(Contract No.: Jin Chu Yin Yu Zu Bao Zi (2018) No. 004 BC)
This Supplemental Agreement (hereinafter referred to as the “Supplemental Agreement”) is entered into by and among the following parties on June28, 2020.
Applicant: Chongqing Yinhai Financial Leasing Co., Ltd. (hereinafter referred to as the “Applicant”)
Legal Representative: Pang Xianwei
Registered Office: No. 62, Xingguang Avenue, Beibu New Area, Chongqing
Postal Code: 401121
Opening Bank of Basic Account: Chongqing High-tech Development Park Sub-Branch of Agricultural Bank of China
Factor: The Export-Import Bank of China (hereinafter referred to as the “Factor”)
Legal Representative: Hu Xiaolian
Registered Office: No. 30, Fuxingmennei Street, Xicheng District, Beijing
Postal Code: 100031
ýGuarantor [/] (hereinafter referred to as the “Guarantor”)
Legal Representative: /
Registered Office: /
Postal Code: /
Telephone: /
Fax: /
þMortgagor: Chongqing Yinhai Financial Leasing Co., Ltd. (hereinafter referred to as the “Mortgagor”)
Legal Representative: Pang Xianwei
Registered Office: No. 62, Xingguang Avenue, Beibu New Area, Chongqing
Postal Code: 401121
þPledgor: Chongqing Yinhai Financial Leasing Co., Ltd. (hereinafter referred to as the “Pledgor”)
Legal Representative: Pang Xianwei
Registered Office: No. 62, Xingguang Avenue, Beibu New Area, Chongqing
Postal Code: 401121
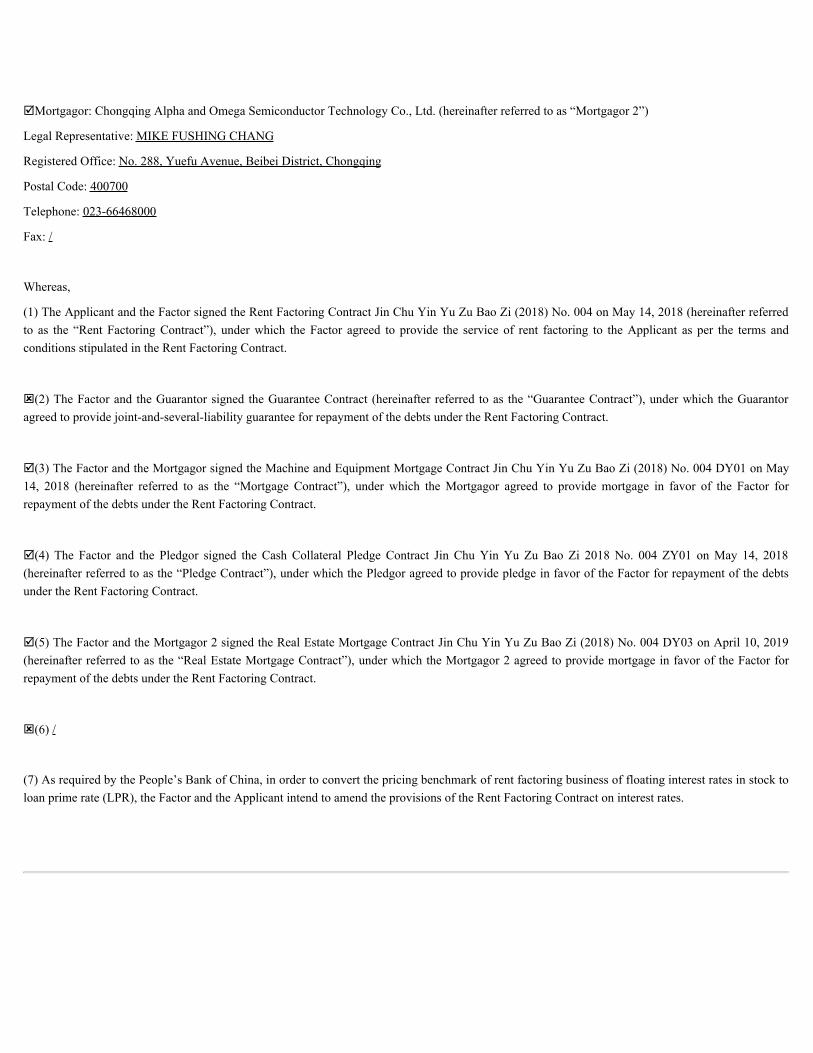
þMortgagor: Chongqing Alpha and Omega Semiconductor Technology Co., Ltd. (hereinafter referred to as “Mortgagor 2”)
Legal Representative: MIKE FUSHING CHANG
Registered Office: No. 288, Yuefu Avenue, Beibei District, Chongqing
Postal Code: 400700
Telephone: 023-66468000
Fax: /
Whereas,
(1) The Applicant and the Factor signed the Rent Factoring Contract Jin Chu Yin Yu Zu Bao Zi (2018) No. 004 on May 14, 2018 (hereinafter referredto as the “Rent Factoring Contract”), under which the Factor agreed to provide the service of rent factoring to the Applicant as per the terms andconditions stipulated in the Rent Factoring Contract.
ý(2) The Factor and the Guarantor signed the Guarantee Contract (hereinafter referred to as the “Guarantee Contract”), under which the Guarantoragreed to provide joint-and-several-liability guarantee for repayment of the debts under the Rent Factoring Contract.
þ(3) The Factor and the Mortgagor signed the Machine and Equipment Mortgage Contract Jin Chu Yin Yu Zu Bao Zi (2018) No. 004 DY01 on May14, 2018 (hereinafter referred to as the “Mortgage Contract”), under which the Mortgagor agreed to provide mortgage in favor of the Factor forrepayment of the debts under the Rent Factoring Contract.
þ(4) The Factor and the Pledgor signed the Cash Collateral Pledge Contract Jin Chu Yin Yu Zu Bao Zi 2018 No. 004 ZY01 on May 14, 2018(hereinafter referred to as the “Pledge Contract”), under which the Pledgor agreed to provide pledge in favor of the Factor for repayment of the debtsunder the Rent Factoring Contract.
þ(5) The Factor and the Mortgagor 2 signed the Real Estate Mortgage Contract Jin Chu Yin Yu Zu Bao Zi (2018) No. 004 DY03 on April 10, 2019(hereinafter referred to as the “Real Estate Mortgage Contract”), under which the Mortgagor 2 agreed to provide mortgage in favor of the Factor forrepayment of the debts under the Rent Factoring Contract.
ý(6) /
(7) As required by the People’s Bank of China, in order to convert the pricing benchmark of rent factoring business of floating interest rates in stock toloan prime rate (LPR), the Factor and the Applicant intend to amend the provisions of the Rent Factoring Contract on interest rates.

The Factor, the Applicant, ý the Guarantor, þ the Mortgagor, þ the Pledgor, and þ the Mortgagor 2 are hereinafter collectively referred to as the“Parties”, and individually as a “Party”.
The Parties, through consultation, hereby agree to enter into the following Supplemental Agreement as the supplement and amendment to the RentFactoring Contract, ý the Guarantee Contract, þ the Mortgage Contract, þ the Pledge Contract and þ the Real Estate Contract:
Article 1 All definitions and terms in the Supplemental Agreement shall have the same meanings with those defined in the Rent Factoring Contract, ýthe Guarantee Contract, þ the Mortgage Contract, þ the Pledge Contract and þ the Real Estate Mortgage Contract unless otherwise stipulated in theSupplemental Agreement.
Article 2 As of the signing date of the Agreement (hereinafter referred to as the “Interest Rate Conversion Day”), the Financing Rate in the RentFactoring Contract shall be determined by the following provisions:
þ For financing by RMB rent factoring, the Financing Rate shall be determined by LPR at ý 1 year þ over 5 years þ plus ý minus 0.8125%. TheFinancing Rate shall be determined on a ý monthly þ quarterly ý semiannually ý annually basis. The Financing Rate floating day shall be calculatedfrom þ Interest Rate Conversion Day ý value date. The value of the LPR shall be the LPR applicable to the working day before the Interest RateConversion Day, commencing on the same day of the next period. Once the floating rate is determined, it shall not be changed during the floatingperiod. After expiry of the floating period, the rate for the next floating period shall be determined by the corresponding LPR.
ý For financing by RMB rent factoring, the fixed annual interest rate of percent ( %) is applied, which equals to the LPR applicable in the working daybefore ý Interest Rate Conversion Day ý value date ý for ý 1 year þ over 5 years ý plus ý minus %.
þ Article 3 To avoid any doubt, before the Interest Rate Conversion Day, the Financing Rate of the financing by RMB rent factoring shall still bedetermined by the previous interest rate in the Rent Factoring Contract before the amendment in the Supplemental Agreement and interests on thefinancing shall be calculated and collected from the Applicant.
Article 4 The Supplemental Agreement, as the amendment and supplement to the Rent Factoring Contract, is an integral part of the Rent FactoringContract. Terms in the Supplemental Agreement shall not affect the force of other terms in the Rent Factoring Contract except those amended andsupplemented in the Supplemental Agreement.
ý The Guarantor, þ the Mortgagor, þ the Pledgor, and þ the Mortgagor 2 hereby confirm that: (1) the guarantee scope, security scope, and debtssecured under ý the Guarantee Contract, þ the Mortgage Contract, þ the Pledge Contract and þ the Real Estate Mortgage Contract include the debtsof the Applicant under the Rent Factoring Contract as amended by the Supplemental Agreement; (2) the security measures created in ý the GuaranteeContract, þ the Mortgage Contract, þ the

Pledge Contract and þ the Real Estate Mortgage Contract are all legal and effective; and (3) their obligations under ý the Guarantee Contract, þ theMortgage Contract, þ the Pledge Contract and þ the Real Estate Mortgage Contract remain legally binding on them.
Article 5 After the Supplemental Agreement takes effect, no Party shall unilaterally modify, suspend or terminate the same. Any modification orsupplement to the Supplemental Agreement shall be made through consultation among the Parties in the form of written supplemental agreements, andshall only be valid with signature of the legal representatives or authorized signatories and the official seal of the Parties.
Article 6 The Supplemental Agreement is governed by the same law and applies the same dispute resolution method as the Rent Factoring Contract.
Article 7 The Parties all confirm that signing and performance of the Supplemental Agreement are the true expression of their intentions, and they havelawfully completed all internal procedures and obtained all company authorizations necessary for signing of the Supplemental Agreement.
Article 8 The Supplemental Agreement comes into effect when it is signed by the legal representatives or authorized signatories of the Parties andsealed with their official seals. The original of the Supplemental Agreement is made in triplicate with each Party holding one copy.
(Remainder of Page Intentionally Left Blank)
Signature Page
Applicant (Seal): Chongqing Yinhai Financial Leasing Co., Ltd.
Legal Representative (or Authorized Signatory) (Signature): /s/Pang Xianwei
Factor (Seal): The Export-Import Bank of China
Legal Representative (or Authorized Signatory) (Signature): /s/Yang Dongzhi
ýGuarantor (Seal):
Legal Representative (or Authorized Signatory) (Signature):
oMortgagor (Seal): Chongqing Yinhai Financial Leasing Co., Ltd.
Legal Representative (or Authorized Signatory) (Signature): /s/Pang Xianwei
oPledgor (Seal): Chongqing Yinhai Financial Leasing Co., Ltd.
Legal Representative (or Authorized Signatory) (Signature): /s/Pang Xianwei
oMortgagor 2 (Seal): Chongqing Alpha and Omega Semiconductor Technology Co., Ltd.
Legal Representative (or Authorized Signatory) (Signature): /s/Mike FuShing Chang
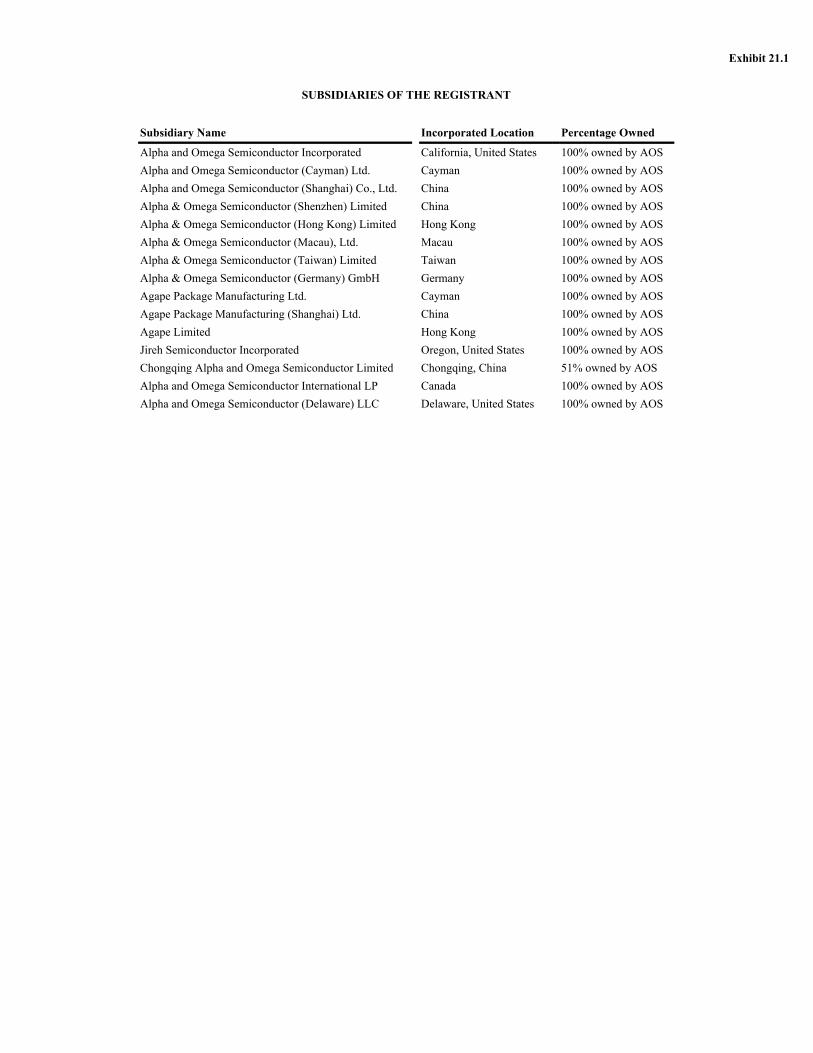
Exhibit 21.1
SUBSIDIARIES OF THE REGISTRANT
Subsidiary Name Incorporated Location Percentage Owned
Alpha and Omega Semiconductor Incorporated California, United States 100% owned by AOSAlpha and Omega Semiconductor (Cayman) Ltd. Cayman 100% owned by AOSAlpha and Omega Semiconductor (Shanghai) Co., Ltd. China 100% owned by AOSAlpha & Omega Semiconductor (Shenzhen) Limited China 100% owned by AOSAlpha & Omega Semiconductor (Hong Kong) Limited Hong Kong 100% owned by AOSAlpha & Omega Semiconductor (Macau), Ltd. Macau 100% owned by AOSAlpha & Omega Semiconductor (Taiwan) Limited Taiwan 100% owned by AOSAlpha & Omega Semiconductor (Germany) GmbH Germany 100% owned by AOSAgape Package Manufacturing Ltd. Cayman 100% owned by AOSAgape Package Manufacturing (Shanghai) Ltd. China 100% owned by AOSAgape Limited Hong Kong 100% owned by AOSJireh Semiconductor Incorporated Oregon, United States 100% owned by AOSChongqing Alpha and Omega Semiconductor Limited Chongqing, China 51% owned by AOSAlpha and Omega Semiconductor International LP Canada 100% owned by AOSAlpha and Omega Semiconductor (Delaware) LLC Delaware, United States 100% owned by AOS

Exhibit 23.1
CONSENT OF INDEPENDENT REGISTERED PUBLIC ACCOUNTING FIRM
Alpha and Omega Semiconductor LimitedSunnyvale, California
We hereby consent to the incorporation by reference in the Registration Statements on Form S3/A (No. 333-214666) and Form S8 (No.333-166403,333-172173,333-180126, 333-186480, 333-190935, 333-207987, and 333-228297) of Alpha and Omega Semiconductor Limited of our reports dated September 2, 2020,relating to the consolidated financial statements and financial statement schedules as of and for the year ended June 30, 2020 and 2019, and the effectiveness ofAlpha and Omega Semiconductor Limited’s internal control over financial reporting as of June 30, 2020, which appear in this Form10-K.
/s/ BDO USA, LLPSan Jose, CaliforniaSeptember 2, 2020

Exhibit 23.2
CONSENT OF INDEPENDENT REGISTERED PUBLIC ACCOUNTING FIRM
We have issued our report dated August 23, 2018, with respect to the consolidated financial statements included in the Annual Report of Alpha and OmegaSemiconductor Ltd. on Form 10-K for the year ended June 30, 2020. We consent to the incorporation by reference of said report in the Registration Statements ofAlpha and Omega Semiconductor Ltd. on Forms S-8 (File Nos. 333-207987, 333-190935, 333-186480, 333-180126, 333-172173, and 333-166403); Form S-3 andForm S-3/A (File No. 333-214666).
/s/ GRANT THORNTON LLP
San Francisco, CaliforniaSeptember 2, 2020
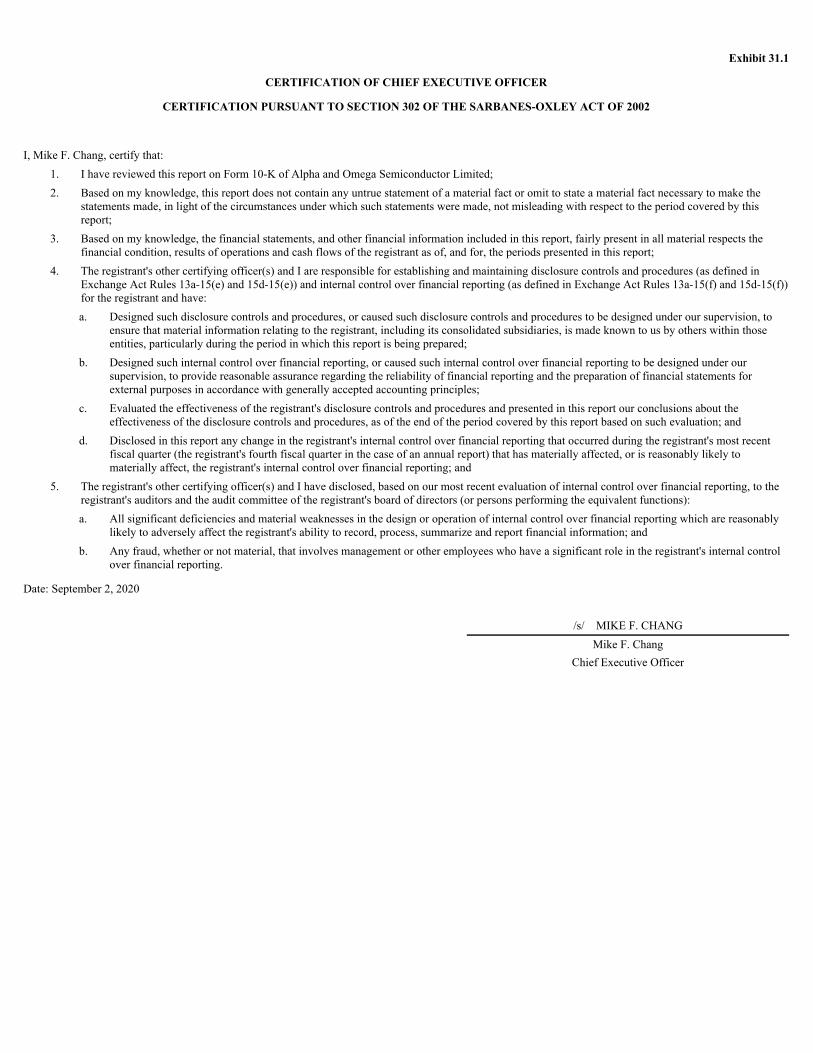
Exhibit 31.1
CERTIFICATION OF CHIEF EXECUTIVE OFFICER
CERTIFICATION PURSUANT TO SECTION 302 OF THE SARBANES-OXLEY ACT OF 2002
I, Mike F. Chang, certify that:1. I have reviewed this report on Form 10-K of Alpha and Omega Semiconductor Limited;2. Based on my knowledge, this report does not contain any untrue statement of a material fact or omit to state a material fact necessary to make the
statements made, in light of the circumstances under which such statements were made, not misleading with respect to the period covered by thisreport;
3. Based on my knowledge, the financial statements, and other financial information included in this report, fairly present in all material respects thefinancial condition, results of operations and cash flows of the registrant as of, and for, the periods presented in this report;
4. The registrant's other certifying officer(s) and I are responsible for establishing and maintaining disclosure controls and procedures (as defined inExchange Act Rules 13a-15(e) and 15d-15(e)) and internal control over financial reporting (as defined in Exchange Act Rules 13a-15(f) and 15d-15(f))for the registrant and have:a. Designed such disclosure controls and procedures, or caused such disclosure controls and procedures to be designed under our supervision, to
ensure that material information relating to the registrant, including its consolidated subsidiaries, is made known to us by others within thoseentities, particularly during the period in which this report is being prepared;
b. Designed such internal control over financial reporting, or caused such internal control over financial reporting to be designed under oursupervision, to provide reasonable assurance regarding the reliability of financial reporting and the preparation of financial statements forexternal purposes in accordance with generally accepted accounting principles;
c. Evaluated the effectiveness of the registrant's disclosure controls and procedures and presented in this report our conclusions about theeffectiveness of the disclosure controls and procedures, as of the end of the period covered by this report based on such evaluation; and
d. Disclosed in this report any change in the registrant's internal control over financial reporting that occurred during the registrant's most recentfiscal quarter (the registrant's fourth fiscal quarter in the case of an annual report) that has materially affected, or is reasonably likely tomaterially affect, the registrant's internal control over financial reporting; and
5. The registrant's other certifying officer(s) and I have disclosed, based on our most recent evaluation of internal control over financial reporting, to theregistrant's auditors and the audit committee of the registrant's board of directors (or persons performing the equivalent functions):a. All significant deficiencies and material weaknesses in the design or operation of internal control over financial reporting which are reasonably
likely to adversely affect the registrant's ability to record, process, summarize and report financial information; andb. Any fraud, whether or not material, that involves management or other employees who have a significant role in the registrant's internal control
over financial reporting.
Date: September 2, 2020
/s/ MIKE F. CHANGMike F. Chang
Chief Executive Officer
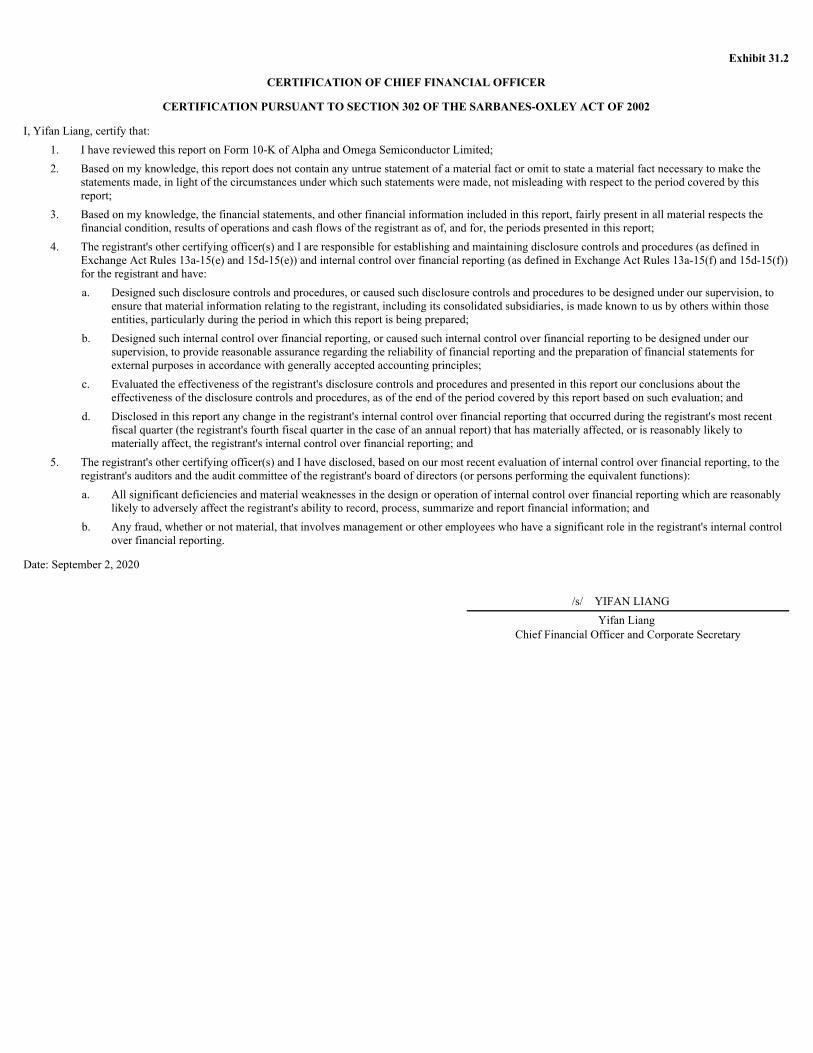
Exhibit 31.2
CERTIFICATION OF CHIEF FINANCIAL OFFICER
CERTIFICATION PURSUANT TO SECTION 302 OF THE SARBANES-OXLEY ACT OF 2002
I, Yifan Liang, certify that:1. I have reviewed this report on Form 10-K of Alpha and Omega Semiconductor Limited;2. Based on my knowledge, this report does not contain any untrue statement of a material fact or omit to state a material fact necessary to make the
statements made, in light of the circumstances under which such statements were made, not misleading with respect to the period covered by thisreport;
3. Based on my knowledge, the financial statements, and other financial information included in this report, fairly present in all material respects thefinancial condition, results of operations and cash flows of the registrant as of, and for, the periods presented in this report;
4. The registrant's other certifying officer(s) and I are responsible for establishing and maintaining disclosure controls and procedures (as defined inExchange Act Rules 13a-15(e) and 15d-15(e)) and internal control over financial reporting (as defined in Exchange Act Rules 13a-15(f) and 15d-15(f))for the registrant and have:a. Designed such disclosure controls and procedures, or caused such disclosure controls and procedures to be designed under our supervision, to
ensure that material information relating to the registrant, including its consolidated subsidiaries, is made known to us by others within thoseentities, particularly during the period in which this report is being prepared;
b. Designed such internal control over financial reporting, or caused such internal control over financial reporting to be designed under oursupervision, to provide reasonable assurance regarding the reliability of financial reporting and the preparation of financial statements forexternal purposes in accordance with generally accepted accounting principles;
c. Evaluated the effectiveness of the registrant's disclosure controls and procedures and presented in this report our conclusions about theeffectiveness of the disclosure controls and procedures, as of the end of the period covered by this report based on such evaluation; and
d. Disclosed in this report any change in the registrant's internal control over financial reporting that occurred during the registrant's most recentfiscal quarter (the registrant's fourth fiscal quarter in the case of an annual report) that has materially affected, or is reasonably likely tomaterially affect, the registrant's internal control over financial reporting; and
5. The registrant's other certifying officer(s) and I have disclosed, based on our most recent evaluation of internal control over financial reporting, to theregistrant's auditors and the audit committee of the registrant's board of directors (or persons performing the equivalent functions):a. All significant deficiencies and material weaknesses in the design or operation of internal control over financial reporting which are reasonably
likely to adversely affect the registrant's ability to record, process, summarize and report financial information; andb. Any fraud, whether or not material, that involves management or other employees who have a significant role in the registrant's internal control
over financial reporting.
Date: September 2, 2020
/s/ YIFAN LIANG Yifan Liang
Chief Financial Officer and Corporate Secretary

Exhibit 32.1
CERTIFICATION OF CHIEF EXECUTIVE OFFICERPURSUANT TO 18 U.S.C. § 1350, AS ADOPTED PURSUANT TO SECTION 906
OF THE SARBANES-OXLEY ACT OF 2002
I, Mike F. Chang, the chief executive officer of Alpha and Omega Semiconductor Limited (the “Company”), certify for the purposes of 18 U.S.C.Section 1350, as adopted pursuant to Section 906 of the Sarbanes-Oxley Act of 2002, that, to the best of my knowledge,
a. the Annual Report of the Company on Form 10-K for the fiscal year ended June 30, 2020 (the “Report”), fully complies with the requirements ofsection 13(a) or 15(d) of the Securities Exchange Act of 1934, as amended; and
b. the information contained in the Report fairly presents, in all material respects, the financial condition and results of operations of the Company.
Date: September 2, 2020
/s/ MIKE F. CHANG
Mike F. Chang
Chief Executive Officer
Exhibit 32.2
CERTIFICATION OF CHIEF FINANCIAL OFFICERPURSUANT TO 18 U.S.C. § 1350, AS ADOPTED PURSUANT TO SECTION 906
OF THE SARBANES-OXLEY ACT OF 2002
I, Yifan Liang, the chief financial officer of Alpha and Omega Semiconductor Limited (the “Company”), certify for the purposes of 18 U.S.C. Section 1350,as adopted pursuant to Section 906 of the Sarbanes-Oxley Act of 2002, that, to the best of my knowledge,
a. the Annual Report of the Company on Form 10-K for the fiscal year ended June 30, 2020 (the “Report”), fully complies with the requirements ofsection 13(a) or 15(d) of the Securities Exchange Act of 1934, as amended; and
b. the information contained in the Report fairly presents, in all material respects, the financial condition and results of operations of the Company.
Date: September 2, 2020
/s/ YIFAN LIANGYifan Liang
Chief Financial Officer and Corporate Secretary


