Embed Size (px)
Citation preview

Altered Elementary Calcium Release Events and Enhanced CalciumRelease by Thymol in Rat Skeletal Muscle
Peter Szentesi,* Henrietta Szappanos,* Csaba Szegedi,* Monika Gonczi,y Istvan Jona,*Julianna Cseri,* Laszlo Kovacs,*y and Laszlo Csernoch*y
*Department of Physiology and yCell Physiology Research Group of the Hungarian Academy of Sciences, Research Centerfor Molecular Medicine, Medical and Health Science Center, University of Debrecen, Debrecen, Hungary
ABSTRACT The effects of thymol on steps of excitation-contraction coupling were studied on fast-twitch muscles of rodents.Thymol was found to increase the depolarization-induced release of calcium from the sarcoplasmic reticulum, which could notbe attributed to a decreased calcium-dependent inactivation of calcium release channels/ryanodine receptors or altered in-tramembrane charge movement, but rather to a more efficient coupling of depolarization to channel opening. Thymol in-creased ryanodine binding to heavy sarcoplasmic reticulum vesicles, with a half-activating concentration of 144 mM and a Hillcoefficient of 1.89, and the open probability of the isolated and reconstituted ryanodine receptors, from 0.09 6 0.03 to 0.22 6
0.04 at 30 mM. At higher concentrations the drug induced long-lasting open events on a full conducting state. Elementarycalcium release events imaged using laser scanning confocal microscopy in the line-scan mode were reduced in size, 0.92 6
0.01 vs. 0.70 6 0.01, but increased in duration, 56 6 1 vs. 79 6 1 ms, by 30 mM thymol, with an increase in the relativeproportion of lone embers. Higher concentrations favored long events, resembling embers in control, with duration oftenexceeding 500 ms. These findings provide direct experimental evidence that the opening of a single release channel willgenerate an ember, rather than a spark, in mammalian skeletal muscle.
INTRODUCTION
Excitation-contraction coupling (E-C coupling) in skeletal
muscle critically depends on the concerted action of two
proteins, the dihydropyridine receptors (DHPRs) and ryano-
dine receptors (RyRs). The former, residing in the transverse-
tubular (T-tubular) membrane, serves as the voltage sensor
and can also carry the L-type calcium current (Rıos and
Pizarro, 1991). The latter is the calcium release channel of
the sarcoplasmic reticulum (SR) through which calcium ions
enter the myoplasmic space upon stimulation (e.g., Meissner,
1994).
Spontaneous openings of RyRs in situ appear as elemen-
tary calcium release events in confocal images (Cheng et al.,
1993). In mammalian muscle they can be subdivided into
sparks and embers (Kirsch et al., 2001), the former
resembling the sparks first described in heart (Cheng et al.,
1993) and then in amphibian skeletal muscle (Tsugorka et al.,
1995; Klein et al., 1996). Embers, a term introduced by
Gonzalez and co-workers (2000b) to denote events having
long duration with constant fluorescence seem, on the other
hand, to be more frequent in mammalian striated muscle
as compared to sparks (Kirsch et al., 2001). Not only do
mammalian calcium release events differ from those of frogs
in their appearance, they seem to be affected less by classic
drugs, e.g., caffeine, that influence E-C coupling and calcium
sparks in amphibians (Gonzalez et al., 2000a). Understand-
ing this morphological variability and resistance to external
influences should lead to a better understanding of how
calcium release channels are regulated in mammalian striated
muscle.
A wide range of phenol derivatives, including 4-chloro-
meta-cresol (4CmC; Herrmann-Frank et al., 1996) and
methyl p-hydroxybenzoate (Cavagna et al., 2000), were
shown to alter RyR function. In a concentration of 0.2 mM
and up, these substances increase the open probability of
isolated RyRs and augment calcium release from intracel-
lular calcium stores. It is interesting to note that a well known
and widely used member of this group, thymol, has also been
shown to alter calcium handling in a variety of cells, in-
cluding skeletal muscle (Koshita and Oba, 1989; Kostyuk
et al., 1991). In rabbit skeletal muscle, thymol first reduced
the Ca21-ATPase activity, then increased the calcium
permeability of the SR membrane. On neurons or on smooth
muscle preparations, calcium transients could occur sponta-
neously in the presence of thymol, and the drug was found
to increase the intracellular calcium concentration (Kostyuk
et al., 1991; Hisayama and Takayanagi, 1986). Thymol is of
special interest not only because it is widely used as a food
preservative, but also because it is the stabilizer of liquid
halothane, and its concentration might build up in the vapor-
izer during anesthesia. Despite its general use and definite
actions on calcium homeostasis, no detailed analysis has so
far been carried out to investigate the effects of thymol on
E-C coupling in depth. Furthermore, no attempts were made
to correlate the drug-induced alterations of SR calcium
release and RyR function with the parameters of elementary
calcium release events.
Here we show that thymol, at a concentration as low as 30
mM, enhances SR calcium release without major effects on
the voltage sensor. Thymol is also shown to increase both
Submitted August 13, 2003, and accepted for publication October 21, 2003.
Address reprint requests to Dr. Laszlo Csernoch, Dept. of Physiology,
University of Debrecen, PO Box 22, Debrecen H-4012, Hungary. Tel.: 36-
52-416-634; Fax: 36-52-432-289; E-mail: [email protected].
� 2004 by the Biophysical Society
0006-3495/04/03/1436/18 $2.00
1436 Biophysical Journal Volume 86 March 2004 1436–1453

[3H]ryanodine binding to heavy SR vesicles and the open
probability (Po) of the isolated and reconstituted RyRs
through inducing long-lasting open events with full con-
ductance at concentrations above 100 mM. These findings
establish thymol as an ideal tool to study elementary calcium
release events in mammalian muscle. Indeed, the drug altered
the morphology of these events by increasing both their
duration and the relative proportion of embers as compared
to sparks. Higher concentrations of the drug induced ex-
tremely long embers that, in all likelihood, originate from
a drug-modified channel, providing direct experimental
evidence that embers, rather than sparks, represent the open-
ing of a single RyR in mammalian skeletal muscle. Some of
these results were presented to the Biophysical Society
(Csernoch et al., 2002).
MATERIALS AND METHODS
Enzymatic isolation and voltage-clampingof single fibers
Single skeletal muscle fibers, isolated enzymatically from the extensor
digitorum communis muscles of rats, were mounted into a double Vaseline-
gap chamber as described earlier (Szentesi et al., 1997). In brief, rats of either
sex were anesthetized and killed by cervical dislocation in accordance with
the guidelines of the European Community (86/609/EEC) following
a protocol approved by the institutional Animal Care Committee. The
muscles were removed and were treated with collagenase (Type I, Sigma, St.
Louis, MO) for 1–1.5 h at 378C. After the dissociation, fibers were allowed
to rest for at least 20 min.
The selected fiber was transferred into the recording chamber filled with
relaxing solution (150 mM K-glutamate, 2 mMMgCl2, 10 mM HEPES, and
1 mMEGTA). The fiber segments in the open-end pools were permeabilized
using 0.01% saponin. Solutions were then exchanged to internal solution in
the open-end pools (120 mM Cs-glutamate, 5.5 mM MgCl2, 5 mM Na2-
ATP, 10 mM Na-phosphocreatine, 10 mM glucose, 5 mM HEPES, and
5 mM EGTA) and to external solution in the middle pool (140 mM
tetraethylammonium-CH3SO3, 2 mM CaCl2, 2 mM MgCl2, 5 mM HEPES,
0.0003 mM tetrodotoxin, and 1 mM 3,4diamino-pyridine). All solutions
were adjusted to pH 7.2 and 300 mosmol/l. The internal solution also
contained 1 mM Antipyrylazo III (APIII) and 100 mM Fura-2 for the
detection of [Ca21]i. The length of the fiber segment in the middle pool was
set to 500 mm.
The experimental setup and the data acquisition have been described in
detail in our earlier reports (e.g., Csernoch et al., 1999b). The fiber was
transilluminated using a tungsten halogen light source (l[600 nm) and was
epiilluminated at 380 nm or at the isosbestic wavelength of Fura-2 using
a 75-W Xenon arc lamp (Oriel 60000, Oriel Instruments, Stratford, CT).
Light intensities were simultaneously recorded at 510, 720, and 850 nm for
the detection of APIII absorbance and Fura-2 fluorescence. Fibers were
voltage-clamped and the holding potential was set to �100 mV. All ex-
periments were performed at 16–188C.
Preparation of SR vesicles and RyRs
Heavy SR (HSR) vesicles were isolated from either rabbit or rat skeletal
muscle as described earlier (Szegedi et al., 1999, and Csernoch et al., 1999b,
respectively). Rabbit HSR vesicles were used for ryanodine binding
experiments, whereas the ryanodine receptor calcium release channel was
isolated from rat HSR vesicles. In brief, skeletal muscles were removed from
the longissimus dorsii (rabbit) or from the front and hind legs of those rats
that were used in the Vaseline-gap experiments. The muscles were cut into
small pieces, quickly frozen using liquid nitrogen, and stored at �708C until
further use. Vesicles were obtained by first homogenizing the tissue then
removing the unsolubilized particles in a clinical centrifuge. Crude
membrane fraction was collected from the supernatant by centrifugation at
40,000 3 g (30 min). The actomyosin content of the pellet was then
dissolved in 600 mM KCl and the crude microsome fraction was collected
by centrifugation at 109,0003 g (30 min). The microsome was loaded onto
a 20–45% linear sucrose gradient and spun for 16 h at 90,000 3 g (48C) in
a swingout (SW-27) Beckman rotor (Beckman-Coulter, Fullerton, CA). The
protein-ring corresponding to the HSR fraction was extracted from the
36–38% region. Vesicles were collected at 124,000 3 g for 60 min then
resuspended in 92.5 mM KCl and 18.5 mM K-MOPS at pH ¼ 7.0 for
vesicular measurements or in 0.4 M sucrose and 10 mM K-PIPES at pH ¼7.2 for RyR preparation. Samples were stored at �708C until further use.
For preparation of RyR, the rat HSR vesicles (3 mg/ml) were solubilized
for 2 h at 48C with 1% CHAPS (3[(3-chloramidopropyl)dimethyl-amino]-1-
propanesulfonate) in a solution containing 1 M NaCl, 100 mM EGTA, 150
mM CaCl2, 5 mM AMP, 0.45% phosphatidylcholine, 20 mM Na-PIPES at
pH ¼ 7.2, and protease inhibitors (Csernoch et al., 1999b). Unsolubilized
proteins were removed by centrifugation at 59,000 3 g, and subsequently
the supernatant was layered on top of a 10–28% sucrose gradient also
containing 1% CHAPS, 0.7 M NaCl, 10 mM AMP, 0.5% phosphatidyl-
choline, 70 mM EGTA, 100 mM CaCl2, 1 mM DTT (dithiothreitol), and 13
mM Na-PIPES at pH ¼ 7.2. Solubilized SR membranes were centrifuged
through the sucrose gradient for 16 h at 90,000 3 g (48C) in a swingout
(SW-27) Beckman rotor. Fractions containing RyRs were collected in small
aliquots. They were then rapidly frozen in liquid nitrogen and stored at
�708C.
Calculation of [Ca21]i and Rrel
In Vaseline-gap experiments the changes in myoplasmic free calcium
concentration ([Ca21]i) were calculated from APIII absorbance with the
correction for intrinsic fiber absorbance at 850 nm and from Fura-2
fluorescence using the kinetic correction. Resting, as well as small changes
in [Ca21]i were determined from changes in Fura-2 saturation, whereas large
increases in [Ca21]i were determined from changes in APIII absorbance.
The rate of calcium release from the SR (Rrel) was calculated from the
calcium transients using the procedure described in Szentesi et al. (1997). In
brief, four parameters of the removal model were fitted simultaneously,
koff,M–P (Mg21 off rate from parvalbumin), PVmax (maximal transport rate of
SR calcium pump), and koff,Ca–E and kon,Ca–E (the rate constants of calcium
binding to EGTA). The calculated Rrel records were corrected for the
depletion of calcium in the SR and expressed as a percentage of SR content.
The voltage dependence (Vm) of either component of calcium release,
Rrel,i(Vm), where i ¼ peak or steady level, was assessed by fitting the two-
state Boltzmann function
Rrel;iðVmÞ ¼ Rrel;i½max�=ð11 expf�ðVm � V50Þ=kgÞ; (1)
where Rrel,i[max] is the maximal release rate, V50 is the voltage at half-
maximal release rate, and k is the slope factor, to the calculated data.
Intramembrane charge movement
Intramembrane charge transfer was calculated by measuring membrane
currents in response to depolarizing and hyperpolarizing pulses as described
in detail previously (Szentesi et al., 1997). Briefly, the linear capacitive
current was determined from hyperpolarizing pulses of �20 mV in am-
plitude. This current was then scaled and subtracted from those measured
during depolarizing steps. The nonlinear capacitive current, representing
intramembranous charge transfer, was integrated to give the amount of
charge moved during the pulse (Q). To assess the membrane potential
dependence of charge transfer, Q(Vm), the measured charge was fitted with
the Boltzmann function
Thymol and E-C Coupling 1437
Biophysical Journal 86(3) 1436–1453

QðVmÞ ¼ Qmax=ð11 expf�ðVm � V50Þ=kgÞ; (2)
where Qmax is the maximal available charge, and V50 and k have their usual
meaning.
Ryanodine binding
Ryanodine binding assay was carried out using [3H]ryanodine in an
incubation medium of 1 M NaCl, 25 mM Na-PIPES at pH 7.1, 1 mM
Pefabloc, (Fluka, Buchs, Switzerland), 300 mM CaCl2, and 205 mM EGTA.
50 ml aliquots, containing 25 mg protein were incubated at 378C for 2 h, with
the various concentrations of the radioligand and of thymol (Herrmann-
Frank et al., 1996). The reaction was terminated by immediately filtering the
samples on a Bio-Dot 96 well filter apparatus (Bio-RAD Lab., Hercules,
CA) using Millipore-50 filter paper (Millipore, Billerica, MA). The dots
were than rinsed with equal aliquots of washing medium without ryanodine
(hot and cold), that were otherwise identical to the incubation medium. Filter
papers were cut into appropriate pieces and their radioactivity was deter-
mined using a liquid scintillation counter. Nonspecific binding was deter-
mined in the presence of 50–100 mM ryanodine, added to the incubation
mixture before the radioligand. Thymol was found not to affect the non-
specific binding. Binding data, as well as the concentration-dependent
effects of thymol on binding, were fitted using the Hill equation
B=Bmax ¼ ½X�n=ð½EC50�n 1 ½X�nÞ; (3)
where B is the concentration of the bound form, Bmax is the theoretical
maximum of B, X is the ligand in question (ryanodine or thymol), and n is
the Hill coefficient. Experiments were carried out in quadruplets and the
averaged data were used in the calculations.
Planar lipid bilayer measurements
CHAPS-solubilized ryanodine receptors (Tripathy and Meissner, 1996)
were incorporated into planar lipid bilayers formed across a 200-mm
aperture of a nolrene cup using a lipid mixture composed of phosphatidyl-
ethanolamine, phosphatidylserine, and phosphatidylcholine in the weight
ratio of 5:4:1. Lipids were dissolved in n-decane up to a final concentration
of 20 mg/ml as described in our previous reports (e.g., Csernoch et al.,
1999b). Reconstitution was initiated in symmetric buffer solution (250 mM
KCl, 100 mM EGTA, 150 mM CaCl2, and 20 mM PIPES, at pH 7.2), by
adding a small aliquot of the solubilized receptor to the cis (cytoplasmic)
side. The current signal was filtered at 1 kHz through an eight-pole low-pass
Bessel filter and digitized at 6 kHz using an Axopatch 200 amplifier and
pClamp software (Axon Instruments, Foster City, CA). Channels with
conductance[400 pS were accepted as RyRs. Open probability values were
calculated from 1-min-long segments of the current traces. Measurements
were carried out at 22–258C, and thymol was applied in the cis chamber.
Measurement of calcium sparks
Single fibers, isolated as detailed above, were mounted into a chamber with
glass bottom. Cells were treated with a modified relaxing solution (125 mM
K-glutamate, 10 mM HEPES, 1 mM EGTA, 6 mMMgCl2, 5 mMNa2-ATP,
10 mM Na-phosphocreatine, 10 mM glucose, 0.13 mM CaCl2, and 8%
dextran) containing 0.002% saponin for 2–3 min. Permeabilization of the
surface membrane was monitored by the addition of 50 mM fluo-3 into the
solution and imaging of the fiber. This solution was then exchanged to
a K2SO4-based internal solution (95 mM K2SO4, 10 mM HEPES, 1 mM
EGTA, 6 mMMgCl2, 5 mMNa2-ATP, 10 mMNa-phosphocreatine, 10 mM
glucose, 0.13 mMCaCl2, 0.1 mM fluo-3, and 8% dextran) since the presence
of sulfate was shown to increase the spark frequency without affecting the
spark morphology in mammalian preparations (Csernoch et al., 2003; Zhou
et al., 2003).
Fibers were imaged using an LSM 510 laser scanning confocal
microscope (Zeiss, Oberkochen, Germany). Line-scan images ([x,t]) were
taken at 1.54 ms/line and 512 pixels/line (pixel size 0.142 mm) with a 403
water immersion objective (1.2 NA; Zeiss) parallel to the fiber axis. Fluo-3
was excited with an argon ion laser (at 488 nm; 5% laser intensity), and
emitted light was collected through a bandpath filter and digitized at 12 bits.
Any bleaching of the dye was corrected for. To avoid photodamage, the
same position was not imaged twice. The bleaching-corrected images
(F[x,t]) were then normalized to baseline fluorescence (F0[x]).Elementary calcium release events were captured using an automatic
computer detection method based on those described earlier (e.g., Cheng
et al., 1999). In brief, the program identified elementary events as regions
with fluorescence above a relative threshold, calculated from the noise in the
images, and having amplitudes[0.3 DF/F0 units. The eventless portion of
the image was used to calculate bleaching (averaged over the x axis and
smoothed) and F0[x] (averaged, but not smoothed over the t axis). Theprogram also determined the parameters of the identified events: amplitude
(as DF/F0); spatial half-width measured at the time of the peak (full width at
half-maximum, FWHM); duration; and rise time for sparks and sparks with
embers. For the lone embers, the average amplitude, duration, and FWHM
parameters were determined. FWHM was obtained from fitting a Gaussian
function to the spatial distribution obtained by averaging three lines at the
peak for sparks or by all lines except the first and last 10 ms of the event for
lone embers.
Chemicals and statistics
Fura-2 and Fluo-3 were purchased from Molecular Probes (Eugene, OR),
whereas APIII was purchased from ICN Biomedicals (Aurora, OH).
Protease inhibitors were from Boehringer (Mannheim, Germany), from
Merck (Darmstadt, Germany), and from Sigma (St. Louis, MO). Lipids were
obtained from Avanti Polar Lipids (Alabaster, AL), [3H]ryanodine was from
Dupont (Boston, MA), and all other chemicals were from Sigma. Thymol
was prepared as a stock of 300 mM in DMSO.
In statistical analyses all values were expressed as mean6 SE. Statistical
significance was calculated with Student’s t-test assuming significance for
p\ 0.05.
RESULTS
Thymol has modest effects on intramembranecharge movement
Recent reports demonstrated the suppression of L-type
calcium currents by thymol on cardiac (Magyar et al., 2002)
as well as skeletal (Szentandrassy et al., 2003) muscle cells
with half-inhibitory concentration above 100 mM. To under-
stand the effects of the drug on E-C coupling we first tested
the involvement of the voltage sensor as a putative binding
site of thymol. Intramembrane charge movements were thus
measured on rat skeletal muscle fibers mounted into the dou-
ble Vaseline-gap chamber.
Fig. 1 A presents nonlinear capacitive currents in the
absence and presence of the drug. The transients were
recorded in response to 100-ms-long depolarizing pulses
exploring the �80–0 mV voltage range. The actual intra-
membrane charge movement currents were normalized to
fiber capacitance to take into account the differences in fiber
size or any possible change in passive electrical properties
during the experiments. It should be noted, however, that the
linear capacitance, on average, did not change significantly
1438 Szentesi et al.
Biophysical Journal 86(3) 1436–1453

during the course of these experiments since it was found to
be 11.36 1.1 nF (n¼ 7) under control conditions and 9.46
1.7 nF on the same cells after the addition of 300 mM thymol.
To assess the voltage dependence of charge transfer, the
currents were integrated and Eq. 2 was fitted to the charge
versus voltage data both before and after the addition of
thymol. Average values of the parameters from these fits
are presented in Table 1. To visualize the effects of thymol
on the voltage dependence of charge transfer, Fig. 1 B plots
the charge as a function of membrane potential during the
test pulse. Thymol, at the concentration tested, shifted the
voltage dependence to the left along the voltage axis, by
10 mV, together with a slight decrease in Qmax (the max-
imally available charge). Whereas the changes in V50 were
statistically significant, the changes in Qmax and in the steep-
ness remained, on average, within the limits of statist-
ical variation. As it will be detailed below, thymol already
had significant effects on SR calcium release at a concen-
tration of 30 mM. Table 1, therefore, presents average values
for the voltage dependence of charge movement at this
concentration.
These data, on the one hand, establish that the suppression
of L-type calcium currents seen in earlier studies with phenol
analogs (Fusi et al., 2001) or with thymol itself cannot be
accounted for by an effect on the voltage sensor. Further-
more, the slight shift in the voltage dependence of in-
tramembrane charge movement could also not explain its
effects on previously reported effects on calcium handling.
Thymol increases the calcium transients
Fig. 2 illustrates the effect of extracellular application of 30
mM thymol on the calcium transients elicited by 60–100-ms-
long depolarizing pulses under voltage-clamp conditions.
Fig. 2 A shows a series of calcium transients, measured with
APIII, elicited by depolarizing pulses of various lengths from
�40 to 0 mV. Measurements in thymol were taken 5�10
min after the solution exchange. This was believed to be long
enough for the drug to reach its binding site and exert its full
effect. Application of thymol produced an;50% increase in
the maximal amplitude of the calcium transient from 1.5 6
0.3 to 2.2 6 0.4 mM (n ¼ 9). The transients showed
a continuous increase in control and after the addition of 30
mM thymol. The increase was present both in the rate of rise
and in the amplitude of the calcium signals. Fig. 2 B shows
the voltage dependence of the mean (n ¼ 9) maximum
change in [Ca21]i reached in control conditions (opensymbols), and upon thymol application (solid symbols). In
FIGURE 1 The effect of thymol on intramembrane
charge movement. (A) Nonlinear capacitive currents in
the absence and presence of 300 mM thymol. The holding
potential was set to�100 mV and the currents representing
the intramembrane charge displacement were recorded in
response to 100-ms-long depolarizing pulses. The mem-
brane potentials during the pulses are given in each row.
The current traces were normalized to the linear capaci-
tance (10.5 nC) of the fiber. (B) The Boltzmann dis-
tribution of intramembrane charge. The current records
presented in A and six other fibers were integrated and the
calculated charges at corresponding voltages were aver-
aged. Eq. 1 was fitted to the data points to assess the
voltage dependence of charge displacement. Superimposed
curves were generated using the parameters obtained from
the fits (Qmax ¼ 38.8 and 37.4 nC mF�1; V50 ¼ �31.2 and
�38.0 mV; k ¼ 15.1; and 14.4 mV in control (�) and in
thymol (m), respectively).
Thymol and E-C Coupling 1439
Biophysical Journal 86(3) 1436–1453

average, the drug produced a 58% elevation of the peak
calcium transient. This effect of thymol was associated with
a slight, but not significant, change in resting [Ca21]i, which,
within this series of measurements, exhibited a mean value
of 51 6 6 and 72 6 9 nM before and after addition of the
drug.
SR permeability is augmented by thymol
Fig. 3 presents the rate of calcium release from the SR (Rrel;
see Methods) calculated from calcium transients shown in
Fig. 2. The figure demonstrates that the above-mentioned
effects of thymol on [Ca21]i were present on Rrel at every
membrane potential tested. Thymol increased both the early
peak and the sustained steady level of the calcium release.
On average the maximal increase in the peak in 30 mM
thymol was found to be 28.4 6 4.0 mM ms�1 (n ¼ 10) for
a 100-ms-long depolarization to 0 mV as compared to 17.8
6 2.2 mM ms�1 measured on the same fibers under control
conditions. Whereas the maximal increase in the steady level
was found to be 10.6 6 2.0 mM ms�1 (n ¼ 10) in the
presence of the drug and 7.3 6 1.0 mM ms�1 was measured
on the same fibers under control conditions, the effect of
thymol was reversible. After washout, the peak returned to
TABLE 1 Effect of thymol on intramembrane charge movement
Qmax (nC mF�1) V50 (mV) k (mV)
Control (n ¼ 7) 35.2 6 3.1 �25.9 6 2.6 12.0 6 1.5
30 mM thymol 34.0 6 4.4 �34.8 6 2.7* 11.6 6 0.9
Control (n ¼ 8) 35.4 6 2.7 �27.8 6 2.4 11.4 6 1.2
300 mM thymol 35.8 6 3.8 �39.8 6 2.9* 13.7 6 0.6
Parameter values obtained by fitting Eq. 2 to the voltage dependence of
intramembrane charge movement.
*Significant difference from control.
FIGURE 2 Effect of 30 mM thymol on the calcium transients. (A)
Changes in [Ca21]i measured with APIII before and after the addition of the
drug. The holding potential was set to �100 mV and the fiber was then
depolarized to the indicated voltages for 60–100 ms. [APIII] ¼ 680–1380
mM. (B) The maximal increase in [Ca21]i during the calcium transients was
averaged from 10 fibers and plotted as a function of the membrane potential
during the depolarizing pulses.
FIGURE 3 Effect of 30 mM thymol on SR permeability. Calcium release
from the SR was calculated from the transients presented in Fig. 2 and then
corrected for the depletion of calcium in the SR. The parameters of
the removal model used in the calculation of SR calcium release were
koff,Mg–P ¼ 9.4 s�1, PVmax ¼ 2.4 mM s�1, kon,Ca–E ¼ 0.76 mM�1 s�1, and
koff,Ca–E ¼ 6.3 s�1. SR calcium content, 2.0 mM, was determined from
the transient obtained in response to the depolarization to 0 mV in control,
and used throughout.
1440 Szentesi et al.
Biophysical Journal 86(3) 1436–1453

826 9%whereas the steady level returned to 826 6% of the
control level.
To describe the effect of thymol on the calcium release
process the rate of calcium release was corrected for de-
pletion of calcium in the SR and the obtained transients were
normalized to SR contents. This content was found to be
fairly stable over the fibers included into the present study
(1.76 0.2 mM; n ¼ 10) and to be unaltered by the treatment
with 30 mM thymol. All calculation used, therefore, the same
SR content in a given fiber in the absence and presence of
the drug. Similarly, thymol left the parameters of the removal
model essentially unaltered. The corresponding values of
the parameters, if fitted independently in control and in the
presence of the drug, were koff,M–P ¼ 7.4 6 1.3 and 4.5 6
0.7 s�1; PVmax¼ 2.56 0.6 and 2.26 0.4 mM s�1; koff,C–E¼7.2 6 1.4 and 6.0 6 0.8 s�1; and kon,C–E ¼ 1.4 6 0.3
and 2.2 6 0.9 mM s�1.
The effect of thymol on calcium release is presented in
Fig. 4, where pooled data of the two kinetic components of
SR permeability are shown as a function of membrane
potential in control, in the presence of the drug and after
wash. The individual data points were normalized before
averaging. To this end Eq. 1 was fitted to the data—peak or
steady level versus voltage—in control for each and every
fiber and the obtained maximum (Rrel,i[max] in Eq. 1) was
used for normalization. Fig. 4 reveals an elevation of both the
early peak and the steady component of SR permeability
reaching [50% in 30 mM thymol. It also shows that
significant recovery was achieved after the removal of the
drug.
To quantify the increase caused by the drug, Eq. 1 was
fitted to the data—peak or steady level versus voltage—in
the presence and absence of thymol and after wash in every
fiber. The obtained parameters, Pmax or Slmax (Rrel,i[max] inEq. 1 with i ¼ peak or steady level, respectively), the
midpoint voltage, and the slope factor, are presented in Table
2, after averaging. The data reveal that 30 mM thymol
significantly (p \ 0.05) elevated the early peak and the
steady level, although the effect on the steady level was
somewhat smaller than on the peak (516 17 vs. 626 17%).
Comparing the voltage dependence of the different
components as well as the effect of thymol on the voltage
dependence did not reveal any systematic difference or trend.
The fact that thymol had very little effect on the voltage
dependence of either component suggested a voltage-in-
dependent activation of SR permeability by the drug.
These data establish that thymol elevates SR permeability
in a voltage-independent manner. The extent of elevation is
equal for the two kinetic components, peak and steady level,
of SR permeability.
Inactivation of Rrel is unaffected by thymol
Previous sections have demonstrated that thymol enhances
the permeability of the SR membrane when stimulated
through the voltage sensors. This augmentation could, in
general, occur through increased activation, decreased
inactivation, or both. In the following we tested whether
FIGURE 4 Effects of thymol on the kinetic components of SR
permeability. (A) Voltage dependence of the peak component of SR
permeability. The voltage dependence of the peak of SR permeability was
first fitted with Eq. 1 in control. The obtained maximum was used to
normalize all values in the given fiber both before (�) and after the addition
(d), and after the removal of the drug (n). The normalized values from 10
fibers were averaged before plotting them. Superimposed curves present the
least-squares fit of Eq. 1 with Max ¼ 1.056 0.04, 1.706 0.04, and 0.846
0.03; V50¼�27.76 1.2,�29.96 0.8, and�25.96 1.0 mV; and k¼ 7.96
0.9, 7.8 6 0.6, and 8.4 6 0.7 mV in control, in the presence of thymol, and
after wash. (B) Voltage dependence of the steady component of SR
permeability. The steady level for a given transient was calculated as the
average of the last 20 points during the depolarizing pulse. The values were
then normalized and averaged as described in A. Superimposed curves again
represent the fit of Eq. 1 with Max ¼ 1.026 0.04, 1.706 0.03, and 0.936
0.02; V50¼�29.76 1.2,�30.56 0.7, and�29.76 0.7 mV; and k¼ 7.66
0.9, 7.9 6 0.5, and 6.9 6 0.6 mV in control, in the presence of thymol, and
after wash. (C) Voltage dependence of the peak/steady ratio. At voltages
\�40 mV, with the exception of data in thymol at�50 mV, the values were
too small to allow a reliable determination of the ratio.
Thymol and E-C Coupling 1441
Biophysical Journal 86(3) 1436–1453

the drug alters the inactivation of the calcium release
channels.
To study the calcium-dependent inactivation of calcium
release, double pulses, separated by 10-ms-long repolariza-
tion to �120 mV to facilitate the return of intramembranous
charge to its resting state, were applied with varying the
amplitude of the first (pre-) pulse and keeping the second
(test) constant. The increase in [Ca21]i during the prepulse
caused a marked suppression of the peak during the test
pulse (Simon et al., 1991; Szentesi et al., 2000) which
corresponded to the inactivation of the channels. Fig. 5
presents SR permeability elicited by double pulses in the
absence (left panel ) and in the presence of 30 mM thymol
(right panel ). The steady-state inactivation was assessed as
the relative suppression of the inactivating component (peak
minus steady level ¼ P–Sl ) during the test pulse (Szentesi
et al., 2000), which was the largest when no prepulse was
applied (P0–Sl0). The effect of a prepulse, if it elicited
measurable calcium release, was to suppress the inactivating
component of the subsequent test pulse (P1–Sl1) without
affecting the steady level. The figure shows that 30 mM
thymol did not cause any visible change in how the channels
inactivate, although it enhanced calcium release both during
the prepulse and the test pulse.
Previous studies revealed that the relative suppres-
sion—the inactivating component of a conditioned test pulse
that is normalized to the inactivating component of a non-
conditioned test pulse, (P1–Sl1)/(P0–Sl0)—is a good measure
of channel inactivation (Pizarro et al., 1997). Fig. 6 A thus
presents the relative suppression as a function of the maximal
SR calcium release during the prepulse in control and in the
presence of 30 mM thymol. In control the relationship is
linear as shown previously (Pizarro et al., 1997; Szentesi
et al., 2000). It describes a direct link between the calcium
concentration reached in the triad and the number of channels
that were inactivated during the test pulse. In the presence of
thymol the linear relationship was maintained although, due
to the larger release in the presence of the drug, it was shifted
to the right. Furthermore, if the data were normalized to the
maximum release on the given fiber in control and in thymol,
respectively, the linear functions were identical in the
absence and the presence of the drug (Fig. 6 B).By plotting the absolute suppression, D(P–Sl ) ¼ (P0–Sl0)
� (P1–Sl1), as a function of the inactivating component of
the prepulse from different fibers (Fig. 6, open symbols in
control, solid symbols in thymol), the relationship became
independent of Vtest, resembling a straight line (Fig. 6 C).Fitting straight lines to the data, independently to the values
in control and in the presence of the drug, gave regression
coefficients close to unity suggesting that exactly those
channels were lost from the test pulse that were inactivated
TABLE 2 Voltage dependence of SR calcium permeability
Peak Steady level
Max* (mM ms�1) V50 (mV) k (mV) Max* (mM ms�1) V50 (mV) k (mV)
Control (n ¼ 10) 16.9 6 1.9 �28.5 6 2.3 6.5 6 0.5 6.2 6 0.8 �28.7 6 2.6 6.4 6 0.7
30 mM thymol 25.6 6 3.1y �31.0 6 1.2 7.0 6 0.5 8.6 6 0.9y �31.5 6 1.0 7.6 6 0.5
Wash 13.3 6 1.6 �22.8 6 3.5 8.6 6 0.9y 5.2 6 0.5 �26.7 6 2.3 7.4 6 0.5
Parameter values obtained by fitting Eq. 1 to the voltage dependence of SR permeability. Values represent mean 6 SE.
*Denoted as Rrel,i[max] with i ¼ peak or steady level in Eq. 1.ySignificant difference from control.
FIGURE 5 Inactivation of SR calcium release in the presence of thymol.
SR permeability was measured with double pulses. The test pulse was
always a depolarization to�20 mV, whereas the membrane potential during
the prepulse was varied between �100 mV, the holding potential, and �20
mV (values indicated between the traces). The depletion factor, 2.0 mM, was
determined in control and used throughout the experiment. The parameters
of the removal model were koff,Mg–P ¼ 16.0 s�1, PVmax ¼ 1.6 mM s�1,
kon,Ca–E ¼ 0.51 mM�1 s�1, and koff,Ca–E ¼ 3.0 s�1.
1442 Szentesi et al.
Biophysical Journal 86(3) 1436–1453

during the prepulse (Pizarro et al., 1997; Szentesi et al.,
2000), in both cases.
These results clearly establish that the calcium-dependent
inactivation of the calcium release channels is not suppressed
in the presence of thymol. They, furthermore, argue in favor
of the hypothesis that the drug does not influence the
inactivation process of the channels at all, other than altering
the [Ca21]i in the triadic junction.
Thymol induces a change in thetransfer function
The data presented in the previous sections clearly
demonstrate that thymol alters the way in which T-tubular
depolarization affects the consequent increase in SR
permeability. This alteration cannot be explained by the
changes in the properties of intramembrane charge move-
ment (see Fig. 1). To characterize the transmission of
information from the T-tubular to the SR membrane, the
transfer function of the triadic events, that is, SR permeabil-
ity as a function of the amount of charge transferred, was
calculated (Csernoch et al., 1999a).
Fig. 7 shows the change in transfer function induced by
the application of 30 mM thymol. To obtain the data points,
the mean normalized steady level of SR permeability was
plotted as a function of the mean normalized charge. The
presence of the drug clearly changed the coupling between
charge movement and the SR permeability increase. As
demonstrated in Fig. 1, the charge movement was prac-
tically unaffected by the thymol (slightly suppressed and
shifted to the left), whereas the steady level of SR perme-
ability was increased. This is evident from the transfer
functions, which demonstrate that the same amount of
charge moved brought about a larger calcium release in the
presence of the drug. To describe the transfer function and
the change induced by the thymol in detail, a straight line
was fitted to the data points above the threshold for the
appearance of detectable calcium release. The transfer func-
tion is then characterized by the slope (m) and the x-axisintercept (Qth,r) of the straight line. The slope indicates the
efficiency of the coupling whereas the intercept is the
relative amount of charge moved before any measurable
calcium release occurs. As the superimposed traces in Fig. 7
demonstrate, thymol increased the slope of the transfer
function significantly, from 1.26 6 0.09 to 2.37 6 0.12,
indicating a more efficient coupling between the voltage
sensors and the calcium release channels. On the other
hand, the drug did not alter Qth,r significantly (from 0.08 6
0.06 to 0.16 6 0.08).
FIGURE 6 Suppression of the inactivating component of SR permeabil-
ity. The inactivating component was calculated as the difference between the
peak (P) and the steady level (Sl ). Open symbols represent measurements in
the absence, whereas solid symbols represent data obtained in the presence
(30 mM) of the drug. (A) The normalized inactivating component as
a function of SR calcium release during the prepulse. Values obtained with
a given membrane potential during the prepulse were averaged from eight
fibers. For normalization the inactivating component of the nonconditioned
(prepulse voltage¼�100 mV) transient (P0–Sl0) was used. (B) Same data as
in A, but calcium release during the prepulse was normalized to the maximal
release in the given fiber as described in Fig. 5. (C) The suppression of the
inactivating component, D(P–Sl) ¼ (P0–Sl0) – (P–Sl ), as a function of the
inactivating component of the prepulse. Different symbols represent
different fibers. Solid lines represent the least-squares fit of a linear function,
constrained to go through the origin, to the data point with a slope of 0.973
and 1.088 in the presence and absence of thymol.
FIGURE 7 The change in transfer function induced by the application of
30 mM thymol. The mean steady level of SR permeability was plotted as
a function of the mean normalized charge. The transfer function was
characterized by the slope (m) and the x axis intercept (Qth,r) of the straight
line fitted to the data points. Thymol increased m (from 1.26 to 2.37), but did
not significantly alter Qth,r (from 0.08 to 0.16) of the transfer function.
Thymol and E-C Coupling 1443
Biophysical Journal 86(3) 1436–1453

Thymol increases ryanodine binding to heavySR vesicles
We have, so far, demonstrated that 30 mM thymol increases
SR permeability by ;50% without altering the voltage-
sensing function of the DHPRs. The results do not, however,
exclude the presence of a putative binding site that might
influence the interaction of DHPRs and RyRs. To exclude
this possibility HSR vesicles were prepared and the effect of
thymol was tested on ryanodine binding.
Ryanodine binding under control conditions was charac-
terized by a single binding site (Fig. 8). The fit of Eq. 1 to
data points in Fig. 8 A revealed a dissociation constant of
25.36 1.4 nM and a Bmax of 8.76 0.3 pmol/mg protein. The
presence of a single binding site per RyR was confirmed
in the Scatchard plot (Fig. 8 B), where the straight line
was constructed using the same parameters as above. The
addition of 300 mM thymol caused a massive increase in
ryanodine binding to HSR vesicles as demonstrated in Fig. 8,
A and B. The drug increased both the affinity of the binding
site (dissociation constant decreased to 15.5 6 1.0 nM) and
the amount bound (Bmax increased to 14.7 6 0.5 pmol/mg
protein).
To describe the concentration dependence of thymol
action, the amount of [3H]ryanodine bound, at a concentra-
tion of 6 nM, was determined at different concentrations of
thymol (Fig. 8 C). The data were then fitted with the Hill
equation. This revealed a half-activating concentration of
144 6 11 mM and a Hill coefficient of 1.89 6 0.27.
Thymol was thus found to enhance ryanodine binding to
HSR vesicles close to threefold. This observation, together
with the results on SR permeability, points to a direct,
stimulating action of thymol on the calcium release channel.
Thymol stimulates the isolated RyRs
To test the direct effect of thymol on the calcium release
channel, isolated RyRs were incorporated into planar lipid
bilayers and the properties of channel gating were de-
termined. Under our experimental conditions the channels
displayed a low open probability (Po ¼ 0.063 in Fig. 9 A).After the addition of 30 mM thymol the Po increased (to
0.105 in Fig. 9 B), demonstrating a direct activating effect of
the drug on the calcium release channel. This effect was
present for all channels tested; the Po increased from 0.0896
0.034 to 0.2216 0.044. Fig. 9 also demonstrates that thymol
did not interfere with the ability of ryanodine to lock the
calcium release channel in the characteristic, half-conducting
state.
Examining the current records in Fig. 9, A and B, revealsthat the size of the current, when the channel was open, was
the same before and after the addition of the drug. This
observation suggests that thymol does not influence the
conductance of RyRs. This hypothesis was tested in the
experiment presented in Fig. 9 C, where the current
amplitude is plotted as a function of the holding potential
both before (open symbols) and after (solid symbols) the
addition of the drug. Fitting straight lines, constrained to
go through the origin, to the data points, revealed a slope of
545 pS in control and 543 pS in the presence of the drug.
To further explore the action of thymol on channel gating
the drug was applied in concentrations of 150 (Fig. 10 B) and300 mM (Fig. 10 C). Together with the increased open
probability long-lasting open events were observed. These
events had, on average, the same lengths ( p [ 0.4) in the
presence of 150 mM thymol (2876 21 s; 235 events) and in
the presence of 300 mM thymol (317 6 41 s; 159 events).
The experiments with isolated and reconstituted RyRs
demonstrated that thymol is a potent activator of the calcium
FIGURE 8 Effects of thymol on ryanodine binding to heavy SR vesicles.
(A) Ryanodine binding determined in the absence (�) and presence (m) of
300 mM thymol at different [3H]ryanodine concentrations. Assuming
a single binding site the Hill fit resulted in k50 ¼ 25.36 1.4 nM and Bmax ¼8.67 6 0.26 pmol/mg protein in control, whereas k50 ¼ 15.5 6 1.0 nM and
Bmax¼ 14.65 6 0.45 pmol/mg protein in the presence of the drug. (B) The
data presented in A were used for constructing the Scatchard plot. Straight
lines were drawn using the parameters given above. (C) Concentration-
dependent effect of thymol on ryanodine binding. Ryanodine binding was
determined in the absence and presence of various concentrations of thymol
at 6 nM [3H]ryanodine concentrations. Fitting the Hill equation resulted in
a half-activating concentration of 1446 11 mM, a Hill coefficient of 1.896
0.27, and approximately three times higher ryanodine binding at saturating
thymol concentration than in control.
1444 Szentesi et al.
Biophysical Journal 86(3) 1436–1453

release channel—one which increases the open probability
of the channel without significantly modifying the single
channel conductance.
Elementary calcium release events are alteredby thymol
Elementary calcium release events in mammalian muscle
fibers exhibit a wide morphological variety. Calcium sparks,
resembling those in frog fibers, can be preceded and/or
followed by embers, or embers can occur on their own
(Kirsch et al., 2001; Zhou et al., 2003). Since thymol was
found to activate RyRs it was of interest to see if it modified
the properties or appearance of the calcium release events.
Calcium sparks and embers were thus measured on
permeabilized fibers and their relative numbers and mor-
phological properties compared in the absence and presence
of the drug.
Under control conditions, calcium release events occurred
with an appreciable frequency (0.0587 6 0.0020 s�1
sarcomere�1; Fig. 11 A) and displayed all the morphological
characteristics described earlier (e.g., Kirsch et al., 2001).
Most abundant were lone sparks (63%; Fig. 11 Ba), but loneembers (22%; Fig. 11 Bb) or sparks with trailing embers
(Fig. 11 Bc) were also readily observable. Sparks with
leading embers (Fig. 11 Bd ) were rare (1.1% of all events). In
the presence of thymol, the frequency increased to 0.06546
0.0016 s�1 sarcomere�1 (Fig. 11 C; p \ 0.01). More no-
ticeable was the change in overall event characteristics, in-
asmuch as longer and more complex events dominated the
images, with lone sparks (Fig. 11 Da) decreasing in relative
proportion (41%). Lone embers (35%, Fig. 11 Db) and
sparks with trailing embers (Fig. 11 Dc) were still readily
distinguishable, with sparks with leading embers (Fig. 11
Dd ) increasing in proportion to[4% of all events.
A total of 2030 vs. 2478 events from 20 vs. 9 fibers were
analyzed under control conditions and in the presence of 30
mM thymol, respectively, and their characteristic parameters
are presented in Table 3. The drug decreased the amplitude
or average amplitude of both sparks and embers by 20–24%
leaving the rise time and FWHM essentially constant. The
decrease in spark amplitude was attributable to a decrease in
FIGURE 9 Effect of 30 mM thymol on the isolated RyRs. Incorporation was initiated in symmetric 250 mM KCl, holding potential was 61 mV; channel
openings are upward deflections. Horizontal lines before each current record mark the closed state. (A) Single channel recordings in control conditions. (B)
Representative segments of single channel behavior taken 5 min after the additions of thymol. (C) Single channel currents measured after the successive
addition of 0.2 mM ryanodine into the cis chamber. (D) Single channel currents plotted as a function of the holding potential. Open symbols represent
measurements under control conditions, whereas solid symbols represent those in the presence of thymol. Straight lines correspond to a single channel
conductance of 545 and 543 pS in control and in the presence of the drug, respectively. All recordings are from a single experiment.
Thymol and E-C Coupling 1445
Biophysical Journal 86(3) 1436–1453

the number of large sparks as depicted in Fig. 11 E. Inparallel, the duration of the calcium release events increased
considerably. As evidenced from Fig. 12 and its inset, the
drug, although reducing the relative proportion of shorter
events, induced events that had durations of several hundred
milliseconds.
Higher concentrations of thymol were found to induce
long open events on isolated RyRs (Fig. 10). The application
of 150 and especially 300 mM thymol to permeabilized
fibers, to investigate their effects on elementary calcium
release events, was in many cases disastrous. A massive
release of calcium followed the addition of the drug, as
evidenced from the sudden increase in fluorescence and
contraction of the fiber (not shown). In only a few occasions
were we successful in recording calcium release events in the
presence of such high concentrations of the drug. Although
this prevented a detailed statistical analysis, the events could
still be characterized.
As shown in Fig. 12, sparks were hardly ever observed in
the presence of 150 mM thymol. Rather, long events
resembling lone embers were detected. Their duration, how-
ever, often exceeded 500 ms, sometimes lasting[1.5 s, the
duration of the image. These events had characteristic ampli-
tudes and full widths similar to the embers measured in the
presence of low thymol concentrations. The fact that the
amplitude of the fluorescence was steady over the entire
event (Fig. 12) suggests that the channel(s) involved were
continuously open.
These data clearly indicate that the long calcium release
events correspond to the long-lasting open events seen for the
thymol-modified isolated RyRs. Since the long calcium
release events were neither preceded nor followed by a spark,
they should be considered as the opening of a single release
channel or the concerted opening of a small group of channels.
It should be stressed, however, that were the latter the actual
arrangement, the channels opening synchronously must al-
ways open together—which would constitute the elementary
release unit. These findings thus strongly argue in favor of the
lone ember being the elementary building block of calcium
release in mammalian skeletal muscle.
DISCUSSION
These experiments give, for the first time, a complete
account of the effects of thymol on steps of excitation-
contraction coupling, from intramembrane charge movement
to elementary calcium release events, in mammalian skeletal
muscle fibers. Thymol was found to only slightly interfere
with the voltage-sensing event but to augment SR calcium
permeability by 50% already at 30 mM. The drug enhanced
ryanodine binding to HSR vesicles by increasing both the
affinity and the amount bound. The isolated and recon-
stituted calcium release channel displayed an increased open
probability in the presence of thymol with the appearance of
long-lasting open events at concentration above 100 mM.
Elementary calcium release events were also modified in
their characteristics with embers becoming more frequent
and of longer duration. At high concentrations of thymol
lone embers with extremely long duration dominated the
images. These experiments argue that in mammalian skeletal
muscle, embers arise from the opening of a single release
channel, or a release unit, and thus represent the elementary
event of calcium release.
Calcium release from the SR in the presenceof thymol
Thymol has been known to affect calcium handling in
a variety of cell types (Hisayama and Takayanagi, 1986;
Kostyuk et al., 1991). In particular, Palade (1987) used it to
FIGURE 10 Effect of higher thymol concentrations on calcium release
channel activity. Measurements were carried out under the same conditions
as in Fig. 9 with the holding potential being �61 mV, and thus channel
openings are downward deflections. Horizontal lines mark the closed state.
The fast gating of the channel seen in control (top) is interrupted by long
open events in the presence of both 150 (second from top) and 300 mM
(second from bottom) thymol. Note that the channel opens to a full
conducting state during the long open events. (Bottom) Ryanodine was
capable of interfering with the thymol-induced alteration in channel gating.
Note that the transition to the half-conducting state, characteristic to the
ryanodine-modified channel, occurred during a long open event.
1446 Szentesi et al.
Biophysical Journal 86(3) 1436–1453
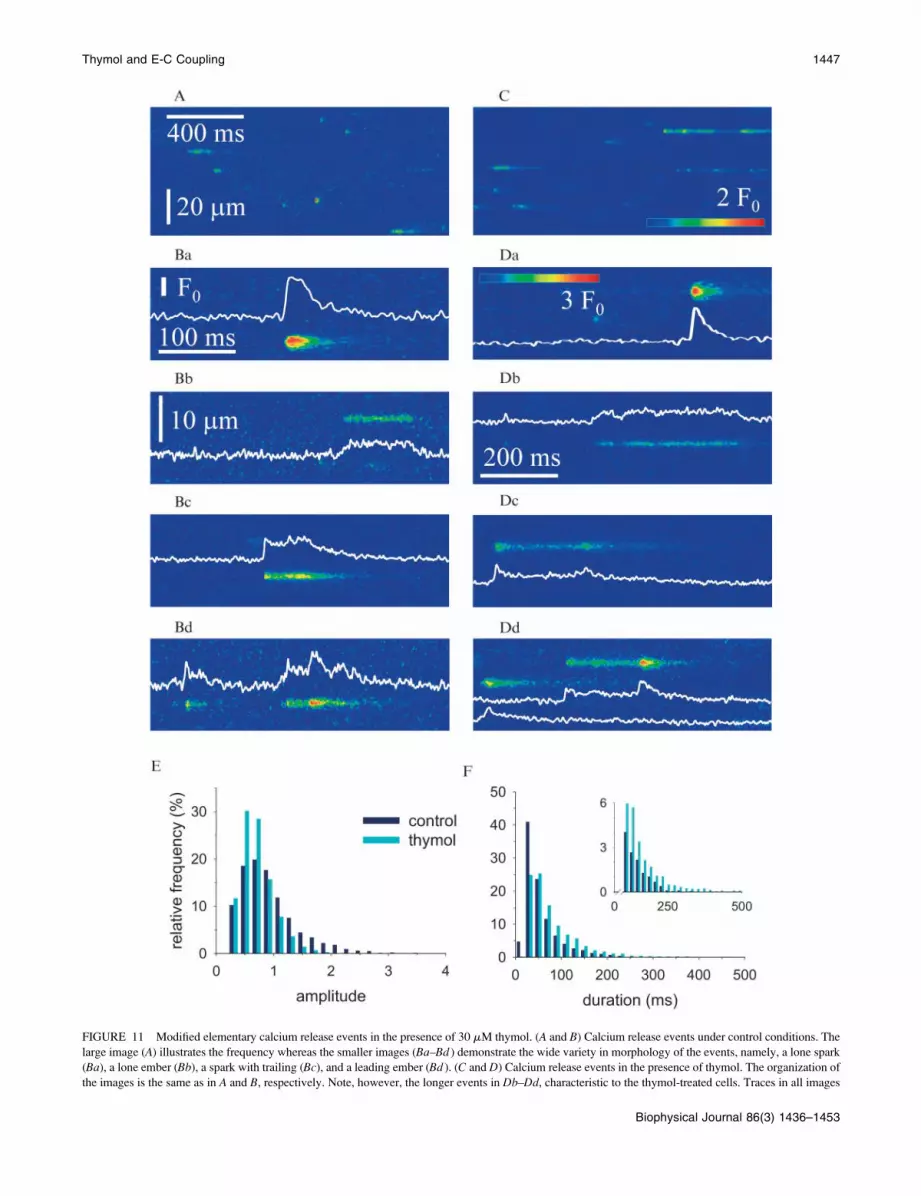
FIGURE 11 Modified elementary calcium release events in the presence of 30 mM thymol. (A and B) Calcium release events under control conditions. The
large image (A) illustrates the frequency whereas the smaller images (Ba–Bd ) demonstrate the wide variety in morphology of the events, namely, a lone spark
(Ba), a lone ember (Bb), a spark with trailing (Bc), and a leading ember (Bd ). (C and D) Calcium release events in the presence of thymol. The organization of
the images is the same as in A and B, respectively. Note, however, the longer events in Db–Dd, characteristic to the thymol-treated cells. Traces in all images
Thymol and E-C Coupling 1447
Biophysical Journal 86(3) 1436–1453

initiate calcium release from HSR vesicles isolated from
rabbit skeletal muscle. Furthermore, thymol is used to
stabilize liquid halothane, in which the added thymol can be
as high as 0.1–0.7% (Thompson and Carlson, 1989). Taking
the usual concentration of halothane in the in vitro con-
tracture tests (1–2 mM), the thymol present can easily reach
the concentration (30 mM) used in this study. Nevertheless,
no account on the effects of the drug on SR calcium release
has been published so far. Not only is this true for mam-
malian skeletal muscle, but to our knowledge, it is also true
for striated muscle cells from other classes of vertebrates or
invertebrates.
It is thus important to note that thymol, on its own, will
facilitate calcium release from the SR, averaging an ;50%
increase at 30 mM (see Table 2). In this respect its action is
similar to that of caffeine (Klein et al., 1990; Csernoch et al.,
1999a) or 4CmC (Struk and Melzer, 1999), although it seems
to be more potent than either one. Its action further resembles
that of caffeine inasmuch as 1), only slight differences
between the effects of thymol on the two kinetic compo-
nents, peak and steady level, of SR permeability (e.g., Table
2) were found and 2), the transfer function was altered in
a way that suggests a more efficient coupling between the
voltage sensors and the RyRs. These findings further
strengthen the close and tight coupling between the two
kinetic components of SR calcium release and favor the
hypothesis that they both originate from the skeletal isoform
of RyRs. Nevertheless, the mode of action of thymol is
clearly distinct from that of caffeine or 4CmC, as evidenced
from its effects on RyRs.
Effects of thymol on RyRs
Thymol is known to induce calcium release from heavy SR
vesicles and was thus used in previous experiments to assess
the action of other drugs on RyR function (Palade, 1987;
Szentesi et al., 2001). Those experiments used concen-
trations of 300 mM. Data from [3H]ryanodine binding
experiments presented in this study (Fig. 8) demonstrate that
thymol in that concentration would cause an approximately
threefold increase in ryanodine binding, which is close to its
maximal effect.
The half-activating concentration of thymol in the
[3H]ryanodine binding experiments was found to be 144
mM. This is approximately fivefold higher than the
concentration in which the drug was capable of augmenting
the calcium transients (Fig. 2) or SR calcium release (Fig. 3).
On the other hand, it is consistent with the observation that
the resting [Ca21]i was only slightly (20 nM) elevated by the
drug in this low concentration. One would predict, based on
these data, that higher concentrations of thymol, especially
at several hundred mM, will initiate large efflux of calcium
from the SR even under resting conditions and would,
therefore, hinder the comparison of SR calcium release in
control conditions and in the presence of the drug. Due to
this foreseen difficulty such experiments were not included
in the present study.
The [3H]ryanodine binding data, however, call attention
to an additional point. The Hill coefficient of thymol action
was found to be 1.89—that is, close to 2 (see Fig. 8). This
indicates that two thymol molecules, acting cooperatively,
are needed to induce the observed stimulating effect.
Analyzing the action of 30 mM thymol on the isolated
and reconstituted RyRs revealed an ;60% increase in open
probability (Fig. 9) with no change in single channel
conductance. In this respect the effect of the drug is similar
to that of caffeine (Rousseau et al., 1988) or 4CmC
(Herrmann-Frank et al., 1996). Unlike 4CmC or caffeine,
however, thymol was found to induce long-lasting open
events, which raises the need for finding an alternative
explanation for its mode of action. Such alternative ex-
planation could be based on the antioxidant effect of the drug
since the calcium release channel is regulated by its redox
state (e.g., Feng et al., 2000; Sun et al., 2001). Although
possible redox regulation of SR calcium release will be
discussed later it should be mentioned here that sulfhydryl
(A–D) represent the timecourse of F/F0 measured at the position of the peak (events with spark) or in the middle of the event (lone ember) by averaging three
neighboring pixels in the x direction. (E) Relative distribution of the amplitudes of events with sparks. (F) Relative distribution of the duration of all events.
Inset shows the lower portion of the graph to demonstrate the presence of events with long duration in the presence of the drug.
TABLE 3 Thymol-induced changes in the morphological characteristics of elementary calcium release events
Control 30 mM thymol
Spark (n ¼ 1576) Ember (n ¼ 454) Spark (n ¼ 1605) Ember (n ¼ 873)
Amplitude 0.92 6 0.01 0.210 6 0.004 0.70 6 0.01* 0.168 6 0.002*
FWHM (mM) 1.81 6 0.03 1.76 6 0.03 1.74 6 0.01* 1.77 6 0.02
Rise time (ms) 9.4 6 0.1 – 9.6 6 0.1 –
Duration (ms) 56 6 1 87 6 2 79 6 1* 102 6 2*
Values represent mean6 SE. All events with sparks were grouped under Spark, whereas the parameters of lone embers are given under Ember. In the case of
embers, the average amplitude is given.
*Significant differences between data in control and in the presence of thymol.
1448 Szentesi et al.
Biophysical Journal 86(3) 1436–1453

oxidation, rather than reduction, was found to increase the Po
of the reconstituted channel (e.g., Suko et al., 2000).
On the other hand, the long-lasting open events with full
conductance observed in the presence of thymol resemble
those measured with bastadin 10 (Chen et al., 1999). The
effects of bastadin 10 were interpreted as a shift in the
free energy of the open state of the drug-modified RyRs.
Furthermore, the removal of FKBP12 from the RyRs
interfered with the action of bastadin 10 (Chen et al.,
1999). Although the present experiments did not test the
FKBP12 sensitivity of effect of thymol, it is, nevertheless,
likely that the two drugs share the capability of lowering the
free energy of the open state of RyRs.
As mentioned above, the value of close to 2 for the Hill
coefficient indicates that two thymol-binding sites are
present for each calcium release channel. Noteworthy is
the observation that channel activity in between long-lasting
open events, in the presence of higher thymol concentrations,
was found to have higher open probability than in control
conditions. This raises the possibility that the binding of the
first thymol molecule would already activate the channel and
thus increase its Po. The binding of the second molecule
could then shift the channel to the long-lasting open state.
Effects of thymol on DHPR function
To our knowledge no previous work has examined the
effects of thymol on the voltage sensor of E-C coupling.
Recent experiments have, on the other hand, demonstrated
that the L-type calcium currents from cardiac (Magyar et al.,
2002) as well as skeletal (Szentandrassy et al., 2003) muscle
are suppressed by the drug. Thymol neither altered the
voltage dependence of current activation nor the reversal
potential for calcium, but attenuated the conductance of the
channels. In cardiac preparations the voltage dependence
of steady-state inactivation was shifted to more negative
membrane potentials (Magyar et al., 2002). In the above
changes thymol had a half-effective concentration ;200
mM. In the experiments presented here thymol failed to
induce marked alterations in intramembrane charge move-
ment even at 300 mM (Fig. 1 and Table 1). Since Qmax did
not change significantly it cannot account for the [50%
reduction in conductance seen in the previous reports. This
observation suggests that either the alteration described for
the calcium current represents specific effects of thymol on
ion permeation of the L-type calcium channels or, alterna-
tively, that intramembrane charge movement and L-type
calcium current originate from distinct subpopulations of
DHPRs.
To interpret the slight change in the voltage dependence
of intramembrane charge movement (see Fig. 1 B and
Table 1) one should consider the large amount of evidence
supporting the idea that altered SR calcium release in-
fluences intramembrane charge movement (Pizarro et al.,
1991; Pape et al., 1996; Shirokova and Rıos, 1996). Re-
sults obtained here, such as little effect on Qmax and a
FIGURE 12 Calcium release events in the presence of 150 mM thymol. Representative images showing events with extremely long duration, otherwise
resembling embers measured under control conditions. Note that the fluorescence (F/F0) and the spatial width of these long events stay essentially constant over
hundreds of milliseconds (A). Note also that the release unit can reopen (B) and give rise to an event with the same spatial and temporal characteristics. Traces in
the images were calculated as described in Fig. 11 for lone embers.
Thymol and E-C Coupling 1449
Biophysical Journal 86(3) 1436–1453

leftward shift in V50, closely resemble those published
earlier for compounds such as caffeine or perchlorate that
enhance SR calcium release (e.g., Gonzalez and Rıos,
1993; Csernoch et al., 1999a). Noteworthy here is the
observation that intramembrane charge movement dis-
played clear delayed components in the presence of thymol
(see Fig. 1). This again is consistent with previous data
suggesting that calcium released from the SR influences
charge movement (e.g., Pizarro et al., 1991). It should
be stressed, however, that mammalian fibers under control
conditions hardly ever show such slow components on
their charge movement currents (e.g., Szentesi et al., 1997).
The observation that thymol can alter charge movement in
such a way that this component becomes visible suggests
that it is present in mammalian muscle, albeit masked
under control conditions.
Redox regulation of the calcium release channel
Thymol, under most conditions, is used as an antioxidant. A
number of studies have called the attention to the redox
sensor function of RyRs (e.g., Abramson and Salama, 1988;
Marengo et al., 1998). The calcium release channel is known
to contain a large number of reactive cysteines, a number of
which can undergo oxidation or reduction under appropriate
conditions (Moore et al., 1999; Sun et al., 2001). RyRs were,
recently, shown to respond to changes in the redox state of
the intracellular environment and thus serve as a redox
sensor (Feng et al., 2000; Xia et al., 2000). Changes in the
redox potential established across the SR membrane by the
reduced and oxidized forms of glutathione, as well as
the oxidation or reduction of reactive cysteines on the RyRs,
have also been shown to alter the open probability of the
calcium release channel (Feng et al., 2000; Sun et al., 2001).
The fact that most studies on SR calcium release in intact or
cut fiber preparations were conducted under ambient oxygen
levels, whereas in situ functioning muscle is an environment
with much lower oxygen content and antioxidants such as
methyl p-hydroxybenzoate (Cavagna et al., 2000) and
thymol (this study) alter RyR function and SR calcium
release, makes the question of redox regulation even more
intriguing.
On the other hand, the treatment of mechanically skinned
mammalian fibers working at ambient oxygen levels with
the strong oxidant H2O2 increased, rather than reduced, SR
calcium release (Posterino et al., 2003). Furthermore,
reducing reagents (as dithiothreitol or reduced glutathione)
affected the calcium sensitivity of the contractile apparatus
and not the calcium release process (Posterino et al., 2003).
Finally, the massive release of calcium from the SR in the
presence of larger thymol concentrations cannot be explained
in a framework where the drug would solely relieve a block
caused by massive oxidation. Taken the above, alternative
explanations must be considered to understand the effects of
thymol.
Due to its lipid solubility thymol is expected to enter all
membranes and possibly influence their fluidity and thus the
interaction between the membrane and its integral proteins,
channels, and pumps.Work on aging rats has indeed revealed
that the administration of thyme oil (or thymol itself) can have
beneficial effect on the polyunsaturated fatty acid composi-
tion of certain membranes (Youdim and Deans, 1999). This
raises the possibility that the actions of thymol seen at larger
([100 mM) concentrations are influenced by thymol’s effect
on the lipids or on the lipid-protein interaction resulting,
as discussed above, in the reduction of the free energy
associated with the open state of the channel.
Calcium release events in permeabilized fibers
Elementary calcium release events in mammalian skeletal
muscle preparations have recently been reported from
a number of laboratories (Conklin et al., 2000; Kirsch et al.,
2001; Zhou et al., 2003). These events differ from those
measured in amphibians (Tsugorka et al., 1995, Klein et al,
1996) mainly in their morphological variability, namely,
that sparks and embers coexist, and in their relative
frequency, events are more numerous in frogs. In line with
previous studies (e.g., Shirokova et al., 1998) we were also
unable to detect calcium sparks in intact (Fluo-3 AM
loaded) or notched fibers (data not shown) and, therefore,
followed the idea of Kirsch et al. (2001) to chemically skin
the fibers. The removal of the surface membrane with
saponin proved to be successful, and elementary calcium
release events were recorded routinely on these fibers.
However, their frequency was still far too low to enable
decent statistical comparison between control and drug-
modified states. To increase the number of events the
measurements were carried out with sulfate as the major
anion in the bathing solution. This indeed resulted in an
appreciable frequency (Fig. 11) without any marked
alterations in the characteristics of the events as described
earlier (Csernoch et al., 2003).
Under these conditions the proportion of events with
embers (lone embers and sparks with embers) was found to
be 37% (22% for lone embers) in good agreement with the
report by Zhou and collaborators (2003), but slightly lower
than that reported by Kirsch et al. (2001; 33% for lone
embers). It should be noted, however, that the composition of
the solutions used here more closely resembled that applied
in the former study and, furthermore, a similar automatic
computerized detection method was used.
The calcium sparks and embers detected in this study were
morphologically similar to those reported earlier. They had
a smaller average amplitude than those reported by Kirsch
et al. (2001), as expected from the use of sulfate and the
consequent lowering of the SR calcium content due to the
precipitation of CaSO4 inside the SR (Csernoch et al., 2003).
The measured FWHM and rise time were essentially
identical with previous values, although the FWHM more
1450 Szentesi et al.
Biophysical Journal 86(3) 1436–1453

closely resembled the value reported by Kirsch et al. (2001;
1.85 mm) than that reported by Csernoch et al. (2003; 2.04
mm). Noteworthy is the difference that Kirsch et al. (2001)
found it sufficient to draw an FDHM (full duration at half-
maximum) [ 50 ms selection criteria for distinguishing
embers from sparks, whereas here, lone embers shorter than
50 ms were, occasionally, also observed. Taken together, the
methods used here were clearly capable of detecting ele-
mentary calcium release events with the spatial and temporal
characteristics observed on previous occasions. This enabled
us to compare the events before and after the addition of
thymol and to analyze the action of the drug.
Calcium release events in the presenceof thymol
Thymol, in a concentration of 30 mM, has slightly increased
the frequency of the elementary calcium release events, from
0.0587 to 0.0654 s�1 sarcomere�1, which is in agreement
with its effects on the calcium release measured on cut fibers
and on the open probability of isolated RyRs. The increase in
event frequency was, however, not as marked as the increase
in global calcium release. Nevertheless, the relative pro-
portion of embers, which, as it will be discussed later, are
more likely to be the elementary events in mammals, were
increased more than the actual frequency.
In higher concentrations the drug resulted, in most cases,
in a massive release of calcium, rendering the detection of
individual events impossible. (This global release could be
interpreted as a drastic increase in event frequency, in line
with the effects described above.) In the few cases where the
fiber survived the addition of 150 mM thymol, the frequency
of the events was reduced and the relative proportion of
embers was further increased.
Comparing the average amplitudes of sparks or embers
before (0.93 and 0.21) and after (0.70 and 0.17) the addition
of thymol (Table 3) reveals a 20–24% decrease in both cases.
This suppression of event amplitude can only be explained as
a drop in SR content due to an increased leak of calcium from
the SR. Together with the decrease in amplitude, the rise
time and the duration of events were increased from 9.4 to
9.6, and from 56 to 79 ms, respectively. The increase in rise
time and duration is, on the one hand, likely to be due to the
effect of thymol on the open time of the release channel. On
the other hand, the decrease in the amplitude of sparks
reflects a lower concentration of calcium at the release site
and, therefore, a possibly less prominent negative feedback
of the released calcium.
The number of channels involved in thegeneration of a spark in mammalian muscle
One of the most intriguing findings of this study is the
appearance of long events observed in the presence of
thymol, especially with the higher, 150 mM, concentration of
the drug. These calcium release events resemble those
measured in frog skeletal muscle treated with imperatoxin A
(Gonzalez et al., 2000a; Shtifman et al., 2000) or bastadin 10
(Gonzalez et al., 2000a). They are most likely due to the
drug-induced alteration in channel gating, namely, the long-
lasting open events seen in lipid bilayer experiments. The
fact that the calcium release events displayed steady
fluorescence and essentially equal spatial width during their
entire timecourse implies that the released calcium reached
a steady state with the diffusion and binding of calcium.
Unlike imperatoxin, which locks the channel in a subcon-
ductance state (Tripathy et al., 1998), but similarly to
bastadin 10 (Chen et al., 1999), thymol did not affect the
conductance of the channel. The change in fluorescence
during the long events should, therefore, provide an upper
limit to the DF, if a single channel, or the elementary release
unit if it is more than a single channel, opens to a full
conductance state. Since the embers measured in the absence
of the drug had an average amplitude comparable to that of
the long events—the slight difference, as discussed above, is
most likely due to the difference in SR contents—they must
represent the opening of an elementary release unit under
control conditions. This unit must either 1), consist of a single
channel, inasmuch as no stepwise increase (only occasional
closings as in Fig. 12 B) in fluorescence was observed duringthe long events that could have indicated the opening or
closing of a channel or 2), the channels involved gate
synchronously (Marx et al., 1998; Zhou et al., 2003).
To estimate the number of channels involved in generating
a spark, note that the largest sparks had an average amplitude
of 2.96 and a FWHM of 2.09 mm (15 largest events). Simi-
lar parameters for large embers were 0.43 and 1.72 mm,
respectively. As discussed earlier (e.g., Rıos et al., 1999;
Jiang et al., 1999) large events represent scans close to the
source and, therefore, give the best possible resolution.
Signal mass (SM; introduced by Sun et al., 1998) was shown
to be proportional to the amplitude and FWHM3 (Chandler
et al., 2003), whereas its first derivative is at the onset of the
event to release current (ZhuGe et al., 2000). It follows,
therefore, that the ratio of release currents, and thus of the
number of channels (N ) involved, is
Ns=Ne ¼ fdðAs 3FWHM3
s Þ=dtg=fdðAe 3FWHM3
e Þ=dtg;(4)
where the subscripts s and e denote spark and ember,
respectively, and A and FWHM should be calculated for
every time point.
There are two possible routes to evaluate Eq. 4. In the
direct approach, A and FWHM are determined by fitting
Gaussian functions to each line, F[x,t ¼ constant], in the
line-scan image. SM is then plotted as a function of time and
its derivative is calculated. For the above-mentioned sparks
and embers, the rate of change in SM was found to be on
average 8.4 6 1.0 and 0.29 6 0.7 pl s�1, respectively. This
Thymol and E-C Coupling 1451
Biophysical Journal 86(3) 1436–1453

yields 29 for the relative number of channels involved in
generating a spark. Note, however, that the scatter for d(SM )/
dt for embers is large. This is due to the poor estimation of
the parameters of the Gaussian function since, for these small
events, the signal/noise ratio is high.
The indirect approach utilizes the observation that SM
increases linearly in time until the channel is open, in-
asmuch as channel conductance remains the same and no
appreciable depletion occurs at early times. Therefore SM
measured at the time of the peak and divided by the rise
time is a good estimate of d(SM)/dt. Note also that the time
to reach steady width for the large embers (10 ms) was
comparable with the rise time of the large sparks (9 ms).
Since the spatial spread of embers reaches a maximum and
then stays constant thereafter, FWHM, calculated as
described in Methods, represents the upper limit of FWHM
during the evolution of the ember. Thus the indirect
approach gives a simple way to get a lower limit for Ns over
Ne. With the data given above for A and FWHM, Ns over Ne
calculates to be 11 in agreement with the value obtained
with the direct method.
In other words,;20–30 times more channels open during
a spark than during an ember. If embers represent single
channel events, sparks are generated when some 20–30
channels open. On the other hand, if embers are generated by
a number of synchronously opening channels, the number of
channels opened during a spark could easily reach 100—that
is, the entire couplon (Stern et al., 1997).
On the other hand, following the line of reasoning given
by ZhuGe et al. (2000), one can estimate d(SM)/dt for a singlechannel. Using 0.5 pA for single channel current, 150 nM
free [Ca21]i and 100 mM for the concentration of the dye
d(SM)/dt calculates to be 0.18 pl s�1. This value suggests
that 1–2 channels are involved in generating an ember and
some 50 channels in generating a spark.
These experiments have demonstrated that thymol enhan-
ces SR calcium release by acting directly on the RyR calcium
release channels. On purified channels reconstituted into lipid
bilayers it increases the open probability and induces long-
lasting open events. In parallel, elementary calcium release
events with long duration, resembling embers, are observed in
line-scan images. These data constitute the first full description,
from the voltage-sensing event to calcium release, of drug-
modified E-C coupling inmammalian skeletalmuscle and give
an experimental estimation of the relative number of release
channels involved in generating amammalian spark. They also
argue in favor of the ember representing the opening of the
elementary calcium release unit, either as a single channel or
a group of channels always opening together, in mammalian
skeletal muscle.
The authors thank Ms. R. }OOri and E. Sagi for skillful technical assistance.
This work was supported by research grants from the Hungarian
government (OTKA T034894, T037727, and TS040773; FKFP 0193/
2001; and ETT 250/2003).
REFERENCES
Abramson, J. J., and G. Salama. 1988. Sulfhydryl oxidation and Ca21
release from sarcoplasmic reticulum. Mol. Cell Biochem. 82:81–84.
Cavagna, D., F. Zorzato, E. Babini, G. Prestipino, and S. Treves. 2000.Methyl p-hydroxybenzoate (E-218) a preservative for drugs and food isan activator of the ryanodine receptor Ca21 release channel. Br. J.Pharmacol. 131:335–341.
Chandler, W. K., S. Hollingworth, and S. M. Baylor. 2003. Simulation ofcalcium sparks in cut skeletal muscle fibers of the frog. J. Gen. Physiol.121:311–324.
Chen, L., T. F. Molinski, and I. N. Pessah. 1999. Bastadin 10 stabilizes theopen conformation of the ryanodine-sensitive Ca21 channel in anFKBP12-dependent manner. J. Biol. Chem. 274:32603–32612.
Cheng, H., W. J. Lederer, and M. B. Cannel. 1993. Calcium sparks:elementary events underlying excitation-contraction coupling in heartmuscle. Science. 262:740–744.
Cheng, H., L. S. Song, N. Shirokova, A. Gonzalez, E. G. Lakatta, E. Rıos,and M. D. Stern. 1999. Amplitude distribution of calcium sparks inconfocal images. Theory and studies with an automatic detection method.Biophys. J. 76:606–617.
Conklin, M. W., C. A. Ahern, P. Vallejo, V. Sorrentino, H. Takeshima, andR. Coronado. 2000. Comparison of Ca21 sparks produced independentlyby two ryanodine receptor isoforms (type 1 or type 3). Biophys. J.78:1777–1785.
Csernoch, L., P. Szentesi, and L. Kovacs. 1999a. Differential effects ofcaffeine and perchlorate on excitation-contraction coupling in mamma-lian skeletal muscle. J. Physiol. 520:217–230.
Csernoch, L., P. Szentesi, S. Sarkozi, C. Szegedi, and I. Jona. 1999b.Effects of tetracaine on sarcoplasmic calcium release in mammalianskeletal muscle fibers. J. Physiol. 515:843–857.
Csernoch, L., P. Szentesi, and L. Kovacs. 2002. Increased calcium releasefrom the sarcoplasmic reticulum (SR) in the presence of thymol inmammalian skeletal muscle fibers. Biophys. J. 21:641a.
Csernoch, L., J. Zhou, B. Launikonis, A. Gonzalez, M. D. Stern, G. Brum,and E. Rıos. 2003. The effects of SO4
2�, a Ca21-precipitating buffer, onCa21 sparks of mammalian and batrachian twitch muscle. Biophys. J.84:386a.
Feng, W., G. Liu, P. D. Allen, and I. N. Pessah. 2000. Transmembraneredox sensor of ryanodine receptor complex. J. Biol. Chem. 275:35902–35907.
Fusi, F., S. Saponara, H. Gagov, and G. Sgaragli. 2001. Effects of somesterically hindered phenols on whole-cell Ca21 current of guinea-piggastric fundus smooth muscle cells. Br. J. Pharmacol. 132:1326–1332.
Gonzalez, A., W. G. Kirsch, N. Shirokova, G. Pizarro, G. Brum, I. N.Pessah, M. D. Stern, H. Cheng, and E. Rıos. 2000a. Involvement ofmultiple intracellular release channels in calcium sparks of skeletalmuscle. Proc. Natl. Acad. Sci. USA. 97:4380–4385.
Gonzalez, A., W. G. Kirsch, N. Shirokova, G. Pizarro, M. D. Stern, and E.Rıos. 2000b. The spark and its ember: separately gated local componentsof Ca21 release in skeletal muscle. J. Gen. Physiol. 115:139–158.
Gonzalez, A., and E. Rıos. 1993. Perchlorate enhances transmission inskeletal muscle excitation-contraction coupling. J. Gen. Physiol. 102:373–421.
Herrmann-Frank, A., M. Richter, S. Sarkozi, U. Mohr, and F. Lehmann-Horn. 1996. 4-Chloro-m-cresol, a potent and specific activator of theskeletal muscle ryanodine receptor. Biochim. Biophys. Acta. 1289:31–40.
Hisayama, T., and I. Takayanagi. 1986. Some properties and mechanismsof thymol-induced release of calcium from the calcium-store in guinea-pig taenia caecum. Jpn. J. Pharmacol. 40:69–82.
Jiang, Y.-H., M. G. Klein, and M. F. Schneider. 1999. Numericalsimulation of Ca21 ‘‘sparks’’ in skeletal muscle. Biophys. J. 77:2333–2357.
Kirsch, W. G., D. Uttenweiler, and R. H. A. Fink. 2001. Spark- and ember-like elementary Ca21 release events in skinned fibres of adultmammalian skeletal muscle. J. Physiol. 537:379–389.
1452 Szentesi et al.
Biophysical Journal 86(3) 1436–1453

Klein, M. G., H. Cheng, L. F. Santana, Y.-H. Jiang, W. J. Lederer, andM. F. Schneider. 1996. Two mechanisms of quantized calcium releasein skeletal muscle. Nature. 379:455–458.
Klein, M. G., B. J. Simon, and M. F. Schneider. 1990. Effects of caffeine oncalcium release from the sarcoplasmic reticulum in frog skeletal musclefibers. J. Physiol. 425:599–626.
Koshita, M., and T. Oba. 1989. Caffeine treatment inhibits drug-inducedcalcium release from sarcoplasmic reticulum and caffeine contracture butnot tetanus in frog skeletal muscle. Can. J. Physiol. Pharmacol. 67:890–895.
Kostyuk, P. G., P. V. Belan, and A. V. Tepikin. 1991. Free calciumtransients and oscillations in nerve cells. Exp. Brain Res. 83:459–464.
Magyar, J., N. Szentandrassy, T. Banyasz, L. Fulop, A. Varro, and P. P.Nanasi. 2002. Effects of thymol on calcium and potassium currents incanine and human ventricular cardiomyocytes. Br. J. Pharmacol.136:330–338.
Marengo, J. J., C. Hidalgo, and R. Bull. 1998. Sulfhydryl oxidationmodifies the calcium dependence of ryanodine-sensitive calciumchannels of excitable cells. Biophys. J. 74:1263–1277.
Marx, S. O., K. Ondrias, and A. R. Marks. 1998. Coupled gating betweenindividual skeletal muscle Ca21 release channels (ryanodine receptors).Science. 281:818–821.
Meissner, G. 1994. Ryanodine receptor/Ca21 release channels and theirregulation by endogenous effectors. Annu. Rev. Physiol. 56:485–508.
Moore, C. P., J.-Z. Zhang, and S. L. Hamilton. 1999. A role for cysteine3635 of RYR1 in redox modulation and calmodulin binding. J. Biol.Chem. 274:36831–36834.
Palade, P. 1987. Drug-induced Ca21 release from isolated sarcoplasmicreticulum. II. Releases involving a Ca21 induced Ca21 release channel.J. Biol. Chem. 262:6142–6148.
Pape, P. C., D. S. Jong, and W. K. Chandler. 1996. A slow component ofintramembranous charge movement during sarcoplasmic reticulumcalcium release in frog cut muscle fibers. J. Gen. Physiol. 107:79–101.
Pizarro, G., L. Csernoch, I. Uribe, M. Rodriguez, and E. Rıos. 1991. Therelationship between Qg and Ca release from the sarcoplasmic reticulumin skeletal muscle. J. Gen. Physiol. 97:913–947.
Pizarro, G., N. Shirokova, A. Tsugorka, and E. Rıos. 1997. ‘‘Quantal’’calcium release operated by membrane voltage in frog skeletal muscle.J. Physiol. 501:289–303.
Posterino, G. S., M. A. Cellini, and G. D. Lamb. 2003. Effects of oxidationand cytosolic redox conditions on excitation-contraction coupling in ratskeletal muscle. J. Physiol. 547:807–823.
Rıos, E., and G. Pizarro. 1991. Voltage sensor of excitation-contractioncoupling in skeletal muscle. Physiol. Rev. 71:849–908.
Rıos, E., M. D. Stern, A. Gonzales, G. Pizarro, and N. Shirokova. 1999.Calcium release flux underlying Ca21 sparks of frog skeletal muscle.J. Gen. Physiol. 114:31–48.
Rousseau, E., J. LaDine, Q. Y. Liu, and G. Meissner. 1988. Activation ofthe Ca21 release channel of skeletal muscle sarcoplasmic reticulum bycaffeine and related compounds. Arch. Biochem. Biophys. 267:75–86.
Shirokova, N., J. Garcıa, and E. Rıos. 1998. Local calcium release inmammalian skeletal muscle. J. Physiol. 512:377–384.
Shirokova, N., and E. Rıos. 1996. Caffeine enhances intramembranouscharge movement in frog skeletal muscle by increasing cytoplasmicCa21 concentration. J. Physiol. 493:341–356.
Shtifman, A., C. W. Ward, J. Wang, H. H. Valdivia, and M. F. Schneider.2000. Effects of imperatoxin A on local sarcoplasmic reticulum Ca21
release in frog skeletal muscle. Biophys. J. 79:814–827.
Simon, B. J., M. G. Klein, and M. F. Schneider. 1991. Calcium dependenceof inactivation of calcium release from the sarcoplasmic reticulum inskeletal muscle fibers. J. Gen. Physiol. 97:437–471.
Stern, M. D., G. Pizarro, and E. Rıos. 1997. Local control model ofexcitation-contraction coupling in skeletal muscle. J. Gen. Physiol. 110:415–440.
Struk, A., and W. Melzer. 1999. Modification of excitation-contractioncoupling by 4-chloro-m-cresol in voltage-clamped cut muscle fibers ofthe frog ( R. pipiens). J. Physiol. 515:221–231.
Suko, J., G. Hellmann, and H. Drobny. 2000. Modulation of thecalmodulin-induced inhibition of sarcoplasmic reticulum calcium releasechannel (ryanodine receptor) by sulfhydryl oxidation in single channelcurrent recordings and [3H]ryanodine binding. J. Membr. Biol. 174:105–120.
Sun, J., L. Xu, J. P. Eu, J. S. Stamler, and G. Meissner. 2001. Classes ofthiols that influence the activity of the skeletal muscle calcium releasechannel. J. Biol. Chem. 276:15625–15630.
Szegedi, C., S. Sarkozi, A. Herzog, I. Jona, and M. Varsanyi. 1999.Calsequestrin: more than ‘‘only’’ a luminal Ca21 buffer inside thesarcoplasmic reticulum. Biochem. J. 337:19–22.
Szentandrassy, N., P. Szentesi, J. Magyar, P. P. Nanasi, and L. Csernoch.2003. Effect of thymol on kinetic properties of Ca and K currents in ratskeletal muscle. BMC Pharmacology. 3:9.
Szentesi, P., C. Collet, S. Sarkozi, C. Szegedi, I. Jona, V. Jacquemond,L Kovacs, and L. Csernoch. 2001. Effects of dantrolene on stepsof excitation-contraction coupling in mammalian skeletal muscle fibers.J. Gen. Physiol. 118:355–375.
Szentesi, P., V. Jacquemond, L. Kovacs, and L. Csernoch. 1997.Intramembrane charge movement and sarcoplasmic calcium release inenzymatically isolated mammalian skeletal muscle fibers. J. Physiol.505:371–384.
Szentesi, P., L. Kovacs, and L. Csernoch. 2000. Deterministic inactivationof calcium release in mammalian skeletal muscle. J. Physiol. 528:447–456.
Sun, X.-P., N. Callamaras, J. S. Marchant, and I. Parker. 1998. Acontinuum of InsP3-mediated elementary Ca21 signalling events inXenopus oocytes. J. Physiol. 509:67–80.
Thompson, R. D., and M. Carlson. 1989. Determination of thymol inhalothane anaesthetic preparations by high-performance liquid chroma-tography. J. Pharm. Biomed. Anal. 7:1199–1206.
Tripathy, A., and G. Meissner. 1996. Sarcoplasmic reticulum luminal Ca21
has access to cytosolic activation and inactivation sites of skeletal muscleCa21 release channel. Biophys. J. 70:2600–2615.
Tripathy, A., W. Resch, L. Xu, H. H. Valdivia, and G. Meissner. 1998.Imperatoxin A induces subconductance states in Ca21 release channels(ryanodine receptors) of cardiac and skeletal muscle. J. Gen. Physiol.111:679–690.
Tsugorka, A., E. Rıos, and L. A. Blatter. 1995. Imaging elementary ofcalcium release in skeletal muscle cells. Science. 269:1723–1726.
Xia, R., T. Stangler, and J. J. Abramson. 2000. Skeletal muscle ryanodinereceptor is a redox sensor with a well defined redox potential that issensitive to channel modulators. J. Biol. Chem. 275:36556–36561.
Youdim, K. A., and S. G. Deans. 1999. Beneficial effects of thyme oil onage-related changes in the phospholipid C20 and C22 polyunsaturatedfatty acid composition of various rat tissues. Biochim. Biophys. Acta.1438:140–146.
Zhou, J., G. Brum, A. Gonzalez, B. Launikonis, M. D. Stern, and E. Rıos.2003. Ca21 sparks and embers of mammalian muscle. Properties of thesources. J. Gen. Physiol. 122:95–114.
ZhuGe, R., K. E. Fogarty, R. A. Tuft, L. M. Lifshitz, K. Sayar, and J. V.Walsh, Jr. 2000. Dynamics of signaling between Ca21 sparks and Ca21-activated K1 channels studied with a novel image-based method fordirect intracellular measurement of ryanodine receptor Ca21 current.J. Gen. Physiol. 116:845–864.
Thymol and E-C Coupling 1453
Biophysical Journal 86(3) 1436–1453


