Embed Size (px)
Citation preview

Alternative Debt-Equity Market: the Sukuk Market
Nicole MaillettePhD Candidate
Professor John Teall
International School of Management (Paris)May 31, 2015
1

INDEX
Page
1.0 INTRODUCTION 3
2.0 LITERATURE REVIEW 4
2.01 Islamic Private Equity Sukuk (bond) concepts (Lufti & Mutalip, 2011): 4
2.02 Wedderburn-Day, A. R. (2010). Sovereign Sukuk: Adaptation and Innovation: 6
2.03 Walker and Unger (2009). Measuring Global Money Laundering: "The Walker
Gravity Model":
6
3.0 METHODOLOGY 8
3.01 The modified Walker Gravity Model: 8
3.02 Resources for Hypothesis 1 (H1) 10
3.021 Jaqueline Nelson Globe and Mail article published May 06, 2013 10
3.022 HSBC Amanah Global Sukuk Market May 18th 2012 10
3.023 Alvi I.A. et al. (2010) International Islamic Financial Market:Sukuk 11
3.024 Rasameel (April 2014). Quaterly Global Sukuk Report 11
3.025 Measuring Worth Website 11
5.0 ANALYSIS 11
5.01 H0 analysis 11
5.02 H1 analysis 14
5.03 Analysis of H0 correlation to H1 15
6.0 CONCLUSION 18
7.0 REFERENCES 20
2

1.0 INTRODUCTION
The Islamic Capital Market is an alternative trading system which has an annual growth rate of
approximately 12 to 15% (Bursa Malaysia, 2014). The following paper introduces alternative
investment bonds (sukuks) which are sold in a fairly young international exchange market (year =
2002). Sukuks are usually associated to real estate developments and the continuous growth of the
Islamic asset class securities in the developing world is attracting investors from the West at an
exponential rate. Even though direct foreign investment in the sukuk market is thriving; its main
activities are still predominantly located in developing Islamic countries.
Since the sukuk's inception, Bursa Malaysia (2014) claims that 20% of its own shares are now
internationally held. Additionally in Malaysia, the Libuan International Financial Exchange (LFX)
review shows that 30% of its listed instruments are also sukuk investments (LFS, March 2015).
Because of the apparent aggressive growth of this new market, this paper assumes that there is an
inherent risk associated to the international expansion of any class asset market because of a negative
correlation between the world population growth and the global amount of agricultural land. Adjoining
to the finite amount of disposable land; history also shows that direct foreign investments positively
affects population growth (Butlin, 2013, page 430). Therefore the expansion of new class asset debt
equity markets associated to real estates would be expected to take away landownership from the
farming community and in return would advantage real estate developments. Furthermore the persistent
erosion of cultivable land (either agricultural or rich in marketable resource) would destabilize a
country's Gross National Product (GNP) growth and could cause war or civil unrest. Expropriation
therefore becomes a strong possibility; in particular when dealing with the Middle East. According to
Agarwal and Feils (January 2015), both lessor and lessee become at risk of loosing land and/or
investment.
The following risk analysis looks at two financial tools in order to show that the success of the sukuk
market and its rapid expansion is mainly due to the proximity of the Middle East Islamic countries.
Regardless of its international interest, foreign investors will be attracted to this trading platform
because of its cultural familiarity.
The first financial tool is a modified money laundering mathematical model: the “Walker Gravity
Model (Walker and Unger, 2009)”. This algebraic representation of linkages between financial
institutions will demonstrate that there exists a strong convergence for the North African Maghreb
region towards familiarity instead of a divergence towards internationally-based western markets.
3
Therefore Hypothesis (H0) is:
H0 = the higher a country (countryi) is attracted to the country who issues debt-equity securities
(countryj); the higher the possibility of direct foreign investment from country “i” into country's “j”
real estates.
The second financial instrument, is a statistical analysis of the nominal yearly dollar value associated to
any trading markets. The collected data in this paper is from year 2008 to year 2012 because of the lack
of complete information on the sukuk market prior to 2008. A predictive analytic software, the
Statistical and Probability for the Social Sciences (SPSS) executes a linear regression between the
sukuk market and various other trading platforms in order to demonstrate that a significant growth can
be associated to attracting conventional traders away from other international trading institutions.
Therefore Hypothesis (H1) is:
H1 = there exists a possibility that class-asset bond issuers in the European and North American real
estate markets will transfer to the Sharia's compliant sukuk market.
Furthermore, the analysis of both H0 and H1 will show that further sukuk market growth due to the
proximity of the Maghreb region and the exponential growth of sukuk sales is indicative of a growing
economy that will be exclusive to few investors.
2.0 LITERATURE REVIEW
In order to understand which market will be introduced in this paper's risk analysis, the following
literature review includes a definition of the sukuk bonds and explains how its market profits.
An account of the “Walker Gravity Model” is also included in the literature review. The reader is
therefore informed on the analytical process that generated graphs # 1 to # 3 and Tables # 1 to # 7.
2.01 Islamic Private Equity Sukuk (bond) concepts (Lufti & Mutalip, 2011):
Since Islamic Banking is intertwined with specific rules or sharias stipulated under the Holy
Q'ran; the structure of Islamic Private Equities (PE) varies. Nevertheless, instead of a General Partner
(GP), the Islamic Investor is committing a sum of money via “mudharabah” or “ijara” contract. The
Mudharabah is basically a contract between a “rab al-mal” (investor) who solely provide the funds
while the mudharib (entrepreneur) solely manages the funds. This is similar to the American
relationship between an investor and its fund manager. Ibn al Qayyim quoted by Huma Rashid
(February 28, 2008) explains that a “mudharib is a trustee, an employee, a deputy and a partner. He is a
4

trustee when he takes the money; a deputy when he uses it, an employee in the work that he executes,
and a partner in the profit. For Mudharabah to be (Islamically) valid, the share of the mudharib should
be clearly specified (Rashid, February 28, 2008)". In a Mudharabah contract the Mudharib buys the
innovation or contracts and resale it to the innovator at a higher price; then distribute the profits back to
the investor. In the ijara contract the innovator leases the innovation for a period of years from the
mudharib and at the end of the contract repay the totality of the capital plus interests.
An investment committee helps the mudharib decides on investment strategies while a Sharia
Committee verifies that Sharia guidelines are followed. A Sharia adviser is directly in contact with the
mudharib in order to follow legal and religious procedures. Only Sharia compliant PE/VC will receive
funds from the mudharib. The Sharia adviser's fee is included in the mudharabah.
In Islam, money is not a commodity and cannot be traded for profits (Lufti & Mutalip, 2011) therefore
an investor cannot receive yearly payments. The investment must be put in social activities that will
benefit mankind.
Moreover, the investment funds can only be used for tangible assets. These assets must be of good
quality and continuous audit, including risk and reward must be fully appraised.
Non permitted Shariah activities include:
(i) financial services based on interest (riba);
(ii) gaming/gambling (maisir);
(iii) conventional insurance;
(iv) manufacture or sale of non-halal products or related products;
(v) entertainment activities that are non-permissible according to Shariah;
(vi) manufacture of sale of tobacco-based products or related products;
(vii) Stockbroking or share trading in Shariah non-compliant securities; and
(viii) Hotels and resorts with non-Shariah compliant activities.
Mudharabah contracts stipulates that:
The conventional debt to total asset ratio must not be higher than 30%; Interest income and non-halal
revenue relative to the total revenue must not exceed 5%; Cash plus income bearing securities relative
to the total asset must not exceed 30%; Cash, cash equivalent and account receivable relative to the
total assets must not exceed 45%. Management fee is approximately 2.5% of total amount of the fund's
portfolio.
5
2.02 Wedderburn-Day, A. R. (2010). Sovereign Sukuk: Adaptation and Innovation:
Wedderburn-Day states that contemporary bonds are illegal in Islamic financial markets;
therefore a similar equity-base security called a “sukuk” is sold on the international exchange markets
for individuals who wish to follow Islamic Sharias. Sukuk issuers are generally located in sovereign or
para-sovereign countries. One of the main characteristic of a sukuk is its asset-class category since the
debt security issuer must have a tangible asset associated to its sukuk notes. For example the Malaysian
sukuk main issuer is “the Federal Lands Commissioner of Malaysia (a statutory entity set up to hold
government land)” (Wedderburn-Day, page 327). A land lease is first contracted via the governmental
land entity which in turn issue asset-class debt securities. Each investor then periodically receives a
percentage of the lease payments until the contract reach maturity. The sukuk is representative of the
issuer's interest in a tangible asset and is always tradable at a later date. In this scenario, the issuer is
considered a Trustee while the lessor and the lessee are sharing the risk in this contract. On the other
hand, the Bahrain sukuk which deals with land-lease legally reinforce the position of the trustee since
the issuer is the Bahrain Government.
The Pakistan sukuks includes the sale of lands located on a motorway. These sukuks are similar to the
Malaysian's but these class-assets are sold on a true sale, while the sukuk title belongs to the issuer; the
Pakistani Government. A similar situation is found in the Ras Al-Khaimah sukuk which allows an
internationally based investor as an issuer.
According to Wedderburn-Day two factors slowed the sales of Sovereign sukuks during the financial
crisis of 2008. The first one has to do with the Islamic scholars negative reaction to the sukuk's
structure. The scholars reassessed the position of sale and leaseback which reduces the amount of
class-asset securities on the sukuk market. The other factor is the delay in the issuance of sharia
compliant debt securities from the UK. The combination of both factors is seen as a cause to the
reduction in sukuk market profitability.
2.03 Walker and Unger (2009). Measuring Global Money Laundering: "The Walker Gravity
Model":
The Walker Gravity Model has been modified to fit the purpose of this paper. Nevertheless
Walker and Unger's 2009 papers explains that their model of money laundering focus on suspicious
transactions in a shadow economy. Prior to developing their model, the authors enumerate various
forms of analysis. For example they use a typical money laundering statistical model called the
6

DYMICMIC (Dynamic Multiple-Indicators Multiple-Causes).
This model uses two observable variables: one of them relates to the causes of criminal behaviours
such as taxation, regulations and prosecution; while the other one is based on a set of indicators. Both
of these variables are then linked to an unobservable variable during a factor analysis. DYMICMIC can
correlate variables which significantly influence the unobservable variable. Nevertheless according to
Walker (2009) even this statistical model has its limitations.
Therefore by using Leontif’s model of Input-Output, the Walker Model utilizes the size of the
population in place A to the “attraction” level by people in place A to deal with place B and the distance
between both places. The Walker’s “prototype” gravity formula assumes the following:
Fij/Mi = Attractivenessj /Distanceij
Where Fij/Mi = (GNP/capita)j * (3BSj+GAj+SWIFTj – 3CFj – CRj +15)
Distanceij
Where Fij/Mi is the share of proceeds of crime that country i send to
Country j,
GNP/capita is Gross National Product per capita,
BS is Banking Secrecy,
GA is Government Attitude,
SWIFT is SWIFT member,
CF is Conflict,
CR is Corruption.
The “distanceij” factor in the model is the number of kilometres between the
countries.
Each variable is associated to a specific financial behaviour which in turn affects how individuals in
country “i” views individuals in country “j”. This model also assumes that the higher the Gross
National Product (GNP) factor; the more capable country “i” is capable of exporting its goods.
On the other hand, the Walker Gravity model also presumes that the richer country “j” is; the more
attractive it becomes to the poorer “i” countries. The availability and ease of access to financial
entities increase the likelihood of finding an institution capable of enabling the money laundering
process.
Therefore in the Walker Gravity Model a cost factor is positively correlated with distance between
7

country “i” and country “j”. Distance can also mean communications between managers, transaction
and cultural or currency exchange rates. Distance also negatively correlates with severe cultural
divergences.
GA or the Government Attitude towards transparency. This model assumes that a high level of
government transparency is positively associated to the amount of rules and regulations against money
laundering.
The SWIFT variable indicates that money launderers are attracted to banking systems that are complex
and can handle large amount of money.
CF is the state of being in a large civil conflict (CF = 0) or not in conflict (CF =1).
CR is the level of corruption found in the Transparency International Website
(https://www.transparency.org/).
Even though this model has been developed to work within corporate international exchanges; it also
can be adapted to national regions. Moreover since the distance between Europe and North America
can produce outliers; cultural distances can be assessed using Geert Hofstede lifelong research (The
Hofstede Center, 2015). The five cultural dimensions of many countries have been digitized in sets of
useable numbers.
3.0 METHODOLOGY
3.01 The modified Walker Gravity Model:
The usual formula:
Fij/Mi = (GNP/capita)j * (3BSj+GAj+SWIFTj – 3CFj – CRj +15)
Distanceij
is modified to include the following variables:
Fij(level of attractiveness to Country “j”)
Distance between Country “j” and Country “i”
=(GNP/capita)j*(3IBj+Indj+SWIFTj-3CFj-CRj+15)
Distanceij
GNP per capita is a numerical indicator of any country's capacity to export goods and services;
therefore the higher the GNP the more profit available for investments. In the above formula, the
8

GNP/capita shows country “j's” future economic expansion capacity.
GNP information was obtained using the US Central Intelligence Agency Website
(https://www.cia.gov/library/publications/the-world-factbook/rankorder/2004rank.html).
BSj is replaced by IBj (the number of Islamic Banks in country “j”).
This paper assumes that due to IBj strict adherence to Sharia laws; Muslims would have a stronger
affiliation to Islamic financing than to SWIFTs type of financial institutions (like in Europe and the
Americas). IBj is also very important when dealing in real estates since it affects local economic
development.
In the Walker Gravity Model, GAj is indicative of the level of transparency while in this modified
model the same variable is replaced by Indj.
Indj represents the nominal value of a country's Individualism dimension according to Geert Hofstede's
ranking from 0 to 100. This numerical value can then be used in a linear regression capable of showing
cultural convergence or divergence.
Since Qatar's cultural information was not available on the Hofstede Website, the country's score of
individualism was provided by the following site (http://localisation.atbar.org/cultural-
nuances/national-cultural-dimensions/).
According to Hofstede (1984) Individualism is defined as follows:
“loosely-knit social framework in which individuals are expected to take care of only
themselves and their immediate families. Its opposite, collectivism, represents a preference for a
tightly-knit framework in society in which individuals can expect their relatives or members of a
particular in-group to look after them in exchange for unquestioning loyalty. A society's position on this
dimension is reflected in whether people’s self-image is defined in terms of “I” or “we.” “(http://geert-
hofstede.com/countries.html).
The Worldwide Interbank Financial Telecommunication code (SWIFT) provide fast electronic
exchanges for investors from the World Wide Banking Website. Therefore SWIFTj indicates how many
North American and European Banks are available in country “j's” financial capital.
A number of Islamic Banks listed under Islamic Banking and Financing from World Wide Banking
(http://listofbanksin.com/ListIslamicBanks.htm).
CFj represents if country “j” is in civil or international conflicts. If in conflict the number “1” is
assigned; if country “j” is not in conflict the number “0” is assigned to the calculations.
Crj represents the level of perceived corruption by the International Markets. A number between 0 to
9

100 is assigned to each country and represent a ranking system developed by Transparency
International (http://www.transparency.org).
Distanceij is the distance between country “j” and country “i”. The longer the distance; the less
attractive country “j” becomes.
The following countries' financial capitals were used in the calculations of the Walker Entropy Model:
New York's Wall Street financial sector; Egypt=Cairo; Saudi Arabia=Riyad; Qatar=Doha;
Bahrain=Manama; Israel=Tel Aviv; Jordan=Amman; Lebanon=Beyrut; Syria=Damascus; West
Bank=East Jerusalem because West Bank is representative of Palestine and East Jerusalem is
Palestine's proposed future capital.
3.02 Resources for Hypothesis 1 (H1)
The following sites were utilized in order to populate the analysis templates for H1.
3.021 Jaqueline Nelson Globe and Mail article published May 06, 2013
Jaqueline Nelson's (2013, May 06) data research for her article labelled “15 top real
estate equity funds” has been inputted in an excel sheet in order to be compared to the information
listed on the Islamic Development Bank site.
The site URL is http://www.theglobeandmail.com/globe-investor/investment-ideas/number-
cruncher/15-top-performing-real-estate-equity-funds/article11742295/
These 15 funds are representative of the real estate global market and are being used as a 10 year
growth in this industry.
3.022 HSBC Amanah Global Sukuk Market May 18th 2012
Information regarding the sukuk market growth was obtained using a paper prepared for
the Conference on the role of Sukuk in Development. The information inputted in the calculation of
risk was limited to year 2008 to 2012 inclusively.
This site URL is
http://siteresources.worldbank.org/FINANCIALSECTOR/Resources/Haneef_Global_Sukuk_Market_
HSBC.pdf
10

3.023 Alvi I.A. et al. (2010) International Islamic Financial Market: Sukuk Report. 1St
Edition.
Alvi I.A et al Sukuk Report in 2010 provided information regarding the sukuk market
growth from 2003 till 2009. Only the data from 2008 and 2009 was inputted in the calculation of risk.
3.024 Rasameel (April 2014). Quaterly Global Sukuk Report
Rasameel's Quaterly Global Sukuk Report provided the last three years growth rate
datum.
3.025 Measuring Worth Website
Williamson Measuring Worth Website which can be found at
http://www.measuringworth.com/DJIA_SP_NASDAQ/ provided up-to-date and historical information
about the Dow Jones Industrial Average Index (DJIA), the American Stock Market Standard & Poor
500 (S&P500) and NASDAQ. The rate of growth for each market was entered in an Excel sheet for the
calculations in H1's validity.
5.0 ANALYSIS
5.01 H0 analysis
H0 stipulates that “the higher a country (countryi) is attracted to the country who issues debt-
equity securities (countryj); the higher the possibility of direct foreign investment from countryi into
countryj's real estates.
H0 used the Maghreb regions (Egypt, Lebanon, Syria, Jordan, Israel, WestBank (Palestine), Bahrain,
Qatar, Saudi Arabia) as its controlled group because the countries main governance falls under Islamic
Sharias. The USA variable was added in order to see if distance was indeed a factor.
11

Table # 1 Level of Attractiveness/Distance between country “i” and “j”
Source: Excel Calculations using data from Hofstede Center, Transparency International, CIA Websites
Table #1's top row represents country “i”.
These are the countries that are seeking a connection to one of countries “j”.
The first column is country “j”. The country that is attractive to country “i”.
In Table #1, which has been constructed using the Walker Gravity Model; the higher the number in
each column, the higher the attraction to one of countries “j”.
Graph #1 Country “i” level of attraction to country “j”
Source: Excel Calculations of the Walker Gravity Model for attractiveness
12
Row 1 Row 2 Row 3 Row 40
2
4
6
8
10
12
Column 1
Column 2
Column 3
EgyptLebanon
SyriaJordan
IsraelWestBank
BahrainQatar
Saudi ArabiaUnited States
0.000
20000.000
40000.000
60000.000
80000.000
Level of attractiveness for Maghreb regions
sub-title
EGYPT LEBANON SYRIA JORDAN
ISRAEL WESTBANK BAHRAIN QATAR
SAUDI ARABIA UNITED STATES
country "j"
leve
l of a
ttra
ctio
n

Graph #1 clearly shows that Jordan and WestBank are the two most attractive countries. Qatar comes
third only because of the level of attraction it receives from Bahrain.
The Maghreb region has no attraction towards the United States.
Due to the results of Fij/Distanceij, a two-factor ANOVA analysis was conducted in order to find out if
the results are significant.
Table # 2 Significance of Distance using Two factor ANOVA analysis
Source: SPSS calculations using data from Table # 1
13

Table #2 shows that distance for country “i” is not significant (p = 1.53), but becomes more significant
for country “j” ( p = 0.07). Being attractive to closer countries is more significant than the level of
attractiveness from country “i”.
H0 is therefore not significant. Although Table # 2 does show some correlation between proximity and
level of attractiveness between country “i” and “j”. Nevertheless the fact that the sukuk market's
location is in the proximity of the Maghreb region increase the probability of investments by followers
of Islam. These investments are more conducted due to convenience than due to who the issuers are.
5.02 H1 analysis
Since H0 analysis indicates that proximity may be a factor in the sukuk market rapid growth,
H1 analysis was conducted. H1 stipulates that if the growth of the sukuk market against one of its
international competitor is significant enough, there may be a risk in loosing issuers from the European
and North American real estate markets.
Graph # 2 Percentage of growth between the TSX, DJIA, S&P500, NASDAQ and the Sukuk Markets
Source: TSX site, Sukuk Market site, Measuring Worth website
14
Row 1 Row 2 Row 3 Row 40
2
4
6
8
10
12
Column 1
Column 2
Column 3
2008 2009 2010 2011 2012
-60
-40
-20
0
20
40
60
80
Comparing the Sukuk Market to North American Markets
S&P/TSX Capped Real Estate Index DJIA
S&P500 NASDAQ
Sukuk Market Growth Rate
Year
% o
r g
row
th

Compared to the four other markets, Graph #2 shows that the sukuk market has been growing at a fast
pace. It is also interesting to see that during the real estates crisis of the year 2007 and 2008, the sukuk
market did have a 6% growth while the other ones had a negative growth.
Therefore Table # 3 was constructed using a Single-factor ANOVA analysis in order to see if the sukuk
market's growth is significant enough to begin measuring risks.
Table # 3 One-Factor ANOVA analysis for the sukuk market rate of growth.
Source: SPSS calculation using information from Graph # 2
Only a Single Factor analysis was conducted with the 5 markets. The variation on each market's rate of
growth between years 2008, 2009, 2010, 2011, 2012 is the factor that will indicate if the sukuk market's
growth is indeed significant. As per Graph # 2, Table # 3 also indicates that the yearly rate of growth
between the groups is significant (p = 0.0004). Which means that the sukuk market has a strong chance
of further growth.
5.03 Analysis of H0 correlation to H1
If we take into consideration both hypothesis in that if the Maghreb region is attractive to its
neighbouring countries and that the growth of the sukuk market is very significant when it is compared
to the North American ones; then there is a high probability that the sukuk market will take away
investors from the North American markets.
Let say that P(H0) is now equal to percentage fraction of the most attractive country of the Middle East
15

(Westbank = 43402.023). Then each item in Table # 1 can therefore be assumed to have also a
percentage of probability that country “j” is attractive to countries “i'.
Therefore Graph # 3 would become:
Source: Excel calculations using graph #1 information.
In order to build P(H0) lets assume that the following countries “j” have suppliers in the sukuk markets.
The five most attractive country “j” have therefore been selected in the calculations of P(H0) and
entered in Table # 4: they are WestBank, Jordan, Qatar, Lebanon, Israel.
Table # 4 The 5 most attractive countries “j”
Source: Excel sheet calculations of attractiveness probability.
In order to build P(H1) lets also assume that the yearly percentage average of each class-asset
international exchange platforms from year 2008 to 2012 is representative of future probable growth
for each platform.
Therefore Table # 5 is representative of P(H1).
Table #5 Average percentage of probability of growth
Source: Excel sheet calculation of average % of growth.
16

Table # 6 was constructed in order to find the probability of growth in the Middle East for each
exchange platforms.
A calculation of P(H0)*P(H1) was performed using the exchange platforms as the dependant variable
and countries “j” as the independent variables.
Table # 6 P(H0) * P(H1) Probability of attractiveness influencing the probability of growth
Source: Excel sheet calculations using Table # 4 * Table # 5
Graph # 3 P(H0) * P(H1) is a visual representation of Table # 6.
Source: Excel sheet calculations of Table # 6
Graph # 3 indicates that the sukuk market surpasses any other international class-asset markets for
future growth.
17
Row 1 Row 2 Row 3 Row 40
2
4
6
8
10
12
Column 1
Column 2
Column 3
WestBank Jordan Qatar Lebanon Israel0.000
10.000
20.000
30.000
40.000
Furure probability of growth for class-asset international markets
Issuers from the Middle East
S&P/TSX Capped Real Estate Index DJIA
S&P500 NASDAQ
Sukuk Market Growth Rate
Country "j"
P(H
0)*
P(H
1)
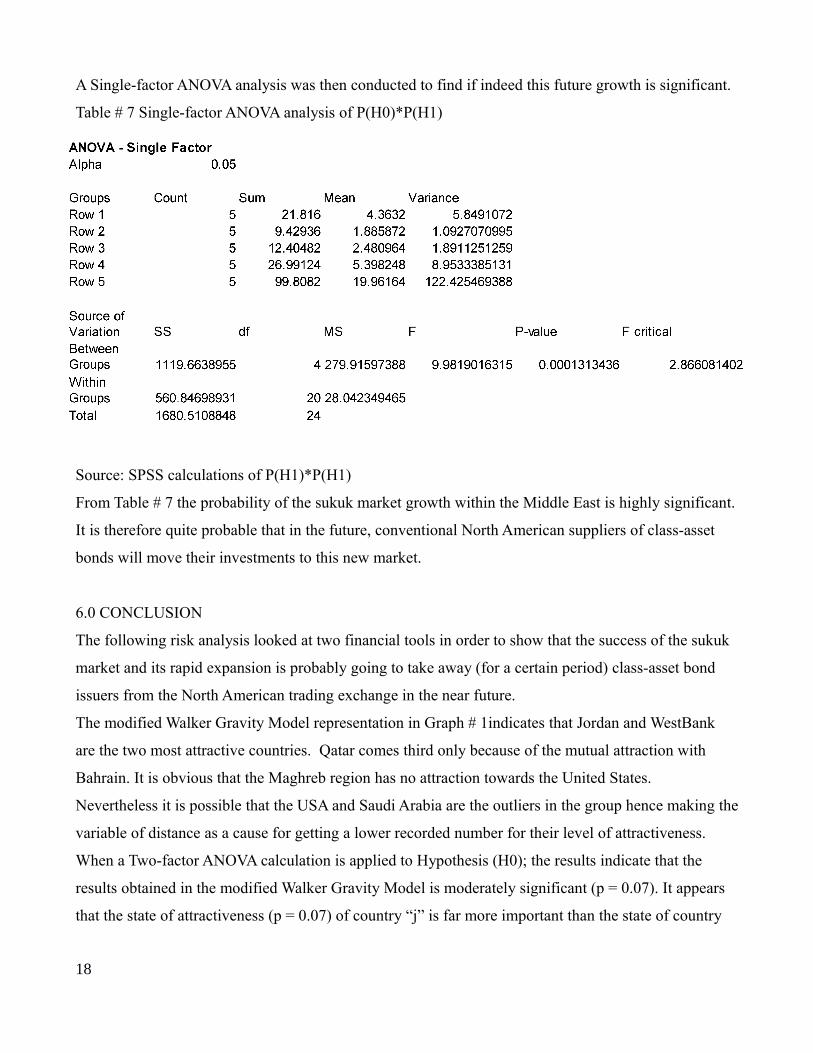
A Single-factor ANOVA analysis was then conducted to find if indeed this future growth is significant.
Table # 7 Single-factor ANOVA analysis of P(H0)*P(H1)
Source: SPSS calculations of P(H1)*P(H1)
From Table # 7 the probability of the sukuk market growth within the Middle East is highly significant.
It is therefore quite probable that in the future, conventional North American suppliers of class-asset
bonds will move their investments to this new market.
6.0 CONCLUSION
The following risk analysis looked at two financial tools in order to show that the success of the sukuk
market and its rapid expansion is probably going to take away (for a certain period) class-asset bond
issuers from the North American trading exchange in the near future.
The modified Walker Gravity Model representation in Graph # 1indicates that Jordan and WestBank
are the two most attractive countries. Qatar comes third only because of the mutual attraction with
Bahrain. It is obvious that the Maghreb region has no attraction towards the United States.
Nevertheless it is possible that the USA and Saudi Arabia are the outliers in the group hence making the
variable of distance as a cause for getting a lower recorded number for their level of attractiveness.
When a Two-factor ANOVA calculation is applied to Hypothesis (H0); the results indicate that the
results obtained in the modified Walker Gravity Model is moderately significant (p = 0.07). It appears
that the state of attractiveness (p = 0.07) of country “j” is far more important than the state of country
18

“i” being attracted (p = 0.15) to country “j”.
Hypothesis H1 proposes that class-asset bond issuers may transfer their businesses from the European
and North American real estate markets to the Sharia's compliant sukuk market. Graph # 2 shows an
exponential increase of the sukuk market when it is compared to the S&P/TSX Capped Real Estate
Index, the DJIA, the S&P500 and NASDAQ. The sukuk market's percentage growth is therefore
highly significant (p = 0.00) when Graph # 2 results was entered in a Single-factor ANOVA analysis.
A probability of future growth analysis was then conducted on the results from H0 and H1.
The probability of attractiveness P(H0) was developed by assuming that the most attractive country (j =
WestBank) would equal to 100% of attractiveness while the other countries “j” would be calculated by
dividing each level of attractiveness against WestBank. Five countries were chosen because of their
percentage of attractiveness. Beside WestBank, Jordan, Qatar, Lebanon and Israel appear to be the most
sought after. It appears that Qatar and Bahrain have a mutual attraction for each other, therefore they
were discarded as possible domestic class-asset bond issuers.
Table # 6 [P(H0) * P(H1)] indicates that the probability of attractiveness can influence the probability
of market growth. Graph # 4 showed that the NASDAQ market has still some influence on all five
countries, but that the sukuk market bypass any other North American class-asset bond markets. A
Single-factor ANOVA analysis indicates that the future sukuk market growth in the Maghreb region is
quite significant ( p = 0.00).
The sukuk market future growth is therefore expected to be substantial and significant; in particular
with countries localized in the Maghreb region.
Nevertheless further study should be conducted with other North African region, in particular with the
Middle East North African (MENA's) countries. It is possible that this alternative trading system might
become temporary due to the buyer's aversion to risk. The international sukuk market growth may
plateau when the buyers from the Maghreb region have reached its economic capacity for expansion.
19

7.0 REFERENCES
Alvi I.A. et al. (2010) International Islamic Financial Market: Sukuk Report. 1St Edition. Retrieved
from www.kantakji.com/media/7465/c9. p df on April 20th 2015.
Agarwal, J., & Feils, D. J. (2015, January). A Comparative Study of Political Risk in Export and
Foreign Direct Investment: The Case of Canadian Firms. In Proceedings of the 2000 Academy of
Marketing Science (AMS) Annual Conference (pp. 478-478). Springer International Publishing.
Bursa Malaysia (2014) The Islamic Capital Market. Retrieved from www.bursamalaysia.com on April
04 2015.
Butlin, N. G. (2013) Investment in Australian economic development, 1861-1900. Cambridge
University Press.
Dusuki, Asyraf Wajdi (December 2010) "Do equity-based Sukuk structures in Islamic capital markets
manifest the objectives of Shariah??." Journal Of Financial Services Marketing 15, no. 3 (December
2010): 203-214. Business Source Premier, EBSCOhost (accessed April 9, 2015).
Hofstede, Geert.
The Hofstede Center: Strategy, Culture, Change.
Retrieved from: http://geert-hofstede.com/national-culture.html on April 25th 2015.
Kadir, N. A., Jaffar, A., Abdullah, N. L., & Harun, N. (2013) Comparison of the financial performance
of Islamic and conventional bank in Malaysia during and after economic crisis. AIP Conference
Proceedings, 1557(1), 247-251. doi:10.1063/1.4823913
LFX (2015). LABUAN INTERNATIONAL FINANCIAL EXCHANGE INC.
http://lfxsys.lfx.com.my/index.asp retrieved on April 17 2015.
Lufti & Mutalip (2011). Islamic Venture Capital and Private Equity: Legal Issues and Challenges.
20

Global Financial Services and Islamic Banking. Azmi & Associates.
Retrieved from: http://www.azmilaw.com on September 15th 2014.
Nelson Jaqueline (2013, May 06). 15 top performance Real Estate equity funds. The Globe and
Mail:Globe Investor: Number Cruncher.
Retrieved from: http://www.theglobeandmail.com/globe-investor/investment-ideas/number-
cruncher/15-top-performing-real-estate-equity-funds/article11742295/ on April 26th 2015.
Rasameel (April 2014). Quaterly Global Sukuk Report. Structured Finance CO.
Retrieved from: http://www.rasameel.com/downloads/RSFGlobalSukukMarketQ12014.pdf on April
24th 2015.
Rashid U. (February 28, 2008). Inside Business 360. Entrepreneurship: The meaning of Mudharabah.
Retrieved from: http://www.insidebusiness360.com/index.php/the-meaning-of-mudharabah-26950/ on
September 16th 2014
Siddiki Moin (2009) Prospects for sukuk stay strong. Business Special Focus. The Middle East
December. IC Publications Ltd. 4 pages.
Transparency International: The Global Coalition Against Corruption.
Retrieved from: https://www.transparency.org/ on April 25th 2015.
Vishwanath, S. R., & Sabahuddin A. (2009) "An Overview of Islamic Sukuk Bonds."Journal Of
Structured Finance 14, no. 4: 58-67. Business Source Premier, EBSCOhost (accessed April 15, 2015).
Walker, J., & Unger, B. (2009). Measuring Global Money Laundering: "The Walker Gravity Model".
Wedderburn-Day, A. R. (2010). SOVEREIGN SUKUK: ADAPTATION AND INNOVATION. Law &
Contemporary Problems 73(4), 325-333.
21


