Embed Size (px)
Citation preview
Ambient Vibration Test on Reinforced Concrete Bridges
Nurul Shazwin Idris1,a, Koh Heng Boon1 and Ahmad Fahmy Kamarudin1 and Sherliza Zaini Sooria2 1Jamilus Research Center, Universiti Tun Hussein Onn Malaysia, 86400 Parit Raja, Johor, Malaysia 2Public Works Department, 50480 Kuala Lumpur, Malaysia
Abstract. An investigation was carried out to determine dynamic characteristic of reinforced concrete (RC) bridges by using ambient vibration test (AVT). The ambient vibration sources on bridges may come from traffic, wind, wave motion and seismic events. AVT describes the dynamic characteristics of the bridge and ground by measuring the natural frequencies using highly sensitive seismometer sensor. This test is beneficial due to light weight equipment and smaller number of operator required, cheap and easy to be handled. It is able to give a true picture of the bridge dynamic behavior without any artificial force excitation when vibration data is recorded. A three-span reinforced concrete bridge located in Sri Medan, Batu Pahat, Johor was measured by using microtremor equipment consist of three units of 1 Hz eigenfrequency passive sensors used in this test was performed in normal operating condition without excitation required from any active sources or short period noise perturbations. Ten measurements were conducted on the bridge deck and ten measurements on the ground surface in order to identify the natural frequencies of the bridge. Several peak frequencies were identified from three components of Fourier Amplitude Spectra (FAS) in transverse (North-South), longitudinal (East-West) and vertical (Up-Down) direction as well as squared average Horizontal to Vertical Spectral Ratio (HVSR) of ground response, computed by using Geopsy software. From the result, it was expected the bridge have five vibration modes frequencies in the range of 1.0 Hz and 7.0 Hz with the first two modes in the transverse and longitudinal direction having a frequency 1.0 Hz, the third mode is 2.2 Hz in transverse direction, fourth and fifth mode is 5.8 Hz and 7.0 Hz. For ground natural frequencies are in range 1.0 Hz to 1.3 Hz for North-South direction and 1.0 Hz to 1.6 Hz for East-West direction. Finally the results are compared with several empirical formulas for simple verification.
1 Introduction Ambient vibration also known as microtremor is the excitation experienced by a structure under its normal operating condition [5]. Examples of ambient vibration exerted on the bridge are traffic vibration, wind, wave motion and seismic excitation. This vibration can be determined by measuring the vibration behavior using highly sensitive acceleration sensor [16]. This test would give the true picture of the behavior of the structure without artificial excitation. In the past research, ambient vibration test widely applied to different types of bridges such as a double-deck bridge [9], pre-stressed concrete box girder bridge [3, 6], continuous girder bridge [15] , reinforced concrete bridge [6], cable stayed bridge [15] and stone masonry bridge [12] in order to determine the dynamic
a Corresponding author : [email protected]
DOI: 10.1051/C© Owned by the authors, published by EDP Sciences, 201
/
0 0 ( 201 )201conf
Web of ConferencesMATECatecm
,0 06
6
6
4477 2
21122
��������������� �������� ��������������������������������������������������������������������� ����� ������� ����������������� ��������������������������������� �������������������������������������������� ����������� ������
4
MATEC Web of Conferences
characteristics of the bridge. Many researchers have used this technique because it is economic and practical to conduct.
It is important to measure the dynamic characteristics for both newly constructed and existing bridge to understand better their dynamic behavior under normal traffic loads and also during extreme loads such as those causes by seismic events or high wind [5]. Dynamic characteristics in terms of natural frequencies, mode shape and damping ratios are important for accurately predicting the dynamic response of the structure at design and reassessment stage [2]. This study only focused on field measurement of ambient vibration from free vibration sources. This information is important for prediction in seismic design and also for reassessment purpose.
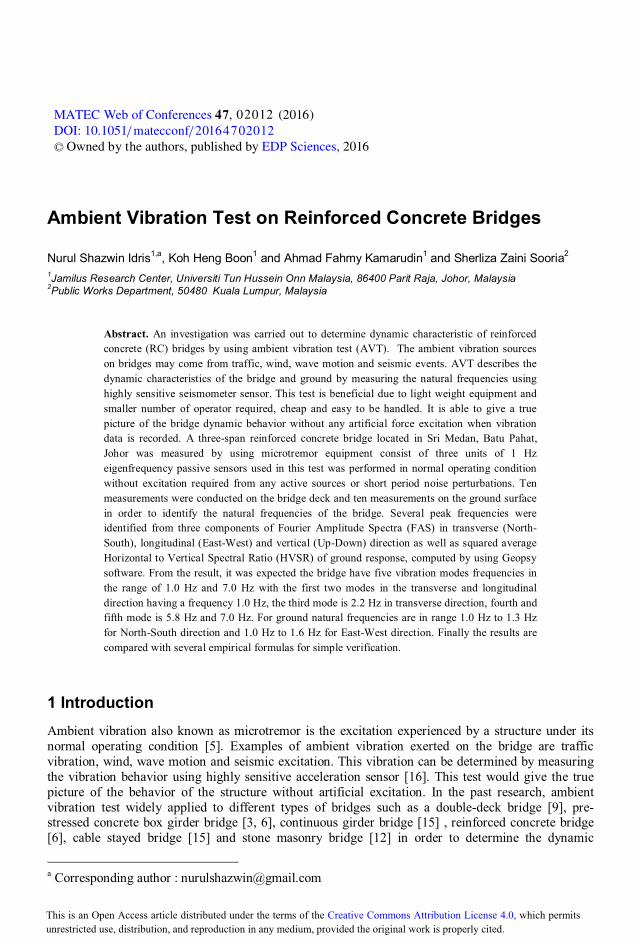
2 Methodology The ambient vibration test (AVT) was conducted on a three-span, two-carriageway of total length of 70 meter with a main span of 30 meter and two side span of 20 meter. The bridge width is 12 meter. The bridge is semi integral bridge and the deck made of pre-stressed concrete T-beam supported by four intermediate and two abutments. The bridge constructed by Jabatan Kerja Raya (JKR) located in Sri Medan, Batu, Johor as shown in Figure 1(a). The bridge was opened to public used in 2013, linked Kampung Parit Laman, Sri Medan to Kangkar Merlimau, Parit Sulong.
Microtremor equipment consists of three units of 1 Hz Lennartz Triaxial seismometer and CityShark II data logger as shown in Figure 1(b). Ten measurements were conducted on bridge deck and also ground, with 15 minutes of recording length for each measurement. The seismometers were portable data and placed at different points on the bridge deck. All real response data recorded using the data logger with 100 Hz sampling of frequency.
Figure 1. (a) Location of Sungai Simpang Kiri Bridge, (b) Setting up data logger and seismometer for deck measurement
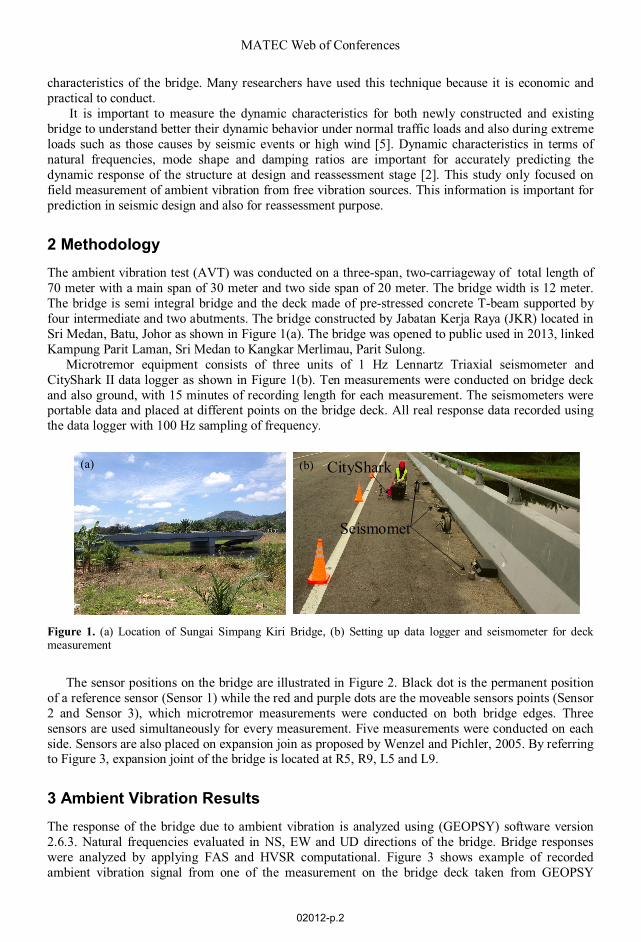
The sensor positions on the bridge are illustrated in Figure 2. Black dot is the permanent position
of a reference sensor (Sensor 1) while the red and purple dots are the moveable sensors points (Sensor 2 and Sensor 3), which microtremor measurements were conducted on both bridge edges. Three sensors are used simultaneously for every measurement. Five measurements were conducted on each side. Sensors are also placed on expansion join as proposed by Wenzel and Pichler, 2005. By referring to Figure 3, expansion joint of the bridge is located at R5, R9, L5 and L9.
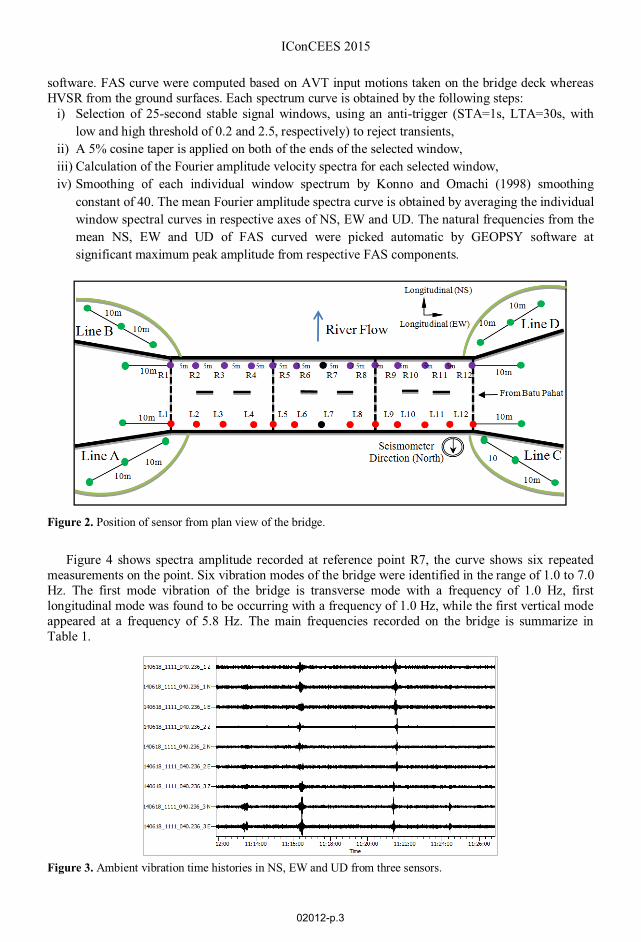
3 Ambient Vibration Results The response of the bridge due to ambient vibration is analyzed using (GEOPSY) software version 2.6.3. Natural frequencies evaluated in NS, EW and UD directions of the bridge. Bridge responses were analyzed by applying FAS and HVSR computational. Figure 3 shows example of recorded ambient vibration signal from one of the measurement on the bridge deck taken from GEOPSY
(a)
Seismomet
(b) CityShark
02012-p.2
software. FAS curve were computed based on AVT input motions taken on the bridge deck whereas HVSR from the ground surfaces. Each spectrum curve is obtained by the following steps:
i) Selection of 25-second stable signal windows, using an anti-trigger (STA=1s, LTA=30s, with low and high threshold of 0.2 and 2.5, respectively) to reject transients,
ii) A 5% cosine taper is applied on both of the ends of the selected window, iii) Calculation of the Fourier amplitude velocity spectra for each selected window, iv) Smoothing of each individual window spectrum by Konno and Omachi (1998) smoothing
constant of 40. The mean Fourier amplitude spectra curve is obtained by averaging the individual window spectral curves in respective axes of NS, EW and UD. The natural frequencies from the mean NS, EW and UD of FAS curved were picked automatic by GEOPSY software at significant maximum peak amplitude from respective FAS components.
Figure 2. Position of sensor from plan view of the bridge.
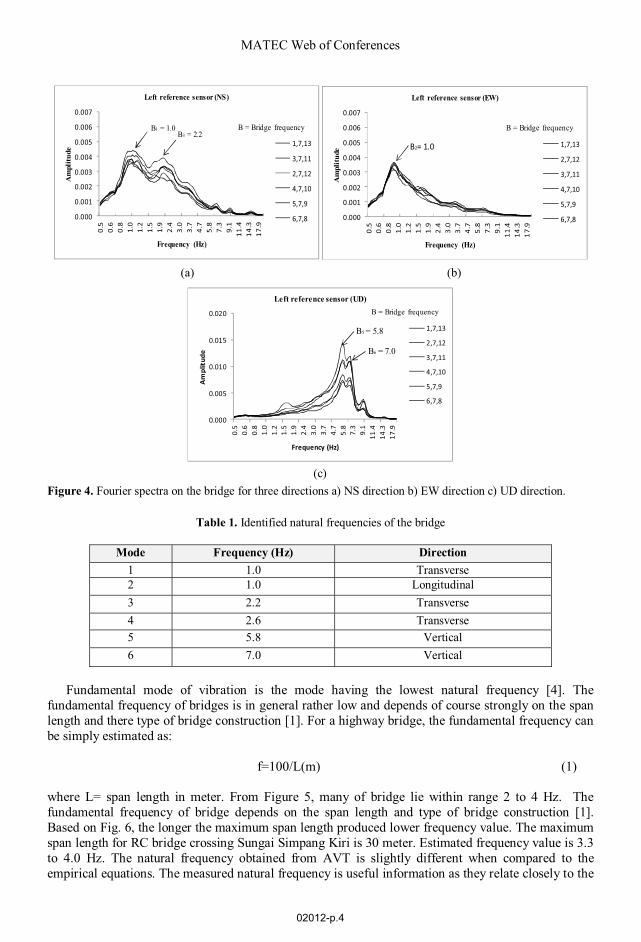
Figure 4 shows spectra amplitude recorded at reference point R7, the curve shows six repeated
measurements on the point. Six vibration modes of the bridge were identified in the range of 1.0 to 7.0 Hz. The first mode vibration of the bridge is transverse mode with a frequency of 1.0 Hz, first longitudinal mode was found to be occurring with a frequency of 1.0 Hz, while the first vertical mode appeared at a frequency of 5.8 Hz. The main frequencies recorded on the bridge is summarize in Table 1.
Figure 3. Ambient vibration time histories in NS, EW and UD from three sensors.
IConCEES 2015
02012-p.3
MATEC Web of Conferences
Figure 4. Fourier spectra on the bridge for three directions a) NS direction b) EW direction c) UD direction.
Table 1. Identified natural frequencies of the bridge
Mode Frequency (Hz) Direction 1 1.0 Transverse 2 1.0 Longitudinal 3 2.2 Transverse 4 2.6 Transverse 5 5.8 Vertical 6 7.0 Vertical
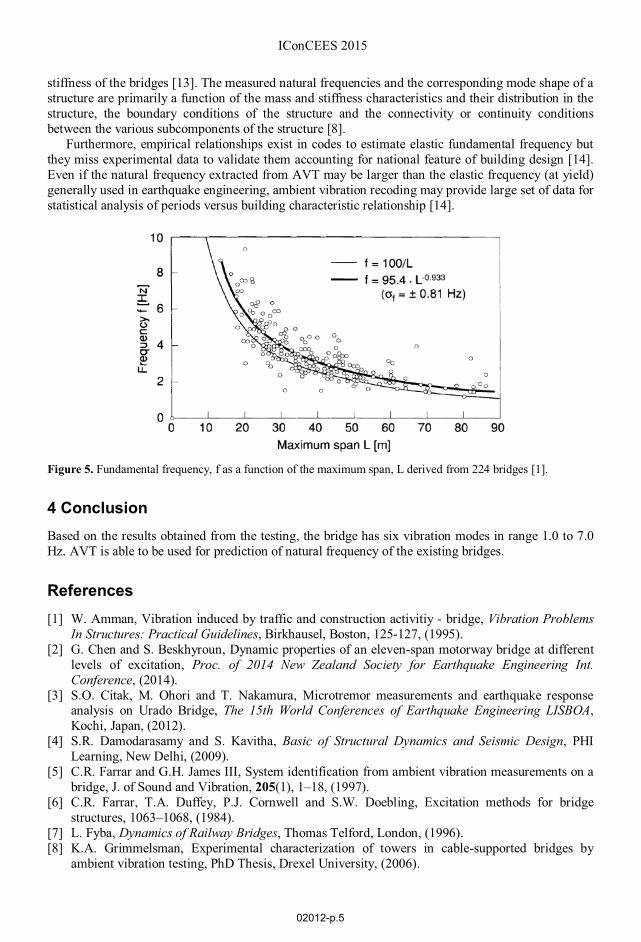
Fundamental mode of vibration is the mode having the lowest natural frequency [4]. The
fundamental frequency of bridges is in general rather low and depends of course strongly on the span length and there type of bridge construction [1]. For a highway bridge, the fundamental frequency can be simply estimated as:
f=100/L(m) (1)
where L= span length in meter. From Figure 5, many of bridge lie within range 2 to 4 Hz. The fundamental frequency of bridge depends on the span length and type of bridge construction [1]. Based on Fig. 6, the longer the maximum span length produced lower frequency value. The maximum span length for RC bridge crossing Sungai Simpang Kiri is 30 meter. Estimated frequency value is 3.3 to 4.0 Hz. The natural frequency obtained from AVT is slightly different when compared to the empirical equations. The measured natural frequency is useful information as they relate closely to the
0.000
0.001
0.002
0.003
0.004
0.005
0.006
0.007
0.5
0.6
0.8
1.0
1.2
1.5
1.9
2.4
3.0
3.7
4.7
5.8
7.3
9.1
11.4
14.3
17.9
Am
plitu
de
Frequency (Hz)
Left reference sensor (NS)
1,7,13
3,7,11
2,7,12
4,7,10
5,7,9
6,7,8
B1 = 1.0 B3 = 2.2
B = Bridge frequency
0.000
0.001
0.002
0.003
0.004
0.005
0.006
0.007
0.5
0.6
0.8
1.0
1.2
1.5
1.9
2.4
3.0
3.7
4.7
5.8
7.3
9.1
11.4
14.3
17.9
Am
plit
ude
Frequency (Hz)
Left reference sensor (EW)
1,7,13
2,7,12
3,7,11
4,7,10
5,7,9
6,7,8
B2= 1.0
B = Bridge frequency
0.000
0.005
0.010
0.015
0.020
0.5
0.6
0.8
1.0
1.2
1.5
1.9
2.4
3.0
3.7
4.7
5.8
7.3
9.1
11.4
14.3
17.9
Am
plit
ude
Frequency (Hz)
Left reference sensor (UD)
1,7,13
2,7,12
3,7,11
4,7,10
5,7,9
6,7,8
B5 = 5.8
B6 = 7.0
B = Bridge frequency
(a) (b)
(c)
02012-p.4
stiffness of the bridges [13]. The measured natural frequencies and the corresponding mode shape of a structure are primarily a function of the mass and stiffness characteristics and their distribution in the structure, the boundary conditions of the structure and the connectivity or continuity conditions between the various subcomponents of the structure [8].
Furthermore, empirical relationships exist in codes to estimate elastic fundamental frequency but they miss experimental data to validate them accounting for national feature of building design [14]. Even if the natural frequency extracted from AVT may be larger than the elastic frequency (at yield) generally used in earthquake engineering, ambient vibration recoding may provide large set of data for statistical analysis of periods versus building characteristic relationship [14].
Figure 5. Fundamental frequency, f as a function of the maximum span, L derived from 224 bridges [1].
4 Conclusion
Based on the results obtained from the testing, the bridge has six vibration modes in range 1.0 to 7.0 Hz. AVT is able to be used for prediction of natural frequency of the existing bridges.
References [1] W. Amman, Vibration induced by traffic and construction activitiy - bridge, Vibration Problems
In Structures: Practical Guidelines, Birkhausel, Boston, 125-127, (1995). [2] G. Chen and S. Beskhyroun, Dynamic properties of an eleven-span motorway bridge at different
levels of excitation, Proc. of 2014 New Zealand Society for Earthquake Engineering Int. Conference, (2014).
[3] S.O. Citak, M. Ohori and T. Nakamura, Microtremor measurements and earthquake response analysis on Urado Bridge, The 15th World Conferences of Earthquake Engineering LISBOA, Kochi, Japan, (2012).
[4] S.R. Damodarasamy and S. Kavitha, Basic of Structural Dynamics and Seismic Design, PHI Learning, New Delhi, (2009).
[5] C.R. Farrar and G.H. James III, System identification from ambient vibration measurements on a bridge, J. of Sound and Vibration, 205(1), 1–18, (1997).
[6] C.R. Farrar, T.A. Duffey, P.J. Cornwell and S.W. Doebling, Excitation methods for bridge structures, 1063–1068, (1984).
[7] L. Fyba, Dynamics of Railway Bridges, Thomas Telford, London, (1996). [8] K.A. Grimmelsman, Experimental characterization of towers in cable-supported bridges by
ambient vibration testing, PhD Thesis, Drexel University, (2006).
IConCEES 2015
02012-p.5
MATEC Web of Conferences
[9] I.E. Harik, D.L. Allen, R.L. Street, M. Guo, J. Harison and M.J. Gawry, Free and ambient vibration of Brent-Spence bridge, J. of Structural Engineering, 123, 1262–1268, (1997).
[10] A. Kibboua and M.N. Farsi, Modal analysis and ambient vibration measurements on Mila-Algeria cable stayed bridge, Structural Engineering and Mechanics, 29(2), 171–186, (2008).
[11] K. Konno and T. Ohmachi, Ground-motion characteristics estimation from spectral ratio between horizontal and vertical component microtremor, Bulletin of the Seismological Society of America, 88(1), 228-241, (1998).
[12] L.S. Krstevska, M. Kustura and L.A. Tashkov, Experimental in-situ testing of reconstructed old bridge in Mostar, The 14th World Conference On Earthquake Engineering, Beijing, China, 1-8, (2008).
[13] C.W. Lin and Y.B. Yang, Use of a passing vehicle to scan the fundamental bridge frequencies: An experimental verification, Engineering Structures, 27(13), 1865–1878, (2005).
[14] C. Micheal, P. Gueguen, Lestuzzi and P.Y. Bard, Comparison between seismic vulnerability models and experimental dynamic properties of existing buildings in France, Bulletin of Earthquake Engineering, 8(6), 1295–1307, (2010).
[15] W. Ren, X. Peng and Y. Lin, Experimental and analytical studies on dynamic characteristics of a large span cable-stayed bridge, Engineering Structures, 27(4), 535–548, (2005).
[16] H. Wenzel and D. Pichler, Ambient Vibration Monitoring, John Wiley and Sons, England, (2005).
02012-p.6


