Embed Size (px)
Citation preview

AMERICAN ASSOCIATION OF WINE ECONOMISTS
AAWE WORKING PAPER
No. 73 Economics
COLLECTIVE REPUTATION EFFECTS:
AN EMPIRICAL APPRAISAL
Olivier Gergaud and Florine Livat
November 2010
www.wine-economics.org

Collective Reputation Effects:An Empirical Appraisal
Olivier Gergaud and Florine Livat∗†
November 12, 2010
Abstract
This paper is an attempt to shed some empirical light on imagelinkages that exist between a collective umbrella brand and its relatedindividual components. To tackle this issue, we estimate an interactionmodel in which a single collective reputation both determines and isdetermined by a series of individual reputations à la Tirole (1996).From an application to Bordeaux wines using detailed survey data
collected in seven European countries, we get positive and significantspillover effects from the umbrella reputation (Bordeaux) which arefound to increase with the individual reputation level of the wine.Controlling for the natural endogeneity of collective reputation in thissetup, allows to capture the important fact that this relationship is
∗We are particularly indebted to Andrew Clark, Tom Coupé, Victor Ginsburgh, Gar-rett Glasgow, Abdul Noury, Frédéric Warzynski and seminar participants at the 31st
Annual Conference of the European Association for Research in Industrial Economics, 1st
European Conference on Cognitive Economics, 3rd annual Conference of the AmericanAssociation of Wine Economists, University of Reims and University of Paris I, for helpfulcomments and suggestions.
†O. Gergaud: Université de Reims Champagne-Ardenne, Reims Management School.Address: 57 bis, rue Pierre Taittinger, 51096 Reims Cedex, E-mail: [email protected]. F. Livat: BEM - Bordeaux Management School (CEREBEM), E-mail:[email protected].
1

faced with marginal diminishing returns. In other words that themarginal impact of Bordeaux as an umbrella brand actually tends todecrease to zero (and not to increase in a linear way) as the reputationlevel of its entities goes up. These spillover effects, when significantlypositive, vary from a minimum of 5% to a maximum of 15% of addi-tional favorable quality opinions.Key Words: Individual Reputation, Collective Reputation, Bor-
deaux wines.JEL Classification: L15 - L66 - Z13
1 Introduction
This paper is an attempt to shed some empirical light on image linkages
that exist between a collective umbrella brand and its related individual
components. This question is of importance given the major role played by
reputation in daily life as recognized at least since von Hayek (1948, ch.V,
p.97) and Marshall (1949, vol.4, xi)1 but also in professional life. Indeed,
a good reputation attracts clients, and often leads to higher prices through
price premia for high quality products2 (Shapiro, 1983). Reputation is also
viewed as a mechanism to provide incentives for agents to exert greater ef-
forts (Mailath and Samuelson 2002, Tadelis, 2002 among others). Another
strand of literature analyses how reputation encourages firms to cooperate,
either by colluding with other oligopolists in price setting, providing a high
quality good or by deterring other firms from entering (see Fudenberg and
Tirole, 1989). Under some conditions, reputation concerns might also cause
2

agents to self-select into different groups, and explain how multiple groups
with different characteristics and behavioral standards can co-exist in equi-
librium (Levin, 2001). For Tirole (1996) ”Our welfare and our incentives
depend not only on our own reputation but also on that of the groups we are
associated with”, (p.18). The impact of both types of reputation (individual
and collective) on prices has been the focus of several applications in wine
economics in recent years (e.g. Landon and Smith, 1997).
In this paper we estimate the impact of the reputation of a group on the
reputation of its members. In other words, we question the existence of a
collective reputation premium, a non-monetary reward that derives from the
group we are associated with,a sort of collective spillover effect that would
result in a positive impact on the level of individual reputation.
From an application to a sample of Bordeaux wines, we show that the
magnitude of this reputation premium varies positively with the individual
reputation level. In this specific context, the most reputed wine appella-
tions are those that enjoy the highest reputation returns from the Bordeaux
umbrella.
This result is in line with the theoretical predictions by Damiano et al.
(2010)who showed the existence of a pecking order effect, according to which
higher ranks within organizations are rewarded with more resources (promo-
tions for instance, corner offices, etc.). We highlight such a pecking order
3

effect in terms of image benefits, and in the context of a highly-reputed or-
ganization with a rate of 50% of favorable opinions among consumers.
To tackle this issue we estimate an interaction model in which a sin-
gle collective reputation both determines and is determined by a series of
individual reputations à la Tirole (1996). The data that we use in this ap-
plication are detailed survey data concerning quality opinions on different
Bordeaux wines. This survey was conducted in 2001 by Sociovision with
a representative sample of 6,394 consumers from seven European countries:
Belgium, Denmark, Germany, France, The Netherlands, Switzerland, United
Kingdom. Information is available about the quality of Bordeaux wines in
general (umbrella) and a series of nine related wines (appellations) such as
Saint-Emilion, Margaux, Médoc, etc.
The paper is organized as follows. Section 2 reviews the literature briefly,
Section 3 sets out the empirical model, Section 4 presents the data, Section
5 describes the empirical strategy and the results, and Section 6 draws some
conclusions.
4

2 Related Literature
2.1 Theoretical Literature
This paper is an attempt at testing part of Tirole’s (1996) collective reputa-
tion theory. In his seminal paper, Tirole models ”the idea of group reputation
as an aggregate of individual reputations” considering that ”a group’s repu-
tation is only as good as that of its members” (p.1). He also assumes that
”belonging to a group generates a rent but is no longer a fait accompli”(p.15)
and more precisely that belonging to a higher reputation group generates
higher rents.
In the umbrella branding literature, collective reputation effects are analysed
from the point of view of the multi-product firm. This literature is also con-
cerned with a more specific issue: brand extension, i.e. the use of an estab-
lished brand name to launch a product in a new market in order to reduce
introductory costs (see Tauber, 1988). A collective brand or name may also
act as a quality signal through spillovers which create reputation linkages
among various products or individuals (Choi et al., 1995). In this context,
individual incentives are associated with those of the group, which provides a
strong commitment to maintain a high quality level for each product. Winfree
and McCluskey (2005) explore, both theoretically and empirically, a market
situation where several producers of a differentiated product (apples) are con-
5

cerned with a single collective name at the regional level (Washington State).
In such a context, where a single name is used by several producers, the col-
lective reputation becomes a public good (non-excludable, non-rivalry) and
the incentives to provide quality decrease as the size of the group increases
(free riding on quality). Indeed it is impossible to exclude a producer from
the benefits of the umbrella and there is non-rivalry in the sense that the use
of the collective name from one producer does not prevent another one from
using the same name at the same time.
The possibility for consumers to identify a range of products with the firm
can provide substantial economies of scope and higher profits in equilibrium.
Andersson (2002) shows that the profits made by a firm carrying a pooled
reputation for producing two goods of high quality are ”not smaller” than
the sum of the profits of two separate firms where each one is producing a
high quality good and carrying its own individual reputation3. For Wern-
erfelt (1988, p.459), by branding a new product, the firm does two things:
it claims that both the old and the new product are of good quality, and
it invites consumers to pool their experience with the two products to infer
both qualities. Brand extension is efficient only when all the products under
the umbrella are of good quality and therefore contribute to the umbrella’s
reputation. This implies that, in equilibrium, only firms producing good
quality actually choose to use the umbrella branding strategy. Cabral (2000)
6

gets similar results using somewhat different assumptions4. In particular, he
shows that it is in the interest of firms producing a lower quality product to
create a new name or reputation for the new product instead of stretching
their initial reputation.
Brand extension practices, and more generally bundling a product of
established quality together with one of unknown quality, can also be seen as
a mechanism for informational leverage, where a firm leverages off a good’s
reputation in one market to mitigate the problem of informational asymmetry
encountered in other markets (Choi, 1998, 2003, 2007).
According to Damanio et al. (2010), agents are usually faced with a
trade-off between the peer effect and the pecking order effect when they have
to decide which group to join. According to the peer effect, people desire
to join organizations with high-quality members because it raises their own
utility or productivity. The pecking order effect implies that they can also get
advantages from their relative position or ranking in a given organization,
especially when they are high up in the pecking order. The latter effect
arises when resources – and presumably collective reputation impacts –
are distributed among the members according to their rank5.
7

2.2 Empirical Literature
Empirically, the notion of collective reputation has received less attention.
Erdem (1998) finds that for oral-hygiene products ”consumers expect the
quality levels of products that are umbrella branded to be correlated highly”.
Sullivan (1990) provides empirical evidence for the existence of positive and
negative image spillovers between the demand for products sold under the
same brand name in the case of automobiles. Jarrell and Peltzman (1985)
assess the effect of a product recall on the demand for this product and also on
the demand for its substitutes in the case of drugs and cars. The responsible
producer bears losses that are greater than the strict recall costs because
of a loss of goodwill, and those losses spill over to competitors. Because
of a negative externality, any favorable effect of a recall on the demand for
substitutes is swamped by a more general negative effect on the industry.
Borenstein and Zimmerman (1988) find that demand losses resulting from a
specific airline crash affect the airline concerned as well as the main competing
airlines.
In a seminal application to Bordeaux wines, Landon and Smith (1997,
1998) show that both individual and collective reputations account for a
substantial fraction of price variations observed for this product. Here, the
collective reputation refers to the appellation name and individual reputa-
8

tions at the firm level are proxied by the average ratings the wines have
received from a popular wine guide. More recently, Costanigro et al. (2009)
showed in the case of the Californian wine industry that consumers are will-
ing to pay for more information to form accurate quality expectations on
specific names when prices (i.e. opportunity costs) are high, while they ac-
cept to use aggregated names for inexpensive products. Frick (2010) finds
statistically significant non-linear returns for individual reputation as well as
significant returns for collective reputation in the case of Mosel Valley wines.
Here, collective reputation refers to two distinct consortia of wine estates
(Verband Deutscher Prädikatsweingüter and Bernkasteler Ring) and not to
regional or sub-regional names as in the case of Bordeaux wines analysed by
Landon and Smith (1997, 1998).
3 Empirical Model
The empirical model discussed in this section is based on the notion of per-
ceived quality as defined earlier by Zeithaml (1988, p.3). While objective
quality can be defined as superiority or excellence, perceived quality can be
viewed as the consumer’s judgment about a product’s overall excellence or
superiority. At the aggregate level, this notion of perceived quality clearly
refers to that of reputation (Shapiro, 1983).
9

Letting h index individual survey respondents, i = 1, ..., n index the ap-
pellations, g denote the group (Bordeaux), the model is:
qhg = Xhg βg +
nPi=1
qhi γi + εhg (0)
qh1 = Xh1 β1 + δ1q
hg + εh1 (1)
...
qhn = Xhnβn + δnq
hg + εhn (n)
where qhg (resp. qhi ) is the quality of the group (resp. sub-appellation i)
as perceived by h, Xhg and X
hi are vectors of exogenous variables including
the characteristics of individual h like his/her self-assessed degree of knowl-
edge of wine, his/her region of origin, socio-professional category (upper,
medium, lower incomes). These two vectors also contain information on past
consumption (whether appellation i or g has been consumed at least once in
the past 12 months or not) and a dummy variable which informs us whether
consumer h knows the wine or not.
δ1...δn are parameters capturing the average impact of qhg , the collective
reputation, on the various individual reputations (qhi ). γ1...γn are parameters
measuring the contribution of each individual reputation to qhg . By construc-
tion, qhg and qhi are endogenous variables. This means that ε
hg is potentially
correlated to every qhi and εhi is not independent of qhg . To be estimated prop-
erly, equation (0) requires valid instruments for each qhi . As our dataset does
10

not provide such variables, we will focus exclusively on the estimation of
equations (1) to (n) which require instruments for qhg only.
The instrument (Zhg ) that we use here to identify qhg is what people
surveyed think about the quality of some famous French appellations such
as Alsace (qhAl), Beaujolais (qhBe), Burgundy (q
hBu), Côtes du Rhône (q
hCr),
Languedoc-Roussillon (qhLr) and Loire Valley (qhLv) (see Map 1). These ap-
pellations are umbrella brands in the same way as qhg . The intuition for the
validity of these instruments is that wine consumers imagine the quality of
a Bordeaux by comparing it with the quality of some of its closest competi-
tors6. Indeed, there is reasonable chance that these opinions on Bordeaux
wines will be based, among other things, on a sort of ranking of the main
wines produced in France. On the other hand, while it makes sense to be-
lieve that wine consumers will compare a Bordeaux with a Beaujolais for
instance (which are two regional appellations), they will not compare so nat-
urally (i.e. frequently) a Côtes-de-Bourg which is a sub-appellation in the
Bordeaux region with a regional appellation such as Burgundy. The main
reason for this intuition is that Côtes-de-Bourg and Burgundy are not at the
same level in the French wine classification system which is based on two
types of appellations: regional (Burgundy, Bordeaux, etc.) and local/village
(Côtes de Bourg, Margaux, etc.). For all of these reasons we expect these
variables (qhAl, qhBe, q
hBu, q
hCr, q
hLr, q
hLv) to be correlated to q
hg and independent
11

of every qhi .
Figure 1: Wine Appellations, France
4 Data
Survey data were collected in 2001 in seven European countries: Belgium
(1,028 wine consumers7), Denmark (613 wine consumers), Germany (1,133
wine consumers), France (819 wine consumers), The Netherlands (1,258 wine
consumers), Switzerland (584 wine consumers), United Kingdom (959 wine
consumers). The survey was conducted by Sociovision on behalf of the
Comité Interprofessionnel des vins de Bordeaux. 6,394 individuals were sur-
veyed in all.
Respondents are 46 years old on average and 51% of them are women.
12

Nearly one-third (32%) of the sample participants perceive themselves as
wine connoisseurs, while 66% estimate that they are not knowledgeable in
wine and 2% have no opinion. People were first invited to give their opin-
ion on French wines in general (Alsace, Beaujolais, Bordeaux, Bourgogne,
Côtes du Rhône, Languedoc-Roussillon, etc.) then on 9 Bordeaux sub-
appellations: Bordeaux Supérieur (BSUP), Côtes de Bourg (CBG), Entre-
deux-Mers (E2M), Graves (GR), Margaux (MGX), Médoc (MDC), Premières
Côtes de Bordeaux (PCB), Saint-Emilion (SEM) and Sauternes (SAU).
Table 1 shows the share of favorable opinions for each wine (qhi and qhg )
including the instrumental variables (qhAl, qhBe, q
hBu, q
hCr, q
hLr, q
hLv). This informs
us about the way the quality of these wines is perceived on average in these
countries.
13

Table 1: Reputation levels*
Bordeaux (umbrella) 50.08
Sub-Appellations within the Bordeaux Region:Bordeaux Supérieur 25.21Entre-deux-Mers 7.65Margaux 19.21Médoc 21.14Saint-Emilion 25.6Côtes de Bourg 7.57Graves 19.32Premières Côtes de Bordeaux 13.85Sauternes 23.02
French wine regions (Instruments):Alsace 3.17Beaujolais 17.91Bourgogne 6.99Languedoc-Roussillon 8.52Côtes du Rhône 0.2Loire 6.05
* Average levels of agreement on quality (percentages)
With a level of agreement on quality higher than 50%, Bordeaux is clearly
the most appreciated French wine appellation in all Western Europe, followed
by Saint-Emilion, Bordeaux Supérieur, Sauternes, Médoc. These appella-
tions have a score of more than 20% of favorable quality opinions. The other
wine regions appear to be far less well reputed, with their reputation level
not exceeding 20%. With the exception of Beaujolais (17.91%), the other
wines produced in France have reputation levels lower than 10%.
14

5 Estimation procedure and Results
As mentioned above, this dataset does not contain enough instrumental vari-
ables to identify each individual reputation (qhi ) which would be required if
we were to provide unbiased estimates for every γi parameter. Hopefully,
it holds valid instruments for qhg , the group’s quality as perceived by the
6,394 respondents. Therefore, we restrict the econometric analysis to the
evaluation of the different umbrella impacts (δ0is).
5.1 Two-Stage Least Squares
First we estimate a series of recursive models with the following structure
using the 2SLS estimation procedure8:
qhi = X
hi βi + δiq
hg + εhi (i)
qhg = Xhg βg + Z
hg θi + εhg (0)
In this setup, qhg is regressed in the collective reputation equation (0)
against Xhg and the instruments Z
hg ; whereas q
hi is regressed against X
hi
and qhg in the individual reputation equation (i). A system like this has
been estimated for each of the 9 appellations beneath the Bordeaux umbrella
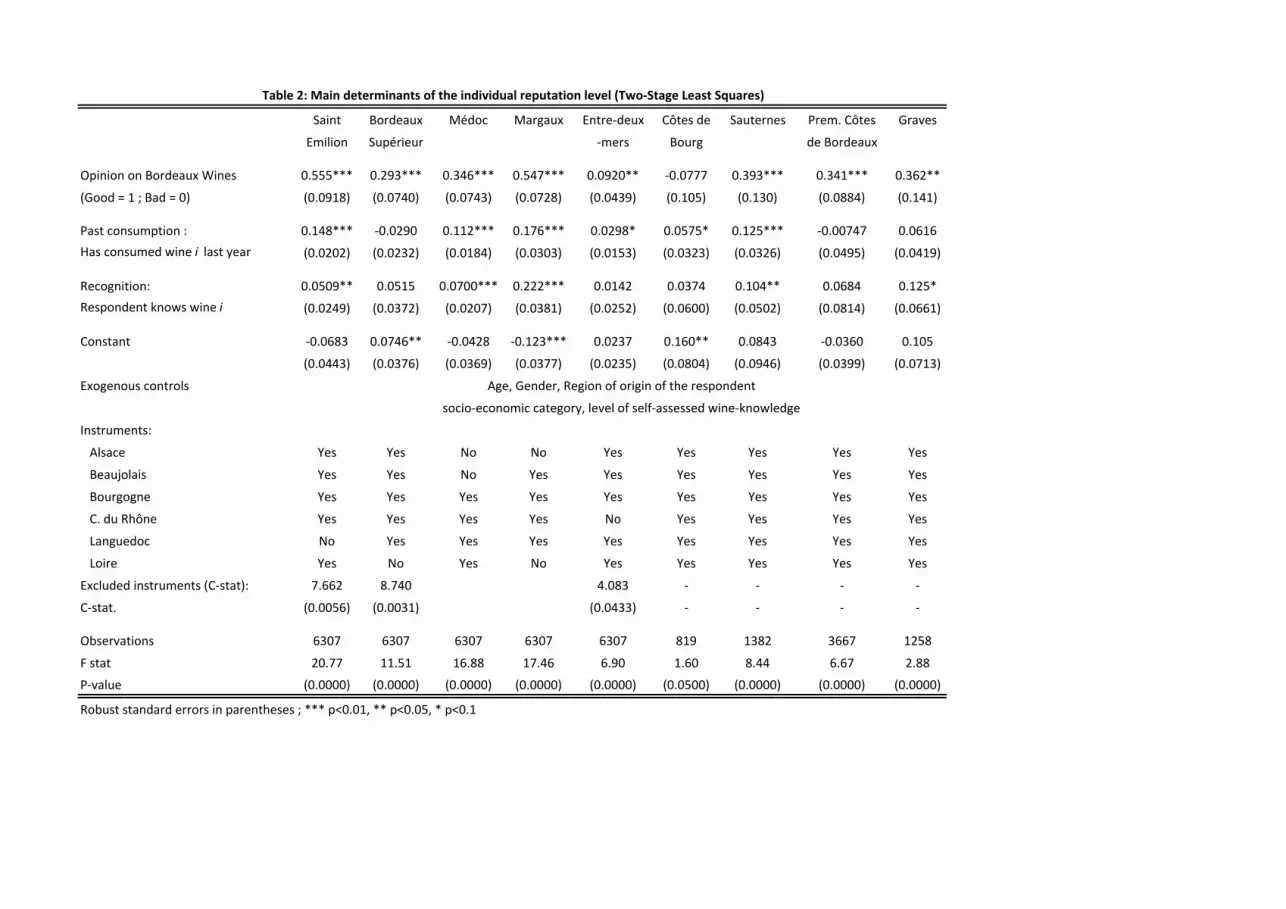
(i = 1, ..., 9). The results are listed in Table 2 along with those of a battery
of tests for the endogeneity of qhg , the validity or weakness of the instruments
(Hansen’s J, Stock and Yogo) in Table 3. Whenever necessary we tested the
15

exogeneity of one or more questionable instruments using the "Difference-
in-Sargan" statistic also known as the C-Statistic. Figure 2 summarizes the
results of the 2SLS procedure which does not allow us to control for the fact
that the quality variables are of the binary type.
[Insert Table 2 around here]
sem
bsupmdc
mgx
e2m
cbg
sautpcb gr
0.2
.4.6
.8U
mbr
ella
Impa
cts
(del
ta c
oeffi
cien
ts)
.05 .1 .15 .2 .25Individual Reputation Level
TSLS Estimates 95% Confidence Interval
Local Polynomial Smooth (Biweight Kernel Function)
Two-Stage Least Squares Estimates
Figure 2 : Delta coefficients (2SLS)
[Insert Table 3 around here]
16

The instruments Zhg turned out to be reasonable predictors of what peo-
ple think about Bordeaux as a generic appellation. Among these, Beaujolais
and Languedoc-Roussillon turned out to be the most predictive (significant).9
The highest relative bias that we get (20-30%) concerns only one regression
(Côtes-de-Bourg) in which qhg were not found endogenous. In the other regres-
sions, the relative bias potentially induced by the weakness of the instruments
is quite acceptable (between 10% and 20% in two regressions and lower than
10% in the others). The results of the various Hansen’s overidentification
tests failed to reject the hypothesis that the instruments are exogenous in
every regression.
5.2 Robustness check
As a robustness check, we ran a second series of regressions using a Recur-
sive Bivariate Probit (RBP) procedure which is more appropriate given that
both qhi and qhg are of the binary type. The RBP results (Table 4) are then
compared to those obtained after a regular ML probit estimation procedure
(Table 5) which ignores the potential endogeneity of qhg in each equation i
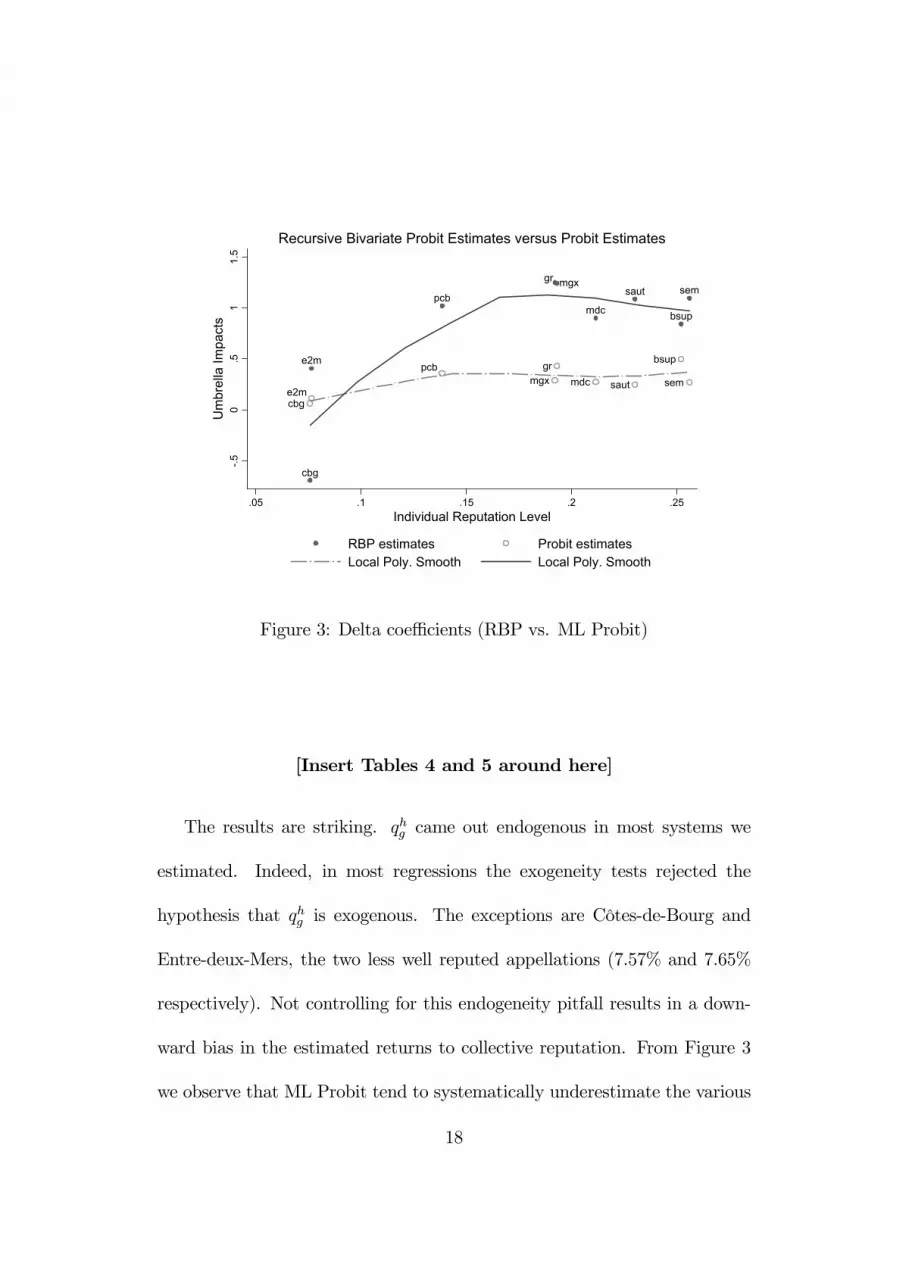
(see Figure 3 for ease of comparison).
17
sem
bsupmdc
mgx
e2m
cbg
sautpcb
gr
sem
bsup
mdcmgxe2mcbg
saut
pcb gr
-.50
.51
1.5
Um
brel
la Im
pact
s
.05 .1 .15 .2 .25Individual Reputation Level
RBP estimates Probit estimatesLocal Poly. Smooth Local Poly. Smooth
Recursive Bivariate Probit Estimates versus Probit Estimates
Figure 3: Delta coefficients (RBP vs. ML Probit)
[Insert Tables 4 and 5 around here]
The results are striking. qhg came out endogenous in most systems we
estimated. Indeed, in most regressions the exogeneity tests rejected the
hypothesis that qhg is exogenous. The exceptions are Côtes-de-Bourg and
Entre-deux-Mers, the two less well reputed appellations (7.57% and 7.65%
respectively). Not controlling for this endogeneity pitfall results in a down-
ward bias in the estimated returns to collective reputation. From Figure 3
we observe that ML Probit tend to systematically underestimate the various
18

impacts compared with those obtained from an appropriate RBP estimation
procedure. Moreover, it fails to capture the fact that this relationship exhibits
marginal diminishing returns (concave shape with RBP versus more linear
shape with ML Probit). In other words, the marginal impact of Bordeaux
(umbrella brand) actually tends to decrease to zero (and not to increase in
a linear way) as the reputation level of its entities goes up.
sembsupmdc
mgx
e2m
cbg
saut
pcb
gr
-20%
0%10
%20
%-1
0%U
mbr
ella
Mar
gina
l Im
pact
s
.05 .15 .25.1 .2Individual Reputation Level
Estimated Marginal Impact (Margeff.ado) 95% Confidence Interval
Local Polynomial Smooth (Biweight Kernel Function)
Recursive Bivariate Probit Estimates
Figure 4: Marginal impacts (RBP)
We get positive and significant spillover effects from the umbrella rep-
utation for 8 individual appellations out of 9. Highly-reputed appellations
19

are found to enjoy larger umbrella impacts than less-reputed appellations.
These image spillover effects when positive vary from a minimum of 5% to a
maximum of 15% of additional favorable quality opinions (see Figure 4 which
reproduces on the vertical axis the marginal effects in percentage points for
the RBP estimates10).
In this group, only the leaders take a significant advantage from the high
level of reputation of Bordeaux. For the followers, there is no advantage in
being part of this group as they are not clearly associated to Bordeaux in the
consumer’s mind. This is particularly true for Entre-deux-Mers and Côtes de
Bourg which do not enjoy the slightest image benefit from the fact that they
are naturally Bordeaux wines. This drawback could certainly be mitigated
through some specific advertising which should consists of strengthening the
link between these appellations and Bordeaux in order to make it more ob-
vious in the mind of the consumer.
6 Conclusion
In this paper we measured the influence of Bordeaux as a brand on a series of
9 appellations beneath this umbrella. Controlling for the fact that both types
of reputation are released simultaneously, we get significant positive spillover
effects from the umbrella, the magnitude of which depends positively on the
20

individual reputation level of the wine under the umbrella. The reputation
of this prestigious wine appellation would thus also act as a positive quality
signal among a significant fraction of surveyed people in Western Europe.
Essentially, due to a lack of appropriate data and available valid instru-
ments, in most studies brand reputation is often treated as exogenous. This
paper shows that not controlling for the natural endogeneity of this variable
in a simultaneous setup such as this generates downward biased estimates of
those spillover effects which derive from the group’s reputation.
This application is based instead on an appropriate IV estimation pro-
cedure (Recursive Bivariate Probit) which guarantees unbiased estimates of
the effect of Bordeaux over the image of its main related wines. Given the
difficulty in identifying each individual reputation with appropriate instru-
ments, we focused the analysis and restricted it to measuring the effect of
Bordeaux’s reputation on that of its major components.
Consumers’ opinions about the quality of some other famous wines pro-
duced in France (Alsace, Beaujolais, Burgundy, Côtes du Rhône, Languedoc-
Roussillon, Loire) have been used as instruments in order to identify the rep-
utation of Bordeaux. These instruments proved to be valid in the sense that
they are reasonably connected to Bordeaux (not weak) and not statistically
related to its 9 components (exogenous).
This result is achieved in a specific environment, with a powerful umbrella
21

which is at least twice as well reputed as its best reputed entities. The result
could have been different had the umbrella been less influential.
Further research is clearly required to confirm these results by applying
this methodology to other goods, services or individuals, although wines do
seem to offer an appropriate field of application, given the presence of valid
instruments as suggested in this article.
Notes
1Cited by Klein and Leffler [1981].
2Several applications of the Hedonic Price Method to wine show that a
strong and positive relationship between the firm’s individual reputation and
the price of a bottle (see among others Landon and Smith [1998]).
3This result holds if and only if the firm has, in the past, produced a high
quality product (credibilty constraint).
4In Wernerfelt [1988], brand stretching signals quality because stretching
is more costly than creating a new name, whereas Cabral [2000] assumes that
brand stretching is cost neutral.
5See Bar-Isaac and Tadelis (2008) for a recent and comprehensive survey
on seller reputation and more specifically section 9.
6This opinion is likely based on foreign wines too but we do not have
22

information about these wines in the dataset.
7In this survey wine consumers drink wine at least once a quarter.
8For simplicity, we assume that there is no image spillovers between the
different individual reputations.
9The results for the first step equations are available from the authors
upon request.
10These effects were computed using Tamás Bartus’ Margeff package for
Stata 10 (see The Stata Journal, Volume 5 Number 3: pp. 309-329).
23

References
[1] Andersson, F., 2002, ’Pooling Reputations’, International Journal of
Industrial Organization, 20(5), pp. 715-730.
[2] Bar-Isaac, E. and Tadelis, S., 2008, ’Seller Reputation’, Foundations and
Trends in Microeconomics, 4(4), 273-351.
[3] Borenstein, S. and Zimmerman, M. B., 1988, ’Market Incentives for Safe
Commercial Airline Operation’, The American Economic Review, 78(5),
December, pp. 913-935.
[4] Cabral, L., 2000, ’Stretching Firm and Brand Reputation’, Rand Journal
of Economics, 31(4), Winter, pp. 658-673.
[5] Choi, C.J., Lee, S.H. and Oh, D., 1995, ’The strategy of grouping and
reputation linkage in clubs and multi-products firms’, European Journal
of Political Economy, 11, pp. 521-533.
[6] Choi, J.P., 1998, ’Brand Extension as Informational Leverage’, Review
of Economic Studies, October, pp. 655-670.
[7] Choi, J.P., 2003, ’Bundling New Products with Old to Signal Qual-
ity, with Application to the Sequencing of New Products’, International
Journal of Industrial Organization, October, 21, pp. 1179-1200.
24

[8] Choi, J.P. and Jeon, D.S., 2007,’A Leverage Theory of Reputation
Building with Co-Branding: Complementarities in Reputation Build-
ing’, Working Paper, Michigan State University.
[9] Damiano, E., Hao, L. and Suen W., 2010, ’First in a Village or Second
in Rome?’, International Economic Review, 51(1), pp. 263-288.
[10] Erdem, T., 1998, ’An Empirical Analysis of Umbrella Branding’, Journal
of Marketing Research, August, pp. 339-351.
[11] Frick, B., 2010, ’The Impact of Individual and Collective Reputation
on Wine Prices: Empirical Evidence from the Mosel Valley’, Working
paper, University of Paderborn.
[12] Fudenberg, D., Tirole J., 1989, ’Noncooperative Game Theory for In-
dustrial Organization: An Introduction and Overview’, in Schmalensee,
R., and Willig, R. (eds.), Handbook of Industrial Organization, vol. 1,
pp. 259-327 (North Holland).
[13] Hayek, F.A., 1948, Individualism and Economic Order (University of
Chicago Press, Chicago).
[14] Jarrell, G. and Peltzman, S., 1985, ’The Impact of Products Recalls on
the Wealth of Sellers’, Journal of Political Economy, 93(3), pp. 512-536.
25

[15] Klein, B. and Leffler, K.B., 1981, ’The Role of Market Forces in Assuring
Contractual Performance’, Journal of Political Economy, 89 (4), pp. 615-
41.
[16] Landon, S. and Smith C.E., 1997, The Use of Quality and Reputation
Indicators by Consumers : The Case of Bordeaux Wine’, Journal of
Consumer Policy, 20, pp. 289-323.
[17] Landon, S. and Smith C.E., 1998, ’Quality Expectations, Reputation
and Price’, Southern Economic Journal, 64, pp. 628-647.
[18] Levin, J., 2001, ’Career Concerns and Collective Reputation’, Mimeo,
Stanford University.
[19] Mailath, G.J. and Samuelson, L., 2002, ’Who Wants a Good Reputation
?’, Review of Economic Studies, 68, pp. 415-441.
[20] Marshall, A., 1949, Principles of Economics : an Introductory Volume
(Macmillan, New York, 8th edition).
[21] Shapiro, C., 1983, ’Premiums for High Quality Products as Returns to
Reputations’, Quarterly Journal of Economics, 98 (4), pp. 659-679.
[22] Sullivan, M., 1990, ’Measuring Image Spillovers in Umbrella-Branded
Products’, Journal of Business, 63(3), pp. 309-329.
26

[23] Tadelis, S., 2002, ’The Market for Reputations as an Incentive Mecha-
nism’, Journal of Political Economy, August, 92(2), pp. 854-882.
[24] Tauber, E.M., 1988, ’Brand leverage: Strategy for Growth in a Cost-
Control World’, Journal of Advertising Research, August/September,
pp. 26-30.
[25] Tirole, J., 1996, ’A Theory of Collective Reputations (with Applications
to the Persistence of Corruption and to Firm Quality)’, The Review of
Economic Studies, 63(1), pp. 1-22.
[26] Wernerfelt, B., 1988, ’Umbrella Branding as a Signal of New Product
Quality : an Example of Signalling by Posting a Bond’, Rand Journal
of Economics, 19(3), Autumn, pp. 458-466.
[27] Zeithaml, V.A., 1988, ’Consumer Perceptions of Price, Quality and
Value : A Means-End Model and Synthesis of Evidence’, Journal of
Marketing, 53, pp. 2-22.
27
Saint Bordeaux Médoc Margaux Entre‐deux Côtes de Sauternes Prem. Côtes Graves
Emilion Supérieur ‐mers Bourg de Bordeaux
Opinion on Bordeaux Wines 0.555*** 0.293*** 0.346*** 0.547*** 0.0920** ‐0.0777 0.393*** 0.341*** 0.362**
(Good = 1 ; Bad = 0) (0.0918) (0.0740) (0.0743) (0.0728) (0.0439) (0.105) (0.130) (0.0884) (0.141)
Past consumption : 0.148*** ‐0.0290 0.112*** 0.176*** 0.0298* 0.0575* 0.125*** ‐0.00747 0.0616
Has consumed wine i last year (0.0202) (0.0232) (0.0184) (0.0303) (0.0153) (0.0323) (0.0326) (0.0495) (0.0419)
Recognition: 0.0509** 0.0515 0.0700*** 0.222*** 0.0142 0.0374 0.104** 0.0684 0.125*
Respondent knows wine i (0.0249) (0.0372) (0.0207) (0.0381) (0.0252) (0.0600) (0.0502) (0.0814) (0.0661)
Constant ‐0.0683 0.0746** ‐0.0428 ‐0.123*** 0.0237 0.160** 0.0843 ‐0.0360 0.105
(0.0443) (0.0376) (0.0369) (0.0377) (0.0235) (0.0804) (0.0946) (0.0399) (0.0713)
Exogenous controls
Instruments:
Alsace Yes Yes No No Yes Yes Yes Yes Yes
Beaujolais Yes Yes No Yes Yes Yes Yes Yes Yes
Bourgogne Yes Yes Yes Yes Yes Yes Yes Yes Yes
C. du Rhône Yes Yes Yes Yes No Yes Yes Yes Yes
Languedoc No Yes Yes Yes Yes Yes Yes Yes Yes
Loire Yes No Yes No Yes Yes Yes Yes Yes
Excluded instruments (C‐stat): 7.662 8.740 4.083 ‐ ‐ ‐ ‐
C‐stat. (0.0056) (0.0031) (0.0433) ‐ ‐ ‐ ‐
Observations 6307 6307 6307 6307 6307 819 1382 3667 1258
F stat 20.77 11.51 16.88 17.46 6.90 1.60 8.44 6.67 2.88
P‐value (0.0000) (0.0000) (0.0000) (0.0000) (0.0000) (0.0500) (0.0000) (0.0000) (0.0000)
Age, Gender, Region of origin of the respondent
Robust standard errors in parentheses ; *** p<0.01, ** p<0.05, * p<0.1
Table 2: Main determinants of the individual reputation level (Two‐Stage Least Squares)
socio‐economic category, level of self‐assessed wine‐knowledge

Saint Bordeaux Médoc Margaux Entre‐deux Côtes de Sauternes Prem. Côtes Graves
Emilion Supérieur ‐mers Bourg de Bordeaux
Exogeneity test (Umbrella) 33.866 3.668 14.457 52.612 2.352 1.496 7.666 8.193 3.723
(0.0000) (0.0555) (0.0001) (0.0000) (0.1251) (0.2213) (0.0056) (0.0042) (0.0537)
Weak identification test:
Kleibergen‐Paap stat. 18.071 21.509 23.137 28.261 23.850 6.454 7.642 11.119 7.410
Relative bias 5‐10% 0% 0% 0% 0% 20‐30% 10‐20% 10‐20% 10‐20%
Hansen's overid. test 5.107 7.011 5.465 5.649 8.050 2.118 1.128 6.105 0.321
(0.5302) (0.3198) (0.3618) (0.3419) (0.2345) (0.7140) (0.9803) (0.4115) (0.9884)
Observations 6307 6307 6307 6307 6307 819 1382 3667 1258
F stat 20.77 11.51 16.88 17.46 6.90 1.60 8.44 6.67 2.88
P‐value (0.0000) (0.0000) (0.0000) (0.0000) (0.0000) (0.0500) (0.0000) (0.0000) (0.0000)
Tests based on 2SLS estimates
Table 3: Exogeneity Tests and Weak Identification Tests*
Robust standard errors in parentheses ; *** p<0.01, ** p<0.05, * p<0.1

Saint Bordeaux Médoc Margaux Entre‐deux Côtes de Sauternes Prem. Côtes Graves
Emilion Supérieur ‐mers Bourg de Bordeaux
Opinion on Bordeaux Wines 0.13*** 0.1173*** 0.1013*** 0.1152*** 0.0248 ‐0.1072 0.1314** 0.082*** 0.1522**
(Good = 1 ; Bad = 0) (0.0216 ) (0.0356 ) (0.0237) (0.017) (0.016) (0.1533) (0.0517) (0.0289) (0.0769)
Past consumption : 0.0652*** ‐0.008 0.0509*** 0.0648*** 0.0173** 0.053* 0.0581*** 0.0069 0.0286
Has consumed wine i last year (0.0071 ) (0.0094) (0.007) (0.0098) (0.0077) (0.0308) (0.0141) (0.0167) (0.0178)
Recognition : 0.0336*** 0.0227 0.0278*** 0.0719*** 0.0056 0.0303 0.0518** 0.0116 0.0585**
Respondent knows wine i (0.0078) (0.0174) (0.0078) (0.0129) (0.0102) (0.0516) (0.0204) (0.0277) (0.0283)
Exogenous controls
Instruments :
Alsace Yes Yes No No Yes Yes Yes Yes Yes
Beaujolais Yes Yes No Yes Yes Yes Yes Yes Yes
Bourgogne Yes Yes Yes Yes Yes Yes Yes Yes Yes
C. du Rhône Yes Yes Yes Yes No Yes Yes Yes Yes
Languedoc No Yes Yes Yes Yes Yes Yes Yes Yes
Loire Yes No Yes No Yes Yes Yes Yes Yes
Observations 6307 6307 6307 6307 6307 819 1382 3667 1258
Wald test of rho = 0 33.6415 2.97198 16.342 61.8815 2.32187 0.439661 7.00309 11.9136 3.09594
P‐value (0.0000) (0.0847) (0.0001) (0.0000) (0.1276) (0.5073) (0.0081) (0.0006) (0.0785)
Wald Chi‐Sq. 2454.82 1393.72 1860.17 35057.09 34525.19 140.02 491.23 30687.25 1881.09
P‐value (0.0000) (0.0000) (0.0000) (0.0000) (0.0000) (0.0000) (0.0000) (0.0000) (0.0000)
Coefficients correspond to marginal impacts
Table 4: Main determinants of the individual reputation level (Recursive Bivariate Probit)
Age, Gender, Region of origin of the respondent
socio‐economic category, level of self‐assessed wine‐knowledge
Robust standard errors in parentheses ; *** p<0.01, ** p<0.05, * p<0.1

Saint Bordeaux Médoc Margaux Entre‐deux Côtes de Sauternes Prem. Côtes Graves
Emilion Supérieur ‐mers Bourg de Bordeaux
Opinion on Bordeaux Wines 0.0734*** 0.1467*** 0.0697*** 0.0668*** 0.0156** 0.0092 0.0713*** 0.0768*** 0.1339***
(Good = 1 ; Bad = 0) (0.0114) (0.0127) (0.0111) (0.0105) (0.0075) (0.023) (0.0271) (0.0147) (0.0325)
Past consumption : 0.1668*** ‐0.011 0 .1194 0.1670*** 0.0389** 0.0548 0.1425*** 0.0224 0.0782*
Has consumed wine i last year (0.0162) (0.0194 ) (0.0154) (0.0243) (0.0167 ) (0.0349) (0.0312) (0.0406) (0.0454)
Recognition 0.0817*** 0.0451 0.0616*** 0.1807*** 0.0126 0.0321 0.1212** 0.0265 0.1526**
Respondent knows wine i (0.0188) (0.0362) (0.0174) (0.0327) (0.0220) (0.0559) (0.0471) (0.0659) (0.0700)
Exogenous controls
Observations 6307 6307 6307 6307 6307 819 1382 3667 1258
Wald Chi‐Sq. 962.47 563.30 737.73 807.04 203.71 29.82 146.68 213.44 66.63
P‐value (0.0000) (0.0000) (0.0000) (0.0000) (0.0000) (0.0541) (0.0000) (0.0000) (0.0000)
Table 5: Main determinants of the individual reputation level (ML Probit)
Age, Gender, Region of origin of the respondent
socio‐economic category, level of self‐assessed wine‐knowledge
Robust standard errors in parentheses ; *** p<0.01, ** p<0.05, * p<0.1 ; Coefficients correspond to marginal impacts.


