Embed Size (px)
Citation preview
American Indian/Alaska Native Uninsurance Disparities:A Comparison of 3 SurveysPamela Jo Johnson, PhD, MPH, Lynn A. Blewett, PhD, Kathleen Thiede Call, PhD, and Michael Davern, PhD
Access to quality health care is a priority for thenation. Access to such care is designated inHealthy People 2010 as one of the 10 LeadingHealth Indicators, marking it as a priority areafor improving the health of the nation1 andreducing health disparities.2 American Indians/Alaska Natives (AIANs) are one group thatcontinues to have substantial health disparitiescompared with other racial groups.3–8 However,disparities in health care coverage and access forAIANs have received only intermittent atten-tion,9–13 leaving a marked gap in our under-standing. Previously documented issues forresearch on AIAN health care disparities includegaps in data availability for AIANs14,15 as wellas problems with national-level estimates mask-ing the differences across geographic areas.13,16
However, it is also possible that there aredifferences in the magnitude of estimates orthe conclusions drawn, depending on whichdata source is used to examine health caredisparities.
Because no single data source contains allpossible measures of health and health care,different data sources are often used to answercomplementary but different questions. Inthe case of national surveillance and annualsnapshot reports, information from numerousdata sources are used to present a more com-plete picture of health for the US population.Healthy People 2010 uses National Health In-terview Survey (NHIS) data to monitor insur-ance coverage and access to a usual source ofcare and uses National Vital Statistics Systemdata to monitor access to prenatal care.1 Inthe chapter on access to care, the NationalHealthcare Disparities Report also uses NHIS datato examine uninsurance and access to a usualsource of care but uses the Medical ExpenditurePanel Survey (MEPS) to examine all-year unin-surance and access to a primary care provider.17
A few recent studies that examined health careaccess for AIANs used other data sources, suchas the National Survey of America’s Families12 orthe Behavioral Risk Factor Surveillance Survey.13
We use 3 general population surveys com-monly used for health care coverage and accessresearch to examine the implications of usingdifferent data sources for estimating health caredisparities specific to AIANs. We use uninsur-ance disparities as an example but acknowl-edge at the outset that different data sourcesmeasure insurance coverage in different ways.Our purpose is not to critically review mea-sures of uninsurance or to critique the surveysthat collect these data. Rather, we aim todemonstrate that choice of data source mattersfor disparities research, often for a variety ofreasons. Our intent is 2-fold: (1) to examinewhether 3 nationally representative data sour-ces produce trustworthy and consistent esti-mates of the AIAN population in the UnitedStates and (2) to highlight the impact thatchoice of data source can have on conclusionsabout uninsurance disparities.
METHODS
We examined health insurance coverage forAIANs aged younger than 65 years by using 3
nationally representative population datasources: the Current Population Survey (CPS),the National Health Interview Survey (NHIS),and the MEPS. We used data originally com-piled for a comprehensive investigation ofmethodological differences across 4 surveysand the consequent differences in 2002 unin-surance estimates produced for the generalpopulation.18
Data Sources
Current Population Survey. The CPS isa monthly survey by the Bureau of LaborStatistics, which is the primary source of laborcharacteristics of the US population. The CPSdata, which represent the civilian noninstitu-tionalized population of the United States, is themost widely used data source for estimates ofhealth insurance coverage at both the nationaland state levels.19 The 2003 CPS data werecollected through a combination of telephoneand in-person modes with computer-assisted in-struments, with a response rate of 85%. Insur-ance coverage is collected in the Annual Socialand Economic Supplement, which is conducted
Objectives. We examined whether 3 nationally representative data sources
produce consistent estimates of disparities and rates of uninsurance among the
American Indian/Alaska Native (AIAN) population and to demonstrate how choice
of data source impacts study conclusions.
Methods. We estimated all-year and point-in-time uninsurance rates for AIANs
and non-Hispanic Whites younger than 65 years using 3 surveys: Current Popula-
tion Survey (CPS), National Health Interview Survey (NHIS), and Medical Expendi-
ture Panel Survey (MEPS).
Results. Sociodemographic differences across surveys suggest that national
samples produce differing estimates of the AIAN population. AIAN all-year
uninsurance rates varied across surveys (3%–23% for children and 18%–35% for
adults). Measures of disparity also differed by survey. For all-year uninsurance, the
unadjusted rate for AIAN children was 2.9 times higher than the rate for White
children with the CPS, but there were no significant disparities with the NHIS or
MEPS. Compared with White adults, AIAN adults had unadjusted rate ratios of 2.5
with the CPS and 2.2 with the NHIS or MEPS.
Conclusions. Different data sources produce substantially different estimates
for the same population. Consequently, conclusions about health care dispar-
ities may be influenced by the data source used. (Am J Public Health. 2010;100:
1972–1979. doi:10.2105/AJPH.2009.167247)
RESEARCH AND PRACTICE
1972 | Research and Practice | Peer Reviewed | Johnson et al. American Journal of Public Health | October 2010, Vol 100, No. 10
in March of each year. The 2003 CPS datareflect interviews with 215424 persons in78310 households.20 The 2003 CPS uninsur-ance estimates represent calendar year 2002.
National Health Interview Survey. The NHIS,a cross-sectional survey by the National Centerfor Health Statistics, has been conductedannually since 1957. This survey, whichrepresents the civilian noninstitutionalizedpopulation of the United States, is the leadingsource of data on the health of the Americanpopulation.21 The NHIS uses an area probabilitysample frame, with an oversample of Hispanicsand Blacks. NHIS data are collected through anin-person survey with computer-assisted per-sonal interviewing in households. The survey isconducted on an ongoing basis throughout theyear. The household response rate for the 2002NHIS was 89.6%. The final person-level re-sponse rate was 88.1%. The 2002 NHIS in-terviews reflect data from 93386 persons in36161 households.22
Medical Expenditure Panel Survey. The MEPSis a set of surveys of families and individuals,their medical providers, and employers acrossthe United States. The MEPS is the mostcomplete source of data on the cost and useof health care and health insurance coverageand comprises 3 components: the HouseholdComponent (MEPS-HC), the Medical ProviderComponent, and the Insurance Component.Since 1996, the MEPS has annually selecteda nationally representative sample (panel) ofhouseholds from the previous year’s NHISrespondents. The initial sample frame of NHIShouseholds is selected to include individualsfrom each of the 50 states and Washington,DC. MEPS data are collected during 5 rounds,which occur every 5 to 6 months acrossa 2-year period through use of computer-assisted instruments. We used data for the2002 MEPS-HC, which includes rounds 3 to 5of the 2001 panel and rounds 1 to 3 of the2002 panel. We derived the overall responserate by using MEPS-HC round-specific re-sponse rates as well as NHIS response rates.For 2002 data, 39165 individuals were in-cluded, with an overall response rate of 65%.23
Samples and Classification of American
Indians/Alaska Natives
We limited our study population to AIANsand non-Hispanic Whites aged younger than
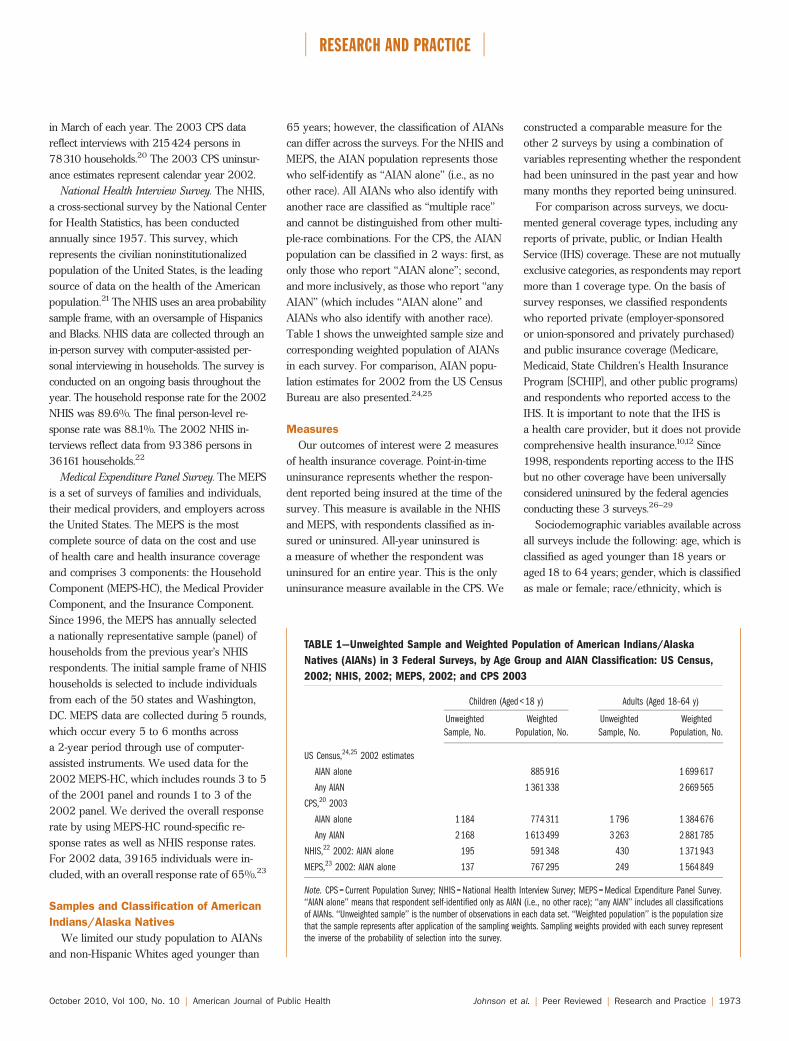
65 years; however, the classification of AIANscan differ across the surveys. For the NHIS andMEPS, the AIAN population represents thosewho self-identify as ‘‘AIAN alone’’ (i.e., as noother race). All AIANs who also identify withanother race are classified as ‘‘multiple race’’and cannot be distinguished from other multi-ple-race combinations. For the CPS, the AIANpopulation can be classified in 2 ways: first, asonly those who report ‘‘AIAN alone’’; second,and more inclusively, as those who report ‘‘anyAIAN’’ (which includes ‘‘AIAN alone’’ andAIANs who also identify with another race).Table 1 shows the unweighted sample size andcorresponding weighted population of AIANsin each survey. For comparison, AIAN popu-lation estimates for 2002 from the US CensusBureau are also presented.24,25
Measures
Our outcomes of interest were 2 measuresof health insurance coverage. Point-in-timeuninsurance represents whether the respon-dent reported being insured at the time of thesurvey. This measure is available in the NHISand MEPS, with respondents classified as in-sured or uninsured. All-year uninsured isa measure of whether the respondent wasuninsured for an entire year. This is the onlyuninsurance measure available in the CPS. We
constructed a comparable measure for theother 2 surveys by using a combination ofvariables representing whether the respondenthad been uninsured in the past year and howmany months they reported being uninsured.
For comparison across surveys, we docu-mented general coverage types, including anyreports of private, public, or Indian HealthService (IHS) coverage. These are not mutuallyexclusive categories, as respondents may reportmore than 1 coverage type. On the basis ofsurvey responses, we classified respondentswho reported private (employer-sponsoredor union-sponsored and privately purchased)and public insurance coverage (Medicare,Medicaid, State Children’s Health InsuranceProgram [SCHIP], and other public programs)and respondents who reported access to theIHS. It is important to note that the IHS isa health care provider, but it does not providecomprehensive health insurance.10,12 Since1998, respondents reporting access to the IHSbut no other coverage have been universallyconsidered uninsured by the federal agenciesconducting these 3 surveys.26–29
Sociodemographic variables available acrossall surveys include the following: age, which isclassified as aged younger than 18 years oraged 18 to 64 years; gender, which is classifiedas male or female; race/ethnicity, which is
TABLE 1—Unweighted Sample and Weighted Population of American Indians/Alaska
Natives (AIANs) in 3 Federal Surveys, by Age Group and AIAN Classification: US Census,
2002; NHIS, 2002; MEPS, 2002; and CPS 2003
Children (Aged < 18 y) Adults (Aged 18–64 y)
Unweighted
Sample, No.
Weighted
Population, No.
Unweighted
Sample, No.
Weighted
Population, No.
US Census,24,25 2002 estimates
AIAN alone 885 916 1 699 617
Any AIAN 1 361 338 2 669 565
CPS,20 2003
AIAN alone 1 184 774 311 1 796 1 384 676
Any AIAN 2 168 1 613 499 3 263 2 881 785
NHIS,22 2002: AIAN alone 195 591 348 430 1 371 943
MEPS,23 2002: AIAN alone 137 767 295 249 1 564 849
Note. CPS = Current Population Survey; NHIS = National Health Interview Survey; MEPS = Medical Expenditure Panel Survey.‘‘AIAN alone’’ means that respondent self-identified only as AIAN (i.e., no other race); ‘‘any AIAN’’ includes all classificationsof AIANs. ‘‘Unweighted sample’’ is the number of observations in each data set. ‘‘Weighted population’’ is the population sizethat the sample represents after application of the sampling weights. Sampling weights provided with each survey representthe inverse of the probability of selection into the survey.
RESEARCH AND PRACTICE
October 2010, Vol 100, No. 10 | American Journal of Public Health Johnson et al. | Peer Reviewed | Research and Practice | 1973
classified as Hispanic or non-Hispanic; educa-tional attainment, which is classified as lessthan high school, high school, some college, orcollege graduate (for children aged youngerthan 18 years, the highest adult educationalattainment in the household is used); employ-ment, which is classified as unemployed,employed part-time (<35 hours per week), oremployed full-time (‡35 hours per week);health status, which is dichotomized froma 5-point scale to represent good health (ex-cellent, very good, or good) and poor health(fair or poor); family poverty level, which isclassified as less than 100%, 100% to 125%,126% to 200%, 201% to 400%, or greaterthan 400% of the federal poverty threshold;and region of residence, which is classifiedaccording to the 4 US Census Bureau regionsof Northeast, Midwest, South, and West.
Analysis
We calculated sociodemographic frequencydistributions for the AIAN populations in eachsurvey to assess whether the classification ofAIAN population mattered within the survey(CPS) and how the AIAN-alone populationcompared across surveys (CPS, NHIS, andMEPS). We then estimated survey-specific ratesof uninsurance by racial/ethnic category andage group. For each survey, measures of dis-parity in uninsurance rates between AIANs andnon-Hispanic Whites were calculated in bothabsolute terms (as a risk difference) and inrelative terms (as a risk ratio). Finally, we usedlinear probability models to estimate adjusteduninsurance rates using the covariates de-scribed in the previous paragraph and esti-mated measures of disparity. We conductedanalyses by using Stata statistical softwareversion 10.0, which produces unbiased esti-mates from data collected through complexsampling designs.30 The survey commandsavailable in Stata properly account for the un-equal probabilities of selection and the stratifiedand clustered sampling designs of the CPS, NHIS,and MEPS data. Variance estimates were pro-duced by Taylor series linearization.
RESULTS
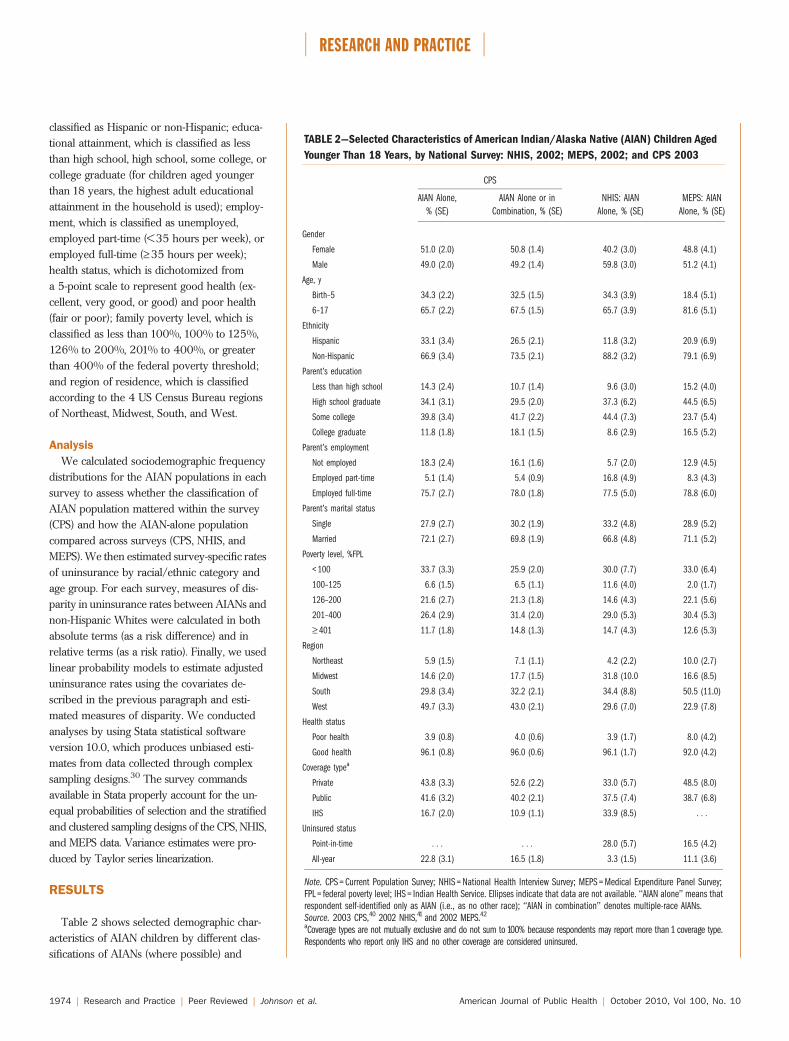
Table 2 shows selected demographic char-acteristics of AIAN children by different clas-sifications of AIANs (where possible) and
TABLE 2—Selected Characteristics of American Indian/Alaska Native (AIAN) Children Aged
Younger Than 18 Years, by National Survey: NHIS, 2002; MEPS, 2002; and CPS 2003
CPS
NHIS: AIAN
Alone, % (SE)
MEPS: AIAN
Alone, % (SE)
AIAN Alone,
% (SE)
AIAN Alone or in
Combination, % (SE)
Gender
Female 51.0 (2.0) 50.8 (1.4) 40.2 (3.0) 48.8 (4.1)
Male 49.0 (2.0) 49.2 (1.4) 59.8 (3.0) 51.2 (4.1)
Age, y
Birth–5 34.3 (2.2) 32.5 (1.5) 34.3 (3.9) 18.4 (5.1)
6–17 65.7 (2.2) 67.5 (1.5) 65.7 (3.9) 81.6 (5.1)
Ethnicity
Hispanic 33.1 (3.4) 26.5 (2.1) 11.8 (3.2) 20.9 (6.9)
Non-Hispanic 66.9 (3.4) 73.5 (2.1) 88.2 (3.2) 79.1 (6.9)
Parent’s education
Less than high school 14.3 (2.4) 10.7 (1.4) 9.6 (3.0) 15.2 (4.0)
High school graduate 34.1 (3.1) 29.5 (2.0) 37.3 (6.2) 44.5 (6.5)
Some college 39.8 (3.4) 41.7 (2.2) 44.4 (7.3) 23.7 (5.4)
College graduate 11.8 (1.8) 18.1 (1.5) 8.6 (2.9) 16.5 (5.2)
Parent’s employment
Not employed 18.3 (2.4) 16.1 (1.6) 5.7 (2.0) 12.9 (4.5)
Employed part-time 5.1 (1.4) 5.4 (0.9) 16.8 (4.9) 8.3 (4.3)
Employed full-time 75.7 (2.7) 78.0 (1.8) 77.5 (5.0) 78.8 (6.0)
Parent’s marital status
Single 27.9 (2.7) 30.2 (1.9) 33.2 (4.8) 28.9 (5.2)
Married 72.1 (2.7) 69.8 (1.9) 66.8 (4.8) 71.1 (5.2)
Poverty level, %FPL
< 100 33.7 (3.3) 25.9 (2.0) 30.0 (7.7) 33.0 (6.4)
100–125 6.6 (1.5) 6.5 (1.1) 11.6 (4.0) 2.0 (1.7)
126–200 21.6 (2.7) 21.3 (1.8) 14.6 (4.3) 22.1 (5.6)
201–400 26.4 (2.9) 31.4 (2.0) 29.0 (5.3) 30.4 (5.3)
‡ 401 11.7 (1.8) 14.8 (1.3) 14.7 (4.3) 12.6 (5.3)
Region
Northeast 5.9 (1.5) 7.1 (1.1) 4.2 (2.2) 10.0 (2.7)
Midwest 14.6 (2.0) 17.7 (1.5) 31.8 (10.0 16.6 (8.5)
South 29.8 (3.4) 32.2 (2.1) 34.4 (8.8) 50.5 (11.0)
West 49.7 (3.3) 43.0 (2.1) 29.6 (7.0) 22.9 (7.8)
Health status
Poor health 3.9 (0.8) 4.0 (0.6) 3.9 (1.7) 8.0 (4.2)
Good health 96.1 (0.8) 96.0 (0.6) 96.1 (1.7) 92.0 (4.2)
Coverage typea
Private 43.8 (3.3) 52.6 (2.2) 33.0 (5.7) 48.5 (8.0)
Public 41.6 (3.2) 40.2 (2.1) 37.5 (7.4) 38.7 (6.8)
IHS 16.7 (2.0) 10.9 (1.1) 33.9 (8.5) . . .
Uninsured status
Point-in-time . . . . . . 28.0 (5.7) 16.5 (4.2)
All-year 22.8 (3.1) 16.5 (1.8) 3.3 (1.5) 11.1 (3.6)
Note. CPS = Current Population Survey; NHIS = National Health Interview Survey; MEPS = Medical Expenditure Panel Survey;FPL = federal poverty level; IHS = Indian Health Service. Ellipses indicate that data are not available. ‘‘AIAN alone’’ means thatrespondent self-identified only as AIAN (i.e., as no other race); ‘‘AIAN in combination’’ denotes multiple-race AIANs.Source. 2003 CPS,40 2002 NHIS,41 and 2002 MEPS.42
aCoverage types are not mutually exclusive and do not sum to 100% because respondents may report more than 1 coverage type.Respondents who report only IHS and no other coverage are considered uninsured.
RESEARCH AND PRACTICE
1974 | Research and Practice | Peer Reviewed | Johnson et al. American Journal of Public Health | October 2010, Vol 100, No. 10
across national surveys. Within one survey,classification of ‘‘AIANs alone’’ and ‘‘AIANs incombination’’ resulted in different populationcharacteristics. In the CPS, compared withAIAN children classified any other way, AIAN-alone children tended to be younger, to live infamilies with incomes below the federal pov-erty threshold, and to live in households withadults who have lower levels of educationalattainment and employment status. Acrosssurveys, using the AIAN-alone classificationwould presumably produce the most socio-demographically comparable AIAN popula-tions; however, compositional characteristicsdiffered. For children, the most notable dif-ferences were in the gender distributions(40% were female in the NHIS sample vs 51%in the CPS sample), the age distributions (18%were aged £ 5 years in the MEPS sample vs34% in the NHIS and CPS samples), Hispanicethnicity (12% in the NHIS sample vs 33% inthe CPS sample), and the geographic distri-butions (23% of the MEPS sample resided inthe West compared with 50% of the CPSsample).
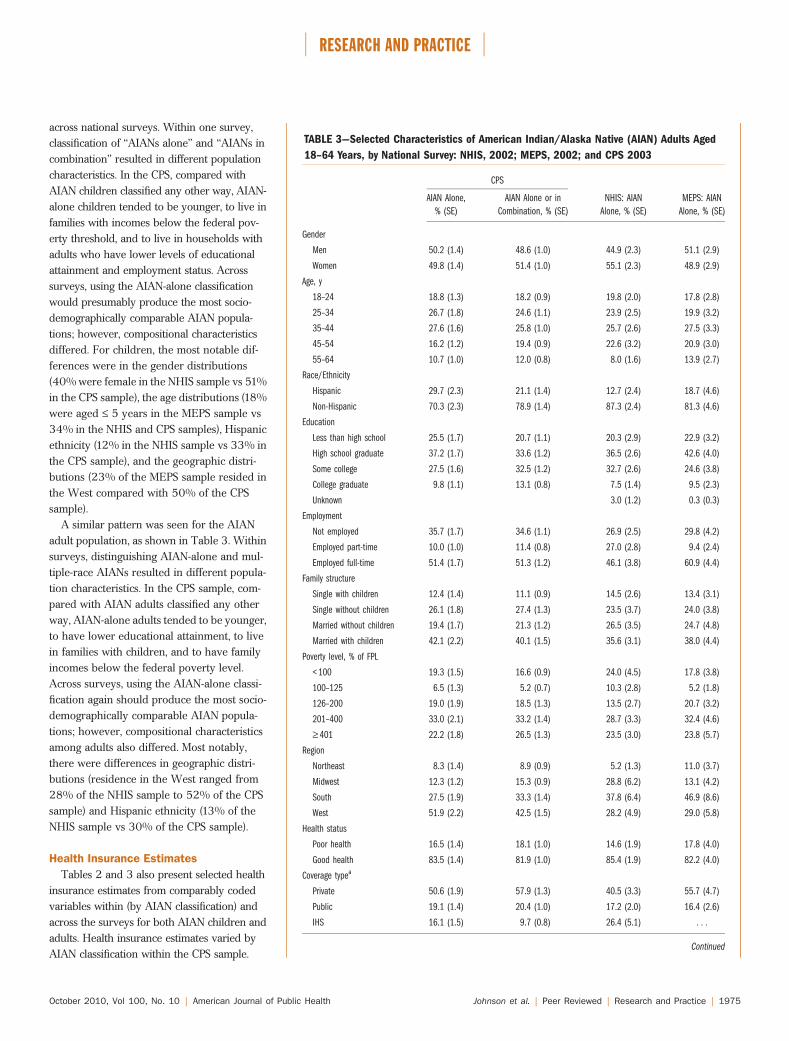
A similar pattern was seen for the AIANadult population, as shown in Table 3. Withinsurveys, distinguishing AIAN-alone and mul-tiple-race AIANs resulted in different popula-tion characteristics. In the CPS sample, com-pared with AIAN adults classified any otherway, AIAN-alone adults tended to be younger,to have lower educational attainment, to livein families with children, and to have familyincomes below the federal poverty level.Across surveys, using the AIAN-alone classi-fication again should produce the most socio-demographically comparable AIAN popula-tions; however, compositional characteristicsamong adults also differed. Most notably,there were differences in geographic distri-butions (residence in the West ranged from28% of the NHIS sample to 52% of the CPSsample) and Hispanic ethnicity (13% of theNHIS sample vs 30% of the CPS sample).
Health Insurance Estimates
Tables 2 and 3 also present selected healthinsurance estimates from comparably codedvariables within (by AIAN classification) andacross the surveys for both AIAN children andadults. Health insurance estimates varied byAIAN classification within the CPS sample.
TABLE 3—Selected Characteristics of American Indian/Alaska Native (AIAN) Adults Aged
18–64 Years, by National Survey: NHIS, 2002; MEPS, 2002; and CPS 2003
CPS
AIAN Alone,
% (SE)
AIAN Alone or in
Combination, % (SE)
NHIS: AIAN
Alone, % (SE)
MEPS: AIAN
Alone, % (SE)
Gender
Men 50.2 (1.4) 48.6 (1.0) 44.9 (2.3) 51.1 (2.9)
Women 49.8 (1.4) 51.4 (1.0) 55.1 (2.3) 48.9 (2.9)
Age, y
18–24 18.8 (1.3) 18.2 (0.9) 19.8 (2.0) 17.8 (2.8)
25–34 26.7 (1.8) 24.6 (1.1) 23.9 (2.5) 19.9 (3.2)
35–44 27.6 (1.6) 25.8 (1.0) 25.7 (2.6) 27.5 (3.3)
45–54 16.2 (1.2) 19.4 (0.9) 22.6 (3.2) 20.9 (3.0)
55–64 10.7 (1.0) 12.0 (0.8) 8.0 (1.6) 13.9 (2.7)
Race/Ethnicity
Hispanic 29.7 (2.3) 21.1 (1.4) 12.7 (2.4) 18.7 (4.6)
Non-Hispanic 70.3 (2.3) 78.9 (1.4) 87.3 (2.4) 81.3 (4.6)
Education
Less than high school 25.5 (1.7) 20.7 (1.1) 20.3 (2.9) 22.9 (3.2)
High school graduate 37.2 (1.7) 33.6 (1.2) 36.5 (2.6) 42.6 (4.0)
Some college 27.5 (1.6) 32.5 (1.2) 32.7 (2.6) 24.6 (3.8)
College graduate 9.8 (1.1) 13.1 (0.8) 7.5 (1.4) 9.5 (2.3)
Unknown 3.0 (1.2) 0.3 (0.3)
Employment
Not employed 35.7 (1.7) 34.6 (1.1) 26.9 (2.5) 29.8 (4.2)
Employed part-time 10.0 (1.0) 11.4 (0.8) 27.0 (2.8) 9.4 (2.4)
Employed full-time 51.4 (1.7) 51.3 (1.2) 46.1 (3.8) 60.9 (4.4)
Family structure
Single with children 12.4 (1.4) 11.1 (0.9) 14.5 (2.6) 13.4 (3.1)
Single without children 26.1 (1.8) 27.4 (1.3) 23.5 (3.7) 24.0 (3.8)
Married without children 19.4 (1.7) 21.3 (1.2) 26.5 (3.5) 24.7 (4.8)
Married with children 42.1 (2.2) 40.1 (1.5) 35.6 (3.1) 38.0 (4.4)
Poverty level, % of FPL
< 100 19.3 (1.5) 16.6 (0.9) 24.0 (4.5) 17.8 (3.8)
100–125 6.5 (1.3) 5.2 (0.7) 10.3 (2.8) 5.2 (1.8)
126–200 19.0 (1.9) 18.5 (1.3) 13.5 (2.7) 20.7 (3.2)
201–400 33.0 (2.1) 33.2 (1.4) 28.7 (3.3) 32.4 (4.6)
‡ 401 22.2 (1.8) 26.5 (1.3) 23.5 (3.0) 23.8 (5.7)
Region
Northeast 8.3 (1.4) 8.9 (0.9) 5.2 (1.3) 11.0 (3.7)
Midwest 12.3 (1.2) 15.3 (0.9) 28.8 (6.2) 13.1 (4.2)
South 27.5 (1.9) 33.3 (1.4) 37.8 (6.4) 46.9 (8.6)
West 51.9 (2.2) 42.5 (1.5) 28.2 (4.9) 29.0 (5.8)
Health status
Poor health 16.5 (1.4) 18.1 (1.0) 14.6 (1.9) 17.8 (4.0)
Good health 83.5 (1.4) 81.9 (1.0) 85.4 (1.9) 82.2 (4.0)
Coverage typea
Private 50.6 (1.9) 57.9 (1.3) 40.5 (3.3) 55.7 (4.7)
Public 19.1 (1.4) 20.4 (1.0) 17.2 (2.0) 16.4 (2.6)
IHS 16.1 (1.5) 9.7 (0.8) 26.4 (5.1) . . .
Continued
RESEARCH AND PRACTICE
October 2010, Vol 100, No. 10 | American Journal of Public Health Johnson et al. | Peer Reviewed | Research and Practice | 1975
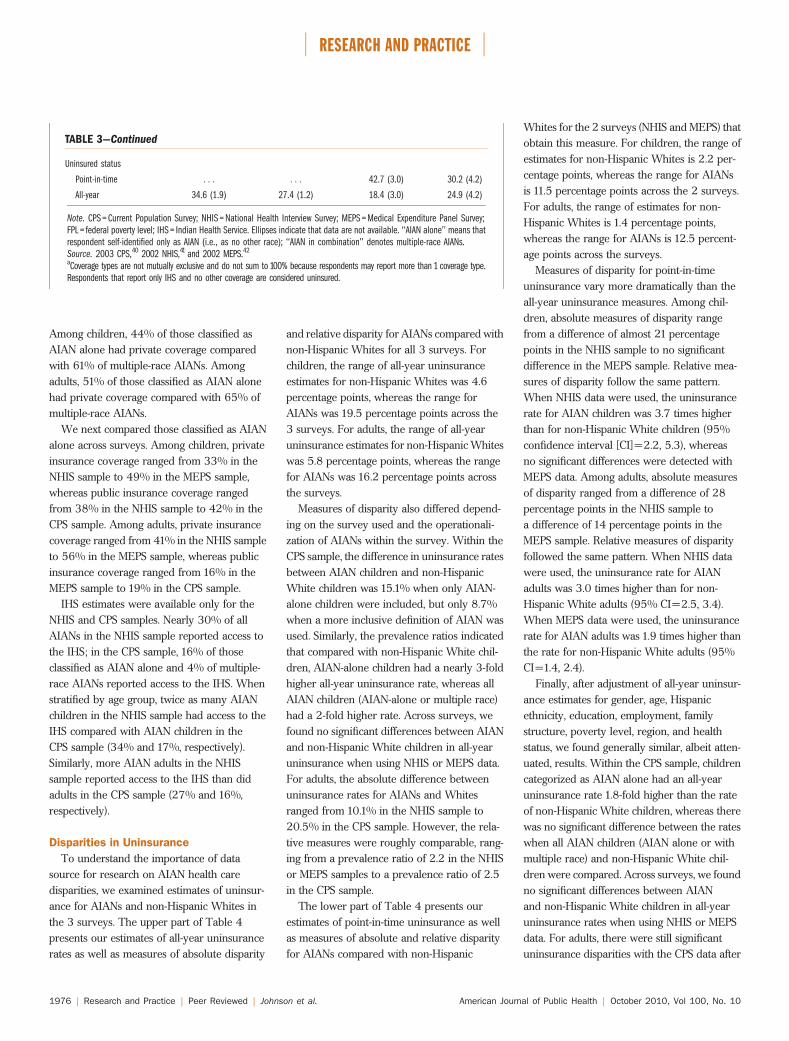
Among children, 44% of those classified asAIAN alone had private coverage comparedwith 61% of multiple-race AIANs. Amongadults, 51% of those classified as AIAN alonehad private coverage compared with 65% ofmultiple-race AIANs.
We next compared those classified as AIANalone across surveys. Among children, privateinsurance coverage ranged from 33% in theNHIS sample to 49% in the MEPS sample,whereas public insurance coverage rangedfrom 38% in the NHIS sample to 42% in theCPS sample. Among adults, private insurancecoverage ranged from 41% in the NHIS sampleto 56% in the MEPS sample, whereas publicinsurance coverage ranged from 16% in theMEPS sample to 19% in the CPS sample.
IHS estimates were available only for theNHIS and CPS samples. Nearly 30% of allAIANs in the NHIS sample reported access tothe IHS; in the CPS sample, 16% of thoseclassified as AIAN alone and 4% of multiple-race AIANs reported access to the IHS. Whenstratified by age group, twice as many AIANchildren in the NHIS sample had access to theIHS compared with AIAN children in theCPS sample (34% and 17%, respectively).Similarly, more AIAN adults in the NHISsample reported access to the IHS than didadults in the CPS sample (27% and 16%,respectively).
Disparities in Uninsurance
To understand the importance of datasource for research on AIAN health caredisparities, we examined estimates of uninsur-ance for AIANs and non-Hispanic Whites inthe 3 surveys. The upper part of Table 4presents our estimates of all-year uninsurancerates as well as measures of absolute disparity
and relative disparity for AIANs compared withnon-Hispanic Whites for all 3 surveys. Forchildren, the range of all-year uninsuranceestimates for non-Hispanic Whites was 4.6percentage points, whereas the range forAIANs was 19.5 percentage points across the3 surveys. For adults, the range of all-yearuninsurance estimates for non-Hispanic Whiteswas 5.8 percentage points, whereas the rangefor AIANs was 16.2 percentage points acrossthe surveys.
Measures of disparity also differed depend-ing on the survey used and the operationali-zation of AIANs within the survey. Within theCPS sample, the difference in uninsurance ratesbetween AIAN children and non-HispanicWhite children was 15.1% when only AIAN-alone children were included, but only 8.7%when a more inclusive definition of AIAN wasused. Similarly, the prevalence ratios indicatedthat compared with non-Hispanic White chil-dren, AIAN-alone children had a nearly 3-foldhigher all-year uninsurance rate, whereas allAIAN children (AIAN-alone or multiple race)had a 2-fold higher rate. Across surveys, wefound no significant differences between AIANand non-Hispanic White children in all-yearuninsurance when using NHIS or MEPS data.For adults, the absolute difference betweenuninsurance rates for AIANs and Whitesranged from 10.1% in the NHIS sample to20.5% in the CPS sample. However, the rela-tive measures were roughly comparable, rang-ing from a prevalence ratio of 2.2 in the NHISor MEPS samples to a prevalence ratio of 2.5in the CPS sample.
The lower part of Table 4 presents ourestimates of point-in-time uninsurance as wellas measures of absolute and relative disparityfor AIANs compared with non-Hispanic
Whites for the 2 surveys (NHIS and MEPS) thatobtain this measure. For children, the range ofestimates for non-Hispanic Whites is 2.2 per-centage points, whereas the range for AIANsis 11.5 percentage points across the 2 surveys.For adults, the range of estimates for non-Hispanic Whites is 1.4 percentage points,whereas the range for AIANs is 12.5 percent-age points across the surveys.
Measures of disparity for point-in-timeuninsurance vary more dramatically than theall-year uninsurance measures. Among chil-dren, absolute measures of disparity rangefrom a difference of almost 21 percentagepoints in the NHIS sample to no significantdifference in the MEPS sample. Relative mea-sures of disparity follow the same pattern.When NHIS data were used, the uninsurancerate for AIAN children was 3.7 times higherthan for non-Hispanic White children (95%confidence interval [CI]=2.2, 5.3), whereasno significant differences were detected withMEPS data. Among adults, absolute measuresof disparity ranged from a difference of 28percentage points in the NHIS sample toa difference of 14 percentage points in theMEPS sample. Relative measures of disparityfollowed the same pattern. When NHIS datawere used, the uninsurance rate for AIANadults was 3.0 times higher than for non-Hispanic White adults (95% CI=2.5, 3.4).When MEPS data were used, the uninsurancerate for AIAN adults was 1.9 times higher thanthe rate for non-Hispanic White adults (95%CI=1.4, 2.4).
Finally, after adjustment of all-year uninsur-ance estimates for gender, age, Hispanicethnicity, education, employment, familystructure, poverty level, region, and healthstatus, we found generally similar, albeit atten-uated, results. Within the CPS sample, childrencategorized as AIAN alone had an all-yearuninsurance rate 1.8-fold higher than the rateof non-Hispanic White children, whereas therewas no significant difference between the rateswhen all AIAN children (AIAN alone or withmultiple race) and non-Hispanic White chil-dren were compared. Across surveys, we foundno significant differences between AIANand non-Hispanic White children in all-yearuninsurance rates when using NHIS or MEPSdata. For adults, there were still significantuninsurance disparities with the CPS data after
TABLE 3—Continued
Uninsured status
Point-in-time . . . . . . 42.7 (3.0) 30.2 (4.2)
All-year 34.6 (1.9) 27.4 (1.2) 18.4 (3.0) 24.9 (4.2)
Note. CPS = Current Population Survey; NHIS = National Health Interview Survey; MEPS = Medical Expenditure Panel Survey;FPL = federal poverty level; IHS = Indian Health Service. Ellipses indicate that data are not available. ‘‘AIAN alone’’ means thatrespondent self-identified only as AIAN (i.e., as no other race); ‘‘AIAN in combination’’ denotes multiple-race AIANs.Source. 2003 CPS,40 2002 NHIS,41 and 2002 MEPS.42
aCoverage types are not mutually exclusive and do not sum to 100% because respondents may report more than 1 coverage type.Respondents that report only IHS and no other coverage are considered uninsured.
RESEARCH AND PRACTICE
1976 | Research and Practice | Peer Reviewed | Johnson et al. American Journal of Public Health | October 2010, Vol 100, No. 10
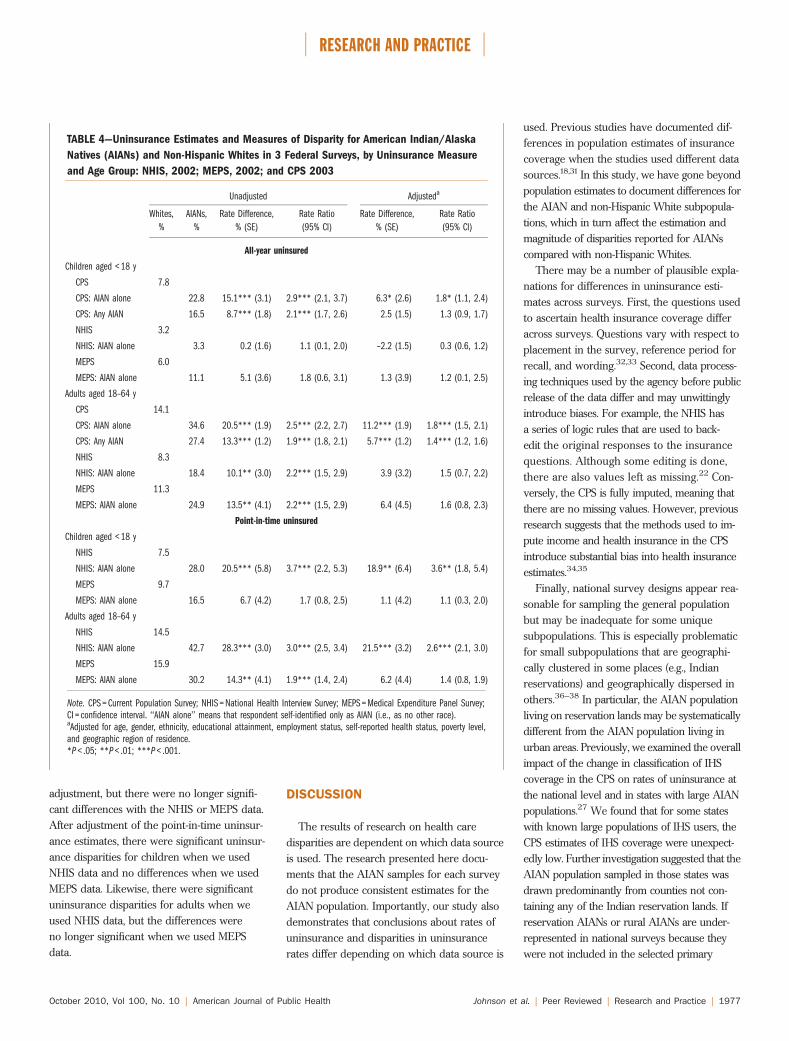
adjustment, but there were no longer signifi-cant differences with the NHIS or MEPS data.After adjustment of the point-in-time uninsur-ance estimates, there were significant uninsur-ance disparities for children when we usedNHIS data and no differences when we usedMEPS data. Likewise, there were significantuninsurance disparities for adults when weused NHIS data, but the differences wereno longer significant when we used MEPSdata.
DISCUSSION
The results of research on health caredisparities are dependent on which data sourceis used. The research presented here docu-ments that the AIAN samples for each surveydo not produce consistent estimates for theAIAN population. Importantly, our study alsodemonstrates that conclusions about rates ofuninsurance and disparities in uninsurancerates differ depending on which data source is
used. Previous studies have documented dif-ferences in population estimates of insurancecoverage when the studies used different datasources.18,31 In this study, we have gone beyondpopulation estimates to document differences forthe AIAN and non-Hispanic White subpopula-tions, which in turn affect the estimation andmagnitude of disparities reported for AIANscompared with non-Hispanic Whites.
There may be a number of plausible expla-nations for differences in uninsurance esti-mates across surveys. First, the questions usedto ascertain health insurance coverage differacross surveys. Questions vary with respect toplacement in the survey, reference period forrecall, and wording.32,33 Second, data process-ing techniques used by the agency before publicrelease of the data differ and may unwittinglyintroduce biases. For example, the NHIS hasa series of logic rules that are used to back-edit the original responses to the insurancequestions. Although some editing is done,there are also values left as missing.22 Con-versely, the CPS is fully imputed, meaning thatthere are no missing values. However, previousresearch suggests that the methods used to im-pute income and health insurance in the CPSintroduce substantial bias into health insuranceestimates.34,35
Finally, national survey designs appear rea-sonable for sampling the general populationbut may be inadequate for some uniquesubpopulations. This is especially problematicfor small subpopulations that are geographi-cally clustered in some places (e.g., Indianreservations) and geographically dispersed inothers.36–38 In particular, the AIAN populationliving on reservation lands may be systematicallydifferent from the AIAN population living inurban areas. Previously, we examined the overallimpact of the change in classification of IHScoverage in the CPS on rates of uninsurance atthe national level and in states with large AIANpopulations.27 We found that for some stateswith known large populations of IHS users, theCPS estimates of IHS coverage were unexpect-edly low. Further investigation suggested that theAIAN population sampled in those states wasdrawn predominantly from counties not con-taining any of the Indian reservation lands. Ifreservation AIANs or rural AIANs are under-represented in national surveys because theywere not included in the selected primary
TABLE 4—Uninsurance Estimates and Measures of Disparity for American Indian/Alaska
Natives (AIANs) and Non-Hispanic Whites in 3 Federal Surveys, by Uninsurance Measure
and Age Group: NHIS, 2002; MEPS, 2002; and CPS 2003
Unadjusted Adjusteda
Whites,
%
AIANs,
%
Rate Difference,
% (SE)
Rate Ratio
(95% CI)
Rate Difference,
% (SE)
Rate Ratio
(95% CI)
All-year uninsured
Children aged < 18 y
CPS 7.8
CPS: AIAN alone 22.8 15.1*** (3.1) 2.9*** (2.1, 3.7) 6.3* (2.6) 1.8* (1.1, 2.4)
CPS: Any AIAN 16.5 8.7*** (1.8) 2.1*** (1.7, 2.6) 2.5 (1.5) 1.3 (0.9, 1.7)
NHIS 3.2
NHIS: AIAN alone 3.3 0.2 (1.6) 1.1 (0.1, 2.0) –2.2 (1.5) 0.3 (0.6, 1.2)
MEPS 6.0
MEPS: AIAN alone 11.1 5.1 (3.6) 1.8 (0.6, 3.1) 1.3 (3.9) 1.2 (0.1, 2.5)
Adults aged 18–64 y
CPS 14.1
CPS: AIAN alone 34.6 20.5*** (1.9) 2.5*** (2.2, 2.7) 11.2*** (1.9) 1.8*** (1.5, 2.1)
CPS: Any AIAN 27.4 13.3*** (1.2) 1.9*** (1.8, 2.1) 5.7*** (1.2) 1.4*** (1.2, 1.6)
NHIS 8.3
NHIS: AIAN alone 18.4 10.1** (3.0) 2.2*** (1.5, 2.9) 3.9 (3.2) 1.5 (0.7, 2.2)
MEPS 11.3
MEPS: AIAN alone 24.9 13.5** (4.1) 2.2*** (1.5, 2.9) 6.4 (4.5) 1.6 (0.8, 2.3)
Point-in-time uninsured
Children aged < 18 y
NHIS 7.5
NHIS: AIAN alone 28.0 20.5*** (5.8) 3.7*** (2.2, 5.3) 18.9** (6.4) 3.6** (1.8, 5.4)
MEPS 9.7
MEPS: AIAN alone 16.5 6.7 (4.2) 1.7 (0.8, 2.5) 1.1 (4.2) 1.1 (0.3, 2.0)
Adults aged 18–64 y
NHIS 14.5
NHIS: AIAN alone 42.7 28.3*** (3.0) 3.0*** (2.5, 3.4) 21.5*** (3.2) 2.6*** (2.1, 3.0)
MEPS 15.9
MEPS: AIAN alone 30.2 14.3** (4.1) 1.9*** (1.4, 2.4) 6.2 (4.4) 1.4 (0.8, 1.9)
Note. CPS = Current Population Survey; NHIS = National Health Interview Survey; MEPS = Medical Expenditure Panel Survey;CI = confidence interval. ‘‘AIAN alone’’ means that respondent self-identified only as AIAN (i.e., as no other race).aAdjusted for age, gender, ethnicity, educational attainment, employment status, self-reported health status, poverty level,and geographic region of residence.*P < .05; **P < .01; ***P < .001.
RESEARCH AND PRACTICE
October 2010, Vol 100, No. 10 | American Journal of Public Health Johnson et al. | Peer Reviewed | Research and Practice | 1977
sampling units, estimates of uninsurance or anyother health or health care outcome may besubstantially biased.
It remains unclear how much each of theseissues contributes to the difference in insurancecoverage estimates across each of the datasources. There is additional concern aboutrepresentativeness of AIANs in national sur-veys. We may need to think differently aboutsampling AIAN populations, which may not fitneatly within standard survey research ap-proaches to national health surveys. Severalalternative sampling approaches have beenrecently suggested for increasing the effectivesample size of small and geographically uniquesubpopulations, such as AIANs, in nationalsurveys.39
Monitoring subpopulations where significanthealth disparities exist is essential for assessingprogress in reducing disparities over time.Unfortunately, our study has shown that dif-ferent sources of data may differently representthe population of AIANs, may produce differ-ent estimates, and may ultimately lead todifferent conclusions about the status of dis-parities in health and health care for AIANs.Each of the 3 surveys examined has itsstrengths and limitations, which may be moreor less important depending on the researchpurpose. For example, the CPS is the bestchoice if one prefers a more inclusive definitionof AIANs (both those classified as AIANalone and those of multiple race) or wants toproduce state-level uninsurance estimates. TheNHIS is the best choice if one needs a variety ofhealth status and health care access measuresfor a comprehensive examination of healthcare disparities. The MEPS would be the bestchoice if one wants to examine medical ex-penditures or the dynamics of health insurancecoverage over time. In the short run, it isessential that health researchers, policymakers,government agencies, and community advo-cates understand that there may be disparitiesin the assessment of health care disparitiesfor AIANs depending on the source of dataused. j
About the AuthorsAt the time of the study, Pamela Jo Johnson, Lynn A.Blewett, Kathleen Thiede Call, and Michael Davern werewith the State Health Access Data Assistance Center,Division of Health Policy and Management, School ofPublic Health, University of Minnesota, Minneapolis.
Correspondence should be sent to Pamela Jo Johnson,MPH, PhD, Center for Healthcare Innovation, AllinaHospitals & Clinics, 2925 Chicago Ave, Route 10105,Minneapolis, MN 55407 (e-mail: [email protected]).Reprints can be ordered at http://www.ajph.org by clickingthe ‘‘Reprints/Eprints’’ link.
This article was accepted February 3, 2010.
ContributorsP. J. Johnson conceptualized the study, conducted theanalyses, and led the writing. L.A. Blewett providedcritical revision of the article. K. T. Call provided com-ments on the article. M. Davern conceptualized theoriginal study, helped interpret findings, and providedcritical comments on the article. All authors revised andapproved the final article.
AcknowledgmentsFunding for this work was supported in part by a taskorder (M. Davern, principal investigator) from the USDepartment of Health and Human Services (Office of theAssistant Secretary for Planning and Evaluation andthe Agency for Healthcare Research and Quality; grant290-00-0017 Task no.6) and a grant from the RobertWood Johnson Foundation (L. A. Blewett, principal in-vestigator; grant 52362).
Human Participant ProtectionThis study was exempt from institutional review boardapproval as it was based solely on publicly available, de-identified survey data.
References1. Healthy People 2010: Understanding and ImprovingHealth. Washington, DC: US Department of Health andHuman Services; 2000.
2. Satcher D. Eliminating racial and ethnic disparities inhealth: the role of the ten leading health indicators. J NatlMed Assoc. 2000;92(7):315–318.
3. Lillie-Blanton M, Roubideaux Y. Understanding andaddressing the health care needs of American Indiansand Alaska Natives. Am J Public Health. 2005;95(5):759–761.
4. Castor ML, Smyser MS, Taualii MM, Park AN,Lawson SA, Forquera RA. A nationwide population-based study identifying health disparities betweenAmerican Indians/Alaska Natives and the general pop-ulations living in select urban counties. Am J PublicHealth. 2006;96(8):1478–1484.
5. Grossman DC, Baldwin LM, Casey S, Nixon B,Hollow W, Hart LG. Disparities in infant health amongAmerican Indians and Alaska Natives in US metropolitanareas. Pediatrics. 2002;109(4):627–633.
6. Paltoo DN, Chu KC. Patterns in cancer incidenceamong American Indians/Alaska Natives, United States,1992–1999. Public Health Rep. 2004;119(4):443–451.
7. Tomashek KM, Qin C, Hsia J, Iyasu S, Barfield WD,Flowers LM. Infant mortality trends and differencesbetween American Indian/Alaska Native infants andwhite infants in the United States, 1989–1991 and1998–2000. Am J Public Health. 2006;96(12):2222–2227.
8. Denny CH, Holtzman D, Goins RT, Croft JB.Disparities in chronic disease risk factors and healthstatus between American Indian/Alaska Native and
white elders: findings from a telephone survey, 2001 and2002. Am J Public Health. 2005;95(5):825–827.
9. Cunningham PJ. Access to care in the Indian HealthService. Health Aff (Millwood). 1993;12(3):224–233.
10. Dixon M. Access to care issues of Native Americanconsumers. In: Dixon M, Roubideaux Y, eds. Promises toKeep: Public Health Policy for American Indians & AlaskaNatives in the 21st Century. Washington, DC: AmericanPublic Health Association; 2001:61–88.
11. Roubideaux Y. A Review of the Quality Of Health Carefor American Indians and Alaska Natives. New York, NY:Commonwealth Fund; 2004.
12. Zuckerman S, Haley J, Roubideaux Y, Lillie-BlantonM. Health service access, use, and insurance coverageamong American Indians/Alaska Natives and whites:what role does the Indian Health Service play? Am JPublic Health. 2004;94(1):53–59.
13. Steele CB, Cardinez CJ, Richardson LC, Tom-OrmeL, Shaw KM. Surveillance for health behaviors of Amer-ican Indians and Alaska Natives—findings from thebehavioral risk factor surveillance system, 2000–2006.Cancer. 2008;113(5 suppl):1131–1141.
14. Moy E, Arispe IE, Holmes JS, Andrews RM. Pre-paring the National Healthcare Disparities Report: gaps indata for assessing racial, ethnic, and socioeconomicdisparities in health care. Med Care. 2005;43(3 suppl):I9–I16.
15. Moy E, Smith CR, Johansson P, Andrews R. Gaps indata for American Indians and Alaska Natives in theNational Healthcare Disparities Report. Am Indian AlskNative Ment Health Res. 2006;13(1):52–69.
16. Johnson PJ, Call KT, Blewett LA. The importance ofgeographic data aggregation in assessing disparities inAmerican Indian prenatal care. Am J Public Health.2010;100(1):122–128.
17. Agency for Healthcare Research and Quality. Na-tional Healthcare Disparities Report, 2008. Rockville, MD:US Dept of Health and Human Services; 2009. AHRQpublication 09-0002.
18. Davern M, Davidson G, Ziegenfuss J, et al. Compar-ing Health Insurance Coverage Estimates From FourNational Surveys: Measurement Issues and Policy Impli-cations. Minneapolis, MN: State Health Access DataAssistance Center (SHADAC); 2008.
19. Blewett LA, Good MB, Call KT, Davern M. Moni-toring the uninsured: a state policy perspective. J HealthPolit Policy Law. 2004;29(1):107–145.
20. US Census Bureau. March 2003: Annual Social andEconomic (ASEC) Supplement. Revised May 16, 2006.Available at: http://www.census.gov/apsd/techdoc/cps/cpsmar03.pdf. Accessed June 15, 2008.
21. Gentleman JF, Pleis JR. The National Health In-terview Survey: an overview. Eff Clin Pract. 2002;5(3suppl):E2.
22. National Center for Health Statistics. 2002 NationalHealth Interview Survey (NHIS) Public Use Data Release:NHIS Survey Description. Available at: ftp://ftp.cdc.gov/pub/Health_Statistics/NCHS/Dataset_Documentation/NHIS/2002/srvydesc.pdf. Accessed June 15, 2008.
23. Agency for Healthcare Research and Quality. MEPS:Medical Expenditure Panel Survey. Available at: http://www.meps.ahrq.gov/mepsweb. Accessed June 15, 2008.
24. US Census Bureau. Annual estimates of the Amer-ican Indian and Alaska Native alone population by sexand age for the United States: April 1, 2000 to July 1,
RESEARCH AND PRACTICE
1978 | Research and Practice | Peer Reviewed | Johnson et al. American Journal of Public Health | October 2010, Vol 100, No. 10
2007. NC-EST2007-04-IA. Available at: http://www.census.gov/popest/national/asrh/NC-EST2007-asrh.html. Accessed July 11, 2010.
25. US Census Bureau. Annual estimates of the Amer-ican Indian and Alaska Native alone or in combinationpopulation by sex and age for the United States: April 1,2000 to July 1, 2007. NC-EST2007-04-IAC. Availableat: http://www.census.gov/popest/national/asrh/NC-EST2007-asrh.html. Accessed July 11, 2010.
26. National Center for Health Statistics. 1998 NationalHealth Interview Survey (NHIS) Public Use Data Release:Person File Codebook. Available at: ftp://ftp.cdc.gov/pub/Health_Statistics/NCHS/Dataset_Documentation/NHIS/1998/personsx.pdf. Accessed March 15, 2009.
27. Reclassifying Health Insurance Coverage for the IndianHealth Service in the Current Population Survey: Impact onState Uninsurance Estimates. Minneapolis: State HealthAccess Data Assistance Center, University of Minnesota;2005.
28. US Census Bureau, Housing and Household Eco-nomic Statistics Division. How edited health insurancevariables are recoded in our programs. Available at: http://www.census.gov/hhes/www/hlthins/hlthinsrecodevar.html. Accessed March 15, 2009.
29. US Census Bureau, Housing and Household Eco-nomic Statistics Division. CPS health insurance defini-tions. July 7, 2010. Available at: http://www.census.gov/hhes/www/hlthins/methodology/definitions/cps.html.Accessed July 11, 2010.
30. StataCorp. Survey Data Reference Manual. CollegeStation, TX: Stata Press; 2007.
31. Fronstin P. Counting the uninsured: a comparison ofnational surveys. EBRI Issue Brief. 2000;225:1–19.
32. Call KT, Davern M, Blewett LA. Estimates of healthinsurance coverage: comparing state surveys with thecurrent population survey. Health Aff (Millwood).2007;26(1):269–278.
33. Davern M, Beebe TJ, Blewett LA, Call KT. Recentchanges to the Current Population Survey: sample ex-pansion, health insurance verification, and state healthinsurance coverage estimates. Public Opin Q. 2003;67(4):603–626.
34. Davern M, Blewett LA, Bershadsky B, Arnold N.Missing the mark? Possible imputation bias in the CurrentPopulation Survey’s state income and health insurancecoverage estimates. J Off Stat. 2004;20(3):519–549.
35. Davern M, Rodin H, Blewett LA, Call KT. Are theCurrent Population Survey uninsurance estimates toohigh? An examination of the imputation process. HealthServ Res. 2007;42(5):2038–2055.
36. Andresen EM, Diehr PH, Luke DA. Public healthsurveillance of low-frequency populations. Annu RevPublic Health. 2004;25:25–52.
37. Ericksen EP. Problems in sampling the NativeAmerican and Alaska Native populations. Popul ResPolicy Rev. 1997;16(1–2):43–59.
38. Kalsbeek WD. Sampling minority groups in healthsurveys. Stat Med. 2003;22(9):1527–1549.
39. Elliott MN, Finch BK, Klein D, et al. Sample designsfor measuring the health of small racial/ethnic subgroups.Stat Med. 2008;27(20):4016–4029.
40. US Census Bureau. Current Population Survey,2003 Annual Social and Economics (ASEC) Supplement.Available at: http://www.bls.census.gov/cps_ftp.html#cpsmarch. Accessed July 11, 2010.
41. National Center for Health Statistics. National HealthInterview Survey, 2002. Available at: ftp://ftp.cdc.gov/pub/Health_Statistics/NCHS/Datasets/NHIS/2002.Accessed July 11, 2010.
42. Agency for Healthcare Research and Quality. MEPSHC-070: 2002 full year consolidated data file. Dataavailable at: http://www.meps.ahrq.gov/mepsweb/data_stats/download_data_files_detail.jsp?cboPufNumber=HC-070. Accessed July 11, 2010.
RESEARCH AND PRACTICE
October 2010, Vol 100, No. 10 | American Journal of Public Health Johnson et al. | Peer Reviewed | Research and Practice | 1979


