Embed Size (px)
Citation preview

Amide I Modes of r-Helical Polypeptide in Liquid Water: Conformational Fluctuation,Phase Correlation, and Linear and Nonlinear Vibrational Spectra
Sihyun Ham,† Seungsoo Hahn,‡ Chewook Lee,‡ Tae-Kyung Kim,‡ Kyungwon Kwak,‡ andMinhaeng Cho*,‡
Department of Chemistry, Sookmyung Women’s UniVersity, Seoul 140-742, Korea, and Department ofChemistry and Center for Multidimensional Spectroscopy, DiVision of Chemistry and Molecular Engineering,Korea UniVersity, Seoul 136-701, Korea
ReceiVed: March 24, 2004; In Final Form: April 14, 2004
Chain length and site dependencies of amide I local mode frequencies ofR-helical polyalanines are theoreticallystudied by carrying out semiempirical quantum chemistry calculations. A theoretical model that can be usedto quantitatively predict both the local amide I mode frequencies and coupling constants between two differentlocal amide I modes is developed. Using this theoretical model and performing molecular dynamics simulationof anR-helical polyalanine in liquid water, we investigate conformational fluctuation and hydrogen-bondingdynamics by monitoring amide I frequency fluctuations. The instantaneous normal-mode analysis method isused to obtain densities of states of the one- and two-exciton bands and to quantitatively investigate theextent of delocalization of the instantaneous amide I normal modes. Also, by introducing a novel concept ofthe so-called weighted phase-correlation factor, the symmetric natures of the delocalized amide I normalmodes are elucidated, and it is also shown that there is no unique way to classify any given amide I normalmode of theR-helical polyalanine in liquid water to be eitherA-mode-like orE1-mode-like. From the ensemble-averaged dipole strength spectrum and density of one-exciton states, the amide I infrared absorption spectrumis numerically calculated and its asymmetric line shape is theoretically described. Considering both transitionsfrom the ground state to one-exciton states and those from one-exciton states to two-exciton states, we calculatethe two-dimensional IR pump-probe spectra and directly compare them with recent experimental results. Abrief discussion on the cross-peaks previously observed in the two-dimensional difference spectrum is presented.
I. Introduction
To establish the relationship between the secondary structureof polypeptide and amide I absorption spectrum, a number oftheoretical models were presented and found to be useful.1-14
For example, there exist several empirical rules such as (i) theamide I infrared (IR) band of anR-helix peaks at 1650 cm-1
and (ii) that of aâ-sheet polypeptide exhibits a major peak atlower frequency region around 1630 cm-1. A bit more quantita-tive method of predicting the hydrogen-bonding effect on theamide I mode frequency red-shift,δν̃I, is to use the fol-lowing empirical formula,δν̃I ) - RHyd{2.6- r(O‚‚‚H)}, wherer(O‚‚‚H) denotes the hydrogen-bond distance in Å and theproportionality constantRHyd was assumed to be 30 cm-1/Å.15,16
However, the authors already showed that this simple formulais not quantitatively reliable in predicting solvatochromic amideI mode frequency shift of the aqueous NMA solution.17,18 Inthe case of intramolecular hydrogen-bonding effect on the amideI mode frequency shift, Brauner et al.’s empirical correctionmethod could be of use, though it is not accurate enough totake into account 3D structure-dependency of amide I localmode frequency shift.19
Due to the difficulties of determining precise distributionsof amide I vibrational frequencies, corresponding eigenvectors,and dipole strengths, it was only possible to qualitatively
determine the existence of a given secondary structure inproteins. Despite the lack of theoretical methods, in addition tothe IR absorption spectroscopy, various alternative experimentalmethods such as nonresonant and resonant Raman scatteringspectroscopy, vibrational circular dichroism, and Raman opticalactivity have been extensively used to obtain complementaryinformation on the secondary structure of a given polypeptide.20-29
Recently, due to the advent of laser technology, a variety ofnovel spectroscopic tools, such as two-dimensional (2D) IRpump-probe and photon echo spectroscopies, have beendeveloped and used to determine 3D structures of smallpolypeptides.30-37 These 2D vibrational spectroscopic techniqueshave been shown to be successful in measuring variousquantities such as vibrational coupling constants, angles betweentransition dipole vectors, etc., which are specifically dependenton the 3D structure of those small polypeptides such astrialanine37 and acetylproline35 in solutions. Furthermore, Wout-ersen and Hamm presented the 2D IR pump-probe spectra ofthe aqueous Fs helix solution, where the Fs helix is one of thebest-known right-handedR-helix with 18 alanine and 3 arginineresidues.34 From the 2D difference spectrum experimentallymeasured, they were able to quantitatively determine theA-E1
frequency splitting to be 10 cm-1. Although by carrying outMonte Carlo (MC) simulations of the Fs helix system they couldnumerically calculate the 2D pump-probe spectra and comparethem with experimental results, there still exist several issuesthat could not be resolved by their MC simulation studies. Forexample, the site-dependencies of the amide I local mode
* To whom correspondence should be addressed. Email address: [email protected].
† Sookmyung Women’s University.‡ Korea University.
9333J. Phys. Chem. B2004,108,9333-9345
10.1021/jp048678e CCC: $27.50 © 2004 American Chemical SocietyPublished on Web 05/29/2004

frequencies and their fluctuation amplitudes, hydrogen-bondingdynamics, local flexibility, delocalization of instantaneous amideI normal modes, spectral distributions of one- and two-excitonstates, existence ofA-like or E1-like normal mode, distributionof transition dipole strength, etc., have not been fully elucidatedyet. Furthermore, the asymmetric shape of the amide I IR bandof R-helix in liquid water and two-dimensional line shapes of2D IR signals for the parallel and perpendicular polarized pumpand probe, and difference pump-probe spectra were nottheoretically described yet.
Despite the existence of numerous different spectroscopicmethods probing amide I vibrational dynamics, to interpretexperimental results it is still necessary to have a theoreticalmodel that is capable of quantitatively predicting both diagonaland off-diagonal Hessian matrix, in the amide I mode subspace,of a given polypeptide. Over the past few years, we havedeveloped a systematic way to take into account the interpeptideas well as solute-solvent interaction effects on the amide I modefrequency shifts and vibrational coupling constants for variouspolypeptides ranging from a monopeptide likeN-methylaceta-mide (NMA) to polypeptides with five peptide groups.17,38-43
For instance, from the ab initio calculation studies of a numberof NMA-water clusters, an extrapolation method for calculatingthe amide I mode frequency of an NMA dissolved in liquidwater was developed17 and used to quantitatively calculate theIR absorption spectrum18 and 2D pump-probe spectra.44
Furthermore, the same method was used to predict various 1Dand 2D spectra of the NMA-methanol solution.45 Overall, wefound that the theory works quantitatively well in not onlypredicting solvation-induced frequency red-shifting behavior butalso simulating 1D and 2D vibrational spectra in comparisonto the experimental results. However, it is not automaticallyclear whether the same method in combination with quantumchemistry calculations is useful to theoretically determine amideI mode frequency shifts and coupling constants of lengthypolypeptides having more than 20 residues. Therefore, in thepresent paper, we will first provide evidence confirming thevalidity of the extrapolation method by carrying out semiem-pirical quantum chemistry calculations of variousR-helicalpolyalanines. Then, the molecular dynamics simulation resultsof the aqueousR-helical polyalanine solution will be presentedand discussed in detail in section III. Numerically calculatedlinear and nonlinear (2D) vibrational spectra will be presentedin sections IV and V, respectively, and directly compared withexperimental results. Finally, the main results and a fewconcluding remarks will be given in section VI.
II. Quantum Chemistry Calculation Results
The local amide I mode frequency was found to be deter-mined by two distinctively different interactions, which aresolute-solvent and interpeptide interactions. In the presentsection, we will focus on the latter type of interaction, and thesolvatochromic frequency shift will be discussed in section III,where a molecular dynamics simulation method is employedto study amide I mode frequency fluctuation.
It was shown that the amide I local mode frequency isstrongly dependent on the relative configurations of the neigh-boring peptides. To develop a model for quantitatively predictingthe local amide I mode frequency, i.e., diagonal Hessian matrixelements, the electrostatic interaction between peptide groupswas mainly considered and the transition and partial charges ofthe four sites, i.e., C(dO), O(dC), N(-H), and H(-N) atomsof a given peptide bond, were obtained by fitting ab initiocalculation results of a variety of di- and tripeptides with a
multivariate linear equation.41,42More specifically, themth localamide I mode frequency in a given polypeptide can be estimatedby calculating electrostatic potential field at the four sites ofthe mth peptide bond as
and
whereφjm
peptide is the electrostatic potential at thejth site of themth peptide bond and it is created by the partial charges of theother peptide groups around themth peptide bond. The referencefrequency, which is that of an isolated NMA molecule, wasdenoted asν̃0 () 1707 cm-1). To quantitatively calculateν̃m
values, one should have not onlylj values but also four partialcharges of the four sites, i.e., O(dC), C(dO), N(-H), andH(-N). The four lj values were obtained by using the multi-variate least-squares fitting analysis of 96N-methylacetamide-nD2O complexes and thus determinedlj values arelO )-0.005 54,lC ) 0.0016,lN ) 0.004 79, andlH ) - 0.000 86.41
Here, the dimension oflj is a fraction of electronic charge,e.Now, using theselj values, we determined the effective partialcharges of the four sites of a given peptide group from the abinitio calculated local amide I mode frequencies for various di-and tripeptides, which were used as the reference data set, andthe four partial charges were found to becO ) - 0.871,cC )0.419, cN ) 0.793, andcH ) - 0.341.42 To calculate theelectrostatic potential, we used the dielectric constant to be 1.Again, the dimension of partial charge,cj, is a fraction ofelectronic charge. The dimension of the electrostatic potentialwas converted into cm-1/e. Although the extrapolation formulain eq 1 was found to be quantitatively reliable for shortpolypeptides as demonstrated in ref 43, we have not confirmedwhether it is also valid for predicting amide I local modefrequencies of lengthy polypeptides such as a PAN (N ≈ 20),whereN denotes the number of peptide bonds. The main goalof this section is to show that eq 1 is useful even for these casesof long R-helices, by carrying out a series of less expensiveAM1 level calculations.46
A. Correlation between Structure and Amide I ModeFrequency. Recently, for a variety of polypeptides we haveconfirmed that the local amide I mode frequency is linearlyproportional to the CdO bond length by using quantumchemistry calculation methods such as HF/6-311++G**. 43
However, the same method and basis set is very expensive andtime-consuming to perform geometry optimization and vibra-tional analysis of a largeR-helix with up to 20 peptide bonds.Thus, we have tried to find an alternative, effective, butquantitatively reliable method for such a purpose and found thatthe semiempirical AM1 model is useful. Although the structuralproperties, such as bond lengths, dihedral angles, etc., obtainedby using the AM1 calculation method have known to be lessaccurate than other higher level ab initio calculation methodssuch as HF, MP2, and DFT, the structure-vibrational frequencyrelationship, i.e., amide I mode frequency vs CdO bond length,is still valid and in good agreement with the HF/6-311++G**results.
B. Hessian Matrix Reconstruction Analysis. Using theAM1 method, we carried out geometry optimization calculationsand vibrational analyses of fourR-helical PAs withN ) 6, 10,15, and 20, where both C- and N-terminals were capped by an
ν̃m ) ν̃0 + δν̃mpeptide
δν̃mpeptide) ∑
j)1
4
l j(m)φj(m)peptide (1)
9334 J. Phys. Chem. B, Vol. 108, No. 26, 2004 Ham et al.

acetyl and methyl groups, respectively. From the AM1 vibra-tional analysis of each helical PA, one can obtain amide Inormal-mode frequencies and corresponding eigenvectors. Now,using the so-called Hessian matrix reconstruction methoddeveloped by the authors recently,41,42 N amide I local modefrequencies and vibrational coupling constants can be deter-mined. In Figure 1a, thus calculated local amide I modefrequencies are plotted with respect to the CdO bond lengths,and the linear relationship between the two is clearsnote thatthe amide I frequencies are not scaled. The best fit isν̃I
AM1 )- 3335dCdO
AM1 + 6149 cm-1. Here, the dimension of the CdO bond length is Å. The same linear relationship, though itsslope is different from that in Figure 1a, was already found fora variety of small polypeptides, where the HF/6-311++G**method was employed. Therefore, even though it is well-knownthat the vibrational frequencies and molecular structures pre-dicted by using AM1 calculations are not as reliable as thoseby HF/6-311++G** method, as long as the amide I modefrequency is concerned one can convert AM1-calculated amideI mode frequencies into those at the HF/6-311++G** level byusing the linear relationship betweenν̃I anddCdO.
Now, to show that the extrapolation method in eq 1 is usefuleven for longR-helices, in Figure 1b we plot the predicted amideI local mode frequencies (open squares, circles, triangles, anddiamonds) by using eq 1 and scaled AM1-calculated amide Ilocal mode frequencies (closed squares, circles, triangles, anddiamonds), where the scaling factor isνm)10
eq1/νm)10AM1 (for
PA20) ) 0.8534. This factor is multiplied to all the AM1-calculated (unscaled) amide I local mode frequencies in Figure1a. We found that eq 1 works well and predicts the generaltrend on the site-dependence of amide I local modes in a givenR-helical PA, though it overestimates the local mode frequenciesof the first three peptide groups. There are two possibleexplanations for the latter discrepancy. The first is that the four-site model, eq 1, with optimized parameters obtained from HF/6-311++G** calculations of small polypeptides (N ) 2-5) isnot sophisticated enough to describe the amide I local modefrequency shifts of the first three peptide groups in theN-terminus. The second is that the AM1-level calculations ofCdO bond length and amide I normal-mode frequencies andeigenvectors are not sufficiently accurate. It is believed that thesecond is the reason for the notable failure of eq 1 in the regionof the N-terminus because the four-site model was found to bereliable for predicting amide I local mode frequencies of shortpolypeptides withN ) 2-5 but in contrast eq 1 works relativelypoorly for PA6 as can be seen in Figure 1b.43 Nevertheless, the
four-site model, eq 1, appears to be a far better method thanany other previous theoretical model or ad hoc methodspresented before and it is found to be an acceptable model forthe longest PA, PA20, considered in this subsection.
C. Chain Length Dependencies of Diagonal and Off-Diagonal Hessian Matrix Elements.For a shortR-helical PA,the amide I local mode frequencies are highly site-dependent.As discussed in ref 42, the interpeptide interaction between twonearest neighboring peptide groups in a givenR-helical polypep-tide is repulsive so that the CdO bond length is shorter thanthat of an isolated peptide bond, which results in an increase ofthe amide I local mode frequency. More specifically, the twoamide I local mode frequencies of a model tripeptide when its3D conformation is anR-helix are larger than 1707 cm-1,meaning that the interpeptide interaction induces blue shifts ofthe amide I local mode frequencies. This trend was found to begeneral as long as the target peptide group does not form anyintramolecular hydrogen bond with other peptide groups.However, as the chain length increases, the peptide bond in theinner region of a lengthyR-helix will experience two competinginteractions, i.e., blue-shifting interpeptide interactions with thetwo nearest neighboring peptide groups and red-shifting hydrogen-bonding interactions with (j(4)th peptide groupssnote that asingle intramolecular hydrogen-bonding interaction between 1and 4 peptide bonds induces about a 20-30 cm-1 red-shift ofthe amide I mode frequency. Consequently, the local amide Imode frequencies of the peptides located in the inner regionbecome rather insensitive to their positions in a givenR-helicalchain. These results suggest that one should not make a simpleassumption that the diagonal Hessian matrix elements in theamide I subspace are identical when the segment in a givenprotein is in anR-helical conformation.
We next consider the vibrational coupling constants betweenneighboring peptides. As found in the recent quantum chemistrycalculation studies on amide I vibrational couplings of variousconformational short polypeptides,42,43the vibrational couplingconstants were found to be almost independent of the chainlength when the number of peptide bonds is less than six. Thisinsensitivity of coupling constant with respect to the chain lengthis still valid even for longer polypeptides having up to 20 peptidebonds. The average 1-2, 1-3, and 1-4 coupling constants (incm-1) are found to be 5.35,-3.63, and-4.33, respectively,and the corresponding standard deviations are 1.67, 1.29, and0.77 cm-1, respectively. This again confirms the notion thatthe vibrational coupling constants do not depend on the chainlength.
Figure 1. (a) Amide I local mode frequencies of PA6, PA10, PA15, and PA20 obtained by using the Hessian matrix reconstruction method, AM1geometry optimization, and vibrational analyses are plotted with respect to the CdO bond lengths. The vibrational frequencies are not scaled. (b)Local amide I mode frequencies of PA6, PA10, PA15, and PA20 predicted by using the four-site model, eq 1, are compared with the scaled amideI local mode frequencies (see context for a detailed procedure on how to re-scale the AM1-calculated amide I frequency).
Amide I Modes ofR-Helical Polypeptide in Liquid Water J. Phys. Chem. B, Vol. 108, No. 26, 20049335

Before we close this section, we summarize the principalresults from the semiempirical (AM1) calculation studies. Thegeneral trends, i.e., (1) the amide I local mode frequencies ofthe second and third peptide bonds from one of the two terminalsare larger than the reference frequency of 1707 cm-1 and site-dependent and (2) the amide I local mode frequencies of thepeptide groups in the inner region of a long PA are more orless independent of their positions, were found to be well-described by the extrapolation formula. Thus, it is believed thatthe main goal of the AM1 study, which is to show that theextrapolation method in eq 1 can be used to quantitativelydescribe the interpeptide-interaction-induced shifts of the amideI local modes in anyR-helical PA, was achieved. In thefollowing section, we will use this extrapolation method withthe set of parameters{lj} and{cj} to numerically calculate theinterpeptide-interaction-induced amide I mode frequency shiftsof PA22 dissolved in liquid water.
III. Molecular Dynamics Simulation Results
To understand the structural fluctuation-spectra relationshipsof R-helices in liquid water, we will particularly consider thePA22 molecule, which was extensively studied experimentallyand theoretically.34,47-53 Recently, Hamm and co-workers carriedout two-dimensional IR pump-probe spectroscopic studies ofthe Fs helix, which has 21 amino acid residues consisting of18 alanines and three arginines.34 Note that the arginine sidechain has a positively charged group that can have hydrogen-bonding interactions with the polypeptide backbone. Further-more, the side chain dynamics is rather slow so that one needsto run a very long MD simulation to fully take into accountthese slow processes. Therefore, we instead chose PA22 insteadof Fs helix because there are no complicated side-chain effectson the amide I mode frequency fluctuation and on the confor-mational fluctuation of the polypeptide backbone as well asbecause PA22 is an idealR-helix system that can be consideredto be the reference system of allR-helical polypeptides.
A. MD Simulation Method. The constant-temperature mo-lecular dynamics (MD) simulations were performed by usingthe SANDER module of the AMBER program packageemploying the parm99 force field.54 The system consists of asingle PA22 and 2192 TIP3P water molecules at neutral pH.Long-range electrostatic interactions are treated with the particle-mesh Ewald method implemented in the AMBER program.55
The solvated system was subject to 1000 steps of conjugategradient energy minimization and then brought into an equi-librium state for 100 ps at 273 K using the Berendsen couplingalgorithm.56 In all calculations, an 8.0 Å nonbonded interactioncutoff was used and nonboned pair lists were updated every 20integration steps. The system was then coupled to an externalheat bath with relaxation time of 0.1 ps. A 0.5 fs time step wasused for the simulation. Structures were saved every 10 fs fordetailed analyses. The simulation was performed for 2 ns. Wealso performed the same MD simulation for Fs helix in liquidwater for 2 ns. However, within the 2 ns trajectory, in all aspectsof statistics and dynamics we found little differences betweenFs helix and PA22 solutions.
B. Structural Fluctuation and Hydrogen-Bonding Dynam-ics. 1. Dihedral Angle Fluctuation.As the amide I local modefrequencies strongly depend on dihedral angles,φj and ψj,conformational fluctuation of the PA22 backbone and dynamicsof surrounding water molecules are expected to considerablycontribute to the overall frequency fluctuations. To this end,we first calculated average dihedral angles57 ⟨φj⟩ and ⟨ψj⟩ andtheir standard deviations, and they are plotted in parts a and b
of Figure 2, respectively. The average dihedral angles of peptidebonds in the inner region of PA22 maintain their helical structuresthroughout the entire equilibrium simulation. Nevertheless, theaverage dihedral angles and their fluctuation amplitudes ofpeptide groups near the two terminals deviate from those valuesof peptide groups in the inner region. This indicates that thebackbone structures near the two terminals are more flexiblethan those in the inner region.53,58-60
2. Hydrogen Bonding Dynamics.To study the hydration effecton each individual peptide CdO group, we first calculated theaverage number of water molecules forming a direct hydrogenbond with the peptide groups (see Figure 2c). Typically, onewater molecule is involved in the hydrogen-bonding interactionwith the carbonyl oxygen atom, whereas the number of watermolecules hydrogen-bonded to the peptide groups near theC-terminus is larger than onesthis means that those peptidegroups are significantly exposed to solvent water. Theseobservations are by no means surprising because the peptidebonds in the inner region form two strong hydrogen-bonds withj(4’th peptide groups though those near the C-terminus do not.A consequence of this distribution of hydrogen-bonding interac-tion strengths is that the dominant mechanism for solvatochro-mic amide I mode frequency shift is strongly dependent on theposition of the target peptide bond in the PA22 chain.
C. Local Amide I Mode Frequency Fluctuation andStatistics: Aqueous PA22 Solution. 1. Local Amide I ModeFrequencies.To numerically predict the solvation-induced amideI mode frequency shift, the following formula will be used
where the four parameters,lj, were already presented in sectionII. φj(m)
water is the electrostatic potential at thejth site of themthpeptide bond, created by the partial charges of the surroundwater molecules. Here, the CHELPG partial charges of thedeuterium and oxygen atoms of D2O were calculated to be 0.412and-0.824, respectively, at the HF/6-311++G** level.17 Thevalidity of the above method, eq 2, was extensively tested forvarious NMA-water clusters,17 aqueous NMA solution,18 andNMA dissolved in liquid methanol45 by making direct com-parisons of numerically predicted amide I IR absorption spectraand 2D IR pump-probe spectra with experimental results.Combining eq 1 with (2), the local amide I mode frequency ofthe mth peptide bond in an aqueous PA22 solution is given as
Note that the electrostatic potentialsφj(m)peptide andφj(m)
water fluc-tuates in time due to the conformational fluctuation andtranslational and rotational motions of the surrounding watermolecules, respectively. In Figure 2d, the average amide I localmode frequencies,⟨ν̃m⟩ for m ) 1-22, are plotted (see closedcircles). It is interesting to note that⟨ν̃m⟩ values, except for thetwo peptide groups at each terminal, are almost constantregardless of its position. This is puzzling because we foundthat the amide I local mode frequencies of gas-phase PAmolecules are strongly site-dependent as shown in Figure 2b.To theoretically explain this observation, we plot the values ofν̃0 + ⟨δν̃m
peptide⟩ andν̃0 + ⟨δν̃mwater⟩ separately, which correspond
to the cases where either interpeptide interaction or solvationinteraction effect is only considered (see open squares and opentriangles in Figure 2d, respectively). Note that the interpeptide-interaction-induced effect on the amide I local mode frequencies
δν̃mwater(t) ) ∑
j)1
4
l jφj(m)water(t) (2)
ν̃m(t) ) ν̃0 + δν̃mpeptide(t) + δν̃m
water(t) (3)
9336 J. Phys. Chem. B, Vol. 108, No. 26, 2004 Ham et al.
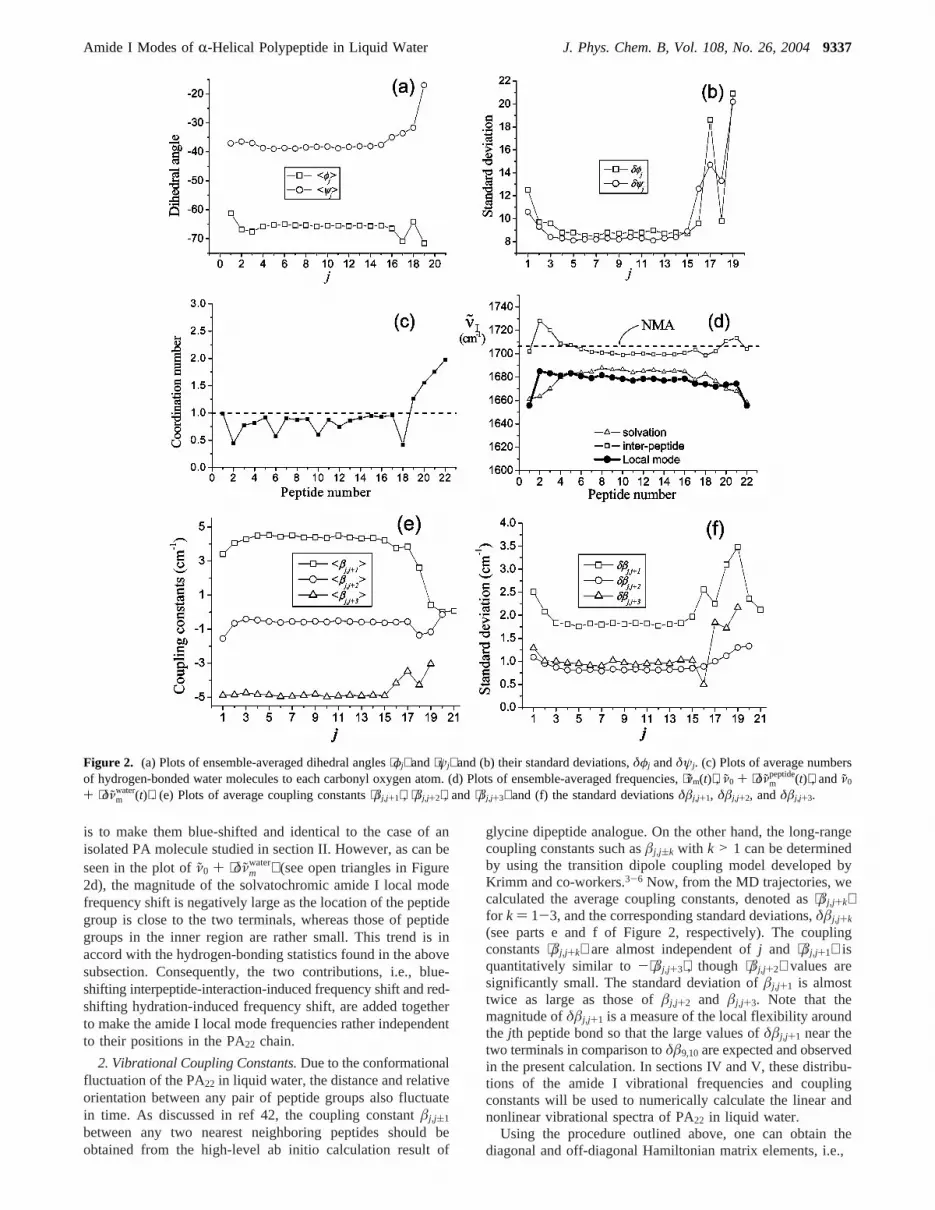
is to make them blue-shifted and identical to the case of anisolated PA molecule studied in section II. However, as can beseen in the plot ofν̃0 + ⟨δν̃m
water⟩ (see open triangles in Figure2d), the magnitude of the solvatochromic amide I local modefrequency shift is negatively large as the location of the peptidegroup is close to the two terminals, whereas those of peptidegroups in the inner region are rather small. This trend is inaccord with the hydrogen-bonding statistics found in the abovesubsection. Consequently, the two contributions, i.e., blue-shifting interpeptide-interaction-induced frequency shift and red-shifting hydration-induced frequency shift, are added togetherto make the amide I local mode frequencies rather independentto their positions in the PA22 chain.
2. Vibrational Coupling Constants.Due to the conformationalfluctuation of the PA22 in liquid water, the distance and relativeorientation between any pair of peptide groups also fluctuatein time. As discussed in ref 42, the coupling constantâj,j(1
between any two nearest neighboring peptides should beobtained from the high-level ab initio calculation result of
glycine dipeptide analogue. On the other hand, the long-rangecoupling constants such asâj,j(k with k > 1 can be determinedby using the transition dipole coupling model developed byKrimm and co-workers.3-6 Now, from the MD trajectories, wecalculated the average coupling constants, denoted as⟨âj,j+k⟩for k ) 1-3, and the corresponding standard deviations,δâj,j+k
(see parts e and f of Figure 2, respectively). The couplingconstants⟨âj,j+k⟩ are almost independent ofj and ⟨âj,j+1⟩ isquantitatively similar to-⟨âj,j+3⟩, though ⟨âj,j+2⟩ values aresignificantly small. The standard deviation ofâj,j+1 is almosttwice as large as those ofâj,j+2 and âj,j+3. Note that themagnitude ofδâj,j+1 is a measure of the local flexibility aroundthe jth peptide bond so that the large values ofδâj,j+1 near thetwo terminals in comparison toδâ9,10are expected and observedin the present calculation. In sections IV and V, these distribu-tions of the amide I vibrational frequencies and couplingconstants will be used to numerically calculate the linear andnonlinear vibrational spectra of PA22 in liquid water.
Using the procedure outlined above, one can obtain thediagonal and off-diagonal Hamiltonian matrix elements, i.e.,
Figure 2. (a) Plots of ensemble-averaged dihedral angles⟨φj⟩ and⟨ψj⟩ and (b) their standard deviations,δφj andδψj. (c) Plots of average numbersof hydrogen-bonded water molecules to each carbonyl oxygen atom. (d) Plots of ensemble-averaged frequencies,⟨ν̃m(t)⟩, ν̃0 + ⟨δν̃m
peptide(t)⟩, andν̃0
+ ⟨δν̃mwater(t)⟩. (e) Plots of average coupling constants⟨âj,j+1⟩, ⟨âj,j+2⟩, and⟨âj,j+3⟩ and (f) the standard deviationsδâj,j+1, δâj,j+2, andδâj,j+3.
Amide I Modes ofR-Helical Polypeptide in Liquid Water J. Phys. Chem. B, Vol. 108, No. 26, 20049337

From the above one-exciton Hamiltonian, one can obtain botheigen-frequencies and eigenvectors associated with the instan-taneous amide I normal modes at timet. In the followingsections, both dynamical and statistical behaviors of the localand normal amide I mode frequencies will be discussed in detail.
D. Correlation Functions of Local Amide I Mode Fre-quencies. Although the equilibrium vibrational properties,ensemble-averaged local mode frequencies, and vibrationalcoupling constants were presented above, yet another piece ofcritical information required in the calculations of vibrationalspectra is their dynamics. Not only the diagonal but also off-diagonal Hessian matrix elements fluctuate over time, and theircorrelation times are strongly related to the time scales ofstructural fluctuation and solute-solvent dynamics. We calcu-lated the following time correlation functions of amide I localmode frequencies
and particularly two of them,Cm)10(t) and Cm)20(t), whichrepresent the middle and terminal peptide groups, are plottedin parts a and b of Figure 3, respectively. It should be notedthat, although all 22 correlation functions are not plotted in thepresent paper, they all exhibit strongly bimodal decayingpatterns. The ultrafast component decays within a few pico-seconds, but the slowly decaying component is very slow incomparison to the experimental time scalesnote that the time-resolved 2D IR pump-probe spectra were obtained for every1 ps up to 4 ps.34 To elucidate the origins of these twodistinctively different components, we rewrite eq 5 as
where
The total correlation functionCm(t) is divided into three parts,correlation function of interpeptide interaction-induced fre-quency fluctuation, correlation function of hydration-inducedfrequency fluctuation, and cross correlation function. The meansquare fluctuation amplitudes,Cm(0) for m ) 1-22, are moreor less constant of 250 cm-2 and independent ofm, thoughCm
peptide(0), Cmwater(0), andCm
peptide-water(0) are strongly dependenton where the peptide bond is in the chain. In Figure 3, these
three contributions toCm(t) are separately plotted form ) 10and 20. It is interesting to note (1) that the decaying pattern ofCm(t) is largely determined byCm
water(t), (2) that bothCmpeptide(t)
and Cmpeptide-water(t) contain very slowly decaying component
that is associated with the conformational fluctuation of thePA22 backbone structure, (3) that the two contributions fromCm
peptide(t) andCmpeptide-water(t) cancel out with each other, and (4)
that the large amplitudes ofC20peptide(t) and C20
peptide-water(t) incomparison to those of the inner peptide bond (m ) 10) arefound to be related to the local flexibility of the 20th peptidegroup near the C-terminus. The ultrafast (subpicosecond)relaxation ofCm
water(t) originates from the solvation dynamicsof water such as librational (hindered rotational) motions.18 Inaddition, the fast decaying component inCm
peptide(t) is associ-ated with fluctuations induced by various (intramolecular) amidevibrations that modulate the amide I vibrational mode frequen-cies. On the basis of the above calculations, even though thereexist ultrafast decaying components in the correlation functionsof the amide I local mode frequency fluctuations, its amplitudeis relatively small and the slowly decaying component is veryslow in comparison to the time scales of vibrational dynamicsand experiments (approximately a few picoseconds). Therefore,the line-broadening process can be approximately described byconsidering the inhomogeneous distributions of instantaneousnormal-mode frequencies.
E. Instantaneous Normal-Mode (INM) Analysis: INMSpectrum and Delocalization.Before we present numericallycalculated IR absorption and 2D vibrational spectra, there are afew important issues that require clarification. In the case ofPA22 in liquid water, unlike a small rigid molecule, the amideI normal modes calculated from each instantaneous configurationof PA22 are poorly defined. In other words, the eigenvectormatrixes change in time constantly and one cannot make a one-to-one correspondence between two normal modes obtainedfrom two different snapshot configurations separated in time.Consequently, the concept of polypeptide normal mode, in aconventional way, is not useful for calculating vibrational spectraof polypeptides in solution. The same situation was also foundin the short-time description of liquid dynamics and theinstantaneous normal-mode analyses were performed for avariety of neat liquids and solutions and found to be useful indescribing ultrafast solvation dynamics, IR and Raman re-sponses, etc.61-64
Now, diagonalizing the instantaneous Hessian matrixesobtained from the MD simulation, one can calculate theinstantaneousamide I normal-mode frequencies and corre-sponding eigenvectors. In Figure 4a, we plot the calculated INMspectrum, which is the density of state (DOS) of the one-excitonband, defined as
where the angle bracket represents the ensemble average overthe instantaneous configurations sampled from the MD trajec-tory. F1(ω) appears to be asymmetric. We will use this INM(DOS of one-exciton band) spectrum for the calculation of thelinear and nonlinear vibrational spectra in the following sections.
Using the corresponding eigenvector elements obtained fromeach individual instantaneous configuration, one can calculatethe inverse participation ratio (IPR) that provides informationon the number of amide I local modes participating in a givennormal mode. For a given instantaneous Hamiltonian matrix at
H1(t) ) [ν̃1(t) â1,2(t) â1,3(t) ‚ ‚ ‚ â1,N(t)â1,2(t) ν̃2(t) â2,3(t) ‚ ‚ ‚ â2,N(t)â1,3(t) â2,3(t) ν̃3(t) ‚ ‚ ‚ â3,N(t)
······
···· · ·
···â1,N(t) â2,N(t) â3,N(t) ‚ ‚ ‚ ν̃N(t)] (4)
Cm(t) ) ⟨{ν̃m(t) - ⟨ν̃m⟩} {ν̃m(0) - ⟨ν̃m⟩}⟩ (5)
Cm(t) ) ⟨{δδν̃mpeptide(t) + δδν̃m
water(t)} {δδν̃mpeptide(0) +
δδν̃mwater(0)}⟩
) Cmpeptide(t) + Cm
water(t) + Cmpeptide-water(t) (6)
δδν̃mpeptide(t) ) δν̃m
peptide(t) - ⟨δν̃mpeptide(t)⟩
δδν̃mwater(t) ) δν̃m
water(t) - ⟨δν̃mwater(t)⟩
Cmpeptide(t) ) ⟨δδν̃m
peptide(t)δδν̃mpeptide(0)⟩
Cmwater(t) ) ⟨δδν̃m
water(t)δδν̃mwater(0)⟩
Cmpeptide-water(t) ) 2⟨δδν̃m
peptide(t)δδν̃mwater(0)⟩ (7)
F1(ω) )1
N⟨∑
Rδ(ω - ωR)⟩ (8)
9338 J. Phys. Chem. B, Vol. 108, No. 26, 2004 Ham et al.

time t, the IPR of theRth instantaneous normal mode can becalculated by
whereUR,j is thejth element of the eigenvector associated withtheRth amide I normal mode. In Figure 4b, the calculated IPRspectrum defined as
is plotted. The IPR value is typically less than 5, meaning thatall instantaneous amide I normal modes are highly localizedonto just a few local modes. It is clear that this localizationprocess is induced by the conformational fluctuation anddiagonal and off-diagonal disorders of the one-exciton Hamil-tonian matrix. It is also interesting to note that the shape ofR(ω) is a Gaussian with the center at 1680 cm-1 and the widthof 37 cm-1.
F. Phase Correlation between Neighboring Local Modes.Although the extent of delocalization of each individual INMcould be quantitatively estimated by examining the IPRspectrum,R(ω), in Figure 4b, there is another critical issue onthe phase relationship between different local amide I modesin a given normal mode. Over the years, it has been believedthat the amide I normal modes of a lengthyR-helix can beclassified into two distinctively different types of vibrations,i.e., A-mode-like andE1-mode like. TheA-mode-like normalmode refers to the normal mode having all eigenvector elementsthe same signs (in-phase). On the other hand, the signs of theeigenvector elements of theE1-mode-like normal mode arealternating, meaning that the eigenvector elements of nearestneighboring local amide I modes are out-of-phase with eachother. On the basis of this notion, there have been numerousattempts to quantitatively determine the frequency splittingbetween these two types of normal modes.65,66However, becausethe diagonal Hessian matrix elements could not be accuratelydetermined for any lengthy polypeptidesin solutions, it wasnot possible to directly address the issue on the existence oftheseA- or E1-like amide I modes of the aqueousR-helix
Figure 3. Correlation functions of fluctuating amide I local mode frequencies of the 10th and 20th peptide groups. The three different contributions(see the context) to the total correlation function are also plotted.
Figure 4. (a) Density of one-exciton states,F1(ω). (b) Inverse participation ratio spectrum,R(ω). (c) Weighted phase-correlation factor spectrum,Φ(ω). (d) Product of WPCF and density of one-exciton states spectra, i.e.,Φ(ω)F1(ω).
IPRR ≡ (∑j
UR,j4 )-1 (9)
R(ω) ≡ N-1⟨∑R
(∑j
UR,j4 )-1δ(ω - ωR)⟩/F1(ω)
Amide I Modes ofR-Helical Polypeptide in Liquid Water J. Phys. Chem. B, Vol. 108, No. 26, 20049339

solution. As can be seen in Figure 4b, due to the localized natureof the instantaneous amide I normal modes, there is no such anidealA-mode norE1-mode in reality. Nevertheless, one can stillmake an argument that, by carefully examining the eigenvectorelements of all INMs, the amide I normal modes are rather closeto A-mode-like instead ofE1-mode-like, and vice versa. Toquantitatively address this issue, we propose that the followingquantity,PR
(n), named as the weighted phase-correlation factor(WPCF), can serve as a measure of how close a given normalmode is toA-mode-like or toE1-mode-like
where sign(UR,jUR,j+n) is either+1 or-1 depending on the signof the productUR,jUR,j+n.
Before we present the calculation result using eq 10, let usconsider a few limiting cases to understand the physical meaningof the WPCF defined in eq 10. First of all, consider the casewhenn ) 1. In this case,PR
(1) is approximately a measure ofweighted phase-correlation between any pair of eigenvectorelements of two nearest neighboring peptides. In the extremecase that a given INM is completely delocalized all over theNpeptide groups and also it is purelyA-mode-like,UR,j for all jequals to 1/xN and then the WPCF valuePR
(1) becomes 1-1/N. Thus, the upper bound of WPCFPR
(1) is 1. On the otherhand, in the other extreme case that the INM is completelydelocalized andE1-mode-like,UR,j for all j equals to (- 1)j/xNand the WPCF valuePR
(1) is -1 + 1/N, which suggests that thelower bound of WPCFPR
(1) is -1. Now, consider the case thatthe normal mode is completely localized on thejth amide I localmode so thatUR,j ) 1 andUR,k ) 0 (for k * j). In this case, theWPCF valuePR
(1) becomes zero. Therefore, on the basis of theabove analysis, we found that thePR
(1) value can provide twoimportant pieces of information, e.g., both the extent ofdelocalization and the phase-relationship of eigenvector elementsof two nearest neighboring amide I local vibrations. Similarly,PR
(2) gives us information on the weighted phase-correlationbetween a pair of eigenvector elements of thejth and (j + 2)thpeptide groups. Other thanPR
(1), one should pay attention tothe value ofPR
(3) because the vibrational coupling constantâj,j(3
between thejth and (j + 3)th peptide groups is as large asâj,j(1
due to the intramolecular hydrogen-bonding interaction betweenthe two (see Figure 2e). Thus,PR
(3) for the Rth INM providesinformation on the weighted phase-correlation betweenUR,j andUR,j+3 (for all j).
Then, taking the ensemble average, one can obtain the WPCFspectra defined asΦ(n)(ω) ≡ N-1⟨∑rPR
(n)δ(ω - TωR)⟩/F1(ω)and forn ) 1-3 we plot them in Figure 4c. The other cases ofΦ(n)(ω) for n > 3 are not plotted here and they are not importantbecause, due to the small coupling constantsâj,j(n (for n > 3),those peptide groups separated far apart along the helical chaindo not strongly participate in a given normal mode. Now, letus consider the WPCF spectrum ofn ) 1, Φ(1)(ω), in Figure4c. Interestingly, theΦ(1)(ω) spectrum is divided into two partswith the boundary at 1680 cm-1. The WPCF values of normalmodes of which frequencies are less than 1680 cm-1 arenegative whereas those of which frequencies are larger than1680 cm-1 are positive. ThisΦ(1)(ω) spectrum suggests thatthe low-frequency INMs can be assigned to theE1-like modesand the high-frequency normal modes areA-like modessnotethat the same pattern was also observed for a model dipeptide,that is to say, the symmetric amide I normal-mode frequencyof the di-peptide in its right-handedR-helical conformation is
about 10-20 cm-1 larger than that of the asymmetric normalmode.41 Therefore, if Φ(1)(ω) spectra were only taken intoconsideration, one might reach a conclusion that the high-frequency amide I INMs areA-mode-like and the low-frequencymodes areE1-mode-like. However, one can make a differentconclusion by carefully examining theΦ(3)(ω) spectrumsnotethat theΦ(2)(ω) spectrum fluctuates around 0, meaning that anypair of peptide groups separated by one peptide do not stronglycouple to each other as can be expected from the smallâj,j(2
values. Again, theΦ(3)(ω) spectrum is divided into two partsmuch like theΦ(1)(ω) spectrum. However, in the case ofΦ(3)(ω)the higher frequency (>1680 cm-1) modes areE1-mode-likewhereas the lower frequency (<1680 cm-1) modes areA-mode-like. This is exactly the opposite conclusion in comparison tothat from theΦ(1)(ω) spectrum. From these detailed analysesof eigenvectors and phase-correlations, can we make anyconclusive statement on the existence ofA-like or E1-like amideI modes in theR-helix in liquid water? It is believed that theconceptual classification ofA-mode-like andE1-mode-like needsto be specified as demonstrated above. If one were interestedin phase correlation between twonearestneighboring amide Ilocal vibrations, we found that the high (low) frequency NMsare rather close toA-(E1-)mode-like. On the other hand, if onewere interested in that betweenjth and (j + 3)th amide I localvibrations, one might reach a conclusion that the high (low)frequency NMs are rather close toE1-(A-)mode-like. Conclu-sively, there is no unique way to classify a given NM to beeitherA-mode-like orE1-mode-like.
To roughly estimate theA-E1 frequency splittings, we plotthe products ofF1(ω) and WPCF spectra, i.e.,Φ(n)(ω)F1(ω) forn ) 1-3, in Figure 4d. In this figure, theA-E1 frequencysplitting from theΦ(1)(ω) spectrum is estimated to be 30 cm-1,whereas that from theΦ(3)(ω) spectrum is to be-33 cm-1.Here, it should be noted that theA-E1 frequency splitting wasmeasured to be 10 cm-1 by Hamm and co-workers by usingthe two-dimensional IR pump-probe spectroscopy, though theyconsidered the Fs-helix instead ofR-helical polyalanine in liquidwater.34 However, as will be discussed in section V, their methodof obtaining difference spectrum is to some extent arbitrary sothat their value of 10 cm-1 is a bit questionable and cannot bedirectly compared with the present calculation results.
IV. Linear Absoprtion Spectrum
To calculate the one-dimensional IR absorption spectrum, wewill use the INM analysis method. That is to say, the permanentdipole moment of the PA22 is linearly expanded with respect tothe instantaneous normal coordinates. Then, the dipole-dipolecorrelation function associated with amide I vibrations can beapproximated to be
whereµI(t) is the time-dependent dipole moment of the amideI vibrations and Qj denotes thejth instantaneous normalcoordinate. In the harmonic approximation, the autocorrelationfunction of harmonic oscillator coordinate is simply given as⟨QR(t)QR(0)⟩ ) ⟨QR
2⟩ cosωRt ) (kBT/MRωR2) cosωRt. Further-
more, by noting that the normal-mode frequencies are in a rathernarrow range from 1640 to 1720 cm-1 (see Figure 4a), eq 11can be approximately written as
⟨µI(t)µI(0)⟩ = ⟨∑R|( ∂µ
∂QR)
0|2QR(t)QR(0)⟩ (11)
PR(n) ≡ ∑
j)1
N-n
sign(UR,jUR,j+n)|UR,jUR,j+n| (10)
9340 J. Phys. Chem. B, Vol. 108, No. 26, 2004 Ham et al.

Then, the IR absorption spectrum, which is linearly propor-tional to the Fourier transform of the above dipole-dipolecorrelation function, is given as
From the instantaneous configurations, we calculated theensemble average of the transition dipole strength,|(∂µ/∂QR)0|2,and the corresponding transition dipole strength spectrum,denoted asD(ω) (≡ I(ω)/F1(ω)) is plotted in Figure 5a.Interestingly, the transition dipole strengths of the high-frequency (>1680 cm-1) INMs are smaller than those of thelow-frequency (<1680 cm-1) INMs. This can be explained byexamining the WPCF spectra in Figure 4c. Suppose that theINMs are strongly localized on two nearest neighboring peptidegroups. Then, as can be seen in theΦ(1)(ω) spectrum, the phasesof the two eigenvector elements of one of the high-frequencyINMs are identical. Then, the transition dipole of the NM isgiven as a linear combination of two local mode transitiondipoles with the weighting factors having the same signs. Inthis case, much like the dipeptide in anR-helical conformation,the transition dipole strength of theA-like mode (or symmetricstretching mode in the case of a dipeptide) is larger than that ofthe E1-like mode (or asymmetric stretching mode in the caseof a dipeptide). However, the numerically calculated transitiondipole strength,D(ω), exhibits the opposite trend and cannotbe explained by using theΦ(1)(ω) spectrum. On the other hand,this puzzling trend ofD(ω) can be explained by consideringtheΦ(3)(ω) spectrum. We will omit any further discussion alongthis line and leave it to the readers, but these results suggestthat the transition dipole strength is largely dictated by thedelocalization over two local modes forming a direct intramo-lecular hydrogen bond to each other.
Now, the IR absorption spectrum can then be obtained bymultiplying the transition dipole strength spectrumD(ω) andINM spectrum,F1(ω), given in Figure 4a. The resultant IRspectrum based on the INM analysis is shown in Figure 5b.Although the distribution of fundamental transition frequencieswas properly taken into account in the above numericalcalculation, the vibrational dephasing contribution to the linearabsorption spectrum was not. Therefore, one can replace theDirac delta function in eq 13 with a Lorentizian function as
where the dephasing constant of theRth INM was denoted asγR. Although γR of each individual normal mode can be afunction of its frequency, we will assume that the dephasingconstants of all INMs are identical and constant to be 8 cm-1
throughout this papersthe dephasing constant of 8 cm-1 isobtained by fitting to experiment as discussed below. In Figure5b, the broadenedI(ω) is also plotted and the line shape is foundto be quantitatively close to the experimentally measuredI(ω)for Fs-helix in ref 34. Also, it is noted thatI(ω) is slightlyasymmetric and its line shape is neither Gaussian nor Lorentzian,which is also similar to the experiment. This asymmetric lineshape of anR-helix in solution has not been clarified before,but now it becomes clear that it originates from (1) the
asymmetric distribution of amide I normal-mode frequencies(Figure 4a) and (2) nonuniform distribution of the transitiondipole strengths with respect to the INM frequencies (Figure5a).
V. Two-Dimensional Infrared Pump-Probe Spectra
Although the one-dimensional IR absorption spectrum nu-merically calculated was compared with experiment and the twowere found to be quantitatively in good agreement with eachother, the more stringent test of the present calculation methodwould be to make direct comparisons of numerically calculated2D IR pump-probe spectra with experimental results of Hammand co-workers.34 Although they carried out 2D IR pump-probeexperiment for the Fs-helix not polyalanine, as mentioned insection III-A we found that there is little difference in the MDsimulation results ofR-helical polyalanine and Fs-helix.
A. Two-Exciton States. To calculate three distinctivelydifferent contributions, stimulated emission, ground-state bleach-ing, and transient absorption, to the 2D IR pump-proberesponse functions, it is necessary to consider two-exciton states,where we assumed that the overtone anharmonicity of each localamide I mode is 16 cm-1 and that the anharmonicities ofcombination modes are used to be 1 cm-1 to fit the experimentalspectra in ref 34. Now, the ensemble-averaged, normalizeddensity of two-exciton states can be calculated by
where the summation is over all two-exciton states obtained bydiagonalizing each instantaneous two-exciton Hamiltonian. ThecalculatedF2(ω) is plotted in Figure 6a. Unlike the case of one-exciton band, the DOS of the two-exciton bandF2(ω) issymmetric and close to a Gaussian function. To understand theone-quantum excitation profile from the one-exciton band tothe two-exciton band, we calculate the ensemble-averaged,normalized two-dimensional transition spectral density (seeFigure 6b) defined as
where the summations overe and f are all over the one- andtwo-exciton states, respectively. From the definition ofFj(ωE,ωF),it can be viewed as a 2D joint probability density. On the basisof direct comparative investigation, we found that the numeri-cally calculatedFj(ωE,ωF) is quantitatively similar to the productof F1(ω) andF2(ω), i.e., Fj(ωE,ωF) = F1(ωE)F2(ωF). This resultsuggests that the probability of finding a one-exciton state withfrequency ofωE is not correlated with the probability of findinga two-exciton state with frequency ofωF. Next, let us considerthe 2D spectral distribution of dipole strength associated withtransitions from|e> to |f>, which is defined as
In Figure 6c, Dh (ωE,ωF) thus calculated is plotted. Thetransition dipole strengths between low-frequency one-excitonstate to low-frequency two-exciton state and between high-frequency one-exciton state to high-frequency two-exciton stateare relatively large. However, the more relevant spectrum is
⟨∑R|( ∂µ
∂QR)
0|2 cosωRt⟩ (12)
I(ω) ∼ ⟨∑R|( ∂µ
∂QR)
0|⟩2
δ(ω - ωR) (13)
I(ω) ∼ ⟨∑R|( ∂µ
∂QR)
0|2
γR
(ω - ωR)2 + γR2⟩ (14)
F2(ω) )2
N(N + 1)⟨∑
f
δ(ω - ωf)⟩ (15)
Fj(ωE,ωF) )2
N2(N + 1)⟨∑
e∑
f
δ(ωE - ωe)δ(ωF - ωf)⟩ (16)
Dh (ωE,ωF) ≡2⟨∑
e∑
f
|µef(ωe,ωf)|2δ(ωE - ωe)δ(ωF - ωf)⟩
N2(N + 1)Fj(ωE,ωF)(17)
Amide I Modes ofR-Helical Polypeptide in Liquid Water J. Phys. Chem. B, Vol. 108, No. 26, 20049341
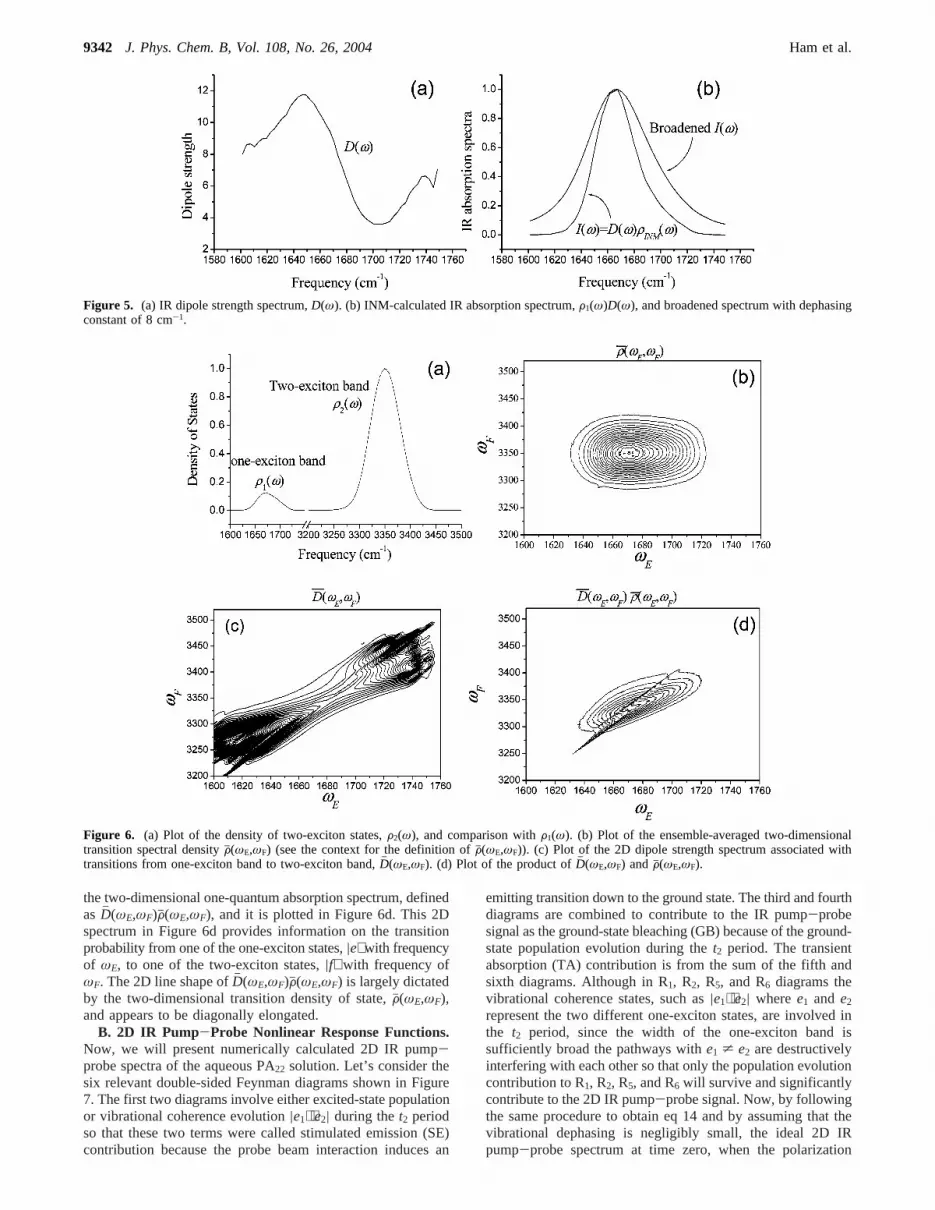
the two-dimensional one-quantum absorption spectrum, definedasDh (ωE,ωF)Fj(ωE,ωF), and it is plotted in Figure 6d. This 2Dspectrum in Figure 6d provides information on the transitionprobability from one of the one-exciton states,|e⟩ with frequencyof ωE, to one of the two-exciton states,|f⟩ with frequency ofωF. The 2D line shape ofDh (ωE,ωF)Fj(ωE,ωF) is largely dictatedby the two-dimensional transition density of state,Fj(ωE,ωF),and appears to be diagonally elongated.
B. 2D IR Pump-Probe Nonlinear Response Functions.Now, we will present numerically calculated 2D IR pump-probe spectra of the aqueous PA22 solution. Let’s consider thesix relevant double-sided Feynman diagrams shown in Figure7. The first two diagrams involve either excited-state populationor vibrational coherence evolution|e1⟩⟨e2| during thet2 periodso that these two terms were called stimulated emission (SE)contribution because the probe beam interaction induces an
emitting transition down to the ground state. The third and fourthdiagrams are combined to contribute to the IR pump-probesignal as the ground-state bleaching (GB) because of the ground-state population evolution during thet2 period. The transientabsorption (TA) contribution is from the sum of the fifth andsixth diagrams. Although in R1, R2, R5, and R6 diagrams thevibrational coherence states, such as|e1⟩⟨e2| wheree1 and e2
represent the two different one-exciton states, are involved inthe t2 period, since the width of the one-exciton band issufficiently broad the pathways withe1 * e2 are destructivelyinterfering with each other so that only the population evolutioncontribution to R1, R2, R5, and R6 will survive and significantlycontribute to the 2D IR pump-probe signal. Now, by followingthe same procedure to obtain eq 14 and by assuming that thevibrational dephasing is negligibly small, the ideal 2D IRpump-probe spectrum at time zero, when the polarization
Figure 5. (a) IR dipole strength spectrum,D(ω). (b) INM-calculated IR absorption spectrum,F1(ω)D(ω), and broadened spectrum with dephasingconstant of 8 cm-1.
Figure 6. (a) Plot of the density of two-exciton states,F2(ω), and comparison withF1(ω). (b) Plot of the ensemble-averaged two-dimensionaltransition spectral densityFj(ωE,ωF) (see the context for the definition ofFj(ωE,ωF)). (c) Plot of the 2D dipole strength spectrum associated withtransitions from one-exciton band to two-exciton band,Dh (ωE,ωF). (d) Plot of the product ofDh (ωE,ωF) andFj(ωE,ωF).
9342 J. Phys. Chem. B, Vol. 108, No. 26, 2004 Ham et al.

direction of the pump pulse is parallel with that of the probepulse, can be calculated as
where
The transition dipole matrix elements were denoted asµge1,µge2, µge, and µef. The angle betweenµge1 and µge2 and thatbetweenµge andµef were denoted asâe1e2 andηef, respectively.Now, the corresponding signal when the probe field polarizationis perpendicular to the pump field polarization can be im-mediately written as
where
From eqs 18-21, one can selectively eliminate the diagonalpeaks (e1 ) e2) by calculating the following difference spectrum
The line broadening induced by the vibrational dephasingprocess can be approximately taken into account by thefollowing replacements in eqs 19 and 21:
In the following numerical calculations, we assume that thevibrational dephasing constant of the coherence state|e⟩⟨f| isidentical to that of|e⟩⟨g| and it was denoted asΓ () 8 cm-1)just for numerical calculations.
C. 2D IR Pump-Probe Spectra.The parallel and perpen-dicular 2D IR pump-probe spectra calculated by using eqs 18-21 are plotted in parts b and c of Figure 8, respectively. Due tothe distributions of one- and two-exciton states, the negative(SE + GB) and positive (TA) peaks exhibit discernible slantfeatures along the diagonal line. Since the two spectra,S|(ωpu,ωpr) andS⊥(ωpu,ωpr), include not only the diagonal peaksbut also cross-peaks, the two appear to be similar to each otherthough the absolute magnitude ofS⊥(ωpu,ωpr) is different fromthat of S|(ωpu,ωpr).
From the theoretical relationship betweenS|(ωpu,ωpr) andS⊥(ωpu,ωpr), it was believed that the diagonal peaks can beselectively eliminated by calculating the difference spectrum,
S|(ωpu,ωpr) ∝ S|SE(ωpu,ωpr) + S|
GB(ωpu,ωpr) + S|TA(ωpu,ωpr)
(18)
S|SE(ωpu,ωpr) ) -
1
15⟨∑
e1
∑e2
{|µge1|2|µge2|2(2 cos2 âe1e2 +
1)} δ(ωpu - ωe1)δ(ωpr - ωe1)⟩
S|GB(ωpu,ωpr) ) -
1
15⟨∑
e1
∑e2
{|µge1|2|µge2|2(2 cos2 âe1e2 +
1)} δ(ωpu - ωe1)δ(ωpr - ωe2)⟩
S|TA(ωpu,ωpr) ) +
1
15⟨∑
e∑
f
{|µge|2|µef|2(2 cos2 ηef + 1)} ×
δ(ωpu - ωe)δ(ωpr - ωf + ωe)⟩ (19)
S⊥(ωpu,ωpr) ∝ S⊥SE(ωpu,ωpr) + S⊥
GB(ωpu,ωpr) + S⊥TA(ωpu,ωpr)
(20)
S⊥SE(ωpu,ωpr) ) -
1
15⟨∑
e1
∑e2
{|µge1|2|µge2|2(2 - cos2 âe1e2)} ×
δ(ωpu - ωe1)δ(ωpr - ωe1)⟩
S⊥GB(ωpu,ωpr) ) -
1
15⟨∑
e1
∑e2
{|µge1|2|µge2|2(2 -
cos2 âe1e2)} δ(ωpu - ωe1)δ(ωpr - ωe2)⟩
S⊥TA(ωpu,ωpr) ) +
1
15⟨∑
e∑
f
{|µge|2|µef|2(2 - cos2 ηef)} ×
δ(ωpu - ωe)δ(ωpr - ωf + ωe)⟩ (21)
∆S(ωpu,ωpr) ) 3S⊥(ωpu,ωpr) - S|(ωpu,ωpr) (22)
δ(ωm - ωn) fΓ
(ωm - ωn)2 + Γ2
(23)
Figure 7. Six double-sided Feynman diagrams associated with the2D IR pump-probe spectroscopy.
Figure 8. (a) Plot of the amide I IR absorption band in Figure 5b forthe sake of comparison: (b)S| (ωpu,ωpr), (c) S⊥(ωpu,ωpr), (d) ∆S(ωpu,ωpr).(e) Plot of the difference spectrum,∆SNorm(ωpu,ωpr), calculated by usingeq 24.
Amide I Modes ofR-Helical Polypeptide in Liquid Water J. Phys. Chem. B, Vol. 108, No. 26, 20049343

∆S(ωpu,ωpr), defined in eq 22, and it is plotted in Figure 8d.Surprisingly, the difference spectrum appears to be featurelessand broad. This Figure 8d should be compared with Figure 1din ref 34, where Woutersen and Hamm presented the differencespectrum obtained from experimentally measuredS|(ωpu,ωpr)and S⊥(ωpu,ωpr). As reported in ref 34, they clearly observeddistinctive cross-peaks, but we do not. At first sight, this notabledifference of our numerically calculated∆S(ωpu,ωpr) in Figure8d with theirs appears to be quite puzzling. One may jump intoa conclusion that our numerical simulation method in combina-tion with four-site model, eq 1, is not reliable. However, it turnsout that their method of obtaining∆S(ωpu,ωpr) from S|(ωpu,ωpr)and S⊥(ωpu,ωpr) that were experimentally measured indepen-dently is likely to be unreliable to some extent. In practice, thelaser pulse intensity varies and fluctuates in time so that theexperimentalist cannot quantitatively compareS|(ωpu,ωpr) andS⊥(ωpu,ωpr) directly since these two signals are obtainedindependently in time. Consequently, they had to normalize thetwo signals by making the maximum of|S|(ωpu,ωpr)| to beidentical to that of|S⊥(ωpu,ωpr)| and obtained∆SNorm(ωpu,ωpr)by using the following procedure, i.e.,
where the subscript “Norm” emphasizes that the differencespectrum in this case is obtained by using the normalizationprocedure. Then, they assumed that the real difference spectrum∆S(ωpu,ωpr) is identical to the above difference spectrum∆SNorm(ωpu,ωpr). The same method (normalization procedure)was also used to obtain the difference spectra of smalloligopeptides such as trialanine in liquid water.67 In the lattercase, where the two amide I normal modes are well definedand the corresponding normal-mode frequencies are wellseparated, the above assumption (normalization procedure) couldbe quantitatively reliablesby carrying out MD simulationstudies of acetylproline in liquid water and chloroform we haveconfirmed that this statement is valid and the results will bepresented elsewhere. However, we found that the abovenormalization procedure in eq 24 is not reliable in the case ofR-helical PA22 solution. To prove this, we also followed thesame normalization procedure, calculated the difference spec-trum, ∆SNorm(ωpu,ωpr) using eq 24, and plotted it in Figure 8e.The ratio, max|S|(ωpu,ωpr)|/max|S⊥(ωpu,ωpr)|, is estimated to be2.0, and Woutersen and Hamm found that this ratio is close to2.4snote that in the figure caption of Figure 1 of ref 34 thescales of the contour lines associated withS|(ωpu,ωpr) andS⊥(ωpu,ωpr) were given to be 0.048 mOD(optical density) and0.020 mOD so that the ratio max|S|(ωpu,ωpr)|/max|S⊥(ωpu,ωpr)|estimated from their experiment is about 2.4. Here, it shouldbe emphasized that this ratio strongly deviates from the idealvalue of 3. Figure 8e is found to be quantitatively close to theexperimental result (compare Figure 8e in the present paper withFigure 1d of ref 34), indicating that our numerically calculatedspectra capture most of the salient features and are in goodagreement with experiments. Nevertheless, it should be men-tioned that Woutersen and Hamm made a conclusive statementthat theA-E1 frequency splitting is 10 cm-1 since the frequencydifference between the two cross-peaks found in Figure 1(d) inref 34 is about 10 cm-1 - note that the same frequency splittingin Figure 8(e) in the present paper is estimated to be about 11cm-1. However, as discussed above, due to the inequality,∆S* ∆SNorm, their conclusion regarding to theA-E1 frequencysplitting needs to be reexamined in the future. This comparative
investigation between the present theoretical studies and ex-perimental results in ref 34 suggests that the normalizationprocedure of eq 24 for obtaining the difference spectrum shouldbe used carefully particularly when the size of polypeptide isso large that the diagonal peaks are produced by complicatedinterferences among various contributions from different non-linear optical transition pathways.
Although we couldn’t observe cross-peaks in the differencespectrum ofR-helical PA22 in liquid water and the validity ofprevious interpretation of cross-peaks observed in∆SNorm-(ωpu,ωpr) was questioned, it is believed we have confirmed thatour numerical calculation method works well because we wereable to reproduceS|(ωpu,ωpr), S⊥(ωpu,ωpr), and∆SNorm(ωpu,ωpr)that were experimentally measured.
VI. Summary and a Few Concluding Remarks
Amide I vibrational dynamics ofR-helical polyalanines hasbeen studied in the present paper. Carrying out extensive AM1calculations of variousR-helical polyalanines with varying chainlength, we found (1) that the vibrational coupling constants arenot dependent on the chain length and (2) that the amide I localmode frequency depends on the location of the peptide bond ina given R-helix. We showed that the corresponding Hessianmatrix in the amide I local mode subspace can be theoreticallyconstructed by using the extrapolation method developedrecently by the authors. To understand the hydrogen-bondingdynamics betweenR-helical polyalanine having 22 peptidebonds and surrounding water molecules, classical MD simulationstudy was performed. The conformational fluctuation amplitudeand amide I local mode frequency correlation functions werecalculated. It turns out that the correlation times of amide I localmode frequency fluctuations are so slow that the line broadeningis largely determined by the inhomogeneous distribution of theinstantaneous conformations. Therefore, the instantaneous nor-mal mode (INM) analysis method was used to obtain densitiesof states of both one- and two-exciton bands. To study the natureof amide I INMs in terms of eitherA-mode-like orE1-mode-like behavior, we introduced a novel function, i.e., weightedphase-correlation factor (WPCF), which can vary from-1 +1/N to 1 - 1/N with N being the number of peptide bonds. Onthe basis of the ensemble-averaged WPCF spectra, we foundthat there is no unique way to classify a given amide I INM tobe eitherA- or E1-mode-like.
Using the MD simulation and INM analysis results, wecalculated the amide I IR absorption spectrum and compared itwith experiment. Although the center frequency of numericallycalculated IR absorption spectrum is about 40 cm-1 higher thanthat of the experimental one, the asymmetric line shape is inexcellent agreement with the experiment. However, the morestringent test on the validity of our numerical calculationmethods was to make direct comparisons of the numericallycalculated 2D IR pump-probe spectra with those experimentallymeasured by Woutersen and Hamm. The 2D line shapes of boththe parallel and perpendicular IR pump-probe spectra, i.e.,S|(ωpu,ωpr) andS⊥(ωpu,ωpr), respectively, were found to be ingood agreement with theirs. However, the ideal differencespectrum, which was defined as 3S⊥(ωpu,ωpr) - S|(ωpu,ωpr), wasfound to be featureless and broad, though Woutersen andHamm’s difference spectrum clearly exhibited cross-peaksrevealing theA-E1 frequency splitting to be 10 cm-1. It turnedout that this notable difference between the difference spectrumin the present paper and theirs originates from the difference inobtaining difference spectrum. They used normalization methodto obtain the difference spectrum instead of directly calculating
∆SNorm(ωpu,ωpr) )S⊥ (ωpu,ωpr)
max|S⊥ (ωpu,ωpr)|-
S| (ωpu,ωpr)
max|S| (ωpu,ωpr)|(24)
9344 J. Phys. Chem. B, Vol. 108, No. 26, 2004 Ham et al.

3S⊥(ωpu,ωpr) - S|(ωpu,ωpr) from the two spectra,S|(ωpu,ωpr)andS⊥(ωpu,ωpr). Following the same normalization method toobtain the difference spectrum, we showed that our∆SNorm-(ωpu,ωpr) is in good agreement with their difference spectrum.This observation suggests that, unlike small polypeptides suchas tri-alanine, the normalization method to obtain the differencespectrum should be used carefully as long as the chain-lengthof the polypeptide is so long that the one- and two-quantumexcited states form bands instead of well-defined and frequency-resolved quantum states.
Although we presented 2D IR pump-probe spectra of anaqueousR-helical polyalanine solution, we could not predictthe time-evolution of the 2D spectra. This is because the currenttheory is not capable of taking into account the dynamicalcorrelations of different INMs nor vibrational energy redistribu-tions within the one- and two-exciton bands. We are currentlydeveloping a theoretical method by considering energy diffusionequation and by numerically calculating time-dependent spectra.
Acknowledgment. This work was supported by the CreativeResearch Initiatives Program of KISTEP (MOST, Korea).
References and Notes
(1) Surewicz, W. K.; Mantsch, H. H. InSpectroscopic Methods forDetermining Protein Structure in Solution; Havel, H. A., Ed.; VCH: NewYork, 1996; p 135.
(2) Gremlich, H.-U.; Yan, B.Infrared and Raman Spectroscopy ofBiological Materials; Marcel Dekker: New York, 2000.
(3) Krimm, S.; Bandekar, J.AdV. Protein Chem.1986, 38, 181.(4) Krimm, S.; Abe, Y.Proc. Natl. Acad. Sci. U.S.A.1972, 69, 2788.
Moore, W. H.; Krimm, S.Proc. Natl. Acad. Sci. U.S.A.1975, 72, 4933.(5) Moore, W. H.; Krimm, S.Biopolymers1976, 15, 2465.(6) Dwivedi, A. M.; Krimm, S.Macromolecules1982, 15, 186;1983,
16, 340.(7) Torii, H.; Tasumi, M.J. Chem. Phys.1992, 96, 3379.(8) Torii, H.; Tasumi, M. InInfrared Spectroscopy of Biomolecules;
Wiley-Liss: New York, 1996; p 1.(9) Ramek, M.; Yu, C.-H.; Schafer, L.Can. J. Chem.1998, 76, 566.
(10) Kubelka, J.; Keiderling, T. A.J. Phys. Chem. A2001, 105, 10922;J. Am. Chem. Soc.2001, 123, 6142;2001, 123, 12048.
(11) Bour, P.; Kubelka, J.; Keiderling, T. A.Biopolymers2000, 53, 380.(12) Silva, R. A. G. D.; Kubelka, J.; Bour, P.; Decatur, S. M.; Keiderling,
T. A. Proc. Natl. Acad. Sci. U.S.A.2000, 97, 8318.(13) Mirkin, N. G.; Krimm, S.J. Phys. Chem. A2002, 106, 3391.(14) Mu, Y.; Stock, G.J. Phys. Chem.B 2002, 106, 5294.(15) Hamm, P.; Lim, M.; Hochstrasser, R. M.J. Phys. Chem. B1998,
102, 6123.(16) Scheurer, C.; Piryatinski, A.; Mukamel, S.J. Am. Chem. Soc.2001,
123, 3114.(17) Ham, S.; Kim, J.-H.; Lee, H.; Cho, M.J. Chem. Phys.2003, 118,
3491.(18) Kwac, K.; Cho, M.;J. Chem. Phys.2003, 119, 2247.(19) Brauner, J. W.; Dugan, C.; Mendelsohn, R.J. Am. Chem. Soc.2000,
122, 677.(20) Arrondo, J. L. R.; Goni, F. M.Prog. Biophys. Mol. Biol.1999, 72,
367.(21) Byler, D. M.; Susi, H.Biopolymer1986, 25, 469.(22) Surewicz, W. K.; Mantsch, H. H.Biochim. Biophys. Acta1988,
952, 115.(23) Jackson, M.; Haris, P. I.; Chapman, D.J. Mol. Struct.1989, 214,
329.(24) Mantsch, H. H.; Casal, H. L.; Jones, R. N. InSpectroscopy of
Biological Systems, AdVances in Spectroscopy; Clark R. J. H., Hester, R.E., Eds.; Wiley: New York, 1986; Vol. 13, p 1.
(25) Mantsch, H. H.; Surewics, W. K.; Chapman, D.Biochemistry1993,32, 389.
(26) Chen, X. G.; Asher, S. A.; Schweitzer-Stenner, R.; Mirkin, N. G.;Krimm, S.J. Am. Chem. Soc.1995, 117, 2884. Chi, Z.; Chen, X. G.; Holtz,J. S. W.; Asher, S. A.Biochemistry1998, 37, 2854.
(27) Schweitzer-Stenner, R.J. Raman Spectrosc.2001, 32, 711.(28) Berova, N.; Nakanishi, K.; Woody, R. W.Circular Dichroism,
Principles and Applications; Wiley-VCH: New York, 2000.(29) Barron, L. D.; Hecht, L.; Bell, A. F.; Wilson, G.Appl. Spectrosc.
1996, 50, 619.(30) Hamm, P.; Lim, M.; Hochstrasser, R. M.J. Phys. Chem. B1998,
102, 6123.(31) Hamm, P.; Lim, M.; DeGrado, W. F.; Hochstrasser, R. M.Proc.
Natl. Acad. Sci. U.S.A.1999, 96, 2036.(32) Moran, A. M.; Park, S.-M.; Dreyer, J.; Mukamel, S.J. Chem. Phys.
2003, 118, 3651.(33) Cho, M. InAdVances in Multi-Photon Processes and Spectroscopy;
Lin, S. H., Villaeys, A. A., Fujimura Y., Eds.; World Scientific: Singapore,1999; Vol. 12, p 229.
(34) Woutersen, S.; Hamm, P.J. Chem. Phys.2001, 115, 7737.(35) Zanni, M. T.; Gnanakaran, S.; Stenger, J.; Hochstrasser, R. M.J.
Phys. Chem. B2001, 105, 6520.(36) Cho, M.PhysChemComm2002, 5, 40.(37) Woutersen, S.; Pfister, R.; Hamm, P.; Mu, Y.; Kosov, D. S.; Stock,
G. J. Chem. Phys.2002, 117, 6833.(38) Choi, J.-H.; Ham, S.; Cho, M.J. Chem. Phys.2003, 117, 6821.(39) Cha, S.; Ham, S.; Cho, M.J. Chem. Phys.2003, 117, 740.(40) Cho, M.J. Chem. Phys.2003, 118, 3480.(41) Ham, S.; Cho, M.J. Chem. Phys.2003, 118, 6915.(42) Ham, S.; Cha, S.; Choi, J.-H.; Cho, M.J. Chem. Phys.2003, 119,
1451.(43) Choi, J.-H.; Ham, S.; Cho, M. J. Phys. Chem. B2003, 107, 9132.(44) Kwac, K.; Cho, M.J. Chem. Phys.2003, 119, 2256.(45) Kwac, K.; Lee, H.; Cho, M.J. Chem. Phys.2004, 120, 1477.(46) Dewar, M.; Thiel, W.J. Am. Chem. Soc.1977, 99, 4499; Dewar,
M.; Zoebisch, E. G.; Healy, E. F.J. Am. Chem. Soc.1985, 107, 3902.(47) Lednev, I. K.; Karnoup, A. S.; Sparrow, M. C.; Asher, S. A.J.
Am. Chem. Soc.1999, 121, 4076;1999, 121, 8074;2001, 123, 2388.(48) Ianoul, A.; Mikhonin, A.; Lednev, I. K.; Asher, S. A.J. Phys. Chem.
A. 2002, 106, 3621.(49) Lockhart, D. J.; Kim, P. S.Sicence1992, 257, 947; 1993, 260,
198.(50) Thompson, P. A.; Eaton, W. A.; Hofrichter, J.Biochemistry1997,
36, 6, 9200.(51) Dyer, R. B.; Gai, F.; Woodruff, W. H.Acc. Chem. Res.1998, 31,
709.(52) Thompson, P. A.; Munoz, V.; Jas, G. S.; Henry, E. R.; Eaton, W.
A.; Hofrichter, J.J. Phys. Chem. B2000, 104 378.(53) Garcia, A. E.; Sanbonmatsu, K. Y.Proc. Natl. Acad. Sci. U.S.A.
2002, 99, 2782.(54) Case, D. A.; Pearlman, D. A.; Caldwell, J. W. et al.AMBER 7;
University of California: San Francisco, 2002.(55) Darden, T.; York, D.; Pedersen, L.J. Chem. Phys.1993, 98, 10089.(56) Berendsen, H. J. C.; Postma, J. P. M.; van Gunsteren, W. F.; DiNola,
A.; Haak, J. R.J. Chem. Phys.1984, 81, 3684.(57) Fersht, A. InStructure and Mechanism in Protein Science; W. H.
Freeman and Co.: New York, 2000; p 17.(58) Decatur, S. M.; Antonic, J.J. Am. Chem. Soc.1999, 121, 11914(59) Silva, P. A. G. D.; Nguyen, J. Y.; Decatur, S. M.Biochemistry
2002, 41, 15296.(60) Liu, H.; Elstner, M.; Kaxiras, E.; Frauenheim, T.; Hermans, J.;
Yang, W.Proteins: Struct., Funct., Genet.2001, 44, 484.(61) Cho, M.; Fleming, G. R.; Saito, S.; Ohmine, I.; Stratt, R. M.J.
Chem. Phys.1994, 100, 6672.(62) Stratt, R. M.; Maroncelli, M.J. Phys. Chem.1996, 100, 12981.(63) Ladanyi, B. M.; Stratt, R. M.J. Phys. Chem.1996, 100, 1266.(64) Keyes, T.J. Phys. Chem. A1997, 101, 2921.(65) Krimm, S.; Reisdorf, W. C., Jr.Faraday Discuss1994, 99, 181.(66) Torii, H.; Tasumi, M.J. Chem. Phys.1992, 97, 86.(67) Woutersen, S.; Hamm, P.J. Chem. Phys. 2001, 114, 2727.
Amide I Modes ofR-Helical Polypeptide in Liquid Water J. Phys. Chem. B, Vol. 108, No. 26, 20049345