Embed Size (px)
Citation preview
AMITY JOURNAL OF MANAGEMENT
Vol. VI, No. 2, July – December, 2018
Bi-annual Journal of Amity Business School, Amity University, Madhya Pradesh
The views expressed in the articles are those of the contributors and not necessarily of the Editorial Board or the Institute.
The Editorial Board invites original, unpublished contributions in the form of research papers, articles, book reviews and case studies.
No part of this publication may be reproduced or transmitted in any form or by any means, or stored in any archival system of any nature without prior written permission. Application for permission for use of copyright material including permission to reproduce extracts in other published works shall be made to the publishers. Full acknowledgement of author, publisher and source must be given.
i
AMITY JOURNAL OF MANAGEMENT
A Journal of Amity Business School, Amity University, Madhya Pradesh
Chief Patron Dr. Aseem Chauhan Additional President RBEF (An umbrella foundation of all Amity institutes) Chancellor, Amity University, Rajasthan Patron Dr. Sunil Saran Chancellor Amity University, Madhya Pradesh Chief Advisor Lt. Gen. V. K. Sharma, AVSM (Retd.) Vice Chancellor Amity University, Madhya Pradesh
Advisor Dr. M.P. Kaushik
Pro Vice Chancellor Amity University, Madhya Pradesh
Chief Editor Dr. Anil Vashisht Director, Amity Business School Amity University, Madhya Pradesh
Editor Dr. Manoj Pandey Associate Professor, Amity Business School Amity University, Madhya Pradesh
Managing Editor Mr. Pankaj Mishra Assistant Professor, Amity Business School Amity University, Madhya Pradesh Sub Editor Mr. Sanjeev Saraswat Assistant Professor, Amity Business School Amity University, Madhya Pradesh
ii
Editorial Advisory Board
Dr. Hanna Yakavenka Principal Lecturer International Business and Economics Department University of Greenwich, London, U.K Prof. (Dr.) Antonia Rosa Gurrieri Professor University of Foggia, Italy
Prof. (Dr.) Sajjad M. Jasimuddin
Professor KEDGE Business School, France
Prof. Aman Agarwal Professor Indian Institute of Finance Greater Noida, India Prof. (Dr.) R.K. Mishra Director Institute of Public Enterprise Osmania University, Hyderabad Prof. Karunesh Saxena Director and Chairman Faculty of Management Studies Mohanlal Sukhadia University, Udaipur Prof. R.C. Mishra Director School of Management Studies and Commerce Uttarakhand Open University, Haldwani Prof. R. K. Tripathi Formerly Head and Dean Faculty of Commerce University of Lucknow, Lucknow
Prof. Manjula Chaudhary Dept. of Tourism & Hotel Management Kurukshetra University, Kurukshetra
iii
Editorial Advisory Board
Prof. (Dr.) V. Suneja
Professor, Faculty of Management Studies University of Delhi North Campus
Mr. Rick Cran
Founder & CEO Cran Enterprises
Prof. (Dr.) Ashish Chandra
Professor of Healthcare Administration College of Business University of Houston - Clear Lake (Texas Medical Center) Executive Editor, Hospital Topics
Prof. (Dr.) Manoj Patwardhan
Associate Professor ABV-Indian Institute of Information Technology & Management, Gwalior
Prof. Rajendra Sahu ABV-Indian Institute of Information Technology and Management Gwalior Prof. (Dr.) BBS Parihar Director RBS College, Agra University, Agra Prof. (Dr.) Shivali Dhingra Director Amity Global Business School, Chandigarh
Prof. P.K. Gupta Formerly Director Institute of Management Studies DAVV, Indore
Prof. Lavkush Mishra Dean, Faculty of Management Director, Institute of Tourism & Hotel Management Dr. B.R. Ambedkar University Khandari Campus, Agra Joint Secretary – Indian Tourism Congress (ITC)
Prof. Nimit Chowdhary Professor –Business Studies and Nodal Officer IITTM, Noida
iv
AMITY JOURNAL OF MANAGEMENT
A Journal of Amity Business School, Amity University, Madhya Pradesh
CONTENTS
__________________________________________________________________________________________
VOLUME VI NUMBER 2 July - December, 2018
DETERMINANTS OF MANUFACTURING SECTOR GROWTH IN 1
ETHIOPIA
Dr. Manoj Kumar Mishra
INDIGENOUS KNOWLEDGE FOR GOOD GOVERNANCE AND 13
DEVELOPMENT: UNLEASHING THE WISDOM OF THE GADA
SYSTEM
Dr. Wogari Negari
4G COMMUNICATION TECHNOLOGY-EVOLUTION AND 30
IMPACT ON BUSINESS AND ECONOMY IN INDIA
Sukanta Saha and Dr. Yogesh C. Joshi
A STUDY ON FACTORS AFFECTING EXPORTS OF LEATHER 37
FOOTWEAR AS A STRONG INITIATIVE OF MAKE IN INDIA:
OPPORTUNITIES AND CHALLENGES
Dr. D S Yadav and Dr. Vijit Chaturvedi
THE EFFECT OF SEASONALITY OVER STOCK EXCHANGES IN INDIA 46
Dr. Silky Vigg Kushwah and Ms. Sulekha Munshi
***
v
FROM THE DESK OF THE EDITOR
Warm welcome to the Volume VI, Issue II of
“Amity Journal of Management (AJM)".
Volume 6, Number 2 edition of the AJM
presents its views on influence of
contemporary factors on business and
economic development. The research papers
and articles published in this edition are
authored by eminent professors of various
Business Institutes and Universities from the
country and abroad.
The first paper seeks to determine the factors
behind manufacturing sector growth in
Ethiopia. The author takes multiple factors
into account for hypotheses testing before
concluding the main determinants.
The second paper attempts to study the
indigenous democratic governance system in
Oromia region of Ethiopia, “Gada” and its
role and contribution in governance and
economic development.
The third paper studies evolution of 4G
technology in India, its impact on usage
pattern of mobile users and on mobile
operators. The authors observe that adoption
of 4G communication technology is going to
provide a fillip to the wellbeing of
population considerably due to its positive
impact on economy and among all sections
of society.
The fourth paper examines the challenges
faced by the leather footwear industry in
India and the factors influencing exports of
leather footwear, specifically, in and around
Agra city. The authors suggest that timely
availability of raw material, high cost of
skilled human resource, lack of product
innovation and highly unorganized nature of
the industry are the major challenges being
faced by the industry.
The fifth paper analyses the influence of
seasonality on the returns of Indian stock
market. The results of the study do not
support the existence of seasonality in the
Indian stock market as no significant
difference in the returns of nifty before and
after the four events considered in the study,
was found.
Therefore sub-theme on „Influence of
contemporary factors on business and
economic development‟ is quite apt and
makes current edition worthy to be read.
So, enjoy your reading and be a part of the
change.
.
Prof. (Dr.) Anil Vashisht
Chief Editor - AJM

Amity Journal of Management Amity Business School Vol. VI, No. 2, July - December 2018 Amity University, Madhya Pradesh (ISSN 2347 – 1832)
1
DETERMINANTS OF MANUFACTURING SECTOR GROWTH IN ETHIOPIA
Dr. Manoj Kumar Mishra1
ABSTRACT
Over the last two decades the Ethiopian manufacturing sector has experienced rapid expansion in terms of the number of foreign direct investment, sales, and employment creation. This paper examines the determinants of the manufacturing sector growth using aggregate data compiled by the Central Statistical Agency (CSA) of Ethiopia. To achieve the objective of the study we used the secondary data and analyzed it using descriptive (percentage, mean, standard deviation) statistics of SPSS analysis. To date, there has been little attention given to how manufacturing sector growth relates to other equally important variables such as manufacturing value added, inflation, and manufacturing export per capita in the country. This study explored the explanatory power of the independent variables of FDI, manufacturing value added, inflation, permanent employment, and manufacturing export per capita. We have used secondary data for this study collected from National Bank of Ethiopia, “World Bank” & Ministry of Finance & Economic Development from 2007/08 to 2016/17. This study shows that the independent variables of manufacturing value added, manufacturing export per capita and inflation were not statistically significant in explaining manufacturing sector growth (dependent variable). The independent variables FDI net flow and permanent employment were statistically significant in explaining manufacturing sector growth (dependent variable).
Keywords: Manufacturing sector, FDI, Per capita income, Economic growth etc.
INTRODUCTION
Manufacturing is defined as physical or chemical transformation of material components into new products (ISIC Rev, 4, 2008). The definition also includes the assembly of component parts of manufactured products as a manufacturing activity whether the production is done at factory or home, sold at retail or wholesale, and whether power driven machine is used or not. According to Narasimha and Ramesh, manufacturing is the engine of economic growth and structural transformation. Ethiopia is one of the few African countries that have formulated and implemented a full-fledged industrial development strategy since early 2000s when industrial policy had been a taboo in the international policy forums. The growth of the manufacturing sector within industry is essential to build national technological capacity, industrial capability, technology progress, productivity and capital accumulation. Transfer of surplus resources
from agriculture to manufacturing, economies of scale and positive spillovers effects and create broad based job opportunity and improve the total factor productivity and competitiveness of the overall economy are also the other advantages of manufacturing. Success experiences of developed countries show that manufacturing is the pillar behind a sustained growth.
According to the “Central Statistical Authority” there were 1,930 large- and medium-scale, 43,338 small-scale, and 974,676 cottage/handicraft establishments during 2007/08 (CSA, 2003). The majority of the establishments do not use power-driven machinery, irrespective of the number of persons employed. The sectoral structure of the manufacturing sub-sector, 2007/08 based on numbers of establishments, reveals that food and beverage establishments accounted for 52% of the total manufacturing enterprises, while textiles accounted for 22%, Ethiopia has experienced rapid economic growth since 2005 with real Gross Domestic Products (GDP) growth rate of 10.5 percent per annum compared to 5 percent for Sub-
1 Associate Professor in Economics, Ethiopian Civil Service University Addis Ababa, Africa
2
Saharan Africa between 2005 to 2014 ,This rapid economic growth particularly for an economy without oil, gas or any significant minerals and much ahead of many notable countries with oil.
During the global economic recession of 1980s, a very low industrial growth was noticed and it was due to the declining oil prices. To address this problem of low growth, Govt. introduced many adjustment reforms, but these reforms were not much successful. Though decades old debate on the relationship between economic growth and the manufacturing sectors was not stopped but on the other side there was no any evidence found to “show how manufacturing sector varied relative to the components of economic development such as FDI(Foreign Direct Investment), labour cost, inflation and manufacturing value added services.” Number of existing studies on manufacturing sector and FDI is not high but produced mixed results, existence of knowledge gaps are confirmed by it. Despite of the fact that manufacturing sector has an important role the in economy of any country, and not only manufacturing sector but the sensitivity of the variables of inflation, labour costs, and manufacturing value added also have important role to play in economy of any country; there are less number of comparative study found which can show the relationship between growth of manufacturing sector and inflation, labour cost, Foreign Direct investment and Manufacturing value added in Ethiopia.
Although ,there exists many empirical studies suggesting a significant relationship between manufacturing sector and FDI and GDP(Quattara, 2004) and (Fedrick, 2000), few other studies examines the relationship between manufacturing „sector growth and explanatory variables, eg labor costs, inflation, FDI, and manufacturing value added in Ethiopia. „The transformation from a traditional economy into modern economy where technology and modern production activities in manufacturing assume a significant role has remained a defining characteristic of economic growth and development (Naude and Szirami,
2012). No over emphasis of the role of manufacturing sector in development of any economy was also discussed (Szirmai, 2009) argued about the empirical correlation between per capita income and degree of industrialization of any developing countries. (Tybot, 2000) discussed manufacturing sector as a growth engine, a key source of creating skilled jobs and avenue of spillovers to other sectors. (Mallik, 2008) focused on limited foreign inflows for developmental purposes which limits the growth of manufacturing sector, which ultimately results as hindrance of the capability of developing countries to invest in growth projects eg projects for infrastructure, education, energy, communications and roads.
Other research scholars (Chudnovsky & Lopez, 2002; Dunning, 2002) discussed about FDI as investment tool for stimulating growth in the manufacturing sector and other vital sectors within an economy. There has been a little evidence to show the varied relationship between growth of manufacturing sector and other important non-economic and financial variables. This study addressed how other variables relate to manufacturing sector growth in Ethiopia. Exploring the explanatory power of these variables will fill the knowledge vacuum that currently exists in the study of manufacturing sector growth in country.
Statement of the Problem
Manufacturing sector play significant role in the creation of employment opportunities and generation of income for quite a large proportion of population. Mead (1998) observes that the health of economy as a whole has strong relationship with the health and nature of manufacturing sectors. Manufacturing sector is a significant role for economic growth in money developing countries worldwide, including Ethiopia. Since the manufacturing sector is very important to the growth of economy, knowledge of its relationship with the macroeconomic determinant present in its economic environment is crucial.
3
Literature recognizes that determinants factors influence the performance of manufacturing sector growth. Though there are empirical studies that highlight factors affecting the performance of manufacturing sectors, there is little work that combines both internal and external environmental factors. On the other hand, other studies (Opler and Titman, 1994) suggest that firm specific (internal) factors seem to be the major determinants of the manufacturing sectors.
Manufacturing industries have to play an important role in terms of contributing to the reduction of unemployment and to better the standard of living of the people of Ethiopia. This study seeks to find out the determinants of manufacturing sectors growth in Ethiopia. The significant role of manufacturing industries in the “Ethiopian economy suggests that an understanding of their performance is crucial to the stability and health of the economy”.
Research Questions
Accordingly, this study aims to address the following research questions.
What are the major determinants that affect the growth of the manufacturing sectors in Ethiopia?
Which determinant has the greatest influence on manufacturing sector growth in Ethiopia?
Objective of the Study
The objective of the research is to identify factors that determine the growth of manufacturing sector in Ethiopia and it will be designed to achieve the following general and specific objective.
General Objective
The general objective of this study is to determine the determinants of manufacturing sector growth in Ethiopia and to recommend alternative solution.
Specific Objective
1. To demonstrate the determinants of the manufacturing sector growth in the economic transformation process in Ethiopia.
2. To identifying the major challenges and opportunities of the manufacturing sector in Ethiopia and to suggest some intervention measures.
Significance of the Study
The significance of this study shows how manufacturing sector interacts with the determinants of its growth. And also, it is important to know how the determinants affect the growth of the manufacturing sector and to give decision for the sector what policies make to improve the performance of growth in the future.
LITERATURE REVIEW
The manufacturing sector plays the most important and dynamic role in the industrialization process. The available evidence indicates that about 25% of the GDP should come from the industrial sector. 17.4 % of the industrial output should originate from the manufacturing sector and 10% of the population should be employed in the industrial sector. The largest industrial sector, and manufacturing within it, grew much faster after 2005. “Manufacturing can be classified into different categories by using different criteria. According to the Central Statistical Authority (CSA)”, the Ethiopian manufacturing sector is classified into three, namely large- and medium-scale, small-scale and cottage/handcraft manufacturing. This categorization is mainly based on the number of people employed and use or non-use of power-driven machinery: Large- and medium-scale manufacturing establishments use power-driven machinery and employ 10 persons and above. Small-scale industries are those establishments that employ less than 10 persons and use power-driven machinery.
Manufacturing sector contributed a significant proportion of the total value added, followed by cottage/handicrafts. This suggests that we should have a closer look at the performance of large- and medium-scale manufacturing establishments. The Ethiopian large and medium-scale manufacturing sub-sector is characterized by the dominance of four-
4
consumer good producing industrial groups, namely the food and beverages, textiles, leather and leather articles groups. These groups of industries account for the bulk of the gross value of output and for the value added of the sub-sector.
Opportunities and Challenges in the Manufacturing Sector
Although manufacturing industries producing clothes, ceramics, machine tools, and leather products began in 1957, it never developed well until the overthrow of the military rule because the sector was obstructed by lack of infrastructure, scarcity of private and public investment as well as lack of appropriate policies, contributed to the insignificance performance of the manufacture sector pre-1991. “Cognizant of the importance of the manufacturing sector for economic, revenue generation and employment, the government has designed various policies and strategies to develop it.” Considering internal, regional, continental and international situations into account, Industrial policies were designed and implemented at different times in a bid to create not only as many job opportunities to the youth as possible but also to facilitate the progress of the entire Industrial development. In this regard, different international organizations and media have persistently commending the boosting manufacturing sector in Ethiopia. International organizations like World Bank and the International Monetary Fund reported the booming manufacture in Ethiopia every year. CNN, BBC, The economist, The Financial Times and Quartz are some among many international organizations that have reported about this progress recently. Quartz emphasized the role of the manufacturing sector to the development of the country. “It reported that the sector has been playing an encouraging role particularly in the past two years of the second Growth and Transformation Plan. “ In doing so, the government managed to provide a lot of job opportunities to its citizens in the manufacturing sector. In fact, the fast sustainable economic development achieved so far could be appreciated but
still there is wide range of opportunities amidst the challenges in developing the manufacturing sector. The government has been attempting to overcome the challenges facing the sector and exploit the opportunities to expand and diversify the manufacturing industries and their products. The idea of developing comprehensive manufacturing industry was started post 1991. The appropriate government policies and strategies is one of the opportunities that helped Ethiopia to develop the manufacturing sector. The policies and strategies carried out by the government encouraged the establishment of various private manufacturing enterprises having reversed the command economic system installed by the previous government. In fact, the Ethiopian government managed to reverse the command economic system in the country through fostering competition, opening free market economy and promoting the private sector. Besides, the government was devoted in liberalizing the foreign exchange market, rationalize public expenditure, introducing new investment codes and removing export tax refund in its attempt to develop the manufacturing sector. The 1994/95 – 1996/97 economic reform program was encouraging and promoting potential private investors to participate in the manufacturing sector. These efforts have contributed to the enhancement of broad-based economic growth in the country in general and the manufacturing sector in particular.
According to Ministry of Finance and Economic Development (MoFED), the manufacturing value added well progressed in 1993. However, that remarkable growth of the manufacturing sector has started to slow down to average value added annual growth of 3 per cent in 1996-2003. Following the slowdown, the government adopted an export promotion strategy focusing on diversifying and maximizing the manufacturing products. Cognizant of such encouraging move towards improving the industrial sector, the government has consolidated its industrial policy and
5
strategy in 2002/03, mainly focusing on the manufacturing sector development in an integrated manner with the smallholder farming. One of the approaches the government has been utilizing to develop the manufacturing sector was integrating it with the agricultural sector. This was mainly implemented in the first Growth and Transformation Plan. In due process, the government has developed and created a conducive environment for the private sector. As a result, the participation of potential investors in the manufacturing sector has begun to grow from time to time due to the various incentives set by the government. These incentives encourage productivity particularly in the textile industry that has performed well in the past two years of the second Growth and Transformation Plan. According to the Central Statistics Agency, the manufacturing sector grew by 11.9 percent and contributed to the Gross Domestic product 36 percent. It is also crystal clear that the large and medium manufacturing sectors have got a special attention through the industrial park developments in different parts of the country. This is another opportunity for the sector to develop its productivity and competitiveness. The expansion of Industrial parks coupled with the previously established industrial zones could play a remarkable role in promoting the manufacturing sector making easy to both public and private investments.
The incentives and government support to those private investors who have been investing on the manufacturing sector could also be considered as another opportunity in enhancing the sector. According to Export Trade Duty Incentive Scheme Establishing Proclamation No. 249/2001, the government provides various investment incentive packages including exemption from income tax and payment of custom duty. Irrespective of all these aforementioned opportunities, there lies a number of perplexing challenges obstructing both the diversification and productivity of the manufacturing sector. According to World Economic Forum‟s
Global Competitiveness Index 2014 and 2015, the measure constraints in developing the manufacturing sector includes inefficient government bureaucracy, foreign currency regulations, access to finance, corruption, and inadequate supply of infrastructure. Rent collection and corrupt practices, inflation, lack of peace and stability could also be other mounting challenges that could jeopardize the manufacturing sector in particular and the entire development schemes of the country in general. These challenges could severely affect the execution of the development targets set in the second Growth and Transformation Plan within the remaining three consecutive years. In conclusion, the manufacturing sector in Ethiopia has been enjoying some opportunities amidst a number of perplexing challenges retarding their development. The government of Ethiopia, since the coming of the Ethiopian People‟s Revolutionary Democratic Front (EPRDF) in to power in 1991, has been exerting a tremendous effort so as to upgrade the expansion, diversification and productivity of the manufacturing sector. Having recognized its benefit to the overall development of the country and its contribution to job creation, the government has been exerting tremendous efforts to develop it (By Tesfaye Lemma).
The manufacturing sector can spur economic growth and development because of its immense potential for employment. However, it needs still to withstand the available obstructions that could retard the forward move. The manufacturing sector of Ethiopia is in its infant stage due to many interrelated problems. These problems are generally related to finance, technology, market, policy, input supply and other socio-economic factors.
Determinants of Manufacturing Sector Growth in Ethiopia
Most of the literature shows that the determinants of manufacturing sector growth are foreign direct investment, saving rate, exports of product, employment creation and value added manufacturing. Many of the other
6
determinants that could advance the growth of the countries, the contribution of manufacturing sector growth are one of the main concerns in our study. Therefore, the determinants that will affect the growth of manufacturing sector are our main focus area.
Production and Value Addition of the Manufacturing Sector in Ethiopia
In most literature review one determinants of manufacturing sector growth is gross value of manufacturing industries. Another indicator of the performance of the manufacturing sector is the value added per person, defined as the ratio of value added created to the number of persons employed. Value added per person is also known as labor productivity. Value added per person declined at an annual average rate of 3.4% during the 1980s. This might have been be due to, among other things, redundancy of labor in the sector together with obsolete and outdated technology causing the marginal product of labor to decline over time. After the reform, however, value added per person increased. Labor productivity was highest in metal, followed by those of food and leather and shoes. Labor productivity registered an annual average growth rate of 33.9%, 30.1%, and 25.6% in the metal, food, and leather and shoe industrial groups, respectively, during the 1991/92 - 1998/99 period.
The manufacturing sector has shown improvements in terms of gross value of output, value added, and value added per person during the post-reform period. This might be attributed to the incentive for profit and the creation of a relatively conducive environment induced by the granting of managerial autonomy to public enterprises; the active involvement of a number of private manufacturing establishments; the improved availability of inputs and spare parts; and the recovery of the agricultural sector, which enhanced the supply of raw materials to the manufacturing sector. These factors are expected to continue to contribute to the
improvements in the performance of the manufacturing sector.
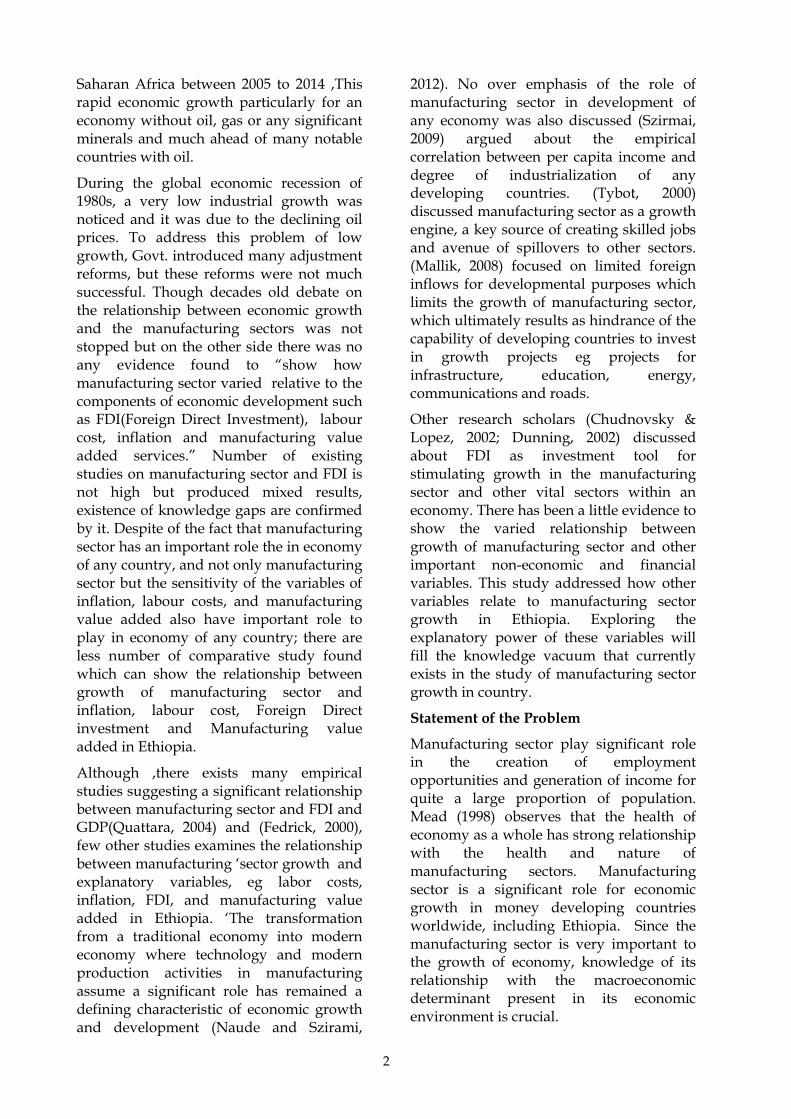
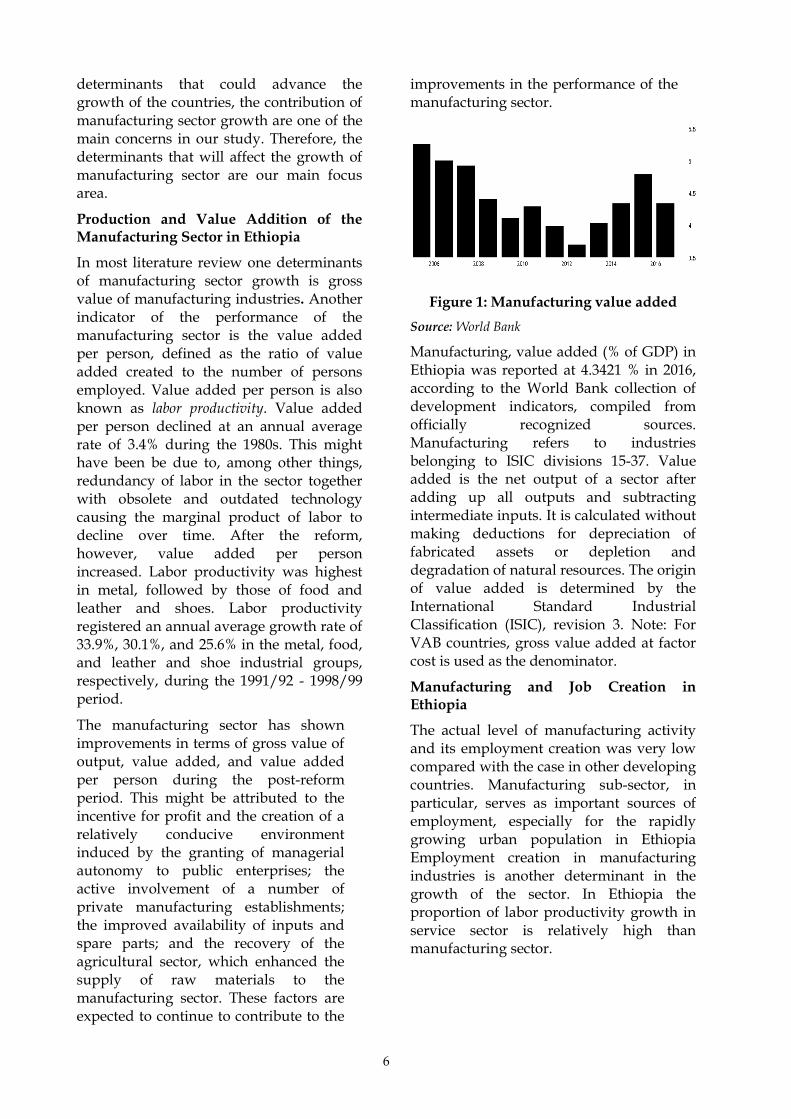
Figure 1: Manufacturing value added
Source: World Bank
Manufacturing, value added (% of GDP) in Ethiopia was reported at 4.3421 % in 2016, according to the World Bank collection of development indicators, compiled from officially recognized sources. Manufacturing refers to industries belonging to ISIC divisions 15-37. Value added is the net output of a sector after adding up all outputs and subtracting intermediate inputs. It is calculated without making deductions for depreciation of fabricated assets or depletion and degradation of natural resources. The origin of value added is determined by the International Standard Industrial Classification (ISIC), revision 3. Note: For VAB countries, gross value added at factor cost is used as the denominator.
Manufacturing and Job Creation in Ethiopia
The actual level of manufacturing activity and its employment creation was very low compared with the case in other developing countries. Manufacturing sub-sector, in particular, serves as important sources of employment, especially for the rapidly growing urban population in Ethiopia Employment creation in manufacturing industries is another determinant in the growth of the sector. In Ethiopia the proportion of labor productivity growth in service sector is relatively high than manufacturing sector.
7
METHODOLOGY OF THE STUDY
Data Collection
We use secondary data for this study collected from National bank of Ethiopia, World Bank & ministry of finance economy development from 2007/08 to 2016/17. Manufacturing sector, FDI, permanent employment, manufacturing export per capita, inflation and manufacturing value added were retrieved from the World Bank Development Indicators. We operationalize the variables as follows: Manufacturing sector growth is defined as a percentage of GDP from 2007/08 to 2016/17. A FDI net inflow is defined as a percentage of GDP from 2007/08 to 2016/17. Inflation is defined as the annual percent change in consumer prices from 2007/08 to 2016/17.
Methods of Data Analysis
The data collected from the survey will be tallied, systematically organized, tabulated and summarized in items based on tables and charts. The study will also employ SPSS and Microsoft-excel to analyze the collected data. In this study, since independent variables are five we use a multiple regression and descriptive statistics to analyze the data gathered from different data sources. Descriptive statistics such as percentage mean and tables were the tools used to summarize and analyze the data. In addition, analysis of variance (ANOVA) was used to test the hypotheses stated because analysis of variance (ANOVA) was used to determine whether there are any significance differences between the means of two or more independent groups.
Variables of the study
Dependent variable: Manufacturing sector growth
Independent variables: FDI net flow, permanent employment, inflation, manufacturing export per capita and manufacturing value added.
DATA ANALYSIS AND DISCUSSION
This section discusses the results of the study based on the research tools presented
in preceding sections of the report. The purpose of this study is to assess the determinants of manufacturing sector growth in Ethiopia. The study has employed SPSS and Microsoft-excel in analyzing the collected data. Percentage, mean and standard deviation have been used to analyses the row data and we analyze the data by using multiple regression to know the significant effect of the manufacturing sector determinate.
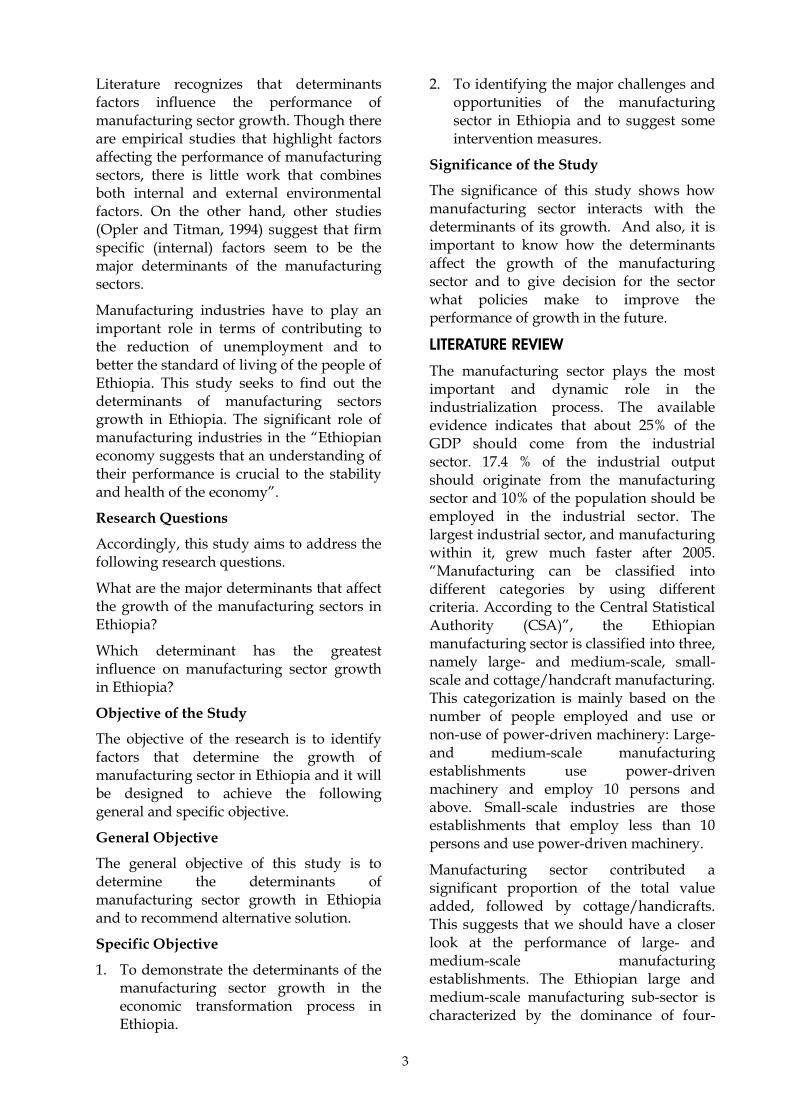
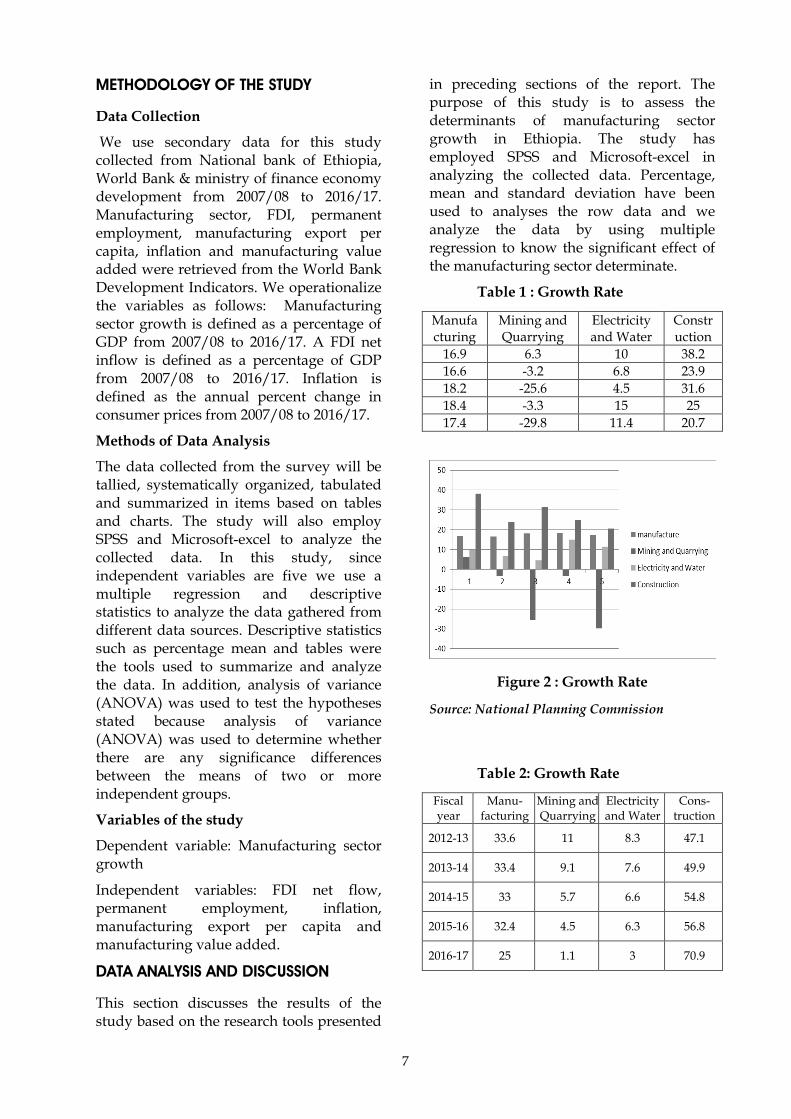
Table 1 : Growth Rate
Manufacturing
Mining and Quarrying
Electricity and Water
Construction
16.9 6.3 10 38.2
16.6 -3.2 6.8 23.9
18.2 -25.6 4.5 31.6
18.4 -3.3 15 25
17.4 -29.8 11.4 20.7
Figure 2 : Growth Rate
Source: National Planning Commission
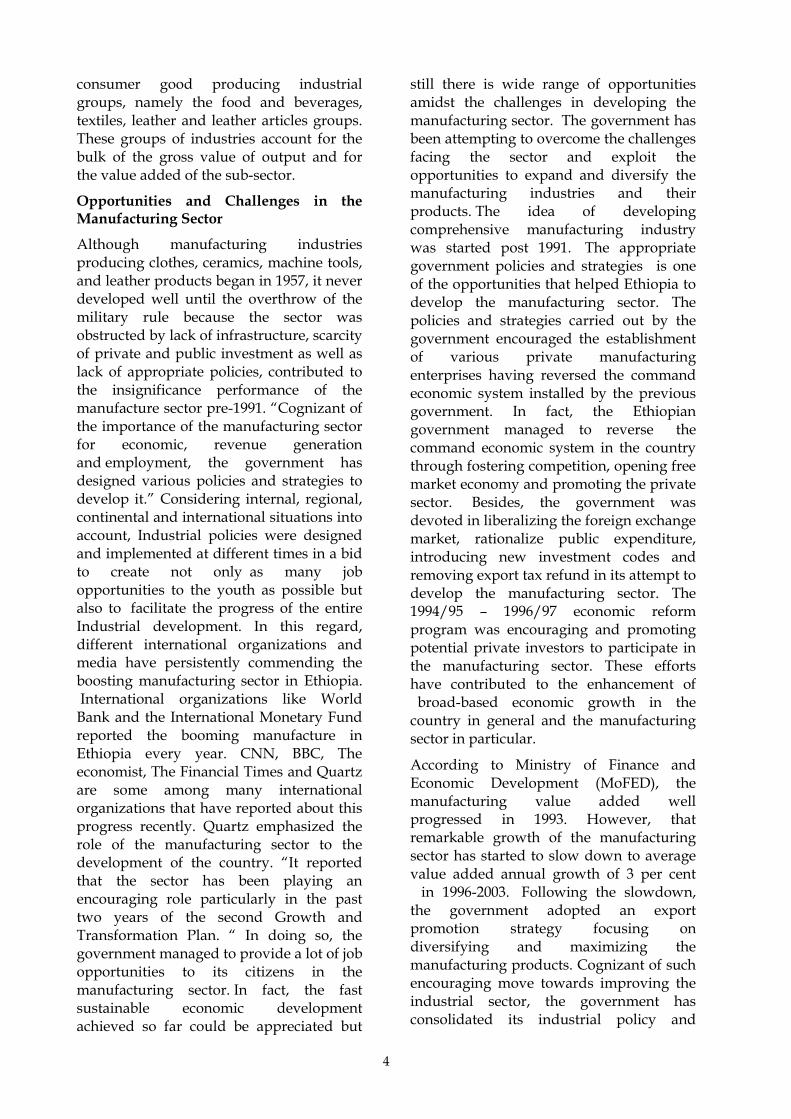
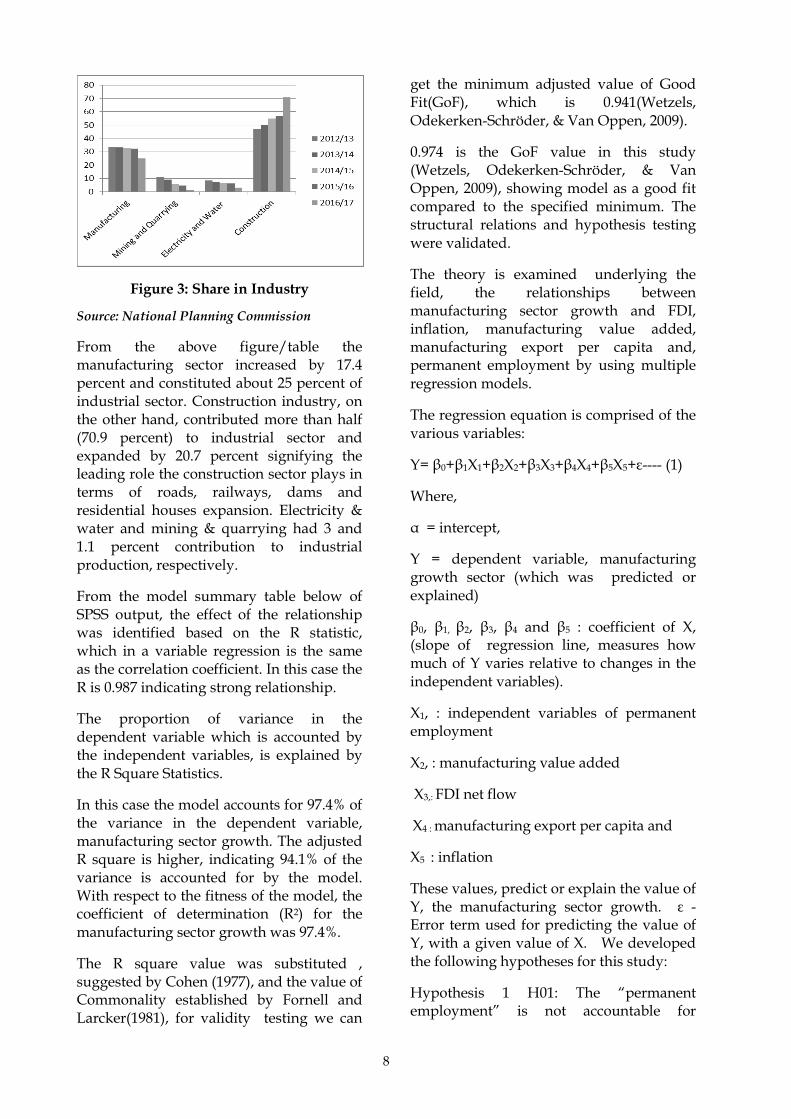
Table 2: Growth Rate
Fiscal year
Manu-facturing
Mining and Quarrying
Electricity and Water
Cons-truction
2012-13 33.6 11 8.3 47.1
2013-14 33.4 9.1 7.6 49.9
2014-15 33 5.7 6.6 54.8
2015-16 32.4 4.5 6.3 56.8
2016-17 25 1.1 3 70.9
8
Figure 3: Share in Industry
Source: National Planning Commission
From the above figure/table the manufacturing sector increased by 17.4 percent and constituted about 25 percent of industrial sector. Construction industry, on the other hand, contributed more than half (70.9 percent) to industrial sector and expanded by 20.7 percent signifying the leading role the construction sector plays in terms of roads, railways, dams and residential houses expansion. Electricity & water and mining & quarrying had 3 and 1.1 percent contribution to industrial production, respectively.
From the model summary table below of SPSS output, the effect of the relationship was identified based on the R statistic, which in a variable regression is the same as the correlation coefficient. In this case the R is 0.987 indicating strong relationship.
The proportion of variance in the dependent variable which is accounted by the independent variables, is explained by the R Square Statistics.
In this case the model accounts for 97.4% of the variance in the dependent variable, manufacturing sector growth. The adjusted R square is higher, indicating 94.1% of the variance is accounted for by the model. With respect to the fitness of the model, the coefficient of determination (R2) for the manufacturing sector growth was 97.4%.
The R square value was substituted , suggested by Cohen (1977), and the value of Commonality established by Fornell and Larcker(1981), for validity testing we can
get the minimum adjusted value of Good Fit(GoF), which is 0.941(Wetzels, Odekerken-Schröder, & Van Oppen, 2009).
0.974 is the GoF value in this study (Wetzels, Odekerken-Schröder, & Van Oppen, 2009), showing model as a good fit compared to the specified minimum. The structural relations and hypothesis testing were validated.
The theory is examined underlying the field, the relationships between manufacturing sector growth and FDI, inflation, manufacturing value added, manufacturing export per capita and, permanent employment by using multiple regression models.
The regression equation is comprised of the various variables:
Y= β0+β1X1+β2X2+β3X3+β4X4+β5X5+ε---- (1)
Where,
α = intercept,
Y = dependent variable, manufacturing growth sector (which was predicted or explained)
β0, β1, β2, β3, β4 and β5 : coefficient of X, (slope of regression line, measures how much of Y varies relative to changes in the independent variables).
X1, : independent variables of permanent employment
X2, : manufacturing value added
X3,: FDI net flow
X4 : manufacturing export per capita and
X5 : inflation
These values, predict or explain the value of Y, the manufacturing sector growth. ε - Error term used for predicting the value of Y, with a given value of X. We developed the following hypotheses for this study:
Hypothesis 1 H01: The “permanent employment” is not accountable for
9
significant variation in manufacturing sector growth.
Ha1: The “permanent employment” is accountable for a significant variation in manufacturing sector growth.
Hypothesis 2 H02: The “manufacturing value added “is not accountable for a significant variation in manufacturing sector growth.
Ha2: The manufacturing value added is accountable for a significant variation in the manufacturing sector.
Hypothesis 3 H03: The “inflow of foreign direct investment” is not accountable for a significant variation in manufacturing sector growth.
Ha3: The “inflow of foreign direct investments” is accountable for a significant variation in manufacturing sector growth.
Hypothesis 4 H04: The “manufacturing export per capita” is not accountable for significant variation in manufacturing sector growth.
Ha4: The “manufacturing export per capita” is accountable for a significant variation in the manufacturing sector.
Hypothesis 5 H05: The “rate of inflation” is not accountable for a significant variation in manufacturing sector growth.
Ha5: The “rate of inflation “is accountable for a significant variation in manufacturing sector growth.
RESULT AND DISCUSSION
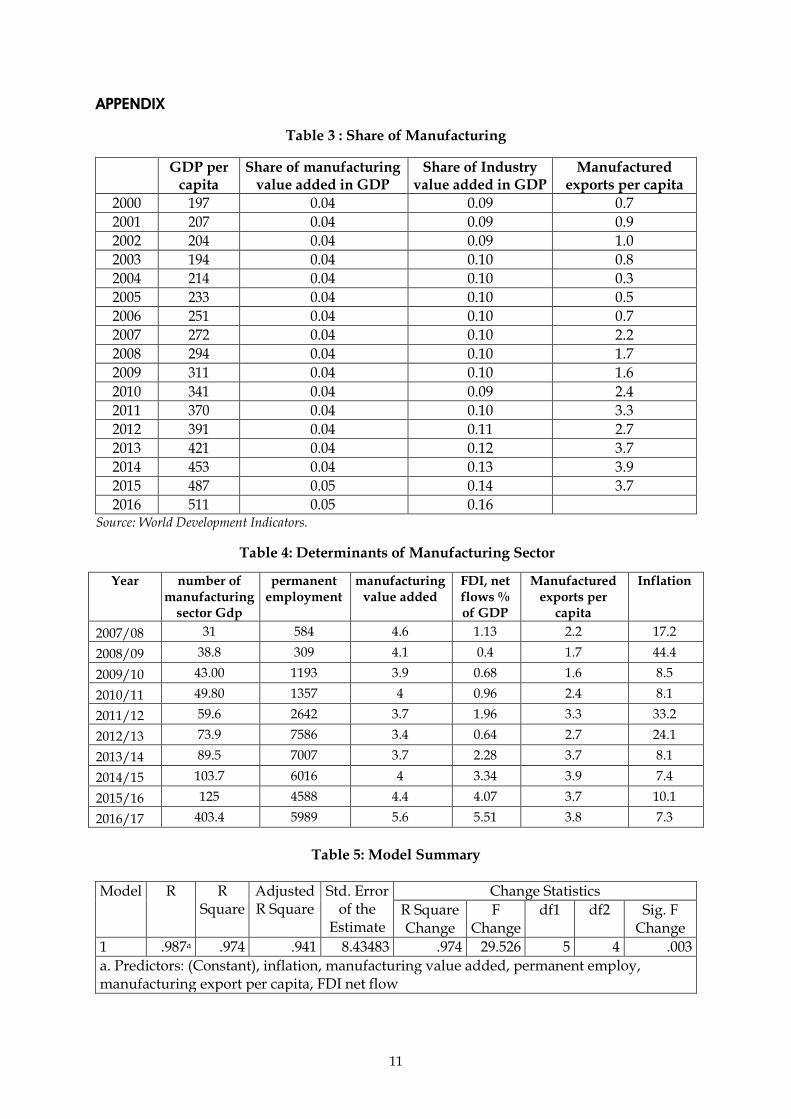
Table 8 shows the descriptive statistics for the dependent and independent variables. List for the results of regression analysis are given in Table 5 of Appendix.
With the dependent variable had a mean average of 62 and SD = 34.6, and the independent variables of permanent employment (M=3727.1 SD 2819.1) and FDI (M= 2.1, SD= 1.71) and manufacturing value added (M=4.14, SD=0.62) inflation rate (M= 16.8, SD= 13.02) and
manufacturing export per capita (M=2.9, SD=0.89).
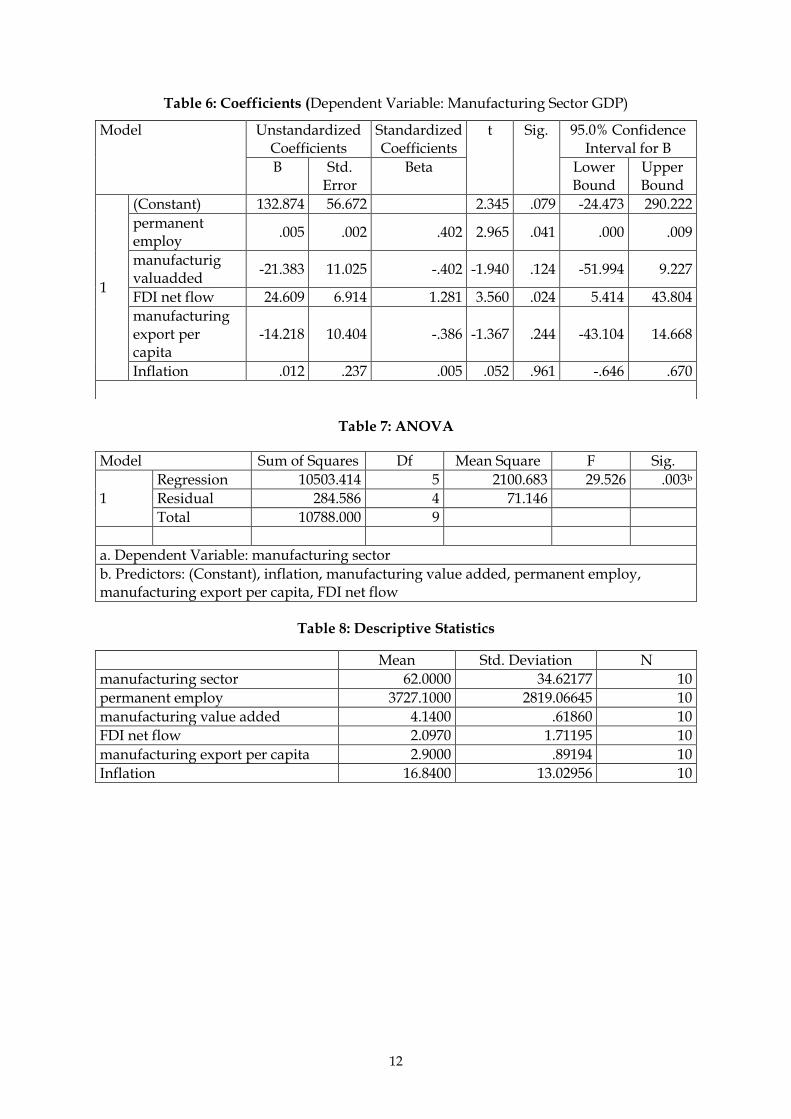
Given the foregoing coefficients the following are the recalls of the research questions for the study, together with the null and alternative hypotheses and the results of the research question. Next is the general form of the regression equation that explains how variations in the independent variables explain manufacturing sector growth in Ethiopia.
Manufacturing sector growth = -132.874+ 0.005*(employment) - 21.383*(value added) + 24.609*(FDI) – 14.218*(export per capita) + 0.012*(inflation). The p-value shows whether the variation in the dependent variable (manufacturing sector growth) explained by the independent variable is significant or not. If the p-value is greater than 0.05, the null hypothesis would not be rejected. The p-value of the data is greater than 0.05, for the coefficients or the independent variables of manufacturing value added manufacturing export per capita and inflation the null hypotheses were not rejected. This implied that the variations in the independent variables (coefficients) were not statistically significant in explaining manufacturing sector growth (dependent variable). The p-value of the data is less than 0.05, for the coefficients or the independent variables FDI net flow and permanent employment the null hypotheses were rejected. This implied that the variations in the independent variables (coefficients) were statistically significant in explaining manufacturing sector growth (dependent variable).
CONCLUSION AND SUGGESTION
Two fundamental questions related to the relationship between the manufacturing growth, FDI, per capita manufacturing export, inflation, permanent employment and manufacturing value added in Ethopia from the year 2007-2008 and from the year 2016-2017 was sought in the study.
The first research question focused the relationship between manufacturing sector
10
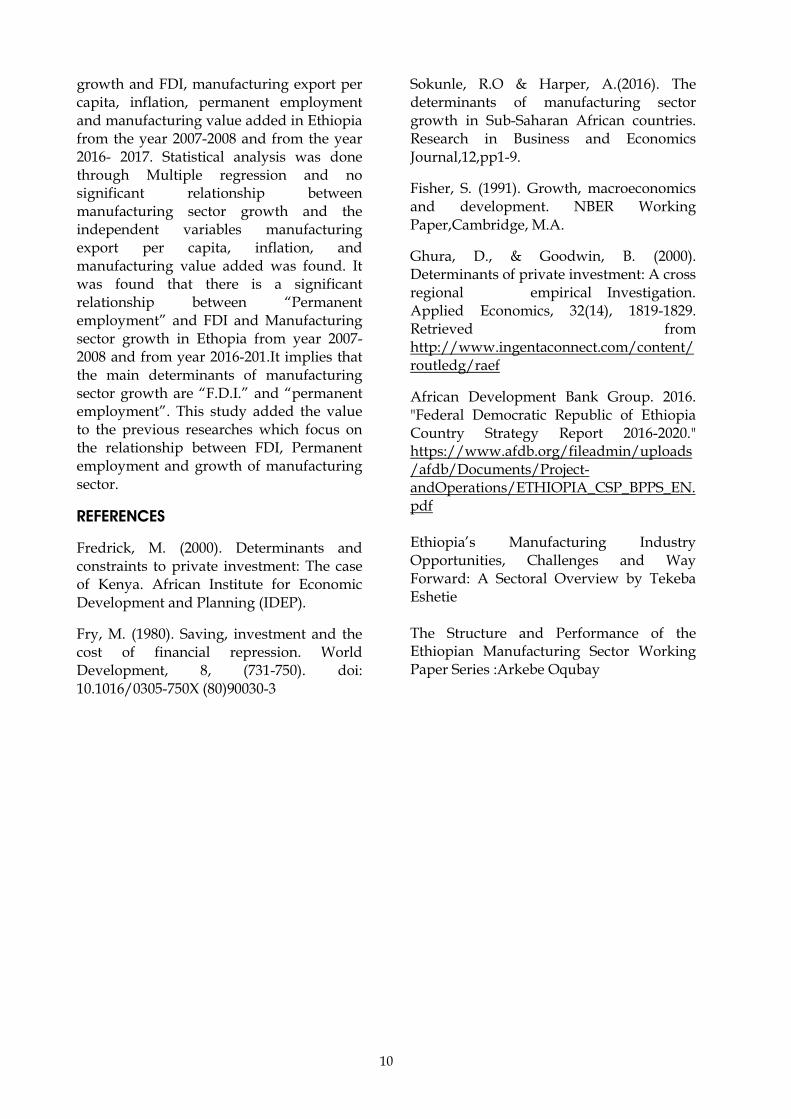
growth and FDI, manufacturing export per capita, inflation, permanent employment and manufacturing value added in Ethiopia from the year 2007-2008 and from the year 2016- 2017. Statistical analysis was done through Multiple regression and no significant relationship between manufacturing sector growth and the independent variables manufacturing export per capita, inflation, and manufacturing value added was found. It was found that there is a significant relationship between “Permanent employment” and FDI and Manufacturing sector growth in Ethopia from year 2007-2008 and from year 2016-201.It implies that the main determinants of manufacturing sector growth are “F.D.I.” and “permanent employment”. This study added the value to the previous researches which focus on the relationship between FDI, Permanent employment and growth of manufacturing sector.
REFERENCES
Fredrick, M. (2000). Determinants and constraints to private investment: The case of Kenya. African Institute for Economic Development and Planning (IDEP).
Fry, M. (1980). Saving, investment and the cost of financial repression. World Development, 8, (731-750). doi: 10.1016/0305-750X (80)90030-3
Sokunle, R.O & Harper, A.(2016). The determinants of manufacturing sector growth in Sub-Saharan African countries. Research in Business and Economics Journal,12,pp1-9.
Fisher, S. (1991). Growth, macroeconomics and development. NBER Working Paper,Cambridge, M.A.
Ghura, D., & Goodwin, B. (2000). Determinants of private investment: A cross regional empirical Investigation. Applied Economics, 32(14), 1819-1829. Retrieved from http://www.ingentaconnect.com/content/routledg/raef
African Development Bank Group. 2016. "Federal Democratic Republic of Ethiopia Country Strategy Report 2016-2020." https://www.afdb.org/fileadmin/uploads/afdb/Documents/Project-andOperations/ETHIOPIA_CSP_BPPS_EN.pdf Ethiopia‟s Manufacturing Industry Opportunities, Challenges and Way Forward: A Sectoral Overview by Tekeba Eshetie The Structure and Performance of the Ethiopian Manufacturing Sector Working Paper Series :Arkebe Oqubay
11
APPENDIX
Table 3 : Share of Manufacturing
GDP per
capita Share of manufacturing
value added in GDP Share of Industry
value added in GDP Manufactured
exports per capita
2000 197 0.04 0.09 0.7
2001 207 0.04 0.09 0.9
2002 204 0.04 0.09 1.0
2003 194 0.04 0.10 0.8
2004 214 0.04 0.10 0.3
2005 233 0.04 0.10 0.5
2006 251 0.04 0.10 0.7
2007 272 0.04 0.10 2.2
2008 294 0.04 0.10 1.7
2009 311 0.04 0.10 1.6
2010 341 0.04 0.09 2.4
2011 370 0.04 0.10 3.3
2012 391 0.04 0.11 2.7
2013 421 0.04 0.12 3.7
2014 453 0.04 0.13 3.9
2015 487 0.05 0.14 3.7
2016 511 0.05 0.16 Source: World Development Indicators.
Table 4: Determinants of Manufacturing Sector
Year number of manufacturing
sector Gdp
permanent employment
manufacturing value added
FDI, net flows % of GDP
Manufactured exports per
capita
Inflation
2007/08 31 584 4.6 1.13 2.2 17.2
2008/09 38.8 309 4.1 0.4 1.7 44.4
2009/10 43.00 1193 3.9 0.68 1.6 8.5
2010/11 49.80 1357 4 0.96 2.4 8.1
2011/12 59.6 2642 3.7 1.96 3.3 33.2
2012/13 73.9 7586 3.4 0.64 2.7 24.1
2013/14 89.5 7007 3.7 2.28 3.7 8.1
2014/15 103.7 6016 4 3.34 3.9 7.4
2015/16 125 4588 4.4 4.07 3.7 10.1
2016/17 403.4 5989 5.6 5.51 3.8 7.3
Table 5: Model Summary
Model R R Square
Adjusted R Square
Std. Error of the
Estimate
Change Statistics
R Square Change
F Change
df1 df2 Sig. F Change
1 .987a .974 .941 8.43483 .974 29.526 5 4 .003
a. Predictors: (Constant), inflation, manufacturing value added, permanent employ, manufacturing export per capita, FDI net flow
12
Table 6: Coefficients (Dependent Variable: Manufacturing Sector GDP)
Table 7: ANOVA
Table 8: Descriptive Statistics
Mean Std. Deviation N
manufacturing sector 62.0000 34.62177 10
permanent employ 3727.1000 2819.06645 10
manufacturing value added 4.1400 .61860 10
FDI net flow 2.0970 1.71195 10
manufacturing export per capita 2.9000 .89194 10
Inflation 16.8400 13.02956 10
Model Unstandardized Coefficients
Standardized Coefficients
t Sig. 95.0% Confidence Interval for B
B Std. Error
Beta Lower Bound
Upper Bound
1
(Constant) 132.874 56.672 2.345 .079 -24.473 290.222
permanent employ
.005 .002 .402 2.965 .041 .000 .009
manufacturig valuadded
-21.383 11.025 -.402 -1.940 .124 -51.994 9.227
FDI net flow 24.609 6.914 1.281 3.560 .024 5.414 43.804
manufacturing export per capita
-14.218 10.404 -.386 -1.367 .244 -43.104 14.668
Inflation .012 .237 .005 .052 .961 -.646 .670
Model Sum of Squares Df Mean Square F Sig.
1
Regression 10503.414 5 2100.683 29.526 .003b
Residual 284.586 4 71.146
Total 10788.000 9
a. Dependent Variable: manufacturing sector
b. Predictors: (Constant), inflation, manufacturing value added, permanent employ, manufacturing export per capita, FDI net flow
Amity Journal of Management Amity Business School Vol. VI, No. 2, July - December 2018 Amity University, Madhya Pradesh (ISSN 2347 – 1832)
13
INDIGENOUS KNOWLEDGE FOR GOOD GOVERNANCE AND DEVELOPMENT:
UNLEASHING THE WISDOM OF THE GADA SYSTEM
Dr. Wogari Negari 1
ABSTRACT
Indigenous knowledge is a source of contemporary world and a cradle of proud for the nation that hosts and leaves a legacy for the future generation. The Gada is the legacy of the Oromo to Ethiopia in particular, and the humankind in general, because it has been given recognition by many scholars of developed countries taking it as a source of democracy, governance and development. Consequently, it has been registered as the intangible world heritage by the UNESCO. The objective of this study is, thus, to uncover the partly unleashed wisdom in the Gada and indicate the role it has in governance, democracy, power succession, and development. To bring the multiple realities in the Gada to the sight of readers, ethnographic research design was utilized, and this design helped the researcher to deeply discuss the wisdom. The targets of the study were some Abba Gadas, Hadha Sinqes, and some elderly people in the east, west, south and North Oromia. To gather the data, qualitative approach was used as the study adopted ethnographic design that seeks in- depth information with the help of gatekeepers that assisted the researcher entered into the society. The key findings of the study revealed that the Gada system, which is the forerunner of the contemporary democracies has been affected by different religious practices, and it has almost lost its flavor in many parts of Oromia. All the Abba Gadas and Hadha Sinqes agree that riots do not occur during power transfer if the Gada is a system of governance. As the Gada provides duties and responsibilities in terms of ages, all citizens know their roles in the society. Many of the respondents indicated that it is the system of humanity consisting of all the required provisions for children, women, men, elderly people, animals, and environment. The Hadha Sinqes and the Abba Gadas particularly disclosed that it is a system that mediates between the Creator and the Mother Earth. This belief makes the Gada share some elements with the philosophy of the ancient Greeks. Some elderly people also expressed that the Gada is a black philosophy that has a lot of abstractions to be explored and put into practice for the good of humanity. Some other Abba Gadas also explained that due to impositions on the Gada, the forest cover of Oromia has deteriorated, and many wild animals left their original places. Adding, they said that the possibility to generate hard currency from tourists has been reduced. The Gada system is against the cutting of big trees unwisely, and if it is required to be cut, instead of one tree two trees should be planted. One of the famous Abba Gada elders underlined that the Gada is a conflict medicine and it has to be adopted for the country as a system of governance if we want to manage conflicts and live in a harmony. He further noted that elderly people hold discussions under the sycamore tree (Odda, which is referred to as a venue for tranquility) to draft laws, reconcile conflicts, discuss different social issues. From these findings, it is possible to conclude that the Gada is a developmental governance system that give regards to all human beings irrespective of color, religion, and any other differences. Based on the key findings, the researcher recommends that the Gada system has to be nurtured at all levels to put it into practice and use it as a social mortar. It can also serve as a system that boosts the interdependence and economy of the region in particular and that of the country in general. Due to this all- touching advantage of it, the eyes of all concerned leaders and citizens should be kept on it, and seek means to protect it unleash its untouched wisdoms to contribute to the development of the country.
Keywords: Gada, cradle, unleash, Hadha Sinqe, Odda, Abba Gada, indigenous, knowledge, legacy, democracy, development, sustainable, power succession, governance.
INTRODUCTION
Wisdom in the indigenous knowledge can be seen as an indigenous knowledge that serves as a basis for living. “The wisdom in
1 Vice-president, Training and Consultancy Service Ethiopian Civil Service University, Addis Ababa, Ethiopia, Africa
14
the Gada surpasses what people think in the usual way; its abyss is not explicable through the usual way of thinking” (one of the Oromo elders). The contemporary world has its origin in the practices and values of communities who walked this earth earlier. What was not recognized in the past in most cases appears in a different form in the current world serving as a record of knowledge. Similarly, the yesterday‟s leadership and development were the reflections of the then indigenous knowledge and values due to the fact that life of communities depends on the way people think, behave, and create.
In Africa, many scientific and social researchers associated with the formulation of development assistance policies are now beginning to recognize the role that indigenous peoples' and their knowledge of the ecosystem can play in the success of development and governance (Lalonde, 1991). Despite the inherent incompatibilities between indigenous knowledge systems and the scientific knowledge system, an important challenge is to find innovative mechanisms to integrate both systems for mutual benefit (ibid). From what Lalonde said, it is apparent that there is a call to put the two ends together.
If indigenous knowledge, as called conflict medicine by Zartman, 2000, is supported by education, the benefit to be gained is more meaningful, and the indigenous societies will be motivated to use their indigenous knowledge for creative reasons, and help them to gain enhanced respect for local culture and wisdom (ibid). From what Zartman said, it is possible to infer that the education system has to help the indigenous knowledge grow and enhance the overall development, rather than planting alien education system that adds little value to the existing practices of societies.
Asmarom (1973) discussed that there are few institutions in the world that afford human beings a wisdom that has all the potential to manage challenges and create harmonious relationship among people. He adds that Africa has a lot of indigenous
knowledge systems that can be a source of wisdom for the world, which include, to mention very few, like: Ibo, Kikuyu, Massai, and Nuer, who rely on their traditional practices in leading.
In Ethiopia, diversity management is the key issue in order to integrate the indigenous knowledge and initiate and sustain multifaceted development. The very thinking of the Federal Democratic Republic of Ethiopia (FDRE) is managing diversity foe development. For example, the Ethiopian Herald (2015) issued on August 25, 2015 underlined that indigenous knowledge is an integral part of the development process of local communities, and it is an underutilized resource in development process of developing countries like Ethiopia. Adding the newspaper illustrated that learning from indigenous knowledge, by investigating first what local communities know and have, can improve understanding of local conditions and provide a productive context for activities designed to help the communities.
Studies by Assefa (2005), Lemessa (2011a) Zartman (2000) and Asmarom (1973) revealed that societies cannot effectively manage conflicts when there is no attempt to see the thing we have anew and look for the human- friendly system. They have also discussed that where there is a comprehensive system that gives attention to all age sets, problem management is effective and development is initiated. However, in these studies, the idea of reviving the Gada in a comprehensive, and developmental way has not been given due attention, which is the target of this study.
In a nutshell, the gaps that the researcher observed in these studies, the scant attention given to the Gada in terms of development, succession of power, democratization process, and the life experiences of the researcher have necessitated this study.
Objective of the Study
The general objective of this study is to assess the role the Gada plays in enhancing democracy, succession of power and
15
development and generate some recommendations.
Based on the objective of this study, the following questions have been set to gather data for this study.
What wisdom is there in the Gada to develop and sustain democratic principles in Oromia?
What are the contributions of the Gada towards practicing power succession in Oromia?
What is the future role of the Gada to enhance the developmental strategies in Oromia?
REVIEW OF LITERATURE
Meanings of Afan Oromo Words
Abba Gada: a leader in the Oromo democratic governance system
Daballe: a citizen with grade between 0 and 8 years
Folle (Gamme Titika): a child with the age between 8 and 16
Gada: a democratic governance system, which is a forerunner of all democracies. It is also an age range between 40 and 48 at which a person starts leading.
Gada Mojji: a person with the age range between 64 and 72. This is age of retirement from working as active Abba Gada. At this age, a person takes care of the environment.
Hadha Sinqe: The first lady, who holds a stick (sinqe) for decision- making purpose
Qallu: A wise person or a prophet who mediates between Waqa and people
Qallu institution: An institution which is entrusted with the responsibility to enhance peace
The Gada as Democratic Social Organization
The peoples in the Horn of Africa in particular and the entire continent in general have been struggling for the democratization of their governance, leadership, and politics and striving to
uproot authoritarian regimes. As a result, many, including Ethiopia, have recorded significant changes in establishing citizen friendly governance systems mainly by giving due regard to their local institutions like Gada system (Lemmu, 1992). Thus, it is necessary to discuss the decisive role that the political culture plays in influencing the leadership, governance, and development processes.
The Gada, which is inseparable from the life of the Oromo, is the indigenous traditional governance system developed by the Oromo and centering the benefits of the society on political, economic, social, cultural, environmental, and religious institutions (Asefa, 2012). Asafa describes the Gada as all- touching and the major cause for development and conflict management. Adding, he illustrated that Oromo were under one Gada administration in an all-encompassing democratic republic even before the few European pilgrims arrived from England on the shores of North America and later built a democracy. This system has the principles of checks and balances through the periodic succession of every eight years, and division of power among executive, legislative, and judicial branches, balanced opposition among the five parties, and power sharing between higher and lower administrative organs to prevent power from falling into the hands of tyrannical ruler (ibid).
The Gada is the most comprehensive indigenous African institution, which is rationale, creative and a base for the contemporary world democracy; it has a capacity to unite and mobilize people into a formidable and invisible force to accomplish any task with the result in mind (Bahrey, 1954).
The Gada has been structured in such a way citizens in the different age groups play their role for the development of Oromia, and hence Ethiopia through the creation of integration, and decentralizing the system of governance. The Gada formalizes age grades through which corporate age sets operate together
16
(Zartman, 2000). The Gada age grades are classified as: Daballe (0 year- 8 years), Folle (Gamme Titika) (8 years- 16 years), Qondala (Gamme Gurguda) (16 years- 24 years), Kusa (24 years- 32 years), Raba (32 years- 40 years), Gada (40 years- 48 years), Yuba I (48 years- 56 years),Yuba II (56 years- 64 years), Gada Mojji (64 years- 72 years), and Jarsa (72 years- 80 years) (Asmarom, 2006, and Zartman, 2000). As can be seen in the classification, all age grades have well- defined purposes. To become a leader, one has to take a 40 year training.
Gada and Power Succession
Power transfer in the Oromo depends on the saying: "We receive power with blessings, we lead with blessings, and we give our power to others with blessings." This saying underscores that the elected people are meant to serve their people with willingly with the spirit of monist. It is the assignments attached to the age grades that keep someone in leadership position. Asefa (2012) says that the Gada system bestows age- based responsibilities on the citizens dividing the stages of life, from childhood to old age into a series of formal steps, each marked by a transition ceremony defined in terms of both what is permitted and what is forbidden. An individual enters the system at a specific age and passes through transition rites at intervals appropriate to the passage from childhood through full adulthood to mature age or leadership age (Asmarom, 1973). It has emphasized that citizens come to power through the provision of the Gada and give power to the coming generation so that the one in power will assume another better position that is in line with his Gada grade.
Gada and Environment
The Gada and the environment are inseparable as its principle underlines the balance in the „Mother Earth.‟ The Gada philosophy agues for nature- friendly environments (which are the concern of all), which are integral to the rituals and community celebrations at ritualized natural sceneries like sacred springs, mountains, trees, groves, and forests for the protection of nature in everyday life
(Lemessa, 2012). Lemessa (2014) has also indicated that despite the recent development efforts prove that the indigenous knowledge systems are widely recognized as genuine and environmental care giving system. Lemessa appreciates the role of the indigenous knowledge in saving the environment with its diverse creatures.
Another study by Lemessa (2014) again indicates that the Oromo believe that the forest is a natural sanctuary for all creatures and the give all the necessary cares to sustain it. Lemessa said that the Oromo take care of the forest as religions handle their worship venues. He briefly stated that enhancing the Gada means enhancing the natural cover of the earth. He also expressed his worry that forest covers have diminished with the advent of western religions by the name modernization, because they destroyed the big trees particularly the Odda.
Contrary to the indigenous knowledge systems, modern knowledge systems are often viewed as catastrophe to the natural ecosystems and local knowledge systems that have been inbuilt there (Dove and Carpenter (2008). This issue attracts the attention of environmentalists in order to make interventions a wise integration of the two knowledge systems.
Gada and Conflict Management
The Gada system is a unifying system irrespective of any preconditions. Touching on its role of unification, Zartman (2000) wrote that many African researchers have looked into the reality in the Gada believing it can serve as one of the „African Conflict Medicines, and many African countries have started browsing their wisdom system to manage conflicts and come together for integrated development.
Amanuel (2014) disclosed that indigenous knowledge plays a pivotal role in keeping peace and order taking the case of Kenya and Ethiopian Oromo divided by a boundary. Amanuel indicated that mystified realities can be transformed into a doable reality if there is a creative conflict management system like the Gada.
17
Asmarom (1973) discussed that the Qallu leaders are the most rooted conflict mediators in Waqefanna of the Gada, an African indigenous monotheistic religion and mediators in conflict. Qallus pacify when there is a conflict among different people through the mediating speech they make bringing the people in conflict. They have a responsibility to mediate conflict, and conflicts that failed to be resolved at lower levels are referred up to the national Qallu councils for mediation.
The Oromo people make all level best efforts to manage conflicts on three different levels: prevent social conflict from occurring, if it occurs, to prevent it from escalating; and if it escalates to make peace between the conflicting parties through the intervention of the Jarsa Biya (community elders) (Zartman, 2000). The ideological themes underpinning the processes of conflict management are effort exerted to manage conflicts; truth (dhugaa basu- giving witness) (unearthing the truth about the causes of the conflict); justice; punishment (guma) (payment for the wrong since the Oromo do not have jails or the death penalty); and reconciliation (keep harmony between humans and nature) (Asmarom (1973). These govern the construction of political structures, (the Gada system), religious customs (the Qallu system), social structure (the eldership or jarsa biya system), and the elaborate processes of reconciliation (arara), systems that the Oromo developed to manage conflicts (ibid).
Customary institutions are implanted in the culture, values, traditions and history of societies, which host them and are entrenched in the socio-political and economic contexts of a given society and serve as conflict medicine and „heal‟ African countries in conflict (Zartman, 2000).
Gada and Development
The way leadership is defined shows the line of thought and development level of societies. That is why leadership and development are not separated entities that stand alone. Development without citizen friendly leadership style (indigenous
leadership knowledge) is not sustainable. That is why writers like Bass (1990) stress the need to examine definition to leadership before introducing any development approach. Briefly, Bass underlines that where there is no fair treatment and inclusive principle, appreciating the gross of the development would not suffice; it can rather be one of the causes of conflicts. The saying that says “Think globally, but act locally” underlines the role of indigenous knowledge that creates a harmony between learning from other contexts and customizing into indigenous leadership system.
Gada and Democratic Government
The Oromo had a form of constitutional and democratic government known as the Gada. Although the Gada system is a well known democratic organization works are very scant on it. It is only the current issue that some works are coming out. During the sixteenth and seventeenth century, when various peoples were fighting over economic resources in the Horn of Africa, the Oromo were effectively organized under the Gada institution for both offensive and defensive wars (Asmarom, 2006).
Hackman and Johnson (1996) defined democratic government associating with increased follower productivity, satisfaction, involvement, and commitment. Member satisfaction and nominations for leadership are greater under democratic leadership (Bass, 1990; Stogdill, 1974). Participation is a core characteristic of democratic government; and the ideal of it is friendly, and encourages participation (Lutharns, 1996).
Gada and Decision- Making
The Gada is founded on the principle of consensus based decision- making. In the process of decision- making perspectives are encouraged and interpreted from different pint of views.
Jeylan (2004) reported that the Gada has a provision to make decisions with the help of Abbaa Bokkuu (carrier of the scepter
18
holding a position similar to that of a magistrate), Abbaaa caffee
(father of legislative assembly), and Abbaa Alangaa (Attorney general). These institutions work together in the process of legal administration, drafting, peace building, social transformation, and integration of the society.
Asmarom (1973) discussed the Gumi Institution is the highest and the most important indigenous social organization. The author is succinct in putting the descriptions of this body as: “The National Assembly”, (Gumi) is made up of all the Gada assemblies of the Oromo, who meet, once every eight years, to review the laws, to proclaim new laws, to evaluate the men in power, and to resolve major conflicts that could not be resolved at lower levels of their judicial organization. Through the Gumi assembly, Abba Gadas revise the existing legal framework and come up with the revised version so that it fits with the current context. It is the most democratic system since power rests on the people and all sections of the nation are directly or indirectly represented in the council (Caffee).
The Gumi Gayo of the Borana Oromo is the colorful and illusive event, where all people of indigenous wisdoms come together to discuss how to reign peace among the Oromo people and the neighboring ones to sustain mutual trust and development (Gumi Gayo Assembly, 37). Gumi Gayo is peace- making venue, where all social concerns are discussed, and new alternatives of conflict management strategies are generated. Abba Gadas lead the Oromo people with the principle “We do want everyone to live freely, legally and equally in our territory, enjoying the benefits of this land with us. But we do not tolerate any nullification on our inalienable democratic rights provided for us by the creator and the law of humanity” (ibid). This quote signifies the dictating principle of the Gada System that gives priority to peace, co- existence, and good governance that nurtures development.
Indigenous Knowledge
Indigenous knowledge emerges from ancestral teachings that are spiritual and sacred in origin (Ermine, 1995). It exists in our visions, dreams, ceremonies, songs, dances, and prayers. It is not knowledge that comes solely from books. It is lived knowledge, experiential knowledge and enacted knowledge. Indigenous knowledge is different from other areas of knowledge like scientific knowledge, or historical knowledge, or art knowledge, which are open to people of any ethnic background. But indigenous knowledge is explicitly attached to particular ethnic groups as cultural knowledge of groups classified as indigenous.
Absolon (2010) reported that elders are cornerstones of indigenous knowledge, culture and heritage. Without elders, it is hardly possible to preserve indigenous knowledge. Oral traditions, languages and historical accounts would be lost without the wisdom, knowledge and experience of elders. What the traditional people say is of value in settling conflicts and bringing the community members together.
Some Gada Centers
Melba (1998) discussed that there are different Gada centers where Oromo people come together and draft laws. The Gada centers are marked by the Odda tree (sacred meeting ground for the enactment of many Oromo ceremonies), which serves as a place that hosts all irrespective of any discrimination.
Some of the major Gada centers, just to cite the very few, are Odaa Nabee (East Shewa), Oda Rooba(in Bale), Madda Walaabuu (South-Western Bale), Oda Bisil (West Shewa), Oda Bultum(West Hararge), Oda Bulluq (Horo Guduru) and Oda el Dallo (Liban). These are being rehabilitated after the Gada has been registered as one of the intangible heritages of the world.
Gada as a Means of Accommodation
The Gada does not discriminate among people. It is the system that gives attention to all irrespective of color, place of origin, culture and religion. The adoption is
19
undertaken by the Abba Gada on behalf of his clan. Before adoption, animal(s) is slaughtered and a knife is dipped in the blood of the victim and planted in the assembly, repeating in chorus what the Abba Gada says. “I hate what you hate, I like what you like, I fight whom you fight, I go where you go, and I chase whom you chase (Hassen 1990). This oath is binding and unbreakable on both sides and the adopted becomes the “son” or daughter of the people, and the blood symbolizes brotherhood and the fight for human rights (Hassen, 1990).
Analytical Framework of the study
In this analytical framework, the different important features of the Gada have been indicated. To analyze the wisdom that the Gada has for the power succession and development have been described by showing the interfaces between the features and the Gada system. If one understands these features, he/ she can understand the role the Gada plays in the lives of people. The data gathering and analysis have been dictated by these provisions of the Gada.
Fig 1: Developed by the researcher based on his experiences and readings
Gada Grades: The Gada grades designate people in terms of their ages for different responsibilities. Passing in these ages is the natural rights for each citizen so as to enjoy the assignments according to their ages.
Odda- Sycamore Tree: This tree is inseparable from the Gada as it serves as a sanctuary for the Gada and all associated rituals. It is a symbol for the accommodative nature of the Gada system.
Sinqe: Sinqe is a female led institution, which is led by Hadha Sinqe. In this
institution, females discuss what they can contribute for their people in general and the female society in particular.
Qallu: Qallu is another component of the Gada System, which works for the perpetuation of peace in the system. Qallu institutions serve as a setting of conflict resolution for the society.
Irecha: Irecha constitutes one of the several religious and cultural practices defining the hallmark of the entire Oromo life. It has promoted and enhanced understanding and unity among the Oromo. It has helped build their common values and shared visions, and consolidated peace, tolerance and resilience.
THE RESEARCH METHODS
In this chapter, the research design and approaches, population and sampling, data sources, data gathering tools, data analysis techniques, and the research ethical considerations have been discussed.
Research Design and Approaches
The research design adopted for this study is ethnographic, because the intention of the study was to learn from the Oromo what the Gada does in terms of democracy, power succession, and development, and interpret learned patterns of behaviors, customs, and ways of life.
The research approach used was qualitative as the objective of this study is to describe what is going on in the Oromo by carefully listening to the indigenous people and generate in-depth data and create a pattern for the practices of the people. Besides, the qualitative approach is an appropriate ethnographic research avenue.
Population and Sampling
The study dealt with the Oromo people by giving special reference to the Abba Gadas, Hadha Sinqe, and the Gada elderly people who have the knowledge and practices in narrating the role the Gada plays in the overall governance system of the people.
From the pool of the people, the researcher purposively took the former Abba Gadas and the Abba Gadas in power from North,
20
South, East, and West ` parts of Oromia National Regional State and Amhara National Regional State. The reason why the researcher identified the resource persons purposively was due to their rich experiences of the Gada and the possibility to collect in-depth information from them.
Sample Frame and Units
The sample frame of the study is the Abba Gadas, Hadha Sinqes, elderly people at different levels and zones of Oromia. From the frame, the regional and local level concerned people were drawn for the study.
Instruments
To gather data for this study, checklist based non participant observation; open ended interview, focus group discussion, and document review were used.
Observation: The objective of using observation was to see sacred trees and rivers and how they are conserved. Observation is very important in that it gives an opportunity to observe naturally occurring events in person. To do this, checklist that is based on the research questions was produced.
Open- ended Interview: Interview is a preferred instrument of data gathering in that it gives a chance to the researcher to hold one- to- one discussion to thoroughly discuss issues in depth. Accordingly, the Abba Gadas and Hadha Sinqes were interviewed.
Focus Group Discussion (FGD): FGD is regarded as a forum of reform in that it helps researchers to have a group of people, who are initiated to forward multiple information, because of the triggering effects the ideas raised by the different participants. In this process, 6- 12 people took part in the discussion. The participants of the FGD included the Gada elderly people from different parts of the region.
Document Review: Documents, which have relevance for the study, were reviewed. These documents were obtained from the different culture and the Abba Gada offices.
Data Analysis Techniques
To analyze the data, first of all, the data were transcribed and polished. Following, the data were categorized under each research question and sub headings were created. The sub headings were further re- categorized to establish more comprehensive themes. Finally, using the content analysis technique, the data were analyzed.
Ethical Considerations
It goes without saying that ethics is the foundation of effective communication between the researcher and the data sources. To this end, the researcher took all the necessary care to make this study ethical. First of all, a letter of cooperation was taken from the university‟s Research Publication and Coordination Office. Following, the objectives of the study was discussed with the various targets of the study. The researcher assured the participants that they could withdraw from participating in the study if they do not feel good with no precondition. With all this surety, the researcher undertook this study.
RESULTS AND DISCUSSIONS
The data collected from different sources have been presented and discussed. The data have also been crosschecked to understand whether there are congruencies or dissimilarities among the ideas generated from the different targets of the study.
Response Rate
All the targeted Abba Gadas have been communicated at their place and the planned information has been secured. The Abba Gadas dealt with include Abba Gadas, the Abba Gadas‟ coalition leader, and the Hadha Sinqe, and the renowned Oromo Gada fathers. One of the Oromo elderly persons, who was granted honorary doctoral degree by Bule Hora University and is regarded as the walking encyclopedia of the Gada System also participated in the study.
21
Demographic Factors
Saving three, all of the participants were males. From this finding, one can realize that the Sinqe System is not as strong as the Abba Gada System. Even though it has been learnt that there is no male domination on women, the Sinqe system is not operating as the Abba Gada system. The half part of the Bokku- stick seems to lag behind the other half part.
Many of the Abba Gadas were the public servants. However, after their anointment they have left the public sectors and devoted their time for the service of the Gada system. Age wise, all are above 40 as it takes 40 years to become mature Abba Gada. Many of the elderly people, who participated in the FGD, were between 60 and 110 years. The religion of all of them is Waqefanna- worshipper of one God.
The major Odda centers include Gumi Gayo and Arero in Borana Zone, Me'e Bokko and Nura in Guji Zone, the Tulama‟s Oda Nabe, Karrayu‟s Hora Sama in East Shoa Zone, the Macha‟s Oda Bisil, Oda Buluk of East Wollega, the Oda Roba in Bale Zone, Madda Walaabuu in South-Western Bale, the Ituu and Humbana‟s Oda Bultum in West Hararghe, and Oda el Dallo in Liban. Moreover, there are number less Oddas in different localities of Oromia and Amhara National States. To mention some of the living Oddas in the latter, Odda of Sheik Mohammed in Kemissie town, Odda of Garado in Chafa, and Odda of Jille Dhumuga. Interviews were held with 12 Abba Gadas from different areas, four Hadha Sinqes (1 regional, and 2 local) and FGDs were held with 48 participants with renowned elderly people from the Gada Centers (Borana, Kamise, Horro Guduru, Guji, Hararghe, Arsi, west shoa, Bale, and Illu Abba Bora. Observations were also made at the major Gada sites to have insights about the current status of the Gada and the Odda centers. Accordingly, Gumi Gayo Odda, Me‟e Bokko Odda, Odda Nabe, Hora Sama, Oda Bisil, and Odda Garado were observed to understand the current status of the
Gada practices. Totally, 63 participants participated in this study.
Sustainability of Democratic Principles and Development
From the places observed by the researcher, it was learnt that the Gada, which is regarded as a system for humanity, has preserved democratic principles and development particularly in Borana, Guji, and Bishoftu. The researcher also observed that the people are transparent, respect the law, accountable, and take responsibilities in what they do. It was also observed that social network created by the Oromo plays a pivotal role in enhancing the capability of the people to support each other. One of the interviews held with one Abba Gada also falls in line with what the researcher observed as it showed that the Gada is a universal culture and has a provision for all creatures and the earth.
One of the interviewees also disclosed Busa Gonofa, which is similar with the present credit and saving institution, is a system established by the Gada to make the Oromo self sufficient get networked with each other development purposes. This institution still operates in different parts of the region.
Another interviewee illustrated that the western democracy or the so called modern democracy has limitations in treating human beings in the same way. He mentioned that people are unfairly treated because of their colors, beliefs and place or origins and the like, while, according to the teaching of the Gada, human beings are equal irrespective of their color, belief, and place of origins.
The Gada‟s First lady, Hadha Sinqe, was also interviewed and she disclosed the fathomless wisdom of the Gada in terms of the strategy of the Gada in bringing development and sustaining it. She also revealed that the Gada system emerged with the emergence of humanity and is a perfect democracy, and the Book of all sorts of laws for humanity.
Coming to the Gada‟s provision for gender equality, she discussed that the stick that is
22
held by the Abba Gada witnesses that male is inseparable from female. The head of the stick shows the male reproductive organ whereas the bottom- the foundation part of it indicates the female reproductive organ. She emphasized that the Gada incomplete if it treats the male and female in isolation.
Again, Hadha Sinqe discussed the role of the Gada in defending territorial integrity. The Hadha Sinqe explained that the Gada believes in peaceful conflict resolution, because it is a system of peacemaking among all human beings. When citizens are forced to wage just war to defend their territories, there is a procedure to become victorious. She joins the heads of the sticks and requires the fighters to pass under it. Anyone who disregards the instruction of Hadha Singe cannot go for the war, because she has disregarded the instruction of the war. She explained that the martyrs‟ statue erected in Adama city symbolizes the time of going for a mission. She again explained that Sinqe system is the origin of the Red Cross or Red Crescent, and the Hadha Sinqe does a mediation work during wars without any discrimination. If parties in war disregard the instruction given by the Hadha Sinqe, they are considered as unlawful ones.
The Hadha Sinqe discussed that the Gada has a system for mediating between a husband and a wife, when they are in conflict, and resolves it in a fair way. In the Gada System, even when there are divorces, ladies do not leave their home like what is common in many traditions. If one of them has to leave the home, there is also a possibility for the man to do so.
In case of adoption, no difference is made between the biological and the adopted child; both have equal rights. If a family that does not have another child before and adopt a child, bears to a child later on, the child that was adopted is considered the first child of the family as the Hadha Sinqe reported.
Two other hadha sinqes reported that the Gada can serve all human beings and sustain peace and development, and it is not biased against any religion, because it is
pro diversity in all possible ways. However, it was touched on those other religions some practices against the Gada tenets.
The Abba Gadas‟ coalition leader in the interview held with him revealed that the Gada system needs attention from the Oromo people, the regional state, and the federal state if it has to flourish like the time of 16th century and contribute for the democratization process and development of the country. He particularly touched on that there are inconsistencies in referring to the Gada system because of the failure of the region to harmonize the exercise across the region. For example, some outsiders or non Oromo consider the system as a local cult and it is against other religions.
Another Abba Gada from south Oromia similarly described the Gada as the initiator of developments has to serve as an alternative governance philosophy. An elderly person aged 110 remarkably shared with the researcher that the Gada is life, love, wealth, source of wisdom, philosophy of the black people, and the beginning of all civilizations.
The Gada and Power Succession Practices
From his observation, the researcher realized that at most parts of the study site, the indigenous venues for the exercise of the Gada are under threat at some places like Kamise, and West Oromia due to the influence of different religious practices, and the then political matters. This action is against the natural cover and productivity the earth. The village where the researcher was born is in a similar problem of loss of big trees. Many places are being threatened by a similar human action.
“Gada is a school of Leadership, and power sharing does not initiate conflicts as all the age grades have their own assignments for people, and rather the Gada is the source of peace and democracy” one elderly person from Guji Me‟e Boku said. The researcher asked him why and he answered that it is so because to become a mature Abba Gada, one has to learn from mature Abba Gadas passing in the five Gada grades consuming 8 years in each.
23
All the Focus Group Discussants revealed that the Qallu institution is an institution that is meant to bring peace and order among the people supporting the Abba Gadas and Hadha Sinqes. Qallu system serves as a councilor to the system to make it democratic and sustainable. It is like the democratic institutions that Ethiopia has to put in place for check and balance.
The principle of the Gada is “Lead with all the transparency.” Before the appointment of the Abba Gada or Hadha Sinqe, proclamations are proclaimed depending on the existing situation. In the renewal congress of Tulama Oromo held in 2017, it was noted that the Gada is registering significant results after its recognition by the UNESCO, and it has to be revived through the exploration and restoration of the Odda and other entities. The Tulama Oromo Gada renaissance congress motivated the Oromo to enhance the Gada as some interviewees explained during the congress.
Similarly, the Gada revival ceremony organized at Odda Nabe revealed that the Gada is taking the right course in reviving the values, cultural, historical, and social heritages of the Oromo. The Abba Gadas coalition leader discussed during the event that the Oromo philosophy of life in general is regaining its natural flavor and moving to a stage that uplifts the pride of the Oromo. One renowned Abba Gada from east Oromia said, “No one steps to power without consent from the people. It is taboo if one does this, and he will be considered as outcast because of his or her violation from the norm provided by the Gada.”
The researcher also discussed with Abba Gaddas from Bale, Arsi, Wollega, and south Shoa, east shoa when they came together for a meeting to Bishoftu and he learnt from the way they were explaining the provision of the Gada and that no one jumps to a power because he is an influential person. The Gada is a tool of peace because it discourages people to operate in a system less way thinking to fulfill one‟s benefit. As the Gada teaches that citizens become selfless servants of the Oromo, the people
respect the norm of coming to power keeping quality services in mind.
The Hadha Sinqe also raised that she was moving to the different parts of rural Oromia and other places where the Oromo live, for example, Kamisse, Raya, Benishangul, South National, Nationalities, and Peoples‟ Regional State to motivate females and assist them to actively engage themselves and promote the Gada for fairness and peaceful transfer of power. “Power belongs to the citizens; no one gains personal power and exercises hidden agenda; it is against the teaching of foremothers and forefathers” said the Hadha Sinqe.
“Peaceful ways of earning position where one can fit into to serve others is the prime principle of the Gada” said another participant. In this quote there are important expressions like peaceful, earn, serve others, and prime. These expressions signify that the person who aspires to lead should walk through peaceful way, have capability, and be selfless. This thinking is similar with the monist leadership style, which is founded on the principle of „sacrificial goat‟ which gives priority to the gains of others.
One of the key informants from Kemise said that the Oromo will not have the current status if they do not have the habit of listening to each other. They are what they are because of their wisdom in sharing ideas.
In all the interviews at Senbete town, it was learnt that the Gada is known by another name, which is called Abigar. The word is used as a substitute for the Gada. This difference, as said by the interviewee, occurred due to geographical differences and the influence of other cultures.
The Gada and Enhancement of Developmental Strategies
In the Focus Group Discussions held, the participants underlined that a person is not respected because of what he or she possesses, it is rather because of his or her selfless service to the people according to

24
what has been entrusted to him depending on his or her age grade.
The Abba Gada coalition leader said “The Gada enhances developmental strategies and democracy through nurturing humankind starting from the childhood.” The Hadha Sinqe also supported the idea raised by the Abba Gada saying “The Gada evolved with human beings to serve all and boost creativity depending on the existing reality.”
One of the participants reflected that non Oromo are not seen as a threat to the Oromo, because it is an opportunity for them due to the fact that both work towards making the earth a conducive place for living. It considers non- Oromo as equally important citizens for the development of effective and developmental system. Adding, the participant noted that the Gada centers peace and democracy for which the Odda is a symbol.
Another Abba Gada reflected that the Gada is a „river‟ of wisdom from which all creatures can drink. Besides, he said that it is a shade for all irrespective of place of origin, color, religion, gender, and any other forms of differences.
Gada and the Future
From the visits paid to some places in Oromia to observe the status of the Gada practices, the researcher observed there are some revivals of the Gada System. Some of the Gada values are being put in place by the region. This can show that the future of the Gada is bright.
Abba Gadas from east, west, north, and south Oromia in general agreed that the future of the Oromo in particular, Ethiopia in general shall be brighter, development- oriented, equitable, and democratic, if the Gada is adopted as a system of governance, development emblem, and globalization formula.
One of the respondents from Kemise explained that the Gada has to be rejuvenated by educating the young generation through the establishment of formal education, and then it will be an
avenue for the comprehensive development of the country. Besides, he discussed that the Oromo and the government have to put what they say into practice if the desire is to scale up and use it as a standard of peace building and development.
The Hadha Sinqe also shared what the Abba Gadas identified and said “adopting the Gada System means planting peace, democracy, equity, vision for the development of the Country.” She, adding, said, it is considered as a sanctuary of all creatures, because it frees people to talk, work, enjoy, share, and live peacefully.
During his trip to Nairobi- Kenya, the researcher had an opportunity to visit some Gada historical places. One of the places he observed was Odda Borana, which was established around a place called Two Rivers. The researcher took some minutes and said to himself self “The Oromo in Ethiopia have to learn something from this to take care of the Oddas.” In the discussion the researcher made with one Kenyan, the Odda is formally protected by the local government of the city government because it is one of the intangible heritages of the country.
CONCLUSION AND RECOMMENDATIONS
Conclusion
The following main issues have been concluded from the key findings of the study.
The Gada is a hub of welcoming diversity, favorable ground for conflict management, peace building, equity, and a homegrown source of development.
Age grade is a standard of the Gada to assign responsibilities to citizens.
That Bokku is a symbol for equality of men and women the base showing the woman and the head showing the man.
The Akko Manoyye‟s (one of the Oromo queens) instruction to build a house between the earth and the sky shows that women had an important role in
25
introducing new thing before their counterparts.
The revival of the Gada is signaling the regaining of the forest cover at the observed places.
The gudifacha (local adoption system) introduced by the Gada is becoming an alternative for the westernized adoption and managing child trafficking.
Busa Gonofa (indigenous support system) is becoming an indigenous system that can help citizens become self reliant.
The Gada has a complete provision for governance and development for the Oromo.
Recommendations
Policy- Makers
From the key findings of the study, the following are recommended to be performed by policy makers.
Policy makers should enact the policy that protects the indigenous knowledge working with all concerned people and organizations.
The regional system has to be given attention while designing polices. If it is so, citizens will benefit from what takes place and diversity is enhanced.
There has to also be education policy that enacts the inclusion of the Gada system in the education policy of the regional state.
The Country at Large
The researcher recommends the following to be carried out at the country level to preserve and sustain the Gada's wisdom.
There should be Gada rehabilitation movement in collaboration with the countries that have rich experiences in preserving and protecting world heritages.
The country has to strengthen the institutions that work on the heritage management and create their branches at different levels.
The country has to devise a strategy to effectively introduce dualism policy to use the indigenous wisdom together with the contemporary system in different affairs.
The different values in the country should not be treated in a fragmented manner; they should be considered as the wealth of the country and promotional works should be done to help citizens understand and utilize for the good of all.
Oromia National Regional State
As the cradle of democratic principles, the Oromia National Regional State has to do the following.
The Region has to mobilize and raise the awareness of the Oromo to preserve the Gada system through the establishment of the Gada enhancement center.
The Regional State should also establish the Gada tourist attractions at places where the Odda centers are situated.
The Gada has to become a part of the school curriculum at all levels.
The fallen Odda trees should also be rehabilitated involving people at different levels.
The Sinqe system has to be strengthened and established at regional and local levels.
Development Planners
Development planners have to do the following activities to rehabilitate the Gada system.
They should understand the role of the Gada for development and develop creative plan that connects the future with the present.
Planners should know that indigenous knowledge carries identity of people protect it in a planned way.
Institution like: The Gada and Developmental State has to be in place to attract the attention of citizens so as to use for the good of all.
26
Future Researchers
Other researchers should undertake the following activities to know the indigenous knowledge better.
Using this study as a springboard, other researchers have to open their eyes and carryout studies on the Gada as black philosophy, and the forerunner of the west philosophy.
Comparative indigenous knowledge study has to be done to raise the awareness of citizens.
Studies have to be undertaken on other provisions of the Gada system relating to development and democracy.
A comparative study has to be taken place on Hadha Sinqe and Abba Gada.
Abba Gadas and Hadha Sinqes
Abba Gadas and Hadha Sinqes are required to do the following tasks.
As the way we were doing businesses may not bring a significant change, both Abba Gadas and Hadha Sinqes should work on the promotion of the Gada system in a system- based way.
They should take initiatives to creatively work with all people at different levels.
BIBLIOGRAPHY
Abba Bahrey (1954). "History of the Galla", Beckingham, Charles Fraser – George WYNN Brereton Huntingford.
Absolon, Kathy (2010). First Peoples Child and Family Review: An Interdisciplinary Journal Honoring the Voices, Perspectives and Knowledges of First Peoples through Research, Critical Analyses, Stories, Standpoints and Media Reviews. V. 5. No. 2, pp. 74- 87.
Abute, W. (2002). Nature, Culture and Effects of Encroachment: Indigenous Resource Management of Gumuz under stress in Metekel, Northwestern
Ethiopia. In Ethiopian Studies at the End of the Second Millennium: Proceedings of the 16th International Conference of Ethiopian St. Addis Ababa: AAU press.1036- 1062.
Alemayehu Haile, Boshi Gonfa, Daniel Deressa, Senbeto Busha and Umer Nure. (2006). History of the Oromo to the Sixteenth Century. Second Edition. First Impression. Finfinne: Oromia Culture and Tourism Bureau.
Alula Pankhurst and Getachew Assefa (eds.). (2008). Grassroots Justice in Ethiopia: The Contribution of Customary Dispute Resolution. Addis Ababa: CFEE
Amanuel Adinew (2014). "Divided Ethnic Communities in the Horn of Africa: An opportunity for Regional Integration: The case of Oromo ethnic community of Ethiopia and Kenya" Journal of Leadership for Transformation, vol. No. 1, pp.15- 40
Asefa Abebe (2005). “Indigenous mechanisms for the presentation of Conflict: The experience of the Oromo.” Conflict in the Horn: Prevention and Resolution. Proceedings of the Second National Workshop of the Ethiopian Chapter of OSSREA. AddisAbaba: Organization for Social Science Research in Eastern and Southern Africa.pp. 50-74.
Asmarom Legesse (2006). Oromo Democracy: An Indigenous African Political System. Trenton, NJ: Red Sea Press.
Asefa Jalata (1993a). Oromia and Ethiopia: State Formation and Ethno-national Conflict, 1868–1992. U.S.A.: Boulder: Lynne Renner publishers Inc.
Assefa Jalata (2012). “Gada: Oromo Democracy: An Example of Classical African Civilazation”.The Journal of Pan African Studies, 5(1), pp. 126-152.
Augsburger. David (1992). Conflict Mediation Across Cultures: Pathways and Patterns. Westminster: John Knox Press.
Baissa Mergo (1992a). “Institutional Forgiveness in Borana Assemblieslies”.
27
Sociology, Ethnology Bulletin, Addis Ababa University: Addis Ababa University Press.
Baissa Mergo (2005b). Decisions in the shade: political and juridical process among the Oromo of Borana. Asmara: The Red Sea Press, Inc.
Bartles, L. (1983). Oromo Religion: Myths and Rites of the Western Oromo of Ethiopia: An Attempt to Understand. Berline: Dietrich Reimer Verlag.
Bass, B. M. (1990). Transformational Leadership: Industrial, Military, and Educational Impact. Mahwah, NJ: Erlbaum.
Bates P., C. M. (2009). Learning and Knowing in Indigenous Societies Today. Paris: UNESCO.
Ben, K. F. (2005). Ideas, Power, and Multilateral Institutions, Washington, DC: Howard University Press.
Byers, A. R. (2001). Linking the Conservation of Culture and Nature: A Case Study of Sacred Forests in Zimbabwe. Harare : Human Ecology.
CSA. (2008). Federal Democratic Republic of Ethiopia Population Census Commission, Summary and Statistical Report of 2007 Population and Housing Census, Populatioon Size by Age and Sex. Addis Ababa: CSA.
Dereje Hinew (2012). Historical Significances of Odaa with Special Reference to Walaabuu at Science, Technology and Arts Research Journal April-June 2012, 1(2):81-90 www.starjournal.org
Dinsa Lepsa (1975). The Gada System of Government era of Oromo (Unpublished Thesis). Addis Ababa University: Addis Ababa University Press.
Dirribi Demissie (2011). “Oromo Wisdom in Black Civilization", Finfinne, Ethiopia.
Dove, M. R. (2008). Envirnmental Anthropology: A Historical Reader . Malden: Blackwell Publishing.
Dove, M. R., & Carpenter,C. eds. (2008). Environmental anthropology: A historical reader. Malden: Blackwell Publishing.
Elias, D. (2003). Sacred Sites in the Tanami Desert, Central Australia: The Importance of Sacred Natural Sites for Biodiversity Conservation: Proceedings of the International Workshop held in Kunming and Xishuangbanna Biosphere Reserve . Paris : Cathy Lee and Thomas Schaaf.
Emeagwali , Gloria (2003). "African Indigenous Knowledge Systems (AIK): Implications for the Curriculum,” in Toyin Falola (ed), Ghana in Africa and the World: Essays in Honor of Adu Boahen. http://www.africahistory.net/cv2004.html
Ermine, W. (1995). Aboriginal epistemology. In M. Battiste & J. Barman (Eds.), First Nations Education in Canada: The circle unfolds (pp. 101-112). Vancouver: UBC Press.
Ethiopian Herald (August 25, 2015). Ethiopia: Indigenous Knowledge and Institutions Indispensable for Sustainable Development.
Firdissa S. (2007). The Socio- Economic Impact of Road Transportation in Horro Guduru. Addis Ababa: Addis Ababa University.
Gada Melba (1988). Oromia: An Introduction. Khartoum, Sudan.
Gastil, J. (1994). A definition and illustration of democratic leadership. Human Relations, 47, 954-971.
Gemechu Megersa (1993). “Identity, knowledge system and the colonizing Structure” (Unpublished PhD Thesis). London: school of Oriental and African studies.
Gonfa Ibsa ( 2014). “Customary Conflict Resolution among the Haro Limu Oromo of Northwest Wollega: The Case of Qallu Institution” (Unpublished MA Thesis). Addis Ababa University.
Grenier, L. (1998). Working with Indigenous Knowledge: A Guide for Researchers (Vols. 53(5- 6)). Canada: IDRC.
Hackman, M. Z., & Johnson, C. E. (1996). Leadership: A communication perspective (2nd ed.). Prospect Heights, IL: Waveland Press.
28
Hamdesa Tuso (2000). "Indigenous Processes of Conflict Resolution in Oromo Society." Traditional Cures for Modern Conflicts: Africa' Conflict Medicine. Washington, DC: Lynne Rienner Publishers.
Harris, C (1844). The highland of Ethiopia vol. III 2nd ed. London: Longman, Brown, Green, and Longmans.
Hassen, M (1990). The Oromo of Ethiopia: A History, 1570-I860. Cambridge: Cambridge University Press, I990.
Hoskins, Marilyn (1984). "Observations on Indigenous and Modern Agro-Forestry Activities in West Africa." In Social. Economic, and Institutional Aspects of Agro-Forestry. J.K. Jackson, (ed.). Tokyo: the United Nations.
IFAD. (2003). Indigenous Peoples and Sustainable Development, Roundtable Discussion for the Twenty- Fifth Anniverssary Session of IFAD's Governing Council.
John, Markakis (2006). Case Study Borana, Guji, Garba Relations in Oromia Regional States. A research paper presented to regional state, federal government and the community, organized by Ethiopia Ministry of Federal Affairs, Adama October 2006.
Jeylan Hussein (2004). “A Cultural Representation of Women in Oromo Society”. African Study Monographs, 25(3): pp. 103-147.
Johnston, A. (2005). Is the Sacred for Sale. Tourism and Indigenous Peoples. London : Earthscan.
Kala, M. &. (2010). Traditional Indian Beliefs: A Key towards Sustainable Living. Environmentalist , 30, 85- 89.
Kumsa K. (1997). The Siiqqee institution of Oromo women. J. Oromo Stud. 4:115-152.
Lalonde, Andre(1991). African Indigenous Knowledge and Its Relevance to Environment and Development Activities. Wakefield, Quebec - CANADA.
Le Grange, L. (2007). Integrating Western and Indigenous Knowledge Systems: The Basis for Effective Science Education in
South Africa. Pretorea: International Review of Education.
Lemessa Mergo (2011a). Caato Sacred Forest; Understanding the Cultural and Environmental Worth a Natural Space in Oromia Region. Indian Journal of Physical Anthropology and Human Genetics , 30 (1& 2), 47- 68.
Lemessa Mergo (2012b). Forest Resources, Deforestation, Forest Policy, and Local Customs in Horo Guduru. Panjab: Panjab University.
Lemessa Mergo (2014c). Indigenous Forest Management among the Oromo of Horro Guduru , Western Ethiopia. 1(2), 5- 22. eISSN: 2408-9532.
Lemmu Baisa (1992). "The Oromo and the Quest for Peace in Ethiopia," Trans Africa ForumVol, 9, No. 1, pp. 57- 68.
Luthans, F. (1998). Organizational Behavior (8th ed). Boston: Irwin McGraw-Hill.
Mamo Hebo (2008). The Role of Elders in Conflict Resolution: the Case of Arsi Oromo with Special Reference to Dodolla District and its Environments, In Tarekegn Adebo and Hannah Tsadik (eds), Making Peace in Ethiopia: Five Cases of Traditional Mechanisms for Conflict Resolution, pp. 48-77.
McNeely, Jeffrey A., and John R. MacKinnon (1990). "Protected Areas, Development, and Land Use in the Tropics." Resource Management and Optimization. Vol. 7(1-4), pp. 191-208.
Milton, K. (1996). Environmentalism and cultural theory: Exploring the role of anthropology in Environmental discourse. London and New York: Routledge.
Mohammed Hassen (2005). “Pilgrimage to the Abba Muuda” In The Journal of Oromo Studies. 12(12). pp.142-157
Mohammed Salih, M.A (2001). African Democracies and African Politics. London: Pluto Press.
Meseret Ambaye (1995). “Qaalluu as a Dispute settling Institution among Oromo with specific Reference to MaccaTulama” LLB.Thesi Addis Ababa University.
29
Mutisi, Martha (2011). The Abunzi Mediation in Rwanda: Opportunities for Engaging withTraditional Institutions of Conflict Resolution. Durban: ACCORD.
Nakashima, D. P. (2000). Tapping into the World Wisdom (Vols. 125, July-August.). Tokyo: UNESCO Sources.
Northhouse, P.G. (1997). Leadership: Theory and Practice. New York: Sage Publications.
Radcliffe, Edward and etal. (1991). "Neem in Niger: A New Context for a System of Indigenous Knowledge." In Indigenous Knowledge Systems; The Cultural Dimension of Development.
Rost, Joseph C. (1991). Leadership for the Twenty First Century. New York: Praeger.
Sillitoe, P. (2009). Local Science Vs Global Science: Approaches to Indigenous Knowledge in International Development. Berghahn: Berghahn Books.
Sirna Zelalem (2015). “Old Wine in New Bottles: Bridging the Peripheral Gadaa Rule to the Mainstream Constitutional Order of the 21st C Ethiopia.” Oromia Law Journal. "http://www.ajol.info/index.php/olj/article/view/120606"
Steger, M. B. (2003). Globalization: A Very Short Introduction . Oxford: Oxford University Press.
Sutton, M. Q., and E. N. Anderson (2004). Introduction to cultural ecology. Oxford: BERG.
Stogdill, R.M. (1974). Handbook of leadership: A survey of the literature, New York: Free Press.
Tesema Tolera (1997). “Some Features of the Qaalluu Institution and its Role in conflict Resolution among the Macca Oromo of Ginda Beret Woreda the case of Ofa Sarba.” (Unpublished BA Thesis), Addis Ababa University.
Tesegaye Regassa (2010). “Learning to Live without Conflict; Federalism as a Tool of Conflict Management in Ethiopia: An overview”. The Article Miazian Law Review vol.4 No.1
World Bank (2004). Indigenous Knowledge: Local Pathways to Global Development. Africa Regional Office: World Bank.
Zeleza, P. T. (2004). The African Academic Diaspora in the United States and Africa. The Challenges of Productive Engagement. In Comparative Studies of South Asia, Africa and the Middle East. 24.1. pp. 261 – 275.
Zeleza, P. T. (2006). The disciplinary, interdisciplinary and global dimensions of African Studies. In International Journal of African Renaissance Studies. Volume 1, No. 2. pp. 195-220.
***
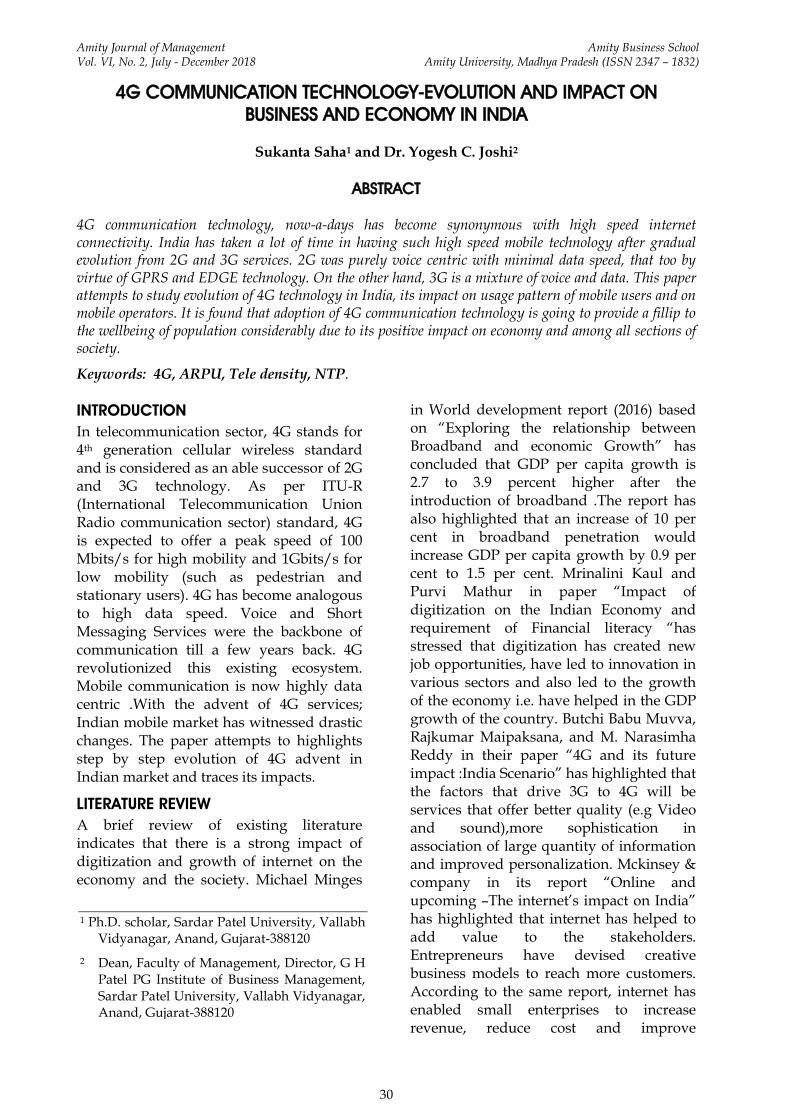
Amity Journal of Management Amity Business School Vol. VI, No. 2, July - December 2018 Amity University, Madhya Pradesh (ISSN 2347 – 1832)
30
4G COMMUNICATION TECHNOLOGY-EVOLUTION AND IMPACT ON
BUSINESS AND ECONOMY IN INDIA
Sukanta Saha1 and Dr. Yogesh C. Joshi2
ABSTRACT
4G communication technology, now-a-days has become synonymous with high speed internet connectivity. India has taken a lot of time in having such high speed mobile technology after gradual evolution from 2G and 3G services. 2G was purely voice centric with minimal data speed, that too by virtue of GPRS and EDGE technology. On the other hand, 3G is a mixture of voice and data. This paper attempts to study evolution of 4G technology in India, its impact on usage pattern of mobile users and on mobile operators. It is found that adoption of 4G communication technology is going to provide a fillip to the wellbeing of population considerably due to its positive impact on economy and among all sections of society.
Keywords: 4G, ARPU, Tele density, NTP.
INTRODUCTION
In telecommunication sector, 4G stands for 4th generation cellular wireless standard and is considered as an able successor of 2G and 3G technology. As per ITU-R (International Telecommunication Union Radio communication sector) standard, 4G is expected to offer a peak speed of 100 Mbits/s for high mobility and 1Gbits/s for low mobility (such as pedestrian and stationary users). 4G has become analogous to high data speed. Voice and Short Messaging Services were the backbone of communication till a few years back. 4G revolutionized this existing ecosystem. Mobile communication is now highly data centric .With the advent of 4G services; Indian mobile market has witnessed drastic changes. The paper attempts to highlights step by step evolution of 4G advent in Indian market and traces its impacts.
LITERATURE REVIEW
A brief review of existing literature indicates that there is a strong impact of digitization and growth of internet on the economy and the society. Michael Minges
in World development report (2016) based on “Exploring the relationship between Broadband and economic Growth” has concluded that GDP per capita growth is 2.7 to 3.9 percent higher after the introduction of broadband .The report has also highlighted that an increase of 10 per cent in broadband penetration would increase GDP per capita growth by 0.9 per cent to 1.5 per cent. Mrinalini Kaul and Purvi Mathur in paper “Impact of digitization on the Indian Economy and requirement of Financial literacy “has stressed that digitization has created new job opportunities, have led to innovation in various sectors and also led to the growth of the economy i.e. have helped in the GDP growth of the country. Butchi Babu Muvva, Rajkumar Maipaksana, and M. Narasimha Reddy in their paper “4G and its future impact :India Scenario” has highlighted that the factors that drive 3G to 4G will be services that offer better quality (e.g Video and sound),more sophistication in association of large quantity of information and improved personalization. Mckinsey & company in its report “Online and upcoming –The internet‟s impact on India” has highlighted that internet has helped to add value to the stakeholders. Entrepreneurs have devised creative business models to reach more customers. According to the same report, internet has enabled small enterprises to increase revenue, reduce cost and improve
1 Ph.D. scholar, Sardar Patel University, Vallabh Vidyanagar, Anand, Gujarat-388120
2 Dean, Faculty of Management, Director, G H Patel PG Institute of Business Management, Sardar Patel University, Vallabh Vidyanagar, Anand, Gujarat-388120
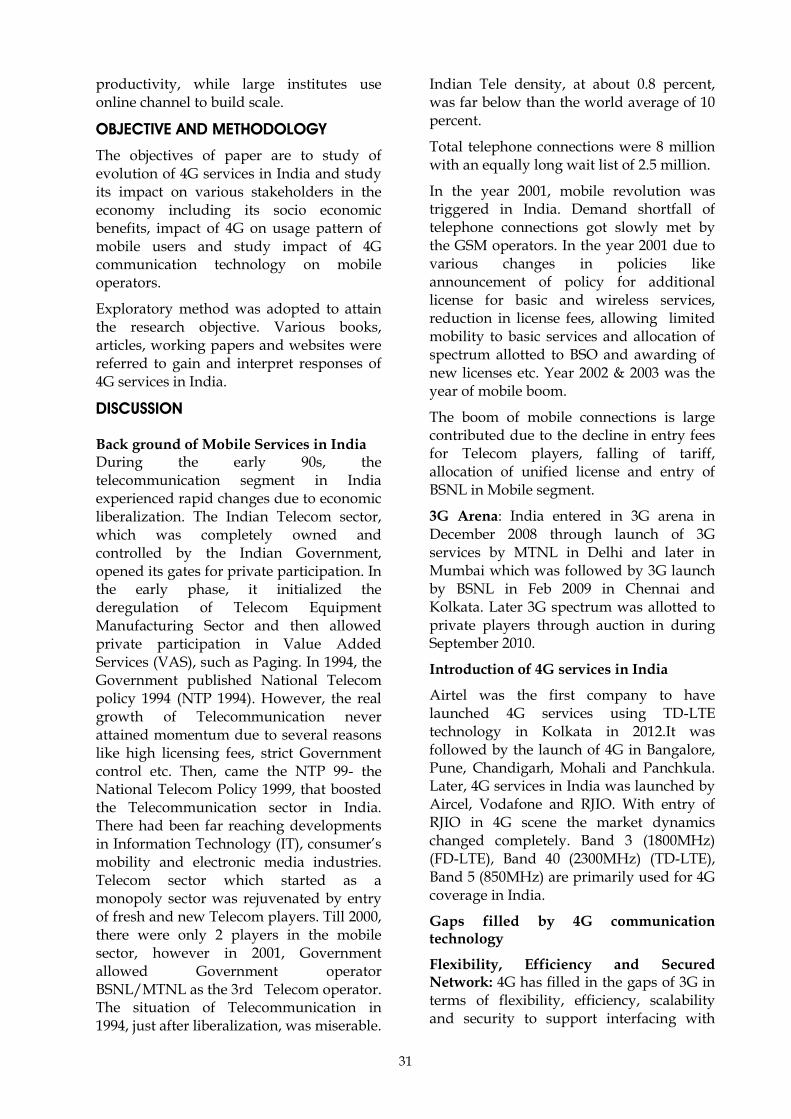
31
productivity, while large institutes use online channel to build scale.
OBJECTIVE AND METHODOLOGY
The objectives of paper are to study of evolution of 4G services in India and study its impact on various stakeholders in the economy including its socio economic benefits, impact of 4G on usage pattern of mobile users and study impact of 4G communication technology on mobile operators.
Exploratory method was adopted to attain the research objective. Various books, articles, working papers and websites were referred to gain and interpret responses of 4G services in India.
DISCUSSION Back ground of Mobile Services in India During the early 90s, the telecommunication segment in India experienced rapid changes due to economic liberalization. The Indian Telecom sector, which was completely owned and controlled by the Indian Government, opened its gates for private participation. In the early phase, it initialized the deregulation of Telecom Equipment Manufacturing Sector and then allowed private participation in Value Added Services (VAS), such as Paging. In 1994, the Government published National Telecom policy 1994 (NTP 1994). However, the real growth of Telecommunication never attained momentum due to several reasons like high licensing fees, strict Government control etc. Then, came the NTP 99- the National Telecom Policy 1999, that boosted the Telecommunication sector in India. There had been far reaching developments in Information Technology (IT), consumer‟s mobility and electronic media industries. Telecom sector which started as a monopoly sector was rejuvenated by entry of fresh and new Telecom players. Till 2000, there were only 2 players in the mobile sector, however in 2001, Government allowed Government operator BSNL/MTNL as the 3rd Telecom operator. The situation of Telecommunication in 1994, just after liberalization, was miserable.
Indian Tele density, at about 0.8 percent, was far below than the world average of 10 percent.
Total telephone connections were 8 million with an equally long wait list of 2.5 million.
In the year 2001, mobile revolution was triggered in India. Demand shortfall of telephone connections got slowly met by the GSM operators. In the year 2001 due to various changes in policies like announcement of policy for additional license for basic and wireless services, reduction in license fees, allowing limited mobility to basic services and allocation of spectrum allotted to BSO and awarding of new licenses etc. Year 2002 & 2003 was the year of mobile boom.
The boom of mobile connections is large contributed due to the decline in entry fees for Telecom players, falling of tariff, allocation of unified license and entry of BSNL in Mobile segment.
3G Arena: India entered in 3G arena in December 2008 through launch of 3G services by MTNL in Delhi and later in Mumbai which was followed by 3G launch by BSNL in Feb 2009 in Chennai and Kolkata. Later 3G spectrum was allotted to private players through auction in during September 2010.
Introduction of 4G services in India
Airtel was the first company to have launched 4G services using TD-LTE technology in Kolkata in 2012.It was followed by the launch of 4G in Bangalore, Pune, Chandigarh, Mohali and Panchkula. Later, 4G services in India was launched by Aircel, Vodafone and RJIO. With entry of RJIO in 4G scene the market dynamics changed completely. Band 3 (1800MHz) (FD-LTE), Band 40 (2300MHz) (TD-LTE), Band 5 (850MHz) are primarily used for 4G coverage in India.
Gaps filled by 4G communication technology
Flexibility, Efficiency and Secured Network: 4G has filled in the gaps of 3G in terms of flexibility, efficiency, scalability and security to support interfacing with
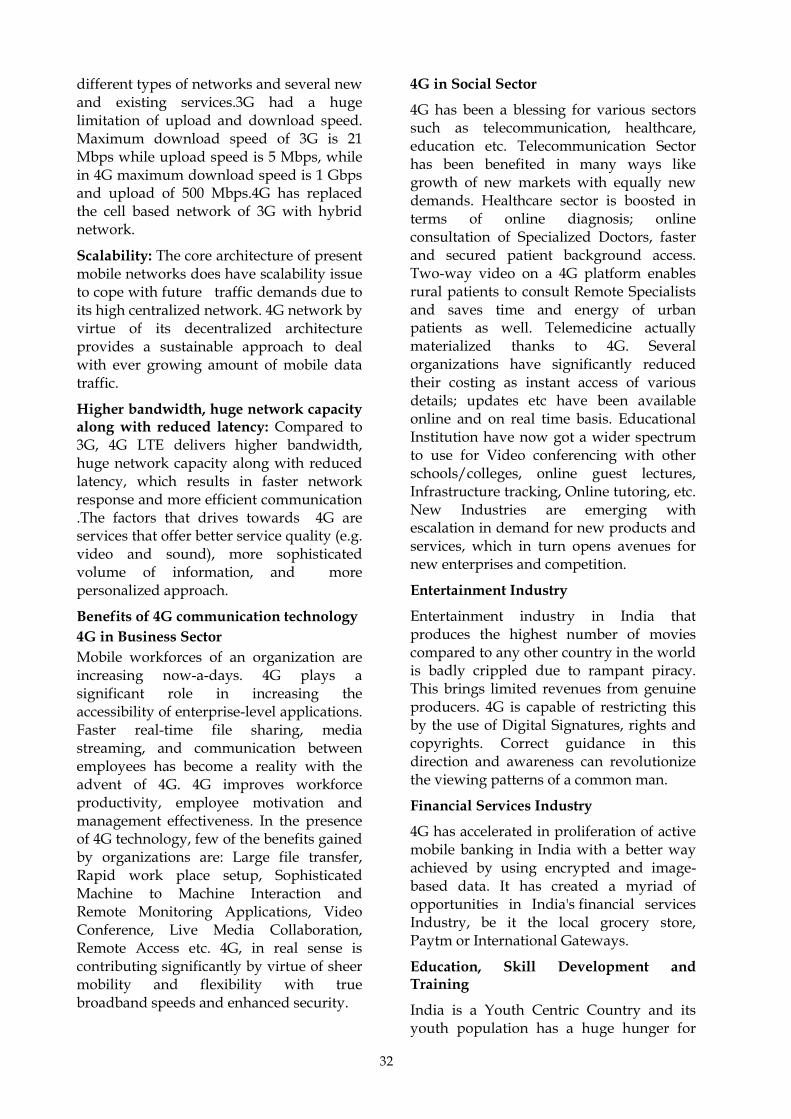
32
different types of networks and several new and existing services.3G had a huge limitation of upload and download speed. Maximum download speed of 3G is 21 Mbps while upload speed is 5 Mbps, while in 4G maximum download speed is 1 Gbps and upload of 500 Mbps.4G has replaced the cell based network of 3G with hybrid network.
Scalability: The core architecture of present mobile networks does have scalability issue to cope with future traffic demands due to its high centralized network. 4G network by virtue of its decentralized architecture provides a sustainable approach to deal with ever growing amount of mobile data traffic.
Higher bandwidth, huge network capacity along with reduced latency: Compared to 3G, 4G LTE delivers higher bandwidth, huge network capacity along with reduced latency, which results in faster network response and more efficient communication .The factors that drives towards 4G are services that offer better service quality (e.g. video and sound), more sophisticated volume of information, and more personalized approach.
Benefits of 4G communication technology
4G in Business Sector
Mobile workforces of an organization are increasing now-a-days. 4G plays a significant role in increasing the accessibility of enterprise-level applications. Faster real-time file sharing, media streaming, and communication between employees has become a reality with the advent of 4G. 4G improves workforce productivity, employee motivation and management effectiveness. In the presence of 4G technology, few of the benefits gained by organizations are: Large file transfer, Rapid work place setup, Sophisticated Machine to Machine Interaction and Remote Monitoring Applications, Video Conference, Live Media Collaboration, Remote Access etc. 4G, in real sense is contributing significantly by virtue of sheer mobility and flexibility with true broadband speeds and enhanced security.
4G in Social Sector
4G has been a blessing for various sectors such as telecommunication, healthcare, education etc. Telecommunication Sector has been benefited in many ways like growth of new markets with equally new demands. Healthcare sector is boosted in terms of online diagnosis; online consultation of Specialized Doctors, faster and secured patient background access. Two-way video on a 4G platform enables rural patients to consult Remote Specialists and saves time and energy of urban patients as well. Telemedicine actually materialized thanks to 4G. Several organizations have significantly reduced their costing as instant access of various details; updates etc have been available online and on real time basis. Educational Institution have now got a wider spectrum to use for Video conferencing with other schools/colleges, online guest lectures, Infrastructure tracking, Online tutoring, etc. New Industries are emerging with escalation in demand for new products and services, which in turn opens avenues for new enterprises and competition.
Entertainment Industry
Entertainment industry in India that produces the highest number of movies compared to any other country in the world is badly crippled due to rampant piracy. This brings limited revenues from genuine producers. 4G is capable of restricting this by the use of Digital Signatures, rights and copyrights. Correct guidance in this direction and awareness can revolutionize the viewing patterns of a common man.
Financial Services Industry
4G has accelerated in proliferation of active mobile banking in India with a better way achieved by using encrypted and image-based data. It has created a myriad of opportunities in India's financial services Industry, be it the local grocery store, Paytm or International Gateways.
Education, Skill Development and Training
India is a Youth Centric Country and its youth population has a huge hunger for
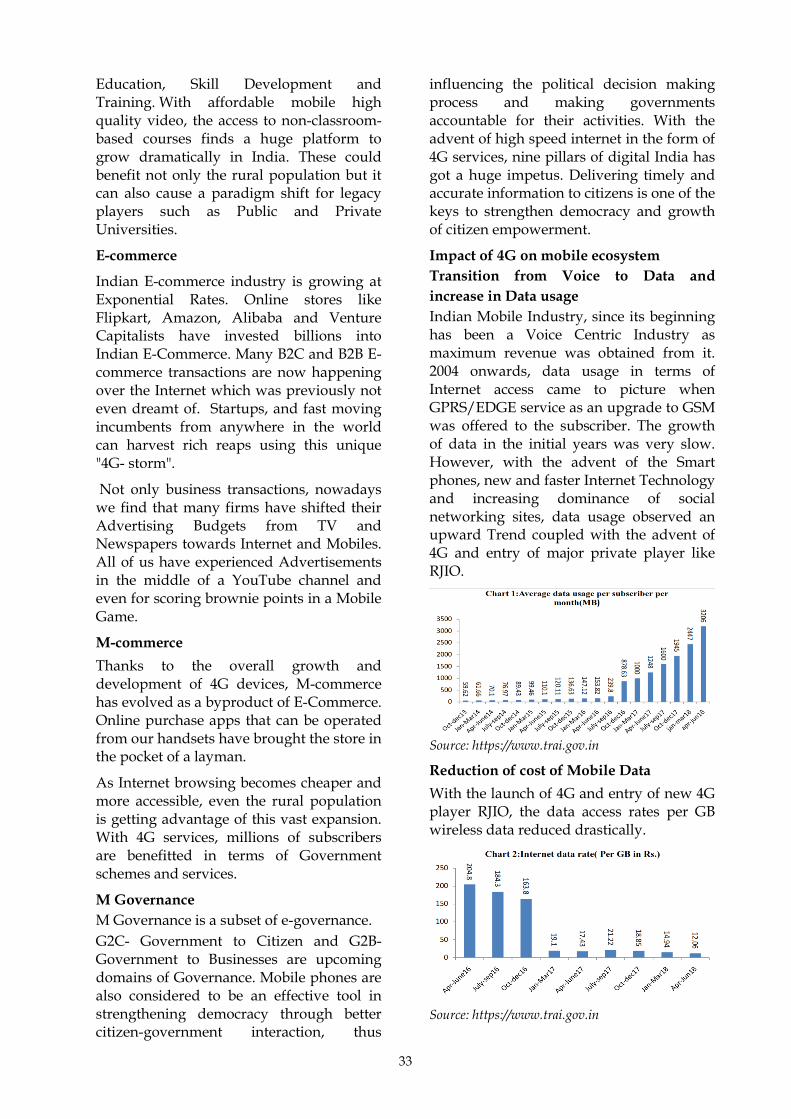
33
Education, Skill Development and Training. With affordable mobile high quality video, the access to non-classroom-based courses finds a huge platform to grow dramatically in India. These could benefit not only the rural population but it can also cause a paradigm shift for legacy players such as Public and Private Universities.
E-commerce
Indian E-commerce industry is growing at Exponential Rates. Online stores like Flipkart, Amazon, Alibaba and Venture Capitalists have invested billions into Indian E-Commerce. Many B2C and B2B E-commerce transactions are now happening over the Internet which was previously not even dreamt of. Startups, and fast moving incumbents from anywhere in the world can harvest rich reaps using this unique "4G- storm".
Not only business transactions, nowadays we find that many firms have shifted their Advertising Budgets from TV and Newspapers towards Internet and Mobiles. All of us have experienced Advertisements in the middle of a YouTube channel and even for scoring brownie points in a Mobile Game.
M-commerce
Thanks to the overall growth and development of 4G devices, M-commerce has evolved as a byproduct of E-Commerce. Online purchase apps that can be operated from our handsets have brought the store in the pocket of a layman.
As Internet browsing becomes cheaper and more accessible, even the rural population is getting advantage of this vast expansion. With 4G services, millions of subscribers are benefitted in terms of Government schemes and services.
M Governance
M Governance is a subset of e-governance.
G2C- Government to Citizen and G2B- Government to Businesses are upcoming domains of Governance. Mobile phones are also considered to be an effective tool in strengthening democracy through better citizen-government interaction, thus
influencing the political decision making process and making governments accountable for their activities. With the advent of high speed internet in the form of 4G services, nine pillars of digital India has got a huge impetus. Delivering timely and accurate information to citizens is one of the keys to strengthen democracy and growth of citizen empowerment.
Impact of 4G on mobile ecosystem
Transition from Voice to Data and
increase in Data usage
Indian Mobile Industry, since its beginning has been a Voice Centric Industry as maximum revenue was obtained from it. 2004 onwards, data usage in terms of Internet access came to picture when GPRS/EDGE service as an upgrade to GSM was offered to the subscriber. The growth of data in the initial years was very slow. However, with the advent of the Smart phones, new and faster Internet Technology and increasing dominance of social networking sites, data usage observed an upward Trend coupled with the advent of 4G and entry of major private player like RJIO.
Source: https://www.trai.gov.in
Reduction of cost of Mobile Data
With the launch of 4G and entry of new 4G player RJIO, the data access rates per GB wireless data reduced drastically.
Source: https://www.trai.gov.in
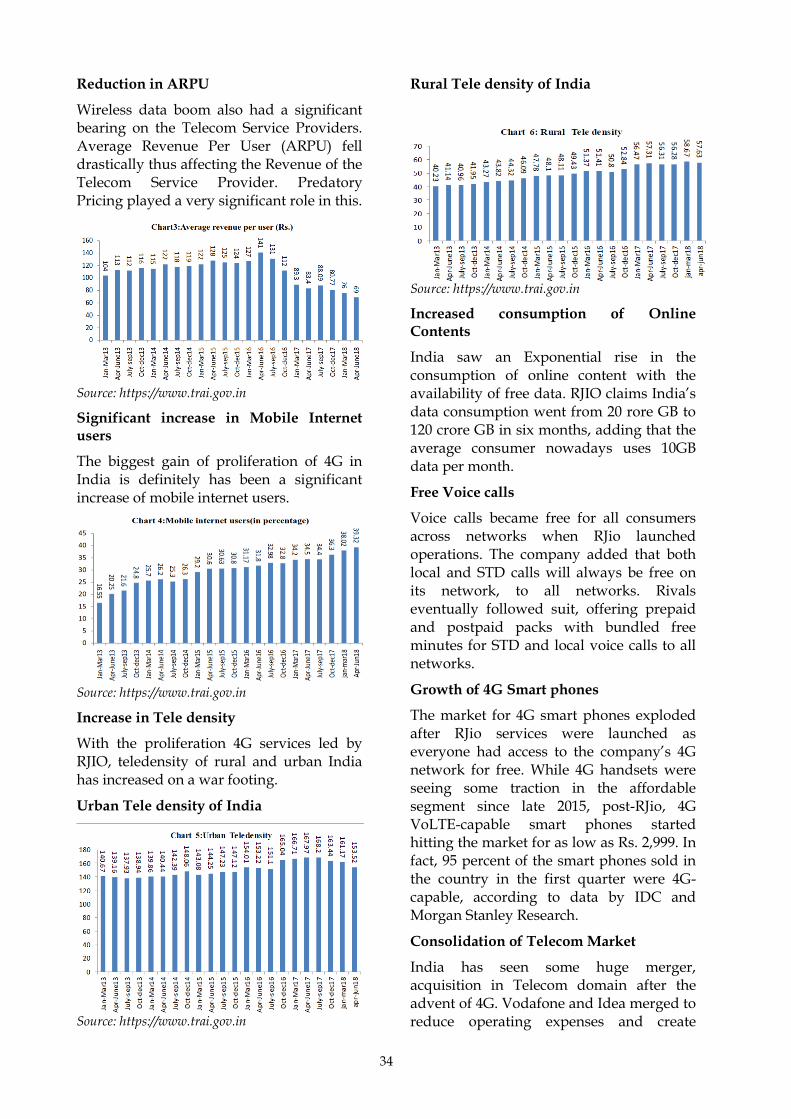
34
Reduction in ARPU
Wireless data boom also had a significant bearing on the Telecom Service Providers. Average Revenue Per User (ARPU) fell drastically thus affecting the Revenue of the Telecom Service Provider. Predatory Pricing played a very significant role in this.
Source: https://www.trai.gov.in
Significant increase in Mobile Internet users
The biggest gain of proliferation of 4G in India is definitely has been a significant increase of mobile internet users.
Source: https://www.trai.gov.in
Increase in Tele density
With the proliferation 4G services led by RJIO, teledensity of rural and urban India has increased on a war footing.
Urban Tele density of India
Source: https://www.trai.gov.in
Rural Tele density of India
Source: https://www.trai.gov.in
Increased consumption of Online Contents
India saw an Exponential rise in the consumption of online content with the availability of free data. RJIO claims India‟s data consumption went from 20 rore GB to 120 crore GB in six months, adding that the average consumer nowadays uses 10GB data per month.
Free Voice calls
Voice calls became free for all consumers across networks when RJio launched operations. The company added that both local and STD calls will always be free on its network, to all networks. Rivals eventually followed suit, offering prepaid and postpaid packs with bundled free minutes for STD and local voice calls to all networks.
Growth of 4G Smart phones
The market for 4G smart phones exploded after RJio services were launched as everyone had access to the company‟s 4G network for free. While 4G handsets were seeing some traction in the affordable segment since late 2015, post-RJio, 4G VoLTE-capable smart phones started hitting the market for as low as Rs. 2,999. In fact, 95 percent of the smart phones sold in the country in the first quarter were 4G-capable, according to data by IDC and Morgan Stanley Research.
Consolidation of Telecom Market
India has seen some huge merger, acquisition in Telecom domain after the advent of 4G. Vodafone and Idea merged to reduce operating expenses and create
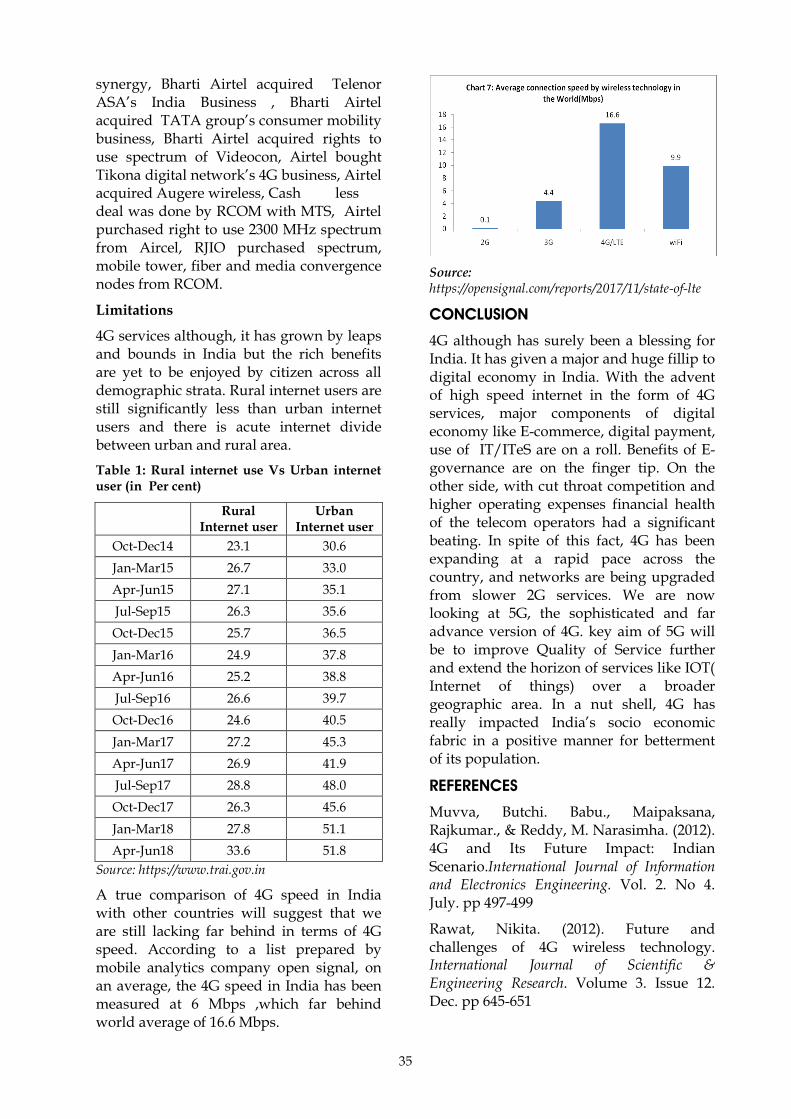
35
synergy, Bharti Airtel acquired Telenor ASA‟s India Business , Bharti Airtel acquired TATA group‟s consumer mobility business, Bharti Airtel acquired rights to use spectrum of Videocon, Airtel bought Tikona digital network‟s 4G business, Airtel acquired Augere wireless, Cash less deal was done by RCOM with MTS, Airtel purchased right to use 2300 MHz spectrum from Aircel, RJIO purchased spectrum, mobile tower, fiber and media convergence nodes from RCOM.
Limitations
4G services although, it has grown by leaps and bounds in India but the rich benefits are yet to be enjoyed by citizen across all demographic strata. Rural internet users are still significantly less than urban internet users and there is acute internet divide between urban and rural area.
Table 1: Rural internet use Vs Urban internet user (in Per cent)
Rural Internet user
Urban Internet user
Oct-Dec14 23.1 30.6
Jan-Mar15 26.7 33.0
Apr-Jun15 27.1 35.1
Jul-Sep15 26.3 35.6
Oct-Dec15 25.7 36.5
Jan-Mar16 24.9 37.8
Apr-Jun16 25.2 38.8
Jul-Sep16 26.6 39.7
Oct-Dec16 24.6 40.5
Jan-Mar17 27.2 45.3
Apr-Jun17 26.9 41.9
Jul-Sep17 28.8 48.0
Oct-Dec17 26.3 45.6
Jan-Mar18 27.8 51.1
Apr-Jun18 33.6 51.8
Source: https://www.trai.gov.in
A true comparison of 4G speed in India with other countries will suggest that we are still lacking far behind in terms of 4G speed. According to a list prepared by mobile analytics company open signal, on an average, the 4G speed in India has been measured at 6 Mbps ,which far behind world average of 16.6 Mbps.
Source: https://opensignal.com/reports/2017/11/state-of-lte
CONCLUSION
4G although has surely been a blessing for India. It has given a major and huge fillip to digital economy in India. With the advent of high speed internet in the form of 4G services, major components of digital economy like E-commerce, digital payment, use of IT/ITeS are on a roll. Benefits of E- governance are on the finger tip. On the other side, with cut throat competition and higher operating expenses financial health of the telecom operators had a significant beating. In spite of this fact, 4G has been expanding at a rapid pace across the country, and networks are being upgraded from slower 2G services. We are now looking at 5G, the sophisticated and far advance version of 4G. key aim of 5G will be to improve Quality of Service further and extend the horizon of services like IOT( Internet of things) over a broader geographic area. In a nut shell, 4G has really impacted India‟s socio economic fabric in a positive manner for betterment of its population.
REFERENCES
Muvva, Butchi. Babu., Maipaksana, Rajkumar., & Reddy, M. Narasimha. (2012). 4G and Its Future Impact: Indian Scenario.International Journal of Information and Electronics Engineering. Vol. 2. No 4. July. pp 497-499
Rawat, Nikita. (2012). Future and challenges of 4G wireless technology. International Journal of Scientific & Engineering Research. Volume 3. Issue 12. Dec. pp 645-651
36
Prasad, K. Krishna.,& Aithal,S. (2016). The growth of 4G technologies in India-Challenges and Opportunities. International Journal of Management, IT and Engineering. Vol.6. Issue 1. Jan. ISSN:2249-0558.pp 543-550
Anon. (2008). Understanding 4G LTE for business. Special Report Series. Retrieved from http://www.Smithellerby.co.uk/wp-content/uploads/2014/08, accessed on 01/12/18
Performance indicator reports.(2018).Retrieved from https://www.trai.gov.in.accessed on 01/12/18
Sinha, Naveen. Kumar. (2013). Emergence of 4G Technology in India and its future implication. International Journal of Engineering and Management Sciences. Volume 4(2). ISSN 2229-600X,pp. 247-249
Gaur, Ashutosh. D.,& Padiya, Jasmin. (2016). A Study Impact of „Digital India‟ in „Make in India‟ Program in IT & BPM Sector. 14th AIMS International Conference on Management. Ahmedabad. Dec. ISBN: 978-1-943295-05-0
Ravi,S.,& Darrel,M.West.(2015,August). Spectrum policy in India. Retrieved from
https://www.brookings.edu/wp-content/uploads/2017/05/spectrum-policy-in-india8515.pdf
Anon. (2018, Feb 22). 4G speed is slowest in world. Times of India. accessed on 1st Dec, 2018.
Open Signal (2018). State of LTE Report. Retrieved from https://opensignal.com/reports/2017/11/state-of-lte. accessed on 01/12/18
Anon. (2012). Online and upcoming : The internet‟s impact on India. Report of Mckinsey & Company. Dec. accessed on 30/11/18.
Minges, Michael. (2016). World development report- Exploring the relationship between Broadband and economic Growth. Retried from http://documents.worldbank.org/curated/en /178701467988875888/Exploring-the-relationship-between-broadband-and-economic-growth
Kaul, Mrinalini.,& Mathur, Purvi. (2017). Impact of digitization on the Indian Economy and requirement of Financial literacy. International conference on Recent Innovation and Technology. Jaipur. Feb. ISBN:978-93-86291-63-9
***
Amity Journal of Management Amity Business School Vol. VI, No. 2, July - December 2018 Amity University, Madhya Pradesh (ISSN 2347 – 1832)
37
A STUDY ON FACTORS AFFECTING EXPORTS OF LEATHER FOOTWEAR AS A
STRONG INITIATIVE OF MAKE IN INDIA: OPPORTUNITIES AND CHALLENGES
Dr D S Yadav1 and Dr Vijit Chaturvedi2
ABSTRACT
India has ample of opportunities in Make in India campaign in the leather footwear sector. Availability of skilled manpower in this sector has motivated investors to manufacture at large scale. Government listed this sector in Make in India campaign which has capacity to contribute in industry turnover from current $12 billion to $27 billion by 2020. This sector also has potential to produce an approximate six million jobs. Indian leather industry is one of the principal producers of leather footwear globally. The major manufacturing centers in India are Tamil Nadu, Andhra Pradesh, Karnataka, Punjab, Delhi, West Bengal, Uttar Pradesh and Maharashtra. The key objective of this paper is to explore opportunities and challenges in Make in India, different factors affecting exports of leather footwear in the leather footwear sector, the initiatives by the government to boost growth in this sector and emerging trends in this industry. It also focuses on different challenges that this industry faces. Based on secondary data and reports available a conceptual overview will be understood. The observations will help in understanding the scope, improvement areas and challenges to be circumvented to boost this industry and strengthen our Economy. Keywords- Leather industry, Footwear, Economic growth.
INTRODUCTION
The Indian leather industry is as an eminent industry both in national as well as in the international market. India is the ninth largest exporter of leather and leather products and the second largest producer of footwear and leather garments, with annual revenue of USD 8,500 million for 2011-12 with exports of USD 4,868.71 million. This sector is among the top foreign currency earning sectors of Indian economy and approx. 2.5 million people gets employment in this sector. Ample raw material, skilled manpower, conformity with environmental standards and growth of the accompanying industries has helped the Indian leather industry to grow manifolds. Small and household units contribute almost 80% of the total production.
The units involved in manufacturing of footwear are, generally, tanneries or either big companies. Majority of the manufacturing units faces many challenges
as they belong to the unorganized sector of the industry. Timely availability of raw materials, high labor cost, Poor product innovation and lack of existence in global fashion market are few of them. The government of India has taken many initiatives to support the sector like - de-controlling the sector, permitting 100% FDI and duty free imports, provision for financial support to the manufacturing units, promotion through industrial parks, execution of various programs for the development of leather industry. Keeping in mind the past performance, strength of the sector and backing from the government, the Indian leather industry is self-assured to grow manifolds.
The Indian leather industry has a high potential for exports, growth and employment. It employs approx. 2.5 million people directly or indirectly. Almost 50% of the workers are skilled/ semi-skilled and women constitute 30% of the total workforce.
Emerging Indian market needs business-friendly policies and strategic initiatives. The youth of India has dreams to live in a country that has development and
1 Associate Professor, RBS Management Technical Campus, Agra.
2 Associate Professor, Amity Business School, Amity University Noida.
38
infrastructure at par with international standards. To achieve economic development on global standards, Indian government must establish definite and realistic goals that are achievable through systematic planning and execution.
Modi government has given a new direction to Indian economy and started a journey of inclusive development, where every Indian citizen would be able to achieve his or her hopes and ambitions. However, the Indian government has numerous social and economic challenges to overcome in a country which is high with ambitions and opportunities. The government has taken several strategic steps and policy initiatives, most of which are praised by the industry and general public.
The „Make in India‟ campaign is one of the promising policy initiative of Modi government. The principal aim of „Make in India‟ campaign is to develop India as a manufacturing hub by welcoming global manufacturers to invest in India and upturn the country‟s Gross Domestic Product (GDP).
To realise the drive of achieving maximum growth, by „Make in India‟ campaign , the government has been focusing on eradication of superfluous regulations, to abbreviate bureaucratic processes, upgrade infrastructure, open up sectors to foreign direct investment (FDI), and most prominently, government wants to be seen as a true business partner. These initiatives could essentially fulfil the „ease-of-doing‟ business philosophy and helps in answering the problems of the leather industry.
Indian government has recognised 25 sectors to be a part of the „Make in India‟ campaign. The leather industry is a key sector of the „Make in India‟ campaign and the growth of this sector is essential to speed up India‟s GDP growth. To augment the revenue of leather industry from the current $12 billion to $27 billion by 2020 is one of the key objectives of this initiative. The successful execution of campaign in
leather industry will generate employment for six million people.
India, with 10% contribution in world‟s total leather production, has become the second largest producer of leather footwear and garments in the world. The SMEs is a key segment of Indian leather industry contributes 80% of the total business done in this sector. Manufacturing is a central function of the Indian leather industry, with a turnover of $11 billion (nearly Rs 72,776 crore) and has a noteworthy share in the overall exports of the country. The exports of Indian leather goods‟ are estimated to grow 24% per annum over the next five years.
Moreover, leather industry is known for its labour intensive manufacturing practices. The footwear sector primarily employs women and has the prospective for substantial expansion. If 'Make in India „campaign is executed magnificently, it will empower women from economically backward sections of the society.
The Indian leather industry employs almost 2.5 million people in the country and 55% of the workforce is below 35 years of age. Powering up manufacturing will lead to an upswing in demand for more skilled hands on the deck. Thus, the leather sector is one of the key industries that can help in solving India‟s unemployment problem. Though in general, things look good for the industry, there are a number of challenges that still need to be tackled.
OBJECTIVES OF STUDY
The paper consists of both conceptual and empirical objectives.
a) To understand the emerging trends in Indian Leather Industry and Government Initiatives
b) To understand factors affecting exports of leather footwear in and around Agra
c) To understand various challenges in leather footwear industry
RESEARCH DESIGN
Data was collected from 42 exporters from in and around Agra with a self-
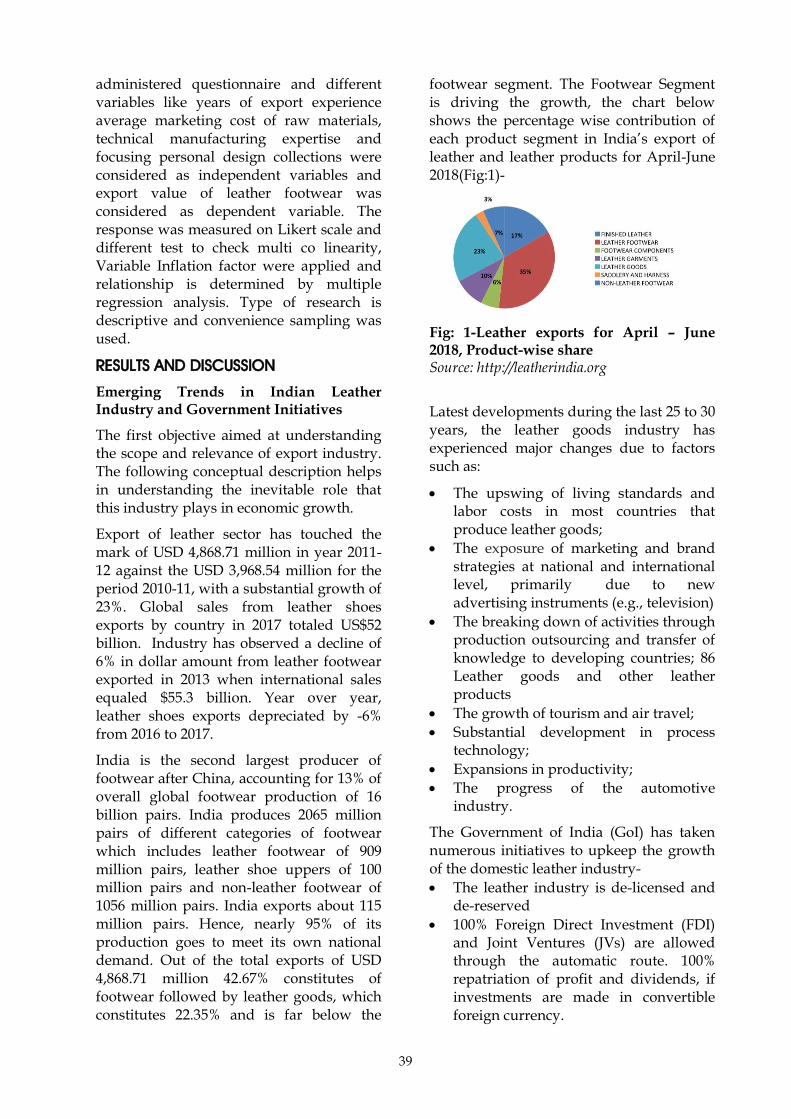
39
administered questionnaire and different variables like years of export experience average marketing cost of raw materials, technical manufacturing expertise and focusing personal design collections were considered as independent variables and export value of leather footwear was considered as dependent variable. The response was measured on Likert scale and different test to check multi co linearity, Variable Inflation factor were applied and relationship is determined by multiple regression analysis. Type of research is descriptive and convenience sampling was used.
RESULTS AND DISCUSSION
Emerging Trends in Indian Leather Industry and Government Initiatives
The first objective aimed at understanding the scope and relevance of export industry. The following conceptual description helps in understanding the inevitable role that this industry plays in economic growth.
Export of leather sector has touched the mark of USD 4,868.71 million in year 2011-12 against the USD 3,968.54 million for the period 2010-11, with a substantial growth of 23%. Global sales from leather shoes exports by country in 2017 totaled US$52 billion. Industry has observed a decline of 6% in dollar amount from leather footwear exported in 2013 when international sales equaled $55.3 billion. Year over year, leather shoes exports depreciated by -6% from 2016 to 2017.
India is the second largest producer of footwear after China, accounting for 13% of overall global footwear production of 16 billion pairs. India produces 2065 million pairs of different categories of footwear which includes leather footwear of 909 million pairs, leather shoe uppers of 100 million pairs and non-leather footwear of 1056 million pairs. India exports about 115 million pairs. Hence, nearly 95% of its production goes to meet its own national demand. Out of the total exports of USD 4,868.71 million 42.67% constitutes of footwear followed by leather goods, which constitutes 22.35% and is far below the
footwear segment. The Footwear Segment is driving the growth, the chart below shows the percentage wise contribution of each product segment in India‟s export of leather and leather products for April-June 2018(Fig:1)-
Fig: 1-Leather exports for April – June 2018, Product-wise share Source: http://leatherindia.org
Latest developments during the last 25 to 30 years, the leather goods industry has experienced major changes due to factors such as:
The upswing of living standards and labor costs in most countries that produce leather goods;
The exposure of marketing and brand strategies at national and international level, primarily due to new advertising instruments (e.g., television)
The breaking down of activities through production outsourcing and transfer of knowledge to developing countries; 86 Leather goods and other leather products
The growth of tourism and air travel;
Substantial development in process technology;
Expansions in productivity;
The progress of the automotive industry.
The Government of India (GoI) has taken numerous initiatives to upkeep the growth of the domestic leather industry-
The leather industry is de-licensed and de-reserved
100% Foreign Direct Investment (FDI) and Joint Ventures (JVs) are allowed through the automatic route. 100% repatriation of profit and dividends, if investments are made in convertible foreign currency.
40
Duty free import of raw materials (namely raw skins, hides, semi- finished leather and finished leather) and of embellishments and parts under specific scheme. Concessional duty on import of listed machinery for use in leather sector Duty neutralization / remission scheme in enactment of Leather footwear initiatives in India.
The domestic leather and footwear industry has undertaken a substantial renovation due to the continuous support of the Government. Identifying the opportunities for Indian leather industry from globalization, the government over the last decade and a half has started numerous initiatives in the areas of investment, taxation, research and cluster initiatives. The erstwhile restrictions on capacity expansion by way of reservation for SMEs has been done away with as the government has de-reserved the manufacture of various types of leather including semi-finished leather, harness leather, leather shoes, etc. from small scale sector.
As a measure of the liberalization processes, most of the articles manufactured in the leather sector have been de-licensed. Further, 100% Foreign Direct Investment and Joint Ventures are allowed through the automatic route. 100% repatriation of profit and dividends is also allowed, if investments are made in convertible foreign currency. Only a declaration to this effect to the Reserve Bank is necessary. The production capacity in the leather & leather product industry has not improved even after the de-reservation of the entire leather sector from small scale sector.
Lack of huge capacities to cater to volume markets like USA, which account for nearly 1/4th of total world imports of leather & leather products, is one of the factors shackling the growth of this sector. Huge investments are required to make the industry technologically and environmentally
sound and viable. However, the industry has not been able to charm high investments to address these issues. In spite of having a liberal FDI policy, the domestic leather industry has managed to attract mere Rs 2.68 billion since 2000. This constitutes a tiny 0.04 per cent of the total FDI inflows received by India. Trade processes Introduction of Foreign Trade Policy (2004-2009) has provided numerous incentives to exporters to lift the export prospects of the industry.
It has also intended at procedural simplification and trade facilitation measures. Existing procedures like the Focus Product Scheme (FPS) and the Duty Entitlement Passbook Scheme (DEPB) have been stretched in the new Foreign Trade Policy (2009-14). Various other benefits available to exporters of leather products include: Duty neutralisation/remission scheme in place like DEPB and Duty Drawback; Duty free import of certain raw materials like raw & finished leather, fur skins, etc.; Concessional duty on import of listed machinery for use in Leather Sector; and low import tariff - Peak Rate 10%. Specific schemes for Sector Development the government has been making efforts to develop the prospects of the domestic leather industry and its swift expansion through the Indian Leather Development Program (ILDP).
This is in extension with the National Leather Development Program (NLDP) executed in the nineties. High land cost, delay in environmental clearance and funding restrictions are the key causes cited for the underachievement in goals. Infrastructure development the insufficient infrastructure has been a major block in the growth of the Indian leather industry.
Much of growth in the leather sector in noticeable traditional centers of Agra, Kanpur, Jalandhar, Ambur, Ranipet, Vaniyambadi and Kolkata was unplanned and was almost only due to
41
private sector initiative. The current infrastructure in various leather clusters i.e. integrated supply chain infrastructure (material markets, tanneries), production infrastructure (water supply, drainage facilities, power supply, effluent treatment plants, factories for ancillary products) and support facilities (design and product development studios, testing laboratory, training institutes, buyer interaction showrooms etc.,) is not up to the mark and needs a major restructuring to make the industry internationally competitive.The above picture highlights and makes clear the role and wide scope that this industry holds.
Factors Affecting the Exports in Leather Footwear Industry
The second objective of study was to understand different factors that affect exports in leather footwear industry. In order to ensure reliability of the variables selected different tests were applied which are being discussed as under.
Table-1: Test of Normality - Shapiro Wiki
Statistics Df Sig
0.935 42 0.899
The sig value of Shapiro Wilk test is 0.899 which assures that the data set is normal and the studied characteristics are normally distributed among the whole population.
Regression Analysis
A multiple regression analysis is applied to measure dependent variable footwear export. The independent variables are years of qualification, years of export experience, energy crisis, ISO certification, average raw material cost per pair, participation in international trade exhibitions, average marketing cost per pair, technical manufacturing expertise and focusing personal design collections.
The relationship between dependent and independent variable is given in a model as;
Y = βo + β1X1 + β2X2 + β3X3 + β4X4 + β5X5+ β6X6+ β7X7+β1D1 + μ
Where; Y = Export value of footwear X1= Years of qualification X2= Years of export experience, X3= Average raw material cost per pair X4= Participation in international trade exhibitions X5= Average marketing cost per pair X6= Technical manufacturing expertise X7= Focusing personal design collections
Table 2: Multi-collinearity Statistics of Variables
Variables Tolerance Variance Inflation
Factor
Qualification 0.801 1.249
Years of experience in Exports
0.819 1.221
Average raw material cost
0.768 1.302
Participation in International trade exhibition
0.735 1.360
Average marketing cost
0.932 1.073
Technical manufacturing expertise
0.786 1.272
Focusing personal design collection
0.917 1.091
Multicollinearity is considered undesirable in any regression analysis. We calculated variance inflation factor (VIF) to test the multicollinearity of our data set whereas tolerance statistic is used to analyze the extent that how much independent variables are linearly related to one another. The absolute value of VIF for no multicollinearity is 0. Thus the value of VIF below 10 is ignorable. Applying this criterion to our results in table 2 we found that there is no multicollinearity exists in our data set.
Table 3: Summary of Regression Results
Model R R Square Adjusted R Square
Std. error of
estimate
1 0.9254 0.865 0.862 0.480
The value of R square 0.899 is suggesting that this is a reliable model. The expansibility power of the model is very strong and this model is explaining almost
42
90 percent to the dependent variable. The sig value of ANOVA is 0.000 it means that this is a significant model.
Table 4: Summary of Regression Results
Variables Coefficient
s Standard Error
t-valu
e
Significance
Constant 1.567 0.534 2.635 .009
Qualification .321 .121 3.26 .003*
Years of experience in Exports
.407 .052 5.114 .000*
Average raw material cost
-.248 .048 -4.26 .000*
Participation in International trade exhibition
.324
.089 3.14 .001*
Average marketing cost
-.128 .078 -.117 .138 (NS)
Technical manufacturing expertise
.168 .067 1.854 .021*
Focusing personal design collections
-.147 .068 -
2.068 .038*
Significant 5% level NS –Not significant
The above table (Table-4) shows the regression results. From the table it is clear that the coefficient shows how strong and important are the independent variables and significance shows that how much the variables are statistically relevant. It is clear that almost all the independent variables are significant and important except few like average raw material cost and marketing cost. It is quite evident that for every one percent increase in the cost of raw material and marketing cost the value of export reduces by .248 and .128 percent respectively. The same holds true for personal design collection which shows negative relation that every one percent increase in personal design reduces the export value by .147 percent. Similarly, for every one percent increase in qualification, years of experience in exports participation in international trade exhibitions and technical manufacturing expertise every one percentage increase in the above variable leads to increase in exports value.
Thus, enough emphasis should be given on the above variable to ensure increase in exports largely. Thus, from the above study and conceptual framework the scope, relevance, importance and areas that require urgent attention in order to enhance exports has been discussed. The findings can help exporters in the relevant area to understand and develop strategies accordingly.
Opportunities and challenges in implementation of Leather footwear initiatives in India
The third objective of the study was to determine the varied opportunities and challenges that this industry faces, it talks of problem in work force, technological, innovation, international quality standards, lack of presence in global fashion market and infrastructure issues.
Thus understanding these challenges will help in minimizing the barriers in exports and will help in effective exports.
A major proportion (around 80%) of the industry is unorganized and has limited scope of mobilizing funds through private equity and bank loans
Although India has abundant supply raw material for leather and leather products, timely availability of raw materials remains a constraint.
High labor charges for skilled workforce
Lack of strong presence in the global fashion market
Unawareness of international quality standards by many players
Lack of product innovation: most of the units work on sub-contract basis where all the design and other specification of the product are provided by the buyer
In order to become the „Make in India‟ scheme a success in Leather industry, there is an urgent need to overcome multiple issues and challenges that the companies in Leather industry are facing.
One of the basic operation in Leather manufacturing sector is Tanning. The
43
process of Tanning faces number of problems, especially in small tanneries, like use of inefficient processes result in increased cost of production per unit area of finished leather. Also the locations which produce forty percent of India's exports and have got around sixty percent of the tanning capacity do not have dedicated industrial areas for manufacturing and processing of leather. The available capacity is poorly utilized which culminates in greater financial cost and liabilities. Therefore it now becomes imperative for the government to resolve these longstanding issues with some creative initiatives.
There are some other hurdles that are slowing down the pace of progress of the leather footwear sector. These include difference in the levels of technology utilised in diferent factories that result in production of low quality products.
Majority of companies in Indian Leather industry function on subcontract basis. It means that the design, component choice and production methods are dictated by the buyers and therefore these do not provide own collections. This problem has a special significance in women‟s segment footwear, which holds sixty three percent share in overall footwear market across the world. However, this share does not reflect in Indian footwear exports in women‟s segment which hovers around at only thirty four percent.
The other challenges that the industry is facing includes-
Uncertainty in Exports
Exporters of leather and related products are finding themselves in troubled waters due to reducing exports and unexpected policy reforms. Leather exports from India have been on the trajectory of decline to the tune of 7% in the time period of April-August 2015. However, the leather sector has been the „focus sector‟ under Indian government‟s „Make in India‟ initiative.
The European Slowdown
Europe holds a majority share receipt of Indian leather exports. However, the
unexpected reduction in demand from Europe has resulted in leather industry facing the unexpected crisis and Agra‟s footwear industry is no exception to it. Though the footwear industry in Agra has grown at a Compounded Annual Growth Rate of 15% during preceding decade, there has been a negative growth of 14% during the first half of financial year of 2016.
Infrastructural issues
The infrastructural impediments as well as apathy from the government are hurting the leather industry‟s growth prospects. For example, leather products from city of Kanpur have immense potential for exports and growth. However the high labor costs as well as scarcity of trained and skilled human resource are hurting the leather industry severely. At the same time the infrastructural factors like roads and power supply are also have hit the operations hard. The increasing competition from neighbouring countries like China, Pakistan and Bangladesh and cheap imports are also the hindrances in the way of prospects of leather industry.
The Beef Ban
The beef ban has aggravated the problem and this has even resulted in delaying the manufacturing process and time as it has led to shortage of raw material. The significant issue with the leather and footwear industry towards new Foreign Trade Policy 2015-20, is diminishing of duty credit under the modified Merchandise Exports from India Scheme (MEIS).
Policy issues
The major policy issue which has been bothering the industry for long time is the „actual user‟ condition put forth by the government in the name of DFIA scheme. Para 4.29 (viii) of FTP 2015-2020 states that “No Duty Free Import Authorisation shall be issued for an export product where SION prescribes „Actual User‟ condition for any input.” Earlier, the condition was limited to just that particular input [para 4.2.7(b) of FTP 2009-2014 stated that “wherever SIONs prescribe actual user condition, DFIA shall be issued with actual
44
user condition for these inputs and no transferability shall be allowed for these inputs even after fulfilment of export obligation”. This difference made has worked as large obstacle for exporters who have been working on very low margins.
Environmental Regulations
The leather industry has been directed to follow the strict environmental regulations and factory compliance with pollution norms. The industry has been asked to adopt the newly introduced Zero Liquid Discharge (ZLD) system has been .However, the industry people feel that ZLD is not a sustainable option since the cost associated is on the higher side. Thus, the stringent pollution norms are hitting the leather industry.
For example, in the year of 2012 the then incumbent UP Chief Minister permitted the allotment of 900 acres of land for establishment of 2 leather parks at two different locations. Initially this action was seen as a strong measure for boosting up the leather production in Uttar Pradesh. However, since then no significant progress has been made. There have been similar other instances as well, wherein due to lack of facilitation and prevailing bottlenecks, major such projects could not see the light of the day.
Action Plan desired
Thus from the above discussion it is evident that it is beyond any doubt that the leather industry has attained immense potential towards Forex earnings for our country. However, there exists need for some small initiatives from the end of policymakers in terms of proper polices and establishment of adequate infrastructure combating the competition. The Indian leather makers have created their own niche in the crowded international market in past amongst presence of foreign competitors and producers of luxury leather goods.
In order to enhance investments and increase the pace of job creation, the Indian government is working on fiscal and non-fiscal fronts for leather and non-leather footwear sector. The incentives announced
will largely be in the direction of recently declared incentives for textiles sector. „Leather‟ is a typical focal point under the 'Make in India' initiative. This is a highly important sector backed by labor intensive activities. The Ministry of Industry & Commerce is working on these plans.
These incentives may come in form of deduction in excise duty, exemptions in labour law and training proposals skill enhancement for the sector. The proposal has been materialized by the ministry in terms of consultation with the Finance Ministry about the probable outcomes. The experts say that the leather industry holds immense employment potential. Currently excise duty on leather footwear‟s worth over Rs 1,000 is 6 per cent, whereas for non-leather it is 12.5 per cent. India is the only country of sufficient size, with a sufficiently large population, and with low labor costs that could eventually replace China as the leading global footwear supplier.
FINDINGS OF STUDY
Thus from the above study it can be understood that leather footwear industry holds great potential in multidimensional avenues and similar are the impediments right from availability of skilled manpower to infrastructural issues. It is also noteworthy to observe that the government has taken several initiatives to support and strengthen this industry and the important areas/variables which obstruct the exports identified in the research needs to be understood and rectified.
Thus, clear policy measure, incentivisation, infrastructural, technological and expertise in this area will help in augmenting exports and bringing manifold benefits.
CONCLUSION
Thus, from the above discussion it is understood that there is inevitably a significant role that leather footwear industry plays in the development and up surgence of many multiple opportunities in India and India being one of the largest exporters of leather & leather accessories, accounts for 2.2% of the worldwide export . The leather industry in India has been
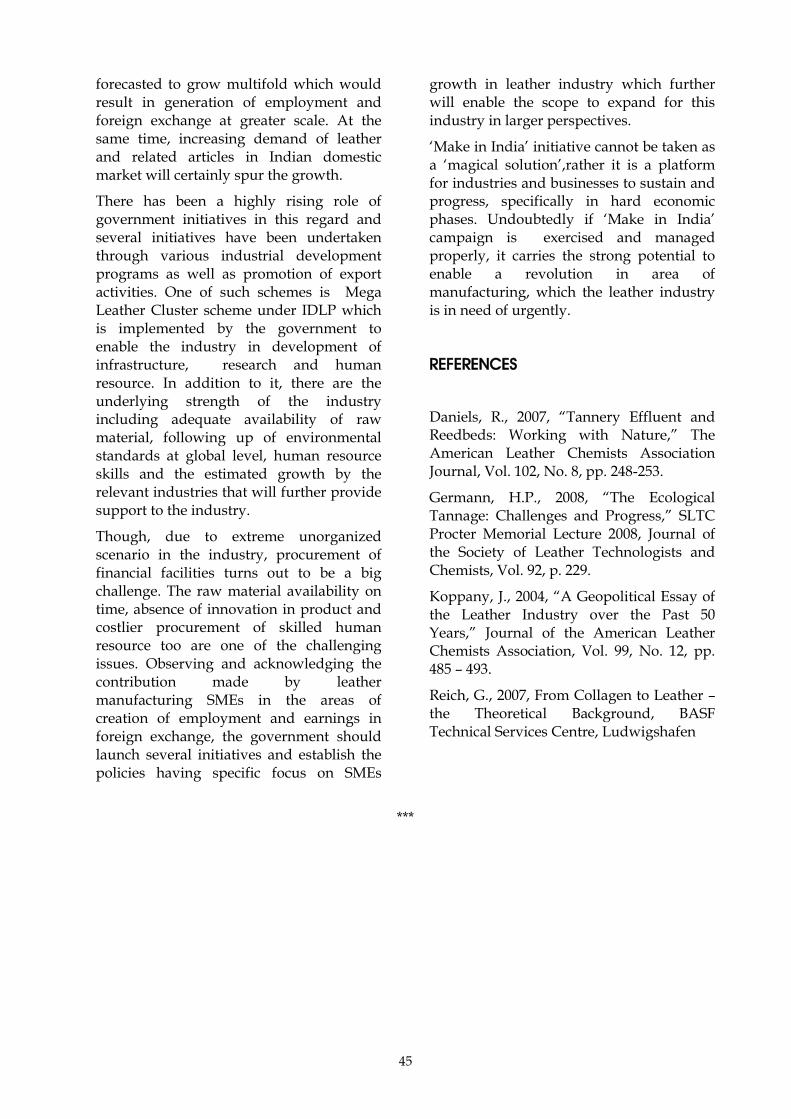
45
forecasted to grow multifold which would result in generation of employment and foreign exchange at greater scale. At the same time, increasing demand of leather and related articles in Indian domestic market will certainly spur the growth.
There has been a highly rising role of government initiatives in this regard and several initiatives have been undertaken through various industrial development programs as well as promotion of export activities. One of such schemes is Mega Leather Cluster scheme under IDLP which is implemented by the government to enable the industry in development of infrastructure, research and human resource. In addition to it, there are the underlying strength of the industry including adequate availability of raw material, following up of environmental standards at global level, human resource skills and the estimated growth by the relevant industries that will further provide support to the industry.
Though, due to extreme unorganized scenario in the industry, procurement of financial facilities turns out to be a big challenge. The raw material availability on time, absence of innovation in product and costlier procurement of skilled human resource too are one of the challenging issues. Observing and acknowledging the contribution made by leather manufacturing SMEs in the areas of creation of employment and earnings in foreign exchange, the government should launch several initiatives and establish the policies having specific focus on SMEs
growth in leather industry which further will enable the scope to expand for this industry in larger perspectives.
„Make in India‟ initiative cannot be taken as a „magical solution‟,rather it is a platform for industries and businesses to sustain and progress, specifically in hard economic phases. Undoubtedly if „Make in India‟ campaign is exercised and managed properly, it carries the strong potential to enable a revolution in area of manufacturing, which the leather industry is in need of urgently.
REFERENCES
Daniels, R., 2007, “Tannery Effluent and Reedbeds: Working with Nature,” The American Leather Chemists Association Journal, Vol. 102, No. 8, pp. 248-253.
Germann, H.P., 2008, “The Ecological Tannage: Challenges and Progress,” SLTC Procter Memorial Lecture 2008, Journal of the Society of Leather Technologists and Chemists, Vol. 92, p. 229.
Koppany, J., 2004, “A Geopolitical Essay of the Leather Industry over the Past 50 Years,” Journal of the American Leather Chemists Association, Vol. 99, No. 12, pp. 485 – 493.
Reich, G., 2007, From Collagen to Leather – the Theoretical Background, BASF Technical Services Centre, Ludwigshafen
***
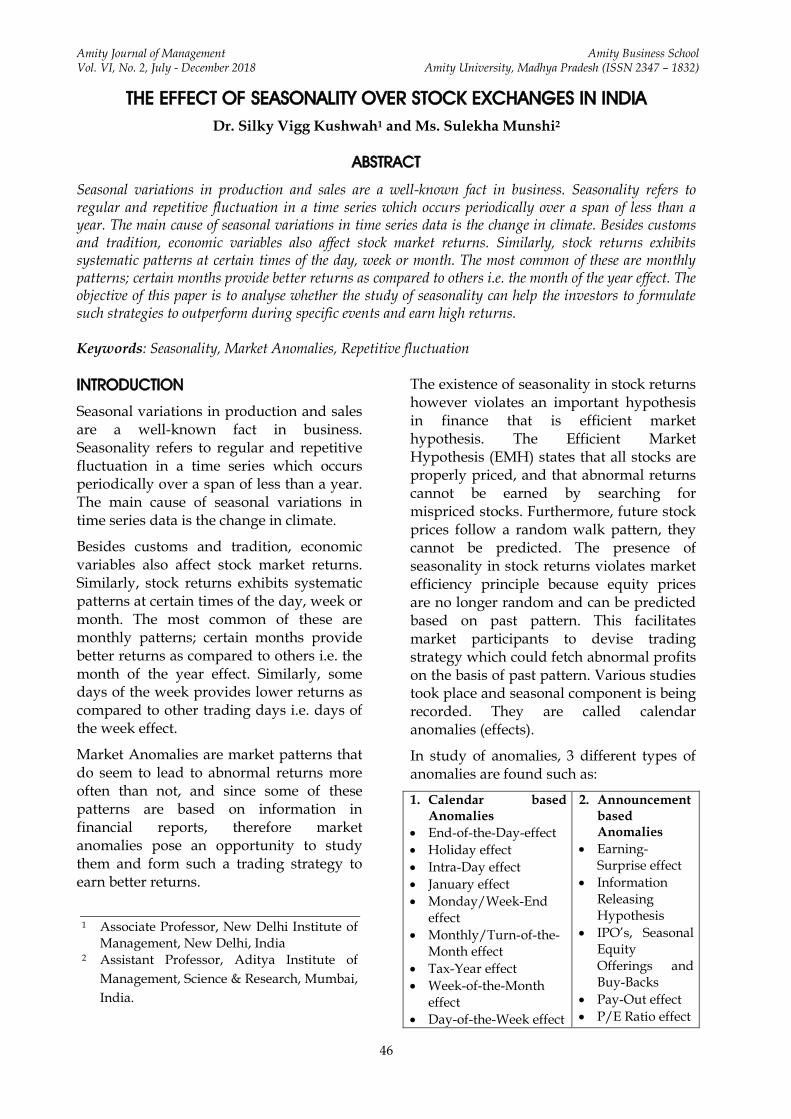
Amity Journal of Management Amity Business School Vol. VI, No. 2, July - December 2018 Amity University, Madhya Pradesh (ISSN 2347 – 1832)
46
THE EFFECT OF SEASONALITY OVER STOCK EXCHANGES IN INDIA
Dr. Silky Vigg Kushwah1 and Ms. Sulekha Munshi2
ABSTRACT
Seasonal variations in production and sales are a well-known fact in business. Seasonality refers to regular and repetitive fluctuation in a time series which occurs periodically over a span of less than a year. The main cause of seasonal variations in time series data is the change in climate. Besides customs and tradition, economic variables also affect stock market returns. Similarly, stock returns exhibits systematic patterns at certain times of the day, week or month. The most common of these are monthly patterns; certain months provide better returns as compared to others i.e. the month of the year effect. The objective of this paper is to analyse whether the study of seasonality can help the investors to formulate such strategies to outperform during specific events and earn high returns. Keywords: Seasonality, Market Anomalies, Repetitive fluctuation
INTRODUCTION
Seasonal variations in production and sales are a well-known fact in business. Seasonality refers to regular and repetitive fluctuation in a time series which occurs periodically over a span of less than a year. The main cause of seasonal variations in time series data is the change in climate.
Besides customs and tradition, economic variables also affect stock market returns. Similarly, stock returns exhibits systematic patterns at certain times of the day, week or month. The most common of these are monthly patterns; certain months provide better returns as compared to others i.e. the month of the year effect. Similarly, some days of the week provides lower returns as compared to other trading days i.e. days of the week effect.
Market Anomalies are market patterns that do seem to lead to abnormal returns more often than not, and since some of these patterns are based on information in financial reports, therefore market anomalies pose an opportunity to study them and form such a trading strategy to earn better returns.
The existence of seasonality in stock returns however violates an important hypothesis in finance that is efficient market hypothesis. The Efficient Market Hypothesis (EMH) states that all stocks are properly priced, and that abnormal returns cannot be earned by searching for mispriced stocks. Furthermore, future stock prices follow a random walk pattern, they cannot be predicted. The presence of seasonality in stock returns violates market efficiency principle because equity prices are no longer random and can be predicted based on past pattern. This facilitates market participants to devise trading strategy which could fetch abnormal profits on the basis of past pattern. Various studies took place and seasonal component is being recorded. They are called calendar anomalies (effects).
In study of anomalies, 3 different types of anomalies are found such as:
1. Calendar based Anomalies
End-of-the-Day-effect
Holiday effect
Intra-Day effect
January effect
Monday/Week-End effect
Monthly/Turn-of-the-Month effect
Tax-Year effect
Week-of-the-Month effect
Day-of-the-Week effect
2. Announcement based Anomalies
Earning-Surprise effect
Information Releasing Hypothesis
IPO‟s, Seasonal Equity Offerings and Buy-Backs
Pay-Out effect
P/E Ratio effect
1 Associate Professor, New Delhi Institute of Management, New Delhi, India
2 Assistant Professor, Aditya Institute of
Management, Science & Research, Mumbai,
India.
47
3. Announcement based
Anomalies
Earning-Surprise effect
Information Releasing Hypothesis
IPO‟s, Seasonal Equity Offerings and Buy-Backs
Pay-Out effect
P/E Ratio effect
4. Other Anomalies
Book-to-Market effect
Low-Beta-Firm effect
Low Price Stock effect
Momentum effect
Reversion to the Mean effect
SEO Underperformance effect
Size effect
Weather effect
In this paper we have conducted researchover returns of Nifty 50 for a period of 10years i.e. 2007-2017. We have considered 4 events to study seasonality. They are:
Budget week
Change in financial year
Change in calendar year
Diwali week
1. Budget week
One of most awaited week of whole year is budget week. On this day government announces its fiscal policy for the next one year. Here government presents their proposed revenue and expenses for the coming financial year. A significant portion of market sentiments are attached with this event. i.e. it is being considered for study. The date when budget was presented is considered as event date. Returns a week before and after the event are considered.
2. Change in financial year
A new financial year starts from 1st April. Prominent change in books of accounts of every company has a significant effect on every financial transaction took place. Therefore, it
is considered as a significant event. The date 1st April is treated as event date. Returns a week before and after the event are considered.
3. Change in calendar year
A new calendar year starts from 1st January. The last week of calendar year i.e. 25 December to 31st January have 2 big effects like Christmas, New Year eve. i.e. to obtain the good sentiments of market 1tJanuary is taken as event date. Returns a week before and after the event are considered.
4. Diwali week
One of the most auspicious day for Indians is Diwali. As every business encounter higher number of sales in this week. Therefore, returns occurring in market before and after the event are considered for study. The date on which Diwali occur (different in every year) is considered as event day.
LITERATURE REVIEW
Several studies have been conducted to examine the effect of seasonality over nifty 50 returns. Researchers used the concept of EMH (Efficient Market Hypothesis). This means efficient market hypothesis is a central paradigm in finance. The EMH relates to how quickly and accurately the market reacts to new information. New data are constantly entering the market place via economic reports, company announcements, political statements, or public surveys. If the market is informational efficient then security prices adjust rapidly and accurately to new information. According to this hypothesis, security prices reflect fully all the information that is available in the market. Since all the information is already incorporated in prices, a trader is not able to make any excess returns. Thus, EMH proposes that it is not possible to outperform the market through market timing or stock selection. However, in the context of financial markets and particularly in the case of equity market
48
seasonal component have been recorded. They are called calendar anomalies (effects) in literature. Presence of seasonal anomalies contradicts the concept of EMH.
On this one of the studies carried out by Ash Narayan Sah () illustrates that Nifty returns do get effected by seasonal abnormalities. Here he had found the effect of days of week, weekend effect and seasonality returns effect over S&P Nifty 50. Nifty 50 is being taken as a representative of stock market. The monthly data on S&P Nifty for the period from April 1997 to March2009 is collected from NSE Website. He has used statistical tools i.e. descriptive statistics and Annova to examine its effect. The study concluded daily and monthly seasonality over Nifty 50. The presence of seasonality effect over nifty is statistically significant. The results established that the Indian stock market is not efficient and investors can improve their returns by timing their investment.
Kumar & Ravidarshini (2010) conducted a study to examine April Anomaly And return predictability in stock market. The effect is studied over 5 indices. The returns were collected for a period of 10 years. The indices used were S&P CNX Nifty, CNX Nifty junior, CNX Midcap, CNX IT and Bank Nifty. In study statistical tool like descriptive statistics, dummy variable regression, Mann-Whitney U test, Kruskal-Wallis test is used and hypothesis is tested whether there exist effect of seasonality over stock exchanges. This study concluded that there is presence of statistically significant effect over Nifty. January Anomaly is specifically found over exchanges returns.
Kumar & Jawa (2017) studies the effect of calendar events on stock market specifically Indian Market. It studies the day of week, weekend and month of the year returns effect over Nifty. The study uses the Arch Model and uses Hypothesis to check the test. The study concluded the presence of seasonal abnormalities over stock exchanges returns. Harish & Sathyanaryana (2017) examined the calendar month anomaly returns over Sensex. For this, BSE
30 index is used as a representative of stock market. Tools like descriptive statistics are used to understand relationship between stock exchange and seasonal anomaly. It has found that there is no significant presence of anomaly returns over exchange returns. Khanna (2014) observes the day of the week effect over stock markets. Sensex index is taken and returns of it are studied. The daily stock price data of the Sensex has been taken for the period of January 31, 2006 upto December, 31 2010. For returns of working days, logathim returns are used. For further analysis ARIMA (Autoregressive Integrated Moving Average) model has been constructed, descriptive statistics are used. Study observed that there is an existence of relationship between days of week returns effect over stock exchanges.
Sarma(2004) studies the effect of seasonality on stock exchanges of emerging markets. Three indexes are used in the study SENSEX, NATEX, BSE 200. Tools like descriptive statistics are used. In order to check test hypothesis are used. Data is collected for a period, January 1st 1996 to August 10th 2002. In study different patterns are made for investment strategies using seasonality effect in order to make greater gains. Study observed presence of seasonality in stock exchanges return. Brooks & Persand (1999) studied seasonality in Southeast Asian stock markets. The study examine day of week effect over different stock exchanges. South Korea, Malaysia, the Philippines, Taiwan and Thailand stock exchanges are considered. Market risk, proxied by the return on the FTA World Price Index, is not sufficient to explain this calendar anomaly. Although an extension of the risk-return equation to incorporate interactive seasonal dummy variables can explain some significant day-of-the week effects, market risk alone appears insufficient to characterise this phenomenon. Data is collected from 31 December, 1989 to 19 January, 1996 ( a total of 1581 observations). Tools like CAPM Model and market model is used as statistical tools to analyse the data.
49
Archana et.al. (2014) conducted a study analyzing calendar effect and stock split effect over stock exchanges return. The study measures the existence of market anomalies with respect to BSE SENSEX Index from 2008 – 2012. The closing price and turnover of BSE index for a period of 5years has been taken for the study. Daily return, average return per month , average return per day for all 5 years were tabulated for analysis. The closing price of the companies before and after stock split was taken to understand the impact of stock split on the market movements. For the study of stock split of 5 companies from different industries are selected, say Bajaj Corporation, HDFC Bank,Jindal steel, Oriental Hotels, Tata steel. Menahem (2004) conducted a study and in it he examines the effect of end of month returns over stock market. The data is collected daily returns for the period from July 1962 through December 1993, which includes a total of 7,927 daily observations. They employ three indices in our analyses: the NYSE value-weighted index, the NYSE equally-weighted index, and the S&P 500 index. Tools like GARCH Model are used to analyse the data.
Aggarwal & Tandon (1994) observe the seasonal anomaly over different stock exchanges. Study is conducted over 18 countries stock exchanges. Research paper studies the day of week effect, turn of month effect, December end month effect , month of year effect (January month). Data is collected for a period from 1971 to 1987 on 18 exchanges. The countries taken into consideration are :- Australia , Brazil, Belgium , Canada , Denmark, France , Germany, Hong Kong , Italy, Japan, Luxembourg , Mexico, Netherland, New Zealand, Singapore, Sweden, Switzerland, UK, USA. Desai & Josh (2015) see the seasonal anomalities in stock exchanges with respect to some blue chip stocks. Research is made to form trading strategies over following stocks in order to gain at the period of seasonality. Study is made on S&P Nifty Index, BSE Sensex, BSE 100 and stocks ACC, BHEL, Bank of India, Colgate, GAIL, Infosys, ONGC, RIL, SBI, Sesa Goa,
Sun Pharma, Tata Steel and Wipro. Data is collected for a period from January 2000 to October 2015. Tools used to analyse the data z- test for day of month effect and t-test for day of week effect and week of month effect over stock exchanges. Study found seasonal effects present in Indian stock Markets. It found day of the month and week of the month effect to be present. For securities tested, only WIPRO did not have any seasonality. Rest other stocks have seasonal effects in their returns.
Angelovska (2013) does an econometric analysis of market anomaly - Day of the week effect on a small emerging market. The selected stock exchange index is MBI10 Index (Macedonian Stock Market). Data is collected for a period January 4, 2005 to December 31, 2009.Tools like descriptive statistics, regression and Annova and Garch model are used to analyse this data. The study concludes returns are not evenly distributed across days of the week. So there is presence of seasonality in stock exchanges. Investors can use these finding to have abnormal gain.
After studying the vast literature, it has been observed that lots of work has been done on seasonality in India and abroad. The results of the above-mentioned study are mixed. Some studies support the existence of seasonality and some studies don‟t support it. Moreover, none of the studies were found that analysed the events like Budget announcement and Diwali festival. This study tries to understand and analyse the impact of these events on the returns of Indian stock market.
RESEARCH DESIGN AND METHODS
The research study is conclusive in nature as its motive to find the relationship between seasonality effects over stock exchanges. Nifty 50 has been taken as reference for stock exchanges returns. The population contains all the returns given by nifty 50 in pre-described duration..S&P CNX Nifty 50 has been taken as sample. Last 10 years returns have been taken. It comprises returns of nifty for the duration of 10 years from 2007-2017.Judgment sampling technique i.e. non random
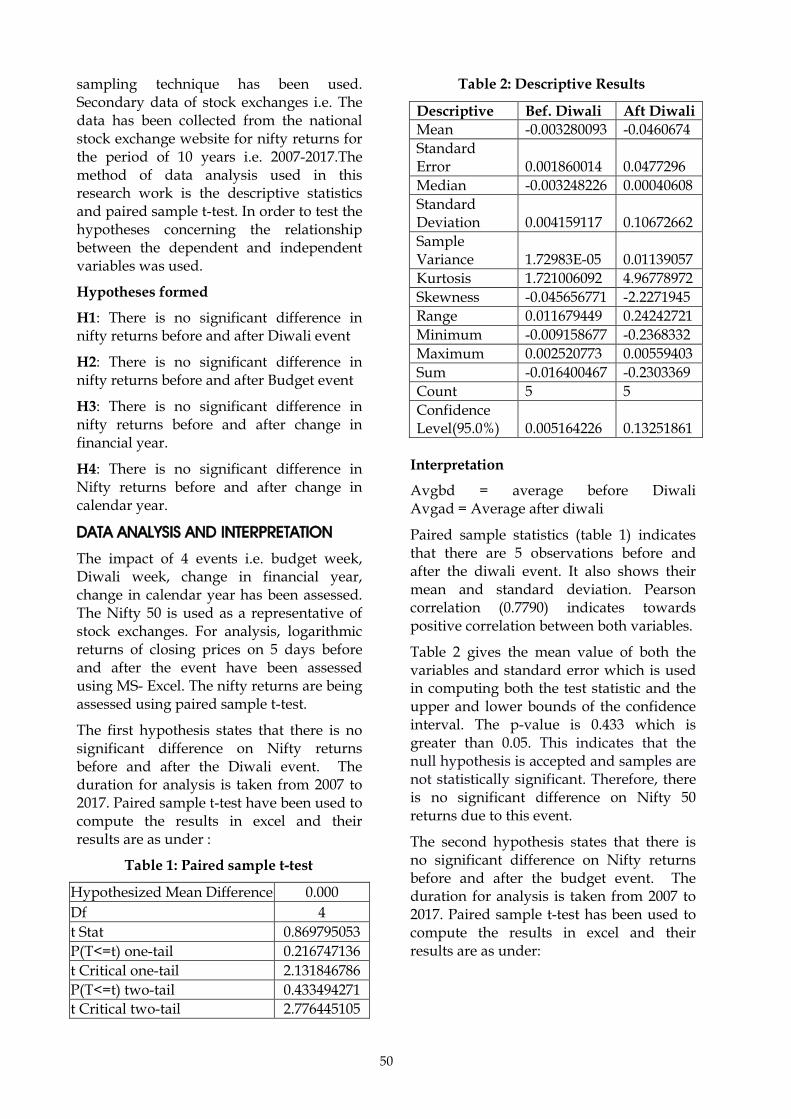
50
sampling technique has been used. Secondary data of stock exchanges i.e. The data has been collected from the national stock exchange website for nifty returns for the period of 10 years i.e. 2007-2017.The method of data analysis used in this research work is the descriptive statistics and paired sample t-test. In order to test the hypotheses concerning the relationship between the dependent and independent variables was used.
Hypotheses formed
H1: There is no significant difference in nifty returns before and after Diwali event
H2: There is no significant difference in nifty returns before and after Budget event
H3: There is no significant difference in nifty returns before and after change in financial year.
H4: There is no significant difference in Nifty returns before and after change in calendar year.
DATA ANALYSIS AND INTERPRETATION
The impact of 4 events i.e. budget week, Diwali week, change in financial year, change in calendar year has been assessed. The Nifty 50 is used as a representative of stock exchanges. For analysis, logarithmic returns of closing prices on 5 days before and after the event have been assessed using MS- Excel. The nifty returns are being assessed using paired sample t-test.
The first hypothesis states that there is no significant difference on Nifty returns before and after the Diwali event. The duration for analysis is taken from 2007 to 2017. Paired sample t-test have been used to compute the results in excel and their results are as under :
Table 1: Paired sample t-test
Hypothesized Mean Difference 0.000
Df 4
t Stat 0.869795053
P(T<=t) one-tail 0.216747136
t Critical one-tail 2.131846786
P(T<=t) two-tail 0.433494271
t Critical two-tail 2.776445105
Table 2: Descriptive Results
Descriptive Bef. Diwali Aft Diwali
Mean -0.003280093 -0.0460674
Standard Error 0.001860014 0.0477296
Median -0.003248226 0.00040608
Standard Deviation 0.004159117 0.10672662
Sample Variance 1.72983E-05 0.01139057
Kurtosis 1.721006092 4.96778972
Skewness -0.045656771 -2.2271945
Range 0.011679449 0.24242721
Minimum -0.009158677 -0.2368332
Maximum 0.002520773 0.00559403
Sum -0.016400467 -0.2303369
Count 5 5
Confidence Level(95.0%) 0.005164226 0.13251861
Interpretation
Avgbd = average before Diwali Avgad = Average after diwali
Paired sample statistics (table 1) indicates that there are 5 observations before and after the diwali event. It also shows their mean and standard deviation. Pearson correlation (0.7790) indicates towards positive correlation between both variables.
Table 2 gives the mean value of both the variables and standard error which is used in computing both the test statistic and the upper and lower bounds of the confidence interval. The p-value is 0.433 which is greater than 0.05. This indicates that the null hypothesis is accepted and samples are not statistically significant. Therefore, there is no significant difference on Nifty 50 returns due to this event.
The second hypothesis states that there is no significant difference on Nifty returns before and after the budget event. The duration for analysis is taken from 2007 to 2017. Paired sample t-test has been used to compute the results in excel and their results are as under:
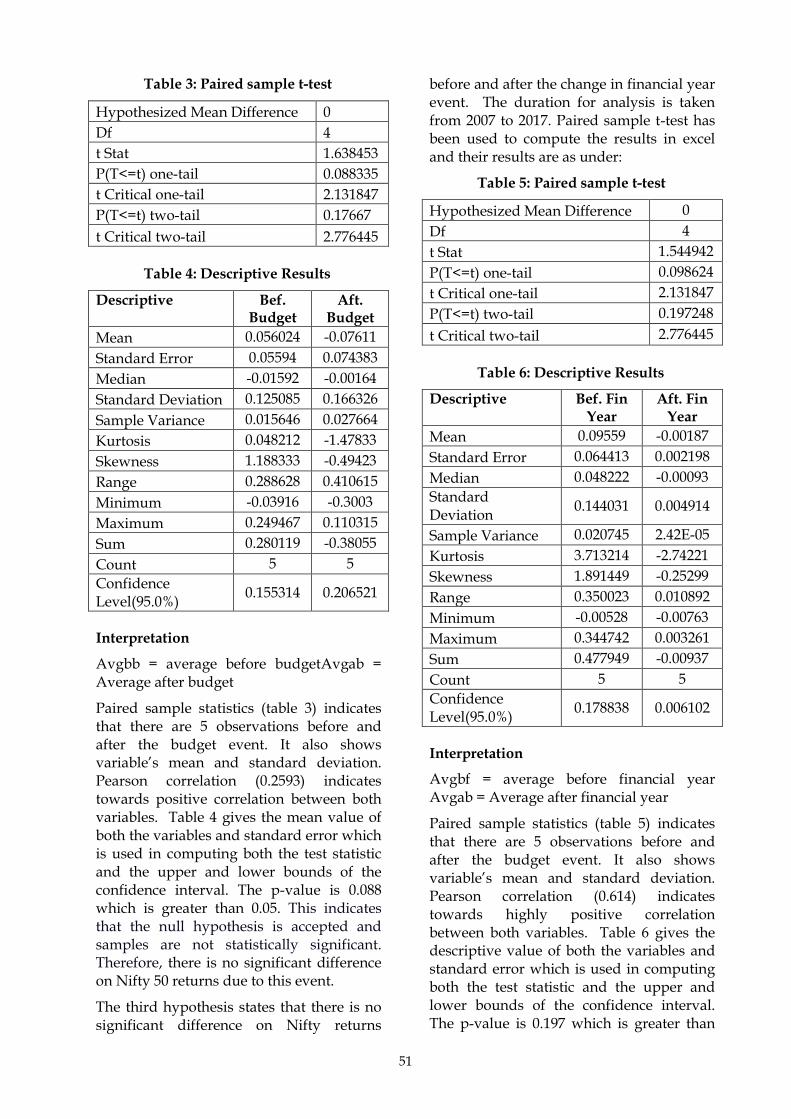
51
Table 3: Paired sample t-test
Hypothesized Mean Difference 0
Df 4
t Stat 1.638453
P(T<=t) one-tail 0.088335
t Critical one-tail 2.131847
P(T<=t) two-tail 0.17667
t Critical two-tail 2.776445
Table 4: Descriptive Results
Descriptive Bef. Budget
Aft. Budget
Mean 0.056024 -0.07611
Standard Error 0.05594 0.074383
Median -0.01592 -0.00164
Standard Deviation 0.125085 0.166326
Sample Variance 0.015646 0.027664
Kurtosis 0.048212 -1.47833
Skewness 1.188333 -0.49423
Range 0.288628 0.410615
Minimum -0.03916 -0.3003
Maximum 0.249467 0.110315
Sum 0.280119 -0.38055
Count 5 5
Confidence Level(95.0%)
0.155314 0.206521
Interpretation
Avgbb = average before budgetAvgab = Average after budget
Paired sample statistics (table 3) indicates that there are 5 observations before and after the budget event. It also shows variable‟s mean and standard deviation. Pearson correlation (0.2593) indicates towards positive correlation between both variables. Table 4 gives the mean value of both the variables and standard error which is used in computing both the test statistic and the upper and lower bounds of the confidence interval. The p-value is 0.088 which is greater than 0.05. This indicates that the null hypothesis is accepted and samples are not statistically significant. Therefore, there is no significant difference on Nifty 50 returns due to this event.
The third hypothesis states that there is no significant difference on Nifty returns
before and after the change in financial year event. The duration for analysis is taken from 2007 to 2017. Paired sample t-test has been used to compute the results in excel and their results are as under:
Table 5: Paired sample t-test
Hypothesized Mean Difference 0
Df 4
t Stat 1.544942
P(T<=t) one-tail 0.098624
t Critical one-tail 2.131847
P(T<=t) two-tail 0.197248
t Critical two-tail 2.776445
Table 6: Descriptive Results
Descriptive Bef. Fin Year
Aft. Fin Year
Mean 0.09559 -0.00187
Standard Error 0.064413 0.002198
Median 0.048222 -0.00093
Standard Deviation
0.144031 0.004914
Sample Variance 0.020745 2.42E-05
Kurtosis 3.713214 -2.74221
Skewness 1.891449 -0.25299
Range 0.350023 0.010892
Minimum -0.00528 -0.00763
Maximum 0.344742 0.003261
Sum 0.477949 -0.00937
Count 5 5
Confidence Level(95.0%)
0.178838 0.006102
Interpretation
Avgbf = average before financial year Avgab = Average after financial year
Paired sample statistics (table 5) indicates that there are 5 observations before and after the budget event. It also shows variable‟s mean and standard deviation. Pearson correlation (0.614) indicates towards highly positive correlation between both variables. Table 6 gives the descriptive value of both the variables and standard error which is used in computing both the test statistic and the upper and lower bounds of the confidence interval. The p-value is 0.197 which is greater than
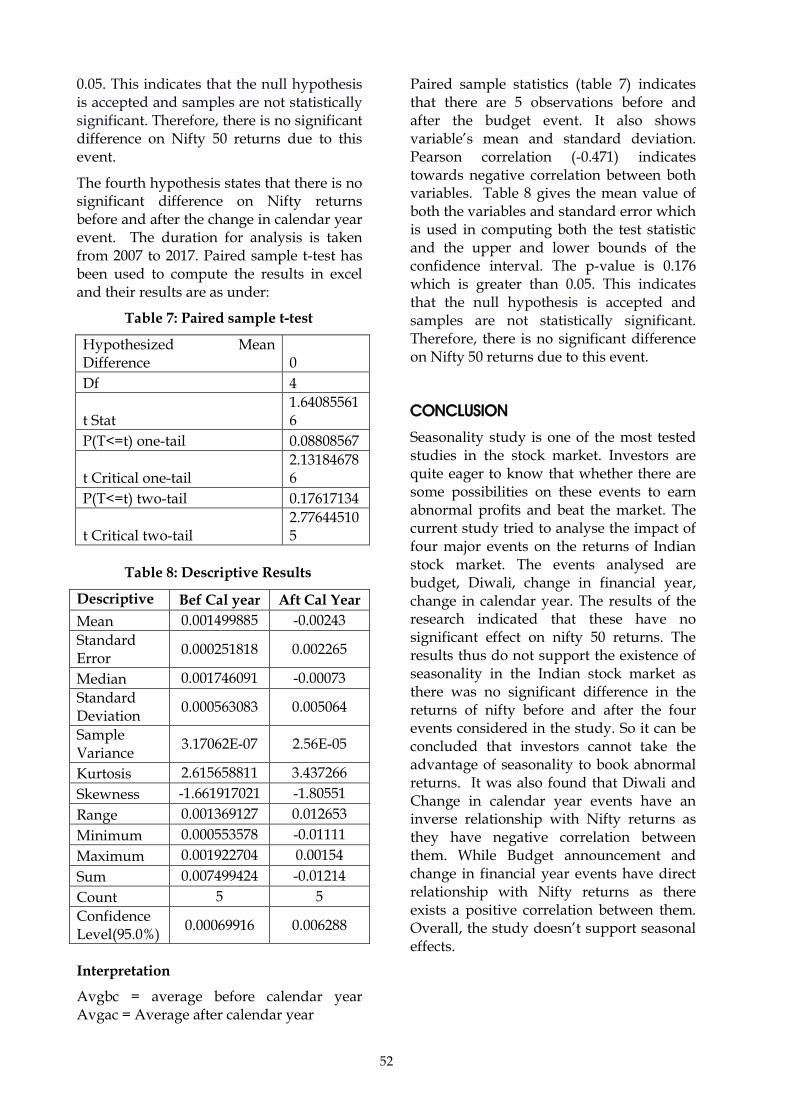
52
0.05. This indicates that the null hypothesis is accepted and samples are not statistically significant. Therefore, there is no significant difference on Nifty 50 returns due to this event.
The fourth hypothesis states that there is no significant difference on Nifty returns before and after the change in calendar year event. The duration for analysis is taken from 2007 to 2017. Paired sample t-test has been used to compute the results in excel and their results are as under:
Table 7: Paired sample t-test
Hypothesized Mean Difference 0
Df 4
t Stat 1.640855616
P(T<=t) one-tail 0.08808567
t Critical one-tail 2.131846786
P(T<=t) two-tail 0.17617134
t Critical two-tail 2.776445105
Table 8: Descriptive Results
Descriptive Bef Cal year Aft Cal Year
Mean 0.001499885 -0.00243
Standard Error
0.000251818 0.002265
Median 0.001746091 -0.00073
Standard Deviation
0.000563083 0.005064
Sample Variance
3.17062E-07 2.56E-05
Kurtosis 2.615658811 3.437266
Skewness -1.661917021 -1.80551
Range 0.001369127 0.012653
Minimum 0.000553578 -0.01111
Maximum 0.001922704 0.00154
Sum 0.007499424 -0.01214
Count 5 5
Confidence Level(95.0%)
0.00069916 0.006288
Interpretation
Avgbc = average before calendar year Avgac = Average after calendar year
Paired sample statistics (table 7) indicates that there are 5 observations before and after the budget event. It also shows variable‟s mean and standard deviation. Pearson correlation (-0.471) indicates towards negative correlation between both variables. Table 8 gives the mean value of both the variables and standard error which is used in computing both the test statistic and the upper and lower bounds of the confidence interval. The p-value is 0.176 which is greater than 0.05. This indicates that the null hypothesis is accepted and samples are not statistically significant. Therefore, there is no significant difference on Nifty 50 returns due to this event.
CONCLUSION
Seasonality study is one of the most tested studies in the stock market. Investors are quite eager to know that whether there are some possibilities on these events to earn abnormal profits and beat the market. The current study tried to analyse the impact of four major events on the returns of Indian stock market. The events analysed are budget, Diwali, change in financial year, change in calendar year. The results of the research indicated that these have no significant effect on nifty 50 returns. The results thus do not support the existence of seasonality in the Indian stock market as there was no significant difference in the returns of nifty before and after the four events considered in the study. So it can be concluded that investors cannot take the advantage of seasonality to book abnormal returns. It was also found that Diwali and Change in calendar year events have an inverse relationship with Nifty returns as they have negative correlation between them. While Budget announcement and change in financial year events have direct relationship with Nifty returns as there exists a positive correlation between them. Overall, the study doesn‟t support seasonal effects.
53
REFERENCES
Agrawal, Anup, and Kishore Tandon(1994), “Anomalies or Illusions Evidence from Stock Markets in Eighteen Countries,” Journal of International Money and Finance, Vol. 13(1), pp.83-106.
Ariel, Robert. A.(1990), “High Stock Returns before Holidays: Existence and Evidence on Possible Causes,” Journal of Finance, Vol. 45(5),pp.1611-26.
Sah, A.N. (2008). Stock Market
Seasonality: A Study of the Indian Stock
Market. NSE Research Paper. Available at
www.nseindia.com/content/research/res_pa
per_final228.pdf
Bodla, B. S.; Jindal, Kiran. (2006) Seasonal
Anomalies in Stock Returns: Evidence from
India and the US Decision (0304-0941).
Jan-Jun2006, Vol. 33 Issue 1, pp.163-178.
Brooks, Chris, and Gita Persand (2001), “Seasonality in Southeast Asian Stock Markets: Some New Evidence on Day-of-the-Week Effects,” Applied Economic Letters Vol.8 (3), pp.155-158 DOI: 10.1080/13504850150504504
Choudhary, K and Sakshi Choudhary (2008), “Day-of-the-Week Effect: Further Empirical Evidence”, Asia-Pacific Business Review, Vol. 4(3), pp.67-74
Dash, Mihir and Sabharwal, Mohit and
Dutta, Anirban, Seasonality and Market
Crashes in Indian Stock Markets (March 14,
2011). Available at SSRN:
https://ssrn.com/abstract=1785112 or
http://dx.doi.org/10.2139/ssrn.1785112.
***

54
Amity Journal of Management
July -December, 2018
Subscription Form
I wish to subscribe to Amity Journal of Management for Rs. 500/- (Annual Subscription Fee).
A draft / cheque bearing no……………………………………….dated……………………….
for Rs.500/- drawn in favour of Amity University Madhya Pradesh, Gwalior is enclosed.
Name : ……………………………………………………………………………………
Address : ……………………………………………………………………………………
: ……………………………………………………………………………………
: ……………………………………………………………………………………
City : ……………………………………………… Pin : ……………………………..
Country : ……………………………………………………………………………………
Email Address : ……………………..…………………………………………………………
Signature : ……………………………………………………………………………………
Mail to: [email protected] Mobile: 08770690283