Embed Size (px)
Citation preview
www.ssoar.info
An agency model to explain trade credit policy andempirical evidencePindado, Julio; Bastos, Rafael Rabelo
Postprint / PostprintZeitschriftenartikel / journal article
Zur Verfügung gestellt in Kooperation mit / provided in cooperation with:www.peerproject.eu
Empfohlene Zitierung / Suggested Citation:Pindado, J., & Bastos, R. R. (2008). An agency model to explain trade credit policy and empirical evidence. AppliedEconomics, 39(20), 2631-2642. https://doi.org/10.1080/00036840600722232
Nutzungsbedingungen:Dieser Text wird unter dem "PEER Licence Agreement zurVerfügung" gestellt. Nähere Auskünfte zum PEER-Projekt findenSie hier: http://www.peerproject.eu Gewährt wird ein nichtexklusives, nicht übertragbares, persönliches und beschränktesRecht auf Nutzung dieses Dokuments. Dieses Dokumentist ausschließlich für den persönlichen, nicht-kommerziellenGebrauch bestimmt. Auf sämtlichen Kopien dieses Dokumentsmüssen alle Urheberrechtshinweise und sonstigen Hinweiseauf gesetzlichen Schutz beibehalten werden. Sie dürfen diesesDokument nicht in irgendeiner Weise abändern, noch dürfenSie dieses Dokument für öffentliche oder kommerzielle Zweckevervielfältigen, öffentlich ausstellen, aufführen, vertreiben oderanderweitig nutzen.Mit der Verwendung dieses Dokuments erkennen Sie dieNutzungsbedingungen an.
Terms of use:This document is made available under the "PEER LicenceAgreement ". For more Information regarding the PEER-projectsee: http://www.peerproject.eu This document is solely intendedfor your personal, non-commercial use.All of the copies ofthis documents must retain all copyright information and otherinformation regarding legal protection. You are not allowed to alterthis document in any way, to copy it for public or commercialpurposes, to exhibit the document in public, to perform, distributeor otherwise use the document in public.By using this particular document, you accept the above-statedconditions of use.
Diese Version ist zitierbar unter / This version is citable under:https://nbn-resolving.org/urn:nbn:de:0168-ssoar-239626
For Peer Review
An agency model to explain trade credit policy and empirical evidence
Journal: Applied Economics
Manuscript ID: APE-05-0252.R1
Journal Selection: Applied Economics
JEL Code: G39 - Other < , M21 - Business Economics <
Keywords: trade credit, agency theory, adverse selection, moral hazard
Editorial Office, Dept of Economics, Warwick University, Coventry CV4 7AL, UK
Submitted Manuscript
For Peer Review
1
An agency model to explain trade credit policy and empirical evidence
Abstract
This paper explains trade credit policy based on the agency theory. According to this theory we
have developed an agency model based on the adverse selection and moral hazard phenomena
arising from the relation between sellers and buyers. This model has been estimated by using panel
data methodology applied to UK companies. Our findings strongly support the model proposed.
We find that smaller firms, those with a smaller proportion of fixed assets, and those that are less
profitable extend more trade credit, whereas firms with a high proportion of variable costs and
high percentage of bad debts extend less.
Keywords: trade credit, agency theory, adverse selection, moral hazard
JEL classification: M21, G39
1. Introduction
Trade credit is a very important source of financing for firms. Although it is an old practice, it is
not completely understood. Regarding trade credit, there are two strands of literature. The first
focuses on studying the demand for trade credit, which is closely related to lending relationships
and lines of credit. The papers in this strand of literature are mainly based on the argument that
firms would increase the level of trade credit used when their alternative sources of finance are
limited, in that trade credit is an important alternative for short and long term bank debt (see, for
instance, Petersen and Rajan, 1994; Petersen and Rajan, 1995; Deloof and Jegers, 1999; Danielson
and Scott, 2004; Alphonse et al., 2004; Niskanen and Niskanen, 2006). The second strand of
literature studies the supply of trade credit (see, for instance, Long et al., 1993; Deloof and Jegers,
1996; Wei and Zee,1997; Ng et al., 1999; Pike et al, 2005). There are also papers such as that of
Petersen and Rajan (1997) and Marotta (2005), which study the trade credit from both points of
Page 1 of 23
Editorial Office, Dept of Economics, Warwick University, Coventry CV4 7AL, UK
Submitted Manuscript
123456789101112131415161718192021222324252627282930313233343536373839404142434445464748495051525354555657585960
For Peer Review
2
view. Additionally, Marotta (2005) provides a study that takes into consideration important
aspects of trade credit such as cash discounts and penalties for ex post delays. In our paper, we
focus on the second strand, since we understand that the seller is the one who decides whether or
not to offer trade credit and, consequently, trade credit policy can be better understood by taking
this fact into account. This approach refers to the study of either the level of the accounts
receivable or the average collection period. According to Long et al. (1993), the average collection
period allows us to measure two separate aspects of trade credit: the length of time that the credit is
outstanding and the fraction of total sales made on credit.
In this second strand of literature, numerous theories have been proposed to explain the
existence and use of trade credit, but none of them can provide a complete explanation of the topic.
While some of the models are more consistent in the case of certain industries or categories of
products, others work better in a financially constrained environment. As far as we know, four
types of explanation have been provided by economic literature: i) a theory based on transactions
costs arguments (proposed by Schwartz, 1974); ii) a liquidity theory (suggested by Emery, 1984);
iii) a tax theory (developed by Brick and Fung, 1984); and iv) a product quality theory (suggested
by Smith, 1987).
This paper focuses on explaining trade credit by using an agency model based on an
extension of the agency problem described by Jensen and Meckling (1976). We take into
consideration the relation between a firm and its clients, an agency relation from which two
phenomena arise: adverse selection and moral hazard. An adverse selection problem stems from
the ex-ante asymmetric information between buyers and sellers. In this case buyers do not know
ex-ante the characteristics and quality of the goods that are being bought. However, a moral hazard
problem arises from the ex-post asymmetric information between sellers and buyers, which gives
rise to the possibility that clients will not pay when payment is due. Therefore, we argue that trade
credit policy is a result of the trade-off between the adverse selection and moral hazard
phenomena. Note that other authors (for example, Long et al., 1993) have taken into account the
Page 2 of 23
Editorial Office, Dept of Economics, Warwick University, Coventry CV4 7AL, UK
Submitted Manuscript
123456789101112131415161718192021222324252627282930313233343536373839404142434445464748495051525354555657585960
For Peer Review
3
adverse selection phenomenon in explaining trade credit policy, but none of them have considered
the moral hazard phenomenon. Consequently, from our point of view, the main contribution of this
paper is to show the importance of the moral hazard phenomenon and it suggests that both
phenomena together could explain trade credit policy.
According to our argument, we have tested an agency model whose explanatory variables are
those that explain the adverse selection and moral hazard phenomena. The empirical evidence is
provided from a sample of UK companies, where, according to previous evidence, trade credit is
highly relevant and represents more than 62% of firms’ total debt (Bevan and Danbolt, 2002)1.
Moreover, the estimation methodology used in this paper is panel data in order to control for
individual heterogeneity.
The results support our agency model. According to the adverse selection phenomenon, we
find that smaller firms, those with a smaller proportion of fixed assets, and those that are less
profitable, tend to extend more trade credit. Regarding the moral hazard phenomenon, our
empirical evidence reveals that the higher the proportion of variable costs and the higher the
percentage of bad debts, the less trade credit offered. Concerning traditional models, our paper
finds empirical evidence against tax and transactions costs theories. Furthermore, as in Marotta
(2005), our results do not support the liquidity argument that links trade credit and credit rationing.
The remainder of the paper is organized as follows. Section 2 focuses on the theories on trade
credit policy. Our agency model explaining trade credit policy is developed in Section 3, and
Section 4 describes the data set and methodology used. Section 5 shows our interpretations of the
estimation results of our agency model and also tests traditional models. Finally, the conclusions
are presented in Section 6.
1 These authors have made a decompositional analysis of capital structure for UK companies. According to them,
determinants of gearing depends on the measure used to proxy it and consequently depend on which component of
debt is being analysed. Their evidence shows that results are very sensitive to whether or not trade credit is included.
Page 3 of 23
Editorial Office, Dept of Economics, Warwick University, Coventry CV4 7AL, UK
Submitted Manuscript
123456789101112131415161718192021222324252627282930313233343536373839404142434445464748495051525354555657585960
For Peer Review
4
2. Theories on trade credit policy
Trade credit is one of the oldest forms of corporate financing and it continues to be very important
at present; it refers to the financing provided by a seller to the client (Wei and Zee, 1997). To
understand the concept of trade credit it is important to know the range of alternative credit
arrangements that can occur in trade. Depending on the type of credit policy, payment can be made
at different times. It can occur before delivery, on delivery or after delivery. In the last case, the
seller may or may not offer discounts for prompt payment, depending on trade arrangements.
When payment does not occur before or on delivery, trade credit is being extended and the seller
assumes the credit risk. Otherwise, trade credit is not being offered and the buyer assumes the risk
that the product may be of low quality.
Although trade credit is a very useful source of resources for different kinds of firms, there is
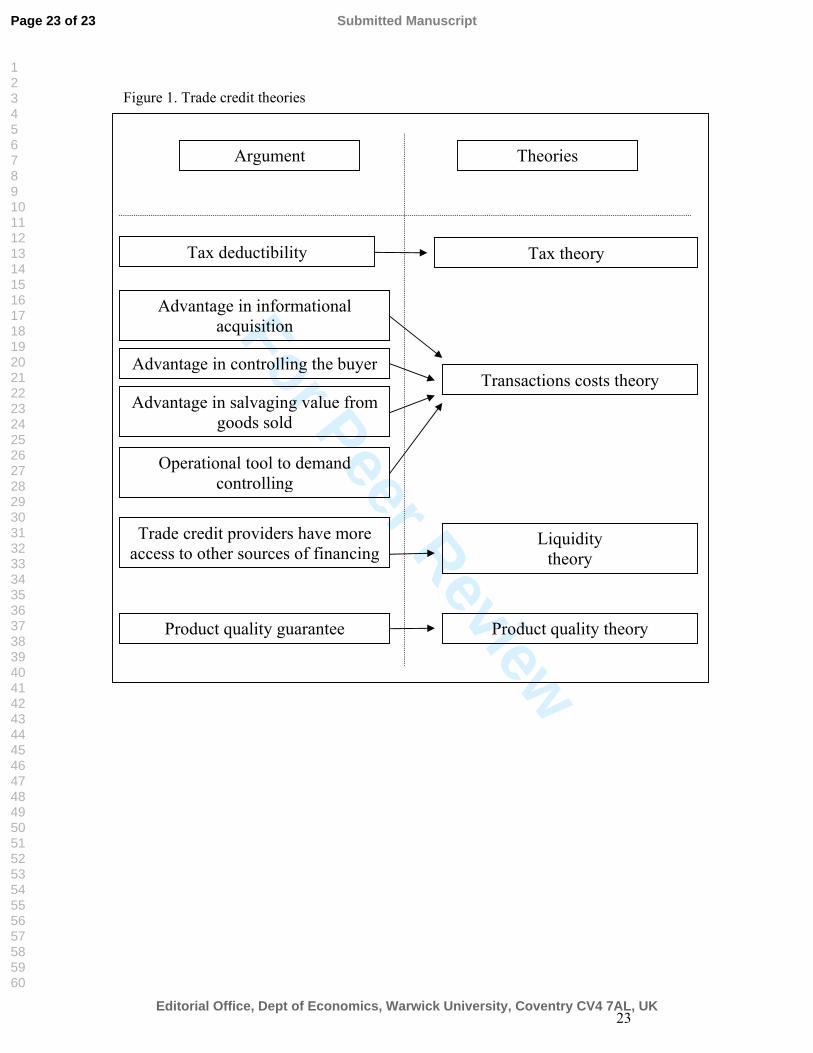
no clear explanation of it yet, as pointed out by Long et al. (1993). In the last three decades, several
theories and models have appeared to explain trade credit. Most of these theories rely on market
imperfections, such as the existence of taxes, transactions costs and asymmetric information, as
shown in Figure 1.
[INSERT FIGURE 1 ABOUT HERE]
2.1. Tax theory
The decision whether or not to accept a trade credit depends on the ability to access other sources
of funds. A buyer should compare different financing alternatives to find out which choice is the
best. In trade between a seller and a buyer a post payment may be offered, but it is not free, there is
an implicit interest rate which is included in the final price. Therefore, to find the best source of
financing, the buyer should check out the real borrowing cost in other sources of funds.
Brick and Fung (1984) suggest that the tax effect should be considered in order to compare
the cost of trade credit with the cost of other financing alternatives. The main reason for this is that
if buyers and sellers are in different tax brackets, they have different borrowing costs, since
interests are tax deductible. The authors’ hypothesis is that firms in a high tax bracket tend to offer
Page 4 of 23
Editorial Office, Dept of Economics, Warwick University, Coventry CV4 7AL, UK
Submitted Manuscript
123456789101112131415161718192021222324252627282930313233343536373839404142434445464748495051525354555657585960
For Peer Review
5
more trade credit than those in low tax brackets. Consequently, only buyers in a lower tax bracket
than the seller will accept credit, since those in a higher tax bracket could borrow more cheaply
directly from a financial institution. Another conclusion is that firms allocated to a given industry
and placed in a tax bracket below the industry average cannot profit from offering trade credit.
Therefore, Brick and Fung (1984) suggest that firms cannot both use and offer trade credit.
2.2. Transactions costs theory
First developed by Schwartz (1974), this theory conjectures that suppliers may have an advantage
over traditional lenders in checking the real financial situation or the credit worthiness of their
clients. Suppliers also have a better ability to monitor and force repayment of the credit. All these
superiorities may give suppliers a cost advantage when compared with financial institutions. Three
sources of cost advantage were classified by Petersen and Rajan (1997) as follows: information
acquisition, controlling the buyer and salvaging value from existing assets.
The first source of cost advantage can be explained by the fact that sellers can get
information about buyers faster and at lower cost because it is obtained in the normal course of
business. That is, the frequency and the amount of the buyer’s orders give suppliers an idea of the
client’s situation; the buyer’s rejection of discounts for early payment may serve to alert the
supplier of a weakening in the credit-worthiness of the buyer, and sellers usually visit customers
more often than financial institutions do. In his model, Smith (1987) concludes that in two-part
credit terms with a high interest rate, those buyers that do not choose to take advantage of the
discount can be identified as high risks, because they may be having financial difficulties.
Recently, Burkart and Ellingsen (2004) argued that the suppliers' monitoring advantage
applies exclusively to input transactions. They posit that the source of suppliers' advantage is the
input transaction itself. According to the authors, an input supplier does not incur in monitoring
costs to know that an input transaction has been completed, but other lenders do. The main
argument supporting the authors' proposition is the difference between cash and input. While the
Page 5 of 23
Editorial Office, Dept of Economics, Warwick University, Coventry CV4 7AL, UK
Submitted Manuscript
123456789101112131415161718192021222324252627282930313233343536373839404142434445464748495051525354555657585960
For Peer Review
6
former is easily diverted, i.e., its use does not maximize lenders' expected return, the latter is not
easily diverted and its illiquidity facilitates trade credit.
The second source of cost advantage arises from the power of the seller to threaten buyers. In
other words, in some cases there are only a few alternative suppliers for the product needed and,
consequently, buyers have very restricted choice. In this case, suppliers can threaten to cut off
future supplies if they note a reduction in the chances of repayment. Compared with suppliers,
financial institutions do not have the same threatening power. This advantage can become stronger
when either the buyers represent only a small part of the supplier’s sales or the supplier is part of a
network and future community sanctions can be made by a group, which makes this threat much
stronger (Kandori, 1992). Empirical evidence supporting this hypothesis can be found in McMillan
and Woodruff (1999). Another interesting finding in this strand of literature was provided by
Petersen and Rajan (1997), whose empirical results suggest that debtors are less willing to repay a
distressed seller. Their argument is that threats of cutting off future supplies made by a supplier
with financial problems are not so credible.
The seller’s ability to salvage value from existing assets is the third source of cost advantage.
In the case of buyer default, the seller can seize the goods that are supplied, of course financial
institutions can reclaim the firm’s assets as well. The difference between them is that since the
firms trading are very often from the same industry, the supplier already has a network to sell the
goods and consequently repossessing and resale costs would be lower. Mian and Smith (1992) and
Petersen and Rajan (1997) provide two interesting approaches related to this cost advantage. The
former obtain evidence supporting the idea that the more durable the goods, the better collateral
they provide and the greater the credit offered by the suppliers. The latter point out that the extent
to which the customers transform the product is also very important. The less they are transformed,
the easier it will be for the supplier to repossess and sell the asset using the same channel.
Another important point refers to the relative value of the goods. Ng et al. (1999) consider
that the value of a product differs between firms and financial institutions; i.e., if a product has
Page 6 of 23
Editorial Office, Dept of Economics, Warwick University, Coventry CV4 7AL, UK
Submitted Manuscript
123456789101112131415161718192021222324252627282930313233343536373839404142434445464748495051525354555657585960
For Peer Review
7
more value as collateral to a seller than to a financial institution, the seller may have a cost
advantage in recuperating the product and selling it again. In this situation, suppliers tend to offer
cheaper credit than financial institutions because of the reduction of the credit risk.
Another paper related to transactions costs is Emery (1987); this author hypothesizes that
there is a positive relation between demand variability and credit offered. This hypothesis is based
on the following argument. When demand fluctuates, a firm has two traditional reactions
(production or price adjustment); however, both are very costly and a better decision could be
taken in that the seller could change trade credit terms according to demand. Terms can be relaxed
when demand drops and tightened when demand increases. In this case, trade credit can be seen as
an operational tool. Long et al. (1993) obtain empirical evidence supporting this hypothesis. Their
results show that firms with variable demand extend more trade credit than firms with stable
demand.
2.3. Liquidity theory
This theory, first suggested by Emery (1984), proposes that credit rationed firms use more trade
credit than those with normal access to financial institutions. The central point of this idea is that
when a firm is financially constrained the offer of trade credit can make up for the reduction of the
credit offer from financial institutions. In accordance with this view, those firms presenting good
liquidity or better access to capital markets can finance those that are credit rationed.
Several approaches have tried to obtain empirical evidence in order to support this assumption.
For example, Nielsen (2002), using small firms as a proxy for credit rationed firms, finds that when
there is a monetary contraction, small firms react by increasing the amount of trade credit accepted.
As financially unconstrained firms are less likely to demand trade credit and more prone to offer it,
a negative relation between a buyer’s access to other sources of financing and trade credit use is
expected. Petersen and Rajan (1997) obtained evidence supporting this negative relation.
Page 7 of 23
Editorial Office, Dept of Economics, Warwick University, Coventry CV4 7AL, UK
Submitted Manuscript
123456789101112131415161718192021222324252627282930313233343536373839404142434445464748495051525354555657585960
For Peer Review
8
2.4. Product quality theory
The trade credit relation gives rise to two problems. On the one hand, sellers do not usually know
the real credit-worthiness of their buyers and; on the other, buyers do not properly know the quality
of the product that is being acquired. To solve the first problem, Smith (1987) suggests a model
where sellers offer two-part credit terms because they can recognize potential defaults faster than
financial intermediaries. And, as commented in Section 2.2, there are many other arguments
supporting the idea that suppliers have cost advantages in acquiring knowledge about a buyer’s
financial situation. Regarding the second problem, Smith (1987) also claims that with asymmetric
information about product quality, sellers offer trade credit to allow buyers to verify product
quality before payment.
Other options to reduce the cost of the above-mentioned problem is to offer money-back
guarantees and warranties. Trade credit has some advantages when compared with these two. First,
in a case of money-back or warranties, if the seller is not in business any more, the buyer can be
damaged. Second, when payment is made at the time of sale, a client who wants to obtain the
advantages of the money-back system must try to convince the seller that the quality of the product
is not as promised.
As pointed out by Smith (1987), one of the major purposes of trade credit is to allow clients
to assess product quality prior to payment; however, this is not true for some categories of product.
Therefore, this theory works better in some industries whose product quality is unknown at the
moment of purchase. According to this argument, sellers will extend more trade credit when selling
products where quality is indefinite at a prior moment and the purchase is not frequent. On the
contrary, sellers will extend less trade credit when trading perishable items where acquisition is
very frequent.
Many financial scholars have studied trade credit from this point of view (see, for instance,
Lee and Stowe, 1993; Long et al, 1993; Deloof and Jegers, 1996; Wei and Zee, 1997; Pike et al.,
2005). In summary, the main results of these authors are as follows. i) Small firms tend to offer
Page 8 of 23
Editorial Office, Dept of Economics, Warwick University, Coventry CV4 7AL, UK
Submitted Manuscript
123456789101112131415161718192021222324252627282930313233343536373839404142434445464748495051525354555657585960
For Peer Review
9
more trade credit than large firms, since small firms still have to establish their reputation about
product quality. ii) Firms with longer production cycles prolong their collection period, since they
produce high-quality goods. iii) Firms selling products whose quality is difficult to measure extend
more trade credit because customers must have enough time to assess quality. iv) Sellers of low
quality goods may try to pass them off as high-quality goods. In this case, as the cost of extending
trade credit increases, these firms will have less incentive to cheat on the information on quality.
2.5. What do these theories not explain?
Although many theories have attempted, in different ways, to explain the existence of trade credit,
they cannot provide a complete explanation of the topic. While some of the models are more
consistent with the case of certain industries or categories of products, others work better in a
financially constrained environment. According to Frank and Maksimovic (1998) “the existing
theories show effects that may be important in specific circumstances, but they do not capture what
seems to be central for explaining the wide-spread use of trade credit and the empirical patterns of
its use”. Let us check theory by theory and identify some inconsistencies or situations that are not
very well explained.
The tax theory suggests that firms in high tax brackets tend to offer credit to those in low tax
brackets. Some research studies have found empirical evidence to support this, but this explanation
does not seem to be enough since it cannot explain trade credit between firms situated in the same
tax bracket.
If trade credit is an operational tool and exists to minimize transactions costs, as Ferris
(1981) suggested, a reduction in the level of trade credit used would be expected since many
improvements in transaction technologies have taken place. However, this reduction has not been
observed in recent years.
The liquidity theory supposes that credit constrained firms use more trade credit than those
with easier access to financial intermediaries. This may be an explanation, but once more, it does
Page 9 of 23
Editorial Office, Dept of Economics, Warwick University, Coventry CV4 7AL, UK
Submitted Manuscript
123456789101112131415161718192021222324252627282930313233343536373839404142434445464748495051525354555657585960
For Peer Review
10
not seem to be enough since it does not explain why financially unconstrained firms also use trade
credit.
The product quality theory argues that trade credit is offered to allow clients to check the real
quality of the goods before payment, but it does not explain why firms selling some products and
services do not offer credit at all; some firms even require clients to pay in advance.
3. An agency model explaining trade credit policy
The main difference between our agency model and other models that attempt to explain trade
credit by assuming the existence of asymmetric information is the inclusion of the moral hazard
phenomenon into our model. According to Jensen and Meckling (1976) the agency problem could
be extended to the relation between a firm and its clients. This agency relation is characterized by
two phenomena: adverse selection and moral hazard. Adverse selection occurs when there is ex-
ante asymmetric information between sellers and buyers. In this case, clients do not know ex-ante
the characteristics and quality of the goods that are being acquired. As described in Section 2.4,
this phenomenon has already been studied by other authors, but not moral hazard, which consists
of the possibility of the contractual relationship not being carried out by the client, facilitated by
the ex-post asymmetric information. This phenomenon has an important consequence in that it
could lead to clients not paying for the goods bought when the payment is due, giving rise to bad
debts. Consequently, we define a function to explain trade credit as follows: DSO=φ(ϖ,µ), where
DSO is the day of sales outstanding, ϖ stands for the agency costs arising from the adverse
selection phenomenon, while µ represents the agency costs caused by the moral hazard
phenomenon. According to our model, the greater the adverse selection costs the more trade credit
provided to clients. In addition, the greater the moral hazard costs the less the trade credit offered
to clients. Therefore, we expect ϖ to be positively related to DSO and µ to be negatively related.
Consequently, our model explains the days of sales outstanding (DSO), which is measured as the
natural logarithm of the accounts receivable divided by daily sales.
Page 10 of 23
Editorial Office, Dept of Economics, Warwick University, Coventry CV4 7AL, UK
Submitted Manuscript
123456789101112131415161718192021222324252627282930313233343536373839404142434445464748495051525354555657585960
For Peer Review
11
The literature has argued that several variables should be taken into account to proxy the
adverse selection phenomenon. First, the goods sold by technical industries need a significant
amount of time to verify their quality level, hence a high adverse selection cost is associated with
these goods. To classify each firm in our sample as part of the technical industry or not, we follow
Titman and Wessels (1988), defining technical industries as those in SIC codes between 3400 and
3999. Other authors that have used the same classification include Long et al. (1993). Additionally,
there are no adverse selection costs when buying some products which are easy to observe
(perishable). Following Long et al. (1993), we consider perishable products to be those sold by
firms in SIC codes between 2000 and 2199. Therefore, we have constructed the Product Quality
Level variable (PQL) in order to measure the product quality level combining these two
characteristics. We also base the construction of the product quality level variable, PQL, on the
argument that if the reputation of the firm selling the product is already known, as is the case of
large firms, less time is needed to verify the quality. Therefore, the PQL variable takes into account
both the kind of product and the size of the firm. This variable takes higher values when the period
needed to verify the quality of the product is longer, and vice versa2. As a result, the product
quality level should be positively related to DSO. Second, the firm’s reputation considerably
reduces the adverse selection costs. The firm’s reputation is proxied by the variable SIZE,
measured as the natural logarithm of a firm’s total assets. The expected relationship between DSO
and SIZE is negative. Third, Prowse (1990) argues that the greater the proportion of fixed assets in
a firm, the smaller the asymmetric information problem. Following Prowse (1990), we compute the
variable fixed assets, FIX, as 1-(Fixed Assets/Total Assets). This variable provides a measure that
is inverse to the fixed assets of a firm; hence we expect FIX to be directly related to DSO. Fourth,
the negative consequences of the problem of adverse selection to the buyer are mitigated by the
2 We calculate the PQL variable as follows: PQL=(30/(1+SIZE)) for technical industries, PQL=(0.5/(1+SIZE)) for
perishable industries, and PQL=(2/(1+SIZE)) for the remaining firms. The figures 30, 2 and 0.5 have been chosen in
order to give more power to the first characteristic related to industry, as suggested in financial literature. However,
note that the second characteristic (size) plays an important role, since it distributes the values within each kind of
industry and provides variability to PQL, which is necessary when using panel data methodology. More details will be
provided by the authors upon request.
Page 11 of 23
Editorial Office, Dept of Economics, Warwick University, Coventry CV4 7AL, UK
Submitted Manuscript
123456789101112131415161718192021222324252627282930313233343536373839404142434445464748495051525354555657585960
For Peer Review
12
supplier’s profitability. To proxy for supplier’s profitability we use the return on assets variable
(ROA), calculated as earnings before interest and taxes divided by total assets. This variable is
expected to be negatively correlated to DSO. Fifth, the last variable we use to proxy the adverse
selection is the days to pay accounts payable (DPA), calculated as in Compustat Global Vantage as
follows: accounts payable times 360 divided by the sum of inventories plus cost of goods sold plus
depreciation and amortization minus the previous value for inventories minus depreciation and
amortization. This variable is entered into the model because high quality firms are prone to
increase the trade credit offered to their clients, and they use this argument to require more trade
credit from their suppliers. Therefore, the expected relation between days to pay accounts payable
and DSO is positive.
We base our variables to proxy the moral hazard phenomenon on Oh (1976). In accordance
with this author, the decision to change a current credit policy to a new one depends on whether the
marginal profitability is greater than the associated marginal opportunity cost. Therefore, when a
firm decides to extend its credit policy it is probably expecting a sales increase and, hence, the firm
is prepared to assume new costs such as collection costs, bad debt losses and variable costs. Thus,
the credit policy decision involves a tradeoff between profits from marginal sales and their
marginal costs.
According to trade credit literature, the more extensive the credit offered, the greater the
amount of bad debt losses the seller will support. To mitigate this problem, firms are motivated to
offer bigger cash payment discounts. Marotta (2005) argues that there is a strong relation between
cash discounts and debt periods, specifically when creditors’ rights protection is more effective.
These discounts must be attractive enough to convince even the risky buyer to pay sooner, because
if they do, it may reduce the possibility of bad debt losses inasmuch as it restricts the amount of
time available to buyers to develop more problems. We proxy this problem (the cost of bad debt
that may arise when trade credit is extended) by using the bad debt provision variable (BDP). This
Page 12 of 23
Editorial Office, Dept of Economics, Warwick University, Coventry CV4 7AL, UK
Submitted Manuscript
123456789101112131415161718192021222324252627282930313233343536373839404142434445464748495051525354555657585960
For Peer Review
13
variable is calculated as the Provision-other item from Compustat Global Vantage divided by total
assets. Consequently, the expected relationship between bad debts provision and DSO is negative.
When trade credit is extended, if the buyer does not pay, the supplier will support all costs
generated by the sales. Therefore, the damage caused by the moral hazard problem will be greater
the higher the percentage of variable costs of the goods sold. As a result, we expect that the greater
the variable costs, the more rigid the credit policy will be. Consequently, an additional variable to
proxy the extent of the moral hazard problem is the variable costs variable (VCO), calculated as
the cost of goods sold divided by total assets. Therefore, a negative relationship between the
variable costs and DSO is expected.
To test the expected relation between trade credit policy and both phenomena, we propose an
agency model incorporating all the variables that we have considered as characterizing the adverse
selection and moral hazard problems. This model would be as follows:
itititittitiitit DPAROAFIXSIZEPQLBDPVCODSO εββββββββ ++++++++= 76543210 (1)
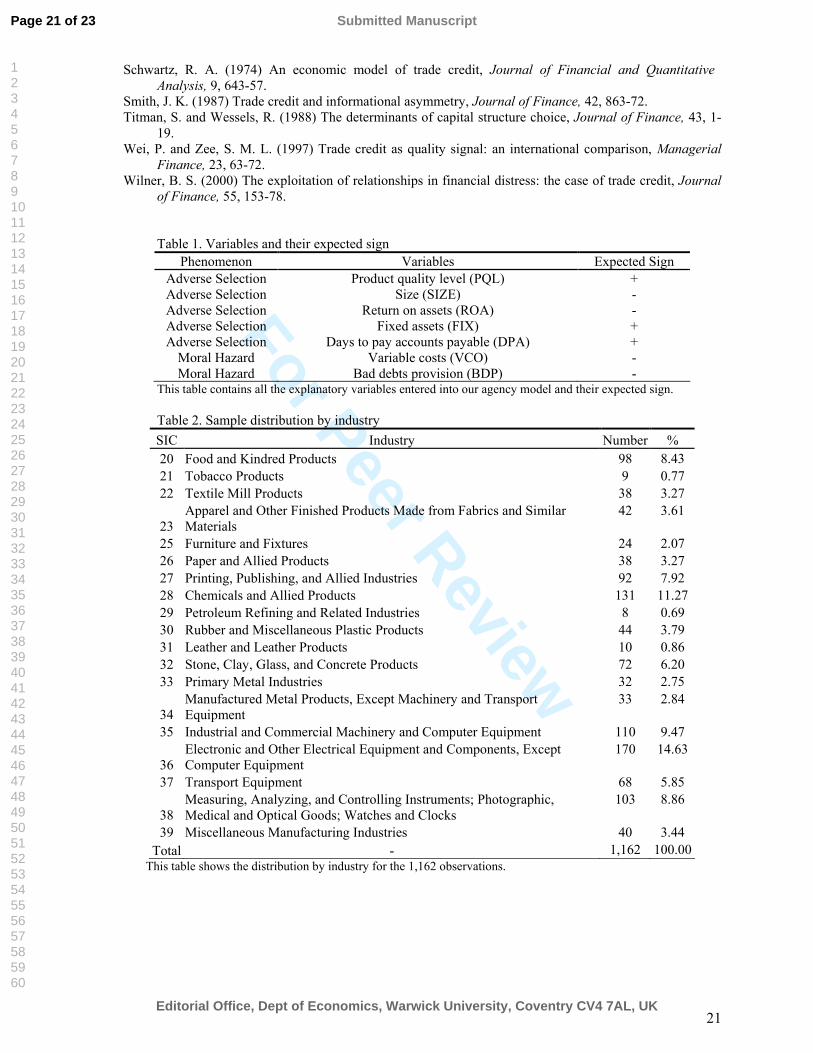
The explanatory variables and their expected sign according to our previous argument are
displayed in Table 1.
[INSERT TABLE 1 ABOUT HERE]
4. Data and methodology
We decided to restrict our sample to manufacturing firms because it is in this category where trade
credit takes place in its habitual form. Consequently, our sample covers active manufacturing
companies in the UK (SIC 2000 through 3999) from the Compustat Global Vantage database for a
four-year period ending in 2002. As a result, we have obtained an unbalanced panel comprising
336 companies and 1,162 observations. The observations in our sample are industry dispersed, i.e.,
the sample does not appear to be more concentrated in any industry. Table 2 shows the distribution
by industry for our sample.
[INSERT TABLE 2 ABOUT HERE]
Page 13 of 23
Editorial Office, Dept of Economics, Warwick University, Coventry CV4 7AL, UK
Submitted Manuscript
123456789101112131415161718192021222324252627282930313233343536373839404142434445464748495051525354555657585960
For Peer Review
14
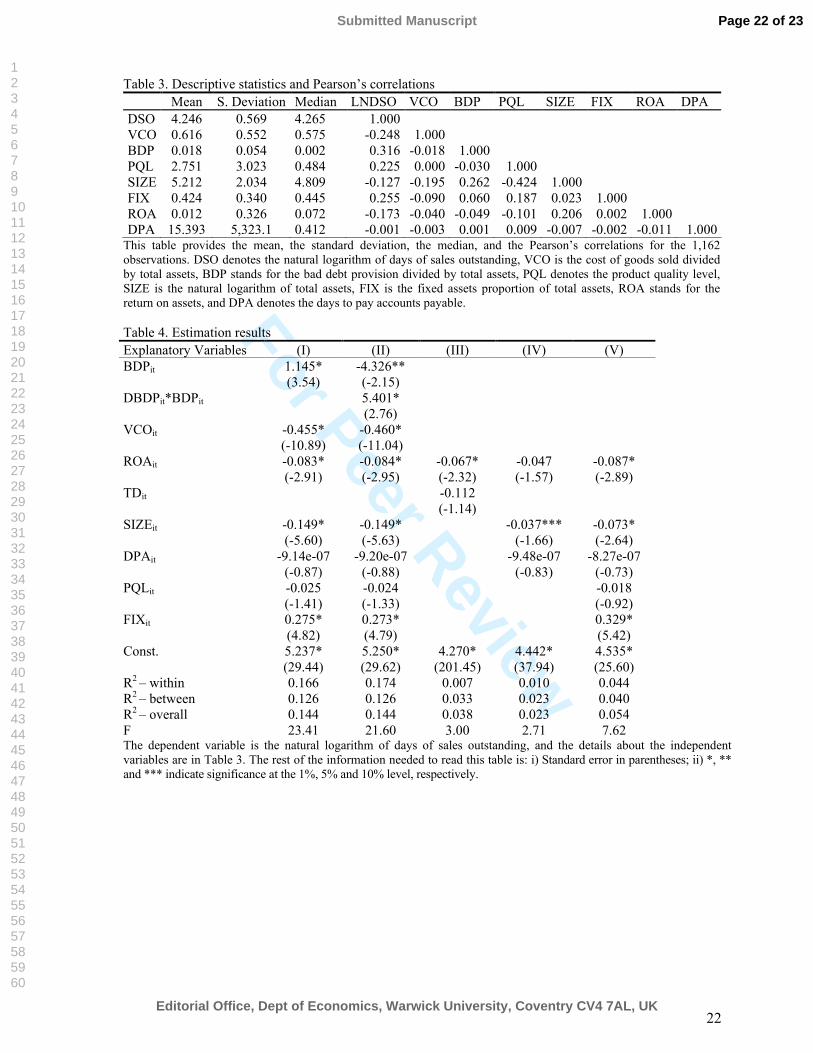
Summary statistics for the variables used in our analysis and Pearson´s correlations are in
Table 3. The days of sales outstanding (DSO) is around 70 days. Note that correlation coefficients
are moderate and do not violate the assumption of independence between explanatory variables.
[INSERT TABLE 3 ABOUT HERE]
To test the hypotheses related to the proposed model, we use panel data methodology
because, unlike cross-sectional analysis, it allows us to control for individual heterogeneity. This
heterogeneity could lead us to biased results (see, for instance, Moulton, 1986, 1987). Therefore, in
our paper we control for heterogeneity by modelling it as an individual effect, ηi. Consequently our
model in Equation 1 would be as follows:
itiititittitiitit DPAROAFIXSIZEPQLBDPVCODSO νηββββββββ +++++++++= 76543210 (2)
where νit is a random disturbance. As a result of the possible correlation between the individual
effect and the explanatory variables, we have estimated the model by using the fixed effects
estimator, since this estimator is unbiased even if the above-mentioned correlation is present.
5. Results
5.1. Estimation results of the agency model
Table 4 (see column I) provides the results from estimating the model in Equation (2). Our
findings show evidence supporting the hypothesis that the greater the adverse selection problem
the more trade credit offered. The SIZE variable is negatively related to DSO, which is in
agreement with the adverse selection phenomenon, related to the product quality guarantee
argument. As a result, smaller firms, with their reputation not yet built, extend more trade credit to
allow clients to check product quality and build their status as high quality firms. The FIX variable
reveals additional support to the abovementioned hypothesis since there is a positive relationship
between FIX and DSO. According to the construction of the variable, the greater its value, the
smaller the proportion of fixed assets of a firm. Thus, trade relations between buyers and suppliers
with a high proportion of fixed assets suffer from smaller problems of adverse selection, which
Page 14 of 23
Editorial Office, Dept of Economics, Warwick University, Coventry CV4 7AL, UK
Submitted Manuscript
123456789101112131415161718192021222324252627282930313233343536373839404142434445464748495051525354555657585960
For Peer Review
15
facilitate the extension of trade credit. The ROA variable is negatively related to DSO. This
relationship implies that the more firms earn, the less credit offered. These results support the
product quality argument in that the greater the seller’s profitability the smaller the adverse
selection problem suffered by buyers, and consequently the less trade credit required by them3.
[INSERT TABLE 4 ABOUT HERE]
Regarding the moral hazard phenomenon, the regression results are partially in accordance
with the arguments presented in Section 3. First, we have found that VCO is negatively related to
DSO. Therefore, variable costs negatively influence the length of the trade credit extended,
because sellers with a high level of variable costs will be more strongly affected in case of buyer
default than those with lower levels and, consequently, they will extend less credit. Second, the
unexpected positive coefficient for the BDP variable could be related to the distress situation of
risky clients. Our argument to explain this result is that firms whose clients are considered “high
risk”, i.e. those presenting high levels of BDP, should raise the cash discounts offered in order to
encourage risky clients to pay early and thus avoid bad debts. Unfortunately, these risky clients
cannot make use of the discounts offered probably because of their distress situation and then they
pay the total value on the net date. Note that this argument is similar to that provided by Fazzari et
al. (2000) to explain the very different results obtained by Kaplan and Zingales (1997) when using
a subsample of those firms facing a distress situation in the sample corresponding to the Fazzari et
al. (1988) seminar paper. Additionally, Pindado et al. (2006) show that when firms face a distress
situation they lose their normal patterns of behavior. Our argument also complements Marotta’s
(2005), who argues that the effectiveness of the decision to offer cash discounts in order to
diminish credit periods will depend on the existence of penalties for ex post delays and on the
extent to which they are enforced. We add that the success of this decision will also depend on the
financial situation of the client.
3 The above-mentioned variables related to the adverse selection phenomenon show the expected relationships with the
dependent variable; however, the PQL and DPA variables are not significant. Therefore, results from regressions do
not allow us to affirm that firms categorized as high tech producers extend more credit than others and that high quality
firms are prone to increase the trade credit offered to their clients in order to use this argument to require more trade
credit from their suppliers.
Page 15 of 23
Editorial Office, Dept of Economics, Warwick University, Coventry CV4 7AL, UK
Submitted Manuscript
123456789101112131415161718192021222324252627282930313233343536373839404142434445464748495051525354555657585960
For Peer Review
16
To distinguish between the firms whose clients are distressed firms from the others, we have
constructed a dummy variable, DBDP, that takes the value of 1 if the bad debt provision of the firm
is higher than the mean and zero otherwise. We have then interacted this dummy variable with the
BDP variable and incorporated this term into the model. Therefore, the new model would be as
follows:
itiitittitiititit DPAROAFIXSIZEPQLBDPDBDPVCODSO νηβββββγβββ ++++++++++= 765431210 )( (3)
This new model, whose results are provided in Table 4 (see column II), allows us to test the
negative relation expected between trade credit and moral hazard, controlling for the distress
situation of the clients. Regarding the BDP variable, the results indicate two different facts. First,
when the firm has a bad debt provision higher than the mean, the dummy variable takes the value
of 1 and, consequently, the coefficient is β2+γ1. We have performed a linear restriction test whose
null hypothesis is H0 = β2+γ1 in order to know if the coefficient β2+γ1=1.0772 is significantly
different from zero. As the t-value is 3.3346, we can reject the null hypothesis and conclude that
the coefficient is significantly different from zero. This result supports our explanation that when
clients present a very high level of risk, seller’s efforts to diminish the average collection period
are never enough and, in this case, a positive relation between trade credit and bad debt provision
arises. Second, when the firm has a bad debt provision lower than the mean, the dummy variable
takes the value of zero and the coefficient is β2 = -4.3698. Therefore, when controlling for the
distress situation the bad debt provision is negatively related to DSO. This result added to the
negative relationship found between the variable costs and DSO supports that the greater the moral
hazard problem, the less trade credit offered.
Note that the results provided in column II show the same results on the adverse selection
phenomenon as those commented above. As a result, we conclude that trade credit policy is
explained by a trade-off between the adverse selection and moral hazard phenomena. Therefore,
these findings support our model based on agency theory.
Page 16 of 23
Editorial Office, Dept of Economics, Warwick University, Coventry CV4 7AL, UK
Submitted Manuscript
123456789101112131415161718192021222324252627282930313233343536373839404142434445464748495051525354555657585960
For Peer Review
17
5.2. Estimation results of the traditional models
As a robustness check for our model, we test the alternative models described in financial
literature. The results show that our model works better in explaining trade credit policy than the
traditional models. Specifically, the results do not support the tax, liquidity and transactions costs
theories. Furthermore, the results only partially support the product quality theory.
To test the tax argument, we use the total debt variable, TD4. The idea behind this theory is as
follows: if sellers have a high level of debt, they are less likely to obtain another loan with tax
deductible interest which would reduce the cost of borrowing. Therefore, we expect the total debt
variable to be negatively related to DSO. This model also includes profitability (ROA) as an
independent variable, since the interest cannot be tax deductible if the seller does not obtain
positive earnings before taxes. Our findings (see column III of Table 4) show that only the ROA
variable is significant. Therefore, this result does not support the tax theory, showing that trade
credit policy cannot be explained by tax motives.
According to the liquidity theory, the DSO is expected to be directly related to the size
(SIZE) and profitability (ROA) variables, and inversely related to the days to pay accounts payable
variable (DPA). As can be seen in column IV of Table 4, our findings do not support the liquidity
theory, since the ROA and DPA variables show non-significant coefficients and SIZE is negatively
related to the dependent variable.
To test the operational argument of transactions costs theory, we regress the DSO using as
the explanatory variable SDS (standard deviation of sales). As this variable is constructed by using
the standard deviation of total revenue over the four-year period ending in 2002, we only have
cross-sectional data. Therefore, we use the ordinary least squares method to estimate the model,
since it was not possible to use panel data methodology. This theory predicts that DSO is positively
related to SDS. The results (provided by the authors upon request) reveal that the coefficient of the
4 This variable is calculated as the sum of long term debt and debt in current liabilities as a percentage of total assets.
Page 17 of 23
Editorial Office, Dept of Economics, Warwick University, Coventry CV4 7AL, UK
Submitted Manuscript
123456789101112131415161718192021222324252627282930313233343536373839404142434445464748495051525354555657585960
For Peer Review
18
variable SDS is not significant; hence the operational argument of the transactions costs theory is
not supported.
The product quality theory is tested by using the same explanatory variables incorporated in
the agency model to proxy the adverse selection phenomenon. The results (see column V of Table
4) are similar, in terms of sign and significance of coefficients, to those obtained when testing our
agency model for the variables capturing the adverse selection phenomenon.
Furthermore, the specification tests could also help us to compare our agency model with the
traditional model. Except for the product quality model, the F statistic shows that the null
hypothesis that all variables are jointly equal to zero cannot be rejected; therefore these models do
not offer a good explanation of the trade credit policy. Although the F statistic for the product
quality model allows us to reject the null hypothesis, the explanatory power of this model is lower
than that of our agency model, as can be seen if we compare the values for the R2 between
displayed in Table 4. Note that by using panel data methodology the R2 between is the directly
relevant measure of goodness of fit. This greater explanatory power is due to the fact that the
product quality model does not include the moral hazard phenomenon, thus providing a limited
explanation of trade credit policy, since the risk of buyers not paying when payment is due is
crucial when making trade credit decisions.
6. Conclusions
This paper proposes an agency model to explain trade credit offered by firms. This model is based
on the two phenomena (adverse selection and moral hazard) arising from the agency relation
between sellers and buyers. According to our argument, firms make their decisions related to trade
credit by taking into account the trade-off between adverse selection (since clients do not know the
characteristics and quality of the goods bought) and moral hazard (in that the buyer might not pay
for the goods bought when the payment is due).
Page 18 of 23
Editorial Office, Dept of Economics, Warwick University, Coventry CV4 7AL, UK
Submitted Manuscript
123456789101112131415161718192021222324252627282930313233343536373839404142434445464748495051525354555657585960
For Peer Review
19
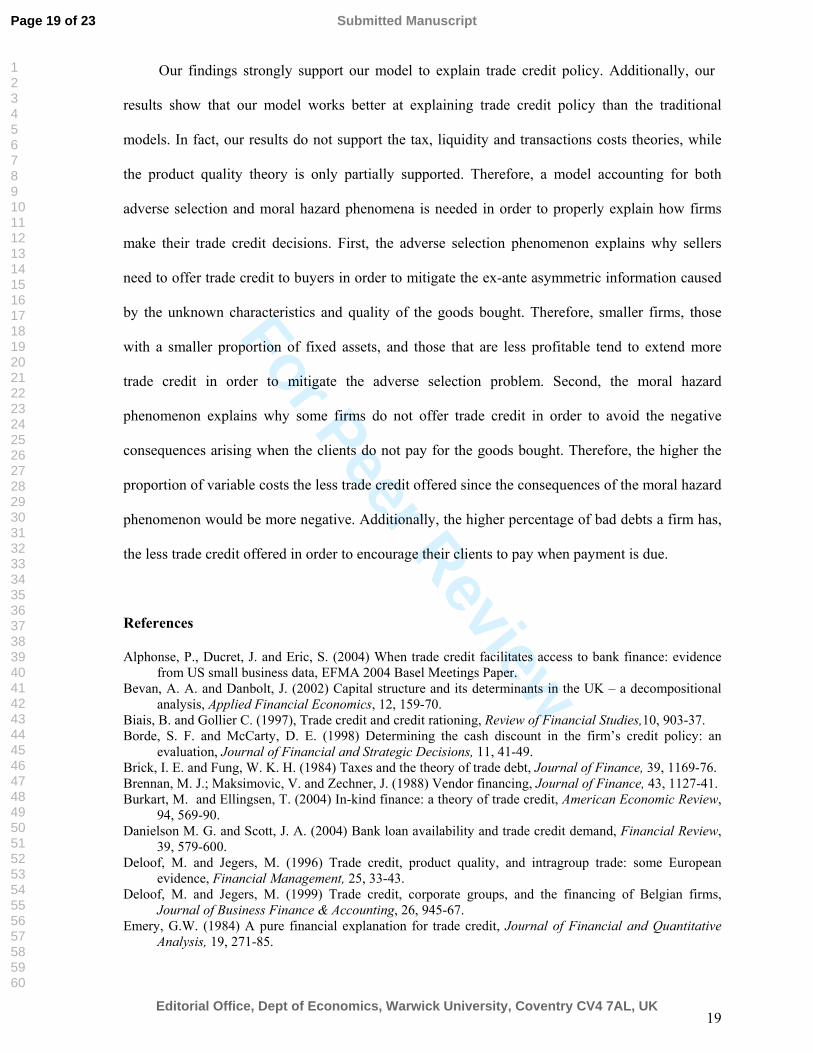
Our findings strongly support our model to explain trade credit policy. Additionally, our
results show that our model works better at explaining trade credit policy than the traditional
models. In fact, our results do not support the tax, liquidity and transactions costs theories, while
the product quality theory is only partially supported. Therefore, a model accounting for both
adverse selection and moral hazard phenomena is needed in order to properly explain how firms
make their trade credit decisions. First, the adverse selection phenomenon explains why sellers
need to offer trade credit to buyers in order to mitigate the ex-ante asymmetric information caused
by the unknown characteristics and quality of the goods bought. Therefore, smaller firms, those
with a smaller proportion of fixed assets, and those that are less profitable tend to extend more
trade credit in order to mitigate the adverse selection problem. Second, the moral hazard
phenomenon explains why some firms do not offer trade credit in order to avoid the negative
consequences arising when the clients do not pay for the goods bought. Therefore, the higher the
proportion of variable costs the less trade credit offered since the consequences of the moral hazard
phenomenon would be more negative. Additionally, the higher percentage of bad debts a firm has,
the less trade credit offered in order to encourage their clients to pay when payment is due.
References
Alphonse, P., Ducret, J. and Eric, S. (2004) When trade credit facilitates access to bank finance: evidence
from US small business data, EFMA 2004 Basel Meetings Paper.
Bevan, A. A. and Danbolt, J. (2002) Capital structure and its determinants in the UK – a decompositional
analysis, Applied Financial Economics, 12, 159-70.
Biais, B. and Gollier C. (1997), Trade credit and credit rationing, Review of Financial Studies,10, 903-37.
Borde, S. F. and McCarty, D. E. (1998) Determining the cash discount in the firm’s credit policy: an
evaluation, Journal of Financial and Strategic Decisions, 11, 41-49.
Brick, I. E. and Fung, W. K. H. (1984) Taxes and the theory of trade debt, Journal of Finance, 39, 1169-76.
Brennan, M. J.; Maksimovic, V. and Zechner, J. (1988) Vendor financing, Journal of Finance, 43, 1127-41.
Burkart, M. and Ellingsen, T. (2004) In-kind finance: a theory of trade credit, American Economic Review,
94, 569-90.
Danielson M. G. and Scott, J. A. (2004) Bank loan availability and trade credit demand, Financial Review,
39, 579-600.
Deloof, M. and Jegers, M. (1996) Trade credit, product quality, and intragroup trade: some European
evidence, Financial Management, 25, 33-43.
Deloof, M. and Jegers, M. (1999) Trade credit, corporate groups, and the financing of Belgian firms,
Journal of Business Finance & Accounting, 26, 945-67.
Emery, G.W. (1984) A pure financial explanation for trade credit, Journal of Financial and Quantitative
Analysis, 19, 271-85.
Page 19 of 23
Editorial Office, Dept of Economics, Warwick University, Coventry CV4 7AL, UK
Submitted Manuscript
123456789101112131415161718192021222324252627282930313233343536373839404142434445464748495051525354555657585960
For Peer Review
20
Emery, G. W. (1987) An optimal financial response to variable demand, Journal of Financial and
Quantitative Analysis, 22, 209-25.
Fazzari, S., Hubbard, G. and Petersen, B. (1988) Financing constraints and corporate investment, Brooking
Papers on Economic Activity, 1, 141-95.
Fazzari, S., Hubbard, G. and Petersen, B. (2000) Investment-cash flow sensitivities are useful: A Comment
on Kaplan and Zingales, The Quarterly Journal of Economics, 115, 695-705.
Ferris, J. S. (1981) A transactions theory of trade credit use, Quarterly Journal of Economics, 96, pp. 243-
70.
Frank, M. and Maksimovic, V. (1998) Trade credit, collateral, and adverse selection, SSRN. Working Paper,
No. 87868.
Hill, N.C. and Riener, K.D. (1979) Determining the cash discount in the firm’s credit policy, Financial
Management, 8, 68-73.
Jensen, M. C. And Meckling, W.H. (1976) Theory of the firm: managerial behavior agency costs and
ownership structure, Journal of Financial Economics, 3, 305-60.
Kandori, M. (1992) Social norms and community enforcement, Review of Economic Studies, 59, 63-80.
Kaplan, S. N. and Zingales, L. (1997) Do investment-cash flow sensitivities provide useful measures of
financing constraints?, The Quarterly Journal of Economics, 112, 169-215.
Lee, Y. W. and Stowe, J. D. (1993) Product risk, asymmetric information, and trade credit, Journal of
Financial and Quantitative Analysis, 28, 285-300.
Long, M. S., Malitz, I. B. and Ravid, S. A. (1993) Trade credit, quality guarantees, and product
marketability’, Financial Management, 22, 117-27.
Marotta, G. (2005) When do trade credit discounts matter? Evidence from Italian firm-level data, Applied
Economics, 37, 403-16.
McMillan, J. and Woodruff, C. (1999) Interfirm relationships and informal credit in Vietnam, The Quarterly
Journal of Economics, 114, 1285-1320.
Meltzer, A. H. (1960), Mercantile credit, monetary policy, and size of firms, Review of Economics and
Statistics, 42, 429-37.
Mian, S. L. and Smith C. W. (1992) Accounts receivables management policy: theory and evidence, Journal
of Finance, 47, 169-200.
Moulton, B. (1986) Random group effects and the precision of regression estimates, Journal of
Econometrics, 32, 385-97.
Moulton, B. (1987) Diagnostics for group effects in regression analysis, Journal of Business and Economic
Statistics, 5, 275-282.
Ng, C. K., Kiholm Smith, J. and Smith, R. L. (1999) Evidence on the determinants of credit terms used in
interfirm trade, Journal of Finance, 54, 1109-30.
Nilsen, J. (2002) Trade credit and the bank lending channel, Journal of Money, Credit, and Banking, 34,
226-53.
Niskanen, J. and Niskanen, M. (2006) The determinants of corporate trade credit policies in a bank-
dominated financial environment. The case of Finnish small firms, European Financial Management,
12, 81-102.
Oh, J. S. (1976) Opportunity cost in the evaluation of investment in accounts receivable, Financial
Management, 5, 32-36.
Petersen, M. A. and Rajan, R. G. (1994) The benefits of lending relationships: evidence from small business
data, The Journal of Finance, 49, 3-37.
Petersen, M. A. and Rajan, R. G. (1995) The effect of credit market competition on lending relations, The
Quartely Journal of Economics, 60, 407-44.
Petersen, M. A. and Rajan, R. G. (1997) Trade credit: theories and evidence, Review of Financial Studies,
10, 661-92.
Pike, R., Cheng, N. S., Cravens, K. and Lamminmaki, D. (2005) Trade credit terms: asymmetric
information and price discrimination evidence from three continents, Journal of Business Finance &
Accounting, 32, 1197-1236.
Pindado, J., Rodrigues, L. and de la Torre, C. (2006) How does financial distress affect small firms financial
structure?, Small Business Economics, forthcoming.
Prowse, S. D. (1990) Institutional investment patterns and corporate financial behavior in the US and Japan,
Journal of Financial Economics, 27, 43-66.
Schwartz, R. A. and Whitcomb, D. K. (1979) The trade credit decision, in Handbook of Financial
Economics (Ed.) J. L. Bicksler, North-Holland, Amsterdam, 257-73.
Page 20 of 23
Editorial Office, Dept of Economics, Warwick University, Coventry CV4 7AL, UK
Submitted Manuscript
123456789101112131415161718192021222324252627282930313233343536373839404142434445464748495051525354555657585960
For Peer Review
21
Schwartz, R. A. (1974) An economic model of trade credit, Journal of Financial and Quantitative
Analysis, 9, 643-57.
Smith, J. K. (1987) Trade credit and informational asymmetry, Journal of Finance, 42, 863-72.
Titman, S. and Wessels, R. (1988) The determinants of capital structure choice, Journal of Finance, 43, 1-
19.
Wei, P. and Zee, S. M. L. (1997) Trade credit as quality signal: an international comparison, Managerial
Finance, 23, 63-72.
Wilner, B. S. (2000) The exploitation of relationships in financial distress: the case of trade credit, Journal
of Finance, 55, 153-78.
Table 1. Variables and their expected sign
Phenomenon Variables Expected Sign
Adverse Selection Product quality level (PQL) +
Adverse Selection Size (SIZE) -
Adverse Selection Return on assets (ROA) -
Adverse Selection Fixed assets (FIX) +
Adverse Selection Days to pay accounts payable (DPA) +
Moral Hazard Variable costs (VCO) -
Moral Hazard Bad debts provision (BDP) - This table contains all the explanatory variables entered into our agency model and their expected sign.
Table 2. Sample distribution by industry
SIC Industry Number %
20 Food and Kindred Products 98 8.43
21 Tobacco Products 9 0.77
22 Textile Mill Products 38 3.27
23
Apparel and Other Finished Products Made from Fabrics and Similar
Materials
42 3.61
25 Furniture and Fixtures 24 2.07
26 Paper and Allied Products 38 3.27
27 Printing, Publishing, and Allied Industries 92 7.92
28 Chemicals and Allied Products 131 11.27
29 Petroleum Refining and Related Industries 8 0.69
30 Rubber and Miscellaneous Plastic Products 44 3.79
31 Leather and Leather Products 10 0.86
32 Stone, Clay, Glass, and Concrete Products 72 6.20
33 Primary Metal Industries 32 2.75
34
Manufactured Metal Products, Except Machinery and Transport
Equipment
33 2.84
35 Industrial and Commercial Machinery and Computer Equipment 110 9.47
36
Electronic and Other Electrical Equipment and Components, Except
Computer Equipment
170 14.63
37 Transport Equipment 68 5.85
38
Measuring, Analyzing, and Controlling Instruments; Photographic,
Medical and Optical Goods; Watches and Clocks
103 8.86
39 Miscellaneous Manufacturing Industries 40 3.44
Total - 1,162 100.00
This table shows the distribution by industry for the 1,162 observations.
Page 21 of 23
Editorial Office, Dept of Economics, Warwick University, Coventry CV4 7AL, UK
Submitted Manuscript
123456789101112131415161718192021222324252627282930313233343536373839404142434445464748495051525354555657585960
For Peer Review
22
Table 3. Descriptive statistics and Pearson’s correlations
Mean S. Deviation Median LNDSO VCO BDP PQL SIZE FIX ROA DPA
DSO 4.246 0.569 4.265 1.000
VCO 0.616 0.552 0.575 -0.248 1.000
BDP 0.018 0.054 0.002 0.316 -0.018 1.000
PQL 2.751 3.023 0.484 0.225 0.000 -0.030 1.000
SIZE 5.212 2.034 4.809 -0.127 -0.195 0.262 -0.424 1.000
FIX 0.424 0.340 0.445 0.255 -0.090 0.060 0.187 0.023 1.000
ROA 0.012 0.326 0.072 -0.173 -0.040 -0.049 -0.101 0.206 0.002 1.000
DPA 15.393 5,323.1 0.412 -0.001 -0.003 0.001 0.009 -0.007 -0.002 -0.011 1.000 This table provides the mean, the standard deviation, the median, and the Pearson’s correlations for the 1,162
observations. DSO denotes the natural logarithm of days of sales outstanding, VCO is the cost of goods sold divided
by total assets, BDP stands for the bad debt provision divided by total assets, PQL denotes the product quality level,
SIZE is the natural logarithm of total assets, FIX is the fixed assets proportion of total assets, ROA stands for the
return on assets, and DPA denotes the days to pay accounts payable.
Table 4. Estimation results
Explanatory Variables (I) (II) (III) (IV) (V)
BDPit 1.145* -4.326**
(3.54) (-2.15)
DBDPit*BDPit 5.401*
(2.76)
VCOit -0.455* -0.460*
(-10.89) (-11.04)
ROAit -0.083* -0.084* -0.067* -0.047 -0.087*
(-2.91) (-2.95) (-2.32) (-1.57) (-2.89)
TDit -0.112
(-1.14)
SIZEit -0.149* -0.149* -0.037*** -0.073*
(-5.60) (-5.63) (-1.66) (-2.64)
DPAit -9.14e-07 -9.20e-07 -9.48e-07 -8.27e-07
(-0.87) (-0.88) (-0.83) (-0.73)
PQLit -0.025 -0.024 -0.018
(-1.41) (-1.33) (-0.92)
FIXit 0.275* 0.273* 0.329*
(4.82) (4.79) (5.42)
Const. 5.237* 5.250* 4.270* 4.442* 4.535*
(29.44) (29.62) (201.45) (37.94) (25.60)
R2 – within 0.166 0.174 0.007 0.010 0.044
R2 – between 0.126 0.126 0.033 0.023 0.040
R2 – overall 0.144 0.144 0.038 0.023 0.054
F 23.41 21.60 3.00 2.71 7.62 The dependent variable is the natural logarithm of days of sales outstanding, and the details about the independent
variables are in Table 3. The rest of the information needed to read this table is: i) Standard error in parentheses; ii) *, **
and *** indicate significance at the 1%, 5% and 10% level, respectively.
Page 22 of 23
Editorial Office, Dept of Economics, Warwick University, Coventry CV4 7AL, UK
Submitted Manuscript
123456789101112131415161718192021222324252627282930313233343536373839404142434445464748495051525354555657585960
For Peer Review
23
Figure 1. Trade credit theories
Product quality theory
Transactions costs theory
Tax theory
Advantage in salvaging value from
goods sold
Advantage in controlling the buyer
Advantage in informational
acquisition
Product quality guarantee
Theories Argument
Tax deductibility
Operational tool to demand
controlling
Liquidity
theory
Trade credit providers have more
access to other sources of financing
Page 23 of 23
Editorial Office, Dept of Economics, Warwick University, Coventry CV4 7AL, UK
Submitted Manuscript
123456789101112131415161718192021222324252627282930313233343536373839404142434445464748495051525354555657585960


