Embed Size (px)
Citation preview

./. Mol. Riol. (1984) 177, 787-818
An Analysis of Incorrectly Folded Protein Models Implications for Structure Predictions
.Jriii %)VoTN+"*, ROBERT BRUCCOLERI"* AND MARTIN KARPI,US*
‘Molecular and Cellular Research Laboratory
Mrrssachusetts General Hospital a,nd Harvard Medical School Boston, MA 02114, U.S.A.
and
*Department of Chemistry
Harvard Cniversity, Cambridge, MA 02138, U.S.A.
(Received 29 November 1983, and in revised form 18 April 1984)
Proteins with homologous amino acid sequences have similar folds and it has been assumed that an unknown three-dimensional structure ran be obtained from a known homologous structure by substituting new side-chains into the polypeptide c:hain backbone, followed by relatively small adjustment of the model. To examine this approach of structure prediction and, more generally, to isolate the characteristics of native proteins, we constructed two incorrectly folded protein models. Sea-worm hemerythrin and the variable domain of mouse immuno- globulin K-chain, two proteins with no sequence homology. were chosen for study: the former is composed of a bundle of four cc-helices and the latter consists of two 4-stranded /?-sheets. Using an automatic computer procedure, hemerythrin side- (*hains were substituted into the immunoglobulin domain and vice versu. The structures were energy-minimized with the program CHARMM and the resulting structures compared with the correctly folded forms. It was found that the incorrect side-chains can be incorporated readily into both types of structures (cc-helicrs. b-sheets) with only small structural adjustments. After constrained c:nrrgy-mlnirci,,ation, which led to an average atomic co-ordinate shift of no more than O.‘i to 0.9 A, the incorrectly folded models arrived at potential energy values comparable to those of the correct structures. Detailed analysis of the energy results shows that the incorrect structures have less stabilizing electrostatic, van der Waals’ and hydrogen-bonding interactions. The difference is particularly pronounced when the electrostatic and van der Waals’ energy terms are c*alculated by modified equations that include an approximate representation of solvent effects. The incorrectly folded structures also have a significantly larger solvent-accessible surface and a greater fraction of non-polar side-chain atoms clxposed to solvent. Examination of their interior shows that the packing of side- (*hams at’ the secondary structure interfaces, although corresponding to sterically allowed conformations, deviates from the characteristics found in normal proteins. The analysis of incorrectly folded structures has made it clear that the absence of bad non-bonded contacts, though necessary, is not sufficient to demonstrate the validity of model-built structures and that modeling of
787 (M)22-283ti/S4/240787-32 $03.00/O ii> 1984 Academic Press Inc.. (I,ontlon) Ltd

78X .J. NOVOTNV, R. 13RU(‘(:OLEI11 ANTI MM. KARPLI’S
homologous structures has to be accompanied by a thorough quantitative rvaluation of the results. Further, certain features that characterize native proteins are made evident by their absence in misfolded models.
1. Introduction
Perut’z et al. (1965) first described the similarity in three-dimensional structure of the homologous proteins, horse hemoglobin and sperm whale myoglobin. It was established soon afterwards that proteins form families in which homologous amino acid sequences have virtually identical folding patterns. Well-known examples of such families, in addition to the above-mentioned globins, are the serine proteases (Sigler et al., 1968; Shotton & Hartley, 1970; Shotton & Watson, 1970). the cytochromes (Dickerson, 1971; Salemme. 1977) and the immunoglobulins (Schiffer et al., 1973; Epp et nZ., 1974; Saul et al., 1978; Segal et nl., 1974; Marquart et al., 1980; Deisenhofer, 1981; Phizackerley et cd., 1979). Tt has been suggested that the pattern of primary structural homology is determined by a requirement to preserve the functionally correct fold (Epstein, 1964,1966; Barnard et nl., 1972; Novotnp & FranBk, 1975). Tndeed, the three-dimensional structure of proteins is known to have evolved more slowly than the amino acid sequence (McLachlan, 1972a), and a strong structural relationship often persists even when amino acid sequences have changed so much that statistical tests show no obvious resemblance (Dickerson, 1971; McLachlan, 1972b).
The discovery of protein families has led to attempts to model unknown three- dimensional structures on the basis of sequence homology. The modeling procedure for determining an unknown protein structure from the one that is known can be divided into two steps. First, homologous segments that form the core of the structure are matched and it is assumed that their peptide backbones have the same or very similar conformations. Identical side-chains are placed as in the known structure and the side-chains that differ are introduced by various simple algorithms. Since the core segments are usually the best-conserved (Perutz et al., 1965), this st,ep often requires only small structural perturbations. Second, less homologous parts of the sequence, most commonly surface residues that form loops or similar structures. are constructed in such a way as t,o connect the core segments with minimal changes in the structure. The loop regions often contain a number of amino acid substitutions and often differ in length due to additions or deletions. To dat,e, no general and reliable solution has been offered for the problem of loop construction.
Browne et al. (1969) were the first to build a Kendrew wire model of a-la&albumin from the crystallographic model of lysozyme and they gave a detailed account of their model-building procedure. Hartley (1970) used a modeling approach to study the chymotrypsin structure, while McLachlan & Shotton (1972) derived the structure of cc-lytic protease (Sorangium sp.) from that of elastase. Other examples include mouse immunoglobulin variable domains of different antigenic specificities (Padlan et al., 1976; Potter et al., 1977; Davies et al., 1977; Kiefer et al., 1983), P-crystallins modeled on bovine y-crystallin (Wistow et al., 1981; Inana et aZ., 1983), a model of renin based on Endothia pepsin (Blundell

MISFOI,I~EI) PROTEINS 7X!)
et aE., 1983), relaxin (Bedarkar et al., 1977) and human insulin-like growth factor (Blundell et al., 1978) modeled on porcine insulin and trypsin-like protease from Streptomyces modeled on trypsin (Jurasek et al., 1976). In modeling the growth factor, Blundell et al. (1978) built a Nicolson push-fit model, read off atomic co-ordinates with a mechanical device, regularized bond lengths. bond and torsion angltas and intramolecular distances with a “modelfit” computer algorithm (Isaacs rt al.. 1975). and finally optimized the model using an interactive computjrr graphics system. Several computer programs now exist that’ allow manipulation of hackbone dihedral angles as well as side-chain substitutions and can be used for model building, e.g. BUILDER (Diamond, 1966), FRODO (Jones, 1978), GUIDE (Brandenburg et al., 1981) and the NTH modeling facility developed by Feldmann (Feldmann rt al., 1978). Applications of t,he latter include a model for thrombin and blood coagulation factors (Furie et al., 1982) and a mouse galactan-binding immunoglobulin Fv fragment (Feldmann et al., 1981).
In a number of examples, models built, by fitting homologous side-chains t)o a known structure have been refined by energy minimization based on empirical potent,ial functions. This approach rationalizes aspects of the structure that do
not conform to normal stereochemistry and removes bad non-bonded contacts. \;2’arme et al. (1974) applied such a procedure to cr-lactalbumin starting with thcb rnodt~l (inscribed by Browne et al. (1969) based on lysozyme. The final potential energy (caf. Momany et al., 1975) of the model compared well with that of thtl cbnergy-minimized structure of lysozyme. Using the same modeling procedure. Swenson rt al. (1978) derived structures of three snake venom inhibitors (Russell’s viper inhibit’or 11 and black mamba inhibitors I and K) using the pancreatic, trypsin inhibitor as the starting structure, while Endres et al. (1975) modeled thromhin from the serine proteases. Again, they arrived at models with excellent final potential energies. Greer recently constructed models of haptoglobin (Grrer. 1980). tnammalian serine proteases (Greer, 198la) and thrombin (Greer, 19816) from those of chymot’rypsin, trypsin and elastase by a computerized modeling IJrocedure followed by energy minimization using the energy minimization program T’AKCZRAF (Katz B Levinthal, 1972).
In addit*ion to modeling proteins by homology, at’tempts have been made to infer protein backbone conformations from statistical data (Kabat & Wu. 1972: Stanford 2 ‘.‘-II. 1981: Coutre et aZ., 1983) or to fold proteins of known structure. starting with arl extended configuration and minimizing the empirical potential energy or ot#her properties of the system. The bovine pancreat,ic trypsin inhibitor (1)eisenhofer & Steigemann, 1975) has served as the model system for many of t.hese studies. Because of the complexity of such a problem, most attempts have been limited to simplified representations of proteins (e.g. rigid backbone geometry (Sem&hy & Scheraga. 1977), simplified side-chains (Levitt & Warshel. 1975; Levitt. 1976); abstract geometrical models using error functions (Kuntz et al., 1976; Crippen. 1977: Have1 et aZ., 1979: YEas et al.. 1978: Goel et al., 1982). residue-residue distance potentials derived from crystallographic data (Oobatakr 8i (‘rippen, 1981). lattice models of protein non-covalent interactions (GT, K- Taketoni. 1978: Krigbaum B Lin. 1982) etc.). Although large reductions in energ) HW obi ainrd on folding and compact structures generally result. they deviatcb

790 .J. NOVOTN%‘, R. BRU(:COLERI ASD M. KARt’LlTS
considerably from the true structure. Somewhat improved geometries are arrived at by introducing supplementary information (e.g. secondary structural data, distance constraints (Goel et al., 1982; Have1 et aE., 1979), limits on the available conformational space (Meirovitch & Scheraga, 1981)), but as yet the problem of determining the structure of an entire protein, given the amino acid sequence, is far from being solved (Hagler & Honig, 1978).
Since methods for predicting protein structures are in widespread use and more extensive applications are expected in the near future, it is essential to determine the validity of their underlying assumptions. As to the correctness of homology- based modeling, most of the published cases await the ultimate test of a crystal st,ructure determination. Only for a-lytic protease from &rangium sp. is the strmture known (Delabaere et nZ., 1979). The prot,ease has been shown t,o consist of two domains, the first one being made of three, the second one of six antiparallel p-strands. The three strands of domain 1 were correctly predicted from the elastase fold by Mcl,achlan & Shotton (1972) but the four strands of domain 2 had so little sequence homology that the correct register was not discerned. A false sequence homology led to misalignments and incorrect suggestions concerning the substrate specificity. Likewise, interatomic distances derived from nuclear magnetic resonance and electron paramagnetic resonance studies of the anti-dinitrophenyl antibody binding site (the Fv fragment of myeloma protein MCPC 315: Dwek et al. (1977)) 1 c o not completely agree with t,he model proposed by Padlan et al. (1976).
One of the assumptions of homology modeling, namely that of minimal structural variation, has been questioned recently by the detailed analyses described by Lesk & Chothia (1980,1982), Chothia & Lesk (1982) and Chothia et al. (1983). Although the general fold of homologous proteins is clearly conserved, evolutionary changes are accompanied by rather large shifts in positions and orientations of structural elements within the core of homologous proteins. In globins, for example, relative positions of homologous pairs of helices differ by as much as 7 A and dihedral angle rotations of 30” occur (T,esk & Chothia, 1980).
In this paper, we have chosen to model patently incorrect structures in order to supplement previous studies of proteins that focused on predicting and analyzing correct structures. By following some of the standard procedures described above, it, is possible to test, t,he basic assumptions of protein modeling and to learn more about the characteristics that differentiate correct, structures from misfolded proteins. Tn particular. we have concentrated on examining the validity of two principal (albeit implicit) assumptions of protein modeling. The first assumption implies t.hat only homologous side-chains can be fitted onto a given protein backbone, extensive non-homologous substitutions being expected to result in unacceptable steric perturbations. The second assumption concerns the use of empirical potential energy functions to gauge the correctness of models. Although it is generally assumed that. a more correct. structure has a lower potential energy (Anfhrsen, 1973; Levitt, 1983), a test of empirical energy functions with structures outside the normal range is helpful in assessing their utility in modeling protein folding.
The first of the two premises, concerned with the specificity of correct, folding, is

MISFOLDED PROTEINS 791
seemingly supported by the fact that interiors of all proteins are close-packed, attaining virtually the maximum possible packing density (Richards, 1974; Chothia, 1975). However, the fact that proteins of widely different tertiary structures and amino acid compositions all have comparable packing densities, could suggest that they can be achieved in many different ways, i.e. the packing constraints on a given sequence cannot distinguish between different secondary and tertiary structures.
The second of the above premises, concerned with energy minimization for the refinement of homologous protein models and folding of small structures, requires additional testing by computer simulations. The empirical potential functions in present use account only for the covalent and non-covalent forces known to describe the protein energetics in wacuo (Levitt & Lifson, 1969; Nemethy di Scheraga, 1977; Hermans & MeQueen, 1974; Robson & Osguthorpe, 1979; Brooks r>t al., 1983). Although such potentials have been shown to yield meaningful results for a range of problems involving small structural changes (Karplus & McCammon, 1983) it is not clear that they are adequate for the large-scale changes that occur in the folding/unfolding transition or for the evaluation of the relative stabilities of very different structures, i.e. in cases where solvent is expected t,o play an important role.
We consider two proteins composed of the same number of amino acids (113) but with very different sequences and structures. They are mouse myeloma immunoglobulin (MCPC 603) light-chain variable domain and Them&e dyscritum hemerythrin. The first is a classical example of a b-sheet protein and the second of an a-helical structure. We model the hemerythrin sequence into the anti-parallel p-sheet structure of MCPC 603 and, conversely, we substitute the MCPC 603 side- chains into the a-helical fold of hemerythrin. We show that incorrectly folded structures can be modeled quite smoothly. Without violating the normal packing density and optimal van der Waals’ contact distances, stereochemically correct structures are obtained after only small structural adjustments. Energy minimization is applied to both the correct and incorrectly folded structures and in all cases satisfactory energies are obtained. However, detailed examination of the results shows essential differences between the structures in terms of their calculated energies, exposed non-polar surface areas and certain other attributes. ln addition to the cautionary effects of this exercise, our results allow us to suggest modifications in the currently used modeling procedures that should improve their usefulness.
2. Methods
In this section, we describe the methods used for model building, energy minimization, solvent accessibility and effective volume calculations.
(a) Modeling procedure
In model-building the incorrect structures, co-ordinates for all the backbone atoms and the identical side-chains were copied directly from the original set. Missing side-chain

792 J. NOVOTNP, R. BRUCCOLERI AND M. KARPLUS
atoms were placed using standard bond length and bond angle values and all the freely adjustable dihedral angle values x” were set equal to 180”. This procedure occasionally led to unacceptable atomic overlaps. In such a case, one or two critical side-chain dihedral angles were changed to gauche or eclipsed conformations.
(b) Representation of structures and energy minimizations
Energy minimization was performed with the program CHARMM, version 16 (Brooks et
al., 1983) in the “explicit hydrogen” atom representation; that is, aliphatic hydrogens were combined together with their heavy atoms into “extended atoms” but hydrogens that can serve as potential hydrogen bond donors were treated explicitly. The empirical energy function used in this program is based on a flexible polypeptide chain geometry that permits variation in all degrees of freedom (bond lengths and bond angles as well as torsional angles). The potential energy function has been reported in detail (Brooks et al.,
1983); it consists of local (covalent) energy terms for bond lengths, bond angles, dihedral angles and improper torsion angles (designed to maintain chirality or planarity around certain atoms) and non-local energy terms for van der Waals’, hydrogen bond and electrostatic interactions.
The structures were minimized by the CHARMM, version 16 program using the Adopted Basis set Newton-Raphson (ABNR) minimization (D. States & M. Karplus, unpublished results), a pseudo-second derivative method. The energy minimization with constraints was done with an update of the hydrogen bond and non-bond lists every 25 steps. The hydrogen bond lists were generated with distance and angle cut-offs of 4.5 AA and 90”: respectively. For the sake of computational efficiency, the non-covalent (van der Waals’ and electrostatic) interactions were limited by a cut-off distance of 8 A; a distance- dependent dielectric constant was used (a = R; Gelin & Karplus. 1975). The first 100 steps of minimization were done allowing motion only of the hydrogen atoms that had been introduced by construction. After this initial period of hydrogen-bond optimization, all atoms were included in the minimization but harmonic constraints equal to 20 kcal (1 cal = 4.184 J) were applied to all the atoms. This makes it possible to relieve bad non- bonded contacts and other faults in a structure while minimizing the changes in geometry (R. Bruccoleri $ M. Karplus, unpublished results). Every 50 steps, the constraints were reassigned to current atomic positions and this procedure was continued for a total of 1506 steps, Alternatively, an ABNR minimization without constraints (1500 steps) was used with the same potential function cut-offs and lists of non-bonded interactions and hydrogen-bonded atoms that were updated every 50 steps.
(c) Potential energy evaluations
The potential energy of the final structures was computed with the same hydrogen bond cut-off used in the minimization, but. a number of different treatments of the van der Waals’ and electrostatic interactions were compared. In addition to that used in energy minimization, calculations were done with no cut-off (i.e. including all interactions) and with a constant dielectric constant (E = 1).
To obtain a more realistic representation of the electrostatic energy in solution. we also evaluated the electrostatic energy in the presence of solvent screening. The protein is regarded as a cavity of low dielectric constant embedded in a medium of a higher dielectric constant. This model, formulated by Kirkwood & Westheimer (1938) and Tanford & Kirkwood (1954) and applied to protein structures by Shire et al. (1974) and others, results in increased screening of pairs of charges as they approach the protein surface. For the present calculation a very simple implementation of the model was used (Northrup et al., 1981). The electrostatic energy is computed with the charges on the atoms multiplied by a factor depending on the ratio of the distance of a given charge from the center of the molecule to the distance from the center of the closest surface atom. The resulting dielectric screening factor decreases the effective charges linearly from a value of unity in the protein

MISFOLDED PROTEINS 793
center to 0.3 on the protein surface; this yields a reduction of the electrostatic interaction by a factor of 9 for a pair of surface atoms.
Another modification to the CHARMM potential energy function was a simplified attempt to model hydrophobic interactions. Several models have been tried in the past to account for interaction of protein atoms with solvent. It is generally assumed that “for a molecule immersed in a solvent, creation of intramolecular contacts through alternation of the configuration must occur at the expense of intermolecular interactions with the solvent. These latter interactions being necessarily attractive, the effect of including them would be to suppress the attractive branch of the (van der Waals’) function occurring at larger distances dj between members of pair j” (Brant & Flory, 1965). This type of treatment. recently revived by Premilat & Maigret (1977), is clearly oversimplified since it does not take into account the difference between the interior of the protein (where all the van der Waals’ interactions should be included) and the surface residues (where the van der Waals’ interactions should be modified by introducing an energetic cost for the exposed non-polar atoms arising from hydrophobic solvation effects). It would be possible to introduce a simple penalty function for exposed hydrophobic side-chains. Instead, we chose to remain within the CHARMM energy function format and modified the Brent-Flory model by considering the repulsive (i.e. steric hindrance) and attractive van der Waals’ terms separately, classifying non-polar atoms into interior and surface types. The attractive term modifications are applied only to the latter; that is, the attractive van der Waals’ interaction for the ajth pair of atoms, -(Bij/Rd6), was omitted for all the carbon atoms. other than carbonyl, and for the sulfur atoms, whenever either one of them had a solvent- accessible surface in excess of 0.1 AZ. Thus, all pairs with one atom even slightly exposed to solvent have their interaction modified, guaranteeing that the whole surface layer of the molecule is included. The very small value of the accessibility used as the criterion takes account of solvent exposure resulting from the internal dynamics of the molecule (Karplus & McCammon, 1983). A different type of solvent correction has been introduced by Mao & McCammon (1983). They modified the van der Waals’ potential to include only repulsive forces for the interactions of pairs involving at least one polar atom. Although this treatment properly accounts for the fact that there is no energetic cost when a polar atom moves from the interior of the molecule to the surface, it also leads to a large positive van der Waals’ potential energy term and neglects those attractive van der Waals’ interactions that are of structural importance for the protein interior.
(d) Computer graphics
Stereo diagrams of molecules were drawn from CHARMM-generated files using the program TERPLOT originally written by T. Horsnell at the MRC, Laboratory of Molecular Biology, Cambridge (England). The program was modified at the Department of Chemistry by J. Ladner to be compatible with the United Graphics System of Stanford Linear Acceleration Center Computation Research Group. This version of the program was transferred to the Cardiac Computer Center at the Massachusetts General Hospital and modified further (J. Eovotn$).
Color-coded, space-filling images of molecular structures were prepared with a program written by R. Bruccoleri. The program uses the Z-buffer algorithm for surface generation (Catmull, 1974; Williams, 1978) and the Phong illumination algorithm (Phong, 1975) to determine the shading of individual atomic spheres. The coefficients of diffuse and specular reflectance are equal across all intensities; the power for the specular reflectance is 6 and the light source is at the viewpoint. A DeAnza image processing system (2 color, 8 bits per color, 512 x 512 resolution raster display) is used for displaying the images. The program has been linked into CHARMM, version 16 so that it can access and use its data structures (atomic co-ordinates, structure and residue topology files) directly.
(e) Solvent accessibility and volume computations
The concepts of solvent accessibility (Lee & Richards, 1971; Shrake & Rupley, 1973; Richmond & Richards, 1978) and protein (Voronoi) volume (Richards, 1974; Gellatly 8:

794 J. NOVOTNP, R. URUCCOLERI AND M. KARPLUY
Finney, 1982) as well as the computational algorithms used have been published. Programs were obtained from the Department of Molecular Biophysics and Biochemistry, Yale University, and were used with minor modifications. The solvent accessibility values were derived using a probe radius of 1.4 b and a fractional error of 0.05 a. Relative solvent accessibilities give the percentage of side-chain accessible surface relative to that obtained for the same residue in a tripeptide Ala-X-Ala in an extended conformation (Lee & Richards, 1971).
(f) Crystallographic co-ordinates
X-ray crystallographic co-ordinates of mouse myeloma MCPC 603 light-chain variable region were obtained from Dr David Davies and those for T. dyscritum hemerythrin were obtained from the Brookhaven Data Bank (Bernstein et al., 1976).
3. Results and Discussion
The primary structure of T. dyscritum hemerythrin was determined by Loehr et al. (1978), that of mouse k--chain variable domain MCPC 603 by Rudikoff et al. (1981). Both proteins are 113 residues long; when aligned (Fig. l), they have only five amino acids in common. The amino acid compositions (Table 1) show that the most abundant residues in hemerythrin are aspartic acid, leucine, isoleucine and lysine, whereas those in the VL domain are serine, glycine, leucine and threonine. Accordingly, the proteins differ somewhat in molecular mass (13,304 for hemerythrin, which has 944 non-hydrogen atoms, and 12,161 for the VL domain, which has 855 non-hydrogen atoms). The X-ray structure of hemerythrin was
TABLE 1
Amino acid compositions of T. dyscritum hemerythrin and mouse immunoglobulin MCPC 603 VL domains
Amino acid Hemerythrin VL domain
Alanine Aspartic acid Arginine Cysteine Glutamic acid Glutamine Glycine Histidine Isoleucine Leucine Lysine Methionine Proline Phenylalanine Serine Threonine Tryptophan Tyrosine Valine Total
1 12 ti 2 4 5 6 7 8
10 9
3 7 3 7 3 6 3
113
Molecular mass 13,304 12,151
6 d 4 2 4 x
10 I 4
10 6 z 6 4
IT 9
25 6
I11

Q
Q

796 J. NOVOTNP, R. BRUCCOLERI AND M. KARPLUS
determined by Stenkamp et al. (1978) and can be described as an antiparallel up- and-down bundle composed of four a-helices (Richardson, 1981); there are two iron atoms liganded by side-chains of residues GM%, His73, His77 and Asp106 (the metal atoms were not included in our studies). The four a-helices are packed against each other with helix axis angles close to 0” (Chothia et al., 1977, cf. Fig. 2). The VL domain (Fig. 2), on the other hand, consists of eight antiparallel /?-strands folded into the “Greek key” topology, its two constituent b-sheets, composed of four strands each, subtending an angle of approximately -30” (Chothia et al., 1977; Chothia & Janin, 1981; Cohen et al., 1981). Thus, both structures are rather typical examples of frequently encountered folding motifs, namely, the all-a and the all-b proteins (Levitt & Chothia, 1976). Secondary- structure prediction analysis (Chou & Fasman, 1974; Rose & Roy, 1980; Novotnj & Auffray, 1984) performed on che two amino acid sequences yields prediction profiles typical of the particular folding classes.
A comparative stereo picture (Fig. 3) shows that, despite their differences, both structures form compact, prolate, ellipsoidal domains of comparable shapes and dimensions.
(a) Energy minimization of crystal structures
Different X-ray structures vary in quality depending on the nominal resolution, the refinement procedure, and other factors. We therefore first calculated the potential energies of both hemerythrin and the VL domain and then energy- refined them in a consistent way; harmonic constraints of 20 kcaljatom were applied to all the atoms in order to minimize their displacements from the original structure in the course of energy refinement. The initial energy of hemerythrin (Stenkamp et al., 1978), a structure that had been refined by the restrained least- squares procedure of Hendrickson & Konnert (1980), was 905 kcal (3783 kJ). Analysis of individual energetic terms shows that most of the unfavorable (positive) potential contribution comes from the bond angles and bond lengths of
(a)
Immunaglob;lln VL domain Myohemerythrin
FIG. 2. Schematic drawings of (a) MCPC 603 myeloma VL domain and (h) !I’. dyscritum hemerythrin. Courtesy of Dr Jane S. Richardson.

MISFOLDED PROTEINS
FIG. 3. Stereo a-carbon tracings of polypeptide chain backbones of 2’. dyscritum hemerythrin (Stenkamp et ul.. 1978) and mouse K-chain VL domain (Sepal et al., 1974). IJsing the CHARMM program (Brooks et al., 1983) both proteins were superimposed by translating their centers of gravity into the origin of the Cartesian co-ordinate system.
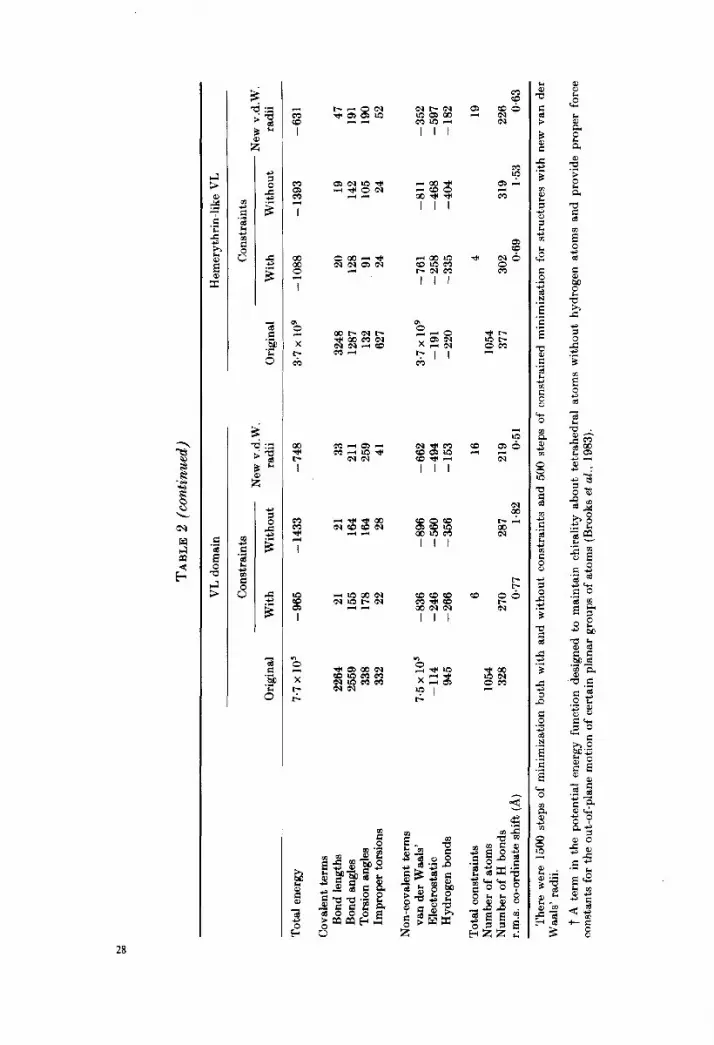
a few side-chains, notably Arg49, Lys95, IleI 13 and Argl 10. The energy of the VL domain X-ray structure (an unrefined co-ordinate set that has currently been superseded by more refined co-ordinates; D. Davies, personal communication) was 770,246 kcal and is due mostly to imperfect side-chain geometry, partial atomic overlaps (repulsive van der Waals’ interaction) and, to a lesser extent, to electrostatic and hydrogen-bonding contribution (Table 2). Table 2 shows that on energy minimization both structures arrive at negative values of potential energy (i.e. - 1578 kcal for hemerythrin, - 965 kcal for the VL domain) with rather small r.m.s.7 co-ordinate shifts from the X-ray structure (0.53 A for hemerythrin. 0.77 A for the VL domain); that the value of the energy is larger for the VL domain than for hemerythrin is in accord with the initial relative energies. Figure 4 shows the structures before and after energy minimization. The small values of the constraint energy (see above) remaining at the end of the minimization (Table 2), namely 4 kcal in the case of hemerythrin and 6 kcal in the case of VL domain, indicate that both structures are sufficiently close in energy to t,hat of a local minimum t,o permit a meaningful analysis.
(b) Construction and energy refinement of incorrectly folded models
The modeling followed the procedure outlined in Methods. We refer to the t,wo misfolded models as VL-like hemerythrin and hemerythrin-like VL.
The VT,-like hemerythrin structure was modeled with all the freely rotatable side- chain dihedral angles, x., equal to 180” (trans). Since the hemerythrin as well as
t Abbreviation used: r.m.s.. root-mean-square.

TABL
E 2
Pote
ntia
l en
ergi
es
befo
re
and
afte
r en
ergy
m
inim
izat
ion
(kca
l)
Hem
eryt
hrin
VL
-like
he
mer
ythr
in
Orig
inal
Con
stra
ints
N
ew
v.d.
W.
With
W
ithou
t ra
dii
Orig
inal
3.3
x 10
’
Con
stra
ints
N
ew
v.d.
W.
With
W
ithou
t ra
dii
Tota
l en
ergy
90
5 -
1578
-
1814
-
1538
Cov
alen
t te
rms
Bond
le
ngth
Bo
nd
angl
es
Tors
ion
angl
es
Impr
oper
to
rsio
nst
590
21
19
41
6086
23
20
54
11
05
151
162
158
2476
18
5 19
0 28
6 26
0 11
1 12
8 16
9 17
1 16
6 17
0 26
2 30
2 25
30
41
67
8 30
32
82
Non
-cov
alen
t te
rms
van
der
Waa
ls’
Elec
trost
atic
H
ydro
gen
bond
s
- 86
8 -
1098
-1
108
-815
3.
3 x
10’
-916
-
276
-432
-
630
-912
-
724
-199
-
208
-361
-4
15
- 22
9 16
1 -2
35
Tota
l co
nstra
ints
4
9 N
umbe
r of
ato
ms
1151
N
umbe
r of
H b
onds
36
1 29
7 33
3 28
1 r.m
.s.
co-o
rdin
ate
shift
(A
) 0.
53
1.37
0.
33
1151
32
4
-942
-
1460
-
467
5
- 10
12
- 52
7 -
558
-537
-3
03
-112
25
245
270
204
0.90
2.
00
0.81
TABL
E 2
(con
tinue
d)
VL
dom
ain
Hem
eryt
hrin
-like
V
L
Orig
inal
Con
stra
ints
C
onst
rain
ts
New
v.
d.W
. N
ew
v.d.
W.
With
W
ithou
t ra
dii
Orig
inal
W
ith
With
out
radi
i
Tota
l en
ergy
7.
1 x
lo5
-965
-
1433
-
748
3.7
x 10
9 -
1088
-
1393
-6
31
Cov
alen
t te
rms
Bond
le
ngth
s Bo
nd
angl
es
Tors
ion
angl
es
Impr
oper
to
rsio
ns
2264
21
21
33
32
48
20
19
47
2559
15
5 16
4 21
1 12
87
128
142
191
338
178
164
259
132
91
105
190
332
22
28
41
627
24
24
52
Non
-cov
alen
t te
rms
van
der
Waa
ls’
Elec
trost
atic
H
ydro
gen
bond
s
7.5
x lo
5 -1
14
945
-836
-
246
- 26
6
3.7
x lo
9 -7
61
-811
-3
52
-191
-
258
- 46
8 -5
97
- 22
0 -3
35
-404
-1
82
Tota
l co
nstra
ints
N
umbe
r of
ato
ms
Num
ber
of H
bon
ds
r.m.s
. co
-ord
inat
e sh
ift
(A)
6 19
10
54
328
-896
-
662
-560
-4
94
- 35
6 -1
53 16
10
54
377
4
270
287
219
0.77
1.
82
0.51
30
2 31
9 22
6 0.
69
1.53
0.
63
Ther
e w
ere
1500
ste
ps
of
min
imiz
atio
n bo
th
with
an
d w
ithou
t co
nstra
ints
an
d 50
0 st
eps
of
cons
train
ed
min
imiz
atio
n fo
r st
ruct
ures
w
ith
new
va
n de
r W
aals
’ ra
dii.
t A
term
in
th
e po
tent
ial
ener
gy
func
tion
desi
gned
to
m
aint
ain
chira
lity
abou
t te
trahe
dral
at
oms
with
out
hydr
ogen
at
oms
and
prov
ide
prop
er
forc
e co
nsta
nts
for
the
out-o
f-pla
ne
mot
ion
of c
erta
in
plan
ar
grou
ps
of a
tom
s (B
rook
s et
al.,
19
83).
J. NOVOTNV, R. BRUCCOLERI AND M. KARPLUS
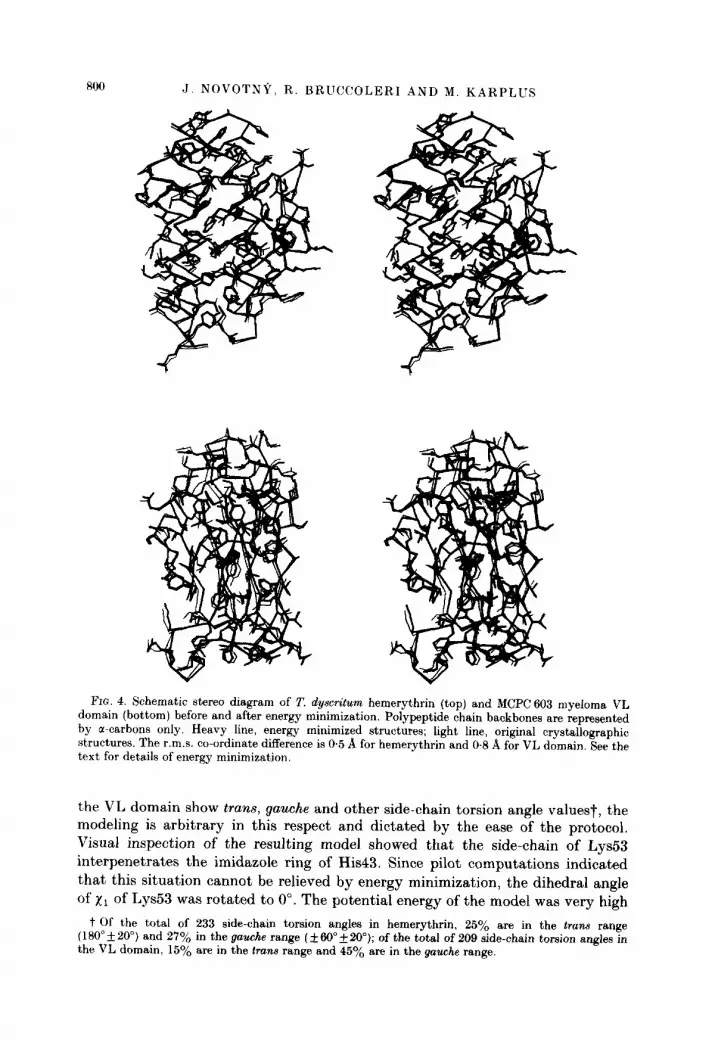
FIG. 4. Schematic stereo diagram of T. dyscritum hemerythrin (top) and MCPC 603 myeloma VL domain (bottom) before and after energy minimization. Polypeptide chain backbones are. represented by a-carbons only. Heavy line, energy minimized structures; light line, original crystallographic structures. The r.m.s. co-ordinate difference is 0.5 A for hemerythrin and 0.8 A for VL domain. See the text for details of energy minimization.
the VT, domain show tram, gauche and other side-chain torsion angle valuest, the modeling is arbitrary in this respect and dictated by the ease of the protocol. Visual inspection of the resulting model showed that the side-chain of Lys53 interpenetrates the imidazole ring of His43. Since pilot computations indicated that this situation cannot be relieved by energy minimization, the dihedral angle of x1 of Lys53 was rotated to 0”. The potential energy of the model was very high
t Of the total of 233 side-chain torsion angles in hemerythrin, 25% are in the trans range ( 180” _+ 20”) and 27% in the gauche range ( _+ 60” _+ 20”); of the total of 209 side-chain torsion angles in the VL domain, 15% are in the tram range and 45% are in the gauche range.

MISFOLDED PROTEINS X01
(3 x lo7 kcal, see Table 2), mostly due to van der Waals’ repulsive energy arising from close contacts. Since some aspects of the side-chain geometries are approximated in the model-building algorithm, bond length and bond angle energy terms are also high. The model was subjected to the same protocol of constrained minimization used for the X-ray structures and a total energy of -942 kcal was obtained, accompanied by a r.m.s. shift in atomic positions of 0.9 A; Figures 5 and 6 show various aspects of the resulting structure. Inspection of individual terms (Table 2) shows that all the contributions to the minimized VL-like hemerythrin energy are in the range found for the minimized crystallographic structures,
The model of hemerythrin-like VL was constructed in a similar way. Apart from many close contacts, the model with all the side-chains in trans conformations did not show any serious structural defects and was directly subjected to constrained energy minimization. With a r.m.s. displacement of atomic positions of only 0.7 A, the potential energy of the model decreased from the original value of 3.7 x 10’ kcal to - 1088 kcal. Again, the energy contributions are in the range expected for correct structures; the resulting structure is depicted in Figures 5 and 6.
It is thus clear that one important question has been answered. There is no difficulty in modeling these two very different structures into each other as far as steric factors involved in the covalent and non-bonded interactions are concerned. Further, this is achieved within a r.m.s. deviation which is well within that observed for highly homologous structures (Lesk & Chothia, 1980,1982).
It has been noted that the van der Waals’ radii used in CHARMM, version 16 lead to an overall reduction in protein size (i.e. the radius of gyration) by several per cent during energy minimization and dynamics (van Gunsteren & Karplus, 1982). A revised set of van der Waals’ radii (Yu, States & Karplus, unpublished results based on values from Jorgensen (1981) and Dunfield et aE. (1978)) avoids this contraction. To make certain that the more permissive van der Waals’ radii are not a factor in the possibility of modeling incorrect structures, we remodeled the m&folded structures using the new set of larger radii (CHARMM, version 17). We found (see Table 2) results similar to those obtained with the smaller radii, i.e. after 500 steps of constrained ABNR minimization, a stereochemically correct st8ructure that has stabilizing non-bonded contacts is achieved with comparat’ively small r.m.s. values.
In the following, we first examine the various structures using criteria based on the vacuum empirical energy function and then supplement the analysis by introducing approximate solvation corrections to determine the nature of t’hr changes that might be expected from a more detailed treatment. Finally, we focus on some structural aspects of the models to obtain additional insight into t,he difference between correctly and incorrectly folded structures.
(c) Analysis of individual energy contributions
The geometry of the energy-minimized models, as represented by the covalent contributions to the energy, is comparable to that of the correct structures

FIG
. 5.
Ste
reo
diag
ram
s of
inc
orre
ctly
fo
lded
st
ruct
ures
. U
pper
le
ft,
hem
eryt
hrin
-like
V
L w
ith
side
-cha
in
tors
iona
l an
gles
m
odel
ed
pred
omin
antly
tra
ns.
Low
er
left,
he
mer
ythr
in-li
ke
VL
with
al
tere
d co
nfor
mat
ions
of
su
rface
-exp
osed
si
de-c
hain
s (h
eavy
lin
es;
see
the
text
fo
r de
tails
). U
pper
rig
ht,
VL-li
ke
hem
eryt
hrin
w
ith
side
-cha
in
tors
iona
l an
gles
m
odel
ed
pred
omin
antly
tra
ns.
Low
er
right
, VL
-like
he
mer
ythr
in
with
al
tere
d co
nfor
mat
ions
of
sur
face
-exp
osed
si
de-c
hain
s (h
eavy
lin
e).

MISFOLDED PROTEINS
FIQ. 6. Stereo diagram showing polypeptide chain backbones of incorrectly folded models before and after constrained energy minimization. Top, hemerythrin-like VL before (light line) and after (heavy line) 1500 steps of ABNR minimization with harmonic constraints of 20 kcal applied to all the atoms. The r.m.8. shift of the 2 co-ordinate sets is 0.69 A. Bottom, ,VL-like hemerythrin. The co-ordinate r.m.8. shift is 0.90 A.
(Table 2). Specifically, the bond length, bond angle, torsion angle and improper torsion energy terms are all in the range normally obtained for reasonably energy- minimized structures; i.e. the residual energies are in the range of 0.02 to O-2 kcal/mol atom. Comparing hemerythrin with VL-like hemerythrin, we see that the correct structure has a slightly lower energy, while for the VL domain versus

804 J. NOVOTN?, R. BRUCCOLERI AND M. KARPLUS
hemerythrin-like VL the reverse is true. However, the differences for the covalent terms are so small that they are not significant when expressed per atom.
The above result implies that occasional geometrical constraints, such as those associated with proline residues (the fixed cp torsion angle, cis- as well as trans- polypeptide bonds, etc.) can be accommodated by any amino acid sequence without serious difficulties. A closer examination of this point reveals that substitution of proline side-chains by, or for, different residues sometimes leads to an energetic penalty but in other cases it has no impact on the covalent energy around the point of substitution. Of the six proline residues in the VL domain (positions 8, 46, 49, 50, 65 and lOI), two exist in c&backbone conformation (residues 8 and 101) and all except Pro8 occur in reverse turns. The conformation of residues 8 and 101 remains cis even after substitution of incorrect side-chains (Tyr8 and His101 in VL-like hemerythrin) although after energy minimization, the C”-C-N-C” dihedral angles deviate from planarity (from 0” to -6” and 8”, respectively) and there is a large increase in the torsion angle energy terms associated with the residue 7. Similarly, the single &s-bond between residues Asp6 and Pro7 in hemerythrin remains cis in misfolded hemerythrin (GlnS-Ser7). Modeling of the incorrectly folded structures involves introduction of proline residues in the middle of a-helices and P-strands, i.e. at positions where they normally occur only very rarely (Chou & Fasman, 1974). For example, all of the three prolines from the irregular N-terminal loop of hemerythrin fall into the first P-strand in the VL-like hemerythrin while four out of six proline residues in the VL domain are located in the middle of a-helices in hemerythrin-like VL. However, in only two out of the nine misplaced proline residues is there an indication of a sterical strain with the torsion angle cp outside the allowed range (Pro7 in a P-strand of VL-like hemerythrin, cp = -97”; Pro65 replacing Ser in a tight turn of hemerythrin-like VL, cp = - 105”). Since the fixed value of the Pro torsion angle cp (C-N-C-C = -60” f20”) is not incompatible with the right- handed a-helical conformation, the absence of proline residues from organized secondary structures is likely to be due in part to its amide nitrogen atom not being able to participate in backbone-backbone hydrogen bonds.
As far as the hydrogen-bonding energy term is concerned, the major energy contribution arises from the polypeptide chain backbone, i.e. the parts of the molecule that are most directly determined by the modeling procedure. Since the number and strength of the hydrogen bonds are related more to the secondary structure than to the sequence, both a-helical molecules (hemerythrin and hemerythrin-like VL) have more hydrogen bonds than both P-sheet molecules (the VL domain and VL-like hemerythrin). Further, the energies per hydrogen bond (- 1.22 kcal in hemerythrin, - 1.11 kcal in hemerythrin-like VL, -0.98 kcal in the VL domain and -0.96 kcal in VL-like hemerythrin) suggest that the hydrogen bonds of the b-sheet domains are slightly less stable than those of the a-helical domains. This is in accord with the idea that antiparallel b-sheets are particularly flexible since they are less constrained geometrically than other types of secondary structure (Salemme, 1981). Comparing the hydrogen bond energies for the models with the same secondary structure, we see that the correct structure (the VL domain versus VL-like hemerythrin and hemerythrin versus

MISFOLDED PROTEINS 805
hemerythrin-like VL) has the larger hydrogen bond stabilization energy. In the former this appears to come mainly from the fact that the hydrogen bonds are better in the correct structure, while in the latter the dominant factor is the larger number of hydrogen bonds. It should be noted that the criterion for hydrogen bonding used in our analyses is a permissive one and a large number of weak hydrogen bond interactions with energies less than 1 kcal/bond are included in the total. The numbers of “strong” hydrogen bonds, which a crystallographer would classify as such, are 117 in hemerythrin, 101 in hemerythrin-like VL, 82 in the VI, domain and 79 in VL-like hemerythrin; thus, the correct secondary structures are favored on this basis.
Analysis of the van der Waals’ and electrostatic interactions is somewhat more complicated because absolute, thermodynamically meaningful values of these quantities depend on a proper treatment of solvent effects. The simplest treatment in VCKUO uses a constant dielectric (E = 1) and includes all the electrostatic and van der Waals’ interactions, i.e. no distance cut-off is introduced to simplify the calculation. The results of this calculation are given in Table 3. It is evident that the non-bonded interactions lead to significant stabilization of the correctly versus the incorrectly folded structures. Actually, the van der LVaals’ energies favor the correct structures only to a slight degree (- I.02 kcal/mol atom for hemerythrin versus - 046 kcal/mol atom for VL-like hemerythrin anti -0.85 kcal/mol atom for the VL domain versus -0.75 kcal/mol atom fol hemerythrin-like VL), although for the new set of atomic radii (Table 2) the correct structures have a larger net van der Waals’ stabilization. As t,o the elect’rostatic contribution, there is a large difference (-0.77 kcal/mol atom for
TABLE 3 Potential energy contributions by alternative calculations
VL-like Hemerythrin Hemerythrin hemerythrin VL domain like VL
I. Covalent bond terms 308 404 377 263 (taken from Table 2)
2. van der Waals’ energy -1177 -988 - 898 -817 with no cut-off
3. Electrostatic with constant energy -890 -197 -749 -49i dielectric (E = 1) and no cut-off
4. Solvent-screened electrostatic term -89 -32 -68 -41 5. Repulsive van der Waals’ term 1814 1714 1470 1594
(steric hindrance) 6. “Hydrophobic force” (attractive -1842 - 1612 - 1479 - 12x0
van der Waals’ term, solvent- exposed non-polar atoms excluded)
7. Total solvent-modified -28 102 -9 314 van der Waals’ interaction (sum of 5+6)
8. Total solvent-modified, non-local -117 70 -77 273 potential energy (i.e. sum of contributions 4+ 7)
All the numbers refer to constrained-minimized structures (1500 minimization steps).

806 J. NOVOTNP, R. BRUCCOLERI AND M. KARPLUS
hemerythrin versus - 0.17 kcal/mol atom for VL-like hemerythrin and -0.71 kcal/mol atom for the VL domain versus - 0.47 kcal/mol atom for hemerythrin-like VL; cf. Table 3).
The above results demonstrate that at least within the range of small (i.e. less than 1.0 A) r.m.s. deviation obtained from constrained minimization, the correctly folded structure is selected by the vacuum energy function. To test whether the same situation holds when larger deviations are permitted, an exhaustive minimization was performed on the four structures (1500 steps of ABNR procedure) without constraints. It is clear (see Table 2) that, on the normalized energy scale of kcal/mol atom, the relative stability of correct versus incorrect structures is preserved in the converged structures, even though significantly larger r.m.s. values are found; Figure 7 compares the backbone shifts in the structures minimized without constraints. The resulting non-bonded energy contributions are - 1.58 kcal/mol atom for hemerythrin versus - 1.32 kcal/mol atom for hemerythrin-like VL and - 1.36 kcal/mol atom for the VL domain versus - 1.27 kcal/mol atom for VL-like hemerythrin.
(d) Solvent effects
Since the potential energy calculated for a protein by programs like CHARMM corresponds to the system in vacuum, the van der Waals’ interactions with solvent are neglected, as are dielectric and other (e.g. solute ion) screening effects on the electrostatic interactions, Also, no explicit consideration is given to hydrophobic contributions to the free energy. Although it is not our purpose here to propose detailed models for the effect of solvent, it is useful to determine whether the trends found for the vacuum potential function are expected to be altered significantly by the presence of solvent. This can be done most easily by introducing implicit solvent effect corrections into the existing potential energy function.
An important effect of solvent is expected to be a decrease in the effective electrostatic energy relative to the unshielded vacuum value in the program. One simple correction is the distance-dependent dielectric constant combined with a non-bonded cut-off first introduced by Gelin & Karplus (19751979) (cf. values in Table 2). Although the cut-off, per se, seems to have little effect as judged by the relative van der Waals’ energies, the electrostatic energy results are, in fact, reversed for the VL domain, though they still favor the correct structure of hemerythrin (cf. Tables 2 and 3). To obtain a more realistic estimate of solvent screening we used the simplified Tanford-Kirkwood model described in Methods. The results obtained with this model (Table 3) do diminish the unrealistically high energy values obtained with Coulomb potential without screening. Nevertheless, they give very different values for the correct and incorrect structures. On a per atom basis we have -0.075 kcal/mol atom for hemerythrin versus -0.037 kcal/mol atom for VL-like hemerythrin and -0.06 kcal/mol atom for the VL domain versus -0.033 kcal/mol atom for hemerythrin-like VL. It is of interest that although hemerythrin contains 29 charged side-chains and the VL domain only 18, the effect of misfolding on the electrostatic energy term is very similar in

MISFOLDED PROTEINS
Fro. 7. Stereo diagrams of polypeptide chain backbones of incorrectly folded structures before and after energy minimization without constraints. Top, hemerythrin-like VL before (light line) and after (heavy line) 1500 steps of ABNR minimization with no constraints. The co-ordinate r.m.s. shift is 1.53 A. Bottom, VL-like hemerythrin. The co-ordinate r.m.s. shift is 2.00 A.
the two molecules once the solvent-screening is introduced. For the unscreened, in vacua values the electrostatic effect in hemerythrin is much larger than that in the VL domain (Table 3).
Next we turn our attention to the hydrophobic corrections. Table 3 shows that the modified van der Waals’ energy, as well as the total non-covalent energy

808 J. NOVOTNP, R. BRUCCOLERI AND M. KARPLUG
including the solvent-modified electrostatic term of the misfolded structures is significantly destabilized relative to the correct structures: the results are + 0.061 kcal/mol atom for VL-like hemerythrin and +@259 kcal/mol atom for hemerythrin-like VL compared to -0.102 kcal/mol atom for hemerythrin and -0.073 kcal/mol atom for the VL domain.
In summary, two simple modifications to the potential energy function, namely, linear electrostatic solvent screening and elimination of van der Waals’ attraction for exposed non-polar atoms yield values for the non-covalent potential energy of the system that differentiate sensitively between the correct and misfolded structures. This suggests that an approach of the present type, with suitable refinements, holds considerable promise for evaluating computer- generated models.
(e) Structural characteristics of the models
The energy function analysis has suggested that correctly and incorrectly folded structures can be distinguished by their non-covalent interactions. It is useful to supplement this result with an examination of features of the structural models,
Figures 8 and 9 show stereo diagrams of the correctly and incorrectly folded structures including only charged side-chains (Fig. 8) and only hydrophobic side- chains (Fig. 9). For the charged side-chains (Fig. 8), the differences between the correctly and incorrectly folded structures are not obvious. However, for the hydrophobic side-chains (Fig. 9), it is clear that the incorrectly folded models look wrong, with aromatic and other non-polar groups protruding into the solvent. To find a quantitative measure of the differences illustrated in the Figures, we examined the surface characteristics of the correct as well as the misfolded structures. Some results are given in Table 4. We see that the total surface area of
TABLE 4 Solvent-accessible surfaces (A’) and total atomic volumes (A3)
Hemerythrin VL-like
hemerythrin VL domain Hemerythrin
like VL
Exposed backbone atoms Exposed polar side-chain
atoms Exposed non-polar side-chain
atoms Total exposed surface Domain surface obtained from
the formula S = Il.1 x &f*‘3 Ratio of side-chain
(non-polar/polar) surface Total atomic volume Number of atoms
617 716 (652) 790 666 (642) 2084 2072 (1594) 1878 1822 (1528)
3484 4561 (4468) 3212 4632 (4794)
6165 7349 (6714) 5880 7120 (6964) 6232 6232 5867 5867
I.69 2.20 (2.80) 1.74 2.50 (3.14)
15,679 16,257 14,336 15,298 1151 1151 1054 1054
Numbers in parentheses relate to misfolded models in which the side-chain dihedral angles of solvent-exposed residues were altered (see the text for details).

Fx;.
8.
Ster
eo
diag
ram
s sh
owin
g po
sitio
ns
of
elec
trica
lly
char
ged
amin
o ar
id
resi
dues
ly
sine
, ar
gini
ne,
aspa
rtir
and
glut
amic
ac
id
(hea
vy
lines
) in
~w
r~c:
tly
and
inro
rrect
ly
fold
ed
stru
ctur
es.
L’pp
er
left,
he
mer
yt,h
rin:
low
er
Irft,
hem
eryt
hrin
-like
VI
,: up
per
right
. V
I, do
mai
n:
louw
rig
ht,.
VL-li
ke
hem
rrvt~
hrin
Po
i,vpe
pt,id
e ch
ain
hack
hone
s ar
e re
pres
ente
d hy
a-
carb
ons
onI?
-.

Pm
. 9.
Ste
reo
diag
ram
s of
hyd
roph
obic
am
ino
acid
re
sidu
es
valin
e,
leuc
ine,
is
oleu
cine
, m
ethi
onin
e,
phen
ylal
anin
e,
tyro
sine
an
d try
ptop
han
(hea
vy
lines
) in
co
rrect
ly
and
inco
rrect
ly
fold
ed
stru
ctur
es.
Upp
er
left,
he
mer
ythr
in;
low
er
left,
he
mer
ythr
in-li
ke
VL;
up
per
right
, V
L do
mai
n;
low
er
right
, VL
-like
he
mer
ythr
in.
Poly
pept
ide
chai
n ba
ckbo
nes
are
repr
esen
ted
by a
-car
bons
on
ly.

MISFOLDED PROTEINS 811
the incorrectly folded structures is significantly larger than that of the correct ones. It has been faund empirically (Chothia, 1975; Teller, 1975; Janin, 1976) that the total accessible surface can be estimated from the molecular weight of a single-domain protein by the formula:
Accessible surface = 11.1 x (molecular weight)2’3.
It is clear that the correct structure values are in good accord with this expression (hemerythrin to - l.l%, VL domain to 0.2%) while the incorrect structures display much larger deviations (hemerythrin-like VL 21*3%, VL-like hemerythrin 17.9%).
Examination of the backbone, polar and non-polar side-chain atom accessibilities in the misfolded structures shows that the dominant part of their excessive solvent-exposed surface arises from the exposure of non-polar groups. This is in accord with the observation that the ratio of side-chain non-polar to polar surface, which has been shown to be constant for globular proteins of comparable molecular weights (Chothia, 1976), is much larger for the incorrectly than the correctly folded structures (Table 4).
Since all the side-chains were modeled using torsion angles xn equal to 180”, it is necessary to correct these results by adjusting the conformations of the solvent- accessible side-chains. This was done systematically by changing the torsion angles of surface-exposed side-chains of both misfolded models in such a way as to create smoother molecular surfaces. Typically, the long aliphatic side-chains (Lys, Met) were folded back onto the backbone while aromatic rings were rotated so that they did not protrude into the solvent. A total of 40 side-chains were repositioned in each of the structures and two-thirds of the new dihedral angle values were chosen from within the gauche range (+60” &20”). Partial atomic overlaps were then relieved by 50 steps of ABNR minimization without constraints, resulting in acceptable potential energies for both the modified models (-844 kcal/mol for VL-like hemerythrin, cf. Fig. 5(d), and - 1000 kcal/mol for hemerythrin-like VL, cf. Fig. 5(b)); further minimization is expected to have Small effects on the surface characteristics. Accessibilities were recomputed and, as can be seen from Table 4, the solvent-exposed areas found in the altered models were significantly smaller than those of the original misfolded structures. The surfaces, however, still remained excessively large compared to the values expected on the basis of the Chothia-Teller-Janin formula. Moreover. remodeling of the surface side-chains resulted in even more anomalous ratios of non-polar/polar exposed atoms (Table 4). These results suggest that, although the solvent-exposed surfaces of modeled structures depend strongly on the set of torsional angles employed in the construction, the correct structures are distinguished by the fact that the solvent-accessible surface is minimized and that the ratio of solvent-exposed non-polar atoms to polar atoms is minimized. Similarly, Levitt (1983) reported that computer-generated models of folded pancreatic trypsin inhibitor had solvent-accessible surfaces 2 to 13% larger than the X-ray structure, with much of the anomalous surface due to non-polar atoms.
A more detailed analysis of relative side-chain accessibility in the correct and misfolded structures (Table 5) uncovers additional trends for the two structural

812 J. NOVOTNP, R. BRUCCOLERI AND M. KARPLUS
types. In hemerythrin, misfolding results in a significant increase in the exposure of most hydrophobic residues, with the largest effect for leucine and tryptophan. In the polar residues, asparagine and aspartic acid side-chains are buried and the other polar residues are less affected, e.g. for glutamic acid there is an increase in exposure in the incorrectly folded structure. In the VL domain, the most frequently exposed non-polar residues are phenylalanine, tryptophan and valine. The most conspicuous change in exposure of polar residues is the burial of lysine
TABLE 5
Relative solvent accessibilities of individual amino acid residues (%)
Hemerythrin Hemerythrin
like VL VL domain VL-like
hemerythrin
Alanine 99.7 83.1 45.3 43.6 Cysteine 51.5 84.3 0.0 103.4 Aspartic acid 60.5 98.8 72.9 27.6 Glutamic acid 43.0 70.8 60.6 69.5 Phenylalanine 25.3 95.9 30.7 52.1 Glycine 153.2 93.6 82.9 99.0 Histidine 18.7 10.4 34.1 42.4 Isoleucine 39.8 42.6 11.6 45.0 Lysine 65.1 23.9 78.7 56.0 Leucine 28.1 74.5 27.8 90.7 Methionine 0.0 21.2 0.1 144.0 Asparagine 73.0 57.8 35.1 33.5 Proline 100.7 55.9 92.1 56.5 Glutamine 766 46.7 52.0 71.7 Arginine 59.5 52.4 48.6 83.9 Serine 62.3 51.7 71.8 64.3 Threonine 67.0 75.4 54.0 43.6 Valine 13.0 96.6 25.0 43.2 Tryptophan 14.3 109.4 0.0 98.9 Tyrosine 24.3 74.1 49.1 56.5
Total 56.2 67.3 53.3 58.6
The values larger than 100% result from the fact that the definition of a completely accessible residue is based on the accessibility of the residue in the tripeptide Ala-X-Ala with a specific configuration (Lee & Richards, 1971).
side-chains; other polar residues behave similarly in the correct and incorrect structures. We also find that the total, summed percentage of buried side-chains is the same in both types of structures (cc-helices, P-sheets), thus confirming Chothia’s (1975) conclusions that the relative accessible surface changes upon folding of different three-dimensional structures are identical.
Differences in summed atomic volumes (cf. Table 4) between hemerythrin and the VL domain reflect the different molecular weights of these proteins. On misfolding, the amino acid sequence of the VL domain accommodates easily into the larger volume of the hemerythrin fold; in fact, the volume of hemerythrin-like VL becomes slightly smaller (15,298 as opposed to 15,679 A3) than that of hemerythrin. The amino acid sequence of hemerythrin, on the other hand, has to

MISFOLDED PROTEINS x 13
be packed into the volume of the VL domain that was originally 1343 A3 smaller and the resulting volume of the VL-like hemerythrin becomes 1921 A3 larger than that of the VL domain. A closer look at average side-chain volumes and their fluctuations suggests that the packing densities are similar in the correctly and the incorrectly folded structures. The average residue volume of hemerythrin and VL-like hemerythrin are 139f39 A3 and 144f38 A3, respectively, while for the VI, domain and hemerythrin-like VL we have 127f42 A3 and 135f45 A3, respectively. Restricting the calculation to buried residues only (Chothia, 1975) leads to comparable results. However, differences in the number of empty grid points that the volume program uses in construction of Voronoi polyhedra (Richards, 1974) implies larger internal cavities in the misfolded structures. The native structures have an approximately equal number of inside grid points unoccupied by protein atoms (160 and 178, respectively) but there are 42 more ( + 24%) in misfolded hemerythrin and 77 more ( +48%) in the misfolded VL domain.
To study the excluded volume effects in greater detail, we created space-filling, csomputer-graphic images of sections through the interior of suitably oriented portions of the structures. The interior of hemerythrin (Fig. 10) shows a regular, uniform distribution of side-chains, which overlap each other in a manner similar t.o that described by Richmond & Richards (1978) for myoglobin. While the overall pattern of helix-helix packing in hemerythrin is in good accord with the “ridges into grooves” model described by Chothia et al. (1977,1981), the uniform packing required by this model is clearly absent from the core of hemerythrin-like VL where one finds irregular side-chain clusters interspersed with empty cavities (Fig. 11). Two different factors are likely to contribute to the imperfect packing of the misfolded a-helices: first, the side-chains of hemerythrin-like VL are, on average, smaller than those of hemerythrin so that the ridges-into-grooves type of contact is difficult to achieve; second, the all-trans side-chain conformations of our model are at variance with the alternating trans-gauche pattern of x1 torsion angles required in side-chains that contact each other across the helix-helix surfaces (Efimov, 1979).
In contrast to the loose helix-helix packing in hemerythrin-like VL, the /?-sheet-B-sheet interface in misfolded VL domain is very tightly packed (Fig. 13). However, it is much rougher and more convoluted than the smooth sheet-sheet interface of the VL domain (Fig. 12). It has been known that the sheet-sheet contact areas are rich in aromatic and branched aliphatic side-chains, thus tnaking the interacting surfaces smooth (Chothia & Janin, 1981), although occasional disturbances can be found in the vicinity of bulky residues (Cohen et
(Il., 1981). Characteristic features of secondary structure interfaces have traditionally been interpreted in relation to specific atomic packing. Our results put tnore emphasis on uniform mass distribution and regularity of secondary structure surfaces than on the tight packing, which is evident in large areas of incorrently folded structures. It is interesting to mention in this regard that Yuschok & Rose (1983) in their study of randomly simulated chains (Schultz, 1980) found the interior clustering and spatial organization indistinguishable from that of native proteins.

FIQ
. 12
. Fr
o.
10.
A cr
oss-
sect
iona
l, st
ereo
vie
w
of
helix
-hel
ix
pack
ing
in
hem
eryt
hrin
. Th
e 4
diffe
rent
a-
helic
es
are
colo
r-cod
ed
and
only
si
de-c
hain
s at
oms
are
disp
laye
d.
A se
ctio
n pe
rpen
dicu
lar
to
the
helic
al
axis
is
con
stru
cted
by
or
ient
ing
the
stru
ctur
e w
ith
helix
ax
es
para
llel
to
the
z-ax
is
of
the
Car
tesi
an
co-
ordi
nate
sy
stem
, an
d by
del
etin
g fro
m
the
pict
ure
all
the
atom
s,
the
z-co
-ord
inat
e of
whi
ch
exce
eds
an a
rbitr
ary
cut-o
ff va
lue
(5 A
in
this
ca
se).
FIG
. 11
. A s
tere
o cr
oss-
sect
iona
l vie
w
of h
elix
-hel
ix
pack
ing
in h
emer
ythr
in-li
ke
VL.
Th
e or
ient
atio
n an
d th
e z
cut-o
ff va
lue
are
iden
tical
to
tho
se i
n Fi
g.
10.
Def
ects
in
ato
mic
pa
ckin
g al
ong
the
pseu
do4-
fold
ax
is
of s
ymm
etry
ar
e cl
early
ap
pare
nt
(cf.
Fig.
10
). FI
O.
12.
A st
ereo
cr
oss-
sect
iona
l vie
w
of
shee
t-she
et
inte
ract
ion
in
the
core
of
th
e V
L do
mai
n.
The
2 /l-
shee
ts
are
colo
r-cod
ed
and
only
si
de-c
hain
s ar
e di
spla
yed.
Th
e z
cut-o
ff va
lue
is 1
9 A,
i.e
. cl
ose
to
one
of t
he
ends
of
the
inte
rface
. N
ote
the
regu
lar
alig
nmen
t of
the
st
rand
s an
d th
e sm
ooth
ness
of
th
e in
terfa
ce.
FIG
. 13
. A s
tere
o cr
oss-
sect
iona
l vie
w
of s
heet
-she
et
inte
ract
ion
in t
he c
ore
of V
L-lik
e he
mer
ythr
in.
The
colo
r-cod
ing
and
the
z cu
t-off-
valu
e ar
e th
e sa
me
as
in F
ig.
10.

MISFOLDED PROTEINS 815
4. Conclusions
Incorrectly folded proteins have been constructed by standard modeling procedures. They have been used to examine some of the underlying assumptions implicit in predicting unknown structures from those of homologous proteins and to test the ability of energy functions to distinguish correct from incorrect structures.
We find that incorrect side-chains can be accommodated into an a-helical or a /?-sheet protein with negligible perturbation to its secondary structure or to the close interatomic packing of its interior. Further, the energies of the incorrectly folded structures, after minimization accompanied by small r.m.s. shifts, are comparable to those found in native proteins. It is very likely that these results are not limited to the particular modeling method used or to the two particular protein structures used as examples.
Although the covalent terms in the energy (bond lengths, bond angle and dihedral angle contributions) are similar in correct and misfolded structures, the non-covalent energy terms (van der Waals’, electrostatic and hydrogen bonding contributions) distinguish between the two. This is true for vacuum potential energy functions and for the energies obtained when modifications are introduced to include the effect of exposed non-polar residues and to account for dielectric screening by the solvent.
Comparison of correctly and incorrectly folded proteins shows that correct folding is accompanied by a larger diminution of exposed non-polar surface and a significant improvement in the attractive electrostatic interactions. Although the importance of the hydrophobic stabilization has long been recognized (Kautzmann, 1956; Nemethy & Scheraga, 1962; Lee & Richards, 1971; Chothia, 197.5), the influence of electrostatic interactions is only beginning to be delineated (Wada & Nakamura, 1981; Paul, 1982; Matthews et al., 1983).
Close atomic packing, although a necessary attribute of native structures, does not seem to be unique to them since it is found in the incorrectly folded models as well. However, the misfolded structures violate the characteristic properties of secondary-structural surfaces (side-chain ridges and grooves spirally wound on a-helices. predominantly flat surfaces of p-sheets), creating apparently disorganized clusters of high (and low) mass densities within the protein core.
In summary, it is clear from the present results that although correct and grossly misfolded structures can be distinguished by the present methods, considerable care and detailed analyses are required to characterize fully the differences between model structures.
VC’e thank Dr David Davies (PU’IH, Bethesda) for atomic co-ordinates and Dr Edgar Haber, Chief of the Cardiac Unit (MGH, Boston) and Mr John Newell, Head of the Cardiac Computer Center (MGH, Boston) for their generous support. Our thanks are due also to Drs Frederick F. Richards (Yale University, New Haven), Cyrus Chothia (MRC, Laboratory of Molecular Biology, Cambridge) and Don Wiley (Harvard University; Cambridge) for comments on the manuscript. We are grateful to Dr Jane Richardson (Duke University, Durham) for permission to use her drawings. The work carried out in the Department of Chemistry was supported in part by a grant from the National Institutes of Health.
20

816 J. NOVOTNP, R.BRUCCOLERI AND M. KARPLUS
REFERENCES Anfinsen, C. (1973). Science, 185, 862-864. Barnard, E. A., Cohen, M. S., Gold, M. H. & Kim, J. K. (1972). Nature (London), 240,395-
398. Bedarkar, S., Turnell. W. G., Blundell, T. L. & Schwabe. C. (19’77). Nature (London), 270,
449-45 1. Bernstein, F. C., Koetzle, T. I?., Williams, 0. J. B., Meyer, E. F., Brice, M. D.. Rodgers,
J. R., Kennard, O., Shimanouchi, T. & Tasumi, M. J. (1977). J. Mol. Biol. 112, 535-542.
Blundell, T. L., Bedarkar, S., Rinderknecht, E. & Humbel, R. E. (1978). Proc. Nut. Acad. Sci., U.S.A. 75, 180-184.
Blundell, T., Sibanda, B. L. & Pearl, L. (1983). Nature (London), 304, 273-275. Brandenburg, K. P., Dempsey, S., Dijkstra, B. W., Lijk, L. J. & HOI, W. CT. J. (1981).
J. Appl. Cryslallogr. 14, 274-279. Brant, D. A. & Flory, P. J. (1965). J. Amer. Chem. Sot. 87, 2791-2800. Brooks, B. Et., Bruccoleri, R. E., Olafson, B. D., States, D. *J., Swaminathan, S. & Karplus,
M. (1983). J. Comput. Chem. 4, 187-217. Browne, W. ,J., North, A. C. T., Phillips, D. C., Brew, K., Vanaman, T. C. & Hill, R. L.
(1969). J. Mol. Biol. 42, 65-86. Catmull, E. (1974). Ph.D. thesis, Department of Computer Science, University of Utah. Chothia. C. (1975). Nature (London), 254, 304-308. Chothia, C. (1976). J. Mol. BioE. 105, I-14. Chothia, C. & Janin, J. (1981). Proc. Nat. Acad. Sci., U.S.A. 78, 4146-4150. Chothia, C. & Lesk. A. M. (1982). J. Mol. Biol. 160, 309-323. Chothia, C., Levitt, M. & Richardson, D. (1977). Proc. Nat Acad. Sci., U.9.A. 74, 4130-
4134. Chothia, C., Levitt., M. & Richardson, D. (1981). J. Mol. Biol. 145, 215-250. Chothia, C., Lesk, A. M.. Dodson, G. G. & Hodgkin. D. C. (1983). Nature (London), 302,
500-505. Chou, P. Y. & Fasman, G. D. (1974). Biochemistry, 13, 222-244. Cohen, F. E., Sternberg, M. J. E. & Taylor, W. R. (1981). J. Mol. Biol. 148, 253-272. Coutre, S. E., Stanford, <J. M.. Hovis, J. G.. Stevens, P. W. & Wu, T. T. (1983). J. Theor.
Biol. 88, 417-434. Crippen, G. M. (1977). Biopolymers, 16, 2189-2201. Davies, D. R. & Padlan, E. A. (1977). In Antibodies in Human Diagnosis and Therapy
(Haber. E. & Krause, R. M., eds), pp. 9-28, Raven Press, New York. Deisenhofer. J. (1981). Biochemistry, 20, 2361-2370. Deisenhofer, J. & Steigemann, W. (1975). Acta Crystallogr. sect. B, 32, 238-250. Delabaere, L. T., Brayer, G. D. & James, M. IT. (1979). Nature (London), 279, 165-168. Diamond, R. (1966). Acta CrystaZlogr. 21, 253-266.
Dickerson, R. E. (1971). J. Mol. BioE. 57, l-15. Dunfield, I. G., Burgess, A. W. & Scheraga, H. A. (1978). J. Phys. Chem. 82, 2609-2616. Dwek, R. A., Wain-Hobson, S.. Dower, S., Gettins. P.; Sutton, B., Perkins, S. ,J. & Givol,
D. (1977). Nature (London), 264, 31-37. Efimov, A. V. (1979). J. &loZ. Biol. 134, 23-40. Endres, G. F.. Swenson, M. K. & Scheraga, H. A. (1975). Arch. Biochem. Biophys. 168,
180-187. Epp, O., Colman, P., Fehlhammer, H., Bode, W., Schiffer, M. & Huber, R. (1974). Eur. J.
Biochem. 45, 513-524. Epstein, J. C. (1964). Nature (London), 203, 1350-1352. Epstein, J. C. (1966). Nature (London), 210, 25-28. Feldmann, R. J.: Bing, D. H., Furie, B. (1. & Furie, B. (1978). PTOC. Xut. Acad. Sei., U.S.A.
75, 5409-5412. Feldmann, R. J., Potter, M. & Glaudemans, C. P. ,J. (1981). Mol. Immunol. 18, 683-698. Furie, B., Bing, D. H., Feldmann, R. J., Robison, D. J.. Burnier, J. P. & Furie, B. C.
(1982). J. Biol. Chem. 257, 3875-3882.

MISFOLDED PROTEINS 817
Gelin. B. & Karplus, M. (1975). Proc. Nut. Acad. Sci., U.S.A. 72, 2002-2006. Gelin. B. & Karplus, M. (1979). Biochemistry, 18, 1256-1268. Gellatly, B. qJ. & Finney, J. L. (1982). J. Mol. Biol. 161, 305-322. GO, N. & Taketomi, H. (1978). Proc. Nut. Acad. Sci., U.S.A. 75, 559-563. Gael, N. S., Rouyanian, B. & Sanati, M. (1982). J. Theor. Biol. 99, 705-757. (ireer, J. (1980). Proc. Nut. Acad. Sci., U.S.A. 77, 3393-3397. (ireer, -1. (1981a). J. Mol. BioE. 153, 1027-1042. (ireer, .I. (1981h). J. Mol. BioE. 153, 1043-1053. Haglrr, A. T. & Honig, B. (1978). Proc. Nat. Acad. Sci., U.S.A. 75. 554-558. Hartley, B. 6. (1970). Phil. Trans. Roy. Sot. ser. B, 257, 77-87. Havrl, T. F., Crippen, G. M., Kuntz, I. D. (1979). Biopolymers, 18, 73-81. Hendrickson, W. A. & Konnert, J. H. (1980). In Biomolecuhr Structure, Function
(‘onjormation and Evolution (Srinivasan, N., ed.). vol. 1. pp. 43-57, Pergamon Press. Oxford.
Hermans. J. & Mc&ueen, J. E. (1974). Acta Crystallogr. sect. A, 30, 730-739. Tnana, G., Piatigorsky, J., Norman, B., Slingsby, C. 8: Blundell, T. (1983). X~turr
(Lon,don), 302, 310-315. Isaac&s. N.. Dodson, E. J. & Rollett, J. (1975). Acta Crystallogr. sect. A., 32, 311-315. *Janin. ,J. (1976). J. Mol. Biol. 105, 13-14. .Jonrs. T. A. (1978). J. Appl. Crystallogr. 11, 268-272. Jorgrnsen, W. L. (1981). J. A mer. Chem. Sot. 103, 335-340. .Jurasek. L., Olafson, R. W., Johnson, P. & Smillie, L. B. (1976). In ProteoZysis and
Physiological Regulation (Ribbons, D. W. & Brew, K.. eds), Miami Winter Symp.. vol. 11, pp. 93.-123, Academic Press, New York.
Kabat. E. A. & Wu, T. T. (1972). Proc. Nat. Acad. Sci., U.S.A. 69, 960-964. Karplus, M. & McCammon, A. (1983). Annu. Rev. Biochem. 52, 263-300. Katz. L. & Levinthal, C. (1976). Annu. Rev. Biophys, Bioeng. 1, 465-504. Kautzmann, W. (1959). Advan. Protein Chem. 14, 1-63. Kiefrr. V. R., McGuirr. B. S., Osserman, E. F. & Garver. F. A. (1983). J. Immunol. 131.
1871-1875. Kirkwood, J. G. & Westheim. F. H. (1938). J. Chem. Phys. 6> 506-512. Krigbaum. W. R. & Lin, S. F. (1982). Macromolecules, 15, 1135-1145. Kuntz. I. D.. Crippen. G. M., Kollman, P. A. & Kimmelman, D. (1976). J. ~Vol. Biol. 106.
Lee, B. & Richards, F. M. (1971). J. Mol. Biol. 55, 379-400. Lesk. A. M. & Chothia, C. (1980). J. Mol. Biol. 136, 225-270. Lesk. A. M. & Chothia, C. (1982). J. Mol. Biol. 160, 325-342. Levitt,. M. (1976). J. Mol. Biol. 104, 59-107. Levitt,, M. (1983). .J. Mol. Biol. 170, 723-764. Levitt, M. & Chothia, C. (1976). Nature (London), 261, 552-558. Levitt. M. & Chothia, C. (1976). Nature, 261, 552-558. Levitt. M. & Lifson, 6. (1969). J. Mol. Biol. 46, 269-279. I,rvitt. M. & Warshel, A. (1975). Nature (London), 253, 694-698. Lo&r. .l. S., Lammers, P. ,J., Brimhall, B. & Hermodson, M. A. (1978). J. Biol. Chem. 253.
5726-5731. Matthews. J. B., Weber, P. C., Salemme, F. R. & Richards, F. M. (1983). Nature (London).
301, 169~171. Mao, J3. 8r McCammon, A. (1983). J. Biol. Chem. 158, 12543-12547. Marquart. M.. Deisenhofer, J. & Huber, R. (1980). J. Mol. Biol. 141, 369-391. McLachlan, A. 11. (1972a). Nature New Biol. 240, 83-85. McLachlan, A. I). (197%). J. Mol. Biol. 64, 417-437. McLachlan, A. D. & Shotton, D. M. (1972). Nature New Biol. 229, 202-205. Meirovitch, H. & Scheraga, H. A. (1981). Proc. Nut. Acad. Sci., U.S.A. 78, 6584-6587. Momany. F. A., McGuire, R. F., Burgess, A. W. & Scheraga, H. A. (1975). J. Phys. Shun..
79. 2361-2381. Nem&hy. (:. & Scheraga, H. A. (1962). J. Phys. Chem. 66, 1773-1789.

818 tJ. NOVOTNi’, R. URUCCOLERI AND M. KARPL[:S
I”u’emethy, G. & Scheraga, H. A. (1977). Quart. Rev. Biophys. 10, 239-352. Northrup, S. H., Pear, M. R., Morgan, J. D., McCammon, J. A. & Karplus, M. (1981).
J. Ailol. Biol. 153, 1087-1109. Sovotny, J. & Auffray, C. (1984). Nucl. Acids Res. 12, 243-255. %o\:otny. ,J. & Fran&k, F. (1975). Nature (Lundon), 258, 641-643. Oobatake, M. & Crippen, G. M. (1981). J. Phys. Chem. 58, 1187-1197. Padlan, E. A.. Davies, 1). R., Pecht, I.. Givol, D. & Wright. C. (1976). CoZd Spring Harbor
Symp. Quant. Biol. 41, 627-637. Paul. C. H. (1982). J. Mol. Biol. 155, 53-62. Perutz. M. F., Kendrew, ,J. C. & Watson, H. C. (1965). .I. Mol. Biol. 13, 669-678. Phizackerley, R. P.. Wishner, B. C., Bryant, S. H.. Amzel, L. M.. Lopez de Castro. J. A. &
Poljak. R. (1979). Mol. Zmmunol. 16, 841-859. Phong, B. T. (1975). Commun. Assoc. Comput. Mach. 18, 311-317. Potter, M., Rudikoff, S., Padlan. E. A. 8r Vrana, ?/I. (1977). In Antibodies in Human
Diugnosia and Therapy (Haber, E. & Krause, R. M., eds), pp. 119-132. Raven Press. New York.
Premilat,, S. & Maigret. B. (1977). J. Chem. Phys. 66, 3418-3425. Richards, F. M. (1974). J. Mol. BioZ. 82, l-14. Richardson, *J. S. (1981). Advan. Protein Ch,em. 34, 167-339. Richmond. T. J. & Richards, F. M. (1978). J. ~Vol. Biol. 119, 537-555. Robson, B. & Osguthorpe, D. J. (1979). J. Mol. Biol. 132, 19-51. Rose, G. I). & Roy, S. (1980). Proc. Nut. Acad. Sci., U.S.A. 77, 4643-4647. Rudikoff. S., Satow. Y ,, Padlan. E., Davies. D. & Potter, M. (1981). Mol. Zmmunol. 18.
705-711. Salemme, F. R. (1977). Annu. Rev. Biochem. 46, 299-329. Salemme. F. R. (1981). J. Mol. Biol. 146, 143-156. Saul, F. A.. Amzel, I,. M. & Poljak, R. J. (1978). J. Biol. Chem. 253, 585-597. Schiffer. M., Girling, R. L., Ely, K. R. & Edmundson. A. B. (1973). Biochemistry, 12, 4620~
4631. Schultz, G. E. (1980). J. Mol. Biol. 138, 335-347. Segal, D. M., Padlan, E. A., Cohen, G. H., Rudikoff, S., Potter, M. & Davies, D. R. (1974).
P~oc. Xat. Ad. SC%., U.S.A. 71, 4298-4302. Shire, S. J., Hanania, G. I. H. & Gurd, F. R. N. (1974). Biochemistry, 13. 2967-2974. Shotton. I). M. & Hartley, B. S. (1970). Nuture (London), 225, 802-811. Shotton, D. M. & Watson. H. C. (1970). Nature (London), 225, 811-816. Shrake, A. & Rupley. J. A. (1973). J. Mol. Riol. 79, 351-371. Sigler. P. B., Blow. D. MI?, Matthews, B. W. & Henderson, R. (1968). J. Mol. Biol. 35. 143-
164. Stanford, ?J. M. 8: Wu, T. T. (1981). J. Theor. Biol. 88. 421-439. Stenkamp, R. E.. Sieker, L. C. & Jensen. L. H. (1978). Acta Crystallogr. sect. B, 38, 784-
792. Swenson, M. K.. Burgess, A. W. & Scheraga, H. A. (1978). In Frontier,? in Physicochemical
Biology, pp. 115-142, Academic Press. London, Tanford? C. & Kirkwood. J. G. (1957). J. Amer. Chem. Sot. 79. 5333-5339. Teller. D. C. (1976). Nature (London), 230. 729-731. van Gunsteren, W. F. & Karplus, M. (1982). Macromolecules, 15, 1528-1544. Wada. A. & Xakamura, H. (1981). Nature (London.), 293, 757-758. Warme. P. K.. Momany, F. A.. Rumball, S. V., Tuttle, R. W. &, Scheraga, H. A. (1974).
Biochemistry, 13> 768-782. Williams, L. (1978). Computer Graphics, 12 (3), 270-274. Wistow. G.. Slingsby, C.. Blundell, T.. Driessen. H.. De Jong, W’. & Bloemendal, H. (1981).
FEBS Letters, 133, 9916. Yeas. M., Gael, pu’. S. & Jacobsen, J. W. (1978). J. Theor. Biol. 72, 443-457. Yuschok. T. J. & Rose, G. D. (1983). Int. J. Pept. Protein Res. 21, 479-484.
Edited by R. Huber


