Embed Size (px)
Citation preview
An Analytical Description of Liquid Slug FlowIn Small-Diameter Vertical Conduit.<::;
JAMES P. SRILL*TED C. DOERR
JUNIOR MEMBERS AIMEKERMIT E. &ROWN*
MEMBER AIME
ABSTRACT
A wide range of intermittent gas-lift tests was conducted in a 1,500-ft experimental well through 1~ - and1¥Z-in. nominal size tubing. The well was equipped w~th
two gas-lift valves, four Maihak electronic pressure transmitters and surface facilities to measure casing and tubingpressures, temperature, liquid production and the rate andvolume of gas injected. Fo'r each tubing size, tests wereconducted varying the slug length, gas volume injected andliquid viscosity and surface tension. From these tests, anempirical "fallback" or liquid loss correlation has beendeveloped. No genoeral fallback correlation could be obtained, and the correlation is presented in the form of onecurve for each slug length of a given liquid and tubing size.
A conceptual model has been developed which combinesthe fallback correlation with equations which govern liquidslug flow. A mathematical simulation of the model in theform of a digital computer program is used to calculatetotal recovery, gas volume used and clearance time for agiven test. Tubing pressures at the gas-lift valve and at thegas-slug interface are calculated as a function of time.Tubing pressures at the surface during slug clearance arealso calculated. The results compare favorably with the testdata and verify the conceptual model.
The extent to which the model can' be used for othertubing sizes, depths, liquids and gas-lift valves can only bedetermined with additional experimental data. Data arealso necessary so that a fallback curve can be constructedfor the particular test conditions studied.
INTRODUCTION
The flow of liquid slugs in vertical conduits has longbeen an established production method in the petroleumindustry. Under the name "intermittent gas lift", many advances have been made in engineering design. However,the unsteady-state nature of liquid slug flow has discouraged attempts to describe the problem analytically. Theresult has been that intermittent gas lift is dominated byrules-of-thumb engineering practices developed over manyyears.
The advent of slim-hole completions has increased thedemand for a more rigorous solution to the intermittentproblem. Small-diameter conduits offer more frictionalresistance to flow, and also reduce the slug volume lifted
Original manuscript received in Society of Petroleum Engineers officeA~. 8, 196·6. Revised manuscript received Jan. 3, 1967. 'Paper (SPE1526) was presented at SPE 41st Annual Fall Meeting held in Dallas,Tex., Oct. Z-5, 1966. @COpyright 19671 American Institute of Mining,Metallurgical, and Petroleum Engineers, Inc.
• Presently on the faculty at the U. of 'I'ulsa, Tulsa, Okla.
MARCH,1961
THE U. OF TEXASAUSTIN, TEX.
per intermittent cycle. Small-diameter conduits are definedto be 1~ -in. nominal size tubing or smaller.
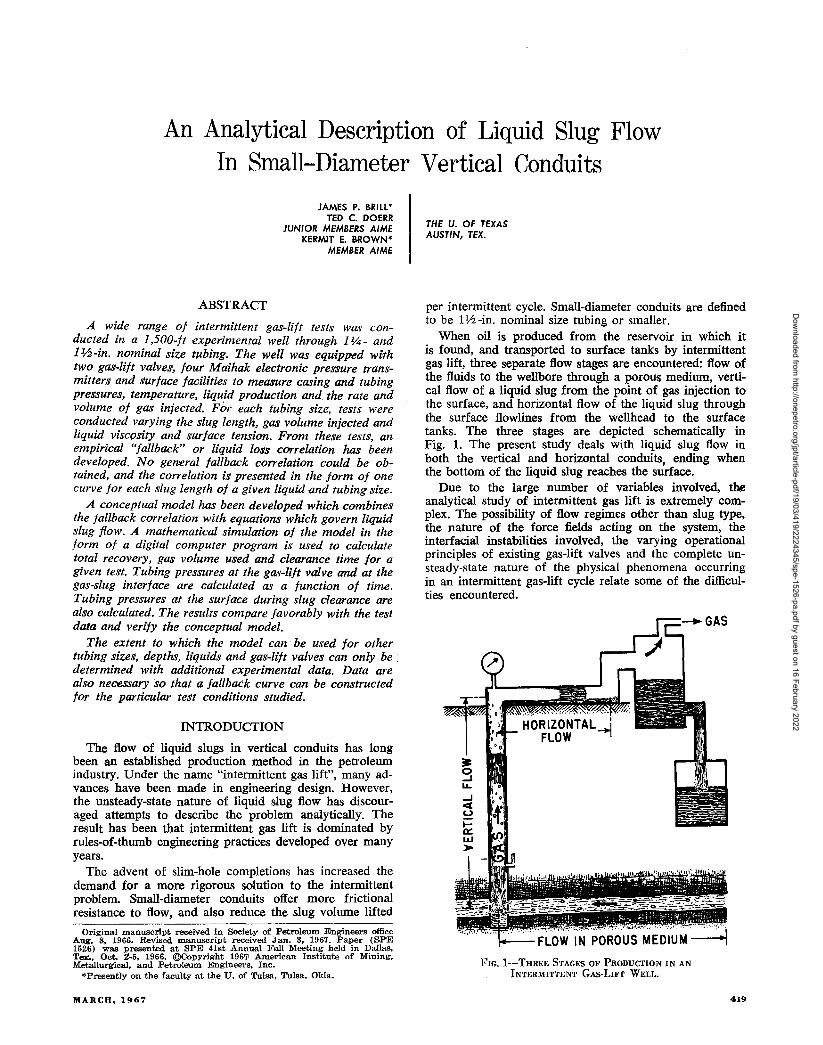
When oil is produced from the reservoir in which itis found, and transported to surface tanks by intermittentgas lift, three separate flow stages are encountered: flow ofthe fluids to the wellbore through a porous medium, vertical flow of a liquid slug from the point of gas injection tothe surface, and horizontal flow of the liquid slug throughthe surface flowlines from the wellhead to the surfacetanks. The three stages are depicted schematically inFig. 1. The present study deals with liquid slug flow inboth the vertical and horizontal conduits ending whenthe bottom of the liquid slug reaches the s..lrface.
Due to the large number of variables involved, theanalytical study of intermittent gas lift is extremely complex. The possibility of flow regimes other than slug type,the nature of the force fields acting on the system, theinterfacial insta:bilities involved, the varying operationalprinciples of existing gas-lift valves and the complete unsteady-state nature of the physical phenomena occurringin an intermittent gas-lift cycle relate some of the difficulties encountered.
FIG. I-THREE STAGES OF PRODUCTION IN ANINTERMITTENT GAs-LIFT WEU••
419
Dow
nloaded from http://onepetro.org/jpt/article-pdf/19/03/419/2224345/spe-1526-pa.pdf by guest on 16 February 2022
The experimental data were taken from a test well located in Dallas. The test well had certain advantages overboth laboratory models and actual field wells. The wellwas deep enough to be outside the range of end-effects,mixing lengths, etc.,· which cause inaccuracies inherent inextrapolation of small-scale model data to full-scale systems. The well was also equipped with two sets of casing such that one annulus could be used to control theliquid slug being produced, a control which cannot be attained in a producing well.
The important independent variables involved in intermittent gas lift can be divided into two fundamentalgroups: those which can be controlled, and those overwhich we have little or no control.
The first group includes (1) tubing size and roughness,(2) depth to injection valve (or valves), (3) type of gas-liftvalve, including port area, (4) opening and closing pressures of the valves, (5) throttling or metering action ofthe valve, (6) injection gas properties, (7) injection time,rate and volume, both at the surface and at the valve,(8) surface back pressure, (9) surface flowline size, lengthand restrictions, (10) original slug length, (11) size ofbottom-hole choke, if any, and (12) presence of a standingvalve.
The second group includes fluid properties and inputperformance relationship of the well-rate of feed-ininto the wellbore. The important time-dependent variables involved in intermittent gas lift include (1) velocityof the slug, (2) acceleration of the slug, (3) penetration velocity of the gas, (4) tubing pressure at the valve, (5) tubing pressure at any point above the valve, (6) location ofthe fallback, (7) velocity of the fallback, (8) accelerationof the fallback, (9) gas volume below the slug and (10)forces at the gas slug interface.
A complete study involving all the independent variables would be prohibitive, both in cost and time. However, a wide enough variety in the variables studied wasnecessary to assure the generality of the conceptual modeldeveloped. Therefore, it was necessary to choose a combination of variables which would facilitate the development of an accurate model that hopefully could be extended to cover the variables not considered.
Data were taken in each of three tubing sizes: 1-, 1~ and lIh-in. nominal diameter. Important pressure recordings in the I-in. data were later found to be faulty, andthe data were discarded. Several of the variables were the
Liquid fallback can represent a substantial part of theoriginal slug. Control of fallback determines the successfulness of an intermittent· gas-lift installation. The inabilityto predict liquid fallback has resulted in faulty designof many installations. In many cases, high percent recoveries are achieved, but too frequently at excessive operational costs which limit the profit-making ability of thewells.
The objectives of the present study were to (1) obtaindata from tests conducted in long conduits, (2) utilizethese data in developing an empirical fallback correlation,(3) conceive a conceptual model for describing liquidslug flow as encountered in single-point injection intermittent gas lift and (4) simulate the conceptual modelmathematically.
The purpose of the experimental work described in thenext section was to obtain the necessary data to developthe fallback correlation and confirm the validity of boththe conceptual model and its mathematical simulation.
SCOPE OF EXPERIMENTAL WORK
D. Valve Closed
B. Fall bock as LiquidDroplets Below Slug
A. Buildup of LiquidSlug
C. Fallback on TubingWall Be.low Slug
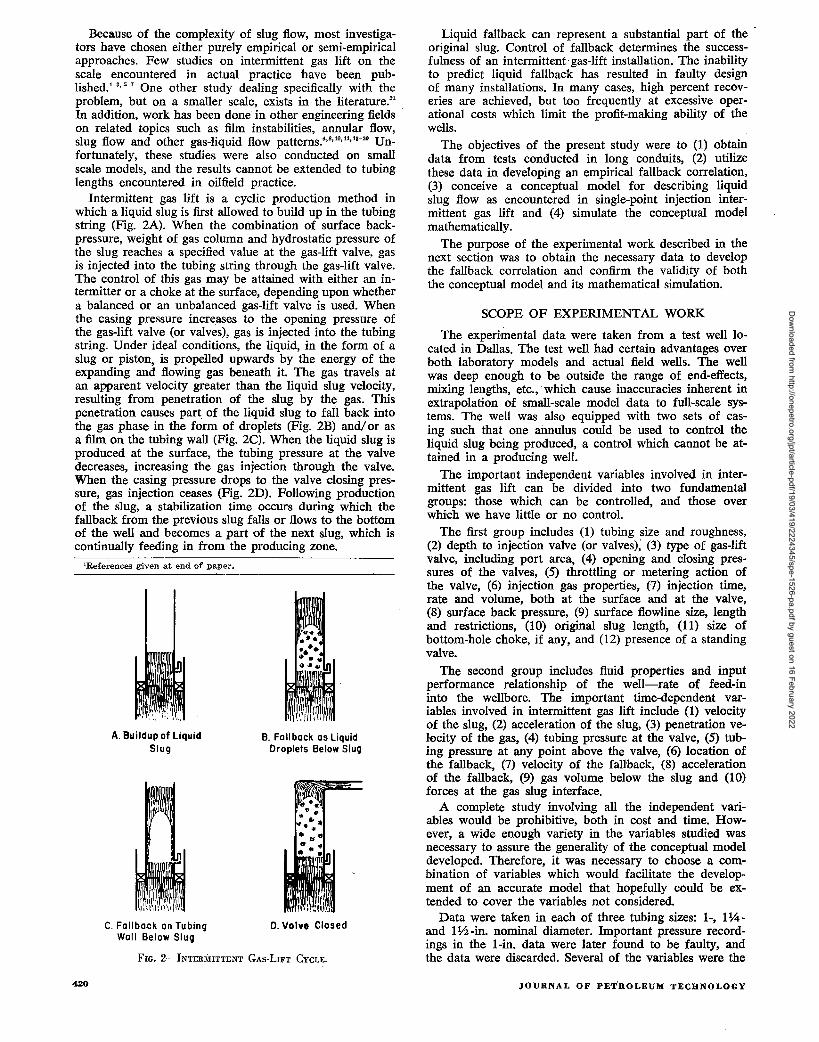
FIG. 2-INTERMITTENT GAs-LIFT CYCLE.
'References given at end of paper.
Because of the complexity of slug flow, most investigators have chosen either purely empirical or semi-empiricalapproaches. Few studies on intermittent gas lift on thescale encountered in actual practice have been published.'-3,5-1 One other study dealing specifically with theproblem, but on a smaller scale, exists in· the literature:'In addition, work has been done in other engineering fieldson related topics such as film instabilities, annular flow,slug flow and other gas-liquid flow patterns.4
,8.'O.11.13-20 Unfortunately, these studies were also conducted on smallscale models, and the results cannot be extended to tubinglengths encountered in oilfield practice.
Intermittent gas lift is a cyclic production method inwhich a liquid slug is first allowed to build up in the tubingstring (Fig. 2A). When the combination of surface backpressure, weight of gas column and hydrostatic pressure ofthe slug reaches a specified value at the gas-lift valve, gasis injected into the tubing string through the gas-lift valve.The control of this gas may be attained with either an intermitter or a choke at the surface, depending upon whethera balanced or an unbalanced gas-lift valve is used. Whenthe casing pressure incrt<ases to the opening pressure ofthe gas-lift valve (or valves), gas is injected into the tubingstring. Under ideal conditions, the liquid, in the form of aslug or piston, is propelled upwards by the energy of theexpanding and flowing gas beneath it. The gas travels atan apparent velocity greater than the liquid slug velocity,resulting from penetration of the slug by the gas. Thispenetration causes part of the liquid slug to fall back intothe gas phase in the form of droplets (Fig. 2B) and/ or asa film on the tubing wall (Fig. 2C). When the liquid slug isproduced at the surface, the tubing pressure at the valvedecreases, increasing the gas injection through the valve.When the casing pressure drops to the valve closing pressure, gas injection ceases (Fig. 2D). Following productionof the slug, a stabilization time occurs during which thefallback from the previous slug falls or flows to the bottomof the well and becomes a part of the next slug, which iscontinually feeding in from the producing zone.
420 JOURNAL OF PET'ROLEUM TECHNOLOGY
Dow
nloaded from http://onepetro.org/jpt/article-pdf/19/03/419/2224345/spe-1526-pa.pdf by guest on 16 February 2022
THEORETICAL DEVELOPMENT
TABLE I-PHYSICAL PROPERTIES OF LIQUIDS
TABLE 2-EQUIVALENT LIQUID SLUG LENGTHS
Since intermittent gas lift is an unsteady-state phenomenon, any conceptual model conceived must be timedependent. In discussing the individual concepts and in simulating them mathematically, it is important to considerthem on a time-increment basis. By considering smallenough time increments, the sum of the incrementalchanges in a variable will represent an integrated variable.Variables of interest include time, distance traveled, liquid loss, gas volume injected, etc.
The important concepts in the conceptual model arediscussed in the order in which they must be simulatedmathematically. It may appear that an excessive numberof approximations have been made. However, it must bestressed that the conceptual model is to be simulatedmathematically, and the more assumptions which can be
0.8610.00
0.8633.81
Viscositycp @ 80F
Equivalent Slug Length (ft)
1y:!-in. Tubing 1% -in. Tubing
Water 34-cp Oil Water 10-cp Oil
105 118 143 154219 251 267 298336 384 381 430450 514 498 569567 647 613 700682 779 728 839
30025020015010050
Specific Surface TensionGravity (dynes/em)
1%-in. Tubing1.000 72.00.856 33.5
ly:!·in. Tubing
1.000 72.00.876 34.7
ApproximatePressure
DifferentialAcross Valve
(psi)
WaterOil
WaterOil
50100150200250300
ApproximateTotal
Pressure Loadat Valve(psig)
same in both tubing sizes. Single-point injection at onedepth through one type of gas-lift valve was used. Thevalves had no spread, i.e., the opening and closing pressures were equal. The operating valves were set at 350 psigand air was used as the injection gas.
Approximately 40 ft of 2-in. surface flowline betweenthe wellhead and the two-phase separator were used foreach tubing size. The surface back-pressure varied from13 to 20 psig in most tests, although several tests were runin the Ph-in. tubing at up to 100 psig back-pressure. Theliquid feed-in rate was controlled by a %4-in. bottom-holechoke placed below the operating gas-lift valves. Since nostanding valve was used, and since the liquid was gravityfed through the choke, the feed-in rate was essentially thesame in each test for a given tubing size and liquid.. Twoliquids were studied in the 1~ -in. tubing tests and twoliquids in the 1;.2 -in. tests. The physical properties of theseliquids are given in Table 1.
For each liquid in a given tubing size, the original sluglength was varied and, for each slug length, the amountof gas injected was also varied. For a given slug length,this resulted in different values for the many time-dependent variables previously discussed. Table 2 lists the liquidslug lengths which were studied.
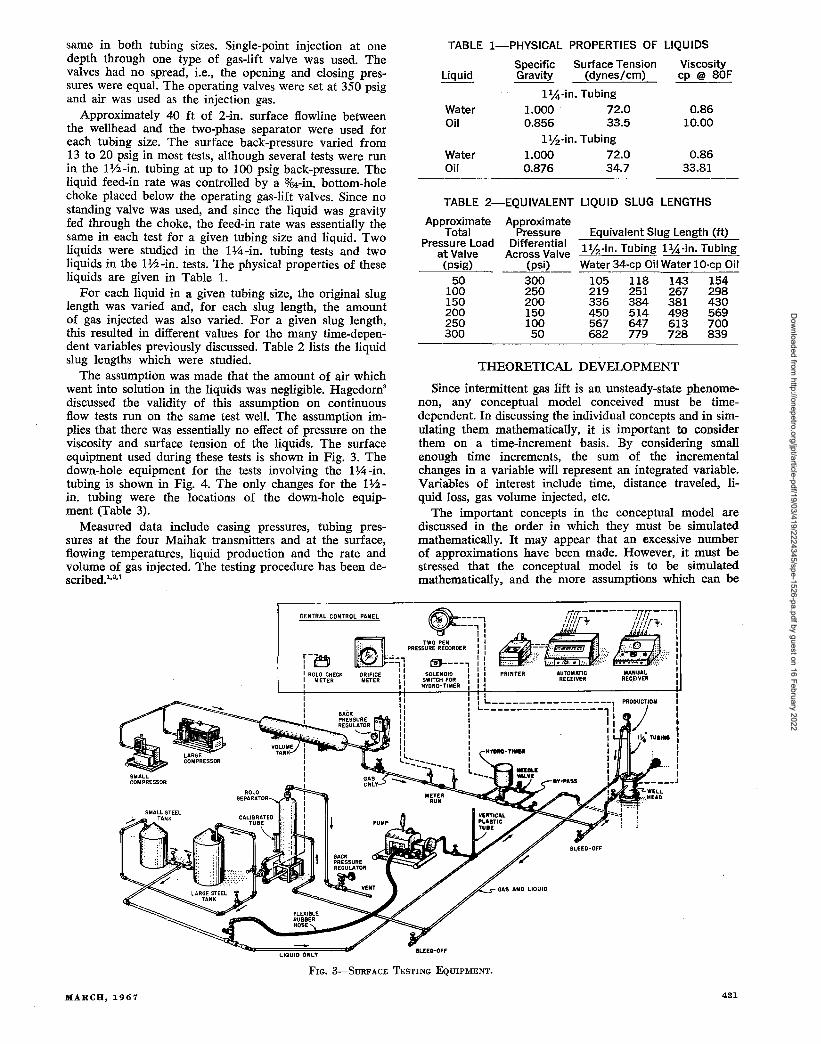
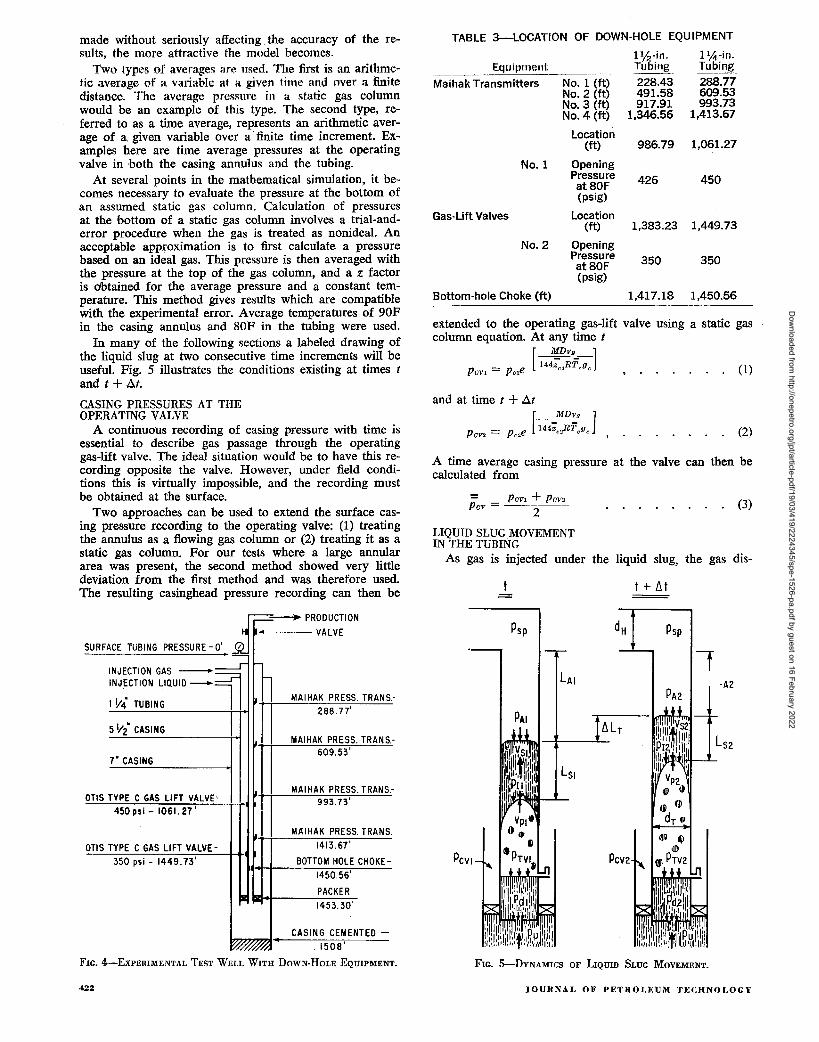
The assumption was made that the amount of air whichwent into solution in the liquids was negligible. Hagedorn"discussed the validity of this assumption on continuousflow tests run on the same test well. The assumption implies that there was essentially no effect of pressure on theviscosity and surface tension of the liquids. The surfaceequipment used during these tests is shown in Fig. 3. Thedown-hole equipment for the tests involving the 1~ -in.tubing is shown in Fig. 4. The only changes for the 1;.2in. tubing were the locations of the down-hole equipment (Table 3).
Measured data include casing pressures, tubing pressures at the four Maihak transmitters and at the surface,flowing temperatures, liquid production and the rate andvolume of gas injected. The testing procedure has been described.1, 2,1
MANUALREC;fIVER
AUTOMATICRECEIVER
PRINTER
I II L ~ ,
~------------------llI:IIIlI
: lIII
r-la::Qo,l LJI ROlO CHECKI METERI
CENTRAL CONTROL PANEL ~."- ----1~ --, II:
ii",: TWO PEN I Ii~~ : PRESSURE RECORDER : I
!~ . ...:_, 1:, -., c»----, I :ORIFICE SOLENOID I IMETER SWITCH FOR I I
HYDRO-TIMER I ,I
LIQUID ONLY
FIG. 3-SURFACE TESTING EQUIPMENT.
MARCH,1967 421
Dow
nloaded from http://onepetro.org/jpt/article-pdf/19/03/419/2224345/spe-1526-pa.pdf by guest on 16 February 2022
(1)
(2)
-A2
Psp
t + Llt
Psp
PCV1
extended to the operating gas-lift valve using a static gascolumn equation. At any time t
[MDVg 1
P- P e 144;:',RT,g,
OVl - C1
TABLE 3-LOCATION OF DOWN-HOLE EQUIPMENT
Ilf2-in. l!,4-in-Equipment Tubing. Tubing
Maihak Transmitters No.1 eft) 228.43 288.77No.2 eft) 491.58 609.53No.3 eft) 917.91 993.73No.4 eft) 1,346.56 1,413.67
Location(ft) 986.79 1,061.27
No.1 OpeningPressure 426 450at80F
(psig)
Gas-Lift Valves Locationeft) 1,383.23 1,449.73
No.2 OpeningPressure 350 350at80F
(psig)
Bottom-hole Choke eft) 1,417.18 1,450.56
and at time t + At
A time average casing pressure at the valve can then becalculated from
= POV' + Pov, (3)pov=--Z--
LIQUID SLUGMOVEMENTIN THE TUBING
As gas is injected under the liquid slug, the gas dis-
INJECTION GAS _--.f"
INJ~CTlON LIQUID-11MAIHAK PRESS. TRANS.
I \14 TUBING288.77'
51;£ CASINGMAIHAK PRESS. TRANS.
7' CASING609.53'
OTIS TYPE C GAS LIFT VALVE"MAIHAK PRESS. TRANS.
993.73'450 psi - 1061.27'
MAIHAK PRESS. TRANS.
OTIS TYPE C GAS LIFT VALVE- 1413.67'
350 psi - 1449.73' BOTTOM HOLE CHOKE-1450.56'
Iz PACKER1453.30'
CASING CEMENTED -.1508'
made without seriously affecting the accuracy of the results, the more attractive the model becomes.
Two types of averages an;. lIsed. 'The first is an arithme=tic average of a variable at a given time and over a finitedistance. The average pressure in a static gas columnwould be an example of this type. The second type, referred to as a time average, represents an arithmetic average of a. given variable over a· finite time increment. Examples here are time average pressures at the operatingvalve in both the casing annulus and the tubing.
At several points in the mathematical simulation, it becomes necessary to evaluate the pressure at the bottom ofan assumed static gas column. Calculation of pressuresat the bottom of a static gas column involves a trial-anderror procedure when the gas is treated as nonideal. Anacceptable approximation is to first calculate a pressurebased on an ideal gas. This pressure is then averaged withthe pressure at the top of the gas column, and a z factoris obtained for the average pressure and a constant temperature. This method gives results which are compatiblewith the experimental error. Average temperatures of 90Fin the casing annulus and SOF in the tubing were used.
In many of the following sections a labeled drawing ofthe liquid slug at two consecutive time increments will beuseful. Fig. 5 illustrates the conditions existing at times tand t + At.
CASING PRESSURES AT THEOPERATING VALVE
A continuous recording of casing pressure with time isessential to describe gas passage through the operatinggas-lift valve. The ideal situation would be to have this recording opposite the valve. However, under field conditions this is virtually impossible, and the recording mustbe obtained at the surface.
Two approaches can be used to extend the surface casing pressure recording to the operating valve: (1) treatingthe annulus as a flowing gas column or (2) treating it as astatic gas column. For our tests where a large annulararea was present, the second method showed very littledeviation from the first method and was therefore used.The resulting casinghead pressure recording can then be
jf~ PRODUCTION
• VALVE
SURFACE TUBING PRESSURE -0' /
FIG. 4-ExPERIMENTAL TEST WELL WITH DOWN-HOLE EQUIPMENT. FIG. 5-DYNAMICS OF LIQUID SLUG MOVEMENT.
422 JOURNAL OF PETROLEUM TECHNOLOGY
Dow
nloaded from http://onepetro.org/jpt/article-pdf/19/03/419/2224345/spe-1526-pa.pdf by guest on 16 February 2022
The length of the gas column above the slug at time t +At becomes
(9)
(10)
(11)
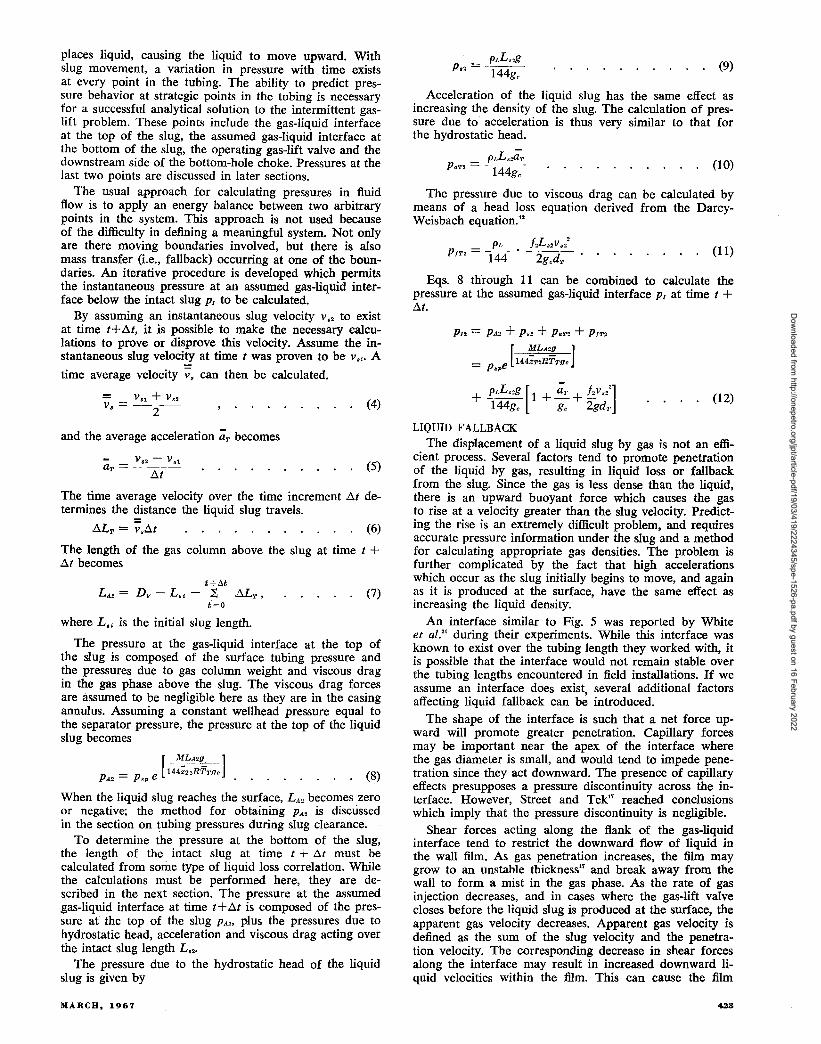
The pressure due to viscous drag can be calculated bymeans of a head loss equation derived from the DarcyWeisbach equation.12
PI, f.L••v.;Pm = -144- . - 2g,d;-- .
+ !!r,L.U] [1 + a7' + f.v!..~] (12)144g, g, 2gd7,
LIQUID FALLBACK
The displacement of a liquid slug by gas is not an efficient process. Several factors tend to promote penetrationof the liquid by gas, resulting in liquid loss or fallbackfrom the slug. Since the gas is less dense than the liquid,there is an upward buoyant force which causes the gasto rise at a velocity greater than the slug velocity. Predicting the rise is an extremely difficult problem, and requiresaccurate pressure information under the slug and a methodfor calculating appropriate gas densities. The problem isfurther complicated by the fact that high accelerationswhich occur as the slug initially begins to move, and againas it is produced at the surface, have the same effect asincreasing the liquid density.
An interface similar to Fig. 5 was reported by Whiteet al." during their experiments. While this interface wasknown to exist over the tubing length they worked with, itis possible that the interface would not remain stable overthe tubing lengths encountered in field installations. If weassume an interface does exist, several additional factorsaffecting liquid fallback can be introduced.
The shape of the interface is such that a net force upward will promote greater penetration. Capillary forcesmay be important near the apex of the interface wherethe gas diameter is small, and would tend to impede penetration since they act downward. The presence of capillaryeffects presupposes a pressure discontinuity across the interface. However, Street and Tek" reached conclusionswhich imply that the pressure discontinuity is negligible.
Shear forces acting along the flank of the gas-liquidinterface tend to restrict the downward flow of liquid inthe wall film. As gas penetration increases, the film maygrow to an unstable thickness" and break away from thewall to form a mist in the gas phase. As the rate of gasinjection decreases, and in cases where the gas-lift valvecloses before the liquid slug is produced at the surface, theapparent gas velocity decreases. Apparent gas velocity isdefined as the sum of the slug velocity and the penetration velocity. The corresponding decrease in shear forcesalong the interface may result in increased downward liquid velocities within the film. This can cause the film
Eqs. 8 through 11 can be combined to calculate thepressure at the assumed gas-liquid interface PI at time t +At.
Acceleration of the liquid slug has the same effect asincreasing the density of the slug. The calculation of pressure due to acceleration is thus very similar to that forthe hydrostatic head.
pLL••aTpaT. = --144g~-
(4)
(5)
(8)
(7)
= V 81 + V s2v. = -2---
and the average acceleration aT becomes
t + IltLA, = D v - L •• - ~ ALT ,
£=0
where L •• is the initial slug length.
The pressure at the gas-liquid interface at the top ofthe slug is composed of the surface tubing pressure andthe pressures due to gas column weight and viscous dragin the gas phase above the slug. The viscous drag forcesare assumed to be negligible here as they are in the casingannulus. Assuming a constant wellhead pressure equal tothe separator pressure, the pressure at the top of the liquidslug becomes
V S2 - V 81
aT = - -i:J-
The time average velocity over the time increment .At determines the distance the liquid slug travels.
ALT = v..6.t (6)
When the liquid slug reaches the surface, LA. becomes zeroor negative; the method for obtaining PA. is discussedin the section on tubing pressures during slug clearance.
To determine the pressure at the bottom of the slug,the length of the intact slug at time t + 6.t must becalculated from some type of liquid loss correlation. Whilethe calculations must be performed here, they are described in the next section. The pressure at the assumedgas-liquid interface at time t+At is composed of the pressure at the top of the slug PA', plus the pressures due tohydrostatic head, acceleration and viscous drag acting overthe intact slug length L ••.
The pressure due to the hydrostatic head of the liquidslug is given by
places liquid, causing the liquid to move upward. Withslug movement, a variation in pressure with time existsat every point in the tubing. The ability to predict pressure behavior at strategic points in the tubing is necessaryfor a successful analytical solution to the intermittent gaslift problem. These points include the gas-liquid interfaceat the top of the slug, the assumed gas-liquid interface atthe bottom of the slug, the operating gas-lift valve and thedownstream side of the bottom-hole choke. Pressures at thelast two points are discussed in later sections.
The usual approach for calculating pressures in fluidflow is to apply an energy balance between two arbitrarypoints in the system. This approach is not used becauseof the difficulty in defining a meaningful system. Not onlyare there moving boundaries involved, but there is alsomass transfer (Le., fallback) occurring at one of the boundaries. An iterative procedure is developed which permitsthe instantaneous pressure at an assumed gas-liquid interface below the intact slug PI to be calculated.
By assuming an instantaneous slug velocity v 02 to existat time t+At, it is possible to make the necessary calculations to prove or disprove this velocity. Assume the instantaneous slug velocity at time t was proven to be v81' A
time average velocity V. can then be calculated.
MARCH, 1967 423
Dow
nloaded from http://onepetro.org/jpt/article-pdf/19/03/419/2224345/spe-1526-pa.pdf by guest on 16 February 2022
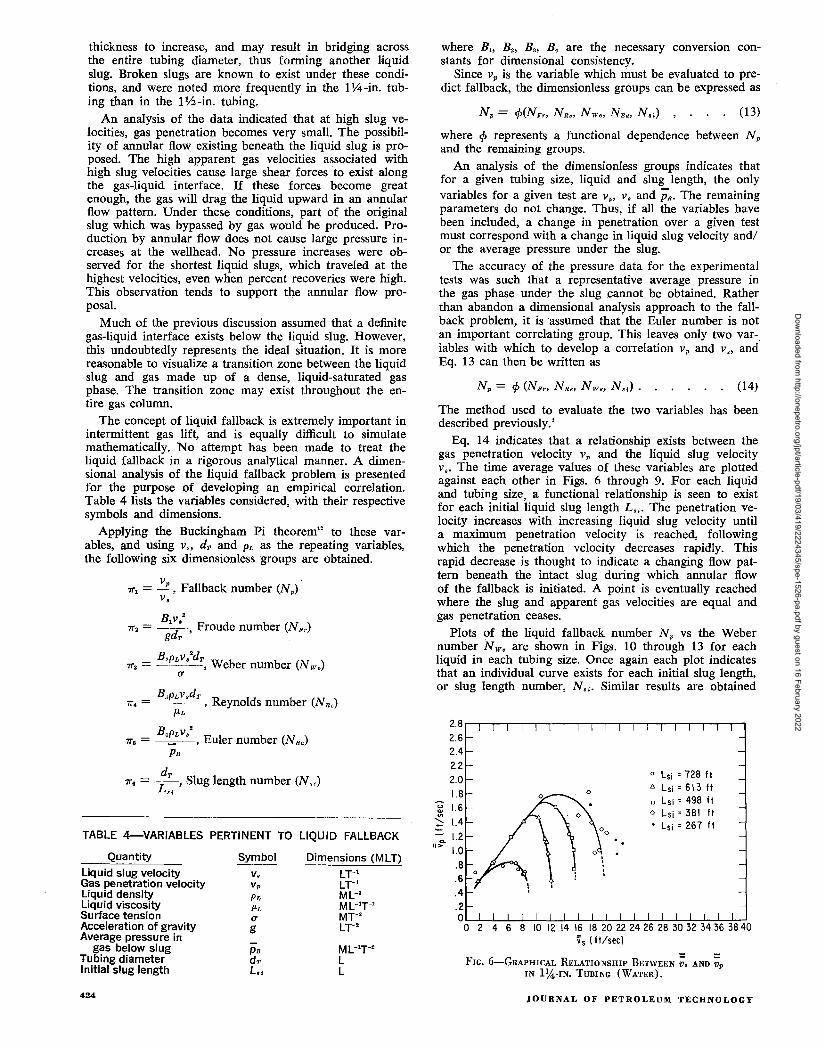
TABLE 4-VARIABLES PERTINENT TO LIQUID FALLBACK
(13)
(14)
o Lsi = 728 It'" Lsi =613 Ito Lsi = 498 It<> Lsi = 381 It
Lsi = 267 It
The method used to evaluate the two variables has beendescribed previously.'
Eq. 14 indicates that a relationship exists between thegas penetration velocity V p and the liquid slug velocityv•. The time average values of these variables are plottedagainst each other in Figs. 6 through 9. For each liquidand tubing size, a functional relationship is seen to existfor each initial liquid slug length L.;. The penetration velocity increases with increasing liquid slug velocity untila maximum penetration velocity is reached, followingwhich the penetration velocity decreases rapidly. Thisrapid decrease is thought to indicate a changing flow pattern beneath the intact slug during which annular flowof the fallback is initiated. A point is eventually reachedwhere the slug and apparent gas velocities are equal andgas penetration ceases.
Plots of the liquid fallback number N p vs the Webernumber N w. are shown in Figs. 10 through 13 for eachliquid in each tubing size. Once again each plot indicatesthat an individual curve exists for each initial slug length,or slug length number, N.,. Similar results are obtained
where 'cf> represents a functional dependence between N p
and the remaining groups.An analysis of the dimensionless groups indicates that
for a given tubing size, liquid and slug length, the onlyvariables for a given test are V p , v. and PR' The remainingparameters do not change. Thus, if all the variables havebeen included, a change in penetration over a given testmust correspond with a change in liquid slug velocity and/or the average pressure under the slug.
The accuracy of the pressure data for the experimentaltests was such that a representative average pressure inthe gas phase under the slug cannot be obtained. Ratherthan abandon a dimensional analysis approach to the fallback problem, it is assumed that -the Euler number is notan important correlating group. This leaves only two variables with which to develop a correlation V p and v" andEq. 13 can then be written as
FIG. 6-GRAPHlcAL RELATIONSHIP BETWEEN ~. AND ~pIN ll,4-IN. TUBING (WATER).
where B" B" B 3 , B 4 are the necessary conversion constants for dimensional consistency.
Since V p is the variable which must be evaluated to predict fallback, the dimensionless groups can be expressed as
2. 8 ro-,.--.--,-r....,---,---,-,-,-r-1-,.--.--,-r...,..,.....~
2.62.4
2.22.01.8
~ 1.6-:; 1.4
~ 1.2II> 1.0
.8
.6
.4
.2OL.--L.--L.--L.--L.--L.--L.--L.--L.--L.--L.--L.--L.-..L.-..L........JL........J'-,--::'L........J'-,--::'--'
o
Dimensions (MLT)
LT-'LT-'ML-3
ML-'T-1
MT-2
LT'
B,v;71", = -d-' Froude number (NFr)
g T
B'PLv:d'l'71"3 = ~----, Weber number (N w.)
17
BJPLv.d'l'71"4 = ---, Reynolds number (NR,)
[tL
B4pLV;71"5 = ----=--, Euler number (NEU)
PH
dT71". = ~,Slug length number (N,;)
"
v .71", = -", Fallback number (Np)
v.
thickness to increase, and may result in bridging acrossthe entire tubing diameter, thus forming another liquidslug. Broken slugs are known to exist under these conditions, and were noted more frequently in the 1~ -in. tubing than in the 1;6 -in. tubing.
An analysis of the data indicated that at high slug velocities, gas penetration becomes very small. The possibility of annular flow existing beneath the liquid slug is proposed. The high apparent gas velocities associated withhigh slug velocities cause large shear forces to exist alongthe gas-liquid interface. If these forces become greatenough, the gas will drag the liquid upward in' an annularflow pattern. Under these conditions, part of the originalslug which was bypassed by gas would be produced. Production by annular flow does not cause large pressure increases at the wellhead. No pressure increases were observed for the shortest liquid slugs, which traveled at thehighest velocities, even when percent recoveries were high.This observation tends to support the annular flow proposal.
Much of the previous discussion assumed that a definitegas-liquid interface exists below the liquid slug. However,this undoubtedly represents the ideal situation. It is morereasonable to visualize a transition zone between the liquidslug and gas made up of a dense, liquid-saturated gasphase. The transition zone may exist throughout the entire gas column.
The concept of liquid fallback is extremely important inintermittent gas lift, and is equally difficult to simulatemathematically. No attempt has been made to treat theliquid fallback in a rigorous analytical manner. A dimensional analysis of the liquid fallback problem is presentedfor the purpose of developing an empirical correlation.Table 4 lists the variables considered, with their respectivesymbols and dimensions.
Applying the Buckingham Pi theorem" to these varables, and using v., dT and PL as the repeating variables,the following six dimensionless groups are obtained.
Liquid slug velocityGas penetration velocityLiquid densityLiquid viscositySurface tensionAcceleration of gravityAverage pressure in
gas belOw slugTubing diameterInitial slug length
Quantity
424 JOURNAL OF PETROLEUM TECHNOLOGY
Dow
nloaded from http://onepetro.org/jpt/article-pdf/19/03/419/2224345/spe-1526-pa.pdf by guest on 16 February 2022
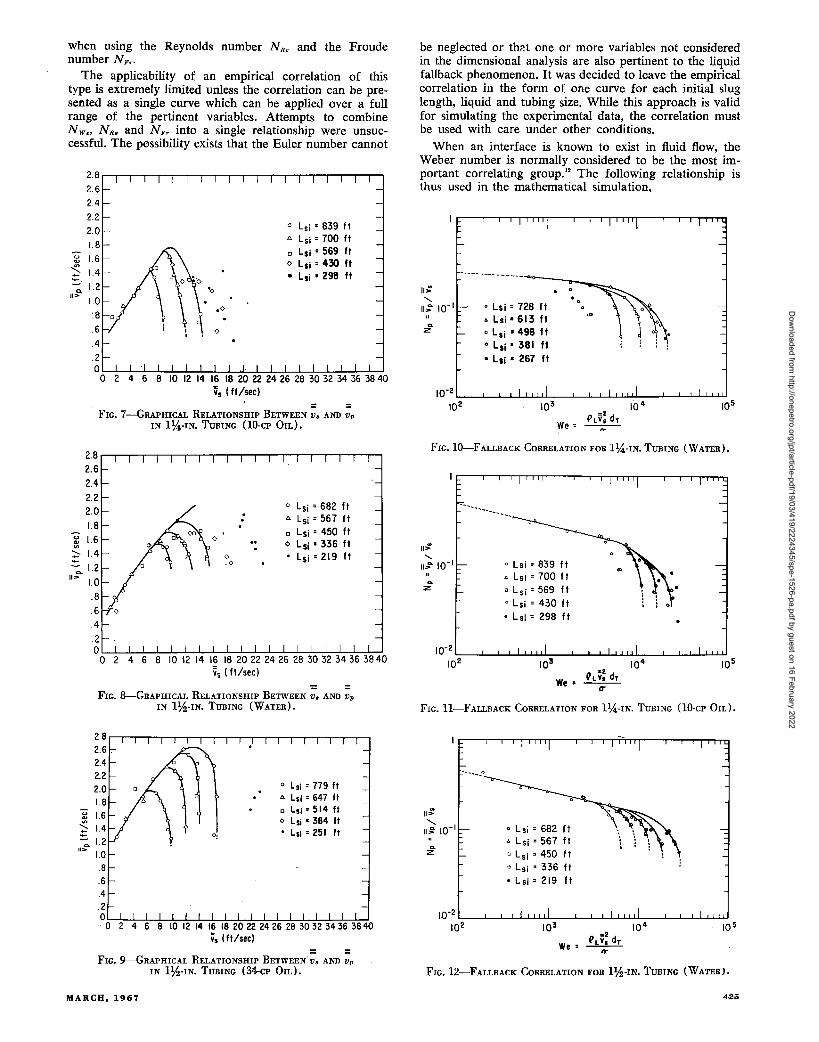
FIG. 7-GRAPHICAL RELATIONSHIP BETWEEN ;, AND ;pIN l!A-IN. TUBING (IO-cp OIL).
---------------~---
o Lsi: 728 ft.Lsi-613ftc Lsi - 498 fto Lsi - 381 ft• Lsi' 267 ft
be neglected or th?t one or more variables not consideredin the dimensional analysis are also pertinent to the liquidfallback phenomenon. It was decided to leave the empiricalcorrelation in the form of one curve for each initial sluglength, liquid and tubing size. While this approach is validfor simulating the experimental data, the correlation mustbe used with care under other conditions.
When an interface is known to exist in fluid flow, theWeber number is normally considered to be the most important correlating group.'2 The following relationship isthus used in the mathematical simulation,
o Lsi' 839 ft" Lsi' 700 fto Lsi: 569 fto Lsi: 430 ft
• Lsi' 298 ft
o
2.8 ....-,--,--,--,--,--,--,--,--,--,--,--,--,--,--,--,--,-,-,...-,
2.62.4
2.22.01.8
i 1.6
~ 1.4-c.
II>
when using the Reynolds number N He and the Froudenumber N Fr•
The applicability of an empirical correlation of thistype is extremely limited unless the correlation can be presented as a single curve which can be applied over a fullrange of the pertinent variables. Attempts to combineNive, N He and N Fr into a single relationship were unsuccessful. The possibility exists that the Euler number cannot
o Lsi =839 ft• Lsi =700 ftc Lsi =569 f to Lsi' 430 ft• Lsi' 298 It
Q.
Z
C'L;: drWe = IT
FIG. ll-FALLBACK CORRELATION FOR l!A-IN. TUBING (lO-cp OIL).
FIG. 10---FALLBACK CORRELATION FOR l!A-IN. TUBING (WATER).
o Lsi: 682 ft" Lsi: 567 fto Lsi: 450 fto Lsi: 336 ft• Lsi: 219 fto
.0
o
FIG. 8--GRAPHICAL RELATIONSHIP BETWEEN ;, AND ;pIN l%-IN. TUBING (WATER).
2.8 '--'r--T-"T---r---r--,.---,---r--r--r-r-,...-,--r---r---r---r--,.--............,
2.62.42.22.01.8
i 1.6::; 1.4
~ 1.2II> 1.0
.8
.6
.4
:2O~:-':---':---:--:':---:7--:-':-:'=-:':-::'::-:':-::':-:'::-:::-:;':;:7::--;;-;-~~o
FIG. 12-FALLBACK CORRELATION FOR l%-IN. TUBING (WATER'.
c Lsi = 682 ft• Lsi =567 ftc Lsi = 450 fto Lsi = 336 ft• Lsi = 219 fl
o Lsi: 779 ft" Lsi: 647 Ito Lsi' 514 fto Lsi - 384 ft• Lsi' 251 It
~ 1.6:; 1.4
~ 1.2II> 1.0
.8.6.4.2o. o=-:---':---:':---:'-:'::---",.....,.,,..-,J;,..-,J;,..-,,I:=-='=~--='::---='=---='=--,!-::--=-:-='=---==--:'·
FIG. 9-GRAPHICAL RELATIONSHIP BETWEEN';, AND ;pIN l%-IN. TUBING (34-cp OIL).
MARCH,1967 425
Dow
nloaded from http://onepetro.org/jpt/article-pdf/19/03/419/2224345/spe-1526-pa.pdf by guest on 16 February 2022

The increment of liquid slug length which is lost over thetime increment !:it is
(22)
(21)
tL B, = ~ (1:iLT - lll-F)
t=O
determining pressures at the valve. Liquid probably existsas both entrained droplets below the slug and as a wettingfilm on the wall of the tubing.
The dynamic properties of the entrained liquid will affect tubing pressures at the valve. Viscous drag betweenthe two phases and acceleration of the entrained liquidtend to increase the tubing pressures. However, it is unreasonable to assume that the entrained liquid duplicatesthe liquid slug movement. For lack of a better approach,the assumption is made that pressures in the tubing dueto entrained liquid can be approximated as a static liquidslug located at the operating valve.
Having made the previous assumption, it becomes necessary to determine the length of the assumed slug. Morespecifically, it requires a knowledge of the portion of liquid feed-in and fallback which exists as entrained droplets, the remainder forming a film on the wall. Three assumptions can be made to approximate this condition:placing all fallback and feed-in on the tubing wall, placingall fallback and feed-in as entrained liquid (or in the assumed slug) and placing an arbitrary (but not necessarilyequal) portion of fallback and feed-in on the tubing wall,the remainder existing as entrained liquid.
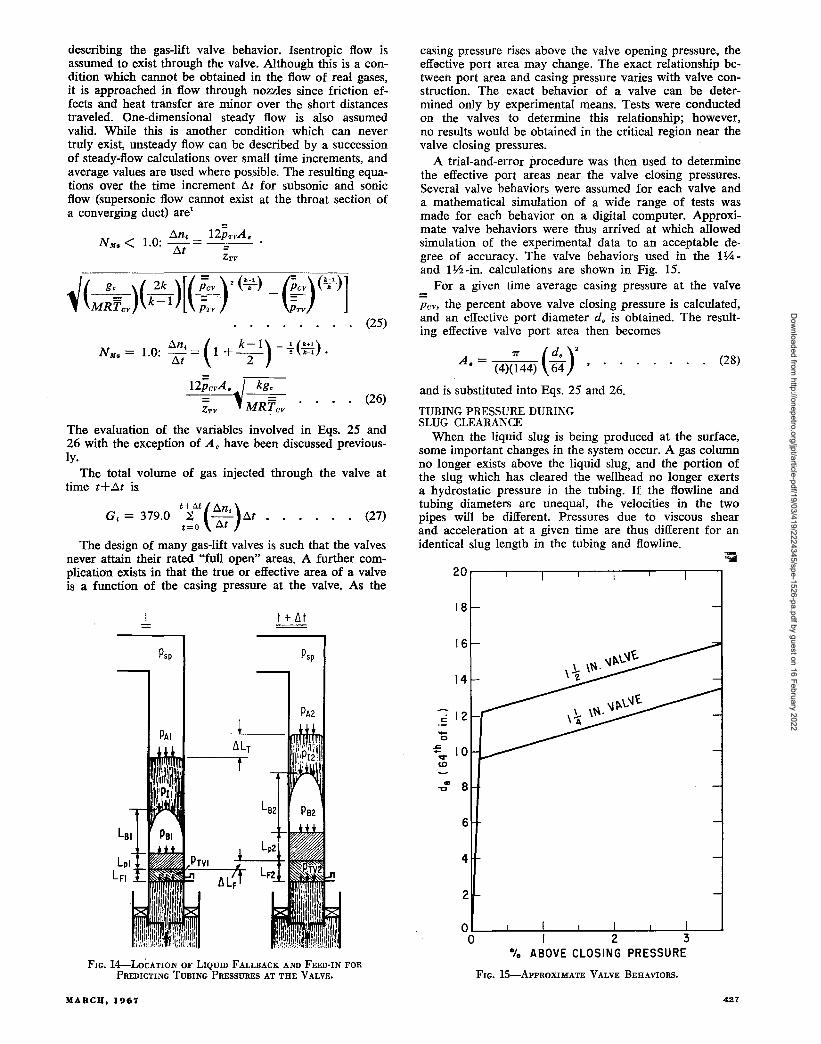
The third condition is probably the one which actuallyexists. However, there is no way to determine the correctportion to use. If all the fallback and feed-in are placedon the tubing walls, the calculations for determining pressures at the operating valve involve adding the pressurefrom a dynamic gas column to the pressure at the assumedgas-liquid interface. This method results in calculatingpressures which are too low. Therefore, the second approximation is used and Fig. 14 illustrates these conditions. Unfortunately, -using this approximation makes itimpossible to make meaningful calculations of pressuresexisting at points in the gas phase other than at the valve.
The contribution of the gas phase below the slug to thetubing pressure at the valve is calculated by assuming thata static gas column exists. Irreversible losses due to viscous drag in the gas phase (neglecting any liquid entrainedin the gas) are assumed to be negligible here as they areabove the slug and in the casing annulus. The length ofthe gas column below the intact slug at time t +1:it becomes
where
(18)
(16)
(20)
(15)
(19)
(17)
!:iLp = vp1:it
and the intact slug length at time t + !:it becomes
where
tL., = L'i - ~ 1:iLp •
t=O
The limitations of the fallback correlations are obvious.To cover the full range of field conditions, a tremendousnumber of working curves would be needed. However, ifand when a general correlation is presented to the industry, it could be used in place of the one presented here.
The liquid fallback number can then be obtained from thefallback curve, and the time average gas penetration velocity is calculated to be
and Figs. 10 through 13 are used as the fallback correlation. In using the fallback correlation, the proper curvefor a given initial slug length, liquid and tubing size mustfirst be selected. The intact slug length L'2 at time t + !:itis then calculated using the following method.
The Weber number is calculated from the time average
velocity V. of Eq. 4.
TUBING PRESSURES AT THEOPERATING VALVE
Tubing pressures at the operating valve are important indetermining both the mass of gas in the tubing and themass of gas which passes through the gas-lift valve. Theyserve as the connecting link for combining the casing annulus behavior with the tubing behavior. As might be expected, these pressures are also the most difficult to calculate rigorously, and the calculations require a large number of assumptions.
The tubing volume beneath the assumed gas-liquid interface contains fluid from three separate sources: gas fromthe casing annulus, liquid from feed-in from the formation and liquid fallback from the slug. The location of theliquid phase below the slug plays an important role in
FIG. 13-FALLBACK CORRELATION FOR l~-IN. TUBING (34-cp OIL).
-2We= l'Lv.dy
CT
(24)
PTV2 = Pl" e [144~~~;Tgc] + p],(LF2__+ Lp,)!. (23)
144 gc
A time average tubing pressure at the valve can then becalculated.
GAS-LIFT VALVE BEHAVIORThe flow of gas through the operating gas-lift valve is
dependent upon both the tubing and casing pressures at thevalve for subsonic flow conditions. In sonic flow the rateis a function of the upstream pressure (or casing pressure)only.
A converging duct equation is most representative for
The pressure at the operating gas-lift valve is then calculated to be
o Lsi = 779 ItA L si=647 Ita Lsi =514 It• Lsi' 384 ft• Lsi' 251 It
0Z
426 JOURNAL OF PETROLEUM TECHNOLOGY
Dow
nloaded from http://onepetro.org/jpt/article-pdf/19/03/419/2224345/spe-1526-pa.pdf by guest on 16 February 2022
(27)
(26)
(28)
describing the gas-lift valve behavior. Isentropic flow isassumed to exist through the valve. Although this is a condition which cannot be obtained in the flow of real gases,it is approached in flow through nozzles since friction effects and heat transfer are minor over the short distancestraveled. One-dimensional steady flow is also assumedvalid. While this is another condition which can nevertruly exist, unsteady flow can be described by a successionof steady-flow calculations over small time increments, andaverage values are used where possible. The resulting equations over the time increment 6.t for subsonic and sonicflow (supersonic flow cannot exist at the throat section ofa converging duct) are'
N < 1 O. .6.n, = 12pTvA • .M. •• 6.t =
ZTV
J(~)(k~I)[(~~"-.,.)' (k~') _ '~av)(k/)]'" MRTav p,·v \j;TV
(25)
N M • = 1.0: ~' = ( 1+~) -+e~~).12~avA.~ kg:: .
ZTV MRTavThe evaluation of the variables involved in Eqs. 25 and26 with the exception of A. have been discussed previously.
The total volume of gas injected through the valve attime t+6.t is
t+At(6.n )G, = 379.0 ~ ~ 6.t •t=O ~t
The design of many gas-lift valves is such that the valvesnever attain their rated "full open" areas. A further complication exists in that the true or effective area of a valveis a function of the casing pressure at the valve. As the
t + llt=
casing pressure rises above the valve opening pressure, theeffective port area may change. The exact relationship between port area and casing pressure varies with valve construction. The exact behavior of a valve can be determined only by experimental means. Tests were conductedon the valves to determine this relationship; however,no results would be obtained in the critical region near thevalve closing pressures.
A trial-and-error procedure was then used to determinethe effective port areas near the valve closing pressures.Several valve behaviors were assumed for each valve anda mathematical simulation of a wide range of tests wasmade for each behavior on a digital computer. Approximate valve behaviors were thus arrived at which allowedsimulation of the experimental data to an acceptable degree of accuracy. The valve behaviors used in the 1%and Ph -in. calculations are shown in Fig. 15.
For a given time average casing pressure at the valve
Pay, the percent above valve closing pressure is calculated,and an effective port diameter d. is obtained. The resulting effective valve port area then becomes
7r (d. )'A. = (4)(144) 64 '
and is substituted into Eqs. 25 and 26.
TUBING PRESSURE DURINGSLUG CLEARANCE
When the liquid slug is being produced at the surface,some important changes in the system occur. A gas columnno longer exists above the liquid slug, and the portion ofthe slug which has cleared the wellhead no longer exertsa hydrostatic pressure in the tubing. If the flowline andtubing diameters are unequal,. the velocities in the twopipes will be different. Pressures due to viscous shearand acceleration at a given time are thus different for anidentical slug length in the tubing and flowline.
20,....--,---,---,---,---,---,------,
18
Psp Psp
cO 12-0J: 10....q-
U)
... 8-.:>
6
4
2
oOl--L--~I---'---:2!:--L-----:3~---J% ABOVE CLOSING PRESSURE
FIG. I4-LoCATION OF LIQUID FALLBACK AND FEED-IN FORPREDICTING TUBING PRESSURES AT THE VALVE. FIG. IS-ApPROXIMATE VALVE BEHAVIORS.
MARCH, 1967 ~7
Dow
nloaded from http://onepetro.org/jpt/article-pdf/19/03/419/2224345/spe-1526-pa.pdf by guest on 16 February 2022
(34)
(33)
(35)
(36)
(37)
, .
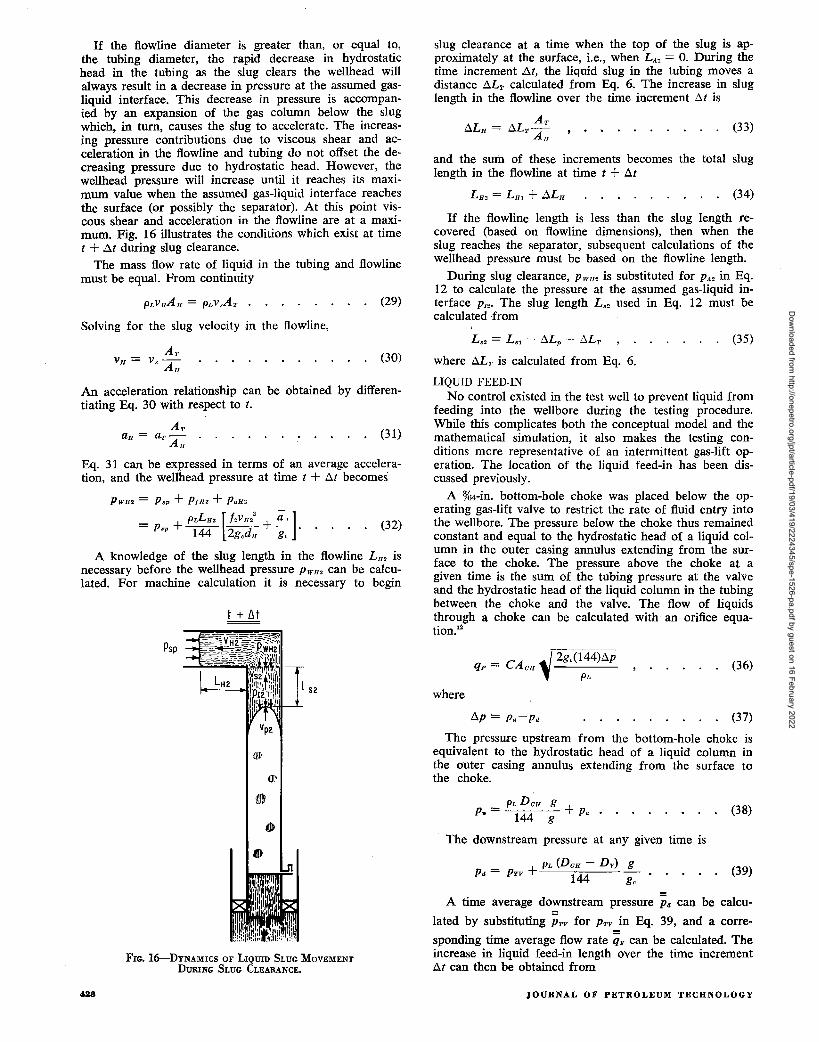
slug clearance at a time when the top of the slug is approximately at the surface, i.e., when L A1 = O. During thetime increment ,6.t, the liquid slug in the tubing moves adistance6.LT calculated from Eq. 6. The increase in sluglength in the flowline over the time increment 6.t is
AT6.Ly = 6.LT
All
The pressure upstream from the bottom-hole choke isequivalent to the hydrostatic head of a liquid column inthe outer casing annulus extending from the surface tothe choke.
where
where 6.LT is calculated from Eq. 6.
LIQUID FEED·INNo control existed in the test well to prevent liquid from
feeding into the wellbore during the testing procedure.While this complicates both the conceptual model and themathematical simulation, it also makes the testing conditions mere representative of an intermittent gas-lift operation. The location of the liquid feed-in has been discussed previously.
A ~il4-in. bottom-hole choke was placed below the operating gas-lift valve to restrict the rate of fluid entry intothe wellbore. The pressure below the choke thus remainedconstant and equal to the hydrostatic head of a liquid column in the outer casing annulus extending from the surface to the choke. The pressure above the choke at agiven time is the sum of the tubing pressure at the valveand the hydrostatic head of the liquid column in the tubingbetween the choke and the valve. The flow of liquidsthrough a choke can be calculated with an orifice equation."
If the flowline length is less than the slug length recovered (based on flowline dimensions), then when theslug reaches the separator, subsequent calculations of thewellhead pressure must be based on the flowline length.
During slug clearance, P1V1l2 is substituted for PA' in Eq.12 to calculate the pressure at the assumed gas-liquid interface PI" The slug length L" used in Eq. 12 must becalculated from
and the sum of these increments becomes the total sluglength in the flowline at time t + 6.t
(32)
(30)
(29)
(31)
An acceleration relationship can be obtained by differentiating Eq. 30 with respect to t.
ATay = a,,- .
All
PWH2 = P,p + P/1l2 + PaY2
_ + pLL H2 [f'VIl; + ;']-P -----sp 144 2gcd JI gc'
A knowledge of the slug length in the flowline L H2 isnecessary before the wellhead pressure PWJI' can be calculated. For machine calculation it is necessary to begin
Eq. 31 can be expressed in terms of an average acceleration, and the wellhead pressure at time t + 6.t becomes
Solving for the slug velocity in the flowline,
Psp
Vp2
If the flowline diameter is greater than, or equal to,the tubing diameter, the rapid decrease in hydrostatichead in the tubing as the slug clears the wellhead willalways result in a decrease in pressure at the assumed gasliquid interface. This decrease in pressure is accompanied by an expansion of the gas column below the slugwhich, in turn, causes the slug to accelerate. The increasing pressure contributions due to viscous shear and acceleration in the flowline and tubing do not offset the decreasing pressure due to hydrostatic head. However, thewellhead pressure will increase until it reaches its maximum value when the assumed gas-liquid interface reachesthe surface (or possibly the separator). At this point viscous shear and acceleration in the flowline are at a maximum. Fig. 16 illustrates the conditions which exist at timet + ,tJ>.t during slug clearance.
The mass flow rate of liquid in the tubing and flowlinemust be equal. From continuity
t + LH
A time average downstream pressure P. can be calcu
lated by substituting PTV for PTV in Eq. 39, and a corre
sponding time average flow rate qF can be calculated. Theincrease in liquid feed-in length over the time increment6.t can then be obtained from
FIG. 16--DYNAMICS OF LIQUID SLUG MOVEMENTDURING SLUG CLEARANCE.
PL DOll gP. = 144g + Pa
The downstream pressure at any given time is
_ + PL (DOlI - D v) gP. - PTV 144 gc
(38)
(39)
428 JOURNAL OF PETROLEUM TECHNOLOGY
Dow
nloaded from http://onepetro.org/jpt/article-pdf/19/03/419/2224345/spe-1526-pa.pdf by guest on 16 February 2022
RESULTS
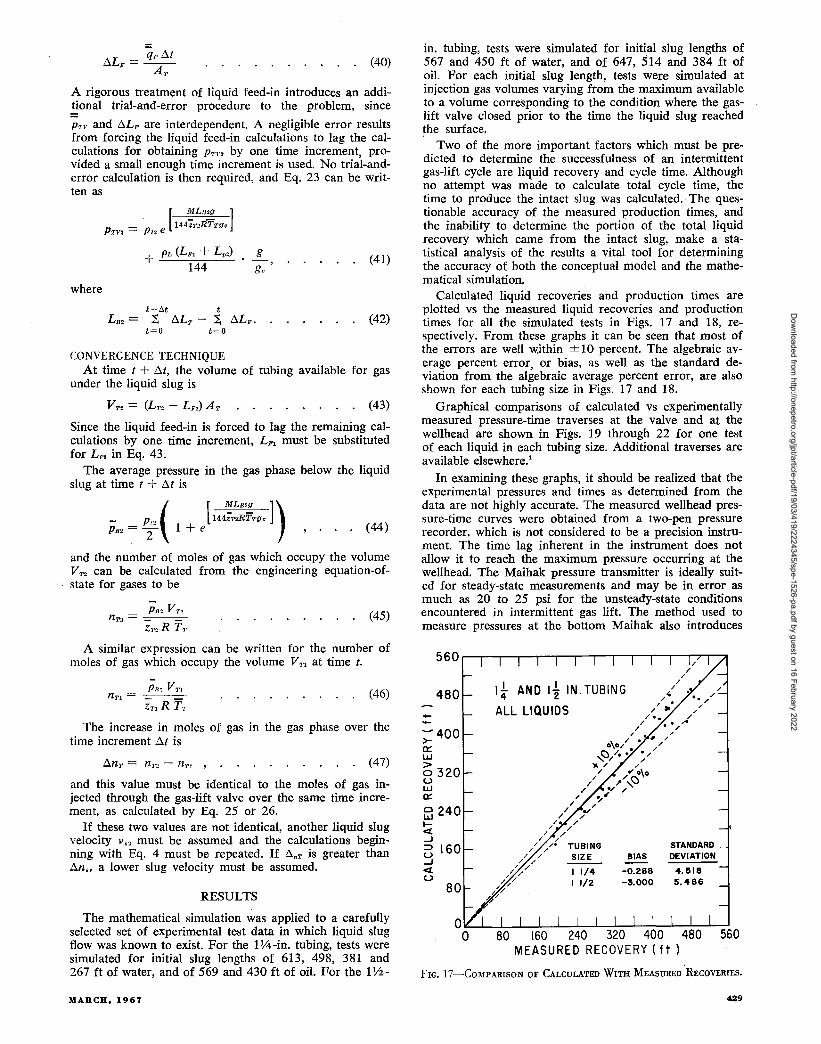
The mathematical simulation was applied to a carefullyselected set of experimental test data in which liquid slugflow was known to exist. For the 11;4 -in. tubing, tests weresimulated for initial slug lengths of 613, 498, 381 and267 ft of water, and of 569 and 430 ft of oil. For the 1;;Z-
560
STANDARDDEVIATION
4.5185.466
BIAS
-0.288-3.000
I i AND It IN. TUBING
ALL LIQUIDS480
80
in. tubing, tests were simulated for initial slug lengths of567 and 450 ft of water, and of 647, 514 and 384 ft ofoil. For each initial slug length, tests were simulated atinjection gas volumes varying from the maximum availableto a volume corresponding to the condition where the gaslift valve closed prior to the time the liquid slug reached~he surface.
Two of the more important factors which must be predicted to determine the successfulness of an intermittentgas-lift cycle are liquid recovery and cycle time. Althoughno attempt was made to calculate total cycle time, thetime to produce the intact slug was calculated.' The questionable accuracy of the measured production times, andthe inability to determine the portion of the total liquidrecovery which came from the intact slug, make a statistical analysis of the results a vital tool for determiningthe accuracy of both the conceptual model and the mathematical simulation.
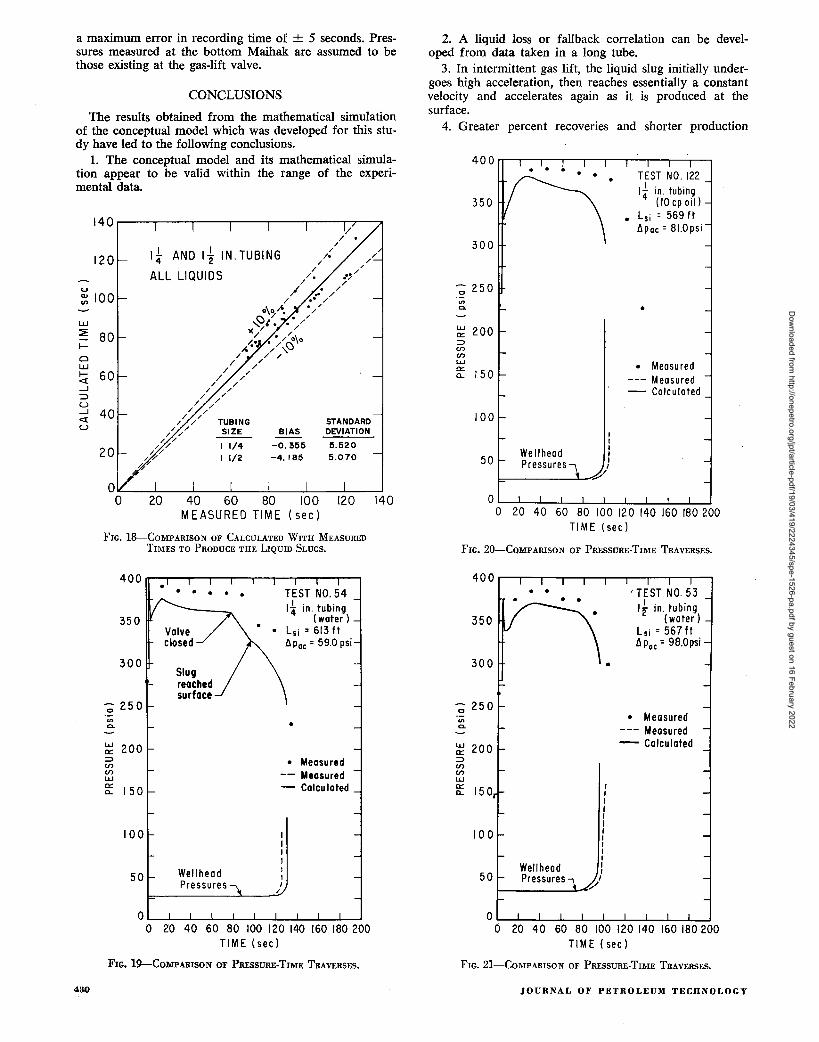
Calculated liquid recoveries and production times areplotted vs the measured liquid recoveries and productiontimes for all the simulated tests in Figs. 17 and 18, respectively. From these graphs it can be seen that most ofthe errors are well ~ithin ± 10 percent. The algebraic average percent error, or bias, as well as the standard deviation from the algebraic average percent error, are alsoshown for each tubing size in Figs. 17 and 18.
Graphical comparisons of calculated vs experimentallymeasured pressure-time traverses at the valve and at thewellhead are shown in Figs. 19 through 22 for one testof each liquid in each tubing size. Additional traverses areavailable elsewhere.'
In examining these graphs, it should be realized that theexperimental pressures and times as determined from thedata are not highly accurate. The measured wellhead pressure-time curves were obtained from a two-pen pressurerecorder, which is not considered to be a precision instrument. The time lag inherent in the instrument does notallow it to reach the maximum pressure occurring at thewellhead. The Maihak pressure transmitter is ideally suited for steady-state measurements and may be in error asmuch as 20 to 25 psi for the unsteady-state conditionsencountered in intermittent gas lift. The method used tomeasure pressures at the bottom Maihak also introduces
;: 4000::U.J>0320uU.J0::
~ 240to«...J
G 160...J«u
--
FIG. 17-COMPARISON OF CALCULATED WITH MEASURED RECOVERIES.
(40)
(41)
(46)
(45)
(42)
(47)
(44)
g+ PL (Lb" + L p ,)
144
t+M tLm = ~AL7' - ~ ALF •
t=O t=O
where
ALF = qFAtAT
A rigorous treatment of liquid feed-in introduces an addiEonal trial-and-error procedure to the problem, since
PTV and ALF are interdependent. A negligible error resultsfrom forcing the liquid feed-in calculations to lag the calculations for obtaining PTrz by one time increment, provided a small enough time increment is used. No trial-anderror calculation is then required, and Eq. 23 can be written as
CONVERGENCE TECHNIQUEAt time t + At, the volume of tubing available for gas
under the liquid slug is
V T, = (LT, - L F,) AT (43)
Since the liquid feed-in is forced to lag the remaining calculations by one time increment, L F , must be substitutedfor L F , in Eq. 43.
The average pressure in the gas phase below the liquidslug at time t + At is
Pn, V T ,
nT2 = =--=ZT' R T"
A similar expression can be written for the number ofmoles of gas which occupy the volume V", at time t.
PH'V",n",= ~-z7'1R TT
The increase in moles of gas in the gas phase over thetime increment At is
_ p" ( [144~~;;TgC l)PH' = T 1 + e
and the number of moles of gas which occupy the volumeVT , can be calculated from the engineering equation-ofstate for gases to be
and this value must be identical to the moles of gas injected through the gas-lift valve over the same time increment, as calculated by Eq. 25 or 26.
If these two values are not identical, another liquid slugvelocity v" must be assumed and the calculations beginning with Eq. 4 must be repeated. If AnT is greater thanAn" a lower slug velocity must be assumed.
MARCH,1967
Dow
nloaded from http://onepetro.org/jpt/article-pdf/19/03/419/2224345/spe-1526-pa.pdf by guest on 16 February 2022
'TEST NO. 53It in. tubing
(water)Lsi: 567 ftII Poe =98.0psi
•
• Measu red--- Measured- Colculated
TEST NO. 122It in. tubing
(10 cp oil)• Lsi : 569 ft
IIpoc: 81.0psi
• Measured--- Measured- Calculated
•
We IIheadPressures
IIIIII
/!=- ---'L-...._"
• •• • •
IIIIIIIIIII
Wellhead I50 Pressures }
t------J,....,,/
100
350
50
J 00
U>a.
300
U>a.
350
300
~ 200:::>enenwg: 150
o '--'---'--'---'----l.._l....-....I..---l.._L...--.-l
o 20 40 60 80 100 120 140 160 180 200TIME (sec)
FIG. 20--COMPARISON OF PRESSURE-TIME TRAVERSES.
-;; 250
400 ,...--.----r---,.-.--.--.---r-r--r-...,
~ 200:::>enenwg: 150
~ 250
2. A liquid loss or fallback correlation can be developed from data taken in a long tube.
3. In intermittent gas lift, the liquid slug initially undergoes high acceleration, then reaches essentially a constantvelocity and accelerates again as it is produced at thesurface.
4. Greater percent recoveries and shorter production
STANDARDDEVIATION
5.5205.070
BIAS
-0.355-4.185
TUBINGSIZE
I 1/4I 1/2
I t AND It IN. TUBING
ALL LIQUIDS
CONCLUSIONS
20 40 60 80 100 120 140MEASURED TIME (sec)
FIG. 18----COMPARISON OF CALCULATED WITH MEASUREDTIMES TO PRODUCE THE LIQUID SLUGS.
400 . . . . . TEST NO.54II. b'4 10. tu 109
350 (water)Valve . Lsi = 613 ftclased llpoc = 59.0 psi
300
~ 250U>a.
W 2000::::::> . Measuredenen -- Measuredw0:::
150 - Calculateda..
100 IIII
Wellhead I50 I
Pressures I/
120
u
~ 100
w:2 80f-
awf- 60<t-.J=>U-.J 40<tU
20
a maximum error in recording time of ± 5 seconds. Pressures measured at the bottom Maihak are assumed to bethose existing at the gas-lift valve.
The results obtained from the mathematical simulationof the conceptual model which was developed for this study have led to the following conclusions.
1. The conceptual model and its mathematical simulation appear to be valid within the range of the experimental data.
oL..-....I..---l.._l....-....I..---l.._l....-....I..---l.._L...--.-l
o 20 40 60 80 100 120 140 160 180200TIME (sec)
oL-....I..---l.._l....-....I..----L_l....-....I..----L_L...--.-l
o 20 40 60 80 100 120 140 160180200TIME (sec)
FIG. 19-COMPARISON OF PRESSURE-TIME TRAVERSES. FIG. 21-COMPARISON OF PRESSURE-TIME TRAVERSES.
430 JOURNAL OF PETROLEUM TECHNOLOGY
Dow
nloaded from http://onepetro.org/jpt/article-pdf/19/03/419/2224345/spe-1526-pa.pdf by guest on 16 February 2022
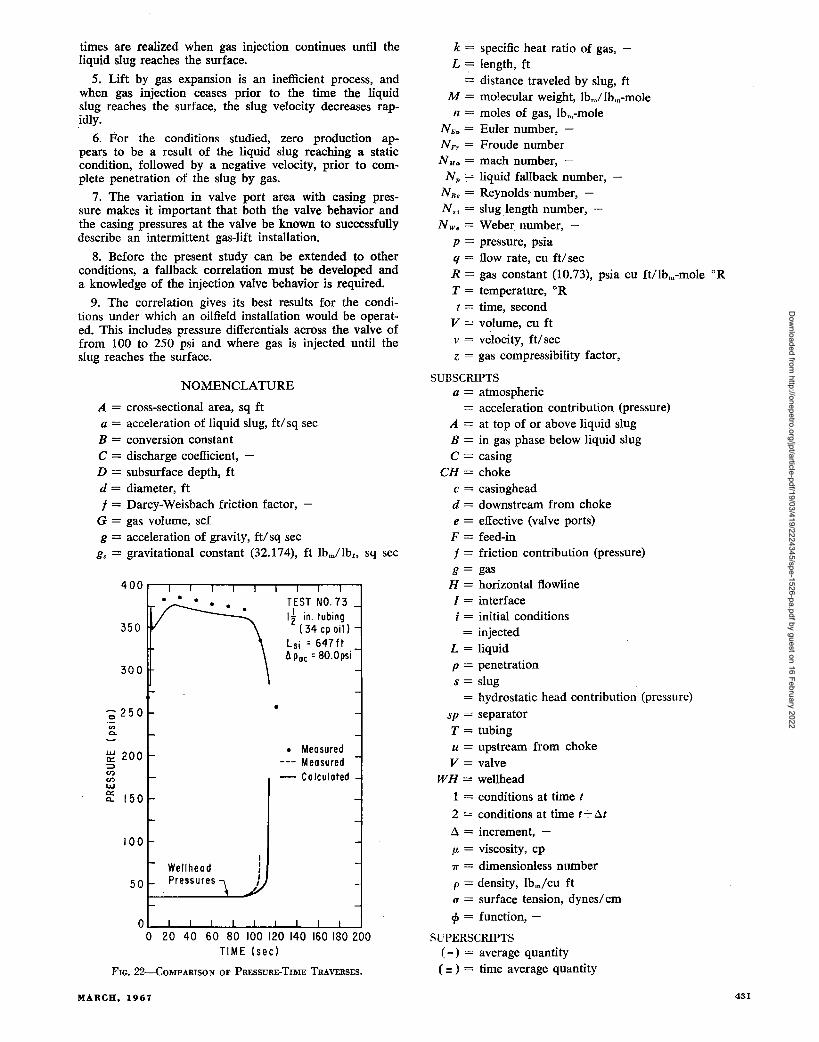
FIG. 22-COMPARISON OF PRESSURE-TIME TRAVERSES.
NOMENCLATURE
400 r-...,.--r-~""'--r-~...,.--r-~.,
k = specific heat ratio of gas, L = length, ft
= distance traveled by slug, ftM = molecular weight, Ibm/Ibm-molen = moles of gas, Ibm-mole
NE. = Euler number, -N1"r = Froude numberN,,~ = mach number, -
N p = liquid fallback number,N R. = Reynolds number, N., = slug length number,
N w. = Weber number, -p = pressure, psiaq = flow rate, cu ftl secR = gas constant (l0.73), psia cu it/Ibm-mole ORT = temperature, ORt = time, second
V = volume, cu ftv = velocity, ftl secz = gas compressibility factor, -
SUBSCRIPTSa = atmospheric
= acceleration contribution (pressure)A = at top of or above liquid slugB = in gas phase below liquid slugC = casing
CH = chokec = casingheadd = downstream from chokee = effective (valve ports)F = feed-inf = friction contribution (pressure)g = gas
H = horizontal flowlineI = interfacei = initial conditions= injected
L = liquidp = penetrations = slug
= hydrostatic head contribution (pressure)sp = separatorT = tubingu = upstream from chokeV = valve
WH = wellhead1 = conditions at time t
2 = conditions at time t+~t
~ = increment, -f.I. = viscosity, cp7r = dimensionless numberp = density, lbm/cu itIT = surface tension, dynes/cmep = function, -
SUPERSCRIPTS( -) = average quantity( =) = time average quantity
TEST NO.73I~ in. tubing
( 34 cp oil)Lsi = 647 ftAPac =80.0psi
• Meosured--- Meosured- Colculoted
•
100
Wellheod50 Pressures
enc.
300
350
~ 200::>enC/)
LLI
g: 150
-;;250
A = cross-sectional area, sq fta = acceleration of liquid slug, ft! sq secB = conversion constantC = discharge coefficient,D = subsurface depth, ftd = diameter, ftf = Darcy-Weisbach friction factor,
G = gas volume, scfg = acceleration of gravity, ft! sq sec
g. = gravitational constant (32.174), ft lbmllb" sq sec
o'---'----'-_'---'----'----J'---'----'----J'---Jo 20 40 60 80 100 120 140 160 180 200
TIME (sec)
times are realized when gas injection continues until theliquid slug reaches the surface.
5. Lift by gas expansion is an inefficient process, andwhen gas injection ceases prior to the time the liquidslug reaches the surface, the slug velocity decreases rapidly.
6. For the conditions studied, zero production appears to be a result of the liquid slug reaching a staticcondition, followed by a negative velocity, prior to complete penetration of the slug by gas.
7. The variation in valve port area with casing pressure makes it important that both the valve behavior andthe casing pressures at the valve be known to successfullydescribe an intermittent gas-lift installation.
8. Before the present study can be extended to otherconditions, a fallback correlation must be developed anda knowledge of the injection valve behavior is required.
9. The correlation gives its best results for the conditions under which an oilfield installation would be operated. This includes pressure differentials across the valve offrom 100 to 250 psi and where gas is injected until theslug reaches the surface.
MARCH, 1967 431
Dow
nloaded from http://onepetro.org/jpt/article-pdf/19/03/419/2224345/spe-1526-pa.pdf by guest on 16 February 2022
ACKNOWLEDGMENTS
The authors wish to thank the management of Otis Engineering Corp. for furnishing their experimental- well toobtain the test data. In addition, all experimental equipment, including valves, Maihak pressure transmitters, wireline work, and labor to perform these operations werefurnished by -Otis. Particular thanks are extended to L.M. Wilhoit, M. B. Roach, Purvis J. Thrash, Carlos Canalizo, Carl Ivey, Phil Pierce, Don Taylor, Ray Sharp, Francis Ellis and numerous others. Sincere thanks are also duethe Gardner-Denver Co. and their representative TomSmith of Dallas for the use of the compressor units whichwere used in these tests.
REFERENCES
1. Blill, J. P.: "The Analytical Descliption of Liquid Slug Flowin Small-Diameter Vertical Conduits", PhD Dissertation, TheU. of Texas, Austin (1966).
2. Brown, K. K: "The Vertical Flow of Liquid Slugs by Intermittent Gas-Lift", PhD Dissertation, The U. of Texas, Austin(1962) .
3. Brown, K. E. and Jessen, F. W.: "Evaluation of Valve PortSize, Surface Chokes, and Fluid Fall Back in Intermittent GasLift Installations", J. Pet. Tech. (March, 1962) 315-322.
4. Charvonia, D. A.: "An Experimental Investigation of the MeanLiquid Film Thickness and the Characteristics of the InterfacialSurface in Annular, Two-Phase Flow", ASME Paper 61-WA-253(1961).
5. Deschner, K K: "Intermittent Gas-Lift Performance in SmallTubing", MS Thesis, The U. of Texas, Austin (1964).
6. Deschner, K K and Brown, K. K: "A Procedure for Determining the Maximum Production Rate from an Intermittent GasLift Well", API Spring Meeting (Southern Dist.), Shreveport,La. (Feb., 1965).
7. Doerr, T. c.: "The Analytical Description of an IntermittentGas-Lift Installation", MS Thesis, The U. of Texas, Austin(1966).
432
8. Griffith, P. and Wallis, G.: "Two Phase Slug Flow", J. HeatTransfer; Trans., ASME, Series C (1961) 83, 307.
9. Hagedorn, A. R.: "Experimental Study of Pressure GradientsOccurring During Vertical Two-Phase Flow in Small-DiameterConduits", PhD Dissertation, The U. of Texas, Austin (1964).
10. Laird, A. D. K.: "Stability of Gas Flow in a Tube as Relatedto Vertical Annular Gas/Liquid Flow", Trans., ASME (1954)76, 1005.
n. Moissis, R. and Griffith, P.: "Entrance Effects in a Two-Ph&seSlug Flow", J. Heat Transfer; Trans., ASME, Series C (1962)84, 29.
12. Olson, R. M.: Essentials of Engineering Fluid Mechanics, International Textbook Co., Scranton, Pa. (1961).
13. Ostrach, '5. and Koestel, A.: "Film Instabilities in Two-PhaseFlows", Preprint 45, ASME-AIChE Joint Heat Transfer Conference, Boston (1963).
14. Quandt, Earl: "Measurement of Some Basic Parameters in TwoPhase AnTl,ular Flow", Preprint 36, AIChE Annual Meeting,Chicago (1962).
15. Quandt, Earl: "Analysis of Gas-Liquid Flow Patterns", Preprint 47, ASME-AIChE Joint Heat Transfer Conference, Boston(1963).
16. Street, J. R.: "A Study of Vertical Gas-Liquid Slug Flow", PhDDissertation, U. of Michigan, Ann Arbor (1962).
17. Street, J. R. and Tek, M. R.: "Dynamics of Bullet ShapedBubbles Encountered in Vertical Gas Liquid Slug Flow", A/ChEJ. (July, 1965) II, 644.
18. Street, J. R. and Tek, M. R.: "Unsteady State Gas-Liquid SlugFlow Through Vertical Pipe", A/ChE J. (July, 1965) II, 601.
19. Taylor, G. I.: "Disposition of a Viscous Fluid on the Wall of aTube, Part 11", J. Fluid Meeh. (March, 1961) 10, 161.
20. Taylor, G. I. and Davies, R. M.: "The Mechanics of LargeBubbles Rising Through Extended Liquids and Through Liquidsin Tubes", Proe., Royal Society, Series A (1950) 200, 375.
21. White, G. W. et al.: "An Analytical Concept of the Static andDynamic Parameters of Intermittent Gas Lift", J. Pet. Tech.(March, 1963) 301-308. ***
JOURNAL OF PETROLEUM TECHNOLOGY
Dow
nloaded from http://onepetro.org/jpt/article-pdf/19/03/419/2224345/spe-1526-pa.pdf by guest on 16 February 2022


![[Vitamin D measurement: pre-analytical and analytical considerations]](https://img.pdfslide.net/doc/110x75/635b7216f6a5e09612017c84/vitamin-d-measurement-pre-analytical-and-analytical-considerations.jpg)


