Embed Size (px)
Citation preview

Ai
SD
a
ARR1A
M69
KHCIAM
1
acpshit
itcapTblbu
h0
Computerized Medical Imaging and Graphics 40 (2015) 62–69
Contents lists available at ScienceDirect
Computerized Medical Imaging and Graphics
j ourna l h omepa ge: www.elsev ier .com/ locate /compmedimag
n automated approach to the segmentation of HEp-2 cells for thendirect immunofluorescence ANA test
imone Tonti, Santa Di Cataldo ∗, Andrea Bottino, Elisa Ficarraept. of Computer and Control Engineering, Politecnico di Torino, Cso Duca degli Abruzzi 24, 10129 Torino, Italy
r t i c l e i n f o
rticle history:eceived 30 June 2014eceived in revised form0 November 2014ccepted 24 December 2014
SC:8U102C55
a b s t r a c t
The automatization of the analysis of Indirect Immunofluorescence (IIF) images is of paramount impor-tance for the diagnosis of autoimmune diseases. This paper proposes a solution to one of the mostchallenging steps of this process, the segmentation of HEp-2 cells, through an adaptive marker-controlledwatershed approach. Our algorithm automatically conforms the marker selection pipeline to the pecu-liar characteristics of the input image, hence it is able to cope with different fluorescent intensitiesand staining patterns without any a priori knowledge. Furthermore, it shows a reduced sensitivity toover-segmentation errors and uneven illumination, that are typical issues of IIF imaging.
© 2015 Elsevier Ltd. All rights reserved.
eywords:Ep-2 cell segmentationell pattern analysis
ndirect immunofluorescenceNA testing
icroscope image processing. Introduction
Pattern recognition techniques are at the basis of computerided diagnosis (CAD) systems in a large number of medical appli-ations. Such systems support and facilitate the decision of thehysicians, help reducing diagnosis errors and enable massivecreening at a moderate cost, with tremendous positive impact onealth care quality and economy [1]. This motivates an ever grow-
ng interest of the research community in providing solutions tohe most challenging medical problems.
Recently, the analysis of indirect immunofluorescence (IIF)mages has received increasing attention, with special regards tohe development of systems for the computer-aided diagnosis ofonnective tissue diseases (CTDs). CTD refers to a broad category ofutoimmune disorders that affect a remarkable percentage of theopulation, such as lupus, rheumatoid arthritis and scleroderma.hese autoimmune disorders are usually diagnosed by means of alood exam called the Antinuclear Antibody (ANA) test. This test
everages on the analysis of IIF images to reveal the presence in thelood serum of antibodies that are responsible for CTDs, typicallysing HEp-2 (Human epithelial type 2) cells as a substrate for the
∗ Corresponding author. Tel.: +39 011 090 7020; fax: +39 011 090 7099.E-mail address: [email protected] (S. Di Cataldo).
ttp://dx.doi.org/10.1016/j.compmedimag.2014.12.005895-6111/© 2015 Elsevier Ltd. All rights reserved.
microscope slides. Different antibodies generate distinct patternsof fluorescence on the HEp-2 cells (see Fig. 1), allowing differentialdiagnosis.
While the ANA test has gained a wide recognition for its diag-nostic capabilities and has now become a routine exam, the visualanalysis of IIF images remains a very challenging task for the physi-cians, who need to inspect a massive amount of images. Moreover,several studies confirm that the reliability of the diagnosis is crit-ically affected by the subjectivity and variability of the humanevaluation [2,3], thus demanding for the automatization of thediagnostic process.
In the last few years, many researchers have applied patternrecognition techniques to this problem, and several automatedtools have been proposed to support all the major steps of theIIF analysis procedure, including methods to automatize imageacquisition and enhance image quality [4,5], image segmentationtechniques [6–10], methods to improve IIF image representa-tion and color conversion [11] as well as classification paradigmsapplied either to the quantification of the fluorescence intensity[12–14], to the recognition of the mitotic cells [15,16] or to thecategorization of the fluorescent patterns [17–22].
Among the other tasks, image segmentation is one of the mostcritical and challenging in a computer-aided diagnosis systemapplied to IIF images. It is critical, because the accuracy of seg-mentation of the HEp-2 cells heavily affects the following steps

S. Tonti et al. / Computerized Medical Imaging and Graphics 40 (2015) 62–69 63
Fig. 1. IIF images with different staining patterns (from left to right: homogeneous, coarse speckled, fine speckled, centromere, nucleolar and cytoplasmic).
ntensi
oetioaetpf
Hflapi(dtdm
tad4
Fig. 2. IIF images with same fluorescent pattern and different i
f the analysis, such as the recognition of mitotic cells and the cat-gorization of fluorescent patterns (details in Section 2.1). Besideshat, HEp-2 cell segmentation is challenging because IIF images arentrinsically subject to tremendous variability. The major sourcesf this variability are: (i) the wide range of staining patterns (Fig. 1)nd intensity levels (Fig. 2) that characterize the cells, (ii) the pres-nce of mitotic cells (i.e. cells undergoing division, Fig. 3), and (iii)he possible generation of artifacts due to uneven illumination andhoto-bleaching effect. This is a very difficult problem that is farrom being solved.
In this work, we propose a fully-automated segmentation ofEp-2 cells in IIF images, without any a priori knowledge of theiruorescence intensity or staining pattern. Our method is designeds a multi-step pipeline. Both the segmentation approach and itsarameters are adapted to the identified characteristics of the
nput image. As such, our pipeline is able to segment HEp-2 cellsincluding mitotic ones) with different intensity levels and with sixifferent fluorescent patterns (see Fig. 1). Furthermore, we assessedhe accuracy of our proposed technique on a publicly availableataset of IIF images, which allows a direct comparison with theost significant works in this area.This paper is organized as follows. After a short overview of
he medical context (Section 2.1) and of the most relevant liter-ture on IIF segmentation (Section 2.2), we characterize the imageataset (Section 3), we describe our proposed technique (Section) and the parameters’ set-up (Section 5) and we discuss our
Fig. 3. Examples of
ty level (left: positive intensity; right: intermediate intensity).
experimental results (Section 6). Finally, Section 7 concludes thepaper and presents future works.
2. Background
2.1. ANA test with indirect immunofluorescence imaging
The ANA test used in conjunction with indirect immunofluo-rescence is able to detect in the blood serum the presence ofautoantibodies responsible for CTDs. The serum is first diluted andthen incubated on a microscope slide coated with HEp-2 cells,whose antigens selectively bind to the serum autoantibodies. Thisbond can be visualized under the microscope by adding a green flu-orescent tag on the slide. The intensity of the fluorescence signalprovides information about the level of the autoantibodies. Whenusing the recommended serum dilution of 1:80, these levels canbe grouped into three categories: negative (no fluorescence at all),intermediate or positive [2]. Depending on the antibody type, theHEp-2 cells (specifically, only the ones with intermediate or posi-tive level) will be characterized by distinct patterns of fluorescence.The ones that are mainly reported in literature are six: homoge-neous, coarse speckled, fine speckled, centromere, nucleolar and
cytoplasmic (Fig. 1).The physicians analyze the microscope slide in three phases.First, they detect the mitotic cells, i.e. cells undergoing division,whose presence guarantees the good quality of the slide. Such cells
mitotic cells.

6 l Imaging and Graphics 40 (2015) 62–69
hciotoi
flrdcc
2
ti
gpodtc
batrppp
ltbba
wlstbbfaspt
3
[hom6pdia
Table 1HEp-2 cell dataset.
Pattern # of images # of cells # of mitosis
Homogeneous 5 345 11Fine speckled 4 225 11Coarse speckled 5 239 14Centromere 6 388 21Nucleolar 4 257 5Cytoplasmic 4 128 8
4 S. Tonti et al. / Computerized Medica
ave very distinct textural characteristics compared to the otherells of the image (Fig. 3). Second, they classify the fluorescencentensity level into negative, intermediate or positive (Fig. 2). Third,nly for the intermediate and positive levels, they categorize each ofhe non-mitotic cells of the slide (namely, the interphase cells) intone of the six staining patterns of Fig. 1. This ultimately providesnformation about the type of CTD affecting the patient.
Most of the techniques for automated mitosis recognition oruorescent patterns classification, such as those cited in Section 1,ely on cell segmentation as a preliminary step, even though theyo not explicitly propose a method for such task. Hence, in theontext of an automatization of the IIF ANA test, the accuracy ofell segmentation heavily affects the whole processing chain.
.2. IIF cells segmentation: related works
In this paper we focus solely on the automated segmentation ofhe HEp-2 cells. For more details about other IIF analysis tasks, thenterested reader can refer to the publications cited in Section 1.
The available approaches to HEp-2 cell segmentation can berouped into three broad categories. A first group includes the sim-lest procedures based on thresholding followed by morphologicalperations [23,24]. This approach is generally less accurate in theetection of cells characterized by irregular intensity patterns (e.g.he ones where very dark and very bright areas coexist in the sameell).
A second group of approaches try to overcome this limitationy splitting the segmentation process into two or more branchesccording to the characteristics of the regions obtained by eitherhresholding the images [6–8,25] or applying the watershed algo-ithm [9]. Most of these approaches have many dataset-dependentarameters, and do not tackle the segmentation of complexatterns such as the centromere (present only in [6]) and the cyto-lasmic.
Finally, a third approach proposed in [10] is based on machineearning methods. Specifically, it performs a first rough segmenta-ion to label the highest and lowest intensity pixels as foreground orackground, respectively. Then, the final classification of the unla-eled pixels (i.e. the pixels with medium intensity) is obtained with
classifier trained on the labeled ones.HEp-2 cell segmentation methods are often tested on IIF images
ith different characteristics in terms of resolution, contrast, noiseevel and fluorescent pattern, which makes a direct compari-on impossible. A rigorous assessment of the most significantechniques in literature has been performed in [10] on a publicenchmark of IIF images (the same used in this work). As confirmedy their results, the accurate segmentation of HEp-2 cells with dif-erent fluorescence patterns and intensity levels is still challenging,nd most of the proposed techniques are sensitive to either over-egmentation (e.g. watershed technique) or under-segmentationroblems (e.g. machine learning approaches). This motivates fur-her research in this field.
. Material
In our experiments we used a public dataset, firstly adopted in10] as a benchmark for IIF CAD systems and available online atttp://mivia.unisa.it. It consists of 28 IIF images acquired with a flu-rescence microscope (40-fold magnification) coupled with a 50 Wercury vapor lamp and a digital camera with CCD squared pixel of
.45 �m. The 24 bit colour images have a resolution of 1388 × 1038
ixels and were manually segmented by medical specialists. Theataset contains a similar amount of positive and intermediatentensity images and a total number of 1582 objects, 70 of whichre mitotic cells (Fig. 3). The remaining objects are interphase cells
Total 28 1582 70
of all the six fluorescent patterns shown in Fig. 1. A detailed char-acterization of the dataset can be seen in Table 1.
4. Proposed method
The objective of our work is to design a segmentation algorithmwhich is robust to the high variance of the IIF image characteristics.To this end, in this paper we propose an adaptive marker-controlledwatershed technique.
Watershed algorithm is a very popular and versatile approachfor cell segmentation [26]. The marker-controlled version of thistechnique leverages on a set of markers defining the position ofthe cells in the image in order to reduce over-segmentation errors(a well-known limitation of watershed) and it has already beenapplied, in many variants, to other contexts of computer visionand biological imaging problems [27,28]. Nevertheless, the auto-matic extraction of “good” markers is very challenging, especiallyin images with very high variabilities. Hence, previous attemptsto perform IIF image segmentation with this method (e.g. [9])had limited success [10]. The implementation of a marker selec-tion technique which self-adapts to the characteristics of the inputimage, as the one proposed in this work, is a possible solution tothis problem.
Before detailing the contributions of our method, we summarizethe two main findings of previous works on HEp-2 cell segmenta-tion (Section 2.2) that were inherited by our technique.
(i) One single segmentation approach tackling all the HEp-2 pat-terns is generally not feasible. A rough pre-classification of theimages into two or more categories of textures helps softeningthis problem [6,8,25].
(ii) A HEp-2 image can be generally divided into three main inten-sity bands. The highest intensity band contains cell pixels andthe lowest intensity band contains background pixels. Themedium intensity band contains pixels whose label (either cellor background) depends on the fluorescent pattern [10].
In order to provide a more general technique capable of tacklingthe widest range of HEp-2 images possible, in our work we designeda novel strategy for watershed marker extraction that exploits boththese ideas.
In addition to this, the main contributions of our work are thefollowing:
(i) a preventive image normalization step, where a morphologi-cal processing, self-adapted to the characteristics of the inputimage, helps softening variabilities due to different fluorescentlevels and patterns;
(ii) the use of an adaptive technique for foreground object detec-
tion based on fuzzy c-means clustering, aimed at reducing thesensitivity to uneven illumination;(iii) an improved technique for the selective separation of touchingcells, which leverages on Randomized Hough Transform.
S. Tonti et al. / Computerized Medical Imaging and Graphics 40 (2015) 62–69 65
the pr
a
ppsi
F
4
oacisp
4
pits
hb
a
fldpi
wprrerorvt
c
4
pas
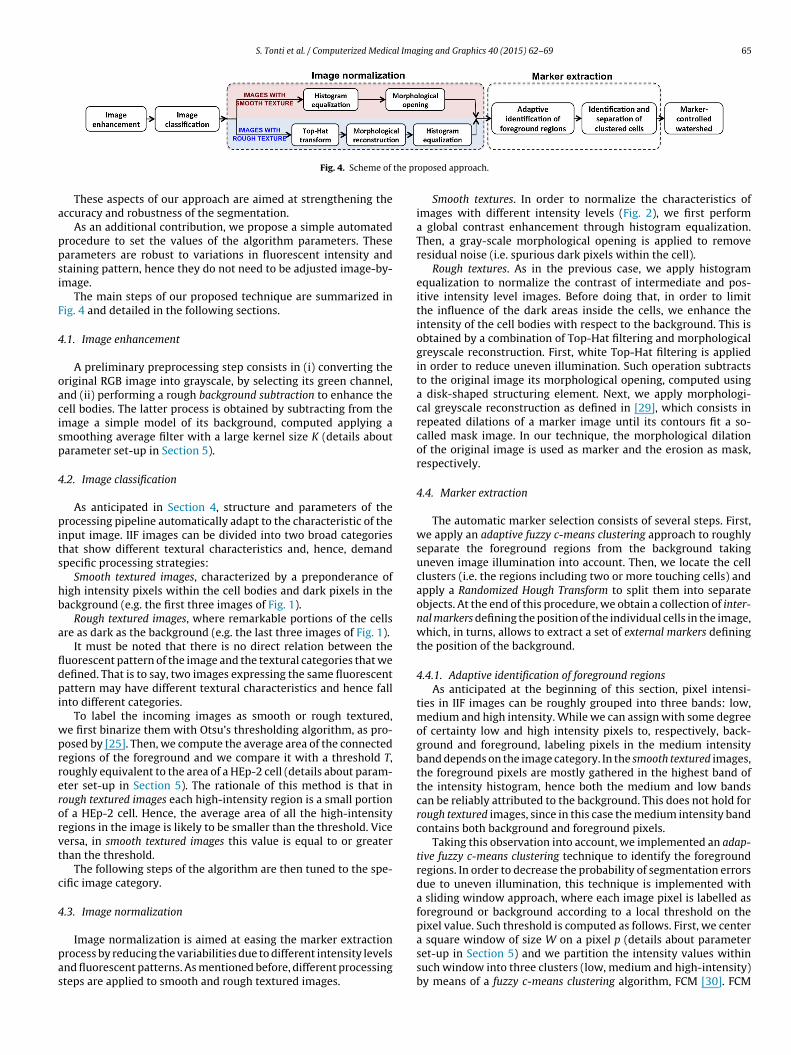
Fig. 4. Scheme of
These aspects of our approach are aimed at strengthening theccuracy and robustness of the segmentation.
As an additional contribution, we propose a simple automatedrocedure to set the values of the algorithm parameters. Thesearameters are robust to variations in fluorescent intensity andtaining pattern, hence they do not need to be adjusted image-by-mage.
The main steps of our proposed technique are summarized inig. 4 and detailed in the following sections.
.1. Image enhancement
A preliminary preprocessing step consists in (i) converting theriginal RGB image into grayscale, by selecting its green channel,nd (ii) performing a rough background subtraction to enhance theell bodies. The latter process is obtained by subtracting from themage a simple model of its background, computed applying amoothing average filter with a large kernel size K (details aboutarameter set-up in Section 5).
.2. Image classification
As anticipated in Section 4, structure and parameters of therocessing pipeline automatically adapt to the characteristic of the
nput image. IIF images can be divided into two broad categorieshat show different textural characteristics and, hence, demandpecific processing strategies:
Smooth textured images, characterized by a preponderance ofigh intensity pixels within the cell bodies and dark pixels in theackground (e.g. the first three images of Fig. 1).
Rough textured images, where remarkable portions of the cellsre as dark as the background (e.g. the last three images of Fig. 1).
It must be noted that there is no direct relation between theuorescent pattern of the image and the textural categories that weefined. That is to say, two images expressing the same fluorescentattern may have different textural characteristics and hence fall
nto different categories.To label the incoming images as smooth or rough textured,
e first binarize them with Otsu’s thresholding algorithm, as pro-osed by [25]. Then, we compute the average area of the connectedegions of the foreground and we compare it with a threshold T,oughly equivalent to the area of a HEp-2 cell (details about param-ter set-up in Section 5). The rationale of this method is that inough textured images each high-intensity region is a small portionf a HEp-2 cell. Hence, the average area of all the high-intensityegions in the image is likely to be smaller than the threshold. Viceersa, in smooth textured images this value is equal to or greaterhan the threshold.
The following steps of the algorithm are then tuned to the spe-ific image category.
.3. Image normalization
Image normalization is aimed at easing the marker extractionrocess by reducing the variabilities due to different intensity levelsnd fluorescent patterns. As mentioned before, different processingteps are applied to smooth and rough textured images.
oposed approach.
Smooth textures. In order to normalize the characteristics ofimages with different intensity levels (Fig. 2), we first performa global contrast enhancement through histogram equalization.Then, a gray-scale morphological opening is applied to removeresidual noise (i.e. spurious dark pixels within the cell).
Rough textures. As in the previous case, we apply histogramequalization to normalize the contrast of intermediate and pos-itive intensity level images. Before doing that, in order to limitthe influence of the dark areas inside the cells, we enhance theintensity of the cell bodies with respect to the background. This isobtained by a combination of Top-Hat filtering and morphologicalgreyscale reconstruction. First, white Top-Hat filtering is appliedin order to reduce uneven illumination. Such operation subtractsto the original image its morphological opening, computed usinga disk-shaped structuring element. Next, we apply morphologi-cal greyscale reconstruction as defined in [29], which consists inrepeated dilations of a marker image until its contours fit a so-called mask image. In our technique, the morphological dilationof the original image is used as marker and the erosion as mask,respectively.
4.4. Marker extraction
The automatic marker selection consists of several steps. First,we apply an adaptive fuzzy c-means clustering approach to roughlyseparate the foreground regions from the background takinguneven image illumination into account. Then, we locate the cellclusters (i.e. the regions including two or more touching cells) andapply a Randomized Hough Transform to split them into separateobjects. At the end of this procedure, we obtain a collection of inter-nal markers defining the position of the individual cells in the image,which, in turns, allows to extract a set of external markers definingthe position of the background.
4.4.1. Adaptive identification of foreground regionsAs anticipated at the beginning of this section, pixel intensi-
ties in IIF images can be roughly grouped into three bands: low,medium and high intensity. While we can assign with some degreeof certainty low and high intensity pixels to, respectively, back-ground and foreground, labeling pixels in the medium intensityband depends on the image category. In the smooth textured images,the foreground pixels are mostly gathered in the highest band ofthe intensity histogram, hence both the medium and low bandscan be reliably attributed to the background. This does not hold forrough textured images, since in this case the medium intensity bandcontains both background and foreground pixels.
Taking this observation into account, we implemented an adap-tive fuzzy c-means clustering technique to identify the foregroundregions. In order to decrease the probability of segmentation errorsdue to uneven illumination, this technique is implemented witha sliding window approach, where each image pixel is labelled asforeground or background according to a local threshold on thepixel value. Such threshold is computed as follows. First, we center
a square window of size W on a pixel p (details about parameterset-up in Section 5) and we partition the intensity values withinsuch window into three clusters (low, medium and high-intensity)by means of a fuzzy c-means clustering algorithm, FCM [30]. FCM
66 S. Tonti et al. / Computerized Medical Ima
Ft
atmotafaf
is
4
etc
uttcact
eRadduerrlm
frotea
4
c(tgib
sponding automated segmentation. The following metrics were
ig. 5. Determination of the intensity thresholds based on FCM membership func-ions.
ssigns to each pixel in the window a [0,1] degree of membershipo each of the three clusters. These values are summarized by theembership functions in Fig. 5, which represent the fuzzy behavior
f the algorithm. Then, if the image was labelled as smooth textured,he threshold for pixel p is calculated as the intersection of the highnd medium membership functions (value th2 in Fig. 5); otherwise,or images labelled as rough textured, the threshold is calculateds the barycenter of the medium intensity cluster’s membershipunction (value th1 in Fig. 5).
Finally, binary morphological operations (i.e. holes filling, open-ng) are applied to regularize the foreground regions and eliminatepurious pixels.
.4.2. Identification and separation of clustered cellsThe foreground regions identified in the previous step may
ither contain one individual cell or multiple touching cells. Inhe latter case, a unique marker must be assigned to each of theiromposing elements.
Individual cells are more elliptical than cell clusters, which aresually characterized by a very irregular shape. Thus, in order toell the cell clusters apart from the individual cells, we impose ahreshold on the ellipticity value of each foreground region, which isomputed as the ratio between the area of a connected componentnd the area of its best-fitted ellipse. The threshold is estimated byalculating the average ellipticity of all the foreground objects inhe image.
Each candidate cell cluster is then divided into a number oflliptical sub-regions through a geometric approach based on theandomized Hough Transform, RHT [31]. RHT is a probabilistic vari-nt of the classical Hough transform that is commonly used toetect curves. The approach is characterized by an iterative ran-om sampling of three points on the object contour, which are thensed to construct the best fitting ellipse. A voting procedure on thellipse parameters allows to select the ones that are the most rep-esentative of the given contour. The resulting ellipses are a veryough approximation of the cell boundaries, and may partially over-ap with each other (see Fig. 6). However, their centers indicate the
ost likely position of the individual cells within the cell clusters.Summarizing, we obtain a set of internal markers including the
ollowing collections of points: (i) the pixels of the foregroundegions labelled as individual cells and (ii) the centers of the ellipsesbtained after the RHT-based decomposition of the candidate clus-ers. The set of external markers is then obtained by picking thedge points of a Voronoi diagram built using the internal markerss seeds.
.5. Marker-controlled watershed
The final cell segmentation is obtained applying a marker-ontrolled watershed on the gradient of the normalized imageSection 4.3). As it is widely known, watershed algorithm treats
he gradient image as a 3D topography surface, starting a regionrowing from its regional minima. Here, we modify the gradientmage so that the regional minima occur at the locations specifiedy the internal and external markers.ging and Graphics 40 (2015) 62–69
5. Parameters set-up
As discussed in Section 2.2, a frequent limitation of previousHEp-2 segmentation techniques is their dependency on a largenumber of parameters that need to be manually adjusted by theuser. In our work, the segmentation pipeline depends on threeparameters only, whose values are strictly related to the dimensionof the objects to be segmented. These parameters are the following:
K – kernel size of the averaging filter (Section 4.1),T – threshold to separate smooth and rough textured images(Section 4.2),W – window size of the adaptive FCM clustering (Section 4.4.1).
In our experiments, K, T and W were set as follows:
(i) we randomly picked six sample images (one per pattern) andperformed a binarization by Otsu thresholding as described inSection 4.2;
(ii) we evaluated the average diameter dAVG and the average areaAAVG of all the connected regions obtained from (i);
(iii) we set K, T and W as, respectively, 3 × dAVG, AAVG and dAVG.
It must be noted that K, T and W are reasonably robust to vari-ations of fluorescent intensity and pattern. Provided that all theimages have been acquired with the same magnification, objectswith the same pattern exhibit small size differences, compared tothe large variation of size displayed by objects with different pat-terns. Indeed, picking one sample image per pattern allows takingboth these variations into account. Hence, the value of the param-eters will ultimately be influenced by image resolution only. Thisis very convenient for the clinical practice, as the parameters canbe fixed once-for-all for datasets acquired with the same magnifi-cation.
The robustness of the proposed technique is confirmed by ourpreliminary experiments, where extensive permutations of theimages used as samples translated into a very low variation of theestimated parameters values (less than 4%). At the same time, man-ually changing the automatically set values by up to 30% for K, 20%for T and 50% for W had no effect on segmentation quality.
6. Experimental results and discussion
The described segmentation pipeline was applied to the datasetof IIF images introduced in Section 3. In order to avoid any bias inthe validation, the segmentation parameters of each image werecalculated using six randomly picked samples (one per pattern, asexplained in Section 5) which did not include the tested one. InFig. 7 we show six examples of final segmentations, one per eachfluorescent pattern.
Based on the qualitative visual assessment of an expert, whowas asked to provide a binary evaluation (correct/not correct) ofthe automated segmentations, our algorithm was able to correctlyidentify about 80% of the cells in the dataset and more than 60%of the mitotic cells. Clustered cells were successfully separated (i.e.with individual cells correctly identified) in 83% of the cases. Detailsof this qualitative assessment in each of the six fluorescent patternsare reported in Table 2.
Besides visual assessment, we performed a thorough quanti-tative evaluation of the accuracy of our technique, based on apixel-wise comparison between the ground truth and the corre-
used:
Precision = TP
TP + FP(1)

S. Tonti et al. / Computerized Medical Imaging and Graphics 40 (2015) 62–69 67
Fig. 6. Separation of a cell cluster: (1) detail of the original image; (2) output of adaptive FCM clustering; (3) internal markers obtained with RHT (red dots); (4) finalsegmentation after marker-controlled watershed. (For interpretation of the references to colour in this figure legend, the reader is referred to the web version of this article.)
F ining
n
R
f
w(Fe
e(pwhlagtw
a
TR
ig. 7. Segmentations obtained with our proposed method in the six different staucleolar and cytoplasmic. The arrows point at examples of mitotic cells.
ecall = TP
TP + FN(2)
-index = 2 · Precision · Recall
Precision + Recall(3)
here for consistency with the previous works, the values of TPnumber of true positives), FP (number of false positives) andN (number of false negatives) were computed according to thextended cell-level definitions proposed in [10].
Back to the evaluation metrics, the precision is a measure of howxact the system is in assigning pixels to the cells, while the recallalso known as sensitivity) is a measure of its ability to identify cellixels among the others. These two metrics are meaningful onlyhen considered jointly. In general, under-segmentation leads toigh values of precision and low recall, while over-segmentation
eads to high recall and low precision. For example, a system thatssigns all the pixels of the image to the cells and none to the back-round would obtain a recall of 100%! Thus, a “good” segmentation
ranslates into a good compromise between precision and recall,hich, in turn, reflects into higher f-index values.Overall, our results show a precision of 89.0%, a recall of 63.9%nd an f-index value of 74.4%.
able 2esults of the qualitative visual assessment.
Pattern # of correctsegmentations (%)
# of cell clusterscorrectly split (%)
Homogeneous 90.5 94.0Fine speckled 80.1 82.0Coarse speckled 85.5 83.0Centromere 81.3 54.0Nucleolar 76.1 75.0Cytoplasmic 57.3 89.0
patterns. Left to right: homogeneous, fine speckled, coarse speckled, centromere,
In order to assess these numbers, we performed a comparisonwith the values obtained on the same IIF images by some of themost representative methods from literature (data from [10]).
Other methods mentioned in Section 2.2, such as the onereported in [25], were not included in this evaluation, becausethey address private databases of IIF images with different char-acteristics in terms of intensity levels and fluorescent patterns.Furthermore, some of them rely on a large number of dataset-dependent parameters. Hence, in absence of a clearly definedmethod to adjust these parameters to different types of images,a direct comparison with our technique would not be fair.
The graph in Fig. 8 reports the performance of our proposedtechnique and of the methods taken for comparison, named withthe same nomenclature used in [10]. Such performances aredepicted as points in a 2D space, where the x coordinate is thevalue of precision and the y coordinate the recall. The f-index valueis represented by the color, where darker zones of the graph areassociated to lower f-index values and brighter ones to higher f-index values, i.e. to better segmentation performance. The idealsegmentation, where all the performance metrics are equal to 1, isrepresented in this space by the upper right corner of the graph.
As shown in Fig. 8, our method outperforms the other techniquesin terms of precision and of f-index, the overall figure of merit. Thereis only one method obtaining a recall higher than ours, namely theone referred to as Watershed [9]. Nevertheless, its lower precision(33.5%) suggests over-segmentation problems. The Auto-learningclassification-based approach proposed in [10], methods (5) and (6)in the graph, obtained precisions similar to our technique (around85%) but much lower recalls (around 45%), which indicates higher
under-segmentation errors.Similar considerations can be made analyzing the individualresults of the six fluorescent patterns. In the first six rows ofTable 3 we compare the values of precision, recall and f-index of

68 S. Tonti et al. / Computerized Medical Imaging and Graphics 40 (2015) 62–69
Table 3Precision, recall and f-index values (%) grouped by pattern. The proposed method is compared with the previous work that obtained the best performance in terms of f-indexfor each specific pattern.
Pattern Previous works Proposed method
Best method Precision Recall f-index Precision Recall f-index
Homogeneous Otsu [23] 89.3 67.2 75.0 94.6 72.2 81.9Fine speckled Auto-learning, MLP [10] 91.9 52.5 66.5 89.2 76.0 82.1Coarse speckled Auto-learning, MLP [10] 92.8 54.2 68.3 85.2 71.0 77.4Centromere Watershed [9] 41.6 88.7 56.2 90.4 57.4 70.3Nucleolar Auto-learning, MLP [10] 82.8 44.0 57.3 88.2 59.8 71.3Cytoplasmic Auto-learning, MLP [10] 55.3 2
Mitotic cells n.a. n.a. n
Fig. 8. Comparison between the proposed technique and other methods: (1) Otsu[23]. (2) Multistage [8]. (3) Watershed [9]. (4) Image reconstruction [10]. (5) Auto-learning, MLP [10]. (6) Auto-learning, NN [10]. The star-shaped marker representst
oii(cgeoItantctctci
aeia
[5] Rödiger S, Schierack P, Böhm A, Nitschke J, Berger I, Frömmel U, et al. A highlyversatile microscope imaging technology platform for the multiplex real-timedetection of biomolecules and autoimmune antibodies. In: Seitz H, Schumacher
he performance of the proposed technique on the segmentation of the mitotic cells.
ur technique with the previous work that obtained the best f-ndex performance in each specific pattern (data from [10]). Again,n all cases we obtained the highest f-index score, higher precisionexcept for speckled patterns) and higher recall (exception made forentromere pattern). Overall, the performance of our method wasood in all the patterns (f-index higher than 70%) with the onlyxception of the cytoplasmic class, where we obtained a f-indexf 49%, still higher than the other techniques by more than 13%.ndeed, cytoplasmic images have a very different pattern comparedo all the others, due to the fact that the fluorescent signal gener-tes from the cytoplasm rather than the nucleus of the cell (as theame Antinuclear Antibody would suggest). Hence, even thoughhe cytoplasmic antibodies are often included with the ANAs in thelinical practice, these images would benefit from the implemen-ation of ad-hoc segmentation strategies to cope with their specificriticalities. Moreover, as clarified in [22], in the IIF dataset differentypes of cytoplasmic antibodies are grouped together in the sameategory, which contains only four images in total. This translatesnto even higher variability of this pattern compared to the others.
Finally, the last row of Table 3 shows the performance of ourlgorithm on the segmentation of the mitotic cells, which is a nec-ssary preventive step of mitosis recognition (see Section 2.1). This
s a type of evaluation that was never reported before in the liter-ture. Despite not excellent values of sensitivity and recall (65.5%6.9 35.9 73.6 37.0 49.3
.a. n.a. 65.5 64.4 65.0
and 64.5%, respectively), their good balance translates into an inter-esting f-index of 65% (see the star-shaped marker in Fig. 8).
7. Conclusions and future works
In this paper we described a procedure for the automated seg-mentation of HEp-2 cells, which is one of the most critical andchallenging steps in a CAD system applied to IIF images.
Our proposed solution is an adaptive marker-controlled water-shed approach, aimed at improving the automatic extraction ofmarkers and, ultimately, the segmentation accuracy. The main fea-tures of our algorithm are:
(i) the adaptiveness of both the preprocessing and the markerselection strategy to the peculiar characteristics of the inputimage;
(ii) an improved pipeline for the watershed marker selection,which takes advantage of domain-specific knowledge aboutthe textural and geometrical characteristics of the HEp-2 cellsto reduce the sensitivity to uneven illumination and over-segmentation errors.
Our experiments show that our solution helps softening themain limitations of the previous techniques in approachingdatasets with high variations of image characteristics. As such, ouralgorithm is able to provide segmentation of IIF images with dif-ferent intensity levels and fluorescent patterns without requiringany a priori knowledge of the image type and with a good level ofaccuracy and robustness.
In the future, we will investigate further improvements of ourwork, with special regards to the design of segmentation strategiesad-hoc for the cytoplasmic images. This would require to extendour dataset first. Finally, we plan to integrate our segmentationtechnique into a complete solution for the automated IIF analysis,including the quantification of fluorescent intensity, the recogni-tion of mitotic cells and the classification of fluorescent patterns.
References
[1] Doi K. Computer-aided diagnosis in medical imaging: historical review, currentstatus and future potential. Comput Med Imag Graph 2007;31(4–5):198–211.
[2] Rigon A, Soda P, Zennaro D, Iannello G, Afeltra A. Indirect immunofluorescencein autoimmune diseases: assessment of digital images for diagnostic purpose.Cytometry B: Clin Cytom 2007;72B(6):472–7.
[3] Melegari A, Bonaguri C, Russo A, Luisita B, Trenti T, Lippi G. A comparativestudy on the reliability of an automated system for the evaluation of cell-basedindirect immunofluorescence. Autoimmun Rev 2012;11(10):713–6.
[4] Hiemann R, Hilger N, Sack U, Weigert M. Objective quality evaluation offluorescence images to optimize automatic image acquisition. Cytometry A2006;69A(3):182–4.
S, editors. Molecular diagnostics, vol. 133 of Advances in biochemical engineer-ing/biotechnology. Berlin, Heidelberg: Springer; 2013. p. 35–74.

l Ima
[
[
[
[
[
[
[
[
[
[
[
[
[
[
[
[
[
[
[
[
176–201.
S. Tonti et al. / Computerized Medica
[6] Creemers C, Guerti K, Geerts S, Van Cotthem K, Ledda A, Spruyt V. HEp-2 cellpattern segmentation for the support of autoimmune disease diagnosis. In:Proceedings of the 4th international symposium on applied sciences in biomed-ical and communication technologies, ISABEL ′11. 2011. p. 28:1–5.
[7] Divya B, Nanjundaswamy H, Muniraj N. Segmentation of IIF HEp-2 ANAcells based on thresholding and connectivity. Int J Microsyst Technol Appl2012;1(1):26–30.
[8] Huang Y-L, Jao Y-L, Hsieh T-Y, Chung C-W. Adaptive automatic segmentationof HEp-2 cells in indirect immunofluorescence images. In: IEEE internationalconference on sensor networks, ubiquitous and trustworthy computing, SUTC′08. 2008. p. 418–22.
[9] Huang Y-L, Chung C-W, Hsieh T-Y, Jao Y-L. Outline detection for the HEp-2cell in indirect immunofluorescence images using watershed segmentation. In:IEEE International conference on sensor networks, ubiquitous and trustworthycomputing, SUTC ′08. 2008. p. 423–7.
10] Percannella G, Soda P, Vento M. A classification-based approach to segmentHEp-2 cells. In: 25th international symposium on computer-based medicalsystems (CBMS). 2012. p. 1–5.
11] Cordelli E, Soda P. Color to grayscale staining pattern representation in IIF. In:24th international symposium on computer-based medical systems (CBMS).2011. p. 1–6.
12] Soda P, Iannello G, Vento M. A multiple expert system for classifying flu-orescent intensity in antinuclear autoantibodies analysis. Pattern Anal Appl2009;12(3):215–26.
13] Bertin D, Jourde-Chiche N, Bongrand P, Bardin N. Original approach forautomated quantification of antinuclear autoantibodies by indirect immuno-fluorescence. Clin Dev Immunol 2013:1–8.
14] Iannello G, Onofri L, Soda P. A slightly supervised approach for positive/negativeclassification of fluorescence intensity in HEp-2 images. In: Image analysis andprocessing, ICIAP 2013. Berlin, Heidelberg: Springer; 2013. p. 319–28.
15] Foggia P, Percannella G, Soda P, Vento M. Early experiences in mitoticcells recognition on HEp-2 slides. In: IEEE 23rd international symposium oncomputer-based medical systems (CBMS). 2010. p. 38–43.
16] Iannello G, Percannella G, Soda P, Vento M. Mitotic cells recognition in HEp-2images. Pattern Recogn Lett 2014;45:136–44.
17] Agrawal P, Vatsa M, Singh R. HEp-2 cell image classification: a comparativeanalysis. In: Machine learning in medical imaging, vol. 8184 of Lecture Notesin Computer Science. 2013. p. 195–202.
[
[
ging and Graphics 40 (2015) 62–69 69
18] Di Cataldo S, Bottino A, Islam IU, Vieira TF, Ficarra E. Subclass discriminantanalysis of morphological and textural features for HEp-2 staining patternclassification. Pattern Recogn 2014;47(7):2389–99.
19] Foggia P, Percannella G, Saggese A, Vento M. Pattern recognition instained HEp-2 cells: where are we now? Pattern Recogn 2014;47(7):2305–14.
20] Kivity S, Gilburd B, Agmon-Levin N, Carrasco M, Tzafrir Y, Sofer Y, et al. Anovel automated indirect immunofluorescence autoantibody evaluation. ClinRheumatol 2012;31(3):503–9.
21] Larsen A, Vestergaard J, Larsen R. HEp-2 cell classification using shapeindex histograms with donut-shaped spatial pooling. IEEE Trans Med Imag2014;33(7):1573–80.
22] Foggia P, Percannella G, Soda P, Vento M. Benchmarking HEp-2 cells classifica-tion methods. IEEE Trans Med Imag 2013;32(10):1878–89.
23] Perner P, Perner H, Mller B. Mining knowledge for HEp-2 cell image classifica-tion. Artif Intell Med 2002;26(1–2):161–73.
24] Sack U, Knoechner S, Warschkau H, Pigla U, Emmrich F, Kamprad M. Computer-assisted classification of HEp-2 immunofluorescence patterns in autoimmunediagnostics. Autoimmun Rev 2003;2(5):298–304.
25] Cheng C-C, Hsieh T-Y, Taur J-S, Chen Y-F. An automatic segmentation andclassification framework for anti-nuclear antibody images. Biomed Eng Online2013;12(1):1–25.
26] Malpica N, de Solórzano CO, Vaquero JJ, Santos A, Vallcorba I, García-Sagredo JM,et al. Applying watershed algorithms to the segmentation of clustered nuclei.Cytometry 1997;28(4):289–97.
27] Han X, Fu Y, Zhang H. A fast two-step marker-controlled watershed imagesegmentation method. In: International conference on mechatronics andautomation (ICMA). 2012. p. 1375–80.
28] Koyuncu CF, Arslan S, Durmaz I, Cetin-Atalay R, Gunduz-Demir C. Smart mark-ers for watershed-based cell segmentation. PLoS ONE 2012;7.
29] Vincent L. Morphological grayscale reconstruction in image analysis: appli-cations and efficient algorithms. IEEE Trans Image Process 1993;2(2):
30] Bezdek JC. Pattern recognition with fuzzy objective function algorithms. Nor-well, MA, USA: Kluwer Academic Publishers; 1981.
31] Xie Y, Ji Q. A new efficient ellipse detection method. In: Proceedings of the 16thinternational conference on pattern recognition, vol. 2. 2002. p. 957–60.


