Embed Size (px)
Citation preview

Computers and Geotechnics 66 (2015) 189–202
Contents lists available at ScienceDirect
Computers and Geotechnics
journal homepage: www.elsevier .com/locate /compgeo
An effective constitutive model for lime treated soils
http://dx.doi.org/10.1016/j.compgeo.2015.01.0100266-352X/� 2015 Elsevier Ltd. All rights reserved.
⇑ Corresponding author.
V. Robin a,b, A.A. Javadi a,⇑, O. Cuisinier b, F. Masrouri b
a Computational Geomechanics Group, Department of Engineering, University of Exeter, United Kingdomb LEMTA – UMR 7563 CNRS, Laboratoire d’Energétique et de Mécanique Théorique et Appliquée, Université de Lorraine, France
a r t i c l e i n f o a b s t r a c t
Article history:Received 16 June 2014Received in revised form 30 November 2014Accepted 18 January 2015
Keywords:Lime treated soilsStructured soilsDegradationConstitutive modelling
The effect of lime on the yield stress, and more generally the presence of structure in the soil, is usuallynot accounted for in the design of geotechnical structures. As a result the potential of lime treatment or ofa structured soil has not been fully exploited. This paper presents a new formulation to account for theeffect of structure on the mechanical behaviour for structured soils. A constitutive model is proposed inthe framework of the Modified Cam Clay model to describe the behaviour of lime treated soils. The newformulation introduces a limited number of additional parameters, all of which have a physical meaningand can be obtained from an isotropic compression test. Due to similarity in behaviour of lime treatedsoils and naturally structured soils, the formulation can be applied to both types of soil. It is shown thatthe proposed model can successfully reproduce the main features of both structured soils such as max-imum rate of dilation at softening and degradation at yield. The model can be applied for any structuredmaterial regardless of the origin of cementation.
� 2015 Elsevier Ltd. All rights reserved.
1. Introduction
The use of on-site materials has become a central issue for civilengineering companies, but it is sometimes difficult to deal with allthe resources available on site. For soils with low mechanical char-acteristics, lime treatment appears to be an efficient method toimprove their mechanical properties and allow their use ingeotechnical earth structures (e.g. [23]). The effects of the additionof lime on the soil parameters such as cohesion and friction anglehave been extensively studied (e.g. [6]). Nevertheless, lime is stillmostly used to dry soils with high water contents and increasethe bearing capacity. However, it is also generally known thatadding lime leads to a significant increase of the yield stress andmodifies other mechanical parameters in compacted soils. Inlime-treated soils, the modification of the mechanical behaviourresults from several physico-chemical processes associated withthe increase in calcium concentration and pH (i.e. cation exchange,pozzolanic reactions, etc.).
From an economical point of view, it is becoming increasinglyimportant to account for the properties of treated materials inthe design of the geotechnical structures. However, despite its pro-ven efficacy, the use of treated materials suffers from several majordrawbacks: there is no reliable method to account for the structurein the calculations. At yield, and for an increasing mechanicalloading, treated materials experience what is called the ‘‘loss of
structure’’, resulting in the degradation of the structure in differentways. To model the behaviour of these materials, a constitutive lawdescribing the behaviour at yield is a requirement.
Some studies [26,3,22,25,16] have shown that naturallystructured soils and artificially treated materials have commonmechanical features; artificial treatment appears to create a‘‘structure’’ in the soil. In this paper, ‘‘structure’’ refers to Burland’sdefinition [7], and is seen as the combination of the fabric and thebonding of the soil skeleton. Fabric accounts for the arrangement ofparticles, which depends on the state of compaction and theirgeometry.
Several constitutive models have been proposed for structuredmaterials. Most of these models use the destructured state as ref-erence to describe the mechanical behaviour of structured soils.[24] proposed a constitutive model, based on the Modified CamClay model (MCC), by adding three additional parameters to theoriginal MCC [36]. Since then, several enhancements (e.g. [18,40])have been proposed. However, various modes of destructurationhave been identified, and the original formulation fails to modelsome of them. A number of other formulations have been devel-oped [19,42,30,5,38,29] and some of which give good agreementwith experimental results. However, it often comes at the cost ofa larger number of parameters, or high computational resources(e.g. mapping rule). Parameters do not always have a physicalmeaning, and some of them can be difficult to determine. All theselimitations make these models difficult to be used in engineeringpractice.

Effective mean stress p
Spec
ific
volu
me
v(-
) ncld
url
Δei
Mode 1Mode 2Mode 3Mode 4
Fig. 1. The four different modes of destructuration in structured soils – ncld:Normal compression line of the destructured state, url: Unloading–reloading line.
190 V. Robin et al. / Computers and Geotechnics 66 (2015) 189–202
The main objective of this paper is to propose a general andsimple formulation capable of fulfilling some fundamentals criteriaregarding the degradation of the structure. This model must becapable of modelling any kind of degradations, and require a lim-ited number of parameters to account for the maximum numberof features of structured materials. These parameters should berapidly obtained from classic experimental tests, and they all musthave a physical meaning. To this end, the paper will focus on twoaspects:
� How can the key features of structured or lime treated materialsbe described?� How can these features be efficiently accounted for in a consti-
tutive model?
This paper is divided into four parts. The first part gives a reviewof the main characteristics of naturally and artificially structuredmaterials that must be reproduced by the model. The second partintroduces the theoretical framework chosen for the model forlime treated soils (MLTS) and the new formulation developed tomodel the degradation of the structure. In the third part, the devel-oped formulation is used to calculate the compliance matrix andobtain the stress–strain relationship. Finally, in the last part, weassess the suitability of the model in predicting experimentalresults obtained from triaxial tests on artificially (i.e. lime treated)and naturally structured materials.
102 103
Mean effective stress p’ (kPa)
1.35
1.40
1.45
1.50
1.55
1.60
Spec
ific
volu
me
v(-
)
ncld
nclr
Isotropic - 0%Isotropic - 0.5%Isotropic - 1%
Fig. 2. Isotropic consolidation curves obtained from specimens of silt treat at 0.5%and 1% in lime – Arrows mark the yield stress p0y;ncld: Normal compression line ofthe destructured state, nclr: Normal compression line of the residual state [34].
2. Features of structured soils
The mechanical behaviour of naturally and artificiallystructured material has been extensively studied [22,17,8,13,27,15,14,11,31,34] and some specific features have been identified.Several studies have pointed out that naturally and artificiallystructured soils have a similar mechanical behaviour. In this sec-tion, we identify the key features common to naturally andartificially structured soils that should be properly reproduced bya model.
2.1. Naturally structured soils
It has been shown that naturally structured soils have a higheryield stress compared to the destructured state [8], the latter beingusually considered as the reference state. For the same stress state,a higher yield stress leads to a higher void ratio at yield comparedto the destructured state, called the additional void ratio De. Onceplastic deformations take place, one can observe that theadditional void ratio decreases. Depending on the material, theadditional void ratio can quickly or slowly decrease until the mate-rial reaches a normal compression line (ncl), which can correspondto the ncl of the reference state (ncld), or a different one, parallel tothe reference ncl but vertically translated along the v axis (nclr)[5,10,40]. More generally, 4 modes of degradation can be identified(Fig. 1):
Mode 1: Destructuration takes place immediately at yield. Theadditional void ratio progressively decreases until it convergestoward the destructured state [45,20].Mode 2: Destructuration takes place immediately at yield, but itdoes not converge toward its destructured state. A different nclappears parallel to the destructured state, but a residual addi-tional void ratio still remains [8,32].Mode 3: No significant destructuration is observed immediatelyafter yield. The process of degradation is initiated later on for ahigher effective mean stress and the additional void ratio com-pletely disappears [10].
Mode 4: No destructuration is observed immediately afteryield. The process of degradation is initiated later on for a high-er effective mean stress. However, a residual additional voidratio remains [37].
Additionally, the volumetric behaviour of naturally structuredsoils was compared with the destructured state by Leroueil andVaughan [22] on heavily overconsolidated specimens from drainedtriaxial test results. They identified two different mechanisms tak-ing place. While the maximum rate of dilation was measuredbefore the peak of the deviatoric stress for the destructured soil,it was observed after the peak of the deviatoric stress for struc-tured soils. This is due to the structure, which binds soil particlestogether. To allow the particles to move freely, the structure hasto be degraded first to release particles [22].
2.2. Lime treated soils
Several studies have shown that addition of lime leads to anincrease of the yield stress compared to the untreated state

V. Robin et al. / Computers and Geotechnics 66 (2015) 189–202 191
[41,1]. As for naturally structured soils, the additional void ratioappears to decrease at yield, i.e. the degradation of the artificialstructure takes place. Robin et al. [34] have assessed the mechan-ical behaviour of a lime treated silt under isotropic loading (Fig. 2).It can be seen that the mode of degradation depends on theamount of lime. For 0.5% in lime, the additional void ratio com-pletely disappears at high stress states (Mode 3), when it is notthe case for 1% lime treated specimens (Mode 4). This latter reach-es a different ncl compared to the untreated specimen. Detailsabout the samples and experimental conditions can be found inRobin et al. [34].
The maximum rate of dilation at shear for specimens experienc-ing softening also appears after the peak for artificially structuredsoils, which indicates that the same kind of mechanism is takingplace. This common feature was pointed out by Leroueil andVaughan [22], and was also observed for the lime treatedspecimens from the current study (Fig. 3).
The influence of a lime treatment on the cohesion and thefriction angle has been studied by several authors [43,4]. Both
0.0 0.5 1.0 1.5 2.0 2.5 3.0Axial strain εa = Δl/l0 (%)
0
10
20
30
40
50
60
70
80
q=
σ1
−σ3
(kPa)
σ3 = 20kPa
Max. rate of dilation
0.0 0.5 1.0 1.5 2.0 2.5 3.0Axial strain εa = Δl/l0 (%)
−0.8
−0.7
−0.6
−0.5
−0.4
−0.3
−0.2
−0.1
0.0
0.1
ε p=
ΔV
/V0
(%)
(a) [CaO]=0%
Fig. 3. Drained triaxial results on (a) untreated and (b) lime treated soils –
cohesion and friction angle appear to increase with the amountof lime. The slope of the critical state line is directly related tothe friction angle, and the increase of cohesion, which increasesthe tensile strength, has an influence on the shape of the yieldfunction. Therefore, in the framework the critical state theory, the-se features should be accounted for in the model.
2.3. Summary
Based on the previous observations, a model for lime treatedsoils might be suitable for naturally structured soils, and thereforeshould be able to reproduce the four modes of destructuration andaccount for the following features:
� The cohesion increases following pozzolanic reactions.� The yield stress increases for lime treated soils compared to the
reference state.� At yield, there exists an additional void ratio compared to the
reference state.
0 2 4 6 8 10Axial strain εa = Δl/l0 (%)
0
200
400
600
800
1000
1200
1400
q=
σ1
−σ3
(kPa)
σ3 = 20kPa
σ3 = 100kPa
σ3 = 245kPa
Max. rate of dilation
0 2 4 6 8 10Axial strain εa = Δl/l0 (%)
−3.5
−3.0
−2.5
−2.0
−1.5
−1.0
−0.5
0.0
0.5
1.0
ε p=
ΔV
/V0
(%)
(b) [CaO]=5%
Stars mark the location where the rate of dilation is maximum [34].

Table 1Conditions on the parameters pII
y and Dec for the 4 modes of degradation.
Parameters Values
Mode 1 Mode 2 Mode 3 Mode 4
pIIy pI
y pIy > pI
y > pIy
Dec 0 >0 0 >0
192 V. Robin et al. / Computers and Geotechnics 66 (2015) 189–202
� At yield, degradation of the structure takes place, which followsone of the four modes identified previously.� Overconsolidated specimens at shear show a maximum rate of
dilation after the peak, describing the degradation of thestructure.� The friction angle is modified due to the effects of the chemical
reactions on the texture of the soil, and therefore the criticalstate as well.
3. Theoretical framework of the model
The model proposed in this paper was developed in theframework of the Modified Cam Clay model (MCC) to model thekey features of lime treated soils previously identified. The newparameters introduced to model the degradation have all aphysical meaning and can be determined from an isotropic com-pression test [35]. We present in this section a new formulationto model the four modes of degradation in structured soils underisotropic loading. This will then be used as a hardening rule forthe determination of the compliance matrix.
3.1. Modelling the structure and its degradation under isotropicloading
To model the degradation of the structure under isotropic load-ing, we propose the framework given in Fig. 4. We introduce theprimary yield stress pI
y, which corresponds to the apparition ofplastic deformations. To describe the stress states for which thedegradation of the structure takes place (hatched area in Fig. 4),we also introduce the degradation stress pII
y . In the case of an imme-diate degradation of the structure at yield (modes 1 and 2 in Fig. 1),which can happen for some structured soils, we have pII
y ¼ pIy. The
additional void ratio Dei at pIy quantifies the initial additional void
ratio at yield. Dec is measured at an effective mean stress abovewhich the additional void ratio remains constant (p0 � pII
y ). By set-ting the parameters as given in Table 1, this framework is capableof describing the four modes of degradation.
In this study, the structure is quantified through the additionalvoid ratio in comparison to the ncld and is assumed to be made oftwo components. The first one, referred to as the available structure,corresponds to the part of structure that will be available duringthe process of destructuration (Dei � Dec). The second one, referredto as the residual structure, corresponds to the persisting additional
p’
Spec
ific
volu
me
v(-
)
ncld
nclr
url
Δei
Δec
Structured Soil
pIIypI
y
Fig. 4. General framework of the degradation of structured soils – Dei: Initialadditional void ratio, Dec: Residual additional void ratio, pI
y: Primary yield stress, pIIy :
degradation stress, hatched area: degradation of the structure, ncld: Normalcompression line of the destructured state, nclr: Normal compression line of theresidual state, url: Unloading–reloading line.
void ratio at high effective mean stress (Dec at p0 � pIy). The latter
can be the consequences of chemical reactions, e.g. a lime treat-ment, which leads to a permanent modification of the fabric ofthe soil [34].
3.1.1. Mathematical formulationTo model these four mechanisms, a flexible formulation using
all the parameters previously introduced is required. Richards’sequation [33] for the sigmoid provides many degrees of freedomto control the shape of the function. This function is frequentlyused for the modelling natural phenomenons where there existsa threshold above which a process is activated, in this case thedegradation. This equation can be written as follows:
8p0 2 pIy;þ1
h hpðp0Þ ¼ 1� 1
1þ e�bðp0�pIIy Þ
ð1Þ
where pIIy [Pa] corresponds to the position of the inflection point
(p00ðpIIy Þ ¼ 0) and describes the stress state for which the degrada-
tion occurs (hatched area in Fig. 4), and b [Pa�1] describes the rateof degradation.
Therefore, we have
8p0 2 R 0 6 pðp0Þ 6 1 ð2Þ
3.1.2. Scaling of pThe function p is scaled to ensure that 8b;8pII
y pðpIyÞ ¼ 1,
which leads to the following final formulation:
8p0 2 pIy;þ1
h hpðp0Þ ¼ ebpI
y þ ebpIIy
ebp0 þ ebpIIy
ð3Þ
which verifies pðpIyÞ ¼ 1 and limp0!þ1pðp0Þ ¼ 0.
The ability to control the rate of degradation at yield of this for-mulation is demonstrated in Fig. 5. It can be seen that the functionp can either slowly decrease with a low b or quickly with a high b
as p0 gets close to pIIy .
3.1.3. Relationship between the specific volume and the effective meanstress for structured soils
The presence of structure can be accounted for in the relation-ship between the specific volume and the effective mean stress(v : p0 relationship) using the following general formulation:
8p0 2 R�þ vðp0Þ ¼ Nk � k lnðp0Þ þ Deðp0Þ ð4Þ
with Nk the intercept on the reference normal compression line ncld
and k the slope of the reference ncl in v : lnðp0Þ plane.Using the function p (Eq. (3)), the equation for the additional
void ratio is given by:
8p0 2 pIy;þ1
h hDe p0ð Þ ¼ Dei � Decð Þ � ebpI
y þ ebpIIy
ebp0 þ ebpIIy
" #þ Dec ð5Þ
which fulfils the boundary value problems:
Deðp0Þ ¼ Dei if p0 ¼ pIy
Dec if p0 ! þ1
�ð6Þ

100 150 200 250 300
p (kPa)
0.00
0.05
0.10
0.15
0.20β
(kPa−
1)
0.9
0.7
0.5
0.3
0.1
0.0 0.1 0.2 0.3 0.4 0.5 0.6 0.7 0.8 0.9 1.0
π(p , β) = eβpI
y +eβpII
y
eβp +eβpII
y
Fig. 5. p values as a function of pIIy and b – pI
y = 100 kPa, pIIy = 200 kPa.
url Mode 1Mode 2
V. Robin et al. / Computers and Geotechnics 66 (2015) 189–202 193
Introducing Eq. (5) in Eq. (4) gives the final equation of the specificvolume for structured soils at yield:
8p0 2 pIy;þ1
h hvsðp0Þ ¼ Nk � k lnðp0Þ þ Dei � Decð Þ � ebpI
y þ ebpIIy
ebp0 þ ebpIIy
" #þ Dec
ð7Þ
1.45
1.50
1.55
Spec
ific
volu
me
v(−
)
ncld
nclr
Δei
Mode 3Mode 4
3.1.4. Determination of bb can be directly determined from the results of an isotropic
compression test. Practically, b is related to the gradient n on thev : p0 curve at p0 ¼ pII
y (Fig. 6). For consistency and stability, thefunction v s for the specific volume in the v : p0 plane must be
strictly monotonic decreasing on pIy;þ1
h h, which imposes b P 0.
Calling n the gradient of the specific volume curve at p0 ¼ pIIy , the
appropriate value for b is obtained by solving the followingequation:
p’
Spec
ific
volu
me
v(-
)
1
ξ ∝ β
Δei
ncld
nclr
url
pIIypI
y
Fig. 6. Physical meaning of b� ncld: Normal compression line of the destructuredstate, nclr: Normal compression line of the residual state, url: Unloading–reloadingline.
dvdp0
� �p0¼pII
y
¼ n () � 14
1þ ebðpIy�pII
y Þ� �
� bðDei � DecÞ �k
pIIy¼ n
ð8Þ
There is no analytical solution to this equation, known as the Lam-bert W function, due to the non-linearity in b. However, this equa-tion can be solved graphically or numerically using methods such asthe Newton–Raphson algorithm [12].
3.1.5. Suitability of the formulationThe v : p0 relationship (Eq. (7)) is used to demonstrate the abil-
ity of the formulation to describe the four modes (Fig. 7). Para-meters used for the simulations are given in Table 2. Theinfluence of the parameters b (Fig. 8) and the degradation stresspII
y (Fig. 9) is assessed and the case pIy ¼ pII
y is considered in Fig. 10.Fig. 8 shows that it is possible to describe the mode 3. Changing
the value of b permits to achieve different rates of degradation. Inthis figure, a non-zero Dec was chosen (Dec > 0), but mode 4 can beachieved by setting Dec ¼ 0. The influence of pII
y is shown in Fig. 9.One can see that this parameter controls the initiation of the pro-cess of degradation, and is successful in describing modes 2 and 4.As previously, modes 1 and 3 can be achieved by setting Dec ¼ 0.Finally, the case pI
y ¼ pIIy is considered in Fig. 10. This case corre-
sponds to an immediate loss of structure at yield. This case doesnot lead to any instabilities of the formulation.
6.2 6.4 6.6 6.8 7.0 7.2
ln p
1.40
Fig. 7. Possibility of the formulation to model the four modes – ncld: Normalcompression line of the untreated state, url: Unloading–reloading line.
Table 2Model parameters used for simulations of the four modes in Fig. 7.
Mode pIyðkPaÞ pII
y ðkPaÞ Dei Dec b (kPa�1)
Mode 1 600 600 0.104 0.0 0.025Mode 2 600 600 0.104 0.026 0.02Mode 3 600 900 0.104 0.0 0.025Mode 4 600 900 0.104 0.052 0.02

6.2 6.4 6.6 6.8 7.0 7.2
ln p
1.40
1.45
1.50
1.55
Spec
ific
volu
me
v(−
)
ncld
nclr
url
Δei − Δec
β = 0β = 0.0125β = 0.025β = 0.05β = 0.1β = 0.6
Fig. 8. Influence of b : pIy ¼ 600 kPa, pII
y ¼ 1000 kPa, Dec > 0 – Mode 4.
6.2 6.4 6.6 6.8 7.0 7.2
ln p
1.40
1.45
1.50
1.55
Spec
ific
volu
me
v(−
)
ncld
nclr
url
Δei − Δec
pIIy = 600 kPa
pIIy = 712 kPa
pIIy = 825 kPa
pIIy = 937 kPa
pIIy = 1050 kPa
Fig. 9. Influence of pIIy : pI
y ¼ 600 kPa, b ¼ 0:025;Dec > 0 – Modes 2 and 4.
6.2 6.3 6.4 6.5 6.6 6.7 6.8 6.9 7.0
ln p
1.45
1.50
1.55
Spec
ific
volu
me
v(−
)
ncld
nclr
url
Δei − Δec
β = 0β = 0.0125β = 0.025β = 0.05β = 0.1β = 0.6
Fig. 10. Influence of b : pIIy ¼ pI
y ¼ 600 kPa, Dec > 0 – Mode 2.
−20 0 20 40 60 80 100p
q
pb pIy
Mf
CSL
Fig. 11. Theoritical yield function for lime treated soils.
194 V. Robin et al. / Computers and Geotechnics 66 (2015) 189–202
3.2. Yield function f
The addition of lime leads to an increase of the cohesion and thefriction angle compared to the untreated soil. Therefore, the equa-tion of the MCC for the yield function f is not sufficient in its origi-nal form. One way to account for the increase of cohesion is toconsider it as an increase of the tensile strength (e.g. Suebsuket al. [39]. This can be modelled by expanding the yield functionin the negative stress domain (Fig. 11). The parameter pb (<0) isintroduced to control the expansion of the yield function due tothe increase of the cohesion and is directly obtained from the equa-tion of the CSL. The critical state line does not necessarily passthrough the origin anymore.
The equation chosen for the yield function can therefore beexpressed as:
f � q2 þM2ðp0 � pIyÞðp0 � pbÞ � 0 ð9Þ
3.3. Plastic potential g
The choice of the formulation for the plastic potential g is amajor issue in the constitutive modelling of soils. The use of non-associated potentials gives a more accurate description of the realbehaviour but comes at the cost of additional parameters with, inmost of the cases, no straightforward physical meaning and whosevalues can rarely be determined from experimental results. Thisstudy aims to develop a model based on meaningful parametersdetermined from classic experimental tests. To this end, alwaysin the framework of the Modified Cam Clay modem, this modelassumes that lime treated materials follow an associated flow ruleand therefore
g � f ) g � q2 þM2ðp0 � pIyÞðp0 � pbÞ ð10Þ
which leads to the following flow rule for lime treated materials:

V. Robin et al. / Computers and Geotechnics 66 (2015) 189–202 195
depp
depq¼ @g=@p0
@g=@q¼ M2ðp0 � pbÞ
2p0g� p0g
2ðp0 � pbÞð11Þ
with g ¼ q=p0. The suitability of this hypothesis will be verified inthe Model evaluation section.
3.4. Summary of the model parameters
Using the sigmoid equation, a new formulation has been devel-oped to model the degradation of structure at yield for lime treatedsoils (Eq. (7)). This formulation has the significant advantage torely on only 4 additional parameters to the original MCC(b; pII
y ;Dei and Dec), which all have a physical meaning and can allbe determined from an isotropic consolidation test performed onthe lime treated material. To model the influence of the cohesionon the deviatoric behaviour the parameter pb, directly related tothe equation of the CSL, was introduced. As a conclusion, the fol-lowing 6 parameters appear to be relevant to account for theeffects of a lime treatment on the mechanical behaviour of amaterial:
pIy
Primary yield stresspIIy
Degradation stressDei
Additional void ratio at pIyDec
Additional void ratio for p0 ! þ1 b Rate of degradation pb Tensile strength due to the increase of the cohesion0 200 400 600 800 1000 1200
p (kPa)
1.45
1.50
1.55
1.60
1.65
1.70
1.75
Spec
ific
volu
me
v( −
)
url
nclrncld
nclmcc
pIypII
y,s
Δei − Δec
Δec
ncls - α = 1ncls - α = 0.9
4. Stress–strain relationship
4.1. Elastic behaviour
It is assumed that only elastic deformation occurs for stressstates lying within the yield surface. According to the ModifiedCam Clay model, the elastic volumetric increments are given by
deep ¼ j
dp0
vp0ð12Þ
deeq ¼
dq3G
ð13Þ
with G the shear modulus. As recommended by several authors (e.g.Liu and Carter [24], Muir Wood [28], Poisson’s ratio m is assumedconstant in this model, although it is known to lead to thermody-namic discrepancies under cyclic loading [46].
4.2. Plastic behaviour
4.2.1. Compliance matrix for hardening caseThe general plastic stress:strain relationship is given by
depp
depq
" #¼ �1
@f@p00
@p00@ep
p
@g@p0 þ
@p00@ep
q
@g@q
� �@f@p0
@g@p0
@f@q
@g@p0
@f@p0
@g@q
@f@q
@g@q
264
375 � dp0
dq
� �ð14Þ
The new formulation of the v : p0 relationship given by Eq. (7) isnow used as the new hardening rule. For the sake of simplicity, itwas assumed that hardening is only controlled by the plasticvolumetric strains (f ðr; ep
pÞ). The volumetric plastic strains for limetreated soils is therefore expressed as
depp ¼
M2ð2p0 � p00 � pbÞ þ 6q
M2ðp0 � pbÞ
!@p00@ep
p
� ��1" #
� dp0 ð15Þ
and the deviatoric plastic strains can be calculated using the flowrule:
depq ¼
M2ðp0 � pbÞ2p0g
� p0g2ðp0 � pbÞ
" #�1
� depp ð16Þ
4.2.2. Compliance matrix for softening caseLime treated specimens experiencing softening at shear show a
maximum rate of dilatation after the peak due to the degradationof the structure. The modelling of these features without introduc-ing additional parameters is a delicate issue. The Structure CamClay model [24] has a formulation for the softening case, but whichcan lead to contraction of the material at softening. More recentlyYang et al. [44] have proposed a simple formulation based on theSCCM, but although promising does not lead to accurate predic-tions of the behaviour.
If Eq. (5) is used to model the softening behaviour on 0; pIy
i i, the
formulation leads to De P Dei and no degradation of the structureis modelled. To model the softening behaviour, we propose a newsoftening rule in the same framework as the one chosen for thehardening case, where the degradation of the structure is describedby the sigmoid equation. To avoid the addition of meaninglessparameters, an automatic procedure is proposed based onexperimental considerations.
Since Dec arises from the lime treatment and modifies the tex-ture of the soil, it is assumed that the material converges towardthe same nclr as under isotropic loading. Based on experimentalobservations [34] the inflexion point, called pII
y;s, was chosen asthe intersection of the url and the nclr (Fig. 12) and is given by
pIIy;s ¼ exp
Nk � Nj þ Dec
k� j
� �ð17Þ
which does not require any additional parameter. This leads to thefollowing expression of the softening rule:
8p0 2 0;pIy
i iv sðp0Þ ¼ Nk � k lnðp0Þ þ Dei � Decð Þ � e�bspI
y þ e�bspIIy;s
e�bsp0 þ e�bspIIy;s
" #þ Dec
ð18Þ
The parameter bs describes the rate of destructuration and is calcu-lated automatically. During the post-yield behaviour, the maximumrate of dilation is observed right after the deviatoric stress reachesits maximum. This is due to the structure experiencing an extensivedegradation. Such feature can be modelled by using as bs, the max-
Fig. 12. Modelling of the behaviour at yield for softening case.

196 V. Robin et al. / Computers and Geotechnics 66 (2015) 189–202
imum rate of degradation b0, leading to vs monotonically decreas-ing (not strictly). In this case, the first derivative being zero onlyfor a single effective mean stress (which is not necessarily pII
y;s). Thismethod presents the advantage that b0 can easily be determinedgraphically or numerically. However, for consistency and numericalstability, v s is preferred to be strictly monotonic decreasing on
0;pIy
i i. For this purpose, we introduced a constant a such that
bs ¼ a� b0 ð19Þ
the bijection (one-to-one correspondence) being ensured bya 20;1½. Practically, a can control the smoothness of the processof destructuration. In this model, a is arbitrarily set to 0.9, whichensures a bijective function and an appropriate rate of degradationat yield (Fig. 12).
This two-step method is the simplest and most reliable way tocalculate bs, simply because the determination of b0 is independentof the stress state and does not require information about the gra-dient at pII
y;s, which cannot be determined from experimentalresults, and may lead to numerical instabilities. The suitability ofthis method will be demonstrated during the Model evaluationsection.
The strain-strain relationship for the softening case is obtainedby introducing Eq. (18) into Eq. (14). Such softening rule respectsthe associated potential hypothesis.
1.2[CaO] = 1%[CaO] = 2%
5. Model evaluation
The robustness of the model for lime treated soils (MLTS) isassessed in predicting the behaviour of artificially and naturallystructured materials under isotropic loading and drained pathsfor different confining pressures. As a first step, we assess the suit-ability of an associated flow rule for the modelling of lime treatedsoils using the experimental results from Robin et al. [34]. Then,the model is used to predict the behaviour of silt specimens treatedwith different lime contents (0.5%, 1%, 2%, and 5% CaO) [34]. Themodel is finally tried out on naturally structured specimens of cal-carenite [20]. For both cases, the additional parameters to theModified Cam Clay were determined from a single isotropic com-pression test performed on the structured specimens (Table 3).
Table 3Values of the model parameters.
Parameters [CaO] CalcareniteRobin et al. [34] Lagioia and
Nova [20]0.5% 1% 2% 5%
MCCpI
y (kPa) 255 600 1260 1900 2300
Nk (–) 1.95 1.99 1.97 2.00 3.76k (–) 0.08 0.08 0.08 0.08 0.23j (–) 0.019 0.032 0.014 0.015 0.020M (–) – 1.15 1.22 1.42 1.42E (kPa) – 45,000 55,000 70,000 77,000
MLTSpII
y (kPa) 1200 1000 2200 3500 2300
Dei (–) 0.027 0.065 0.129 0.159 0.134Dec (–) 0.0 0.046 0.109 0.136 0.0pb (kPa) – �41.8 �120.3 �144.7 �25.6b (kPa�1) 0.020 0.035 0.020 0.020 0.047
MCC: Modified Cam Clay model, MLTS: Model for Lime Treated Soils.
5.1. Associated flow rule hypothesis
In this section, we assess the validity of an associated flow rulefor lime treated soils. Plastic strain increment vectors from drainedtriaxial tests performed on specimens treated with 1%, 2%, and 5%in lime were determined. The yield loci values were normalizedwith respect to the primary yield stress pI
y. Fig. 13 shows that itseems reasonable to assume that plastic strain increment vectorsare normal to the yield surface. The hypothesis of an associatedflow rule for the modelling of lime treated soils appears thereforesuitable.
5.2. Lime treated specimens
5.2.1. Isotropic consolidationThe new formulation to model the degradation of the structure
at yield (Eq. (7)) was applied on lime treated specimens. Two setsof experimental results of isotropic compressions tests were usedto verify the general nature of the formulation. The first set wastreated with 0.5% CaO and follows the mode 3 (Dec ¼ 0), and thesecond with 1% CaO and follows the mode 4 (Dec > 0) (Fig. 14).For the two sets the parameter b was determined from the gradientof the curve at p0 ¼ pII
y using the Newton–Raphson algorithm.The use of the sigmoid equation appears very appropriate to
model the degradation experienced at yield by lime treated mate-rials. For both concentrations in lime, there is a very good agree-ment between the experimental results and the model. Thedegradation is initiated at the right effective mean stress and withthe correct rate, and both sets converge toward the correct normalcompression line.
5.2.2. Shear behaviourNo additional parameters to the MCC are required by this model
to describe the degradation of the structure at shear apart from pb
that is derived from the equation of the CSL. The model wasapplied on lime treated specimens along different drained stresspaths and confining pressures (Figs. 15–17). Three concentrations
0.0 0.2 0.4 0.6 0.8 1.0 1.2p
pIy
/εpp
0.0
0.2
0.4
0.6
0.8
1.0
q pI y
/εp q
[CaO] = 5%Plastic increment
Fig. 13. Vectors of plastic strain increment plotted at yield points obtained fromdrained triaxial tests on lime treated specimens.

0 500 1000 1500 2000
p (kPa)
1.35
1.40
1.45
1.50
1.55
1.60
Spec
ific
volu
me
v(−
)
ncld
nclr
[CaO]=0.0 %[CaO]=0.5 %[CaO]=1.0 %Simulation
Fig. 14. Validation of the formulation on 0.5% and 1% lime treated specimens – ncld:normal compression line of the untreated state, nclr: normal compression line ofthe residual state. 0 5 10 15 20
Axial strain εa = Δl/l0 (%)
0
200
400
600
800
1000
1200
1400
q=
σ1
−σ3
(kPa)
σ3 = 20 kPa
σ3 = 245 kPa
σ3 = 400 kPa
σ3 = 600 kPa
Experimental dataSimulation
0 5 10 15 20Axial strain εa = Δl/l0 (%)
−3
−2
−1
0
1
2
3
4
5
6
ε p=
ΔV
/V0
(%)σ3 = 20 kPa
σ3 = 245 kPa
σ3 = 400 kPa
σ3 = 600 kPa
Fig. 15. Comparison between experimental results and the model of drainedtriaxial tests performed on lime treated specimens with 1% CaO [34].
V. Robin et al. / Computers and Geotechnics 66 (2015) 189–202 197
in lime were tested to consider various degrees of structure: 1%, 2%and 5% CaO.
The yield loci and the convergence toward the critical stateappear satisfactory modelled for all the lime contents tested. Theyconfirm the appropriateness of the equation of the yield function fand the suitability of the parameter pb to account for the influenceof the lime treatment on the cohesion and the critical state.
For both hardening and softening cases, the volumetric defor-mations are very accurately predicted by the model. This supportsthe assumption of the volumetric deformations being mostly con-trolled by the structure. The evolution of the specific volume forthe softening case is particularly accurate (Fig. 18). The model issuccessful to reproduce the dilation post-yield of the specimensand the maximum rate of dilation after the deviatoric stress peak,which is one of the key features of structured soils.
The framework chosen for the softening case appears suitableand very powerful. The assumptions made to calculate auto-matically in the background the parameters pII
y;s and bs (Fig. 12)are therefore relevant and successful to reproduce the majorityof the main features of behaviour of lime treated soils, and thatusing only information from isotropic test results. It also ensuresthat the material experiences dilation at yield for samples in thedry side.
The MLTS appears very satisfactory to model the key features oflime treated soils considering the limited number of parametersand the straightforwardness of their determination. Nevertheless,the model tends to deviate from the experimental results duringthe post-yield stage before converging back toward the critical stateat high axial strains for some samples subjected to a high precon-solidation pressure (600 kPa in Fig. 15, 900 kPa in Fig. 16). In thismodel, potentials f and g are associated and hardening is controlledby the plastic volumetric deformations ep
p only (f ðr; eppÞ). This has for
consequences to reflect the degradation of the structure on thedeviatoric stress. However, lime treated specimens experiencinghardening do not show any sign of this phenomenon for any ofthe concentrations tested. This might come from the fact that thecontribution of ep
q was neglected in this model, and/or that the‘amount’ of structure is too low to significantly affect the stresses.
For samples in the dry side, the model predicts larger values forthe yield loci than what is experimentally observed. One of theknown limitations of the MCC is that it overestimates the valuesin such situation; the fact that we extended the yield function inthe tensile domain with pb amplifies this feature.
5.3. Naturally structured soils
Although the formulation was originally designed for limetreated soils, there are several common features of behaviourbetween artificially and naturally materials that could also makeit suitable for the latter.
5.3.1. Isotropic consolidationThe suitability of the formulation to model the degradation of
naturally structured soils under isotropic loading is verified usingthe results from Lagioia and Nova [20] on natural calcarenite(Fig. 19). Likewise the lime treated specimens, calcarenite experi-ences a degradation of the structure at yield but that occurs imme-diately at yield (pI
y ¼ pIIy ) and at a very high rate. Again, b was solved
numerically using the Newton–Raphson procedure. There is noinformation about the behaviour of the destructured calcarenite

0 5 10 15 20
Axial strain εa = Δl/l0 (%)
0
500
1000
1500
2000
2500
q=
σ1
−σ3
(kPa)
σ3 = 20 kPa
σ3 = 100 kPa
σ3 = 400 kPa
σ3 = 900 kPa
Experimental dataSimulation
0 5 10 15 20
Axial strain εa = Δl/l0 (%)
−5
−4
−3
−2
−1
0
1
2
3
4
ε p=
ΔV
/V0
(%)
σ3 = 20 kPa
σ3 = 100 kPa
σ3 = 400 kPa
σ3 = 900 kPa
Fig. 16. Comparison between experimental results and the model of drainedtriaxial tests performed on lime treated specimens with 2% CaO [34].
0 5 10 15 20
Axial strain εa = Δl/l0 (%)
0
500
1000
1500
2000
2500
3000
3500
q=
σ1
−σ3
(kPa)
σ3 = 100 kPa
σ3 = 245 kPa
σ3 = 900 kPa
Experimental dataSimulation
0 5 10 15 20
Axial strain εa = Δl/l0 (%)
−3
−2
−1
0
1
2
3
4
ε p=
ΔV
/V0
(%)
σ3 = 100 kPa
σ3 = 245 kPa
σ3 = 900 kPa
Fig. 17. Comparison between experimental results and the model of drainedtriaxial tests performed on lime treated specimens with 5% CaO [34].
198 V. Robin et al. / Computers and Geotechnics 66 (2015) 189–202
under isotropic loading, and therefore no information is given aboutthe value of the residual void ratio Dec. However, Lagioia and Nova[20] considered that calcarenite converges toward the ncl of thedestructured state. Thus, it is assumed that calcarenite has no resi-dual void ratio (Dec ¼ 0) and follows the mode 1. The parametersused for the simulations are given in Table 3.
Though the origin of the cementation is different, the MLTSappears suitable to model naturally structured materials underisotropic loading. As for the lime treated specimens, the degrada-tion is initiated at the right effective mean stress and at the correctrate till it reaches the normal compression line of the destructuredstate.
5.3.2. Shear behaviourThe model is now tried to reproduce the behaviour of samples
naturally structured calcarenite at shear submitted to drained
triaxial tests. The parameter pb was determined from the equationof CSL given in Lagioia and Nova [20].
For samples of calcarenite experiencing hardening (Fig. 20) theMLTS gives a very good agreement with the experimental results ofthe yield loci and the convergence toward the critical state. Atyield, the degradation of the structure seems to affect the deviato-ric stress, which is successfully described by model. The specificvolume at yield (Fig. 21) is accurately modelled and the trends ofthe volumetric deformations (Fig. 20) are satisfactory, althoughthe values appear underestimated at large deformations.
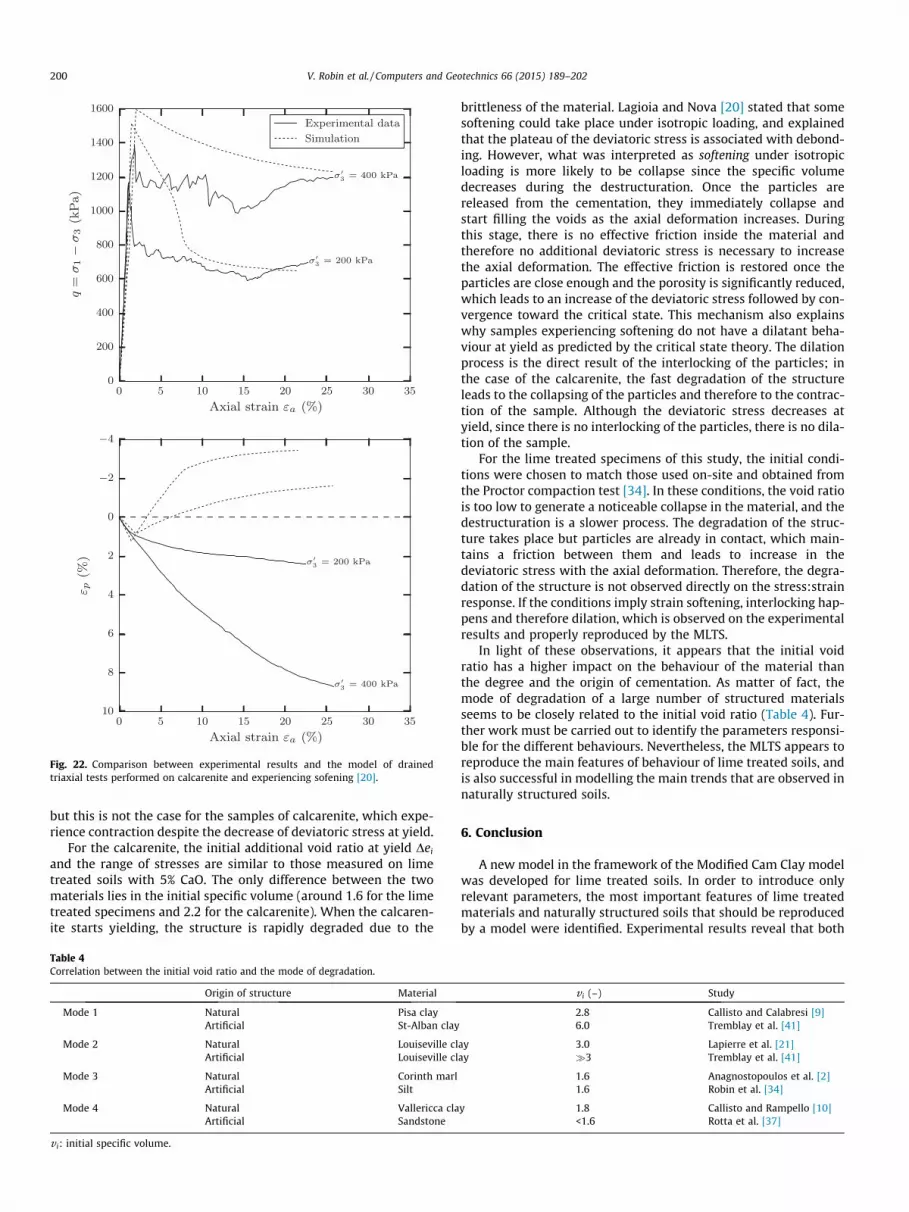
For samples experiencing softening (Fig. 22) the MLTS gives anaccurate prediction of the yield loci and the convergence towardthe critical state. However, samples revealed an unusual behaviourin the framework of the MCC and the critical state theory regardingthe volumetric deformations. It is generally accepted that for thesoftening case samples experience dilation at yield. However, the

−100 0 100 200 300 400 500 600
Effective mean stress p (kPa)
1.58
1.59
1.60
1.61
1.62
1.63
1.64
1.65
1.66
Spec
ific
volu
me
v(-
)
CaO = 1%σ3 = 20 kPa
CaO = 2%σ3 = 100 kPa
CaO = 5%σ3 = 100 kPa
Experimental data Simulation
Fig. 18. Comparison between drained triaxial results and the model of the specificvolume for different lime contents [34].
0 500 1000 1500 2000 2500 3000 3500 4000
Effective mean stress p (kPa)
1.85
1.90
1.95
2.00
2.05
2.10
2.15
2.20
2.25
Spec
ific
volu
me
v(-
) url
ncldExperimental dataSimulation
Fig. 19. Validation of the formulation on natural calcarenite (after [20] – ncl:normal compression line.
0 10 20 30 40 50Axial strain εa (%)
0
1000
2000
3000
4000
5000
q=
σ1
−σ3
(kPa)
σ3 = 1300 kPa
σ3 = 2000 kPa
Experimental dataSimulation
0 10 20 30 40 50Axial strain εa (%)
0
5
10
15
20
25
ε p(%
)
σ3 = 1300 kPa
σ3 = 2000 kPa
Fig. 20. Comparison between experimental results and the model of drainedtriaxial tests performed on calcarenite and experiencing hardening [20].
2.1
2.2Experimental data Simulation
V. Robin et al. / Computers and Geotechnics 66 (2015) 189–202 199
calcarenite seems to behave differently and keeps contracting atyield, although the deviatoric stress decreases.
0 1000 2000 3000 4000 5000
Effective mean stress p (kPa)
1.5
1.6
1.7
1.8
1.9
2.0
Spec
ific
volu
me
v(-
)
1300 kPa
2000 kPa
Fig. 21. Comparison between the experimental results and the model for thespecific volume [20].
5.4. Discussion: influence of the initial void ratio on the degradationmode
The MLTS can successfully reproduce a large number of featuresof both lime treated soils and naturally structured soils. However,the model deviates from the experimental results for (1) limetreated specimens subjected to high preconsolidation pressuresexperiencing hardening, and (2) samples of calcarenite experienc-ing softening. In this section, we propose a hypothesis to explainthese limitations using the initial void ratio of the material.
During the early post-yield stage, the degradation of the struc-ture seems to affect the stress:strain response for samples of cal-carenite experiencing hardening, but not for the lime treatedspecimens. Furthermore, for the softening case, lime treated speci-mens experience dilation, as predicted by the critical state theory,
0 5 10 15 20 25 30 35Axial strain εa (%)
0
200
400
600
800
1000
1200
1400
1600
q=
σ1
−σ3
(kPa)
σ3 = 200 kPa
σ3 = 400 kPa
Experimental dataSimulation
0 5 10 15 20 25 30 35Axial strain εa (%)
−4
−2
0
2
4
6
8
10
ε p(%
) σ3 = 200 kPa
σ3 = 400 kPa
Fig. 22. Comparison between experimental results and the model of drainedtriaxial tests performed on calcarenite and experiencing sofening [20].
200 V. Robin et al. / Computers and Geotechnics 66 (2015) 189–202
but this is not the case for the samples of calcarenite, which expe-rience contraction despite the decrease of deviatoric stress at yield.
For the calcarenite, the initial additional void ratio at yield Dei
and the range of stresses are similar to those measured on limetreated soils with 5% CaO. The only difference between the twomaterials lies in the initial specific volume (around 1.6 for the limetreated specimens and 2.2 for the calcarenite). When the calcaren-ite starts yielding, the structure is rapidly degraded due to the
Table 4Correlation between the initial void ratio and the mode of degradation.
Origin of structure Material
Mode 1 Natural Pisa clayArtificial St-Alban clay
Mode 2 Natural Louiseville clArtificial Louiseville cl
Mode 3 Natural Corinth marlArtificial Silt
Mode 4 Natural Vallericca claArtificial Sandstone
v i: initial specific volume.
brittleness of the material. Lagioia and Nova [20] stated that somesoftening could take place under isotropic loading, and explainedthat the plateau of the deviatoric stress is associated with debond-ing. However, what was interpreted as softening under isotropicloading is more likely to be collapse since the specific volumedecreases during the destructuration. Once the particles arereleased from the cementation, they immediately collapse andstart filling the voids as the axial deformation increases. Duringthis stage, there is no effective friction inside the material andtherefore no additional deviatoric stress is necessary to increasethe axial deformation. The effective friction is restored once theparticles are close enough and the porosity is significantly reduced,which leads to an increase of the deviatoric stress followed by con-vergence toward the critical state. This mechanism also explainswhy samples experiencing softening do not have a dilatant beha-viour at yield as predicted by the critical state theory. The dilationprocess is the direct result of the interlocking of the particles; inthe case of the calcarenite, the fast degradation of the structureleads to the collapsing of the particles and therefore to the contrac-tion of the sample. Although the deviatoric stress decreases atyield, since there is no interlocking of the particles, there is no dila-tion of the sample.
For the lime treated specimens of this study, the initial condi-tions were chosen to match those used on-site and obtained fromthe Proctor compaction test [34]. In these conditions, the void ratiois too low to generate a noticeable collapse in the material, and thedestructuration is a slower process. The degradation of the struc-ture takes place but particles are already in contact, which main-tains a friction between them and leads to increase in thedeviatoric stress with the axial deformation. Therefore, the degra-dation of the structure is not observed directly on the stress:strainresponse. If the conditions imply strain softening, interlocking hap-pens and therefore dilation, which is observed on the experimentalresults and properly reproduced by the MLTS.
In light of these observations, it appears that the initial voidratio has a higher impact on the behaviour of the material thanthe degree and the origin of cementation. As matter of fact, themode of degradation of a large number of structured materialsseems to be closely related to the initial void ratio (Table 4). Fur-ther work must be carried out to identify the parameters responsi-ble for the different behaviours. Nevertheless, the MLTS appears toreproduce the main features of behaviour of lime treated soils, andis also successful in modelling the main trends that are observed innaturally structured soils.
6. Conclusion
A new model in the framework of the Modified Cam Clay modelwas developed for lime treated soils. In order to introduce onlyrelevant parameters, the most important features of lime treatedmaterials and naturally structured soils that should be reproducedby a model were identified. Experimental results reveal that both
v i (–) Study
2.8 Callisto and Calabresi [9]6.0 Tremblay et al. [41]
ay 3.0 Lapierre et al. [21]ay �3 Tremblay et al. [41]
1.6 Anagnostopoulos et al. [2]1.6 Robin et al. [34]
y 1.8 Callisto and Rampello [10]<1.6 Rotta et al. [37]

V. Robin et al. / Computers and Geotechnics 66 (2015) 189–202 201
naturally and artificially cemented soils have a very similarmechanical behaviour at yield.
To account for the effects of structure on the behaviour of soils,a new formulation was developed based on Richards’s equation.Only 4 new additional parameters to the MCC were introduced:the degradation stress pII
y , the rate of degradation b, the additional
void ratio at pIy, and the additional void ratio Dec at p0 ! þ1. The
power of this model is that all the additional parameters have aphysical meaning and can be determined from a single isotropicconsolidation test performed on the structured material. A trans-parent and powerful procedure was developed for the softeningrule. The two parameters required by the sigmoid function to mod-el the degradation are automatically determined from the 4 para-meters obtained from the isotropic tests.
The model was applied for lime treated soils and naturallystructured samples of calcarenite. The formulation is in goodagreement with the experimental results and the main trends areproperly reproduced. The formulation proposed as softening ruleis successful to model the dilation observed on lime treated sam-ples at yield and the maximum rate of dilation after the peak,one of the most representative features of structured soils. Howev-er, the results on the calcarenite have risen interesting consid-erations for the modelling of the structured materials in general,naturally or artificially.
The initial porosity appeared to be the key parameter controllingthe influence of the mode of structure degradation on the mechan-ical behaviour of lime treated specimens and the calcarenite. Oncethe material starts yielding the degradation of the bonding struc-ture takes place, and therefore the release of the particles. Depend-ing on the initial void ratio, the material can either experiencedilation (particles are in contact and expand due to the interlock-ing) or collapse until particles start interacting again. This can leadto reduction of volume even for heavily over consolidated samples.
Further work must be carried out to develop a model capable ofaccounting for the influence of the initial void ratio on the post-yield behaviour.
Appendix A. Notation
Symbol
Definition CSL Critical State Line E Young’s modulus f yield function g plastic potential G shear modulus M slope of critical state line MCC Modified Cam Clay Model MLTS Model for Lime Treated Soils ncl normal compression line ncld normal compression line of the destructured state nclr normal compression line of the residual state nclmcc normal compression line of modified Cam Claymodel
Nk specific volume at p0 ¼ 1 kPa p0 effective mean stress pb tensile stress pIy
primary yield stresspIIy
degradation stresspIIy;s
degradation stress for softening caseq
deviatoric stress url unloading–reloading line v specific volumevs
specific volume for the structured soil a parameter of bijection for softening case b rate of degradation bs rate of degradation for softening case b0 rate of degradation for monotonic decreasingfunction vs
Dec
residual additional void ratio at p0 ! þ1 Dei initial additional void ratio at p0 ¼ pIy
ep; eep; e
pp
total, elastic, and plastic volumetric strainseq; eeq; e
pq
total, elastic, and plastic deviatoric strainsj
elastic stiffness parameter for changes in effectivemean stressk
plastic stiffness parameter for changes in effectivemean stressn
gradient of the curve v : p0ð Þ at p0 ¼ pIIyr1;r3
axial, radial stressReferences
[1] Ahnberg H. On yield stresses and the influence of curing stresses on stresspaths and strength measured in triaxial testing of stabilized soils. Can GeotechJ 2007;44(1):54–66.
[2] Anagnostopoulos aG, Kalteziotis N, Tsiambaos GK, Kavvadas M. Geotechnicalproperties of the Corinth Canal marls. Geotech Geol Eng 1991;9(1):1–26.
[3] Aversa S. Mechanical behaviour of soft rocks: some remarks. In: Proc of theworkshop on experimental characterization and modelling of soils and soft,vol. 98. 1991. p. 191–223.
[4] Balasubramaniam A, Buessucesco B, Oh Y-NE, Bolton MW, Bergado D, LorenzoG. Strength degradation and critical state seeking behaviour of lime treatedsoft clay. In: International conference on deep mixing-best practice and recentadvances, vol. 1. Stockholm; 2005. p. 35–40.
[5] Baudet B, Stallebrass S. A constitutive model for structured clays.Géotechnique 2004;54(4):269–78.
[6] Brandl H. Alteration of soil parameters by stabilization with lime. In: 10thinternational conference on soil mechanics and foundation engineering.Stockholm; 1981. p. 587–94.
[7] Burland JB. On the compressibility and shear strength of natural clays.Géotechnique 1990;40(3):329–78.
[8] Burland JB, Rampello S, Georgiannou VN, Calabresi G. A laboratory study of thestrength of four stiff clays. Géotechnique 1996;46(3):491–514.
[9] Callisto L, Calabresi G. Mechanical behaviour of a natural soft clay.Géotechnique 1998;48(4):495–513.
[10] Callisto L, Rampello S. An interpretation of structural degradation for threenatural clays. Can Geotech J 2004;41(3):392–407.
[11] Consoli NC, Lopes LdS, Prietto PDM, Festugato L, Cruz RC. Variables controllingstiffness and strength of lime-stabilized soils. J Geotech Geoenviron Eng2011;137(6):628–32.
[12] Corless RM, Gonnet GH, Hare DEG, Jeffrey DJ, Knuth DE. On the Lambert WFunction. Adv Comput Math 1996;5:329–59.
[13] Cotecchia F, Chandler RJ. A general framework for the mechanical behaviour ofclays. Géotechnique 2000;50(4):431–47.
[14] Cuisinier O, Auriol J-C, Le Borgne T, Deneele D. Microstructure and hydraulicconductivity of a compacted lime-treated soil. Eng Geol 2011;123(3):187–93.
[15] Cuisinier O, Masrouri F, Pelletier M, Villieras F, Mosser-Ruck R. Microstructureof a compacted soil submitted to an alkaline PLUME. Appl Clay Sci 2008;40(1-4):159–70.
[16] Flora A, Lirer S, Amorosi A, Elia G. Experimental observations and theoreticalinterpretation of the mechanical behaviour of a grouted pyroclastic silty sand.In: Proc VI European conference on numerical methods in geotechnicalengineering, NUMGE 06. Graz, Austria; 2006.
[17] Gens A, Nova R. Conceptual bases for a constitutive model for bonded soils andweak rocks. Geotech Eng Hard Soils-Soft Rocks 1993;1(1):485–94.
[18] Horpibulsuk S, Liu MD, Liyanapathirana DS, Suebsuk J. Behaviour of cementedclay simulated via the theoretical framework of the Structured Cam Claymodel. Comput Geotech 2010;37(1-2):1–9.
[19] Kavvadas M, Amorosi A. A constitutive model for structured soils.Géotechnique 2000;50(3):263–73.
[20] Lagioia R, Nova R. An experimental and theoretical study of the behaviour of acalcarenite in triaxial compression. Géotechnique 1995;45(4):633–48.
[21] Lapierre C, Leroueil S, Locat J. Mercury intrusion and permeability ofLouiseville clay. Can Geotech J 1990;27(6):761–73.
[22] Leroueil S, Vaughan PR. The general and congruent effects of structure innatural soils and weak rocks. Géotechnique 1990;40(3):467–88.
[23] Little DN. Stabilization of pavement subgrades and base courses withlime. Kendall Hunt Pub Co.; 1995.

202 V. Robin et al. / Computers and Geotechnics 66 (2015) 189–202
[24] Liu MD, Carter JP. A structured Cam Clay model. Can Geotech J2002;39(6):1313–32.
[25] Liu MD, Carter JP. Volumetric deformation of natural clays. Int J Geomech2003;3(2):236–52.
[26] Maccarini M. Laboratory studies for a weakly bonded artificial soil. Ph.D.thesis. Imperial College London (University of London); 1987.
[27] Malandraki V, Toll DG. Triaxial tests on weakly bonded soil with changes instress path. J Geotech Geoenviron Eng 2001;127(3):282–91.
[28] Muir Wood D. Geotechnical modelling. Applied Ge CRC Press; 2004 [vol.].[29] Nguyen LD, Fatahi B, Khabbaz H. A constitutive model for cemented clays
capturing cementation degradation. Int J Plast 2014;56:1–18.[30] Nova R, Castellanza R, Tamagnini C. A constitutive model for bonded
geomaterials subject to mechanical and/or chemical degradation. Int JNumer Anal Methods Geomech 2003;27(9):705–32.
[31] Oliveira PV. Effect of stress level and binder composition on secondarycompression of an artificially stabilized soil. J Geotech Geoenviron Eng2013;139(5):810–20.
[32] Rampello S, Callisto L. A study on the subsoil of the Tower of Pisa based onresults from standard and high-quality samples. Can Geotech J1998;35(6):1074–92.
[33] Richards F. A flexible growth function for empirical use. J Exp Botany1959;10(29):290–300.
[34] Robin V, Cuisinier O, Masrouri F, Javadi AA. Chemo-mechanical modelling oflime treated soils. Appl Clay Sci 2014;95:211–9.
[35] Robin V, Javadi AA, Cuisinier O, Masrouri F. A new formulation to model thedegradation in structured soils. In: 8th European conference on numericalmethods in geotechnical engineering. Delft; 2014. p. 97–102.
[36] Roscoe KH, Burland JB. On the generalized stress-strain behaviour of wet clay.Eng Plast 1968:535–609.
[37] Rotta GV, Consoli NC, Prietto PDM, Coop MR, Graham J. Isotropic yielding in anartificially cemented soil cured under stress. Géotechnique 2003;53(5):493–501.
[38] Rouainia M, Muir wood D. A kinematic hardening constitutive model fornatural clays with loss of structure; 2000.
[39] Suebsuk J, Horpibulsuk S, Liu MD. Modified structured Cam Clay: a generalisedcritical state model for destructured, naturally structured and artificiallystructured clays. Comput Geotech 2010;37(7-8):956–68.
[40] Suebsuk J, Horpibulsuk S, Liu MD. A critical state model for overconsolidatedstructured clays. Comput Geotech 2011;38(5):648–58.
[41] Tremblay H, Leroueil S, Locat J. Mechanical improvement and vertical yieldstress prediction of clayey soils from eastern Canada treated with lime orcement. Can Geotech J 2001;38(3):567–79.
[42] Vatsala A, Nova R, Srinivasa Murthy BR. Elastoplastic model for cemented soils.J Geotech Geoenviron Eng 2001;127(8):679–87.
[43] Wissa AE, Ladd CC, Lambe TW, Effective stress strength parameters ofstabilized soils. In: International conference on soil mechanics andfoundation engineering. Montréal; 1965. p. 412–16.
[44] Yang C, Carter JP, Sheng D. Description of compression behaviour of structuredsoils and its application 2014;933(July 2013):921–33.
[45] Yong R, Nagaraj T. Investigation of fabric and compressibility of a sensitiveclay. In: Proceedings of the international symposium on soft clay, asianinstitute of technology; 1977. p. 327–33.
[46] Zytynski M, Randolph M, Nova R, Wroth C. On modelling the unloading-reloading behaviour of soils. Int J Numer Anal Meth Geomech1978;2(1):87–93.


