Embed Size (px)
Citation preview

J. Vis. Commun. Image R. 21 (2010) 787–797
Contents lists available at ScienceDirect
J. Vis. Commun. Image R.
journal homepage: www.elsevier .com/ locate/ jvc i
An integrated aurora image retrieval system: AuroraEye
Rong Fu a, Xinbo Gao a, Xuelong Li b, Dacheng Tao c,*, Yongjun Jian a, Jie Li a, Hongqiao Hu d, Huigen Yang d
a School of Electronic Engineering, Xidian University, Xi’an 710071, Shaanxi, Chinab Center for OPTical IMagery Analysis and Learning (OPTIMAL), State Key Laboratory of Transient Optics and Photonics, Xi’an Institute of Optics and Precision Mechanics,Chinese Academy of Sciences, Xi’an 710119, Shaanxi, Chinac School of Computer Engineering, Nanyang Technological University, 50 Nanyang Avenue, Blk N4, Singapore 639798, Singapored SOA Key Laboratory for Polar Science, Polar Research Institute of China, Shanghai 200136, China
a r t i c l e i n f o a b s t r a c t
Article history:Received 1 November 2009Accepted 11 June 2010Available online 1 July 2010
Keywords:Content-based image retrievalAuroraAdaptive LBPGaborImage texture analysisDatabaseFeature extractionLocal binary pattern
1047-3203/$ - see front matter � 2010 Elsevier Inc. Adoi:10.1016/j.jvcir.2010.06.002
* Corresponding author. Tel.: +65 6790 6250; fax: +E-mail address: [email protected] (D. Tao).
With the digital all-sky imager (ASI) emergence in aurora research, millions of images are captured annu-ally. However, only a fraction of which can be actually used. To address the problem incurred by low effi-cient manual processing, an integrated image analysis and retrieval system is developed. For preciselyrepresenting aurora image, macroscopic and microscopic features are combined to describe aurora tex-ture. To reduce the feature dimensionality of the huge dataset, a modified local binary pattern (LBP)called ALBP is proposed to depict the microscopic texture, and scale-invariant Gabor and orientation-invariant Gabor are employed to extract the macroscopic texture. A physical property of aurora isinducted as region features to bridge the gap between the low-level visual features and high-level seman-tic description. The experiments results demonstrate that the ALBP method achieves high classificationrate and low computational complexity. The retrieval simulation results show that the developed retrie-val system is efficient for huge dataset.
� 2010 Elsevier Inc. All rights reserved.
1. Introduction
Aurora is a permanent feature of the earth environment. It con-stantly changes in brightness and shape around the earth’s northand south geomagnetic poles. People showed great interests in aur-ora research even as early as 17th century. Modern scientistsdiscover that aurora is produced by the collision of charged particlesfrom earth’s magnetosphere and solar wind [1]. The traditional dataanalysis on aurora utilizes measurements of physical properties, e.g.,electron density, solar wind speed and etc. [2]. These quantitativecharacteristics are often used in analyzing plasma processes in themagnetosphere and the ionosphere. In fact, beside the propertiesabove, the luminance and the form of the auroras are also importantcharacteristics for aurora research. With the digital all-sky imager(ASI) emergence in aurora research, images captured from the ASIplay a significant role in studying auroral phenomena [3]. Differentappearances of aurora contain different physical meanings. Thestructures of auroras which vary in shape, position and luminancecorrespond to homologous dynamics process in the magnetosphereand have abundant semantic information. The mechanisms whichlead to temporal and spatial structure in aurora are the subject ofintense study, and so optical observations of the aurora are of thefundamental importance in this field [2].
ll rights reserved.
65 6792 6559.
Static aurora image classification is the basis for aurora re-search. Early aurora classification is manually implemented by ex-perts with naked-eye. In 1955, Carl Stormer [1] classified aurorainto three categories, i.e., forms with ray structure, forms withoutray structure and flaming aurora, which was the first attempt ofaurora classification. Akasofu [4] manually divided the aurora intofour categories along the equator direction in 1964. Hu et al. [5]sorted the aurora into four types in 1999, which are band, corona,active surge and sun-aligned arc. Until 2004, Syrjasuo and Donovan[2], Syrjasuo et al. [6] introduced the machine vision technologyinto aurora research and identified three distinct categories ofauroral appearance in the all-sky images as Fig. 1:
� Arcs: one or more auroral arcs.� Patchy auroras: irregular patches of auroral intensity visible in
the whole field-of-view.� Omega-bands: brighter shapes that resemble those seen when
an Omega-band is visible in the field-of-view.
This paper focuses on the study of diurnal patchy auroras. Sincediurnal patchy auroras are the main form of aurora at magneticnoon, which reflects the dynamics process of the interaction of so-lar wind and earth magnetosphere. The study of diurnal patchyauroras is of great significance to analyze the ionosphere and itsdynamic features [5,7]. According to their different characters, theyare classified again into three subcategories [8] named drapery

Fig. 1. Three distinct categories of aurora: (a) patchy auroras, (b) arcs, and (c) Omega-bands.
788 R. Fu et al. / J. Vis. Commun. Image R. 21 (2010) 787–797
corona aurora, radial corona aurora, and hot-spot aurora, respec-tively as showed in Fig. 2.
� Drapery corona aurora presents multiple, east–west elongatedrayed bands with weak emission at 557.7 nm and looks likewaving curtains layer upon layer.� Radial corona shows radial structure with weak emission at
557.7 nm, but strong at 630.0 nm. Rays in ASI image radiatefrom the zenith to all directions and change rapidly.� Hot-spot aurora is a complex auroral structure, including radial
structures, transient brightening rayed bundles, spot and irreg-ular patches with intense emission at 427.8, 557.7 and630.0 nm.
The patterns of the three subcategories of patchy auroras aresignificantly different from arcs and Omega-bands. The Omega-bands look like a kind of special arc shape and is a small quantityof aurora images. Since there are only 2 Omega-bands from 13,225images in the database, so we combine arcs and Omega-bands intoone category named multi-arc. Thus there are four main categories,i.e., drapery corona, radial corona and hot-spot and multi-arcauroras.
The emergence of digital imaging technology makes it possiblefor researchers to acquire more and more aurora data. However,the wide application of aurora imaging systems results in massdata which is difficult to manually process. Therefore automaticanalysis and retrieval of aurora images in the huge dataset hasevolved into an essential topic. The research of content-based im-age retrieval has been very active in recent years [9–13,29–34], yetonly a few applications for auroral image retrieval are developed.In 2004, Syrjasuo implemented the content-based retrieval ofauroral images based on shape features [14] and then mergedthe relevance feedback technology into the retrieval system tosearch for one rare auroral form (‘‘north–south structure”) [15].Both of the retrieval algorithms are based on shape feature andsuitable for the aurora images with clear shape, like arcs. But ourgoal is to retrieve the diurnal patchy auroras with extremely
Fig. 2. Three subcategories of patchy auroras: (a) drapery coron
complicated shape which is difficult to describe. For example, theauroral light of radial corona aurora looks like rays emitting fromone point and has no apparent shapes. Therefore only shape prop-erties are not suitable for all kinds of aurora images. Through theobservation of the aurora images, it is found that different kindsof aurora have different textures. For example, the texture of drap-ery corona aurora behaves layer upon layer like waving curtainsand is very regular, whereas multi-arc composed of one or morebright bands stochastically makes the texture changing acutely.So the texture characteristics are employed to describe auroraimages in our research.
The integrated aurora image retrieval system, called AuroraEyeis developed based on several processing modules including fea-tures extraction, image classification, and image retrieval. In thesystem, the aurora image is represented by two kinds of informa-tion from different aspects. One of them is the metadata which in-cludes the date when aurora occurs, category to which the aurorabelongs and the radio band in which the aurora is captured. Theother kind of information is the features which are extracted fromthe aurora image to describe the low-level characters of image. Ga-bor [16,17] and LBP [18] are used to extract the macroscopic andmicroscopic texture information from the aurora image, respec-tively. Considering the global characterization alone cannot ensuresatisfactory retrieval results, the features of localized region of theaurora image are integrated in the system.
2. The overview of AuroraEye
Fig. 3 presents the architecture of the developed aurora imageretrieval system, AuroraEye. It consists of a graphic user interface,three databases, and four subsystems. The function of major com-ponents of the system and the techniques applied to correspondingsubsystem are detailed below Fig. 4.
The image preprocessing subsystem preprocesses the imagesoff-line. The images of AuroraEye come from Chinese Arctic YellowRiver Station, which are 3-wavelength (427.8, 557.7 and 630.0 nm)
a aurora, (b) radial corona aurora, and (c) hot-spot aurora.

Graphic User Interface
Image Retrieval Subsystem
Image Preprocessing Subsystem
Feature Extraction Subsystem
The image classification and metadata processing subsystem
Image database
Metadata database
Feature database
Query text or example image Result Set
Fig. 3. Architecture of the AuroraEye system.
Aurora image
Metadata Features
Global features
Region features
Macroscopic features
Microscopic features
Fig. 4. Information used to describe aurora image.
R. Fu et al. / J. Vis. Commun. Image R. 21 (2010) 787–797 789
all-sky images and cannot be used by auroral researchers directly.Therefore, the ASI images should be preprocessed first, includingmetadata information analysis, image format conversion and im-age enhancement.
The feature extraction subsystem includes global feature andregion feature extraction. The global features consist of macro-scopic and microscopic features which are obtained from Gaborfilters and ALBP method, respectively. Before the region features
extracted, a crucial step is to segment the region of interest fromthe background. Then the region features are extracted and concat-enated with global feature to describe the aurora image.
The image classification subsystem automatically identifiesimages based on the extracted texture features. The categories ofthe images automatically labeled by SVM are utilized as metadataand inserted into the metadata database.
The image retrieval subsystem is composed of two parts: theautomatic analysis of user query image and similarity computingbetween the query image and candidate images in database.
In AuroraEye system, the aurora image is represented by a set ofinformation as demonstrated in Table 4.
3. Feature extraction
As the aurora is transparent, the edges and shape boundariesare difficult to extract and represent [14], but the distribution ofauroral rays expresses different texture structures which areappropriate to describe the aurora image. In this system, the com-bination of global and region features are considered. ALBP is anadvanced LBP method and is used to extract the global microscopicfeatures from the whole image. Although ALBP features can cap-ture most of textural information, the pixel interaction that takeplace outside the local neighborhood is not considered [19]. Toavoid losing the information of distant pixel interaction, featuresbased on Gabor filter band are utilized as the complement to ALBPfeatures.

790 R. Fu et al. / J. Vis. Commun. Image R. 21 (2010) 787–797
3.1. Global microscopic features: adaptive local binary patterns
The local binary pattern [18] is proposed by Timo Ojala. In thismethod a neighborhood of the image is introduced and the centralpixel is considered as a threshold to be compared with the pixels inthe neighborhood. If the gray value of the pixel in the neighbor-hood is greater than or equal to the gray value of the central pixel,it is set to 1, otherwise to 0. The sequence of 1 s and 0 s is trans-formed into a decimal number by assigning a binomial factor 2P
for each u(gi � gc). The decimal number is then employed as thefeature of central pixel.
LBPP;R ¼Xp�1
i¼0
u gi � gcð Þ2i; uðxÞ ¼1; x P 0;0; x < 0;
�ð1Þ
In Eq. (1), gc is the gray value of the central pixel, gi means thegray value of the ith pixel in neighborhood, P is the number of pix-els and R denotes the radius of the neighborhood.
LBPriP;R ¼min CirðLBPðP;RÞ; iÞð Þ; i ¼ 0;1; . . . ; P � 1; ð2Þ
where Cir(X, i) performs a circular bit-wise shift on binary number Xby i times. Eq. (2) show that a LBP descriptor rotates (P � 1) times toget different LBP labels from which a minimum value is selected asthe rotation invariant LBP descriptor.
LBPri;U2P;R ¼
PP�1
i¼0u gi � gcð Þ; if U 6 2;
P þ 1; otherwise;
8><>: ð3Þ
Assume U is the number of the transitions between 1 and 0 inthe pattern. In Eq. (3) if U 6 2, the number of 1s is used as the uni-form LBP (ULBP) label for the central pixel, else instead of the valueof (P + 1). If the ULBP is used to depict the feature of the texture, ithas to be sure that the uniform patterns occupy high percentage. Infact, the ULBP can effectively represent the textures which arecomposed of straight and low curvature edges [19]. However, sometextures of aurora image are composed of complicated shapeswhich cannot satisfy the condition. Although these shapes containa lot of texture information, they are labeled non-uniform and notused as features. So ULBP is applicable to simple textures with lowcurvature edges rather than complicated textures with high curva-ture edges.
In basic and modified versions of LBP, selecting neighborhood incircular form is to make the algorithm invariant to rotation [18].Since orientation is an important physical property for aurora,rotation of aurora can be avoided, selecting circular neighborhoodis unnecessary. On the other hand, computing gray values, whichdo not fall exactly in the center of pixels using interpolation in cir-cular neighborhood, takes much more CPU time. It is not suitablefor real-time processing, especially image retrieval. Therefore, inthe proposed method, a square neighborhood is considered. It isused as the ALBP processing unit called ALBP mask. P is the numberof pixel in the square neighborhood and L is the length of each side.The example of ALBP8,3 is illustrated in Fig. 5.
The ALBP algorithm includes two main steps: construction ofmain pattern set off-line and feature extraction. Every local binarypattern is labeled by a LBP value. The frequently occurred patterns
29 88 59
48 60 86
76 34 33
centre pixel
as threshold
0 1 0
0 1
1 0 0
Fig. 5. ALBP square neighborhood P = 8, L = 3.
contain the main texture information, which are selected to formthe main pattern set. Different main pattern sets describe differenttexture structures. Whereas using the ULBP is not sufficient to cap-ture the textual information, it is unnecessary to utilize the wholepossible patterns either. As Ojala illustrated that the occurrencefrequencies of different patterns varied greatly and even some ofthem rarely occurred in a texture image [18]. The proportions ofthese patterns are very small and dispensable for features descrip-tion. In this paper the frequently occurred patterns are selected asthe features to represent the texture information. The new ap-proach not only avoids the inadequate description caused by usinguniform patterns, but also the redundancy incurred by using allpatterns. ALBP algorithm is detailed below:
Step 1. Construction of main pattern set.
Assume there are M sample images in training set and N pointsin each image. When LBP mask is L � L and the number of neigh-borhood is P, every LBP mask has Q different patterns. The histo-grams of rotation invariant LBP in training set are summarizedand regulated to get the average histogram denoted as SumH.The matrix is sorted in descending order. The first G patterns,whose summated probabilities are greater than a threshold, arechosen to form the main pattern set named as SubLBP.
Step 2. Extraction of ALBP features from the image.
The histogram of rotation invariant LBP from the images is com-puted from which the main G patterns are selected through themethod described in the first step. The probabilities and corre-sponding pattern labels of the G patterns are employed as the ALBPfeatures of the image.
3.2. Global macroscopic features: Gabor features
Although the microscopic information can effectively representthe small, local pattern distribution in the image, it is still insuffi-cient to represent all the information or characteristics of thewhole image. To avoid losing the macroscopic information, the cir-cularly symmetric Gabor filters are used to extract global macro-scopic features of the image.
3.2.1. Conventional Gabor vectorsThe conventional Gabor function is defined as follows [17]:
wl;mx
y
� �¼ kkl;mk2
r2 � exp �kkl;mk2kzk2
2r2
( )� exp ikl;mz
� �� exp �r2
2
� �� �;
ð4Þ
where l and m are the orientation and the scale of the Gabor filters,respectively. kl,m is the wave vector defined by
kl;m ¼km cos Ul
km sin Ul
� �; ð5Þ
where km = kmax/km in which kmax is the maximum frequency and k isthe spacing factor between wavelets in the frequency domain. Ul isassigned l (p/8) .The Gabor features of an aurora image are the con-volution of the image with a set of Gabor filters. Let I(x, y) be theaurora image, the result of the convolution is given as follows:
Gl;mðx; yÞ ¼ Iðx; yÞ � wl;mx
y
� �: ð6Þ
Five scale m e {0, 1, 2, 3, 4} and eight orientations m e {0, 1,2, . . ., 7} representing 0, p/8, 2p/8, . . ., 7p/8, respectively are uti-lized to construct the filter band as showed in Fig. 6. Then

Fig. 6. Real parts of the Gabor filters with five scales and eight orientations.
R. Fu et al. / J. Vis. Commun. Image R. 21 (2010) 787–797 791
5 � 8 = 40 Gabor filters are produced and a series of Gabor magni-tude pictures (GMP) are obtained by convolving the aurora imagewith multi-orientation and multi-scale Gabor filters.
The mean and the standard deviation of the magnitude of thefiltered images, which are used to construct the global macroscopicfeature vector, are defined as
m ¼XL�1
i¼0
zjpðzjÞ; r ¼XL�1
i¼0
zj �m� �2pðzjÞ
!12
; ð7Þ
where zi is a random variable representing gray level belonging toGu,v(x, y), p(zi) is the percentage of zi in Gu,v(x, y), L is the numberof distinct gray levels, m is the mean value of z and r denotes thestandard deviation. Therefore, 5 � 8 � 2 = 80 features are utilizedto form the feature vector for each aurora image.
3.2.2. Orientation-invariant and scale-invariant Gabor vectorsFor texture images, although the resulted signal energy distri-
bution at each scale is different from band to band, however, thetotal energy of the Gabor filters yielded in each band tends to bequite constant, in spite of the orientation and the number of scalesinvolved. Therefore the Gabor filter responses under different ori-entations but the same scale are summed up for obtaining orienta-tion-invariance, and the responses under different scales and alongthe same orientation could be summed up to achieve scale-invariance.
The orientation-invariant Gabor filter bank wrim is obtained by
summing all the filters in different angles at each scale.
wrim ðx; yÞ ¼
X7
l¼0
wl;mðx; yÞ; m ¼ 0;1; . . . ;4; ð8Þ
where each wrim ðx; yÞ is a filter at a specific scale band covering all the
orientations. Thus the orientation-invariant Gabor property of theimage I(x, y) is
Grim x; yð Þ ¼ I x0; y0ð Þ � wri
m x� x0; y� y0ð Þ; m ¼ 0;1; . . . ;4: ð9Þ
Thus the orientation-invariant features of the image, which in-clude the mean value and the standard deviation of the convolu-tion result in Eq. (9), are defined as
mrim ¼
XL�1
i¼0
zrim;jp zri
m;j
; rri
m ¼XL�1
i¼0
zrim;j �mri
m
2p zri
m;j
!12
; ð10Þ
where zrim;j means a random variable representing gray level j belong-
ing to Grim ðx; yÞ. The orientation -invariant Gabor feature vector is
fri ¼ mri0 ;r
ri0 ;m
ri1 ;r
ri1 ; . . . ;mri
4 ;rri4
� �: ð11Þ
Similarly, to obtain scale-invariance, the responses under differ-ent scales and along the same orientation direction are summedup. The scale-invariant Gabor filter bank is defined in Eqs. (12)and (13) denotes the scale-invariant Gabor property of the imageI(x, y). The scale-invariant features of the image are illustrated inEq. (14).
wsil x; yð Þ ¼
X4
m¼0
wl;m x; yð Þ; l ¼ 0;1; . . . ;7; ð12Þ
Gsil x; yð Þ ¼ I x0; y0ð Þ � wsi
l x� x0; y� y0ð Þ; l ¼ 0;1; . . . ;7; ð13Þ
msil ¼
XL�1
i¼0
zsil;jp zsi
l;j
; rsi
l ¼XL�1
i¼0
zsil;j �msi
l
2p zsi
l;j
!12
; ð14Þ
where zsil;j comes from Gsi
lðx; yÞ.The scale-invariant Gabor feature vector is
fsi ¼ msi0 ;r
si0 ;m
si1 ;r
si1 ; . . . ;msi
7 ;rsi7
� �; ð15Þ
After the summating, the 80 features from the conventional Ga-bor of one image are combined into two sets which contain 10 ele-ments in Eq. (11) and 16 elements in Eq. (15), respectively. Thedimensionality of features is greatly reduced.
3.3. Region features
Texture is one of the important low-level visual features. But inretrieval process, the gap between visual feature and the semanticmeaning results in the misunderstanding of the user’s query. Re-gion feature is one of the effective methods to bridge the gap [20].
Different kinds of images have different region segmentationand region feature extraction methods. According to aurora image,the geographic orientation of an auroral shape is usually an impor-tant clue of the on-going plasma process. Although small rotationdifferences are acceptable, the large ones are not [15], whichmeans not only the distribution but also the orientation of theauroral light is important. If the ASI image is divided into parts, dif-ferent parts must contain different proportions of aurora light. Twosimilar aurora images ought to have similar distributions of theproportions and vice versa. In fact the proportion of aurora to back-ground of sky (PAS for short) is a physical property used to analyzethe aurora transforming sequence with the timeline. OTSU [21]method is introduced to segment auroral light from sky. Thenthe segmented image is divided into same size windows to com-puter PAS of each window.
ASI images are different from common images, only the pixelswithin the circle contain useful information. Almost all of the grayvalues outside the circle are zeros. So if OTSU algorithm is appliedto the whole image, pixels outside the circle would disturb thethreshold obtained from OTSU. In order to apply the OTSU effec-tively, it is considered that using mask matrix to mask the pixelsoutside the circle with zeros. The segmentation results of modifiedOTSU method in Fig. 7(c) are apparently much better than the re-sults of original OTSU in Fig. 7(b).
In order to utilize the physical property PAS, the aurora imageshould be divided into windows. To get proper size of the window,different shapes and different sizes were tested (for exampleFig. 8(b) and (c)) and the square window of size of 32 � 32 pixelyielded the best results. As images in aurora database are128 � 128, every image is divided into 16 regions and the PAS ofeach region are concatenated to form the region feature vector.

Fig. 7. Segmentation result with OTSU method: (a) the original aurora images, (b) the segmentation result with OTSU, and (c) the segmentation result with the modifiedOTSU.
Fig. 8. Some examples of different partition strategies.
792 R. Fu et al. / J. Vis. Commun. Image R. 21 (2010) 787–797
4. Automatic aurora image classification
The classification problem addressed in this paper is as follows:given a set of aurora images of unknown categories, assign eachimage in the database into one of the classes that are learned fromtraining samples. In this section, SVM [22] is used to categorizeaurora images based on the ALBP features. Since the method issupervised, it includes two steps: training and testing. In the begin-ning, two aurora image datasets are given: one is the training dataset that is used for learning to construct the classification hyper-plane; the other is the testing data set that needs to be classified.
The first step of the algorithm is the preprocessing of textureimages in both the training database and the query databasethrough extracting ALBP features described above. The outputs ofthis step are two datasets:
� Training dataset of ALBP features to train the classifiers.
� Testing dataset of ALBP features to be classified.
The models of texture classes are learned from the trainingdataset using the SVM. The model of each aurora image classtrained is a hyperplane represented by a set of support vectors inthe texture feature space. Once the models of SVM are constructed,they are used to classify the images in the testing dataset. To eval-uate the classification subsystem, some experiments are showed inSection 6.
5. Aurora image retrieval system
The image retrieval system provides a number of facilities forsearching, which are the combinations of content-based retrievaland metadata-based retrieval.
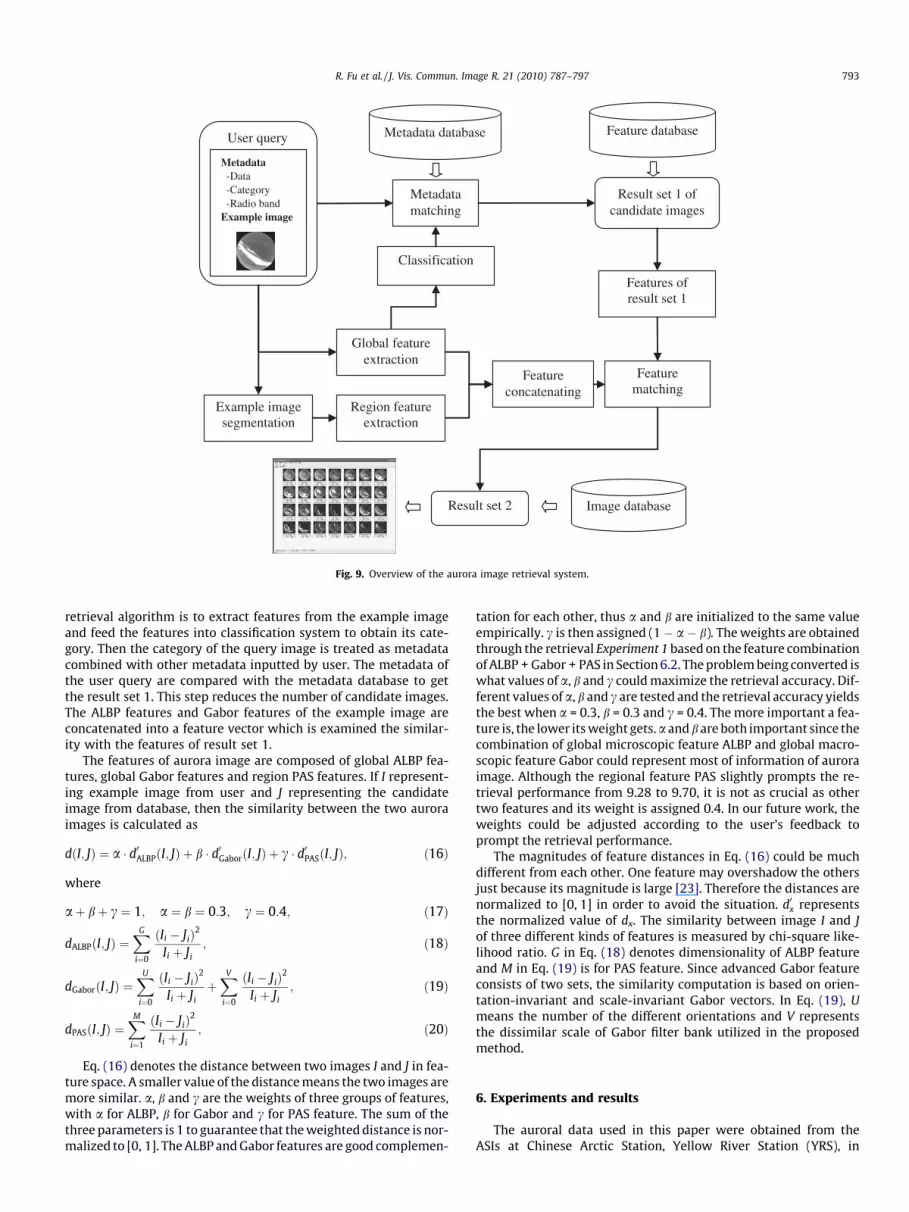
User can implement the retrieval by providing any combinationof metadata and an example is given in Fig. 9. The first step of the
User query
Metadata-Data-Category-Radio band
Example image
Image database
Metadata database Feature database
Metadata matching
Example imagesegmentation
Region featureextraction
Featureconcatenating
Result set 1 of candidate images
Features of result set 1
Global feature extraction
Result set 2
Classification
Feature matching
Fig. 9. Overview of the aurora image retrieval system.
R. Fu et al. / J. Vis. Commun. Image R. 21 (2010) 787–797 793
retrieval algorithm is to extract features from the example imageand feed the features into classification system to obtain its cate-gory. Then the category of the query image is treated as metadatacombined with other metadata inputted by user. The metadata ofthe user query are compared with the metadata database to getthe result set 1. This step reduces the number of candidate images.The ALBP features and Gabor features of the example image areconcatenated into a feature vector which is examined the similar-ity with the features of result set 1.
The features of aurora image are composed of global ALBP fea-tures, global Gabor features and region PAS features. If I represent-ing example image from user and J representing the candidateimage from database, then the similarity between the two auroraimages is calculated as
dðI; JÞ ¼ a � d0ALBPðI; JÞ þ b � d0GaborðI; JÞ þ c � d0PASðI; JÞ; ð16Þ
where
aþ bþ c ¼ 1; a ¼ b ¼ 0:3; c ¼ 0:4; ð17Þ
dALBP I; Jð Þ ¼XG
i¼0
Ii � Jið Þ2
Ii þ Ji; ð18Þ
dGabor I; Jð Þ ¼XU
i¼0
Ii � Jið Þ2
Ii þ JiþXV
i¼0
Ii � Jið Þ2
Ii þ Ji; ð19Þ
dPAS I; Jð Þ ¼XM
i¼1
Ii � Jið Þ2
Ii þ Ji; ð20Þ
Eq. (16) denotes the distance between two images I and J in fea-ture space. A smaller value of the distance means the two images aremore similar. a, b and c are the weights of three groups of features,with a for ALBP, b for Gabor and c for PAS feature. The sum of thethree parameters is 1 to guarantee that the weighted distance is nor-malized to [0, 1]. The ALBP and Gabor features are good complemen-
tation for each other, thus a and b are initialized to the same valueempirically. c is then assigned (1 � a � b). The weights are obtainedthrough the retrieval Experiment 1 based on the feature combinationof ALBP + Gabor + PAS in Section 6.2. The problem being converted iswhat values of a, b and c could maximize the retrieval accuracy. Dif-ferent values of a, b and c are tested and the retrieval accuracy yieldsthe best when a = 0.3, b = 0.3 and c = 0.4. The more important a fea-ture is, the lower its weight gets. a and b are both important since thecombination of global microscopic feature ALBP and global macro-scopic feature Gabor could represent most of information of auroraimage. Although the regional feature PAS slightly prompts the re-trieval performance from 9.28 to 9.70, it is not as crucial as othertwo features and its weight is assigned 0.4. In our future work, theweights could be adjusted according to the user’s feedback toprompt the retrieval performance.
The magnitudes of feature distances in Eq. (16) could be muchdifferent from each other. One feature may overshadow the othersjust because its magnitude is large [23]. Therefore the distances arenormalized to [0, 1] in order to avoid the situation. d0x representsthe normalized value of dx. The similarity between image I and Jof three different kinds of features is measured by chi-square like-lihood ratio. G in Eq. (18) denotes dimensionality of ALBP featureand M in Eq. (19) is for PAS feature. Since advanced Gabor featureconsists of two sets, the similarity computation is based on orien-tation-invariant and scale-invariant Gabor vectors. In Eq. (19), Umeans the number of the different orientations and V representsthe dissimilar scale of Gabor filter bank utilized in the proposedmethod.
6. Experiments and results
The auroral data used in this paper were obtained from theASIs at Chinese Arctic Station, Yellow River Station (YRS), in

794 R. Fu et al. / J. Vis. Commun. Image R. 21 (2010) 787–797
Ny-Ålesund, Svalbard. YRS is located at geographic coordinates78.92�N, 11.93�E and corrected geomagnetic latitude 76.24 fl,where MLT � UT + 3 h. The optical system at YRS contains threeASIs which have been utilized to measure the photo-emissions at427.8, 557.7 and 630.0 nm since December 2003. The opticalinstruments at YRS can make 24 h surveys of auroral emissionsat intervals of 10 s. In this paper, we concentrate on the diurnalaurora. 13,225 ASI images, acquired from December 2003 to Janu-ary 2004 at 557.7 nm, are selected to construct the dataset, whichare classified and labeled by auroral scientists and experts for com-paring with automatic classification and in-depth research.
Table 2Accuracy of aurora image classification (%).
Group 1 2 3 4 5 Average
LBPri8;3
83 85 90 85 88 86.2
LBPri16;5
78 74 82 88 88 82.0
LBPri;u28;3
85 89 81 89 85 85.8
LBPri;u216;5
81 87 87 87 94 87.2
ALBP908;3
87 88 95 89 93 90.4
ALBP9016;5
80 85 91 85 94 87.0
ALBP808;3
84 88 88 87 83 86.0
ALBP80 84 89 85 82 81 84.2
6.1. Classification experiments
In order to evaluate the validity of the proposed aurora imagesclassification system, experiments are designed and conducted.There are five groups which are 500 samples per group selectedrandomly. Each group is divided into 5 parts. To obtain objectiveresult of classification, every part of the group is treated as the test-ing dataset alternately and the rest four parts are the training data-sets. The average of the five classification results of testing datasetis term as the classification rate for this group. The classificationaccuracies of ALBP method proposed in this paper are comparedwith several other methods.
Syrjasuo classified aurora into three distinct categories whichare arcs, patchy auroras and Omega-bands, respectively [2]. Themoments of histogram and basic gray level aura matrices (BGLAM)[24] were used by Syrjasuo to extract features for aurora imageclassification [2,6]. Whereas our research object is the diurnal pat-chy auroras, the categories in our research are different. Thereforethe two methods used by Syrjasuo are also applied to our datasetto compare with the proposed method.
In Table 1 ALBP908;3 means that the features are composed of
main 90% patterns when P = 8, L = 3. According to the average offive groups with 25 classification experiments for each method,the experimental results in Table 1 illustrate that the classificationresult of Gabor is the best; ALBP is very close to Gabor. Althoughthe accuracy of Gabor method is the best, its computational com-plexity is very high. ALBP method is simple and efficient comparedwith Gabor. Considering the requirement of real-time performanceand classification accuracy, ALBP is the most appropriate one.
ALBP-based method is advanced from the traditional LBP meth-od, thus the comparison between different LBP methods is neces-sary. LBPri
P;L means the rotation invariant LBP with neighborhoodof P items and the width of L. LBPri;u2
P;L means the uniform (U 6 2)and rotation invariant LBP. The percent in ALBPpercent
P;L is treated asthe limit that the sum of the probabilities of main pattern set isgreater than or equal to percent. Different resolutions of P = 8,L = 3 and P = 16, L = 5, respectively are applied to each methods.According to ALBP, different percentages of main patterns are alsotested. The classification performances of percentage less than 70%are not good enough empirically. Therefore the main pattern per-centages of 70%, 80% and 90% are utilized to extract features forcomparison.
Table 1Accuracy of aurora image classification (%).
Group Moments BGLAM Gabor ALBP908;3
1 73 78 90 872 78 81 89 883 85 93 97 954 78 83 94 895 75 79 92 93
Average 79.0 82.8 92.4 90.4
Table 2 lists the classification accuracies of different definitionsof LBP method in different resolutions. It is found that the classifi-cation rate of ALBP90
8;3 is the best. Since the texture of aurora imageis not coarse, the small width of the LBP mask is fit for matchingthe texture structure. ULBP divides patterns into uniform andnon-uniform. Some patterns that occur frequently are abandonedin ULBP method because they are not uniform. Whereas ALBP se-lects the frequent occurrence patterns as features regardless uni-form or not, which achieve more objective feature description ofimage and higher accuracy than ULBP.
In content-based retrieval, the time of response is very impor-tant. The dimensionality reduction means the performance promo-tion of the retrieval system [25]. As illustrated in Table 3, whenP = 8, L = 3, the dimensionality of ULBP is 10 and ALBP of 90% is8, whereas number of ALBP of 70% is 4. The classification rate ofALBP70
8;3 is 84.4% and is 6% lower than the best one ALBP908;3, but
the dimensionality of ALBP708;3 is just half of ALBP90
8;3. Consideringthe connection between the number of features and the real-timeresponse, ALBP70
8;3 is utilized to extract global microscopic featuresfrom aurora image in retrieval system to meet the real-timerequirement.
6.2. Retrieval experiments
6.2.1. Experiment 1: retrieval in testing dataset with labelsAurora image is a kind of special image. In order to evaluate the
performance of the retrieval system, 100 image (with ten groupswhich are different from each other in shape, direction or lumi-nance) with manually assigned labels are selected to constructthe testing set as Fig. 10.
The ten groups are selected to test different kinds of features.For example, images in Group1 and Group10 contain a lot of micro-scopic texture information which is sensitive to ALBP method. Theaurora light in Group7 and Group8 emits from center to all direc-tions, so the images of these two groups have abundant directioninformation which is sensitive to Gabor method. We constructthe testing set with special images like Group9 which are easy tobe detected and also considering the similar groups like Group4and Group6 to measure the retrieval performance.
To evaluate the performance, we randomly picked one imagefrom each group alternately as the example image in the query-
16;5
ALBP708;3
82 85 84 87 84 84.4
ALBP7016;5
82 84 86 88 89 85.8
Table 3Number of aurora image features (%).
P, L LBPriP;L LBPri;u2
P;L ALBP90P;L ALBP80
P;L ALBP70P;L
8,3 36 10 8 6 416,5 4116 18 17 10 8

Fig. 10. Testing set for retrieval algorithm.
R. Fu et al. / J. Vis. Commun. Image R. 21 (2010) 787–797 795
by-example type retrieval and compute the distances between theexample image and images in testing set. Considering the order ofthe retrieval results is very important for user, a new approach isdesigned to assess the performance of the aurora retrieval system.
First the similarities between the query image and the imagesin testing set are calculated and the results are sorted in ascendingorder. Then top 20 images are selected as retrieval results to eval-uate the performance:
C ¼ mþ n�w; ð21Þ
where C represents weighted value of the correct retrieval images.In an ideal case, the top ten images should be in the same groupwith the query image. m represents the number of correct resultson top 10, while n denotes how many correct images in 11–20.When the ideal state is met, C is 10. If the correct result is not listedon top 10 but 11–20, the position is treated as weight w = 0.8.
For example, the retrieval results of Group9 and Group10 basedon Gabor features are shown in Figs. 11 and 12, respectively. Thefirst image in the first line served as query image is compared withthe images in testing set. Twenty images are retrieved for Group9and Group10. Apparently, the result of Group10 is much betterthan that of Group9, since the most of the correct images are ontop 10 for Group10 in Fig. 12, whereas only 2 images are on top10 for Group9 in Fig. 11. The difference should be reflected through
the coefficient C. Therefore C of Group9 is 2 + 7 � 0.8 = 7.6 and C ofGroup10 is 8 + 2 � 0.8 = 9.6.
The bar chart of Fig. 13 illustrates retrieval results of the tengroups. Each group implements three experiments: the first oneis retrieval based on Gabor features to detect the directional infor-mation; the second utilizes ALBP features to detect the compact lo-cal texture information; and the last one uses the combination ofthe two methods. From Fig. 10, we can find that Group5, Group7,Group8, and Group10 are constructed of auroral rays emitting tovarious direction, thus these groups are sensitive to orientationand suitable to be represented by Gabor features. The retrieval re-sults of Gabor also confirmed it. Group5 also has a lot of local tex-ture information as Group1, Group4, and Group7 and the retrievalresults of them based on ALBP method are very good. But not allgroups are similar as Group5 containing abundant information inorientation and local textures. For example, Group8 owns muchorientation information but the local texture information is not en-ough, while Group4 is good at local textures but has less informa-tion at orientation. That means only one kind of features cannotrepresent all images comprehensively. Thereby the combinationof Gabor and ALBP features is employed to describe various auroraimages. The third bar of the cluster in Fig. 13 is the retrieval resultbased on the two merged features, whose average grade 9.28 of theten groups is higher than other two bars, with Gabor 6.86 and ALBP6.12. The experiments also confirmed that the ALBP and Gabor fea-

Fig. 11. Retrieval results of Group9, in which only 2 images are in top 10.
Fig. 12. Retrieval results of Group10, in which 8 images are in top 10.
Fig. 13. Bar chart of retrieval results based on Gabor, ALBP and combination ofthem.
Fig. 14. Bar chart of retrieval results based on two combination strategies.
Table 4Time consuming and accuracy for four combinations of different methods.
ALBP Gabor Gabor + ALBP Gabor + ALBP + PAS
Time (s) 5.32 7.62 9.50 12.32Accuracy (%) 55 70 86 93
796 R. Fu et al. / J. Vis. Commun. Image R. 21 (2010) 787–797
tures are good complement for each other, thus the combination ofthem are better than the only one of them.
According to retrieval results based on the combination of Ga-bor and ALBP features in Fig. 13, the average accuracy 9.28 is sat-isfying, but we also notice that there is still one result is notgood, e.g., Group7. Therefore the region feature PAS is merged intothe combination to promote the retrieval performance. The threekinds of features are used to depict the various aspects of auroraimage. The experiments in Fig. 14 present the comparison of retrie-val result constructed on Gabor + ALBP and Gabor + ALBP + PASfeatures. The global and region feature combination results in thebest 9.70 on average.
6.2.2. Experiment 2: retrieval in huge dataset without labelIf the candidate images in database are not labeled, it is hard to
quantify the precision. Therefore we evaluated the results re-trieved from 13,225 images manually. Before utilizing the data-base, the images of database should be processed first to extractfeatures, which include global microscopic features of ALBP, globalmacroscopic features of Gabor features and region features PAS onmodified OTSU method. The feature extraction and classificationcost several hours, but these parts are off-line processed. On thecontrary, the retrievals just require about ten seconds on average.
The retrieval experiments based on four methods are assessedby 3 experts who are very experienced in aurora image analysisand processing. The score is designed from 0 to 100. If the retrieval
result is very satisfying, it is labeled 100. The score increases withthe rise in satisfying degree. 100 images randomly selected fromdatabase are served as query example image. Each image is re-trieved four times according to four different feature combinations.The average time elapsed in retrieval process and the retrievalaccuracy is listed in Table 4. The combination of Gabor, ALBP andPAS features yields the most satisfying result 93%, which is alsowithin reasonable time limit even though it is most time consum-ing in caparison with the other combinations.
7. Conclusions
An integrated retrieval system is developed in this paper to pro-vide a powerful aurora research tool. In the system, a new texturerepresentation method that encodes the global and local texture isutilized to analyze aurora image texture structure. To bridge thegap between the low-level visual features and high-level semanticinformation, region features are introduced into the feature repre-sentation. The combination describes aurora image in different as-

R. Fu et al. / J. Vis. Commun. Image R. 21 (2010) 787–797 797
pects and is suitable for different kinds of aurora images. Whiletested with a small manually pre-labeled set, the combination ofthe three kinds of features performs very well. Considering ASIscapture millions of aurora images, to obtain highly efficient systemALBP is proposed to reduce the dimensionality of the local feature;scale-invariant and orientation-invariant Gabor are employed toextract the macroscopic texture to decrease the dimensionality offeatures from 80 to 26. The experiments in huge dataset illustratedthe time consuming in retrieval just use about 12 s.
The content-based retrieval for aurora image is on its earlystage. Our future work includes conducting experiments on hugedataset to find more representative features to describe differentkinds of aurora. The relevance feedback is another important tech-nology to bridge the gap between the computer and user [26–28,32,34], and thus we plan to introduce it into the retrieval pro-cess to obtain a better performance.
Acknowledgments
This research was supported by the R&D Special Fund for PublicWelfare Industry (meteorology) (GYHY200706043), the Ph.D. Pro-grams Foundation of Ministry of Education of China (No.20090203110002), the Natural Science Basic Research Plane inShaanxi Province of China (2009JM8004). We also would like tothank YRS for providing labeled samples of aurora.
References
[1] C. Stormer, The Polar Aurora, Clarendon Press, Oxford, 1955.[2] M.T. Syrjasuo, E.F. Donovan, Diurnal auroral occurrence statistics obtained via
machine vision, Annales Geophysicae 22 (4) (2004) 1103–1113.[3] H.G. Yang, N. Sato, K. Makita, et al., Synoptic observations of auroras along the
postnoon oval: a survey with all-sky TV observations at Zhongshan, Antarctica,Journal of Atmospheric and Solar-Terrestrial Physics 62 (9) (2000) 787–797.
[4] S.I. Akasofu, The development of the auroral substorm, Planetary and SpaceScience 12 (1964) 273–282.
[5] H.Q. Hu, R.Y. Liu, J.F. Wang, et al., Statistic characteristics of the auroraobserved at Zhongshan Station, Antarctica, Chinese Journal of Polar Research11 (1) (1999) 8–18.
[6] M.T. Syrjasuo, E.F. Donovan, et al., Automatic classification of auroral images insubstorm studies, in: Eight International Conference on Substorms (ICS8),University of Calgary, Alberta, Canada, 2007, pp. 309–313.
[7] H.G. Yang et al., Multiple wavelengths observation of dayside auroras in visiblerange – a preliminary result of the first wintering aurora observation inChinese Arctic Station at Ny-Alesund, Chinese Journal of Polar Research 17 (2)(2005) 107–114.
[8] Z.J. Hu, H.G. Yang, D. Huang, et al., Synoptic distribution of dayside aurora:multiple-wavelength all-sky observation at Yellow River Station in Ny-Alesund, Svalbard, Journal of Atmospheric and Solar-Terrestrial Physics 71(2009) 794–804.
[9] X. Gao, X. Li, J. Feng, D. Tao, Shot-based video retrieval with optical flow tensorand HMMs, Pattern Recognition Letters 30 (2) (2009) 140–147.
[10] D. Tao, X. Tang, X. Li, Which components are important for interactive imagesearching, IEEE Transactions on Circuits and Systems for Video Technology 18(1) (2008) 3–11.
[11] X. Li, Watermarking in secure image retrieval, Pattern Recognition Letters 24(14) (2003) 2431–2434.
[12] X. Li, Image retrieval based on perceptive weighted color blocks, PatternRecognition Letters 24 (12) (2003) 1935–1941.
[13] Z. He, X. You, Y. Yuan, Texture image retrieval based on non-tensor productwavelet filter banks, Signal Processing 89 (8) (2009) 1501–1510.
[14] M.T. Syrjasuo, E.F. Donovan, L.L. Cogger, Content-based retrieval of auroralimages-thousands of irregular shapes, in: Proceeding of the Fourth IASTEDInternational Conference on Visualization, Imaging, and Image Processing,Marbella, Spain, 2004, pp. 224–228.
[15] M.T. Syrjasuo, E.F. Donovan, Using relevance feedback in retrieving auroralimages, in: Proceeding of the Fourth IASTED International Conference onComputational Intelligence, Calgary Alberta, Canada, 2005, pp. 420–425.
[16] B. Zhou, M. Ransey, H. Chen, Creating a large-scale content-based airphotoimage digital library, IEEE Transactions on Image Processing 9 (1) (2000) 163–167.
[17] J. Han, K.K. Ma, Rotation-invariant and scale-invariant Gabor features fortexture image retrieval, Image and Vision Computing 25 (9) (2007) 1474–1481.
[18] T. Ojala, M. Pietikinen, T. Menp, Multiresolution gray-scale and rotationinvariant texture classification with local binary patterns, IEEE Transactions onPattern Analysis and Machine Intelligence 24 (7) (2002) 71–987.
[19] S. Liao, M. Law, A. Chung, Dominant local binary patterns for textureclassification, IEEE Transactions on Image Processing 18 (5) (2009) 107–1118.
[20] W. Jiang, G.H. Er, Q.H. Dai, et al. Relevance feedback learning with featureselection in region-based image retrieval, in: IEEE International Conference onAcoustics, Speech, and Signal Processing, Philadelphia, PA, USA, 2005, pp. 509–512.
[21] N. Otsu, A threshold selection method from gray-level histogram, IEEETransactions on Systems, Man and Cybernetics 9 (1) (1979) 62–66.
[22] A. Tefas, C. Kotropoulos, I. Pitas, Using support vector machines to enhance theperformance of elastic graph matching for frontal face authentication, IEEETransactions on Pattern Analysis and Machine Intelligence 23 (7) (2001) 735–746.
[23] Y. Rui, T. Huang, et al., Relevance feedback: a power tool for interactivecontent-based image retrieval, IEEE Transactions on Circuits and Systems forVideo Technology 8 (5) (1998) 644–655.
[24] X.J. Qin, Y.H. Yang, Basic gray level aura matrices: theory and its application totexture synthesis, IEEE International Conference on Computer Vision 1 (2005)128–135.
[25] Y. Yuan, X. Li, Y. Pang, et al., Binary sparse nonnegative matrix factorization,IEEE Transactions on Circuits and Systems for Video Technology 19 (5) (2009)772–777.
[26] M. Wang, X.S. Hua, J.H. Tang, et al., Beyond distance measurement:constructing neighborhood similarity for video annotation, IEEE Transactionson Multimedia 11 (3) (2009) 465–476.
[27] M. Wang, X.S. Hua, R.C. Hong, et al., Unified video annotation via multi-graphlearning, IEEE Transactions on Circuits and Systems for Video Technology 19(5) (2009) 733–746.
[28] M. Wang, K.Y. Yang, X.S. Hua, et al. Visual tag dictionary: interpreting tags withvisual words, in: IEEE International Multimedia Conference Proceedings of theFirst Workshop on Web-Scale Multimedia Corpus, Beijing, China, 2009, pp. 1–8.
[29] X. Tian, D. Tao, X.-S. Hua, X. Wu, Active reranking for web image search, IEEETransactions on Image Processing 19 (3) (2010) 805–820.
[30] S. Si, D. Tao, K.P. Chan, Evolutionary cross-domain discriminative hessianeigenmaps, IEEE Transactions on Image Processing 19 (4) (2010) 1075–1086.
[31] D. Tao, X. Li, X. Wu, S.J. Maybank, Geometric mean for subspace selection, IEEETransactions on Pattern Analysis and Machine Intelligence 31 (2) (2009) 260–274.
[32] W. Bian, D. Tao, Biased discriminant euclidean embedding for content basedimage retrieval, IEEE Transactions on Image Processing 19 (2) (2010) 545–554.
[33] D. Song, D. Tao, Biologically inspired feature manifold for scene classification,IEEE Transactions on Image Processing 19 (1) (2010) 174–184.
[34] D. Tao, X. Tang, X. Li, X. Wu, Asymmetric bagging and random subspace forsupport vector machines-based relevance feedback in image retrieval, IEEETransactions on Pattern Analysis and Machine Intelligence 28 (7) (2006)1088–1099.


