Embed Size (px)
Citation preview
An integrated dataset for in silico drug discovery
Simon J Cockell1, Jochen Weile2, Phillip Lord2, Claire Wipat3, Dmytro Andriychenko3, Matthew Pocock2, Darren Wilkinson4,5, Malcolm Young3, and Anil Wipat2,4,*
1Bioinformatics Support Unit, Institute for Cell and Molecular Biosciences, Newcastle University, Newcastle-upon-Tyne, NE1 7RH, UK.
2School of Computing Science, Claremont Tower, Newcastle University, Newcastle–upon-Tyne, NE1 7RH, UK.
3e-Therapeutics PLC, Holland Park, Holland Drive, Newcastle-upon-Tyne, NE2 4LZ, UK.
4Centre for Integrated Systems Biology of Ageing and Nutrition, Newcastle University, NE1 7RH, UK.
5School of Mathematics & Statistics, Newcastle University, Newcastle-upon-Tyne, NE1 7RH, UK.
Summary
Drug development is expensive and prone to failure. It is potentially much less risky and
expensive to reuse a drug developed for one condition for treating a second disease, than
it is to develop an entirely new compound. Systematic approaches to drug repositioning
are needed to increase throughput and find candidates more reliably. Here we address this
need with an integrated systems biology dataset, developed using the Ondex data
integration platform, for the in silico discovery of new drug repositioning candidates. We
demonstrate that the information in this dataset allows known repositioning examples to
be discovered. We also propose a means of automating the search for new treatment
indications of existing compounds.
1 Introduction
The drug development process is increasing in cost and becoming less productive. In order to
arrest the decline in the productivity curve, pharmaceutical companies, biotechnology
companies and academic researchers are turning to systems biology approaches to discover
new uses for existing pharmacotherapies, and in some cases, reviving abandoned ones [1].
Here, we describe the use of the Ondex data integration platform for this purpose.
1.1 Drug Repositioning
There is recognition in the pharmaceutical industry that the current paradigm of research and
development needs to change. Drugs based on novel chemistry still take 10-15 years to reach
the market, and development costs are usually between $500 million and $2 billion [2][3].
Most novel drug candidates fail in or before the clinic, and the costs of these failures must be
borne by the companies concerned. These costs make it difficult even for large
pharmaceutical companies to bring truly new drugs to market, and are completely prohibitive
* To whom correspondence should be addressed. E-mail: [email protected]
Journal of Integrative Bioinformatics, 7(3):116, 2010 http://journal.imbio.de
doi:10.2390/biecoll-jib-2010-116 1
for publicly-funded researchers. An alternative means of discovering new treatments is to
find new uses for existing drugs or for drug candidates for which there is substantial safety
data. This repositioning approach bypasses the need for many of the pre-approval tests
required of completely new therapeutic compounds, since the agent has already been
documented as safe for its original purpose [4].
There are a number of examples where a new use for a drug has been discovered by a chance
observation. New uses have been discovered for drugs from the observation of interesting
side-effects during clinical trials, or by drug administration for one condition having
unintended effects on a second. Sildenafil is probably the best-known example of the former;
this drug was developed by Pfizer as a treatment for pulmonary arterial hypertension; during
clinical trials, the serendipitous discovery was made that the drug was a potential treatment of
erectile dysfunction in men. The direction of research was changed and sildenafil was
renamed “Viagra” [5].
In order that a systematic approach may be taken to repositioning, a methodology that is less
dependent on chance observation is required for the identification of compounds for
alternative use. For instance, duloxetine (Cymbalta) was originally developed as an anti-
depressant, and was postulated to be a more effective alternative to selective serotonin
reuptake inhibitors (SSRIs) such as fluoxetine (Prozac). However, a secondary indication, as a
treatment for stress urinary incontinence was found by examining its mode of action [6].
Performing such an analysis on a drug-by-drug basis is impractical, time consuming and
inappropriate for systematic screens. Nevertheless, such a re-screening approach, in which
alternative single targets for existing drugs or drug candidates are sought by simple screening,
has been attempted by Ore Pharmaceuticals [33]. Systems biology provides a complementary
method to manual reductionist approaches, by taking an integrated view of cellular and
molecular processes. Combining data integration technology with systems approaches
facilitates the analysis of an entire knowledgebase at once, and is therefore more likely to
identify promising leads. This general approach, of using Systems approaches to search for
repositionable candidates, is also being developed by e-Therapeutics plc and others exploring
Network Pharmacology [34][35]. However, network pharmacology differs from the approach
we set out here, by examining the broadest range of the interventions in the proteome caused
by a molecule, and using complex network analysis to interpret these in terms of efficacy in
multiple clinical indications [36].
1.2 The Ondex data integration and visualisation platform
Biological data exhibit a wide variety of technical, syntactic and semantic heterogeneity. To
use these data in a common analysis regime, the differences between datasets need to be
tackled by assigning a common semantics. Different data integration platforms tackle this
complicated problem in a variety of ways. BioMart [7], for instance, relies on transforming
disparate database schema into a unified Mart format, which can then be accessed through a
standard query interface. On the other hand, systems such as the Distributed Annotation
System (DAS) take a federated approach to data integration; leaving data on multiple,
distributed servers and drawing it together on a client application to provide an integrated
view [8].
Ondex is a data integration platform for Systems Biology [9], which addresses the problem of
data integration by representing many types of data as a network of interconnected nodes. By
allowing the nodes (or concepts) and edges (or relations) of the graph to be annotated with
Journal of Integrative Bioinformatics, 7(3):116, 2010 http://journal.imbio.de
doi:10.2390/biecoll-jib-2010-116 2
semantically rich metadata, multiple sources of information can be brought together
meaningfully in the same graph. So, each concept has a Concept Class, and each relation a
Relation Type. In this way it is possible to encode complex biological relationships within the
graph structure; for example, two concepts of class Protein may be joined by an
interacts_with relation, or a Transcription Factor may be joined to a Gene by a regulates
relation. The Ondex data structure also allows both concepts and relations to have attributes,
accessions and names. This feature means that almost any information can be attached to the
graph in a systematic way. The parsing mechanism also records the provenance of the data in
the graph. Ondex data is stored in the OXL data format [10], a custom XML format designed
for the exchange of integrated datasets, and closely coupled with the design of the data
structure of Ondex.
The Ondex framework therefore combines large-scale database integration with sequence
analysis, text mining and graph-based analysis. The system is not only useful for integrating
disparate data, but can also be used as a novel analysis platform.
Using Ondex, we have built an integrated dataset of around 120,000 concepts and 570,000
relations to visualise the links between drugs, proteins and diseases. We have included
information from a wide variety of publicly available databases, allowing analysis on the
basis of: drug molecule similarity; protein similarity; tissue specific gene expression;
metabolic pathways and protein family analysis. We analysed this integrated dataset to
highlight known examples of repositioned drugs, and their connectivity across multiple data
sources. We also suggest methods of automated analysis for discovery of new repositioning
opportunities on the basis of indicative semantic motifs.
2 Methods
The general methods used are typical of any Ondex workflow. Parsers import data into the
OXL data format [10], using the Ondex integration backend; mappers and transformers are
then used to join different data sets, remove unconnected nodes and add additional
information to the network. As a final step, the network is analysed for interesting examples
of repositioning by manually traversing the data using Ondex.
2.1 The Data Sources
The data included in the drug repositioning dataset were limited to publicly available sources,
to enable their wide redistribution. The databases and analysis methods used to generate the
dataset were: DrugBank [11], UniProt [12], HPRD [13], KEGG [14], PFam [15], SymAtlas
[16], G-Sesame [17], OpenBabel [18] and BLAST [19]. The cross references from UniProt
are used to include accession numbers from many other linked datasets (e.g. OMIM,
ENSEMBL, GO, PRINTS and more).
2.2 The Integration Workflow
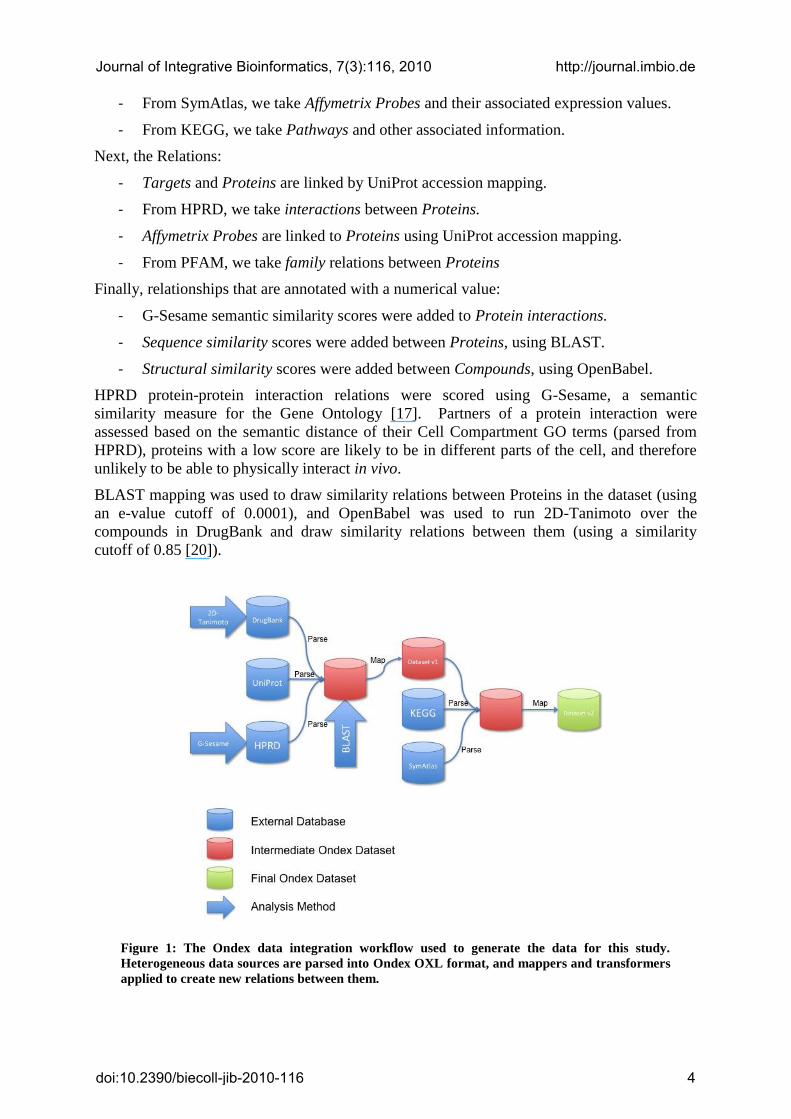
Figure 1 summarises the Ondex workflow used to produce the dataset for this study. The
Concepts and Relations are italicised.
Considering first the Concepts:
- From DrugBank, we take Compounds (called “Drugs” in DrugBank) and Target.
- From UniProt, we take Protein.
Journal of Integrative Bioinformatics, 7(3):116, 2010 http://journal.imbio.de
doi:10.2390/biecoll-jib-2010-116 3
- From SymAtlas, we take Affymetrix Probes and their associated expression values.
- From KEGG, we take Pathways and other associated information.
Next, the Relations:
- Targets and Proteins are linked by UniProt accession mapping.
- From HPRD, we take interactions between Proteins.
- Affymetrix Probes are linked to Proteins using UniProt accession mapping.
- From PFAM, we take family relations between Proteins
Finally, relationships that are annotated with a numerical value:
- G-Sesame semantic similarity scores were added to Protein interactions.
- Sequence similarity scores were added between Proteins, using BLAST.
- Structural similarity scores were added between Compounds, using OpenBabel.
HPRD protein-protein interaction relations were scored using G-Sesame, a semantic
similarity measure for the Gene Ontology [17]. Partners of a protein interaction were
assessed based on the semantic distance of their Cell Compartment GO terms (parsed from
HPRD), proteins with a low score are likely to be in different parts of the cell, and therefore
unlikely to be able to physically interact in vivo.
BLAST mapping was used to draw similarity relations between Proteins in the dataset (using
an e-value cutoff of 0.0001), and OpenBabel was used to run 2D-Tanimoto over the
compounds in DrugBank and draw similarity relations between them (using a similarity
cutoff of 0.85 [20]).
Figure 1: The Ondex data integration workflow used to generate the data for this study.
Heterogeneous data sources are parsed into Ondex OXL format, and mappers and transformers
applied to create new relations between them.
Journal of Integrative Bioinformatics, 7(3):116, 2010 http://journal.imbio.de
doi:10.2390/biecoll-jib-2010-116 4
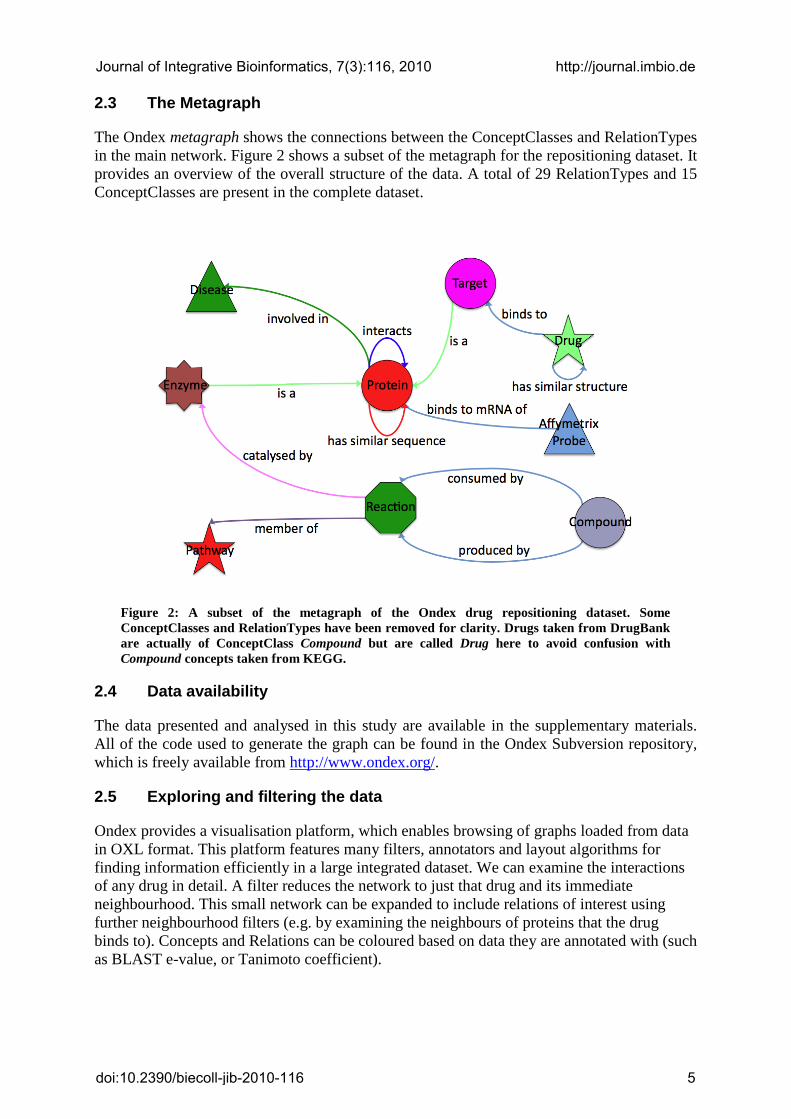
2.3 The Metagraph
The Ondex metagraph shows the connections between the ConceptClasses and RelationTypes
in the main network. Figure 2 shows a subset of the metagraph for the repositioning dataset. It
provides an overview of the overall structure of the data. A total of 29 RelationTypes and 15
ConceptClasses are present in the complete dataset.
Figure 2: A subset of the metagraph of the Ondex drug repositioning dataset. Some
ConceptClasses and RelationTypes have been removed for clarity. Drugs taken from DrugBank
are actually of ConceptClass Compound but are called Drug here to avoid confusion with
Compound concepts taken from KEGG.
2.4 Data availability
The data presented and analysed in this study are available in the supplementary materials.
All of the code used to generate the graph can be found in the Ondex Subversion repository,
which is freely available from http://www.ondex.org/.
2.5 Exploring and filtering the data
Ondex provides a visualisation platform, which enables browsing of graphs loaded from data
in OXL format. This platform features many filters, annotators and layout algorithms for
finding information efficiently in a large integrated dataset. We can examine the interactions
of any drug in detail. A filter reduces the network to just that drug and its immediate
neighbourhood. This small network can be expanded to include relations of interest using
further neighbourhood filters (e.g. by examining the neighbours of proteins that the drug
binds to). Concepts and Relations can be coloured based on data they are annotated with (such
as BLAST e-value, or Tanimoto coefficient).
Journal of Integrative Bioinformatics, 7(3):116, 2010 http://journal.imbio.de
doi:10.2390/biecoll-jib-2010-116 5
3 Results & Discussion
3.1 Chlorpromazine
The motivation for building this Ondex dataset for drug and protein interaction data is to find
examples of molecules that might have a therapeutic purpose additional to those already
known. The first stage of this process is to look for examples of drugs that already have a
known additional use to see if both indications can be found in the data. We consider, here,
the example of chlorpromazine (Thorazine). The discovery of this drug resulted from a search
for new and more effective antihistamines in the 1930s and 40s. It was one of a series of
compounds shown, as well as being antihistaminic, to have greater sedative and antiemetic
effects than previous drugs. On the basis of these effects, the original proposed use of
chlorpromazine was as a post-surgical therapy [21]. However, treatment with chlorpromazine
goes beyond simple sedation; patients also demonstrate improvements in emotional
behaviour. It was this observed activity that led to it being trialled as an anti-psychotic.
Chlorpromazine was eventually approved, and is used, for both purposes [22].
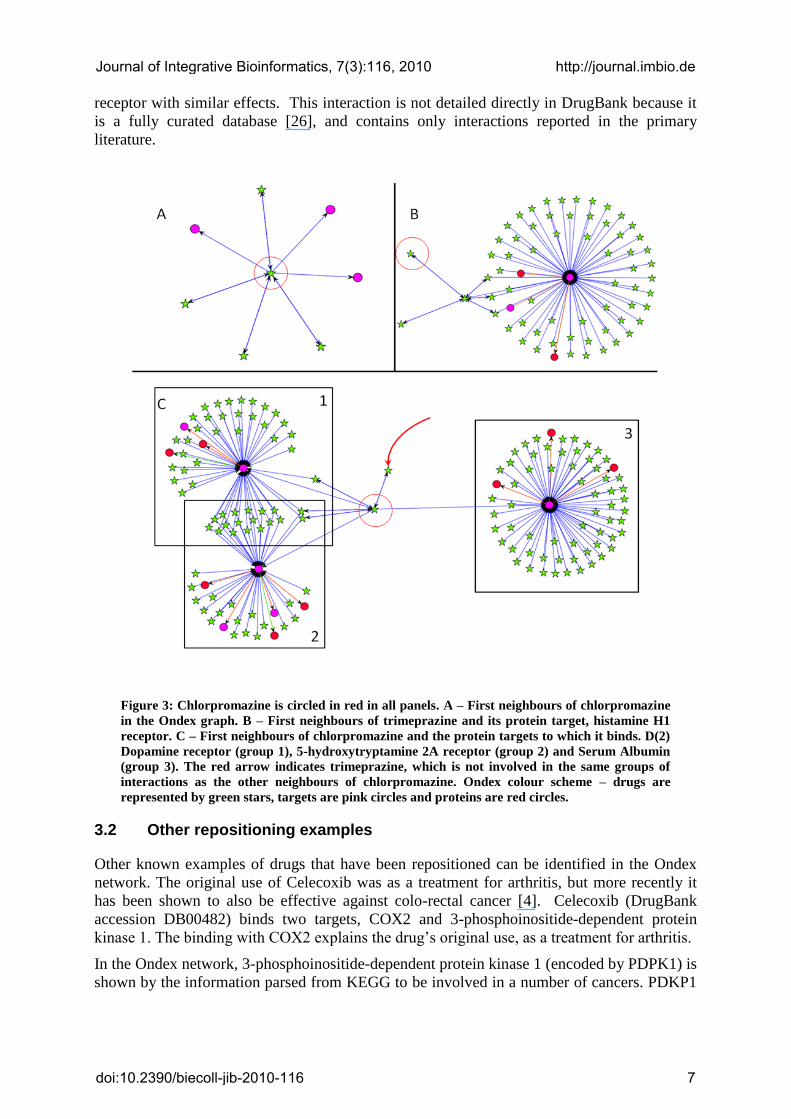
Chlorpromazine, in the Ondex drug repositioning network (DrugBank accession number
DB00477), has seven immediate neighbours (Figure 3A). Three of these neighbours are
targets – D(2) Dopamine Receptor, 5-hydroxytryptamine 2A Receptor and Serum Albumin –
and four are similar drugs – trimeprazine, promazine, prochlorprezine and perphenazine.
Expanding the network to include the first neighbours of the targets of chlorpromazine,
results in a graph with two clusters. Chlorpromazine, being the central node, connects to both
clusters (Figure 3C). Two of the targets of chlorpromazine– D(2) Dopamine Receptor and 5-
hydroxytryptamine 2A receptor – are present in the largest cluster, while the other – Serum
Albumin – forms the hub of the second cluster. Binding to serum albumin is common
amongst cationic drugs such as chlorpromazine and serves to reduce bioavailability. This
binding is probably responsible for some side-effects, but is not clinically relevant [23]. The
larger cluster contains the two targets mentioned above, several related proteins (other similar
receptors) and a large number of other drugs, many of which bind both targets, and most of
which are also anti-psychotics (e.g. clozapine, haloperidol and loxapine). Also included in
these drugs are three of the four compounds that are structurally similar to chlorpromazine
(promazine, prochlorprezine and perphenazine). It is known that the interaction of
chlorpromazine with the D(2) dopamine receptor is central to its anti-psychotic activity [24].
The interaction of chlorpromazine with the 5-hydroxytryptamine 2A receptor has anti-
aggressive and anti-depressive effects, and also attenuates the extra-pyramidal side-effects
that are common, and undesirable, with anti-psychotic drugs [25].
These two clusters of drug-target interactions involve all of the first neighbours of
chlorpromazine apart from one: trimeprazine (DrugBank accession DB01246). Unlike the
other three drugs similar to chlorpromazine, this drug does not seem to bind the same
receptors; it therefore seems unlikely to have the same function. To examine the function of
trimeprazine, a network of its first neighbours was drawn (Figure 3B). Trimeprazine has just
one recognised target in DrugBank, the histamine H1 receptor. Drugs binding to this receptor
generally have a vasodilatory and antiemetic effect (trimeprazine is primarily used as a travel
sickness treatment), as well as an antihistaminic effect.
This similarity between chlorpromazine and trimeprazine, a known antagonist of the
histamine H1 receptor, might suggest a molecular mechanism for the antiemetic mode of
action of chlorpromazine. The similarity of the two drugs suggests that they both bind the
Journal of Integrative Bioinformatics, 7(3):116, 2010 http://journal.imbio.de
doi:10.2390/biecoll-jib-2010-116 6
receptor with similar effects. This interaction is not detailed directly in DrugBank because it
is a fully curated database [26], and contains only interactions reported in the primary
literature.
Figure 3: Chlorpromazine is circled in red in all panels. A – First neighbours of chlorpromazine
in the Ondex graph. B – First neighbours of trimeprazine and its protein target, histamine H1
receptor. C – First neighbours of chlorpromazine and the protein targets to which it binds. D(2)
Dopamine receptor (group 1), 5-hydroxytryptamine 2A receptor (group 2) and Serum Albumin
(group 3). The red arrow indicates trimeprazine, which is not involved in the same groups of
interactions as the other neighbours of chlorpromazine. Ondex colour scheme – drugs are
represented by green stars, targets are pink circles and proteins are red circles.
3.2 Other repositioning examples
Other known examples of drugs that have been repositioned can be identified in the Ondex
network. The original use of Celecoxib was as a treatment for arthritis, but more recently it
has been shown to also be effective against colo-rectal cancer [4]. Celecoxib (DrugBank
accession DB00482) binds two targets, COX2 and 3-phosphoinositide-dependent protein
kinase 1. The binding with COX2 explains the drug’s original use, as a treatment for arthritis.
In the Ondex network, 3-phosphoinositide-dependent protein kinase 1 (encoded by PDPK1) is
shown by the information parsed from KEGG to be involved in a number of cancers. PDKP1
Journal of Integrative Bioinformatics, 7(3):116, 2010 http://journal.imbio.de
doi:10.2390/biecoll-jib-2010-116 7
is also shown to possess sequence similarity with AKT1. KEGG information in the network
indicates that AKT1 is involved specifically in colorectal cancer, which helps to explain the
role of celecoxib in treating this disease.
Mifepristone (DrugBank accession DB00834) found its first use as an abortifacient, a
function which is explained by its binding to the progesterone receptor. The second use of the
drug, as a treatment for psychotic major depression, is also directly explained by binding, of
mifepristone to the glucocorticoid receptor [27].
3.3 Semantic Motifs
Browsing the large Ondex network for known examples of repositioning is a simple matter. It
demonstrates that the information is of real utility in highlighting potential new purposes for
drugs. It is not, however, a viable approach for analysing the whole graph for possible new
drugs and targets of interest. For such a search, methods are needed to uncover regions of
interest in the graph. To this end, we propose one method to exploit the semantically rich
information of the Ondex graph model to extract semantic motifs: subgraphs, or motifs, that
match a particular metadata, or semantic, structure.
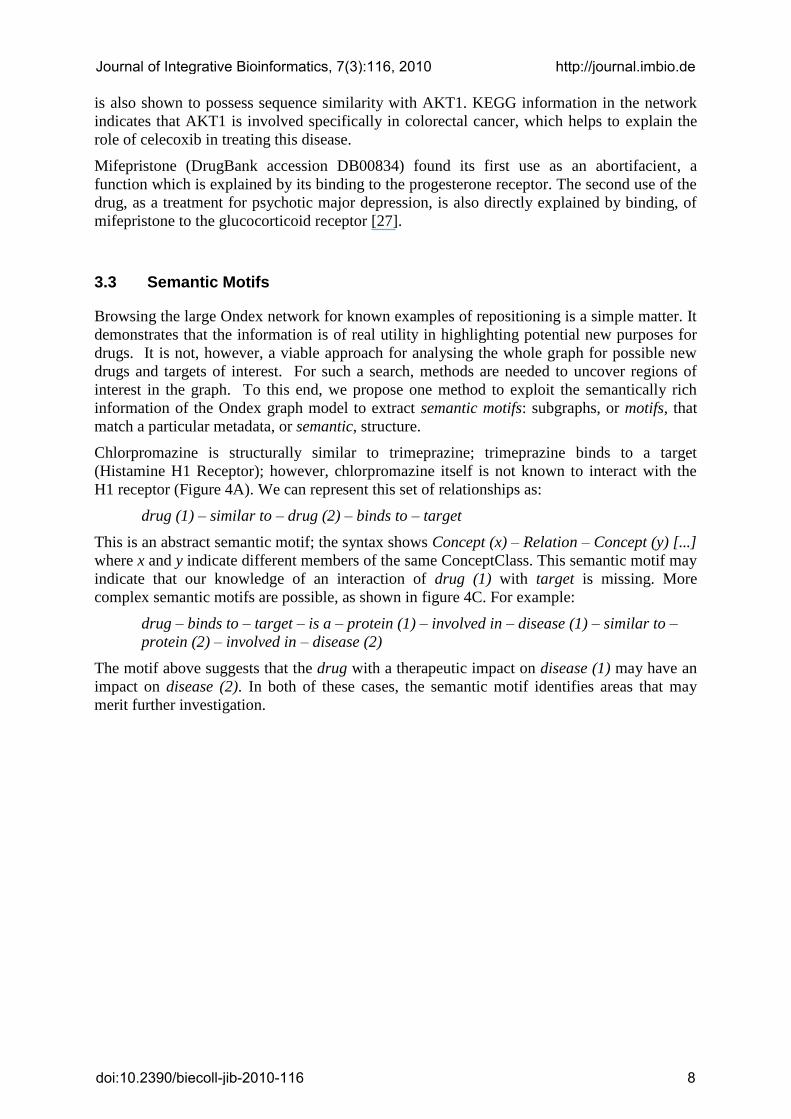
Chlorpromazine is structurally similar to trimeprazine; trimeprazine binds to a target
(Histamine H1 Receptor); however, chlorpromazine itself is not known to interact with the
H1 receptor (Figure 4A). We can represent this set of relationships as:
drug (1) – similar to – drug (2) – binds to – target
This is an abstract semantic motif; the syntax shows Concept (x) – Relation – Concept (y) [...]
where x and y indicate different members of the same ConceptClass. This semantic motif may
indicate that our knowledge of an interaction of drug (1) with target is missing. More
complex semantic motifs are possible, as shown in figure 4C. For example:
drug – binds to – target – is a – protein (1) – involved in – disease (1) – similar to –
protein (2) – involved in – disease (2)
The motif above suggests that the drug with a therapeutic impact on disease (1) may have an
impact on disease (2). In both of these cases, the semantic motif identifies areas that may
merit further investigation.
Journal of Integrative Bioinformatics, 7(3):116, 2010 http://journal.imbio.de
doi:10.2390/biecoll-jib-2010-116 8
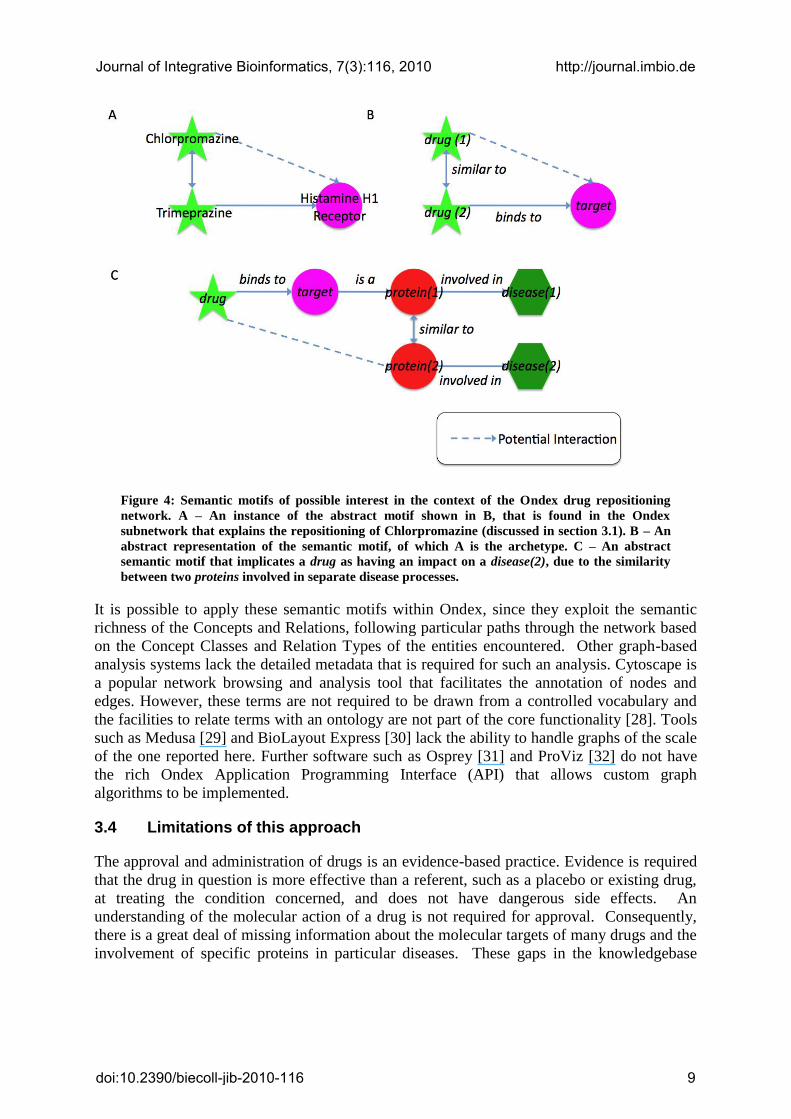
Figure 4: Semantic motifs of possible interest in the context of the Ondex drug repositioning
network. A – An instance of the abstract motif shown in B, that is found in the Ondex
subnetwork that explains the repositioning of Chlorpromazine (discussed in section 3.1). B – An
abstract representation of the semantic motif, of which A is the archetype. C – An abstract
semantic motif that implicates a drug as having an impact on a disease(2), due to the similarity
between two proteins involved in separate disease processes.
It is possible to apply these semantic motifs within Ondex, since they exploit the semantic
richness of the Concepts and Relations, following particular paths through the network based
on the Concept Classes and Relation Types of the entities encountered. Other graph-based
analysis systems lack the detailed metadata that is required for such an analysis. Cytoscape is
a popular network browsing and analysis tool that facilitates the annotation of nodes and
edges. However, these terms are not required to be drawn from a controlled vocabulary and
the facilities to relate terms with an ontology are not part of the core functionality [28]. Tools
such as Medusa [29] and BioLayout Express [30] lack the ability to handle graphs of the scale
of the one reported here. Further software such as Osprey [31] and ProViz [32] do not have
the rich Ondex Application Programming Interface (API) that allows custom graph
algorithms to be implemented.
3.4 Limitations of this approach
The approval and administration of drugs is an evidence-based practice. Evidence is required
that the drug in question is more effective than a referent, such as a placebo or existing drug,
at treating the condition concerned, and does not have dangerous side effects. An
understanding of the molecular action of a drug is not required for approval. Consequently,
there is a great deal of missing information about the molecular targets of many drugs and the
involvement of specific proteins in particular diseases. These gaps in the knowledgebase
Journal of Integrative Bioinformatics, 7(3):116, 2010 http://journal.imbio.de
doi:10.2390/biecoll-jib-2010-116 9
mean many potential repositioning opportunities will be missed, as the data that are required
to identify them in this way do not exist.
There is a possibility that in leveraging data such as that found in the Ondex network,
information that is known is simply being recapitulated in a new form. Particularly when
searching for examples of drugs that are known to have been repurposed. However, the
chlorpromazine example shows that even when information is held to be true, it is not
necessarily represented within the databases being integrated. Therefore it is possible to
derive new knowledge from the network analysis for even well-studied examples.
Searching for semantic motifs will return many hits. For example, the simple motif
abstraction in Figure 4B has 26,693 instances in the repositioning graph. It is likely that a
large proportion of these results will not be true repositioning possibilities, and will not turn
out to be useful. This problem may be ameliorated somewhat by the implementation of a
robust scoring function for semantic motifs. There are a number of measures in the dataset
that could assist in the construction of such an algorithm, such as the Tanimoto coefficient,
BLAST e-values, G-Sesame scores for protein-protein interactions, and tissue-specific
expression values. By prioritising the consideration of high scoring motifs, and those drugs
that appear in a number of different motifs, it is possible that many true positives could be
prioritised.
4 Conclusions
Ondex is a data integration platform for systems biology. Critically, the datasets that it
generates employ metadata that represents more of the semantic richness of the biological
knowledge. In this paper, we have investigated drug repositioning using a custom-built
dataset. We have shown that this integrated dataset can uncover knowledge suitable for
discovery of additional therapeutic uses for drugs. We suggest a mechanism, semantic motifs,
which can exploit both the dataset and its semantic richness.
Ideally, a systems biology model would have complete knowledge of the biological system,
however, the normal practice of biology and drug discovery means that this is always lacking.
An integrated dataset may provide us with some of the information we need for these models;
here we have also suggested that they can be used to highlight gaps in existing knowledge by
searching for semantic motifs.
In conclusion, we have shown that adding additional semantics into an integrative
bioinformatics approach using Ondex can support repositioning and drug discovery, and
could provide a rich underpinning for future systems biology.
Acknowledgements
The authors are pleased to acknowledge funding from the Biotechnology and Biological
Sciences Research Council (BBSRC) Systems Approaches to Biological Research (SABR)
initiative (Grant number – BB/F006039/1).
Journal of Integrative Bioinformatics, 7(3):116, 2010 http://journal.imbio.de
doi:10.2390/biecoll-jib-2010-116 10
References
[1] W. Loging, L. Harland, and B. Williams-Jones, “High-throughput electronic biology:
mining information for drug discovery,” Nat Rev Drug Discov, vol. 6, Mar. 2007, pp.
220-230.
[2] J.A. DiMasi, R.W. Hansen, and H.G. Grabowski, “The price of innovation: new
estimates of drug development costs,” Journal of Health Economics, vol. 22, Mar.
2003, pp. 151-185.
[3] C. Adams and V. Brantner, “Estimating the cost of new drug development: is it really
802 million dollars?,” Health affairs (Project Hope), vol. 25, r. 2006, pp. 428, 420.
[4] T. Ashburn and K. Thor, “Drug repositioning: identifying and developing new uses for
existing drugs,” Nature Reviews Drug Discovery, vol. 3, 2004, pp. 683, 673.
[5] I. Goldstein, T.F. Lue, H. Padma-Nathan, R.C. Rosen, W.D. Steers, and P.A. Wicker,
“Oral sildenafil in the treatment of erectile dysfunction. Sildenafil Study Group,” The
New England Journal of Medicine, vol. 338, May. 1998, pp. 1397-1404.
[6] K.B. Thor and M.A. Katofiasc, “Effects of duloxetine, a combined serotonin and
norepinephrine reuptake inhibitor, on central neural control of lower urinary tract
function in the chloralose-anesthetized female cat,” J Pharmacol Exp Ther.
[7] S. Haider, B. Ballester, D. Smedley, J. Zhang, P. Rice, and A. Kasprzyk, “BioMart
Central Portal--unified access to biological data.,” Nucleic acids research, vol. 37, Jul.
2009, pp. 27, W23.
[8] A. Prlić, T.A. Down, E. Kulesha, R.D. Finn, A. Kähäri, and T.J.P. Hubbard,
“Integrating sequence and structural biology with DAS,” BMC Bioinformatics, vol. 8,
2007, p. 333.
[9] J. Kohler, J. Baumbach, J. Taubert, M. Specht, A. Skusa, A. Ruegg, C. Rawlings, P.
Verrier, and S. Philippi, “Graph-based analysis and visualization of experimental results
with ONDEX,” Bioinformatics, vol. 22, Jun. 2006, pp. 1390, 1383.
[10] J. Taubert, K.P. Sieren, M. Hindle, B. Hoekman, R. Winnenburg, S. Philippi, C.
Rawlings, and J. Kohler, “The OXL format for the exchange of integrated datasets,”
Journal of Integrative Bioinformatics, vol. 4, 2007.
[11] D. Wishart, C. Knox, A.C. Guo, D. Cheng, S. Shrivastava, D. Tzur, B. Gautam, and M.
Hassanali, “DrugBank: a knowledgebase for drugs, drug actions and drug targets.,”
Nucleic acids research, vol. 36, Jan. 2008, p. gkm958.
[12] “The Universal Protein Resource (UniProt) 2009.,” Nucleic acids research, vol. 37,
Jan. 2009, pp. 174, D169.
[13] T. Keshava Prasad, R. Goel, K. Kandasamy, S. Keerthikumar, S. Kumar, S.
Mathivanan, D. Telikicherla, R. Raju, B. Shafreen, A. Venugopal, L. Balakrishnan, A.
Marimuthu, S. Banerjee, D. Somanathan, A. Sebastian, S. Rani, S. Ray, C. Harrys
Kishore, S. Kanth, M. Ahmed, M. Kashyap, R. Mohmood, Y. Ramachandra, V.
Krishna, A. Rahiman, S. Mohan, P. Ranganathan, S. Ramabadran, R. Chaerkady, and
A. Pandey, “Human Protein Reference Database--2009 update.,” Nucleic acids
research, vol. 37, Jan. 2009, p. gkn892.
Journal of Integrative Bioinformatics, 7(3):116, 2010 http://journal.imbio.de
doi:10.2390/biecoll-jib-2010-116 11
[14] M. Kanehisa, M. Araki, S. Goto, M. Hattori, M. Hirakawa, M. Itoh, T. Katayama, S.
Kawashima, S. Okuda, T. Tokimatsu, and Y. Yamanishi, “KEGG for linking genomes
to life and the environment.,” Nucleic acids research, vol. 36, Jan. 2008, pp. 484,
D480.
[15] R. Finn, J. Tate, J. Mistry, P. Coggill, S.J. Sammut, H. Hotz, G. Ceric, K. Forslund, S.
Eddy, E. Sonnhammer, and A. Bateman, “The Pfam protein families database.,” Nucleic
acids research, vol. 36, Jan. 2008, pp. 288, D281.
[16] A. Su, T. Wiltshire, S. Batalov, H. Lapp, K. Ching, D. Block, J. Zhang, R. Soden, M.
Hayakawa, G. Kreiman, M. Cooke, J. Walker, and J. Hogenesch, “A gene atlas of the
mouse and human protein-encoding transcriptomes.,” Proceedings of the National
Academy of Sciences of the United States of America, vol. 101, Apr. 2004, pp. 6067,
6062.
[17] Z. Du, L. Li, C. Chen, P. Yu, and J. Wang, “G-SESAME: web tools for GO-term-based
gene similarity analysis and knowledge discovery,” Nucl. Acids Res., vol. 37, Jul. 2009,
pp. 349, W345.
[18] “Open Babel.”
[19] S. Altschul, W. Gish, W. Miller, E. Myers, and D. Lipman, “Basic local alignment
search tool.,” Journal of molecular biology, vol. 215, Oct. 1990, pp. 410, 403.
[20] H. Matter, “Selecting optimally diverse compounds from structure databases: a
validation study of two-dimensional and three-dimensional molecular descriptors,”
Journal of Medicinal Chemistry, vol. 40, Apr. 1997, pp. 1219-1229.
[21] J.H. MOYER, B. KENT, R.W. KNIGHT, G. MORRIS, M. DIZON, S. ROGERS, and
C. SPURR, “Clinical studies of an anti-emetic agent, chlorpromazine,” The American
Journal of the Medical Sciences, vol. 228, Aug. 1954, pp. 174-189.
[22] R.F. Prien and J.O. Cole, “High Dose Chlorpromazine Therapy in Chronic
Schizophrenia: Report of National Institute of Mental Health--Psychopharmacology
Research Branch Collaborative Study Group,” Arch Gen Psychiatry, vol. 18, Apr.
1968, pp. 482-495.
[23] M.D. Rukhadze, G.S. Bezarashvili, N.S. Sidamonidze, and S.K. Tsagareli,
“Investigation of binding process of chlorpromazine to bovine serum albumin by means
of passive and active experiments,” Biomedical Chromatography: BMC, vol. 15, Oct.
2001, pp. 365-373.
[24] P. Seeman, “Atypical antipsychotics: mechanism of action,” Canadian Journal of
Psychiatry. Revue Canadienne De Psychiatrie, vol. 47, Feb. 2002, pp. 27-38.
[25] I. Kusumi, Y. Takahashi, K. Suzuki, K. Kameda, and T. Koyama, “Differential effects
of subchronic treatments with atypical antipsychotic drugs on dopamine D2 and
serotonin 5-HT2A receptors in the rat brain,” Journal of Neural Transmission, vol.
107, Mar. 2000, pp. 295-302.
[26] D.S. Wishart, C. Knox, A.C. Guo, S. Shrivastava, M. Hassanali, P. Stothard, Z. Chang,
and J. Woolsey, “DrugBank: a comprehensive resource for in silico drug discovery and
exploration,” Nucleic Acids Research, vol. 34, Jan. 2006, pp. D668-672.
Journal of Integrative Bioinformatics, 7(3):116, 2010 http://journal.imbio.de
doi:10.2390/biecoll-jib-2010-116 12
[27] J.K. Belanoff, B.H. Flores, M. Kalezhan, B. Sund, and A.F. Schatzberg, “Rapid reversal
of psychotic depression using mifepristone,” Journal of Clinical Psychopharmacology,
vol. 21, Oct. 2001, pp. 516-521.
[28] P. Shannon, A. Markiel, O. Ozier, N.S. Baliga, J.T. Wang, D. Ramage, N. Amin, B.
Schwikowski, and T. Ideker, “Cytoscape: A Software Environment for Integrated
Models of Biomolecular Interaction Networks,” Genome Research, vol. 13, Nov. 2003,
pp. 2498-2504.
[29] S.D. Hooper and P. Bork, “Medusa: a simple tool for interaction graph analysis,”
Bioinformatics (Oxford, England), vol. 21, Dec. 2005, pp. 4432-4433.
[30] T.C. Freeman, L. Goldovsky, M. Brosch, S. van Dongen, P. Mazière, R.J. Grocock, S.
Freilich, J. Thornton, and A.J. Enright, “Construction, visualisation, and clustering of
transcription networks from microarray expression data,” PLoS Computational Biology,
vol. 3, Oct. 2007, pp. 2032-2042.
[31] B. Breitkreutz, C. Stark, and M. Tyers, “Osprey: a network visualization system,”
Genome Biology, vol. 4, 2003, p. R22.
[32] F. Iragne, M. Nikolski, B. Mathieu, D. Auber, and D. Sherman, “ProViz: protein
interaction visualization and exploration,” Bioinformatics (Oxford, England), vol. 21,
Jan. 2005, pp. 272-274.
[33] Byrnes J.J., Gross S., Ellard C., Connolly K., Donahue S., and Picarella D. “Effects of
the ACE2 inhibitor GL1001 on acute dextran sodium sulfate-induced colitis in mice.”
Inflammation Research 58:819-827, 2009.
[34] A.L Hopkins “Network pharmacology: the next paradigm in drug discovery” 4:682-
690, 2008, Nature Chemical Biology.
[35] Zimmer S. and Young M.P. From low productivity to efficient network-based drug
discovery. Innovation in Pharmaceutical Technology 18: 38-41, 2009.
[36] Young MP. Prediction versus attrition in drug discovery. Drug Discovery World, 3: 9-
12, 2008.
Journal of Integrative Bioinformatics, 7(3):116, 2010 http://journal.imbio.de
doi:10.2390/biecoll-jib-2010-116 13


