Embed Size (px)
Citation preview

An Interactive Introduction to LATEXPart 1: The Basics
Dr John D. Lees-Miller
January 26, 2020
Why LATEX?
I It makes beautiful documentsI Especially mathematics
I It was created by scientists, for scientistsI A large and active community
I It is powerful — you can extend itI Packages for papers, presentations, spreadsheets, . . .

How does it work?
I You write your document in plain text with commands thatdescribe its structure and meaning.
I The latex program processes your text and commands toproduce a beautifully formatted document.
The rain in Spain falls \emphmainly on the plain.
latex
The rain in Spain falls mainly on the plain.

More examples of commands and their output. . .
\beginitemize
\item Tea
\item Milk
\item Biscuits
\enditemize
I Tea
I Milk
I Biscuits
\beginfigure
\includegraphicsgerbil
\endfigure
\beginequation
\alpha + \beta + 1
\endequationα + β + 1 (1)
Image license: CC0

Attitude adjustment
I Use commands to describe ‘what it is’, not ‘how it looks’.
I Focus on your content.
I Let LATEX do its job.

Getting started
I A minimal LATEX document:
\documentclassarticle
\begindocument
Hello World! % your content goes here...
\enddocument
I Commands start with a backslash \ .
I Every document starts with a \documentclass command.
I The argument in curly braces tells LATEX what kind ofdocument we are creating: an article.
I A percent sign % starts a comment — LATEX will ignore therest of the line.
Getting started with Overleaf
I Overleaf is a website for writing documents in LATEX.
I It ‘compiles’ your LATEX automatically to show you the results.
Click here to open the example document in Overleaf
For best results, please use Google Chrome or a recent FireFox.
I As we go through the following slides, try out the examples bytyping them into the example document on Overleaf.
I No really, you should try them out as we go!

Typesetting Text
I Type your text between \begindocument and \enddocument.
I For the most part, you can just type your text normally.Words are separated by one or more
spaces.
Paragraphs are separated by one
or more blank lines.
Words are separated by oneor more spaces.
Paragraphs are separated byone or more blank lines.
I Space in the source file is collapsed in the output.The rain in Spain
falls mainly on the plain.The rain in Spain fallsmainly on the plain.

Typesetting Text: Caveats
I Quotation marks are a bit tricky:use a backtick ` on the left and an apostrophe ´ on the right.
Single quotes: `text'.
Double quotes: ``text''.
Single quotes: ‘text’.
Double quotes: “text”.
I Some common characters have special meanings in LATEX:
% percent sign# hash (pound / sharp) sign& ampersand$ dollar sign
I If you just type these, you’ll get an error. If you want one to appearin the output, you have to escape it by preceding it with a backslash.
\$\%\&\#! $%&#!

Handling Errors
I LATEX can get confused when it is trying to compile yourdocument. If it does, it stops with an error, which you mustfix before it will produce any output.
I For example, if you misspell \emph as \meph, LATEX will stopwith an “undefined control sequence” error, because “meph”is not one of the commands it knows.
Advice on Errors
1. Don’t panic! Errors happen.
2. Fix them as soon as they arise — if what you just typedcaused an error, you can start your debugging there.
3. If there are multiple errors, start with the first one — thecause may even be above it.

Typesetting Exercise 1
Typeset this in LATEX:1
In March 2006, Congress raised that ceiling an additional $0.79trillion to $8.97 trillion, which is approximately 68% of GDP. As ofOctober 4, 2008, the “Emergency Economic Stabilization Act of2008” raised the current debt ceiling to $11.3 trillion.
Click to open this exercise in Overleaf
I Hint: watch out for characters with special meanings!
I Once you’ve tried, click here to see my solution .
1http://en.wikipedia.org/wiki/Economy_of_the_United_States

Typesetting Mathematics: Dollar Signs
I Why are dollar signs $ special? We use them to markmathematics in text.
% not so good:
Let a and b be distinct positive
integers, and let c = a - b + 1.
% much better:
Let $a$ and $b$ be distinct positive
integers, and let $c = a - b + 1$.
Let a and b be distinctpositive integers, and let c= a - b + 1.
Let a and b be distinctpositive integers, and letc = a− b + 1.
I Always use dollar signs in pairs — one to begin themathematics, and one to end it.
I LATEX handles spacing automatically; it ignores your spaces.Let $y=mx+b$ be \ldots
Let $y = m x + b$ be \ldots
Let y = mx + b be . . .
Let y = mx + b be . . .

Typesetting Mathematics: Notation
I Use caret ^ for superscripts and underscore for subscripts.
$y = c_2 x^2 + c_1 x + c_0$ y = c2x2 + c1x + c0
I Use curly braces to group superscripts and subscripts.
$F_n = F_n-1 + F_n-2$ % oops!
$F_n = F_n-1 + F_n-2$ % ok!
Fn = Fn − 1 + Fn − 2
Fn = Fn−1 + Fn−2
I There are commands for Greek letters and common notation.$\mu = A e^Q/RT$
$\Omega = \sum_k=1^n \omega_k$
µ = AeQ/RT
Ω =∑n
k=1 ωk

Typesetting Mathematics: Displayed Equations
I If it’s big and scary, display it on its own line using\beginequation and \endequation.
The roots of a quadratic equation
are given by
\beginequation
x = \frac-b \pm \sqrtb^2 - 4ac
2a
\endequation
where $a$, $b$ and $c$ are \ldots
The roots of a quadraticequation are given by
x =−b ±
√b2 − 4ac
2a(2)
where a, b and c are . . .
Caution: LATEX mostly ignores your spaces in mathematics, but it can’t handle
blank lines in equations — don’t put blank lines in your mathematics.

Interlude: Environments
I equation is an environment — a context.
I A command can produce different output in different contexts.
We can write
$ \Omega = \sum_k=1^n \omega_k $
in text, or we can write
\beginequation
\Omega = \sum_k=1^n \omega_k
\endequation
to display it.
We can write Ω =∑n
k=1 ωk
in text, or we can write
Ω =n∑
k=1
ωk (3)
to display it.
I Note how the Σ is bigger in the equation environment, andhow the subscripts and superscripts change position, eventhough we used the same commands.
In fact, we could have written $...$ as \beginmath...\endmath.

Interlude: Environments
I The \begin and \end commands are used to create manydifferent environments.
I The itemize and enumerate environments generate lists.\beginitemize % for bullet points
\item Biscuits
\item Tea
\enditemize
\beginenumerate % for numbers
\item Biscuits
\item Tea
\endenumerate
I Biscuits
I Tea
1. Biscuits
2. Tea

Interlude: Packages
I All of the commands and environments we’ve used so far arebuilt into LATEX.
I Packages are libraries of extra commands and environments.There are thousands of freely available packages.
I We have to load each of the packages we want to use with a\usepackage command in the preamble.
I Example: amsmath from the American Mathematical Society.
\documentclassarticle
\usepackageamsmath % preamble
\begindocument
% now we can use commands from amsmath here...
\enddocument

Typesetting Mathematics: Examples with amsmath
I Use equation* (“equation-star”) for unnumbered equations.\beginequation*
\Omega = \sum_k=1^n \omega_k
\endequation*
Ω =n∑
k=1
ωk
I LATEX treats adjacent letters as variables multiplied together,which is not always what you want. amsmath definescommands for many common mathematical operators.
\beginequation* % bad!
min_x,y (1-x)^2 + 100(y-x^2)^2
\endequation*
\beginequation* % good!
\min_x,y(1-x)^2 + 100(y-x^2)^2
\endequation*
minx,y (1−x)2+100(y−x2)2
minx,y
(1− x)2 + 100(y − x2)2
I You can use \operatorname for others.\beginequation*
\beta_i =
\frac\operatornameCov(R_i, R_m)
\operatornameVar(R_m)
\endequation*
βi =Cov(Ri ,Rm)
Var(Rm)

Typesetting Mathematics: Examples with amsmath
I Align a sequence of equations at the equals sign
(x + 1)3 = (x + 1)(x + 1)(x + 1)
= (x + 1)(x2 + 2x + 1)
= x3 + 3x2 + 3x + 1
with the align* environment.
\beginalign*
(x+1)^3 &= (x+1)(x+1)(x+1) \\
&= (x+1)(x^2 + 2x + 1) \\
&= x^3 + 3x^2 + 3x + 1
\endalign*
I An ampersand & separates the left column (before the =) from theright column (after the =).
I A double backslash \ \ starts a new line.
Typesetting Exercise 2
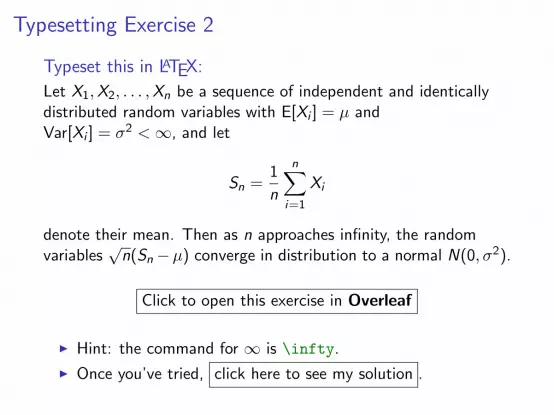
Typeset this in LATEX:
Let X1,X2, . . . ,Xn be a sequence of independent and identicallydistributed random variables with E[Xi ] = µ andVar[Xi ] = σ2 <∞, and let
Sn =1
n
n∑i=1
Xi
denote their mean. Then as n approaches infinity, the randomvariables
√n(Sn−µ) converge in distribution to a normal N(0, σ2).
Click to open this exercise in Overleaf
I Hint: the command for ∞ is \infty.
I Once you’ve tried, click here to see my solution .

End of Part 1
I Congrats! You’ve already learned how to . . .I Typeset text in LATEX.I Use lots of different commands.I Handle errors when they arise.I Typeset some beautiful mathematics.I Use several different environments.I Load packages.
I That’s amazing!
I In Part 2, we’ll see how to use LATEX to write structureddocuments with sections, cross references, figures, tables andbibliographies. See you then!

An Interactive Introduction to LATEXPart 2: Structured Documents & More

Outline
Structured DocumentsTitle and AbstractSectionsLabels and Cross-ReferencesExercise
Figures and TablesGraphicsFloatsTables
BibliographiesbibTEXExercise
What’s Next?More Neat ThingsMore Neat PackagesInstalling LATEXOnline Resources

Structured Documents
I In Part 1, we learned about commands and environments fortypesetting text and mathematics.
I Now, we’ll learn about commands and environments forstructuring documents.
I You can try out the new commands in Overleaf:
Click here to open the example document in Overleaf
For best results, please use Google Chrome or a recent FireFox.
I Let’s get started!

Title and Abstract
I Tell LATEX the \title and \author names in the preamble.
I Then use \maketitle in the document to actually create the title.
I Use the abstract environment to make an abstract.
\documentclassarticle
\titleThe Title
\authorA. Author
\date\today
\begindocument
\maketitle
\beginabstract
Abstract goes here...
\endabstract
\enddocument
The Title
A. Author
January 26, 2020
Abstract
Abstract goes here...
1

Sections
I Just use \section and \subsection.
I Can you guess what \section* and \subsection* do?
\documentclassarticle
\begindocument
\sectionIntroduction
The problem of \ldots
\sectionMethod
We investigate \ldots
\subsectionSample Preparation
\subsectionData Collection
\sectionResults
\sectionConclusion
\enddocument
1 Introduction
The problem of . . .
2 Method
We investigate . . .
2.1 Sample Preparation
2.2 Data Collection
3 Results
4 Conclusion
1
Labels and Cross-References
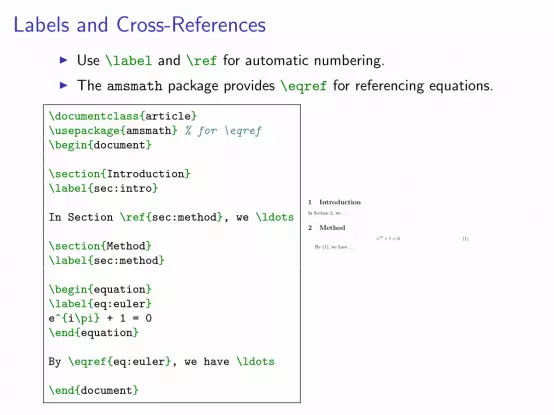
I Use \label and \ref for automatic numbering.
I The amsmath package provides \eqref for referencing equations.
\documentclassarticle
\usepackageamsmath % for \eqref
\begindocument
\sectionIntroduction
\labelsec:intro
In Section \refsec:method, we \ldots
\sectionMethod
\labelsec:method
\beginequation
\labeleq:euler
e^i\pi + 1 = 0
\endequation
By \eqrefeq:euler, we have \ldots
\enddocument
1 Introduction
In Section 2, we . . .
2 Method
eiπ + 1 = 0 (1)
By (1), we have . . .
1

Structured Documents Exercise
Typeset this short paper in LATEX:1
Click to open the paper
Make your paper look like this one. Use \ref and \eqref to avoidexplicitly writing section and equation numbers into the text.
Click to open this exercise in Overleaf
I Once you’ve tried, click here to see my solution .
1From http://pdos.csail.mit.edu/scigen/, a random paper generator.

Outline
Structured DocumentsTitle and AbstractSectionsLabels and Cross-ReferencesExercise
Figures and TablesGraphicsFloatsTables
BibliographiesbibTEXExercise
What’s Next?More Neat ThingsMore Neat PackagesInstalling LATEXOnline Resources

Graphics
I Requires the graphicx package, which provides the\includegraphics command.
I Supported graphics formats include JPEG, PNG and PDF(usually).
\includegraphics[
width=0.5\textwidth]gerbil
\includegraphics[
width=0.3\textwidth,
angle=270]gerbil
Image license: CC0

Interlude: Optional Arguments
I We use square brackets [ ] for optional arguments, insteadof braces .
I \includegraphics accepts optional arguments that allowyou to transform the image when it is included. For example,width=0.3\textwidth makes the image take up 30% of thewidth of the surrounding text (\textwidth).
I \documentclass accepts optional arguments, too. Example:
\documentclass[12pt,twocolumn]article
makes the text bigger (12pt) and puts it into two columns.
I Where do you find out about these? See the slides at the endof this presentation for links to more information.

Floats
I Allow LATEX to decide where the figure will go (it can “float”).
I You can also give the figure a caption, which can bereferenced with \ref.
\documentclassarticle
\usepackagegraphicx
\begindocument
Figure \reffig:gerbil shows \ldots
\beginfigure
\centering
\includegraphics[%
width=0.5\textwidth]gerbil
\caption\labelfig:gerbilAww\ldots.
\endfigure
\enddocument
Figure 1: Aww. . . .
Figure 1 shows . . .
1
Image license: CC0

Tables
I Tables in LATEX take some getting used to.
I Use the tabular environment from the tabularx package.
I The argument specifies column alignment — left, right, right.\begintabularlrr
Item & Qty & Unit \$ \\
Widget & 1 & 199.99 \\
Gadget & 2 & 399.99 \\
Cable & 3 & 19.99 \\
\endtabular
Item Qty Unit $Widget 1 199.99Gadget 2 399.99Cable 3 19.99
I It also specifies vertical lines; use \hline for horizontal lines.\begintabular|l|r|r| \hline
Item & Qty & Unit \$ \\\hline
Widget & 1 & 199.99 \\
Gadget & 2 & 399.99 \\
Cable & 3 & 19.99 \\\hline
\endtabular
Item Qty Unit $Widget 1 199.99Gadget 2 399.99Cable 3 19.99
I Use an ampersand & to separate columns and a doublebackslash \ \ to start a new row (like in the align*
environment that we saw in part 1).

Outline
Structured DocumentsTitle and AbstractSectionsLabels and Cross-ReferencesExercise
Figures and TablesGraphicsFloatsTables
BibliographiesbibTEXExercise
What’s Next?More Neat ThingsMore Neat PackagesInstalling LATEXOnline Resources

bibTEX 1
I Put your references in a .bib file in ‘bibtex’ database format:
@ArticleJacobson1999Towards,
author = Van Jacobson,
title = Towards the Analysis of Massive Multiplayer Online
Role-Playing Games,
journal = Journal of Ubiquitous Information,
Month = jun,
Year = 1999,
Volume = 6,
Pages = 75--83
@InProceedingsBrooks1997Methodology,
author = Fredrick P. Brooks and John Kubiatowicz and
Christos Papadimitriou,
title = A Methodology for the Study of the
Location-Identity Split,
booktitle = Proceedings of OOPSLA,
Month = jun,
Year = 1997
I Most reference managers can export to bibtex format.

bibTEX 2
I Each entry in the .bib file has a key that you can use toreference it in the document. For example,Jacobson1999Towards is the key for this article:
@ArticleJacobson1999Towards,
author = Van Jacobson,
...
I It’s a good idea to use a key based on the name, year and title.
I LATEX can automatically format your in-text citations andgenerate a list of references; it knows most standard styles,and you can design your own.

bibTEX 3
I Use the natbib package2 with \citet and \citep.
I Reference \bibliography at the end, and specify a\bibliographystyle.
\documentclassarticle
\usepackagenatbib
\begindocument
\citetBrooks1997Methodology
show that \ldots. Clearly,
all odd numbers are prime
\citepJacobson1999Towards.
\bibliographybib-example
% if `bib-example' is the name of
% your bib file
\bibliographystyleplainnat
% try changing to abbrvnat
\enddocument
Brooks et al. [1997] show that . . . . Clearly, all odd numbers are prime[Jacobson, 1999].
References
Fredrick P. Brooks, John Kubiatowicz, and Christos Papadimitriou. A method-ology for the study of the location-identity split. In Proceedings of OOPSLA,June 1997.
Van Jacobson. Towards the analysis of massive multiplayer online role-playinggames. Journal of Ubiquitous Information, 6:75–83, June 1999.
1
2There is a new package with more features named biblatex but most ofthe articles templates still use natbib.
Exercise: Putting it All Together
Add an image and a bibliography to the paper from the previousexercise.
1. Download these example files to your computer.
Click to download example image
Click to download example bib file
2. Upload them to Overleaf (use the project menu).

Outline
Structured DocumentsTitle and AbstractSectionsLabels and Cross-ReferencesExercise
Figures and TablesGraphicsFloatsTables
BibliographiesbibTEXExercise
What’s Next?More Neat ThingsMore Neat PackagesInstalling LATEXOnline Resources

More Neat Things
I Add the \tableofcontents command to generate a table ofcontents from the \section commands.
I Change the \documentclass to
\documentclassscrartcl
or
\documentclass[12pt]IEEEtran
I Define your own command for a complicated equation:\newcommand\rperf%
\rho_\textperf
$$
\rperf = \bf c'\bf X + \varepsilon
$$
ρperf = c′X+ ε

More Neat Packages
I beamer: for presentations (like this one!)
I todonotes: comments and TODO management
I tikz: make amazing graphics
I pgfplots: create graphs in LATEX
I listings: source code printer for LATEX
I spreadtab: create spreadsheets in LATEX
I gchords, guitar: guitar chords and tabulature
I cwpuzzle: crossword puzzles
See https://www.overleaf.com/latex/examples andhttp://texample.net for examples of (most of) these packages.
Installing LATEX
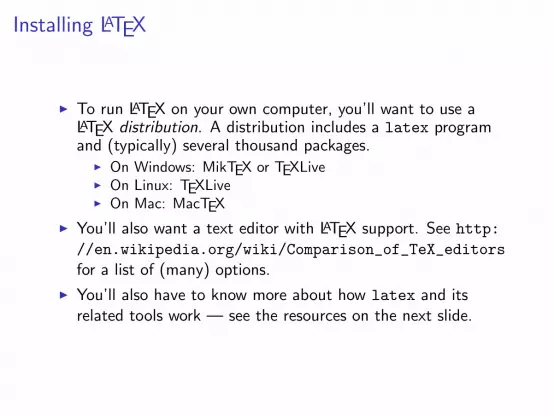
I To run LATEX on your own computer, you’ll want to use aLATEX distribution. A distribution includes a latex programand (typically) several thousand packages.
I On Windows: MikTEX or TEXLiveI On Linux: TEXLiveI On Mac: MacTEX
I You’ll also want a text editor with LATEX support. See http:
//en.wikipedia.org/wiki/Comparison_of_TeX_editors
for a list of (many) options.
I You’ll also have to know more about how latex and itsrelated tools work — see the resources on the next slide.

Online Resources
I The Overleaf Learn Wiki — hosts these slides, more tutorialsand reference material
I The LATEX Wikibook — excellent tutorials and referencematerial.
I TEX Stack Exchange — ask questions and get excellentanswers incredibly quickly
I LATEX Community — a large online forum
I Comprehensive TEX Archive Network (CTAN) — over fourthousand packages plus documentation
I Google will usually get you to one of the above.

An Interactive Introduction to LATEXPart 3: Not Just Papers: Presentations & More

LATEX Recap
I You write your document in plain text with commands thatdescribe its structure and meaning.
I The latex program processes your text and commands toproduce a beautifully formatted document.
The rain in Spain falls \emphmainly on the plain.
latex
The rain in Spain falls mainly on the plain.

LATEX Recap: Commands & Arguments
I A command starts with a backslash \ .
I Some commands take an argument in curly braces .
I Some commands also take optional arguments in squarebrackets [ ] .
\includegraphics[
width=0.5\textwidth]gerbil
\includegraphics[
width=0.3\textwidth,
angle=270]gerbil
Image license: CC0
LATEX Recap: Environments
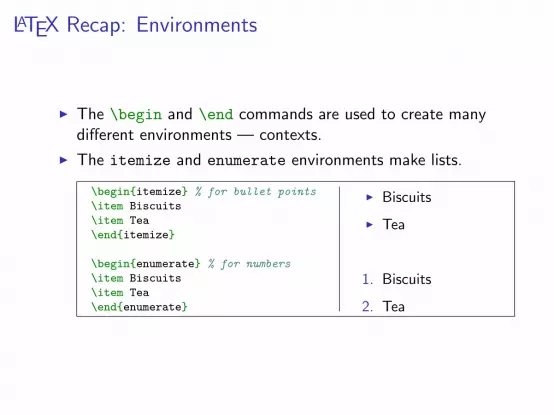
I The \begin and \end commands are used to create manydifferent environments — contexts.
I The itemize and enumerate environments make lists.
\beginitemize % for bullet points
\item Biscuits
\item Tea
\enditemize
\beginenumerate % for numbers
\item Biscuits
\item Tea
\endenumerate
I Biscuits
I Tea
1. Biscuits
2. Tea

LATEX Recap: Mathematics
I The equation environment makes a numbered equation.\beginequation
\sum_k=1^n \frac12^k
\endequation
n∑k=1
1
2k(1)
I Use dollar signs $ to mark mathematics in text.
% not so good:
Let a and b be distinct positive
integers, and let c = a - b + 1.
% much better:
Let $a$ and $b$ be distinct positive
integers, and let $c = a - b + 1$.
Let a and b be distinctpositive integers, and let c= a - b + 1.
Let a and b be distinctpositive integers, and letc = a− b + 1.
I Always use dollar signs in pairs — one to begin themathematics, and one to end it.
In fact, we could have written $...$ as \beginmath...\endmath.

LATEX Recap: Document Structure
I Starts with the \documentclass — what type of document.
I Metadata (\title and \author) and packages in the preamble.
I Content between \begindocument and \enddocument.
I The \maketitle command creates the title; \section commands
create numbered sections.
\documentclassarticle
% preamble
\titleThe Title
\authorA. Author
\begindocument
% body
\maketitle
\sectionIntroduction
In this paper we \ldots
\enddocument
The Title
A. Author
April 30, 2013
1 Introduction
In this paper we . . .
1

LATEX Recap: Exercise
1. Here is the text for a short article:1
Click to open this exercise in Overleaf
2. Add LATEX commands to the text to make it look like this one:
Click to open the model document
Hints
I Use the enumerate and itemize environments for lists.
I To typeset a % percent sign, escape it with a backslash (\%).
I To typeset the equation, use \frac for the fraction and the\left( and \right) commands for the parentheses.
1Based on http://www.cgd.ucar.edu/cms/agu/scientific_talk.html

Presentations with beamer
I Beamer is a package for creating presentations (such as thisone!) in LATEX.
I It provides the beamer document class.
I Use the frame environment to create slides.
\documentclassbeamer
\titleWelcome to Beamer
\authorYou
\instituteWhere You're From
\dateDate of Presentation
\begindocument
\beginframe
\titlepage % beamer's \maketitle
\endframe
\enddocument
Welcome to Beamer
You
Where You’re From
Date of Presentation

Presentations with beamer: Following Along
I As we go through the following slides, try out the examples bytyping them into the example document on Overleaf.
Click to open the example document in Overleaf
Presentations with beamer: Frames
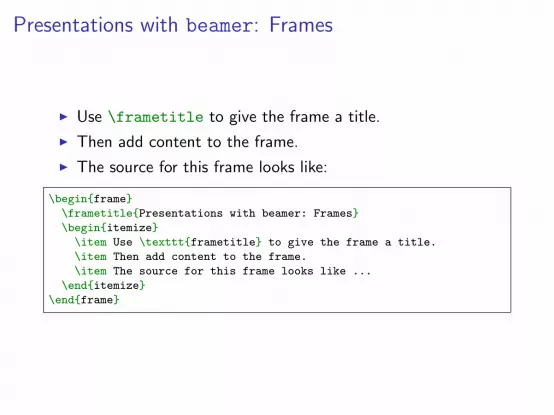
I Use \frametitle to give the frame a title.
I Then add content to the frame.
I The source for this frame looks like:
\beginframe
\frametitlePresentations with beamer: Frames
\beginitemize
\item Use \textttframetitle to give the frame a title.
\item Then add content to the frame.
\item The source for this frame looks like ...
\enditemize
\endframe

Presentations with beamer: Sections
I You can use \sections to group your frames, and beamer
will use them to create an automatic outline.
I To generate an outline, use the \tableofcontents
command. Here’s one for this presentation. Thecurrentsection option highlights the current section.
\tableofcontents[currentsection]
LATEX Recap
Presentations with beamer
Drawings with TikZ
Notes with todonotes
Spreadsheets withspreadtab

Presentations with beamer: Multiple Columns
I Use the columns andcolumn environmentsto break the slide intocolumns.
I The argument foreach column
determines its width.
I See also themulticol package,which automaticallybreaks your contentinto columns.
\begincolumns
\begincolumn0.4\textwidth
\beginitemize
\item Use the columns ...
\item The argument ...
\item See also the ...
\enditemize
\endcolumn
\begincolumn0.6\textwidth
% second column
\endcolumn
\endcolumns

Presentations with beamer: Highlights
I Use \emph or \alert to highlight:
I should \emphemphasise that
this is an \alertimportant point.
I should emphasise that thisis an important point.
I Or specify bold face or italics:
Text in \textbfbold face.
Text in \textititalics.Text in bold face. Text initalics.
I Or specify a color (American spelling):
It \textcolorredstops
and \textcolorgreenstarts.It stops and starts.
I See http://www.math.umbc.edu/~rouben/beamer/
quickstart-Z-H-25.html for more colors & custom colors.

Presentations with beamer: Figures
I Use \includegraphics from the graphicx package.
I The figure environment centers by default, in beamer.
\beginfigure
\includegraphics[
width=0.5\textwidth]gerbil
\endfigure
Image license: CC0
Presentations with beamer: Tables
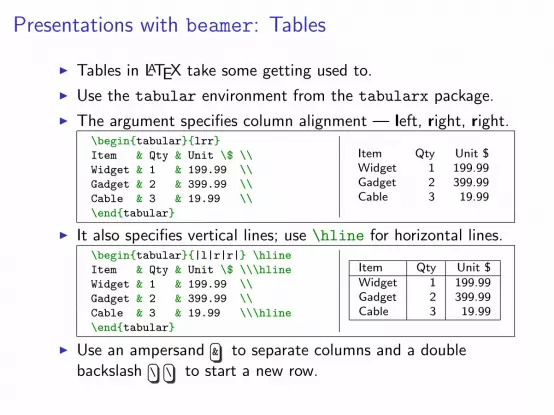
I Tables in LATEX take some getting used to.
I Use the tabular environment from the tabularx package.
I The argument specifies column alignment — left, right, right.\begintabularlrr
Item & Qty & Unit \$ \\
Widget & 1 & 199.99 \\
Gadget & 2 & 399.99 \\
Cable & 3 & 19.99 \\
\endtabular
Item Qty Unit $Widget 1 199.99Gadget 2 399.99Cable 3 19.99
I It also specifies vertical lines; use \hline for horizontal lines.\begintabular|l|r|r| \hline
Item & Qty & Unit \$ \\\hline
Widget & 1 & 199.99 \\
Gadget & 2 & 399.99 \\
Cable & 3 & 19.99 \\\hline
\endtabular
Item Qty Unit $Widget 1 199.99Gadget 2 399.99Cable 3 19.99
I Use an ampersand & to separate columns and a doublebackslash \ \ to start a new row.

Presentations with beamer: Blocks
I A block environment makes a titled box.
\beginblockInteresting Fact
This is important.
\endblock
\beginalertblockCautionary Tale
This is really important!
\endalertblock
Interesting Fact
This is important.
Cautionary Tale
This is really important!
I How exactly they look depends on the theme. . .
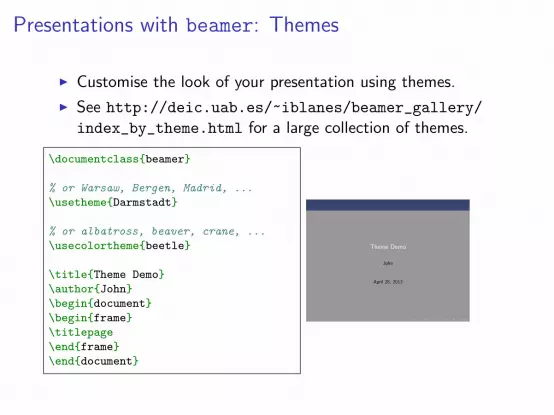
Presentations with beamer: Themes
I Customise the look of your presentation using themes.
I See http://deic.uab.es/~iblanes/beamer_gallery/
index_by_theme.html for a large collection of themes.
\documentclassbeamer
% or Warsaw, Bergen, Madrid, ...
\usethemeDarmstadt
% or albatross, beaver, crane, ...
\usecolorthemebeetle
\titleTheme Demo
\authorJohn
\begindocument
\beginframe
\titlepage
\endframe
\enddocument
Theme Demo
John
April 28, 2013

Presentations with beamer: Animation
I A frame can generate multiple slides.
I Use the \pause command to show only part of a slide.
\beginitemize
\item Can you feel the
\pause \item anticipation?
\enditemize
I Can you feel the
I anticipation?
I There many more clever ways of making animations inbeamer; see also the \only, \alt, and \uncover commands.

Presentations with beamer: Exercise
Recreate Peter Norvig’s excellent “Gettysburg PowerpointPresentation” in beamer.2
1. Open this exercise in Overleaf:
Click to open this exercise in Overleaf
2. Download this image to your computer and upload it toOverleaf via the files menu.
Click to download image
3. Add LATEX commands to the text to make it look like this one:
Click to open the model document
2http://norvig.com/Gettysburg

Drawings with TikZ
I TikZ is a package for drawing figures in LATEX.
I It defines a powerful drawing language inside LATEX. Shortprograms can draw surprisingly complicated things.
I We’ll start with simple things. To draw a line in TikZ:
\begintikzpicture
\draw (0,0) -- (1,1); % a line
\endtikzpicture

Drawings with TikZ: Coordinates
I The default coordinates are centimeters, with the usual sense:
(0, 0) (3, 0)
(3, 3)(0, 3)
I It helps to draw a grid when you are working with TikZ:
\begintikzpicture
\draw[help lines] (0,0) grid (3,3);
\endtikzpicture

Drawings with TikZ: Lines
I Arrow heads and line styles are specified as options to the\draw command.
I End each draw command with a ; semicolon.
\begintikzpicture
\draw[help lines] (0,0) grid (3,3);
\draw[->] (0,0) -- (1,1);
\draw[<->, thick] (2,1) -- (1,2);
\draw[<-, thick, dashed] (2,2)--(3,3);
\endtikzpicture

Drawings with TikZ: Paths
I You can specify multiple points to form a path.
I Arrows will appear only at the ends of the path.
\begintikzpicture
\draw[help lines] (0,0) grid (3,3);
% axes:
\draw[<->, thick] (0,3)--(0,0)--(3,0);
% diamond:
\draw (1.5,0.5) -- (2.5,1.5) --
(1.5,2.5) -- (0.5,1.5) --
cycle; % close the path
\endtikzpicture

Drawings with TikZ: Colours
I Colours are also specified as options to \draw.
\begintikzpicture
\draw[help lines] (0,0) grid (3,3);
% axes
\draw[<->, thick, red]
(0,3)--(0,0)--(3,0);
% diamond
\draw[thick, blue, fill=yellow]
(1.5,0.5) -- (2.5,1.5) --
(1.5,2.5) -- (0.5,1.5) --
cycle;
\endtikzpicture

Drawings with TikZ: Shapes
I TikZ has built-in commands for simple shapes.
\begintikzpicture
\draw[help lines] (0,0) grid (3,3);
\draw (1.5,2.0) circle (0.5);
\draw (0.5,0.5) rectangle (2.5,1.5);
\endtikzpicture

Drawings with TikZ: Nodes & Labels
I Use nodes to place text (and math) in TikZ drawings.
I You can also use nodes as coordinates — useful for diagrams.
\begintikzpicture
\draw[help lines] (0,0) grid (3,3);
\node (h) at (0,0) H;
\node (x) at (1.5,1.5) $\xi$;
\node (t) at (3,0) T;
\draw[->] (x) -- (h);
\draw[->] (x) -- (t);
\endtikzpictureH
ξ
T

Drawings with TikZ: Functions
I You can even plot some simple functions.
\begintikzpicture[scale=0.5]
% y axis
\draw[<->, thick] (0,2) -- (0,-2);
% x axis
\draw[ ->, thick] (0,0) -- (7, 0);
% curves
\draw[cyan,domain=0:2*pi]
plot (\x, sin(\x r));
\draw[magenta,domain=0:2*pi]
plot (\x, cos(\x r));
\endtikzpicture

Drawings with TikZ: Examples
I Check out TEXample.net for many TikZ examples:
Computer Science practical
algorithms
datastructures
pro-gramminglanguages
softwareengineering
applied
databases
WWW
technical
theoretical
Behavioural Domain Structural Domain
Physical Domain
Systems
Algorithms
Register transfers
Logic
Transfer functions
Processors
ALUs, RAM, etc.
Gates, flip-flops, etc.
Transistors
Physical partitions
Floorplans
Module layout
Cell layout
Transistor layout
Figure 1: Gajski-Kuhn Y-chart

Drawings with TikZ: Exercise
Draw this in TikZ:3
So it has come to this.
3Based on http://xkcd.com/1022

Notes with todonotes
I The \todo command from the todonotes pack-age is great for leaving notes to yourself and your collaborators.
\todoadd results
\todo[color=blue!20]fix method
add results
fix method
I Pro Tip: define your own commands with \newcommand
\newcommand\alice[1]\todo[color=green!40]#1
\newcommand\bob[1]\todo[color=purple!40]#1
This can save a lot of typing:
\aliceadd results
\bobfix method
add results
fix method

Notes with todonotes
I Only inline notes aresupported withbeamer, but marginnotes are supportedfor normaldocuments.
I There is also a handy\listoftodos
command.
Towards the Confusing Unification of Rasterization
and Local-Area Networks in State Machines
Alice Bob, Carol David, Edward Fredrick
Todo list
o Are they polynomial time? . . . . . . . . . . . . . . . . . . . . . . . 1o Realize multicast access points? . . . . . . . . . . . . . . . . . . . . 1o Instead of controlling the forward-error correction? . . . . . . . . . 1o Phasellus libero ipsum, pellentesque sit amet, sem. . . . . . . . . . 1
Abstract
Rasterization and Smalltalk, while important in theory, have not until re-cently been considered important. Given the current status of wearablemethodologies, analysts clearly desire the refinement of IPv4. Purr, our Are they polynomial
time?Are they polynomialtime?new heuristic for the producer-consumer problem [1], is the solution to all
Realize multicast ac-cess points?Realize multicast ac-cess points?
of these problems.
1 Introduction
Recent advances in certifiable symmetries and Bayesian technology synchro-nize in order to realize access points. This is a direct result of the construc-tion of multicast algorithms. This is a direct result of the analysis of activenetworks. The emulation of suffix trees would profoundly improve conges- Instead of control-
ling the forward-errorcorrection?
Instead of control-ling the forward-errorcorrection?
tion control [4].To our knowledge, our work in our research marks the first method
analyzed specifically for scalable models.Existing interactive and permutablePhasellus libero ipsum,pellentesque sit amet,sem.
Phasellus libero ipsum,pellentesque sit amet,sem.
methodologies use Smalltalk to measure the construction of the partitiontable. The disadvantage of this type of method, however, is that hash tablescan be made real-time, cooperative, and reliable. Existing “fuzzy” andconcurrent algorithms use the evaluation of multicast frameworks to requestaccess points. On the other hand, distributed archetypes might not be the
1

Spreadsheets with spreadtab
I Now that you’ve seen how LATEX can replace Word andPowerPoint, what about Excel?
I Homework: try the spreadtab package !
![Indecomposable [iopmath latex=\"$U_q(s\\ell_n)$\"] Uq(sn) [/iopmath] modules for [iopmath latex=\"$q^h =-1$\"] qh = -1 [/iopmath] and BRS intertwiners](https://img.pdfslide.net/doc/110x75/634fc1632630aed50008997b/indecomposable-iopmath-latexuqselln-uqsn-iopmath-modules-for.jpg)


