Embed Size (px)
Citation preview

ISSN: 2249 - 6300Vol. 1 No. 1
January - June 2012
An International Peer-Reviewed Journal on Managerial Science
w w w . t r p . o r g . i n
Asian Journal of Managerial Science
Journals Division
THE RESEARCHP U B L I C A T I O Nw w w . t r p . o r g . in
MSAsian Journal ofManagerial Science

Asian Journal of Managerial Science(ISSN: 2249-6300)
Editorial Advisory Board
AJMS is an international peer-reviewed research journal published half-yearly by The Research Publication. Responsibility for the contents rests upon the authors and not upon the AJMS. For copying or reprint permission, write to Copyright Department, AJMS, The Research Publication, Coimbatore - 641 031, Tamil Nadu, India.
Editor-in-Chief
Dr. Balan SundarakaniFaculty of Business and ManagementUniversity of Wollongong in DubaiKnowledge Village, Dubai, UAE
Dr. K. Ganesh Knowledge SpecialistSupply Chain Management - Center of CompetenceMcKinsey Knowledge Center, McKinsey and CompanyGurgaon, Haryana, India
Associate Editor
Dr. Nicholas Apergis
Dr. Satya Paul
Dr. Yi-Kuei Lin
Dr. B. Muniyandi
Dr. Matti Muhos
Prof. Siau Ching Lenny Koh
Prof. Tzong-Ru (Jiun-Shen) Lee
Dr. Paivi Iskanius
Professor in EconomicsDepartment of Banking and Financial ManagementUniversity of Piraeus, Greece
Professor in EconomicsSchool of Economics and FinanceUniversity of Western Sydney, Australia
Chair Professor, Department of Industrial ManagementNational Taiwan University of Science & TechnologyTaiwan
Professor & Dean, Faculty of ArtsBharathiar UniversityCoimbatore, Tamil Nadu, India
Research Director, Oulu Southern InstituteUniversity of OuluNivala, Finland
ProfessorUniversity of Sheffield Management SchoolSheffield, UK
Department of MarketingNational Chung Hsing UniversityTaichung City, Taiwan
Project ManagerNorthern Research and Innovation PlatformUniversity of Oulu, Finland
Prof. Sihyun Paik
Prof. T.T. Narendran
Prof. M. Punniyamoorthy
Dr. Suseela Malakolunthu
Prof. Bruce Chien-Ta Ho
Prof. Yves Ducq
Dr. Seema Narayan
Dr. Lefteris Tsoulfidis
Department of Management Information SystemYanBian University of Science and TechnologyYanji City, Jilin Province, China
Department of Management StudiesIndian Institute of Technology MadrasChennai, Tamil Nadu, India
Department of Management StudiesNational Institute of TechnologyTrichy, Tamil Nadu, India
Department of ManagementPlanning and Educational PolicyFaculty of Education, University of Malaya, Malaysia
Institute of Electronic CommerceCenter for Electronic Commerce & Knowledge Economics Research
National Chung Hsing University, Taiwan
LAP-GRAI - IMSUniversity of Bordeaux 1Talence, Cedex, France
School of EconomicsRMIT UniversityMelbourne, Australia
Department of EconomicsUniversity of Macedonia, Greece

1. The Effectiveness of Organisational Climate on Job Involvement 01
K. Uthayasuriyan and A. Jayasagar
2. Human Resources for Diseases Control: Administrative Function or Strategic Priorities 07 Farhad Ali, Belaynew Wassie, Alessandro Greblo and Purnima Bhoi
3. FII Flows and Indian Equity Market Performance 12 P. Karthikeyan and T. Mohanasundaram
4. An Investigation into Work Postures of Workers Engaged in Casting Industry: 17
A Study in India
Lakhwinder Pal Singh
5. A Study on Occupational Stress Among Teachers in Selective Engineering Colleges 23
Affiliated to Anna University of Technology, Trichy C. Muthuvelayutham and H. Mohanasundaram
6. HRM Practices in NRI Medical Sciences and General Hospital in 30
Guntur District, Andra Pradesh
V. Tulasi Das and V. Krishna Reddy
7. Is it Time to Replace Skill With Style? A Case for Studying Communication Style 38
Vinay Kumar Chaganti
8. Application of SERVPERF for Rural Retailer: Reliability and Factor Analysis 43
R. Saravanan and P. Kannan
9. Behind the Boom: What is Leading the Entrpreneurial Fire and its Nature in India 53
Kavita Meena
10. Successful Women Entrepreneurs in India: Attributes Based Analysis 57
Raj Kumar, Saumya Singh and Nitam Singh
11. Job Satisfaction in Banking Sector: An Exploratory Analysis 63
G. V. S. S. N.Sanyasi Raju
Asian Journal of Managerial Science
Volume 1 Number 1 January – June 2012
CONTENTS
Sl. No. Title Page No.

The Effectiveness of Organisational Climate on Job Involvement
1K. Uthayasuriyan and
1Department of International Business & Commerce, Alagappa University, Karaikudi - 630 004, Tamil Nadu, India. 2Research Scholar, Manonmaniam Sundaranar University, Tirunelveli - 627 012, Tamil Nadu, India.
Email: [email protected],
(Received on 02 September 2011 and accepted on 05 December 2011)
2A. Jayasagar
Abstract - Every organization operates in terms of a set of policies
and norms, which are sometimes clearly laid down, while at other
times, are in the form of traditions and conventions. Thus, an
internal environment is created, consisting of a set of
organizational characteristics, which can be induced in the way
an organization deals with its members. As such, Organizations
Climate (OC) may be defined as the human environment within
an organization was an employee does their work. It is the
shared perception of employees who work and live in the
organization. Organizational climate is the root cause for the
success or failure of every organization. It is the resultant effect of
an interaction of a number of internal variables like structure,
system, culture, leaders' behavior, working conditions and
psychological needs of employees with one another.
Organizational climate can have a major influence on
motivation, productivity and job satisfaction. Climate
determines the action and it creates little expectancy as to
consequences. This article traces the relationship between OC
and the other organizational variables, especially job
involvement, which ultimately determines the performance of
the employees.
Keywords: Job Involvement, Organisational Climate
I. INTRODUCTION
In recent years, several studies were made on
Organizational Climate (OC) and Job Involvement (JI),
regarding the contents and structures of these phenomena,
their relationships to other phenomena, their necessity for Job
Involvement, good / bad organizational performance, etc.
Organizational Climate reflects the struggles, both internal
and external, the type of people who compose the
organization, the work processes, the means of
communication and the exercise of authority within the
individual organization. Further, they recognize that it is easy
to detect differences in the climate of organizations, but it is
difficult to name the dimensions of these differences.
The various aspects of work environment, as affecting
productivity of labour, generalization is neither intended nor
attempted. The fact that organizational conditions are not
going to change their names is well understood, but the fact
that effectiveness of labour in production is dependent on the
perception of the work force is still to be understood. The
efforts are toward understanding the details of OC through the
perception of the men in organization. Within any
organization, there are always some employees, who are more
job involved than others. But, all employees consider their job
to be instrumental in satisfying some of their need.
Differences in their Job Involvement attitudes may influence
employee to look at the same job in different perspectives, and
may direct them to emphasize different kinds of goal
attainments in the job.
II. RESEARCH STUDIES IN OC AND JI
The importance of a conducive OC is generally conceded
by most organizations, but they usually provide a large
number of material rewards to create favourable service
conditions, eg., attractive salary, comfortable working
conditions, job security, and other service benefits. The
concepts of organizational culture, internal work climate, and
management values remain largely elusive and their links with
administrative practices and procedures are further uncertain.
Kumar (1979) has observed negative relationship between the
perception of OC and some self-actualization factors on the
variables that arouse need achievement and positive
correlations between those that arouse need affiliation.
Subha and Anantharaman (1981) found that a deficiency
was felt in the fulfillment of needs and that the correlations
between need satisfaction and OC variables were negative.
This shows that when needs are not met, the perception of OC
is negative. Dhingra and Pathak (1973) analysed the
differences among managers working in different kinds of
organizational cultures. The study was undertaken in two
types of organization: (a) proprietary and partnership firms,
and (b) subsidiaries of foreign companies. The study showed
significant differences between the managers of the two types
of organization with regard to their socio-personal
background, values and work-related attitudes, and
behavioural preferences for certain simulated job incidents.
Akhtar and Pertonjee (1967) examined the effectiveness of
different types of organizational structure in terms of job
1AJMS Vol.1 No.1 January - June 2012

adjustment and satisfaction. The findings showed that job
adjustment and satisfaction with work were positive in the
employee oriented structure and climate.
Menon (1971) has found that supervisors feel responsible
and committed when they experience satisfaction due to
opportunities in the job for learning new things and the
challenging nature of work in an atmosphere characterized by
a high degree of support from supervisors. This support from
supervisors seems to be instrumental in bringing about a sense
of responsibility and commitment to work, especially on the
part of subordinates who do not look for detailed work
instructions.
Jayalakshmi Indiresan (1981) has analyzed the
relationship between the OC dimensions and the satisfaction
of five need areas namely, physical, social, esteem, autonomy
and self-actualization. The data were obtained from a sample
of 158 teachers from nine different higher technological
institutions from all parts of India. Analysis of data has shown
that there is a positive and significant correlation between the
overall perception of OC and overall need satisfaction.
Kumar and Srivastava (1979) have studied the modes of
conflict resolution adopted by 110 managers and their
relationship with OC. They have found that the managers
present a well-defined value hierarchy of strategies of conflict
resolution considered desirable, which might be associated
with the nature of the organizational environment.
Meera Komarraju (1981) analyzed the relationship
between climate and productivity. Data were collected from a
sample of 70 workers of a medium-sized, public sector
industrial organization. The results suggested that the
perception of OC did not influence productivity. That is,
whether the perception of climate was positive or negative, its
effect on the productivity level of the workers was non-
significant. Further, the relationship between perception of
OC and job tenure was also found to be non-significant.
III. RESEARCH PROBLEM
The above recent researches have demonstrated that
effective responses (Job Involvement) to work are related
more directly to structural characteristic (Supervisory and
Non-Supervisory) of the organization than to individual
differences. Individual characteristics, however, have often
been thought to be antecedent to job satisfaction, but relevant
empirical evidence supporting this notion has not been
accumulated. If achievement concern is such an important
factor in the economic development of a country, the next
logical question is how to tap this valuable source or how to
develop this need in this people?.
Some organizations are encouraging employees at lower
levels in the organization to take a much more active role in
how the company is run. This may include easy means to
express ideas to higher level management and involvement in
setting work schedules and goals. The behavior of the human
component plays a pivotal role in maximizing organizational
effectiveness. The concept of Job Involvement determines the
behavior of the human component in the work context, and
maximization of organizational effectiveness depends on the
achievement of the highest level of Job Involvement on the
part of the members of the organization. Thus all efforts
maximizing organizational effectiveness have to be directed
towards improving the level of Job Involvement to the highest
point possible. In this context, it is proposed to undertake a
study to examine the link between perception of climate and
job involvement in order to formulate viable suggestions to
improve job involvement in terms of climate dimensions.
IV. OBJECTIVES
The present study principally aimed at the determinants of
job involvement in terms of climatic dimensions. With this
end in view of the study sharply focuses on the following
objectives:
1. To identify the significant relationship that exists between
OC and level of job involvement;
2. To bring out the major determinants of job involvement in
terms of climatic dimensions for a better overall employee
performance.
V. HYPOTHESES
In order to serve the above stated objectives, the following
hypotheses have been proposed and tested in this study:
H - There is no significant relationship between OC and JI. 1
H There is no significant difference in the determinants of JI 2
between employees of Production and Service
departments.
VI. METHODOLOGY
A. Sources of Data
This study is mainly based on the primary data collected
from the sample respondents with the help of the standardized
questionnaire used by several researchers in the past.
Perception of OC was measured with the help of the
questionnaire developed by Baldev R. Sharma (1987).
Although the questionnaire contains nine dimensions of OC
with three statements for each dimension, it was reduced to
sevenfactors with three statements for each factor. The
2
K. Uthayasuriyan and A. Jayasagar
AJMS Vol.1 No.1 January - June 2012

climatic factors incorporated in the questionnaire are: Pay,
Promotion, Welfare Facilities, Training and Development,
Grievance Handling, Participative Management and
Performance Reward Relationship. For each statement, score
was obtained using the Likert type 5-point scoring system
ranging from to 'Strongly Agree (5) to Strongly Disagree (1)'.
B. Sampling
The respondents for the study were chosen from Packing
India Private Limited, Pondicherry the largest flexible
packaging company in South India, supplying to a wide
variety of customers including HLL, Henkel-Spic, GM Pens,
Britannia, Godrej etc. The sample was obtained after
stratifying the total population into regular and casual. After
stratification, the total population of 230 was ultimately
reduced to 150 regular employees from which the sample
subjects 70, a composite of 30 from Production and 40 from
Service were proportionately and randomly selected,
constituting nearly half of the stratified population.
VII . ANALYSIS OF DATA
In this study, the data were analysed by using statistical
methods like Factor Analysis and Discriminant Analysis.
Factor analysis is a method for determining the number of
structures of the underlying variables among a larger number of
measures. This is a powerful method of statistical analysis that
aims at explaining relationships among numerous variables in
terms of a relatively few underlying factor variants. Further,
Discriminant Analysis is used to study the discriminating
power of those factors of OC on the scores of JI. The
computation was done for the total sample, besides an analysis
carried out with a break-up of respondents of production and
service centres and the results are presented as follows.
The seven dimensions of OC have been separately
processed for inter-correlation and factor analysis to arrive at
the cluster of factors. The principal component factor analysis
method was applied to the inter-correlation matrix of seven
dimensions of OC and the results are rotated using Kaizer's
(1958) varimax criteria. Three-factor solutions emerged for
the total respondents. The results of the pigeon value and
rotated factor analysis are presented in Tables I and II
respectively.
Factor I
It is observed that factors OCF1, OCF2 and OCF5 are
loading high on Factor I. These dimensions and their
corresponding factor loadings are:
0.8937 - Pay (OCF1)
0.5517 - Promotion (OCF2)
0.8494 - Grievance Handling (OCF5)
Factor II
Dimensions OCF3, OCF4 and OCF6 show high loading
on Factor II as presented below:
0.9279 - Welfare Facilities (OCF3)
0.6620 - Training and Development (OCF4)
0.4663 - Participative Management (OCF6)
Factor III
The remaining factor OCF7 has high loading on Factor III.
That is, 0.9196 - Performance Reward Relationship
(OCF7).
Thus, by using inter-correlation matrix and factor analysis
the seven dimensions of OC have been grouped into three
different factors (F1, F2 and F3) for the total respondents as
well for each group of respondents (Production and Service).
The different factors and the variables within a factor with
their corresponding loading scores are presented in Tables III,
IV and V for all respondents, production centre and service
centre respectively.
Subsequently an attempt was made to study whether these
three factors have any influence on the level of involvement.
That is, whether these three factors had the power of
discriminating the extreme group of involved employees. It
was also aimed to identify the major determinant of Job
Involvement among the three factors of climate. The group
difference had been examined, using climate factors through
two- group discriminating analysis. As the 'Z' values are not
statistically significant for the total respondents (Table VI) as
well as for each group of respondents (Production and
Service), it is observed that none of the three factors influences
the level of job involvement (Table VII).
3
The Effectiveness of Organisational Climate on Job Involvement
AJMS Vol.1 No.1 January - June 2012

TABLE I EIGEN VALUES – ALL RESPONDENTS
(N=70)
OC Dimensions
Eigen Value
Percentage of Variance Explained
Cumulative Percentage of
Variance
OCF1
2.5439
36.34
36.34
OCF2
1.3818
19.74
56.08
OCF3
1.0501
15.00
71.08
OCF4 0.9103 13.00 84.09
OCF5 0.5020 7.17 91.26
OCF6
0.3764
5.38
96.63
OCF7
0.2356
3.37
100.00
TABLE II ROTATED FACTOR MATRIX – ALL RESPONDENTS
Sl.
No.
OC Dimensions
Factor Loadings
Communality h2
Factor I
Factor II
Factor III
1
2
3
4
5 6 7
OCF1
OCF2
OCF3
OCF4
OCF5 OCF6 OCF7
0.8937
0.5517
-0.0127
0.1972
0.8494 0.4038 -0.0785
-0.0232
0.3985
0.9279
0.6620
0.1100 0.4663 -0.0142
-0.0249
0.4302
0.1043
-0.4430
0.1127 0.0606 -0.9196
0.7998
0.6482
0.8720
0.6733
0.7462 0.3842 0.8520
Eigen Value (Common Variance)
2.0328 1.6882 1.2547 4.9757
Proportional of Total Variance
0.2904 (29.04%)
0.2412 (24.12%)
0.1792 (17.92%)
0.7108 71.08
Cumulative Variance
(29.04%)
(53.16%)
(71.08%)
Proportion of Common Variance
0.4085 (40.85%)
0.3393 (33.93%)
0.2522 (25.22%)
1.0000 100.00
(N=70)
TABLE III ROTATED FACTOR MATRIX – PRODUCTION RESPONDENTS
S1.No.
OC DimensionsFactor Loadings
Communality h2
Factor I Factor II Factor III
1
2
3
4
5
6
7
OCF1
OCF2
OCF3
OCF4
OCF5
OCF6
OCF7
0.9386
0.5193
-0.0956
0.0705
0.7944
0.7543
-0.1730
0.0307
0.6819
0.6251
-0.0367
0.3830
0.1290
-0.8348
-0.0515
0.0009
0.3362
0.9457
0.2499
0.0524
0.1499
0.88460.73470.51290.90070.84020.58830.7494
Eigen Value (Common Variance)
2.3948
1.7183
1.0977
5.2109
Proportional of Total Variance
0.3421 (34.21%)
0.2455 (24.55%)
0.1568 (15.68%)
0.7444 74.44
Cumulative Variance
(34.21%)
(58.76%)
(74.44%)
Proportion of Common Variance
0.4596
(45.96%)
0.3298
(32.98%)
0.2107
(21.07%)1.0000 100.00
(N = 30)
4
K. Uthayasuriyan and A. Jayasagar
AJMS Vol.1 No.1 January - June 2012

S1. No.
OC Dimensions
Factor LoadingsCommunality
h2
Factor I
Factor II
Factor III
1
OCF1
0.7371
0.1307
-0.1395 0.5798
2
OCF2
0.7756
0.3141
-0.0813 0.7068
3
OCF3
0.1265
0.869
0.1581 0.7962
4
OCF4
0.2758
0.4932
0.6167 0.6996
5
OCF5
0.8702
-0.1057
0.2209 0.8172
6
OCF6
-0.0200
0.8317
-0.1333 0.7100
7
OCF7
-0.0362
-0.0478
0.8937 0.8024
Eigen Value (Common Variance)
1.9958
1.8195
1.2967 5.112
Proportional of Total Variance
0.2851 (28.51%)
0.2599 (25.99%)
0.1852 (18.52%)
0.7303 73.03
Cumulative Variance
(28.51%)
(54.50%)
(73.03%)
Proportion of Common Variance
0.3904 (39.04%)
0.3559 (35.59%)
0.2537 (25.37%)
1.0000 100.00
TABLE IV ROTATED FACTOR MATRIX – SERVICE RESPONDENTS
TABLE V FACTORS OBTAINED FOR DIFFERENT GROUPS OF RESPONDENTS
Respondents Factor I Factor II Factor III
All
Respondents
OCF1 –
0.8937
OCF2 –
0.3517
OCF3 –
0.8494
OCF3 –
0.9279
OCF4 –
0.6620
OCF6 –
0.4663
OCF7 –
0.9196
Production
Staff
OCF1 – 0.9386
OCF5 – 0.7944 OCF6 –
0.7543
OCF2 – 0.6819
OCF3 – 0.6251 OCF7 –
0.8348
OCF4 – 0.9457
Service Staff
OCF1 –
0.7371
OCF2 –
0.7756
OCF5 – 0.8702
OCF3 –
0.8690
OCF6 –
0.8317
OCF4 –
0.6167
OCF7 –
0.8937
H - There is no significant relationship between OC and JIo
Tool Used: Discriminant Analysis
EquationWilks’
LambdaF-Value ‘P’ Value
Overall Wilks’
Lambda
Overall F Value
Overall ‘P’
Value
All Respondents (N = 70)
Factor I
Factor II
Factor III
0.9717
0.9517
0.9464
1.2200
0.5573
0.3821
0.28
0.46
0.54
0.9349 0.7198 0.55
5
The Effectiveness of Organisational Climate on Job Involvement
AJMS Vol.1 No.1 January - June 2012
(N=40)
TABLE VI RESULTS OF DISCRIMINANT ANALYSIS BETWEEN LOW-HIGH LEVEL OF JOB INVOLVEMENT

H - There is no significant difference in the determinants of JI between employees of Production and Service departmentso
Tool Used: Discriminant Analysis
Equation Wilks’ Lambda
F-Value ‘P’ Value Overall Wilks’
Lambda
Overall F Value
Overall ‘P’
Value
Production Department (N = 30)
Factor I Factor II
Factor III
0.7792 0.8223
0.9006
0.4116 1.0439
2.1905
0.53 0.33
0.17
0.7511
1.2253
0.35
Service Department (N = 40) Factor I
Factor II
Factor III
0.9753
0.9010
0.9091
1.4798
0.1489
0.2942
0.24
0.70
0.600.8927
0.6410
0.60
Decision: None of the above factors has discriminating power
on the level of Job involvement. However, it is observed that
Factor III has the discriminating power in the Job involvement
of Production staff if the rejected region is relaxed to 20 %.
VIII. MAJOR FINDINGS
Based on the above analyzed results, the important
observations are recorded as follows:
1. In general, no significant relationship is observed
between the respondents' perception scores on OC and
their level of job involvement, which indicates that
perception of OC does not influence job involvement.
2. However, among the various dimensions of OC, it was
observed that the factor 'Training and Development'
influence the level of job involvement for the
respondents as a whole.
3. There is no significant difference in the impact of OC
on job involvement for the respondents as a whole.
4. Difference in the impact of OC on job involvement also
exists between the two groups of the respondents,
Production and Service. It is mainly due to the factor
'Promotion'.
IX. CONCLUSION
Though, there exist no relationship between the overall
scores of OC and Job Involvement, one of the factors of OC
namely 'Training and Development' influences the level of job
involvement. Likewise, the factor, 'Promotion' has the
discriminating power between the two groups of respondents,
namely Production and Service departments, which indicates
that employees of service centers are happier with the
promotional policies and opportunities compared to the
employees of production centre. Therefore, it is suggested that
the organization could improve the climate by modifying
some of its Training and Development methods to the
expectations of the employees. There should be sufficient
scope for promotion and career advancement. Due
recognition should be given to efficient workers,
distinguishing them from average workers to motivate the
employees, which will enable the organization to improve the
level of Job Involvement and thereby the performance of the
employees.
REFERENCES
1. Baldev.R.Sharma, Not by Bread Alone : A Study of OC and Employer-
Employee Relations in India , Shri Ram Centre for Industrial Relations and
Human Relations. New Delhi, 1987.
2. U.C. Davis, “Performance Measurement-Organizational Climate”. Staff
Workload issues Task Force's Report and Recommendation, December
1998.
3. H.F. Kaizer, “The Varimax Criterian for Analytic Rotation in Factor
Analysis”, Psychometrics, Vol. 23, pp. 187-200, 1958.
4. R.N. Kanungo, “Measurement of Job and Work Involvement”, Journal of
Applied Psychology, Vol. 67, No.3, pp. 341-349, 2002.
5. Knoop, “Job Involvement. Anelisive concept”, Psychological Reports,
Vol.59, pp.451-456, 2006.
6. Meera Komarraju, “OC and Productivity”, Managerial Psychology,
Vol.2,No.1, pp.61-68, 1981.
7. S. Sharma, “A Study of Relationship between OC with Organizational
Commitment and Psychological weil-Being”, Unpublished Ph.D. Thesis,
Himachal Pradesh University, 1989.
8. O.P. Dhingra and V.K. Pathak, “Organizational Culture and Managers”,.
Indian Journal of Industrial Relations, Vol. 8, pp. 387-405, 1973.
9. Jayalakshmi Induresan, “Some correlates of perception of Organizational
Climate”. Managerial Psychology, Vol.2, No.2, pp.40-43, 1981.
10. Meera Komarraju, “OC and Productivity”, Managerial Psychology, Vol.2,
No.1, pp.61-68. 1981.
11. A.S. Menon Performance effects , Shri Ram Centre for Industrial Relations
and Human Resources. New Delhi, Unpublished Manuscript, 1971.
12. V.Subha and R.N. Anantharaman, “OC and Need Satisfaction”, Indian
Journal of Applied Psychology, Vol. 18, No. 1, pp.8-10, 1989.
6
K. Uthayasuriyan and A. Jayasagar
AJMS Vol.1 No.1 January - June 2012
TABLE VII RESULTS OF DISCRIMINANT ANALYSIS BETWEEN LOW-HIGH LEVEL OF JOB INVOLVEMENT FOR PRODUCTION AND SERVICE DEPARTMENTS

Human Resources for Diseases Control: Administrative Function or Strategic Priorities
1 1 2 3Farhad Ali Belaynew Wassie , Alessandro Greblo and Purnima Bhoi,
1International Public Health Consultant, IPE-GLOBAL,New Delhi -110 016, India 2Head School of Public Health, College of Medicine and Health Sciences, University of Gondar, Ethiopia
3Institute of Public Health, University of Heidelberg, GermanyE-mail : [email protected],
(Received on 05 September 2011 and accepted on 08 December 2011)
Abstract - The health sector is one of the most challenged sectors
in developing countries given to the shortage of trained
manpower particularly in the developing countries. Human
resource is a very important aspect of any functioning health
system. However this aspect is often neglected in the development
of the health system and when it comes to the disease control
programmes not enough importance is given to this aspect.
Generally human resource in health is often ignored and just seen
as an administrative function in disease control programmes.
This affects the overall effectiveness of the programmes in terms
of its impact on disease control. We observe an acute shortage of
trained manpower especially in the developing countries. There
are several reasons of such a crisis like situation in human
resources in health system. Among them some are like HIV/AIDS
Epidemic, Training Capacity, Brain drain, Poor working
conditions and Remuneration. Especially the HIV/AIDS control
programmes have suffered a lot due the shortage of trained
manpower particularly in countries where HIV is among the
main health problems. However there are ways in which such
problems can be addressed to ensure the sustainability of HIV
control and other disease control initiatives in developing world
to reach near to the Millennium Development Goals (MDG
–particularly Goal-6) in health. In this paper authors discuss the
evidence based solutions to the problem of human resource in
health sector to combat HIV/AIDS and other diseases in
developing countries. Some of the initiative to address the
problem may be improving the training capacity, improving use
of available skills, staff retention and support, recognizing the
health workers rights and putting them first along with taking
care of administrative issues involved in the management of the
human resources.
Keywords: Health, Health and Human Resource, Human
Resource Crisis, Disease Control, HIV/AIDS
I. INTRODUCTION
The health sector is one of the most challenged sectors in
developing countries given to the shortage of trained
manpower. For instance, the density of total health workforce
in South – East Asia is 4.3 per 1000 population. In Africa the
situation is even worst where there are 2.3 total health
workforce is available for every 1000 population. On the other
hand it is 24.8 for America and 18.9 for Europe. In Asia and
Africa the majority of these health workers are lowly skilled
workers. The disproportionate burden of disease, disability
and death in poor countries is caused by, and aggravated by
numerous complex factors. There is a consensus that the
inadequate number of health workers is the most important
factor in the crisis of health care delivery in poor countries.
Weak health systems, rapid population growth, corruption,
poverty and poor health financing by central governments
only worsen the situation.
Moreover, due to the interaction of widespread poverty,
breakdown of health services and the HIV/AIDS epidemic,
and several other factors, there has been sharp increase in
communicable diseases. At the same time, there has been
another rise in cases of lifestyle-related diseases like heart
disease and diabetes especially in the urban areas of these
countries. HIV/AIDS, the resurgence of TB, and malaria have
dramatically increased the number of patients in need of health
services. These three diseases alone have increased demand
for hospital admissions, and increased the length of stay in
hospitals, thus creating more demand for labour-force in
health facilities. In addition, health staff themselves have also
been seriously afflicted, especially by HIV/AIDS, leading to
more staff absence from work or death, hence poor service
delivery, especially in sub Saharan Africa. As an illustration,
in 1997, Malawi lost 44 nurses to HIV/AIDS, representing
44% of all nurses trained. By comparison, Zambia lost 185
nurses in 1999, representing 38% of all nurses trained in
government institutions that year. All these add to the strain
felt by the over burdened health workers in these countries,
and contribute to the human resource crisis.
The human resource is the first and foremost important
aspect of any disease control programme and thus for
HIV/AIDS. Many disease control programmes in the
developing countries suffer negligence of human resource
aspect. HIV/AIDS programme and scaling up of the
antiretroviral therapy is particularly such a case in Sub-
Saharan Africa and in Asia in this respect. In the context of
Asia, countries such as India, Nepal, Bangladesh, Pakistan
and Sri Lanka also suffer the shortage of the trained human
resources in health.7
AJMS Vol.1 No.1 January - June 2012

There is worldwide shortage of the trained manpower in
health sector. This shortage is highest in the countries where
health problems are more. The health sector is not the priority
in many developing countries and the public spending in
health is very low. These low income countries have to depend
upon the donor agencies for supporting the health
programmes. The donors have not shown interest in investing
in the human resource problems in these developing
countries. The concern of the donors is that they do not want to
increase the dependency on the external donations.
The estimation of the global shortage of the health workers
is more than 4 million. A recent study reveals that the Sub-
Saharan African countries must nearly triple their current
number of workers by adding the equivalent of one million
workers through retention, recruitment, and training if they
are to come close to approaching the Millennium
Development Goals (MDGs) for health particularly the
HIV/AIDS related MDG (Goal-6). The scenario of Southeast
Asia is further more dramatic where there is a shortage of
trained health human resource coupled by the mal-distribution
of the health work force in rural areas the shortage is more than
the urban and semi-urban areas. For instance, maternal health
is a major public health problem in India and the role of
emergency obstetric care is critically important for reducing
mater mortality ratio. Lack of trained professionals to deal
with the issues of emergency obstetric care is a major
bottleneck in bringing women to health institutions for
delivery and there by curtailing the mother to child
transmission of HIV in India. India faces acute shortage of
obstetricians. The shortage is further more in rural areas . In
the recent years India has suffered shortage of all most all
cadre of trained human resource due to fiscal difficulties and
civil service reform.
According to Charles Hongoro human resources in health
is like the heart of the health system in any country, the most
important aspect of health care systems, and a critical
component in health policies. The country specific
sustainable solutions to human resource problems have to be
found in order to achieve targets of disease control. In health
system in each country is different and the context in which
the health system functions is also unique.
The health human resource problems should be seen in the
context of a specific health system and local solution should
be aimed keeping in mind the future health demand of the
population and it should be made responsive to the needs of
the people in general and to control various endemic diseases
and HIV/AIDS in particular where HIV forms a major health
problem. In this manuscript the authors have attempted to
identify the specific reasons of the crisis like situation in health
human resources and suggested some means and ways to
address these problems in the context of developing counties.
II. METHODOLOGY
The published research work was reviewed on the topic
using Science Direct data base. The keywords used for
searching the research papers on the topic were – 'health
human resource', 'HIV/AIDS and human resource and human
resource crisis in developing countries'. The first search
resulted in 216595 journal articles, 21184 book articles and
3832 reference work. The research with second keyword
resulted in 14569 journal articles, 1967 book articles and 425
reference works. The search with the third key word resulted in
19854 journal articles, 2895 book articles and 691 reference
works. This search resulted in several papers which were
addressing similar issues under various contexts. Only those
papers selected finally for review which were considered more
close to the topic. For screening the papers further following
criteria were used – inclusion of both qualitative and
quantitative research papers, articles of last 10 years, relevant
to Africa and Asia and having the words such as health, human
resource, crisis, skill etc. This was done manually. As a result
of this the number of articles reduced significantly to the tune
of 57. The abstracts of these 57 papers were printed and read
thoroughly. During this process those papers were marked and
selected that discus about the problems of disease control
programmes, HIV/AIDS, human resources crisis and solution
to the shortage of trained health human resources in the
context of developing countries in Asia and Africa. This
further reduced the number of selected articles to the tune of 9.
These 9 full articles were downloaded and printed and
thoroughly read. Apart from this database search, the some
reports relevant to the topic in the context of Africa and Asia
were also searched using Google Search.
The authors studied the papers, internalized the findings
and commented and interpreted the results based on their field
and academic experiences.
III. RESULT AND DISCUSSION
A. Human Resource Situation in Developing World
We search results that there is an acute shortage of all
cadres of trained health human resources. The shortage is
further acute in the rural areas. WHO (year 2006) estimated
that there are 57 countries facing critical shortage of health
workers. Over half of them are in Africa and rest in Asia and
Latin America. The situation of health workforce in Asia is
also similar but relatively better. In Africa there is an acute
shortage of human resource for scaling up of antiretroviral
8
Farhad Ali, Belaynew Wassie, Alessandro Greblo and Purnima Bhoi
AJMS Vol.1 No.1 January - June 2012
therapy. In India the shortage of trained workforce in
antiretroviral therapy is a major constraint and as a result the
therapy is available only at the tertiary level of the care. This
limits the geographic access of antiretroviral therapy. This
also increases the cost of the therapy in terms of loss of wages,
transport to the health facility and expenses of patient's
companion.
A current situation of the physicians and nurses is shown in
some of the developing countries in Asia and Africa in the
following table.
TABLE I PHYSICIANS AND NURSES PER 100 000 POPULATION IN SOME OF THE DEVELOPING COUNTRIES IN ASIA AND AFRICA
S. No.
CountryPhysicians per
100 000 Population
Nurses per 100 000
Population
1 Bangladesh 23 24
2 India 51 61
3
Pakistan
66
47
4
Sri Lanka
43
79
5
Niger
3
27
6
Bolivia
73
32
7
Papua New Guinea
5
53
8
Ethiopia[10]
2.7
22
9
Global Average
170
399
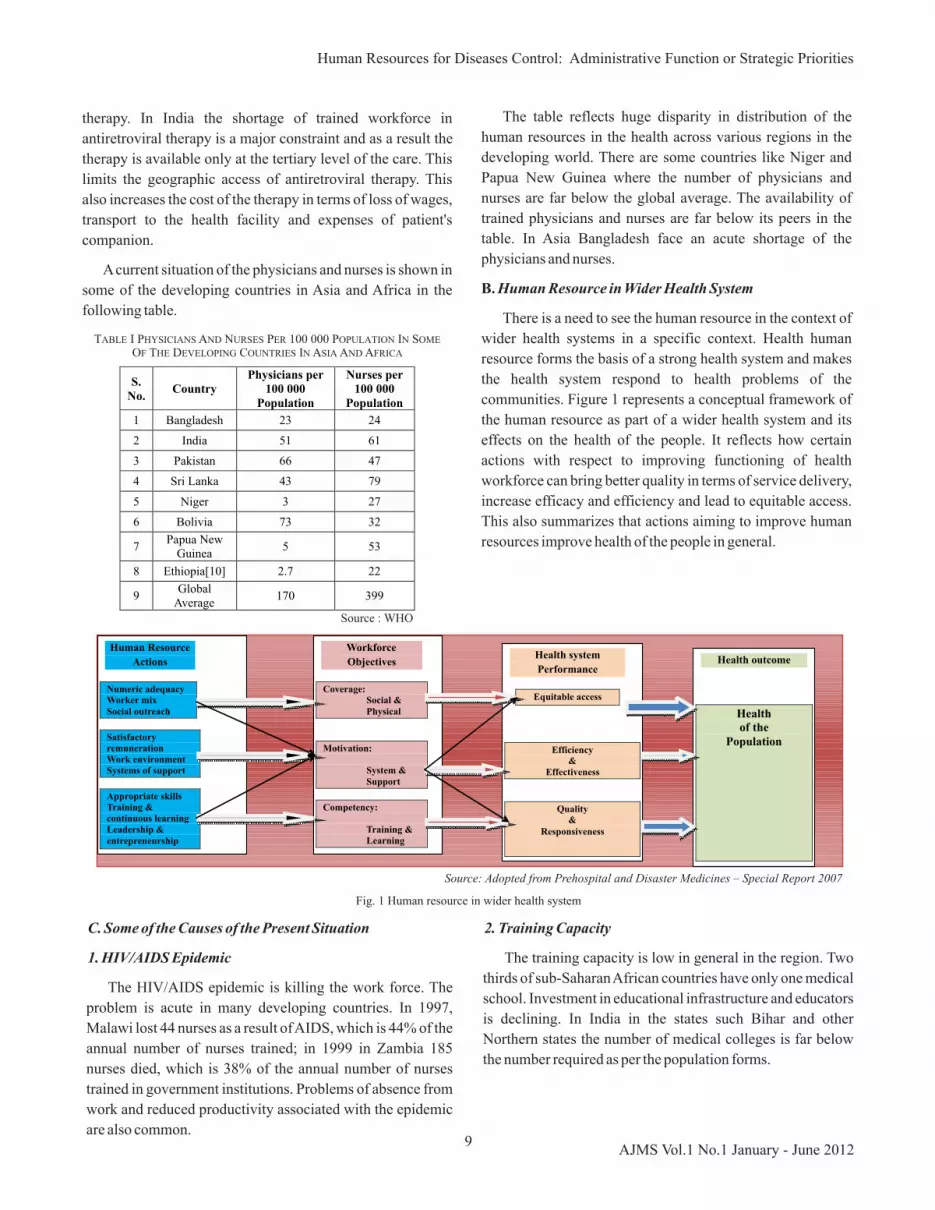
The table reflects huge disparity in distribution of the
human resources in the health across various regions in the
developing world. There are some countries like Niger and
Papua New Guinea where the number of physicians and
nurses are far below the global average. The availability of
trained physicians and nurses are far below its peers in the
table. In Asia Bangladesh face an acute shortage of the
physicians and nurses.
B. Human Resource in Wider Health System
There is a need to see the human resource in the context of
wider health systems in a specific context. Health human
resource forms the basis of a strong health system and makes
the health system respond to health problems of the
communities. Figure 1 represents a conceptual framework of
the human resource as part of a wider health system and its
effects on the health of the people. It reflects how certain
actions with respect to improving functioning of health
workforce can bring better quality in terms of service delivery,
increase efficacy and efficiency and lead to equitable access.
This also summarizes that actions aiming to improve human
resources improve health of the people in general.
Human Resource
Actions
Numeric adequacy
Worker mixSocial outreach
Satisfactory remuneration Work environment Systems of support
Appropriate skills Training & continuous learning
Leadership & entrepreneurship
Workforce
Objectives
Coverage:
Social &
Physical
Motivation: System & Support
Competency:
Training &
Learning
Health system
Performance
Equitable access
Efficiency &
Effectiveness
Quality
&
Responsiveness
Health outcome
Healthof the
Population
C. Some of the Causes of the Present Situation
1. HIV/AIDS Epidemic
The HIV/AIDS epidemic is killing the work force. The
problem is acute in many developing countries. In 1997,
Malawi lost 44 nurses as a result of AIDS, which is 44% of the
annual number of nurses trained; in 1999 in Zambia 185
nurses died, which is 38% of the annual number of nurses
trained in government institutions. Problems of absence from
work and reduced productivity associated with the epidemic
are also common.
2. Training Capacity
The training capacity is low in general in the region. Two
thirds of sub-Saharan African countries have only one medical
school. Investment in educational infrastructure and educators
is declining. In India in the states such Bihar and other
Northern states the number of medical colleges is far below
the number required as per the population forms.
9
Human Resources for Diseases Control: Administrative Function or Strategic Priorities
AJMS Vol.1 No.1 January - June 2012
Source : WHO
Fig. 1 Human resource in wider health system
Source: Adopted from Prehospital and Disaster Medicines – Special Report 2007

3. Brain Drain
The brain drain in these countries is high. This is both
internal as well as external. Professional bodies that protect the
interests of their members have played a part in defending
training that promotes a level of specialization inappropriate
to the health needs of low and middle income countries. One of
the main reasons of the brain drain (internal and external) is the
poor HR policies in the health sector of these countries.
4. Poor Working Conditions and Remuneration
A survey of African health workers intending to migrate or
already migrated showed that issues of salary and living
conditions dominated, with 80% of health workers surveyed
in Cameroon citing living conditions, and 72% in Uganda and
89% in Senegal citing salary as reasons for intending to leave
their country. The living and working conditions in Asia and
particularly in the countries such as India and Bangladesh are
very poor.
5. Skill Imbalance
Skill imbalance is a major issue particularly in the context
of the developing countries. The effect of the colonial
governments' medical education is prominent. The medical
education should be according to the health needs of the
people in specific country.
Skill imbalance in the workforce created lot of
inefficiencies in many developing countries and these
countries should change their plan to develop their workforce
that is closer to the public health needs in these countries.
6. Mal-Distribution and Poor Knowledge Base
Across various regions in the developing world, the
concentration of the health service providers is around the
cities and urban areas. In the rural areas in India the doctors
and nurses are very few. The retention of the health workforce
in the rural areas is a huge challenge.
The knowledge base of the workforce is poor. It means that
the data is lacking with respect to the knowledge and skills
level of the workforce. It is a main constraint in planning of the
programmes and policy for training and further development
of the workforce.
D. Solution to the Problem of Human Resource Crisis
1. Improving the Training Capacity
HIV/AIDS and TB have not only affected the general
population but these disease conditions have also affected the
health workforce. Malawi has suffered in terms of loss of
human resource due the HIV/AIDS. Other factor that affected
the availability of the human resource is brain drain.
Increasing the training capacity seems be promising in terms
of improving the supply of the trained manpower. Two
important factors that need to be considered are sustainability
of the resources for increasing the training capacity and ways
and means to ensure that the increased flow of trained
manpower is retained and absorbed in the health system of the
country.
2. Improving Use of Available Skills
Auxiliary cadres are often less employable abroad,
especially if the qualifications involved do not easily translate
into those used in the developed world, such as medical
assistant or clinical officer. The skills enhancement of this
cadre can be useful. In Africa, for example, nurse aids,
medical assistants (with more basic training than a nurse), and
clinical officers (the equivalent of medical assistants in
Tanzania and Uganda) are doing essential medical tasks,
especially in rural areas, despite the existence of professional
restrictions and regulations. A good example is Malawi, where
clinical officers are a major resource in surgical procedures
and medical care. Task shifting is a major debate in many
developing countries especially in Sub-Saharan Africa. Many
believe that it is not a panacea and undermine the health
system development and would weaken the health system in
long run. Task Shifting and scale up of ART in Malawi
through non-physicians clinicians resulted providing
lifesaving drugs to 130 488 patients .
Health services such as condom distribution, food and
hygiene counseling, distribution of insecticide impregnated
bed nets, and nutrition education can safely be provided by
trained community workers.
3. Staff Retention and Support
The way the health system is funded, organized, managed,
and regulated affects heath workers' supply, retention, and
performance. There are no universal formula for staff
retention and support. In some countries incentive has worked
and in some other countries it did not.
The idea of giving incentives to the workers who work in
difficult settings is being proposed in many settings. This has
shown some good results in terms of retaining the staff.
However the legal bonding of the workers to stay in their job
has not shown good results in many parts of the world and
professional bodies have opposed it. Interestingly these
strategies have worked in Thailand to retain the health
workers where bonding of the doctors along with incentives
was used.
10
Farhad Ali, Belaynew Wassie, Alessandro Greblo and Purnima Bhoi
AJMS Vol.1 No.1 January - June 2012

4. Recognizing the Health Workers Rights and Putting them
First
The workers are very important for any diseases control
program. Strong leadership, sustained finances and political
will are needed to ensure that workers get what they need to
deliver at the workplace.
5. Development of National Workforce Strategic Plans
All countries should develop national workforce strategic
plans to guide human resource development and should
examine and increase their investments in appropriate
education, deployment, and retention of human resources.
National level initiatives need to be taken in this direction and
country specific policy on health human resources is
necessary.
6. Combating Health Emergencies
Certain health conditions have not only affected masses
but also affected a huge number of the health workers.
HIV/AIDS and TB are among those health conditions. These
two health conditions particularly resulted in increase in the
absenteeism and deaths. Safety of the staff against HIV/AIDS
and TB is crucial. It is very important that the use of universal
precaution is encouraged among the health workers and
appropriate environment should be developed for the same.
7. Building Knowledge Base and Simultaneous Learning
It is important that knowledge and continuous learning of
the health workers is encouraged and promoted. One such
example of building knowledge base at district level health
planning and management is there in India. The Public Health
Resource Network which is a networking and capacity
building programme running in four state of India is a good
example. However its impact on retention on the health
workers is yet to be evaluated.
8. Non - Financial Incentives
The experiences from the field show that across various
countries under different circumstances non-financial
incentives in the form of acknowledgement, recognition,
career development have helped in increasing the motivation
of the staff and retention. This is very important in realizing
the objectives of the project.
IV. CONCLUSION
The development of the health system is very critical to
address the health human resource crisis. All the developing
countries should evolve an appropriate action plan to
strengthen their health system. Country specific strategic
investment should be made in developing human resources.
There is a need of a national policy on the human resources
that clearly defines the strategy to recruit, deploy, retain and
develop human resources.
It can be concluded that in the developing countries the
acute shortage of the human resource is an important issues
with respect to sustainability of the disease control and making
health services responsive to people's need. Country specific
strategies need to be developed and understood as a strategic
function rather than administrative routine.
REFERENCES
[1] B. Samb, F. Celletti, J. Holloway, W. Van Damme, K. M. De Cock, and
M. Dybul, "Rapid expansion of the health workforce in response to
the HIV epidemic.," The New England journal of medicine, Vol. 357,
No. 24, pp. 2510-4, Dec. 2007.
[2] Commission for Africa Report. 2005, pp. 40.
[3] K. Kober and W. Van Damme, "Public sector nurses in Swaziland: can
the downturn be reversed?," Human resources for health, Vol. 4, pp. 13,
Jan. 2006.
[4] C. Hongoro and B. McPake, "How to bridge the gap in human resources
for health.," Lancet, Vol. 364, No. 9443, pp. 1451-6.
[5] D. Palmer, "Tackling Malawi's Human Resources Crisis," Reproductive
Health Matters, Vol. 14, No. 27, pp. 27-39, 2006.
[6] C. Kanchanachitra et al., "Human resources for health in southeast Asia:
shortages, distributional challenges, and international trade in health
services.," Lancet, Vol. 377, No. 9767, pp. 769-81, Feb. 2011.
[7] D. Mavalankar, A. Singh, R. Bhat, A. Desai, and S. R. Patel, "Indian
public-private partnership for skilled birth-attendance.," Lancet, Vol.
371, No. 9613, pp. 631-2, Feb. 2008.
[8] The Health Sector Resour esource Human R esour ce Crisis in Africa: An
Issue Paper, pp.40, 2003.
[9] R. Zachariah et al., "Task shifting in HIV/AIDS: opportunities,
challenges and proposed actions for sub-Saharan Africa.," Transactions
of the Royal Society of Tropical Medicine and Hygiene, Vol. 103, No. 6,
pp. 549-58, Jun. 2009.
[10] "Country Health System Fact Sheet 2006 Ethiopia," World Health.
World Health Organisation, pp. 1-8, 2006.
[11] "Human Resources and Management of Health Systems," in Human
Resources and Management of Health Systems, 2008, pp. 12, 2008.
[12] A. D. Harries, E. J. Schouten, and E. Libamba, "Scaling up antiretroviral
treatment in resource-poor settings.," Lancet, Vol. 367, No. 9525, pp.
1870-2, Jun. 2006.
[13] L. Chen et al., "Human resources for health: overcoming the crisis.,"
Lancet, Vol. 364, No. 9449, pp. 1984-90.
11
Human Resources for Diseases Control: Administrative Function or Strategic Priorities
AJMS Vol.1 No.1 January - June 2012
FII Flows and Indian Equity Market Performance P. Karthikeyan and T. Mohanasundaram
School of Management Studies, Kongu Engineering College, Perundurai, Erode - 638 052,
Tamil Nadu, India.
E-Mail: [email protected], [email protected]
(Received on 10 September 2011 and accepted on 15 December 2011)
Abstract -This study mainly focuses on the FII flows in India and
its impact on Indian equity market viz. BSE, NSE and S&P CNX
500. The data used for the study is secondary in nature. The study
period is 10 years i.e., from 2001 to 2010. Literature collection
and review helps the researcher to get the knowledge on the
research topic and proceedings. Research design used in the
study is analytical research and the statistical tools used are
Correlation, Regression and Simple percentage. The study shows
that there is a positive relationship between the FII flows and
Indian equity market performance but the impact is not
significant. This makes the researcher to conclude that Indian
equity market performance is not only depending upon FIIs but
also other unexplained factors like domestic investors, inflation,
interest rate, government policy etc.
Keywords: Foreign Institutional Investors, Sensex, Nifty, Capital
Flows, Investment
I. INTRODUCTION
Any investment flowing from one country into another is
foreign investment. The Government of India differentiates
cross-border capital inflows into various categories like
foreign direct investment (FDI), foreign institutional
investment (FII), non-resident Indian (NRI) and person of
Indian origin (PIO) investment. Inflow of investment from
other countries is encouraged since it complements domestic
investments in capital-scarce economies of developing
countries. Foreign investments not only help in creating
additional economic activity and employment generation but
also facilitate flow of technology in to our country and help the
economy to become more competitive. India opened up to
foreign investments gradually over the past two decades,
especially since the landmark economic liberalization of
1991. Initially, Indian government holds a higher control on
foreign investments and slowly the government has reduced
controls on foreign trade and investment. Higher limits on
foreign direct investment were permitted in a few key sectors,
such as automobiles, textiles, telecommunications etc.
However, tariff spikes in sensitive categories including
agriculture are still hindering the foreign access to India's vast
and growing market.
FIIs have been allowed to invest in the Indian capital
market since September 1992 when the guidelines for Foreign
Institutional Investment were issued by the Government. The
Foreign Institutional Investors (FIIs) have emerged as
important players in the Indian equity market in the recent past
with a contribution of nearly 60% of the total foreign
investment. FIIs include asset management companies,
pension funds, mutual funds, investment trusts as nominee
companies, incorporated/institutional portfolio managers or
their power of attorney holders, university funds, endowment
foundations, charitable trusts and charitable societies. FIIs can
buy/sell securities on Indian stock exchanges, but they have to
get registered with stock market regulator Securities Exchange
Board of India (SEBI). They can also invest in listed and
unlisted securities outside stock exchanges if the price at which
stake is sold has been approved by RBI. No individual FII/sub-
account can acquire more than 10% of the paid-up capital of an
Indian company.
The FII inflows into Indian equity market can be classified
in to two ways viz., Primary market and secondary market. The
FII inflow to primary market in India comes mainly through
the conversion of foreign currency convertible bonds
(FCCBs), private placement to qualified institutions
placements (QIPs), initial public offers (IPOs), follow-on
overseas offers, conversion of warrants and preferential offers.
As far as the secondary market is concerned, the significance of
FIIs is every much evident as one of the familiar reasons
offered by the market analysts may be “FIIs fuel rally” at the
time of market rises and “Market melts due to FIIs selling” at
the time of down trend. To fasten the economic performance
FIIs role is inherent one for developing nations.
II. OVERVIEW OF INDIAN STOCK MARKET
The working of stock exchanges in India started in 1875.
BSE is the oldest stock market in India. National Stock
Exchange comes second to BSE in terms of popularity. BSE
and NSE represent themselves as synonyms of Indian stock
market. The 30 stock sensitive index or Sensex was first
compiled in 1986. The Sensex is compiled based on the
performance of the stocks of 30 financially sound benchmark
companies. In 1990 the BSE crossed the 1000 mark for the
12AJMS Vol.1 No.1 January - June 2012

first time. It crossed 2000, 3000 and 4000 figures in 1992.
The reason for such huge surge in the stock market was the
liberal financial policies announced by the then financial
minister Dr. Manmohan Singh. The up-beat mood of the
market was suddenly lost with Harshad Mehta scam. It came
to public knowledge that Mr. Mehta, also known as the big-
bull of Indian stock market diverted huge funds from banks
through fraudulent means. He played with 270 million
shares of about 90 companies. Millions of small-scale
investors became victims to the fraud as the Sensex fell flat
shedding 570 points. To prevent such frauds, the
Government formed The Securities and Exchange Board of
India, through an Act in 1992. SEBI is the statutory body that
controls and regulates the functioning of stock exchanges,
brokers, sub-brokers, portfolio managers investment
advisors etc. SEBI oblige several rigid measures to protect
the interest of investors. Now with the inception of online
trading and daily settlements the chances for a fraud is nil,
says top officials of SEBI.
India, after United States hosts the largest number of listed
companies. Global investors now ardently seek India as their
preferred location for investment. Once viewed with
scepticism, stock market now appeals to middle class Indians
also. The past incidents that led to growing interest among
Indian middle class are the initial public offers announced by
Tata Consultancy Services, Maruti Udyog Limited, ONGC,
Reliance and big names like that. Good monsoons always
raise the market sentiments. A good monsoon means
improved agricultural produce and more spending capacity
among rural folk. The bullish run of the stock market can be
associated with a steady growth of around 6% in GDP, the
growth of Indian companies to MNCs, large potential of
growth in the fields of telecommunication, mass media,
education, tourism and IT sectors backed by economic
reforms ensure that Indian stock market continues its bull run.
The following chart shows India's average GDP growth rate
over the period of time.
Source: www.tradechakra.com
Fig.1 India's average GDP Growth rate
III. PROBLEM IDENTIFICATION
In the recent past, investments made in the Indian equity
market have seen a huge surge. Predominantly, foreign
investments in India are rising. Among the investments from
foreign nations, FIIs plays a vital role in the Indian equity
market as they are the main source of foreign investments in
India. This induced the researcher to study the relationship
between FII flows and Indian Equity market performance. The
FII's contribute a major chunk of volumes on the Indian
bourses and this in turn impacts the market moves.
This research paper studies the relationship between FIIs
investment and stock indices. For this purpose India's two
major indices i.e., Sensex and S&P CNX Nifty along with
S&P CNX 500 are selected. These indices, in a way, represent
the true picture of India's stock markets. So this paper reveals
the impact of FII on the Indian capital market. There may be
many other factors on which a stock index may depend i.e.,
Government policies, budgets, bullion market, inflation,
economic and political condition of the country, FDI, Foreign
exchange rate etc but, for this study, only one independent
variable is selected i.e., Foreign Institutional Investors (FIIs).
IV. OBJECTIVES
1. To study the Foreign Institutional Investor (FII) flows
into India and its impact on Indian equity market viz
BSE and NSE along with the S&P CNX 500 index;
2. To find the relationship between the FIIs equity
investment pattern and Indian stock indices.
V. LITERATURE REVIEW
Krishna Reddy Chittedi (2008) analyzed the performance
of the Sensex Vs.FIIs in Indian stock market. The study shows
that the liquidity as well as volatility was highly influenced by
FII flows. FIIs are significant factor determining the liquidity
and volatility in the stock market prices.
Dr.Tanupa Chakraborty (2007) has examined the Foreign
Institutional Investment (FII) flows, i.e., capital flows across
national borders, to emerging market economies (EMEs). The
empirical study has been undertaken to throw some light on
the direction of causality between FII flows and Indian stock
market returns using data on both the variables from over the
period April 1997-March 2005. The study shows that BSE
National Index return series show greater variability than net
FII flows. It may be noted that as information flows in
financial markets drive both stock market returns and
investment flows.
13
FII Flows and Indian Equity Market Performance
AJMS Vol.1 No.1 January - June 2012

Mohd. Aamir Khan, Rohit, Siddharth Goyal, Gaurav
Agrawal (2010) investigated the causal relationship between
Nifty and FIIs' net investment for the period January, 1999 to
February, 2009 using daily data. Correlation between FII and
Nifty was the maximum in the bear phase as compared to all
other phases. Further they found the causality between Nifty
returns and FIIs net investment. Granger Causality
highlighted unidirectional relationship of Nifty over FIIs
during each phase in the long run. Variance decomposition
and impulse response functions determined the short term
causal relationship which reveals that there was only positive
unidirectional causality from Nifty to FIIs. No reverse
causality was observed in any phase.
Paramita Mukherjee, Suchismita Bose and Dipankor
Coondoo (2002) explored the relationship of Foreign
Institutional Investment (FII) flows to the Indian equity
market with its possible covariates based on a daily data-set
for the period January 1999 to May 2002. Some interesting
results: viz., (1) the FII net inflow is correlated with the return
in Indian equity market and the former is more likely to be the
effect than the cause of the Indian equity market return; (2) so
far as investment in Indian equity market is concerned,
foreign investors do not seem to be at an informational
disadvantage compared to domestic investors; and (3) the
Asian crisis marked a regime shift in the sense that in the post-
Asian crisis period the return in the Indian equity market
turned out to be the sole driver of the FII inflow, whereas for
the pre-Asian crisis period other covariates reflecting return in
other competing markets, urge for diversification etc., were
also found to be correlated with FII net inflow.
Rajesh Chakrabarti (2001) studied the FII flows to India
and analysed the FII flows and their relationship with other
economic variables and arrive at the following major
conclusions:
(a) While the flows are highly correlated with equity
returns in India, they are more likely to be the effect than the
cause of these returns; (b) The FIIs do not seem to be at an
informational disadvantage in India compared to the local
investors; (c) The Asian Crisis marked a regime shift in the
determinants of FII flows to India with the domestic equity
returns becoming the sole driver of these flows since the crisis.
Given the thinness of the Indian market and its susceptibility
to manipulations, FII flows can aggravate the equity market
bubbles, though they do not actually start them.
VI. RESEARCH METHODOLOGY
Historical data for the past 10 years have been used and
analysed to make a critical evaluation of the material. So the
research design is analytical in nature. Secondary data
collection method is used for various literatures, FII, Sensex,
Nifty & S&P CNX 500 data. Various analysis tools used in this
research are Correlation Analysis, Regression Analysis and
Simple Percentage Analysis.
VII. DATA ANALYSIS
TABLE 1 NET CHANGE IN SENSEX, NIFTY, SNP 500 AND FII (YOY)
YEAR SENSEX NIFTY SNP 500 FII
2001
-709.79
-204.5
-212.25
12795.80
2002
114.95
34.45
72.25
3629.60
2003
2461.68
786.25
758.5
30458.70
2004 763.73 200.75 273.55 38965.10
2005 2795.24 756.05 654.3 47181.20
2006 4388.98 1129.85 835.85 36539.70
2007
6500.08
2172.2
2059.65
71486.50
2008
-10639.7
-3179.45
-3058.95
-52987.10
2009
7817.5
2241.9
2033.35
83423.89
2010 3044.28 933.45 611.85 133266.00
Fig. 2 Net Change - FII Vs SENSEX
Fig. 3 Net Change - FII Vs NIFTY
14
P. Karthikeyanand T. Mohanasundaram
AJMS Vol.1 No.1 January - June 2012

Fig. 4 Net Change - FII Vs S&P CNX 500
1. FII VS SENSEX (YOY)
The data includes 10 observations of yearly Sensex and
FIIs in a decade.
There is positive effect of FII on Sensex and the correlation
coefficient is 0.790 which is high. This means that Sensex has
a positive relation with FII and also the significance is low.
The regression coefficient is 0.6241 which reflects 62.41%
variability in Sensex with the independent variable (FII) and
the level to which FII affects the Sensex over the year. The
standard error comes out to be 3306.84 which is very high and
so it means that the deviation from the mean value is very high.
This does not mean the relation is false but we can say that the
error in linear relation is high.
There is positive effect of FII on nifty and the correlation
coefficient is 0.795 which is high. This means that nifty has a
positive relation with FII and also the significance is low. The
regression coefficient is 0.6316 which reflects 63.16%
variability in Nifty with the independent variable (FII) and the
level to which FII affects the Nifty over the year.
TABLE II CORRELATION - FII VS SENSEX (YOY)
NET CHANGE
IN SENSEX
NET CHANGE
IN FII
NET CHANGE IN SENSEX
Pearson Correlation
1 0.790
Sig. (2-tailed)
0.007
N
10 10
NET CHANGE IN FII
Pearson Correlation
.790 1
Sig. (2-tailed)
.007
N 10 10
TABLE III REGRESSION – FII VS SENSEX (YOY)
Regression Statistics
Multiple R
0.789999
R Square
0.624099
Adjusted R Square 0.577112
VIII. CORRELATION AND REGRESSION
2. FII VS NIFTY (YOY)
TABLE IV CORRELATION – FII VS NIFTY (YOY)
NET CHANGE
IN FII
NET CHANGE IN NIFTY
NET CHANGE IN FII Pearson Correlation
1 0.795
Sig. (2-tailed) 0.006
N 10 10
NET CHANGE IN NIFTY
Pearson
Correlation
.795 1
Sig. (2-tailed)
.006
N
10 10
TABLE V REGRESSION – FII VS NIFTY (YOY)
Regression Statistics
Multiple R
0.794721
R Square
0.631581
Adjusted R Square 0.585529
There is positive effect of FII on nifty and the correlation
coefficient is 0.795 which is high. This means that nifty has a
positive relation with FII and also the significance is low. The
regression coefficient is 0.6316 which reflects 63.16%
variability in Nifty with the independent variable (FII) and the
level to which FII affects the Nifty over the year.
3. FII VS S & P CNX 500 (YOY)
NET CHANGE
IN FII
NET CHANGE
IN S&P CNX 500
NET CHANGE IN FII
Pearson
Correlation
1
0.765
Sig. (2-tailed)
0.010
N
10
10
NET CHANGE IN S&P CNX 500
Pearson Correlation
.765
1
Sig. (2-tailed)
.010
N 10 10
TABLE VII REGRESSION – FII VS S&P CNX 500(YOY)
Regression Statistics
Multiple R
0.764668
R Square
0.584717
Adjusted R Square 0.532807
There is positive effect of FII on S&P CNX 500 and the
correlation coefficient is 0.765 which is high. This means that
S&P CNX 500 has a positive but not strong relation with FII
and also there is significance between the two. The regression
coefficient is 0.5847 which reflects 58.47% variability in S&P
CNX 500 with the independent variable (FII) and the level to
which FII affects the S&P CNX 500 over the year.
15
FII Flows and Indian Equity Market Performance
AJMS Vol.1 No.1 January - June 2012
TABLE VI CORRELATION – FII VS S&P CNX 500 (YOY)

IX. OUTCOME OF THE STUDY
FIIs have positive relationship with Indian equity market,
but they do no have strong impact on the stock market. Though
there is a positive relationship between FII flows and equity
market movements, Indian equity market is not fully
depending upon FIIs as the regression score is not too high.
Domestic investors may concentrate equally on other
variables like Inflation, Interest rate, Government policy etc
along with FII flows as they also influence the market
movements.
X. CONCLUSION
In developing countries like India, foreign investment
avenues provide a channel through which country can have
access to foreign capital. This study concludes that FIIs are not
the only determinant to have any significant impact on the
Indian Stock Market but there are other factors like
government policies, budgets, bullion market, inflation,
economical and political condition, etc. The research may be
extended by using the data on daily or monthly basis which
may give more accurate and detailed results.
REFERENCES
[1] Aamir Khan, Rohit, Siddharth Goyal, and Gaurav Agrawal,
“Investigation of Casuality Between FII's Investment and Stock Market
Returns”, International Research Journal of Finance and Economics,
Vol. 40, 2010.
[2] Bose Suchismita and Coondoo Dipaankar, “The Impact of FII
Regulations in India”, International Journal of Financial Market
Trends, Vol. 30, 2005.
[3] Chakrabarti, “FII Flows to India: Nature and Causes”, Journal of
Foreign Institution Investments, Vol. 27, 2001.
[4] Krishna Reddy Chittedi, “Volatility of Indian Stock Market and FII's”,
The India Economic Review, Vol.5, No.31, 2008.
[5] Tanupa Chakraborty, “Foreign Institutional Investment Flows and
Indian Stock Market Returns - A Cause and Effect Relationship Study”,
Indian Accounting Review, Vol. 11, No.1, pp 35-48., 2007.
[6] D. Ilangovan and M. Tamilselvan, “Extra Mileage In Foreign
Investment in Resurging India”, International Journal of Foreign Money
Supply Management, Vol. 28, 1997.
[7] K. S. Chalapati Rao, M R Murthy and K V K Ranganathan: “Foreign
Institutional Investments and the Indian Stock Market”, Journal of
Indian School of Political Economy, Vol . 11, No.4, 1999.
[8] Paramita Mukherjee, Suchismita Bose & Dipankor Coondoo, “Foreign
Institutional Investments in the Indian Equity Market”, ICRA Money and
Finance, 2002.
[9] M.T. Raju and Ghosh Anirban, “Stock Market Volatility – An
International Comparison”, Research on Indian Stock Volatilit, Vol 14,
2004.
[10] P. Samy Chella and Murugan Bala, “A Study on Capital Stock Market
Movement in India – Present Scenario”, European Business Review,
Vol 15 , 2006.
[11] S. Sivakumar, “FIIs: Bane or boon?”, Journal of Stock Market Volatility ,
Vol. 34, 2003.
16
P. Karthikeyanand T. Mohanasundaram
AJMS Vol.1 No.1 January - June 2012
An Investigation into Work Postures of Workers Engaged in Casting Industry: A Study in India
Lakhwinder Pal Singh Department of Industrial and Production Engineering, Dr. B.R. Ambedkar National Institute of Technology,
Jalandhar - 144 011, Punjab, India.E-mail : [email protected]
(Received on 18 September 2011 and accepted on 20 December 2011)
Abstract - Casting industry in India is appreciably providing
employment to more than 5 million people. These are various
jobs which may cause musculoskeletal disorders among the
working generation. Awkward posture, lifting, forceful
movements and manual work at rapid rate contribute to
musculoskeletal disorders. Present study is focused on assessing
the work posture of workers engaged in different actives of
casting units. A video film was recorded in real postures during
the various actives performed by the workers. Snaps were
cropped after an interval of 10 second for each of the activity. The
work postures were evaluated using OWAS, RULA and REBA
tools. As per the OWAS assessment, 17% workers required
immediately corrective measures and 46% workers needed to
correct their postures as soon as possible. In RULA assessment
reveals that workers at high and medium risk levels were 64%
and 22% respectively. In REBA assessment 27% workers were at
very high, 34% workers were high and 32% workers were at
medium risk levels. This paper is restricted to only posture
analysis on observation based, however application of
ergonomics posture could was suggested to the workers.
Awkward postures and manual material handing in the
workplace should be eliminated. These industries must adopt
ergonomics techniques and low cost automation so that
workload can be reduced and efficiency can be increased to affect
the organizational cost and the society as a whole.
Keywords : Work Posture in SMEs, Services, Design for Quality.
I. INTRODUCTION
Ergonomics enhances human performance including the
health, safety and productivity of workers. The International
Ergonomics Association (IEA) defines ergonomics as; the
scientific discipline concerned with the understanding of
interactions among humans and other elements of a system,
and the profession that applies theory, principles, data and
methods to design in order to optimize human well-being and
overall system performance. Indians live in an ocean of bad
ergonomic design. Sadly, almost all good ergonomic design
seen in our country is of foreign origin (Gupta, 2004). There is
an amazing lack of awareness and knowledge about this field
even today. It is the professional and ethical duty of all
designers to keep ergonomics above all other considerations,
and ensure that the interaction between their design and its
final user does not become unpleasant, difficult to use
(difficult to reach and clean too), confusing, tiring, illegible,
unintelligible, mistake-prone, harmful or dangerous even in
the smallest possible way (Gupta, 2004). Shikdar & Al-
Hadhrami (2007) reported that flexibility in workstation set-
up can eliminate the anthropometric and ergonomic problems
of fixed workstations and boost the operator's performance.
Erdinc & Vayvay (2008) reported that ergonomics
interventions that enhance employee performance lead to
better quality in manufacturing. Other study by
Balasubramanian et al. (2011) reported safe driving places
importance on cognitive aspects, such as perception,
vigilance, reasoning, judgment as well as efficient motor
skills. Cognitive fatigue brings about a loss of attentiveness in
drivers, which could be detrimental; decrease in attentiveness
can be measured using electroencephalogram (EEG) signals.
Balasubramanian et al. (2011) provided a single measure of
the ergonomic assessment in terms of several factors (e.g.
posture, biomechanical forces, environmental, etc.)
collectively contributing to ergonomic impairments. This
integrated score provides a clearer picture of the risk involved
in the job and hence it can be used as a basis for prioritizing
operations for ergonomic interventions.
For many years it has been possible to observe the reasons
behind injuries in small scale and medium scale industries. In
these industries casting process is a physically demanding
occupation, the work operations often involve lifting heavy
objects, moving and carrying equipment and awkward
working postures, all of which are risk factors for back injuries
and other musculoskeletal disorders (MSDs). Manual material
handling has been known to be one of the prime causes of
musculoskeletal disorders (MSDs). The small and medium
scale enterprises (SMEs) do not only have contribution in
growth of national economy but in spite of all progress bad
occupational status, too.
The objective of this study is to analyse the working
postures of workers engaged in various processes of small
scale casting industry. The study used three assessment tools
like Ovaku Work posture Analysis (OWAS), RULA (Rapid
Upper Limb Assessment) and REBA (Rapid Entire Body
Assessment), and recommended the changes to be made in the
body posture while working.
17AJMS Vol.1 No.1 January - June 2012

OWAS is a method for the evaluation of postural load
during work. The OWAS method is based on a simple and
systematic classification of work postures combined with
observations of work tasks. The method can be applied for the
development of a workplace or a work method, to reduce its
musculoskeletal load and to make it safer and more
productive (Karhu et al. 1977).
RULA was developed earlier by McAtamney and Corlett,
1993, to provide a rapid objective measure of musculoskeletal
risk caused by mainly sedentary tasks where upper body
demands were high; where work related upper limb disorders
are reported. RULA assesses the posture, force and movement
associated with sedentary tasks such tasks include computer
tasks, manufacturing or retail tasks where the worker is seated
or standing without moving about. This tool requires no
special equipment in providing a quick assessment of postures
of the neck, trunk and upper limbs along with muscle function
and the external loads experienced by the body. A coding
system is used to generate an action list which indicates the
level of intervention required to reduce the risks of injury due
to physical loading on the operator.
REBA (Rapid Entire Body Assessment) was developed by
Hignett, S. and McAtamney, L. 2000, to provide a quick and
easy observational postural analysis tool for whole body
activities (static and dynamic giving musculoskeletal risk
action level. The development of REBA is aimed to divide the
body into segments to be coded individually with reference to
movement planes. It provides a scoring system for muscle
activity caused by static, dynamic, rapid changing or unstable
postures. It reflects that coupling is important in handling of
the loads but may not always be via the hands. It also gives an
action level with an indication of urgency.
II. LITERATURE SURVEY
Manual material handling is one of the major causes of
severe industrial injury. Foundries are an industry where
manual material handling is performed routinely. For the last
four decades various studies have been conducted on
assessment of health related problems and musculoskeletal
disorders (MSD). One of the study on women workers in a
woollen textile factory found that pain and fatigue are the
major problems for the women in the spinning section. The
study recommended that ergonomic factors such as provision
of backrest and frequent rest periods could remediate the
musculo-skeletal symptoms (Karhu et al. 1977).
Visual discomfort has a high prevalence for Visual
Display Unit (VDU) workers. In three different prospective
epidemiological studies, correlation between Visual
discomfort and average pain intensity in the neck and
shoulder were studied. Three different prospective
epidemiological studies have shown that there is a clear
indication of a relationship between visual discomfort and
pain in the neck and shoulder (McAtamney et al. 1993). In an
anthropometric survey was carried out for female agricultural
workers from north-eastern India, it appeared that most body
dimensions are higher in the middle age group and lower with
higher age groups and hence, there is a great scope of
improving the agricultural tools (Hignett et al. 2000). The
musculo-skeletal disorders (MSDs) in Chinese restaurant
cooks were studied using National Health Insurance data. The
most affected body parts was low back with epicondyle and
elbow at highest risk (Karhu et al. 1977). The highest
prevalence was reported in lower back, knees and upper back
and recommendations were made for elimination of awkward
postures and manual material handling (Moen, S. Torp, 2005) .
A relationship between work-related factors and disorders in
neck-shoulder and low-back region among male and female
ambulance personnel was studied. Technical improvements
such as design of ambulance vehicles were needed to facilitate
physically demanding tasks along with psychosocial work
environment in the ambulance service (Singh et al. 2010).
Cleaning is associated with high physical and psychosocial
workloads and musculo-skeletal disorders related to it were
studied. A few studies concern equipment design, working
environments and factors affecting individual workers. A need
to conduct research on cleaning tools/equipment, working
environments and individual risk factors is apparent Singh et
al. 2008). The Strain Index to Analyze Jobs for Risk of Distal
Upper Extremity Disorders was developed. Three different
studies have shown that it is capable of identifying jobs with
no distal upper extremity morbidity as “safe” and jobs with
distal upper morbidity as “hazardous.” The results provide
evidence of the Strain Index's generalizibility and predictive
validity (Fredericks et al. 2008). A study was conducted to
modify an existing data reduction method for directly
quantifying physical exposures during variable non-cyclic
work. CEVA (Clustered Exposure Variation Analysis) is a
useful modification of EVA (Exposure Variation Analysis) for
contrasting the non-cyclic work typical of understudied
industries like construction. A simplification of
electromyography with summary measures such as CEVA
provides a comprehensible, yet accurate measure of forceful
exertions during work tasks (Hutchinson TP, 2008). This study
investigated the effects of implementing or improving
occupational H&S management on the work environment,
H&S-related behavior and musculoskeletal health of workers
in small and medium-sized companies. The satisfactory result
was come out in companies with improved H&S management
from baseline to follow-up reported increased satisfaction
18
Lakhwinder Pal Singh
AJMS Vol.1 No.1 January - June 2012

with the H&S activities at the garage; improved support from
management and colleagues; improved health-related support
and control; and increased participation in H&S activities
(Metgud et al. 2008). OWAS method of postural analysis
classifies that the postures adopted by the workers while
performing the tasks of casting and grinding are very
awkward. The frequency of load lifting in these workers is
much more and thus it further puts the workers into more
stressed conditions of work (Kilbom et al .2001). According to
the Strain Index method the workers of small scale forging
industry were found with higher risk of distal upper
extremities disorders (DUE) (
III. MATERIAL AND METHOD
The study was carried out in a small scale casting unit in
Punjab and observations were made in different sections of the
casting unit. It was observed that in various casting operations
like pattern making, mould making, core making, molding,
sand preparation, and molten metal pouring etc, people are
dealing with hazardous postures. Few problem areas were
identified based on observation made over the operations and
operating conditions. A video film was recorded on different
casting operations with the emphasis over the each activity.
After recording the video, the snapshots were cropped after
every ten seconds of time gap. The snapshots of 100 in
numbers were cropped in such a way that a range of postures of
body parts in the activities were clear to observe. The
snapshots were analyzed to fill the scores in OWAS, RULA
and REBA; score sheets (Figure 1-3). As a protocol of the
study, the first step was overall body posture assessment using
OWAS method. The jobs with the involvement of high risk
were numbered higher and those with less risk involvement
were numbered 1. Immediate corrective actions and necessary
changes were recommended for activities numbered higher to
avoid any risk. The upper limbs mainly arms and wrist of (both
the sides; left and right) posture was assessed using RULA
score sheet; the range of movement for each body part is
divided into sections. These sections are numbered so that the
number 1 is given to the range of movement or working
posture where the risk factors present are minimal. Higher
numbers are allocated to parts of the movement range with
more extreme postures indicating an increasing presence of
risk factors causing load on the structures of the body segment.
The exposure scores according to RULA were divided into
four exposure categories: negligible, low, medium and high.
Medium and high risk actions should be urgently addressed to
reduce the level of exposure of risk factors. For those activities
where whole body and limbs motion needs to be assessed
REBA was used which is also a pen paper technique. In REBA
the body parts are divided into sections and each body part is
scored according to its range of movement. Higher scores are
Krause et al. 2004).
Fig.1 OWAS score sheet
Fig. 2 RULA score sheet
Fig. 3 REBA score sheet
19
An Investigation into Work Postures of Workers Engaged in Casting Industry: A Study in India
AJMS Vol.1 No.1 January - June 2012
given to the body parts where presence of risk factors are more
and lower scores are given to those where presence of risk
factors are minimal. The REBA scores were divided into five
categories: negligible, low, medium, high and very high.
Medium, high and very high needed an immediate action to
avoid any musculoskeletal disorder.
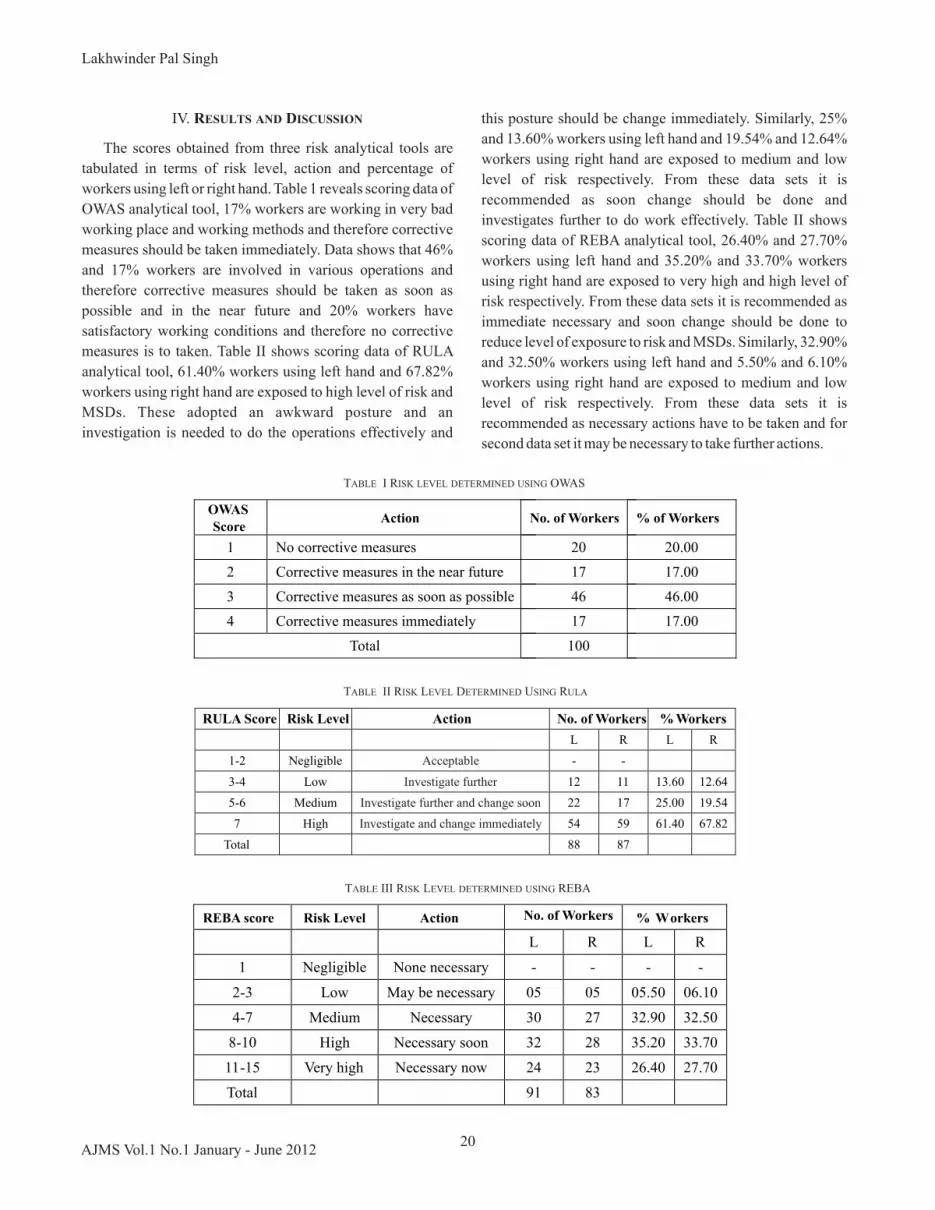
IV. RESULTS AND DISCUSSION
The scores obtained from three risk analytical tools are
tabulated in terms of risk level, action and percentage of
workers using left or right hand. Table 1 reveals scoring data of
OWAS analytical tool, 17% workers are working in very bad
working place and working methods and therefore corrective
measures should be taken immediately. Data shows that 46%
and 17% workers are involved in various operations and
therefore corrective measures should be taken as soon as
possible and in the near future and 20% workers have
satisfactory working conditions and therefore no corrective
measures is to taken. Table II shows scoring data of RULA
analytical tool, 61.40% workers using left hand and 67.82%
workers using right hand are exposed to high level of risk and
MSDs. These adopted an awkward posture and an
investigation is needed to do the operations effectively and
TABLE I RISK LEVEL DETERMINED USING OWAS
OWAS Score
Action
No. of Workers
% of Workers
1
No corrective measures
20
20.00
2 Corrective measures in the near future 17 17.00
3 Corrective measures as soon as possible 46 46.00
4 Corrective measures immediately 17 17.00
Total 100
TABLE II RISK LEVEL DETERMINED USING RULA
this posture should be change immediately. Similarly, 25%
and 13.60% workers using left hand and 19.54% and 12.64%
workers using right hand are exposed to medium and low
level of risk respectively. From these data sets it is
recommended as soon change should be done and
investigates further to do work effectively. Table II shows
scoring data of REBA analytical tool, 26.40% and 27.70%
workers using left hand and 35.20% and 33.70% workers
using right hand are exposed to very high and high level of
risk respectively. From these data sets it is recommended as
immediate necessary and soon change should be done to
reduce level of exposure to risk and MSDs. Similarly, 32.90%
and 32.50% workers using left hand and 5.50% and 6.10%
workers using right hand are exposed to medium and low
level of risk respectively. From these data sets it is
recommended as necessary actions have to be taken and for
second data set it may be necessary to take further actions.
RULA Score Risk Level Action No. of Workers % Workers
L
R
L
R
1-2 Negligible
Acceptable
-
-
3-4 Low
Investigate further
12
11
13.60
12.64
5-6 Medium
Investigate further and change soon
22
17
25.00
19.54
7 High
Investigate and change immediately
54
59
61.40
67.82
Total 88 87
TABLE III RISK LEVEL DETERMINED USING REBA
REBA score
Risk Level
Action
No. of Workers
% Workers
L
R
L
R
1
Negligible
None necessary
-
-
- -
2-3
Low
May be necessary 05
05
05.50
06.10
4-7
Medium
Necessary
30
27
32.90
32.50
8-10 High Necessary soon 32 28 35.20 33.70
11-15 Very high Necessary now 24 23 26.40 27.70
Total 91 83
20
Lakhwinder Pal Singh
AJMS Vol.1 No.1 January - June 2012

Fig. 4 Workers Performing various activities in awkward postures
TABLE. IV PROCESS-WISE DISTRIBUTION OF OWAS SCORE
ProcessScores
1 2 3 4
Mould making
4 5 10 7
Mould lifting
9 4 20 2
Pattern making
1 1 5 -
Molten metal lifting/carrying to mould box
2 1 3 -
Molten metal pouring
4 6 8 8
The entire process of casting unit can be categorized as
five main processes which are mould making, mould lifting,
pattern making, molten metal lifting to mould box, molten
metal pouring. According to OWAS, no awkward posture and
high level of risk are found in pattern making process and
molten metal lifting/ carrying to mould box process. In mould
making process 41.17% workers are at high risk and
therefore, corrective measures need to be taken immediately.
Similarly, 21.73% workers are at medium risk, 29.41%
workers are at low risk l and 20% workers are at negligible
risk level and corrective measures need to taken accordingly.
In case of mould lifting 11.76% workers are at high risk,
43.47% workers at medium risk, 23.52% workers at low risk
and 45% workers at negligible risk level. Similarly, in pattern
making process 10.86% people are at medium risk, 5.88% are
at low risk and 5% are at negligible risk. In molten metal
lifting to mould box process 6.52% people are at medium risk,
5.88% are at low risk and 10% are at negligible risk. In
process of molten metal pouring about 47.05% employees are
under severe level of risk which is a big count, so immediate
actions are needed. Similarly, 17.39% workers are at medium
level of risk, 35.29% are at low level of risk and 20% are at
negligible level of risk. Thus, according to severity of job
postures the corrective measures are needed.
TABLE V PROCESS-WISE DISTRIBUTION OF RULA SCORE
Process
Scores
1-2 3-4 5-6 7
L R L R L R L R
Mould making
-
- - - 9 6 13 15
Mould lifting
-
- 8 8 3 3 17 19
Pattern making
-
- - - 4 2 2 5
Molten metal lifting to mould box
-
- - - 2 1 4 5
Molten metal pouring
-
- 4 3 4 5 17 20
According to RULA, in this casting unit in mould making
process 24.74% workers are at high risk, therefore a keen
investigation is needed and posture should change
immediately. Also, in this process 38.09% workers are at
medium risk level, therefore further investigation is needed. In
process of mould lifting with the help of mechanical
equipments 31.84% workers are at high level of risk, 15.63%
are at medium level of risk and 69.69% are at low level of risk.
The corrective actions are recommended accordingly.
Similarly, in process of pattern making only 6.08% workers are
at high level of risk, and only 14.97% workers are at medium
level of risk, and therefore suitable actions are in demand. In
process of molten metal lifting/carrying to mould box 7.93%
workers are engaged in jobs with awkward postures and are at
high level of risk, likewise 7.48% people are at medium level
of risk. In molten metal pouring about 32.68% employees are
doing their jobs at the cost of health having adverse effect on
body causing MSD's so, at high risk level, hence some
remedial actions, automation and ergonomics techniques
should be adopted. In the same process 23.79% workers are at
medium risk level and 30.30% are at low level of risk.
According to REBA, 59.59% workers from mould making
process are at very high level of risk, that's why remedial
actions and initiative steps should be taken immediately and
28.12% workers are at high level of risk, so actions should be
taken soon. Similarly 15.73% workers are at medium risk level
and 20% workers are at low risk level. In the process of mould
lifting 12.77% workers are at very high risk, 41.51% workers
are at high risk, 36.84% workers are at medium level of risk
and 70% workers are at low level of risk and thus as per
severity of risk necessary actions have to be taken. The process
of pattern making involve 4.25% employees at very high risk
level, 11.60% employees at high risk level and 5.36%
employees at medium level risk. Molten metal lifting to mould
box is the process involve a long movement with heavy
workload, about 4.25% workers engaged in this process are
working at very high level of risk and therefore ergonomics
training, conveyer techniques and other necessary actions are
to be taken. In this process 6.69% workers are at high level of
21
An Investigation into Work Postures of Workers Engaged in Casting Industry: A Study in India
AJMS Vol.1 No.1 January - June 2012

risk and 10.55% are at medium level of risk. In the other
process of molten metal pouring which is to be mentioned as
quite laborious work 42.56% workers are at very high level of
risk among all the workers under this category. Similarly
13.61% workers are at high level of risk and 31.47% workers
are at medium level of risk. The remedial action should be
taken for the people at high level of risk as soon as possible.
TABLE VI PROCESS WISE DISTRIBUTION OF REBA SCORE
Process
Scores
1 2-3 4-7 8-10 11-15
L
R
L
R
L
R
L R L R
Mould making
-
-
1
1
5
4
10 7 7 7
Mould lifting
-
-
3
4
11
10
14 11 3 3
Pattern making
-
-
-
-
1
2
4 3 1 1
Molten metal lifting to mould box
-
-
-
-
3
3
2 2 1 1
Molten metal pouring - - - - 10 8 3 5 10 10
V. CONCLUSION
This study reveals that the workers of in small and medium
scale enterprises (SMEs) are at high risk of musculoskeletal
disorders. Awkward postures and manual material handing in
the workplace should be eliminated & small and medium scale
industries should adopt ergonomics techniques and
automation techniques like installation of mechanical aids
such as pneumatic lifts, conveyors, and/or automated material
handling equipment will undoubtedly decrease the risk of
injuries and musculoskeletal disorders (MSDs) for workers
employed by foundries and therefore workload can be
reduced and efficiency can be increased to put the effect to
organizational cost and the society as a whole. It is
recommended as the distance of carrying molten metal in
crucibles should be diminished and there should be a proper
training of metal pouring by ergonomics techniques and well
defined plant layout.
REFERENCES
[1] V. Balasubramanian, A. Adalarasu and A. Gupta, “EEG based
analysis of cognitive fatigue during simulated driving”, International
Journal of Industrial and Systems Engineering , Vol. 7, No.2 pp. 135 -
149, 2011.
[2] V. Balasubramanian, TT. Narendran, V.S. Praveen, “RBG risk scale: an
integrated tool for ergonomic risk assessments”, International Journal
of Industrial and Systems Engineering,Vol. 8, No.1, pp. 104 - 116,
2011.
[3] P. Chandna, S. Deswal, A. Chandra, An anthropometric survey of
industrial workers of the northern region of India , 2010.
[4] O. Erdinc, O.Vayvay, “Ergonomics interventions improve quality in
manufacturing: a case study”, International Journal of Industrial and
Systems Engineering, Vol. 3, No. 6 pp. 727 - 745, 2008.
[5] L. McAtamney and E.N. Corlett, “RULA: a survey method for the
investigation of work related upper limb disorders”, Applied
Ergonomics, Vol. 24, pp. 91-99, 1993.
[6] S. Hignett and L.McAtamney, “Rapid Entire Body assessment
(REBA)”, Applied Ergonomics, Vol. 31, pp. 201- 205, 2000.
[7] O. Karhu, P. Kansi and I.Kuorinka, “Correcting working postures in
industry: a practical method for analysis. Applied Ergonomics, Vol.8,
No.4, pp. 199-201.
[8] S. Moen Torp, “The effects of occupational health and safety
management on work environment and health: A prospective study”,
Faculty of Health Science, Vestfold University College, Department of
Public Health and Primary Health Care, Norway, 2005.
[9] L.P.Singh, A. Bhardwa, K.K. Deepak and S. Sahu, “Small & medium
Scale Casting and Forging Industry in India: an ergonomic study,
Ergonomics, Vol. 22, No.1, 2010.
[10] L.P.Singh, A. Bhardwaj, K.K.Deepak and S. Shahu, “ Evaluation of
Work Strain on Workers Working in Small Scale Forging Industry,”
Journal of Environmental Physiology, Vol. 1, No.20, pp.83-92, 2008.
[11] T.K. Fredericks, A.R. Kumar and S. Karim, “ An ergonomic evaluation
of a manual metal pouring operation”, International Journal of
Industrial Ergonomics, Vol. 38, pp.182–192., 2008.
[12] T.P. Hutchinson, “On ratings of comfort and exertion by visual display
unit users and ratings of workplace layout and working posture by
expert ergonomists”, Applied Ergonomics, Vol. 39, No. 1, pp. 131-
132, 2008.
[13] D.C. Metgud, M.G. Mokashi, P.N. Saha and S. Khatri, “An
ergonomics study of women in a woolen textile factory for
identification of health-related problems”, Indian J. Occup Environ
Med., Vol. 12, No.1, pp. 14–19, 2008.
[14] A. Kilbom, E.V. Juntura, N.Fallentin and M.Waersted, “Evaluation of
physical workload standards and guidelines from a Nordic
perspective”, National Institute of Occupational Health Copenhagen,
Denmark, Finnish Institute of Occupational Health Helsinki, Finland,
National Institute of Occupational Health Oslo, Norway, National
Institute for Working Life Stockholm, Sweden, Scand J Work Environ
Health ,Vol. 27, pp. 21-52, 2001.
[15] N.Krause, Rs.Rugulies and S.L. Syme, 'Physical Workload, Ergonomic
Problems, and Incidence of Low Back Injury: A 7.5-Year Prospective
Study of San Francisco Transit Operators”, Department of Medicine,
University of California, San Francisco, National Institute of
Occupational Health, Denmark, Department of Epidemiology and
Biostatistics, School of Public Health, University of California,
Berkeley”, American Journal of Industrial Medicine, Vol. 46, pp.570-
585, 2004.
22
Lakhwinder Pal Singh
AJMS Vol.1 No.1 January - June 2012

A Study on Occupational Stress Among Teachers in Selective Engineering Colleges Affiliated to Anna University
of Technology, Trichy1 2C. Muthuvelayutham and H. Mohanasundaram
1DODE, Anna University of Technology Coimbatore, Coimbatore – 641 047, Tamil Nadu, India2Sengunther B-School for Women,Tiruchengode - 637 205, Tamil Nadu, India
E-mail :[email protected](Received on 25 September 2011 and accepted on 28 December 2011)
Abstract - This study focus on finding out the perceived level of
occupational stress among teachers in selective engineering
colleges affiliated to Anna University of Technology, Trichy.
Stress is the major factor which affects the health and efficiency
of a teacher. So the researcher prepared a questionnaire to
measure the level of occupational stress among teachers. For
conducting the survey twenty eight colleges having crossed five
years were chosen to collect samples. Out of the total (2065)
population 422 teachers having completed two years of service
in their present institution were circulated questionnaire for
data collection. Collected data were analysed through SPSS
software. Finally researcher found that some socio-
demographic variables have an impact on occupational stress
index of teachers. So the management should take necessary
steps to reduce occupational stress among teachers because it
will result in increased job satisfaction and quality of education.
Keywords: Engineering College, Faculty Members,
Occupational Stress
I. INTRODUCTION
It is the known fact that pressure is the part of all work
situation and pressure, which can lead to stress that in turn,
undermine performance, adversely affects the health and also
has a negative impact on personal and social life.
Stress is an inevitable and unavoidable component of life
due to increasing complexities and competitiveness in living
standards. The speed at which change is taking place in the
world today is certainly overwhelming and breathe taking. In
the fast changing world of today, no individual is free from
stress and no profession is stress free. Everyone experiences
stress, whether it is within the family, business, organization,
study, work, or any other social or economical activity. Stress,
long considered alien to Indian lifestyle, is now a major health
problem / hazard.
II. REVIEW OF LITERATURE
Research conducted in the United Kingdom (UK), Unites
States of America (USA), Australia and New Zealand has
identified several key stressors commonly associated with
stress among academic staff. These include work overload,
time constraints, lack of promotion opportunities, inadequate
recognition, inadequate salary, changing job role, inadequate
management and/or participation in management, inadequate
resources and funding and student interactions (Blix, Cruise,
Mitchel, & Blix, 1994; Boyd & Wylie, 1994; Cross & Carroll,
1990; Daniels & Guppy, 1994; Doyle & Hind, 1998; Kinman,
1998).
Kinman (1998), in her survey for the Association of
University Teachers (AUT), suggests that the impact of the
changing nature of the academic's work and the resulting work
overload, longer working hours, and job insecurity has led to
increased stress in this occupational group. Research and
publication demands ( Blix, Cruise,Mitchell& Blix, 1994) as
significant sources of job stress.
Teacher stress has been viewed as an interactive process
which occurs between teachers and their teaching environment
which leads to excessive demands being placed on them and
resulting in physiological and psychological distress (Forlin &
Hattie, 1996). The consequences of stress include health
problems and reduction in work performance effectiveness
(Quick & Quick, 1984).
Salami (2006) also identified heavy workload, working
under pressure, large classes, students' disruption of lectures
and delayed and inadequate salaries as sources of stress among
college of education lecturers in Nigeria. In fact, a bit of stress
is necessary to gain outstanding success. Because of this,
successful people are those who convert their stress to creative
energy and creative power (Krüger, 1993).
Various studies have highlighted that time pressure with
regards to administrative demands and excessive paper work
are major sources of stress for teachers, as there is inadequate
time for preparation; unrealistic deadlines imposed and issues
concerning the workload of teachers (Dinham, 1993;
Kyriacou, 2001; Louden, 1987; Pithers & Soden, 1999; Punch
& Tuetteman, 1996).
Certain demographic and career faculty characteristics are
considered to affect job-related stress and, consequently job
23AJMS Vol.1 No.1 January - June 2012

performance. These characteristics may be characterized as
either personal or professional in nature. Some of these
personal characteristics may include age, gender, and marital
status. Professional characteristics may include teaching
field, academic rank, tenure status, and years of service at an
institution (Bayer & Braxton, 1998; Gmelch, Wilke, &
Lovrich, 1986; Happ & Yoder, 1991; Iiacqua, Schumacher, &
Li, 1995; Jenkins, 1996; Thomspon & Dey, 1998).
TABLE I AGE VS OCCUPATIONAL STRESS INDEX - TEACHERS
OSI Sum of Squares
df Mean Square
F Sig.
I often have headaches and migraines
Between Groups
12.926 3 4.309 2.718 .044
Within Groups
662.732
418
1.585
Total
675.659
421
I feel tired even when I wake
after an adequate sleep
Between Groups
15.654
3
5.218
3.464 .016
Within Groups
629.721
418
1.507
Total
645.374
421
Having repetitions in teaching assignments
Between Groups
9.292
3
3.097
2.629 .050
Within Groups
492.473
418
1.178
Total
501.765
421
Lack of information about what is going on
Between Groups
14.600
3
4.867
4.598 .004
Within Groups
442.452
418
1.058
Total
457.052
421
Lack of time to undertake research
Between Groups
16.961
3
5.654
4.520 .004
Within Groups
522.852
418
1.251
Total
539.813
421
Assignment of
duties that take me away from my office
Between Groups
8.633
3
2.878
2.663 .048
Within Groups
451.765
418
1.081
Total
460.398
421
Frequent changes in Management policies
Between Groups
10.970
3
3.657
3.704 .012
Within Groups 412.613 418 .987
Total 423.583 421
I often make complaints with colleagues about work related things
Between Groups
10.201 3 3.400 2.733 .043
Within Groups 520.017 418 1.244
Total 530.218 421
Organizational policies, the structure and the climate of the
organization, physical conditions and process are the basic
factors of stress in the organization (Luthans,1994). Kahn and
Cooper (1993) also indicate that limited opportunities for
advancement, insufficient performance feedback,
performance assessment measures being inadequate and
biased control systems and culture within the organisation,
may be perceived as potential stressors.
24
C.Muthuvelayutham and H.Mohanasundaram
AJMS Vol.1 No.1 January - June 2012

III. METHODOLOGY
To analyse the perceived level of occupational stress
among teachers in selective engineering colleges affiliated to
Anna University Trichy, the researcher has used descriptive
research design. Descriptive research studies are concerned
with describing the characteristics of a particular individual,
or a group (C.R.Kothari, 2007). For conducting the survey
twenty eight colleges having crossed five years were chosen to
collect samples. Out of the total population faculty members
having completed two years of service in their present
institution were circulated questionnaire. There are 2065
teachers working with two years of experience in present
institution during 2011. Out of which 422 samples were
collected from the list. Here the researcher has used stratified
random sampling to collect the samples from the universe. For
collecting the data researcher has used questionnaire where he
has categorized the questions into two perspectives
(demographic variables, occupational stress index) which will
enable the researcher to understand and analyse the perceived
level of occupational stress among teachers. Finally the
researcher has used SPSS software for analyzing the data and
the results are interpreted on the basis of outputs.
IV. ANALYSIS AND INTERPRETATIONS
H : There is no significant difference between the age 0
group(s) with that of occupational stress index of teachers.
H : There is a significant difference between the age 1
group(s) with that of occupational stress index of teachers.
From the above Table I it is inferred that in one-way
ANOVA, the total variation is partitioned into two
components. Between groups represents variation of the
group means around the overall mean and within groups
represents variation of the individual scores around their
respective group means, significance indicates the
significance level of the F-test. Small significance value
(<.05) indicate group difference, from the above table, it is
inferred that the significance level is observed to be less than
.05. Hence, null hypothesis is rejected and alternate
hypothesis is accepted and inferred that there is a significant
difference observed between the age with that of
occupational stress index of teachers.
TABLE II ANOVA RESULT FOR THE SEX AND OCCUPATIONAL STRESS INDEX - TEACHERS
OSI Sum of Squares
df Mean
Square F Sig.
I often have headaches and migraines
Between Groups 17.383 1 17.383 11.091 .001
Within Groups 658.275 420 1.567
Total
675.659
421
I feel that I do not have enough time for teaching preparation
Between Groups 7.858
1
7.858
5.754
.017
Within Groups 573.592
420
1.366
Total
581.450
421
Having repetitions in teaching assignments
Between Groups
8.700
1
8.700
7.411
.007
Within Groups
493.065
420
1.174
Total
501.765
421
Teaching large classes / more students
Between Groups
6.737
1
6.737
5.309
.022
Within Groups
532.981
420
1.269
Total
539.718
421
I often make complaints with colleagues about work related things
Between Groups
6.101
1
6.101
4.889
.028
Within Groups
524.117
420
1.248
Total 530.218 421
25
A Study on Occupational Stress Among Teachers in SelectiveEngineering Colleges Affiliated to Anna University of Technology, Trichy
AJMS Vol.1 No.1 January - June 2012

From the above Table II, it is inferred that the significance
level is observed to be less than 0.05. Hence, null hypothesis is
rejected and alternate hypothesis is accepted and inferred that
there is a significant difference observed between the sex with
that of occupational stress index of teachers.
From the above Table III, it is inferred that the significance
level is observed to be less than.05. Hence, null hypothesis is
rejected and alternate hypothesis is accepted and inferred that
there is a significant difference observed between the
educational qualifications with that of occupational stress
index of teachers.
TALBE III ANOVA RESULT FOR THE EDUCATIONAL QUALIFICATION AND OSI - TEACHERS
OSISum of Squares
dfMean
SquareF Sig.
It is difficult to achieve my career goals in this organisation
Between Groups
18.693
3
6.231
4.283 .005
Within Groups
608.143
418
1.455
Total
626.836
421
I feel that I do not have enough time for teaching preparation
Between Groups
12.723
3
4.241
3.117 .026
Within Groups
568.727
418
1.361
Total
581.450
421
Inadequate facilities (office, library, labs)
Between Groups
15.580
3
5.193
3.702 .012
Within Groups 586.449 418 1.403
Total 602.028 421
TABLE IV ANOVA RESULT FOR THE DEPARTMENTS AND OCCUPATIONAL STRESS INDEX - TEACHERS
OSI
Sum of Squares
df
Mean Square
F Sig.
I find myself grinding my teeth
Between Groups 13.074 3 4.358 3.795 .010
Within Groups 479.988 418 1.148
Total
493.062
421
It is difficult to achieve my career goals in this organisation
Between Groups
18.433
3
6.144 4.221 .006
Within Groups
608.404
418
1.456
Total
626.836
421
I feel that I do not have enough time for teaching preparation
Between Groups
24.753
3
8.251 6.195 .000
Within Groups
556.698
418
1.332
Total
581.450
421
Increased caffeine intake (coffee, tea, etc.)
Between Groups
36.619
3
12.206 9.102 .000
Within Groups
560.585
418
1.341
Total
597.204
421
Teaching large classes / more students
Between Groups
20.552
3
6.851 5.516 .001
Within Groups
519.166
418
1.242
Total 539.718 421
Insufficient institutional recognition and support for research
Between Groups 18.987 3 6.329 5.304 .001
Within Groups 498.759 418 1.193
Total 517.746 421
26
C.Muthuvelayutham and H.Mohanasundaram
AJMS Vol.1 No.1 January - June 2012
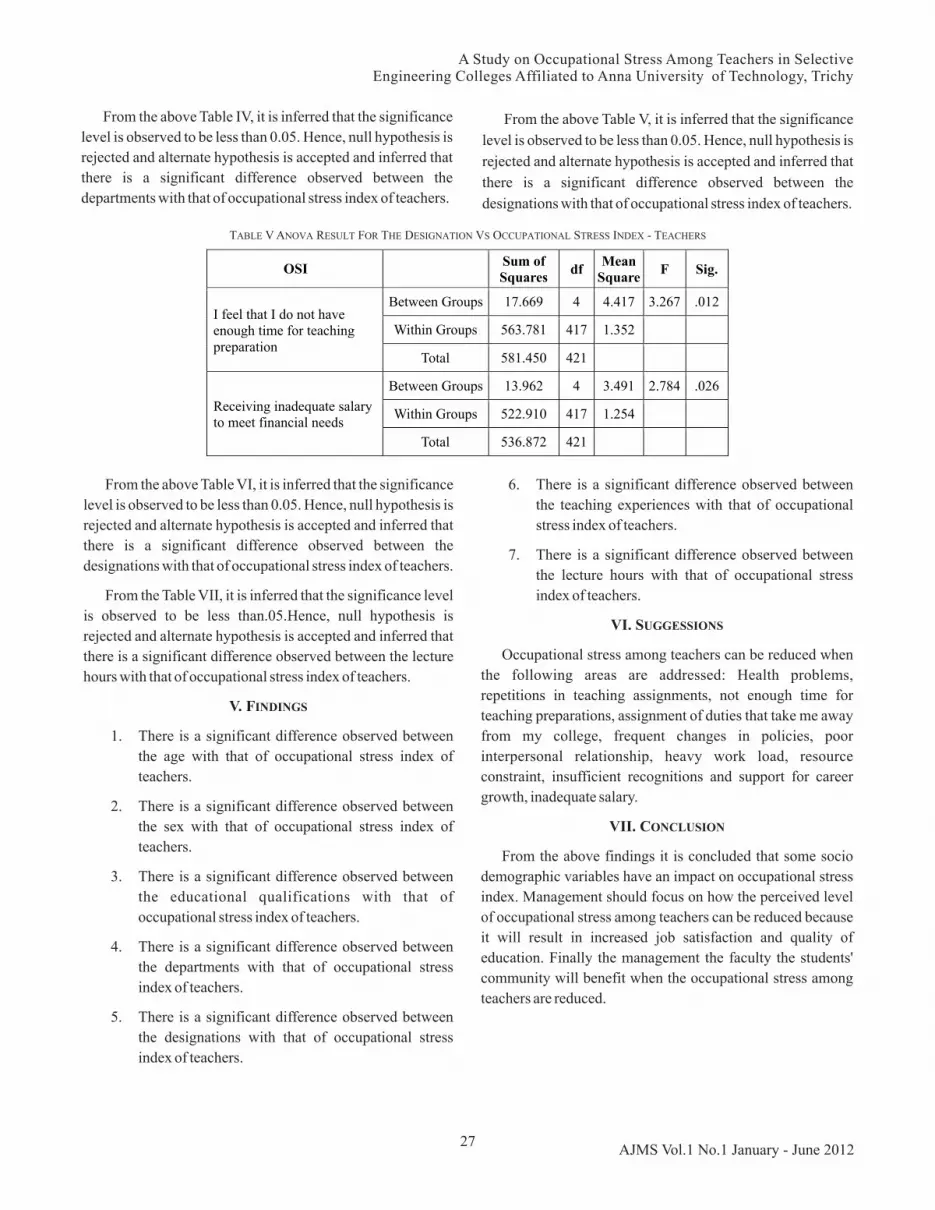
From the above Table IV, it is inferred that the significance
level is observed to be less than 0.05. Hence, null hypothesis is
rejected and alternate hypothesis is accepted and inferred that
there is a significant difference observed between the
departments with that of occupational stress index of teachers.
27
A Study on Occupational Stress Among Teachers in SelectiveEngineering Colleges Affiliated to Anna University of Technology, Trichy
AJMS Vol.1 No.1 January - June 2012
From the above Table V, it is inferred that the significance
level is observed to be less than 0.05. Hence, null hypothesis is
rejected and alternate hypothesis is accepted and inferred that
there is a significant difference observed between the
designations with that of occupational stress index of teachers.
OSI
Sum of Squares
df
Mean Square
F Sig.
I feel that I do not have enough time for teaching preparation
Between Groups
17.669
4
4.417
3.267 .012
Within Groups
563.781
417
1.352
Total
581.450
421
Receiving inadequate salary to meet financial needs
Between Groups
13.962
4
3.491
2.784 .026
Within Groups 522.910 417 1.254
Total 536.872 421
TABLE V ANOVA RESULT FOR THE DESIGNATION VS OCCUPATIONAL STRESS INDEX - TEACHERS
From the above Table VI, it is inferred that the significance
level is observed to be less than 0.05. Hence, null hypothesis is
rejected and alternate hypothesis is accepted and inferred that
there is a significant difference observed between the
designations with that of occupational stress index of teachers.
From the Table VII, it is inferred that the significance level
is observed to be less than.05.Hence, null hypothesis is
rejected and alternate hypothesis is accepted and inferred that
there is a significant difference observed between the lecture
hours with that of occupational stress index of teachers.
V. FINDINGS
1. There is a significant difference observed between
the age with that of occupational stress index of
teachers.
2. There is a significant difference observed between
the sex with that of occupational stress index of
teachers.
3. There is a significant difference observed between
the educational qualifications with that of
occupational stress index of teachers.
4. There is a significant difference observed between
the departments with that of occupational stress
index of teachers.
5. There is a significant difference observed between
the designations with that of occupational stress
index of teachers.
6. There is a significant difference observed between
the teaching experiences with that of occupational
stress index of teachers.
7. There is a significant difference observed between
the lecture hours with that of occupational stress
index of teachers.
VI. SUGGESSIONS
Occupational stress among teachers can be reduced when
the following areas are addressed: Health problems,
repetitions in teaching assignments, not enough time for
teaching preparations, assignment of duties that take me away
from my college, frequent changes in policies, poor
interpersonal relationship, heavy work load, resource
constraint, insufficient recognitions and support for career
growth, inadequate salary.
VII. CONCLUSION
From the above findings it is concluded that some socio
demographic variables have an impact on occupational stress
index. Management should focus on how the perceived level
of occupational stress among teachers can be reduced because
it will result in increased job satisfaction and quality of
education. Finally the management the faculty the students'
community will benefit when the occupational stress among
teachers are reduced.

28
C.Muthuvelayutham and H.Mohanasundaram
AJMS Vol.1 No.1 January - June 2012
TABLE VI ANOVA RESULT FOR THE TEACHING EXPERIENCE AND OSI - TEACHERS
OSI Sum of
Squares df
Mean
SquareF Sig.
I work hard but accomplish little
Between Groups 12.934 4 3.234 2.366 .052
Within Groups
569.919
417
1.367
Total
582.853
421
I feel that I do not have enough time for teaching preparation
Between Groups
18.685
4
4.671 3.461 .008
Within Groups
562.765
417
1.350
Total
581.450
421
Feeling pressure to compete with my colleagues
Between Groups
13.131
4
3.283 2.989 .019
Within Groups
458.044
417
1.098
Total
471.175
421
Having repetitions in teaching assignments
Between Groups
13.271
4
3.318 2.832 .024
Within Groups
488.495
417
1.171
Total
501.765
421
Lack of information about what is going on
Between Groups
13.471
4
3.368 3.166 .014
Within Groups
443.581
417
1.064
Total
457.052
421
Behavioral Problems (students) in classrooms
Between Groups
14.710
4
3.678 3.222 .013
Within Groups
476.003
417
1.141
Total
490.713
421
Assignment of duties that take me away from my office
Between Groups
14.690
4
3.673 3.436 .009
Within Groups
445.708
417
1.069
Total
460.398
421
Insufficient institutional recognition and support for research
Between Groups
13.155
4
3.289 2.718 .029
Within Groups 504.592 417 1.210
Total 517.746 421
I often make complaints with colleagues about work related things
Between Groups 15.423 4 3.856 3.123 .015
Within Groups 514.795 417 1.235
Total 530.218 421

29
A Study on Occupational Stress Among Teachers in SelectiveEngineering Colleges Affiliated to Anna University of Technology, Trichy
AJMS Vol.1 No.1 January - June 2012
TABLE VII ANOVA RESULT FOR THE LECTURE HOURS AND OCCUPATIONAL STRESS INDEX - TEACHERS
OSISum of Squares
dfMean
SquareF Sig.
Feeling pressure to compete with my colleagues
Between Groups
7.487
2
3.744
3.383 .035
Within Groups
463.688
419
1.107
Total
471.175
421
Excessive paperwork
Between Groups
7.912
2
3.956
3.283 .038
Within Groups
504.840
419
1.205
Total
512.751
421
Frequent changes to timetable or courses
Between Groups
9.203
2
4.601
4.081 .018
Within Groups
472.392
419
1.127
Total 481.595 421
REFERENCES
[1] G. Kinman, Pressure points: A survey into the causes and
consequences of occupational stress in the UK academic and related
staff. London: Association of University Teachers, 1998.
[2] A.E. Bayer and J.M. Braxton, “The Normative Structure of
Community College Teaching: A Marker of Professionalism”,
Journal of Higher Education, Vol. 69, pp. 187- 206, 1998.
[3] C. Forlin, G. Douglas and J. Hattie, “Inclusive practices: How
accepting are teachers?”, International Journal of Disability,
Development and Education, Vol. 43, No.2, pp. 119-133, 1996.
[4] J.C. Quick and J.D.Quick,Organizational stress and preventive
management. New York: McGraw-Hill, 1984.
[5] J.A. Iiacqua, P. Schumacher and H.C. Li, “Factors Contributing To
Job Satisfaction in Higher Education”, Education,Vol. 116, pp. 51-62.
[6] C. Kyriacou, “Teacher stress: Directions for future research”,
Educational Research, Vol. 53, No.1, pp. 27-35, 2001.
[7] S.O.Salami, “Management of Stress Among Trainee-Teachers
Through Cognitive Behavior Therapy”, Personality Study and Group
Behaviour, Vol. 26, pp. 1-25, 2006.
[8] C. Doyle , and P. Hind, “Occupational Stress, Burnout and Job Status
in Female Academics”, Gender, Work and Organisations, Vol.5, pp.
67-82,1998.
[9] C. McInnis, “Change and Diversity in Work Patterns Of Australian
Academics”, Higher Education,Vol. 8, pp. 105-117, 1999.
[10] A.G. Blix, R.J. Cruise, B.M. Mitchell and G.G. Blix, “Occupational
stress among university teachers”, Educational Research, Vol. 36,
pp.157-169, 1994.
[11] S. Forrest and E. Jepson, “Individual Contributory Factors in Teacher
Stress: The Role of Achievement Striving and Occupational
Commitment”, British Journal of Educational Psychology, Vol. 76,
pp.183-197,2006.
[12] R. Lewis, “Teachers coping with the stress of classroom discipline”,
Social Psychology of Education, Vol.3, pp.155-171, 1999.
[13] R.L. Kahn and C.L. Cooper, Stress in the Dealing Room: High
performers under pressure, Routledge: London and New York., 1993.
[14] F.Luthans, Organizational behavior. Boston: Mc Graw Hill
Publishing, 1994.

HRM Practices in NRI Medical Sciences and General Hospital in Guntur District, Andra Pradesh
V. Tulasi Das and 1 2Department of HRM, Deapartment of Commerce & Business Administration,
Acharya Nagarjuna University. Guntur - 522 510, Andhra Pradesh, India E-mail: [email protected]
(Received on 28 September 2011 and accepted on 07 January 2012)
1 2V. Krishna Reddy
Abstract - Deregulation of services and the application of new
technologies are presenting considerable challenges to service
quality, especially in healthcare services. Health care service
quality is crucial to the patient and the hospital / clinic. To
deliver the quality services to patients, the quality of human
resources is essential. The quality of human resources depends
upon the quality of Human Resource Management (HRM)
practices been practicing by the organization. Therefore,
keeping in view the significance acquired by the HR practices,
the present research work entitled HRM Practices in NRI
Medical Sciences and General Hospital in Guntur district of
Andhra Pradesh was undertaken. The HR practices at NRI
Medical Science and General Hospital yielding positive results
and make the organizations as the well result oriented.
Keywords: HRM Practicies, Medical Sciences, General
Hospital
I. INTRODUCTION
Health is above wealth, a proverb was effective
yesterday, it is effective today and it would remain effective
tomorrow or even a day after tomorrow. This is due mainly to
the fact that a sound health is a pre-requisite for a healthy and
sound mind. The accelerated pace of economic
transformation, we can image the contributions of human
beings and to improve the quality and strength of human
beings, we estimate high the contribution of healthcare
services. Deregulation of services and the application of new
technologies are presenting considerable challenges to
service quality, especially in healthcare services. Healthcare
service quality is crucial to the patient and the hospital /
clinic. Healthcare hospitals / clinics use service quality in
maintaining competitive advantage and patients use
healthcare service quality to differentiate between hospitals
and doctors. The quality concept applies in several different
areas in healthcare services i.e. sanitation, medical, clinical,
pharma, ICU, emergency, post operation of the patient,
inpatient, outpatient services etc. To deliver the quality
services to patients, the quality of human resources is
essential. The quality of human resources depends upon the
quality of Human Resource Management (HRM) practices
been practicing by the organization.
II. OBJECTIVES OF THE STUDY
Therefore, keeping in view the significance acquired by
the HR practices, the present research work entitled HRM
Practices in NRI Medical Sciences and General Hospital in
Guntur district of Andhra Pradesh was undertaken with the
following specific objectives.
1. To examine the socio-economic profile of the
respondents of Employees of NRI;
2. To study the perception of employees towards
various aspects of HR Practices; and
3. To forward certain conclusions based on findings
arrived.
III. HYPOTHESIS
The study was carried out with the basic presumption that
there is no systematic HR practices been practising in NRI
Medical Sciences and Hospitals.
IV. METHODOLOGY OF THE STUDY
To fulfil afore said objectives, the data were collected both
primary sources as well as secondary sources. The secondary
data were collected from the various journals, books,
periodicals and web. The primary data were collected with
support of well designed questionnaire from the sample
respondents. The sample consisted of 75 respondents working
in NRI organization. The sample size consisted of various
departments in the hospital. The data were collected
personally by the researcher, using the non-probability
incidental sampling with an assurance that the information
obtained would be kept confidential. The data were collected
with an assumption that they would possess an accurate and
comprehensive perception of the HRM practices employed.
The sole purpose of this sampling was to get an honest picture
of the HRM practices of the organization. Employee's
perception towards different aspects of HR practices were
analysed through Analysis of Variance (ANOVA) Standard
Deviation etc., with experiences as the basic factor. The
results arrived at by analysing the data have been discussed in
the paper.
30AJMS Vol.1 No.1 January - June 2012

V. REVIEW OF THE LITERATURE
It has been already been accepted both in domestic and
international markets that employees can be an important
source of competitive advantage for corporations (Peteraf,
1993). Therefore, it is critical that corporations adopt
Human Resources Management (HRM) policies and
practices that utilize the particular employee's potential to
the fullest (Boxall & Purcell, 2000; Grant, 1996). Thorough
recruitment and selection processes, effective compensation
systems, extensive training and development activities,
adequate job satisfaction and employment security all impact
positively on the overall business and performance of a
corporation. It has also been found that if HRM is linked to the
overall business of an organization, it may further enhance the
performance of the organization (Pfeffer, 1998). Moreover,
due to the complexity of managing people from different
socio-economic and cultural background, it is argued that the
way global employees are managed will also have a
significant impact on a firm's economic outcome (Bjorkman
& Xiucheng, 2002). However, it has been noted that few
organizations know how to manage HR effectively in a
dynamic global environment because best practices in one
context do not always translate to other contexts with differing
socio-economic conditions and cultures (Chilton, 1993).
Human Resources (HR) are usually considered as one of
the most valuable assets in an organization, but only few
organizations generate real benefit out of this resource
(Pfeffer, 1998). The resource-based view of the firm poses that
superior performance is the result of the proper and timely mix
of corporate resources including HR. It follows then that
Human Resource Management (HRM) practices may lead
to higher firm performance and act as a source of long-lasting
competitive advantage because these practices are usually
ambiguous, often unique and difficult to imitate (Wright,
Duford & Snell, 2001).
Despite the general applicability of HRM theories, HRM
practices carry a significant amount of local flavors. In any
particular nation, HRM practices will be rooted in the
country's historical, political, social and political differences
(Tanure & Duarte, 2005). Tayeb (1998) claims that as opposed
to universal aspects, locally meaningful aspects of HRM are
based on employee's work-related values and attitudes. These
deep rooted values and attitudes have a strong association
with the employee's occupational, cultural and social
backgrounds.
A growing body of empirical research has examined the
effect of HRM practices on organizational performance
(Vlachos, 2008). The list of HR practices that can affect
employees individual, as well as the organization's
performance either independently or in bundles is quite long.
However, not every HR practice can be a source of sustained
competitive advantage (Ahmad & Schroeder, 2003; Cardon &
Stevens 2004; Guest 1997). In order to examine the effect of
HR practices on employee and organizational performance in
the NRI context, we have chosen to examine the key HRM
practices as proposed by Pfeffer (1998), Ahmad and Schroeder
(2003) and Aycan (2005). A number of studies have been
conducted in different settings to test the relationships
between the stated HR practices and organizational
performance. Many studies have found that significant
relationships exist between the stated HR practices and
organizational performance (Vlachos, 2008). Ahmad and
Schroeder (2003) conducted a study to generalize the
findings of impact of HR practices proposed by Pfeffer
(1998) on operations management across countries and
industries. Their findings provide overall support for Pfeffer's
proposed HR practices.
VI. DATA ANALYSIS AND INTREPRETATION
A. Socio-Economic Profile of the Respondents
The data were presented in the Table 1 shows that the
Socio-Economic profile of the respondent employees of NRI.
Age: The data were presented in the table shows that about
32% of employees were in the age group of 16 – 30 years.
Nearly about 43% were in the age group of 31 – 45 years. This
shows that majority of the respondents were belongs to middle
age group and experienced people were working with NRI.
Sex: Majority of the (64%) employee respondents were
female, while only 36% were male. This indicates that, the
female dominate in the service sector in extended services to
people.
Educational Background: The data presented in the table
shows that 56% of the total respondent having the educational
level up to graduation, while 29% of the respondents with
above graduation level education, where the remaining
studied up to SSC level. This indicates that majority of the
employees have qualified up to graduation level of education.
More the qualifications, more the chances to understand about
the organizational human resource practices.
Experience: The data were presented in the table reveals
that majority of the respondent employees were up to five
years of experience. About 32% of the respondents having the
experience of in between six to 15 years. It is interesting to
note that about six respondents were having the job experience
of more than 15 years.
31
HRM Practices in NRI Medical Sciences and General Hospital in Guntur District, Andra Pradesh
AJMS Vol.1 No.1 January - June 2012

Monthly Income: The data were presented in the table
shows that 56% of employees with low monthly income up to
Rs. 25,000 per month, while 28% of the total respondents
having monthly income of between Rs. 25,001 to 50,000 per
month and about 12% of the respondents having the monthly
income of between Rs.50,001 to 75,000. This shows that
employees at NRI were enjoying attractive salaries.
B. Recruitment and Selection at NRI
In the HRM system, the selection and recruitment process
has an important place. Proper selection and recruitment
processes can ensure that the right people, with desirable
characteristics and knowledge, are in the right place, so that
they fit with the culture and climate of the organization
(Aycan, 2005). In addition, identifying the right employees in
the first place can decrease the cost of employees
Socio-Economic Profile
Number of Respondent
Percentage
Age (Years)
16 – 30 24 32
31 – 45 32 43
46 – 60 19 25
Gender
Male 37 36
Female 48 64
Qualifications
Up to SSC
11 15
Up to Graduation
42 56
Above Graduation
22 29
Experience (in years)
Up to 5 years
37 49
6 to 10 years
18 24
11 to 15 years
14 19
More than 15 years
06 08
Monthly Income
(in Rupees)
Up to 25,000
42 56
25,001 to 50,000
21 28
50,001 to 75,000
09 12
More than 75,000 03 04
training and development. In addition, organizations have to
attract skillful employees whose values and goals are
consistent with the organization.
TABLE I SOCIO-ECONOMIC PROFILE OF THE RESPONDENT
AT NRI MEDICAL COLLEGE AND HOSPITAL.
TABLE II METHOD OF RECRUITMENT PRACTICED
BY NRI HOSPITAL AND MEDICAL COLLEGE
Socio-Economic Profile
Number of Respondent
Percentage
Age (Years)
16 – 30 24 32
31 – 45 32 43
46 – 60 19 25
Gender
Male 37 36
Female 48 64
Qualifications
Up to SSC 11 15
Up to Graduation 42 56
Above Graduation 22 29
Experience (in years)
Up to 5 years
37 49
6 to 10 years
18 24
11 to 15 years
14 19
More than 15 years
06 08
Monthly Income
(in Rupees)
Up to 25,000
42 56
25,001 to 50,000
21 28
50,001 to 75,000
09 12
More than 75,000
03 04
In NRI Academy of Sciences, main sources of recruitment
are casual applications, applications through present
employees and paper publications. For recruitment of freshers,
we mostly depend on casual applications and applications
through the present employees. For recruiting clerks/computer
operators/ data entry operators, short listed candidates will be
called from the applications we have already received and
their computer skills will be tested mainly in MS Office. If
they are good in computer skills, they will be interviewed to
know their back ground and salary expectation. If they are
acceptable to the terms and conditions of our Institute, they
will be appointed on probation for a period of six months. If
their services are good, they will be absorbed in regular service
with scale.
32
V. Tulasi Das and V. Krishna Reddy
AJMS Vol.1 No.1 January - June 2012

TABLE III SELECTION TOOLS AND TECHNIQUES FOLLOWED BY THE NRI
ANOVAANOVA
Tools & Techniques Number of Respondents
Percentage
Tests
--
--
Interview
07
9.34
Test and Interview
34
45.33
Reference Check
--
--
Medical Examination
--
--
All the above 34 45.33
F-ratio 1.98
F-crit
2.68
P Value 0.124
Sum of Squares df
Mean Square F Sig.
Between Groups 14.930
3
4.977
1.988 124
Within Groups
177.737 71
2.503
Total 192.667 74
For recruiting Officers/Managers, advertisement will be
given in largest circulated daily papers calling applications
f rom the sui table candidates . After receiving
applications/resumes/Curriculum Vitae, they will be
examined by HR department and short list will be prepared.
After that they will be called for interview. Selection board
consists of Dean, Principal, Medical Superintendent and
Subject expert will interview the candidates and select the
suitable candidate for the posts.
For recruiting major posts such as Chief Administrative
Officer, Chief Financial Officers, Chief Executive Officer,
Hospital Administrators, paper advertisement will be given in
largest circulated news papers of different languages in South
India. Selection board as stated supra will select the suitable
candidate. While selecting candidates, age, previous
experience, salary expectation will be taken into
consideration. For recruiting technicians such as Lab
technicians, Ophthalmology technicians, X-ray technicians,
Respiratory technician etc, our paramedical college students
will be preferred. House Keeping and Security services have
been outsourced. Respective contractors look after their day -
to-day work. The above ANOVA test results show that at 0.05
level is not significant hence we accept the null hypothesis and
reject the research hypothesis and it can be inferred that there
is no variance in Selection Tools and Techniques Followed by
the NRI by linking experience.
TABLE IV OPINION ON RECRUITMENT POLICY AND SELECTION
Opinion Number of Respondents
Percentage
Good
28
37.33
Satisfactory
34
45.33
Average
07
9.34
Poor 06
8
Can’t say -- -- F-ratio 6.18 F-crit
2.76
P Value 0.001
Sum of Squares df
Mean Square F Sig.
Between Groups
401.398 3
133.799
6.186 .001
Within Groups 1535.749 71 21.630
Total 1937.147 74
The data were presented in the table reveals that majority of
the respondents (45%) express their satisfaction on
recruitment and selection process been practiced in NRI.
About 37% felt the process was good. Where 9% and 8% have
expressed their opinion as average and poor respectively. The
analysis of the table clearly pictures out that majority of the
employees in NRI have perceived that the recruitment and
selection practices were good and satisfactory. The above
ANOVA test results show that at 0.05 level is significant hence
we accept the research hypothesis and reject the null
hypothesis and it can be inferred that there is positive HR
practices on Recruitment Policy by linking experience in NRI
hospital.
C. Job Security at NRI
In today's fiercely competitive world where employees
are hired and fired instantly based on a company's needs, job
security has emerged as one of the most important issues to
employees around the world. Job security helps to create an
environment of confidence among employees which
reinforces their commitment to the company (Pfeffer, 1998).
W hen companies do provide job security, it can have a positive
impact on the company's performance. This relates to the
notion that job security both increases an employee's
commitment, and has a significant effect on an employee's
level of motivation as well (Nohria et al., 2008).
Ahmad and Schroeder (2003) found that job
security also affects operational performance of an
33
HRM Practices in NRI Medical Sciences And General Hospital in Guntur District, Andra Pradesh
AJMS Vol.1 No.1 January - June 2012

Sum of Squares
dfMean
SquareF Sig.
3.989
3
1.330 2.716 .051
Within Groups
34.758
71
.490
Total 38.747
74
Between Groups
organization indirectly through organizational commitment.
In their study of 101 foreign companies operating in Russia,
Fey et al. (2000) also found that job security improves
company performance. Delery and Doty (1996) studied the
US banking sector and found significant support for a positive
relationship between job security and organizational
performance (Vlachos, 2008).
Job security is particularly important to the employees
because they want to avoid the risk of losing their jobs.
In collectivist cultures, losing a job is considered as a discredit
to the employees. Most of the time, the cause of the job loss
is irrelevant to other members of the group. Hence, in the
collectivist cultures, employees are often motivated to put
considerable effort in their jobs to make sure that they are not
fired or laid off. In the NRI context, job security is one of the
most important elements for employee motivation. People
put considerable effort into making sure that their job is
secure.
TABLE V OPINION ON JOB SECURITY AT NRI HOSPITAL AND MEDICAL COLLEGE
Level of Satisfaction
Number of
Respondents Percentage
Highly Secured
48
64.00
Secured 17 22.67
Not Secured
10
13.33
Can’t Say
--
--
F-ratio
2.716
F-crit 2.68
P Value 0.051
ANOVA
Assurance (or lack of it) that an employee has about the
continuity of gainful employment for his or her life. Job
security usually arises from the terms of the contract of
employment, collective bargaining agreement, or labor
legislation that prevents arbitrary termination, layoffs, and
lockouts. It may also be affected by general economic
conditions. Job security is a must to every employee to work
freely without any stress. In NRI Academy of Sciences, there
is job security. The employees working here feel it like a
government job. Nobody has been terminated or removed
from the organization so far. There are no retrenchments also.
The above ANOVA test results show that at 0.05 level is
significant hence we accept the research hypothesis and reject
the null hypothesis and it can be inferred that there is positive
HR practices on job security by linking experience in NRI
hospital.
D. Training and Development
Training and development activities have been identified
as crucial to organizational growth and survival in today's
competitive world (Dee Saa-Davis, 2006). Training
programs increase employee skills, which has a direct impact
on employee productivity (Huselid, 1995). In addition,
training is an effective way to overcome the factors that
decrease employee job performance and satisfaction (Xiao,
1996). Like job security, training and development requires
a certain degree of reciprocity: a company that
continuously trains and develops its employees is actually
increasing the market value of its employees, which affects
employees productivity, commitment and may decrease the
motivation to quit the company (Vlachos, 2008). In the NRI
context, providing adequate training not only equips the
employees with necessary knowledge and skills to perform
their assigned duties but also makes the employees more
loyal and committed to the company due to the perception that
the company has done them a favor by allowing them to get
adequate training.
TABLE VI METHOD OF TRAINING PRACTICED AT NRI
HOSPITAL AND MEDICAL COLLEGE
Method of TrainingNumber of
RespondentsPercentage
On the job methods
68
90.67
Off the job methods
07
9.33
F-ratio 2.883
F-crit 2.68
P Value 0.042
ANOVA
Sum of Squares
dfMean
SquareF Sig.
Between Groups 6.290 3 2.097 2.883 042
Within Groups 51.630 71 727
Total
57.920 74
34
V. Tulasi Das and V. Krishna Reddy
AJMS Vol.1 No.1 January - June 2012

Sum of Squares
dfMean Square
F Sig.
Between Groups 19.614 3 6.538 12.591 0.000
Within Groups
36.866 71 0.519
Total
56.480 74
In NRI Academy of Medical Sciences, only new recruited
trainees involved in training. Those who are selected as trainee
Lab Technicians will be trained in our Labs. Senior
technicians will guide them in doing tests. Likewise
technicians in other departments such as bio-medical,
Operation Theatres, Cathlabs, will be properly trained by the
HOD's as well as senior technicians, so that they will be able to
do work on their own within a short span of time. As soon as a
fresher is recruited, they will be sent to the department for
which he is selected and appointed as a trainee with a
probation period of 6 months. After successful completion of
probation, their service will be regularized. Before
completion of probation, they will be given full fledge
training. Then only they will be regularized. Every employee
needs training. Without training, human resources cannot be
utilized in a proper way. Majority of the time the organization
been practiced on the job training methods in extending
training for their employees.
The above ANOVA test results show that at 0.05 level is
significant hence we accept the research hypothesis and reject
the null hypothesis and it can be inferred that there is positive
HR practices on training and development by linking
experience in NRI hospital.
E. Decentralization / Team Work
Decentralization and teamwork are critical to
organizational competitiveness and innovativeness (Lau &
Ngo, 2004; Mivvis, 1997). Team activities not only
improve cooperation and communication among
employees, but also create an appropriate work culture
(Kaya, 2006). In most contemporary organizations more and
more employees are required to work in teams and make joint
decisions to meet team and organizational goals (Aycan,
2005). Ahmad and Schroeder (2003) assert that effective
team working requires professional people skills, including a
deep understanding of aptitudes, abilities, and personal traits
of team members.
Tata and Prasad (2004) found that decentralization and
teamwork promotes employee commitment and creates a
sense of attachment to the organization. A number of studies
identified decentralization and teamwork as important high-
performance HRM practices (Pfeffer, 1998; Wagner, 1994,
Singer & Daval, 2000). In a study of differential outcomes of
team structures for workers, supervisors and middle managers
in a large telecommunications company, Butt (2004) found
that participation in decentralized teams was associated
with significantly higher level of employment security
and satisfaction for workers. In the NRI context, employees
prefer teamwork and decentralized decision making.
F. Information Sharing
Information sharing has emerged as a significant HR
practice in contemporary organizations. Sharing information
on both the individual and company performance fosters
organizational openness. This in turn enhances loyalty and
trust of the employees to the company which results in
enhanced motivation and co-operative behaviors (Grzelak,
1988; Stone, 1998). Aycan(2000) asserts that
communicating performance data on a routine basis help
employees to improve and develop. In the absence of any
feedback, employees may perceive to have a satisfactory
performance when in reality they don't (Choe et al., 1999).
Besides, information sharing leads to organizational
transparency that helps to enhance employee commitment and
reduce turnover (Ahmad & Schroeder, 2003). In his study,
Morishimo (1991) found a positive association between
information sharing, and productivity and profitability. In the
NRI context, employees accept the fact that not all
information will be shared with them by their superiors and
there will be a certain degree of lack of transparency in
information sharing.
TABLE VII OPINION OF EMPLOYEES ON INFORMATION SHARING AT NRI HOSPITAL AND MEDICAL COLLEGE
OpinionNumber of
the Respondents
Percentage
Very Frequently
11 14.67
Frequently 19 25.33
If Necessary
37 49.33
Never Share
08 10.67
Can’t Say
-- --
F-ratio
12.591
F-crit
2.68
P Value
0.000
ANOVA
35
HRM Practices in NRI Medical Sciences and General Hospital in Guntur District, Andra Pradesh
AJMS Vol.1 No.1 January - June 2012

The data were presented in the above table comprehended
that majority of the respondents (49%) have to share the
information if necessary. About 25% and 15% stated that they
have share the information frequently and very frequently
respectively. Whereas only 11% of the total respondents
expressed their opinion that they have never share the
information. The analysis of the table discloses that
employees working in the NRI have to share the information if
necessary and frequently. The above ANOVA test results show
that at 0.05 level is significant hence we accept the research
hypothesis and reject the null hypothesis and it can be inferred
that there is positive HR practices on information sharing by
linking experience in NRI hospital.
G. Compensation Policy
Performance-based compensation is one of the most
important HR practices that companies use to evaluate and
reward employees (Colin & Clark, 2003). Many studies have
found that there is a positive link between performance-based
compensation and employees performance (Cardon &
Stevens, 2004). Empirical studies on the relationship between
performance related pay and company performance have also
found a positive relationship (Singh, 2005). Uen and Chien
(2004) identified performance-based compensation and
merit-based promotion as ingredients in company's
incentive systems that encourage employees
performance and higher commitment level. In the NRI
context, employees do not resist the fact that differential
salaries and benefits are paid to different employees based on
subjective decisions of the top management rather than paying
salaries and benefits based on a structured compensation
policy.
Individualism and collectivism can also play an important
role in deciding what kind of reward system a company
should adopt. As opposed to a focus on individual
performance and the related pay-for-performance system, in
collectivistic cultures, there is a strong emphasis on group-
based rewards (Glushinos, 1988). As individual differences
are downplayed in collectivistic cultures, the equality
principle in compensation and reward systems is very
significant (Aycan, 2005). Indirect compensation which
includes benefits and allowances offered by an organization is
also subject to cross-cultural variations. Hao and Von Glinow
(1995) found a strong positive correlation between
collectivism and flexible benefit plans. Preferred benefits for
collectivist cultures include welfare programs such as
contribution to children education fund, housing loan, etc
(Sparrow and Budhwar, 1997). In NRI Academy of Sciences,
Incentives are provided only to the Pharmacists basing on the
sales and profit. They are not providing any incentive to the
employees working in other departments.
TABLE VIII EMPLOYEE SATISFACTION WITH OVERALL
COMPENSATION POLICY OF NRI HOSPITAL AND MEDICAL COLLEGE
Level of Satisfaction
Number of Respondents
Percentage
Highly Satisfied
1824
Satisfied 34 45.33
Not Satisfied
16
21.33
Dissatisfied
07
9.34
Can’t Say
--
--
F-ratio 3.670
F-crit 2.68
P Value 0.016
ANOVA
Sum of Squares df
Mean Square F Sig.
Between Groups 8.065
3
2.688 3.670 .016
Within Groups 52.015 71 .733
Total 60.080
74
The data were presented in the above table reveals the
satisfaction of employees of NRI on overall wage and
compensation policy, been practiced in NRI. Out of the total
respondents about 45% have satisfied with the current wage
and compensation policy. Nearly 24% have highly satisfied
and only 21% were dissatisfied with the existing wage and
compensation policy of NRI. Hence, proper policy should be
designed to satisfy all the employees of the organization to
relive dissatisfactions and make them better performed. The
above ANOVA test results show that at 0.05 level is significant
hence we accept the research hypothesis and reject the null
hypothesis and it can be inferred that there is positive HR
practices on overall compensation policy by linking
experience in NRI hospital.
VII. CONCLUSION
This paper has discussed six salient HR practices (i.e.
compensation policy, job security, training and
development, selection and recruitment, decentralization
and team work and job security) at NRI Medical Sciences
and General Hospitals. The HR practices at NRI Medical
Science and General Hospital yielding positive results and
make the organizations as the well performed. In some
practices they must take extra care to make the organization as
better competitive positioning. Furthermore, these indicators
are believed to have a significant impact on employee
36
V. Tulasi Das and V. Krishna Reddy
AJMS Vol.1 No.1 January - June 2012

expectations in the context of NRI. Future quantitative
analysis is proposed to identify specific employees cognitive
and behavioral outcomes of job satisfaction, commitment and
motivation as these are significantly affected by the identified
elements of HR practices.
REFERENCES
[1] S. Ahmad, and R.G.Schroeder, “The Impact of Human Resource
Management Practices on Operational Performance:
Recognizing Country and Industry Differences”, Journal of
Operations Management, Vol. 21, pp.19 - 43, 2003.
[2] Z. Aycan, “The Interplay Between Culture and Institutional/Structural
Contingencies in Human Resource Management Practices”,
International Journal of Human Resource Management, Vol.16,
No.7, pp.1083-1119, 2005.
[3] I. Bjorkman and F. Xiucheng, “Human Resource Management and the
Performance of Western firms in China”, International Journal of
Human Resource Management, Vol. 13, No.6, 2003.
[4] P. Boxall and J. Purcell, J, “Strategic Human Resource Management:
W here Have W e Come From and Where Should W e be
Going?”, International Journal of Management Reviews, Vol. 2,
No.2, pp. 183- 203, 2000.
[5] M.S. Cardon and C.E. Stevens, “Managing Human Resources in
Small Organizations: W hat Do W e Know?”, Human Resource
Management Review, Vol.14, pp. 295- 323, 2004.
[6] K. Chilton, “Lincoln Electric's Incentive System: Can it be Transferred
Overseas?”, Compensation and Benefits Review, Vol, 25, No.6, pp.
21-30, 2008.
[7] B.A. Friedman, “Globalization Implications for Human Resource
Management Roles”, Employee Response Rights Journal, Vol.19,
pp.157-171, 2007.
[8] R.M. Grant, “ Prospering in Dynamically-Competitive
Environments: Organizational Capability as Knowledge Integration”,
Organization Science, Vol. 7, No.4, pp.375-389, 1996.
[9] A.K.Gupta and V.Govindarajan, “Converting Global Presence into
Competitive Advantage”, Academy of Management Executive: The
Thinking Manager's Source, Vol. 15, pp.45-56, 2001.
[10] M.A. Huselid, “The Impact of Human Resource Management
Practices on Turnover, Productivity a n d C o r p o r a t e
Financial Performance”, Academy of Management Journal, Vol. 38,
No.3, pp. 635–672, 1995.
[11] N. Kaya, “The Impact of Human Resource Management Practices and
Corporate Entrepreneurship on Firm Performance: Evidence of
Turkish Firms”, International Journal of Human Resource
Management, Vol. 17, No.12, pp. 2074-2090, 2006.
[12] N. Nohria, B. Groysberg and L. Lee, “Employee Motivation:A
Powerful New Model”, Harvard Business Review, Vol.86, No.7/8, pp.
78-84, 2008.
[13] M. A. Peteraf, “The Cornerstones of Competitive Advantage: A
Resource Based View”, Strategic Management Journal, Vol. 14, pp.
179-191, 1998.
[14] J. Pfeffer, The Human Equation, Boston, M.A: Harvard Business
School Press., 1998.
[15] P. Sparrow and P.C. Wu, “Does National Culture Really Matter?
Predicting HRM Preferences of Taiwanese Employees”, Employee
Relations, Vol. 20, No.1, pp. 26–56, 1998.
[16] P.R. Sparrow and P.S. Budhwar, “Competition and Change: Mapping
the Indian HRM Recipe against W orld-wide Patterns”, Journal of
World Business, Vol. 32, No.3, pp.224–243, 1997.
[17] B. Tanure and R.G. Duarte, “Leveraging Competitiveness Upon
National Culture Traits: The Management of People in Brazilian
Companies”, International Journal of Human Resource
Management, Vol. 16, No.12, pp. 2201-2217, 2005.
[18] H. Tayeb, The Management of Multicultural Workforce, University of
Edinburgh, England, 1999.
[19] M. Tayeb, “Organizations and National Culture: Methodology
Consideration”, Organization Studies, Vol. 14, pp. 429-446, 1995.
[20] D. Ulrich and W. Brockbank, The Value Proposition, Boston: Harvard
Business School Press, 2005.
[21] I. Vlachos, “The Effect of Human Resource Practices on
Organizational Performance: Evidence from Greece”, International
Journal of Human Resource Management, Vol. 19, No.1, pp. 74-97,
1998.
[22] P.M. Wright, B.B. Dunford and S.A. Snell, “Human Resources and the
Resource-based View of the Firm”, Journal of Management, Vol. 27,
pp. 701-721, 2001.
37
HRM Practices in NRI Medical Sciences and General Hospital in Guntur District, Andra Pradesh
AJMS Vol.1 No.1 January - June 2012

Is it Time to Replace Skill With Style? A Case for Studying Communication Style
Vinay Kumar Chaganti School of Management Studies, Maharaj Vijayaram Gajapati Raj College of Engineering,
Vizianagaram - 535 005, Andra Pradesh, India.E-mail : [email protected]
(Received on 05 October 2011 and accepted on 09 January 2012)
Abstract - Three terms that scholars from Interpersonal
Communication would be well-aware of are communication
skills, communication competence, and communication style. Of
the three streams, communication style seems inadequately
studied and finds itself losing the scholarly attention. While there
is very little recent literature in this stream, it looks promising to
renew the research interest and contribute to building theory.
This paper presents introductory literature on what is
communication style, makes qualitative elaborations for scholar
search results, and goes on to build a case for active study in this
area. It was a surprising finding that this construct beats the
other two in generational development, while on the contrary it
finds itself diminishing.
Keywords: Communication Style, Communication Skill,
Communication Competence, Interpersonal Communication,
Case for Study, Literature Review
I. INTRODUCTION
Ask a job seeker who sat for multiple interviews without
much success, his reason for failure. The answer is more
common than it should be, and perhaps more wrong than right:
lack of communication skill. In the daily usage, the meaning
of communication skill is trivialized to treating
communication as a trainable motor skill. That means nothing
more than understanding communication as mere information
exchange. This is not just with the case of a losing job seeker,
but with various others in diverse facets of life. The meaning
of what communication is and should be is seldom discussed,
while the need for communication skills is discoursed more
frequently. That perhaps makes the state of life worse, since
the demands on the right kind of communication is increasing,
without really any knowledge of what right communication is.
An internet search on Google Scholar for 'Communication
Skill' and 'Communication Skills' gave out a whopping 7, 14, th300 articles (browsed on 17 June, 2011). On application of
just one constraint, that is to remove all articles with 'training',
the result comes down drastically to less than a lakh; a drop of
more than 86%. This is a reason for retrospection! And even
more, a justification to the claim that the meaning of
communication today is trivialized to a trainable motor skill.
This is not to claim that training does not help one improve
one's communication, but only to indicate that what goes on
under the umbrella of communication skill has proved less
useful than it should be, for the magnitude of work that went
into it.
II. NEED FOR AN ALTERNATIVE
In an interactional setting, if one thought skill matters
most, then perhaps it is time to consider an alternative to 'skill'.
In the arena of Interpersonal Communication, scholars have
been working on two other constructs which could prove
better: communication competence and communication style.
If one had to track the genesis of these constructs in the
contemporary literature, communication skill came at around
1940s, while communication style came in late 1950s, and
communication competence in late 1960s. So on one hand, it is
not surprising that the most commonly used construct is
'communication skill', for it has existed at least a generation
longer than 'communication style'. But what is surprising is
that the pursuit of research in 'communication competence'
exceeds the effort that goes into 'communication style'. While
this is not to indicate a bias towards the study of
'communication style', there was a need for finding the reasons
why it was being subsided and if they were reasons enough.
Fig.1 Google Books Ngram
The above chart is a Google Books Ngram. It displays how
frequently a set of words have been used in all books ever
published in a certain time frame. This graph here shows the
frequency of use of the words skill, style, and competence, in
books published between 1800 and 2011. It is evident that
'style' is the most used word over skill and competence. This
does not allow the author to infer that 'style' is what is being
studied most, but definitely allows to express that 'style' is
what most general audience reads and refers to.
38AJMS Vol.1 No.1 January - June 2012

Fig.2 Tracks the usage of words communication skill
This is another Ngram that tracks the usage of words
communication skill, communication style, and
communication competence. While the graph here shows the
elevated use of communication skill between 1940 and 2000,
there is a steady progress that communication style and
communication competence made from mid 1960s. As on
date, Communication style is what is most frequently used in
books getting published while communication skill and
communication competence are on a steep decline. However,
it is also a matter of concern that all three constructs are
showing different degrees of decline, meaning that not
sufficient focus is being given to them, or at least not as much
as it was a decade ago. This graph also shows that the study of
'communication style' fits well within the current trend of
what the general audience is reading and referring to.
TABLE I SEARCH WITH CONDITION: ALL IN TITLE
Time Period Criteria used in Search / Search
String
Communication
Style
Communicator
Style
Communication
Competence
Communicator Competence
Communication
Skills
1951-1960
2
0
0
0
40
1961-1970
4
0
2
1
111
1971-1980
57
30
52
0
755
1981-1990
117
102
212
4
1160
1991-2000
143
57
279
2
1710
2001-2011 (10th May) 185 20 414 3 2580
Total 508 209 959 10 6356
There is one problem with the use of Google Ngram that it
is not entirely scholarly. Therefore, the case that Google
Ngram makes for the study of communication style is only
suggestive but not confirmative. One might also pose a
question that if there is more happening already in this area,
then why is there a case being made up for more of its study.
The point is that Google Ngrams is only an indication of how
frequently authors use these terms in all published books. This
in no way indicates the amount of scholarly work that goes in
this area. But one conclusion that a Ngram should support
strongly is a construct's fit with the trend.
III. WHERE THE SCHOLARLY EFFORTS ARE
To address this issue, the author reverted to another
Google technology, custom made for scholars, Google
Scholar. Google Scholar is a platform that enables scholars
across the globe to search for works and provides links where
the article may be accessed. Though full-access is not possible
through Google Scholar, since full-access comes at the
discretion of the publisher, it is useful in sourcing the abstracts
more often than not. However, in this case, the author chose to
use Google Scholar to track down the generational
development of these constructs in terms of the number of
works directly addressing the construct, and number of works
that may have at least referred to these constructs.
It is reasonable to assume that if the construct appears in
the title of a publication, then it must be in direct reference to
the construct. Thus Table I may be treated as indicative of the
number of publications in each construct in the decade
mentioned in the first column. Similarly, it is reasonable to
assume that if the construct appears in a publication
anywhere, then it must have been used making a reference to
the central theme of the paper. Hence, Table II may be treated
as indicative of the number of publications in which these
constructs are either directly dealt with or are made use of to
support, elaborate, or contradict the central theme.
To draw a comparison between communication style and
communication competence, it is paradoxical that
communication style is referred more (21563 references), but
pursued less (508 publications), while communication
competence is pursued more than communication style (959
publications) but referred less (10467 references). To conclude
that communication competence has the potential to invade
the virgin areas of this discipline may be premature, since the
number of times its works are referred is less than 50% to that
of the number of times communication style is referred. Yet at
39
Is it Time to Replace Skill With Style? A Case for Studying Communication Style
AJMS Vol.1 No.1 January - June 2012

the same time, one cannot promise that communication style
might have the potential to do so, because it dealt with much
lesser times by much smaller community. These numbers may
not allow a hard conclusion about the strength of the stream of
research or suggest a stream as priority. But these numbers
allow to strongly denying the criticism that communication
competence has encompassed communication style, a
criticism one of the reputed scholars made in an email
communication with the author.
Even in comparison with communication skill,
communication style definitely made a competitive progress
albeit it came a generation after. For evidence, look at Table II,
and find the number of papers that refer to the construct in
TABLE II SEARCH WITH NO CONSTRAINT
Time Period Criteria used in Search / Search
String
Communication
Style
Communicator Style
Communication Competence
Communicator Competence
Communication Skills (One Constraint:
Exclude 'training')
1951-1960
6
0
2
0
241
1961-1970
45
3
26
2
948
1971-1980
382
64
314
5
4640
1981-1990
1300
388
995
42
8560
1991-2000
4630
418
2180
64
150002001-2011 (10th May)
15200
594
6950
130
19800
Total
21563
1467
10467
243
49189
thcommunication style in the decade 2001 to 2011, 6
generation for this construct (15200 references), and compare
that with the number of papers that cite communication skill in thits 6 generation, that is the decade 1991 to 2000 (15000
references). There is a hope thus that communication style too
would pick up.
IV. THE SCHOLARLY CASE
While the Ngrams and Tables made a case for promoting
the study in communication style, it may not be sufficient until
the construct itself shows promise for theory development.
The author thus chose to scan the literature in the field and find
suitable reasons that might encourage research in this area.
TABLE III SAMPLE DISTRIBUTION
Duration (Including)
# Works in Sample
# Total Works
Sample as %
of Total
1971-1980
31
87
35.63
1981-1990 59 219 26.94
1991-2000 54 200 27.002001-May, 2011
79 205 38.54
Of all the published works in the area of communication
style including journal publications, conference proceedings,
and thesis works, the author could source the abstracts of a few
of them which served as a sample for the study. Details of the
sample are given in Table III. Total sample as a percentage of
total works published in this area is 31.36%. These abstracts
were further content analyzed to seek, sort and filter a list of
variables that are studied in conjunction with communication
style. A total of 187 variables were identified, sorted and
filtered based on their conceptual closeness. A final list of 37
variables was taken out since they were different from one
another making a reasonably mutually exclusive
representation of all variables studied together with
communication style. Some of these variables may still
appear similar the ones already in the list, and that was
allowed because of the considerable magnitude of research
done around those variables. These variables are listed here in
Table IV.
40
Vinay Kumar Chaganti
AJMS Vol.1 No.1 January - June 2012
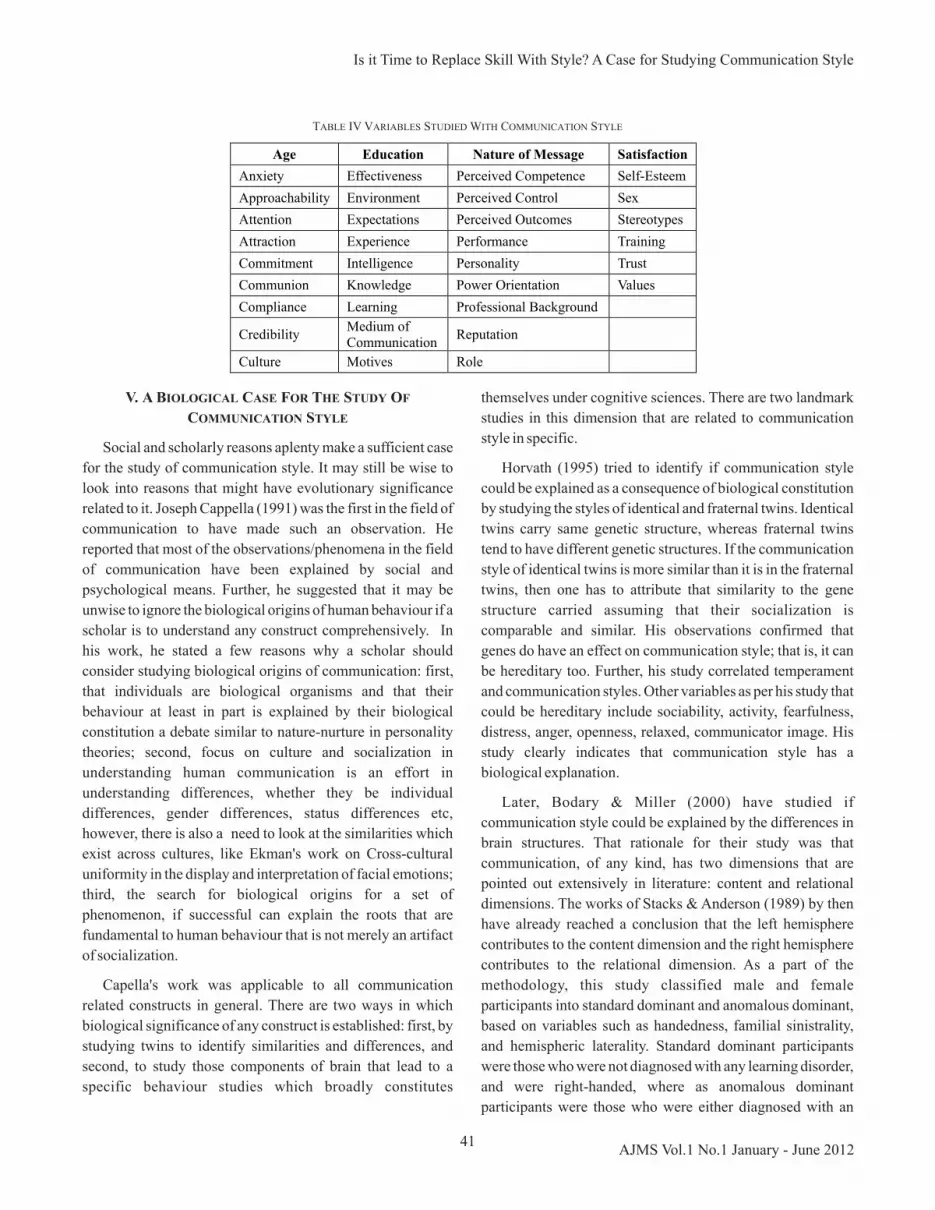
TABLE IV VARIABLES STUDIED WITH COMMUNICATION STYLE
Age Education Nature of Message Satisfaction
Anxiety
Effectiveness
Perceived Competence
Self-Esteem
Approachability
Environment
Perceived Control
Sex
Attention
Expectations
Perceived Outcomes
Stereotypes
Attraction
Experience
Performance
Training
Commitment Intelligence
Personality
Trust
Communion
Knowledge
Power Orientation
Values
Compliance Learning Professional Background
Credibility Medium of Communication
Reputation
Culture
Motives
Role
V. A BIOLOGICAL CASE FOR THE STUDY OF
COMMUNICATION STYLE
Social and scholarly reasons aplenty make a sufficient case
for the study of communication style. It may still be wise to
look into reasons that might have evolutionary significance
related to it. Joseph Cappella (1991) was the first in the field of
communication to have made such an observation. He
reported that most of the observations/phenomena in the field
of communication have been explained by social and
psychological means. Further, he suggested that it may be
unwise to ignore the biological origins of human behaviour if a
scholar is to understand any construct comprehensively. In
his work, he stated a few reasons why a scholar should
consider studying biological origins of communication: first,
that individuals are biological organisms and that their
behaviour at least in part is explained by their biological
constitution a debate similar to nature-nurture in personality
theories; second, focus on culture and socialization in
understanding human communication is an effort in
understanding differences, whether they be individual
differences, gender differences, status differences etc,
however, there is also a need to look at the similarities which
exist across cultures, like Ekman's work on Cross-cultural
uniformity in the display and interpretation of facial emotions;
third, the search for biological origins for a set of
phenomenon, if successful can explain the roots that are
fundamental to human behaviour that is not merely an artifact
of socialization.
Capella's work was applicable to all communication
related constructs in general. There are two ways in which
biological significance of any construct is established: first, by
studying twins to identify similarities and differences, and
second, to study those components of brain that lead to a
specific behaviour studies which broadly constitutes
themselves under cognitive sciences. There are two landmark
studies in this dimension that are related to communication
style in specific.
Horvath (1995) tried to identify if communication style
could be explained as a consequence of biological constitution
by studying the styles of identical and fraternal twins. Identical
twins carry same genetic structure, whereas fraternal twins
tend to have different genetic structures. If the communication
style of identical twins is more similar than it is in the fraternal
twins, then one has to attribute that similarity to the gene
structure carried assuming that their socialization is
comparable and similar. His observations confirmed that
genes do have an effect on communication style; that is, it can
be hereditary too. Further, his study correlated temperament
and communication styles. Other variables as per his study that
could be hereditary include sociability, activity, fearfulness,
distress, anger, openness, relaxed, communicator image. His
study clearly indicates that communication style has a
biological explanation.
Later, Bodary & Miller (2000) have studied if
communication style could be explained by the differences in
brain structures. That rationale for their study was that
communication, of any kind, has two dimensions that are
pointed out extensively in literature: content and relational
dimensions. The works of Stacks & Anderson (1989) by then
have already reached a conclusion that the left hemisphere
contributes to the content dimension and the right hemisphere
contributes to the relational dimension. As a part of the
methodology, this study classified male and female
participants into standard dominant and anomalous dominant,
based on variables such as handedness, familial sinistrality,
and hemispheric laterality. Standard dominant participants
were those who were not diagnosed with any learning disorder,
and were right-handed, where as anomalous dominant
participants were those who were either diagnosed with an
41
Is it Time to Replace Skill With Style? A Case for Studying Communication Style
AJMS Vol.1 No.1 January - June 2012
immune or learning disorder such as dyslexia, stuttering, and
asthma among others, and were left-handed. Communication
style preferences of standard dominant males and anomalous
dominant males were different, and so it was for the female
participants too. Anomalous dominant males reported higher
friendly, impression-leaving, animated, open, and
communicator image style scores. Standard dominant males
had the highest relaxed style scores. These results again
confirm the hypothesis that communication style has a
biological explanation to it.
VI. CONCLUSION
In this paper, the author tried to present the state of research
around communication style, explaining the reasons why it
needs more attention, perhaps more than what is given to
communication competence or communication skill. With
evidence, the paper shows that communication style has
evolutionary significance in that the construct could be
explained based on the biology of human beings, and also that
communication style is the construct that is more read and
written about in the general community. A decadal analysis of
all the three constructs has been presented. And from an
extensive literature review, a list of variables that are
commonly studied with communication style is presented. In
one sense, this paper could serve as a reference point for the
scholars intending to work in this area further.
Unlike these more researched constructs, communication
style may have just had a nominal theoretical foundation, but
the initial efforts showed directions in which theory can be
developed. The first three generations of research in this area
grew horizontally with changes in the study setting. And,
though the last couple of decades saw a dip in research interest
in this area, few recent works have retriggered an enthusiasm
that this construct needed much. For example, deVries et al
(2009) came up using a lexical method for the study of
communication styles, and Waldherr and Muck (2011)
proposed that the study of communication style may have the
theories of personality as a framework to support theory
development. Dianne, Barbara & Basma (2005) have already
expressed a surprise at how little has been done in this area and
elaborated the need for study in this discipline.
REFERENCES
[1] Dianne Hofner Saphiere, Barbara Kappler Mikk, & Basma Ibrahim
DeVries, Communication Highwire. Yarmouth, ME: Intercultural
Press, 2005.
[2] R.W.Norton, Communicator Style: Theory, Applications and Measures.
Beverly Hills, CA: Sage, 1983.
[3] R.E. De Vries, A. Bakker-Pieper, R.A. Siberg, K. Van Gameren, and M.
Vlug, “The Content and Dimensionality of Communication Styles”,
Communication Research, Vol. 36, No.2, pp.178-206, 2009.
[4] H. Flynn and S.M. Corey, “Teaching Communication Skills through the
Use of Sound Films”, The School Review, Vol. 53, No.6, pp. 348-352,
1945.
[5] R. Shinn, The effects of sensitivity training on oral communication
competence among secondary school social studies student teachers,
Dissertation Abstracts International, pp. 4319-4320. 1970.
[6] Cappella, J. N., The Biological Origins of Automated Patterns of Human
Interaction. Communication Theory, Vol.1, No.1, pp. 4-35, 1989.
[7] C.W. Horvath, “Biological Origins of Communicator Style”,
Communication Quarterly, Vol. 43, No. 4, pp.394-407, 1990.
[8] D.L. Bodary, and L.D. Miller, “Neurobiological substrates of
communicator style”, Communication Education, Vol. 49, No.1, pp.82-
98., 1991.
42
Vinay Kumar Chaganti
AJMS Vol.1 No.1 January - June 2012

Application of SERVPERF for Rural Retailer: Reliability and
Factor Analysis 1
R. Saravanan and
1School of Management, Sri Krishna College of Technology, Kovaipudur, Coimbatore - 641 042, Tamil Nadu, India 2Department of Management Studies, N.P.R. College of Engineering & Technology, Natham - 624 401, Tamil Nadu, India
E-mail : [email protected], [email protected]
(Received on 05 October 2011 and accepted on 10 January 2012)
2P. Kannan
Abstract - Retail sector is the booming sector in global and Indian
economy. The Indian retail industry is divided into organized and
unorganized sectors. The Indian retail sector is highly fragmented
with 97% of its business being run by the unorganized retailers
like the traditional family run stores and corner stores. This is the
right time to know the quality of rural retailers. This study focuses
on the rural retailer's quality level through SERVPERF
measuring scale (Croin, 1992). The tool was applied for 385
respondents from rural area in Dindigal District, Tamil Nadu.
This research describe that most of the rural people are
dissatisfied with the rural retailer services. At the same time
qualification of the respondents and their position in the society
play a major role to determine the attitude towards satisfaction.
The rural retailer improves competiveness among them, and then
only they will compete with organized retailer.
Keywords: Competiveness, Threats, Quality, Organized Retailer,
SERVPERF
I. INTRODUCTION
Retailing and rural marketing both are booming the
Indian economy. Retailing currently contributes 10% of
India's GDP and 6-7% of employment opportunities
(Kalhan, 2007). Bottom of the pyramid concept clearly
shows the opportunities and advantages of the rural market.
Retailing is the interface between the producer and the
individual consumer buying for personal consumption
(Anmol Soi, 2009). Retail has traditionally been a major
sector in India employing millions of people. The Indian
retail industry is divided into organized and unorganized
sectors. Both of them have different characteristics, features,
activities and types. The Indian retail industry is estimated to
worth Rs 13-14 lakh crore in Financial year 2008 (India
Retail report 2009-IMAGES research). The country's
dynamic retail landscape presents a grand opportunity to
investors from across the globe, to use India as a strategic
business hub. With the changing face of retail, the Indian
consumer is in for a rapid transformation. With retail
spending growing at double digit, Private Final
Consumption Expenditure (PFCE) at current prices was
estimated at Rs. 26,07,584 crore in 2007-08 as against Rs.
23,12,105 crore in 2006-07 (R S Roy, 2009).
A few of the Indian & International retail brands are operating
in India currently. Pantaloon Retail, Shoppers Stop, Tata Trent
Ltd, RPG Enterprises, Landmark Group, Madura Garments,
Vivek Group, Globus, Subhiksha Trading Services, Nilgiris
Ltd., Trinethra Super Retail Ltd., Provogue Ltd., Bata India
Ltd., Archies Ltd are some of the Indian retail brands to
mention. Nine West, United Colors of Benetton, Adidas,
Mango, Pizza, Marcoricci Italy, Red Earth, Nike, TGI
Friday's, Mc Donalds, Samsonite, Promod, Lasenza, KFC,
Reebok are a few International retail brands to highlight.
A. Unorganized Retailing in Rural Area
Unorganized retailing refers to the traditional formats of
low-cost retailing, for example, the local Kirana shops, owner
manned general stores, paan / beedi shops, convenience stores,
hand cart and pavement vendors, etc. Unorganized retailing is
characterized by a distorted real-estate market, poor
infrastructure and inefficient upstream processes, lack of
modern technology, inadequate funding and absence of skilled
manpower. Therefore, there is a need to promote unorganized
retailing.
There are a total of 3,697,527 shops (retail outlets) in the
rural sector, leading to an average of 5.85 shops per village. In
Tamil Nadu and Pondicherry there are 7 or more shops per
village. The unorganized sector defined as “The
unorganized/informal sector consists of all unincorporated
private enterprises owned by individuals or households
engaged in the sale and production of goods and services
operated on a proprietary of partnership basis and with less
than ten total workers”.
The Indian retail sector is highly fragmented with 97% of
its business being run by the unorganized retailers like the
traditional family run stores and corner stores. The Indian
retail industry report pinpoint that unorganized retail have US
$ 266 billion marketing opportunities compare to organized
retail (US $14 billion) which is very high.
43AJMS Vol.1 No.1 January - June 2012
Shaoni Shabnam (2008) stated that since 1991, Indian
economy retail sector has gradually undergone considerable
changes in its form. The major shift has been the emergence of
an organized sector within the retail industry. Shilpa Sharma,
(2009) explored that we need to understand that Rural India
which is heterogonous in nature. An old saying captures the
variations in rural India perfectly - “Kos-kos par badle paani,
chaar kos pe baani”, which translates to – at every mile taste
of water changes and every four miles dialect (baani). Chitale
C. M. et al., (2008) reported that overall market for food and
grocery is estimated to be Rs 6.7 lakh crore, of which the share
of organized retail is estimated at Rs 4,000 crore, which is less
than 0.6%. This segment is estimated to grow at a CAGR
(compounded annual growth rate) of 33% over the next
five years. Over 12 million small and medium retail outlets
exist in India, the highest in any country. Traditional retail
formats are highly popular in small towns and cities with
primary presence of neighborhood “kirana” stores, push-cart
vendors, “melas” and “mandis” (Retail, December 2008). The
Current & Traditional Format Retailers or Unorganized
Retail Models in India is i) Kiranas: Traditional Mom and Pop
Stores, ii) Kiosks, iii) Street Markets, iv) Exclusive
/Multiple Brand Outlets.
B. Boom of Organized Retailing in Rural India
Booming of organized retailing in rural India is a biggest
threat to the rural retailer. The Indian retail market has been
ranked the second most attractive emerging market for
investment after Vietnam (AT Kearney's seventh annual
Global Retail Development Index (GRDI), in 2008).
The organized retail sector is expected to grow stronger
than GDP growth in the next five years driven by changing
lifestyles, strong income growth and favorable demographic
patterns (KPMG, 2005).The Organized Retail market stood at
Rs.96, 500 crore in 2008. The industry has grown at a CAGR
of 36% between 2004 and 2008. This growth was mainly
driven by changing lifestyles, rising disposable incomes,
favorable demographics, and easy credit availability, etc.
(NSDC report). Organized Retailing in India is growing at a
very fast pace. Modern Format Stores on the other hand
would have to work on the ambience, variety,
convenience and facilities that they offer to ensure regular
footfalls (Aparna Tembulkar, 2007).
As per the result of F&R Research estimates for India
Retail Report the Indian Retail market stood at Rs.1,330,000
crore in 2007 with annual growth of about 10.8 % Of this, the
share of organized Retail in 2007 was estimated to be only
5.9%, which was Rs.78,300 crore. But this modern retail
segment grew at the rate of 42.4% in 2007, and is expected to
maintain a faster growth rate over the next three years,
especially in view of the fact that major global players and
Indian corporate houses are seen entering the fray in a big way.
Even at the going rate, organized retail is expected to touch
Rs.2,30,000 cr by 2010, constituting roughly 13% of the total
retail market (R S Roy, 2009).
Organized retail all over India will require 200 million sq.
ft. by the end of 2010. Not only that a great demand for at least
50,000 new hotel rooms in the next five years is emerging and
the hospitality sector looks forward to attain this target
(Dr.R.Venkatesh, 2007). Organized Retailing has Foreign
Direct Investment to the extent of 49% that is permitted in
India. Food World operates as a 51:49 joint venture with Dairy
Farm International of the Jar dine Matheson Group, a US $ 4.5
billion retail giant operating in the Asia-Pacific markets with
the requisite experience (Dr.Vikram Singh, 2003).
In India with 15 million retailers, most of them owning
small mom and pop outlets, we also have a modern retail
flourishing like never before. There is little room for conflict
as evidenced from the fact that India presents a unique case of
consumption-driven economy. Poor infrastructural facilities
in rural segments have been one of the factors holding back
rural industrialization in India.
C. SERVPERF Scores on Service Quality Factors
Cronin and Taylor (1992) were amongst the researchers
who leveled maximum criticism on the SERVQUAL scale.
They provided empirical evidence across four industries to
corroborate the superiority of their 'performance only'
instrument over disconfirmation-based on SERVQUAL
Scale. In equation form, it can be expressed as:
k
Sqi = ∑ Pij
j=1 Where,
SQi = perceived service quality of individual 'I'
k = Number of attributes / items
P = Perception of individual 'i' with respect to performance of
a service firm on attribute 'j’
The SERVPERF scale is found to be superior not only as
the efficient scale but also more efficient in reducing the
number of items to be measured by 50%. (Hartline and
Ferrell, 1996; Babakus and Boller, 1992; Bolton and Drew,
1991). Lots of researcher have used the SERVPERF scale to
measure the customer perception of Public School
Volunteerism (P. Marshall, 2004) retail banking
(Vanniarajan & Anbazhagan, 2007), Higher education
44
R. Saravanan and P. Kannan
AJMS Vol.1 No.1 January - June 2012

'HEdPERF' (Brochado & Marques, 2007), private bank
(Cuong, 2009), Musem (L.P. Mey & Mohamed, 2010),
retail shopping (P. Marshall et al). This is the first study to
measure the quality of rural retailer using SERVPERF scale.
II. OBJECTIVE OF THE STUDY
The primary objective of the study is to measure reliability
of SERVPERF to rural market and measure the service
quality of rural retailers. The Secondary objective is to
conform whether demographic factors influence the
perception of the rural customer.
III. HYPOTHESIS TESTING
The objectives of the study will justify with following
hypothesis assumption. This study tests the following null
hypothesis.
1. Customer age group didn't determine the perception
of rural retailer service quality.
2. Qualification of the respondents didn't influence the
perception of the customer.
3. Designation is not a matter to influence perception of
the customer.
4. Family income of the customer didn't influence the
perception.
5. Competition among the rural retailer never influence
the perception of customer.
IV. STUDY METHODOLOGY
Descriptive research design was used to study the
perception of service quality among rural retailer. The
primary data was collected based on convenience sampling
method. The total rural population in Dindigul district is
13, 53, 808. That is 62.63% of total population of Dindigul
district. SERVPERF scale was used to collect primary data
from 400 (0.03% of total rural population) samples from
rural customers in Dindigul district. 385 (96.25%) samples
were qualified. The secondary data was collected from the
articles, newspapers, books and internet. The percentage
method, correlation, two tailed T-Test, F statistics, reliability
test and factor analysis were used to measure the quality of
retailers in rural areas. The collected data have been analyzed
with the help of SPSS package. The scope of this study is to
know the service quality of retailers in rural areas. This study
shows the present level of quality of services and indicates
the area for improvement.
TABLE I DEMOGRAPHIC DETAIL OF THE RESPONDENT
Particulars % Particulars % Particulars %
Age Group
Below 20 26.8 No. of Retail
Outlet Below 5
22.3 DesignationsFormer
21.8
21 to 30 19.0 6 to 10 16.9 Daily Wager 25.2
31 to 40
16.4 11 to 15
21.0
Professional 22.3
41 to 50
17.1 16 to 20
20.8
Self Employee
17.9
51 & Above
20.8
21 & Above
19.0
Students and others
12.7
Total
100
Total
100
Total 100
Particulars
%
Particulars
%
Particulars %
Qualification
Illiterate
16.4
Family Income
Below 3000
14.0
GenderMale
57.4
Schooling
20.3
3001 to 10000
23.6
Female 42.6
Diploma 26.510001 to
2000018.7
U.G 19.720001 to
3000020.5
P.G & More 17.130001 & Above
23.1
Total 100 Total 100 Total 100
Source: Primary Data
45
Application of SERVPERF for Rural Retailer: Reliability and Factor Analysis
AJMS Vol.1 No.1 January - June 2012
V. DATA ANALYSIS

Knowing customer demographic factors are very essential
because these are the factor are determining individual
behavior, perception and expectation. Need, wants, desire
vary based on income level, educational qualifications, age
group, designation and their family setup. Most of the rural
people live in joint family. In joint family purchase decision is
entirely different than nuclear family people. Those who are
earning more, their expectation and perception level will vary
with those who are earning less. The individual behavior has
lots of difference based on their job profile. The results of
demographic details are shown in table I.
The Table I shows that 57.4 % are male and 42.6 % are
female, 26.8% of the respondents come under below 20 age
group. The young blood has quick decision making and easy
to move alternative. So the competitiveness plays a major role
to determine the service preference 22.3% of the respondents
live with minimum of 5 retail shop at the same time 19% of the
respondents came in 21 and above retailers. 23.6% of the
respondent's family earn 3001 to 10000 and 23.1%
respondents family earn more than 30001. Another important
TABLE II IMPORTANT SERVICE QUALITY FACTORS IN RURAL RETAILING
factor to determine the service preferences is intelligence of
the respondents. Most of the rural people have lots of
experiences, but 16.4% of the rural population is Illiterate and
26.5 % are diploma holders. Like qualification respondents
designation also disturb the service preferences. This study
found that 25.2% of the respondents are daily wagers. They
involve in agri culture, mason, helpers, textile mill labour and
other field.
The important service quality factors in retailing are
identified with the help of factor analysis. Before conducting
the factor analysis, the validity of data for factor analysis is
examined with the help of Kaiser-Mayer-Ohlin measure of
sampling adequacy and Bartletts test of sphericity. The KMO
measure of sampling adequacy (0.503) which is very close to
the standard minimum of 0.50. And the chi-square is
significant even at zero per cent level. Both these tests confirm
the validity of the data for factor analysis. The scores on
seventeen variables related to the service quality of retailing
are included for factor analysis. The factor analysis results in
four important service quality factors namely reliability,
responsiveness, assurance and tangibles.
Variables in Service qualityFactor
LoadingEgien Value
% of Variation
ReliabilityBeing sincere to solve problems
0.5837
6.2578 36.81Providing services at promissed time 0.4084
Promise to do something on time 0.5641
Keeping records correctly 0.5717
Performing the service right at first time 0.6305
ResponsivenessTelling customer exactly what they do
0.6090
4.1515 24.42Prompt services to customers
0.4836
Employees willingness to help
0.4861
Employee oblige the requests of customers
0.5908
Assurance
Employees are trustworthy
0.5491
3.5860 21.09Knowledgeable employees
0.5702
Consistent courteous
0.5705
Feeling safe in money transaction
0.5373
Tangibles
Upto date equipments
0.5909
3.0046 17.67Physical facilities
0.5645
Neatness of employees
0.6178
Communication material
0.4936
Kaiser-Meyer-Olkin Measure of Sampling Adequacy: 0.503 Bartlett's Test of Sphericity: Approx. Chi-Square: 127.995** Significant at zero percent level.
46
R. Saravanan and P. Kannan
AJMS Vol.1 No.1 January - June 2012

The narrated four service quality factors explain the
service quality variables in rural retailers to the extent of
99.99%. The most important factor is the 'reliability' factor.
The eigen value and the per cent of variation explained by
this factor are 6.257 and 36.81% respectively. The second
important factor is responsiveness. The Eigen value and the
percent of variation are 4.1515 and 24.42% respectively.
The next two important factors are assurance and tangibles
with four variables in each. The first important service
TABLE III OVERALL ATTITUDES OF RURAL RETAILERS
quality variable are “Performing the service right at first
time” , “Neatness of employees”, “Telling customer exactly
what they do” and “Upto date equipments”.
The overall attitude towards retail banking services
offered by the bankers have also been measured at five point
scale namely highly satisfied, satisfied, moderate,
dissatisfied and highly dissatisfied. The distributions of
customers on the basis of their overall attitude towards
banking are presented in Table III.
Factors of Service Quality Reliability Responsiveness Assurance Tangibiles Total
Overall Attitude NO %
NO %
NO % NO %
NO %
Highly dissatisfied 398 20.68 304 19.74 266 17.27 311 20.19 1279 19.54
Dissatisfied 388 20.16 299 19.42 360 23.38 323 20.97 1370 20.93
Moderate 346 17.97 338 21.95 300 19.48 314 20.39 1298 19.83
Satisfied 384 19.95 297 19.29 302 19.61 293 19.03 1276 19.49
Highly Satisfied 409 21.25 302 19.61 312 20.26 299 19.42 1322 20.19
Source: Primary Data
TABLE IV PERCEPTION ON SERVICE QUALITY VARIABLES AMONG CUSTOMERS
Variables in Service Quality MeanStd. Devi
F Statistics
Mean square
F Sig.
ReliabilityBeing sincere to solve problems
2.9506 1.4773 0.8594 0.3913 0.8149
Providing services at promissed time
3.0338
1.4239
2.4706
1.2213
0.3012
Promise to do something on time
3.0338
1.4813
3.8536*
1.7704
0.1341
Keeping records correctly
3.0597
1.4212
1.5886
0.7847
0.5356
Performing the service right at first time
2.9688
1.4083
1.5989
0.8045
0.5229
Responsiveness
Telling customer exactly what they do
2.9870
1.4040
3.5960*
1.8403
0.1204
Prompt services to customers
2.9688
1.3935
3.4236
1.7774
0.1326
Employees willingness to help
2.9506
1.3939
2.2789
1.1751
0.3213
Employee oblige the requests of customers
3.0779
1.4139
1.3261
0.6610
0.6194
Assurance
Employees are trustworthy
3.0416
1.4264
1.6452
0.8069
0.5213
Knowledgeable employees
3.0130
1.4206
1.6663
0.8242
0.5103
Consistent courteous
3.0052
1.3405
2.7074
1.5148
0.1971
Feeling safe in money transaction
3.0286
1.3756
1.3173
0.6939
0.5966
Tangibles
Upto date equipments
3.0675
1.4033
2.7834
1.4195
0.2268
Physical facilities
2.9506
1.4032
1.3581
0.6875
0.6009
Neatness of employees
2.9377
1.3736
4.9839*
2.6880
0.0310
Communication material
2.9039
1.4537
0.7579
0.3562
0.8397
Grand Mean = 3.00
* Significant at 5% level
47
Application of SERVPERF for Rural Retailer: Reliability and Factor Analysis
AJMS Vol.1 No.1 January - June 2012

TABLE V CUSTOMER AGE GROUP DIDN'T DETERMINE THE PERCEPTION OF RURAL RETAILER SERVICE QUALITY
Factors of Service Quality Correlation T test
Value Sig. T value Sig. (2-tailed)
Reliability Being sincere to solve problems
0.039
0.443
0.84
0.402
Providing services at promised time -0.116*
0.023**
1.54
0.124
Promise to do something on time 0.053
0.304
1.639
0.102
Keeping records correctly
-0.027* 0.602
1.85
0.065
Performing the service right at first time
-0.007*
0.892
1.012
0.312Responsiveness
Telling customer exactly what they do
0.018
0.729
1.201
0.23Prompt services to customers
-0.037*
0.47
1.002
0.317Employees willingness to help
0.013
0.80
0.852
0.395Employee oblige the requests of customers
-0.045*
0.376
2.007
0.045Assurance
Employees are trustworthy
-0.07*
0.168
1.642
0.101Knowledgeable employees
0.066
0.199
1.48
0.14Consistent courteous
-0.015*
0.766
1.383
0.167Feeling safe in money transaction
0.089
0.081
1.679
0.094Tangibles
Upto date equipments
-0.025*
0.621
1.936
0.05**Physical facilities 0.02 0.692 0.852 0.395Neatness of employees -0.007* 0.896 0.724 0.469Communication material 0.036 0.485 0.398 0.691
As a maximum of 23.38% of the customers are
dissatisfied in their attitude towards the assurance of rural
retailer followed by 21.95% who have a Moderate attitude
the responsiveness of rural retailer. Next to that 21.25 &
20.26 % of customers are highly satisfied in their attitude
towards Reliability & Assurance respectively. From this
overall attitude analysis it clearly explains that rural
retailers are creating very low impact in tangibles and
assurance. In over all perception of attitudes towards the
retailers, 20.93% of the customers are dissatisfied with
their services, at the same time 2.19 % of the customers are
highly satisfied with rural retailer's service.
The rural people are asked to rate the seventeen
variables from SERVPERF scale at five point scale from
highly satisfied to highly dissatisfied. The scores assigned
on these scales are from 5 to 1 respectively. The mean score
of these service quality variables have been computed to
show the customers attitude towards the various aspects of
service quality. The One-way Analysis of Variance has been
used. The resulted mean score and the respective 'F'
statistics are shown in Table IV.
The highly perceived service quality variables among
the rural customers are keeping records correctly. The mean
score is 3.0597. The retailer didn't use any hi tech data base.
They know customer personally. The reason is they have
very less customer. Employees trustworthy got the mean
score of 3.0416 followed by providing services at promised
time and promise to do something on time have mean score
is 3.0338. Rural retailer have very limited customer, that is
the reason they can serve at promised time. Regarding the
perception on service quality variables in the rural retailer,
the significant difference among the customers are
identified especially in case of Neatness of the employees
since the respective 'F' statistics are significant at five per
cent level.
* Negative Correlation ** Significant at 5% level
48
R. Saravanan and P. Kannan
AJMS Vol.1 No.1 January - June 2012

TABLE VI QUALIFICATION OF THE RESPONDENTS DIDN'T INFLUENCE THE PERCEPTION OF THE CUSTOMER
Factors of Service Quality Correlation T Test
Value Sig. T value Sig. (2-tailed)
Reliability Being sincere to solve problems -0.002* 0.962 -0.591 0.555 Providing services at promised time -0.042* 0.414 0.231 0.817 Promise to do something on time
0.08 0.119
0.241
0.81
Keeping records correctly
0.054 0.293
0.513
0.608
Performing the service right at first time 0.013 0.803
-0.425
0.671
Responsiveness Telling customer exactly what they do
-0.013*
0.806
-0.236
0.813
Prompt services to customers
0.003
0.953
-0.425
0.671
Employees willingness to help
0.002
0.974
-0.611
0.542
Employee oblige the requests of customers
0.022
0.669
0.692
0.489
Assurance
Employees are trustworthy
-0.035*
0.496
0.309
0.757
Knowledgeable employees
0.004
0.936
0.026
0.979
Consistent courteous
0.01
0.841
-0.054
0.957
Feeling safe in money transaction
-0.025*
0.631
0.185
0.853
Tangibles
Upto date equipments
0.001
0.984
0.582
0.561
Physical facilities
0.033
0.524
-0.618
0.537
Neatness of employees
0.022
0.669
-0.757
0.449
Communication material
-0.006*
0.903
-1.061
0.29
Qualification of the customer is a main factor to influence
the perception of the retailer service. Customer perception
levels always correlate with their level of qualification. 'Being
sincere to solve problems, 'Providing services at promised
time' variables in reliability and 'Telling customer exactly
what they do' variables in responsiveness and 'Employees are
trustworthy' , 'Feeling sage in money transaction' variables in
assurance and 'Communication material' variables in
tangibles were got the negative correlation value.
Correlation between customer designation and service
quality variables had both positive and negative results.
'Providing services at promised time' and performing the
services right at first time' variables got the positive
correlation in reliability dimensions. 'Prompt services to
customers' and employee oblige the requests of customers
variables got the positive correlation in responsiveness
dimension. Knowledgeable employees and feeling safe in
money transaction variables got negative correlation.
* Negative Correlation ** Significant at 5% level
All tangible variables are not influenced by income level of
the customer expect upto date equipments. Customer income
increase changes of changing their perception. Employees'
willingness to help never affect the income increases of the
customer. Reliability dimensions got more negative
correlation score. Promise to do something on time and
performing the service right at first time got the positive
correlation value. Income levels of the customer play a vital
role to determine the perception value.
Reliability, responsiveness, assurance and tangibles
dimensions are influenced by the competition among retailer
in the rural areas. Reliability dimension got more negative
correlation value expect performing the service right at first
time and being sincere to solve problems which got positive
correlation. Competence of the rural retailer is a major factor
to provide greater service to their customer. If retailer wants to
lead and sustain the competition, they must concentrate more
on reliability, responsiveness, assurance and tangible aspects
of their service to their customer.
49
Application of SERVPERF for Rural Retailer: Reliability and Factor Analysis
AJMS Vol.1 No.1 January - June 2012

TABLE VII DESIGNATION IS NOT A MATTER TO INFLUENCE PERCEPTION OF THE CUSTOMER
Factors of Service Quality
Correlation T-Test
Value
Sig.
T value
Sig. (2-tailed)
Reliability
Being sincere to solve problems
-0.01*
0.838 2.019 0.044**Providing services at promised time
0.045
0.382 2.977 0.003**Promise to do something on time
-0.002*
0.965 2.844 0.005**Keeping records correctly
-0.046*
0.369 3.105 0.002**Performing the service right at first time 0.011
0.828 2.28 0.023**Responsiveness
Telling customer exactly what they do
-0.027*
0.597 2.424 0.016**Prompt services to customers
0.061
0.235 2.353 0.019**Employees willingness to help
-0.097*
0.057 2 0.046**Employee oblige the requests of customers
0.008
0.878 3.381 0.001**Assurance
Employees are trustworthy
0.059
0.245 3.078 0.002**Knowledgeable employees
-0.058*
0.258 2.629 0.009**Consistent courteous
0.034 0.5** 2.753 0.006**Feeling safe in money transaction -0.057* 0.261 2.83 0.005**TangiblesUpto date equipments 0.023 0.649 3.314 0.001**Physical facilities -0.036* 0.479 2.05 0.041**Neatness of employees 0.054 0.288 2.033 0.043**Communication material
-0.114*0.025
** 1.498 0.135
* Negative Correlation ** Significant at 5% level
VI. CONCLUSION
Bottom of pyramid play a major role in Indian market both
service and product marketing. Over all analysis is insisting
to the rural retailer to develop all aspect of service variables to
provide better service. The rural retailer should awake now to
improve the service. If, they miss this opportunity the
organized retailer would capture the rural market. Organized
retailer entry in rural areas will create more problems to the
rural retailer.
Rural market is a very fast growing market in India.
Retailing is booming and contributing more to Indian GDP.
India has unorganized retailing at the rate of 97%. The
emergence of organized retailing is good for Indian economy,
at the same time it may create a problem to the unorganized
retailers. Most of the organized retailers have great strategy
of these three dimensions. Rural unorganized retailers have
small and tinny shops for their business; one or two
employees may work in their shops. They have less variety of
goods and they sell only for rural people's daily needs. This
study clearly shows that the unorganized retailers are not
good in tangibles, reliability and empathy. They must
concentrate on their tangibles, reliability and empathy
dimensions based on their target people expectation and
perception values. Rural people are cleverer than urban
people. Rural customer's expectations increase more because
of mass communication like television, mobile phone etc.
They want to live in stylize way at cheaper cost.
50
R. Saravanan and P. Kannan
AJMS Vol.1 No.1 January - June 2012

TABLE VIII FAMILY INCOME OF THE CUSTOMER DIDN'T INFLUENCE THE PERCEPTION
Factors of Service QualityCorrelation T- Test
Value Sig. T valueSig. (2-tailed)
ReliabilityBeing sincere to solve problems -0.047* 0.354 -1.896 0.059Providing services at promised time -0.004* 0.939 -1.154 0.249Promise to do something on time 0.081 0.11 -1.181 0.238Keeping records correctly -0.042*
0.414 -0.882 0.379Performing the service right at first time 0.014
0.777 -1.821 0.069Responsiveness
Telling customer exactly what they do
0.029
0.568 -1.654 0.099Prompt services to customers
0.013
0.795 -1.83 0.068Employees willingness to help
-0.041*
0.425 -1.96 0.05**Employee oblige the requests of customers
0.023
0.649 -0.73 0.466Assurance
Employees are trustworthy
0.046
0.371 -1.103 0.271Knowledgeable employees
-0.033*
0.521 -1.341 0.181Consistent
courteous
0.016
0.748 -1.495 0.136Feeling safe in Money transaction
-0.027*
0.598 -1.212 0.226Tangibles
Upto date equipments
0.073
0.155 -0.86 0.39Physical facilities
0.031
0.548 -2.024 0.044**Neatness of employees
0.056
0.275 -2.207 0.028**Communication material
-0.041*
0.425 -2.366 0.018**
* Negative Correlation ** Significant at 5% level
51
Application of SERVPERF for Rural Retailer: Reliability and Factor Analysis
AJMS Vol.1 No.1 January - June 2012
TABLE IX COMPETITION AMONG THE RURAL RETAILER NEVER INFLUENCE THE PERCEPTION OF CUSTOMER
Factors of Service Quality
Correlation T- Test
Value
Sig.
T Value
Sig. (2-tailed)
Reliability
Being sincere to solve problems
0.057
0.261
-0.205 0.838Providing services at promised time
-0.021*
0.677
0.601 0.548Promise to do something on time
-0.004*
0.93
0.594 0.553Keeping records correctly
-0.022*
0.663
0.851 0.395
Performing the service right at first time 0.07
0.173
-0.026 0.979Responsiveness
Telling customer exactly what they do -0.041* 0.428 0.15 0.881Prompt services to customers
0.073 0.153 -0.027 0.979Employees willingness to help 0.01 0.848 -0.205 0.837Employee oblige the requests of customers
0.057
0.267
1.071 0.285Assurance
Employees are trustworthy
0.042
0.416
0.697 0.486
Knowledgeable employees
0.009
0.857
0.407 0.684Consistent courteous
-0.093*
0.07
0.324 0.746Feeling safe in money transaction
0.04
0.431
0.578 0.564Tangibles
Upto date equipments
-0.093
0.069
0.902 0.368Physical facilities
-0.027*
0.601
-0.201 0.841Neatness of employees
-0.13*
0.011
-0.315 0.753Communication material 0.03 0.556 -0.661 0.509
* Negative Correlation ** Significant at 5% level

52
R. Saravanan and P. Kannan
AJMS Vol.1 No.1 January - June 2012
REFERENCES
[1] Anmol Soi, “Case Study:Impact of Global Meltdown on Retail
Sector in India”, Delhi Business Review, Vol. 10, No. 1, 2009.
[2] Aparna Tembulkar, “Impact of Organised Retail Development on
Small Retailers and Consumers”, International Marketing
Conference on Creating, Communicating, and Delivering Value in
Growing Markets, 2007.
[3] AT Kearney's seventh annual Global Retail Development Index
(GRDI), 2008.
[4] H.M. Awan and K.S. Bukahri, “BE SQUAL: A Multiple-Item Scale
For Evaluating Service Quality Of Business Education In Pakistan” rd, in 3 International Conference on Assessing Quality in Higher
th thEducation, 6 -8 December, 2010, Lahore, Pakistan.
[5] A. Brochado and R.C. Marques, “Comparing Alternative
Instruments to Measure Service Quality in Higher Education”, FEP
Working Paper, December 2007.
[6] C.M. Chitale, Surbhi Jain and R.N. Pahurkar, “Contemporary
Challenges of the Retail Sector in India with Special Reference to
Pune City”, in AFBE 2008 Conference, pp.148-172, 2008.
[7] J.J. Cronin and S.A. Taylor, “Measuring Service Quality: A
Reexamination and Extensio', Journal of Marketing, Vol. 56, pp.
55-68, 1992.
[8] T. Vanniarajan and B. Anbazhagan, “SERVPERF Analysis In Retail
Banking”, International Marketing Conference on Marketing &
Society, IIMK , 8-10 April, 2007.
[9] India Retail report 2009, IMAGES research.
[10] A. Kalhan, Impact of Malls on Small Shops and Hawkers, EPW, June
2, 2007.
[11] K.P.Marshall, Relationships of Service Quality Perceptions to
Public School Volunteerism Among Non-Parents, 2004.
[12] K.P. Marshall, J.R. Smith and G. Glover, Race-Ethnic Variations in
Service Quality Retail Clothing Shopping Experiences: A
SERVPERF Comparison.
[13] L.P. Mey and B. Mohamed, “Service Quality, Visitor Satisfaction
and Behavioural Intentions: Pilot Study at a Museum in Malaysia”,
Journal of Global Business and Economics, Vol.1, No. 1, pp.226,
2010.
[14] Nguyen Quoc Cuong, “The Effects of Perceived Service Quality,
Corporate Image, Customer Satisfaction and Switching Costs on
Customer Loyalty in Vietnamese Private Banks: A Study of Asia
Commercial Bank in Ho Chi Minh City” , GSB Student's
Contribution, 2004.
[15] Shaoni Shabnam, “Employment in Retail Sector: A Comparison of
Unorganized and Organized Retail in India”, Discussion Paper 7,
Adecco Tiss Labour Market Research Initiatives (Atlmri), 2008.
[16] Shilpa Sharma, Rural India Calling, USID Foundation, USID2009,
Hyderabad, India, September, 2009.
[17] R. Venkatesh, “Recent Trends In Real Estate Marketing Scene In
India”, International Marketing Conference on Creating,
Communicating, and Delivering Value in Growing Markets, 2007.
[18] Vikram Singh, “Organized Food Retailing: Few Cases”, Spice, Vol. 1
No. 7, November 2003.

Behind the Boom: What is Leading the Entrpreneurial Fire and its Nature in India
Kavita MeenaDepartment of Management, Central University of Rajasthan, Kishangarh - 305 802, Rajasthan, India
Email:
(Received on 10 October 2011 and accepted on 25 January 2012)
Abstract - This case study is meant for discussing emergence,
growth and characteristics of the New Age Indian
Entrepreneur. Since time immemorial, the Indian business
segment has been dominated by family-run businesses, with
most of them hailing from traditional, money-lending or
trading communities, known for their sharp business acumen.
But over the past 18 years the number of new generation
entrepreneurs is mushrooming. The young are engaged in
varied form of small and medium enterprises varying from
paper to electronics, engineering to electrical, textile to metal,
construction to food processing, education to handicrafts.
Considering this trend, on the basis of qualitative data
generated through the case studies of Indian entrepreneurs,
this articles makes an effort to report on the characteristics of
new generation entrepreneurs and explores the motivational
factors and importance of other factors such as educational
qualification, role of mentoring, prior experience. The article
also brings out comparative study of new entrepreneurs and
first generation entrepreneurs. The findings suggest that
prominent 'Motivation Triggers' are 'Independence', 'Market
Opportunity', 'Family Background', 'New Idea', 'Challenge',
and 'Dream Desire'. Motivation triggers vary according to
parameters such as gender, family background, and market
opportunity. This new wave of entrepreneurship in India is
more dominated by factors of higher education, training and
incubation, work experience prior to opening a new venture.
Keywords: New Age Entrepreneur, Motivational Factors,
First Generation Entrepreneur, Changing Trends,
Independence, Education
I. INTRODUCTION
Entrepreneurship is the professional application of
knowledge, skills and competencies and/or of monetizing a
new idea, by an individual or a set of people by launching an
enterprise de novo or diversifying from an existing one
(distinct from seeking self -employment as in a profession
or trade), thus to pursue growth while generating wealth,
employment and social good.
As per the 2008 Global Entrepreneurship Monitor
Report (GEM), 11.5% of India's working population was in
an early entrepreneurial stage while the overall
entrepreneurial activity stood at 27.6% as against 8.5% and
13.9% in 2007. These statistics indicate the increasing
prevalence of entrepreneurship in India. After Indian
independence, entrepreneurshipwas restricted to big
industrial houses and family-run businesses. However,
after liberalisation of the Indian economy in 1991, the
environment became conducive for entrepreneurship to
flourish and since then entrepreneurs have increased. Since
2004–2005, India has witnessed the emergence of a new
breed of entrepreneurs. Most of them are young, well-
educated and first-generation entrepreneurs, showing
distinct difference from the entrepreneurs of the past.
II. OBJECTIVES
1. To study the changing class of entrepreneurship in India;
2. To conduct comparative studyof various motivational
triggers among new generation entrepreneurs and with
first generation entrepreneurs;
3. To study the changing trends of new age entrepreneurs.
III. REASERCH METHOD
The methodology adopted in preparing this report is based
on the analysis of case studies first generation and new
generation entrepreneurs in India from diverse sources and
background.
IV. INDIAN ENTREPRENEURSHIP: CHANGING LANDSCAPE
India always had a very large proportion of self-employed
in its working population, and even now, by some estimates;
over 65% of all adult Indians in the working age group are
engaged in myriad self-employing vocations.
India, of course, has also seen some extraordinary
entrepreneurs in the last 100 years and more and the myriad
businesses that they gave birth to continue to provide a very
visible growth momentum to the economy.
A. Emerging “Middle Class” in the Context of
Entrepreneurship
Until a generation ago, there were largely two classes of
entrepreneurs in India. There were the mega (by the then
Indian economy standards) entrepreneurs, which included
major business houses such as Tata and Birla and a host of
others, and the small & medium ones that owed their existence
partly to the anachronistic policy of reserving thousands of
articles of normal consumption for small-scale entrepreneurs.53
AJMS Vol.1 No.1 January - June 2012

The big became bigger due to their ability to successfully
compete for the licences as well as successfully seek public
capital by way of equity and debt. The small started up under
the umbrella of the Small Scale Industries (SSI) reservation
policy but the same policy subsequently came in the way of
their becoming medium-scale enterprises.
It is really exciting to know that many are succeeding, and
this success will provide motivation to tens of thousands of
others to start the next generation of entrepreneurial ventures
in incredibly diverse sectors.
This new “middle class” of entrepreneurs is
fundamentally different from their yesteryear counterparts.
They are, in many ways, more “genuine” entrepreneurs, since
most of them are starting out in a field that is much more level
than ever, and hence the competitive landscape for them is
also much more challenging.
Further, the aspirations of most of this new breed of
entrepreneurs go way beyond just achieving a comfortable
living. They dream big, and while they may have respect for
today's mega entrepreneurs-which include, beyond the Tata,
Birla and Godrej families, the Ambanis, the Mittals, the
Mahindras, the Ruias and the Munjals, among others- they are
not overawed by them.
Indeed, many who were till recently “middle class”
entrepreneurs, such as Adani, GMR and GVK, have already
joined the ranks of mega entrepreneurs and hundreds more
will do so over the next decade. These Gen Next
entrepreneurs are also far more tuned with the emerging
needs of the Indian (and global) economy and hence are
aggressively entering potentially more exciting sectors of the
future such as agri and biotechnology, healthcare, education,
green energy, consumer-oriented services such as travel &
hospitality, food services, etc., setting themselves up to join
the ranks of the mega entrepreneurs of the next decade.
B. Emergence of New Generation Entrepreneurs
Moreover, entrepreneurship in the Indian scenario has
long been associated with the 'Tatas', 'Birlas' or 'Ambanis'.
However, with many first-generation entrepreneurs
bombarding the Indian business sector in the recent years, this
trend has taken a back seat. Although these legendary
business houses have played a major role in the country's
business scenario, majority of the Indian start-ups in the
recent past, are the brainchild of first-generation, middle-
class entrepreneurs. Dictating professions by means of caste
and social strata has become a matter of the past. The
economic reforms and liberalisation have rekindled the latent
entrepreneurial streak of the Indian people, making
entrepreneurship a desired choice of career. Further, easy
access to resources and growing social acceptance has
encouraged many Indians to jump on to the entrepreneurship
bandwagon. Driven by the aim of creating ventures based on
feasible business models and backed by innovative ideas,
these new entrepreneurs are not leaving any stone unturned.
However, over the past 18 years, a host of factors has
provided a very conducive environment for India's Gen Next
entrepreneurs to venture into uncharted waters. These have
included elimination of licensing and quotas, easier and more
universal access to capital including risk capital, steady
economic growth, increasing globalisation, profound changes
in consumption not only in absolute terms but also in the
consumption basket itself and increased spending by the
Indian government in physical and social infrastructure.
V. MOTIVATIONAL TRIGGERS OF ENTREPRENEURSHIP
There are varied reasons to understanding why new
generation is deciding to venture into Entrepreneurship and,
thereby, 'breaking traditional ways of doing things'.There can
be various numerous studies psychological attitudes or
profiles that describe all entrepreneurs or characteristics to
which entrepreneurs generally conform.
Some theoretical explanations of what motivates
entrepreneurs include the following:
1. The 'Achievement Orientation' or the desire to achieve
purely for the sake of achievement alone'.
2. The interrelation between religion, norms, values,
behaviour and the economy in a particular epoch.
3. The ability to comprehend opportunity, i.e., 'to reinterpret
the meaning of things, fit them together in new ways' and
'see what others may have missed, such as an unsatisfied
demand'.
4. The capacity to sustain a high degree of interest in the
advancement and technological development of the
industrial process and in the improvement in the scale of
industrial operations.
5. The ability to make the best of what one has, in order to
get what one needs, i.e., the capacity to innovate in
figuring out the best ways to reachthe market with
minimum expenditure of time, effort and money.
A. Comparison of Motivational Factor of First Generation
and New Generation Entrepreneurs
The new-age entrepreneur is different in more ways than
one. When it comes to business, they are primarily driven by
54AJMS Vol.1 No.1 January - June 2012
Kavita Meena

the urge to gain socio-economic independence and implement
their ideas compared to those from the pre-1990s, who were
mainly driven by factors like family background and market
opportunity.
1. Family Background: It was family background which
drove entrepreneurs before the economy opened up. But the
influence of family history as a trigger for entrepreneurship
has reduced significantly to only 12% of entrepreneurs' post-
2000.
2. Independence: The study found that 35% of
entrepreneurs who started their business after 2000 were
driven by the urge to gain independence; only 12%
businessmen had this as a motivating factor in the pre-1990s.
3. Market Opportunity: The study found 'market
opportunity' has become an increasingly significant
motivating trigger since the economic liberalization gathered
momentum. 28% of those in the sample who started
enterprises during 1991-99 and 22% of those starting after
2000 cited 'market opportunity' as themain motivating factor,
compared to 11% of those starting enterprises before 1991.
B.Comparison of Motivational Factor across Gender
'Challenge' is the principal motivation driver or positive
factor, even if not the most important trigger. Entrepreneurs
view the future in terms of the nature and quality of work as
well as turnover increase. By their very nature, entrepreneurs
tend to be ambitious. Monetary gain is not as significant as
either challenge or independence.
1. Women:Most of the business women surveyed said the
sense of independence, challenge and employment generation
is what drives them to be enterprising. Money is their last
priority.
2. Men: Challenge is the most exciting factor,
independence and money are also important.
VI. CHANGING TRENDS: NEW GENERATION
ENTREPRENEURS
A. Education
Generating a critical mass of entrepreneurs oriented to
high levels of growth depends on the quality of education
provided and the presence of an environment that encourages
innovation.
A dynamic entrepreneurial environmentis supported by a
vibrant academic culture with innovation linking the two as a
generator of new ideas and opportunities. Professional
education (MBA & Engineering) is playing an important role
in increasing the number of entrepreneurs in India.
1. Qualification
The study also reveals an interesting fact about the
educational background of an entrepreneur. Most of the new-
age (2000 onwards) entrepreneurs are post graduates, as
compared to those in pre-2000 era, who were mostly
undergraduates.
2. Professional Education
Skill development remains a crucial aspect for the growth
of businessmen and the economy as well. The study also
points towards increasing number of management graduates
amongst those who turn entrepreneur. As against only 20% of
entrepreneurs who were MBAs in pre-2000 years, 70% of
new-age entrepreneurs who were surveyed turned out to be
trained MBAs.This may be a trend among knowledge
entrepreneurs for gaining formal experience through
employment prior to starting their own enterprises.
B. Training and Incubation
1. 58% did get some kind of support, either in terms
incubation or mentoring.
2. About 21% got incubation support from one of the
premier institutions in the country and support from alma
mater, alumni network and acquaintances who were
successful entrepreneurs.
3. 16% have preferredgoing without a mentor so that they
can make their own mistakes. For some, support from
mentors was invaluable when it came to new idea
validation and helping them with the fundamentals of
running a business.
4. Interestingly, 5% were helped by ex-bosses and academic
deans.
C. Prior Experience
Prior experience is playing major role in effecting the
growth of entrepreneurial activity. It is found to enhance the
entrepreneurial alertness, which has helped them to increase
the awareness of the changing trends in the market and
recognise the business opportunities.
1. Interestingly, 95% of the entrepreneurs have worked in a
corporate establishment before starting up.
2. 67% had 0-5 years of experience before they decided to
turn entrepreneurs. It is here that they gained valuable
work experience and probably expertise in their domain
of choice.
55AJMS Vol.1 No.1 January - June 2012
Behind the Boom: What is Leading the Entrpreneurial Fire and its Nature in India

D. Shift from Corporate to Become their Own Boss
There has been find a new trend in new generation
entrepreneurs, where there is shift from their lucrative jobs in
corporates towards starting their own venture.While they do
get their experience working in a corporate set up, it is here
that situations push them towards becoming their own boss.
1. A huge 83% of the entrepreneurs have quit because there
was an urge to break out and make my own idea come
true . Out of which nearly half (56%) of the
entrepreneurs decided on quitting and setting up a
business because they had a business idea they could no
longer hold back. It could be because the idea was linked
to some developments in the industry they are operating
in. As more time passed by, the idea could lose its
effectiveness.
2. About 56% were making money or doing well for
someone else, not for themselves. A similar percentage
was not comfortable working as a part of strict hierarchy
which exists in some corporate houses.
4. 50% felt they had to cope with seniors whose views were
different from their own.
5. 39% recalled that they quit because they were forced to
work on ideas that they did not agree with.
E. Barriers
1. When they were contemplating setting up their business,
funding was the biggest barrier in front of them, as
indicated by 53% of the respondents.
2. 36% had problems because the market for their idea was
not very well defined, they could not convince partners
and could not source quality products consistently.
3. About 11% of the respondents felt one of the barriers was
lack of family support.
VII. CONCLUSION
From 2000 there has spread a new wave of entrepreneurs
supported by the benefits of economic reforms and
liberalisation and entrepreneurship has become another name
of career. The development of Entrepreneurship in a
particular milieu depends not on a single overriding factor but
rather on 'a constellation of factors'. These factors are both
internals factors of motivation and external factors.
REFERENCES
[1] Blythe Camenson, Careers for new agers and other cosmic types, Tata
McGraw, Hill, New Delhi, 2006.
[2] Peter.F.Drucker, Innovation and Entrepreneurship. Harper business,
2009.
[3] S. Santha and R. Vasanthagopal, “Women Entrepreneurship in India”.
New century Publication, New Delhi, 2008.
[4] S.Bagchi, Lessons in Entrepreneurship from the Indian IT Industry.
Speech at LST 2005, September 24, Mumbai: National
Entrepreneurship Network.
[5] W.Baumol, “Entrepreneurship, Productive, Unproductive and
Destructive”, Journal of Political Economy, Vol.98, No.5, pp.893-921.
[6] V.Gupta, I.MacMillan and G. Surie, “Entrepreneurial Leadership:
Developing a Cross-Cultural Construct”, Journal of Business
Venturing, Vol.19, No.3, pp.241-260, 2004.
[7] C.Jayanthi, "Women Entrepreneurs in the New Wave Economic
Development Programme", Yojana, Vol. 47, Aug. 2003.
[8] Azhar Kazmi, “What Young Entrepreneurs Think and Do: A Study of
Second Generation Business Entrepreneurs,” The Journal of
Entrepreneurship, Vol.8, No.1, pp. 67-78, 1999.
[9] Dwijendra Tripathy, “Indian Entrepreneurship in Historical
Perspective,” Economic and Political Weekly, Vol. 6, No. 22, pp. M59-
M68,May 29, 2001.
56AJMS Vol.1 No.1 January - June 2012
Kavita Meena
Successful Women Entrepreneurs in India: Attributes Based Analysis
Raj Kumar, Saumya Singh and Nitam SinghFaculty of Management Studies, Banaras Hindu University, Varanasi - 221 005, Utter Pradesh, India
E-mail: [email protected](Received on 20 October 2011 and accepted 25 January 2012)
Abstract - A woman in entrepreneurship is a fresh phenomenon in
India. Women's entrepreneurship can make a particularly
strong contribution to the economic well-being of the family and
communities, poverty reduction and women's empowerment,
thus contributing to the first and third Millennium Development
Goals (MDGs). Government also supports through various
schemes and programme which has accelerated the growth of
women entrepreneurs in India. Among the reasons for women to
run organized enterprises are their skill and knowledge, their
talents, abilities and creativity in business and a compelling
desire of wanting to do something positive. Women
entrepreneurs are engaged in entrepreneurial venture due to
push and pull factors empowering women in economic and social
fields. Pull factors means the factors which drive women to start
their own enterprise with a desire to do something independently
and push factors force them to take up business to support their
family financially. This paper analyzes the cases of 20 successful
women entrepreneurs and tries to identify the motivational
factors behind their venturing into entrepreneurship.
Keywords: Women Entrepreneurs, Pull Factors, Push Factors
I. INTRODUCTION
Women owned business are highly increasing in the
economies of almost all the countries. Although small
businesses owned by women have traditionally focused on
fashion, handicrafts and other services sector, but recently
women entrepreneurs have been moving rapidly into
manufacturing, construction and other industrial filed. The
hidden entrepreneurial potentials of women have gradually
been changing with the growing economic status in the
society. Skill, knowledge and adaptability in business are the
main reasons for women to emerge into business venture. The
challenges and opportunities provided to the women of
globalization era are growing rapidly that the job seeker are
converting into the job creators. They are flourishing as
designers, interior decorators, doctors, engineers, publisher,
manufacturers and still discovering new avenues for the
economic participation.
In the early 70's women who entered into entrepreneurial
activities mainly got involved in producing traditional items
like handicrafts, food processing and food products.
Participation of women as industrial entrepreneurs is
comparatively a recent phenomenon. In 1875 after the
declaration of International Women's Year the approach
towards women entrepreneurs began to change. The number
of women entrepreneurs has increased especially during
1990s. In India, in the year 1981, only 5.2% of women to total
were self-employed, but as per the census 2009, this figure has
risen to 19.9% as compared to men (Geetika & Shefali Nandan
2010, p.3).
The first national conference of women entrepreneurship
in Indian held at New Delhi in 1981, the sixth-five year
proposal for the promoting female employment in women
owned industries were some of the initiatives for the
promotion of women entrepreneurship in this country.
Women owned businesses are highly increasing in the
economies of almost all countries. Thus, government has
defined the women entrepreneurs as an enterprise owned and
controlled by women having a minimum financial interest of
51% of the capital and giving at least 51% of employment
generated in the enterprise to women (Maheshwar Sahu &
S.K.Baral 2010, p. 123).
Today, we can see that women are taking risks and entering
into every industry and competing with their male
counterparts. They are constantly looking out for new and
innovative ways which lead to strong economic participation.
Their achievement orientation and desire to do something
positive are among the reasons for women to establish and
manage organized industries and take up challenging
ventures. Women in India have been very much conscious of
their rights and duties. Further, with spreading awareness
amongst the women, they have come forward to participate in
all sorts of activities leading to the economic development of
this country.
In this paper, we have done analysis of 20 successful
women entrepreneurs from India about their socio-
demographic profile i.e., educational status, geographical
background, type of Industry they are associated with, year of
experience in business till date and the motivational factors
that influence the women to start their own venture. This paper
is also an attempt to demonstrate the financial aids provided
57AJMS Vol.1 No.1 January - June 2012

by banks and financial institutions in India and the various
programmes and acts implemented in this regard. The paper
also includes a multifaceted motivational model which was
developed through the factors that motivated the women to
start their own venture based on McClelland need theory of
motivation.
II. REVIEW OF LITERATURE
It has been found that women entrepreneurs face more
problems than their men counterparts. Women entrepreneurs
are more mostly illiterate or are simply graduates and very few
of them have any professional qualifications (Singh and
Sengupta, 1985; Vinze, 1998; Singh 1992, Jyoti and Prasad,
1993). In general even if women are educated they lack
technical and skill oriented knowledge (Hisrich and peters,
1995).
Another research found that women are under represented
in science and technology related fields and over represented
in the humanities (O' Dubhchair and Hunter, 1995; Klawe and
levenson, 1995). According to Lisowaska (1996) & Brannon
(1999), as women plays multiple roles they are often left with
less time to devote to business and therefore women
entrepreneurs all over the world find it difficult to balance
work with family.
Susanne E. Jalbert (2000) examined that today's world is
changing at a startling pace, political and economic
transformations seems to be occurring every where - as
countries convert from command to demand economies,
dictatorships move towards democracy, and monarchies build
new civil institutions. They also explained how women
entrepreneurs affect the global economy, why women start
businesses, how women's business associations promote
entrepreneurs, and to what extent women contribute to
international trade.
Muriel Orhan and Don Scott (2001) developed a
motivational model with the help of case study and survey at
15 women entrepreneurs with various associated influencing
factors. Bharti & Indira (2005) talked about the era of fifties to stthe 21 centuries and how transformation has occurred in the
women roles.
Pooja Nayyar , Avinash Sharma and Jatinder Kishtwaria
(2007) have concluded that women entrepreneurs faced
constraints in aspects of financial, marketing, production,
workplace facility and health problem. Financial problems
faced were non-availability of long term finance, regular and
frequent need of working capital.
Dr. Sunil & Ms. Sunita(2009) said in their report that the
emergence of entrepreneurs in a society depends to a great
extent on economic, social, religious, cultural and
psychological factors prevailing in the society. In many of the
advanced countries of the world there is a phenomenal
increase in the number of self-employed women after the
world war. Shamika Ravi (2009) focused on entrepreneurship
development within the Micro, Small and Medium Enterprise
(MSME) sector in India. The MSME sector has often been
termed the 'engine of growth' for developing economies.
Mr. A. A. Jahanshahi (2010) explained that Today's world
is changing at a startling pace. Political and economic
transformations seem to be occurring everywhere as countries
convert from command to demand economies, dictatorships
move toward democracy, and monarchies build new civil
institutions. These changes have created economic
opportunities for women who want to own and operate
businesses. Sathiabama (2010) quoted that The Self Help
Groups (SHGs) have paved the way for economic
independence of rural women. The members of SHGs are
involved in Micro - Entrepreneurships. Through that, they are
becoming economically independent and providing
employment opportunities to others.
R. Z. Masood (2011) focused on the concept of woman
entrepreneurs in India; their traits in business, the problems
faced by them when they set up and make some suggestions
for future prospects for development of Women
Entrepreneurs. Robita & Ms. Nandita (2011) stated that
women entrepreneurship can bring about women
empowerment. Social entrepreneurship can eliminate the
ignorance and poverty.
III. OBJECTIVE OF THE STUDY
The objectives of the present study are:
1. To analyze the socio-demographic profile of some top
women entrepreneurs in India;
2. To find out the factors that motivated the women to start
their own enterprise;
3. To develop a model on the basis of factors identified
through the study of these women entrepreneurs.
IV. RESEARCH METHODOLOGY
The present study is qualitative in nature for which 20
successful women entrepreneurs have been randomly
selected, a convenience sample technique was used to analyze
the cases of these 20 women entrepreneurs and to identify the
motivational factors behind their success. Secondary data
collection technique has been used to collect the information
from different websites, books and journals. 58
AJMS Vol.1 No.1 January - June 2012
Raj Kumar, Saumya Singh and Nitam Singh

V. DISCUSSION AND INTERPRETATION
Fig. 1 Educational Status of The Women Entrepreneurs
The study found that more than half of the women
entrepreneurs are post graduate and about one fourth of them
are graduates. It reflects that most of the women entrepreneurs
are well educated and some of them also have professional
degrees and diplomas.
The study depicted that most of the successful
entrepreneurs are located in the metro cities which provide a
more liberal work environment for the females and ample
opportunities to grow.
Fig. 2 Geographical Distribution
Fig. 3 Age Group Of Women Entrepreneurs When Entered Into Entrepreneurship
After analyzing the data it was found that 70% of the
women started their enterprise in the age group 21-30 years.
This result is consistent with another study which also showed
that most women entrepreneurs started their business or
venture between the age 29-34 years (Menakshi and Kakoli,
2010).
Fig. 4 Type Of Business Run by the Women Entrepreneurs
Among the total, 35% women belong to fashion and
entertainment industry as well as manufacturing Industry,
while 20% are belong to hospitality Industry and only 10%
belongs to pharmacy industry.
Fig. 5 Experience Level Of Women Entrepreneurs
The data shows that out of those top women entrepreneurs,
most of them have their experience in business is between 15-
25 years, where some has experience between 26-35 years,
while few women are highly experienced.
Fig. 6I Motivational Factors For The Women To Become An Entrepreneur
While thoroughly analyzing the cases of women
entrepreneurs, total four motivational attributes have been
found. The primary motivational factor for women
entrepreneurs is the desire to promote new marketable idea;
Next factor which motivate them was their ambition in life to
make their own identity and to become role model for
everyone. On the other hand, feasible family environment was
also key motivator that influences the women to form the
enterprise. Also, few women started their venture due to their
need and provide support to the family as most of these women
entrepreneurs have financially strong family background.
59AJMS Vol.1 No.1 January - June 2012
Successful Women Entrepreneurs in India: Attributes Based Analysis

VI. ASSISTANCE PROVIDED BY BANKS AND FINANCIAL
INSTITUTIONS
The banks play an important role in providing and
arranging finances to these women entrepreneurs in spite of
them having a sound financial and affluent family background
as it helps in reducing the risk involved in the business. The
bank also goes a step further for providing infrastructure
facility and promoting financial and marketing discipline. In
addition to providing individual finance to women enterprise,
the banks also promotes the formation of self help groups,
especially women comprising of 10-20 women members.
Total financial independence is given to women members
including choice of project activities. These banks also show
keen interest in production and providing assistance and
adequate marketing infrastructure facilities. The government
of India also provided special incentives to the women
beneficiaries in form of subsidy or additional risk coverage for
lending.
VII. PRESENT SCHEMES AND PROGRAMME
IMPLEMENTED BY GOVERNMENT
As discussed earlier in the model in order to encourage
more and more women to set up their own enterprise various
schemes under SME sector has been formulated by the
ministry. Important schemes that are made specifically for
women or give special benefits to women are
1. Trade Related Entrepreneurship Assistance and
Development scheme for Women (TREAD): This
scheme has been launched to encourage women in thsetting their own ventures during the 11 five year
p lan . The scheme envisaged economic
empowerment of women through the development
of their entrepreneurial skills in non-farm activities.
2. Micro & Small Enterprises Cluster Development
Programme (MSE-CDP): The schemes provides
assistance for capacity building, common facilities,
marketing etc the delivery, assimilation and
diffusion of the identified technology from its
producers to the recipient user/ cluster of small
enterprises.
3. Credit Guarantee Fund Scheme: The government
introduced the scheme for small scale Industries in
May 2000 with the objective of making credit to SSI
units, particularly tiny units, for loans up to Rs 25
lakh without collateral/ third party guarantees. The
scheme is being operated by the credit Guarantee
Fund Trust for small industries (CGTSI) set up
jointly by government of India and SIDBI.
4. Support for Entrepreneurial and Management
Development through EDPS/ MDPS, etc.: MSME
DIs regularly conducts EDPs/MDPs for existing and
prospective entrepreneurs and charge fee for such
courses. To encourage more entrepreneurs from
among the SC/ST, women and physically challenged
groups, it is proposed that such beneficiaries will not
be charged any fees but, instead they paid a stipend of
Rs. 500/- per capita per month.
5. Exhibitions for Women Under Promotional Package
for Micro & Small Enterprises Approved by CCEA
Under Marketing Support: DC (MSME) has
formulated a scheme for women entrepreneurs to
encourage Small & Micro manufacturing units
owned by women in their efforts at tapping and
developing overseas markets, to increase
participation of representatives of small/ micro
manufacturing enterprises under SIDO stall at
International Trade Fairs/ Exhibitions, to enhance
export from such units. Under this scheme
participation of women entrepreneurs in 25 thinternational exhibitions is envisaged during 11
plan.
VIII. CONCLUSION
Having overcome the controversial situations,
today Indian women have ventured into various field and
encountered great success. Women entrepreneurs represent a
group of women who have broken away from the beaten track
and are exploring new avenues of economic participation.
Among the reasons for women to run organized enterprises are
their skill and knowledge, their talents, abilities and creativity
in business and a compelling desire of wanting to do
something positive. Women entrepreneurs are fast becoming a
force to reckon with in the business world and are not only
involved in business for survival but to satisfy their inner urge
of creativity and to prove their capabilities. Educated Women
is contributing to a great extent to the social transformation
and in the future, will be seen that more women venturing into
areas traditionally dominated by men. Today's women are
taking more and more professional and technical degrees to
cope up with market need and are flourishing as designers,
interior decorators, exporters, publishers, garment
manufacturers and still exploring new avenues of economic
The Indian woman has the ability to observe and learn
from her surroundings. Known for persuasiveness and an open
style of problem solving, the Indian woman knows how to win
with panache and accepts risks with grace. These are the
qualities that perhaps make Indian women the best
entrepreneurs.
60AJMS Vol.1 No.1 January - June 2012
Raj Kumar, Saumya Singh and Nitam Singh

APPENDIX I PROFILE OF SELECTED WOMEN ENTREPRENEURS
Case Name Enterprise Educational
Status (when start their enterprise).
Geographical Background
Present Age (Yr of
Exp.) Motivational Factors
A Anu Aga Anu Thermax Groups Post graduate Pune 69 yrs. (16 yrs),
1. Family business environment
2. Need & support of Family.
B Anuradha Acharya
Founder and CEO of Ocimum Biosolutions
Post graduate Hyderabad
40 yrs
(12 yrs),
1. New market Idea
2. Role model
C Dr. Blossom
Kochhar Aroma Magic
Diploma in beautician
New Delhi 66 yrs
(40 yrs)
1. New market Idea
2. Role model
D Dr. Kiran
Mazumdar Shaw
Biocon
Graduate
Bangalore 59 yrs.
(34 yrs) 1. New market Idea
2. Role model
E
Ekta Kapoor Balaji Telifilms &
soap Operas. Graduate
Mumbai
34 yrs (17 yrs)
1. New market Idea
2. Role model
F
Indra Nooyi
PepsiCo
PGDM
Chennai 57 yrs.
(18 yrs) Role model/ ambition
G
Jyoti nayak Shri MahilaGriha
Udyog Lijjat Papad
Graduate
Mumbai
58 yrs. (20 yrs)
1. New market Idea
2. Need & support to
Family.
H
Mallika Srinivasan
TAFE
Post graduate
Chennai
52 yrs. (27 yrs)
Role model/ ambition
I
Parmeshwar Godrej
Godrej properties ltd, NAZ
foundation
Post graduate
Mumbai
1989 (23),
65 yrs
Family business environment
J
Priya Paul
World Travel
Tourism Council
Graduate
Delhi
45 yrs
(22 yrs)
Family business environment
K
Preetha Reddy
Apollo Hospitals
Enterprise
Post Graduate
New Delhi
55 yrs
(21 yrs)
Family business environment
L
Rajshree Pathy
Rajshree Group of Companies
Graduate
coimbatore
55
yrs (20 yrs)
1. Family business environment
2. Need & support of Family.
M
Ritu Beri
Ritu wears
Graduated and
Fashion designing Diploma
Noida
46 yrs (18 yrs)
1. New market Idea
2. Role model
N
Ritu Kapoor-Nanda
Escolife
Post graduate
New Delhi
64 yrs
(35 yrs)
New market Idea
O
Sharan Apparao
Apparao Gallaries
Professional Degree in fine Arts
Chennai
52 yrs (29 yrs)
1. New market Idea
2. Role model
P
Shahnaz Husain
Shahnaz Herbals
Professional degree in beautician
New Delhi
64 yrs (35 yrs)
1. New market Idea
2. Role model
Q
Simone Tata
Trent Limited
Post graduate
Mumbai
76 yrs (51 yrs)
Family business environment
R
Sulajja Firodia Motwan
Kinetic Engineering Ltd
Post graduate
Pune
42 yrs (20 yrs)
1. Family business environment
2. Role model
S
Vandana Luthra
VLCC
Post
graduate
New
Delhi
47 yrs
(23 yrs)
New market Idea
T
Zia Mody
AZB & Partners
and Bodhi Global
(law firm)
Post
graduate
Pune
55 yrs
(28 yrs)
1. New market Idea
2. Family business environment
61AJMS Vol.1 No.1 January - June 2012
Successful Women Entrepreneurs in India: Attributes Based Analysis

participation The Indian women entrepreneurs are making
their presence globally. They not only are successful
entrepreneurs, but are doing a wonderful job striking a balance
between their home and career. The Government has also laid
special weight age on the requirement for conducting special
entrepreneurial training programs for women to enable them
to start their own ventures. Financial institutions and banks
have also set up particular cells to help women entrepreneurs.
This has rebound the women entrepreneurs on the economic
scene in the recent years although many women's
entrepreneurship enterprises are still remained a much
neglected field.
REFERENCES
[1] A. A. Jahanshahi, “Issues and Challenges for Women Entrepreneurs in
Global Scene, with Special Reference to India”, Australian Journal of
Basic and Applied Sciences. pp. 4347-4356.
[2] Bharti and Indira, “Reflection of Indian women in Entrepreneurial
world”, Journal of IIMA, 2005.
[3] Muriel Orhan and Don Scott, “Why Women Enter into
Entrepreneurship: An Explanatory model”, Women in Management
Review, 2001.
[4] Meenakshi Gandhi and Kakoli Sen, “Women Entrepreneurship
Development-Prospects and Problems: an Exploratory Study in the
NCR of India”, Women Entrepreneurship and Development, pp. 71- 93,
2010.
[5] Maheshwar Sahu and S. K. Baral, “Need of Strategic Marketing in
Promotion of Women Entrepreneurship in India”, The Utkal Business
Reviews, pp.122-136, 2010.
[6] McGrath Cohoon, Vivek Wadhwa and Lesa Mtchell, “Are Successful
Women Entrepreneurs Different From Men”, The Foundation of
Entrepreneurship, 2010.
[7] Naveen Gadwal, “Problem and Prospects of Micro, Small and Medium
Scale Enterprises in India”, Journal of Applied Management &
Computer Science, BIZ n BYTES, 2011.
[8] Rana Zehra Masood, “Emergence of Women Owned Businesses”,
Indian Journal of Arts Science & Commerce, 2011.
[9] Robita and Nandita, “Women Entrepreneurship in Manipur, North-East
India”, Interdisciplinary Journal of Research in Business, 2011.
[10] Sunil Deshpande and Sunita Sethi, “Women Entrepreneurship:
Problems, Solutions & Future Prospects of Development”, International
Research Journal, 2009.
[11] Sathiabama, “Rural Women Empowerment and Entrepreneurship
Development”, Women Empowerment, 2010.
[12] Shamika Ravi, Entrepreneurship Development in the Micro Small and
Medium Enterprise Sector in India, Indian School of Business, 2009.
[13] Usha Kiran and Alok Rai , Women Entrepreneurship Development:
Issues and Perspectives.
[14] Robinsson, Organisational Behaviour.
62AJMS Vol.1 No.1 January - June 2012
Raj Kumar, Saumya Singh and Nitam Singh

Job Satisfaction in Banking Sector: An Exploratory AnalysisG.V.S.S.N. Sanyasi Raju
School of Management Studies, Mahraj Vijayaram Gajapati Raj College of Engineering,
Vizianagaram – 535 005, Andhra Pradesh, IndiaE-mail:
(Received on 02 January 2012 and accepted on 12 March 2012
Abstract - This paper attempts to focus on job satisfaction in
banking sector. The total sample covers 362 bank employees
working in both public and private sector banks. To study job
satisfaction, dimensions like job aspects, work environment,
innovative aspects and interpersonal relations are focused.
Further, variables like age, sex, marital status, qualification and
type of organization are considered for the analysis. A study into
relationship between the dimensions reveals that a significant
relationship between dimensions under study is existed. More
over dimensional-wise analysis reveals that innovative and work
environment as well as job aspects and interpersonal relations
are strongly correlated. While job aspects and innovative aspects
were associated relatively very low, differences in opinion
between the variable-wise respondents is also revealed by the
study.
Keywords: Job Satisfaction, Banking Sector, Literature Review,
Empirical Study
I. INTRODUCTION
In any organization, role of employee is very crucial
though other factors also contribute significantly to its
success. Employee behavior, attitude at work directs the
organization towards either positive or negative path. Work
related attitudes of employees are under constant scanner by
psychologists as well as social researchers. Work related
attitudes mainly include job satisfaction, job involvement and
commitment to organization. Among all these, job satisfaction
has been given relatively higher attention by the researchers
since it is presumed that other attitudes directly or indirectly
contribute to this and in a way one can say “job satisfaction” is
a summary reflection of these other attitudes.
Job satisfaction can be defined as a positive feeling about
one's job resulting from an evaluation of its characteristics
(B. M. Staw & L.L.Cummings-1996). An individual with
high level of job satisfaction holds positive feelings about the
job. On the other hand, one who dissatisfied holds negative
feelings about it. Interestingly, job satisfaction of an
employee is correlated to his attitude at work as well as his
performance. Thus, every organization tries to create
conducive atmosphere in the work place by various measures
to satisfy their employees which in turn results in better
performance.
II. INDIAN BANKING SCENARIO
A major stepping stone in Indian banking sector had taken
place with the formation of Reserve Bank of India (RBI) in the
year 1935. It has been making its efforts to bring the economy
in a visible success through banking sector activities in the
country. Banking system in India has been playing an
appreciable role in promotion of the economy through its
continuous efforts. It had crossed three major milestones in its
long voyage like, pre-nationalization, post -nationalization and
financial reforms in the country, faced various challenges and
emerged victorious. Prior to introduction of financial sector
reforms in the country, the Indian banking has been carried out
under traditional way.
The basic objective of financial sector reforms was to
strengthen the Indian banking sector and make them
internationally competitive and encourage them to play an
effective role in accelerating the process of growth. Committee
on Financial Sectors Reforms (popularly known as
Narasimham committee) 1991, had stressed the need for
strengthening of banking sector activities in the country. In
pursuance of recommendations of the said committee various
measures have been initiated in Indian Banking sector such as
Deregulation, Prudential Measures, Competitive policies etc.
Consequently, tremendous changes have been incorporated in
Indian banking sector like, massive branch expansion,
expansion of branch network to rural areas. Ultimately, this
improved productivity of the banking sector as a whole and its
operational performance. Now technology has became an
integral part of banking in the country. Through technology
banks in the country have been reaching its customers and meet
their needs with considerable flexibility. More over, with the
updated policies as well as modern operational practices,
Indian banks have been able to make use of opportunities in
terms of new areas and products.
In spite of the progressive trends in Indian banking for the
past nearly two decades, there are certain new challenges to
Indian banking have been cropped up. The customer oriented
strategy is one among them. The new generation customers
prefer to have several products with innovative approach, apart
from traditional facilities. The entrance of foreign banks with
63AJMS Vol.1 No.1 January - June 2012

their versatile features in the country has been giving a threat
to Indian banks. As a result, a wide gap existed between
customer needs and bank services. The customers of Indian
public sector banks are also seeking variety of services as
offered by the foreign banks. Though a number of changes in
terms of services in public sector banks have been
incorporated like, Bank automation, ATMs, internet banking,
yet the role of human resources in banking services is not
isolated. The role of employees in promotion of banks
business is pivotal and decisive. Their attitude and behavior at
work reflects over the reputation as well as the business
continuity of a bank. Ultimately, all these are inter-linked with
employee's satisfaction towards their job. A satisfied
employee could add value to the services and support the
organization very well. Employees whose involvement in
work is always positive yields better results. At present the
customers expectations from their banks are diversified and
ever increasing. The bank managements are also changing
their policies and always trying to meet their customer
expectations. At this juncture, the role of a satisfied bank
employee is pivotal to the dynamic development of banking
sector in India.
III. REVIEW OF LITERATURE
Though a good number of works on employees job
satisfaction were done by various authors in spheres. But a
few of the earlier studies are reviewed in this context.
'Job Satisfaction as involving cognitive, affective and
evaluative reactions or attitudes and states it is a pleasurable or
positive emotional state resulting from the appraisal of one's
job or job experience' (E.A.Locke, 1976). Job satisfaction is a
result of employees' perception of how well their job provides
those things that are viewed as important. It is generally
recognized in the field of organizational behavior field that job
satisfaction is the most important and frequently studied
attitude.
Bola Adekola, 2011) in their work on “Career
Management as correlates for career development and job
satisfaction - A case study of Nigerian Bank employees”
explored the link between career planning and career
management as antecedents of career development and job
satisfaction, and career commitment as its outcome. A sample
of 505 employees of a Nigerian Bank revealed the significant
link between the variables of career planning and career
management, and career development, and in turn, with job
satisfaction and career commitment. Further, those
organizational level initiatives like continuous guidance to the
employees to manage their careers engender positive
motivation levels and can lead to employees feeling valued. In
turn, those initiatives also assist in reducing the turnover rates
and help increase the levels of job satisfaction in the bank.
K. R. Sowmya and N. Panchanatham (2011) have studied
job satisfaction of employees in new private sector and select
public sector banks specifically in the banking sector of the
main metropolitan city i.e,,Chennai. The researchers have
applied factor analysis using principle component method to
find out the different factors that affect the job satisfaction of
banking sectors employees. It reveals that the employees have
significant inclination towards optimistic supervisory
behavior and pleasant organizational setup. Further, it is also
identified that the job suitability as well as the working
conditions and other interpersonal relationship among the
workers are able to ascertain their level of satisfaction within
the working domain.
Masud Ibn Rahman (2006) studied 'Where the Job
Satisfaction of Bank Employees Lies: An Analysis of the
Satisfaction Factors in Bangladesh'. This paper investigates
the level of job satisfaction of bank employees in Dhaka City
identifying the important factors that are associated with the
overall satisfaction of bank employees. Factors including
payment, healthy relationship with colleagues, sense of
personal accomplishment, adequate information available to
do job, ability to implement new ideas and overall job
satisfaction are found important for improving job satisfaction
of bank employees in Dhaka City. These factors are
significantly related to the overall satisfaction of the
employees. The higher the level of these factors involved, the
higher the overall satisfaction likely to be. The factors that are
influential have been identified following overall job
satisfaction through some statistical techniques.
Muhammad Farhan Siddiqui and Dr. Nabeel Ahmad
Zubairi (2010) had investigated the job satisfaction among the
officers of Habib Bank Limited Karachi in connection with a
proposal made by Pakistan government to privatize the
nationalized banks on priority basis. The study revealed that
the relationship between organizational factors like; High
Commitment, Environment, Corresponding Co-worker
Support, Organizational Communication, Task control and
Participant Decision Making and job satisfaction on the
employees of the banking ultimately lead to employees and
bank client satisfaction.
Rabia Hadi and Adnan Adil (2010) have demonstrated the
predictive validity of job characteristics in relation to work
motivation and job satisfaction through their study, revealed a
64AJMS Vol.1 No.1 January - June 2012
G.V.S.S.N. Sanyasi Raju

definite pattern of correlations among job characteristics,
work motivation, and job satisfaction. All job characteristics
were found to be significant and positive correlate of intrinsic
motivation. Skill variety, task significance, and task identity
were significantly and positively related to job satisfaction.
Task identity and feedback were significant and positive
correlates of extrinsic motivation. Further, it is also revealed
that feedback may be conceived as interference of boss in
one's job responsibilities or it may have been conceived in
terms of the criticism of boss on one's job performance both of
which are more prevalent in our work settings as compared to
positive reinforcement and appreciation of subordinate's
work.
Yorkshire Bank (2009) has studied 'From Office to beach
UK workers can't get no (job) satisfaction'. A survey from
Clydesdale and Yorkshire Banks, looking at attitudes to work
within SMEs, has revealed that 37% of workers are not
enjoying their job as much as they used to across the UK, only
those workers from the East Midlands, South West and
Scotland feel that they are happier in their jobs. The East
Midlands has shown the biggest increase in job satisfaction
(40%), closely followed by the South West (39%) and
Scotland (35%). Jerry M.Newman & Frank J.Krzystofiak
(1993) studied Changes in Employee Attitudes after an
Acquisition'. This study disclosed that Information on job
characteristics, facet satisfaction, overall satisfaction, and
organizational commitment were obtained from bank
employees both before the announcement of the acquisition
and after the acquisition. Correlation analysis and ANOVA
indicated significant decline in perceived job characteristics,
satisfaction, and organizational commitment after the
acquisition. The nature of these changes is discussed along
with recommendations for minimizing the disruptive effect of
an acquisition. Alf Crossman and Bassem Abou-Zaki (2003)
studied 'Job Satisfaction and Employee Performance of
Lebanese Banking Staff'. This paper investigates the
relationships between job satisfaction, individual job facets,
socio-demographic variables and job performance in the
Lebanese commercial banking sector. The results indicate that
job satisfaction is not independent in all job facets and that
satisfaction with one facet might lead to satisfaction with
another. Female employees were found to be less satisfied
with all facets except pay. Employees with lower educational
qualifications were least satisfied. Self-reported job
performance was found to increase with tenure. Against this
back ground, the present study proposes to investigate
employee's job satisfaction of commercial banks in
Vizianagaram town in this attempt.
IV. PROBLEM OF THE STUDY
The problem posed in this study is to focus on job
satisfaction among bank employees. It also tries to establish
the relationship among the dimensions of job satisfaction
among bank employees and to focus on difference in opinion
among the sample.
V. OBJECTIVES OF THE STUDY
1. To find the significance of relationship between the
dimensions of Job Satisfaction;
2. To find relationship of the demographic and Professional
Variables of bank employees with their job satisfaction.
VI. METHODOLOGY
A.Hypotheses
H = There is no significance of relationship between the 1
dimensions of Job Satisfaction.
H = There is no significance of difference in opinion of 2
the sample towards dimension of job satisfaction.
B.Tool Administration
The researchers have designed a tool to collect employee's
perception from the sample. It consists of 25 statements
covering four dimensions viz., Job Aspects -7 items (28%),
Work Environment - 6items (24%), Innovative - 6itmes(24%)
and Inter Personnel aspects - 6items (24%). Further, to collect
the responses5 - Point scaling (Likert) technique is applied by
assigning five alternatives (such as., Strongly Agree, Agree,
Neutral, Disagree and Strongly Disagree). Subsequently
responses were scored from 5 to 1 for analysis.
C. Data Collection and Sample
In order to collect the opinion of bank employees towards
their job satisfaction, public and private sector banks
operating in Vizianagaram town in Andhra Pradesh, India
were purposively selected . In selection of the sample simple
random sample is applied. The investigators have personally
administered and canvassed the designed schedule among 375
Bank Employees of different banks (Public and Private
sector). But finally, the study was confined to 362 employees
and the remaining 13 questionnaires are retained on account of
furnishing incomplete information. The Characteristics of
variable wise sample are presented in Table: I.
65AJMS Vol.1 No.1 January - June 2012
Job Satisfaction in Banking Sector: An Exploratory Analysis

VII. RESULTS AND DISCUSSION
Initially, to study the relationship between the dimensions
chosen for the an attempt is made with testing of null
hypothesis H by using correlation values (Table II).1
It is understood from the table II that the obtained 'r' values
in respect of all the dimensions are positive but very low. The
higher 'r' values are associated between the dimensions like
innovative and work environment (0.53) as well as between
Interpersonal Relations and job aspects (0.54). On the other
hand, a weak correlation is existed between job aspects and
innovative dimensions (0.29). Hence the hypothesis “There is
no significance of relationship between the dimensions of Job
Satisfaction” is rejected. Now restating, the accepted
statement should read as “there is consistently significant
relationship among various dimensions of job satisfaction”.
One more very valid outcome of this analysis is that all the
dimensions are positively and significantly related to the
overall outcome of job satisfaction in this present study.
Further, to study the significant differences in opinion of
sample selected under different variables taken, an attempt is
made to test the null hypothesis H under different dimensions 2
of the study. From table III, it can be seen that there are
significant differences in opinion between the employees
under Sex, Age, Qualification, and Experience towards job
aspects dimension. The obtained Critical Ratio (Cr) values are
more than 1.96 which is significant at 5% LOS. Hence, H is2
rejected. While in the case of variables such as, Marital Status
and Type of organization, though there is significance of
difference opinion is identified, and hence, the null
hypothesis H is accepted.2
Further, mean values for the scores representing sample
like, Male, age (below 40yrs), married , graduates and the
employees experience below 20 yrs, reveal that those are
relatively less satisfied than that of other respondents in
respect of Job aspects.
It can be stated (Table IV) that there is a significance of
difference in the opinion among the employees such as, sex,
age, marital status and experience are statistically
corroborated. The obtained CR values are more than 1.96
which are significant at 5 % LOS. Hence, the hypothesis H is 2
rejected. While in the case of the variables like, Qualification
and Type of organization the obtained CR values are less than
the 1.96 which are insignificant at 5 % LOS. Thus, the
hypotheses H is accepted.2
Further, relatively lower mean values of the sample
categories under study represents low satisfaction towards
their job in terms of work environment such as female, age
above 40 yrs, unmarried, and experience below 20 yrs.
It is understood from the table V (as revealed by mean
values) in terms of innovative aspects differ, but the obtained
CR values are insignificant at any level of LOS. Hence, the
hypothesis H is accepted. 2
Further, it is also revealed that among the sample under
study, employees like, male, age above 40 yrs, married,
graduates, experienced (above 20 yrs), working in public
sector banks are relatively more satisfied with respect to
innovative aspects.
From the table VI, it can be stated that there is significant
difference between the employee's opinion considered under
age, qualifications and experience. The obtained values of
Critical Ratio's are more than 1.96 at 5% LOS. Hence, the
hypothesis H is rejected. Further, the categories like, sex, 2
marital status and type of organizations, CR values are less
than 1.96 and insignificant at 5% Los. Hence, the hypothesis
H is accepted.2
VIII. FINDINGS AND CONCLUSION
The present study clearly shows that significant
relationship is identified among the various dimensions
considered for evaluation of job satisfaction of employees
under study. The relationship between the dimensions like
innovative and work environment as well as job aspects and
interpersonal relations are relatively higher.
Further, variable wise analysis of employee's opinion
towards each dimension under study reveals that:
1. Difference in opinion between male and female
employees was identified in terms of their job aspects
as well as work environment. Particularly, opinion
survey reveals that male employees have given a
very low rating towards statement on automation of
operations and its impact. Like wise some amount of
dissatisfaction was identified among female
employees towards customer's attitude in this study.
2. In the case of work environment also, sex-wise
differences in opinion were identified. More
specifically, dissatisfaction is expressed by female
employees to the statement “economic benefits and
communication channel”.
66AJMS Vol.1 No.1 January - June 2012
G.V.S.S.N. Sanyasi Raju

3. Where as difference in opinion was also identified in
job aspects, work environment, inter personnel
relations among the sample in terms of their age.
Employees less than 40 years have given low rating
to statement of job aspect dimension “free time to
hold additional jobs”.
4. Likewise, the employees of more than 40years of age
have expressed a very low satisfaction towards
statement like, “post retirement benefits”, “Dealing
with problems occur due to computers” and
“Relationship with peers”.
5. Similarly, differences in opinion between the
married and un-married employees were also
revealed by the study in respect of work
environment. More particularly, unmarried
employees have expressed their dissatisfaction
towards “recreation facilities”.
6. Where as employees under the study in terms of their
qualification (graduate and post graduates) also
differed in their opinion towards job aspects as well
as interpersonal relations.
7. Accordingly, graduates are relatively dissatisfied
with promotional avenues and Post-graduates are
dissatisfied with relationship with superiors.
8. Likewise, employees on the basis of their experience
showed difference of opinion in all dimensions
under study “except innovative aspects”. Employees
having less than 20 years of experience are
dissatisfied in terms of training and orientation;
working ambiance, cooperation from peers.
9. Apart from all these, none of the employees
irrespective of organization (public or private sector
banks) have differed in their opinion towards any
dimension under study.
However, the employees working in public sector banks
are relatively more satisfied than those of private sector banks.
Therefore the policy makers in the banking sector shall
consider these factors while formulating policies, towards
strengthening their human resources as it is a vehicle which
determines the very existence and longevity of the banks .
TABLE I CHARACTERISTICS OF SAMPLE VARIABLE -WISE
Variable Category of Variable Sample
Size %
Sex
Male Female Total
296 66
362
81.7618.24100
Age
Below 40 years Above 40 years Total
170 192 362
46.9653.04100
Marital Status
Married Unmarried
Total
282 80
362
77.922.1100
Qualifications
Graduates
Post-Graduates
Total
285
77
362
78.7221.28100
Experience
Below 20 years
Above 20 years
Total
173
189
362
47.7952.21100
Type of OrganizationPublic Sector Banks
Private Sector BanksTotal
305
57
362
84.2515.75100
67AJMS Vol.1 No.1 January - June 2012
Job Satisfaction in Banking Sector: An Exploratory Analysis

TABLE II SIGNIFICANCE OF RELATIONSHIP BETWEEN THE DIMENSIONS
Dimension
Job Aspects
Work
Environment
Innovative
Inter-Personal Relations
Total of Job Satisfaction
Job aspects 1.00 0.45 0.29 0.51 0.43
Work Environment 1.00 0.53 0.43 0.41
Innovative 1.00 0.36 0.48
Inter-Personal
1.00 0.52
Total of Job
1.00
TABLE III JOB SATISFACTION IN JOB ASPECTS
S. No. Category of Variable Mean S.D N C.R.
1
Male
Female
26.13
28.07
4.23
6.50
296
66
2.34
2
Below 40 Years Age
Above 40 Years Age
23.63
25.42
4.45
4.42
170
192
3.89
3
Married
Unmarried
24.49
25.36
4.26
6.49
282
80
1.12
4 Graduates
Post-graduates 24.39
26.16 4.31
6.72 285
77 2.21
5
Below 20 yrs Experience
Above 20 yrs Experience
25.66
26.58
4.28
4.26
173
189 2.04
6 Public Sector Banks
Private Sector Banks 27.51
25.83 3.82
6.95 305
57 1.73
TABLE IV JOB SATISFACTION IN 'WORK ENVIRONMENT'
S.No. Category of Variable Mean S.D N C.R.
1
Male
Female
23.85
21.92
3.96
5.78
29666
2.57
2 Below 40 Years Age
Above 40 Years Age 25.36
23.57 4.51
4.65 170
192 4.41
3
Married
Unmarried
24.71
23.37
4.05
5.78
282
80 2.00
4 Graduates
Post-graduates 24.12
23.65 4.63
6.92 285
77 0.56
5
Below 20 yrs Experience Above 20 yrs Experience
25.67 26.59
4.21 4.19
173 189
2.09
6
Public Sector Banks Private Sector Banks
25.74 24.57
3.68 6.95
305 57
1.03
68AJMS Vol.1 No.1 January - June 2012
G.V.S.S.N. Sanyasi Raju

TABLE V JOB SATISFACTION - 'INNOVATIVE ASPECTS'
S.No. Category of Variable Mean S.D N C.R.
1
Male Female
22.76 21.07
3.83 6.34
296 66
1.62
2
Below 40 Years Age Above 40 Years Age
22.47 23.08
4.67 4.59
170 192
1.27
3
Married Unmarried
26.45 25.52
3.08 6.41
282 80
1.25
4
Graduates
Post-graduates
23.78
23.06
3.06
5.97
285
77
1.02
5
Below 20 yrs Experience
Above 20 yrs Experience
24.45
24.95
3.98
4.05
173
189
1.19
6
Public Sector Banks
Private Sector Banks
23.94
22.85
3.27
6.89
305
57
1.17
TABLE VI JOB SATISFACTION IN 'INTER-PERSONAL RELATIONS'
S.No.
Category of Variable
Mean
S.D
N
C.R.
1 Male
Female
27.15
25.26
5.28
8.78
296
66 1.30
2 Below 40 Years Age
Above 40 Years Age 28.49
25.72 6.21
5.93 170
192 4.32
3 Married Unmarried
27.93 28.05
4.25 8.98
282 80
0.09
4 Graduates Post-graduates
28.79 26.63
3.68 7.85
285 77
2.34
5 Below 20 yrs Experience Above 20 yrs Experience
25.41 24.85
4.54 4.21
173 189
2.52
6
Public Sector Banks Private Sector Banks
24.78 23.59
3.49 5.97
305 57
1.46
REFERENCES
[1] Alf Crossman and Bassem Abou-Zaki, “Job Satisfaction and
Employee Performance of Lebanese Banking Staff”, Journal of
Managerial Psychology, Vol.18, No.4, pp.368-376, 2003.
[2] Andre Bussing, Thomas Bissls, Vera Fuchs and Klaus M. Perrar, “A
Dynamic Model of Work Satisfaction: Qualitative Approaches”,
Human Relations, Vol.52, No.8, pp. 999, 1999.
[3] Bola Adekola, “ Career Management as Correlates for Career
Development and Job Satisfaction- A Case Study of Nigerian
Bank employees”, Australian Journal of Business and
Management Research, Vol.1, No.2, May 2011.
[4] B.M.Staw and L.L.Cummings, Research in Organizational
Behaviour, Vol.18, (Greenwich), C.T: Jai Press, pp.1-3, 1996.
[5] H. Beynon and R.M. Blackburn, Perceptions of Work, Cambridge
University Press, 1972.
[6] A.N. Brayfield, R. Wells and M. Strate, “Inter Relationships among
Measures of Job Satisfaction and General Satisfaction”, Journal of
Applied Psychology, 1957.
69AJMS Vol.1 No.1 January - June 2012
Job Satisfaction in Banking Sector: An Exploratory Analysis
[7] C.L. Cooper and J. Marshall, Eds., White Collar and Professional
Status, Chichester, England, Johnwiley, 1980.
[8] E.A. Locke, Handbook of Industrial Organizational Psychology,
Rand Mc.Nally, Chicago, 1976, p.1300.
[9] Garrett. E. Henry, Statistics in Psychology and Education, NewYor
David Mc.Kay Co., Inc., 1955.
[10] E.Gross, Work and Society, New York, Tomas, Y. Cromwell, 1958.
[11] R. Hackman and G.R. Oldham, “Development of Job Diagnostic
Survey”, Journal of Applied Psychology, Vol. 60, No.1, 1975.
[12] Jerry M. Newman and Frank J. Krzystofiak, “State University of
New York, Group & Organization Management”, Vol.18, No.4,
pp.390-410, 1993.
[13] K. R. Sowmya and N. Panchanatham, “Factors Influencing Job
Satisfaction of Banking Sector Employees in Chennai, India”,
Journal of Law and Conflict Resolution, Vol. 3, No.5, pp. 76-79,
May 2011. Available online at
Journals.org/JLCR, ISSN 2006-9804 ©2011
http://www.academic

70AJMS Vol.1 No.1 January - June 2012
G.V.S.S.N. Sanyasi Raju
[14] Rabia Hadi and Adnan Adil, “Job Characteristics as Predictors of
Work Motivation and Job Satisfaction of Bank Employees”,
Journal of the Indian Academy of Applied Psychology, Vol.36,
No.2, pp.294-299, 2010.
[15] Masud Ibn Rahman, Sampa Saha and Hemanta Bahadur Gurung,
“Where the Job Satisfaction of Bank Employees Lies: An Analysis
of the Satisfaction Factors in Bangladesh”, Journal of ICMAB,
Vol.34. No.3, May-June, 2006.
[16] Muhammad Farhan Siddiqui and Nabeel Ahmad Zubairi, “A
Sociological Study of Organizational Factors Affecting Job
Satisfaction Among Officers of Habib Bank Ltd., Karach”, Ma'arif
Research Journal, pp. 6-10, 2011.
[17] S.P. Robbins and Timothy A. judge, Organisational Behaviour,
Prentice Hall of India, NewDelhi, 2007.
[18] Donald Von Eschen, Privatization and its Labor Consequences in
Yorkshire Bank 'From Office to Beach: UK Workers Can't Get No
(Job) Satisfaction, U.K, 2009.

w w w . t r p . o r g . i n
The Research Publication(A Global Research Publishing House)
11/19 A, MTP Road, NSN Palayam, Coimbatore - 641 031, Tamil Nadu, India.Ph: 0422 - 2461001 • Mobile: +91 99425 57347 • E-mail: [email protected]
The Subscription Manager
Contact Information
For Subscription, please contact directly to the publisher (address given below) or contact your preferred subscription agent. All orders should be accompanied by payment. Please make Demand Draft in favor of The Research Publication payable at Coimbatore.
SUBSCRIPTION
The Research Publication presents peer-reviewed engineering and scientific journals in print form only. Free online versions are available in the respective journals site.
Guidelines for Submission
References
Example
The manuscript should be about 8-10 pages in length, typed in double space with Times New Roman font, size 10, double column on A4 size paper with one inch margin on all sides and should include 75-200 words abstract, 5-10 relevant keywords. The pages should be consecutively numbered, starting with the title page and through the text, references, tables, figures and legends. The title should be brief, specific and amenable to indexing. The article should include an abstract, introduction, body of paper containing headings, sub-headings, illustrations and conclusions.
A numbered list of references must be provided at the end of the paper. The list should be arranged in the order of citation in text, not in alphabetical order. Each reference number should be enclosed by square brackets.
[1] O. Oyeniyi and A.A. Joachim, “Customer Service in the Retention of Mobile Phone Users in Nigeria”, African Journal of Business Management, Vol.2, No.2, pp. 26-31, 2008.
[2] A. R. Andreasen, “Life Status Changes and Changes in Consumer Preferences and Satisfaction”, Journal of Consumer Research, Vol. 2, No.3, pp. 784-794, 1984.
For more details please visit www.trp.org.in
Asian Journal of Managerial Science(ISSN: 2249-6300)
Title of the Journal Domestic(INR) (USD)
The Asian Review of Civil Engineering (TARCE) 2000 250
Asian Review of Mechanical Engineering (ARME) 2000 250
Asian Journal of Electrical Sciences (AJES) 2000 250
Asian Journal of Computer Science and Technology (AJCST) 2000 250
Asian Journal of Information Science and Technology (AJIST) 2000 250
Asian Journal of Engineering and Applied Technology (AJEAT) 2000 250
Asian Journal of Science and Applied Technology (AJSAT) 2000 250
Asian Journal of Managerial Science (AJMS) 2000 250
Asian Review of Social Sciences (ARSS) 2000 250
Indian Journal of Information Sources and Services (IJISS) 2000 250
International
MSAsian Journal ofManagerial Science

Asian Journal of Managerial Science
Volume 1 Number 1, January - June 2012
CONTENTS
Ph : 0422 - 2461001Mobile : +91 99425 57347E-mail : [email protected] : www.trp.org.in
Published by
Journals Division
(A Global Research Publishing House)Coimbatore – 641 031, Tamil Nadu, India
THE RESEARCHP U B L I C A T I O Nw w w . t r p . o r g . in
MSAsian Journal ofManagerial Science
The Effectiveness of Organisational Climate on Job Involvement 01K. Uthayasuriyan and A. Jayasagar
Human Resources for Diseases Control: Administrative Function or Strategic Priorities 07 Farhad Ali, Belaynew Wassie, Alessandro Greblo and Purnima Bhoi
FII Flows and Indian Equity Market Performance 12 P. Karthikeyan and T. Mohanasundaram
An Investigation into Work Postures of Workers Engaged in Casting Industry: 17A Study in India Lakhwinder Pal Singh
A Study on Occupational Stress Among Teachers in Selective Engineering Colleges 23Affiliated to Anna University of Technology, Trichy
C. Muthuvelayutham and H. Mohanasundaram
HRM Practices in NRI Medical Sciences and General Hospital in 30Guntur District, Andra PradeshV. Tulasi Das and V. Krishna Reddy
Is it Time to Replace Skill With Style? A Case for Studying Communication Style 38Vinay Kumar Chaganti
Application of SERVPERF for Rural Retailer: Reliability and Factor Analysis 43R. Saravanan and P. Kannan
Behind the Boom: What is Leading the Entrpreneurial Fire and its Nature in India 53Kavita Meena
Successful Women Entrepreneurs in India: Attributes Based Analysis 57Raj Kumar, Saumya Singh and Nitam Singh
Job Satisfaction in Banking Sector: An Exploratory Analysis 63G. V. S. S. N.Sanyasi Raju


