Embed Size (px)
Citation preview
b i om a s s a n d b i o e n e r g y x x x ( 2 0 1 0 ) 1e8
Avai lab le a t www.sc iencedi rec t .com
ht tp : / /www.e lsev ier . com/ loca te /b iombioe
Anaerobic acidification of sugar-beet processing wastes: Effectof operational parameters
Emrah Alkaya, Goksel N. Demirer*
Department of Environmental Engineering, Middle East Technical University, Inonu Bulvari, 06531 Ankara, Turkey
a r t i c l e i n f o
Article history:
Received 20 January 2010
Received in revised form
2 August 2010
Accepted 2 August 2010
Available online xxx
Keywords:
Anaerobic digestion
Sugar industry
Acidification
Volatile fatty acids
* Corresponding author. Tel.: þ90 312 210 58E-mail address: [email protected] (G.N
Please cite this article in press as: Alkayoperational parameters, Biomass and Bio
0961-9534/$ e see front matter ª 2010 Elsevdoi:10.1016/j.biombioe.2010.08.002
a b s t r a c t
The objective of this study was to maximize the hydrolysis and acidification of sugar-beet
processing wastewater and beet pulp for volatile fatty acid (VFA) production through
acidogenic anaerobic metabolism. Experiments were conducted to determine the optimum
operational conditions (HRT, waste-mixing ratio and pH) for effective acidification in daily-
fed, continuously mixed anaerobic reactors. For this purpose, reactors were operated at
35 � 1 �C with different combinations of HRT (2e4 days), wastewater-pulp mixing ratios
(1:0e1:1, in terms of COD) and pH ranges (5.7e7.5). Increased OLRs, resulting from pulp
addition, increased the amount of acidification products (VFAs) which led to relatively low
operational pH values (5.7e6.8). In this pH range, methanogenic activity was successfully
inhibited and the lowest methane percentages (5.6e16.3%) were observed in the produced
biogas. The optimum operational conditions were determined to be 2-day HRT and 1:1
waste mixing ratio (in terms of COD) without external alkalinity addition. These opera-
tional conditions led to the highest tVFA concentration (3635 � 209 mg/L as H-Ac) with the
acidification degree of 46.9 � 2.1%.
ª 2010 Elsevier Ltd. All rights reserved.
1. Introduction systems to treat many kinds of solid, industrial and agro-
Anaerobic digestion is an established technology, used for the
treatment of wide variety of organic wastes throughout the
decades. It is one of the several biological processing strate-
gies which produce bioenergy and/or biochemicals while
treating industrial and agricultural wastes [1]. Anaerobic
biodegradation can be separated into two phases in order to
enhance treatment efficiencies and/or produce bio-products.
Two-phase anaerobic systems have been extensively
studied and numerous advantages of phase separation over
conventional anaerobic digestion have been described/
demonstrated in numerous studies [2e8]. Some of these
advantages include, increased process stability and control,
smaller reactor volumes and high tolerance to toxicity and
shock loads. These advantages enable the two-phase anaerobic
67; fax: þ90 312 210 26 4. Demirer).
a E, Demirer GN, Anaerenergy (2010), doi:10.10
ier Ltd. All rights reserved
industrial wastes such as distillery, landfill leachate, coffee,
cheesewhey, dairy, starch, fruit, vegetable solid, food, pulp and
paper, olive mill, abattoir, dye wastewaters, primary and acti-
vated sludge [9].
Along with its applications as the first step of a phase-
separated anaerobic waste treatment configuration, anaero-
bic acidification can be exploited separately for bio-product
formation. For example, Parawira et al. [10] stated that
anaerobic acidification could be useful for the production of
organic acids (e.g. VFA) which have variety of industrial uses.
VFAs are utilized for the manufacture of various organic
compounds and some plastics [11]. Moreover, these organic
acids play an instrumental role as a carbon source in the
removal of nutrients from wastewaters [12]. Recently, acid-
phase anaerobic digestion received considerable attention
6.
obic acidification of sugar-beet processing wastes: Effect of16/j.biombioe.2010.08.002
.
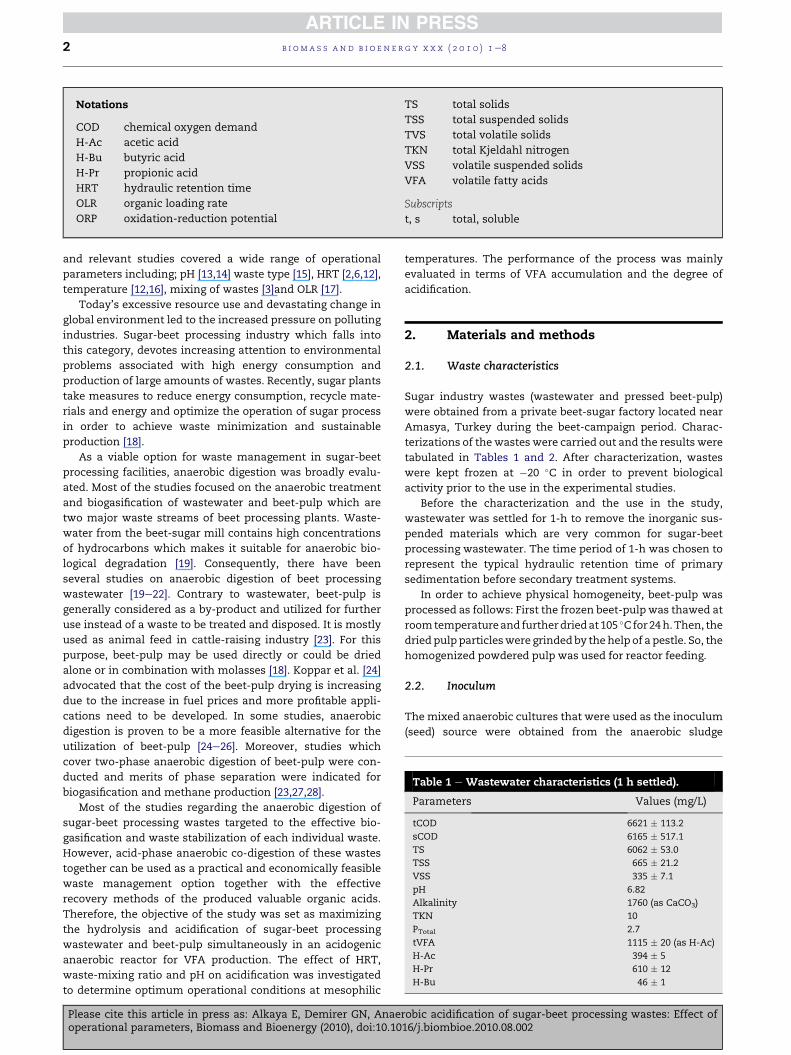
Table 1 e Wastewater characteristics (1 h settled).
Parameters Values (mg/L)
tCOD 6621 � 113.2
sCOD 6165 � 517.1
TS 6062 � 53.0
TSS 665 � 21.2
VSS 335 � 7.1
pH 6.82
Alkalinity 1760 (as CaCO3)
TKN 10
PTotal 2.7
tVFA 1115 � 20 (as H-Ac)
H-Ac 394 � 5
H-Pr 610 � 12
H-Bu 46 � 1
Notations
COD chemical oxygen demand
H-Ac acetic acid
H-Bu butyric acid
H-Pr propionic acid
HRT hydraulic retention time
OLR organic loading rate
ORP oxidation-reduction potential
TS total solids
TSS total suspended solids
TVS total volatile solids
TKN total Kjeldahl nitrogen
VSS volatile suspended solids
VFA volatile fatty acids
Subscripts
t, s total, soluble
b i om a s s a n d b i o e n e r g y x x x ( 2 0 1 0 ) 1e82
and relevant studies covered a wide range of operational
parameters including; pH [13,14] waste type [15], HRT [2,6,12],
temperature [12,16], mixing of wastes [3]and OLR [17].
Today’s excessive resource use and devastating change in
global environment led to the increased pressure on polluting
industries. Sugar-beet processing industry which falls into
this category, devotes increasing attention to environmental
problems associated with high energy consumption and
production of large amounts of wastes. Recently, sugar plants
take measures to reduce energy consumption, recycle mate-
rials and energy and optimize the operation of sugar process
in order to achieve waste minimization and sustainable
production [18].
As a viable option for waste management in sugar-beet
processing facilities, anaerobic digestion was broadly evalu-
ated. Most of the studies focused on the anaerobic treatment
and biogasification of wastewater and beet-pulp which are
two major waste streams of beet processing plants. Waste-
water from the beet-sugar mill contains high concentrations
of hydrocarbons which makes it suitable for anaerobic bio-
logical degradation [19]. Consequently, there have been
several studies on anaerobic digestion of beet processing
wastewater [19e22]. Contrary to wastewater, beet-pulp is
generally considered as a by-product and utilized for further
use instead of a waste to be treated and disposed. It is mostly
used as animal feed in cattle-raising industry [23]. For this
purpose, beet-pulp may be used directly or could be dried
alone or in combination with molasses [18]. Koppar et al. [24]
advocated that the cost of the beet-pulp drying is increasing
due to the increase in fuel prices and more profitable appli-
cations need to be developed. In some studies, anaerobic
digestion is proven to be a more feasible alternative for the
utilization of beet-pulp [24e26]. Moreover, studies which
cover two-phase anaerobic digestion of beet-pulp were con-
ducted and merits of phase separation were indicated for
biogasification and methane production [23,27,28].
Most of the studies regarding the anaerobic digestion of
sugar-beet processing wastes targeted to the effective bio-
gasification and waste stabilization of each individual waste.
However, acid-phase anaerobic co-digestion of these wastes
together can be used as a practical and economically feasible
waste management option together with the effective
recovery methods of the produced valuable organic acids.
Therefore, the objective of the study was set as maximizing
the hydrolysis and acidification of sugar-beet processing
wastewater and beet-pulp simultaneously in an acidogenic
anaerobic reactor for VFA production. The effect of HRT,
waste-mixing ratio and pH on acidification was investigated
to determine optimum operational conditions at mesophilic
Please cite this article in press as: Alkaya E, Demirer GN, Anaeoperational parameters, Biomass and Bioenergy (2010), doi:10.10
temperatures. The performance of the process was mainly
evaluated in terms of VFA accumulation and the degree of
acidification.
2. Materials and methods
2.1. Waste characteristics
Sugar industry wastes (wastewater and pressed beet-pulp)
were obtained from a private beet-sugar factory located near
Amasya, Turkey during the beet-campaign period. Charac-
terizations of the wastes were carried out and the results were
tabulated in Tables 1 and 2. After characterization, wastes
were kept frozen at �20 �C in order to prevent biological
activity prior to the use in the experimental studies.
Before the characterization and the use in the study,
wastewater was settled for 1-h to remove the inorganic sus-
pended materials which are very common for sugar-beet
processing wastewater. The time period of 1-h was chosen to
represent the typical hydraulic retention time of primary
sedimentation before secondary treatment systems.
In order to achieve physical homogeneity, beet-pulp was
processed as follows: First the frozen beet-pulp was thawed at
roomtemperatureand furtherdriedat105 �Cfor24h.Then, the
dried pulp particleswere grindedby thehelp of a pestle. So, the
homogenized powdered pulp was used for reactor feeding.
2.2. Inoculum
The mixed anaerobic cultures that were used as the inoculum
(seed) source were obtained from the anaerobic sludge
robic acidification of sugar-beet processing wastes: Effect of16/j.biombioe.2010.08.002
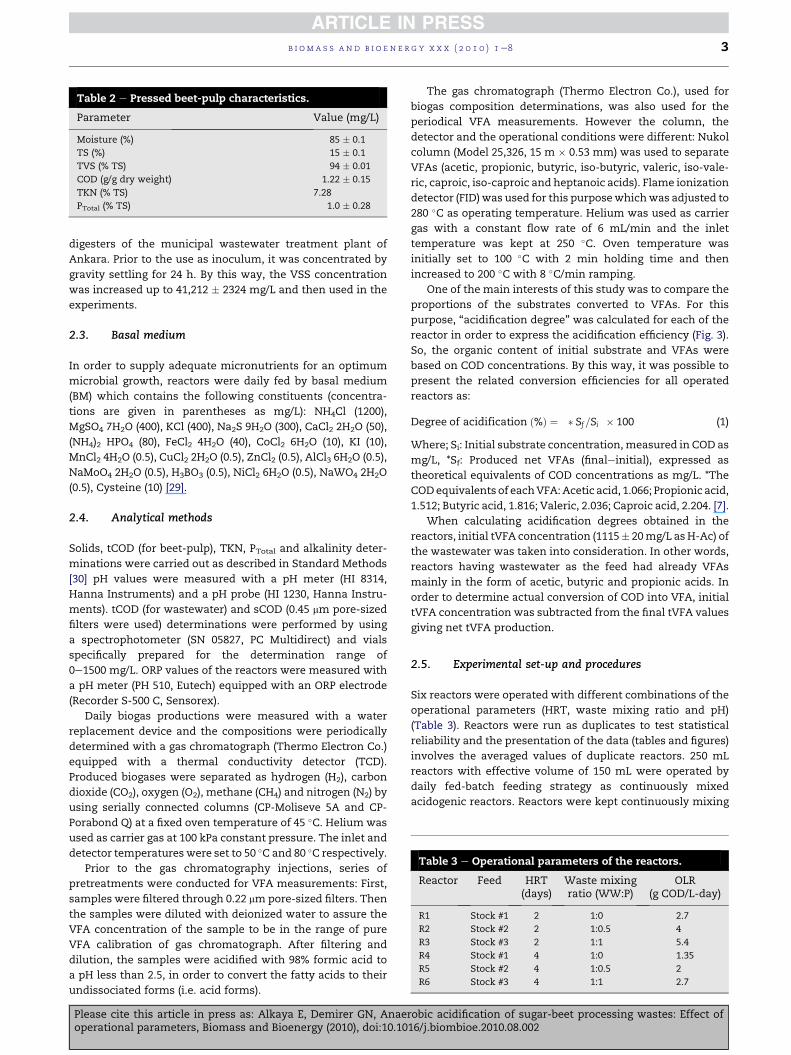
Table 2 e Pressed beet-pulp characteristics.
Parameter Value (mg/L)
Moisture (%) 85 � 0.1
TS (%) 15 � 0.1
TVS (% TS) 94 � 0.01
COD (g/g dry weight) 1.22 � 0.15
TKN (% TS) 7.28
PTotal (% TS) 1.0 � 0.28
Table 3 e Operational parameters of the reactors.
Reactor Feed HRT(days)
Waste mixingratio (WW:P)
OLR(g COD/L-day)
R1 Stock #1 2 1:0 2.7
R2 Stock #2 2 1:0.5 4
R3 Stock #3 2 1:1 5.4
R4 Stock #1 4 1:0 1.35
R5 Stock #2 4 1:0.5 2
R6 Stock #3 4 1:1 2.7
b i om a s s a n d b i o e n e r g y x x x ( 2 0 1 0 ) 1e8 3
digesters of the municipal wastewater treatment plant of
Ankara. Prior to the use as inoculum, it was concentrated by
gravity settling for 24 h. By this way, the VSS concentration
was increased up to 41,212 � 2324 mg/L and then used in the
experiments.
2.3. Basal medium
In order to supply adequate micronutrients for an optimum
microbial growth, reactors were daily fed by basal medium
(BM) which contains the following constituents (concentra-
tions are given in parentheses as mg/L): NH4Cl (1200),
MgSO4 7H2O (400), KCl (400), Na2S 9H2O (300), CaCl2 2H2O (50),
(NH4)2 HPO4 (80), FeCl2 4H2O (40), CoCl2 6H2O (10), KI (10),
MnCl2 4H2O (0.5), CuCl2 2H2O (0.5), ZnCl2 (0.5), AlCl3 6H2O (0.5),
NaMoO4 2H2O (0.5), H3BO3 (0.5), NiCl2 6H2O (0.5), NaWO4 2H2O
(0.5), Cysteine (10) [29].
2.4. Analytical methods
Solids, tCOD (for beet-pulp), TKN, PTotal and alkalinity deter-
minations were carried out as described in Standard Methods
[30] pH values were measured with a pH meter (HI 8314,
Hanna Instruments) and a pH probe (HI 1230, Hanna Instru-
ments). tCOD (for wastewater) and sCOD (0.45 mm pore-sized
filters were used) determinations were performed by using
a spectrophotometer (SN 05827, PC Multidirect) and vials
specifically prepared for the determination range of
0e1500 mg/L. ORP values of the reactors were measured with
a pH meter (PH 510, Eutech) equipped with an ORP electrode
(Recorder S-500 C, Sensorex).
Daily biogas productions were measured with a water
replacement device and the compositions were periodically
determined with a gas chromatograph (Thermo Electron Co.)
equipped with a thermal conductivity detector (TCD).
Produced biogases were separated as hydrogen (H2), carbon
dioxide (CO2), oxygen (O2), methane (CH4) and nitrogen (N2) by
using serially connected columns (CP-Moliseve 5A and CP-
Porabond Q) at a fixed oven temperature of 45 �C. Helium was
used as carrier gas at 100 kPa constant pressure. The inlet and
detector temperatures were set to 50 �C and 80 �C respectively.
Prior to the gas chromatography injections, series of
pretreatments were conducted for VFA measurements: First,
samples were filtered through 0.22 mmpore-sized filters. Then
the samples were diluted with deionized water to assure the
VFA concentration of the sample to be in the range of pure
VFA calibration of gas chromatograph. After filtering and
dilution, the samples were acidified with 98% formic acid to
a pH less than 2.5, in order to convert the fatty acids to their
undissociated forms (i.e. acid forms).
Please cite this article in press as: Alkaya E, Demirer GN, Anaeroperational parameters, Biomass and Bioenergy (2010), doi:10.10
The gas chromatograph (Thermo Electron Co.), used for
biogas composition determinations, was also used for the
periodical VFA measurements. However the column, the
detector and the operational conditions were different: Nukol
column (Model 25,326, 15 m � 0.53 mm) was used to separate
VFAs (acetic, propionic, butyric, iso-butyric, valeric, iso-vale-
ric, caproic, iso-caproic and heptanoic acids). Flame ionization
detector (FID) was used for this purposewhichwas adjusted to
280 �C as operating temperature. Helium was used as carrier
gas with a constant flow rate of 6 mL/min and the inlet
temperature was kept at 250 �C. Oven temperature was
initially set to 100 �C with 2 min holding time and then
increased to 200 �C with 8 �C/min ramping.
One of the main interests of this study was to compare the
proportions of the substrates converted to VFAs. For this
purpose, “acidification degree” was calculated for each of the
reactor in order to express the acidification efficiency (Fig. 3).
So, the organic content of initial substrate and VFAs were
based on COD concentrations. By this way, it was possible to
present the related conversion efficiencies for all operated
reactors as:
Degree of acidification ð%Þ ¼ � � Sf=Si
�� 100 (1)
Where; Si: Initial substrate concentration,measured in COD as
mg/L, *Sf: Produced net VFAs (finaleinitial), expressed as
theoretical equivalents of COD concentrations as mg/L. *The
CODequivalents of eachVFA:Acetic acid, 1.066; Propionic acid,
1.512; Butyric acid, 1.816; Valeric, 2.036; Caproic acid, 2.204. [7].
When calculating acidification degrees obtained in the
reactors, initial tVFA concentration (1115� 20mg/L asH-Ac) of
the wastewater was taken into consideration. In other words,
reactors having wastewater as the feed had already VFAs
mainly in the form of acetic, butyric and propionic acids. In
order to determine actual conversion of COD into VFA, initial
tVFA concentration was subtracted from the final tVFA values
giving net tVFA production.
2.5. Experimental set-up and procedures
Six reactors were operated with different combinations of the
operational parameters (HRT, waste mixing ratio and pH)
(Table 3). Reactors were run as duplicates to test statistical
reliability and the presentation of the data (tables and figures)
involves the averaged values of duplicate reactors. 250 mL
reactors with effective volume of 150 mL were operated by
daily fed-batch feeding strategy as continuously mixed
acidogenic reactors. Reactors were kept continuously mixing
obic acidification of sugar-beet processing wastes: Effect of16/j.biombioe.2010.08.002
b i om a s s a n d b i o e n e r g y x x x ( 2 0 1 0 ) 1e84
at 175 rpm by using a mechanical shaker in a temperature
controlled room (35 � 1 �C) for 41 days.
In order to prevent uncontrolled pH drops and to investi-
gate the effect of higher operational pH (6.9e7.5) on the acid-
ification, first 20 days of operation was carried out by adding
external alkalinity in the form of NaHCO3. In this period,
reactors were supplied with NaHCO3 to set daily initial
concentrations to 6000mg/L by daily additions along with BM.
Then, the reactors were operated 21 more days without
adding any external alkalinity to observe the natural pH drop,
as a result of acidification, and to investigate the effect of
lower operational pH (5.7e7.4) on acidification.
For the purpose of reactor feeding, three different stock
solutions were prepared (Table 4). In order to investigate the
effect of waste mixing ratio on acidification, prepared stock
solutions involved same concentrations of BM but different
mixing ratio of wastewater (WW) and pulp (P) in terms of
tCOD.
As the control parameters of reactor operations, pH, ORP,
biogas production, biogas composition, VFA and sCOD
concentrations weremeasured. Among these parameters, pH,
ORP and biogas production were daily, VFA, sCOD, and biogas
compositions were periodically measured.
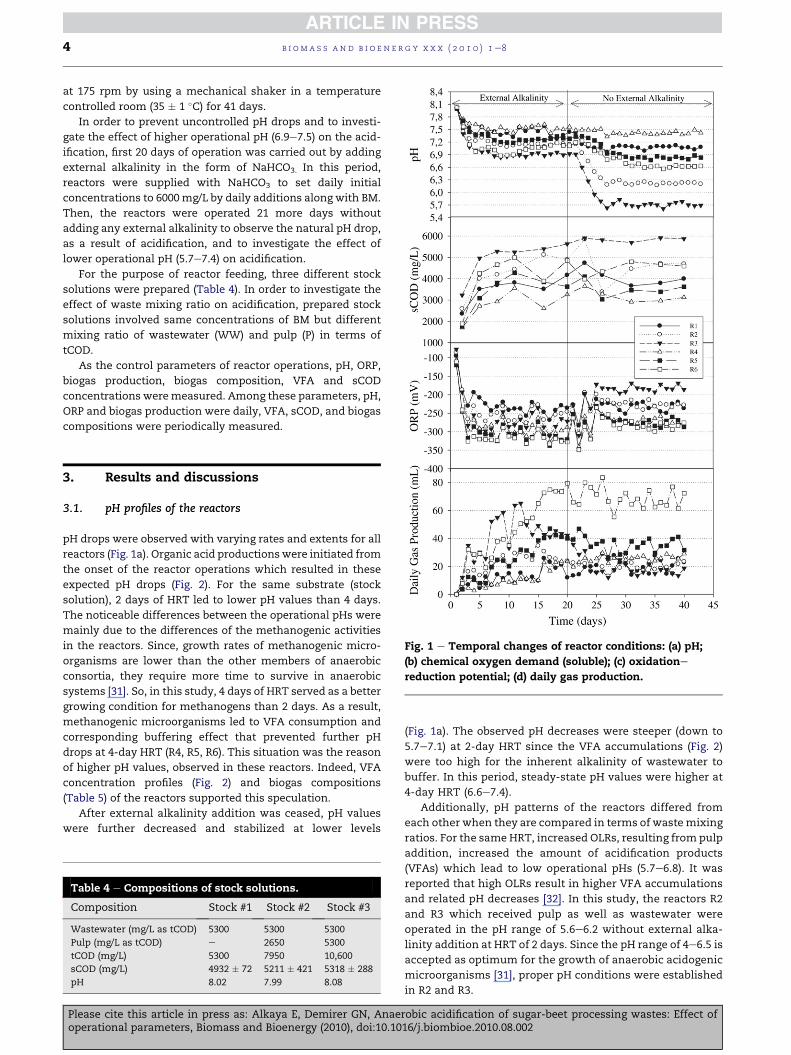
Fig. 1 e Temporal changes of reactor conditions: (a) pH;
(b) chemical oxygen demand (soluble); (c) oxidatione
reduction potential; (d) daily gas production.
3. Results and discussions
3.1. pH profiles of the reactors
pH drops were observed with varying rates and extents for all
reactors (Fig. 1a). Organic acid productionswere initiated from
the onset of the reactor operations which resulted in these
expected pH drops (Fig. 2). For the same substrate (stock
solution), 2 days of HRT led to lower pH values than 4 days.
The noticeable differences between the operational pHs were
mainly due to the differences of the methanogenic activities
in the reactors. Since, growth rates of methanogenic micro-
organisms are lower than the other members of anaerobic
consortia, they require more time to survive in anaerobic
systems [31]. So, in this study, 4 days of HRT served as a better
growing condition for methanogens than 2 days. As a result,
methanogenic microorganisms led to VFA consumption and
corresponding buffering effect that prevented further pH
drops at 4-day HRT (R4, R5, R6). This situation was the reason
of higher pH values, observed in these reactors. Indeed, VFA
concentration profiles (Fig. 2) and biogas compositions
(Table 5) of the reactors supported this speculation.
After external alkalinity addition was ceased, pH values
were further decreased and stabilized at lower levels
Table 4 e Compositions of stock solutions.
Composition Stock #1 Stock #2 Stock #3
Wastewater (mg/L as tCOD) 5300 5300 5300
Pulp (mg/L as tCOD) e 2650 5300
tCOD (mg/L) 5300 7950 10,600
sCOD (mg/L) 4932 � 72 5211 � 421 5318 � 288
pH 8.02 7.99 8.08
Please cite this article in press as: Alkaya E, Demirer GN, Anaeoperational parameters, Biomass and Bioenergy (2010), doi:10.10
(Fig. 1a). The observed pH decreases were steeper (down to
5.7e7.1) at 2-day HRT since the VFA accumulations (Fig. 2)
were too high for the inherent alkalinity of wastewater to
buffer. In this period, steady-state pH values were higher at
4-day HRT (6.6e7.4).
Additionally, pH patterns of the reactors differed from
each other when they are compared in terms of waste mixing
ratios. For the same HRT, increased OLRs, resulting from pulp
addition, increased the amount of acidification products
(VFAs) which lead to low operational pHs (5.7e6.8). It was
reported that high OLRs result in higher VFA accumulations
and related pH decreases [32]. In this study, the reactors R2
and R3 which received pulp as well as wastewater were
operated in the pH range of 5.6e6.2 without external alka-
linity addition at HRT of 2 days. Since the pH range of 4e6.5 is
accepted as optimum for the growth of anaerobic acidogenic
microorganisms [31], proper pH conditions were established
in R2 and R3.
robic acidification of sugar-beet processing wastes: Effect of16/j.biombioe.2010.08.002
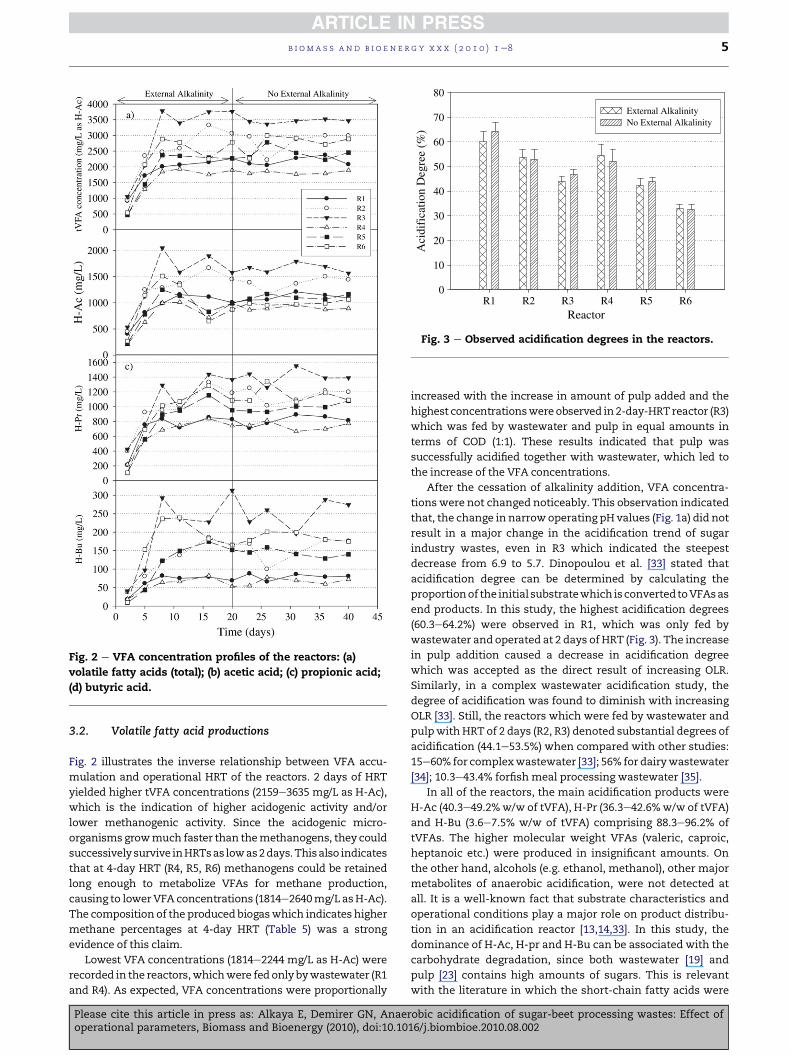
Fig. 2 e VFA concentration profiles of the reactors: (a)
volatile fatty acids (total); (b) acetic acid; (c) propionic acid;
(d) butyric acid.
ReactorR1 R2 R3 R4 R5 R6
)%(
eergeD
noitac if id icA
0
10
20
30
40
50
60
70
80
External AlkalinityNo External Alkalinity
Fig. 3 e Observed acidification degrees in the reactors.
b i om a s s a n d b i o e n e r g y x x x ( 2 0 1 0 ) 1e8 5
3.2. Volatile fatty acid productions
Fig. 2 illustrates the inverse relationship between VFA accu-
mulation and operational HRT of the reactors. 2 days of HRT
yielded higher tVFA concentrations (2159e3635 mg/L as H-Ac),
which is the indication of higher acidogenic activity and/or
lower methanogenic activity. Since the acidogenic micro-
organisms growmuch faster than themethanogens, they could
successively survive inHRTsas lowas2days.Thisalso indicates
that at 4-day HRT (R4, R5, R6) methanogens could be retained
long enough to metabolize VFAs for methane production,
causing to lowerVFA concentrations (1814e2640mg/L asH-Ac).
The composition of the produced biogaswhich indicates higher
methane percentages at 4-day HRT (Table 5) was a strong
evidence of this claim.
Lowest VFA concentrations (1814e2244 mg/L as H-Ac) were
recorded in the reactors,whichwere fed only bywastewater (R1
and R4). As expected, VFA concentrations were proportionally
Please cite this article in press as: Alkaya E, Demirer GN, Anaeroperational parameters, Biomass and Bioenergy (2010), doi:10.10
increased with the increase in amount of pulp added and the
highest concentrationswere observed in2-day-HRTreactor (R3)
which was fed by wastewater and pulp in equal amounts in
terms of COD (1:1). These results indicated that pulp was
successfully acidified together with wastewater, which led to
the increase of the VFA concentrations.
After the cessation of alkalinity addition, VFA concentra-
tions were not changed noticeably. This observation indicated
that, the change in narrow operating pH values (Fig. 1a) did not
result in a major change in the acidification trend of sugar
industry wastes, even in R3 which indicated the steepest
decrease from 6.9 to 5.7. Dinopoulou et al. [33] stated that
acidification degree can be determined by calculating the
proportionof the initial substratewhich isconvertedtoVFAsas
end products. In this study, the highest acidification degrees
(60.3e64.2%) were observed in R1, which was only fed by
wastewater and operated at 2 days of HRT (Fig. 3). The increase
in pulp addition caused a decrease in acidification degree
which was accepted as the direct result of increasing OLR.
Similarly, in a complex wastewater acidification study, the
degree of acidification was found to diminish with increasing
OLR [33]. Still, the reactors which were fed by wastewater and
pulpwith HRT of 2 days (R2, R3) denoted substantial degrees of
acidification (44.1e53.5%) when compared with other studies:
15e60% for complexwastewater [33]; 56% for dairywastewater
[34]; 10.3e43.4% forfish meal processing wastewater [35].
In all of the reactors, the main acidification products were
H-Ac (40.3e49.2%w/w of tVFA), H-Pr (36.3e42.6%w/w of tVFA)
and H-Bu (3.6e7.5% w/w of tVFA) comprising 88.3e96.2% of
tVFAs. The higher molecular weight VFAs (valeric, caproic,
heptanoic etc.) were produced in insignificant amounts. On
the other hand, alcohols (e.g. ethanol, methanol), other major
metabolites of anaerobic acidification, were not detected at
all. It is a well-known fact that substrate characteristics and
operational conditions play a major role on product distribu-
tion in an acidification reactor [13,14,33]. In this study, the
dominance of H-Ac, H-pr and H-Bu can be associated with the
carbohydrate degradation, since both wastewater [19] and
pulp [23] contains high amounts of sugars. This is relevant
with the literature in which the short-chain fatty acids were
obic acidification of sugar-beet processing wastes: Effect of16/j.biombioe.2010.08.002
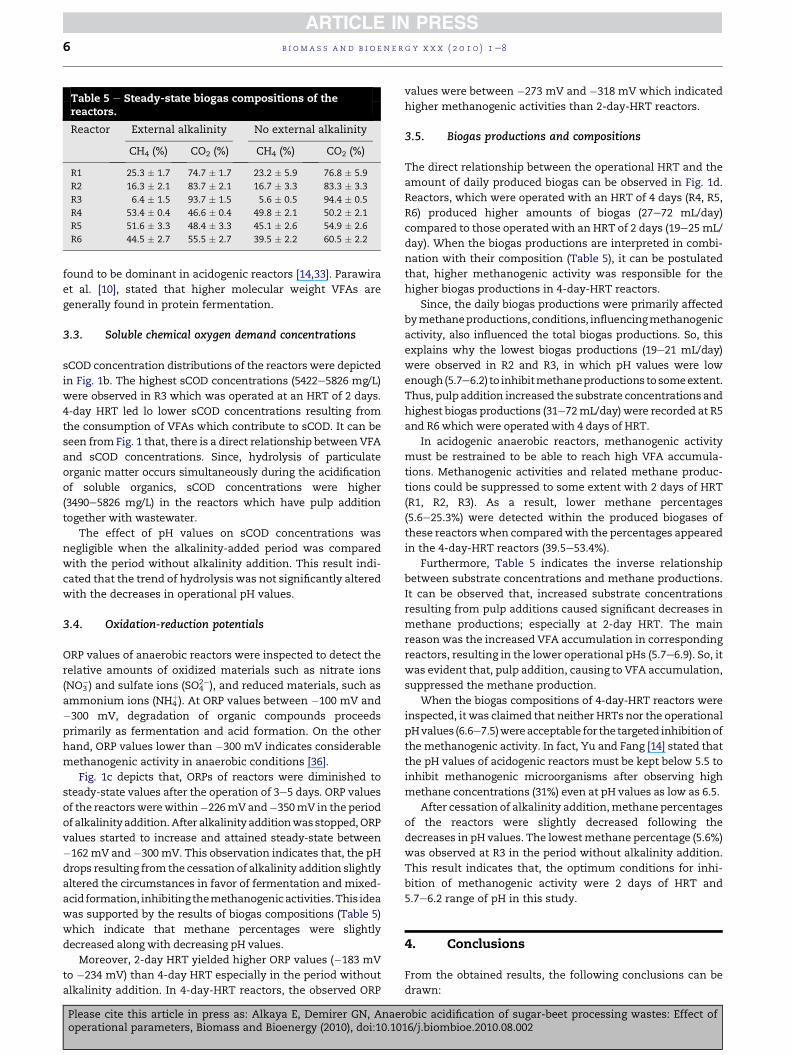
Table 5 e Steady-state biogas compositions of thereactors.
Reactor External alkalinity No external alkalinity
CH4 (%) CO2 (%) CH4 (%) CO2 (%)
R1 25.3 � 1.7 74.7 � 1.7 23.2 � 5.9 76.8 � 5.9
R2 16.3 � 2.1 83.7 � 2.1 16.7 � 3.3 83.3 � 3.3
R3 6.4 � 1.5 93.7 � 1.5 5.6 � 0.5 94.4 � 0.5
R4 53.4 � 0.4 46.6 � 0.4 49.8 � 2.1 50.2 � 2.1
R5 51.6 � 3.3 48.4 � 3.3 45.1 � 2.6 54.9 � 2.6
R6 44.5 � 2.7 55.5 � 2.7 39.5 � 2.2 60.5 � 2.2
b i om a s s a n d b i o e n e r g y x x x ( 2 0 1 0 ) 1e86
found to be dominant in acidogenic reactors [14,33]. Parawira
et al. [10], stated that higher molecular weight VFAs are
generally found in protein fermentation.
3.3. Soluble chemical oxygen demand concentrations
sCOD concentration distributions of the reactors were depicted
in Fig. 1b. The highest sCOD concentrations (5422e5826 mg/L)
were observed in R3 which was operated at an HRT of 2 days.
4-day HRT led lo lower sCOD concentrations resulting from
the consumption of VFAs which contribute to sCOD. It can be
seen from Fig. 1 that, there is a direct relationship between VFA
and sCOD concentrations. Since, hydrolysis of particulate
organic matter occurs simultaneously during the acidification
of soluble organics, sCOD concentrations were higher
(3490e5826 mg/L) in the reactors which have pulp addition
together with wastewater.
The effect of pH values on sCOD concentrations was
negligible when the alkalinity-added period was compared
with the period without alkalinity addition. This result indi-
cated that the trend of hydrolysis was not significantly altered
with the decreases in operational pH values.
3.4. Oxidation-reduction potentials
ORP values of anaerobic reactors were inspected to detect the
relative amounts of oxidized materials such as nitrate ions
(NO3�) and sulfate ions (SO4
2�), and reduced materials, such as
ammonium ions (NH4þ). At ORP values between �100 mV and
�300 mV, degradation of organic compounds proceeds
primarily as fermentation and acid formation. On the other
hand, ORP values lower than �300 mV indicates considerable
methanogenic activity in anaerobic conditions [36].
Fig. 1c depicts that, ORPs of reactors were diminished to
steady-state values after the operation of 3e5 days. ORP values
of the reactorswerewithin�226mVand�350mV in the period
of alkalinityaddition.After alkalinity additionwasstopped,ORP
values started to increase and attained steady-state between
�162mV and�300 mV. This observation indicates that, the pH
drops resulting from the cessation of alkalinity addition slightly
altered the circumstances in favor of fermentation and mixed-
acidformation, inhibitingthemethanogenicactivities.This idea
was supported by the results of biogas compositions (Table 5)
which indicate that methane percentages were slightly
decreased along with decreasing pH values.
Moreover, 2-day HRT yielded higher ORP values (�183 mV
to �234 mV) than 4-day HRT especially in the period without
alkalinity addition. In 4-day-HRT reactors, the observed ORP
Please cite this article in press as: Alkaya E, Demirer GN, Anaeoperational parameters, Biomass and Bioenergy (2010), doi:10.10
values were between �273 mV and �318 mV which indicated
higher methanogenic activities than 2-day-HRT reactors.
3.5. Biogas productions and compositions
The direct relationship between the operational HRT and the
amount of daily produced biogas can be observed in Fig. 1d.
Reactors, which were operated with an HRT of 4 days (R4, R5,
R6) produced higher amounts of biogas (27e72 mL/day)
compared to those operated with an HRT of 2 days (19e25 mL/
day). When the biogas productions are interpreted in combi-
nation with their composition (Table 5), it can be postulated
that, higher methanogenic activity was responsible for the
higher biogas productions in 4-day-HRT reactors.
Since, the daily biogas productions were primarily affected
bymethaneproductions, conditions, influencingmethanogenic
activity, also influenced the total biogas productions. So, this
explains why the lowest biogas productions (19e21 mL/day)
were observed in R2 and R3, in which pH values were low
enough (5.7e6.2) to inhibitmethaneproductions tosomeextent.
Thus, pulp addition increased the substrate concentrations and
highest biogas productions (31e72mL/day) were recorded at R5
and R6 which were operated with 4 days of HRT.
In acidogenic anaerobic reactors, methanogenic activity
must be restrained to be able to reach high VFA accumula-
tions. Methanogenic activities and related methane produc-
tions could be suppressed to some extent with 2 days of HRT
(R1, R2, R3). As a result, lower methane percentages
(5.6e25.3%) were detected within the produced biogases of
these reactors when comparedwith the percentages appeared
in the 4-day-HRT reactors (39.5e53.4%).
Furthermore, Table 5 indicates the inverse relationship
between substrate concentrations and methane productions.
It can be observed that, increased substrate concentrations
resulting from pulp additions caused significant decreases in
methane productions; especially at 2-day HRT. The main
reason was the increased VFA accumulation in corresponding
reactors, resulting in the lower operational pHs (5.7e6.9). So, it
was evident that, pulp addition, causing to VFA accumulation,
suppressed the methane production.
When the biogas compositions of 4-day-HRT reactors were
inspected, it was claimed that neither HRTs nor the operational
pHvalues (6.6e7.5)wereacceptable for the targeted inhibitionof
the methanogenic activity. In fact, Yu and Fang [14] stated that
the pH values of acidogenic reactors must be kept below 5.5 to
inhibit methanogenic microorganisms after observing high
methane concentrations (31%) even at pH values as low as 6.5.
After cessation of alkalinity addition,methane percentages
of the reactors were slightly decreased following the
decreases in pH values. The lowestmethane percentage (5.6%)
was observed at R3 in the period without alkalinity addition.
This result indicates that, the optimum conditions for inhi-
bition of methanogenic activity were 2 days of HRT and
5.7e6.2 range of pH in this study.
4. Conclusions
From the obtained results, the following conclusions can be
drawn:
robic acidification of sugar-beet processing wastes: Effect of16/j.biombioe.2010.08.002
b i om a s s a n d b i o e n e r g y x x x ( 2 0 1 0 ) 1e8 7
� Sugar industry wastewater and beet-pulp can simulta-
neously be converted to VFAs in acidogenic anaerobic reac-
tors with considerable acidification degrees (43.8e52.9%).
� In this study, wastewater was used for dilution of beet-pulp
instead of fresh water, which serves for resource conser-
vation. By this way, external alkalinity addition, a common
application, could also be avoided due to the inherent
alkalinity of the wastewater.
� Increased OLRs, resulting from pulp addition, increased the
amount of acidification products (VFAs) which lead to
relatively low operational pH values (5.7e6.8). In this pH
range, methanogenic activity was inhibited and lowest
methane percentages (5.6e16.3%) were observed in biogas
compositions.
� The optimum operational conditions were selected as 2-day
HRT and 1:1 waste mixing ratio (in terms of COD) without
external alkalinity addition. These operational conditions
led to the highest tVFA concentrations (3635 � 209 mg/L as
H-Ac) with an acidification degree of 46.9% at the highest
OLR of 5.4 g COD/L-d.
Acknowledgments
This study was funded by The Scientific and Technological
Research Council of Turkey through Grant Number 104I127.
r e f e r e n c e s
[1] Angenent LT, Karim K, Al-Dahhan MH, Wrenn BA,Domiguez-Espinosa R. Production of bioenergy andbiochemicals from industrial and agricultural wastewater.Trends Biotechnol 2004;22(9):477e85.
[2] De La Rubia MA, Raposo F, Rincon B, Borja R. Evaluation ofthe hydrolyticeacidogenic step of a two-stagemesophilicanaerobic digestion process of sunflower oil cake.BioresourTechnol 2009;100:4133e8.
[3] Li R, Chen S, Li X. Biogas production from anaerobic co-digestion of food waste with dairy manure in a two-phasedigestion system. Appl Biochem Biotechnol 2010;160:643e54.
[4] Rincon B, Borja R, Martın MA, Martin A. Evaluation of themethanogenic step of a two-stage anaerobic digestionprocess of acidified olive mill solid residue from a previoushydrolyticeacidogenic step. Waste Manage 2009;29:2566e73.
[5] Koutrouli EC, Kalfas H, Gavala HN, Skiadas IV,Stamatelatou K, Lyberatos G. Hydrogen and methaneproduction through two-stage mesophilic anaerobicdigestion of olive pulp. Bioresour Technol 2009;100:3718e23.
[6] Demirer GN, Chen S. Effect of retention time and organicloading rate on anaerobic acidification and biogasification ofdairy manure. J Chem Technol Biotechnol 2004;79(12):1381e7.
[7] Yilmaz V, Demirer GN. Improved anaerobic acidification ofunscreened dairy manure. Environ Eng Sci 2007;25:309e18.
[8] Demirer GN, Othman M. Two phase thermophilicacidification and mesophilic methanogenesis anaerobicdigestion of waste activated sludge. Environ Eng Sci 2008;25(9):1291e300.
[9] Ke S, Shi Z, Fang HHP. Applications of two-phase anaerobicdegradation in industrial wastewater treatment. Int J EnvironPollut 2005;23(1):65e79.
Please cite this article in press as: Alkaya E, Demirer GN, Anaeroperational parameters, Biomass and Bioenergy (2010), doi:10.10
[10] ParawiraW, Murto M, Read JS, Mattiasson B. Volatile fatty acidproduction during anaerobic mesophilic digestion of solidpotato waste. J Chem Technol Biotechnol 2004;79:673e7.
[11] Compere AL, Griffith WL. Fermentation of waste materials toproduce industrial intermediates. DevInd Microbiol 1975;17:247e52.
[12] Maharaj I, Elefsiniotis P. The role of HRT and lowtemperature on the acid-phase anaerobic digestion ofmunicipal and industrial wastewaters. Bioresour Technol2001;76:191e7.
[13] Hwang JH, Choi JA, Abou-Shanab RAI, Bhatnagar A, Min B,Song H. Effect of pH and sulfate concentration on hydrogenproduction using anaerobic mixed microflora. Int J HydrogenEnerg 2009;34(24):9702e10.
[14] Yu HQ, Fang HHP. Acidogenesis of dairy wastewater atvarious pH levels. Water Sci Technol 2002;45(10):201e6.
[15] Dareioti MA, Dokianakis SN, Stamatelatou K, Zafiri C,Kornaros M. Biogas production from anaerobic co-digestionof agroindustrial wastewaters under mesophilic conditionsin a two-stage process. Desalination 2009;248(1e3):891e906.
[16] Komemoto K, Lim YG, Nagao N, Onoue Y, Niwa C, Toda T.Effect of temperature on VFA’s and biogas production inanaerobic solubilization of food waste. Waste Manage 2009;29(12):2950e5.
[17] Ding HB, Wang JY. Responses of the methanogenic reactor todifferent effluent fractions of fermentative hydrogenproduction in a phase-separated anaerobic digestion system.Int J Hydrogen Energ 2008;33:6993e7005.
[18] Krajnc D, Mele M, Glavic P. Improving the economic andenvironmental performances of the beet sugar industry inSlovenia: increasing fuel efficiency and using by-products forethanol. J Clean Prod 2007;15:1240e52.
[19] Wang BZ, Sui J, Liu RF, Yang G, Qi PS. Anaerobic reactorstreating beet sugar effluents. Effluent Water Treat 1986;26(5):150e62.
[20] Shore M, Broughton NW, Bumstead N. Anaerobic treatmentof waste waters in the beet sugar industry. Water PollutControl 1984;83(4):499e506.
[21] Iza J, Palencia JI, Fdz-Polanco F. Waste water management ina sugar beet factory: a case study of comparison betweenanaerobic technologies. Water Sci Technol 1990;22(9):123e30.
[22] Farhadian M, Borghei M, Umrania VV. Treatment of beetsugar wastewater by UAFB bioprocess. Bioresour Technol2007;98:3080e3.
[23] Hutnan M, Drtil M, Mrafkova L. Anaerobic biodegradation ofsugar beet pulp. Biodegradation 2000;11:203e11.
[24] Koppar A, Pullammanappallil P. Single-stage, batch, leach-bed, thermophilic anaerobic digestion of spent sugar beetpulp. Bioresour Technol 2008;99:2831e9.
[25] Lane AG. Laboratory scale anaerobic digestion of fruit andvegetable solid waste. Biomass 1984;5:245e59.
[26] Weiland P. One- and two-step anaerobic digestion of solidagroindustrial residues. Water Sci Technol 1993;27:145e51.
[27] Stoppok E, Buchholz K. Continuous anaerobic conversion ofsugar beet pulp to biogas. Biotechnol Lett 1985;7(2):119e24.
[28] Hutnan M, Drtil M, Derco J, Mrafkova L, Hornak M, Mico S.Two-step pilot-scale anaerobic treatment of sugar beet pulp.Polish J Environ Stud 2001;10(4):237e43.
[29] Gungor-Demirci G, Demirer GN. Effect of initial CODconcentration, nutrient addition, temperature and microbialacclimation on anaerobic treatability of broiler and cattlemanure. Bioresour Technol 2004;93:109e17.
[30] APHA. Standard methods for the examination of water andwastewater. 21st ed. Washington, DC, USA: American PublicHealth Association; 2005.
[31] Speece RE. Anaerobic biotechnology for industrialwastewaters. Nashville, USA: Arachae Press; 1996.
obic acidification of sugar-beet processing wastes: Effect of16/j.biombioe.2010.08.002

b i om a s s a n d b i o e n e r g y x x x ( 2 0 1 0 ) 1e88
[32] Ghosh S. Improved sludge gasification by two-phaseanaerobic digestion. J Environ Eng 1987;113:1265e84.
[33] Dinopoulou G, Rudd T, Lester JN. Anaerobic acidogenesis ofa complex wastewater: 1. the influence of operationalparameters on reactor performance. Biotechnol Bioeng 1988;31:958e68.
[34] Demirel B, Yenigun O. Anaerobic acidogenesis of dairywastewater: the effects of variations in hydraulic retention
Please cite this article in press as: Alkaya E, Demirer GN, Anaeoperational parameters, Biomass and Bioenergy (2010), doi:10.10
time with no pH control. J Chem Technol Biotechnol 2004;79:755e60.
[35] Guerrero L, Omil F, Mendez R, Lema JM. Anaerobic hydrolysisand acidogenesis of wastewaters from food industries withhigh content of organic solids and protein. Water Res 1999;33(10):3281e90.
[36] Gerardi MH. The microbiology of anaerobic digesters.Hoboken, New Jersey: John Wiley & Sons, Inc.; 2003.
robic acidification of sugar-beet processing wastes: Effect of16/j.biombioe.2010.08.002