Embed Size (px)
Citation preview

Interstate 84 / Route 8 “MIXMASTER” INTERCHANGE
A U G U S T 2020
ANALYSIS, NEEDS AND
DEFICIENCIES REPORT

TABLE OF CONTENTS
INTERSTATE 84 / ROUTE 8 “MIXMASTER” INTERCHANGE | ANALYSIS, NEEDS AND DEFICIENCIES REPORT 2
Table of ContentsTable of Contents..................................................................................................................................................................................2
Table of Figures.....................................................................................................................................................................................4
List of Tables..........................................................................................................................................................................................7
List of Appendices ................................................................................................................................................................................8
1 Introduction .....................................................................................................................................................................................10
1.1 Purpose ...................................................................................................................................................................................10
1.2 Study Areas.............................................................................................................................................................................10
1.3 Prior Reports and Studies ....................................................................................................................................................12
1.4 Ongoing and Recent Projects ..............................................................................................................................................12
1.4.1 CTDOT I-84 Waterbury Widening .........................................................................................................................12
1.4.2 CTDOT Route 8/I-84 Mixmaster Rehabilitation ...................................................................................................12
1.4.3 Naugatuck River Greenway (NRG)..........................................................................................................................12
1.4.4 W.A.T.E.R. Project......................................................................................................................................................12
1.4.5 Waterbury POCD Projects ........................................................................................................................................12
1.5 Project Goals ..........................................................................................................................................................................14
2 Existing (2017) Transportation Conditions.................................................................................................................................15
2.1 Description of Transportation Network............................................................................................................................15
2.2 Existing Traffic Data .............................................................................................................................................................15
2.2.1 Highway Traffic Volumes..........................................................................................................................................15
2.2.2 Arterial and Intersection Traffic Volumes ..............................................................................................................17
2.2.3 Heavy Vehicle Volumes .............................................................................................................................................19
2.2.4 Origins and Destinations ...........................................................................................................................................19
2.2.5 Travel Speeds ...............................................................................................................................................................28
2.2.6 Traffic Signal Data ......................................................................................................................................................33
2.2.7 Queue Length Observations ......................................................................................................................................33
2.3 Existing Traffic Operations..................................................................................................................................................34
2.3.1 Modeling Overview ....................................................................................................................................................34
2.3.2 Travel Demand Model ...............................................................................................................................................34
2.3.3 Hybrid Simulation Model..........................................................................................................................................34
2.3.4 Traffic Simulation Model...........................................................................................................................................34
2.3.5 Traffic Analysis Tools.................................................................................................................................................34
2.3.6 Freeway Operations Overview ..................................................................................................................................35
2.3.7 Freeway Operation (Mainline, Weave, and Diverge Segments) ..........................................................................35
2.3.8 Intersection Operations Overview............................................................................................................................48
2.3.9 Intersection Operations .............................................................................................................................................48
2.4 Roadway Geometrics ............................................................................................................................................................53
2.4.1 Methodology................................................................................................................................................................53
2.4.2 Interstate 84 .................................................................................................................................................................53
2.4.3 Route 8..........................................................................................................................................................................56
2.4.4 Ramps ...........................................................................................................................................................................58
2.5 Crash Data and Safety Analysis...........................................................................................................................................85
2.5.1 I-84 and Route 8 Interchange System ......................................................................................................................85
2.5.2 Intersections.................................................................................................................................................................88
2.5.3 Bicyclists and Pedestrians ..........................................................................................................................................90
2.6 Existing Structural Conditions ............................................................................................................................................91
2.6.1 Background..................................................................................................................................................................91
2.6.2 Evaluations and Results..............................................................................................................................................92
2.6.3 Summary ......................................................................................................................................................................97
3 Future (2045) Transportation Conditions ...................................................................................................................................98
3.1 Forecasting Traffic Growth..................................................................................................................................................98
3.2 Future Traffic Volumes ........................................................................................................................................................98
3.3 Future (2045) Traffic Simulation Model..........................................................................................................................100
3.3.1 Model Inputs .............................................................................................................................................................100
3.3.2 Model Performance ..................................................................................................................................................100
3.4 Future Traffic Operations ..................................................................................................................................................102
3.4.1 Freeway Operations (Mainline, Weave, and Diverge Segments).......................................................................102
3.4.2 Intersection Operations ...........................................................................................................................................113
3.5 Future Structural Conditions ............................................................................................................................................117
4 Existing Social, Economic, and Environmental Conditions ...................................................................................................119
4.1 Key Context Features and Characteristics.......................................................................................................................119
4.1.1 City-Wide Inventory ................................................................................................................................................121
4.1.2 Neighborhood Assessment......................................................................................................................................146

TABLE OF CONTENTS
INTERSTATE 84 / ROUTE 8 “MIXMASTER” INTERCHANGE | ANALYSIS, NEEDS AND DEFICIENCIES REPORT 3
4.2 Transit and Rail Assessment..............................................................................................................................................149
4.2.1 Demographic Characteristics..................................................................................................................................149
4.2.2 Transit Service Summary.........................................................................................................................................149
4.3 Bicycle and Pedestrian Assessment ..................................................................................................................................153
4.3.1 Current Bicycle/Pedestrian Initiatives ...................................................................................................................153
4.3.2 Existing Conditions ..................................................................................................................................................155
4.4 Environmental and Natural Resources ............................................................................................................................158
4.4.1 Environmental Constraints .....................................................................................................................................158
4.5 Geotechnical Conditions....................................................................................................................................................171
4.5.1 Site Geology ...............................................................................................................................................................171
4.5.2 Soil/Rock Data...........................................................................................................................................................176
4.5.3 Summary ....................................................................................................................................................................176
5 Summary of Findings....................................................................................................................................................................180
5.1 Existing and Future Traffic Operations ...........................................................................................................................180
5.2 Roadway Geometrics ..........................................................................................................................................................181
5.3 Structural Conditions .........................................................................................................................................................182
5.4 Safety Crash Analysis..........................................................................................................................................................182
5.5 Transit and Rail ...................................................................................................................................................................183
5.6 Key Context Features and Characteristics.......................................................................................................................183
5.7 Bicycle and Pedestrian Infrastructure ..............................................................................................................................184
5.8 Environmental Constraints ...............................................................................................................................................184

TABLE OF CONTENTS
INTERSTATE 84 / ROUTE 8 “MIXMASTER” INTERCHANGE | ANALYSIS, NEEDS AND DEFICIENCIES REPORT 4
Table of FiguresFigure 1-1 Study Areas Map..............................................................................................................................................................11
Figure 1-2 Current Planning Projects Map.....................................................................................................................................13
Figure 2-1 Mainline Peak Hour Traffic Volumes ..........................................................................................................................16
Figure 2-2 I-84 Daily Traffic Volume Variation ............................................................................................................................16
Figure 2-3 I-84 Weekly Traffic Volume Variation ........................................................................................................................16
Figure 2-4 I-84 Yearly Traffic Volume Variation ..........................................................................................................................16
Figure 2-5 Route 8 Daily Traffic Volume Variation......................................................................................................................17
Figure 2-6 Route 8 Weekly Traffic Volume Variation ..................................................................................................................17
Figure 2-7 Route 8 Yearly Traffic Volume Variation ....................................................................................................................17
Figure 2-8 Arterial Peak Hour Traffic Volumes.............................................................................................................................18
Figure 2-9 Origin and Destination Map I-84 Eastbound AM Peak Hour..................................................................................20
Figure 2-10 Origin and Destination Map I-84 Eastbound PM Peak Hour ................................................................................21
Figure 2-11 Origin and Destination Map I-84 Westbound AM Peak Hour..............................................................................22
Figure 2-12 Origin and Destination Map I-84 Westbound PM Peak Hour ..............................................................................23
Figure 2-13 Origin and Destination Map Route 8 Northbound AM Peak Hour......................................................................24
Figure 2-14 Origin and Destination Map Route 8 Northbound PM Peak Hour ......................................................................25
Figure 2-15 Origin and Destination Map Route 8 Southbound AM Peak Hour ......................................................................26
Figure 2-16 Origin and Destination Map Route 8 Southbound PM Peak Hour.......................................................................27
Figure 2-17 Existing (2017) Average Speed Map Mainline AM Peak Hour ..............................................................................29
Figure 2-18 Existing (2017) Average Speed Map Mainline PM Peak Hour...............................................................................30
Figure 2-19 Existing (2017) Average Speed Map System Ramps AM Peak Hour.....................................................................31
Figure 2-20 Existing (2017) Average Speed Map System Ramps PM Peak Hour .....................................................................32
Figure 2-21 Existing (2017) Level of Service Map I-84 Eastbound AM Peak Hour..................................................................37
Figure 2-22 Existing (2017) Level of Service Map I-84 Eastbound PM Peak Hour ..................................................................38
Figure 2-23 Existing (2017) Level of Service Map I-84 Westbound AM Peak Hour................................................................39
Figure 2-24 Existing (2017) Level of Service Map I-84 Westbound PM Peak Hour ................................................................40
Figure 2-25 Existing (2017) Level of Service Map Route 8 Northbound AM............................................................................41
Figure 2-26 Existing (2017) Level of Service Map Route 8 Northbound PM ............................................................................42
Figure 2-27 Existing (2017) Level of Service Map Route 8 Southbound AM ............................................................................43
Figure 2-28 Existing (2017) Level of Service Map Route 8 Southbound PM.............................................................................44
Figure 2-29 Existing (2017) Level of Service Map System Ramps AM Peak Hour ...................................................................46
Figure 2-30 Existing (2017) Level of Service Map System Ramps PM Peak Hour....................................................................47
Figure 2-31 Analyzed Arterials and Intersections Map ................................................................................................................48
Figure 2-32 Existing (2017) Level of Service Map Intersections AM Peak Hour......................................................................50
Figure 2-33 Existing (2017) Level of Service Map Intersections PM Peak Hour ......................................................................51
Figure 2-34 Existing (2017) Level of Service Map Intersections Saturday Peak Hour .............................................................52
Figure 2-35 Geometric Deficiencies, Design Speed by Classification .........................................................................................69
Figure 2-36 Design Speed and Horizontal Alignment (1 of 5) ....................................................................................................70
Figure 2-37 Design Speed and Horizontal Alignment (2 of 5) ....................................................................................................71
Figure 2-38 Design Speed and Horizontal Alignment (3 of 5) ....................................................................................................72
Figure 2-39 Design Speed and Horizontal Alignment (4 of 5) ....................................................................................................73
Figure 2-40 Design Speed and Horizontal Alignment (5 of 5) ....................................................................................................74
Figure 2-41 Stopping Sight Distance and Vertical Geometry (1 of 5) ........................................................................................75
Figure 2-42 Stopping Sight Distance and Vertical Geometry (2 of 5) ........................................................................................76
Figure 2-43 Stopping Sight Distance and Vertical Geometry (3 of 5) ........................................................................................77
Figure 2-44 Stopping Sight Distance and Vertical Geometry (4 of 5) ........................................................................................78
Figure 2-45 Stopping Sight Distance and Vertical Geometry (5 of 5) ........................................................................................79
Figure 2-46 Ramp Deficiencies (1 of 5) ...........................................................................................................................................80
Figure 2-47 Ramp Deficiencies (2 of 5) ...........................................................................................................................................81
Figure 2-48 Ramp Deficiencies (3 of 5) ...........................................................................................................................................82
Figure 2-49 Ramp Deficiencies (4 of 5) ...........................................................................................................................................83
Figure 2-50 Ramp Deficiencies (5 of 5) ...........................................................................................................................................84
Figure 2-51 Freeway Crash Severity.................................................................................................................................................85
Figure 2-52 Crash Type .....................................................................................................................................................................85
Figure 2-53 Mainline Crash Density Map.......................................................................................................................................86
Figure 2-54 Mainline Crash Severity Map ......................................................................................................................................87
Figure 2-55 Freeway Crash Contributing Factors..........................................................................................................................88
Figure 2-56 Existing (2017) High Crash Intersection Locations .................................................................................................89
Figure 2-57 Previous Bridge Rehabilitation Projects.....................................................................................................................91
Figure 2-58 NBIS Condition Rating Scale and Example of Major Bridge Components ..........................................................92
Figure 2-59 Existing Overall Bridge Condition..............................................................................................................................92
Figure 2-60 Existing Major Bridge Component Conditions ........................................................................................................92
Figure 2-61 Existing Physical Conditions Map (Overall Bridge) Study Area Bridges..............................................................94
Figure 2-62 Existing Physical Conditions Map (Overall Bridge) Core Interchange Bridges ..................................................95

TABLE OF CONTENTS
INTERSTATE 84 / ROUTE 8 “MIXMASTER” INTERCHANGE | ANALYSIS, NEEDS AND DEFICIENCIES REPORT 5
Figure 2-63 Bridge Sufficiency Rating Distribution ......................................................................................................................96
Figure 3-1 I-84 Eastbound 2017 vs 2045 Daily Traffic Volumes .................................................................................................99
Figure 3-2 I-84 Westbound 2017 vs 2045 Daily Traffic Volumes ...............................................................................................99
Figure 3-3 Route 8 Northbound 2017 vs 2045 Daily Traffic Volumes .......................................................................................99
Figure 3-4 Route 8 Southbound 2017 vs 2045 Daily Traffic Volumes........................................................................................99
Figure 3-5 Model Performance and Observations.......................................................................................................................101
Figure 3-6 Future (2045) Level of Service Map I-84 Eastbound AM Peak Hour ....................................................................103
Figure 3-7 Future (2045) Level of Service Map I-84 Eastbound PM Peak Hour.....................................................................104
Figure 3-8 Future (2045) Level of Service Map I-84 Westbound AM Peak Hour ..................................................................105
Figure 3-9 Future (2045) Level of Service Map I-84 Westbound PM Peak Hour ...................................................................106
Figure 3-10 Future (2045) Level of Service Map Route 8 Northbound AM ............................................................................107
Figure 3-11 Future (2045) Level of Service Map Route 8 Northbound PM.............................................................................108
Figure 3-12 Future (2045) Level of Service Map Route 8 Southbound AM.............................................................................109
Figure 3-13 Future (2045) Level of Service Map Route 8 Southbound PM .............................................................................110
Figure 3-14 Future (2045) Level of Service Map System Ramps AM Peak Hour ...................................................................111
Figure 3-15 Future (2045) Level of Service Map System Ramps PM Peak Hour ....................................................................112
Figure 3-16 Future (2045) Level of Service Map Intersections AM Peak Hour ......................................................................114
Figure 3-17 Future (2045) Level of Service Map Intersections PM Peak Hour.......................................................................115
Figure 3-18 Future (2045) Level of Service Map Intersections Saturday Peak Hour..............................................................116
Figure 3-19 Proactive Maintenance vs. Reactive Maintenance .................................................................................................117
Figure 4-1 Key Area Boundary and Neighborhoods Map..........................................................................................................120
Figure 4-2 Population Density Map...............................................................................................................................................122
Figure 4-2.1 Percentage of Minorities Map ..................................................................................................................................124
Figure 4-2.2 Average Household Income Map ............................................................................................................................125
Figure 4-3 Environmental Justice Populations Map ...................................................................................................................128
Figure 4-4 Neighborhoods and Neighborhood Groups Map ....................................................................................................130
Figure 4-5 Land Use Map................................................................................................................................................................131
Figure 4-6 Future Land Use Map ...................................................................................................................................................132
Figure 4-7 Community Resources and Institutions Map ...........................................................................................................134
Figure 4-8 Waterbury Historical Resources Map ........................................................................................................................136
Figure 4-8.1 Historical and Archaeological Map 1 of 9 ..............................................................................................................137
Figure 4-8.2 Historical and Archaeological Map 2 of 9 ..............................................................................................................138
Figure 4-8.3 Historical and Archaeological Map 3 of 9 ..............................................................................................................139
Figure 4-8.4 Historical and Archaeological Map 4 of 9 ..............................................................................................................140
Figure 4-8.5 Historical and Archaeological Map 5 of 9 ..............................................................................................................141
Figure 4-8.6 Historical and Archaeological Map 6 of 9 ..............................................................................................................142
Figure 4-8.7 Historical and Archaeological Map 7 of 9 ..............................................................................................................143
Figure 4-8.8 Historical and Archaeological Map 8 of 9 ..............................................................................................................144
Figure 4-8.9 Historical and Archaeological Map 9 of 9 ..............................................................................................................145
Figure 4-9 Photos of Waterbury Green (Left) and Library Park (Right)..................................................................................146
Figure 4-10 Photos of City Hall (Left) and Train Station/Library Green (Right) ...................................................................146
Figure 4-11 Photos of Bank/Grand (Left) and Meadow/Field Intersections (Right) .............................................................146
Figure 4-12 Photos of Benedict Street (Left) and Benedict/West Clay Intersection (Right) .................................................147
Figure 4-13 Photos of Big Box Retail (Left) and Vacant Land on Benedict Street (Right) ....................................................147
Figure 4-14 Photos of W. Dover Street at South End (Left) and S. Main Street (Right) ........................................................147
Figure 4-15 Photos of E. Dover Street (Left) and Mill Street (Right)........................................................................................147
Figure 4-16 Photos of St. Anne's Church (Left) and Maloney Elementary School (Right) ...................................................147
Figure 4-17 Photos of Alder Street (Left) and Washington Avenue (Right) in Brooklyn .....................................................148
Figure 4-18 Photos of Riverside Cemetery (Left) and Chase Park (Right) ..............................................................................148
Figure 4-19 Photos of Highland Ave (Left) and Wilson Street (Right) in West End .............................................................148
Figure 4-20 WATS Graphic ............................................................................................................................................................150
Figure 4-21 CT Transit - Hartford Map........................................................................................................................................150
Figure 4-22 CT transit - Waterbury...............................................................................................................................................151
Figure 4-23 Existing and Planned Bicycle Pedestrian Infrastructure Map ..............................................................................154
Figure 4-24 Photos of Waterbury Green (Left) and Grand Street (Right) ...............................................................................155
Figure 4-25 Photos of Market Square (Left) and Jewelry Street (Right)...................................................................................155
Figure 4-26 Photos of Recently Constructed Freight Street Multi-Use Path...........................................................................155
Figure 4-27 Photos of South Main Street (Left) and Bank Street (Right) Underpasses .........................................................156
Figure 4-28 Photo of Meadow Street Underpass .........................................................................................................................156
Figure 4-29 Photos of South Elm Street Overpass (Left) and McMahon Street Access (Right) ...........................................156
Figure 4-30 Overpasses and Underpasses Map............................................................................................................................157
Figure 4-31 Photos of the Naugatuck River..................................................................................................................................159
Figure 4-32 Surface and Groundwater Water Resources Map ..................................................................................................160
Figure 4-33 National Wetlands Inventory Map...........................................................................................................................162
Figure 4-34 Potential Wetland Areas Map ...................................................................................................................................163
Figure 4-35 Floodplains Map..........................................................................................................................................................165

TABLE OF CONTENTS
INTERSTATE 84 / ROUTE 8 “MIXMASTER” INTERCHANGE | ANALYSIS, NEEDS AND DEFICIENCIES REPORT 6
Figure 4-36 USDA NCRS Web Soil Survey Map .........................................................................................................................167
Figure 4-37 USDA NCRS Farmland Soils Map............................................................................................................................168
Figure 4-38 Natural Diversity Database Map (Endangered Species) ........................................................................................170
Figure 4-39 Surficial Materials Map ..............................................................................................................................................172
Figure 4-40 Quaternary Geology Map...........................................................................................................................................173
Figure 4-41 Bedrock Geology Map ................................................................................................................................................175

TABLE OF CONTENTS
INTERSTATE 84 / ROUTE 8 “MIXMASTER” INTERCHANGE | ANALYSIS, NEEDS AND DEFICIENCIES REPORT 7
List of TablesTable 2-1 Arterial Peak Hour Traffic Volumes ..............................................................................................................................18
Table 2-2 Mainline Percent Heavy Vehicles ...................................................................................................................................19
Table 2-3 Origin and Destination Summary (AM Peak Hour) ...................................................................................................19
Table 2-4 Origin and Destination Summary (PM Peak Hour)....................................................................................................19
Table 2-5 Existing (2017) Average Speeds, Major Arterials .........................................................................................................28
Table 2-6 Freeway Level of Service Criteria ....................................................................................................................................35
Table 2-7 I-84 Traffic Operations.....................................................................................................................................................35
Table 2-8 Route 8 Traffic Operations ..............................................................................................................................................35
Table 2-9 Level of Service Criteria for Signalized and Unsignalized Intersections...................................................................48
Table 2-10 Signalized and Unsignalized Intersection Capacity Analysis Results......................................................................49
Table 2-11 I-84 Mainline Horizontal Curve Deficiencies.............................................................................................................53
Table 2-12 I-84 Mainline Right Shoulder Width Deficiencies.....................................................................................................54
Table 2-13 I-84 Mainline Left Shoulder Width Deficiencies........................................................................................................54
Table 2-14 I-84 Mainline Geometric Deficiencies Matrix ............................................................................................................55
Table 2-15 Route 8 Mainline Geometric Deficiencies Matrix......................................................................................................57
Table 2-16 System Ramp Horizontal Curve Deficiencies .............................................................................................................58
Table 2-17 System Ramp Right Shoulder Width Deficiencies .....................................................................................................58
Table 2-18 System Ramp Left Shoulder Width Deficiencies........................................................................................................58
Table 2-19 System Ramp Geometric Deficiencies Matrix ............................................................................................................60
Table 2-20 I-84 Service Ramp Horizontal Curve Deficiencies.....................................................................................................61
Table 2-21 I-84 Service Ramp Grade Deficiencies.........................................................................................................................61
Table 2-22 I-84 Service Ramp Lane Width Deficiencies...............................................................................................................61
Table 2-23 I-84 Service Ramp Right Shoulder Width Deficiencies.............................................................................................61
Table 2-24 I-84 Service Ramp Left Shoulder Width Deficiencies ...............................................................................................62
Table 2-25 I-84 Service Ramp Deceleration Lane Length Deficiencies ......................................................................................62
Table 2-26 I-84 Service Ramp Compound Curve Deficiencies....................................................................................................62
Table 2-27 I-84 Service Ramp Intersection Sight Distance Deficiencies ....................................................................................62
Table 2-28 Route 8 Service Ramp Maximum Grade Deficiencies...............................................................................................62
Table 2-29 Route 8 Service Ramp Minimum Grade Deficiencies ...............................................................................................62
Table 2-30 Route 8 Service Ramp Right Shoulder Width Deficiencies ......................................................................................63
Table 2-31 Route 8 Service Ramp Left Shoulder Width Deficiencies .........................................................................................63
Table 2-32 Route 8 Service Ramp Deceleration Lane Length Deficiencies ................................................................................63
Table 2-33 Route 8 Service Ramp Acceleration Lane Length Deficiencies ................................................................................63
Table 2-34 Route 8 Service Ramp Compound Curve Deficiencies .............................................................................................63
Table 2-35 Route 8 Superelevation Rate and Transition Length Deficiencies...........................................................................63
Table 2-36 I-84 Eastbound Service Ramp Geometric Deficiencies Matrix ................................................................................64
Table 2-37 I-84 Westbound Service Ramp Geometric Deficiencies Matrix ..............................................................................65
Table 2-38 Route 8 Northbound Service Ramp Geometric Deficiencies Matrix ......................................................................66
Table 2-39 Route 8 Southbound Service Ramp Geometric Deficiencies Matrix.......................................................................67
Table 2-40 I-84 Eastbound Ramp Spacing Deficiencies................................................................................................................68
Table 2-41 I-84 Westbound Ramp Spacing Deficiencies..............................................................................................................68
Table 2-42 Route 8 Northbound Ramp Spacing Deficiencies......................................................................................................68
Table 2-43 Route 8 Southbound Spacing Deficiencies..................................................................................................................68
Table 2-44 Cyclist Collisions (2015 – 2017)....................................................................................................................................90
Table 2-45 Pedestrian Collisions (2015 – 2017) .............................................................................................................................90
Table 2-46 Current and Planned (2018 through 2022) Bridge Rehabilitation Projects ...........................................................91
Table 2-47 Characteristics and Existing Conditions of Studied Bridges ....................................................................................93
Table 3-1 2017 and 2045 VMT Comparison ..................................................................................................................................98
Table 3-2 2045 Traffic Volume Observations.................................................................................................................................98
Table 3-3 Traffic Simulation Model Performance Measures .....................................................................................................100
Table 3-4 Traffic Simulation Model Performance Comparison................................................................................................100
Table 3-5 I-84 Future (2045) Traffic Operations (LOS) .............................................................................................................102
Table 3-6 Route 8 Future (2045) Traffic Operations (LOS) .......................................................................................................102
Table 3-7 No Build (2045) Intersection Levels of Service...........................................................................................................113
Table 3-8 Major Bridge Forecasted Year 2045 Conditions.........................................................................................................118
Table 4-1 Waterbury Population Age Distribution.....................................................................................................................121
Table 4-2 Environmental Justice Populations Matrix .................................................................................................................126
Table 4-3 City of Waterbury Historical Resources ......................................................................................................................135
Table 4-4 City of Waterbury Population Mode Split ..................................................................................................................149
Table 4-5 City of Waterbury Vehicles per Household ................................................................................................................149
Table 4-6 Studied Bridge Soil Profiles and Existing Foundations .............................................................................................177
Table 5-1 2017 and 2045 Deficient I-84 Freeway Segments .......................................................................................................180
Table 5-2 2017 and 2045 Deficient Route 8 Freeway Segments.................................................................................................180

TABLE OF CONTENTS
INTERSTATE 84 / ROUTE 8 “MIXMASTER” INTERCHANGE | ANALYSIS, NEEDS AND DEFICIENCIES REPORT 8
List of AppendicesAppendix 2.2 Existing Traffic Data
Analysis Location Figures
Raw ATR Data
Peak Hour Selection Memo
Highway Volume Maps
Raw TMC Data
Arterial Volume Maps
Raw CC Class Counts
O/D Matrices and Backup
Raw Highway Speed Run Data
Raw Arterial Speed Run Data
Traffic Signal Timing Plans
Queuing Aerials
Appendix 2.3 Existing Traffic Operations
Weave Calculations and Volumes
Expressway Free Flow Speeds
Expressway Peak Hour Factors
Highway Capacity Software Outputs
Intersection Analysis Location Figures
Intersection Peak Hour Factor and Heavy Vehicle Percentages Calculations
Field Signal Timings
Existing (2017) Peak Hour Traffic Operation Summary
Existing (2017) Level of Service Maps
Existing (2017) Synchro Printouts
Appendix 2.4 Roadway Geometrics
Interstate 84 Design Criteria Tables
Route 8 Design Criteria Tables
System Interchange – Turning Roadways Design Criteria Tables
Service Ramps Design Criteria Tables
Ramp and Interchange Spacing
Appendix 2.5 Crash Data and Safety Analysis
Crash Analysis at Arterial Intersections
Appendix 3.1 Forecasting Traffic Growth
Macroscopic Model Development and Calibration
Appendix 3.2 Future Traffic Volumes
Future (2045) Peak Hour Travel Volume Figures
Future (2045) Weave Calculations and Volumes
Future (2045) No-Build Arterial Network Traffic Volumes
Future (2045) Weave Calculations and Volumes
Appendix 3.3 Future (2045) Traffic Simulation Model
Future (2045) No-Build Modeled Travel Speeds
Appendix 3.4 Future Traffic Operations
Future (2045) Highway Capacity Software Outputs
Future (2045) No-Build Intersection Peak Hour Traffic Operation Summary
Future (2045) No-Build Intersection Synchro Printouts
Future (2045) No-Build Intersection Levels of Service Maps
Appendix 4.1 Key Context Features and Characteristics
National Register of Historic Places Map
Appendix 4.4 Environmental and Natural Resources
Environmental Resources References
CT DEEP Ground and Surface Water Quality Map
US EPA Sole Source Aquifer Map
CT DEEP Aquifer Protection Area (APA) Map
CT DEEP Coastal Area Management (CAM) Zone Map
National Wetland Inventory Map
Potential Wetland Areas Map
FEMA FIRM Map
USDA NRCS Web Soil Survey Maps
USDA NRCS Farmland Soils Map
USFWS IPaC Tool

TABLE OF CONTENTS
INTERSTATE 84 / ROUTE 8 “MIXMASTER” INTERCHANGE | ANALYSIS, NEEDS AND DEFICIENCIES REPORT 9
CT DEEP Natural Diversity Database (NDDB) Map
CT DEEP Critical Habitat Map
CT DEEP Northern Long-Eared Bat Areas of Concern

SECTION 1 INTRODUCTION
INTERSTATE 84 / ROUTE 8 “MIXMASTER” INTERCHANGE | ANALYSIS, NEEDS AND DEFICIENCIES REPORT 10
1 Introduction1.1 PURPOSEThis report summarizes the details and results of various studies which have been performed as part of the Connecticut Department of Transportation’s (CTDOT) planning process for the Reconstruction of Interstate 84/CT Route 8 Interchange Project (the I-84 Mixmaster Reconstruction Project, the Project). The Project has been initiated by the CTDOT to enhance safety, improve structural conditions, and correct operational and geometric deficiencies of the Interstate 84 (I-84) and Route 8 “Mixmaster” interchange and larger transportation network in the Waterbury area.
The studies that are summarized in this report consist of data collection efforts and engineering analyses for transportation and context (or environmental) features within the Project study area. These studies have collectively been performed to identify the existing (2017) transportation network’s deficiencies and to predict its future (2045) deficiencies in a hypothetical “no build” scenario.
The content of this Analysis, Needs, and Deficiencies Report is primarily intended to guide the development of conceptual Project improvements. The future “no build” scenario will be used as a benchmark condition for comparison and evaluation of improvement concepts. This report purposefully does not discuss or consider Project improvement concepts.
This report will also serve as a source of information to develop the Project’s Draft Purpose and Need Statement as part of the Planning and Environmental Linkages (PEL) process that the CTDOT is undertaking. The Draft Purpose and Need Statement will also be used in the subsequent National Environmental Policy Act (NEPA) process that the CTDOT will follow.
1.2 STUDY AREASThe City of Waterbury is a major employment center in Connecticut and the governmental, institutional, and cultural center of the Naugatuck River Valley. Waterbury is a formerly renowned capital of general manufacturing and is nicknamed “The Brass City” for its dominance of the U.S. brass industry during the 20th century. In this century, the City is managing a change from industrial roots to a service-sector economy. The City of Waterbury today is home to about 65,000 jobs and is currently implementing a comprehensive strategic plan to reclaim its position as a regional employment center and commercial hub (refer to the City of Waterbury Downtown Strategic Plan, available on the City’s website, for additional detail).
Within Connecticut, I-84 serves as a critical east-west transportation link between New York and Massachusetts. In Waterbury, I-84 is located just south of the City’s greater downtown area. Route 8 is a north-south state highway that follows the Naugatuck River and connects Waterbury to the I-95 corridor. Nearly 29,000 people use these highways to commute into the City each day1.
The general study areas for this report are shown in Figure 1-1 that follows. These areas include the Project Study Corridor; the Traffic Data Collection Area; and the Key Area Boundary that was used to identify key community resources proximate to the interchange. Each area boundary is unique and was deliberately defined for the purposes of evaluating the deficiencies of the transportation network and the needs of natural and human environments within the Project vicinity. The Project Study Corridor was used to evaluate the deficiencies of the transportation network and for evaluation of the natural environment. The Key Area Boundary was used during analyses of the built human environment. Resource-specific project study areas, such as for Environmental Justice presented in Section 4.1, also were developed.
The Project Study Corridor limits are roughly defined by numbered exits on the I-84 and Route 8 highways. On I-84, the corridor limits run from Exit 17 to 23; on Route 8 they extend just outside Exits 30 and 35. The Mixmaster interchange is located where I-84 and Route 8 cross. It is an elevated, full system, diamond interchange that was designed and constructed to fit within challenging topographical and site constraints. As a result, the interchange has four vertical levels, contains two stacked structures, and has a large number of left-handed entrance and exit ramps.
The study area includes more than 5-miles of highway, 65 studied intersections, 62 bridges (including culverts), and over 100,000 square feet of retaining walls. Significant features within the study area include the Naugatuck and Mad Rivers, several brooks and unnamed tributaries, ten neighborhoods, five parks, three historic districts, many historic places/properties (including Riverside Cemetery), the Metro North Railroad (MNR) Waterbury Branch Line, ten major employers, and the proposed (future) Freight Street District.
1 From City of Waterbury Downtown Strategic Plan August 2015

SECTION 1 INTRODUCTION
INTERSTATE 84 / ROUTE 8 “MIXMASTER” INTERCHANGE | ANALYSIS, NEEDS AND DEFICIENCIES REPORT 11
Figure 1-1 Study Areas Map

SECTION 1 INTRODUCTION
INTERSTATE 84 / ROUTE 8 “MIXMASTER” INTERCHANGE | ANALYSIS, NEEDS AND DEFICIENCIES REPORT 12
1.3 PRIOR REPORTS AND STUDIESThe CTDOT, City of Waterbury, and the former Naugatuck Valley Council of Governments have contemplated a means to address the long-term transportation needs of the I-84 and Route 8 corridors through Waterbury since at least 1995. Initialized as part of the CTDOT’s vision, the I-84 Mixmaster Reconstruction Project is the most recent effort to address these transportation needs. Prior reports and studies which are pertinent to the Project include:
CTDOT Needs and Deficiencies Analysis in the I-84 Corridor Waterbury to Southington, 1995
Central Naugatuck Valley Regional Plan of Conservation and Development, 1998
CTDOT I-84 West of Waterbury (WOW) Needs and Deficiencies Study, 2001
CTDOT Waterbury Interchange Needs Study (WINS), 2010 City of Waterbury Downtown Strategic Plan, 2015 City of Waterbury Plan of Conservation and Development (POCD) 2015-
2025 The POCD outlines policy priorities for the physical, economic, and social
future of Waterbury and establishes goals for future land use, development, and natural resources. Elements from the POCD that are most pertinent to the Project are discussed in Section 1.4 Ongoing and Recent Projects.
City of Waterbury Freight Street Redevelopment Strategy, 2018
1.4 ONGOING AND RECENT PROJECTSOngoing and recent projects that are pertinent to the I-84 Mixmaster Reconstruction Project and discussion in this report are described in this section for general reference. See Figure 1-2 for the general location of City planning projects. Additional details on previous and programmed bridge rehabilitation projects can be found in Section 2.6 Existing Structural Conditions.
1.4.1 CTDOT I-84 Waterbury Widening
The completed I-84 Waterbury Project (State Project No. 151-273) involved upgrades to a 2.7-mile segment of I-84 that is located between the I-84 Mixmaster Reconstruction Project’s eastern study limit and Pierpont Road. Upgrades from the I-84 Waterbury Project included addition of a third travel lane and full width shoulders (in each direction), safety improvements, and elimination of an existing substandard “S” curve alignment, among others.
In the interest of time, a project-level decision was made to collect traffic data during the I-84 Waterbury Widening’s construction rather than waiting for its eventual completion. Consequently, this collected data may not precisely
represent transportation conditions in the study area pre- or post-project construction. This data was then used in several subsequent engineering analyses which are summarized in this report. How this aspect of the data collection was accounted for during the affected analyses is described in the respective report sections.
1.4.2 CTDOT Route 8/I-84 Mixmaster Rehabilitation
The ongoing CTDOT Route 8/I-84 Mixmaster Rehabilitation Project (State Project Nos. 151-326/151-312/151-313) began construction in June 2018. The project involves rehabilitations to several major bridges (including the four stacked mainline bridges) that are located within the Project Study Corridor. The purpose of the rehabilitation project is to preserve the bridges’ structural integrity and extend their service lives by 25-years.
The rehabilitation project is a stop-gap measure that is distinct from the I-84 Mixmaster Reconstruction Project. This rehabilitation project is necessary to maintain the safety of the traveling public for the duration of the I-84 Mixmaster Reconstruction Project’s design phase. How the ongoing rehabilitation project was considered during analyses of existing and future structural conditions is explained in the respective sections of this report.
1.4.3 Naugatuck River Greenway (NRG)
The Naugatuck River Greenway (NRG) is an ongoing greenway project to construct a 44-mile long multi-use trail which will connect eleven municipalities along the Naugatuck River. Geographically, the City of Waterbury is located in the middle of the proposed greenway, and 7.1 miles of the greenway is within the City boundary. A 2010 study of potential greenway developments within Waterbury anticipated the future Mixmaster reconstruction and understood that it would include connections along the greenway in addition to realignments of roads and highway ramps. As a result, the proposed NRG developments in Waterbury include planned phases and interim connections through the study area to accommodate the I-84 Mixmaster Reconstruction Project.
1.4.4 W.A.T.E.R. Project
The W.A.T.E.R. project (Waterbury Active Transportation and Economic Resurgence) is a complete street project that is being funded through a TIGER VI Grant. This project intends to improve transportation infrastructure (local roads, shared use paths, and gathering places) in the Waterbury downtown to better integrate areas of the City and to provide connectivity and recreation opportunities. W.A.T.E.R Project components within the study area include:
Waterbury Naugatuck River Greenway Phase 1 Extension. Freight Street Reconstruction, a completed improvement to the deteriorated
main street which added an urban side path trail, bicycle, and pedestrian lanes.
Meadow Street Bicycle and Pedestrian Improvements. Jackson Street Reconstruction and Extension, a planned north-south
connection between Brooklyn and the future Freight Street District. Library-Station-Riverfront Connector, a planned pedestrian bridge to
connect Library Park to the riverfront and train station.
1.4.5 Waterbury POCD Projects
The following initiatives and projects as described in the Waterbury Plan of Conservation and Development (POCD) are part of the vision and the revitalization of the City’s urban core which is located within the study area:
Waterbury Next, an ongoing initiative to revitalize downtown Waterbury that includes funding for streetscapes, drainage improvements, and upgrades to the Waterbury Green.
Downtown Gateways, a planned project to develop six downtown gateways throughout the Central Business District. These gateways would serve as entry points into downtown Waterbury.
Planned brownfield developments include a former industrial property near the Mixmaster (the Anamet site at 698 South Main Street) which has received funding for demolition and remediation.
The Mad River Greenway extension and construction in Waterbury is envisioned to be a future component to the City’s development strategy.
Other downtown developments including renovations to the historic train station, retrofitting single-use buildings into mixed-used buildings, developing vacant land and surface parking, and redevelopment of the Freight Street District through a strategic master plan

SECTION 1 INTRODUCTION
INTERSTATE 84 / ROUTE 8 “MIXMASTER” INTERCHANGE | ANALYSIS, NEEDS AND DEFICIENCIES REPORT 13
Figure 1-2 Current Planning Projects Map

SECTION 1 INTRODUCTION
INTERSTATE 84 / ROUTE 8 “MIXMASTER” INTERCHANGE | ANALYSIS, NEEDS AND DEFICIENCIES REPORT 14
1.5 PROJECT GOALSA Draft Purpose and Need Statement is being developed for the Project as part of the PEL process. Presently, the Project has the following general goals and considerations:
Replace structurally and operationally deficient bridges Correct highway geometric deficiencies Address deficiencies with traffic operations and improve access to highways Improve safety and reduce the high crash rate throughout the study area Improve the local roadway network, encourage residents to use local roads
for traversing the City Minimize construction impacts to the City and traveling public Provide for multimodal opportunities in the study area Support long-term economic opportunities by considering planned
developments
The Draft Purpose and Need Statement will be advanced as the Project progresses. The Project goals and objectives to address current and future needs of the I-84 and Route 8 corridors in Waterbury will be further defined in this statement.

INTERSTATE 84 / ROUTE 8 “MIXMASTER” INTERCHANGE | ANALYSIS, NEEDS AND DEFICIENCIES REPORT
SECTION 2.1 DESCRIPTION OF TRANSPORTATION NETWORK
15
2 Existing (2017) Transportation Conditions2.1 DESCRIPTION OF TRANSPORTATION NETWORKAlong the I-84 corridor from the western study limit, the existing topography slopes up to the east. Near Highland Avenue, there is a ridge line and the ground descends very rapidly to the Naugatuck River valley. On the narrow west side of the valley, Riverside Street is a local collector road; on the wider east side, are former factory sites and a railyard. There are high embankments containing the river on both banks.
I-84 continues easterly, descending to the south of the city center, reaching its lowest point at the South Elm Street overpass near the Mad River crossing. The topography then begins to climb as it progresses to the east following the Mad River valley, turning to the southeast around Holy Land before heading east at the eastern study limit.
Route 8 is a north-south oriented limited access highway that parallels the Naugatuck River on its west side through the study limits. South of I-84, Route 8 is a stacked viaduct (northbound over southbound) due to the narrow width between the historic Riverside Cemetery and the Naugatuck River.
At the center of the study area is the Mixmaster, an elevated, full system interchange. It is a full diamond configuration with four vertical levels. The stacked I-84 viaduct structure exists as the top two levels (Levels 3 and 4) and crosses over Route 8, a railyard, local roads, and the Naugatuck River. Route 8 is located at Level 2, and the local road network is defined as Level 1. The railroad is located vertically between Levels 1 and 2, and the Naugatuck River is located below Level 1.
The system interchange has four left and four right exit ramps but has five left-handed and three right-handed entrance ramps. The system ramps within the Mixmaster are I-84 Exits 19 and 20 and Route 8 Exits 31 and 33. The service ramps within the study area are I-84 Exits 17, 18, 21, 22 and 23 and Route 8 Exits 30, 32, 34 and 35.
The City of Waterbury does not have an extensive roadway network near the core of the interchange, which limits options for detours for the mainlines. Starting north and moving south, Waterbury has four local street crossings of the Naugatuck River. These local crossings are: West Main Street, Freight Street, Bank Street, and Washington Avenue. The rail line that crosses each of these roadways also restricts the vertical clearance, ranging from 13'-7" to 12'-2".
There are two major local north-south roadways through Waterbury on the west side of the Naugatuck River: Riverside Street and Highland Avenue to the west. Charles Street/South Leonard Street, Riverside Street, and Watertown Avenue are the local streets that run along and under the Route 8 viaduct through the study area.
2.2 EXISTING TRAFFIC DATATraffic data was collected to assess existing traffic conditions (or operations) that would eventually be used as a benchmark for future conditions. The collected data was used to calibrate traffic simulation models that were developed for the analyses described in Section 2.3 Existing Traffic Operations and Section 3.4 Future Traffic Operations.
Data was gathered for segments of I-84, Route 8, and the local street network to develop a full understanding of traffic conditions in the Project Study Corridor. Data collection was generally limited to the Traffic Data Collection Area shown in the Figure 1-1 Study Areas Map (See Appendix 2.2 for detailed maps of data collection locations; refer to Analysis Location Figures). The local street network extents in the study area were chosen to include all nearby roads that are critical to travel in the Waterbury downtown. Note, critical roads are referred to as “arterials” throughout this report. The various types of data collected included:
Highway traffic volumes for I-84 between Exits 17 and 23 and Route 8 between Exits 30 and 35
Arterial traffic volumes at 65 intersections Heavy vehicle volumes at continuous count stations along I-84 and Route 8 Origin and destination data along I-84, Route 8, and through the study area Travel speed data along I-84, Route 8, and major arterials Traffic signal data Mainline existing queue length observations for I-84 and Route 8
It should be noted that construction associated with the I-84 Waterbury Widening Project was ongoing at Project Study Corridor’s eastern limit throughout the traffic data collection efforts (see Section 1.4 Ongoing and Recent Projects). The effects of this construction cannot be separated from the data and are therefore inherently reflected in the volumes, origin and destination patterns,
travel speeds, and queues that were recorded. However, the project’s change to lane configurations was ultimately reflected in the future 2045 “no build” modeling efforts.
2.2.1 Highway Traffic Volumes
Highway traffic volume data was obtained in 2017 for I-84 and Route 8 by placing automated traffic recorders and 24-hour video cameras at select highway ramp and mainline locations within the Project Study Corridor. Raw data and detailed data collection locations are shown in Appendix 2.2 (refer to Raw Automated Traffic Recorder (ATR) Data and Analysis Location Figures).
The raw data from automatic traffic recorders and 24-hour video cameras was summarized to determine that the peak hours for weekday highway traffic analysis are 7:30 to 8:30 AM and 4:30 to 5:30 PM. In addition, it was determined that Saturday analysis between 12:00 and 1:00 PM would be warranted along I-84. Further information on these determinations can be found in Appendix 2.2 (refer to Peak Hour Selection Memo).
Figure 2-1 shows the calibrated (or balanced) traffic volumes for each corridor during the selected peak hours along and their corresponding 2017 average daily traffic (ADT). Additional detailed volume maps can be found in Appendix 2.2 (refer to Highway Volume Maps).
Technical Information on Traffic Calibration
For calibration, all counts were factored to 2016 average weekday equivalents using two CTDOT continuous count stations: Continuous Count Station 54, located west of the Study Area in Middlebury between Interchange 16 and 17 on I-84, and Continuous Count Station 23 in Watertown, located at Interchange 37 on Route 8. Combined with 24-hour ramp counts taken every three years, these count stations provide a reliable overview of weekday traffic patterns along the freeway.
System vs. Service Ramps
System ramps are roadways that connect “limited access” highway to another (e.g. Route 8 NB to I-84 EB)
Service ramps are roadways that connect the local roadway network to a limited access highway and are commonly referred to as on and off ramps.

INTERSTATE 84 / ROUTE 8 “MIXMASTER” INTERCHANGE | ANALYSIS, NEEDS AND DEFICIENCIES REPORT
SECTION 2.2 EXISTING TRAFFIC DATA
16
Figure 2-1 Mainline Peak Hour Traffic Volumes
0358
1013151820232528303335
I-84 Eastbound¹I-84
Westbound²Route 8
Northbound³Route 8
Southbound⁴ADT (2017) 33,490 33,837 15,001 15,591AM Volume 4,470 4,390 2,700 4,500PM Volume 4,540 5,480 4,930 3,310Saturday Volume 4,190 4,520
Mainline Peak Hour Traffic Volumes
Nu
mb
er o
f V
ehic
les
(Th
ou
san
ds)
¹ I-84 Eastbound between Exits 19 & 20² I-84 Westbound at various locations³ Route 8 Northbound between Exits 34 & 35⁴ Route 8 Southbound between Exits 35 & 34
Figure 2-2 through Figure 2-7 show the daily and weekly traffic volume variation for I-84 and Route 8.
Figure 2-2 I-84 Daily Traffic Volume Variation
12:0
0 A
M1:
00 A
M2:
00 A
M3:
00 A
M4:
00 A
M5:
00 A
M6:
00 A
M6:
59 A
M8:
00 A
M9:
00 A
M9:
59 A
M11
:00
AM
12:0
0 PM
1:00
PM
1:59
PM
3:00
PM
4:00
PM
4:59
PM
6:00
PM
7:00
PM
7:59
PM
9:00
PM
10:0
0 PM
10:5
9 PM
0%
1%
2%
3%
4%
5%
6%
7%
8%
I-84 Eastbound I-84 Westbound Combined
I-84 Daily TrafficVolume Variation (Weekdays)
(2016 CTDOT Continuous Count Station Data)
Per
cen
t o
f A
vera
ge
Dai
ly T
raff
ic
Figure 2-3 I-84 Weekly Traffic Volume Variation
Sunday Monday Tuesday Wednesday Thursday Friday Saturday70%
75%
80%
85%
90%
95%
100%
105%
110%
115%
120%
I-84 Eastbound I-84 Westbound
I-84 Weekly TrafficVolume Variation
(2016 CTDOT Continuous Count Station Data)
Per
cen
t o
f A
vera
ge
Dai
ly T
raff
ic
Figure 2-4 I-84 Yearly Traffic Volume Variation
January
February
March
April MayJune
July
August
Septem
ber
October
November
December
70%
75%
80%
85%
90%
95%
100%
105%
110%
I-84 Eastbound I-84 Westbound
I-84 Yearly TrafficVolume Variation
(2016 CTDOT Continuous Count Station Data)
Per
cen
t o
f A
vera
ge
Mo
nth
ly T
raff
ic

INTERSTATE 84 / ROUTE 8 “MIXMASTER” INTERCHANGE | ANALYSIS, NEEDS AND DEFICIENCIES REPORT
SECTION 2.2 EXISTING TRAFFIC DATA
17
Figure 2-5 Route 8 Daily Traffic Volume Variation
12:0
0 A
M1:
00 A
M2:
00 A
M3:
00 A
M4:
00 A
M5:
00 A
M6:
00 A
M6:
59 A
M8:
00 A
M9:
00 A
M9:
59 A
M11
:00
AM
12:0
0 PM
1:00
PM
1:59
PM
3:00
PM
4:00
PM
4:59
PM
6:00
PM
7:00
PM
7:59
PM
9:00
PM
10:0
0 PM
10:5
9 PM
0%1%2%3%4%5%6%7%8%9%
10%
Route 8 Northbound Route 8 Southbound Combined
Route 8 Daily TrafficVolume Variation (Weekdays)
(2016 CTDOT Continuous Count Station Data)
Per
cen
t o
f A
vera
ge
Dai
ly T
raff
ic
Figure 2-6 Route 8 Weekly Traffic Volume Variation
Sunday Monday Tuesday Wednesday Thursday Friday Saturday70%
75%
80%
85%
90%
95%
100%
105%
110%
115%
120%
Route 8 Northbound Route 8 Southbound
Route 8 Weekly TrafficVolume Variation
(2016 CTDOT Continuous Count Station Data)
Per
cen
t o
f A
vera
ge
Dai
ly T
raff
icFigure 2-7 Route 8 Yearly Traffic Volume Variation
January
February
March
April MayJune
July
August
Septem
ber
October
November
December
70%
75%
80%
85%
90%
95%
100%
105%
110%
Route 8 Northbound Route 8 Southbound
Route 8 Yearly TrafficVolume Variation
(2016 CTDOT Continuous Count Station Data)
Per
cen
t o
f A
vera
ge
Mo
nth
ly T
raff
ic
2.2.2 Arterial and Intersection Traffic Volumes
Arterial and intersection traffic volume data was obtained in 2017 for 65 intersections (see Figure 2-31) using manual turning movement counts that included conflicting pedestrians and vehicle classifications. These counts were conducted on weekdays from 6:00 to 9:00 AM, from 3:00 to 6:00 PM, and from 12:00 to 4:00 PM on Saturday. Raw turning movement count data is provided in Appendix 2.2.
Turning movement counts were supplemented by automatic traffic recorders placed for a period of seven days at 30 locations along the arterials. Raw automatic traffic recorder (ATR) data and collection locations are shown in Appendix 2.2 (refer to Raw ATR Data and Analysis Location Figures).
The raw data from turning movement counts and automatic traffic recorders was summarized to determine that the peak hours for weekday arterial and intersection traffic analysis are 7:30 to 8:30 AM and 4:30 to 5:30 PM. In addition, it was determined that Saturday analysis between 12:00 and 1:00 PM would be warranted at thirteen intersections. Further information on these determinations can be found in the Peak Hour Selection Memo in Appendix 2.2.
Table 2-1 shows calibrated (or balanced) traffic volumes for a selection of high-volume arterials on major corridors and their corresponding 2017 average daily traffic (ADT). Balanced traffic volumes were used for further intersection analyses and for calibration and validation of traffic models (see Section 2.3 Existing Traffic Operations for more on traffic models). Additional detailed volume maps can be found in Appendix 2.2 (refer to Arterial Volume Maps).

INTERSTATE 84 / ROUTE 8 “MIXMASTER” INTERCHANGE | ANALYSIS, NEEDS AND DEFICIENCIES REPORT
SECTION 2.2 EXISTING TRAFFIC DATA
18
Figure 2-8 Arterial Peak Hour Traffic Volumes
Baldwin St. Bank St. Chase Pkwy. / Sunnyside Ave.
Chase Pkwy. / West Main St.
East Main St. Grand /Union St.
Highland Ave. Meadow St. Riverside St.(Northbound)
Riverside St.(Southbound)
South Main St. Washington St. / Washington Ave.
0
200
400
600
800
1,000
1,200
1,400
AM Volume PM Volume Saturday Volume
Arterial Peak Hour Traffic Volumes
Tra
ffic
Vo
lum
e
Table 2-1 Arterial Peak Hour Traffic Volumes
Corridor Direction AM PM SaturdayADT
(2017) LocationBaldwin St. Two-way 740 1,025 12,645 Between McMahon and Scovill / Mill St.Bank St. Two-way 390 530 6,720 Between Meadow and Jackson St.
Chase Pkwy. / Sunnyside Ave. Two-way 625 825 8,905Between Chase Collegiate School Dr. and I-84 EB On-Ramp (Exit 18)
Chase Pkwy. / West Main St. Two-way 1,215 1,100 17,900 Between Riverside St. and Thomaston Ave.East Main St. Two-way 565 805 11,010 Between Maple and Baldwin St.Grand / Union St. Two-way 625 795 685 10,020 Between South Main and Bank St.Highland Ave. Two-way 825 995 13,740 Between Chase Pkwy. and Birchwood St.Meadow St. Two-way 755 845 710 10,605 Between Field and Grand St.
Northbound 280 370 3,685Riverside St.
Southbound 150 250 2,735North of Sunnyside Ave.
South Main St. Two-way 805 825 7,225 Between Washington Ave. and Mill St.Washington St. / Washington Ave. Two-way 505 705 470 7,885 Between South Leonard and Lafayette St.Watertown Ave. Two-way **No ATR along Watertown Ave.**

INTERSTATE 84 / ROUTE 8 “MIXMASTER” INTERCHANGE | ANALYSIS, NEEDS AND DEFICIENCIES REPORT
SECTION 2.2 EXISTING TRAFFIC DATA
19
2.2.3 Heavy Vehicle Volumes
Data was collected at continuous count stations that are west of Exit 17 on I-84 and south of Exit 30 on Route 8 to determine the weekday vehicle classifications along the highway mainlines. Weekend vehicle classifications were taken from the data collected in 2017 at Exit 17 on I-84. The percent heavy vehicles (vehicles with six or more tires, three or more axles, and/or buses) in each peak hour are shown in Table 2-2 below and detailed information is provided in Appendix 2.2 (refer to Raw CC Class Counts).
Table 2-2 Mainline Percent Heavy Vehicles
Corridor AM PM SaturdayI-84 Eastbound 9.7% 7.1% 5.5%I-84 Westbound 10.2% 11.2% 5.6%Rt. 8 Northbound 6.1% 4.0%Rt. 8 Southbound 5.0% 2.6%
2.2.4 Origins and Destinations
Study Area O/D Data
Origin and destination (O/D) traffic data was obtained in 2017 for I-84 and Route 8 from time-lapse aerial photographic (TLAP) surveys of highway traffic flows. O/D points were identified at the study area boundaries and at all interchange on and off ramps through the study area. Table 2-3 and Table 2-4 show an O/D summary for the weekday AM and PM peak hours. Figure 2-9 through Figure 2-16 that follow are graphical depictions of these O/D summaries. Detailed O/D matrices and charts are shown in Appendix 2.2.
As discussed previously, the CTDOT I-84 Waterbury Widening project was ongoing during collection of this O/D data. As a result of construction related congestion, certain travel pattern “irregularities” were reflected in the data. One irregular travel pattern that was observed was a strong tendency for through traffic to avoid congestion on I-84 Eastbound by using a local road bypass from Exit 23 to a temporary ramp at Hamilton Avenue. The O/D data showed that about 24 percent of I-84 Eastbound through traffic used this bypass route in the AM peak hour and 13 percent used it in the PM peak hour. Because this pattern was a temporary condition attributed to construction, data summaries and subsequent analyses that relied on the O/D data considered all bypass traffic as “through traffic” (rather than traffic entering the local road network). Table 2-3 and Table 2-4 reflect the adjusted O/D data.
Table 2-3 Origin and Destination Summary (AM Peak Hour)
CorridorI-84EB
I-84WB
Route 8 NB
Route 8 SB
Local Streets
I-84 Eastbound 52% 16% 4% 28%I-84 Westbound 39% 18% 12% 31%Rt. 8 Northbound 14% 11% 34% 41%Rt. 8 Southbound 21% 20% 29% 30%Local Roads 17% 14% 12% 22% 35%
Note: EB = Eastbound, WB = Westbound, NB = Northbound, SB = Southbound
Table 2-4 Origin and Destination Summary (PM Peak Hour)
CorridorI-84EB
I-84WB
Route 8NB
Route 8SB
Local Streets
I-84 Eastbound 50% 21% 5% 24%I-84 Westbound 42% 25% 12% 21%Rt. 8 Northbound 12% 7% 53% 28%Rt. 8 Southbound 16% 14% 33% 37%Local Roads 17% 9% 16% 23% 35%
Note: EB = Eastbound, WB = Westbound, NB = Northbound, SB = Southbound
Regional O/D Data
O/D traffic data at a regional level was developed based on INRIX trip records for automobiles and trucks. INRIX operates the largest crowd-sourced data network in the world, tapping into 30 million anonymous GPS and smartphone devices worldwide. GPS pings from trucks, delivery vans, fleet vehicles, and everyday smart phone users are gathered and processed by INRIX to generate distinct vehicle trip records.
INRIX records were evaluated for two data sets: a 2017 full study area data set (approximate 20-mile radius from the Mixmaster) and a 2014 reduced study area data set (approximate 5-mile radius from the Mixmaster). The 2014 data set was reviewed to investigate potential differences between pre-, mid- and post-construction travel patterns for State Project No. 151-273 which was completed in 2018 and widened I-84 east of Waterbury from two to three lanes. The 2017 data set was summarized for Tuesday-Thursday between 7:00 to 9:00 AM and 4:00 to 6:00 PM and in included in Appendix 2.2 along with figures showing both INRIX study areas (refer to Analysis Location Figures).
Summary statistics for the INRIX 2017 full study area data set follow:
During the weekday AM peak hour 78,159 trips were observed with an average trip length of 35 miles and average travel speed of 34 MPH
During the weekday PM peak hour 64,805 trips were observed with an average trip length of 40 miles and average travel speed of 33 MPH
The INRIX O/D data was summarized for use in the validation of network modeling.

INTERSTATE 84 / ROUTE 8 “MIXMASTER” INTERCHANGE | ANALYSIS, NEEDS AND DEFICIENCIES REPORT
SECTION 2.2 EXISTING TRAFFIC DATA
20
Figure 2-9 Origin and Destination Map I-84 Eastbound AM Peak Hour

INTERSTATE 84 / ROUTE 8 “MIXMASTER” INTERCHANGE | ANALYSIS, NEEDS AND DEFICIENCIES REPORT
SECTION 2.2 EXISTING TRAFFIC DATA
21
Figure 2-10 Origin and Destination Map I-84 Eastbound PM Peak Hour

INTERSTATE 84 / ROUTE 8 “MIXMASTER” INTERCHANGE | ANALYSIS, NEEDS AND DEFICIENCIES REPORT
SECTION 2.2 EXISTING TRAFFIC DATA
22
Figure 2-11 Origin and Destination Map I-84 Westbound AM Peak Hour

INTERSTATE 84 / ROUTE 8 “MIXMASTER” INTERCHANGE | ANALYSIS, NEEDS AND DEFICIENCIES REPORT
SECTION 2.2 EXISTING TRAFFIC DATA
23
Figure 2-12 Origin and Destination Map I-84 Westbound PM Peak Hour

INTERSTATE 84 / ROUTE 8 “MIXMASTER” INTERCHANGE | ANALYSIS, NEEDS AND DEFICIENCIES REPORT
SECTION 2.2 EXISTING TRAFFIC DATA
24
Figure 2-13 Origin and Destination Map Route 8 Northbound AM Peak Hour

INTERSTATE 84 / ROUTE 8 “MIXMASTER” INTERCHANGE | ANALYSIS, NEEDS AND DEFICIENCIES REPORT
SECTION 2.2 EXISTING TRAFFIC DATA
25
Figure 2-14 Origin and Destination Map Route 8 Northbound PM Peak Hour
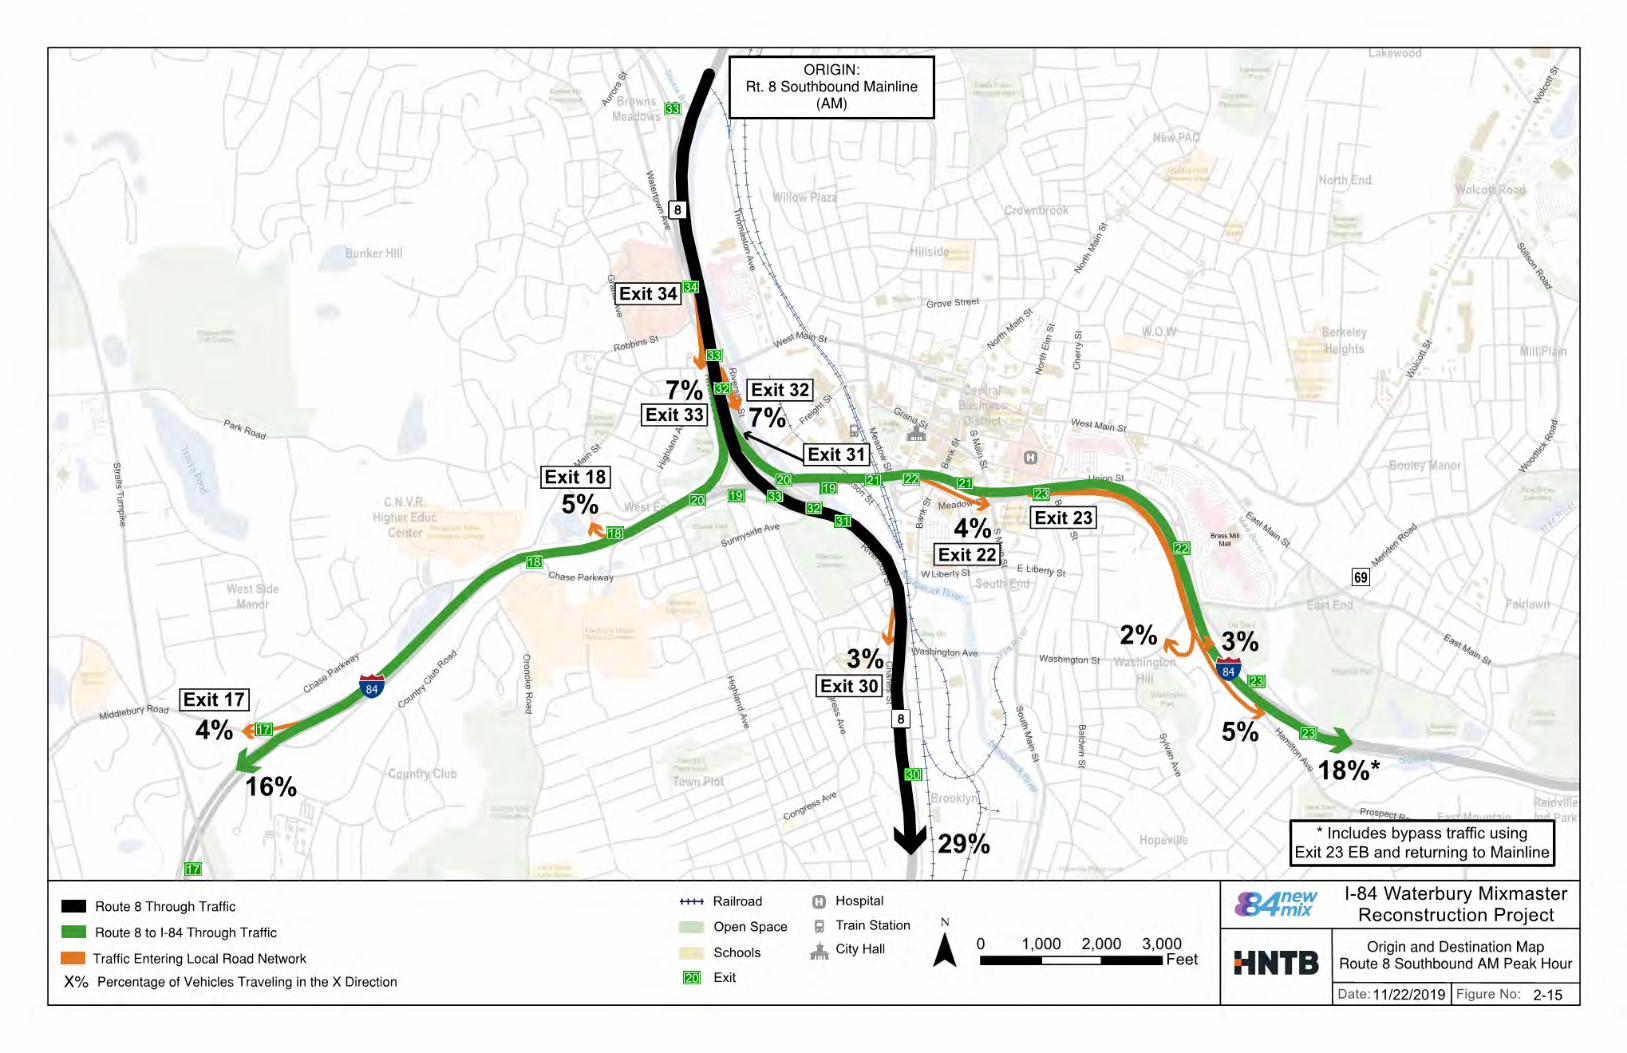
INTERSTATE 84 / ROUTE 8 “MIXMASTER” INTERCHANGE | ANALYSIS, NEEDS AND DEFICIENCIES REPORT
SECTION 2.2 EXISTING TRAFFIC DATA
26
Figure 2-15 Origin and Destination Map Route 8 Southbound AM Peak Hour

INTERSTATE 84 / ROUTE 8 “MIXMASTER” INTERCHANGE | ANALYSIS, NEEDS AND DEFICIENCIES REPORT
SECTION 2.2 EXISTING TRAFFIC DATA
27
Figure 2-16 Origin and Destination Map Route 8 Southbound PM Peak Hour

INTERSTATE 84 / ROUTE 8 “MIXMASTER” INTERCHANGE | ANALYSIS, NEEDS AND DEFICIENCIES REPORT
SECTION 2.2 EXISTING TRAFFIC DATA
28
2.2.5 Travel Speeds
Highways
Highway speed data was obtained through travel time runs conducted in 2017 on the I-84 and Route 8 mainlines. Travel time runs were performed for each origin and destination pair on I-84 and Route 8 using the “floating car” driving style. Total travel time and delay data from these runs was used to compute an average travel speed which was then used for calibration and validation of traffic models (see Section 2.3 Existing Traffic Operations for more on traffic models). Figure 2-17 through Figure 2-20 show average travel speed on the I-84 and Route 8 mainline and system ramps for the weekday AM and PM peak hours. Raw data and additional summaries can be found in Appendix 2.2 (refer to Raw Highway Speed Run Data).
Arterials
Arterial speed data was obtained through travel time runs conducted in 2017 on 12 major arterial corridors. A minimum of five runs were conducted for each arterial using the “floating car” driving style. Total travel time and delay data from these runs was used to compute an average travel speed which was then used for calibration and validation of traffic models (see Section 2.3 Existing Traffic Operations for more on traffic models). Table 2-5 shows the average travel speed on each arterial corridor. Raw data and additional summaries can be found in Appendix 2.2 (refer to Raw Arterial Speed Run Data).
Table 2-5 Existing (2017) Average Speeds, Major Arterials
Corridor Direction AM PM SaturdaySpeed Limit
Northbound 18.1 16.6 25Baldwin St.
Southbound 23.3 20.6 25Northbound 15.2 19.7 25
Bank St.Southbound 12.7 13.0 25Eastbound 18.6 19.2 25-35
Chase Pkwy. / Sunnyside Ave.Westbound 22.7 21.3 25-35Eastbound 22.4 15.7 20.7 25-35
Chase Pkwy. / West Main St.Westbound 26.4 15.7 22.6 25-35Eastbound 18.9 13.3 25
East Main St.Westbound 22.4 14.1 25Eastbound 16.3 15.8 15.3 25-35
Grand / Union St.Westbound 20.2 15.7 17.0 25-35Northbound 29.8 29.3 25
Highland Ave.Southbound 22.8 13.3 25Northbound 11.4 12.4 15.3 25
Meadow St.Southbound 12.4 16.5 14.6 25Northbound 18.8 16.4 25-35
Riverside St.Southbound 25.5 24.7 25-35Northbound 13.0 11.4 25
South Main St.Southbound 11.0 13.5 25Eastbound 16.9 10.2 14.9 25-35Washington St. / Washington
Ave. Westbound 22.0 17.1 18.9 25-35Northbound 30.0 22.7 25-35
Watertown Ave.Southbound 24.4 15.9 25-35
How to Float a Car with Style
Travel time runs are one of the oldest methods of collecting traffic data or information. The method relies on a member from the data collection team (a test driver) operating a test vehicle in live traffic. One major benefit to travel time runs over modern techniques is the test driver’s ability to control their driving behavior (or style) which allows consistency of data collection.
The floating car style is the most common driving style employed by test drivers during a travel time run. The driver “floats” with the traffic by traveling at the prevailing speed and attempting to safely pass the same number of vehicles as those which pass the test vehicle.
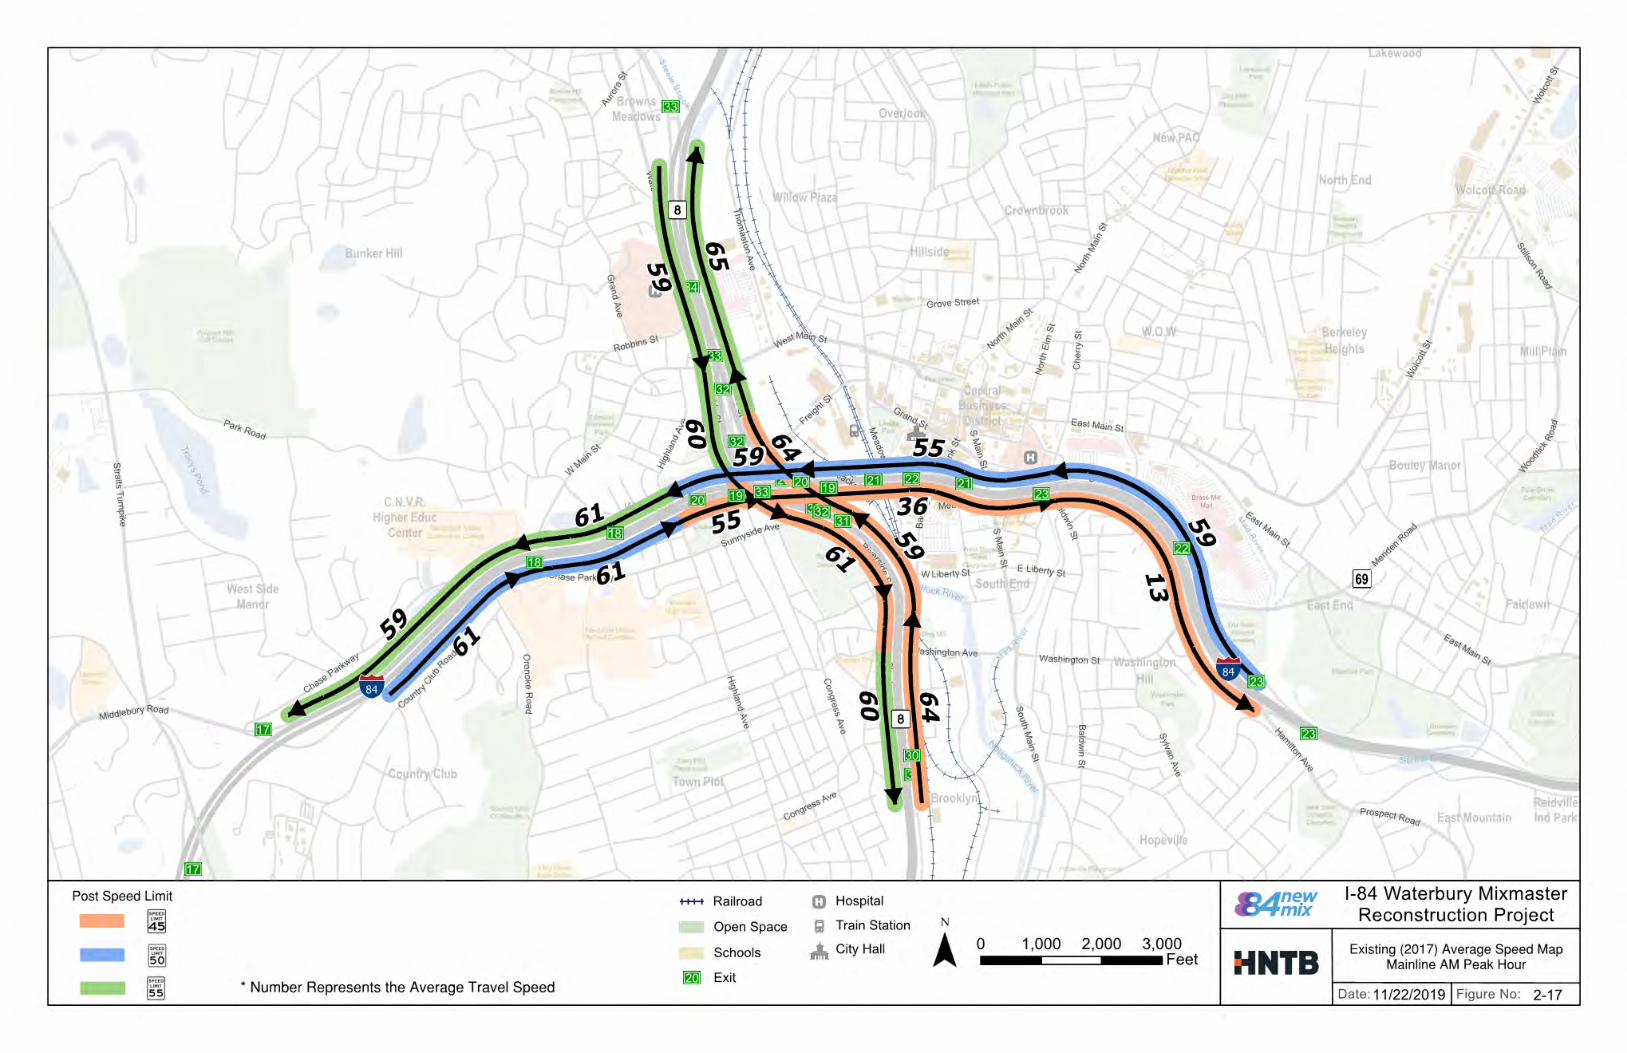
INTERSTATE 84 / ROUTE 8 “MIXMASTER” INTERCHANGE | ANALYSIS, NEEDS AND DEFICIENCIES REPORT
SECTION 2.2 EXISTING TRAFFIC DATA
29
Figure 2-17 Existing (2017) Average Speed Map Mainline AM Peak Hour

INTERSTATE 84 / ROUTE 8 “MIXMASTER” INTERCHANGE | ANALYSIS, NEEDS AND DEFICIENCIES REPORT
SECTION 2.2 EXISTING TRAFFIC DATA
30
Figure 2-18 Existing (2017) Average Speed Map Mainline PM Peak Hour

INTERSTATE 84 / ROUTE 8 “MIXMASTER” INTERCHANGE | ANALYSIS, NEEDS AND DEFICIENCIES REPORT
SECTION 2.2 EXISTING TRAFFIC DATA
31
Figure 2-19 Existing (2017) Average Speed Map System Ramps AM Peak Hour

INTERSTATE 84 / ROUTE 8 “MIXMASTER” INTERCHANGE | ANALYSIS, NEEDS AND DEFICIENCIES REPORT
SECTION 2.2 EXISTING TRAFFIC DATA
32
Figure 2-20 Existing (2017) Average Speed Map System Ramps PM Peak Hour

INTERSTATE 84 / ROUTE 8 “MIXMASTER” INTERCHANGE | ANALYSIS, NEEDS AND DEFICIENCIES REPORT
SECTION 2.2 EXISTING TRAFFIC DATA
33
2.2.6 Traffic Signal Data
Traffic signal timing plans were obtained from the CTDOT and the City of Waterbury for use in calibration and validation of traffic models (see Section 2.3 Existing Traffic Operations for more on traffic models). This data was field verified using the turning movement count video recordings described in the previous Section 2.2.2 Arterial and Intersection Traffic Volumes. The compiled data can be found in Appendix 2.2 (refer to Traffic Signal Timing Plans).
2.2.7 Queue Length Observations
Queue length observations were made in 2017 for the I-84 and Route 8 mainlines for calibration and validation of traffic models (see Section 2.3 Existing Traffic Operations for more on traffic models). These observations were made in 15-minute intervals for the weekday AM and PM peak hours using aerial surveillance data.
Weekday AM peak hour queuing was observed at the lane drop between Exits 20 and 23 and east of Exit 23 at the temporary ramp to Hamilton Avenue. Peak queue lengths were 4,830 feet and 1,040 feet respectively.
Weekday PM peak hour queuing was observed at the lane drop between Exits 20 and 23, at the lane drop between Exits 17 and 18, and at the Exit 19 gore area. Peak queue lengths were 4,070 feet, 2,870 feet, and 1,420 feet respectively. Detailed images for both AM and PM peak hour queues are provided in Appendix 2.2 (refer to Queuing Aerials).
Queueing vs Congestion
For this report, queues were characterized and identified by stop-and-go conditions where vehicles were stopped (or at a rolling stop) and there was less than a car length gap (25 feet) between vehicles.
Congestion was defined as stop-and-go conditions where vehicle spacings exceeded a car length.

INTERSTATE 84 / ROUTE 8 “MIXMASTER” INTERCHANGE | ANALYSIS, NEEDS AND DEFICIENCIES REPORT
SECTION 2.3 EXISTING TRAFFIC OPERATIONS
34
2.3 EXISTING TRAFFIC OPERATIONS The Interstate 84 (I-84) and Route 8 “Mixmaster” interchange and surrounding Waterbury street network within the study area function as a highly complex transportation system. I-84 and Route 8 serve as the primary regional transportation access means configured with weaving sections, right and left-hand highway exits, as well as closely spaced service and system ramps. The City of Waterbury street network is effectively split into quadrants due to the Naugatuck River and Route 8 aligned in the north-south direction and I-84 aligned in the east-west direction. Few roadways provide local access across these major features which encourages intracity trip access via I-84 and Route 8.
To most accurately understand travel patterns and traffic operations within and surrounding the complex study area a series of modeling tools and methodologies are used to identify travel demands, poorly operating intersections, safety and mobility hot spots, and general deficiencies. Having an established baseline of existing traffic operations will be a catalyst for understanding future focus areas and mitigation measures as design concepts advance.
The following sections describe the development of the hierarchical traffic models and traffic analysis tools.
2.3.1 Modeling Overview
There are several modeling tools used in analyzing complex transportation systems that assist in understanding travel behaviors, travel patterns, vehicle queue lengths, and future traffic conditions. Travel speeds, number of lanes, facility types (e.g. limited access freeway), land use, household vehicle ownership, and employment characteristics are a few of the modeling elements taken into consideration. For this project, the following types of models were developed:
Travel Demand Model: Evaluates traffic flow as a whole, taking trip generation, trip distribution, mode choice and travel assignment into consideration to forecast future population, employment and land use changes over large regions
Hybrid Simulation Model: Simulates the movement of individual vehicles based on traffic flow equations to further refine forecasted travel patterns and travel time compared to a travel demand model
Traffic Simulation Model: Assists in representing the behavior of individual vehicles in a network, simulating interactions of real-world traffic such as weaving, lane use, and queuing using complex algorithms
The project’s models were developed, calibrated, and validated using traffic data detailed in previous sections. Following validation, the models were used to analyze and identify deficiencies in the transportation network’s conditions (or operations). Finally, the performance of freeway, ramps, weave sections and intersections within the study area was measured and documented from the analysis results. The sections that follow discuss the development and performance results from the project models.
2.3.2 Travel Demand Model
Travel demand models are “big picture” models which focus on regional and statewide travel patterns based on forecasted population, employment and land use changes. The CTDOT statewide travel demand forecasting model was provided to the project team who made refinements and reran the model to forecast trips within and outside of defined areas, truck trips, single occupant vehicles, and high occupancy vehicles.
This updated travel demand model replicates existing conditions and will serve as the technical foundation for evaluating likely changes in the future 2045 travel patterns associated with new Mixmaster interchange concepts.
2.3.3 Hybrid Simulation Model
A Hybrid Simulation Model was developed to further refine the understanding of the traffic patterns for the study transportation network established within the Travel Demand Model.
Hybrid Simulation Models incorporate the simulation of individual vehicle movement based on industry standard formulas to dynamically update travel routes based on delay and roadway capacity constraints. Specifically, the Hybrid Simulation Model iteratively routes trips to develop balanced and optimized travel paths based on volume and delay and further optimizes routes and traffic data by simulating vehicle behavior considering the impacts of traffic controls, queuing, merging and lane changing on traffic operations and travel times.
2.3.4 Traffic Simulation Model
In an effort to simulate and evaluate detailed traffic conditions within the study area, a Simulation Model (using VISSIM software) was developed and calibrated to existing conditions (2017) for the Interstate 84/Route 8 Mixmaster interchange. The Simulation Model uses driver behavior characteristics to
simulate individual vehicles interacting with other vehicles in the network. Real-world traffic interactions such as weaving, lane use, and queuing are modeled using complex algorithms. The movements of individually modeled vehicles are tracked by the software and aggregated to produce a record of vehicle performance for the entire network. The existing conditions model will become the foundation of all subsequent simulation modeling analyses and will provide a baseline for comparison with future “no build” and build concepts. Additionally, the VISSIM model allows for 3D animations, assisting in visualizing traffic patterns and presenting planned infrastructure improvements.
The highway mainline segments were modeled beyond the study area limits as a conservative measure, to capture any potential spillback of vehicle queuing that originates within the study area. Local service ramps within the study area were modeled up to the off-ramp intersections. Termini and local intersections were not modeled in VISSIM. Operations analysis at termini and local intersections are summarized in a subsequent section.
Traffic data collected and summarized in the Existing Traffic Data section provide the basis for the vehicle input data along with the calibrated demand and travel pattern data developed with the Hybrid Simulation Model. The Simulation Model was calibrated using FHWA standard methodology. The results of the simulation model analysis are summarized in the next section.
2.3.5 Traffic Analysis Tools
Traffic Analysis Tools are designed to implement the procedures of the Highway Capacity Manual (HCM) for analyzing the performance of isolated or minor transportation facilities. Analysis tools estimate traffic operational performance on a variety of transportation facilities but have limited ability to analyze network or system characteristics.
This study uses Highway Capacity Software (HCS) 2010 to analyze highway mainline, weave, merge and diverge segments and Synchro 9.0 software to analyze ramp termini and local intersections within the study area.
Modeling tools and methodologies refer to nationally accepted mathematical formulas and software programs that assist in representing real-time conditions and operational characteristics.
These tools and methodologies account for existing conditions such as lane geometry, travel speed, traffic volumes, and land use which assist in the prediction of future conditions.

INTERSTATE 84 / ROUTE 8 “MIXMASTER” INTERCHANGE | ANALYSIS, NEEDS AND DEFICIENCIES REPORT
SECTION 2.3 EXISTING TRAFFIC OPERATIONS
35
2.3.6 Freeway Operations Overview
“Level of Service” (LOS) is an important metric to understand as it relates to operations and performance. LOS is a qualitative measure of driver satisfaction that consists of several factors which are heavily influenced by the degree of traffic congestion. The factors include speed, travel time, traffic interruption, freedom of maneuverability, safety, driving comfort and convenience, and delay. LOS is measured using the letters A through F, with A being the best or optimal condition and F being the worst.
Analyses to understand the performance of Interstate 84 and Route 8 mainline, merge/diverge and weave sections were conducted, focusing on LOS and the density of sections (or passenger cars per mile per lane – pc/mi/ln). The following table defines general LOS criteria for each of these sections:
Table 2-6 Freeway Level of Service Criteria
Merge or Diverge Weave MainlineLevel of Service Density (pc/mi/ln) Density (pc/mi/ln) Density (pc/mi/ln)
A ≤10 ≤10 ≤11B >10-20 >10-20 >11-18C >20-28 >20-28 >18-26D >28-35 >28-35 >26-35E >35 >35 >35-45
FDemand Exceeds
CapacityDemand Exceeds
Capacity>45 or Demand Exceeds
Capacity
2.3.7 Freeway Operation (Mainline, Weave, and Diverge Segments)
Operational analyses for the mainline, weave, merge and diverge segments, and system ramps to/from one highway to another highway were performed using the VISSIM model, defined previously in this section. As a check, operational analyses for the mainline, weave, and merge and diverge segments were also performed using methods outlined in the Transportation Research Board’s Highway Capacity Manual (HCM) 2010 and Highway Capacity Software (HCS) 2010.
Table 2-7 and Table 2-8 summarize the operations for I-84 and Route 8 based on HCS analysis, respectively.
Interstate 84
Table 2-7 I-84 Traffic Operations
Level of ServiceSegment A B C D E F Acceptable Deficient Total
AM PEAKMainline 0 2 5 4 1 0 11 1 12Weaves 0 3 4 5 0 0 12 0 12Merge/Diverge 0 0 3 4 1 1 7 2 9
PM PEAKMainline 0 1 7 3 1 0 11 1 12Weaves 0 0 6 6 0 0 12 0 12Merge/Diverge 0 0 1 7 0 1 8 1 9
SAT PEAKMainline 0 2 6 4 0 0 12 0 12Weaves 0 4 8 0 0 0 12 0 12Merge/Diverge 0 0 3 6 0 0 9 0 9
As shown above, according to HCS analysis, one mainline facility segment along I-84 operates at an unacceptable LOS during the AM and PM Peak Hours and is considered operationally deficient:
I-84 Westbound between Exit 23 Off-Ramp and Exit 22 Off-Ramp.
HCS analysis also identified two merge/diverge areas as operationally deficient:
Exit 22 Off-Ramp during the AM and PM Peak Hours Exit 17 Off-Ramp during the AM Peak Hour
Route 8
As shown below, according to HCS analysis, there are no facilities along Route 8 within the study area operating at an unacceptable level of service.
Table 2-8 Route 8 Traffic Operations
Level of ServiceSegment A B C D E F Acceptable Deficient Total
AM PEAKMainline 1 4 4 1 0 0 10 0 10Weaves 0 2 4 0 0 0 6 0 6Merge/Diverge 0 3 4 0 0 0 7 0 7
PM PEAKMainline 1 3 4 2 0 0 10 0 10Weaves 0 4 0 2 0 0 6 0 6Merge/Diverge 0 1 4 2 0 0 7 0 7
What Level of Service is it?
Level of Service A: Free flow. Low traffic volumes, high degree of freedom to maneuver and select speed.
Level of Service B: Reasonably free flow. High degree of freedom to select speed with some influence from other users.
Level of Service C: Stable flow. Moderately restricted maneuverability characterized by frequent interactions with other users. Convenience declines but traffic conditions are not typically perceived as uncomfortable.
Level of Service D: Approaching unstable flow. High traffic density with severely restricted maneuverability. Comfort and convenience have declined. LOS D is generally considered to be a marginally acceptable level of service.
Level of Service E: Unstable flow. Traffic volume is nearing network capacity. Low freedom to maneuver. Delays are frequent and driver comfort level is low. LOS E is generally considered to be an unacceptable level of service.
Level of Service F: Forced or breakdown traffic flow. Traffic volumes are exceeding network capacity. Characterized by frequent slowing, delays, low comfort and convenience, and increased crash exposure. LOS F is considered an unacceptable level of service.

INTERSTATE 84 / ROUTE 8 “MIXMASTER” INTERCHANGE | ANALYSIS, NEEDS AND DEFICIENCIES REPORT
SECTION 2.3 EXISTING TRAFFIC OPERATIONS
36
Both HCS and VISSIM analysis findings are reported as each has value in interpreting the traffic operations along the study highways. The HCS estimated traffic operations reflect expected traffic operations at an isolated facility without interaction from upstream or downstream conditions. VISSIM analysis estimates traffic operations throughout the network including the impact of congestion and complex geometric configurations at upstream and downstream facilities.
Figure 2-21 through Figure 2-30 illustrate the VISSIM and HCS analysis results for the mainline, weave, and merge and diverge segments.
Figure 2-21 and Figure 2-22 show that the VISSIM analysis estimates higher vehicle density and worse levels of service along the I-84 Eastbound facilities relative to the HCS analysis and lower vehicle density and better levels of service along the westbound I-84 facilities. This is likely due to the construction project operations to the east of the study area. The construction operations constrain eastbound I-84 traffic flow through the study area as traffic slows but meter westbound I-84 flow, thereby reducing mainline density and simultaneously improving the ability of vehicles in merge/diverge and weave areas to navigate the facility.
Figure 2-25 and Figure 2-26 show that the VISSIM and HCS operational analysis findings for Route 8 Northbound are very similar. VISSIM estimates only marginally higher vehicle density along the corridor which indicates that the interference of upstream or downstream traffic conditions is minimal along the corridor. Figure 2-27 and Figure 2-28 show that the VISSIM analysis estimates slightly higher vehicle density and worse levels of service along southbound Route 8 facilities relative to the HCS analysis. This indicates that interference of upstream or downstream traffic conditions has a greater effect on travel along this corridor.

INTERSTATE 84 / ROUTE 8 “MIXMASTER” INTERCHANGE | ANALYSIS, NEEDS AND DEFICIENCIES REPORT
SECTION 2.3 EXISTING TRAFFIC OPERATIONS
37
Figure 2-21 Existing (2017) Level of Service Map I-84 Eastbound AM Peak Hour

INTERSTATE 84 / ROUTE 8 “MIXMASTER” INTERCHANGE | ANALYSIS, NEEDS AND DEFICIENCIES REPORT
SECTION 2.3 EXISTING TRAFFIC OPERATIONS
38
Figure 2-22 Existing (2017) Level of Service Map I-84 Eastbound PM Peak Hour

INTERSTATE 84 / ROUTE 8 “MIXMASTER” INTERCHANGE | ANALYSIS, NEEDS AND DEFICIENCIES REPORT
SECTION 2.3 EXISTING TRAFFIC OPERATIONS
39
Figure 2-23 Existing (2017) Level of Service Map I-84 Westbound AM Peak Hour

INTERSTATE 84 / ROUTE 8 “MIXMASTER” INTERCHANGE | ANALYSIS, NEEDS AND DEFICIENCIES REPORT
SECTION 2.3 EXISTING TRAFFIC OPERATIONS
40
Figure 2-24 Existing (2017) Level of Service Map I-84 Westbound PM Peak Hour

INTERSTATE 84 / ROUTE 8 “MIXMASTER” INTERCHANGE | ANALYSIS, NEEDS AND DEFICIENCIES REPORT
SECTION 2.3 EXISTING TRAFFIC OPERATIONS
41
Figure 2-25 Existing (2017) Level of Service Map Route 8 Northbound AM

INTERSTATE 84 / ROUTE 8 “MIXMASTER” INTERCHANGE | ANALYSIS, NEEDS AND DEFICIENCIES REPORT
SECTION 2.3 EXISTING TRAFFIC OPERATIONS
42
Figure 2-26 Existing (2017) Level of Service Map Route 8 Northbound PM

INTERSTATE 84 / ROUTE 8 “MIXMASTER” INTERCHANGE | ANALYSIS, NEEDS AND DEFICIENCIES REPORT
SECTION 2.3 EXISTING TRAFFIC OPERATIONS
43
Figure 2-27 Existing (2017) Level of Service Map Route 8 Southbound AM
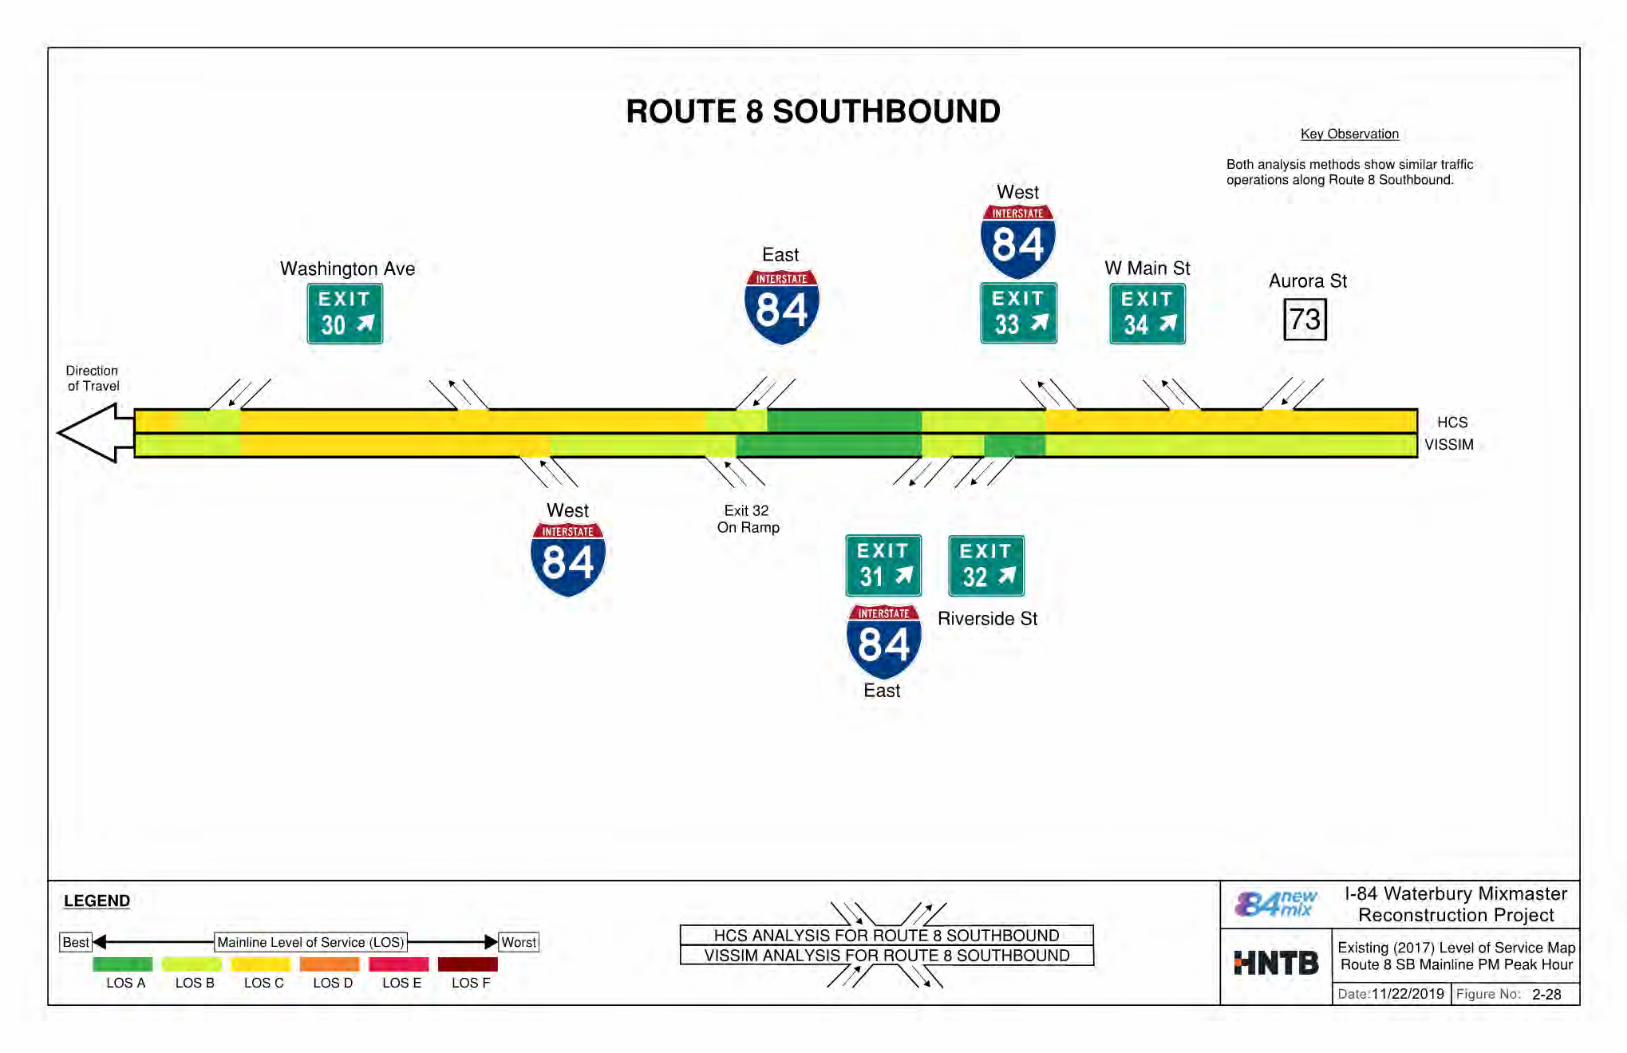
INTERSTATE 84 / ROUTE 8 “MIXMASTER” INTERCHANGE | ANALYSIS, NEEDS AND DEFICIENCIES REPORT
SECTION 2.3 EXISTING TRAFFIC OPERATIONS
44
Figure 2-28 Existing (2017) Level of Service Map Route 8 Southbound PM

INTERSTATE 84 / ROUTE 8 “MIXMASTER” INTERCHANGE | ANALYSIS, NEEDS AND DEFICIENCIES REPORT
SECTION 2.3 EXISTING TRAFFIC OPERATIONS
45
Figure 2-29 and Figure 2-30 represent the LOS results for system ramps.
As shown in Figure 2-29, all system ramps are estimated to operate at acceptable levels of service during the AM Peak Hour. Figure 2-30 shows that all system ramps are estimated to operate at acceptable levels of service except for the I-84 Westbound System Ramp to Route 8 Northbound which experiences a higher than acceptable density, operating at LOS E.
Assumptions, calculations, and detailed output results can be found in Appendix 2.3 (refer to Weave Calculations and Volumes, Expressway Free Flow Speeds, Expressway Peak Hour Factors, and Highway Capacity Software Outputs).

INTERSTATE 84 / ROUTE 8 “MIXMASTER” INTERCHANGE | ANALYSIS, NEEDS AND DEFICIENCIES REPORT
SECTION 2.3 EXISTING TRAFFIC OPERATIONS
46
Figure 2-29 Existing (2017) Level of Service Map System Ramps AM Peak Hour

INTERSTATE 84 / ROUTE 8 “MIXMASTER” INTERCHANGE | ANALYSIS, NEEDS AND DEFICIENCIES REPORT
SECTION 2.3 EXISTING TRAFFIC OPERATIONS
47
Figure 2-30 Existing (2017) Level of Service Map System Ramps PM Peak Hour

INTERSTATE 84 / ROUTE 8 “MIXMASTER” INTERCHANGE | ANALYSIS, NEEDS AND DEFICIENCIES REPORT
SECTION 2.3 EXISTING TRAFFIC OPERATIONS
48
2.3.8 Intersection Operations Overview
As discussed earlier, LOS is a qualitative measure of traffic operations. LOS for intersections are rated differently than highway features. Instead of density, intersection LOS is based on control delay per vehicle in seconds. Control delay per vehicle is a measure of how long it takes to get through the intersection due to the traffic control in place. LOS for signalized and unsignalized intersections are shown in Table 2-9.
Table 2-9 Level of Service Criteria for Signalized and Unsignalized Intersections
Level of Service
Signalized Intersections Control Delay per Vehicle
(seconds)
Unsignalized Intersections Control Delay per Vehicle
(seconds)A ≤ 10 ≤ 10B > 10 and ≤ 20 > 10 and ≤ 15C > 20 and ≤ 35 > 15 and ≤ 25D > 35 and ≤ 55 >25 and ≤ 35E > 55 and ≤ 80 > 35 and ≤ 50F > 80 > 50
2.3.9 Intersection Operations
Surface street analyses were performed using methods outlined in the HCM 2010 and Synchro 9.0 traffic modeling software.
A total of 65 intersections were analyzed in the AM and PM peak hours. A limited Saturday mid-day (SAT) analysis was performed on 12 intersections around the Brass Mill Center Shopping Mall and at the intersection of West Main Street and Thomaston Avenue. The peak traffic conditions identified for analysis were determined to be 7:30 AM – 8:30 AM, 4:30 – 5:30 PM, and 12:00 PM – 1:00 PM, for the AM, PM and SAT peak hours, respectively. A map of the intersections analyzed is shown in Figure 2-31 (a detailed map of analysis locations can be found in Appendix 2.3 (refer to Intersection Analysis Location Figures). The intersections with state-owned traffic signals that were studied include:
1. Highland Avenue at Chase Parkway and Sunnyside Avenue2. Washington Street at Interstate 84 Eastbound Off Ramp (Exit 23)3. Watertown Avenue at Aurora Street4. Route 73 at Watertown Avenue and Huntingdon Avenue5. Route 73 at Aurora Street and East Aurora Street
Figure 2-31 Analyzed Arterials and Intersections Map

INTERSTATE 84 / ROUTE 8 “MIXMASTER” INTERCHANGE | ANALYSIS, NEEDS AND DEFICIENCIES REPORT
SECTION 2.3 EXISTING TRAFFIC OPERATIONS
49
Traffic signal timings found on current signal plans for State Maintained intersections were used for analysis. Traffic signal field timings were collected for all city-maintained signals within the study area and these timings were compared with the signal plans to match the cycle lengths on the plans. Engineering judgment was used in many cases throughout the study area as the cycle length did not match field timings.
Out of the 65 study intersections, HCM evaluation methods were not applicable to 5 locations due to unconventional controls or configurations. Out of the limited Saturday analysis network, 1 intersection out of 12 was not supported for analysis by HCM methods due to unconventional control or configurations.
The following intersections were therefore omitted from analysis:
Chase Parkway at Interstate 84 EB On-Ramp (Exit 18) Charles Street at Fifth Street and CT Route 8 SB On-Ramp (Exit 30) Market Square at Bank Street Field Street at Meadow Street #2 and Interstate 84 WB Off-Ramp (Exit 21) Highland Avenue at Interstate 84 EB On-Ramp (Exit 18)
Table 2-10 summarizes the capacity analysis findings for the study intersections.
Table 2-10 Signalized and Unsignalized Intersection Capacity Analysis Results
Level of ServiceA B C D E F Acceptable Deficient Total
AM PEAK 13 20 20 7 0 0 60 0 60PM PEAK 12 14 20 6 6 2 52 8 60SAT PEAK 3 5 2 1 0 0 11 0 11
As shown in Table 2-10, all study intersections analyzed are estimated to operate at acceptable levels of service during the AM and Saturday Peak Hours. During the PM Peak Hour, 8 out of 60 intersections (approximately 13%) operate at unacceptable levels of service and are considered operationally deficient.
Figure 2-32, Figure 2-33 and Figure 2-34 illustrates the LOS at the subject intersections for the AM, PM and Saturday Midday peak hours. More detailed information is provided in Appendix 2.3 (refer to Existing (2017) Peak Hour Traffic Operation Summary, Existing (2017) Level of Service Maps, and Existing (2017) Synchro Printouts).

INTERSTATE 84 / ROUTE 8 “MIXMASTER” INTERCHANGE | ANALYSIS, NEEDS AND DEFICIENCIES REPORT
SECTION 2.3 EXISTING TRAFFIC OPERATIONS
50
Figure 2-32 Existing (2017) Level of Service Map Intersections AM Peak Hour

INTERSTATE 84 / ROUTE 8 “MIXMASTER” INTERCHANGE | ANALYSIS, NEEDS AND DEFICIENCIES REPORT
SECTION 2.3 EXISTING TRAFFIC OPERATIONS
51
Figure 2-33 Existing (2017) Level of Service Map Intersections PM Peak Hour

INTERSTATE 84 / ROUTE 8 “MIXMASTER” INTERCHANGE | ANALYSIS, NEEDS AND DEFICIENCIES REPORT
SECTION 2.3 EXISTING TRAFFIC OPERATIONS
52
Figure 2-34 Existing (2017) Level of Service Map Intersections Saturday Peak Hour

INTERSTATE 84 / ROUTE 8 “MIXMASTER” INTERCHANGE | ANALYSIS, NEEDS AND DEFICIENCIES REPORT
SECTION 2.4 ROADWAY GEOMETRICS
53
2.4 ROADWAY GEOMETRICSThis section of the Analysis, Needs and Deficiencies Report, serves to document existing geometric conditions and identify roadway and geometric deficiencies for Interstate 84 (I-84), Connecticut Route 8 (Route 8), System Ramps and Service ramps at the “Mixmaster” interchange and surrounding areas within the study limits based on current design standards. The original project was designed in accordance with the 1958 Geometric Highway Design Standards. Vehicle speeds and projected design traffic volumes were much less than current day.
2.4.1 Methodology
The criteria used to define roadway geometric deficiencies within the study area was derived from the standards established in the Connecticut Department of Transportation, Highway Design Manual, (2003 Edition Including Revisions to February 2013) and American Associate of State Highway and Transportation Officials (AASHTO), A Policy on Geometric Design of Highways and Streets, (7th Edition, 2018). Controlling design criteria, highway design elements that require a design exception if values are not met, are established within these resources. The following are the controlling design criteria that are included in this report:
a. Design Speedb. Travel Lane and Shoulder Widthsc. Horizontal Alignment
a. Minimum Radii, andb. Compound Curve Ratio
d. Vertical Curvaturea. K-Value at Crests/Sagsb. Maximum/Minimum Grades
e. Stopping Sight Distancef. Cross Slopesg. Superelevation
a. Maximum Rateb. Transition Lengths
h. Vertical Clearancesi. Intersection Sight Distances
In addition to the controlling design criteria, the following operational factors were included in this analysis:
Interchange Spacing Ramp Acceleration and Deceleration Lengths Highway/Ramp Weaving
The minimum Design Criteria, listed above, are based on the functional classification of the highway. I-84 is classified as an Urban Interstate Principal Arterial (Urban Freeway) and Route 8 is classified as Urban Expressway Principal Arterial (Urban Freeway).
Existing geometric data within the study area was collected using original construction documents and rehabilitation plans, including current State Project #151-312/313/326 (Rehabilitation of Interstate 84 Eastbound, 84 Westbound and Route 8 Bridges). In addition to these sources, ground survey mapping, digital terrain models, and aerial imaging was used to aid in the data collection process.
2.4.2 Interstate 84
Interstate 84 is an east-west roadway, classified as an Urban Interstate Principal Arterial (Urban Freeway) with varying design speeds through the Study Area Limits. Through the core of the Mixmaster, I-84 is an elevated, stacked structure that drops elevation from west to east. These structures span local roadway networks, Route 8, the Naugatuck River and the railyard. The upper level is I-84 Eastbound (Bridge 03191A) while the lower level is I-84 Westbound (Bridge 03191B).
The posted speed limits vary in each direction. In the Eastbound direction, the posted speed limit is 50 mph from the western study area limit through the core of the Mixmaster before increasing to 55 mph at the South Main Street structure. In the Westbound direction, the posted speed limit is 55 mph from the eastern study area limit to the Union Street Ramp where it decreases to 50 mph. The posted 50 mph speed limit is continuous through the core of the Mixmaster to the Highland Avenue Underpass where it increases to 55 mph through the western study area limit.
Geometric Deficiencies Interstate 84
The Design Criteria Tables for I-84 are contained in Appendix 2.4 (refer to Interstate 84 Design Criteria Tables).
Table 2-14 summarizes the geometric deficiencies along Interstate 84 Eastbound and Westbound as analyzed using the controlling design criteria from the CTDOT Highway Design Manual. Within the table, the mainlines are evaluated separately by on-structure and off-structure segments. A green dot indicates that the entire length of the roadway meets the controlling design criteria. A red dot indicates that either a portion or the entire length of roadway does not meet the controlling design criteria.
Design Speed and Minimum Radius:
The current CTDOT standards for a roadway classified as an Urban Freeway in a Suburban/Intermediate type area, requires a 65-70 mph design speed. I-84 through the project study area has 2 existing marginally deficient horizontal curves.
Table 2-11 I-84 Mainline Horizontal Curve Deficiencies
Location
Req’dDesignSpeed¹
ActualSpeed²
Minimum Radius for
65 - 70 mphExistingRadius
I-84 EB from area west of Chase Parkway to an area west of the Highland Ave. overpass
65-70 mph
64 mph
1,665 ft. – 2,050 ft
1,600 ft.
I-84 WB from area west of Chase Parkway to an area west of the Highland Ave. overpass
65-70 mph
63 mph
1,665 ft. – 2,050 ft
1,531 ft.
¹Required Design Speed for Roadway Classification²Actual Speed Based on Horizontal Alignment

INTERSTATE 84 / ROUTE 8 “MIXMASTER” INTERCHANGE | ANALYSIS, NEEDS AND DEFICIENCIES REPORT
SECTION 2.4 ROADWAY GEOMETRICS
54
Travel Lane and Shoulder Widths:
Based on the roadway classification, the Design Criteria requires lane widths for I-84 to be 12 feet wide. The required right shoulder width is 10 feet and the required left shoulder width 8 feet. However, based on the heavy truck volumes through the I-84 corridor, the Design Criteria requires that both the left and right shoulders be increased to 12’ to meet minimum design standards.
All existing through lanes and auxiliary lanes through the corridor meet the minimum design standard of 12 feet. The shoulder widths, however, are substandard in all locations through the I-84 corridor.
Right Shoulder Width Deficiencies:
Table 2-12 I-84 Mainline Right Shoulder Width Deficiencies
Location
On or Off
Bridge
Req’d Right Shoulder
Width
Actual Right Shoulder
WidthI-84 (EB/WB) from the Chase Parkway Overpass to the area west of the Highland Avenue overpass
Off 12 ft. 10 ft.
I-84 (EB/WB) from the overpass at South Main Street to the area of the Hamilton Avenue overpass
Off 12 ft. 10 ft.
I-84 (EB/WB) from the area west of the Highland Avenue overpass to the overpass at South Main Street
On 12 ft. 3 ft.-11 in.
I-84 (EB/WB) from the area west of the Highland Avenue overpass to the overpass at South Main Street
Off 12 ft. 10 in.
Left Shoulder Width Deficiencies:
Table 2-13 I-84 Mainline Left Shoulder Width Deficiencies
Location
On or Off
Bridge
Req’d Left Shoulder
Width
Actual Left Shoulder
WidthI-84 (EB/WB) from the Chase Parkway Overpass to the area west of the Highland Avenue overpass
On 12 ft. 5 ft.
I-84 (EB/WB) from the Chase Parkway Overpass to the area west of the Highland Avenue overpass
Off 12 ft. 4 ft.
I-84 (EB/WB) from the area west of the Highland Avenue overpass to the overpass at South Main Street
On 12 ft. 3 ft.-11 in.
I-84 (EB/WB) from the area west of the Highland Avenue overpass to the overpass at South Main Street
Off 12 ft. 4 in.
Stopping Sight Distance on Vertical Curves:
The minimum stopping sight distance (SSD), or the sum of the distance traveled during a driver’s brake reaction and the distance traveled while decelerating to a complete stop, was determined from Chapter 7 of the CTDOT Highway Design Manual. For a 65-70 mph Design Speed, a minimum SSD of 645’ must be achieved. There are seven vertical curves on I-84 Eastbound and nine vertical curves on I-84 Westbound that do not meet the minimum standard.
Operational Deficiencies (I-84):
Per CTDOT Highway Design Manual Section 12-2.04, it is desirable to avoid left hand exits and entrances to the freeway. It becomes a safety issue to merge or exit to/from a low speed ramp onto/off from the high-speed lane of a freeway. Interstate 84 Eastbound has two left-hand ramps.
Exit 20 off-ramp to Route 8 Northbound (TR 806) Route 8 Southbound on-ramp (TR 809) lane add
Interstate 84 Westbound has two left-hand ramps.
Exit 19 off-ramp to Route 8 Southbound (TR 812) Route 8 Northbound on-ramp (TR 808) parallel style
On Interstate 84 Eastbound, the movement from the Exit 18 on-ramp, which is a right-hand on-ramp, can cross two through lanes to reach the left-hand Exit 20 off-ramp to Route 8 Northbound. This creates a short weave with a distance of approximately 1,200 feet.
On Interstate 84 Eastbound, the movement from the Route 8 Southbound on-ramp (TR 809), which is a left-hand lane add, can cross two through lanes to reach the Exit 21 and/or Exit 22 off-ramps.
On Interstate 84 Westbound, the movement from the Route 8 Northbound on-ramp (TR 808) can cross three through lanes to reach the Exit 18 off-ramp.
The Interstate 84 Eastbound auxiliary lane that exists between the Route 8 Northbound on-ramp (TR 811) and the Exit 21 off-ramp has a very short weave distance.

INTERSTATE 84 / ROUTE 8 “MIXMASTER” INTERCHANGE | ANALYSIS, NEEDS AND DEFICIENCIES REPORT
SECTION 2.4 ROADWAY GEOMETRICS
55
Table 2-14 I-84 Mainline Geometric Deficiencies Matrix
I-84 HIGHWAY GEOMETRICSHorizontal Alignment Vertical Curvature
RoadwayDesign Speed
Travel Lane Widths
Shoulder Widths
Auxiliary Lane Widths
Minimum Radius
Compound Curvature Ratio
K Value CREST
K Value SAG
Maximum Grade
Minimum Grade
Stopping Sight Distance
Travel Lane & Shoulder Cross
Slopes Superelevation
Superelevation Transition Lengths
Vertical Clearance
I-84 Eastbound (On-Structure) ● ● ● ● ● N/A ● ● ● ● ● ● ● ● ●I-84 Eastbound (Off-Structure) ● ● ● ● ● N/A ● ● ● ● ● ● ● ● ●I-84 Westbound (On-Structure) ● ● ● ● ● N/A ● ● ● ● ● ● ● ● ●I-84 Westbound (Off-Structure) ● ● ● ● ● N/A ● ● ● ● ● ● ● ● ●Eastbound Collector Distributor Road(On-Structure)
● ● ● N/A N/A N/A ● N/A ● ● ● ● N/A N/A ●Eastbound Collector Distributor Road(Off-Structure)
● ● ● ● ● ● ● N/A ● ● ● ● ● ● ●● = ENTIRE LENGTH OF ROADWAY MEETS CONTROLLING DESIGN CRITERIA
● = EITHER A PORTION OR ENTIRE LENGTH OF ROADWAY DOES NOT MEET CONTROLLING DESIGN CRITERIA
● = EITHER A PORTION OR ENTIRE LENGTH OF ROADWAY MARGINALLY MEETS CONTROLLING DESIGN CRITERIA
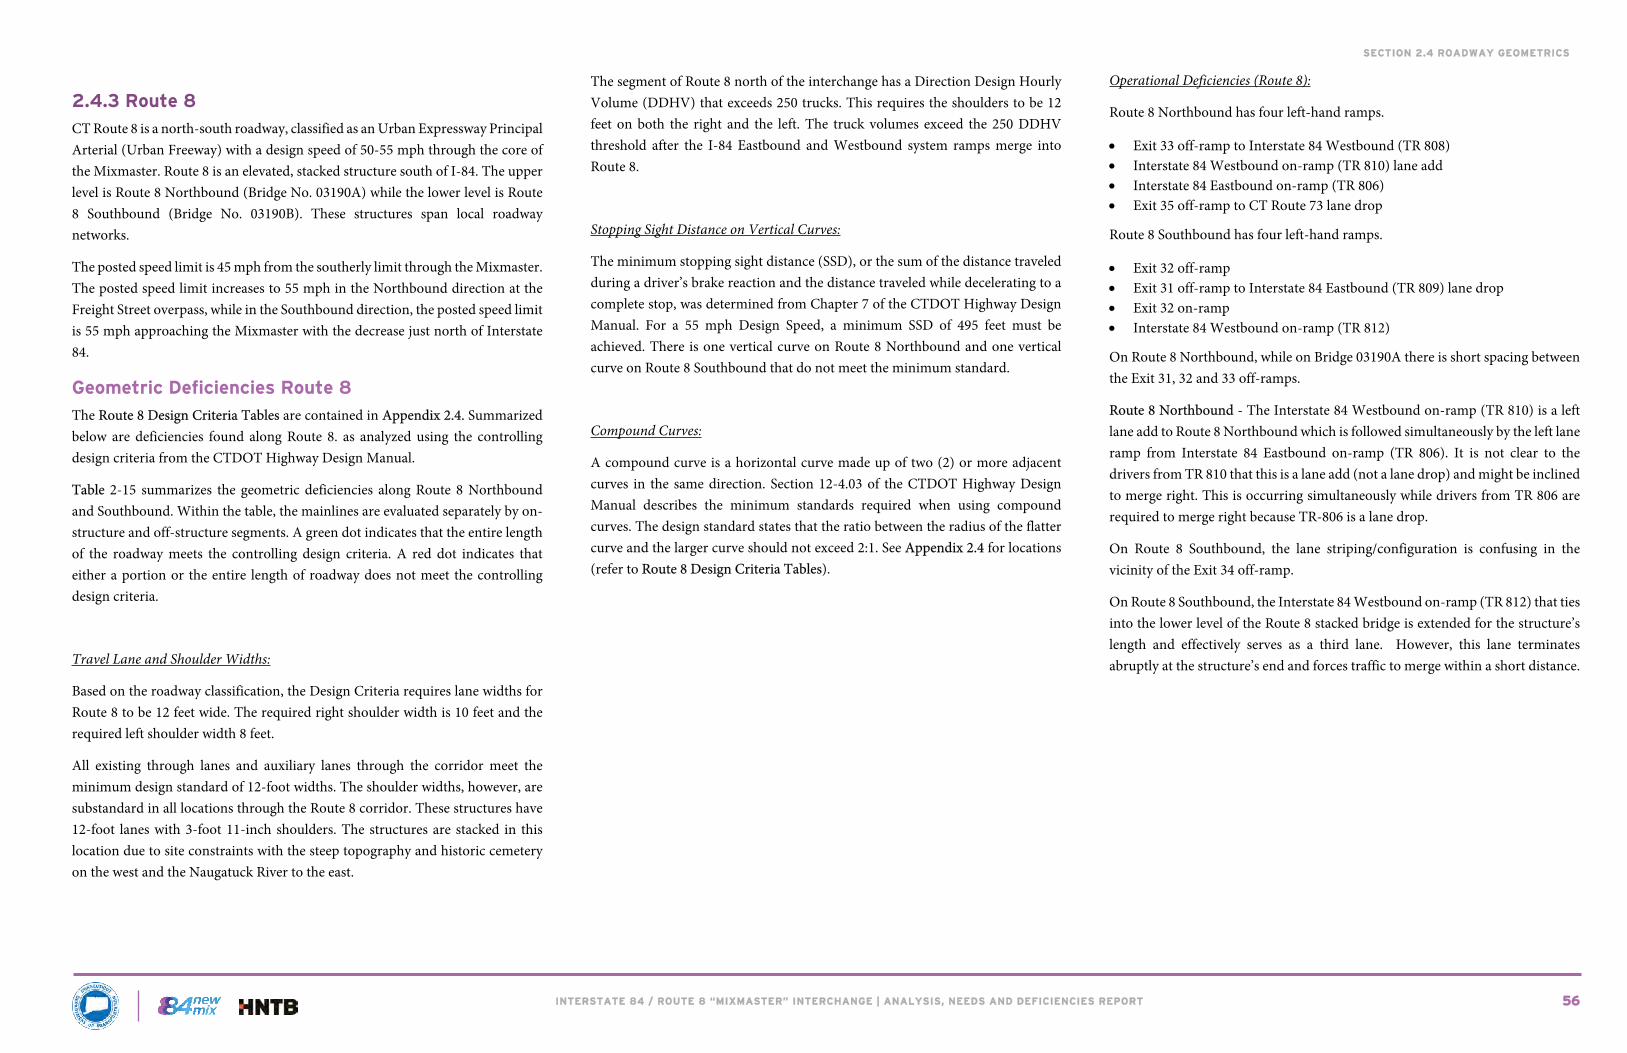
INTERSTATE 84 / ROUTE 8 “MIXMASTER” INTERCHANGE | ANALYSIS, NEEDS AND DEFICIENCIES REPORT
SECTION 2.4 ROADWAY GEOMETRICS
56
2.4.3 Route 8
CT Route 8 is a north-south roadway, classified as an Urban Expressway Principal Arterial (Urban Freeway) with a design speed of 50-55 mph through the core of the Mixmaster. Route 8 is an elevated, stacked structure south of I-84. The upper level is Route 8 Northbound (Bridge No. 03190A) while the lower level is Route 8 Southbound (Bridge No. 03190B). These structures span local roadway networks.
The posted speed limit is 45 mph from the southerly limit through the Mixmaster. The posted speed limit increases to 55 mph in the Northbound direction at the Freight Street overpass, while in the Southbound direction, the posted speed limit is 55 mph approaching the Mixmaster with the decrease just north of Interstate 84.
Geometric Deficiencies Route 8
The Route 8 Design Criteria Tables are contained in Appendix 2.4. Summarized below are deficiencies found along Route 8. as analyzed using the controlling design criteria from the CTDOT Highway Design Manual.
Table 2-15 summarizes the geometric deficiencies along Route 8 Northbound and Southbound. Within the table, the mainlines are evaluated separately by on-structure and off-structure segments. A green dot indicates that the entire length of the roadway meets the controlling design criteria. A red dot indicates that either a portion or the entire length of roadway does not meet the controlling design criteria.
Travel Lane and Shoulder Widths:
Based on the roadway classification, the Design Criteria requires lane widths for Route 8 to be 12 feet wide. The required right shoulder width is 10 feet and the required left shoulder width 8 feet.
All existing through lanes and auxiliary lanes through the corridor meet the minimum design standard of 12-foot widths. The shoulder widths, however, are substandard in all locations through the Route 8 corridor. These structures have 12-foot lanes with 3-foot 11-inch shoulders. The structures are stacked in this location due to site constraints with the steep topography and historic cemetery on the west and the Naugatuck River to the east.
The segment of Route 8 north of the interchange has a Direction Design Hourly Volume (DDHV) that exceeds 250 trucks. This requires the shoulders to be 12 feet on both the right and the left. The truck volumes exceed the 250 DDHV threshold after the I-84 Eastbound and Westbound system ramps merge into Route 8.
Stopping Sight Distance on Vertical Curves:
The minimum stopping sight distance (SSD), or the sum of the distance traveled during a driver’s brake reaction and the distance traveled while decelerating to a complete stop, was determined from Chapter 7 of the CTDOT Highway Design Manual. For a 55 mph Design Speed, a minimum SSD of 495 feet must be achieved. There is one vertical curve on Route 8 Northbound and one vertical curve on Route 8 Southbound that do not meet the minimum standard.
Compound Curves:
A compound curve is a horizontal curve made up of two (2) or more adjacent curves in the same direction. Section 12-4.03 of the CTDOT Highway Design Manual describes the minimum standards required when using compound curves. The design standard states that the ratio between the radius of the flatter curve and the larger curve should not exceed 2:1. See Appendix 2.4 for locations (refer to Route 8 Design Criteria Tables).
Operational Deficiencies (Route 8):
Route 8 Northbound has four left-hand ramps.
Exit 33 off-ramp to Interstate 84 Westbound (TR 808) Interstate 84 Westbound on-ramp (TR 810) lane add Interstate 84 Eastbound on-ramp (TR 806) Exit 35 off-ramp to CT Route 73 lane drop
Route 8 Southbound has four left-hand ramps.
Exit 32 off-ramp Exit 31 off-ramp to Interstate 84 Eastbound (TR 809) lane drop Exit 32 on-ramp Interstate 84 Westbound on-ramp (TR 812)
On Route 8 Northbound, while on Bridge 03190A there is short spacing between the Exit 31, 32 and 33 off-ramps.
Route 8 Northbound - The Interstate 84 Westbound on-ramp (TR 810) is a left lane add to Route 8 Northbound which is followed simultaneously by the left lane ramp from Interstate 84 Eastbound on-ramp (TR 806). It is not clear to the drivers from TR 810 that this is a lane add (not a lane drop) and might be inclined to merge right. This is occurring simultaneously while drivers from TR 806 are required to merge right because TR-806 is a lane drop.
On Route 8 Southbound, the lane striping/configuration is confusing in the vicinity of the Exit 34 off-ramp.
On Route 8 Southbound, the Interstate 84 Westbound on-ramp (TR 812) that ties into the lower level of the Route 8 stacked bridge is extended for the structure’s length and effectively serves as a third lane. However, this lane terminates abruptly at the structure’s end and forces traffic to merge within a short distance.

INTERSTATE 84 / ROUTE 8 “MIXMASTER” INTERCHANGE | ANALYSIS, NEEDS AND DEFICIENCIES REPORT
SECTION 2.4 ROADWAY GEOMETRICS
57
Table 2-15 Route 8 Mainline Geometric Deficiencies Matrix
ROUTE 8 GEOMETRICSHorizontal Alignment Vertical Curvature
RoadwayDesignSpeed
TravelLane
WidthsShoulderWidths
AuxiliaryLane
WidthsMinimum
Radius
CompoundCurvature
RatioK ValueCREST
K ValueSAG
MaximumGrade
MinimumGrade
StoppingSight
Distance
Travel Lane& Shoulder
Cross Slopes Superelevation
SuperelevationTransition
LengthsVertical
ClearanceRoute 8 Northbound (On-Structure) ● ● ● ● ● ● ● ● ● ● ● ● ● N/A ●Route 8 Northbound (Off-Structure) ● ● ● N/A ● ● ● ● ● ● ● ● ● ● ●Route 8 Southbound (On-Structure) ● ● ● ● ● ● ● ● ● ● ● ● ● ● ●Route 8 Southbound (Off-Structure) ● ● ● ● ● ● ● ● ● ● ● ● ● ● ●● = ENTIRE LENGTH OF ROADWAY MEETS CONTROLLING DESIGN CRITERIA
● = EITHER A PORTION OR ENTIRE LENGTH OF ROADWAY DOES NOT MEET CONTROLLING DESIGN CRITERIA

INTERSTATE 84 / ROUTE 8 “MIXMASTER” INTERCHANGE | ANALYSIS, NEEDS AND DEFICIENCIES REPORT
SECTION 2.4 ROADWAY GEOMETRICS
58
2.4.4 Ramps
System Ramps
The Mixmaster is a full system interchange with an equal number of left and right-hand ramps exiting the mainlines and with five left and three right-hand ramps entering the mainlines. The interchange covers four levels, as Route 8 Northbound and Southbound are at level 2 above the local roadways (level 1), with Interstate 84 Westbound at level 3 of the stacked viaduct and Interstate 84 Eastbound at level 4. Route 8 is a stacked viaduct to the south of Interstate 84 with Route 8 Southbound at level 2 and Route 8 Northbound at level 3. With the difference in levels, seven of the System Ramps, also known as Turning Roadways (TR number), are partially or completely on structure. For the purposes of this report, they will only be referred to as System Ramps, but the TR number will remain.
The system ramps within the Mixmaster are, on I-84 – Exits 19 and 20 and on Route 8 – Exits 31 and 33. Descriptions of each are listed below:
Exit 19 - Interstate 84 Eastbound to Route 8 Southbound (TR 805) – on embankment
Exit 20 - Interstate 84 Eastbound to Route 8 Northbound (TR 806) – Left Exit, Structures #03209 and #03200 and on embankment
Exit 33 – Route 8 Southbound to Interstate 84 Westbound (TR 807) – Structure #03206 and on embankment
Exit 33 – Route 8 Northbound to Interstate 84 Westbound (TR 808) – Left Exit, Structure #03190F
Exit 31 – Route 8 Southbound to Interstate 84 Eastbound (TR 809) – Left Exit, Structure #03191D and on embankment
Exit 20 – Interstate 84 Westbound to Route 8 Northbound (TR 810) – Structure #03191E and on embankment
Exit 31 – Route 8 Northbound to Interstate 84 Eastbound (TR 811) – Structure #03190C
Exit 19 – Interstate 84 Westbound to Route 8 Southbound (TR 812) – Left Exit, Structure #03190D
Geometric Deficiencies - System Ramps
The Design Criteria Tables for the System Ramps are contained in Appendix 2.4 (refer to System Interchange- Turning Roadways Design Criteria Tables). Summarized below are deficiencies found on the System Ramps.
Design Speed:
The current CTDOT design standards for Design Speeds are a function of the Mainline Design Speed which results in a 40mph minimum design speed on System Ramps. All the existing System Ramps are posted with advisory speeds ranging from 25mph to 35mph therefore not meeting design standards.
Minimum Radii:
The horizontal radii of the system ramps were analyzed to determine which ramp radii did not meet the minimum requirements based on design speed. All the radii design requirements were determined assuming a 6% superelevation rate.
Minimum Radius Deficiencies:
Table 2-16 System Ramp Horizontal Curve Deficiencies
LocationMinimum Radius
based on a 40 mph Design Speed Existing RadiusRoute 8 NB Exit 31(TR 811)
510 ft. 202 ft.
I-84 WB Exit 19(TR 812)
510 ft. 240 ft.
I-84 EB Exit 19(TR 805)
510 ft. 500 ft.
Ramp Travel Lane and Shoulder Widths:
Per CTDOT design standards, the minimum width of a one lane ramp is 26 feet (A 4-foot left shoulder, 12-foot travel way, and a 10-foot right shoulder). The minimum width for a 2-lane ramp is 38 feet (4-foot left shoulder, 2 – 12-foot travel lanes and a 10-foot right shoulder).
All single lane ramps listed above and summarized below have a curb to curb width of 23-foot 10-inch and therefore do not meet the standard.
Multi-lane Turning Roadways on structure have twelve (12) foot lanes with 3-foot 11-inch left and right shoulders. When used as a single lane Turning Roadway, these have adequate width.
Table 2-17 System Ramp Right Shoulder Width Deficiencies
Location DescriptionOn or Off
BridgeRequired
Shoulder WidthExisting Right
Shoulder WidthExit 19(TR 805)
I-84 EB toRoute 8 SB
Off 10 ft. 8 ft.
Exit 19(TR 812)
I-84 WB toRoute 8 SB
On 10 ft. 8 ft.
Exit 20(TR 806)
I-84 EB toRoute 8 NB
On 10 ft. 8 ft.
Exit 20(TR 806)
I-84 EB toRoute 8 NB
Off 10 ft. 8 ft.
Exit 31(TR 809)
Route 8 SB toI-84 EB
On 10 ft.4 ft.
(Bridge No. 03205)Exit 31(TR 811)
Route 8 NB toI-84 EB
On 10 ft. 9 ft.-10 in.
Exit 33(TR 807)
Route 8 SB toI-84 WB
On 10 ft. 8 ft.
Exit 33(TR 807)
Route 8 SB toI-84 WB
Off 10 ft. 3 ft.
Exit 33(TR 808)
Route 8 NB toI-84 WB
On 10 ft. 8 ft.-10 in.
Exit 33(TR 808)
Route 8 NB toI-84 WB
Off 10 ft. 8 ft.
Table 2-18 System Ramp Left Shoulder Width Deficiencies
Location DescriptionOn or Off
BridgeRequired
Shoulder WidthExisting Left
Shoulder WidthExit 19(TR 812)
I-84 WB toRoute 8 SB
On 4 ft. 3 ft.-10 in.
Exit 20(TR 806)
I-84 EB toRoute 8 NB
Off 4 ft. 1 ft.-6 in.
Exit 31(TR 811)
Route 8 NB toI-84 EB
On 4 ft. 2 ft.
Exit 33(TR 808)
Route 8 NB toI-84 WB
On 4 ft. 3 ft.-11 in.

INTERSTATE 84 / ROUTE 8 “MIXMASTER” INTERCHANGE | ANALYSIS, NEEDS AND DEFICIENCIES REPORT
SECTION 2.4 ROADWAY GEOMETRICS
59
Compound Curves:
A compound curve is a horizontal curve made up of two (2) or more adjacent curves in the same direction. Section 12-4.03 of the CTDOT Highway Design Manual describes the minimum standards required when using compound curves. The design standard states that the ratio between the radius of the flatter curve and the larger curve should not exceed 2:1. Exit 31 (TR 811) has nine (9) consecutive compound curves which affects rideability. For location, see Appendix 2.4 (refer to System Interchange- Turning Roadways Design Criteria Tables)
Vertical Grades and Stopping Sight Distance:
Highway grades have a major impact on safety and operations of the ramps. The CTDOT Highway Design Manual has established maximum and minimum grades for roadways. Maximum grades are established in order to provide adequate stopping sight distance. These are based on roadway classification. Minimum grades are established in order to provide proper drainage of the roadway and avoid ponding of storm water. All roadway classifications have a minimum vertical grade of 0.50%.
The minimum stopping sight distance (SSD), or the sum of the distance traveled during a driver brake reaction and the distance traveled while decelerating to a complete stop, was determined from Chapter 7 of the CTDOT Highway Design Manual. Exit 31 (TR 811) and Exit 19 (TR 812) have stopping sight distance less than the required 305’ for a 40 mph Design Speed.
There are four system ramps that do not meet the minimum roadway grade. They are Exit Ramp 31 (TR 809), Exit 20 (TR 811) and Exit 19 (TR 812). Portions of these ramps are relatively flat and therefore do not meet the minimum vertical grade standard.
Table 2-19 summarizes the geometric deficiencies of the system interchange. Within the table, the system ramps are evaluated separately by on-structure and off-structure segments. A green dot indicates that the entire length of the roadway meets the controlling design criteria. A red dot indicates that either a portion or the entire length of roadway does not meet the controlling design criteria.

INTERSTATE 84 / ROUTE 8 “MIXMASTER” INTERCHANGE | ANALYSIS, NEEDS AND DEFICIENCIES REPORT
SECTION 2.4 ROADWAY GEOMETRICS
60
Table 2-19 System Ramp Geometric Deficiencies Matrix
SYSTEM RAMPS GEOMETRICSHorizontal Alignment Vertical Curvature
RoadwayDesignSpeed
TravelLane
WidthsShoulderWidths
AuxiliaryLane
WidthsMinimum
Radius
CompoundCurvature
RatioK ValueCREST
K ValueSAG
MaximumGrade
MinimumGrade
StoppingSight
Distance
Travel Lane& Shoulder
Cross Slopes Superelevation
SuperelevationTransition
LengthsVertical
ClearanceIntersection
Sight DistanceAcceleration
Length
Exit 19 Off-Ramp: I-84 Eastbound to Route 8 Southbound
(Off-Structure Only) ● ● ● N/A ● ● ● ● ● ● ● ● ● ● ● ● N/A
Exit 20 Off-Ramp: I-84 Eastbound to Route 8 Northbound
(On-Structure) ● ● ● N/A ● ● ● N/A ● ● ● N/A ● ● N/A N/A N/A
Exit 20 Off-Ramp: I-84 Eastbound to Route 8 Northbound
(Off-Structure) ● ● ● N/A ● ● ● ● ● ● ● ● ● ● ● ● ●Exit 33 Off-Ramp: Route 8 Southbound to I-84 Westbound
(On-Structure) ● ● ● N/A N/A N/A N/A ● ● ● ● ● N/A N/A N/A N/A N/A
Exit 33 Off-Ramp: Route 8 Southbound to I-84 Westbound
(Off-Structure) ● ● ● N/A ● N/A ● ● ● ● ● ● ● ● N/A N/A ●Exit 33 Off-Ramp: Route 8 Northbound to I-84
Westbound (On-Structure) ● ● ● N/A ● N/A ● ● ● ● ● ● N/A N/A ● N/A N/A
Exit 33 Off-Ramp: Route 8 Northbound to I-84
Westbound (Off-Structure) ● ● ● N/A ● N/A ● N/A ● ● ● ● ● ● ● N/A N/A
Exit 31 Off-Ramp: Route 8 Southbound to I-84 Eastbound
(On-Structure) ● ● ● N/A ● ● ● ● ● ● ● N/A ● ● N/A N/A N/A
Exit 31 Off-Ramp: Route 8 Southbound to I-84 Eastbound
(Off-Structure) ● ● ● N/A ● ● ● ● ● ● ● N/A ● ● ● N/A N/A
Exit 20 Off-Ramp: I-84 Westbound to Route 8 Northbound
(On-Structure) ● ● ● N/A ● ● ● ● ● ● ● N/A ● ● ● N/A N/A
Exit 20 Off-Ramp: I-84 Westbound to Route 8 Northbound
(Off-Structure) ● ● ● N/A ● N/A ● ● ● ● ● ● ● ● N/A N/A N/A
Exit 31 Off-Ramp: Route 8 Northbound to I-84 Eastbound
(On-Structure Only) ● ● ● N/A ● ● ● ● ● ● ● ● ● ● ● N/A N/A
Exit 19 Off-Ramp: I-84 Westbound to Route 8 Southbound
(On-Structure Only) ● ● ● N/A ● N/A ● ● ● ● ● ● ● ● ● ● N/A
● = ENTIRE LENGTH OF ROADWAY MEETS CONTROLLING DESIGN CRITERIA
● = EITHER A PORTION OR ENTIRE LENGTH OF ROADWAY DOES NOT MEET CONTROLLING DESIGN CRITERIA

INTERSTATE 84 / ROUTE 8 “MIXMASTER” INTERCHANGE | ANALYSIS, NEEDS AND DEFICIENCIES REPORT
SECTION 2.4 ROADWAY GEOMETRICS
61
Service Ramp Interchanges
There are five service ramp interchanges providing access to I-84 and four providing access to Route 8 within the study area. A service ramp is defined as a ramp that has a terminus on the limited access highway and another terminus at a local roadway network.
Along Interstate 84, the service ramp interchanges are listed below:
Exit 17 – Half interchange (Westbound off, Eastbound on)Exit 18 – Full interchange with additional Eastbound on-rampExit 21 – Full interchangeExit 22 – 3/4 interchange (no Eastbound on)Exit 23 – 3/4 interchange (no Westbound on) Eastbound becomes a Collector
Distributor (CD) Roadway
Along Route 8, the service ramp interchanges are listed below:
Exit 30 – Full interchangeExit 32 – Full interchangeExit 34 – Half interchange (Southbound off, Northbound on)Exit 35 – Half interchange (Northbound off, Southbound on)
Geometric Deficiencies - Service Ramps
The Service Ramps Design Criteria Tables are contained in Appendix 2.4. Summarized below are deficiencies found on the Service Ramps.
Interstate 84 Service Ramps
Minimum Radius:
Exit 17 on I-84 Eastbound does not meet the minimum requirement for horizontal radius (curvature).
Table 2-20 I-84 Service Ramp Horizontal Curve Deficiencies
Location On or Off BridgeMinimum Radius
based on Design Speed Existing RadiusExit 17 EBOn-Ramp
On 665 ft. 650 ft.
Exit 17 EBOn-Ramp
Off 665 ft. 363.36 ft.
Minimum/Maximum Grades:
I-84 has five service ramps that have vertical grades that exceed maximum standards and one ramp that does not meet the minimum grade standard.
Table 2-21 I-84 Service Ramp Grade Deficiencies
Location On or Off BridgeMaximum Grade
based on Design Speed Existing GradeExit 17 EBOn-Ramp
Off 4% 8%
Exit 18 EBOn-Ramp
On 6.5% -7%
Exit 18 EBOn-Ramp
Off 6.5% -7%
Exit 19 EBOff-Ramp
Off 6.5% -8.44%
Exit 21 EBOff-Ramp
On 6.5% -7%
Exit 21 EBOff-Ramp
Off 6.5% -7%
Exit 22 EBOff-Ramp
On 6.5% -7%
Exit 22 EBOff-Ramp
Off 6.5% -7%
Lane widths:
I-84 has one service ramp serving as a Collector Distributor (CD) Roadway having a substandard lane width.
Table 2-22 I-84 Service Ramp Lane Width Deficiencies
LocationOn or Off
BridgeRequired Lane
WidthExisting Lane
WidthRamp 2 Baldwin Street to EB CD Road
Off 12 ft. 11 ft.
Right Shoulder Widths:
I-84 has four service ramps that have right shoulder widths that do not meet the minimum standards.
Table 2-23 I-84 Service Ramp Right Shoulder Width Deficiencies
LocationOn or Off
BridgeRequired Right Shoulder Width
Existing Right Shoulder Width
Exit 22 EB Off-Ramp On 10 ft. 7 ft.Exit 22 EB Off-Ramp Off 10 ft. 8 ft.Ramp 2 Baldwin Street to EB CD Road
Off 10 ft. 3 ft.
Exit 22 WB Off-Ramp On 10 ft. 8 ft.Exit 22 WB Off-Ramp Off 10 ft. 6 ft.Exit 18 WB Off-Ramp Off 10 ft. 8 ft.

INTERSTATE 84 / ROUTE 8 “MIXMASTER” INTERCHANGE | ANALYSIS, NEEDS AND DEFICIENCIES REPORT
SECTION 2.4 ROADWAY GEOMETRICS
62
Left Shoulder Widths:
I-84 has seven service ramps that have left shoulder widths that do not meet the minimum standards.
Table 2-24 I-84 Service Ramp Left Shoulder Width Deficiencies
LocationOn or Off
BridgeRequired Left
Shoulder WidthExisting Left
Shoulder WidthExit 21 EB Off-Ramp On 4 ft. 1.5 ft.Exit 22 EB Off-Ramp On 4 ft. 2 ft.Ramp 1 McMahon Street to EB CD Road Off 4 ft. 2 ft.
Ramp 2 Baldwin Street to EB CD Road Off 4 ft. 2 ft.
Exit 22 WB On-Ramp Off 4 ft. 2 in.On 4 ft. 0 ft.Exit 21 WB Off-RampOff 4 ft. 0 ft.On 4 ft. 3 ft.Exit 21 WB On-RampOff 4 ft. 0 ft.
Deceleration Lane Length:
I-84 has one exit ramp that does not have adequate deceleration lane length. Sufficient deceleration lane length is required for a vehicle to safely exit a limited access, high speed roadway.
Table 2-25 I-84 Service Ramp Deceleration Lane Length Deficiencies
LocationOn or Off
BridgeRequired Deceleration
LengthExisting Deceleration
LengthExit 18 EB Off-Ramp
Off 300 ft. 219 ft.
Compound Curve Ratio:
I-84 has three exit ramps that do not meet the requirements for compound curves.
Table 2-26 I-84 Service Ramp Compound Curve Deficiencies
LocationOn or Off
BridgeRequired Compound
Curve RatioExisting Compound
Curve RatioExit 21 EB On-Ramp Off 1.5:1, 2:1 Max 4.1, 4:1Exit 22 EB On-Ramp Off 1.5:1, 2:1 Max 4:1Ramp 2 Baldwin Street to EB CD Road
Off 1.5:1, 2:1 Max 2.6, 7:1
Stopping Sight Distance (SSD):
I-84 has one exit ramp that does not have the adequate SSD of 250’. Exit 18 EB On-Ramp (Highland Avenue) has an SSD of 209-feet.
Superelevation Rate and Transition Length:
The superelevation rate, or the rate at which a curve is banked, exceeds the maximum design standard at the Eastbound CD Roadway. The superelevation transition length (affects rideability driving into a banked curve) is below the design standard.
Intersection Sight distance (ISD):
There is one off-ramp that has an ISD at a local road that is below design standard.
Table 2-27 I-84 Service Ramp Intersection Sight Distance Deficiencies
Location On or Off Bridge Required ISD Existing ISDExit 19 EB Off-Ramp(Sunnyside Avenue)
Off 390 ft. 197 ft.
Route 8 Service Ramps
Minimum/Maximum Grades:
Route 8 has one service ramp that have vertical grades that exceed maximum standards.
Table 2-28 Route 8 Service Ramp Maximum Grade Deficiencies
LocationOn or Off
BridgeMaximum Grade based on
Design SpeedExisting Grade
Exit 30 NB On-Ramp
Off 6.5% 9.7%
Route 8 has six ramps that do not meet the minimum grade standard.
Table 2-29 Route 8 Service Ramp Minimum Grade Deficiencies
LocationOn or Off
BridgeMinimum Grade based on
Design SpeedExisting Grade
Exit 30 NB On-Ramp
Off 0.5% -0.40%
Exit 30 SB Off-Ramp
Off 0.5% 0.39%
Exit 32 NB Off-Ramp
Off 0.5% -0.35%
Exit 34 NB On-Ramp
Off 0.5% -0.08%
Exit 34 SB Off-Ramp
Off 0.5% -0.43%
Exit 30 NB Off-Ramp
Off 0.5% 0.24%

INTERSTATE 84 / ROUTE 8 “MIXMASTER” INTERCHANGE | ANALYSIS, NEEDS AND DEFICIENCIES REPORT
SECTION 2.4 ROADWAY GEOMETRICS
63
Right Shoulder Widths:
Route 8 has three service ramps that have right shoulder widths that do not meet the minimum standards.
Table 2-30 Route 8 Service Ramp Right Shoulder Width Deficiencies
LocationOn or Off
BridgeRequired Right Shoulder Width
Existing Right Shoulder Width
On 10 ft. 8 ft.Exit 30 NB On-Ramp Off 10 ft. 8 ft.Exit 30 NB Off-Ramp
Off 10 ft. 6 ft.
On 10 ft. 8 ft.-10 in.Exit 32 NB Off-Ramp Off 10 ft. 8 ft.
Left Shoulder Widths:
Route 8 has three service ramp that have left shoulder widths that do not meet the minimum standards.
Table 2-31 Route 8 Service Ramp Left Shoulder Width Deficiencies
LocationOn or Off
BridgeRequired Right Shoulder Width
Existing Left Shoulder Width
On 4 ft. 0 ft.Exit 30 NB On-Ramp Off 4 ft. 0 ft.Exit 32 NB Off-Ramp
On 4 ft. 2 ft.
On 4 ft. 0 ft.Exit 30 SB Off-Ramp Off 4 ft. 2 ft.
Deceleration Lane Length:
There is one off ramp that does not have adequate deceleration lane length. Sufficient deceleration lane length is required for a vehicle to safely exit a freeway.
Table 2-32 Route 8 Service Ramp Deceleration Lane Length Deficiencies
Location On or Off Bridge
Required Deceleration Length
Existing Deceleration Length
Exit 30 NB Off-Ramp
Off 285 ft. 151 ft.
Acceleration Lane Length:
Route 8 has one on ramp that does not have adequate acceleration lane length. The acceleration lane length is critical for vehicle acceleration as it enters the freeway.
Table 2-33 Route 8 Service Ramp Acceleration Lane Length Deficiencies
LocationOn or Off
BridgeRequired Acceleration
LengthExisting Acceleration
LengthExit 32 NB On-Ramp
On 350 ft. 301 ft.
Compound Curve Ratio:
Route 8 has two exit ramps that do not meet the requirements for compound curves.
Table 2-34 Route 8 Service Ramp Compound Curve Deficiencies
LocationOn or Off
BridgeRequired Compound
Curve RatioExisting Compound
Curve RatioExit 35 SB On-Ramp
Off 1.5:1, 2:1 Max 2.25:1
Exit 30 SB Off-Ramp
Off 1.5:1, 2:1 Max 2.5:1
Superelevation Rate and Transition Length:
Route 8 has two ramps that that have a superelevation transition length that are substandard.
Table 2-35 Route 8 Superelevation Rate and Transition Length Deficiencies
LocationOn or Off
BridgeRequired Superelevation
Transition LengthExisting Superelevation
Transition LengthExit 32 SB Off-Ramp
Off 101.6 100
Exit 30 SB Off-Ramp
On 132 130
Table 2-36 thorough
Table 2-39 summarize the geometric deficiencies along the service ramps Within the tables, the ramps are evaluated separately by on-structure and off-structure segments. A green dot indicates that the entire length of the roadway meets the controlling design criteria. A red dot indicates that either a portion or the entire length of roadway does not meet the controlling design criteria.

INTERSTATE 84 / ROUTE 8 “MIXMASTER” INTERCHANGE | ANALYSIS, NEEDS AND DEFICIENCIES REPORT
SECTION 2.4 ROADWAY GEOMETRICS
64
Table 2-36 I-84 Eastbound Service Ramp Geometric Deficiencies Matrix
I-84 EASTBOUND SERVICE RAMPS GEOMETRICS
Horizontal Alignment Vertical Curvature
RoadwayDesignSpeed
TravelLane
WidthsShoulderWidths
AuxiliaryLane
WidthsMinimum
Radius
CompoundCurvature
RatioK ValueCREST
K ValueSAG
MaximumGrade
MinimumGrade
StoppingSight
Distance
Travel Lane& Shoulder
Cross Slopes Superelevation
SuperelevationTransition
LengthsVertical
ClearanceIntersection
Sight DistanceAcceleration
LengthDeceleration
LengthExit 17 On-Ramp: Route 64 toI-84 Eastbound (On-Structure) ● ● ● N/A ● N/A ● N/A ● ● ● ● ● ● N/A N/A N/A N/A
Exit 17 On-Ramp: Route 64 toI-84 Eastbound (Off-Structure) ● ● ● N/A ● N/A ● ● ● ● ● ● ● ● N/A N/A ● N/A
Exit 18 Off-Ramp: I-84 Eastbound toChase Parkway (Off-Structure Only) ● ● ● N/A ● ● ● ● ● ● ● ● ● ● N/A ● N/A ●Exit 18 On-Ramp: Chase Parkway toI-84 Eastbound (Off-Structure Only) ● ● ● N/A ● ● ● ● ● ● ● ● ● ● N/A N/A N/A N/A
Exit 18 On-Ramp: Highland Avenue toI-84 Eastbound (On-Structure) ● ● ● N/A ● ● N/A ● ● ● ● ● ● ● N/A N/A ● N/A
Exit 18 On-Ramp: Highland Avenue toI-84 Eastbound (Off-Structure) ● ● ● N/A N/A N/A ● N/A ● ● ● ● N/A N/A N/A N/A N/A N/A
Exit 19 Off-Ramp: I-84 Eastbound toSunnyside Avenue (Off-Structure Only) ● ● ● N/A ● N/A ● ● ● ● ● ● ● ● ● ● N/A ●Exit 21 On-Ramp: Bank Street toI-84 Eastbound (On-Structure) ● ● ● N/A ● N/A N/A ● ● ● ● N/A ● ● ● N/A N/A N/A
Exit 21 On-Ramp: Bank Street toI-84 Eastbound (Off-Structure) ● ● ● N/A ● ● ● ● ● ● ● ● ● ● ● N/A N/A N/A
Exit 21 Off-Ramp: I-84 Eastbound toMeadow Street (On-Structure) ● ● ● N/A ● ● ● N/A ● ● ● N/A ● ● N/A ● N/A N/A
Exit 21 Off-Ramp: I-84 Eastbound toMeadow Street (Off-Structure) ● ● ● N/A ● ● N/A ● ● ● ● ● ● ● N/A ● N/A N/A
Exit 22 Off-Ramp: I-84 Eastbound toMcMahon Street (On-Structure) ● ● ● N/A ● N/A ● ● ● ● ● ● ● ● N/A N/A N/A ●Exit 22 Off-Ramp: I-84 Eastbound toMcMahon Street (Off-Structure) ● ● ● N/A ● ● ● ● ● ● ● N/A ● ● N/A ● N/A N/A
Exit 23 Off-Ramp: I-84 Eastbound toEastbound Collector Distributor Road(Off-Structure Only)
● ● ● N/A ● ● N/A ● ● ● ● ● ● ● ● N/A N/A N/A
On-Ramp 1: McMahon Street toEastbound Collector Distributor Road (Off-Structure Only)
● ● ● N/A ● N/A ● ● ● ● ● ● ● ● N/A N/A N/A N/A
On-Ramp 2: Baldwin Street toEastbound Collector Distributor Road (Off-Structure Only)
● ● ● ● ● ● N/A ● ● ● ● ● ● ● N/A N/A N/A N/A
Off-Ramp 4: Eastbound CollectorDistributor Road to Washington Street(Off-Structure Only)
● ● ● N/A ● ● ● ● ● ● ● ● ● ● ● ● N/A ●● = ENTIRE LENGTH OF ROADWAY MEETS CONTROLLING DESIGN CRITERIA
● = EITHER A PORTION OR ENTIRE LENGTH OF ROADWAY DOES NOT MEET CONTROLLING DESIGN CRITERIA

INTERSTATE 84 / ROUTE 8 “MIXMASTER” INTERCHANGE | ANALYSIS, NEEDS AND DEFICIENCIES REPORT
SECTION 2.4 ROADWAY GEOMETRICS
65
Table 2-37 I-84 Westbound Service Ramp Geometric Deficiencies Matrix
I-84 WESTBOUND SERVICE RAMPS GEOMETRICS
Horizontal Alignment Vertical Curvature
RoadwayDesignSpeed
TravelLane
WidthsShoulderWidths
AuxiliaryLane
WidthsMinimum
Radius
CompoundCurvature
RatioK ValueCREST
K ValueSAG
MaximumGrade
MinimumGrade
StoppingSight
Distance
Travel Lane& Shoulder
Cross Slopes Superelevation
SuperelevationTransition
LengthsVertical
ClearanceIntersection
Sight DistanceAcceleration
LengthDeceleration
LengthExit 22 Off-Ramp: I-84 Westbound toUnion Street (On-Structure) ● ● ● N/A ● N/A ● N/A ● ● ● ● ● ● N/A N/A N/A N/A
Exit 22 Off-Ramp: I-84 Westbound toUnion Street (Off-Structure) ● ● ● N/A ● N/A ● N/A ● ● ● ● ● ● ● ● N/A ●Exit 22 On-Ramp: Union Street toI-84 Westbound (Off-Structure Only) ● ● ● N/A ● N/A N/A ● ● ● ● ● ● ● ● N/A ● N/A
Exit 21 Off-Ramp: I-84 Westbound toField Street (On-Structure) ● ● ● N/A ● N/A ● N/A ● ● ● N/A ● ● N/A N/A N/A N/A
Exit 21 Off-Ramp: I-84 Westbound toField Street (Off-Structure) ● ● ● N/A ● N/A ● ● ● ● ● ● ● ● N/A N/A N/A ●Exit 21 On-Ramp (Right): Bank Street toI-84 Westbound (On-Structure) ● ● ● N/A ● N/A ● N/A ● ● ● ● N/A N/A ● N/A N/A N/A
Exit 21 On-Ramp (Right): Bank Street toI-84 Westbound (Off-Structure) ● ● ● N/A ● N/A ● ● ● ● ● ● ● ● ● N/A N/A N/A
Exit 21 On-Ramp (Left): Bank Street toI-84 Westbound (On-Structure) ● ● ● N/A ● N/A ● N/A ● ● ● ● N/A N/A ● N/A N/A N/A
Exit 21 On-Ramp (Left): Bank Street toI-84 Westbound (Off-Structure) ● ● ● N/A ● N/A N/A ● ● ● ● N/A ● ● ● N/A N/A N/A
Exit 18 Off-Ramp: I-84 Westbound toHighland Avenue (Off-Structure Only) ● ● ● N/A ● ● ● ● ● ● ● ● ● ● ● ● N/A N/A
Exit 18 On-Ramp: Route 64 toI-84 Westbound (Off-Structure Only) ● ● ● N/A ● N/A ● ● ● ● ● ● ● ● N/A N/A ● N/A
Exit 17 Off-Ramp: I-84 Westbound toRoute 64 (Off-Structure Only) ● ● ● N/A ● N/A ● ● ● ● ● ● ● ● N/A N/A N/A ●● = ENTIRE LENGTH OF ROADWAY MEETS CONTROLLING DESIGN CRITERIA
● = EITHER A PORTION OR ENTIRE LENGTH OF ROADWAY DOES NOT MEET CONTROLLING DESIGN CRITERIA

INTERSTATE 84 / ROUTE 8 “MIXMASTER” INTERCHANGE | ANALYSIS, NEEDS AND DEFICIENCIES REPORT
SECTION 2.4 ROADWAY GEOMETRICS
66
Table 2-38 Route 8 Northbound Service Ramp Geometric Deficiencies Matrix
ROUTE 8 NORTHBOUND SERVICE RAMPS GEOMETRICSHorizontal Alignment Vertical Curvature
RoadwayDesignSpeed
TravelLane
Widths
ShoulderWidths
AuxiliaryLane
WidthsMinimum
Radius
CompoundCurvature
RatioK ValueCREST
K ValueSAG
MaximumGrade
MinimumGrade
StoppingSight
Distance
Travel Lane& Shoulder
Cross SlopesSuperelevation
SuperelevationTransition
Lengths
VerticalClearance
IntersectionSight Distance
AccelerationLength
DecelerationLength
Exit 30 Off-Ramp: Route 8 Northbound toSouth Leonard Street (Off-Structure Only) ● ● ● N/A ● N/A ● ● ● ● ● ● N/A N/A N/A N/A N/A ●Exit 30 On-Ramp: Washington Street toRoute 8 Northbound (On-Structure) ● ● ● N/A ● ● ● N/A ● ● ● ● ● ● ● N/A N/A N/A
Exit 30 On-Ramp: Washington Streetto Route 8 Northbound (Off-Structure) ● ● ● N/A ● ● ● ● ● ● ● ● ● ● ● N/A N/A N/A
Exit 32 Off-Ramp: Route 8 Northboundto Northbound Riverside Street(On-Structure)
● ● ● N/A ● N/A ● N/A ● ● ● N/A ● ● ● N/A N/A ●Exit 32 Off-Ramp: Route 8 Northboundto Northbound Riverside Street(Off-Structure)
● ● ● N/A ● N/A ● ● ● ● ● ● N/A N/A ● ● N/A N/A
Exit 32 On-Ramp: Northbound RiversideStreet to Route 8 Northbound(On-Structure)
● ● ● N/A N/A N/A ● N/A ● ● ● ● N/A N/A N/A N/A ● N/A
Exit 32 On-Ramp: Northbound RiversideStreet to Route 8 Northbound(Off-Structure)
● ● ● N/A ● N/A ● ● ● ● ● ● N/A N/A N/A N/A N/A N/A
Exit 34 On-Ramp: Northbound WatertownAvenue to Route 8 Northbound(Off-Structure Only)
● ● ● N/A ● N/A ● ● ● ● ● ● N/A N/A N/A N/A ● N/A
Exit 35 Off-Ramp: Route 8 Northbound toRoute 73 Northbound (Off-Structure Only) ● ● ● N/A ● ● ● ● ● ● ● ● ● ● ● ● N/A N/A
● = ENTIRE LENGTH OF ROADWAY MEETS CONTROLLING DESIGN CRITERIA
● = EITHER A PORTION OR ENTIRE LENGTH OF ROADWAY DOES NOT MEET CONTROLLING DESIGN CRITERIA

INTERSTATE 84 / ROUTE 8 “MIXMASTER” INTERCHANGE | ANALYSIS, NEEDS AND DEFICIENCIES REPORT
SECTION 2.4 ROADWAY GEOMETRICS
67
Table 2-39 Route 8 Southbound Service Ramp Geometric Deficiencies Matrix
ROUTE 8 SOUTHBOUND SERVICE RAMPS GEOMETRICSHorizontal Alignment Vertical Curvature
RoadwayDesignSpeed
TravelLane
Widths
ShoulderWidths
AuxiliaryLane
WidthsMinimum
Radius
CompoundCurvature
RatioK ValueCREST
K ValueSAG
MaximumGrade
MinimumGrade
StoppingSight
Distance
Travel Lane& Shoulder
Cross SlopesSuperelevation
SuperelevationTransition
Lengths
VerticalClearance
IntersectionSight Distance
AccelerationLength
DecelerationLength
Exit 35 On-Ramp: Route 73 Southbound to Route 8 Southbound (Off-Structure Only) ● ● ● N/A ● ● ● ● ● ● ● ● ● ● N/A N/A N/A N/A
Exit 34 Off-Ramp: Route 8 Southbound to West Main Street (On-Structure) ● ● ● N/A N/A N/A ● N/A ● ● ● ● N/A N/A N/A N/A N/A N/A
Exit 34 Off-Ramp: Route 8 Southbound to West Main Street (Off-Structure) ● ● ● N/A ● N/A ● ● ● ● ● ● ● ● ● ● N/A N/A
Exit 32 Off-Ramp: Route 8 Southbound to Southbound Riverside Street (Off-Structure Only) ● ● ● N/A ● ● ● ● ● ● ● ● ● ● ● N/A N/A ●Exit 32 On-Ramp: Southbound Riverside Street to Route 8 Southbound (Off-Structure Only) ● ● ● N/A ● ● ● ● ● ● ● ● ● ● ● N/A ● N/A
Exit 30 Off-Ramp: Route 8 Southbound to Charles Street (On-Structure) ● ● ● N/A ● N/A ● N/A ● ● ● N/A ● ● N/A N/A N/A N/A
Exit 30 Off-Ramp: Route 8 Southbound to Charles Street (Off-Structure) ● ● ● N/A ● ● ● ● ● ● ● ● ● ● ● ● N/A ●Exit 30 On-Ramp: Charles Street to Route 8 Southbound (Off-Structure Only) ● ● ● N/A ● N/A ● N/A ● ● ● ● N/A N/A N/A N/A N/A N/A
● = ENTIRE LENGTH OF ROADWAY MEETS CONTROLLING DESIGN CRITERIA
● = EITHER A PORTION OR ENTIRE LENGTH OF ROADWAY DOES NOT MEET CONTROLLING DESIGN CRITERIA

INTERSTATE 84 / ROUTE 8 “MIXMASTER” INTERCHANGE | ANALYSIS, NEEDS AND DEFICIENCIES REPORT
SECTION 2.4 ROADWAY GEOMETRICS
68
Interchange Spacing
The National Cooperative Highway Research Program (NCHRP) Report 687 “Guidelines for Ramp and Interchange Spacing” provided guidance for this section. There are no set standards for interchange spacing, however, there is the historic rule of thumb “one mile spacing” in urban areas. The distance between interchanges did vary within urban areas to provide access. Interchange Spacing is defined as the distance measured between the respective centerlines of freeway cross streets that include ramps to or from that freeway. Ramp Spacing is defined as the distance measured from painted tip to painted tip or physical gore to physical gore of the ramp. CTDOT measures from physical gore to physical gore.
There are four major components when assessing these spacings: Traffic Operations, Signing, Safety and Geometric Design.
The Traffic Operations analysis that was performed includes Level of Service analyses for each Weaving Influence Area (auxiliary lane), Merge Influence Area (on-ramp) & Diverge Influence Area (off-ramp) and Mainline sections for the AM, PM and Saturday peak hours. See the Reconstruction of Interstate 84/Route 8 Interchange “Mixmaster” – Level of Service Analysis Existing Conditions (Expressways) Report.
The Signing throughout the study area limits is currently being upgraded with all new signs under CTDOT Projects #151-312/313/326 and #151-273.
The Safety component is part of the Crash Analysis Report. This report has been summarized in Section 2.5 Crash Data and Safety Analysis. Further detail can be found in the complete report titled Reconstruction of Interstate 84/Route 8 Interchange “Mixmaster” – Crash Analysis Mainline (Interstate 84, Route 8, Turning Roadways and Ramps) and Local Roadways (Arterials) Report.
The Geometric component analyzes the ramp elements for horizontal and vertical alignment to account for appropriate speed change and sight distance as well as the cross-section elements (see Sections 12-3.02 and 12-4.0 of the CTDOT Highway Design Manual). Additionally, the measured distances for the following four conditions must be analyzed when ramps are in close proximity to each other:
Exit Ramp to Entrance Ramp (EX-EN) – AASHTO 2018 Green Book Entrance Ramp to Exit Ramp (EN-EX) – Auxiliary Lane – AASHTO 2018
Green Book Exit Ramp to Exit Ramp (EX-EX) – CTDOT Highway Design Manual Figure
12-2E
Entrance Ramp to Entrance Ramp (EN-EN) - CTDOT Highway Design Manual Figure 12-2FBelow are the results from the geometric analysis of the ramps.
Interstate 84 Eastbound Ramp Spacing
Interstate 84 Eastbound has the following ramps within the study area limits that do not meet design standards. See Appendix 2.4 (refer to Ramp and Interchange Spacing) for more information.
Table 2-40 I-84 Eastbound Ramp Spacing Deficiencies
Ramp DescriptionRamp Spacing
RequiredActual Ramp
SpacingExit 18 on-ramp to Exit 19 off-ramp 2000 ft. 1024 ft.Exit 19 off-ramp to Exit 20 off-ramp 1500 ft. 370 ft.Exit 18 on-ramp to Exit 20 on-ramp 800 ft. 610 ft.Exit 20 on-ramp to Exit 19 on-ramp 800 ft. 635 ft.Exit 19 on-ramp to Exit 21 off-ramp 2000 ft. 349 ft.Exit 21 off-ramp to Exit 22 off-ramp 1500 ft. 670 ft.Exit 21 on-Ramp to Exit 23 off-ramp 1600 ft. 1012 ft.CD Roadway on-Ramp 1 to CD Roadway on-Ramp 2
800 ft. 584 ft.
Interstate 84 Westbound Ramp Spacing
Interstate 84 Westbound has the following ramps within the study area limits that do not meet ramp spacing design standards. See Appendix 2.4 (refer to Ramp and Interchange Spacing) for more information.
Table 2-41 I-84 Westbound Ramp Spacing Deficiencies
Ramp DescriptionRamp Spacing
RequiredActual Ramp
SpacingExit 21 on-ramp (to Rte 8 SB) to Exit 21 on-ramp (to I-84 WB) from Bank Street
800 ft. 151 ft.
Exit 21 on-ramp to Exit 19 off-ramp 2000 ft. 561 ft.Exit 19 off-ramp to Exit 20 off-ramp 1500 ft. 791 ft.Exit 21 on-ramp to Exit 20 off-ramp 2000 ft. 1427 ft.Exit 19 on-ramp to Exit 20 on-ramp 800 ft. 678 ft.Exit 20 on-ramp to Exit 18 off-ramp 2000 ft. 1394 ft.
Route 8 Northbound Ramp Spacing
Route 8 Northbound has the following ramps within the study area limits that do not meet design standards. See Appendix 2.4 (refer to Ramp and Interchange Spacing) for more information.
Table 2-42 Route 8 Northbound Ramp Spacing Deficiencies
Ramp DescriptionRamp Spacing
RequiredActual Ramp
SpacingExit 30 on-ramp to Exit 31 off-ramp 2000 ft. 808 ft.Exit 31 off-ramp to Exit 32 off-ramp 1500 ft. 594 ft.Exit 32 off-ramp to Exit 33 off-ramp 1500 ft. 400 ft.Exit 31 on-ramp to Exit 33 on-ramp 800 ft. 436 ft.Exit 33 on-ramp to Exit 32 on-ramp 800 ft. 526 ft.
Route 8 Southbound Ramp Spacing
Route 8 Southbound has the following ramps within the study area limits that do not meet design standards. See Appendix 2.4 (refer to Ramp and Interchange Spacing) for more information.
Table 2-43 Route 8 Southbound Spacing Deficiencies
Ramp DescriptionRamp Spacing
RequiredActual Ramp
SpacingExit 35 on-ramp to Exit 34 off-ramp 1600 ft. 1535 ft.Exit 33 off-ramp (right) to Exit 32 off-ramp (left)
1500 ft. 67 ft.
Exit 32 off-ramp to Exit 31 off-ramp 1500 ft. 517 ft.Exit 32 on-ramp (left) to Exit 33 on-ramp (right)
800 ft. 25 ft.
Exit 32 on-ramp to Exit 31 on-ramp 800 ft. 600 ft.Exit 31 on-ramp to Exit 30 off-ramp 2000 ft. 1361 ft.

INTERSTATE 84 / ROUTE 8 “MIXMASTER” INTERCHANGE | ANALYSIS, NEEDS AND DEFICIENCIES REPORT
SECTION 2.4 ROADWAY GEOMETRICS
69
Figure 2-35 Geometric Deficiencies, Design Speed by Classification

INTERSTATE 84 / ROUTE 8 “MIXMASTER” INTERCHANGE | ANALYSIS, NEEDS AND DEFICIENCIES REPORT
SECTION 2.4 ROADWAY GEOMETRICS
70
Figure 2-36 Design Speed and Horizontal Alignment (1 of 5)

INTERSTATE 84 / ROUTE 8 “MIXMASTER” INTERCHANGE | ANALYSIS, NEEDS AND DEFICIENCIES REPORT
SECTION 2.4 ROADWAY GEOMETRICS
71
Figure 2-37 Design Speed and Horizontal Alignment (2 of 5)

INTERSTATE 84 / ROUTE 8 “MIXMASTER” INTERCHANGE | ANALYSIS, NEEDS AND DEFICIENCIES REPORT
SECTION 2.4 ROADWAY GEOMETRICS
72
Figure 2-38 Design Speed and Horizontal Alignment (3 of 5)

INTERSTATE 84 / ROUTE 8 “MIXMASTER” INTERCHANGE | ANALYSIS, NEEDS AND DEFICIENCIES REPORT
SECTION 2.4 ROADWAY GEOMETRICS
73
Figure 2-39 Design Speed and Horizontal Alignment (4 of 5)

INTERSTATE 84 / ROUTE 8 “MIXMASTER” INTERCHANGE | ANALYSIS, NEEDS AND DEFICIENCIES REPORT
SECTION 2.4 ROADWAY GEOMETRICS
74
Figure 2-40 Design Speed and Horizontal Alignment (5 of 5)

INTERSTATE 84 / ROUTE 8 “MIXMASTER” INTERCHANGE | ANALYSIS, NEEDS AND DEFICIENCIES REPORT
SECTION 2.4 ROADWAY GEOMETRICS
75
Figure 2-41 Stopping Sight Distance and Vertical Geometry (1 of 5)

INTERSTATE 84 / ROUTE 8 “MIXMASTER” INTERCHANGE | ANALYSIS, NEEDS AND DEFICIENCIES REPORT
SECTION 2.4 ROADWAY GEOMETRICS
76
Figure 2-42 Stopping Sight Distance and Vertical Geometry (2 of 5)

INTERSTATE 84 / ROUTE 8 “MIXMASTER” INTERCHANGE | ANALYSIS, NEEDS AND DEFICIENCIES REPORT
SECTION 2.4 ROADWAY GEOMETRICS
77
Figure 2-43 Stopping Sight Distance and Vertical Geometry (3 of 5)

INTERSTATE 84 / ROUTE 8 “MIXMASTER” INTERCHANGE | ANALYSIS, NEEDS AND DEFICIENCIES REPORT
SECTION 2.4 ROADWAY GEOMETRICS
78
Figure 2-44 Stopping Sight Distance and Vertical Geometry (4 of 5)

INTERSTATE 84 / ROUTE 8 “MIXMASTER” INTERCHANGE | ANALYSIS, NEEDS AND DEFICIENCIES REPORT
SECTION 2.4 ROADWAY GEOMETRICS
79
Figure 2-45 Stopping Sight Distance and Vertical Geometry (5 of 5)

INTERSTATE 84 / ROUTE 8 “MIXMASTER” INTERCHANGE | ANALYSIS, NEEDS AND DEFICIENCIES REPORT
SECTION 2.4 ROADWAY GEOMETRICS
80
Figure 2-46 Ramp Deficiencies (1 of 5)

INTERSTATE 84 / ROUTE 8 “MIXMASTER” INTERCHANGE | ANALYSIS, NEEDS AND DEFICIENCIES REPORT
SECTION 2.4 ROADWAY GEOMETRICS
81
Figure 2-47 Ramp Deficiencies (2 of 5)

INTERSTATE 84 / ROUTE 8 “MIXMASTER” INTERCHANGE | ANALYSIS, NEEDS AND DEFICIENCIES REPORT
SECTION 2.4 ROADWAY GEOMETRICS
82
Figure 2-48 Ramp Deficiencies (3 of 5)

INTERSTATE 84 / ROUTE 8 “MIXMASTER” INTERCHANGE | ANALYSIS, NEEDS AND DEFICIENCIES REPORT
SECTION 2.4 ROADWAY GEOMETRICS
83
Figure 2-49 Ramp Deficiencies (4 of 5)

INTERSTATE 84 / ROUTE 8 “MIXMASTER” INTERCHANGE | ANALYSIS, NEEDS AND DEFICIENCIES REPORT
SECTION 2.4 ROADWAY GEOMETRICS
84
Figure 2-50 Ramp Deficiencies (5 of 5)

INTERSTATE 84 / ROUTE 8 “MIXMASTER” INTERCHANGE | ANALYSIS, NEEDS AND DEFICIENCIES REPORT
SECTION 2.5 CRASH DATA AND SAFETY ANALYSIS
85
2.5 CRASH DATA AND SAFETY ANALYSISCrash data for the I-84 and Route 8 interchange system within the Project Study Corridor was obtained for a three-year period (January 1, 2015 to December 31, 2017) from the Connecticut Crash Data Repository (CTCDR). The CTCDR is a source of crash information which is compiled from reports that have been filed by state or local law enforcement officials at the scene of a crash. Crash data is listed by date and includes information about the location, crash type, light, pavement and weather conditions, vehicles involved, direction of travel, severity of injuries, and reason for each incident.
Crash data for 65 local road intersections within the study area was obtained for this same period from the CTCDR and a combination of other data sources. The intersection crash data also included crashes involving cyclists and pedestrians.
These data were compiled, analyzed, then reviewed to summarize crash trends and patterns and to identify potential safety related deficiencies within the study area. The analysis results for crashes occurring on the I-84 and Route 8 mainlines and crashes occurring at intersections are provided in the sections that follow.
2.5.1 I-84 and Route 8 Interchange System
A total of 1,365 crashes along I-84 and Route 8 were reported in the study area during the analyzed three-year period (about one crash per day). A total of 861 crashes occurred on I-84, 189 crashes occurred on Route 8, and 315 crashes occurred on interchange ramps.
The frequency of crashes on I-84 was computed to be 4.5 crashes per million daily vehicle miles traveled (DVMT). This is substantially higher than the average statewide crash rate for all roads of 3.5 crashes per million DVMT. This is significant since crash rates for freeways are typically expected to be lower than the average rate for all roads. The frequency of crashes on this segment of I-84 contributes to non-recurring traffic delays in the Project Study Corridor.
The frequency of crashes on Route 8 was computed to be 3.0 crashes DVMT.
Crash Severity and Crash Types
Overall, the distribution of crash rates by severity and type are generally consistent with expectations given the existing geometry, queueing, and speeds through the study area.
A total of 249 crashes (approximately 18 percent of all crashes) resulted in injury during the study period. A total of 5 fatalities (<1 percent of all crashes) occurred
during the study period. Crashes attributed to congestion also typically occur at lower speeds and the high percentage (81 percent) of crashes with no apparent injuries supports this finding. A total of 1,111 crashes resulted in property damage only.
A summary of mainline crash statistics by severity is provided in the following figure.
Figure 2-51 Freeway Crash Severity
0
100
200
300
400
500
600
I-84 EB I-84 WB Route 8 NB Route 8 SBInterchange
RampsProperty Damage Only 444 272 78 70 247Injury 528 330 105 83 314Fatality 530 331 105 84 315
Freeway Crash Severity
Cra
shes
The overall proportion of rear-end crashes (46 percent) seems consistent with observed congested flow conditions where vehicles may need to stop suddenly. Specifically, approximately 60% of I-84 eastbound crashes were rear-end type which corresponds to the higher vehicle density and worse capacity performance observed for eastbound I-84 noted in Section 2.3 Existing Traffic Operations.
Similarly, the fixed object crashes that involved no secondary vehicle highlight potential geometric and/or speeding concerns. Fixed object crashes represented a large portion of crashes (45 percent) along Route 8 which can be primarily attributed to existing shoulder widths and compound curve features that do not meet current design standards.
Lastly, sideswipe crashes (25 percent) on limited access highway facilities are usually associated with merging and weaving maneuvers, or attempted avoidance maneuvers attributed to sudden braking for congestion, all of which are prevalent throughout the study area.
A summary of mainline crash statistics by type is provided in the following figure.
Figure 2-52 Crash Type
0
100
200
300
400
500
600
I-84 EB I-84 WB Route 8 NB Route 8 SBInterchange
RampsFront to Rear 319 127 26 27 123Sideswipe 468 227 51 48 182Fixed Object 514 309 102 82 301Other 530 331 105 84 315
Freeway Crash Types
Cra
shes
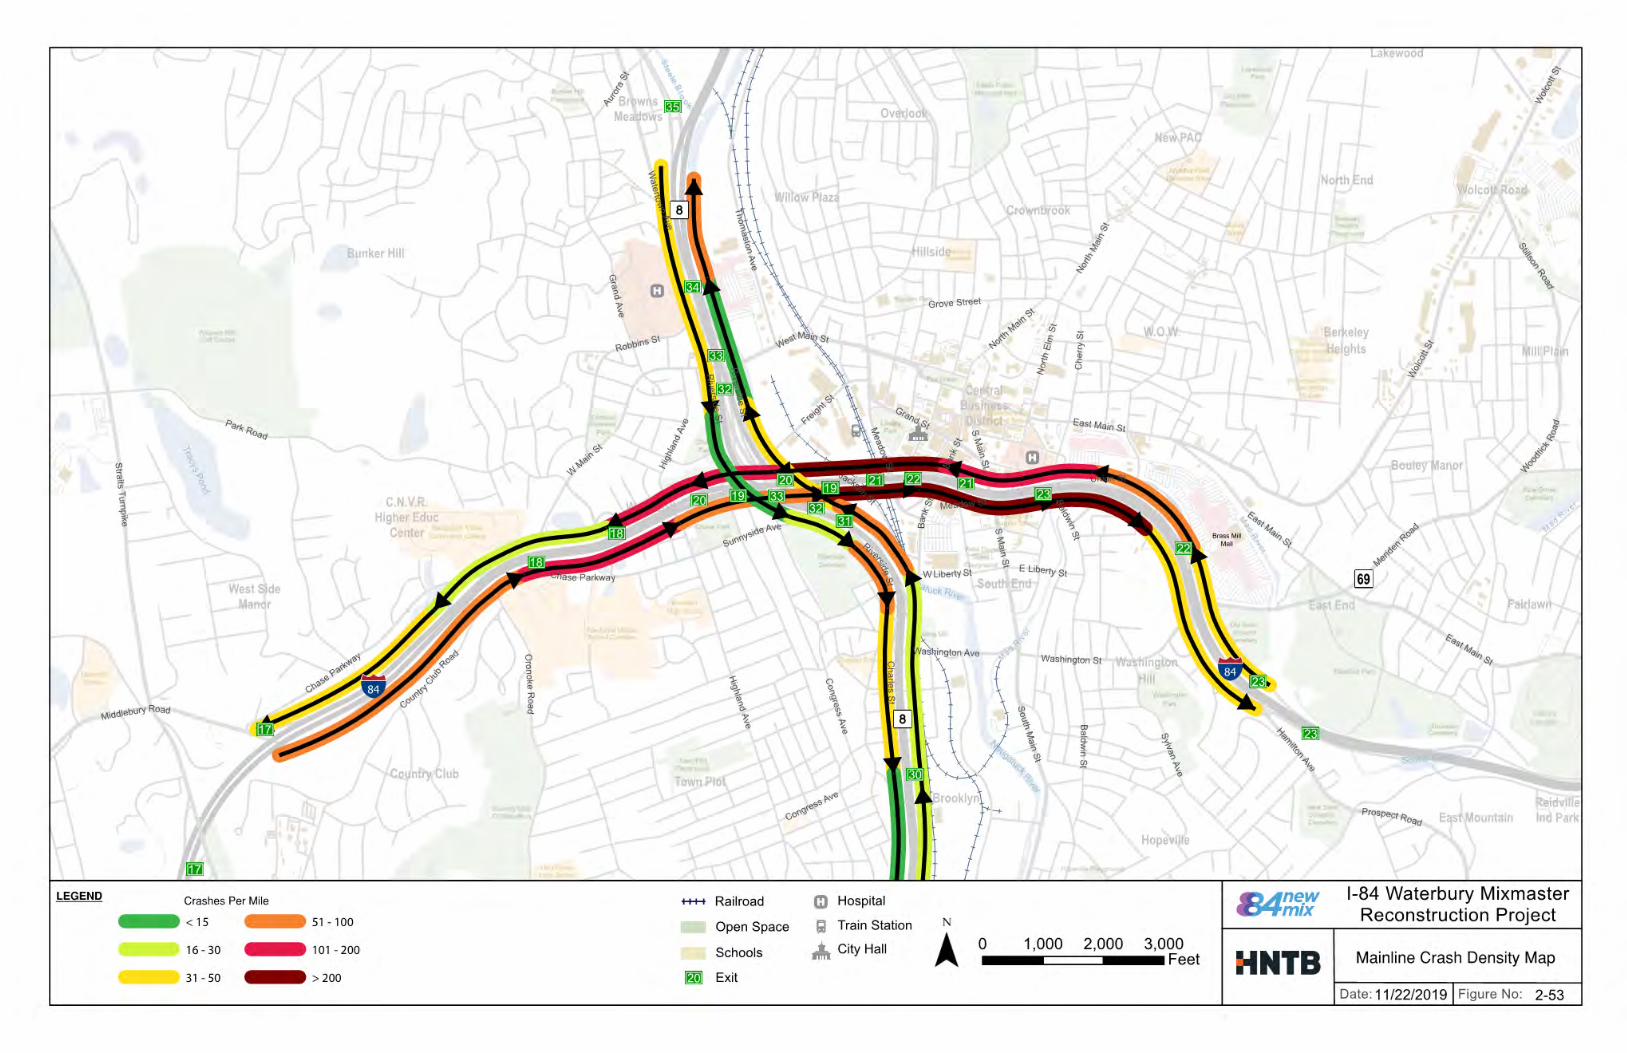
INTERSTATE 84 / ROUTE 8 “MIXMASTER” INTERCHANGE | ANALYSIS, NEEDS AND DEFICIENCIES REPORT
SECTION 2.5 CRASH DATA AND SAFETY ANALYSIS
86
Figure 2-53 Mainline Crash Density Map

INTERSTATE 84 / ROUTE 8 “MIXMASTER” INTERCHANGE | ANALYSIS, NEEDS AND DEFICIENCIES REPORT
SECTION 2.5 CRASH DATA AND SAFETY ANALYSIS
87
Figure 2-54 Mainline Crash Severity Map

INTERSTATE 84 / ROUTE 8 “MIXMASTER” INTERCHANGE | ANALYSIS, NEEDS AND DEFICIENCIES REPORT
SECTION 2.5 CRASH DATA AND SAFETY ANALYSIS
88
Crash Contributing Factors
A detailed review of incident reports from the crash data set was performed to
ascertain the underlying contributing factors to the crash. Documentation of this
detailed crash analysis can be found in Appendix 2.5. The main conclusions from
the analysis are summarized below:
1. The primary contributing factors to crashes on I-84 Eastbound were road
geometry (1.57%), traffic congestion (80.11%), and driver behavior and other
factors (18.32%). Congestion was generally attributed to the steep grades at
the Mixmaster’s approach and queuing conditions after the interchange.
Geometry and driving behavior related crashes were observed more
frequently near the core of the Mixmaster interchange where service ramps
become closely spaced.
2. The primary contributing factors to crashes on I-84 Westbound are road
geometry (5.08%), traffic congestion (60.17%), and driver behavior and other
factors (34.75%). Congestion appeared to be influenced by the presence of a
work-zone during the analyzed period. Geometry and driver behavior related
crashes became more prevalent as travel speeds increased through and after
the interchange.
3. The primary contributing factors to crashes on Route 8 southbound were
congestion (55.55%), geometry (14.29%) and driver behavior (30.16%).
Geometry and driver behavior influenced crashes were generally explained
by observed merging and diverging traffic, lane drops, and weaving
conditions.
4. The primary contributing factors to crashes on Route 8 northbound were
congestion (36.47%), geometry (21.18%) and driver behavior (42.35%).
Geometry and driver behavior influenced crashes can be attributed to
merging and diverging traffic, lane drops, and weaving conditions at higher
speeds.
5. The primary contributing factors to crashes on the Mixmaster interchange
ramps were geometry (50.00%) and driver behavior (27.27%) that was
generally attributed to the presence of left hand exits and sharp roadway
curvature. Congestion related crashes made up the remainder (22.73%).
A summary of mainline crash statistics by contributing factors is provided in the
following figure.
Figure 2-55 Freeway Crash Contributing Factors
2.5.2 Intersections
A total of 1,715 crashes at 65 intersections were reported in the study area during
the analyzed three-year period. This equates to an average of 1.6 crashes per day
occurring at a location within the study area. The highest number of reported
incidences at a single location was 142 crashes at the intersection of Route 69
(Meriden Road/Silver Street) with East Main Street.
Review of the study area crash data shows that about 69 percent of reported
crashes resulted in property damage alone, while the remaining 31 percent
involved an injury or fatality. The crash data included 1 fatal crash and 528
crashes that resulted in a potential or confirmed injury. The single fatal crash in
the three-year period occurred at the intersection of Route 73 at Aurora Street
and East Aurora Street. The crash type was angle, involved two fatalities, and
occurred on June 23, 2017 at 7:55 AM.
High crash locations were identified through a two-step screening process. This
screening process includes an evaluation of each intersection against a crash
quantity threshold along with a critical index threshold which is a measure of the
relative crash frequency at each location. The crash quantity threshold is met at
any intersection with more than 15 crashes. The critical index measure is a ratio
of actual crashes to the intersection’s critical crash rate and is met for ratio values
equal to or over 1.00. A value greater than 1.00 indicates that the site experiences
more crashes than other similar locations in the State. The critical index for each
location was calculated using crash rates determined for each study intersection
and unofficial critical crash rates previously developed by CTDOT. Of the 65
intersections analyzed, 36 (55%) of the intersections were found to be high crash
locations.
High crash intersections are depicted in Figure 2-56.
I-84 EB I-84 WBRoute 8
NB
Route 8
SB
Interchan
ge Ramps
Driver Behavior/Other 18% 35% 30% 42% 27%
Geometry 2% 5% 14% 21% 50%
Traffic Congestion 80% 60% 56% 36% 23%
0%
20%
40%
60%
80%
100%
Pe
rce
nta
ge
Freeway Crash Contributing Factors

INTERSTATE 84 / ROUTE 8 “MIXMASTER” INTERCHANGE | ANALYSIS, NEEDS AND DEFICIENCIES REPORT
SECTION 2.5 CRASH DATA AND SAFETY ANALYSIS
89
Figure 2-56 Existing (2017) High Crash Intersection Locations

INTERSTATE 84 / ROUTE 8 “MIXMASTER” INTERCHANGE | ANALYSIS, NEEDS AND DEFICIENCIES REPORT
SECTION 2.5 CRASH DATA AND SAFETY ANALYSIS
90
2.5.3 Bicyclists and Pedestrians
Cyclist and pedestrian crashes were also summarized. There was a total of 27 pedestrian crashes and 3 cyclist collisions in the study area during the analyzed three-year period. There are no existing bicycle facilities at any of the locations where a crash involving a bicycle occurred.
The cyclist collisions occurred at the following intersections:
Table 2-44 Cyclist Collisions (2015 – 2017)
IntersectionBank Street at Grand StreetRiverside Street at North Leonard Street, Washington Avenue, and CT Route 8 NB On-RampSouth Main Street at Market Square and I-84 EB Off-Ramp
Intersections with pedestrian collisions are listed below:
Table 2-45 Pedestrian Collisions (2015 – 2017)
Intersection Number of CollisionsWest Main Street at Highland Avenue 1West Main Street at Meadow and Willow Streets 1Chase Parkway at I-84 EB On Ramp 1Meadow Street at Grand Street 1Bank Street at Grand Street 1Union Street at Elm Street 2Union Street at I-84 WB Off Ramp/Brass Mill Drive 1South Main Street at Washington Avenue 1Route 69 (Silver Street/Meriden Road) at East Main Street 4East Main Street at Brass Mill Drive and Welton Street 4Watertown Avenue at Aurora Street 1Highland Avenue at I-84 EB On Ramp 1Baldwin Street at Mill Street 4Baldwin Street at East Main Street 4
Cyclist and pedestrian collisions are shown on the individual intersection Crash Data Analysis Sheets in Appendix 2.5.

INTERSTATE 84 / ROUTE 8 “MIXMASTER” INTERCHANGE | ANALYSIS, NEEDS AND DEFICIENCIES REPORT
SECTION 2.6 EXISTING STRUCTURAL CONDITIONS
91
2.6 EXISTING STRUCTURAL CONDITIONS
2.6.1 Background
A total of 62 bridges2 in the study area were identified as being pertinent to the existing (and future) needs of I-84, Route 8, or the Project’s constructability. Bridge inspection reports, load ratings, and plans were studied for these bridges to assess their existing structural conditions3.
Most of the studied bridges carry I-84 and Route 8 mainlines or ramps (system and service); others are overpasses which carry local roads over the highway. Many were built in the 1960s as part of the original “Mixmaster” interchange construction. Deficiencies in these bridges’ existing structural conditions were identified through a series of evaluations:
Physical condition (a condition rating) Load carrying capacity (a load rating) Functional adequacy (an appraisal rating) Sufficiency rating Fracture critical bridges and fatigue cracking Pile corrosion (where applicable)
Details and results of these evaluations are provided in the following sections.
Note, the results of these evaluations must be understood within the context that this is only a snapshot in time. The original Mixmaster was constructed and opened to traffic in 1968. Since then, at least seven rehabilitation projects have been administered to improve and maintain bridge structural conditions in the Project Study Corridor (see Figure 2-57) At least 10 of the 62 bridges studied has planned rehabilitation work in an ongoing or programmed project (see Table 2-46). Weighted by deck area, more than 60 percent of these bridges are scheduled for rehabilitation. Furthermore, after a bridge’s initial rehabilitation, regular rehabilitation projects are typically required every 20 to 25 years. How rehabilitation projects were accounted for when forecasting future structural conditions is explained further under Section 3.5 Future Structural Conditions.
2 Eight out of the 62 studied bridges would be more commonly referred to as culverts based on their structure type. When used in this section the term bridge is meant to include culverts as well.3 Source information was generally taken from the CTDOT’s ProjectWise database. The volume of studied information did not lend to its inclusion as an appendix to this report.
Figure 2-57 Previous Bridge Rehabilitation Projects Table 2-46 Current and Planned (2018 through 2022) Bridge Rehabilitation Projects
Deck Superstructure
BridgeNo.
FeatureCarried W
ater
pro
ofi
ng
Mem
bra
ne
Dec
k J
oin
ts
Dec
k R
epai
rs
Dec
k R
epla
cem
ent
Par
apet
Rep
lace
men
t
Par
apet
Mo
dif
icat
ion
s
Ste
el R
epai
rs
Su
per
stru
ctu
re S
tren
gth
enin
g
Bea
rin
g R
epla
cem
ent
Cra
ck R
epai
rs
Bea
m E
nd
Rep
airs
an
d P
ain
tin
g
Su
bst
ruct
ure
Rep
airs
03190A RTE 8 NB ✔ ✔ ✔ ✔ ✔ ✔ ✔ ✔
03190B RTE 8 SB ✔ ✔ ✔ ✔ ✔ ✔ ✔ ✔ ✔
03190CSystemRamp ✔ ✔ ✔ ✔ ✔ ✔ ✔ ✔
03190DSystemRamp ✔ ✔ ✔ ✔ ✔ ✔ ✔ ✔
03190EServiceRamp ✔ ✔ ✔ ✔ ✔ ✔ ✔
03190FSystemRamp ✔ ✔ ✔ ✔ ✔ ✔ ✔ ✔
03191A I-84 EB ✔ ✔ ✔ ✔ ✔ ✔ ✔ ✔ ✔
03191B I-84 WB ✔ ✔ ✔ ✔ ✔ ✔ ✔ ✔ ✔
03191DSystemRamp ✔ ✔ ✔ ✔ ✔ ✔ ✔ ✔
03191ESystemRamp ✔ ✔ ✔ ✔ ✔ ✔ ✔

INTERSTATE 84 / ROUTE 8 “MIXMASTER” INTERCHANGE | ANALYSIS, NEEDS AND DEFICIENCIES REPORT
SECTION 2.6 EXISTING STRUCTURAL CONDITIONS
92
2.6.2 Evaluations and Results
Physical Condition
The CTDOT follows the Federal Highway Administration (FHWA) National Bridge Inspection Standards (NBIS) to inspect and assess the physical condition of the state-owned bridge inventory. Inspectors record NBIS “condition ratings” for major bridge components using a scale from 0 (failed) to 9 (excellent). The condition ratings are assigned during regular inspections to track each components’ physical deterioration over time. For a typical bridge, there are three major components which are assigned condition ratings: deck, superstructure, and substructure (see Figure 2-58). The lowest of the three component ratings determines the overall condition rating of the bridge. Three ranges of NBIS condition ratings are defined that broadly classify a bridge (and its components) as being in good, fair, or poor condition (see Figure 2-58).
Figure 2-58 NBIS Condition Rating Scale and Example of Major Bridge Components
A bridge that is in poor condition is also considered “structurally deficient.” Thus, if any major component is classified as being in poor condition, the overall bridge will be considered structurally deficient. Note that the fact that a bridge is classified as structurally deficient does not imply that the bridge is unsafe, just that deficiencies have been identified that require maintenance, rehabilitation, or replacement.
The existing physical conditions of bridges in the project study area were investigated by reviewing current CTDOT bridge inspection reports. Most of these bridges are in overall poor condition and structurally deficient; about 60 percent when weighted by total deck area (see Figure 2-59). By this same measure they account for around 17 percent of all structurally deficient bridges in the State’s National Highway System (NHS) NBI bridge inventory:
Figure 2-59 Existing Overall Bridge Condition
Good 5%
Fair 35%
Poor 60%
Existing Overall Bridge Condition(Weighted by Deck Area)
Existing physical conditions of the studied bridges are also summarized by major components in Figure 2-60.
Figure 2-60 Existing Major Bridge Component Conditions
Good 6%
Fair 35%
Poor 59%
Existing Deck Condition(Weighted by Deck Area)
Good 6%
Fair 34%
Poor 60%
Existing Superstructure Condition(Weighted by Deck Area)
Good 10%
Fair 53%
Poor 37%
Existing Substructure Condition(Weighted by Deck Area)

INTERSTATE 84 / ROUTE 8 “MIXMASTER” INTERCHANGE | ANALYSIS, NEEDS AND DEFICIENCIES REPORT
SECTION 2.6 EXISTING STRUCTURAL CONDITIONS
93
The poor condition of the decks on the stacked I-84 mainline bridges over the Naugatuck River are notable deficiencies among the studied bridges. Continued degradation of the upper bridge deck’s concrete is an ongoing safety concern for motorists who travel on the lower deck. Because of this concern, core samples were taken in 2015 at various bridge deck locations and tests were performed to measure the chloride concentrations within these decks. Bridge waterproofing membranes naturally break down over time, commonly resulting in chloride (or salt) contamination of deck concrete from repeated winter applications of deicing agents. These chlorides will accelerate deterioration in a bridge deck when they exceed a certain concentration.
The results of the 2015 sampling and testing were reviewed to supplement condition rating data from inspection reports. Testing results showed that about 40 percent of the 81 sampled locations exceed the acceptable chloride concentration threshold.
Table 2-47 details several geometric characteristics of the studied bridges and shows deck, superstructure, substructure, and culvert (where applicable) condition ratings for each. Figure 2-61 and Figure 2-62 that follow show the studied bridge locations and graphically depict their overall physical conditions and deficiencies.
Table 2-47 Characteristics and Existing Conditions of Studied Bridges
Bridge Condition Rating
Bridge No. Feature Carried/ Crossed
No. of Spans
Length(Feet)
Deck Area
(Sq. Feet) Dec
k
Su
per
stru
ctu
re
Su
bst
ruct
ure
Cu
lver
ts
01173 I-84 EB over RTE 63 (Middlebury) 3 209 9,222 6 5 7 N/A01174 I-84 WB over RTE 63 (Middlebury) 3 198 8,657 6 6 6 N/A01715 RTE 8 over SR 846 NB 1 96 12,048 6 5 6 N/A01716 RTE 8 SB over RTE 73 WB 3 261 11,432 7 5 6 N/A01717 RTE 8 SB over Steele Brook 2 183 8,016 7 6 6 N/A01718 RTE NB over Steele Brook 2 150 6,570 7 7 6 N/A01731 SR 845 Chase Parkway over I-84 & Ramp 053 2 230 13,271 7 6 6 N/A03183A RTE 8 NB over Fifth Street 1 94 4,089 6 7 7 N/A03183B RTE 8 SB over Fifth Street 1 94 4,089 5 7 7 N/A03184A RTE 8 NB over Porter Street 1 95 4,132 6 7 7 N/A03184B RTE 8 SB over Porter Street 1 95 4,133 6 7 7 N/A03185 RTE 8 NS over Washington Ave 1 73 3,176 6 7 6 N/A03186 RTE 8 SB over Washington Ave 1 77 3,350 6 7 6 N/A03187 RTE 8 SB over Bank Street & S. Leonard Street 3 199 11,681 6 6 6 N/A03188 RTE 8 NB over Bank Street & S. Leonard Street 2 165 7,210 6 6 6 N/A03189 RTE 8 Ramp 077 over Bank Street 1 106 2,915 7 6 7 N/A03190A RTE 8 NB over RTE 8 SB & Local Roads 36 2,634 131,987 3 4 4 N/A03190B RTE 8 SB over Riverside Street and Sunnyside Avenue 21 1,589 75,312 4 4 6 N/A03190C I-84 TR 811 over I-84 TR 812 & Naugatuck River 9 877 24,188 5 5 5 N/A03190D I-84 TR 812 over Riverside Street and Naugatuck River 9 778 21,395 5 5 5 N/A03190E RTE 8 Ramp 128 over Riverside Street SB 7 495 13,613 6 6 7 N/A03190F I-84 TR 808 over RTE-8 SB & RAMP 129 10 652 17,930 5 4 4 N/A
Bridge Condition Rating
Bridge No. Feature Carried/ Crossed
No. of Spans
Length(Feet)
Deck Area
(Sq. Feet) Dec
k
Su
per
stru
ctu
re
Su
bst
ruct
ure
Cu
lver
ts
03191A I-84 EB over I-84 WB, RTE 8 and Naugatuck River 46 3,766 231,227 4 4 4 N/A03191B I-84 WB over RTE 8 and Naugatuck River 30 2,461 154,873 4 4 4 N/A03191C I-84 Ramp 169 over I-84 TR 805 & 808 4 408 11,220 5 6 5 N/A03191D I-84 TR 809 over RTE 8 NB & Riverside Street 10 781 27,726 4 4 4 N/A03191E I-84 TR 810 over RTE 8 NB & Ramp 128 8 630 22,365 6 4 6 N/A03191F I-84 Ramp 197 over RAMP 202 Meadow Street 11 672 18,480 4 5 6 N/A03191G I-84 Ramp 199 over Meadow Street 3 228 6,316 5 5 6 N/A03191H I-84 Ramp 198 over No Notable Feature 1 70 1,890 6 6 5 N/A03191I I-84 Ramp 200 over I-84 Ramps 199&202, Bank Street 3 296 10,508 5 6 6 N/A03192 I-84 Ramp 202 over Bank Street 1 81 2,729 6 7 6 N/A03193 I-84 WB over Bank Street & Ramp 198 2 133 6,344 6 6 6 N/A03194 I-84 Ramp 201 over I-84 Ramp 198 & Bank Street 3 195 5,402 5 6 6 N/A03195 I-84 over Great Brook 1 10 3,500 N/A N/A N/A 603196 I-84 over SR 847 (South Main St.) 1 64 8,480 6 5 6 N/A03197 South Elm St. over I-84 & Mcmahon St. 3 201 8,547 6 6 6 N/A03198 RTE 8 NB over Freight Street 3 138 6,030 5 6 6 N/A03199 RTE 8 over Sled Haul Brook 1 5 3,725 N/A N/A N/A 703200 I-84 TR 806 over I-84 TR 808, 809, Riverside 6 703 19,332 7 5 6 N/A03201 Pedestrian Walk over RTE 8 SB 4 362 3,620 6 7 7 N/A03202 I-84 over Welton Brook 2 24 6,480 N/A N/A N/A 603203A RTE 8 NB over West Main Street No. 1 1 134 9,058 6 6 6 N/A03203B RTE 8 SB over Main Street No. 1 1 134 8,589 6 6 6 N/A03203C RTE 8 Ramp 131 over West Main Street #1 1 134 4,234 6 6 7 N/A03204 RTE 94 EB/ I-84 Ramp over I-84 5 387 12,191 6 5 6 N/A03205 RTE 8 SB over Riverside Street 1 117 12,648 6 6 6 N/A03206 I-84 EB over Sled Haul Brook 1 10 2,250 N/A N/A N/A 603207 Highland Ave over I-84 3 288 15,120 6 6 7 N/A03208 I-84 WB over Sled Haul Brook 1 10 6,000 N/A N/A N/A 603209 I-84 EB TR 806 over I-84 WB 1 141 5,798 6 7 6 N/A03296 RTE 8 NB over Dye Shop Brook 1 6 720 N/A N/A N/A 703297 RTE 8 SB over Dye Shop Brook 1 6 688 N/A N/A N/A 704166 Freight Street over Naugatuck River 2 178 11,178 N/A 6 6 N/A04234R Torrington Secondary over Freight Street 4 95 6,717 N/A 4 4 N/A04318 Baldwin Street #1 over I-84, Ramps & Local Roads 3 545 37,333 5 6 7 N/A04319A I-84, Ramps & Local Roads over Mad River 2 67 24,297 N/A N/A N/A 604319B I-84, Ramp, EB Coll over No Notable Feature 1 35 13,152 N/A 7 7 N/A04320A I-84 EB over Washington Street 1 164 10,961 6 6 6 N/A04320B I-84 WB over Washing Street 1 164 10,783 6 6 6 N/A04320C I-84 EB Collector over Washington 1 165 9,059 6 7 6 N/A04321 RTE 69 over I-84 2 180 9,450 4 5 6 N/A

SECTION 2.6 EXISTING STRUCTURAL CONDITIONS
INTERSTATE 84 / ROUTE 8 “MIXMASTER” INTERCHANGE | ANALYSIS, NEEDS AND DEFICIENCIES REPORT 94
Figure 2-61 Existing Physical Conditions Map (Overall Bridge) Study Area Bridges

SECTION 2.6 EXISTING STRUCTURAL CONDITIONS
INTERSTATE 84 / ROUTE 8 “MIXMASTER” INTERCHANGE | ANALYSIS, NEEDS AND DEFICIENCIES REPORT 95
Figure 2-62 Existing Physical Conditions Map (Overall Bridge) Core Interchange Bridges

SECTION 2.6 EXISTING STRUCTURAL CONDITIONS
INTERSTATE 84 / ROUTE 8 “MIXMASTER” INTERCHANGE | ANALYSIS, NEEDS AND DEFICIENCIES REPORT 96
Load Carrying Capacity
Before a bridge is constructed, an engineer designs its structural elements to have a capacity that meets (or exceeds) the anticipated demand from vehicular loading. After construction, bridge inspections are generally performed once every two years to assess physical condition and note any deterioration or damage to structural elements that could reduce load carrying capacity. Based on the observed physical condition, the CTDOT may choose to perform an engineering analysis that will produce a “load rating” for the bridge.
Load rating analyses are performed to assess an in-service bridge’s safe load carrying capacity by considering various vehicle loading patterns, physical deterioration, and other uncertainties. Load ratings are developed for vehicular loads that the bridge can carry safely on a regular basis (a legal load rating) and the maximum allowable loads for permitted vehicles that periodically use the bridge (a permit load rating).
The load carrying capacity of the studied bridges was evaluated by reviewing current CTDOT bridge inspection and load rating reports. Load ratings of all 62 bridges within the study area were satisfactory for legal vehicles. In addition, at the completion of the ongoing rehabilitation project (State Project Nos. 151-312/313/326) the Mixmaster will have satisfactory ratings for all permit vehicles which regularly operate in Connecticut.
Functional Adequacy
The CTDOT monitors the functional adequacy of the state-owned bridge inventory using “appraisal ratings” that are defined by the NBIS. Appraisal ratings are used to establish a bridge’s relative level of service by comparing details of its construction to current standards for new construction. The functionality of the bridge is appraised by assessing the following criteria:
Traffic safety features Structural evaluation Deck geometry Underclearance Bridge posting Waterway adequacy Approach roadway alignment
The functional adequacy of the studied bridges was evaluated by reviewing current CTDOT bridge inspection reports. Bridges that would qualify as “functionally obsolete” by the CTDOT’s criteria were identified. Functionally obsolete bridges are generally those that do not have adequate lane widths, shoulder widths, vertical clearances, or those that occasionally flood. Over 40 percent of the studied bridges qualify as deficient due to the functional obsolescence.
For detailed information on appraisal ratings refer to the FHWA’s Recording and Coding Guide for the Structure Inventory and Appraisal of the Nation’s Bridges.
Sufficiency Rating
A sufficiency rating is a value from 0 to 100 percent which indicates a bridge’s sufficiency to remain in service. It is calculated with an FHWA prescribed formula that considers “essentiality for public use” in addition to condition rating, load rating, and appraisal rating data (see previous sections). Sufficiency ratings are used primarily as a planning tool for prioritization of bridge projects.
The sufficiency ratings of the studied bridges were summarized from current CTDOT bridge inspection reports and weighted by deck area (see Figure 2-63 below). More than 50 percent of the studied bridges have a sufficiency rating of less than 50.
Figure 2-63 Bridge Sufficiency Rating Distribution
30 - 40 40 - 50 50 - 60 60 - 70 70 - 80 80 - 90 90 - 1000%
5%
10%
15%
20%
25%
30%
35%
Bridge Sufficiency Rating Distribution(Weighted by Deck Area)
Per
cen
tag
e o
f S
tud
ied
Bri
dg
e P
op
ula
tio
n

SECTION 2.6 EXISTING STRUCTURAL CONDITIONS
INTERSTATE 84 / ROUTE 8 “MIXMASTER” INTERCHANGE | ANALYSIS, NEEDS AND DEFICIENCIES REPORT 97
Fracture Critical Bridges and Fatigue Cracking
Most steel bridges are designed to be redundant, meaning their structural system is capable of carrying loads after localized damage or the failure of one or more of its members. Some bridges lack this desirable redundancy because one or more of its primary load carrying members are considered “fracture critical.” Fracture critical bridges per the NBIS definition are steel bridges having primary members whose individual failure would probably cause a portion of, or the entire bridge, to collapse.
Fatigue cracks (with respect to bridges) are cracks in steel members that initiate and are propagated by cyclic loading in regions of concentrated tensile stress. Put more simply, fatigue cracking and fracture is what happens when you repeatedly bend a wire hanger or the tab on an aluminum can. Modern bridge design codes have made provisions to prevent in-service fatigue cracking. However, there are many bridges still in service which have details that would be considered “fatigue prone” by modern standards.
Fracture critical bridges and spans in the study area were identified by reviewing current CTDOT bridge inspection reports. When weighted by deck area, about 19 percent of the studied bridges (43 spans) contain members or details that classify them as fracture critical. The overwhelming majority of these fracture critical spans are located on mainline bridges. Many of these spans have also experienced active fatigue related cracking for decades.
The existing condition of these fracture critical spans is a notable deficiency among the studied bridges. Rehabilitation projects have been performed regularly (and are ongoing) to stop the propagation of cracks in fracture critical members. However, these existing fatigue prone details cannot be fully addressed through rehabilitation work. Consequently, it is anticipated that crack formation and propagation will continue at many of the studied bridges until they are completely replaced.
Pile Corrosion
As part of the Interstate 84/Route 8 Interchange (Mixmaster) project in Waterbury, the HNTB Team was requested by Connecticut Department of Transportation (CTDOT) to perform a subsurface exploration program to investigate the fill material and subsurface composition at substructure locations within the Mixmaster. The intent of the subsurface exploration program was to determine if the fill material below specific foundations presented a potential to cause accelerated corrosion of the steel H-piles supporting those foundations. Waterbury, being an older industrial city with many former industries along the Naugatuck River including brass factories, has fill materials that contain cinders, ash, and other acidic materials that, when combined with groundwater, can cause corrosion of metals at the interface with the groundwater level. The Mixmaster was constructed in the mid to late 1960s as a series of bridges that were built upon manufactured fills at various locations throughout the interchange. Many of the Mixmaster superstructure spans were constructed on steel h-pile supported foundations. H-pile supported foundations have been found to be susceptible to accelerated corrosion if the underlying fill material provides a favorable environment for a corrosion cell to occur. The basis of this study was to determine if the underlying materials and subsurface environment within the interchange produced this excessively corrosive environment for the H pile foundations supporting the Mixmaster interchange.
Seven (7) pile supported pier locations were selected for the investigation. Field borings were completed in May of 2019 and one hundred and two (102) split spoon samples were obtained for testing from the seven (7) locations. The borings varied in depth from 17’ to 44’. The samples were tested for Chlorides, Electrical Resistivity, Oxidation-Reduction Potential, pH, Sulfates, and Sulfides.
The results from both the field exploration and lab testing showed very few and localized locations with borderline corrosivity potential due to the in-situ fills. There is no large scale or consistent pattern of factors that would indicate an environment that could cause accelerated corrosion rates of the existing steel H-piles that support the bridge foundations; therefore, the conclusion was that field results and lab data support a finding of minor concern regarding the potential accelerated corrosion of the existing steel H-piles. Based on these findings, additional investigations were not considered warranted.
2.6.3 Summary
There are 62 bridges in the study area which have a combined total deck area of about 1.1 million square feet. During the last 50 years there have been at least seven rehabilitation projects to address structural deficiencies and extend the service life of these bridges. About 60 percent of the studied bridges are presently in poor condition when weighted by total deck area, however, all have satisfactory ratings for legal vehicles. Weighted by deck area, over 40 percent of the studied bridges are functionally obsolete and over 50 percent have a sufficiency rating that make their complete replacement eligible for federal funding.
The decks of the stacked I-84 mainline bridge over the Naugatuck River are in poor physical condition. Recent testing performed on these decks has shown that the concrete has been contaminated with an unacceptable amount of chlorides which will continue to accelerate its deterioration. Continued degradation of top deck concrete is an ongoing safety concern for motorists who travel on the lower deck.
About 19 percent of the studied bridges are considered fracture critical. Some of these fracture critical bridges have fatigue prone details which have caused reoccurring problems with crack formation in steel members. Crack propagation has been managed over the past 30 years, but it is expected that cracks will continue to develop and propagate at multiple fatigue prone locations for the remainder of the structures’ service lives.
Finally, the corrosion potential for existing steel pile bridge foundations was investigated. The investigation concluded that the corrosion potential of soils in the study are low.

SECTION 3.1 FORECASTING TRAFFIC GROWTH
INTERSTATE 84 / ROUTE 8 “MIXMASTER” INTERCHANGE | ANALYSIS, NEEDS AND DEFICIENCIES REPORT 98
3 Future (2045) Transportation ConditionsTraffic and structural conditions have been forecasted for the year 2045 and analyzed to identify future needs and deficiencies in the Project Study Corridor. The results from these analyses represent a future “no build” scenario that will be used during the Project’s development as a benchmark condition for comparing Project improvement concepts.
Analyses of future traffic operations and future structural conditions are provided in the sections that follow. These analyses build upon the data, models, discussion, and conclusions from the previous Section 2.0 Existing (2017) Transportation Conditions.
3.1 FORECASTING TRAFFIC GROWTHThe study developed 2045 trip information by using the Travel Demand Model developed under Existing Conditions along with CTDOT’s 2045 Travel Demand Model to establish a new 2045 Travel Demand Forecasting Model. A detailed explanation of this process and supporting documentation is provided in Appendix 3.1 (refer to Macroscopic Model Development and Calibration)
Table 3-1 illustrates the daily change in vehicle miles traveled (VMT) in the subarea network from 2017 to 2045. VMT is calculated by taking the daily traffic for a roadway segment multiplying that by the length of a segment and summing all the segments for a geographic area of concern. In general, the total VMT in the network increased by about 8.6% between 2017 and 2045.
Table 3-1 2017 and 2045 VMT Comparison
DifferenceFacility Type 2045 VMT 2017 VMT VMT %
Freeway 2,893,226 2,747,498 145,728 5.3Major 1,432,198 1,309,118 123,080 9.4Minor 3,234,191 2,968,148 266,043 9.0Collector 3,216,702 2,904,025 312,677 10.8Ramp 411,626 369,135 42,491 11.5Total 11,187,943 10,297,924 890,019 8.6
3.2 FUTURE TRAFFIC VOLUMESTraffic volumes were projected to the year 2045 based on the Travel Demand Model developed by the HNTB Team. The volumes produced by the model were used as a basis for the 2045 volumes, which were balanced and reflected trends in the existing 2017 volumes. To maintain consistency with the expressway analysis, the arterial street network was balanced based on the ramp termini volumes.Daily and Peak Hour traffic volumes for the study area are depicted in Appendix 3.2 (refer to Future (2045) Peak Hour Travel Volume Figures).
Figure 3-1 through Figure 3-4 provide a comparison between existing (2017) and future (2045) “no build” traffic volumes for the freeway mainlines.
Significant future “no build” traffic volume observations are summarized below:
Table 3-2 2045 Traffic Volume Observations
Traffic VolumeGrowth in Percentage
Facility ADTPeakHour
MinimumVolume Location
MaximumVolume Location
I-84Eastbound
14%-27% 9%-35%East of Exit 20Off-Ramp(40,100 VPD)
East of Exit 19On-Ramp(77,900 VPD)
I-84Westbound
8%-18% 2%-19%West of Exit 17Off-Ramp(38,700 VPD)
East of Exit 21Off-Ramp(76,000 VPD)
Route 8Northbound
7%-20% 13%-32%South of Exit 33On-Ramp(18,200 VPD)
South of Exit 35Off-Ramp(54,600 VPD)
Route 8Southbound
9%-15% 5%-20%North of Exit 33Off-Ramp(16,700 VPD)
North of Exit 34On-Ramp(53,800 VPD)
Note: VPD = Vehicles Per Day

SECTION 3.2 FUTURE TRAFFIC VOLUMES
INTERSTATE 84 / ROUTE 8 “MIXMASTER” INTERCHANGE | ANALYSIS, NEEDS AND DEFICIENCIES REPORT 99
Figure 3-1 I-84 Eastbound 2017 vs 2045 Daily Traffic Volumes
33
4340
4541
33
38
55
6663
5659
42
50
42
5349
55
50
40
47
66
7874
6569
49
57
West Extent
17 On 18 Off 18 On 19 Off 20 Off 18 On 20 On 19 On 21 Off 22 Off 21 On 23 OffEast
Extent2017 33 43 40 45 41 33 38 55 66 63 56 59 42 502045 42 53 49 55 50 40 47 66 78 74 65 69 49 57
I-84 Eastbound Daily Traffic Volumes
Veh
icle
s (I
n T
ho
usa
nd
s)
Figure 3-2 I-84 Westbound 2017 vs 2045 Daily Traffic Volumes
33
4341
54
43
38
56
69
6165
4852
39
5048
63
49
44
63
76
67
72
52
57
West Extent
18 On 18 Off 20 On 19 On 20 Off 19 Off 21 On 21 Off 22 On 22 OffEast
Extent2017 33 43 41 54 43 38 56 69 61 65 48 522045 39 50 48 63 49 44 63 76 67 72 52 57
I-84 Westbound Daily Traffic Volumes
Veh
icle
s (I
n T
ho
usa
nd
s)Figure 3-3 Route 8 Northbound 2017 vs 2045 Daily Traffic Volumes
3028
34
2320
15
33
4143
47
323230
39
2724
18
37
4749
55
37
South Extent
30 Off 30 On 31 Off 32 Off 33 Off 33 On 31 On 32 On 34 OnNorth Extent
2017 30 28 34 23 20 15 33 41 43 47 322045 32 30 39 27 24 18 37 47 49 55 37
Route 8 Northbound Daily Traffic Volumes
Veh
icle
s (I
n T
ho
usa
nd
s)
Figure 3-4 Route 8 Southbound 2017 vs 2045 Daily Traffic Volumes
3329
34
22
15
3234
4347
3337
32
38
24
17
3639
49
54
38
South Extent
30 On 30 Off 33 On31 & 32
On33 Off 31 Off 32 Off 33 Off
North Extent
2017 33 29 34 22 15 32 34 43 47 332045 37 32 38 24 17 36 39 49 54 38
Route 8 Southbound Daily Traffic Volumes
Veh
icle
s (I
n T
ho
usa
nd
s)

SECTION 3.3 FUTURE (2045) TRAFFIC SIMULATION MODEL
INTERSTATE 84 / ROUTE 8 “MIXMASTER” INTERCHANGE | ANALYSIS, NEEDS AND DEFICIENCIES REPORT 100
3.3 FUTURE (2045) TRAFFIC SIMULATION MODELThis section has been prepared to summarize the traffic simulation (VISSIM) models that were developed for the future 2045 “no build” condition, presenting the results and findings from the model review and calibration process.
3.3.1 Model Inputs
The 2045 “no build” models were developed by updating the calibrated Existing Conditions models to reflect future conditions. The microsimulation study area remains unchanged from the Existing Conditions models, consisting of the highway mainline and ramp facilities along both Interstate 84 and Route 8 within the City of Waterbury. However, one item that has been modified in the 2045 includes geometry associated with the completion of I-84 widening project, State Project #151-273. Specific items that are reflected in the 2045 future year include:
Three (3) continuous through lanes for I-84 EB east of Baldwin Street Three (3) continuous through lanes for I-84 WB east of Union Street off ramp Addition of I-84 EB exit 25 to Harpers Ferry Road, located west of Hamilton
Avenue Bridge Removal of temporary Hamilton Avenue slip-lane on-ramp to I-84 EB
(formerly located west of Hamilton Avenue Bridge)
The 2045 “no build” AM and PM peak hour highway volumes within the study area were obtained from the macroscopic modeling for 2045 “no build” condition.
3.3.2 Model Performance
Traffic simulation model performance is measured by metrics which describe various attributes of traffic operations for individual vehicles as well as the entire network. The following table defines network performance measures used to describe the model traffic operations.
Table 3-3 Traffic Simulation Model Performance Measures
Table 3-4 summarizes the Network Performance Measure findings for the Existing (2017) and Future (2045) Simulation Models.
Table 3-4 Traffic Simulation Model Performance Comparison
Performance Measure UnitExisting(2017)
Future(2045)
Difference(+/-%)
AM PeakVMT mi 136,039 71,106 -48%VHT h 2,702 1,469 -46%Average Speed mph 50 49 -2%Average Delay Time sec 28 35 25%Number of Stops ea. 53,392 29,080 -46%Total Stopped Delay h 19 17 -11%
PM PeakVMT mi 75,578 69,786 -8%VHT h 1,706 2,217 30%Average Speed mph 44 33 -25%Average Delay Time sec 63 156 148%Number of Stops ea. 148,713 439,755 196%Total Stopped Delay h 34 102 200%
Key findings include: VMT: Despite an increase in traffic volumes, the 2045 Future Conditions
models show a decrease in vehicle miles traveled reflecting congestion experienced in both AM and PM Peak networks. The AM Peak model specifically shows a 48% decrease in VMT.
VHT: The AM Peak 2045 Future model shows a 46% reduction in vehicle hours traveled. However, this does not reflect more efficient flow. In this case, the congestion forecasted by the model backs up and does not allow all vehicle demand to enter the network. Despite traffic volumes forecasted to increase in 2045, the 2045 Model processed 37% fewer vehicles (21,622) than the 2017 Model (34,362).
Average Speed: As expected with forecasted congestion increases, average vehicle speeds decrease in future modeled conditions.
Average Delay Time: As expected with forecasted congestion increases, average delay times increase in future modeled conditions.
Number of Stops: As expected with forecasted congestion increases, the number of stops increase in the 2045 PM Peak model compared to the 2017 PM Peak model. The number of stops decreases in the 2045 AM Peak model relative to the 2017 AM Peak model due to severe congestion forecasted which blocked vehicle demand from entering the network.
Total Stopped Delay: As expected with forecasted congestion increases, total stopped delay time increases in the 2045 PM Peak model compared to the 2017 PM Peak model. The duration of total stopped delay decreases in the 2045 AM Peak model relative to the 2017 AM Peak model due to vehicle demand blocked from entering the network.
The notable points of congestion observed in the 2045 “no build” models are depicted on Figure 3-5. A summary of the modeled travel speeds for the 2045 “no build” condition along Interstate 84 and Route 8, for the AM and PM peak hours can be found in Appendix 3.3.
Performance Measure Definition ContextVehicle Miles Traveled (VMT)
The cumulative total distance traveled by all vehicles in the network.
A higher VMT is desirable. This indicates that vehicles were able to travel further during the simulation.
Vehicle Hours Traveled(VHT)
The cumulative total travel time recorded for all vehicles in the network.
A lower VHT is desirable. This indicates that vehicles take less time to arrive at their destination.
Average Speed(in miles per hour)
Travel speed averaged over all vehicles in the network. A higher speed is desirable (mathematically modeled around the speed limit) This indicates that vehicles travel uninfluenced by congestion or other constraints.
Average Delay Time(in seconds per vehicle)
The averaged additional time experienced by vehicles in the network below the free-flow speed of the facility.
A lower average delay time is desirable. This indicates that vehicles are not forced to reduce speeds.
Number of StopsThe cumulative total number of stops vehicles experience traveling within the network.
Fewer stops are desirable. This indicates that vehicles are not forced to stop by congestion or other constraints.
Total Stopped Delay(in vehicle hours)
The cumulative duration of delay experienced by vehicles under a stopped condition.
A lower stopped delay is desirable. This indicates vehicles incur less waiting time or delay while stopped within the network.

SECTION 3.3 FUTURE (2045) TRAFFIC SIMULATION MODEL
INTERSTATE 84 / ROUTE 8 “MIXMASTER” INTERCHANGE | ANALYSIS, NEEDS AND DEFICIENCIES REPORT 101
Figure 3-5 Model Performance and Observations
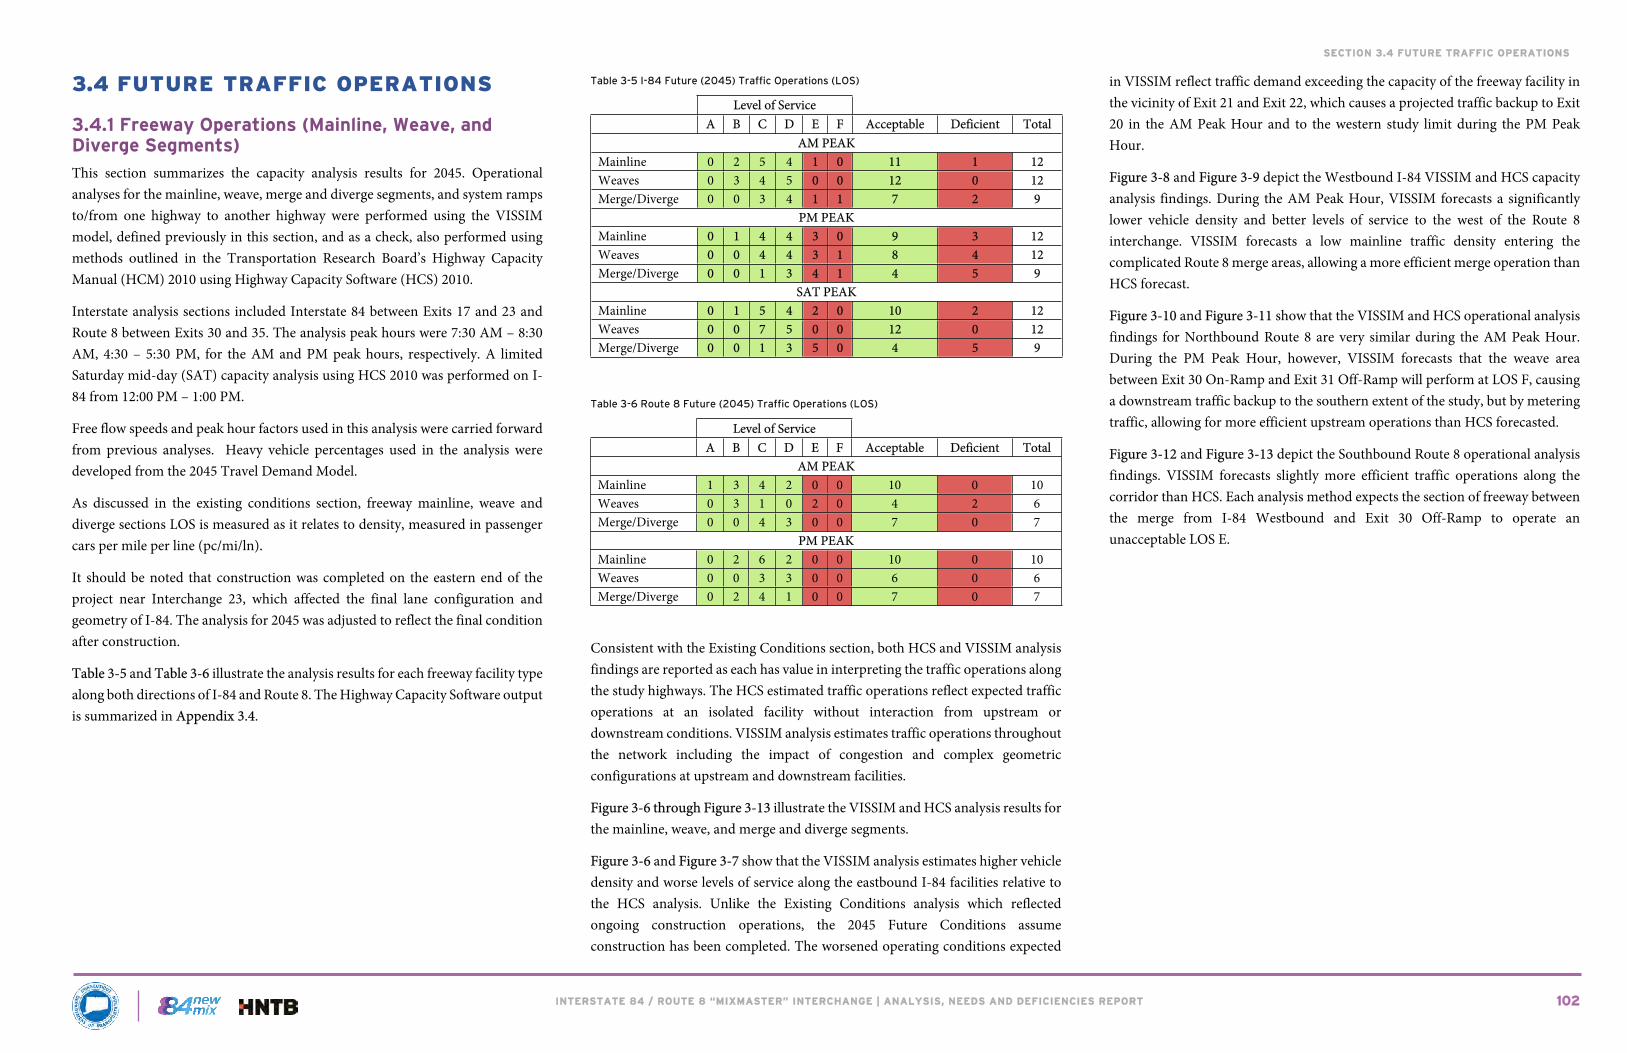
SECTION 3.4 FUTURE TRAFFIC OPERATIONS
INTERSTATE 84 / ROUTE 8 “MIXMASTER” INTERCHANGE | ANALYSIS, NEEDS AND DEFICIENCIES REPORT 102
3.4 FUTURE TRAFFIC OPERATIONS
3.4.1 Freeway Operations (Mainline, Weave, and Diverge Segments)
This section summarizes the capacity analysis results for 2045. Operational analyses for the mainline, weave, merge and diverge segments, and system ramps to/from one highway to another highway were performed using the VISSIM model, defined previously in this section, and as a check, also performed using methods outlined in the Transportation Research Board’s Highway Capacity Manual (HCM) 2010 using Highway Capacity Software (HCS) 2010.
Interstate analysis sections included Interstate 84 between Exits 17 and 23 and Route 8 between Exits 30 and 35. The analysis peak hours were 7:30 AM – 8:30 AM, 4:30 – 5:30 PM, for the AM and PM peak hours, respectively. A limited Saturday mid-day (SAT) capacity analysis using HCS 2010 was performed on I-84 from 12:00 PM – 1:00 PM.
Free flow speeds and peak hour factors used in this analysis were carried forward from previous analyses. Heavy vehicle percentages used in the analysis were developed from the 2045 Travel Demand Model.
As discussed in the existing conditions section, freeway mainline, weave and diverge sections LOS is measured as it relates to density, measured in passenger cars per mile per line (pc/mi/ln).
It should be noted that construction was completed on the eastern end of the project near Interchange 23, which affected the final lane configuration and geometry of I-84. The analysis for 2045 was adjusted to reflect the final condition after construction.
Table 3-5 and Table 3-6 illustrate the analysis results for each freeway facility type along both directions of I-84 and Route 8. The Highway Capacity Software output is summarized in Appendix 3.4.
Table 3-5 I-84 Future (2045) Traffic Operations (LOS)
Level of ServiceA B C D E F Acceptable Deficient Total
AM PEAKMainline 0 2 5 4 1 0 11 1 12Weaves 0 3 4 5 0 0 12 0 12Merge/Diverge 0 0 3 4 1 1 7 2 9
PM PEAKMainline 0 1 4 4 3 0 9 3 12Weaves 0 0 4 4 3 1 8 4 12Merge/Diverge 0 0 1 3 4 1 4 5 9
SAT PEAKMainline 0 1 5 4 2 0 10 2 12Weaves 0 0 7 5 0 0 12 0 12Merge/Diverge 0 0 1 3 5 0 4 5 9
Table 3-6 Route 8 Future (2045) Traffic Operations (LOS)
Level of ServiceA B C D E F Acceptable Deficient Total
AM PEAKMainline 1 3 4 2 0 0 10 0 10Weaves 0 3 1 0 2 0 4 2 6Merge/Diverge 0 0 4 3 0 0 7 0 7
PM PEAKMainline 0 2 6 2 0 0 10 0 10Weaves 0 0 3 3 0 0 6 0 6Merge/Diverge 0 2 4 1 0 0 7 0 7
Consistent with the Existing Conditions section, both HCS and VISSIM analysis findings are reported as each has value in interpreting the traffic operations along the study highways. The HCS estimated traffic operations reflect expected traffic operations at an isolated facility without interaction from upstream or downstream conditions. VISSIM analysis estimates traffic operations throughout the network including the impact of congestion and complex geometric configurations at upstream and downstream facilities.
Figure 3-6 through Figure 3-13 illustrate the VISSIM and HCS analysis results for the mainline, weave, and merge and diverge segments.
Figure 3-6 and Figure 3-7 show that the VISSIM analysis estimates higher vehicle density and worse levels of service along the eastbound I-84 facilities relative to the HCS analysis. Unlike the Existing Conditions analysis which reflected ongoing construction operations, the 2045 Future Conditions assume construction has been completed. The worsened operating conditions expected
in VISSIM reflect traffic demand exceeding the capacity of the freeway facility in the vicinity of Exit 21 and Exit 22, which causes a projected traffic backup to Exit 20 in the AM Peak Hour and to the western study limit during the PM Peak Hour.
Figure 3-8 and Figure 3-9 depict the Westbound I-84 VISSIM and HCS capacity analysis findings. During the AM Peak Hour, VISSIM forecasts a significantly lower vehicle density and better levels of service to the west of the Route 8 interchange. VISSIM forecasts a low mainline traffic density entering the complicated Route 8 merge areas, allowing a more efficient merge operation than HCS forecast.
Figure 3-10 and Figure 3-11 show that the VISSIM and HCS operational analysis findings for Northbound Route 8 are very similar during the AM Peak Hour. During the PM Peak Hour, however, VISSIM forecasts that the weave area between Exit 30 On-Ramp and Exit 31 Off-Ramp will perform at LOS F, causing a downstream traffic backup to the southern extent of the study, but by metering traffic, allowing for more efficient upstream operations than HCS forecasted.
Figure 3-12 and Figure 3-13 depict the Southbound Route 8 operational analysis findings. VISSIM forecasts slightly more efficient traffic operations along the corridor than HCS. Each analysis method expects the section of freeway between the merge from I-84 Westbound and Exit 30 Off-Ramp to operate an unacceptable LOS E.

SECTION 3.4 FUTURE TRAFFIC OPERATIONS
INTERSTATE 84 / ROUTE 8 “MIXMASTER” INTERCHANGE | ANALYSIS, NEEDS AND DEFICIENCIES REPORT 103
Figure 3-6 Future (2045) Level of Service Map I-84 Eastbound AM Peak Hour

SECTION 3.4 FUTURE TRAFFIC OPERATIONS
INTERSTATE 84 / ROUTE 8 “MIXMASTER” INTERCHANGE | ANALYSIS, NEEDS AND DEFICIENCIES REPORT 104
Figure 3-7 Future (2045) Level of Service Map I-84 Eastbound PM Peak Hour

SECTION 3.4 FUTURE TRAFFIC OPERATIONS
INTERSTATE 84 / ROUTE 8 “MIXMASTER” INTERCHANGE | ANALYSIS, NEEDS AND DEFICIENCIES REPORT 105
Figure 3-8 Future (2045) Level of Service Map I-84 Westbound AM Peak Hour

SECTION 3.4 FUTURE TRAFFIC OPERATIONS
INTERSTATE 84 / ROUTE 8 “MIXMASTER” INTERCHANGE | ANALYSIS, NEEDS AND DEFICIENCIES REPORT 106
Figure 3-9 Future (2045) Level of Service Map I-84 Westbound PM Peak Hour

SECTION 3.4 FUTURE TRAFFIC OPERATIONS
INTERSTATE 84 / ROUTE 8 “MIXMASTER” INTERCHANGE | ANALYSIS, NEEDS AND DEFICIENCIES REPORT 107
Figure 3-10 Future (2045) Level of Service Map Route 8 Northbound AM

SECTION 3.4 FUTURE TRAFFIC OPERATIONS
INTERSTATE 84 / ROUTE 8 “MIXMASTER” INTERCHANGE | ANALYSIS, NEEDS AND DEFICIENCIES REPORT 108
Figure 3-11 Future (2045) Level of Service Map Route 8 Northbound PM

SECTION 3.4 FUTURE TRAFFIC OPERATIONS
INTERSTATE 84 / ROUTE 8 “MIXMASTER” INTERCHANGE | ANALYSIS, NEEDS AND DEFICIENCIES REPORT 109
Figure 3-12 Future (2045) Level of Service Map Route 8 Southbound AM

SECTION 3.4 FUTURE TRAFFIC OPERATIONS
INTERSTATE 84 / ROUTE 8 “MIXMASTER” INTERCHANGE | ANALYSIS, NEEDS AND DEFICIENCIES REPORT 110
Figure 3-13 Future (2045) Level of Service Map Route 8 Southbound PM

SECTION 3.4 FUTURE TRAFFIC OPERATIONS
INTERSTATE 84 / ROUTE 8 “MIXMASTER” INTERCHANGE | ANALYSIS, NEEDS AND DEFICIENCIES REPORT 111
Figure 3-14 Future (2045) Level of Service Map System Ramps AM Peak Hour

SECTION 3.4 FUTURE TRAFFIC OPERATIONS
INTERSTATE 84 / ROUTE 8 “MIXMASTER” INTERCHANGE | ANALYSIS, NEEDS AND DEFICIENCIES REPORT 112
Figure 3-15 Future (2045) Level of Service Map System Ramps PM Peak Hour
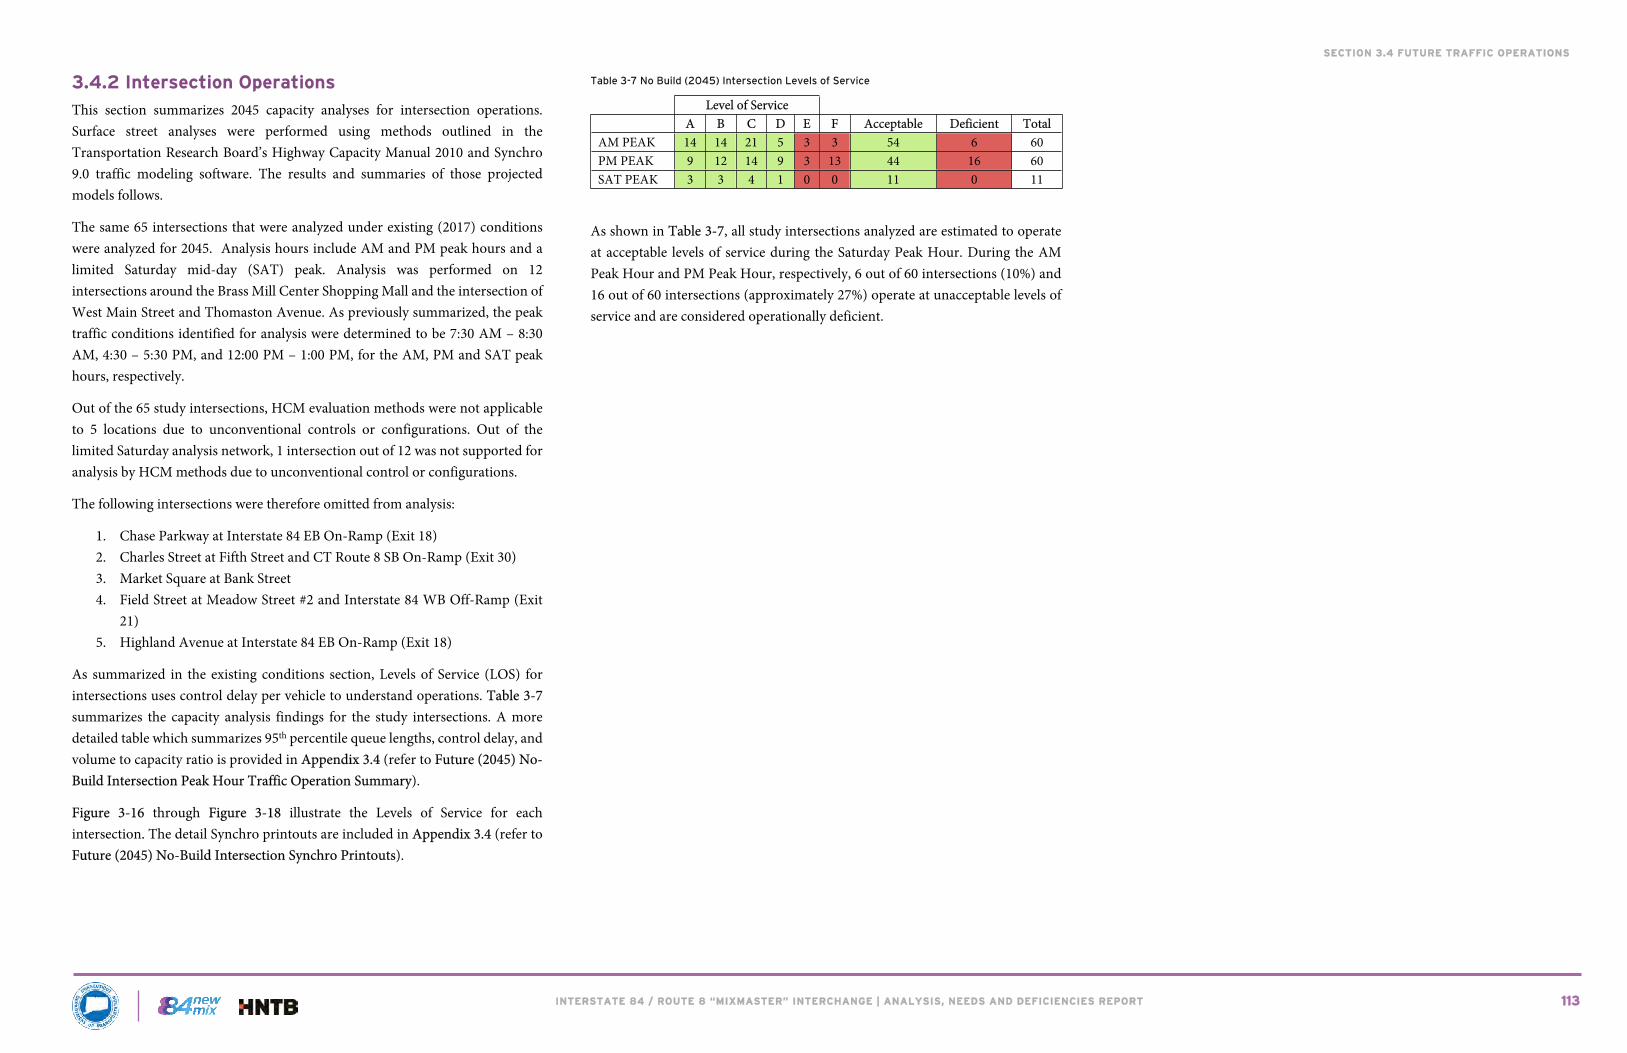
SECTION 3.4 FUTURE TRAFFIC OPERATIONS
INTERSTATE 84 / ROUTE 8 “MIXMASTER” INTERCHANGE | ANALYSIS, NEEDS AND DEFICIENCIES REPORT 113
3.4.2 Intersection Operations
This section summarizes 2045 capacity analyses for intersection operations. Surface street analyses were performed using methods outlined in the Transportation Research Board’s Highway Capacity Manual 2010 and Synchro 9.0 traffic modeling software. The results and summaries of those projected models follows.
The same 65 intersections that were analyzed under existing (2017) conditions were analyzed for 2045. Analysis hours include AM and PM peak hours and a limited Saturday mid-day (SAT) peak. Analysis was performed on 12 intersections around the Brass Mill Center Shopping Mall and the intersection of West Main Street and Thomaston Avenue. As previously summarized, the peak traffic conditions identified for analysis were determined to be 7:30 AM – 8:30 AM, 4:30 – 5:30 PM, and 12:00 PM – 1:00 PM, for the AM, PM and SAT peak hours, respectively.
Out of the 65 study intersections, HCM evaluation methods were not applicable to 5 locations due to unconventional controls or configurations. Out of the limited Saturday analysis network, 1 intersection out of 12 was not supported for analysis by HCM methods due to unconventional control or configurations.
The following intersections were therefore omitted from analysis:
1. Chase Parkway at Interstate 84 EB On-Ramp (Exit 18)2. Charles Street at Fifth Street and CT Route 8 SB On-Ramp (Exit 30)3. Market Square at Bank Street4. Field Street at Meadow Street #2 and Interstate 84 WB Off-Ramp (Exit
21)5. Highland Avenue at Interstate 84 EB On-Ramp (Exit 18)
As summarized in the existing conditions section, Levels of Service (LOS) for intersections uses control delay per vehicle to understand operations. Table 3-7 summarizes the capacity analysis findings for the study intersections. A more detailed table which summarizes 95th percentile queue lengths, control delay, and volume to capacity ratio is provided in Appendix 3.4 (refer to Future (2045) No-Build Intersection Peak Hour Traffic Operation Summary).
Figure 3-16 through Figure 3-18 illustrate the Levels of Service for each intersection. The detail Synchro printouts are included in Appendix 3.4 (refer to Future (2045) No-Build Intersection Synchro Printouts).
Table 3-7 No Build (2045) Intersection Levels of Service
Level of ServiceA B C D E F Acceptable Deficient Total
AM PEAK 14 14 21 5 3 3 54 6 60PM PEAK 9 12 14 9 3 13 44 16 60SAT PEAK 3 3 4 1 0 0 11 0 11
As shown in Table 3-7, all study intersections analyzed are estimated to operate at acceptable levels of service during the Saturday Peak Hour. During the AM Peak Hour and PM Peak Hour, respectively, 6 out of 60 intersections (10%) and 16 out of 60 intersections (approximately 27%) operate at unacceptable levels of service and are considered operationally deficient.

SECTION 3.4 FUTURE TRAFFIC OPERATIONS
INTERSTATE 84 / ROUTE 8 “MIXMASTER” INTERCHANGE | ANALYSIS, NEEDS AND DEFICIENCIES REPORT 114
Figure 3-16 Future (2045) Level of Service Map Intersections AM Peak Hour

SECTION 3.4 FUTURE TRAFFIC OPERATIONS
INTERSTATE 84 / ROUTE 8 “MIXMASTER” INTERCHANGE | ANALYSIS, NEEDS AND DEFICIENCIES REPORT 115
Figure 3-17 Future (2045) Level of Service Map Intersections PM Peak Hour

SECTION 3.4 FUTURE TRAFFIC OPERATIONS
INTERSTATE 84 / ROUTE 8 “MIXMASTER” INTERCHANGE | ANALYSIS, NEEDS AND DEFICIENCIES REPORT 116
Figure 3-18 Future (2045) Level of Service Map Intersections Saturday Peak Hour

SECTION 3.5 FUTURE STRUCTURAL CONDITIONS
INTERSTATE 84 / ROUTE 8 “MIXMASTER” INTERCHANGE | ANALYSIS, NEEDS AND DEFICIENCIES REPORT 117
3.5 FUTURE STRUCTURAL CONDITIONSForecasts of study area bridge conditions were developed for the year 2045 based on engineering judgment4, planned rehabilitation projects, and their existing physical condition.
Predicting post-rehabilitation physical condition was a major consideration in these forecasts. The CTDOT administers preventative rehabilitation projects to maintain the condition of state-owned bridges. Rather than restoring a bridge to “like-new” condition in reaction to severe deterioration, this method of asset management uses relatively minor rehabilitation projects to keep each bridge in a “state of good repair” throughout its life. Appreciable savings can be realized over a bridge’s life by using this proactive approach to asset management (see Figure 3-19). However, a natural trend resulting from this approach is the increased frequency of preservation/rehabilitation projects performed as the bridge ages. Another observed trend is that rehabilitation projects performed later in the asset’s life tend to be more substantial and are generally less effective.
4 An analytics-based approach to forecasting future conditions with computer models and deterioration curves, while desirable, would be problematic because of insufficient data (the sample of structures similar to those in the study area is small) and the lack of an established analysis method.
Figure 3-19 Proactive Maintenance vs. Reactive Maintenance 5
5 Source: Rhode Island DOT, Investing Rhode Island’s Future: A 10-Year Plan to Strengthen Our State’s Transportation Systems, 2014. Based on an analysis published by TXDOT. Texas DOT, Typical Life Cycle Costs of a Highway, 2014, http://ftp.dot.state.tx.us/pub/txdot-info/tpp/2040/Life Cycle-costs-of-a-highway.pdf

SECTION 3.5 FUTURE STRUCTURAL CONDITIONS
INTERSTATE 84 / ROUTE 8 “MIXMASTER” INTERCHANGE | ANALYSIS, NEEDS AND DEFICIENCIES REPORT 118
Weighted by deck area, more than 60 percent of the studied bridges are scheduled for rehabilitation before the year 2045 (a subset that includes all major bridges in the study area). Also, by 2045 many of these bridges will be about 80 years old and far beyond their originally intended design life. Table 3-8 gives the forecasted year 2045 physical conditions for major components of these bridges. These forecasts were made by considering the bridges’ age and the trends described in the previous paragraph.
Table 3-8 Major Bridge Forecasted Year 2045 Conditions
Bridge No.
ProgrammedRehabilitation
Projects
2045Deck
Rating
2045Superstructure
Rating
2045Substructure
Rating03190A 6 5 503190B 6 5 503190C 4 5 503190D 4 5 503190E 4 5 503190F 4 5 503191D 4 5 503191E
State ProjectNo. 151-326
4 5 5
03191AState ProjectNo. 151-312
4 4 5
03191BState ProjectNo. 151-313
4 4 5
It was ultimately judged that programmed rehabilitation projects will only be effective at maintaining these bridges in overall “fair” condition through 2045 (the threshold for Structurally Deficient; see Section 2.6 Existing Structural Conditions). Even within this subset there are important exceptions:
1. The condition of bridge decks (and other elements) that are being completely replaced during the programmed rehabilitation projects will likely be satisfactory by 2045 (Bridge Nos. 03190A and B).
2. The condition of many mainline bridge decks is a notable deficiency due to measured 2015 chloride contamination exceeding acceptable concentration thresholds. Their deterioration is expected to accelerate through 2045. Due to the lack of a suitable detour, a complete replacement of these decks was determined to be cost prohibitive and infeasible. It is assumed that programmed rehabilitations involving deck patching will only be effective at maintaining these decks in a “poor” condition (Bridge Nos. 03190C thru F and Bridge Nos. 03191A, B, D, and E).
3. Because of ongoing safety concerns, the poor condition of decks on the stacked I-84 mainline bridges over the Naugatuck River (Bridge Nos. 03191A and 03191B) are already notable deficiencies among the studied bridges. These deficiencies will remain unaddressed through 2045 in the “no build” scenario.
4. The condition of fracture critical members and spans experiencing fatigue related cracking is already a notable deficiency among the studied bridges (see Section 2.6 Existing Structural Conditions). Rehabilitation projects to stop crack propagation are already programmed for many of these spans, however, there are still fatigue prone locations on several bridges that are not being fully addressed through rehabilitation. It is assumed that programmed rehabilitations will only be effective at maintaining these bridge superstructures in “fair/poor” condition through 2045 (Bridge Nos. 03190A and B and Bridge Nos. 03191A and B).
Finally, the programmed rehabilitation projects are not intended to improve the studied bridge’s functional adequacy or eliminate fatigue prone details. Therefore, existing structural and functional deficiencies fracture critical spans will remain unchanged in 2045.

SECTION 4.1 KEY CONTEXT FEATURES AND CHARACTERISTICS
INTERSTATE 84 / ROUTE 8 “MIXMASTER” INTERCHANGE | ANALYSIS, NEEDS AND DEFICIENCIES REPORT 119
4 Existing Social, Economic, and Environmental Conditions4.1 KEY CONTEXT FEATURES AND CHARACTERISTICSThis section inventories key context features and characteristics within the I-84 Mixmaster Reconstruction Project’s study area. Depending on the social, economic and environmental resource to be evaluated, the Study Area for the Project may be larger or smaller than that shown in Figure 1-1.
Project improvement concepts for the transportation network that are proposed during design development will be evaluated within the framework of this “contextual inventory.” The Project will use a Context Sensitive Design Solutions (CSS) approach to project development and implementation. This contextual inventory is just one component of the CSS process. Using CSS, the Project will also present opportunities to restore, enhance, and expand local context and economic identifiers through an integrated design solution.
Context Sensitive Design Solutions (CSS)
The Federal Highway Administration (FHWA) describes CSS as “a collaborative, interdisciplinary approach that involves all stakeholders in providing a transportation facility that fits its setting. It is an approach that leads to preserving and enhancing scenic, aesthetic, historic, community, and environmental resources, while improving or maintaining safety, mobility, and infrastructure conditions.” According to Context Sensitive Solutions section on the FHWA website, the process is guided by four core principles:
1. A shared stakeholder vision to provide a basis for decisions.2. A comprehensive understanding of contexts.3. Continuing communication and collaboration to achieve
consensus.4. Flexibility and creativity to shape effective transportation
solutions, while preserving and enhancing community and natural environments.
The process allows for identifying a wide range of objectives, including livability, sustainability, active transportation, and placemaking. The CTDOT further defines its objectives for its approach to CSS in its Project Development Guide (2012).
The contextual inventory was compiled from data sources owned by the State of Connecticut, City of Waterbury, and the Naugatuck Valley Council of Governments, through online research, and through qualitative data collected during site visits. In addition, various state-wide, regional, and city-wide planning studies and projects6 were reviewed during the development of this inventory including:
Waterbury Interchange Needs Study (WINS) City of Waterbury Adopted Plan of Conservation and Development (POCD)
2015-2025 Freight Street Redevelopment Strategy Master Plan (2018) Waterbury Active Transportation and Economic Resurgence (W.A.T.E.R.)
TIGER Capital Project Grant Application Naugatuck River Greenway (NRG)
The collected data was inventoried at both a city-wide and community scale. Planning studies and maps were reviewed to identify key elements at the city-wide scale. At the community scale, a key inventory area was delineated to complete a more in-depth neighborhood assessment. The key area includes the Central Business District (CBD) and the neighborhoods of Brooklyn, South End, and West End which are directly adjacent to the Mixmaster (see Figure 4-1).
6 For further description of these planning studies and projects refer to Section 1.4 Ongoing and Recent Projects

SECTION 4.1 KEY CONTEXT FEATURES AND CHARACTERISTICS
INTERSTATE 84 / ROUTE 8 “MIXMASTER” INTERCHANGE | ANALYSIS, NEEDS AND DEFICIENCIES REPORT 120
Figure 4-1 Key Area Boundary and Neighborhoods Map

SECTION 4.1 KEY CONTEXT FEATURES AND CHARACTERISTICS
INTERSTATE 84 / ROUTE 8 “MIXMASTER” INTERCHANGE | ANALYSIS, NEEDS AND DEFICIENCIES REPORT 121
4.1.1 City-Wide Inventory
The city-wide inventory is the macro-scale inventory analysis for the City of Waterbury. It is summarized under three major themes – Demographics, Land Use and Zoning, and Economic and Cultural Drivers. Note, environmental, natural, and historical resources are discussed in Section 4.4 Environmental and Natural Resources.
Demographics
Population Characteristics
According to the US Census Bureau American Community Survey7, Waterbury’s population in 2017 was 109,250 people, a slight decrease from 110,430 people in 2010. The POCD states that the growth or decline of population varies depending on the geographic location. The fastest growing areas are in the City’s outer edges, while neighborhoods close to the Mixmaster, such as South End and Brooklyn saw their populations decline between 2000 and 2010. Population density also varies from neighborhood to neighborhood. Figure 4-2 shows that neighborhoods surrounding Downtown Waterbury have a higher population density, creating an urban core.
Table 4-1 compares the age distributions in Waterbury and Connecticut. At both the state level and within Waterbury, the primary age groups were 25-44 and 45-64 years of age. The median age in Waterbury was thirty-five, younger than the state median of forty. The age distribution supports the revitalization effort of downtown Waterbury as shifting trends throughout the country show both younger populations and empty-nesters are choosing to live in urban areas with a walkable downtown and less automobile dependency.
7 U.S. Census Bureau, American Community Survey (ACS), “Age and Sex” 2017: Five-Year Estimates Subject Tables.
Table 4-1 Waterbury Population Age Distribution8
Population characteristics regarding race and income for Waterbury as of 2017 are summarized below9:
The largest racial groups are White (38.5%), Hispanic or Latino (37.2%), and Black (17.9%);
The median household income is $39,681; The unemployment rate is 8.1%, higher than the New Haven County average
(5.5%) and Connecticut State average (5.1%); and The poverty rate is 25.4%, significantly higher than the County (12.8%) and
State (10.4%) rates.
Due to the racial composition and poverty rate, the City of Waterbury is considered an “Environmental Justice" community. This is described in more detail in the following section.
8 U.S. Census Bureau, American Community Survey (ACS), “Age and Sex” 2017: Five-Year Estimates Subject Tables.
9 U.S. Census Bureau, American Community Survey (ACS), “Income In the Past Twelve Months” and "ACS Demographic and Housing Estimates" 2017: Five-Year Estimates Subject Tables.
AgeWaterbury No. of Persons
Waterbury %
Connecticut No. of Person
Connecticut %
0-4 7,619 7% 186,188 5.20%5-14 15,655 14.30% 432,367 12%15-24 15,680 14.30% 495,626 13.70%25-44 29,751 27.30% 872,640 24.20%45-64 33,169 24.20% 1,031,900 28.70%65+ 14,077 12.90% 575,757 16%Total 109,250 100% 3,594,478 100%

SECTION 4.1 KEY CONTEXT FEATURES AND CHARACTERISTICS
INTERSTATE 84 / ROUTE 8 “MIXMASTER” INTERCHANGE | ANALYSIS, NEEDS AND DEFICIENCIES REPORT 122
Figure 4-2 Population Density Map
OK

SECTION 4.1 KEY CONTEXT FEATURES AND CHARACTERISTICS
INTERSTATE 84 / ROUTE 8 “MIXMASTER” INTERCHANGE | ANALYSIS, NEEDS AND DEFICIENCIES REPORT 123
Title VI/Environmental Justice
According to the United States Environmental Protection Agency (EPA), Environmental Justice is “the fair treatment and meaningful involvement of all people regardless of race, color, national origin, or income with respect to the development, implementation and enforcement of environmental laws, regulations and policies.” Federal protections for Environmental Justice include Executive Order (EO) 12898, Federal Actions that Address Environmental Justice in Minority Populations and Low-Income Populations, and Title VI of the Civil Rights Act of 1964. EO 12898 directs federal agencies to “make achieving environmental justice part of its mission by identifying and addressing, as appropriate, disproportionately high and adverse human health or environmental effects of its programs, policies, and activities on minority populations and low-income populations.” Title VI of the Civil Rights Act of 1964 requires that no person shall, on the ground of race, color, or national origin, be excluded from participation in, be denied the benefits of, or be subjected to discrimination under any program or activity receiving Federal financial assistance.
As shown in Figure 4-2.1 and Figure 4-2.2, the EJ Study Area includes the Project Study Corridor, the Traffic Data Collections Area, and the Key Area Boundary-study area limits illustrated in Figure 1-1. To be more inclusive, the EJ Study Area also includes all US Census block groups that touch those study area limits. For block groups with boundaries extending beyond the EJ Study Area limits, the entirety of the block group is included in the analysis. This results in fifty-five block groups that are included in the Environmental Justice assessment.
For this analysis, the threshold definition for racial minority and low-income populations used to identify Environmental Justice populations within the Environmental Justice (EJ) Study Area are as follows:
a. Racial Minority
Federal guidance provided by the Council on Environmental Quality (CEQ) states "minority populations should be identified where either (a) the minority population of the affected area exceeds 50 percent or (b) the minority population percentage of the affected area is meaningfully greater than the minority population percentage in the general population or other appropriate unit of geographic analysis."10 The term “meaningfully” provides the lead and sponsoring agencies room to exercise discretion in determining
10 Council on Environmental Quality Executive Office of the President, Environmental Justice Guidance Under the National Environmental Policy Act, December 10, 1997. Accessed at https://www.epa.gov/sites/production/files/2015-02/documents/ej_guidance_nepa_ceq1297.pdf
the appropriate thresholds. Given an analysis of the local context, demographics and county and state averages, this project will be following part (b) of the CEQ definition. As such, the EJ threshold for racial minority is considered to be anything greater than the State’s average minority population of 32%. The unit of geographical analysis used for this study is the census block group.
b. Low-Income Population
According to the US Census Bureau American Community Survey, in the State of Connecticut, the average household size in 2017 was 2.65, making the federal poverty threshold $18,95711. The Connecticut General Statutes (CGS) (Chapter 439, Section 22a-20a) defines an EJ community as a United States census block group for which thirty percent or more of the population consists of low income persons who are not institutionalized and have an income below two hundred percent of the federal poverty level. Two hundred percent of the federal threshold is $37,914. Environmental Justice block groups exceed this threshold if 30% or more of the population has a household income of less than $37,914.
Table 4-2 provides data on the State, County, City, study area and individual block groups racial minority composition and low-income populations, while Figure 4-3 depicts the location of Environmental Justice block groups. All data used to develop these maps and tables was collected from the 2017 US American Community Survey. Due to the racial composition and/or income findings, forty-eight of the fifty-five EJ Study Area block groups are considered EJ communities. Fourteen of the seventeen of block groups that are immediately adjacent to either Route 8 or I-84 are EJ communities, and all block groups surrounding the immediate interchange are EJ block groups (see Figure 4-3).
The City of Waterbury has also been on the Connecticut Distressed Municipalities List12 since 1999, when the State started to publish the list. The list is determined annually based on indicators that measure the fiscal capacity of each municipality based on its tax base. In 2017, Waterbury was ranked third on the list. As both the EJ findings and Distressed Municipalities list indicate, the needs of the local community will be an important consideration in the development of highway alternatives.
11 Federal Register by the Department of Health and Human Services (HHS), Annual Update of the HHS Poverty Guidelines 2017.
12 Department of Economic and Community Development, State of Connecticut. Distressed Municipalities. From http://www.ct.gov/ecd/cwp/view.asp?a=1105&q=251248

SECTION 4.1 KEY CONTEXT FEATURES AND CHARACTERISTICS
INTERSTATE 84 / ROUTE 8 “MIXMASTER” INTERCHANGE | ANALYSIS, NEEDS AND DEFICIENCIES REPORT 124
Figure 4-2.1 Percentage of Minorities Map

SECTION 4.1 KEY CONTEXT FEATURES AND CHARACTERISTICS
INTERSTATE 84 / ROUTE 8 “MIXMASTER” INTERCHANGE | ANALYSIS, NEEDS AND DEFICIENCIES REPORT 125
Figure 4-2.2 Average Household Income Map

SECTION 4.1 KEY CONTEXT FEATURES AND CHARACTERISTICS
INTERSTATE 84 / ROUTE 8 “MIXMASTER” INTERCHANGE | ANALYSIS, NEEDS AND DEFICIENCIES REPORT 126
Table 4-2 Environmental Justice Populations Matrix

SECTION 4.1 KEY CONTEXT FEATURES AND CHARACTERISTICS
INTERSTATE 84 / ROUTE 8 “MIXMASTER” INTERCHANGE | ANALYSIS, NEEDS AND DEFICIENCIES REPORT 127
Table 4-2 Environmental Justice Populations Matrix (continued)

SECTION 4.1 KEY CONTEXT FEATURES AND CHARACTERISTICS
INTERSTATE 84 / ROUTE 8 “MIXMASTER” INTERCHANGE | ANALYSIS, NEEDS AND DEFICIENCIES REPORT 128
Figure 4-3 Environmental Justice Populations Map
SECTION 4.1 KEY CONTEXT FEATURES AND CHARACTERISTICS
INTERSTATE 84 / ROUTE 8 “MIXMASTER” INTERCHANGE | ANALYSIS, NEEDS AND DEFICIENCIES REPORT 129
Land Use and Zoning
To develop an understanding of the setting in which the Mixmaster is located, land use and zoning information for the City of Waterbury was collected. According to the 2015 POCD, Waterbury has a total land area of approximately 18,640 acres, with a variety of land uses. The land use was comprised of:
35.7% Residential 17.3% Infrastructure and Right-of-Way 18.0% Vacant Land 11.3% Open Space 6.0% Institutional 5.7% Commercial and Office Uses 6.0% Industrial Uses
Majority of the commercial and office uses are located within and adjacent to the CBD. The CBD has a range of mixed use residential and commercial buildings. More than half of the industrial land is light industry clustered in industrial parks near I-84 and Route 8. Figure 4-5 illustrates the existing land use, while Figure 4-6 illustrates the future land use proposed in the POCD around the key area. The Future Land Use Plan is based upon appropriate locations for and relationships between land uses, existing land use and development patterns, environmental and natural features, physical features, current and potential zoning, planning analysis, public workshops and community survey to reflect the desires and visions of citizens and stakeholders.
The City of Waterbury has three active Neighborhood Revitalization Zones (NRZ) and twenty-one active neighborhood groups. The NRZ Program was established by the State of Connecticut in 1995 to revitalize neighborhoods through the collaborative involvement of residents, business, and government to determine a common vision and set of priorities. Of the four neighborhoods surrounding the Mixmaster, the neighborhood of Brooklyn, on the south side of the Mixmaster, is the only designated NRZ. The other two NRZ neighborhoods, St. Margaret/Willow Plaza and Walnut Orange Walsh, are outside the key area boundary of the Mixmaster, as indicated on the city-wide neighborhood map in Figure 4-4.

SECTION 4.1 KEY CONTEXT FEATURES AND CHARACTERISTICS
INTERSTATE 84 / ROUTE 8 “MIXMASTER” INTERCHANGE | ANALYSIS, NEEDS AND DEFICIENCIES REPORT 130
Figure 4-4 Neighborhoods and Neighborhood Groups Map

SECTION 4.1 KEY CONTEXT FEATURES AND CHARACTERISTICS
INTERSTATE 84 / ROUTE 8 “MIXMASTER” INTERCHANGE | ANALYSIS, NEEDS AND DEFICIENCIES REPORT 131
Figure 4-5 Land Use Map

SECTION 4.1 KEY CONTEXT FEATURES AND CHARACTERISTICS
INTERSTATE 84 / ROUTE 8 “MIXMASTER” INTERCHANGE | ANALYSIS, NEEDS AND DEFICIENCIES REPORT 132
Figure 4-6 Future Land Use Map

SECTION 4.1 KEY CONTEXT FEATURES AND CHARACTERISTICS
INTERSTATE 84 / ROUTE 8 “MIXMASTER” INTERCHANGE | ANALYSIS, NEEDS AND DEFICIENCIES REPORT 133
Open Space
In 1997, the State of Connecticut added in its General Statutes, a goal of conserving 21%, or 673,210 acres, of State land for open space by year 2023. According to the POCD, the City of Waterbury’s current goal is to conserve 21%, a 10% increase from the current state, of its land for open space but a specific strategy has not been proposed.
Currently, the open spaces in the City of Waterbury consist of:
7.0% Public Parks and Recreation 2.0% Preserved Open Space 1.7% Cemeteries
Major public parks in the key area include: (see Figure 4-7)
Waterbury Green Library Park Riverside Cemetery Chase Park Hamilton Park Washington Park
Streetscape
Streetscape elements such as street trees and urban planting serve as an environmentally conscience planning precedent that improves water quality, mitigates urban heat island effect, and reduces air pollution. Some of Waterbury’s neighborhoods are lined with these streetscape elements which also help enhance the experience of being in the city in addition to the environmental benefits. The newly installed Freight Street Reconstruction also includes green infrastructure to manage stormwater and create a visually attractive buffer between vehicular traffic and bicycle/pedestrian paths.
Economic and Cultural Drivers
Economic and cultural drivers for the City of Waterbury were identified to ensure the Project is designed to promote economic and cultural preservation and growth in the city (see Figure 4-7). In Waterbury, the largest employer is City government. The largest private-sector employers are St. Mary’s Hospital and Waterbury Hospital. St. Mary’s Hospital is in downtown Waterbury and Waterbury Hospital is adjacent to Route 8, just north of the interchange. All three employers have 1,000 or more employees.
Waterbury has several major retail centers, in addition to the local shops in the CBD. The major retail centers within the city boundaries are Brass Mill Center, immediately adjacent to downtown on the east, and Naugatuck Valley Shopping Center at the outskirt along Route 69. Downtown Waterbury is currently undergoing revitalization and it is the City of Waterbury’s goal to transform the area through mixed-use development.
Mattatuck Museum and the Palace Theater are two examples of major cultural resources located in downtown Waterbury. The Palace Theater was renovated in 2004, alongside the opening of the Waterbury Arts Magnet School. A short distance from the Mixmaster, south of Brass Mill Center, is the Seven Angels Theater at Hamilton Park which is a venue for regional and national touring performances.
In addition to art and cultural venues, Waterbury is home to several educational institutions. Adjacent to the key study area, is the University of Connecticut Waterbury Campus in the CBD. The Naugatuck Valley Community College (NVCC) is located west of the interchange and not included in the key area.
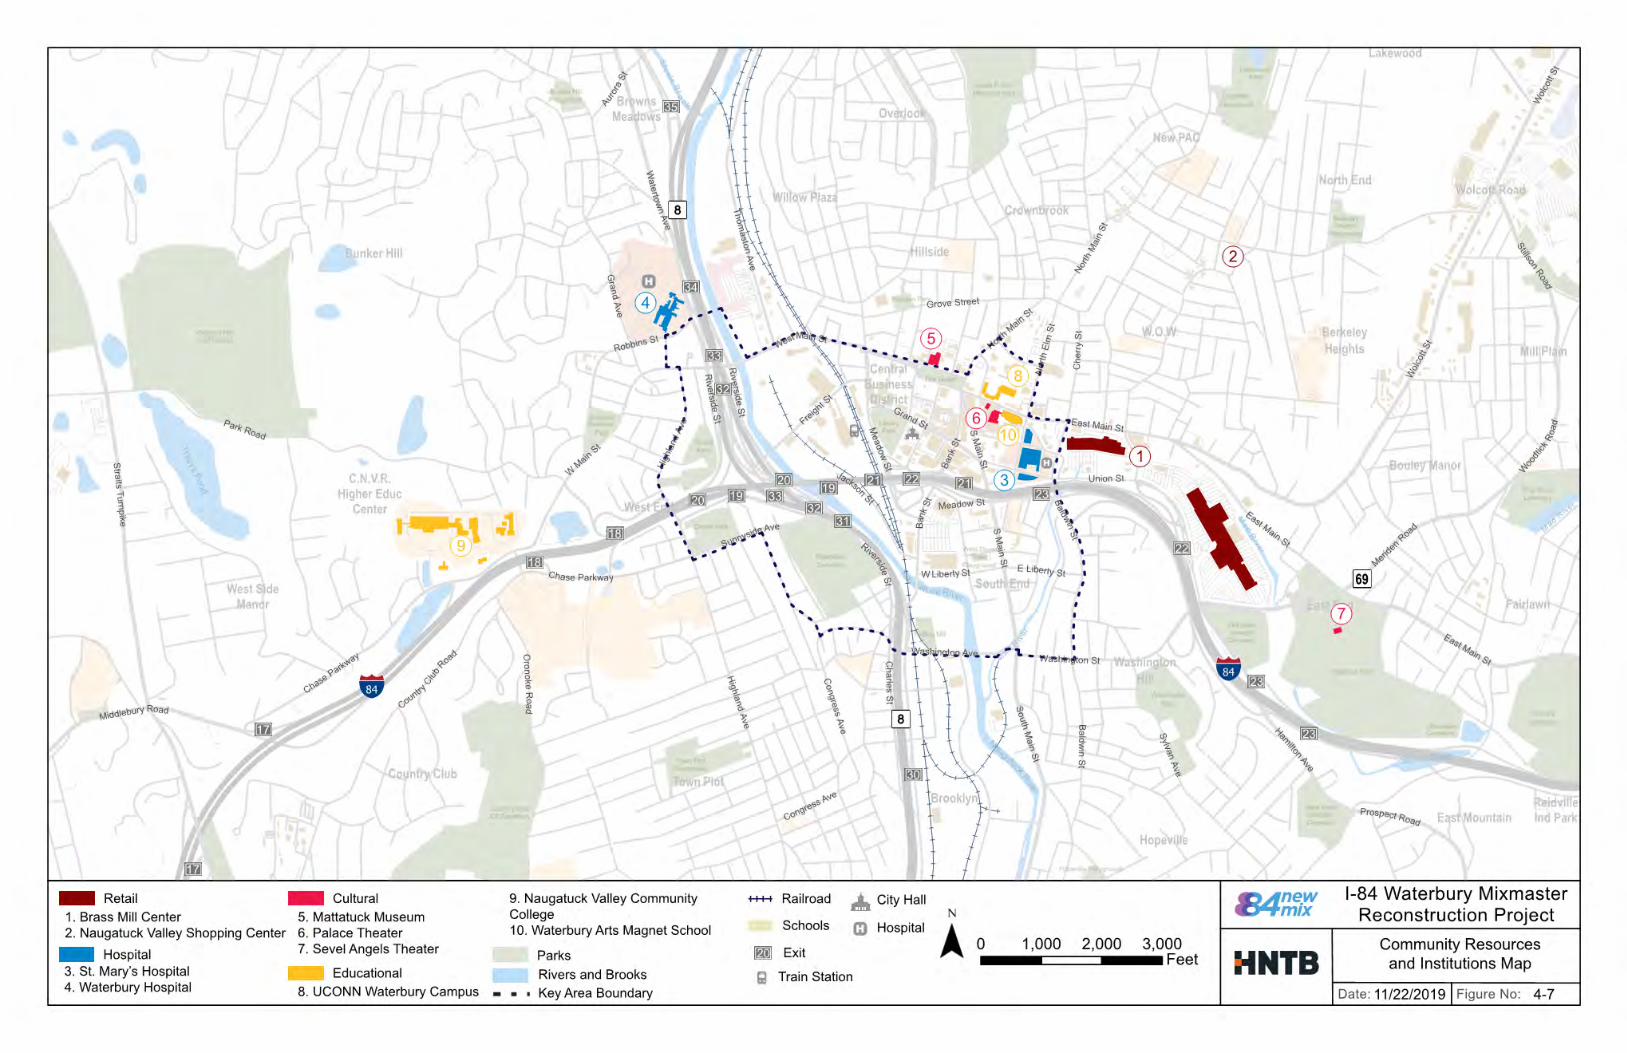
SECTION 4.1 KEY CONTEXT FEATURES AND CHARACTERISTICS
INTERSTATE 84 / ROUTE 8 “MIXMASTER” INTERCHANGE | ANALYSIS, NEEDS AND DEFICIENCIES REPORT 134
Figure 4-7 Community Resources and Institutions Map

SECTION 4.1 KEY CONTEXT FEATURES AND CHARACTERISTICS
INTERSTATE 84 / ROUTE 8 “MIXMASTER” INTERCHANGE | ANALYSIS, NEEDS AND DEFICIENCIES REPORT 135
Historical Resources
The City of Waterbury has a wealth of historic inventory (see Figure 4-8). There are four historic Districts on the Federal and State Register, thirteen properties on the Connecticut Register of Historic Places, and thirty-one properties on the National Register of Historic Places (see Table 4-3).
Mapping from the NPS National Register of Historic Places’ unrestricted database shows three historically significant areas that are partially located within the Project Study Corridor (see Figure 4-8). These resources include Riverside Cemetery, a cultural resource site, and Downtown Waterbury Historic District and Hamilton Park, which are both considered cultural resource districts. Other smaller resources including cultural resource buildings, sites, and structures are mapped in the vicinity, but outside of the Project Study Corridor. It should be noted that since this mapping is from unrestricted database, there are potentially additional resources present in or near the existing alignment that may be included in databases which are not available to the public.
Additional historical and archaeological mapping is provided in Figure 4-8.1 through Figure 4-8.9 which show Approximate Project Limits in relation to known cultural resources on file with the CTDOT Office of Environmental Planning.
Table 4-3 City of Waterbury Historical Resources
Connecticut Register of Historic Places National Register of Historic Places, Properties Catholic Charities, 56 Church Street Leavenworth House, 35 Park Place Mattatuck Museum, 119 W Main Street New Haven Rail Road Station (Union Station), 389 Meadow Rose Hill, 63 Prospect Street Waterbury Business & Professional Women’s Club, 269-300 W Main St Residence, 1 Welton Place Residence, 33 Church St Residence, 41 Church Street Chase Building, 236 Grand Street City Hall Water Fountain/Monument, N Main Street The Rectory Building (St Patrick’s Hall), 110-118 E Main Street
National Register of Historic Places, District Bank Street Historic District, 207-231 Bank Street Downtown Waterbury Historic District, bounded by Main, Meadow, and Elm
Streets Hillside Historic District, bounded by Woodlawn Terr., W Main Street, and
Willow Street
George S Abbott, Building, 235-47 N. Main Street. Benedict-Miller House, 32 Hillside Ave Beth El, 259-375 Cooke Street Bishop School, 178 Bishop Street Elton Hotel, 16-30 W Main Street Lewis Fulton, Memorial Park, bounded by Cook, Pine, Fern and Charlotte Streets Hamilton Park, bounded by Silver Street, E Main Street, Idlywood Ave, Plank Rod, the Mad
River and I-84 Enoch Hubbard House and George Grannis, 41 Church Street and 33 Church Street John Kendrick, 119 W Main Street Matthews and Willard Factor, 16 Cherry Ave Palace Theater, 86-110 E Main Street Riverside Cemetery, Riverside Street from Sunnyside to Summit Street Sheffield Street Bridge, Sheffield Street over Hancock Brook Stapleton Building, 751 N Main Street Washington Avenue Bridge, Washington Ave over Mad River Waterbury Brass Mill, Idlewood Ave in Hamilton Park Waterbury Clock Company, N Elm, Cherry Street, and Cherry Ave Waterbury Municipal Center Complex, 235, 236 Grand Street; 7, 35, 43 Field Street Waterbury Union Station, 389 Meadow Street Webster School, Easton Ave at Aetna Street Wilby High School, 260 Grove Street
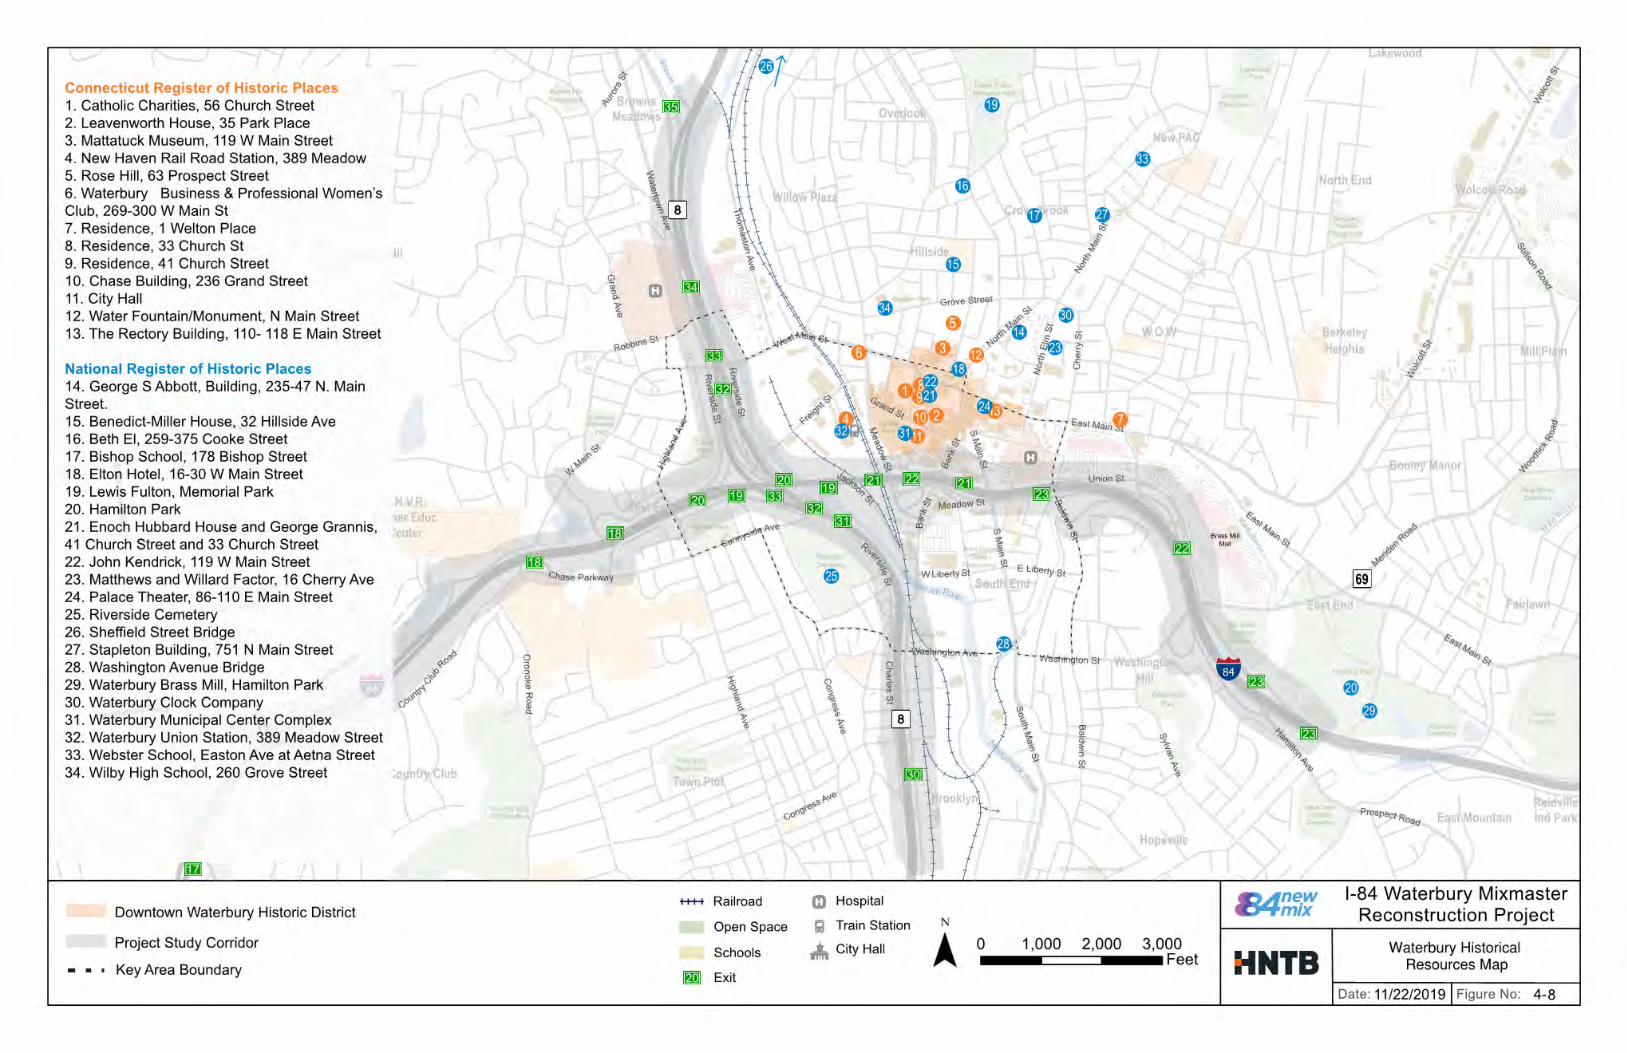
SECTION 4.1 KEY CONTEXT FEATURES AND CHARACTERISTICS
INTERSTATE 84 / ROUTE 8 “MIXMASTER” INTERCHANGE | ANALYSIS, NEEDS AND DEFICIENCIES REPORT 136
Figure 4-8 Waterbury Historical Resources Map

SECTION 4.1 KEY CONTEXT FEATURES AND CHARACTERISTICS
INTERSTATE 84 / ROUTE 8 “MIXMASTER” INTERCHANGE | ANALYSIS, NEEDS AND DEFICIENCIES REPORT 137
Figure 4-8.1 Historical and Archaeological Map 1 of 9

SECTION 4.1 KEY CONTEXT FEATURES AND CHARACTERISTICS
INTERSTATE 84 / ROUTE 8 “MIXMASTER” INTERCHANGE | ANALYSIS, NEEDS AND DEFICIENCIES REPORT 138
Figure 4-8.2 Historical and Archaeological Map 2 of 9

SECTION 4.1 KEY CONTEXT FEATURES AND CHARACTERISTICS
INTERSTATE 84 / ROUTE 8 “MIXMASTER” INTERCHANGE | ANALYSIS, NEEDS AND DEFICIENCIES REPORT 139
Figure 4-8.3 Historical and Archaeological Map 3 of 9
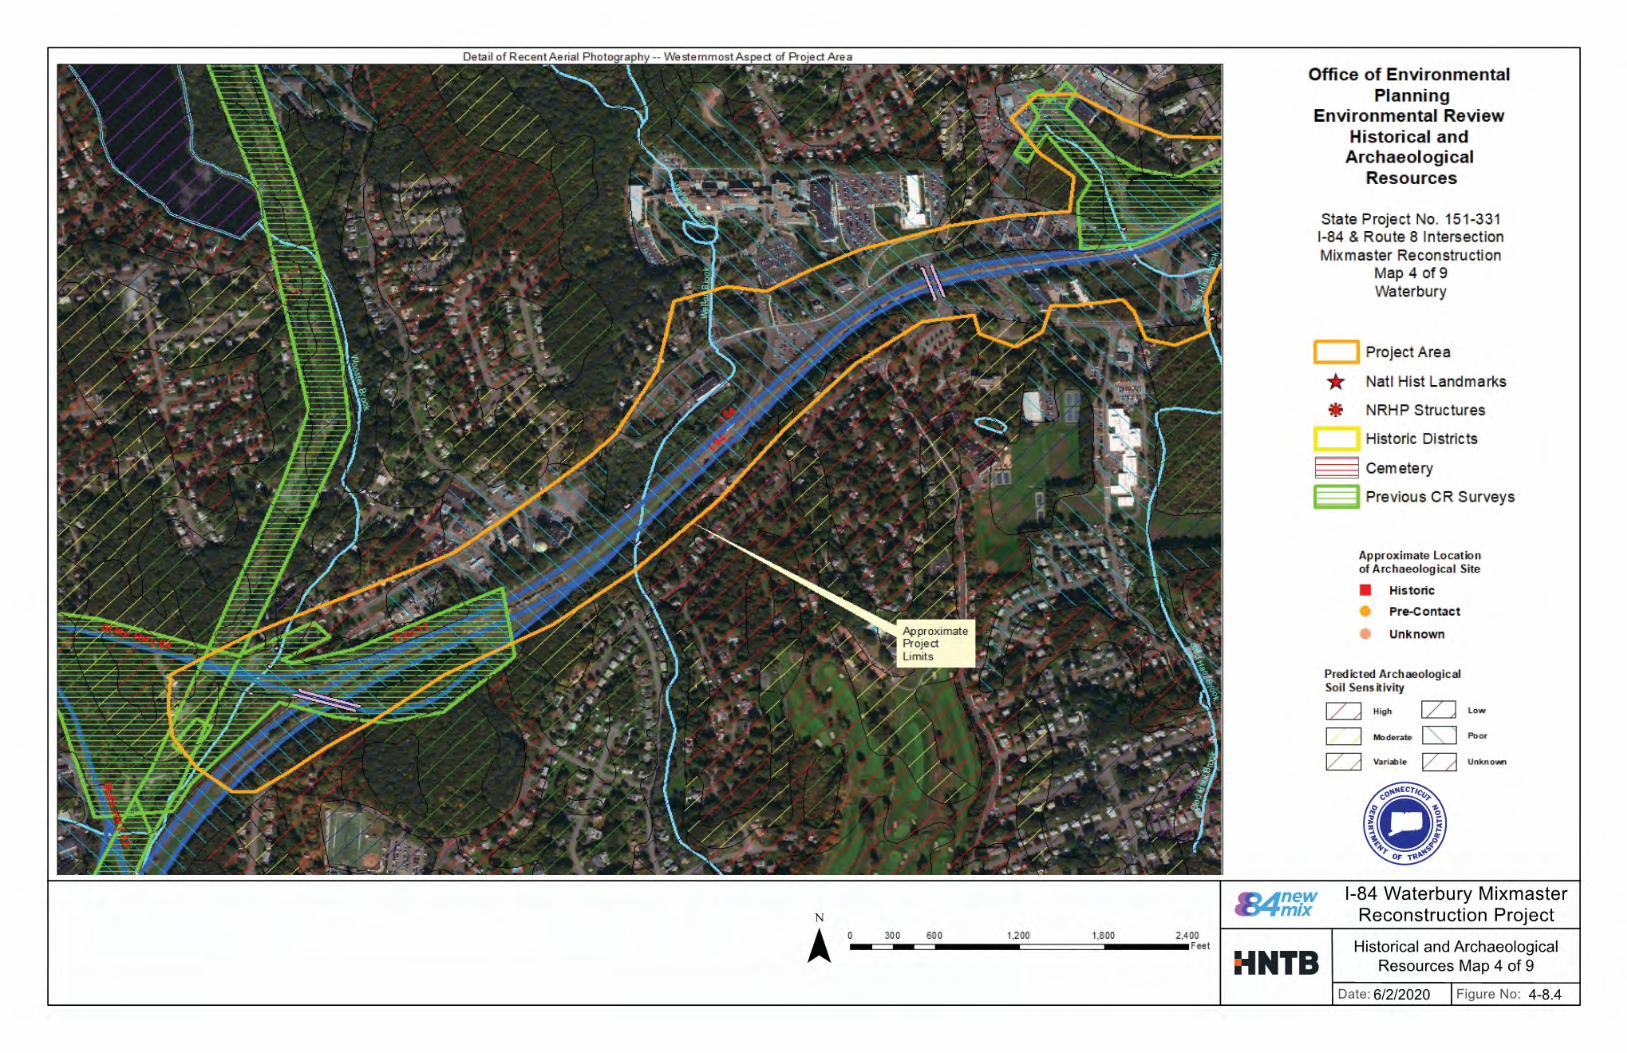
SECTION 4.1 KEY CONTEXT FEATURES AND CHARACTERISTICS
INTERSTATE 84 / ROUTE 8 “MIXMASTER” INTERCHANGE | ANALYSIS, NEEDS AND DEFICIENCIES REPORT 140
Figure 4-8.4 Historical and Archaeological Map 4 of 9

SECTION 4.1 KEY CONTEXT FEATURES AND CHARACTERISTICS
INTERSTATE 84 / ROUTE 8 “MIXMASTER” INTERCHANGE | ANALYSIS, NEEDS AND DEFICIENCIES REPORT 141
Figure 4-8.5 Historical and Archaeological Map 5 of 9

SECTION 4.1 KEY CONTEXT FEATURES AND CHARACTERISTICS
INTERSTATE 84 / ROUTE 8 “MIXMASTER” INTERCHANGE | ANALYSIS, NEEDS AND DEFICIENCIES REPORT 142
Figure 4-8.6 Historical and Archaeological Map 6 of 9

SECTION 4.1 KEY CONTEXT FEATURES AND CHARACTERISTICS
INTERSTATE 84 / ROUTE 8 “MIXMASTER” INTERCHANGE | ANALYSIS, NEEDS AND DEFICIENCIES REPORT 143
Figure 4-8.7 Historical and Archaeological Map 7 of 9

SECTION 4.1 KEY CONTEXT FEATURES AND CHARACTERISTICS
INTERSTATE 84 / ROUTE 8 “MIXMASTER” INTERCHANGE | ANALYSIS, NEEDS AND DEFICIENCIES REPORT 144
Figure 4-8.8 Historical and Archaeological Map 8 of 9

SECTION 4.1 KEY CONTEXT FEATURES AND CHARACTERISTICS
INTERSTATE 84 / ROUTE 8 “MIXMASTER” INTERCHANGE | ANALYSIS, NEEDS AND DEFICIENCIES REPORT 145
Figure 4-8.9 Historical and Archaeological Map 9 of 9

SECTION 4.1 KEY CONTEXT FEATURES AND CHARACTERISTICS
INTERSTATE 84 / ROUTE 8 “MIXMASTER” INTERCHANGE | ANALYSIS, NEEDS AND DEFICIENCIES REPORT 146
4.1.2 Neighborhood Assessment
The neighborhood assessment looks deeper into the area surrounding the Mixmaster as discussed in the city-wide assessment. The neighborhoods surrounding the Mixmaster are roughly divided into four neighborhood quadrants, due to the intersection of I-84 and Route 8, as shown on Figure 4-9 through Figure 4-19. The four neighborhoods are the Central Business District, South End, Brooklyn, and West End. This micro-scale analysis provides in-depth detail into land uses, cultural and natural resources, and a qualitative assessment of each neighborhood (see Figure 4-9 through Figure 4-19 for key elements identified in this section).
Central Business District (CBD)
Waterbury’s CBD is a historical downtown, located north of I-84 and east of the Naugatuck River. Waterbury Green (see Figure 4-9, left), a linear open space on West Main Street and Bank Street, serves as the main hub and a central transit stop for many bus lines. During the day, it is a leisurely, well-used public space. During commuting hours, the area is heavily trafficked by pedestrians and public transit. Framing the Waterbury Green are several important civic buildings – Mattatuck Museum, Basilica of the Immaculate Conception, and Greater Waterbury YMCA. The area is lined with street trees and benches and is generally well-maintained.
Figure 4-9 Photos of Waterbury Green (Left) and Library Park (Right)
Another major nexus of the CBD is Library Park (see Figure 4-9, right). At the intersection of Meadow Street and Grand Street, the park is framed by notable public buildings – Waterbury Train Station, the Superior Court and Waterbury Courthouse, the Silas Bronson Public Library, and Waterbury City Hall (see Figure 4-10). It is important to note that Library Park is at grade on the north along Grand Street while the streets on the south side are at a significantly lower grade. As a result, a tall brick retaining wall was built along three sides of the park with a generous staircase on the south side for access. The W.A.T.E.R. project (Waterbury Active Transportation and Economic Resurgence) aims to address the grade change by implementing a connector between Library Park, Waterbury Train Station, and the Naugatuck River Greenway (NRG) (Library Park-Train-Station-Riverfront) with a pedestrian bridge and improved streetscape.
Figure 4-10 Photos of City Hall (Left) and Train Station/Library Green (Right)
Both Waterbury Green and Library Park are located within the Downtown Waterbury Historic District and listed under the National Register of Historic Places (NRHP). Many buildings within the historic district are also listed as historical properties on the national or state level and are well maintained. Most historical buildings have been renovated to contemporary uses such as public buildings, offices, or mixed-uses. There is also the Bank Street Historic District on Bank Street in the CBD, which consists of four, late 19th Century brick buildings.
Outside of the historic districts, buildings in the CBD are mostly nondescript. Most major streets have a continuous building façade that provide an urban density to the general downtown area. Alongside streets and closer to I-84, there are significant number of surface parking lots and vacant land. Furthermore, there are several large parking garages closer to the I-84 and St. Mary’s Hospital in the southern part of the CBD (see Figure 4-11). These land uses create unmaintained and unwelcoming spaces in an otherwise walkable downtown.
Figure 4-11 Photos of Bank/Grand (Left) and Meadow/Field Intersections (Right)
Most of the existing planning projects consider improvements and connections to the CBD as major components. The underpasses and overpasses that connect CBD with surrounding neighborhoods are important gateways and special attention should be paid to their physical treatment and design. The Project should also be sensitive to the historical and cultural resources in the neighborhood in order to minimize and mitigate disruptions to the features that make the CBD vibrant.
Furthermore, the ongoing Freight Street District redevelopment, directly adjacent to downtown, will be an important consideration for the Project. The proposed strategy for the district would likely introduce mixed-use and high-density residential development to the area, with a strong connection to downtown and Naugatuck River Greenway (NRG_. The Project will need to develop concepts that integrate with the goals of the Freight Street District redevelopment.

SECTION 4.1 KEY CONTEXT FEATURES AND CHARACTERISTICS
INTERSTATE 84 / ROUTE 8 “MIXMASTER” INTERCHANGE | ANALYSIS, NEEDS AND DEFICIENCIES REPORT 147
South End
South of the CBD is the neighborhood of South End. South End is a small neighborhood with a mix of land uses – big box retail, light industry, and single-family residential. On the west side of the neighborhood, Benedict Street and Bank Street are dominated by two big box retail footprints and large surface parking lots. Given the configuration of these large lots, this area is a deterrent for walking and biking. Moreover, the surrounding streets are rarely used on a weekday afternoon (see Figure 4-12 and Figure 4-13).
Figure 4-12 Photos of Benedict Street (Left) and Benedict/West Clay Intersection (Right)
Figure 4-13 Photos of Big Box Retail (Left) and Vacant Land on Benedict Street (Right)
Similarly, the east side of Benedict Street is dotted with large vacant manufacturing buildings, light industrial uses, and surface parking lots. Land uses gradually become more residential toward the east side. Most residential properties are two-story row houses with several three-story apartment buildings along South Main Street. In addition, there are numerous neighborhood retail stores, light industry uses, and vacant lots on and near South Main Street (see Figure 4-14 and Figure 4-15).
Figure 4-14 Photos of W. Dover Street at South End (Left) and S. Main Street (Right)
Figure 4-15 Photos of E. Dover Street (Left) and Mill Street (Right)
Continuing easterly, two civic institutions are located at the intersection of South Main Street, East Clay Street, and South Elm Street – St Anne’s Catholic Church and Maloney Elementary School (see Figure 4-16). St. Anne’s twin steeples have served as a beacon from various viewpoints throughout the city, however they are currently in the process of being removed due to age, repair costs and liability.
Figure 4-16 Photos of St. Anne's Church (Left) and Maloney Elementary School (Right)

SECTION 4.1 KEY CONTEXT FEATURES AND CHARACTERISTICS
INTERSTATE 84 / ROUTE 8 “MIXMASTER” INTERCHANGE | ANALYSIS, NEEDS AND DEFICIENCIES REPORT 148
Brooklyn
West of the South End, spanning the Naugatuck River is the neighborhood of Brooklyn. Most of the land in Brooklyn is occupied as high- and middle-density, single-family residential, except for the light industrial zoned area between Route 8 and Naugatuck River and an unused area east of Naugatuck River (see Figure 4-17).
Located west of Route 8 are two major open spaces in Brooklyn, the historical Riverside Cemetery and Chase Park (see Figure 4-18). Connections between Brooklyn, CBD, Naugatuck River Greenway, and other neighborhoods will be a focus for the Project.
Figure 4-17 Photos of Alder Street (Left) and Washington Avenue (Right) in Brooklyn
Figure 4-18 Photos of Riverside Cemetery (Left) and Chase Park (Right)
West End
West of the CBD and north of I-84 is the neighborhood of West End. The area west of the Naugatuck River is mostly single-family residential. Given its lower density, this area also has more green space between buildings (Figure 4-19).
Figure 4-19 Photos of Highland Ave (Left) and Wilson Street (Right) in West End
Waterbury Hospital is a major employer and civic institution. The hospital is located immediately north of West End on Robbins Street (see Figure 4-7 Community Resources and Institutions Map). The landscaped campus with standard sidewalks blends into the neighborhood. However, access to the hospital will need to be considered in the design of the new interchange.
The area between the Naugatuck River and the CBD is designated as Freight Street District. The District is currently undergoing redevelopment planning as part of the Freight Street Redevelopment Strategy Master Plan, as previously described in Section 1.4 Ongoing and Recent Projects. The area is zoned as a Central Business District, though most of the current land uses are light industrial. Given that the redevelopment plan for Freight Street has been proposed recently, the redevelopment effort is at a very early stage and has not yet physically transformed the area.
Similar to Brooklyn, West End, outside of the Freight Street District, is not a focus of potential development area but its connections between Brooklyn, downtown, and other neighborhoods will continue to be a focus for the Project.

SECTION 4.2 TRANSIT AND RAIL ASSESSMENT
INTERSTATE 84 / ROUTE 8 “MIXMASTER” INTERCHANGE | ANALYSIS, NEEDS AND DEFICIENCIES REPORT 149
4.2 TRANSIT AND RAIL ASSESSMENTThis section summarizes transit services in the Waterbury area including an evaluation focused on the frequency and type of service provided. An additional focus was placed on programmed improvements to existing services or the infrastructure used in the delivery of those services. The findings of this investigation are summarized in Section 4.2.2 Transit Service Summary and outline the impact of the current and future transit services on the study area. Analysis of impacts also includes a discussion of the demographic characteristics that drive the transit needs of the region.
4.2.1 Demographic Characteristics
The City of Waterbury had a population of 118,098 as of the year 2018. The metropolitan area around Waterbury, particularly its urban core, has a relatively large transit dependent population with 20 percent of households not having access to a vehicle and approximately 40 percent only having access to a single vehicle. This means the transit services in the region are a need as opposed to a choice for many residents. Table 4-4 and Table 4-5 depict Waterbury’s modal split and vehicles available by household. Data is derived from 2016 American Community Survey 5-year estimates.
Table 4-4 City of Waterbury Population Mode Split
Modal Split EstimateMargin of
Error% of Working
PopulationDrove Alone 34,771 +/-1,365 79.53%Carpooled 4,745 +/-674 10.85%Public transportation 2,073 +/-360 4.74%Walked 994 +/-177 2.27%Other means 455 +/-154 1.04%Worked at home 685 +/-188 1.57%Total Working Population 43,723 +/-1,230 100%
Table 4-5 City of Waterbury Vehicles per Household
Vehicles per Household EstimateMargin of
Error % of HouseholdsNo vehicle available 8,037 +/-611 20.23%1 vehicle available 16,027 +/-808 40.33%2 vehicles available 11,044 +/-577 27.79%3 vehicles available 3,339 +/-350 8.40%4 or more vehicles available 1,288 +/-246 3.24%Total Households 39,735 +/-778 100%
4.2.2 Transit Service Summary
The Waterbury area has a robust fixed-route transit network serviced by CTtransit Waterbury for local service; CTtransit New Haven and CTtransit Hartford for express service; Peter Pan, and Greyhound for regularly scheduled intercity service; and North East Transportation (NET) operating paratransit and dial-a-ride services through the Greater Waterbury Transit District. In addition, the Metro North Waterbury Branch Line (WBL) provides commuter rail service from Waterbury to Bridgeport for rail connections to the New Haven Line (NHL) and Grand Central Terminal (GCT) in New York. These services accommodate diverse user groups within the region through weekday and weekend rail and transit services with connections to urban, suburban and rural areas around the Mixmaster.
While the transit and rail services in the Waterbury area are extensive, there is little direct impact of these services on the day-to-day traffic of the Mixmaster Interchange. Moreover, much of the traffic generated on the Mixmaster originates outside of Waterbury and therefore changes in transit dependency in the region are not likely to significantly impact traffic volumes over the Mixmaster. None of the local CTtransit Waterbury buses operating throughout the Waterbury area operate directly through the Mixmaster interchange. Two CT Transit Express bus routes (routes 925, and 928) provide express service from Waterbury to Hartford with all boardings occurring in downtown Waterbury. The routes operate east of the Mixmaster using local roads before merging onto I-84 towards the eastern boundary of the study area. A relatively small number of intercity transit vehicles operate over and through the Mixmaster network itself. These services include over the road coach buses operated by various intercity bus providers (such as Peter Pan, Greyhound, and Mega Bus) and several other smaller bus companies with charter service.

SECTION 4.2 TRANSIT AND RAIL ASSESSMENT
INTERSTATE 84 / ROUTE 8 “MIXMASTER” INTERCHANGE | ANALYSIS, NEEDS AND DEFICIENCIES REPORT 150
CTtransit - Waterbury
The CTtransit - Waterbury Division (see Figure 4-22) operates seven days a week to provide fixed route service to the Naugatuck Valley. They contract with NET to operate 22 local bus routes in Waterbury. Service usually operates from 6:00 AM to midnight on weekdays, 9:30 AM to midnight on Saturdays, and 9:30 AM to 5:00 PM on Sundays. In addition, three commuter-oriented routes, operating during peak hours only, provide access to suburban employment opportunities in Waterbury and surrounding communities. Specific
The system carried more than 2.72 million passengers in 2015 and 36 vehicles are in operation during peak service. Multiple bus stops are located near the Waterbury Green, on East and West Main Streets. Most routes have coordinated arrivals at the Green, allowing for transfers between routes, then departing in a “pulse” on the half hour or on the hour.
The transit system has undergone and continues to benefit from ongoing capital upgrades and service improvements. More recent improvements include a new maintenance facility in Watertown and a new fare system. The new fareboxes include automatic vehicle location (AVL) and automatic passenger counters (APC).
Figure 4-20 WATS Graphic
The Naugatuck Valley Council of Governments (NVCOG) completed a Waterbury Area Transit Study (WATS) in 2017, identifying immediate, short-term and long-term opportunities for improved service using existing resources and expanding the system to provide high quality, frequent service. Figure 4-20 represents the general scale and summary of improvements.
CTtransit – New Haven
The CTtransit – New Haven Division operates seven days a week to provide fixed route service. One route in this system, Route 229, extends from Union Station in New Haven to the downtown Waterbury Green via Hamden and Cheshire. This route operations 7 days a week with 18 round trips daily with weekday headways of 30-minutes during peak hour and 60-minutes in the off-peak hours. Saturday frequency is 60 minutes. The service operates weekdays from 5:00AM to 8:00PM and on the weekends from 5:00AM to 6:00PM. Average daily ridership for this route is approximately 2,139 with a travel time of 73 minutes.
CTfastrak and Express Bus Service
CTfastrak is Connecticut’s first bus rapid transit (BRT) system, featuring a 9.4 mile dedicated, bus-only guideway between downtown New Britain and Hartford with routes that integrate into the larger CTtransit system. Two routes operate between Hartford and Waterbury, using CTfastrak for a portion of the route, the 925 and the 928. The 925 operates during weekday peak hours only while the 928 operates during the off peak and on weekends. The primary difference between the two routes is that the 925 does not stop at the Cheshire Milldale Park & Ride or the Southington Plantsville Park & Ride. In Waterbury, both routes serve the Metro North Waterbury Train Station (stopping on Meadow Street), the Waterbury Green, and St. Mary’s Hospital.
The 450 Torrington/Waterbury Flyer is a weekday express bus that serves the Metro North Waterbury Train Station when heading inbound towards the Waterbury Green. Nine trips are provided on weekdays between 5:50 AM and 8:48 PM. There is no weekend service.
Figure 4-21 CT Transit - Hartford Map
Intercity Bus Service
Intercity bus service for Waterbury is provided by Peter Pan Bus Lines and Greyhound. The Waterbury Travel Center (intercity bus station) is located at 188 Bank Street, approximately 1,000 feet from the Waterbury Green and local bus route pulse point, and 1,800 feet from the Waterbury train station. Peter Pan operates six trips weekdays and five trips on weekends. In addition, Peter Pan operates three trips on weekdays and weekends between Waterbury and New Haven. Greyhound operates a similar service, with six trips on weekdays and four trips on weekends to Hartford and just one trip daily between Waterbury and New Haven.
Paratransit Service and Dial-a-Ride
The Americans with Disabilities Act (ADA) requires operators of regular fixed-route bus service to provide complementary paratransit services to persons that are unable to use regular bus service. This service is available to all ADA eligible residents that have origins and destinations within ¾ of a mile of a local fixed route. Rides must be scheduled one day in advance and the hours of operation mirror local fixed route service.
North East Transportation (NET) operates the ADA paratransit program linked to the CTtransit-Waterbury fixed route service. NET also operates the dial-a-ride program for the Greater Waterbury Transit District (GWTD). GWTD was formed to provide service for elderly and disabled residents in 9 towns, including the City of Waterbury.

SECTION 4.2 TRANSIT AND RAIL ASSESSMENT
INTERSTATE 84 / ROUTE 8 “MIXMASTER” INTERCHANGE | ANALYSIS, NEEDS AND DEFICIENCIES REPORT 151
Figure 4-22 CT transit - Waterbury

SECTION 4.2 TRANSIT AND RAIL ASSESSMENT
INTERSTATE 84 / ROUTE 8 “MIXMASTER” INTERCHANGE | ANALYSIS, NEEDS AND DEFICIENCIES REPORT 152
Passenger Rail Service: Waterbury Branch Line (WBL)
The WBL is one of three Metro North Railroad (MNR) branches off the New Haven Line (NHL). The branch is 27.1 miles long and primarily serves 6 stations. The WBL begins at the NHL’s Bridgeport station and has stops in Derby, Ansonia, Seymour, Beacon Falls, Naugatuck, and Waterbury. Some weekday trains also stop in Stratford between Bridgeport and Derby-Shelton. Service is operated seven days a week.
The WBL also operates limited through service to Grand Central Terminal (GCT) in New York City which also makes stops in Stamford. The WBL passenger train schedule consists of 15 weekday trains between Waterbury and Bridgeport. There are eight northbound and seven southbound trains daily, Monday through Friday. Except for one AM Peak train, service to GCT requires a transfer at Bridgeport Station; these transfers are synchronized with NHL trains. The AM Peak for the NHL and its branches is defined as trains arriving at GCT between 5:00AM and 10:00AM or departing from GCT between 5:30AM and 9:00AM. There are two southbound and one northbound AM peak trains. The PM Peak is defined as trains that depart GCT between 4:00PM and 8:00PM; there are two northbound and one southbound PM Peak trains.
A weekday trip between Waterbury and GCT takes an average of two hours and 31 minutes in each direction. A trip between Waterbury and Bridgeport takes on average 55 minutes. The average northbound trip on the WBL takes a minute longer than its southbound counterpart. The scheduled transfer wait time in Bridgeport is 5-7 minutes on weekends and 3-10 minutes on weekdays. However, if a transfer is missed heading towards Waterbury, there is a three hour wait for the next train. This is extremely prohibitive in the overall use of the system and is a major factor which limits branch line ridership.
Overall ridership on the WBL is weak with approximately 1,014 daily riders; however, it is reflective of the overall service being provided. The inbound (towards GCT) 7:38 AM and outbound (towards Waterbury) 6:00 PM have the greatest number of riders. Service on the WBL is limited by the lack of signalization and passing sidings, which prevent the operation of more than one trainset on the line at a time. Capital improvements are underway to both signalize the line and add passing sidings. In addition to the new signal system the four passing sidings, one in Devon, Derby, Beacon Falls and Waterbury will allow up to 10 trains to safely operate along the branch line at the same time. When completed, the improvements will lead to better, more consistent service that would likely draw better ridership. However, regardless of the improved ridership realized as a result of better service, it would be unlikely to have any
significant impact on traffic volumes over the Mixmaster or through the study area.
The WBL is in the process of receiving major capital improvements that will facilitate expanded service. The branch line is currently un-signalized and lacks passing sidings; this prohibits multiple trains from operating on the line simultaneously. The new signal system will allow more trains to operate, which will likely increase ridership in the coming decades.

SECTION 4.3 BICYCLE AND PEDESTRIAN ASSESSMENT
INTERSTATE 84 / ROUTE 8 “MIXMASTER” INTERCHANGE | ANALYSIS, NEEDS AND DEFICIENCIES REPORT 153
4.3 BICYCLE AND PEDESTRIAN ASSESSMENTThe intent of this section is to gain an understanding of the existing bicycle and pedestrian infrastructure and activities within as related to the Mixmaster interchange. The Project provides an opportunity to improve non-vehicular circulation and overall experience across and around I-84 and Route 8. As discussed in the previous Demographics section (see 4.1.1City-Wide Inventory), Waterbury residents have limited access to vehicles and would benefit from improved bicycle and pedestrian connections.
Bicycle and pedestrian data have been collected through online research and qualitative data from site visits. In addition, current bicycle and pedestrian initiatives within the area were reviewed for the development of this assessment. Data collection and reviews focused on the local road network within the previously defined Key Area Boundary (see Figure 1-1 Study Areas Map and Figure 4-1 Key Area Boundary and Neighborhoods Map).
It is not part of this phase of the Project to conduct interviews with community stakeholders nor conduct quantitative research such as pedestrian/bicycle counts. In addition, there are no current studies available to evaluate pedestrian and cyclist safety.
4.3.1 Current Bicycle/Pedestrian Initiatives
The Statewide Bicycle and Pedestrian Transportation Plan and Statewide Bicycle Map was published in 2009, however, CTDOT began the process of updating the documents in 2015. As a result, the information in this section refers to the Draft 2017 Connecticut Bicycle and Pedestrian Transportation Plan Update. The CTDOT vision is to implement an integrated network of on-road facilities and multi-use trails that connect municipalities with key destinations and strengthen links to neighboring states. Three main goals are recommended to achieve this vision:
Improve bicyclist and pedestrian safety; Enhance mobility for bicyclists and pedestrians; Maximize resources to achieve meaningful improvements
In addition, a statewide Bicycle and Pedestrian Advisory board was established in 2009, to examine and promote bicyclists and pedestrians’ programs and facilities. Let’s Go CT, a transportation plan for the state of Connecticut, laid out action plans for bicycling and pedestrian infrastructure improvements and implemented the Community Connectivity Grant Program to achieve a safer and more reliable multi-modal transportation system.
In Waterbury, the following projects featured significant improvements to the bicycle and pedestrian network within the Key Area Boundary (see Figure 4-23):
Naugatuck River Greenway (NRG) Waterbury Active Transportation and Economic Resurgence (W.A.T.E.R.)
Project
o NRG Phase 1 Extensiono Freight Street Reconstructiono Meadow Street Bicycle and Pedestrian Improvementso Jackson Street Reconstruction and Extensiono Library-Station-Riverfront Connector
See Section 1.4 Ongoing and Recent Projects for a more detailed description of these projects.

SECTION 4.3 BICYCLE AND PEDESTRIAN ASSESSMENT
INTERSTATE 84 / ROUTE 8 “MIXMASTER” INTERCHANGE | ANALYSIS, NEEDS AND DEFICIENCIES REPORT 154
Figure 4-23 Existing and Planned Bicycle Pedestrian Infrastructure Map

SECTION 4.3 BICYCLE AND PEDESTRIAN ASSESSMENT
INTERSTATE 84 / ROUTE 8 “MIXMASTER” INTERCHANGE | ANALYSIS, NEEDS AND DEFICIENCIES REPORT 155
4.3.2 Existing Conditions
To develop an understanding of cyclist and pedestrian needs in Waterbury, a site visit was conducted to collect qualitative data on bicycle paths and sidewalks in the Key Area Boundary.
Bicycle Infrastructure
Mapping data on bicycle infrastructure within the City of Waterbury was not available for use in this analysis. Furthermore, designated bicycle paths were not observed except for the newly reconstructed Freight Street Bike Path. There are a fair number of bicycle racks in the Central Business District area, compared to other neighborhoods. Given the significant amount of proposed bicycle improvements through the NRG and W.A.T.E.R. projects, bicycle infrastructure should be an important part of the Project in order to continue bicycle access improvements in Waterbury.
Sidewalks and Crossings
The existing conditions of sidewalks and crossings in Waterbury vary neighborhood to neighborhood. The following conditions were observed during site visits:
Central Business District (CBD)
The CBD offers a significant amount of pedestrian infrastructure (see Figure 2-25), supporting the heavy pedestrian traffic observed in the neighborhood:
Sidewalks
o Are present on almost every streeto Generally, have a standard of 5 feeto Have more generous widths within the historic district and on main
streetso Are well maintained with adequate street lightingo Are lined with street trees and street furniture, providing a welcoming
and pleasant experience for pedestrians
Crossings
o Some but not all key crossings are signalized and have crosswalk stripingo Crossings near I-84 are wide and difficult to cross in one cycle, creating
safety concerns
Figure 4-24 Photos of Waterbury Green (Left) and Grand Street (Right)
South End
Compared to the CBD, the South End does not have strong pedestrian infrastructure (see Figure 4-25).
Most of the neighborhoods have continuous sidewalks along the main roads, but they are not particularly well maintained, especially those that pass by vacant or semi-used lots.
On side streets, there are either sidewalks on one side of the road or sidewalks without curbs.
Most sidewalks are on uneven ground and are generally narrow. There is a lack of street trees and pedestrian friendly amenities such as
pedestrian lights, benches, or trash receptacles. Sidewalks along the big box retail parcels and parallel to I-84 have harsh
conditions with narrow, exposed sidewalks, and no building frontage.
Figure 4-25 Photos of Market Square (Left) and Jewelry Street (Right)
Brooklyn and West End
Riverside Street Northbound and Southbound span through the neighborhoods of Brooklyn and West End. The previously performed CTDOT Waterbury Interchange Needs Study (WINS) included a field inspection of Riverside Street as part of its evaluation on pedestrian and bicycle needs. The existing sidewalk deficiencies as described in the WINS is summarized below:
Riverside Street Northbound: The sidewalk on the east side is in poor condition, overgrown with weeds and heavily silted. It is also discontinued between Sunnyside Avenue and Bank Street. There are no sidewalks on the west side.
Riverside Street Southbound: There are no sidewalks between West Main Street and Sunnyside Avenue.
In West End, the Freight Street Reconstruction (part of the W.A.T.E.R. Project) has been recently and successfully implemented (see Figure 4-26). The newly paved street now includes the urban side trail that provides generous bicycle lanes, pedestrian paths, and green infrastructure between the vehicular lanes and trail to manage stormwater and provide an aesthetically pleasing buffer. At the terminus of Freight Street on Riverside Street is a pedestrian ramp and bridge that crosses Route 8 Southbound and continues to the residential area of West End (see Figure 4-26).
Figure 4-26 Photos of Recently Constructed Freight Street Multi-Use Path

SECTION 4.3 BICYCLE AND PEDESTRIAN ASSESSMENT
INTERSTATE 84 / ROUTE 8 “MIXMASTER” INTERCHANGE | ANALYSIS, NEEDS AND DEFICIENCIES REPORT 156
Overpasses and Underpasses
The current Mixmaster interchange configuration divides the key area and limits connections among neighborhoods. The overpasses and underpasses that serve as connections are primarily for vehicles to cross I-84 and Route 8 (see Figure 4-30 for locations). Generally, the widths provided are generous for vehicles and narrow for pedestrians. The following conditions were observed during site visits:
Underpasses (Figure 4-27 and Figure 4-28)
Conditions are generally unwelcoming. The large overhead interchange creates a dark and overwhelming
environment for pedestrians. Sidewalks are not present on both sides of the road and most existing
sidewalks are very narrow, with no buffer from vehicular traffic. There is a lack of lighting underneath the interchange, creating safety
concerns at night or during unfavorable weather.
Figure 4-27 Photos of South Main Street (Left) and Bank Street (Right) Underpasses
Figure 4-28 Photo of Meadow Street Underpass
Overpasses (Figure 4-29)
Conditions are generally unwelcoming Sidewalks are narrow, with no buffer from heavy vehicular traffic Areas are exposed as there are no street planting nor protection from the road Often, there is no lighting on the bridge except for at the beginning and end. The lack of pedestrian friendly elements creates an unpleasant experience
especially at night or during unfavorable weather.
Furthermore, although there is stairway access from the South Elm Street overpass to McMahon Street below, the stairway is poorly maintained and littered with trash (see Figure 4-29). This is a notable issue because South Elm Street overpass serves as a major gateway from South End to downtown and St. Mary’s Hospital. Overall, these conditions create an unwelcoming environment for walking or bicycling in addition to potential safety issues.
Figure 4-29 Photos of South Elm Street Overpass (Left) and McMahon Street Access (Right)
Although there are a fair number of existing I-84 crossings (albeit in poor condition) there is a lack of Naugatuck River and Route 8 crossings, especially between the neighborhood of South End and Brooklyn. Furthermore, there is no access to the Naugatuck River and the Mad River in the key area.
Cyclist and Pedestrian Collisions
Section 2.5 Crash Data and Safety Analysis documents crash data for the study area. As previously mentioned, there were a total of 27 pedestrian crashes and 3 cyclist collision in the study area (see Figure 2-54) between 2015-2017. Notably, the pedestrian and bicycle collisions are located to the far east of the study area, outside of any planned pedestrian and bicycle improvements.

SECTION 4.3 BICYCLE AND PEDESTRIAN ASSESSMENT
INTERSTATE 84 / ROUTE 8 “MIXMASTER” INTERCHANGE | ANALYSIS, NEEDS AND DEFICIENCIES REPORT 157
Figure 4-30 Overpasses and Underpasses Map

SECTION 4.4 ENVIRONMENTAL AND NATURAL RESOURCES
INTERSTATE 84 / ROUTE 8 “MIXMASTER” INTERCHANGE | ANALYSIS, NEEDS AND DEFICIENCIES REPORT 158
4.4 ENVIRONMENTAL AND NATURAL RESOURCESEnvironmental and natural resources in Waterbury were inventoried to identified.
4.4.1 Environmental Constraints
Waterbury is a host to various natural resources including watercourses, wetlands, soils, and endangered species, in addition to an abundance of historical resources. To determine the existing impacts to natural and historical resources within the study area, the following resources at the state or federal level were consulted:
Connecticut Department of Energy and Environmental Protection (CT DEEP)
o Surface Water Quality and Ground Water Qualityo Atlas of Public Water Supply Sourceso Aquifer Protection Area (APA)o Coastal Area Management (CAM) Zoneo Natural Diversity Database (NDDB)o Critical Habitato Northern Long-Eared Bat Location Map
United States Environmental Protection Agency (US EPA)
o Sole Source Aquifer
United States Fish and Wildlife Service (USFWS)
o National Wetlands Inventory (NWI)o Information for Planning and Conservation (IPaC) tool
United Stated Department of Homeland Security (US DHS)
o Federal Emergency Management Agency (FEMA) Flood Insurance Rate Maps (FIRM)
United States Department of Agriculture (USDA) Natural Resource Service (NRCS)
o Web Soil Surveyo Farmland Soils
Field investigations will be scheduled once the design concepts have been identified. For the evaluation of environmental constraints, the study area was limited to 300-feet from the edge of existing roadways. This study area includes
Route 8, Interstate 84, on- and off-ramps and is referred to throughout the report as the Project Study Corridor (see Figure 1-1 Study Areas Map).

SECTION 4.4 ENVIRONMENTAL AND NATURAL RESOURCES
INTERSTATE 84 / ROUTE 8 “MIXMASTER” INTERCHANGE | ANALYSIS, NEEDS AND DEFICIENCIES REPORT 159
Water Resources
One of Waterbury’s most prominent natural resources is the Naugatuck River; however, the highway currently serves as a barrier between the river and the city, leaving no access to the river’s edge (see Figure 4-31). As discussed in Section 1.4 Ongoing and Recent Projects, the Naugatuck River Greenway project is currently under various design stages depending on the geographic location and seeks to address the lack of access to the river. Waterbury also has several small rivers and brooks including Mad River, Sled Haul Brook, Welton Brook, and Wooster Brook that are located near the Mixmaster. Mad River is located on the eastern edge of the South End neighborhood. Similar to the Naugatuck River, the edge is mostly inaccessible, which may be addressed in the long-term as part of the Mad River Greenway.
Figure 4-31 Photos of the Naugatuck River
Water Quality
The protection of surface and ground water sources from contamination is important for cutting water treatment costs, reducing risk to public health, and protecting the habitats of fish and other aquatic life. The CT DEEP Surface Water and Ground Water Quality map categorizes the water sources in Connecticut by quality (see Figure 4-32).
Ground water quality for the western portion of the existing alignment is mapped as “GA”. Groundwater classified GA is designated as existing private and potential public or private supplies of water suitable for drinking without treatment. It is also baseflow for hydraulically-connected surface water bodies. The central and eastern portion of the existing alignment is classified as “GB”. Groundwater classified as GB is designated as industrial process water, cooling waters, and baseflow for hydraulically-connected water bodies. This ground water is presumed not suitable for human consumption without treatment.
Wooster Brook, Welton Brook, and Sled Haul Brook are all classified as “A” surface waters. Class A surface water designated uses include habitat for fish and other aquatic life and wildlife, potential drinking water supplies, recreation,
navigation, and water supply for industry and agriculture. The Naugatuck River and Mad River are both classified as “B” surface waters. Class B surface water designated uses include habitat for fish and aquatic life and wildlife, recreation, navigation, and industrial and agricultural water supply.
Water Impacts
To evaluate existing and potential impacts to surface and ground water, public supply watersheds and aquifers in Connecticut were identified. A public supply watershed is an area of land that will drain to a specific waterbody that is used for domestic, commercial, and industrial purposes. An aquifer is defined as an underground layer of water-bearing rock located beneath the water table.
A review of a physical copy of the CT DEEP Atlas of Public Supply Sources indicates that the existing alignment is not located within a public water supply watershed. This resource is not publicly available, and mapping cannot be reproduced, therefore mapping for this resource will not be provided in this report.
The US EPA classifies a sole source aquifer as one where:
The aquifer supplies at least 50% of the drinking water for its service area There are no reasonably available alternative drinking water sources should
the aquifer become contaminated
According to the US EPA Sole Source Aquifer Map within Appendix 4.4, there are two sole source aquifers within Connecticut – Pootatuck Aquifer in the towns of Newton, Easton, and Monroe, and the Pawcatuck River Aquifer in the towns of Sterling, Voluntown, North Stonington, and Stonington. The Project is located in Waterbury and is therefore not situated within nor in immediate proximity to a sole source aquifer. In addition to sole source aquifers, the CT DEEP Aquifer Protection Area (APA) was reviewed, and can be found in Appendix 4.4. There are 127 active well fields located within 80 towns in the State of Connecticut. These areas aim to protect sand and gravel aquifers that serve more than 1,000 people. Currently, Waterbury does not have any final or preliminary aquifer protection areas and is not part of the APA program.
In addition to a review of the surface and ground water sources, impacts to coastal areas were also considered. CT DEEP emphasizes the importance of coastal areas with the following statement, “Our coastal area provides myriad opportunities for recreation, public access, commercial fishing, marine trades, and international shipping, as well as habitat for fish, shellfish, birds, wildlife and plants. We all use our coast and we all have to work together to make sure it is available for future generations.”13 An assessment of the CT DEEP Coastal Area
13 Connecticut Department of Energy and Environmental Protection (CT DEEP). (2019, April 2). Overview of the Connecticut Coastal Management Program. Retrieved from Department of Energy & Environmental Protection:
Management (CAM) Zones indicates that the City of Waterbury, approximately 18 miles inland, is not located within a CAM Zone. For the CT DEEP Coastal Area Management (CAM) Zone Map refer to Appendix 4.4
https://www.ct.gov/deep//cwp/view.asp?q=323536&deepNav_GID=1622

SECTION 4.4 ENVIRONMENTAL AND NATURAL RESOURCES
INTERSTATE 84 / ROUTE 8 “MIXMASTER” INTERCHANGE | ANALYSIS, NEEDS AND DEFICIENCIES REPORT 160
Figure 4-32 Surface and Groundwater Water Resources Map

SECTION 4.4 ENVIRONMENTAL AND NATURAL RESOURCES
INTERSTATE 84 / ROUTE 8 “MIXMASTER” INTERCHANGE | ANALYSIS, NEEDS AND DEFICIENCIES REPORT 161
Wetlands
The US EPA defines wetlands as “areas where water covers the soil or is present either at or near the surface of the soil all year or for varying periods of time during the year, including during the growing season.”14 Wetlands serve as diverse ecosystems, providing necessary resources for aquatic and terrestrial species.
The USFWS National Wetlands Inventory (NWI) map (see Figure 4-33) identifies multiple riverine, freshwater forested/shrub wetlands, and freshwater ponds within the existing alignment. Named perennial watercourses within the existing alignment include Wooster Brook, Welton Brook, Sled Haul Brook, the Naugatuck River, and Mad River. Several other smaller, unnamed tributaries and wetlands or ponds also appear on the mapping. Based on the NWI depiction, several of the watercourses appear to be piped through culverts along the existing alignment.
Utilizing data from NWI, web soil survey, and aerial imagery, several areas through throughout the existing alignments were identified as potential wetlands or watercourses (see Figure 4-34). These areas include the named perennial watercourses in addition to potential floodplain wetlands near the Naugatuck River and Mad River. There is also a small wetland and potential vernal pool within the gore area between the I-84 Eastbound Exit 23 off-ramp and Washington Street. A potentially isolated wetland that may also function as a vernal pool in the westernmost portion of the existing alignment, south of the I-84 Eastbound Exit 17 on-ramp.
14 United States Environmental Protection Agency (US EPA). (2018, July 5). How do Wetlands Function and Why are they Valuable? Retrieved from United States Environmental Protection Agency: https://www.epa.gov/wetlands/how-do-wetlands-function-and-why-are-they-valuable

SECTION 4.4 ENVIRONMENTAL AND NATURAL RESOURCES
INTERSTATE 84 / ROUTE 8 “MIXMASTER” INTERCHANGE | ANALYSIS, NEEDS AND DEFICIENCIES REPORT 162
Figure 4-33 National Wetlands Inventory Map

SECTION 4.4 ENVIRONMENTAL AND NATURAL RESOURCES
INTERSTATE 84 / ROUTE 8 “MIXMASTER” INTERCHANGE | ANALYSIS, NEEDS AND DEFICIENCIES REPORT 163
Figure 4-34 Potential Wetland Areas Map

SECTION 4.4 ENVIRONMENTAL AND NATURAL RESOURCES
INTERSTATE 84 / ROUTE 8 “MIXMASTER” INTERCHANGE | ANALYSIS, NEEDS AND DEFICIENCIES REPORT 164
Floodplains
Floodplains are defined as an area of land subject to overflow from an adjacent waterbody. Floodways are located within floodplains and are defined as the minimum area of land that must remain free of obstruction to facilitate the discharge of a flood. Mitigating impacts to floodplains are crucial for maintaining public safety and the environmental benefits provided by floodplains such as increased soil moisture and the growth of diverse biological species.
FEMA FIRM maps indicate that both floodway and the 100-year and 500-year floodplains are present within the existing alignment (see Figure 4-35 Floodplains Map). The number of years indicates the average frequency of a flood incident of a certain intensity. Specifically, a 100-year floodplain represents the area of land that is likely to be flooded in a storm event that has the probability of occurring once in 100 years. Floodways are associated with Wooster Brook in the western portion of the Mixmaster, the Naugatuck River in the central portion, and the Mad River in the eastern portion. Wooster Brook, Welton Brook, and the Mad River have mapped associated 100-year floodplains and mapped 500-year floodplains are present in the vicinity of Wooster Brook, the Naugatuck River, and the Mad River.

SECTION 4.4 ENVIRONMENTAL AND NATURAL RESOURCES
INTERSTATE 84 / ROUTE 8 “MIXMASTER” INTERCHANGE | ANALYSIS, NEEDS AND DEFICIENCIES REPORT 165
Figure 4-35 Floodplains Map

SECTION 4.4 ENVIRONMENTAL AND NATURAL RESOURCES
INTERSTATE 84 / ROUTE 8 “MIXMASTER” INTERCHANGE | ANALYSIS, NEEDS AND DEFICIENCIES REPORT 166
Soils
Soil is one of the most essential natural resources, providing several vital functions needed to sustain life on Earth. As described by the NRCS, “soils sustain biological activity such as plant growth and microbial activity; regulate and partition the flow of water through the landscape; filter, transform, immobilize, buffer, and degrade organic and inorganic materials such as municipal and animal wastes; store and cycle nutrients and other elements such as carbon dioxide; and support buildings and protect archeological treasures.”15
According to the USDA NRCS Web Soil Survey, most of the land within the existing alignment consists of Udorthent-Urban land complex, urban land, and water. Additionally, two wetland soil series are mapped within the limits; these soils include Ridgebury, Leicester, and Whitman soils (3) and Catden and Freetown Soils (18) (see Figure 4-36).
A review of the USDA NRCS Farmland Soils map reveals that both Prime Farmland Soils and Statewide Important Farmland Soils are present within the existing alignment (see Figure 4-37). These soils are largely concentrated on the western side of Route 8, north and south of I-84. These soils are also present in the easternmost portion of the existing alignment, north of I-84 westbound Exit 23. No Locally Important Farmland Soils are mapped within the existing alignment.
15 United States Department of Agriculture (USDA). (1995, November). Soil Quality. Retrieved from USDA Natural Resources Conservation Service: https://www.nrcs.usda.gov/wps/portal/nrcs/detail/national/technical/nra/rca/?cid=nrcs143_014198
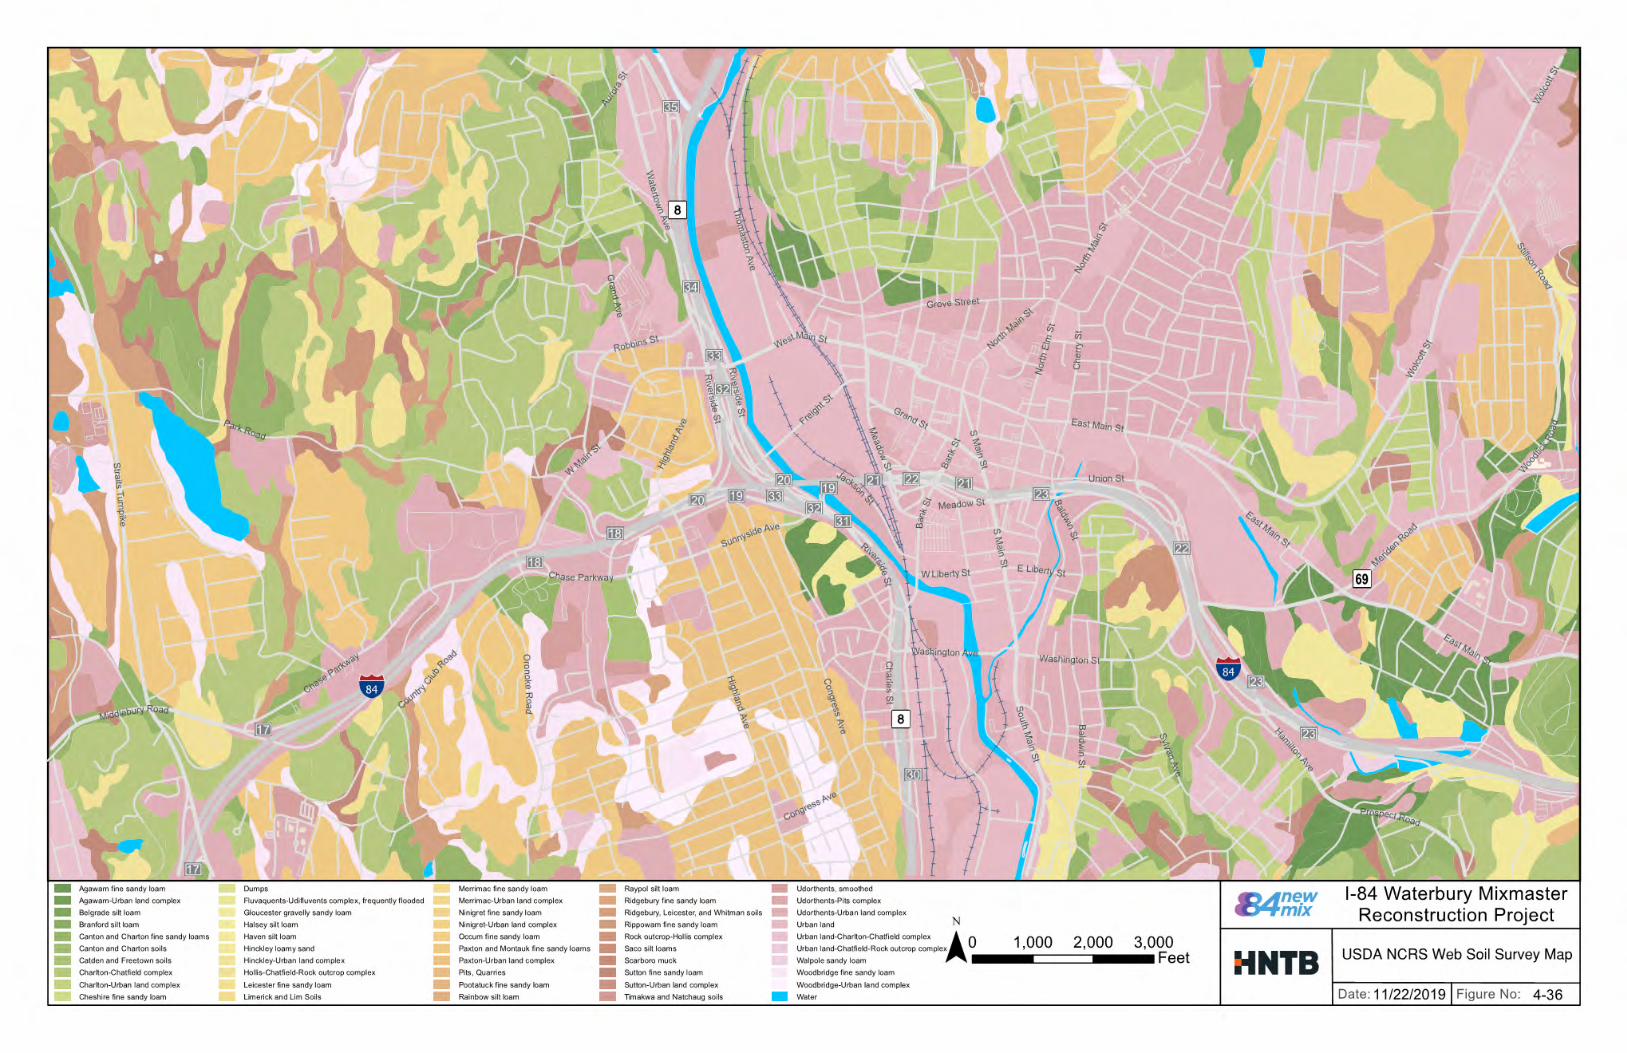
SECTION 4.4 ENVIRONMENTAL AND NATURAL RESOURCES
INTERSTATE 84 / ROUTE 8 “MIXMASTER” INTERCHANGE | ANALYSIS, NEEDS AND DEFICIENCIES REPORT 167
Figure 4-36 USDA NCRS Web Soil Survey Map

SECTION 4.4 ENVIRONMENTAL AND NATURAL RESOURCES
INTERSTATE 84 / ROUTE 8 “MIXMASTER” INTERCHANGE | ANALYSIS, NEEDS AND DEFICIENCIES REPORT 168
Figure 4-37 USDA NCRS Farmland Soils Map
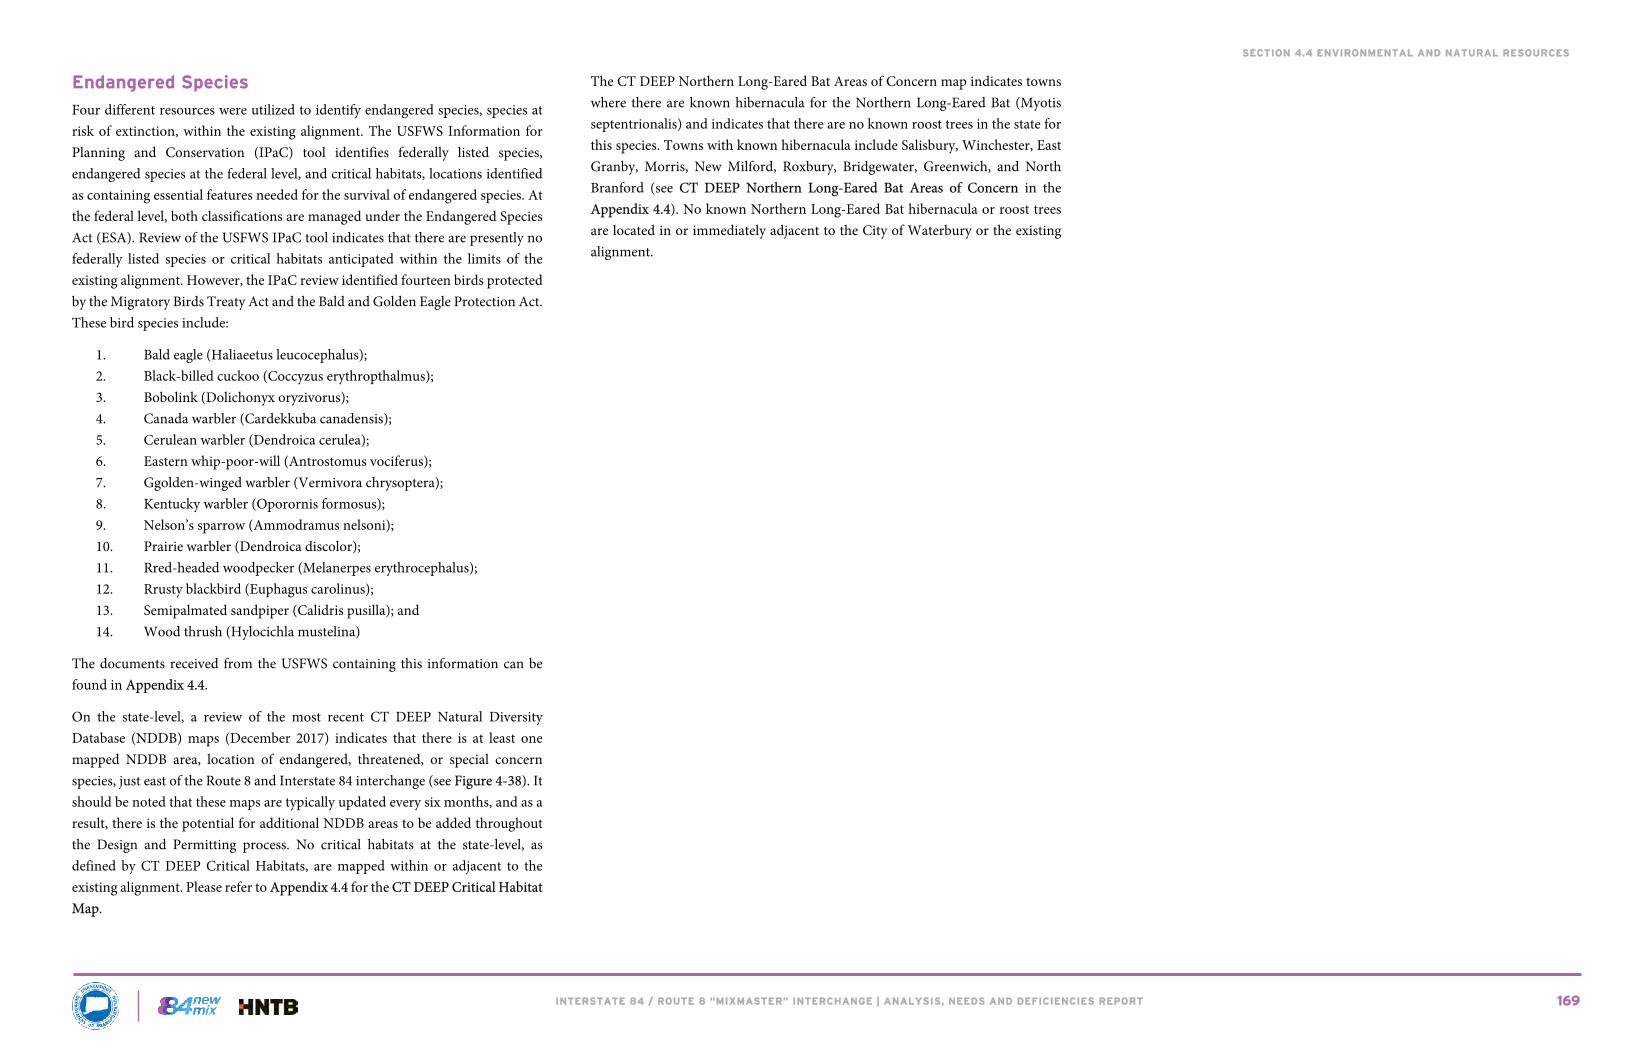
SECTION 4.4 ENVIRONMENTAL AND NATURAL RESOURCES
INTERSTATE 84 / ROUTE 8 “MIXMASTER” INTERCHANGE | ANALYSIS, NEEDS AND DEFICIENCIES REPORT 169
Endangered Species
Four different resources were utilized to identify endangered species, species at risk of extinction, within the existing alignment. The USFWS Information for Planning and Conservation (IPaC) tool identifies federally listed species, endangered species at the federal level, and critical habitats, locations identified as containing essential features needed for the survival of endangered species. At the federal level, both classifications are managed under the Endangered Species Act (ESA). Review of the USFWS IPaC tool indicates that there are presently no federally listed species or critical habitats anticipated within the limits of the existing alignment. However, the IPaC review identified fourteen birds protected by the Migratory Birds Treaty Act and the Bald and Golden Eagle Protection Act. These bird species include:
1. Bald eagle (Haliaeetus leucocephalus);2. Black-billed cuckoo (Coccyzus erythropthalmus);3. Bobolink (Dolichonyx oryzivorus);4. Canada warbler (Cardekkuba canadensis);5. Cerulean warbler (Dendroica cerulea);6. Eastern whip-poor-will (Antrostomus vociferus);7. Ggolden-winged warbler (Vermivora chrysoptera);8. Kentucky warbler (Oporornis formosus);9. Nelson’s sparrow (Ammodramus nelsoni);10. Prairie warbler (Dendroica discolor);11. Rred-headed woodpecker (Melanerpes erythrocephalus);12. Rrusty blackbird (Euphagus carolinus);13. Semipalmated sandpiper (Calidris pusilla); and 14. Wood thrush (Hylocichla mustelina)
The documents received from the USFWS containing this information can be found in Appendix 4.4.
On the state-level, a review of the most recent CT DEEP Natural Diversity Database (NDDB) maps (December 2017) indicates that there is at least one mapped NDDB area, location of endangered, threatened, or special concern species, just east of the Route 8 and Interstate 84 interchange (see Figure 4-38). It should be noted that these maps are typically updated every six months, and as a result, there is the potential for additional NDDB areas to be added throughout the Design and Permitting process. No critical habitats at the state-level, as defined by CT DEEP Critical Habitats, are mapped within or adjacent to the existing alignment. Please refer to Appendix 4.4 for the CT DEEP Critical Habitat Map.
The CT DEEP Northern Long-Eared Bat Areas of Concern map indicates towns where there are known hibernacula for the Northern Long-Eared Bat (Myotis septentrionalis) and indicates that there are no known roost trees in the state for this species. Towns with known hibernacula include Salisbury, Winchester, East Granby, Morris, New Milford, Roxbury, Bridgewater, Greenwich, and North Branford (see CT DEEP Northern Long-Eared Bat Areas of Concern in the Appendix 4.4). No known Northern Long-Eared Bat hibernacula or roost trees are located in or immediately adjacent to the City of Waterbury or the existing alignment.

SECTION 4.4 ENVIRONMENTAL AND NATURAL RESOURCES
INTERSTATE 84 / ROUTE 8 “MIXMASTER” INTERCHANGE | ANALYSIS, NEEDS AND DEFICIENCIES REPORT 170
Figure 4-38 Natural Diversity Database Map (Endangered Species)

SECTION 4.5 GEOTECHNICAL CONDITIONS
INTERSTATE 84 / ROUTE 8 “MIXMASTER” INTERCHANGE | ANALYSIS, NEEDS AND DEFICIENCIES REPORT 171
4.5 GEOTECHNICAL CONDITIONSThis section documents and summarizes existing subsurface data for I-84, Route 8, system and service ramps at the “Mixmaster” and surrounding areas. This task consisted of researching and collecting existing subsurface information for the study area. Relevant geologic data was available from geology maps and reports, soil/rock boring logs from bridge and highway plans, and soil/water information from conservation service surveys.
The HNTB team contacted CTDOT Soils and Foundations Section for any available geotechnical reports of structures, pile driving records, load-tests, or other field data. No existing, archived geotechnical reports were located at the Section’s office; however, some data was provided regarding potential steel pile corrosion in fill materials, which is discussed in Section 2.6 Existing Structural Conditions.
4.5.1 Site Geology
Physical Features
The Waterbury area or quadrangle lies near the eastern edge of the Western Connecticut Highlands, with the City of Waterbury occupying the east-central part. The center of the City is near a topographic low-point at the confluence of the Naugatuck River and its tributary the Mad River. The local topography exhibits numerous hills ranging from 150 to 300 feet in height.
Figure 4-36 shows, at the subject project’s area, the soil survey from the map produced by Connecticut Department of Energy and Environmental Protection (CTDEEP) in October 2009 and titled “Connecticut Soils – Waterbury, CT.” The soil survey map contains interpretation of land uses which are based on the properties of the shallow soil/rock. Most of the land rating around the project’s interchange is “Urban land”. The map also shows the two major waterways; the Naugatuck and Mad Rivers.
Surficial Geology
The map produced by CTDEEP in August 2009 and titled “Surficial Materials – Glacial and Postglacial Deposits – Waterbury, Connecticut” shows the extent and texture of surficial deposits, that range from a few feet to several hundred feet in thickness, overlying the bedrock surface. These materials are glacially derived and divided in two broad categories: Glacial Ice-Laid deposits (tills and moraine) which are generally exposed in the uplands; and Glacial Meltwater deposits (stratified fine and/or coarse soils) which are commonly concentrated in valleys and lowlands. There also exists some localized Postglacial sediments (floodplain alluvium and swamp deposits). See Figure 4-39.
Glacial Ice-Laid deposits were derived directly from the ice. The matrix of the tills is predominantly sand and silt, with sparse to abundant boulders. Some tills contain lenses of sand and gravel, with occasional masses of laminated fine-grained sediment. Tills blanket the bedrock surface in variable thicknesses and underlie the Meltwater deposits.
Glacial Meltwater deposits were laid down in glacial streams, lakes, and ponds which occupied the lowlands as the last ice-sheet melted away to the north. These deposits are composed of layers of sands, gravels, silts, and clays with few to no boulders. Meltwater deposits are better sorted, more permeable, and are relatively easy to excavate and build highways on.
Postglacial Sediments are less widely distributed and are typically thinner than the glacial deposits that they overlie. Deposits of floodplain alluvium are composed of sands, gravels, and silts that have been reworked and mixed with organic matter.
Similarly, the “Quaternary Geology – Waterbury, Connecticut” map produced by CT DEEP in December 2010 (see Figure 4-40) illustrates the geologic features formed during the Quaternary Period, from about 2.6 million years ago to the present time and includes the Pleistocene (glacial) and Holocene (postglacial) Epochs. At least twice in the Pleistocene, continental ice-sheets swept across Connecticut from the north.

SECTION 4.5 GEOTECHNICAL CONDITIONS
INTERSTATE 84 / ROUTE 8 “MIXMASTER” INTERCHANGE | ANALYSIS, NEEDS AND DEFICIENCIES REPORT 172
Figure 4-39 Surficial Materials Map

SECTION 4.5 GEOTECHNICAL CONDITIONS
INTERSTATE 84 / ROUTE 8 “MIXMASTER” INTERCHANGE | ANALYSIS, NEEDS AND DEFICIENCIES REPORT 173
Figure 4-40 Quaternary Geology Map
SECTION 4.5 GEOTECHNICAL CONDITIONS
INTERSTATE 84 / ROUTE 8 “MIXMASTER” INTERCHANGE | ANALYSIS, NEEDS AND DEFICIENCIES REPORT 174
Bedrock Geology
The Bedrock Geology map of the Waterbury Quadrangle, with its related report No. 22, was published in 1967 by the State Geological and Natural History Survey of Connecticut. The map and report describe the “Waterbury Formation” (which outcrops within 1 ½ miles of the center of the City) as a meta-sedimentary complex (gneiss and schist) forming the core of a dome. The complexly folded meta-sediments are intermixed in magmatic fashion with granitic to quartz-diorite rocks. Rocks typical of the formation are found on Pine Hill within the City (see Figure 4-41)
The gneisses are in migmatitic mixtures (light-colored igneous rocks in a host of darker meta-sedimentary rocks). The formation is a series of thinly to thickly interlayered rocks, intricately folded, with the layers ranging from an inch to several feet. Metamorphic conditions, such as melting and regional migmatization, have produced the Waterbury Formation rocks which are generally hard, tough, coherent, and tend to weather with a rough surface. Most outcrops are irregularly rounded as a result of glacial abrasion. The age of the Waterbury Formation is most probably Pre-Cambrian, older than 360 million years.

SECTION 4.5 GEOTECHNICAL CONDITIONS
INTERSTATE 84 / ROUTE 8 “MIXMASTER” INTERCHANGE | ANALYSIS, NEEDS AND DEFICIENCIES REPORT 175
Figure 4-41 Bedrock Geology Map

SECTION 4.5 GEOTECHNICAL CONDITIONS
INTERSTATE 84 / ROUTE 8 “MIXMASTER” INTERCHANGE | ANALYSIS, NEEDS AND DEFICIENCIES REPORT 176
4.5.2 Soil/Rock Data
This section presents the available subsurface information on the 62 bridges/structures within the Mixmaster in Waterbury, CT. Existing plans were not available for eleven structures and for six structures the existing plans did not contain any boring logs. The remaining 45 structures are summarized below.
Based on available information, subsurface conditions generally consist of medium dense (MD) to very dense (VD), Sand and Gravel (S&G) overlying predominantly Gneiss bedrock. The S&G contains small amounts of cohesive material, with layers of stiff Silt or Clayey Silt uncovered at some locations. Boulders and cobbles (B&Cs) were encountered at most structures. The Gneiss bedrock was generally jointed/fractured with the occasional seam of Quartz, and some cores samples were classified as Schist rock.
Deep foundations consist of steel H-piles driven to bedrock or 12-inch tapered cast-in-place (CIP) concrete piles bearing in dense sand. Shallow foundations consist of footings erected on compacted gravel fill, dense natural soil material, or bedrock.
Table 4-6 summarizes the general soil profile and foundations at each structure where existing plans were available. An average ground surface elevation was used when determining the range of depths to bedrock for each structure.
4.5.3 Summary
The anticipated site geology from online maps generally agrees with the subsurface conditions detailed in the existing plans. With dense sand and gravel overlying bedrock, the shallow and deep foundations appear adequate for the existing loads.

SECTION 4.5 GEOTECHNICAL CONDITIONS
INTERSTATE 84 / ROUTE 8 “MIXMASTER” INTERCHANGE | ANALYSIS, NEEDS AND DEFICIENCIES REPORT 177
Table 4-6 Studied Bridge Soil Profiles and Existing Foundations
Bridge # Bridge Description Soil Profile (feet) Existing Foundation
ExistingBridgePlan
Existing BridgePlan Notes
01173 I-84 EB over RTE 63 (Middlebury)
5-20': S&G, MD to D, some B&C, some peat behind East Abut. Rock: Hard, gray, seamy
E/W Piers: footings on rock Abuts: footing on fill
1962 "Part A" Pg 117-130 Use avg gnd El. 402
01174 I-84 WB over RTE 63 (Middlebury)
5-20': S&G, MD to D, some B&C Rock: Hard, gray, seamy
E. Pier: combined ftng on fill W. Pier: footings on rock Abuts: footing on fill
1962 "Part A" Pg 117-130 Use avg. gnd El. 402
01714 RTE 8 Ramp 079 over SR 846 NB
Only inspection reports available
01715 RTE 8 over SR 846 NB
Only inspection reports and rehab plans available
01716 RTE 8 SB over RTE 73 WB
70-90': Sand, MD to D Rock: Granite Gneiss, 48-99% Rec.
Piers: combined ftng on fill Abuts: footing on fill
1963 Structure #17"Br. 01716" Pg 93-103Use RTE 73 as gnd El. 270
01717 RTE 8 SB over Steele Brook
70-120': Sand, M. Dense. At 50' becomes Dense w/ more Gravel.
Pier & Abuts: tapered CIP concrete piles (12-8" diam.) with battered outer piles
1963 Structure #18"Br. 01716" Pg 104-112Use channel as gnd El. 260
01718 RTE 8 NB over Steele Brook
80-110': Sand, M. Dense. At 60' becomes Dense w/ more Gravel.
Pier & Abuts: tapered CIP concrete piles (12-8" diam.) with battered outer piles
1963 Structure #18"Br. 01716" Pg 104-112 Use channel as gnd El. 260
01731 SR 845 Chase Parkway over I-84 & Ramp 053
5-20': S&G, li. Silt, MD to VD, over shallow ledge Rock: Gneiss with seams of Schist
Pier: footings on rock Abuts: footing on rock
1962 Structure #31 Over RTE 84 EB & WB "Br. 01731." Pg 56-65
03183A RTE 8 NB over Fifth Street
Only inspection reports available
03183B RTE 8 SB over Fifth Street
Only inspection reports and rehab plans available
03184A RTE 8 NB over Porter Street
Only inspection report available
03184B RTE 8 SB over Porter Street
Only inspection report and rehab plan available
03185 RTE 8 NB over Washington Street
60-70': Sand, MD to Dense Rock: Gneiss, 12-22% Rec.
Abuts: footing on sand 1964 Structure #30 "Br. 03189…" Pg 67-76 Washington as gnd El. 275
03186 RTE 8 SB over Washington Street
60': Sand, MD to Dense Rock: Gneiss, 55-58% Rec.
Abuts: footing on sand 1964 Structure #30 "Br. 03189…" Pg 67-76 Washington as gnd El. 275
Bridge # Bridge Description Soil Profile (feet) Existing Foundation
ExistingBridgePlan
Existing BridgePlan Notes
03187 RTE 8 SB over Bank Street & S. Leonard Street
60-80': Sand & Gravel, MD to VD Rock: Gneiss, 35-60% Rec.
Piers: combined ftng on sand Abuts: footing on fill
1962 Struct #33 over Riverside "Br. 03189…" Pg 77-90 Use Bank St as gnd El. 265
03188 RTE 8 NB over Bank Street &S. Leonard Street
80': S&G, MD to VD (Nested B&Cs at 70' depth) Rock: Gneiss, 50-60% Rec.
Pier: combined ftng on fill Abuts: footing on fill
1964 Struct #29 over Riverside "Br. 03189…" Pg 57-66 Use Bank St as gnd El. 260
03189 RTE 8 Ramp 077 over Bank Street
70-80': Sand, li. Gravel, MD to VD Rock: Gneiss, 22-55% Rec.
Abuts: footing on fill 1964 Structure #34 Ramp 34 "Br. 03189…" Pg 91-101 Use Bank St as gnd El. 258
03190A RTE 8 NB over RTE 8 SB &Local Roads
45-55': S&G, MD to Dense Rock: Gneiss w/ quartz, 30-90% Rec.
All fdns: 10BP42 & 12BP53 H-piles, outer piles battered Piers: indiv. & comb. ftngs
1964 Structure #20 RTE 8 NB & SB Use avg. gnd El. 270
03190B RTE 8 SB over Riverside Street & Sunnyside Avenue
45-55': S&G, MD to Dense Rock: Gneiss w/ quartz, 30-90% Rec.
All fdns: 10BP42 & 12BP53 H-piles, outer piles battered Piers: indiv. & comb. ftngs
1964 Structure #20 RTE 8 NB & SB Use avg. gnd El. 270
03190C I-84 TR 811 over I-84 TR 812& Naugatuck River
Fill: up to 15' misc. Fill w/ Cinders Natural: S&G, MD to VD Rock: 45-90' depth, Gneiss
All fdns: 12BP53 H-piles, outer piles battered Piers: indiv. & comb. ftngs
1964 Structure #11 SE & ES Roadways over Naugatuck Use avg. gnd El. 262
03190D I-84 TR 812 over Riverside Street & Naugatuck River
Fill: up to 10' misc. Fill w/ Cinders Natural: S&G, loose to VD Rock: 60-85' depth, Gneiss
All fdns: 12BP74 H-piles, outer piles battered
1964 Structure #12 RTE 84 EB & WB Use El. 265 for gnd
03190E RTE 8 Ramp 128 over Riverside Street SB
20-50': S&G, loose to Dense Rock: Gneiss, seam of Schist
All fdns: 10BP42 H-piles, outer piles battered
1964 Structure #16 Ramp 20 Use El. 270 for gnd
03190F I-84 TR 808 over RTE-8 SB & RAMP 129
~5': Dense S&G over shallow rock Rock: Granite Gneiss w/ seams of Schist & Quartz, some wthrd
Abut & Piers: footings on rock Pier 9: footing on sand
1964 Structure #24 SW Roadway over Conn. 8 SB & Ramp 21
03191A I-84 EB over I-84 WB, RTE 8 & Naugatuck River
~10': Fill w/ cinders, ashes, iron 90-120': Sand & Gravel, MD to VD
12" CIP conc. piles and 10BP42 H- piles, outer piles battered
1963 Structure #9 RTE 84 EB & WB Bi-Level East of Naugatuck River
03191B I-84 WB over RTE 8 & Naugatuck River
~10': Fill w/ cinders, ashes, iron 90-120': Sand & Gravel, MD to VD
12" CIP conc. piles and 10BP42 H- piles, outer piles battered
1963 Structure #9RTE 84 EB & WB Bi-Level East of Naugatuck River
03191C I-84 Ramp 169 over I-84 TR 805 & 808
5-40': S&G, li. Silt, many B&Cs, MD to VD Rock: Gneiss w/ seams of Quartz
Abuts & Piers: spread footing on soil/rock Pier 14 & 15: 10BP42 H-piles
1964 Structure #25 & #27 Ramp 25 & RTE 84 EB & WB West of Naugatuck River

SECTION 4.5 GEOTECHNICAL CONDITIONS
INTERSTATE 84 / ROUTE 8 “MIXMASTER” INTERCHANGE | ANALYSIS, NEEDS AND DEFICIENCIES REPORT 178
Bridge # Bridge Description Soil Profile (feet) Existing Foundation
ExistingBridgePlan
Existing BridgePlan Notes
03191D I-84 TR 809 over RTE 8 NB &Riverside Street
No boring logs in plans. "N-E Roadway" borings D-56, D-225 to-230, D-216, D-205
All fdns: 10BP42 H-piles, outer piles battered
1964 Structure #22 N-E Roadway
03191E I-84 TR 810 over RTE 8 NB &Ramp 128
No boring logs in plans. "E-N Roadway" borings D-217 to -224 and D-216-2
All fdns: 10BP42 H-piles, outer piles battered
1964 Structure #26 E-N Roadway
03191F I-84 Ramp 197 over Ramp 202 Meadow Street
~10': Fill w/ cinders, ashes & coal 30-90': S&G, li. Silt, MD to VD Rock: Gneiss, 40-100' depth
Abut & Piers: 10BP42 H-piles, outer piles battered
1963 Structure #10 Ramp 10 over Meadow St. & Ramp 5 Use El. 265 for gnd
03191G I-84 Ramp 199 over Meadow Street
1963 Only inspection report and rehab plan available
03191H I-84 Ramp 198 over No Notable Feature
1963 Only inspection report and rehab plan available
03191I I-84 Ramp 200 over I-84 Ramps 199 & 202, Bank Street
Only inspection report and rehab plan available
03192 I-84 Ramp 202 over Bank Street
30-40': S&G, MD to Dense, B&Cs Rock: Gneiss w/ Granite, 3-67% Rec.
W. Abut: shallow footing E. Abut: shallow footing on fill
1963 Structure #5 Ramp 5 Use Bank St. as gnd @ El. 262
03193 I-84 WB over Ramp 198 & Bank Street
40-50': S&G, MD. Layers of Silt starting @20' w/ lenses of clay Rock: Gneiss, 22-87% Rec.
W. Abut & Pier: 10BP42 H-piles E. Abut: shallow footing
1963 Structure #4 over Ramp 9 Use Bank St. as gnd @ El. 270
03194 I-84 Ramp 201 over I-84 Ramp 198 & Bank Street
35-55': S&G, MD to VD Rock: Gneiss, 53-92% Rec. with nested Boulders
Pier 1: shallow footing Pier 2: 10BP42 H-piles Abuts: footing on fill
1963 Structure #7, Ramps 8, 9 Use Bank St. as gnd @ El. 275
03195 I-84 over Great Brook
No boring logs in plans Concrete culvert on soil surrounded by pervious structure backfill
1963 Relocated Great Brook Culvert
03196 I-84 over SR 847 (South Main St.)
5-10': FILL Sand, li. Gravel, MD Natural: S&G, many B&Cs, VD Rock: Gneiss, 20-35' depth
E/W Abuts: shallow footing on fill
1963 Structure #2 RTE 8 EB & WB Use South Main St. as gnd @ El. 270
03197 South Elm St. over I-84 & Mcmahon St.
10': Sand & Silt, Medium Dense 10-15': S&G, many B&Cs, D to VD Rock: Gneiss, 20-25' depth
Piers: combined footing on natural sand Abuts: footing on sand
1963 Structure #1 over 84 EB & WB, Ramp 3 & McMahon St Use 84 EB as gnd El. 282
03198 RTE 8 NB over Freight Street
20-25': S&G, many B&C, MD to VD Rock: Gneiss & Schist, 0-72% Rec.
Piers: combined ftng on sand Abuts: footing on fill
1964 Structure #14Use Freight St as gnd @ El. 280
03199 RTE 8 over Sled Haul Brook
Sand & Gravel overlying shallow rock - Gneiss with Quartz banding
Concrete culvert on natural sand and rock
1964 NB: D-701, STA 168+20 to 168+60SB: D-236, 164+50 to 164+90
Bridge # Bridge Description Soil Profile (feet) Existing Foundation
ExistingBridgePlan
Existing BridgePlan Notes
03200 I-84 TR 806 over I-84 TR808, 809, Riverside
10-50': S&G, few B&Cs, MD to VD Rock: Gneiss, shallow to south, slopes down to north
Piers: footing N. Abut: 10BP42 H-piles S. Abut: footing on fill
1964 Struct. #21 WN Roadway ovr 8- SB, NE, Riverside & R-18Use avg. gnd of El. 315
03201 Pedestrian Walk over RTE 8 SB
0-35': Sand, some Gravel, li. Silt, few B&Cs, MD to VD Rock: Gneiss w/ Quartz & Feldspar
Piers: footings on rock/soil W. Abut: footing on sand E. Abut: footing on fill
1963 Structure #37Use RTE 8 SB as gnd @ El. 330
03202 I-84 over Welton Brook
Previously ~25' of Peat overlying firm material, Peat removed
Swamp/peat removed and replaced with 24" min. gravel for full length of culvert
1962 Welton Brook Culvert Page 78
03203A RTE 8 NB over West Main Street No. 1
50': Sand & Gravel, MD to VD 70': Fine Sand, Dense to VD Rock @120': Gneiss, 82% Rec.
Tapered CIP piles installed 20 to 50' below abut. footing
1963 Structure #19 (Pg 113) Use W. Main St as gnd @ El. 275
03203B RTE 8 SB over West Main Street No. 1
50': Sand & Gravel, MD to VD 70': Fine Sand, Dense to VD Rock @120': Gneiss, 72% Rec.
Tapered CIP piles installed 20 to 50' below abut. footing
1963 Structure #19 (Pg 113) Use W. Main St as gnd @ El. 275
03203C RTE 8 Ramp 131 over West Main Street No. 1
80': Sand & Gravel, MD to VD 50': Fine Sand, Dense to VD Rock @130': Gneiss, 72% Rec.
Tapered CIP piles installed 20 to 50' below abut. footing
1963 Structure #19 (Pg 113) Use W. Main St as gnd @ El. 275
03204 RTE 64 EB/ I-84 Ramp over I-84
Sand & Clayey Silt & decomposed rock overlying shallow ledge Rock: Gneiss, 10-95% Rec.
Piers: footings on rock Abuts: footing on sand
1962 Structure #32 Ramp 32 over RTE 84 EB & WB Use El. 485 for 84 EB/WB
03205 RTE 8 SB over Riverside Street
Sand & Gravel w/ B&Cs overlying shallow rock - Gneiss w/ Quartz
N/S Abuts: footing on rock Long Wingwalls: on rock
1964 Structure #13 RTE 8 SB, NE & NW Roadway over Riv. Use Riv St as gnd El. 305
03206 I-84 EB over Sled Haul Brook
10': Sand, li. Gravel, MD to VD, cobbles above top of rock Rock: Gneiss, 52% Rec.
Concrete culvert on rock surrounded by pervious structure backfill
1964 Relocated Sled Haul Brook Boring D-702
03207 Highl & Ave over I-84
At E. Abut: Sand & Silt, li. Gravel, few B&Cs, VD Rock: Gneiss & seam of Schist
Piers: indiv. footings on rock W. Abut: footing on rock E. Abut: footing on Sand
1964 Structure #23 Use 84 EB as gnd @ El. 412
03208 I-84 WB over Sled Haul Brook
30': S&G, Dense, many Boulders Rock: ~5' decomposed rock over Gneiss with 67% Rec.
Concrete culvert on rock surrounded by pervious structure backfill
1964 Relocated Sled Haul Brook Boring D-286-1
03209 I-84 EB TR 806 over I-84 WB
30-40': S&G, many B&C, VD@S. Abut: hard clayey Silt
Abuts: shallow footing on natural sand, SW wingwall partially on rock
1964 Structure #15 WN Roadway over RTE 84 WB Boring D-280-1
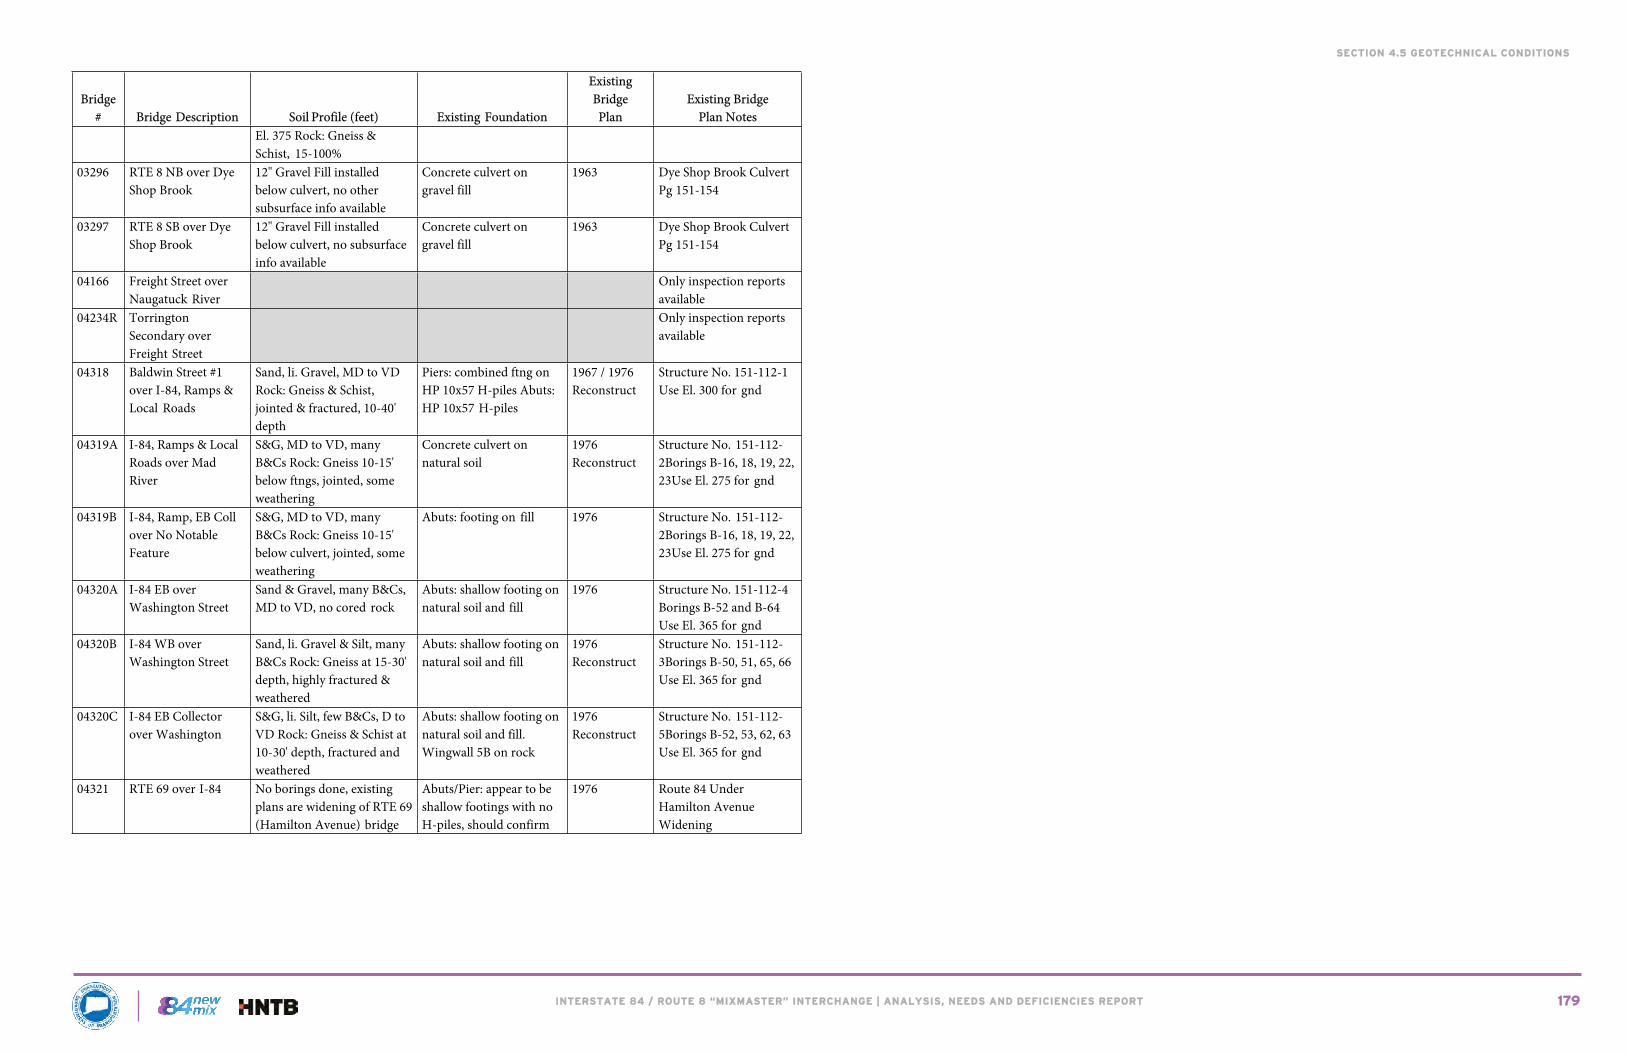
SECTION 4.5 GEOTECHNICAL CONDITIONS
INTERSTATE 84 / ROUTE 8 “MIXMASTER” INTERCHANGE | ANALYSIS, NEEDS AND DEFICIENCIES REPORT 179
Bridge # Bridge Description Soil Profile (feet) Existing Foundation
ExistingBridgePlan
Existing BridgePlan Notes
El. 375 Rock: Gneiss & Schist, 15-100%
03296 RTE 8 NB over Dye Shop Brook
12" Gravel Fill installed below culvert, no other subsurface info available
Concrete culvert on gravel fill
1963 Dye Shop Brook Culvert Pg 151-154
03297 RTE 8 SB over Dye Shop Brook
12" Gravel Fill installed below culvert, no subsurface info available
Concrete culvert on gravel fill
1963 Dye Shop Brook Culvert Pg 151-154
04166 Freight Street over Naugatuck River
Only inspection reports available
04234R Torrington Secondary over Freight Street
Only inspection reports available
04318 Baldwin Street #1 over I-84, Ramps & Local Roads
Sand, li. Gravel, MD to VD Rock: Gneiss & Schist, jointed & fractured, 10-40' depth
Piers: combined ftng on HP 10x57 H-piles Abuts: HP 10x57 H-piles
1967 / 1976 Reconstruct
Structure No. 151-112-1 Use El. 300 for gnd
04319A I-84, Ramps & Local Roads over Mad River
S&G, MD to VD, many B&Cs Rock: Gneiss 10-15' below ftngs, jointed, some weathering
Concrete culvert on natural soil
1976 Reconstruct
Structure No. 151-112-2Borings B-16, 18, 19, 22, 23Use El. 275 for gnd
04319B I-84, Ramp, EB Coll over No Notable Feature
S&G, MD to VD, many B&Cs Rock: Gneiss 10-15' below culvert, jointed, some weathering
Abuts: footing on fill 1976 Structure No. 151-112-2Borings B-16, 18, 19, 22, 23Use El. 275 for gnd
04320A I-84 EB over Washington Street
Sand & Gravel, many B&Cs, MD to VD, no cored rock
Abuts: shallow footing on natural soil and fill
1976 Structure No. 151-112-4 Borings B-52 and B-64 Use El. 365 for gnd
04320B I-84 WB over Washington Street
Sand, li. Gravel & Silt, many B&Cs Rock: Gneiss at 15-30' depth, highly fractured & weathered
Abuts: shallow footing on natural soil and fill
1976 Reconstruct
Structure No. 151-112-3Borings B-50, 51, 65, 66 Use El. 365 for gnd
04320C I-84 EB Collector over Washington
S&G, li. Silt, few B&Cs, D to VD Rock: Gneiss & Schist at 10-30' depth, fractured and weathered
Abuts: shallow footing on natural soil and fill. Wingwall 5B on rock
1976 Reconstruct
Structure No. 151-112-5Borings B-52, 53, 62, 63 Use El. 365 for gnd
04321 RTE 69 over I-84 No borings done, existing plans are widening of RTE 69 (Hamilton Avenue) bridge
Abuts/Pier: appear to be shallow footings with no H-piles, should confirm
1976 Route 84 Under Hamilton Avenue Widening

INTERSTATE 84 / ROUTE 8 “MIXMASTER” INTERCHANGE | ANALYSIS, NEEDS AND DEFICIENCIES REPORT
SECTION 5 SUMMARY OF FINDINGS
180
5 Summary of FindingsThis section summarizes the needs and deficiencies identified in the analysis.
5.1 EXISTING AND FUTURE TRAFFIC OPERATIONSSection 2.3 Existing Traffic Operations and Section 3.4 Future Traffic Operations summarized existing and forecasted future traffic operations for freeway facilities and local intersections within the study area. A summarization and comparison of the findings and deficiencies identified in those sections that follow
Interstate 84
Table 3-1 below summarizes the deficient freeway segments as analyzed by HCS along Interstate 84 under 2017 and 2045 conditions:
Table 5-1 2017 and 2045 Deficient I-84 Freeway Segments
# of Deficient Segments2017 2045 No Build
Segment Type
# of Segments
AM Peak
PM Peak
SAT Peak
AM Peak
PM Peak
SAT Peak
WESTBOUND
Mainline 71
(14%)1
(14%)-
1(14%)
2(29%)
1(14%)
Weave 6 - - -1
(17%)1
(17%)-
Ramp / Diverge
52
(40%)1
(20%)-
3(60%)
3(60%)
3(60%)
EASTBOUND
Mainline 5 - - - -1
(20%)1
(20%)
Weave 6 - - -4
(67%)3
(50%)-
Ramp / Diverge
4 - - -1
(25%)2
(50%)2
(50%)
The Existing Condition Traffic Simulation Model (VISSIM) also identified deficient facilities along Interstate 84 based on the interaction of freeway facilities as a system. Overall, 2017 Interstate 84 deficient segments include:
Eastbound
Western study limit to Exit 20 Route 8 On-Ramp (VISSIM)
Westbound
Mainline east of Exit 22 Off-Ramp (HCS) Exit 22 Off-Ramp (HCS) Exit 17 Off-Ramp (HCS)
The Future Condition Traffic Simulation Model identified additional deficient facilities along Interstate 84 based on the interaction of freeway facilities as a system. Overall, 2045 Interstate 84 deficient segments include:
Eastbound
West of Exit 18 On-Ramp (HCS & VISSIM) Exit 18 On-Ramp to Exit 19 Route 8 SB On-Ramp (VISSIM) Exit 19 On-Ramp and Exit 22 Off-Ramp (HCS & VISSIM)
Westbound
Eastern study limit to Exit 20 Route 8 NB Off-Ramp (VISSIM) Exit 22 On-Ramp to Exit 21 Off-Ramp (HCS) Between Exit 21 Off-Ramp and Exit 21 On-Ramp (HCS) Exit 19 Off-Ramp to Exit 20 Off-Ramp (HCS) Exit 19 Route 8 SB On-Ramp to Exit 18 Off-Ramp (HCS) Exit 18 On-Ramp to Exit 17 Off-Ramp (HCS)
Route 8
Table 5-2 summarizes the deficient freeway segments as analyzed by HCS along Route 8 under 2017 and 2045 conditions.
Table 5-2 2017 and 2045 Deficient Route 8 Freeway Segments
# of Deficient Segments2017 2045 No Build
Segment Type # of Segments AM Peak PM Peak AM Peak PM PeakNORTHBOUND
Mainline 4 - - - -
Weave 4 - - - -
Ramp / Diverge 3 - - - -
SOUTHBOUND
Mainline 6 - - - -
Weave 2 - -2
(100%)-
Ramp / Diverge 4 - - - -
The Future Condition Traffic Simulation Model also identified deficient facilities along Route 8 based on the interaction of freeway facilities as a system. Overall, 2045 Route 8 deficient segments include:
Northbound
Southern study extent to Exit 31 I-84 EB Off-Ramp (VISSIM)
Southbound
Exit 35 On-Ramp to Exit 34 Off-Ramp (HCS) Exit 33 I-84 WB On-Ramp to Exit 30 Off-Ramp (HCS & VISSIM)

INTERSTATE 84 / ROUTE 8 “MIXMASTER” INTERCHANGE | ANALYSIS, NEEDS AND DEFICIENCIES REPORT
SECTION 5 SUMMARY OF FINDINGS
181
Intersection Operations
In the Year 2017, eight (8) intersections operate at a LOS E or F, all in the PM peak hour
In the Year 2045, sixteen (16) during the PM peak hour operate at a LOS E or F and six (6) operate at a LOS E or F during the AM peak hour. Four (4) intersections operate at a LOS E or F for the AM and PM peak hour. These intersections are:
o West Main Street at Park Road and Interstate 84 Westbound Off Ramp (Exit 18)
o West Main Street at Highland Avenue and Private Driveo West Main Street at Watertown Avenue and CT Route 8 Southbound Off
Ramp (Exit 34)o South Main Street at Union Street and Grand Street
5.2 ROADWAY GEOMETRICS
Interstate 84
Based on the controlling design criteria, geometric deficiencies identified at least once along Interstate 84 within the study area include:
Design speed below design standard Shoulder width below design standard Auxiliary lane width below design standard Minimum horizontal radius below design standard K value crest and sag below design standard Maximum vertical grade above design standard Stopping sight distance below design standard Travel lane and shoulder cross slope below design standard Superelevation above design standard Vertical clearance below design standard
Based on operational factors, geometric deficiencies identified along Interstate 84 within the study area include:
Interchange spacing for several ramps are below design standard Two left hand ramps on Interstate 84 Eastbound. Two on-ramps can cross
two through lanes to reach the left-hand off-ramps. Three left-hand ramps on Interstate 84 Westbound. One on-ramp can cross
three through lanes to reach one of the right-hand off-ramps. The Interstate 84 Eastbound auxiliary lane that exists between the Route 8
Northbound on-ramp (TR 811) and the Exit 21 off-ramp has a very short weave distance.
Route 8
Based on the controlling design criteria, geometric deficiencies identified at least once along Route 8 within the study area include:
Shoulder width below design standard Compound curvature ratio above design standard K value sag below design standard Vertical clearance below design standard
Based on operational factors, geometric deficiencies identified along Interstate 84 within the study area include:
Interchange spacing for several ramps are below design standard Four left-hand ramps on Route 8 Northbound Four left-hand ramps on Route 8 Southbound On Route 8 Northbound, the left lane add from the Interstate 84 Westbound
on-ramp (TR 810) followed simultaneously by the left lane ramp from Interstate 84 Eastbound on-ramp (TR 806). The drivers from TR 810 may not realize this is a lane add and may be looking to merge while additional traffic is merging in on their left-hand side.
On Route 8 Southbound, the lane striping/configuration is confusing in the vicinity of the Exit 34 off-ramp.
On Route 8 Southbound, the extended parallel section of the Interstate 84 Westbound on-ramp (TR 812) while on structure, then terminating/merging with the center lane.
System Ramps
Based on the controlling design criteria, geometric deficiencies identified at least once along the eight existing system ramps within the study area include:
Design speed below design standard for all existing system ramps. Shoulder width below design standard Minimum horizontal radius below design standard Compound curvature ratio below design standard on Exit 19. K value sag below design standard Minimum vertical grade below design standard Stopping sight distance below design standard Superelevation transition length below design standard on Exit 33. Vertical clearance below design standard on Exit 19.
Service Ramps
Based on the controlling design criteria, geometric deficiencies identified at least once along the existing Interstate 84 service ramps within the study area include:
Design speed below design standard Shoulder width below design standard Auxiliary lane width below design standard on Collector Distributor Ramp 2 Minimum horizontal radius below design standard Compound curvature ratio below design standard K value crest and sag below design standard Maximum vertical grade above design standard Minimum vertical grade below design standard Stopping sight distance below design standard on Exit 30 Northbound On-
Ramp Travel lane and cross slope below design standard Superelevation transition length below design standard Vertical clearance below design standard on Exit 19 Eastbound Off-Ramp. Vertical clearance below design standard on Exit 19 Eastbound Off-Ramp.
Based on operational factors, geometric deficiencies identified along the existing Interstate 84 service ramps within the study area include:
Deceleration length below design standard on Exit 18 Eastbound Off-Ramp
Based on the controlling design criteria, geometric deficiencies identified at least once along the existing Route 8 service ramps within the study area include:
Design speed below design standard Travel lane width below design standard on Exit 30 Southbound Off-Ramp Shoulder width below design standard Compound curvature ratio below design standard K value crest and sag below design standard Maximum vertical grade above design standard on Exit 30 Northbound On-
Ramp Minimum vertical grade below design standard Stopping sight distance below design standard Travel lane and cross slope below design standard Superelevation transition length below design standard Vertical clearance below design standard on Exit 35 Northbound Off-Ramp
Based on operational factors, geometric deficiencies identified along the existing Route 8 service ramps within the study area include:
Acceleration length below design standard on Exit 32 Northbound On-Ramp Deceleration length below design standard on Exit 30 Northbound Off-Ramp

INTERSTATE 84 / ROUTE 8 “MIXMASTER” INTERCHANGE | ANALYSIS, NEEDS AND DEFICIENCIES REPORT
SECTION 5 SUMMARY OF FINDINGS
182
5.3 STRUCTURAL CONDITIONSOverall, 10 of the 62 bridges (16%) within the study limits are categorized as poor as determined by the lowest rating of deck, superstructure, substructure, or culvert. If measured by deck area, 696,067 square feet (sf) of the overall 1,167,436 sf of deck area (60%) within the study limits is categorized as poor.
7 of the 62 bridges (11%) within the study limits are categorized as having poor decks. If measured by deck area, 60% of the decks are categorized as poor.
8 of the 62 bridges (13%) within the study limits are categorized as having poor superstructures. If measured by deck area, 60% of the superstructures are categorized as poor.
6 of the 62 bridges (10%) within the study limits are categorized as having poor substructures. If measured by deck area, 51% of the substructures are categorized as poor.
In the year 2045 (assuming the “no build” condition):
Mainline Structures will remain stacked: Interstate 84 approximately 2,455 feet of the westbound bridge under the eastbound bridge, Route 8 approximately 1,400 feet of the southbound bridge under the northbound bridge. There are ongoing safety concerns associated with these stacked structures.
Non-redundant, fracture critical spans will remain on the Route 8 and I-84 mainline bridges. These fracture critical spans have fatigue prone connections that continue to crack and deteriorate.
The majority of the concrete decks on I-84 as well as steel members and the substructures will be 80 years old. Preservation or rehabilitation projects will by necessity become increasing frequent to maintain the condition of these bridges. These preservation/rehabilitation efforts will become less effective and more costly as the bridges continue to age.
5.4 SAFETY CRASH ANALYSIS
Interstate 84
The contributing circumstances for crashes on Interstate 84 Eastbound were congestion (80%) and geometry and driving behavior related factors (20%). On Interstate 84 Westbound the contributing circumstances were congestion (60%) and geometry and driving behavior related factors (40%). This leads to the following conclusions:
Eastbound
West of the interchange area, the predominant influence on crashes is attributed to congestion. The steep uphill grade approaching the study area has a climbing lane to provide relief from slower moving vehicles. Nonetheless, this grade contributes to a lower overall travel speed and congested conditions.
Immediately west of and through the core of the interchange area, some crashes may be influenced by curvature, grades and short spacing between ramps. However, the primary influence is attributed to congestion and queuing of traffic to the east, which backs up into the study area and impacts the operation of this freeway segment with close interchange spacing and multiple lane drops.
East of the interchange area, crashes are predominantly attributed to congestion, although other influences are seen more frequently, suggesting that difficult geometry entering the construction zone, driver impatience, difficult merges and unexpected, sudden traffic slowdown may all contribute to the crashes in this area.
Westbound
East of the interchange core, crash history indicates that the predominant influence on crashes is attributed to the westbound congestion leading to the Route 8 ramps.
West of the interchange core, Interstate 84 crashes are also influenced primarily by congestion;
A relatively high percentage of “other” causes, such as driver inattentiveness, objects in the road, weather, and speeding could be influenced, in part, by the return to an open freeway after passing through the construction area or attributed to the unusual roadway features in the core interchange.
Route 8
The contributing circumstances for crashes on Route 8 Northbound are road geometry and driver behavior related factors (64%) and traffic congestion (36%). On Route 8 Southbound. the contributing circumstances are traffic congestion (56%), and geometry and driver behavior related factors (44%). This leads to the following conclusions:
Northbound
South of the interchange core, congestion levels appear to be low. As traffic approaches the interchange, speeds are reduced as congestion increases, and the influences of ramps merging and diverging are noticed. The mix of contributing factors begins to shift to a higher percentage of congestion related crashes closer to the interchange core.
Route 8 Northbound through the core area exhibits a crash pattern that is more evenly distributed between contributing factors. This is likely attributed to the lower congestion levels, and is influenced by the multiple merges, diverges, lane drops, and weaves through the interchange core.
North of the interchange, Route 8 Northbound has a mix of influencing factors, with congestion being less of an influence as speeds increase and geometric issues, such as weaves, become less common.
Southbound
Route 8 Southbound enters the study area at a merge with Route 73, where Route 73 simultaneously merges from 2 lanes to 1 lane. There is a major weave across the Route 8 Southbound operational lanes, as the freeway approaches the core area. Crash history in this area shows a fairly even split between contributing factors.
Approaching the core interchange, the influence of geometric issues, such as multiple merging and diverging ramps, lane drops, lane additions and weaves, becomes apparent, although the influence of congestion is significant. It is likely that these weaving and lane change maneuvers, which occur on a short highway segment, are influenced by queues and congestion, which shorten the available maneuvering room, and force merges to occur in more restricted areas.
South of the core interchange, highest crash numbers are influenced by the multiple ramps, poor weaving geometry and congestion. It is also likely that the very long acceleration lane from the Interstate 84 Westbound ramp causes merging issues, because it functions more like a lane drop than an acceleration lane.

INTERSTATE 84 / ROUTE 8 “MIXMASTER” INTERCHANGE | ANALYSIS, NEEDS AND DEFICIENCIES REPORT
SECTION 5 SUMMARY OF FINDINGS
183
System Ramps
The primary contributing circumstances for crashes on interchange ramps were road geometry (50%) and driver behavior related factors (27%). Traffic congestion contributed to 22% of crashes. This leads to the following conclusions:
The Interstate 84 Westbound exit ramp to Route 8 Southbound (TR812) exhibits a crash history that is influenced by congestion and a mix of other factors. The geometry of this left-hand exit does not appear to be a significant factor. Other than improved operations that would result from a reduction in congestion, the crash rates do not show a significant pattern.
The Route 8 Northbound exit to Interstate 84 Eastbound (TR811) shows a strong influence by the poor ramp geometrics. The tightening, sharp curve catches drivers unaware and they lose control on the ramp. This is further influenced by poor weather conditions.
Intersections
Of the 65 intersections analyzed within the study area, 36 (55%) were found to be high crash locations, indicating that the intersection had more than 15 crashes and a ratio of actual crashes to the intersection’s critical crash rate was equal to or over 1.00.
Bicyclists and Pedestrians
Within the study area, a total of 27 pedestrian crashes and 3 cyclist collisions were identified.
5.5 TRANSIT AND RAILThe Waterbury area has a robust fixed-route transit network including local bus services; regularly scheduled intercity services; and paratransit and dial-a-ride services. The area is further serviced by CTtransit express bus and CTfastrak service between Hartford and Waterbury, and between New Haven and Waterbury. In addition, the Metro North Waterbury Branch Line provides commuter rail service from Waterbury to Bridgeport for rail connections to the New Haven Line and Grand Central Terminal in New York. While the transit and rail services in the Waterbury area are extensive, there is little direct impact of these services on the day-to-day traffic of the Mixmaster. Although the transit routes in the region do operate in part, on both Interstate 84 and Route 8, they do not go through the interchange itself. Moreover, much of the traffic generated on the Mixmaster originates outside of Waterbury and therefore changes in transit dependency in the region are not likely to significantly impact traffic volumes over the Mixmaster.
5.6 KEY CONTEXT FEATURES AND CHARACTERISTICSThe local context such as natural resources, scenic, aesthetic, historic and cultural identifiers will be considered as part of an integrated design process to enhance and expand upon the unique character of the community within the study area.
Design concepts should integrate with the intent of the following local planning and development projects:
W.A.T.E.R (Waterbury Active Transportation and Economic Resurgence) Project
Naugatuck River Greenway Freight Street District Waterbury Next
City-wide analysis shows that:
Environmental justice communities surround the interchange and their needs will be an important consideration during concept development.
Most of the historical properties, cultural, and institutional resources are in downtown Waterbury.
Naugatuck River and Mad River are two important natural resources that lack community access.
Neighborhood assessment illustrates that:
The Central Business District (CBD) is a historic urban core and generally well-maintained. However, there are pockets of area that are underutilized and unmaintained.
The neighborhood of South End has a mix of big box retail, light industrial, and single family residential. Some parcels and properties in the neighborhood are underutilized and vacant, and there is a prevalence of large parking lots.
Brooklyn is highly residential, developed and well-maintained for area on the west side of Route 8. There are underutilized and vacant land east of Route 8, in the area zoned as light industrial. It is difficult to access downtown from Brooklyn.
Overpasses, underpasses and crossings have an unsafe and uninviting character.
Existing and future primary and neighborhood generators were identified to help inform the effort to identify opportunities and develop an urban planning strategy.
Majority of the existing generators are in the Central Business District including:
o Metro North Railroad (MNR) Train Stationo St. Mary’s Hospitalo University of Connecticut Waterbury Campuso The Palace Theatero Local churches, schools, and retail establishments
Future generators currently under design or implementation include:
o Freight Street Districto W.A.T.E.R.o Former Anamet Site

INTERSTATE 84 / ROUTE 8 “MIXMASTER” INTERCHANGE | ANALYSIS, NEEDS AND DEFICIENCIES REPORT
SECTION 5 SUMMARY OF FINDINGS
184
5.7 BICYCLE AND PEDESTRIAN INFRASTRUCTUREThe existing bicycle and pedestrian infrastructure and activities as related to the Mixmaster were evaluated to identify opportunities to improve pedestrian and cyclist circulation and overall experience across and around Interstate 84 and Route 8.
Demographics show that the City of Waterbury has a relatively large transit dependent population with most transit activities taking place at Waterbury Green and MNR Train Station. Bicycle and pedestrian infrastructure connections from surrounding neighborhoods to major transit, cultural and institutional destinations are limited and uninviting.
A summary of current bicycle and pedestrian initiatives is shown below:
The Connecticut Bicycle Plan and Map is currently undergoing an updating process.
The Naugatuck River Greenway project would incorporate bicycle and pedestrian infrastructure and recommend improvements for various intersections in Waterbury.
The W.A.T.E.R. project includes two bicycle/pedestrian initiatives: Reconstruction of Freight Street and Library Park-Train Station-Riverfront Connector.
The following ongoing projects have bicycle and pedestrian infrastructure as major components:
Naugatuck River Greenway Jackson Street Reconstruction and Extension The Library-Train-Riverfront Connector Freight Street Reconstruction
A summary of the existing condition of sidewalk and crossings is listed below:
The CBD has well-maintained sidewalks throughout much of the district. South End does not have strong pedestrian infrastructure; some areas are
badly maintained or non-existent. Brooklyn and West End have some deficient sidewalks. Overpasses and underpasses have narrow sidewalks and lack lighting and safe
crossings.
5.8 ENVIRONMENTAL CONSTRAINTSFourteen environmental mapping resources at the state or federal level were consulted during the desktop investigation to identify resource impacts within the existing alignment. The following was found:
Multiple riverine, freshwater forested/shrub wetlands, and freshwater ponds were identified including Wooster Brook, Welton Brook, Sled Haul Brook, the Naugatuck River, and Mad River. Several other smaller, unnamed tributaries and wetlands or ponds also appear on the mapping. Numerous watercourses appear to be piped through culverts along the existing alignment.
No federally listed species or critical habitats are anticipated within the existing alignment.
Fourteen (14) birds protected by the Migratory Birds Treaty Act and the Bald and Golden Eagle Protection Act were identified.
Two wetland soil series were mapped within the limits, including Ridgebury, Leicester, and Whitman soils (3) and Catden and Freetown Soils (18).
Both Prime Farmland Soils and Statewide Important Farmland Soils are present. No Locally Important Farmland Soils are mapped within the existing alignment.
No sole source aquifer is situated within nor in immediate proximity to the existing alignment.
Present floodways associated with Wooster Brook, Naugatuck River, and the Mad River were located within the existing alignment. Wooster Brook, Welton Brook, and the Mad River also have 100-year floodplains and 500-year floodplains mapped near Wooster Brook, the Naugatuck River, and the Mad River.
Three historically significant areas were found that are partially located within the existing alignment, including the Riverside Cemetery, a cultural resource site, and Downtown Waterbury Historic District and Hamilton Park.
No Coastal Area Management (CAM) Zone is located within the existing alignment.
No public water supply watershed is located within the existing alignment. No Aquifer Protection Area (APA) is located within the existing alignment. At least one mapped Natural Diversity Data Base (NDDB) area was identified
within the existing alignment. No critical habitat is mapped within or adjacent to the existing alignment. Ground water quality is mapped as “GA” for the western portion of the
existing alignment and “GB” for the central and eastern portion of the existing alignment.
Wooster Brook, Welton Brook, and Sled Haul Brook are all classified as “A” surface waters. The Naugatuck River and Mad River are both classified as “B” surface waters.
No known Northern Long-Eared Bat hibernacula or roost trees are located in or immediately adjacent to the existing alignment.
Several areas throughout the existing alignment that appear to be wetlands or watercourses include Wooster Brook, Welton Brook, Sled Haul Brook, Tamarack Swamp, Naugatuck River and potential floodplain wetlands, Mad River and potential floodplain wetlands. A small wetland a potential vernal pool was identified in addition to a potentially isolated wetland that may also function as a vernal pool.


