Embed Size (px)
Citation preview

Journal of Experimental Botany, Vol. 58, No. 10, pp. 2583–2594, 2007
doi:10.1093/jxb/erm126 Advance Access publication 27 June, 2007This paper is available online free of all access charges (see http://jxb.oxfordjournals.org/open_access.html for further details)
RESEARCH PAPER
Analysis of citrate accumulation during peach fruitdevelopment via a model approach
B. H. Wu1, M. Genard2,*, P. Lobit3, J. J. Longuenesse2, F. Lescourret2, R. Habib2 and S. H. Li1
1 Institute of Botany, Chinese Academy of Sciences, 100093 Beijing, PR China2 UR1115 Plantes et Systemes de culture Horticoles, INRA, F-84000 Avignon, France3 Instituto de Investigaciones Agropecuarias y Forestales, Universidad Michoacana de San Nicolas de Hidalgo,Tarimbaro, Michoacan, CP. 58880, Mexico
Received 15 February 2007; Revised 11 May 2007; Accepted 14 May 2007
Abstract
Based on the citrate model of Lobit and colleagues and
measured data, a new model, which is able to re-
produce the variation over time of citrate concentration
in two peach cultivars, has been proposed. As in the
original one, the new model calculates the rate of citrate
synthesis or degradation as the product of a ‘synthesis
potential’ and an ‘efficiency level’. While in the old
model the ‘efficiency level’ was a simple linear function
of temperature and respiration, in the new one its
relationship with respiration is accounted for by a
coefficient that decreases throughout fruit develop-
ment. The differences in model parameters between
the two cultivars were investigated: late-maturing cv.
Suncrest had significantly lower citrate synthesis
potential than mid-maturing cv. Fidelia. The responses
of citrate concentration to model parameters, tempera-
ture, fruit respiration, and growth curves were studied.
The most important parameter in the new model, k4,2,
represented the date when the relationship between
respiration and ‘efficiency level’ changed from positive
to negative. Raising mean temperature increased the
citrate concentration at the beginning and decreased it
near maturity for cv. Suncrest, while citrate concentra-
tion increased throughout fruit development and more
strongly for cv. Fidelia. An increase in the mesocarp dry
weight increased both fruit respiration and citrate
concentration at the beginning of fruit development,
while near maturity it increased fruit respiration but
decreased citrate concentration. The model was also
able to reproduce the effect of assimilate supply
(leaf:fruit ratio). Further potential uses of the model
were discussed.
Key words: Citrate, fruit, leaf:fruit ratio, metabolism, model,
peach.
Introduction
Organic acids are important components of fruit flavourand, as such, contribute with soluble sugars and aromas tothe overall organoleptic quality (Sweeney et al., 1970).Citrate is one of the most important organic acids formany fruits (Tucker, 1993). Understanding the develop-ment of acidity during fruit development requires studyingthe mechanisms involved in the accumulation of citrate.The ongoing studies of metabolism, enzyme activities orgene regulation throughout fruit development have notyet advanced adequate explanations to elucidate thecomplexity of the mechanisms involved in citrate accu-mulation. Moing et al. (1999, 2000) found that PEP-carboxylase, a key enzyme in organic acid biosynthesis,might participate in the control of organic acid accumu-lation during fruit development in the normal-acid peachfruit of cv. Fantasia with juice pH about 3.5 at maturity,while little relation between PEP-carboxylase activityand acid accumulation was found in the low-acid peachfruit of cv. Jalousia with juice pH about 4.5 at maturity.They suggested that mechanisms other than organic acidsynthesis might account for the differences in aciditybetween normal-acid and low-acid peach fruit. Similarly,studies focusing on tonoplastic transport system (Canelet al., 1995) or mitochondrial citrate synthase (Canelet al., 1996) failed to explain the differences in citrateaccumulation between high- and low-acidity citrus culti-vars. In addition, Etienne et al. (2002) detected six genes
* To whom correspondence should be addressed. E-mail: [email protected]
ª 2007 The Author(s).This is an Open Access article distributed under the terms of the Creative Commons Attribution Non-Commercial License (http://creativecommons.org/licenses/by-nc/2.0/uk/) whichpermits unrestricted non-commercial use, distribution, and reproduction in any medium, provided the original work is properly cited.
by guest on June 2, 2013http://jxb.oxfordjournals.org/
Dow
nloaded from

involved in organic acid metabolism and found that theirexpression patterns were also not always correlated withthe changes in organic acid concentration in peach. Itappears difficult to identify single steps controlling acidaccumulation.Recently, a physiological model, constructed by Lobit
et al. (2003), was proposed to be an integrating approachfor analysing citrate accumulation at the whole fruit level.This citrate model was based on metabolic control theory(Fell, 1997) and a ‘top-down’ approach (Kell and Mendes,2000): the fluxes in the citrate cycle, the transport ofmetabolites between the cytosol and the mitochondria, andthe regulatory behaviour for the related enzymes wererepresented as linear combinations of regulatory factors(temperature, energy state, and metabolite concentrations);then groups of successive reactions were modelled as a sin-gle reaction. It has been successfully used to analyse theresponse of citrate concentration in peach fruit to varia-tions of temperature and fruit growth (Lobit et al., 2003).In this study, the focus was on improving the citrate
model of Lobit et al. (2003) with a large body of experi-mental data sets incorporating different peach cultivars,assimilate availabilities, and years, and the sensitivities ofcitrate concentration to model parameters, temperature,fruit respiration, and growth were analysed further. Theability of the model to predict the relative importance ofmetabolism and dilution as a result of increasing fruit sizewas also analysed.
Description of the model
Citrate model established by Lobit et al. (2003)
A citrate model, which predicts the rate of net citrate pro-duction per fruit in response to fruit respiration andtemperature, was established by Lobit et al. (2003). Inthis model, the rate of citrate metabolism was representedas the product of two terms: (i) a ‘synthesis potential’ [(a)in the equation below, that is the rate of dicarboxylic acidsentering the mitochondria that, if metabolized into citrate,would define the maximum rate of citrate synthesis],which varies linearly with temperature (with parameter k1and k2 accounting for the synthesis potential and its re-sponse to temperature respectively), and (ii) an ‘efficiencylevel’ [(b) in the equation below, that is the proportion ofmitochondrial malate being degraded through the malicenzyme], dependent on temperature (represented by para-meter k3) and respiratory load on the mitochondria (rep-resented by parameter k4). The model equation was:
dMcit
dt¼
k1ð1þk2ðT�T0ÞÞ ð1þk3ðT�T0Þþk4 RespÞðaÞ ðbÞ
ð1Þ
where Mcit is the citrate amount in fruit mesocarp (mmolfruit�1), t the date (days after bloom, DAB) and dMcit
dt thenet citrate production (mmol fruit�1 d�1). T0 is an arbitrary
temperature (25 �C), and T is the mean temperature at datet. Resp is the respiration of fruit mesocarp in mmol CO2
d�1. k1 (mmol d�1) is the rate of net citrate productionwhen T is equal to T0 and Resp is zero. k2 and k3 (�C�1)are temperature response coefficients. k4 (d mmol�1 CO2)is related to respiration and equal to � 1
Resp when T is equalto T0 and
dMcitdt is zero.
Total citrate amount in the mesocarp is obtained byintegrating dMcit
dt over the monitored period, starting withcitrate concentration observed at the beginning of thisperiod. Citrate concentration in the mesocarp is obtainedby dividing the total citrate amount by the mesocarp freshweight:
Ccit ¼ 100
FW
Z t
t0
dMcit
dtdt
where Ccit (mmol 100 g�1 FW) is citrate concentration inthe mesocarp, FW the mesocarp fresh weight (g), t thedate (in DAB) and t0 the date of the beginning of theexperiment. The differential equation is integrated numeri-cally using the first order Runge Kutta method with a one-day integration step. All data analyses were performedwith S-Plus language (Splus software, MathSoft Inc.,Cambrige, Mass., USA).
Model inputs
The daily respiration of fruit mesocarp (Resp in mmolCO2 d�1), daily mean temperature (T in �C), days afterfull bloom (DAB), and daily estimates of fresh mesocarpweight (FW in g) are needed as entries of the model.The respiration of fruit mesocarp is expressed as the
sum of maintenance respiration Respm and growthrespiration Respg:
Resp ¼ Respm þ Respg ¼ qm DWQT�2010
10 þ qgdDW
dt
where qm (mmol CO2 g�1 d�1) is the maintenance respi-ration coefficient at 20 �C, qg (mmol CO2 g
�1) the growthrespiration coefficient and Q10 the temperature ratio ofmaintenance respiration (dimensionless). Values of qm, qg,and Q10, taken from DeJong et al. (1987) and DeJong andGoudriaan (1989), are 0.0543 mmol CO2 g�1 d�1, 7.023mmol CO2 g�1, and 1.96, respectively. DW (g) is thedaily dry mesocarp weight, and dDW
dt (g d�1) the growthrate of dry mesocarp weight. Daily fresh and drymesocarp weights were calculated using weekly measuredvalues by local regression.
Modifications to the citrate model of Lobit et al. (2003)
Because metabolic processes vary with fruit developmentin many fruits, including apple (Yamaki and Ishikawa,1986), tomato (Robinson et al., 1988), pear (Moriguchiet al., 1992), and peach (Moriguchi et al., 1990), Lelievre
2584 Wu et al.
by guest on June 2, 2013http://jxb.oxfordjournals.org/
Dow
nloaded from
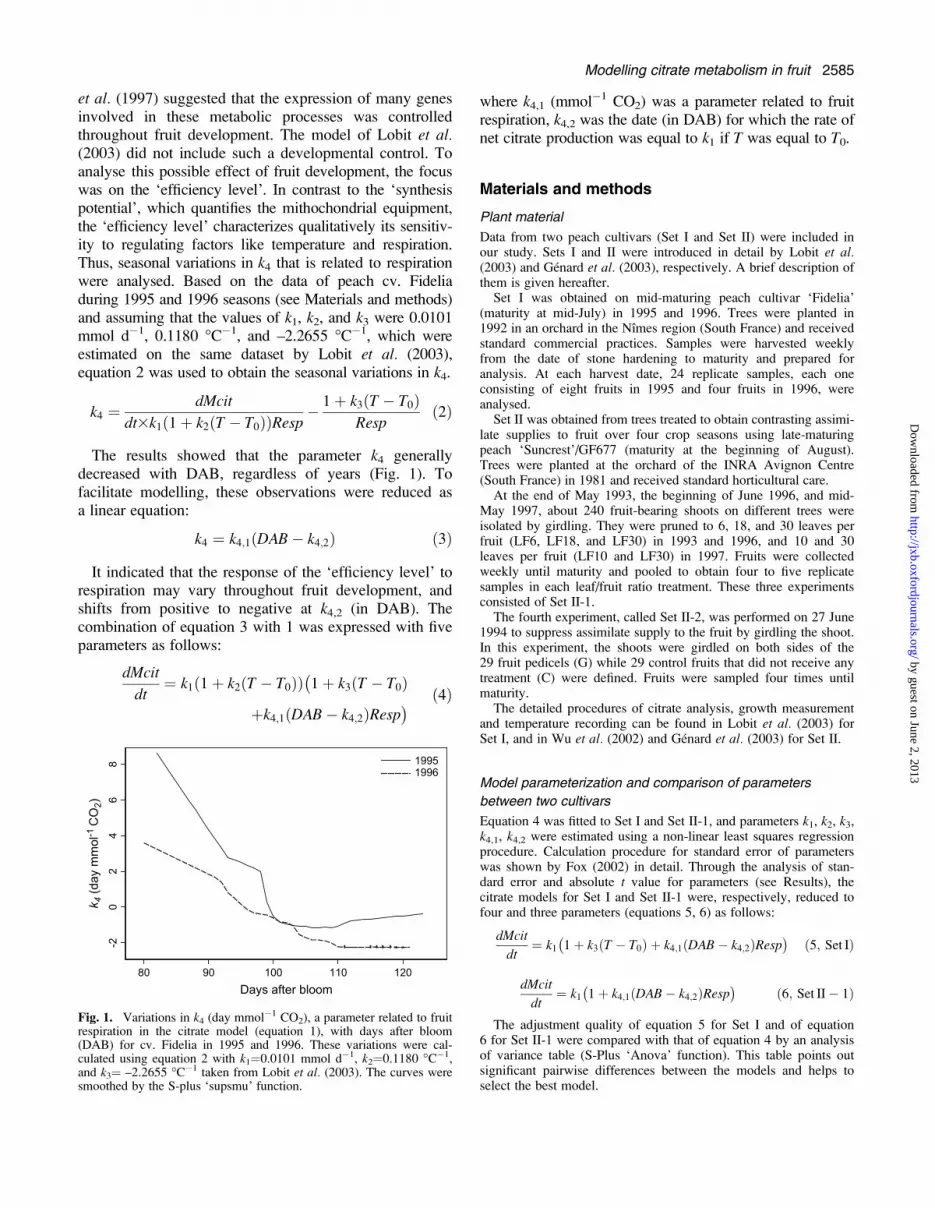
et al. (1997) suggested that the expression of many genesinvolved in these metabolic processes was controlledthroughout fruit development. The model of Lobit et al.(2003) did not include such a developmental control. Toanalyse this possible effect of fruit development, the focuswas on the ‘efficiency level’. In contrast to the ‘synthesispotential’, which quantifies the mithochondrial equipment,the ‘efficiency level’ characterizes qualitatively its sensitiv-ity to regulating factors like temperature and respiration.Thus, seasonal variations in k4 that is related to respirationwere analysed. Based on the data of peach cv. Fideliaduring 1995 and 1996 seasons (see Materials and methods)and assuming that the values of k1, k2, and k3 were 0.0101mmol d�1, 0.1180 �C�1, and –2.2655 �C�1, which wereestimated on the same dataset by Lobit et al. (2003),equation 2 was used to obtain the seasonal variations in k4.
k4 ¼dMcit
dt3k1ð1þ k2ðT � T0ÞÞResp� 1þ k3ðT � T0Þ
Respð2Þ
The results showed that the parameter k4 generallydecreased with DAB, regardless of years (Fig. 1). Tofacilitate modelling, these observations were reduced asa linear equation:
k4 ¼ k4;1ðDAB� k4;2Þ ð3Þ
It indicated that the response of the ‘efficiency level’ torespiration may vary throughout fruit development, andshifts from positive to negative at k4,2 (in DAB). Thecombination of equation 3 with 1 was expressed with fiveparameters as follows:
dMcit
dt¼ k1ð1þ k2ðT � T0ÞÞ
�1þ k3ðT � T0Þ
þk4;1ðDAB� k4;2ÞResp� ð4Þ
where k4,1 (mmol�1 CO2) was a parameter related to fruitrespiration, k4,2 was the date (in DAB) for which the rate ofnet citrate production was equal to k1 if T was equal to T0.
Materials and methods
Plant material
Data from two peach cultivars (Set I and Set II) were included inour study. Sets I and II were introduced in detail by Lobit et al.(2003) and Genard et al. (2003), respectively. A brief description ofthem is given hereafter.Set I was obtained on mid-maturing peach cultivar ‘Fidelia’
(maturity at mid-July) in 1995 and 1996. Trees were planted in1992 in an orchard in the Nımes region (South France) and receivedstandard commercial practices. Samples were harvested weeklyfrom the date of stone hardening to maturity and prepared foranalysis. At each harvest date, 24 replicate samples, each oneconsisting of eight fruits in 1995 and four fruits in 1996, wereanalysed.Set II was obtained from trees treated to obtain contrasting assimi-
late supplies to fruit over four crop seasons using late-maturingpeach ‘Suncrest’/GF677 (maturity at the beginning of August).Trees were planted at the orchard of the INRA Avignon Centre(South France) in 1981 and received standard horticultural care.At the end of May 1993, the beginning of June 1996, and mid-
May 1997, about 240 fruit-bearing shoots on different trees wereisolated by girdling. They were pruned to 6, 18, and 30 leaves perfruit (LF6, LF18, and LF30) in 1993 and 1996, and 10 and 30leaves per fruit (LF10 and LF30) in 1997. Fruits were collectedweekly until maturity and pooled to obtain four to five replicatesamples in each leaf/fruit ratio treatment. These three experimentsconsisted of Set II-1.The fourth experiment, called Set II-2, was performed on 27 June
1994 to suppress assimilate supply to the fruit by girdling the shoot.In this experiment, the shoots were girdled on both sides of the29 fruit pedicels (G) while 29 control fruits that did not receive anytreatment (C) were defined. Fruits were sampled four times untilmaturity.The detailed procedures of citrate analysis, growth measurement
and temperature recording can be found in Lobit et al. (2003) forSet I, and in Wu et al. (2002) and Genard et al. (2003) for Set II.
Model parameterization and comparison of parameters
between two cultivars
Equation 4 was fitted to Set I and Set II-1, and parameters k1, k2, k3,k4,1, k4,2 were estimated using a non-linear least squares regressionprocedure. Calculation procedure for standard error of parameterswas shown by Fox (2002) in detail. Through the analysis of stan-dard error and absolute t value for parameters (see Results), thecitrate models for Set I and Set II-1 were, respectively, reduced tofour and three parameters (equations 5, 6) as follows:
dMcit
dt¼ k1
�1þ k3ðT � T0Þ þ k4;1ðDAB� k4;2ÞResp
�ð5; Set IÞ
dMcit
dt¼ k1
�1þ k4;1ðDAB� k4;2ÞResp
�ð6; Set II� 1Þ
The adjustment quality of equation 5 for Set I and of equation6 for Set II-1 were compared with that of equation 4 by an analysisof variance table (S-Plus ‘Anova’ function). This table points outsignificant pairwise differences between the models and helps toselect the best model.
80 90 100 110 120
-20
24
68 1995
1996
k4 (d
ay m
mol
-1 C
O2)
Days after bloom
Fig. 1. Variations in k4 (day mmol�1 CO2), a parameter related to fruitrespiration in the citrate model (equation 1), with days after bloom(DAB) for cv. Fidelia in 1995 and 1996. These variations were cal-culated using equation 2 with k1¼0.0101 mmol d�1, k2¼0.1180 �C�1,and k3¼ –2.2655 �C�1 taken from Lobit et al. (2003). The curves weresmoothed by the S-plus ‘supsmu’ function.
Modelling citrate metabolism in fruit 2585
by guest on June 2, 2013http://jxb.oxfordjournals.org/
Dow
nloaded from

The difference in parameters k1, k4,1, and k4,2 between equation 5and 6, i.e. between cv. Fidelia (Set I) and cv. Suncrest (Set II-1),was tested following the Chamber and Hastie (1992) procedure.Fitting equation 5 and equation 6, respectively, to Set I and Set II-1produced fitted model objects (fitI, fitII). Refitting Set I and Set II-1together, holding all but one of the parameters constant (forexample k1), produced another fitted model object (fitboth). Thenthe F value for F-test (Fval) was calculated as below:
Fval ¼ +resfitboth2 �+resfitI2 �+resfitII2�+resfitI2 þ+resfitII2
�=ðdffitI þ dffitIIÞ
where res and df are residuals and degrees of freedom, respectively.
Goodness of fit and predictive quality of the model
A criterion was computed to evaluate (i) the goodness-of-fit of themodel on the basis of data Set I and Set II-1, which were separatelyused for parameterization, and (ii) the predictive quality of the modelfor the independent data Set II-2, which is a special situation of Set II-1.The adopted criterion was the root mean squared error (RMSE), a
common criterion to quantify the mean difference between simulationand measurement (Kobayashi and Us Salam, 2000), here defined as:
RMSE ¼
ffiffiffiffiffiffiffiffiffiffiffiffiffiffiffiffiffiffiffiffiffiffiffiffiffiffi+niðxi � yiÞ2
N
s
where ni, xi, and yi are the number of observed data, the simulationdata, and the mean observed data at the measurement date i,respectively, and N is the total number of observed data. The smallerthe RMSE in comparison with measurements, the better the goodness-of-fit, which can be represented through relative RMSE (RRMSE):
RRMSE ¼ RMSE
�y
where �y is the mean of all observed values.Cross-validation, a common approach to estimating prediction
error, was performed on data Set II-1 to review the predictivequality of the model further. The principles of cross-validation areas follows (Wallach et al., 2001). The data Set II-1 is split into twoparts: one part has only a single situation (the target situation); theother part has all the data independent of the target situation. In thiscase, the second part of the data only includes situations that are notfrom the same year as the target situation. The parameters are esti-mated using the second part of the data, and the resulting parametervalues are used to calculate RMSE and RRMSE for the target situ-ation. The procedure is repeated using every situation in turn as thetarget situation. Averaging the RMSEs or RRMSEs over all thetarget situations gives the overall estimate of the absolute or relativeroot mean squared error of prediction (RMSEP or RRMSEP).
Sensitivity analysis
A sensitivity analysis was performed to investigate model responsesto parameters, temperature, and fruit growth. The sensitivity of theresponses to parameters and temperature was quantified by the nor-malized sensitivity coefficients, defined as the ratio between therelative variations of predicted citrate concentration and the relativevariation of parameters and temperature. These coefficients wereestimated by computing the responses of citrate concentrations tovariations of60.01% on the parameters and temperature.The effects of different fruit growth curves on citrate concentra-
tion were also simulated. A logistic function was used to model thegrowth curve of dry mesocarp weight (DW):
DW ¼ a1 þa2
1þ e�4G maxðDAB�DmaxÞ
a2
ð7Þ
where a1 and a2 are parameters, and DAB is the day after full bloom.Parameter Gmax and Dmax are, respectively, the maximum growthrate and the time (in DAB) at which maximum growth rate occurs.For the sensitivity analysis, the equation was reparameterized in
terms of the initial dry weight (DW0) and the maximum dry weight(DWmax) instead of a1 and a2. DWmax is given by
DWmax ¼ a1 þ a2 ð8Þand DW0 (on DAB0) can be expressed as
DW0 ¼ DWmax� a2 þa2
1þ e�4GmaxðDAB0�DmaxÞ
a2
ð9Þ
Values of Gmax, Dmax, DW0, and DWmax obtained by fittingto the data were multiplied by ratios of 0.5, 1, and 1.5 to obtaindifferent growth curves. In order to apply equation 7, a2 was firstcalculated by solving equation 9 with the root finder for continuousfunctions of S-Plus software, then a1 was calculated from equation 8.The corresponding growth curve of fresh mesocarp weight was
obtained by the equations:
FW ¼ 8:5113þ 7:6201DWðSet I; r ¼ 0:96� � �;P<0:001Þ
FW ¼ 10:8370þ 7:0614DWðSet II; r ¼ 0:95� � �;P<0:001Þ
These two equations were established by linear regression usingobserved data from Set I and Set II, respectively.
Application of the model to analyse the effect of
metabolism and dilution
The citrate concentration in fruit mesocarp (Ccit in mmol 100 g�1
FW) depends on the citrate amount in fruit mesocarp (Mcit in mmolfruit�1) and fresh mesocarp weight (FW in g fruit�1) as follows:
Ccit ¼ 100Mcit
FWð10Þ
Differentiation of equation 10 leads to:
dCit
dt¼ 100
FW
DMcit
dt� 1
FWCcit
dFW
dt
fmeg fdigð11Þ
Equation 11 introduces the two components causing change incitrate concentration: metabolism (me) and dilution attributable toincreasing fruit size (di). Equation 11 can be combined with thecitrate model (equations 5 and 6) to get equation 12 for Set I andequation 13 for Set II-1:
dCcit
dt¼ 100
FWk1ð1þ k3ðT � T0Þ þ k4;1ðDAB� k4;2ÞRespÞ
� 1
FWCcit
dFW
dtfmeg
fdig
ð12Þ
dCcit
dt¼ 100
FWk1ð1þ k4;1ðDAB� k4;2ÞRespÞ �
1
FWCcit
dFW
dt
fmeg fdigð13Þ
Results
Model parameterization, adjustment, andpredictive quality
The equation 4 was fitted to Set I and Set II-1, and theparameters were estimated (Table 1). The standard error
2586 Wu et al.
by guest on June 2, 2013http://jxb.oxfordjournals.org/
Dow
nloaded from

for k2 in Set I was found rather high, as well as for k2 andk3 in Set II-1. Their estimated values were not signifi-cantly different from zero at P¼0.05 level. Thus inequation 4, k2 for Set I as well as k2 and k3 for Set II-1were supposed to be zero, and equations 5 and 6 werefurther proposed for Set I and Set II-1, respectively.The adjustment qualities, indicated by RMSE and
RRMSE, of equation 1, 4, and 5 (for Set I) and 6 (for SetII-1) were shown in Table 2. Compared with the model ofLobit et al. (2003) (equation 1), equations 4, 5, and 6obviously reduced RMSE and RRMSE, although theyprovided little or no improvement for cv. Fidelia in 1995and for the LF10 treatment of cv. Suncrest in 1997.Equation 5 for Set I and equation 6 for Set II-1 did notshow obvious difference in RMSE and RRMSE withequation 4, except that equation 5 reduced RMSE andRRMSE to less than half for cv. Fidelia in 1995.Subsequently, using analysis of variance the adjustmentqualities of equation 5 for Set I and equation 6 for Set II-1
were further compared with that of equation 4. For SetI no significant difference was detected between equations5 and 4. Similarly, for Set II-1 the adjustment quality ofequation 6 did not significantly differ from that ofequation 4. When the adjustment quality of the simplermodel had no significant difference with that of the morecomplex model, the simpler model was chosen Thenumber of parameters for equations 5 (4 parameters) and6 (3 parameters) was less than equation 4 (5 parameters),and therefore they were preferred as the final appropriatecitrate models for Set I and Set II-1, respectively.Parameter values of equations 5 and 6 are presented in
Table 3. Standard errors of the parameters were small.Late-maturing cv. Suncrest (Set II-1) had significantlylower values of k1 and higher values of k4,2 than mid-maturing cv. Fidelia (Set I). k4,1 was not significantlydifferent between the two cultivars. Simulated citrateconcentrations by these two models well matched theexperimental results (Figs 2, 3). RMSEP and RRMSEP for
Table 1. Parameter values and standard errors using equation4 for cv. Fidelia during the 1995 and 1996 seasons (data Set I)and cv. Suncrest during the 1993, 1996 and 1997 seasons (dataSet II-1)
Parameter Set I Set II-1
Estimatedvalue
Standarderror
Estimatedvalue
Standarderror
k1 0.0414 0.0028 0.0261 0.0025k2 �0.0190 nsa 0.0283 0.0818 ns 0.0472k3 0.1588 0.0105 �0.0940 ns 0.0476k4,1 �0.0339 0.0047 �0.0277 0.0053k4,2 101.48 0.8079 112.10 1.0884
a ns indicates that the estimated value is not significantly differentfrom zero at P¼0.05.
Table 2. Root mean squared error between observed andsimulated values (RMSE in mmol 100 g�1 FW) and relativeRMSE (RRMSE) using equations 1, 4, and 5 for cv. Fideliaduring the 1995 and 1996 seasons (data Set I), and equation 1,4, and 6 for cv. Suncrest during the 1993, 1996, and 1997seasons (data Set II-1)
Cultivar Year Treat Equation 1 Equation 4 Equation 5
RMSE RRMSE RMSE RRMSE RMSE RRMSE
Fidelia 1995 0.30 0.19 0.57 0.37 0.33 0.211996 0.42 0.21 0.20 0.10 0.19 0.10
Equation 6Suncrest 1993 LF6 0.48 0.25 0.30 0.15 0.31 0.16
LF18 0.80 0.57 0.41 0.29 0.43 0.31LF30 0.83 0.53 0.46 0.30 0.45 0.29
1996 LF6 0.59 0.30 0.51 0.26 0.48 0.25LF18 0.76 0.40 0.47 0.24 0.46 0.24LF30 0.60 0.39 0.24 0.15 0.23 0.15
1997 LF10 0.29 0.17 0.48 0.27 0.49 0.28LF30 0.53 0.39 0.40 0.29 0.42 0.31
Table 3. Parameter values and standard errors using equation5 for cv. Fidelia during the 1995 and 1996 seasons (data Set I)and equation 6 for cv. Suncrest during the 1993, 1996 and 1997seasons (data Set II-1)
Parameter Set I Set II-1
Estimatedvalue
Standarderror
Estimatedvalue
Standarderror
k1 0.0399 aa 0.0021 0.0234 b 0.0013k3 0.1530 0.0106 – –k4,1 –0.0369 a 0.0027 –0.0357 a 0.0030k4,2 101.86 a 0.4868 111.51 b 0.9240
a In each line, the estimated values with different letters aresignificantly different according to F-test (P¼0.05).
70 80 90 100 110 120
01
23
4
1995
70 80 90 100 110 120
1996
Days after bloom
Citr
ate
(mm
ol 1
00g-1
FW
)
Fig. 2. Measured and simulated citrate concentrations by the citratemodel (equation 5) for cv. Fidelia during the 1995 and 1996 seasons(data Set I). Crosses represent repetitions of the measurements, andsolid lines simulated citrate evolution.
Modelling citrate metabolism in fruit 2587
by guest on June 2, 2013http://jxb.oxfordjournals.org/
Dow
nloaded from

Set II-1 (predictive quality) were 0.52 mmol 100 g�1 FWand 0.32, which can be considered as acceptable. Themodel adequately simulated the positive effect of assimi-late supply on citrate concentration at the beginning offruit growth and the negative effect at the end of fruitgrowth.The parameter values, obtained by Set II-1, were further
applied to the independent data Set II-2 (Fig. 4). Althoughthe RRMSE was high (0.54), the model simulated thedecrease of citrate concentration for the control treatmentduring the late period of fruit development. More in-terestingly, it predicted the lack of such decrease when theassimilate supply was suppressed, which was corroboratedby the data from the girdling treatment.
Sensitivity analysis
The responses of the model to variations of parameters(k1, k3, k4,1, k4,2, qm, qg, Q10), temperature, and growth
curve of dry mesocarp weight were very similar fordifferent years. Because of this reason, only thoseobtained on Set I in 1996 and Set II-1 in 1996 will beshown hereafter.Sensitivity to k1 rapidly increased during the first 10 d
and then was close to being constant (about 0.8) (Fig. 5).Cultivar, year, and assimilate supply had little influence onsensitivity to k1. Sensitivities to k4,1 and qg exhibited quitesimilar tendencies. They increased during the first 10 d,then decreased, and were higher for fruits with moreassimilate supply. Sensitivities to k4,2 were positive andincreased throughout fruit growth. They were more than tentimes higher than those of the other parameters, whichreflects the strong dependence of citrate concentration onk4,2. In the case of cv. Fidelia in 1995, increasing k4,2 by0.01% can increase citrate concentration by up to about0.57% (not shown). Fruits with a high assimilate supplywere more sensitive to k4,2 than fruits with a low assimilatesupply. Sensitivities to qm, and Q10 were smaller than those
4
LF 6
1993
LF 6
1996
LF 10
1997
4
LF 18 LF 18
LF 30 LF 30 LF 30
00
12
30
12
30
12
34
12
34
80 100 120 140 80 90 100 110 120 130 140Days after bloom
80 100 120 140
Citr
ate
(mm
ol 1
00g-1
FW
)
Fig. 3. Measured and simulated citrate concentrations by the citrate model (equation 6) for cv. Suncrest during the 1993, 1996, and 1997 seasons(data Set II-1). The labels LF6, LF10, LF18, and LF30 indicate the leaf:fruit ratio. Crosses represent repetitions of the measurements, and linessimulated citrate evolution.
2588 Wu et al.
by guest on June 2, 2013http://jxb.oxfordjournals.org/
Dow
nloaded from

to other parameters (k1, k4,1, k4,2, and qg), and had similarvariation independently of assimilate supply, year, andcultivar. They increased from 0 to 0.1 at the beginning offruit growth, then decreased and finally ranged from –0.02to –0.07 at maturity. The maximum and minimum dailymean temperatures for cvs Fidelia and Suncrest during allthe measured growing seasons did not obviously differ,16–27 �C for cv. Suncrest and 15–28 �C for cv. Fidelia,although seasonal variations in daily mean temperaturewere different (not shown). Sensitivity to temperature forcv. Suncrest was similar to that to qm and Q10. Sensitivityto temperature for cv. Fidelia was positive and increased to0.4 with fruit growth. Conversely, for cv. Fidelia in 1996,sensitivity to k3, which is related to temperature, wasnegative and varied from 0 to –1.2.The effects of changes in dry mesocarp weight growth
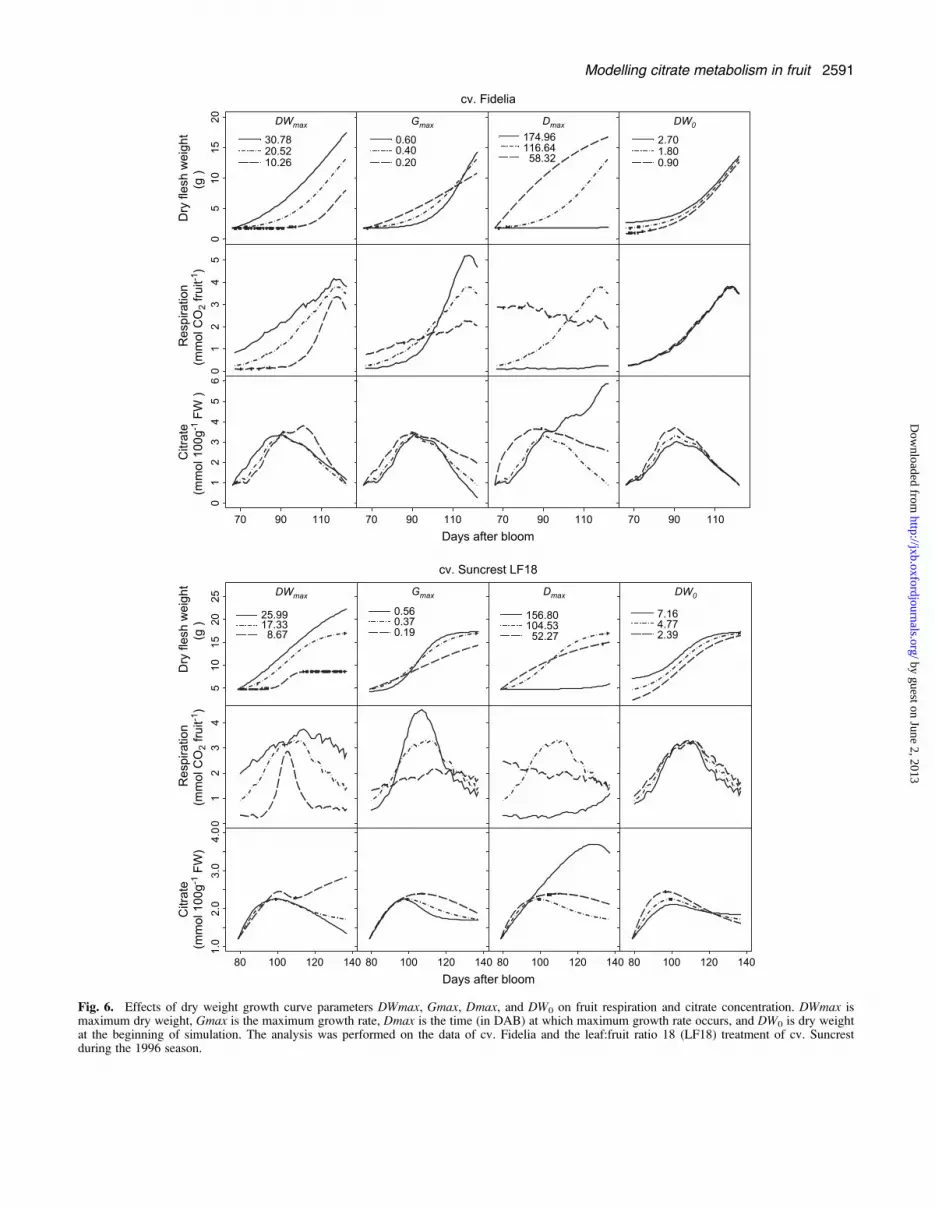
curve parameters were analysed, that is: maximum dryweight (DWmax), initial dry mesocarp weight at the firstsimulated date (DW0), maximum growth rate (Gmax) andthe date when maximum growth rate was reached (Dmax)on citrate concentration (Fig. 6). Although the twocultivars showed the same general trends, their response
to changes in fruit growth pattern was cultivar specific.While variations of DWmax had little effect of citrateaccumulation in cv. Fidelia, increasing DWmax led tomuch smaller citrate concentrations during the last stagesof fruit growth in Suncrest. Increasing DW0 led to smallerpeak citrate concentrations during fruit development inboth cvs Fidelia and Suncrest. At harvest there was noeffect of citrate concentration in cv. Fidelia, whileincreasing DW0 led to higher concentrations in cv.Suncrest. The responses to changes in parameters Gmaxand Dmax were similar for cvs Fidelia and Suncrest. Atharvest, increasing Gmax resulted in faster growth leadingto increased respiration and lower citrate concentration.Increasing Dmax resulted in delayed growth and respira-tion leading to higher citrate concentration at harvest forcv. Fidelia and for cv. Suncrest.
Effects of metabolism and dilution on citrateconcentration
Seasonal variations in metabolism and dilution (me and diin equations 12 and 13) were analysed (Fig. 7), and therelative importance of metabolism and dilution werecompared (Fig. 8). The results from Set I and Set II-1 in1996 are represented, since they are representative of thepattern of variation for different years. Metabolism ofcitrate generally decreased with fruit growth, but variedmore for cv. Fidelia showing an increase in the middle offruit growth. The effect of dilution followed a bell shape.The number of leaves did not show an obvious effect oncitrate metabolism. At the beginning of fruit growth, theability for dilution was different in fruits with more leavesand with fewer leaves, while near maturity the number ofleaves had no marked effect. Figure 8 showed that thevariation in citrate concentration at the beginning of fruitgrowth resulted mainly from citrate metabolism. Nearmaturity, dilution had a stronger effect on citrate concen-tration, although both metabolism and dilution decreasedthroughout fruit growth. Indeed, at maturity, the metabo-lism value could be negative, which means that thedegradation of citrate was more than its synthesis.
Discussion
It was attempted to improve the citrate model of Lobitet al. (2003) considering fruit development, respiration,and temperature as input variables. In the original model,the rate of citrate synthesis or degradation was the productof a ‘synthesis potential’ and an ‘efficiency level’, bothindependent from the developmental stage of the fruit.The new model includes the fact that the response of the‘efficiency level’ to respiration may vary throughout fruitdevelopment, and represents this by a linear decrease of k4with time (with parameters k4,1 and k4,2 representing the
CRMSE=0.44RRMSE=0.19
1994
01
23
40
12
34
80 100 120 140
GRMSE=0.96RRMSE=0.54
Days after bloom
Citr
ate
(mm
ol 1
00g-1
FW
)
Fig. 4. Test of the predictive quality of the citrate model (equation 6)using cv. Suncrest during the 1994 season (data Set II-2) with parametervalues derived from cv. Suncrest during the 1993, 1996, and 1997seasons (data Set II-1). The labels C and G indicate the control andgirdling treatments, respectively. Crosses represent repetitions of themeasurements, and lines simulated citrate evolution. RMSE is the rootmean squared error and RRMSE the relative RMSE.
Modelling citrate metabolism in fruit 2589
by guest on June 2, 2013http://jxb.oxfordjournals.org/
Dow
nloaded from

rate of decrease and the date when k4 becomes null).Besides embedding fruit development, the adjustmentqualities of the new model in terms of RMSE and RRMSEare better than those of the original model. With the newmodel, there was a good agreement between predicted andobserved citrate concentrations in two cultivars in differ-ent years, and the effects of assimilate supply on seasonalvariations in citrate concentration was well predicted. Inaddition, for cv. Suncrest the new model has one lessparameter than the original model. Therefore, the newmodel is significantly improved based on the originalmodel of Lobit et al. (2003).A comparison of the model parameters between culti-
vars and an examination of the model sensitivity toparameters highlighted differences that may concernmetabolism.Parameter k1 was 35% to 40% lower in cv. Suncrest
than for cv. Fidelia, while its sensitivity coefficient wasaround 0.8 for the different cultivars, years and assimilatesupply considered. Since this parameter accounts for the
rate of dicarboxylate uptake by the mitochondria, it can beconsidered as an indicator of the mitochondrial activityper unit dry matter in the young fruit. Cv. Suncrest usuallyhas a lower relative growth rate (0.004–0.043 g g�1 DW)than cv. Fidelia (0.02–0.07 g g�1 DW). It is not surprisingthat late-season cultivars, which grow more slowly thanmid-season cultivars, may have lower mitochondrialactivity and lower citrate synthesis potential.Important parameters determining citrate concentration
in peach fruit mesocarp are k4,1 and k4,2, since theyaccount for the response of citrate metabolism torespiration. Particularly important is k4,2, as citrateconcentration was most responsive to k4,2 among allparameters. k4,2 can be interpreted as the date wherea turning point in citrate metabolism is reached: beforethis date, increasing respiration stimulates citrate synthe-sis, while after it stimulates citrate degradation. In thisstudy, this date was soon after the peak of citrateconcentration during fruit development and obviouslylater for the late-maturing cultivar (DAB 112 for cv.
0.0
0.2
0.4
0.6
0.8
1.0
cv.Fideliacv.Suncrest LF6cv.Suncrest LF18cv.Suncrest LF30 -0
.05
0.05
0.15
-1.0
-0.6
-0.2
0.2
0.6
-0.2
0.2Se
nsiti
vity
coe
ffici
ent
-0.0
6-0
.02
-0.2
0.02
Sens
itivi
ty c
oeffi
cien
t
0.6
05
1015
80 100 120 140
-0.1
0.0
0.1
80 100 120 140Days after bloom
0.0
0.2
0.4
60 80 100 120 140
k1
k3
k4,1
k4,2
qm
qg
Q10
T
Fig. 5. Sensitivity coefficients with respect to model parameters (k1, k3, k4,1, k4,2), the maintenance respiration coefficient at 20 �C (qm), the growthrespiration coefficient (qg), the temperature ratio of maintenance respiration (Q10), and daily mean temperature (T). The analysis was performed usingthe data of cvs Fidelia and Suncrest during the 1996 season. The labels LF6, LF18, and LF30 indicate the leaf:fruit ratio. Coefficients were defined asthe ratio between the relative variations of citrate concentration and the relative variation of parameters and temperature. Here they were estimated bycomputing the responses of citrate concentration to variations of 60.01% in the parameters and temperature.
2590 Wu et al.
by guest on June 2, 2013http://jxb.oxfordjournals.org/
Dow
nloaded from
1015
20
30.7820.5210.26
0.600.400.20
174.96116.64
58.32
cv. Fidelia
2.701.800.90
05
01
23
45
01
23
45
6
70 90 110 70 90 110 70 90 110Days after bloom
70 90 110
25.9917.338.67
0.560.370.19
156.80104.5352.27
cv. Suncrest LF18
7.164.772.39
01
1.0
3.0
510
1520
252
34
2.0
4.0
80 100 120 140 80 100 120 140 80 100 120 140Days after bloom
80 100 120 140
Citr
ate
(mm
ol 1
00g-1
FW
) R
espi
ratio
n(m
mol
CO
2 fru
it-1)
DWmax
Gmax
Dmax
DW0
Dry
fles
h w
eigh
t(g
)
DWmax
Gmax
Dmax
DW0
Dry
fles
h w
eigh
t(g
) R
espi
ratio
n(m
mol
CO
2 fru
it-1)
Citr
ate
(mm
ol 1
00g-1
FW
)
Fig. 6. Effects of dry weight growth curve parameters DWmax, Gmax, Dmax, and DW0 on fruit respiration and citrate concentration. DWmax ismaximum dry weight, Gmax is the maximum growth rate, Dmax is the time (in DAB) at which maximum growth rate occurs, and DW0 is dry weightat the beginning of simulation. The analysis was performed on the data of cv. Fidelia and the leaf:fruit ratio 18 (LF18) treatment of cv. Suncrestduring the 1996 season.
Modelling citrate metabolism in fruit 2591
by guest on June 2, 2013http://jxb.oxfordjournals.org/
Dow
nloaded from

Suncrest) than for the mid-maturing cultivar (DAB102 for cv. Fidelia). k4,1 was similar for both cultivars.Sensitivity to temperature was analysed. For cv.
Suncrest raising mean temperature during fruit develop-ment increased citrate concentration, but this increase didnot persist until maturity. Near maturity fruit grown underelevated temperatures had lower citrate concentration.This sensitivity analysis was in agreement with theexperimental results on citrus by Marsh et al. (1999),which indicated that raising temperature at the end of fruitdevelopment favoured the accumulation of sucrose ratherthan onward metabolism to organic acid. For cv. Fideliaraising mean temperature during fruit development in-creased citrate concentration much more strongly than forcv. Suncrest. The main reason was that for cv. Fidelia,a parameter k3 related to temperature was additionallyincluded in the model (equation 5), compared with themodel (equation 6) for cv. Suncrest. It is interesting tonotice that sensitivity analysis to k3 indicated that in-creased k3 could decrease citrate concentration during fruitdevelopment.Four parameters related to fruit respiration (qm, Q10, qg,
and k4,1) were investigated. Variations in the growthrespiration coefficient (qg) and in k4,1 had similar
significant effects on citrate concentration. Generally,increasing qg, seemed to increase citrate concentration,while this effect diminished near maturity. By contrast,variations in the maintenance respiration coefficient at20 �C (qm) and the temperature ratio of maintenancerespiration (Q10) affected citrate metabolism very little. Inaddition, these two parameters appear not to vary betweencultivars (DeJong et al., 1987; Pavel and DeJong, 1993),which make them bad candidates to explain differences ofcitrate metabolism between cultivars.The relationships between citrate concentration, respira-
tion, and fruit growth were analysed in a comprehensivemanner by simulating different growth curves andcorresponding respiration curves. In spite of the between-cultivar difference in respiration curves, these simulationssuggested that, in general, at the beginning of fruitdevelopment an increase of the mesocarp dry weightincreased both fruit respiration and citrate concentration,and near maturity increased fruit respiration but decreasedcitrate concentration. These simulated results were inagreement with the effects of assimilate supply as reportedby Wu et al. (2002). How the opposite effects of fruitgrowth and respiration on citrate concentration waspartitioned at k4,2 is worth further study.
-0.1
0.15
0.0
0.1
0.2
0.3
0.0
0.05
0.10
80 100 120 140Days after bloom
Met
abol
ism
(mm
ol 1
00g-1
FW
day
-1)
Dilu
tion
(mm
ol 1
00g-1
FW
day
-1)
cv. Fideliacv. Suncrest
LF6LF18LF30
Fig. 7. Simulated seasonal variations in the components of citrateconcentration (equations 12 and 13). The components are citratemetabolism and dilution. The analysis was performed using the data ofcvs Fidelia and Suncrest during the 1996 season. The labels LF6, LF18,and LF30 indicate the leaf:fruit ratio.
cv. Fidelia
-0.1
0.0
-0.1
0.0
0.1
0.2
0.3
0.1
0.2
0.3
80 100 120 140
cv. Suncrest
Days after bloom
Metabolism Dilution
Con
tribu
tion
to c
itrat
e co
ncen
tratio
n(m
mol
100
g-1 F
W d
ay-1
)Fig. 8. Simulated contributions of citrate metabolism and dilution tocitrate concentration. The analysis was performed on the data of cv.Fidelia using equation 12 and cv. Suncrest using equation 13 during the1996 season. For cv. Suncrest only results on the leaf:fruit ratio 18(LF18) treatment are shown.
2592 Wu et al.
by guest on June 2, 2013http://jxb.oxfordjournals.org/
Dow
nloaded from

An attempt was made to distinguish the effects ofmetabolism and dilution on citrate concentration in peachfruits via the citrate model. It was demonstrated thatcitrate concentration was mainly linked to its metabolismat the beginning of fruit growth. As the fruit grew, thedilution effect became more important than metabolismNear maturity both metabolism and dilution tended todecrease, and metabolism could be negative, whichindicated citrate degradation. These results are in accor-dance with Sadka et al. (2000) studies on citrus fruit, inwhich the accumulation of citrate at the beginning of fruitdevelopment and its decline toward fruit maturity was alsotypical. Active catabolism occurred mostly after the citratehad peaked, which they attributed to an increase inNADP+-isocitrate dehydrogenase activity and gene ex-pression. The model also shows degradation in citrateafter citrate concentration has peaked.As in the original model, this improved model does not
represent individually the mechanisms involved in citratemetabolism. For example, it cannot be used to quantifythe effect of a variation of the NADP+-isocitrate de-hydrogenase activity. The model parameters only accountfor the combined effect of these mechanisms. Forexample, parameters k2 and k3 in both the original andthe improved model account for the combined effect ofdifferent sensitivities to temperature of all transport andenzymatic reactions occurring in the mitochondria. Simi-larly, parameters k4,1 and k4,2 introduced in the new modelaccount for variations of several enzymes and transportsystems throughout fruit development. Even so, the modelparameters are closely related to the properties ofmitochondrial transport systems and enzymes, and differ-ences in these parameters reflect changes in the underlyingmetabolic properties of the fruit. In the near future, weexpect to describe the between-genotype variation of theparameters k1, k4,1, and k4,2 using a peach breedingpopulation derived from a clone of a wild peach by threegenerations of crosses with commercial nectarine varieties(Wu et al., 2003, 2005).From an ecophysiological point of view, it is interesting
to understand if environmental conditions affect citrateconcentration due to direct effects on metabolism orindirect effects like dilution. The model can be used todetermine the relative contribution of metabolism anddilution, caused by change in fruit volume, on thevariation of citrate concentration.Finally, the pattern of citrate accumulation described in
peaches is common to other fruit species, such as tomato(Knee and Finger, 1992) and citrus (Marsh et al., 1999).Therefore, the present model is likely to be applicableto a variety of species with only minor modifications.Combined with models for other organic acids, such asmalate (Lobit et al., 2006), and models relating titratableacidity, pH, and composition in fruit mesocarp (Lobit et al.,2002), it would be a useful tool to study fruit acidity.
Acknowledgements
We gratefully acknowledge R Laurent and J Hostalery for theirassistance in the field experiments, and D Dumont, E Rubio,M Reich, L Gomez, M Bonafous, and M Souty for their assistancein acid analyses.
References
Canel C, Bailey-Serres JN, Roose ML. 1995. In vitro [14C]citrate uptake by tonoplast vesicles of acidless Citrus juice cells.Journal of the American Society for Horticultural Science 120,510–514.
Canel C, Bailey-Serres JN, Roose ML. 1996. Molecular charac-terization of the citrate synthase gene of an acidless pummelo(Citrus maxima). Plant Molecular Biology 31, 143–147.
Chamber JM, Hastie TJ. 1992. Nonlinear models. In: ChamberJM, Hastie TJ, eds. Statistical models in S. Pacific Grove,California: Wadsworth & Brooks/Cole Advanced Books &Software, 432–433.
DeJong TM, Doyle JF, Day KR. 1987. Seasonal patterns ofreproductive and vegetative sink activity in early and latematuring peach (Prunus persica) cultivars. Physiologia Plant-arum 71, 83–88.
DeJong TM, Goudriaan J. 1989. Modeling peach fruit growth andcarbohydrate requirements: reevaluation of the double-sigmoidgrowth pattern. Journal of the American Society for HorticulturalScience 114, 800–804.
Etienne C, Moing A, Dirlewanger E, Raymond P, Monet R,Rothan C. 2002. Isolation and characterisation of six peachcDNAs encoding key proteins in organic acid metabolism andsolute accumulation: involvement in peach fruit acidity. Physio-logia Plantarum 114, 259–270.
Fell DA. 1997. Systems properties of metabolic networks. In:Proceedings of International Conference on Complex Systems.Nashua. NH, 21–26 Sept, 163–177.
Fox J. 2002. Nonlinear regression and nonlinear least squares. In:Appendix to An R and S-PLUS. Companion to Applied Re-gression. (http://cran.r-project.org/doc/contrib/Fox-Companion/appendix-nonlinear-regression.pdf).
Genard M, Lescourret F, Gomez L, Habib R. 2003. Changes infruit sugar concentrations in response to assimilate supply,metabolism and dilution: a modeling approach applied to peachfruit (Prunus persica). Tree Physiology 23, 373–385.
Kell DB, Mendes P. 2000. Snapshots of systems: metabolic controlanalysis and biotechnology in the post-genomic era. In: Cornish-Bowden AJ, Cardenas ML, eds. Technological and medicalimplications of metabolic control analysis. Kluwer AcademicPublishers, 3–25.
Knee MF, Finger FL. 1992. NADP+malic enzyme and organicacid levels in developing tomato fruits. Journal of the AmericanSociety for Horticultural Science 117, 799–801.
Kobayashi K, Salam MU. 2000. Comparing simulated andmeasured values using mean squared deviation and its compo-nent. Agronomy Journal 92, 345–352.
Lelievre JG, Latche A, Jones B, Bouzayen M, Pech JC. 1997.Ethylene and fruit ripening. Physiologia Plantarum 101, 727–739.
Lobit P, Genard M, Soing P, Habib R. 2006. Modelling malicacid accumulation in fruits: relationships with organic acids,potassium, and temperature. Journal of Experimental Botany 57,1471–1483.
Lobit P, Genard M, Wu BH, Soing P, Habib R. 2003. Modellingcitrate metabolism in fruits: responses to growth and temperature.Journal of Experimental Botany 54, 2489–2501.
Modelling citrate metabolism in fruit 2593
by guest on June 2, 2013http://jxb.oxfordjournals.org/
Dow
nloaded from
Lobit P, Soing P, Genard M, Habib R. 2002. Theoretical analysisof relationships between composition, pH, and titratable acidity ofpeach fruit. Journal of Plant Nutrition 25, 2775–2792.
Marsh KB, Richardson AC, Macrae EA. 1999. Early- and mid-season temperature effects on the growth and composition ofsatsuma mandarins. Journal of Horticultural Science and Bio-technology 74, 443–451.
Moing A, Rothan C, Svanella L, Just D, Diakou P, Raymond P,Gaudillere JP, Monet R. 2000. Role of phosphoenolpyruvatecarboxylase in organic acid accumulation during peach fruitdevelopment. Physiologia Plantarum 108, 1–10.
Moing A, Svanella L, Gaudillere M, Gaudillere JP, Monet R.1999. Organic acid concentration is little controlled by phospho-enolpyruvate carboxylase activity in peach fruit. AustralianJournal of Plant Physiology 26, 579–585.
Moriguchi T, Abe K, Sanada T, Yamaki S. 1992. Levels and roleof sucrose synthase, sucrose-phosphate synthase, and acid in-vertase in sucrose accumulation in fruit of Asian pear. Journal ofthe American Society for Horticultural Science 117, 274–278.
Moriguchi T, Sanada T, Yamaki S. 1990. Seasonal fluctuations ofsome enzymes relating to sucrose and sorbitol metabolism inpeach fruit. Journal of the American Society for HorticulturalScience 115, 278–281.
Pavel EW, DeJong TM. 1993. Relative growth rate and itsrelationship to compositional changes of nonstructural carbohyd-rates in the mesocarp of developing peach fruits. Journal of theAmerican Society for Horticultural Science 118, 503–508.
Robinson NL, Hewitt JD, Bennett AB. 1988. Sink metabolism intomato fruit. I. Developmental changes in carbohydrate metabo-lizing enzymes. Plant Physiology 87, 727–730.
Sadka A, Dahan E, Or E, Cohen L. 2000. NADP+-isocitratedehydrogenase gene expression and isozyme activity during citrusfruit development. Plant Science 158, 173–181.
Sweeney JP, Chapman VJ, Hepner PA. 1970. Sugar, acid andflavour in flesh fruits. Journal of the American DieteticAssociation 57, 432–435.
Tucker GA. 1993. Introduction. In: Seymour GB, Taylor JE,Tucker GA, eds. Biochemistry of fruit ripening. London:Chapman & Hall, 1–51.
Wallach D, Goffinet B, Bergez JE, Debaeke P, Leenhardt D,Aubertot JN. 2001. Parameter estimation for crop models: a newapproach and application to a corn model. Agronomy Journal 93,757–766.
Wu BH, Genard M, Lescourret F, Gomez L, Li SH. 2002.Influence of the assimilate and water supply on seasonal variationof acids in peach (cv. Suncrest). Journal of the Science of Foodand Agriculture 82, 1829–1836.
Wu BH, Quilot B, Genard M, Kervella J, Li SH. 2005. Sea-sonal changes of sugar and organic acid concentrations incultivated and wild peaches, and their hybrids analysed byPrincipal Component Analysis. Scientia Horticulturae 103,429–439.
Wu BH, Quilot B, Kervella J, Genard M, Li SH. 2003. Analysisof genotypic variation of sugar and acid contents in peaches andnectarines through the Principle Component Analysis. Euphytica132, 375–384.
Yamaki S, Ishikawa K. 1986. Role of four sorbitol relatedenzymes and invertase in the seasonal alteration of sugarmetabolism in apple tisse. Journal of the American Society forHorticultural Science 111, 134–137.
2594 Wu et al.
by guest on June 2, 2013http://jxb.oxfordjournals.org/
Dow
nloaded from


![[Quality attributes of ´flordaking´ peach fruit grown at the central-east zone of Santa Fe province (Argentina)]](https://img.pdfslide.net/doc/110x75/635189683226491aee08407f/quality-attributes-of-flordaking-peach-fruit-grown-at-the-central-east-zone.jpg)

![Phenotypic diversity and relationships of fruit quality traits in peach and nectarine [Prunus persica (L.) Batsch] breeding progenies](https://img.pdfslide.net/doc/110x75/63242345078ed8e56c0b31ac/phenotypic-diversity-and-relationships-of-fruit-quality-traits-in-peach-and-nectarine-1677906506.jpg)
![Phenotypic diversity and relationships of fruit quality traits in peach and nectarine [ Prunus persica (L.) Batsch] breeding progenies](https://img.pdfslide.net/doc/110x75/6324230c5f71497ea904aa14/phenotypic-diversity-and-relationships-of-fruit-quality-traits-in-peach-and-nectarine.jpg)


