Embed Size (px)
Citation preview
American Journal of Engineering Research (AJER) 2017
American Journal of Engineering Research (AJER)
e-ISSN: 2320-0847 p-ISSN : 2320-0936
Volume-6, Issue-7, pp-75-87
www.ajer.org
Research Paper Open Access
w w w . a j e r . o r g
Page 75
Analysis of Corona Effect on Transmission Line
*Vincent N. Ogar
1, Sampson A. Bendor
2, Akpama E. James
3
*1Department of Electrical/Electronic Engineering, Cross River University of Technology, Nigeria
2Department of Electrical/Electronic Engineering, Cross River University of Technology, Nigeria
3Department of Electrical/Electronic Engineering, Cross River University of Technology, Nigeria
Abstract: The effect of Corona on high voltage transmission line is one of the cause of power loss in power
system and this is uneconomical and undesirable. The study of Corona and factors responsible for the loss is
investigated through sample calculation based on Peek’s formula and Peterson, the distance between
generating station, frequency and load center as well as the amount of power to be handled. The study of an
Extra High Voltage (EHV) line of about 1200Kv is used and the problems posed in using such high voltage are
analyzed. The interest in corona loss and it advantage will find this research useful. This paper will also include
the factor affecting Corona losses, application of Corona and the benefit of Corona, all these will be considered
here. This paper will also present the relations between power loss due to Corona and Corona parameter using
Matlab program to analyze and suggests some possible steps taken to minimize the phenomenon.
Keywords: Corona, Visual critical voltage, Disruptive critical voltage, w.f. Peek’s method and Peterson’s
method and matlab/simulink
I. INTRODUCTION When an alternating potential difference is applied across two conductor, whose spacing is large in
comparison with their diameter then the atmosphere Air surrounding the conductors is subjected to electrostatic
stresses at low voltage there is no change in the condition of atmosphere Air around the conductor, However,
when the potential difference is gradually increases a stage arrived when a faint luminous glow of violet color
appear together with a hissing noise, these phenomenon is called visual corona and is accompanied by the
production of ozone which is ready detected because or it characteristic odor. [1. The glow is due to the fact
that the atmosphere Air around the conductor becomes conducting due to loss of energy which increases very
rapidly once the visual critical voltage is Exceed the power loss due to corona is heavily depends upon weather
condition during humid and moist climate corona loss is much increased the energy loss accompanied by the
phenomenon called the corona. A violet glow is observed around the conductor it also produced ozone which
can be readily detected by it characteristic odour.When in an insulation system, the voltage gradient (voltage
stress) exceeds a critical voltage, the air molecules surrounding the high voltage transmission line conductors
become ionized (transient gaseous ionization) resulting in partial discharges. Corona loss occurs if the line to
line voltage exceeds the corona threshold. The conductive region is not high enough to cause electrical
breakdown or arcing to any nearby objects [2]. Corona can occur within voids of an insulator, at the conductor
or at the insulator interface. Rough surfaces are more liable to corona because the unevenness of the surface
decreases the value of the breakdown voltage. It can be detected due to its visible light in form of purple glow
consisting of micro arcs and its sound can be heard through its hissing and cracking sound [3]. The smelling of
the presence of ozone production is noticed during corona activity [4]. The effects of corona are cumulative and
permanent and the failure can occur without warning. In insulation system, corona discharges result in voltage
transients. The effects of corona associated with the operation of high voltage transmission lines include radio
interference, audible noise, gaseous effluents (Ozone and Nitrogen oxide) and shock potential. Conductor
voltage, diameter and shape, dusts, water drops, and surface irregularities such as scratches are factors that
affect the performance and conductor’s electrical surface gradients. The energy loss due to corona is
transformed into sound, radio noise, chemical reactions of the air components and heat [5]. Corona reduces the
reliability of insulation system thereby degrading insulation and causes system failure due to dielectric
breakdown. The study becomes necessary because of the prevailing negative effect of corona parameters on the
power loss of high voltage transmission lines. The power loss under fair weather conditions and under stormy
weather conditions when investigated analyzed and simulated using MATLAB programs gives the results,
American Journal of Engineering Research (AJER) 2017
w w w . a j e r . o r g
Page 76
which help us to take necessary measures to minimize the power loss under fair and stormy weather conditions.
High quality insulated and good service design underground high transmission cables can help to eliminate the
loss due to corona effect The advantage of corona is that the sound generated during corona activity can be used
to build high accuracy audio speakers and also it has no mass to be moved to create the sound so that transient
response is improved. The controlled corona discharge can be used for filtrations and printing
In transmission line corona has become one of the major problem that causes power failure in our society and
needed to be under consideration there phenomenon called corona, this occur when the voltage between
conductor of an over head line Exceed the disruptive critical value a hissing noise is accompanied by a violet
glow appear. The physical state of the atmosphere as well as by the condition of the line the corona is affected
by the following factor
Atmospheric factor
Size of Conductor factor
Spacing between conductor factor
Line voltage factor
So many power failures we are experiencing now a day is caused by corona loss.
This research will study the two vital methods that are used in the calculation of corona and power loss. The two
methods are
W.F. Peek’s method
Peterson’s method
According to peek’s method the power loss due to corona under fair weather condition can be
determined. And Peterson method which as to do with stormy weather condition the disruptive critical voltage
(dcv) is taken as 0.8 time that of the fair weather value.
II. FORMATION OF CORONA The corona discharges observed at the surface of a conductor are due to the formation of electron
avalanches which occur when the intensity of the electric field at the conductor surface exceeds a certain critical
value. There are always a few free electrons in the air as a result of radioactive materials in the earth’s crust and
bombardment of the earth from other space. As the conductors become energized on each half cycle of the AC
voltage wave, the electrons in the air near its surface are accelerated by the electrostatic field. The electrons
having an inherent negative charge are accelerated towards the conduction on its positive half cycle and away
from the conduction on it negative, half cycle. Corona is formed when the voltages of a conductor passes the
disruptive critical voltage and disappear when the voltage descends through the same value. This occurs on each
conductor in every half cycle and developed a pulsating frequency.
2.1 Factors Affecting Corona The following factor affect corona, these are:
Atmosphere
Size of Conductor
Spacing between conductor
Line voltage
2.1.1 Effect of Corona The presence of corona can reduce the reliability of a system by degrading insulation, over a long period of
time. These effects of corona are cumulative and permanent and failure can occur without warming. The causes
of corona are:
Light
Ultraviolet radiation
Sound (hissing or cracking) as caused by explosion gas expansion
Ozone
Nitric and various other acid
Salt, sometime seen as white powder deposit
2.1.2 Benefits of Corona The sound generation effect of corona can be utilized to build accuracy audio speaking
The major advantage is that there is zero mass that need to be moved to create the sound so that transient is
improved.
American Journal of Engineering Research (AJER) 2017
w w w . a j e r . o r g
Page 77
2.2 Visual Critical Voltage In the case of parallel wires it is found that visual corona does not begin at the voltage Vdo at which the
disruptive gradient of air goes is reached. But at a higher voltage Vuo called the visual critical voltage.
The visual critical voltage is defined as the minimum phase to neutral voltage whichglow and appears all along
the line conductor thus, when corona begins the potential gradient gv at the conductor surface is higher than the
disruptive gradient go. According to Peek’s which states that the disruptive critical voltage must be so exceeded
that the stress is greater than the breakdown value up to a distance of 0.3 from the conductor. Thus,
visual corona will occur when the breakdown value is attained at the distance r+0.3 from the axis,
instead of the distance r, this required that the voltage 60 neutral be .1+ time the disruptive critical voltage.
Thus the visual critical voltage is
Vvo = gomvr(1+ )loge Kv to neutral (1)
Where mv is a roughness factor which is the unity for smooth conductor.
III. ANALYSIS OF CORONA EFFECTS This aspect of analysis will deal with two vital methods; these are:
W. F. Peek’s method (1929)
Peterson method
According to Peek’s formulas the power loss under fair weather condition can be expressed
mathematically as:
PUFWC = (f+28) ( –vdo)2x10
-5 Km/phase (2)
Where PU is the power loss
F is the supply frequency in Hz
WC is the weather condition
K = is the constant which varied with the ratio of
= Is the air density correction Factor
R = Radius of the Conductor
D = diameter of the conductor
VL = is the line voltage
Vdo = is the disruptive critical voltage to neutral in Kv
EDCV = is the disruptive critical voltage
= Is the three phase (AC) supply voltage
Under stormy weather conduction Vdo is taken as 0.8time it fair weather value and power loss due to
corona is given by expression below
Pc = (f +25) (Vph – 0.8Vdo)2 x 10
-5 Kw/km/phase (3)
Ppet = which can be applied in calculating problem under stormy weather conduction
+ + +q A
-q B
c
p
d
x dx
American Journal of Engineering Research (AJER) 2017
w w w . a j e r . o r g
Page 78
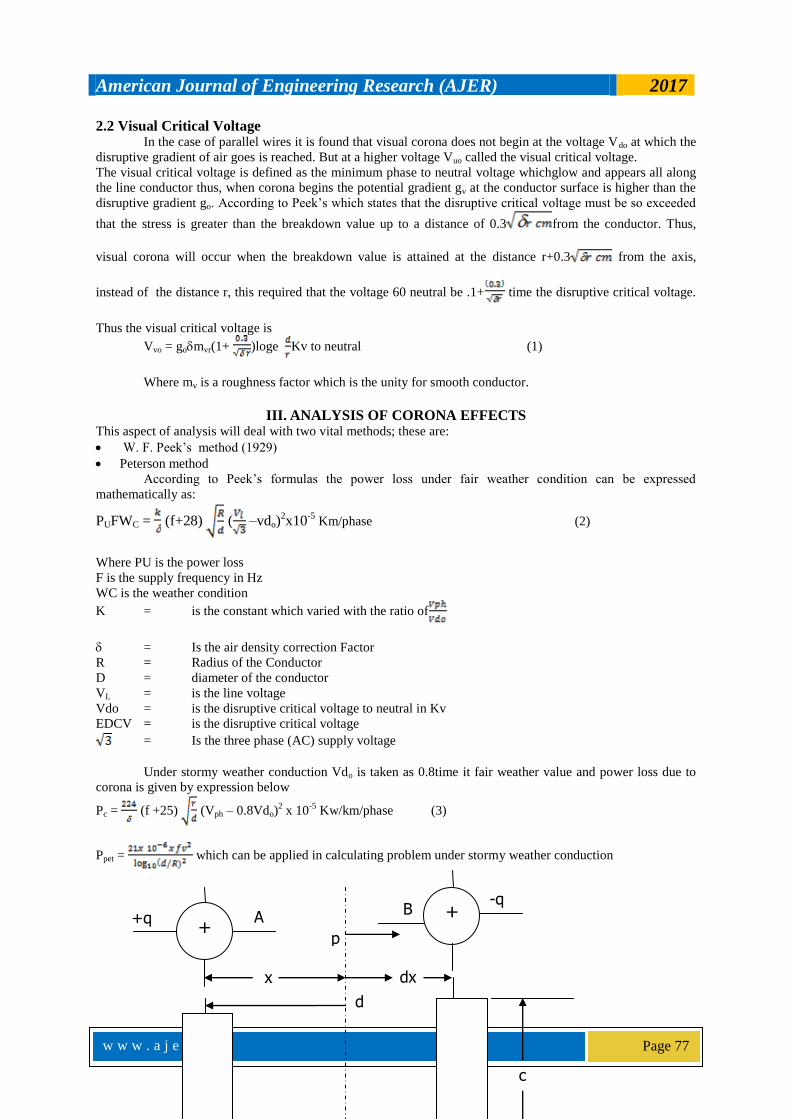
Fig: 3. Disruptive Critical Voltage
Let us consider the two-wire line in fig 1 where
r = radius of the line conductor
d = the distance between their center
q = charge per meter of conductor length is given to A When a negative charge of q coulombs per
meter of conductor length is induced on conductor B consider point P at the distance of x meters from conductor
A Electric field intensity at point P due to charge on conduction
A = acting toward B
B = P due to induced charge on conductor B
Resultant electric field intensity at point P
Ex = + = (4)
PD between conductor A and B
V = dx (5)
= [loge x – loge (d-x)d-r
r loge
Since r is very small as compared to d1
V = (6)
Gradient at any point x from the centre of the conductor A is given by
Ex = (7)
Substituting for q we have
Ex= . . (8)
Where v is voltage between two conductors
Ex= . (9)
In case of 3-phase system
V= (10)
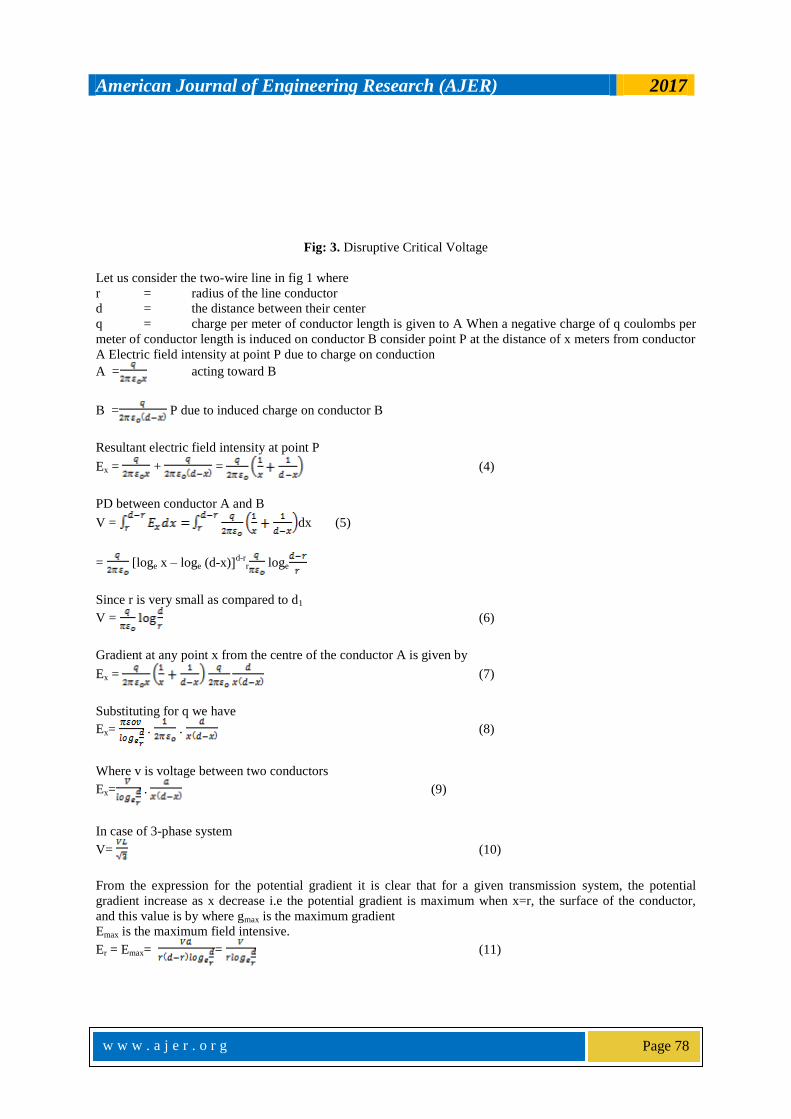
From the expression for the potential gradient it is clear that for a given transmission system, the potential
gradient increase as x decrease i.e the potential gradient is maximum when x=r, the surface of the conductor,
and this value is by where gmax is the maximum gradient
Emax is the maximum field intensive.
Er = Emax= = (11)
American Journal of Engineering Research (AJER) 2017
w w w . a j e r . o r g
Page 79
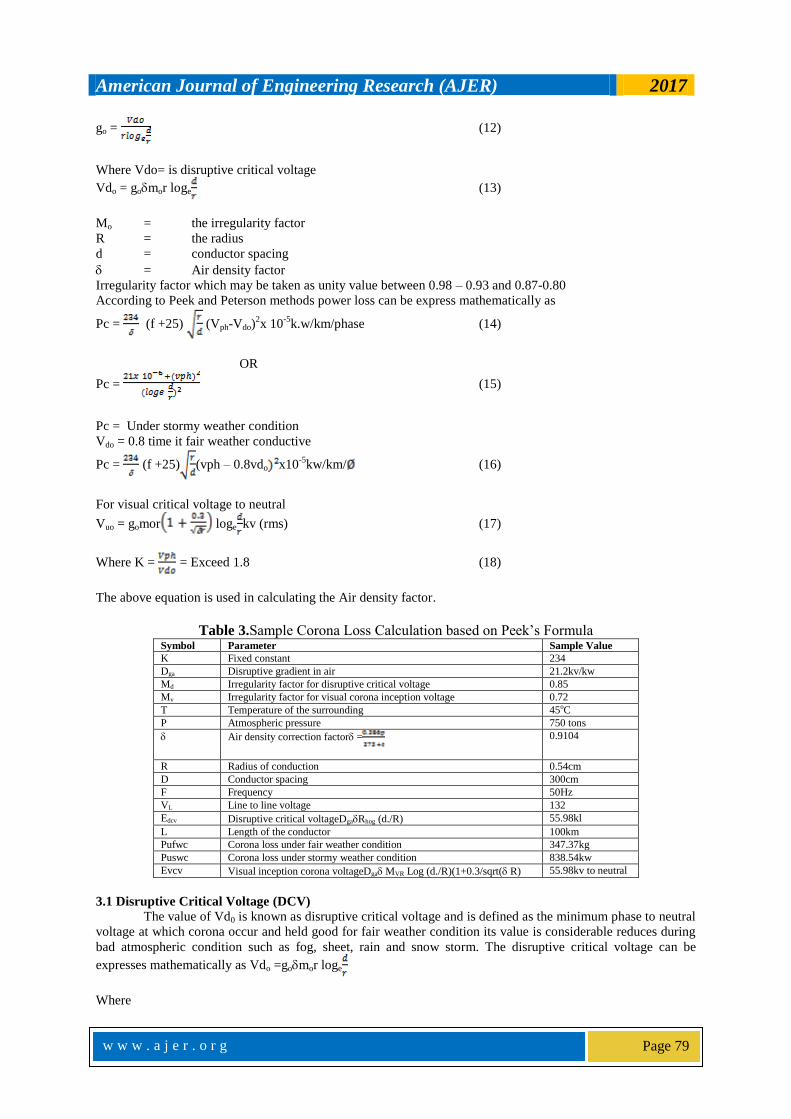
go = (12)
Where Vdo= is disruptive critical voltage
Vdo = gomor loge (13)
Mo = the irregularity factor
R = the radius
d = conductor spacing
= Air density factor
Irregularity factor which may be taken as unity value between 0.98 – 0.93 and 0.87-0.80
According to Peek and Peterson methods power loss can be express mathematically as
Pc = (f +25) (Vph-Vdo)2x 10
-5k.w/km/phase (14)
OR
Pc = (15)
Pc = Under stormy weather condition
Vdo = 0.8 time it fair weather conductive
Pc = (f +25) (vph – 0.8vdo x10-5
kw/km/ (16)
For visual critical voltage to neutral
Vuo = gomor loge kv (rms) (17)
Where K = = Exceed 1.8 (18)
The above equation is used in calculating the Air density factor.
Table 3.Sample Corona Loss Calculation based on Peek’s Formula Symbol Parameter Sample Value
K Fixed constant 234
Dga Disruptive gradient in air 21.2kv/kw
Md Irregularity factor for disruptive critical voltage 0.85
Mv Irregularity factor for visual corona inception voltage 0.72
T Temperature of the surrounding 45oC
P Atmospheric pressure 750 tons
Air density correction factor = 0.9104
R Radius of conduction 0.54cm
D Conductor spacing 300cm
F Frequency 50Hz
VL Line to line voltage 132
Edcv Disruptive critical voltageDgaRhog (d./R) 55.98kl
L Length of the conductor 100km
Pufwc Corona loss under fair weather condition 347.37kg
Puswc Corona loss under stormy weather condition 838.54kw
Evcv Visual inception corona voltageDga MVR Log (d./R)(1+0.3/sqrt( R) 55.98kv to neutral
3.1 Disruptive Critical Voltage (DCV)
The value of Vd0 is known as disruptive critical voltage and is defined as the minimum phase to neutral
voltage at which corona occur and held good for fair weather condition its value is considerable reduces during
bad atmospheric condition such as fog, sheet, rain and snow storm. The disruptive critical voltage can be
expresses mathematically as Vdo =gomor loge
Where
American Journal of Engineering Research (AJER) 2017
w w w . a j e r . o r g
Page 80
Vdo = Disruptive Critical Voltage
Mo = Irregularity Factor
f = Supply frequency
d = Spacing of conductor
r = Conductor Radius
= Air Density Correction Factor
go = Dielectric Strength Of Air
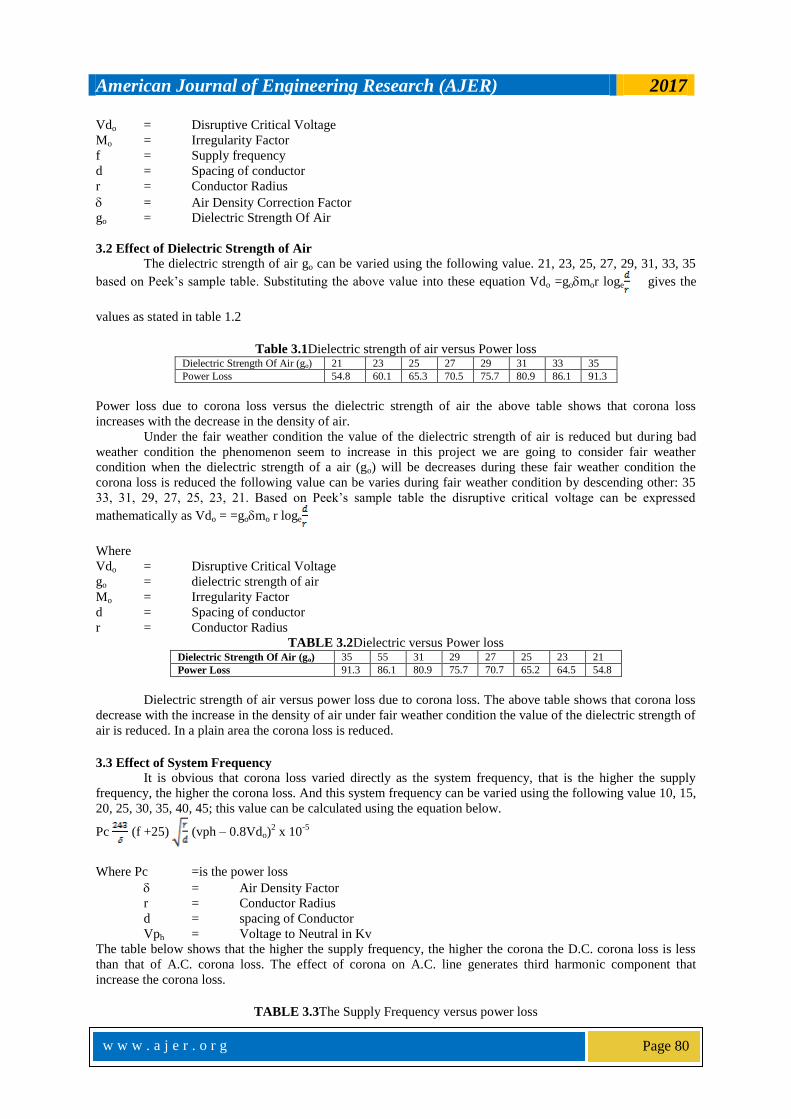
3.2 Effect of Dielectric Strength of Air
The dielectric strength of air go can be varied using the following value. 21, 23, 25, 27, 29, 31, 33, 35
based on Peek’s sample table. Substituting the above value into these equation Vdo =gomor loge gives the
values as stated in table 1.2
Table 3.1Dielectric strength of air versus Power loss
Dielectric Strength Of Air (go) 21 23 25 27 29 31 33 35
Power Loss 54.8 60.1 65.3 70.5 75.7 80.9 86.1 91.3
Power loss due to corona loss versus the dielectric strength of air the above table shows that corona loss
increases with the decrease in the density of air.
Under the fair weather condition the value of the dielectric strength of air is reduced but during bad
weather condition the phenomenon seem to increase in this project we are going to consider fair weather
condition when the dielectric strength of a air (go) will be decreases during these fair weather condition the
corona loss is reduced the following value can be varies during fair weather condition by descending other: 35
33, 31, 29, 27, 25, 23, 21. Based on Peek’s sample table the disruptive critical voltage can be expressed
mathematically as Vdo = =gomo r loge
Where
Vdo = Disruptive Critical Voltage
go = dielectric strength of air
Mo = Irregularity Factor
d = Spacing of conductor
r = Conductor Radius
TABLE 3.2Dielectric versus Power loss Dielectric Strength Of Air (go) 35 55 31 29 27 25 23 21
Power Loss 91.3 86.1 80.9 75.7 70.7 65.2 64.5 54.8
Dielectric strength of air versus power loss due to corona loss. The above table shows that corona loss
decrease with the increase in the density of air under fair weather condition the value of the dielectric strength of
air is reduced. In a plain area the corona loss is reduced.
3.3 Effect of System Frequency
It is obvious that corona loss varied directly as the system frequency, that is the higher the supply
frequency, the higher the corona loss. And this system frequency can be varied using the following value 10, 15,
20, 25, 30, 35, 40, 45; this value can be calculated using the equation below.
Pc (f +25) (vph – 0.8Vdo)2 x 10
-5
Where Pc =is the power loss
= Air Density Factor
r = Conductor Radius
d = spacing of Conductor
Vph = Voltage to Neutral in Kv
The table below shows that the higher the supply frequency, the higher the corona the D.C. corona loss is less
than that of A.C. corona loss. The effect of corona on A.C. line generates third harmonic component that
increase the corona loss.
TABLE 3.3The Supply Frequency versus power loss
American Journal of Engineering Research (AJER) 2017
w w w . a j e r . o r g
Page 81
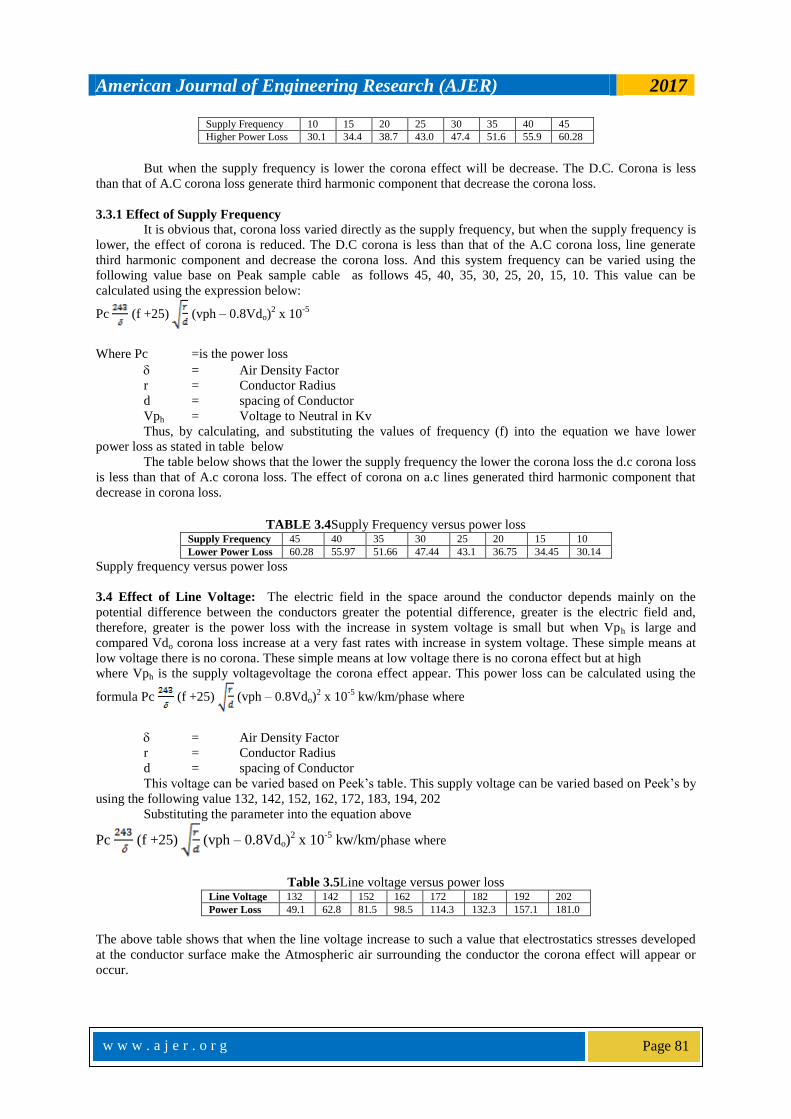
Supply Frequency 10 15 20 25 30 35 40 45
Higher Power Loss 30.1 34.4 38.7 43.0 47.4 51.6 55.9 60.28
But when the supply frequency is lower the corona effect will be decrease. The D.C. Corona is less
than that of A.C corona loss generate third harmonic component that decrease the corona loss.
3.3.1 Effect of Supply Frequency
It is obvious that, corona loss varied directly as the supply frequency, but when the supply frequency is
lower, the effect of corona is reduced. The D.C corona is less than that of the A.C corona loss, line generate
third harmonic component and decrease the corona loss. And this system frequency can be varied using the
following value base on Peak sample cable as follows 45, 40, 35, 30, 25, 20, 15, 10. This value can be
calculated using the expression below:
Pc (f +25) (vph – 0.8Vdo)2 x 10
-5
Where Pc =is the power loss
= Air Density Factor
r = Conductor Radius
d = spacing of Conductor
Vph = Voltage to Neutral in Kv
Thus, by calculating, and substituting the values of frequency (f) into the equation we have lower
power loss as stated in table below
The table below shows that the lower the supply frequency the lower the corona loss the d.c corona loss
is less than that of A.c corona loss. The effect of corona on a.c lines generated third harmonic component that
decrease in corona loss.
TABLE 3.4Supply Frequency versus power loss
Supply Frequency 45 40 35 30 25 20 15 10
Lower Power Loss 60.28 55.97 51.66 47.44 43.1 36.75 34.45 30.14
Supply frequency versus power loss
3.4 Effect of Line Voltage: The electric field in the space around the conductor depends mainly on the
potential difference between the conductors greater the potential difference, greater is the electric field and,
therefore, greater is the power loss with the increase in system voltage is small but when Vph is large and
compared Vdo corona loss increase at a very fast rates with increase in system voltage. These simple means at
low voltage there is no corona. These simple means at low voltage there is no corona effect but at high
where Vph is the supply voltagevoltage the corona effect appear. This power loss can be calculated using the
formula Pc (f +25) (vph – 0.8Vdo)2 x 10
-5 kw/km/phase where
= Air Density Factor
r = Conductor Radius
d = spacing of Conductor
This voltage can be varied based on Peek’s table. This supply voltage can be varied based on Peek’s by
using the following value 132, 142, 152, 162, 172, 183, 194, 202
Substituting the parameter into the equation above
Pc (f +25) (vph – 0.8Vdo)2 x 10
-5 kw/km/phase where
Table 3.5Line voltage versus power loss Line Voltage 132 142 152 162 172 182 192 202
Power Loss 49.1 62.8 81.5 98.5 114.3 132.3 157.1 181.0
The above table shows that when the line voltage increase to such a value that electrostatics stresses developed
at the conductor surface make the Atmospheric air surrounding the conductor the corona effect will appear or
occur.
American Journal of Engineering Research (AJER) 2017
w w w . a j e r . o r g
Page 82
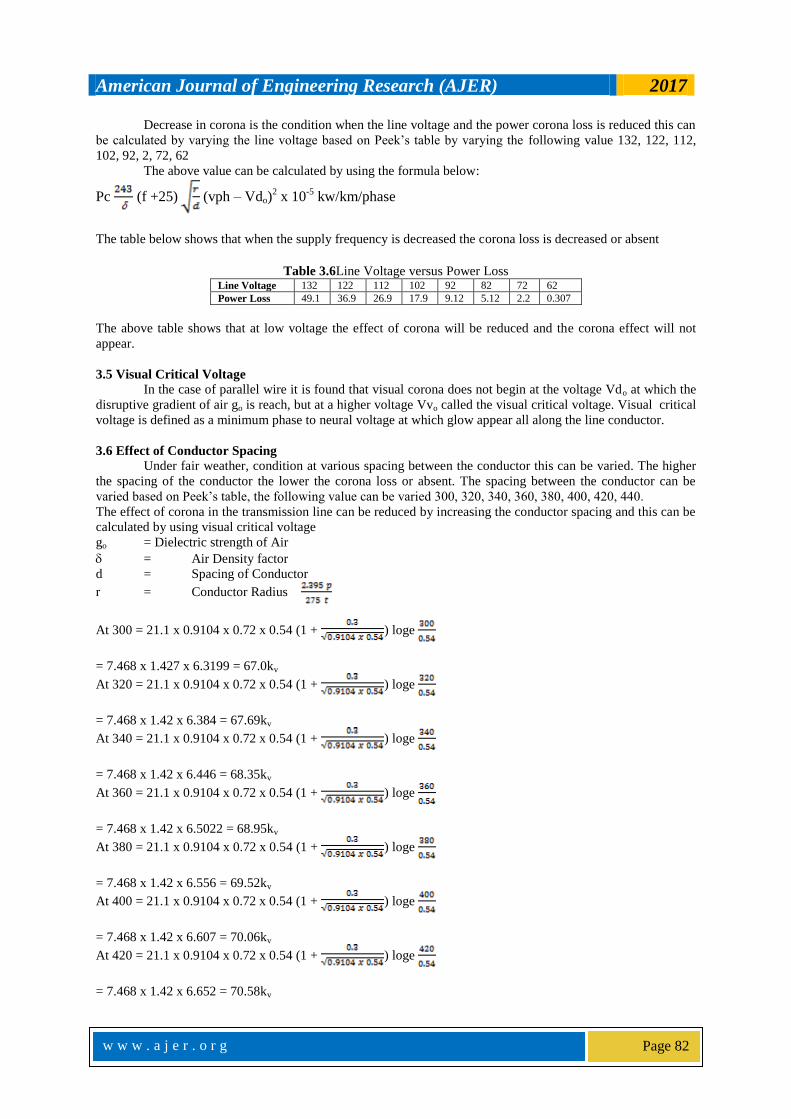
Decrease in corona is the condition when the line voltage and the power corona loss is reduced this can
be calculated by varying the line voltage based on Peek’s table by varying the following value 132, 122, 112,
102, 92, 2, 72, 62
The above value can be calculated by using the formula below:
Pc (f +25) (vph – Vdo)2 x 10
-5 kw/km/phase
The table below shows that when the supply frequency is decreased the corona loss is decreased or absent
Table 3.6Line Voltage versus Power Loss
Line Voltage 132 122 112 102 92 82 72 62
Power Loss 49.1 36.9 26.9 17.9 9.12 5.12 2.2 0.307
The above table shows that at low voltage the effect of corona will be reduced and the corona effect will not
appear.
3.5 Visual Critical Voltage
In the case of parallel wire it is found that visual corona does not begin at the voltage Vdo at which the
disruptive gradient of air go is reach, but at a higher voltage Vvo called the visual critical voltage. Visual critical
voltage is defined as a minimum phase to neural voltage at which glow appear all along the line conductor.
3.6 Effect of Conductor Spacing
Under fair weather, condition at various spacing between the conductor this can be varied. The higher
the spacing of the conductor the lower the corona loss or absent. The spacing between the conductor can be
varied based on Peek’s table, the following value can be varied 300, 320, 340, 360, 380, 400, 420, 440.
The effect of corona in the transmission line can be reduced by increasing the conductor spacing and this can be
calculated by using visual critical voltage
go = Dielectric strength of Air
= Air Density factor
d = Spacing of Conductor
r = Conductor Radius
At 300 = 21.1 x 0.9104 x 0.72 x 0.54 (1 + ) loge
= 7.468 x 1.427 x 6.3199 = 67.0kv
At 320 = 21.1 x 0.9104 x 0.72 x 0.54 (1 + ) loge
= 7.468 x 1.42 x 6.384 = 67.69kv
At 340 = 21.1 x 0.9104 x 0.72 x 0.54 (1 + ) loge
= 7.468 x 1.42 x 6.446 = 68.35kv
At 360 = 21.1 x 0.9104 x 0.72 x 0.54 (1 + ) loge
= 7.468 x 1.42 x 6.5022 = 68.95kv
At 380 = 21.1 x 0.9104 x 0.72 x 0.54 (1 + ) loge
= 7.468 x 1.42 x 6.556 = 69.52kv
At 400 = 21.1 x 0.9104 x 0.72 x 0.54 (1 + ) loge
= 7.468 x 1.42 x 6.607 = 70.06kv
At 420 = 21.1 x 0.9104 x 0.72 x 0.54 (1 + ) loge
= 7.468 x 1.42 x 6.652 = 70.58kv
American Journal of Engineering Research (AJER) 2017
w w w . a j e r . o r g
Page 83
At 440 = 21.1 x 0.9104 x 0.72 x 0.54 (1 + ) loge
= 7.468 x 1.42 x 6.7029 = 71.08
Table 3.7Conductor spacing versus power loss Conductor Spacing 300 320 340 360 380 400 420 440
Power Loss 67.0 67.7 68.4 68.9 69.2 70.1 70.6 71.1
The table above shows that under the fair weather condition at various spacing between the conductors
corona is inversely proportional to the spacing between conductors. If the spacing is made to be very large
corona loss may be absent. But when the spacing between the conductor is closed especially under fair weather
condition at various spacing between the conductor the corona effect will be increase and this can be calculated
by varying the following value 300, 280, 260, 240, 220, 200, 180, 160 based on Peek’s table
Using visual critical voltage formula
Vdo =gomvr(1 + ) loge kv (rms) where
go = Dielectric strength of Air
= Air Density factor
d = Spacing of Conductor
r = Conductor Radius
Table 3.8Conductor Spacing Versus Power Loss Conductor Spacing 300 380 260 240 220 200 180 160
Power Loss 67.0 66.3 65.4 64.6 63.5 62.5 61.5 60.6
The above table shows increase in corona when the spacing between conductor is closed especially under fair
weather condition the corona effect will increased the can result in power loss.
3.7 Effect of Conductor Radius
The electrical field intensity decrease with the increase in radius of conductor. Hence with conductor of
large radius, electric field intensity decrease resulting in lower in power loss. The conductor radius can be varied
by using the following value
Radius R= 0.54, 0.56, 0.58, 0.60, 0.62, 0.64, 0.66, 0.68
Using the visual critical voltage equation
Vdo =gomvr(1+ ) loge kv (rms) where
Where
go = Dielectric strength of Air
= Air Density factor
mv = Irregularity factor
r = Conductor Radius of the conductor
Table 3.9Conductor radius versus power loss Conductor Radius 0.54 0.56 0.58 0.60 0.62 0.64 0.66 0.68
Power Loss 67.3 69.1 71.3 72.5 74.2 75.83 77.1 79.1
But when the electric field intensity increase with the decrease in radius of conductor hence with conductor of
small radius, electric field intensity increase resulting in higher corona power loss.
The conductor radius can be varied by using the following value 0.54, 0.52, 0.50, 0.48, 0.46, 0.44, 0.42,
0.40. using the visual critical voltage equation
Vuo =gomvr(1 + ) loge kv (rms) where
The table below shows that he electric field intensity increase with the decrease in radius of conductor, hence
small radius increase electric field intensity resulting in larger corona power loss.
American Journal of Engineering Research (AJER) 2017
w w w . a j e r . o r g
Page 84
Table 3.9.1 Conductor radius versus power loss Conductor Radius 0.54 0.52 0.50 0.48 0.46 0.44 0.42 0.40
Power loss 67.3 65.6 63.9 62.1 60.3 58.4 56.7 54.8
IV. DISCUSSION OF RESULTS/GRAPHS 4.1 Analysis of Result
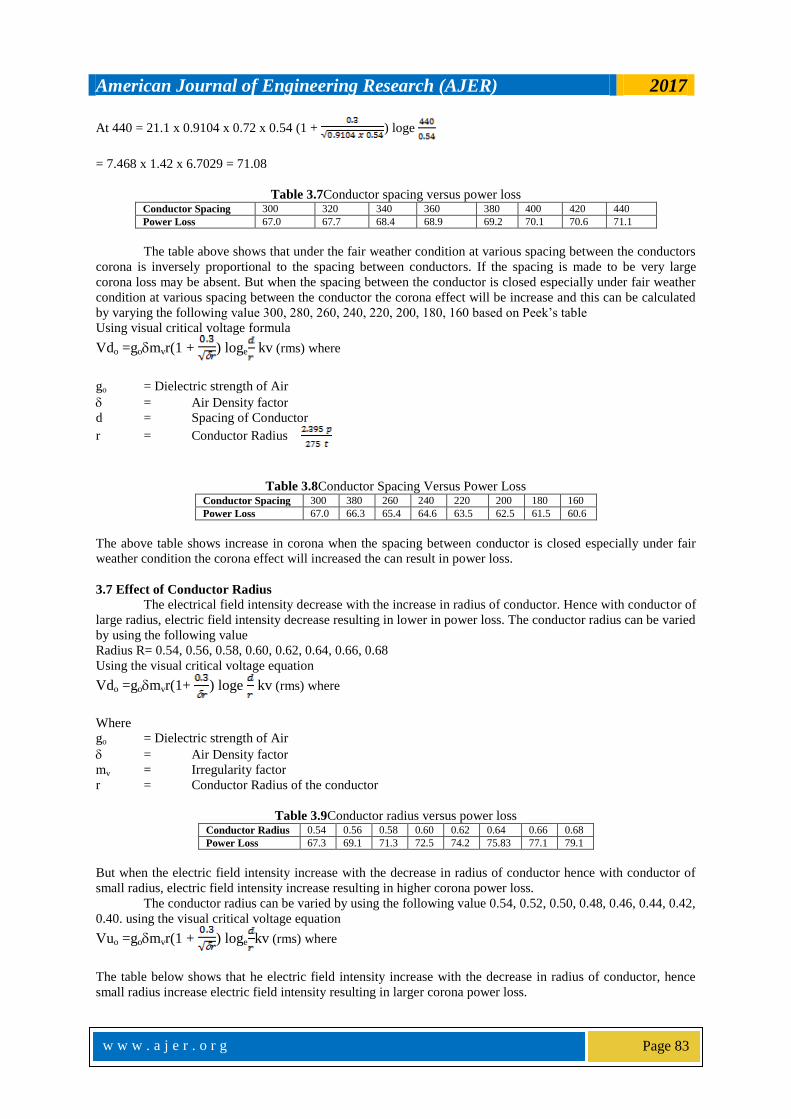
Using matlab to analyze, it was observed from the analysis that the effect of line voltage largely affects
the corona effect. According to table3.5, it is observed that when the line voltage is increased to a certain value,
the electrostatics stresses developed at a conductor surface thereby making the atmospheric air surrounding the
conductor to conduct. The corona effect will appear and this is displayed in the graphs of figure4 shown below:
130 140 150 160 170 180 190 200 21040
60
80
100
120
140
160
180
200GRAPH OF POWER LOSS VS LINE VOLTAGE (FOR INCREASING LINE VOLTAGE)
LINE VOLTAGE
PO
WE
R L
OS
S
Fig 4.Graph of Power Loss versus Line Voltage (for increasing line voltage)
This effect can also be reduced, it is also observed that the effect of line voltage can be reduced
according to tables 3 it was observed that when the line voltage is decrease to such value that electrostatic stress
developed at a conductor surface is make the atmospheric air surround the conductor is reduced (i.e) at low
voltage there is no corona effect and this can be display in the graphs of figure 4.1 below.
60 70 80 90 100 110 120 130 1400
5
10
15
20
25
30
35
40
45
50POWER LOSS VS LINE VOLTAGE FOR DECREASING LINE VOLTAGE
LINE VOLTAGE
PO
WE
R L
OS
S
Fig. 4.1Graph of Power Loss versus Line Voltage (for decreasing line voltage)
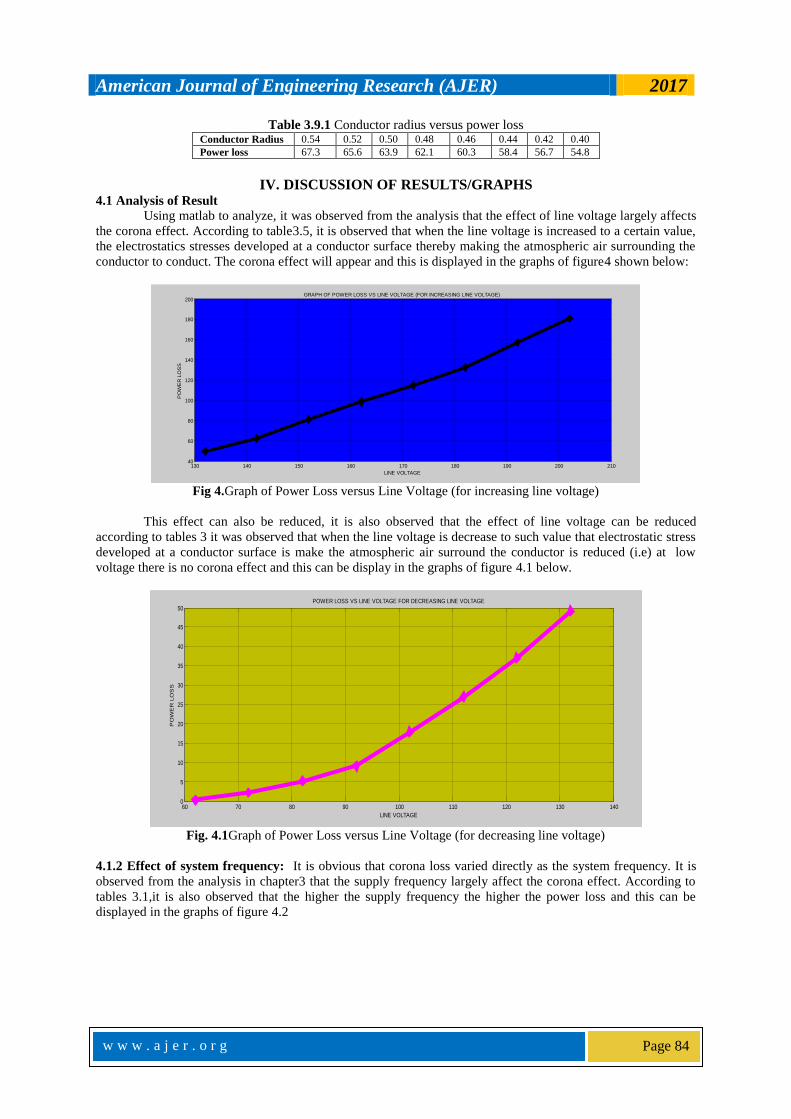
4.1.2 Effect of system frequency: It is obvious that corona loss varied directly as the system frequency. It is
observed from the analysis in chapter3 that the supply frequency largely affect the corona effect. According to
tables 3.1,it is also observed that the higher the supply frequency the higher the power loss and this can be
displayed in the graphs of figure 4.2
American Journal of Engineering Research (AJER) 2017
w w w . a j e r . o r g
Page 85
20 25 30 3530
35
40
45
50
55
60
65GRAPH OF POWER VS FREQUENCY
Frequency Supply
PO
WE
R L
OS
S
Fig. 4.2Graph of Power Loss versus System Frequency (for increasing the frequency)
It is also obvious that corona loss varied directly as the system frequency from the analysis it is observed that
the lower the supply frequency the lower the corona loss and this can be displayed in the graphs of figure 4.3
10 15 20 25 30 35 40 4530
35
40
45
50
55
60
65THE GRAPH OF POWER LOSS VS FREQUENCY(FOR DECREASING VALUES OF FREQUENCY AND POWER LOSS )
FREQUENCY
PO
WE
R L
OS
S
Fig. 4.3Graph of Power Loss versus System Frequency (for decreasing the Frequency)
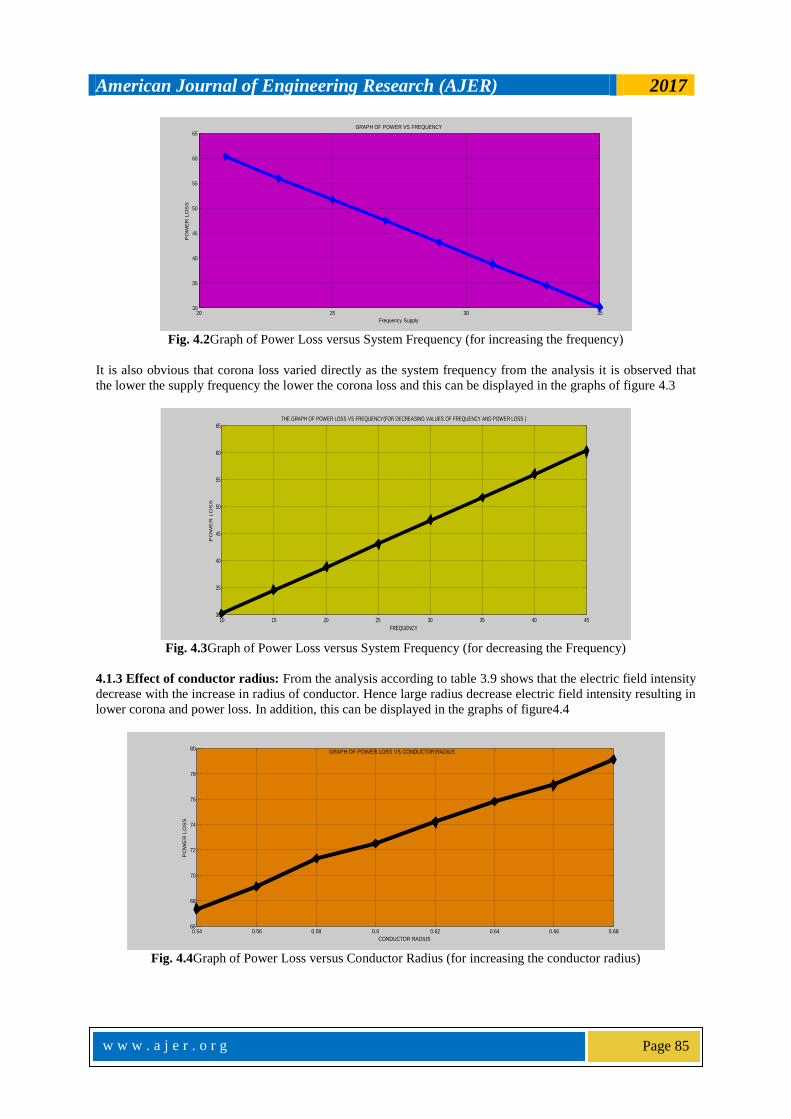
4.1.3 Effect of conductor radius: From the analysis according to table 3.9 shows that the electric field intensity
decrease with the increase in radius of conductor. Hence large radius decrease electric field intensity resulting in
lower corona and power loss. In addition, this can be displayed in the graphs of figure4.4
0.54 0.56 0.58 0.6 0.62 0.64 0.66 0.6866
68
70
72
74
76
78
80GRAPH OF POWER LOSS VS CONDUCTOR RADIUS
CONDUCTOR RADIUS
PO
WE
R L
OS
S
Fig. 4.4Graph of Power Loss versus Conductor Radius (for increasing the conductor radius)
American Journal of Engineering Research (AJER) 2017
w w w . a j e r . o r g
Page 86
4.1.4 Effect of conductor radius: From the analysis according to table 3.9 shows that the electric field intensity
increases with the decrease in radius of conductor. Hence small radius increase electric field intensity resulting
in large corona power loss. Moreover, this can be displayed in the graphs of figure4.5
20 25 30 3550
55
60
65
70
75
80
85
90
95
DIELECTRIC STRENGTH OF AIR(go)
Pow
er
Loss
Graph of Power Loss VS Dielectric Strength
Fig. 4.5Graph of Power Loss versus Conductor Radius (for decreasing the conductor radius)
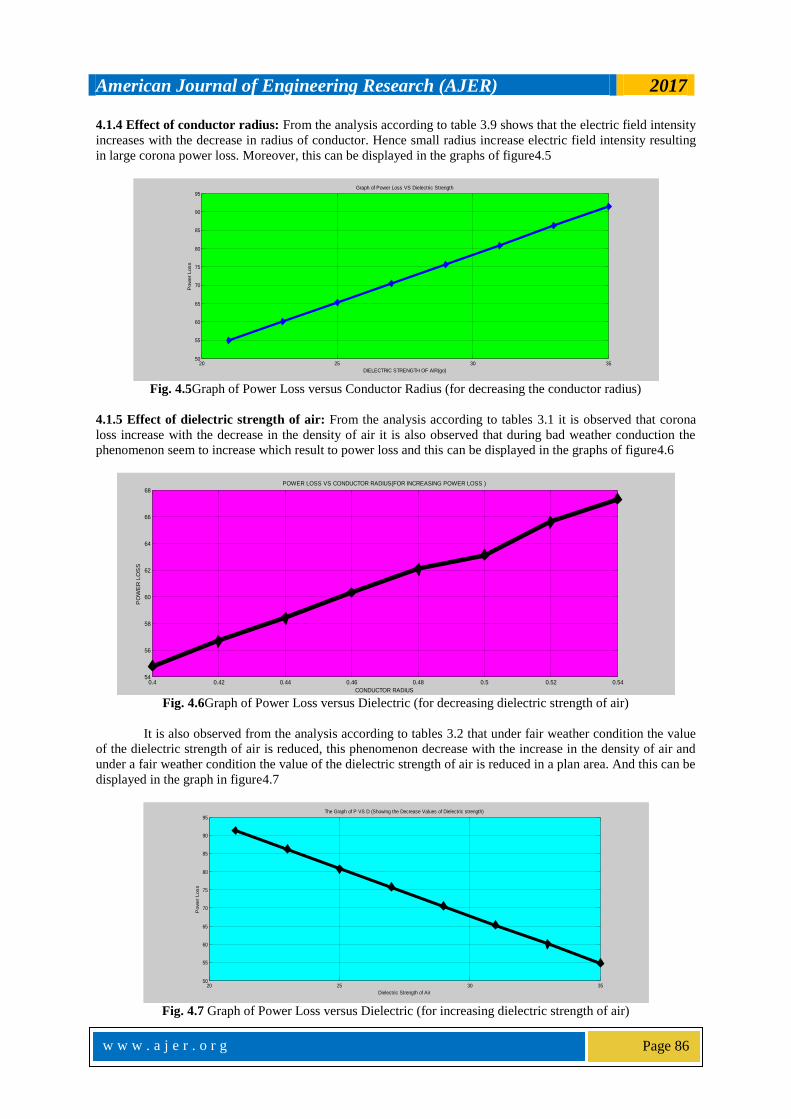
4.1.5 Effect of dielectric strength of air: From the analysis according to tables 3.1 it is observed that corona
loss increase with the decrease in the density of air it is also observed that during bad weather conduction the
phenomenon seem to increase which result to power loss and this can be displayed in the graphs of figure4.6
0.4 0.42 0.44 0.46 0.48 0.5 0.52 0.5454
56
58
60
62
64
66
68POWER LOSS VS CONDUCTOR RADIUS(FOR INCREASING POWER LOSS )
CONDUCTOR RADIUS
PO
WE
R L
OS
S
Fig. 4.6Graph of Power Loss versus Dielectric (for decreasing dielectric strength of air)
It is also observed from the analysis according to tables 3.2 that under fair weather condition the value
of the dielectric strength of air is reduced, this phenomenon decrease with the increase in the density of air and
under a fair weather condition the value of the dielectric strength of air is reduced in a plan area. And this can be
displayed in the graph in figure4.7
20 25 30 3550
55
60
65
70
75
80
85
90
95The Graph of P VS D (Showing the Decrease Values of Dielectric strength)
Dielectric Strength of Air
Pow
er
Loss
Fig. 4.7 Graph of Power Loss versus Dielectric (for increasing dielectric strength of air)
American Journal of Engineering Research (AJER) 2017
w w w . a j e r . o r g
Page 87
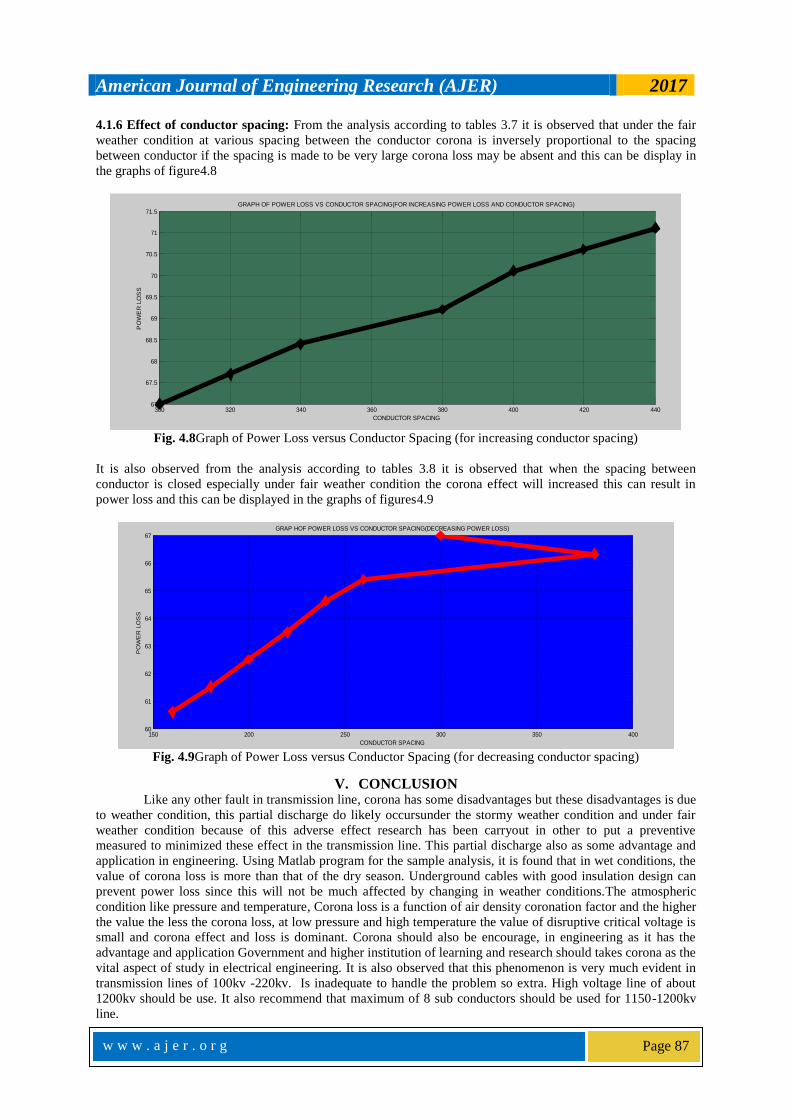
4.1.6 Effect of conductor spacing: From the analysis according to tables 3.7 it is observed that under the fair
weather condition at various spacing between the conductor corona is inversely proportional to the spacing
between conductor if the spacing is made to be very large corona loss may be absent and this can be display in
the graphs of figure4.8
300 320 340 360 380 400 420 44067
67.5
68
68.5
69
69.5
70
70.5
71
71.5GRAPH OF POWER LOSS VS CONDUCTOR SPACING(FOR INCREASING POWER LOSS AND CONDUCTOR SPACING)
CONDUCTOR SPACING
PO
WE
R L
OS
S
Fig. 4.8Graph of Power Loss versus Conductor Spacing (for increasing conductor spacing)
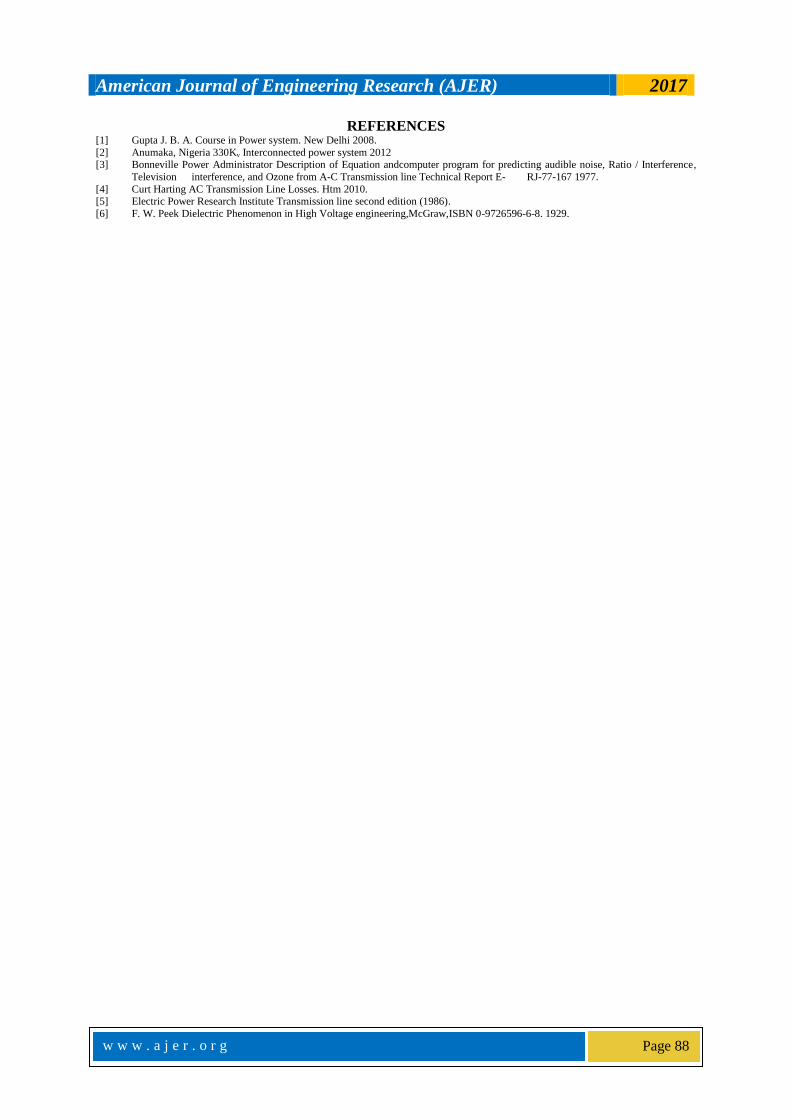
It is also observed from the analysis according to tables 3.8 it is observed that when the spacing between
conductor is closed especially under fair weather condition the corona effect will increased this can result in
power loss and this can be displayed in the graphs of figures4.9
150 200 250 300 350 40060
61
62
63
64
65
66
67GRAP HOF POWER LOSS VS CONDUCTOR SPACING(DECREASING POWER LOSS)
CONDUCTOR SPACING
PO
WE
R L
OS
S
Fig. 4.9Graph of Power Loss versus Conductor Spacing (for decreasing conductor spacing)
V. CONCLUSION Like any other fault in transmission line, corona has some disadvantages but these disadvantages is due
to weather condition, this partial discharge do likely occursunder the stormy weather condition and under fair
weather condition because of this adverse effect research has been carryout in other to put a preventive
measured to minimized these effect in the transmission line. This partial discharge also as some advantage and
application in engineering. Using Matlab program for the sample analysis, it is found that in wet conditions, the
value of corona loss is more than that of the dry season. Underground cables with good insulation design can
prevent power loss since this will not be much affected by changing in weather conditions.The atmospheric
condition like pressure and temperature, Corona loss is a function of air density coronation factor and the higher
the value the less the corona loss, at low pressure and high temperature the value of disruptive critical voltage is
small and corona effect and loss is dominant. Corona should also be encourage, in engineering as it has the
advantage and application Government and higher institution of learning and research should takes corona as the
vital aspect of study in electrical engineering. It is also observed that this phenomenon is very much evident in
transmission lines of 100kv -220kv. Is inadequate to handle the problem so extra. High voltage line of about
1200kv should be use. It also recommend that maximum of 8 sub conductors should be used for 1150-1200kv
line.
American Journal of Engineering Research (AJER) 2017
w w w . a j e r . o r g
Page 88
REFERENCES [1] Gupta J. B. A. Course in Power system. New Delhi 2008.
[2] Anumaka, Nigeria 330Kv Interconnected power system 2012 [3] Bonneville Power Administrator Description of Equation andcomputer program for predicting audible noise, Ratio / Interference,
Television interference, and Ozone from A-C Transmission line Technical Report E- RJ-77-167 1977.
[4] Curt Harting AC Transmission Line Losses. Htm 2010. [5] Electric Power Research Institute Transmission line second edition (1986).
[6] F. W. Peek Dielectric Phenomenon in High Voltage engineering,McGraw,ISBN 0-9726596-6-8. 1929.


