Embed Size (px)
Citation preview

BioMed CentralBMC Plant Biology
ss
Open AcceResearch articleAnalysis of tall fescue ESTs representing different abiotic stresses, tissue types and developmental stagesMA Rouf Mian†1,5, Yan Zhang†1, Zeng-Yu Wang1, Ji-Yi Zhang1, Xiaofei Cheng1, Lei Chen1, Konstantin Chekhovskiy1, Xinbin Dai2, Chunhong Mao3, Foo Cheung4, Xuechun Zhao2, Ji He2, Angela D Scott2, Christopher D Town4 and Gregory D May*2,6Address: 1Forage Improvement Division, The Samuel Roberts Noble Foundation, 2510 Sam Noble Parkway, Ardmore, OK 73402, USA, 2Plant Biology Division, The Samuel Roberts Noble Foundation, 2510 Sam Noble Parkway, Ardmore, OK 73402, USA, 3Virginia Bioinformatics Institute, 1750 Kraft Drive Suite 1400, Virginia Tech, Blacksburg, VA 24061, USA, 4The J. Craig Venter Institute, 9712 Medical Center Drive, Rockville, MD 20850, USA, 5USDA-ARS, The Ohio State University & OARDC, 1680 Madison Avenue, Wooster, OH 44691, USA and 6National Center for Genome Resources, 2935 Rodeo Park Drive East, Santa Fe, NM 87505, USA
Email: MA Rouf Mian - [email protected]; Yan Zhang - [email protected]; Zeng-Yu Wang - [email protected]; Ji-Yi Zhang - [email protected]; Xiaofei Cheng - [email protected]; Lei Chen - [email protected]; Konstantin Chekhovskiy - [email protected]; Xinbin Dai - [email protected]; Chunhong Mao - [email protected]; Foo Cheung - [email protected]; Xuechun Zhao - [email protected]; Ji He - [email protected]; Angela D Scott - [email protected]; Christopher D Town - [email protected]; Gregory D May* - [email protected]
* Corresponding author †Equal contributors
AbstractBackground: Tall fescue (Festuca arundinacea Schreb) is a major cool season forage and turf grass speciesgrown in the temperate regions of the world. In this paper we report the generation of a tall fescueexpressed sequence tag (EST) database developed from nine cDNA libraries representing tissues fromdifferent plant organs, developmental stages, and abiotic stress factors. The results of inter-library andlibrary-specific in silico expression analyses of these ESTs are also reported.
Results: A total of 41,516 ESTs were generated from nine cDNA libraries of tall fescue representingtissues from different plant organs, developmental stages, and abiotic stress conditions. The Festuca GeneIndex (FaGI) has been established. To date, this represents the first publicly available tall fescue ESTdatabase. In silico gene expression studies using these ESTs were performed to understand stressresponses in tall fescue. A large number of ESTs of known stress response gene were identified fromstressed tissue libraries. These ESTs represent gene homologues of heat-shock and oxidative stressproteins, and various transcription factor protein families. Highly expressed ESTs representing genes ofunknown functions were also identified in the stressed tissue libraries.
Conclusion: FaGI provides a useful resource for genomics studies of tall fescue and other closely relatedforage and turf grass species. Comparative genomic analyses between tall fescue and other grass species,including ryegrasses (Lolium sp.), meadow fescue (F. pratensis) and tetraploid fescue (F. arundinacea varglaucescens) will benefit from this database. These ESTs are an excellent resource for the development ofsimple sequence repeat (SSR) and single nucleotide polymorphism (SNP) PCR-based molecular markers.
Published: 4 March 2008
BMC Plant Biology 2008, 8:27 doi:10.1186/1471-2229-8-27
Received: 22 September 2007Accepted: 4 March 2008
This article is available from: http://www.biomedcentral.com/1471-2229/8/27
© 2008 Mian et al; licensee BioMed Central Ltd. This is an Open Access article distributed under the terms of the Creative Commons Attribution License (http://creativecommons.org/licenses/by/2.0), which permits unrestricted use, distribution, and reproduction in any medium, provided the original work is properly cited.
Page 1 of 13(page number not for citation purposes)
BMC Plant Biology 2008, 8:27 http://www.biomedcentral.com/1471-2229/8/27
BackgroundOn a worldwide basis, grasslands occupy twice the landarea of grain crops [1]. Tall fescue (Festuca arundinaceaSchreb) is a major cool season forage and turf grass with agenome size of approximately 6 × 10³ Mbp and an out-crossing mode of reproduction [2]. Tall fescue is a hexa-ploid species that contains three genomes (P, G1, andG2). The P (2x) genome originates from F. pratensis whilethe G1 and G2 (4x) genomes are derived from F. arundi-nacea var 'Glaucescens' [3]. Tall fescue is closely related toa number of Lolium species including perennial ryegrass(Lolium perenne) and annual ryegrass (Lolium multiflorum).The Festuca-Lolium complex contains well-adapted, highlyproductive grass species that are widely distributed inmany parts of the world [4]. These cultivated foragegrasses provide numerous benefits to humans, includingproviding feed and fodder for millions of dairy and beefcattle, horses, sheep, and countless wild animals [5]. Turfgrass production for use in golf courses and lawns is amulti-billion dollar U.S. industry. Besides the direct eco-nomic benefits gained from forage and turf grasses, theircontributions in soil conservation, environmental protec-tion, recreation, and aesthetics are substantial.
To date, complete genome sequences are available foronly two plant species, Arabidopsis thaliana and Oryzasativa, both with relatively small genome sizes comparedto most crop plants. The genome of tall fescue is approxi-mately 14 times larger than that of rice. It is unlikely thata complete genome sequence will be available for tall fes-cue or any other forage or turf grass species in the nearfuture. For grass species with large genomes, focusedlarge-scale development and analysis of ESTs can providea basis for gene discovery and the determination of genefunction [6].
The out-crossing nature of reproduction and genomecomplexity of tall fescue make conventional molecularstudies difficult and inefficient. Thus molecular studies intall fescue have lagged far behind those of major cerealspecies. Tall fescue EST and database resources will be use-ful for comparative genomic analyses of this importantplant species with other major grass species, including rice[7], and help cross-species transfer of genetic knowledgefrom the well characterized species (e.g., rice) to those lessstudied.
Here we report the generation of 41,516 tall fescue ESTscharacterized from nine cDNA libraries representing tis-sues from different plant organs, developmental stages,and abiotic stress factors. We also report the results ofinter-library and library-specific in silico EST expressionanalyses.
Results and discussionFestuca cDNA libraries and generation of unigene setsMore than 49,000 EST sequences were generated fromnine tall fescue cDNA libraries constructed from tissuesrepresenting various tissue types (leaves, roots, stems, andfloral meristems), growth stages (young seedlings, juve-nile vegetative stage, and early reproductive stages), andabiotic stress factors (drought, heat, and multi-factor fieldstress) (Table 1). DNA sequencing success rates variedbetween 75 – 97% for all libraries with an overall averagelength of 536 bp. The young seedling (SD1) and heatstressed shoot (HSS) libraries had the highest (598 bp)and lowest (505 bp) average trimmed EST lengths, respec-tively (Table 1). Sequences less than 50 nucleotides inlength (7.7%), low quality sequences (1.8%), chimericsequences (1.8%), and contaminated sequences (3.4%)were removed from the data set. A total of 41,834 ESTsequences were deposited in the GenBank dbEST.
In collaboration with The Institute for Genomic Research(TIGR) the Festuca Gene Index (FaGI) containing 41,516high-quality ESTs was established [8]. A library-basedbreakdown of the ESTs is shown in Table 1. Cluster anal-ysis revealed 17,806 unigene sequences that included11,917 singletons and 5,889 tentative consensus (TC)sequences assembled from 29,599 ESTs (Table 2). Morethan 67% of the unique sequences or 29% of all ESTs weresingletons. The number of ESTs in the TCs ranged fromtwo to 981 ESTs with an average of five ESTs per TC (Fig-ure 1). More than 99% of TCs are less than 2 kb in length,including TCs <1 kb (78%) and those between 1 to 2 kb(21%) (data not shown). The longest tentative consensus(TC 2128) was 3,215 bp and encodes a rice beta-galactos-idase homologue (Table 2). Approximately 30% ofunique sequences are expressed at a low to medium level,i.e. they are represented by TCs assembled from two tonine ESTs and accounted for 42% of all sequences. Only2.7% of unique sequences are highly expressed as they arerepresented by TCs comprising more than ten ESTs. Thehighly expressed genes covered 30% of the ESTs (Figure1). Among them were 15 TCs that consist of more than234 ESTs each. Eight of these highly expressed transcripts,derived from stem or leaf tissue libraries, demonstratesequence similarities to genes with known function, mostof which are involved in carbon fixation (rubisco, pho-torespiration, photosystem II) and carbon metabolism.TC1995, comprising the largest number of ESTs (981), ismost similar to a rice hypothetical protein of unknownfunction.
To compare ESTs characterized from each library, thenumbers of singletons, ESTs in unique TCs and uniqueESTs were calculated. Singleton percentages were calcu-lated by dividing singletons by the total number of ESTsin each library. Singleton percentages ranged from 3.9%
Page 2 of 13(page number not for citation purposes)

BMC Plant Biology 2008, 8:27 http://www.biomedcentral.com/1471-2229/8/27
to 61% in the DR1 and FSS libraries, respectively. Only2.6% of ESTs assembled into unique TCs in the FSSlibrary. The percentage of unique ESTs, which includeboth singleton and ESTs in unique TCs, is based on ESTspresent in each library, and therefore, suggests library spe-cificity of ESTs. Almost two-thirds of the ESTs from the FSSlibrary are unique to this library (Table 1).
Annotation of the unigene setsBLASTX [9] was conducted against the GenBank non-redundant protein (nr) database to assign putative iden-tity to the Festuca unigene set. Based on an E-value cutoffof ≤ 1 e-5, 68% (12,077) of the Festuca unigenes showedsignificant levels of similarity to nr. Approximately 28%(3,410) of these protein homologues were annotated asunknown, hypothetical, or expressed proteins, while theremaining (8,667) correspond to proteins with putativeknown functions.
Functional annotation was assigned by mapping unigenesonto the Gene Ontology Consortium [10] structure usingthe FaGI (1.0). Unigenes with assigned putative functionswere classified into three ontologies: molecular function,biological process, and cellular component by controlledGO vocabulary [10]. In total, 2,410 unigenes (including1,762 TCs and 648 singletons) were mapped to one or
more ontologies, with multiple assignments possible for agiven protein within a single ontology. Thus, 2,305assignments were made to the molecular function ontol-ogy, with more than 75% of these in the catalytic activityand binding category annotations such ligase, transferase,helicase, and nucleotide binding proteins (Figure 2A).Branch child terms for transporter and transcription regu-lator activities revealed several genes implicated in waterchannel (e.g., Q40047 and Q8S4X5), carbohydrate trans-porter (e.g., Q8GTR0 and Q5XF02), as well as predictedtranscription factors with putative roles in stress responses(e.g. heat shock factor RHSF6, HMG1/2-like protein,MYB-like protein Q4L214 and Q4JL76, and zinc fingerprotein genes Q5Z9H7 and O82115). Under the biologi-cal process ontology, the majority of the 1,773 assign-ments were to the physiological process (76%) andcellular process (66%) categories, with frequent sub-clas-sification into the response to stress, response to externalstimulus, and cell growth and maintenance categories(Figure 2B). The abundance of stress-related annotationsis not surprising, considering that a significant portion ofthe ESTs were generated from tissues subjected to abioticstresses. Of the 1,725 unigenes mapped into cellular com-ponent ontologies, the largest groups were assigned intothe cell (66%) and organelle (53%) categories (Figure2C).
Table 1: Tall fescue cDNA library and ESTs summary
cDNA library namea
NCBI dbEST accession No.
Average length (bp)
No. of ESTs No. of TCc No. of singleton
No. of unique TCe
No. of ESTs in unique TC
No. of unique sequencesf
Drought stressed root (DR1)
DT674223 to DT679214
518 4,954 (81)b 613 191 (3.9)d 170 955 (19.3)d 361 (2.0) g
Drought stressed shoot (DS1)
DT679215 to DT684265
508 4,972 (75) 1621 1,704 (34.3) 135 305 (6.1) 1,839 (10.3)
Field stressed shoot (FSS)
DT684266 to DT685476
579 1,210 (97) 367 741 (61.2) 14 32 (2.6) 755 (4.2)
Floral meristem (TFM)
DT685477 to DT690490
522 4,965 (76) 1624 1,263 (25.4) 519 1376 (27.7) 1,782 (10.0)
Heat stressed shoot (HSS)
DT690491 to DT695609
505 5,090 (82) 1743 1,551 (30.5) 506 1202 (23.6) 2,057 (11.6)
Greenhouse grown leaf (LF1)
DT695610 to DT700548
518 4,885 (89) 1346 1,079 (22.1) 158 383 (7.8) 1,237 (6.9)
Greenhouse grown root (RT1)
DT700549 to DT706237
554 5,679 (92) 1917 1,691 (29.8) 274 661 (11.6) 1,965 (11.0)
Field grown stem (ST1)
DT706238 to DT711272
554 4,991 (87) 1627 1,866 (37.4) 194 447 (9.0) 2,060 (11.6)
Young seedling (SD1)
DT711273 to DT716056
598 4,770 (96) 1643 1,831 (38.4) 179 401 (8.4) 2,010 (11.3)
Total 536 41,516
aDetails on plant growing conditions, tissue sampling, and library construction for each cDNA library are available at NCBI.bNumber within parenthesis indicates percent sequencing success rate.cNumber of tentative consensus (TC) sequences generated from EST library members.dPercentage (%)of the total number of ESTs in each library.eNumber of unique TCs assembled from ESTs only present in each library.fNumber of unique sequences only present in each library, including singleton and unique TC.g Fraction of unique sequences in this library to all 17,806 unique sequences.
Page 3 of 13(page number not for citation purposes)

BMC Plant Biology 2008, 8:27 http://www.biomedcentral.com/1471-2229/8/27
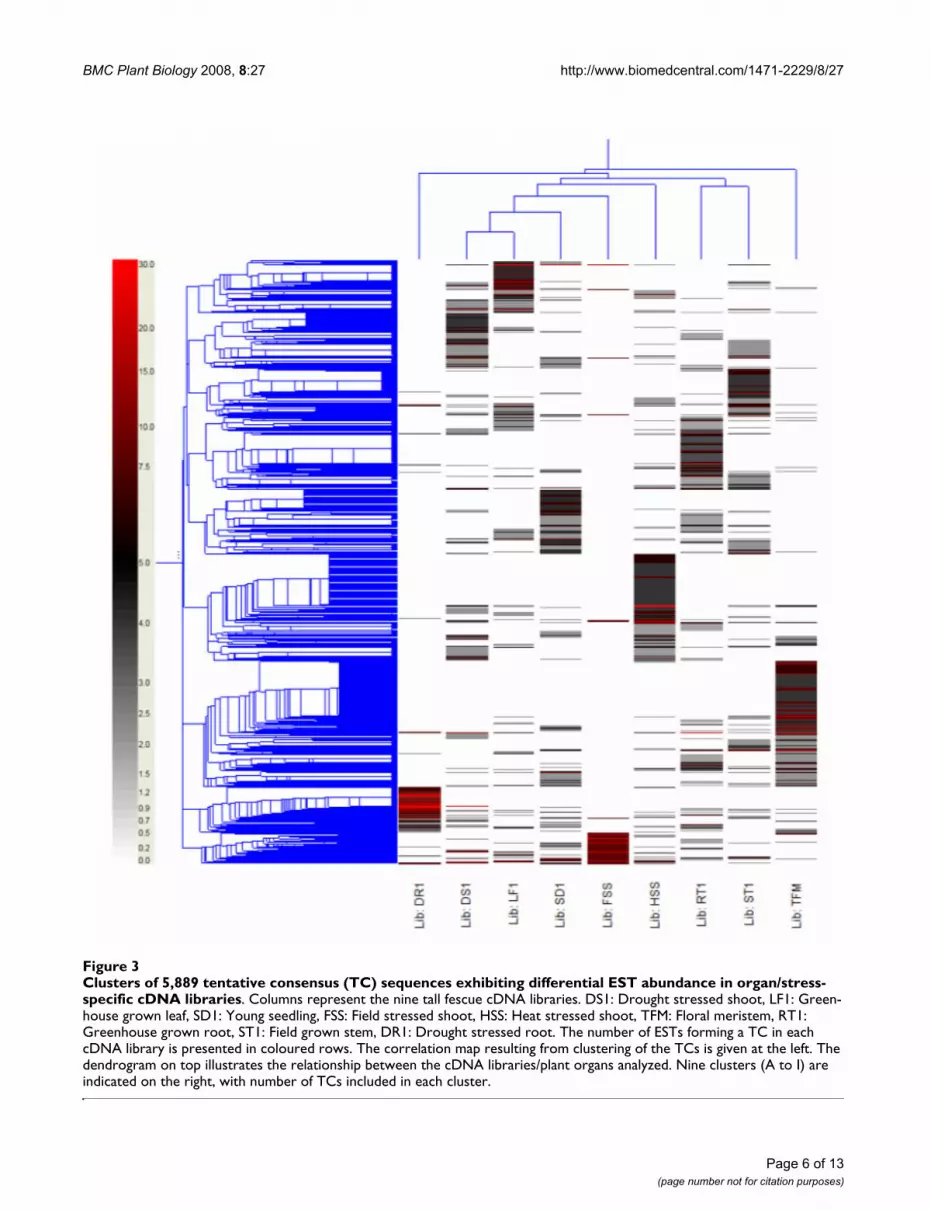
In silico analysis of gene expressionTo identify putative differentially expressed genes, in silicoexpression analysis were conducted by hierarchical clus-tering [11] of expression levels of all 5,889 TCs in the ninecDNA libraries, represented as EST counts normalizedaccording to library size, using GeneSpring 7.2. The librar-ies were separated into four arbitrary groups based onclustering analysis (Figure 3). Five libraries, includingDS1, LF1, SD1, FSS, and HSS formed the largest group bystep further relationships. Three libraries (DS1, FSS, andHSS) were from stressed above ground tissues, and there-fore, may share similar gene expression memberships.Another group contains RT1 and ST1 libraries, which con-
tain apical meristem tissues active in cell division, elonga-tion, and differentiation. Expression of ESTs generatedfrom stressed root tissue (DR1) significantly differed fromother libraries, and was therefore grouped into a thirdblock. As expected, TFM (floral meristem) library, repre-senting ESTs from reproductive tissue showed uniqueexpression that differentiated from all other tissue typelibraries.
Genes sharing quantitatively and functionally relatedexpression patterns were also identified. Based on theirlibrary specificity, TCs were classified into nine majorclusters (A to I) as shown in Figure 3. Each library was
Table 2: Tall fescue ESTs summary statistics on clustering analyses
Number of sequence Minimum length (bp) Maximum length (bp) Average length (bp)
TCs 5,889 106 3,215 810ESTs which appear in TCs 29,599 100 736 537Singletons 11,917 100 731 532Unique sequencesa 17,806 100 3,215 624All EST 41,516 100 736 536
a Unique sequences = TCs + singletons
Distribution of Festuca unique sequencesFigure 1Distribution of Festuca unique sequences. Numbers on bar tops indicate the number of ESTs and TCs for each category.
Page 4 of 13(page number not for citation purposes)

BMC Plant Biology 2008, 8:27 http://www.biomedcentral.com/1471-2229/8/27
assigned a major cluster containing genes specificallyexpressed in the particular tissue type or stress treatmentof the library. Number of TCs included in each cluster wasfrom 303 (cluster I) to 1,232 (cluster G) (Figure 3).
The majority of the genes in cluster A were generated fromleaf tissue-derived ESTs. Not surprisingly, numerous pho-tosynthesis and carbon fixation genes were highlyexpressed, e.g., protein homologue of chloroplast car-bonic anhydrase and rubisco activase gene transcriptswere represented by more than 570 and 244 ESTs, respec-tively from this library. In addition, more than 40 TCs incluster A were the homologues of chlorophyll a/b binding(CAB) and photosystem II (PSII) proteins. Abundant stemtissue ESTs were grouped in cluster C. Included in this
cluster are homologues of enzymes involved in cytosolicglycolysis. For example, ESTs of genes that encode forsucrose synthase, glucose dehydrogenase, malate dehy-drogenase, and fructose 1,6-bisphosphate aldolase werepresent at 20 or greater copies in the stem library.
Cluster D includes genes specifically expressed in roots(RT1) and contains high-copy number ESTs encoding dif-ferent classes of methionine synthases and methyl trans-ferases. ESTs of a barley metallothionein-like protein(MT) homologue were highly expressed in the root (RT1)library and were clustered into six TCs comprised of 139copies. MT1, one of the four classes of metallothioneinswas previously reported to express significantly higher inroot than in other tissues such as leaf and flower [12].
The genes associated with clusters E and G are mainlyexpressed in actively dividing (young seedling and floralmeristem) tissues. Products of genes in these clusters arenecessary for cell cycle regulation, transcription and trans-lation. Germination-specific cluster E contains a numberof genes coding for transcriptional factors (e.g., shaggy-related protein kinase, CBL-interacting protein kinase,MYB29 protein). In addition, genes involved in photosyn-thesis were also highly expressed in young seedlings. G,the largest cluster comprised of 101 TCs, contains signifi-cant numbers of floral meristem ribosomal and histoneprotein isoforms that comprise approximately 8% of themembers of this cluster. Histone H2, a meristem-specificgene homologue, was present in 19 TCs from this library.Histone H2 mRNA is transiently accumulated during aperiod of the cell cycle that mostly overlaps the S phase[13]. Our results show increased expression of these tran-scripts which may be indicative of active cell division infloral meristem tissues [14].
Cluster B, F, H, and I represent drought-stressed (DS1),heat-stressed shoot (HSS), drought stressed root (DR1),and field stressed shoot (FSS) libraries, respectively. Atotal of 2,338 TCs were contained in these four clusters,and accounted for 40% of all contigs. Large numbers ofstress response genes were found in these four clusters,including homologues of heat-shock and oxidative-stressproteins, and various classes of transcription factors. Dif-ferences in stress-related gene expression were alsoobserved among libraries. Perhaps this is due to differ-ences in stress mechanisms and in other environmentaland biological factors among libraries. For example, 23TCs coding for different classes of heat-shock proteins(cluster F) were found in the heat-stressed shoot library.This is significantly higher than the number of heat-shockTCs observed in other stress libraries. Heat stress inducedby high temperatures can result in damage to the photo-synthetic apparatus [15] thus many chloroplast and pho-tosynthesis related genes found in this cluster were
Distribution of Festuca unigenes with putative functions assigned through Gene Ontology annotationFigure 2Distribution of Festuca unigenes with putative func-tions assigned through Gene Ontology annotation. A, Molecular function. B, Biological process. C, Cellular compo-nent. Assignments are based on the data available at FaGI (1.0).
Page 5 of 13(page number not for citation purposes)
BMC Plant Biology 2008, 8:27 http://www.biomedcentral.com/1471-2229/8/27
Page 6 of 13(page number not for citation purposes)
Clusters of 5,889 tentative consensus (TC) sequences exhibiting differential EST abundance in organ/stress-specific cDNA librariesFigure 3Clusters of 5,889 tentative consensus (TC) sequences exhibiting differential EST abundance in organ/stress-specific cDNA libraries. Columns represent the nine tall fescue cDNA libraries. DS1: Drought stressed shoot, LF1: Green-house grown leaf, SD1: Young seedling, FSS: Field stressed shoot, HSS: Heat stressed shoot, TFM: Floral meristem, RT1: Greenhouse grown root, ST1: Field grown stem, DR1: Drought stressed root. The number of ESTs forming a TC in each cDNA library is presented in coloured rows. The correlation map resulting from clustering of the TCs is given at the left. The dendrogram on top illustrates the relationship between the cDNA libraries/plant organs analyzed. Nine clusters (A to I) are indicated on the right, with number of TCs included in each cluster.

BMC Plant Biology 2008, 8:27 http://www.biomedcentral.com/1471-2229/8/27
expected. TC1995 had high EST numbers in bothdrought-stressed shoot (107) and drought-stressed root(1,873) libraries, but was not detected in other libraries(non-stressed shoot or root, other tissue types, or stresstreatments). This novel drought-specific TC has no simi-larity to any gene in the nr database. Another highlyexpressed TC, a homologue of a DNA binding protein,contained 1,272 ESTs in drought-stressed shoot and 56EST in drought-stressed root libraries.
Environmental conditions and gene expressionHot dry summers limit the production of cool season for-age and turf grasses including tall fescue, therefore, abiotic
stresses constitute challenges to forage production. Heatand drought stress typically overlap during summer tallfescue production, and both stresses may induce plantresponses leading to similar physiological changes. Toidentify genes induced under stress conditions, ESTs weregenerated from four cDNA libraries constructed fromdrought stressed shoot (DS1), drought stressed root(DR1), heat stressed shoot (HSS), and field stressed shoot(FSS) tissues. ESTs were assigned GO molecular functionannotations, and EST percentages were calculated basedon comparison to libraries representing non-stressed,greenhouse-grown tissues to identify stressed-associatedgenes (Figure 4).
Library comparisons based on gene ontology Molecular Function assignmentsFigure 4Library comparisons based on gene ontology Molecular Function assignments. X axis: library (as listed in Table 1). Y axis, GO function: 1. chaperone regulator activity, 2. triplet codon-amino acid adaptor activity, 3. protein tag, 4. energy trans-ducer activity, 5. chemoattractant activity, 6. chemorepellant activity, 7. nutrient reservoir activity, 8. motor activity, 9. signal transducer activity, 10. enzyme regulator activity, 11. antioxidant activity, 12. translation regulator activity, 13. transcription regulator activity, 14. structural molecule activity, 15. transporter activity, 16. molecular function unknown, 17. binding, 18. cat-alytic activity. Z axis: percentage of ESTs with known GO molecular function in each library, calculated as number of ESTs with GO assignments/total number of EST in each library.
Page 7 of 13(page number not for citation purposes)

BMC Plant Biology 2008, 8:27 http://www.biomedcentral.com/1471-2229/8/27
The field-stressed shoot library was constructed using theentire shoot and leaf tissues harvested from field-grownplants during mid-July with high daily average air temper-atures ranging from 35.2°C to 38.7°C. Plants were underenvironmental stresses including heat, drought as well aspossible field pathogens, representing severe summer pas-ture growth conditions in the U.S. southern Great Plains.FSS ESTs were compared to the greenhouse-grown leaflibrary to examine stress-response of above ground tis-sues. Many ESTs identified in the field-stressed libraryinclude a number of stress-related gene homologoues(e.g., cysteine proteinase, cytochrome P450, and proline-rich proteins). In addition, the percentage of ESTsinvolved in enzyme regulator activity, based on ontology,was much higher than those from non-stressed leaf(0.74% vs. 0.27%) (Figure 4). However, a higher percent-age of ESTs having transporter, binding, and catalyticactivity GO function may suggest active growth of non-stressed leaf tissue. Large numbers of genes involved inphotosynthesis and carbon fixation were found only inthe greenhouse-grown leaf library.
Comparison of drought stressed (DR1) vs. non-stressed,greenhouse-grown root libraries revealed an elevation intranscription regulator ESTs in drought stressed roots (Fig-ure 4). ESTs of genes coding for components of signaltransduction pathways (MAP kinase MAPK2, Ras-relatedGTP-binding protein), transcription factors (Zinc-fingerprotein, WRKY transcription factors, and MYB factor), andhormone-mediated signalling proteins (auxin responsefactor 1, and 2) are included in this group. Homologuesof the rice s-adenosylmethionine synthetase gene werehighly induced in drought-stressed roots (70 ESTs), whileonly four ESTs of this gene were found in non-stressedroot tissues. Ontology analyses indicate that antioxidant,translation regulator, transporter, binding, and catalyticactivities of drought stressed root were suppressed in com-parison to greenhouse grown roots (Figure 4). The expres-sion of root-specific metallothionein-like protein geneswere significantly decreased in drought-stressed root tis-sues (0.46%) when compared to roots from greenhouse-grown plants (1.49%). This may suggest physiologicalprocesses, including chelation of toxic metal ions and pro-tection against oxidative damage during the process of cel-lular death and degradation [12], may have been reducedin stressed roots. ESTs unique to drought-stress were alsoidentified. A drought-specific gene (TC1995), which washighly expressed only in drought-stressed root and shootlibraries (928 ESTs – cluster H) showed no similarity tosequences in nr. Between library EST comparisons weremade to examine changes in shoot tissue ESTs from tallfescue plants subjected to drought-, heat-, or field-stress (acombination of drought, heat and other environmentalstresses). Under multiple stress conditions, field stressedshoots expressed fewer classes of genes compared to heat-
(HSS) or drought- (DS1) stress alone (Figure 4). However,many ESTs expressed in at least two of the three librarieswere found. Proline-rich protein ESTs were expressed inboth DS1 and FSS libraries, and may suggest a commonmechanism of producing osmoprotectants in response todrought under either condition. Among the transcriptsexpressed in field- and heat-stressed shoots, transcriptsencoding mitochondrial proteins such as various subunitsof NADH dehydrogenase and cytochrome c oxidase wereidentified. Expression of these transcripts correlated withthe enhanced respiratory activity [16] detected in plantssubjected to heat stress or field stress. As expected, largenumbers of HSPs genes were expressed under both envi-ronments. Transcripts expressed under all three treat-ments include genes for transcriptional factors, oxidativeburst, and stress-related homologues (e.g., zinc-fingerprotein, ubiquitin conjugating enzyme, oxidase, DnaK-type molecular chaperone, wound-responsive family pro-tein, proline-rich protein, jasmonate-induced protein,cysteine proteinase inhibitor, and catalase). Our resultsindicate universal expression of these genes in response tostress conditions, similar to those reported in other stud-ies [16-19].
Heat shock proteins and beyondDue to the important roles of heat shock proteins (HSPs)in multi-stress conditions, we compared the expression ofHSPs in all nine cDNA libraries (Table 3). A total 53 HSPgene homologues were identified, representing four of thefive classes of heat shock proteins [20]. Based on their pre-dicted molecular mass, tall fescue HSPs were grouped intolow molecular weight (15–30 kDa), HSP70 (69–71 kDa),high molecular weight (80–114 kDa), and unclassifiedHSPs (Table 3), each contains 22, 7, 9, and 15 HSPs,respectively. Although special focus was placed on stresstreated tissues, HSPs ESTs were also present in rapidlydeveloping tissues of floral meristems, roots, and youngseedlings.
Generation of low molecular weight (LMW) or small (sm)heat shock proteins is one of the unique aspects of theheat shock response in plants [21]. Six classes of smHSPshave been identified in stressed plants [22]. Although thefunction of smHSPs has not been defined, evidence sug-gests that they serve as molecular chaperones to protectcells from stress damage, but that they are not required fornormal cellular function [23]. Our EST analysis showedthat 16 LMW-HSP genes were expressed in the heatstressed shoot library, which is significantly different fromtheir expression in other libraries (Table 3). The expres-sion of five LMW-HSP genes in field-stressed shoot tissuesmay reflect the high temperatures encountered duringsummer. Previously we found that LMW-HSP genes werehighly induced in heat treated tall fescue but not detecta-ble in non-stressed plants [24]. Sun et al. [25] found the
Page 8 of 13(page number not for citation purposes)

BMC Plant Biology 2008, 8:27 http://www.biomedcentral.com/1471-2229/8/27
Table 3: Tall fescue HSP and heat shock transcription factor (HSF) gene expression
Unigene IDa DR1 DS1 FSS TFM HSS LF1 RT1 ST1 SD1 Annotation
Low molecular weight (LMW) HSPs
TC3677 0 b 0 0 0 4 0 0 0 0 UP|HSP11_WHEAT (P12810) 16.9 kDa class I hspDT693759 0 0 0 0 2 0 0 0 0 PRF|1908439B|445140|1908439B hsp 16.9B. {O. sativa}DT696482 0 0 0 0 0 2 0 0 0 UP|Q40866_PENAM (Q40866) hsp 17.0TC739 0 0 0 0 8 0 0 0 0 UP|Q96458_HORVU (Q96458) 17 kDa class I small hspDT706802 0 0 0 0 0 0 0 2 0 PRF|NP_175807.1|17.4 kDa class III hsp {A.thaliana}TC4040 48 0 0 0 2 0 0 0 0 UP|Q94KM0_WHEAT (Q94KM0) Small hsp HSP17.8TC2206 0 0 0 0 2 0 2 2 0 UP|Q40867_PENAM (Q40867) hsp 17.9TC2205 0 0 8 0 12 0 0 0 0 UP|Q8W007_ORYSA (Q8W007) Class I lmw-hsp 17.9DT684410 0 0 8 0 0 0 0 0 0 UP|Q5R1P5_BOMMO (Q5R1P5) hsp21.4TC2142 0 0 0 0 4 0 0 0 0 UP|O64960_MAIZE (O64960) lmw-hsp (HSP22)TC1295 0 0 0 0 4 0 0 0 0 PIR|S65051|S65051 lmw-hsp (Hsp22.5) {G. max}TC2141 0 0 0 0 28 0 0 0 0 UP|Q9ZP25_WHEAT (Q9ZP25) sm Hsp23.5 precursorDT695134 0 0 0 0 2 0 0 0 0 UP|Q41568_WHEAT (Q41568)hsp 26.6BTC2085 0 0 8 0 18 0 0 0 0 UP|Q8GV35_9POAL (Q8GV35) Chl lmw-hsp HSP26.7bDT685446 0 0 8 0 0 0 0 0 0 UP|Q8GV37_9POAL (Q8GV37) Chl lmw-hsp HSP26.8DT693763 0 0 0 0 2 0 0 0 0 UP|O80432_LYCES (O80432) Mitochondrial smhspTC4358 0 0 0 0 10 0 0 2 0 PDB|1GME_A|1GME_Eukaryotic smhsp {T. aestivum}TC501 0 0 0 0 12 0 0 0 0 UP|Q40978_PAPSO (Q40978) lmw-hspDT695083 0 0 0 0 2 0 0 0 0 UP|Q41218_SOLTU (Q41218) smhsp homologDT684541 0 0 8 0 0 0 0 0 0 UP|Q4ZHH0_9BASI (Q4ZHH0) smhsp fragDT713365 0 0 0 0 0 0 0 0 2 UP|Q58FS1_TRIHA (Q58FS1) smhsp
Unigene ID DR1 DS1 FSS TFM HSS LF1 RT1 ST1 SD1 Annotation
TC4794 0 0 0 0 4 0 0 0 0 UP|Q8L470_LYCES (Q8L470) smhspHSP 70
DT679789 0 2 0 0 0 0 0 0 0 GB|CAA54419.1|450880|ATHSC701 hs cognate 70-1 {A. thaliana}TC64 0 0 0 0 2 0 0 4 0 UP|HSP72_LYCES (P27322) hs cognate 70 kDa prot 2DT691644 0 0 0 0 2 0 0 0 0 UP|HSP74_HUMAN (P34932) hs 70 kDa protein 4 (HSP70RY)DT695482 0 0 0 0 2 0 0 0 0 UP|HSP7S_PEA (Q02028) Stromal 70 kDa hs-related proteinDT682340 0 2 0 0 0 0 0 0 0 UP|O50036_SPIOL (O50036) hs 70 proteinDT692072 0 0 0 0 2 0 0 0 0 UP|O04056_CITLA (O04056) hsp precursorTC63 8 14 0 38 4 4 21 2 0 UP|Q84TA1_ORYSA (Q84TA1) hspgnate 70
High molecular weight HSPs
DT692018 0 0 0 0 2 0 0 0 0 UP|Q9ZRG0_WHEAT (Q9ZRG0) hspTC149 0 0 0 4 2 4 2 2 0 UP|HSP82_ORYSA (P33126) hspTC5768 0 0 0 0 4 0 0 0 0 PIR|A48426|A48426 HSP82 – maize {Z. mays}TC148 0 0 0 12 2 0 4 10 4 UP|Q7XJ80_HORVU (Q7XJ80) Cytosolic hsp 90DT684503 0 0 8 0 0 0 0 0 0 UP|Q45XA1_BEMTA (Q45XA1) 90 kDa hspDT710057 0 0 0 0 0 0 0 2 0 UP|HS101_ORYSA (Q6F2Y7) hsp 101DT697638 0 0 0 0 0 2 0 0 0 UP|Q6Z517_ORYSA 101 kDa hsp; HSP101-likeTC2500 0 0 0 0 2 0 0 0 8 UP|Q9LF37_ARATH (Q9LF37) ClpB hsp -likeTC950 0 0 0 2 0 0 0 0 4 UP|HS105_HUMAN (Q92598) hsp 105 kDa
Unclassified HSPs
TC5675 0 0 0 0 0 0 0 0 4 UP|O23638_ARATH (O23638) hsp precursorDT708187 0 0 0 0 0 0 0 2 0 UP|O49457_ARATH (O49457) hspTC3195 0 0 0 0 2 0 2 0 0 UP|P93437_ORYSA (P93437) hspTC2515 0 4 0 0 0 2 0 0 4 UP|Q43638_SECCE (Q43638) hspTC1929 0 0 0 0 4 0 0 0 0 UP|Q4LDR0_LYCES (Q4LDR0) hsp
Unigene ID DR1 DS1 FSS TFM HSS LF1 RT1 ST1 SD1 Annotation
Page 9 of 13(page number not for citation purposes)

BMC Plant Biology 2008, 8:27 http://www.biomedcentral.com/1471-2229/8/27
expression of HSP17.6A, a cytoplasmic class II smHSPgene in Arabidopsis was triggered by changed water poten-tial and was critical in osmotic stress tolerance. TC4040codes for a wheat smHSP17.8 homologue that was highlyexpressed in drought-stressed roots (48 ESTs), however,no expression was detected in drought-stressed shoot.
HSP70 proteins have been proven to be essential for nor-mal cell function [26]. Some members of the HSP70 fam-ily are expressed constitutively while others are inducedby heat or cold [27]. TC63 was expressed in seven of thenine libraries (Table 3). Interestingly, more than twentyESTs of this TC were found in floral meristem and green-house grown root libraries- tissues active in cell divisionand elongation.
Divergent from LMW-HSP and HSP70 gene transcripts,expression of high molecular weight HSP genes occurredmostly in developing tissues (floral meristem, greenhousegrown root, stem, and young seedlings) rather than instressed tissues. For example, TC148, which encodes abarley cytosolic HSP90 homologue, was represented bymultiple ESTs in all developing tissue libraries. As a chap-erone complex in plants, HSP90 functions in response toexternal stimuli (abiotic stresses and pathogens) and it isinvolved in phenotypic plasticity, developmental stabil-ity, and buffering of genetic variation [28]. A gene homo-
logue of ClpB, a subfamily of HSP100 [29], had mid-levelexpression in young seedling tissues in addition to expres-sion in heat-stressed shoots of tall fescue. A previous studyhas shown this nuclear-localized protein has a negativeinfluence to the growth rate of the primary root in addi-tion to its role in thermotolerance in maize [30].
Because the expression of HSPs is regulated by the activityof heat shock transcription factors (HSFs) [31], the expres-sion pattern of HSF genes was examined for tall fescue. Weidentified ten HSF genes representing eight classes ofHSFs, all of which had homologues in O. sativa. It is wellaccepted that at least two families of heat shock transcrip-tion factors (HSFs) exist in plants: Class A HSFs are prima-rily responsible for stress-inducible activation of heatshock genes whereas some of the class B HSFs may be spe-cialized for repression, or down-regulation, of the heatshock response [32]. This may explain the difference ofthe expression patterns for ten tall fescue HSF genes. Forexample, DT694677 which codes for HSF3 homologuewas expressed in heat-stressed shoot tissue only. This issimilar to findings regarding AtHSF3, which functions asa key regulator of the immediate stress-induced activationof heat shock gene transcription in Arabidopsis [33]. AHSF6 gene homologue (TC2134) had high levels ofexpression in drought-stressed roots, heat-stressed shoots,and young seedlings, and therefore, may function in both
TC4728 0 0 8 0 4 0 0 0 0 UP|Q5ZBN6_ORYSA (Q5ZBN6) hs-like proteinDT702768 0 0 0 0 0 0 2 0 0 UP|Q6ER93_ORYSA (Q6ER93) hsp -likeTC1335 0 0 0 2 0 0 2 0 0 UP|Q6K2F0_ORYSA (Q6K2F0) hsp -likeTC3822 0 0 0 0 0 0 2 2 0 UP|Q96269_ARATH (Q96269) hspTC3007 0 0 0 0 0 0 2 0 4 UP|Q9FHQ0_ARATH (Q9FHQ0) Calmodulin-binding hspDT710639 0 0 0 0 0 0 0 2 0 UP|STIP_SOYBN (Q43468) hsp STI (Stress inducible pron)
(GmSTI)DT710259 0 0 0 0 0 0 0 2 0 PRF|NP_175842.1 hs family protein {A. thaliana}DT690417 0 0 0 2 0 0 0 0 0 PRF|NP_187434.1|NP_187434 hsp -related {A. thaliana}TC4128 0 4 0 4 4 0 9 4 0 PRF|NP_191819.1 DNAJ hs family protein {A. thaliana}DT679933 0 2 0 0 0 0 0 0 0 PRF|NP_194764.1 hsp -related {A. thaliana}
HSFs
DT694163 0 0 0 0 2 0 0 0 0 UP|Q6VBB5_ORYSA (Q6VBB5) hsf RHSF2DT694677 0 0 0 0 2 0 0 0 0 GB|AAQ23057.1|33591100|hsf RHSF3 {O. sativa}DT688511 0 0 0 2 0 0 0 0 0 GB|AAQ23059.1|33591104|hsf RHSF5 {O. sativa}TC2134 14 0 0 0 10 0 0 0 8 GB|AAQ23060.1|33591106 hsf RHSF6 {O. sativa}TC5588 0 0 0 0 4 0 0 0 0 GB|AAQ23061.1|33591108|heat shock factor RHSF7 {O. sativa}DT705016 0 0 0 0 0 0 2 0 0 GB|AAQ23062.1|33591110|hsf RHSF8 {O. sativa}TC3473 0 0 0 0 4 0 0 0 0 UP|Q657C0_ORYSA (Q657C0) hs tf HSF8-likeDT679516 0 2 0 0 0 0 0 0 0 UP|Q6Z7B3_ORYSA (Q6Z7B3) hsf protein hsf8-likeTC3759 0 0 0 0 0 0 4 0 0 UP|Q94J16_ORYSA (Q94J16) hsf RHSF9TC1477 0 2 0 0 2 0 0 0 0 UP|Q5Z9D6_ORYSA (Q5Z9D6) hsf RHSF13-like
aUnigene ID. DT = singleton, TC = tentative consensus, Drought stressed root = DR1, Drought stressed shoot = DS1, Field stressed shoot = FSS, Floral meristem = TFM, Heat stressed shoot = HSS, Greenhouse grown leaf = LF1, Greenhouse grown root = RT1, Field grown stem = ST1, Young seedling = SD1.b Numbers of normalized ESTs found matching known HSPs or HSFs were listed in individual library.
Table 3: Tall fescue HSP and heat shock transcription factor (HSF) gene expression (Continued)
Page 10 of 13(page number not for citation purposes)

BMC Plant Biology 2008, 8:27 http://www.biomedcentral.com/1471-2229/8/27
stressed and developing tissues. HSFA9 is a transcriptionfactor critically involved in developmental activation ofhsp17.6G1 and specifically expressed during embryogen-esis in sunflower in the absence of environmental stress[34]. A tall fescue homologue of RHSF9 was expressed ingreenhouse grown root tissues.
Expression of ascorbate peroxidase (APX), a defenceenzyme controlled by HSFs and elevated during heatstress was also examined [35]. APX isoenzymes are criticalcomponents that prevent oxidative stress in photosyn-thetic organisms by removing reactive oxygen intermedi-ates [36]. Six genes coding for APX homologues wereidentified in our tall fescue EST gene index, all of whichwere expressed in heat stressed shoot. Expression of thesegenes was also present in eight of the nine cDNA libraries,but not in field stressed shoot library (data not shown). Aprevious study has shown that the expression of APX wasinduced shortly after tall fescue plants were exposed toheat (12 hrs at 39°C) [37]. However, APX expression wasreduced with increased temperatures and exposure time.Therefore, it is not surprising to find low (or no) expres-sion of APX in plants grown under prolonged high-stress(field) conditions.
ConclusionPrior to this study, little or no genomic information wasavailable for tall fescue. In this study, we analyzed 41,516tall fescue ESTs from nine cDNA libraries representing dif-ferent abiotic stresses, tissue types and developmentalstages. A large number of known stress response gene ESTswere identified from stressed tissue libraries. These ESTsrepresent gene homologues of heat-shock and oxidativestress proteins, and various transcription factor proteinfamilies. The EST database reported herein has been usedfor the development of 145 EST-SSR markers [38] thathave been used to generate a genetic linkage map of Fes-tuca [39]. The development of additional EST-SSR markersis underway [40]. A study using tall fescue EST-SSR mark-ers in a phylogenetic analysis of 12 cool-season foragegrass species representing eight genera of four tribes fromtwo subfamilies of Poaceae demonstrated the utility ofthese markers for comparative genomics studies amonggrass species [41].
The EST characterized in this study can be used for thedevelopment of microarrays and mined for single nucle-otide polymorphism markers. This database provides abasis for further gene discovery and the determination ofgene function. Additional cDNA libraries representing tis-sues subjected to other abiotic stress factors, e.g., phos-phate starvation, high salt stress, summer field stress, notincluded in this study will enrich this database. Moreover,an important growth component of tall fescue, endo-phyte-host interactions, has not been studied in relation
to gene expression. Development of ESTs from fungalendophyte-infected tall fescue tissue may assist in betterunderstanding of plant-fungal symbiotic relationships.
MethodscDNA library constructionNine cDNA libraries were constructed to characterizedevelopmental stage-, environmental stress-, and tissue-specific ESTs (Table 1). Details on the libraries are availa-ble from GenBank dbEST [42]. Endophyte-free tall fescue(cv. Kentucky 31) plants were used for cDNA library con-struction. In an out-crossing species, plants within a culti-var (population) are not genetically identical. Therefore,tissues were collected from 25 plants at each samplingtime point in order to account for the genetic variationwithin the cultivar. Total RNA was extracted by Tri-Rea-gent (MRC, Cincinnati, OH). Quality and quantity ofRNA were assessed using both an Eppendorf Biophotom-eter (Eppendorf, Hamburg, Germany) and formamide gelelectrophoresis according to standard protocols. An equalamount of each appropriate RNA sample was pooledtogether to form a composite total RNA sample. mRNAisolation to construct the cDNA library. The mRNA waspurified by Oligotex mRNA Midi kit (Qiagen, Valencia,CA). cDNA libraries were constructed using the ZAP-cDNA Gigapack III Gold Cloning Kit (Stratagene, La Jolla,CA). cDNA was size fractionated following manufacturersinstructions. Fractions containing cDNA greater than1,000 bp were selected for library construction.
DNA sequencing and data processingPlasmid isolation and DNA sequence analyses were per-formed on an ABI 3730 DNA Analyzer using standardprocedures. Sequence data generated from this projectwere processed through ESTAP [43]. Sequences werescreened for overall base quality and contaminating vec-tor, mitochondrial, ribosomal and E. coli sequences wereremoved.
EST assembly and annotationSequences with either short length (<100 bp) or low com-plexity were excluded from the gene index. High qualityESTs were clustered and assembled by TGI Clusteringtools (TGICL) [44]. Tentative consensus (TC) and single-ton EST sequences are available for downloading fromThe Dana Faber Cancer Center [45]. A batch BLASTX [46]comparison of the ESTs to the GenBank nr database [47]was performed. A BLASTP search was performed againstthe database of sequences associated with GO gene prod-ucts which was downloaded from the GO website [48]along with GO controlled vocabulary terms and their rela-tionships. Following annotation, a Perl script embeddedwith SQL statements was executed to count the number ofmembers for each library at different go term branch andsub-branches.
Page 11 of 13(page number not for citation purposes)

BMC Plant Biology 2008, 8:27 http://www.biomedcentral.com/1471-2229/8/27
In silico analysis of gene expressionBased on the assumption that the occurrence of a gene ina cDNA library may represent the level of its tissue-specificexpression, TC member numbers were counted accordingto the corresponding library by Perl and Unix bash scripts,and a matrix exhibiting the expression differentiation ofTCs across the nine libraries was generated. In this matrix,TCs and their membership size in each library are pro-vided in each row and column, respectively. The datamatrix was normalized to compensate for variation in ESTsample size among libraries. Normalized gene expressionlevel in each library was calculated as: TC membershipsize in a library/total number of ESTs of the library ×10,000. Data was imported into GeneSpring GX 7.3 (Agi-lent Technologies, Palo Alto, CA) for expression analysis.To compare between libraries, hierarchical clusteringanalysis was performed on the matrix of in silico geneexpression pattern (counts of normalized EST copy num-bers) generated by tracking unigene membership from allnine libraries. The clustering algorithm implemented bythe GeneSpring software package measures similarity of insilico gene expression pattern by calculating "standard cor-relation" and further generates hierarchical clusters usingthe "average linkage" clustering algorithm. Figure 3 showsa heat map of the data matrix with data organized basedon gene tree and condition tree clusters.
Authors' contributionsYZ, JZ, XC, LC, MARM constructed cDNA libraries; KC,ADS conducted sequencing; YZ, MARM, ZW, GDM con-tributed to the manuscript writing; XD, JH, XZ, CM con-ducted the bioinformatics; FC, CDT established TIGRFaGI; MARM and GDM managed the overall project. Allauthors read and approved the final manuscript.
AcknowledgementsWe are grateful to Dr. Robert Gonzales, Ann Harris, and Jarrod Steele for their technical support in sequencing the cDNA clones. We also acknowl-edge John C. Zwonitzer for his help in growing and maintaining seeds and plants for this project. This work was supported by the Samuel Roberts Noble Foundation.
References1. Jauhar PP: Cytogenetics of the Festuca-Lolium complex: rele-
vance to breeding. In Monographs on Theoretical and Applied Genet-ics Volume 18. Edited by: Frankel et al. Berlin: Springer; 1993.
2. Seal AG: DNA variation in Festuca. Heredity 1983, 50:225-236.3. Sleper DA: Breeding tall fescue. J Plant Breed Rev 1985, 3:313-342.4. Moser LE, Hoveland CS: Cool-season grass overview. In Cool-Sea-
son Forage Grasses Edited by: Moser et al. Madison: American Societyof Agronomy, Crop Science Society of America, Soil Science Societyof America; 1996:1-14.
5. Wang Z, Hopkins A, Mian R: Forage and turf grass biotechnol-ogy. Critical Rev in Plant Sci 2001, 20:573-619.
6. Rudd S: Expressed sequence tags: alternative or complementto whole genome sequences? Trends Plant Sci 2003, 8:321-329.
7. Gale MD, Devos KM: Comparative genetics in the grasses. ProcNatl Acad Sci USA 1998, 95:1971-1974.
8. The Festuca Gene Index [http://compbio.dfci.harvard.edu/tgi/cgi-bin/tgi/gimain.pl?gudb=f_arundinacea]
9. Altschul SF, Madden TL, Schaffer AA, Zhang J, Zhang Z, Miller W, Lip-man DJ: Gapped BLAST and PSI-BLAST: a new generation ofprotein database search programs. Nucleic Acids Res 1997,25:3389-3402.
10. Gene Ontology Consortium: Gene Ontology: tool for the unifi-cation of biology. Nat Genet 2000, 25:25-29.
11. Eisen MB, Spellman PT, Brown PO, Botstein D: Cluster analysisand display of genome-wide expression patterns. Proc NatlAcad Sci USA 1998, 95:14863-14868.
12. Morris CA, Nicolaus B, Sampson V, Harwood JL, Kille P: Identifica-tion and characterization of a recombinant metallothioneinprotein from a marine alga, Fucus vesiculosus. Biochem J 1999,338:553-560.
13. Tanimoto EY, Rost TL, Comai L: DNA replication-dependent his-tone H2A mRNA expression in pea root tips. Plant Physiol1993, 103:1291-1297.
14. Gaudin V, Lunness PA, Fobert PR, Towers M, Riou-Khamlichi C, Mur-ray JA, Coen E, Doonan JH: The expression of D-cyclin genesdefines distinct developmental zones in snapdragon apicalmeristems and is locally regulated by the Cycloidea gene.Plant Physiol 2000, 122:1137-1148.
15. Weis E, Berry JA: Plants and high temperature stress. Symp SocExp Biol 1988, 42:329-346.
16. Rizhsky L, Liang H, Shuman J, Shulaev V, Davletova S, Mittler R:When defense pathways collide. The response of Arabidopsisto a combination of drought and heat stress. Plant Physiol 2004,134:1683-1696.
17. Schenk PM, Kazan K, Wilson I, Anderson JP, Richmond T, SomervilleSC, Manners JM: Coordinated plant defense responses in Ara-bidopsis revealed by microarray analysis. Proc Natl Acad Sci USA2000, 97:11655-11660.
18. Mysore KS, D'Ascenzo MD, He X, Martin GB: Overexpression ofthe disease resistance gene Pto in tomato induces geneexpression changes similar to immune responses in humanand fruitfly. Plant Physiol 2003, 132:1901-1912.
19. Rostoks N, Mudie S, Cardle L, Russell J, Ramsay L, Booth A, SvenssonJT, Wanamaker SI, Walia H, Rodriguez EM, Hedley PE, Liu H, MorrisJ, Close TJ, Marshall DF, Waugh R: Genome-wide SNP discoveryand linkage analysis in barley based on genes responsive toabiotic stress. Mol Genet Genomics 2005, 274:515-527.
20. Vierling E: The roles of heat shock proteins in plants. Annual RevPlant Physiol and Plant Mol Biol 1991, 42:579-620.
21. Waters ER, Lee GJ, Vierling E: Evolution, structure and functionof the small heat shock proteins in plants. J Exp Bot 1996,47:325-338.
22. Scharf KD, Siddique M, Vierling E: The expanding family of Arabi-dopsis thaliana small heat stress proteins and a new family ofproteins containing alpha-crystallin domains (Acd proteins).Cell Stress and Chaperones 2001, 6(3):225-237.
23. Sun W, Van Montagu M, Verbruggen N: Small heat shock proteinsand stress tolerance in plants. Bioch et Biophy Acta 2002,1577:1-9.
24. Zhang Y, Mian MAR, Chekhovskiy K, So S, Kupfer D, Lai H, Roe BA:Differential gene expression in Festuca under heat stress con-ditions. J Exp Bot 2005, 56:897-907.
25. Sun W, Bernard C, van de Cotte B, Van Montagu M, Verbruggen N:At-HSP17.6A, encoding a small heat-shock protein in Arabi-dopsis, can enhance osmotolerance upon overexpression.Plant J 2001, 27:407-415.
26. Hartl FU: Molecular chaperones in cellular protein folding.Nature 1996, 381:571-579.
27. Karlin S, Brocchieri L: Heat shock protein 70 family: multiplesequence comparisons, function, and evolution. J Mol Evol1998, 47:565-577.
28. Sangster TA, Queitsch C: The HSP90 chaperone complex, anemerging force in plant development and phenotypic plastic-ity. Curr Opin Plant Biol 2005, 8:86-92.
29. Schirmer EC, Glover JR, Singer MA, Lindquist SL: HSP100/Clp pro-teins: A common mechanism explains diverse functions.Trends Biochem Sci 1996, 21:289-295.
30. Nieto-Sotelo J, Martinez LM, Ponce G, Cassab GI, Alagon A, MeeleyRB, Ribaut JM, Yang R: Maize HSP101 plays important roles inboth induced and basal thermotolerance and primary rootgrowth. Plant Cell 2002, 14:1621-1633.
31. Nover L, Bharti K, Doring P, Mishra SK, Ganguli A, Scharf KD: Ara-bidopsis and the heat stress transcription factor world: how
Page 12 of 13(page number not for citation purposes)

BMC Plant Biology 2008, 8:27 http://www.biomedcentral.com/1471-2229/8/27
Publish with BioMed Central and every scientist can read your work free of charge
"BioMed Central will be the most significant development for disseminating the results of biomedical research in our lifetime."
Sir Paul Nurse, Cancer Research UK
Your research papers will be:
available free of charge to the entire biomedical community
peer reviewed and published immediately upon acceptance
cited in PubMed and archived on PubMed Central
yours — you keep the copyright
Submit your manuscript here:http://www.biomedcentral.com/info/publishing_adv.asp
BioMedcentral
many heat stress transcription factors do we need? Cell StreChaper 2001, 6(3):177-189.
32. Czarnecka-Verner E, Yuan CX, Scharf KD, Englich G, Gurley WB:Plants contain a novel multi-member class of heat shock fac-tors without transcriptional activator potential. Plant Mol Biol2000, 43:459-471.
33. Lohmann C, Eggers-Schumacher G, Wunderlich M, Schoffl F: Twodifferent heat shock transcription factors regulate immedi-ate early expression of stress genes in Arabidopsis. Mol GenetGenomics 2004, 271:11-21.
34. Almoguera C, Rojas A, Diaz-Martin J, Prieto-Dapena P, Carranco R,Jordano J: A seed-specific heat-shock transcription factorinvolved in developmental regulation during embryogenesisin sunflower. J Biol Chem 2002, 277:43866-43872.
35. Panchuk II, Volkov RA, Schoffl F: Heat stress- and heat shocktranscription factor-dependent expression and activity ofascorbate peroxidase in Arabidopsis. Plant Physiol 2002,129:838-853.
36. Mittler R: Oxidative stress, antioxidants and stress tolerance.Trends Plant Sci 2002, 7:405-410.
37. Zhang Y, Zwonitzer JC, Chekhovskiy K, May GD, Mian MAR: A func-tional genomics approach for identification of heat tolerancegenes in tall fescue. In Molecular Breeding of Forage and Turf Editedby: Hopkins A, Wang ZY, Mian R, Sledge M, Barker RE. Netherlands:Kluwer Acad Pub; 2004:87-96.
38. Saha MC, Mian MAR, Eujayl I, Zwonitzer JC, Wang L, May GD: Tallfescue EST-SSR markers with transferability across severalgrass species. Theor Appl Genet 2004, 109:783-791.
39. Saha MC, Mian MAR, Zwonitzer JC, Chekhovskiy K, Hopkins AA: AnSSR and AFLP based genetic linkage map of tall fescue. TheorAppl Genet 2005, 110:323-336.
40. Saha M, Chekhovskiy K, Reddy I, He J, Zhao X: Development of tallfescue EST-SSRs and their transferability across grass spe-cies. Abstracts of Plant & Animal Genome XI Conf: 14–18 January 2006;San Diego 2006. Poster Abstracts145
41. Mian MA, Saha MC, Hopkins AA, Wang ZY: Use of tall fescue EST-SSR markers in phylogenetic analysis of cool-season foragegrasses. Genome 2005, 48:637-647.
42. GenBank dbEST [http://www.ncbi.nlm.nih.gov/dbEST/]43. Mao C, Cushman JC, May GD, Weller JW: ESTAP-an automated
system for the analysis of EST data. Bioinformatics 2003,19:1720-1722.
44. TGI Clustering Tools [http://www.tigr.org/tdb/tgi/software/]45. Tall Fescue TC and EST Download [http://compbio.dfci.har
vard.edu/tgi/cgi-bin/tgi/download.pl?ftp_dir=data&file_dir=Festuca_arundinacea]
46. Altschul SF, Gish W, Miller W, Myers EW, Lipman DJ: Basic localalignment search tool. J Mol Biol 1990, 215:403-410.
47. Benson DA, Karsch-Mizrachi I, Lipman DJ, Ostell J, Rapp BA, WheelerDL: GenBank. Nucleic Acids Res 2000, 28:15-18.
48. Gene Ontology [http://www.geneontology.org/]
Page 13 of 13(page number not for citation purposes)


