Embed Size (px)
Citation preview
1
Ι ww
w.3
ds.c
om Ι
© D
assa
ult
Sys
tèm
es Ι
Q3
2011
Ear
ning
s A
nnou
ncem
ent
Bernard Charlès, President and CEO
Thibault de Tersant, Senior EVP and CFO
Dassault Systèmes Analysts Meeting Q3 2011
The Value of V6 Integration
2
Ι ww
w.3
ds.c
om Ι
© D
assa
ult
Sys
tèm
es Ι
Q3
2011
Ear
ning
s A
nnou
ncem
ent
Forward Looking Information
Statements herein that are not historical facts but express expectations or objectives for the future, including but not limited to
statements regarding the Company’s non-IFRS financial performance objectives, are forward-looking statements.
Such forward-looking statements are based on Dassault Systèmes management's current views and assumptions and involve known
and unknown risks and uncertainties. Actual results or performances may differ materially from those in such statements due to a
range of factors. If global economic and business conditions continue to be volatile or deteriorate, the Company’s business results
may not develop as currently anticipated and may remain below their earlier levels for an extended period of time. In this regard, the
impact of the earthquake of March 11, 2011, in Japan remains difficult to evaluate, but may be expected to have a negative impact on
the Japanese economy. Furthermore, due to factors affecting sales of the Company’s products and services, there may be a
substantial time lag between an improvement in global economic and business conditions and an upswing in the Company’s business
results.
In preparing such forward-looking statements, the Company has in particular assumed an average U.S. dollar to euro exchange rate
of US$1.42 per €1.00 and an average Japanese yen to euro exchange rate of JPY115 to €1.00 for 2011; however, currency values
fluctuate, and the Company’s results of operations may be significantly affected by changes in exchange rates. The Company’s actual
results or performance may also be materially negatively affected by changes in the current global economic context, difficulties or
adverse changes affecting its partners or its relationships with its partners, changes in exchange rates, new product developments,
and technological changes; errors or defects in its products; growth in market share by its competitors; and the realization of any risks
related to the integration of any newly acquired company and internal reorganizations. Unfavorable changes in any of the above or
other factors described in the Company’s regulatory reports, including the 2010 Document de référence, and 2011 Half Year Report
as filed with the French Autorité des marchés financiers (AMF) on April 1, 2011, and July 29, 2011, respectively, could materially affect
the Company’s financial position or results of operations.
3
Ι ww
w.3
ds.c
om Ι
© D
assa
ult
Sys
tèm
es Ι
Q3
2011
Ear
ning
s A
nnou
ncem
ent
Forward Looking Information
Readers are cautioned that the supplemental non-IFRS information presented in this press release is subject to inherent
limitations. It is not based on any comprehensive set of accounting rules or principles and should not be considered as a substitute for IFRS measurements. Also, the Company’s supplemental non-IFRS financial information may not be comparable to similarly titled non-IFRS measures used by other companies. Further specific limitations for individual non-IFRS measures, and the reasons for presenting non-IFRS financial information, are set forth in the Company’s annual report for the year ended December 31, 2010 included in the Company’s 2010 Document de reference and 2011 Half Year Report filed with the AMF on April 1, 2011 and July 29, 2011, respectively.
In the tables accompanying this press release the Company sets forth its supplemental non-IFRS figures for revenue, operating income, operating margin, net income and diluted earnings per share, which exclude the effect of adjusting the carrying value of acquired companies’ deferred revenue, stock-based compensation expense, the expenses for the amortization of acquired intangible assets, other income and expense, net, certain one-time gains included in financial revenue and other, net, and the income tax effect of the non-IFRS adjustments and certain one-time effects in 2010. The tables also set forth the most comparable IFRS financial measure and reconciliations of this information with non-IFRS information.
When the Company believes it would be helpful for understanding trends in its business, the Company provides percentage increases or decreases in its revenue (in both IFRS as well as non-IFRS) to eliminate the effect of changes in currency values, particularly the U.S. dollar and the Japanese yen, relative to the euro. When trend information is expressed herein "in constant currencies", the results of the "current" period have first been recalculated using the average exchange rates of the comparable period in the preceding year, and then compared with the results of the comparable period in the preceding year.
4
Ι ww
w.3
ds.c
om Ι
© D
assa
ult
Sys
tèm
es Ι
Q3
2011
Ear
ning
s A
nnou
ncem
ent
Agenda
1. Q3 2011 Business Review
2. Q3 2011 Financial Highlights
3. Q4 & FY 2011 Objectives
4. Financial Information Appendix
5
Ι ww
w.3
ds.c
om Ι
© D
assa
ult
Sys
tèm
es Ι
Q3
2011
Ear
ning
s A
nnou
ncem
ent
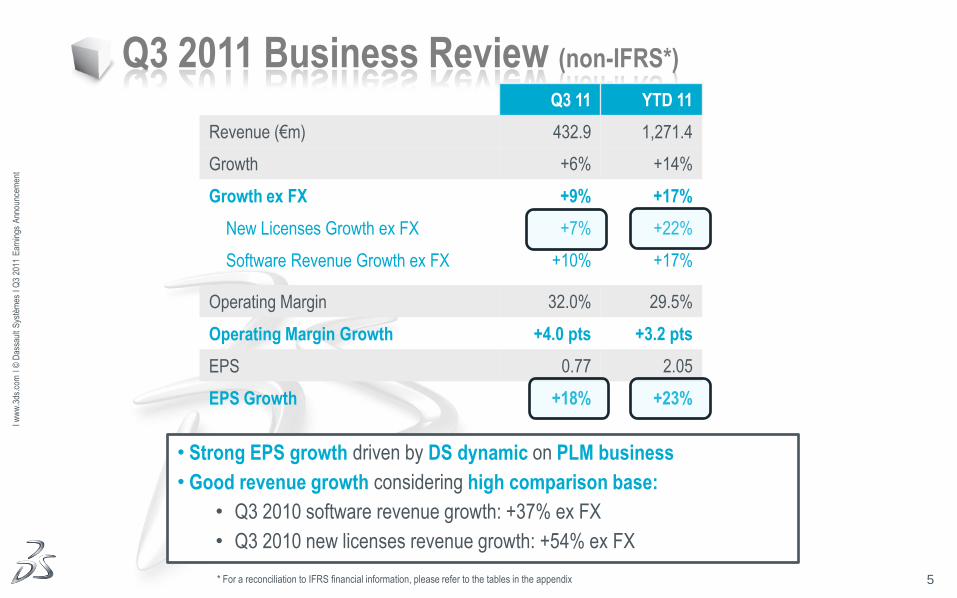
Q3 2011 Business Review (non-IFRS*)
Q3 11 YTD 11
Revenue (€m) 432.9 1,271.4
Growth +6% +14%
Growth ex FX +9% +17%
New Licenses Growth ex FX +7% +22%
Software Revenue Growth ex FX +10% +17%
Operating Margin 32.0% 29.5%
Operating Margin Growth +4.0 pts +3.2 pts
EPS 0.77 2.05
EPS Growth +18% +23%
* For a reconciliation to IFRS financial information, please refer to the tables in the appendix
• Strong EPS growth driven by DS dynamic on PLM business
• Good revenue growth considering high comparison base:
• Q3 2010 software revenue growth: +37% ex FX
• Q3 2010 new licenses revenue growth: +54% ex FX
6
Ι ww
w.3
ds.c
om Ι
© D
assa
ult
Sys
tèm
es Ι
Q3
2011
Ear
ning
s A
nnou
ncem
ent
Q3 2011 Business Review
1. PLM & SolidWorks Business
2. Focus on ENOVIA
3. Elsys and Simulayt Acquisitions
7
Ι ww
w.3
ds.c
om Ι
© D
assa
ult
Sys
tèm
es Ι
Q3
2011
Ear
ning
s A
nnou
ncem
ent
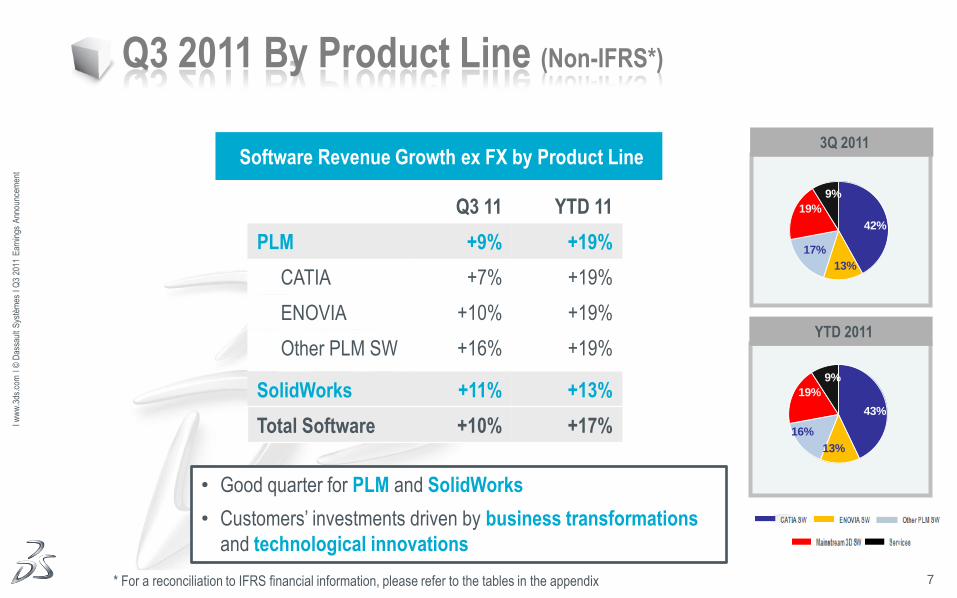
Q3 2011 By Product Line (Non-IFRS*)
• Good quarter for PLM and SolidWorks
• Customers’ investments driven by business transformations
and technological innovations
Q3 11 YTD 11
PLM +9% +19%
CATIA +7% +19%
ENOVIA +10% +19%
Other PLM SW +16% +19%
SolidWorks +11% +13%
Total Software +10% +17%
* For a reconciliation to IFRS financial information, please refer to the tables in the appendix
Software Revenue Growth ex FX by Product Line 3Q 2011
YTD 2011
42%
13%
17%
19%
9%
43%
13%
16%
19%
9%
8
Ι ww
w.3
ds.c
om Ι
© D
assa
ult
Sys
tèm
es Ι
Q3
2011
Ear
ning
s A
nnou
ncem
ent
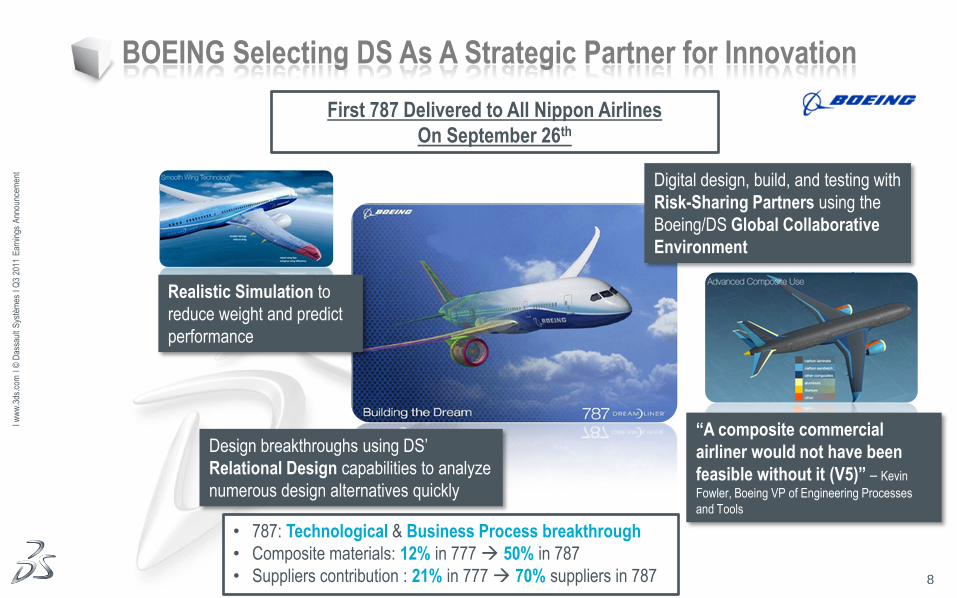
First 787 Delivered to All Nippon Airlines
On September 26th
BOEING Selecting DS As A Strategic Partner for Innovation
Design breakthroughs using DS’
Relational Design capabilities to analyze
numerous design alternatives quickly
Digital design, build, and testing with
Risk-Sharing Partners using the
Boeing/DS Global Collaborative
Environment
Realistic Simulation to
reduce weight and predict
performance
“A composite commercial
airliner would not have been
feasible without it (V5)” – Kevin
Fowler, Boeing VP of Engineering Processes
and Tools
• 787: Technological & Business Process breakthrough
• Composite materials: 12% in 777 50% in 787
• Suppliers contribution : 21% in 777 70% suppliers in 787
9
Ι ww
w.3
ds.c
om Ι
© D
assa
ult
Sys
tèm
es Ι
Q3
2011
Ear
ning
s A
nnou
ncem
ent
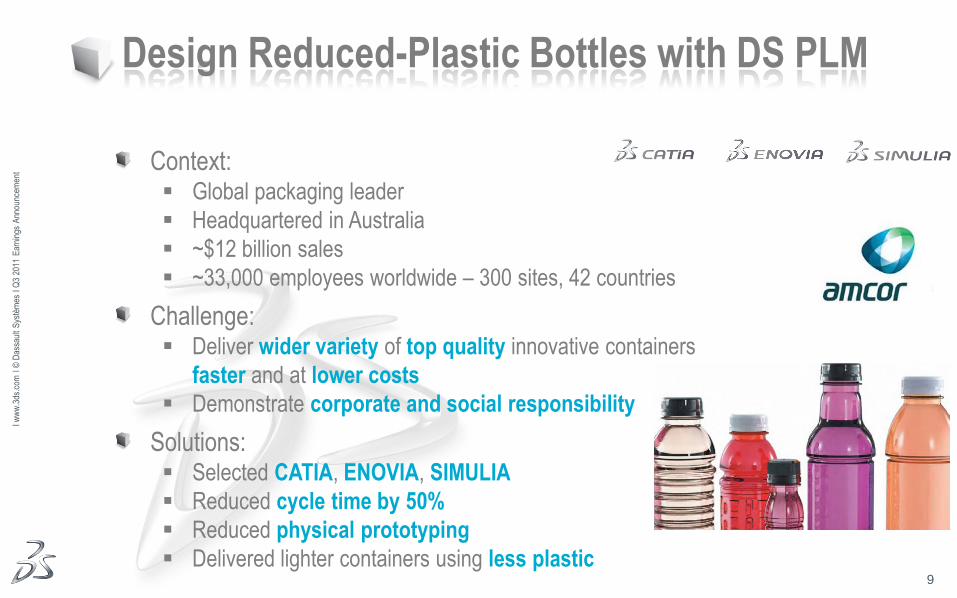
Design Reduced-Plastic Bottles with DS PLM
Context: Global packaging leader
Headquartered in Australia
~$12 billion sales
~33,000 employees worldwide – 300 sites, 42 countries
Challenge: Deliver wider variety of top quality innovative containers
faster and at lower costs
Demonstrate corporate and social responsibility
Solutions: Selected CATIA, ENOVIA, SIMULIA
Reduced cycle time by 50%
Reduced physical prototyping
Delivered lighter containers using less plastic
10
Ι ww
w.3
ds.c
om Ι
© D
assa
ult
Sys
tèm
es Ι
Q3
2011
Ear
ning
s A
nnou
ncem
ent
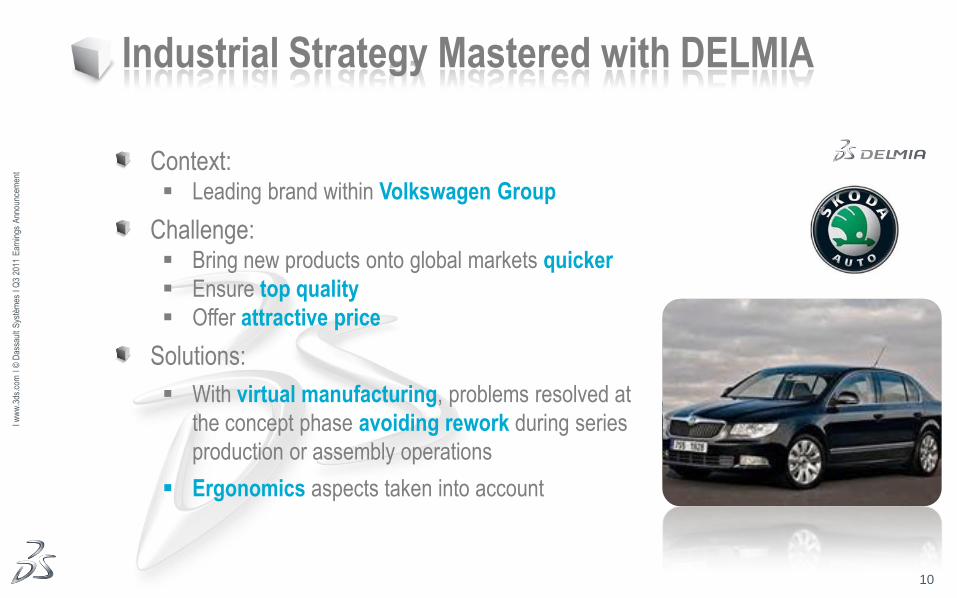
Industrial Strategy Mastered with DELMIA
Context: Leading brand within Volkswagen Group
Challenge: Bring new products onto global markets quicker
Ensure top quality
Offer attractive price
Solutions:
With virtual manufacturing, problems resolved at
the concept phase avoiding rework during series
production or assembly operations
Ergonomics aspects taken into account
11
Ι ww
w.3
ds.c
om Ι
© D
assa
ult
Sys
tèm
es Ι
Q3
2011
Ear
ning
s A
nnou
ncem
ent
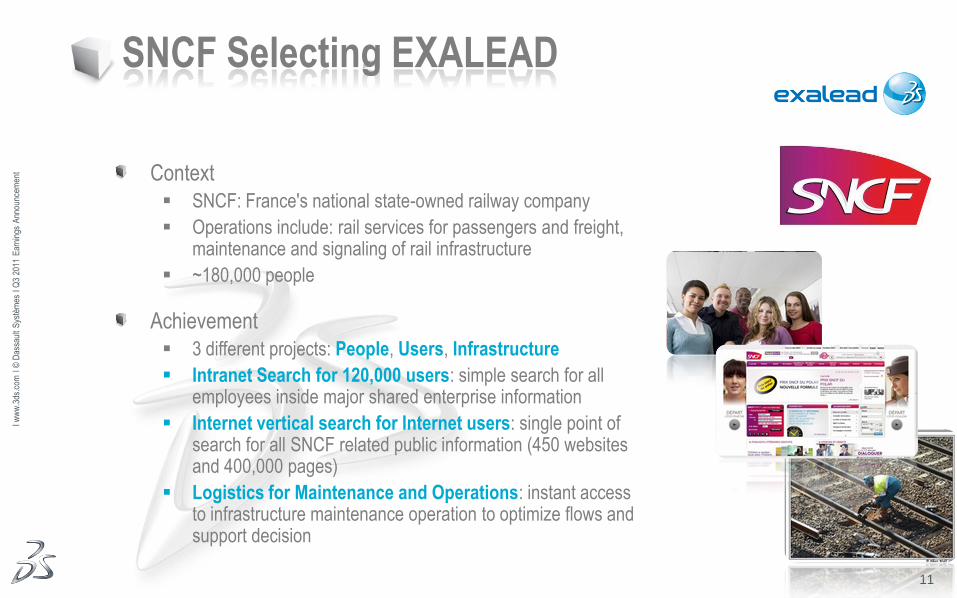
SNCF Selecting EXALEAD
Context
SNCF: France's national state-owned railway company
Operations include: rail services for passengers and freight, maintenance and signaling of rail infrastructure
~180,000 people
Achievement
3 different projects: People, Users, Infrastructure
Intranet Search for 120,000 users: simple search for all employees inside major shared enterprise information
Internet vertical search for Internet users: single point of search for all SNCF related public information (450 websites and 400,000 pages)
Logistics for Maintenance and Operations: instant access to infrastructure maintenance operation to optimize flows and support decision
12
Ι ww
w.3
ds.c
om Ι
© D
assa
ult
Sys
tèm
es Ι
Q3
2011
Ear
ning
s A
nnou
ncem
ent
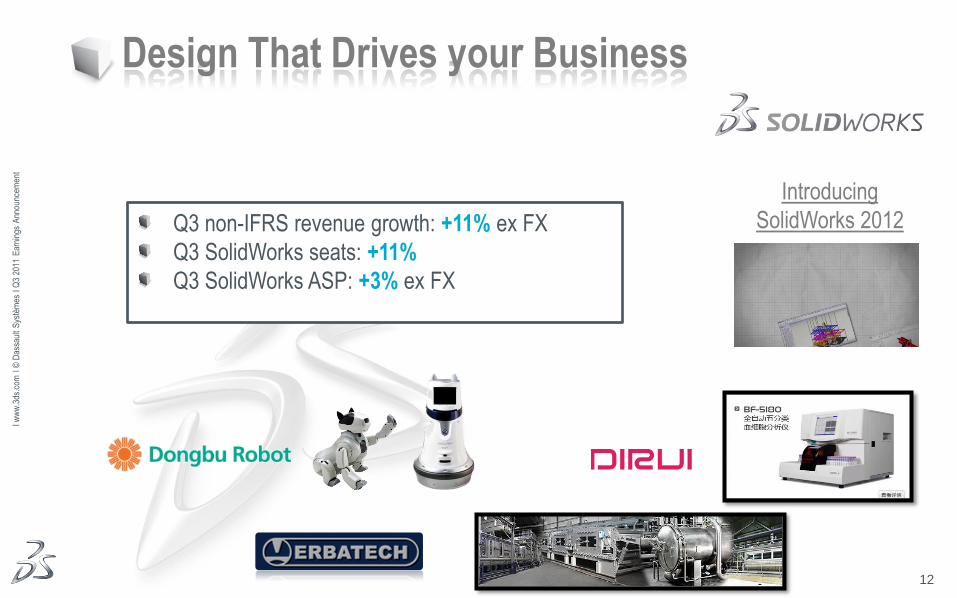
Q3 non-IFRS revenue growth: +11% ex FX
Q3 SolidWorks seats: +11%
Q3 SolidWorks ASP: +3% ex FX
Design That Drives your Business
Introducing
SolidWorks 2012
13
Ι ww
w.3
ds.c
om Ι
© D
assa
ult
Sys
tèm
es Ι
Q3
2011
Ear
ning
s A
nnou
ncem
ent
Q3 2011 Business Review
1. PLM & SolidWorks Business
2. Focus on ENOVIA
3. Elsys and Simulayt Acquisitions
14
Ι ww
w.3
ds.c
om Ι
© D
assa
ult
Sys
tèm
es Ι
Q3
2011
Ear
ning
s A
nnou
ncem
ent
Focus on ENOVIA
ENOVIA Business Value
V6 Product Cycle Dynamic
Full V6 Deployments & Industrial References
ENOVIA, Driver of Vertical Diversification
15
Ι ww
w.3
ds.c
om Ι
© D
assa
ult
Sys
tèm
es Ι
Q3
2011
Ear
ning
s A
nnou
ncem
ent
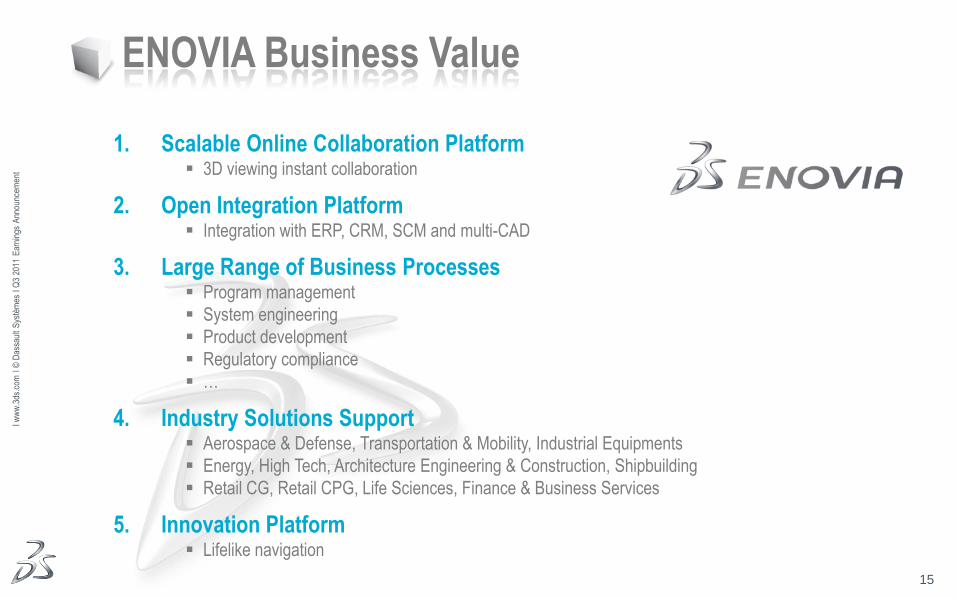
ENOVIA Business Value
1. Scalable Online Collaboration Platform 3D viewing instant collaboration
2. Open Integration Platform Integration with ERP, CRM, SCM and multi-CAD
3. Large Range of Business Processes Program management
System engineering
Product development
Regulatory compliance
…
4. Industry Solutions Support Aerospace & Defense, Transportation & Mobility, Industrial Equipments
Energy, High Tech, Architecture Engineering & Construction, Shipbuilding
Retail CG, Retail CPG, Life Sciences, Finance & Business Services
5. Innovation Platform Lifelike navigation
16
Ι ww
w.3
ds.c
om Ι
© D
assa
ult
Sys
tèm
es Ι
Q3
2011
Ear
ning
s A
nnou
ncem
ent
Focus on ENOVIA
ENOVIA Business Value
V6 Product Cycle Dynamic
Full V6 Deployments & Industrial References
ENOVIA, Driver of Vertical Diversification
17
Ι ww
w.3
ds.c
om Ι
© D
assa
ult
Sys
tèm
es Ι
Q3
2011
Ear
ning
s A
nnou
ncem
ent
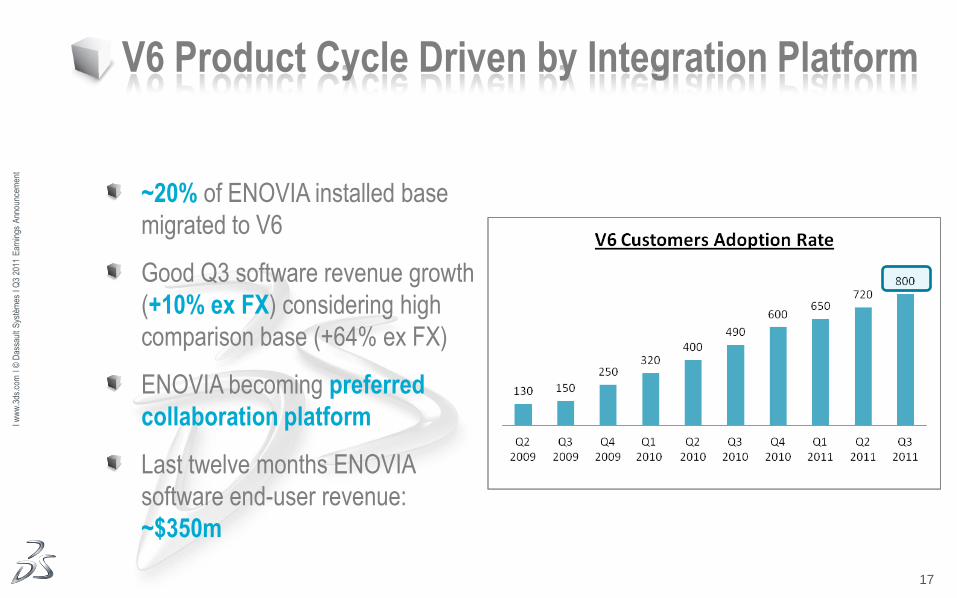
~20% of ENOVIA installed base
migrated to V6
Good Q3 software revenue growth
(+10% ex FX) considering high
comparison base (+64% ex FX)
ENOVIA becoming preferred
collaboration platform
Last twelve months ENOVIA
software end-user revenue:
~$350m
V6 Product Cycle Driven by Integration Platform
18
Ι ww
w.3
ds.c
om Ι
© D
assa
ult
Sys
tèm
es Ι
Q3
2011
Ear
ning
s A
nnou
ncem
ent
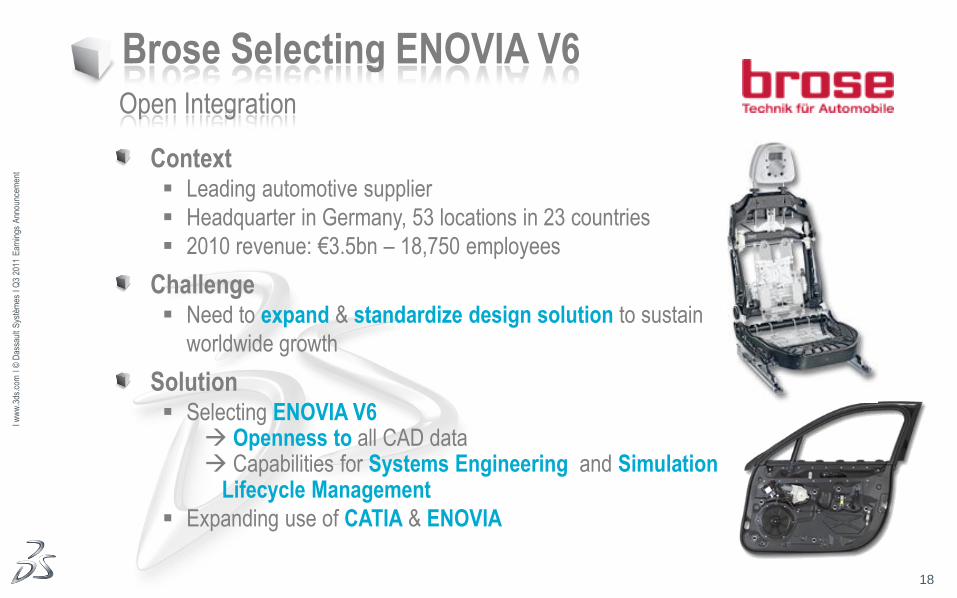
Brose Selecting ENOVIA V6
Context Leading automotive supplier
Headquarter in Germany, 53 locations in 23 countries
2010 revenue: €3.5bn – 18,750 employees
Challenge Need to expand & standardize design solution to sustain
worldwide growth
Solution Selecting ENOVIA V6
Openness to all CAD data Capabilities for Systems Engineering and Simulation
Lifecycle Management
Expanding use of CATIA & ENOVIA
Open Integration
19
Ι ww
w.3
ds.c
om Ι
© D
assa
ult
Sys
tèm
es Ι
Q3
2011
Ear
ning
s A
nnou
ncem
ent
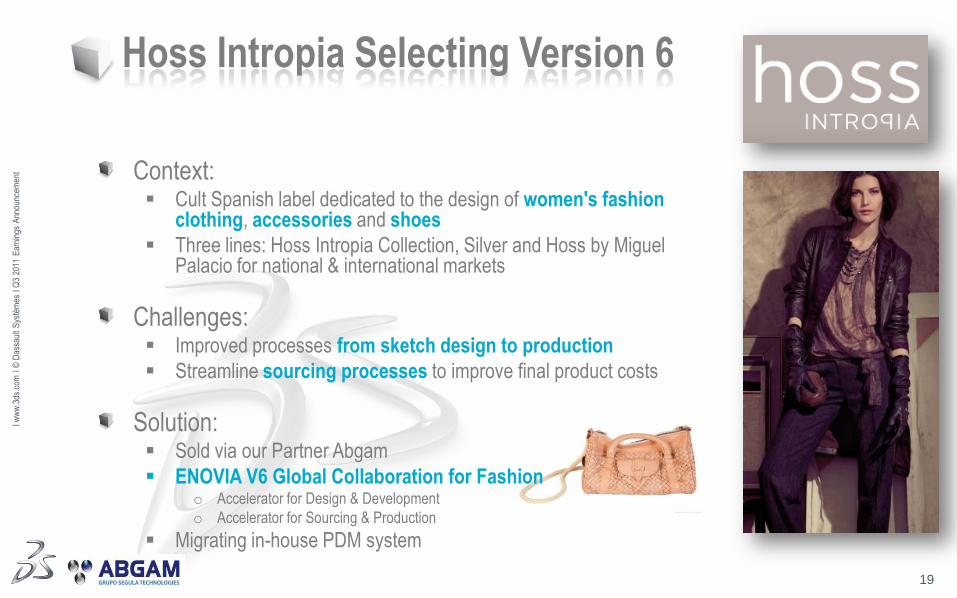
Hoss Intropia Selecting Version 6
Context: Cult Spanish label dedicated to the design of women's fashion
clothing, accessories and shoes
Three lines: Hoss Intropia Collection, Silver and Hoss by Miguel Palacio for national & international markets
Challenges: Improved processes from sketch design to production
Streamline sourcing processes to improve final product costs
Solution: Sold via our Partner Abgam
ENOVIA V6 Global Collaboration for Fashion o Accelerator for Design & Development
o Accelerator for Sourcing & Production
Migrating in-house PDM system
20
Ι ww
w.3
ds.c
om Ι
© D
assa
ult
Sys
tèm
es Ι
Q3
2011
Ear
ning
s A
nnou
ncem
ent
Focus on ENOVIA
ENOVIA Business Value
V6 Product Cycle Dynamic
Full V6 Deployments & Industrial References
ENOVIA, Driver of Vertical Diversification
21
Ι ww
w.3
ds.c
om Ι
© D
assa
ult
Sys
tèm
es Ι
Q3
2011
Ear
ning
s A
nnou
ncem
ent
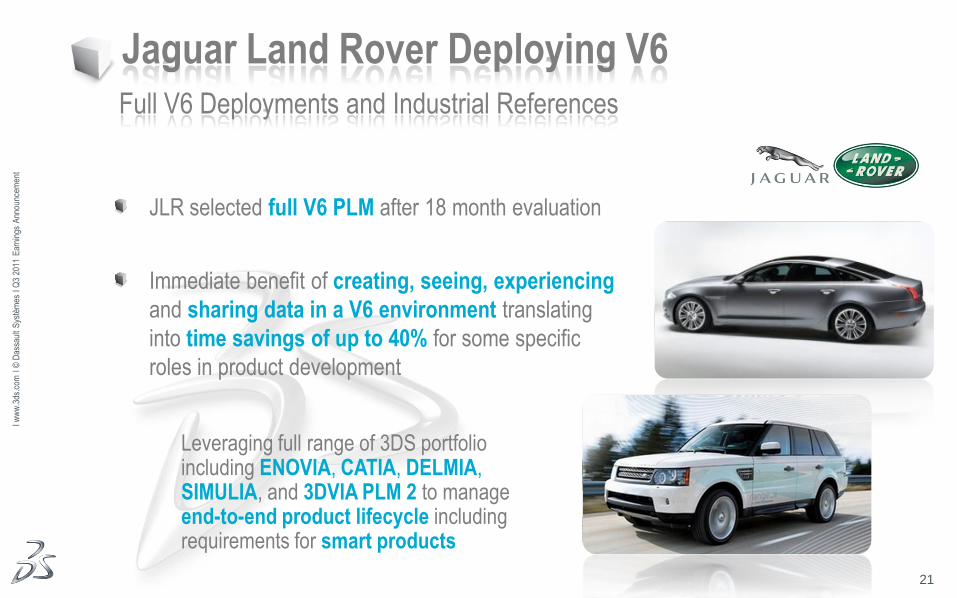
Jaguar Land Rover Deploying V6
JLR selected full V6 PLM after 18 month evaluation
Immediate benefit of creating, seeing, experiencing
and sharing data in a V6 environment translating
into time savings of up to 40% for some specific
roles in product development
Full V6 Deployments and Industrial References
Leveraging full range of 3DS portfolio including ENOVIA, CATIA, DELMIA, SIMULIA, and 3DVIA PLM 2 to manage end-to-end product lifecycle including requirements for smart products
22
Ι ww
w.3
ds.c
om Ι
© D
assa
ult
Sys
tèm
es Ι
Q3
2011
Ear
ning
s A
nnou
ncem
ent
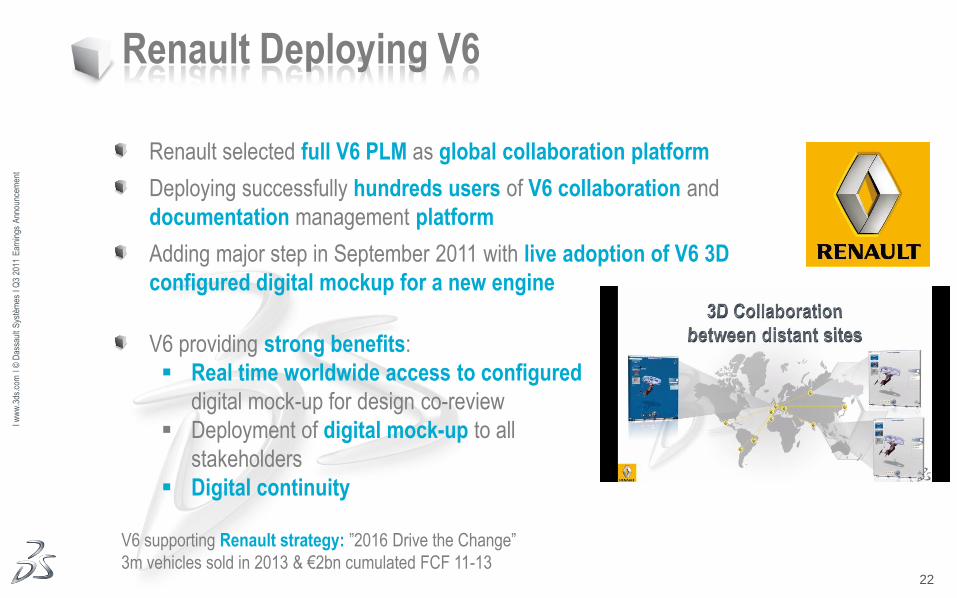
Renault Deploying V6
Renault selected full V6 PLM as global collaboration platform
Deploying successfully hundreds users of V6 collaboration and
documentation management platform
Adding major step in September 2011 with live adoption of V6 3D
configured digital mockup for a new engine
V6 providing strong benefits:
Real time worldwide access to configured
digital mock-up for design co-review
Deployment of digital mock-up to all
stakeholders
Digital continuity
V6 supporting Renault strategy: ”2016 Drive the Change”
3m vehicles sold in 2013 & €2bn cumulated FCF 11-13
23
Ι ww
w.3
ds.c
om Ι
© D
assa
ult
Sys
tèm
es Ι
Q3
2011
Ear
ning
s A
nnou
ncem
ent
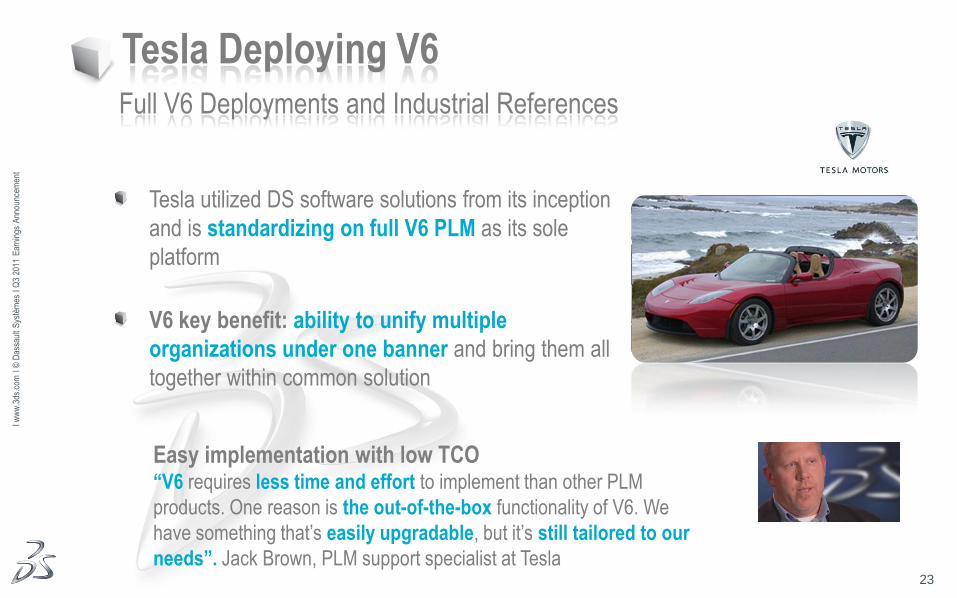
Tesla Deploying V6
Tesla utilized DS software solutions from its inception
and is standardizing on full V6 PLM as its sole
platform
V6 key benefit: ability to unify multiple
organizations under one banner and bring them all
together within common solution
Full V6 Deployments and Industrial References
Easy implementation with low TCO “V6 requires less time and effort to implement than other PLM
products. One reason is the out-of-the-box functionality of V6. We
have something that’s easily upgradable, but it’s still tailored to our
needs”. Jack Brown, PLM support specialist at Tesla
24
Ι ww
w.3
ds.c
om Ι
© D
assa
ult
Sys
tèm
es Ι
Q3
2011
Ear
ning
s A
nnou
ncem
ent
Focus on ENOVIA
ENOVIA Business Value
V6 Product Cycle Dynamic
Full V6 Deployments & Industrial References
ENOVIA, Driver of Vertical Diversification
25
Ι ww
w.3
ds.c
om Ι
© D
assa
ult
Sys
tèm
es Ι
Q3
2011
Ear
ning
s A
nnou
ncem
ent
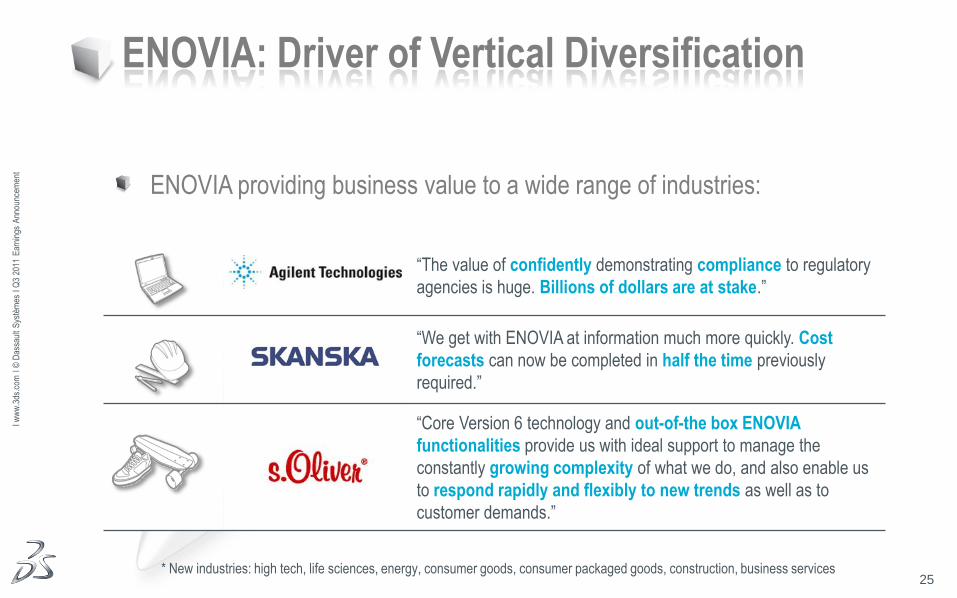
“The value of confidently demonstrating compliance to regulatory
agencies is huge. Billions of dollars are at stake.”
“We get with ENOVIA at information much more quickly. Cost
forecasts can now be completed in half the time previously
required.”
“Core Version 6 technology and out-of-the box ENOVIA
functionalities provide us with ideal support to manage the
constantly growing complexity of what we do, and also enable us
to respond rapidly and flexibly to new trends as well as to
customer demands.”
ENOVIA: Driver of Vertical Diversification
ENOVIA providing business value to a wide range of industries:
* New industries: high tech, life sciences, energy, consumer goods, consumer packaged goods, construction, business services
26
Ι ww
w.3
ds.c
om Ι
© D
assa
ult
Sys
tèm
es Ι
Q3
2011
Ear
ning
s A
nnou
ncem
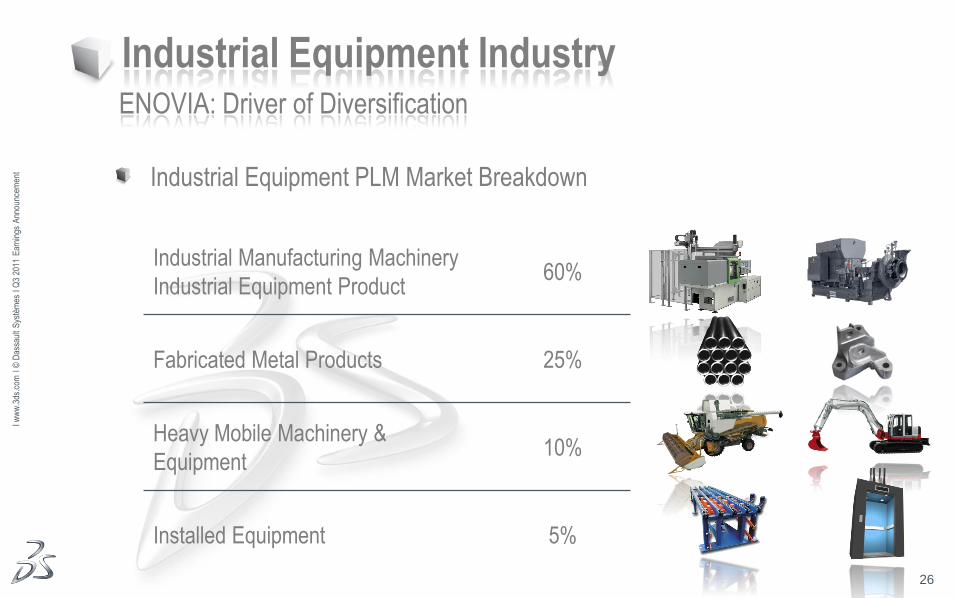
ent Industrial Equipment PLM Market Breakdown
ENOVIA: Driver of Diversification
Industrial Equipment Industry
Industrial Manufacturing Machinery
Industrial Equipment Product 60%
Fabricated Metal Products 25%
Heavy Mobile Machinery &
Equipment 10%
Installed Equipment 5%
27
Ι ww
w.3
ds.c
om Ι
© D
assa
ult
Sys
tèm
es Ι
Q3
2011
Ear
ning
s A
nnou
ncem
ent
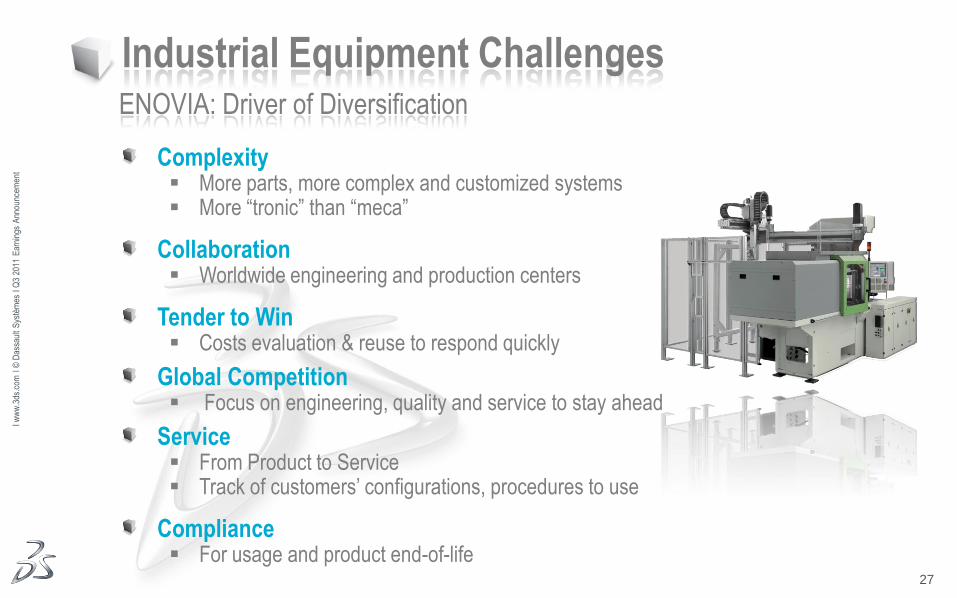
Industrial Equipment Challenges
Complexity More parts, more complex and customized systems More “tronic” than “meca”
Collaboration Worldwide engineering and production centers
Tender to Win Costs evaluation & reuse to respond quickly
Global Competition Focus on engineering, quality and service to stay ahead
Service From Product to Service Track of customers’ configurations, procedures to use
Compliance For usage and product end-of-life
ENOVIA: Driver of Diversification
28
Ι ww
w.3
ds.c
om Ι
© D
assa
ult
Sys
tèm
es Ι
Q3
2011
Ear
ning
s A
nnou
ncem
ent
ENOVIA V6 for Industrial Equipment
DS already well established in Industrial Equipment with all DS
portfolio: ~20% of YTD software end-user revenue (2nd largest
industry)
Leveraging DS installed base to increase ENOVIA penetration:
Providing seamless CAD / Ebom (engineering bill of material) / ECO
(engineering change order) integration for engineering change
management
ENOVIA V6 new licenses revenue growth in Industrial Equipment: more
than +60% in the last two years*
ENOVIA: Driver for Diversification
* From Q3 2009 to Q3 2011
29
Ι ww
w.3
ds.c
om Ι
© D
assa
ult
Sys
tèm
es Ι
Q3
2011
Ear
ning
s A
nnou
ncem
ent
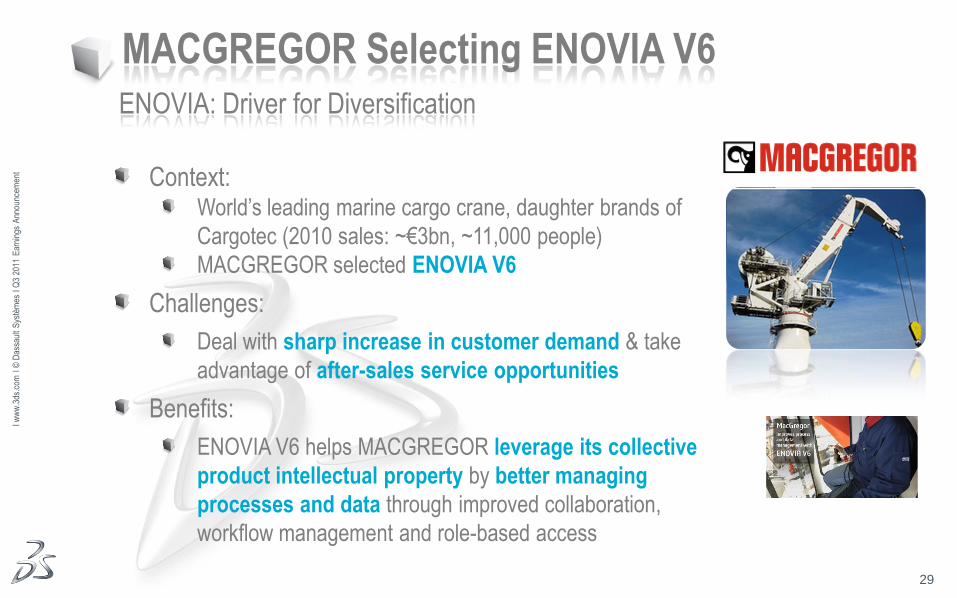
MACGREGOR Selecting ENOVIA V6
ENOVIA: Driver for Diversification
Context: World’s leading marine cargo crane, daughter brands of
Cargotec (2010 sales: ~€3bn, ~11,000 people)
MACGREGOR selected ENOVIA V6
Challenges:
Deal with sharp increase in customer demand & take
advantage of after-sales service opportunities
Benefits:
ENOVIA V6 helps MACGREGOR leverage its collective
product intellectual property by better managing
processes and data through improved collaboration,
workflow management and role-based access
30
Ι ww
w.3
ds.c
om Ι
© D
assa
ult
Sys
tèm
es Ι
Q3
2011
Ear
ning
s A
nnou
ncem
ent
Q3 2011 Business Review
1. PLM & SolidWorks Business
2. Focus on ENOVIA
3. Elsys and Simulayt Acquisitions
31
Ι ww
w.3
ds.c
om Ι
© D
assa
ult
Sys
tèm
es Ι
Q3
2011
Ear
ning
s A
nnou
ncem
ent
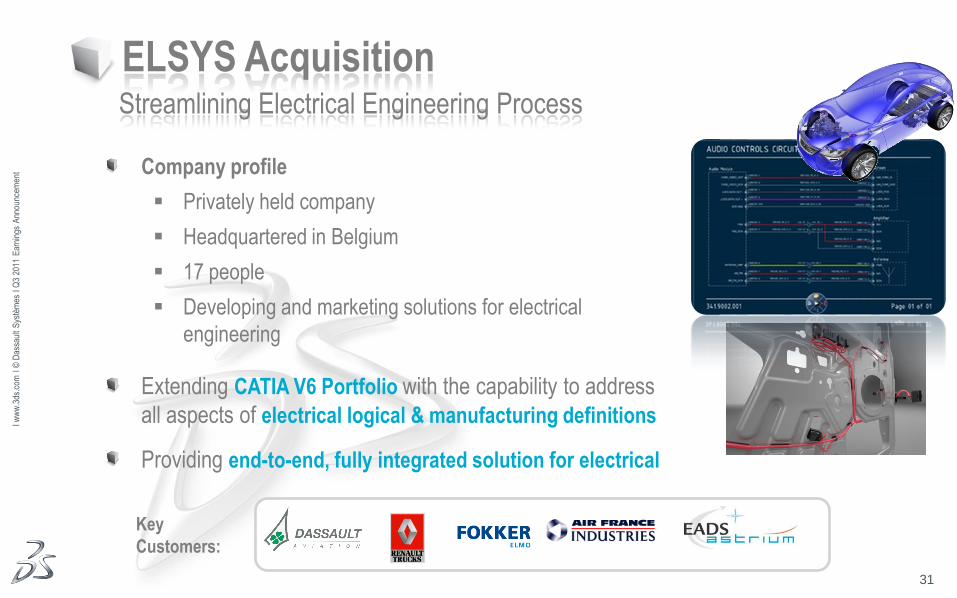
ELSYS Acquisition
Company profile
Privately held company
Headquartered in Belgium
17 people
Developing and marketing solutions for electrical
engineering
Extending CATIA V6 Portfolio with the capability to address
all aspects of electrical logical & manufacturing definitions
Providing end-to-end, fully integrated solution for electrical
Streamlining Electrical Engineering Process
Key
Customers:
32
Ι ww
w.3
ds.c
om Ι
© D
assa
ult
Sys
tèm
es Ι
Q3
2011
Ear
ning
s A
nnou
ncem
ent
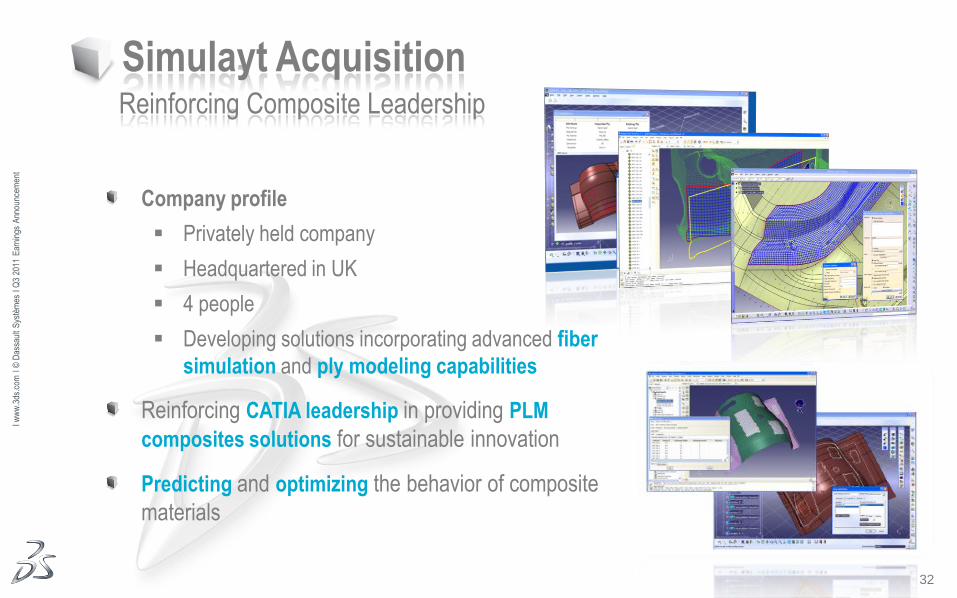
Simulayt Acquisition
Company profile
Privately held company
Headquartered in UK
4 people
Developing solutions incorporating advanced fiber
simulation and ply modeling capabilities
Reinforcing CATIA leadership in providing PLM
composites solutions for sustainable innovation
Predicting and optimizing the behavior of composite
materials
Reinforcing Composite Leadership
33
Ι ww
w.3
ds.c
om Ι
© D
assa
ult
Sys
tèm
es Ι
Q3
2011
Ear
ning
s A
nnou
ncem
ent
Agenda
1. Q3 2011 Business Review
2. Q3 2011 Financial Highlights
3. Q4 & FY 2011 Objectives
4. Financial Information Appendix
34
Ι ww
w.3
ds.c
om Ι
© D
assa
ult
Sys
tèm
es Ι
Q3
2011
Ear
ning
s A
nnou
ncem
ent
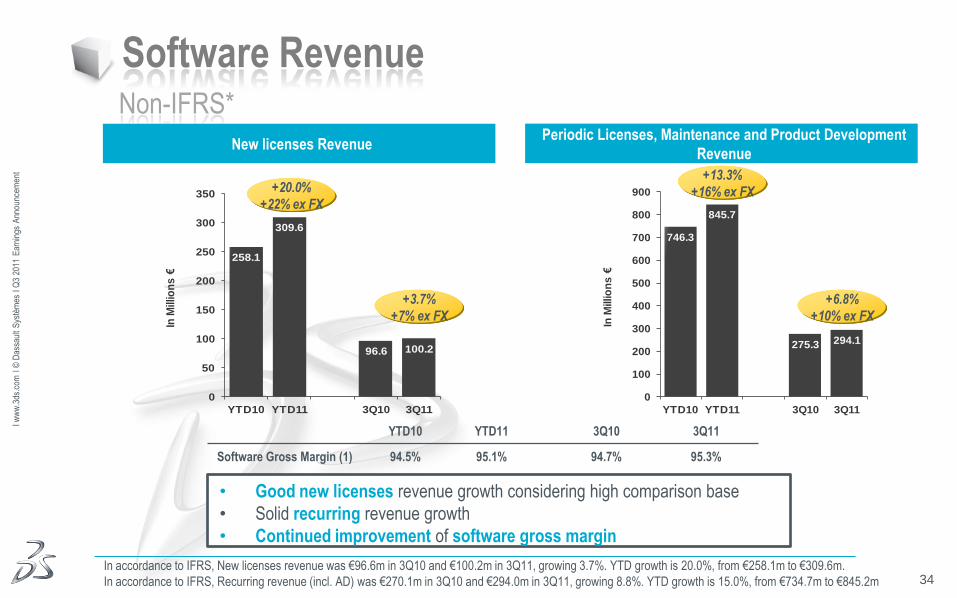
Software Revenue Non-IFRS*
New licenses Revenue Periodic Licenses, Maintenance and Product Development
Revenue
• Good new licenses revenue growth considering high comparison base
• Solid recurring revenue growth
• Continued improvement of software gross margin
746.3
845.7
275.3 294.1
0
100
200
300
400
500
600
700
800
900
YTD10 YTD11 3Q10 3Q11
In M
illio
ns
€
258.1
309.6
96.6 100.2
0
50
100
150
200
250
300
350
YTD10 YTD11 3Q10 3Q11
In M
illio
ns
€
+20.0%
+22% ex FX
+3.7%
+7% ex FX
+13.3%
+16% ex FX
+6.8%
+10% ex FX
YTD10 YTD11 3Q10 3Q11
Software Gross Margin (1) 94.5% 95.1% 94.7% 95.3%
In accordance to IFRS, New licenses revenue was €96.6m in 3Q10 and €100.2m in 3Q11, growing 3.7%. YTD growth is 20.0%, from €258.1m to €309.6m.
In accordance to IFRS, Recurring revenue (incl. AD) was €270.1m in 3Q10 and €294.0m in 3Q11, growing 8.8%. YTD growth is 15.0%, from €734.7m to €845.2m
35
Ι ww
w.3
ds.c
om Ι
© D
assa
ult
Sys
tèm
es Ι
Q3
2011
Ear
ning
s A
nnou
ncem
ent
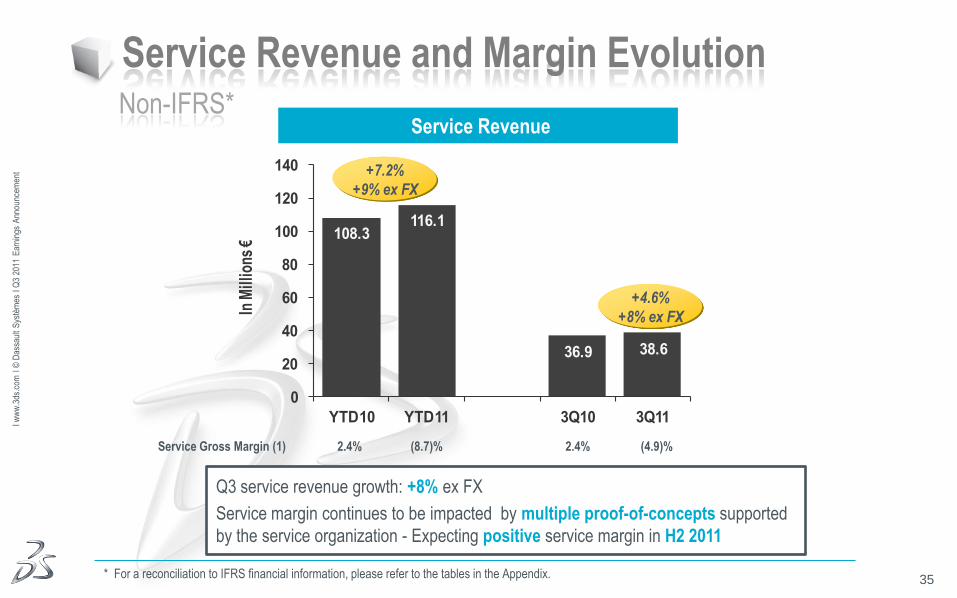
Service Revenue and Margin Evolution Non-IFRS*
* For a reconciliation to IFRS financial information, please refer to the tables in the Appendix.
Service Revenue
Q3 service revenue growth: +8% ex FX
Service margin continues to be impacted by multiple proof-of-concepts supported
by the service organization - Expecting positive service margin in H2 2011
108.3116.1
36.9 38.6
0
20
40
60
80
100
120
140
YTD10 YTD11 3Q10 3Q11
In M
illio
ns €
+4.6%
+8% ex FX
+7.2%
+9% ex FX
Service Gross Margin (1) 2.4% (8.7)% 2.4% (4.9)%
36
Ι ww
w.3
ds.c
om Ι
© D
assa
ult
Sys
tèm
es Ι
Q3
2011
Ear
ning
s A
nnou
ncem
ent
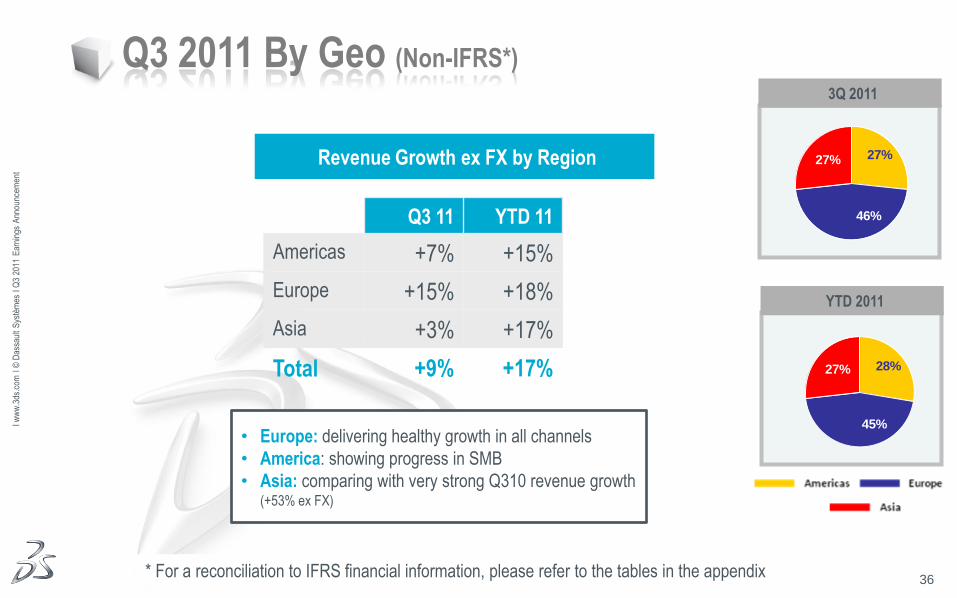
Q3 2011 By Geo (Non-IFRS*)
• Europe: delivering healthy growth in all channels
• America: showing progress in SMB
• Asia: comparing with very strong Q310 revenue growth (+53% ex FX)
Q3 11 YTD 11
Americas +7% +15%
Europe +15% +18%
Asia +3% +17%
Total +9% +17%
* For a reconciliation to IFRS financial information, please refer to the tables in the appendix
Revenue Growth ex FX by Region
3Q 2011
YTD 2011
27%
46%
27%
28%
45%
27%
37
Ι ww
w.3
ds.c
om Ι
© D
assa
ult
Sys
tèm
es Ι
Q3
2011
Ear
ning
s A
nnou
ncem
ent
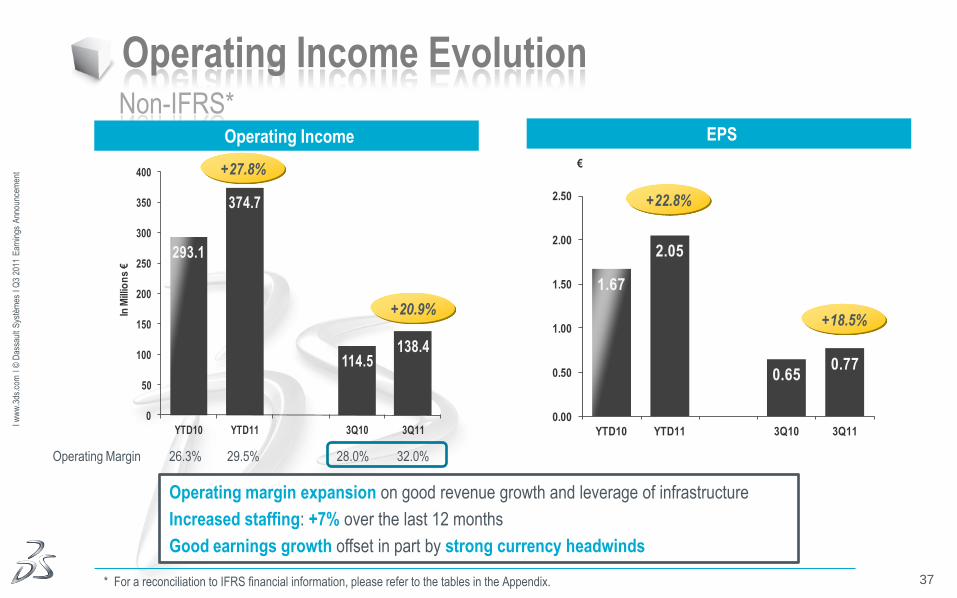
Operating Income Evolution Non-IFRS*
* For a reconciliation to IFRS financial information, please refer to the tables in the Appendix.
Operating Income EPS
Operating margin expansion on good revenue growth and leverage of infrastructure
Increased staffing: +7% over the last 12 months
Good earnings growth offset in part by strong currency headwinds
293.1
374.7
114.5138.4
0
50
100
150
200
250
300
350
400
YTD10 YTD11 3Q10 3Q11
In M
illio
ns
€
+20.9%
+27.8%
Operating Margin 26.3% 29.5% 28.0% 32.0%
1.67
2.05
0.650.77
0.00
0.50
1.00
1.50
2.00
2.50
YTD10 YTD11 3Q10 3Q11
€
+18.5%
+22.8%
38
Ι ww
w.3
ds.c
om Ι
© D
assa
ult
Sys
tèm
es Ι
Q3
2011
Ear
ning
s A
nnou
ncem
ent
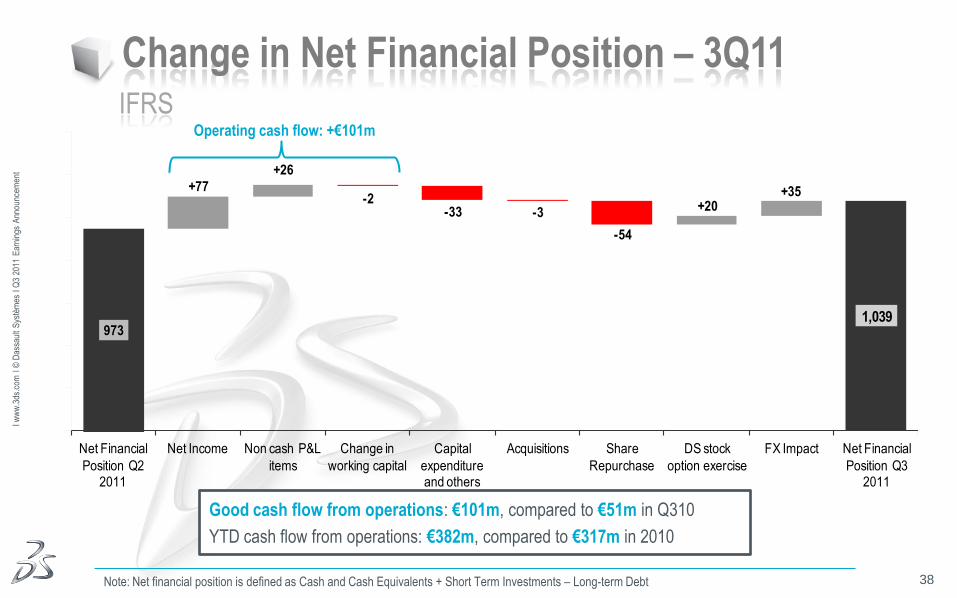
1,039973
+77
+26
-2-33 -3
-54
+20+35
500
600
700
800
900
1,000
1,100
1,200
Net Financial
Position Q2 2011
Net Income Non cash P&L
items
Change in
working capital
Capital
expenditure and others
Acquisitions Share
Repurchase
DS stock
option exercise
FX Impact Net Financial
Position Q3 2011
Change in Net Financial Position – 3Q11 IFRS
Note: Net financial position is defined as Cash and Cash Equivalents + Short Term Investments – Long-term Debt
Good cash flow from operations: €101m, compared to €51m in Q310
YTD cash flow from operations: €382m, compared to €317m in 2010
Operating cash flow: +€101m
39
Ι ww
w.3
ds.c
om Ι
© D
assa
ult
Sys
tèm
es Ι
Q3
2011
Ear
ning
s A
nnou
ncem
ent
Agenda
1. Q3 2011 Business Review
2. Q3 2011 Financial Highlights
3. Q4 & FY 2011 Objectives
4. Financial Information Appendix
40
Ι ww
w.3
ds.c
om Ι
© D
assa
ult
Sys
tèm
es Ι
Q3
2011
Ear
ning
s A
nnou
ncem
ent
1,400
1,450
1,500
1,550
1,600
1,650
1,700
1,750
Initial Obj. FX impact Q3 Activity New Obj.
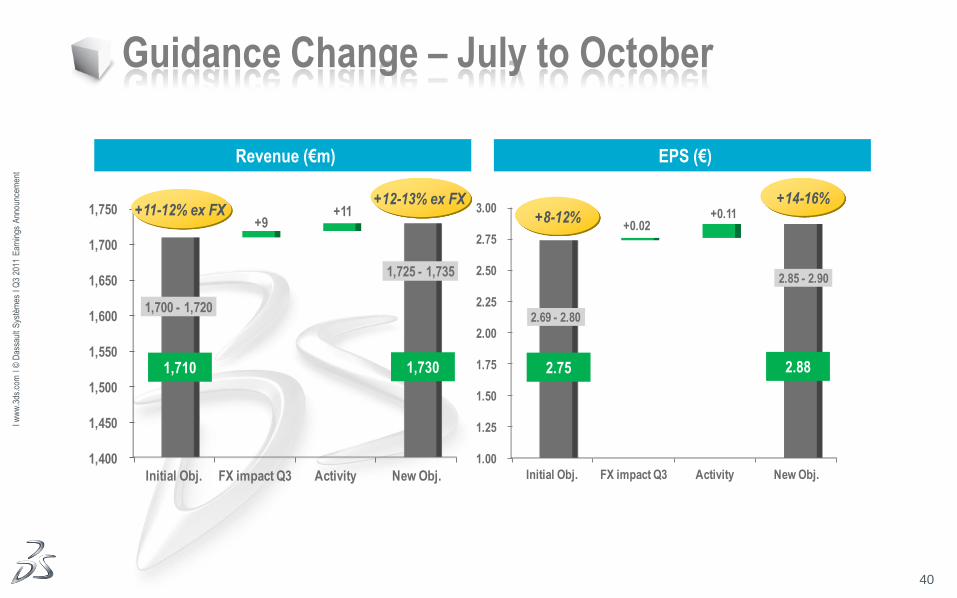
1,700 - 1,720
1,725 - 1,735
+9+11
1.00
1.25
1.50
1.75
2.00
2.25
2.50
2.75
3.00
Initial Obj. FX impact Q3 Activity New Obj.
2.69 - 2.80
2.85 - 2.90
+0.02+0.11
Guidance Change – July to October
Revenue (€m) EPS (€)
1,710 1,730 2.75 2.88
+11-12% ex FX +8-12% +12-13% ex FX +14-16%
41
Ι ww
w.3
ds.c
om Ι
© D
assa
ult
Sys
tèm
es Ι
Q3
2011
Ear
ning
s A
nnou
ncem
ent
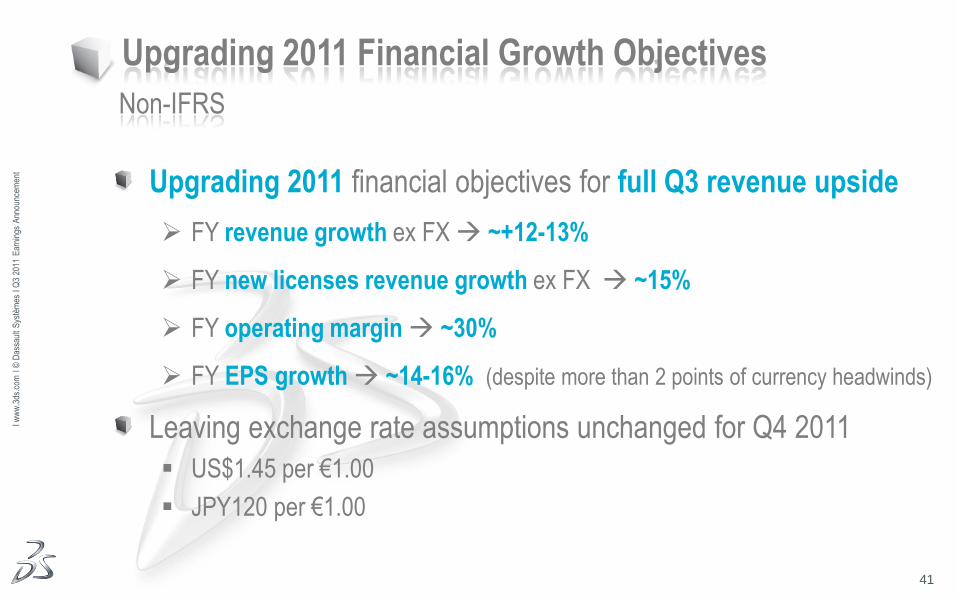
Upgrading 2011 Financial Growth Objectives
Upgrading 2011 financial objectives for full Q3 revenue upside
FY revenue growth ex FX ~+12-13%
FY new licenses revenue growth ex FX ~15%
FY operating margin ~30%
FY EPS growth ~14-16% (despite more than 2 points of currency headwinds)
Leaving exchange rate assumptions unchanged for Q4 2011
US$1.45 per €1.00
JPY120 per €1.00
Non-IFRS
42
Ι ww
w.3
ds.c
om Ι
© D
assa
ult
Sys
tèm
es Ι
Q3
2011
Ear
ning
s A
nnou
ncem
ent
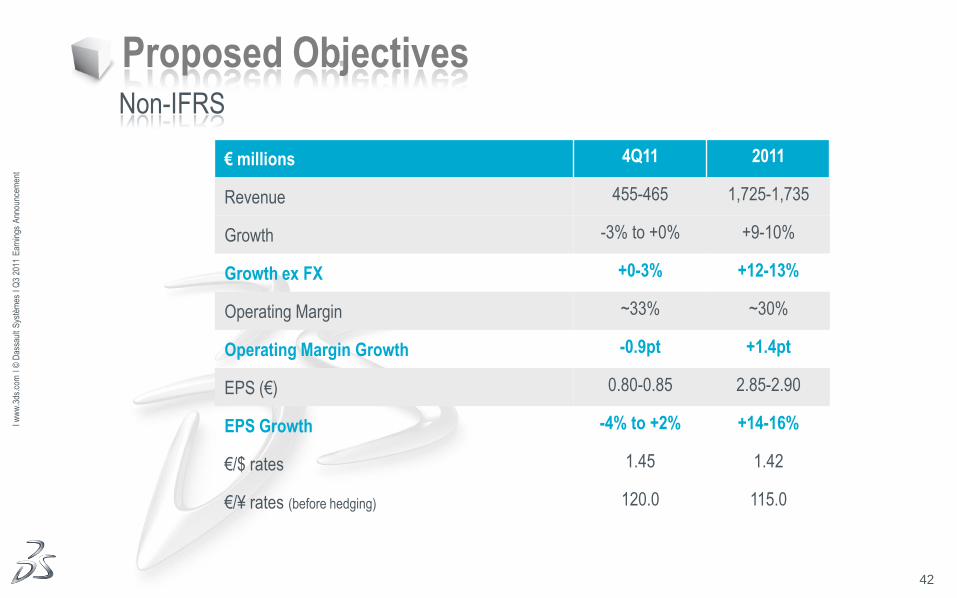
Proposed Objectives Non-IFRS
€ millions 4Q11 2011
Revenue 455-465 1,725-1,735
Growth -3% to +0% +9-10%
Growth ex FX +0-3% +12-13%
Operating Margin ~33% ~30%
Operating Margin Growth -0.9pt +1.4pt
EPS (€) 0.80-0.85 2.85-2.90
EPS Growth -4% to +2% +14-16%
€/$ rates 1.45 1.42
€/¥ rates (before hedging) 120.0 115.0
43
Ι ww
w.3
ds.c
om Ι
© D
assa
ult
Sys
tèm
es Ι
Q3
2011
Ear
ning
s A
nnou
ncem
ent
Agenda
1. Q3 2011 Business Review
2. Q3 2011 Financial Highlights
3. Q4 & FY 2011 Objectives
4. Financial Information Appendix

44
Ι ww
w.3
ds.c
om Ι
© D
assa
ult
Sys
tèm
es Ι
Q3
2011
Ear
ning
s A
nnou
ncem
ent
Revenue by Region IFRS
* For a reconciliation to IFRS financial information, please refer to the tables in the Appendix. Americas Europe Asia
3Q 2011 3Q 2010 YTD 2011 YTD 2010
Note: Ex FX data for Europe assumes that all the revenue in Europe is recognized in € and £
in €m 3Q11 3Q10 GrowthGrowth
ex FXYTD11 YTD10 Growth
Growth
ex FX
Americas 116.0 116.3 -0% +9% 353.1 324.2 +9% +17%
Europe 200.6 173.0 +16% +16% 575.8 487.6 +18% +18%
Asia 116.2 114.3 +2% +4% 342.0 289.3 +18% +19%
Total Revenue 432.8 403.6 +7% +11% 1,270.9 1,101.1 +15% +18%
29%
43%
28% 30%
44%
26%27%
46%
27% 28%
45%
27%
45
Ι ww
w.3
ds.c
om Ι
© D
assa
ult
Sys
tèm
es Ι
Q3
2011
Ear
ning
s A
nnou
ncem
ent
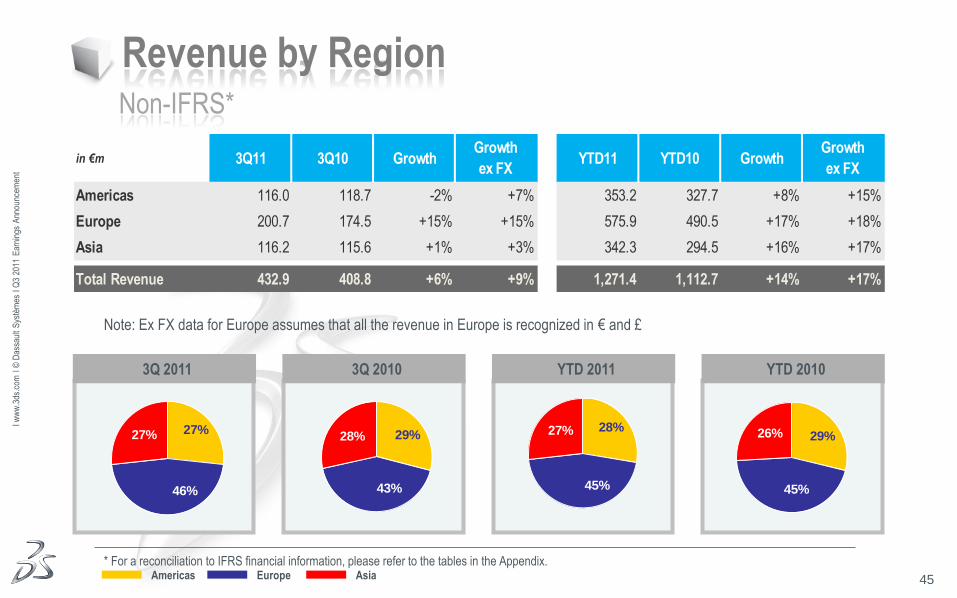
Revenue by Region Non-IFRS*
* For a reconciliation to IFRS financial information, please refer to the tables in the Appendix. Americas Europe Asia
Note: Ex FX data for Europe assumes that all the revenue in Europe is recognized in € and £
3Q 2011 3Q 2010 YTD 2011 YTD 2010
in €m 3Q11 3Q10 GrowthGrowth
ex FXYTD11 YTD10 Growth
Growth
ex FX
Americas 116.0 118.7 -2% +7% 353.2 327.7 +8% +15%
Europe 200.7 174.5 +15% +15% 575.9 490.5 +17% +18%
Asia 116.2 115.6 +1% +3% 342.3 294.5 +16% +17%
Total Revenue 432.9 408.8 +6% +9% 1,271.4 1,112.7 +14% +17%
29%
43%
28% 29%
45%
26%27%
46%
27%28%
45%
27%
46
Ι ww
w.3
ds.c
om Ι
© D
assa
ult
Sys
tèm
es Ι
Q3
2011
Ear
ning
s A
nnou
ncem
ent
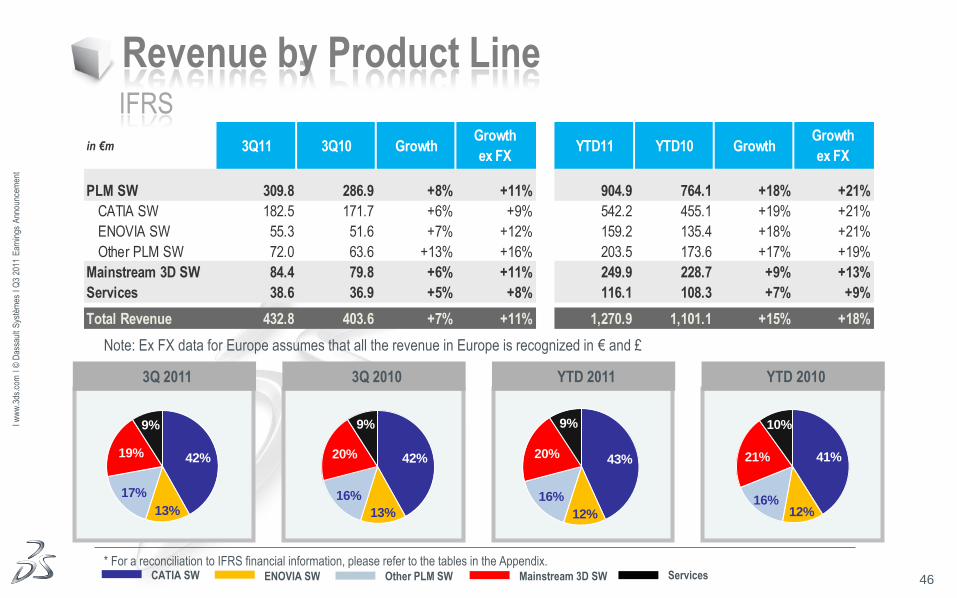
Revenue by Product Line IFRS
* For a reconciliation to IFRS financial information, please refer to the tables in the Appendix. CATIA SW ENOVIA SW Other PLM SW Mainstream 3D SW Services
3Q 2011 3Q 2010 YTD 2011 YTD 2010
Note: Ex FX data for Europe assumes that all the revenue in Europe is recognized in € and £
in €m 3Q11 3Q10 GrowthGrowth
ex FXYTD11 YTD10 Growth
Growth
ex FX
PLM SW 309.8 286.9 +8% +11% 904.9 764.1 +18% +21%
CATIA SW 182.5 171.7 +6% +9% 542.2 455.1 +19% +21%
ENOVIA SW 55.3 51.6 +7% +12% 159.2 135.4 +18% +21%
Other PLM SW 72.0 63.6 +13% +16% 203.5 173.6 +17% +19%
Mainstream 3D SW 84.4 79.8 +6% +11% 249.9 228.7 +9% +13%
Services 38.6 36.9 +5% +8% 116.1 108.3 +7% +9%
Total Revenue 432.8 403.6 +7% +11% 1,270.9 1,101.1 +15% +18%
42%
13%
16%
20%
9%
41%
12%16%
21%
10%
42%
13%
17%
19%
9%
43%
12%
16%
20%
9%
47
Ι ww
w.3
ds.c
om Ι
© D
assa
ult
Sys
tèm
es Ι
Q3
2011
Ear
ning
s A
nnou
ncem
ent
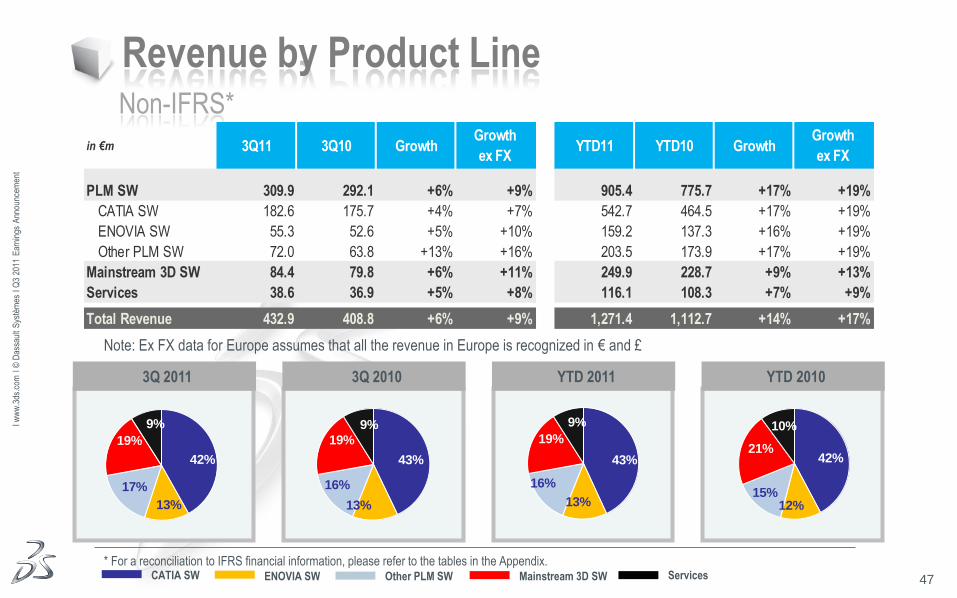
Revenue by Product Line Non-IFRS*
* For a reconciliation to IFRS financial information, please refer to the tables in the Appendix. CATIA SW ENOVIA SW Other PLM SW Mainstream 3D SW Services
3Q 2011 3Q 2010 YTD 2011 YTD 2010
Note: Ex FX data for Europe assumes that all the revenue in Europe is recognized in € and £
in €m 3Q11 3Q10 GrowthGrowth
ex FXYTD11 YTD10 Growth
Growth
ex FX
PLM SW 309.9 292.1 +6% +9% 905.4 775.7 +17% +19%
CATIA SW 182.6 175.7 +4% +7% 542.7 464.5 +17% +19%
ENOVIA SW 55.3 52.6 +5% +10% 159.2 137.3 +16% +19%
Other PLM SW 72.0 63.8 +13% +16% 203.5 173.9 +17% +19%
Mainstream 3D SW 84.4 79.8 +6% +11% 249.9 228.7 +9% +13%
Services 38.6 36.9 +5% +8% 116.1 108.3 +7% +9%
Total Revenue 432.9 408.8 +6% +9% 1,271.4 1,112.7 +14% +17%
43%
13%
16%
19%
9%
42%
12%15%
21%
10%
42%
13%
17%
19%
9%
43%
13%
16%
19%
9%
48
Ι ww
w.3
ds.c
om Ι
© D
assa
ult
Sys
tèm
es Ι
Q3
2011
Ear
ning
s A
nnou
ncem
ent
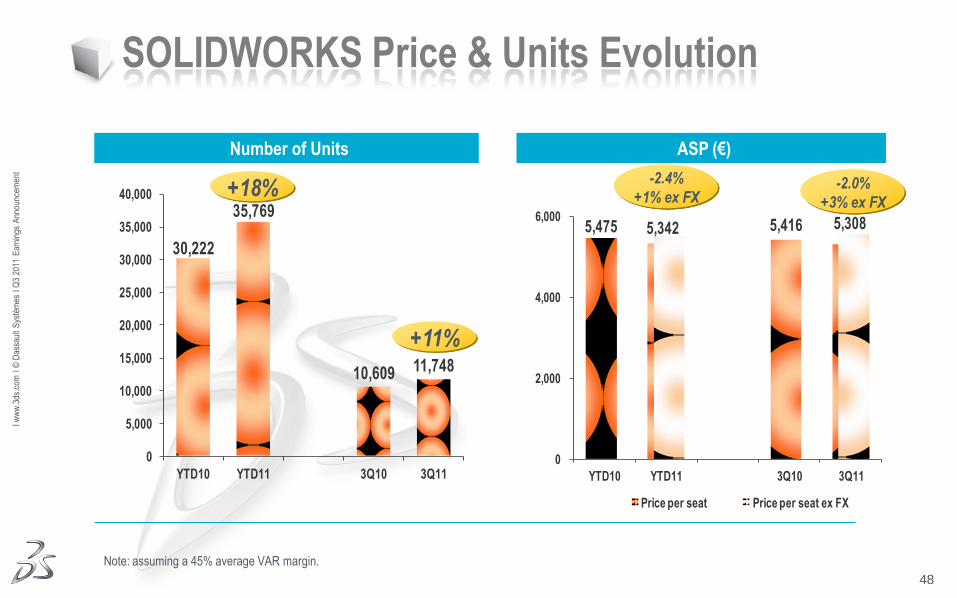
5,475 5,342 5,416 5,308
0
2,000
4,000
6,000
YTD10 YTD11 3Q10 3Q11
Price per seat Price per seat ex FX
30,222
35,769
10,609 11,748
0
5,000
10,000
15,000
20,000
25,000
30,000
35,000
40,000
YTD10 YTD11 3Q10 3Q11
SOLIDWORKS Price & Units Evolution
Note: assuming a 45% average VAR margin.
Number of Units ASP (€)
+11%
-2.0%
+3% ex FX +18%
-2.4%
+1% ex FX
49
Ι ww
w.3
ds.c
om Ι
© D
assa
ult
Sys
tèm
es Ι
Q3
2011
Ear
ning
s A
nnou
ncem
ent
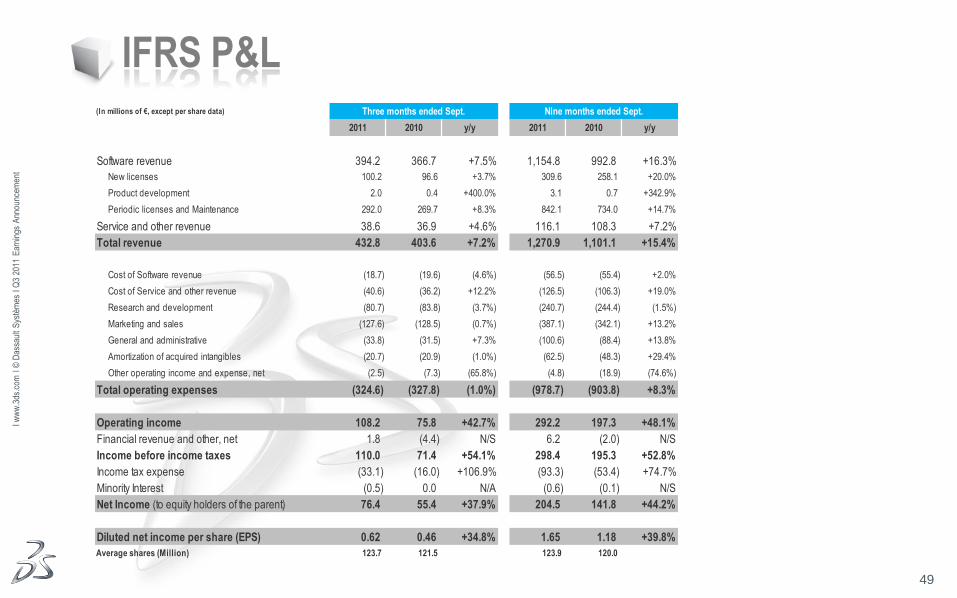
IFRS P&L (In millions of €, except per share data) Three months ended Sept. Nine months ended Sept.
2011 2010 y/y 2011 2010 y/y
Software revenue 394.2 366.7 +7.5% 1,154.8 992.8 +16.3%
New licenses 100.2 96.6 +3.7% 309.6 258.1 +20.0%
Product development 2.0 0.4 +400.0% 3.1 0.7 +342.9%
Periodic licenses and Maintenance 292.0 269.7 +8.3% 842.1 734.0 +14.7%
Service and other revenue 38.6 36.9 +4.6% 116.1 108.3 +7.2%
Total revenue 432.8 403.6 +7.2% 1,270.9 1,101.1 +15.4%
Cost of Software revenue (18.7) (19.6) (4.6%) (56.5) (55.4) +2.0%
Cost of Service and other revenue (40.6) (36.2) +12.2% (126.5) (106.3) +19.0%
Research and development (80.7) (83.8) (3.7%) (240.7) (244.4) (1.5%)
Marketing and sales (127.6) (128.5) (0.7%) (387.1) (342.1) +13.2%
General and administrative (33.8) (31.5) +7.3% (100.6) (88.4) +13.8%
Amortization of acquired intangibles (20.7) (20.9) (1.0%) (62.5) (48.3) +29.4%
Other operating income and expense, net (2.5) (7.3) (65.8%) (4.8) (18.9) (74.6%)
Total operating expenses (324.6) (327.8) (1.0%) (978.7) (903.8) +8.3%
Operating income 108.2 75.8 +42.7% 292.2 197.3 +48.1%
Financial revenue and other, net 1.8 (4.4) N/S 6.2 (2.0) N/S
Income before income taxes 110.0 71.4 +54.1% 298.4 195.3 +52.8%
Income tax expense (33.1) (16.0) +106.9% (93.3) (53.4) +74.7%
Minority Interest (0.5) 0.0 N/A (0.6) (0.1) N/S
Net Income (to equity holders of the parent) 76.4 55.4 +37.9% 204.5 141.8 +44.2%
Diluted net income per share (EPS) 0.62 0.46 +34.8% 1.65 1.18 +39.8%
Average shares (Million) 123.7 121.5 123.9 120.0
50
Ι ww
w.3
ds.c
om Ι
© D
assa
ult
Sys
tèm
es Ι
Q3
2011
Ear
ning
s A
nnou
ncem
ent
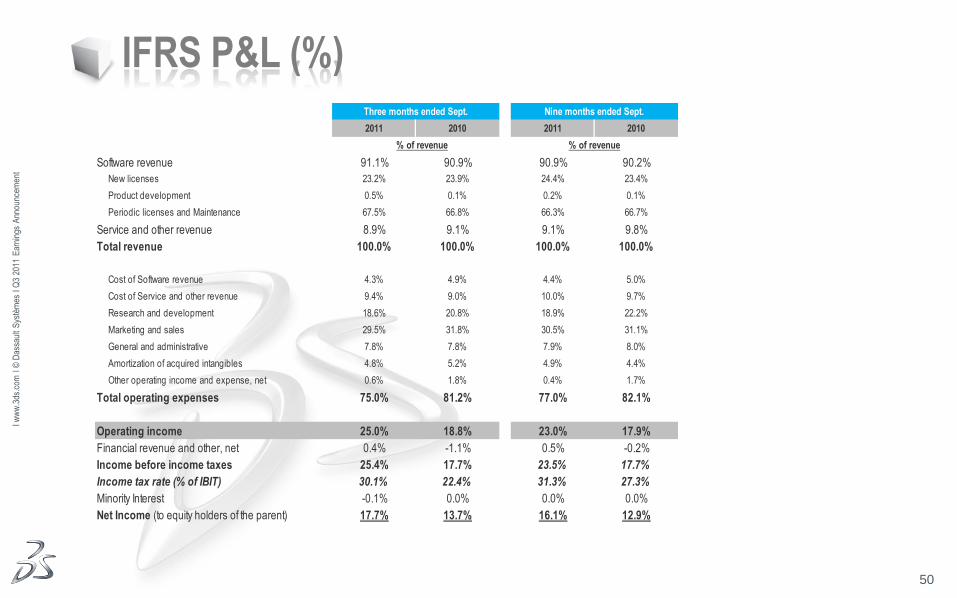
IFRS P&L (%) Three months ended Sept. Nine months ended Sept.
2011 2010 2011 2010
% of revenue % of revenue
Software revenue 91.1% 90.9% 90.9% 90.2%
New licenses 23.2% 23.9% 24.4% 23.4%
Product development 0.5% 0.1% 0.2% 0.1%
Periodic licenses and Maintenance 67.5% 66.8% 66.3% 66.7%
Service and other revenue 8.9% 9.1% 9.1% 9.8%
Total revenue 100.0% 100.0% 100.0% 100.0%
Cost of Software revenue 4.3% 4.9% 4.4% 5.0%
Cost of Service and other revenue 9.4% 9.0% 10.0% 9.7%
Research and development 18.6% 20.8% 18.9% 22.2%
Marketing and sales 29.5% 31.8% 30.5% 31.1%
General and administrative 7.8% 7.8% 7.9% 8.0%
Amortization of acquired intangibles 4.8% 5.2% 4.9% 4.4%
Other operating income and expense, net 0.6% 1.8% 0.4% 1.7%
Total operating expenses 75.0% 81.2% 77.0% 82.1%
Operating income 25.0% 18.8% 23.0% 17.9%
Financial revenue and other, net 0.4% -1.1% 0.5% -0.2%
Income before income taxes 25.4% 17.7% 23.5% 17.7%
Income tax rate (% of IBIT) 30.1% 22.4% 31.3% 27.3%
Minority Interest -0.1% 0.0% 0.0% 0.0%
Net Income (to equity holders of the parent) 17.7% 13.7% 16.1% 12.9%
51
Ι ww
w.3
ds.c
om Ι
© D
assa
ult
Sys
tèm
es Ι
Q3
2011
Ear
ning
s A
nnou
ncem
ent
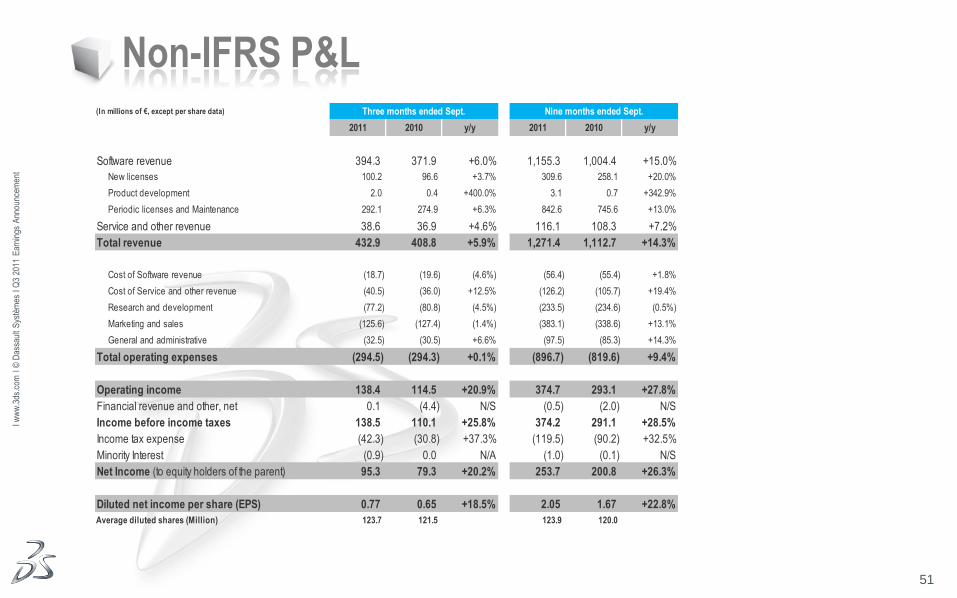
Non-IFRS P&L (In millions of €, except per share data) Three months ended Sept. Nine months ended Sept.
2011 2010 y/y 2011 2010 y/y
Software revenue 394.3 371.9 +6.0% 1,155.3 1,004.4 +15.0%
New licenses 100.2 96.6 +3.7% 309.6 258.1 +20.0%
Product development 2.0 0.4 +400.0% 3.1 0.7 +342.9%
Periodic licenses and Maintenance 292.1 274.9 +6.3% 842.6 745.6 +13.0%
Service and other revenue 38.6 36.9 +4.6% 116.1 108.3 +7.2%
Total revenue 432.9 408.8 +5.9% 1,271.4 1,112.7 +14.3%
Cost of Software revenue (18.7) (19.6) (4.6%) (56.4) (55.4) +1.8%
Cost of Service and other revenue (40.5) (36.0) +12.5% (126.2) (105.7) +19.4%
Research and development (77.2) (80.8) (4.5%) (233.5) (234.6) (0.5%)
Marketing and sales (125.6) (127.4) (1.4%) (383.1) (338.6) +13.1%
General and administrative (32.5) (30.5) +6.6% (97.5) (85.3) +14.3%
Total operating expenses (294.5) (294.3) +0.1% (896.7) (819.6) +9.4%
Operating income 138.4 114.5 +20.9% 374.7 293.1 +27.8%
Financial revenue and other, net 0.1 (4.4) N/S (0.5) (2.0) N/S
Income before income taxes 138.5 110.1 +25.8% 374.2 291.1 +28.5%
Income tax expense (42.3) (30.8) +37.3% (119.5) (90.2) +32.5%
Minority Interest (0.9) 0.0 N/A (1.0) (0.1) N/S
Net Income (to equity holders of the parent) 95.3 79.3 +20.2% 253.7 200.8 +26.3%
Diluted net income per share (EPS) 0.77 0.65 +18.5% 2.05 1.67 +22.8%
Average diluted shares (Million) 123.7 121.5 123.9 120.0
52
Ι ww
w.3
ds.c
om Ι
© D
assa
ult
Sys
tèm
es Ι
Q3
2011
Ear
ning
s A
nnou
ncem
ent
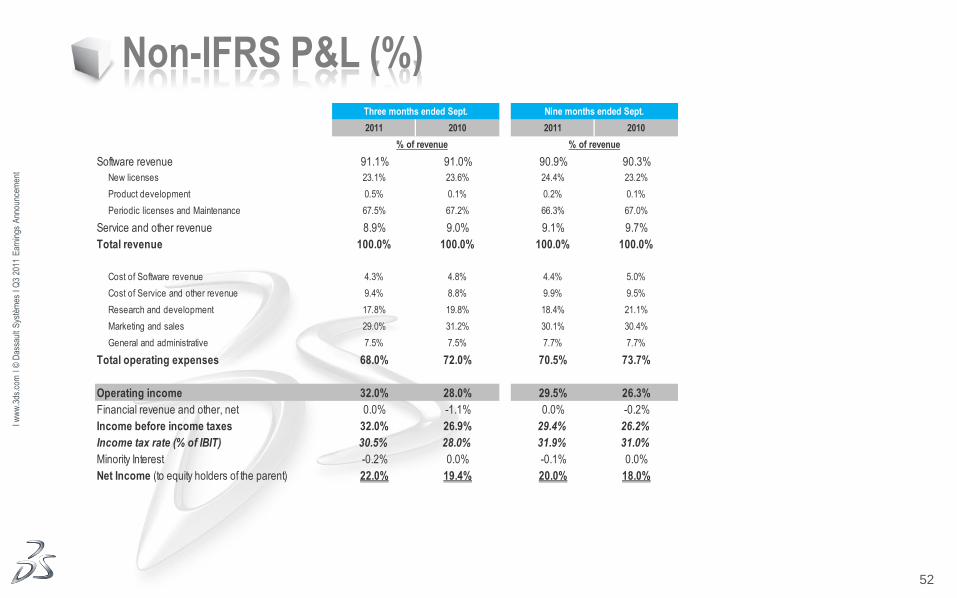
Non-IFRS P&L (%) Three months ended Sept. Nine months ended Sept.
2011 2010 2011 2010
% of revenue % of revenue
Software revenue 91.1% 91.0% 90.9% 90.3%
New licenses 23.1% 23.6% 24.4% 23.2%
Product development 0.5% 0.1% 0.2% 0.1%
Periodic licenses and Maintenance 67.5% 67.2% 66.3% 67.0%
Service and other revenue 8.9% 9.0% 9.1% 9.7%
Total revenue 100.0% 100.0% 100.0% 100.0%
Cost of Software revenue 4.3% 4.8% 4.4% 5.0%
Cost of Service and other revenue 9.4% 8.8% 9.9% 9.5%
Research and development 17.8% 19.8% 18.4% 21.1%
Marketing and sales 29.0% 31.2% 30.1% 30.4%
General and administrative 7.5% 7.5% 7.7% 7.7%
Total operating expenses 68.0% 72.0% 70.5% 73.7%
Operating income 32.0% 28.0% 29.5% 26.3%
Financial revenue and other, net 0.0% -1.1% 0.0% -0.2%
Income before income taxes 32.0% 26.9% 29.4% 26.2%
Income tax rate (% of IBIT) 30.5% 28.0% 31.9% 31.0%
Minority Interest -0.2% 0.0% -0.1% 0.0%
Net Income (to equity holders of the parent) 22.0% 19.4% 20.0% 18.0%
53
Ι ww
w.3
ds.c
om Ι
© D
assa
ult
Sys
tèm
es Ι
Q3
2011
Ear
ning
s A
nnou
ncem
ent
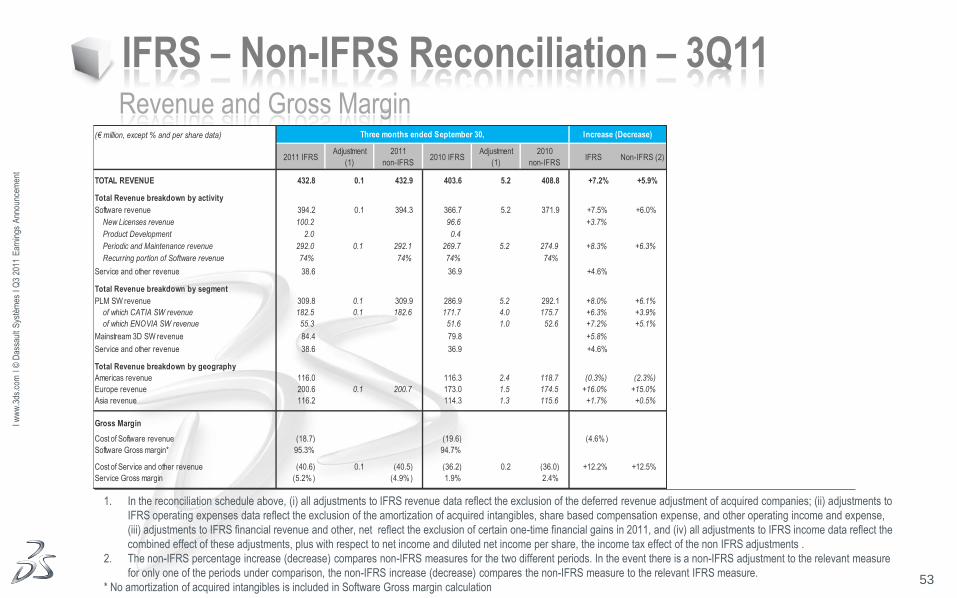
IFRS – Non-IFRS Reconciliation – 3Q11 Revenue and Gross Margin
1. In the reconciliation schedule above, (i) all adjustments to IFRS revenue data reflect the exclusion of the deferred revenue adjustment of acquired companies; (ii) adjustments to
IFRS operating expenses data reflect the exclusion of the amortization of acquired intangibles, share based compensation expense, and other operating income and expense,
(iii) adjustments to IFRS financial revenue and other, net reflect the exclusion of certain one-time financial gains in 2011, and (iv) all adjustments to IFRS income data reflect the
combined effect of these adjustments, plus with respect to net income and diluted net income per share, the income tax effect of the non IFRS adjustments .
2. The non-IFRS percentage increase (decrease) compares non-IFRS measures for the two different periods. In the event there is a non-IFRS adjustment to the relevant measure
for only one of the periods under comparison, the non-IFRS increase (decrease) compares the non-IFRS measure to the relevant IFRS measure.
* No amortization of acquired intangibles is included in Software Gross margin calculation
(€ million, except % and per share data)
2011 IFRSAdjustment
(1)
2011
non-IFRS2010 IFRS
Adjustment
(1)
2010
non-IFRSIFRS Non-IFRS (2)
TOTAL REVENUE 432.8 0.1 432.9 403.6 5.2 408.8 +7.2% +5.9%
Total Revenue breakdown by activity
Software revenue 394.2 0.1 394.3 366.7 5.2 371.9 +7.5% +6.0%
New Licenses revenue 100.2 96.6 +3.7%
Product Development 2.0 0.4
Periodic and Maintenance revenue 292.0 0.1 292.1 269.7 5.2 274.9 +8.3% +6.3%
Recurring portion of Software revenue 74% 74% 74% 74%
Service and other revenue 38.6 36.9 +4.6%
Total Revenue breakdown by segment
PLM SW revenue 309.8 0.1 309.9 286.9 5.2 292.1 +8.0% +6.1%
of which CATIA SW revenue 182.5 0.1 182.6 171.7 4.0 175.7 +6.3% +3.9%
of which ENOVIA SW revenue 55.3 51.6 1.0 52.6 +7.2% +5.1%
Mainstream 3D SW revenue 84.4 79.8 +5.8%
Service and other revenue 38.6 36.9 +4.6%
Total Revenue breakdown by geography
Americas revenue 116.0 116.3 2.4 118.7 (0.3%) (2.3%)
Europe revenue 200.6 0.1 200.7 173.0 1.5 174.5 +16.0% +15.0%
Asia revenue 116.2 114.3 1.3 115.6 +1.7% +0.5%
Gross Margin
Cost of Software revenue (18.7) (19.6) (4.6% )
Software Gross margin* 95.3% 94.7%
Cost of Service and other revenue (40.6) 0.1 (40.5) (36.2) 0.2 (36.0) +12.2% +12.5%
Service Gross margin (5.2% ) (4.9%) 1.9% 2.4%
Increase (Decrease)Three months ended September 30,
54
Ι ww
w.3
ds.c
om Ι
© D
assa
ult
Sys
tèm
es Ι
Q3
2011
Ear
ning
s A
nnou
ncem
ent
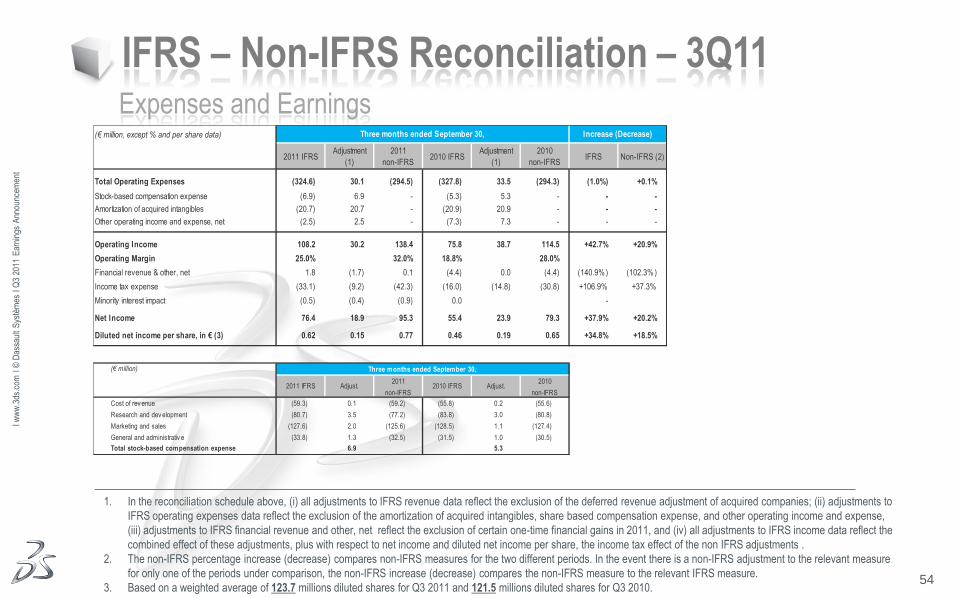
IFRS – Non-IFRS Reconciliation – 3Q11 Expenses and Earnings
1. In the reconciliation schedule above, (i) all adjustments to IFRS revenue data reflect the exclusion of the deferred revenue adjustment of acquired companies; (ii) adjustments to
IFRS operating expenses data reflect the exclusion of the amortization of acquired intangibles, share based compensation expense, and other operating income and expense,
(iii) adjustments to IFRS financial revenue and other, net reflect the exclusion of certain one-time financial gains in 2011, and (iv) all adjustments to IFRS income data reflect the
combined effect of these adjustments, plus with respect to net income and diluted net income per share, the income tax effect of the non IFRS adjustments .
2. The non-IFRS percentage increase (decrease) compares non-IFRS measures for the two different periods. In the event there is a non-IFRS adjustment to the relevant measure
for only one of the periods under comparison, the non-IFRS increase (decrease) compares the non-IFRS measure to the relevant IFRS measure.
3. Based on a weighted average of 123.7 millions diluted shares for Q3 2011 and 121.5 millions diluted shares for Q3 2010.
(€ million, except % and per share data)
2011 IFRSAdjustment
(1)
2011
non-IFRS2010 IFRS
Adjustment
(1)
2010
non-IFRSIFRS Non-IFRS (2)
Total Operating Expenses (324.6) 30.1 (294.5) (327.8) 33.5 (294.3) (1.0%) +0.1%
Stock-based compensation expense (6.9) 6.9 - (5.3) 5.3 - - -
Amortization of acquired intangibles (20.7) 20.7 - (20.9) 20.9 - - -
Other operating income and expense, net (2.5) 2.5 - (7.3) 7.3 - - -
Operating Income 108.2 30.2 138.4 75.8 38.7 114.5 +42.7% +20.9%
Operating Margin 25.0% 32.0% 18.8% 28.0%
Financial revenue & other, net 1.8 (1.7) 0.1 (4.4) 0.0 (4.4) (140.9% ) (102.3% )
Income tax expense (33.1) (9.2) (42.3) (16.0) (14.8) (30.8) +106.9% +37.3%
Minority interest impact (0.5) (0.4) (0.9) 0.0 -
Net Income 76.4 18.9 95.3 55.4 23.9 79.3 +37.9% +20.2%
Diluted net income per share, in € (3) 0.62 0.15 0.77 0.46 0.19 0.65 +34.8% +18.5%
(€ million)
Cost of rev enue (59.3) 0.1 (59.2) (55.8) 0.2 (55.6)
Research and dev elopment (80.7) 3.5 (77.2) (83.8) 3.0 (80.8)
Marketing and sales (127.6) 2.0 (125.6) (128.5) 1.1 (127.4)
General and administrativ e (33.8) 1.3 (32.5) (31.5) 1.0 (30.5)
Total stock-based compensation expense 6.9 5.3
2010
non-IFRS
2011
non-IFRS
Increase (Decrease)Three months ended September 30,
Adjust.
Three months ended September 30,
2011 IFRS Adjust. 2010 IFRS
55
Ι ww
w.3
ds.c
om Ι
© D
assa
ult
Sys
tèm
es Ι
Q3
2011
Ear
ning
s A
nnou
ncem
ent
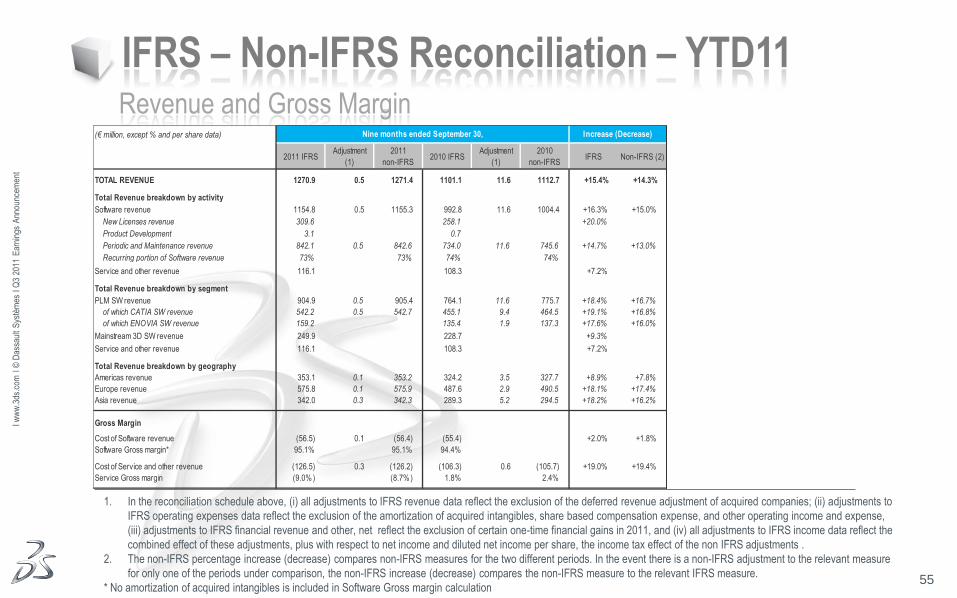
IFRS – Non-IFRS Reconciliation – YTD11 Revenue and Gross Margin
1. In the reconciliation schedule above, (i) all adjustments to IFRS revenue data reflect the exclusion of the deferred revenue adjustment of acquired companies; (ii) adjustments to
IFRS operating expenses data reflect the exclusion of the amortization of acquired intangibles, share based compensation expense, and other operating income and expense,
(iii) adjustments to IFRS financial revenue and other, net reflect the exclusion of certain one-time financial gains in 2011, and (iv) all adjustments to IFRS income data reflect the
combined effect of these adjustments, plus with respect to net income and diluted net income per share, the income tax effect of the non IFRS adjustments .
2. The non-IFRS percentage increase (decrease) compares non-IFRS measures for the two different periods. In the event there is a non-IFRS adjustment to the relevant measure
for only one of the periods under comparison, the non-IFRS increase (decrease) compares the non-IFRS measure to the relevant IFRS measure.
* No amortization of acquired intangibles is included in Software Gross margin calculation
(€ million, except % and per share data)
2011 IFRSAdjustment
(1)
2011
non-IFRS2010 IFRS
Adjustment
(1)
2010
non-IFRSIFRS Non-IFRS (2)
TOTAL REVENUE 1270.9 0.5 1271.4 1101.1 11.6 1112.7 +15.4% +14.3%
Total Revenue breakdown by activity
Software revenue 1154.8 0.5 1155.3 992.8 11.6 1004.4 +16.3% +15.0%
New Licenses revenue 309.6 258.1 +20.0%
Product Development 3.1 0.7
Periodic and Maintenance revenue 842.1 0.5 842.6 734.0 11.6 745.6 +14.7% +13.0%
Recurring portion of Software revenue 73% 73% 74% 74%
Service and other revenue 116.1 108.3 +7.2%
Total Revenue breakdown by segment
PLM SW revenue 904.9 0.5 905.4 764.1 11.6 775.7 +18.4% +16.7%
of which CATIA SW revenue 542.2 0.5 542.7 455.1 9.4 464.5 +19.1% +16.8%
of which ENOVIA SW revenue 159.2 135.4 1.9 137.3 +17.6% +16.0%
Mainstream 3D SW revenue 249.9 228.7 +9.3%
Service and other revenue 116.1 108.3 +7.2%
Total Revenue breakdown by geography
Americas revenue 353.1 0.1 353.2 324.2 3.5 327.7 +8.9% +7.8%
Europe revenue 575.8 0.1 575.9 487.6 2.9 490.5 +18.1% +17.4%
Asia revenue 342.0 0.3 342.3 289.3 5.2 294.5 +18.2% +16.2%
Gross Margin
Cost of Software revenue (56.5) 0.1 (56.4) (55.4) +2.0% +1.8%
Software Gross margin* 95.1% 95.1% 94.4%
Cost of Service and other revenue (126.5) 0.3 (126.2) (106.3) 0.6 (105.7) +19.0% +19.4%
Service Gross margin (9.0% ) (8.7% ) 1.8% 2.4%
Nine months ended September 30, Increase (Decrease)
56
Ι ww
w.3
ds.c
om Ι
© D
assa
ult
Sys
tèm
es Ι
Q3
2011
Ear
ning
s A
nnou
ncem
ent
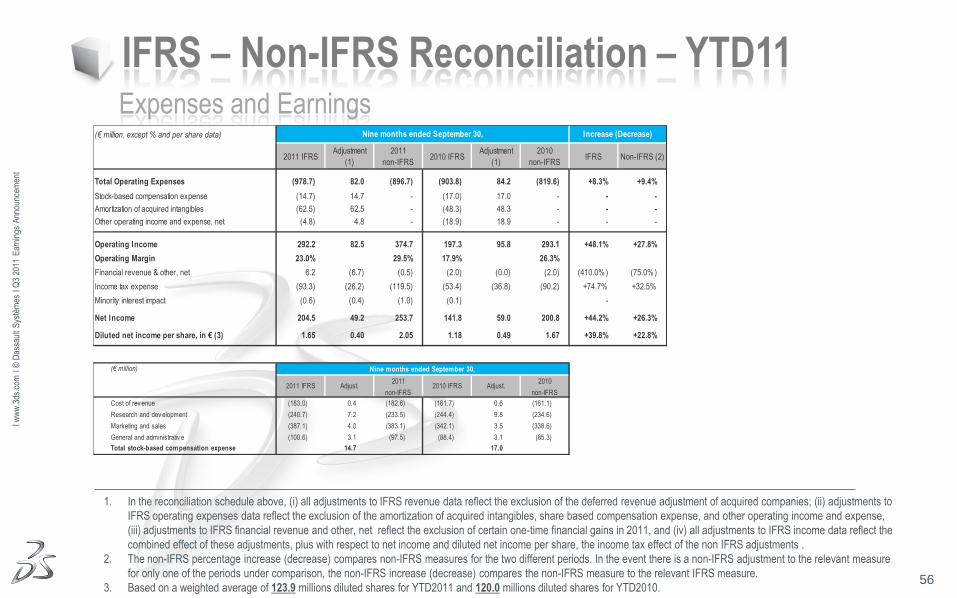
IFRS – Non-IFRS Reconciliation – YTD11 Expenses and Earnings
1. In the reconciliation schedule above, (i) all adjustments to IFRS revenue data reflect the exclusion of the deferred revenue adjustment of acquired companies; (ii) adjustments to
IFRS operating expenses data reflect the exclusion of the amortization of acquired intangibles, share based compensation expense, and other operating income and expense,
(iii) adjustments to IFRS financial revenue and other, net reflect the exclusion of certain one-time financial gains in 2011, and (iv) all adjustments to IFRS income data reflect the
combined effect of these adjustments, plus with respect to net income and diluted net income per share, the income tax effect of the non IFRS adjustments .
2. The non-IFRS percentage increase (decrease) compares non-IFRS measures for the two different periods. In the event there is a non-IFRS adjustment to the relevant measure
for only one of the periods under comparison, the non-IFRS increase (decrease) compares the non-IFRS measure to the relevant IFRS measure.
3. Based on a weighted average of 123.9 millions diluted shares for YTD2011 and 120.0 millions diluted shares for YTD2010.
(€ million, except % and per share data)
2011 IFRSAdjustment
(1)
2011
non-IFRS2010 IFRS
Adjustment
(1)
2010
non-IFRSIFRS Non-IFRS (2)
Total Operating Expenses (978.7) 82.0 (896.7) (903.8) 84.2 (819.6) +8.3% +9.4%
Stock-based compensation expense (14.7) 14.7 - (17.0) 17.0 - - -
Amortization of acquired intangibles (62.5) 62.5 - (48.3) 48.3 - - -
Other operating income and expense, net (4.8) 4.8 - (18.9) 18.9 - - -
Operating Income 292.2 82.5 374.7 197.3 95.8 293.1 +48.1% +27.8%
Operating Margin 23.0% 29.5% 17.9% 26.3%
Financial revenue & other, net 6.2 (6.7) (0.5) (2.0) (0.0) (2.0) (410.0% ) (75.0% )
Income tax expense (93.3) (26.2) (119.5) (53.4) (36.8) (90.2) +74.7% +32.5%
Minority interest impact (0.6) (0.4) (1.0) (0.1) -
Net Income 204.5 49.2 253.7 141.8 59.0 200.8 +44.2% +26.3%
Diluted net income per share, in € (3) 1.65 0.40 2.05 1.18 0.49 1.67 +39.8% +22.8%
(€ million)
Cost of rev enue (183.0) 0.4 (182.6) (161.7) 0.6 (161.1)
Research and dev elopment (240.7) 7.2 (233.5) (244.4) 9.8 (234.6)
Marketing and sales (387.1) 4.0 (383.1) (342.1) 3.5 (338.6)
General and administrativ e (100.6) 3.1 (97.5) (88.4) 3.1 (85.3)
Total stock-based compensation expense 14.7 17.0
Nine months ended September 30,
Nine months ended September 30, Increase (Decrease)
2011 IFRS Adjust. 2010 IFRS2010
non-IFRS
2011
non-IFRSAdjust.
57
Ι ww
w.3
ds.c
om Ι
© D
assa
ult
Sys
tèm
es Ι
Q3
2011
Ear
ning
s A
nnou
ncem
ent
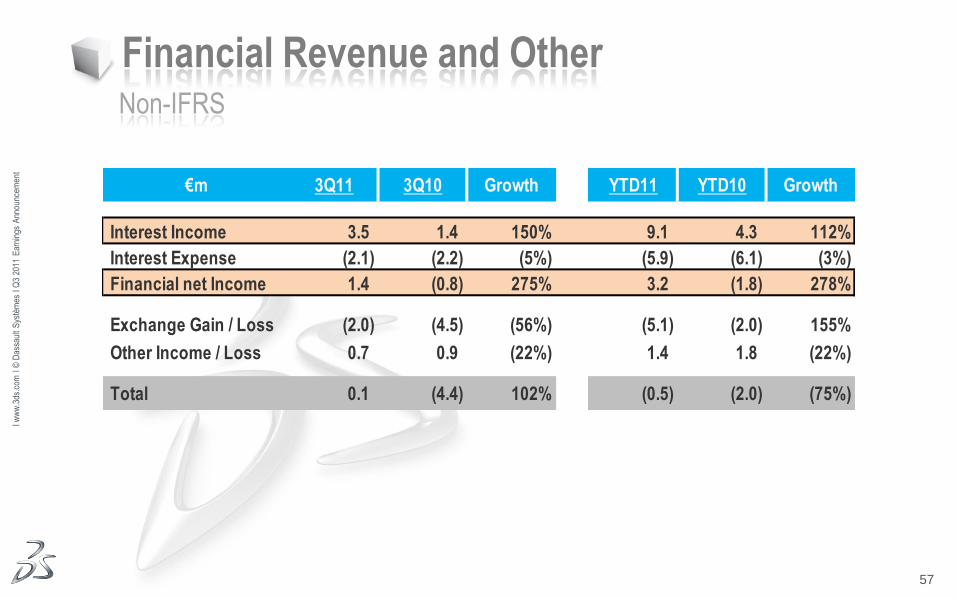
Financial Revenue and Other Non-IFRS
€m 3Q11 3Q10 Growth YTD11 YTD10 Growth
Interest Income 3.5 1.4 150% 9.1 4.3 112%
Interest Expense (2.1) (2.2) (5%) (5.9) (6.1) (3%)
Financial net Income 1.4 (0.8) 275% 3.2 (1.8) 278%
Exchange Gain / Loss (2.0) (4.5) (56%) (5.1) (2.0) 155%
Other Income / Loss 0.7 0.9 (22%) 1.4 1.8 (22%)
Total 0.1 (4.4) 102% (0.5) (2.0) (75%)
58
Ι ww
w.3
ds.c
om Ι
© D
assa
ult
Sys
tèm
es Ι
Q3
2011
Ear
ning
s A
nnou
ncem
ent
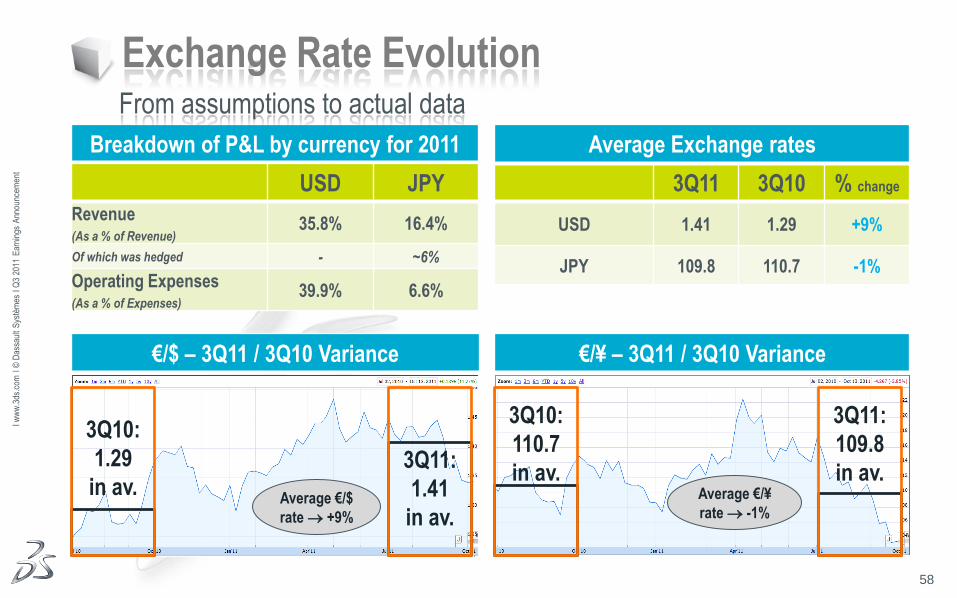
Breakdown of P&L by currency for 2011
Exchange Rate Evolution From assumptions to actual data
USD JPY
Revenue (As a % of Revenue)
35.8% 16.4%
Of which was hedged - ~6%
Operating Expenses (As a % of Expenses)
39.9% 6.6%
3Q11 3Q10 % change
USD 1.41 1.29 +9%
JPY 109.8 110.7 -1%
Average Exchange rates
€/$ – 3Q11 / 3Q10 Variance €/¥ – 3Q11 / 3Q10 Variance
Average €/¥
rate -1% Average €/$
rate +9%
3Q10:
1.29
in av.
3Q11:
1.41
in av.
3Q10:
110.7
in av.
3Q11:
109.8
in av.
59
Ι ww
w.3
ds.c
om Ι
© D
assa
ult
Sys
tèm
es Ι
Q3
2011
Ear
ning
s A
nnou
ncem
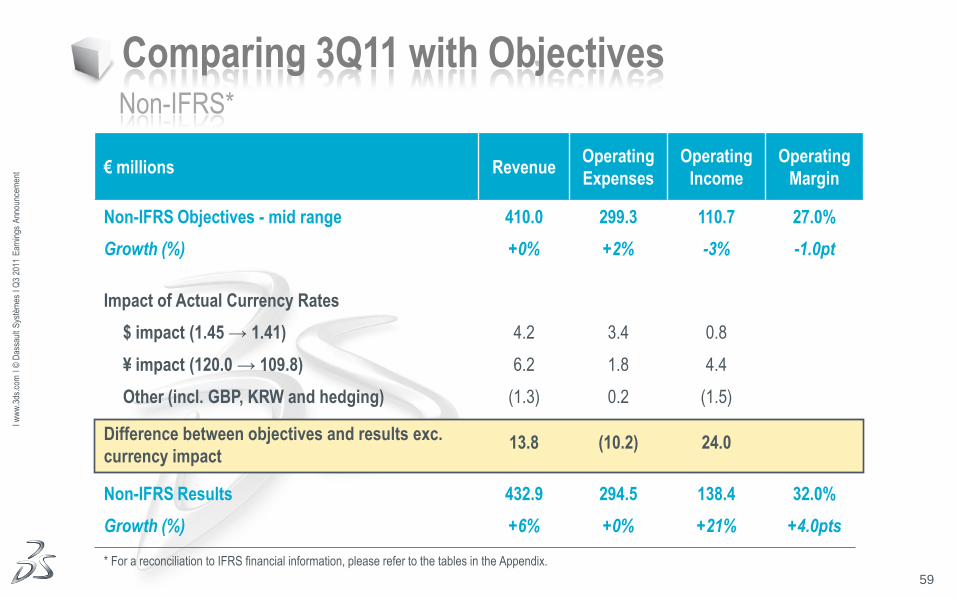
ent € millions Revenue
Operating
Expenses
Operating
Income
Operating
Margin
Non-IFRS Objectives - mid range 410.0 299.3 110.7 27.0%
Growth (%) +0% +2% -3% -1.0pt
Impact of Actual Currency Rates
$ impact (1.45 → 1.41) 4.2 3.4 0.8
¥ impact (120.0 → 109.8) 6.2 1.8 4.4
Other (incl. GBP, KRW and hedging) (1.3) 0.2 (1.5)
Difference between objectives and results exc.
currency impact 13.8 (10.2) 24.0
Non-IFRS Results 432.9 294.5 138.4 32.0%
Growth (%) +6% +0% +21% +4.0pts
Comparing 3Q11 with Objectives Non-IFRS*
* For a reconciliation to IFRS financial information, please refer to the tables in the Appendix.
60
Ι ww
w.3
ds.c
om Ι
© D
assa
ult
Sys
tèm
es Ι
Q3
2011
Ear
ning
s A
nnou
ncem
ent
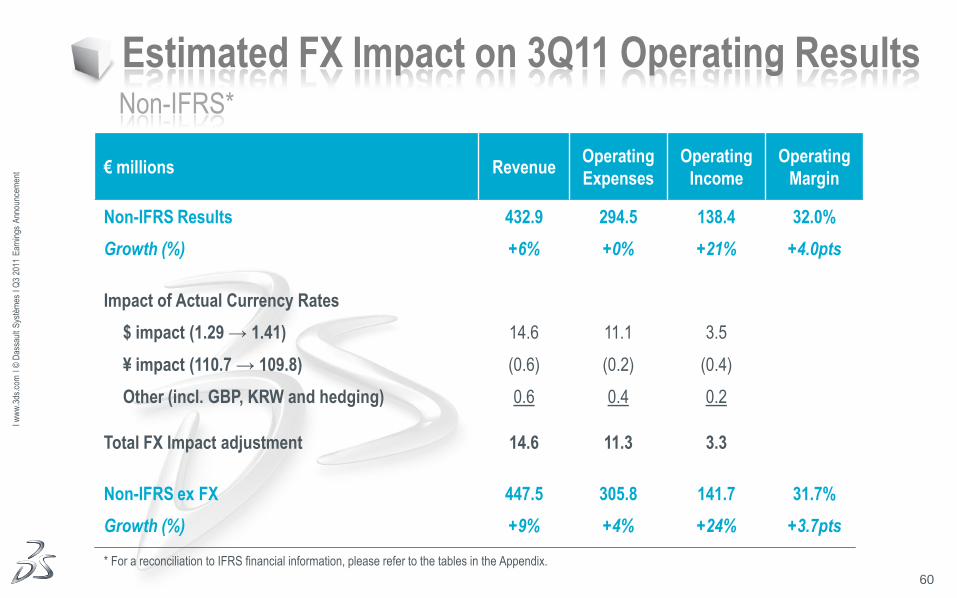
Estimated FX Impact on 3Q11 Operating Results Non-IFRS*
* For a reconciliation to IFRS financial information, please refer to the tables in the Appendix.
€ millions Revenue Operating
Expenses
Operating
Income
Operating
Margin
Non-IFRS Results 432.9 294.5 138.4 32.0%
Growth (%) +6% +0% +21% +4.0pts
Impact of Actual Currency Rates
$ impact (1.29 → 1.41) 14.6 11.1 3.5
¥ impact (110.7 → 109.8) (0.6) (0.2) (0.4)
Other (incl. GBP, KRW and hedging) 0.6 0.4 0.2
Total FX Impact adjustment 14.6 11.3 3.3
Non-IFRS ex FX 447.5 305.8 141.7 31.7%
Growth (%) +9% +4% +24% +3.7pts
61
Ι ww
w.3
ds.c
om Ι
© D
assa
ult
Sys
tèm
es Ι
Q3
2011
Ear
ning
s A
nnou
ncem
ent
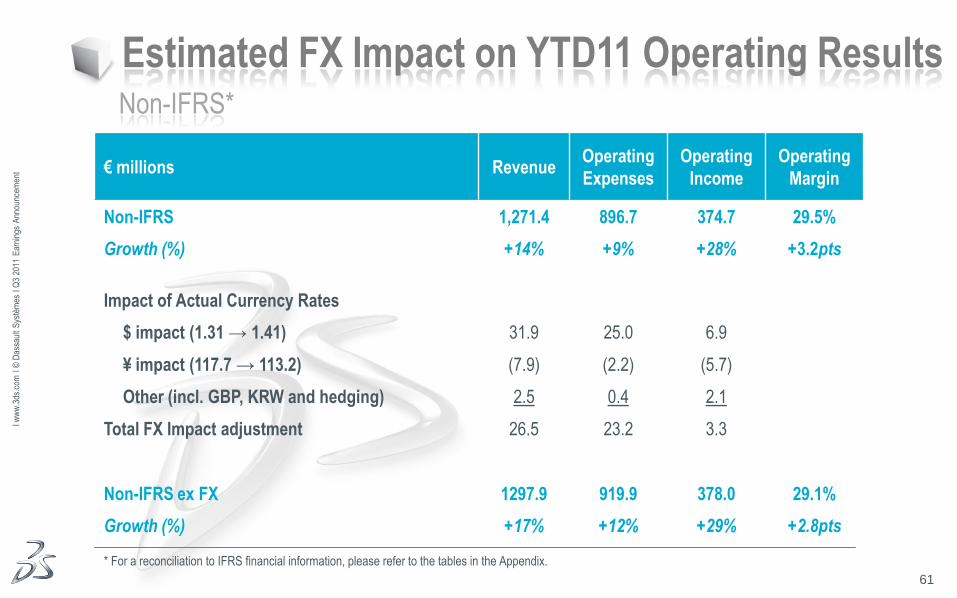
Estimated FX Impact on YTD11 Operating Results Non-IFRS*
* For a reconciliation to IFRS financial information, please refer to the tables in the Appendix.
€ millions Revenue Operating
Expenses
Operating
Income
Operating
Margin
Non-IFRS 1,271.4 896.7 374.7 29.5%
Growth (%) +14% +9% +28% +3.2pts
Impact of Actual Currency Rates
$ impact (1.31 → 1.41) 31.9 25.0 6.9
¥ impact (117.7 → 113.2) (7.9) (2.2) (5.7)
Other (incl. GBP, KRW and hedging) 2.5 0.4 2.1
Total FX Impact adjustment 26.5 23.2 3.3
Non-IFRS ex FX 1297.9 919.9 378.0 29.1%
Growth (%) +17% +12% +29% +2.8pts
62
Ι ww
w.3
ds.c
om Ι
© D
assa
ult
Sys
tèm
es Ι
Q3
2011
Ear
ning
s A
nnou
ncem
ent
0
200
400
600
800
1,000
1,200
1,400
YTD10 YTD11 3Q10 3Q11
Non Recurring
Recurring
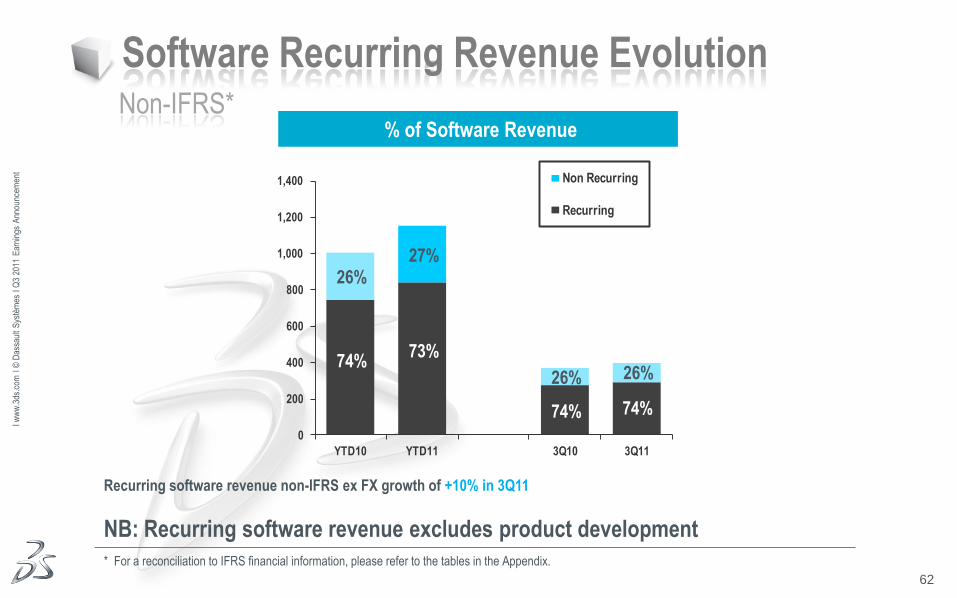
Software Recurring Revenue Evolution Non-IFRS*
* For a reconciliation to IFRS financial information, please refer to the tables in the Appendix.
73%
% of Software Revenue
Recurring software revenue non-IFRS ex FX growth of +10% in 3Q11
NB: Recurring software revenue excludes product development
74%
74% 74%
27% 26%
26% 26%
63
Ι ww
w.3
ds.c
om Ι
© D
assa
ult
Sys
tèm
es Ι
Q3
2011
Ear
ning
s A
nnou
ncem
ent
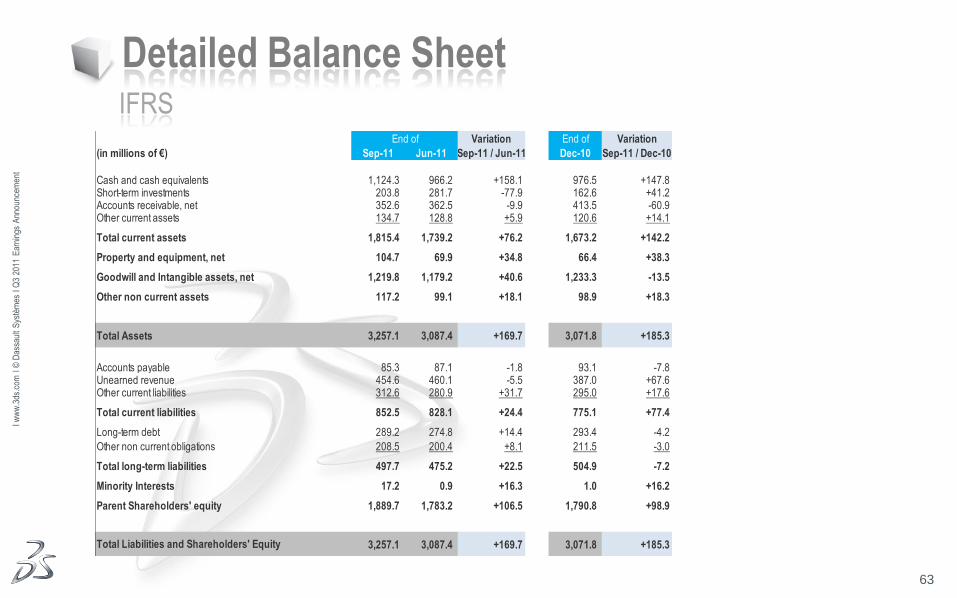
Detailed Balance Sheet IFRS
End of Variation End of Variation
(in millions of €) Sep-11 Jun-11 Sep-11 / Jun-11 Dec-10 Sep-11 / Dec-10
Cash and cash equivalents 1,124.3 966.2 +158.1 976.5 +147.8Short-term investments 203.8 281.7 -77.9 162.6 +41.2Accounts receivable, net 352.6 362.5 -9.9 413.5 -60.9Other current assets 134.7 128.8 +5.9 120.6 +14.1
Total current assets 1,815.4 1,739.2 +76.2 1,673.2 +142.2
Property and equipment, net 104.7 69.9 +34.8 66.4 +38.3
Goodwill and Intangible assets, net 1,219.8 1,179.2 +40.6 1,233.3 -13.5
Other non current assets 117.2 99.1 +18.1 98.9 +18.3
Total Assets 3,257.1 3,087.4 +169.7 3,071.8 +185.3
Accounts payable 85.3 87.1 -1.8 93.1 -7.8Unearned revenue 454.6 460.1 -5.5 387.0 +67.6Other current liabilities 312.6 280.9 +31.7 295.0 +17.6
Total current liabilities 852.5 828.1 +24.4 775.1 +77.4
Long-term debt 289.2 274.8 +14.4 293.4 -4.2
Other non current obligations 208.5 200.4 +8.1 211.5 -3.0
Total long-term liabilities 497.7 475.2 +22.5 504.9 -7.2
Minority Interests 17.2 0.9 +16.3 1.0 +16.2
Parent Shareholders' equity 1,889.7 1,783.2 +106.5 1,790.8 +98.9
3,257.1 3,087.4 +169.7 3,071.8 +185.3Total Liabilities and Shareholders' Equity
64
Ι ww
w.3
ds.c
om Ι
© D
assa
ult
Sys
tèm
es Ι
Q3
2011
Ear
ning
s A
nnou
ncem
ent
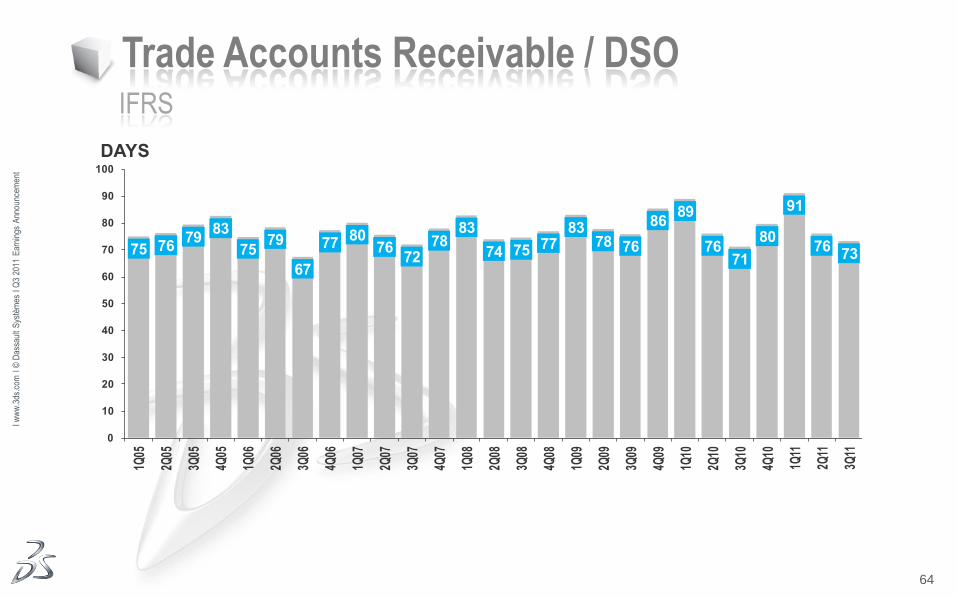
Trade Accounts Receivable / DSO IFRS
75 7679
83
7579
67
7780
7672
7883
74 75 7783
78 76
8689
7671
80
91
7673
0
10
20
30
40
50
60
70
80
90
100
1Q05
2Q05
3Q05
4Q05
1Q06
2Q06
3Q06
4Q06
1Q07
2Q07
3Q07
4Q07
1Q08
2Q08
3Q08
4Q08
1Q09
2Q09
3Q09
4Q09
1Q10
2Q10
3Q10
4Q10
1Q11
2Q11
3Q11
DAYS
65
Ι ww
w.3
ds.c
om Ι
© D
assa
ult
Sys
tèm
es Ι
Q3
2011
Ear
ning
s A
nnou
ncem
ent
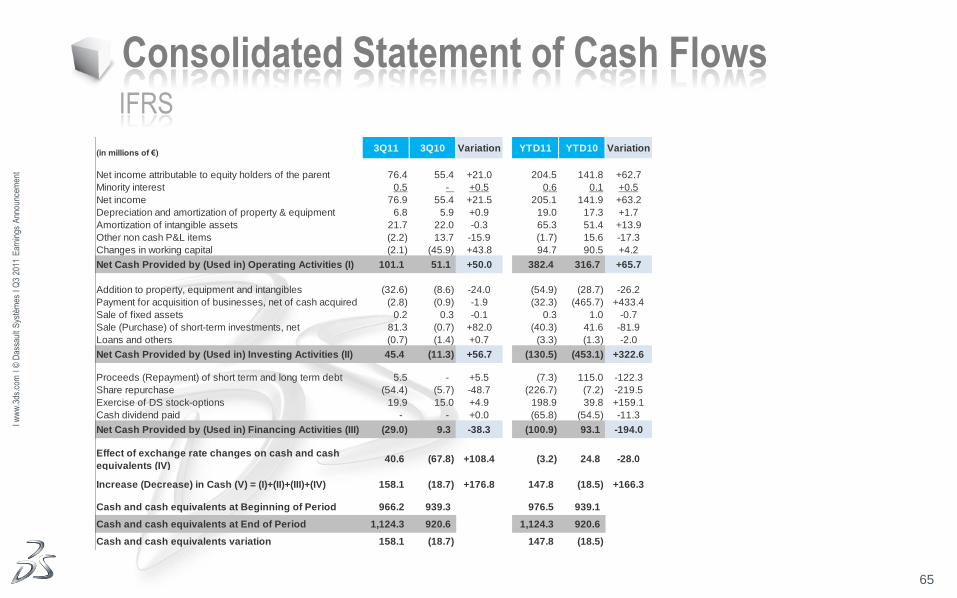
Consolidated Statement of Cash Flows IFRS
(in millions of €)3Q11 3Q10 Variation YTD11 YTD10 Variation
Net income attributable to equity holders of the parent 76.4 55.4 +21.0 204.5 141.8 +62.7
Minority interest 0.5 - +0.5 0.6 0.1 +0.5
Net income 76.9 55.4 +21.5 205.1 141.9 +63.2
Depreciation and amortization of property & equipment 6.8 5.9 +0.9 19.0 17.3 +1.7
Amortization of intangible assets 21.7 22.0 -0.3 65.3 51.4 +13.9
Other non cash P&L items (2.2) 13.7 -15.9 (1.7) 15.6 -17.3
Changes in working capital (2.1) (45.9) +43.8 94.7 90.5 +4.2
Net Cash Provided by (Used in) Operating Activities (I) 101.1 51.1 +50.0 382.4 316.7 +65.7
Addition to property, equipment and intangibles (32.6) (8.6) -24.0 (54.9) (28.7) -26.2
Payment for acquisition of businesses, net of cash acquired (2.8) (0.9) -1.9 (32.3) (465.7) +433.4
Sale of fixed assets 0.2 0.3 -0.1 0.3 1.0 -0.7
Sale (Purchase) of short-term investments, net 81.3 (0.7) +82.0 (40.3) 41.6 -81.9
Loans and others (0.7) (1.4) +0.7 (3.3) (1.3) -2.0
Net Cash Provided by (Used in) Investing Activities (II) 45.4 (11.3) +56.7 (130.5) (453.1) +322.6
Proceeds (Repayment) of short term and long term debt 5.5 - +5.5 (7.3) 115.0 -122.3
Share repurchase (54.4) (5.7) -48.7 (226.7) (7.2) -219.5
Exercise of DS stock-options 19.9 15.0 +4.9 198.9 39.8 +159.1
Cash dividend paid - - +0.0 (65.8) (54.5) -11.3
Net Cash Provided by (Used in) Financing Activities (III) (29.0) 9.3 -38.3 (100.9) 93.1 -194.0
40.6 (67.8) +108.4 (3.2) 24.8 -28.0
Increase (Decrease) in Cash (V) = (I)+(II)+(III)+(IV) 158.1 (18.7) +176.8 147.8 (18.5) +166.3
Cash and cash equivalents at Beginning of Period 966.2 939.3 976.5 939.1
Cash and cash equivalents at End of Period 1,124.3 920.6 1,124.3 920.6
Cash and cash equivalents variation 158.1 (18.7) 147.8 (18.5)
Effect of exchange rate changes on cash and cash
equivalents (IV)
66
Ι ww
w.3
ds.c
om Ι
© D
assa
ult
Sys
tèm
es Ι
Q3
2011
Ear
ning
s A
nnou
ncem
ent
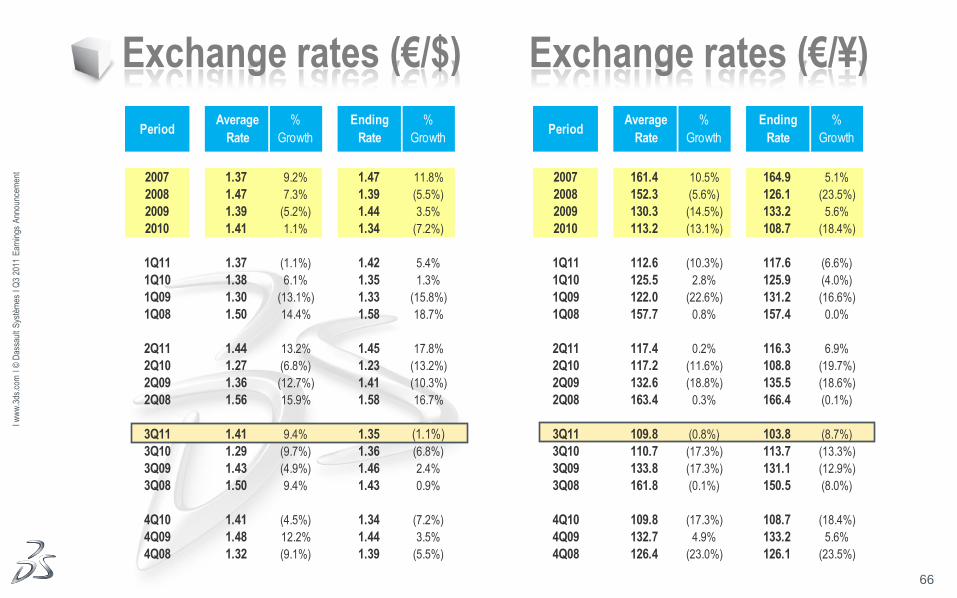
Exchange rates (€/$) Exchange rates (€/¥)
PeriodAverage
Rate
%
Growth
Ending
Rate
%
Growth
2007 1.37 9.2% 1.47 11.8%
2008 1.47 7.3% 1.39 (5.5%)
2009 1.39 (5.2%) 1.44 3.5%
2010 1.41 1.1% 1.34 (7.2%)
1Q11 1.37 (1.1%) 1.42 5.4%
1Q10 1.38 6.1% 1.35 1.3%
1Q09 1.30 (13.1%) 1.33 (15.8%)
1Q08 1.50 14.4% 1.58 18.7%
2Q11 1.44 13.2% 1.45 17.8%
2Q10 1.27 (6.8%) 1.23 (13.2%)
2Q09 1.36 (12.7%) 1.41 (10.3%)
2Q08 1.56 15.9% 1.58 16.7%
3Q11 1.41 9.4% 1.35 (1.1%)
3Q10 1.29 (9.7%) 1.36 (6.8%)
3Q09 1.43 (4.9%) 1.46 2.4%
3Q08 1.50 9.4% 1.43 0.9%
4Q10 1.41 (4.5%) 1.34 (7.2%)
4Q09 1.48 12.2% 1.44 3.5%
4Q08 1.32 (9.1%) 1.39 (5.5%)
PeriodAverage
Rate
%
Growth
Ending
Rate
%
Growth
2007 161.4 10.5% 164.9 5.1%
2008 152.3 (5.6%) 126.1 (23.5%)
2009 130.3 (14.5%) 133.2 5.6%
2010 113.2 (13.1%) 108.7 (18.4%)
1Q11 112.6 (10.3%) 117.6 (6.6%)
1Q10 125.5 2.8% 125.9 (4.0%)
1Q09 122.0 (22.6%) 131.2 (16.6%)
1Q08 157.7 0.8% 157.4 0.0%
2Q11 117.4 0.2% 116.3 6.9%
2Q10 117.2 (11.6%) 108.8 (19.7%)
2Q09 132.6 (18.8%) 135.5 (18.6%)
2Q08 163.4 0.3% 166.4 (0.1%)
3Q11 109.8 (0.8%) 103.8 (8.7%)
3Q10 110.7 (17.3%) 113.7 (13.3%)
3Q09 133.8 (17.3%) 131.1 (12.9%)
3Q08 161.8 (0.1%) 150.5 (8.0%)
4Q10 109.8 (17.3%) 108.7 (18.4%)
4Q09 132.7 4.9% 133.2 5.6%
4Q08 126.4 (23.0%) 126.1 (23.5%)
67
Ι ww
w.3
ds.c
om Ι
© D
assa
ult
Sys
tèm
es Ι
Q3
2011
Ear
ning
s A
nnou
ncem
ent
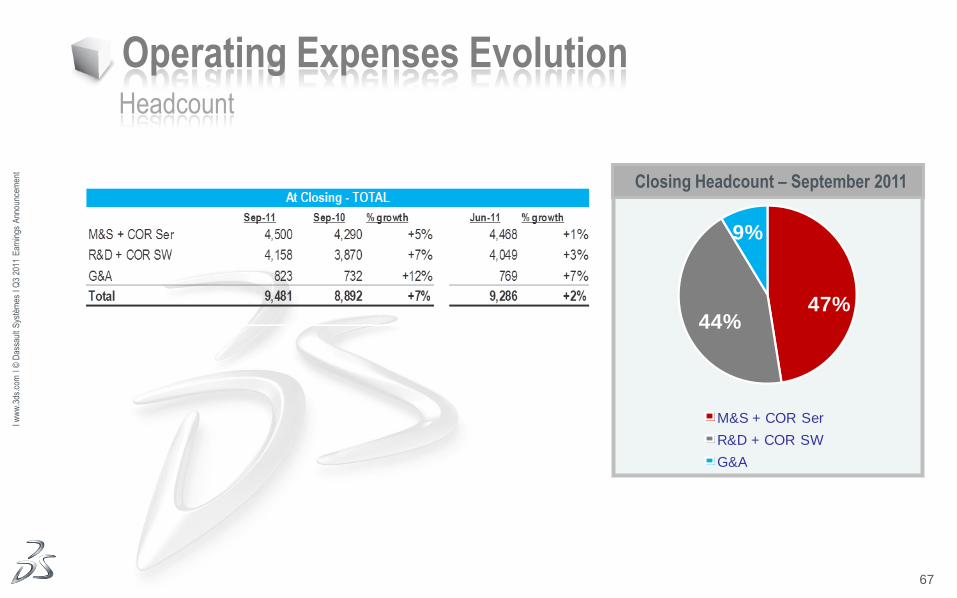
Operating Expenses Evolution Headcount
Closing Headcount – September 2011
47%44%
9%
M&S + COR Ser
R&D + COR SW
G&A
68
Ι ww
w.3
ds.c
om Ι
© D
assa
ult
Sys
tèm
es Ι
Q3
2011
Ear
ning
s A
nnou
ncem
ent
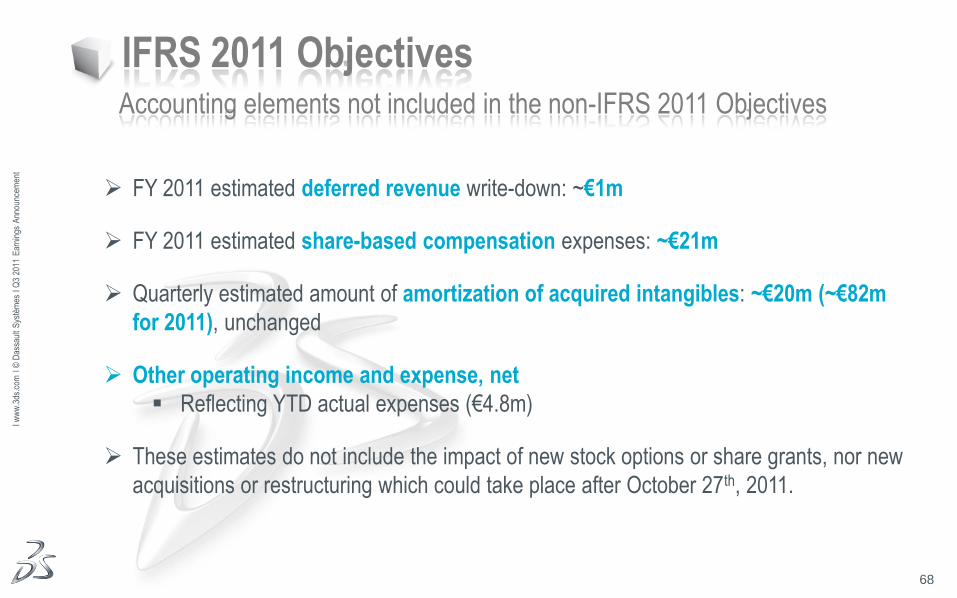
IFRS 2011 Objectives Accounting elements not included in the non-IFRS 2011 Objectives
FY 2011 estimated deferred revenue write-down: ~€1m
FY 2011 estimated share-based compensation expenses: ~€21m
Quarterly estimated amount of amortization of acquired intangibles: ~€20m (~€82m
for 2011), unchanged
Other operating income and expense, net
Reflecting YTD actual expenses (€4.8m)
These estimates do not include the impact of new stock options or share grants, nor new
acquisitions or restructuring which could take place after October 27th, 2011.

69
Ι ww
w.3
ds.c
om Ι
© D
assa
ult
Sys
tèm
es Ι
Q3
2011
Ear
ning
s A
nnou
ncem
ent
69


![Revista dir animal v6[1]](https://img.pdfslide.net/doc/110x75/63241cd63c19cb2bd106d5ad/revista-dir-animal-v61.jpg)

