Embed Size (px)
Citation preview
7.11. MICRONUTRIENT DEFICIENCIES Introduction Goitre due to iodine deficiency, blindness due to Vitamin A deficiency, dry and wet beriberi and pellagra were the major public health problems in pre-independent India. Sustained dietary changes of the population resulted in the elimination of beriberi and pellagra. Keratomalacia due to severe Vitamin A deficiency is no longer a public health problem. However, there has not been any decline in the prevalence of anaemia due to iron and folic acid deficiency; the decline in Vitamin A deficiency and iodine deficiency disorders has been very slow. In the last five years several major surveys (NNMB, NFHS and DLHS) have been done to obtain data on prevalence of micronutrient deficiencies in India. NNMB carried out a micronutrient survey on preschool children, adolescent girls, pregnant and lacating women in the rural communities in 9 states (2003). Data regarding prevalence of anaemia in adult men is available from the 2006 NNMB survey conducted in rural areas. ICMR carried out a task force study on micronutrient deficiency disorders including anaemia in pregnant women and adolescent girls 16 districts of India (2001). District Level Household Survey (DLHS) carried out haemoglobin estimation in preschool children, adolescent girls and pregnant women in 548 districts in all states. All these surveys had used cyanmethaemoglobin method for haemoglobin estimation. NFHS 2 and 3 also undertook haemoglobin estimation in women in reproductive age group and preschool children using haemocue and improved hemocue methods respectively. Studies from India had shown that hemocue method overestimates Hb and under estimates the prevalence of anaemia. All the surveys also provide information on coverage under IFA supplementation. All these surveys also provide information on coverage under massive dose vitamin A administration. NNMB surveys provide information on prevalence of Bitot’s spots in preschool children and goitre in 6-12 year old children. NIN has undertaken vitamin A estimation in a sub sample of children in NNMB states to compute the prevalence of subclinical vitamin A deficiency. All these surveys provide data on household access to iodised salt. NNMB surveys provide data on goitre prevalence in school children. There are small-scale studies on IDD using urinary excretion of iodine and IQ in children. These provided indepth information on impact of IDD in different time periods.
267
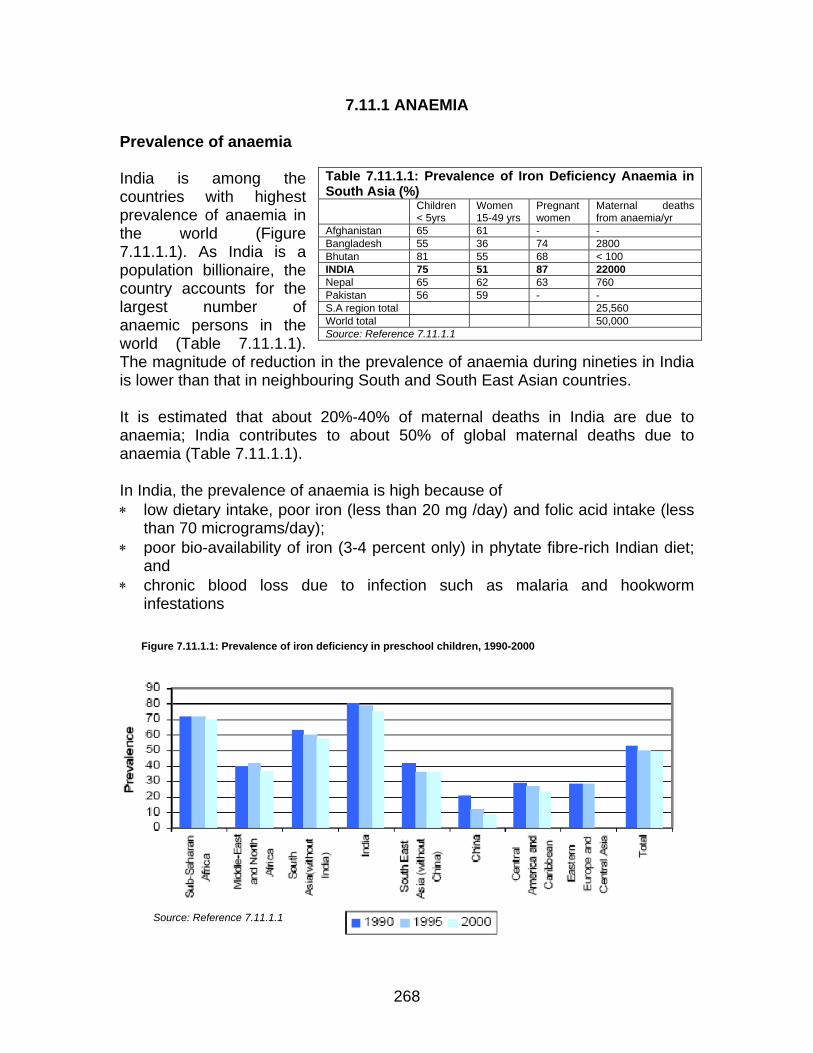
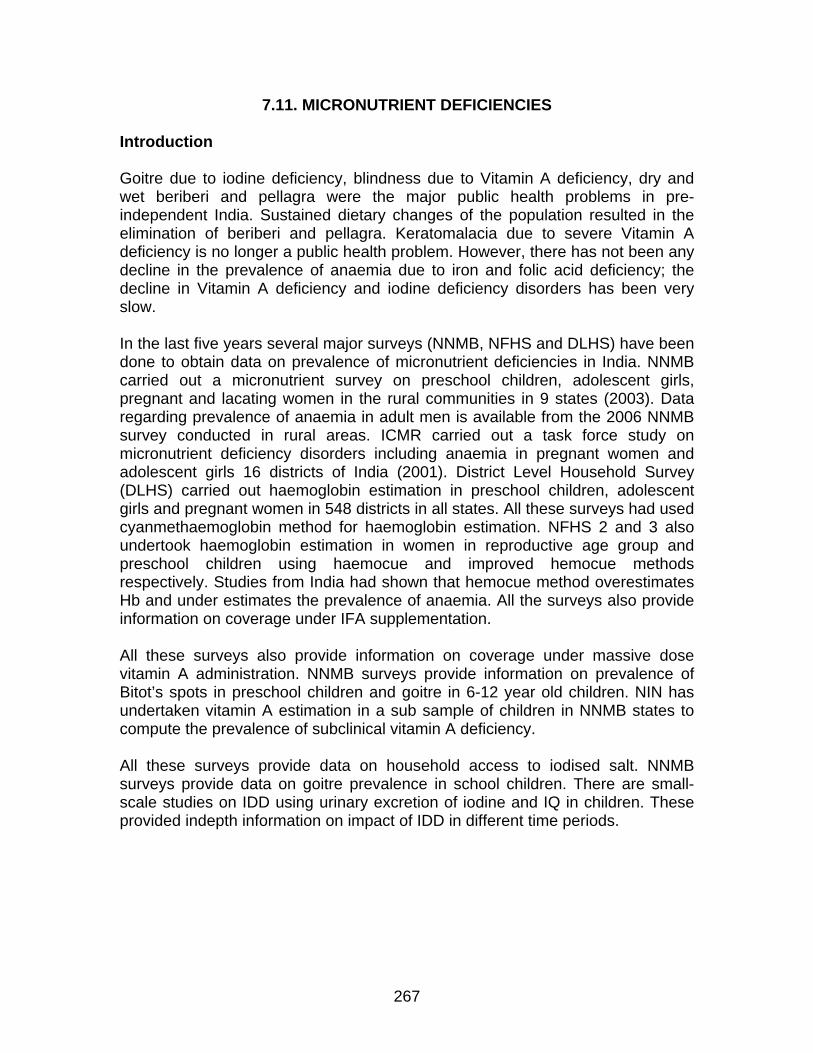
7.11.1 ANAEMIA Prevalence of anaemia India is among the countries with highest prevalence of anaemia in the world (Figure 7.11.1.1). As India is a population billionaire, the country accounts for the largest number of anaemic persons in the world (Table 7.11.1.1). The magnitude of reduction in the prevalence of anaemia during nineties in India is lower than that in neighbouring South and South East Asian countries.
Table 7.11.1.1: Prevalence of Iron Deficiency Anaemia in South Asia (%) Children
< 5yrs Women 15-49 yrs
Pregnant women
Maternal deaths from anaemia/yr
Afghanistan 65 61 - - Bangladesh 55 36 74 2800 Bhutan 81 55 68 < 100 INDIA 75 51 87 22000 Nepal 65 62 63 760 Pakistan 56 59 - - S.A region total 25,560 World total 50,000 Source: Reference 7.11.1.1
It is estimated that about 20%-40% of maternal deaths in India are due to anaemia; India contributes to about 50% of global maternal deaths due to anaemia (Table 7.11.1.1). In India, the prevalence of anaemia is high because of ∗ low dietary intake, poor iron (less than 20 mg /day) and folic acid intake (less
than 70 micrograms/day); ∗ poor bio-availability of iron (3-4 percent only) in phytate fibre-rich Indian diet;
and ∗ chronic blood loss due to infection such as malaria and hookworm
infestations
Figure 7.11.1.1: Prevalence of iron deficiency in preschool children, 1990-2000
Source: Reference 7.11.1.1
268
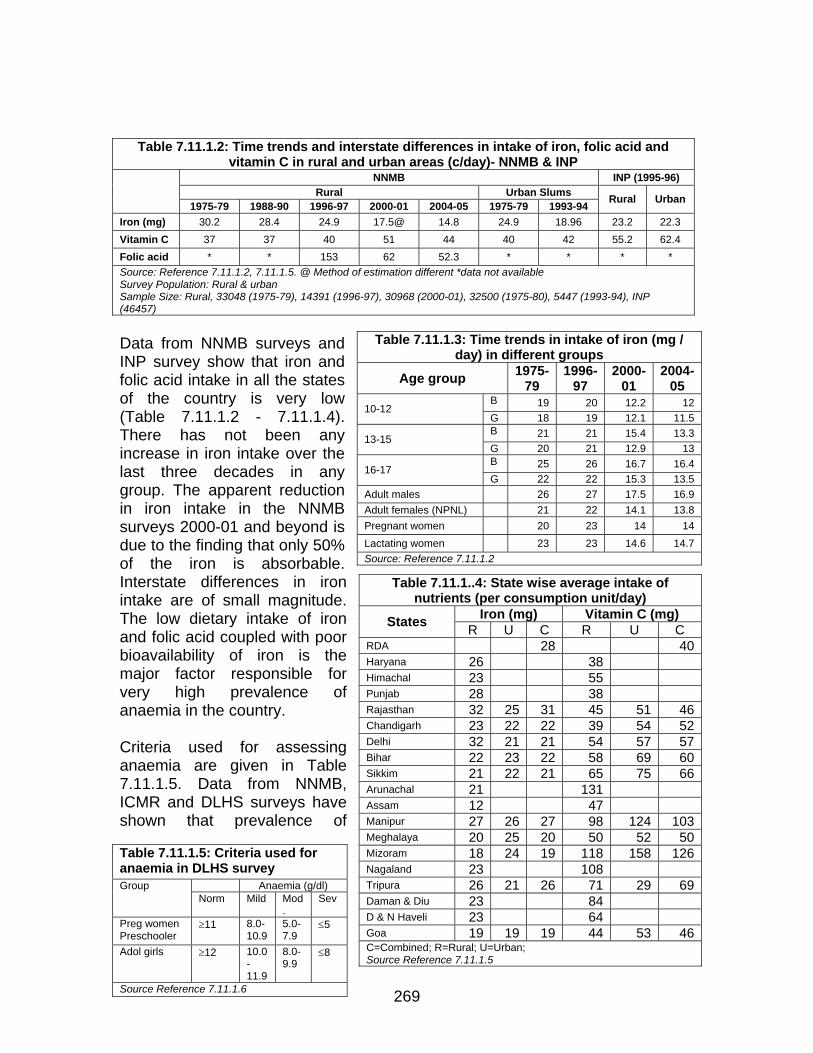
Table 7.11.1.2: Time trends and interstate differences in intake of iron, folic acid and vitamin C in rural and urban areas (c/day)- NNMB & INP
NNMB INP (1995-96) Rural Urban Slums
1975-79 1988-90 1996-97 2000-01 2004-05 1975-79 1993-94 Rural Urban
Iron (mg) 30.2 28.4 24.9 17.5@ 14.8 24.9 18.96 23.2 22.3 Vitamin C 37 37 40 51 44 40 42 55.2 62.4 Folic acid * * 153 62 52.3 * * * * Source: Reference 7.11.1.2, 7.11.1.5. @ Method of estimation different *data not available Survey Population: Rural & urban
Sample Size: Rural, 33048 (1975-79), 14391 (1996-97), 30968 (2000-01), 32500 (1975-80), 5447 (1993-94), INP (46457)
Data from NNMB surveys and INP survey show that iron and folic acid intake in all the states of the country is very low (Table 7.11.1.2 - 7.11.1.4). There has not been any increase in iron intake over the last three decades in any group. The apparent reduction in iron intake in the NNMB surveys 2000-01 and beyond is due to the finding that only 50% of the iron is absorbable. Interstate differences in iron intake are of small magnitude. The low dietary intake of iron and folic acid coupled with poor bioavailability of iron is the major factor responsible for very high prevalence of anaemia in the country.
Table 7.11.1.3: Time trends in intake of iron (mg / day) in different groups
Age group 1975-79
1996-97
2000-01
2004-05
B 19 20 12.2 12 10-12 G 18 19 12.1 11.5 B 21 21 15.4 13.3 13-15 G 20 21 12.9 13 B 25 26 16.7 16.4 16-17 G 22 22 15.3 13.5
Adult males 26 27 17.5 16.9 Adult females (NPNL) 21 22 14.1 13.8 Pregnant women 20 23 14 14 Lactating women 23 23 14.6 14.7 Source: Reference 7.11.1.2
269
Criteria used for assessing anaemia are given in Table 7.11.1.5. Data from NNMB, ICMR and DLHS surveys have shown that prevalence of
Table 7.11.1..4: State wise average intake of nutrients (per consumption unit/day)
Iron (mg) Vitamin C (mg) States R U C R U C RDA 28 40Haryana 26 38 Himachal 23 55 Punjab 28 38 Rajasthan 32 25 31 45 51 46Chandigarh 23 22 22 39 54 52Delhi 32 21 21 54 57 57Bihar 22 23 22 58 69 60Sikkim 21 22 21 65 75 66Arunachal 21 131 Assam 12 47 Manipur 27 26 27 98 124 103Meghalaya 20 25 20 50 52 50Mizoram 18 24 19 118 158 126Nagaland 23 108 Tripura 26 21 26 71 29 69Daman & Diu 23 84 D & N Haveli 23 64 Goa 19 19 19 44 53 46
Table 7.11.1.5: Criteria used for anaemia in DLHS survey
Anaemia (g/dl) Group Norm Mild Mod
. Sev
Preg women Preschooler
≥11 8.0-10.9
5.0-7.9
≤5
Adol girls ≥12 10.0-11.9
8.0-9.9
≤8
Source Reference 7.11.1.6
C=Combined; R=Rural; U=Urban; Source Reference 7.11.1.5
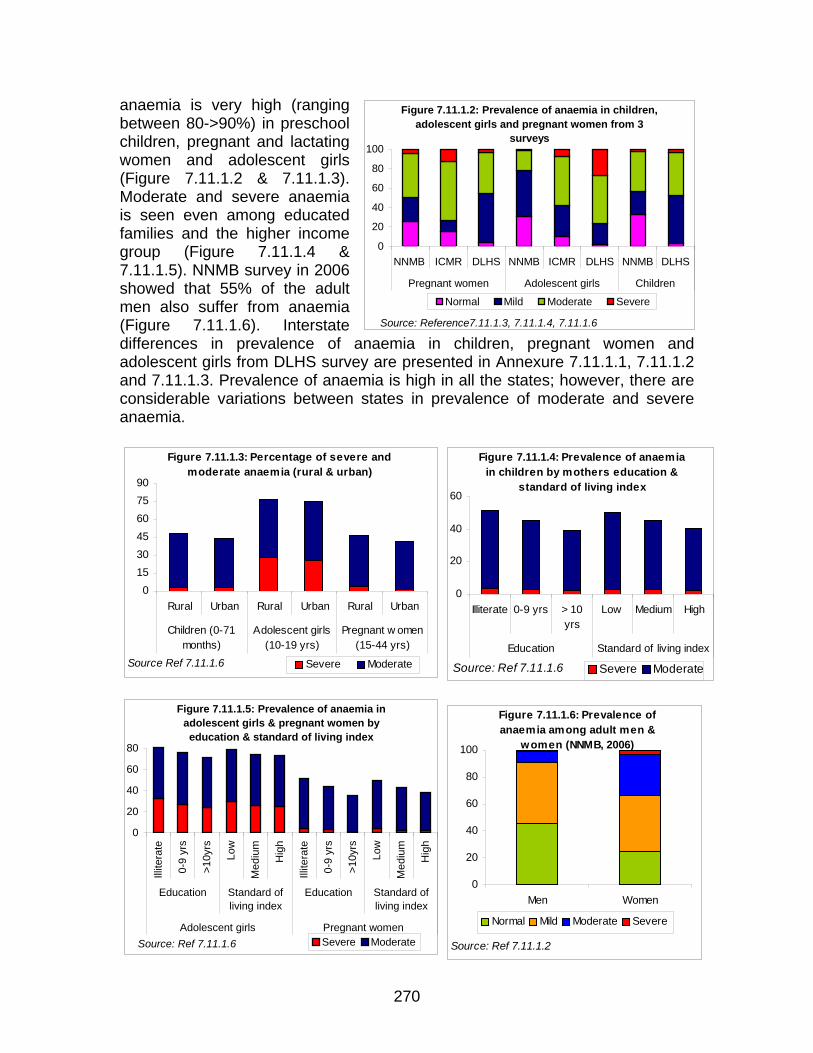
Figure 7.11.1.2: Prevalence of anaemia in children, adolescent girls and pregnant women from 3
surveys
0
20
40
60
80
100
NNMB ICMR DLHS NNMB ICMR DLHS NNMB DLHS
Pregnant women Adolescent girls Children
Normal Mild Moderate Severe
Source: Reference7.11.1.3, 7.11.1.4, 7.11.1.6
anaemia is very high (ranging between 80->90%) in preschool children, pregnant and lactating women and adolescent girls (Figure 7.11.1.2 & 7.11.1.3). Moderate and severe anaemia is seen even among educated families and the higher income group (Figure 7.11.1.4 & 7.11.1.5). NNMB survey in 2006 showed that 55% of the adult men also suffer from anaemia (Figure 7.11.1.6). Interstate differences in prevalence of anaemia in children, pregnant women and adolescent girls from DLHS survey are presented in Annexure 7.11.1.1, 7.11.1.2 and 7.11.1.3. Prevalence of anaemia is high in all the states; however, there are considerable variations between states in prevalence of moderate and severe anaemia.
Figure 7.11.1.3: Percentage of severe and moderate anaemia (rural & urban)
45607590
01530
Rural Urban Rural Urban Rural Urban
Children (0-71months)
Adolescent girls(10-19 yrs)
Pregnant w omen(15-44 yrs)
Severe ModerateSource Ref 7.11.1.6
Figure 7.11.1.4: Prevalence of anaemia in children by mothers education &
standard of living index
40
60
0
20
Illiterate 0-9 yrs > 10yrs
Low Medium High
Education Standard of living index
Severe ModerateSource: Ref 7.11.1.6
Figure 7.11.1.5: Prevalence of anaemia in
adolescent girls & pregnant women by education & standard of living index
0
20
40
60
80
Illite
rate
0-9
yrs
>10y
rs
Low
Med
ium
Hig
h
Illite
rate
0-9
yrs
>10y
rs
Low
Med
ium
Hig
h
Figure 7.11.1.6: Prevalence of anaemia among adult men &
women (NNMB, 2006)
0
20
40
60
80
100
Men Women
Normal Mild Moderate Severe
Education Standard ofliving index
Education Standard ofliving index
Adolescent girls Pregnant women Severe ModerateSource: Ref 7.11.1.6 Source: Ref 7.11.1.2
270
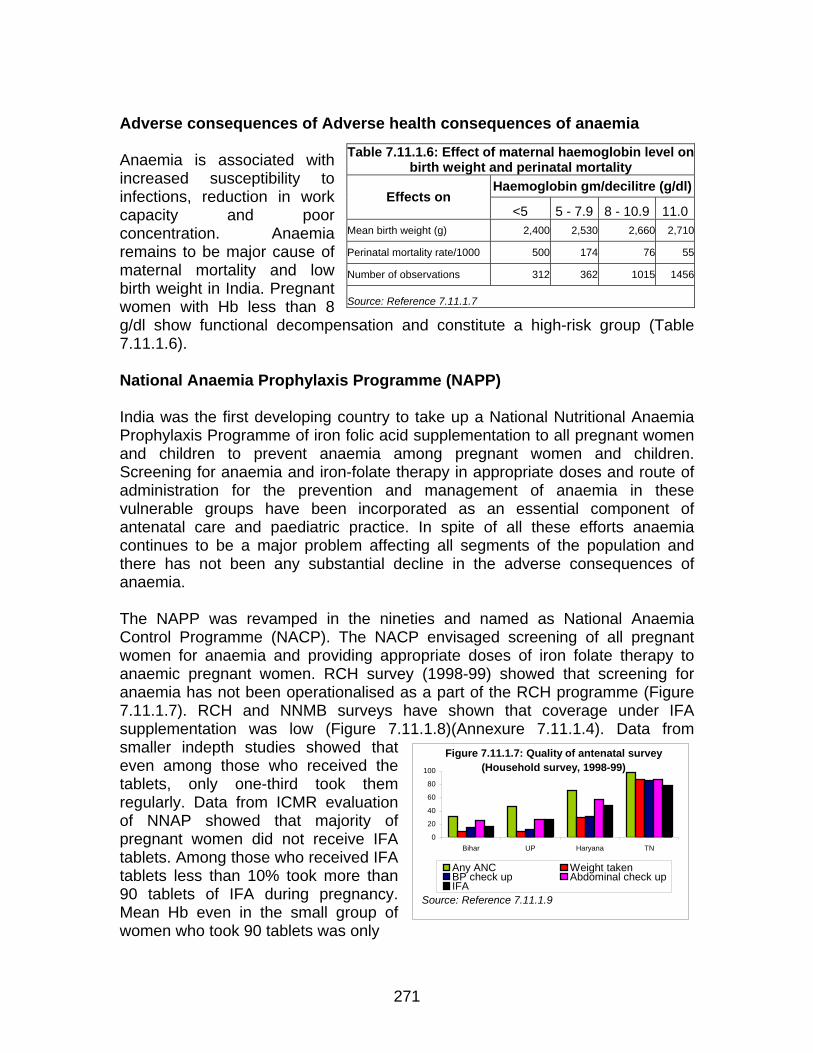
Figure 7.11.1.7: Quality of antenatal survey (Household survey, 1998-99)
0
20
40
60
80
100
Bihar UP Haryana TN
Any ANC Weight takenBP check up Abdominal check upIFA
Source: Reference 7.11.1.9
dverse consequences of Adverse health consequences of anaemia
naemia is associated with
ute a high-risk group (Table
ational Anaemia Prophylaxis Programme (NAPP)
dia was the first developing country to take up a National Nutritional Anaemia
he NAPP was revamped in the nineties and named as National Anaemia
vel on
A
Table 7.11.1.6: Effect of maternal haemoglobin leAincreased susceptibility to infections, reduction in work capacity and poor concentration. Anaemia remains to be major cause of maternal mortality and low birth weight in India. Pregnant women with Hb less than 8 g/dl show functional decompen7.11.1.6).
birth weight and perinatal mortality Haemoglobin gm/decilitre (g/dl)
Effects on <5 5 - 7.9 8 - 10.9 11.0
Mean birth weight (g) 002,4 2,530 2,660 2,710
Perinatal mortality rate/1000 500 174 76 55
Number of observations 312 362 10 1415 56
Source: Reference 7.11.1.7
sation and constit
N InProphylaxis Programme of iron folic acid supplementation to all pregnant women and children to prevent anaemia among pregnant women and children. Screening for anaemia and iron-folate therapy in appropriate doses and route of administration for the prevention and management of anaemia in these vulnerable groups have been incorporated as an essential component of antenatal care and paediatric practice. In spite of all these efforts anaemia continues to be a major problem affecting all segments of the population and there has not been any substantial decline in the adverse consequences of anaemia. TControl Programme (NACP). The NACP envisaged screening of all pregnant women for anaemia and providing appropriate doses of iron folate therapy to anaemic pregnant women. RCH survey (1998-99) showed that screening for anaemia has not been operationalised as a part of the RCH programme (Figure 7.11.1.7). RCH and NNMB surveys have shown that coverage under IFA supplementation was low (Figure 7.11.1.8)(Annexure 7.11.1.4). Data from smaller indepth studies showed that even among those who received the tablets, only one-third took them regularly. Data from ICMR evaluation of NNAP showed that majority of pregnant women did not receive IFA tablets. Among those who received IFA tablets less than 10% took more than 90 tablets of IFA during pregnancy. Mean Hb even in the small group of women who took 90 tablets was only
271
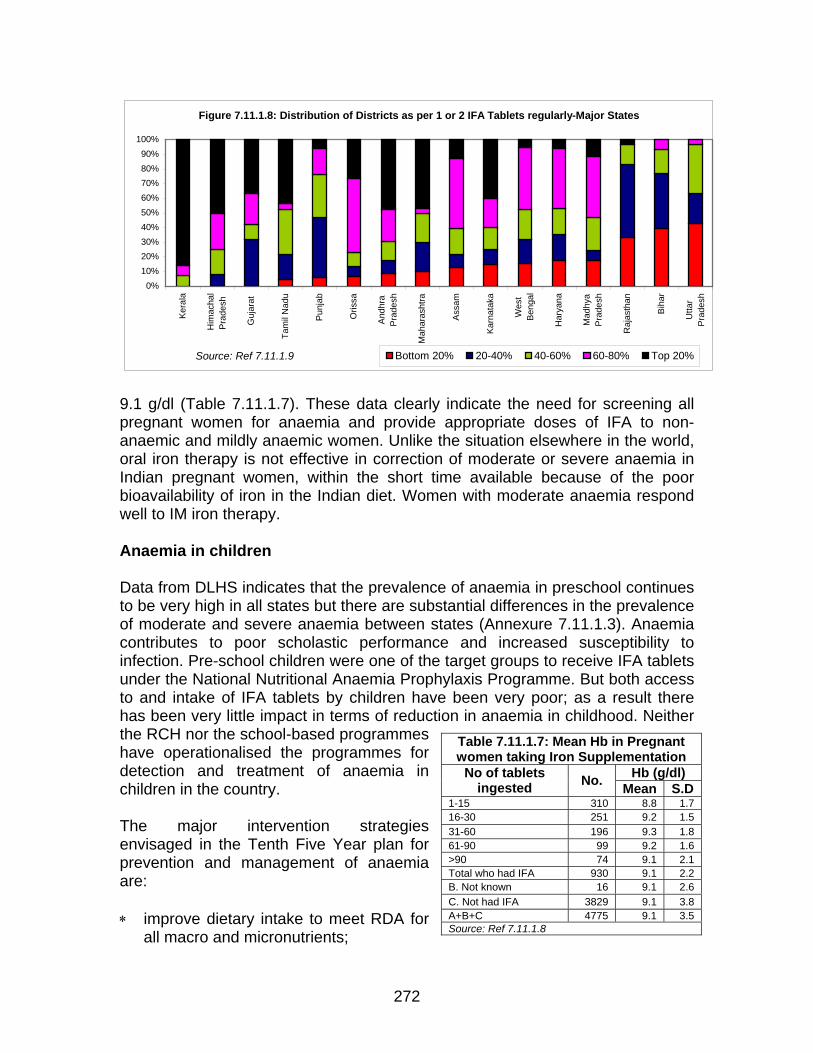
9.1 g/dl (Table 7.11.1.7). These data clearly indicate the need for screening all
regnant women for anaemia and provide appropriate doses of IFA to non-
tes that the prevalence of anaemia in preschool continues be very high in all states but there are substantial differences in the prevalence
ntion strategies nvisaged in the Tenth Five Year plan for
prove dietary intake to meet RDA for all macro and micronutrients;
panaemic and mildly anaemic women. Unlike the situation elsewhere in the world, oral iron therapy is not effective in correction of moderate or severe anaemia in Indian pregnant women, within the short time available because of the poor bioavailability of iron in the Indian diet. Women with moderate anaemia respond well to IM iron therapy. Anaemia in children Data from DLHS indicatoof moderate and severe anaemia between states (Annexure 7.11.1.3). Anaemia contributes to poor scholastic performance and increased susceptibility to infection. Pre-school children were one of the target groups to receive IFA tablets under the National Nutritional Anaemia Prophylaxis Programme. But both access to and intake of IFA tablets by children have been very poor; as a result there has been very little impact in terms of reduction in anaemia in childhood. Neither the RCH nor the school-based programmes have operationalised the programmes for detection and treatment of anaemia in children in the country. The major interve
Table 7.11.1.7: Mean Hb in Pregnant women taking Iron Supplementation
eprevention and management of anaemia are: ∗ im
Hb (g/dl) No of tablets ingested No. Mean S.D
1-15 310 8.8 1.716-30 251 9.2 1.5 31-60 196 9.3 1.8 61-90 99 9.2 1.6 >90 74 9.1 2.1 Total who had IFA 930 9.1 2.2 B. Not known 16 9.1 2.6 C. Not had IFA 3829 9.1 3.8 A+B+C 4775 9.1 3.5 Source: Ref 7.11.1.8
Figure 7.11.1.8: Distribution of Districts as per 1 or 2 IFA Tablets regularly-Major States
0%10%20%30%40%50%60%70%80%90%
100%
Ker
ala
Him
acha
lP
rade
sh
Guj
arat
Tam
il N
adu
Pun
jab
Oris
sa
And
hra
Pra
desh
Mah
aras
htra
Ass
am
Kar
nata
ka
Wes
tB
enga
l
Har
yana
Mad
hya
Pra
desh
Raj
asth
an
Bih
ar
Utta
rP
rade
sh
Bottom 20% 20-40% 40-60% 60-80% Top 20%Source: Ref 7.11.1.9
272
∗ dietary diversification ensuring inclusion of iron folate rich foods as well as
∗ f iron and iodine-fortified salt omote
∗ ulnerable groups (such as
∗ ment of anaemia depending upon its severity, chronicity,
enth Plan goals were: -
Screening of children for anaemia wherever required and appropriate
∗ women for anaemia and appropriate
∗ the prevalence of anaemia by 25 per cent in children, pregnant
ome of the strategies suggested in the Tenth Five Year Plan have been
eferences Undernourished Children: A Call For Reform and Action, World Bank
food items that promote iron absorption; food fortification, especially introduction o
∗ health and nutrition education to improve over all dietary intakes and prconsumption of iron and folate-rich foodstuffs; and screening for early detection of anaemia among vpregnant women). appropriate managephysiological status of the individual and the time available for correction of anaemia
T ∗
treatment of those found anaemic. Universal screening of pregnanttreatment Reducing and lactating women and adolescents.
Soperationalised in some institutions (screening for anaemia during pregnancy- Delhi) and states (double fortified salt supply through PDS- Chattisgarh and DFS in ICDS food supplementation in Uttarakhand). However, the integrated package of all interventions has not been operationalised in any state. As a result, goals set have not been achieved. It is hoped that the package of interventions will be fully operationalised in the Eleventh Plan so that the goals set in Tenth plan could be achieved by 2012. R7.11.1.1 India’s
Report:http://siteresources.worldbank.org/HEALTHNUTRITIONANDPOPULATION/Resources/281627-1095698140167/IndiaUndernourishedChildrenFinal.pdf; last accessed on 24/09/07
toring Bureau (NNMB). 1975-2006. NNMB Reports. National 7.11.1.2 National Nutrition MoniInstitute of Nutrition, Hyderabad
7.11.1.3 National Nutrition Monitoring Bureau (NNMB). 2002. NNMB Micronutrient Survey. National Institute of Nutrition, Hyderabad
7.11.1.4 Indian Council of Medical Research (ICMR) 2004. Micronutrient Profile of Indian Population. New Delhi
7.11.1.5 Department of Women and Child Development (DWCD). 1995-96. India Nutrition Profile. Government of India, New Delhi.
7.11.1.6 IIPS . District Level Household Survey, RCH survey 2, 2006 www.iipsindia.org7.11.1.7 Prema Ramachandran. 1989. Nutrition in Pregnancy. In Women and Nutrition in
7.11.1.8 I
India, Eds. C. Gopalan, Suminder Kaur. Special Publication No. 5. Nutrition Foundation of India, New Delhi.
CMR: Evaluation of National Nutrition Anaemia Prophylaxis Program. 1989. ICMR, New Delhi.
Annexure 7.11.1.1
273
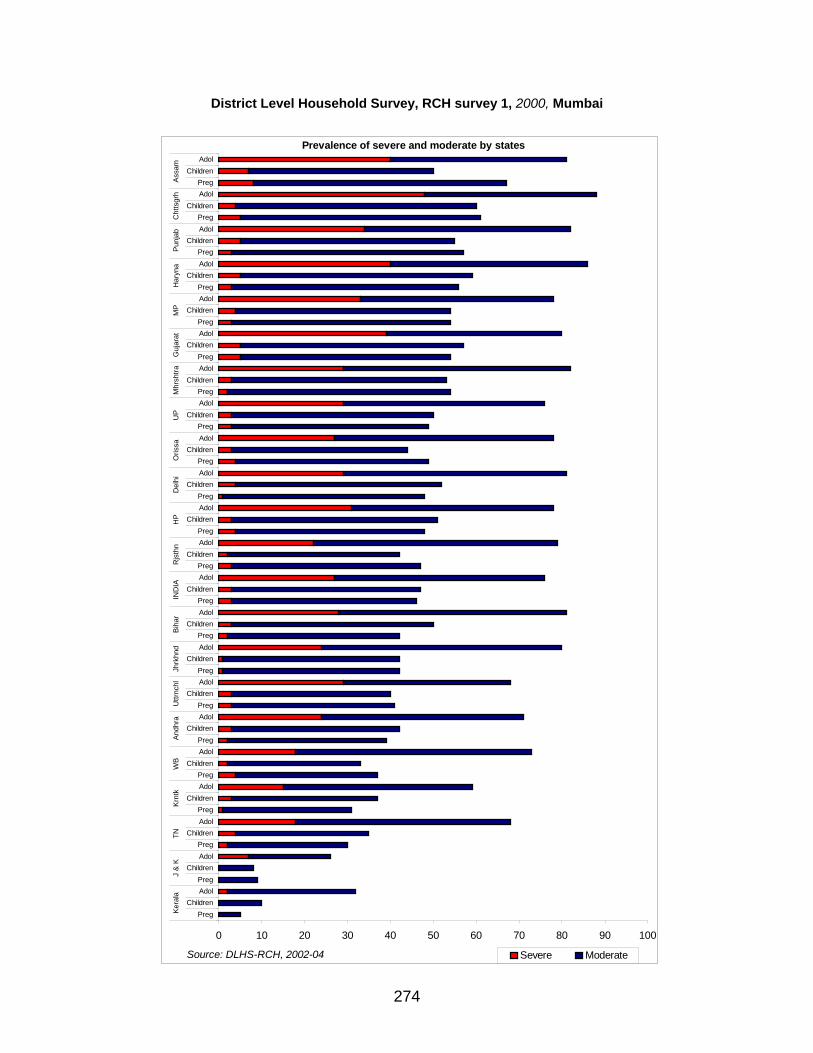
District Level Household Survey, RCH survey 1, 2000, Mum
bai
Prevalence of severe and moderate by states
00 10 20 30 40 50 60 70 80 90 10
PregChildren
AdolPreg
ChildrenAdolPreg
ChildrenAdolPreg
ChildrenAdolPreg
ChildrenAdolPreg
ChildrenAdolPreg
ChildrenAdolPreg
ChildrenAdolPreg
ChildrenAdolPreg
ChildrenAdolPreg
ChildrenAdolPreg
ChildrenAdolPreg
ChildrenAdolPreg
ChildrenAdolPreg
ChildrenAdolPreg
ChildrenAdolPreg
ChildrenAdolPreg
ChildrenAdolPreg
ChildrenAdolPreg
ChildrenAdolPreg
ChildrenAdolPreg
ChildrenAdol
Kera
laJ
& K
TNKr
ntk
WB
Andh
raU
ttrnc
hlJh
rkhn
dBi
har
IND
IAR
jsth
nH
PD
elhi
Oris
saU
PM
hrsh
traG
ujar
atM
PH
aryn
aPu
njab
Cht
tsgr
hAs
sam
Severe ModerateSource: DLHS-RCH, 2002-04
274
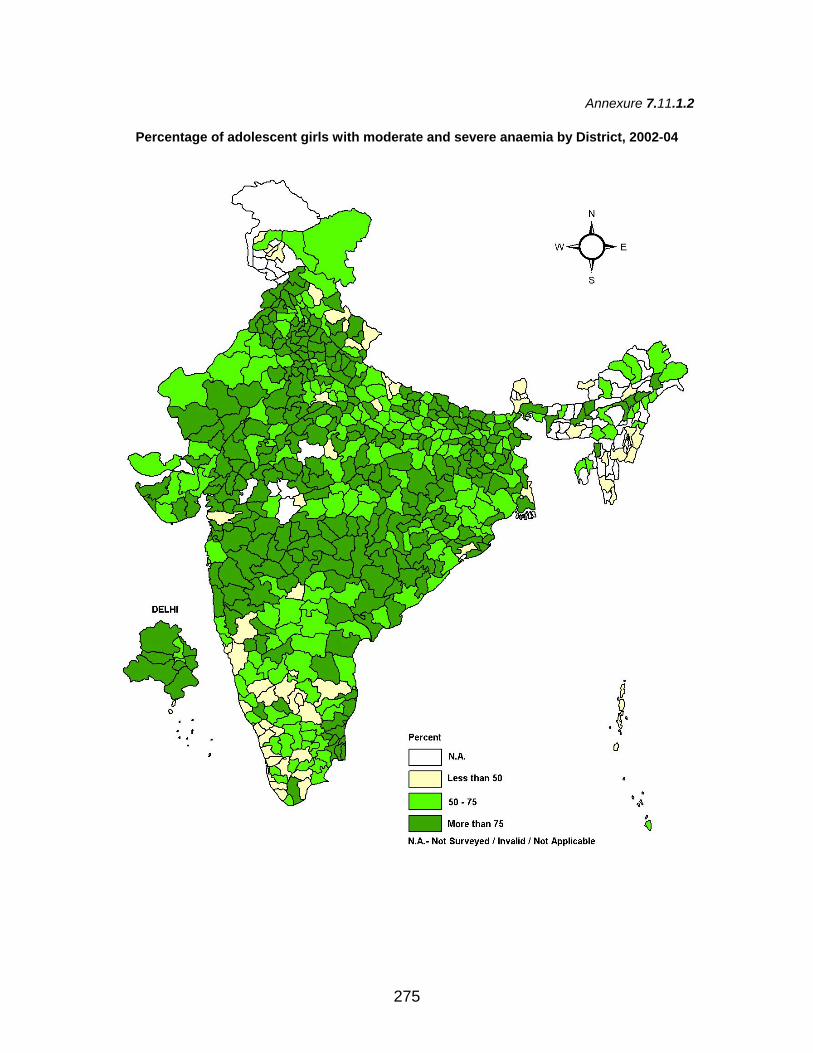
Annexure 7.11.1.2
Percentage of adolescent girls with moderate and severe anaemia by District, 2002-04
275
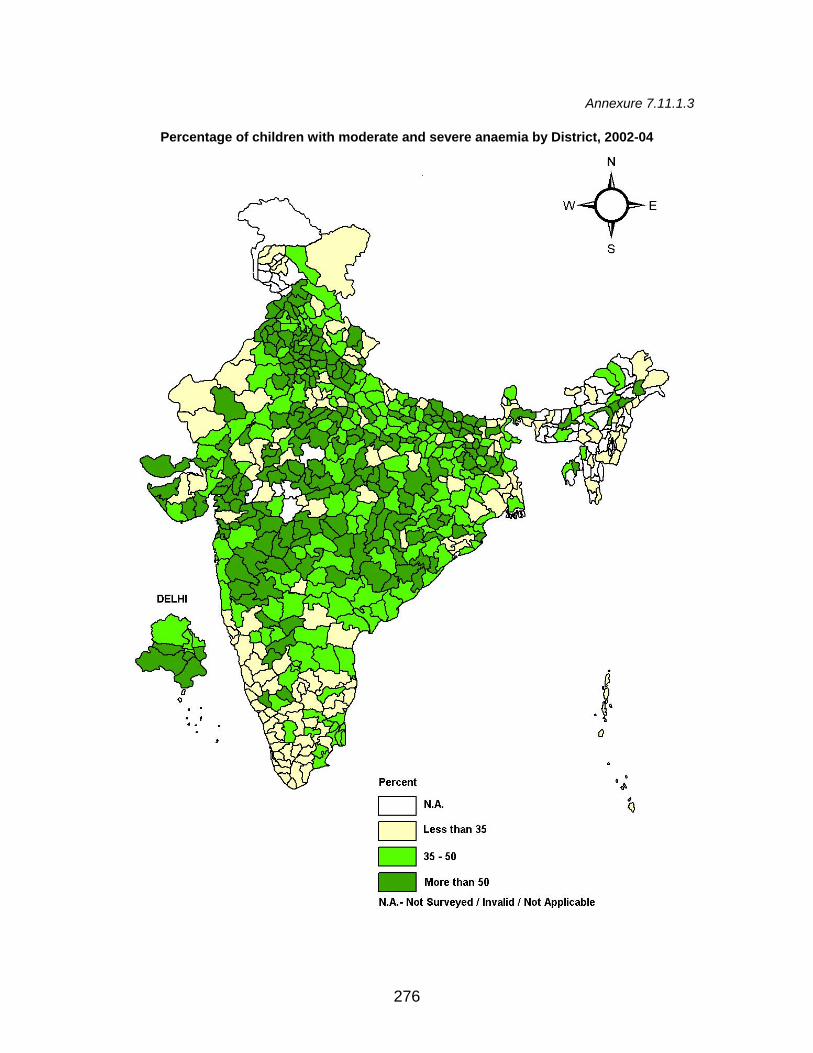
Annexure 7.11.1.3
Percentage of children with moderate and severe anaemia by District, 2002-04
276
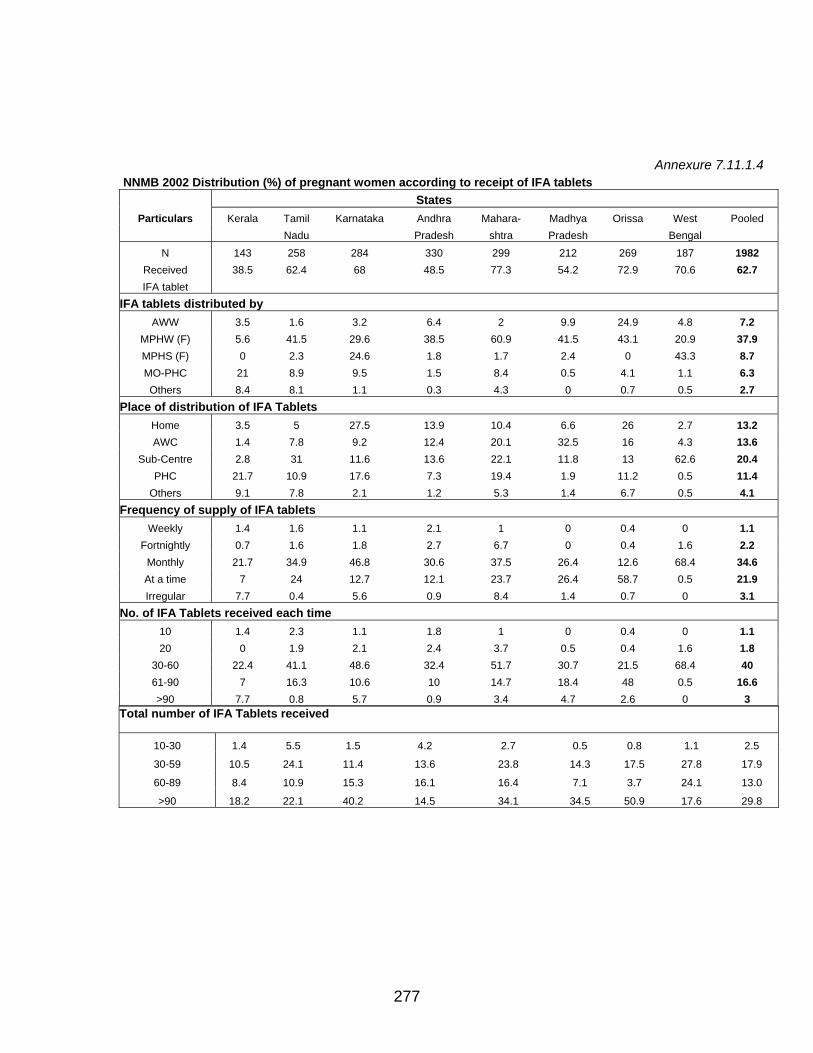
Annexure 7.11.1.4 NNMB 2002 Distribution (%) of pregnant women according to receipt of IFA tablets States
Particulars Kerala Tamil Karnataka Andhra Mahara- Madhya Orissa West Pooled Nadu Pradesh shtra Pradesh Bengal
N 143 258 284 330 299 212 269 187 1982 Received 38.5 62.4 68 48.5 77.3 54.2 72.9 70.6 62.7 IFA tablet
IFA tablets distributed by AWW 3.5 1.6 3.2 6.4 2 9.9 24.9 4.8 7.2
MPHW (F) 5.6 41.5 29.6 38.5 60.9 41.5 43.1 20.9 37.9 MPHS (F) 0 2.3 24.6 1.8 1.7 2.4 0 43.3 8.7 MO-PHC 21 8.9 9.5 1.5 8.4 0.5 4.1 1.1 6.3 Others 8.4 8.1 1.1 0.3 4.3 0 0.7 0.5 2.7
Place of distribution of IFA Tablets Home 3.5 5 27.5 13.9 10.4 6.6 26 2.7 13.2 AWC 1.4 7.8 9.2 12.4 20.1 32.5 16 4.3 13.6
Sub-Centre 2.8 31 11.6 13.6 22.1 11.8 13 62.6 20.4 PHC 21.7 10.9 17.6 7.3 19.4 1.9 11.2 0.5 11.4
Others 9.1 7.8 2.1 1.2 5.3 1.4 6.7 0.5 4.1 Frequency of supply of IFA tablets
Weekly 1.4 1.6 1.1 2.1 1 0 0.4 0 1.1 Fortnightly 0.7 1.6 1.8 2.7 6.7 0 0.4 1.6 2.2
Monthly 21.7 34.9 46.8 30.6 37.5 26.4 12.6 68.4 34.6 At a time 7 24 12.7 12.1 23.7 26.4 58.7 0.5 21.9 Irregular 7.7 0.4 5.6 0.9 8.4 1.4 0.7 0 3.1
No. of IFA Tablets received each time 10 1.4 2.3 1.1 1.8 1 0 0.4 0 1.1 20 0 1.9 2.1 2.4 3.7 0.5 0.4 1.6 1.8
30-60 22.4 41.1 48.6 32.4 51.7 30.7 21.5 68.4 40 61-90 7 16.3 10.6 10 14.7 18.4 48 0.5 16.6 >90 7.7 0.8 5.7 0.9 3.4 4.7 2.6 0 3
Total number of IFA Tablets received
10-30 1.4 5.5 1.5 4.2 2.7 0.5 0.8 1.1 2.5
30-59 10.5 24.1 11.4 13.6 23.8 14.3 17.5 27.8 17.9
60-89 8.4 10.9 15.3 16.1 16.4 7.1 3.7 24.1 13.0
>90 18.2 22.1 40.2 14.5 34.1 34.5 50.9 17.6 29.8
277

278