Embed Size (px)
Citation preview
1SHANGHAI COMMERCIAL BANK ANNUAL REPORT 2013
Contents
2 Corporate Profile
3 Five-Year Financial Summary
4 Notice of Annual General Meeting
5-6 Board of Directors
7 Management
8-11 Biographical Details of Directors and Senior Management
12-17 2013 at a Glance
18-19 Message to Shareholders
20-22 Report of the Directors
23-26 Corporate Governance Report
27 Independent Auditor’s Report
28 Consolidated Income Statement
29 Consolidated Statement of Comprehensive Income
30 Income Statement
31 Statement of Comprehensive Income
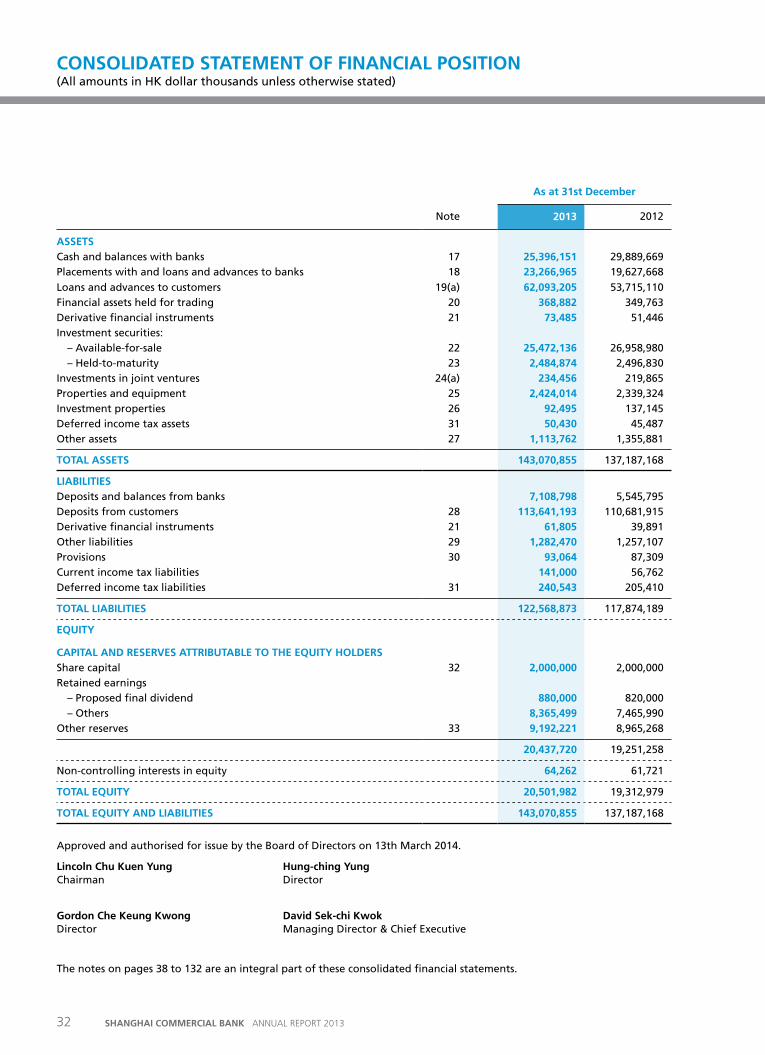
32 Consolidated Statement of Financial Position
33 Statement of Financial Position
34-35 Consolidated Statement of Changes in Equity
36-37 Consolidated Statement of Cash Flows
38-132 Notes to the Consolidated Financial Statements
133-152 Supplementary Financial Information
153-154 Branches and Subsidiary Companies
2 SHANGHAI COMMERCIAL BANK ANNUAL REPORT 2013
Corporate profile
Established in November 1950, Shanghai Commercial Bank (the ‘Bank’) is one of the renowned local Chinese banks in Hong Kong and has a niche market position in the corporate and trade finance sectors.
The Bank has always been pursuing the motto of its founder, Mr. Kwang-pu Chen, to ‘Serve the Community’. The Bank’s slogan of ‘For Personalized Service’ and ‘All in a Family’ denotes the Bank’s devotion to providing personalized services to its clients and promoting a harmonious relationship among its staff members.
The Bank offers a comprehensive range of retail and corporate banking services and products including deposits, securities trading, credit cards, wealth management services and corporate and personal loans.
In addition to 44 branches in Hong Kong, the Bank has a global network of overseas branches in San Francisco, Los Angeles, New York and London. In Mainland China, the Bank has established a branch presence in Shenzhen and Shanghai.
3SHANGHAI COMMERCIAL BANK ANNUAL REPORT 2013
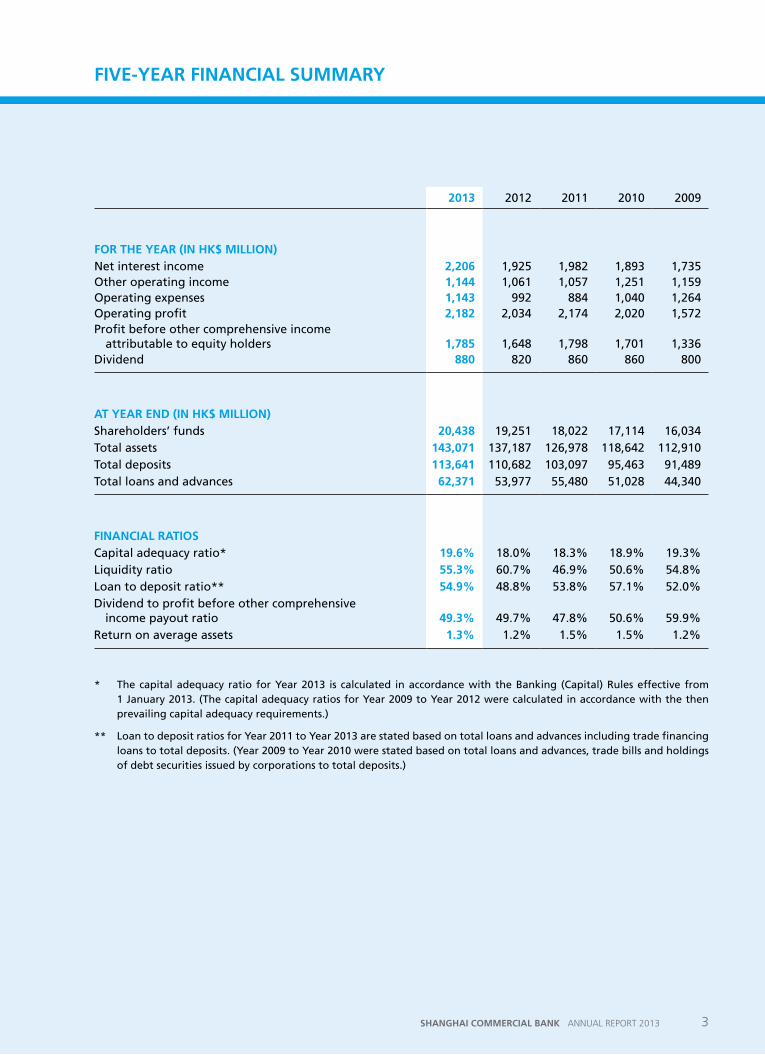
2013 2012 2011 2010 2009
for tHe Year (in HK$ Million)Net interest income 2,206 1,925 1,982 1,893 1,735 Other operating income 1,144 1,061 1,057 1,251 1,159 Operating expenses 1,143 992 884 1,040 1,264 Operating profit 2,182 2,034 2,174 2,020 1,572 Profit before other comprehensive income
attributable to equity holders 1,785 1,648 1,798 1,701 1,336 Dividend 880 820 860 860 800
at Year enD (in HK$ Million)Shareholders’ funds 20,438 19,251 18,022 17,114 16,034 Total assets 143,071 137,187 126,978 118,642 112,910 Total deposits 113,641 110,682 103,097 95,463 91,489 Total loans and advances 62,371 53,977 55,480 51,028 44,340
finanCial ratiosCapital adequacy ratio* 19.6% 18.0% 18.3% 18.9% 19.3%Liquidity ratio 55.3% 60.7% 46.9% 50.6% 54.8%Loan to deposit ratio** 54.9% 48.8% 53.8% 57.1% 52.0%Dividend to profit before other comprehensive
income payout ratio 49.3% 49.7% 47.8% 50.6% 59.9%Return on average assets 1.3% 1.2% 1.5% 1.5% 1.2%
* The capital adequacy ratio for Year 2013 is calculated in accordance with the Banking (Capital) Rules effective from 1 January 2013. (The capital adequacy ratios for Year 2009 to Year 2012 were calculated in accordance with the then prevailing capital adequacy requirements.)
** Loan to deposit ratios for Year 2011 to Year 2013 are stated based on total loans and advances including trade financing loans to total deposits. (Year 2009 to Year 2010 were stated based on total loans and advances, trade bills and holdings of debt securities issued by corporations to total deposits.)
fiVe-Year finanCial sUMMarY
4 SHANGHAI COMMERCIAL BANK ANNUAL REPORT 2013
notiCe of annUal General MeetinG
NOTICE IS HEREBY GIVEN that the Sixty-third Annual General Meeting of the Members of the Bank will be held at its Registered Office, 35/F., Gloucester Tower, The Landmark, 15 Queen’s Road Central, Hong Kong on Thursday, 8th May 2014 at 10:00 a.m. to transact the following business:
(1) To receive and consider the audited financial statements and the Reports of the Directors and of the Auditor for the year ended 31st December 2013;
(2) To declare Dividend in respect of the year 2013;(3) To elect Directors;(4) To approve the payment of Directors’ fees for the year ended 31st December 2013;(5) To re-appoint Auditor and to authorise the Directors to fix their remuneration.
A Member entitled to attend and vote at the Meeting is entitled to appoint a proxy to attend and vote instead of him. A proxy need not also be a Member.
The Register of Members of the Bank will be closed from Wednesday, 30th April 2014 to Thursday, 8th May 2014, both days inclusive.
By Order of the BoardMay Yuen-ling KwokCorporate Secretary
Hong Kong, 22nd January 2014
5SHANGHAI COMMERCIAL BANK ANNUAL REPORT 2013
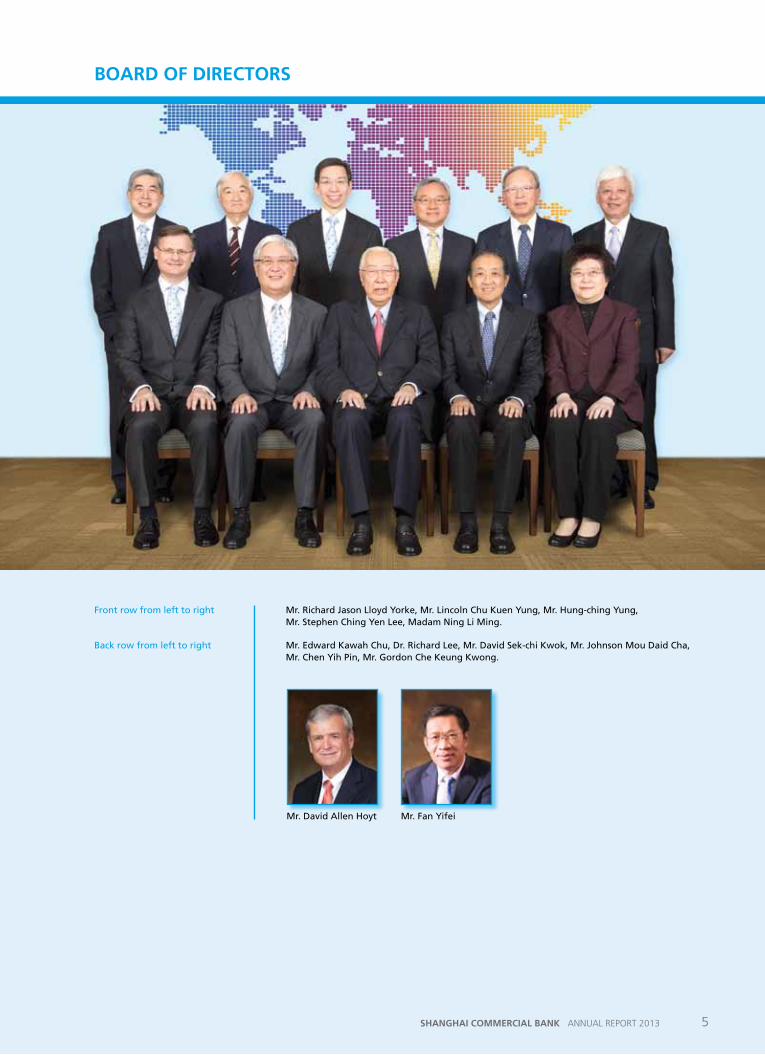
Front row from left to right Mr. Richard Jason Lloyd Yorke, Mr. Lincoln Chu Kuen Yung, Mr. Hung-ching Yung, Mr. Stephen Ching Yen Lee, Madam Ning Li Ming.
Back row from left to right Mr. Edward Kawah Chu, Dr. Richard Lee, Mr. David Sek-chi Kwok, Mr. Johnson Mou Daid Cha, Mr. Chen Yih Pin, Mr. Gordon Che Keung Kwong.
Mr. Fan YifeiMr. David Allen Hoyt
boarD of DireCtors
6 SHANGHAI COMMERCIAL BANK ANNUAL REPORT 2013
boarD of DireCtors (ContinUeD)
# lincoln Chu Kuen Yung, JP, FHKIB Chairman & Non-executive Director
^ David sek-chi Kwok, FHKIB, FCIB Managing Director & Chief Executive
# Hung-ching Yung, JP
* Dr. richard lee
* Johnson Mou Daid Cha (Dr. Lam Chat Yu, Alternate)
# stephen Ching Yen lee
^ edward Kawah Chu
# David allen Hoyt (John Van Antwerp Rindlaub, Alternate)
# Chen Yih pin (Yi-Jen Chiou, Alternate) (resigned on 6th March 2013) (John Con-sing Yung, Alternate) (appointed on 6th March 2013)
* Gordon Che Keung Kwong
# ning li Ming (Ye Jun, Alternate)
# richard Jason lloyd Yorke (Ignatius Wooi-kean Choong, Alternate)
# fan Yifei (Li Jian Guo, Alternate)
^ Executive Directors
* Independent Non-executive Directors
# Non-executive Directors
7SHANGHAI COMMERCIAL BANK ANNUAL REPORT 2013
ManaGeMent
eXeCUtiVes
Managing Director & Chief executive David Sek-chi Kwok
alternate Chief executives Edward Kawah Chu Paul Kun-kow Wong
assistant General Managers Hon-ming Mak Burton Chi-shan Cheng Stephen Siu-fung Lee Frank Shui-sang Jin Danny Kong-keung Tsang
senior Managers Francis Yue-cheong Wong Annie Wai-yu Cheung Wendy Li-chien Weng Stephen Wing-hing Lai Blanche Oi-hung Chan Michael Yiu-wing Fung Jerome Chee-keong Goh Jenny Chui-yeung Chau
Managers Eric Kai-chiu Fok Nap-man Cheung Tim Yuen Steve Wai-fan Tong Man-kue Lee Matthew Wai-hung Law Denis Man-heung Wong Jason Chin-keung Law Kai-wah Poon Vicky Yuen-tung Wan
oVerseas branCHes
los angeles branch executive Vice president & Manager Ching-hsing Kao
new York branch senior Vice president & Manager Timothy Kam-tim Chan
san francisco branch senior Vice president & Manager Philip She-hoi Lee
london branch Manager Frederick Yan Chu
MainlanD branCHes
shenzhen branch Manager Vincent Chi-wing Man
shanghai branch Manager Lydia Li-ying Chen
8 SHANGHAI COMMERCIAL BANK ANNUAL REPORT 2013
bioGrapHiCal Details of DireCtors anD senior ManaGeMent
DireCtors
Mr. linColn CHU KUen YUnG, Jp, fHKib
Aged 68. Chairman and Non-executive Director. Mr. Yung was appointed a Director of the Bank since September 1998 and was elected Chairman in December 2007. He has been a Director of The Shanghai Commercial & Savings Bank, Ltd. since March 1991, where he served as Managing Director from 1994 to 2004. He is currently the Chairman of Paofoong Insurance Company (Hong Kong) Limited, the Deputy Managing Director of Nanyang Holdings Limited and is also an Independent Non-executive Director of Tai Ping Carpets International Limited. Mr. Yung has extensive experience in the textile industry, banking and investment. He was a member of the Basic Law Consultative Committee (from 1985 to 1990) and has been involved in various government committees. He is a Fellow of The Hong Kong Institute of Bankers.
Mr. DaViD seK-CHi KwoK, fHKib, fCib
Aged 60. Managing Director and Chief Executive of the Bank. Joined the Bank in October 1971. Appointed a Director in October 2001. General Manager since July 2004, and Managing Director and Chief Executive since October 2007.
Mr. HUnG-CHinG YUnG, Jp
Aged 91. Appointed a Director of the Bank in March 1973. Managing Director of Nanyang Holdings Limited. Chairman of The Shanghai Commercial & Savings Bank, Ltd. A Director of Paofoong Insurance Company (Hong Kong) Limited and The Wing On Enterprises, Limited.
Dr. riCHarD lee
Aged 76. Appointed a Director of the Bank in April 2001. Honorary Chairman of TAL Apparel Limited and a Director of Jardine Matheson Holdings Limited, Hongkong Land Holdings Limited and Mandarin Oriental International Limited.
Mr. JoHnson MoU DaiD CHa
Aged 62. Appointed a Director of the Bank in September 2001. Director of Mingly Corporation, HKR International Limited, Hanison Construction Holdings Limited and China International Capital Corporation Limited. Member of the Council, Finance Committee and Investment Sub-committee of The Chinese University of Hong Kong.
Mr. stepHen CHinG Yen lee
Aged 67. Appointed a Director of the Bank in June 2004. Managing Director of The Shanghai Commercial & Savings Bank, Ltd., Great Malaysia Textile Investments Private Limited. Chairman of Singapore Airlines Limited and NTUC Income Insurance Co-Operative Limited. Director of CapitaLand Limited and COFCO Corporation (China).
9SHANGHAI COMMERCIAL BANK ANNUAL REPORT 2013
Mr. eDwarD KawaH CHU
Aged 58. Assistant General Manager of the Bank. Joined the Bank in December 1979. Appointed a Director in February 2005. Alternate Chief Executive since October 2007.
Mr. DaViD allen HoYt
Aged 58. Appointed a Director of the Bank in April 2006. Senior Executive Vice President, Wholesale Banking, Wells Fargo & Company.
Mr. CHen YiH pin
Aged 74. Appointed a Director of the Bank in April 2006 and had served as an Alternate Director of the Bank from June 2004 to April 2006. Resident Managing Director of The Shanghai Commercial & Savings Bank, Ltd.
Mr. GorDon CHe KeUnG KwonG
Aged 64. Appointed a Director of the Bank in August 2008. Chairman of the Audit Committee of the Bank since January 2009. A fellow member of the Institute of Chartered Accountants in England and Wales, and the Hong Kong Institute of Certified Public Accountants. An Independent Non-executive Director of a number of locally listed companies, including Chow Tai Fook Jewellery Group Limited, NWS Holdings Limited, Henderson Land Development Company Limited, and China COSCO Holdings Company Limited.
MaDaM ninG li MinG
Aged 64. Appointed a Director of the Bank in July 2009. Director of Shanghai United International Investment Limited. An Independent Non-executive Director of Shenergy Company Limited. Chairman of Sino-US United MetLife Insurance Company Limited.
Mr. riCHarD Jason lloYD YorKe
Aged 46. Appointed a Director of the Bank in June 2011. Executive Vice President & Group Head International, Wells Fargo Bank, N.A. A Director of Wells Fargo International Banking Corporation and Wells Fargo Bank International, Ireland.
Mr. fan Yifei
Aged 49. Appointed a Director of the Bank in May 2012. Chairman of Bank of Shanghai. Director of Shanghai United International Investment Limited, and Executive Vice President of China Investment Corporation.
10 SHANGHAI COMMERCIAL BANK ANNUAL REPORT 2013
Mr. iGnatiUs wooi-Kean CHoonG
Aged 52. Served as an Alternate Director of the Bank since January 1997. Appointed an Alternate Director to Mr. Richard Jason Lloyd Yorke in April 2012. Director, Wells Fargo Bank, N.A.
Dr. laM CHat YU
Aged 62. Appointed an Alternate Director to Mr. Johnson Mou Daid Cha in May 2002. He has more than 30 years of experience in asset management and technology investment in Silicon Valley, California and Asia. He is a Director of Mingly Corporation.
Mr. Ye JUn
Aged 41. Served as an Alternate Director of the Bank since July 2009. Appointed an Alternate Director to Madam Ning Li Ming in May 2012. Director of Bank of Shanghai, Shanghai United International Investment Limited and Sino-US United MetLife Insurance Company Limited.
Mr. li Jian GUo
Aged 50. Served as an Alternate Director of the Bank since August 2009. Appointed an Alternate Director to Mr. Fan Yifei in May 2012. Vice President of Bank of Shanghai. Director of Shanghai United International Investment Limited.
Mr. JoHn Van antwerp rinDlaUb
Aged 69. Appointed an Alternate Director to Mr. David Allen Hoyt in April 2012. Executive Vice President and Asia Regional President, Wells Fargo Bank, N.A. Director of Wells Fargo International Banking Corporation.
Mr. JoHn Con-sinG YUnG
Aged 45. Appointed an Alternate Director to Mr. Chen Yih Pin in March 2013. Director, Executive Vice President and Chief Information Officer of The Shanghai Commercial & Savings Bank, Ltd. Director of Nanyang Holdings Limited.
bioGrapHiCal Details of DireCtors anD senior ManaGeMent (ContinUeD)
11SHANGHAI COMMERCIAL BANK ANNUAL REPORT 2013
senior ManaGeMent
Mr. DaViD seK-CHi KwoK
(Biographical details are set out on page 8)
Mr. eDwarD KawaH CHU
(Biographical details are set out on page 9)
Mr. paUl KUn-Kow wonG
Aged 62. Assistant General Manager & Chief of Treasury of the Bank. Joined the Bank in February 1974. Alternate Chief Executive since August 2012.
Mr. Hon-MinG MaK
Aged 62. Assistant General Manager & Chief of Corporate Banking of the Bank. Joined the Bank in March 1971.
Mr. bUrton CHi-sHan CHenG
Aged 52. Assistant General Manager & Chief of Information Technology & Operations of the Bank. Rejoined the Bank in August 1996.
Mr. stepHen siU-fUnG lee
Aged 47. Assistant General Manager & Chief of Retail Banking of the Bank. Joined the Bank in March 2010.
Mr. franK sHUi-sanG Jin
Aged 56. Assistant General Manager & Chief of General Administration of the Bank. Joined the Bank in May 2010.
Mr. DannY KonG-KeUnG tsanG
Aged 55. Assistant General Manager & Chief of Legal, Compliance & Risk Management of the Bank. Joined the Bank in May 2008.
Ms. wenDY li-CHien wenG
Aged 44. Chief Financial Controller of the Bank. Joined the Bank in May 2012.
Mr. MiCHael YiU-winG fUnG
Aged 56. Chief Auditor of the Bank. Joined the Bank in September 1982.
12 SHANGHAI COMMERCIAL BANK ANNUAL REPORT 2013
2013 AT A GLANCE
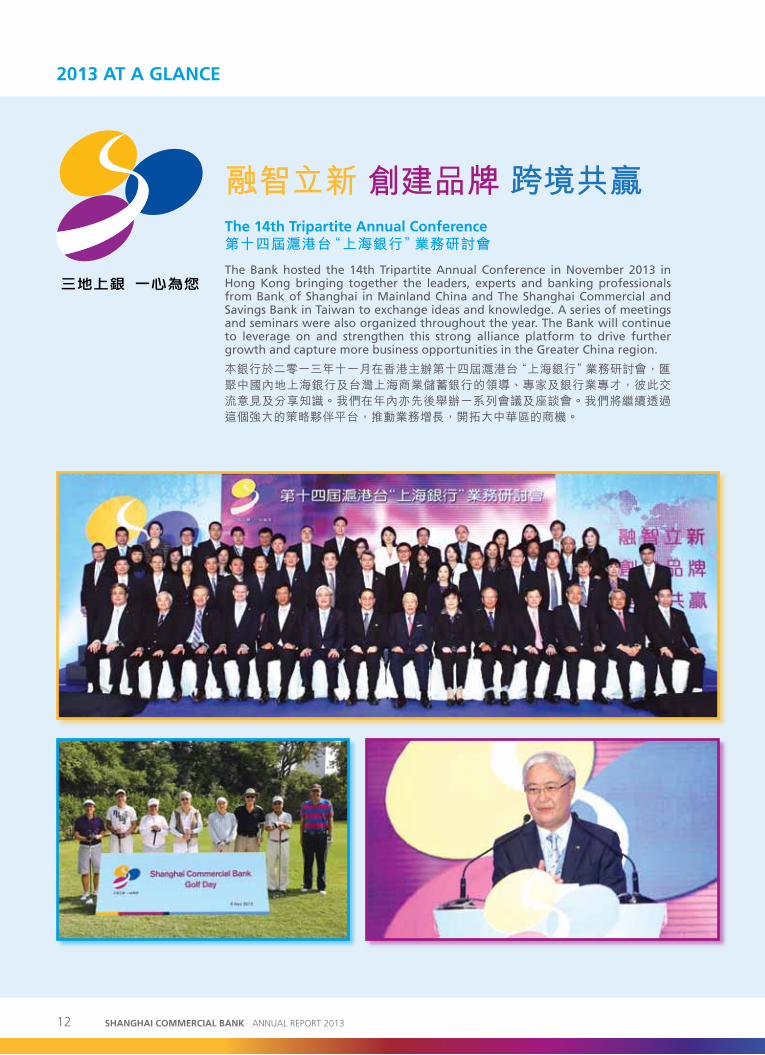
融智立新 創建品牌 跨境共贏the 14th tripartite annual Conference第十四屆滬港台“上海銀行”業務研討會
The Bank hosted the 14th Tripartite Annual Conference in November 2013 in Hong Kong bringing together the leaders, experts and banking professionals from Bank of Shanghai in Mainland China and The Shanghai Commercial and Savings Bank in Taiwan to exchange ideas and knowledge. A series of meetings and seminars were also organized throughout the year. The Bank will continue to leverage on and strengthen this strong alliance platform to drive further growth and capture more business opportunities in the Greater China region.
本銀行於二零一三年十一月在香港主辦第十四屆滬港台“上海銀行”業務研討會,匯聚中國內地上海銀行及台灣上海商業儲蓄銀行的領導、專家及銀行業專才,彼此交流意見及分享知識。我們在年內亦先後舉辦一系列會議及座談會。我們將繼續透過這個強大的策略夥伴平台,推動業務增長,開拓大中華區的商機。
13SHANGHAI COMMERCIAL BANK ANNUAL REPORT 2013
previous Conference themes (2000-2012) 過往業務研討會主題(2000-2012年)
2000年 迎接入世 加強合作 共同發展
2003年 乘勢而上 加強合作 共謀發展
2001年 總結經驗 展望未來 再創商機
2005年 務實創新 優勢互補 掌握契機
2004年 緊密合作 突顯聯盟 再創商機
2002年 加強交流 促進合作 共創三贏2007年 合作無間 迸發創意 共建佳績
2010年 互動參與 長遠發展 邁向國際
2008年 同心協力 創新價值 拓展商機
2012年 創新驅動 共謀發展 攜手並進
2011年 合作創新 通路造富 全球發展
2009年 融匯才智 互惠共榮 創贏未來
2006年 開拓創新 融通智慧 合作共贏
14 SHANGHAI COMMERCIAL BANK ANNUAL REPORT 2013
2013 AT A GLANCE
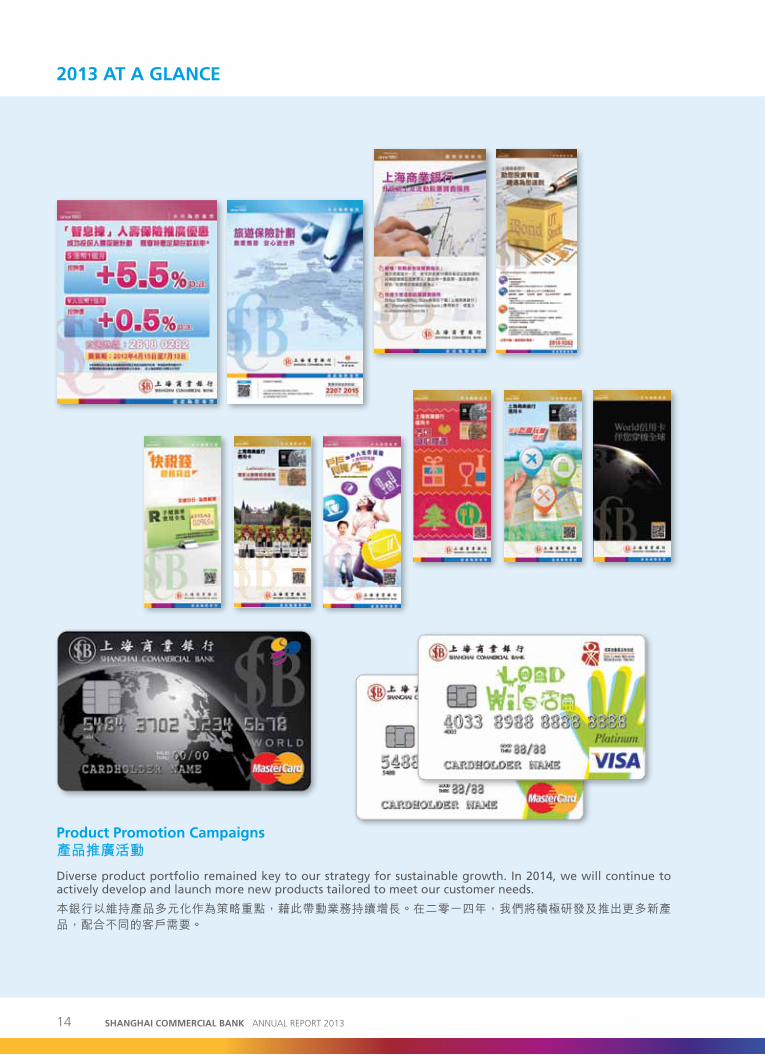
product promotion Campaigns產品推廣活動
Diverse product portfolio remained key to our strategy for sustainable growth. In 2014, we will continue to actively develop and launch more new products tailored to meet our customer needs.
本銀行以維持產品多元化作為策略重點,藉此帶動業務持續增長。在二零一四年,我們將積極研發及推出更多新產品,配合不同的客戶需要。
15SHANGHAI COMMERCIAL BANK ANNUAL REPORT 2013
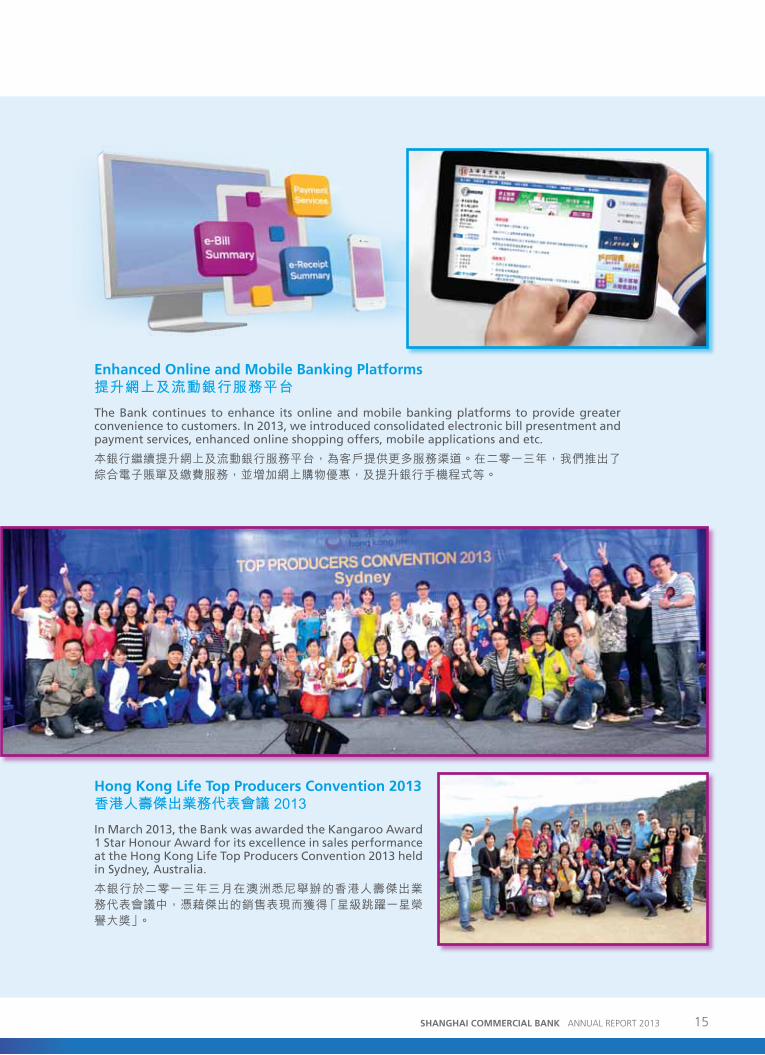
enhanced online and Mobile banking platforms提升網上及流動銀行服務平台
The Bank continues to enhance its online and mobile banking platforms to provide greater convenience to customers. In 2013, we introduced consolidated electronic bill presentment and payment services, enhanced online shopping offers, mobile applications and etc.
本銀行繼續提升網上及流動銀行服務平台,為客戶提供更多服務渠道。在二零一三年,我們推出了綜合電子賬單及繳費服務,並增加網上購物優惠,及提升銀行手機程式等。
Hong Kong life top producers Convention 2013香港人壽傑出業務代表會議 2013
In March 2013, the Bank was awarded the Kangaroo Award 1 Star Honour Award for its excellence in sales performance at the Hong Kong Life Top Producers Convention 2013 held in Sydney, Australia.
本銀行於二零一三年三月在澳洲悉尼舉辦的香港人壽傑出業務代表會議中,憑藉傑出的銷售表現而獲得「星級跳躍一星榮譽大獎」。
16 SHANGHAI COMMERCIAL BANK ANNUAL REPORT 2013
2013 AT A GLANCE
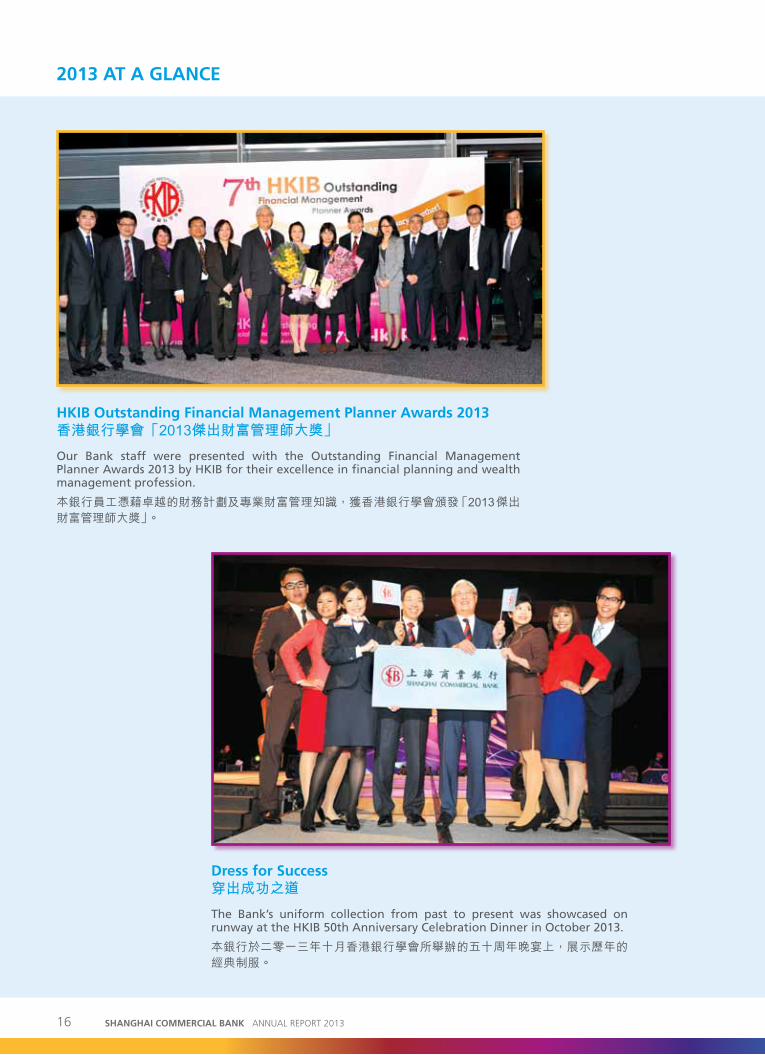
HKib outstanding financial Management planner awards 2013香港銀行學會「2013傑出財富管理師大獎」
Our Bank staff were presented with the Outstanding Financial Management Planner Awards 2013 by HKIB for their excellence in financial planning and wealth management profession.
本銀行員工憑藉卓越的財務計劃及專業財富管理知識,獲香港銀行學會頒發「2013傑出財富管理師大獎」。
Dress for success穿出成功之道
The Bank’s uniform collection from past to present was showcased on runway at the HKIB 50th Anniversary Celebration Dinner in October 2013.
本銀行於二零一三年十月香港銀行學會所舉辦的五十周年晚宴上,展示歷年的經典制服。
17SHANGHAI COMMERCIAL BANK ANNUAL REPORT 2013
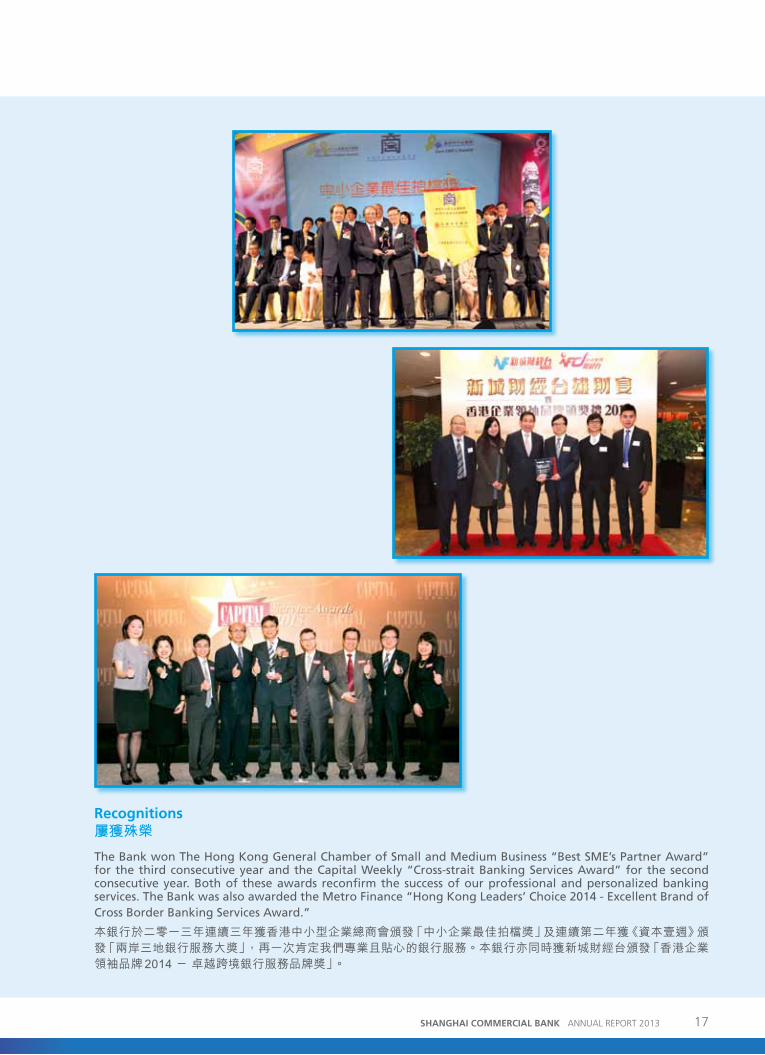
recognitions屢獲殊榮
The Bank won The Hong Kong General Chamber of Small and Medium Business “Best SME’s Partner Award” for the third consecutive year and the Capital Weekly “Cross-strait Banking Services Award” for the second consecutive year. Both of these awards reconfirm the success of our professional and personalized banking services. The Bank was also awarded the Metro Finance “Hong Kong Leaders’ Choice 2014 - Excellent Brand of Cross Border Banking Services Award.”
本銀行於二零一三年連續三年獲香港中小型企業總商會頒發「中小企業最佳拍檔獎」及連續第二年獲《資本壹週》頒發「兩岸三地銀行服務大獎」,再一次肯定我們專業且貼心的銀行服務。本銀行亦同時獲新城財經台頒發「香港企業領袖品牌 2014 - 卓越跨境銀行服務品牌獎」。
18 SHANGHAI COMMERCIAL BANK ANNUAL REPORT 2013
MessaGe to sHareHolDers
In 2013, Shanghai Commercial Bank (the ‘Bank’) reported a consolidated net profit after tax of
HK$1,787.9 million, representing an increase of 8.3% or HK$136.4 million, as compared with the
previous year. The anticipation of the eventual tapering of quantitative easing in the U.S. affected
the mark-to-market valuation of the Bank’s debt investment portfolio. The total comprehensive
income attributable to equity holders at year end of HK$2,006.5 million was 3.9% or HK$82.3 million
lower than that of 2012. On a year-on-year basis, total loans and advances increased by 15.6% while
total customer deposits increased by 2.7%. Loan-to-deposit ratio increased from 48.8% to 54.9%.
Net interest margin improved by 13 basis points to 1.68% and net interest income increased by
14.6%. Net fee and commission income increased by 11.5% due mainly to increase in securities
brokerage income. In 2013, the Bank continued to maintain a strong capital adequacy ratio at
19.6% at the year end and a comfortable liquidity ratio at 55.3% for the year. The return on average
total assets and average equity were 1.3% and 9.0% respectively, and the cost-to-income ratio was
34.1%, as compared to 33.2% in 2012.
Trade financing, property related lending and providing financial solutions to Small and Medium
Enterprises (“SMEs”) customers continue to be the focus of the Bank. We endeavour to expand
our customer base both locally and in the Greater China region through broadened product range,
quality service and the use of varied distribution channels to support the provision of one-stop
tailor-made financial and banking services. More resources will be allocated to further promote
mobile and internet banking with the aim to attract the younger generation and to increase cross-
selling opportunities.
19SHANGHAI COMMERCIAL BANK ANNUAL REPORT 2013
Our operations in Mainland China will remain one of the key focuses of the Bank. Following the
establishment of the Shanghai Branch in January 2013, we are making preparation for a presence in
the China (Shanghai) Pilot Free Trade Zone. The Bank will continue to leverage on the alliance with
Bank of Shanghai in Mainland China and our parent, The Shanghai Commercial & Savings Bank, Ltd.
in Taiwan for further growth and new business opportunities.
The completion of the state of the art Head Office Building is expected to be in 2016. Upon its
completion, it will become a landmark in Central and will promote the Bank’s image.
We are saddened by the passing away of Sir Run Run Shaw on 7th January 2014. Sir Run Run served
on the Board from August 1980 to September 2001. He made invaluable contributions and we
derived great benefit from his wise counsel. We welcome Mr. John Con-sing Yung, Executive Vice
President & Chief Information Officer of The Shanghai Commercial & Savings Bank, Ltd. in Taiwan,
who joined our Board, as an Alternate Director to Mr. Y. P. Chen, in March 2013.
On behalf of the Board, we would like to express our sincere thanks to our loyal customers for their
patronage and continued support, to our staff for their hard work and commitment. The outlook
for 2014 is uncertain but we look forward to it with expectation.
lincoln Chu Kuen Yung David sek-Chi Kwok
Chairman Managing Director & Chief Executive
Hong Kong, 13th March 2014
20 SHANGHAI COMMERCIAL BANK ANNUAL REPORT 2013
report of tHe DireCtors
The Directors have pleasure in submitting their report together with the audited consolidated financial statements for the year ended 31st December 2013.
principal activitiesShanghai Commercial Bank Limited (the ‘Bank’) and its subsidiary companies (together, the ‘Group’) are engaged in the provision of banking and related financial services.
profit and appropriationsThe Group’s profit for the year after taxation and other comprehensive income less non-controlling interests is set out in the consolidated statement of changes in equity on pages 34 and 35.
The Directors recommend the payment of a final dividend of HK$44 per ordinary share totalling HK$880,000,000.
other reservesMovements in the other reserves of the Group and the Bank during the year are set out in Note 33 to the consolidated financial statements.
DonationsDuring the year donations made by the Bank and its subsidiary companies for charitable and other purposes amounted to HK$2,605,000.
properties and equipmentDetails of the movements in properties and equipment of the Group and the Bank are shown in Note 25 to the consolidated financial statements.
20 sHanGHai CoMMerCial banK ANNUAL REPORT 2013
21SHANGHAI COMMERCIAL BANK ANNUAL REPORT 2013
DirectorsThe Directors of the Bank during the year and up to the date of this report were:
Hung-ching Yung
lincoln Chu Kuen Yung
Dr. richard lee
Johnson Mou Daid Cha (Dr. Lam Chat Yu, Alternate)
David sek-chi Kwok
stephen Ching Yen lee
edward Kawah Chu
David allen Hoyt (John Van Antwerp Rindlaub, Alternate)
Chen Yih pin (Yi-Jen Chiou, Alternate) (resigned on 6th March 2013) (John Con-sing Yung, Alternate) (appointed on 6th March 2013)
Gordon Che Keung Kwong
ning li Ming (Ye Jun, Alternate)
richard Jason lloyd Yorke (Ignatius Wooi-kean Choong, Alternate)
fan Yifei (Li Jian Guo, Alternate)
22 SHANGHAI COMMERCIAL BANK ANNUAL REPORT 2013
In accordance with Article 104(A) of the Bank’s Articles of Association, Dr. Richard Lee, Mr. Stephen Ching Yen Lee, Mr. Edward Kawah Chu and Mr. David Allen Hoyt shall retire by rotation at the forthcoming Annual General Meeting and, being eligible, offer themselves for re-election.
Directors’ interestsNo contracts of significance in relation to the Group’s business to which the Bank, its subsidiary companies, its fellow subsidiaries or its holding companies was a party and in which a Director of the Bank had a material interest, whether directly or indirectly, subsisted at the end of the year or at any time during the year.
At no time during the year were the Bank, its subsidiaries, its fellow subsidiaries or its holding companies a party to any arrangement to enable the Directors and Chief Executive of the Bank (including their spouse and children under 18 years of age) to hold any interests or short positions in the shares or underlying shares in, or debentures of, the Bank or its associated corporation.
Management contractsNo substantial contracts concerning the management and administration of the whole or any substantial part of the business of the Bank were entered into or existed during the year.
financial disclosures The Bank has followed the disclosure requirements set out in the ‘Banking (Disclosure) Rules’ and the ‘Guideline on the Application of the Banking (Disclosure) Rules’ under the Supervisory Policy Manual issued by the Hong Kong Monetary Authority (‘HKMA’). The Bank has complied with the capital requirements related to capital base and capital adequacy ratio stipulated by the HKMA.
Compliance with the Corporate Governance Code and Corporate Governance reportThe Directors of the Bank acknowledge their responsibility for preparing the consolidated financial statements that give a true and fair view of the state of affairs of the Bank and the Group in accordance with the statutory requirements and applicable accounting standards. According to Article 123 of the Bank’s Articles of Association, the Bank adopts the guidelines set out in the Code of Best Practice contained in Appendix 14 to the Rules Governing the Listing of Securities on The Stock Exchange of Hong Kong Limited (‘Code of Best Practice’). The Code of Best Practice has eventually developed into the present form known as The Corporate Governance Code and Corporate Governance Report which became effective commencing from 1st April 2012. After taking into consideration the individual circumstances of the Bank, which is a private company, the Board of Directors of the Bank has adopted those provisions in the Code on Corporate Governance Practices that are relevant to the Bank.
auditorThe consolidated financial statements have been audited by PricewaterhouseCoopers who retire and, being eligible, offer themselves for re-appointment.
On behalf of the Boardlincoln Chu Kuen YungChairman
Hong Kong, 13th March 2014
report of tHe DireCtors (ContinUeD)
Shanghai Commercial Bank Limited (the ‘Bank’) and its subsidiary companies (together, the ‘Group’) are committed to promoting good corporate governance to safeguard the interests of the shareholders, depositors and other relevant stakeholders. The Corporate Governance Code and Corporate Governance Report (‘The Code’, effective from 1st April 2012) as set out in Appendix 14 of the Rules Governing the Listing of Securities on The Stock Exchange of Hong Kong Ltd. (the ‘Listing Rules’) is applicable to financial reports covering the financial period which ends after 31st December 2012. During the financial year ended 31st December 2013, the Board of Directors (the ‘Board’) of the Bank, after taking into consideration the individual circumstances of the Bank, as a private company, has adopted those provisions that are relevant to the Bank.
The Bank has also complied with Supervisory Policy Manual CG-1 on Corporate Governance of Locally Incorporated Authorized Institutions issued by the Hong Kong Monetary Authority (‘HKMA’).
Directors’ securities transactionsThis Code provision is not applicable to the Bank. The Board or Directors have not adopted Code provision A.6.4 in relation to the setting up of written guidelines for relevant employees in respect of their dealings in the Bank’s securities as the Bank’s shares are not publicly listed.
Board of DirectorsThe Board is responsible for the operations and the financial soundness of the Bank and all Directors should act bona fide in the interest of the Bank, and on an informed and prudent basis, in accordance with applicable laws, regulations and supervisory standards. The written Terms of Reference of the Board clearly state that such duties vest in the Board as per relevant sections in the Articles of Association of the Bank, and the Board should adhere to the standards set out in the Code, and to follow the standards set out in the codes and guidelines as may from time to time be issued by the HKMA. The Board shall establish specialised committees of the Board for the supervision of major functional areas and to delegate the powers of the Board to these committees.
The Board comprises of thirteen Directors, including eight Non-Executive Directors, two Executive Directors and three Independent Non-Executive Directors. The Directors are accountable for ensuring that the operations and functions are discharged by the management in a prudent, professional and competent manner. One of the Independent Non-Executive Directors possesses the appropriate professional accounting qualifications or related financial management expertise as required under the Listing Rules.
The Board meets regularly to review and approve objectives, strategies, business plans and annual budgets and to review the actual performance against these plans and budgets, material investments in new projects, policies, procedures and controls to manage various types of risks with which it is faced, and etc. All Directors have access to board papers and related materials which are provided in a timely manner. The Company Secretary keeps the minutes of Board meetings.
The Bank has maintained insurance coverage for its Directors and officers.
Five physical board meetings were held in 2013. Attendance of individual Directors is listed below:
Non-Executive Directors AttendanceMr. Lincoln Chu Kuen Yung – Chairman of the Board 5/5Mr. Hung-ching Yung 5/5Mr. Stephen Ching Yen Lee 4/5Mr. David Allen Hoyt (Mr. John Van Antwerp Rindlaub, Alternate) 3/5Mr. Chen Yih Pin (Mr. Yi-Jen Chiou, Alternate up to 6 March 2013 when 5/5 Mr. John Con-sing Yung appointed as Alternate Director to Mr. Chen)Madam Ning Li Ming (Mr. Ye Jun, Alternate) 5/5Mr. Richard Jason Lloyd Yorke (Mr. Ignatius Wooi-kean Choong, Alternate) 5/5Mr. Fan Yifei (Mr. Li Jian Guo, Alternate) 5/5
23SHANGHAI COMMERCIAL BANK ANNUAL REPORT 2013
CorporatE GovErNaNCE rEport
Board of Directors (Continued)Five physical board meetings were held in 2013. Attendance of individual Directors is listed below: (Continued)
Executive Directors AttendanceMr. David Sek-chi Kwok – Managing Director & Chief Executive 5/5Mr. Edward Kawah Chu 5/5
Independent Non-Executive Directors AttendanceDr. Richard Lee 5/5Mr. Johnson Mou Daid Cha (Dr. Lam Chat Yu, Alternate) 5/5Mr. Gordon Che Keung Kwong 5/5
The Board has not adopted Code provision A.6.6 in relation to the Directors’ disclosure of the number and nature of offices they held in public companies or organisations and other significant commitments, as well as the time involved as it is considered not applicable to the Bank for the time being but the matter would be evaluated whenever necessary.
Directors’ continuous professional developmentThe Directors of the Bank had participated in various forms of professional training during the year. In accordance with the letter issued by the HKMA on 14th August 2013, the Bank had filed a summary of training records participated by each Director with the HKMA on 28th January 2014.
Executive CommitteeThe Bank has established an Executive Committee with specific written Terms of Reference which deal clearly with its authority and duties to operate as a general management committee under the direct authority of the Board to review the management and performance of the Bank. The Committee consists of two Executive Directors, and three Non-Executive Directors whom all are representatives from each of the three substantial shareholders.
A total of twelve monthly meetings were held in 2013. Attendance of individual Directors is listed below:
AttendanceMr. David Sek-chi Kwok – Chairman 12/12Mr. Hung-ching Yung 12/12Mr. David Allen Hoyt (Mr. John Van Antwerp Rindlaub, Alternate) 12/12Madam Ning Li Ming 12/12Mr. Edward Kawah Chu 12/12
auditor’s remunerationFor the year ended 31st December 2013, fees payable to the auditors of the Group for (a) general audit and (b) non-statutory audit as well as other services amounted to HK$6,273,000 and HK$5,385,000 respectively.
audit CommitteeThe Bank has established an Audit Committee with specific written Terms of Reference which deal clearly with its authority and duties to consider the nature and scope of audit reviews, as well as to review the Bank’s financial statements, the findings of both internal and external auditors and the effectiveness of the internal control systems of the Bank. The Committee consists of one Non-Executive Director and two Independent Non-Executive Directors.
The Committee met four times in 2013. Attendance of individual Directors is listed below:
AttendanceMr. Gordon Che Keung Kwong - Chairman 4/4Mr. Lincoln Chu Kuen Yung 3/4Dr. Richard Lee 3/4
24 SHANGHAI COMMERCIAL BANK ANNUAL REPORT 2013
CorporatE GovErNaNCE rEport (CoNtINuED)
remuneration CommitteeThe Bank has established a Remuneration Committee with specific written Terms of Reference which deal clearly with its authority and duties to oversee the implementation of a sound remuneration policy including the recommendations to the Board on the remuneration of the Directors and senior management of the Bank. In doing so, independent professional advice may be sought if considered necessary. No Director or any of his / her associates is involved in deciding his / her own remuneration. The Committee consists of one Non-Executive Director and two Independent Non-Executive Directors.
The Committee met twice in 2013. Attendance of individual Directors is listed below:
AttendanceMr. Hung-ching Yung – Chairman 2/2Dr. Richard Lee 2/2Mr. Johnson Mou Daid Cha 2/2
The Board has not adopted Code provision B.1.5 in relation to the detail disclosure of any remuneration payable to members of senior management by band in the Bank’s annual reports as it is considered not applicable to the Bank for the time being but the matter would be evaluated whenever necessary.
Nomination CommitteeThe Bank has established a Nomination Committee with specific written Terms of Reference which deal clearly with its authority and duties to review the structure, size, composition of the Board, to identify, consider and select individuals qualified for recommendations to the Board for their appointments, re-appointment and succession planning as Directors and senior management in order to complement the Bank’s business strategies. The Committee consists of one Non-Executive Director and two Independent Non-Executive Directors.
The Committee met twice in 2013. Attendance of individual Directors is listed below:
AttendanceMr. Lincoln Chu Kuen Yung – Chairman 2/2Dr. Richard Lee 2/2Mr. Johnson Mou Daid Cha 2/2
risk Management CommitteeThe Bank has established a Risk Management Committee with specific written Terms of Reference which deal clearly with its authority and duties to oversee the various aspects of risk management on an integrated basis, to review and make recommendations to the Board on the risk management strategies as well as the risk tolerance and risk appetite of the Bank. The Committee consists of one Non-Executive Director and two Independent Non-Executive Directors.
The Committee was set up in August 2013 by the Board and met once in 2013. Attendance of the individual Directors is listed below:
AttendanceMr. Lincoln Chu Kuen Yung – Chairman 1/1Mr. Johnson Mou Daid Cha 1/1Mr. Gordon Che Keung Kwong 1/1
Delegation by the BoardIn addition to the Executive Committee, Audit Committee, Remuneration Committee, Nomination Committee and Risk Management Committee as described above, the Board has also established the following key specialized committees, each of which has specific written Terms of Reference in order to ensure that they discharge their functions properly and their meeting minutes shall be sent to all members of the Board for review.
25SHANGHAI COMMERCIAL BANK ANNUAL REPORT 2013
CorporatE GovErNaNCE rEport (CoNtINuED)
Delegation by the Board (Continued)Information on these committees is set out below:
(a) Asset and Liability Committee The Asset and Liability Committee meets at least monthly to oversee the Bank’s operations relating to
interest rate risk, liquidity risk, foreign exchange risk and etc. and in particular to ensure that the Bank has adequate funds to meet its obligations. The members of the Asset and Liability Committee are Mr. David Sek-chi Kwok (Chairman), Mr. Edward Kawah Chu, Mr. Paul Kun-kow Wong, Mr. Burton Chi-shan Cheng, Mr. Stephen Siu-fung Lee, Mr. Frank Shui-sang Jin, Mr. Hon-ming Mak, Mr. Danny Kong-keung Tsang, Mr. Francis Yue-cheong Wong, Ms. Wendy Li-chien Weng and Ms. Blanche Oi-hung Chan.
(b) Credit Committee The Credit Committee meets at least monthly to ensure that the Bank’s credit policies are adequate and
lending activities are conducted in accordance with established policies and relevant laws and regulations. The Credit Committee is also responsible for establishing credit policies, monitoring loan portfolio quality, ensuring compliance with statutory and internal lending limits, and evaluating credit applications and making credit decisions. The members of the Credit Committee are Mr. David Sek-chi Kwok (Chairman), Mr. Edward Kawah Chu, Mr. Paul Kun-kow Wong, Mr. Stephen Siu-fung Lee, Mr. Frank Shui-sang Jin, Mr. Hon-ming Mak, Mr. Danny Kong-keung Tsang and Mr. Sau-man Hui.
(c) Operational Risk Management Committee The Operational Risk Management Committee meets at least bi-monthly to establish and to review
operational risk management policies, processes and procedures for managing operational risk in all of the Bank’s material products, activities, processes and systems. The Operational Risk Management Committee is also responsible for overseeing the identification, assessment, monitoring and control of operational risk exposures. The members of the Operational Risk Management Committee are Mr. David Sek-chi Kwok (Chairman), Mr. Edward Kawah Chu, Mr. Paul Kun-kow Wong, Mr. Burton Chi-shan Cheng, Mr. Stephen Siu-fung Lee, Mr. Frank Shui-sang Jin, Mr. Hon-ming Mak, Mr. Danny Kong-keung Tsang, Mr. Francis Yue-cheong Wong, Mr. Michael Yiu-wing Fung and Ms. Blanche Oi-hung Chan.
Directors’ responsibility StatementThe Directors acknowledge their responsibility for preparing the financial statements of the Group in accordance with statutory requirements and applicable accounting standards. The Group’s annual results and interim results are announced in a timely manner.
The independent auditor’s report states the auditor's reporting responsibilities.
Company SecretaryThe Company Secretary ensures that board procedures are followed and is responsible for advising the Board on governance matters and facilitating the induction and professional development of Directors.
Shareholders’ rightsAs the Bank is a private company comprising of four shareholders, the Chairman of the Board is committed to maintaining a constant communication with the shareholders in order to ensure they have fair and timely access to the Bank’s information. In this regard, the Board has not adopted Code provision E.1.4 in relation to the setting up of shareholders’ communication policy as it is considered not applicable for the time being but the matter would be evaluated whenever necessary.
Hong Kong, 13th March 2014
26 SHANGHAI COMMERCIAL BANK ANNUAL REPORT 2013
CorporatE GovErNaNCE rEport (CoNtINuED)
We have audited the consolidated financial statements of Shanghai Commercial Bank Limited (the ‘Bank’) and its subsidiaries (together, the ‘Group’) set out on pages 28 to 132, which comprise the consolidated and company statements of financial position as at 31st December 2013, and the consolidated and company income statements, the consolidated and company statements of comprehensive income, the consolidated statement of changes in equity and the consolidated statement of cash flows for the year then ended, and a summary of significant accounting policies and other explanatory information.
Directors’ responsibility for the Consolidated Financial Statements
The directors of the Bank are responsible for the preparation of consolidated financial statements that give a true and fair view in accordance with Hong Kong Financial Reporting Standards issued by the Hong Kong Institute of Certified Public Accountants, and the Hong Kong Companies Ordinance, and for such internal control as the directors determine is necessary to enable the preparation of consolidated financial statements that are free from material misstatement, whether due to fraud or error.
auditor’s responsibility
Our responsibility is to express an opinion on these consolidated financial statements based on our audit and to report our opinion solely to you, as a body, in accordance with section 141 of the Hong Kong Companies Ordinance and for no other purpose. We do not assume responsibility towards or accept liability to any other person for the contents of this report.
We conducted our audit in accordance with Hong Kong Standards on Auditing issued by the Hong Kong Institute of Certified Public Accountants. Those standards require that we comply with ethical requirements and plan and perform the audit to obtain reasonable assurance about whether the consolidated financial statements are free from material misstatement.
An audit involves performing procedures to obtain audit evidence about the amounts and disclosures in the consolidated financial statements. The procedures selected depend on the auditor’s judgment, including the assessment of the risks of material misstatement of the consolidated financial statements, whether due to fraud or error. In making those risk assessments, the auditor considers internal control relevant to the entity’s preparation of consolidated financial statements that give a true and fair view in order to design audit procedures that are appropriate in the circumstances, but not for the purpose of expressing an opinion on the effectiveness of the entity’s internal control. An audit also includes evaluating the appropriateness of accounting policies used and the reasonableness of accounting estimates made by the directors, as well as evaluating the overall presentation of the consolidated financial statements.
We believe that the audit evidence we have obtained is sufficient and appropriate to provide a basis for our audit opinion.
opinion
In our opinion, the consolidated financial statements give a true and fair view of the state of affairs of the Bank and of the Group as at 31st December 2013, and of the Bank’s and the Group’s profits and cash flows of the Group for the year then ended in accordance with Hong Kong Financial Reporting Standards and have been properly prepared in accordance with the Hong Kong Companies Ordinance.
pricewaterhouseCoopersCertified Public Accountants
Hong Kong, 13th March 2014
27SHANGHAI COMMERCIAL BANK ANNUAL REPORT 2013
INDEpENDENt auDItor’S rEport to tHE SHarEHoLDErS oF SHaNGHaI CoMMErCIaL BaNK LIMItED(Incorporated in Hong Kong with limited liability)
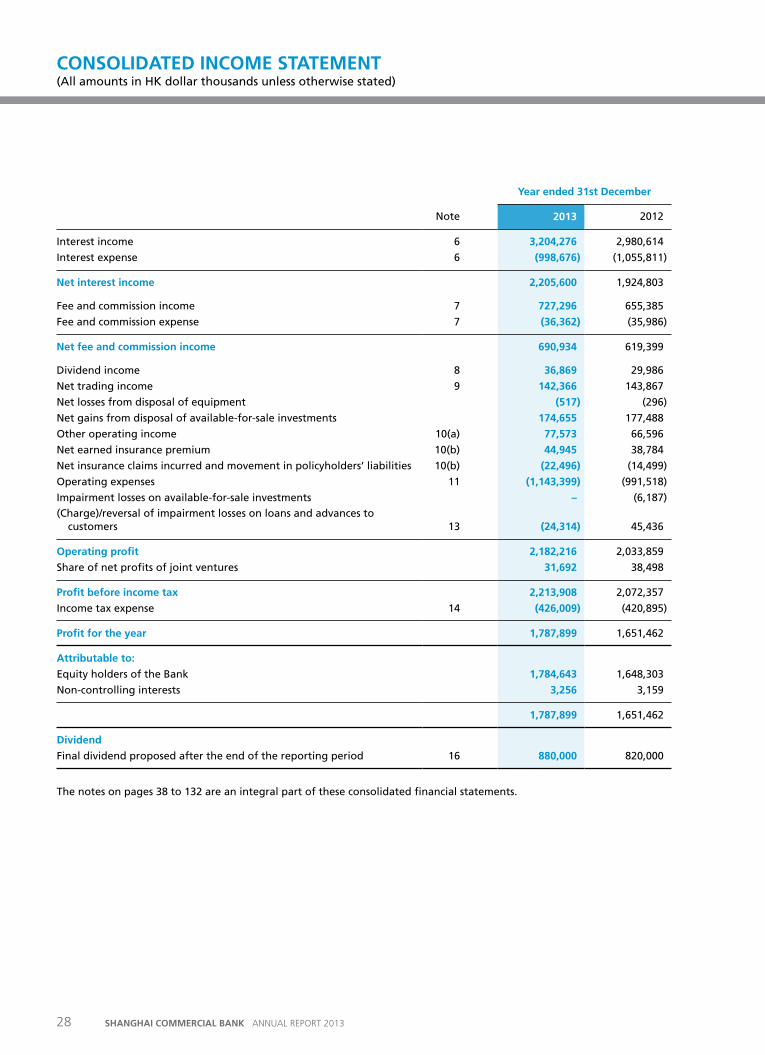
Year ended 31st December
Note 2013 2012
Interest income 6 3,204,276 2,980,614
Interest expense 6 (998,676) (1,055,811)
Net interest income 2,205,600 1,924,803
Fee and commission income 7 727,296 655,385
Fee and commission expense 7 (36,362) (35,986)
Net fee and commission income 690,934 619,399
Dividend income 8 36,869 29,986
Net trading income 9 142,366 143,867
Net losses from disposal of equipment (517) (296)
Net gains from disposal of available-for-sale investments 174,655 177,488
Other operating income 10(a) 77,573 66,596
Net earned insurance premium 10(b) 44,945 38,784
Net insurance claims incurred and movement in policyholders’ liabilities 10(b) (22,496) (14,499)
Operating expenses 11 (1,143,399) (991,518)
Impairment losses on available-for-sale investments – (6,187)
(Charge)/reversal of impairment losses on loans and advances to customers 13 (24,314) 45,436
operating profit 2,182,216 2,033,859
Share of net profits of joint ventures 31,692 38,498
profit before income tax 2,213,908 2,072,357
Income tax expense 14 (426,009) (420,895)
profit for the year 1,787,899 1,651,462
attributable to:
Equity holders of the Bank 1,784,643 1,648,303
Non-controlling interests 3,256 3,159
1,787,899 1,651,462
Dividend
Final dividend proposed after the end of the reporting period 16 880,000 820,000
The notes on pages 38 to 132 are an integral part of these consolidated financial statements.
28 SHANGHAI COMMERCIAL BANK ANNUAL REPORT 2013
CoNSoLIDatED INCoME StatEMENt (All amounts in HK dollar thousands unless otherwise stated)
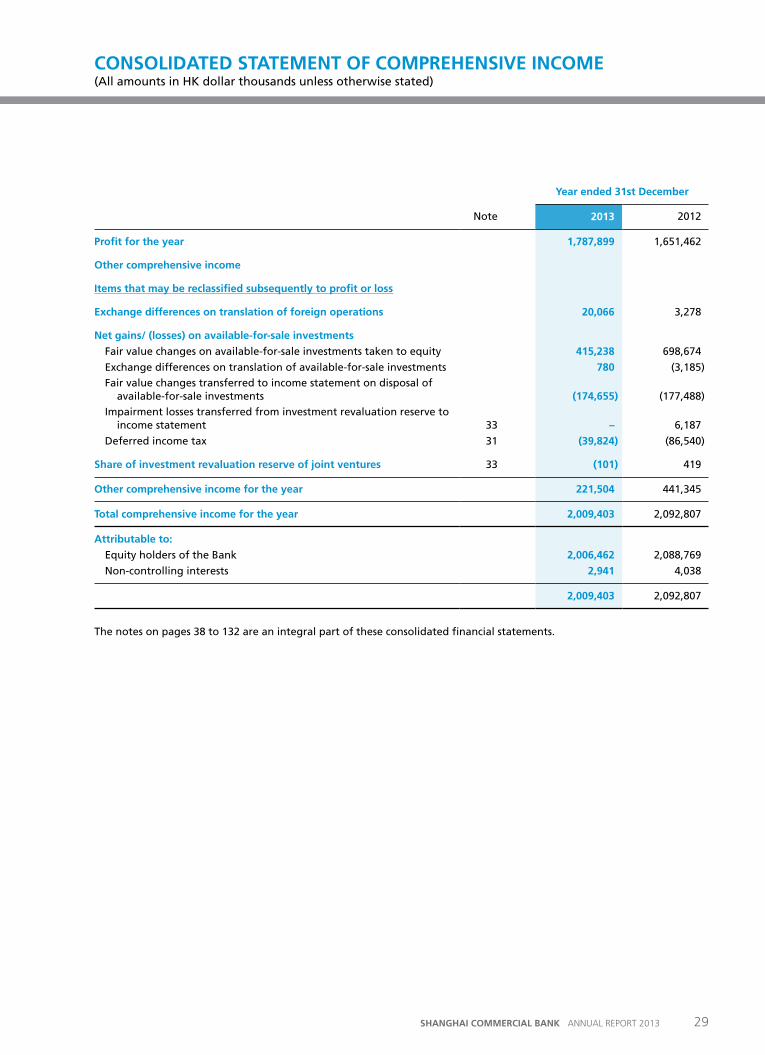
Year ended 31st December
Note 2013 2012
profit for the year 1,787,899 1,651,462
other comprehensive income
Items that may be reclassified subsequently to profit or loss
Exchange differences on translation of foreign operations 20,066 3,278
Net gains/ (losses) on available-for-sale investments
Fair value changes on available-for-sale investments taken to equity 415,238 698,674
Exchange differences on translation of available-for-sale investments 780 (3,185)
Fair value changes transferred to income statement on disposal of available-for-sale investments (174,655) (177,488)
Impairment losses transferred from investment revaluation reserve to income statement 33 – 6,187
Deferred income tax 31 (39,824) (86,540)
Share of investment revaluation reserve of joint ventures 33 (101) 419
other comprehensive income for the year 221,504 441,345
total comprehensive income for the year 2,009,403 2,092,807
attributable to:
Equity holders of the Bank 2,006,462 2,088,769
Non-controlling interests 2,941 4,038
2,009,403 2,092,807
The notes on pages 38 to 132 are an integral part of these consolidated financial statements.
29SHANGHAI COMMERCIAL BANK ANNUAL REPORT 2013
CoNSoLIDatED StatEMENt oF CoMprEHENSIvE INCoME (All amounts in HK dollar thousands unless otherwise stated)
Year ended 31st December
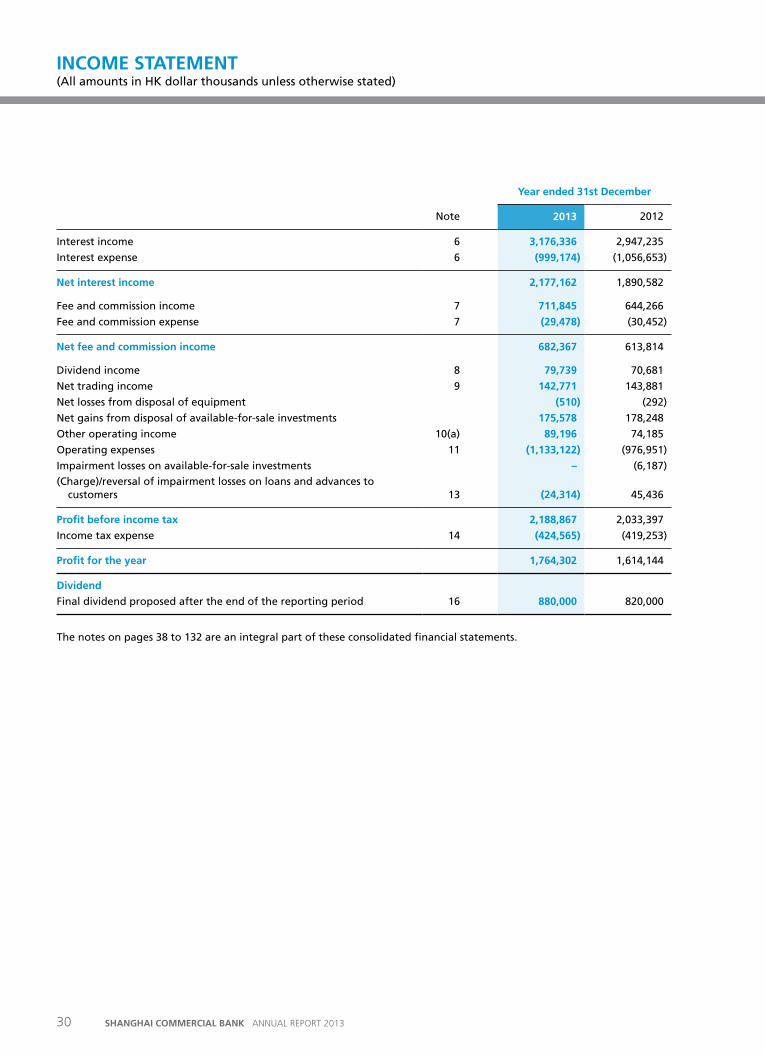
Note 2013 2012
Interest income 6 3,176,336 2,947,235
Interest expense 6 (999,174) (1,056,653)
Net interest income 2,177,162 1,890,582
Fee and commission income 7 711,845 644,266
Fee and commission expense 7 (29,478) (30,452)
Net fee and commission income 682,367 613,814
Dividend income 8 79,739 70,681
Net trading income 9 142,771 143,881
Net losses from disposal of equipment (510) (292)
Net gains from disposal of available-for-sale investments 175,578 178,248
Other operating income 10(a) 89,196 74,185
Operating expenses 11 (1,133,122) (976,951)
Impairment losses on available-for-sale investments – (6,187)
(Charge)/reversal of impairment losses on loans and advances to customers 13 (24,314) 45,436
profit before income tax 2,188,867 2,033,397
Income tax expense 14 (424,565) (419,253)
profit for the year 1,764,302 1,614,144
Dividend
Final dividend proposed after the end of the reporting period 16 880,000 820,000
The notes on pages 38 to 132 are an integral part of these consolidated financial statements.
30 SHANGHAI COMMERCIAL BANK ANNUAL REPORT 2013
INCoME StatEMENt (All amounts in HK dollar thousands unless otherwise stated)
Year ended 31st December
Note 2013 2012
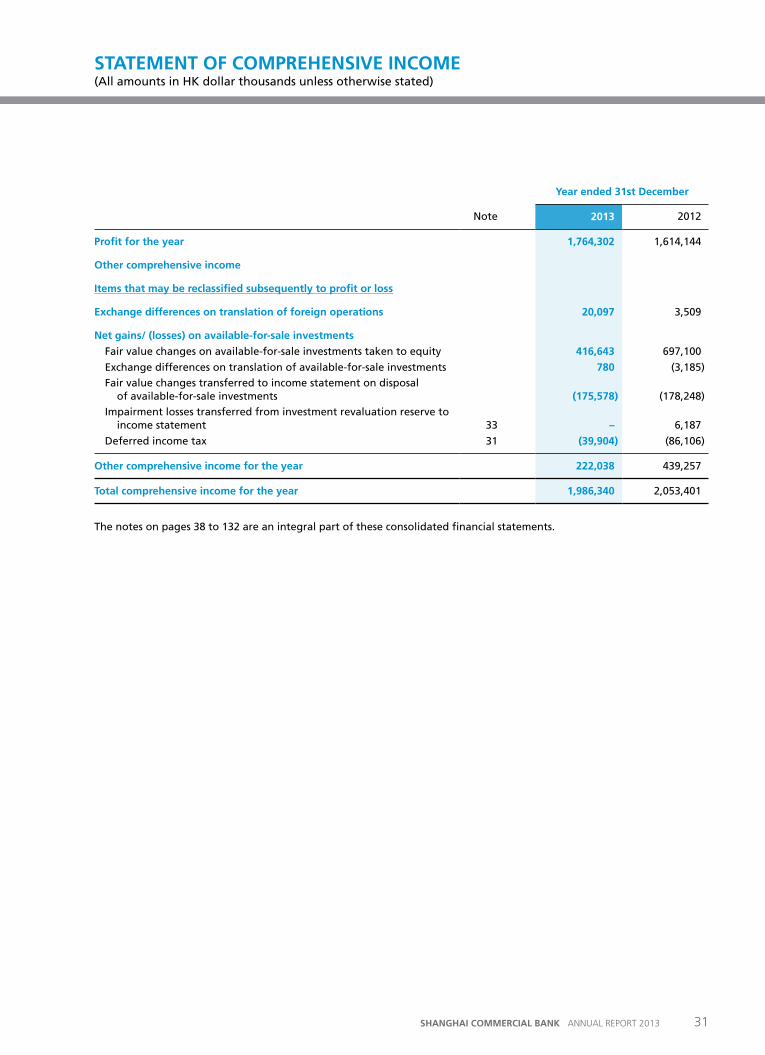
profit for the year 1,764,302 1,614,144
other comprehensive income
Items that may be reclassified subsequently to profit or loss
Exchange differences on translation of foreign operations 20,097 3,509
Net gains/ (losses) on available-for-sale investments
Fair value changes on available-for-sale investments taken to equity 416,643 697,100
Exchange differences on translation of available-for-sale investments 780 (3,185)
Fair value changes transferred to income statement on disposal of available-for-sale investments (175,578) (178,248)
Impairment losses transferred from investment revaluation reserve to income statement 33 – 6,187
Deferred income tax 31 (39,904) (86,106)
other comprehensive income for the year 222,038 439,257
total comprehensive income for the year 1,986,340 2,053,401
The notes on pages 38 to 132 are an integral part of these consolidated financial statements.
31SHANGHAI COMMERCIAL BANK ANNUAL REPORT 2013
StatEMENt oF CoMprEHENSIvE INCoME (All amounts in HK dollar thousands unless otherwise stated)
as at 31st December
Note 2013 2012
aSSEtSCash and balances with banks 17 25,396,151 29,889,669 Placements with and loans and advances to banks 18 23,266,965 19,627,668
Loans and advances to customers 19(a) 62,093,205 53,715,110 Financial assets held for trading 20 368,882 349,763 Derivative financial instruments 21 73,485 51,446 Investment securities: – Available-for-sale 22 25,472,136 26,958,980 – Held-to-maturity 23 2,484,874 2,496,830 Investments in joint ventures 24(a) 234,456 219,865 Properties and equipment 25 2,424,014 2,339,324 Investment properties 26 92,495 137,145 Deferred income tax assets 31 50,430 45,487 Other assets 27 1,113,762 1,355,881
totaL aSSEtS 143,070,855 137,187,168
LIaBILItIESDeposits and balances from banks 7,108,798 5,545,795 Deposits from customers 28 113,641,193 110,681,915 Derivative financial instruments 21 61,805 39,891 Other liabilities 29 1,282,470 1,257,107 Provisions 30 93,064 87,309 Current income tax liabilities 141,000 56,762 Deferred income tax liabilities 31 240,543 205,410
totaL LIaBILItIES 122,568,873 117,874,189
EQuItY
CapItaL aND rESErvES attrIButaBLE to tHE EQuItY HoLDErSShare capital 32 2,000,000 2,000,000 Retained earnings – Proposed final dividend 880,000 820,000 – Others 8,365,499 7,465,990 Other reserves 33 9,192,221 8,965,268
20,437,720 19,251,258
Non-controlling interests in equity 64,262 61,721
totaL EQuItY 20,501,982 19,312,979
totaL EQuItY aND LIaBILItIES 143,070,855 137,187,168
Approved and authorised for issue by the Board of Directors on 13th March 2014.
Lincoln Chu Kuen Yung Hung-ching YungChairman Director
Gordon Che Keung Kwong David Sek-chi KwokDirector Managing Director & Chief Executive
The notes on pages 38 to 132 are an integral part of these consolidated financial statements.
32 SHANGHAI COMMERCIAL BANK ANNUAL REPORT 2013
CoNSoLIDatED StatEMENt oF FINaNCIaL poSItIoN (All amounts in HK dollar thousands unless otherwise stated)
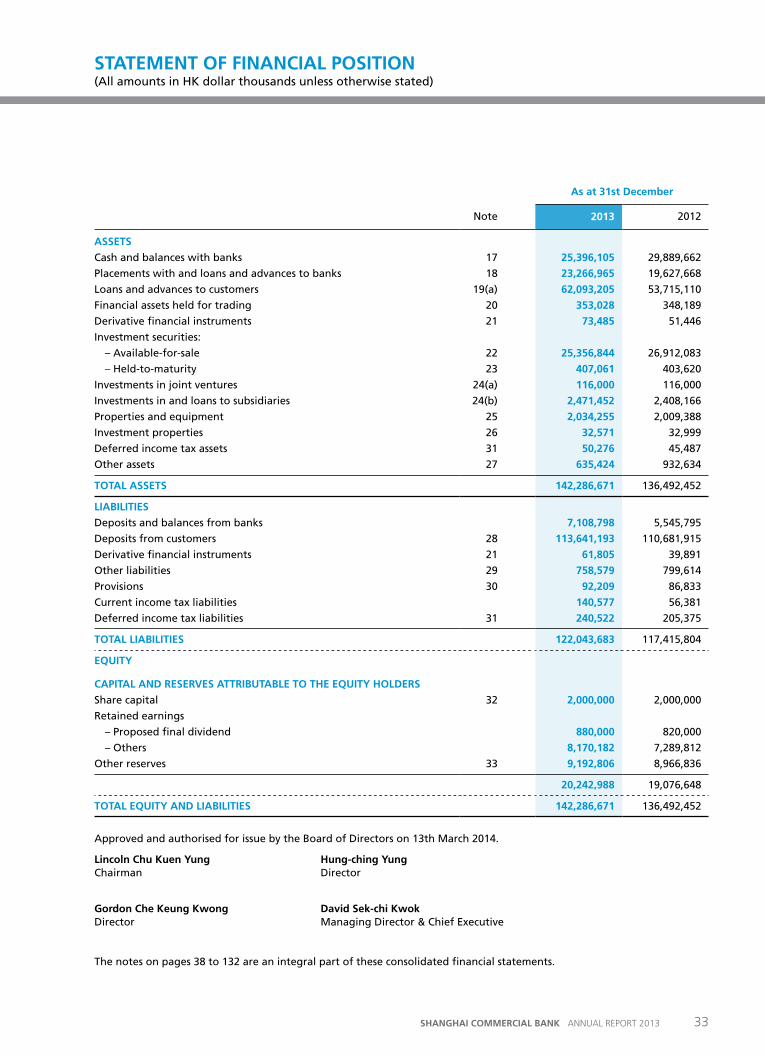
as at 31st December
Note 2013 2012
aSSEtS
Cash and balances with banks 17 25,396,105 29,889,662
Placements with and loans and advances to banks 18 23,266,965 19,627,668
Loans and advances to customers 19(a) 62,093,205 53,715,110
Financial assets held for trading 20 353,028 348,189
Derivative financial instruments 21 73,485 51,446
Investment securities:
– Available-for-sale 22 25,356,844 26,912,083
– Held-to-maturity 23 407,061 403,620
Investments in joint ventures 24(a) 116,000 116,000
Investments in and loans to subsidiaries 24(b) 2,471,452 2,408,166
Properties and equipment 25 2,034,255 2,009,388
Investment properties 26 32,571 32,999
Deferred income tax assets 31 50,276 45,487
Other assets 27 635,424 932,634
totaL aSSEtS 142,286,671 136,492,452
LIaBILItIES
Deposits and balances from banks 7,108,798 5,545,795
Deposits from customers 28 113,641,193 110,681,915
Derivative financial instruments 21 61,805 39,891
Other liabilities 29 758,579 799,614
Provisions 30 92,209 86,833
Current income tax liabilities 140,577 56,381
Deferred income tax liabilities 31 240,522 205,375
totaL LIaBILItIES 122,043,683 117,415,804
EQuItY
CapItaL aND rESErvES attrIButaBLE to tHE EQuItY HoLDErS
Share capital 32 2,000,000 2,000,000
Retained earnings
– Proposed final dividend 880,000 820,000
– Others 8,170,182 7,289,812
Other reserves 33 9,192,806 8,966,836
20,242,988 19,076,648
totaL EQuItY aND LIaBILItIES 142,286,671 136,492,452
Approved and authorised for issue by the Board of Directors on 13th March 2014.
Lincoln Chu Kuen Yung Hung-ching YungChairman Director
Gordon Che Keung Kwong David Sek-chi KwokDirector Managing Director & Chief Executive
The notes on pages 38 to 132 are an integral part of these consolidated financial statements.
33SHANGHAI COMMERCIAL BANK ANNUAL REPORT 2013
StatEMENt oF FINaNCIaL poSItIoN (All amounts in HK dollar thousands unless otherwise stated)
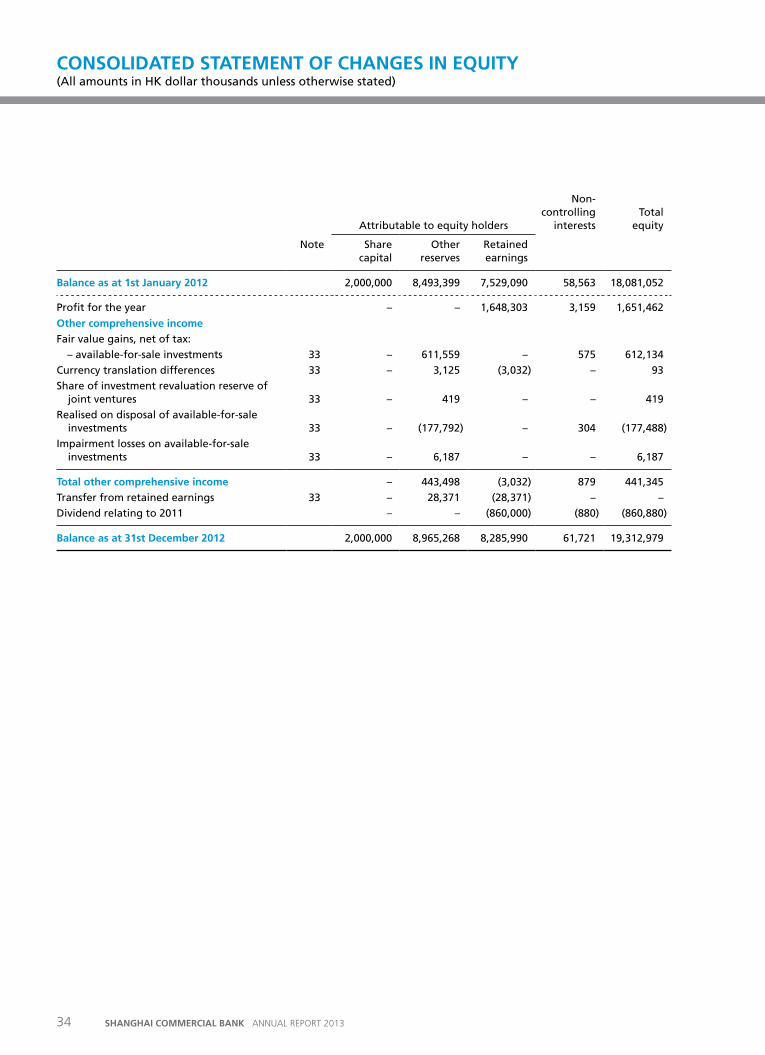
Attributable to equity holders
Non-controlling
interestsTotal
equity
Note Share capital
Other reserves
Retained earnings
Balance as at 1st January 2012 2,000,000 8,493,399 7,529,090 58,563 18,081,052
Profit for the year – – 1,648,303 3,159 1,651,462
other comprehensive income
Fair value gains, net of tax:
– available-for-sale investments 33 – 611,559 – 575 612,134
Currency translation differences 33 – 3,125 (3,032) – 93
Share of investment revaluation reserve of joint ventures 33 – 419 – – 419
Realised on disposal of available-for-sale investments 33 – (177,792) – 304 (177,488)
Impairment losses on available-for-sale investments 33 – 6,187 – – 6,187
total other comprehensive income – 443,498 (3,032) 879 441,345
Transfer from retained earnings 33 – 28,371 (28,371) – –
Dividend relating to 2011 – – (860,000) (880) (860,880)
Balance as at 31st December 2012 2,000,000 8,965,268 8,285,990 61,721 19,312,979
34 SHANGHAI COMMERCIAL BANK ANNUAL REPORT 2013
CoNSoLIDatED StatEMENt oF CHaNGES IN EQuItY (All amounts in HK dollar thousands unless otherwise stated)
attributable to equity holders
Non-controlling
intereststotal
equity
Note Share capital
other reserves
retained earnings
Balance as at 1st January 2013 2,000,000 8,965,268 8,285,990 61,721 19,312,979
Profit for the year – – 1,784,643 3,256 1,787,899
other comprehensive income
Fair value gains, net of tax: – available-for-sale investments 33 – 375,914 – (500) 375,414
Currency translation differences 33 – 16,890 3,956 – 20,846
Share of investment revaluation reserve of joint ventures 33 – (101) – – (101)
Realised on disposal of available-for-sale investments 33 – (174,840) – 185 (174,655)
total other comprehensive income – 217,863 3,956 (315) 221,504
Transfer from retained earnings 33 – 9,090 (9,090) – –
Dividend relating to 2012 – – (820,000) (400) (820,400)
Balance as at 31st December 2013 2,000,000 9,192,221 9,245,499 64,262 20,501,982
Year ended 31st December
2013 2012
proposed dividend in retained earnings 880,000 820,000
The notes on pages 38 to 132 are an integral part of these consolidated financial statements.
35SHANGHAI COMMERCIAL BANK ANNUAL REPORT 2013
CoNSoLIDatED StatEMENt oF CHaNGES IN EQuItY (CoNtINuED) (All amounts in HK dollar thousands unless otherwise stated)
Year ended 31st December
2013 2012
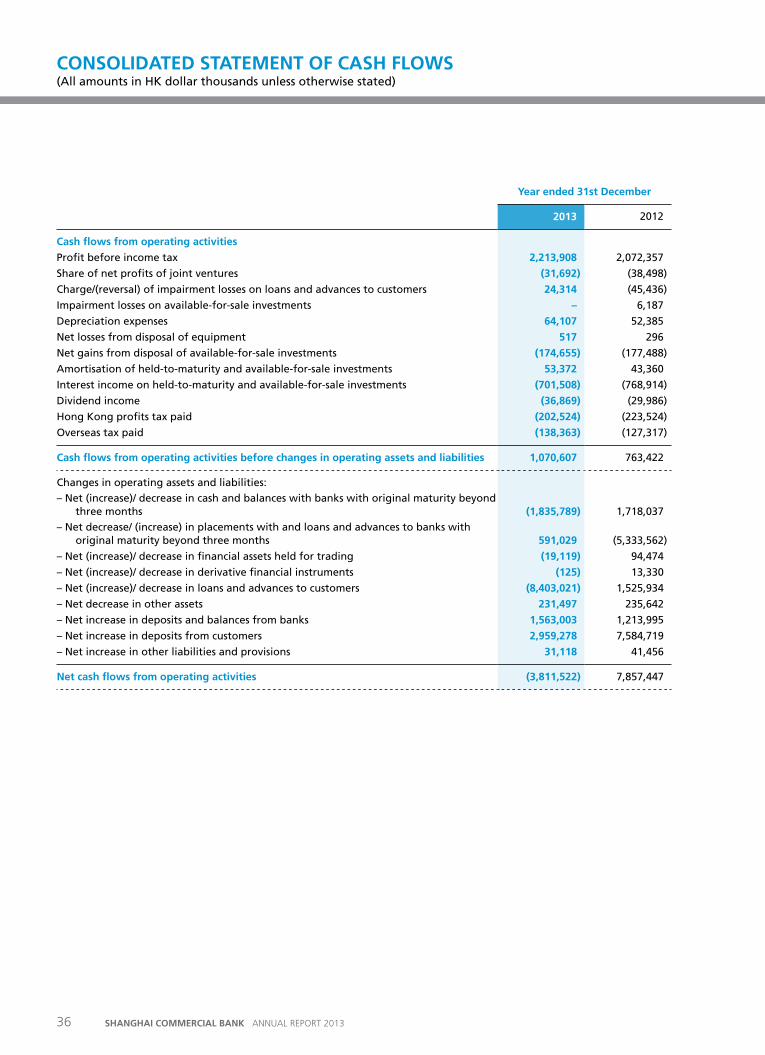
Cash flows from operating activities
Profit before income tax 2,213,908 2,072,357
Share of net profits of joint ventures (31,692) (38,498)
Charge/(reversal) of impairment losses on loans and advances to customers 24,314 (45,436)
Impairment losses on available-for-sale investments – 6,187
Depreciation expenses 64,107 52,385
Net losses from disposal of equipment 517 296
Net gains from disposal of available-for-sale investments (174,655) (177,488)
Amortisation of held-to-maturity and available-for-sale investments 53,372 43,360
Interest income on held-to-maturity and available-for-sale investments (701,508) (768,914)
Dividend income (36,869) (29,986)
Hong Kong profits tax paid (202,524) (223,524)
Overseas tax paid (138,363) (127,317)
Cash flows from operating activities before changes in operating assets and liabilities 1,070,607 763,422
Changes in operating assets and liabilities:
– Net (increase)/ decrease in cash and balances with banks with original maturity beyond three months (1,835,789) 1,718,037
– Net decrease/ (increase) in placements with and loans and advances to banks with original maturity beyond three months 591,029 (5,333,562)
– Net (increase)/ decrease in financial assets held for trading (19,119) 94,474
– Net (increase)/ decrease in derivative financial instruments (125) 13,330
– Net (increase)/ decrease in loans and advances to customers (8,403,021) 1,525,934
– Net decrease in other assets 231,497 235,642
– Net increase in deposits and balances from banks 1,563,003 1,213,995
– Net increase in deposits from customers 2,959,278 7,584,719
– Net increase in other liabilities and provisions 31,118 41,456
Net cash flows from operating activities (3,811,522) 7,857,447
36 SHANGHAI COMMERCIAL BANK ANNUAL REPORT 2013
CoNSoLIDatED StatEMENt oF CaSH FLoWS (All amounts in HK dollar thousands unless otherwise stated)
Year ended 31st December
Note 2013 2012
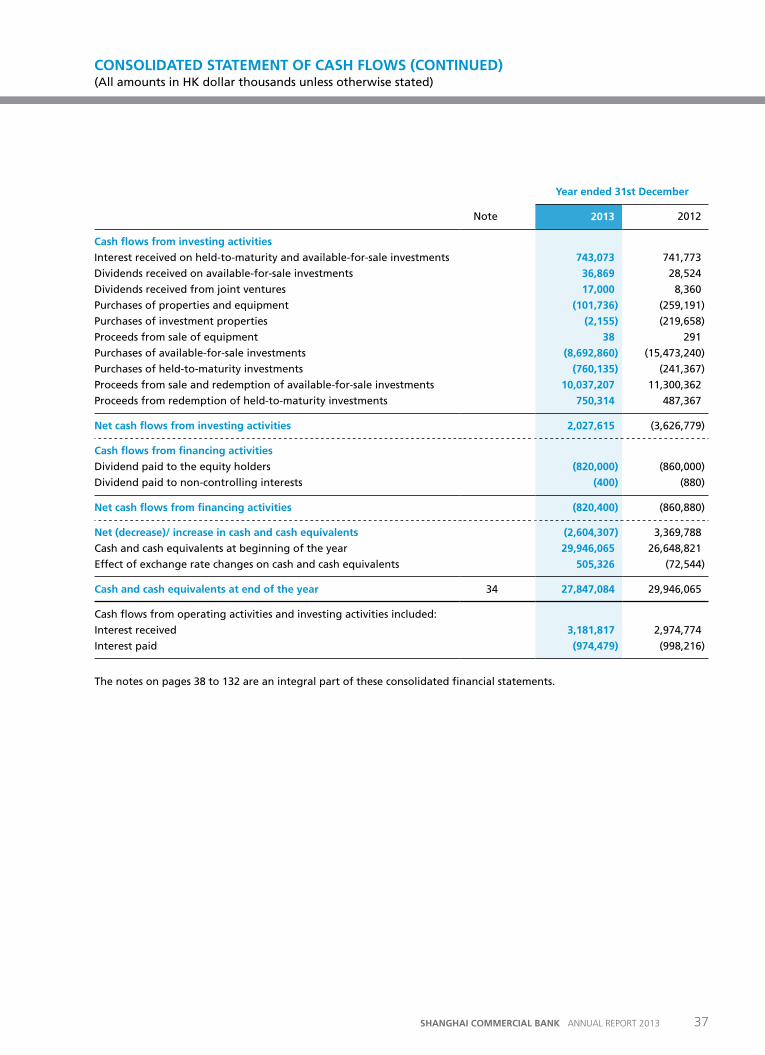
Cash flows from investing activities
Interest received on held-to-maturity and available-for-sale investments 743,073 741,773
Dividends received on available-for-sale investments 36,869 28,524
Dividends received from joint ventures 17,000 8,360
Purchases of properties and equipment (101,736) (259,191)
Purchases of investment properties (2,155) (219,658)
Proceeds from sale of equipment 38 291
Purchases of available-for-sale investments (8,692,860) (15,473,240)
Purchases of held-to-maturity investments (760,135) (241,367)
Proceeds from sale and redemption of available-for-sale investments 10,037,207 11,300,362
Proceeds from redemption of held-to-maturity investments 750,314 487,367
Net cash flows from investing activities 2,027,615 (3,626,779)
Cash flows from financing activities
Dividend paid to the equity holders (820,000) (860,000)
Dividend paid to non-controlling interests (400) (880)
Net cash flows from financing activities (820,400) (860,880)
Net (decrease)/ increase in cash and cash equivalents (2,604,307) 3,369,788
Cash and cash equivalents at beginning of the year 29,946,065 26,648,821
Effect of exchange rate changes on cash and cash equivalents 505,326 (72,544)
Cash and cash equivalents at end of the year 34 27,847,084 29,946,065
Cash flows from operating activities and investing activities included:
Interest received 3,181,817 2,974,774
Interest paid (974,479) (998,216)
The notes on pages 38 to 132 are an integral part of these consolidated financial statements.
37SHANGHAI COMMERCIAL BANK ANNUAL REPORT 2013
CoNSoLIDatED StatEMENt oF CaSH FLoWS (CoNtINuED) (All amounts in HK dollar thousands unless otherwise stated)
1 GENERAL INFORMATIONShanghai Commercial Bank Limited (the ‘Bank’) and its subsidiary companies (together, the ‘Group’) are engaged in the provision of banking and related financial services in Hong Kong, United States, United Kingdom and the People’s Republic of China.
The Bank is a financial institution incorporated in Hong Kong. The address of its registered office is 35/F., Gloucester Tower, The Landmark, 15 Queen’s Road Central, Hong Kong.
These consolidated financial statements are presented in thousands of units of Hong Kong Dollars (HK$‘000), unless otherwise stated. These consolidated financial statements were approved for issue by the Board of Directors on 13th March 2014.
2 SUMMARY OF SIGNIFICANT ACCOUNTING POLICIESThe principal accounting policies applied in the preparation of these consolidated financial statements are set out below. These policies have been consistently applied to all the years presented, unless otherwise stated.
2.1 Basis of preparationThe consolidated financial statements of the Group and the financial statements of the Bank have been prepared in accordance with Hong Kong Financial Reporting Standards (‘HKFRSs’) issued by the Hong Kong Institute of Certified Public Accountants (‘HKICPA’). The consolidated financial statements of the Group and the financial statements of the Bank have been prepared under the historical cost convention, as modified by the revaluation of available-for-sale investments, financial assets designated at fair value, financial assets held for trading and derivative financial instruments at fair value.
The preparation of financial statements in conformity with HKFRSs requires the use of certain critical accounting estimates. It also requires management to exercise its judgment in the process of applying the Group’s accounting policies. The areas involving a higher degree of judgment or complexity, or areas where assumptions and estimates are significant to the consolidated financial statements, are disclosed in Note 4.
(a) the following standards, amendments and interpretations, which became effective in 2013, are relevant to the Group:
HKAS 1 (Amendment) ‘Financial statements presentation – Presentation of items of other comprehensive income’ is effective for the accounting period beginning on or after 1st July 2012. The amendments require an entity to classify items within other comprehensive income under two categories: (i) items which may be reclassified to profit or loss in the future and (ii) items which would never be reclassified to profit or loss. The adoption of the amendment only affects the disclosure of the consolidated statement of comprehensive income.
HKFRS 7 (Amendment) ‘Financial instruments: Disclosures - Offsetting financial assets and financial liabilities’ is effective for the accounting period beginning on or after 1st January 2013. This amendment requires an entity to disclose information about rights to set-off and related arrangements (e.g., collateral agreements). The disclosures would provide users with information that is useful in evaluating the effect of netting arrangements on an entity’s financial position. The new disclosures are required for all recognised financial instruments that are set off in accordance with HKAS 32 ‘Financial instruments: Presentation’. The disclosures also apply to recognised financial instruments that are subject to an enforceable master netting arrangement or similar agreement, irrespective of whether they are set off in accordance with HKAS 32. The additional disclosures under the HKFRS 7 (Amendment) are disclosed in note 36.
38 SHANGHAI COMMERCIAL BANK ANNUAL REPORT 2013
NotES to tHE CoNSoLIDatED FINaNCIaL StatEMENtS (All amounts in HK dollar thousands unless otherwise stated)
2 SUMMARY OF SIGNIFICANT ACCOUNTING POLICIES (CONTINUED)
2.1 Basis of preparation (Continued)(a) the following standards, amendments and interpretations, which became effective in 2013, are relevant to
the Group: (Continued)
HKFRS 10 ‘Consolidated financial statements’ is effective for the accounting period beginning on or after 1st January 2013. The standard builds on existing principles by identifying the concept of control as the determining factor in whether an entity should be included within the consolidated financial statements of the parent company. The standard provides additional guidance to assist in the determination of control where this is difficult to assess. The standard does not have impact on the Group’s financial statements as there is no change in the number of subsidiaries consolidated by the Bank as a result of the effective of HKFRS 10.
HKFRS 11 ‘Joint arrangements’ is effective for accounting period beginning on or after 1st January 2013. HKFRS 11 classifies joint arrangements as either joint operations (combining the existing concepts of jointly controlled assets and jointly controlled operations) or joint ventures (equivalent to the existing concept of a jointly controlled entity). Joint operation is a joint arrangement whereby the parties that have joint control have rights to the assets and obligations for the liabilities. Joint venture is a joint arrangement whereby the parties that have joint control of the arrangement have rights to the net assets of the arrangement. HKFRS 11 requires the use of equity method of accounting for interests in joint ventures thereby eliminating the proportionate consolidation method. The determination of as to whether a joint arrangement is a joint operation or a joint venture is based on the parties’ rights and obligations under the arrangement, with the existence of a separate legal vehicle no longer being the key factor. HKFRS 11 does not have material impact to the Group as the Group accounts for its interest in joint ventures using equity method.
HKFRS 12 ‘Disclosures of interests in other entities’ is effective for the accounting period on or after 1st January 2013. HKFRS 12 includes the disclosure requirements for all forms of interests in other entities, including joint arrangements, associates, special purpose vehicles and other off balance sheet vehicles. The new disclosure requirement under HKFRS 12 in respect of investment in joint ventures is disclosed in note 24(a) to the Group’s financial statements.
HKFRS 13 ‘Fair value measurement’ is effective for the accounting period beginning on or after 1st January 2013. HKFRS 13 establishes a single source of guidance for all fair value measurements required or permitted by HKFRSs. It clarifies the definition of fair value as an exit price, which is defined as a price at which an orderly transaction to sell the asset or transfer the liability would take place between market participants at the measurement date under market conditions, and enhances disclosures about fair value measurement. HKFRS 13 also includes additional disclosure requirements in respect of fair value hierarchy and fair value estimation. The additional disclosures are disclosed in note 3.4 to the Group’s financial statements.
HKAS 19 (Revised 2011) ‘Employee benefits’ is effective for the accounting period beginning on or after 1st January 2013. Retrospective application is required with certain exceptions. The amendments require the recognition of changes in the defined benefit obligation and in plan assets when those changes occur, eliminating the corridor approach and accelerating the recognition of past service costs. Changes in the defined benefit obligation and in plan assets are disaggregated into three components: service costs, net interest on the net defined benefit liabilities or assets and re-measurements of the net defined benefit liabilities or assets. The revised standard does not have significant impact on the Group’s financial statements as the defined benefit plan operated by the Group is not material.
NOTES TO THE CONSOLIDATED FINANCIAL STATEMENTS (CONTINuED) (All amounts in HK dollar thousands unless otherwise stated)
39SHANGHAI COMMERCIAL BANK ANNUAL REPORT 2013
2 SUMMARY OF SIGNIFICANT ACCOUNTING POLICIES (CONTINUED)
2.1 Basis of preparation (Continued)(a) the following standards, amendments and interpretations, which became effective in 2013, are relevant to
the Group: (Continued)
HKAS 27 (Revised 2011) ‘Separate financial statements’ has been amended for the issuance of HKFRS 10 but retains the current guidance for separate financial statements. HKAS 27 (Revised 2011) is effective for the accounting period beginning on or after 1st January 2013. The revised standard does not have significant impact on the Group’s financial statements.
HKAS 28 (Revised 2011) ‘Investments in associates and joint ventures’ has been amended for conforming changes based on the issuance of HKFRS 10 and HKFRS 11. HKAS 28 (Revised 2011) is effective for the accounting period beginning on or after 1st January 2013. The revised standard does not have significant impact on the Group’s financial statements.
(b) the following new standards, new interpretations and amendments to standards and interpretations have been issued but are not effective for the financial year beginning 1st January 2013. the Group did not early-adopt these new or amended standards in 2013.
HKFRS 9 ‘Financial instruments’, mandatory effective date is dependent on International Financial Reporting Standard 9 ‘Financial instruments’ (‘IFRS9’), which is being reviewed by International Accounting Standards Board (‘IASB’). The standard addresses the classification, measurement and recognition of financial assets and financial liabilities. HKFRS 9 was issued in November 2009 and October 2010. It replaces the parts of HKAS 39 that relate to the classification and measurement of financial instruments. HKFRS 9 requires financial assets to be classified into two measurement categories: those measured as at fair value and those measured at amortised cost. The determination is made at initial recognition. The classification depends on the entity’s business model for managing its financial instruments and the contractual cash flow characteristics of the instrument. For financial liabilities, the standard retains most of the HKAS 39 requirements. The main change is that, in cases where the fair value option is taken for financial liabilities, the part of a fair value change due to an entity’s own credit risk is recorded in other comprehensive income rather than the income statement, unless this creates an accounting mismatch. The HKICPA also issued amendments to HKFRS 9 in December 2013 which brings into effect a substantial overhaul of hedge accounting models. The Group will consider the impact of the amendments / changes to HKFRS 9 when IFRS 9’s review is completed by the IASB.
NOTES TO THE CONSOLIDATED FINANCIAL STATEMENTS (CONTINuED) (All amounts in HK dollar thousands unless otherwise stated)
40 SHANGHAI COMMERCIAL BANK ANNUAL REPORT 2013
2 SUMMARY OF SIGNIFICANT ACCOUNTING POLICIES (CONTINUED)
2.1 Basis of preparation (Continued)(b) the following new standards, new interpretations and amendments to standards and interpretations have
been issued but are not effective for the financial year beginning 1st January 2013. the Group did not early-adopt these new or amended standards in 2013. (Continued)
Amendments to HKFRS 10 ‘Consolidated financial statements – Investment entities’ is effective for the accounting period beginning on or after 1st January 2014. The amendments give relief from consolidation to those parents which meet certain criteria as set out in the amendments. Such parents are referred to as ‘investment entities’ in the amendments, and typical examples of these entities include private equity organisations, venture capital organisations, etc. Under the amendments, investment entities are prohibited from consolidating their subsidiaries, instead, they are required to carry their subsidiaries at fair value through profit or loss (‘FVTPL’). The only subsidiaries that fall outside the FVTPL requirements are those subsidiaries which provide services which relate to the investment entity’s investment activities. Such service subsidiaries would still need to be consolidated by the investment entity. The exemption from consolidation is only applicable to parents who qualify as investment entities in their own right. It does not carry upwards to parents higher up the group if those higher parents are not themselves investment entities. In such cases, the higher parents would have to consolidate all entities that it controls, including those controlled through an investment entity subsidiary. HKFRS 12 and HKAS 27 (2011) are also amended as a result of these amendments. The amendments are not expected to have significant impact on the Group.
HKAS 32 (Amendment) ‘Financial instruments: Presentation - offsetting financial assets and financial liabilities’ is effective for the accounting period beginning on or after 1st January 2014. The amendment addresses inconsistencies in current practice when applying the offsetting criteria and clarifies the meaning of ‘currently has a legally enforceable right of set-off’; and the application of offsetting criteria to some gross settlement systems (such as central clearing house systems) that may be considered equivalent to net settlement. The Group is considering the financial impact of the amendment.
Amendments to HKAS 36 ‘Impairment of assets’, the amendments remove certain disclosures of the recoverable amount of cash-generating units which had been included in HKAS 36 by the issue of HKFRS 13. The amendments are effective for the accounting period on or after 1st January 2014 and the amendments are not expected to have significant impact on the Group.
HK(IFRIC) Int-21 ‘Levies’ is effective for the accounting period beginning on or after 1st January 2014. This interpretation sets out the accounting for an obligation to pay a levy that is not income tax. The interpretation addresses what the obligating event is that gives rise to pay a levy and when should a liability be recognised. The Group is not currently subject to significant levies so the impact on the Group is not material.
NOTES TO THE CONSOLIDATED FINANCIAL STATEMENTS (CONTINuED) (All amounts in HK dollar thousands unless otherwise stated)
41SHANGHAI COMMERCIAL BANK ANNUAL REPORT 2013
2 SUMMARY OF SIGNIFICANT ACCOUNTING POLICIES (CONTINUED)
2.2 ConsolidationThe consolidated financial statements include the financial statements of the Bank and all its subsidiaries made up to 31st December 2013.
(a) Subsidiaries
Subsidiaries are all entities (including structured entities) over which the Group has control. The Group controls an entity when the Group is exposed to, or has rights to, variable returns from its involvement with the entity and has the ability to affect those returns through its power over the entity. Subsidiaries are fully consolidated from the date on which control is transferred to the Group. They are deconsolidated from the date that control ceases.
Investments in subsidiaries are accounted for at cost less impairment. Cost is adjusted to reflect changes in consideration arising from contingent consideration amendments. Cost also includes direct attributable costs of investment.
Inter-company transactions, balances and unrealised gains on transactions between group companies are eliminated. Unrealised losses are also eliminated unless the transaction provides evidence of impairment of the asset transferred. Accounting policies of subsidiaries have been changed where necessary to ensure consistency with the policies adopted by the Group.
(b) transactions with non-controlling interests
The Group treats transactions with non-controlling interests as transactions with equity owners of the Group. For purchases from non-controlling interests, the difference between any consideration paid and the relevant share acquired of the carrying value of net assets of the subsidiary is recorded in equity. Gains or losses on disposals to non-controlling interests are also recorded in equity.
When the Group ceases to have control or significant influence, any retained interest in the entity is remeasured to its fair value, with the change in carrying amount recognised in profit or loss. The fair value is the initial carrying amount for the purposes of subsequently accounting for the retained interest as an associate, joint venture or financial asset. In addition, any amounts previously recognised in other comprehensive income in respect of that entity are accounted for as if the Group had directly disposed of the related assets or liabilities. This may mean that amounts previously recognised in other comprehensive income are reclassified to profit or loss.
(c) Joint ventures
A joint venture is an arrangement whereby the Group and other parties contractually agree to share control of the arrangement and have right to the net assets of the arrangement. Joint ventures are accounted for using the equity method.
Under the equity method of accounting, interests in joint ventures are initially recognised at cost and adjusted thereafter to recognise the Group’s share of the post-acquisition profits or losses and movements in other comprehensive income. When the Group’s share of losses in a joint venture equals or exceeds its interests in the joint ventures (which includes any long-term interests that, in substance, form part of the Group’s net investment in the joint ventures), the Group does not recognise further losses, unless it has incurred obligations or made payments on behalf of the joint ventures.
Unrealised gains on transactions between the Group and its joint ventures are eliminated to the extent of the Group’s interest in the joint ventures. Unrealised losses are also eliminated unless the transaction provides evidence of an impairment of the asset transferred.
NOTES TO THE CONSOLIDATED FINANCIAL STATEMENTS (CONTINuED) (All amounts in HK dollar thousands unless otherwise stated)
42 SHANGHAI COMMERCIAL BANK ANNUAL REPORT 2013
2 SUMMARY OF SIGNIFICANT ACCOUNTING POLICIES (CONTINUED)
2.3 Foreign currency translation(a) Functional and presentation currency
Items included in the financial statements of each of the Group’s entities are measured using the currency of the primary economic environment in which the entity operates (‘the functional currency’). The consolidated financial statements are presented in thousands of units of Hong Kong Dollars (HK$‘000), which is the Bank’s functional and presentation currency.
(b) transactions and balances
Foreign currency transactions that are transactions denominated, or that require settlement, in a foreign currency are translated into the functional currency using the exchange rates prevailing at the dates of the transactions.
Monetary items denominated in foreign currency are translated with the closing rate as at the reporting date. Non-monetary items measured at historical cost denominated in a foreign currency are translated with the exchange rate as at the date of initial recognition; non-monetary items in a foreign currency that are measured at fair value are translated using the exchange rates at the date when the fair value was determined.
Foreign exchange gains and losses resulting from the settlement of foreign currency transactions and from the translation at exchange rates at statement of financial position dates of monetary assets and liabilities denominated in foreign currencies are recognised in the income statement.
All foreign exchange gains and losses recognised in the income statement are presented net in the income statement within the corresponding item. Foreign exchange gains and losses on other comprehensive income items are presented in other comprehensive income within the corresponding item.
In the case of changes in the fair value of monetary assets denominated in foreign currency classified as available-for-sale, a distinction is made between translation differences resulting from changes in amortised cost of the security and other changes in the carrying amount of the security.
Translation differences related to changes in the amortised cost are recognised in profit or loss, and other changes in the carrying amount, except impairment, are recognised in other comprehensive income.
Translation differences on non-monetary financial instruments, such as equities held at fair value through profit or loss, are reported as part of the fair value gain or loss. Translation differences on non-monetary financial instruments, such as equities classified as available-for-sale investments, are included in other comprehensive income.
(c) Group companies and overseas branches
The results and financial positions of all the Group’s entities that have a functional currency different from the presentation currency are translated into the presentation currency as follows:
– Assets and liabilities for each statement of financial position presented are translated at the closing rate at the date of that statement of financial position;
– Income and expenses for each income statement are translated at average exchange rates (unless this average is not a reasonable approximation of the cumulative effect of the rates prevailing on the transaction dates, in which case income and expenses are translated at the dates of the transactions); and
– All resulting exchange differences are recognised in other comprehensive income.
NOTES TO THE CONSOLIDATED FINANCIAL STATEMENTS (CONTINuED) (All amounts in HK dollar thousands unless otherwise stated)
43SHANGHAI COMMERCIAL BANK ANNUAL REPORT 2013
2 SUMMARY OF SIGNIFICANT ACCOUNTING POLICIES (CONTINUED)2.3 Foreign currency translation (Continued)
(c) Group companies and overseas branches (Continued)
On consolidation, exchange differences arising from the translation of the net investment in foreign entities, are taken to other comprehensive income. When a foreign operation is disposed of, or partially disposed of, such exchange differences that were recorded in equity are recognised in the income statement as part of the gain or loss on sale.
Goodwill and fair value adjustments arising on the acquisition of a foreign entity are treated as assets and liabilities of the foreign entity and translated at the closing rate.
2.4 Interest income and expenseInterest income and expense for all interest-bearing financial instruments, except for those classified as held for trading or designated at fair value through profit or loss, are recognised within ‘interest income’ and ‘interest expense’ in the income statement using the effective interest method.
The effective interest method is a method of calculating the amortised cost of a financial asset or a financial liability and of allocating the interest income or interest expense over the relevant period. The effective interest rate is the rate that exactly discounts estimated future cash payments or receipts through the expected life of the financial instrument or, where appropriate, a shorter period to the net carrying amount of the financial asset or financial liability. When calculating the effective interest rate, the Group estimates cash flows considering all contractual terms of the financial instrument, but does not consider future credit losses. The calculation includes all fees and points paid or received between parties to the contract that are an integral part of the effective interest rate.
Once a financial asset or a group of similar financial assets has been written down as a result of an impairment loss, interest income is recognised using the rate of interest used to discount the future cash flows for the purpose of measuring the impairment loss.
2.5 Fee and commission income and expenseFees and commissions are generally recognised on an accrual basis when the service has been provided. Loan commitment fees for loans that are likely to be drawn down are deferred (together with related direct costs) and recognised as an adjustment to the effective interest rate on the loan. Loan syndication fees are recognised as revenue when the syndication has been completed and the Group retained no part of the loan package for itself or retained a part at the same effective interest rate as the other participants. Commissions and fees arising from negotiating, or participating in the negotiation of, a transaction for a third party - such as the arrangement of the acquisition of shares or other securities or the purchase or sale of businesses - are recognised on completion of the underlying transaction. Portfolio and other management advisory and service fees are recognised based on the applicable service contracts, usually on a time-apportionate basis. Asset management fees related to investment funds are recognised rateably over the period the service is provided. The same principle is applied for wealth management, financial planning and custody services that are continuously provided over an extended period of time.
2.6 Dividend incomeDividends are recognised in the income statement when the entity’s right to receive payment is established.
NOTES TO THE CONSOLIDATED FINANCIAL STATEMENTS (CONTINuED) (All amounts in HK dollar thousands unless otherwise stated)
44 SHANGHAI COMMERCIAL BANK ANNUAL REPORT 2013
2 SUMMARY OF SIGNIFICANT ACCOUNTING POLICIES (CONTINUED)
2.7 Leases(a) operating lease
Leases in which a significant portion of the risks and rewards of ownership are retained by the lessor are classified as operating leases. Payments made under operating lease (net of any incentives received from the lessor) are charged to the income statement on a straight-line basis over the period of the lease.
(b) Finance lease
Leasehold land classified as finance lease commences amortisation from the time when the land interest becomes available for its intended use. Amortisation on leasehold land classified as finance lease and depreciation on those assets is calculated using the straight-line method to allocate their cost over their estimated useful lives. Interest in leasehold land is amortised on a straight-line basis over the unexpired period of the lease term.
2.8 properties and equipment(a) Land and bank premises
Land and buildings comprise mainly branches and offices. Leasehold land classified as finance lease and buildings are stated at historical cost, which includes expenditure that is directly attributable to the acquisition of the items, less accumulated depreciation and impairment losses. Depreciation of land and buildings is provided annually by charging a sum sufficient to write down the cost of the land and buildings systematically. The land is depreciated over the lease term. The depreciation of the buildings is based on management’s appraisal of their conditions, which includes estimations of the remaining useful lives, which are not expected to exceed 40 years.
Interest in freehold land is stated at cost and included as properties and equipment on the statement of financial position.
(b) Furniture, fittings and equipment
Furniture, fittings and equipment are stated at historical cost less accumulated depreciation and impairment losses. Depreciation of furniture, fittings and equipment other than computer equipment is calculated to write off the cost of the assets over their estimated useful lives on a reducing balance basis at a rate of 25% in the year of addition and at 20% per annum thereafter. Computer equipment is depreciated on a straight line basis over four years.
Subsequent costs are included in the asset’s carrying amount or recognised as a separate asset, as appropriate, only when it is probable that future economic benefits associated with the item will flow to the Group and the cost of the item can be measured reliably. All other repairs and maintenance are expensed in the income statement during the financial period in which they are incurred.
(c) property under development
Leasehold land for property under development is stated at historical cost, less accumulated depreciation and impairment losses, and development expenditure is stated at the aggregate amount of costs incurred up to the date of completion. For depreciation of leasehold land for properties under development, please refer to Note 2.8(a) above.
The assets’ residual values and useful lives are reviewed, and adjusted if appropriate, at the end of each reporting period. Assets that are subject to amortisation are reviewed for impairment whenever events or changes in circumstances indicate that the carrying amount may not be recoverable. An asset’s carrying amount is written down immediately to its recoverable amount if the asset’s carrying amount is greater than its estimated recoverable amount (Note 2.22). The recoverable amount is the higher of the asset’s fair value less costs to sell and value in use.
Gains or losses on disposals are determined by comparing proceeds and the carrying amount of the relevant assets and are recognised in the income statement.
NOTES TO THE CONSOLIDATED FINANCIAL STATEMENTS (CONTINuED) (All amounts in HK dollar thousands unless otherwise stated)
45SHANGHAI COMMERCIAL BANK ANNUAL REPORT 2013
2 SUMMARY OF SIGNIFICANT ACCOUNTING POLICIES (CONTINUED)
2.9 Financial assets
2.9.1 Classification
The Group classifies its financial assets in the following categories: financial assets at fair value through profit or loss, loans and receivables, held-to-maturity investments and available-for-sale investments. The classification depends on the purpose for which the financial assets were acquired. Management determines the classification of its financial assets at initial recognition.
(a) Financial assets at fair value through profit or loss
This category has two sub-categories: financial assets held for trading, and financial assets designated at fair value through profit or loss upon initial recognition.
A financial asset is classified as held for trading if it is acquired or incurred principally for the purpose of selling or repurchasing in the near term or if it is part of a portfolio of identified financial instruments that are managed together and for which there is evidence of recent actual pattern of short-term profit-making. Derivatives are also categorised as held for trading unless they are designated as hedging instruments. Financial assets held for trading consist of debt instruments, including money-market paper, traded corporate and bank loans, and equity instruments, as well as financial assets with embedded derivatives. They are recognised in the consolidated statement of financial position as ‘Financial assets held for trading’.
Financial instruments included in this category are recognised initially at fair value; transaction costs are taken directly to the consolidated income statement. Gains and losses arising from changes in fair value are included directly in the consolidated income statement and are reported as ‘Net trading income’. Interest income and expense and dividend income on financial assets held for trading are included in ‘Net trading income. The instruments are derecognised when the rights to receive cash flows have expired or the Group has transferred substantially all the risks and rewards of ownership and the transfer qualifies for derecognition.
The Group designates certain financial assets upon initial recognition as at fair value through profit or loss (fair value option). This designation cannot subsequently be changed. According to HKAS 39, the fair value option is only applied when the following conditions are met:
(i) the application on the fair value option reduces or eliminates an accounting mismatch that would otherwise arise; or
(ii) the financial assets are part of a portfolio of financial instruments which is risk managed and reported to senior management on a fair value basis; or
(iii) the financial assets consist of debt hosts and embedded derivatives that must be separated.
Financial assets for which the fair value option is applied are recognised in the consolidated statement of financial position as ‘Financial assets designated at fair value’. Fair value changes relating to financial assets designated at fair value through profit or loss are recognised in ‘Net income from financial instruments designated at fair value through profit or loss’.
NOTES TO THE CONSOLIDATED FINANCIAL STATEMENTS (CONTINuED) (All amounts in HK dollar thousands unless otherwise stated)
46 SHANGHAI COMMERCIAL BANK ANNUAL REPORT 2013
2 SUMMARY OF SIGNIFICANT ACCOUNTING POLICIES (CONTINUED)
2.9 Financial assets (Continued)
2.9.1 Classification (Continued)
(b) Loans and receivables
Loans and receivables are non-derivative financial assets with fixed or determinable payments that are not quoted in an active market, other than: (i) those that the entity intends to sell immediately or in the short term, which are classified as held for trading, and those that the entity upon initial recognition designates as at fair value through profit or loss; (ii) those that the entity upon initial recognition designates as available-for-sale; or (iii) those for which the holder may not recover substantially all of its initial investment, other than because of credit deterioration.
Loans and receivables are initially recognised at fair value which is the cash given originally to purchase the loan including any transaction costs and measured subsequently at amortised cost using the effective interest rate method. Loans and receivables are reported in the statement of financial position as placements with and loans and advances to banks or customers. Interest on loans is included in the income statement and is reported as interest income. In the case of an impairment, it is reported as a deduction from the carrying value of the loans and advances to banks and customers and recognised in the income statement as impairment losses on loans and advances to banks and customers, as appropriate.
(c) Held-to-maturity investments
Held-to-maturity investments are non-derivative financial assets with fixed or determinable payments and fixed maturities that the Group’s management has the positive intention and ability to hold to maturity, other than:
(i) those that the Group upon initial recognition designates as at fair value through profit or loss;
(ii) those that the Group designates as available-for-sale investments; and
(iii) those that meet the definition of loans and receivables.
They are initially recognised at fair value including direct and incremental transaction costs and measured subsequently at amortised cost, using the effective interest method. They are derecognised when the rights to receive cash flows have expired.
Interest on held-to-maturity investments is included in the income statement and is reported as interest income. In the case of an impairment, it has been reported as a deduction from the carrying value of the investment and recognised in the income statement as impairment charges on held-to-maturity investments.
(d) available-for-sale investments
Available-for-sale investments are financial assets that are intended to be held for an indefinite period of time, which may be sold in response to needs for liquidity or changes in interest rates, exchange rates or equity prices or that are not classified as loans and receivables, held-to-maturity investments or financial assets at fair value through profit or loss. Available-for-sale investments consist mainly of debt and equity investments.
Available-for-sale investments are initially recognised at fair value which is the cash given including any transaction costs and measured subsequently at fair value with gains and losses been recognised in other comprehensive income, except for impairment losses and foreign exchange gains and losses, until the financial assets are derecognised. If an available-for-sale investment is determined to be impaired the cumulative gain or loss previously recognised in the statement of comprehensive income is recognised in the income statement. However, interest is calculated using the effective interest method and foreign currency gains and losses on monetary assets classified as available-for-sale investments are recognised in the income statement. Dividends on available-for-sale equity instruments are recognised in the income statement as ‘Dividend income’ when the Group’s right to receive payment is established.
NOTES TO THE CONSOLIDATED FINANCIAL STATEMENTS (CONTINuED) (All amounts in HK dollar thousands unless otherwise stated)
47SHANGHAI COMMERCIAL BANK ANNUAL REPORT 2013
2 SUMMARY OF SIGNIFICANT ACCOUNTING POLICIES (CONTINUED)
2.9 Financial assets (Continued)
2.9.2 Reclassification of financial assets
The Group may choose to reclassify a non-derivative trading financial asset out of the held for trading category if the financial asset is no longer held for the purpose of selling it in the near term. Financial assets are permitted to be reclassified out of the held for trading category only in rare circumstances arising from a single event that is unusual and highly unlikely to recur in the near term. In addition, the Group may choose to reclassify financial assets that would meet the definition of loans and receivables out of the held for trading or available-for-sale investments categories if the Group has the intention and ability to hold these financial assets for the foreseeable future or until maturity at the date of reclassification.
Reclassifications are made at fair value as of the reclassification date. Fair value becomes the new cost or amortised cost as applicable, and no reversals of fair value gains or losses recorded before reclassification date are subsequently made. Effective interest rates for financial assets reclassified to loans and receivables and held-to-maturity investments categories are determined at the reclassification date. Further increases in estimates of cash flows adjust effective interest rates prospectively.
On reclassification of a financial asset out of the ‘at fair value through profit or loss’ category all embedded derivatives are re-assessed and, if necessary, separately accounted for.
2.9.3 Recognition and measurement
Regular-way purchases and sales of financial assets at fair value through profit or loss, held-to-maturity investments and available-for-sale investments are recognised on trade-date - the date on which the Group commits to purchase or sell the asset.
Financial assets are initially recognised at fair value plus transaction costs for all financial assets not carried at fair value through profit or loss. Financial assets carried at fair value through profit or loss are initially recognised at fair value, and transaction costs are expensed in the income statement. Financial assets are derecognised when the rights to receive cash flows from the financial assets have expired or where the Group has transferred substantially all risks and rewards of ownership. Financial liabilities are derecognised when they are extinguished − that is, when the obligation is discharged, cancelled or expires.
Available-for-sale investments and financial assets at fair value through profit or loss are subsequently carried at fair value. Loans and receivables and held-to-maturity investments are carried at amortised cost using the effective interest method. Gains and losses arising from changes in the fair value of the ‘financial assets at fair value through profit or loss’ category are included in the income statement in the period in which they arise. They are presented within ‘net trading income’ (for financial assets that are held for trading), and within ‘net income from financial instruments designated at fair value through profit or loss’ (for financial assets that are designated at fair value through profit or loss). Gains and losses arising from changes in the fair value of available-for-sale investments are recognised directly in other comprehensive income, until the financial asset is derecognised or impaired. At this time the cumulative gain or loss previously recognised in the equity is recognised in the income statement. However, interest calculated using the effective interest method and foreign currency gains and losses on monetary assets classified as available-for-sale investments are recognised in the income statement.
2.10 offsetting financial instruments
Financial assets and liabilities are offset and the net amount reported in the statement of financial position when there is a legally enforceable right to offset the recognised amounts and there is an intention to settle on a net basis or realise the asset and settle the liability simultaneously.
NOTES TO THE CONSOLIDATED FINANCIAL STATEMENTS (CONTINuED) (All amounts in HK dollar thousands unless otherwise stated)
48 SHANGHAI COMMERCIAL BANK ANNUAL REPORT 2013
2 SUMMARY OF SIGNIFICANT ACCOUNTING POLICIES (CONTINUED)
2.11 Impairment of financial assets(a) assets carried at amortised cost
The Group assesses at the end of each reporting period whether there is objective evidence that a financial asset or a group of financial assets is impaired. A financial asset or a group of financial assets is impaired and impairment losses are incurred only if there is objective evidence of impairment as a result of one or more events that occurred after the initial recognition of the asset (a ‘loss event’) and that loss event (or events) has an impact on the estimated future cash flows of the financial asset or the group of financial assets that can be reliably estimated.
The criteria that the Group uses to determine that there is objective evidence of an impairment loss include:
• Delinquencyincontractualpaymentsofprincipalorinterest;• Cashflowdifficultiesexperiencedbytheborrower;• Breachofloancovenantsorconditions;• Initiationofbankruptcyproceedings;• Deteriorationoftheborrower’scompetitiveposition;• Deteriorationinthevalueofcollateral;and• Downgradingbelowinvestmentgradelevel.
The estimated period between a loss occurring and its identification is determined by local management for each identified portfolio. In general, the periods used vary between 3 months and 12 months; in exceptional cases, longer periods are warranted.
The Group first assesses whether objective evidence of impairment exists individually for financial assets that are individually significant, and individually or collectively for financial assets that are not individually significant. If the Group determines that no objective evidence of impairment exists for an individually assessed financial asset, whether significant or not, it includes the asset in a group of financial assets with similar credit risk characteristics and collectively assesses them for impairment. Assets that are individually assessed for impairment and for which an impairment loss is or continues to be recognised are not included in a collective assessment of impairment.
For loans and receivables category, the amount of the loss is measured as the difference between the asset’s carrying amount and the present value of estimated future cash flows (excluding future credit losses that have not been incurred) discounted at the financial asset’s original effective interest rate. The carrying amount of the asset is reduced through the use of an allowance account and the amount of the loss is recognised in the income statement. If a loan or held-to-maturity investment has a variable interest rate, the discount rate for measuring any impairment loss is the current effective interest rate determined under the contract. As a practical expedient, the Group may measure impairment on the basis of an instrument’s fair value using an observable market price.
The calculation of the present value of the estimated future cash flows of a collateralised financial asset reflects the cash flows that may result from foreclosure less costs for obtaining and selling the collateral, whether or not foreclosure is probable.
For the purposes of a collective evaluation of impairment, financial assets are grouped on the basis of similar credit risk characteristics (i.e. on the basis of the Group’s grading process that considers asset type, industry, geographical location, collateral type, past due status and other relevant factors). Those characteristics are relevant to the estimation of future cash flows for groups of such assets by being indicative of the debtors’ ability to pay all amounts due according to the contractual terms of the assets being evaluated.
Future cash flows in a group of financial assets that are collectively evaluated for impairment are estimated on the basis of the contractual cash flows of the assets in the Group and historical loss experience for assets with credit risk characteristics similar to those in the Group. Historical loss experience is adjusted on the basis of current observable data to reflect the effects of current conditions that did not affect the period on which the historical loss experience is based and to remove the effects of conditions in the historical period that do not currently exist.
NOTES TO THE CONSOLIDATED FINANCIAL STATEMENTS (CONTINuED) (All amounts in HK dollar thousands unless otherwise stated)
49SHANGHAI COMMERCIAL BANK ANNUAL REPORT 2013
2 SUMMARY OF SIGNIFICANT ACCOUNTING POLICIES (CONTINUED)
2.11 Impairment of financial assets (Continued)(a) assets carried at amortised cost (Continued)
Estimates of changes in future cash flows for groups of assets should reflect and be directionally consistent with changes in related observable data from period to period (for example, changes in unemployment rates, property prices, payment status, or other factors indicative of changes in the probability of losses in the Group and their magnitude). The methodology and assumptions used for estimating future cash flows are reviewed regularly by the Group to reduce any differences between loss estimates and actual loss experience.
When a loan is uncollectible, it is written off against the related allowances for loan impairment. Such loans are written off after all the necessary procedures have been completed and the amount of the loss has been determined.
If, in a subsequent period, the amount of the impairment loss decreases and the decrease can be related objectively to an event occurring after the impairment was recognised (such as an improvement in the debtor’s credit rating), the previously recognised impairment loss is reversed by adjusting the allowance account. The amount of the reversal is recognised in the income statement.
(b) assets classified as available-for-sale investments
The Group assesses at the end of each reporting period whether there is objective evidence that a financial asset or a group of financial assets is impaired. For debt securities, the group uses the criteria set out in (a) above. In the case of equity investments classified as available-for-sale, a significant or prolonged decline in the fair value of the security below its cost is considered in determining whether the assets are impaired. If any such evidence exists for available-for-sale investments, the cumulative loss - measured as the difference between the acquisition cost (net of any principal repayment and amortisation) and the current fair value, less any impairment loss on that investment previously recognised in the income statement - is removed from equity and recognised in the income statement. Impairment losses recognised in the income statement on equity instruments are not reversed through the income statement. If, in a subsequent period, the fair value of a debt instrument classified as available-for-sale investments increases and the increase can be objectively related to an event occurring after the impairment loss was recognised in the income statement, the impairment loss is reversed through the income statement.
2.12 Financial liabilitiesFinancial liabilities are classified into two categories: financial liabilities at fair value through profit or loss and other financial liabilities. All financial liabilities are classified at inception and recognised initially at fair value.
(a) Financial liabilities at fair value through profit or loss
This category has two sub-categories: financial liabilities held for trading, and those designated at fair value through profit or loss at inception.
A financial liability is classified as held for trading if it is incurred principally for the purpose of repurchasing in the short term. It is carried at fair value and any gains and losses from changes in fair value are recognised in the income statement.
NOTES TO THE CONSOLIDATED FINANCIAL STATEMENTS (CONTINuED) (All amounts in HK dollar thousands unless otherwise stated)
50 SHANGHAI COMMERCIAL BANK ANNUAL REPORT 2013
2 SUMMARY OF SIGNIFICANT ACCOUNTING POLICIES (CONTINUED)
2.12 Financial liabilities (Continued)
(a) Financial liabilities at fair value through profit or loss (Continued)
A financial liability is typically classified as fair value through profit or loss at inception if it meets the following criteria:
(i) The designation eliminates or significantly reduces a measurement or recognition inconsistency (sometimes referred to as ‘an accounting mismatch’) that would otherwise arise from measuring the financial liabilities or recognising the gains and losses on them on different bases; or
(ii) Part of a group of financial liabilities, that are managed and evaluated on a fair value basis in accordance with a documented risk management or investment strategy and reported to key management personnel on that basis, are designated at fair value through profit or loss; or
(iii) Financial instruments, such as debt securities issued, containing one or more embedded derivatives significantly modify the cash flows, are designated at fair value through profit or loss.
Financial liabilities designated as at fair value through profit or loss are designated as such at inception. Financial liabilities designated at fair value through profit or loss are carried at fair value and any gains and losses from changes in fair value are recognised in the income statement.
(b) other financial liabilities
Other financial liabilities are recognised initially at fair value net of transaction costs incurred. Other financial liabilities are subsequently stated at amortised cost; any difference between proceeds net of transaction costs and the redemption value is recognised in the income statement over the period of the other financial liabilities using the effective interest method.
2.13 Determination of fair valueFor financial instruments traded in active markets, the determination of fair values of financial assets and financial liabilities is based on quoted market prices or dealer price quotations. This includes listed equity securities and quoted debt instruments on major exchanges and broker quotes from Bloomberg and Reuters.
A financial instrument is regarded as quoted in an active market if quoted prices are readily and regularly available from an exchange, dealer, broker, industry group, pricing service or regulatory agency, and those prices represent actual and regularly occurring market transactions on an arm’s length basis. If the above criteria are not met, the market is regarded as being inactive. Indications that a market is inactive are when there is a wide bid-offer spread or significant increase in the bid-offer spread or there are few recent transactions.
For all other financial instruments, fair value is determined using valuation techniques. In these techniques, fair values are estimated from observable data in respect of similar financial instruments, using models to estimate the present value of expected future cash flows or other valuation techniques, using inputs (for example, LIBOR yield curve, FX rates, volatilities and counterparty spreads) existing at the dates of the statement of financial position.
The Group uses widely recognised valuation models for determining fair values of non-standardised financial instruments of lower complexity, such as options or interest rate and currency swaps. For these financial instruments, inputs into models are generally market-observable.
For more complex instruments, the Group uses developed models, which are usually based on valuation methods and techniques generally recognised as standard within the industry. Valuation models are used primarily to value derivatives transacted in the over-the-counter market, unlisted debt securities (including those with embedded derivatives) and other debt instruments for which markets were or have become illiquid. Some of the inputs to these models may not be market observable and are therefore estimated based on assumptions.
NOTES TO THE CONSOLIDATED FINANCIAL STATEMENTS (CONTINuED) (All amounts in HK dollar thousands unless otherwise stated)
51SHANGHAI COMMERCIAL BANK ANNUAL REPORT 2013
2 SUMMARY OF SIGNIFICANT ACCOUNTING POLICIES (CONTINUED)
2.13 Determination of fair value (Continued)The output of a model is always an estimate or approximation of a value that cannot be determined with certainty, and valuation techniques employed may not fully reflect all factors relevant to the positions the Group holds. Valuations are therefore adjusted, where appropriate, to allow for additional factors including model risks, liquidity risk and counterparty risk. Based on the established fair value model governance policies, and related controls and procedures applied, management believes that these valuation techniques are necessary and appropriate to fairly state the values of financial instruments carried at fair value in the statement of financial position. Price data and parameters used in the measurement procedures applied are generally reviewed carefully and adjusted, if necessary, particularly in view of the current market developments.
In cases when the fair value of unlisted equity instruments cannot be determined reliably, the instruments are carried at cost less impairment. The fair value for loans and receivables as well as liabilities to banks and customers are determined using a present value model on the basis of contractually agreed cash flows, taking into account credit quality, liquidity and costs.
The fair values of contingent liabilities and irrevocable loan commitments correspond to their carrying amounts.
2.14 Derivative financial instrumentsDerivatives are initially recognised at fair value on the date on which a derivative contract is entered into and are subsequently remeasured at their fair value. Fair values are obtained from quoted market prices in active markets, including recent market transactions, and valuation techniques, including discounted cash flow models and options pricing models, as appropriate. All derivatives are carried as assets when fair value is positive and as liabilities when fair value is negative.
2.15 Current and deferred income taxThe tax expense for the period comprises current and deferred tax. Tax is recognised in the income statement, except to the extent that it relates to items recognised in other comprehensive income or directly in equity. In this case, the tax is also recognised in other comprehensive income or directly in equity.
The current income tax charge is calculated on the basis of the tax laws enacted or substantively enacted at the end of the reporting period in the countries where the Group’s entities operate and generate taxable income. Management periodically evaluates positions taken in tax returns with respect to situations in which applicable tax regulation is subject to interpretation. It establishes provisions where appropriate on the basis of amounts expected to be paid to the tax authorities.
Deferred income tax is recognised, using the liability method, on temporary differences arising between the tax bases of assets and liabilities and their carrying amounts in the financial statements. Deferred income tax is determined using tax rates (and laws) that have been enacted or substantially enacted by the end of the reporting period and are expected to apply when the related deferred income tax asset is realised or the deferred income tax liability is settled.
The principal temporary differences arise from depreciation of properties and equipment, revaluation of certain financial assets and liabilities including derivative contracts, provisions for pensions and other post-retirement benefits and tax losses carried forward; and, in relation to acquisitions, on the difference between the fair values of the net assets acquired and their tax base. However, the deferred income tax is not accounted for if it arises from initial recognition of an asset or liability in a transaction other than a business combination that at the time of the transaction affects neither accounting nor taxable profit or loss.
NOTES TO THE CONSOLIDATED FINANCIAL STATEMENTS (CONTINuED) (All amounts in HK dollar thousands unless otherwise stated)
52 SHANGHAI COMMERCIAL BANK ANNUAL REPORT 2013
2 SUMMARY OF SIGNIFICANT ACCOUNTING POLICIES (CONTINUED)
2.15 Current and deferred income tax (Continued)Deferred income tax assets are recognised only to the extent that it is probable that future taxable profit will be available against which the temporary differences can be utilised.
Deferred income tax is provided on temporary differences arising on investments in subsidiaries and joint ventures, except for deferred income tax liability where the timing of the reversal of the temporary difference is controlled by the Group and it is probable that the temporary difference will not be reversed in the foreseeable future.
Deferred tax related to fair value re-measurement of available-for-sale investments, which are charged or credited to other comprehensive income, is also credited or charged to other comprehensive income and is subsequently recognised in the income statement together with the deferred gain or loss upon disposal.
2.16 Employee benefits(a) retirement benefit costs
The Group operates three retirement benefit schemes comprising of a defined contribution scheme, a Mandatory Provident Fund Scheme and a defined benefit scheme that are available to the Group’s employees. However, the principal schemes that the Group contributes to are the defined contribution scheme and the Mandatory Provident Fund Scheme. The assets of the Group’s Mandatory Provident Fund Scheme, the defined contribution scheme and the defined benefit scheme are held separately from those of the Group in independently administered funds.
The Group’s contributions to the defined contribution scheme and the Mandatory Provident Fund Scheme are charged to the income statement.
The defined benefit scheme is funded by payments from the Group by taking recommendations of independent qualified actuaries. The defined benefit costs are assessed using the Attained Age Method and the cost of providing the benefit is charged to the income statement so as to spread the regular cost over the service lives of employees in accordance with the advice of qualified actuaries, who value the scheme once every three years.
(b) Employee leave entitlements
Employee entitlements to annual leave are recognised when they accrue to employees. Employee entitlements to sick leave and maternity leave are recognised when the absences occur.
(c) termination benefits
Termination benefits are payable when employment is terminated by the Group before the normal retirement date, or whenever an employee accepts voluntary redundancy in exchange for these benefits. The Group recognises termination benefits when it is demonstrably committed: a termination when the entity has a detailed formal plan to terminate the employment of current employees without possibility of withdrawal or when the entity recognises costs for a restructuring that is within the scope of HKAS 37 and involves payment of termination benefits. In the case of an offer made to encourage voluntary redundancy the termination benefits are measured based on the number of employees expected to accept the offer. Benefits falling due more than 12 months after the end of the reporting period are discounted to present value.
NOTES TO THE CONSOLIDATED FINANCIAL STATEMENTS (CONTINuED) (All amounts in HK dollar thousands unless otherwise stated)
53SHANGHAI COMMERCIAL BANK ANNUAL REPORT 2013
2 SUMMARY OF SIGNIFICANT ACCOUNTING POLICIES (CONTINUED)
2.17 related partiesFor the purposes of these financial statements, a party is considered to be related to the Group if that party controls, jointly controls or has significant influence over the Group; is a member of the same financial reporting group, such as parents, subsidiaries and fellow subsidiaries; is an associate or a joint venture of the Group or parent reporting group; is a key management personnel of the Group or parents, or where the Group and the party are subject to common control. Related parties may be individuals or entities.
2.18 Investment propertiesProperty that is held for long-term rental yields or for capital appreciation or both is classified as investment property. Investment properties are land and office buildings. Investment properties are measured at cost less subsequent accumulated depreciation and any accumulated impairment losses. Depreciation is charged so as to write off the cost of investment properties using the straight-line method over the unexpired period of the lease term for land and the shorter of the leases or 40 years for buildings.
2.19 repossessed assetsRepossessed collateral assets are recorded as ‘Repossessed assets’ and reported in ‘Other assets’ and the relevant loans are derecognised. The repossessed collateral assets are measured at the lower of carrying amount and fair value less cost to sell.
2.20 Cash and cash equivalentsFor the purposes of the statement of cash flows, cash and cash equivalents comprise balances with less than three months’ maturity from the date of acquisition including cash, balances with banks, placements with and loans and advances to banks, treasury bills and certificates of deposit that are readily convertible to known amounts of cash and which are subject to an insignificant risk of changes in value.
2.21 Fiduciary activitiesThe Group commonly acts as trustees and in other fiduciary capacities, for a fee and commission income, that result in the holding or placing of assets on behalf of individuals, trusts and other institutions. These assets and income arising thereon are excluded from these financial statements, as they are not assets of the Group.
2.22 Impairment of investment in subsidiaries, joint ventures and non-financial assetsAssets that have an indefinite useful life are not subject to amortisation and are tested annually for impairment. Assets are reviewed for impairment whenever events or changes in circumstances indicate that the carrying amount may not be recoverable. An impairment loss is recognised for the amount by which the asset’s carrying amount exceeds its recoverable amount. The recoverable amount is the higher of an asset’s fair value less costs to sell and value in use. For the purposes of assessing impairment, assets are grouped at the lowest levels for which there are separately identifiable cash flows (cash-generating units). Non-financial assets other than goodwill that suffered an impairment are reviewed for possible reversal of the impairment at each reporting date.
NOTES TO THE CONSOLIDATED FINANCIAL STATEMENTS (CONTINuED) (All amounts in HK dollar thousands unless otherwise stated)
54 SHANGHAI COMMERCIAL BANK ANNUAL REPORT 2013
2 SUMMARY OF SIGNIFICANT ACCOUNTING POLICIES (CONTINUED)
2.23 provisionsProvisions are recognised when the Group has a present legal or constructive obligation as a result of past events; it is more likely than not that an outflow of resources will be required to settle the obligation; and the amount has been reliably estimated.
Where there are a number of similar obligations, the likelihood that an outflow will be required in settlement is determined by considering the class of obligations as a whole. A provision is recognised even if the likelihood of an outflow with respect to any one item included in the same class of obligations may be small.
Provisions are measured at the present value of the expenditures expected to be required to settle the obligation using a pre-tax rate that reflects current market assessments of the time value of money and the risks specific to the obligation. The increase in the provision due to the passage of time is recognised as interest expense.
2.24 Financial guarantee contractsFinancial guarantee contracts are contracts that require the issuer to make specified payments to reimburse the holder for a loss it incurs because a specified debtor fails to make payments when due, in accordance with the terms of a debt instrument. Such financial guarantees are given to banks, financial institutions and other bodies on behalf of customers to secure loans, overdrafts and other banking facilities.
Financial guarantees are initially recognised in the financial statements at fair value on the date the guarantee was given. The fair value of a financial guarantee at the time of signature is zero because all guarantees are agreed on arm’s length terms and the value of the premium agreed corresponds to the value of the guarantee obligation. No receivable for the future premiums is recognised. Subsequent to initial recognition, the Group’s liabilities under such guarantees are measured at the higher of the initial amount, less amortisation of fees recognised in accordance with HKAS 18, and the best estimate of the amount required to settle the guarantee. These estimates are determined based on experience of similar transactions and history of past losses, supplemented by the judgment of management. The fee income earned is recognised on a straight-line basis over the life of the guarantee.
Any increase in the liability relating to guarantees is reported in the income statement within other operating expenses.
3 FINANCIAL RISK MANAGEMENTThe Group’s activities expose it to a variety of financial risks and those activities involve the analysis, evaluation, acceptance and management of some degree of risk or combination of risks. Taking risk is core to the financial business, and the operational risks are an inevitable consequence of being in business. The Group’s aim is therefore to achieve an appropriate balance between risk and return and minimise potential adverse effects on the Group’s financial performance.
The Group’s risk management policies are designed to identify and analyse these risks, to set appropriate risk limits and controls, and to monitor the risks and adherence to limits by means of reliable and up-to-date information systems. The Group regularly reviews its risk management policies and systems to reflect changes in markets, products and emerging best practice.
NOTES TO THE CONSOLIDATED FINANCIAL STATEMENTS (CONTINuED) (All amounts in HK dollar thousands unless otherwise stated)
55SHANGHAI COMMERCIAL BANK ANNUAL REPORT 2013
3 FINANCIAL RISK MANAGEMENT (CONTINUED)The Group has in place policies and procedures for the identification, measurement, control and monitoring of credit, liquidity, market, interest rate, foreign exchange and operational risks. One of the major functions of the Board of Directors is to ensure that the Group establishes policies, procedures and controls to manage the various types of risk it faces. The Board of Directors has delegated its powers to the Risk Management Committee, the Executive Committee, the Asset and Liability Committee, the Credit Committee and the Operational Risk Management Committee for the supervision of major functional areas. Senior management is always watchful for changes in economic, political and market conditions in which the Group operates and the inherent risks the Group faces.
The Risk Management Department is responsible for monitoring the overall risk management of the Group’s operations, except for credit risk, which is managed by the Credit Committee. Reconciliation procedures are also in place to ensure that the systems capture all necessary data. Prior to implementation of any new product or service, various analyses, testing, development and planning will be performed and its proposal will be endorsed by the Product Development Supervisory Committee before submission to the management for approval. All of the above arrangements ensure that the risk management processes are operating effectively.
Supporting the Audit Committee, the Audit Department performs regular audits to ensure compliance with the policies and procedures.
3.1 Credit riskThe Group takes on exposure to credit risk, which is the risk that a counterparty will cause a financial loss for the Group by failing to discharge an obligation. Significant changes in the economy, or in the health of a particular industry segment that represents a concentration in the Group’s portfolio, could result in losses that are different from those provided for at the end of the reporting period.
The Group has in place effective credit review, monitoring and control systems including an effective loan classification system that identify, monitor, and determine loan loss provisions in a timely manner. Management therefore carefully manages the exposure to credit risk.
The Group structures the levels of credit risk it undertakes by placing limits on the amount of risk accepted in relation to one borrower, or groups of borrowers, and to geographical and industry segments. Such risks are monitored on a revolving basis and subject to an annual or more frequent review. Limits on the level of credit risk by product, industry sector and by country are approved annually by the Board of Directors.
The exposure to any one counterparty including banks and brokers is further restricted by sub-limits covering on- and off-balance sheet exposures, and daily delivery risk limits in relation to trading items such as forward foreign exchange contracts. Actual exposures against limits are monitored daily.
Exposure to credit risk is managed through regular analysis of the ability of borrowers and potential borrowers to meet interest and principal repayment obligations and by changing these lending limits where appropriate. The Group has in place effective monitoring and control systems to identify, monitor and address problem credits in an accurate and timely manner. Exposure to credit risk is also managed in part by obtaining collateral and corporate and personal guarantees. The Group further mitigates credit risk by entering into netting arrangements with counterparties such as banks with which it undertakes credit activities.
NOTES TO THE CONSOLIDATED FINANCIAL STATEMENTS (CONTINuED) (All amounts in HK dollar thousands unless otherwise stated)
56 SHANGHAI COMMERCIAL BANK ANNUAL REPORT 2013
3 FINANCIAL RISK MANAGEMENT (CONTINUED)
3.1 Credit risk (Continued)
3.1.1 Risk limit control and mitigation policies
(a) Collateral
The Group employs a range of policies and practices to mitigate credit risk. The most traditional of these methods is the taking of security for funds advanced, which is a common practice. The Group implements guidelines on the acceptability of specific classes of collateral for credit risk mitigation. The principal collateral types for loans and advances are:
– Mortgages over residential properties;– Charges over business assets such as premises, inventory and accounts receivable; and– Charges over bank deposits and financial instruments such as debt securities and equities.
In addition to the above, the Group will also seek for guarantee where appropriate. To minimise credit loss, the Group will seek additional collateral from the counterparty as soon as impairment indicators are noticed for the relevant individual loans and advances which are partially secured or unsecured.
(b) Derivatives
The Group maintains strict control limits on net open derivatives positions (i.e. the difference between purchase and sale contracts), by both amount and term. At any one time, the amount subject to credit risk is limited to the current fair value of instruments that are favourable to the Group (i.e. assets where their fair values are positive), which in relation to derivatives is only a small fraction of the contract or notional values used to express the volume of instruments outstanding. This credit risk exposure is managed as part of the overall lending limits with customers, together with potential exposures from market movements. Collateral or other security is not usually obtained for credit risk exposures on these instruments, except where the Group requires margin deposits from counterparties.
(c) Credit-related commitments
The Group has issued credit related commitments including guarantees and letters of credit. These instruments carry similar credit risk as loans. The primary purpose of these instruments is to ensure that funds are available to a customer as required. Guarantees and standby letters of credit - which represent irrevocable assurances that the Group will make payments in the event that a customer cannot meet its obligations to third parties - carry the same credit risk as loans. Documentary and commercial letters of credit - which are written undertakings by the Group on behalf of a customer authorising a third party to draw drafts on the Group up to a stipulated amount under specific terms and conditions - are collateralised by the underlying shipments of goods to which they relate and therefore carry less risk than a direct loan.
Commitments to extend credit represent unused portions of authorisations to extend credit in the form of loans, guarantees or letters of credit. With respect to credit risk on commitments to extend credit, the Group is potentially exposed to loss in an amount equal to the total unused commitments. However, the likely amount of loss is less than the total unused commitments, as most commitments to extend credit are contingent upon customers maintaining specific credit standards. The Group monitors the term to maturity of credit commitments because longer-term commitments generally have a greater degree of credit risk than shorter-term commitments.
NOTES TO THE CONSOLIDATED FINANCIAL STATEMENTS (CONTINuED) (All amounts in HK dollar thousands unless otherwise stated)
57SHANGHAI COMMERCIAL BANK ANNUAL REPORT 2013
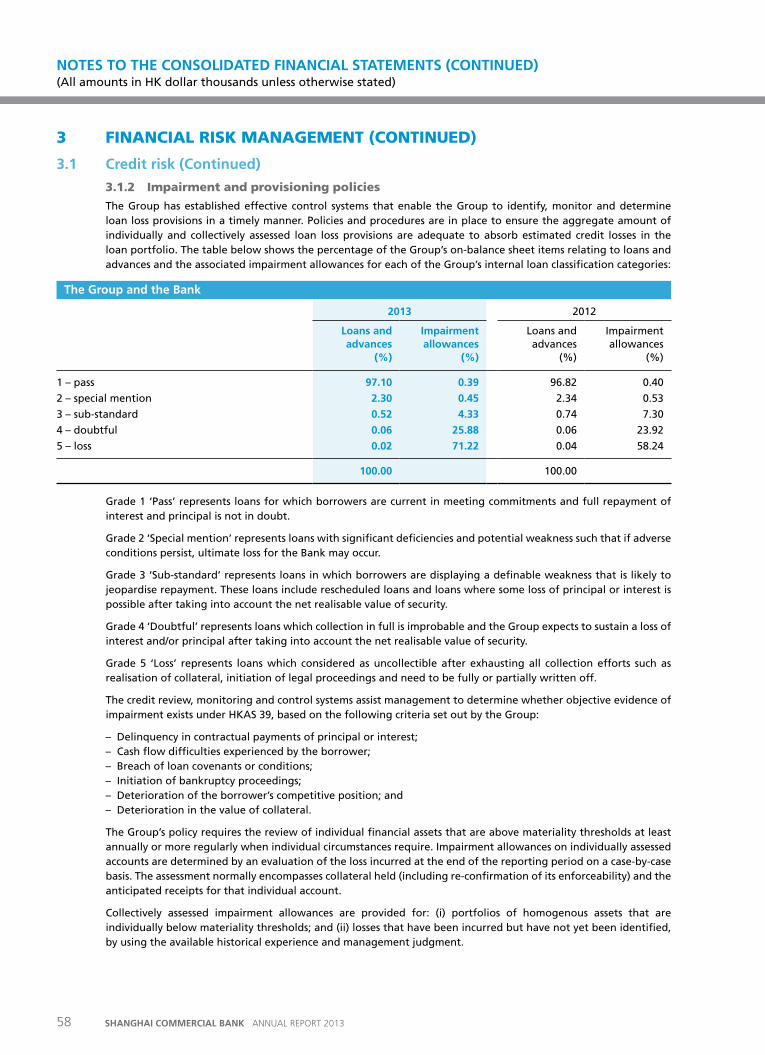
3 FINANCIAL RISK MANAGEMENT (CONTINUED)
3.1 Credit risk (Continued)
3.1.2 Impairment and provisioning policies
The Group has established effective control systems that enable the Group to identify, monitor and determine loan loss provisions in a timely manner. Policies and procedures are in place to ensure the aggregate amount of individually and collectively assessed loan loss provisions are adequate to absorb estimated credit losses in the loan portfolio. The table below shows the percentage of the Group’s on-balance sheet items relating to loans and advances and the associated impairment allowances for each of the Group’s internal loan classification categories:
the Group and the Bank
2013 2012
Loans and advances
(%)
Impairment allowances
(%)
Loans and advances
(%)
Impairment allowances
(%)
1 – pass 97.10 0.39 96.82 0.40
2 – special mention 2.30 0.45 2.34 0.53
3 – sub-standard 0.52 4.33 0.74 7.30
4 – doubtful 0.06 25.88 0.06 23.92
5 – loss 0.02 71.22 0.04 58.24
100.00 100.00
Grade 1 ‘Pass’ represents loans for which borrowers are current in meeting commitments and full repayment of interest and principal is not in doubt.
Grade 2 ‘Special mention’ represents loans with significant deficiencies and potential weakness such that if adverse conditions persist, ultimate loss for the Bank may occur.
Grade 3 ‘Sub-standard’ represents loans in which borrowers are displaying a definable weakness that is likely to jeopardise repayment. These loans include rescheduled loans and loans where some loss of principal or interest is possible after taking into account the net realisable value of security.
Grade 4 ‘Doubtful’ represents loans which collection in full is improbable and the Group expects to sustain a loss of interest and/or principal after taking into account the net realisable value of security.
Grade 5 ‘Loss’ represents loans which considered as uncollectible after exhausting all collection efforts such as realisation of collateral, initiation of legal proceedings and need to be fully or partially written off.
The credit review, monitoring and control systems assist management to determine whether objective evidence of impairment exists under HKAS 39, based on the following criteria set out by the Group:
– Delinquency in contractual payments of principal or interest;– Cash flow difficulties experienced by the borrower;– Breach of loan covenants or conditions;– Initiation of bankruptcy proceedings;– Deterioration of the borrower’s competitive position; and– Deterioration in the value of collateral.
The Group’s policy requires the review of individual financial assets that are above materiality thresholds at least annually or more regularly when individual circumstances require. Impairment allowances on individually assessed accounts are determined by an evaluation of the loss incurred at the end of the reporting period on a case-by-case basis. The assessment normally encompasses collateral held (including re-confirmation of its enforceability) and the anticipated receipts for that individual account.
Collectively assessed impairment allowances are provided for: (i) portfolios of homogenous assets that are individually below materiality thresholds; and (ii) losses that have been incurred but have not yet been identified, by using the available historical experience and management judgment.
NOTES TO THE CONSOLIDATED FINANCIAL STATEMENTS (CONTINuED) (All amounts in HK dollar thousands unless otherwise stated)
58 SHANGHAI COMMERCIAL BANK ANNUAL REPORT 2013
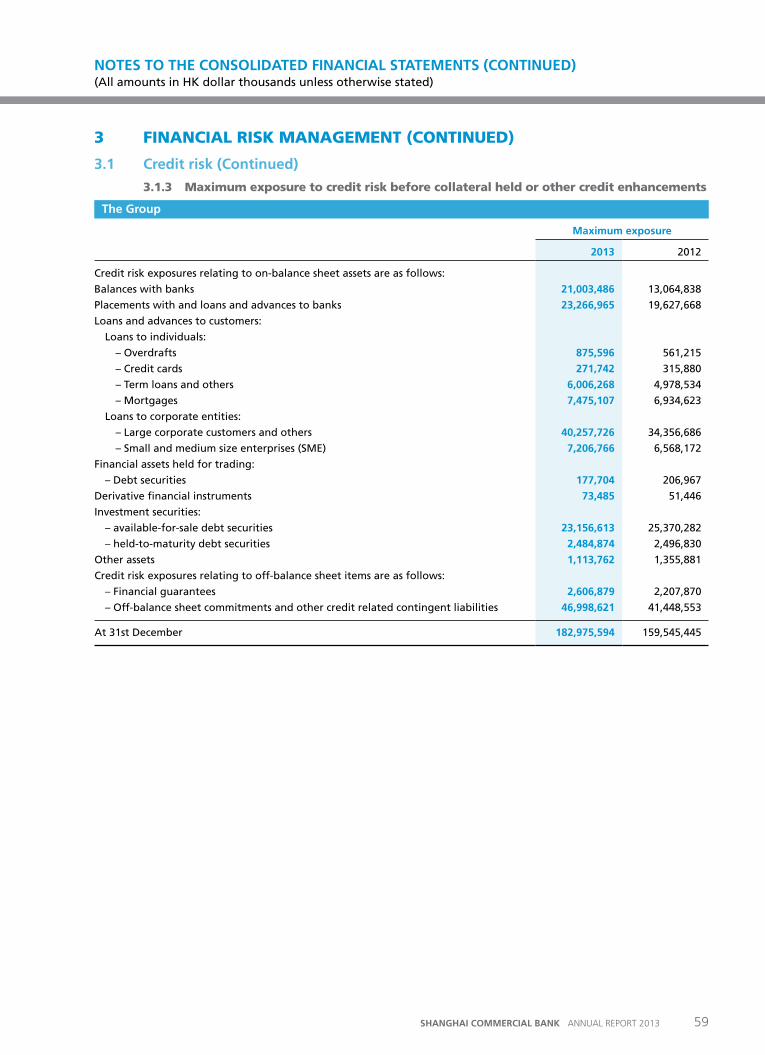
3 FINANCIAL RISK MANAGEMENT (CONTINUED)
3.1 Credit risk (Continued)
3.1.3 Maximum exposure to credit risk before collateral held or other credit enhancements
the Group
Maximum exposure
2013 2012
Credit risk exposures relating to on-balance sheet assets are as follows:
Balances with banks 21,003,486 13,064,838
Placements with and loans and advances to banks 23,266,965 19,627,668
Loans and advances to customers:
Loans to individuals:
– Overdrafts 875,596 561,215
– Credit cards 271,742 315,880
– Term loans and others 6,006,268 4,978,534
– Mortgages 7,475,107 6,934,623
Loans to corporate entities:
– Large corporate customers and others 40,257,726 34,356,686
– Small and medium size enterprises (SME) 7,206,766 6,568,172
Financial assets held for trading:
– Debt securities 177,704 206,967
Derivative financial instruments 73,485 51,446
Investment securities:
– available-for-sale debt securities 23,156,613 25,370,282
– held-to-maturity debt securities 2,484,874 2,496,830
Other assets 1,113,762 1,355,881
Credit risk exposures relating to off-balance sheet items are as follows:
– Financial guarantees 2,606,879 2,207,870
– Off-balance sheet commitments and other credit related contingent liabilities 46,998,621 41,448,553
At 31st December 182,975,594 159,545,445
NOTES TO THE CONSOLIDATED FINANCIAL STATEMENTS (CONTINuED) (All amounts in HK dollar thousands unless otherwise stated)
59SHANGHAI COMMERCIAL BANK ANNUAL REPORT 2013
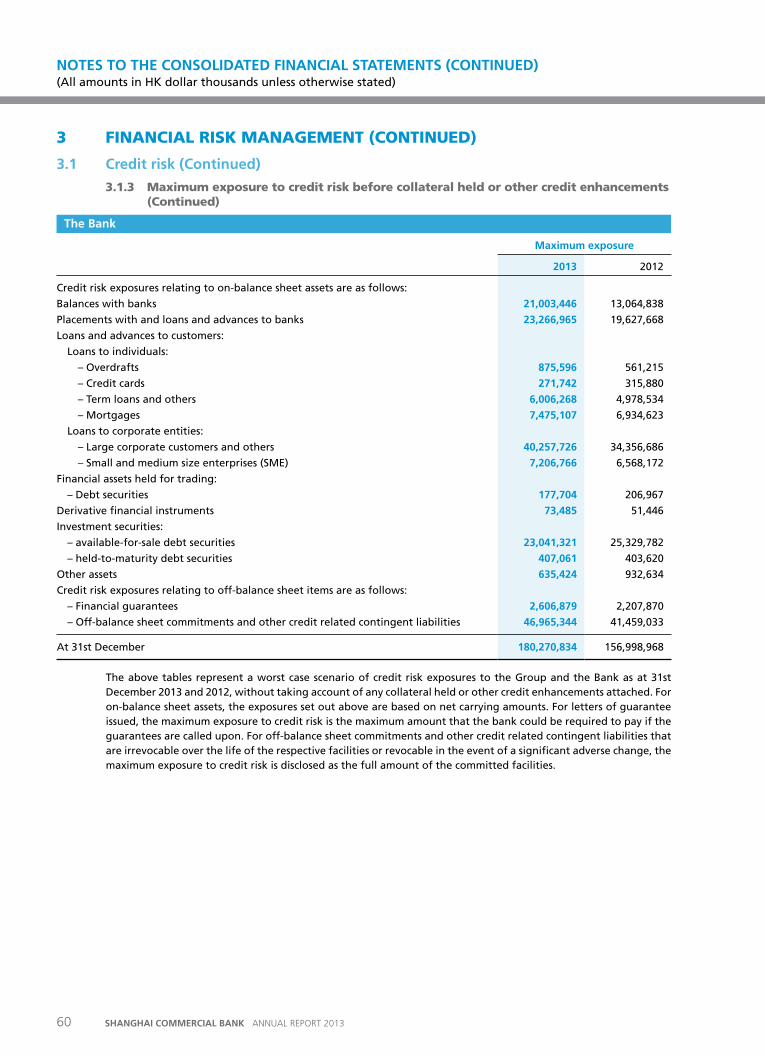
3 FINANCIAL RISK MANAGEMENT (CONTINUED)
3.1 Credit risk (Continued)
3.1.3 Maximum exposure to credit risk before collateral held or other credit enhancements (Continued)
the Bank
Maximum exposure
2013 2012
Credit risk exposures relating to on-balance sheet assets are as follows:
Balances with banks 21,003,446 13,064,838
Placements with and loans and advances to banks 23,266,965 19,627,668
Loans and advances to customers:
Loans to individuals:
– Overdrafts 875,596 561,215
– Credit cards 271,742 315,880
– Term loans and others 6,006,268 4,978,534
– Mortgages 7,475,107 6,934,623
Loans to corporate entities:
– Large corporate customers and others 40,257,726 34,356,686
– Small and medium size enterprises (SME) 7,206,766 6,568,172
Financial assets held for trading:
– Debt securities 177,704 206,967
Derivative financial instruments 73,485 51,446
Investment securities:
– available-for-sale debt securities 23,041,321 25,329,782
– held-to-maturity debt securities 407,061 403,620
Other assets 635,424 932,634
Credit risk exposures relating to off-balance sheet items are as follows:
– Financial guarantees 2,606,879 2,207,870
– Off-balance sheet commitments and other credit related contingent liabilities 46,965,344 41,459,033
At 31st December 180,270,834 156,998,968
The above tables represent a worst case scenario of credit risk exposures to the Group and the Bank as at 31st December 2013 and 2012, without taking account of any collateral held or other credit enhancements attached. For on-balance sheet assets, the exposures set out above are based on net carrying amounts. For letters of guarantee issued, the maximum exposure to credit risk is the maximum amount that the bank could be required to pay if the guarantees are called upon. For off-balance sheet commitments and other credit related contingent liabilities that are irrevocable over the life of the respective facilities or revocable in the event of a significant adverse change, the maximum exposure to credit risk is disclosed as the full amount of the committed facilities.
NOTES TO THE CONSOLIDATED FINANCIAL STATEMENTS (CONTINuED) (All amounts in HK dollar thousands unless otherwise stated)
60 SHANGHAI COMMERCIAL BANK ANNUAL REPORT 2013
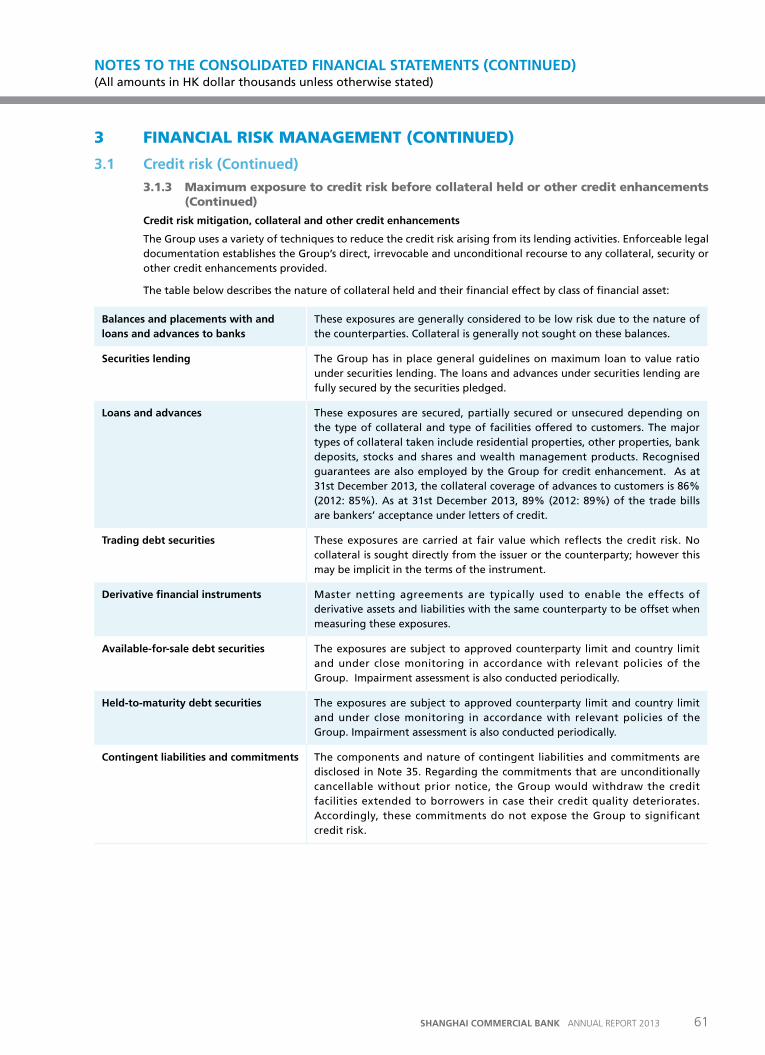
3 FINANCIAL RISK MANAGEMENT (CONTINUED)
3.1 Credit risk (Continued)
3.1.3 Maximum exposure to credit risk before collateral held or other credit enhancements (Continued)
Credit risk mitigation, collateral and other credit enhancements
The Group uses a variety of techniques to reduce the credit risk arising from its lending activities. Enforceable legal documentation establishes the Group’s direct, irrevocable and unconditional recourse to any collateral, security or other credit enhancements provided.
The table below describes the nature of collateral held and their financial effect by class of financial asset:
Balances and placements with and loans and advances to banks
These exposures are generally considered to be low risk due to the nature of the counterparties. Collateral is generally not sought on these balances.
Securities lending The Group has in place general guidelines on maximum loan to value ratio under securities lending. The loans and advances under securities lending are fully secured by the securities pledged.
Loans and advances These exposures are secured, partially secured or unsecured depending on the type of collateral and type of facilities offered to customers. The major types of collateral taken include residential properties, other properties, bank deposits, stocks and shares and wealth management products. Recognised guarantees are also employed by the Group for credit enhancement. As at 31st December 2013, the collateral coverage of advances to customers is 86% (2012: 85%). As at 31st December 2013, 89% (2012: 89%) of the trade bills are bankers’ acceptance under letters of credit.
trading debt securities These exposures are carried at fair value which reflects the credit risk. No collateral is sought directly from the issuer or the counterparty; however this may be implicit in the terms of the instrument.
Derivative financial instruments Master netting agreements are typically used to enable the effects of derivative assets and liabilities with the same counterparty to be offset when measuring these exposures.
available-for-sale debt securities The exposures are subject to approved counterparty limit and country limit and under close monitoring in accordance with relevant policies of the Group. Impairment assessment is also conducted periodically.
Held-to-maturity debt securities The exposures are subject to approved counterparty limit and country limit and under close monitoring in accordance with relevant policies of the Group. Impairment assessment is also conducted periodically.
Contingent liabilities and commitments The components and nature of contingent liabilities and commitments are disclosed in Note 35. Regarding the commitments that are unconditionally cancellable without prior notice, the Group would withdraw the credit facilities extended to borrowers in case their credit quality deteriorates. Accordingly, these commitments do not expose the Group to significant credit risk.
NOTES TO THE CONSOLIDATED FINANCIAL STATEMENTS (CONTINuED) (All amounts in HK dollar thousands unless otherwise stated)
61SHANGHAI COMMERCIAL BANK ANNUAL REPORT 2013
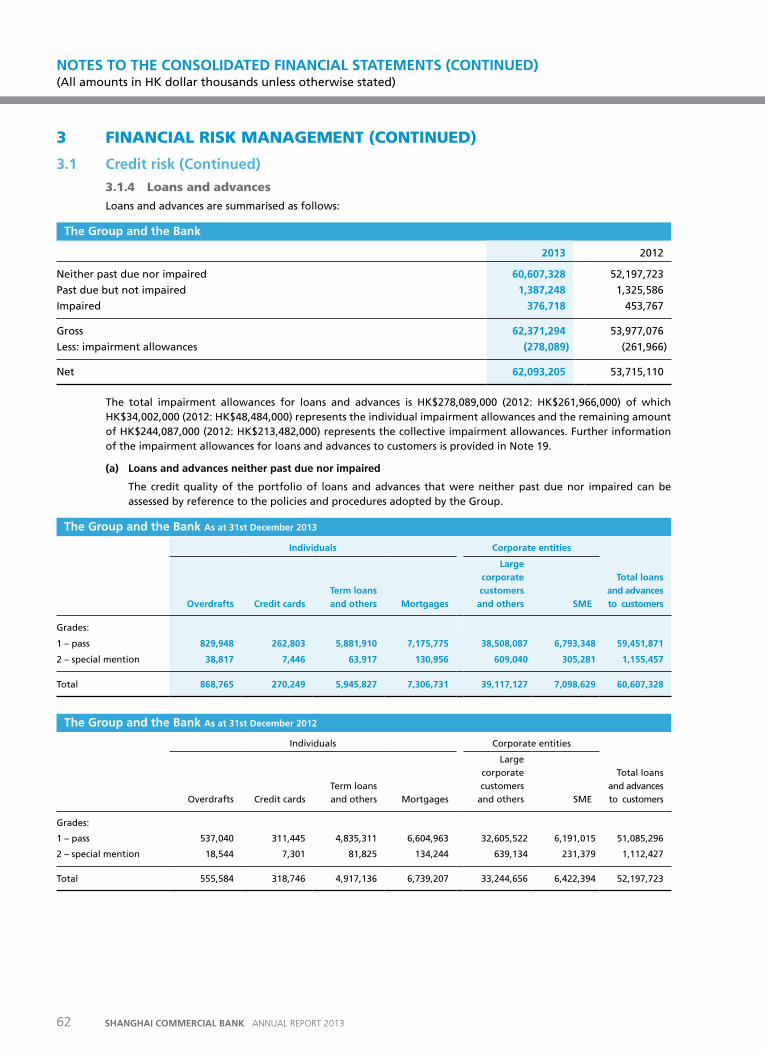
3 FINANCIAL RISK MANAGEMENT (CONTINUED)
3.1 Credit risk (Continued)
3.1.4 Loans and advances
Loans and advances are summarised as follows:
the Group and the Bank
2013 2012
Neither past due nor impaired 60,607,328 52,197,723
Past due but not impaired 1,387,248 1,325,586
Impaired 376,718 453,767
Gross 62,371,294 53,977,076
Less: impairment allowances (278,089) (261,966)
Net 62,093,205 53,715,110
The total impairment allowances for loans and advances is HK$278,089,000 (2012: HK$261,966,000) of which HK$34,002,000 (2012: HK$48,484,000) represents the individual impairment allowances and the remaining amount of HK$244,087,000 (2012: HK$213,482,000) represents the collective impairment allowances. Further information of the impairment allowances for loans and advances to customers is provided in Note 19.
(a) Loans and advances neither past due nor impaired
The credit quality of the portfolio of loans and advances that were neither past due nor impaired can be assessed by reference to the policies and procedures adopted by the Group.
the Group and the Bank as at 31st December 2013
Individuals Corporate entities
overdrafts Credit cardsterm loans and others Mortgages
Large corporate customers
and others SME
total loans and advances to customers
Grades:
1 – pass 829,948 262,803 5,881,910 7,175,775 38,508,087 6,793,348 59,451,871
2 – special mention 38,817 7,446 63,917 130,956 609,040 305,281 1,155,457
Total 868,765 270,249 5,945,827 7,306,731 39,117,127 7,098,629 60,607,328
the Group and the Bank as at 31st December 2012
Individuals Corporate entities
Overdrafts Credit cardsTerm loans and others Mortgages
Large corporate customers
and others SME
Total loans and advances to customers
Grades:
1 – pass 537,040 311,445 4,835,311 6,604,963 32,605,522 6,191,015 51,085,296
2 – special mention 18,544 7,301 81,825 134,244 639,134 231,379 1,112,427
Total 555,584 318,746 4,917,136 6,739,207 33,244,656 6,422,394 52,197,723
NOTES TO THE CONSOLIDATED FINANCIAL STATEMENTS (CONTINuED) (All amounts in HK dollar thousands unless otherwise stated)
62 SHANGHAI COMMERCIAL BANK ANNUAL REPORT 2013
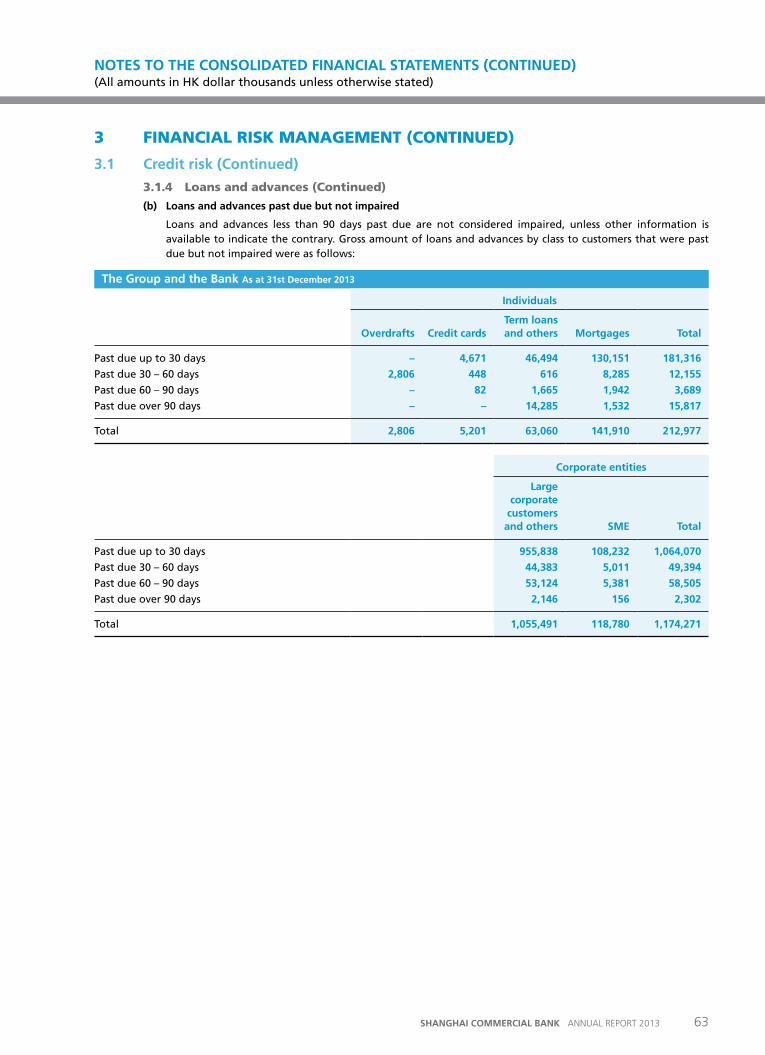
3 FINANCIAL RISK MANAGEMENT (CONTINUED)
3.1 Credit risk (Continued)
3.1.4 Loans and advances (Continued)
(b) Loans and advances past due but not impaired
Loans and advances less than 90 days past due are not considered impaired, unless other information is available to indicate the contrary. Gross amount of loans and advances by class to customers that were past due but not impaired were as follows:
the Group and the Bank as at 31st December 2013
Individuals
overdrafts Credit cards term loans and others Mortgages total
Past due up to 30 days – 4,671 46,494 130,151 181,316
Past due 30 – 60 days 2,806 448 616 8,285 12,155
Past due 60 – 90 days – 82 1,665 1,942 3,689
Past due over 90 days – – 14,285 1,532 15,817
Total 2,806 5,201 63,060 141,910 212,977
Corporate entities
Large corporate
customers and others SME total
Past due up to 30 days 955,838 108,232 1,064,070
Past due 30 – 60 days 44,383 5,011 49,394
Past due 60 – 90 days 53,124 5,381 58,505
Past due over 90 days 2,146 156 2,302
Total 1,055,491 118,780 1,174,271
NOTES TO THE CONSOLIDATED FINANCIAL STATEMENTS (CONTINuED) (All amounts in HK dollar thousands unless otherwise stated)
63SHANGHAI COMMERCIAL BANK ANNUAL REPORT 2013
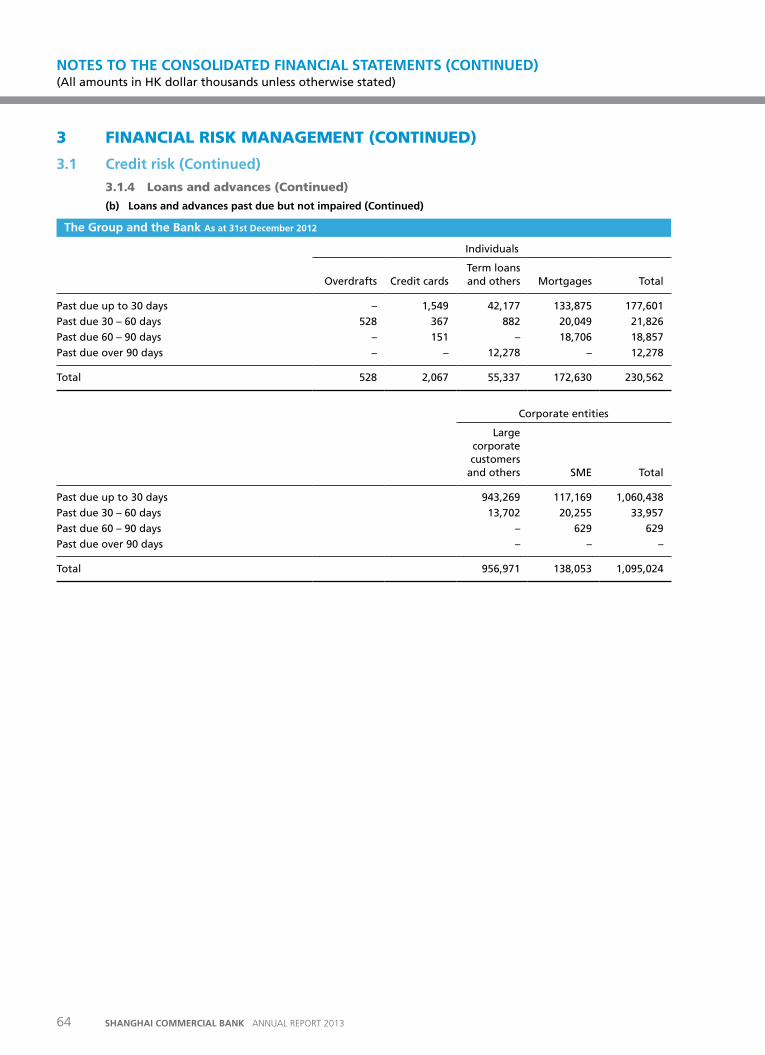
3 FINANCIAL RISK MANAGEMENT (CONTINUED)
3.1 Credit risk (Continued)
3.1.4 Loans and advances (Continued)
(b) Loans and advances past due but not impaired (Continued)
the Group and the Bank as at 31st December 2012
Individuals
Overdrafts Credit cards Term loans and others Mortgages Total
Past due up to 30 days – 1,549 42,177 133,875 177,601
Past due 30 – 60 days 528 367 882 20,049 21,826
Past due 60 – 90 days – 151 – 18,706 18,857
Past due over 90 days – – 12,278 – 12,278
Total 528 2,067 55,337 172,630 230,562
Corporate entities
Large corporate customers
and others SME Total
Past due up to 30 days 943,269 117,169 1,060,438
Past due 30 – 60 days 13,702 20,255 33,957
Past due 60 – 90 days – 629 629
Past due over 90 days – – –
Total 956,971 138,053 1,095,024
NOTES TO THE CONSOLIDATED FINANCIAL STATEMENTS (CONTINuED) (All amounts in HK dollar thousands unless otherwise stated)
64 SHANGHAI COMMERCIAL BANK ANNUAL REPORT 2013
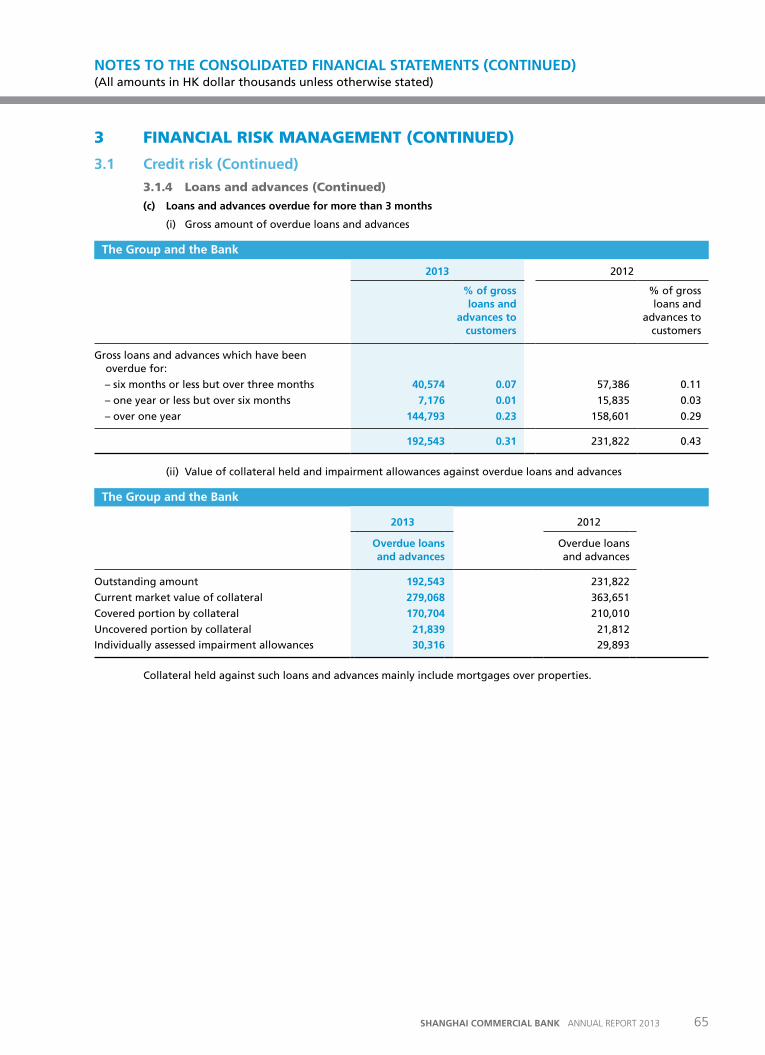
3 FINANCIAL RISK MANAGEMENT (CONTINUED)
3.1 Credit risk (Continued)
3.1.4 Loans and advances (Continued)
(c) Loans and advances overdue for more than 3 months
(i) Gross amount of overdue loans and advances
the Group and the Bank
2013 2012
% of gross loans and
advances to customers
% of gross loans and
advances to customers
Gross loans and advances which have been overdue for:
– six months or less but over three months 40,574 0.07 57,386 0.11
– one year or less but over six months 7,176 0.01 15,835 0.03
– over one year 144,793 0.23 158,601 0.29
192,543 0.31 231,822 0.43
(ii) Value of collateral held and impairment allowances against overdue loans and advances
the Group and the Bank
2013 2012
overdue loans and advances
Overdue loans and advances
Outstanding amount 192,543 231,822
Current market value of collateral 279,068 363,651
Covered portion by collateral 170,704 210,010
Uncovered portion by collateral 21,839 21,812
Individually assessed impairment allowances 30,316 29,893
Collateral held against such loans and advances mainly include mortgages over properties.
NOTES TO THE CONSOLIDATED FINANCIAL STATEMENTS (CONTINuED) (All amounts in HK dollar thousands unless otherwise stated)
65SHANGHAI COMMERCIAL BANK ANNUAL REPORT 2013
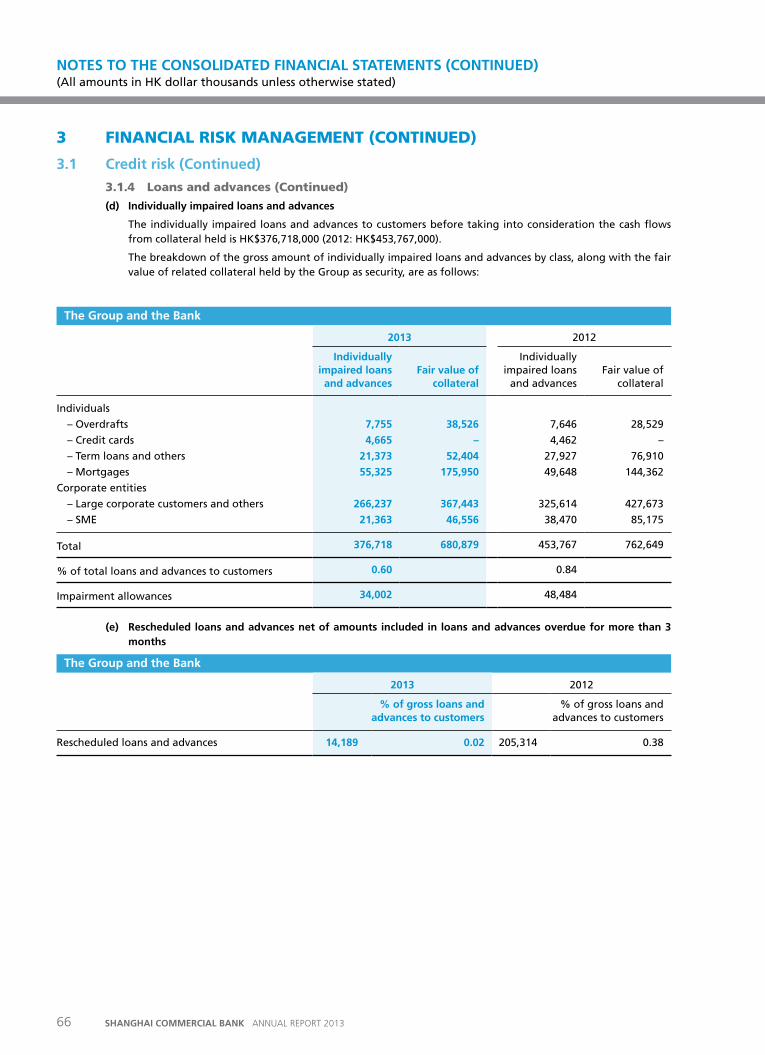
3 FINANCIAL RISK MANAGEMENT (CONTINUED)
3.1 Credit risk (Continued)
3.1.4 Loans and advances (Continued)
(d) Individually impaired loans and advances
The individually impaired loans and advances to customers before taking into consideration the cash flows from collateral held is HK$376,718,000 (2012: HK$453,767,000).
The breakdown of the gross amount of individually impaired loans and advances by class, along with the fair value of related collateral held by the Group as security, are as follows:
the Group and the Bank
2013 2012
Individually impaired loans and advances
Fair value of collateral
Individually impaired loans
and advancesFair value of
collateral
Individuals
– Overdrafts 7,755 38,526 7,646 28,529
– Credit cards 4,665 – 4,462 –
– Term loans and others 21,373 52,404 27,927 76,910
– Mortgages 55,325 175,950 49,648 144,362
Corporate entities
– Large corporate customers and others 266,237 367,443 325,614 427,673
– SME 21,363 46,556 38,470 85,175
Total 376,718 680,879 453,767 762,649
% of total loans and advances to customers 0.60 0.84
Impairment allowances 34,002 48,484
(e) rescheduled loans and advances net of amounts included in loans and advances overdue for more than 3 months
the Group and the Bank
2013 2012
% of gross loans and advances to customers
% of gross loans and advances to customers
Rescheduled loans and advances 14,189 0.02 205,314 0.38
NOTES TO THE CONSOLIDATED FINANCIAL STATEMENTS (CONTINuED) (All amounts in HK dollar thousands unless otherwise stated)
66 SHANGHAI COMMERCIAL BANK ANNUAL REPORT 2013
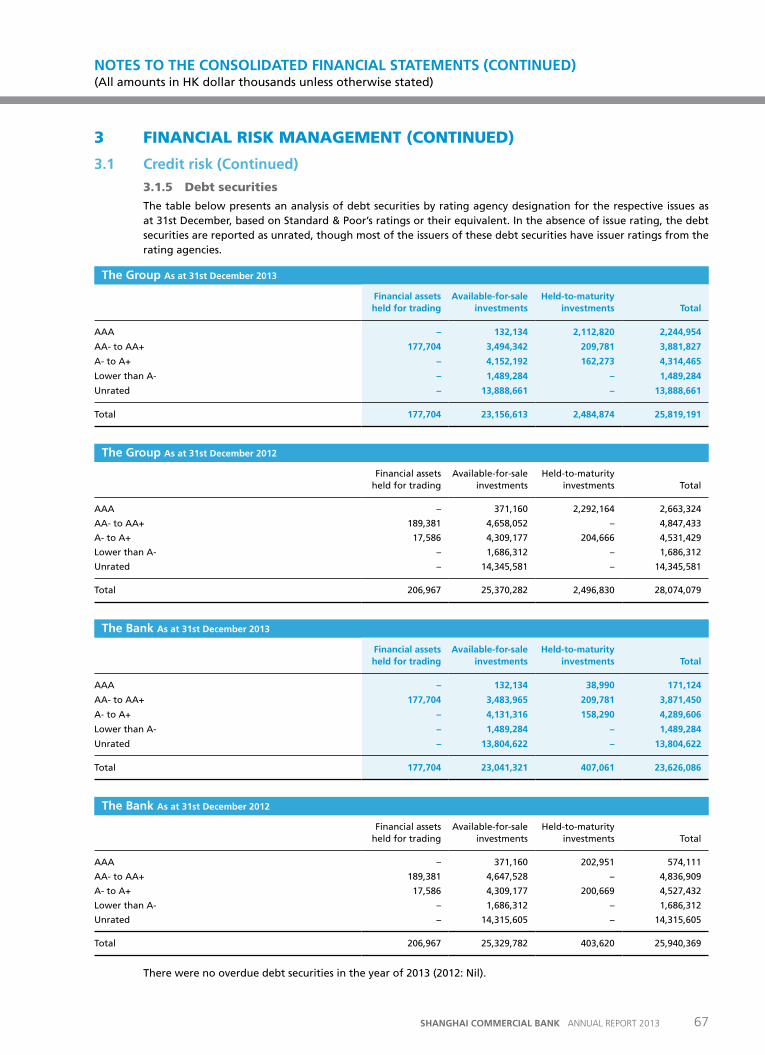
3 FINANCIAL RISK MANAGEMENT (CONTINUED)
3.1 Credit risk (Continued)
3.1.5 Debt securities
The table below presents an analysis of debt securities by rating agency designation for the respective issues as at 31st December, based on Standard & Poor’s ratings or their equivalent. In the absence of issue rating, the debt securities are reported as unrated, though most of the issuers of these debt securities have issuer ratings from the rating agencies.
the Group as at 31st December 2013
Financial assets held for trading
available-for-sale investments
Held-to-maturity investments total
AAA – 132,134 2,112,820 2,244,954
AA- to AA+ 177,704 3,494,342 209,781 3,881,827
A- to A+ – 4,152,192 162,273 4,314,465
Lower than A- – 1,489,284 – 1,489,284
Unrated – 13,888,661 – 13,888,661
Total 177,704 23,156,613 2,484,874 25,819,191
the Group as at 31st December 2012
Financial assets held for trading
Available-for-sale investments
Held-to-maturity investments Total
AAA – 371,160 2,292,164 2,663,324
AA- to AA+ 189,381 4,658,052 – 4,847,433
A- to A+ 17,586 4,309,177 204,666 4,531,429
Lower than A- – 1,686,312 – 1,686,312
Unrated – 14,345,581 – 14,345,581
Total 206,967 25,370,282 2,496,830 28,074,079
the Bank as at 31st December 2013
Financial assets held for trading
available-for-sale investments
Held-to-maturity investments total
AAA – 132,134 38,990 171,124
AA- to AA+ 177,704 3,483,965 209,781 3,871,450
A- to A+ – 4,131,316 158,290 4,289,606
Lower than A- – 1,489,284 – 1,489,284
Unrated – 13,804,622 – 13,804,622
Total 177,704 23,041,321 407,061 23,626,086
the Bank as at 31st December 2012
Financial assets held for trading
Available-for-sale investments
Held-to-maturity investments Total
AAA – 371,160 202,951 574,111
AA- to AA+ 189,381 4,647,528 – 4,836,909
A- to A+ 17,586 4,309,177 200,669 4,527,432
Lower than A- – 1,686,312 – 1,686,312
Unrated – 14,315,605 – 14,315,605
Total 206,967 25,329,782 403,620 25,940,369
There were no overdue debt securities in the year of 2013 (2012: Nil).
NOTES TO THE CONSOLIDATED FINANCIAL STATEMENTS (CONTINuED) (All amounts in HK dollar thousands unless otherwise stated)
67SHANGHAI COMMERCIAL BANK ANNUAL REPORT 2013
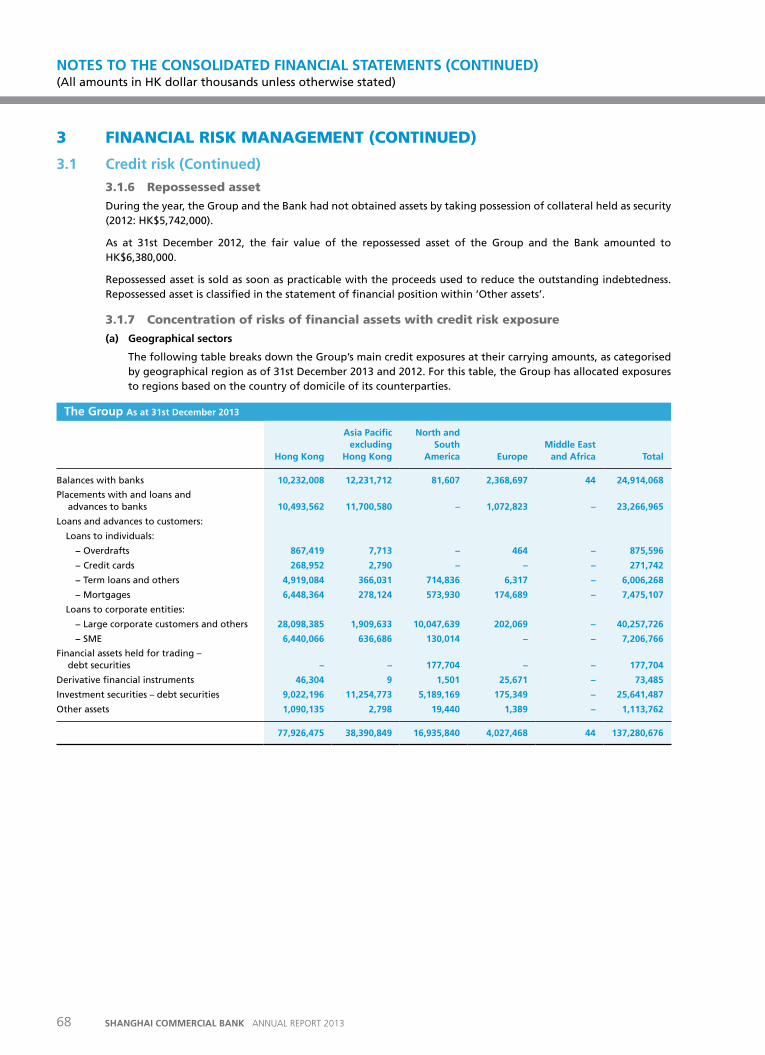
3 FINANCIAL RISK MANAGEMENT (CONTINUED)
3.1 Credit risk (Continued)
3.1.6 Repossessed asset
During the year, the Group and the Bank had not obtained assets by taking possession of collateral held as security (2012: HK$5,742,000).
As at 31st December 2012, the fair value of the repossessed asset of the Group and the Bank amounted to HK$6,380,000.
Repossessed asset is sold as soon as practicable with the proceeds used to reduce the outstanding indebtedness. Repossessed asset is classified in the statement of financial position within ‘Other assets’.
3.1.7 Concentration of risks of financial assets with credit risk exposure
(a) Geographical sectors
The following table breaks down the Group’s main credit exposures at their carrying amounts, as categorised by geographical region as of 31st December 2013 and 2012. For this table, the Group has allocated exposures to regions based on the country of domicile of its counterparties.
the Group as at 31st December 2013
Hong Kong
asia pacific excluding
Hong Kong
North and South
america Europe Middle East
and africa total
Balances with banks 10,232,008 12,231,712 81,607 2,368,697 44 24,914,068
Placements with and loans and advances to banks 10,493,562 11,700,580 – 1,072,823 – 23,266,965
Loans and advances to customers:
Loans to individuals:
− Overdrafts 867,419 7,713 – 464 – 875,596
− Credit cards 268,952 2,790 – – – 271,742
− Term loans and others 4,919,084 366,031 714,836 6,317 – 6,006,268
− Mortgages 6,448,364 278,124 573,930 174,689 – 7,475,107
Loans to corporate entities:
− Large corporate customers and others 28,098,385 1,909,633 10,047,639 202,069 – 40,257,726
− SME 6,440,066 636,686 130,014 – – 7,206,766
Financial assets held for trading – debt securities – – 177,704 – – 177,704
Derivative financial instruments 46,304 9 1,501 25,671 – 73,485
Investment securities – debt securities 9,022,196 11,254,773 5,189,169 175,349 – 25,641,487
Other assets 1,090,135 2,798 19,440 1,389 – 1,113,762
77,926,475 38,390,849 16,935,840 4,027,468 44 137,280,676
NOTES TO THE CONSOLIDATED FINANCIAL STATEMENTS (CONTINuED) (All amounts in HK dollar thousands unless otherwise stated)
68 SHANGHAI COMMERCIAL BANK ANNUAL REPORT 2013
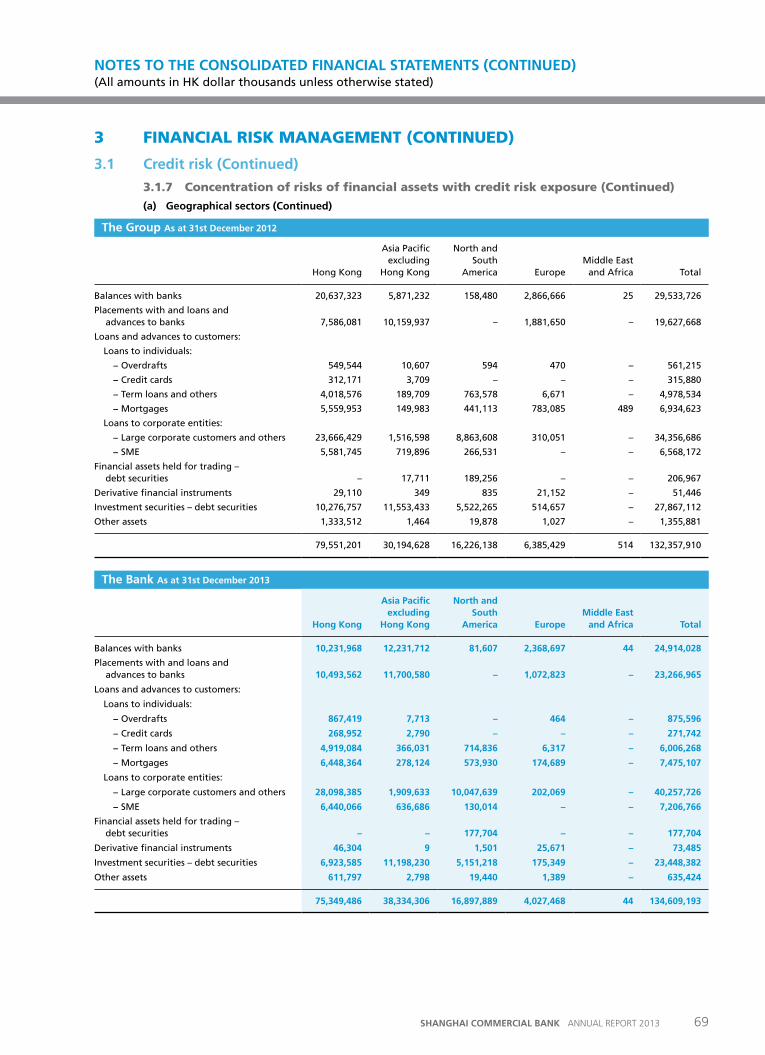
3 FINANCIAL RISK MANAGEMENT (CONTINUED)
3.1 Credit risk (Continued)
3.1.7 Concentration of risks of financial assets with credit risk exposure (Continued)
(a) Geographical sectors (Continued)
the Group as at 31st December 2012
Hong Kong
Asia Pacific excluding
Hong Kong
North and South
America Europe Middle East
and Africa Total
Balances with banks 20,637,323 5,871,232 158,480 2,866,666 25 29,533,726
Placements with and loans and advances to banks 7,586,081 10,159,937 – 1,881,650 – 19,627,668
Loans and advances to customers:
Loans to individuals:
− Overdrafts 549,544 10,607 594 470 – 561,215
− Credit cards 312,171 3,709 – – – 315,880
− Term loans and others 4,018,576 189,709 763,578 6,671 – 4,978,534
− Mortgages 5,559,953 149,983 441,113 783,085 489 6,934,623
Loans to corporate entities:
− Large corporate customers and others 23,666,429 1,516,598 8,863,608 310,051 – 34,356,686
− SME 5,581,745 719,896 266,531 – – 6,568,172
Financial assets held for trading – debt securities – 17,711 189,256 – – 206,967
Derivative financial instruments 29,110 349 835 21,152 – 51,446
Investment securities – debt securities 10,276,757 11,553,433 5,522,265 514,657 – 27,867,112
Other assets 1,333,512 1,464 19,878 1,027 – 1,355,881
79,551,201 30,194,628 16,226,138 6,385,429 514 132,357,910
the Bank as at 31st December 2013
Hong Kong
asia pacific excluding
Hong Kong
North and South
america Europe Middle East
and africa total
Balances with banks 10,231,968 12,231,712 81,607 2,368,697 44 24,914,028
Placements with and loans and advances to banks 10,493,562 11,700,580 – 1,072,823 – 23,266,965
Loans and advances to customers:
Loans to individuals:
− Overdrafts 867,419 7,713 – 464 – 875,596
− Credit cards 268,952 2,790 – – – 271,742
− Term loans and others 4,919,084 366,031 714,836 6,317 – 6,006,268
− Mortgages 6,448,364 278,124 573,930 174,689 – 7,475,107
Loans to corporate entities:
− Large corporate customers and others 28,098,385 1,909,633 10,047,639 202,069 – 40,257,726
− SME 6,440,066 636,686 130,014 – – 7,206,766
Financial assets held for trading – debt securities – – 177,704 – – 177,704
Derivative financial instruments 46,304 9 1,501 25,671 – 73,485
Investment securities – debt securities 6,923,585 11,198,230 5,151,218 175,349 – 23,448,382
Other assets 611,797 2,798 19,440 1,389 – 635,424
75,349,486 38,334,306 16,897,889 4,027,468 44 134,609,193
NOTES TO THE CONSOLIDATED FINANCIAL STATEMENTS (CONTINuED) (All amounts in HK dollar thousands unless otherwise stated)
69SHANGHAI COMMERCIAL BANK ANNUAL REPORT 2013
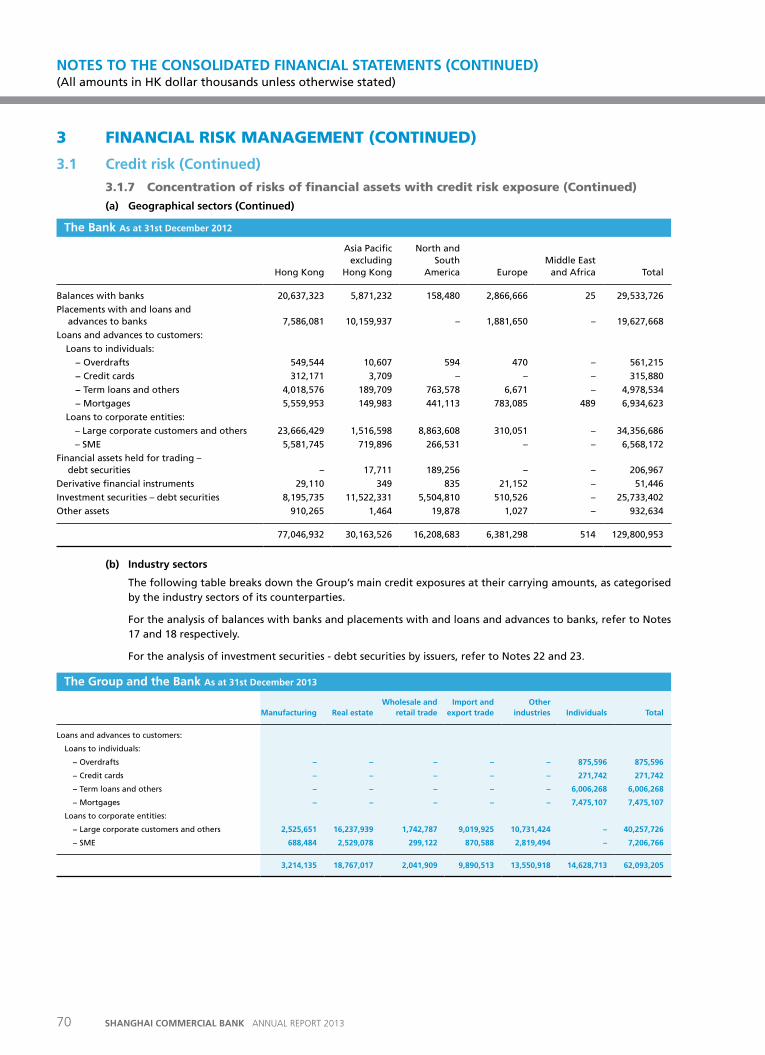
3 FINANCIAL RISK MANAGEMENT (CONTINUED)
3.1 Credit risk (Continued)
3.1.7 Concentration of risks of financial assets with credit risk exposure (Continued)
(a) Geographical sectors (Continued)
the Bank as at 31st December 2012
Hong Kong
Asia Pacific excluding
Hong Kong
North and South
America Europe Middle East
and Africa Total
Balances with banks 20,637,323 5,871,232 158,480 2,866,666 25 29,533,726
Placements with and loans and advances to banks 7,586,081 10,159,937 – 1,881,650 – 19,627,668
Loans and advances to customers:
Loans to individuals:
− Overdrafts 549,544 10,607 594 470 – 561,215
− Credit cards 312,171 3,709 – – – 315,880
− Term loans and others 4,018,576 189,709 763,578 6,671 – 4,978,534
− Mortgages 5,559,953 149,983 441,113 783,085 489 6,934,623
Loans to corporate entities:
– Large corporate customers and others 23,666,429 1,516,598 8,863,608 310,051 – 34,356,686
– SME 5,581,745 719,896 266,531 – – 6,568,172
Financial assets held for trading – debt securities – 17,711 189,256 – – 206,967
Derivative financial instruments 29,110 349 835 21,152 – 51,446
Investment securities – debt securities 8,195,735 11,522,331 5,504,810 510,526 – 25,733,402
Other assets 910,265 1,464 19,878 1,027 – 932,634
77,046,932 30,163,526 16,208,683 6,381,298 514 129,800,953
(b) Industry sectors
The following table breaks down the Group’s main credit exposures at their carrying amounts, as categorised by the industry sectors of its counterparties.
For the analysis of balances with banks and placements with and loans and advances to banks, refer to Notes 17 and 18 respectively.
For the analysis of investment securities - debt securities by issuers, refer to Notes 22 and 23.
the Group and the Bank as at 31st December 2013
Manufacturing real estate Wholesale and
retail trade Import and
export trade other
industries Individuals total
Loans and advances to customers:
Loans to individuals:
− Overdrafts – – – – – 875,596 875,596
− Credit cards – – – – – 271,742 271,742
− Term loans and others – – – – – 6,006,268 6,006,268
− Mortgages – – – – – 7,475,107 7,475,107
Loans to corporate entities:
− Large corporate customers and others 2,525,651 16,237,939 1,742,787 9,019,925 10,731,424 – 40,257,726
− SME 688,484 2,529,078 299,122 870,588 2,819,494 – 7,206,766
3,214,135 18,767,017 2,041,909 9,890,513 13,550,918 14,628,713 62,093,205
NOTES TO THE CONSOLIDATED FINANCIAL STATEMENTS (CONTINuED) (All amounts in HK dollar thousands unless otherwise stated)
70 SHANGHAI COMMERCIAL BANK ANNUAL REPORT 2013
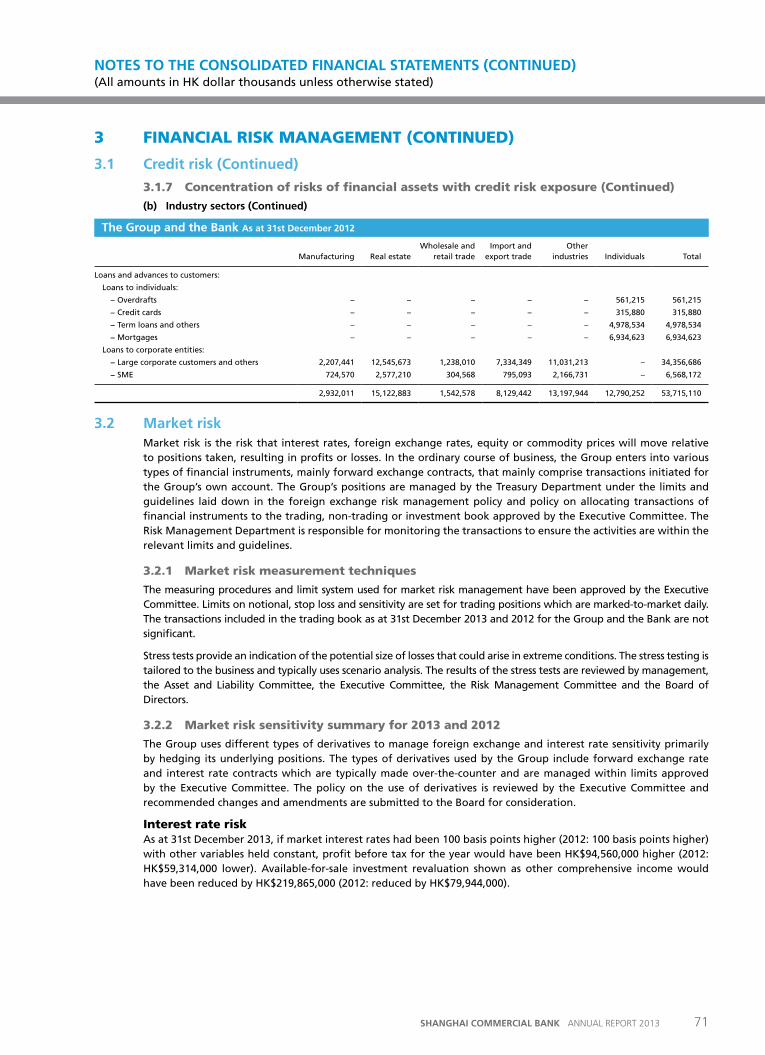
3 FINANCIAL RISK MANAGEMENT (CONTINUED)
3.1 Credit risk (Continued)
3.1.7 Concentration of risks of financial assets with credit risk exposure (Continued)
(b) Industry sectors (Continued)
the Group and the Bank as at 31st December 2012
Manufacturing Real estate Wholesale and
retail trade Import and
export trade Other
industries Individuals Total
Loans and advances to customers:
Loans to individuals:
− Overdrafts – – – – – 561,215 561,215
− Credit cards – – – – – 315,880 315,880
− Term loans and others – – – – – 4,978,534 4,978,534
− Mortgages – – – – – 6,934,623 6,934,623
Loans to corporate entities:
− Large corporate customers and others 2,207,441 12,545,673 1,238,010 7,334,349 11,031,213 – 34,356,686
− SME 724,570 2,577,210 304,568 795,093 2,166,731 – 6,568,172
2,932,011 15,122,883 1,542,578 8,129,442 13,197,944 12,790,252 53,715,110
3.2 Market riskMarket risk is the risk that interest rates, foreign exchange rates, equity or commodity prices will move relative to positions taken, resulting in profits or losses. In the ordinary course of business, the Group enters into various types of financial instruments, mainly forward exchange contracts, that mainly comprise transactions initiated for the Group’s own account. The Group’s positions are managed by the Treasury Department under the limits and guidelines laid down in the foreign exchange risk management policy and policy on allocating transactions of financial instruments to the trading, non-trading or investment book approved by the Executive Committee. The Risk Management Department is responsible for monitoring the transactions to ensure the activities are within the relevant limits and guidelines.
3.2.1 Market risk measurement techniques
The measuring procedures and limit system used for market risk management have been approved by the Executive Committee. Limits on notional, stop loss and sensitivity are set for trading positions which are marked-to-market daily. The transactions included in the trading book as at 31st December 2013 and 2012 for the Group and the Bank are not significant.
Stress tests provide an indication of the potential size of losses that could arise in extreme conditions. The stress testing is tailored to the business and typically uses scenario analysis. The results of the stress tests are reviewed by management, the Asset and Liability Committee, the Executive Committee, the Risk Management Committee and the Board of Directors.
3.2.2 Market risk sensitivity summary for 2013 and 2012
The Group uses different types of derivatives to manage foreign exchange and interest rate sensitivity primarily by hedging its underlying positions. The types of derivatives used by the Group include forward exchange rate and interest rate contracts which are typically made over-the-counter and are managed within limits approved by the Executive Committee. The policy on the use of derivatives is reviewed by the Executive Committee and recommended changes and amendments are submitted to the Board for consideration.
Interest rate riskAs at 31st December 2013, if market interest rates had been 100 basis points higher (2012: 100 basis points higher) with other variables held constant, profit before tax for the year would have been HK$94,560,000 higher (2012: HK$59,314,000 lower). Available-for-sale investment revaluation shown as other comprehensive income would have been reduced by HK$219,865,000 (2012: reduced by HK$79,944,000).
NOTES TO THE CONSOLIDATED FINANCIAL STATEMENTS (CONTINuED) (All amounts in HK dollar thousands unless otherwise stated)
71SHANGHAI COMMERCIAL BANK ANNUAL REPORT 2013
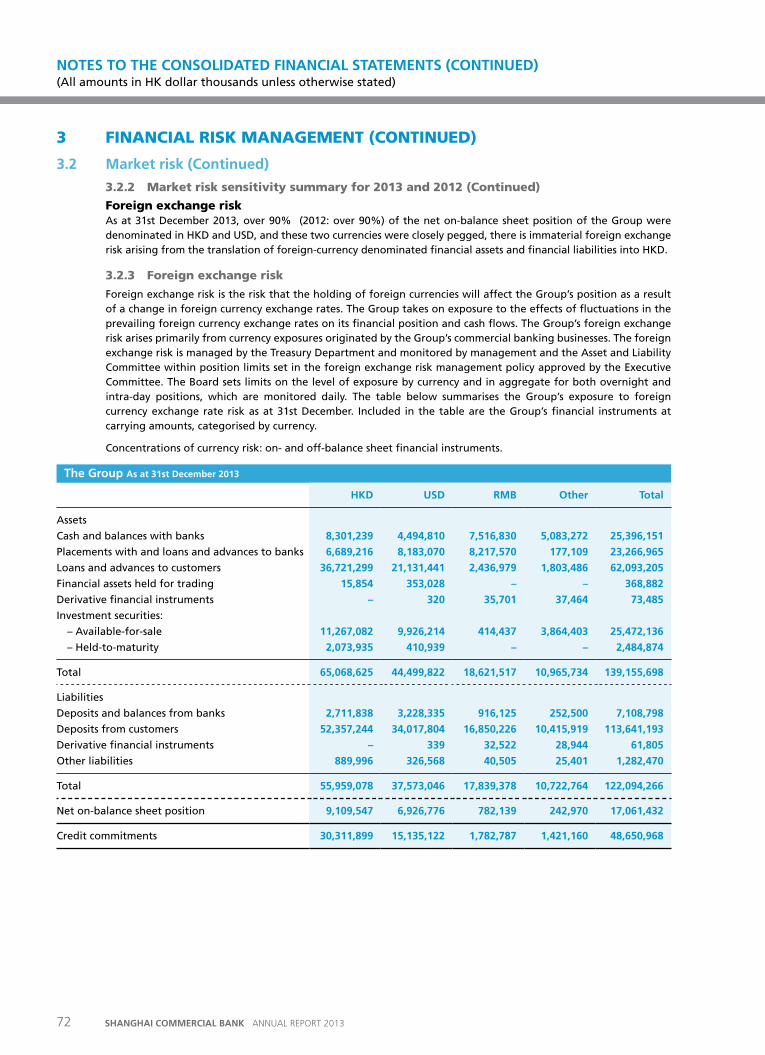
3 FINANCIAL RISK MANAGEMENT (CONTINUED)
3.2 Market risk (Continued)
3.2.2 Market risk sensitivity summary for 2013 and 2012 (Continued)
Foreign exchange riskAs at 31st December 2013, over 90% (2012: over 90%) of the net on-balance sheet position of the Group were denominated in HKD and USD, and these two currencies were closely pegged, there is immaterial foreign exchange risk arising from the translation of foreign-currency denominated financial assets and financial liabilities into HKD.
3.2.3 Foreign exchange risk
Foreign exchange risk is the risk that the holding of foreign currencies will affect the Group’s position as a result of a change in foreign currency exchange rates. The Group takes on exposure to the effects of fluctuations in the prevailing foreign currency exchange rates on its financial position and cash flows. The Group’s foreign exchange risk arises primarily from currency exposures originated by the Group’s commercial banking businesses. The foreign exchange risk is managed by the Treasury Department and monitored by management and the Asset and Liability Committee within position limits set in the foreign exchange risk management policy approved by the Executive Committee. The Board sets limits on the level of exposure by currency and in aggregate for both overnight and intra-day positions, which are monitored daily. The table below summarises the Group’s exposure to foreign currency exchange rate risk as at 31st December. Included in the table are the Group’s financial instruments at carrying amounts, categorised by currency.
Concentrations of currency risk: on- and off-balance sheet financial instruments.
the Group as at 31st December 2013
HKD uSD rMB other total
Assets
Cash and balances with banks 8,301,239 4,494,810 7,516,830 5,083,272 25,396,151
Placements with and loans and advances to banks 6,689,216 8,183,070 8,217,570 177,109 23,266,965
Loans and advances to customers 36,721,299 21,131,441 2,436,979 1,803,486 62,093,205
Financial assets held for trading 15,854 353,028 – – 368,882
Derivative financial instruments – 320 35,701 37,464 73,485
Investment securities:
– Available-for-sale 11,267,082 9,926,214 414,437 3,864,403 25,472,136
– Held-to-maturity 2,073,935 410,939 – – 2,484,874
Total 65,068,625 44,499,822 18,621,517 10,965,734 139,155,698
Liabilities
Deposits and balances from banks 2,711,838 3,228,335 916,125 252,500 7,108,798
Deposits from customers 52,357,244 34,017,804 16,850,226 10,415,919 113,641,193
Derivative financial instruments – 339 32,522 28,944 61,805
Other liabilities 889,996 326,568 40,505 25,401 1,282,470
Total 55,959,078 37,573,046 17,839,378 10,722,764 122,094,266
Net on-balance sheet position 9,109,547 6,926,776 782,139 242,970 17,061,432
Credit commitments 30,311,899 15,135,122 1,782,787 1,421,160 48,650,968
NOTES TO THE CONSOLIDATED FINANCIAL STATEMENTS (CONTINuED) (All amounts in HK dollar thousands unless otherwise stated)
72 SHANGHAI COMMERCIAL BANK ANNUAL REPORT 2013
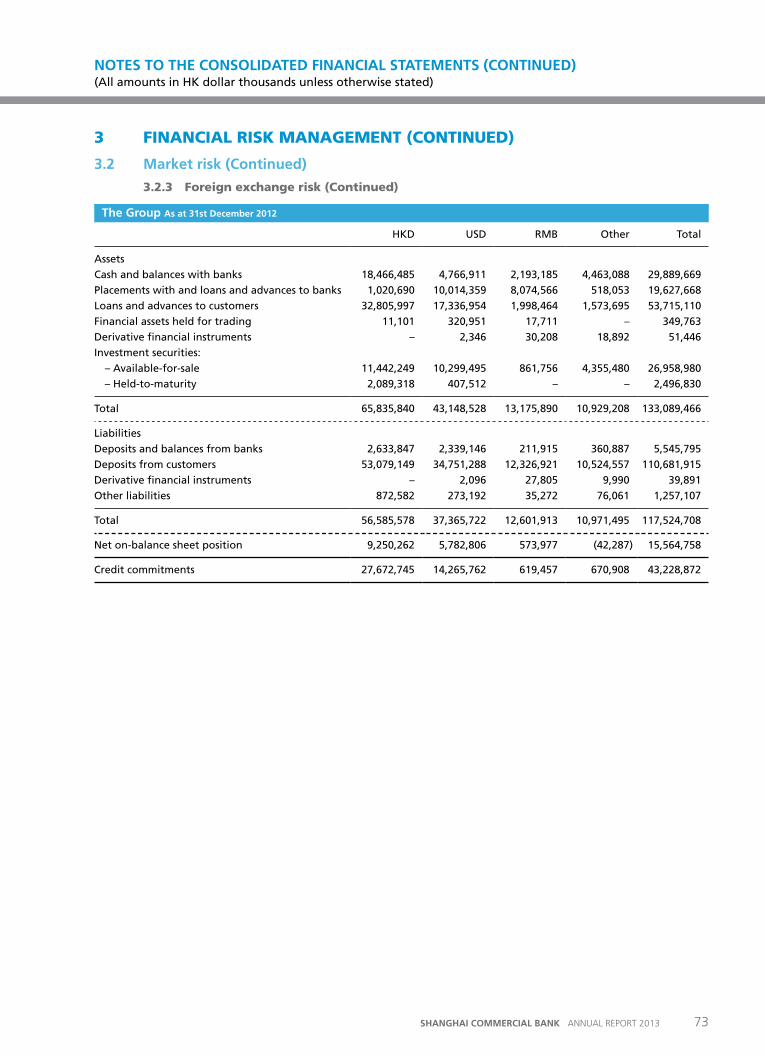
3 FINANCIAL RISK MANAGEMENT (CONTINUED)
3.2 Market risk (Continued)
3.2.3 Foreign exchange risk (Continued)
the Group as at 31st December 2012
HKD USD RMB Other Total
Assets
Cash and balances with banks 18,466,485 4,766,911 2,193,185 4,463,088 29,889,669
Placements with and loans and advances to banks 1,020,690 10,014,359 8,074,566 518,053 19,627,668
Loans and advances to customers 32,805,997 17,336,954 1,998,464 1,573,695 53,715,110
Financial assets held for trading 11,101 320,951 17,711 – 349,763
Derivative financial instruments – 2,346 30,208 18,892 51,446
Investment securities:
– Available-for-sale 11,442,249 10,299,495 861,756 4,355,480 26,958,980
– Held-to-maturity 2,089,318 407,512 – – 2,496,830
Total 65,835,840 43,148,528 13,175,890 10,929,208 133,089,466
Liabilities
Deposits and balances from banks 2,633,847 2,339,146 211,915 360,887 5,545,795
Deposits from customers 53,079,149 34,751,288 12,326,921 10,524,557 110,681,915
Derivative financial instruments – 2,096 27,805 9,990 39,891
Other liabilities 872,582 273,192 35,272 76,061 1,257,107
Total 56,585,578 37,365,722 12,601,913 10,971,495 117,524,708
Net on-balance sheet position 9,250,262 5,782,806 573,977 (42,287) 15,564,758
Credit commitments 27,672,745 14,265,762 619,457 670,908 43,228,872
NOTES TO THE CONSOLIDATED FINANCIAL STATEMENTS (CONTINuED) (All amounts in HK dollar thousands unless otherwise stated)
73SHANGHAI COMMERCIAL BANK ANNUAL REPORT 2013
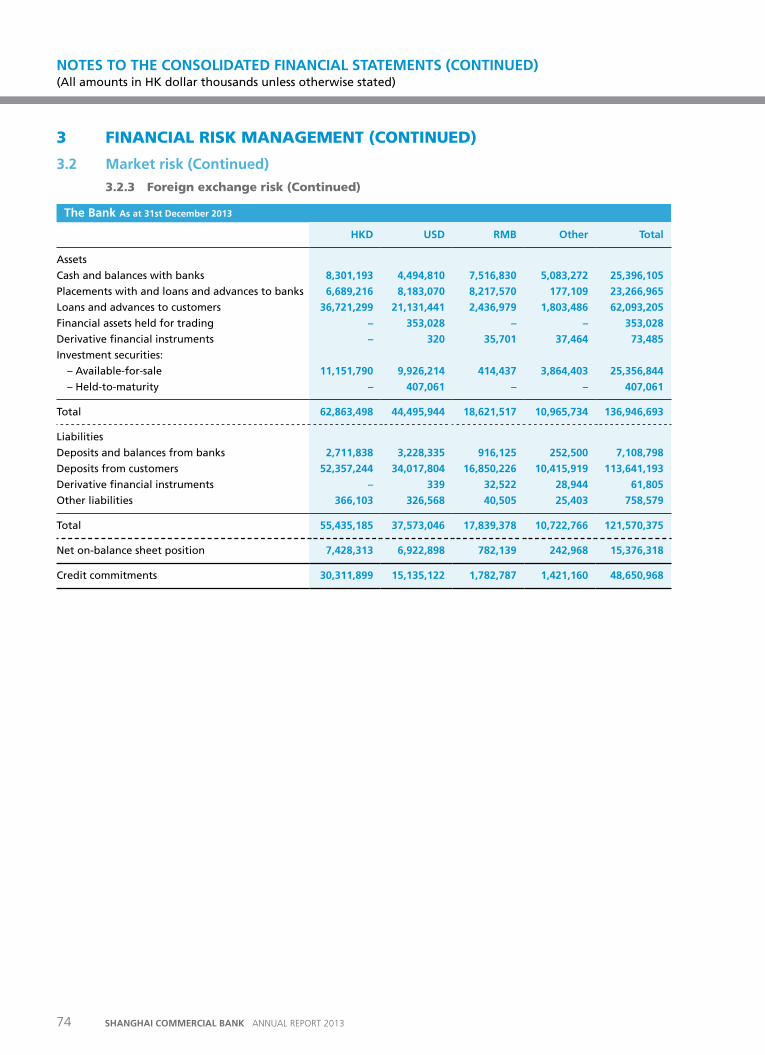
3 FINANCIAL RISK MANAGEMENT (CONTINUED)
3.2 Market risk (Continued)
3.2.3 Foreign exchange risk (Continued)
the Bank as at 31st December 2013
HKD uSD rMB other total
Assets
Cash and balances with banks 8,301,193 4,494,810 7,516,830 5,083,272 25,396,105
Placements with and loans and advances to banks 6,689,216 8,183,070 8,217,570 177,109 23,266,965
Loans and advances to customers 36,721,299 21,131,441 2,436,979 1,803,486 62,093,205
Financial assets held for trading – 353,028 – – 353,028
Derivative financial instruments – 320 35,701 37,464 73,485
Investment securities:
– Available-for-sale 11,151,790 9,926,214 414,437 3,864,403 25,356,844
– Held-to-maturity – 407,061 – – 407,061
Total 62,863,498 44,495,944 18,621,517 10,965,734 136,946,693
Liabilities
Deposits and balances from banks 2,711,838 3,228,335 916,125 252,500 7,108,798
Deposits from customers 52,357,244 34,017,804 16,850,226 10,415,919 113,641,193
Derivative financial instruments – 339 32,522 28,944 61,805
Other liabilities 366,103 326,568 40,505 25,403 758,579
Total 55,435,185 37,573,046 17,839,378 10,722,766 121,570,375
Net on-balance sheet position 7,428,313 6,922,898 782,139 242,968 15,376,318
Credit commitments 30,311,899 15,135,122 1,782,787 1,421,160 48,650,968
NOTES TO THE CONSOLIDATED FINANCIAL STATEMENTS (CONTINuED) (All amounts in HK dollar thousands unless otherwise stated)
74 SHANGHAI COMMERCIAL BANK ANNUAL REPORT 2013
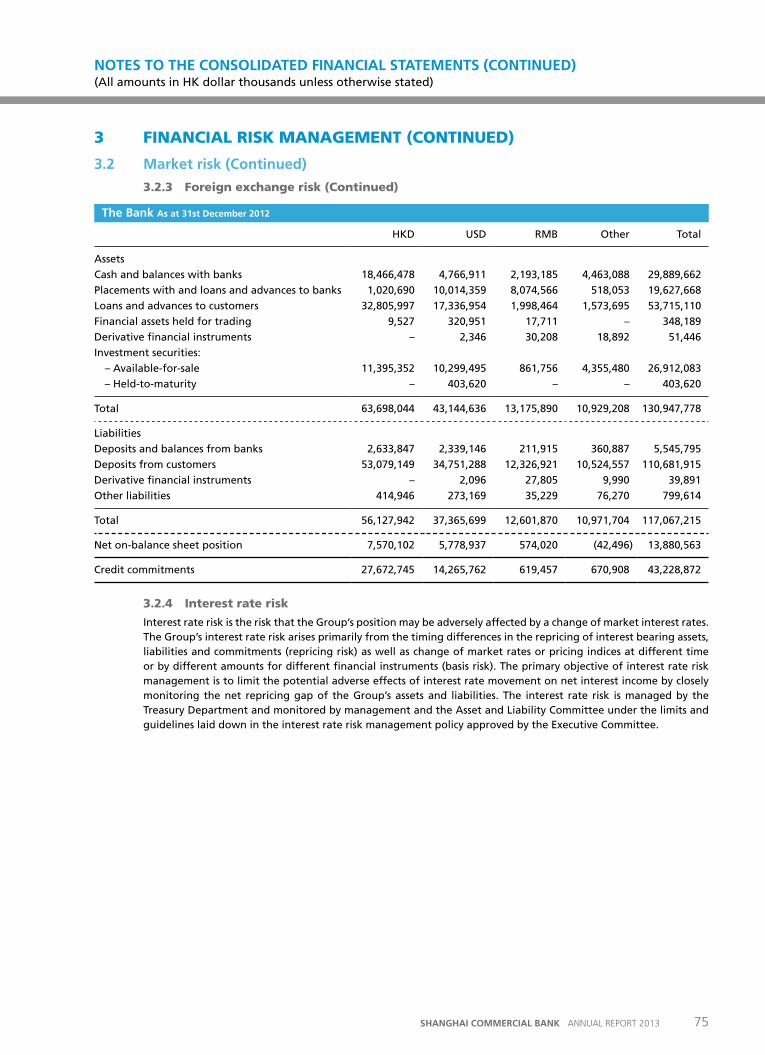
3 FINANCIAL RISK MANAGEMENT (CONTINUED)
3.2 Market risk (Continued)
3.2.3 Foreign exchange risk (Continued)
the Bank as at 31st December 2012
HKD USD RMB Other Total
Assets
Cash and balances with banks 18,466,478 4,766,911 2,193,185 4,463,088 29,889,662
Placements with and loans and advances to banks 1,020,690 10,014,359 8,074,566 518,053 19,627,668
Loans and advances to customers 32,805,997 17,336,954 1,998,464 1,573,695 53,715,110
Financial assets held for trading 9,527 320,951 17,711 – 348,189
Derivative financial instruments – 2,346 30,208 18,892 51,446
Investment securities:
– Available-for-sale 11,395,352 10,299,495 861,756 4,355,480 26,912,083
– Held-to-maturity – 403,620 – – 403,620
Total 63,698,044 43,144,636 13,175,890 10,929,208 130,947,778
Liabilities
Deposits and balances from banks 2,633,847 2,339,146 211,915 360,887 5,545,795
Deposits from customers 53,079,149 34,751,288 12,326,921 10,524,557 110,681,915
Derivative financial instruments – 2,096 27,805 9,990 39,891
Other liabilities 414,946 273,169 35,229 76,270 799,614
Total 56,127,942 37,365,699 12,601,870 10,971,704 117,067,215
Net on-balance sheet position 7,570,102 5,778,937 574,020 (42,496) 13,880,563
Credit commitments 27,672,745 14,265,762 619,457 670,908 43,228,872
3.2.4 Interest rate risk
Interest rate risk is the risk that the Group’s position may be adversely affected by a change of market interest rates. The Group’s interest rate risk arises primarily from the timing differences in the repricing of interest bearing assets, liabilities and commitments (repricing risk) as well as change of market rates or pricing indices at different time or by different amounts for different financial instruments (basis risk). The primary objective of interest rate risk management is to limit the potential adverse effects of interest rate movement on net interest income by closely monitoring the net repricing gap of the Group’s assets and liabilities. The interest rate risk is managed by the Treasury Department and monitored by management and the Asset and Liability Committee under the limits and guidelines laid down in the interest rate risk management policy approved by the Executive Committee.
NOTES TO THE CONSOLIDATED FINANCIAL STATEMENTS (CONTINuED) (All amounts in HK dollar thousands unless otherwise stated)
75SHANGHAI COMMERCIAL BANK ANNUAL REPORT 2013
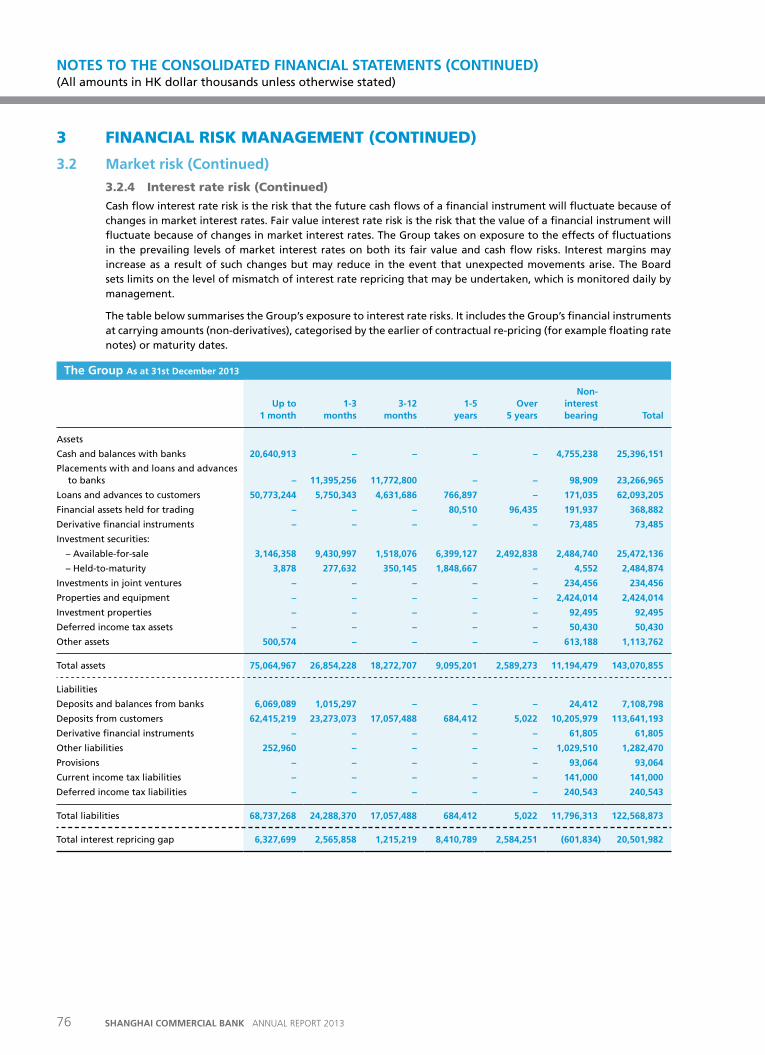
3 FINANCIAL RISK MANAGEMENT (CONTINUED)
3.2 Market risk (Continued)
3.2.4 Interest rate risk (Continued)
Cash flow interest rate risk is the risk that the future cash flows of a financial instrument will fluctuate because of changes in market interest rates. Fair value interest rate risk is the risk that the value of a financial instrument will fluctuate because of changes in market interest rates. The Group takes on exposure to the effects of fluctuations in the prevailing levels of market interest rates on both its fair value and cash flow risks. Interest margins may increase as a result of such changes but may reduce in the event that unexpected movements arise. The Board sets limits on the level of mismatch of interest rate repricing that may be undertaken, which is monitored daily by management.
The table below summarises the Group’s exposure to interest rate risks. It includes the Group’s financial instruments at carrying amounts (non-derivatives), categorised by the earlier of contractual re-pricing (for example floating rate notes) or maturity dates.
the Group as at 31st December 2013
up to 1 month
1-3 months
3-12 months
1-5 years
over 5 years
Non- interest bearing total
Assets
Cash and balances with banks 20,640,913 – – – – 4,755,238 25,396,151
Placements with and loans and advances to banks – 11,395,256 11,772,800 – – 98,909 23,266,965
Loans and advances to customers 50,773,244 5,750,343 4,631,686 766,897 – 171,035 62,093,205
Financial assets held for trading – – – 80,510 96,435 191,937 368,882
Derivative financial instruments – – – – – 73,485 73,485
Investment securities:
– Available-for-sale 3,146,358 9,430,997 1,518,076 6,399,127 2,492,838 2,484,740 25,472,136
– Held-to-maturity 3,878 277,632 350,145 1,848,667 – 4,552 2,484,874
Investments in joint ventures – – – – – 234,456 234,456
Properties and equipment – – – – – 2,424,014 2,424,014
Investment properties – – – – – 92,495 92,495
Deferred income tax assets – – – – – 50,430 50,430
Other assets 500,574 – – – – 613,188 1,113,762
Total assets 75,064,967 26,854,228 18,272,707 9,095,201 2,589,273 11,194,479 143,070,855
Liabilities
Deposits and balances from banks 6,069,089 1,015,297 – – – 24,412 7,108,798
Deposits from customers 62,415,219 23,273,073 17,057,488 684,412 5,022 10,205,979 113,641,193
Derivative financial instruments – – – – – 61,805 61,805
Other liabilities 252,960 – – – – 1,029,510 1,282,470
Provisions – – – – – 93,064 93,064
Current income tax liabilities – – – – – 141,000 141,000
Deferred income tax liabilities – – – – – 240,543 240,543
Total liabilities 68,737,268 24,288,370 17,057,488 684,412 5,022 11,796,313 122,568,873
Total interest repricing gap 6,327,699 2,565,858 1,215,219 8,410,789 2,584,251 (601,834) 20,501,982
NOTES TO THE CONSOLIDATED FINANCIAL STATEMENTS (CONTINuED) (All amounts in HK dollar thousands unless otherwise stated)
76 SHANGHAI COMMERCIAL BANK ANNUAL REPORT 2013
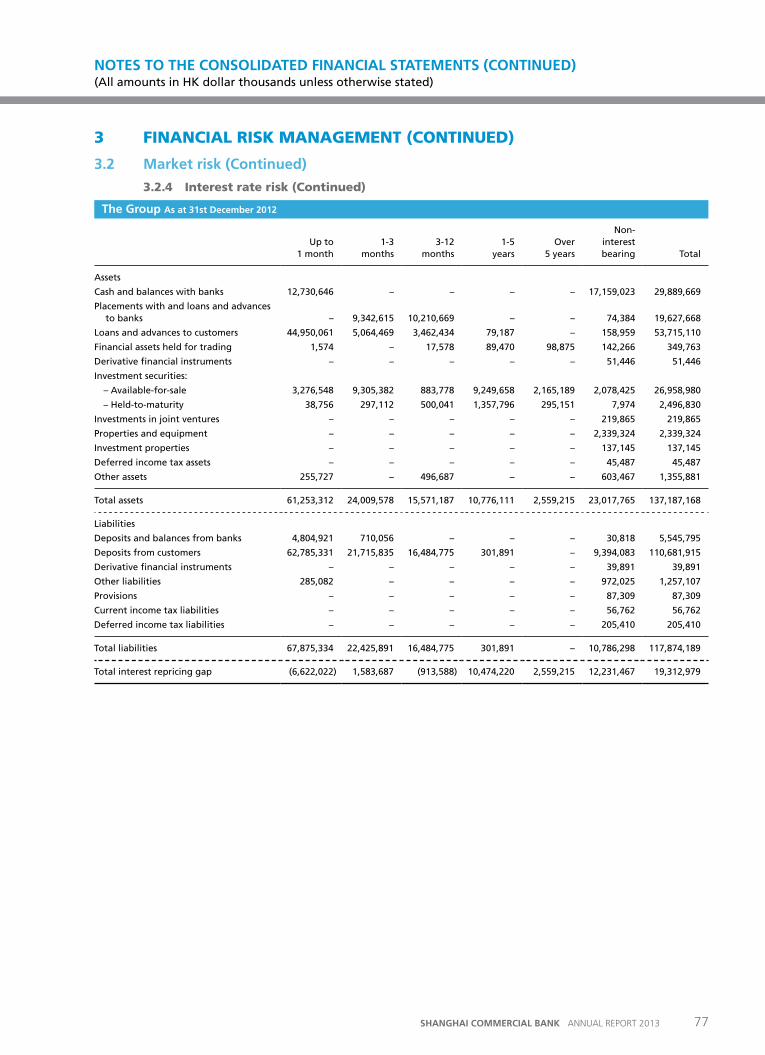
3 FINANCIAL RISK MANAGEMENT (CONTINUED)
3.2 Market risk (Continued)
3.2.4 Interest rate risk (Continued)
the Group as at 31st December 2012
Up to 1 month
1-3 months
3-12 months
1-5 years
Over 5 years
Non-interest bearing Total
Assets
Cash and balances with banks 12,730,646 – – – – 17,159,023 29,889,669
Placements with and loans and advances to banks – 9,342,615 10,210,669 – – 74,384 19,627,668
Loans and advances to customers 44,950,061 5,064,469 3,462,434 79,187 – 158,959 53,715,110
Financial assets held for trading 1,574 – 17,578 89,470 98,875 142,266 349,763
Derivative financial instruments – – – – – 51,446 51,446
Investment securities:
– Available-for-sale 3,276,548 9,305,382 883,778 9,249,658 2,165,189 2,078,425 26,958,980
– Held-to-maturity 38,756 297,112 500,041 1,357,796 295,151 7,974 2,496,830
Investments in joint ventures – – – – – 219,865 219,865
Properties and equipment – – – – – 2,339,324 2,339,324
Investment properties – – – – – 137,145 137,145
Deferred income tax assets – – – – – 45,487 45,487
Other assets 255,727 – 496,687 – – 603,467 1,355,881
Total assets 61,253,312 24,009,578 15,571,187 10,776,111 2,559,215 23,017,765 137,187,168
Liabilities
Deposits and balances from banks 4,804,921 710,056 – – – 30,818 5,545,795
Deposits from customers 62,785,331 21,715,835 16,484,775 301,891 – 9,394,083 110,681,915
Derivative financial instruments – – – – – 39,891 39,891
Other liabilities 285,082 – – – – 972,025 1,257,107
Provisions – – – – – 87,309 87,309
Current income tax liabilities – – – – – 56,762 56,762
Deferred income tax liabilities – – – – – 205,410 205,410
Total liabilities 67,875,334 22,425,891 16,484,775 301,891 – 10,786,298 117,874,189
Total interest repricing gap (6,622,022) 1,583,687 (913,588) 10,474,220 2,559,215 12,231,467 19,312,979
NOTES TO THE CONSOLIDATED FINANCIAL STATEMENTS (CONTINuED) (All amounts in HK dollar thousands unless otherwise stated)
77SHANGHAI COMMERCIAL BANK ANNUAL REPORT 2013
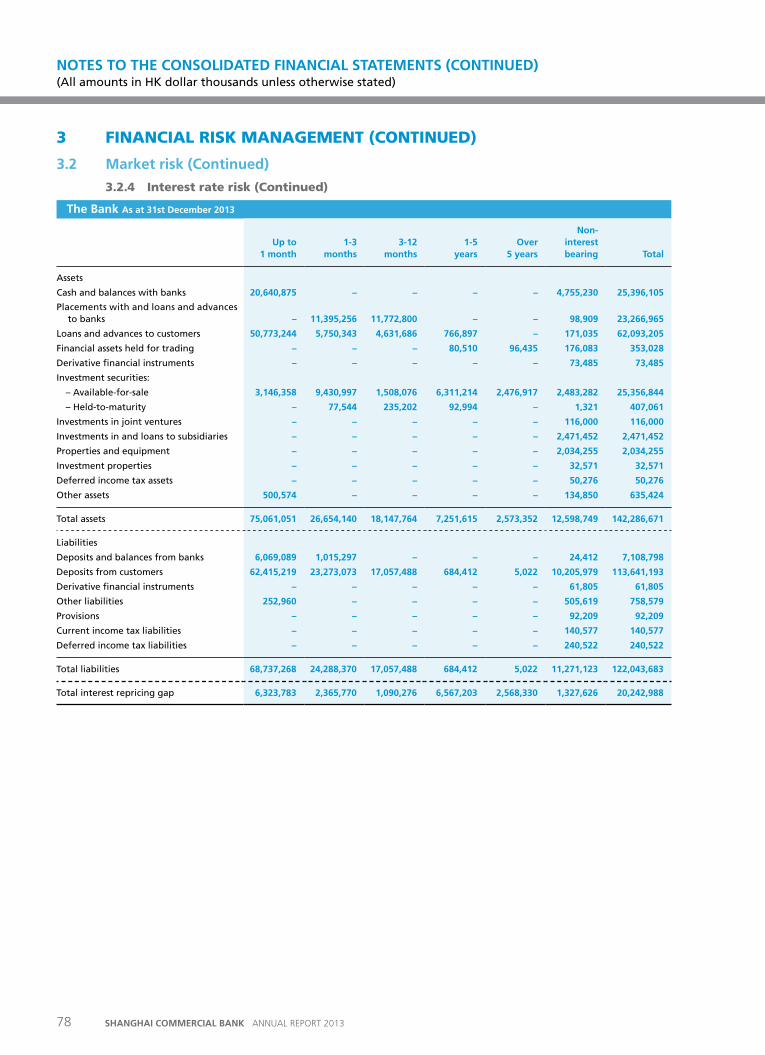
3 FINANCIAL RISK MANAGEMENT (CONTINUED)
3.2 Market risk (Continued)
3.2.4 Interest rate risk (Continued)
the Bank as at 31st December 2013
up to 1 month
1-3 months
3-12 months
1-5 years
over 5 years
Non- interest bearing total
Assets
Cash and balances with banks 20,640,875 – – – – 4,755,230 25,396,105
Placements with and loans and advances to banks – 11,395,256 11,772,800 – – 98,909 23,266,965
Loans and advances to customers 50,773,244 5,750,343 4,631,686 766,897 – 171,035 62,093,205
Financial assets held for trading – – – 80,510 96,435 176,083 353,028
Derivative financial instruments – – – – – 73,485 73,485
Investment securities:
– Available-for-sale 3,146,358 9,430,997 1,508,076 6,311,214 2,476,917 2,483,282 25,356,844
– Held-to-maturity – 77,544 235,202 92,994 – 1,321 407,061
Investments in joint ventures – – – – – 116,000 116,000
Investments in and loans to subsidiaries – – – – – 2,471,452 2,471,452
Properties and equipment – – – – – 2,034,255 2,034,255
Investment properties – – – – – 32,571 32,571
Deferred income tax assets – – – – – 50,276 50,276
Other assets 500,574 – – – – 134,850 635,424
Total assets 75,061,051 26,654,140 18,147,764 7,251,615 2,573,352 12,598,749 142,286,671
Liabilities
Deposits and balances from banks 6,069,089 1,015,297 – – – 24,412 7,108,798
Deposits from customers 62,415,219 23,273,073 17,057,488 684,412 5,022 10,205,979 113,641,193
Derivative financial instruments – – – – – 61,805 61,805
Other liabilities 252,960 – – – – 505,619 758,579
Provisions – – – – – 92,209 92,209
Current income tax liabilities – – – – – 140,577 140,577
Deferred income tax liabilities – – – – – 240,522 240,522
Total liabilities 68,737,268 24,288,370 17,057,488 684,412 5,022 11,271,123 122,043,683
Total interest repricing gap 6,323,783 2,365,770 1,090,276 6,567,203 2,568,330 1,327,626 20,242,988
NOTES TO THE CONSOLIDATED FINANCIAL STATEMENTS (CONTINuED) (All amounts in HK dollar thousands unless otherwise stated)
78 SHANGHAI COMMERCIAL BANK ANNUAL REPORT 2013
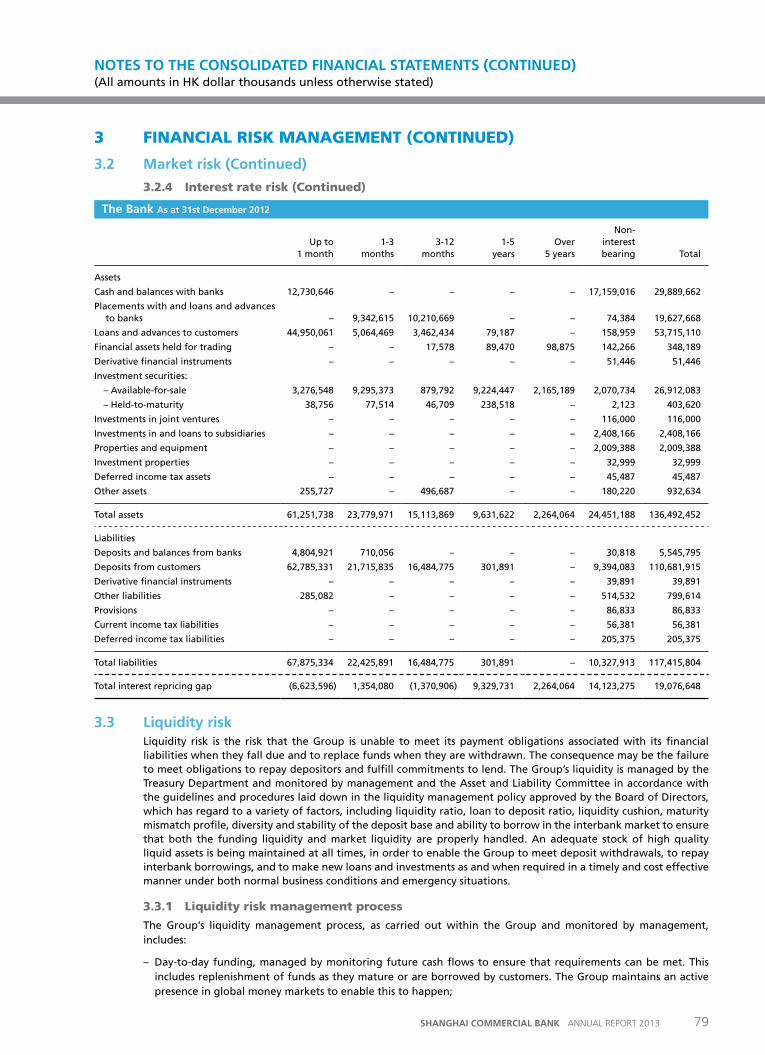
3 FINANCIAL RISK MANAGEMENT (CONTINUED)
3.2 Market risk (Continued)
3.2.4 Interest rate risk (Continued)
the Bank as at 31st December 2012
Up to 1 month
1-3 months
3-12 months
1-5 years
Over 5 years
Non-interest bearing Total
Assets
Cash and balances with banks 12,730,646 – – – – 17,159,016 29,889,662
Placements with and loans and advances to banks – 9,342,615 10,210,669 – – 74,384 19,627,668
Loans and advances to customers 44,950,061 5,064,469 3,462,434 79,187 – 158,959 53,715,110
Financial assets held for trading – – 17,578 89,470 98,875 142,266 348,189
Derivative financial instruments – – – – – 51,446 51,446
Investment securities:
– Available-for-sale 3,276,548 9,295,373 879,792 9,224,447 2,165,189 2,070,734 26,912,083
– Held-to-maturity 38,756 77,514 46,709 238,518 – 2,123 403,620
Investments in joint ventures – – – – – 116,000 116,000
Investments in and loans to subsidiaries – – – – – 2,408,166 2,408,166
Properties and equipment – – – – – 2,009,388 2,009,388
Investment properties – – – – – 32,999 32,999
Deferred income tax assets – – – – – 45,487 45,487
Other assets 255,727 – 496,687 – – 180,220 932,634
Total assets 61,251,738 23,779,971 15,113,869 9,631,622 2,264,064 24,451,188 136,492,452
Liabilities
Deposits and balances from banks 4,804,921 710,056 – – – 30,818 5,545,795
Deposits from customers 62,785,331 21,715,835 16,484,775 301,891 – 9,394,083 110,681,915
Derivative financial instruments – – – – – 39,891 39,891
Other liabilities 285,082 – – – – 514,532 799,614
Provisions – – – – – 86,833 86,833
Current income tax liabilities – – – – – 56,381 56,381
Deferred income tax liabilities – – – – – 205,375 205,375
Total liabilities 67,875,334 22,425,891 16,484,775 301,891 – 10,327,913 117,415,804
Total interest repricing gap (6,623,596) 1,354,080 (1,370,906) 9,329,731 2,264,064 14,123,275 19,076,648
3.3 Liquidity risk Liquidity risk is the risk that the Group is unable to meet its payment obligations associated with its financial liabilities when they fall due and to replace funds when they are withdrawn. The consequence may be the failure to meet obligations to repay depositors and fulfill commitments to lend. The Group’s liquidity is managed by the Treasury Department and monitored by management and the Asset and Liability Committee in accordance with the guidelines and procedures laid down in the liquidity management policy approved by the Board of Directors, which has regard to a variety of factors, including liquidity ratio, loan to deposit ratio, liquidity cushion, maturity mismatch profile, diversity and stability of the deposit base and ability to borrow in the interbank market to ensure that both the funding liquidity and market liquidity are properly handled. An adequate stock of high quality liquid assets is being maintained at all times, in order to enable the Group to meet deposit withdrawals, to repay interbank borrowings, and to make new loans and investments as and when required in a timely and cost effective manner under both normal business conditions and emergency situations.
3.3.1 Liquidity risk management process
The Group’s liquidity management process, as carried out within the Group and monitored by management, includes:
– Day-to-day funding, managed by monitoring future cash flows to ensure that requirements can be met. This includes replenishment of funds as they mature or are borrowed by customers. The Group maintains an active presence in global money markets to enable this to happen;
NOTES TO THE CONSOLIDATED FINANCIAL STATEMENTS (CONTINuED) (All amounts in HK dollar thousands unless otherwise stated)
79SHANGHAI COMMERCIAL BANK ANNUAL REPORT 2013
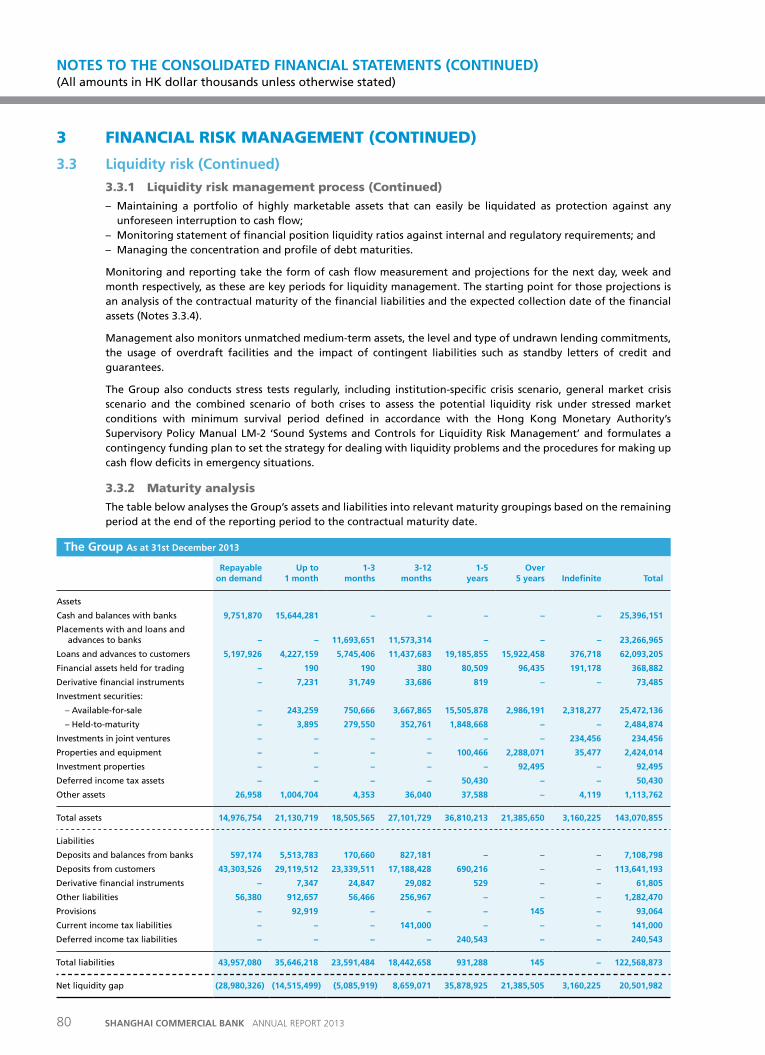
3 FINANCIAL RISK MANAGEMENT (CONTINUED)
3.3 Liquidity risk (Continued)
3.3.1 Liquidity risk management process (Continued)
– Maintaining a portfolio of highly marketable assets that can easily be liquidated as protection against any unforeseen interruption to cash flow;
– Monitoring statement of financial position liquidity ratios against internal and regulatory requirements; and– Managing the concentration and profile of debt maturities.
Monitoring and reporting take the form of cash flow measurement and projections for the next day, week and month respectively, as these are key periods for liquidity management. The starting point for those projections is an analysis of the contractual maturity of the financial liabilities and the expected collection date of the financial assets (Notes 3.3.4).
Management also monitors unmatched medium-term assets, the level and type of undrawn lending commitments, the usage of overdraft facilities and the impact of contingent liabilities such as standby letters of credit and guarantees.
The Group also conducts stress tests regularly, including institution-specific crisis scenario, general market crisis scenario and the combined scenario of both crises to assess the potential liquidity risk under stressed market conditions with minimum survival period defined in accordance with the Hong Kong Monetary Authority’s Supervisory Policy Manual LM-2 ‘Sound Systems and Controls for Liquidity Risk Management’ and formulates a contingency funding plan to set the strategy for dealing with liquidity problems and the procedures for making up cash flow deficits in emergency situations.
3.3.2 Maturity analysis
The table below analyses the Group’s assets and liabilities into relevant maturity groupings based on the remaining period at the end of the reporting period to the contractual maturity date.
the Group as at 31st December 2013
repayable on demand
up to 1 month
1-3 months
3-12 months
1-5 years
over 5 years Indefinite total
Assets
Cash and balances with banks 9,751,870 15,644,281 – – – – – 25,396,151
Placements with and loans and advances to banks – – 11,693,651 11,573,314 – – – 23,266,965
Loans and advances to customers 5,197,926 4,227,159 5,745,406 11,437,683 19,185,855 15,922,458 376,718 62,093,205
Financial assets held for trading – 190 190 380 80,509 96,435 191,178 368,882
Derivative financial instruments – 7,231 31,749 33,686 819 – – 73,485
Investment securities:
– Available-for-sale – 243,259 750,666 3,667,865 15,505,878 2,986,191 2,318,277 25,472,136
– Held-to-maturity – 3,895 279,550 352,761 1,848,668 – – 2,484,874
Investments in joint ventures – – – – – – 234,456 234,456
Properties and equipment – – – – 100,466 2,288,071 35,477 2,424,014
Investment properties – – – – – 92,495 – 92,495
Deferred income tax assets – – – – 50,430 – – 50,430
Other assets 26,958 1,004,704 4,353 36,040 37,588 – 4,119 1,113,762
Total assets 14,976,754 21,130,719 18,505,565 27,101,729 36,810,213 21,385,650 3,160,225 143,070,855
Liabilities
Deposits and balances from banks 597,174 5,513,783 170,660 827,181 – – – 7,108,798
Deposits from customers 43,303,526 29,119,512 23,339,511 17,188,428 690,216 – – 113,641,193
Derivative financial instruments – 7,347 24,847 29,082 529 – – 61,805
Other liabilities 56,380 912,657 56,466 256,967 – – – 1,282,470
Provisions – 92,919 – – – 145 – 93,064
Current income tax liabilities – – – 141,000 – – – 141,000
Deferred income tax liabilities – – – – 240,543 – – 240,543
Total liabilities 43,957,080 35,646,218 23,591,484 18,442,658 931,288 145 – 122,568,873
Net liquidity gap (28,980,326) (14,515,499) (5,085,919) 8,659,071 35,878,925 21,385,505 3,160,225 20,501,982
NOTES TO THE CONSOLIDATED FINANCIAL STATEMENTS (CONTINuED) (All amounts in HK dollar thousands unless otherwise stated)
80 SHANGHAI COMMERCIAL BANK ANNUAL REPORT 2013
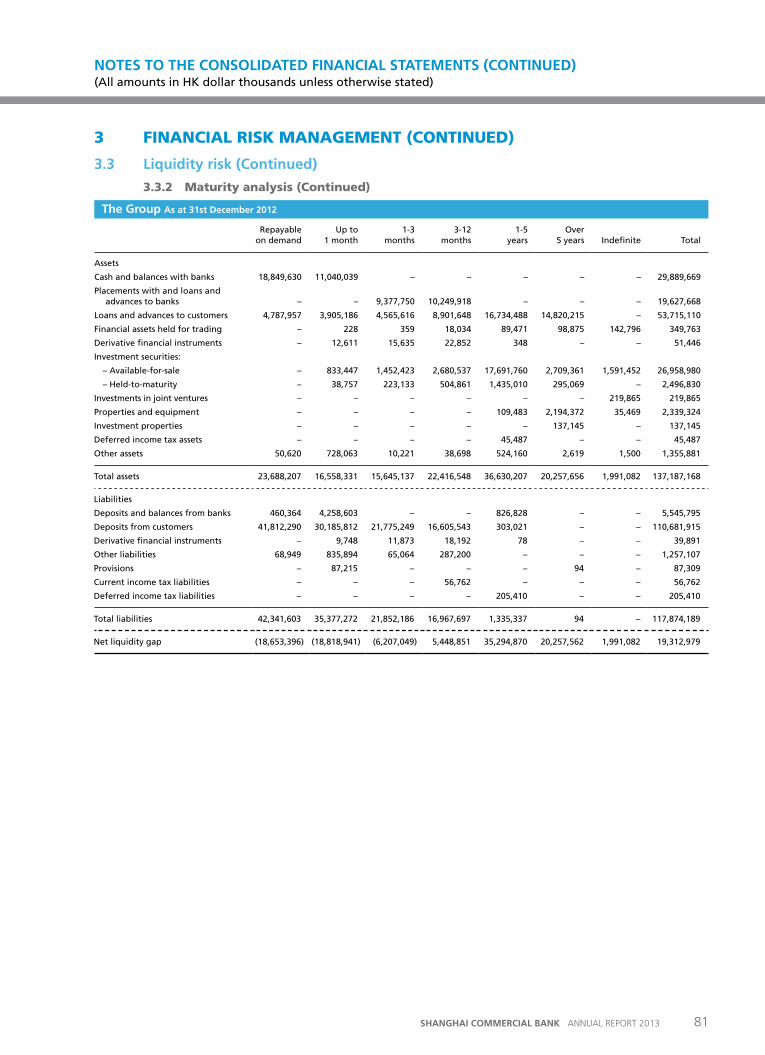
3 FINANCIAL RISK MANAGEMENT (CONTINUED)
3.3 Liquidity risk (Continued)
3.3.2 Maturity analysis (Continued)
the Group as at 31st December 2012
Repayable on demand
Up to 1 month
1-3 months
3-12 months
1-5 years
Over 5 years Indefinite Total
Assets
Cash and balances with banks 18,849,630 11,040,039 – – – – – 29,889,669
Placements with and loans and advances to banks – – 9,377,750 10,249,918 – – – 19,627,668
Loans and advances to customers 4,787,957 3,905,186 4,565,616 8,901,648 16,734,488 14,820,215 – 53,715,110
Financial assets held for trading – 228 359 18,034 89,471 98,875 142,796 349,763
Derivative financial instruments – 12,611 15,635 22,852 348 – – 51,446
Investment securities:
– Available-for-sale – 833,447 1,452,423 2,680,537 17,691,760 2,709,361 1,591,452 26,958,980
– Held-to-maturity – 38,757 223,133 504,861 1,435,010 295,069 – 2,496,830
Investments in joint ventures – – – – – – 219,865 219,865
Properties and equipment – – – – 109,483 2,194,372 35,469 2,339,324
Investment properties – – – – – 137,145 – 137,145
Deferred income tax assets – – – – 45,487 – – 45,487
Other assets 50,620 728,063 10,221 38,698 524,160 2,619 1,500 1,355,881
Total assets 23,688,207 16,558,331 15,645,137 22,416,548 36,630,207 20,257,656 1,991,082 137,187,168
Liabilities
Deposits and balances from banks 460,364 4,258,603 – – 826,828 – – 5,545,795
Deposits from customers 41,812,290 30,185,812 21,775,249 16,605,543 303,021 – – 110,681,915
Derivative financial instruments – 9,748 11,873 18,192 78 – – 39,891
Other liabilities 68,949 835,894 65,064 287,200 – – – 1,257,107
Provisions – 87,215 – – – 94 – 87,309
Current income tax liabilities – – – 56,762 – – – 56,762
Deferred income tax liabilities – – – – 205,410 – – 205,410
Total liabilities 42,341,603 35,377,272 21,852,186 16,967,697 1,335,337 94 – 117,874,189
Net liquidity gap (18,653,396) (18,818,941) (6,207,049) 5,448,851 35,294,870 20,257,562 1,991,082 19,312,979
NOTES TO THE CONSOLIDATED FINANCIAL STATEMENTS (CONTINuED) (All amounts in HK dollar thousands unless otherwise stated)
81SHANGHAI COMMERCIAL BANK ANNUAL REPORT 2013
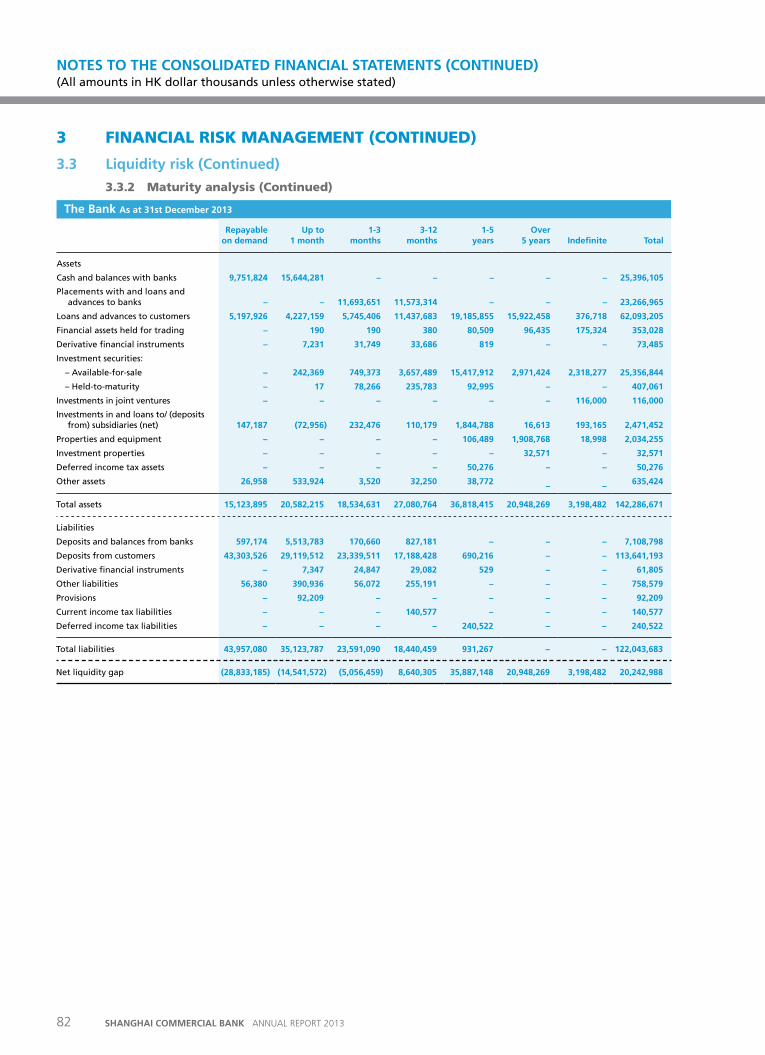
3 FINANCIAL RISK MANAGEMENT (CONTINUED)
3.3 Liquidity risk (Continued)
3.3.2 Maturity analysis (Continued)
the Bank as at 31st December 2013
repayable on demand
up to 1 month
1-3 months
3-12 months
1-5 years
over 5 years Indefinite total
Assets
Cash and balances with banks 9,751,824 15,644,281 – – – – – 25,396,105
Placements with and loans and advances to banks – – 11,693,651 11,573,314 – – – 23,266,965
Loans and advances to customers 5,197,926 4,227,159 5,745,406 11,437,683 19,185,855 15,922,458 376,718 62,093,205
Financial assets held for trading – 190 190 380 80,509 96,435 175,324 353,028
Derivative financial instruments – 7,231 31,749 33,686 819 – – 73,485
Investment securities:
– Available-for-sale – 242,369 749,373 3,657,489 15,417,912 2,971,424 2,318,277 25,356,844
– Held-to-maturity – 17 78,266 235,783 92,995 – – 407,061
Investments in joint ventures – – – – – – 116,000 116,000
Investments in and loans to/ (deposits from) subsidiaries (net) 147,187 (72,956) 232,476 110,179 1,844,788 16,613 193,165 2,471,452
Properties and equipment – – – – 106,489 1,908,768 18,998 2,034,255
Investment properties – – – – – 32,571 – 32,571
Deferred income tax assets – – – – 50,276 – – 50,276
Other assets 26,958 533,924 3,520 32,250 38,772 – – 635,424
Total assets 15,123,895 20,582,215 18,534,631 27,080,764 36,818,415 20,948,269 3,198,482 142,286,671
Liabilities
Deposits and balances from banks 597,174 5,513,783 170,660 827,181 – – – 7,108,798
Deposits from customers 43,303,526 29,119,512 23,339,511 17,188,428 690,216 – – 113,641,193
Derivative financial instruments – 7,347 24,847 29,082 529 – – 61,805
Other liabilities 56,380 390,936 56,072 255,191 – – – 758,579
Provisions – 92,209 – – – – – 92,209
Current income tax liabilities – – – 140,577 – – – 140,577
Deferred income tax liabilities – – – – 240,522 – – 240,522
Total liabilities 43,957,080 35,123,787 23,591,090 18,440,459 931,267 – – 122,043,683
Net liquidity gap (28,833,185) (14,541,572) (5,056,459) 8,640,305 35,887,148 20,948,269 3,198,482 20,242,988
NOTES TO THE CONSOLIDATED FINANCIAL STATEMENTS (CONTINuED) (All amounts in HK dollar thousands unless otherwise stated)
82 SHANGHAI COMMERCIAL BANK ANNUAL REPORT 2013
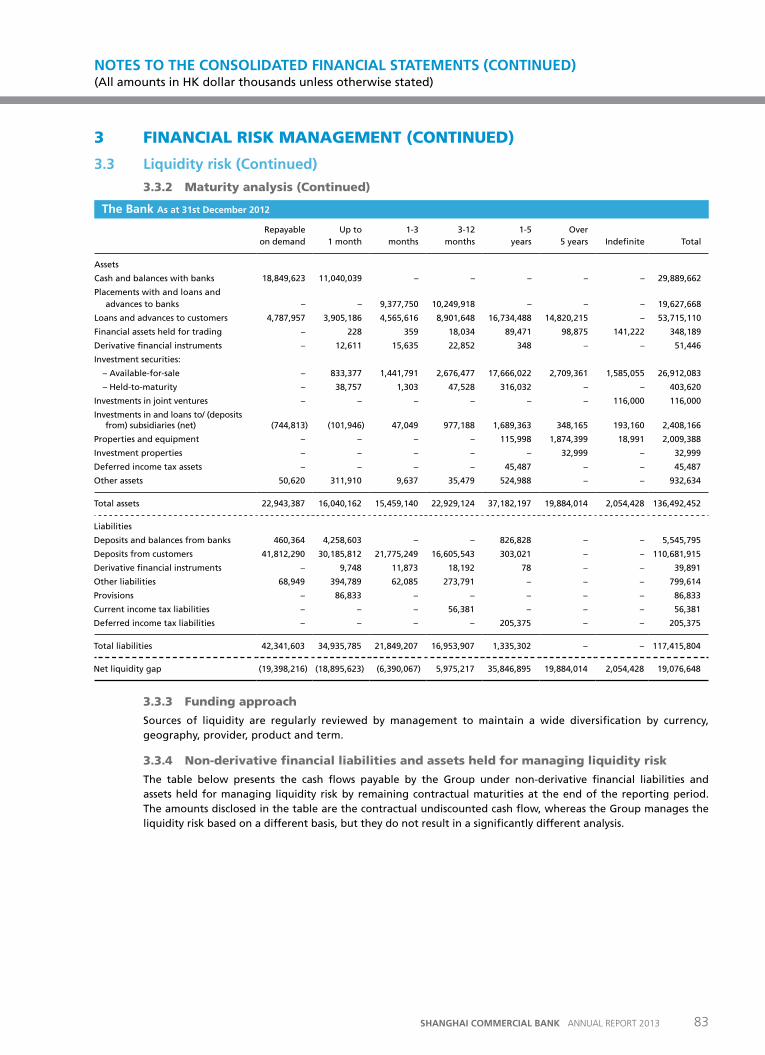
3 FINANCIAL RISK MANAGEMENT (CONTINUED)
3.3 Liquidity risk (Continued)
3.3.2 Maturity analysis (Continued)
the Bank as at 31st December 2012
Repayable on demand
Up to 1 month
1-3 months
3-12 months
1-5 years
Over 5 years Indefinite Total
Assets
Cash and balances with banks 18,849,623 11,040,039 – – – – – 29,889,662
Placements with and loans and advances to banks – – 9,377,750 10,249,918 – – – 19,627,668
Loans and advances to customers 4,787,957 3,905,186 4,565,616 8,901,648 16,734,488 14,820,215 – 53,715,110
Financial assets held for trading – 228 359 18,034 89,471 98,875 141,222 348,189
Derivative financial instruments – 12,611 15,635 22,852 348 – – 51,446
Investment securities:
– Available-for-sale – 833,377 1,441,791 2,676,477 17,666,022 2,709,361 1,585,055 26,912,083
– Held-to-maturity – 38,757 1,303 47,528 316,032 – – 403,620
Investments in joint ventures – – – – – – 116,000 116,000
Investments in and loans to/ (deposits from) subsidiaries (net) (744,813) (101,946) 47,049 977,188 1,689,363 348,165 193,160 2,408,166
Properties and equipment – – – – 115,998 1,874,399 18,991 2,009,388
Investment properties – – – – – 32,999 – 32,999
Deferred income tax assets – – – – 45,487 – – 45,487
Other assets 50,620 311,910 9,637 35,479 524,988 – – 932,634
Total assets 22,943,387 16,040,162 15,459,140 22,929,124 37,182,197 19,884,014 2,054,428 136,492,452
Liabilities
Deposits and balances from banks 460,364 4,258,603 – – 826,828 – – 5,545,795
Deposits from customers 41,812,290 30,185,812 21,775,249 16,605,543 303,021 – – 110,681,915
Derivative financial instruments – 9,748 11,873 18,192 78 – – 39,891
Other liabilities 68,949 394,789 62,085 273,791 – – – 799,614
Provisions – 86,833 – – – – – 86,833
Current income tax liabilities – – – 56,381 – – – 56,381
Deferred income tax liabilities – – – – 205,375 – – 205,375
Total liabilities 42,341,603 34,935,785 21,849,207 16,953,907 1,335,302 – – 117,415,804
Net liquidity gap (19,398,216) (18,895,623) (6,390,067) 5,975,217 35,846,895 19,884,014 2,054,428 19,076,648
3.3.3 Funding approach
Sources of liquidity are regularly reviewed by management to maintain a wide diversification by currency, geography, provider, product and term.
3.3.4 Non-derivative financial liabilities and assets held for managing liquidity risk
The table below presents the cash flows payable by the Group under non-derivative financial liabilities and assets held for managing liquidity risk by remaining contractual maturities at the end of the reporting period. The amounts disclosed in the table are the contractual undiscounted cash flow, whereas the Group manages the liquidity risk based on a different basis, but they do not result in a significantly different analysis.
NOTES TO THE CONSOLIDATED FINANCIAL STATEMENTS (CONTINuED) (All amounts in HK dollar thousands unless otherwise stated)
83SHANGHAI COMMERCIAL BANK ANNUAL REPORT 2013
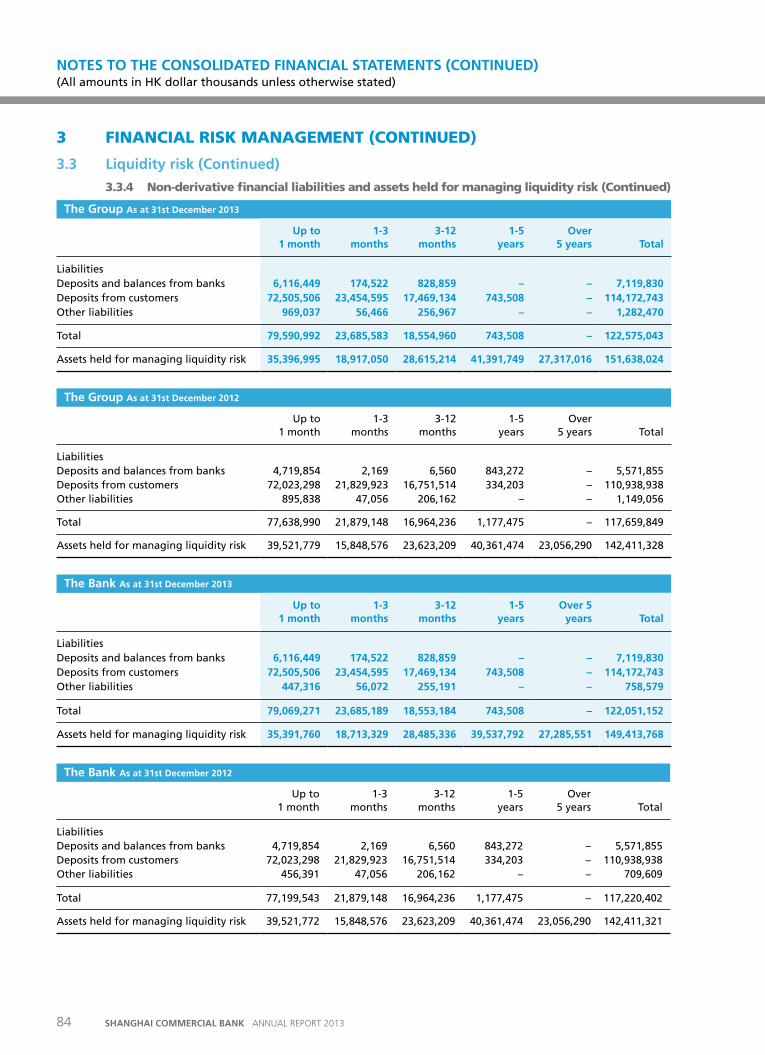
3 FINANCIAL RISK MANAGEMENT (CONTINUED)
3.3 Liquidity risk (Continued)
3.3.4 Non-derivative financial liabilities and assets held for managing liquidity risk (Continued)
the Group as at 31st December 2013
up to 1 month
1-3 months
3-12 months
1-5 years
over 5 years total
LiabilitiesDeposits and balances from banks 6,116,449 174,522 828,859 – – 7,119,830 Deposits from customers 72,505,506 23,454,595 17,469,134 743,508 – 114,172,743 Other liabilities 969,037 56,466 256,967 – – 1,282,470
Total 79,590,992 23,685,583 18,554,960 743,508 – 122,575,043
Assets held for managing liquidity risk 35,396,995 18,917,050 28,615,214 41,391,749 27,317,016 151,638,024
the Group as at 31st December 2012
Up to 1 month
1-3 months
3-12 months
1-5 years
Over 5 years Total
LiabilitiesDeposits and balances from banks 4,719,854 2,169 6,560 843,272 – 5,571,855 Deposits from customers 72,023,298 21,829,923 16,751,514 334,203 – 110,938,938 Other liabilities 895,838 47,056 206,162 – – 1,149,056
Total 77,638,990 21,879,148 16,964,236 1,177,475 – 117,659,849
Assets held for managing liquidity risk 39,521,779 15,848,576 23,623,209 40,361,474 23,056,290 142,411,328
the Bank as at 31st December 2013
up to 1 month
1-3 months
3-12 months
1-5 years
over 5 years total
LiabilitiesDeposits and balances from banks 6,116,449 174,522 828,859 – – 7,119,830 Deposits from customers 72,505,506 23,454,595 17,469,134 743,508 – 114,172,743 Other liabilities 447,316 56,072 255,191 – – 758,579
Total 79,069,271 23,685,189 18,553,184 743,508 – 122,051,152
Assets held for managing liquidity risk 35,391,760 18,713,329 28,485,336 39,537,792 27,285,551 149,413,768
the Bank as at 31st December 2012
Up to 1 month
1-3 months
3-12 months
1-5 years
Over 5 years Total
LiabilitiesDeposits and balances from banks 4,719,854 2,169 6,560 843,272 – 5,571,855 Deposits from customers 72,023,298 21,829,923 16,751,514 334,203 – 110,938,938 Other liabilities 456,391 47,056 206,162 – – 709,609
Total 77,199,543 21,879,148 16,964,236 1,177,475 – 117,220,402
Assets held for managing liquidity risk 39,521,772 15,848,576 23,623,209 40,361,474 23,056,290 142,411,321
NOTES TO THE CONSOLIDATED FINANCIAL STATEMENTS (CONTINuED) (All amounts in HK dollar thousands unless otherwise stated)
84 SHANGHAI COMMERCIAL BANK ANNUAL REPORT 2013
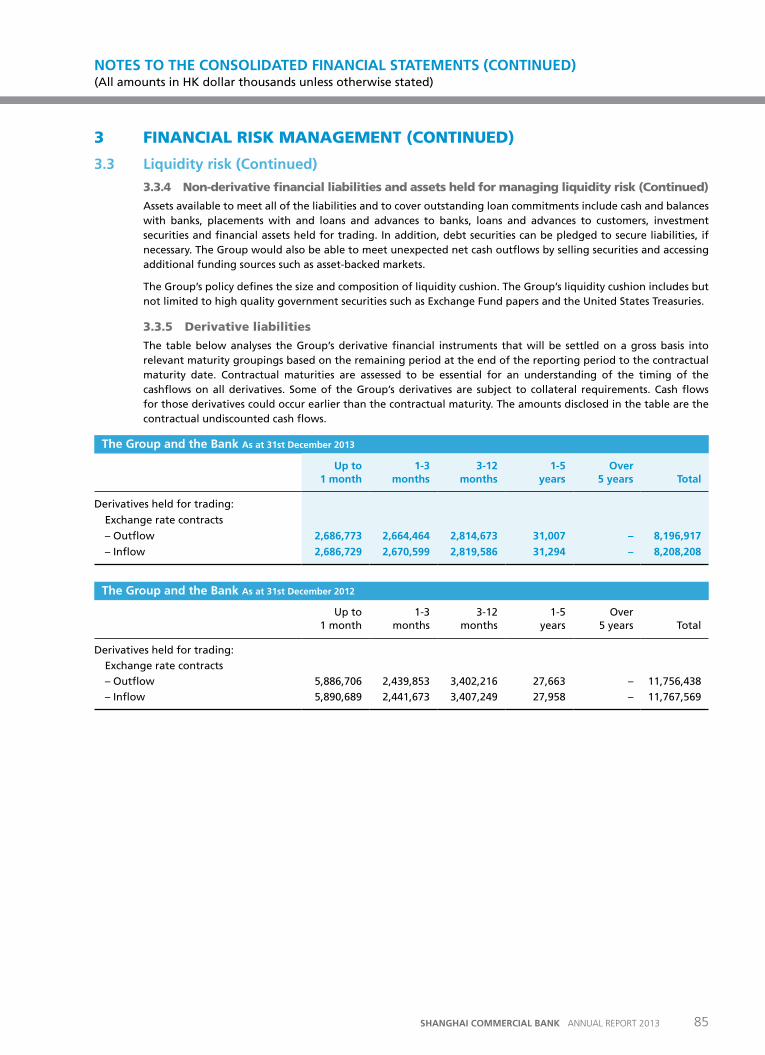
3 FINANCIAL RISK MANAGEMENT (CONTINUED)
3.3 Liquidity risk (Continued)
3.3.4 Non-derivative financial liabilities and assets held for managing liquidity risk (Continued)
Assets available to meet all of the liabilities and to cover outstanding loan commitments include cash and balances with banks, placements with and loans and advances to banks, loans and advances to customers, investment securities and financial assets held for trading. In addition, debt securities can be pledged to secure liabilities, if necessary. The Group would also be able to meet unexpected net cash outflows by selling securities and accessing additional funding sources such as asset-backed markets.
The Group’s policy defines the size and composition of liquidity cushion. The Group’s liquidity cushion includes but not limited to high quality government securities such as Exchange Fund papers and the United States Treasuries.
3.3.5 Derivative liabilities
The table below analyses the Group’s derivative financial instruments that will be settled on a gross basis into relevant maturity groupings based on the remaining period at the end of the reporting period to the contractual maturity date. Contractual maturities are assessed to be essential for an understanding of the timing of the cashflows on all derivatives. Some of the Group’s derivatives are subject to collateral requirements. Cash flows for those derivatives could occur earlier than the contractual maturity. The amounts disclosed in the table are the contractual undiscounted cash flows.
the Group and the Bank as at 31st December 2013
up to 1 month
1-3 months
3-12 months
1-5 years
over 5 years total
Derivatives held for trading:
Exchange rate contracts
– Outflow 2,686,773 2,664,464 2,814,673 31,007 – 8,196,917
– Inflow 2,686,729 2,670,599 2,819,586 31,294 – 8,208,208
the Group and the Bank as at 31st December 2012
Up to 1 month
1-3 months
3-12 months
1-5 years
Over 5 years Total
Derivatives held for trading:
Exchange rate contracts
– Outflow 5,886,706 2,439,853 3,402,216 27,663 – 11,756,438
– Inflow 5,890,689 2,441,673 3,407,249 27,958 – 11,767,569
NOTES TO THE CONSOLIDATED FINANCIAL STATEMENTS (CONTINuED) (All amounts in HK dollar thousands unless otherwise stated)
85SHANGHAI COMMERCIAL BANK ANNUAL REPORT 2013
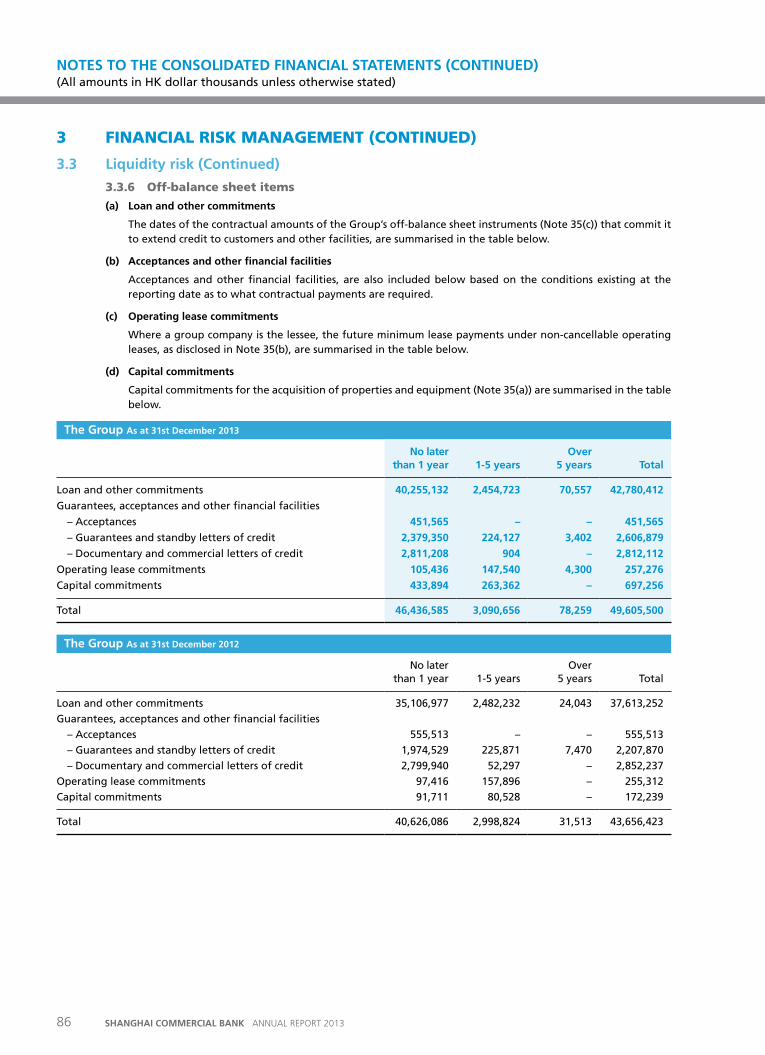
3 FINANCIAL RISK MANAGEMENT (CONTINUED)
3.3 Liquidity risk (Continued)
3.3.6 Off-balance sheet items
(a) Loan and other commitments
The dates of the contractual amounts of the Group’s off-balance sheet instruments (Note 35(c)) that commit it to extend credit to customers and other facilities, are summarised in the table below.
(b) acceptances and other financial facilities
Acceptances and other financial facilities, are also included below based on the conditions existing at the reporting date as to what contractual payments are required.
(c) operating lease commitments
Where a group company is the lessee, the future minimum lease payments under non-cancellable operating leases, as disclosed in Note 35(b), are summarised in the table below.
(d) Capital commitments
Capital commitments for the acquisition of properties and equipment (Note 35(a)) are summarised in the table below.
the Group as at 31st December 2013
No later than 1 year 1-5 years
over 5 years total
Loan and other commitments 40,255,132 2,454,723 70,557 42,780,412
Guarantees, acceptances and other financial facilities
– Acceptances 451,565 – – 451,565
– Guarantees and standby letters of credit 2,379,350 224,127 3,402 2,606,879
– Documentary and commercial letters of credit 2,811,208 904 – 2,812,112
Operating lease commitments 105,436 147,540 4,300 257,276
Capital commitments 433,894 263,362 – 697,256
Total 46,436,585 3,090,656 78,259 49,605,500
the Group as at 31st December 2012
No later than 1 year 1-5 years
Over 5 years Total
Loan and other commitments 35,106,977 2,482,232 24,043 37,613,252
Guarantees, acceptances and other financial facilities
– Acceptances 555,513 – – 555,513
– Guarantees and standby letters of credit 1,974,529 225,871 7,470 2,207,870
– Documentary and commercial letters of credit 2,799,940 52,297 – 2,852,237
Operating lease commitments 97,416 157,896 – 255,312
Capital commitments 91,711 80,528 – 172,239
Total 40,626,086 2,998,824 31,513 43,656,423
NOTES TO THE CONSOLIDATED FINANCIAL STATEMENTS (CONTINuED) (All amounts in HK dollar thousands unless otherwise stated)
86 SHANGHAI COMMERCIAL BANK ANNUAL REPORT 2013
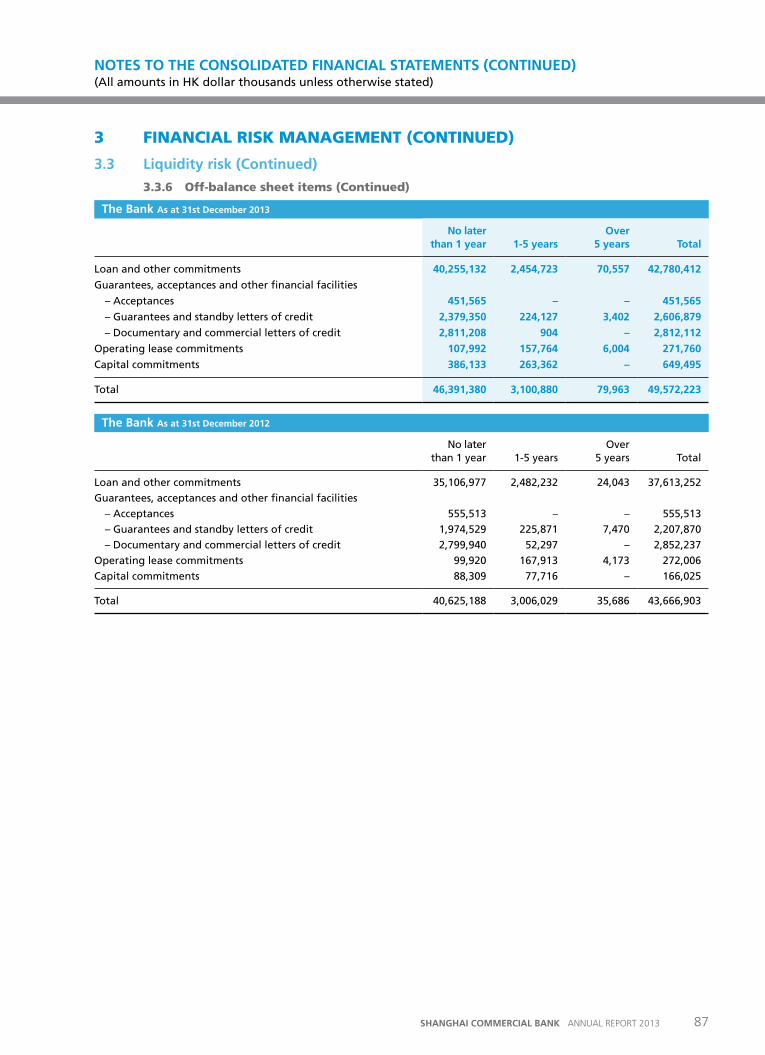
3 FINANCIAL RISK MANAGEMENT (CONTINUED)
3.3 Liquidity risk (Continued)
3.3.6 Off-balance sheet items (Continued)
the Bank as at 31st December 2013
No later than 1 year 1-5 years
over 5 years total
Loan and other commitments 40,255,132 2,454,723 70,557 42,780,412
Guarantees, acceptances and other financial facilities
– Acceptances 451,565 – – 451,565
– Guarantees and standby letters of credit 2,379,350 224,127 3,402 2,606,879
– Documentary and commercial letters of credit 2,811,208 904 – 2,812,112
Operating lease commitments 107,992 157,764 6,004 271,760
Capital commitments 386,133 263,362 – 649,495
Total 46,391,380 3,100,880 79,963 49,572,223
the Bank as at 31st December 2012
No later than 1 year 1-5 years
Over 5 years Total
Loan and other commitments 35,106,977 2,482,232 24,043 37,613,252
Guarantees, acceptances and other financial facilities
– Acceptances 555,513 – – 555,513
– Guarantees and standby letters of credit 1,974,529 225,871 7,470 2,207,870
– Documentary and commercial letters of credit 2,799,940 52,297 – 2,852,237
Operating lease commitments 99,920 167,913 4,173 272,006
Capital commitments 88,309 77,716 – 166,025
Total 40,625,188 3,006,029 35,686 43,666,903
NOTES TO THE CONSOLIDATED FINANCIAL STATEMENTS (CONTINuED) (All amounts in HK dollar thousands unless otherwise stated)
87SHANGHAI COMMERCIAL BANK ANNUAL REPORT 2013
3 FINANCIAL RISK MANAGEMENT (CONTINUED)
3.4 Fair value of financial assets and liabilities(a) Financial instruments not measured at fair value
(i) Balances with banks and placements with and loans and advances to banks
Balances with banks and placements with and loans and advances to banks include inter-bank placements. The maturities of these financial assets are within one year. The carrying amount at statement of financial position approximates their fair value.
(ii) Loans and advances to customers
Loans and advances are stated net of impairment allowances. An insignificant portion of loans and advances to customers bears interest at fixed rate. The carrying amount at statement of financial position approximates their fair value.
(iii) Investment securities
The fair value for held-to-maturity securities is based on market prices or broker/dealer price quotations. Where this information is not available, fair value is estimated using quoted market prices for securities with similar credit, maturity and yield characteristics. For the carrying value and fair value of held-to-maturity securities, please refer to Note 23. The fair value of held-to-maturity securities is classified under Level 1 (2013: HK$2,384,922,000, 2012: HK$2,557,121,000) and Level 2 (2013: HK$115,114,000, 2012: Nil) in the fair value hierarchy. Please refer to Note 3.4(b) for the definition of fair value hierarchy.
(iv) Deposits and balances from banks and deposits from customers
Substantially all the deposits and balances from banks and deposits from customers mature within one year from the statement of financial position date. Hence, the carrying amount at statement of financial position approximates their fair value.
(v) Loans to and balances with subsidiaries
Loans to subsidiaries are secured, interest free and have no fixed term of repayment. Balances with subsidiaries are unsecured, interest free and have no fixed term of repayment. The carrying amount at statement of financial position approximates their fair value.
NOTES TO THE CONSOLIDATED FINANCIAL STATEMENTS (CONTINuED) (All amounts in HK dollar thousands unless otherwise stated)
88 SHANGHAI COMMERCIAL BANK ANNUAL REPORT 2013
3 FINANCIAL RISK MANAGEMENT (CONTINUED)
3.4 Fair value of financial assets and liabilities (Continued)(b) Fair value hierarchy
valuation governance
The Group has in place fair valuation policy to ensure adequate governance and control processes for the designation and valuation of financial instruments to be measured at fair value for financial reporting, risk management and regulatory capital purposes. The valuation process is conducted by control units independent of risk taking units.
The Group is to recognise transfers into and transfers out of fair value hierarchy levels as of that date of the event or change in circumstances that caused the transfer.
HKFRS 13 specifies a hierarchy of valuation techniques based on whether the inputs to those valuation techniques are observable or unobservable. Observable inputs reflect market data obtained from independent sources; unobservable inputs reflect the Group’s market assumptions. These two types of inputs have created the following fair value hierarchy:
Level 1 – Quoted prices (unadjusted) in active markets for identical assets or liabilities. This level includes listed equity securities and debt securities on exchanges (for example, The Hong Kong Stock Exchange, The London Stock Exchange, The Frankfurt Stock Exchange and The New York Stock Exchange) and paper gold.
Level 2 – Inputs other than quoted prices included within Level 1 that are observable for the assets or liabilities, either directly (that is, as prices) or indirectly (that is, derived from prices). This level includes the OTC derivative contracts, unlisted equities securities and unlisted debt securities. The sources of input parameters such as HIBOR and LIBOR yield curves or counterparty credit risk are obtained from Bloomberg and Reuters.
Level 3 – Inputs for the assets or liabilities that are not based on observable market data (unobservable inputs). This level includes equity investments and debt instruments with significant unobservable components.
This hierarchy requires the use of observable market data when available. The Group considers relevant and observable market prices in its valuations where possible.
NOTES TO THE CONSOLIDATED FINANCIAL STATEMENTS (CONTINuED) (All amounts in HK dollar thousands unless otherwise stated)
89SHANGHAI COMMERCIAL BANK ANNUAL REPORT 2013
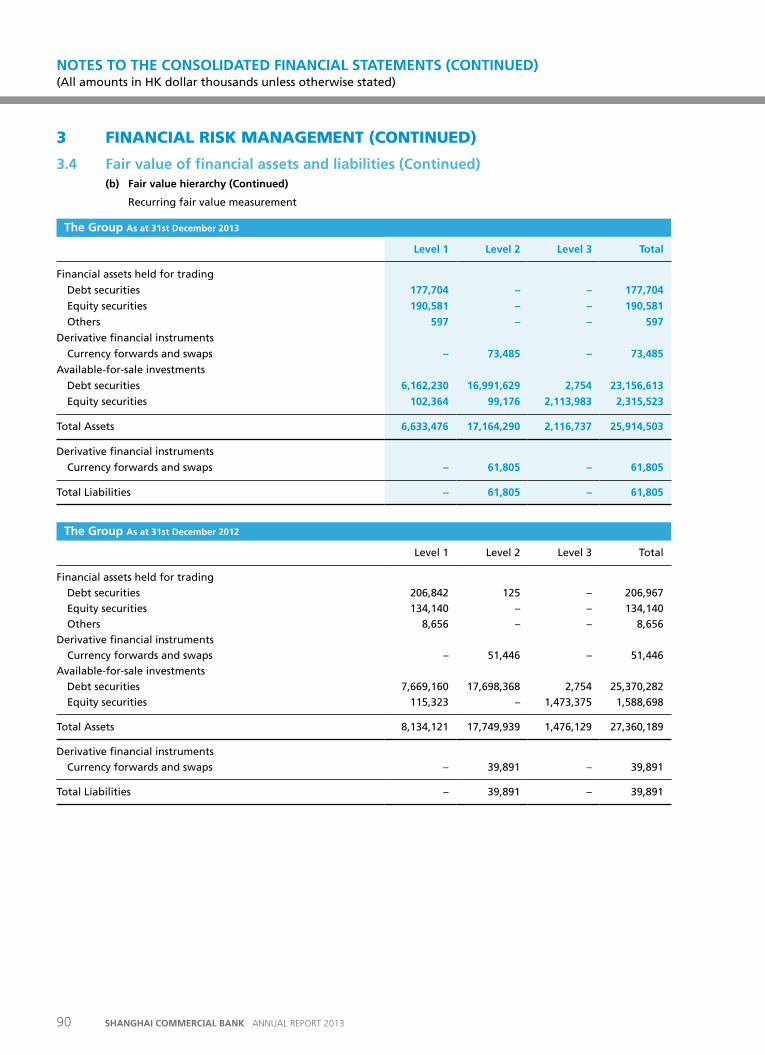
3 FINANCIAL RISK MANAGEMENT (CONTINUED)
3.4 Fair value of financial assets and liabilities (Continued)(b) Fair value hierarchy (Continued)
Recurring fair value measurement
the Group as at 31st December 2013
Level 1 Level 2 Level 3 total
Financial assets held for trading
Debt securities 177,704 – – 177,704
Equity securities 190,581 – – 190,581
Others 597 – – 597
Derivative financial instruments
Currency forwards and swaps – 73,485 – 73,485
Available-for-sale investments
Debt securities 6,162,230 16,991,629 2,754 23,156,613
Equity securities 102,364 99,176 2,113,983 2,315,523
Total Assets 6,633,476 17,164,290 2,116,737 25,914,503
Derivative financial instruments
Currency forwards and swaps – 61,805 – 61,805
Total Liabilities – 61,805 – 61,805
the Group as at 31st December 2012
Level 1 Level 2 Level 3 Total
Financial assets held for trading
Debt securities 206,842 125 – 206,967
Equity securities 134,140 – – 134,140
Others 8,656 – – 8,656
Derivative financial instruments
Currency forwards and swaps – 51,446 – 51,446
Available-for-sale investments
Debt securities 7,669,160 17,698,368 2,754 25,370,282
Equity securities 115,323 – 1,473,375 1,588,698
Total Assets 8,134,121 17,749,939 1,476,129 27,360,189
Derivative financial instruments
Currency forwards and swaps – 39,891 – 39,891
Total Liabilities – 39,891 – 39,891
NOTES TO THE CONSOLIDATED FINANCIAL STATEMENTS (CONTINuED) (All amounts in HK dollar thousands unless otherwise stated)
90 SHANGHAI COMMERCIAL BANK ANNUAL REPORT 2013
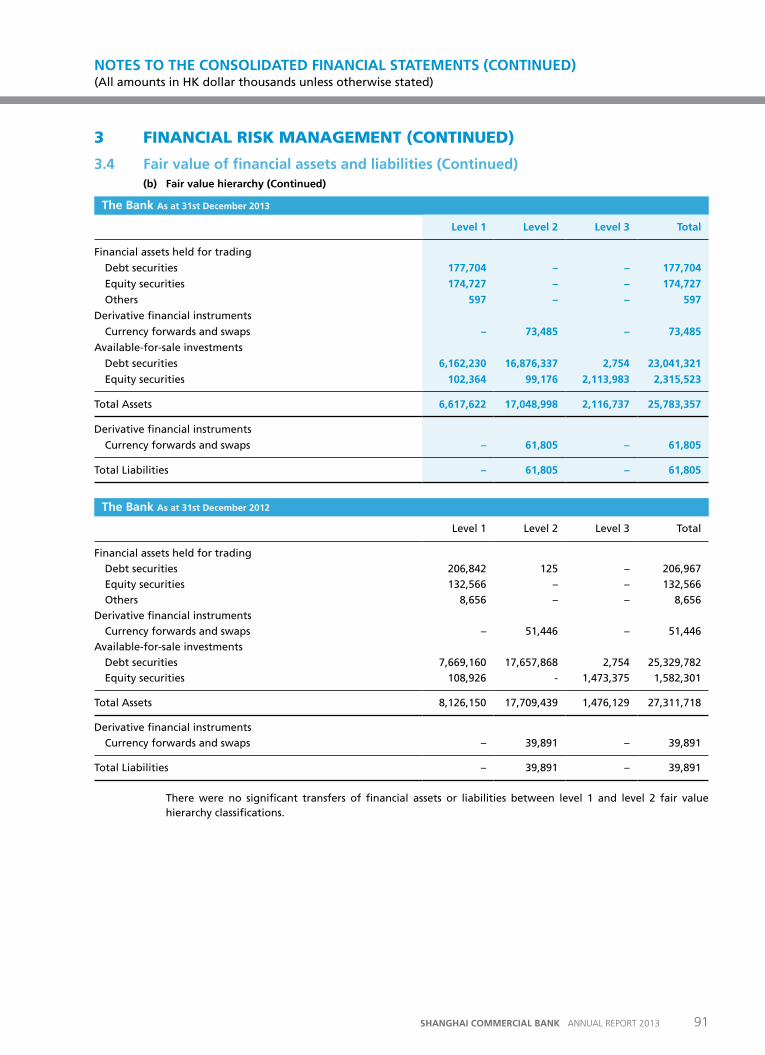
3 FINANCIAL RISK MANAGEMENT (CONTINUED)
3.4 Fair value of financial assets and liabilities (Continued)(b) Fair value hierarchy (Continued)
the Bank as at 31st December 2013
Level 1 Level 2 Level 3 total
Financial assets held for trading
Debt securities 177,704 – – 177,704
Equity securities 174,727 – – 174,727
Others 597 – – 597
Derivative financial instruments
Currency forwards and swaps – 73,485 – 73,485
Available-for-sale investments
Debt securities 6,162,230 16,876,337 2,754 23,041,321
Equity securities 102,364 99,176 2,113,983 2,315,523
Total Assets 6,617,622 17,048,998 2,116,737 25,783,357
Derivative financial instruments
Currency forwards and swaps – 61,805 – 61,805
Total Liabilities – 61,805 – 61,805
the Bank as at 31st December 2012
Level 1 Level 2 Level 3 Total
Financial assets held for trading
Debt securities 206,842 125 – 206,967
Equity securities 132,566 – – 132,566
Others 8,656 – – 8,656
Derivative financial instruments
Currency forwards and swaps – 51,446 – 51,446
Available-for-sale investments
Debt securities 7,669,160 17,657,868 2,754 25,329,782
Equity securities 108,926 - 1,473,375 1,582,301
Total Assets 8,126,150 17,709,439 1,476,129 27,311,718
Derivative financial instruments
Currency forwards and swaps – 39,891 – 39,891
Total Liabilities – 39,891 – 39,891
There were no significant transfers of financial assets or liabilities between level 1 and level 2 fair value hierarchy classifications.
NOTES TO THE CONSOLIDATED FINANCIAL STATEMENTS (CONTINuED) (All amounts in HK dollar thousands unless otherwise stated)
91SHANGHAI COMMERCIAL BANK ANNUAL REPORT 2013
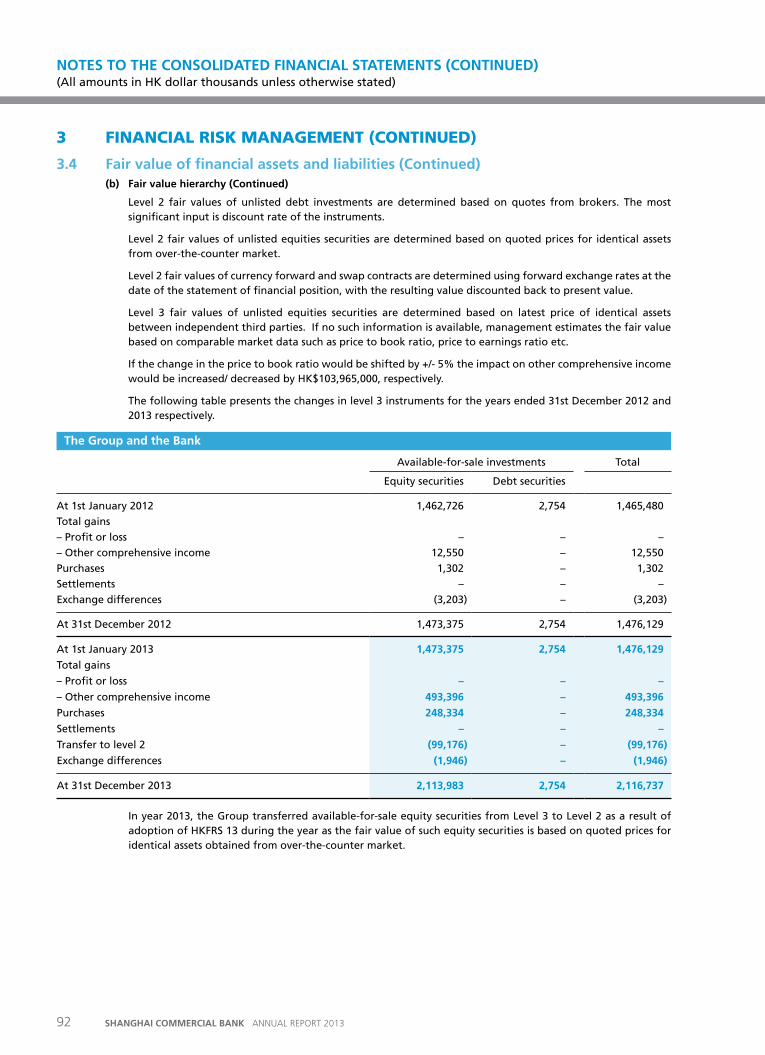
3 FINANCIAL RISK MANAGEMENT (CONTINUED)
3.4 Fair value of financial assets and liabilities (Continued)(b) Fair value hierarchy (Continued)
Level 2 fair values of unlisted debt investments are determined based on quotes from brokers. The most significant input is discount rate of the instruments.
Level 2 fair values of unlisted equities securities are determined based on quoted prices for identical assets from over-the-counter market.
Level 2 fair values of currency forward and swap contracts are determined using forward exchange rates at the date of the statement of financial position, with the resulting value discounted back to present value.
Level 3 fair values of unlisted equities securities are determined based on latest price of identical assets between independent third parties. If no such information is available, management estimates the fair value based on comparable market data such as price to book ratio, price to earnings ratio etc.
If the change in the price to book ratio would be shifted by +/- 5% the impact on other comprehensive income would be increased/ decreased by HK$103,965,000, respectively.
The following table presents the changes in level 3 instruments for the years ended 31st December 2012 and 2013 respectively.
the Group and the Bank
Available-for-sale investments Total
Equity securities Debt securities
At 1st January 2012 1,462,726 2,754 1,465,480
Total gains
– Profit or loss – – –
– Other comprehensive income 12,550 – 12,550
Purchases 1,302 – 1,302
Settlements – – –
Exchange differences (3,203) – (3,203)
At 31st December 2012 1,473,375 2,754 1,476,129
At 1st January 2013 1,473,375 2,754 1,476,129
Total gains
– Profit or loss – – –
– Other comprehensive income 493,396 – 493,396
Purchases 248,334 – 248,334
Settlements – – –
Transfer to level 2 (99,176) – (99,176)
Exchange differences (1,946) – (1,946)
At 31st December 2013 2,113,983 2,754 2,116,737
In year 2013, the Group transferred available-for-sale equity securities from Level 3 to Level 2 as a result of adoption of HKFRS 13 during the year as the fair value of such equity securities is based on quoted prices for identical assets obtained from over-the-counter market.
NOTES TO THE CONSOLIDATED FINANCIAL STATEMENTS (CONTINuED) (All amounts in HK dollar thousands unless otherwise stated)
92 SHANGHAI COMMERCIAL BANK ANNUAL REPORT 2013
3 FINANCIAL RISK MANAGEMENT (CONTINUED)
3.5 Capital managementThe Group’s policy is to maintain a strong capital base to support the development of the Group’s business and to ensure compliance with the statutory capital adequacy ratio requirement, a requirement used to assess the capital adequacy of banks. Capital is allocated to the various activities of the Group depending on the risk taken by each business division. Where the subsidiaries or branches are directly regulated by other regulators, they are required to maintain capital according to the rules of those regulators.
The Group’s objectives when managing capital, which is a broader concept than the ‘equity’ on the face of statement of financial position, are:
– To comply with the capital requirements under the Banking (Capital) Rules of the Banking Ordinance;
– To safeguard the Group’s ability to continue as a going concern so that it can continue to provide returns for shareholders and benefits for other stakeholders;
– To support the Group’s stability and growth;
– To allocate capital in an efficient and risk based approach to optimise risk adjusted return to the shareholders; and
– To maintain a strong capital base to support the development of its business.
Capital adequacy and the use of regulatory capital are monitored daily by the Group’s management, employing techniques based on the Banking (Capital) Rules. The required information is filed with the Hong Kong Monetary Authority (‘HKMA’) on a quarterly basis.
The HKMA requires each bank or banking group to maintain a ratio of total regulatory capital to the risk-weighted asset (the capital adequacy ratio) at or above the minimum of 8%. In addition, those individual banking subsidiaries or similar financial institutions not incorporated in Hong Kong are also directly regulated and supervised by their local banking supervisors, which may differ from country to country. Subsidiaries of the Group are also subject to statutory capital requirements from other regulatory authorities, such as the Securities and Futures Commission.
The regulatory capital requirements are strictly observed when managing economic capital. The Group’s regulatory capital is managed by its central Group Treasury and comprises two tiers:
– Tier 1 capital: share capital, general reserve, available-for-sale investment revaluation reserve and retained earnings; and
– Tier 2 capital: collective impairment allowances and regulatory reserve.
2013 2012
Capital adequacy ratio 19.6% 18.0%
Tier 1 capital ratio / core capital ratio 19.0% 17.8%
NOTES TO THE CONSOLIDATED FINANCIAL STATEMENTS (CONTINuED) (All amounts in HK dollar thousands unless otherwise stated)
93SHANGHAI COMMERCIAL BANK ANNUAL REPORT 2013
3 FINANCIAL RISK MANAGEMENT (CONTINUED)
3.6 operational risk managementOperational risk is the risk of loss resulting from inadequate or failed internal processes, people and systems or from external events. It is inherent in all material products, activities, processes and systems. The Operational Risk Management Committee oversees the Group’s operational risk to ensure the operations are in accordance with the controls and procedures laid down in the operational risk management policy approved by the Executive Committee. The Risk Management Department is responsible for the central operational risk management function. Policies and procedures have been established to control exposures and to identify operational risk factors. Insurance policies are taken to mitigate unforeseeable operational risk. A Business Continuity Plan is established to ensure the Group’s ability to operate on an ongoing basis and limit losses in the event of severe business disruption, particularly where the Group’s physical, telecommunication, or information technology infrastructures have been damaged or made inaccessible.
4 CRITICAL ACCOUNTING ESTIMATES AND JUDGMENTS IN APPLYING ACCOUNTING POLICIES
4.1 Critical accounting estimates and assumptionsThe Group’s financial statements and its financial results are influenced by accounting policies, assumptions, estimates, and management judgment which necessarily have to be made in the course of preparation of the consolidated financial statements.
The Group makes estimates and assumptions that affect the reported amounts of assets and liabilities within the next financial year. Estimates and judgments are continually evaluated and are based on historical experience and other factors, including expectations of future events.
Accounting policies and management’s judgments for certain items are especially critical for the Group’s results and financial situation due to their materiality in amount.
(i) Impairment allowances on loans and advances
The Group reviews its loan portfolios to assess impairment at least on a quarterly basis. In determining whether an impairment loss should be recorded in the income statement, the Group makes judgments as to whether there is any observable data indicating that there is a measurable decrease in the estimated future cash flows from a portfolio of loans before the decrease can be identified with an individual loan in that portfolio. This evidence may include observable data indicating that there has been an adverse change in the payment status of borrowers in a group, or national or local economic conditions that correlate with defaults on assets in the group. Management uses estimates based on historical loss experience for assets with credit risk characteristics and objective evidence of impairment similar to those in the portfolio when scheduling its future cash flows. The methodology and assumptions used for estimating both the amount and timing of future cash flows are reviewed regularly to reduce any differences between loss estimates and actual loss experience.
(ii) Impairment of available-for-sale investments
The Group follows the guidance of HKAS 39 to determine when available-for-sale investments are impaired. This determination requires judgment. In making this judgment, the Group evaluates among other factors, the duration and extent to which the fair value of an investment is less than its cost; and the financial health of and near-term business outlook for the investee, including factors such as industry and sector performance, changes in technology and operational and financing cash flows.
NOTES TO THE CONSOLIDATED FINANCIAL STATEMENTS (CONTINuED) (All amounts in HK dollar thousands unless otherwise stated)
94 SHANGHAI COMMERCIAL BANK ANNUAL REPORT 2013
4 CRITICAL ACCOUNTING ESTIMATES AND JUDGMENTS IN APPLYING ACCOUNTING POLICIE (CONTINUED)
4.1 Critical accounting estimates and assumptions (Continued) (iii) Held-to-maturity investments
The Group follows the guidance of HKAS 39 on classifying non-derivative financial assets with fixed or determinable payments and fixed maturity as held-to-maturity. This classification requires significant judgment. In making this judgment, the Group evaluates its intention and ability to hold such investments to maturity. If the Group fails to keep these investments to maturity other than for the specific circumstances – for example, selling an insignificant amount close to maturity – it will be required to reclassify the entire class as available-for-sale investments. The investments would therefore be measured at fair value not amortised cost.
(iv) Income taxes
The Group is subject to income taxes in numerous jurisdictions. Significant judgment is required in determining the worldwide provision for income taxes. There are many transactions and calculations for which the ultimate tax determination is uncertain. The Group recognises liabilities for anticipated tax audit issues based on estimates of whether additional taxes will be due. Where the final tax outcome of these matters is different from the amounts that were initially recorded, such differences will impact the current and deferred income tax and deferred tax assets and liabilities in the period in which such determination is made.
4.2 Critical judgments in applying the Group’s accounting policiesDistinction between investment property and owner-occupied property
The Group determines whether a property qualifies as investment property. In making its judgment, the Group considers whether the property generates cash flows largely independent of the other assets held by an entity. Owner-occupied properties generate cash flows that are attributable not only to property but also to other assets used in the production or supply process.
Some properties comprise a portion that is held to earn rentals or for capital appreciation and another portion that is held for use in the production or supply of goods or services or for administrative purposes. If these portions can be sold separately (or leased out separately under a finance lease), the Group accounts for the portions separately. If the portions cannot be sold separately, the property is accounted for as investment property only if an insignificant portion is held for use in the production or supply of goods or services or for administrative purposes. Judgment is applied in determining whether ancillary services are so significant that a property does not qualify as investment property. The Group considers each property separately in making its judgment.
NOTES TO THE CONSOLIDATED FINANCIAL STATEMENTS (CONTINuED) (All amounts in HK dollar thousands unless otherwise stated)
95SHANGHAI COMMERCIAL BANK ANNUAL REPORT 2013
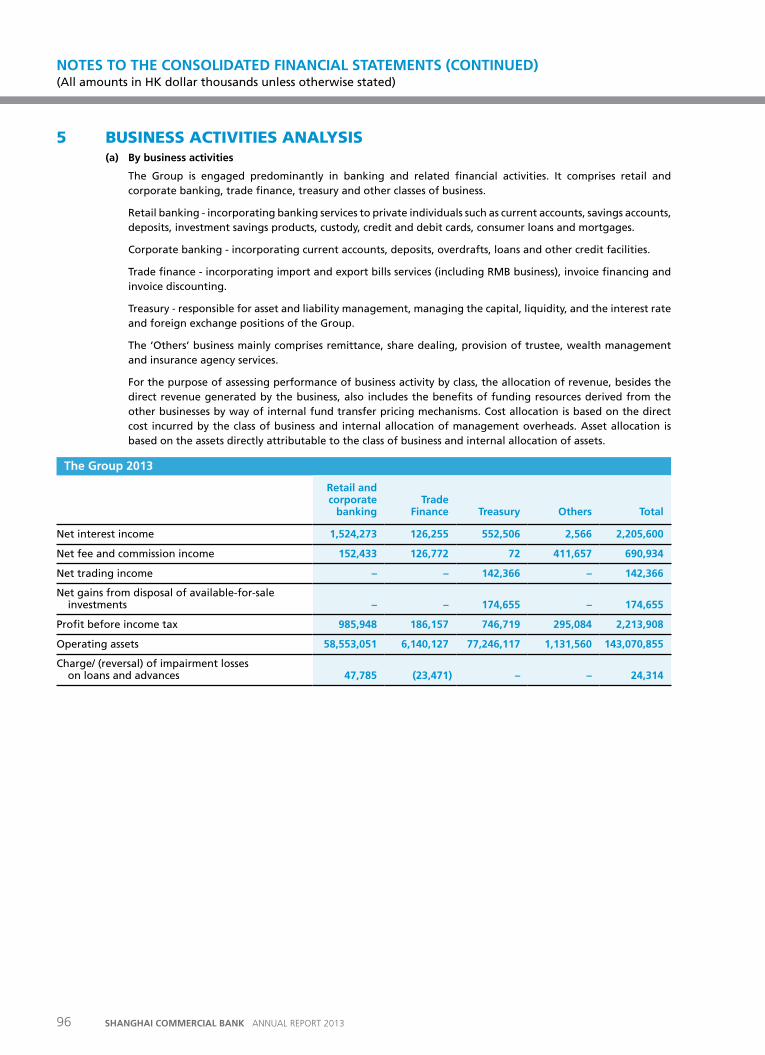
5 BUSINESS ACTIvITIES ANALYSIS(a) By business activities
The Group is engaged predominantly in banking and related financial activities. It comprises retail and corporate banking, trade finance, treasury and other classes of business.
Retail banking - incorporating banking services to private individuals such as current accounts, savings accounts, deposits, investment savings products, custody, credit and debit cards, consumer loans and mortgages.
Corporate banking - incorporating current accounts, deposits, overdrafts, loans and other credit facilities.
Trade finance - incorporating import and export bills services (including RMB business), invoice financing and invoice discounting.
Treasury - responsible for asset and liability management, managing the capital, liquidity, and the interest rate and foreign exchange positions of the Group.
The ‘Others’ business mainly comprises remittance, share dealing, provision of trustee, wealth management and insurance agency services.
For the purpose of assessing performance of business activity by class, the allocation of revenue, besides the direct revenue generated by the business, also includes the benefits of funding resources derived from the other businesses by way of internal fund transfer pricing mechanisms. Cost allocation is based on the direct cost incurred by the class of business and internal allocation of management overheads. Asset allocation is based on the assets directly attributable to the class of business and internal allocation of assets.
the Group 2013
retail and corporate
banking trade
Finance treasury others total
Net interest income 1,524,273 126,255 552,506 2,566 2,205,600
Net fee and commission income 152,433 126,772 72 411,657 690,934
Net trading income – – 142,366 – 142,366
Net gains from disposal of available-for-sale investments – – 174,655 – 174,655
Profit before income tax 985,948 186,157 746,719 295,084 2,213,908
Operating assets 58,553,051 6,140,127 77,246,117 1,131,560 143,070,855
Charge/ (reversal) of impairment losses on loans and advances 47,785 (23,471) – – 24,314
NOTES TO THE CONSOLIDATED FINANCIAL STATEMENTS (CONTINuED) (All amounts in HK dollar thousands unless otherwise stated)
96 SHANGHAI COMMERCIAL BANK ANNUAL REPORT 2013
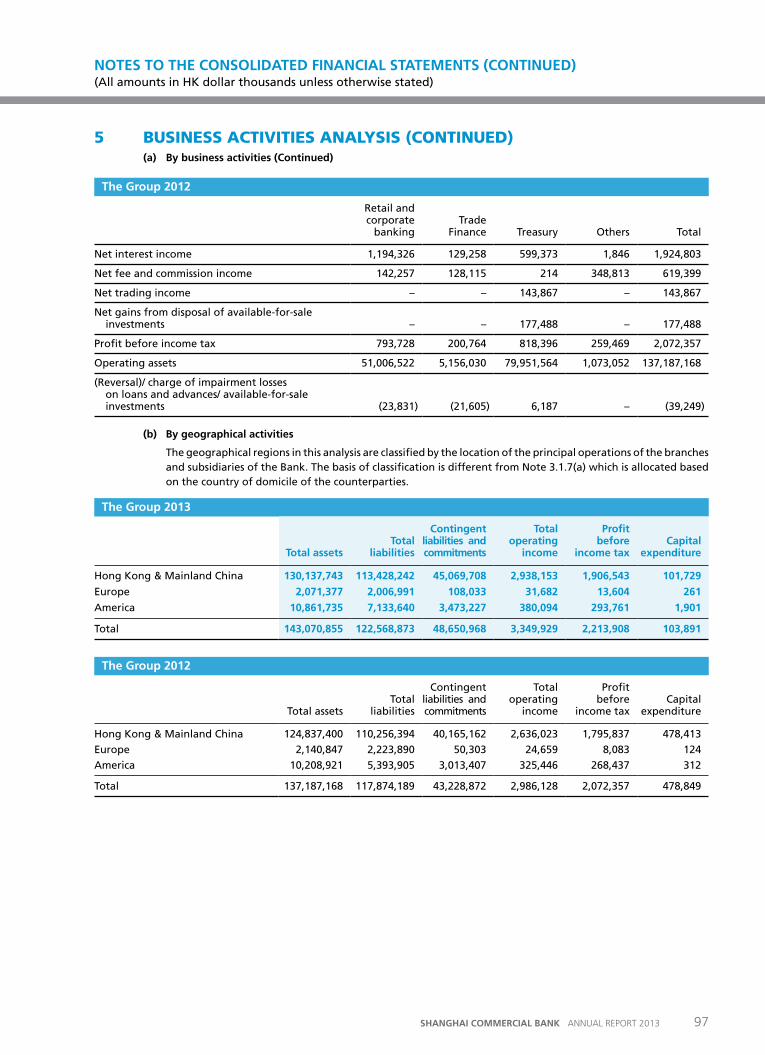
5 BUSINESS ACTIvITIES ANALYSIS (CONTINUED)(a) By business activities (Continued)
the Group 2012
Retail and corporate
banking Trade
Finance Treasury Others Total
Net interest income 1,194,326 129,258 599,373 1,846 1,924,803
Net fee and commission income 142,257 128,115 214 348,813 619,399
Net trading income – – 143,867 – 143,867
Net gains from disposal of available-for-sale investments – – 177,488 – 177,488
Profit before income tax 793,728 200,764 818,396 259,469 2,072,357
Operating assets 51,006,522 5,156,030 79,951,564 1,073,052 137,187,168
(Reversal)/ charge of impairment losses on loans and advances/ available-for-sale investments (23,831) (21,605) 6,187 – (39,249)
(b) By geographical activities
The geographical regions in this analysis are classified by the location of the principal operations of the branches and subsidiaries of the Bank. The basis of classification is different from Note 3.1.7(a) which is allocated based on the country of domicile of the counterparties.
the Group 2013
total assets total
liabilities
Contingent liabilities and commitments
total operating
income
profit before
income tax Capital
expenditure
Hong Kong & Mainland China 130,137,743 113,428,242 45,069,708 2,938,153 1,906,543 101,729
Europe 2,071,377 2,006,991 108,033 31,682 13,604 261
America 10,861,735 7,133,640 3,473,227 380,094 293,761 1,901
Total 143,070,855 122,568,873 48,650,968 3,349,929 2,213,908 103,891
the Group 2012
Total assets Total
liabilities
Contingent liabilities and commitments
Total operating
income
Profit before
income tax Capital
expenditure
Hong Kong & Mainland China 124,837,400 110,256,394 40,165,162 2,636,023 1,795,837 478,413
Europe 2,140,847 2,223,890 50,303 24,659 8,083 124
America 10,208,921 5,393,905 3,013,407 325,446 268,437 312
Total 137,187,168 117,874,189 43,228,872 2,986,128 2,072,357 478,849
NOTES TO THE CONSOLIDATED FINANCIAL STATEMENTS (CONTINuED) (All amounts in HK dollar thousands unless otherwise stated)
97SHANGHAI COMMERCIAL BANK ANNUAL REPORT 2013
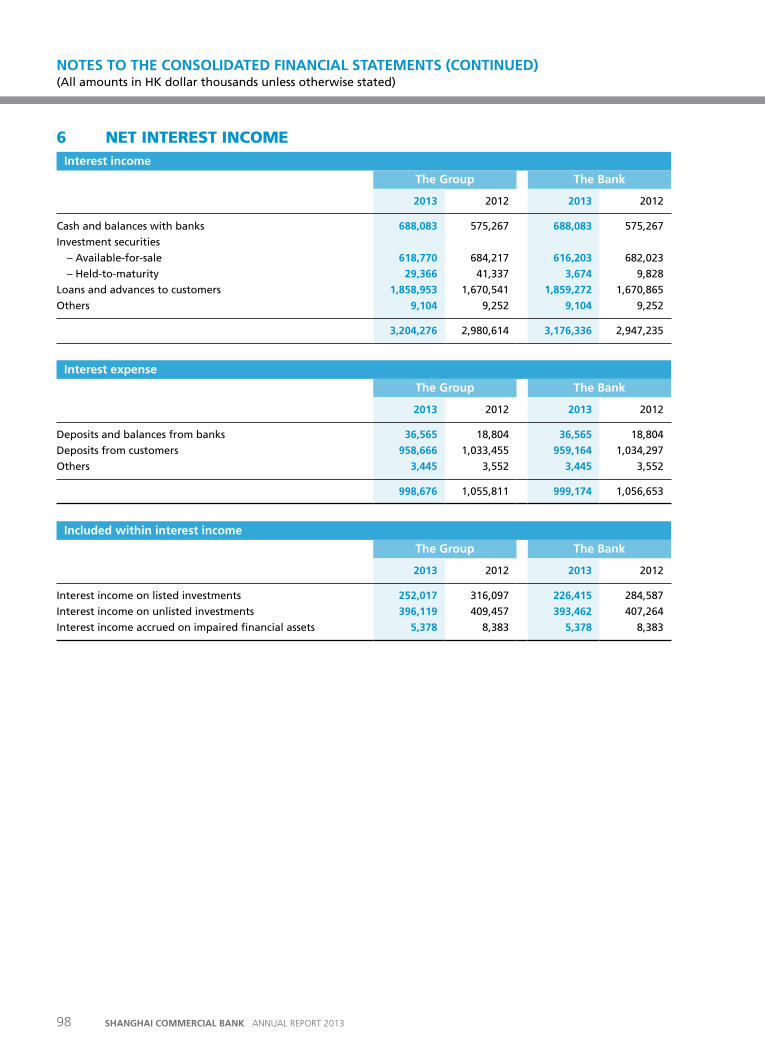
6 NET INTEREST INCOME Interest income
the Group the Bank
2013 2012 2013 2012
Cash and balances with banks 688,083 575,267 688,083 575,267
Investment securities
– Available-for-sale 618,770 684,217 616,203 682,023
– Held-to-maturity 29,366 41,337 3,674 9,828
Loans and advances to customers 1,858,953 1,670,541 1,859,272 1,670,865
Others 9,104 9,252 9,104 9,252
3,204,276 2,980,614 3,176,336 2,947,235
Interest expense
the Group the Bank
2013 2012 2013 2012
Deposits and balances from banks 36,565 18,804 36,565 18,804
Deposits from customers 958,666 1,033,455 959,164 1,034,297
Others 3,445 3,552 3,445 3,552
998,676 1,055,811 999,174 1,056,653
Included within interest income
the Group the Bank
2013 2012 2013 2012
Interest income on listed investments 252,017 316,097 226,415 284,587
Interest income on unlisted investments 396,119 409,457 393,462 407,264
Interest income accrued on impaired financial assets 5,378 8,383 5,378 8,383
NOTES TO THE CONSOLIDATED FINANCIAL STATEMENTS (CONTINuED) (All amounts in HK dollar thousands unless otherwise stated)
98 SHANGHAI COMMERCIAL BANK ANNUAL REPORT 2013
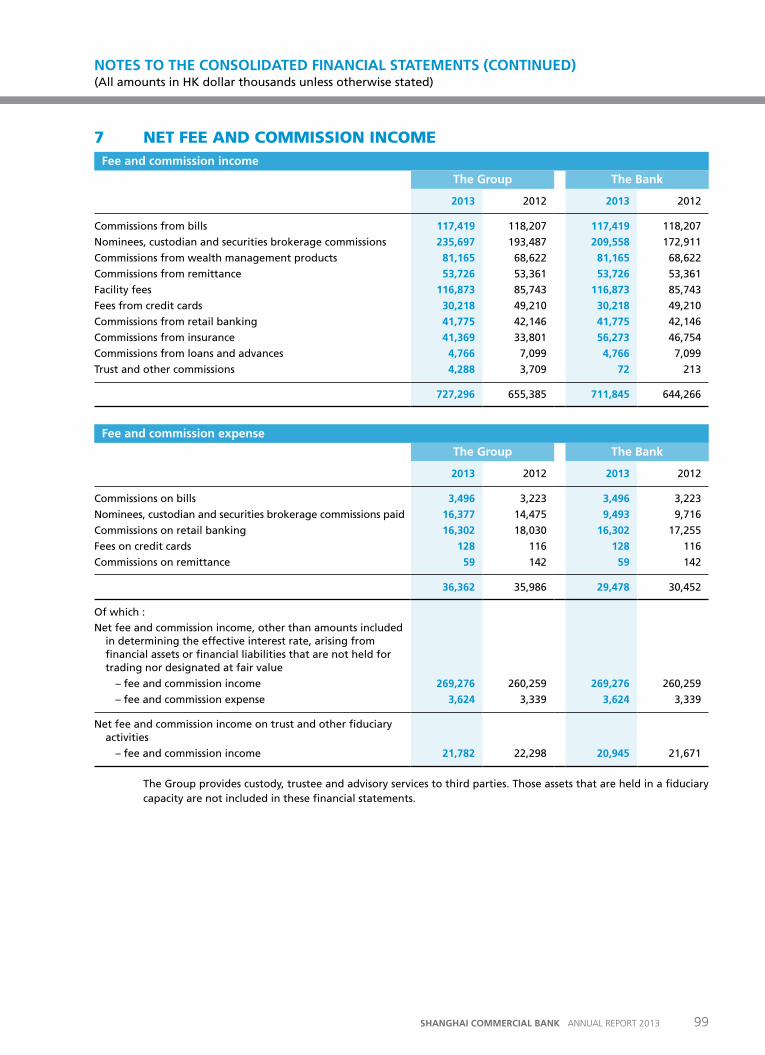
7 NET FEE AND COMMISSION INCOMEFee and commission income
the Group the Bank
2013 2012 2013 2012
Commissions from bills 117,419 118,207 117,419 118,207
Nominees, custodian and securities brokerage commissions 235,697 193,487 209,558 172,911
Commissions from wealth management products 81,165 68,622 81,165 68,622
Commissions from remittance 53,726 53,361 53,726 53,361
Facility fees 116,873 85,743 116,873 85,743
Fees from credit cards 30,218 49,210 30,218 49,210
Commissions from retail banking 41,775 42,146 41,775 42,146
Commissions from insurance 41,369 33,801 56,273 46,754
Commissions from loans and advances 4,766 7,099 4,766 7,099
Trust and other commissions 4,288 3,709 72 213
727,296 655,385 711,845 644,266
Fee and commission expense
the Group the Bank
2013 2012 2013 2012
Commissions on bills 3,496 3,223 3,496 3,223
Nominees, custodian and securities brokerage commissions paid 16,377 14,475 9,493 9,716
Commissions on retail banking 16,302 18,030 16,302 17,255
Fees on credit cards 128 116 128 116
Commissions on remittance 59 142 59 142
36,362 35,986 29,478 30,452
Of which :
Net fee and commission income, other than amounts included in determining the effective interest rate, arising from financial assets or financial liabilities that are not held for trading nor designated at fair value
– fee and commission income 269,276 260,259 269,276 260,259
– fee and commission expense 3,624 3,339 3,624 3,339
Net fee and commission income on trust and other fiduciary activities
– fee and commission income 21,782 22,298 20,945 21,671
The Group provides custody, trustee and advisory services to third parties. Those assets that are held in a fiduciary capacity are not included in these financial statements.
NOTES TO THE CONSOLIDATED FINANCIAL STATEMENTS (CONTINuED) (All amounts in HK dollar thousands unless otherwise stated)
99SHANGHAI COMMERCIAL BANK ANNUAL REPORT 2013
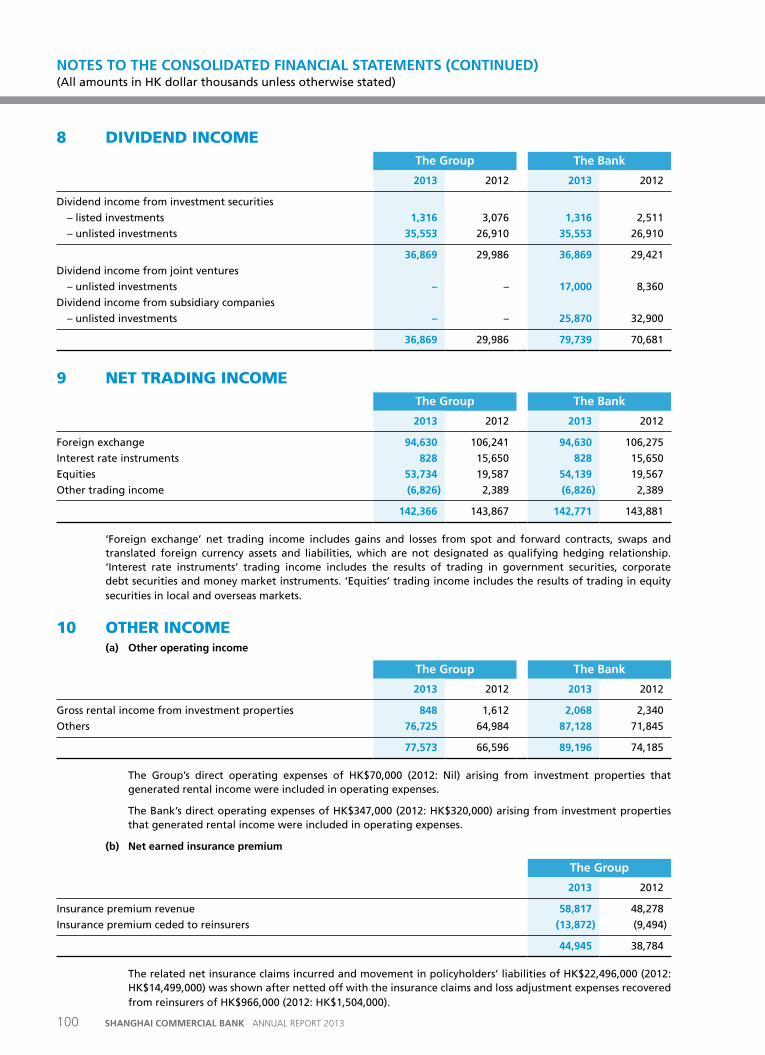
8 DIvIDEND INCOMEthe Group the Bank
2013 2012 2013 2012
Dividend income from investment securities
– listed investments 1,316 3,076 1,316 2,511
– unlisted investments 35,553 26,910 35,553 26,910
36,869 29,986 36,869 29,421
Dividend income from joint ventures
– unlisted investments – – 17,000 8,360
Dividend income from subsidiary companies
– unlisted investments – – 25,870 32,900
36,869 29,986 79,739 70,681
9 NET TRADING INCOMEthe Group the Bank
2013 2012 2013 2012
Foreign exchange 94,630 106,241 94,630 106,275
Interest rate instruments 828 15,650 828 15,650
Equities 53,734 19,587 54,139 19,567
Other trading income (6,826) 2,389 (6,826) 2,389
142,366 143,867 142,771 143,881
‘Foreign exchange’ net trading income includes gains and losses from spot and forward contracts, swaps and translated foreign currency assets and liabilities, which are not designated as qualifying hedging relationship. ‘Interest rate instruments’ trading income includes the results of trading in government securities, corporate debt securities and money market instruments. ‘Equities’ trading income includes the results of trading in equity securities in local and overseas markets.
10 OTHER INCOME(a) other operating income
the Group the Bank
2013 2012 2013 2012
Gross rental income from investment properties 848 1,612 2,068 2,340
Others 76,725 64,984 87,128 71,845
77,573 66,596 89,196 74,185
The Group’s direct operating expenses of HK$70,000 (2012: Nil) arising from investment properties that generated rental income were included in operating expenses.
The Bank’s direct operating expenses of HK$347,000 (2012: HK$320,000) arising from investment properties that generated rental income were included in operating expenses.
(b) Net earned insurance premium
the Group
2013 2012
Insurance premium revenue 58,817 48,278
Insurance premium ceded to reinsurers (13,872) (9,494)
44,945 38,784
The related net insurance claims incurred and movement in policyholders’ liabilities of HK$22,496,000 (2012: HK$14,499,000) was shown after netted off with the insurance claims and loss adjustment expenses recovered from reinsurers of HK$966,000 (2012: HK$1,504,000).
NOTES TO THE CONSOLIDATED FINANCIAL STATEMENTS (CONTINuED) (All amounts in HK dollar thousands unless otherwise stated)
100 SHANGHAI COMMERCIAL BANK ANNUAL REPORT 2013
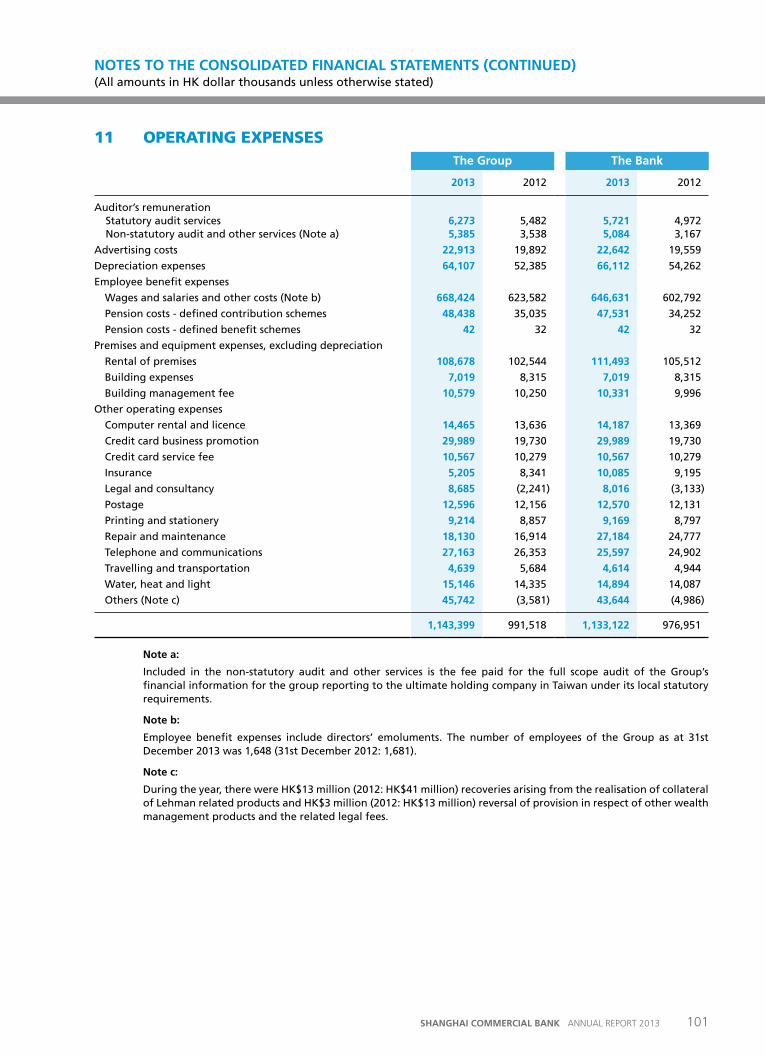
11 OPERATING EXPENSESthe Group the Bank
2013 2012 2013 2012
Auditor’s remuneration Statutory audit services Non-statutory audit and other services (Note a)
6,2735,385
5,4823,538
5,7215,084
4,972 3,167
Advertising costs 22,913 19,892 22,642 19,559
Depreciation expenses 64,107 52,385 66,112 54,262
Employee benefit expenses
Wages and salaries and other costs (Note b) 668,424 623,582 646,631 602,792
Pension costs - defined contribution schemes 48,438 35,035 47,531 34,252
Pension costs - defined benefit schemes 42 32 42 32
Premises and equipment expenses, excluding depreciation
Rental of premises 108,678 102,544 111,493 105,512
Building expenses 7,019 8,315 7,019 8,315
Building management fee 10,579 10,250 10,331 9,996
Other operating expenses
Computer rental and licence 14,465 13,636 14,187 13,369
Credit card business promotion 29,989 19,730 29,989 19,730
Credit card service fee 10,567 10,279 10,567 10,279
Insurance 5,205 8,341 10,085 9,195
Legal and consultancy 8,685 (2,241) 8,016 (3,133)
Postage 12,596 12,156 12,570 12,131
Printing and stationery 9,214 8,857 9,169 8,797
Repair and maintenance 18,130 16,914 27,184 24,777
Telephone and communications 27,163 26,353 25,597 24,902
Travelling and transportation 4,639 5,684 4,614 4,944
Water, heat and light 15,146 14,335 14,894 14,087
Others (Note c) 45,742 (3,581) 43,644 (4,986)
1,143,399 991,518 1,133,122 976,951
Note a:
Included in the non-statutory audit and other services is the fee paid for the full scope audit of the Group’s financial information for the group reporting to the ultimate holding company in Taiwan under its local statutory requirements.
Note b:
Employee benefit expenses include directors’ emoluments. The number of employees of the Group as at 31st December 2013 was 1,648 (31st December 2012: 1,681).
Note c:
During the year, there were HK$13 million (2012: HK$41 million) recoveries arising from the realisation of collateral of Lehman related products and HK$3 million (2012: HK$13 million) reversal of provision in respect of other wealth management products and the related legal fees.
NOTES TO THE CONSOLIDATED FINANCIAL STATEMENTS (CONTINuED) (All amounts in HK dollar thousands unless otherwise stated)
101SHANGHAI COMMERCIAL BANK ANNUAL REPORT 2013
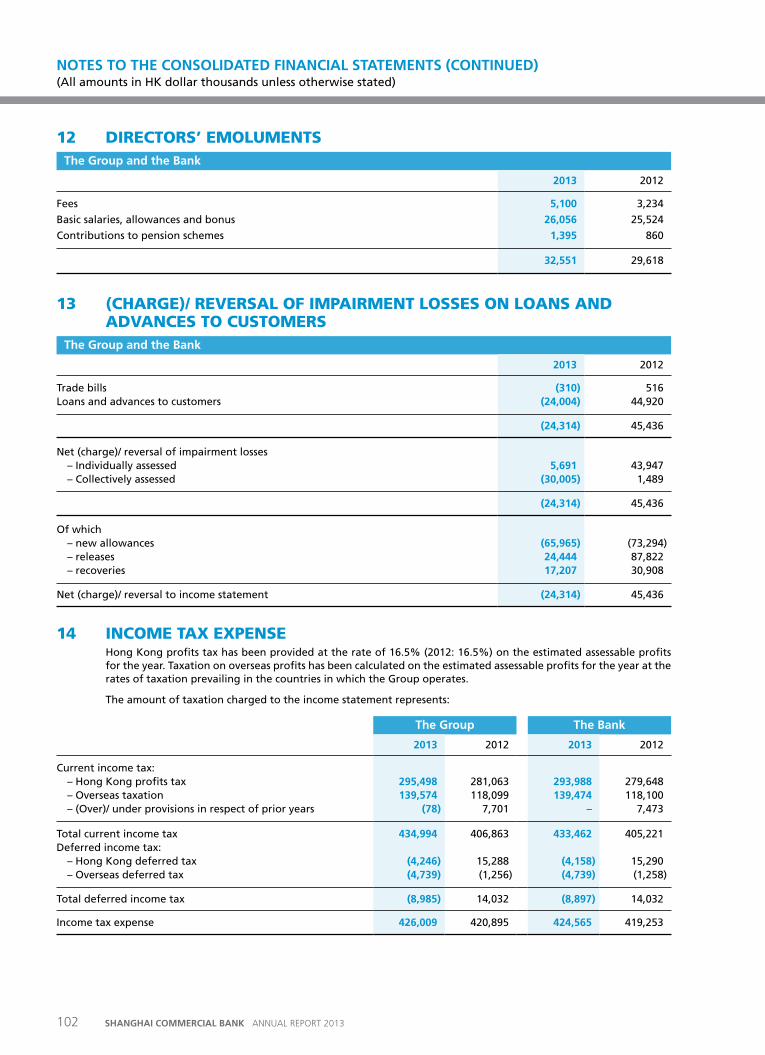
12 DIRECTORS’ EMOLUMENTS the Group and the Bank
2013 2012
Fees 5,100 3,234
Basic salaries, allowances and bonus 26,056 25,524
Contributions to pension schemes 1,395 860
32,551 29,618
13 (CHARGE)/ REvERSAL OF IMPAIRMENT LOSSES ON LOANS AND ADvANCES TO CUSTOMERS
the Group and the Bank
2013 2012
Trade bills (310) 516 Loans and advances to customers (24,004) 44,920
(24,314) 45,436
Net (charge)/ reversal of impairment losses – Individually assessed 5,691 43,947 – Collectively assessed (30,005) 1,489
(24,314) 45,436
Of which – new allowances (65,965) (73,294) – releases 24,444 87,822 – recoveries 17,207 30,908
Net (charge)/ reversal to income statement (24,314) 45,436
14 INCOME TAX EXPENSEHong Kong profits tax has been provided at the rate of 16.5% (2012: 16.5%) on the estimated assessable profits for the year. Taxation on overseas profits has been calculated on the estimated assessable profits for the year at the rates of taxation prevailing in the countries in which the Group operates.
The amount of taxation charged to the income statement represents:
the Group the Bank
2013 2012 2013 2012
Current income tax: – Hong Kong profits tax 295,498 281,063 293,988 279,648 – Overseas taxation 139,574 118,099 139,474 118,100 – (Over)/ under provisions in respect of prior years (78) 7,701 – 7,473
Total current income tax 434,994 406,863 433,462 405,221 Deferred income tax: – Hong Kong deferred tax (4,246) 15,288 (4,158) 15,290 – Overseas deferred tax (4,739) (1,256) (4,739) (1,258)
Total deferred income tax (8,985) 14,032 (8,897) 14,032
Income tax expense 426,009 420,895 424,565 419,253
NOTES TO THE CONSOLIDATED FINANCIAL STATEMENTS (CONTINuED) (All amounts in HK dollar thousands unless otherwise stated)
102 SHANGHAI COMMERCIAL BANK ANNUAL REPORT 2013
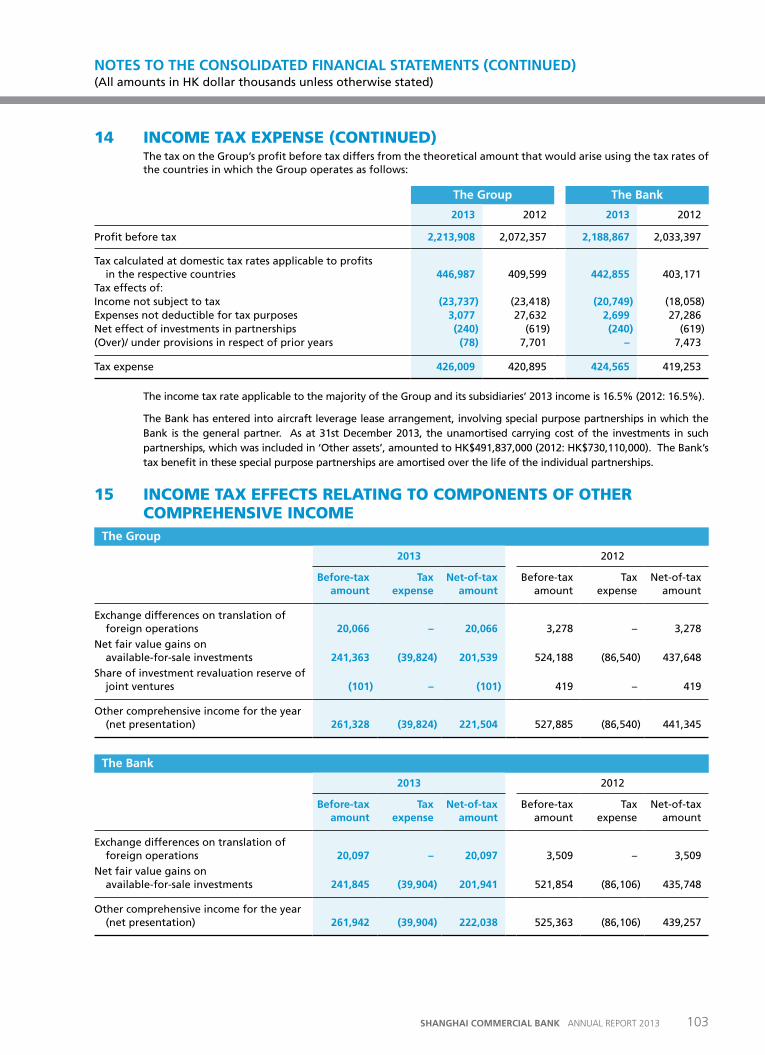
14 INCOME TAX EXPENSE (CONTINUED)The tax on the Group’s profit before tax differs from the theoretical amount that would arise using the tax rates of the countries in which the Group operates as follows:
the Group the Bank
2013 2012 2013 2012
Profit before tax 2,213,908 2,072,357 2,188,867 2,033,397
Tax calculated at domestic tax rates applicable to profits in the respective countries 446,987 409,599 442,855 403,171
Tax effects of:Income not subject to tax (23,737) (23,418) (20,749) (18,058)Expenses not deductible for tax purposes 3,077 27,632 2,699 27,286 Net effect of investments in partnerships (240) (619) (240) (619)(Over)/ under provisions in respect of prior years (78) 7,701 – 7,473
Tax expense 426,009 420,895 424,565 419,253
The income tax rate applicable to the majority of the Group and its subsidiaries’ 2013 income is 16.5% (2012: 16.5%).
The Bank has entered into aircraft leverage lease arrangement, involving special purpose partnerships in which the Bank is the general partner. As at 31st December 2013, the unamortised carrying cost of the investments in such partnerships, which was included in ‘Other assets’, amounted to HK$491,837,000 (2012: HK$730,110,000). The Bank’s tax benefit in these special purpose partnerships are amortised over the life of the individual partnerships.
15 INCOME TAX EFFECTS RELATING TO COMPONENTS OF OTHER COMPREHENSIvE INCOME
the Group
2013 2012
Before-tax amount
tax expense
Net-of-tax amount
Before-tax amount
Tax expense
Net-of-tax amount
Exchange differences on translation of foreign operations 20,066 – 20,066 3,278 – 3,278
Net fair value gains on available-for-sale investments 241,363 (39,824) 201,539 524,188 (86,540) 437,648
Share of investment revaluation reserve of joint ventures (101) – (101) 419 – 419
Other comprehensive income for the year (net presentation) 261,328 (39,824) 221,504 527,885 (86,540) 441,345
the Bank
2013 2012
Before-tax amount
tax expense
Net-of-tax amount
Before-tax amount
Tax expense
Net-of-tax amount
Exchange differences on translation of foreign operations 20,097 – 20,097 3,509 – 3,509
Net fair value gains on available-for-sale investments 241,845 (39,904) 201,941 521,854 (86,106) 435,748
Other comprehensive income for the year (net presentation) 261,942 (39,904) 222,038 525,363 (86,106) 439,257
NOTES TO THE CONSOLIDATED FINANCIAL STATEMENTS (CONTINuED) (All amounts in HK dollar thousands unless otherwise stated)
103SHANGHAI COMMERCIAL BANK ANNUAL REPORT 2013
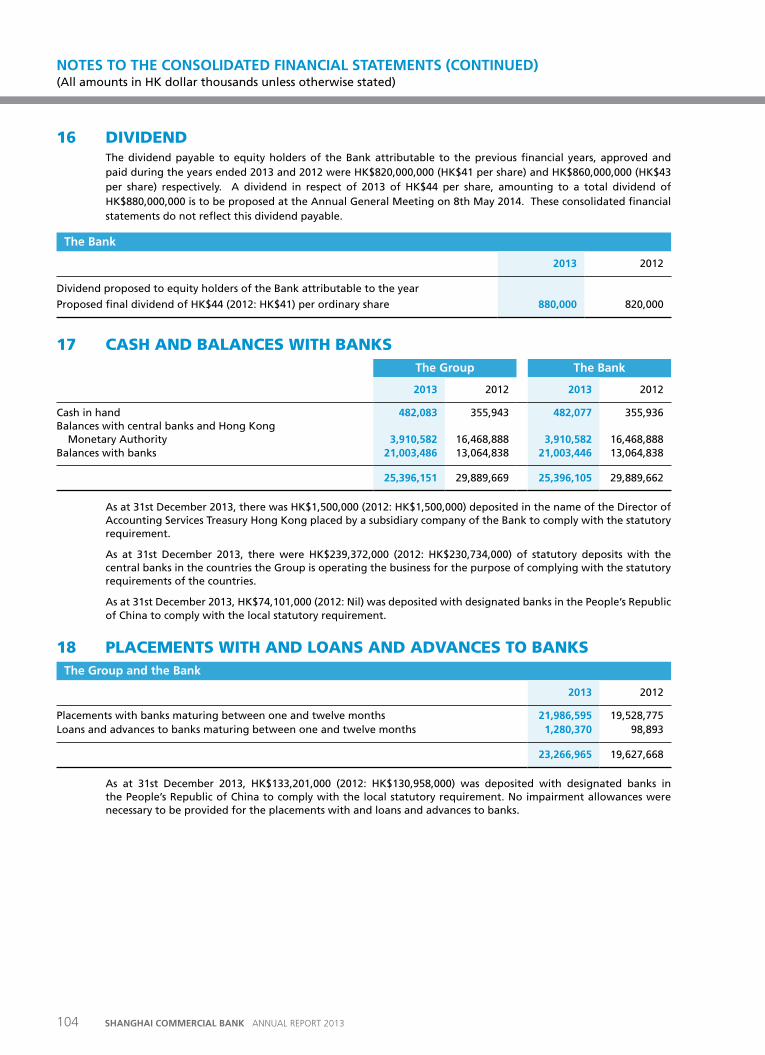
16 DIvIDENDThe dividend payable to equity holders of the Bank attributable to the previous financial years, approved and paid during the years ended 2013 and 2012 were HK$820,000,000 (HK$41 per share) and HK$860,000,000 (HK$43 per share) respectively. A dividend in respect of 2013 of HK$44 per share, amounting to a total dividend of HK$880,000,000 is to be proposed at the Annual General Meeting on 8th May 2014. These consolidated financial statements do not reflect this dividend payable.
the Bank
2013 2012
Dividend proposed to equity holders of the Bank attributable to the year
Proposed final dividend of HK$44 (2012: HK$41) per ordinary share 880,000 820,000
17 CASH AND BALANCES WITH BANKSthe Group the Bank
2013 2012 2013 2012
Cash in hand 482,083 355,943 482,077 355,936 Balances with central banks and Hong Kong
Monetary Authority 3,910,582 16,468,888 3,910,582 16,468,888 Balances with banks 21,003,486 13,064,838 21,003,446 13,064,838
25,396,151 29,889,669 25,396,105 29,889,662
As at 31st December 2013, there was HK$1,500,000 (2012: HK$1,500,000) deposited in the name of the Director of Accounting Services Treasury Hong Kong placed by a subsidiary company of the Bank to comply with the statutory requirement.
As at 31st December 2013, there were HK$239,372,000 (2012: HK$230,734,000) of statutory deposits with the central banks in the countries the Group is operating the business for the purpose of complying with the statutory requirements of the countries.
As at 31st December 2013, HK$74,101,000 (2012: Nil) was deposited with designated banks in the People’s Republic of China to comply with the local statutory requirement.
18 PLACEMENTS WITH AND LOANS AND ADvANCES TO BANKSthe Group and the Bank
2013 2012
Placements with banks maturing between one and twelve months 21,986,595 19,528,775 Loans and advances to banks maturing between one and twelve months 1,280,370 98,893
23,266,965 19,627,668
As at 31st December 2013, HK$133,201,000 (2012: HK$130,958,000) was deposited with designated banks in the People’s Republic of China to comply with the local statutory requirement. No impairment allowances were necessary to be provided for the placements with and loans and advances to banks.
NOTES TO THE CONSOLIDATED FINANCIAL STATEMENTS (CONTINuED) (All amounts in HK dollar thousands unless otherwise stated)
104 SHANGHAI COMMERCIAL BANK ANNUAL REPORT 2013
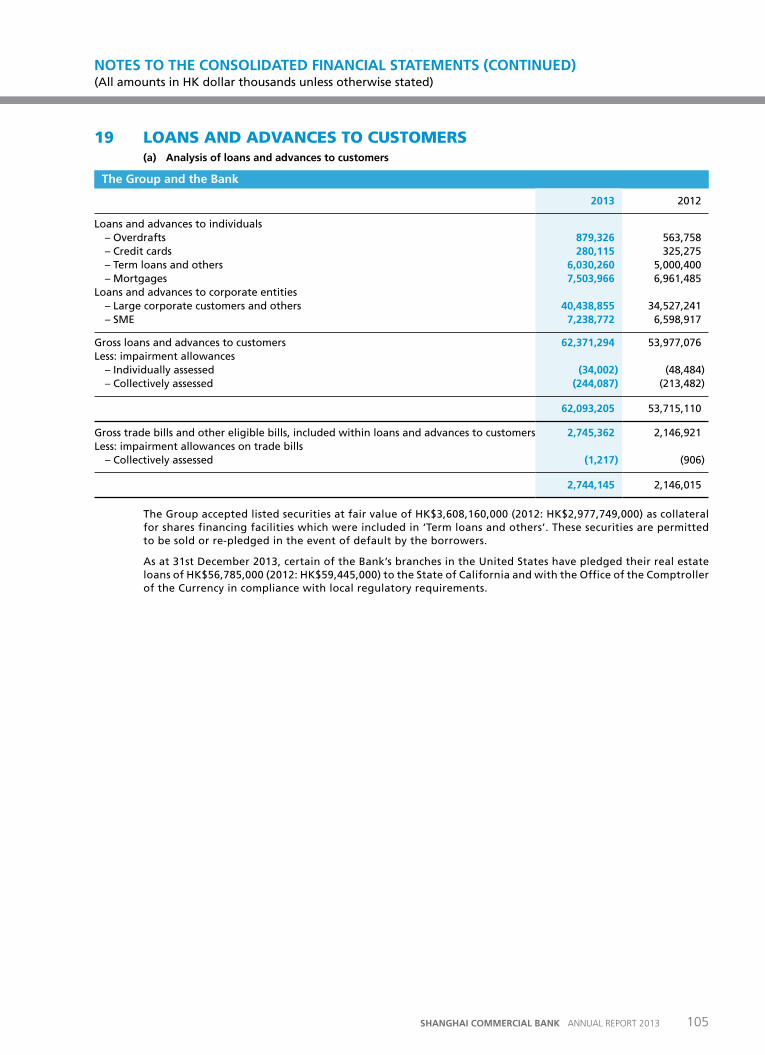
19 LOANS AND ADvANCES TO CUSTOMERS(a) analysis of loans and advances to customers
the Group and the Bank
2013 2012
Loans and advances to individuals – Overdrafts 879,326 563,758 – Credit cards 280,115 325,275 – Term loans and others 6,030,260 5,000,400 – Mortgages 7,503,966 6,961,485 Loans and advances to corporate entities – Large corporate customers and others 40,438,855 34,527,241 – SME 7,238,772 6,598,917
Gross loans and advances to customers 62,371,294 53,977,076 Less: impairment allowances – Individually assessed (34,002) (48,484) – Collectively assessed (244,087) (213,482)
62,093,205 53,715,110
Gross trade bills and other eligible bills, included within loans and advances to customers 2,745,362 2,146,921 Less: impairment allowances on trade bills – Collectively assessed (1,217) (906)
2,744,145 2,146,015
The Group accepted listed securities at fair value of HK$3,608,160,000 (2012: HK$2,977,749,000) as collateral for shares financing facilities which were included in ‘Term loans and others’. These securities are permitted to be sold or re-pledged in the event of default by the borrowers.
As at 31st December 2013, certain of the Bank’s branches in the United States have pledged their real estate loans of HK$56,785,000 (2012: HK$59,445,000) to the State of California and with the Office of the Comptroller of the Currency in compliance with local regulatory requirements.
NOTES TO THE CONSOLIDATED FINANCIAL STATEMENTS (CONTINuED) (All amounts in HK dollar thousands unless otherwise stated)
105SHANGHAI COMMERCIAL BANK ANNUAL REPORT 2013
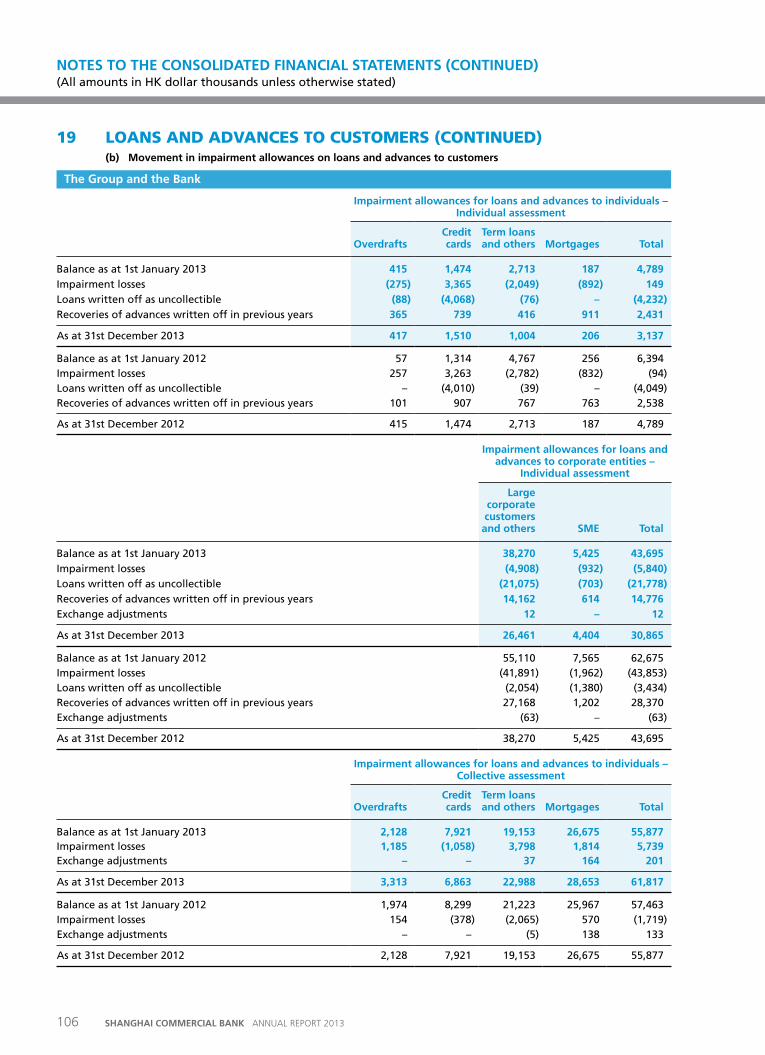
19 LOANS AND ADvANCES TO CUSTOMERS (CONTINUED)(b) Movement in impairment allowances on loans and advances to customers
the Group and the Bank
Impairment allowances for loans and advances to individuals – Individual assessment
overdrafts Credit cards
term loans and others Mortgages total
Balance as at 1st January 2013 415 1,474 2,713 187 4,789 Impairment losses (275) 3,365 (2,049) (892) 149 Loans written off as uncollectible (88) (4,068) (76) – (4,232)Recoveries of advances written off in previous years 365 739 416 911 2,431
As at 31st December 2013 417 1,510 1,004 206 3,137
Balance as at 1st January 2012 57 1,314 4,767 256 6,394 Impairment losses 257 3,263 (2,782) (832) (94)Loans written off as uncollectible – (4,010) (39) – (4,049)Recoveries of advances written off in previous years 101 907 767 763 2,538
As at 31st December 2012 415 1,474 2,713 187 4,789
Impairment allowances for loans and advances to corporate entities –
Individual assessment
Large corporate customers
and others SME total
Balance as at 1st January 2013 38,270 5,425 43,695 Impairment losses (4,908) (932) (5,840)Loans written off as uncollectible (21,075) (703) (21,778)Recoveries of advances written off in previous years 14,162 614 14,776 Exchange adjustments 12 – 12
As at 31st December 2013 26,461 4,404 30,865
Balance as at 1st January 2012 55,110 7,565 62,675 Impairment losses (41,891) (1,962) (43,853)Loans written off as uncollectible (2,054) (1,380) (3,434)Recoveries of advances written off in previous years 27,168 1,202 28,370 Exchange adjustments (63) – (63)
As at 31st December 2012 38,270 5,425 43,695
Impairment allowances for loans and advances to individuals – Collective assessment
overdrafts Credit cards
term loans and others Mortgages total
Balance as at 1st January 2013 2,128 7,921 19,153 26,675 55,877 Impairment losses 1,185 (1,058) 3,798 1,814 5,739 Exchange adjustments – – 37 164 201
As at 31st December 2013 3,313 6,863 22,988 28,653 61,817
Balance as at 1st January 2012 1,974 8,299 21,223 25,967 57,463 Impairment losses 154 (378) (2,065) 570 (1,719)Exchange adjustments – – (5) 138 133
As at 31st December 2012 2,128 7,921 19,153 26,675 55,877
NOTES TO THE CONSOLIDATED FINANCIAL STATEMENTS (CONTINuED) (All amounts in HK dollar thousands unless otherwise stated)
106 SHANGHAI COMMERCIAL BANK ANNUAL REPORT 2013
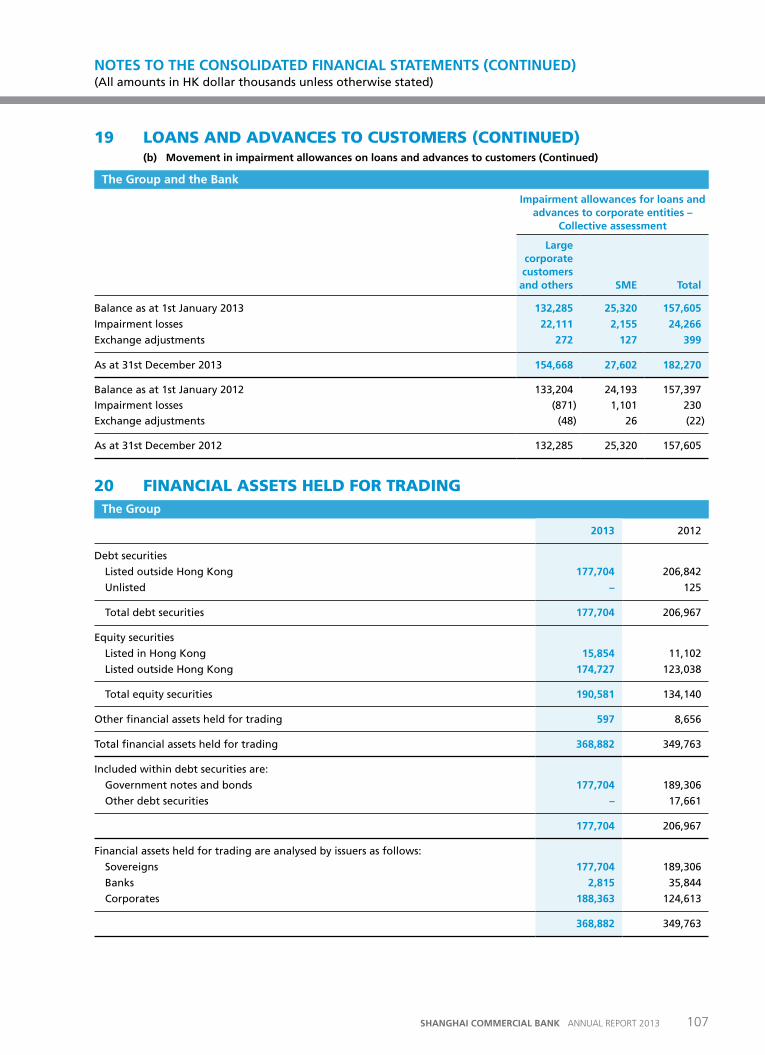
19 LOANS AND ADvANCES TO CUSTOMERS (CONTINUED)(b) Movement in impairment allowances on loans and advances to customers (Continued)
the Group and the Bank
Impairment allowances for loans and advances to corporate entities –
Collective assessment
Large corporate customers
and others SME total
Balance as at 1st January 2013 132,285 25,320 157,605
Impairment losses 22,111 2,155 24,266
Exchange adjustments 272 127 399
As at 31st December 2013 154,668 27,602 182,270
Balance as at 1st January 2012 133,204 24,193 157,397
Impairment losses (871) 1,101 230
Exchange adjustments (48) 26 (22)
As at 31st December 2012 132,285 25,320 157,605
20 FINANCIAL ASSETS HELD FOR TRADINGthe Group
2013 2012
Debt securities
Listed outside Hong Kong 177,704 206,842
Unlisted – 125
Total debt securities 177,704 206,967
Equity securities
Listed in Hong Kong 15,854 11,102
Listed outside Hong Kong 174,727 123,038
Total equity securities 190,581 134,140
Other financial assets held for trading 597 8,656
Total financial assets held for trading 368,882 349,763
Included within debt securities are:
Government notes and bonds 177,704 189,306
Other debt securities – 17,661
177,704 206,967
Financial assets held for trading are analysed by issuers as follows:
Sovereigns 177,704 189,306
Banks 2,815 35,844
Corporates 188,363 124,613
368,882 349,763
NOTES TO THE CONSOLIDATED FINANCIAL STATEMENTS (CONTINuED) (All amounts in HK dollar thousands unless otherwise stated)
107SHANGHAI COMMERCIAL BANK ANNUAL REPORT 2013
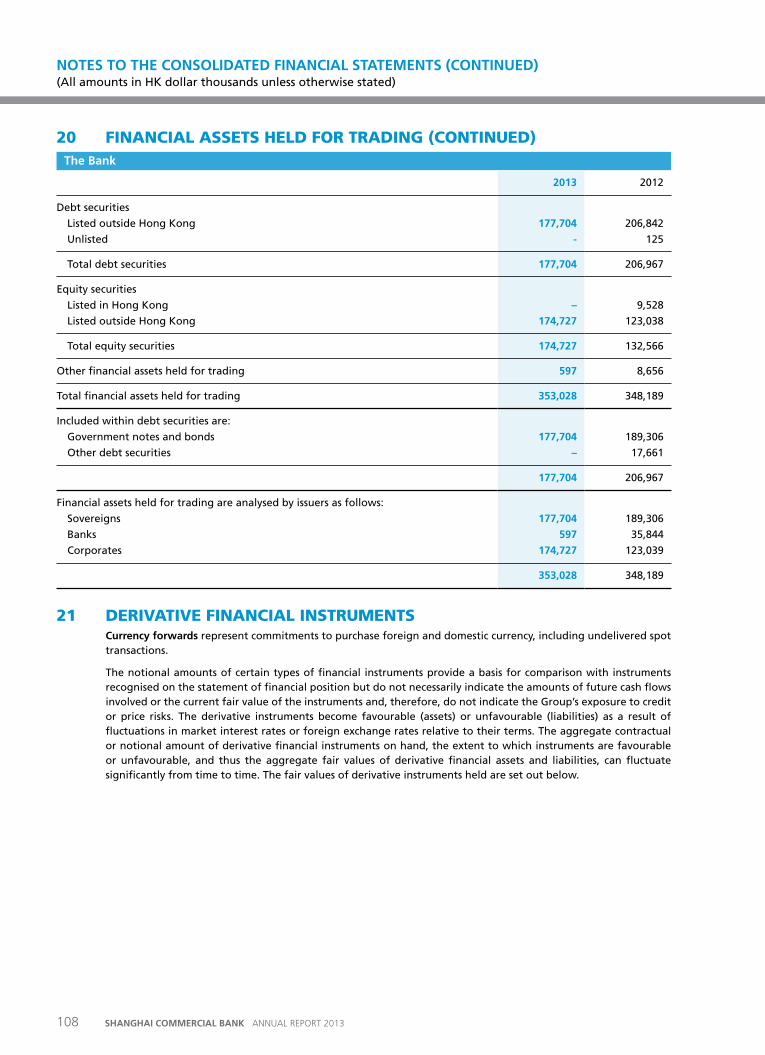
20 FINANCIAL ASSETS HELD FOR TRADING (CONTINUED)the Bank
2013 2012
Debt securities
Listed outside Hong Kong 177,704 206,842
Unlisted - 125
Total debt securities 177,704 206,967
Equity securities
Listed in Hong Kong – 9,528
Listed outside Hong Kong 174,727 123,038
Total equity securities 174,727 132,566
Other financial assets held for trading 597 8,656
Total financial assets held for trading 353,028 348,189
Included within debt securities are:
Government notes and bonds 177,704 189,306
Other debt securities – 17,661
177,704 206,967
Financial assets held for trading are analysed by issuers as follows:
Sovereigns 177,704 189,306
Banks 597 35,844
Corporates 174,727 123,039
353,028 348,189
21 DERIvATIvE FINANCIAL INSTRUMENTSCurrency forwards represent commitments to purchase foreign and domestic currency, including undelivered spot transactions.
The notional amounts of certain types of financial instruments provide a basis for comparison with instruments recognised on the statement of financial position but do not necessarily indicate the amounts of future cash flows involved or the current fair value of the instruments and, therefore, do not indicate the Group’s exposure to credit or price risks. The derivative instruments become favourable (assets) or unfavourable (liabilities) as a result of fluctuations in market interest rates or foreign exchange rates relative to their terms. The aggregate contractual or notional amount of derivative financial instruments on hand, the extent to which instruments are favourable or unfavourable, and thus the aggregate fair values of derivative financial assets and liabilities, can fluctuate significantly from time to time. The fair values of derivative instruments held are set out below.
NOTES TO THE CONSOLIDATED FINANCIAL STATEMENTS (CONTINuED) (All amounts in HK dollar thousands unless otherwise stated)
108 SHANGHAI COMMERCIAL BANK ANNUAL REPORT 2013
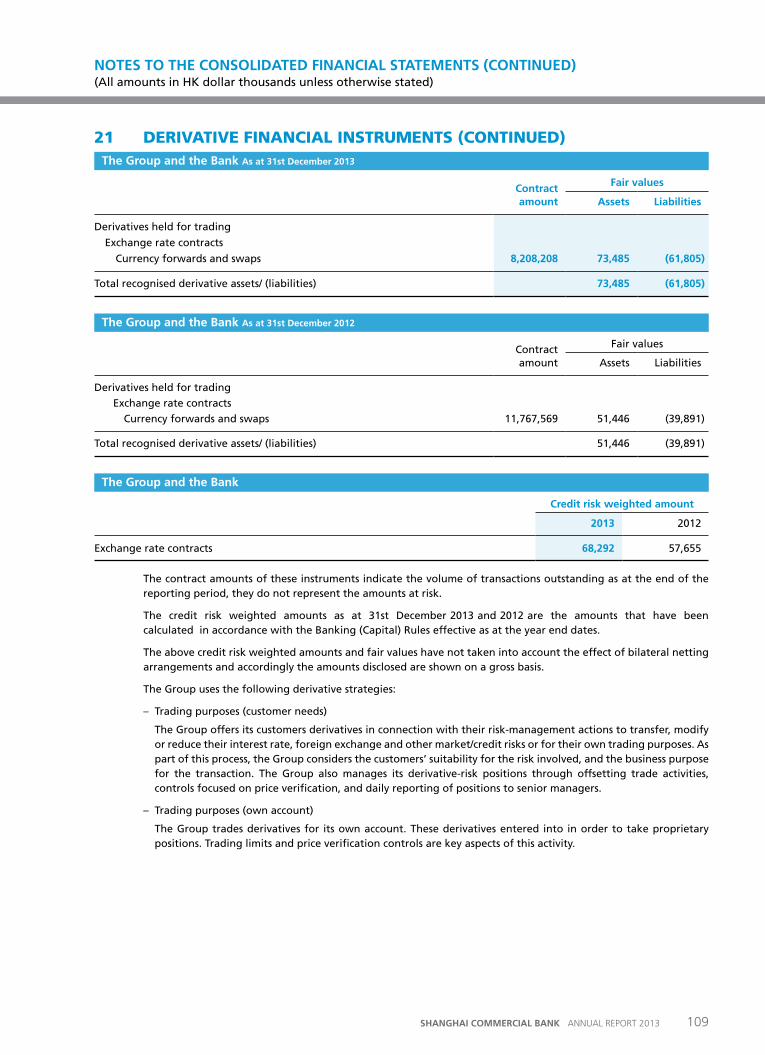
21 DERIvATIvE FINANCIAL INSTRUMENTS (CONTINUED)the Group and the Bank as at 31st December 2013
Contract amount
Fair values
assets Liabilities
Derivatives held for trading
Exchange rate contracts
Currency forwards and swaps 8,208,208 73,485 (61,805)
Total recognised derivative assets/ (liabilities) 73,485 (61,805)
the Group and the Bank as at 31st December 2012
Contract amount
Fair values
Assets Liabilities
Derivatives held for trading
Exchange rate contracts
Currency forwards and swaps 11,767,569 51,446 (39,891)
Total recognised derivative assets/ (liabilities) 51,446 (39,891)
the Group and the Bank
Credit risk weighted amount
2013 2012
Exchange rate contracts 68,292 57,655
The contract amounts of these instruments indicate the volume of transactions outstanding as at the end of the reporting period, they do not represent the amounts at risk.
The credit risk weighted amounts as at 31st December 2013 and 2012 are the amounts that have been calculated in accordance with the Banking (Capital) Rules effective as at the year end dates.
The above credit risk weighted amounts and fair values have not taken into account the effect of bilateral netting arrangements and accordingly the amounts disclosed are shown on a gross basis.
The Group uses the following derivative strategies:
– Trading purposes (customer needs)
The Group offers its customers derivatives in connection with their risk-management actions to transfer, modify or reduce their interest rate, foreign exchange and other market/credit risks or for their own trading purposes. As part of this process, the Group considers the customers’ suitability for the risk involved, and the business purpose for the transaction. The Group also manages its derivative-risk positions through offsetting trade activities, controls focused on price verification, and daily reporting of positions to senior managers.
– Trading purposes (own account)
The Group trades derivatives for its own account. These derivatives entered into in order to take proprietary positions. Trading limits and price verification controls are key aspects of this activity.
NOTES TO THE CONSOLIDATED FINANCIAL STATEMENTS (CONTINuED) (All amounts in HK dollar thousands unless otherwise stated)
109SHANGHAI COMMERCIAL BANK ANNUAL REPORT 2013
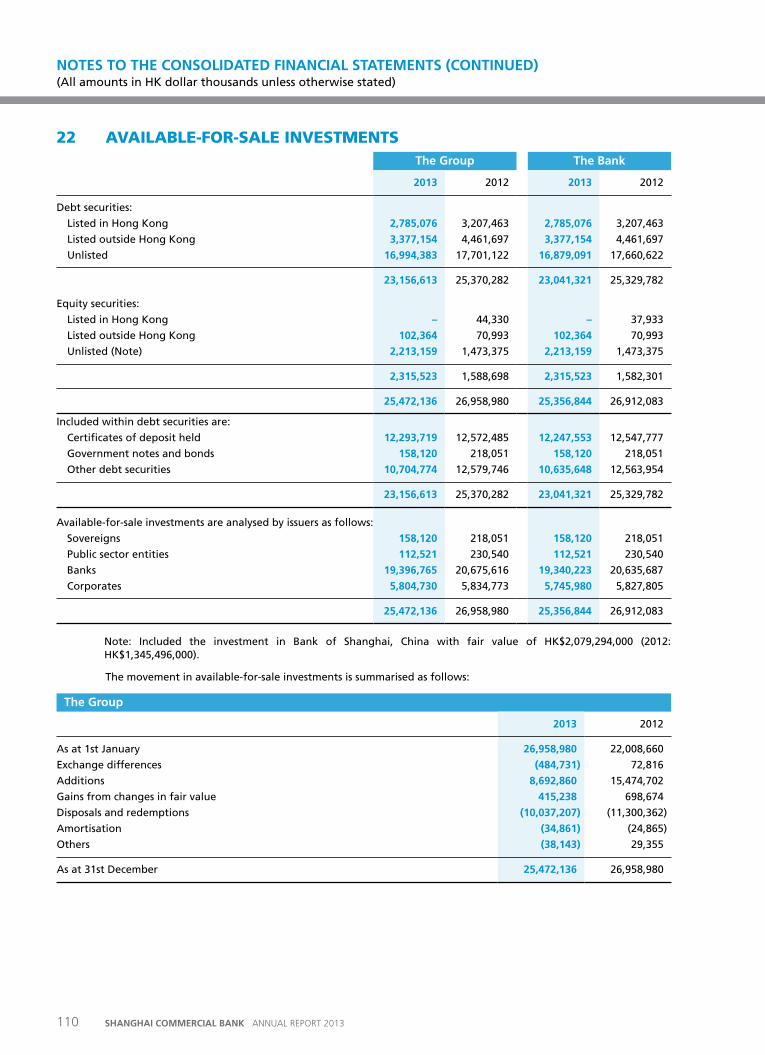
22 AvAILABLE-FOR-SALE INvESTMENTSthe Group the Bank
2013 2012 2013 2012
Debt securities:
Listed in Hong Kong 2,785,076 3,207,463 2,785,076 3,207,463
Listed outside Hong Kong 3,377,154 4,461,697 3,377,154 4,461,697
Unlisted 16,994,383 17,701,122 16,879,091 17,660,622
23,156,613 25,370,282 23,041,321 25,329,782
Equity securities:
Listed in Hong Kong – 44,330 – 37,933
Listed outside Hong Kong 102,364 70,993 102,364 70,993
Unlisted (Note) 2,213,159 1,473,375 2,213,159 1,473,375
2,315,523 1,588,698 2,315,523 1,582,301
25,472,136 26,958,980 25,356,844 26,912,083
Included within debt securities are:
Certificates of deposit held 12,293,719 12,572,485 12,247,553 12,547,777
Government notes and bonds 158,120 218,051 158,120 218,051
Other debt securities 10,704,774 12,579,746 10,635,648 12,563,954
23,156,613 25,370,282 23,041,321 25,329,782
Available-for-sale investments are analysed by issuers as follows:
Sovereigns 158,120 218,051 158,120 218,051
Public sector entities 112,521 230,540 112,521 230,540
Banks 19,396,765 20,675,616 19,340,223 20,635,687
Corporates 5,804,730 5,834,773 5,745,980 5,827,805
25,472,136 26,958,980 25,356,844 26,912,083
Note: Included the investment in Bank of Shanghai, China with fair value of HK$2,079,294,000 (2012: HK$1,345,496,000).
The movement in available-for-sale investments is summarised as follows:
the Group
2013 2012
As at 1st January 26,958,980 22,008,660
Exchange differences (484,731) 72,816
Additions 8,692,860 15,474,702
Gains from changes in fair value 415,238 698,674
Disposals and redemptions (10,037,207) (11,300,362)
Amortisation (34,861) (24,865)
Others (38,143) 29,355
As at 31st December 25,472,136 26,958,980
NOTES TO THE CONSOLIDATED FINANCIAL STATEMENTS (CONTINuED) (All amounts in HK dollar thousands unless otherwise stated)
110 SHANGHAI COMMERCIAL BANK ANNUAL REPORT 2013
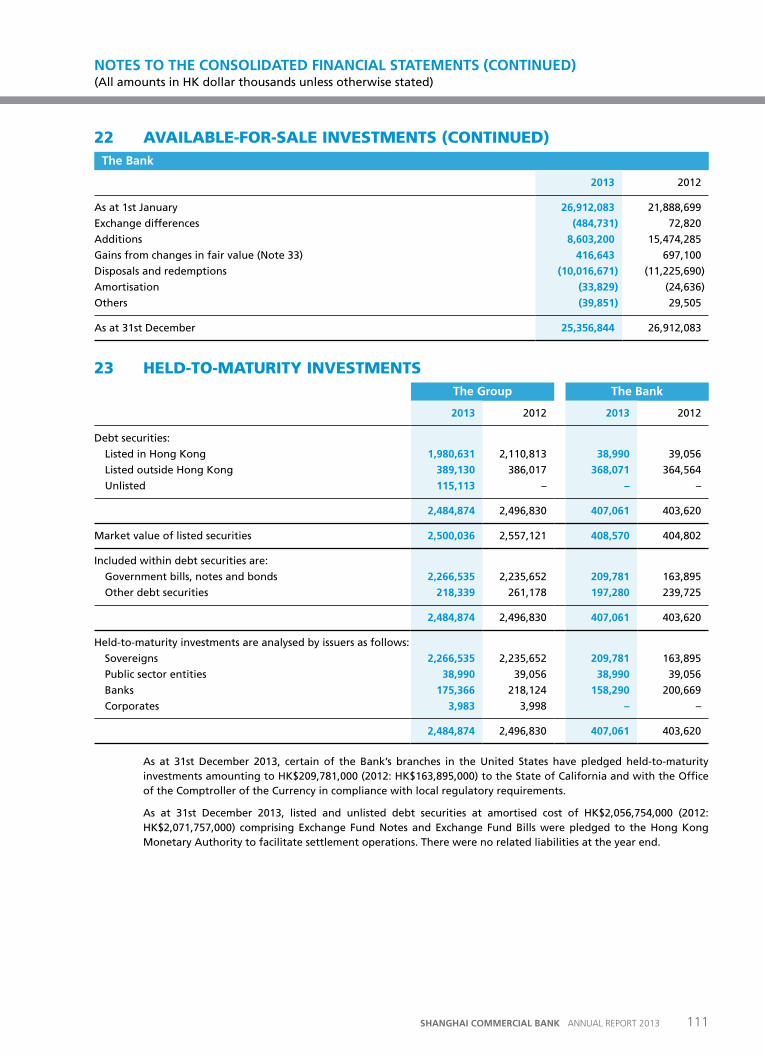
22 AvAILABLE-FOR-SALE INvESTMENTS (CONTINUED)the Bank
2013 2012
As at 1st January 26,912,083 21,888,699
Exchange differences (484,731) 72,820
Additions 8,603,200 15,474,285
Gains from changes in fair value (Note 33) 416,643 697,100
Disposals and redemptions (10,016,671) (11,225,690)
Amortisation (33,829) (24,636)
Others (39,851) 29,505
As at 31st December 25,356,844 26,912,083
23 HELD-TO-MATURITY INvESTMENTSthe Group the Bank
2013 2012 2013 2012
Debt securities:
Listed in Hong Kong 1,980,631 2,110,813 38,990 39,056
Listed outside Hong Kong 389,130 386,017 368,071 364,564
Unlisted 115,113 – – –
2,484,874 2,496,830 407,061 403,620
Market value of listed securities 2,500,036 2,557,121 408,570 404,802
Included within debt securities are:
Government bills, notes and bonds 2,266,535 2,235,652 209,781 163,895
Other debt securities 218,339 261,178 197,280 239,725
2,484,874 2,496,830 407,061 403,620
Held-to-maturity investments are analysed by issuers as follows:
Sovereigns 2,266,535 2,235,652 209,781 163,895
Public sector entities 38,990 39,056 38,990 39,056
Banks 175,366 218,124 158,290 200,669
Corporates 3,983 3,998 – –
2,484,874 2,496,830 407,061 403,620
As at 31st December 2013, certain of the Bank’s branches in the United States have pledged held-to-maturity investments amounting to HK$209,781,000 (2012: HK$163,895,000) to the State of California and with the Office of the Comptroller of the Currency in compliance with local regulatory requirements.
As at 31st December 2013, listed and unlisted debt securities at amortised cost of HK$2,056,754,000 (2012: HK$2,071,757,000) comprising Exchange Fund Notes and Exchange Fund Bills were pledged to the Hong Kong Monetary Authority to facilitate settlement operations. There were no related liabilities at the year end.
NOTES TO THE CONSOLIDATED FINANCIAL STATEMENTS (CONTINuED) (All amounts in HK dollar thousands unless otherwise stated)
111SHANGHAI COMMERCIAL BANK ANNUAL REPORT 2013
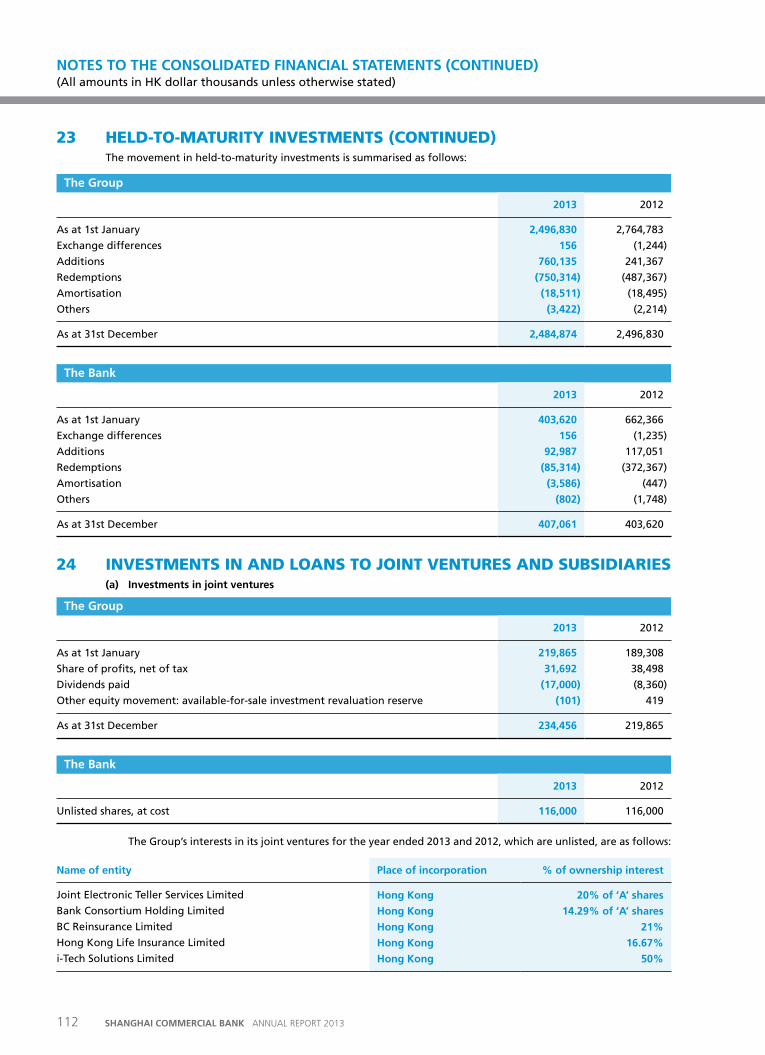
23 HELD-TO-MATURITY INvESTMENTS (CONTINUED)The movement in held-to-maturity investments is summarised as follows:
the Group
2013 2012
As at 1st January 2,496,830 2,764,783
Exchange differences 156 (1,244)
Additions 760,135 241,367
Redemptions (750,314) (487,367)
Amortisation (18,511) (18,495)
Others (3,422) (2,214)
As at 31st December 2,484,874 2,496,830
the Bank
2013 2012
As at 1st January 403,620 662,366
Exchange differences 156 (1,235)
Additions 92,987 117,051
Redemptions (85,314) (372,367)
Amortisation (3,586) (447)
Others (802) (1,748)
As at 31st December 407,061 403,620
24 INvESTMENTS IN AND LOANS TO JOINT vENTURES AND SUBSIDIARIES(a) Investments in joint ventures
the Group
2013 2012
As at 1st January 219,865 189,308
Share of profits, net of tax 31,692 38,498
Dividends paid (17,000) (8,360)
Other equity movement: available-for-sale investment revaluation reserve (101) 419
As at 31st December 234,456 219,865
the Bank
2013 2012
Unlisted shares, at cost 116,000 116,000
The Group’s interests in its joint ventures for the year ended 2013 and 2012, which are unlisted, are as follows:
Name of entity place of incorporation % of ownership interest
Joint Electronic Teller Services Limited Hong Kong 20% of ‘a’ shares
Bank Consortium Holding Limited Hong Kong 14.29% of ‘a’ shares
BC Reinsurance Limited Hong Kong 21%
Hong Kong Life Insurance Limited Hong Kong 16.67%
i-Tech Solutions Limited Hong Kong 50%
NOTES TO THE CONSOLIDATED FINANCIAL STATEMENTS (CONTINuED) (All amounts in HK dollar thousands unless otherwise stated)
112 SHANGHAI COMMERCIAL BANK ANNUAL REPORT 2013
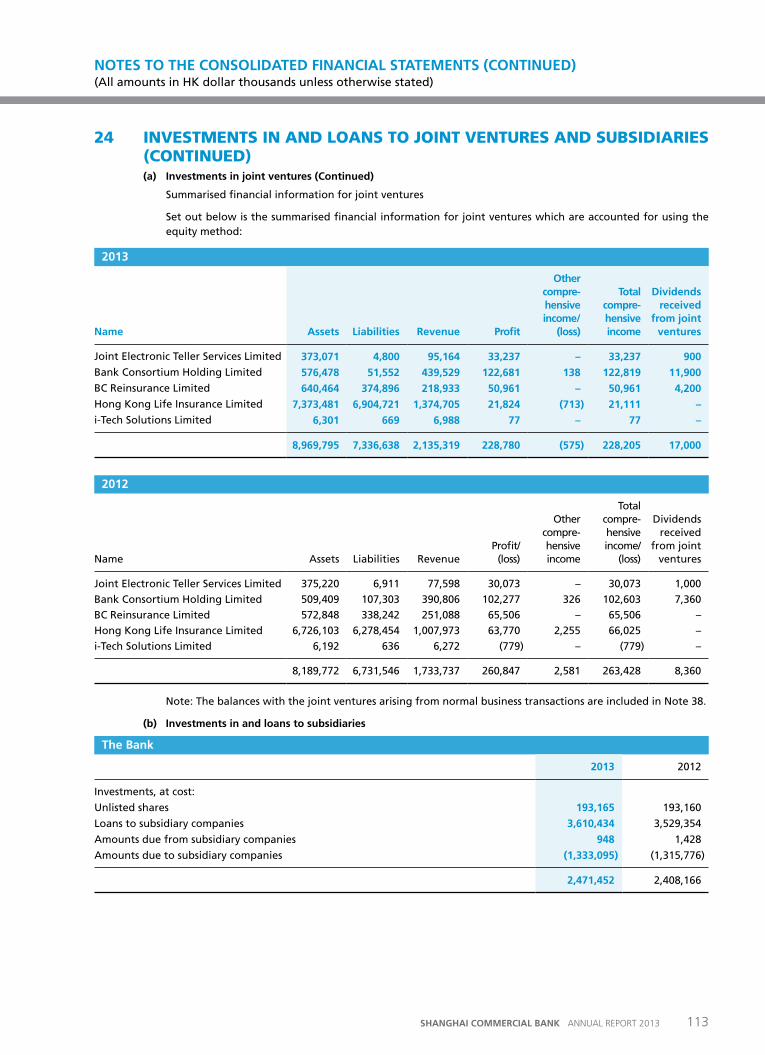
24 INvESTMENTS IN AND LOANS TO JOINT vENTURES AND SUBSIDIARIES (CONTINUED)(a) Investments in joint ventures (Continued)
Summarised financial information for joint ventures
Set out below is the summarised financial information for joint ventures which are accounted for using the equity method:
2013
Name assets Liabilities revenue profit
other compre-hensive income/
(loss)
total compre-hensive income
Dividends received
from joint ventures
Joint Electronic Teller Services Limited 373,071 4,800 95,164 33,237 – 33,237 900
Bank Consortium Holding Limited 576,478 51,552 439,529 122,681 138 122,819 11,900
BC Reinsurance Limited 640,464 374,896 218,933 50,961 – 50,961 4,200
Hong Kong Life Insurance Limited 7,373,481 6,904,721 1,374,705 21,824 (713) 21,111 –
i-Tech Solutions Limited 6,301 669 6,988 77 – 77 –
8,969,795 7,336,638 2,135,319 228,780 (575) 228,205 17,000
2012
Name Assets Liabilities Revenue Profit/
(loss)
Other compre-hensive income
Total compre-hensive income/
(loss)
Dividends received
from joint ventures
Joint Electronic Teller Services Limited 375,220 6,911 77,598 30,073 – 30,073 1,000
Bank Consortium Holding Limited 509,409 107,303 390,806 102,277 326 102,603 7,360
BC Reinsurance Limited 572,848 338,242 251,088 65,506 – 65,506 –
Hong Kong Life Insurance Limited 6,726,103 6,278,454 1,007,973 63,770 2,255 66,025 –
i-Tech Solutions Limited 6,192 636 6,272 (779) – (779) –
8,189,772 6,731,546 1,733,737 260,847 2,581 263,428 8,360
Note: The balances with the joint ventures arising from normal business transactions are included in Note 38.
(b) Investments in and loans to subsidiaries
the Bank
2013 2012
Investments, at cost:
Unlisted shares 193,165 193,160
Loans to subsidiary companies 3,610,434 3,529,354
Amounts due from subsidiary companies 948 1,428
Amounts due to subsidiary companies (1,333,095) (1,315,776)
2,471,452 2,408,166
NOTES TO THE CONSOLIDATED FINANCIAL STATEMENTS (CONTINuED) (All amounts in HK dollar thousands unless otherwise stated)
113SHANGHAI COMMERCIAL BANK ANNUAL REPORT 2013
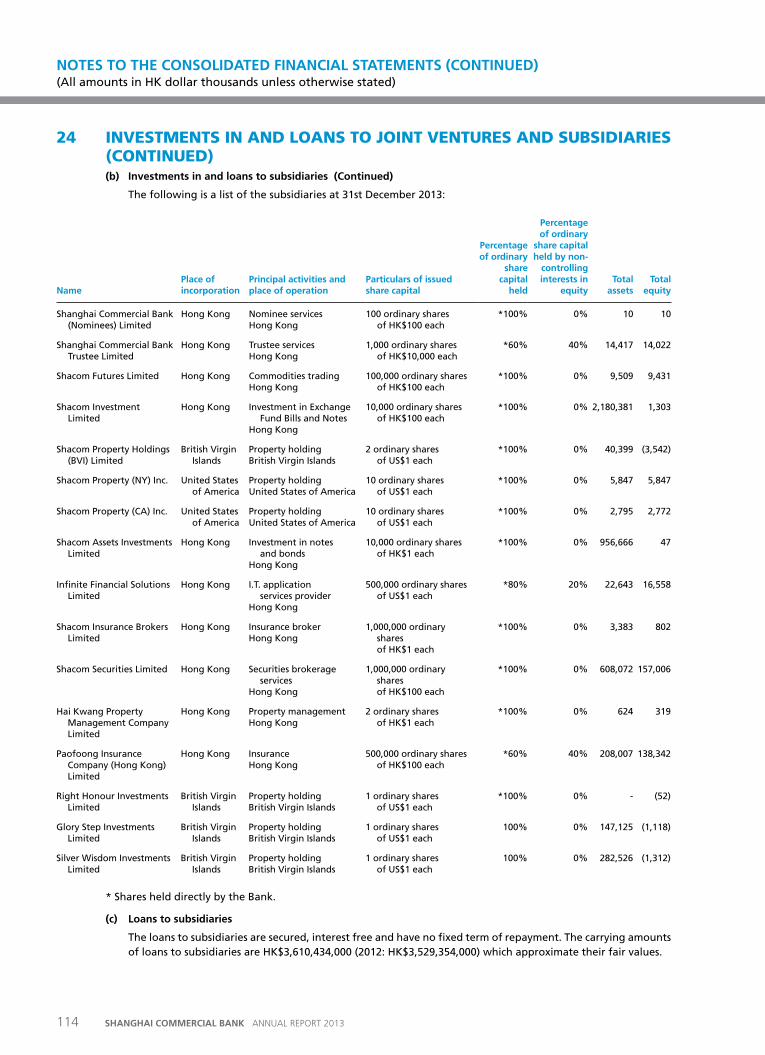
24 INvESTMENTS IN AND LOANS TO JOINT vENTURES AND SUBSIDIARIES (CONTINUED)(b) Investments in and loans to subsidiaries (Continued)
The following is a list of the subsidiaries at 31st December 2013:
Nameplace of incorporation
principal activities and place of operation
particulars of issued share capital
percentage of ordinary
share capital
held
percentage of ordinary
share capital held by non-
controlling interests in
equitytotal
assetstotal
equity
Shanghai Commercial Bank (Nominees) Limited
Hong Kong Nominee services Hong Kong
100 ordinary shares of HK$100 each
*100% 0% 10 10
Shanghai Commercial Bank Trustee Limited
Hong Kong Trustee services Hong Kong
1,000 ordinary shares of HK$10,000 each
*60% 40% 14,417 14,022
Shacom Futures Limited Hong Kong Commodities tradingHong Kong
100,000 ordinary shares of HK$100 each
*100% 0% 9,509 9,431
Shacom Investment Limited
Hong Kong Investment in Exchange Fund Bills and Notes
Hong Kong
10,000 ordinary shares of HK$100 each
*100% 0% 2,180,381 1,303
Shacom Property Holdings (BVI) Limited
British Virgin Islands
Property holding British Virgin Islands
2 ordinary shares of US$1 each
*100% 0% 40,399 (3,542)
Shacom Property (NY) Inc. United States of America
Property holding United States of America
10 ordinary shares of US$1 each
*100% 0% 5,847 5,847
Shacom Property (CA) Inc. United States of America
Property holding United States of America
10 ordinary shares of US$1 each
*100% 0% 2,795 2,772
Shacom Assets Investments Limited
Hong Kong Investment in notes and bonds
Hong Kong
10,000 ordinary shares of HK$1 each
*100% 0% 956,666 47
Infinite Financial Solutions Limited
Hong Kong I.T. application services provider
Hong Kong
500,000 ordinary shares of US$1 each
*80% 20% 22,643 16,558
Shacom Insurance Brokers Limited
Hong Kong Insurance broker Hong Kong
1,000,000 ordinary shares of HK$1 each
*100% 0% 3,383 802
Shacom Securities Limited Hong Kong Securities brokerage services
Hong Kong
1,000,000 ordinary shares of HK$100 each
*100% 0% 608,072 157,006
Hai Kwang Property Management Company Limited
Hong Kong Property managementHong Kong
2 ordinary shares of HK$1 each
*100% 0% 624 319
Paofoong Insurance Company (Hong Kong) Limited
Hong Kong Insurance Hong Kong
500,000 ordinary shares of HK$100 each
*60% 40% 208,007 138,342
Right Honour Investments Limited
British Virgin Islands
Property holding British Virgin Islands
1 ordinary shares of US$1 each
*100% 0% - (52)
Glory Step Investments Limited
British Virgin Islands
Property holding British Virgin Islands
1 ordinary shares of US$1 each
100% 0% 147,125 (1,118)
Silver Wisdom Investments Limited
British Virgin Islands
Property holding British Virgin Islands
1 ordinary shares of US$1 each
100% 0% 282,526 (1,312)
* Shares held directly by the Bank.
(c) Loans to subsidiaries
The loans to subsidiaries are secured, interest free and have no fixed term of repayment. The carrying amounts of loans to subsidiaries are HK$3,610,434,000 (2012: HK$3,529,354,000) which approximate their fair values.
NOTES TO THE CONSOLIDATED FINANCIAL STATEMENTS (CONTINuED) (All amounts in HK dollar thousands unless otherwise stated)
114 SHANGHAI COMMERCIAL BANK ANNUAL REPORT 2013
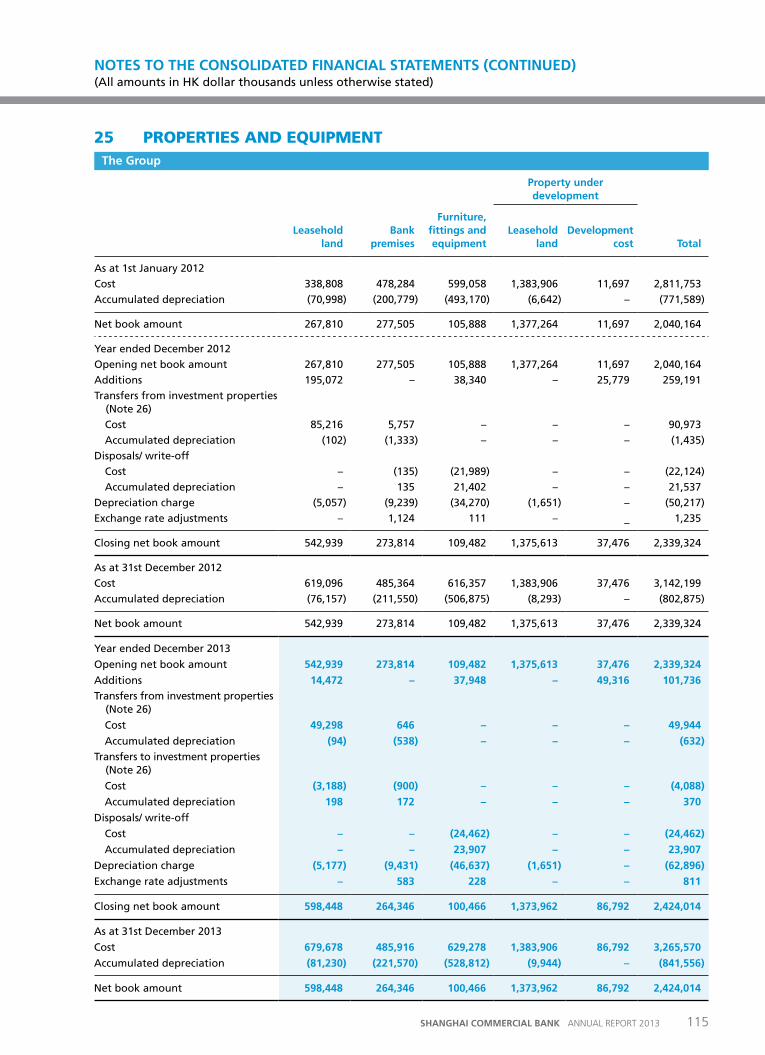
25 PROPERTIES AND EQUIPMENTthe Group
property under development
Leasehold land
Bank premises
Furniture, fittings and equipment
Leasehold land
Development cost total
As at 1st January 2012
Cost 338,808 478,284 599,058 1,383,906 11,697 2,811,753
Accumulated depreciation (70,998) (200,779) (493,170) (6,642) – (771,589)
Net book amount 267,810 277,505 105,888 1,377,264 11,697 2,040,164
Year ended December 2012
Opening net book amount 267,810 277,505 105,888 1,377,264 11,697 2,040,164
Additions 195,072 – 38,340 – 25,779 259,191
Transfers from investment properties (Note 26)
Cost 85,216 5,757 – – – 90,973
Accumulated depreciation (102) (1,333) – – – (1,435)
Disposals/ write-off
Cost – (135) (21,989) – – (22,124)
Accumulated depreciation – 135 21,402 – – 21,537
Depreciation charge (5,057) (9,239) (34,270) (1,651) – (50,217)
Exchange rate adjustments – 1,124 111 – – 1,235
Closing net book amount 542,939 273,814 109,482 1,375,613 37,476 2,339,324
As at 31st December 2012
Cost 619,096 485,364 616,357 1,383,906 37,476 3,142,199
Accumulated depreciation (76,157) (211,550) (506,875) (8,293) – (802,875)
Net book amount 542,939 273,814 109,482 1,375,613 37,476 2,339,324
Year ended December 2013
Opening net book amount 542,939 273,814 109,482 1,375,613 37,476 2,339,324
Additions 14,472 – 37,948 – 49,316 101,736
Transfers from investment properties (Note 26)
Cost 49,298 646 – – – 49,944
Accumulated depreciation (94) (538) – – – (632)
Transfers to investment properties (Note 26)
Cost (3,188) (900) – – – (4,088)
Accumulated depreciation 198 172 – – – 370
Disposals/ write-off
Cost – – (24,462) – – (24,462)
Accumulated depreciation – – 23,907 – – 23,907
Depreciation charge (5,177) (9,431) (46,637) (1,651) – (62,896)
Exchange rate adjustments – 583 228 – – 811
Closing net book amount 598,448 264,346 100,466 1,373,962 86,792 2,424,014
As at 31st December 2013
Cost 679,678 485,916 629,278 1,383,906 86,792 3,265,570
Accumulated depreciation (81,230) (221,570) (528,812) (9,944) – (841,556)
Net book amount 598,448 264,346 100,466 1,373,962 86,792 2,424,014
NOTES TO THE CONSOLIDATED FINANCIAL STATEMENTS (CONTINuED) (All amounts in HK dollar thousands unless otherwise stated)
115SHANGHAI COMMERCIAL BANK ANNUAL REPORT 2013
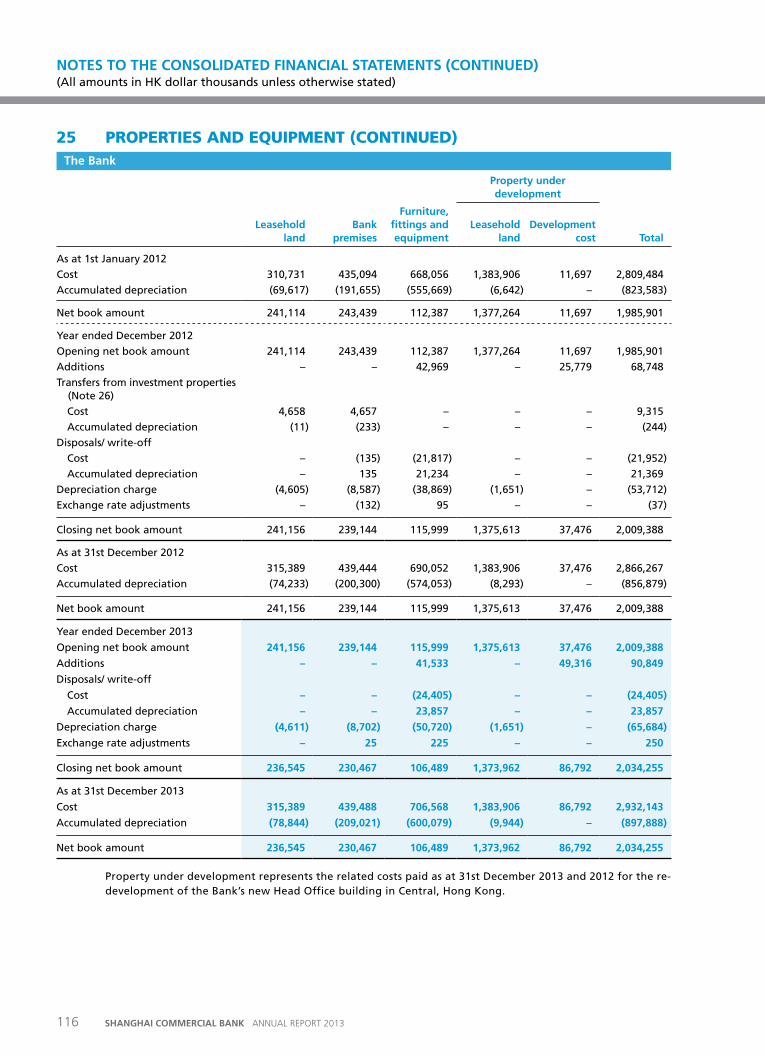
25 PROPERTIES AND EQUIPMENT (CONTINUED)the Bank
property under development
Leasehold land
Bank premises
Furniture, fittings and equipment
Leasehold land
Development cost total
As at 1st January 2012
Cost 310,731 435,094 668,056 1,383,906 11,697 2,809,484
Accumulated depreciation (69,617) (191,655) (555,669) (6,642) – (823,583)
Net book amount 241,114 243,439 112,387 1,377,264 11,697 1,985,901
Year ended December 2012
Opening net book amount 241,114 243,439 112,387 1,377,264 11,697 1,985,901
Additions – – 42,969 – 25,779 68,748
Transfers from investment properties (Note 26)
Cost 4,658 4,657 – – – 9,315
Accumulated depreciation (11) (233) – – – (244)
Disposals/ write-off
Cost – (135) (21,817) – – (21,952)
Accumulated depreciation – 135 21,234 – – 21,369
Depreciation charge (4,605) (8,587) (38,869) (1,651) – (53,712)
Exchange rate adjustments – (132) 95 – – (37)
Closing net book amount 241,156 239,144 115,999 1,375,613 37,476 2,009,388
As at 31st December 2012
Cost 315,389 439,444 690,052 1,383,906 37,476 2,866,267
Accumulated depreciation (74,233) (200,300) (574,053) (8,293) – (856,879)
Net book amount 241,156 239,144 115,999 1,375,613 37,476 2,009,388
Year ended December 2013
Opening net book amount 241,156 239,144 115,999 1,375,613 37,476 2,009,388
Additions – – 41,533 – 49,316 90,849
Disposals/ write-off
Cost – – (24,405) – – (24,405)
Accumulated depreciation – – 23,857 – – 23,857
Depreciation charge (4,611) (8,702) (50,720) (1,651) – (65,684)
Exchange rate adjustments – 25 225 – – 250
Closing net book amount 236,545 230,467 106,489 1,373,962 86,792 2,034,255
As at 31st December 2013
Cost 315,389 439,488 706,568 1,383,906 86,792 2,932,143
Accumulated depreciation (78,844) (209,021) (600,079) (9,944) – (897,888)
Net book amount 236,545 230,467 106,489 1,373,962 86,792 2,034,255
Property under development represents the related costs paid as at 31st December 2013 and 2012 for the re-development of the Bank’s new Head Office building in Central, Hong Kong.
NOTES TO THE CONSOLIDATED FINANCIAL STATEMENTS (CONTINuED) (All amounts in HK dollar thousands unless otherwise stated)
116 SHANGHAI COMMERCIAL BANK ANNUAL REPORT 2013
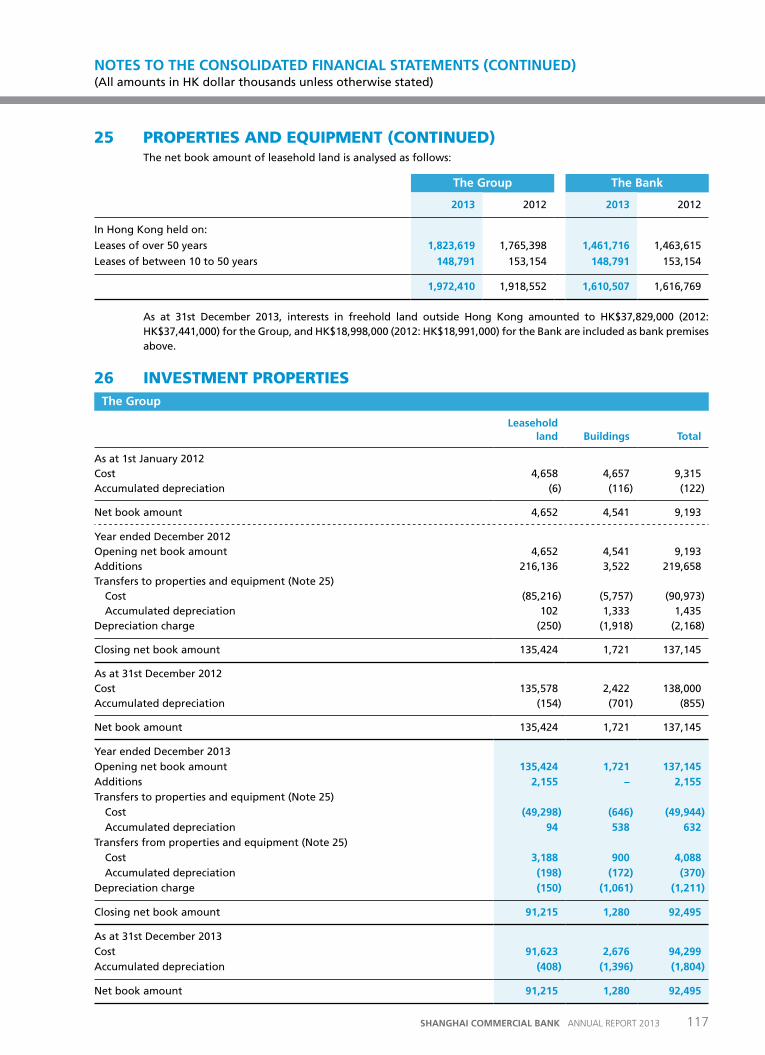
25 PROPERTIES AND EQUIPMENT (CONTINUED) The net book amount of leasehold land is analysed as follows:
the Group the Bank
2013 2012 2013 2012
In Hong Kong held on:
Leases of over 50 years 1,823,619 1,765,398 1,461,716 1,463,615
Leases of between 10 to 50 years 148,791 153,154 148,791 153,154
1,972,410 1,918,552 1,610,507 1,616,769
As at 31st December 2013, interests in freehold land outside Hong Kong amounted to HK$37,829,000 (2012: HK$37,441,000) for the Group, and HK$18,998,000 (2012: HK$18,991,000) for the Bank are included as bank premises above.
26 INvESTMENT PROPERTIESthe Group
Leasehold land Buildings total
As at 1st January 2012Cost 4,658 4,657 9,315 Accumulated depreciation (6) (116) (122)
Net book amount 4,652 4,541 9,193
Year ended December 2012Opening net book amount 4,652 4,541 9,193 Additions 216,136 3,522 219,658 Transfers to properties and equipment (Note 25) Cost (85,216) (5,757) (90,973) Accumulated depreciation 102 1,333 1,435 Depreciation charge (250) (1,918) (2,168)
Closing net book amount 135,424 1,721 137,145
As at 31st December 2012 Cost 135,578 2,422 138,000 Accumulated depreciation (154) (701) (855)
Net book amount 135,424 1,721 137,145
Year ended December 2013Opening net book amount 135,424 1,721 137,145 Additions 2,155 – 2,155 Transfers to properties and equipment (Note 25) Cost (49,298) (646) (49,944) Accumulated depreciation 94 538 632 Transfers from properties and equipment (Note 25) Cost 3,188 900 4,088 Accumulated depreciation (198) (172) (370)Depreciation charge (150) (1,061) (1,211)
Closing net book amount 91,215 1,280 92,495
As at 31st December 2013Cost 91,623 2,676 94,299 Accumulated depreciation (408) (1,396) (1,804)
Net book amount 91,215 1,280 92,495
NOTES TO THE CONSOLIDATED FINANCIAL STATEMENTS (CONTINuED) (All amounts in HK dollar thousands unless otherwise stated)
117SHANGHAI COMMERCIAL BANK ANNUAL REPORT 2013
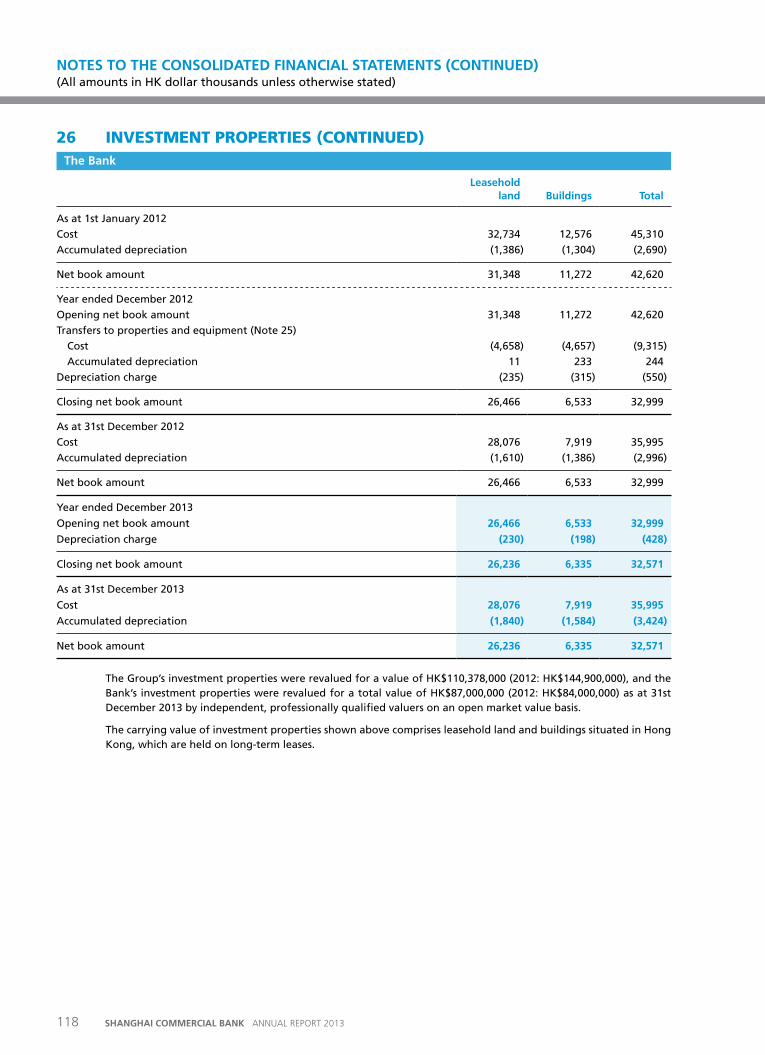
26 INvESTMENT PROPERTIES (CONTINUED)the Bank
Leasehold land Buildings total
As at 1st January 2012
Cost 32,734 12,576 45,310
Accumulated depreciation (1,386) (1,304) (2,690)
Net book amount 31,348 11,272 42,620
Year ended December 2012
Opening net book amount 31,348 11,272 42,620
Transfers to properties and equipment (Note 25)
Cost (4,658) (4,657) (9,315)
Accumulated depreciation 11 233 244
Depreciation charge (235) (315) (550)
Closing net book amount 26,466 6,533 32,999
As at 31st December 2012
Cost 28,076 7,919 35,995
Accumulated depreciation (1,610) (1,386) (2,996)
Net book amount 26,466 6,533 32,999
Year ended December 2013
Opening net book amount 26,466 6,533 32,999
Depreciation charge (230) (198) (428)
Closing net book amount 26,236 6,335 32,571
As at 31st December 2013
Cost 28,076 7,919 35,995
Accumulated depreciation (1,840) (1,584) (3,424)
Net book amount 26,236 6,335 32,571
The Group’s investment properties were revalued for a value of HK$110,378,000 (2012: HK$144,900,000), and the Bank’s investment properties were revalued for a total value of HK$87,000,000 (2012: HK$84,000,000) as at 31st December 2013 by independent, professionally qualified valuers on an open market value basis.
The carrying value of investment properties shown above comprises leasehold land and buildings situated in Hong Kong, which are held on long-term leases.
NOTES TO THE CONSOLIDATED FINANCIAL STATEMENTS (CONTINuED) (All amounts in HK dollar thousands unless otherwise stated)
118 SHANGHAI COMMERCIAL BANK ANNUAL REPORT 2013
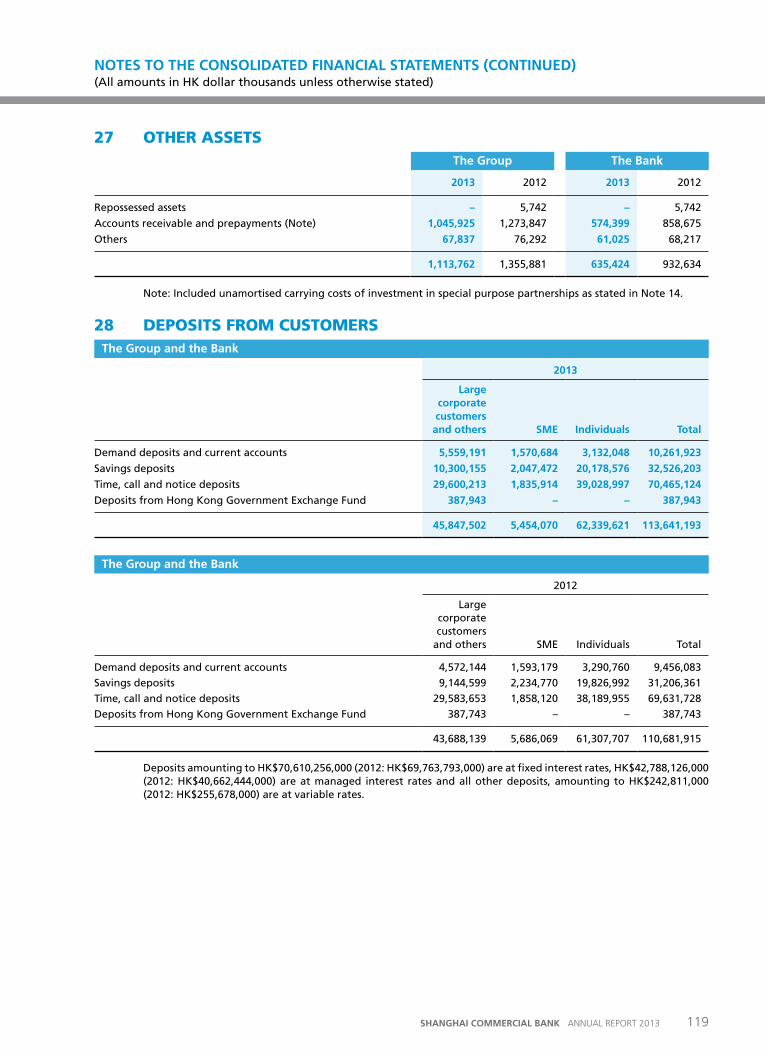
27 OTHER ASSETSthe Group the Bank
2013 2012 2013 2012
Repossessed assets – 5,742 – 5,742
Accounts receivable and prepayments (Note) 1,045,925 1,273,847 574,399 858,675
Others 67,837 76,292 61,025 68,217
1,113,762 1,355,881 635,424 932,634
Note: Included unamortised carrying costs of investment in special purpose partnerships as stated in Note 14.
28 DEPOSITS FROM CUSTOMERSthe Group and the Bank
2013
Large corporate customers
and others SME Individuals total
Demand deposits and current accounts 5,559,191 1,570,684 3,132,048 10,261,923
Savings deposits 10,300,155 2,047,472 20,178,576 32,526,203
Time, call and notice deposits 29,600,213 1,835,914 39,028,997 70,465,124
Deposits from Hong Kong Government Exchange Fund 387,943 – – 387,943
45,847,502 5,454,070 62,339,621 113,641,193
the Group and the Bank
2012
Large corporate customers
and others SME Individuals Total
Demand deposits and current accounts 4,572,144 1,593,179 3,290,760 9,456,083
Savings deposits 9,144,599 2,234,770 19,826,992 31,206,361
Time, call and notice deposits 29,583,653 1,858,120 38,189,955 69,631,728
Deposits from Hong Kong Government Exchange Fund 387,743 – – 387,743
43,688,139 5,686,069 61,307,707 110,681,915
Deposits amounting to HK$70,610,256,000 (2012: HK$69,763,793,000) are at fixed interest rates, HK$42,788,126,000 (2012: HK$40,662,444,000) are at managed interest rates and all other deposits, amounting to HK$242,811,000 (2012: HK$255,678,000) are at variable rates.
NOTES TO THE CONSOLIDATED FINANCIAL STATEMENTS (CONTINuED) (All amounts in HK dollar thousands unless otherwise stated)
119SHANGHAI COMMERCIAL BANK ANNUAL REPORT 2013
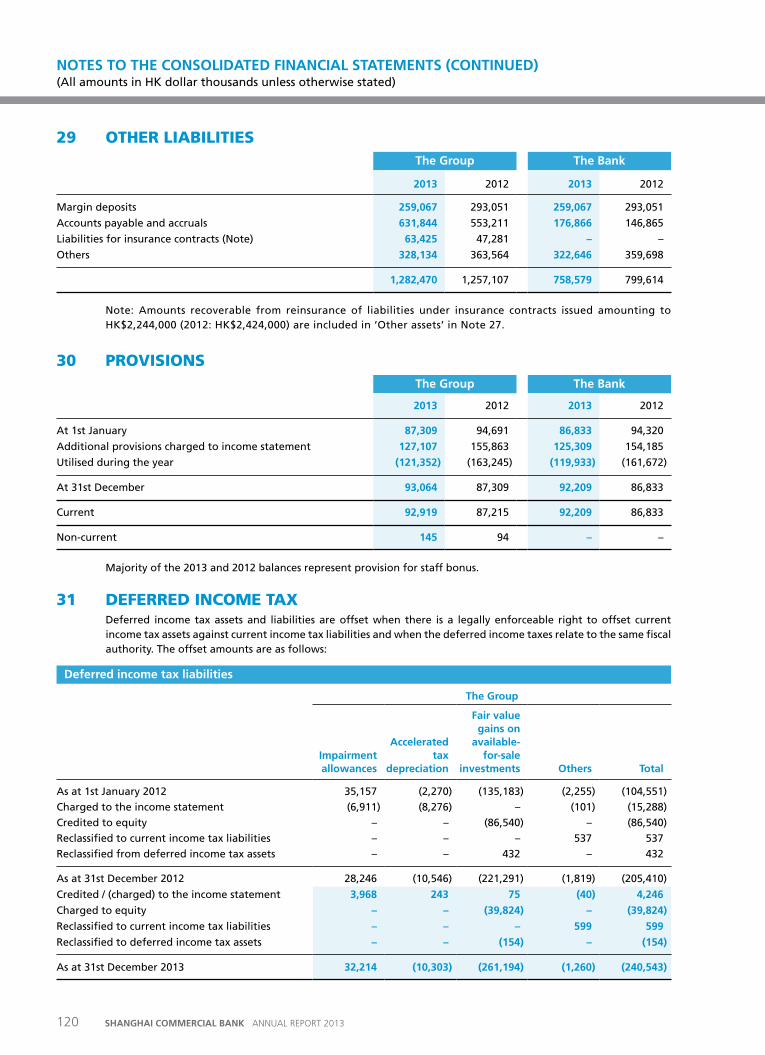
29 OTHER LIABILITIESthe Group the Bank
2013 2012 2013 2012
Margin deposits 259,067 293,051 259,067 293,051
Accounts payable and accruals 631,844 553,211 176,866 146,865
Liabilities for insurance contracts (Note) 63,425 47,281 – –
Others 328,134 363,564 322,646 359,698
1,282,470 1,257,107 758,579 799,614
Note: Amounts recoverable from reinsurance of liabilities under insurance contracts issued amounting to HK$2,244,000 (2012: HK$2,424,000) are included in ‘Other assets’ in Note 27.
30 PROvISIONSthe Group the Bank
2013 2012 2013 2012
At 1st January 87,309 94,691 86,833 94,320
Additional provisions charged to income statement 127,107 155,863 125,309 154,185
Utilised during the year (121,352) (163,245) (119,933) (161,672)
At 31st December 93,064 87,309 92,209 86,833
Current 92,919 87,215 92,209 86,833
Non-current 145 94 – –
Majority of the 2013 and 2012 balances represent provision for staff bonus.
31 DEFERRED INCOME TAXDeferred income tax assets and liabilities are offset when there is a legally enforceable right to offset current income tax assets against current income tax liabilities and when the deferred income taxes relate to the same fiscal authority. The offset amounts are as follows:
Deferred income tax liabilities
the Group
Impairment allowances
accelerated tax
depreciation
Fair value gains on
available-for-sale
investments others total
As at 1st January 2012 35,157 (2,270) (135,183) (2,255) (104,551)
Charged to the income statement (6,911) (8,276) – (101) (15,288)
Credited to equity – – (86,540) – (86,540)
Reclassified to current income tax liabilities – – – 537 537
Reclassified from deferred income tax assets – – 432 – 432
As at 31st December 2012 28,246 (10,546) (221,291) (1,819) (205,410)
Credited / (charged) to the income statement 3,968 243 75 (40) 4,246
Charged to equity – – (39,824) – (39,824)
Reclassified to current income tax liabilities – – – 599 599
Reclassified to deferred income tax assets – – (154) – (154)
As at 31st December 2013 32,214 (10,303) (261,194) (1,260) (240,543)
NOTES TO THE CONSOLIDATED FINANCIAL STATEMENTS (CONTINuED) (All amounts in HK dollar thousands unless otherwise stated)
120 SHANGHAI COMMERCIAL BANK ANNUAL REPORT 2013
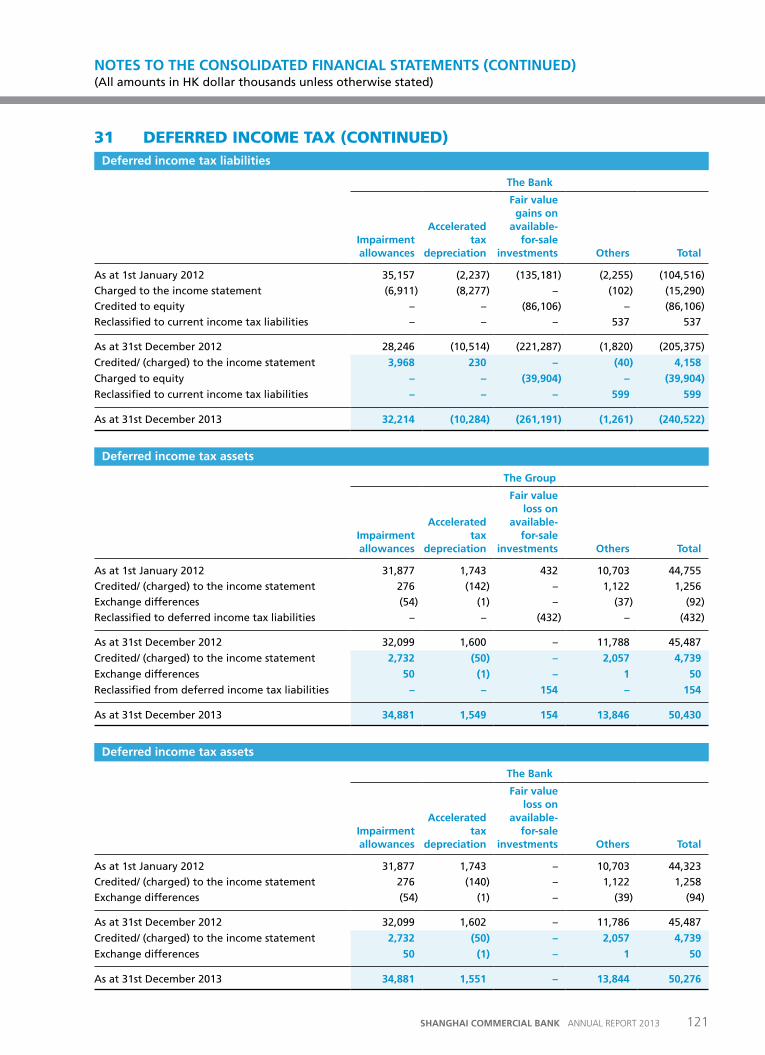
31 DEFERRED INCOME TAX (CONTINUED)Deferred income tax liabilities
the Bank
Impairment allowances
accelerated tax
depreciation
Fair value gains on
available-for-sale
investments others total
As at 1st January 2012 35,157 (2,237) (135,181) (2,255) (104,516)
Charged to the income statement (6,911) (8,277) – (102) (15,290)
Credited to equity – – (86,106) – (86,106)
Reclassified to current income tax liabilities – – – 537 537
As at 31st December 2012 28,246 (10,514) (221,287) (1,820) (205,375)
Credited/ (charged) to the income statement 3,968 230 – (40) 4,158
Charged to equity – – (39,904) – (39,904)
Reclassified to current income tax liabilities – – – 599 599
As at 31st December 2013 32,214 (10,284) (261,191) (1,261) (240,522)
Deferred income tax assets
the Group
Impairment allowances
accelerated tax
depreciation
Fair value loss on
available-for-sale
investments others total
As at 1st January 2012 31,877 1,743 432 10,703 44,755
Credited/ (charged) to the income statement 276 (142) – 1,122 1,256
Exchange differences (54) (1) – (37) (92)
Reclassified to deferred income tax liabilities – – (432) – (432)
As at 31st December 2012 32,099 1,600 – 11,788 45,487
Credited/ (charged) to the income statement 2,732 (50) – 2,057 4,739
Exchange differences 50 (1) – 1 50
Reclassified from deferred income tax liabilities – – 154 – 154
As at 31st December 2013 34,881 1,549 154 13,846 50,430
Deferred income tax assets
the Bank
Impairment allowances
accelerated tax
depreciation
Fair value loss on
available-for-sale
investments others total
As at 1st January 2012 31,877 1,743 – 10,703 44,323
Credited/ (charged) to the income statement 276 (140) – 1,122 1,258
Exchange differences (54) (1) – (39) (94)
As at 31st December 2012 32,099 1,602 – 11,786 45,487
Credited/ (charged) to the income statement 2,732 (50) – 2,057 4,739
Exchange differences 50 (1) – 1 50
As at 31st December 2013 34,881 1,551 – 13,844 50,276
NOTES TO THE CONSOLIDATED FINANCIAL STATEMENTS (CONTINuED) (All amounts in HK dollar thousands unless otherwise stated)
121SHANGHAI COMMERCIAL BANK ANNUAL REPORT 2013
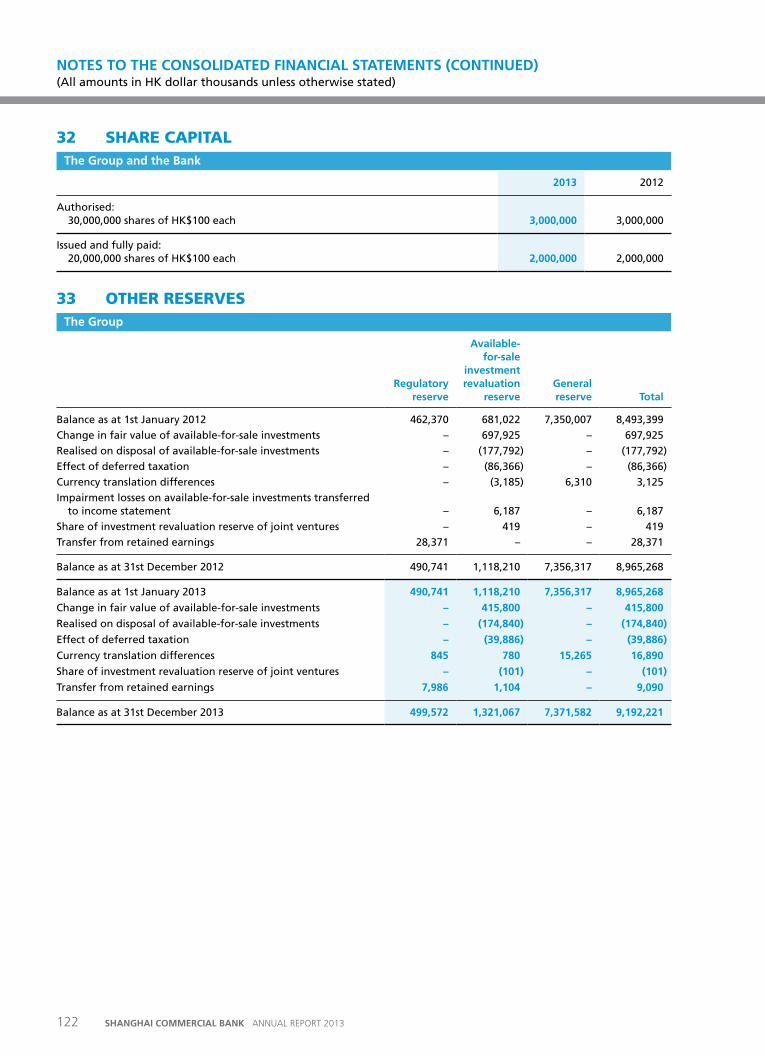
32 SHARE CAPITALthe Group and the Bank
2013 2012
Authorised: 30,000,000 shares of HK$100 each 3,000,000 3,000,000
Issued and fully paid: 20,000,000 shares of HK$100 each 2,000,000 2,000,000
33 OTHER RESERvESthe Group
regulatory reserve
available-for-sale
investment revaluation
reserveGeneral reserve total
Balance as at 1st January 2012 462,370 681,022 7,350,007 8,493,399
Change in fair value of available-for-sale investments – 697,925 – 697,925
Realised on disposal of available-for-sale investments – (177,792) – (177,792)
Effect of deferred taxation – (86,366) – (86,366)
Currency translation differences – (3,185) 6,310 3,125
Impairment losses on available-for-sale investments transferred to income statement – 6,187 – 6,187
Share of investment revaluation reserve of joint ventures – 419 – 419
Transfer from retained earnings 28,371 – – 28,371
Balance as at 31st December 2012 490,741 1,118,210 7,356,317 8,965,268
Balance as at 1st January 2013 490,741 1,118,210 7,356,317 8,965,268
Change in fair value of available-for-sale investments – 415,800 – 415,800
Realised on disposal of available-for-sale investments – (174,840) – (174,840)
Effect of deferred taxation – (39,886) – (39,886)
Currency translation differences 845 780 15,265 16,890
Share of investment revaluation reserve of joint ventures – (101) – (101)
Transfer from retained earnings 7,986 1,104 – 9,090
Balance as at 31st December 2013 499,572 1,321,067 7,371,582 9,192,221
NOTES TO THE CONSOLIDATED FINANCIAL STATEMENTS (CONTINuED) (All amounts in HK dollar thousands unless otherwise stated)
122 SHANGHAI COMMERCIAL BANK ANNUAL REPORT 2013
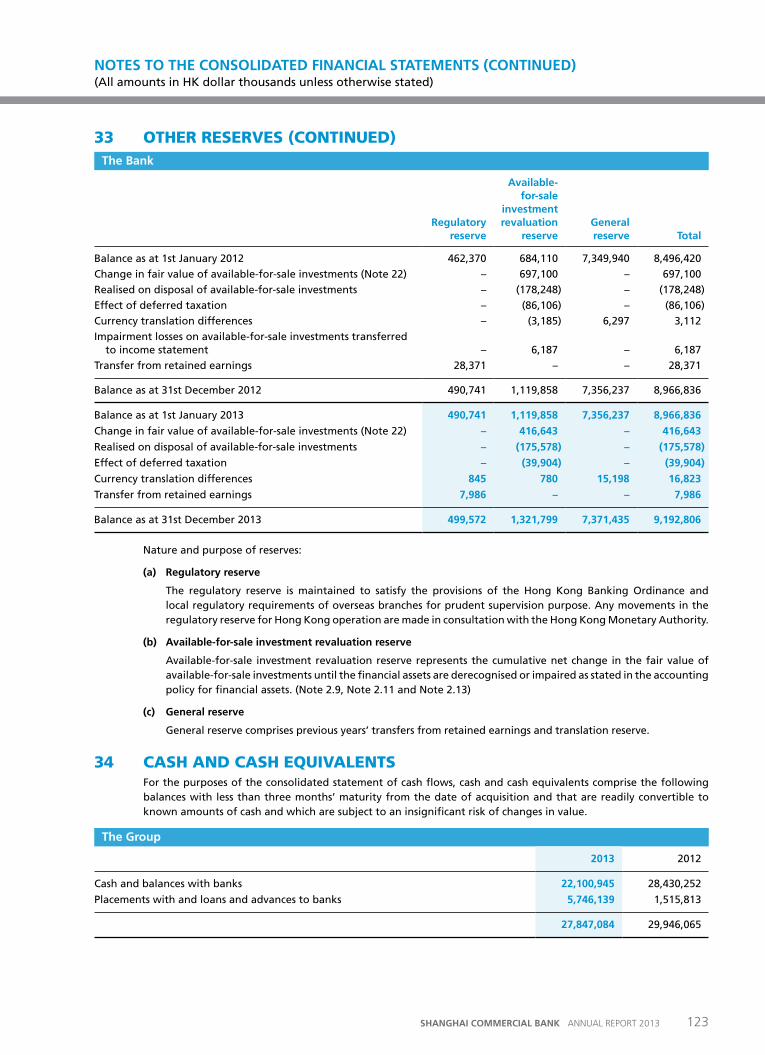
33 OTHER RESERvES (CONTINUED)the Bank
regulatory reserve
available-for-sale
investment revaluation
reserve General reserve total
Balance as at 1st January 2012 462,370 684,110 7,349,940 8,496,420
Change in fair value of available-for-sale investments (Note 22) – 697,100 – 697,100
Realised on disposal of available-for-sale investments – (178,248) – (178,248)
Effect of deferred taxation – (86,106) – (86,106)
Currency translation differences – (3,185) 6,297 3,112
Impairment losses on available-for-sale investments transferred to income statement – 6,187 – 6,187
Transfer from retained earnings 28,371 – – 28,371
Balance as at 31st December 2012 490,741 1,119,858 7,356,237 8,966,836
Balance as at 1st January 2013 490,741 1,119,858 7,356,237 8,966,836
Change in fair value of available-for-sale investments (Note 22) – 416,643 – 416,643
Realised on disposal of available-for-sale investments – (175,578) – (175,578)
Effect of deferred taxation – (39,904) – (39,904)
Currency translation differences 845 780 15,198 16,823
Transfer from retained earnings 7,986 – – 7,986
Balance as at 31st December 2013 499,572 1,321,799 7,371,435 9,192,806
Nature and purpose of reserves:
(a) regulatory reserve
The regulatory reserve is maintained to satisfy the provisions of the Hong Kong Banking Ordinance and local regulatory requirements of overseas branches for prudent supervision purpose. Any movements in the regulatory reserve for Hong Kong operation are made in consultation with the Hong Kong Monetary Authority.
(b) available-for-sale investment revaluation reserve
Available-for-sale investment revaluation reserve represents the cumulative net change in the fair value of available-for-sale investments until the financial assets are derecognised or impaired as stated in the accounting policy for financial assets. (Note 2.9, Note 2.11 and Note 2.13)
(c) General reserve
General reserve comprises previous years’ transfers from retained earnings and translation reserve.
34 CASH AND CASH EQUIvALENTSFor the purposes of the consolidated statement of cash flows, cash and cash equivalents comprise the following balances with less than three months’ maturity from the date of acquisition and that are readily convertible to known amounts of cash and which are subject to an insignificant risk of changes in value.
the Group
2013 2012
Cash and balances with banks 22,100,945 28,430,252
Placements with and loans and advances to banks 5,746,139 1,515,813
27,847,084 29,946,065
NOTES TO THE CONSOLIDATED FINANCIAL STATEMENTS (CONTINuED) (All amounts in HK dollar thousands unless otherwise stated)
123SHANGHAI COMMERCIAL BANK ANNUAL REPORT 2013
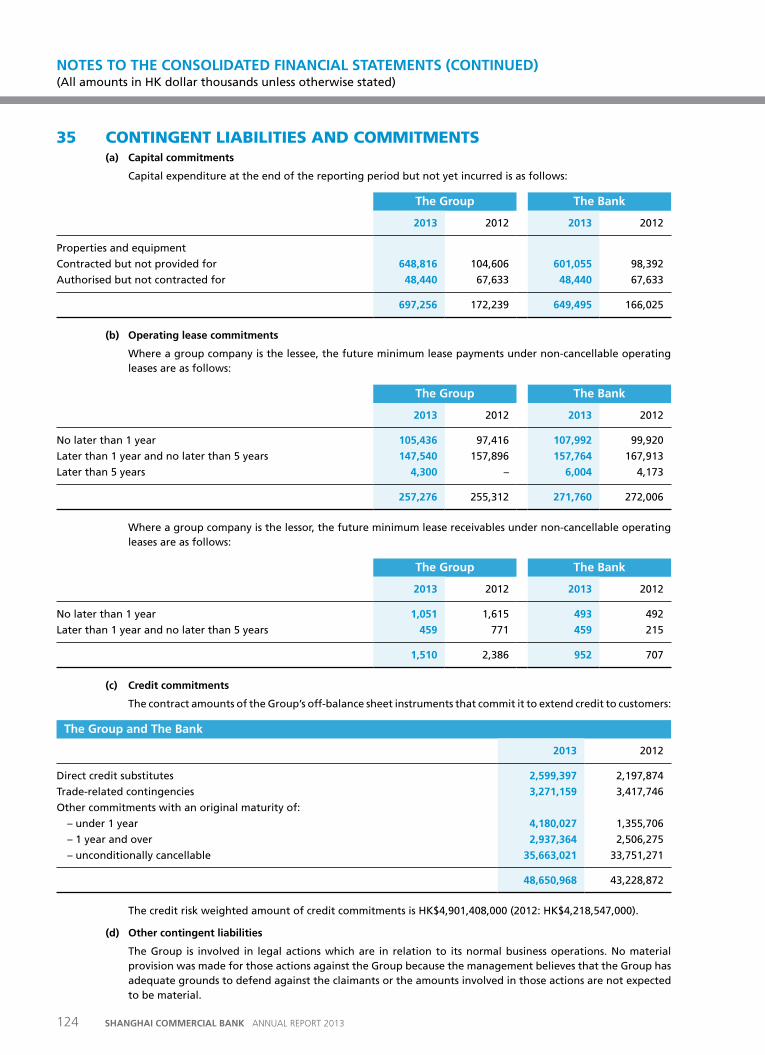
35 CONTINGENT LIABILITIES AND COMMITMENTS(a) Capital commitments
Capital expenditure at the end of the reporting period but not yet incurred is as follows:
the Group the Bank
2013 2012 2013 2012
Properties and equipment
Contracted but not provided for 648,816 104,606 601,055 98,392
Authorised but not contracted for 48,440 67,633 48,440 67,633
697,256 172,239 649,495 166,025
(b) operating lease commitments
Where a group company is the lessee, the future minimum lease payments under non-cancellable operating leases are as follows:
the Group the Bank
2013 2012 2013 2012
No later than 1 year 105,436 97,416 107,992 99,920
Later than 1 year and no later than 5 years 147,540 157,896 157,764 167,913
Later than 5 years 4,300 – 6,004 4,173
257,276 255,312 271,760 272,006
Where a group company is the lessor, the future minimum lease receivables under non-cancellable operating leases are as follows:
the Group the Bank
2013 2012 2013 2012
No later than 1 year 1,051 1,615 493 492
Later than 1 year and no later than 5 years 459 771 459 215
1,510 2,386 952 707
(c) Credit commitments
The contract amounts of the Group’s off-balance sheet instruments that commit it to extend credit to customers:
the Group and the Bank
2013 2012
Direct credit substitutes 2,599,397 2,197,874
Trade-related contingencies 3,271,159 3,417,746
Other commitments with an original maturity of:
– under 1 year 4,180,027 1,355,706
– 1 year and over 2,937,364 2,506,275
– unconditionally cancellable 35,663,021 33,751,271
48,650,968 43,228,872
The credit risk weighted amount of credit commitments is HK$4,901,408,000 (2012: HK$4,218,547,000).
(d) other contingent liabilities
The Group is involved in legal actions which are in relation to its normal business operations. No material provision was made for those actions against the Group because the management believes that the Group has adequate grounds to defend against the claimants or the amounts involved in those actions are not expected to be material.
NOTES TO THE CONSOLIDATED FINANCIAL STATEMENTS (CONTINuED) (All amounts in HK dollar thousands unless otherwise stated)
124 SHANGHAI COMMERCIAL BANK ANNUAL REPORT 2013
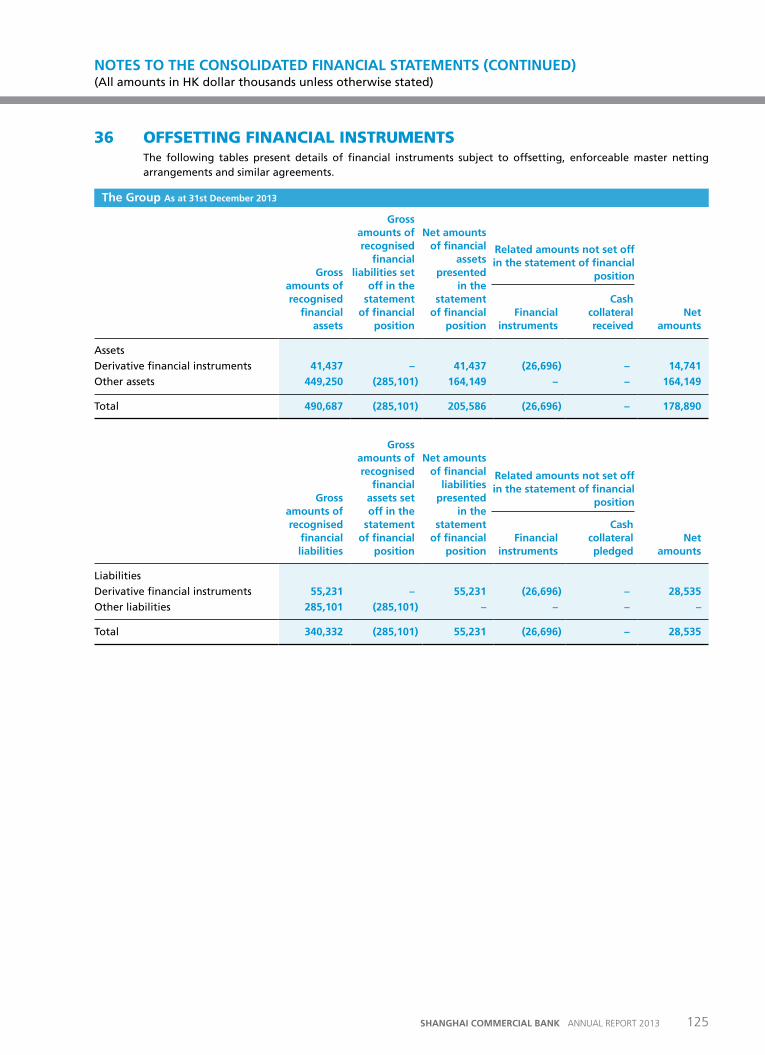
36 OFFSETTING FINANCIAL INSTRUMENTSThe following tables present details of financial instruments subject to offsetting, enforceable master netting arrangements and similar agreements.
the Group as at 31st December 2013
Gross amounts of recognised
financial assets
Gross amounts of recognised
financial liabilities set
off in the statement
of financial position
Net amounts of financial
assets presented
in the statement
of financial position
Net amounts
Financial instruments
Cash collateral received
Assets
Derivative financial instruments 41,437 – 41,437 (26,696) – 14,741
Other assets 449,250 (285,101) 164,149 – – 164,149
Total 490,687 (285,101) 205,586 (26,696) – 178,890
Gross amounts of recognised
financial liabilities
Gross amounts of recognised
financial assets set off in the
statement of financial
position
Net amounts of financial
liabilities presented
in the statement
of financial position
Financial instruments
Cash collateral pledged
Net amounts
Liabilities
Derivative financial instruments 55,231 – 55,231 (26,696) – 28,535
Other liabilities 285,101 (285,101) – – – –
Total 340,332 (285,101) 55,231 (26,696) – 28,535
related amounts not set off in the statement of financial
position
related amounts not set off in the statement of financial
position
NOTES TO THE CONSOLIDATED FINANCIAL STATEMENTS (CONTINuED) (All amounts in HK dollar thousands unless otherwise stated)
125SHANGHAI COMMERCIAL BANK ANNUAL REPORT 2013
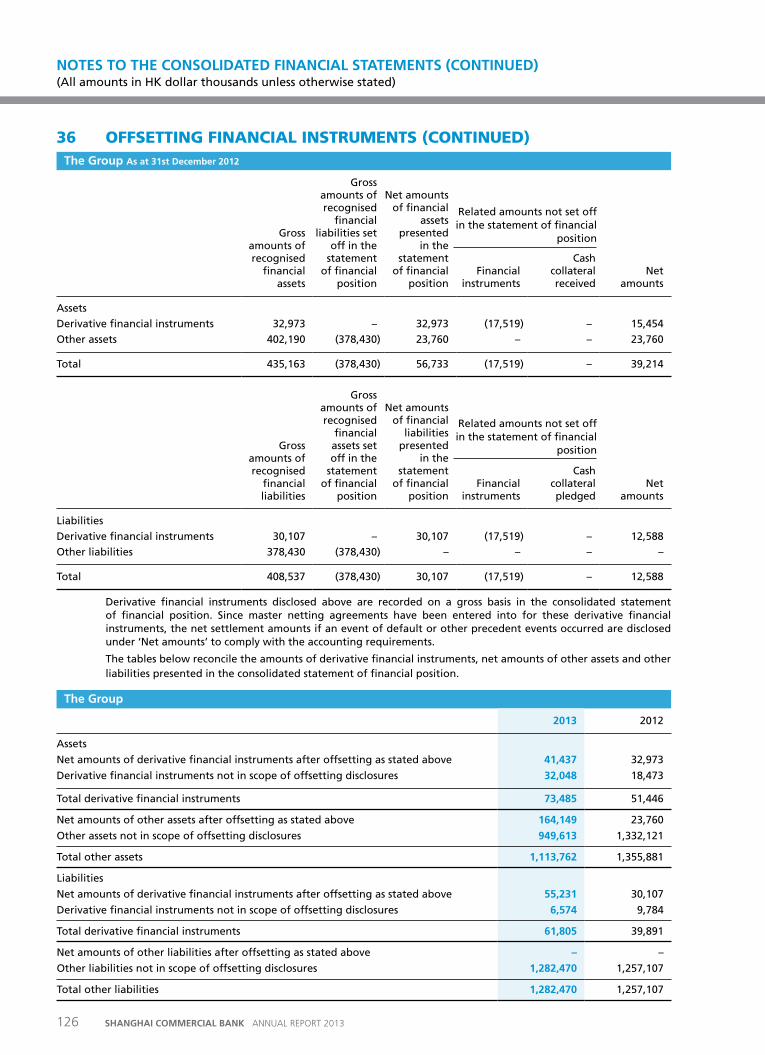
36 OFFSETTING FINANCIAL INSTRUMENTS (CONTINUED)the Group as at 31st December 2012
Gross amounts of recognised
financial assets
Gross amounts of recognised
financial liabilities set
off in the statement
of financial position
Net amounts of financial
assets presented
in the statement
of financial position
Financial instruments
Cash collateral received
Net amounts
Assets
Derivative financial instruments 32,973 – 32,973 (17,519) – 15,454
Other assets 402,190 (378,430) 23,760 – – 23,760
Total 435,163 (378,430) 56,733 (17,519) – 39,214
Gross amounts of recognised
financial liabilities
Gross amounts of recognised
financial assets set off in the
statement of financial
position
Net amounts of financial
liabilities presented
in the statement
of financial position
Financial instruments
Cash collateral pledged
Net amounts
Liabilities
Derivative financial instruments 30,107 – 30,107 (17,519) – 12,588
Other liabilities 378,430 (378,430) – – – –
Total 408,537 (378,430) 30,107 (17,519) – 12,588
Derivative financial instruments disclosed above are recorded on a gross basis in the consolidated statement of financial position. Since master netting agreements have been entered into for these derivative financial instruments, the net settlement amounts if an event of default or other precedent events occurred are disclosed under ‘Net amounts’ to comply with the accounting requirements.
The tables below reconcile the amounts of derivative financial instruments, net amounts of other assets and other liabilities presented in the consolidated statement of financial position.
the Group
2013 2012
Assets
Net amounts of derivative financial instruments after offsetting as stated above 41,437 32,973
Derivative financial instruments not in scope of offsetting disclosures 32,048 18,473
Total derivative financial instruments 73,485 51,446
Net amounts of other assets after offsetting as stated above 164,149 23,760
Other assets not in scope of offsetting disclosures 949,613 1,332,121
Total other assets 1,113,762 1,355,881
Liabilities
Net amounts of derivative financial instruments after offsetting as stated above 55,231 30,107
Derivative financial instruments not in scope of offsetting disclosures 6,574 9,784
Total derivative financial instruments 61,805 39,891
Net amounts of other liabilities after offsetting as stated above – –
Other liabilities not in scope of offsetting disclosures 1,282,470 1,257,107
Total other liabilities 1,282,470 1,257,107
Related amounts not set off in the statement of financial
position
Related amounts not set off in the statement of financial
position
NOTES TO THE CONSOLIDATED FINANCIAL STATEMENTS (CONTINuED) (All amounts in HK dollar thousands unless otherwise stated)
126 SHANGHAI COMMERCIAL BANK ANNUAL REPORT 2013
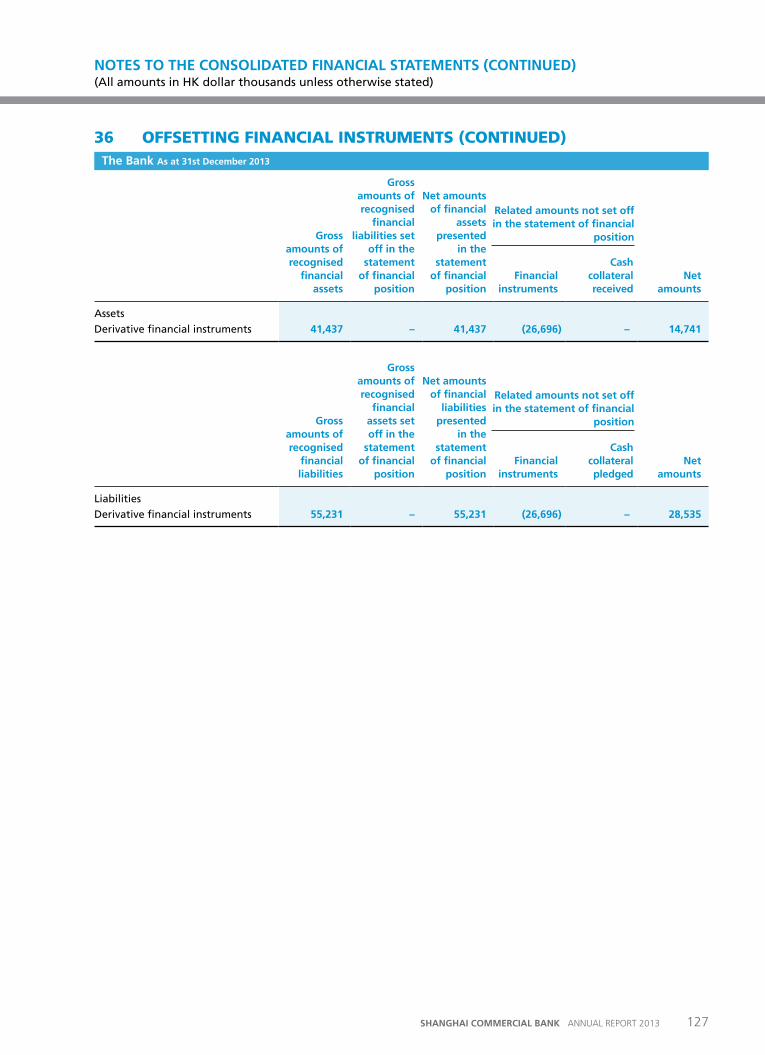
36 OFFSETTING FINANCIAL INSTRUMENTS (CONTINUED)the Bank as at 31st December 2013
Gross amounts of recognised
financial assets
Gross amounts of recognised
financial liabilities set
off in the statement
of financial position
Net amounts of financial
assets presented
in the statement
of financial position
Financial instruments
Cash collateral received
Net amounts
Assets
Derivative financial instruments 41,437 – 41,437 (26,696) – 14,741
Gross amounts of recognised
financial liabilities
Gross amounts of recognised
financial assets set off in the
statement of financial
position
Net amounts of financial
liabilities presented
in the statement
of financial position
Financial instruments
Cash collateral pledged
Net amounts
Liabilities
Derivative financial instruments 55,231 – 55,231 (26,696) – 28,535
related amounts not set off in the statement of financial
position
related amounts not set off in the statement of financial
position
NOTES TO THE CONSOLIDATED FINANCIAL STATEMENTS (CONTINuED) (All amounts in HK dollar thousands unless otherwise stated)
127SHANGHAI COMMERCIAL BANK ANNUAL REPORT 2013
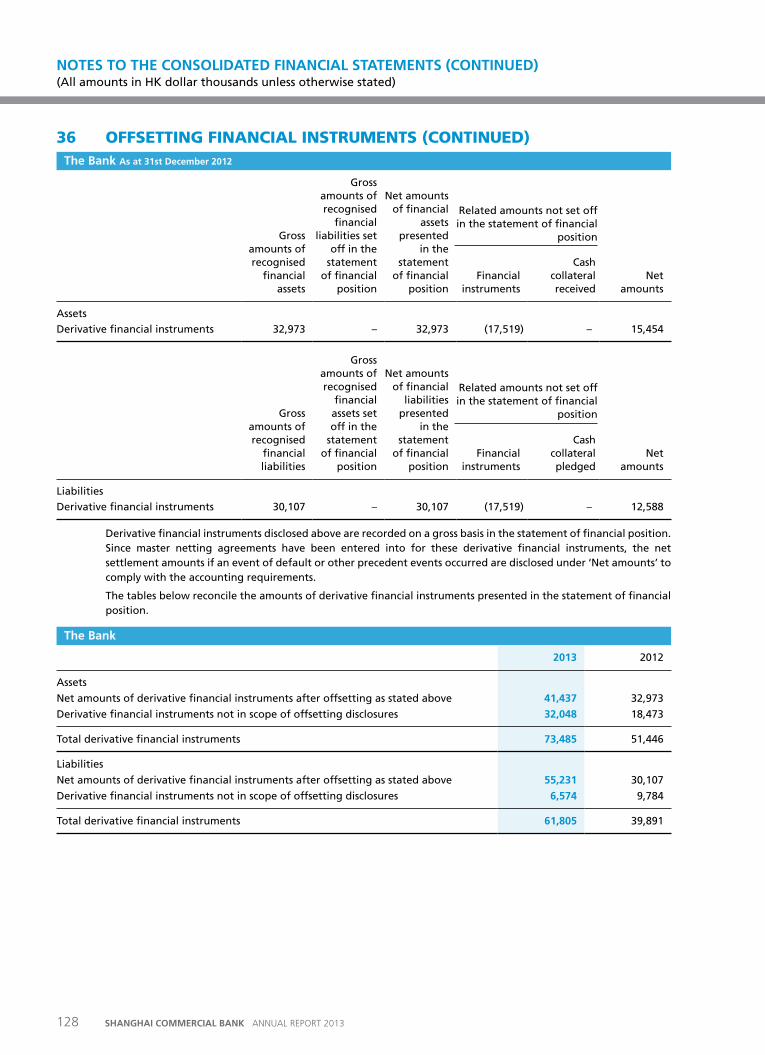
36 OFFSETTING FINANCIAL INSTRUMENTS (CONTINUED)the Bank as at 31st December 2012
Gross amounts of recognised
financial assets
Gross amounts of recognised
financial liabilities set
off in the statement
of financial position
Net amounts of financial
assets presented
in the statement
of financial position
Financial instruments
Cash collateral received
Net amounts
Assets
Derivative financial instruments 32,973 – 32,973 (17,519) – 15,454
Gross amounts of recognised
financial liabilities
Gross amounts of recognised
financial assets set off in the
statement of financial
position
Net amounts of financial
liabilities presented
in the statement
of financial position
Financial instruments
Cash collateral pledged
Net amounts
Liabilities
Derivative financial instruments 30,107 – 30,107 (17,519) – 12,588
Derivative financial instruments disclosed above are recorded on a gross basis in the statement of financial position. Since master netting agreements have been entered into for these derivative financial instruments, the net settlement amounts if an event of default or other precedent events occurred are disclosed under ‘Net amounts’ to comply with the accounting requirements.
The tables below reconcile the amounts of derivative financial instruments presented in the statement of financial position.
the Bank
2013 2012
Assets
Net amounts of derivative financial instruments after offsetting as stated above 41,437 32,973
Derivative financial instruments not in scope of offsetting disclosures 32,048 18,473
Total derivative financial instruments 73,485 51,446
Liabilities
Net amounts of derivative financial instruments after offsetting as stated above 55,231 30,107
Derivative financial instruments not in scope of offsetting disclosures 6,574 9,784
Total derivative financial instruments 61,805 39,891
Related amounts not set off in the statement of financial
position
Related amounts not set off in the statement of financial
position
NOTES TO THE CONSOLIDATED FINANCIAL STATEMENTS (CONTINuED) (All amounts in HK dollar thousands unless otherwise stated)
128 SHANGHAI COMMERCIAL BANK ANNUAL REPORT 2013
37 LOANS TO OFFICERSParticulars of loans made by the Bank to officers and companies related to officers and disclosed pursuant to Section 161B of the Hong Kong Companies Ordinance are as follows:
Balance outstanding as at 31st December
Maximum balance during the year
2013 2012 2013 2012
Aggregate amount outstanding in respect of principal and interest 348,408 510,052 607,529 733,798
38 RELATED PARTY TRANSACTIONSA number of banking transactions were entered into with related parties by the Group or the Bank in the normal course of business and at arm’s length basis. These include loans, deposits, trade finance transactions and foreign currency transactions. The volumes of related party transactions, outstanding balances at the year end, and related expense and income for the year are as follows:
Included in the following statement of financial position captions are balances with the ultimate holding company:
the Group and the Bank
2013 2012
Cash and balances with banks 150,052 265,062
Available-for-sale investments 99,176 93,202
Other assets 6,011 2,164
255,239 360,428
Deposits and balances from banks as at 1st January 490,659 646,676
Deposits and balances from banks received during the year 301,909 28,621
Deposits and balances from banks repaid during the year (8,683) (184,638)
Deposits and balances from banks as at 31st December 783,885 490,659
Interest income on balances with the ultimate holding company 1,576 1,399
Interest expense on deposits from the ultimate holding company 4,502 4,617
Contingent liabilities and other commitments 80,766 108,745
Included in the following statement of financial position captions are balances with subsidiary companies of the ultimate holding company:
the Group and the Bank
2013 2012
Deposits from customers as at 1st January 318,699 310,161
Deposits from customers received during the year 3,142 15,161
Deposits from customers repaid during the year (2,131) (6,623)
Deposits from customers as at 31st December 319,710 318,699
Interest expense on deposits from the subsidiary companies of the ultimate holding company 2,116 2,025
NOTES TO THE CONSOLIDATED FINANCIAL STATEMENTS (CONTINuED) (All amounts in HK dollar thousands unless otherwise stated)
129SHANGHAI COMMERCIAL BANK ANNUAL REPORT 2013
38 RELATED PARTY TRANSACTIONS (CONTINUED)Included in the following statement of financial position captions are balances with other shareholders:
the Group and the Bank
2013 2012
Cash and balances with banks 9,206 65,011
Available-for-sale and held-to-maturity investments 181,887 38,757
191,093 103,768
Deposits from customers as at 1st January 174,203 121,557
Deposits from customers received during the year 311,754 165,301
Deposits from customers repaid during the year (7,152) (112,655)
Loans and advances to customers as at 31st December 478,805 174,203
Interest income on loans and advances to other shareholders 265 1,770
Interest expense on deposits from other shareholders 3,044 938
Included in the following statement of financial position captions are balances with joint ventures:
the Group and the Bank
2013 2012
Loans and advances to customers as at 1st January 14,337 37,600
Loans and advances to customers repaid during the year (2,834) (23,263)
Loans and advances to customers as at 31st December 11,503 14,337
Collectively assessed impairment allowances 46 57
Deposits from customers as at 1st January 271,648 296,583
Deposits from customers received during the year 59,007 89,128
Deposits from customers repaid during the year (99,494) (114,063)
Deposits from customers as at 31st December 231,161 271,648
Interest income on loans and advances to joint ventures 385 319
Interest expense on deposits from joint ventures 2,999 3,425
Contingent liabilities and other commitments 2,000 2,000
Amounts due from/ (to) subsidiary companies are included in Note 24(b).
NOTES TO THE CONSOLIDATED FINANCIAL STATEMENTS (CONTINuED) (All amounts in HK dollar thousands unless otherwise stated)
130 SHANGHAI COMMERCIAL BANK ANNUAL REPORT 2013
38 RELATED PARTY TRANSACTIONS (CONTINUED)Included in the following statement of financial position captions are balances with the Directors of the Bank and the ultimate holding company and their relatives:
the Group and the Bank
2013 2012
Loans and advances to customers as at 1st January 263,423 382,728
Loans and advances to customers granted during the year 1,256 6,237
Loans and advances to customers repaid during the year (121,066) (125,542)
Loans and advances to customers as at 31st December 143,613 263,423
Collectively assessed impairment allowances 594 1,076
Deposits from customers as at 1st January 248,054 100,676
Deposits from customers received during the year 85,086 190,038
Deposits from customers repaid during the year (144,202) (42,660)
Deposits from customers as at 31st December 188,938 248,054
Interest income on loans and advances to the Directors and their relatives 4,941 7,593
Interest expense on deposits from the Directors and their relatives 613 849
Contingent liabilities and other commitments 77,002 156,240
Included in the following statement of financial position captions are balances with companies controlled by the Directors of the Bank and the ultimate holding company and their relatives:
the Group and the Bank
2013 2012
Loans and advances to customers as at 1st January 246,256 321,494
Loans and advances to customers granted during the year – 23,124
Loans and advances to customers repaid during the year (75,215) (98,362)
Loans and advances to customers as at 31st December 171,041 246,256
Collectively assessed impairment allowances 684 985
Deposits from customers as at 1st January 203,895 227,702
Deposits from customers received during the year 46,923 99,371
Deposits from customers repaid during the year (104,114) (123,178)
Deposits from customers as at 31st December 146,704 203,895
Interest income on loans and advances to the companies controlled by the Directors and their relatives 9,204 11,610
Interest expense on deposits from the companies controlled by the Directors and their relatives 4,217 2,441
Contingent liabilities and other commitments 487,450 492,461
NOTES TO THE CONSOLIDATED FINANCIAL STATEMENTS (CONTINuED) (All amounts in HK dollar thousands unless otherwise stated)
131SHANGHAI COMMERCIAL BANK ANNUAL REPORT 2013
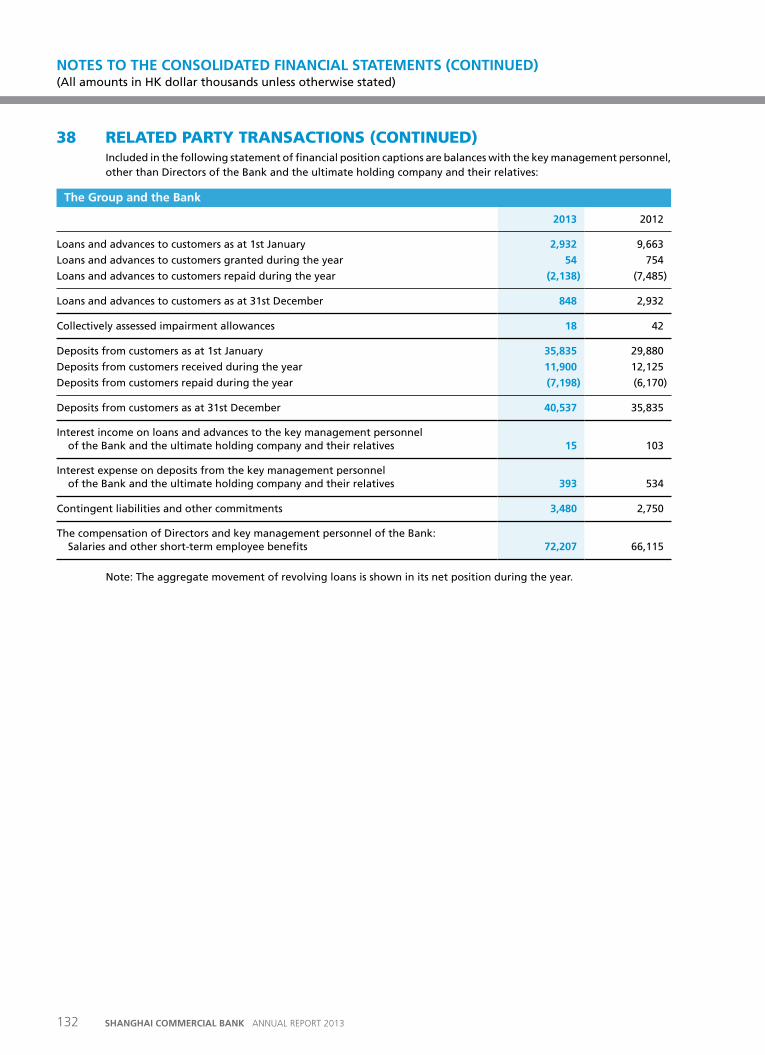
38 RELATED PARTY TRANSACTIONS (CONTINUED)Included in the following statement of financial position captions are balances with the key management personnel, other than Directors of the Bank and the ultimate holding company and their relatives:
the Group and the Bank
2013 2012
Loans and advances to customers as at 1st January 2,932 9,663
Loans and advances to customers granted during the year 54 754
Loans and advances to customers repaid during the year (2,138) (7,485)
Loans and advances to customers as at 31st December 848 2,932
Collectively assessed impairment allowances 18 42
Deposits from customers as at 1st January 35,835 29,880
Deposits from customers received during the year 11,900 12,125
Deposits from customers repaid during the year (7,198) (6,170)
Deposits from customers as at 31st December 40,537 35,835
Interest income on loans and advances to the key management personnel of the Bank and the ultimate holding company and their relatives 15 103
Interest expense on deposits from the key management personnel of the Bank and the ultimate holding company and their relatives 393 534
Contingent liabilities and other commitments 3,480 2,750
The compensation of Directors and key management personnel of the Bank: Salaries and other short-term employee benefits 72,207 66,115
Note: The aggregate movement of revolving loans is shown in its net position during the year.
NOTES TO THE CONSOLIDATED FINANCIAL STATEMENTS (CONTINuED) (All amounts in HK dollar thousands unless otherwise stated)
132 SHANGHAI COMMERCIAL BANK ANNUAL REPORT 2013
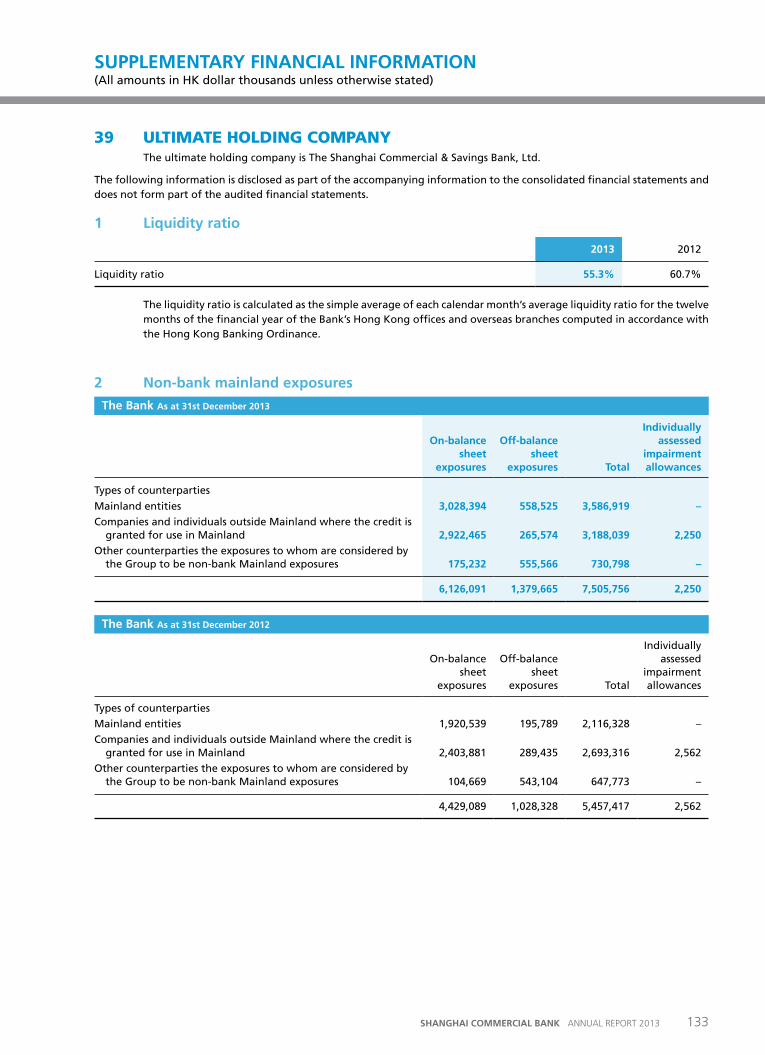
39 ULTIMATE HOLDING COMPANYThe ultimate holding company is The Shanghai Commercial & Savings Bank, Ltd.
The following information is disclosed as part of the accompanying information to the consolidated financial statements and does not form part of the audited financial statements.
1 Liquidity ratio
2013 2012
Liquidity ratio 55.3% 60.7%
The liquidity ratio is calculated as the simple average of each calendar month’s average liquidity ratio for the twelve months of the financial year of the Bank’s Hong Kong offices and overseas branches computed in accordance with the Hong Kong Banking Ordinance.
2 Non-bank mainland exposures
the Bank as at 31st December 2013
on-balance sheet
exposures
off-balance sheet
exposures total
Individually assessed
impairment allowances
Types of counterparties
Mainland entities 3,028,394 558,525 3,586,919 –
Companies and individuals outside Mainland where the credit is granted for use in Mainland 2,922,465 265,574 3,188,039 2,250
Other counterparties the exposures to whom are considered by the Group to be non-bank Mainland exposures 175,232 555,566 730,798 –
6,126,091 1,379,665 7,505,756 2,250
the Bank as at 31st December 2012
On-balance sheet
exposures
Off-balance sheet
exposures Total
Individually assessed
impairment allowances
Types of counterparties
Mainland entities 1,920,539 195,789 2,116,328 –
Companies and individuals outside Mainland where the credit is granted for use in Mainland 2,403,881 289,435 2,693,316 2,562
Other counterparties the exposures to whom are considered by the Group to be non-bank Mainland exposures 104,669 543,104 647,773 –
4,429,089 1,028,328 5,457,417 2,562
133SHANGHAI COMMERCIAL BANK ANNUAL REPORT 2013
SuppLEMENtarY FINaNCIaL INForMatIoN (All amounts in HK dollar thousands unless otherwise stated)
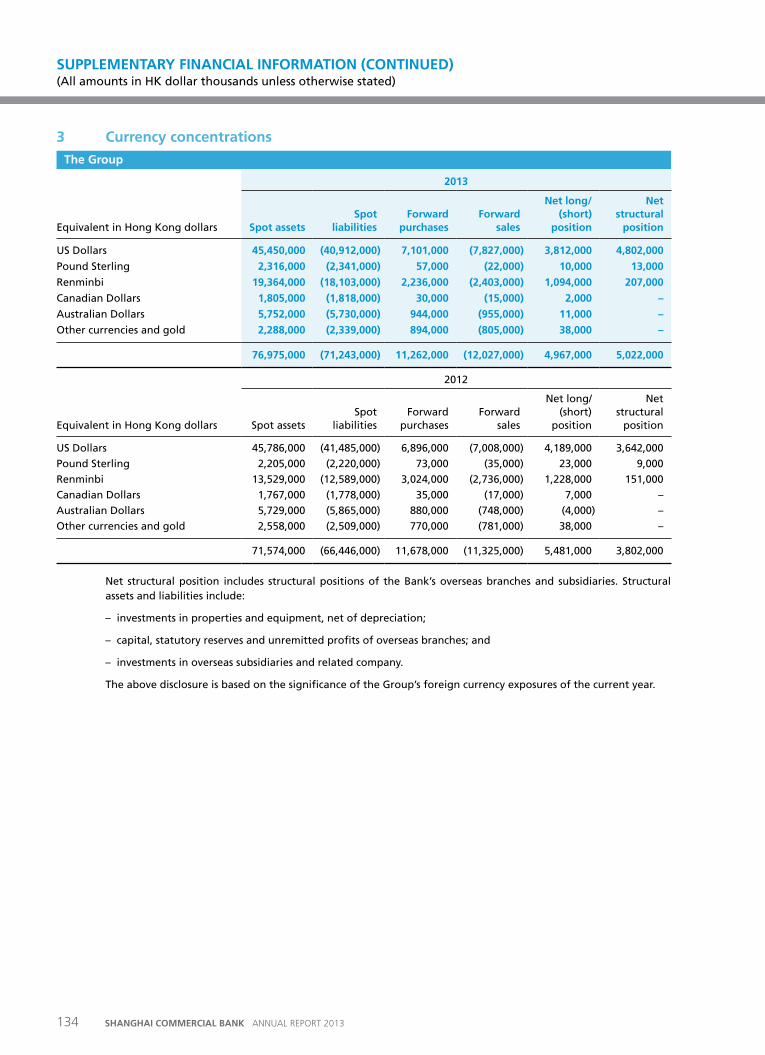
134 SHANGHAI COMMERCIAL BANK ANNUAL REPORT 2013
SUPPLEMENTARY FINANCIAL INFORMATION (CONTINUEd) (All amounts in HK dollar thousands unless otherwise stated)
3 Currency concentrations
the Group
2013
Equivalent in Hong Kong dollars Spot assets Spot
liabilities Forward
purchases Forward
sales
Net long/ (short)
position
Net structural
position
US Dollars 45,450,000 (40,912,000) 7,101,000 (7,827,000) 3,812,000 4,802,000
Pound Sterling 2,316,000 (2,341,000) 57,000 (22,000) 10,000 13,000
Renminbi 19,364,000 (18,103,000) 2,236,000 (2,403,000) 1,094,000 207,000
Canadian Dollars 1,805,000 (1,818,000) 30,000 (15,000) 2,000 –
Australian Dollars 5,752,000 (5,730,000) 944,000 (955,000) 11,000 –
Other currencies and gold 2,288,000 (2,339,000) 894,000 (805,000) 38,000 –
76,975,000 (71,243,000) 11,262,000 (12,027,000) 4,967,000 5,022,000
2012
Equivalent in Hong Kong dollars Spot assets Spot
liabilities Forward
purchases Forward
sales
Net long/ (short)
position
Net structural
position
US Dollars 45,786,000 (41,485,000) 6,896,000 (7,008,000) 4,189,000 3,642,000
Pound Sterling 2,205,000 (2,220,000) 73,000 (35,000) 23,000 9,000
Renminbi 13,529,000 (12,589,000) 3,024,000 (2,736,000) 1,228,000 151,000
Canadian Dollars 1,767,000 (1,778,000) 35,000 (17,000) 7,000 –
Australian Dollars 5,729,000 (5,865,000) 880,000 (748,000) (4,000) –
Other currencies and gold 2,558,000 (2,509,000) 770,000 (781,000) 38,000 –
71,574,000 (66,446,000) 11,678,000 (11,325,000) 5,481,000 3,802,000
Net structural position includes structural positions of the Bank’s overseas branches and subsidiaries. Structural assets and liabilities include:
– investments in properties and equipment, net of depreciation;
– capital, statutory reserves and unremitted profits of overseas branches; and
– investments in overseas subsidiaries and related company.
The above disclosure is based on the significance of the Group’s foreign currency exposures of the current year.
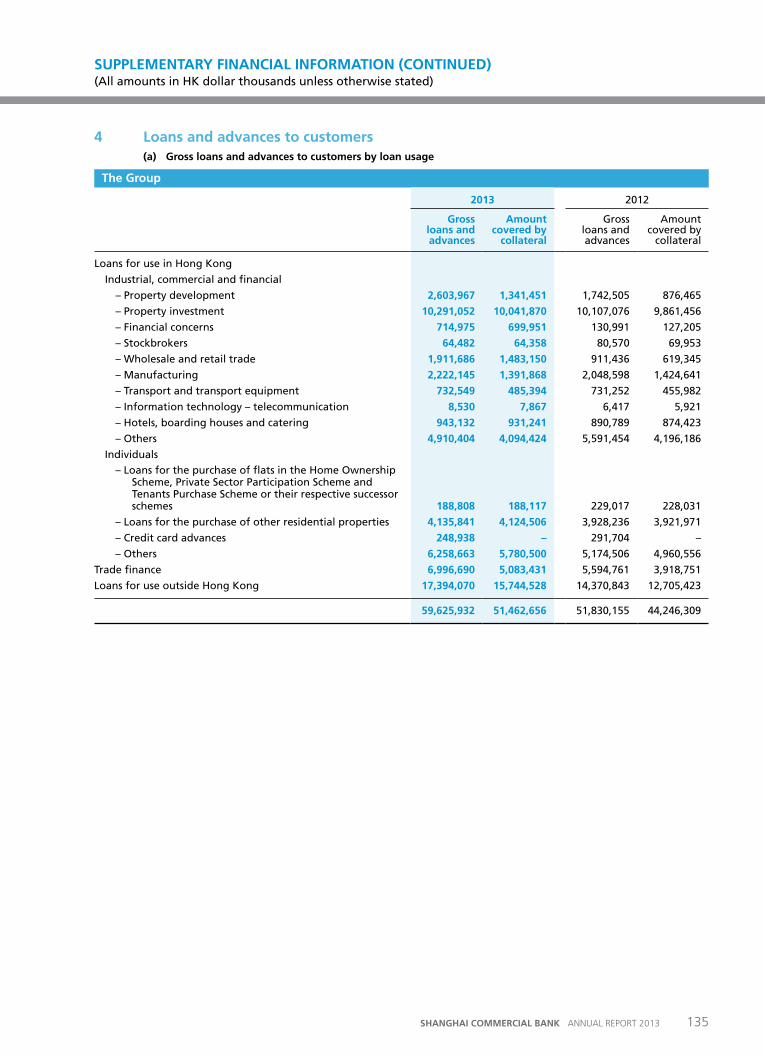
135SHANGHAI COMMERCIAL BANK ANNUAL REPORT 2013
SUPPLEMENTARY FINANCIAL INFORMATION (CONTINUEd) (All amounts in HK dollar thousands unless otherwise stated)
4 Loans and advances to customers(a) Gross loans and advances to customers by loan usage
the Group
2013 2012
Gross loans and advances
amount covered by
collateral
Gross loans and advances
Amount covered by
collateral
Loans for use in Hong Kong
Industrial, commercial and financial
– Property development 2,603,967 1,341,451 1,742,505 876,465
– Property investment 10,291,052 10,041,870 10,107,076 9,861,456
– Financial concerns 714,975 699,951 130,991 127,205
– Stockbrokers 64,482 64,358 80,570 69,953
– Wholesale and retail trade 1,911,686 1,483,150 911,436 619,345
– Manufacturing 2,222,145 1,391,868 2,048,598 1,424,641
– Transport and transport equipment 732,549 485,394 731,252 455,982
– Information technology – telecommunication 8,530 7,867 6,417 5,921
– Hotels, boarding houses and catering 943,132 931,241 890,789 874,423
– Others 4,910,404 4,094,424 5,591,454 4,196,186
Individuals
– Loans for the purchase of flats in the Home Ownership Scheme, Private Sector Participation Scheme and Tenants Purchase Scheme or their respective successor schemes 188,808 188,117 229,017 228,031
– Loans for the purchase of other residential properties 4,135,841 4,124,506 3,928,236 3,921,971
– Credit card advances 248,938 – 291,704 –
– Others 6,258,663 5,780,500 5,174,506 4,960,556
Trade finance 6,996,690 5,083,431 5,594,761 3,918,751
Loans for use outside Hong Kong 17,394,070 15,744,528 14,370,843 12,705,423
59,625,932 51,462,656 51,830,155 44,246,309
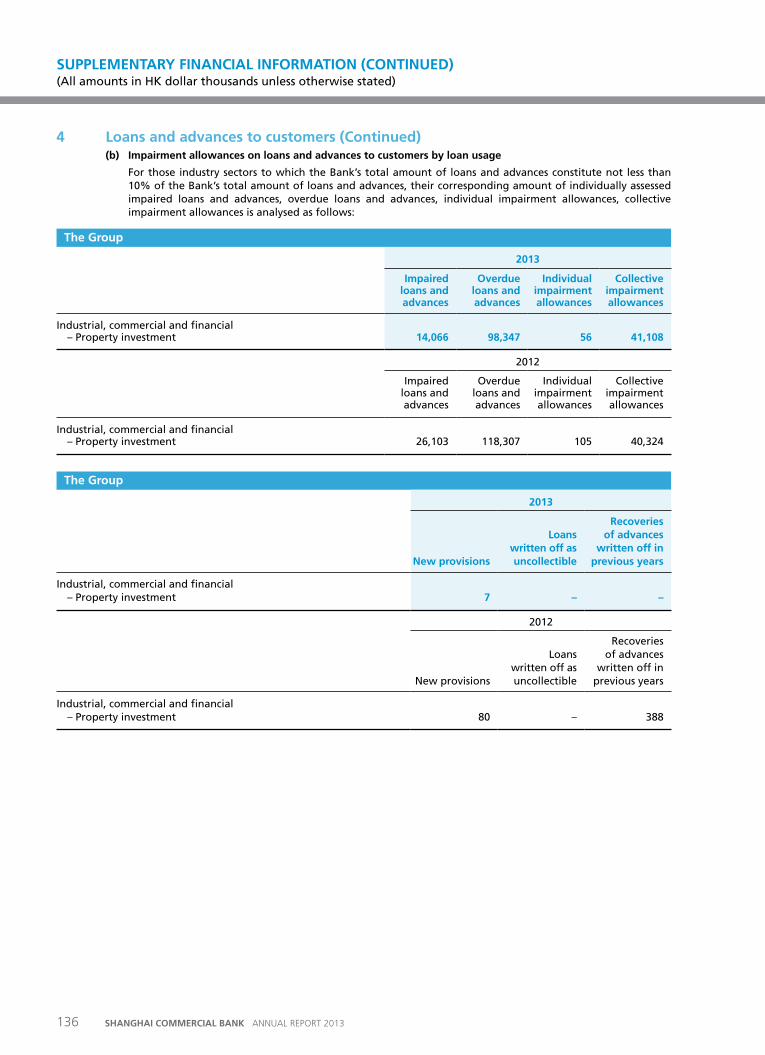
136 SHANGHAI COMMERCIAL BANK ANNUAL REPORT 2013
SUPPLEMENTARY FINANCIAL INFORMATION (CONTINUEd) (All amounts in HK dollar thousands unless otherwise stated)
4 Loans and advances to customers (Continued)(b) Impairment allowances on loans and advances to customers by loan usage
For those industry sectors to which the Bank’s total amount of loans and advances constitute not less than 10% of the Bank’s total amount of loans and advances, their corresponding amount of individually assessed impaired loans and advances, overdue loans and advances, individual impairment allowances, collective impairment allowances is analysed as follows:
the Group
2013
Impaired loans and advances
overdue loans and advances
Individual impairment allowances
Collective impairment allowances
Industrial, commercial and financial – Property investment 14,066 98,347 56 41,108
2012
Impaired loans and advances
Overdue loans and advances
Individual impairment allowances
Collective impairment allowances
Industrial, commercial and financial – Property investment 26,103 118,307 105 40,324
the Group
2013
New provisions
Loans written off as uncollectible
recoveries of advances
written off in previous years
Industrial, commercial and financial – Property investment 7 – –
2012
New provisions
Loans written off as uncollectible
Recoveries of advances
written off in previous years
Industrial, commercial and financial – Property investment 80 – 388
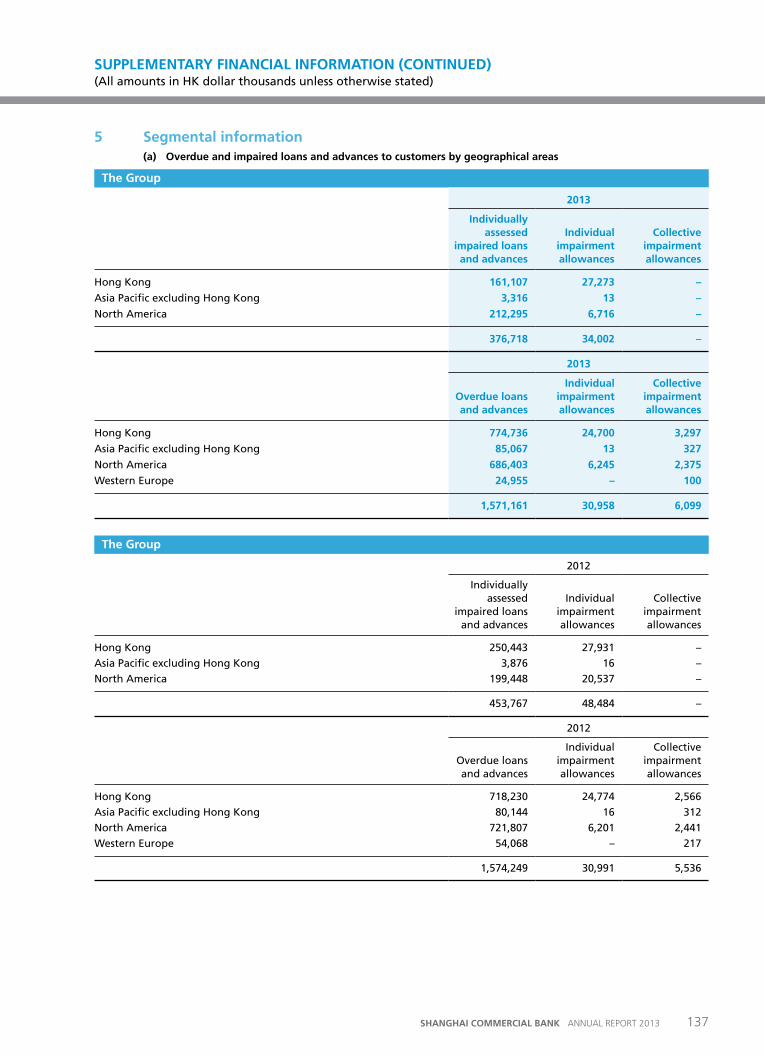
137SHANGHAI COMMERCIAL BANK ANNUAL REPORT 2013
SUPPLEMENTARY FINANCIAL INFORMATION (CONTINUEd) (All amounts in HK dollar thousands unless otherwise stated)
5 Segmental information(a) overdue and impaired loans and advances to customers by geographical areas
the Group
2013
Individually assessed
impaired loans and advances
Individual impairment allowances
Collective impairment allowances
Hong Kong 161,107 27,273 –
Asia Pacific excluding Hong Kong 3,316 13 –
North America 212,295 6,716 –
376,718 34,002 –
2013
overdue loans and advances
Individual impairment allowances
Collective impairment allowances
Hong Kong 774,736 24,700 3,297
Asia Pacific excluding Hong Kong 85,067 13 327
North America 686,403 6,245 2,375
Western Europe 24,955 – 100
1,571,161 30,958 6,099
the Group
2012
Individually assessed
impaired loans and advances
Individual impairment allowances
Collective impairment allowances
Hong Kong 250,443 27,931 –
Asia Pacific excluding Hong Kong 3,876 16 –
North America 199,448 20,537 –
453,767 48,484 –
2012
Overdue loans and advances
Individual impairment allowances
Collective impairment allowances
Hong Kong 718,230 24,774 2,566
Asia Pacific excluding Hong Kong 80,144 16 312
North America 721,807 6,201 2,441
Western Europe 54,068 – 217
1,574,249 30,991 5,536
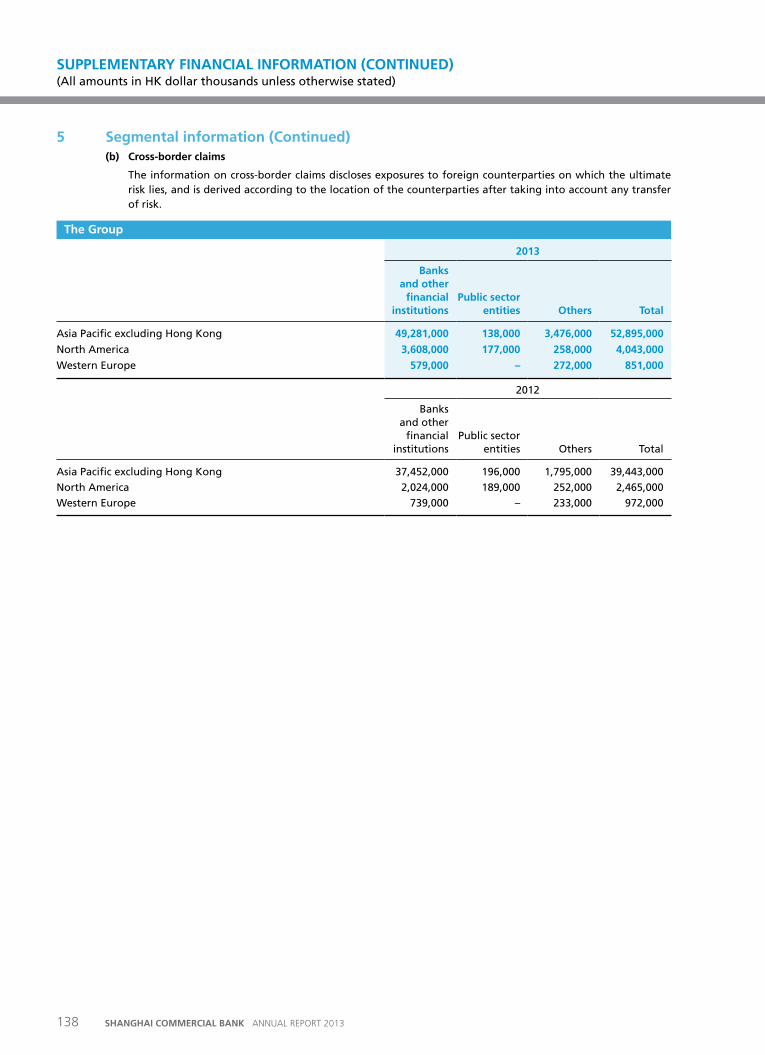
138 SHANGHAI COMMERCIAL BANK ANNUAL REPORT 2013
SUPPLEMENTARY FINANCIAL INFORMATION (CONTINUEd) (All amounts in HK dollar thousands unless otherwise stated)
5 Segmental information (Continued)(b) Cross-border claims
The information on cross-border claims discloses exposures to foreign counterparties on which the ultimate risk lies, and is derived according to the location of the counterparties after taking into account any transfer of risk.
the Group
2013
Banks and other
financial institutions
public sector entities others total
Asia Pacific excluding Hong Kong 49,281,000 138,000 3,476,000 52,895,000
North America 3,608,000 177,000 258,000 4,043,000
Western Europe 579,000 – 272,000 851,000
2012
Banks and other
financial institutions
Public sector entities Others Total
Asia Pacific excluding Hong Kong 37,452,000 196,000 1,795,000 39,443,000
North America 2,024,000 189,000 252,000 2,465,000
Western Europe 739,000 – 233,000 972,000
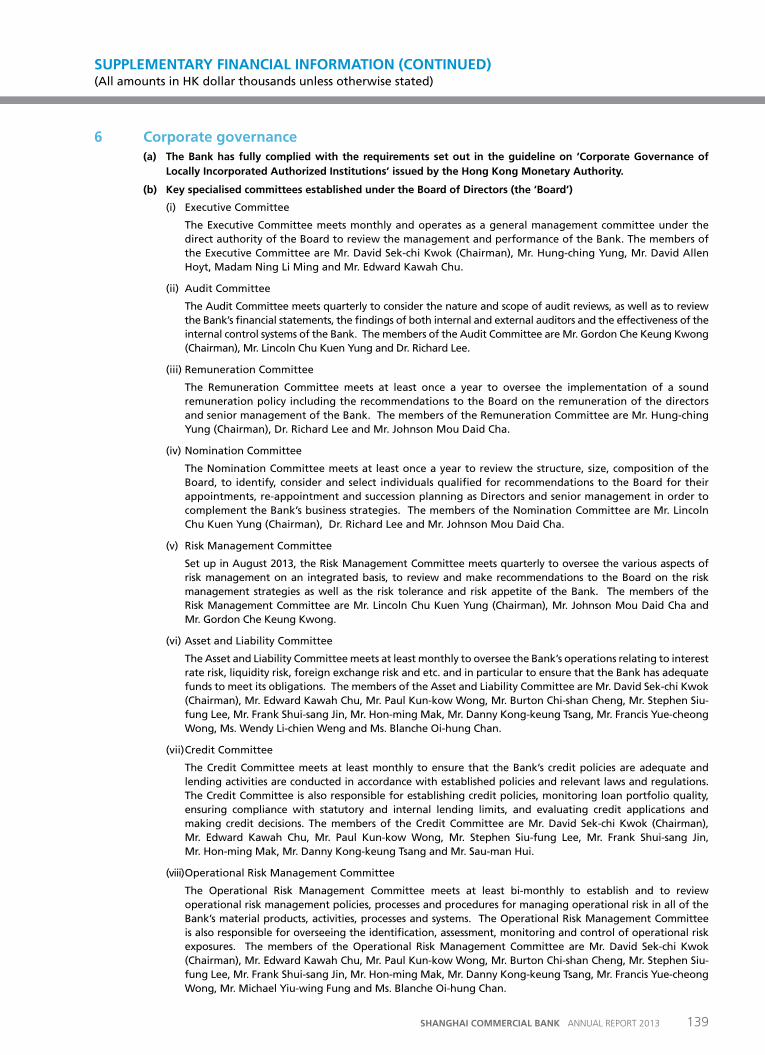
139SHANGHAI COMMERCIAL BANK ANNUAL REPORT 2013
SUPPLEMENTARY FINANCIAL INFORMATION (CONTINUEd) (All amounts in HK dollar thousands unless otherwise stated)
6 Corporate governance(a) the Bank has fully complied with the requirements set out in the guideline on ‘Corporate Governance of
Locally Incorporated authorized Institutions’ issued by the Hong Kong Monetary authority.
(b) Key specialised committees established under the Board of Directors (the ‘Board’)
(i) Executive Committee
The Executive Committee meets monthly and operates as a general management committee under the direct authority of the Board to review the management and performance of the Bank. The members of the Executive Committee are Mr. David Sek-chi Kwok (Chairman), Mr. Hung-ching Yung, Mr. David Allen Hoyt, Madam Ning Li Ming and Mr. Edward Kawah Chu.
(ii) Audit Committee
The Audit Committee meets quarterly to consider the nature and scope of audit reviews, as well as to review the Bank’s financial statements, the findings of both internal and external auditors and the effectiveness of the internal control systems of the Bank. The members of the Audit Committee are Mr. Gordon Che Keung Kwong (Chairman), Mr. Lincoln Chu Kuen Yung and Dr. Richard Lee.
(iii) Remuneration Committee
The Remuneration Committee meets at least once a year to oversee the implementation of a sound remuneration policy including the recommendations to the Board on the remuneration of the directors and senior management of the Bank. The members of the Remuneration Committee are Mr. Hung-ching Yung (Chairman), Dr. Richard Lee and Mr. Johnson Mou Daid Cha.
(iv) Nomination Committee
The Nomination Committee meets at least once a year to review the structure, size, composition of the Board, to identify, consider and select individuals qualified for recommendations to the Board for their appointments, re-appointment and succession planning as Directors and senior management in order to complement the Bank’s business strategies. The members of the Nomination Committee are Mr. Lincoln Chu Kuen Yung (Chairman), Dr. Richard Lee and Mr. Johnson Mou Daid Cha.
(v) Risk Management Committee
Set up in August 2013, the Risk Management Committee meets quarterly to oversee the various aspects of risk management on an integrated basis, to review and make recommendations to the Board on the risk management strategies as well as the risk tolerance and risk appetite of the Bank. The members of the Risk Management Committee are Mr. Lincoln Chu Kuen Yung (Chairman), Mr. Johnson Mou Daid Cha and Mr. Gordon Che Keung Kwong.
(vi) Asset and Liability Committee
The Asset and Liability Committee meets at least monthly to oversee the Bank’s operations relating to interest rate risk, liquidity risk, foreign exchange risk and etc. and in particular to ensure that the Bank has adequate funds to meet its obligations. The members of the Asset and Liability Committee are Mr. David Sek-chi Kwok (Chairman), Mr. Edward Kawah Chu, Mr. Paul Kun-kow Wong, Mr. Burton Chi-shan Cheng, Mr. Stephen Siu-fung Lee, Mr. Frank Shui-sang Jin, Mr. Hon-ming Mak, Mr. Danny Kong-keung Tsang, Mr. Francis Yue-cheong Wong, Ms. Wendy Li-chien Weng and Ms. Blanche Oi-hung Chan.
(vii) Credit Committee
The Credit Committee meets at least monthly to ensure that the Bank’s credit policies are adequate and lending activities are conducted in accordance with established policies and relevant laws and regulations. The Credit Committee is also responsible for establishing credit policies, monitoring loan portfolio quality, ensuring compliance with statutory and internal lending limits, and evaluating credit applications and making credit decisions. The members of the Credit Committee are Mr. David Sek-chi Kwok (Chairman), Mr. Edward Kawah Chu, Mr. Paul Kun-kow Wong, Mr. Stephen Siu-fung Lee, Mr. Frank Shui-sang Jin, Mr. Hon-ming Mak, Mr. Danny Kong-keung Tsang and Mr. Sau-man Hui.
(viii) Operational Risk Management Committee
The Operational Risk Management Committee meets at least bi-monthly to establish and to review operational risk management policies, processes and procedures for managing operational risk in all of the Bank’s material products, activities, processes and systems. The Operational Risk Management Committee is also responsible for overseeing the identification, assessment, monitoring and control of operational risk exposures. The members of the Operational Risk Management Committee are Mr. David Sek-chi Kwok (Chairman), Mr. Edward Kawah Chu, Mr. Paul Kun-kow Wong, Mr. Burton Chi-shan Cheng, Mr. Stephen Siu-fung Lee, Mr. Frank Shui-sang Jin, Mr. Hon-ming Mak, Mr. Danny Kong-keung Tsang, Mr. Francis Yue-cheong Wong, Mr. Michael Yiu-wing Fung and Ms. Blanche Oi-hung Chan.
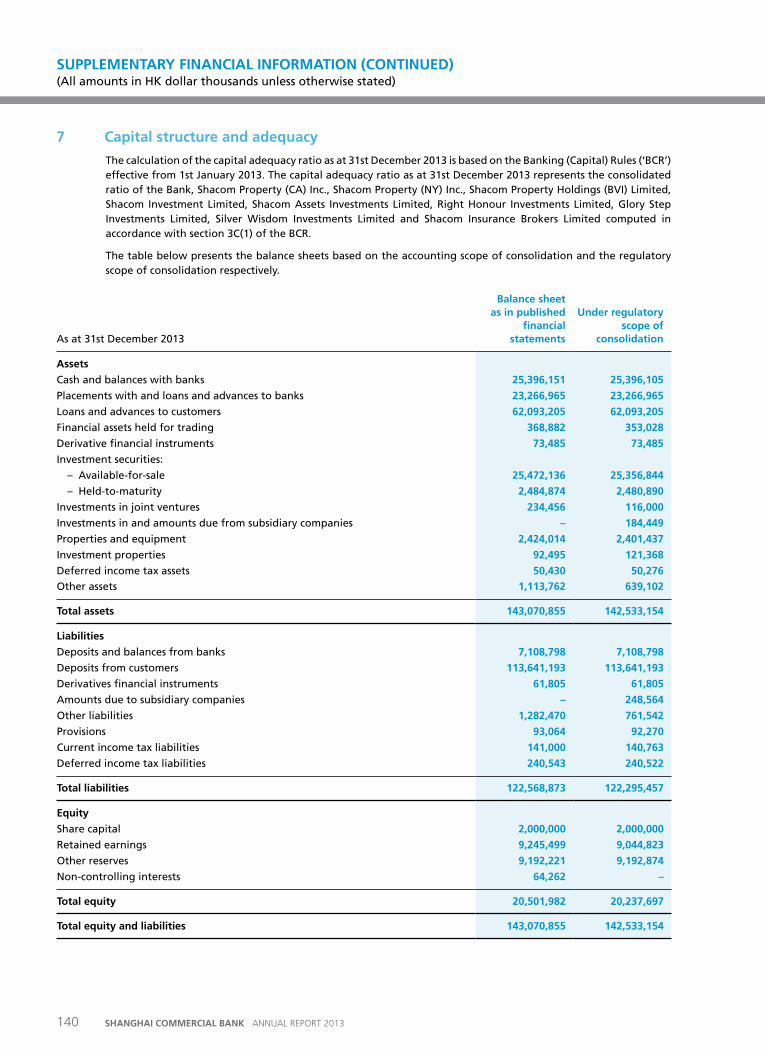
140 SHANGHAI COMMERCIAL BANK ANNUAL REPORT 2013
SUPPLEMENTARY FINANCIAL INFORMATION (CONTINUEd) (All amounts in HK dollar thousands unless otherwise stated)
7 Capital structure and adequacy
The calculation of the capital adequacy ratio as at 31st December 2013 is based on the Banking (Capital) Rules (‘BCR’) effective from 1st January 2013. The capital adequacy ratio as at 31st December 2013 represents the consolidated ratio of the Bank, Shacom Property (CA) Inc., Shacom Property (NY) Inc., Shacom Property Holdings (BVI) Limited, Shacom Investment Limited, Shacom Assets Investments Limited, Right Honour Investments Limited, Glory Step Investments Limited, Silver Wisdom Investments Limited and Shacom Insurance Brokers Limited computed in accordance with section 3C(1) of the BCR.
The table below presents the balance sheets based on the accounting scope of consolidation and the regulatory scope of consolidation respectively.
As at 31st December 2013
Balance sheet as in published
financial statements
under regulatory scope of
consolidation
assets
Cash and balances with banks 25,396,151 25,396,105
Placements with and loans and advances to banks 23,266,965 23,266,965
Loans and advances to customers 62,093,205 62,093,205
Financial assets held for trading 368,882 353,028
Derivative financial instruments 73,485 73,485
Investment securities:
– Available-for-sale 25,472,136 25,356,844
– Held-to-maturity 2,484,874 2,480,890
Investments in joint ventures 234,456 116,000
Investments in and amounts due from subsidiary companies – 184,449
Properties and equipment 2,424,014 2,401,437
Investment properties 92,495 121,368
Deferred income tax assets 50,430 50,276
Other assets 1,113,762 639,102
total assets 143,070,855 142,533,154
Liabilities
Deposits and balances from banks 7,108,798 7,108,798
Deposits from customers 113,641,193 113,641,193
Derivatives financial instruments 61,805 61,805
Amounts due to subsidiary companies – 248,564
Other liabilities 1,282,470 761,542
Provisions 93,064 92,270
Current income tax liabilities 141,000 140,763
Deferred income tax liabilities 240,543 240,522
total liabilities 122,568,873 122,295,457
Equity
Share capital 2,000,000 2,000,000
Retained earnings 9,245,499 9,044,823
Other reserves 9,192,221 9,192,874
Non-controlling interests 64,262 –
total equity 20,501,982 20,237,697
total equity and liabilities 143,070,855 142,533,154
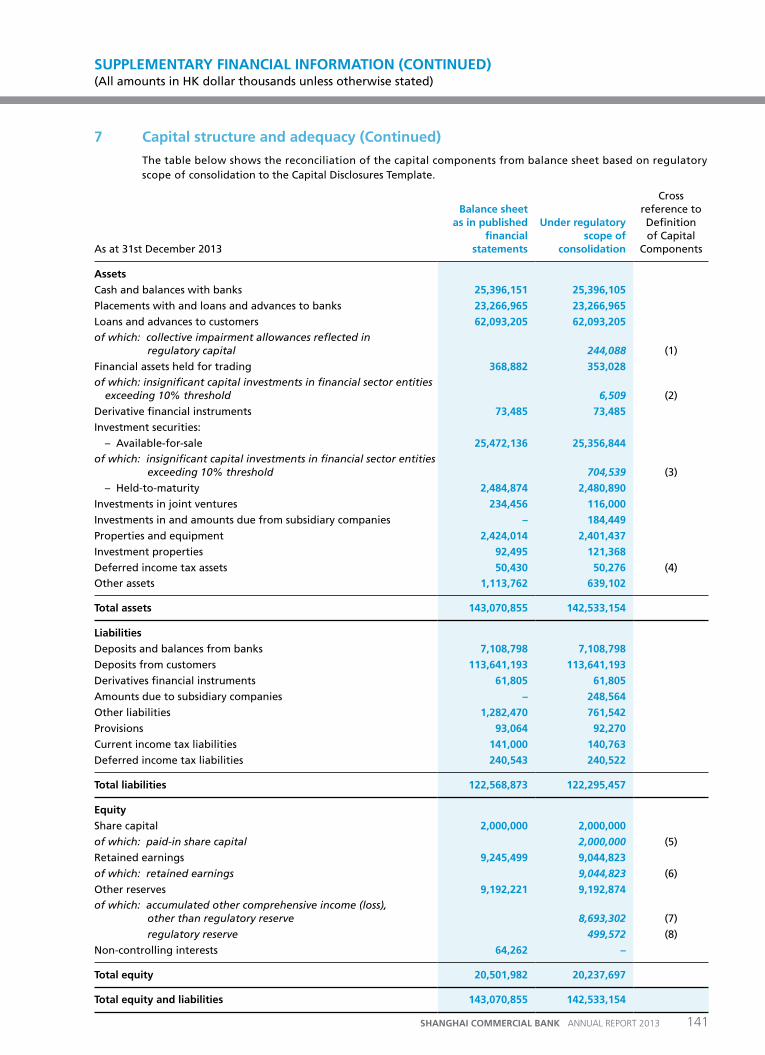
141SHANGHAI COMMERCIAL BANK ANNUAL REPORT 2013
SUPPLEMENTARY FINANCIAL INFORMATION (CONTINUEd) (All amounts in HK dollar thousands unless otherwise stated)
7 Capital structure and adequacy (Continued)
The table below shows the reconciliation of the capital components from balance sheet based on regulatory scope of consolidation to the Capital Disclosures Template.
As at 31st December 2013
Balance sheet as in published
financial statements
under regulatory scope of
consolidation
Cross reference to Definition of Capital
Components
assets
Cash and balances with banks 25,396,151 25,396,105
Placements with and loans and advances to banks 23,266,965 23,266,965
Loans and advances to customers 62,093,205 62,093,205
of which: collective impairment allowances reflected in regulatory capital 244,088 (1)
Financial assets held for trading 368,882 353,028
of which: insignificant capital investments in financial sector entities exceeding 10% threshold 6,509 (2)
Derivative financial instruments 73,485 73,485
Investment securities:
– Available-for-sale 25,472,136 25,356,844
of which: insignificant capital investments in financial sector entities exceeding 10% threshold 704,539 (3)
– Held-to-maturity 2,484,874 2,480,890
Investments in joint ventures 234,456 116,000
Investments in and amounts due from subsidiary companies – 184,449
Properties and equipment 2,424,014 2,401,437
Investment properties 92,495 121,368
Deferred income tax assets 50,430 50,276 (4)
Other assets 1,113,762 639,102
total assets 143,070,855 142,533,154
Liabilities
Deposits and balances from banks 7,108,798 7,108,798
Deposits from customers 113,641,193 113,641,193
Derivatives financial instruments 61,805 61,805
Amounts due to subsidiary companies – 248,564
Other liabilities 1,282,470 761,542
Provisions 93,064 92,270
Current income tax liabilities 141,000 140,763
Deferred income tax liabilities 240,543 240,522
total liabilities 122,568,873 122,295,457
Equity
Share capital 2,000,000 2,000,000
of which: paid-in share capital 2,000,000 (5)
Retained earnings 9,245,499 9,044,823
of which: retained earnings 9,044,823 (6)
Other reserves 9,192,221 9,192,874
of which: accumulated other comprehensive income (loss), other than regulatory reserve 8,693,302 (7)
regulatory reserve 499,572 (8)
Non-controlling interests 64,262 –
total equity 20,501,982 20,237,697
total equity and liabilities 143,070,855 142,533,154
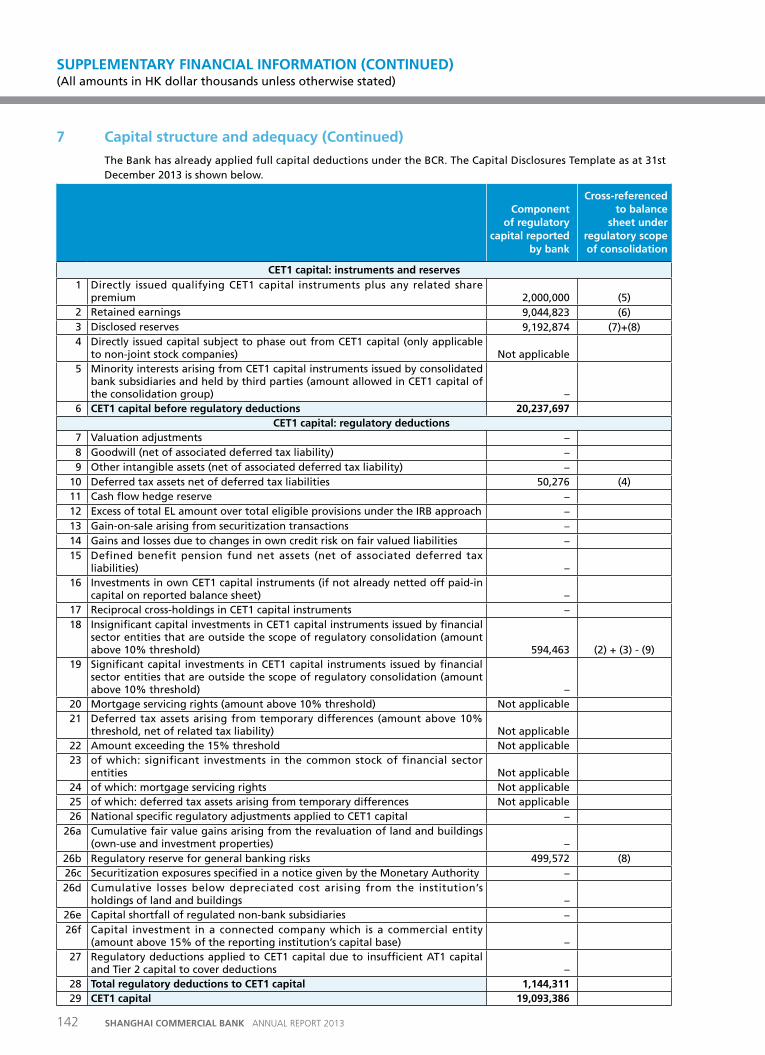
142 SHANGHAI COMMERCIAL BANK ANNUAL REPORT 2013
SUPPLEMENTARY FINANCIAL INFORMATION (CONTINUEd) (All amounts in HK dollar thousands unless otherwise stated)
7 Capital structure and adequacy (Continued)
The Bank has already applied full capital deductions under the BCR. The Capital Disclosures Template as at 31st December 2013 is shown below.
Component of regulatory
capital reported by bank
Cross-referenced to balance
sheet under regulatory scope of consolidation
CEt1 capital: instruments and reserves1 Directly issued qualifying CET1 capital instruments plus any related share
premium 2,000,000 (5)2 Retained earnings 9,044,823 (6)3 Disclosed reserves 9,192,874 (7)+(8)4 Directly issued capital subject to phase out from CET1 capital (only applicable
to non-joint stock companies) Not applicable 5 Minority interests arising from CET1 capital instruments issued by consolidated
bank subsidiaries and held by third parties (amount allowed in CET1 capital of the consolidation group) –
6 CEt1 capital before regulatory deductions 20,237,697 CEt1 capital: regulatory deductions
7 Valuation adjustments –8 Goodwill (net of associated deferred tax liability) –9 Other intangible assets (net of associated deferred tax liability) –
10 Deferred tax assets net of deferred tax liabilities 50,276 (4)11 Cash flow hedge reserve –12 Excess of total EL amount over total eligible provisions under the IRB approach –13 Gain-on-sale arising from securitization transactions –14 Gains and losses due to changes in own credit risk on fair valued liabilities –15 Defined benefit pension fund net assets (net of associated deferred tax
liabilities) –16 Investments in own CET1 capital instruments (if not already netted off paid-in
capital on reported balance sheet) –17 Reciprocal cross-holdings in CET1 capital instruments –18 Insignificant capital investments in CET1 capital instruments issued by financial
sector entities that are outside the scope of regulatory consolidation (amount above 10% threshold) 594,463 (2) + (3) - (9)
19 Significant capital investments in CET1 capital instruments issued by financial sector entities that are outside the scope of regulatory consolidation (amount above 10% threshold) –
20 Mortgage servicing rights (amount above 10% threshold) Not applicable 21 Deferred tax assets arising from temporary differences (amount above 10%
threshold, net of related tax liability) Not applicable 22 Amount exceeding the 15% threshold Not applicable 23 of which: significant investments in the common stock of financial sector
entities Not applicable 24 of which: mortgage servicing rights Not applicable 25 of which: deferred tax assets arising from temporary differences Not applicable 26 National specific regulatory adjustments applied to CET1 capital –
26a Cumulative fair value gains arising from the revaluation of land and buildings (own-use and investment properties) –
26b Regulatory reserve for general banking risks 499,572 (8)26c Securitization exposures specified in a notice given by the Monetary Authority –26d Cumulative losses below depreciated cost arising from the institution’s
holdings of land and buildings –26e Capital shortfall of regulated non-bank subsidiaries –26f Capital investment in a connected company which is a commercial entity
(amount above 15% of the reporting institution’s capital base) –27 Regulatory deductions applied to CET1 capital due to insufficient AT1 capital
and Tier 2 capital to cover deductions –28 total regulatory deductions to CEt1 capital 1,144,311 29 CEt1 capital 19,093,386
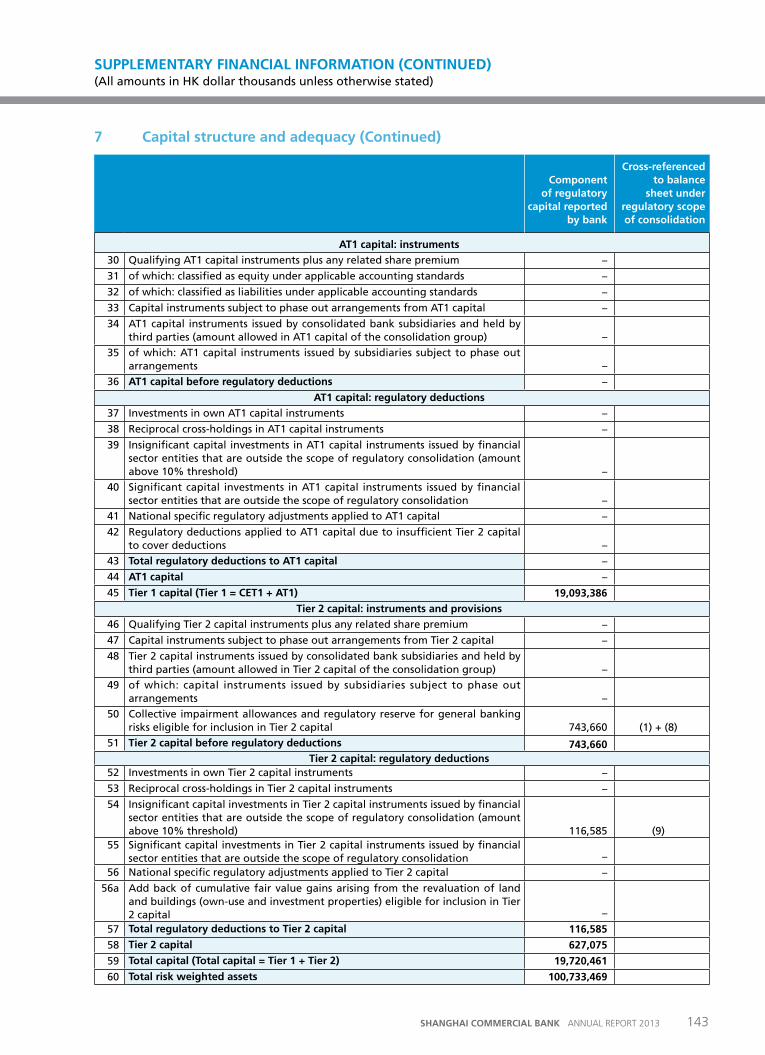
143SHANGHAI COMMERCIAL BANK ANNUAL REPORT 2013
SUPPLEMENTARY FINANCIAL INFORMATION (CONTINUEd) (All amounts in HK dollar thousands unless otherwise stated)
7 Capital structure and adequacy (Continued)
Component of regulatory
capital reported by bank
Cross-referenced to balance
sheet under regulatory scope of consolidation
at1 capital: instruments
30 Qualifying AT1 capital instruments plus any related share premium –
31 of which: classified as equity under applicable accounting standards –
32 of which: classified as liabilities under applicable accounting standards –
33 Capital instruments subject to phase out arrangements from AT1 capital –
34 AT1 capital instruments issued by consolidated bank subsidiaries and held by third parties (amount allowed in AT1 capital of the consolidation group) –
35 of which: AT1 capital instruments issued by subsidiaries subject to phase out arrangements –
36 at1 capital before regulatory deductions –
at1 capital: regulatory deductions
37 Investments in own AT1 capital instruments –
38 Reciprocal cross-holdings in AT1 capital instruments –
39 Insignificant capital investments in AT1 capital instruments issued by financial sector entities that are outside the scope of regulatory consolidation (amount above 10% threshold) –
40 Significant capital investments in AT1 capital instruments issued by financial sector entities that are outside the scope of regulatory consolidation –
41 National specific regulatory adjustments applied to AT1 capital –
42 Regulatory deductions applied to AT1 capital due to insufficient Tier 2 capital to cover deductions –
43 total regulatory deductions to at1 capital –
44 at1 capital –
45 tier 1 capital (tier 1 = CEt1 + at1) 19,093,386
tier 2 capital: instruments and provisions
46 Qualifying Tier 2 capital instruments plus any related share premium –
47 Capital instruments subject to phase out arrangements from Tier 2 capital –
48 Tier 2 capital instruments issued by consolidated bank subsidiaries and held by third parties (amount allowed in Tier 2 capital of the consolidation group) –
49 of which: capital instruments issued by subsidiaries subject to phase out arrangements –
50 Collective impairment allowances and regulatory reserve for general banking risks eligible for inclusion in Tier 2 capital 743,660 (1) + (8)
51 tier 2 capital before regulatory deductions 743,660 tier 2 capital: regulatory deductions
52 Investments in own Tier 2 capital instruments –
53 Reciprocal cross-holdings in Tier 2 capital instruments –
54 Insignificant capital investments in Tier 2 capital instruments issued by financial sector entities that are outside the scope of regulatory consolidation (amount above 10% threshold) 116,585 (9)
55 Significant capital investments in Tier 2 capital instruments issued by financial sector entities that are outside the scope of regulatory consolidation –
56 National specific regulatory adjustments applied to Tier 2 capital –
56a Add back of cumulative fair value gains arising from the revaluation of land and buildings (own-use and investment properties) eligible for inclusion in Tier 2 capital –
57 total regulatory deductions to tier 2 capital 116,585
58 tier 2 capital 627,075
59 total capital (total capital = tier 1 + tier 2) 19,720,461
60 total risk weighted assets 100,733,469
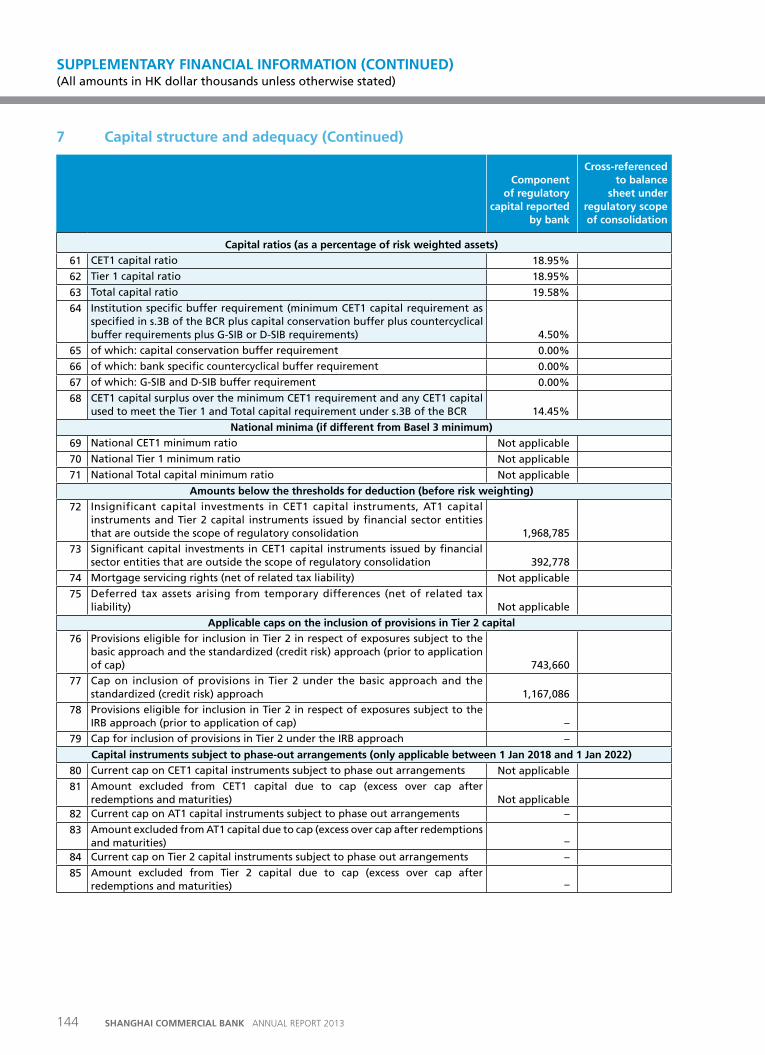
144 SHANGHAI COMMERCIAL BANK ANNUAL REPORT 2013
SUPPLEMENTARY FINANCIAL INFORMATION (CONTINUEd) (All amounts in HK dollar thousands unless otherwise stated)
7 Capital structure and adequacy (Continued)
Component of regulatory
capital reported by bank
Cross-referenced to balance
sheet under regulatory scope of consolidation
Capital ratios (as a percentage of risk weighted assets)
61 CET1 capital ratio 18.95%
62 Tier 1 capital ratio 18.95%
63 Total capital ratio 19.58%
64 Institution specific buffer requirement (minimum CET1 capital requirement as specified in s.3B of the BCR plus capital conservation buffer plus countercyclical buffer requirements plus G-SIB or D-SIB requirements) 4.50%
65 of which: capital conservation buffer requirement 0.00%
66 of which: bank specific countercyclical buffer requirement 0.00%
67 of which: G-SIB and D-SIB buffer requirement 0.00%
68 CET1 capital surplus over the minimum CET1 requirement and any CET1 capital used to meet the Tier 1 and Total capital requirement under s.3B of the BCR 14.45%
National minima (if different from Basel 3 minimum)
69 National CET1 minimum ratio Not applicable
70 National Tier 1 minimum ratio Not applicable
71 National Total capital minimum ratio Not applicable
amounts below the thresholds for deduction (before risk weighting)
72 Insignificant capital investments in CET1 capital instruments, AT1 capital instruments and Tier 2 capital instruments issued by financial sector entities that are outside the scope of regulatory consolidation 1,968,785
73 Significant capital investments in CET1 capital instruments issued by financial sector entities that are outside the scope of regulatory consolidation 392,778
74 Mortgage servicing rights (net of related tax liability) Not applicable
75 Deferred tax assets arising from temporary differences (net of related tax liability) Not applicable
applicable caps on the inclusion of provisions in tier 2 capital
76 Provisions eligible for inclusion in Tier 2 in respect of exposures subject to the basic approach and the standardized (credit risk) approach (prior to application of cap) 743,660
77 Cap on inclusion of provisions in Tier 2 under the basic approach and the standardized (credit risk) approach 1,167,086
78 Provisions eligible for inclusion in Tier 2 in respect of exposures subject to the IRB approach (prior to application of cap) –
79 Cap for inclusion of provisions in Tier 2 under the IRB approach –
Capital instruments subject to phase-out arrangements (only applicable between 1 Jan 2018 and 1 Jan 2022)
80 Current cap on CET1 capital instruments subject to phase out arrangements Not applicable
81 Amount excluded from CET1 capital due to cap (excess over cap after redemptions and maturities) Not applicable
82 Current cap on AT1 capital instruments subject to phase out arrangements –
83 Amount excluded from AT1 capital due to cap (excess over cap after redemptions and maturities) –
84 Current cap on Tier 2 capital instruments subject to phase out arrangements –
85 Amount excluded from Tier 2 capital due to cap (excess over cap after redemptions and maturities) –
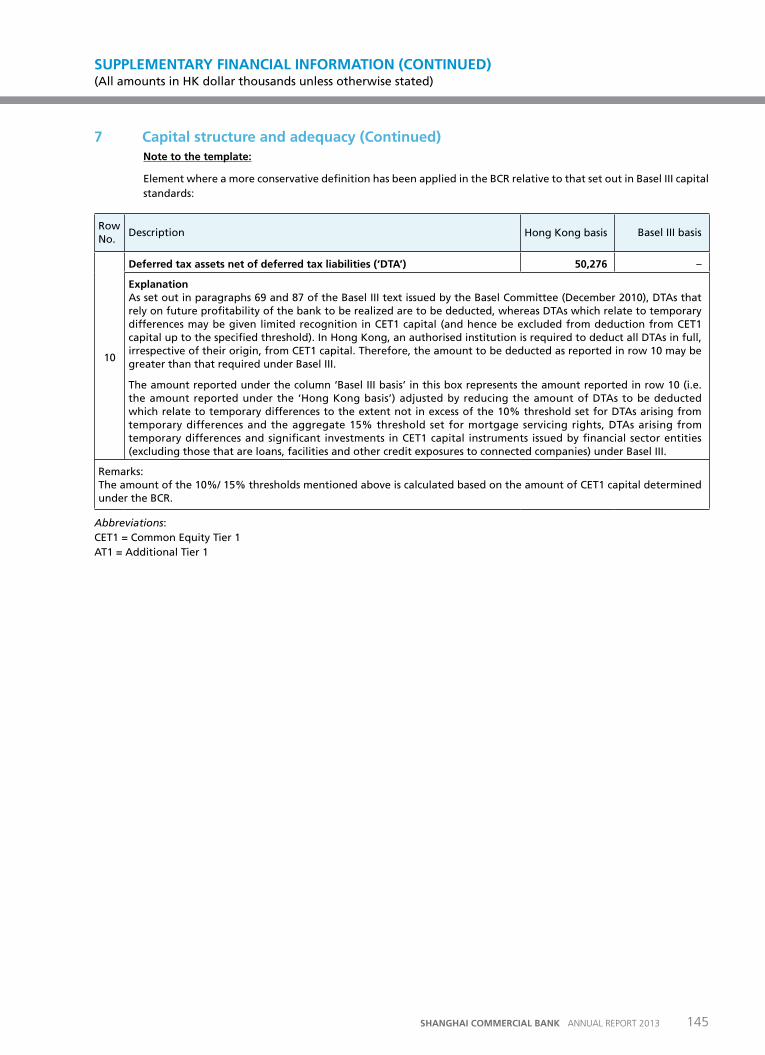
145SHANGHAI COMMERCIAL BANK ANNUAL REPORT 2013
SUPPLEMENTARY FINANCIAL INFORMATION (CONTINUEd) (All amounts in HK dollar thousands unless otherwise stated)
7 Capital structure and adequacy (Continued)Note to the template:
Element where a more conservative definition has been applied in the BCR relative to that set out in Basel III capital standards:
Row No.
Description Hong Kong basis Basel III basis
10
Deferred tax assets net of deferred tax liabilities (‘Dta’) 50,276 –
ExplanationAs set out in paragraphs 69 and 87 of the Basel III text issued by the Basel Committee (December 2010), DTAs that rely on future profitability of the bank to be realized are to be deducted, whereas DTAs which relate to temporary differences may be given limited recognition in CET1 capital (and hence be excluded from deduction from CET1 capital up to the specified threshold). In Hong Kong, an authorised institution is required to deduct all DTAs in full, irrespective of their origin, from CET1 capital. Therefore, the amount to be deducted as reported in row 10 may be greater than that required under Basel III.
The amount reported under the column ‘Basel III basis’ in this box represents the amount reported in row 10 (i.e. the amount reported under the ‘Hong Kong basis’) adjusted by reducing the amount of DTAs to be deducted which relate to temporary differences to the extent not in excess of the 10% threshold set for DTAs arising from temporary differences and the aggregate 15% threshold set for mortgage servicing rights, DTAs arising from temporary differences and significant investments in CET1 capital instruments issued by financial sector entities (excluding those that are loans, facilities and other credit exposures to connected companies) under Basel III.
Remarks:The amount of the 10%/ 15% thresholds mentioned above is calculated based on the amount of CET1 capital determined under the BCR.
Abbreviations:CET1 = Common Equity Tier 1AT1 = Additional Tier 1
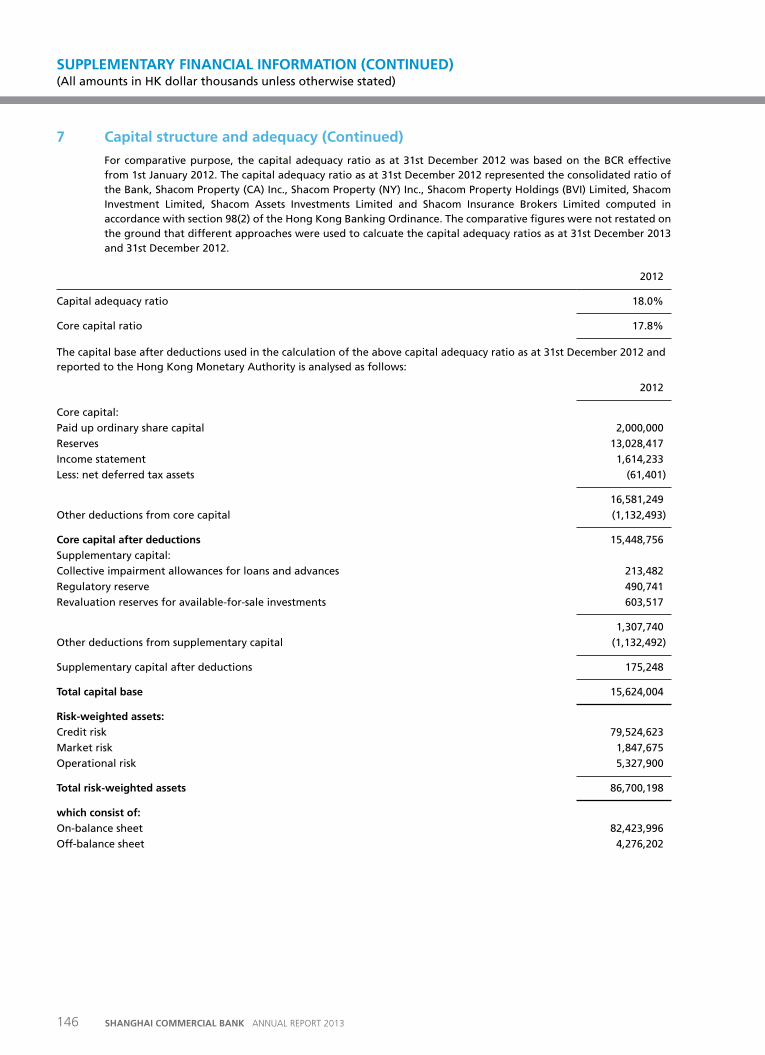
146 SHANGHAI COMMERCIAL BANK ANNUAL REPORT 2013
SUPPLEMENTARY FINANCIAL INFORMATION (CONTINUEd) (All amounts in HK dollar thousands unless otherwise stated)
7 Capital structure and adequacy (Continued)
For comparative purpose, the capital adequacy ratio as at 31st December 2012 was based on the BCR effective from 1st January 2012. The capital adequacy ratio as at 31st December 2012 represented the consolidated ratio of the Bank, Shacom Property (CA) Inc., Shacom Property (NY) Inc., Shacom Property Holdings (BVI) Limited, Shacom Investment Limited, Shacom Assets Investments Limited and Shacom Insurance Brokers Limited computed in accordance with section 98(2) of the Hong Kong Banking Ordinance. The comparative figures were not restated on the ground that different approaches were used to calcuate the capital adequacy ratios as at 31st December 2013 and 31st December 2012.
2012
Capital adequacy ratio 18.0%
Core capital ratio 17.8%
The capital base after deductions used in the calculation of the above capital adequacy ratio as at 31st December 2012 and reported to the Hong Kong Monetary Authority is analysed as follows:
2012
Core capital:
Paid up ordinary share capital 2,000,000
Reserves 13,028,417
Income statement 1,614,233
Less: net deferred tax assets (61,401)
16,581,249
Other deductions from core capital (1,132,493)
Core capital after deductions 15,448,756
Supplementary capital:
Collective impairment allowances for loans and advances 213,482
Regulatory reserve 490,741
Revaluation reserves for available-for-sale investments 603,517
1,307,740
Other deductions from supplementary capital (1,132,492)
Supplementary capital after deductions 175,248
total capital base 15,624,004
risk-weighted assets:
Credit risk 79,524,623
Market risk 1,847,675
Operational risk 5,327,900
total risk-weighted assets 86,700,198
which consist of:
On-balance sheet 82,423,996
Off-balance sheet 4,276,202
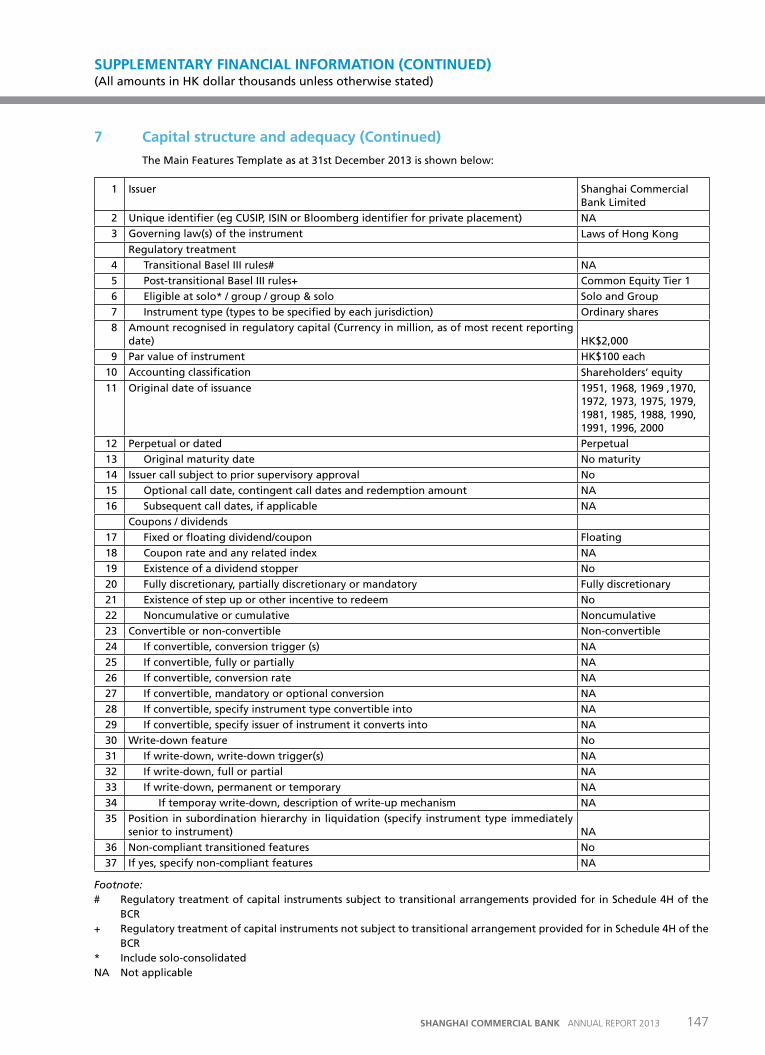
147SHANGHAI COMMERCIAL BANK ANNUAL REPORT 2013
SUPPLEMENTARY FINANCIAL INFORMATION (CONTINUEd) (All amounts in HK dollar thousands unless otherwise stated)
7 Capital structure and adequacy (Continued)
The Main Features Template as at 31st December 2013 is shown below:
1 Issuer Shanghai Commercial Bank Limited
2 Unique identifier (eg CUSIP, ISIN or Bloomberg identifier for private placement) NA
3 Governing law(s) of the instrument Laws of Hong Kong
Regulatory treatment
4 Transitional Basel III rules# NA
5 Post-transitional Basel III rules+ Common Equity Tier 1
6 Eligible at solo* / group / group & solo Solo and Group
7 Instrument type (types to be specified by each jurisdiction) Ordinary shares
8 Amount recognised in regulatory capital (Currency in million, as of most recent reporting date) HK$2,000
9 Par value of instrument HK$100 each
10 Accounting classification Shareholders’ equity
11 Original date of issuance 1951, 1968, 1969 ,1970, 1972, 1973, 1975, 1979, 1981, 1985, 1988, 1990, 1991, 1996, 2000
12 Perpetual or dated Perpetual
13 Original maturity date No maturity
14 Issuer call subject to prior supervisory approval No
15 Optional call date, contingent call dates and redemption amount NA
16 Subsequent call dates, if applicable NA
Coupons / dividends
17 Fixed or floating dividend/coupon Floating
18 Coupon rate and any related index NA
19 Existence of a dividend stopper No
20 Fully discretionary, partially discretionary or mandatory Fully discretionary
21 Existence of step up or other incentive to redeem No
22 Noncumulative or cumulative Noncumulative
23 Convertible or non-convertible Non-convertible
24 If convertible, conversion trigger (s) NA
25 If convertible, fully or partially NA
26 If convertible, conversion rate NA
27 If convertible, mandatory or optional conversion NA
28 If convertible, specify instrument type convertible into NA
29 If convertible, specify issuer of instrument it converts into NA
30 Write-down feature No
31 If write-down, write-down trigger(s) NA
32 If write-down, full or partial NA
33 If write-down, permanent or temporary NA
34 If temporay write-down, description of write-up mechanism NA
35 Position in subordination hierarchy in liquidation (specify instrument type immediately senior to instrument) NA
36 Non-compliant transitioned features No
37 If yes, specify non-compliant features NA
Footnote:# Regulatory treatment of capital instruments subject to transitional arrangements provided for in Schedule 4H of the
BCR+ Regulatory treatment of capital instruments not subject to transitional arrangement provided for in Schedule 4H of the
BCR* Include solo-consolidatedNA Not applicable
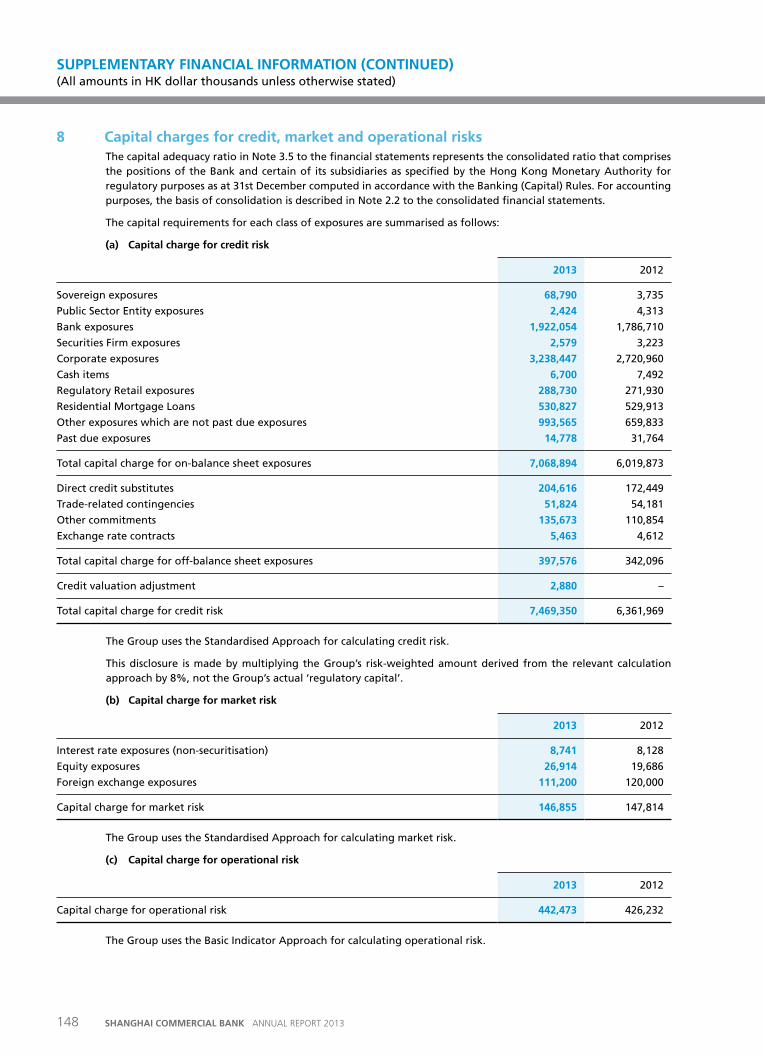
148 SHANGHAI COMMERCIAL BANK ANNUAL REPORT 2013
SUPPLEMENTARY FINANCIAL INFORMATION (CONTINUEd) (All amounts in HK dollar thousands unless otherwise stated)
8 Capital charges for credit, market and operational risksThe capital adequacy ratio in Note 3.5 to the financial statements represents the consolidated ratio that comprises the positions of the Bank and certain of its subsidiaries as specified by the Hong Kong Monetary Authority for regulatory purposes as at 31st December computed in accordance with the Banking (Capital) Rules. For accounting purposes, the basis of consolidation is described in Note 2.2 to the consolidated financial statements.
The capital requirements for each class of exposures are summarised as follows:
(a) Capital charge for credit risk
2013 2012
Sovereign exposures 68,790 3,735
Public Sector Entity exposures 2,424 4,313
Bank exposures 1,922,054 1,786,710
Securities Firm exposures 2,579 3,223
Corporate exposures 3,238,447 2,720,960
Cash items 6,700 7,492
Regulatory Retail exposures 288,730 271,930
Residential Mortgage Loans 530,827 529,913
Other exposures which are not past due exposures 993,565 659,833
Past due exposures 14,778 31,764
Total capital charge for on-balance sheet exposures 7,068,894 6,019,873
Direct credit substitutes 204,616 172,449
Trade-related contingencies 51,824 54,181
Other commitments 135,673 110,854
Exchange rate contracts 5,463 4,612
Total capital charge for off-balance sheet exposures 397,576 342,096
Credit valuation adjustment 2,880 –
Total capital charge for credit risk 7,469,350 6,361,969
The Group uses the Standardised Approach for calculating credit risk.
This disclosure is made by multiplying the Group’s risk-weighted amount derived from the relevant calculation approach by 8%, not the Group’s actual ‘regulatory capital’.
(b) Capital charge for market risk
2013 2012
Interest rate exposures (non-securitisation) 8,741 8,128
Equity exposures 26,914 19,686
Foreign exchange exposures 111,200 120,000
Capital charge for market risk 146,855 147,814
The Group uses the Standardised Approach for calculating market risk.
(c) Capital charge for operational risk
2013 2012
Capital charge for operational risk 442,473 426,232
The Group uses the Basic Indicator Approach for calculating operational risk.
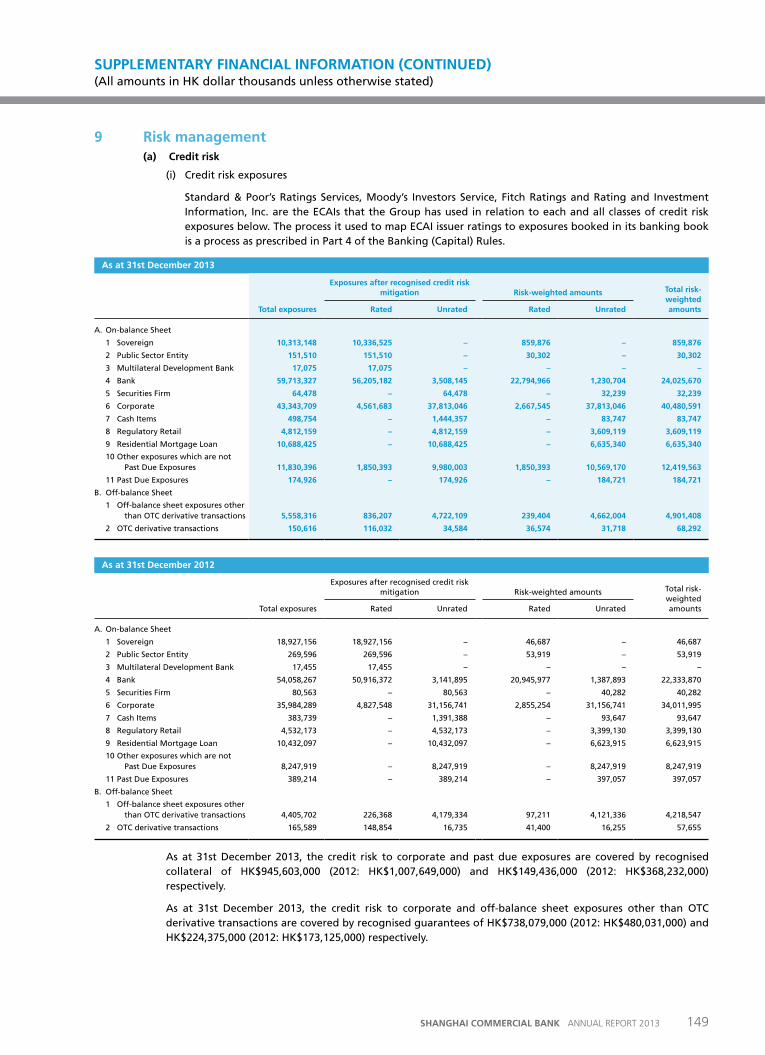
149SHANGHAI COMMERCIAL BANK ANNUAL REPORT 2013
SUPPLEMENTARY FINANCIAL INFORMATION (CONTINUEd) (All amounts in HK dollar thousands unless otherwise stated)
9 risk management(a) Credit risk
(i) Credit risk exposures
Standard & Poor’s Ratings Services, Moody’s Investors Service, Fitch Ratings and Rating and Investment Information, Inc. are the ECAIs that the Group has used in relation to each and all classes of credit risk exposures below. The process it used to map ECAI issuer ratings to exposures booked in its banking book is a process as prescribed in Part 4 of the Banking (Capital) Rules.
as at 31st December 2013
total exposures
Exposures after recognised credit risk mitigation risk-weighted amounts total risk-
weighted amounts rated unrated rated unrated
A. On-balance Sheet
1 Sovereign 10,313,148 10,336,525 – 859,876 – 859,876
2 Public Sector Entity 151,510 151,510 – 30,302 – 30,302
3 Multilateral Development Bank 17,075 17,075 – – – –
4 Bank 59,713,327 56,205,182 3,508,145 22,794,966 1,230,704 24,025,670
5 Securities Firm 64,478 – 64,478 – 32,239 32,239
6 Corporate 43,343,709 4,561,683 37,813,046 2,667,545 37,813,046 40,480,591
7 Cash Items 498,754 – 1,444,357 – 83,747 83,747
8 Regulatory Retail 4,812,159 – 4,812,159 – 3,609,119 3,609,119
9 Residential Mortgage Loan 10,688,425 – 10,688,425 – 6,635,340 6,635,340
10 Other exposures which are not Past Due Exposures 11,830,396 1,850,393 9,980,003 1,850,393 10,569,170 12,419,563
11 Past Due Exposures 174,926 – 174,926 – 184,721 184,721
B. Off-balance Sheet
1 Off-balance sheet exposures other than OTC derivative transactions 5,558,316 836,207 4,722,109 239,404 4,662,004 4,901,408
2 OTC derivative transactions 150,616 116,032 34,584 36,574 31,718 68,292
as at 31st December 2012
Total exposures
Exposures after recognised credit risk mitigation Risk-weighted amounts Total risk-
weighted amounts Rated Unrated Rated Unrated
A. On-balance Sheet
1 Sovereign 18,927,156 18,927,156 – 46,687 – 46,687
2 Public Sector Entity 269,596 269,596 – 53,919 – 53,919
3 Multilateral Development Bank 17,455 17,455 – – – –
4 Bank 54,058,267 50,916,372 3,141,895 20,945,977 1,387,893 22,333,870
5 Securities Firm 80,563 – 80,563 – 40,282 40,282
6 Corporate 35,984,289 4,827,548 31,156,741 2,855,254 31,156,741 34,011,995
7 Cash Items 383,739 – 1,391,388 – 93,647 93,647
8 Regulatory Retail 4,532,173 – 4,532,173 – 3,399,130 3,399,130
9 Residential Mortgage Loan 10,432,097 – 10,432,097 – 6,623,915 6,623,915
10 Other exposures which are not Past Due Exposures 8,247,919 – 8,247,919 – 8,247,919 8,247,919
11 Past Due Exposures 389,214 – 389,214 – 397,057 397,057
B. Off-balance Sheet
1 Off-balance sheet exposures other than OTC derivative transactions 4,405,702 226,368 4,179,334 97,211 4,121,336 4,218,547
2 OTC derivative transactions 165,589 148,854 16,735 41,400 16,255 57,655
As at 31st December 2013, the credit risk to corporate and past due exposures are covered by recognised collateral of HK$945,603,000 (2012: HK$1,007,649,000) and HK$149,436,000 (2012: HK$368,232,000) respectively.
As at 31st December 2013, the credit risk to corporate and off-balance sheet exposures other than OTC derivative transactions are covered by recognised guarantees of HK$738,079,000 (2012: HK$480,031,000) and HK$224,375,000 (2012: HK$173,125,000) respectively.
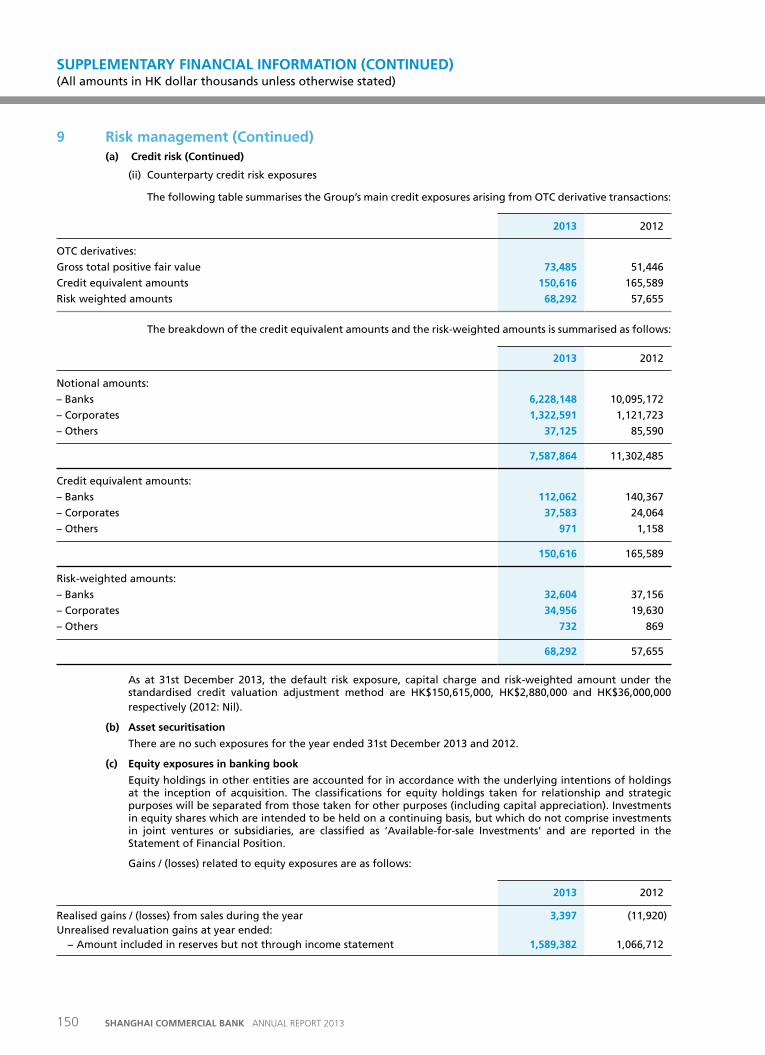
150 SHANGHAI COMMERCIAL BANK ANNUAL REPORT 2013
SUPPLEMENTARY FINANCIAL INFORMATION (CONTINUEd) (All amounts in HK dollar thousands unless otherwise stated)
9 risk management (Continued)(a) Credit risk (Continued)
(ii) Counterparty credit risk exposures
The following table summarises the Group’s main credit exposures arising from OTC derivative transactions:
2013 2012
OTC derivatives:
Gross total positive fair value 73,485 51,446
Credit equivalent amounts 150,616 165,589
Risk weighted amounts 68,292 57,655
The breakdown of the credit equivalent amounts and the risk-weighted amounts is summarised as follows:
2013 2012
Notional amounts:
– Banks 6,228,148 10,095,172
– Corporates 1,322,591 1,121,723
– Others 37,125 85,590
7,587,864 11,302,485
Credit equivalent amounts:
– Banks 112,062 140,367
– Corporates 37,583 24,064
– Others 971 1,158
150,616 165,589
Risk-weighted amounts:
– Banks 32,604 37,156
– Corporates 34,956 19,630
– Others 732 869
68,292 57,655
As at 31st December 2013, the default risk exposure, capital charge and risk-weighted amount under the standardised credit valuation adjustment method are HK$150,615,000, HK$2,880,000 and HK$36,000,000 respectively (2012: Nil).
(b) asset securitisation
There are no such exposures for the year ended 31st December 2013 and 2012.
(c) Equity exposures in banking book
Equity holdings in other entities are accounted for in accordance with the underlying intentions of holdings at the inception of acquisition. The classifications for equity holdings taken for relationship and strategic purposes will be separated from those taken for other purposes (including capital appreciation). Investments in equity shares which are intended to be held on a continuing basis, but which do not comprise investments in joint ventures or subsidiaries, are classified as ‘Available-for-sale Investments’ and are reported in the Statement of Financial Position.
Gains / (losses) related to equity exposures are as follows:
2013 2012
Realised gains / (losses) from sales during the year 3,397 (11,920)Unrealised revaluation gains at year ended: − Amount included in reserves but not through income statement 1,589,382 1,066,712
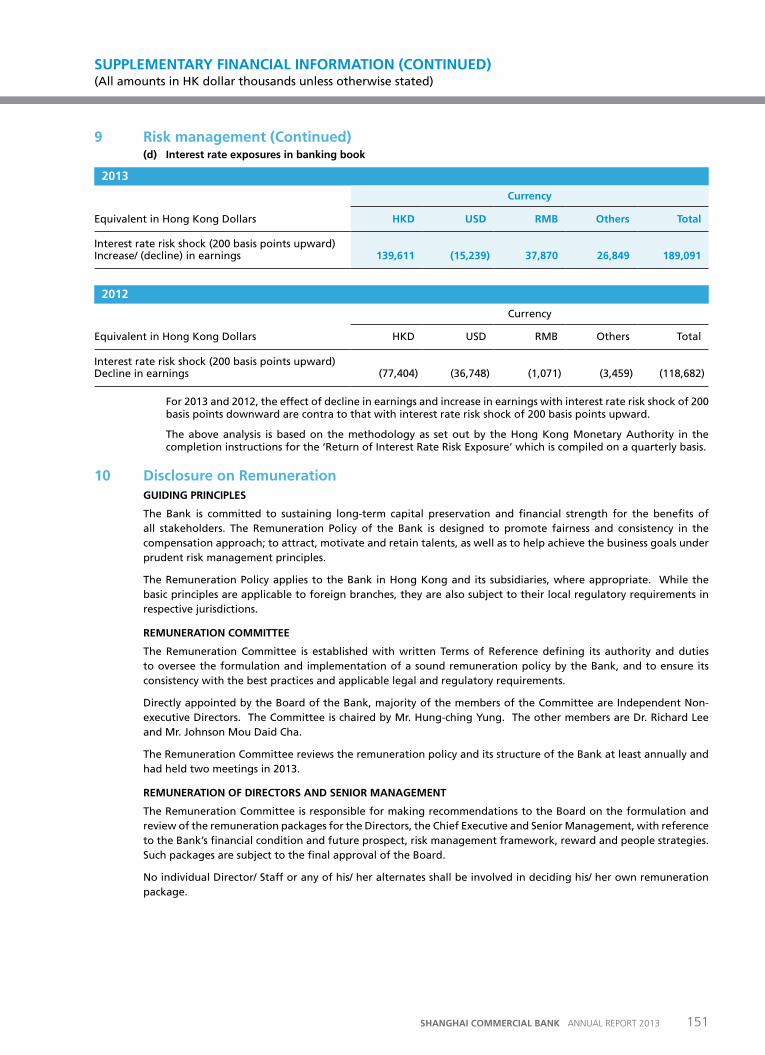
151SHANGHAI COMMERCIAL BANK ANNUAL REPORT 2013
SUPPLEMENTARY FINANCIAL INFORMATION (CONTINUEd) (All amounts in HK dollar thousands unless otherwise stated)
9 risk management (Continued)(d) Interest rate exposures in banking book
2013
Currency
Equivalent in Hong Kong Dollars HKD uSD rMB others total
Interest rate risk shock (200 basis points upward) Increase/ (decline) in earnings 139,611 (15,239) 37,870 26,849 189,091
2012
Currency
Equivalent in Hong Kong Dollars HKD USD RMB Others Total
Interest rate risk shock (200 basis points upward) Decline in earnings (77,404) (36,748) (1,071) (3,459) (118,682)
For 2013 and 2012, the effect of decline in earnings and increase in earnings with interest rate risk shock of 200 basis points downward are contra to that with interest rate risk shock of 200 basis points upward.
The above analysis is based on the methodology as set out by the Hong Kong Monetary Authority in the completion instructions for the ‘Return of Interest Rate Risk Exposure’ which is compiled on a quarterly basis.
10 Disclosure on remunerationGuIDING prINCIpLES
The Bank is committed to sustaining long-term capital preservation and financial strength for the benefits of all stakeholders. The Remuneration Policy of the Bank is designed to promote fairness and consistency in the compensation approach; to attract, motivate and retain talents, as well as to help achieve the business goals under prudent risk management principles.
The Remuneration Policy applies to the Bank in Hong Kong and its subsidiaries, where appropriate. While the basic principles are applicable to foreign branches, they are also subject to their local regulatory requirements in respective jurisdictions.
rEMuNEratIoN CoMMIttEE
The Remuneration Committee is established with written Terms of Reference defining its authority and duties to oversee the formulation and implementation of a sound remuneration policy by the Bank, and to ensure its consistency with the best practices and applicable legal and regulatory requirements.
Directly appointed by the Board of the Bank, majority of the members of the Committee are Independent Non-executive Directors. The Committee is chaired by Mr. Hung-ching Yung. The other members are Dr. Richard Lee and Mr. Johnson Mou Daid Cha.
The Remuneration Committee reviews the remuneration policy and its structure of the Bank at least annually and had held two meetings in 2013.
rEMuNEratIoN oF DIrECtorS aND SENIor MaNaGEMENt
The Remuneration Committee is responsible for making recommendations to the Board on the formulation and review of the remuneration packages for the Directors, the Chief Executive and Senior Management, with reference to the Bank’s financial condition and future prospect, risk management framework, reward and people strategies. Such packages are subject to the final approval of the Board.
No individual Director/ Staff or any of his/ her alternates shall be involved in deciding his/ her own remuneration package.
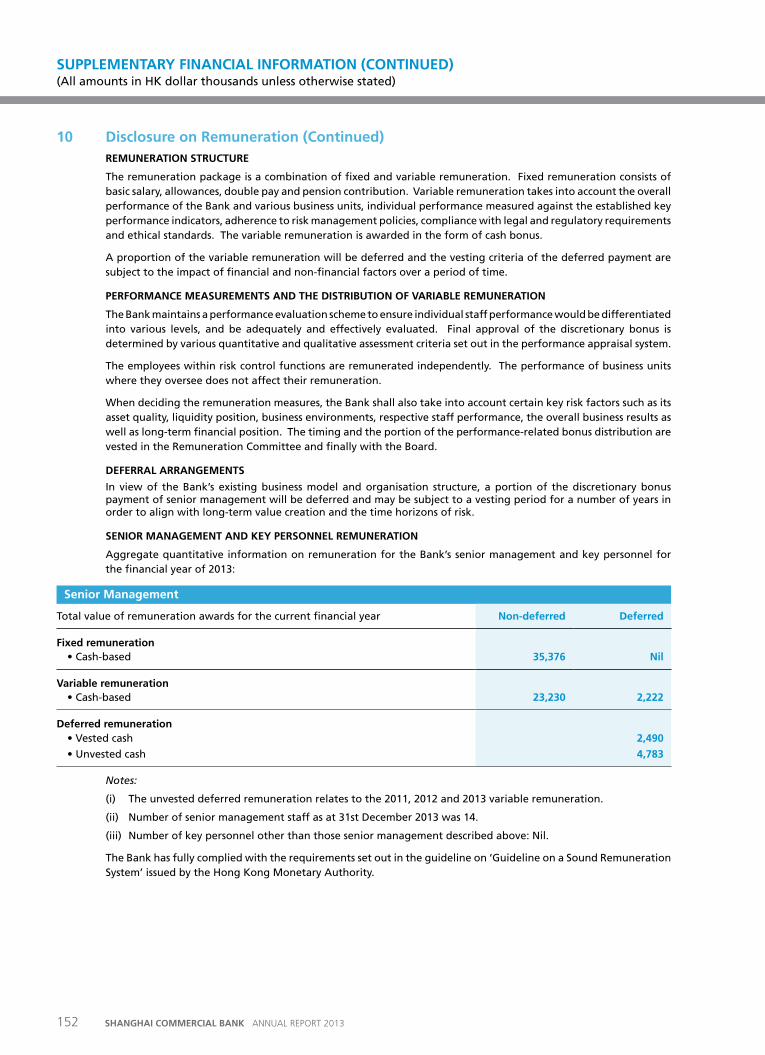
152 SHANGHAI COMMERCIAL BANK ANNUAL REPORT 2013
SUPPLEMENTARY FINANCIAL INFORMATION (CONTINUEd) (All amounts in HK dollar thousands unless otherwise stated)
10 Disclosure on remuneration (Continued)rEMuNEratIoN StruCturE
The remuneration package is a combination of fixed and variable remuneration. Fixed remuneration consists of basic salary, allowances, double pay and pension contribution. Variable remuneration takes into account the overall performance of the Bank and various business units, individual performance measured against the established key performance indicators, adherence to risk management policies, compliance with legal and regulatory requirements and ethical standards. The variable remuneration is awarded in the form of cash bonus.
A proportion of the variable remuneration will be deferred and the vesting criteria of the deferred payment are subject to the impact of financial and non-financial factors over a period of time.
pErForMaNCE MEaSurEMENtS aND tHE DIStrIButIoN oF varIaBLE rEMuNEratIoN
The Bank maintains a performance evaluation scheme to ensure individual staff performance would be differentiated into various levels, and be adequately and effectively evaluated. Final approval of the discretionary bonus is determined by various quantitative and qualitative assessment criteria set out in the performance appraisal system.
The employees within risk control functions are remunerated independently. The performance of business units where they oversee does not affect their remuneration.
When deciding the remuneration measures, the Bank shall also take into account certain key risk factors such as its asset quality, liquidity position, business environments, respective staff performance, the overall business results as well as long-term financial position. The timing and the portion of the performance-related bonus distribution are vested in the Remuneration Committee and finally with the Board.
DEFErraL arraNGEMENtS
In view of the Bank’s existing business model and organisation structure, a portion of the discretionary bonus payment of senior management will be deferred and may be subject to a vesting period for a number of years in order to align with long-term value creation and the time horizons of risk.
SENIor MaNaGEMENt aND KEY pErSoNNEL rEMuNEratIoN
Aggregate quantitative information on remuneration for the Bank’s senior management and key personnel for the financial year of 2013:
Senior Management
Total value of remuneration awards for the current financial year Non-deferred Deferred
Fixed remuneration •Cash-based 35,376 Nil
variable remuneration •Cash-based 23,230 2,222
Deferred remuneration •Vestedcash 2,490
•Unvestedcash 4,783
Notes:
(i) The unvested deferred remuneration relates to the 2011, 2012 and 2013 variable remuneration.
(ii) Number of senior management staff as at 31st December 2013 was 14.
(iii) Number of key personnel other than those senior management described above: Nil.
The Bank has fully complied with the requirements set out in the guideline on ‘Guideline on a Sound Remuneration System’ issued by the Hong Kong Monetary Authority.
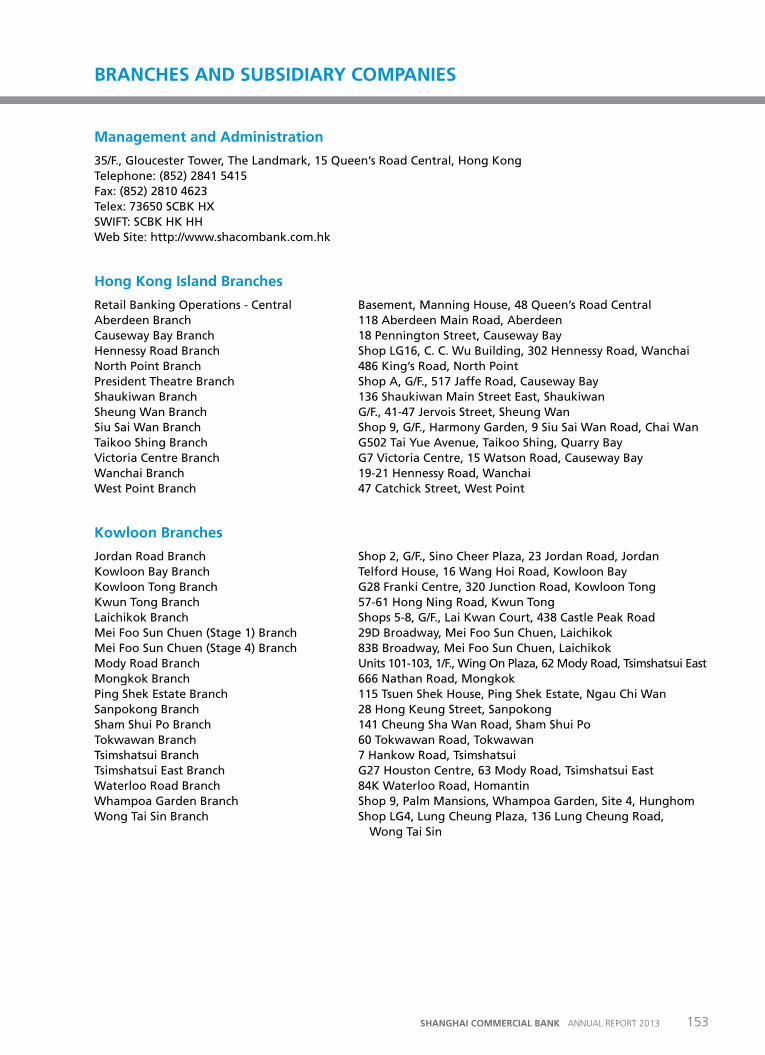
Management and administration
35/F., Gloucester Tower, The Landmark, 15 Queen’s Road Central, Hong KongTelephone: (852) 2841 5415Fax: (852) 2810 4623Telex: 73650 SCBK HXSWIFT: SCBK HK HHWeb Site: http://www.shacombank.com.hk
Hong Kong Island Branches
Retail Banking Operations - Central Basement, Manning House, 48 Queen’s Road CentralAberdeen Branch 118 Aberdeen Main Road, AberdeenCauseway Bay Branch 18 Pennington Street, Causeway BayHennessy Road Branch Shop LG16, C. C. Wu Building, 302 Hennessy Road, WanchaiNorth Point Branch 486 King’s Road, North PointPresident Theatre Branch Shop A, G/F., 517 Jaffe Road, Causeway BayShaukiwan Branch 136 Shaukiwan Main Street East, ShaukiwanSheung Wan Branch G/F., 41-47 Jervois Street, Sheung WanSiu Sai Wan Branch Shop 9, G/F., Harmony Garden, 9 Siu Sai Wan Road, Chai WanTaikoo Shing Branch G502 Tai Yue Avenue, Taikoo Shing, Quarry BayVictoria Centre Branch G7 Victoria Centre, 15 Watson Road, Causeway BayWanchai Branch 19-21 Hennessy Road, WanchaiWest Point Branch 47 Catchick Street, West Point
Kowloon Branches
Jordan Road Branch Shop 2, G/F., Sino Cheer Plaza, 23 Jordan Road, JordanKowloon Bay Branch Telford House, 16 Wang Hoi Road, Kowloon BayKowloon Tong Branch G28 Franki Centre, 320 Junction Road, Kowloon TongKwun Tong Branch 57-61 Hong Ning Road, Kwun TongLaichikok Branch Shops 5-8, G/F., Lai Kwan Court, 438 Castle Peak RoadMei Foo Sun Chuen (Stage 1) Branch 29D Broadway, Mei Foo Sun Chuen, LaichikokMei Foo Sun Chuen (Stage 4) Branch 83B Broadway, Mei Foo Sun Chuen, LaichikokMody Road Branch Units 101-103, 1/F., Wing On Plaza, 62 Mody Road, Tsimshatsui EastMongkok Branch 666 Nathan Road, MongkokPing Shek Estate Branch 115 Tsuen Shek House, Ping Shek Estate, Ngau Chi WanSanpokong Branch 28 Hong Keung Street, SanpokongSham Shui Po Branch 141 Cheung Sha Wan Road, Sham Shui PoTokwawan Branch 60 Tokwawan Road, TokwawanTsimshatsui Branch 7 Hankow Road, TsimshatsuiTsimshatsui East Branch G27 Houston Centre, 63 Mody Road, Tsimshatsui EastWaterloo Road Branch 84K Waterloo Road, HomantinWhampoa Garden Branch Shop 9, Palm Mansions, Whampoa Garden, Site 4, HunghomWong Tai Sin Branch Shop LG4, Lung Cheung Plaza, 136 Lung Cheung Road,
Wong Tai Sin
BraNCHES aND SuBSIDIarY CoMpaNIES
153SHANGHAI COMMERCIAL BANK ANNUAL REPORT 2013
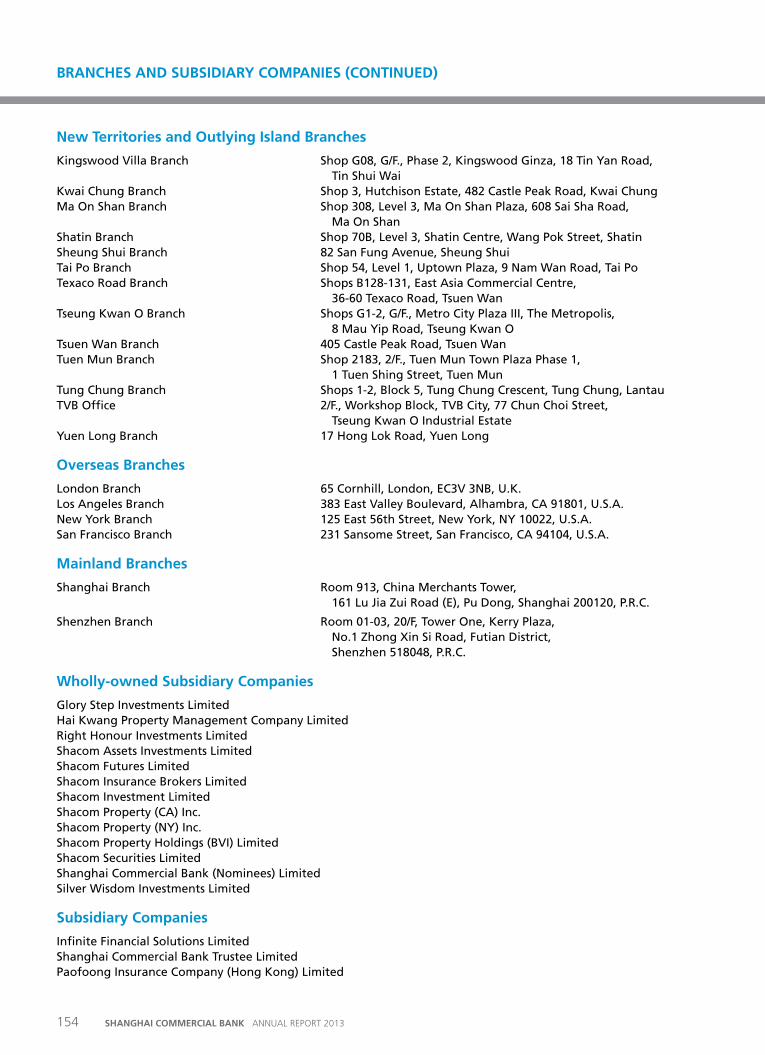
New territories and outlying Island Branches
Kingswood Villa Branch Shop G08, G/F., Phase 2, Kingswood Ginza, 18 Tin Yan Road, Tin Shui Wai
Kwai Chung Branch Shop 3, Hutchison Estate, 482 Castle Peak Road, Kwai ChungMa On Shan Branch Shop 308, Level 3, Ma On Shan Plaza, 608 Sai Sha Road,
Ma On ShanShatin Branch Shop 70B, Level 3, Shatin Centre, Wang Pok Street, ShatinSheung Shui Branch 82 San Fung Avenue, Sheung ShuiTai Po Branch Shop 54, Level 1, Uptown Plaza, 9 Nam Wan Road, Tai PoTexaco Road Branch Shops B128-131, East Asia Commercial Centre,
36-60 Texaco Road, Tsuen WanTseung Kwan O Branch Shops G1-2, G/F., Metro City Plaza III, The Metropolis,
8 Mau Yip Road, Tseung Kwan OTsuen Wan Branch 405 Castle Peak Road, Tsuen WanTuen Mun Branch Shop 2183, 2/F., Tuen Mun Town Plaza Phase 1,
1 Tuen Shing Street, Tuen MunTung Chung Branch Shops 1-2, Block 5, Tung Chung Crescent, Tung Chung, LantauTVB Office 2/F., Workshop Block, TVB City, 77 Chun Choi Street,
Tseung Kwan O Industrial EstateYuen Long Branch 17 Hong Lok Road, Yuen Long
overseas Branches
London Branch 65 Cornhill, London, EC3V 3NB, U.K.Los Angeles Branch 383 East Valley Boulevard, Alhambra, CA 91801, U.S.A.New York Branch 125 East 56th Street, New York, NY 10022, U.S.A.San Francisco Branch 231 Sansome Street, San Francisco, CA 94104, U.S.A.
Mainland Branches
Shanghai Branch Room 913, China Merchants Tower, 161 Lu Jia Zui Road (E), Pu Dong, Shanghai 200120, P.R.C.
Shenzhen Branch Room 01-03, 20/F, Tower One, Kerry Plaza, No.1 Zhong Xin Si Road, Futian District, Shenzhen 518048, P.R.C.
Wholly-owned Subsidiary Companies
Glory Step Investments Limited Hai Kwang Property Management Company LimitedRight Honour Investments LimitedShacom Assets Investments LimitedShacom Futures LimitedShacom Insurance Brokers LimitedShacom Investment LimitedShacom Property (CA) Inc.Shacom Property (NY) Inc.Shacom Property Holdings (BVI) LimitedShacom Securities LimitedShanghai Commercial Bank (Nominees) LimitedSilver Wisdom Investments Limited
Subsidiary Companies
Infinite Financial Solutions LimitedShanghai Commercial Bank Trustee LimitedPaofoong Insurance Company (Hong Kong) Limited
BraNCHES aND SuBSIDIarY CoMpaNIES (CoNtINuED)
154 SHANGHAI COMMERCIAL BANK ANNUAL REPORT 2013


