Embed Size (px)
Citation preview

ANNUAL REPORT2020

His Highness Sheikh Khalifa Bin Zayed Al Nahyan
President of the United Arab Emirates and Ruler of Abu Dhabi
His Highness Sheikh Mohammed Bin Rashid Al Maktoum
Vice President and Prime Minister of the United Arab Emirates
and Ruler of Dubai
His Highness Sheikh Saud Bin Saqr Al Qasimi
Supreme Council Member and Ruler of Ras Al Khaimah
His Highness Sheikh Mohammed Bin Saud Bin Saqr Al Qasimi
Crown Prince of Ras Al Khaimah
R AK CER A MI C S

20
OPERATIONAL UPDATE
08
CORPORATE UPDATE
02
INTRODUCTION
ANNUAL REP ORT 2020
CONTENT OVERVIEW
INTRODUCTION
Chairman’s Message 04
Group CEO’s Message 06
SECTION 1 – CORPORATE UPDATE
Performance Overview 10
Core Business Performance 12
Regional Performance 13
Global Operations 14
Board of Directors, Advisers and Leadership 16
SECTION 2 – OPERATIONAL UPDATE
Tiles 22
Sanitaryware 24
Faucets 26
Tableware 28
Sales and Marketing 30
Corporate Social Responsibility 32
Awards, Events and Sponsorship 33
Health, Safety and the Environment 34
Corporate Governance 35
Training and Development 36
Information Technology 37
SECTION 3 – FINANCIAL REVIEW
Financial Highlights 41
Independent Auditors’ Report 42
Consolidated Income Statement 47
Consolidated Statement of Profit or Loss and Other Comprehensive Income 48
Consolidated Statement of Financial Position 49
Consolidated Statement of Cash Flows 50
Consolidated Statement of Changes in Equity 52
Notes to the Consolidated Financial Statements 56
39
FINANCIAL REVIEW

2

3
INTRODUC TION
ANNUAL REP ORT 2020
4
Chairman’s Message
INTRODUC TION
Dear Shareholders
It would be an understatement to say that 2020 was a challenging environment. However, despite the disruptions caused by the pandemic, I am proud to report that RAK Ceramics has shown remarkable resilience. This performance has only been possible with our management’s commitment, the loyalty of our staff, and the dedicated support of the UAE.
Although the current business environment brings a new and unfamiliar set of challenges, the UAE is resilient. It will continue growing as a business hub due to its strong infrastructure, forward-looking leadership and robust talent pool. These conditions have enabled RAK Ceramics to enjoy steady long-term growth, and today we are one of the world’s top ceramic producers.
2021 represents a considerable milestone as the company celebrates 30 years of production. Since we began to produce our first tiles in 1991, our clients, production technologies and product designs
have evolved tremendously. However, we have always maintained a consistent focus on manufacturing innovation and delivering impeccably high product standards.
This passion has opened many opportunities to us, and as an organisation, we have much to be proud of. Over the last three decades, the company has helped create icons and build marvels all over the world.
Looking forward, we will continue to strengthen our position as world leaders in the field of global ceramics, focusing on innovation and delivering on our vision to become the world’s leading ceramics lifestyle solutions provider.
With this in mind, it gives me great pleasure to introduce our 2020 Annual Report.
KHALID BIN SAUD AL QASIMIChairman of the board

5CHAIRM AN ’ S ME SSAG E
2021 represents a considerable milestone as the company celebrates 30 years of production.

6 INTRODUC TION
Our strong performance in 2020 has been a result of our ability to act decisively during times of crisis and from our appetite to adapt and innovate.
7
Group CEO’s Message
G ROUP CEO ME SSAG E
Dear Shareholders
As far as RAK Ceramics is concerned, it would be an understatement to say that 2020 was a challenging environment. The nature of our business is closely linked to the construction and hospitality sector, which has been and continues to be negatively affected by the pandemic.
Despite this, I am pleased to say that we delivered satisfactory results in 2020. I am proud to say that this performance has been a result of our ability to act decisively during times of crisis and from our appetite, as an organisation, to adapt and innovate.
We have been proactive in implementing a raft of measures designed to mitigate the impact of COVID-19, and by the end of March, we took the decision to shut down production in India and Bangladesh completely and significantly reduced our production in the UAE. We took steps to manage our liquidity, reduce expenses and placed all non-essential investments on hold.
However, despite the closures and postponements, we were focused on maintaining our customer relationships. We established a unique COVID-19 Task Force, responsible for designing and initiating critical business continuity policies and guidelines to minimise risk and maximise our staff’s safety.
We launched new sales channels in markets where retail operations were closed and a virtual reality showroom experience that allows customers to view and interact with our products virtually.
We placed extra focus on maintaining our product development. I am pleased to say that we launched a range of innovative new products across all our business divisions, including a unique glaze that can be applied to a range of tile and sanitaryware products that eliminate bacteria. We continued our strategy to partner with international designers and developed some genuinely unique sanitaryware products, and we also developed a range of COVID-19 safe tableware collections.
The pandemic continues to cause disruption and uncertainty in our daily lives and business. Still, at RAK Ceramics, we are committed to providing our customers with the best possible access to our ceramic experts, products and services during these difficult times across all our markets.
I am genuinely humbled by all the efforts and sacrifices made by my associates and colleagues across the company to enable RAK Ceramics’ to deliver on its promise.
Although the pandemic seems to be easing at the time of writing this, we are under no illusion that this situation will continue to impact our performance as we enter 2021. However, we are confident that we can face this unique challenge and move forward, given our strong foundations and sound business model.
I would like to take this opportunity to thank our Board of Directors for their unwavering support, and our management team and employees for their hard work and dedication during this unprecedented year.
ABDALLAH MASSAADGroup CEO

8
9S EC TION 1
CORPOR ATE UPDATE
10
Performance Overview
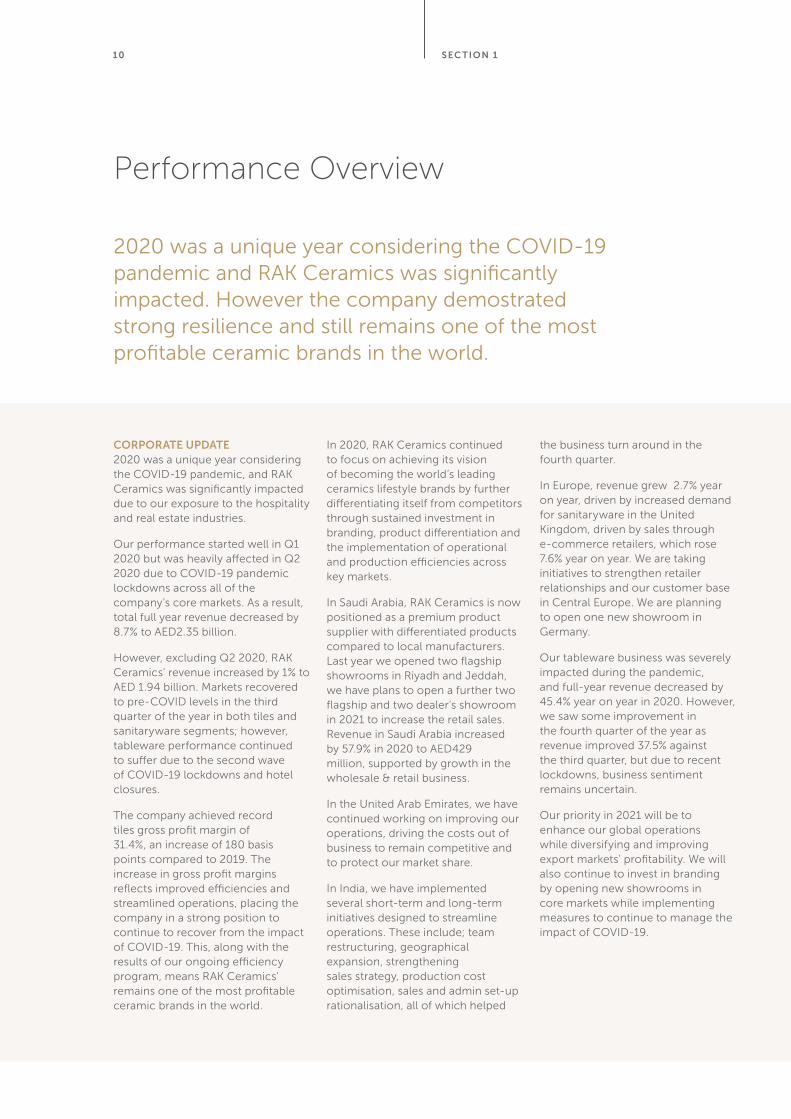
CORPORATE UPDATE 2020 was a unique year considering the COVID-19 pandemic, and RAK Ceramics was significantly impacted due to our exposure to the hospitality and real estate industries.
Our performance started well in Q1 2020 but was heavily affected in Q2 2020 due to COVID-19 pandemic lockdowns across all of the company’s core markets. As a result, total full year revenue decreased by 8.7% to AED2.35 billion.
However, excluding Q2 2020, RAK Ceramics’ revenue increased by 1% to AED 1.94 billion. Markets recovered to pre-COVID levels in the third quarter of the year in both tiles and sanitaryware segments; however, tableware performance continued to suffer due to the second wave of COVID-19 lockdowns and hotel closures.
The company achieved record tiles gross profit margin of 31.4%, an increase of 180 basis points compared to 2019. The increase in gross profit margins reflects improved efficiencies and streamlined operations, placing the company in a strong position to continue to recover from the impact of COVID-19. This, along with the results of our ongoing efficiency program, means RAK Ceramics’ remains one of the most profitable ceramic brands in the world.
In 2020, RAK Ceramics continued to focus on achieving its vision of becoming the world’s leading ceramics lifestyle brands by further differentiating itself from competitors through sustained investment in branding, product differentiation and the implementation of operational and production efficiencies across key markets.
In Saudi Arabia, RAK Ceramics is now positioned as a premium product supplier with differentiated products compared to local manufacturers. Last year we opened two flagship showrooms in Riyadh and Jeddah, we have plans to open a further two flagship and two dealer’s showroom in 2021 to increase the retail sales. Revenue in Saudi Arabia increased by 57.9% in 2020 to AED429 million, supported by growth in the wholesale & retail business.
In the United Arab Emirates, we have continued working on improving our operations, driving the costs out of business to remain competitive and to protect our market share.
In India, we have implemented several short-term and long-term initiatives designed to streamline operations. These include; team restructuring, geographical expansion, strengthening sales strategy, production cost optimisation, sales and admin set-up rationalisation, all of which helped
the business turn around in the fourth quarter.
In Europe, revenue grew 2.7% year on year, driven by increased demand for sanitaryware in the United Kingdom, driven by sales through e-commerce retailers, which rose 7.6% year on year. We are taking initiatives to strengthen retailer relationships and our customer base in Central Europe. We are planning to open one new showroom in Germany.
Our tableware business was severely impacted during the pandemic, and full-year revenue decreased by 45.4% year on year in 2020. However, we saw some improvement in the fourth quarter of the year as revenue improved 37.5% against the third quarter, but due to recent lockdowns, business sentiment remains uncertain.
Our priority in 2021 will be to enhance our global operations while diversifying and improving export markets’ profitability. We will also continue to invest in branding by opening new showrooms in core markets while implementing measures to continue to manage the impact of COVID-19.
S EC TION 1
2020 was a unique year considering the COVID-19 pandemic and RAK Ceramics was significantly impacted. However the company demostrated strong resilience and still remains one of the most profitable ceramic brands in the world.
1 1
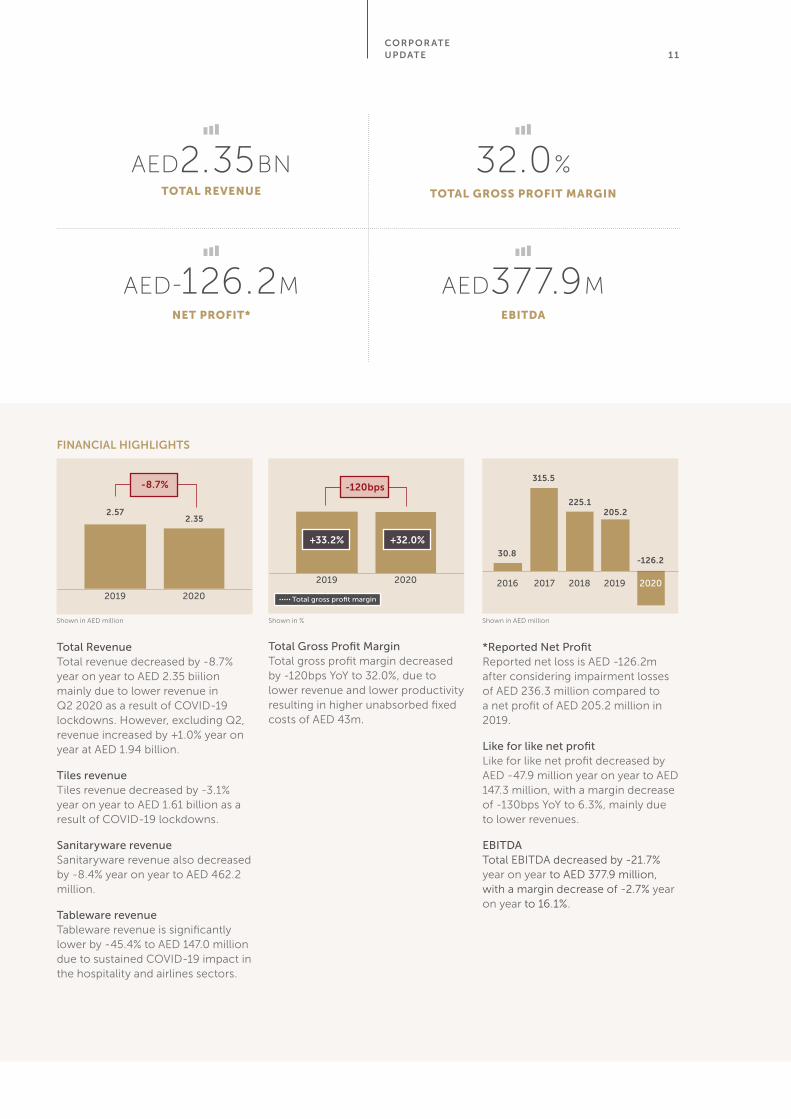
Total RevenueTotal revenue decreased by -8.7% year on year to AED 2.35 biilion mainly due to lower revenue in Q2 2020 as a result of COVID-19 lockdowns. However, excluding Q2, revenue increased by +1.0% year on year at AED 1.94 billion.
Tiles revenueTiles revenue decreased by -3.1% year on year to AED 1.61 billion as a result of COVID-19 lockdowns.
Sanitaryware revenueSanitaryware revenue also decreased by -8.4% year on year to AED 462.2 million.
Tableware revenueTableware revenue is significantly lower by -45.4% to AED 147.0 million due to sustained COVID-19 impact in the hospitality and airlines sectors.
CORP OR ATE UPDATE
AED2.35BNTOTAL REVENUE
AED-126.2MNET PROFIT*
32.0%TOTAL GROSS PROFIT MARGIN
AED377.9MEBITDA
Total Gross Profit MarginTotal gross profit margin decreased by -120bps YoY to 32.0%, due to lower revenue and lower productivity resulting in higher unabsorbed fixed costs of AED 43m.
*Reported Net ProfitReported net loss is AED -126.2m after considering impairment losses of AED 236.3 million compared to a net profit of AED 205.2 million in 2019.
Like for like net profit Like for like net profit decreased by AED -47.9 million year on year to AED 147.3 million, with a margin decrease of -130bps YoY to 6.3%, mainly due to lower revenues.
EBITDATotal EBITDA decreased by -21.7% year on year to AED 377.9 million, with a margin decrease of -2.7% year on year to 16.1%.
20192016 2017 2018
205.2
30.8
2020
-126.2
315.5
225.1
+33.2% +32.0%
2019 2020
-120bps
2.57
-8.7%
2019 2020
2.35
FINANCIAL HIGHLIGHTS
Shown in AED million Shown in % Shown in AED million
1 2
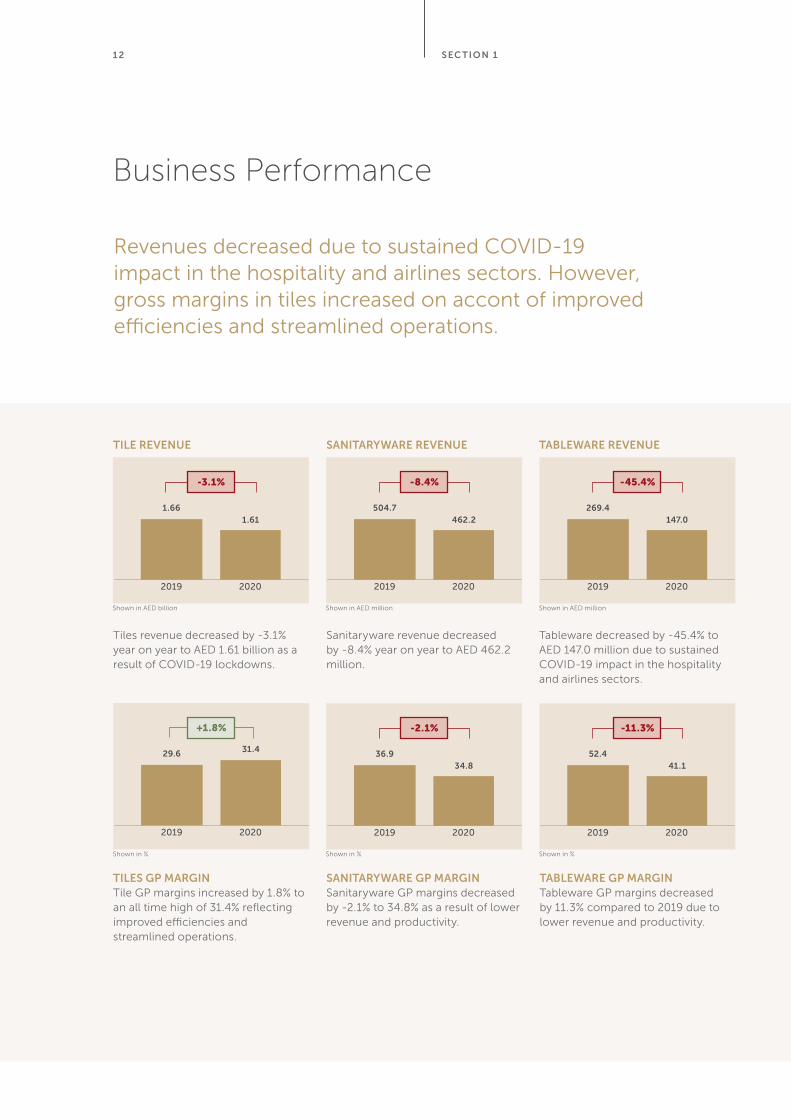
TABLEWARE REVENUE
Tableware decreased by -45.4% to AED 147.0 million due to sustained COVID-19 impact in the hospitality and airlines sectors.
TILE REVENUE
Tiles revenue decreased by -3.1% year on year to AED 1.61 billion as a result of COVID-19 lockdowns.
TILES GP MARGINTile GP margins increased by 1.8% to an all time high of 31.4% reflectingimproved efficiencies and streamlined operations.
SANITARYWARE GP MARGINSanitaryware GP margins decreased by -2.1% to 34.8% as a result of lower revenue and productivity.
TABLEWARE GP MARGINTableware GP margins decreased by 11.3% compared to 2019 due to lower revenue and productivity.
SANITARYWARE REVENUE
Sanitaryware revenue decreased by -8.4% year on year to AED 462.2 million.
1.66
-3.1%
2019 2020
1.61
Shown in AED billion
504.7
-8.4%
2019 2020
462.2
Shown in AED million
269.4
-45.4%
2019 2020
147.0
Shown in AED million
36.9
-2.1%
2019 2020
34.8
Shown in %
52.4
-11.3%
2019 2020
41.1
Shown in %
Business Performance
Revenues decreased due to sustained COVID-19 impact in the hospitality and airlines sectors. However, gross margins in tiles increased on accont of improved efficiencies and streamlined operations.
S EC TION 1
29.6
+1.8%
2019 2020
31.4
Shown in %
1 3
Regional Performance
Strong growth in Saudi Arabia on the back of the introduction of differentiated products and retail and wholesale sales focus. Increased revenue in Europe driven by higher tiles and sanitaryware demand.
CORP OR ATE UPDATE
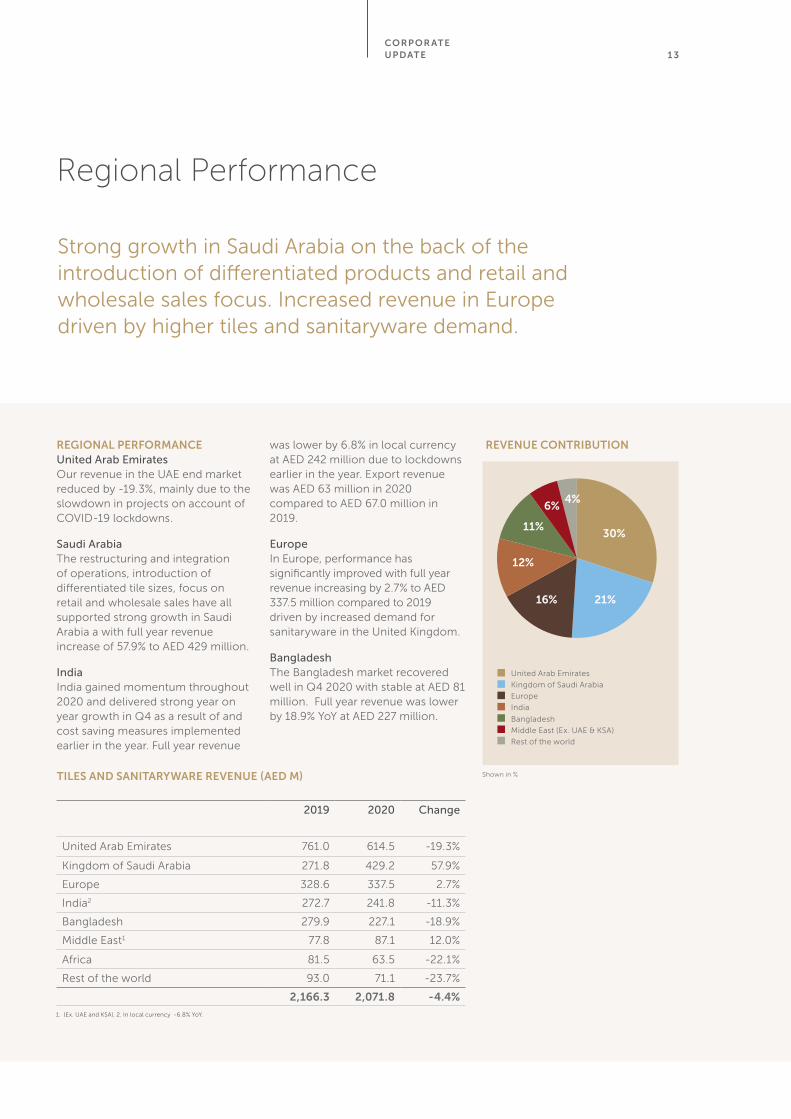
REGIONAL PERFORMANCEUnited Arab EmiratesOur revenue in the UAE end market reduced by -19.3%, mainly due to the slowdown in projects on account of COVID-19 lockdowns.
Saudi ArabiaThe restructuring and integration of operations, introduction of differentiated tile sizes, focus on retail and wholesale sales have all supported strong growth in Saudi Arabia a with full year revenue increase of 57.9% to AED 429 million.
IndiaIndia gained momentum throughout 2020 and delivered strong year on year growth in Q4 as a result of and cost saving measures implemented earlier in the year. Full year revenue
was lower by 6.8% in local currency at AED 242 million due to lockdowns earlier in the year. Export revenue was AED 63 million in 2020 compared to AED 67.0 million in 2019.
EuropeIn Europe, performance has significantly improved with full year revenue increasing by 2.7% to AED 337.5 million compared to 2019 driven by increased demand for sanitaryware in the United Kingdom.
BangladeshThe Bangladesh market recovered well in Q4 2020 with stable at AED 81 million. Full year revenue was lower by 18.9% YoY at AED 227 million.
TILES AND SANITARYWARE REVENUE (AED M)
2019 2020 Change
United Arab Emirates 761.0 614.5 -19.3%
Kingdom of Saudi Arabia 271.8 429.2 57.9%
Europe 328.6 337.5 2.7%
India2 272.7 241.8 -11.3%
Bangladesh 279.9 227.1 -18.9%
Middle East1 77.8 87.1 12.0%
Africa 81.5 63.5 -22.1%
Rest of the world 93.0 71.1 -23.7%
2,166.3 2,071.8 -4.4%
REVENUE CONTRIBUTION
United Arab Emirates
Kingdom of Saudi Arabia
Europe
India
Bangladesh
Middle East (Ex. UAE & KSA)
Rest of the world
Shown in %
1. (Ex. UAE and KSA). 2. In local currency -6.8% YoY.
30%
21%
11%
6%
16%
12%
4%
14
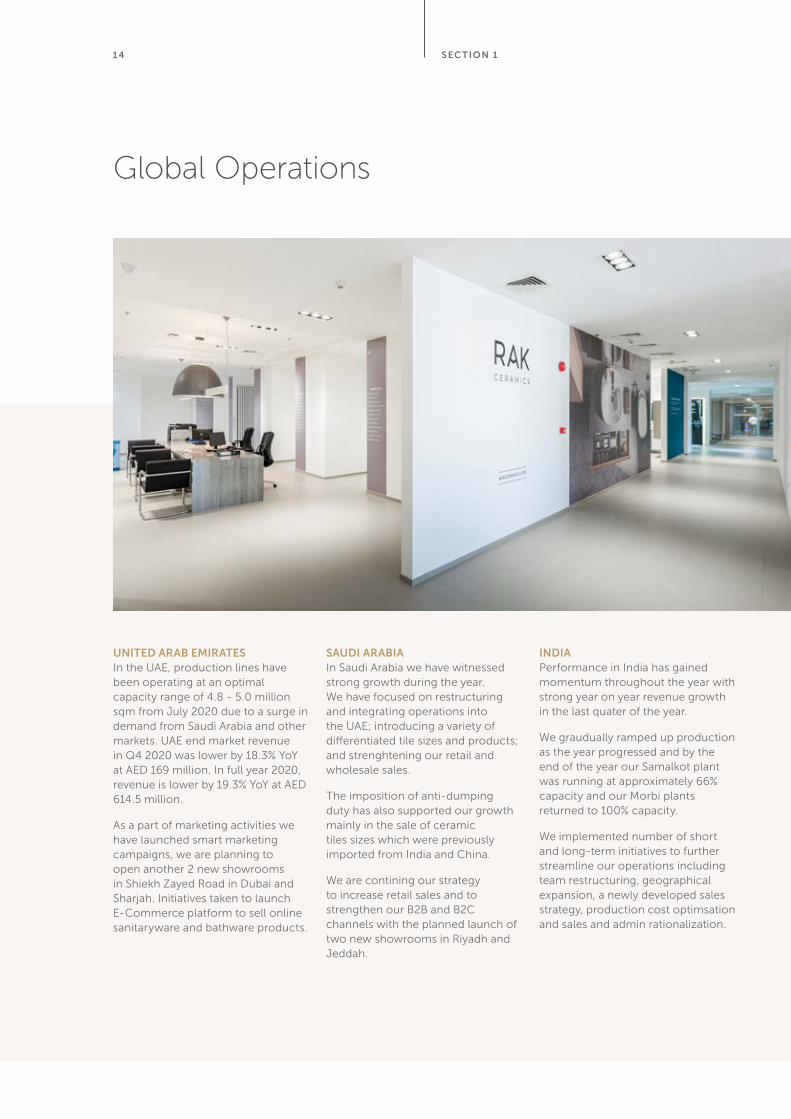
UNITED ARAB EMIRATESIn the UAE, production lines have been operating at an optimal capacity range of 4.8 - 5.0 million sqm from July 2020 due to a surge in demand from Saudi Arabia and other markets. UAE end market revenue in Q4 2020 was lower by 18.3% YoY at AED 169 million. In full year 2020, revenue is lower by 19.3% YoY at AED 614.5 million.
As a part of marketing activities we have launched smart marketing campaigns, we are planning to open another 2 new showrooms in Shiekh Zayed Road in Dubai and Sharjah. Initiatives taken to launch E-Commerce platform to sell online sanitaryware and bathware products.
SAUDI ARABIAIn Saudi Arabia we have witnessed strong growth during the year. We have focused on restructuring and integrating operations into the UAE; introducing a variety of differentiated tile sizes and products; and strenghtening our retail and wholesale sales.
The imposition of anti-dumping duty has also supported our growth mainly in the sale of ceramic tiles sizes which were previously imported from India and China.
We are contining our strategy to increase retail sales and to strengthen our B2B and B2C channels with the planned launch of two new showrooms in Riyadh and Jeddah.
INDIAPerformance in India has gained momentum throughout the year with strong year on year revenue growth in the last quater of the year.
We graudually ramped up production as the year progressed and by the end of the year our Samalkot plant was running at approximately 66% capacity and our Morbi plants returned to 100% capacity.
We implemented number of short and long-term initiatives to further streamline our operations including team restructuring, geographical expansion, a newly developed sales strategy, production cost optimsation and sales and admin rationalization.
S EC TION 1
Global Operations

EUROPEIn Europe, the operational performance continued to improve in 2020 with significant increases in tiles and sanitaryware sales.
Building on this performance we aim to further strengthen our distribution entities in Europe, by continuing to focus on higher-margin tile, sanitaryware and tableware products.
In the United Kingdom, where we have a growing market share in sanitaryware sales, we opened a flagship showroom in Birmingham.
BANGLADESHPerformance in Banglandesh was impacted due to COVID-19 lockdowns. However the market recovered well in the second half of the year and by the end of 2020, reached pre-COVID-19 levels.
We have launched differentiated products for rural and urban segments such as marketing commodity products to the rural segment and value added products to urban and luxury construction projects. By the end of the year our plants were operating at full capacity and we are continuing to strengthen the dealers network.
REST OF WORLDIn Africa and rest of world revenues in 2020 decreased due to Covid-19 impact. In 2021 we will continue to focus on growing our distributor’s channel in our current markets and opening further new markets around the world.
We are planning to introduce new product ranges and initiate digital marketing activities to target a new segment of consumers
1 5CORP OR ATE UPDATE

16
Board of Directors, Advisers and Leadership
SHEIKH KHALID BIN SAUD AL QASIMIChairman of the Board
Board Member since 2015. Sheikh Khalid holds business management qualification from New York University, Abu Dhabi Campus. Sheikh Khalid Bin Saud Al Qasimi is the Chairman of RAK Ceramics PJSC and is also Chairman of Al Marjan Island, Ras Al Khaimah and Vice Chairman of the Investment and Development Office, Government of Ras Al Khaimah. Sheikh Khalid Bin Saud Al Qasimi has extensive experience in finance and investment management.
SHIRISH SARAFVice Chairman of the Board
Board member since 2014. Shirish Saraf is the Founder and Vice Chairman of Samena Capital and in June 2014, he led the acquisition of a significant stake in RAK Ceramics PJSC. Previously he was co-founder at Abraaj Capital, Dubai UAE; Vice President- Direct Investments and Syndication for TAIB Bank, Bahrain and Vice President of AMZ Merchant Bank. In September 2013, he was listed as one of Asia’s 25 most influential people in Private Equity by Asian Investors. Mr Saraf was educated at Charterhouse (England) and holds a BSc (Economics) from the London School of Economics and Political Science.
KHALED ABDULLA YOUSEFBoard Member
Board member since 2012. Mr. Khaled has over 24 years’ experience providing fiscal, strategic and operations leadership with expertise in finance, budgeting, cost management, public relations media, strategic planning, sales, marketing, profitability analysis, cost analysis, policy and procedures development. Executive member of the Board for RAKEZ, and RAK Chamber of Commerce and Julphar PJSC. He is the founder of KAY Invest, a UAE based Investment Company with a diverse portfolio including finance, properties and trading. He is also the CEO and Member of the Board of Directors of Majan Printing and Packaging Co, one of the largest printing and packaging companies in the Middle East.. Mr. Khaled holds a Bachelor’s Degree in Business Management from the University of Arkansas, USA.
S EC TION 1
17
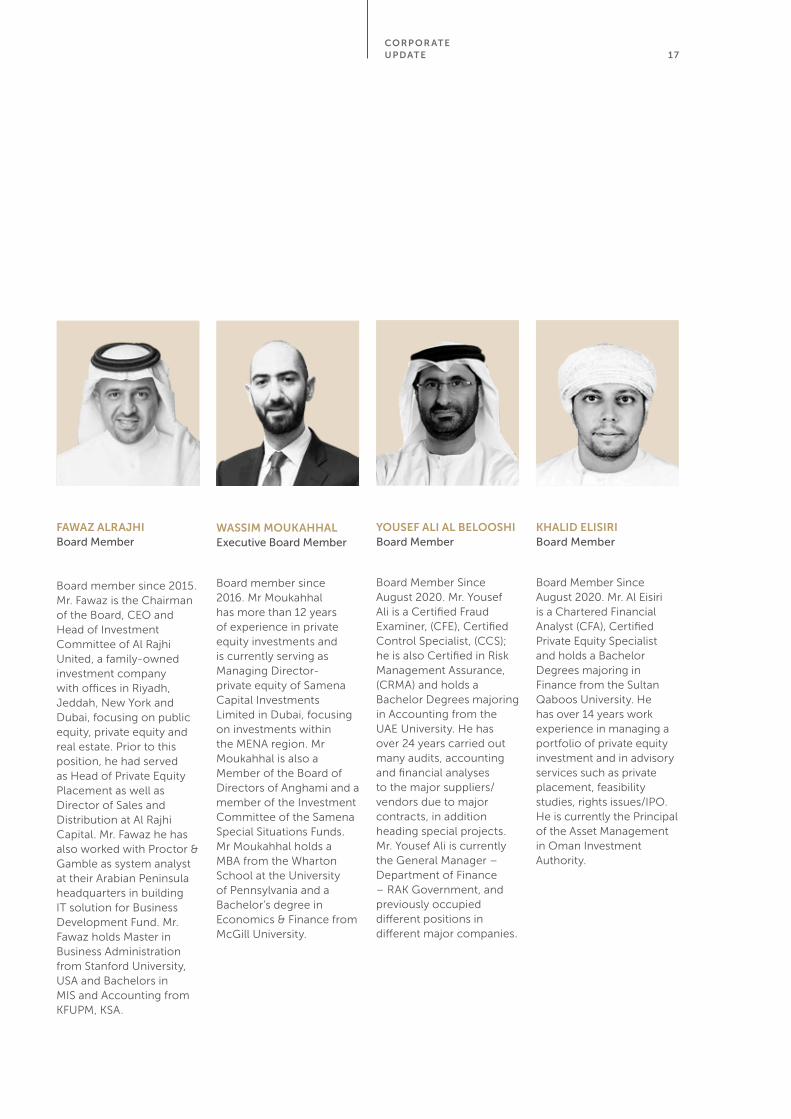
KHALID ELISIRIBoard Member
Board Member Since August 2020. Mr. Al Eisiri is a Chartered Financial Analyst (CFA), Certified Private Equity Specialist and holds a Bachelor Degrees majoring in Finance from the Sultan Qaboos University. He has over 14 years work experience in managing a portfolio of private equity investment and in advisory services such as private placement, feasibility studies, rights issues/IPO. He is currently the Principal of the Asset Management in Oman Investment Authority.
FAWAZ ALRAJHI Board Member
Board member since 2015. Mr. Fawaz is the Chairman of the Board, CEO and Head of Investment Committee of Al Rajhi United, a family-owned investment company with offices in Riyadh, Jeddah, New York and Dubai, focusing on public equity, private equity and real estate. Prior to this position, he had served as Head of Private Equity Placement as well as Director of Sales and Distribution at Al Rajhi Capital. Mr. Fawaz he has also worked with Proctor & Gamble as system analyst at their Arabian Peninsula headquarters in building IT solution for Business Development Fund. Mr. Fawaz holds Master in Business Administration from Stanford University, USA and Bachelors in MIS and Accounting from KFUPM, KSA.
YOUSEF ALI AL BELOOSHIBoard Member
Board Member Since August 2020. Mr. Yousef Ali is a Certified Fraud Examiner, (CFE), Certified Control Specialist, (CCS); he is also Certified in Risk Management Assurance, (CRMA) and holds a Bachelor Degrees majoring in Accounting from the UAE University. He has over 24 years carried out many audits, accounting and financial analyses to the major suppliers/vendors due to major contracts, in addition heading special projects. Mr. Yousef Ali is currently the General Manager – Department of Finance – RAK Government, and previously occupied different positions in different major companies.
CORP OR ATE UPDATE
WASSIM MOUKAHHALExecutive Board Member
Board member since 2016. Mr Moukahhal has more than 12 years of experience in private equity investments and is currently serving as Managing Director- private equity of Samena Capital Investments Limited in Dubai, focusing on investments within the MENA region. Mr Moukahhal is also a Member of the Board of Directors of Anghami and a member of the Investment Committee of the Samena Special Situations Funds. Mr Moukahhal holds a MBA from the Wharton School at the University of Pennsylvania and a Bachelor’s degree in Economics & Finance from McGill University.

18
PHILIP GORE-RANDALLExpert Adviser to Audit Committee
Mr Gore-Randall is Expert Adviser to the Audit Committee and is also a Director at Samena Capital. Mr Gore-Randall has extensive experience at a senior level in large private and publicly held international organisations. Previously Mr Gore-Randall was an Audit Partner at Andersen where he ran the firm’s UK practice and subsequently became the Global COO. Mr Gore-Randall is a UK Chartered Accountant and holds an MA from University College, Oxford..
ABDALLAH MASSAADGroup Chief Executive Officer
Abdallah Massaad is Group CEO of RAK Ceramics. He has more than 22 years experience in ceramics manufacturing, sales management, product marketing and business leadership. Prior to RAK Ceramics, Abdallah Massaad was GM of ICC SARL, Lebanon. Abdallah Massaad holds post graduate qualifications in Management (DEA in Business Administration) and an undergraduate degree (Maitrise in Business Administration - Marketing) from Université Saint-Esprit de Kaslik, Lebanon.
Advisers and Leadership
S EC TION 1

19
P K CHANDChief Financial Officer
GEORGE RABAHIE Chief Legal Counsel
VIBHUTI BHUSHAN Chief Compliance Officer
SHAKTI ARORAChief Procurement Officer
ANIL BEEJAWATChief Executive Officer (India)
SATEESH KAMATH Chief Technical Officer (Sanitaryware)
BASAVARAJ PATIL Chief Technical Officer (Tiles)
RENU OOMMENChief Marketing Officer (Tableware)
SAK EKRAMUZZAMAN Managing Director (Bangladesh)
CORP OR ATE UPDATE
SAJI OOMMENChief Information Officer

20

21S EC TION 2
OPER ATIONAL UPDATE

22
Tiles
NEW COLLECTIONSDespite government-imposed lockdowns and uncertainty across all of our markets, our product development and marketing teams managed to produce more than 80 new collections across all our product technologies and categories. These new collections include large format slabs in the UAE and India; a range of red and white body and porcelain tiles; new small-sized (subway) tiles; and a range of new and innovative collections in our Signature Collection.
PRODUCT INNOVATIONIn 2019 we began developing a unique translucent slab product, a genuinely remarkable semi-transparent ceramic tile that culminated in design and technology. In 2020, RAK Ceramics launched the product under an annual exclusivity agreement. It was the first manufacturer in the world to harness the technology required to manufacture such an effect in mega slab format industrially.
We also introduced a range of high-performance technical products, versatile unglazed multi-charged products that were much anticipated and appreciated by architects and consultants worldwide. These unglazed multi-charged products are beneficial for applications which require slip resistance in wet conditions.
As a result of the COVID-19 pandemic, we witnessed a high demand for antibacterial tiles in 2020. We met this demand by launching a full range of antibacterial solutions under the brand name Rak-Sanit. The RAK-Sanit glaze can be applied to a range of tile, surfaces and sanitaryware products and eliminates 99.99% of bacteria. RAK-Sanit is permanent and guarantees built-in protection throughout the entire expected product lifetime.
In summary, we developed a range of product innovations in 2020 including big translucent slabs (LUCE) in 6mm, antibacterial tiles, Barefoot+ antislip tiles, Klima tiles, a new natural finish for the big marble slabs; a new honed finish for all the slabs; and a soluble salt for the high-performance products.
PRODUCTION ENHANCEMENTDuring 2020, we focused on upgrading our production lines in the UAE and India. These enhancements will give RAK Ceramics the ability to produce small and large-sized ceramic tiles, integrated with all technical innovation introduced in PDI.
S EC TION 2

23OPER ATIONAL UPDATE
In 2020 we introducted 80 new collections across all our product technologies and categories.
24
Sanitaryware
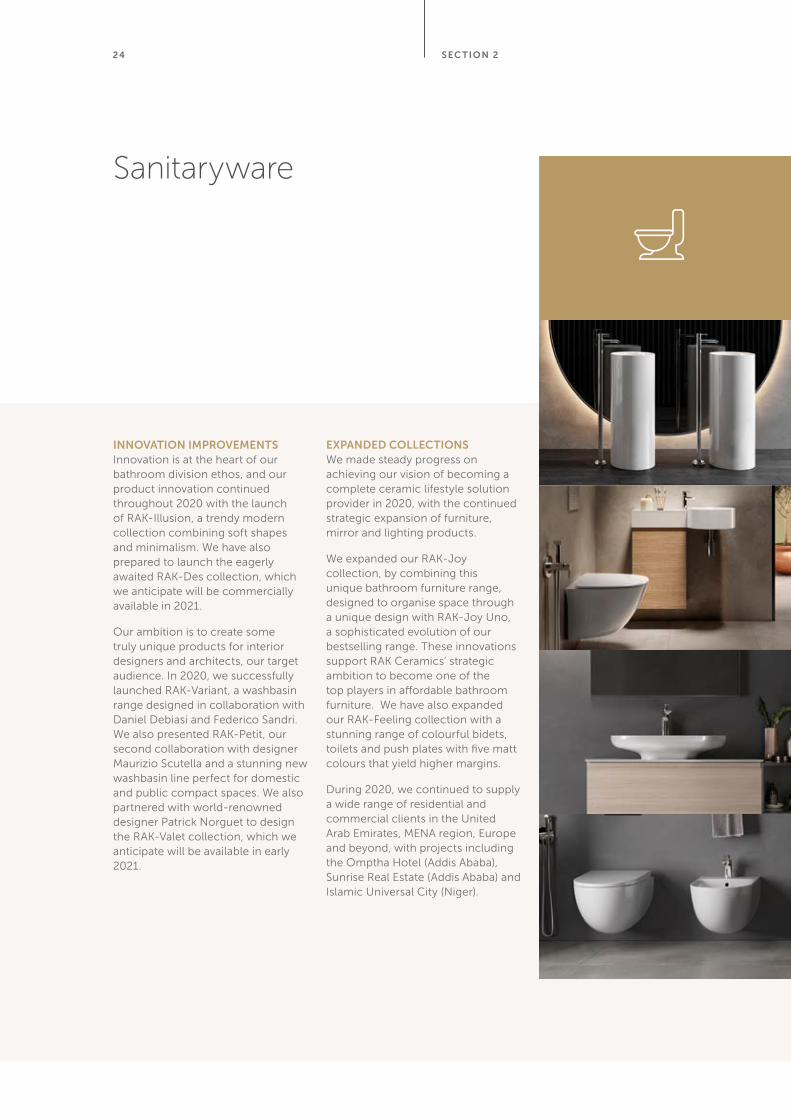
INNOVATION IMPROVEMENTSInnovation is at the heart of our bathroom division ethos, and our product innovation continued throughout 2020 with the launch of RAK-Illusion, a trendy modern collection combining soft shapes and minimalism. We have also prepared to launch the eagerly awaited RAK-Des collection, which we anticipate will be commercially available in 2021.
Our ambition is to create some truly unique products for interior designers and architects, our target audience. In 2020, we successfully launched RAK-Variant, a washbasin range designed in collaboration with Daniel Debiasi and Federico Sandri. We also presented RAK-Petit, our second collaboration with designer Maurizio Scutella and a stunning new washbasin line perfect for domestic and public compact spaces. We also partnered with world-renowned designer Patrick Norguet to design the RAK-Valet collection, which we anticipate will be available in early 2021.
EXPANDED COLLECTIONSWe made steady progress on achieving our vision of becoming a complete ceramic lifestyle solution provider in 2020, with the continued strategic expansion of furniture, mirror and lighting products.
We expanded our RAK-Joy collection, by combining this unique bathroom furniture range, designed to organise space through a unique design with RAK-Joy Uno, a sophisticated evolution of our bestselling range. These innovations support RAK Ceramics’ strategic ambition to become one of the top players in affordable bathroom furniture. We have also expanded our RAK-Feeling collection with a stunning range of colourful bidets, toilets and push plates with five matt colours that yield higher margins.
During 2020, we continued to supply a wide range of residential and commercial clients in the United Arab Emirates, MENA region, Europe and beyond, with projects including the Omptha Hotel (Addis Ababa), Sunrise Real Estate (Addis Ababa) and Islamic Universal City (Niger).
S EC TION 2

25OPER ATIONAL UPDATE
Our approach to product innovation and design further evolved in 2020 by allying with world renowned designers.
26
Faucets
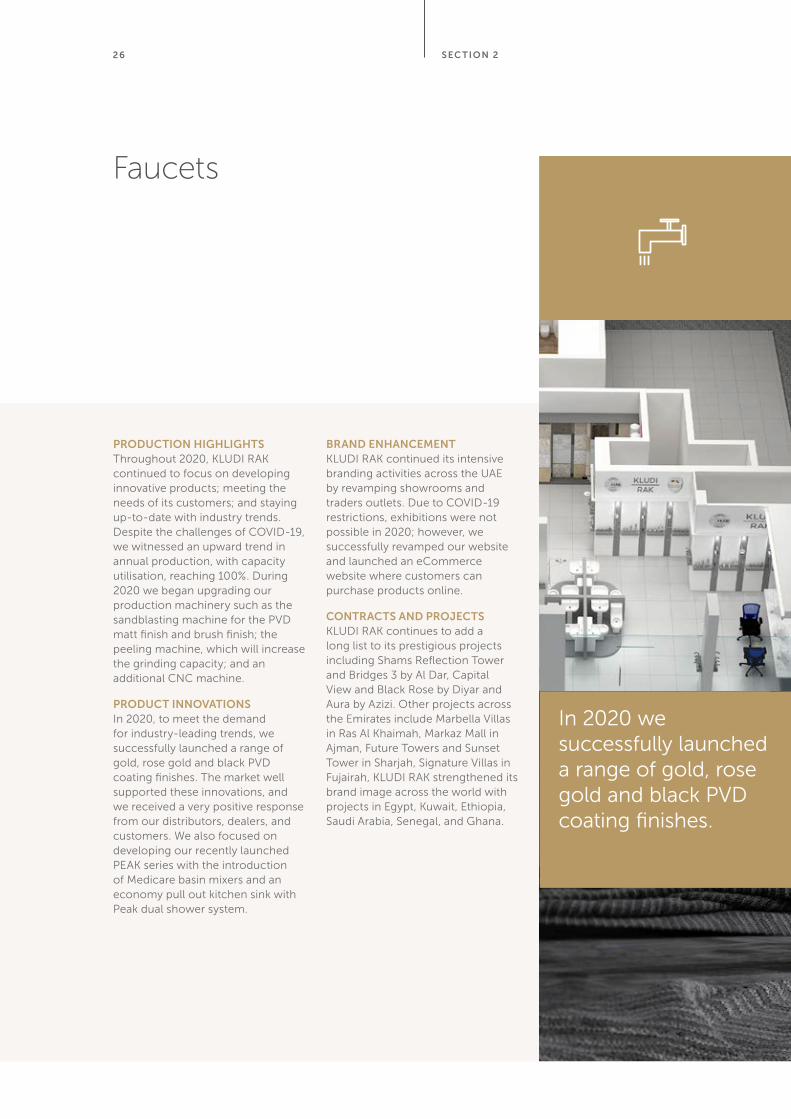
PRODUCTION HIGHLIGHTSThroughout 2020, KLUDI RAK continued to focus on developing innovative products; meeting the needs of its customers; and staying up-to-date with industry trends. Despite the challenges of COVID-19, we witnessed an upward trend in annual production, with capacity utilisation, reaching 100%. During 2020 we began upgrading our production machinery such as the sandblasting machine for the PVD matt finish and brush finish; the peeling machine, which will increase the grinding capacity; and an additional CNC machine.
PRODUCT INNOVATIONSIn 2020, to meet the demand for industry-leading trends, we successfully launched a range of gold, rose gold and black PVD coating finishes. The market well supported these innovations, and we received a very positive response from our distributors, dealers, and customers. We also focused on developing our recently launched PEAK series with the introduction of Medicare basin mixers and an economy pull out kitchen sink with Peak dual shower system.
BRAND ENHANCEMENTKLUDI RAK continued its intensive branding activities across the UAE by revamping showrooms and traders outlets. Due to COVID-19 restrictions, exhibitions were not possible in 2020; however, we successfully revamped our website and launched an eCommerce website where customers can purchase products online.
CONTRACTS AND PROJECTSKLUDI RAK continues to add a long list to its prestigious projects including Shams Reflection Tower and Bridges 3 by Al Dar, Capital View and Black Rose by Diyar and Aura by Azizi. Other projects across the Emirates include Marbella Villas in Ras Al Khaimah, Markaz Mall in Ajman, Future Towers and Sunset Tower in Sharjah, Signature Villas in Fujairah, KLUDI RAK strengthened its brand image across the world with projects in Egypt, Kuwait, Ethiopia, Saudi Arabia, Senegal, and Ghana.
S EC TION 2
In 2020 we successfully launched a range of gold, rose gold and black PVD coating finishes.

27OPER ATIONAL UPDATE
28
Tableware
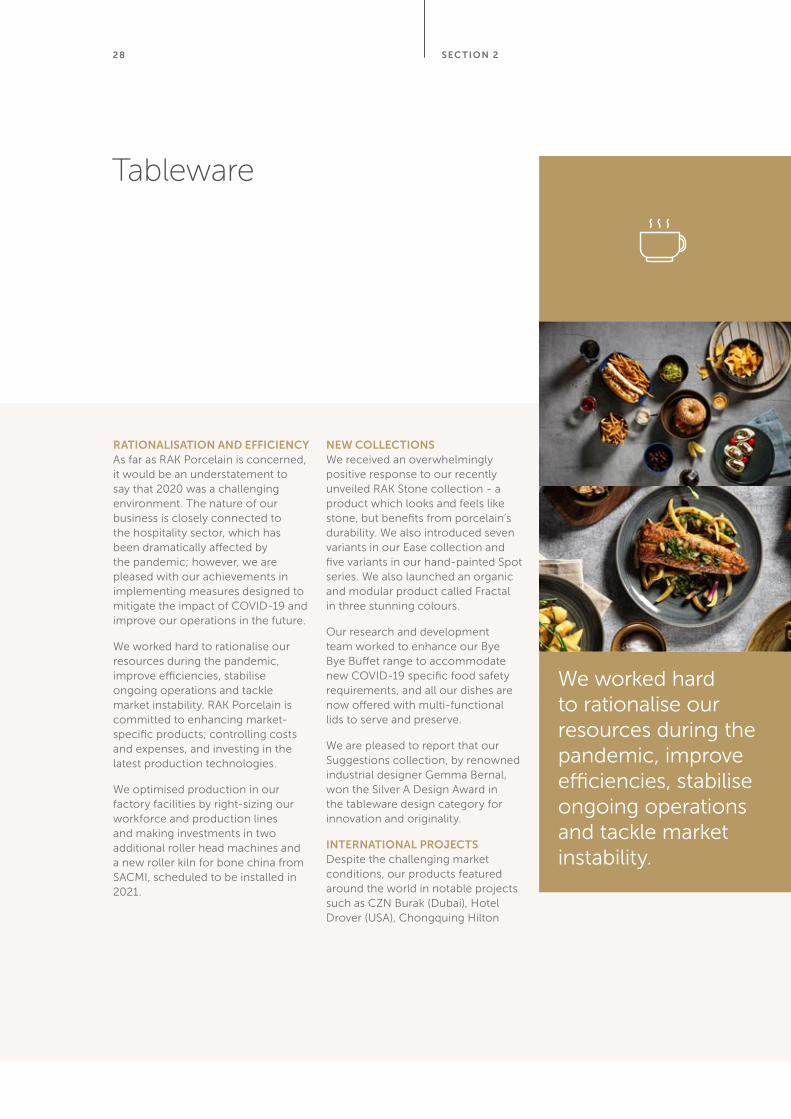
RATIONALISATION AND EFFICIENCYAs far as RAK Porcelain is concerned, it would be an understatement to say that 2020 was a challenging environment. The nature of our business is closely connected to the hospitality sector, which has been dramatically affected by the pandemic; however, we are pleased with our achievements in implementing measures designed to mitigate the impact of COVID-19 and improve our operations in the future.
We worked hard to rationalise our resources during the pandemic, improve efficiencies, stabilise ongoing operations and tackle market instability. RAK Porcelain is committed to enhancing market-specific products; controlling costs and expenses, and investing in the latest production technologies.
We optimised production in our factory facilities by right-sizing our workforce and production lines and making investments in two additional roller head machines and a new roller kiln for bone china from SACMI, scheduled to be installed in 2021.
NEW COLLECTIONSWe received an overwhelmingly positive response to our recently unveiled RAK Stone collection - a product which looks and feels like stone, but benefits from porcelain’s durability. We also introduced seven variants in our Ease collection and five variants in our hand-painted Spot series. We also launched an organic and modular product called Fractal in three stunning colours.
Our research and development team worked to enhance our Bye Bye Buffet range to accommodate new COVID-19 specific food safety requirements, and all our dishes are now offered with multi-functional lids to serve and preserve.
We are pleased to report that our Suggestions collection, by renowned industrial designer Gemma Bernal, won the Silver A Design Award in the tableware design category for innovation and originality.
INTERNATIONAL PROJECTSDespite the challenging market conditions, our products featured around the world in notable projects such as CZN Burak (Dubai), Hotel Drover (USA), Chongquing Hilton
(China), Wyndham Kumming (China), Taj Bengal (India) and JW Marriott Mumbai (India), Kempinski (Egypt) and the Grand Hyatt (Saudi Arabia).
S EC TION 2
We worked hard to rationalise our resources during the pandemic, improve efficiencies, stabilise ongoing operations and tackle market instability.

29OPER ATIONAL UPDATE

30 S EC TION 2
We have invested in new communication channels, new digital tools and new ways to interact with our customers.
Sales and Marketing
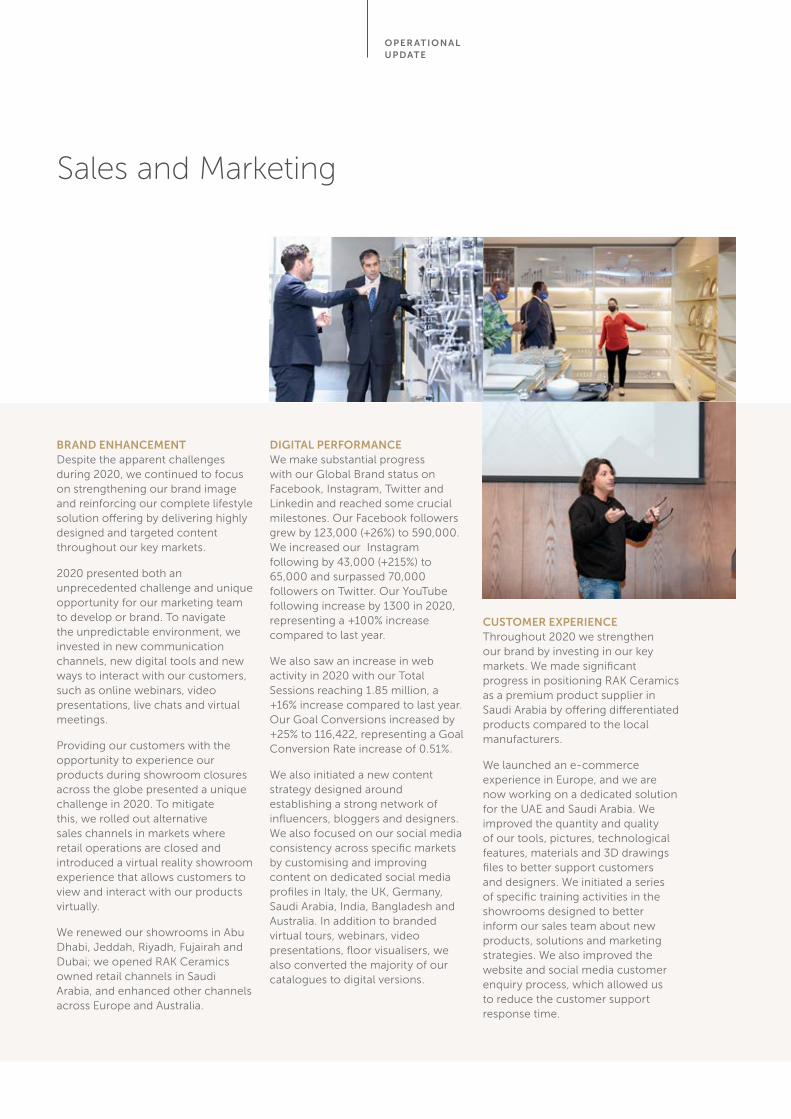
BRAND ENHANCEMENTDespite the apparent challenges during 2020, we continued to focus on strengthening our brand image and reinforcing our complete lifestyle solution offering by delivering highly designed and targeted content throughout our key markets.
2020 presented both an unprecedented challenge and unique opportunity for our marketing team to develop or brand. To navigate the unpredictable environment, we invested in new communication channels, new digital tools and new ways to interact with our customers, such as online webinars, video presentations, live chats and virtual meetings.
Providing our customers with the opportunity to experience our products during showroom closures across the globe presented a unique challenge in 2020. To mitigate this, we rolled out alternative sales channels in markets where retail operations are closed and introduced a virtual reality showroom experience that allows customers to view and interact with our products virtually.
We renewed our showrooms in Abu Dhabi, Jeddah, Riyadh, Fujairah and Dubai; we opened RAK Ceramics owned retail channels in Saudi Arabia, and enhanced other channels across Europe and Australia.
DIGITAL PERFORMANCEWe make substantial progress with our Global Brand status on Facebook, Instagram, Twitter and Linkedin and reached some crucial milestones. Our Facebook followers grew by 123,000 (+26%) to 590,000. We increased our Instagram following by 43,000 (+215%) to 65,000 and surpassed 70,000 followers on Twitter. Our YouTube following increase by 1300 in 2020, representing a +100% increase compared to last year.
We also saw an increase in web activity in 2020 with our Total Sessions reaching 1.85 million, a +16% increase compared to last year. Our Goal Conversions increased by +25% to 116,422, representing a Goal Conversion Rate increase of 0.51%.
We also initiated a new content strategy designed around establishing a strong network of influencers, bloggers and designers. We also focused on our social media consistency across specific markets by customising and improving content on dedicated social media profiles in Italy, the UK, Germany, Saudi Arabia, India, Bangladesh and Australia. In addition to branded virtual tours, webinars, video presentations, floor visualisers, we also converted the majority of our catalogues to digital versions.
CUSTOMER EXPERIENCEThroughout 2020 we strengthen our brand by investing in our key markets. We made significant progress in positioning RAK Ceramics as a premium product supplier in Saudi Arabia by offering differentiated products compared to the local manufacturers.
We launched an e-commerce experience in Europe, and we are now working on a dedicated solution for the UAE and Saudi Arabia. We improved the quantity and quality of our tools, pictures, technological features, materials and 3D drawings files to better support customers and designers. We initiated a series of specific training activities in the showrooms designed to better inform our sales team about new products, solutions and marketing strategies. We also improved the website and social media customer enquiry process, which allowed us to reduce the customer support response time.
OPER ATIONAL UPDATE

32
Corporate Social Responsibility
SUSTAINABILITY SUPPORTOur vision is to become the world’s leading ceramics lifestyle solutions provider, and as a company, it is essential that we sustainably manufacture our products. We have worked across operations to improve energy efficiency, reduce pollution, enhance biodiversity and improve the quality of life for our employees, partners and people in surrounding communities.
We continue to invest in new technologies such as solar rooftops and co-generation technologies in the manufacturing process. We are a large energy consumer, so adopting new technologies that improve our
energy consumption, helps us be more sustainable and ultimately improves the bottom line.
We work hard to make our manufacturing processes environmentally friendly. Still, we also remain focused on running an efficient and profitable business by protecting our growth in the UAE, India, and Bangladesh and progressing our growth plans in Saudi Arabia.
For more information about our sustainability strategy, please refer to our 2020 Sustainability Report, which is available to download from our website.
STAFF SUPPORTCOVID-19, as a global crisis, will impact the way we work for a long time to come. At RAK Ceramics, we have implemented procedures across our operations and production facilities to minimise risk while maximising productivity. Our priority is to protect our employee’s health and wellbeing, and we continue to ensure that our staff are well supported.
S EC TION 2
Our priority is to protect our employee’s health and wellbeing.
33
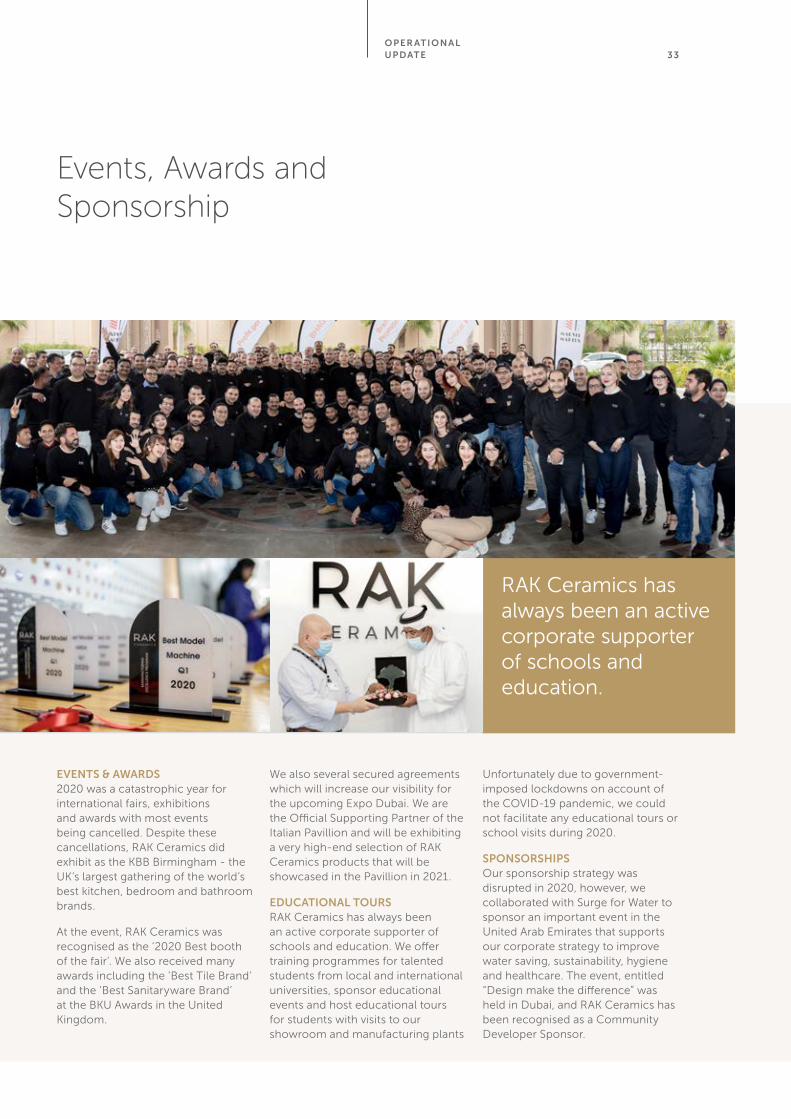
EVENTS & AWARDS2020 was a catastrophic year for international fairs, exhibitions and awards with most events being cancelled. Despite these cancellations, RAK Ceramics did exhibit as the KBB Birmingham - the UK’s largest gathering of the world’s best kitchen, bedroom and bathroom brands.
At the event, RAK Ceramics was recognised as the ‘2020 Best booth of the fair’. We also received many awards including the ‘Best Tile Brand’ and the ‘Best Sanitaryware Brand’ at the BKU Awards in the United Kingdom.
We also several secured agreements which will increase our visibility for the upcoming Expo Dubai. We are the Official Supporting Partner of the Italian Pavillion and will be exhibiting a very high-end selection of RAK Ceramics products that will be showcased in the Pavillion in 2021.
EDUCATIONAL TOURSRAK Ceramics has always been an active corporate supporter of schools and education. We offer training programmes for talented students from local and international universities, sponsor educational events and host educational tours for students with visits to our showroom and manufacturing plants
Unfortunately due to government-imposed lockdowns on account of the COVID-19 pandemic, we could not facilitate any educational tours or school visits during 2020.
SPONSORSHIPSOur sponsorship strategy was disrupted in 2020, however, we collaborated with Surge for Water to sponsor an important event in the United Arab Emirates that supports our corporate strategy to improve water saving, sustainability, hygiene and healthcare. The event, entitled “Design make the difference” was held in Dubai, and RAK Ceramics has been recognised as a Community Developer Sponsor.
Events, Awards and Sponsorship
OPER ATIONAL UPDATE
RAK Ceramics has always been an active corporate supporter of schools and education.
3 4
Health, Safety, and the Environment
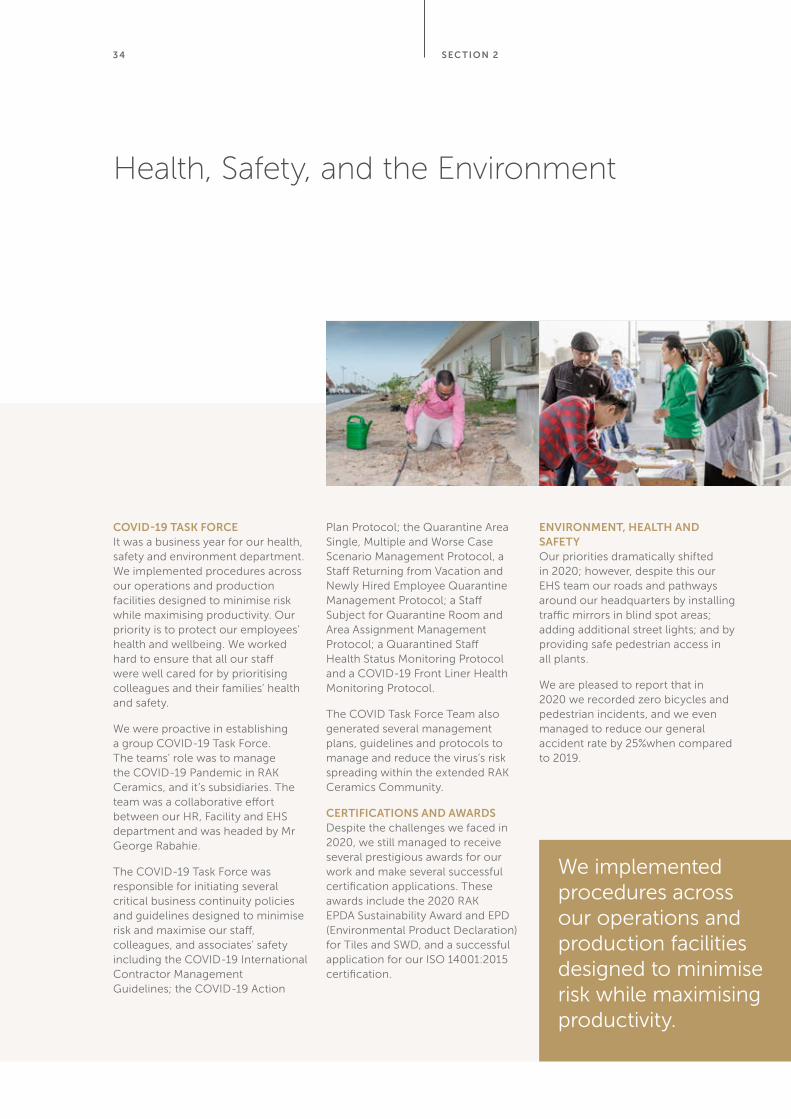
COVID-19 TASK FORCEIt was a business year for our health, safety and environment department. We implemented procedures across our operations and production facilities designed to minimise risk while maximising productivity. Our priority is to protect our employees’ health and wellbeing. We worked hard to ensure that all our staff were well cared for by prioritising colleagues and their families’ health and safety.
We were proactive in establishing a group COVID-19 Task Force. The teams’ role was to manage the COVID-19 Pandemic in RAK Ceramics, and it’s subsidiaries. The team was a collaborative effort between our HR, Facility and EHS department and was headed by Mr George Rabahie.
The COVID-19 Task Force was responsible for initiating several critical business continuity policies and guidelines designed to minimise risk and maximise our staff, colleagues, and associates’ safety including the COVID-19 International Contractor Management Guidelines; the COVID-19 Action
Plan Protocol; the Quarantine Area Single, Multiple and Worse Case Scenario Management Protocol, a Staff Returning from Vacation and Newly Hired Employee Quarantine Management Protocol; a Staff Subject for Quarantine Room and Area Assignment Management Protocol; a Quarantined Staff Health Status Monitoring Protocol and a COVID-19 Front Liner Health Monitoring Protocol.
The COVID Task Force Team also generated several management plans, guidelines and protocols to manage and reduce the virus’s risk spreading within the extended RAK Ceramics Community.
CERTIFICATIONS AND AWARDSDespite the challenges we faced in 2020, we still managed to receive several prestigious awards for our work and make several successful certification applications. These awards include the 2020 RAK EPDA Sustainability Award and EPD (Environmental Product Declaration) for Tiles and SWD, and a successful application for our ISO 14001:2015 certification.
ENVIRONMENT, HEALTH AND SAFETY Our priorities dramatically shifted in 2020; however, despite this our EHS team our roads and pathways around our headquarters by installing traffic mirrors in blind spot areas; adding additional street lights; and by providing safe pedestrian access in all plants.
We are pleased to report that in 2020 we recorded zero bicycles and pedestrian incidents, and we even managed to reduce our general accident rate by 25%when compared to 2019.
S EC TION 2
We implemented procedures across our operations and production facilities designed to minimise risk while maximising productivity.
35
Corporate Governance
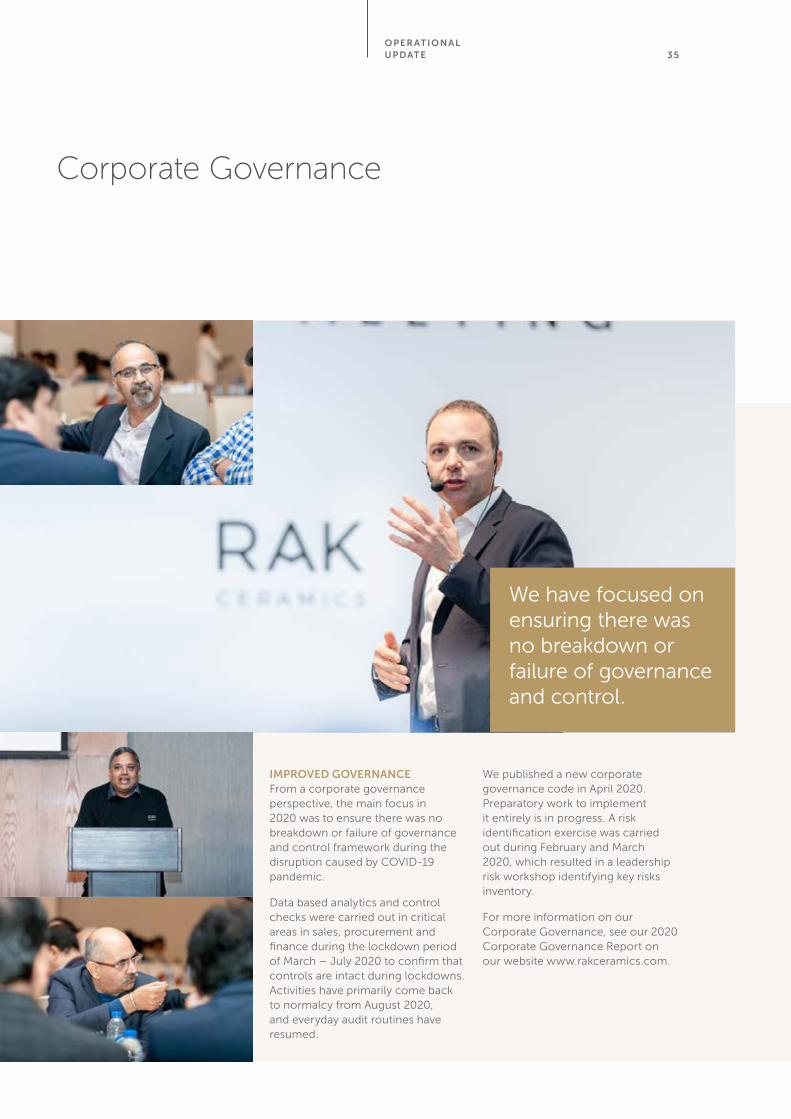
IMPROVED GOVERNANCE From a corporate governance perspective, the main focus in 2020 was to ensure there was no breakdown or failure of governance and control framework during the disruption caused by COVID-19 pandemic.
Data based analytics and control checks were carried out in critical areas in sales, procurement and finance during the lockdown period of March – July 2020 to confirm that controls are intact during lockdowns. Activities have primarily come back to normalcy from August 2020, and everyday audit routines have resumed.
We published a new corporate governance code in April 2020. Preparatory work to implement it entirely is in progress. A risk identification exercise was carried out during February and March 2020, which resulted in a leadership risk workshop identifying key risks inventory.
For more information on our Corporate Governance, see our 2020 Corporate Governance Report on our website www.rakceramics.com.
OPER ATIONAL UPDATE
We have focused on ensuring there was no breakdown or failure of governance and control.

36
Training and Development
BUSINESS PERFORMANCEWith the onset of the COVID-19 pandemic, health and safety assumed significant precedence. RAK Ceramics took early steps in Feb 2020 to protect employee health and ultimately safeguard business continuity. We are happy to report that our operations continued unabated despite the challenges of the pandemic.
Our ‘Pay for Performance’ culture was further reinforced by the introduction of two new schemes; a commission scheme linked to sales teams’ performance; and an
incentive programme related to improving operational efficiencies and manufacturing cost reductions.
TALENT DEVELOPMENTWe successfully introduced Graduate Engineers into our workforce from top-performing engineering institutes in the manufacturing division. The Graduate Engineer trainees will get a well-rounded exposure to various manufacturing processes over a two-year programme. We also continued to hire new Management Graduates in to our workforce.
For the first time, the Internal Job Posting (IJP) programme was implemented for the manufacturing division. The IJP process is aimed at providing opportunities for people to grow within the organisation. 15 Employees were placed in higher-level jobs in the process. The IJP will continue in 2021 as well.
Despite the lockdown challenges, the Manufacturing Excellence Program continued, and two training sessions were conducted with more than 100+ participants from Manufacturing and allied functions.
S EC TION 2
RAK Ceramics took early steps to protect employee health and ultimately safeguard business continuity.
January 2020
37
Information Technology
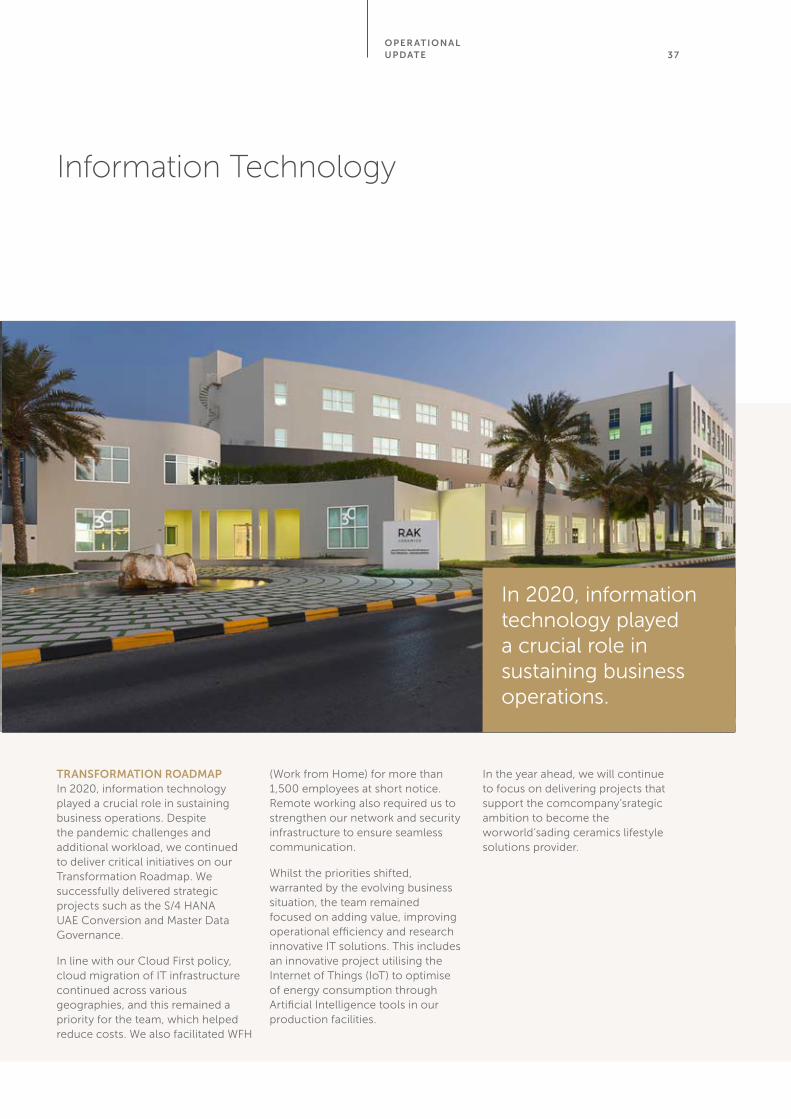
TRANSFORMATION ROADMAPIn 2020, information technology played a crucial role in sustaining business operations. Despite the pandemic challenges and additional workload, we continued to deliver critical initiatives on our Transformation Roadmap. We successfully delivered strategic projects such as the S/4 HANA UAE Conversion and Master Data Governance.
In line with our Cloud First policy, cloud migration of IT infrastructure continued across various geographies, and this remained a priority for the team, which helped reduce costs. We also facilitated WFH
(Work from Home) for more than 1,500 employees at short notice. Remote working also required us to strengthen our network and security infrastructure to ensure seamless communication.
Whilst the priorities shifted, warranted by the evolving business situation, the team remained focused on adding value, improving operational efficiency and research innovative IT solutions. This includes an innovative project utilising the Internet of Things (IoT) to optimise of energy consumption through Artificial Intelligence tools in our production facilities.
In the year ahead, we will continue to focus on delivering projects that support the comcompany’srategic ambition to become the worworld’sading ceramics lifestyle solutions provider.
OPER ATIONAL UPDATE
In 2020, information technology played a crucial role in sustaining business operations.

38

39S EC TION 3
FINANCIAL RE VIEW
S EC TION 340
FINANCIAL REVIEW
Financial highlights 41
Independent auditors’ report 42
Consolidated statement of profit or loss 47
Consolidated statement of profit or loss and other comprehensive income 48
Consolidated statement of financial position 49
Consolidated statement of cash flows 50
Consolidated statement of changes in equity 52
Notes to the consolidated financial statements 56
FINANCIAL
RE VIEW 41
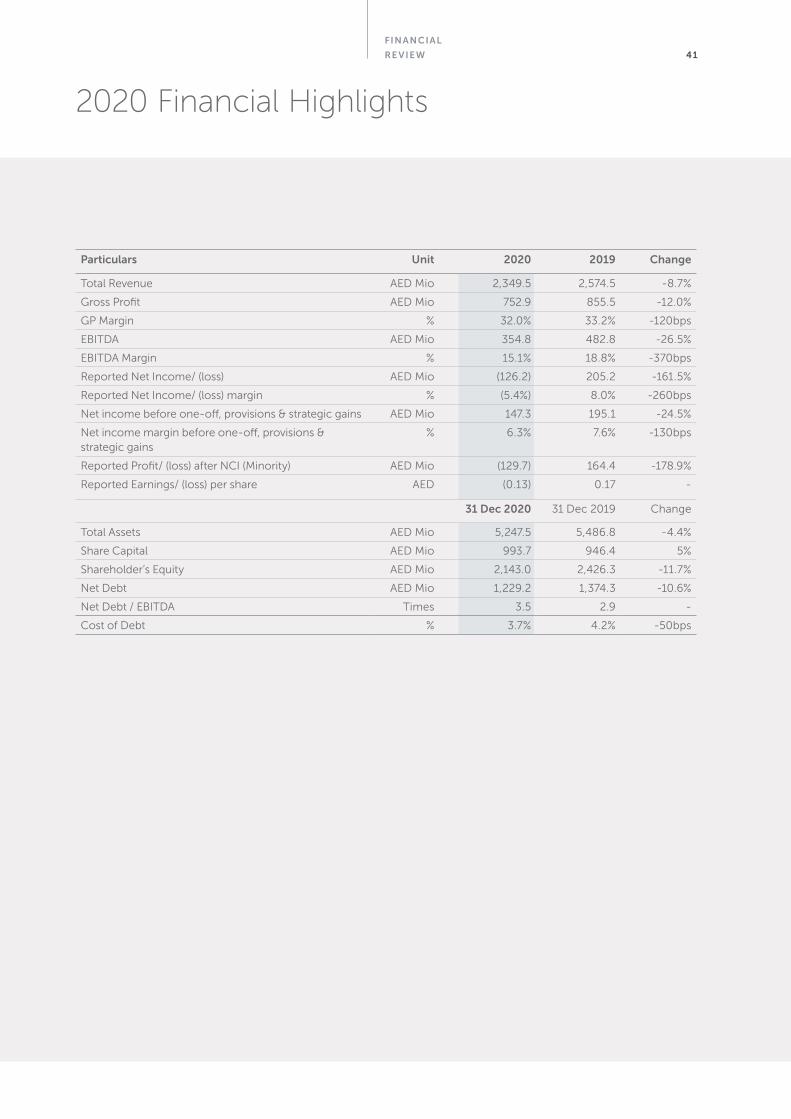
Particulars Unit 2020 2019 Change
Total Revenue AED Mio 2,349.5 2,574.5 -8.7%
Gross Profit AED Mio 752.9 855.5 -12.0%
GP Margin % 32.0% 33.2% -120bps
EBITDA AED Mio 354.8 482.8 -26.5%
EBITDA Margin % 15.1% 18.8% -370bps
Reported Net Income/ (loss) AED Mio (126.2) 205.2 -161.5%
Reported Net Income/ (loss) margin % (5.4%) 8.0% -260bps
Net income before one-off, provisions & strategic gains AED Mio 147.3 195.1 -24.5%
Net income margin before one-off, provisions & strategic gains
% 6.3% 7.6% -130bps
Reported Profit/ (loss) after NCI (Minority) AED Mio (129.7) 164.4 -178.9%
Reported Earnings/ (loss) per share AED (0.13) 0.17 -
31 Dec 2020 31 Dec 2019 Change
Total Assets AED Mio 5,247.5 5,486.8 -4.4%
Share Capital AED Mio 993.7 946.4 5%
Shareholder’s Equity AED Mio 2,143.0 2,426.3 -11.7%
Net Debt AED Mio 1,229.2 1,374.3 -10.6%
Net Debt / EBITDA Times 3.5 2.9 -
Cost of Debt % 3.7% 4.2% -50bps
2020 Financial Highlights
S EC TION 342
The Shareholders of R.A.K. Ceramics P.J.S.C. Ras Al Khaimah United Arab Emirates
Report on the audit of the consolidated financial statements.
Opinion
We have audited the consolidated financial statements of R.A.K. Ceramics P.J.S.C. (“the Company”) and its subsidiaries (together the “Group”), which comprise the consolidated statement of financial position as at 31 December 2020 and the consolidated statement of profit or loss, consolidated statement of profit or loss and other comprehensive income, consolidated statement of changes in equity and consolidated statement of cash flows for the year then ended, and notes to the consolidated financial statements, including a summary of significant accounting policies.
In our opinion, the accompanying consolidated financial statements present fairly, in all material respects, the consolidated financial position of the Group as at 31 December 2020, and its consolidated financial performance and its consolidated cash flows for the year then ended in accordance with International Financial Reporting Standards (IFRSs).
Basis for opinion
We conducted our audit in accordance with International Standards on Auditing (ISAs). Our responsibilities under those standards are further described in the Auditors’ Responsibilities for the Audit of the Consolidated Financial Statements section of our report. We are independent of the Group in accordance with International Ethics Standards Board for Accountants Code of Ethics for Professional Accountants (IESBA Code) together with the ethical requirements that are relevant to our audit of the consolidated financial statements in the United Arab Emirates, and we have fulfilled our other ethical responsibilities in accordance with these requirements and the IESBA Code. We believe that the audit evidence we have obtained is sufficient and appropriate to provide a basis for our opinion.
Key audit matters
Key audit matters are those matters that, in our professional judgment, were of most significance in our audit of the consolidated financial statements of the current year and include the most significant assessed risks of material misstatement (whether or not due to fraud) that we identified. These matters included those which had the greatest effect on the overall audit strategy, the allocation of resources in the audit; and directing the efforts of the engagement team.
These matters were addressed in the context of our audit of the consolidated financial statements as a whole, and in forming our opinion thereon, and we do not provide a separate opinion on these matters.
Independent auditors’ report
FINANCIAL
RE VIEW 43
Key audit matter
Valuation of goodwill
As at 31 December 2020, the carrying value of goodwill as disclosed in note 15 to the consolidated financial statements includes goodwill recognised on acquisition of subsidiaries - Ceramin FZ LLC, ARK International Trading Company Limited and RAK Saudi LLC amounted to AED 108.9 million which is 2.1% of total assets.
In accordance with International Accounting Standard (IAS) 36 Impairment of Assets, an entity is required to test goodwill acquired in a business combination for impairment at least annually irrespective of whether there is any indication of impairment. An impairment is recognised in profit or loss when the recoverable amount is less than the net carrying amount in accordance with IAS 36.
The determination of the recoverable amount is mainly based on the identification of the relevant cash generating unit (“CGU”) and the related discounted future cash flows. We considered the impairment of goodwill recognised on acquisition of Ceramin FZ LLC, ARK International Trading Company Limited and RAK Saudi LLC to be a key audit matter, given the significant judgements applied and estimates made when determining the recoverable amount.
How our audit addressed the key audit matters
Our audit procedures included but were not limited to, the following:
• We obtained an understanding of management’s procees to identify the CGU and the related discounted cash flows;
• We evaluated the design and determined the implementation of relevant controls over the determination of the recoverable amount of goodwill to determine if they had been appropriately designed and implemented;
• We assessed the principles and methods used for determining the recoverable amount of the CGU to which the goodwill was allocated in accordance with the requirements of IAS 36;
• We reconciled the net carrying amount of the goodwill allocated to the CGU to the Group’s accounting records;
• We enquired of management about the assumptions on which budget estimates underlying the cash flows used in the valuation models are based and further assessed the assumptions including the growth rates used in calculations based on the results of our audit procedures. For this purpose, we also compared the estimates of cash flow projections of previous periods with actual corresponding results, to assess the pertinence and reliability of the cash flow forecasting process;
• We assessed the discount rates applied in forming the impairment review against external benchmarks and used our internal valuation specialists in this assessment;
• We performed a sensitivity analysis in respect of key assumptions to determine at what level changes in these would result in impairment;
• We tested the arithmetical accuracy of the cash flow forecasts prepared by the Group;
• Assessment of any evidence contradictory to management’s assumptions; and
• We assessed the disclosures in the consolidated financial statements relating to goodwill against the requirements of IFRSs.
S EC TION 34 4
Independent auditors’ report (contd.)
Key audit matter
Valuation of investment properties
Investment properties represented 17.6% of total assets as at 31 December 2020. Investment properties are measured in accordance with the cost model described in International Accounting Standard 40 Investment Properties. Management obtained valuations from independent external valuers for the purposes of identifying impairment indicators and compiling fair value disclosures.
The valuation of investment properties, as detailed in Note 18, requires significant judgement and estimates be made by both management and the independent external valuers. Consequently, we considered this to be a key audit matter.
How our audit addressed the key audit matter
We obtained an understanding of management’s process of valuing investment properties. Further, we performed the following:
• We obtained an understanding of management’s process of determining the valuation of the investment properties;
• We evaluated the design and determined the implementation of relevant controls over the determination of the fair value of investment property to determine if they had been appropriately designed and implemented;
• We assessed the competence, skills, qualifications and objectivity of the independent external valuer;
• We reviewed the scope of the engagement between the external valuer and the Group to determine if this was sufficient for audit purposes;
• We verified the accuracy, completeness and relevance of the input data used for deriving fair values;
• We utilised our internal valuation experts on a sample basis to evaluate the methodology used and the appropriateness of the model and key assumptions used in the investment property valuations;
• We reperformed the mathematical accuracy of the valuations on a sample basis;
• We agreed the results of the valuations to the amounts disclosed in the consolidated financial statements; and
• We assessed the adequacy of disclosures included in the consolidated financial statements against the requirements of IFRSs.
Other information
The Board of Directors and management is responsible for the other information. The other information comprises the annual report of the Group. We obtained the Directors’ report prior to the date of this auditor’s report and the remaining information of the annual report is expected to be made available to us after that date. The other information does not include the consolidated financial statements and our auditor’s report thereon.
Our opinion on the consolidated financial statements does not cover the other information and we do not express any form of assurance conclusion thereon.
In connection with our audit of the consolidated financial statements, our responsibility is to read the other information identified above and, in doing so, consider whether the other information is materially inconsistent with the consolidated financial statements or our knowledge obtained in the audit, or otherwise appears to be materially misstated.
If, based on the work we have performed on the other information obtained up to the date of this auditor’s report, we conclude that there is a material misstatement of this other information, we are required to report that fact. We have nothing to report in this regard.
When we read the remaining information of the annual report of the Group, if we conclude that there is a material misstatement therein, we are required to communicate the matter to those charged with governance.
FINANCIAL
RE VIEW 45
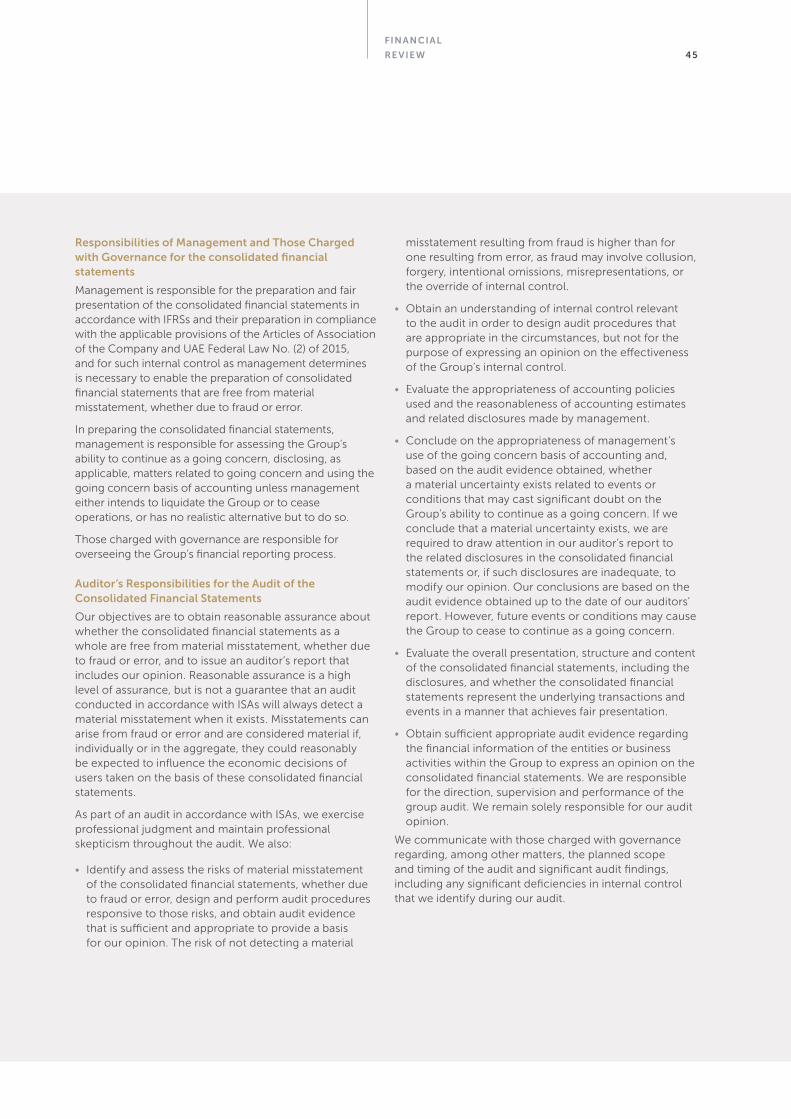
Responsibilities of Management and Those Charged with Governance for the consolidated financial statements
Management is responsible for the preparation and fair presentation of the consolidated financial statements in accordance with IFRSs and their preparation in compliance with the applicable provisions of the Articles of Association of the Company and UAE Federal Law No. (2) of 2015, and for such internal control as management determines is necessary to enable the preparation of consolidated financial statements that are free from material misstatement, whether due to fraud or error.
In preparing the consolidated financial statements, management is responsible for assessing the Group’s ability to continue as a going concern, disclosing, as applicable, matters related to going concern and using the going concern basis of accounting unless management either intends to liquidate the Group or to cease operations, or has no realistic alternative but to do so.
Those charged with governance are responsible for overseeing the Group’s financial reporting process.
Auditor’s Responsibilities for the Audit of the Consolidated Financial Statements
Our objectives are to obtain reasonable assurance about whether the consolidated financial statements as a whole are free from material misstatement, whether due to fraud or error, and to issue an auditor’s report that includes our opinion. Reasonable assurance is a high level of assurance, but is not a guarantee that an audit conducted in accordance with ISAs will always detect a material misstatement when it exists. Misstatements can arise from fraud or error and are considered material if, individually or in the aggregate, they could reasonably be expected to influence the economic decisions of users taken on the basis of these consolidated financial statements.
As part of an audit in accordance with ISAs, we exercise professional judgment and maintain professional skepticism throughout the audit. We also:
• Identify and assess the risks of material misstatement of the consolidated financial statements, whether due to fraud or error, design and perform audit procedures responsive to those risks, and obtain audit evidence that is sufficient and appropriate to provide a basis for our opinion. The risk of not detecting a material
misstatement resulting from fraud is higher than for one resulting from error, as fraud may involve collusion, forgery, intentional omissions, misrepresentations, or the override of internal control.
• Obtain an understanding of internal control relevant to the audit in order to design audit procedures that are appropriate in the circumstances, but not for the purpose of expressing an opinion on the effectiveness of the Group’s internal control.
• Evaluate the appropriateness of accounting policies used and the reasonableness of accounting estimates and related disclosures made by management.
• Conclude on the appropriateness of management’s use of the going concern basis of accounting and, based on the audit evidence obtained, whether a material uncertainty exists related to events or conditions that may cast significant doubt on the Group’s ability to continue as a going concern. If we conclude that a material uncertainty exists, we are required to draw attention in our auditor’s report to the related disclosures in the consolidated financial statements or, if such disclosures are inadequate, to modify our opinion. Our conclusions are based on the audit evidence obtained up to the date of our auditors’ report. However, future events or conditions may cause the Group to cease to continue as a going concern.
• Evaluate the overall presentation, structure and content of the consolidated financial statements, including the disclosures, and whether the consolidated financial statements represent the underlying transactions and events in a manner that achieves fair presentation.
• Obtain sufficient appropriate audit evidence regarding the financial information of the entities or business activities within the Group to express an opinion on the consolidated financial statements. We are responsible for the direction, supervision and performance of the group audit. We remain solely responsible for our audit opinion.
We communicate with those charged with governance regarding, among other matters, the planned scope and timing of the audit and significant audit findings, including any significant deficiencies in internal control that we identify during our audit.
S EC TION 346
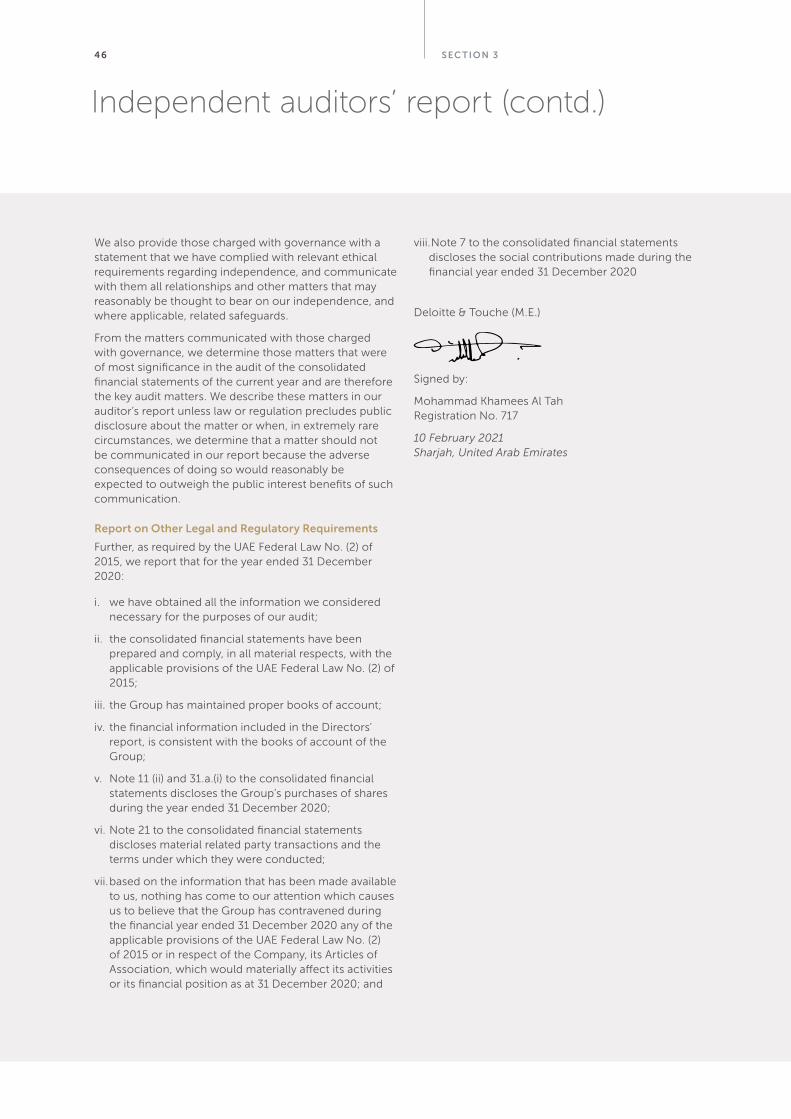
Independent auditors’ report (contd.)
We also provide those charged with governance with a statement that we have complied with relevant ethical requirements regarding independence, and communicate with them all relationships and other matters that may reasonably be thought to bear on our independence, and where applicable, related safeguards.
From the matters communicated with those charged with governance, we determine those matters that were of most significance in the audit of the consolidated financial statements of the current year and are therefore the key audit matters. We describe these matters in our auditor’s report unless law or regulation precludes public disclosure about the matter or when, in extremely rare circumstances, we determine that a matter should not be communicated in our report because the adverse consequences of doing so would reasonably be expected to outweigh the public interest benefits of such communication.
Report on Other Legal and Regulatory Requirements
Further, as required by the UAE Federal Law No. (2) of 2015, we report that for the year ended 31 December 2020:
i. we have obtained all the information we considered necessary for the purposes of our audit;
ii. the consolidated financial statements have been prepared and comply, in all material respects, with the applicable provisions of the UAE Federal Law No. (2) of 2015;
iii. the Group has maintained proper books of account;
iv. the financial information included in the Directors’ report, is consistent with the books of account of the Group;
v. Note 11 (ii) and 31.a.(i) to the consolidated financial statements discloses the Group’s purchases of shares during the year ended 31 December 2020;
vi. Note 21 to the consolidated financial statements discloses material related party transactions and the terms under which they were conducted;
vii. based on the information that has been made available to us, nothing has come to our attention which causes us to believe that the Group has contravened during the financial year ended 31 December 2020 any of the applicable provisions of the UAE Federal Law No. (2) of 2015 or in respect of the Company, its Articles of Association, which would materially affect its activities or its financial position as at 31 December 2020; and
viii. Note 7 to the consolidated financial statements discloses the social contributions made during the financial year ended 31 December 2020
Deloitte & Touche (M.E.)
Signed by:
Mohammad Khamees Al Tah Registration No. 717
10 February 2021 Sharjah, United Arab Emirates
FINANCIAL
RE VIEW 47
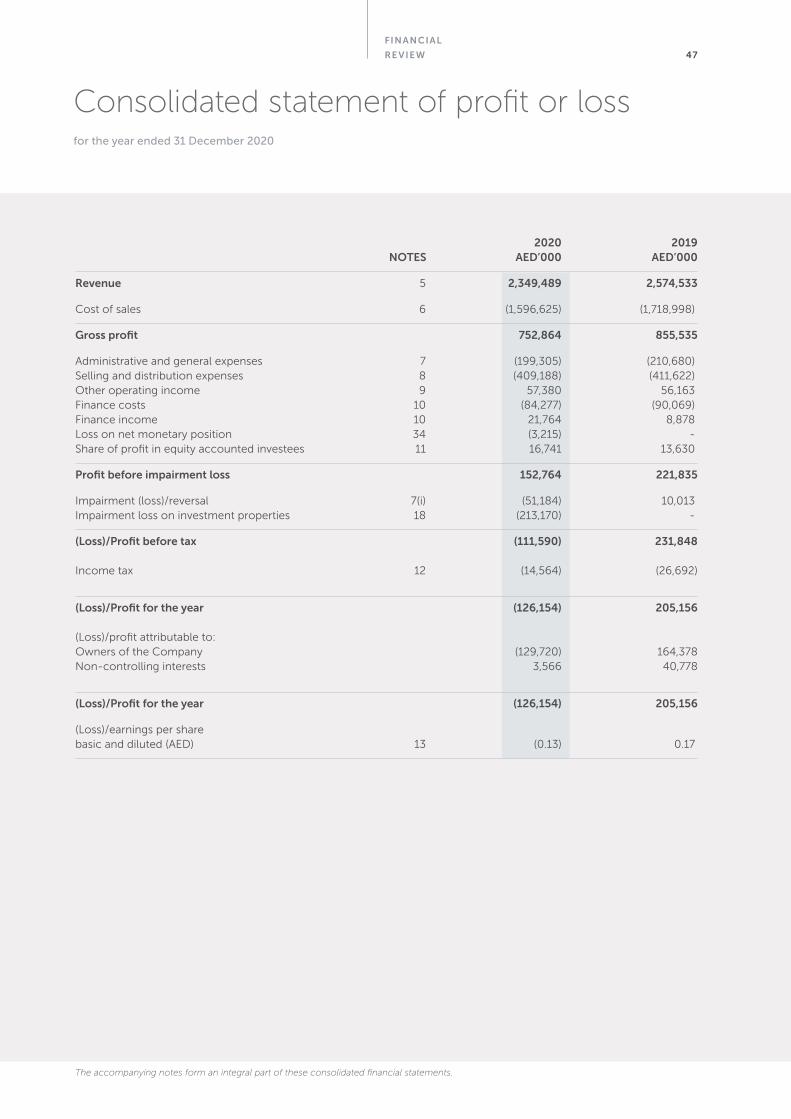
Consolidated statement of profit or lossfor the year ended 31 December 2020
2020 2019 NOTES AED’000 AED’000
Revenue 5 2,349,489 2,574,533
Cost of sales 6 (1,596,625) (1,718,998)
Gross profit 752,864 855,535
Administrative and general expenses 7 (199,305) (210,680) Selling and distribution expenses 8 (409,188) (411,622)Other operating income 9 57,380 56,163Finance costs 10 (84,277) (90,069)Finance income 10 21,764 8,878Loss on net monetary position 34 (3,215) -Share of profit in equity accounted investees 11 16,741 13,630
Profit before impairment loss 152,764 221,835
Impairment (loss)/reversal 7(i) (51,184) 10,013Impairment loss on investment properties 18 (213,170) -
(Loss)/Profit before tax (111,590) 231,848
Income tax 12 (14,564) (26,692)
(Loss)/Profit for the year (126,154) 205,156
(Loss)/profit attributable to: Owners of the Company (129,720) 164,378 Non-controlling interests 3,566 40,778
(Loss)/Profit for the year (126,154) 205,156
(Loss)/earnings per share basic and diluted (AED) 13 (0.13) 0.17
The accompanying notes form an integral part of these consolidated financial statements.

S EC TION 348
2020 2019 AED’000 AED’000
(Loss)/profit for the year (126,154) 205,156
Other comprehensive (loss)/income Items that may be reclassified subsequently to profit or loss Foreign exchange differences on translation of foreign operations (25,282) (81,180)Cash flow hedges – effective portion of changes in fair value loss on hedging instruments (19,470) (16,148)Effects of application of hyperinflation accounting (note 34) 38,151 -
Total comprehensive (loss)/income for the year (132,755) 107,828 Total comprehensive (loss)/income attributable to: Owners of the Company (136,878) 69,690Non-controlling interests 4,123 38,138
Total comprehensive (loss)/income for the year (132,755) 107,828
Consolidated statement of profit or loss and other comprehensive incomefor the year ended 31 December 2020
The accompanying notes form an integral part of these consolidated financial statements.
FINANCIAL
RE VIEW 49
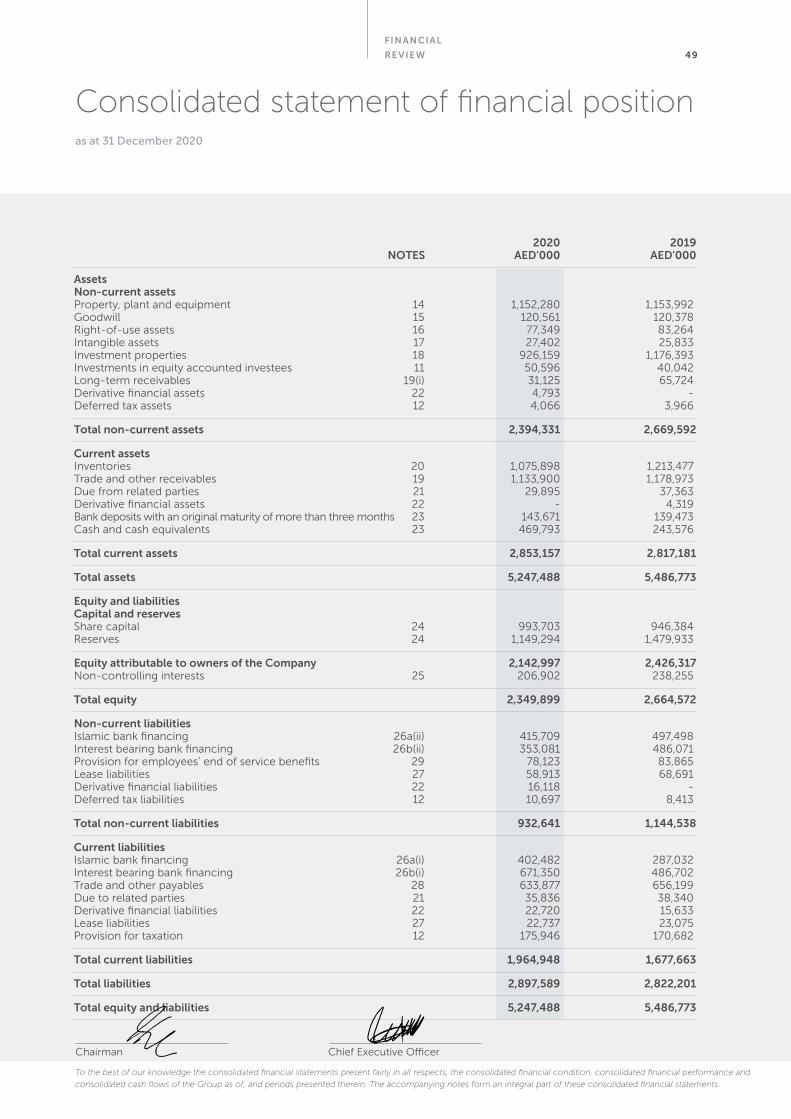
2020 2019 NOTES AED’000 AED’000
Assets Non-current assets Property, plant and equipment 14 1,152,280 1,153,992Goodwill 15 120,561 120,378Right-of-use assets 16 77,349 83,264Intangible assets 17 27,402 25,833Investment properties 18 926,159 1,176,393Investments in equity accounted investees 11 50,596 40,042Long-term receivables 19(i) 31,125 65,724Derivative financial assets 22 4,793 -Deferred tax assets 12 4,066 3,966
Total non-current assets 2,394,331 2,669,592
Current assets Inventories 20 1,075,898 1,213,477Trade and other receivables 19 1,133,900 1,178,973Due from related parties 21 29,895 37,363Derivative financial assets 22 - 4,319Bank deposits with an original maturity of more than three months 23 143,671 139,473Cash and cash equivalents 23 469,793 243,576
Total current assets 2,853,157 2,817,181
Total assets 5,247,488 5,486,773
Equity and liabilities Capital and reserves Share capital 24 993,703 946,384Reserves 24 1,149,294 1,479,933
Equity attributable to owners of the Company 2,142,997 2,426,317Non-controlling interests 25 206,902 238,255
Total equity 2,349,899 2,664,572
Non-current liabilities Islamic bank financing 26a(ii) 415,709 497,498Interest bearing bank financing 26b(ii) 353,081 486,071Provision for employees’ end of service benefits 29 78,123 83,865Lease liabilities 27 58,913 68,691Derivative financial liabilities 22 16,118 -Deferred tax liabilities 12 10,697 8,413
Total non-current liabilities 932,641 1,144,538
Current liabilities Islamic bank financing 26a(i) 402,482 287,032Interest bearing bank financing 26b(i) 671,350 486,702Trade and other payables 28 633,877 656,199Due to related parties 21 35,836 38,340Derivative financial liabilities 22 22,720 15,633Lease liabilities 27 22,737 23,075Provision for taxation 12 175,946 170,682
Total current liabilities 1,964,948 1,677,663
Total liabilities 2,897,589 2,822,201
Total equity and liabilities 5,247,488 5,486,773
Chairman Chief Executive Officer
Consolidated statement of financial positionas at 31 December 2020
To the best of our knowledge the consolidated financial statements present fairly in all respects, the consolidated financial condition, consolidated financial performance and
consolidated cash flows of the Group as of, and periods presented therein. The accompanying notes form an integral part of these consolidated financial statements.
S EC TION 350
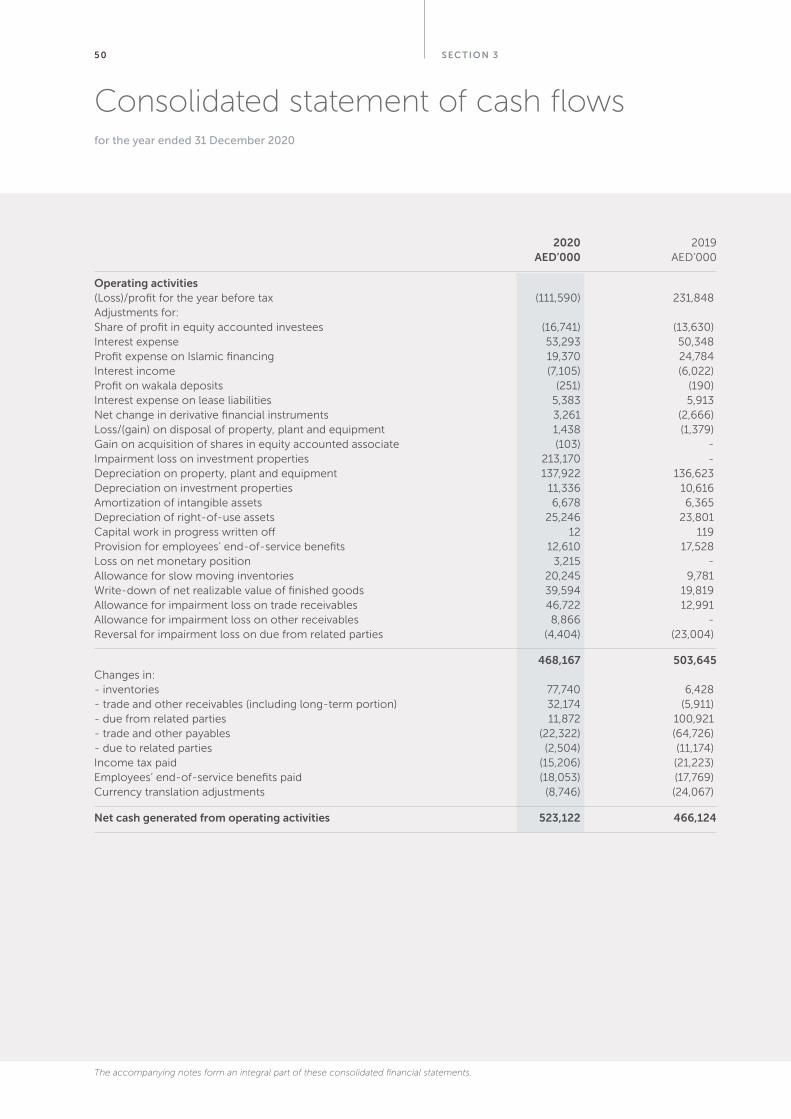
2020 2019 AED’000 AED’000
Operating activities(Loss)/profit for the year before tax (111,590) 231,848Adjustments for: Share of profit in equity accounted investees (16,741) (13,630)Interest expense 53,293 50,348Profit expense on Islamic financing 19,370 24,784Interest income (7,105) (6,022)Profit on wakala deposits (251) (190)Interest expense on lease liabilities 5,383 5,913Net change in derivative financial instruments 3,261 (2,666)Loss/(gain) on disposal of property, plant and equipment 1,438 (1,379)Gain on acquisition of shares in equity accounted associate (103) -Impairment loss on investment properties 213,170 -Depreciation on property, plant and equipment 137,922 136,623Depreciation on investment properties 11,336 10,616Amortization of intangible assets 6,678 6,365Depreciation of right-of-use assets 25,246 23,801Capital work in progress written off 12 119Provision for employees’ end-of-service benefits 12,610 17,528Loss on net monetary position 3,215 -Allowance for slow moving inventories 20,245 9,781Write-down of net realizable value of finished goods 39,594 19,819Allowance for impairment loss on trade receivables 46,722 12,991Allowance for impairment loss on other receivables 8,866 -Reversal for impairment loss on due from related parties (4,404) (23,004)
468,167 503,645Changes in: - inventories 77,740 6,428- trade and other receivables (including long-term portion) 32,174 (5,911)- due from related parties 11,872 100,921- trade and other payables (22,322) (64,726)- due to related parties (2,504) (11,174)Income tax paid (15,206) (21,223)Employees’ end-of-service benefits paid (18,053) (17,769)Currency translation adjustments (8,746) (24,067)
Net cash generated from operating activities 523,122 466,124
Consolidated statement of cash flowsfor the year ended 31 December 2020
The accompanying notes form an integral part of these consolidated financial statements.
FINANCIAL
RE VIEW 51
Consolidated statement of cash flows (contd.)for the year ended 31 December 2020
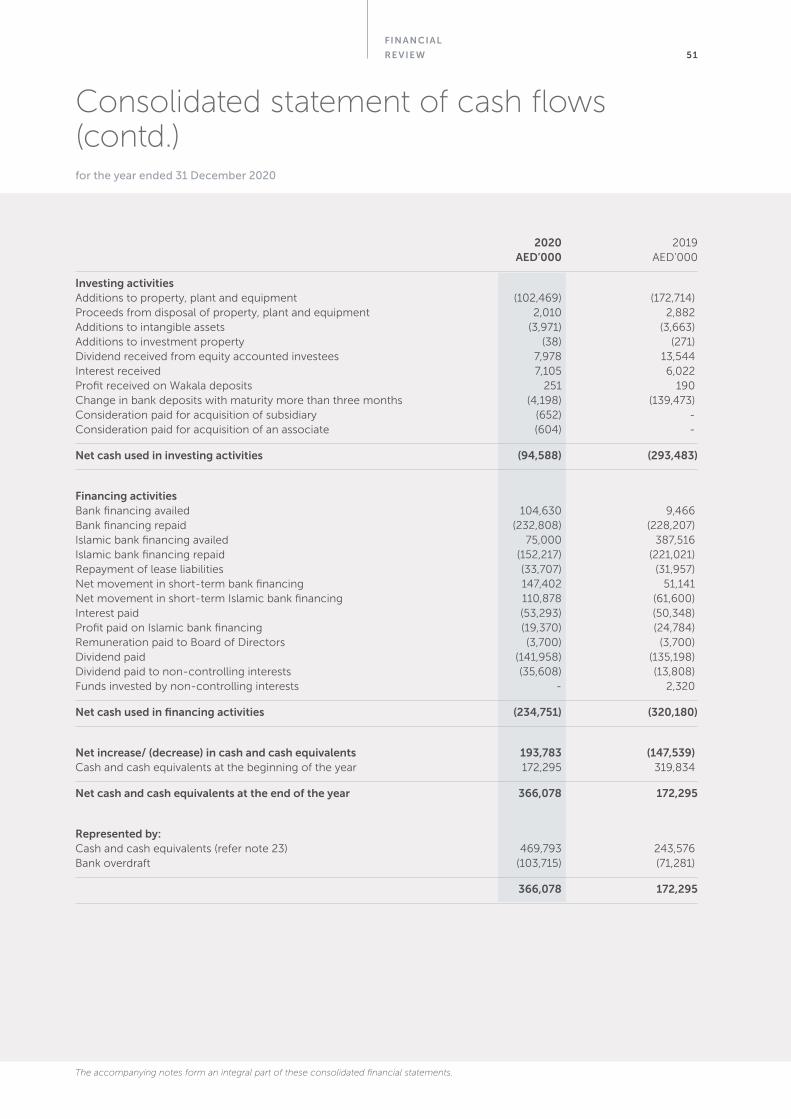
2020 2019 AED’000 AED’000
Investing activities Additions to property, plant and equipment (102,469) (172,714)Proceeds from disposal of property, plant and equipment 2,010 2,882Additions to intangible assets (3,971) (3,663)Additions to investment property (38) (271)Dividend received from equity accounted investees 7,978 13,544Interest received 7,105 6,022Profit received on Wakala deposits 251 190Change in bank deposits with maturity more than three months (4,198) (139,473)Consideration paid for acquisition of subsidiary (652) -Consideration paid for acquisition of an associate (604) -
Net cash used in investing activities (94,588) (293,483)
Financing activities Bank financing availed 104,630 9,466Bank financing repaid (232,808) (228,207)Islamic bank financing availed 75,000 387,516Islamic bank financing repaid (152,217) (221,021)Repayment of lease liabilities (33,707) (31,957)Net movement in short-term bank financing 147,402 51,141Net movement in short-term Islamic bank financing 110,878 (61,600)Interest paid (53,293) (50,348)Profit paid on Islamic bank financing (19,370) (24,784)Remuneration paid to Board of Directors (3,700) (3,700)Dividend paid (141,958) (135,198)Dividend paid to non-controlling interests (35,608) (13,808)Funds invested by non-controlling interests - 2,320
Net cash used in financing activities (234,751) (320,180)
Net increase/ (decrease) in cash and cash equivalents 193,783 (147,539)Cash and cash equivalents at the beginning of the year 172,295 319,834
Net cash and cash equivalents at the end of the year 366,078 172,295
Represented by: Cash and cash equivalents (refer note 23) 469,793 243,576Bank overdraft (103,715) (71,281)
366,078 172,295
The accompanying notes form an integral part of these consolidated financial statements.
S EC TION 352
Consolidated statement of changes in equityfor the year ended 31 December 2020
Non- Hyper controlling Share Share Legal Translation inflation Hedging General Capital Retained Total interests Total capital premium reserve reserve reserve reserve reserve reserve earnings reserves Total (NCI) equity AED’000 AED’000 AED’000 AED’000 AED’000 AED’000 AED’000 AED’000 AED’000 AED’000 AED’000 AED’000 AED’000
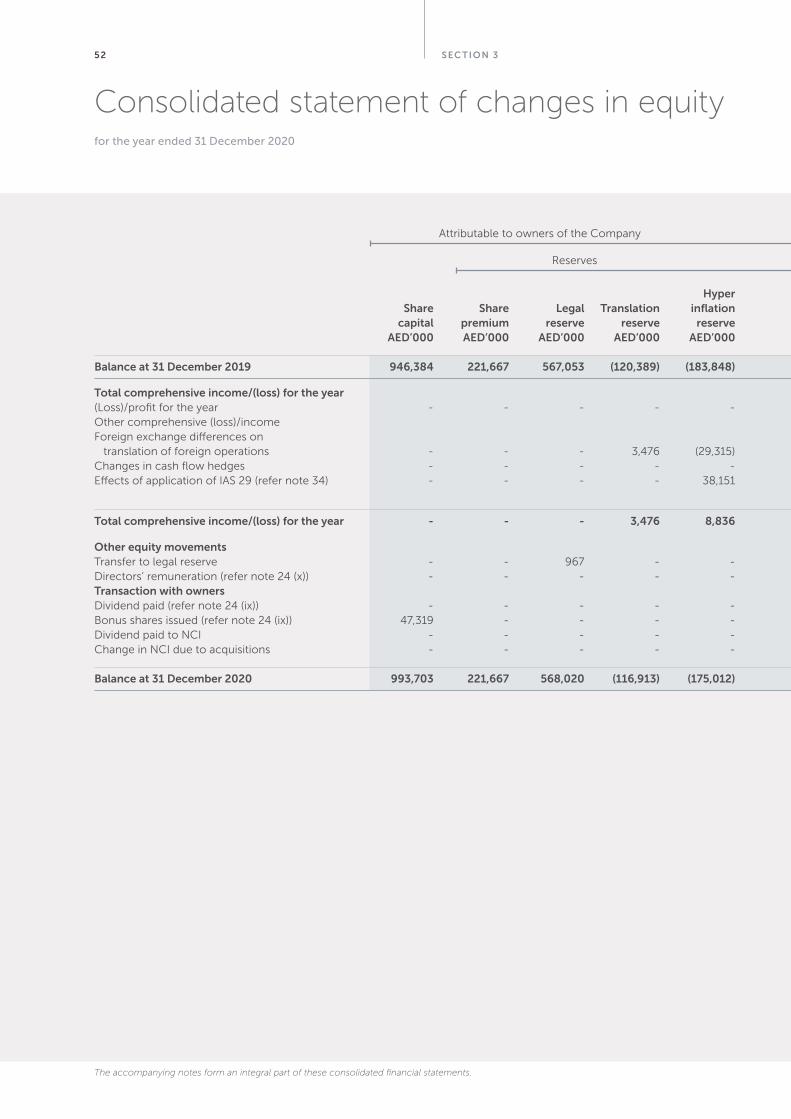
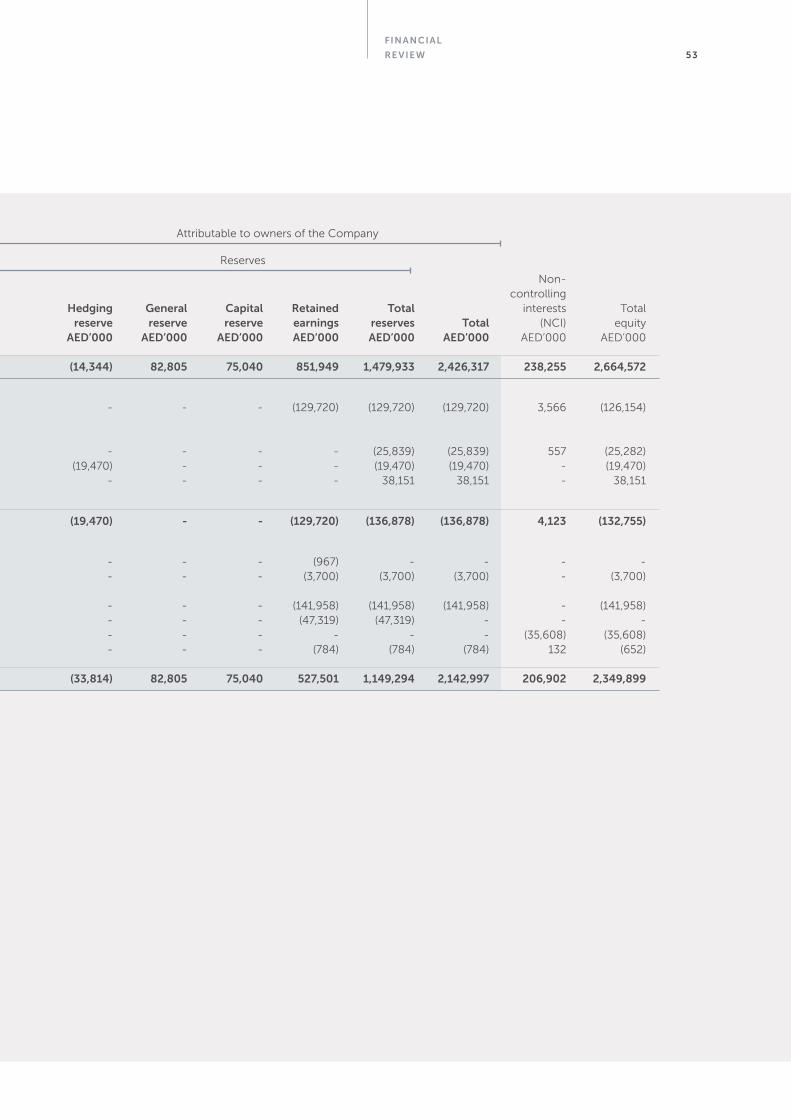
Balance at 31 December 2019 946,384 221,667 567,053 (120,389) (183,848) (14,344) 82,805 75,040 851,949 1,479,933 2,426,317 238,255 2,664,572
Total comprehensive income/(loss) for the year(Loss)/profit for the year - - - - - - - - (129,720) (129,720) (129,720) 3,566 (126,154)Other comprehensive (loss)/income Foreign exchange differences on translation of foreign operations - - - 3,476 (29,315) - - - - (25,839) (25,839) 557 (25,282)Changes in cash flow hedges - - - - - (19,470) - - - (19,470) (19,470) - (19,470)Effects of application of IAS 29 (refer note 34) - - - - 38,151 - - - - 38,151 38,151 - 38,151
Total comprehensive income/(loss) for the year - - - 3,476 8,836 (19,470) - - (129,720) (136,878) (136,878) 4,123 (132,755)
Other equity movements Transfer to legal reserve - - 967 - - - - - (967) - - - -Directors’ remuneration (refer note 24 (x)) - - - - - - - - (3,700) (3,700) (3,700) - (3,700)Transaction with owners Dividend paid (refer note 24 (ix)) - - - - - - - - (141,958) (141,958) (141,958) - (141,958)Bonus shares issued (refer note 24 (ix)) 47,319 - - - - - - - (47,319) (47,319) - - -Dividend paid to NCI - - - - - - - - - - - (35,608) (35,608)Change in NCI due to acquisitions - - - - - - - - (784) (784) (784) 132 (652)
Balance at 31 December 2020 993,703 221,667 568,020 (116,913) (175,012) (33,814) 82,805 75,040 527,501 1,149,294 2,142,997 206,902 2,349,899
Attributable to owners of the Company
Reserves
The accompanying notes form an integral part of these consolidated financial statements.
FINANCIAL
RE VIEW 53
Non- Hyper controlling Share Share Legal Translation inflation Hedging General Capital Retained Total interests Total capital premium reserve reserve reserve reserve reserve reserve earnings reserves Total (NCI) equity AED’000 AED’000 AED’000 AED’000 AED’000 AED’000 AED’000 AED’000 AED’000 AED’000 AED’000 AED’000 AED’000
Balance at 31 December 2019 946,384 221,667 567,053 (120,389) (183,848) (14,344) 82,805 75,040 851,949 1,479,933 2,426,317 238,255 2,664,572
Total comprehensive income/(loss) for the year(Loss)/profit for the year - - - - - - - - (129,720) (129,720) (129,720) 3,566 (126,154)Other comprehensive (loss)/income Foreign exchange differences on translation of foreign operations - - - 3,476 (29,315) - - - - (25,839) (25,839) 557 (25,282)Changes in cash flow hedges - - - - - (19,470) - - - (19,470) (19,470) - (19,470)Effects of application of IAS 29 (refer note 34) - - - - 38,151 - - - - 38,151 38,151 - 38,151
Total comprehensive income/(loss) for the year - - - 3,476 8,836 (19,470) - - (129,720) (136,878) (136,878) 4,123 (132,755)
Other equity movements Transfer to legal reserve - - 967 - - - - - (967) - - - -Directors’ remuneration (refer note 24 (x)) - - - - - - - - (3,700) (3,700) (3,700) - (3,700)Transaction with owners Dividend paid (refer note 24 (ix)) - - - - - - - - (141,958) (141,958) (141,958) - (141,958)Bonus shares issued (refer note 24 (ix)) 47,319 - - - - - - - (47,319) (47,319) - - -Dividend paid to NCI - - - - - - - - - - - (35,608) (35,608)Change in NCI due to acquisitions - - - - - - - - (784) (784) (784) 132 (652)
Balance at 31 December 2020 993,703 221,667 568,020 (116,913) (175,012) (33,814) 82,805 75,040 527,501 1,149,294 2,142,997 206,902 2,349,899
Attributable to owners of the Company
Reserves
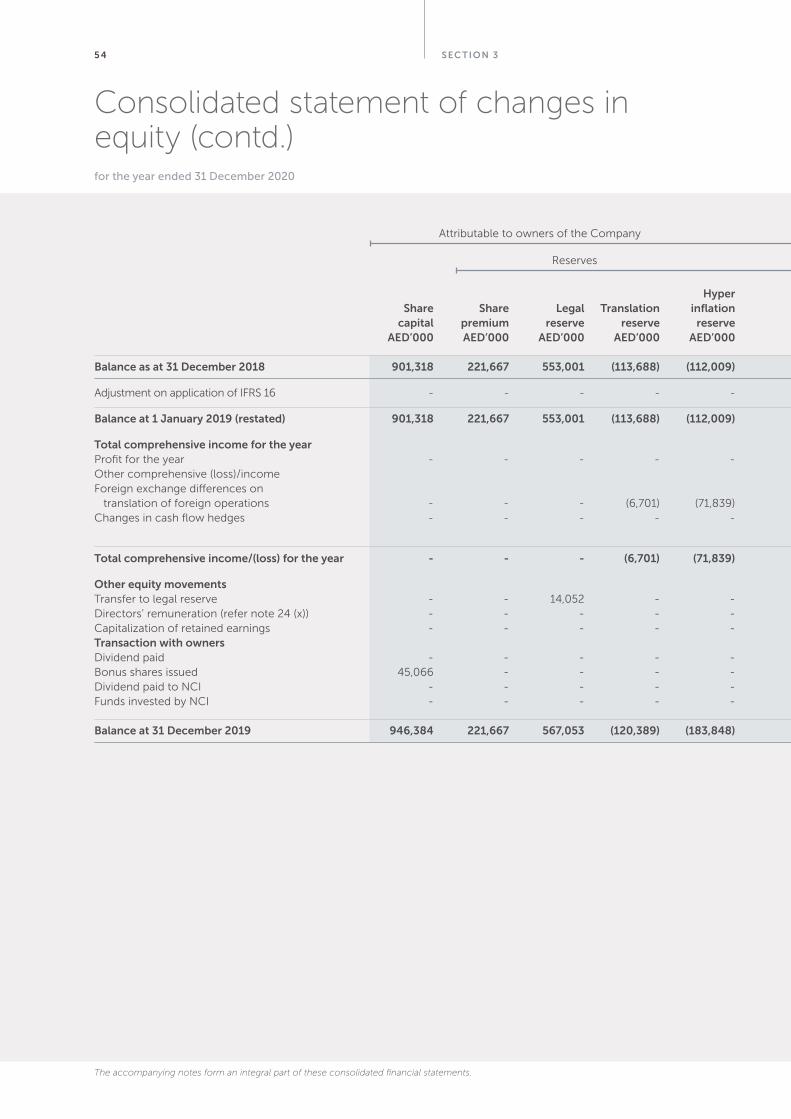
S EC TION 35 4
Consolidated statement of changes in equity (contd.)for the year ended 31 December 2020
Non- Hyper controlling Share Share Legal Translation inflation Hedging General Capital Retained Total interests Total capital premium reserve reserve reserve reserve reserve reserve earnings reserves Total (NCI) equity AED’000 AED’000 AED’000 AED’000 AED’000 AED’000 AED’000 AED’000 AED’000 AED’000 AED’000 AED’000 AED’000
Balance as at 31 December 2018 901,318 221,667 553,001 (113,688) (112,009) 1,804 82,805 63,419 903,095 1,600,094 2,501,412 212,697 2,714,109
Adjustment on application of IFRS 16 - - - - - - - - (5,887) (5,887) (5,887) (1,092) (6,979)
Balance at 1 January 2019 (restated) 901,318 221,667 553,001 (113,688) (112,009) 1,804 82,805 63,419 897,208 1,594,207 2,495,525 211,605 2,707,130
Total comprehensive income for the yearProfit for the year - - - - - - - - 164,378 164,378 164,378 40,778 205,156Other comprehensive (loss)/income Foreign exchange differences on translation of foreign operations - - - (6,701) (71,839) - - - - (78,540) (78,540) (2,640) (81,180)Changes in cash flow hedges - - - - - (16,148) - - - (16,148) (16,148) - (16,148)
Total comprehensive income/(loss) for the year - - - (6,701) (71,839) (16,148) - - 164,378 69,690 69,690 38,138 107,828
Other equity movementsTransfer to legal reserve - - 14,052 - - - - - (14,052) - - - -Directors’ remuneration (refer note 24 (x)) - - - - - - - - (3,700) (3,700) (3,700) - (3,700)Capitalization of retained earnings - - - - - - - 11,621 (11,621) - - - -Transaction with owners Dividend paid - - - - - - - - (135,198) (135,198) (135,198) - (135,198)Bonus shares issued 45,066 - - - - - - - (45,066) (45,066) - - -Dividend paid to NCI - - - - - - - - - - - (13,808) (13,808)Funds invested by NCI - - - - - - - - - - - 2,320 2,320
Balance at 31 December 2019 946,384 221,667 567,053 (120,389) (183,848) (14,344) 82,805 75,040 851,949 1,479,933 2,426,317 238,255 2,664,572
Attributable to owners of the Company
Reserves
The accompanying notes form an integral part of these consolidated financial statements.
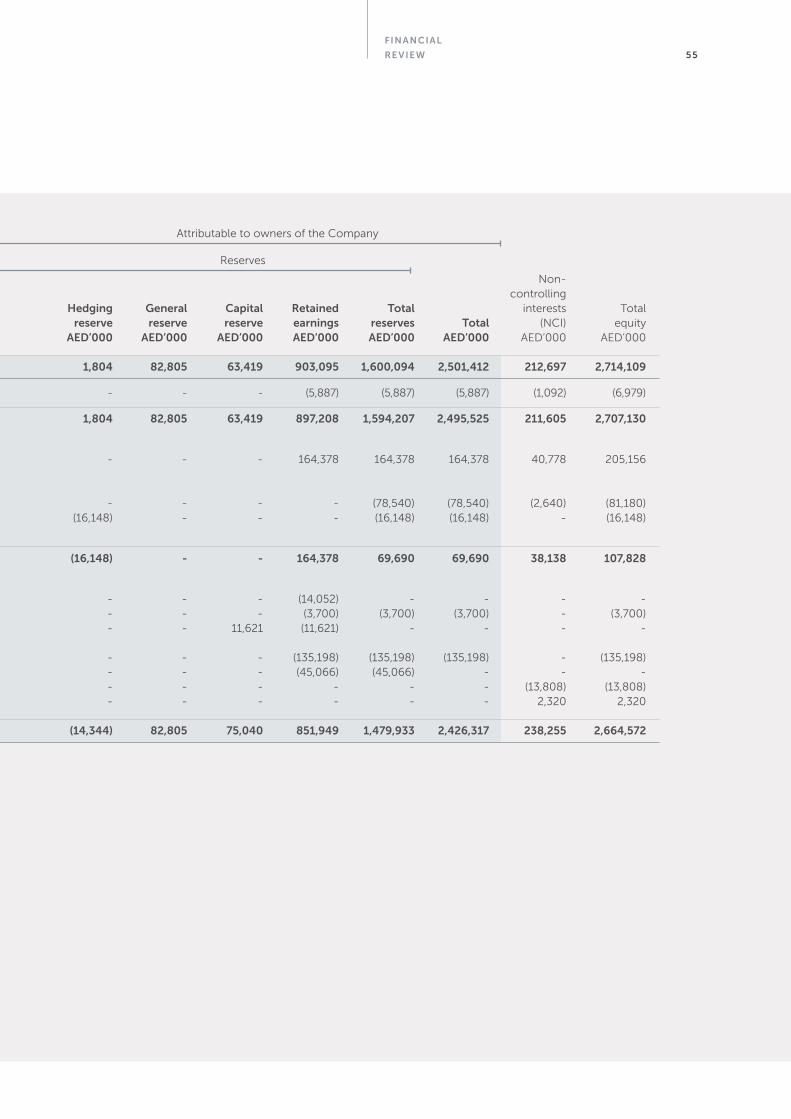
FINANCIAL
RE VIEW 55
Non- Hyper controlling Share Share Legal Translation inflation Hedging General Capital Retained Total interests Total capital premium reserve reserve reserve reserve reserve reserve earnings reserves Total (NCI) equity AED’000 AED’000 AED’000 AED’000 AED’000 AED’000 AED’000 AED’000 AED’000 AED’000 AED’000 AED’000 AED’000
Balance as at 31 December 2018 901,318 221,667 553,001 (113,688) (112,009) 1,804 82,805 63,419 903,095 1,600,094 2,501,412 212,697 2,714,109
Adjustment on application of IFRS 16 - - - - - - - - (5,887) (5,887) (5,887) (1,092) (6,979)
Balance at 1 January 2019 (restated) 901,318 221,667 553,001 (113,688) (112,009) 1,804 82,805 63,419 897,208 1,594,207 2,495,525 211,605 2,707,130
Total comprehensive income for the yearProfit for the year - - - - - - - - 164,378 164,378 164,378 40,778 205,156Other comprehensive (loss)/income Foreign exchange differences on translation of foreign operations - - - (6,701) (71,839) - - - - (78,540) (78,540) (2,640) (81,180)Changes in cash flow hedges - - - - - (16,148) - - - (16,148) (16,148) - (16,148)
Total comprehensive income/(loss) for the year - - - (6,701) (71,839) (16,148) - - 164,378 69,690 69,690 38,138 107,828
Other equity movementsTransfer to legal reserve - - 14,052 - - - - - (14,052) - - - -Directors’ remuneration (refer note 24 (x)) - - - - - - - - (3,700) (3,700) (3,700) - (3,700)Capitalization of retained earnings - - - - - - - 11,621 (11,621) - - - -Transaction with owners Dividend paid - - - - - - - - (135,198) (135,198) (135,198) - (135,198)Bonus shares issued 45,066 - - - - - - - (45,066) (45,066) - - -Dividend paid to NCI - - - - - - - - - - - (13,808) (13,808)Funds invested by NCI - - - - - - - - - - - 2,320 2,320
Balance at 31 December 2019 946,384 221,667 567,053 (120,389) (183,848) (14,344) 82,805 75,040 851,949 1,479,933 2,426,317 238,255 2,664,572
Attributable to owners of the Company
Reserves

S EC TION 356
Notes to the consolidated financial statementsfor the year ended 31 December 2020
R.A.K. Ceramics P.J.S.C. (“the Company” or “the Holding Company”) was incorporated under Emiri Decree No. 6/89 dated 26 March 1989 as a limited liability company in the Emirate of Ras Al Khaimah, UAE. Subsequently, under Emiri Decree No. 9/91 dated 6 July 1991, the legal status of the Company was changed to Public Shareholding Company. The registered address of the Company is P.O. Box 4714, Al Jazeerah Al Hamra City, Ras Al Khaimah, United Arab Emirates. The Company is listed on Abu Dhabi Securities Exchange, UAE.
These consolidated financial statements as at and for the year ended 31 December 2020 comprise the financial statements of the Company and its subsidiaries (collectively referred to as “the Group” and individually as “the Group entities”) and the Group’s interest in equity accounted investees. The Group’s subsidiaries and equity accounted investees, their principal activities and the Group’s interest have been disclosed in note 36 to these consolidated financial statements.
The principal activities of the Group are manufacturing and sale of a variety of ceramic products including tiles, bathroom sets, sanitary wares and table wares. The Company and certain entities in the Group are also engaged in investing in other entities, in the UAE or globally, that undertake similar or ancillary activities. Accordingly, the Company also acts as a Holding Company of the Group entities. The Group is also engaged in contracting and other industrial manufacturing activities.
Federal Decree-Law No. 26 of 2020 which amends certain provisions of Federal Law No. 2 of 2015 on Commercial Companies was issued on 27 September 2020 and the amendments came into effect on 2 January 2021. The Company is in the process of reviewing the new provisions and will apply the requirements thereof no later than one year from the date on which the amendments came into effect.
1. GENERAL INFORMATION
FINANCIAL
RE VIEW 57
Notes to the consolidated financial statementsfor the year ended 31 December 2020
2.1 New and revised IFRSs applied by the Group
In the current year, the Group has applied the following amendments to IFRSs issued by the International Accounting Standards Board (“IASB”) that are mandatorily effective for an accounting period that begins on or after 1 January 2020. Their adoption has not had any material impact on the amounts reported in these consolidated financial statements.
• Definition of Material – Amendments to IAS 1 ‘Presentation of Financial Statements’ and IAS 8 ‘Accounting Policies, Changes in Accounting Estimates and Errors’.
• Definition of a Business – Amendments to IFRS 3 ‘Business Combinations’
• Amendments to References to the Conceptual Framework in IFRS Standards. The standards which are amended are IFRS 2, IFRS 3, IFRS 6, IFRS 14, IAS 1, IAS 8, IAS 34, IAS 37, IAS 38, IFRIC 12, IFRIC 19, IFRIC 20, IFRIC 22 and SIC32.
• Amendments to IFRS 7 ‘Financial Instruments: Disclosures’ and IFRS 9 ‘Financial Instruments’ relating to Interest Rate Benchmark Reforms. In September 2019, the IASB issued Interest Rate Benchmark Reforms (Amendments to IFRS 9, IAS 39 and IFRS 7). These amendments modify specific hedge accounting requirements to allow hedge accounting to continue for affected hedges during the period of uncertainty before the hedged items or hedging instruments affected by the current interest rate benchmarks are amended as a result of the on-going interest rate benchmark reforms. The amendments are relevant to the Group given that it applies hedge accounting to its benchmark interest rate exposures. The application of the amendments impacts the Group’s accounting in the following ways:
• The Group has floating rate debt, linked to USD and GBP IBOR, which it hedges using interest rate swaps. The amendments permit continuation of hedge accounting even though there is uncertainty about the timing and amount of the hedged cash flows due to the interest rate benchmark reforms.
• The Group will retain the cumulative gain or loss in the cash flow hedge reserve for designated cash flow hedges that are subject to interest rate benchmark reforms even though there is uncertainty arising from the interest rate benchmark reform with respect to the timing and amount of the cash flows of the hedged items. Should the Group consider that the hedged future cash flows are no longer expected to occur due to reasons other than interest rate benchmark reform, the cumulative gain or loss will be immediately reclassified to profit or loss.
• Amendment to IFRS 16 ‘Leases’ to provide lessees with an exemption from assessing whether a COVID-19 related rent concession is a lease modification. The effective date is 1 June 2020. In May 2020, the IASB issued Covid-19-Related Rent Concessions (Amendment to IFRS 16) that provides practical relief to lessees in accounting for rent concessions occurring as a direct consequence of the COVID-19 pandemic, by introducing a practical expedient to IFRS 16. The practical expedient permits a lessee to elect not to assess whether a COVID- 19-related rent concession is a lease modification. A lessee that makes this election shall account for any change in lease payments resulting from the COVID-19-related rent concession the same way it would account for the change applying IFRS 16 if the change were not a lease modification. The practical expedient applies only to rent concessions occurring as a direct consequence of COVID-19 and only if all of the following conditions are met:
• The change in lease payments results in revised consideration for the lease that is substantially the same as, or less than, the consideration for the lease immediately preceding the change;
• Any reduction in lease payments affects only payments originally due on or before 30 June 2021 (a rent concession meets this condition if it results in reduced lease payments on or before 30 June 2021 and increased lease payments that extend beyond 30 June 2021); and
• There is no substantive change to other terms and conditions of the lease.
2. APPLICATION OF NEW AND REVISED INTERNATIONAL FINANCIAL REPORTING STANDARDS (“IFRSs”)
S EC TION 358
Notes to the consolidated financial statementsfor the year ended 31 December 2020
2.2 New and revised IFRS standards and interpretations but not yet effective
Management does not expect that the adoption of the below standards will have material impact on the consolidated financial statements.
• IFRS 17 ‘Insurance Contracts’ implementation challenges and those relating to providing a more uniform measurement and presentation approach for all insurance contracts (effective for annual periods beginning on or after 1 January 2023).
• Amendments to IFRS 10 ‘Consolidated Financial Statements’ and IAS 28 ‘Investments in Associates and Joint Ventures’ (2011) relating to the treatment of the sale or contribution of assets from an investor and its associate or joint venture (effective date deferred indefinitely, early adoption permitted).
• IAS 1 ‘Presentation of Financial Statements’ – Amendments on Classifications. Effective for annual periods beginning on or after 1 January 2023, early adoption permitted.
• Amendments relating to IAS 16, IAS 37, IFRS 3 and some annual improvements on IFRS 1, IFRS 9, IAS 41 and IFRS 16 (effective for annual periods beginning on or after 1 January 2022).
• IFRS 4 relating to amendments regarding the expiry date of the deferral approach. The fixed expiry date for the temporary exemption in IFRS 4 from applying IFRS 9 is now 1 January 2023.
• Amendments to IFRS 9, IAS 39, IFRS 7, IFRS 4 and IFRS 16 relating to ‘Interest Rate Benchmark Reform — Phase 2’, that address issues that might affect financial reporting after the reform of an interest rate benchmark, including its replacement with alternative benchmark rates. The amendments are effective for annual periods beginning on or after 1 January 2021, with earlier application permitted.
• Amendments to IFRS 9 that clarifies that for the purpose of performing the ‘’10 per cent test’ for derecognition of financial liabilities in determining those fees paid net of fees received, a borrower includes only fees paid or received between the borrower and the lender, including fees paid or received by either the borrower or lender on the other’s behalf. The amendments are effective for annual periods beginning on or after 1 January 2022, with earlier application permitted.
2. APPLICATION OF NEW AND REVISED INTERNATIONAL FINANCIAL REPORTING STANDARDS (“IFRSs”) (CONTD.)
FINANCIAL
RE VIEW 59
Notes to the consolidated financial statementsfor the year ended 31 December 2020
(a) Statement of compliance
These consolidated financial statements have been prepared in accordance with International Financial Reporting Standards (“IFRS”) and comply with the Articles of Association of the Company and the UAE Federal Law No. (2) of 2015. Details of the Group’s accounting policies are included in Note 4.
(b) Basis of measurement
These consolidated financial statements have been prepared on a historical cost convention except for certain financial instruments which are carried at fair value, as explained in the accounting policies below. Historical cost is generally based on the fair value of consideration given in exchange for goods and services.
(c) Functional and presentation currency
These consolidated financial statements are presented in United Arab Emirates Dirhams (“AED”), which is the functional currency of the Company. All amounts have been rounded to the nearest thousand, unless otherwise indicated.
(d) Use of estimates and judgments
In preparing these consolidated financial statements, management has made judgments, estimates and assumptions that affect the application of the Group’s accounting policies and the reported amounts of assets and liabilities, income and expenses. The estimates and associated assumptions are based on historical experience and other factors which are considered to be relevant. Actual results may differ from these estimates.
Estimates and underlying assumptions are reviewed by the management on an ongoing basis. Revisions to estimates are recognized prospectively.
Information about significant areas of estimation uncertainty and critical judgments in applying accounting policies that have the most significant effect on the amounts recognized in the consolidated financial statements are described in note 37.
(e) Measurement of fair values
Fair value is the price that would be received on sale of an asset or paid to transfer a liability in an orderly transaction between market participants at the measurement date, regardless of whether that price is directly observable or estimated using another valuation technique.
In estimating the fair value of an asset or a liability, the Group takes into account the characteristics of the asset or liability if market participants would take those characteristics into account when pricing the asset or liability at the measurement date. Fair value for measurement and/or disclosure purposes in these consolidated financial statements is determined on such basis, except for share-based payment transactions that are within the scope of IFRS 2, leasing transactions that are within the scope of IFRS 16, and measurements that have some similarities to fair value but are not fair value, such as net realizable value in IAS 2 or value in use in IAS 36.
When measuring the fair value of an asset or a liability, the Group uses market observable data as far as possible. Fair values are categorized into different levels in a fair value hierarchy based on the inputs used in the valuation techniques as follows:
• Level 1: quoted prices (unadjusted) in active markets for identical assets or liabilities;
• Level 2: inputs other than quoted prices included in Level 1 that are observable for the asset or liability, either directly (i.e. as prices) or indirectly (i.e. derived from prices); or
• Level 3: inputs for the asset or liability that are not based on observable market data (unobservable inputs).
3 BASIS OF PREPARATION
S EC TION 360
Notes to the consolidated financial statementsfor the year ended 31 December 2020
If the inputs used to measure the fair value of an asset or a liability might be categorized in different levels of the fair value hierarchy, then the fair value measurement is categorized in its entirety in the same level of the fair value hierarchy as the lowest level input that is significant to the entire measurement.
The Group recognizes transfers between levels of the fair value hierarchy at the end of the reporting period during which the change has occurred.
(f) Basis of consolidation
The consolidated financial statements of the Group incorporate the financial statements of the Company and the Group entities controlled by the Company (its Subsidiaries) made up to 31 December each year.
Control is achieved when the Company:
• has power over the investee;
• is exposed, or has rights, to variable returns from its involvement with the investee; and
• has the ability to use its power to affect its returns.
The Company reassesses whether or not it controls an investee if facts and circumstances indicate that there are changes to one or more of the three elements of control listed above.
When the Company has less than a majority of the voting rights of an investee, it has power over the investee when the voting rights are sufficient to give it the practical ability to direct the relevant activities of the investee unilaterally.
The Company considers all relevant facts and circumstances in assessing whether or not the Company’s voting rights in an investee are sufficient to give it power, including:
• the size of the Company’s holding of voting rights relative to the size and dispersion of holdings of the other vote holders;
• potential voting rights held by the Company, other vote holders or other parties;
• rights arising from other contractual arrangements; and
• any additional facts and circumstances that indicate that the Company has, or does not have, the current ability to direct the relevant activities at the time that decisions need to be made, including voting patterns at previous shareholders’ meetings.
Consolidation of a subsidiary begins when the Company obtains control over the subsidiary and ceases when the Company loses control of the subsidiary. Specifically, income and expenses of a subsidiary acquired or disposed of during the year are included in the consolidated income statement and consolidated statement of other comprehensive income from the date the Company gains control until the date when the Company ceases to control the subsidiary.
Profit or loss and each component of other comprehensive income are attributed to the owners of the Company and to the non-controlling interests. Total comprehensive income of subsidiaries is attributed to the owners of the Company and to the non-controlling interests even if this results in the non-controlling interests having a deficit balance.
When necessary, adjustments are made to the financial statements of subsidiaries to bring their accounting policies in line with the Group’s accounting policies.
All intragroup assets and liabilities, equity, income, expenses and cash flows relating to transactions between members of the Group are eliminated in full on consolidation.
3 BASIS OF PREPARATION (CONTD.)
FINANCIAL
RE VIEW 61
Notes to the consolidated financial statementsfor the year ended 31 December 2020
Changes in the Group’s interests in subsidiaries that do not result in a loss of control are accounted for as equity transactions. The carrying amount of the Group’s interests and the non-controlling interests are adjusted to reflect the changes in their relative interests in the subsidiaries. Any difference between the amount by which the non-controlling interests are adjusted and the fair value of the consideration paid or received is recognized directly in equity and attributed to the owners of the Company.
When the Group loses control of a subsidiary, the gain or loss on disposal recognized in profit or loss is calculated as the difference between (i) the aggregate of the fair value of the consideration received and the fair value of any retained interest and (ii) the previous carrying amount of the assets (including goodwill), less liabilities of the subsidiary and any non-controlling interests. All amounts previously recognized in other comprehensive income in relation to that subsidiary are accounted for as if the Group had directly disposed of the related assets or liabilities of the subsidiary (i.e. reclassified to profit or loss or transferred to another category of equity as required/permitted by applicable IFRS Standards). The fair value of any investment retained in the former subsidiary at the date when control is lost is regarded as the fair value on initial recognition for subsequent accounting under IFRS 9 when applicable, or the cost on initial recognition of an investment in an associate or a joint venture.
3 BASIS OF PREPARATION (CONTD.)
S EC TION 362
Notes to the consolidated financial statementsfor the year ended 31 December 2020
(a) Business combinations
Acquisitions of businesses are accounted for using the acquisition method. The consideration transferred in a business combination is measured at fair value, which is calculated as the sum of the acquisition-date fair values of the assets transferred by the Group, liabilities incurred by the Group to the former owners of the acquiree and the equity interests issued by the Group in exchange for control of the acquiree. Acquisition-related costs are generally recognized in profit or loss as incurred.
At the acquisition date, the identifiable assets acquired and the liabilities assumed are recognized at their fair value.
Goodwill is measured as the excess of the sum of the consideration transferred, the amount of any non-controlling interests in the acquiree, and the fair value of the acquirer’s previously held equity interest in the acquiree (if any) over the net of the acquisition-date amounts of the identifiable assets acquired and the liabilities assumed. If, after reassessment, the net of the acquisition-date amounts of the identifiable assets acquired and liabilities assumed exceeds the sum of the consideration transferred, the amount of any non-controlling interests in the acquiree and the fair value of the acquirer’s previously held interest in the acquiree (if any), the excess is recognized immediately in profit or loss as a bargain purchase gain.
Non-controlling interests are the present ownership interests and entitle their holders to a proportionate share of the entity’s net assets in the event of liquidation may be initially measured either at fair value or at the non-controlling interests’ proportionate share of the recognized amounts of the acquiree’s identifiable net assets. The choice of measurement basis is made on a transaction-by-transaction basis. Other types of non-controlling interests are measured at fair value or, when applicable, on the basis specified in another IFRS.
When a business combination is achieved in stages, the Group’s previously held equity interest in the acquiree is re-measured to fair value at the acquisition date (i.e. the date when the Group obtains control) and the resulting gain or loss, if any, is recognized in profit or loss. Amounts arising from interests in the acquiree prior to the acquisition date that have previously been recognized in other comprehensive income are reclassified to profit or loss where such treatment would be appropriate if those interests were disposed of.
(b) Goodwill
Goodwill is not amortized but is reviewed for impairment at least annually. For the purpose of impairment testing, goodwill is allocated to each of the Group’s cash-generating units (or groups of cash-generating units) expected to benefit from the synergies of the combination. Cash-generating units to which goodwill has been allocated are tested for impairment annually, or more frequently when there is an indication that the unit may be impaired. If the recoverable amount of the cash-generating unit is less than the carrying amount of the unit, the impairment loss is allocated first to reduce the carrying amount of any goodwill allocated to the unit and then to the other assets of the unit pro-rata on the basis of the carrying amount of each asset in the unit. An impairment loss recognized for goodwill is not reversed in a subsequent period. On disposal of a cash-generating unit, the attributable amount of goodwill is included in the determination of the profit or loss on disposal.
(c) Interests in equity accounted investees
An associate is an entity over which the Group has significant influence and that is neither a subsidiary nor an interest in a joint venture. Significant influence is the power to participate in the financial and operating policy decisions of the investee but is not control or joint control over those policies.
A joint venture is a joint arrangement whereby the parties that have joint control of the arrangement have rights to the net assets of the joint arrangement. Joint control is the contractually agreed sharing of control of an arrangement, which exists only when decisions about the relevant activities require unanimous consent of the parties sharing control.
4. SUMMARY OF SIGNIFICANT ACCOUNTING POLICIES
FINANCIAL
RE VIEW 63
Notes to the consolidated financial statementsfor the year ended 31 December 2020
The results and assets and liabilities of associates or joint ventures are incorporated in these consolidated financial statements using the equity method of accounting, except when the investment is classified as held for sale, in which case it is accounted for in accordance with IFRS 5.
Under the equity method, an investment in an associate or a joint venture is recognized initially in the consolidated statement of financial position at cost and adjusted thereafter to recognize the Group’s share of the profit or loss and other comprehensive income of the associate or joint venture. When the Group’s share of losses of an associate or a joint venture exceeds the Group’s interest in that associate or joint venture (which includes any long-term interests that, in substance, form part of the Group’s net investment in the associate or joint venture), the Group discontinues recognizing its share of further losses. Additional losses are recognized only to the extent that the Group has incurred legal or constructive obligations or made payments on behalf of the associate or joint venture.
On acquisition of the investment in an associate or a joint venture, any excess of the cost of the investment over the Group’s share of the net fair value of the identifiable assets and liabilities of the investee is recognized as goodwill, which is included within the carrying amount of the investment. Any excess of the Group’s share of the net fair value of the identifiable assets and liabilities over the cost of the investment, after reassessment, is recognized immediately in profit or loss in the period in which the investment is acquired.
The requirements of IAS 36 are applied to determine whether it is necessary to recognize any impairment loss with respect to the Group’s investment in an associate or a joint venture. When necessary, the entire carrying amount of the investment (including goodwill) is tested for impairment in accordance with IAS 36 as a single asset by comparing its recoverable amount (higher of value in use and fair value less costs of disposal) with its carrying amount. Any impairment loss recognized is not allocated to any asset, including goodwill that forms part of the carrying amount of the investment. Any reversal of that impairment loss is recognized in accordance with IAS 36 to the extent that the recoverable amount of the investment subsequently increases.
The Group discontinues the use of the equity method from the date when the investment ceases to be an associate or a joint venture. When a Group entity transacts with an associate or a joint venture of the Group, profits and losses resulting from the transactions with the associate or joint venture are recognized in the Group’s consolidated financial statements only to the extent of interests in the associate or joint venture that are not related to the Group.
(d) Hyperinflation
The financial statements of subsidiary companies whose functional currency is the currency of a hyperinflationary economy are adjusted for inflation in accordance with IAS 29 Financial Reporting in Hyperinflationary Economies, prior to their translation to AED for its consolidation into the consolidated financial statements. Amounts shown for prior years for comparative purposes are not restated at consolidation level as the presentation currency of the Group is not that of a hyperinflationary economy. On consolidation, the effect of price changes in the prior periods on the financial statements of the subsidiary is recognized in other comprehensive income and presented in the hyperinflation reserve in equity.
The financial statements of subsidiaries whose functional currency is the currency of a hyperinflationary economy are adjusted to reflect the changes in purchasing power of the local currency, such that all items in the statement of financial position not expressed in current terms (non-monetary items) are restated by applying a general price index at the reporting date and all income and expenses are restated quarterly by applying appropriate conversion factors. The difference from initial adjusted amounts is taken to profit or loss.
When a functional currency of a subsidiary ceases to be hyperinflationary, the Group discontinues hyperinflation accounting in accordance with IAS 29 for annual periods ending on or after the date that the economy is identified as being non-hyperinflationary. The amounts expressed in the measuring unit current at the end of the last period in which IAS 29 was applied are used as the basis for the carrying amounts in subsequent financial statements.
To determine the existence or cessation of hyperinflation, the Group assesses the qualitative characteristics of the economic environment of the country, such as the trends in inflation rates over the preceding 36 months to the reporting date.
4. SUMMARY OF SIGNIFICANT ACCOUNTING POLICIES (CONTD.)
S EC TION 36 4
Notes to the consolidated financial statementsfor the year ended 31 December 2020
(e) Foreign currencies
In preparing the financial statements of the Group entities, transactions in currencies other than the entity’s functional currency (foreign currencies) are recognized at the rates of exchange prevailing on the dates of the transactions. At each reporting date, monetary assets and liabilities that are denominated in foreign currencies are retranslated at the rates prevailing at that date. Non-monetary items carried at fair value that are denominated in foreign currencies are translated at the rates prevailing at the date when the fair value was determined. Non-monetary items that are measured in terms of historical cost in a foreign currency are not retranslated. Exchange differences are recognized in profit or loss in the period in which they arise except for:
• exchange differences on foreign currency borrowings relating to assets under construction for future productive use, which are included in the cost of those assets when they are regarded as an adjustment to interest costs on those foreign currency borrowings;
• exchange differences on transactions entered into to hedge certain foreign currency risks (see below under financial instruments/hedge accounting); and
• exchange differences on monetary items receivable from or payable to a foreign operation for which settlement is neither planned nor likely to occur in the foreseeable future (therefore forming part of the net investment in the foreign operation), which are recognized initially in other comprehensive income and reclassified from equity to profit or loss on disposal or partial disposal of the net investment.
For the purpose of presenting consolidated financial statements, the assets and liabilities of the Group’s foreign operations are translated at exchange rates prevailing on the reporting date. Income and expense items are translated at the average exchange rates for the period, unless exchange rates fluctuate significantly during that period, in which case the exchange rates at the date of transactions are used. Exchange differences arising, if any, are recognized in other comprehensive income and accumulated in a foreign exchange translation reserve. Foreign currency translation differences pertaining to hyperinflationary economies are recorded in the hyperinflation reserve in equity.
On the disposal of a foreign operation (i.e. a disposal of the Group’s entire interest in a foreign operation, or a disposal involving loss of control over a subsidiary that includes a foreign operation or a partial disposal of an interest in a joint arrangement or an associate that includes a foreign operation of which the retained interest becomes a financial asset), all of the exchange differences accumulated in a foreign exchange translation reserve in respect of that operation attributable to the owners of the Company are reclassified to profit or loss.
In addition, in relation to a partial disposal of a subsidiary that includes a foreign operation that does not result in the Group losing control over the subsidiary, the proportionate share of accumulated exchange differences are re-attributed to non-controlling interests and are not recognized in profit or loss. For all other partial disposals (i.e. partial disposals of associates or joint arrangements that do not result in the Group losing significant influence or joint control), the proportionate share of the accumulated exchange differences is reclassified to profit or loss.
Goodwill and fair value adjustments arising on the acquisition of a foreign entity are treated as assets and liabilities of the foreign entity and are translated at the closing rate. Exchange differences arising at the time of translation are recognized in other comprehensive income.
4. SUMMARY OF SIGNIFICANT ACCOUNTING POLICIES (CONTD.)
FINANCIAL
RE VIEW 65
Notes to the consolidated financial statementsfor the year ended 31 December 2020
(f) Financial instruments
Financial assets and financial liabilities are recognized in the Group’s consolidated statement of financial position when the Group becomes a party to the contractual provisions of the instrument.
Financial assets and financial liabilities are initially measured at fair value. Transaction costs that are directly attributable to the acquisition or issue of financial assets and financial liabilities (other than financial assets and financial liabilities at fair value through profit or loss) are added to or deducted from the fair value of the financial assets or financial liabilities, as appropriate, on initial recognition. Transaction costs directly attributable to the acquisition of financial assets or financial liabilities at fair value through profit or loss are recognized immediately in profit or loss.
Financial assets
All regular purchases or sales of financial assets are recognized and derecognized on a trade date basis. Regular purchases or sales are purchases or sales of financial assets that require delivery of assets within the time frame established by regulation or convention in the marketplace. All recognized financial assets are measured subsequently in their entirety at either amortized cost or fair value, depending on the classification of the financial assets.
Cash and cash equivalents comprise cash and short-term bank deposits with an original maturity of three months or less, net of outstanding bank overdrafts.
Classification of financial assets
Debt instruments that meet the following conditions are measured subsequently at amortized cost:
• the financial asset is held within a business model whose objective is to hold financial assets in order to collect contractual cash flows; and
• the contractual terms of the financial asset give rise on specified dates to cash flows that are solely payments of principal and interest on the principal amount outstanding.
Debt instruments that meet the following conditions are measured subsequently at fair value through other comprehensive income (FVTOCI):
• the financial asset is held within a business model whose objective is achieved by both collecting contractual cash flows and selling the financial assets; and
• the contractual terms of the financial asset give rise on specified dates to cash flows that are solely payments of principal and interest on the principal amount outstanding.
By default, all other financial assets are measured subsequently at fair value through profit or loss (FVTPL).
Amortized cost and effective interest method
The effective interest method is a method of calculating the amortized cost of a debt instrument and of allocating interest income over the relevant period.
The amortized cost of a financial asset is the amount at which the financial asset is measured at initial recognition minus the principal repayments, plus the cumulative amortization using the effective interest method resulting in any difference between that initial amount and the maturity amount, adjusted for any loss allowance. The gross carrying amount of a financial asset is the amortized cost of a financial asset before adjusting for any loss allowance.
For financial assets, interest income is calculated by applying the effective interest rate to the gross carrying amount of a financial asset. For financial assets that have subsequently become credit-impaired, interest income is recognized by applying the effective interest rate to the amortized cost of the financial asset. If, in subsequent reporting periods, the credit risk on the credit-impaired financial instrument improves so that the financial asset is no longer credit-impaired, interest income is recognized by applying the effective interest rate to the gross carrying amount of the financial asset.
4. SUMMARY OF SIGNIFICANT ACCOUNTING POLICIES (CONTD.)
S EC TION 366
Notes to the consolidated financial statementsfor the year ended 31 December 2020
A financial asset is held for trading if:
• it has been acquired principally for the purpose of selling it in the near term; or
• on initial recognition it is part of a portfolio of identified financial instruments that the Group manages together and has evidence of a recent actual pattern of short-term profit-taking; or
• it is a derivative (except for a derivative that is a financial guarantee contract or a designated and effective hedging instrument).
Financial assets at FVTPL are measured at fair value at the end of each reporting period, with any fair value gains or losses recognized in profit or loss to the extent they are not part of a designated hedging relationship (see hedge accounting policy). The net gain or loss recognized in profit or loss includes any dividend or interest earned on the financial asset and is included in the ‘other gains and losses’.
Impairment of financial assets
The Group recognizes a loss allowance for expected credit losses (ECL) on other receivables, due from related parties and trade receivables as well as on financial guarantee contracts. The amount of expected credit losses is updated at each reporting date to reflect changes in credit risk since initial recognition of the respective financial instrument.
The Group estimates impairment allowances using the general or simplified approach. Under the general approach, the Group applies a three stage approach to estimate allowance for credit losses, using an expected credit loss approach as required under IFRS 9, for the financial assets that are not measured at FVTPL or FVTOCI. Financial assets migrate through three stages based on the change in credit risk since initial recognition.
The three stage ECL model is based on the change in credit quality of financial assets since initial recognition:
• Under Stage 1, where there has not been a significant increase in credit risk since initial recognition, an amount equal to 12 months ECL will be recorded.
• Under Stage 2, where there has been a significant increase in credit risk since initial recognition but the financial instruments are not considered as credit impaired, an amount equal to the default probability-weighted lifetime ECL will be recorded.
• Under the Stage 3, where there is objective evidence of impairment at the reporting date these financial instruments are classified as credit impaired and an amount equal to the lifetime ECL will be recorded for the financial assets.
ECLs under the general approach, are a probability-weighted estimate of credit losses. Credit losses are measured as the present value of all cash shortfalls (i.e. the difference between the cash flows due to the entity in accordance with the contract and the cash flows that the Group expects to receive). ECLs are discounted at the effective interest rate of the financial asset.
Under the simplified approach, the Group uses an allowance matrix to measure the ECLs of trade receivables from individual customers. Loss rates are calculated using a ‘roll rate’ method based on the probability of a receivable progressing through successive stages of delinquency to write-off. Impairment allowances are always measured at an amount equal to lifetime ECL.
Lifetime ECL represents the expected credit losses that will result from all possible default events over the expected life of a financial instrument. In contrast, 12-month ECL represents the portion of lifetime ECL that is expected to result from default events on a financial instrument that are possible within 12 months after the reporting date.
The Group always recognizes lifetime expected credit losses (ECL) for trade receivables, contract assets and lease receivables. The expected credit losses on these financial assets are estimated using a provision matrix based on the Group’s historical credit loss experience, adjusted for factors that are specific to the debtors, general economic conditions and an assessment of both the current as well as the forecast direction of conditions at the reporting date, including the time value of money where appropriate.
4. SUMMARY OF SIGNIFICANT ACCOUNTING POLICIES (CONTD.)
FINANCIAL
RE VIEW 67
Notes to the consolidated financial statementsfor the year ended 31 December 2020
For all other financial instruments, the Group recognizes lifetime ECL when there has been a significant increase in credit risk since initial recognition. However, if the credit risk on the financial instrument has not increased significantly since initial recognition, the Group measures the loss allowance for that financial instrument at an amount equal to 12-month ECL.
Significant increase in credit risk
In assessing whether the credit risk on a financial instrument has increased significantly since initial recognition, the Group compares the risk of a default occurring on the financial instrument at the reporting date with the risk of a default occurring on the financial instrument at the date of initial recognition. In making this assessment, the Group considers both quantitative and qualitative information that is reasonable and supportable, including historical experience and forward-looking information that is available without undue cost or effort. Forward-looking information considered includes the future prospects of the industries in which the Group’s debtors operate, obtained from economic expert reports, financial analysts, governmental bodies, relevant think-tanks and other similar organizations, as well as consideration of various external sources of actual and forecast economic information that relate to the Group’s core operations.
In particular, the following information is taken into account when assessing whether credit risk has increased significantly since initial recognition:
• an actual or expected significant deterioration in the financial instrument’s external (if available) or internal credit rating;
• significant deterioration in external market indicators of credit risk for a particular financial instrument, e.g. a significant increase in the credit spread, the credit default swap prices for the debtor, or the length of time or the extent to which the fair value of a financial asset has been less than its amortized cost;
• existing or forecast adverse changes in business, financial or economic conditions that are expected to cause a significant decrease in the debtor’s ability to meet its debt obligations;
• an actual or expected significant deterioration in the operating results of the debtor;
• significant increases in credit risk on other financial instruments of the same debtor; and
• an actual or expected significant adverse change in the regulatory, economic, or technological environment of the debtor that results in a significant decrease in the debtor’s ability to meet its debt obligations.
Despite the foregoing, the Group assumes that the credit risk on a financial instrument has not increased significantly since initial recognition if the financial instrument is determined to have low credit risk at the reporting date. A financial instrument is determined to have low credit risk if:
• the financial instrument has a low risk of default;
• the debtor has a strong capacity to meet its contractual cash flow obligations in the near term; and
• adverse changes in economic and business conditions in the longer term may, but will not necessarily, reduce the ability of the borrower to fulfil its contractual cash flow obligations.
The Group considers a financial asset to have low credit risk when the asset has external credit rating of ‘investment grade’ in accordance with the globally understood definition or if an external rating is not available, the asset has an internal rating of ‘performing’. Performing means that the counterparty has a strong financial position and there is no past due amounts.
For financial guarantee contracts, the date that the Group becomes a party to the irrevocable commitment is considered to be the date of initial recognition for the purposes of assessing the financial instrument for impairment.
4. SUMMARY OF SIGNIFICANT ACCOUNTING POLICIES (CONTD.)
S EC TION 368
Notes to the consolidated financial statementsfor the year ended 31 December 2020
In assessing whether there has been a significant increase in the credit risk since initial recognition of a financial guarantee contract, the Group considers the changes in the risk that the specified debtor will default on the contract. The Group regularly monitors the effectiveness of the criteria used to identify whether there has been a significant increase in credit risk and revises them as appropriate to ensure that the criteria are capable of identifying significant increase in credit risk before the amount becomes past due.
Definition of default
The Group considers the following as constituting an event of default for internal credit risk management purposes as historical experience indicates that financial assets that meet either of the following criteria are generally not recoverable:
• when there is a breach of financial covenants by the debtor; or
• information developed internally or obtained from external sources indicates that the debtor is unlikely to pay its creditors, including the Group, in full (without taking into account any collateral held by the Group).
Irrespective of the above analysis, the Group considers that default has occurred when a financial asset is more than 180 days past due unless the Group has reasonable and supportable information to demonstrate that a more lagging default criterion is more appropriate.
Write-off policy
The Group writes off a financial asset when there is information indicating that the debtor is in severe financial difficulty and there is no realistic prospect of recovery, e.g. when the debtor has been placed under liquidation or has entered into bankruptcy proceedings. Financial assets written off may still be subject to enforcement activities under the Group’s recovery procedures, taking into account legal advice where appropriate. Any recoveries made are recognized in profit or loss.
Measurement and recognition of ECL
The measurement of ECL is a function of the probability of default, loss given default (i.e. the magnitude of the loss if there is a default) and the exposure at default. The assessment of the probability of default and loss given default is based on historical data adjusted by forward-looking information as described above. As for the exposure at default, for financial assets, this is represented by the assets’ gross carrying amount at the reporting date; for financial guarantee contracts, the exposure includes the amount drawn down as at the reporting date, together with any additional amounts expected to be drawn down in the future by default date determined based on historical trend, the Group’s understanding of the specific future financing needs of the debtors, and other relevant forward-looking information.
For financial assets, ECL is estimated as the difference between all contractual cash flows that are due to the Group in accordance with the contract and all the cash flows that the Group expects to receive, discounted at the original effective interest rate.
For a financial guarantee contract, as the Group is required to make payments only in the event of a default by the debtor in accordance with the terms of the instrument that is guaranteed, the expected loss allowance is the expected payments to reimburse the holder for a credit loss that it incurs less any amounts that the Group expects to receive from the holder, the debtor or any other party.
If the Group has measured the loss allowance for a financial instrument at an amount equal to lifetime ECL in the previous reporting period, but determines at the current reporting date that the conditions for lifetime ECL are no longer met, the Group measures the loss allowance at an amount equal to 12-month ECL at the current reporting date, except for assets for which the simplified approach was used.
The Group recognizes an impairment gain or loss in profit or loss for all financial instruments with a corresponding adjustment to their carrying amount through a loss allowance account.
4. SUMMARY OF SIGNIFICANT ACCOUNTING POLICIES (CONTD.)
FINANCIAL
RE VIEW 69
Notes to the consolidated financial statementsfor the year ended 31 December 2020
Derecognition of financial assets
The Group derecognizes a financial asset only when the contractual rights to the cash flows from the asset expire, or when it transfers the financial asset and substantially all the risks and rewards of ownership of the asset to another entity. If the Group neither transfers nor retains substantially all the risks and rewards of ownership and continues to control the transferred asset, the Group recognizes its retained interest in the asset and an associated liability for amounts it may have to pay. If the Group retains substantially all the risks and rewards of ownership of a transferred financial asset, the Group continues to recognize the financial asset and also recognizes a collateralized borrowing for the proceeds received.
Hedge accounting
The Group designates certain derivatives as hedging instruments in respect of foreign currency risk and interest rate risk in fair value hedges, hedges of certain interest rate and commodity derivatives as cash flow hedges.
At the inception of the hedge relationship, the Group documents the relationship between the hedging instrument and the hedged item, along with its risk management objectives and its strategy for undertaking various hedge transactions. Furthermore, at the inception of the hedge and on an ongoing basis, the Group documents whether the hedging instrument is effective in offsetting changes in fair values or cash flows of the hedged item attributable to the hedged risk, which is when the hedging relationship meets all of the following hedge effectiveness requirements:
• there is an economic relationship between the hedged item and the hedging instrument;
• the effect of credit risk does not dominate the value changes that result from that economic relationship; and
• the hedge ratio of the hedging relationship is the same as that resulting from the quantity of the hedged item that the Group actually hedges and the quantity of the hedging instrument that the Group actually uses to hedge that quantity of hedged item.
If a hedging relationship ceases to meet the hedge effectiveness requirement relating to the hedge ratio but the risk management objective for that designated hedging relationship remains the same, the Group adjusts the hedge ratio of the hedging relationship (i.e. rebalances the hedge) so that it meets the qualifying criteria again.
The Group designates the full change in the fair value of a forward contract (i.e. including the forward elements) and interest rate swap contracts as the hedging instrument for all of its hedging relationships involving forward/interest rate swap contracts.
The Group designates only the intrinsic value of option contracts as a hedged item, i.e. excluding the time value of the option. The changes in the fair value of the aligned time value of the option are recognized in other comprehensive income and accumulated in the cost of hedging reserve. If the hedged item is transaction-related, the time value is reclassified to profit or loss when the hedged item affects profit or loss. If the hedged item is time-period related, then the amount accumulated in the cost of hedging reserve is reclassified to profit or loss on a rational basis – the Group applies straight-line amortization. Those reclassified amounts are recognized in profit or loss in the same line as the hedged item. If the hedged item is a non-financial item, then the amount accumulated in the cost of hedging reserve is removed directly from equity and included in the initial carrying amount of the recognized non-financial item. Furthermore, if the Group expects that some or all of the loss accumulated in cost of hedging reserve will not be recovered in the future, that amount is immediately reclassified to profit or loss.
Fair value hedges
The fair value change on qualifying hedging instruments is recognized in profit or loss.
The carrying amount of a hedged item not already measured at fair value is adjusted for the fair value change attributable to the hedged risk with a corresponding entry in profit or loss.
Where hedging gains or losses are recognized in profit or loss, they are recognized in the same line as the hedged item.
4. SUMMARY OF SIGNIFICANT ACCOUNTING POLICIES (CONTD.)
S EC TION 370
Notes to the consolidated financial statementsfor the year ended 31 December 2020
The Group discontinues hedge accounting only when the hedging relationship (or a part thereof) ceases to meet the qualifying criteria (after rebalancing, if applicable). This includes instances when the hedging instrument expires or is sold, terminated or exercised. The discontinuation is accounted for prospectively. The fair value adjustment to the carrying amount of the hedged item arising from the hedged risk is amortized to profit or loss from that date.
Cash flow hedges
The effective portion of changes in the fair value of derivatives and other qualifying hedging instruments that are designated and qualify as cash flow hedges is recognized in other comprehensive income and accumulated under the heading of cash flow hedging reserve, limited to the cumulative change in fair value of the hedged item from inception of the hedge. The gain or loss relating to the ineffective portion is recognized immediately in profit or loss, and is included in the ‘other gains and losses’.
Amounts previously recognized in other comprehensive income and accumulated in equity are reclassified to profit or loss in the periods when the hedged item affects profit or loss. However, when the hedged forecast transaction results in the recognition of a non-financial asset or a non-financial liability, the gains and losses previously recognized in other comprehensive income and accumulated in equity are transferred from equity and included in the initial measurement of the cost of the non-financial asset or non-financial liability. This transfer does not affect other comprehensive income. Furthermore, if the Group expects that some or all of the loss accumulated in the cash flow hedging reserve will not be recovered in the future, that amount is immediately reclassified to profit or loss.
The Group discontinues hedge accounting only when the hedging relationship (or a part thereof) ceases to meet the qualifying criteria (after rebalancing, if applicable). This includes instances when the hedging instrument expires or is sold, terminated or exercised. The discontinuation is accounted for prospectively. Any gain or loss recognized in other comprehensive income and accumulated in cash flow hedge reserve at that time remains in equity and is reclassified to profit or loss when the forecast transaction occurs. When a forecast transaction is no longer expected to occur, the gain or loss accumulated in the cash flow hedge reserve is reclassified immediately to profit or loss.
Derivative financial instruments
The Group enters into a variety of derivative financial instruments to manage its exposure to interest rate, foreign exchange rate and commodity price risks, including foreign exchange forward contracts, options and interest rate swaps.
Derivatives are recognized initially at fair value at the date a derivative contract is entered into and are subsequently re-measured to their fair value at each reporting date. The resulting gain or loss is recognized in profit or loss immediately unless the derivative is designated and effective as a hedging instrument, in which event the timing of the recognition in profit or loss depends on the nature of the hedge relationship.
A derivative with a positive fair value is recognized as a financial asset whereas a derivative with a negative fair value is recognized as a financial liability. Derivatives are not offset in the financial statements unless the Group has both a legally enforceable right and intention to offset. A derivative is presented as a non-current asset or a non-current liability if the remaining maturity of the instrument is more than 12 months and it is not due to be realized or settled within 12 months. Other derivatives are presented as current assets or current liabilities.
Embedded derivatives
An embedded derivative is a component of a hybrid contract that also includes a non-derivative host – with the effect that some of the cash flows of the combined instrument vary in a way similar to a stand-alone derivative.
Derivatives embedded in hybrid contracts with a financial asset host within the scope of IFRS 9 are not separated. The entire hybrid contract is classified and subsequently measured as either amortized cost or fair value as appropriate.
Derivatives embedded in hybrid contracts with hosts that are not financial assets within the scope of IFRS 9 (e.g. financial liabilities) are treated as separate derivatives when they meet the definition of a derivative, their risks and characteristics are not closely related to those of the host contracts and the host contracts are not measured at FVTPL.
4. SUMMARY OF SIGNIFICANT ACCOUNTING POLICIES (CONTD.)
FINANCIAL
RE VIEW 71
Notes to the consolidated financial statementsfor the year ended 31 December 2020
If the hybrid contract is a quoted financial liability, instead of separating the embedded derivative, the Group generally designates the whole hybrid contract at FVTPL.
An embedded derivative is presented as a non-current asset or non-current liability if the remaining maturity of the hybrid instrument to which the embedded derivative relates is more than 12 months and is not expected to be realized or settled within 12 months.
Financial liabilities and equity
Financial liabilities
All financial liabilities are measured subsequently at amortized cost using the effective interest method.
The effective interest method is a method of calculating the amortized cost of a financial liability and of allocating interest expense over the relevant period. The effective interest rate is the rate that exactly discounts estimated future cash payments (including all fees and points paid or received that form an integral part of the effective interest rate, transaction costs and other premiums or discounts) through the expected life of the financial liability, or (where appropriate) a shorter period, to the amortized cost of a financial liability.
Derecognition of financial liabilities
The Group derecognizes financial liabilities when, and only when, the Group’s obligations are discharged, cancelled or have expired. The difference between the carrying amount of the financial liability derecognized and the consideration paid and payable is recognized in profit or loss.
Classification as debt or equity
Debt and equity instruments are classified as either financial liabilities or as equity in accordance with the substance of the contractual arrangements and the definitions of a financial liability and an equity instrument.
Equity instruments
An equity instrument is any contract that evidences a residual interest in the assets of an entity after deducting all of its liabilities. Equity instruments issued by the Group are recognized at the proceeds received, net of direct issue costs.
Repurchase of the Company’s own equity instruments is recognized and deducted directly in equity. No gain or loss is recognized in profit or loss on the purchase, sale, issue or cancellation of the Company’s own equity instruments.
Share capital
Ordinary shares are classified as equity. Incremental costs directly attributable to the issue of ordinary shares are recognized as a deduction from equity, net of any tax effects.
Offsetting
Financial assets and financial liabilities are offset and the net amount presented in the statement of financial position when, and only when, the Group currently has a legally enforceable right to set off the amounts and it intends either to settle them on a net basis or to realize the asset and settle the liability simultaneously.
4. SUMMARY OF SIGNIFICANT ACCOUNTING POLICIES (CONTD.)
S EC TION 37 2
Notes to the consolidated financial statementsfor the year ended 31 December 2020
(g) Property, plant and equipment
Recognition and measurement
Items of property plant and equipment (except land and capital work in progress) are measured at cost less accumulated depreciation and identified impairment losses (see accounting policy on impairment), if any.
Cost includes expenditure that is directly attributable to the acquisition of the asset. The cost of self-constructed assets includes the following:
• cost of materials and direct labour;
• any other costs directly attributable to bringing the assets to a working condition for their intended use; and
• capitalized borrowing costs.
Purchased software that is integral to the functionality of the related equipment is capitalized as part of that equipment. If significant parts of an item of property, plant and equipment have different useful lives, then they are accounted for as separate items (major components) of property, plant and equipment. Any gain or loss on disposal of an item of property, plant and equipment is recognized in the profit or loss.
Subsequent expenditure
Subsequent expenditure is capitalized only when it is probable that the future economic benefits associated with the expenditure will flow to the Group. Ongoing repairs and maintenance is expensed as incurred.
Reclassification to investment property
When the use of a property changes from owner-occupied to investment property, the property is reclassified as investment property at its carrying value at the time of reclassification considering that the accounting policy for investment property is the ‘Cost Model’ in accordance with IAS 40.
Depreciation
Depreciation is calculated to write off the cost of items of property, plant and equipment (except land and capital work in progress) less their estimated residual values using the straight-line method over their estimated useful lives. Leased assets are depreciated over the shorter of the lease term and their useful lives unless it is reasonably certain that the Group will obtain ownership by the end of the lease term. Land is not depreciated. The estimated useful lives for the current and comparative years of significant items of property, plant and equipment are as follows:
Life (years)
Buildings 20-35
Plant and equipment 4-15
Vehicles 3-10
Furniture and fixtures 3-10
Office equipment 2-10
Roads and asphalting 5-10
Depreciation methods, useful lives and residual values are reviewed at each reporting date and adjusted if appropriate.
4. SUMMARY OF SIGNIFICANT ACCOUNTING POLICIES (CONTD.)
FINANCIAL
RE VIEW 73
Notes to the consolidated financial statementsfor the year ended 31 December 2020
(h) Capital work in progress
Capital work in progress is stated at cost less impairment, if any, until the construction is completed. Upon completion of construction, the cost of such assets together with the cost directly attributable to construction, including capitalized borrowing costs are transferred to the respective class of asset. No depreciation is charged on capital work in progress.
(i) Intangible assets
Recognition and measurement
Other intangible asset, which are acquired by the Group and have finite useful lives are measured at cost less accumulated amortization and identified impairment losses, if any. Trademarks are initially measured at the purchase cost and are amortized on a straight line basis over their estimated lives.
Subsequent expenditure
Subsequent expenditure is capitalized only when it increases the future economic benefits embodied in the specific asset to which it relates.
Amortization
Amortization is calculated to write off the cost of intangible assets less their estimated residual values using the straight-line method over their estimated useful lives of 5 to 15 years from the date that they are available for use, and is generally recognized in profit or loss. Amortization methods, useful lives and residual values are reviewed at each reporting date and adjusted if appropriate.
(j) Investment properties
Investment properties are properties held either to earn rental income or for capital appreciation or for both, but not for sale in the ordinary course of business, use in the production or supply of goods or rendering services or for administrative purposes.
Investment properties are accounted for using the “Cost Model” under the IAS 40 “Investment Property” and is stated at cost less accumulated depreciation and impairment losses, if any. Depreciation on buildings is charged over its estimated useful life of 20 to 35 years. Investment properties are individually tested for impairment, at least annually, based on their prevailing fair market values. Any impairment to the carrying value is charged to profit or loss.
Cost includes expenditure which is directly attributable to the acquisition of the investment property. The cost of self-constructed investment properties includes the cost of materials and direct labour, any other costs directly attributable to bringing the investment property to a working condition for their intended use and capitalized borrowing costs.
The cost of investment properties acquired in exchange for a non-monetary asset or assets, or a combination of monetary and non-monetary assets, comprises the fair value of the asset received or asset given up. If the fair value of the asset received and asset given up can be measured reliably, the fair value of the asset given up is used to measure cost, unless the fair value of the asset received is more clearly evident. Any gain or loss on disposal of investment properties (calculated as the difference between the net proceeds from disposal and the carrying amount of the item) is recognized in profit or loss.
When the use of properties changes such that it is reclassified as property, plant and equipment or inventory, the transfer is effected at the carrying value of such property at the date of reclassification.
4. SUMMARY OF SIGNIFICANT ACCOUNTING POLICIES (CONTD.)
S EC TION 374
Notes to the consolidated financial statementsfor the year ended 31 December 2020
(k) Leases
At inception of the contract, the Group assesses whether a contract is or contains a lease. The Group recognizes a right-of-use asset and a corresponding lease liability with respect to all lease arrangements in which it is the lessee, except for short-term leases (defined as leases with a lease term of 12 months or less) and leases of low value assets. For these leases, the Group recognizes the lease payments as an operating expense on a straight-line basis over the term of the lease unless another systematic basis is more representative of the time pattern in which economic benefits from the leased assets are consumed.
The lease liability is initially measured at the present value of the lease payments that are not paid at the commencement date, discounted by using the rate implicit in the lease. If this rate cannot be readily determined, the lessee uses its incremental borrowing rate.
Lease payments included in the measurement of the lease liability comprise:
• fixed payments (including in-substance fixed payments), less any lease incentives receivable,
• amounts expected to be payable by the lessee under residual value guarantees,
• the exercise price of a purchase option if the lessee is reasonably certain to exercise that option, and
• payments of penalties for terminating the lease, if the lease term reflects the lessee exercising that option.
The lease liability is subsequently measured by increasing the carrying amount to reflect interest on the lease liability (using the effective interest method) and by reducing the carrying amount to reflect the lease payments made.
The Group re-measures the lease liability (and makes a corresponding adjustment to the related right-of-use asset) whenever:
• The lease term has changed or there is a significant event or change in circumstances resulting in a change in the assessment of exercise of a purchase option, in which case the lease liability is re-measured by discounting the revised lease payments using a revised discount rate.
• The lease payments change due to changes in an index or rate or a change in expected payment under a guaranteed residual value, in which cases the lease liability is re-measured by discounting the revised lease payments using an unchanged discount rate. If the change in lease payments is due to a change in a floating interest rate, then the discount rate is also revised.
• A lease contract is modified and the lease modification is not accounted for as a separate lease, in which case the lease liability is re-measured based on the lease term of the modified lease by discounting the revised lease payments using a revised discount rate at the effective date of the modification.
The Group did not make any such adjustments during the period(s) presented.
The right-of-use assets comprise the initial measurement of the corresponding lease liability, lease payments made at or before the commencement day, less any lease incentives received and any initial direct costs. They are subsequently measured at cost less accumulated depreciation and impairment losses.
Whenever the Group incurs an obligation for costs to dismantle and remove a leased asset, restore the site on which it is located or restore the underlying asset to the condition required by the terms and conditions of the lease, a provision is recognized and measured under IAS 37. To the extent that the costs relate to a right-of-use asset, the costs are included in the related right-of-use asset, unless those costs are incurred to produce inventories.
4. SUMMARY OF SIGNIFICANT ACCOUNTING POLICIES (CONTD.)
FINANCIAL
RE VIEW 75
Notes to the consolidated financial statementsfor the year ended 31 December 2020
Right-of-use assets are depreciated over the shorter period of lease term and useful life of the underlying asset. If a lease transfers ownership of the underlying asset or the cost of the right-of-use asset reflects that the Group expects to exercise a purchase option, the related right-of-use asset is depreciated over the useful life of the underlying asset. The depreciation starts at the commencement date of the lease.
The Group applies IAS 36 to determine whether a right-of-use asset is impaired and accounts for any identified impairment loss as described in the ‘Property, Plant and Equipment’ policy. As a practical expedient, IFRS 16 permits a lessee not to separate non-lease components, and instead account for any lease and associated non-lease components as a single arrangement. The Group has not used this practical expedient.
The Group as lessor
The Group enters into lease agreements as a lessor with respect to some of its investment properties.
Leases for which the Group is a lessor are classified as finance or operating leases. Whenever the terms of the lease transfer substantially all the risks and rewards of ownership to the lessee, the contract is classified as a finance lease. All other leases are classified as operating leases.
When the Group is an intermediate lessor, it accounts for the head lease and the sublease as two separate contracts. The sublease is classified as a finance or operating lease by reference to the right-of-use asset arising from the head lease.
Rental income from operating leases is recognized on a straight-line basis over the term of the relevant lease. Initial direct costs incurred in negotiating and arranging an operating lease are added to the carrying amount of the leased asset and recognized on a straight-line basis over the lease term.
Amounts due from lessees under finance leases are recognized as receivables at the amount of the Group’s net investment in the leases. Finance lease income is allocated to accounting periods so as to reflect a constant periodic rate of return on the Group’s net investment outstanding in respect of the leases. When a contract includes lease and non-lease components, the Group applies IFRS 15 to allocate the consideration under the contract to each component.
Leased assets
Leases of assets that transfer to the Group substantially all of the risks and rewards of ownership are classified as finance leases. The leased assets are measured initially at an amount equal to the lower of their fair value and the present value of the minimum lease payments. Subsequent to initial recognition, the assets are accounted for in accordance with the accounting policy applicable to that asset.
Assets held under other leases are classified as operating leases and are not recognized in the Group’s consolidated statement of financial position.
4. SUMMARY OF SIGNIFICANT ACCOUNTING POLICIES (CONTD.)
S EC TION 376
Notes to the consolidated financial statementsfor the year ended 31 December 2020
(l) Inventories
Inventories are measured at the lower of cost and net realizable value. The cost of inventories is based on the weighted average cost method, and includes expenditure incurred in acquiring the inventories, production or conversion costs, and other costs incurred in bringing them to their existing location and condition. In the case of manufactured inventories and work in progress, cost includes an appropriate share of production overheads based on normal operating capacity. Net realizable value is the estimated selling price in the ordinary course of business, less the estimated costs of completion and selling expenses.
(m) Impairment of non-financial assets
At each reporting date, the Group reviews the carrying amounts of its non-financial assets (other than investment property, inventories and deferred tax assets) to determine whether there is any indication of impairment. If any such indication exists, then the asset’s recoverable amount is estimated. Goodwill is tested annually for impairment or more frequently if there are indicators that goodwill might be impaired. Where the asset does not generate cash flows that are independent from other assets, the Group estimates the recoverable amount of the cash-generating unit to which the asset belongs. When a reasonable and consistent basis of allocation can be identified, corporate assets are also allocated to individual cash-generating units, or otherwise they are allocated to the smallest group of cash-generating units for which a reasonable and consistent allocation basis can be identified.
Intangible assets with an indefinite useful life are tested for impairment at least annually or whenever there is an indication at the end of a reporting period that the asset may be impaired.
Recoverable amount is the higher of fair value less costs of disposal and value in use. In assessing value in use, the estimated future cash flows are discounted to their present value using a pre-tax discount rate that reflects current market assessments of the time value of money and the risks specific to the asset for which the estimates of future cash flows have not been adjusted.
If the recoverable amount of an asset (or cash-generating unit) is estimated to be less than its carrying amount, the carrying amount of the asset (or cash-generating unit) is reduced to its recoverable amount.
Where an impairment loss subsequently reverses, the carrying amount of the asset (or cash-generating unit) is increased to the revised estimate of its recoverable amount, but so that the increased carrying amount does not exceed the carrying amount that would have been determined had no impairment loss been recognized for the asset (or cash-generating unit) in prior years. A reversal of an impairment loss is recognized immediately in profit or loss to the extent that it eliminates the impairment loss which has been recognized for the asset in prior years.
(n) Employee benefits
Short- term employee benefits
Short-term employee benefits are expensed as the related service is provided. A liability is recognized for the amount expected to be paid if the Group has a present legal or constructive obligation to pay this amount as a result of past service provided by the employee and the obligation can be estimated reliably.
Defined contribution plans
UAE national employees of the Group are members of the Government-managed retirement pension and social security benefit scheme pursuant to U.A.E. labour law no. 7 of 1999. The Group is required to contribute 12.5% of the “contribution calculation salary” of payroll costs to the retirement benefit scheme to fund the benefits. The employees and the Government contribute 5% and 2.5% of the “contribution calculation salary” respectively, to the scheme. The only obligation of the Group with respect to the retirement pension and social security scheme is to make the specified contributions. The contributions are charged to profit or loss.
4. SUMMARY OF SIGNIFICANT ACCOUNTING POLICIES (CONTD.)
FINANCIAL
RE VIEW 7 7
Notes to the consolidated financial statementsfor the year ended 31 December 2020
Annual leave and leave passage
An accrual is made for the estimated liability for employees’ entitlement to annual leave and leave passage as a result of services rendered by eligible employees up to the end of the year.
Terminal benefits
The provision for staff terminal benefits is based on the liability which would arise if the employment of all staff was terminated at the reporting date and is calculated in accordance with the provisions of UAE Federal Labour Law and the relevant local laws applicable to overseas subsidiaries. Management considers these as long-term obligations and accordingly they are classified as long-term liabilities.
(o) Provisions
Provisions are recognized when the Group has a present obligation (legal or constructive) as a result of a past event, it is probable that the Group will be required to settle that obligation and a reliable estimate can be made of the amount of the obligation.
The amount recognized as a provision is the best estimate of the consideration required to settle the present obligation at the reporting date, taking into account the risks and uncertainties surrounding the obligation. Where a provision is measured using the cash flows estimated to settle the present obligation, its carrying amount is the present value of those cash flows (when the effect of the time value of money is material).
When some or all of the economic benefits required to settle a provision are expected to be recovered from a third party, if it is virtually certain that such reimbursement will be received and the amount of the receivable can be measured reliably, a receivable is recognized as an asset.
(p) Warranties
A provision for warranties is recognized when the underlying products or services are sold, based on historical warranty data and a weighting of possible outcomes against their associated probabilities.
(q) Assets held for sale
Non-current assets (and disposal groups) classified as held for sale are measured at the lower of carrying amount and fair value less costs to sell.
Non-current assets and disposal groups are classified as held for sale if their carrying amount will be recovered through a sale transaction rather than through continuing use. This condition is regarded as met only when the sale is highly probable and the asset (or disposal group) is available for immediate sale in its present condition. Management must be committed to the sale which should be expected to qualify for recognition as a completed sale within one year from the date of classification.
When the Group is committed to a sale plan involving loss of control of a subsidiary, all of the assets and liabilities of that subsidiary are classified as held for sale when the criteria described above are met, regardless of whether the Group will retain a non-controlling interest in its former subsidiary after the sale.
When the Group is committed to a sale plan involving disposal of an investment in an associate or, a portion of an investment in an associate, the investment, or the portion of the investment in the associate, that will be disposed of is classified as held for sale when the criteria described above are met. The Group then ceases to apply the equity method in relation to the portion that is classified as held for sale. Any retained portion of an investment in an associate that has not been classified as held for sale continues to be accounted for using the equity method.
4. SUMMARY OF SIGNIFICANT ACCOUNTING POLICIES (CONTD.)
S EC TION 378
Notes to the consolidated financial statementsfor the year ended 31 December 2020
(r) Revenue
The Group recognizes revenue mainly from sale of goods consisting of tiles, sanitary wares, and related items. Revenue is measured based on the consideration to which the Group expects to be entitled in a contract with a customer and excludes amounts collected on behalf of third parties. The Group recognizes revenue when it transfers control of a product or service to a customer.
For sales of goods to the wholesale market, revenue is recognized when control of the goods has transferred, being when the goods have been shipped to the wholesaler’s specific location (delivery). Following delivery, the wholesaler has full discretion over the manner of distribution and price to sell the goods, has the primary responsibility when on-selling the goods and bears the risks of obsolescence and loss in relation to the goods. A receivable is recognized by the Group when the goods are delivered to the wholesaler as this represents the point in time at which the right to consideration becomes unconditional, as only the passage of time is required before payment is due.
For sales of goods to retail customers, revenue is recognized when control of the goods has transferred, being at the point the customer purchases the goods at the retail outlet. Payment of the transaction price is due immediately at the point the customer purchases the goods.
The Group has a right to recover the product when customers exercise their right of return. Consequently, the Group recognizes a right to returned goods asset and a corresponding adjustment to cost of sales. The Group uses its past experience to estimate the number of returns on a portfolio level using the expected value method. It is considered highly probable that a significant reversal in the cumulative revenue recognized will not occur given the consistent level of returns over previous years.
Rendering of services
Revenue is recognized point in time as services are provided. Invoices for services are issued when the Group provides services and are payable in accordance with the credit terms or agreements.
Dividend income
Dividend income is recognized in profit or loss on the date that the Group’s right to receive the payment is established.
(s) Finance income and finance costs
Finance income comprises interest income on bank deposits, profit on wakala deposits and amount due from related parties. Finance income is recognized in profit or loss as it accrues, using the effective interest rate method.
Finance cost comprises interest expense on bank borrowings, profit expense on Islamic financing and bank charges. All finance costs are recognized in profit or loss using the effective interest rate method. However, borrowing costs which are directly attributable to the acquisition or construction of a qualifying asset are capitalized as part of the cost of that asset.
A qualifying asset is an asset which necessarily takes a substantial period of time to get ready for its intended use or sale. Capitalization of borrowing costs ceases when substantially all the activities necessary to prepare the asset for its intended use or sale are complete.
Foreign currency gains and losses are reported on a net basis as either finance income or finance cost depending on whether the foreign currency movements are in a net gain or net loss position.
4. SUMMARY OF SIGNIFICANT ACCOUNTING POLICIES (CONTD.)
FINANCIAL
RE VIEW 79
Notes to the consolidated financial statementsfor the year ended 31 December 2020
(t) Tax
The income tax expense represents the sum of the tax currently payable and deferred tax.
Current tax
The tax currently payable is based on taxable profit for the year. Taxable profit differs from net profit as reported in profit or loss because it excludes items of income or expense that are taxable or deductible in other years and it further excludes items that are never taxable or deductible. The Group’s liability for current tax is calculated using tax rates that have been enacted or substantively enacted by the end of the reporting period.
A provision is recognized for those matters for which the tax determination is uncertain but it is considered probable that there will be a future outflow of funds to a tax authority. The provisions are measured at the best estimate of the amount expected to become payable. The assessment is based on the judgement of tax professionals within the Company supported by previous experience in respect of such activities.
Deferred tax
Deferred tax is the tax expected to be payable or recoverable on differences between the carrying amounts of assets and liabilities in the financial statements and the corresponding tax bases used in the computation of taxable profit, and is accounted for using the liability method. Deferred tax liabilities are generally recognized for all taxable temporary differences and deferred tax assets are recognized to the extent that it is probable that taxable profits will be available against which deductible temporary differences can be utilized. Such assets and liabilities are not recognized if the temporary difference arises from the initial recognition of goodwill or from the initial recognition (other than in a business combination) of other assets and liabilities in a transaction that affects neither the taxable profit nor the accounting profit. In addition, a deferred tax liability is not recognized if the temporary difference arises from the initial recognition of goodwill.
Deferred tax liabilities are recognized for taxable temporary differences arising on investments in subsidiaries and associates, and interests in joint ventures, except where the Group is able to control the reversal of the temporary difference and it is probable that the temporary difference will not reverse in the foreseeable future. Deferred tax assets arising from deductible temporary differences associated with such investments and interests are only recognized to the extent that it is probable that there will be sufficient taxable profits against which to utilize the benefits of the temporary differences and they are expected to reverse in the foreseeable future.
The carrying amount of deferred tax assets is reviewed at each reporting date and reduced to the extent that it is no longer probable that sufficient taxable profits will be available to allow all or part of the asset to be recovered. Deferred tax is calculated at the tax rates that are expected to apply in the period when the liability is settled or the asset is realized based on tax laws and rates that have been enacted or substantively enacted at the reporting date.
The measurement of deferred tax liabilities and assets reflects the tax consequences that would follow from the manner in which the Group expects, at the end of the reporting period, to recover or settle the carrying amount of its assets and liabilities.
Deferred tax assets and liabilities are offset when there is a legally enforceable right to set off current tax assets against current tax liabilities and when they relate to income taxes levied by the same taxation authority and the Group intends to settle its current tax assets and liabilities on a net basis.
Current tax and deferred tax for the year
Current and deferred tax are recognized in profit or loss, except when they relate to items that are recognized in other comprehensive income or directly in equity, in which case, the current and deferred tax are also recognized in other comprehensive income or directly in equity respectively. Where current tax or deferred tax arises from the initial accounting for a business combination, the tax effect is included in the accounting for the business combination.
4. SUMMARY OF SIGNIFICANT ACCOUNTING POLICIES (CONTD.)
S EC TION 380
Notes to the consolidated financial statementsfor the year ended 31 December 2020
Zakat
In respect of operations in certain subsidiaries and equity accounted investees, zakat is provided in accordance with relevant fiscal regulations. Zakat is recognized in profit or loss except to the extent it relates to items recognized directly in equity, in which case it is recognized in equity.
The provision for zakat is charged to profit or loss. Additional amount, if any, that may become due on finalization of an asset is accounted for in the year in which assessment is finalized.
(u) Basic and diluted earnings per share
The Group presents basic and diluted earnings per share data for its ordinary shares. Basic earnings per share is calculated by dividing the profit or loss attributable to ordinary shareholders of the Company by the weighted average number of ordinary shares outstanding during the year, adjusted for own shares held. Diluted earnings per share is determined by adjusting the profit or loss attributable to ordinary shareholders and the weighted average number of ordinary shares outstanding, adjusted for own shares held, for the effects of all dilutive potential ordinary shares.
(v) Segment reporting
An operating segment is a component of the Group which engages in business activities from which it may earn revenues and incur expenses, including revenues and expenses that relate to transactions with any of the Group’s other components.
Segment results which are reported to the Company’s CEO (chief operating decision maker) include items directly attributable to a segment as well as those which can be allocated on a reasonable basis. Segment capital expenditure is the total cost incurred during the year to acquire property, plant and equipment, and intangible assets other than goodwill.
4. SUMMARY OF SIGNIFICANT ACCOUNTING POLICIES (CONTD.)
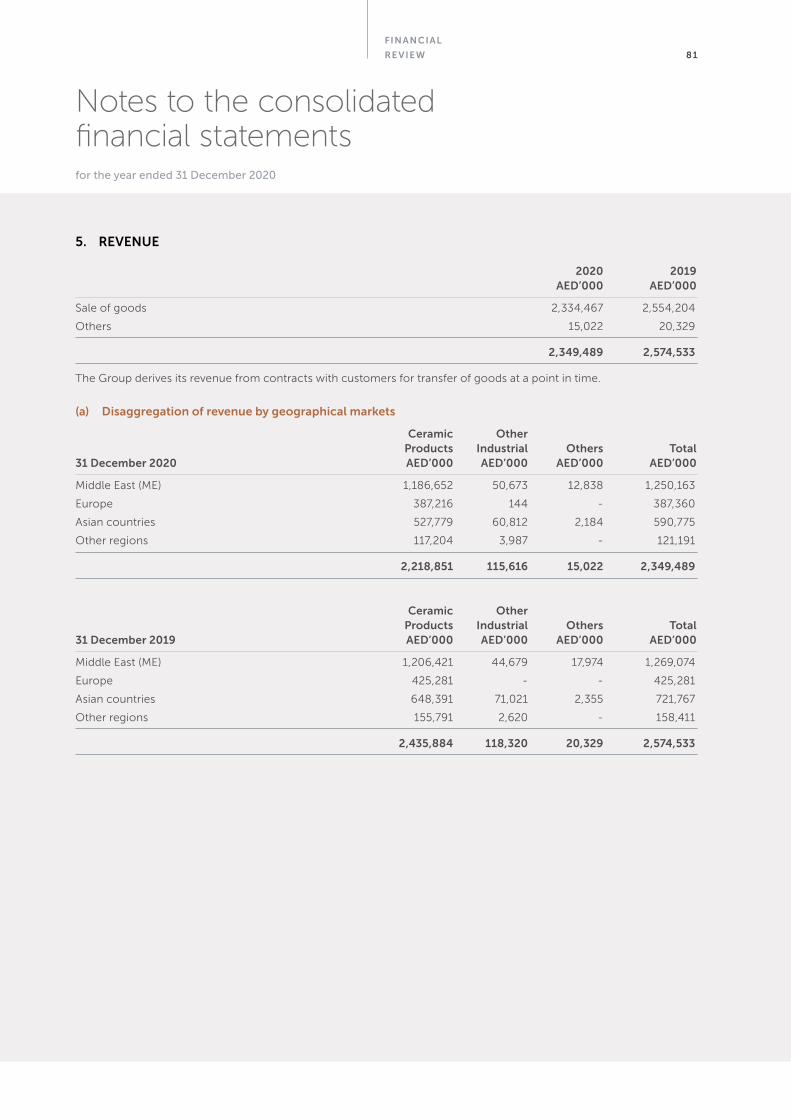
FINANCIAL
RE VIEW 81
Notes to the consolidated financial statementsfor the year ended 31 December 2020
2020 2019 AED’000 AED’000
Sale of goods 2,334,467 2,554,204
Others 15,022 20,329
2,349,489 2,574,533
The Group derives its revenue from contracts with customers for transfer of goods at a point in time.
(a) Disaggregation of revenue by geographical markets
Ceramic Other Products Industrial Others Total 31 December 2020 AED’000 AED’000 AED’000 AED’000
Middle East (ME) 1,186,652 50,673 12,838 1,250,163
Europe 387,216 144 - 387,360
Asian countries 527,779 60,812 2,184 590,775
Other regions 117,204 3,987 - 121,191
2,218,851 115,616 15,022 2,349,489
Ceramic Other Products Industrial Others Total 31 December 2019 AED’000 AED’000 AED’000 AED’000
Middle East (ME) 1,206,421 44,679 17,974 1,269,074
Europe 425,281 - - 425,281
Asian countries 648,391 71,021 2,355 721,767
Other regions 155,791 2,620 - 158,411
2,435,884 118,320 20,329 2,574,533
5. REVENUE
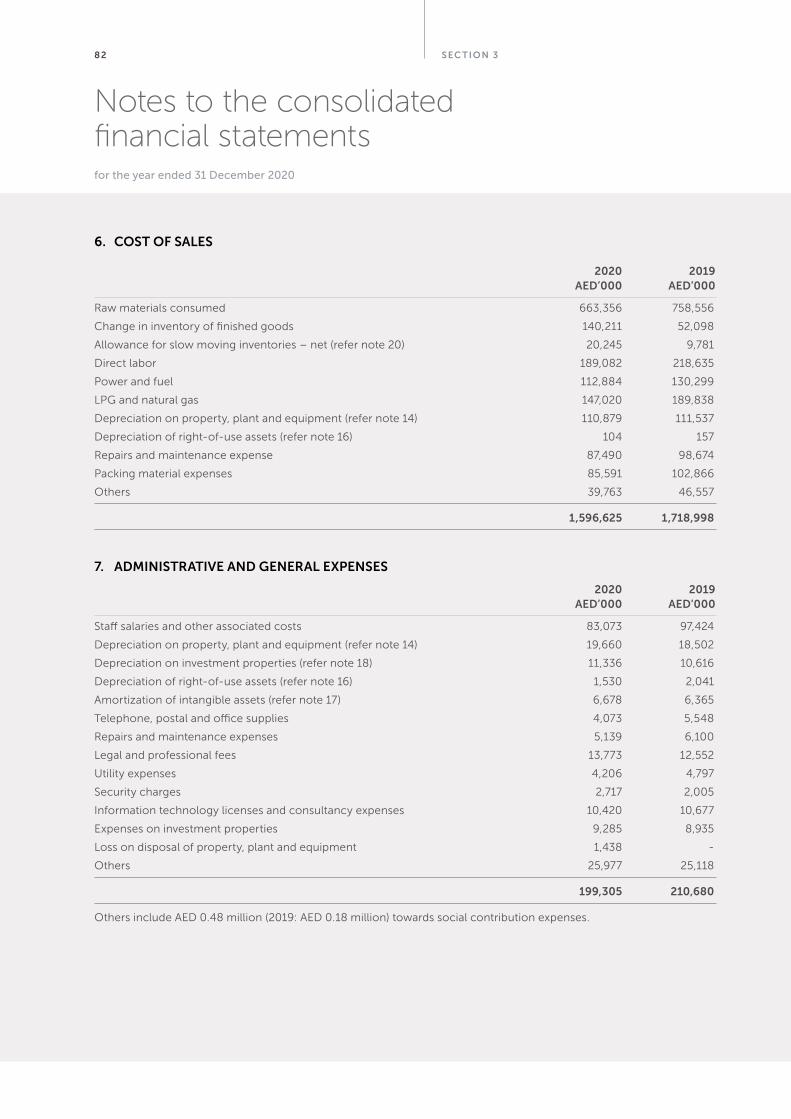
S EC TION 382
Notes to the consolidated financial statementsfor the year ended 31 December 2020
2020 2019 AED’000 AED’000
Raw materials consumed 663,356 758,556
Change in inventory of finished goods 140,211 52,098
Allowance for slow moving inventories – net (refer note 20) 20,245 9,781
Direct labor 189,082 218,635
Power and fuel 112,884 130,299
LPG and natural gas 147,020 189,838
Depreciation on property, plant and equipment (refer note 14) 110,879 111,537
Depreciation of right-of-use assets (refer note 16) 104 157
Repairs and maintenance expense 87,490 98,674
Packing material expenses 85,591 102,866
Others 39,763 46,557
1,596,625 1,718,998
7. ADMINISTRATIVE AND GENERAL EXPENSES
2020 2019 AED’000 AED’000
Staff salaries and other associated costs 83,073 97,424
Depreciation on property, plant and equipment (refer note 14) 19,660 18,502
Depreciation on investment properties (refer note 18) 11,336 10,616
Depreciation of right-of-use assets (refer note 16) 1,530 2,041
Amortization of intangible assets (refer note 17) 6,678 6,365
Telephone, postal and office supplies 4,073 5,548
Repairs and maintenance expenses 5,139 6,100
Legal and professional fees 13,773 12,552
Utility expenses 4,206 4,797
Security charges 2,717 2,005
Information technology licenses and consultancy expenses 10,420 10,677
Expenses on investment properties 9,285 8,935
Loss on disposal of property, plant and equipment 1,438 -
Others 25,977 25,118
199,305 210,680
Others include AED 0.48 million (2019: AED 0.18 million) towards social contribution expenses.
6. COST OF SALES
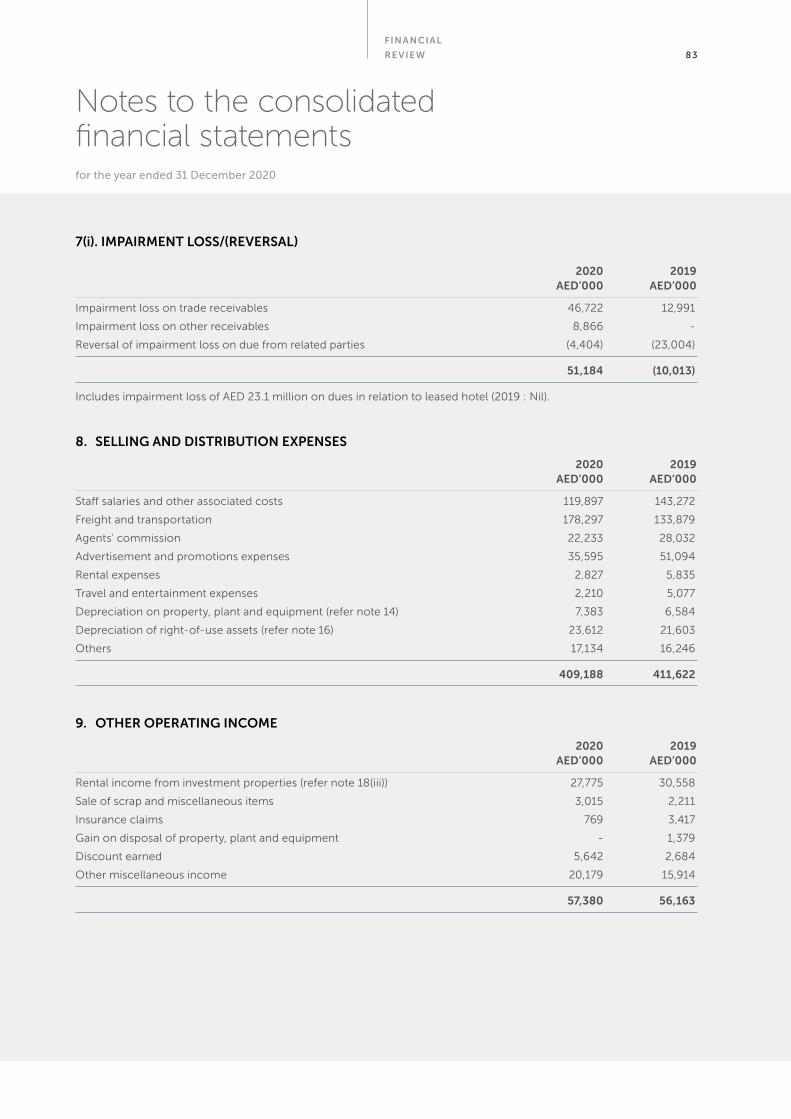
FINANCIAL
RE VIEW 83
Notes to the consolidated financial statementsfor the year ended 31 December 2020
2020 2019 AED’000 AED’000
Impairment loss on trade receivables 46,722 12,991
Impairment loss on other receivables 8,866 -
Reversal of impairment loss on due from related parties (4,404) (23,004)
51,184 (10,013)
Includes impairment loss of AED 23.1 million on dues in relation to leased hotel (2019 : Nil).
8. SELLING AND DISTRIBUTION EXPENSES
2020 2019 AED’000 AED’000
Staff salaries and other associated costs 119,897 143,272
Freight and transportation 178,297 133,879
Agents’ commission 22,233 28,032
Advertisement and promotions expenses 35,595 51,094
Rental expenses 2,827 5,835
Travel and entertainment expenses 2,210 5,077
Depreciation on property, plant and equipment (refer note 14) 7,383 6,584
Depreciation of right-of-use assets (refer note 16) 23,612 21,603
Others 17,134 16,246
409,188 411,622
9. OTHER OPERATING INCOME
2020 2019 AED’000 AED’000
Rental income from investment properties (refer note 18(iii)) 27,775 30,558
Sale of scrap and miscellaneous items 3,015 2,211
Insurance claims 769 3,417
Gain on disposal of property, plant and equipment - 1,379
Discount earned 5,642 2,684
Other miscellaneous income 20,179 15,914
57,380 56,163
7(i). IMPAIRMENT LOSS/(REVERSAL)
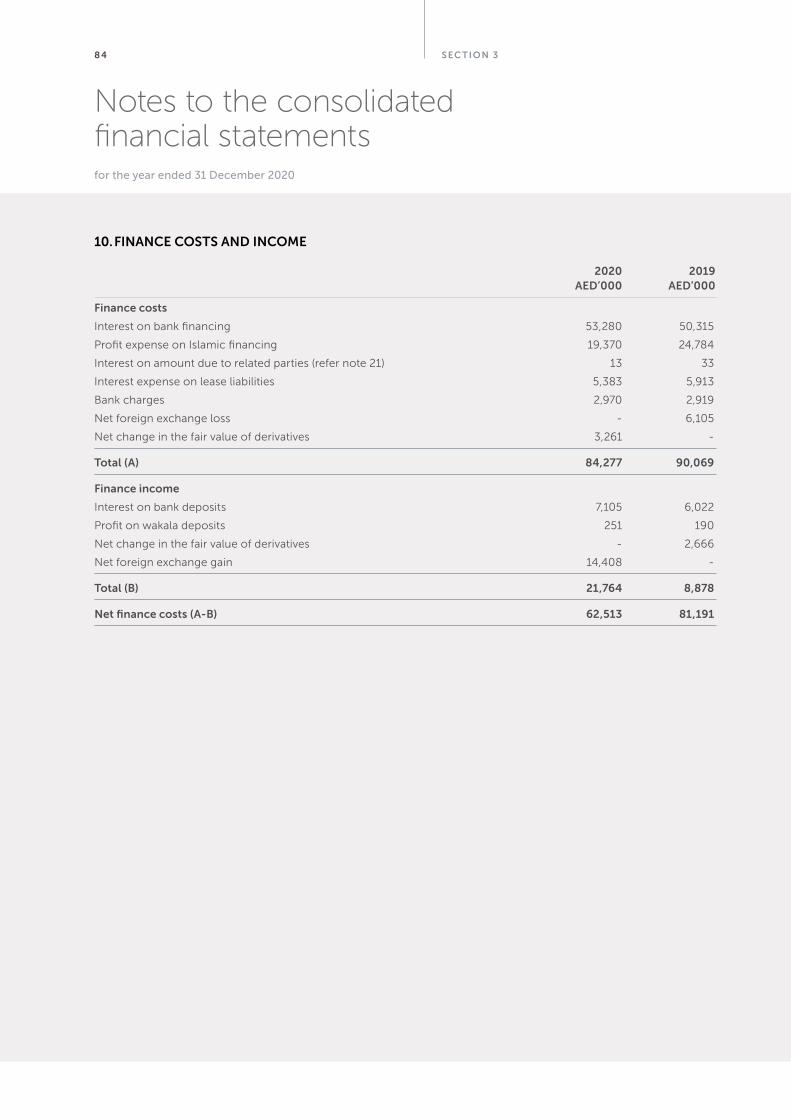
S EC TION 38 4
Notes to the consolidated financial statementsfor the year ended 31 December 2020
2020 2019 AED’000 AED’000
Finance costs
Interest on bank financing 53,280 50,315
Profit expense on Islamic financing 19,370 24,784
Interest on amount due to related parties (refer note 21) 13 33
Interest expense on lease liabilities 5,383 5,913
Bank charges 2,970 2,919
Net foreign exchange loss - 6,105
Net change in the fair value of derivatives 3,261 -
Total (A) 84,277 90,069
Finance income
Interest on bank deposits 7,105 6,022
Profit on wakala deposits 251 190
Net change in the fair value of derivatives - 2,666
Net foreign exchange gain 14,408 -
Total (B) 21,764 8,878
Net finance costs (A-B) 62,513 81,191
10. FINANCE COSTS AND INCOME
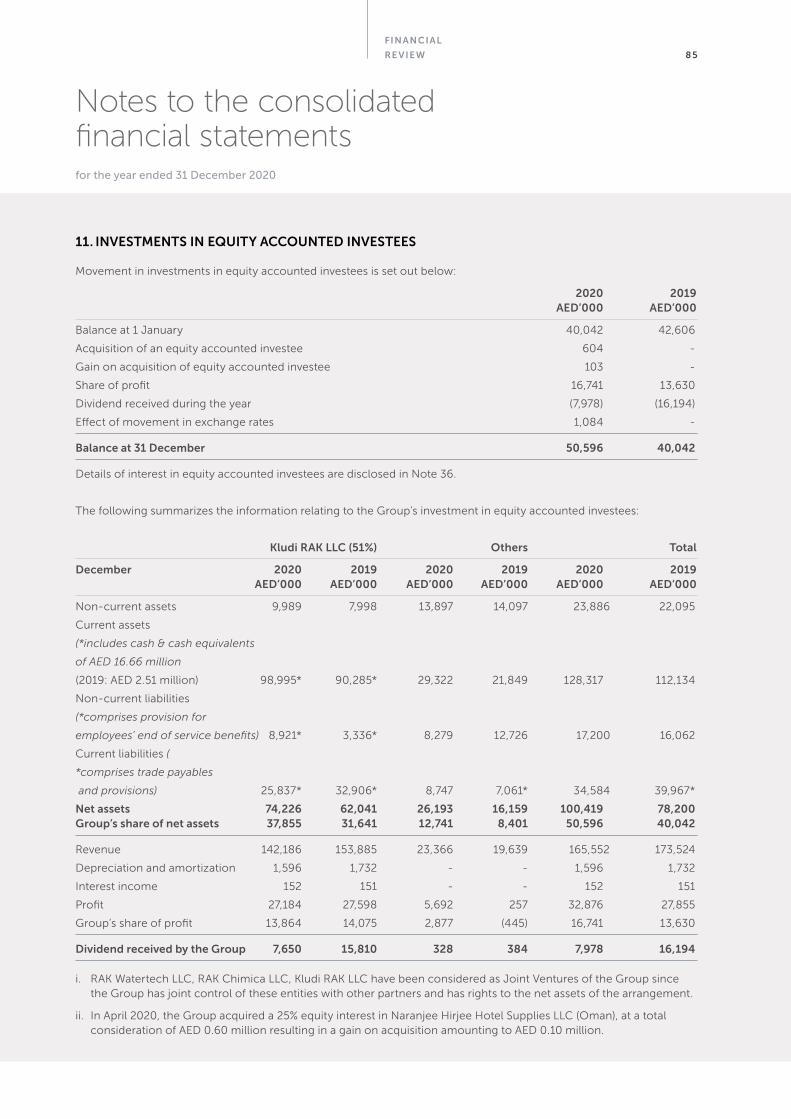
FINANCIAL
RE VIEW 85
Notes to the consolidated financial statementsfor the year ended 31 December 2020
Movement in investments in equity accounted investees is set out below:
2020 2019 AED’000 AED’000
Balance at 1 January 40,042 42,606
Acquisition of an equity accounted investee 604 -
Gain on acquisition of equity accounted investee 103 -
Share of profit 16,741 13,630
Dividend received during the year (7,978) (16,194)
Effect of movement in exchange rates 1,084 -
Balance at 31 December 50,596 40,042
Details of interest in equity accounted investees are disclosed in Note 36.
The following summarizes the information relating to the Group’s investment in equity accounted investees:
Kludi RAK LLC (51%) Others Total
December 2020 2019 2020 2019 2020 2019 AED’000 AED’000 AED’000 AED’000 AED’000 AED’000
Non-current assets 9,989 7,998 13,897 14,097 23,88 6 22,095
Current assets
(*includes cash & cash equivalents
of AED 16.66 million
(2019: AED 2.51 million) 98,995* 90,285* 29,322 21,849 128,317 112,134
Non-current liabilities
(*comprises provision for
employees’ end of service benefits) 8,921* 3,336* 8,279 12,726 17,20 0 16,062
Current liabilities (
*comprises trade payables
and provisions) 25,837* 32,906* 8,747 7,061* 34,58 4 39,967*
Net assets 74,226 62,041 26,193 16,159 100,419 78,200 Group’s share of net assets 37,855 31,641 12,741 8,401 50,596 40,042
Revenue 142,186 153,885 23,366 19,639 165,55 2 173,524
Depreciation and amortization 1,596 1,732 - - 1,596 1,732
Interest income 152 151 - - 152 151
Profit 27,184 27,598 5,692 257 32,876 27,855
Group’s share of profit 13,864 14,075 2,877 (445) 16,741 13,630
Dividend received by the Group 7,650 15,810 328 384 7,978 16,194
i. RAK Watertech LLC, RAK Chimica LLC, Kludi RAK LLC have been considered as Joint Ventures of the Group since the Group has joint control of these entities with other partners and has rights to the net assets of the arrangement.
ii. In April 2020, the Group acquired a 25% equity interest in Naranjee Hirjee Hotel Supplies LLC (Oman), at a total consideration of AED 0.60 million resulting in a gain on acquisition amounting to AED 0.10 million.
11. INVESTMENTS IN EQUITY ACCOUNTED INVESTEES
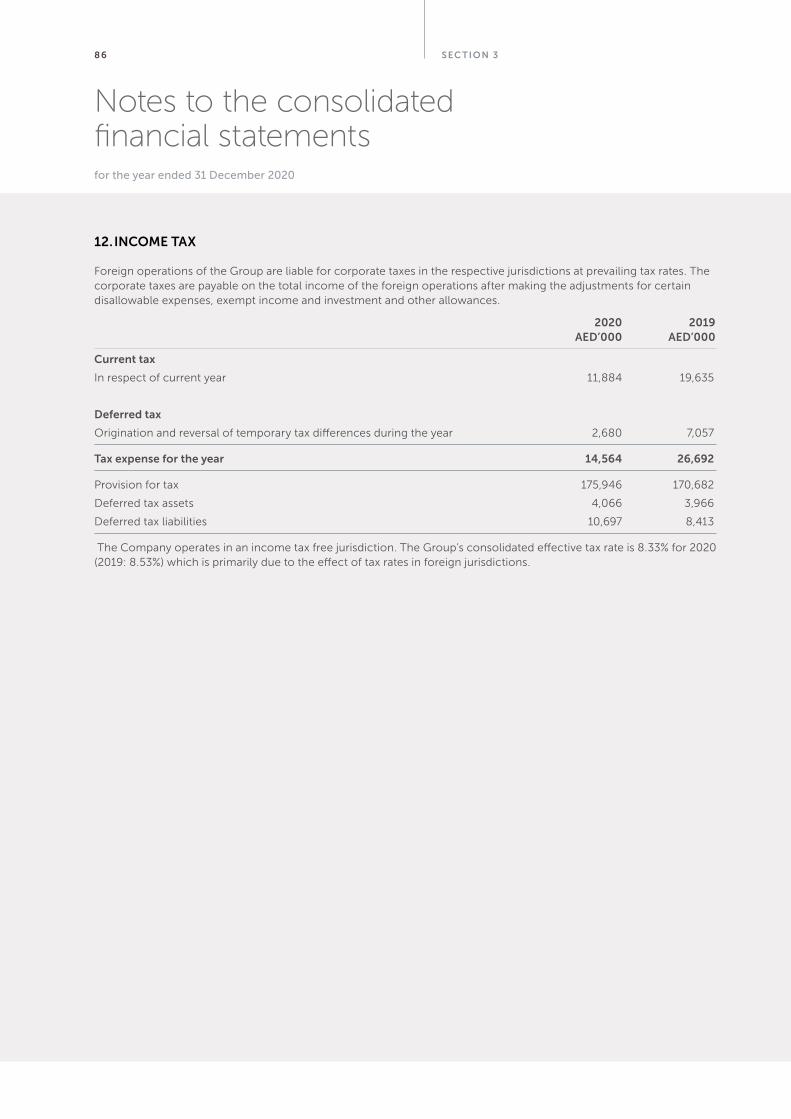
S EC TION 386
Notes to the consolidated financial statementsfor the year ended 31 December 2020
Foreign operations of the Group are liable for corporate taxes in the respective jurisdictions at prevailing tax rates. The corporate taxes are payable on the total income of the foreign operations after making the adjustments for certain disallowable expenses, exempt income and investment and other allowances.
2020 2019 AED’000 AED’000
Current tax
In respect of current year 11,884 19,635
Deferred tax
Origination and reversal of temporary tax differences during the year 2,680 7,057
Tax expense for the year 14,564 26,692
Provision for tax 175,946 170,682
Deferred tax assets 4,066 3,966
Deferred tax liabilities 10,697 8,413
The Company operates in an income tax free jurisdiction. The Group’s consolidated effective tax rate is 8.33% for 2020 (2019: 8.53%) which is primarily due to the effect of tax rates in foreign jurisdictions.
12. INCOME TAX
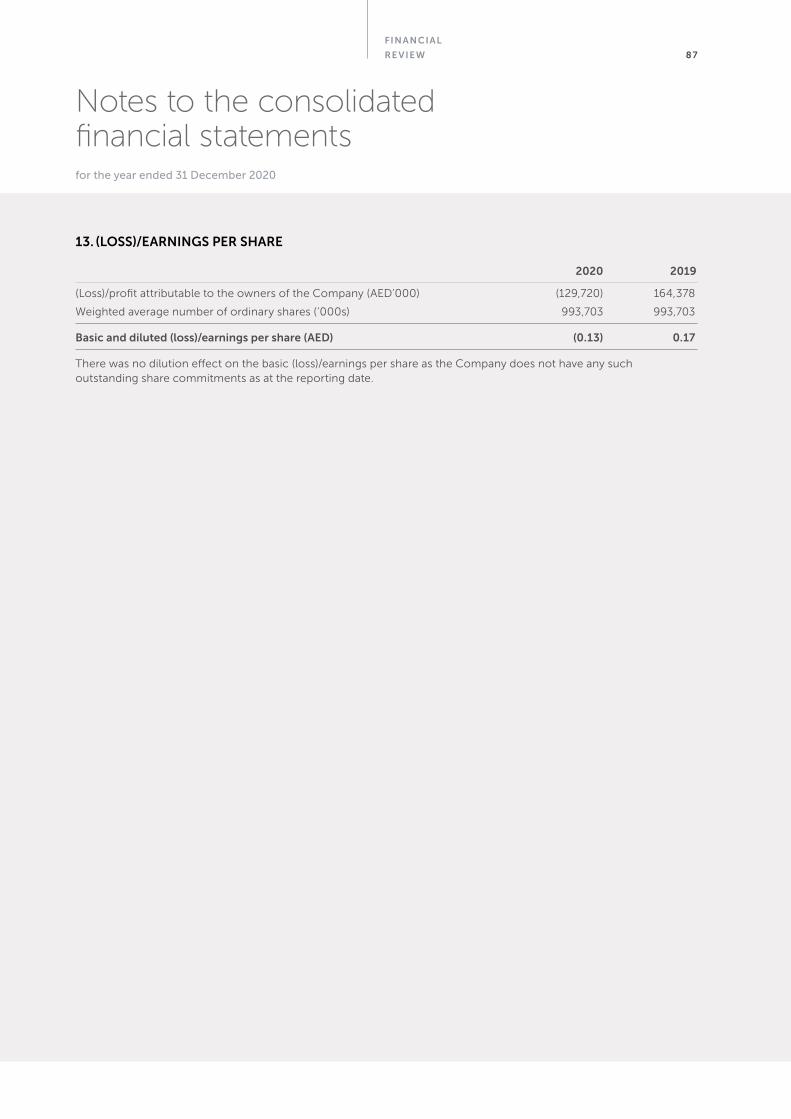
FINANCIAL
RE VIEW 87
Notes to the consolidated financial statementsfor the year ended 31 December 2020
2020 2019
(Loss)/profit attributable to the owners of the Company (AED’000) (129,720) 164,378
Weighted average number of ordinary shares (‘000s) 993,703 993,703
Basic and diluted (loss)/earnings per share (AED) (0.13) 0.17
There was no dilution effect on the basic (loss)/earnings per share as the Company does not have any such outstanding share commitments as at the reporting date.
13. (LOSS)/EARNINGS PER SHARE
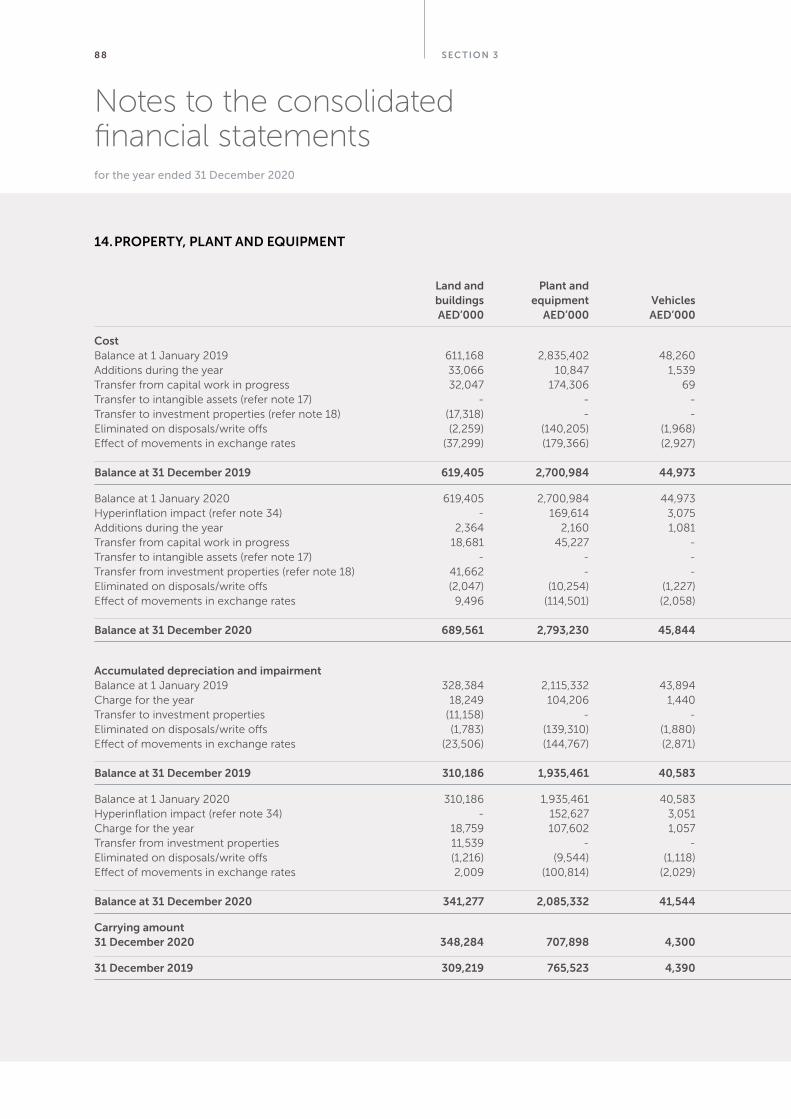
S EC TION 388
Notes to the consolidated financial statementsfor the year ended 31 December 2020
14. PROPERTY, PLANT AND EQUIPMENT
Land and Plant and Furniture and Office Road and Capital work buildings equipment Vehicles fixtures equipment asphalting in progress Total AED’000 AED’000 AED’000 AED’000 AED’000 AED’000 AED’000 AED’000
CostBalance at 1 January 2019 611,168 2,835,402 48,260 54,455 70,200 21,607 143,776 3,784,868Additions during the year 33,066 10,847 1,539 3,355 2,990 160 120,757 172,714Transfer from capital work in progress 32,047 174,306 69 1,598 460 3,611 (212,091) -Transfer to intangible assets (refer note 17) - - - - - - (1,380) (1,380)Transfer to investment properties (refer note 18) (17,318) - - - - - (279) (17,597)Eliminated on disposals/write offs (2,259) (140,205) (1,968) (1,400) (4,057) - (119) (150,008)Effect of movements in exchange rates (37,299) (179,366) (2,927) (1,497) (838) (1,508) (4,174) (227,609)
Balance at 31 December 2019 619,405 2,700,984 44,973 56,511 68,755 23,870 46,490 3,560,988
Balance at 1 January 2020 619,405 2,700,984 44,973 56,511 68,755 23,870 46,490 3,560,988Hyperinflation impact (refer note 34) - 169,614 3,075 599 554 1,671 8 175,521Additions during the year 2,364 2,160 1,081 2,892 1,753 100 92,119 102,469Transfer from capital work in progress 18,681 45,227 - 3,072 376 - (67,356) -Transfer to intangible assets (refer note 17) - - - - - - (4,050) (4,050)Transfer from investment properties (refer note 18) 41,662 - - - - - - 41,662Eliminated on disposals/write offs (2,047) (10,254) (1,227) (5,870) (3,939) - (12) (23,349)Effect of movements in exchange rates 9,496 (114,501) (2,058) 187 (169) (1,238) (15) (108,298) Balance at 31 December 2020 689,561 2,793,230 45,844 57,391 67,330 24,403 67,184 3,744,943
Accumulated depreciation and impairmentBalance at 1 January 2019 328,384 2,115,332 43,894 41,005 58,019 16,933 - 2,603,567Charge for the year 18,249 104,206 1,440 6,232 5,520 976 - 136,623Transfer to investment properties (11,158) - - - - - - (11,158)Eliminated on disposals/write offs (1,783) (139,310) (1,880) (1,377) (4,036) - - (148,386)Effect of movements in exchange rates (23,506) (144,767) (2,871) (473) (541) (1,492) - (173,650)
Balance at 31 December 2019 310,186 1,935,461 40,583 45,387 58,962 16,417 - 2,406,996
Balance at 1 January 2020 310,186 1,935,461 40,583 45,387 58,962 16,417 - 2,406,996Hyperinflation impact (refer note 34) - 152,627 3,051 415 297 1,494 - 157,884Charge for the year 18,759 107,602 1,057 4,888 4,504 1,112 - 137,922Transfer from investment properties 11,539 - - - - - - 11,539Eliminated on disposals/write offs (1,216) (9,544) (1,118) (4,090) (3,921) - - (19,889)Effect of movements in exchange rates 2,009 (100,814) (2,029) 205 (56) (1,104) - (101,789)
Balance at 31 December 2020 341,277 2,085,332 41,544 46,805 59,786 17,919 - 2,592,663
Carrying amount 31 December 2020 348,284 707,898 4,300 10,586 7,544 6,484 67,184 1,152,280
31 December 2019 309,219 765,523 4,390 11,124 9,793 7,453 46,490 1,153,992
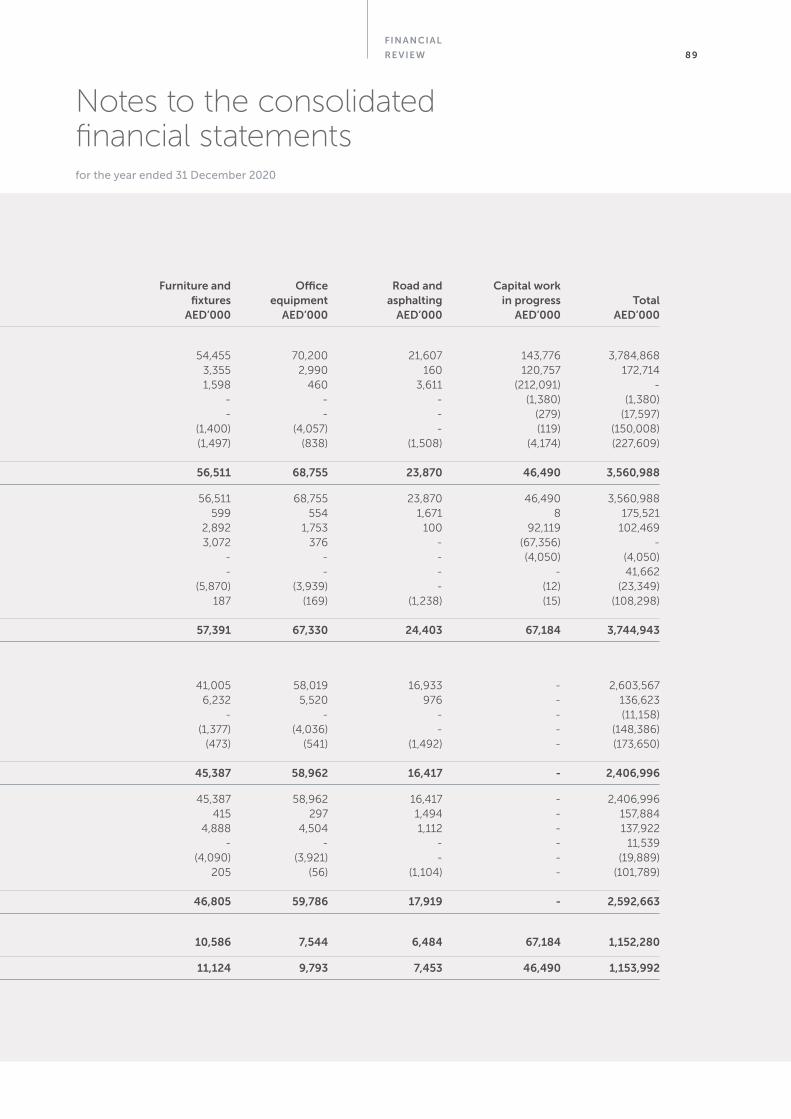
FINANCIAL
RE VIEW 89
Notes to the consolidated financial statementsfor the year ended 31 December 2020
Land and Plant and Furniture and Office Road and Capital work buildings equipment Vehicles fixtures equipment asphalting in progress Total AED’000 AED’000 AED’000 AED’000 AED’000 AED’000 AED’000 AED’000
CostBalance at 1 January 2019 611,168 2,835,402 48,260 54,455 70,200 21,607 143,776 3,784,868Additions during the year 33,066 10,847 1,539 3,355 2,990 160 120,757 172,714Transfer from capital work in progress 32,047 174,306 69 1,598 460 3,611 (212,091) -Transfer to intangible assets (refer note 17) - - - - - - (1,380) (1,380)Transfer to investment properties (refer note 18) (17,318) - - - - - (279) (17,597)Eliminated on disposals/write offs (2,259) (140,205) (1,968) (1,400) (4,057) - (119) (150,008)Effect of movements in exchange rates (37,299) (179,366) (2,927) (1,497) (838) (1,508) (4,174) (227,609)
Balance at 31 December 2019 619,405 2,700,984 44,973 56,511 68,755 23,870 46,490 3,560,988
Balance at 1 January 2020 619,405 2,700,984 44,973 56,511 68,755 23,870 46,490 3,560,988Hyperinflation impact (refer note 34) - 169,614 3,075 599 554 1,671 8 175,521Additions during the year 2,364 2,160 1,081 2,892 1,753 100 92,119 102,469Transfer from capital work in progress 18,681 45,227 - 3,072 376 - (67,356) -Transfer to intangible assets (refer note 17) - - - - - - (4,050) (4,050)Transfer from investment properties (refer note 18) 41,662 - - - - - - 41,662Eliminated on disposals/write offs (2,047) (10,254) (1,227) (5,870) (3,939) - (12) (23,349)Effect of movements in exchange rates 9,496 (114,501) (2,058) 187 (169) (1,238) (15) (108,298) Balance at 31 December 2020 689,561 2,793,230 45,844 57,391 67,330 24,403 67,184 3,744,943
Accumulated depreciation and impairmentBalance at 1 January 2019 328,384 2,115,332 43,894 41,005 58,019 16,933 - 2,603,567Charge for the year 18,249 104,206 1,440 6,232 5,520 976 - 136,623Transfer to investment properties (11,158) - - - - - - (11,158)Eliminated on disposals/write offs (1,783) (139,310) (1,880) (1,377) (4,036) - - (148,386)Effect of movements in exchange rates (23,506) (144,767) (2,871) (473) (541) (1,492) - (173,650)
Balance at 31 December 2019 310,186 1,935,461 40,583 45,387 58,962 16,417 - 2,406,996
Balance at 1 January 2020 310,186 1,935,461 40,583 45,387 58,962 16,417 - 2,406,996Hyperinflation impact (refer note 34) - 152,627 3,051 415 297 1,494 - 157,884Charge for the year 18,759 107,602 1,057 4,888 4,504 1,112 - 137,922Transfer from investment properties 11,539 - - - - - - 11,539Eliminated on disposals/write offs (1,216) (9,544) (1,118) (4,090) (3,921) - - (19,889)Effect of movements in exchange rates 2,009 (100,814) (2,029) 205 (56) (1,104) - (101,789)
Balance at 31 December 2020 341,277 2,085,332 41,544 46,805 59,786 17,919 - 2,592,663
Carrying amount 31 December 2020 348,284 707,898 4,300 10,586 7,544 6,484 67,184 1,152,280
31 December 2019 309,219 765,523 4,390 11,124 9,793 7,453 46,490 1,153,992
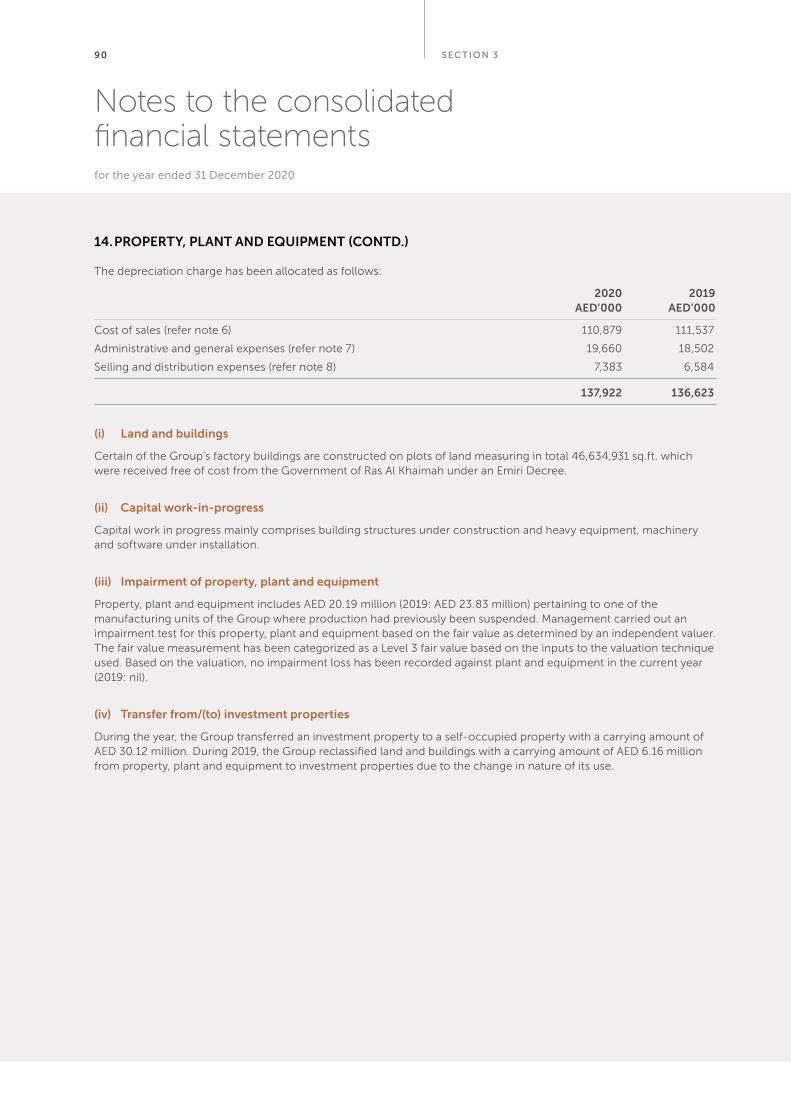
S EC TION 390
Notes to the consolidated financial statementsfor the year ended 31 December 2020
The depreciation charge has been allocated as follows:
2020 2019 AED’000 AED’000
Cost of sales (refer note 6) 110,879 111,537
Administrative and general expenses (refer note 7) 19,660 18,502
Selling and distribution expenses (refer note 8) 7,383 6,584
137,922 136,623
(i) Land and buildings
Certain of the Group’s factory buildings are constructed on plots of land measuring in total 46,634,931 sq.ft. which were received free of cost from the Government of Ras Al Khaimah under an Emiri Decree.
(ii) Capital work-in-progress
Capital work in progress mainly comprises building structures under construction and heavy equipment, machinery and software under installation.
(iii) Impairment of property, plant and equipment
Property, plant and equipment includes AED 20.19 million (2019: AED 23.83 million) pertaining to one of the manufacturing units of the Group where production had previously been suspended. Management carried out an impairment test for this property, plant and equipment based on the fair value as determined by an independent valuer. The fair value measurement has been categorized as a Level 3 fair value based on the inputs to the valuation technique used. Based on the valuation, no impairment loss has been recorded against plant and equipment in the current year (2019: nil).
(iv) Transfer from/(to) investment properties
During the year, the Group transferred an investment property to a self-occupied property with a carrying amount of AED 30.12 million. During 2019, the Group reclassified land and buildings with a carrying amount of AED 6.16 million from property, plant and equipment to investment properties due to the change in nature of its use.
14. PROPERTY, PLANT AND EQUIPMENT (CONTD.)
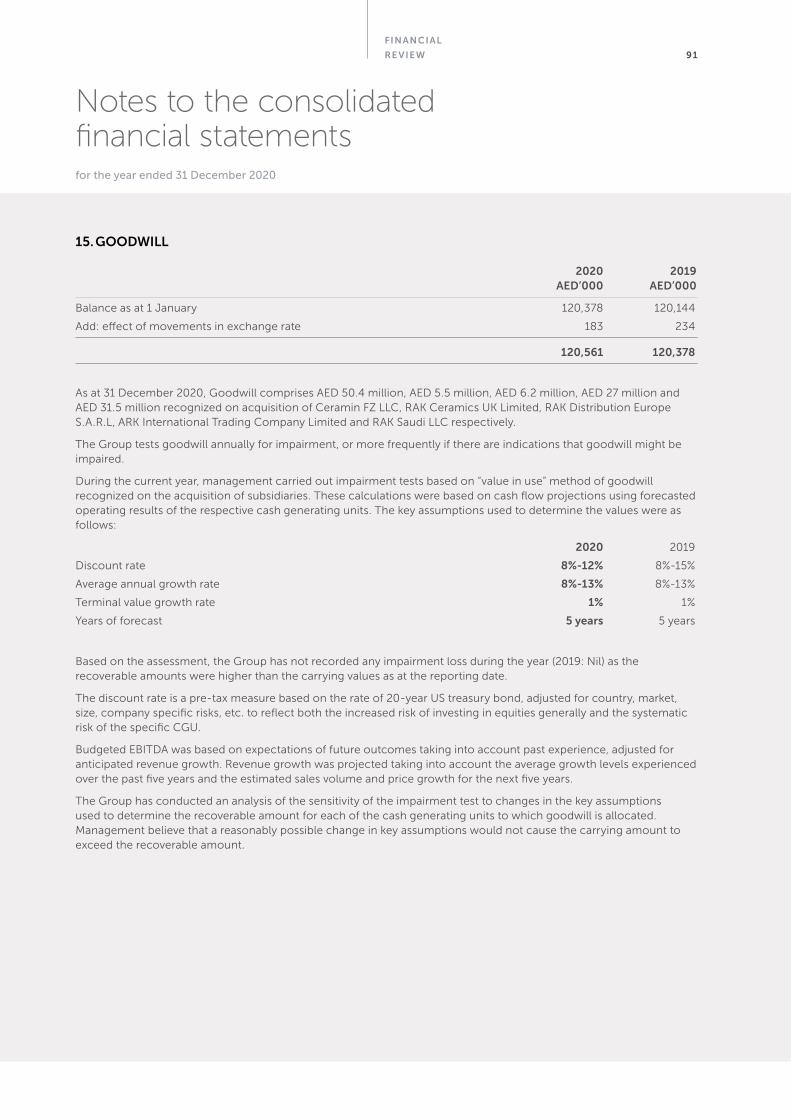
FINANCIAL
RE VIEW 91
Notes to the consolidated financial statementsfor the year ended 31 December 2020
2020 2019 AED’000 AED’000
Balance as at 1 January 120,378 120,144
Add: effect of movements in exchange rate 183 234
120,561 120,378
As at 31 December 2020, Goodwill comprises AED 50.4 million, AED 5.5 million, AED 6.2 million, AED 27 million and AED 31.5 million recognized on acquisition of Ceramin FZ LLC, RAK Ceramics UK Limited, RAK Distribution Europe S.A.R.L, ARK International Trading Company Limited and RAK Saudi LLC respectively.
The Group tests goodwill annually for impairment, or more frequently if there are indications that goodwill might be impaired.
During the current year, management carried out impairment tests based on “value in use” method of goodwill recognized on the acquisition of subsidiaries. These calculations were based on cash flow projections using forecasted operating results of the respective cash generating units. The key assumptions used to determine the values were as follows:
2020 2019
Discount rate 8%-12% 8%-15%
Average annual growth rate 8%-13% 8%-13%
Terminal value growth rate 1% 1%
Years of forecast 5 years 5 years
Based on the assessment, the Group has not recorded any impairment loss during the year (2019: Nil) as the recoverable amounts were higher than the carrying values as at the reporting date.
The discount rate is a pre-tax measure based on the rate of 20-year US treasury bond, adjusted for country, market, size, company specific risks, etc. to reflect both the increased risk of investing in equities generally and the systematic risk of the specific CGU.
Budgeted EBITDA was based on expectations of future outcomes taking into account past experience, adjusted for anticipated revenue growth. Revenue growth was projected taking into account the average growth levels experienced over the past five years and the estimated sales volume and price growth for the next five years.
The Group has conducted an analysis of the sensitivity of the impairment test to changes in the key assumptions used to determine the recoverable amount for each of the cash generating units to which goodwill is allocated. Management believe that a reasonably possible change in key assumptions would not cause the carrying amount to exceed the recoverable amount.
15. GOODWILL
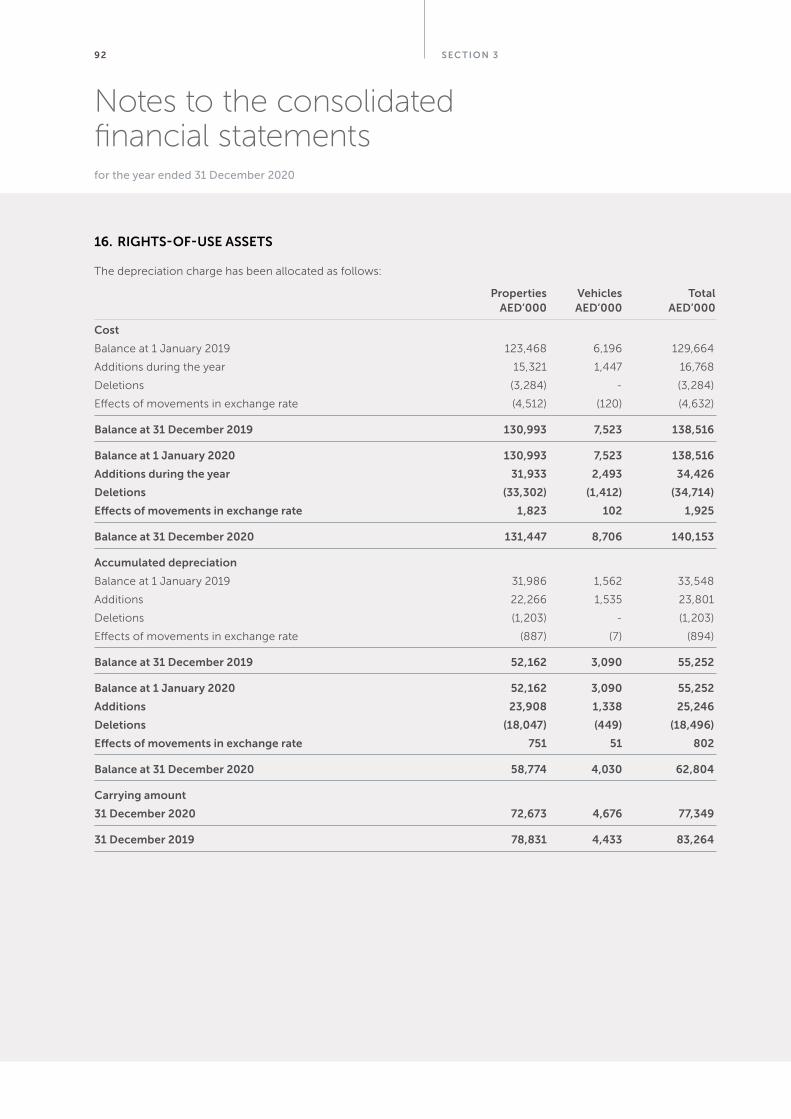
S EC TION 392
Notes to the consolidated financial statementsfor the year ended 31 December 2020
The depreciation charge has been allocated as follows:
Properties Vehicles Total AED’000 AED’000 AED’000
Cost
Balance at 1 January 2019 123,468 6,196 129,664
Additions during the year 15,321 1,447 16,768
Deletions (3,284) - (3,284)
Effects of movements in exchange rate (4,512) (120) (4,632)
Balance at 31 December 2019 130,993 7,523 138,516
Balance at 1 January 2020 130,993 7,523 138,516
Additions during the year 31,933 2,493 34,426
Deletions (33,302) (1,412) (34,714)
Effects of movements in exchange rate 1,823 102 1,925
Balance at 31 December 2020 131,447 8,706 140,153
Accumulated depreciation
Balance at 1 January 2019 31,986 1,562 33,548
Additions 22,266 1,535 23,801
Deletions (1,203) - (1,203)
Effects of movements in exchange rate (887) (7) (894)
Balance at 31 December 2019 52,162 3,090 55,252
Balance at 1 January 2020 52,162 3,090 55,252
Additions 23,908 1,338 25,246
Deletions (18,047) (449) (18,496)
Effects of movements in exchange rate 751 51 802
Balance at 31 December 2020 58,774 4,030 62,804
Carrying amount
31 December 2020 72,673 4,676 77,349
31 December 2019 78,831 4,433 83,264
16. RIGHTS-OF-USE ASSETS
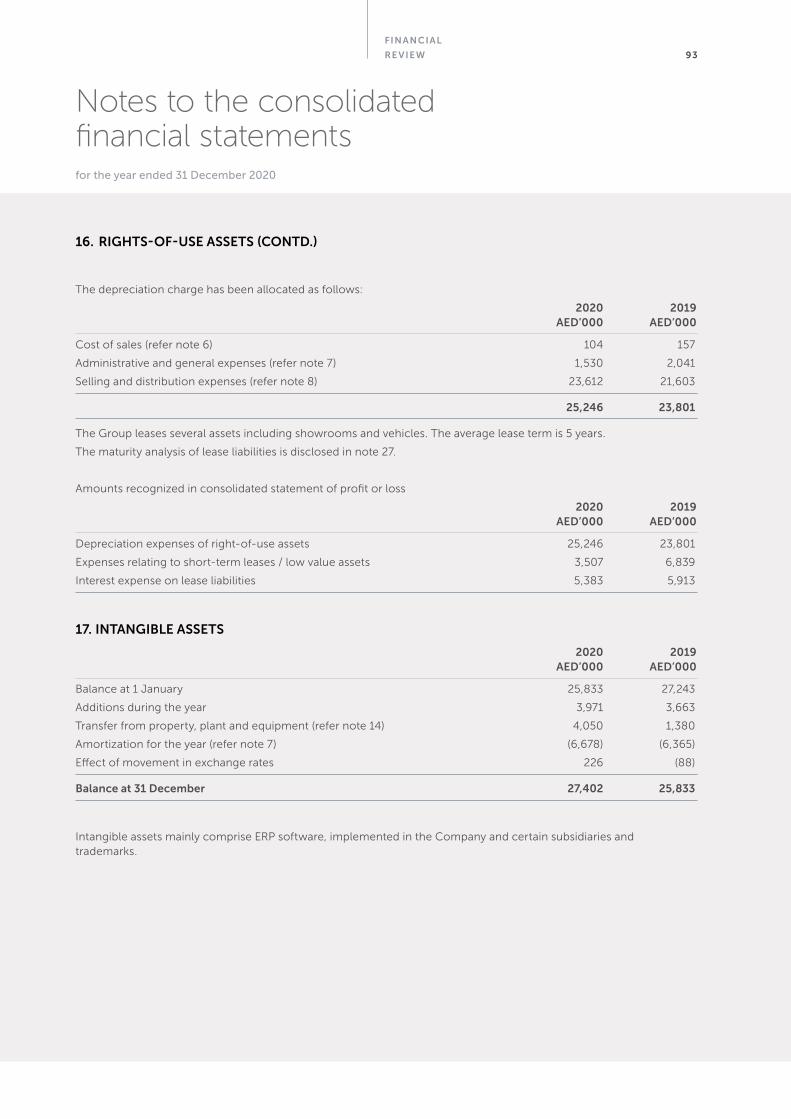
FINANCIAL
RE VIEW 93
Notes to the consolidated financial statementsfor the year ended 31 December 2020
The depreciation charge has been allocated as follows:
2020 2019 AED’000 AED’000
Cost of sales (refer note 6) 104 157
Administrative and general expenses (refer note 7) 1,530 2,041
Selling and distribution expenses (refer note 8) 23,612 21,603
25,246 23,801
The Group leases several assets including showrooms and vehicles. The average lease term is 5 years.
The maturity analysis of lease liabilities is disclosed in note 27.
Amounts recognized in consolidated statement of profit or loss
2020 2019 AED’000 AED’000
Depreciation expenses of right-of-use assets 25,246 23,801
Expenses relating to short-term leases / low value assets 3,507 6,839
Interest expense on lease liabilities 5,383 5,913
17. INTANGIBLE ASSETS
2020 2019 AED’000 AED’000
Balance at 1 January 25,833 27,243
Additions during the year 3,971 3,663
Transfer from property, plant and equipment (refer note 14) 4,050 1,380
Amortization for the year (refer note 7) (6,678) (6,365)
Effect of movement in exchange rates 226 (88)
Balance at 31 December 27,402 25,833
Intangible assets mainly comprise ERP software, implemented in the Company and certain subsidiaries and trademarks.
16. RIGHTS-OF-USE ASSETS (CONTD.)
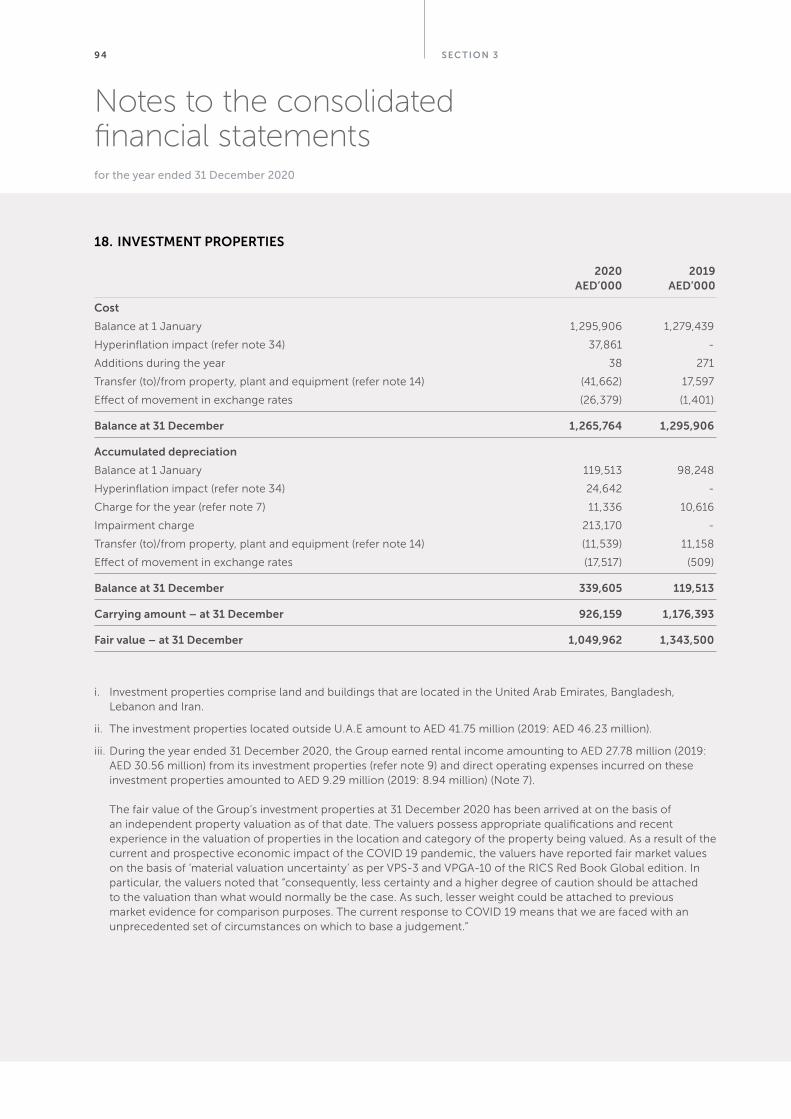
S EC TION 394
Notes to the consolidated financial statementsfor the year ended 31 December 2020
2020 2019 AED’000 AED’000
Cost
Balance at 1 January 1,295,906 1,279,439
Hyperinflation impact (refer note 34) 37,861 -
Additions during the year 38 271
Transfer (to)/from property, plant and equipment (refer note 14) (41,662) 17,597
Effect of movement in exchange rates (26,379) (1,401)
Balance at 31 December 1,265,764 1,295,906
Accumulated depreciation
Balance at 1 January 119,513 98,248
Hyperinflation impact (refer note 34) 24,642 -
Charge for the year (refer note 7) 11,336 10,616
Impairment charge 213,170 -
Transfer (to)/from property, plant and equipment (refer note 14) (11,539) 11,158
Effect of movement in exchange rates (17,517) (509)
Balance at 31 December 339,605 119,513
Carrying amount – at 31 December 926,159 1,176,393
Fair value – at 31 December 1,049,962 1,343,500
i. Investment properties comprise land and buildings that are located in the United Arab Emirates, Bangladesh, Lebanon and Iran.
ii. The investment properties located outside U.A.E amount to AED 41.75 million (2019: AED 46.23 million).
iii. During the year ended 31 December 2020, the Group earned rental income amounting to AED 27.78 million (2019: AED 30.56 million) from its investment properties (refer note 9) and direct operating expenses incurred on these investment properties amounted to AED 9.29 million (2019: 8.94 million) (Note 7). The fair value of the Group’s investment properties at 31 December 2020 has been arrived at on the basis of an independent property valuation as of that date. The valuers possess appropriate qualifications and recent experience in the valuation of properties in the location and category of the property being valued. As a result of the current and prospective economic impact of the COVID 19 pandemic, the valuers have reported fair market values on the basis of ‘material valuation uncertainty’ as per VPS-3 and VPGA-10 of the RICS Red Book Global edition. In particular, the valuers noted that “consequently, less certainty and a higher degree of caution should be attached to the valuation than what would normally be the case. As such, lesser weight could be attached to previous market evidence for comparison purposes. The current response to COVID 19 means that we are faced with an unprecedented set of circumstances on which to base a judgement.”
18. INVESTMENT PROPERTIES
FINANCIAL
RE VIEW 95
Notes to the consolidated financial statementsfor the year ended 31 December 2020
The investment properties were valued using the residual method, investment method, comparison method or market approach, for varying properties, adjusted by the influence of the major market factors, including demand, transactions, availability, inflation, the purchasing power of money and critical judgements around approved used class of the property. The Group has considered inflation rate, risk free rate, risk premium, interest rate and statistical average growth rate. The valuation conforms to International Valuation Standards. The fair value measurement has been categorized as a Level 3 fair value based on the inputs to the valuation technique used and in estimating the fair value, the highest and best use of the properties is their current use. As the recoverable amount was lower than the carrying value, the Group has recorded an impairment loss of AED 213.17 million during the year (2019: Nil). A change of +/- 5% to 10% in various assumptions would result in a further change in the fair value of the impaired investment properties in the range of -7.5% and +7.8%.
iv. As disclosed in Note 14(iv), during the year, the Group transferred an investment property to property, plant and equipment with a carrying amount of AED 30.12 million and during the previous year the Group reclassified land and buildings with a carrying amount of AED 6.16 million from property, plant and equipment to investment properties due to the change in nature of its use.
18. INVESTMENT PROPERTIES (CONTD.)
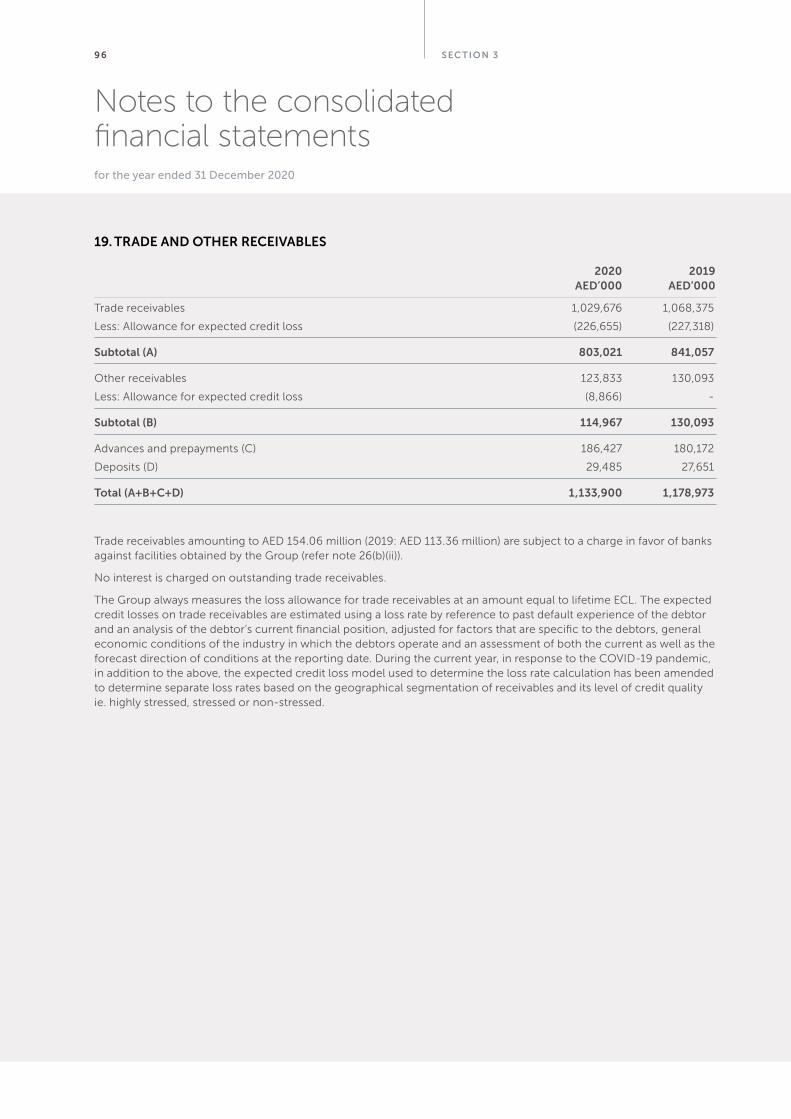
S EC TION 396
Notes to the consolidated financial statementsfor the year ended 31 December 2020
2020 2019 AED’000 AED’000
Trade receivables 1,029,676 1,068,375
Less: Allowance for expected credit loss (226,655) (227,318)
Subtotal (A) 803,021 841,057
Other receivables 123,833 130,093
Less: Allowance for expected credit loss (8,866) -
Subtotal (B) 114,967 130,093
Advances and prepayments (C) 186,427 180,172
Deposits (D) 29,485 27,651
Total (A+B+C+D) 1,133,900 1,178,973
Trade receivables amounting to AED 154.06 million (2019: AED 113.36 million) are subject to a charge in favor of banks against facilities obtained by the Group (refer note 26(b)(ii)).
No interest is charged on outstanding trade receivables.
The Group always measures the loss allowance for trade receivables at an amount equal to lifetime ECL. The expected credit losses on trade receivables are estimated using a loss rate by reference to past default experience of the debtor and an analysis of the debtor’s current financial position, adjusted for factors that are specific to the debtors, general economic conditions of the industry in which the debtors operate and an assessment of both the current as well as the forecast direction of conditions at the reporting date. During the current year, in response to the COVID-19 pandemic, in addition to the above, the expected credit loss model used to determine the loss rate calculation has been amended to determine separate loss rates based on the geographical segmentation of receivables and its level of credit quality ie. highly stressed, stressed or non-stressed.
19. TRADE AND OTHER RECEIVABLES
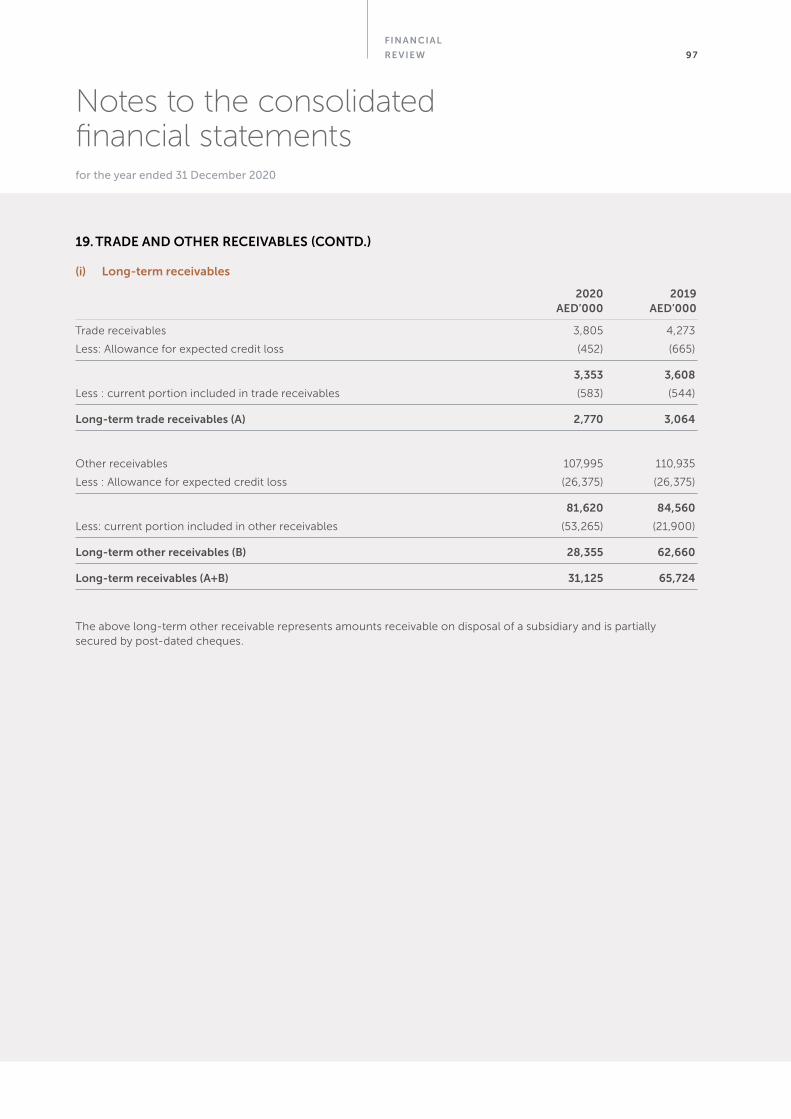
FINANCIAL
RE VIEW 97
Notes to the consolidated financial statementsfor the year ended 31 December 2020
(i) Long-term receivables
2020 2019 AED’000 AED’000
Trade receivables 3,805 4,273
Less: Allowance for expected credit loss (452) (665)
3,353 3,608
Less : current portion included in trade receivables (583) (544)
Long-term trade receivables (A) 2,770 3,064
Other receivables 107,995 110,935
Less : Allowance for expected credit loss (26,375) (26,375)
81,620 84,560
Less: current portion included in other receivables (53,265) (21,900)
Long-term other receivables (B) 28,355 62,660
Long-term receivables (A+B) 31,125 65,724
The above long-term other receivable represents amounts receivable on disposal of a subsidiary and is partially secured by post-dated cheques.
19. TRADE AND OTHER RECEIVABLES (CONTD.)
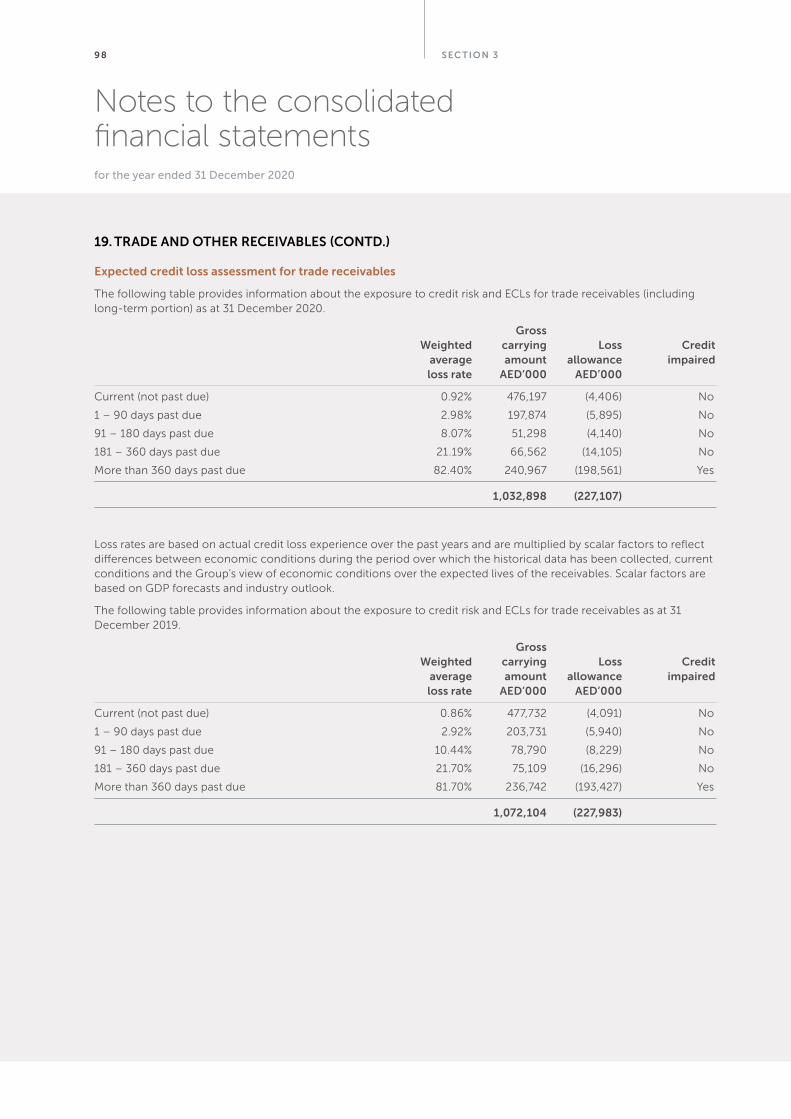
S EC TION 398
Notes to the consolidated financial statementsfor the year ended 31 December 2020
Expected credit loss assessment for trade receivables
The following table provides information about the exposure to credit risk and ECLs for trade receivables (including long-term portion) as at 31 December 2020.
Gross Weighted carrying Loss Credit average amount allowance impaired loss rate AED’000 AED’000
Current (not past due) 0.92% 476,197 (4,406) No
1 – 90 days past due 2.98% 197,874 (5,895) No
91 – 180 days past due 8.07% 51,298 (4,140) No
181 – 360 days past due 21.19% 66,562 (14,105) No
More than 360 days past due 82.40% 240,967 (198,561) Yes
1,032,898 (227,107)
Loss rates are based on actual credit loss experience over the past years and are multiplied by scalar factors to reflect differences between economic conditions during the period over which the historical data has been collected, current conditions and the Group’s view of economic conditions over the expected lives of the receivables. Scalar factors are based on GDP forecasts and industry outlook.
The following table provides information about the exposure to credit risk and ECLs for trade receivables as at 31 December 2019.
Gross Weighted carrying Loss Credit average amount allowance impaired loss rate AED’000 AED’000
Current (not past due) 0.86% 477,732 (4,091) No
1 – 90 days past due 2.92% 203,731 (5,940) No
91 – 180 days past due 10.44% 78,790 (8,229) No
181 – 360 days past due 21.70% 75,109 (16,296) No
More than 360 days past due 81.70% 236,742 (193,427) Yes
1,072,104 (227,983)
19. TRADE AND OTHER RECEIVABLES (CONTD.)
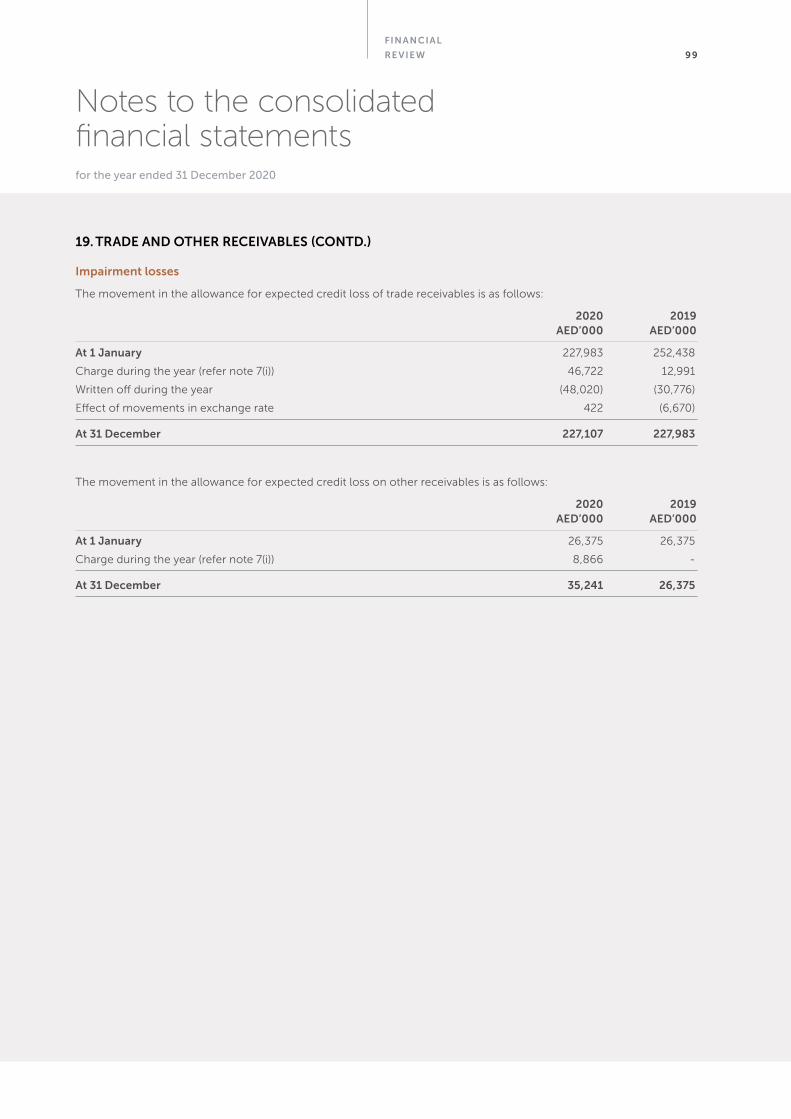
FINANCIAL
RE VIEW 99
Notes to the consolidated financial statementsfor the year ended 31 December 2020
Impairment losses
The movement in the allowance for expected credit loss of trade receivables is as follows:
2020 2019 AED’000 AED’000
At 1 January 227,983 252,438
Charge during the year (refer note 7(i)) 46,722 12,991
Written off during the year (48,020) (30,776)
Effect of movements in exchange rate 422 (6,670)
At 31 December 227,107 227,983
The movement in the allowance for expected credit loss on other receivables is as follows:
2020 2019 AED’000 AED’000
At 1 January 26,375 26,375
Charge during the year (refer note 7(i)) 8,866 -
At 31 December 35,241 26,375
19. TRADE AND OTHER RECEIVABLES (CONTD.)
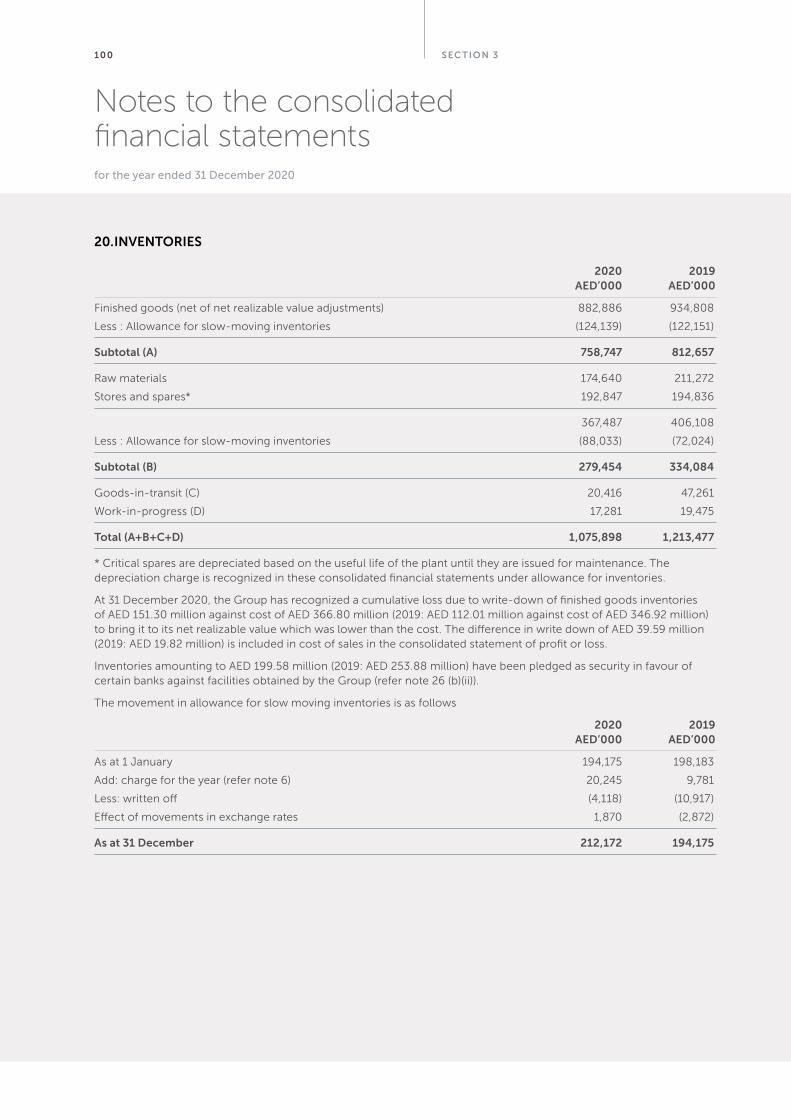
S EC TION 310 0
Notes to the consolidated financial statementsfor the year ended 31 December 2020
2020 2019 AED’000 AED’000
Finished goods (net of net realizable value adjustments) 882,886 934,808
Less : Allowance for slow-moving inventories (124,139) (122,151)
Subtotal (A) 758,747 812,657
Raw materials 174,640 211,272
Stores and spares* 192,847 194,836
367,487 406,108
Less : Allowance for slow-moving inventories (88,033) (72,024)
Subtotal (B) 279,454 334,084
Goods-in-transit (C) 20,416 47,261
Work-in-progress (D) 17,281 19,475
Total (A+B+C+D) 1,075,898 1,213,477
* Critical spares are depreciated based on the useful life of the plant until they are issued for maintenance. The depreciation charge is recognized in these consolidated financial statements under allowance for inventories.
At 31 December 2020, the Group has recognized a cumulative loss due to write-down of finished goods inventories of AED 151.30 million against cost of AED 366.80 million (2019: AED 112.01 million against cost of AED 346.92 million) to bring it to its net realizable value which was lower than the cost. The difference in write down of AED 39.59 million (2019: AED 19.82 million) is included in cost of sales in the consolidated statement of profit or loss.
Inventories amounting to AED 199.58 million (2019: AED 253.88 million) have been pledged as security in favour of certain banks against facilities obtained by the Group (refer note 26 (b)(ii)).
The movement in allowance for slow moving inventories is as follows
2020 2019 AED’000 AED’000
As at 1 January 194,175 198,183
Add: charge for the year (refer note 6) 20,245 9,781
Less: written off (4,118) (10,917)
Effect of movements in exchange rates 1,870 (2,872)
As at 31 December 212,172 194,175
20. INVENTORIES
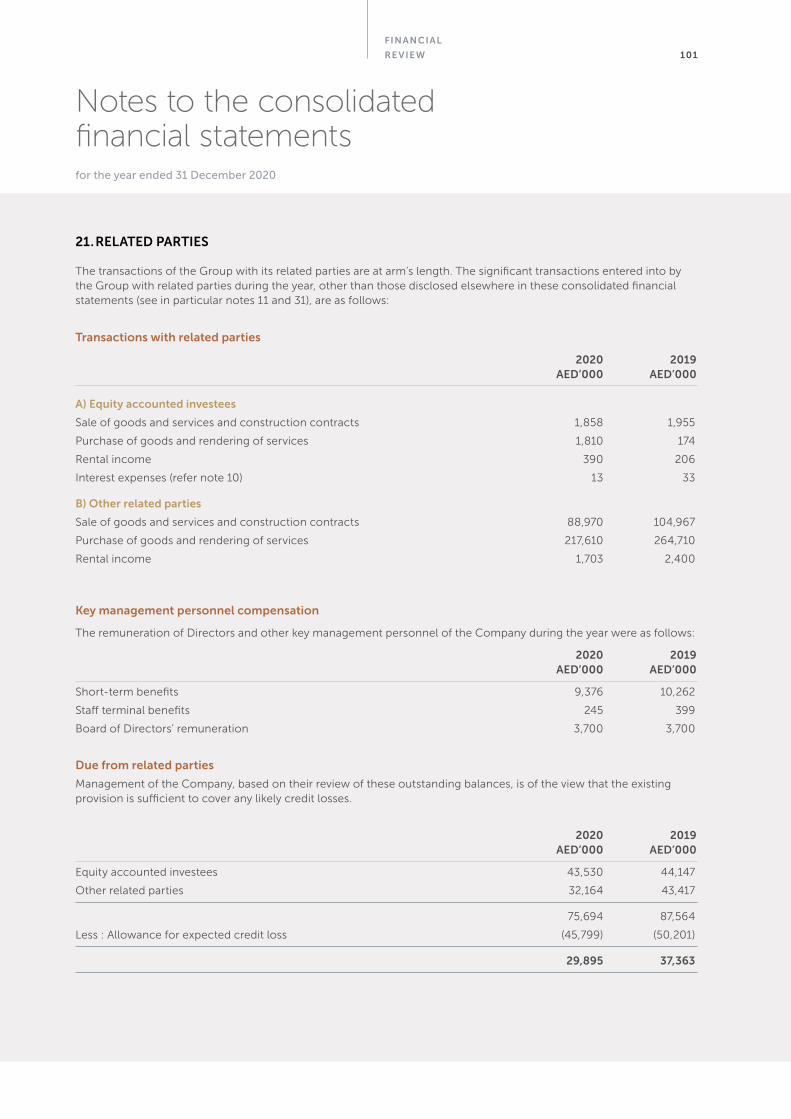
FINANCIAL
RE VIEW 101
Notes to the consolidated financial statementsfor the year ended 31 December 2020
The transactions of the Group with its related parties are at arm’s length. The significant transactions entered into by the Group with related parties during the year, other than those disclosed elsewhere in these consolidated financial statements (see in particular notes 11 and 31), are as follows:
Transactions with related parties
2020 2019 AED’000 AED’000
A) Equity accounted investees
Sale of goods and services and construction contracts 1,858 1,955
Purchase of goods and rendering of services 1,810 174
Rental income 390 206
Interest expenses (refer note 10) 13 33
B) Other related parties
Sale of goods and services and construction contracts 88,970 104,967
Purchase of goods and rendering of services 217,610 264,710
Rental income 1,703 2,400
Key management personnel compensation
The remuneration of Directors and other key management personnel of the Company during the year were as follows:
2020 2019 AED’000 AED’000
Short-term benefits 9,376 10,262
Staff terminal benefits 245 399
Board of Directors’ remuneration 3,700 3,700
Due from related parties
Management of the Company, based on their review of these outstanding balances, is of the view that the existing provision is sufficient to cover any likely credit losses.
2020 2019 AED’000 AED’000
Equity accounted investees 43,530 44,147
Other related parties 32,164 43,417
75,694 87,564
Less : Allowance for expected credit loss (45,799) (50,201)
29,895 37,363
21. RELATED PARTIES
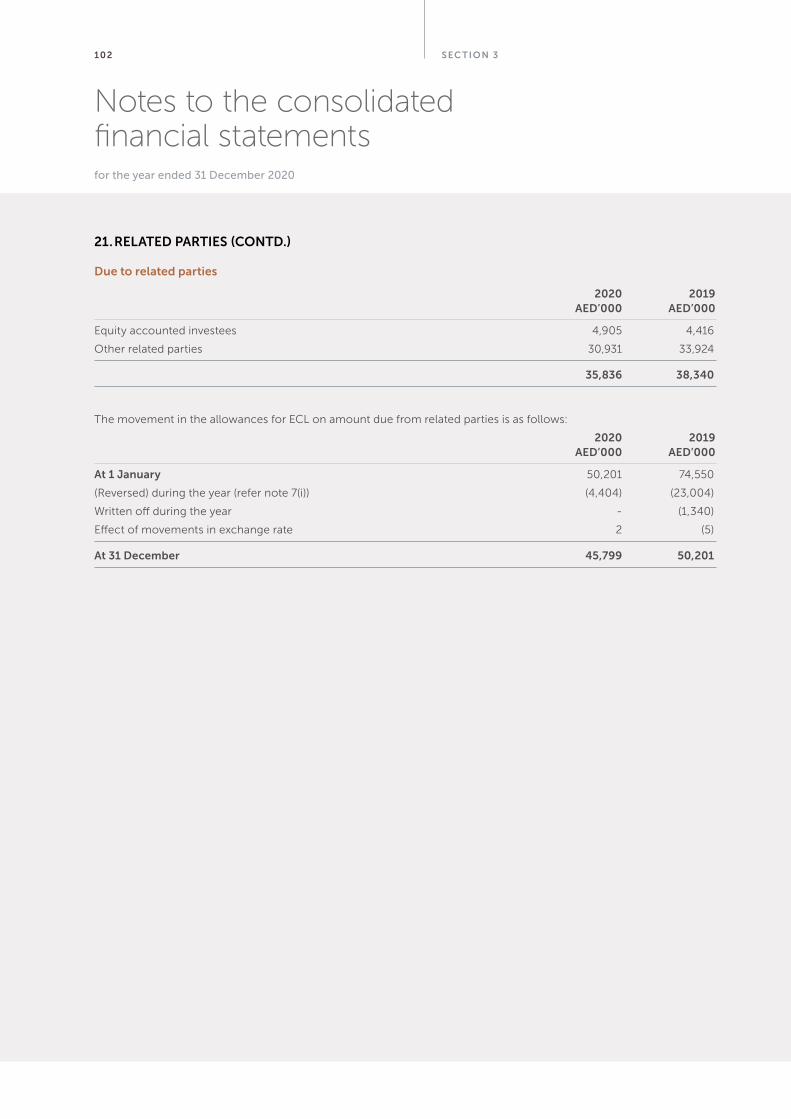
S EC TION 3102
Notes to the consolidated financial statementsfor the year ended 31 December 2020
Due to related parties
2020 2019 AED’000 AED’000
Equity accounted investees 4,905 4,416
Other related parties 30,931 33,924
35,836 38,340
The movement in the allowances for ECL on amount due from related parties is as follows:
2020 2019 AED’000 AED’000
At 1 January 50,201 74,550
(Reversed) during the year (refer note 7(i)) (4,404) (23,004)
Written off during the year - (1,340)
Effect of movements in exchange rate 2 (5)
At 31 December 45,799 50,201
21. RELATED PARTIES (CONTD.)
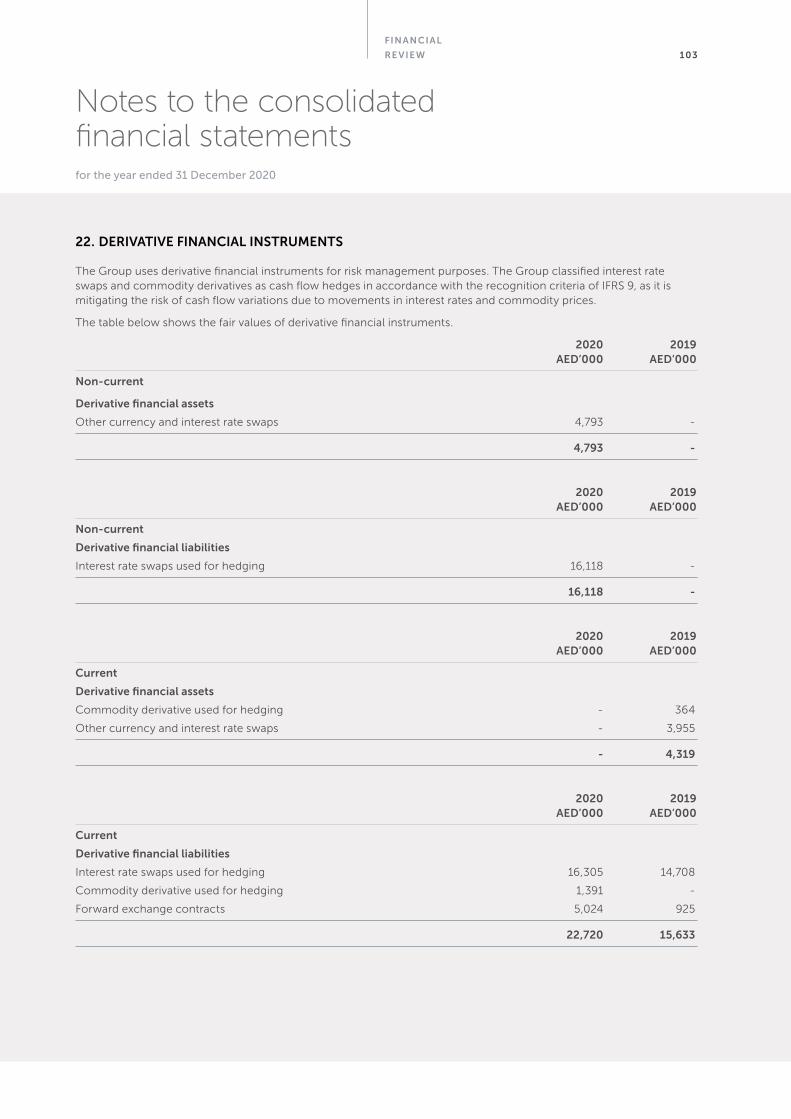
FINANCIAL
RE VIEW 103
Notes to the consolidated financial statementsfor the year ended 31 December 2020
The Group uses derivative financial instruments for risk management purposes. The Group classified interest rate swaps and commodity derivatives as cash flow hedges in accordance with the recognition criteria of IFRS 9, as it is mitigating the risk of cash flow variations due to movements in interest rates and commodity prices.
The table below shows the fair values of derivative financial instruments.
2020 2019 AED’000 AED’000
Non-current
Derivative financial assets
Other currency and interest rate swaps 4,793 -
4,793 -
2020 2019 AED’000 AED’000
Non-current
Derivative financial liabilities
Interest rate swaps used for hedging 16,118 -
16,118 -
2020 2019 AED’000 AED’000
Current
Derivative financial assets
Commodity derivative used for hedging - 364
Other currency and interest rate swaps - 3,955
- 4,319
2020 2019 AED’000 AED’000
Current
Derivative financial liabilities
Interest rate swaps used for hedging 16,305 14,708
Commodity derivative used for hedging 1,391 -
Forward exchange contracts 5,024 925
22,720 15,633
22. DERIVATIVE FINANCIAL INSTRUMENTS
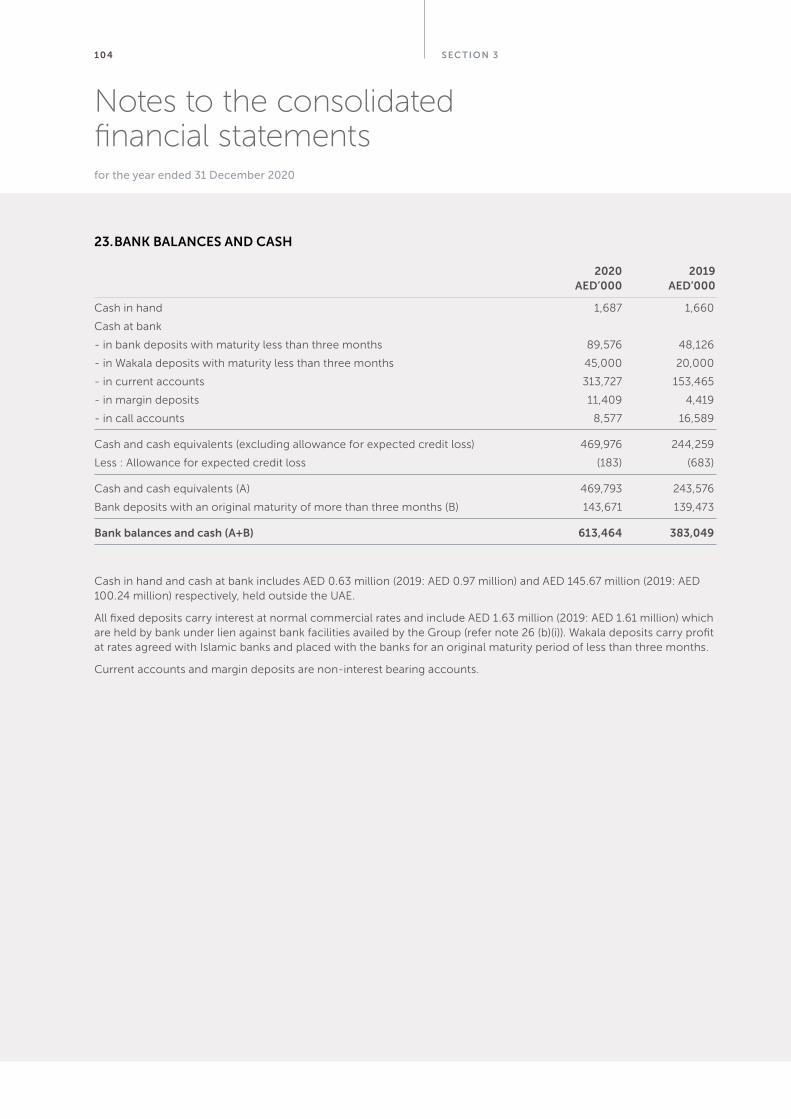
S EC TION 3104
Notes to the consolidated financial statementsfor the year ended 31 December 2020
2020 2019 AED’000 AED’000
Cash in hand 1,687 1,660
Cash at bank
- in bank deposits with maturity less than three months 89,576 48,126
- in Wakala deposits with maturity less than three months 45,000 20,000
- in current accounts 313,727 153,465
- in margin deposits 11,409 4,419
- in call accounts 8,577 16,589
Cash and cash equivalents (excluding allowance for expected credit loss) 469,976 244,259
Less : Allowance for expected credit loss (183) (683)
Cash and cash equivalents (A) 469,793 243,576
Bank deposits with an original maturity of more than three months (B) 143,671 139,473
Bank balances and cash (A+B) 613,464 383,049
Cash in hand and cash at bank includes AED 0.63 million (2019: AED 0.97 million) and AED 145.67 million (2019: AED 100.24 million) respectively, held outside the UAE.
All fixed deposits carry interest at normal commercial rates and include AED 1.63 million (2019: AED 1.61 million) which are held by bank under lien against bank facilities availed by the Group (refer note 26 (b)(i)). Wakala deposits carry profit at rates agreed with Islamic banks and placed with the banks for an original maturity period of less than three months.
Current accounts and margin deposits are non-interest bearing accounts.
23. BANK BALANCES AND CASH
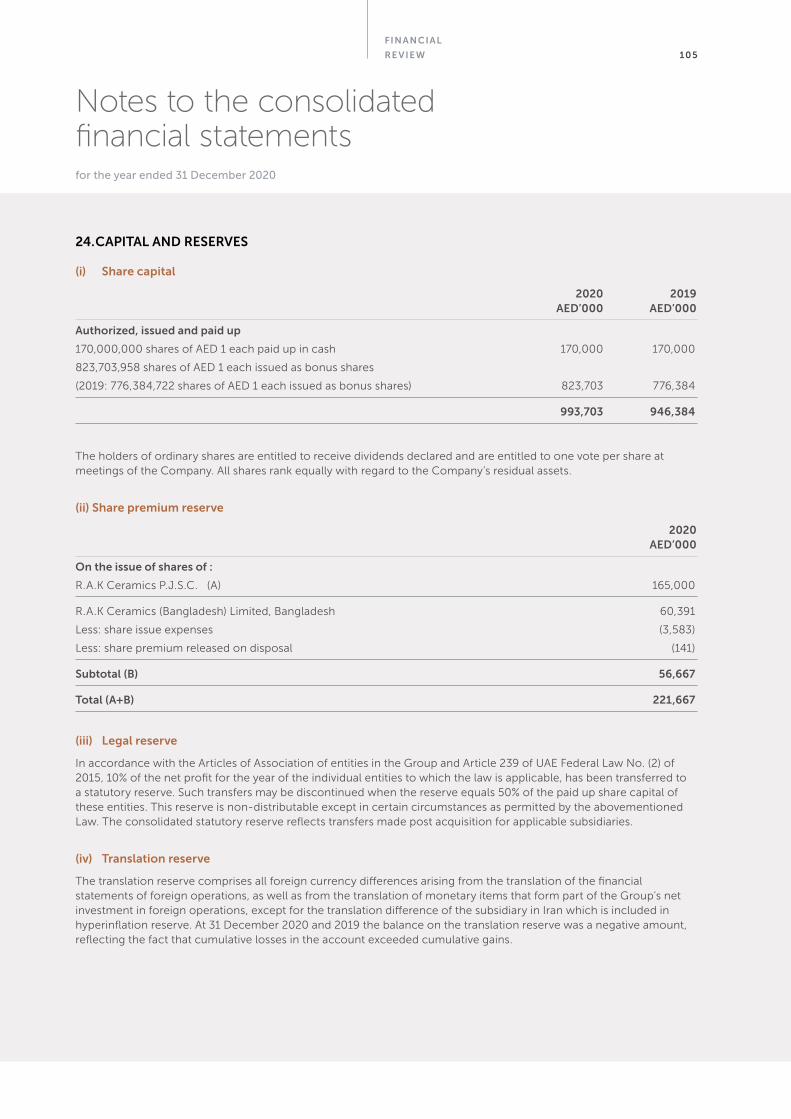
FINANCIAL
RE VIEW 105
Notes to the consolidated financial statementsfor the year ended 31 December 2020
(i) Share capital
2020 2019 AED’000 AED’000
Authorized, issued and paid up
170,000,000 shares of AED 1 each paid up in cash 170,000 170,000
823,703,958 shares of AED 1 each issued as bonus shares
(2019: 776,384,722 shares of AED 1 each issued as bonus shares) 823,703 776,384
993,703 946,384
The holders of ordinary shares are entitled to receive dividends declared and are entitled to one vote per share at meetings of the Company. All shares rank equally with regard to the Company’s residual assets.
(ii) Share premium reserve
2020 AED’000
On the issue of shares of :
R.A.K Ceramics P.J.S.C. (A) 165,000
R.A.K Ceramics (Bangladesh) Limited, Bangladesh 60,391
Less: share issue expenses (3,583)
Less: share premium released on disposal (141)
Subtotal (B) 56,667
Total (A+B) 221,667
(iii) Legal reserve
In accordance with the Articles of Association of entities in the Group and Article 239 of UAE Federal Law No. (2) of 2015, 10% of the net profit for the year of the individual entities to which the law is applicable, has been transferred to a statutory reserve. Such transfers may be discontinued when the reserve equals 50% of the paid up share capital of these entities. This reserve is non-distributable except in certain circumstances as permitted by the abovementioned Law. The consolidated statutory reserve reflects transfers made post acquisition for applicable subsidiaries.
(iv) Translation reserve
The translation reserve comprises all foreign currency differences arising from the translation of the financial statements of foreign operations, as well as from the translation of monetary items that form part of the Group’s net investment in foreign operations, except for the translation difference of the subsidiary in Iran which is included in hyperinflation reserve. At 31 December 2020 and 2019 the balance on the translation reserve was a negative amount, reflecting the fact that cumulative losses in the account exceeded cumulative gains.
24. CAPITAL AND RESERVES
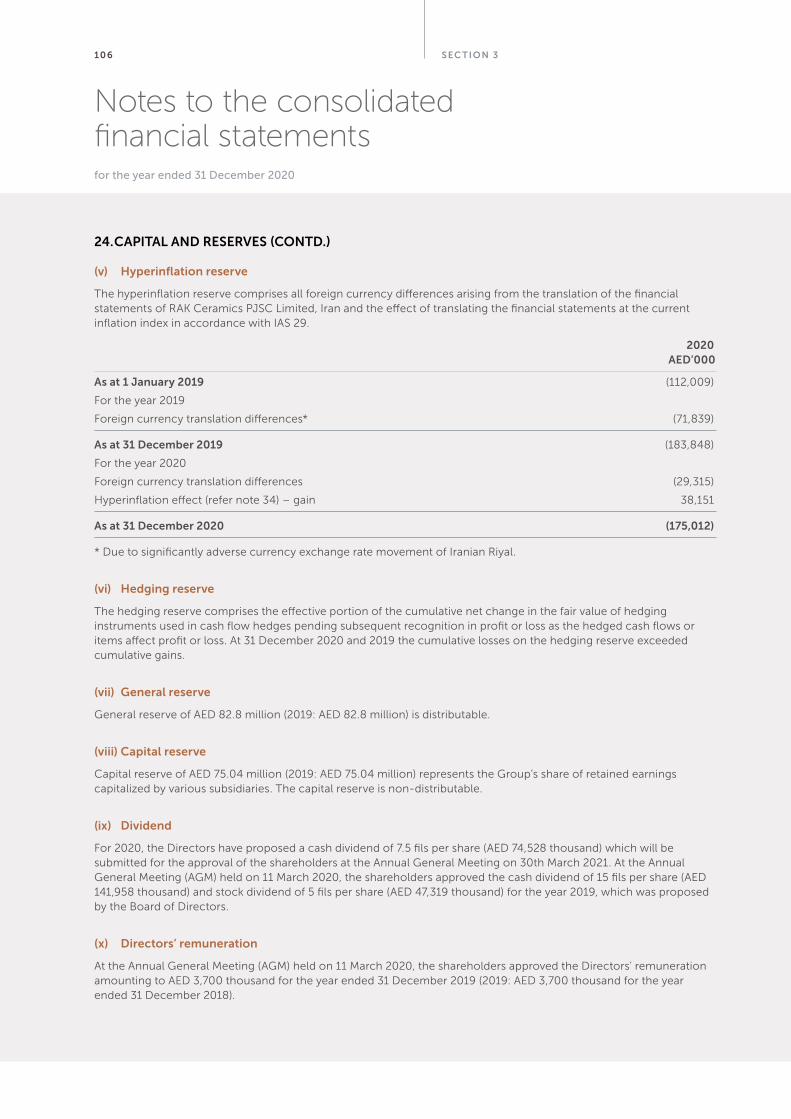
S EC TION 3106
Notes to the consolidated financial statementsfor the year ended 31 December 2020
(v) Hyperinflation reserve
The hyperinflation reserve comprises all foreign currency differences arising from the translation of the financial statements of RAK Ceramics PJSC Limited, Iran and the effect of translating the financial statements at the current inflation index in accordance with IAS 29.
2020 AED’000
As at 1 January 2019 (112,009)
For the year 2019
Foreign currency translation differences* (71,839)
As at 31 December 2019 (183,848)
For the year 2020
Foreign currency translation differences (29,315)
Hyperinflation effect (refer note 34) – gain 38,151
As at 31 December 2020 (175,012)
* Due to significantly adverse currency exchange rate movement of Iranian Riyal.
(vi) Hedging reserve
The hedging reserve comprises the effective portion of the cumulative net change in the fair value of hedging instruments used in cash flow hedges pending subsequent recognition in profit or loss as the hedged cash flows or items affect profit or loss. At 31 December 2020 and 2019 the cumulative losses on the hedging reserve exceeded cumulative gains.
(vii) General reserve
General reserve of AED 82.8 million (2019: AED 82.8 million) is distributable.
(viii) Capital reserve
Capital reserve of AED 75.04 million (2019: AED 75.04 million) represents the Group’s share of retained earnings capitalized by various subsidiaries. The capital reserve is non-distributable.
(ix) Dividend
For 2020, the Directors have proposed a cash dividend of 7.5 fils per share (AED 74,528 thousand) which will be submitted for the approval of the shareholders at the Annual General Meeting on 30th March 2021. At the Annual General Meeting (AGM) held on 11 March 2020, the shareholders approved the cash dividend of 15 fils per share (AED 141,958 thousand) and stock dividend of 5 fils per share (AED 47,319 thousand) for the year 2019, which was proposed by the Board of Directors.
(x) Directors’ remuneration
At the Annual General Meeting (AGM) held on 11 March 2020, the shareholders approved the Directors’ remuneration amounting to AED 3,700 thousand for the year ended 31 December 2019 (2019: AED 3,700 thousand for the year ended 31 December 2018).
24. CAPITAL AND RESERVES (CONTD.)

FINANCIAL
RE VIEW 107
Notes to the consolidated financial statementsfor the year ended 31 December 2020
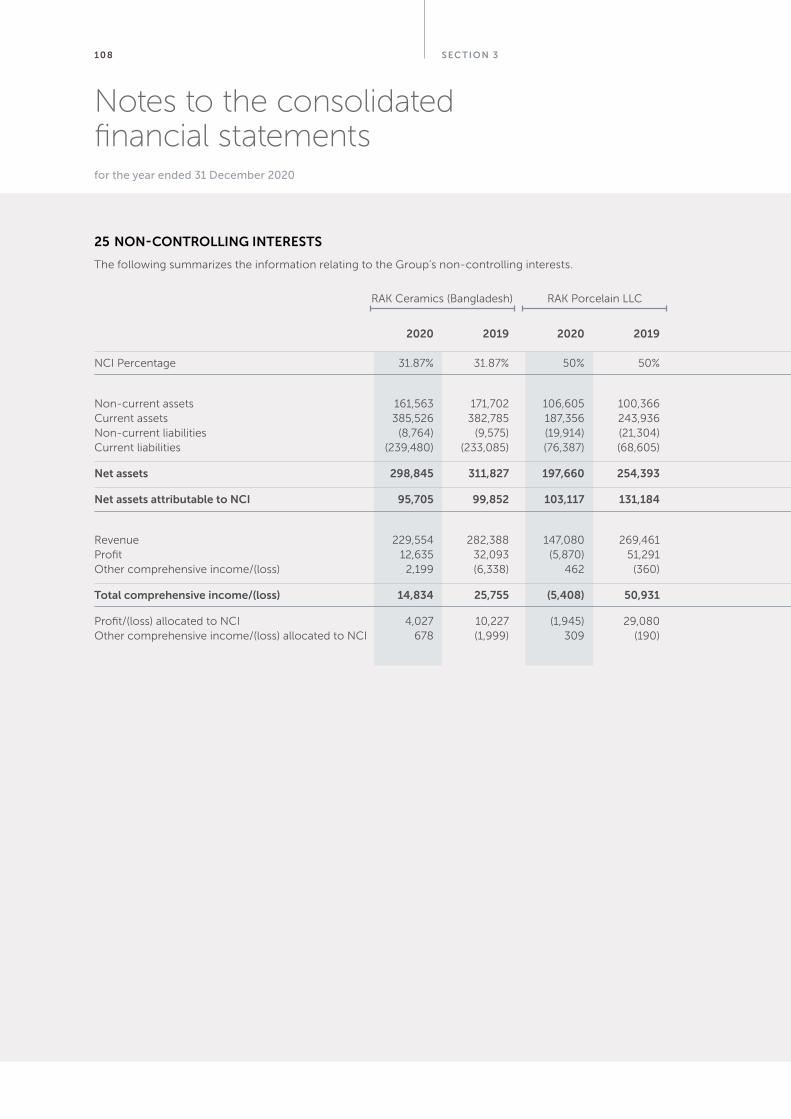
S EC TION 3108
Notes to the consolidated financial statementsfor the year ended 31 December 2020
25 NON-CONTROLLING INTERESTS
The following summarizes the information relating to the Group’s non-controlling interests.
2020 2019 2020 2019 2020 2019 2020 2019 2020 2019
NCI Percentage 31.87% 31.87% 50% 50%
Non-current assets 161,563 171,702 106,605 100,366Current assets 385,526 382,785 187,356 243,936Non-current liabilities (8,764) (9,575) (19,914) (21,304)Current liabilities (239,480) (233,085) (76,387) (68,605)
Net assets 298,845 311,827 197,660 254,393
Net assets attributable to NCI 95,705 99,852 103,117 131,184 22,296 21,620 (14,216) (14,401) 206,902 238,255
Revenue 229,554 282,388 147,080 269,461 Profit 12,635 32,093 (5,870) 51,291 Other comprehensive income/(loss) 2,199 (6,338) 462 (360)
Total comprehensive income/(loss) 14,834 25,755 (5,408) 50,931
Profit/(loss) allocated to NCI 4,027 10,227 (1,945) 29,080 1,484 1,471 - - 3,566 40,778Other comprehensive income/(loss) allocated to NCI 678 (1,999) 309 (190) (430) (451) - - 557 (2,640)
RAK Ceramics (Bangladesh) RAK Porcelain LLC
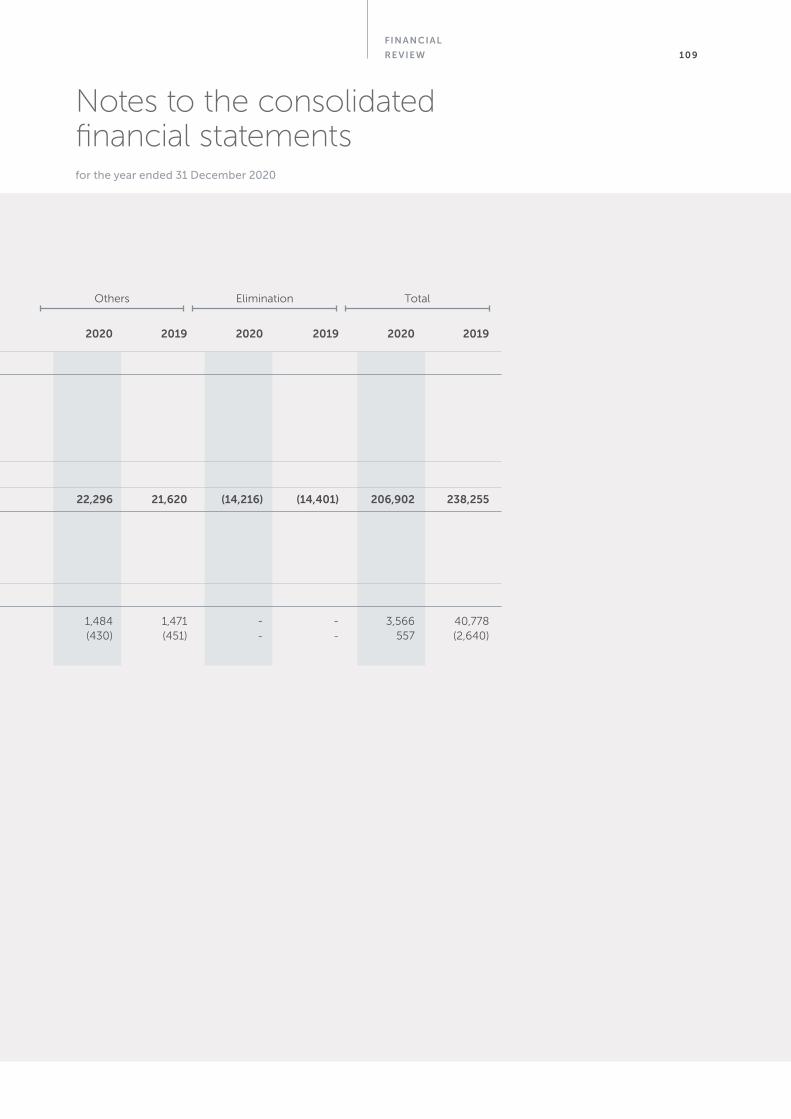
FINANCIAL
RE VIEW 109
Notes to the consolidated financial statementsfor the year ended 31 December 2020
2020 2019 2020 2019 2020 2019 2020 2019 2020 2019
NCI Percentage 31.87% 31.87% 50% 50%
Non-current assets 161,563 171,702 106,605 100,366Current assets 385,526 382,785 187,356 243,936Non-current liabilities (8,764) (9,575) (19,914) (21,304)Current liabilities (239,480) (233,085) (76,387) (68,605)
Net assets 298,845 311,827 197,660 254,393
Net assets attributable to NCI 95,705 99,852 103,117 131,184 22,296 21,620 (14,216) (14,401) 206,902 238,255
Revenue 229,554 282,388 147,080 269,461 Profit 12,635 32,093 (5,870) 51,291 Other comprehensive income/(loss) 2,199 (6,338) 462 (360)
Total comprehensive income/(loss) 14,834 25,755 (5,408) 50,931
Profit/(loss) allocated to NCI 4,027 10,227 (1,945) 29,080 1,484 1,471 - - 3,566 40,778Other comprehensive income/(loss) allocated to NCI 678 (1,999) 309 (190) (430) (451) - - 557 (2,640)
Others Elimination Total
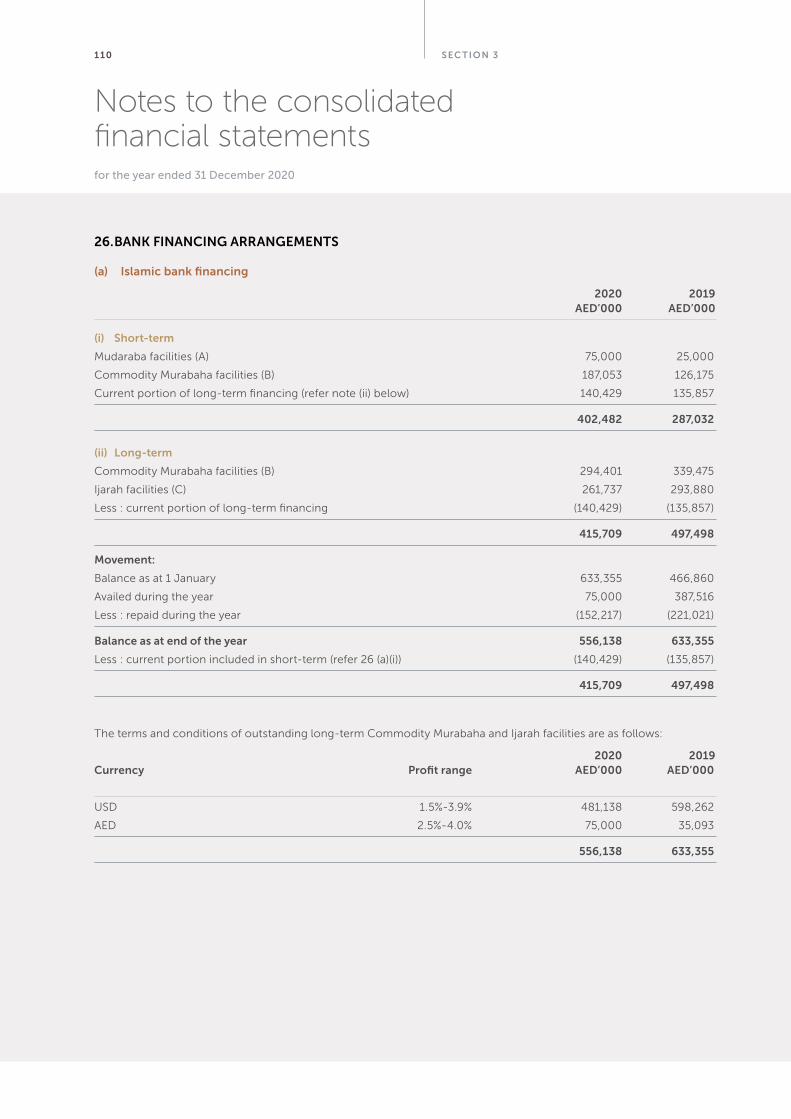
S EC TION 31 10
Notes to the consolidated financial statementsfor the year ended 31 December 2020
(a) Islamic bank financing
2020 2019 AED’000 AED’000
(i) Short-term
Mudaraba facilities (A) 75,000 25,000
Commodity Murabaha facilities (B) 187,053 126,175
Current portion of long-term financing (refer note (ii) below) 140,429 135,857
402,482 287,032
(ii) Long-term
Commodity Murabaha facilities (B) 294,401 339,475
Ijarah facilities (C) 261,737 293,880
Less : current portion of long-term financing (140,429) (135,857)
415,709 497,498
Movement:
Balance as at 1 January 633,355 466,860
Availed during the year 75,000 387,516
Less : repaid during the year (152,217) (221,021)
Balance as at end of the year 556,138 633,355
Less : current portion included in short-term (refer 26 (a)(i)) (140,429) (135,857)
415,709 497,498
The terms and conditions of outstanding long-term Commodity Murabaha and Ijarah facilities are as follows:
2020 2019 Currency Profit range AED’000 AED’000
USD 1.5%-3.9% 481,138 598,262
AED 2.5%-4.0% 75,000 35,093
556,138 633,355
26. BANK FINANCING ARRANGEMENTS
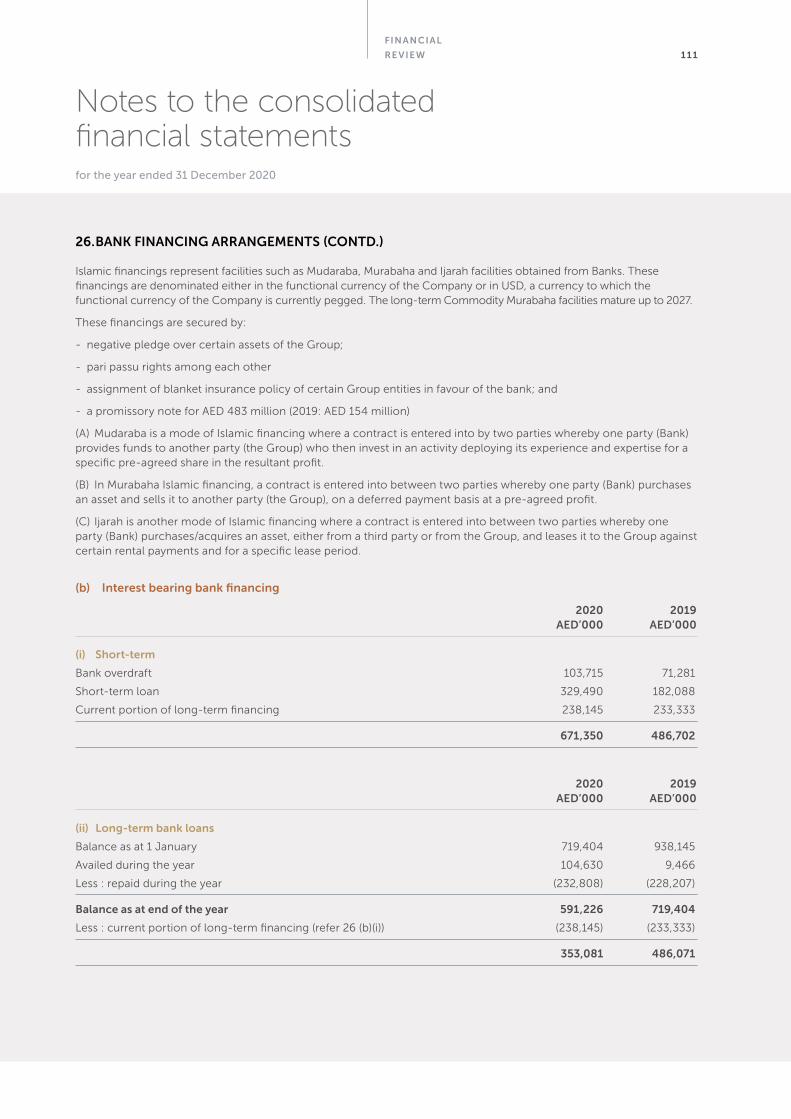
FINANCIAL
RE VIEW 1 1 1
Notes to the consolidated financial statementsfor the year ended 31 December 2020
Islamic financings represent facilities such as Mudaraba, Murabaha and Ijarah facilities obtained from Banks. These financings are denominated either in the functional currency of the Company or in USD, a currency to which the functional currency of the Company is currently pegged. The long-term Commodity Murabaha facilities mature up to 2027.
These financings are secured by:
- negative pledge over certain assets of the Group;
- pari passu rights among each other
- assignment of blanket insurance policy of certain Group entities in favour of the bank; and
- a promissory note for AED 483 million (2019: AED 154 million)
(A) Mudaraba is a mode of Islamic financing where a contract is entered into by two parties whereby one party (Bank) provides funds to another party (the Group) who then invest in an activity deploying its experience and expertise for a specific pre-agreed share in the resultant profit.
(B) In Murabaha Islamic financing, a contract is entered into between two parties whereby one party (Bank) purchases an asset and sells it to another party (the Group), on a deferred payment basis at a pre-agreed profit.
(C) Ijarah is another mode of Islamic financing where a contract is entered into between two parties whereby one party (Bank) purchases/acquires an asset, either from a third party or from the Group, and leases it to the Group against certain rental payments and for a specific lease period.
(b) Interest bearing bank financing
2020 2019 AED’000 AED’000
(i) Short-term
Bank overdraft 103,715 71,281
Short-term loan 329,490 182,088
Current portion of long-term financing 238,145 233,333
671,350 486,702
2020 2019 AED’000 AED’000
(ii) Long-term bank loans
Balance as at 1 January 719,404 938,145
Availed during the year 104,630 9,466
Less : repaid during the year (232,808) (228,207)
Balance as at end of the year 591,226 719,404
Less : current portion of long-term financing (refer 26 (b)(i)) (238,145) (233,333)
353,081 486,071
26. BANK FINANCING ARRANGEMENTS (CONTD.)
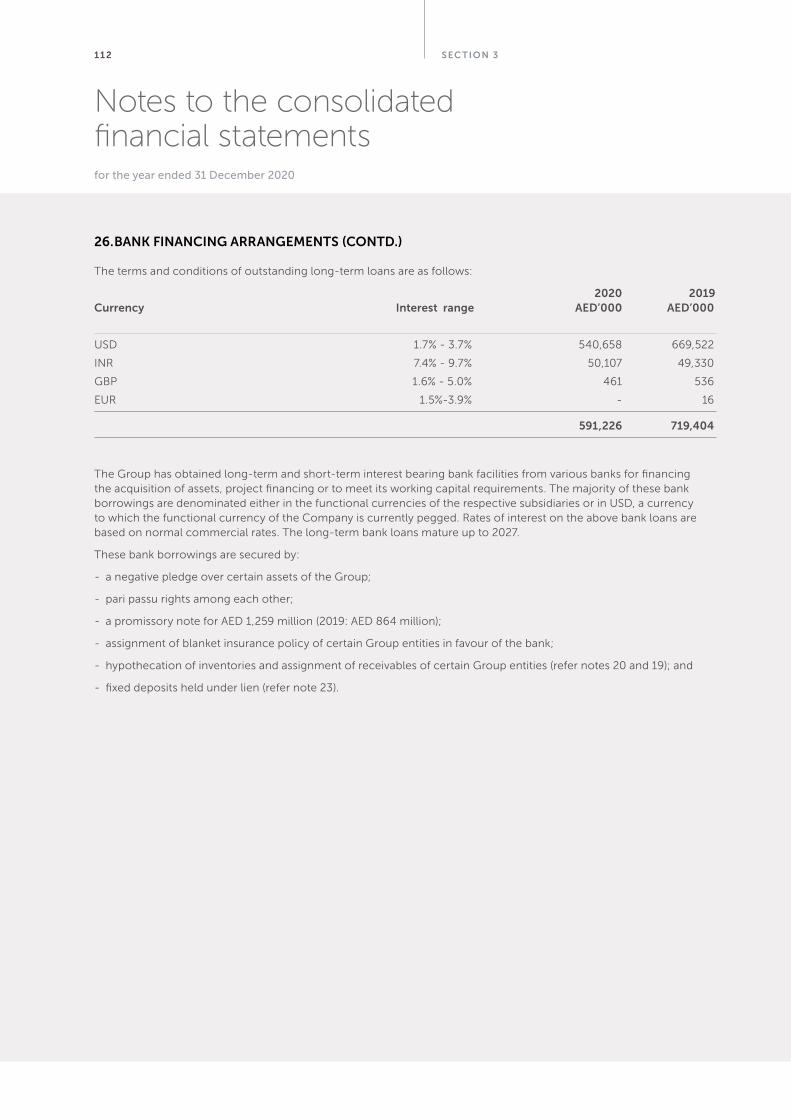
S EC TION 31 1 2
Notes to the consolidated financial statementsfor the year ended 31 December 2020
The terms and conditions of outstanding long-term loans are as follows:
2020 2019 Currency Interest range AED’000 AED’000
USD 1.7% - 3.7% 540,658 669,522
INR 7.4% - 9.7% 50,107 49,330
GBP 1.6% - 5.0% 461 536
EUR 1.5%-3.9% - 16
591,226 719,404
The Group has obtained long-term and short-term interest bearing bank facilities from various banks for financing the acquisition of assets, project financing or to meet its working capital requirements. The majority of these bank borrowings are denominated either in the functional currencies of the respective subsidiaries or in USD, a currency to which the functional currency of the Company is currently pegged. Rates of interest on the above bank loans are based on normal commercial rates. The long-term bank loans mature up to 2027.
These bank borrowings are secured by:
- a negative pledge over certain assets of the Group;
- pari passu rights among each other;
- a promissory note for AED 1,259 million (2019: AED 864 million);
- assignment of blanket insurance policy of certain Group entities in favour of the bank;
- hypothecation of inventories and assignment of receivables of certain Group entities (refer notes 20 and 19); and
- fixed deposits held under lien (refer note 23).
26. BANK FINANCING ARRANGEMENTS (CONTD.)
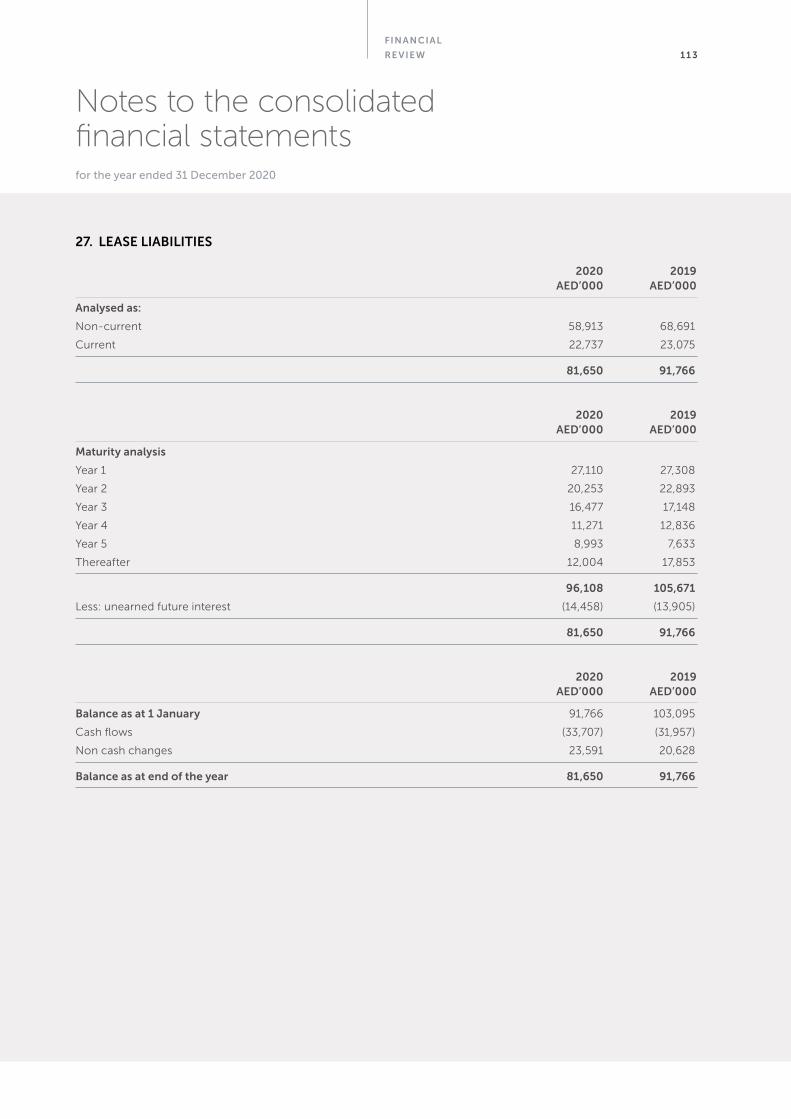
FINANCIAL
RE VIEW 1 1 3
Notes to the consolidated financial statementsfor the year ended 31 December 2020
2020 2019 AED’000 AED’000
Analysed as:
Non-current 58,913 68,691
Current 22,737 23,075
81,650 91,766
2020 2019 AED’000 AED’000
Maturity analysis
Year 1 27,110 27,308
Year 2 20,253 22,893
Year 3 16,477 17,148
Year 4 11,271 12,836
Year 5 8,993 7,633
Thereafter 12,004 17,853
96,108 105,671
Less: unearned future interest (14,458) (13,905)
81,650 91,766
2020 2019 AED’000 AED’000
Balance as at 1 January 91,766 103,095
Cash flows (33,707) (31,957)
Non cash changes 23,591 20,628
Balance as at end of the year 81,650 91,766
27. LEASE LIABILITIES
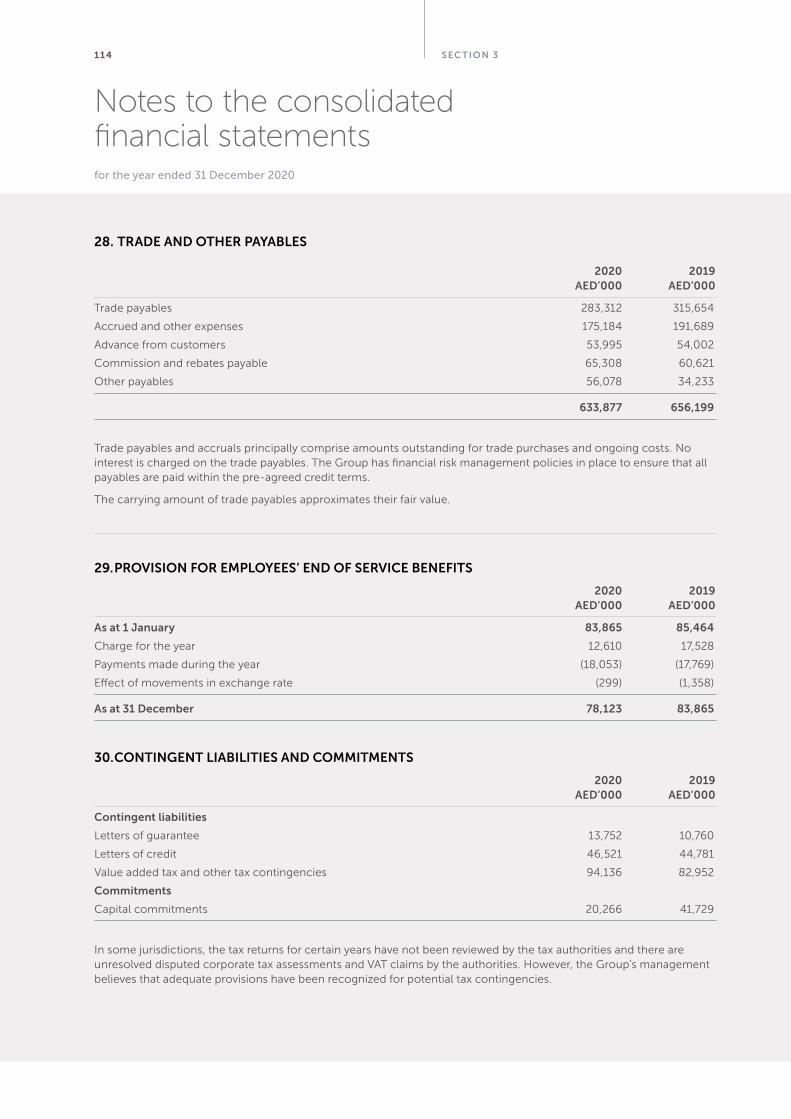
S EC TION 31 14
Notes to the consolidated financial statementsfor the year ended 31 December 2020
2020 2019 AED’000 AED’000
Trade payables 283,312 315,654
Accrued and other expenses 175,184 191,689
Advance from customers 53,995 54,002
Commission and rebates payable 65,308 60,621
Other payables 56,078 34,233
633,877 656,199
Trade payables and accruals principally comprise amounts outstanding for trade purchases and ongoing costs. No interest is charged on the trade payables. The Group has financial risk management policies in place to ensure that all payables are paid within the pre-agreed credit terms.
The carrying amount of trade payables approximates their fair value.
29. PROVISION FOR EMPLOYEES’ END OF SERVICE BENEFITS
2020 2019 AED’000 AED’000
As at 1 January 83,865 85,464
Charge for the year 12,610 17,528
Payments made during the year (18,053) (17,769)
Effect of movements in exchange rate (299) (1,358)
As at 31 December 78,123 83,865
30. CONTINGENT LIABILITIES AND COMMITMENTS
2020 2019 AED’000 AED’000
Contingent liabilities
Letters of guarantee 13,752 10,760
Letters of credit 46,521 44,781
Value added tax and other tax contingencies 94,136 82,952
Commitments
Capital commitments 20,266 41,729
In some jurisdictions, the tax returns for certain years have not been reviewed by the tax authorities and there are unresolved disputed corporate tax assessments and VAT claims by the authorities. However, the Group’s management believes that adequate provisions have been recognized for potential tax contingencies.
28. TRADE AND OTHER PAYABLES
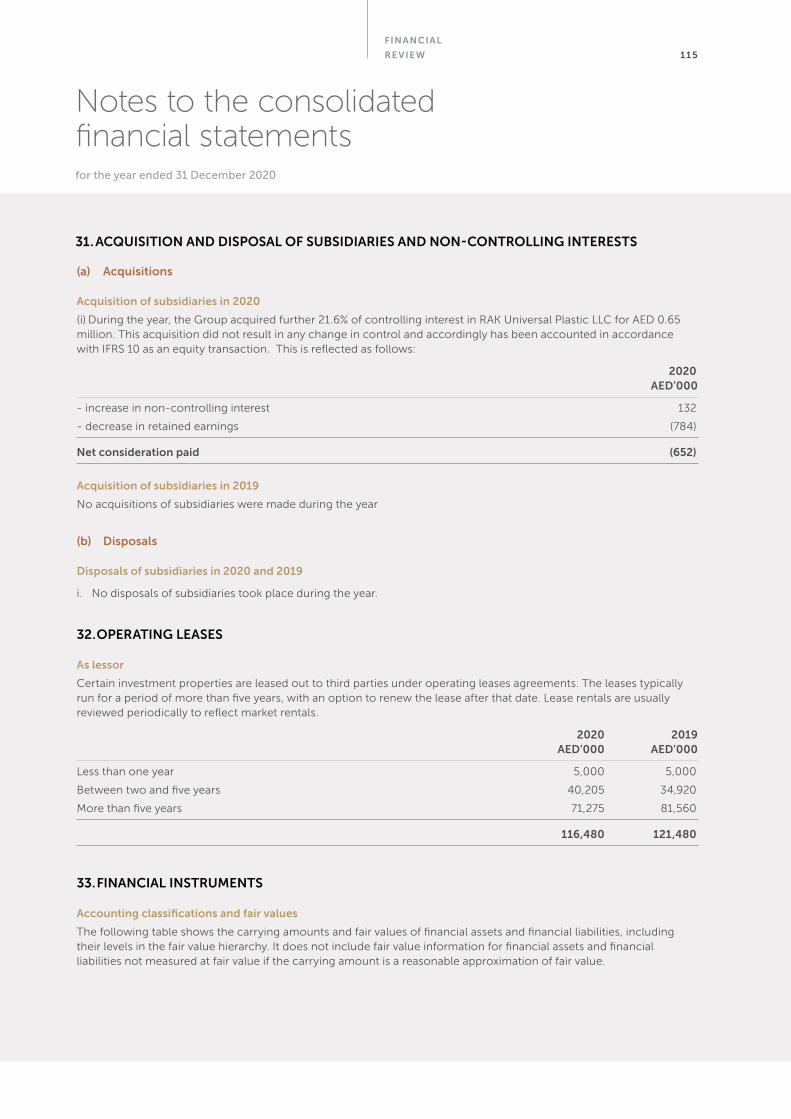
FINANCIAL
RE VIEW 1 1 5
Notes to the consolidated financial statementsfor the year ended 31 December 2020
(a) Acquisitions
Acquisition of subsidiaries in 2020
(i) During the year, the Group acquired further 21.6% of controlling interest in RAK Universal Plastic LLC for AED 0.65 million. This acquisition did not result in any change in control and accordingly has been accounted in accordance with IFRS 10 as an equity transaction. This is reflected as follows:
2020 AED’000
- increase in non-controlling interest 132
- decrease in retained earnings (784)
Net consideration paid (652)
Acquisition of subsidiaries in 2019
No acquisitions of subsidiaries were made during the year
(b) Disposals
Disposals of subsidiaries in 2020 and 2019
i. No disposals of subsidiaries took place during the year.
32. OPERATING LEASES
As lessor
Certain investment properties are leased out to third parties under operating leases agreements. The leases typically run for a period of more than five years, with an option to renew the lease after that date. Lease rentals are usually reviewed periodically to reflect market rentals.
2020 2019 AED’000 AED’000
Less than one year 5,000 5,000
Between two and five years 40,205 34,920
More than five years 71,275 81,560
116,480 121,480
33. FINANCIAL INSTRUMENTS
Accounting classifications and fair values
The following table shows the carrying amounts and fair values of financial assets and financial liabilities, including their levels in the fair value hierarchy. It does not include fair value information for financial assets and financial liabilities not measured at fair value if the carrying amount is a reasonable approximation of fair value.
31. ACQUISITION AND DISPOSAL OF SUBSIDIARIES AND NON-CONTROLLING INTERESTS
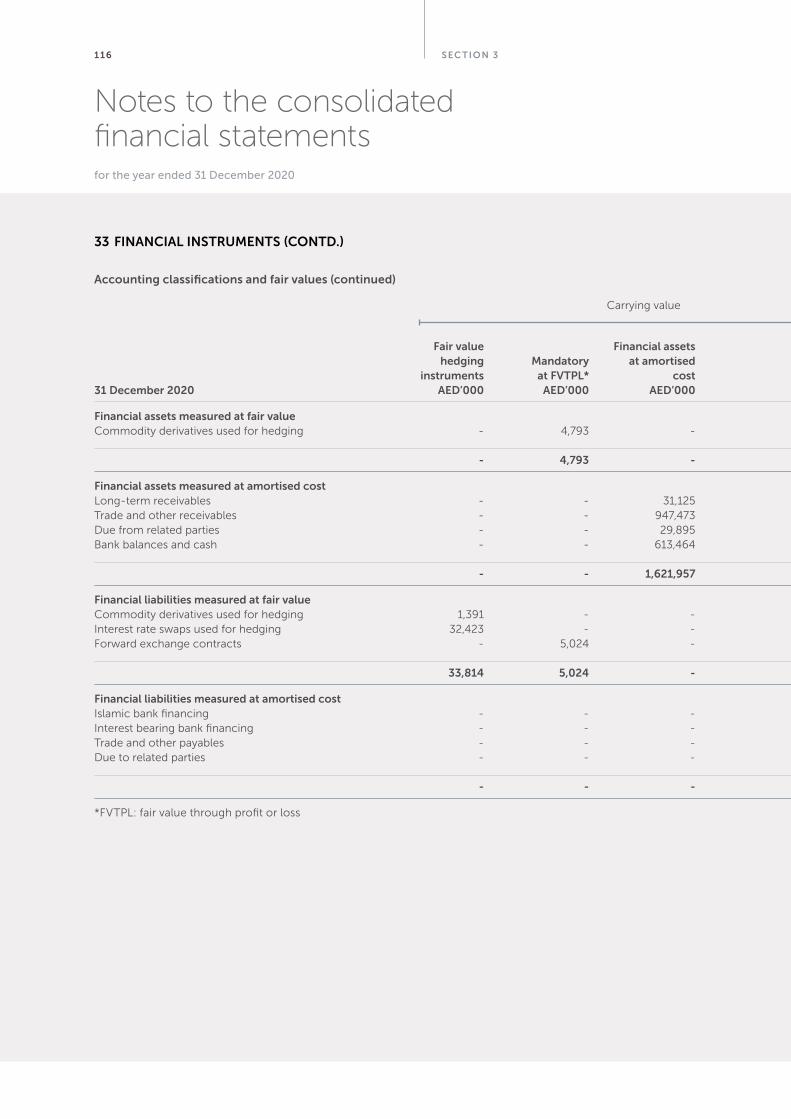
S EC TION 31 16
Notes to the consolidated financial statementsfor the year ended 31 December 2020
Carrying value
33 FINANCIAL INSTRUMENTS (CONTD.)
Accounting classifications and fair values (continued)
Fair value Financial assets Other hedging Mandatory at amortised financial instruments at FVTPL* cost liabilities Total Level 1 Level 2 Level 3 Total 31 December 2020 AED’000 AED’000 AED’000 AED’000 AED’000 AED’000 AED’000 AED’000 AED’000
Financial assets measured at fair value Commodity derivatives used for hedging - 4,793 - - 4,793 - 4,793 - 4,793
- 4,793 - - 4,793 - 4,793 - 4,793
Financial assets measured at amortised cost Long-term receivables - - 31,125 - 31,125 - - - -Trade and other receivables - - 947,473 - 947,473 - - - -Due from related parties - - 29,895 - 29,895 - - - -Bank balances and cash - - 613,464 - 613,464 - - - -
- - 1,621,957 - 1,621,957 - - - -
Financial liabilities measured at fair value Commodity derivatives used for hedging 1,391 - - - 1,391 - 1,391 - 1,391Interest rate swaps used for hedging 32,423 - - - 32,423 - 32,423 - 32,423Forward exchange contracts - 5,024 - - 5,024 - 5,024 - 5,024
33,814 5,024 - - 38,838 - 38,838 - 38,838
Financial liabilities measured at amortised cost Islamic bank financing - - - 818,191 818,191 - - - -Interest bearing bank financing - - - 1,024,431 1,024,431 - - - -Trade and other payables - - - 579,882 579,882 - - - -Due to related parties - - - 35,836 35,836 - - - -
- - - 2,458,340 2,458,340 - - - -
*FVTPL: fair value through profit or loss
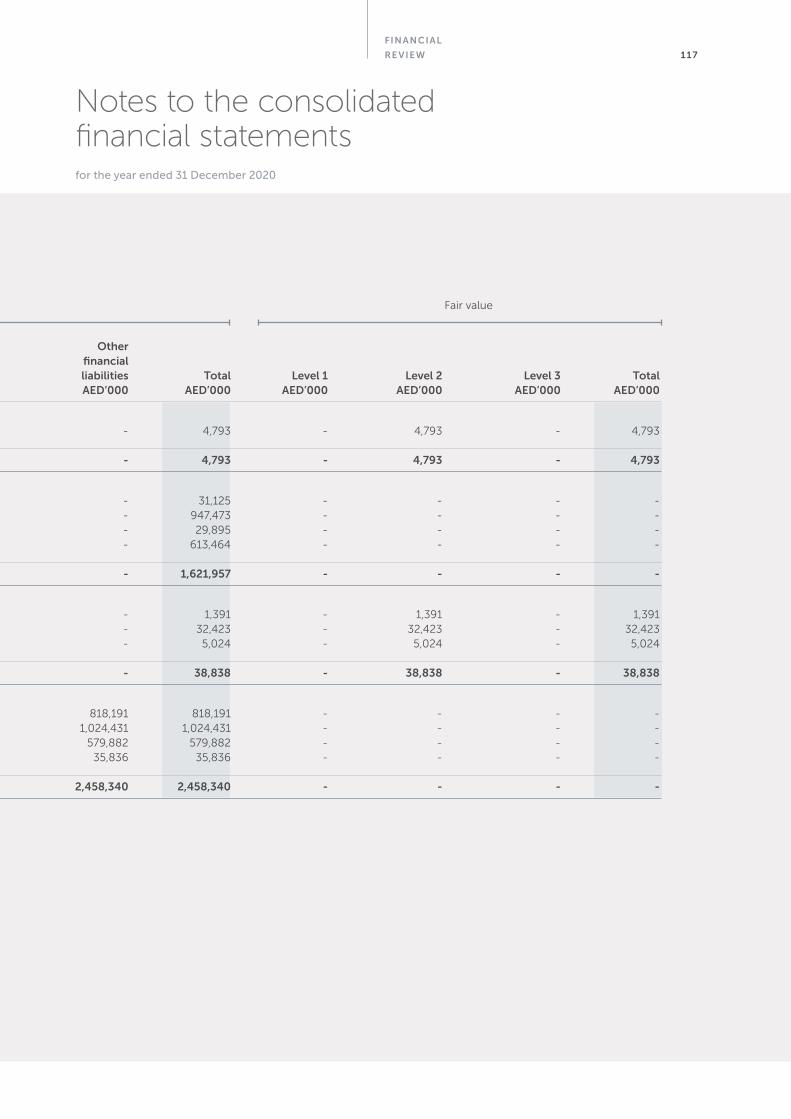
FINANCIAL
RE VIEW 1 17
Notes to the consolidated financial statementsfor the year ended 31 December 2020
Fair value
Fair value Financial assets Other hedging Mandatory at amortised financial instruments at FVTPL* cost liabilities Total Level 1 Level 2 Level 3 Total 31 December 2020 AED’000 AED’000 AED’000 AED’000 AED’000 AED’000 AED’000 AED’000 AED’000
Financial assets measured at fair value Commodity derivatives used for hedging - 4,793 - - 4,793 - 4,793 - 4,793
- 4,793 - - 4,793 - 4,793 - 4,793
Financial assets measured at amortised cost Long-term receivables - - 31,125 - 31,125 - - - -Trade and other receivables - - 947,473 - 947,473 - - - -Due from related parties - - 29,895 - 29,895 - - - -Bank balances and cash - - 613,464 - 613,464 - - - -
- - 1,621,957 - 1,621,957 - - - -
Financial liabilities measured at fair value Commodity derivatives used for hedging 1,391 - - - 1,391 - 1,391 - 1,391Interest rate swaps used for hedging 32,423 - - - 32,423 - 32,423 - 32,423Forward exchange contracts - 5,024 - - 5,024 - 5,024 - 5,024
33,814 5,024 - - 38,838 - 38,838 - 38,838
Financial liabilities measured at amortised cost Islamic bank financing - - - 818,191 818,191 - - - -Interest bearing bank financing - - - 1,024,431 1,024,431 - - - -Trade and other payables - - - 579,882 579,882 - - - -Due to related parties - - - 35,836 35,836 - - - -
- - - 2,458,340 2,458,340 - - - -
*FVTPL: fair value through profit or loss
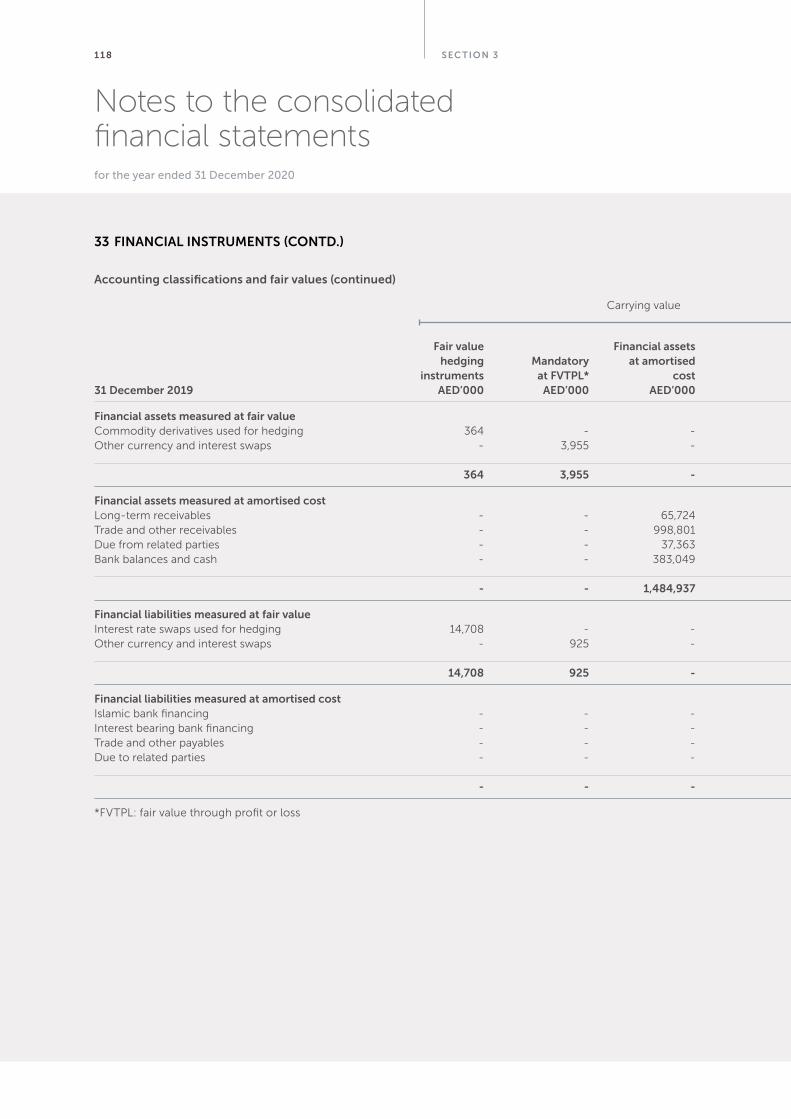
S EC TION 31 18
Notes to the consolidated financial statementsfor the year ended 31 December 2020
Carrying value
Fair value Financial assets Other hedging Mandatory at amortised financial instruments at FVTPL* cost liabilities Total Level 1 Level 2 Level 3 Total 31 December 2019 AED’000 AED’000 AED’000 AED’000 AED’000 AED’000 AED’000 AED’000 AED’000
Financial assets measured at fair value Commodity derivatives used for hedging 364 - - - 364 - 364 - 364Other currency and interest swaps - 3,955 - - 3,955 - 3,955 - 3,955
364 3,955 - - 4,319 - 4,319 - 4,319
Financial assets measured at amortised cost Long-term receivables - - 65,724 - 65,724 - - - -Trade and other receivables - - 998,801 - 998,801 - - - -Due from related parties - - 37,363 - 37,363 - - - -Bank balances and cash - - 383,049 - 383,049 - - - -
- - 1,484,937 - 1,484,937 - - - -
Financial liabilities measured at fair value Interest rate swaps used for hedging 14,708 - - - 14,708 - 14,708 - 14,708Other currency and interest swaps - 925 - - 925 - 925 - 925
14,708 925 - - 15,633 - 15,633 - 15,633
Financial liabilities measured at amortised cost Islamic bank financing - - - 784,530 784,530 - - - -Interest bearing bank financing - - - 972,773 972,773 - - - -Trade and other payables - - - 602,197 602,197 - - - -Due to related parties - - - 38,340 38,340 - - - -
- - - 2,397,840 2,397,840 - - - -
*FVTPL: fair value through profit or loss
33 FINANCIAL INSTRUMENTS (CONTD.)
Accounting classifications and fair values (continued)
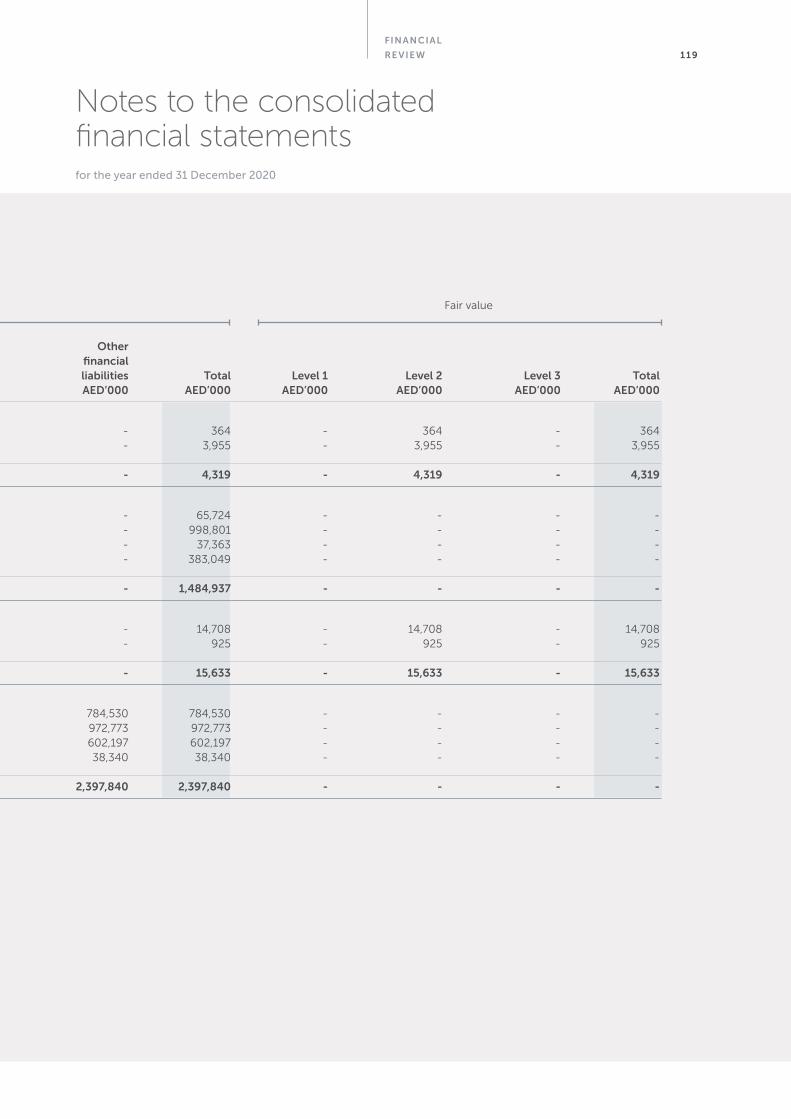
FINANCIAL
RE VIEW 1 19
Notes to the consolidated financial statementsfor the year ended 31 December 2020
Fair value
Fair value Financial assets Other hedging Mandatory at amortised financial instruments at FVTPL* cost liabilities Total Level 1 Level 2 Level 3 Total 31 December 2019 AED’000 AED’000 AED’000 AED’000 AED’000 AED’000 AED’000 AED’000 AED’000
Financial assets measured at fair value Commodity derivatives used for hedging 364 - - - 364 - 364 - 364Other currency and interest swaps - 3,955 - - 3,955 - 3,955 - 3,955
364 3,955 - - 4,319 - 4,319 - 4,319
Financial assets measured at amortised cost Long-term receivables - - 65,724 - 65,724 - - - -Trade and other receivables - - 998,801 - 998,801 - - - -Due from related parties - - 37,363 - 37,363 - - - -Bank balances and cash - - 383,049 - 383,049 - - - -
- - 1,484,937 - 1,484,937 - - - -
Financial liabilities measured at fair value Interest rate swaps used for hedging 14,708 - - - 14,708 - 14,708 - 14,708Other currency and interest swaps - 925 - - 925 - 925 - 925
14,708 925 - - 15,633 - 15,633 - 15,633
Financial liabilities measured at amortised cost Islamic bank financing - - - 784,530 784,530 - - - -Interest bearing bank financing - - - 972,773 972,773 - - - -Trade and other payables - - - 602,197 602,197 - - - -Due to related parties - - - 38,340 38,340 - - - -
- - - 2,397,840 2,397,840 - - - -
*FVTPL: fair value through profit or loss
S EC TION 31 20
Notes to the consolidated financial statementsfor the year ended 31 December 2020
During the current and previous years, there were no transfers between Level 1 and Level 2 fair value measurements, and no transfers into or out of Level 3 fair value measurements.
Risk management framework
The Group has exposure to the following risks from its use of financial instruments:
• Credit risk
• Liquidity risk
• Market risk
This note presents information about the Group’s exposure to each of the above risks, the Group’s objectives, policies and processes for measuring and managing risk, and the Group’s management of capital.
The Board of Directors has overall responsibility for the establishment and oversight of the Group’s risk management framework. The Group’s senior management are responsible for developing and monitoring the Group’s risk management policies and report regularly to the Board of Directors on their activities. The Group’s current financial risk management framework is a combination of formally documented risk management policies in certain areas and informal risk management practices in others.
The Group’s risk management policies (both formal and informal) are established to identify and analyse the risks faced by the Group, to set appropriate risk limits and controls, and to monitor risks and adherence to limits. Risk management policies and systems are reviewed regularly to reflect changes in market conditions and the Group’s activities. The Group, through its training and management standards and procedures, aims to develop a disciplined and constructive control environment in which all employees understand their roles and obligations.
The Audit Committee oversees how management monitors compliance with the Group’s risk management policies and procedures, and reviews the adequacy of the risk management framework in relation to the risks faced by the Group. The Audit Committee is assisted in its oversight role by the Internal Control department. Internal control undertakes both regular and ad hoc reviews of risk management controls and procedures, the results of which are reported to the Audit Committee.
As part of the application of the risk management policies, senior management is also responsible for development and implementation of controls to address operational risks arising from a wide variety of causes associated with the Group’s processes, personnel, technology and infrastructure, and from external factors arising from legal and regulatory requirements, political and economic stability in the jurisdictions that the Group operates and generally accepted standards of corporate behavior (also refer note 37 - COVID-19 impact).
The Group’s non-derivative financial liabilities comprise bank borrowings, trade and other payables (excluding advances to suppliers) and amounts due to related parties. The Group has various financial assets such as trade and other receivables, bank balances and deposits and amounts due from related parties.
Due to the political situation in Iran and the imposition of stricter financial and trade sanctions and oil embargo, the movement of funds through banking channels from Iran has been restricted. Management continues to assess and monitor the implications of such changes on the business. Based on its review, management is of the view that the Group will be able to recover its investment in Iran and accordingly is of the view that no allowance for impairment is required to be recognized in these consolidated financial statements as at the reporting date.
Credit risk
Credit risk is the risk of financial loss to the Group if a customer or counterparty to a financial instrument fails to meet its contractual obligations, and arises principally from the Group’s trade and other receivables, amount due from related parties and balances with banks. To manage this risk, the Group periodically assesses country and customer credit risk, assigns individual credit limits and takes appropriate actions to mitigate credit risk.
33. FINANCIAL INSTRUMENTS (CONTD.)
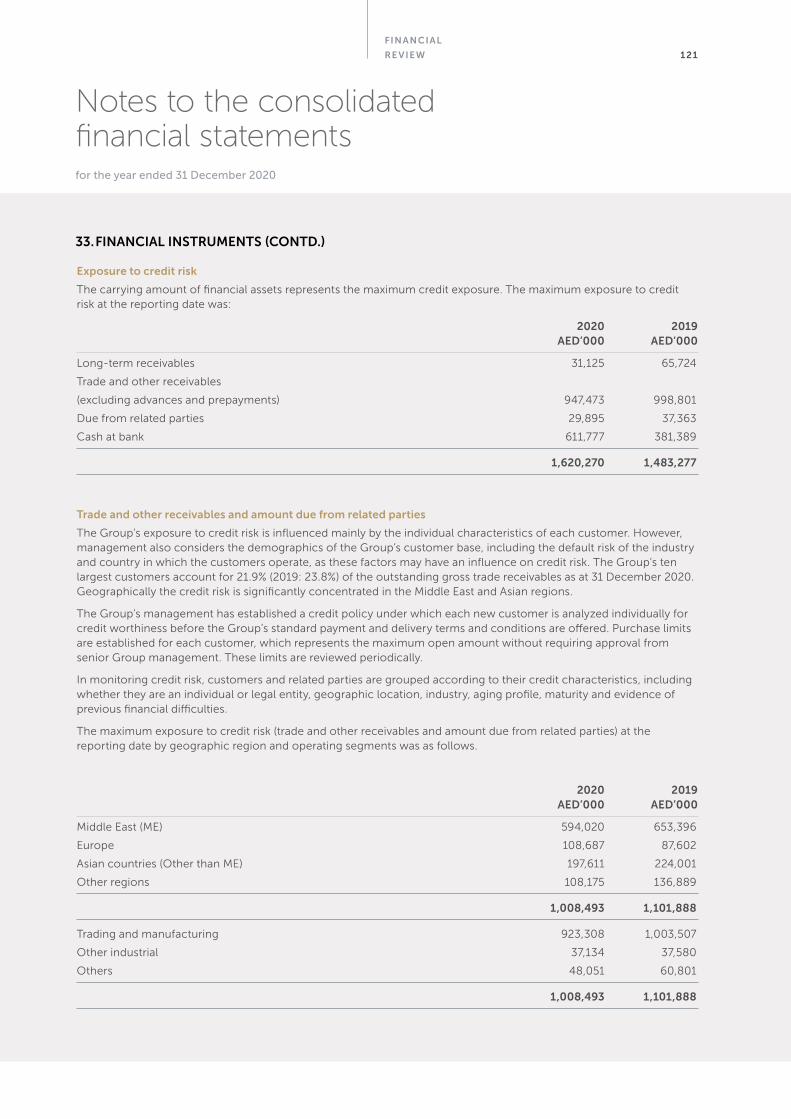
FINANCIAL
RE VIEW 1 21
Notes to the consolidated financial statementsfor the year ended 31 December 2020
Exposure to credit risk
The carrying amount of financial assets represents the maximum credit exposure. The maximum exposure to credit risk at the reporting date was:
2020 2019 AED’000 AED’000
Long-term receivables 31,125 65,724
Trade and other receivables
(excluding advances and prepayments) 947,473 998,801
Due from related parties 29,895 37,363
Cash at bank 611,777 381,389
1,620,270 1,483,277
Trade and other receivables and amount due from related parties
The Group’s exposure to credit risk is influenced mainly by the individual characteristics of each customer. However, management also considers the demographics of the Group’s customer base, including the default risk of the industry and country in which the customers operate, as these factors may have an influence on credit risk. The Group’s ten largest customers account for 21.9% (2019: 23.8%) of the outstanding gross trade receivables as at 31 December 2020. Geographically the credit risk is significantly concentrated in the Middle East and Asian regions.
The Group’s management has established a credit policy under which each new customer is analyzed individually for credit worthiness before the Group’s standard payment and delivery terms and conditions are offered. Purchase limits are established for each customer, which represents the maximum open amount without requiring approval from senior Group management. These limits are reviewed periodically.
In monitoring credit risk, customers and related parties are grouped according to their credit characteristics, including whether they are an individual or legal entity, geographic location, industry, aging profile, maturity and evidence of previous financial difficulties.
The maximum exposure to credit risk (trade and other receivables and amount due from related parties) at the reporting date by geographic region and operating segments was as follows.
2020 2019 AED’000 AED’000
Middle East (ME) 594,020 653,396
Europe 108,687 87,602
Asian countries (Other than ME) 197,611 224,001
Other regions 108,175 136,889
1,008,493 1,101,888
Trading and manufacturing 923,308 1,003,507
Other industrial 37,134 37,580
Others 48,051 60,801
1,008,493 1,101,888
33. FINANCIAL INSTRUMENTS (CONTD.)
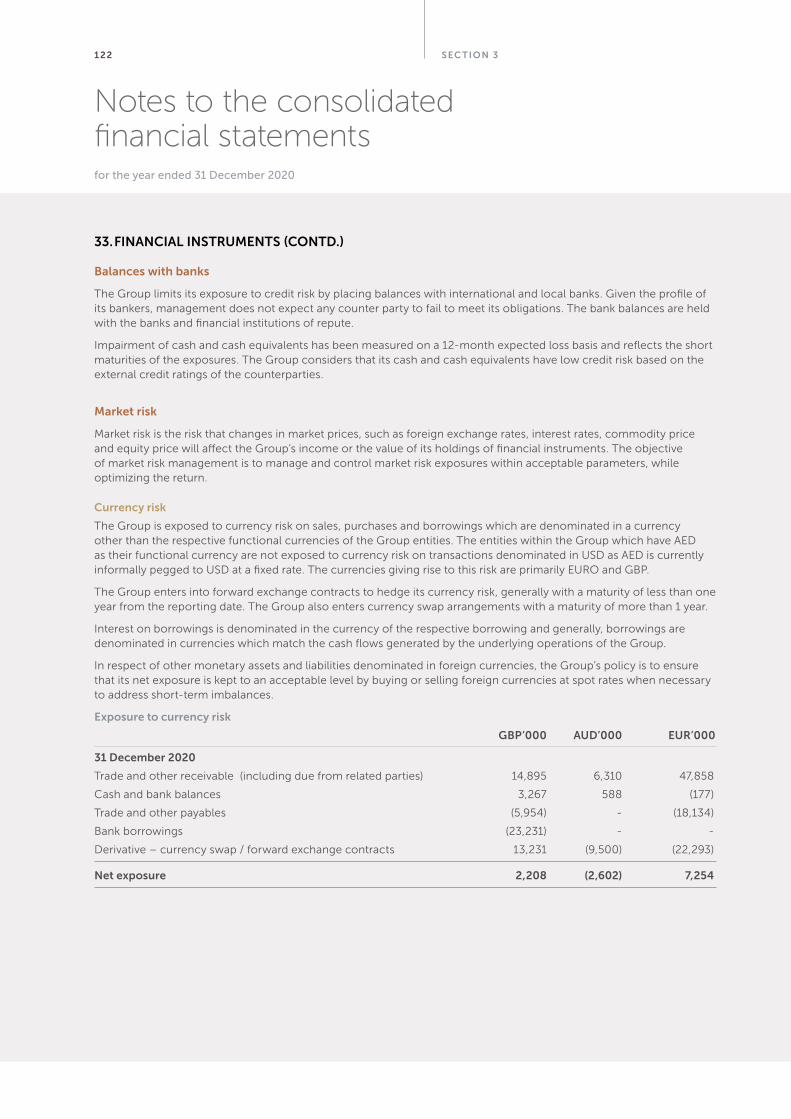
S EC TION 31 22
Notes to the consolidated financial statementsfor the year ended 31 December 2020
Balances with banks
The Group limits its exposure to credit risk by placing balances with international and local banks. Given the profile of its bankers, management does not expect any counter party to fail to meet its obligations. The bank balances are held with the banks and financial institutions of repute.
Impairment of cash and cash equivalents has been measured on a 12-month expected loss basis and reflects the short maturities of the exposures. The Group considers that its cash and cash equivalents have low credit risk based on the external credit ratings of the counterparties.
Market risk
Market risk is the risk that changes in market prices, such as foreign exchange rates, interest rates, commodity price and equity price will affect the Group’s income or the value of its holdings of financial instruments. The objective of market risk management is to manage and control market risk exposures within acceptable parameters, while optimizing the return.
Currency risk
The Group is exposed to currency risk on sales, purchases and borrowings which are denominated in a currency other than the respective functional currencies of the Group entities. The entities within the Group which have AED as their functional currency are not exposed to currency risk on transactions denominated in USD as AED is currently informally pegged to USD at a fixed rate. The currencies giving rise to this risk are primarily EURO and GBP.
The Group enters into forward exchange contracts to hedge its currency risk, generally with a maturity of less than one year from the reporting date. The Group also enters currency swap arrangements with a maturity of more than 1 year.
Interest on borrowings is denominated in the currency of the respective borrowing and generally, borrowings are denominated in currencies which match the cash flows generated by the underlying operations of the Group.
In respect of other monetary assets and liabilities denominated in foreign currencies, the Group’s policy is to ensure that its net exposure is kept to an acceptable level by buying or selling foreign currencies at spot rates when necessary to address short-term imbalances.
Exposure to currency risk
GBP’000 AUD’000 EUR’000
31 December 2020
Trade and other receivable (including due from related parties) 14,895 6,310 47,858
Cash and bank balances 3,267 588 (177)
Trade and other payables (5,954) - (18,134)
Bank borrowings (23,231) - -
Derivative – currency swap / forward exchange contracts 13,231 (9,500) (22,293)
Net exposure 2,208 (2,602) 7,254
33. FINANCIAL INSTRUMENTS (CONTD.)
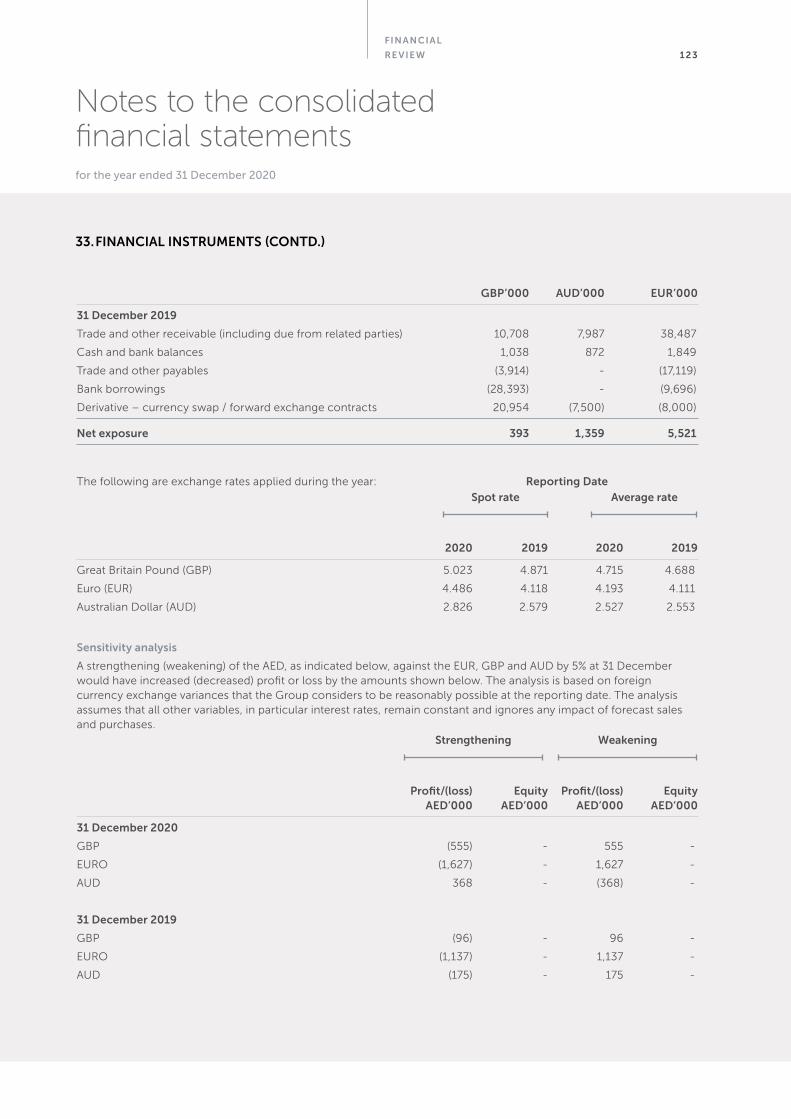
FINANCIAL
RE VIEW 1 23
Notes to the consolidated financial statementsfor the year ended 31 December 2020
GBP’000 AUD’000 EUR’000
31 December 2019
Trade and other receivable (including due from related parties) 10,708 7,987 38,487
Cash and bank balances 1,038 872 1,849
Trade and other payables (3,914) - (17,119)
Bank borrowings (28,393) - (9,696)
Derivative – currency swap / forward exchange contracts 20,954 (7,500) (8,000)
Net exposure 393 1,359 5,521
The following are exchange rates applied during the year: Reporting Date
2020 2019 2020 2019
Great Britain Pound (GBP) 5.023 4.871 4.715 4.688
Euro (EUR) 4.486 4.118 4.193 4.111
Australian Dollar (AUD) 2.826 2.579 2.527 2.553
Sensitivity analysis
A strengthening (weakening) of the AED, as indicated below, against the EUR, GBP and AUD by 5% at 31 December would have increased (decreased) profit or loss by the amounts shown below. The analysis is based on foreign currency exchange variances that the Group considers to be reasonably possible at the reporting date. The analysis assumes that all other variables, in particular interest rates, remain constant and ignores any impact of forecast sales and purchases.
Profit/(loss) Equity Profit/(loss) Equity AED’000 AED’000 AED’000 AED’000
31 December 2020
GBP (555) - 555 -
EURO (1,627) - 1,627 -
AUD 368 - (368) -
31 December 2019
GBP (96) - 96 -
EURO (1,137) - 1,137 -
AUD (175) - 175 -
33. FINANCIAL INSTRUMENTS (CONTD.)
Average rateSpot rate
WeakeningStrengthening
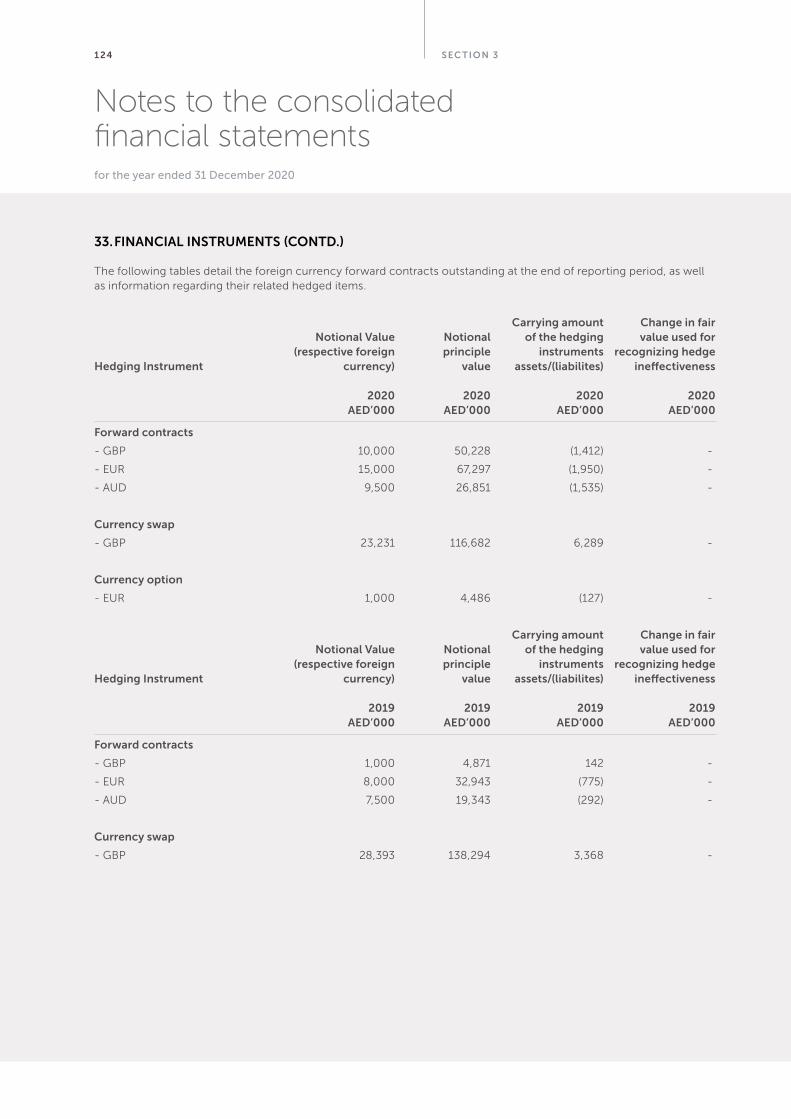
S EC TION 31 24
Notes to the consolidated financial statementsfor the year ended 31 December 2020
The following tables detail the foreign currency forward contracts outstanding at the end of reporting period, as well as information regarding their related hedged items.
Carrying amount Change in fair Notional Value Notional of the hedging value used for (respective foreign principle instruments recognizing hedge Hedging Instrument currency) value assets/(liabilites) ineffectiveness
2020 2020 2020 2020 AED’000 AED’000 AED’000 AED’000
Forward contracts
- GBP 10,000 50,228 (1,412) -
- EUR 15,000 67,297 (1,950) -
- AUD 9,500 26,851 (1,535) -
Currency swap
- GBP 23,231 116,682 6,289 -
Currency option
- EUR 1,000 4,486 (127) -
Carrying amount Change in fair Notional Value Notional of the hedging value used for (respective foreign principle instruments recognizing hedge Hedging Instrument currency) value assets/(liabilites) ineffectiveness
2019 2019 2019 2019 AED’000 AED’000 AED’000 AED’000
Forward contracts
- GBP 1,000 4,871 142 -
- EUR 8,000 32,943 (775) -
- AUD 7,500 19,343 (292) -
Currency swap
- GBP 28,393 138,294 3,368 -
33. FINANCIAL INSTRUMENTS (CONTD.)
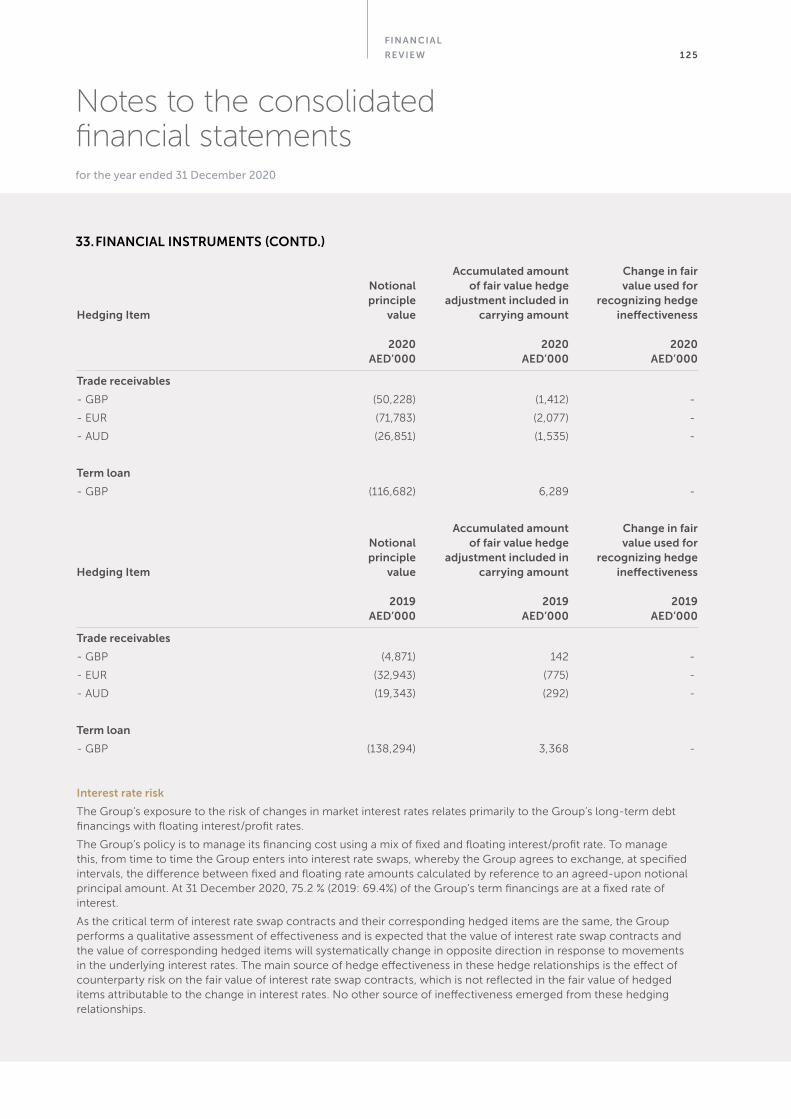
FINANCIAL
RE VIEW 1 25
Notes to the consolidated financial statementsfor the year ended 31 December 2020
Accumulated amount Change in fair Notional of fair value hedge value used for principle adjustment included in recognizing hedge Hedging Item value carrying amount ineffectiveness
2020 2020 2020 AED’000 AED’000 AED’000
Trade receivables
- GBP (50,228) (1,412) -
- EUR (71,783) (2,077) -
- AUD (26,851) (1,535) -
Term loan
- GBP (116,682) 6,289 -
Accumulated amount Change in fair Notional of fair value hedge value used for principle adjustment included in recognizing hedge Hedging Item value carrying amount ineffectiveness
2019 2019 2019 AED’000 AED’000 AED’000
Trade receivables
- GBP (4,871) 142 -
- EUR (32,943) (775) -
- AUD (19,343) (292) -
Term loan
- GBP (138,294) 3,368 -
Interest rate risk
The Group’s exposure to the risk of changes in market interest rates relates primarily to the Group’s long-term debt financings with floating interest/profit rates.
The Group’s policy is to manage its financing cost using a mix of fixed and floating interest/profit rate. To manage this, from time to time the Group enters into interest rate swaps, whereby the Group agrees to exchange, at specified intervals, the difference between fixed and floating rate amounts calculated by reference to an agreed-upon notional principal amount. At 31 December 2020, 75.2 % (2019: 69.4%) of the Group’s term financings are at a fixed rate of interest.
As the critical term of interest rate swap contracts and their corresponding hedged items are the same, the Group performs a qualitative assessment of effectiveness and is expected that the value of interest rate swap contracts and the value of corresponding hedged items will systematically change in opposite direction in response to movements in the underlying interest rates. The main source of hedge effectiveness in these hedge relationships is the effect of counterparty risk on the fair value of interest rate swap contracts, which is not reflected in the fair value of hedged items attributable to the change in interest rates. No other source of ineffectiveness emerged from these hedging relationships.
33. FINANCIAL INSTRUMENTS (CONTD.)
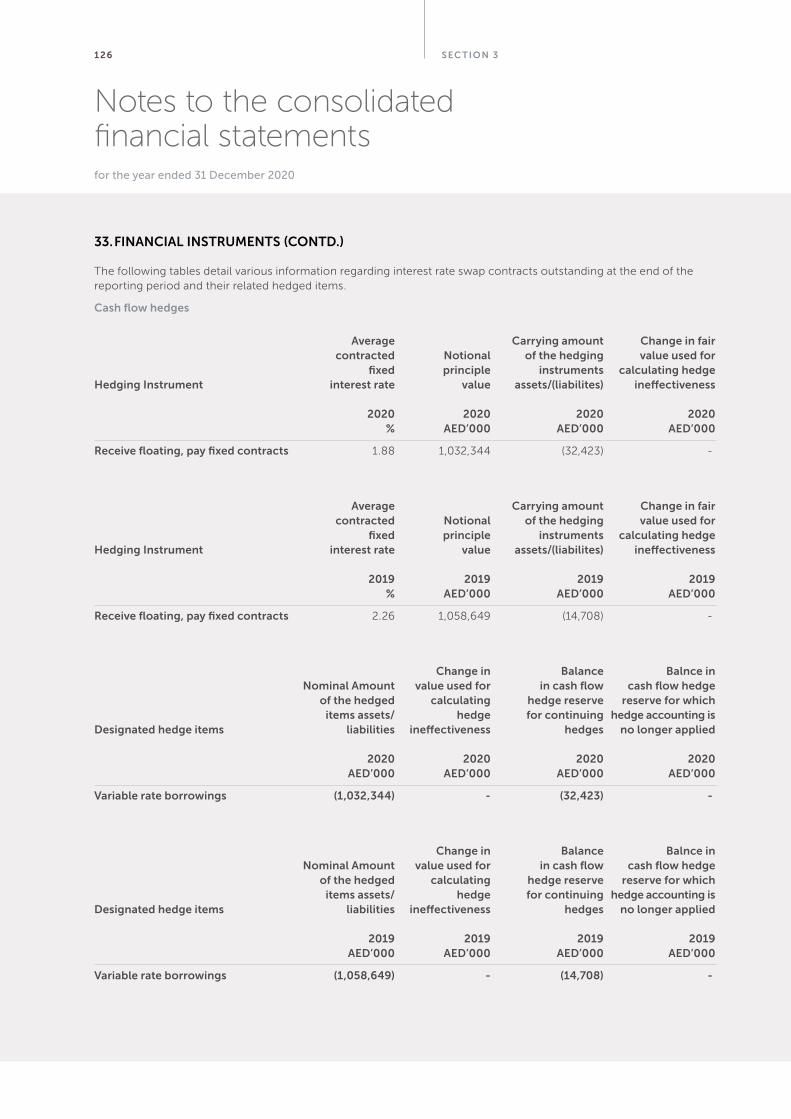
S EC TION 31 26
Notes to the consolidated financial statementsfor the year ended 31 December 2020
The following tables detail various information regarding interest rate swap contracts outstanding at the end of the reporting period and their related hedged items.
Cash flow hedges
Average Carrying amount Change in fair contracted Notional of the hedging value used for fixed principle instruments calculating hedge Hedging Instrument interest rate value assets/(liabilites) ineffectiveness
2020 2020 2020 2020 % AED’000 AED’000 AED’000
Receive floating, pay fixed contracts 1.88 1,032,344 (32,423) -
Average Carrying amount Change in fair contracted Notional of the hedging value used for fixed principle instruments calculating hedge Hedging Instrument interest rate value assets/(liabilites) ineffectiveness
2019 2019 2019 2019 % AED’000 AED’000 AED’000
Receive floating, pay fixed contracts 2.26 1,058,649 (14,708) -
Change in Balance Balnce in Nominal Amount value used for in cash flow cash flow hedge of the hedged calculating hedge reserve reserve for which items assets/ hedge for continuing hedge accounting is Designated hedge items liabilities ineffectiveness hedges no longer applied
2020 2020 2020 2020 AED’000 AED’000 AED’000 AED’000
Variable rate borrowings (1,032,344) - (32,423) -
Change in Balance Balnce in Nominal Amount value used for in cash flow cash flow hedge of the hedged calculating hedge reserve reserve for which items assets/ hedge for continuing hedge accounting is Designated hedge items liabilities ineffectiveness hedges no longer applied
2019 2019 2019 2019 AED’000 AED’000 AED’000 AED’000
Variable rate borrowings (1,058,649) - (14,708) -
33. FINANCIAL INSTRUMENTS (CONTD.)
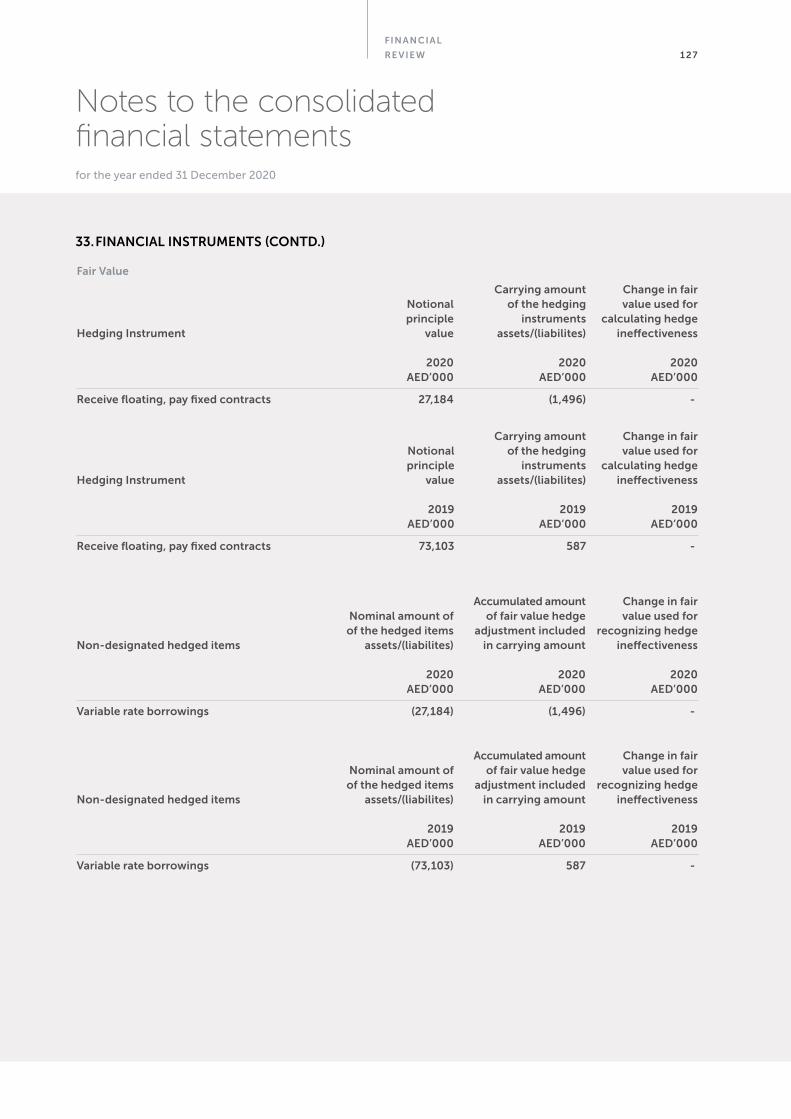
FINANCIAL
RE VIEW 1 27
Notes to the consolidated financial statementsfor the year ended 31 December 2020
Fair Value
Carrying amount Change in fair Notional of the hedging value used for principle instruments calculating hedge Hedging Instrument value assets/(liabilites) ineffectiveness
2020 2020 2020 AED’000 AED’000 AED’000
Receive floating, pay fixed contracts 27,184 (1,496) -
Carrying amount Change in fair Notional of the hedging value used for principle instruments calculating hedge Hedging Instrument value assets/(liabilites) ineffectiveness
2019 2019 2019 AED’000 AED’000 AED’000
Receive floating, pay fixed contracts 73,103 587 -
Accumulated amount Change in fair Nominal amount of of fair value hedge value used for of the hedged items adjustment included recognizing hedge Non-designated hedged items assets/(liabilites) in carrying amount ineffectiveness
2020 2020 2020 AED’000 AED’000 AED’000
Variable rate borrowings (27,184) (1,496) -
Accumulated amount Change in fair Nominal amount of of fair value hedge value used for of the hedged items adjustment included recognizing hedge Non-designated hedged items assets/(liabilites) in carrying amount ineffectiveness
2019 2019 2019 AED’000 AED’000 AED’000
Variable rate borrowings (73,103) 587 -
33. FINANCIAL INSTRUMENTS (CONTD.)
S EC TION 31 28
Notes to the consolidated financial statementsfor the year ended 31 December 2020
The Group is exposed to the following interest rate benchmarks within its hedge accounting relationships, which are subject to interest rate benchmark reform: USD IBOR and GBP IBOR (collectively ‘IBORs’). The Group has closely monitored the market and the output from the various industry working groups managing the transition to new benchmark interest rates. This includes announcements made by the IBOR regulators. The regulators have made clear that, at the end of 2021, they will no longer seek to persuade, or compel, banks to submit IBORs.
None of the Group’s current IBOR linked contracts include adequate and robust fallback provisions for a cessation of the referenced benchmark interest rate. Different working groups in the industry are working on fallback language for different instruments and different IBORs, which the Group is monitoring closely and it will look to implement these when appropriate.
For the Group’s derivatives, the International Swaps and Derivatives Association’s (ISDA) fall-back clauses were made available at the end of 2020 and the Group is in discussion with its bankers with the aim of implementing this language into its ISDA agreements.
For the Group’s floating rate debt, the Group has started discussions with Banks to change benchmark reference rates and aims to finalize these amendments some time in 2021.
The Group will continue to apply the amendments to IFRS 9 until the end of the uncertainty arising from the interest rate benchmark reforms to which the Group is exposed with respect to the timing and the amount of the underlying cash flows. The Group has assumed that this uncertainty will not end until the Group’s contracts that reference IBORs are amended to specify the date on which the interest rate benchmark will be replaced, the cash flows of the alternative benchmark rate and the relevant spread adjustment. This will, in part, be dependent on the introduction of fallback clauses which have yet to be added to the Group’s contracts and negotiations with lenders.
At the reporting date, the interest/profit rate profile of the Group’s financial instruments was:
2020 2019 AED’000 AED’000
Fixed rate instruments
Financial assets
Bank deposits 278,247 207,599
Due from related parties 882 -
Financial liabilities
Islamic bank financing 719,464 538,146
Interest bearing bank financing 666,268 681,940
Due to related parties 4,000 4,000
Variable rate instruments
Financial liabilities
Islamic bank financing 98,727 246,384
Interest bearing bank financing 358,163 290,833
Fair value sensitivity analysis for fixed rate instruments
The Group does not account for any fixed rate financial assets and liabilities at fair value through profit or loss. Therefore, a change in interest rates at the reporting date would not affect profit or loss.
Cash flow sensitivity analysis for variable rate instruments
A change of 100 basis points in interest/variable profit at the reporting date would have increased/ (decreased) profit or loss by the amounts shown below. The analysis assumes that all other variables, in particular foreign currency rates, remain constant.
33. FINANCIAL INSTRUMENTS (CONTD.)
FINANCIAL
RE VIEW 1 29
Notes to the consolidated financial statementsfor the year ended 31 December 2020
100bp 100bp Increase Decrease AED’000 AED’000
31 December 2020
Financial liability
Variable instruments (4,569) 4,569
31 December 2019
Financial liability
Variable instruments (5,372) 5,372
Commodity price risk
Commodity price risk in the Group primarily arises from price fluctuations of Brent crude oil. The Group entered into derivative transactions to limit these risks. Hedging activities are evaluated regularly to align with Group expectations about the price changes and defined risk appetite; ensuring the most cost-effective hedging strategies are applied.
Commodity options
In the current year, the Group has designated certain commodity options as a cash flow hedge of highly probable purchases. Because the critical terms, i.e. the quantity, maturity and observation period of the commodity option and their corresponding hedged items are the same, the Group performs a qualitative assessment of effectiveness and it is expected that the intrinsic value of the commodity option and the value of the corresponding hedged items will systematically change in opposite directions in response to movements in the price of the underlying commodity.
The main potential source of hedge ineffectiveness is the effect of the counterparty and the Group’s own credit risk on the fair value of the option contracts, which is not reflected in the fair value of the hedged item, and circumstances in which the forecast transaction will happen earlier or later than originally expected.
Cash flow hedge
Change in fair Carrying amount value used for Average of the hedging calculating hedge Hedging Instrument strike price Quantity instruments ineffectiveness
2020 2020 2020 2020 USD Barrels AED’000 AED’000
Commodity option 57.19 60,000 (1,391) -
Change in fair Carrying amount value used for Average of the hedging calculating hedge Hedging Instrument strike price Quantity instruments ineffectiveness
2019 2019 2019 2019 USD Barrels AED’000 AED’000
Commodity option 58.76 40,250 364 -
33. FINANCIAL INSTRUMENTS (CONTD.)Profit/(loss)
S EC TION 31 30
Notes to the consolidated financial statementsfor the year ended 31 December 2020
Cash flow hedge
Balance in cash Change in fair Balance in flow hedge reserve value used for cash flow hedge for which hedge calculating hedge reserve for accounting is no Designated hedged items ineffectiveness continuing hedges longer applied
2020 2020 2020 AED’000 AED’000 AED’000
Forcast purchase - (1,391) -
Balance in cash Change in fair Balance in flow hedge reserve value used for cash flow hedge for which hedge calculating hedge reserve for accounting is no Designated hedged items ineffectiveness continuing hedges longer applied
2019 2019 2019 AED’000 AED’000 AED’000
Forcast purchase - 364 -
Commodity price sensitivity analysis
If the commodity prices had been 5 per cent higher (lower) as of 31 December 2020, profit after tax would have been AED 1.85 million (2019: AED 3.59 million) lower (higher).
Liquidity risk
Liquidity risk is the risk that the Group will encounter difficulty in meeting the obligations associated with its financial liabilities that are settled by delivering cash or other financial assets. The Group’s approach to managing liquidity is to ensure, as far as possible, that it will always have sufficient liquidity to meet its liabilities when due, under both normal and stressed conditions, without incurring unacceptable losses or risking damage to the Group’s reputation.
Ultimate responsibility for liquidity risk management rests with the Board of Directors, which has established an appropriate liquidity risk management framework for management of the Group’s short, medium and long-term funding and liquidity management requirements. The Group manages liquidity risk by maintaining adequate reserves, banking facilities and reserve borrowing facilities, by continuously monitoring forecast and actual cash flows, and by matching the maturity profiles of financial assets and liabilities.
The Group’s credit terms require the amounts to be received within 90-180 days (2019: 90 -180 days) from the date of invoice. Trade payables are normally settled within 45-90 days (2019: 45-90 days) of the date of purchase.
The Group ensures that it has sufficient cash to meet expected operational expenses, including the servicing of financial obligations; this excludes the potential impact of extreme circumstances that cannot be reasonably predicted, such as natural disasters.
The following are the remaining contractual maturities of the Group’s financial liabilities at the reporting dates, including estimated interest/profit payments:
33. FINANCIAL INSTRUMENTS (CONTD.)
FINANCIAL
RE VIEW 1 31
Notes to the consolidated financial statementsfor the year ended 31 December 2020
Carrying 0-1 1-2 More than amount Total year years 2 years AED’000 AED’000 AED’000 AED’000 AED’000
At 31 December 2020
Non-derivative financial liabilities
Bank financing 1,842,622 (1,908,094) (1,097,659) (303,097) (507,338)
Trade and other payables 579,882 (579,882) (579,882) - -
Due to related parties 35,836 (35,836) (35,836) - -
2,458,340 (2,523,812) (1,713,377) (303,097) (507,338)
Derivative financial liabilities
Commodity derivative used for hedging 1,391 (1,391) (1,391) - -
Forward exchange contracts 5,024 (5,024) (5,024) - -
Interest rate swaps used for Hedging 32,423 (33,697) (16,305) (9,942) (7,450)
38,838 (40,112) (22,720) (9,942) (7,450)
Carrying 0-1 1-2 More than amount Total year years 2 years AED’000 AED’000 AED’000 AED’000 AED’000
At 31 December 2019
Non-derivative financial liabilities
Bank financing 1,757,303 (1,869,428) (820,867) (403,974) (644,587)
Trade and other payables 602,197 (602,197) (602,197) - -
Due to related parties 38,340 (38,340) (38,340) - -
2,397,840 (2,509,965) (1,461,404) (403,974) (644,587)
Derivative financial liabilities
Forward exchange contracts 925 (925) (925) - -
Interest rate swaps used for Hedging 14,708 (17,219) (7,081) (5,899) (4,239)
15,633 (18,144) (8,006) (5,899) (4,239)
33. FINANCIAL INSTRUMENTS (CONTD.)Contractual cash flows
Contractual cash flows
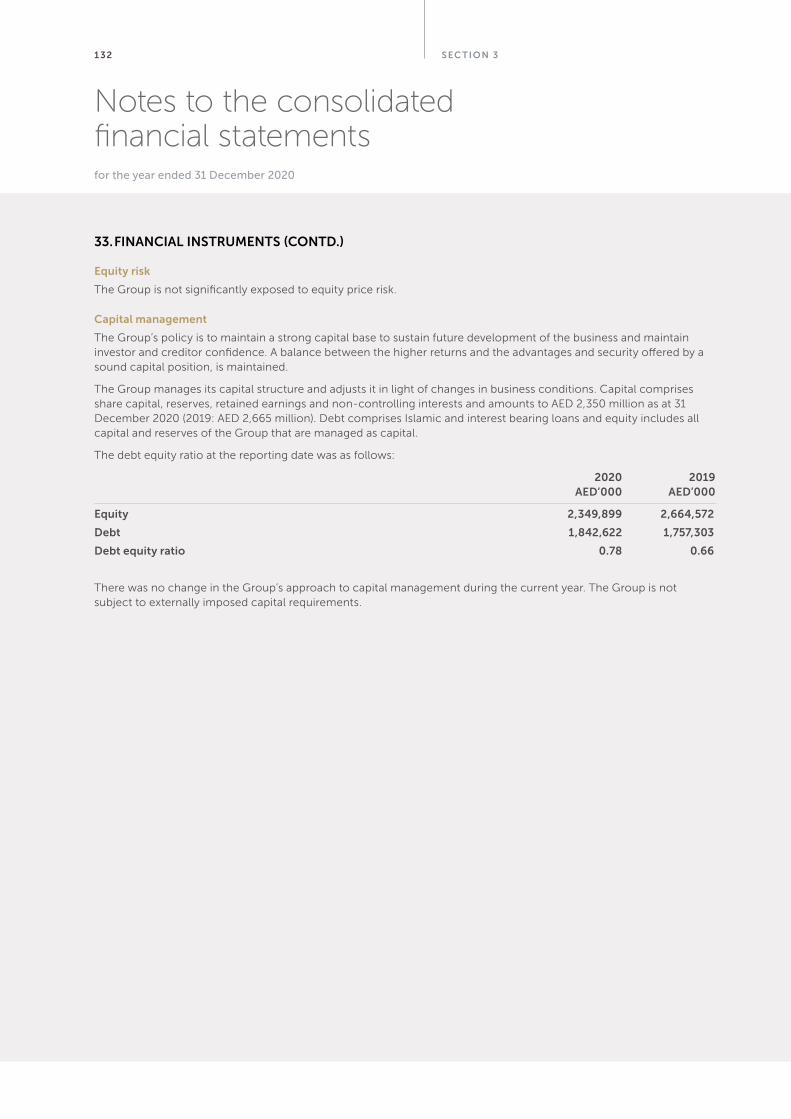
S EC TION 31 32
Notes to the consolidated financial statementsfor the year ended 31 December 2020
Equity risk
The Group is not significantly exposed to equity price risk.
Capital management
The Group’s policy is to maintain a strong capital base to sustain future development of the business and maintain investor and creditor confidence. A balance between the higher returns and the advantages and security offered by a sound capital position, is maintained.
The Group manages its capital structure and adjusts it in light of changes in business conditions. Capital comprises share capital, reserves, retained earnings and non-controlling interests and amounts to AED 2,350 million as at 31 December 2020 (2019: AED 2,665 million). Debt comprises Islamic and interest bearing loans and equity includes all capital and reserves of the Group that are managed as capital.
The debt equity ratio at the reporting date was as follows:
2020 2019 AED’000 AED’000
Equity 2,349,899 2,664,572
Debt 1,842,622 1,757,303
Debt equity ratio 0.78 0.66
There was no change in the Group’s approach to capital management during the current year. The Group is not subject to externally imposed capital requirements.
33. FINANCIAL INSTRUMENTS (CONTD.)
FINANCIAL
RE VIEW 1 33
Notes to the consolidated financial statementsfor the year ended 31 December 2020
The Group has a subsidiary in the Islamic Republic of Iran which was designated as hyper-inflationary economy during the current year, having previously ceased to be so in 2015. The subsidiary did not have material operations during the years ended 31 December 2019 or 31 December 2020 and the total assets of the Iranian subsidiary are approximately 0.52% of the Group’s consolidated total assets as at 31 December 2020.
The hyperinflation impact has been calculated by means of conversion factors derived from the Consumer Price Index (CPI). The conversion factors used to restate the financial statements of the subsidiary are as follows:
Index Conversion factor
31 December 2020 280.60 1.4479
31 December 2019 193.80 1.2775
31 December 2018 151.70 1.3558
31 December 2017 111.90
The above mentioned restatement is affected as follows:
• Hyperinflation accounting was applied as of 1 January 2020;
• The statement of profit or loss is adjusted at the end of each reporting period using the change in the general price index and is converted at the closing exchange rate of each period (rather than the year to date average rate for non-hyperinflationary economies), thereby restating the year to date consolidated statement of profit or loss for both the inflation index and currency conversion;
• Monetary assets and liabilities are not restated because they are already expressed in terms of the monetary unit current at the date of the consolidated statement of financial position. Monetary items are money held and items to be recovered or paid in money;
• Non-monetary assets and liabilities are initially recorded at historical cost (e.g. property plant and equipment, investment properties etc.) and restated using an inflation index. The hyperinflation impact resulting from changes in the general purchasing power until 31 December 2019 has been reported in Hyperinflation reserve directly as a component of equity and the impact of changes in the general purchasing power from 1 January 2020 is reported through the consolidated statement of profit or loss as loss on net monetary position. In addition, depreciation is calculated and charged based on the inflation adjusted values of property, plant and equipment and investment properties.
• All items in the consolidated statement of profit or loss are restated by applying the relevant quarterly average or year-end conversion factors.
The impact of hyperinflationary accounting on the consolidated financial statements due to the subsidiary in the Republic of Iran is as follows:
34. HYPERINFLATIONARY ECONOMY
S EC TION 31 3 4
Notes to the consolidated financial statementsfor the year ended 31 December 2020
1 January 2020 AED’000
Impact on consolidated statement of financial position
Increase in property, plant and equipment - net 17,637
Increase in investment properties - net 13,219
Increase in other assets 7,295
Increase in equity 38,151
Allocated to: Increase in opening equity due to cumulative hyperinflation 38,151
2020 AED’000
Impact on consolidated statement of profit or loss
Increase in depreciation charge for the year 5,835
Loss on net monetary position 3,215
9,050
35. SEGMENT REPORTING
Basis for segmentation
The Group has made some minor classification changes to its segment reporting during the year to better reflect operational results and the comparatives have been reclassified accordingly.
The Group has broadly three reportable segments as discussed below, which are the Group’s strategic business units. The strategic business units operate in different sectors and are managed separately because they require different strategies. The following summary describes the operation in each of the Group’s reportable segments:
Ceramics products includes manufacture and sale of ceramic wall and floor tiles, gres porcellanato, bath-ware and table ware products.
Other industrial includes manufacturing and distribution of power, paints, plastics, mines, chemicals, and faucets.
Others includes security services, material movement, real estate, construction projects and civil works.
34. HYPERINFLATIONARY ECONOMY (CONTD.)
FINANCIAL
RE VIEW 1 35
Notes to the consolidated financial statementsfor the year ended 31 December 2020
Information about the reportable segments
Information regarding each reportable segment is set out below. Segment profit (loss) before tax is used to measure performance because management believes that this information is the most relevant in evaluating the results of respective segments relative to other entities that operate in the same industries
Ceramic Other producs industrial Others Elimination Total AED’000 AED’000 AED’000 AED’000 AED’000
At 31 December 2020
External revenue 2,218,851 115,616 15,022 - 2,349,489
Intersegment revenue 556,330 81,977 2,365 (640,672) -
Segment revenue 2,775,181 197,593 17,387 (640,672 ) 2,349,489
Segment profit/(loss) 178,712 22,233 (228,025) (99,074) (126,154)
Segment EBITDA 441,861 27,122 (11,049) (103,135) 354,799
Interest/profit income 7,910 240 2,425 (3,219) 7,356
Interest/profit expense 80,932 826 20 (3,732) 78,046
Depreciation and amortization 174,090 3,889 6,238 (3,035) 181,182
Share of profit in equity accounted investees 2,877 13,864 - - 16,741
Segment assets 6,991,837 182,139 311,576 (2,238,064) 5,247,488
Segment liabilities 3,704,481 73,633 110,363 (990,888) 2,897,589
Ceramic Other producs industrial Others Elimination Total AED’000 AED’000 AED’000 AED’000 AED’000
At 31 December 2019
External revenue 2,435,884 118,320 20,329 - 2,574,533
Intersegment revenue 438,207 96,238 2,361 (536,806) -
Segment revenue 2,874,091 214,558 22,690 (536,806) 2,574,533
Segment profit 214,474 23,593 5,976 (38,887) 205,156
Segment EBITDA 483,250 28,560 13,224 (42,208) 482,826
Interest/profit income 7,166 117 2,391 (3,462) 6,212
Interest/profit expense 84,407 315 54 (3,731) 81,045
Depreciation and amortization 167,145 3,329 9,715 (2,784) 177,405
Share of profit in equity accounted investees (444) 14,074 - - 13,630
Segment assets 7,060,284 186,114 361,336 (2,120,961) 5,486,773
Segment liabilities 3,539,268 80,182 109,749 (906,998) 2,822,201
EBITDA is earnings for the period before net interest expense, net profit expense on Islamic financing, income tax expense, depreciation, amortization, gain or loss on sale of assets and impairment loss on investment properties.
35. SEGMENT REPORTING (CONTD.)
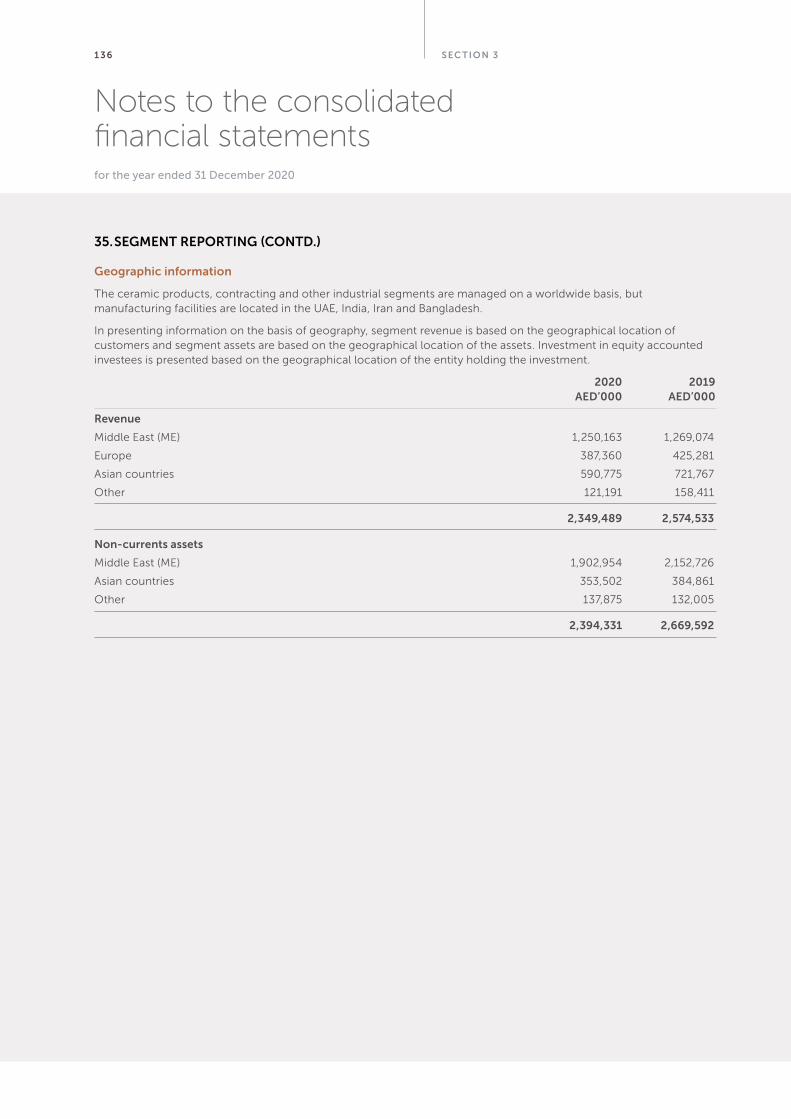
S EC TION 31 36
Notes to the consolidated financial statementsfor the year ended 31 December 2020
Geographic information
The ceramic products, contracting and other industrial segments are managed on a worldwide basis, but manufacturing facilities are located in the UAE, India, Iran and Bangladesh.
In presenting information on the basis of geography, segment revenue is based on the geographical location of customers and segment assets are based on the geographical location of the assets. Investment in equity accounted investees is presented based on the geographical location of the entity holding the investment.
2020 2019 AED’000 AED’000
Revenue
Middle East (ME) 1,250,163 1,269,074
Europe 387,360 425,281
Asian countries 590,775 721,767
Other 121,191 158,411
2,349,489 2,574,533
Non-currents assets
Middle East (ME) 1,902,954 2,152,726
Asian countries 353,502 384,861
Other 137,875 132,005
2,394,331 2,669,592
35. SEGMENT REPORTING (CONTD.)
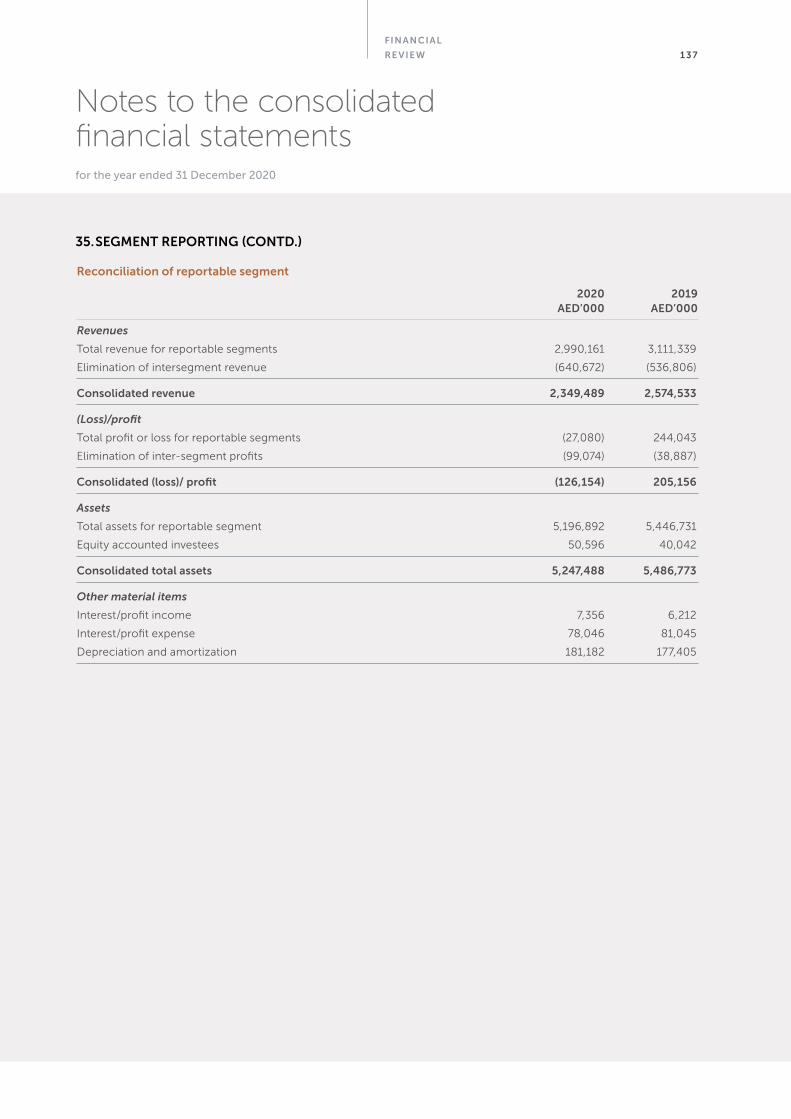
FINANCIAL
RE VIEW 1 37
Notes to the consolidated financial statementsfor the year ended 31 December 2020
Reconciliation of reportable segment
2020 2019 AED’000 AED’000
Revenues
Total revenue for reportable segments 2,990,161 3,111,339
Elimination of intersegment revenue (640,672) (536,806)
Consolidated revenue 2,349,489 2,574,533
(Loss)/profit
Total profit or loss for reportable segments (27,080) 244,043
Elimination of inter-segment profits (99,074) (38,887)
Consolidated (loss)/ profit (126,154) 205,156
Assets
Total assets for reportable segment 5,196,892 5,446,731
Equity accounted investees 50,596 40,042
Consolidated total assets 5,247,488 5,486,773
Other material items
Interest/profit income 7,356 6,212
Interest/profit expense 78,046 81,045
Depreciation and amortization 181,182 177,405
35. SEGMENT REPORTING (CONTD.)
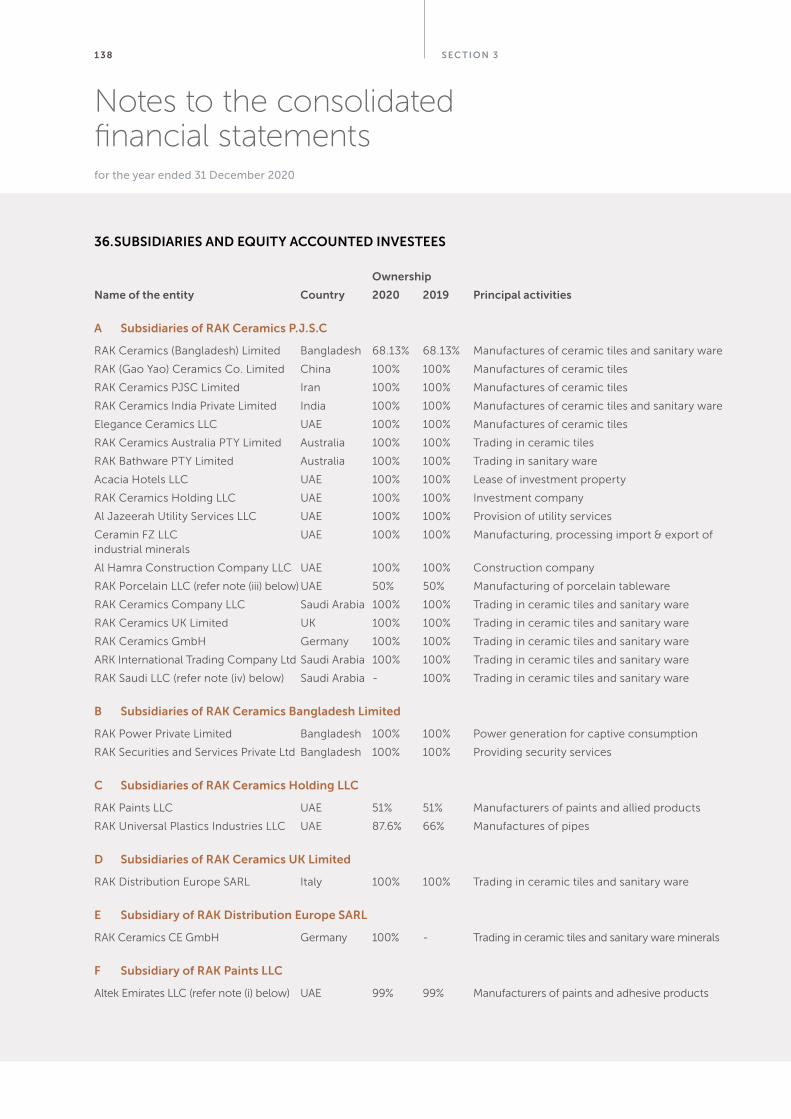
S EC TION 31 38
Notes to the consolidated financial statementsfor the year ended 31 December 2020
Ownership
Name of the entity Country 2020 2019 Principal activities
A Subsidiaries of RAK Ceramics P.J.S.C
RAK Ceramics (Bangladesh) Limited Bangladesh 68.13% 68.13% Manufactures of ceramic tiles and sanitary ware
RAK (Gao Yao) Ceramics Co. Limited China 100% 100% Manufactures of ceramic tiles
RAK Ceramics PJSC Limited Iran 100% 100% Manufactures of ceramic tiles
RAK Ceramics India Private Limited India 100% 100% Manufactures of ceramic tiles and sanitary ware
Elegance Ceramics LLC UAE 100% 100% Manufactures of ceramic tiles
RAK Ceramics Australia PTY Limited Australia 100% 100% Trading in ceramic tiles
RAK Bathware PTY Limited Australia 100% 100% Trading in sanitary ware
Acacia Hotels LLC UAE 100% 100% Lease of investment property
RAK Ceramics Holding LLC UAE 100% 100% Investment company
Al Jazeerah Utility Services LLC UAE 100% 100% Provision of utility services
Ceramin FZ LLC UAE 100% 100% Manufacturing, processing import & export of industrial minerals
Al Hamra Construction Company LLC UAE 100% 100% Construction company
RAK Porcelain LLC (refer note (iii) below) UAE 50% 50% Manufacturing of porcelain tableware
RAK Ceramics Company LLC Saudi Arabia 100% 100% Trading in ceramic tiles and sanitary ware
RAK Ceramics UK Limited UK 100% 100% Trading in ceramic tiles and sanitary ware
RAK Ceramics GmbH Germany 100% 100% Trading in ceramic tiles and sanitary ware
ARK International Trading Company Ltd Saudi Arabia 100% 100% Trading in ceramic tiles and sanitary ware
RAK Saudi LLC (refer note (iv) below) Saudi Arabia - 100% Trading in ceramic tiles and sanitary ware
B Subsidiaries of RAK Ceramics Bangladesh Limited
RAK Power Private Limited Bangladesh 100% 100% Power generation for captive consumption
RAK Securities and Services Private Ltd Bangladesh 100% 100% Providing security services
C Subsidiaries of RAK Ceramics Holding LLC
RAK Paints LLC UAE 51% 51% Manufacturers of paints and allied products
RAK Universal Plastics Industries LLC UAE 87.6% 66% Manufactures of pipes
D Subsidiaries of RAK Ceramics UK Limited
RAK Distribution Europe SARL Italy 100% 100% Trading in ceramic tiles and sanitary ware
E Subsidiary of RAK Distribution Europe SARL
RAK Ceramics CE GmbH Germany 100% - Trading in ceramic tiles and sanitary ware minerals
F Subsidiary of RAK Paints LLC
Altek Emirates LLC (refer note (i) below) UAE 99% 99% Manufacturers of paints and adhesive products
36. SUBSIDIARIES AND EQUITY ACCOUNTED INVESTEES
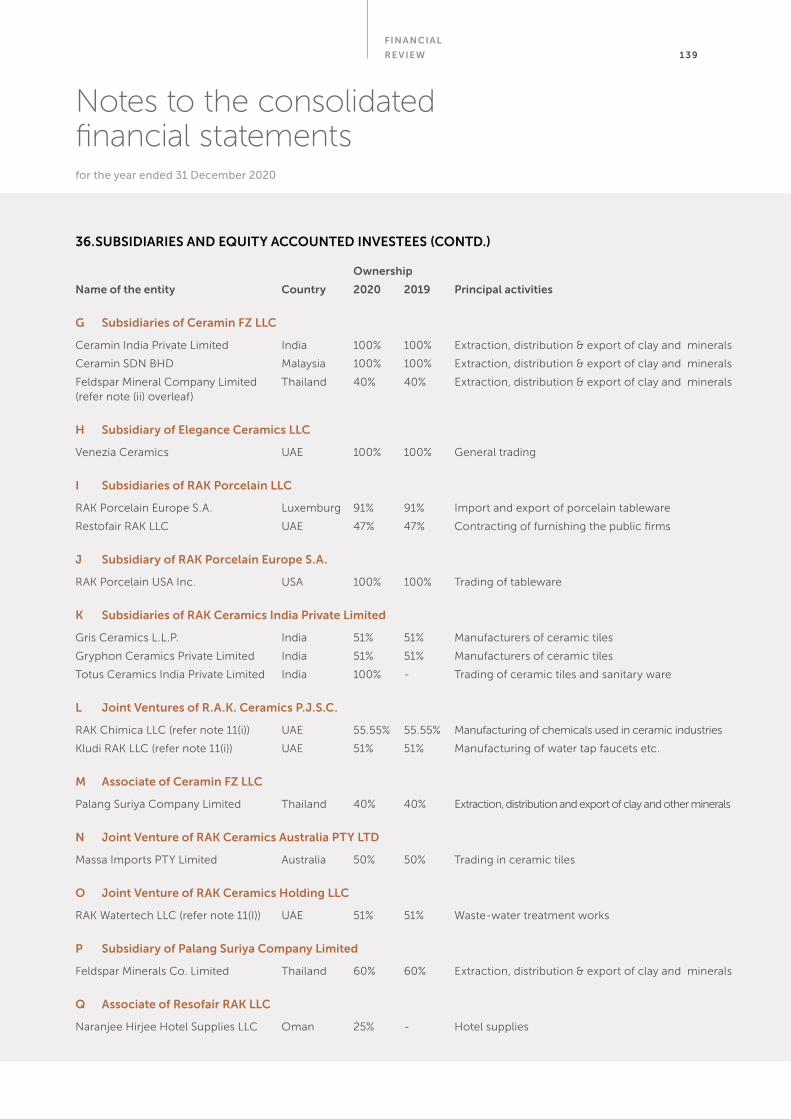
FINANCIAL
RE VIEW 1 39
Notes to the consolidated financial statementsfor the year ended 31 December 2020
36. SUBSIDIARIES AND EQUITY ACCOUNTED INVESTEES (CONTD.)
Ownership
Name of the entity Country 2020 2019 Principal activities
G Subsidiaries of Ceramin FZ LLC
Ceramin India Private Limited India 100% 100% Extraction, distribution & export of clay and minerals
Ceramin SDN BHD Malaysia 100% 100% Extraction, distribution & export of clay and minerals
Feldspar Mineral Company Limited Thailand 40% 40% Extraction, distribution & export of clay and minerals (refer note (ii) overleaf)
H Subsidiary of Elegance Ceramics LLC
Venezia Ceramics UAE 100% 100% General trading
I Subsidiaries of RAK Porcelain LLC
RAK Porcelain Europe S.A. Luxemburg 91% 91% Import and export of porcelain tableware
Restofair RAK LLC UAE 47% 47% Contracting of furnishing the public firms
J Subsidiary of RAK Porcelain Europe S.A.
RAK Porcelain USA Inc. USA 100% 100% Trading of tableware
K Subsidiaries of RAK Ceramics India Private Limited
Gris Ceramics L.L.P. India 51% 51% Manufacturers of ceramic tiles
Gryphon Ceramics Private Limited India 51% 51% Manufacturers of ceramic tiles
Totus Ceramics India Private Limited India 100% - Trading of ceramic tiles and sanitary ware
L Joint Ventures of R.A.K. Ceramics P.J.S.C.
RAK Chimica LLC (refer note 11(i)) UAE 55.55% 55.55% Manufacturing of chemicals used in ceramic industries
Kludi RAK LLC (refer note 11(i)) UAE 51% 51% Manufacturing of water tap faucets etc.
M Associate of Ceramin FZ LLC
Palang Suriya Company Limited Thailand 40% 40% Extraction, distribution and export of clay and other minerals
N Joint Venture of RAK Ceramics Australia PTY LTD
Massa Imports PTY Limited Australia 50% 50% Trading in ceramic tiles
O Joint Venture of RAK Ceramics Holding LLC
RAK Watertech LLC (refer note 11(I)) UAE 51% 51% Waste-water treatment works
P Subsidiary of Palang Suriya Company Limited
Feldspar Minerals Co. Limited Thailand 60% 60% Extraction, distribution & export of clay and minerals
Q Associate of Resofair RAK LLC
Naranjee Hirjee Hotel Supplies LLC Oman 25% - Hotel supplies
S EC TION 3140
Notes to the consolidated financial statementsfor the year ended 31 December 2020
i. In addition to 99% equity interest in Altek Emirates LLC held by RAK Paints LLC, the remaining 1% equity interest is held by RAK Ceramics Holding LLC, a fully owned subsidiary of the Group. Accordingly, the entity has been treated as fully owned subsidiary of the Group.
ii. Ceramin FZ LLC holds a 40% equity interest in Feldspar Minerals Company Limited. In addition to this, Palang Suriya Company Limited in which Ceramin FZC holds a 40% equity interest, also has 60% equity interest in this entity. Accordingly, the Group effectively holds a 64% equity interest in Feldspar Minerals Company Limited.
iii. RAK Porcelain has been considered as a subsidiary since the Group has ability to use its power to affect its returns.
iv. RAK Saudi LLC has been merged with ARK International Trading Company Limited and it operates as a branch, effective from 1 January 2020.
37. SIGNIFICANT ACCOUNTING ESTIMATES AND CRITICAL ACCOUNTING JUDGEMENTS
The Group makes estimates and assumptions which affect the reported amounts of assets and liabilities within the next financial year. Estimates and critical accounting judgements are continually evaluated and are based on historical experience and other factors, including expectations of future events that are believed to be reasonable under the circumstances. Significant areas of estimation uncertainty and critical judgements in applying accounting policies that have the most significant effect on amounts recognized in the consolidated financial statements are as follows.
COVID-19 impact
The existence of novel coronavirus (Covid-19) was confirmed in early 2020 and it spread across the globe causing disruption to businesses and economic activity. Many countries adopted extraordinary containment measures with complete or partial lock-down including restrictions on the day to day activities of citizens except those deemed to be in essential roles. The Group was proactive in implementing a raft of measures designed to mitigate the impact of Covid-19, to fully implement governmental regulations and recommendations to ensure the safety and security of staff and provide, to the extent possible, uninterrupted service to its customers. The Group established a COVID 19 Command Center to closely monitor the situation and take timely decisions as part of its crisis management procedure.
Management has considered the unique circumstances of the global pandemic that have a material impact on the business operations, assets and liabilities of the Group and concluded that the main impact on the Group’s profitability/ liquidity position could arise from the following possible risks:
• interruption of production,
• supply chain disruptions,
• unavailability of personnel,
• reduction in sales due to closure of projects sites,
• increase in expected credit losses from trade receivables, and
• impairment of non-financial assets (including goodwill).
During the current year, the construction industry in the UAE continued to operate and the Group’s production lines in the UAE were running throughout the period as they were not subject to many of the restrictions. Similarly, supplies in the Kingdom of Saudi Arabia, Europe, United Kingdom and Australia continued throughout the period amid certain intermittent supply chain issues. The operations in India and Bangladesh had to be shut down in the last week of March 2020 following government regulation. They resumed by the first week of June 2020 and were running seamlessly during the third and fourth quarters. Management is satisfied that the Group has sufficient resources to continue in operation for the foreseeable future, a period of not less than 12 months from the date of this report.
The Group continues to adopt the going concern basis in preparing the consolidated financial statements.
36. SUBSIDIARIES AND EQUITY ACCOUNTED INVESTEES (CONTD.)
FINANCIAL
RE VIEW 141
Notes to the consolidated financial statementsfor the year ended 31 December 2020
37. SIGNIFICANT ACCOUNTING ESTIMATES AND CRITICAL ACCOUNTING JUDGEMENTS (CONTD.)
Critical accounting judgements
Classification of properties
As disclosed in note 14(iv), the Group has started to use a building which earlier was classified as investment property, and accordingly, this building with carrying amount of AED 30.12 million has been transferred from investment property, to property, plant and equipment during the year due to change of its use.
Key sources of estimation uncertainty
The key assumptions concerning the future, and other key sources of estimation uncertainty at the reporting period that may have a significant risk of causing a material adjustment to the carrying amounts of assets and liabilities within the next financial year, are discussed below.
Estimated useful life and residual value of property, plant and equipment and investment properties
The Group estimates the useful lives of property, plant and equipment and investment properties based on the period over which the assets are expected to be available for use. The estimated useful lives are reviewed periodically and are updated if expectations differ from previous estimates due to physical wear and tear, technical or commercial obsolescence and legal or other limits on the use of the assets. In addition, estimation of the useful lives of property and equipment is based on collective assessment of industry practice, internal technical evaluation and on historical experience with similar assets. It is possible, however, that future results of operations could be materially affected by changes in estimates brought about by changes in the factors mentioned above. The amounts and timing of recorded expenses for any period would be affected by changes in these factors and circumstances.
Fair valuation of investment properties
The Group follows the Cost Model per IAS 40 whereby investment properties are stated at cost less accumulated depreciation and impairment losses, if any. Fair values of investment properties is disclosed in note 18. The fair values for buildings has been determined by taking into consideration both income/profits and comparable sales approach having regard to market rental and transactional evidence. Fair values for land has been determined either having regard to recent market transactions in vicinity or by using the residual method.
Allowance for slow moving inventories and net realizable value write down on inventories
The Group reviews its inventory for any write down for net realizable value adjustments on a regular basis. In determining whether a provision for slow moving inventory should be recorded in profit and loss, the Group makes judgments as to whether there is any observable data indicating that there is any future salability of the product and the net realizable value for such product. Provision is made where the net realizable value is less than cost based on best estimates by management. The provision for slow moving inventory is based on its ageing and the past trend of consumption.
Impairment of goodwill
The Group determines whether goodwill is impaired at least on an annual basis. This requires an estimation of the value-in-use of the cash generating units to which goodwill is allocated. Estimating the value-in-use requires the Group to make an estimate of the expected future cash flows from each cash generating unit and also to choose a suitable discount rate in order to calculate the present value of those cash flows.
Management has carried out an impairment test for goodwill at the year end and has concluded that no impairment has taken place. For this purpose, the recoverable amount of each cash generating unit has been determined based on a value-in-use calculation using cash flow projections, based on financial budgets approved by senior management, covering a five-year period. Cash flows beyond the five-year period are extrapolated using a growth rate, which management believes approximates the long-term growth rate for the industry in which the cash generating unit operates.
S EC TION 3142
Notes to the consolidated financial statementsfor the year ended 31 December 2020
Key assumptions used for the calculation of value-in-use
The calculation of value-in-use is sensitive to the following assumptions:
Growth rate
Growth rates are based on management’s assessment of the market share having regard to the forecast growth and demand for the products offered. Growth rates of 8% -13% per annum have been applied in the calculation.
Profit margins
Profit margins are based on management’s assessment of achieving a stable level of performance based on the approved business plan of the cash generating unit for the next five years.
Discount rates
Management has used a discount rate of 8% - 12% per annum throughout the assessment period, reflecting the estimated weighted average cost of capital of the Group and specific market risk profile.
Calculation of loss allowance
When measuring expected credit losses, the Group uses reasonable and supportable forward looking information, which is based on assumptions for the future movement of different economic drivers and how these drivers will affect each other.
Loss given default is an estimate of the loss arising on default. It is based on the difference between the contractual cash flows due and those that the lender would expect to receive, taking into account cash flows from collateral and integral credit enhancements.
Probability of default constitutes a key input in measuring ECL. Probability of default is an estimate of the likelihood of default over a given time horizon, the calculation of which includes historical data, assumptions and expectations of future conditions.
If the ECL rates on trade receivables between 91 and 180 days past due had been 5 per cent higher (lower) as of 31 December 2020, the loss allowance on trade receivables would have been AED 0.21 million (2019: AED 0.41 million) higher (lower).
If the ECL rates on trade receivables between 181 and 360 days past due had been 5 per cent higher (lower) as of 31 December 2020, the loss allowance on trade receivables would have been AED 0.74 million (2019: AED 0.82 million) higher (lower).
38. APPROVAL OF THE CONSOLIDATED FINANCIAL STATEMENTS
The consolidated financial statements were approved by the Board of Directors and authorized for issue on 10 February 2021.
37. SIGNIFICANT ACCOUNTING ESTIMATES AND CRITICAL ACCOUNTING JUDGEMENTS (CONTD.)


R AKCER A MIC S .COM
HEAD OFFICE
RAK Ceramics P.O. Box: 4714, Ras Al Khaimah
United Arab Emirates
Tel. +971 (0) 7 246 7000 Fax. +971 (0) 7 244 5270
Email. [email protected]


