Embed Size (px)
Citation preview
ANNUAL REPORT 2021
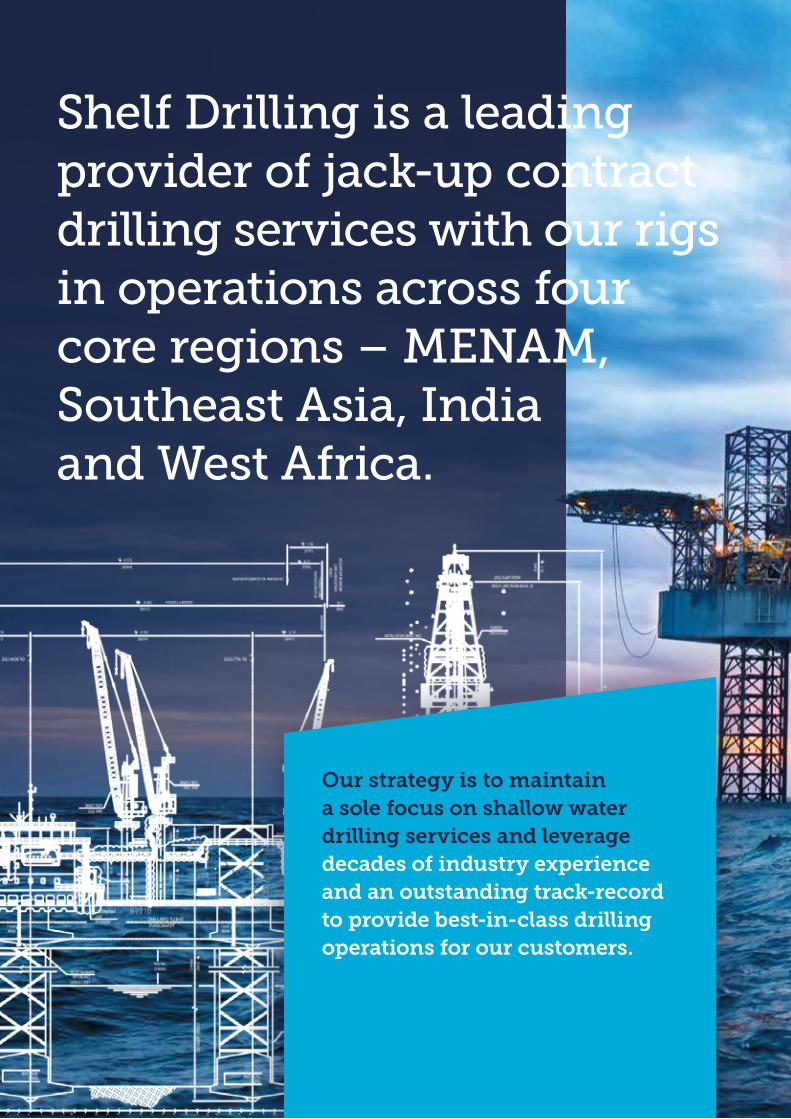
Shelf Drilling is a leading provider of jack-up contract drilling services with our rigs in operations across four core regions – MENAM, Southeast Asia, India and West Africa.
Our strategy is to maintain a sole focus on shallow water drilling services and leverage decades of industry experience and an outstanding track-record to provide best-in-class drilling operations for our customers.
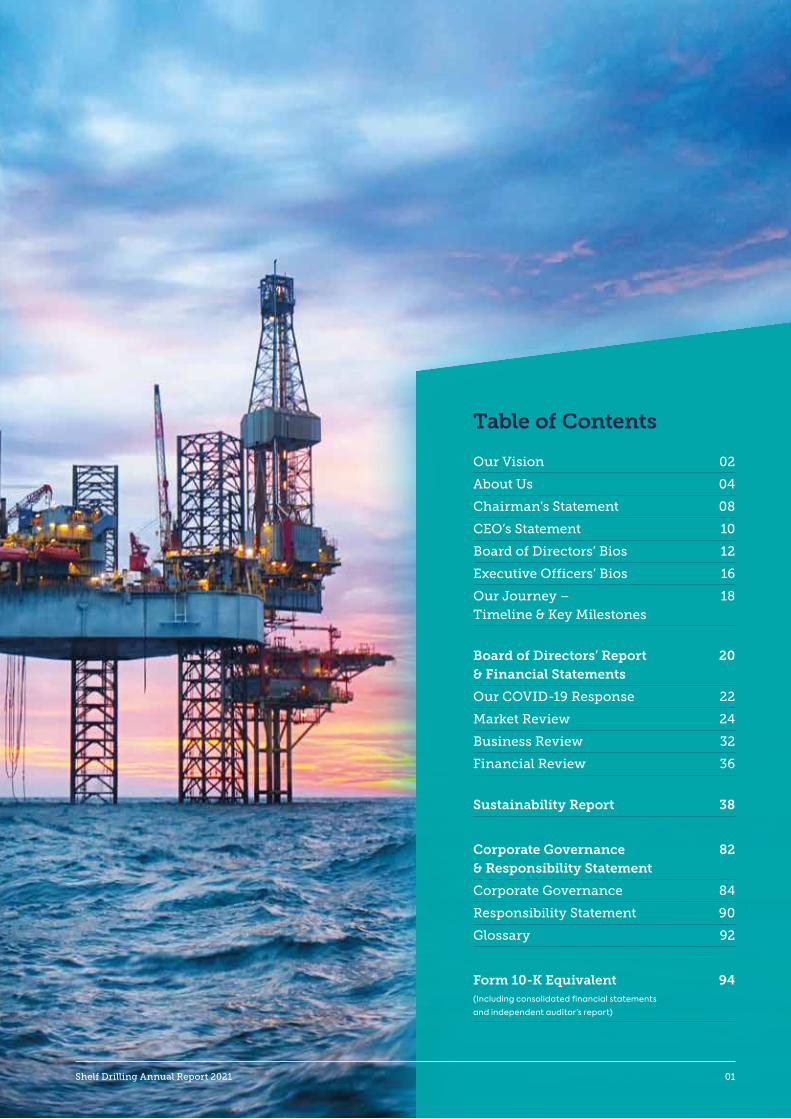
Table of Contents Our Vision 02
About Us 04
Chairman’s Statement 08
CEO’s Statement 10
Board of Directors’ Bios 12
Executive Officers’ Bios 16
Our Journey – 18 Timeline & Key Milestones
Board of Directors’ Report 20 & Financial Statements
Our COVID-19 Response 22
Market Review 24
Business Review 32
Financial Review 36
Sustainability Report 38
Corporate Governance 82 & Responsibility Statement
Corporate Governance 84
Responsibility Statement 90
Glossary 92
Form 10-K Equivalent 94(Including consolidated financial statements
and independent auditor’s report)
Shelf Drilling Annual Report 2021 01
Our Vision To be the international jack-up contractor of choice
OUR VISION
02 Shelf Drilling Annual Report 2021
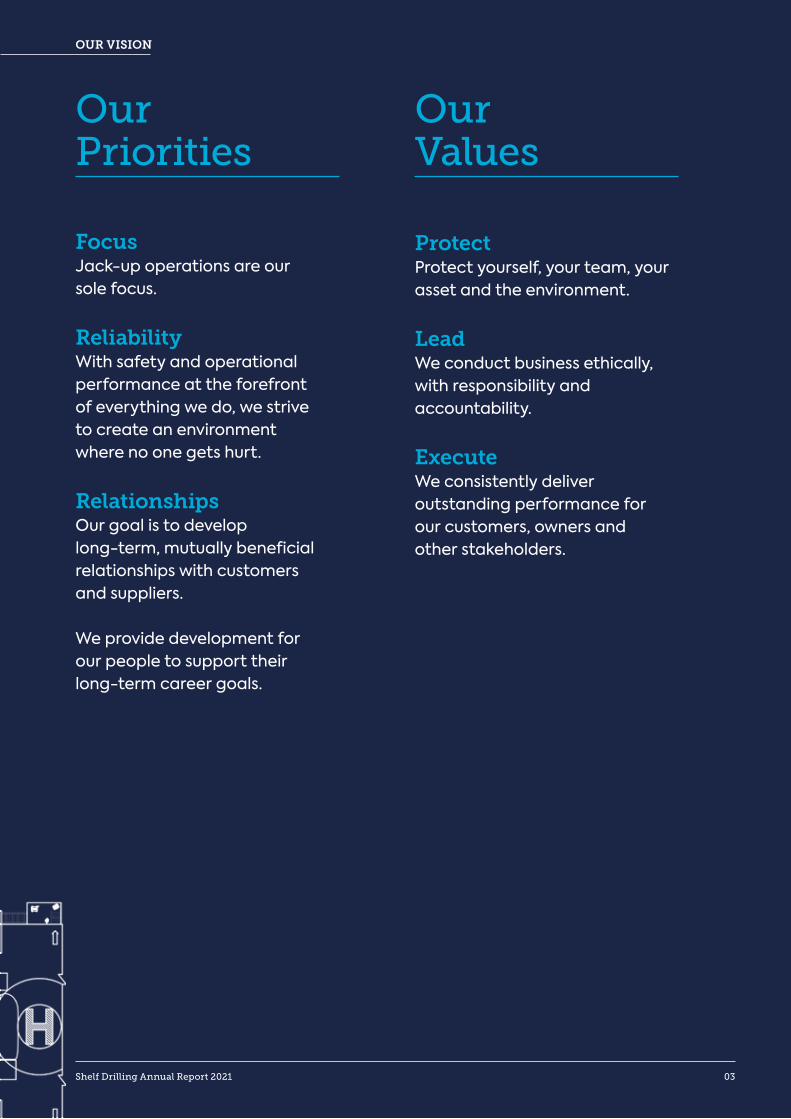
Our Priorities
Our Values
FocusJack-up operations are our sole focus.
Reliability With safety and operational performance at the forefront of everything we do, we strive to create an environment where no one gets hurt.
RelationshipsOur goal is to develop long-term, mutually beneficial relationships with customers and suppliers.
We provide development for our people to support their long-term career goals.
Protect Protect yourself, your team, your asset and the environment.
Lead We conduct business ethically, with responsibility and accountability.
Execute We consistently deliver outstanding performance for our customers, owners and other stakeholders.
OUR VISION
Shelf Drilling Annual Report 2021 03
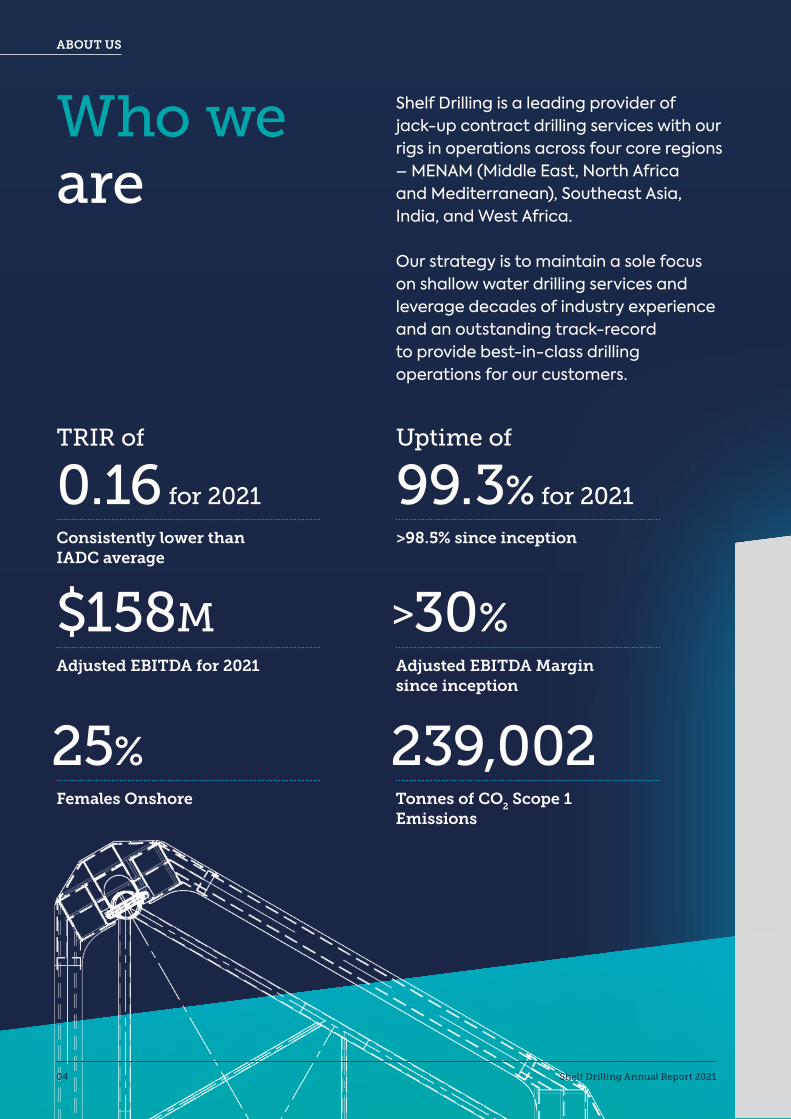
Who we are
Shelf Drilling is a leading provider of jack-up contract drilling services with our rigs in operations across four core regions – MENAM (Middle East, North Africa and Mediterranean), Southeast Asia, India, and West Africa.
Our strategy is to maintain a sole focus on shallow water drilling services and leverage decades of industry experience and an outstanding track-record to provide best-in-class drilling operations for our customers.
Consistently lower than IADC average
>98.5% since inception
Uptime of
99.3% for 2021
TRIR of
0.16 for 2021
Females Onshore
25%Tonnes of CO2 Scope 1 Emissions
239,002
Adjusted EBITDA Margin since inception
>30%Adjusted EBITDA for 2021
$158M
ABOUT US
04 Shelf Drilling Annual Report 2021
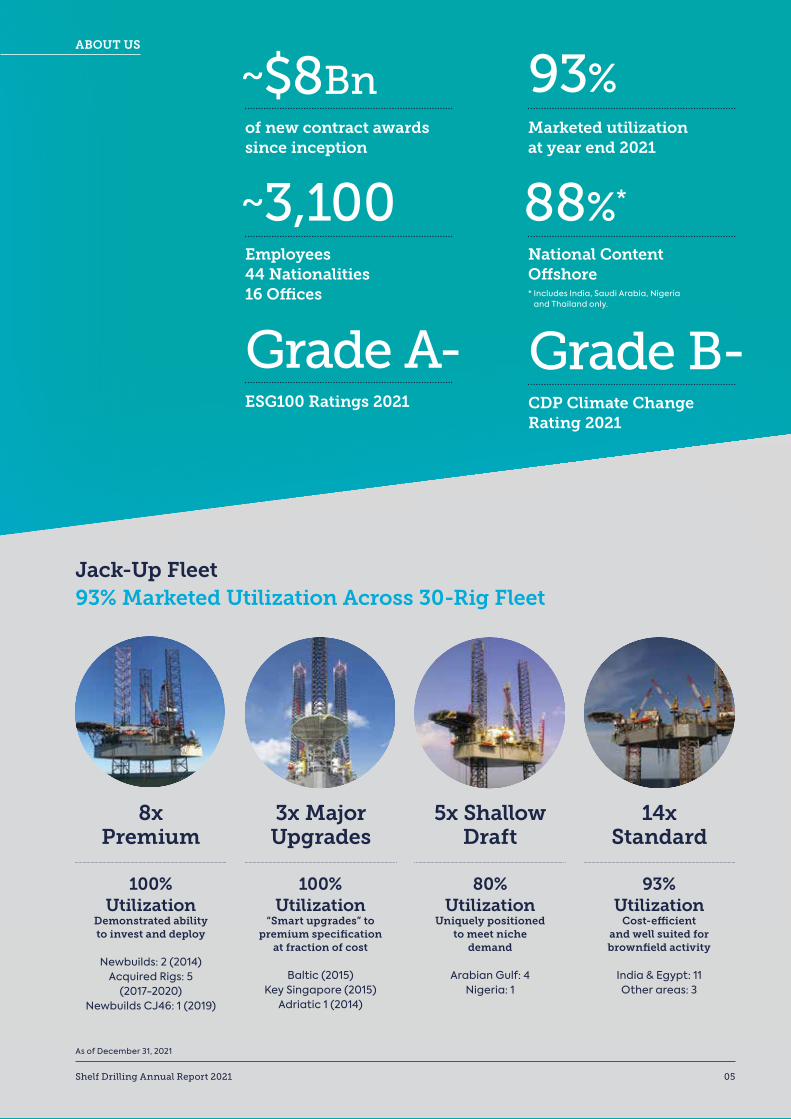
Jack-Up Fleet 93% Marketed Utilization Across 30-Rig Fleet
8x Premium
3x Major Upgrades
5x Shallow Draft
14x Standard
100% Utilization
Demonstrated ability to invest and deploy
Newbuilds: 2 (2014)Acquired Rigs: 5
(2017-2020)Newbuilds CJ46: 1 (2019)
100% Utilization
“Smart upgrades” to premium specification
at fraction of cost
Baltic (2015)Key Singapore (2015)
Adriatic 1 (2014)
80% Utilization
Uniquely positionedto meet niche
demand
Arabian Gulf: 4Nigeria: 1
93% Utilization
Cost-efficient and well suited for brownfield activity
India & Egypt: 11Other areas: 3
Marketed utilization at year end 2021
93%of new contract awards since inception
~$8Bn
National Content Offshore
88%*
Employees44 Nationalities 16 Offices
~3,100
CDP Climate Change Rating 2021
Grade B-ESG100 Ratings 2021
Grade A-
As of December 31, 2021
* Includes India, Saudi Arabia, Nigeria and Thailand only.
ABOUT US
Shelf Drilling Annual Report 2021 05
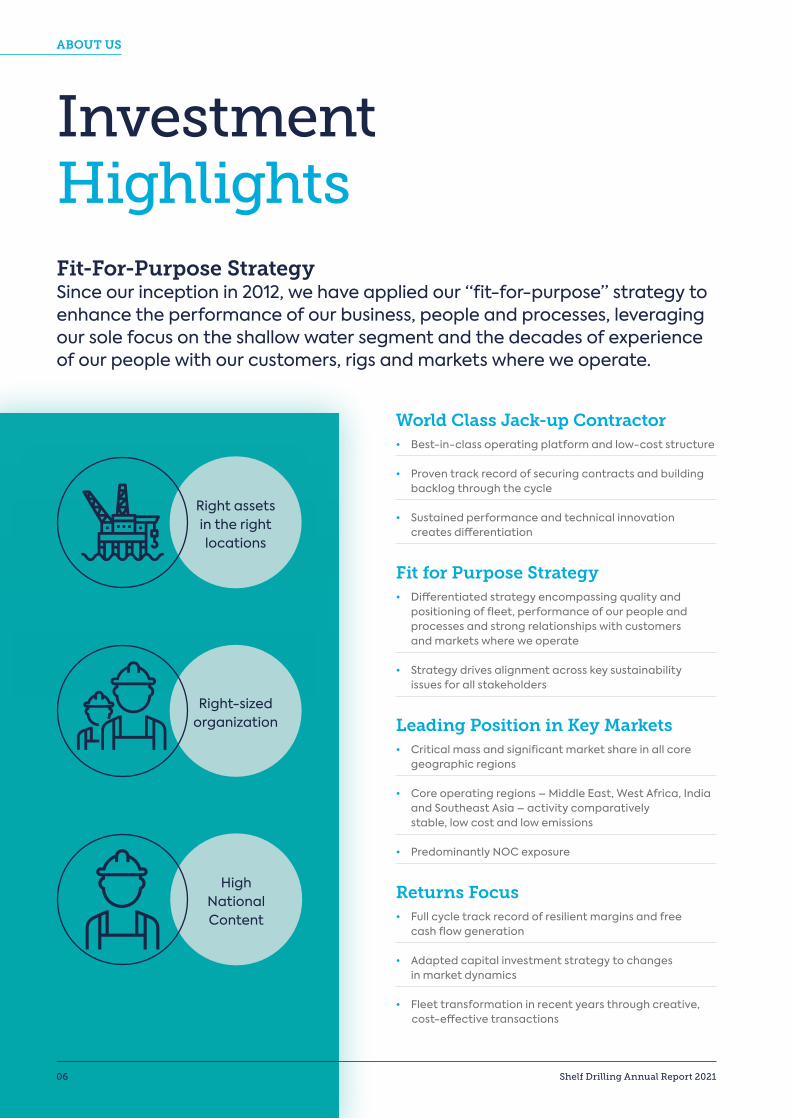
InvestmentHighlightsFit-For-Purpose StrategySince our inception in 2012, we have applied our ‘‘fit-for-purpose’’ strategy to enhance the performance of our business, people and processes, leveraging our sole focus on the shallow water segment and the decades of experience of our people with our customers, rigs and markets where we operate.
Right-sized Organization
High National Content
World Class Jack-up Contractor• Best-in-class operating platform and low-cost structure
• Proven track record of securing contracts and building backlog through the cycle
• Sustained performance and technical innovation creates differentiation
Fit for Purpose Strategy• Differentiated strategy encompassing quality and
positioning of fleet, performance of our people and processes and strong relationships with customers and markets where we operate
• Strategy drives alignment across key sustainability issues for all stakeholders
Leading Position in Key Markets• Critical mass and significant market share in all core
geographic regions
• Core operating regions – Middle East, West Africa, India and Southeast Asia – activity comparatively stable, low cost and low emissions
• Predominantly NOC exposure
Returns Focus• Full cycle track record of resilient margins and free
cash flow generation • Adapted capital investment strategy to changes in market dynamics • F leet transformation in recent years through creative, cost-effective transactions
Right assets in the right locations
Right-sizedorganization
ABOUT US
06 Shelf Drilling Annual Report 2021
#4
#4
#1
#1*
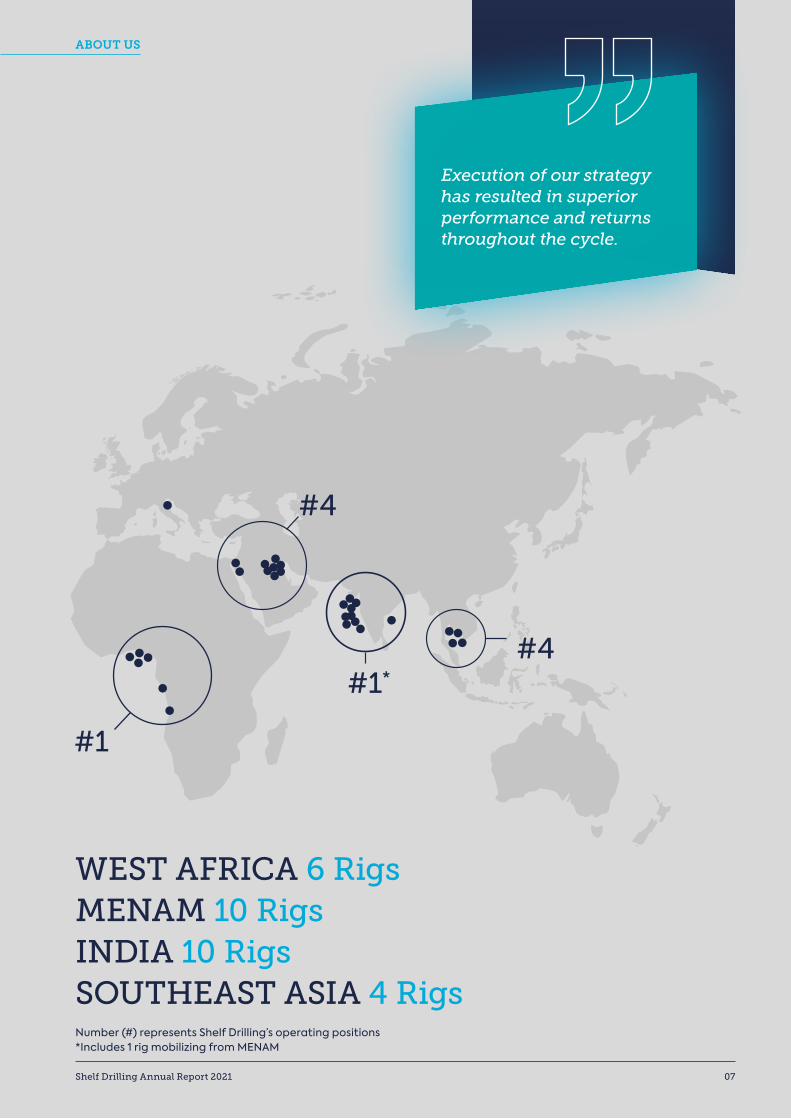
Execution of our strategy has resulted in superior performance and returns throughout the cycle.
WEST AFRICA 6 Rigs MENAM 10 RigsINDIA 10 RigsSOUTHEAST ASIA 4 Rigs
ABOUT US
Shelf Drilling Annual Report 2021 07
Number (#) represents Shelf Drilling’s operating positions *Includes 1 rig mobilizing from MENAM
Preparing for the future
To all stakeholders of Shelf Drilling, Ltd.We entered 2021 facing a great deal of uncertainty following the onset of the COVID-19 pandemic. Throughout the year, Shelf Drilling took the necessary steps to navigate some significant challenges and to position the Company for success as the market recovers. The COVID-19 protocols implemented by our management team to protect the well-being of our employees and to minimize the risk of transmission to our rigs were expanded to include vaccine access for our workforce as soon as practically possible. While we have seen operational disruptions due to infections on a few of our rigs, overall, this has been extremely well managed, and I commend our employees, contractors, and management teams for their dedication to these protocols despite the disruption this brings to them and their families.
CHAIRMAN’S MESSAGE
08 Shelf Drilling Annual Report 2021
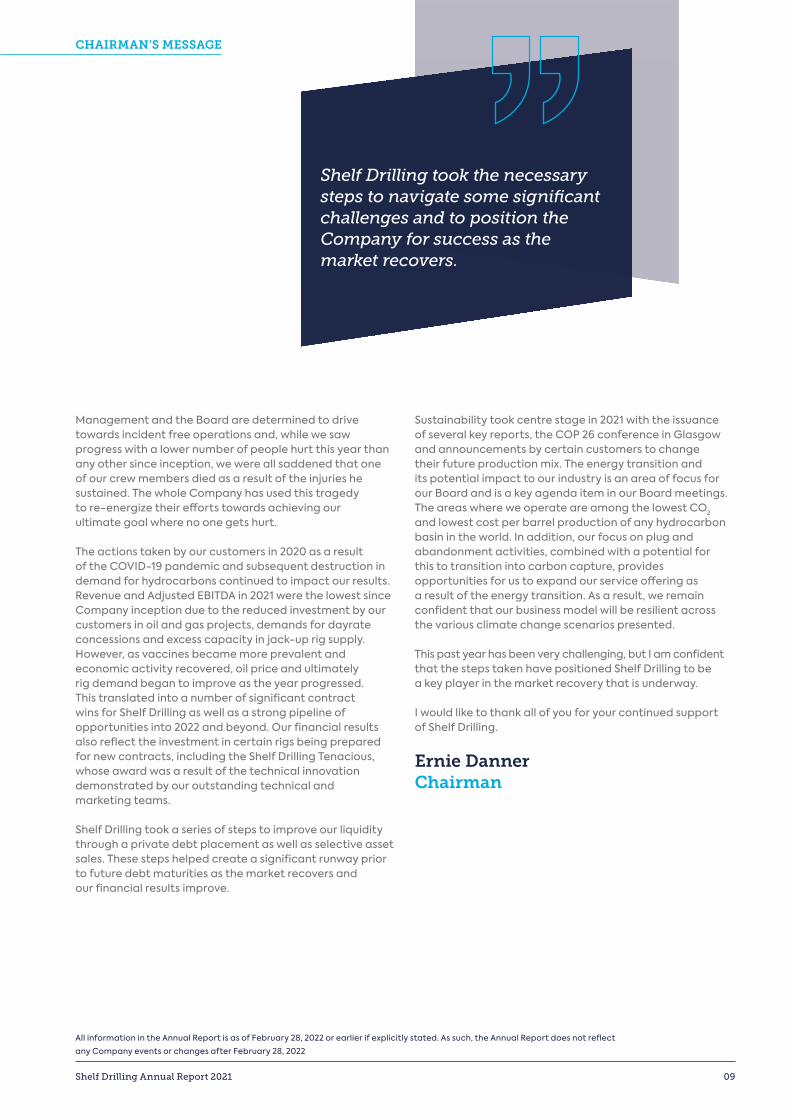
Shelf Drilling took the necessary steps to navigate some significant challenges and to position the Company for success as the market recovers.
Management and the Board are determined to drive towards incident free operations and, while we saw progress with a lower number of people hurt this year than any other since inception, we were all saddened that one of our crew members died as a result of the injuries he sustained. The whole Company has used this tragedy to re-energize their efforts towards achieving our ultimate goal where no one gets hurt.
The actions taken by our customers in 2020 as a result of the COVID-19 pandemic and subsequent destruction in demand for hydrocarbons continued to impact our results. Revenue and Adjusted EBITDA in 2021 were the lowest since Company inception due to the reduced investment by our customers in oil and gas projects, demands for dayrate concessions and excess capacity in jack-up rig supply. However, as vaccines became more prevalent and economic activity recovered, oil price and ultimately rig demand began to improve as the year progressed. This translated into a number of significant contract wins for Shelf Drilling as well as a strong pipeline of opportunities into 2022 and beyond. Our financial results also reflect the investment in certain rigs being prepared for new contracts, including the Shelf Drilling Tenacious, whose award was a result of the technical innovation demonstrated by our outstanding technical and marketing teams.
Shelf Drilling took a series of steps to improve our liquidity through a private debt placement as well as selective asset sales. These steps helped create a significant runway prior to future debt maturities as the market recovers and our financial results improve.
Sustainability took centre stage in 2021 with the issuance of several key reports, the COP 26 conference in Glasgow and announcements by certain customers to change their future production mix. The energy transition and its potential impact to our industry is an area of focus for our Board and is a key agenda item in our Board meetings. The areas where we operate are among the lowest CO2
and lowest cost per barrel production of any hydrocarbon basin in the world. In addition, our focus on plug and abandonment activities, combined with a potential for this to transition into carbon capture, provides opportunities for us to expand our service offering as a result of the energy transition. As a result, we remain confident that our business model will be resilient across the various climate change scenarios presented.
This past year has been very challenging, but I am confident that the steps taken have positioned Shelf Drilling to be a key player in the market recovery that is underway. I would like to thank all of you for your continued support of Shelf Drilling.
Ernie DannerChairman
All information in the Annual Report is as of February 28, 2022 or earlier if explicitly stated. As such, the Annual Report does not reflect
any Company events or changes after February 28, 2022
CHAIRMAN’S MESSAGE
Shelf Drilling Annual Report 2021 09
The positive impact of vaccination programs combined with a recovery in the demand for hydrocarbons and OPEC plus discipline on supply resulted in a strong oil price trajectory from the end of the first quarter through to year-end 2021. As a result, demand for jack-up rig services slowly improved and this translated into a very positive marketing performance, the second best year in terms of contract awards and incremental backlog since 2014. We finished the year with $1.7 billion in contract backlog, corresponding to a book to bill of approximately 1.4x, with 28 of our 30 rigs under contract and a solid pipeline of opportunities ahead of us. The adverse effects of the COVID-19 pandemic continued to impact our business throughout 2021. This resulted in complications to crew change schedules, delays in shipyard projects and disruption of our supply chain, all combining to impact operating cost and the timely delivery of rigs from out of service projects.
We were, however, able to substantially offset the impact of the COVID-19 impact through the various actions initiated in 2020 that were consistent with the 3 key priorities:
1. To keep our people and rigs safe and free of COVID-19,2. To maintain business continuity, and 3. To preserve cash
Since inception, Shelf Drilling has focused on driving for incident-free operations across our fleet. We have continued to make progress towards this goal each year and have consistently had a safety performance that has been significantly better than the industry average. While we did reduce the number of injuries in the workplace in 2021, the company was shaken by a fatality that occurred following an accident on the CE Thornton in India, the first in the Company’s history. We immediately shared the details and lessons learned across our fleet and reinvigorated our determination to work incident-free. As a result of these efforts, we finished the year with a total of 7 recordable injuries for 2021, corresponding to a Total Recordable Incident Rate (TRIR) of 0.16, the lowest since Company inception. This progress however cannot take away from the profound impact the fatality has had. Our focus on solid planning to achieve incident-free operations also results in more efficient and effective operations for our customers. One measure of this is our uptime performance, which in 2021 was 99.3%, the second best in the Company’s history despite the many supply chain and personnel challenges imposed by the pandemic.
This outstanding achievement is due in part to the highly centralized procurement and technical support functions which ensure that relevant spare parts and equipment are maintained in a ready-to-go state wherever they may be needed across our fleet. It is also in part a result of the flat and “fit-for-purpose” organization where the rig crews can get immediate access to the support they need to resolve any equipment issues that may arise.
In March, we completed a debt private placement that provided certainty of strong liquidity for multiple years. The net proceeds of the $310 million issuance of new 8.875% Senior Secured First Lien Notes due in 2024 were used to repay and terminate our revolving credit facility, cash collateralize bank guarantees issued under the revolving credit facility, redeem all outstanding 8.75% Senior Secured Notes due in 2024 and for general corporate purposes. The Shelf Drilling Journey sale, which was announced in December 2020, closed in February for net proceeds of $77 million. In addition, we sold the High Island VII for non-drilling purposes as soon as its contract concluded in the third quarter and a further 4 rigs that were held-for-sale as of the end of 2020. The result of the private placement and rig sales was to substantially improve our liquidity position, simplify our capital structure and push out the near term maturities.
Since inception, we have retired or sold for non-drilling purposes 15 rigs and added 8 premium jack-ups to significantly transform our fleet.
We enjoyed a very strong marketing performance over the past year with 21 contract awards or extensions generating $730 million of backlog corresponding to 36 rig-years. The backlog at year end was a significant improvement from year-end 2020. Currently there are a number of opportunities either in play or anticipated across all of our operating regions for the rigs that are scheduled to roll off contract in 2022 and the 2 idle rigs.
One of the most significant awards in 2021 was the contract for the Shelf Drilling Tenacious in Angola. We were able to design a rig upgrade modification that will enable our customer to use the rig to construct the platform prior to drilling the wells. This unique solution is a further demonstration of the technical innovation our teams show in helping to solve our customers’ challenges. The rig has also been highly customized for “factory-style” operations, consistent with the rigs we have deployed in Thailand, which have set the benchmark for both efficient drilling and well abandonment operations.
The activity in the first half of 2021 continued to be impacted by the severe downturn of the prior year with 4 rigs on standby or suspension and a further two contract cancellations in the first quarter.
A Year of Transition
CEO’S MESSAGE
10 Shelf Drilling Annual Report 2021
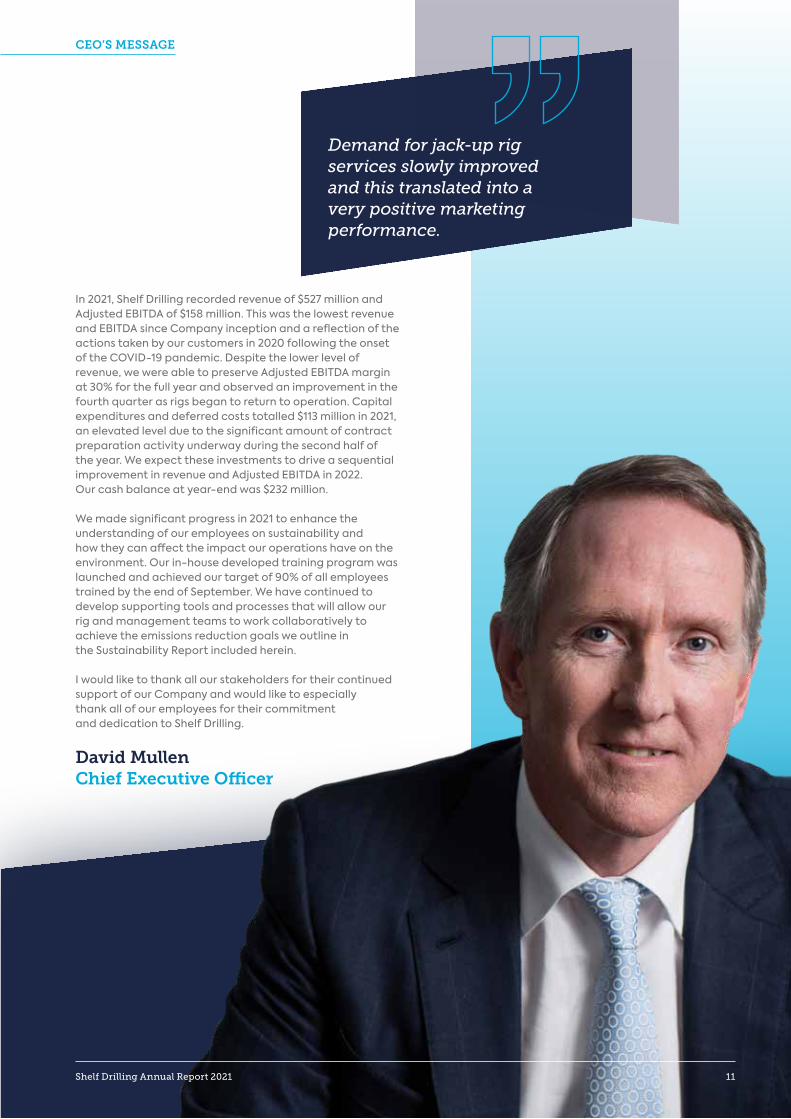
Demand for jack-up rig services slowly improved and this translated into a very positive marketing performance.
In 2021, Shelf Drilling recorded revenue of $527 million and Adjusted EBITDA of $158 million. This was the lowest revenue and EBITDA since Company inception and a reflection of the actions taken by our customers in 2020 following the onset of the COVID-19 pandemic. Despite the lower level of revenue, we were able to preserve Adjusted EBITDA margin at 30% for the full year and observed an improvement in the fourth quarter as rigs began to return to operation. Capital expenditures and deferred costs totalled $113 million in 2021, an elevated level due to the significant amount of contract preparation activity underway during the second half of the year. We expect these investments to drive a sequential improvement in revenue and Adjusted EBITDA in 2022. Our cash balance at year-end was $232 million.
We made significant progress in 2021 to enhance the understanding of our employees on sustainability and how they can affect the impact our operations have on the environment. Our in-house developed training program was launched and achieved our target of 90% of all employees trained by the end of September. We have continued to develop supporting tools and processes that will allow our rig and management teams to work collaboratively to achieve the emissions reduction goals we outline in the Sustainability Report included herein. I would like to thank all our stakeholders for their continued support of our Company and would like to especially thank all of our employees for their commitment and dedication to Shelf Drilling.
David MullenChief Executive Officer
CEO’S MESSAGE
Shelf Drilling Annual Report 2021 11
Board of Directors’BiographiesErnie DannerChairman of the Board
David MullenDirector & CEO
John K.CastleDirector
Mr. Danner joined our board of directors in October 2013 and has served as Chairman of the Board since November 2018.
Since January 2018 Mr. Danner has served as an Operating Partner of SCF Partners, a private equity firm focused on oil service investments, which he joined in October 2012. Currently Mr. Danner serves as Chairman of the board of directors of Nine Energy Service, Inc., a NYSE listed company providing completion services to oil and gas producers in North America and Chairman of the board of directors of BCCK Engineering, Inc, a private company that designs, fabricates and installs natural gas processing plants in North America. Mr. Danner also serves as Chairman of the board of directors of Pipeline Plastics LLC, a manufacturer of HDPE pipe. Mr. Danner served as President and Chief Executive Officer of Exterran Holdings Inc. from July 2009 to October 2011 and as a member of its board of directors from 1998 to October 2011. He also served as President, Chief Executive Officer and a director of Exterran GP LLC the general partner of Exterran Partners L.P. Exterran was a global leader in natural gas compression products and services and a provider of equipment and solutions for processing, production, air emissions and water treatment to the energy sector with over 10,000 employees with operations in 30 countries. Mr. Danner has a Masters of Accounting and Bachelor of the Arts degree from Rice University.
Since April 2018, Mr. Mullen has served as an Independent Director of Subsea 7 S.A. From September 2010 to April 2011, Mr. Mullen was CEO of Wellstream Holdings PLC, a UK listed company that designed and manufactured subsea pipeline products and included as part of the product offering, subsea services and installation. From April 2008 to August 2010, Mr. Mullen served as Chief Executive Officer of Ocean Rig ASA, a Norwegian listed ultra-deep water drilling contractor. Prior to Ocean Rig ASA, Mr. Mullen also spent four years as a senior leader of Transocean Ltd. As Senior Vice President of Global Marketing, Business Development and M&A at Transocean Ltd., Mr. Mullen spearheaded marketing and strategic planning. Mr. Mullen had a 23-year career at Schlumberger, including as President of Oilfield Services for North and South America. Mr. Mullen received a B.A. in Geology & Physics from Trinity College Dublin and an M.Sc. degree in Geophysics from University College Galway.
Mr. Mullen has over 35 years’ experience in the oil services business and has been our Chief Executive Officer since October 2012.
Mr. Castle joined our board of directors in November 2012 and has served as Chairman of the Nomination Committee since February 2019.
Mr. Castle has served as Chairman and Chief Executive Officer of Castle Harlan, Inc. since 1987, and as Chairman and Chief Executive Officer of Branford Castle, Inc since 1986. Prior to forming Castle Harlan, Inc., Mr. Castle was President and Chief Executive of investment banking firm Donaldson, Lufkin & Jenrette, Inc. Mr. Castle is a board member of various private equity companies, and he has previously been a director of numerous private and public companies. He also served as a Director of the Equitable Life Assurance Society of the U.S. Mr. Castle is a Life Member of the Corporation of the Massachusetts Institute of Technology. Previously, he had served for 22 years as a Trustee of New York Medical College, including 11 of those years as Chairman of the board. Mr. Castle is a Trustee and Chairman of the Executive Committee of the St. Patrick’s Cathedral in New York City and is a member of the Finance Council of the Archdiocese of New York. From 2000 to 2018, Mr. Castle was a Director of Castle Harlan Australian Mezzanine Partners Pty Ltd and a Director of CHAMP Group Holdings Pty Ltd. He has served on various visiting committees at Harvard University, including the Harvard Business School. Mr. Castle received his Bachelor’s degree from the Massachusetts Institute of Technology, his M.B.A. as a Baker Scholar with High Distinction from Harvard University, and has four Honorary Doctorate Degrees of Humane Letters.
BOARD OF DIRECTORS
12 Shelf Drilling Annual Report 2021
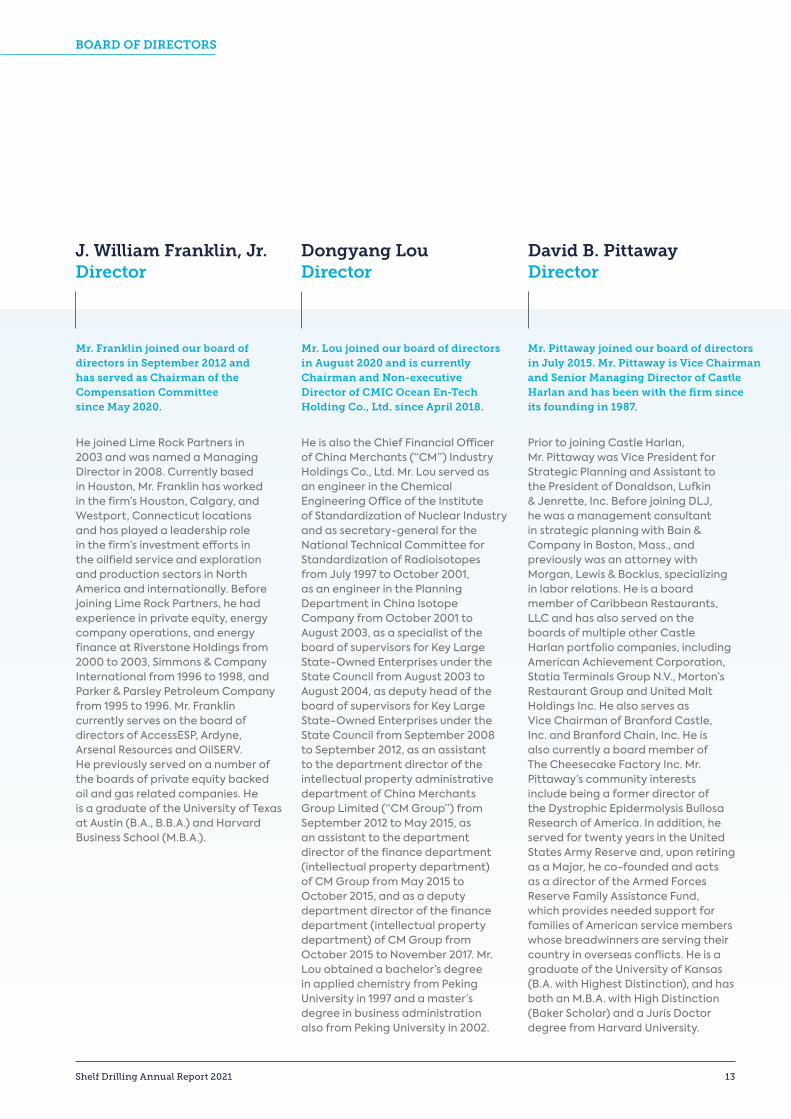
J. William Franklin, Jr. Director
Dongyang Lou Director
David B. PittawayDirector
Mr. Franklin joined our board of directors in September 2012 and has served as Chairman of the Compensation Committee since May 2020.
Mr. Lou joined our board of directors in August 2020 and is currently Chairman and Non-executive Director of CMIC Ocean En-Tech Holding Co., Ltd. since April 2018.
He joined Lime Rock Partners in 2003 and was named a Managing Director in 2008. Currently based in Houston, Mr. Franklin has worked in the firm’s Houston, Calgary, and Westport, Connecticut locations and has played a leadership role in the firm’s investment efforts in the oilfield service and exploration and production sectors in North America and internationally. Before joining Lime Rock Partners, he had experience in private equity, energy company operations, and energy finance at Riverstone Holdings from 2000 to 2003, Simmons & Company International from 1996 to 1998, and Parker & Parsley Petroleum Company from 1995 to 1996. Mr. Franklin currently serves on the board of directors of AccessESP, Ardyne, Arsenal Resources and OilSERV. He previously served on a number of the boards of private equity backed oil and gas related companies. He is a graduate of the University of Texas at Austin (B.A., B.B.A.) and Harvard Business School (M.B.A.).
He is also the Chief Financial Officer of China Merchants (“CM”) Industry Holdings Co., Ltd. Mr. Lou served as an engineer in the Chemical Engineering Office of the Institute of Standardization of Nuclear Industry and as secretary-general for the National Technical Committee for Standardization of Radioisotopes from July 1997 to October 2001, as an engineer in the Planning Department in China Isotope Company from October 2001 to August 2003, as a specialist of the board of supervisors for Key Large State-Owned Enterprises under the State Council from August 2003 to August 2004, as deputy head of the board of supervisors for Key Large State-Owned Enterprises under the State Council from September 2008 to September 2012, as an assistant to the department director of the intellectual property administrative department of China Merchants Group Limited (“CM Group”) from September 2012 to May 2015, as an assistant to the department director of the finance department (intellectual property department) of CM Group from May 2015 to October 2015, and as a deputy department director of the finance department (intellectual property department) of CM Group from October 2015 to November 2017. Mr. Lou obtained a bachelor’s degree in applied chemistry from Peking University in 1997 and a master’s degree in business administration also from Peking University in 2002.
Mr. Pittaway joined our board of directors in July 2015. Mr. Pittaway is Vice Chairman and Senior Managing Director of Castle Harlan and has been with the firm since its founding in 1987.
Prior to joining Castle Harlan, Mr. Pittaway was Vice President for Strategic Planning and Assistant to the President of Donaldson, Lufkin & Jenrette, Inc. Before joining DLJ, he was a management consultant in strategic planning with Bain & Company in Boston, Mass., and previously was an attorney with Morgan, Lewis & Bockius, specializing in labor relations. He is a board member of Caribbean Restaurants, LLC and has also served on the boards of multiple other Castle Harlan portfolio companies, including American Achievement Corporation, Statia Terminals Group N.V., Morton’s Restaurant Group and United Malt Holdings Inc. He also serves as Vice Chairman of Branford Castle, Inc. and Branford Chain, Inc. He is also currently a board member of The Cheesecake Factory Inc. Mr. Pittaway’s community interests include being a former director of the Dystrophic Epidermolysis Bullosa Research of America. In addition, he served for twenty years in the United States Army Reserve and, upon retiring as a Major, he co-founded and acts as a director of the Armed Forces Reserve Family Assistance Fund, which provides needed support for families of American service members whose breadwinners are serving their country in overseas conflicts. He is a graduate of the University of Kansas (B.A. with Highest Distinction), and has both an M.B.A. with High Distinction (Baker Scholar) and a Juris Doctor degree from Harvard University.
BOARD OF DIRECTORS
Shelf Drilling Annual Report 2021 13
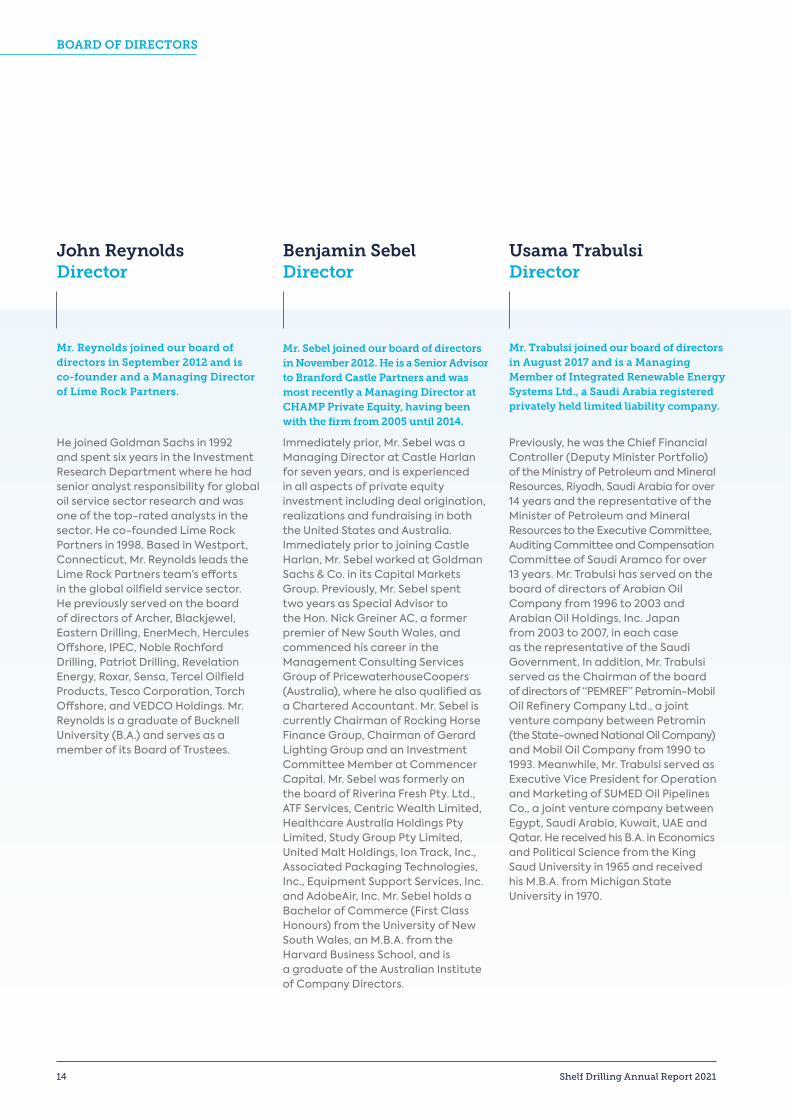
John ReynoldsDirector
Benjamin SebelDirector
Usama TrabulsiDirector
Mr. Reynolds joined our board of directors in September 2012 and is co-founder and a Managing Director of Lime Rock Partners.
He joined Goldman Sachs in 1992 and spent six years in the Investment Research Department where he had senior analyst responsibility for global oil service sector research and was one of the top-rated analysts in the sector. He co-founded Lime Rock Partners in 1998. Based in Westport, Connecticut, Mr. Reynolds leads the Lime Rock Partners team’s efforts in the global oilfield service sector. He previously served on the board of directors of Archer, Blackjewel, Eastern Drilling, EnerMech, Hercules Offshore, IPEC, Noble Rochford Drilling, Patriot Drilling, Revelation Energy, Roxar, Sensa, Tercel Oilfield Products, Tesco Corporation, Torch Offshore, and VEDCO Holdings. Mr. Reynolds is a graduate of Bucknell University (B.A.) and serves as a member of its Board of Trustees.
Immediately prior, Mr. Sebel was a Managing Director at Castle Harlan for seven years, and is experienced in all aspects of private equity investment including deal origination, realizations and fundraising in both the United States and Australia. Immediately prior to joining Castle Harlan, Mr. Sebel worked at Goldman Sachs & Co. in its Capital Markets Group. Previously, Mr. Sebel spent two years as Special Advisor to the Hon. Nick Greiner AC, a former premier of New South Wales, and commenced his career in the Management Consulting Services Group of PricewaterhouseCoopers (Australia), where he also qualified as a Chartered Accountant. Mr. Sebel is currently Chairman of Rocking Horse Finance Group, Chairman of Gerard Lighting Group and an Investment Committee Member at Commencer Capital. Mr. Sebel was formerly on the board of Riverina Fresh Pty. Ltd., ATF Services, Centric Wealth Limited, Healthcare Australia Holdings Pty Limited, Study Group Pty Limited, United Malt Holdings, Ion Track, Inc., Associated Packaging Technologies, Inc., Equipment Support Services, Inc. and AdobeAir, Inc. Mr. Sebel holds a Bachelor of Commerce (First Class Honours) from the University of New South Wales, an M.B.A. from the Harvard Business School, and is a graduate of the Australian Institute of Company Directors.
Mr. Sebel joined our board of directors in November 2012. He is a Senior Advisor to Branford Castle Partners and was most recently a Managing Director at CHAMP Private Equity, having been with the firm from 2005 until 2014.
Mr. Trabulsi joined our board of directors in August 2017 and is a Managing Member of Integrated Renewable Energy Systems Ltd., a Saudi Arabia registered privately held limited liability company.
Previously, he was the Chief Financial Controller (Deputy Minister Portfolio) of the Ministry of Petroleum and Mineral Resources, Riyadh, Saudi Arabia for over 14 years and the representative of the Minister of Petroleum and Mineral Resources to the Executive Committee, Auditing Committee and Compensation Committee of Saudi Aramco for over 13 years. Mr. Trabulsi has served on the board of directors of Arabian Oil Company from 1996 to 2003 and Arabian Oil Holdings, Inc. Japan from 2003 to 2007, in each case as the representative of the Saudi Government. In addition, Mr. Trabulsi served as the Chairman of the board of directors of “PEMREF” Petromin-Mobil Oil Refinery Company Ltd., a joint venture company between Petromin (the State-owned National Oil Company) and Mobil Oil Company from 1990 to 1993. Meanwhile, Mr. Trabulsi served as Executive Vice President for Operation and Marketing of SUMED Oil Pipelines Co., a joint venture company between Egypt, Saudi Arabia, Kuwait, UAE and Qatar. He received his B.A. in Economics and Political Science from the King Saud University in 1965 and received his M.B.A. from Michigan State University in 1970.
BOARD OF DIRECTORS
14 Shelf Drilling Annual Report 2021
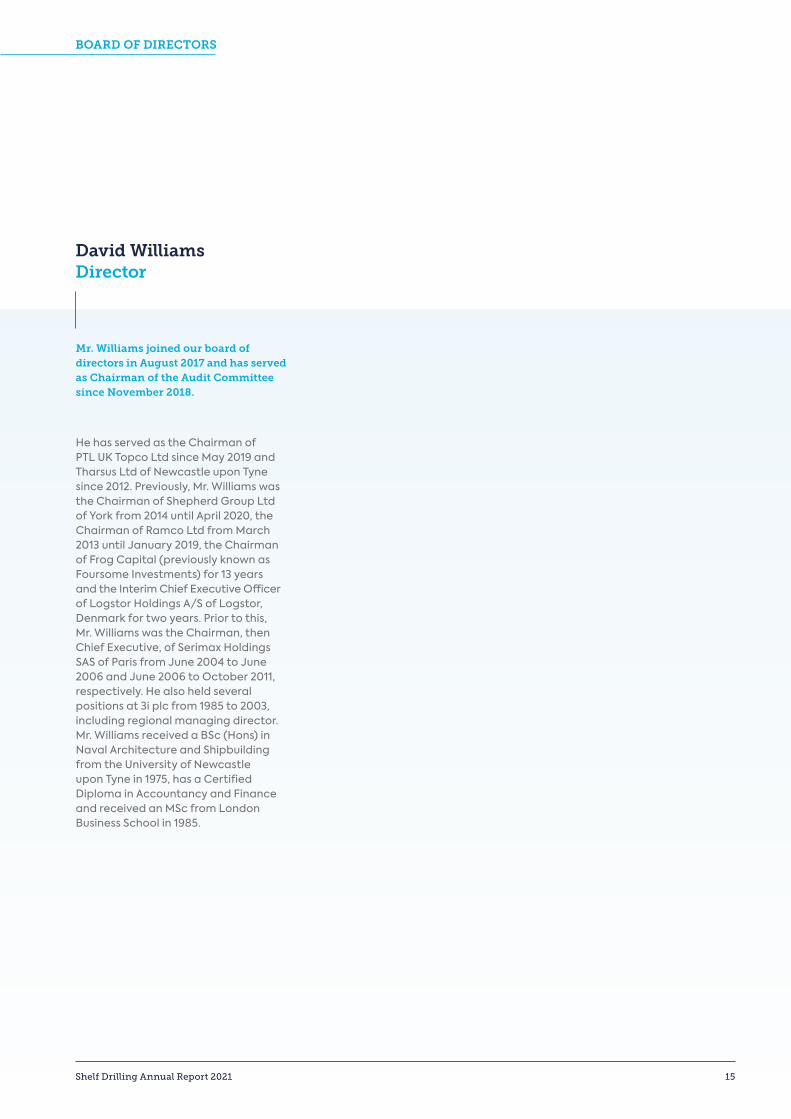
David Williams Director
Mr. Williams joined our board of directors in August 2017 and has served as Chairman of the Audit Committee since November 2018.
He has served as the Chairman of PTL UK Topco Ltd since May 2019 and Tharsus Ltd of Newcastle upon Tyne since 2012. Previously, Mr. Williams was the Chairman of Shepherd Group Ltd of York from 2014 until April 2020, the Chairman of Ramco Ltd from March 2013 until January 2019, the Chairman of Frog Capital (previously known as Foursome Investments) for 13 years and the Interim Chief Executive Officer of Logstor Holdings A/S of Logstor, Denmark for two years. Prior to this, Mr. Williams was the Chairman, then Chief Executive, of Serimax Holdings SAS of Paris from June 2004 to June 2006 and June 2006 to October 2011, respectively. He also held several positions at 3i plc from 1985 to 2003, including regional managing director. Mr. Williams received a BSc (Hons) in Naval Architecture and Shipbuilding from the University of Newcastle upon Tyne in 1975, has a Certified Diploma in Accountancy and Finance and received an MSc from London Business School in 1985.
BOARD OF DIRECTORS
Shelf Drilling Annual Report 2021 15
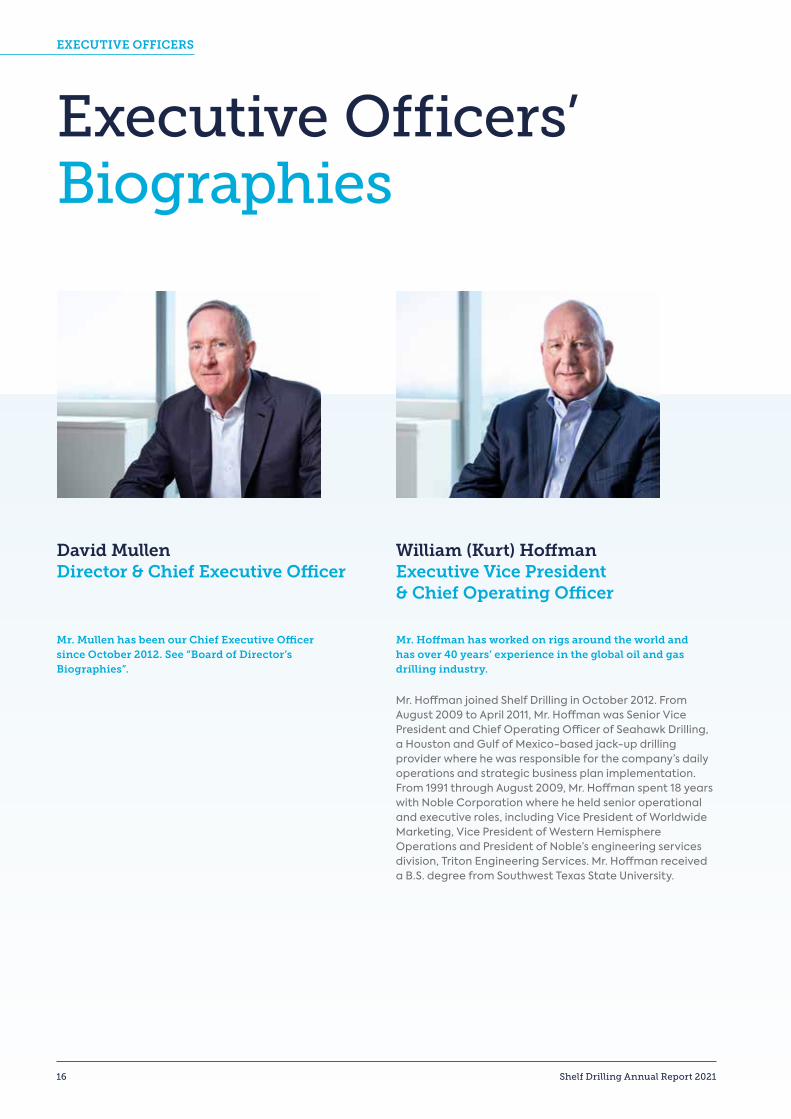
David MullenDirector & Chief Executive Officer
Mr. Mullen has been our Chief Executive Officer since October 2012. See “Board of Director’s Biographies”.
William (Kurt) Hoffman Executive Vice President & Chief Operating Officer
Mr. Hoffman has worked on rigs around the world and has over 40 years’ experience in the global oil and gas drilling industry.
Mr. Hoffman joined Shelf Drilling in October 2012. From August 2009 to April 2011, Mr. Hoffman was Senior Vice President and Chief Operating Officer of Seahawk Drilling, a Houston and Gulf of Mexico-based jack-up drilling provider where he was responsible for the company’s daily operations and strategic business plan implementation. From 1991 through August 2009, Mr. Hoffman spent 18 years with Noble Corporation where he held senior operational and executive roles, including Vice President of Worldwide Marketing, Vice President of Western Hemisphere Operations and President of Noble’s engineering services division, Triton Engineering Services. Mr. Hoffman received a B.S. degree from Southwest Texas State University.
Executive Officers’Biographies
EXECUTIVE OFFICERS
16 Shelf Drilling Annual Report 2021
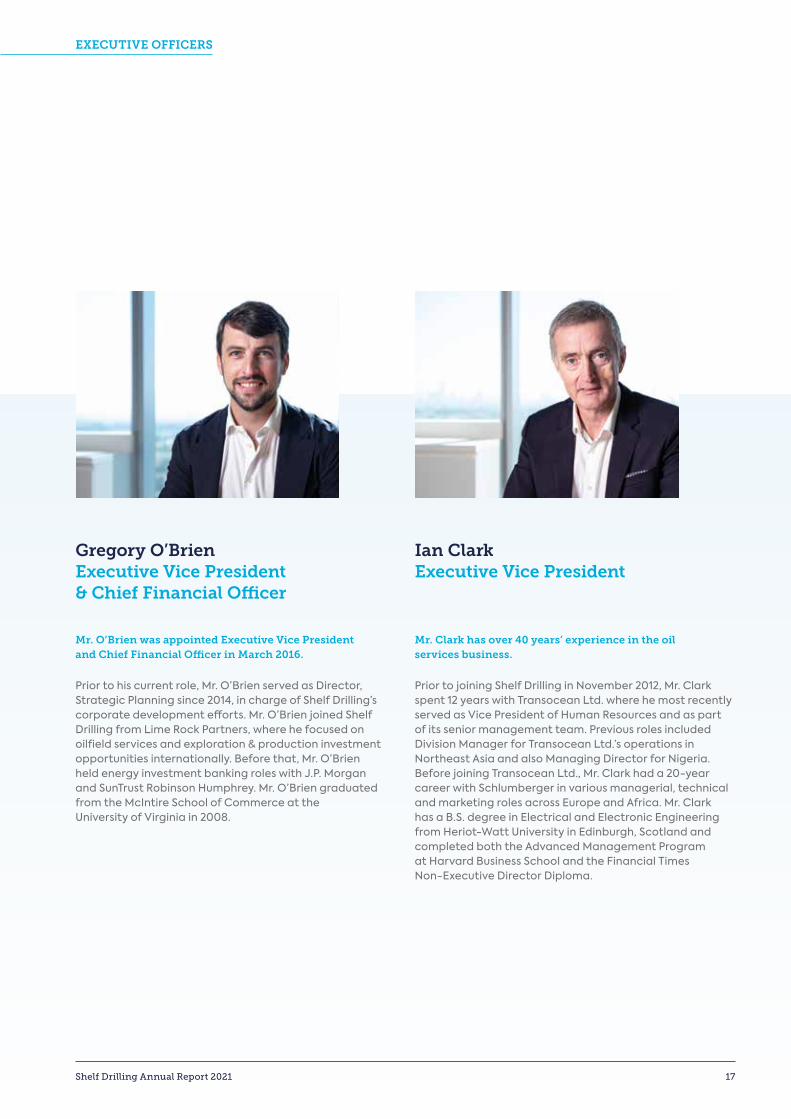
Gregory O’BrienExecutive Vice President & Chief Financial Officer
Mr. O’Brien was appointed Executive Vice President and Chief Financial Officer in March 2016.
Prior to his current role, Mr. O’Brien served as Director, Strategic Planning since 2014, in charge of Shelf Drilling’s corporate development efforts. Mr. O’Brien joined Shelf Drilling from Lime Rock Partners, where he focused on oilfield services and exploration & production investment opportunities internationally. Before that, Mr. O’Brien held energy investment banking roles with J.P. Morgan and SunTrust Robinson Humphrey. Mr. O’Brien graduated from the McIntire School of Commerce at the University of Virginia in 2008.
Ian ClarkExecutive Vice President
Mr. Clark has over 40 years’ experience in the oil services business.
Prior to joining Shelf Drilling in November 2012, Mr. Clark spent 12 years with Transocean Ltd. where he most recently served as Vice President of Human Resources and as part of its senior management team. Previous roles included Division Manager for Transocean Ltd.’s operations in Northeast Asia and also Managing Director for Nigeria. Before joining Transocean Ltd., Mr. Clark had a 20-year career with Schlumberger in various managerial, technical and marketing roles across Europe and Africa. Mr. Clark has a B.S. degree in Electrical and Electronic Engineering from Heriot-Watt University in Edinburgh, Scotland and completed both the Advanced Management Program at Harvard Business School and the Financial Times Non-Executive Director Diploma.
EXECUTIVE OFFICERS
Shelf Drilling Annual Report 2021 17
20162015
20142013
2012
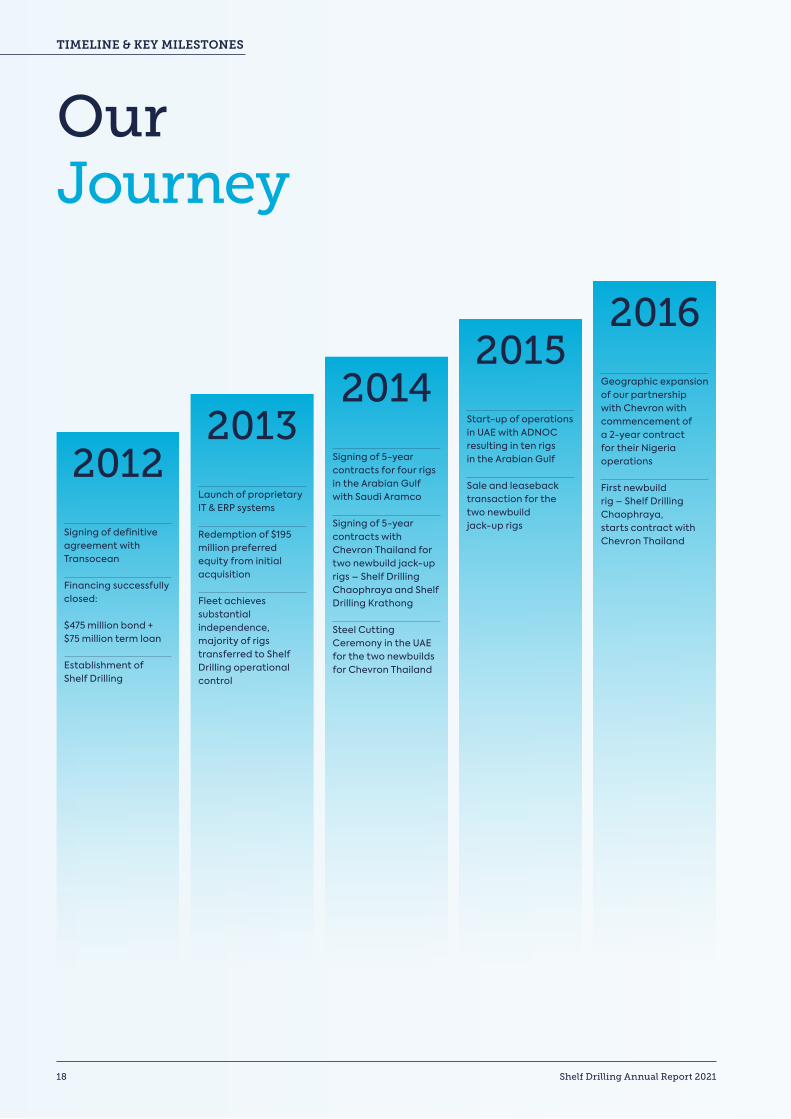
Geographic expansion of our partnership with Chevron with commencement of a 2-year contract for their Nigeria operations
First newbuild rig – Shelf Drilling Chaophraya, starts contract with Chevron Thailand
Start-up of operations in UAE with ADNOC resulting in ten rigs in the Arabian Gulf
Sale and leaseback transaction for the two newbuild jack-up rigs
Signing of 5-year contracts for four rigs in the Arabian Gulf with Saudi Aramco
Signing of 5-year contracts with Chevron Thailand for two newbuild jack-up rigs – Shelf Drilling Chaophraya and Shelf Drilling Krathong
Steel Cutting Ceremony in the UAE for the two newbuilds for Chevron Thailand
Launch of proprietary IT & ERP systems
Redemption of $195 million preferred equity from initial acquisition
Fleet achieves substantial independence, majority of rigs transferred to Shelf Drilling operational control
Signing of definitive agreement with Transocean
Financing successfully closed:
$475 million bond + $75 million term loan
Establishment of Shelf Drilling
OurJourney
TIMELINE & KEY MILESTONES
18 Shelf Drilling Annual Report 2021
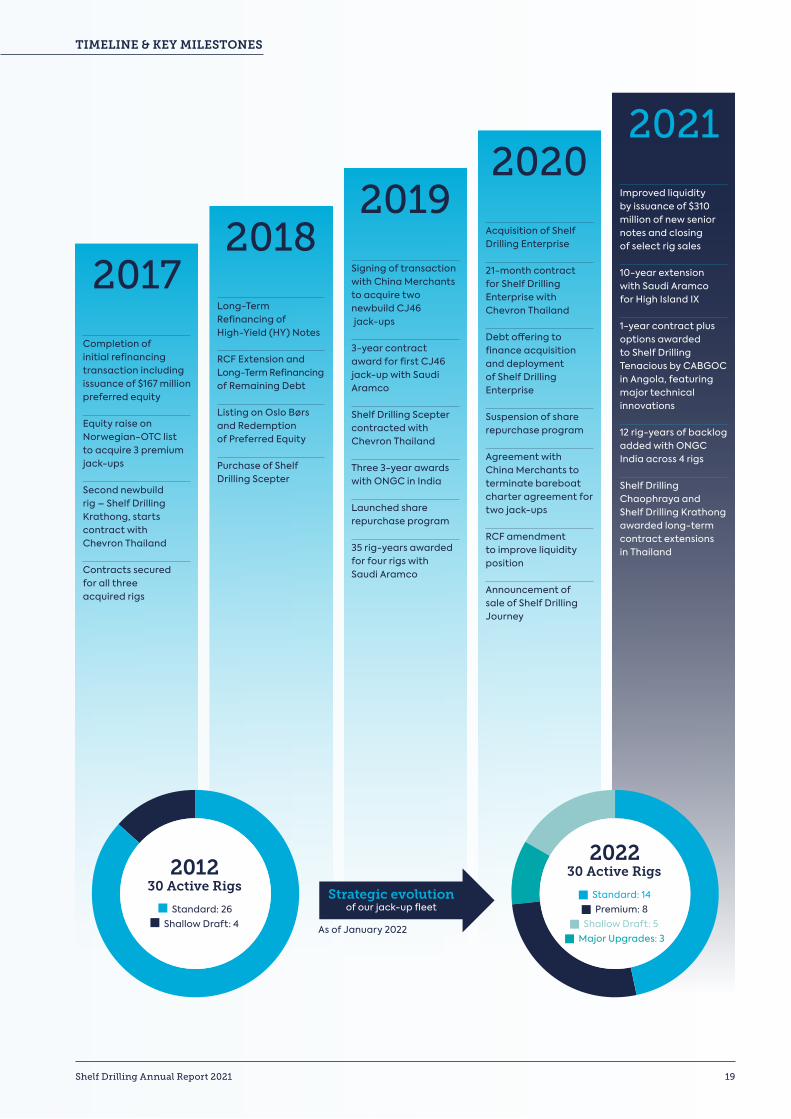
Improved liquidity by issuance of $310 million of new senior notes and closing of select rig sales
10-year extension with Saudi Aramco for High Island IX
1-year contract plus options awarded to Shelf Drilling Tenacious by CABGOC in Angola, featuring major technical innovations
12 rig-years of backlog added with ONGC India across 4 rigs
Shelf Drilling Chaophraya and Shelf Drilling Krathong awarded long-term contract extensions in Thailand
20202019
20182017
2021
Acquisition of Shelf Drilling Enterprise
21-month contract for Shelf Drilling Enterprise with Chevron Thailand
Debt offering to finance acquisition and deployment of Shelf Drilling Enterprise
Suspension of share repurchase program
Agreement with China Merchants to terminate bareboat charter agreement for two jack-ups
RCF amendment to improve liquidity position
Announcement of sale of Shelf Drilling Journey
Signing of transaction with China Merchants to acquire two newbuild CJ46 jack-ups
3-year contract award for first CJ46 jack-up with Saudi Aramco
Shelf Drilling Scepter contracted with Chevron Thailand Three 3-year awards with ONGC in India
Launched share repurchase program 35 rig-years awarded for four rigs with Saudi Aramco
Long-Term Refinancing of High-Yield (HY) Notes
RCF Extension and Long-Term Refinancing of Remaining Debt
Listing on Oslo Børs and Redemption of Preferred Equity
Purchase of Shelf Drilling Scepter
Completion of initial refinancing transaction including issuance of $167 million preferred equity
Equity raise on Norwegian-OTC list to acquire 3 premium jack-ups
Second newbuild rig – Shelf Drilling Krathong, starts contract with Chevron Thailand
Contracts secured for all three acquired rigs
As of January 2022
202230 Active Rigs
Standard: 14
Premium: 8
Shallow Draft: 5
Major Upgrades: 3
201230 Active Rigs
Standard: 26 Shallow Draft: 4
Strategic evolution of our jack-up fleet
TIMELINE & KEY MILESTONES
Shelf Drilling Annual Report 2021 19
In this section Our COVID-19 Response 22
Market Review 24
Business Review 32
Financial Review 36
BOARD OF DIRECTORS REPORT & FINANCIAL STATEMENTS
20 Shelf Drilling Annual Report 2021
Shelf Drilling Annual Report 2021 21
The COVID-19 pandemic continued to disrupt economic activities throughout the world with new and virulent variants, namely Delta and Omicron. Vaccination drives and mandates coming into effect around the world have kept the global economic recovery largely on track despite sporadic and localized lockdowns. 100% of Shelf Drilling’s onshore employees and 98% of our offshore workforce have received the recommended dosage of vaccines. We remain committed to ensuring the health and wellbeing of all our employees.
Our COVID-19Response
Impact on Our Business
Health and safety of our employees remain our primary concern.
Travel restrictions have eased in many of our operating regions, allowing for some degree of normalization in our crew change schedules and frequency. Supply chain challenges have been exacerbated by the effects of the pandemic, either due to temporary lockdowns in certain shipping hubs or lack of workforce in other locations.
The price of crude oil has trended in the positive direction thanks to supply side discipline and global inventory draw. Demand for oil and gas continues to approach pre-pandemic levels.
Our Response Our robust IT infrastructure, flat organization, and high national content have all adapted well to most of our onshore staff working from home. In addition, we have welcomed most of our Dubai HQ employees back to the office in late-2021, but working arrangements are subject to dynamic adjustments as circumstances dictate. We believe the worst of COVID-19 to be behind us.
With the availability of vaccines and ongoing research into medicines for the coronavirus, we do not foresee a future wave having as profound an impact on our business and industry as the first wave did in 2020. However, we constantly remind our employees to remain vigilant and not grow complacent while the pandemic is still ongoing. Specific measures we took are as follows:
Protecting Employees
• Encouraging and facilitating vaccination against COVID-19 for our global workforce, and working with our customers to ensure that all who visit our rigs are masked and tested in line with local government regulations
• Implementation of location-specific quarantine requirements for crew members prior to embarking onto our rigs, and dynamically adjusting lengths of quarantine as recommended by local governments and customers
• Conducting regular sanitation of our rigs and office facilities with non-toxic chemicals to the extent possible, while continuing to enforce all masking and social distancing rules
Business Continuity
• Our offshore crews’ continued unwavering commitment and incredible sacrifices have undoubtedly secured our business continuity in the face of rolling waves of COVID-19 infections across many of our operating regions in 2021. Crew change schedules were set to as high as 56 days on & off with additional days in quarantine for some of our rigs when onshore situations deteriorated
• Uninterrupted lines of communication ensured our rigs were constantly supplied with necessary goods and services that not only facilitated safe operations per customer requirements and contractual obligations, but also stocked our rigs with ample food and medicine in the event of sudden announcements of lockdowns
MARKET REVIEW
22 Shelf Drilling Annual Report 2021
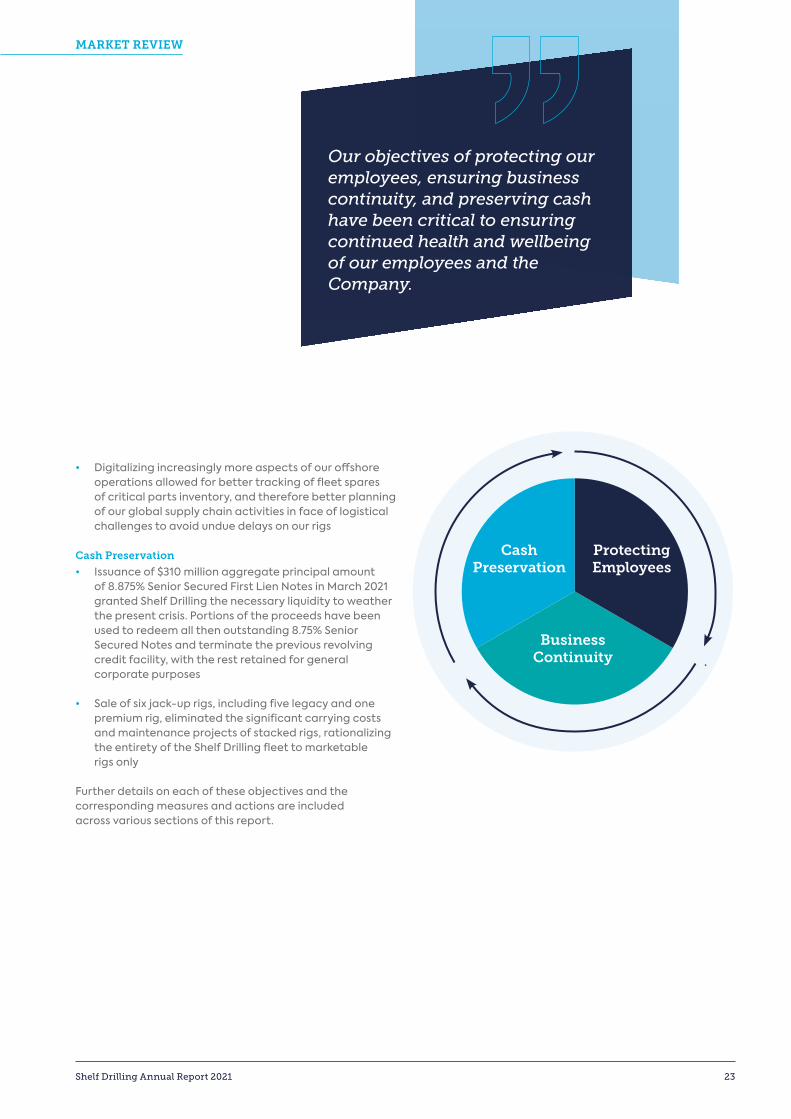
Our objectives of protecting our employees, ensuring business continuity, and preserving cash have been critical to ensuring continued health and wellbeing of our employees and the Company.
• Digitalizing increasingly more aspects of our offshore
operations allowed for better tracking of fleet spares of critical parts inventory, and therefore better planning of our global supply chain activities in face of logistical challenges to avoid undue delays on our rigs
Cash Preservation
• Issuance of $310 million aggregate principal amount of 8.875% Senior Secured First Lien Notes in March 2021 granted Shelf Drilling the necessary liquidity to weather the present crisis. Portions of the proceeds have been used to redeem all then outstanding 8.75% Senior Secured Notes and terminate the previous revolving credit facility, with the rest retained for general corporate purposes
• Sale of six jack-up rigs, including five legacy and one premium rig, eliminated the significant carrying costs and maintenance projects of stacked rigs, rationalizing the entirety of the Shelf Drilling fleet to marketable rigs only
Further details on each of these objectives and the corresponding measures and actions are included across various sections of this report.
ProtectingEmployees
CashPreservation
BusinessContinuity
MARKET REVIEW
Shelf Drilling Annual Report 2021 23
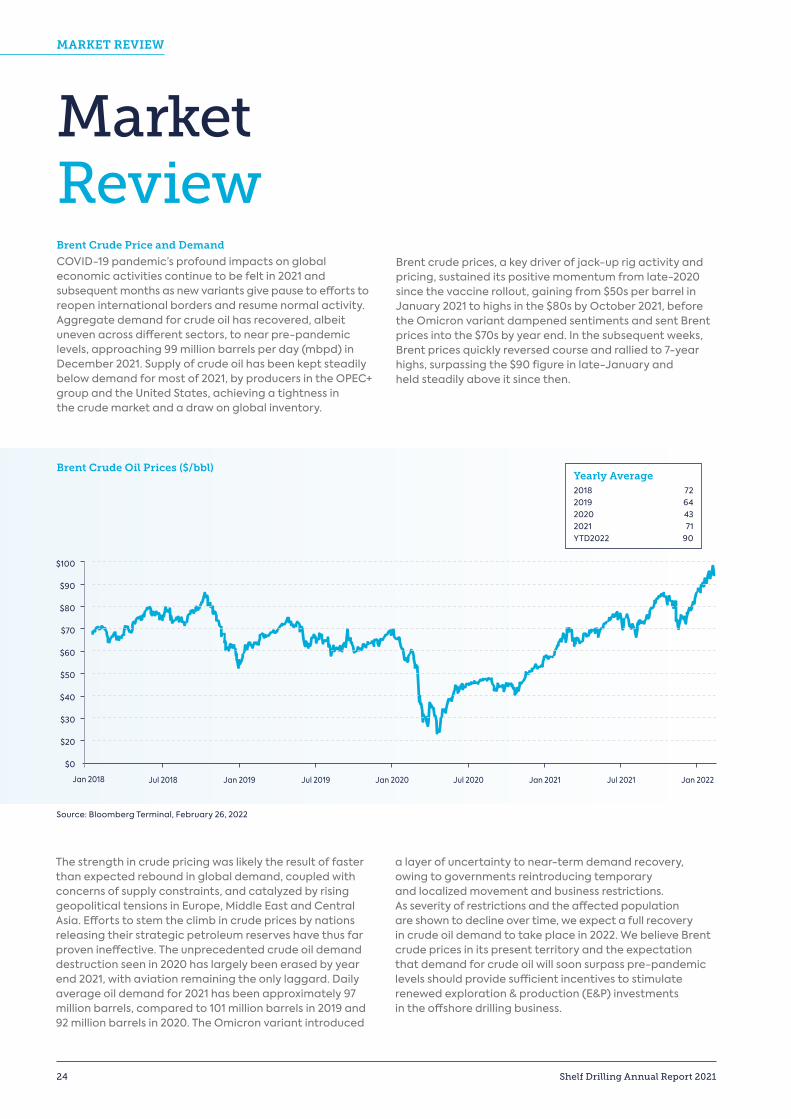
Market ReviewBrent Crude Price and Demand
COVID-19 pandemic’s profound impacts on global economic activities continue to be felt in 2021 and subsequent months as new variants give pause to efforts to reopen international borders and resume normal activity. Aggregate demand for crude oil has recovered, albeit uneven across different sectors, to near pre-pandemic levels, approaching 99 million barrels per day (mbpd) in December 2021. Supply of crude oil has been kept steadily below demand for most of 2021, by producers in the OPEC+ group and the United States, achieving a tightness in the crude market and a draw on global inventory.
Brent crude prices, a key driver of jack-up rig activity and pricing, sustained its positive momentum from late-2020 since the vaccine rollout, gaining from $50s per barrel in January 2021 to highs in the $80s by October 2021, before the Omicron variant dampened sentiments and sent Brent prices into the $70s by year end. In the subsequent weeks, Brent prices quickly reversed course and rallied to 7-year highs, surpassing the $90 figure in late-January and held steadily above it since then.
Source: Bloomberg Terminal, February 26, 2022
The strength in crude pricing was likely the result of faster than expected rebound in global demand, coupled withconcerns of supply constraints, and catalyzed by rising geopolitical tensions in Europe, Middle East and Central Asia. Efforts to stem the climb in crude prices by nations releasing their strategic petroleum reserves have thus far proven ineffective. The unprecedented crude oil demand destruction seen in 2020 has largely been erased by year end 2021, with aviation remaining the only laggard. Daily average oil demand for 2021 has been approximately 97 million barrels, compared to 101 million barrels in 2019 and 92 million barrels in 2020. The Omicron variant introduced
a layer of uncertainty to near-term demand recovery, owing to governments reintroducing temporary and localized movement and business restrictions. As severity of restrictions and the affected population are shown to decline over time, we expect a full recovery in crude oil demand to take place in 2022. We believe Brent crude prices in its present territory and the expectation that demand for crude oil will soon surpass pre-pandemic levels should provide sufficient incentives to stimulate renewed exploration & production (E&P) investments in the offshore drilling business.
$100
$90
$80
$70
$60
$50
$40
$30
$20
$0
Jan 2018 Jul 2018 Jul 2019 Jul 2020Jan 2019 Jan 2020 Jan 2021 Jul 2021 Jan 2022
Yearly Average2018 722019 642020 432021 71YTD2022 90
Brent Crude Oil Prices ($/bbl)
MARKET REVIEW
24 Shelf Drilling Annual Report 2021
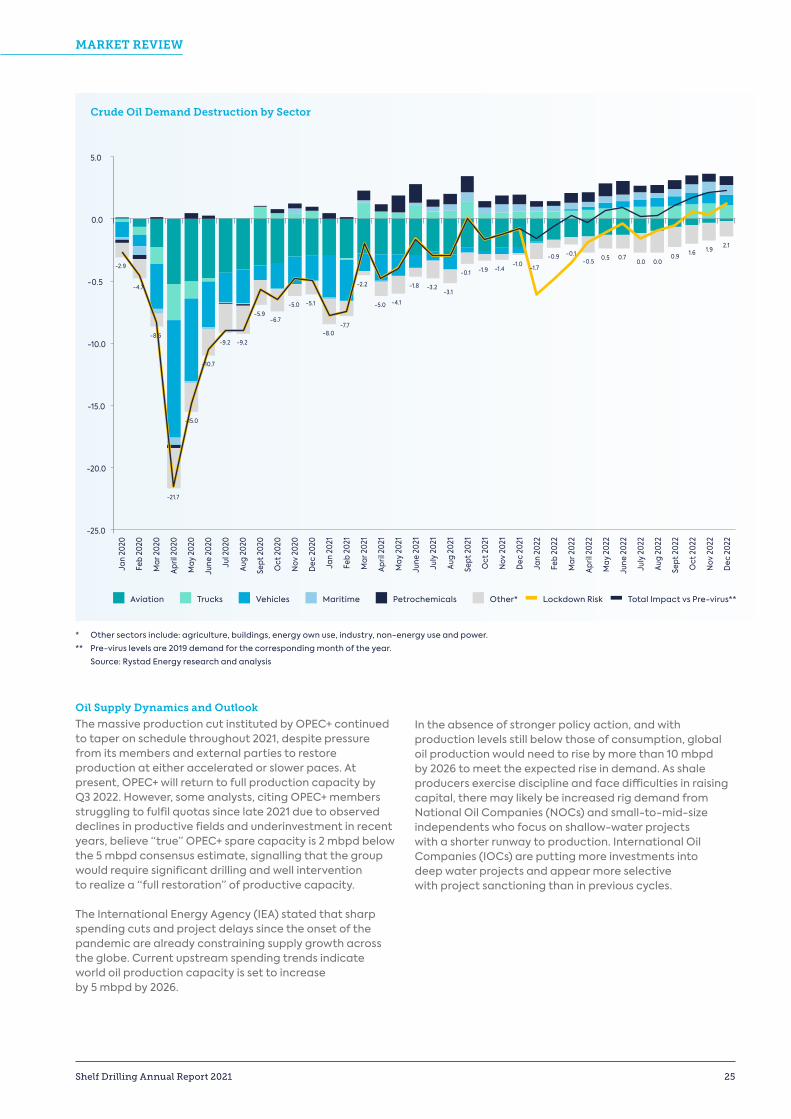
Oil Supply Dynamics and Outlook
The massive production cut instituted by OPEC+ continued to taper on schedule throughout 2021, despite pressure from its members and external parties to restore production at either accelerated or slower paces. At present, OPEC+ will return to full production capacity by Q3 2022. However, some analysts, citing OPEC+ members struggling to fulfil quotas since late 2021 due to observed declines in productive fields and underinvestment in recent years, believe “true” OPEC+ spare capacity is 2 mbpd below the 5 mbpd consensus estimate, signalling that the group would require significant drilling and well intervention to realize a “full restoration” of productive capacity.
The International Energy Agency (IEA) stated that sharp spending cuts and project delays since the onset of the pandemic are already constraining supply growth across the globe. Current upstream spending trends indicate world oil production capacity is set to increase by 5 mbpd by 2026.
In the absence of stronger policy action, and with production levels still below those of consumption, global oil production would need to rise by more than 10 mbpd by 2026 to meet the expected rise in demand. As shale producers exercise discipline and face difficulties in raising capital, there may likely be increased rig demand from National Oil Companies (NOCs) and small-to-mid-size independents who focus on shallow-water projects with a shorter runway to production. International Oil Companies (IOCs) are putting more investments into deep water projects and appear more selective with project sanctioning than in previous cycles.
* Other sectors include: agriculture, buildings, energy own use, industry, non-energy use and power.
** Pre-virus levels are 2019 demand for the corresponding month of the year.
Source: Rystad Energy research and analysis
Aviation Trucks Vehicles Maritime Petrochemicals Other* Lockdown Risk Total Impact vs Pre-virus**
Jan
2020
Feb
2020
Mar
202
0
April
202
0
May
202
0
June
202
0
Jul 2
020
Aug
2020
Sept
202
0
Oct
202
0
Nov
202
0
Dec
202
0
Jan
2021
Jan
2022
Feb
2021
Feb
2022
Mar
202
1
Mar
202
2
April
202
1
April
202
2
May
202
1
May
202
2
June
202
1
June
202
2
July
202
1
July
202
2
Aug
2021
Aug
2022
Sept
202
1
Sept
202
2
Oct
202
1
Oct
202
2
Nov
202
1
Nov
202
2
Dec
202
1
Dec
202
2
5.0
0.0
-0.5
-10.0
-15.0
-20.0
-25.0
-2.9
-8.5
-21.7
-15.0
-10.7
-9.2 -9.2
-5.9-6.7
-5.0 -5.1
-8.0-7.7
-2.2
-5.0 -4.1
-1.8 -3.2-3.1
-0.1 -1.9 -1.4-1.0 -1.7
-0.9 -0.1-0.5 0.5 0.7
0.0 0.00.9 1.6 1.9
2.1
Crude Oil Demand Destruction by Sector
-4.7
MARKET REVIEW
Shelf Drilling Annual Report 2021 25
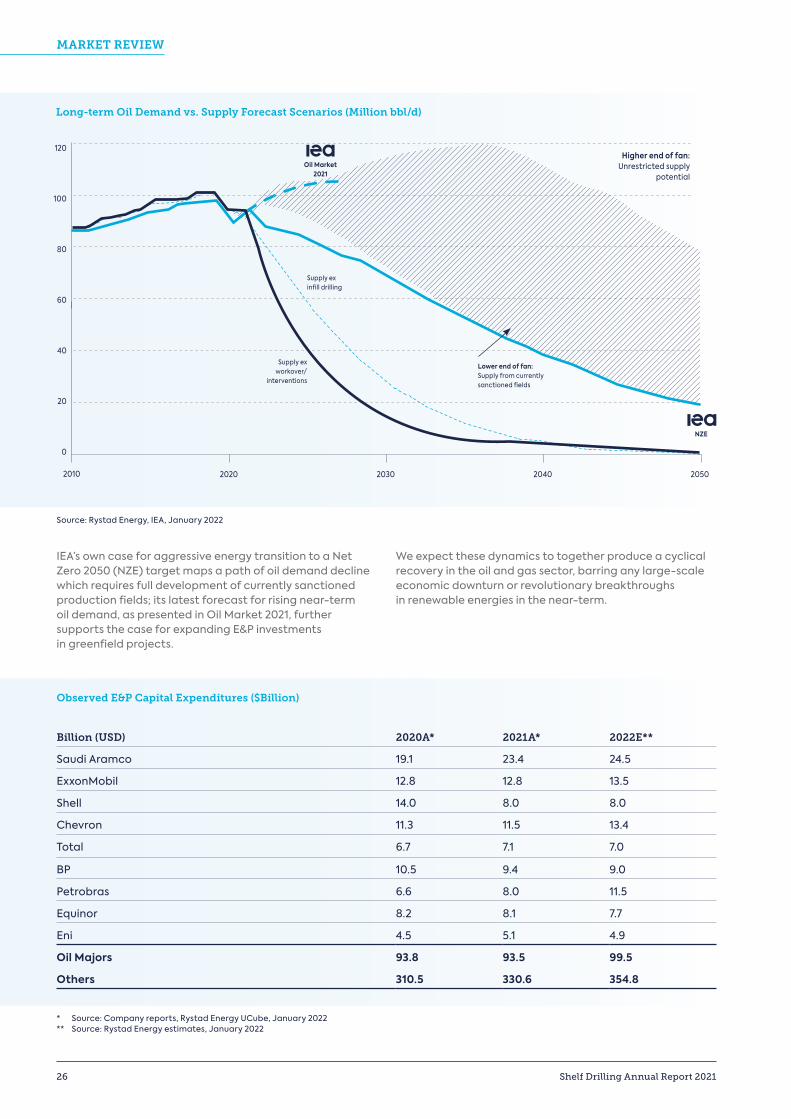
IEA’s own case for aggressive energy transition to a Net Zero 2050 (NZE) target maps a path of oil demand decline which requires full development of currently sanctioned production fields; its latest forecast for rising near-term oil demand, as presented in Oil Market 2021, further supports the case for expanding E&P investments in greenfield projects.
We expect these dynamics to together produce a cyclical recovery in the oil and gas sector, barring any large-scale economic downturn or revolutionary breakthroughs in renewable energies in the near-term.
Source: Rystad Energy, IEA, January 2022
Long-term Oil Demand vs. Supply Forecast Scenarios (Million bbl/d)
Billion (USD) 2020A* 2021A* 2022E**
Saudi Aramco 19.1 23.4 24.5
ExxonMobil 12.8 12.8 13.5
Shell 14.0 8.0 8.0
Chevron 11.3 11.5 13.4
Total 6.7 7.1 7.0
BP 10.5 9.4 9.0
Petrobras 6.6 8.0 11.5
Equinor 8.2 8.1 7.7
Eni 4.5 5.1 4.9
Oil Majors 93.8 93.5 99.5
Others 310.5 330.6 354.8
Observed E&P Capital Expenditures ($Billion)
* Source: Company reports, Rystad Energy UCube, January 2022** Source: Rystad Energy estimates, January 2022
120
100
80
60
40
20
0
2010 2050204020302020
Supply ex infill drilling
Higher end of fan:Unrestricted supply
potential
Supply ex workover/
interventions
Lower end of fan:Supply from currentlysanctioned fields
MARKET REVIEW
26 Shelf Drilling Annual Report 2021
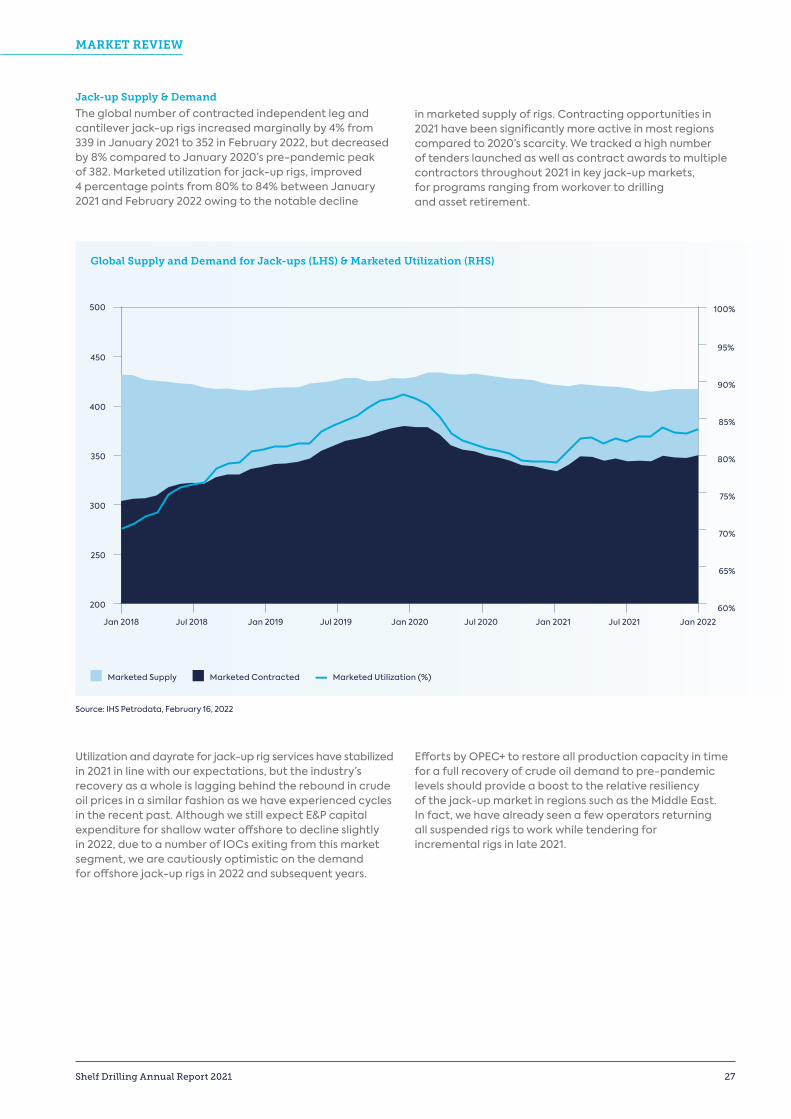
Jack-up Supply & Demand
The global number of contracted independent leg and cantilever jack-up rigs increased marginally by 4% from 339 in January 2021 to 352 in February 2022, but decreased by 8% compared to January 2020’s pre-pandemic peak of 382. Marketed utilization for jack-up rigs, improved 4 percentage points from 80% to 84% between January 2021 and February 2022 owing to the notable decline
in marketed supply of rigs. Contracting opportunities in 2021 have been significantly more active in most regions compared to 2020’s scarcity. We tracked a high number of tenders launched as well as contract awards to multiple contractors throughout 2021 in key jack-up markets, for programs ranging from workover to drilling and asset retirement.
Utilization and dayrate for jack-up rig services have stabilized in 2021 in line with our expectations, but the industry’s recovery as a whole is lagging behind the rebound in crude oil prices in a similar fashion as we have experienced cycles in the recent past. Although we still expect E&P capital expenditure for shallow water offshore to decline slightly in 2022, due to a number of IOCs exiting from this market segment, we are cautiously optimistic on the demand for offshore jack-up rigs in 2022 and subsequent years.
Efforts by OPEC+ to restore all production capacity in time for a full recovery of crude oil demand to pre-pandemic levels should provide a boost to the relative resiliency of the jack-up market in regions such as the Middle East. In fact, we have already seen a few operators returning all suspended rigs to work while tendering for incremental rigs in late 2021.
Source: IHS Petrodata, February 16, 2022
Marketed Supply Marketed Contracted Marketed Utilization (%)
Global Supply and Demand for Jack-ups (LHS) & Marketed Utilization (RHS)
500
450
400
350
300
250
200
90%
100%
95%
85%
80%
75%
70%
65%
60%
Jan 2018 Jul 2018 Jan 2019 Jan 2020Jul 2019 Jul 2020 Jan 2021 Jan 2022Jul 2021
MARKET REVIEW
Shelf Drilling Annual Report 2021 27
Where We Work
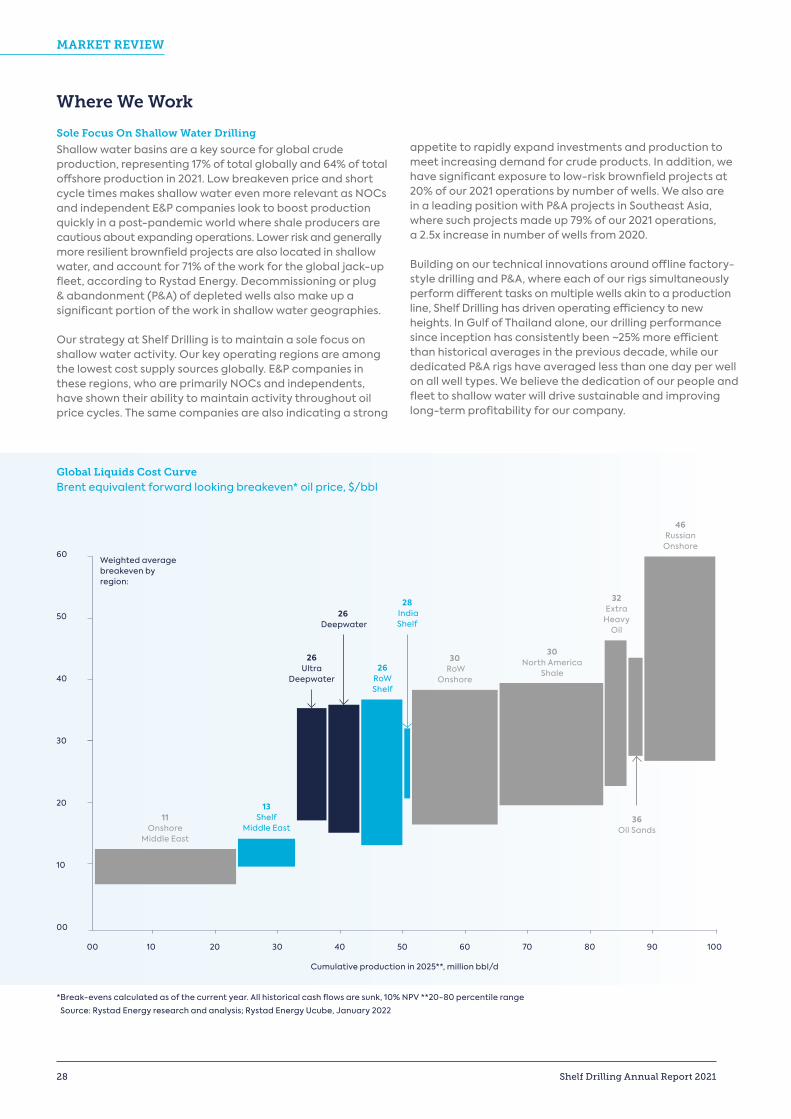
Sole Focus On Shallow Water Drilling
Shallow water basins are a key source for global crude production, representing 17% of total globally and 64% of total offshore production in 2021. Low breakeven price and short cycle times makes shallow water even more relevant as NOCs and independent E&P companies look to boost production quickly in a post-pandemic world where shale producers are cautious about expanding operations. Lower risk and generally more resilient brownfield projects are also located in shallow water, and account for 71% of the work for the global jack-up fleet, according to Rystad Energy. Decommissioning or plug & abandonment (P&A) of depleted wells also make up a significant portion of the work in shallow water geographies.
Our strategy at Shelf Drilling is to maintain a sole focus on shallow water activity. Our key operating regions are among the lowest cost supply sources globally. E&P companies in these regions, who are primarily NOCs and independents, have shown their ability to maintain activity throughout oil price cycles. The same companies are also indicating a strong
appetite to rapidly expand investments and production to meet increasing demand for crude products. In addition, we have significant exposure to low-risk brownfield projects at 20% of our 2021 operations by number of wells. We also are in a leading position with P&A projects in Southeast Asia, where such projects made up 79% of our 2021 operations, a 2.5x increase in number of wells from 2020.
Building on our technical innovations around offline factory-style drilling and P&A, where each of our rigs simultaneously perform different tasks on multiple wells akin to a production line, Shelf Drilling has driven operating efficiency to new heights. In Gulf of Thailand alone, our drilling performance since inception has consistently been ~25% more efficient than historical averages in the previous decade, while our dedicated P&A rigs have averaged less than one day per well on all well types. We believe the dedication of our people and fleet to shallow water will drive sustainable and improving long-term profitability for our company.
* Break-evens calculated as of the current year. All historical cash flows are sunk, 10% NPV **20-80 percentile range
Source: Rystad Energy research and analysis; Rystad Energy Ucube, January 2022
Global Liquids Cost CurveBrent equivalent forward looking breakeven* oil price, $/bbl
Cumulative production in 2025**, million bbl/d
00
10
20
30
40
50
60
00 10010 20 30 40 50 60 70 80 90
11Onshore
Middle East
30North America
Shale
26Ultra
Deepwater26
RoW Shelf
32Extra
Heavy Oil
13Shelf
Middle East
26 Deepwater
30 RoW
Onshore
28 India Shelf
36Oil Sands
46Russian
Onshore
Weighted average breakeven by region:
MARKET REVIEW
28 Shelf Drilling Annual Report 2021
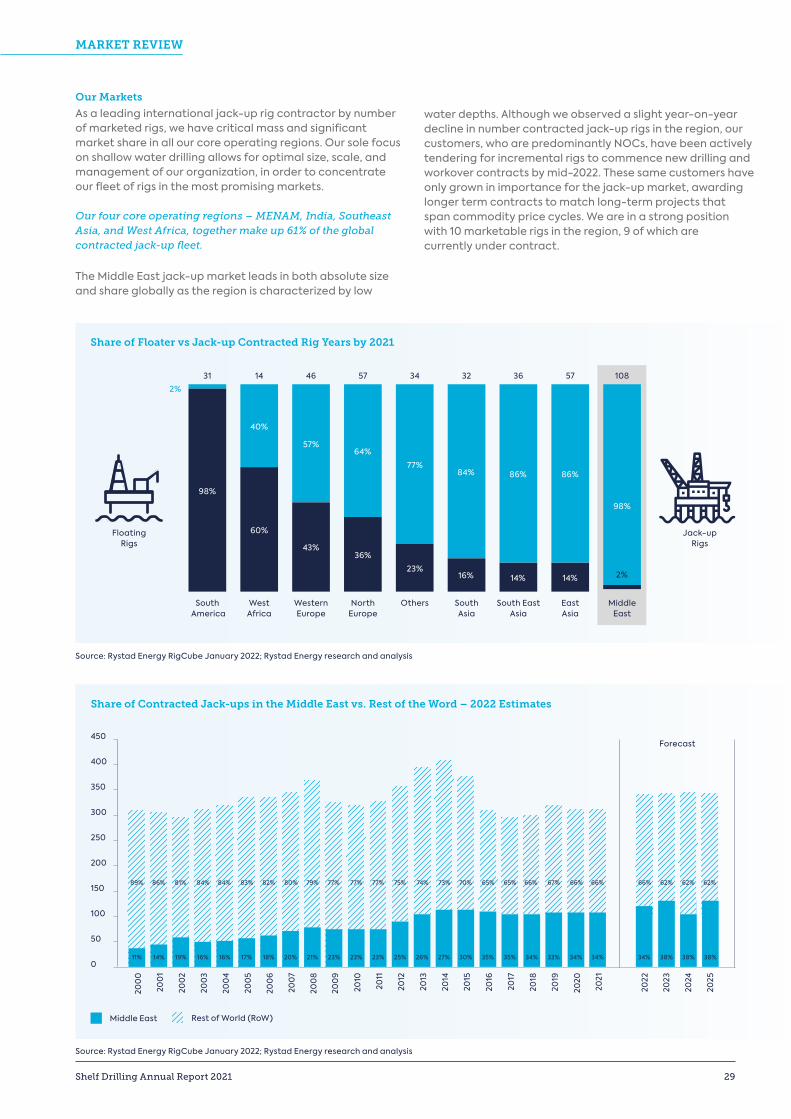
Our Markets
As a leading international jack-up rig contractor by number of marketed rigs, we have critical mass and significant market share in all our core operating regions. Our sole focus on shallow water drilling allows for optimal size, scale, and management of our organization, in order to concentrate our fleet of rigs in the most promising markets. Our four core operating regions – MENAM, India, Southeast Asia, and West Africa, together make up 61% of the global contracted jack-up fleet.
The Middle East jack-up market leads in both absolute size and share globally as the region is characterized by low
water depths. Although we observed a slight year-on-year decline in number contracted jack-up rigs in the region, our customers, who are predominantly NOCs, have been actively tendering for incremental rigs to commence new drilling and workover contracts by mid-2022. These same customers have only grown in importance for the jack-up market, awarding longer term contracts to match long-term projects that span commodity price cycles. We are in a strong position with 10 marketable rigs in the region, 9 of which are currently under contract.
Source: Rystad Energy RigCube January 2022; Rystad Energy research and analysis
Share of Floater vs Jack-up Contracted Rig Years by 2021
60%
43%36%
40%
57%64%
77%84% 86% 86%
23%16% 14% 14%
98%
South America
Floating Rigs
Jack-upRigs
31 14 46 57 34 32 36 57 1082%
WestAfrica
WesternEurope
NorthEurope
Others SouthAsia
South EastAsia
EastAsia
MiddleEast
98%
2%
Source: Rystad Energy RigCube January 2022; Rystad Energy research and analysis
Middle East Rest of World (RoW)
Share of Contracted Jack-ups in the Middle East vs. Rest of the Word – 2022 Estimates
450
400
350
300
250
200
150
100
50
0
Forecast
19% 16% 17% 18% 20% 21% 23% 23% 23% 25% 26% 27% 30% 35% 35% 34% 33% 34% 34%11%
89%
14% 16%
86% 81% 84% 84% 83% 82% 80% 79% 77% 77% 77% 75% 74% 73% 70% 65% 65% 66% 66% 66%
38% 38%38%34%
66% 62% 62% 62%67%
2024
2025
200
2
200
4
200
5
200
6
200
7
200
8
200
9
2010
2011
2012
2013
2014
2015
2016
2017
2018
2019
2020
2021
2023
2022
200
0
200
1
200
3
MARKET REVIEW
Shelf Drilling Annual Report 2021 29

India maintained a stable level of jack-up activity without much fluctuation in 2021. During the year, we saw high potential for further growth in activity. Customers in the region, also primarily NOCs along with a number of independents, launched their respective programs on both coasts and neighbouring waters. A number of these programs have gone to tender and resulted in contract awards to multiple contractors, including ourselves. Shelf Drilling has leading position in India, adding 1 rig in 2021 and soon 1 more contracted rig to a total of 90% utilization across 10 marketed rigs in the region.
West Africa, following a year of lackluster activity in 2020 due to the pandemic, is seeing independent E&Ps beginning to tender for jack-up rigs. While the independents are driving the largest share of activity in Nigeria, IOCs are also returning to countries such as Angola and Congo. Shelf Drilling has added 2 premium rigs to this region for long- and short-term contracts, one of which requires a heavily modified jack-up rig with a number of technically innovative features to perform factory-style drilling similar to our rigs in the Gulf of Thailand. Shelf Drilling is a major jack-up services contractor in West Africa with 6 rigs of which 5 are contracted.
Southeast Asia’s jack-up contracting activity is likewise recovering from the effects of the COVID-19 pandemic, as NOCs in Thailand, Malaysia, Vietnam, and Indonesia tender and issue contract awards for incremental rigs. Moreover, we recently announced contract extensions for our two highly customized, fit-for-purpose newbuilds in the Gulf of Thailand, while our dedicated P&A rigs continue to set new performance benchmarks in the region. Shelf Drilling values its long-standing partnership with our customers and remains committed to the Kingdom of Thailand with 4 rigs at 100% utilization.
The jack-up market in China and Mexico maintained a consistent level of activity in 2021 and saw little change year-on-year. Meanwhile, the North Sea jack-up market is tightening with recovering demand and continued decline in marketed rigs. Stranded newbuild rigs in various shipyards continued to be commissioned throughout 2021 but tended to fulfil opportunities typically not sought out by Shelf Drilling. We also noticed a few of these newbuilds have been converted to non-drilling vessels, further reducing the global supply of jack-up rigs.
Number of Contracted Jack-ups by Region
Contracted Jack-ups
Regions Jan 2020
Dec 2020
Dec 2021
% of Peak
(Jan-20)
Change since trough (Jan–2017)
Marketed Utilization
Middle East 133 130 126 95% 9 87%
India 33 32 31 94% -6 91%
West Africa 17 9 10 59% 3 71%
SE Asia 43 32 38 88% 11 75%
North Sea 34 34 33 97% 4 88%
China 53 54 54 102% 27 92%
US GOM 4 3 4 100% -2 67%
Mexico 34 37 32 91% 6 77%
Sub-total 352 331 328 93% 52 85%
Total 382 341 350 92% 49 83%
% of Total 92% 97% 94% 106%
Source: IHS Petrodata, December 31, 2021
MARKET REVIEW
30 Shelf Drilling Annual Report 2021
MARKET REVIEW
Shelf Drilling Annual Report 2021 31
Continued progress through a very challenging year Our 2021 Key Performance Indicators
Business Review
0.16TRIR
99.3%Uptime
$1.7BBacklog
73%Effective
Utilization
30.6Average
Marketable Rigs
$60.5kAverage Dayrate
Safety & Operational Performance
While we continued to make progress in reducing the number of people hurt in our operations, Shelf Drilling incurred the first fatality in our history following an accident on the C.E. Thornton in India. Overall, the number of recordable incidents reduced from 9 in 2020 to 7 in 2021 resulting in a TRIR of 0.16, the lowest achieved to date and 72% below the IADC industry average of 0.57. Our Lost Time Incident Rate (LTIR) was 0.02, and our total potential severity rate (a measure of how serious a safety incident could have been) was 4.92, the second lowest in our history. For 6 months of the year, and four consecutive months following the fatality, our entire fleet operated without a recordable safety incident. Nineteen of our operating rigs including our entire fleet in North Africa and Mediterranean, were recordable incident-free throughout 2021.
Our 2021 fleetwide operational uptime of 99.3% was delivered despite the various COVID related personnel and supply chain challenges that arose throughout the year. This was in line with the 99.4% achieved in 2020, the best in our history, and further demonstrates the effectiveness of our centralized, fit-for-purpose maintenance and supply chain organization, processes, and systems.
Our rigs in North Africa & Mediterranean achieved 99.8% uptime and ranked as the highest performing region in our fleet two years in a row. The UAE achieved 99.7% uptime, followed by West Africa with 99.7% and India at 99.6%. We had seven rigs that finished the year with less than 5 hours downtime and in addition both the Main Pass IV in Saudi Arabia and the Key Manhattan in Italy achieved 100% uptime in 2021. Both of these rigs also operated with no recordable incident, embodying our vision of “Perfect Execution”.
Our Capital Projects team continues to deliver outstanding results. Since the inception of Shelf Drilling, we have invested more than $1.2 billion in shipyard projects, and have, on average, beaten budgeted time and cost targets by 3%. Our unique approach towards project management, built on our philosophy of customer engagement, agile execution, and technical innovation, has helped us deliver industry-beating results year after year.
In 2021, despite a number of challenges brought upon by COVID (personnel, supply chain and cost), we successfully completed 7 shipyard projects, largely on time and in line with the budget. These included the readiness for sale of the Shelf Drilling Journey, three projects on our Saudi Arabia fleet (High Island II, Main Pass I and High Island IX), and three rig preparation projects for new contracts – the Compact Driller for deployment in India, Shelf Drilling Mentor for deployment in Congo, and Shelf Drilling Tenacious for deployment in Angola.
Backlog
After a relatively slow start, with the improvement in the oil price, contracting activity picked up throughout the year and Shelf Drilling closed out 2021 with contract backlog of $1,679 million. Twenty-one new contracts, contract extension or options were signed generating $730 million of additional backlog. Fourteen of these were with the existing customers, demonstrating the value of our focus on building long-term, stable customer relations through outstanding service delivery. Two contracts were for opportunities in new countries and one for a new customer in India, expanding further the range of customers we serve in this key market.
Our customer base comprises NOC, IOC, and independent oil and gas companies, including but not limited to Saudi Arabian Oil Company (Saudi Aramco), Chevron Corporation (Chevron), Oil and Natural Gas Corporation Limited (ONGC), Ente Nazionale Idrocarburi S.p.A (ENI), and Total Energies S.A. (Total).
Overall, we added 36 rig-years of activity to our fleet in 2021 with 28 of our 30 rigs contracted at year end resulting in a marketed utilization of 93% and an average of 885 contracted days per rig. Our marketing performance in 2021 was the second best since the last cycle peak in 2014, fully illustrating the improving market in the shallow water markets that we serve.
BUSINESS REVIEW
32 Shelf Drilling Annual Report 2021
19 rigs including the entire fleet in North Africa and Mediterranean achieved zero recordable incidents in 2021
Other KPIs
Effective utilization (a measure that is impacted by periods off hire and not on full day rate such as downtime, waiting on weather and other factors) decreased from 80% in 2020 to 73% in 2021 as a result of idle time on rigs in Nigeria, the Mediterranean, and the UAE and idle time on rigs rolling off contract in India prior to starting new contracts (in the case of Trident XII and J.T. Angel).
Average marketable rigs decreased from 32.1 to 30.6 as a result of the opportunistic sales of the Shelf Drilling Journey, the High Island VII after it rolled off its contract in the UAE as well as the impact of the Trident XIV that was sold in 2020 after coming off contract in Nigeria. The four additional rigs that were sold for recycling in 2021 were already held for sale throughout 2020 and did not contribute to our marketable rig statistic.
Average dayrate for the rigs under operation in 2021 increased slightly from $58.9k per day to $60.5k per day as a result of a change in the revenue mix across our operating regions as well as the start-up of the Shelf Drilling Enterprise in Thailand.
Backlog by Customer Type
Backlog by Region
MENAM Asia
India West Africa
NOC IOC Other
80%
19%
1%
13%4%
13%
70%
BUSINESS REVIEW
Shelf Drilling Annual Report 2021 33
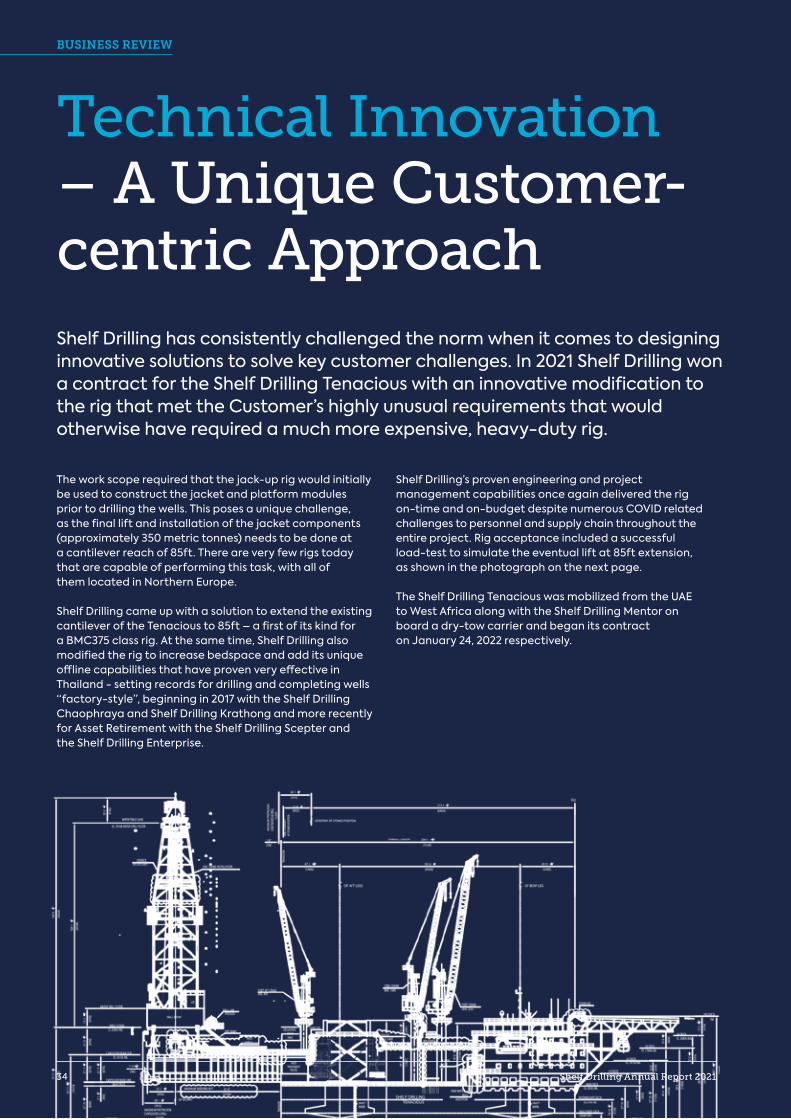
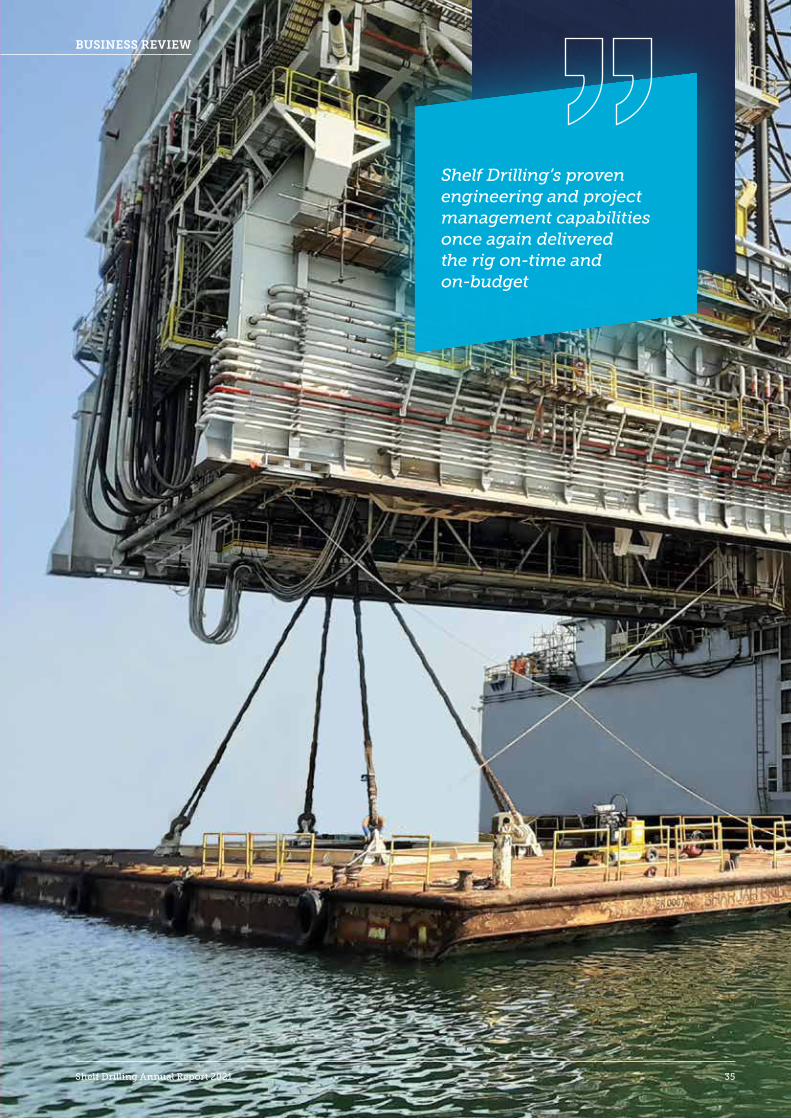
The work scope required that the jack-up rig would initially be used to construct the jacket and platform modules prior to drilling the wells. This poses a unique challenge, as the final lift and installation of the jacket components (approximately 350 metric tonnes) needs to be done at a cantilever reach of 85ft. There are very few rigs today that are capable of performing this task, with all of them located in Northern Europe. Shelf Drilling came up with a solution to extend the existing cantilever of the Tenacious to 85ft – a first of its kind for a BMC375 class rig. At the same time, Shelf Drilling also modified the rig to increase bedspace and add its unique offline capabilities that have proven very effective in Thailand - setting records for drilling and completing wells “factory-style”, beginning in 2017 with the Shelf Drilling Chaophraya and Shelf Drilling Krathong and more recently for Asset Retirement with the Shelf Drilling Scepter and the Shelf Drilling Enterprise.
Shelf Drilling’s proven engineering and project management capabilities once again delivered the rig on-time and on-budget despite numerous COVID related challenges to personnel and supply chain throughout the entire project. Rig acceptance included a successful load-test to simulate the eventual lift at 85ft extension, as shown in the photograph on the next page.
The Shelf Drilling Tenacious was mobilized from the UAE to West Africa along with the Shelf Drilling Mentor on board a dry-tow carrier and began its contract on January 24, 2022 respectively.
Shelf Drilling has consistently challenged the norm when it comes to designing innovative solutions to solve key customer challenges. In 2021 Shelf Drilling won a contract for the Shelf Drilling Tenacious with an innovative modification to the rig that met the Customer’s highly unusual requirements that would otherwise have required a much more expensive, heavy-duty rig.
Technical Innovation – A Unique Customer-centric Approach
BUSINESS REVIEW
34 Shelf Drilling Annual Report 2021
Shelf Drilling’s proven engineering and project management capabilities once again delivered the rig on-time and on-budget
BUSINESS REVIEW
Shelf Drilling Annual Report 2021 35
The beginning of the year was characterized by several of our rigs being suspended, terminated or renegotiated at lower dayrates with our customers. In this context, we managed to improve our cash position and establish a strong liquidity outlook for several years by completing a private debt offering and divesting certain assets from our fleet.
On the back of new contract awards as the demand for jack-up services improved during the year, our results also
reflect a number of investments and contract preparation expenditures for several rigs which began to contribute cash flow in late 2021 or early 2022 when they returned to operations. Improved liquidity and positioned for future successDespite a reduction in revenue in 2021 resulting from the actions taken by our customers in response to the pandemic, Shelf Drilling delivered an Adjusted EBITDA margin of 30% and closed the year with a cash balance of $232 million.
Our 2021 Key Performance Indicators
The effects of the COVID-19 pandemic significantly impacted the Company’s financial performance in 2021.
Financial Review
Significant Transactions in 2021
As we entered 2021, Shelf Drilling continued to be impacted by several contract terminations, rigs on standby or suspension as a direct consequence of the COVID-19 pandemic and resulting economic instability that emerged from March 2020. Shelf Drilling accomplished critical steps to navigate this uncertain environment and to position the Company for success.
In line with our priority to preserve and enhance our liquidity and financial flexibility, we completed in March 2021 a private offering of $310 million aggregate principal amount of 8.875% Senior Secured First Lien Notes due in 2024, to repay and terminate the Company’s revolving credit facility, due April 2023, cash collateralize bank guarantees issued under the revolving credit facility and to redeem and repurchase all of the outstanding 8.75% Senior Secured Notes due November 15, 2024. This transaction improved our balance sheet, simplified our capital structure and provided great visibility for the next several years.
During the course of 2021, we also closed the sale transactions of six rigs for total net proceeds of $81.3 million. This included the opportunistic asset divestitures of the Shelf Drilling Journey and High Island VII, as well as the retirement of four stacked units which contributed to the reduction of cost outlay for non-working rigs. As the economies reopened in 2021 following the positive development of vaccination programs, the demand for hydrocarbons started to recover and contributed to a supportive oil price. In this context, we were successful to execute several significant new contracts which began to contribute cash flow in late 2021 or early 2022 and which involved significant upfront contract preparation expenditures in 2021. This included in particular the new contract for the Shelf Drilling Tenacious which mobilized from the Middle East to West Africa and commenced operations in Angola in January 2022.
$527MRevenue
$158MAdjusted EBITDA
30%Adjusted EBITDA
Margin
$113MCapital Expenditure
& Deferred Costs
FINANCIAL REVIEW
36 Shelf Drilling Annual Report 2021
Total revenue for 2021 was $527 million. Adjusted EBITDA was $158 million and Adjusted EBITDA margin was 30%. Net loss of $79 million was primarily due to the deterioration of the effective utilization level to 73% as well as continued pressure on average dayrates as a consequence from rig contract suspensions and renegotiations resulting from the COVID-19 pandemic. Year-over-year, our total operating and maintenance and general and administrative expenses decreased by $17 million in 2021 compared to 2020, representing our continuous effort to reduce costs following the implementation of cost savings measures across the Company in 2020. The income tax expense for 2021 was $18 million or 3.5% of total revenue. Diluted loss per share was $(0.57).
Capital expenditures and deferred costs in 2021 of $113 million included primarily $67 million for regulatory and capital maintenance, $29 million for contract preparation, $1 million associated with rig acquisitions, and $16 million for fleet spares and others. This elevated level of spending was the result of three primary factors. With the Shelf Drilling Tenacious, we invested $23 million in rig upgrades
and contract preparation ahead of the program in Angola that commenced in January 2022. In addition, we had a high concentration of planned shipyard activity and capital spending in 2021 relative to both prior years and expectations for 2022. Lastly, we increased our spending in fleet spares in 2021 to support an increase in the number of working rigs in 2022.
At the end of 2021, Shelf Drilling’s cash balance was $232 million. The net cash used in operations in 2021 was $16 million and the total debt was $1.2 billion as of December 31, 2021. Net debt increased marginally by $10 million during 2021, despite the $59 million decrease in revenue from 2020. Our total backlog / net debt ratio was 1.7 as of December 31, 2021, compared to 1.4 in the prior year.
The demand for jack-up services is continuing to recover and, as of December 31, 2021, 28 of our 30 rigs were contracted. The actions taken in 2021 to navigate significant market challenges and improve the Company’s liquidity and financial flexibility have positioned Shelf Drilling for success to capitalize on opportunities in our sector.
P&L 2021 2020
Revenue $526,566 $585,176
Operating and Maintenance $323,994 $341,426
Adjusted EBITDA $158,298 $200,261
Loss Before Income Taxes $(60,167) $(255,164)
Net Loss $(78,637) $(274,859)
Balance Sheet 2021 2020
Current Assets $436,646 $336,146Long-term Assets $1,180,891 $1,180,207Total Assets $1,617,537 $1,516,353Current Liabilities $158,881 $147,327Long-term Liabilities $1,244,985 $1,080,063Equity $213,671 $288,963
Key Ratios & Statistics
Net Debt / LTM Adjusted EBITDA 6.1x 4.7xTotal Contract Backlog / Net Debt 1.7x 1.4xAdjusted EBITDA Margin 30% 34%Adjusted Free Cash Flow $(74,811) $24,987Diluted Loss per Share $(0.57) $(2.02)Number of Shares Issued and Outstanding 137,116 136,223
2021 Revenue by Country ($M)
Saudi Arabia
Thailand
India
Nigeria
UAE
Others
$143
$168
$81
$53
$26
$56
Revenue Adjusted EBITDA Adjusted EBITDA Margin
05
10
15
20
25
30
35
40
00
Q1 2021
$130
$47 Q42021
$136
$44Q2 2021
$131
$34 Q3 2021
$130
$34
36%
32%
26% 26%
00
160
140
120
100
60
40
20
80
Financial Performance Summary (Amounts in thousands, except ratios, percentages & per share data)
Quarterly 2021 Revenue ($M), Adjusted EBITDA ($M) & Adjusted EBITDA Margin (%)
FINANCIAL REVIEW
Shelf Drilling Annual Report 2021 37
SUSTAINABILITY REPORT
In this section CEO Sustainability Statement 40
Sustainability Highlights 42
Sustainability at Shelf Drilling 43
Health and Safety 50
People and Society 54
Climate and Environment 64
Responsible Business Conduct 74
2021 Disclosures 78
38 Shelf Drilling Annual Report 2021
Shelf Drilling Annual Report 2021 39
CEO SustainabilityStatement
Our high national content again provided a significant benefit as in countries such as India, Egypt and Nigeria we were not exposed to international travel restrictions. However, the unequal distribution of vaccines around the world created additional challenges for us as we pursued a plan to have all crews fully vaccinated as soon as possible. The resilience and determination of our local management teams was essential to ensuring that we achieved this objective before the end of the year.
While we continued to make progress on reducing the number of injuries in our operations, tragically one of our crew members died as a result of the injuries he sustained from an accident on the CE Thornton in India. Our local management team provided immediate support to the family and colleagues in the aftermath of this tragedy. This is the first fatality that has occurred since Company inception, and we have reinforced the commitment and dedication of our entire workforce to strive for incident-free operations. To this end, we recently launched a ‘Make It Safe Today’ campaign where we encourage reporting of all unsafe acts and conditions as a way to uncover opportunities for improvement and learning.
We have continued to enhance the quality and depth of our reporting externally as well as engagement with external stakeholders such as Carbon Disclosure Project (CDP) and other rating organizations. We are very pleased to report that these efforts have been recognized through improved scoring where we achieved a B- rating with CDP, and an A- rating when benchmarked to the Oslo Stock Exchange ESG100 report. One of the key areas for improvement was the lack of published targets, and within this report we have included details on the goals that we have set for emissions reduction as well as other key sustainability related topics.
COP26 reaffirmed the world’s determination to keeping global temperatures within manageable levels and Shelf Drilling supports this commitment. We also believe that oil and gas will remain an important energy source for the long term and that Shelf Drilling’s areas of operations, type of activity and lower cost base allows us to play a significant role in meeting the worlds energy needs. In addition, our focus on developing a leading position in plug and abandonment, decommissioning and in future carbon capture opportunities, will provide further business opportunities as the energy transition unfolds.
In 2021 we focused our efforts on building the key elements that will allow us to drive for meaningful and sustainable emissions reductions from our operations including an in-house training module for all crews and employees. In addition, we developed an integrated emission tracking and reporting tool that provides a simple, effective and cloud-based solution for our employees to use and dashboards for Management to monitor. This tool will ensure that we are able to provide reliable and consistent emissions data to our employees and ultimately all stakeholders.
We will continue to pursue further opportunities to support our emissions reduction efforts such as digital monitoring of fuel consumption and engine performance as well as hybrid power systems.
This sustainability report has been prepared consistent with last year’s, which was in line with the recommendations of the Sustainability Accounting Standards Board (SASB) as well as the recommendations of other bodies including CDP, Task Force on Climate-related Financial Disclosure (TCFD) and, where relevant, is aligned with the Global Reporting Initiative (GRI) standards.
Throughout 2021, COVID-19 continued to create significant disruption to our people and operations with certain countries having to deal with incredible turmoil and distress as the number of cases and deaths continued to rise. The protocols we had established in 2020 ensured that in general our rigs and employees stayed COVID-19 free, though their family, friends and communities remained exposed, creating additional stress for our crews on-board the rigs.
SUSTAINABILITY REPORT
40 Shelf Drilling Annual Report 2021
I would like to thank all our stakeholders, and in particular all our employees, for their support and commitment to Shelf Drilling.
David MullenChief Executive Officer
In 2021, we focused our efforts on building the key elements that will allow us to drive for meaningful and sustainable emissions reductions from our operations.
SUSTAINABILITY REPORT
Shelf Drilling Annual Report 2021 41
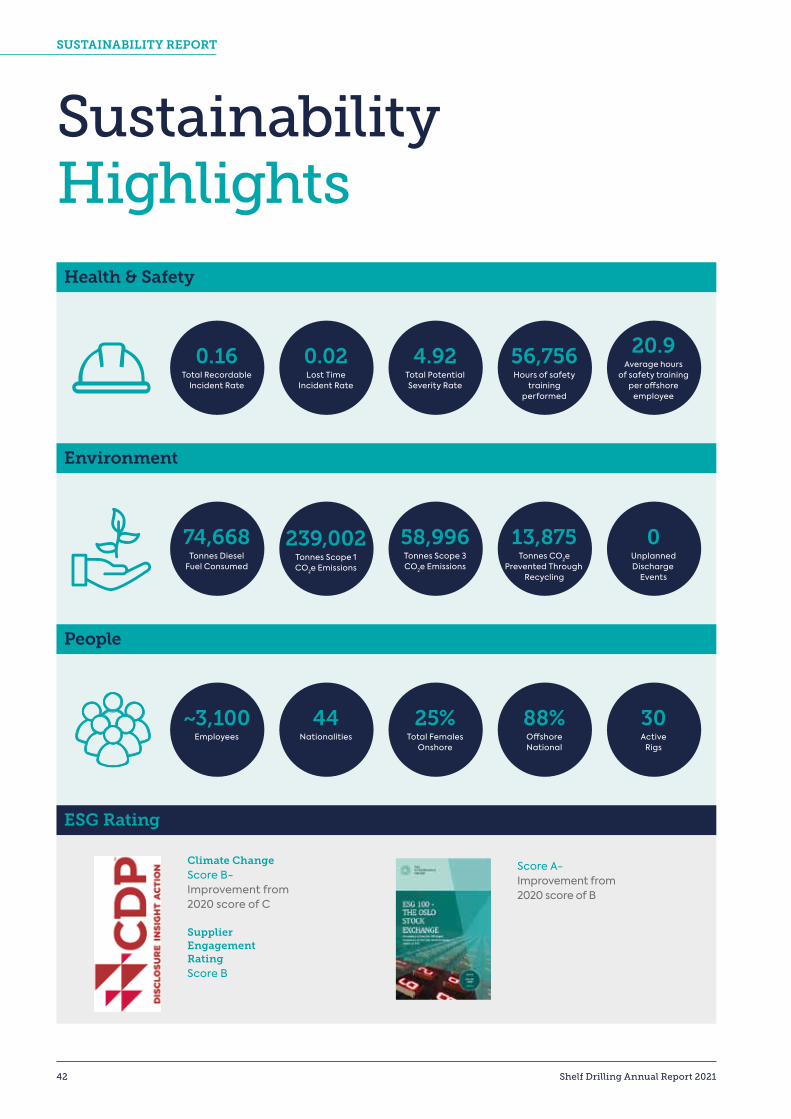
SustainabilityHighlightsHealth & Safety
Environment
People
ESG Rating
0.16Total Recordable
Incident Rate
0.02Lost Time
Incident Rate
4.92Total PotentialSeverity Rate
56,756Hours of safety
trainingperformed
20.9Average hours
of safety training per offshore
employee
74,668Tonnes Diesel
Fuel Consumed
~3,100Employees
239,002Tonnes Scope 1 CO2e Emissions
44Nationalities
58,996Tonnes Scope 3CO2e Emissions
25%Total Females
Onshore
13,875 Tonnes CO2e
Prevented ThroughRecycling
88%Offshore National
0UnplannedDischarge
Events
30Active
Rigs
Climate ChangeScore B- Improvement from 2020 score of C
Supplier Engagement RatingScore B
Score A- Improvement from 2020 score of B
SUSTAINABILITY REPORT
42 Shelf Drilling Annual Report 2021
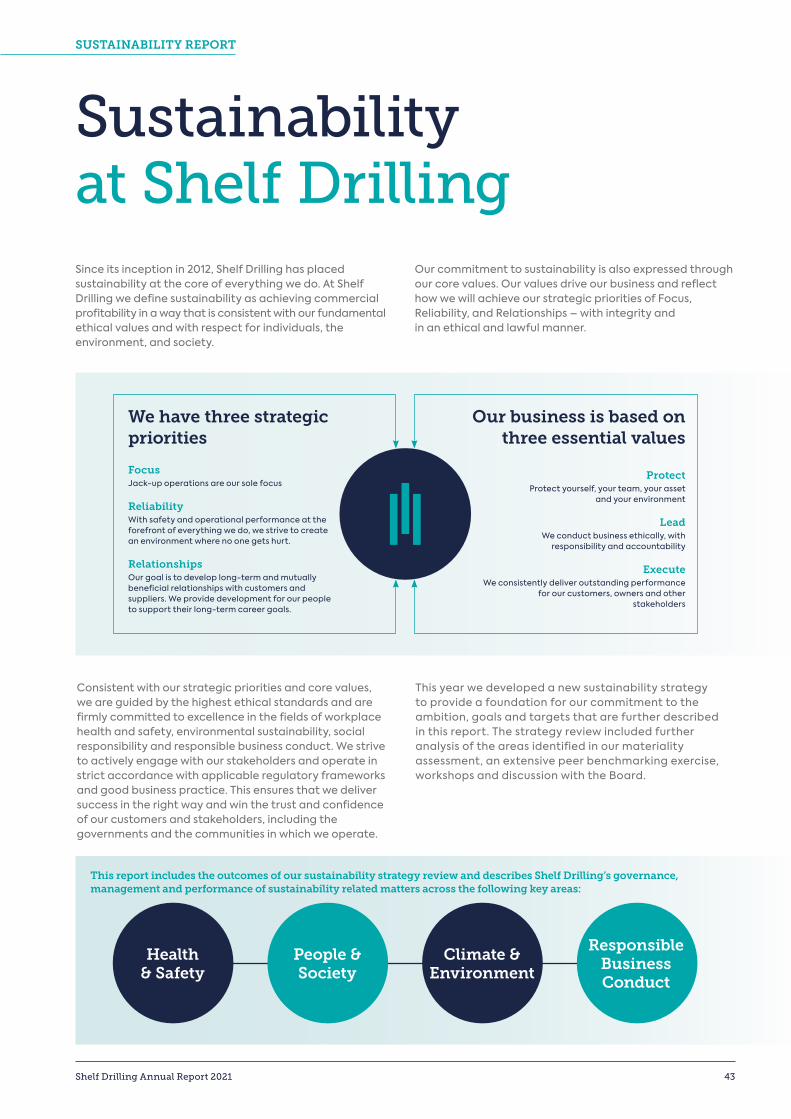
Sustainabilityat Shelf DrillingSince its inception in 2012, Shelf Drilling has placed sustainability at the core of everything we do. At Shelf Drilling we define sustainability as achieving commercial profitability in a way that is consistent with our fundamental ethical values and with respect for individuals, the environment, and society.
Our commitment to sustainability is also expressed through our core values. Our values drive our business and reflect how we will achieve our strategic priorities of Focus, Reliability, and Relationships – with integrity and in an ethical and lawful manner.
Consistent with our strategic priorities and core values, we are guided by the highest ethical standards and are firmly committed to excellence in the fields of workplace health and safety, environmental sustainability, social responsibility and responsible business conduct. We strive to actively engage with our stakeholders and operate in strict accordance with applicable regulatory frameworks and good business practice. This ensures that we deliver success in the right way and win the trust and confidence of our customers and stakeholders, including the governments and the communities in which we operate.
This year we developed a new sustainability strategy to provide a foundation for our commitment to the ambition, goals and targets that are further described in this report. The strategy review included further analysis of the areas identified in our materiality assessment, an extensive peer benchmarking exercise, workshops and discussion with the Board.
This report includes the outcomes of our sustainability strategy review and describes Shelf Drilling’s governance, management and performance of sustainability related matters across the following key areas:
Health& Safety
People & Society
Climate & Environment
Responsible Business Conduct
We have three strategic priorities
Our business is based on three essential values
FocusJack-up operations are our sole focus
ReliabilityWith safety and operational performance at the forefront of everything we do, we strive to create an environment where no one gets hurt.
RelationshipsOur goal is to develop long-term and mutually beneficial relationships with customers and suppliers. We provide development for our people to support their long-term career goals.
ProtectProtect yourself, your team, your asset
and your environment
LeadWe conduct business ethically, with
responsibility and accountability
ExecuteWe consistently deliver outstanding performance
for our customers, owners and other stakeholders
SUSTAINABILITY REPORT
Shelf Drilling Annual Report 2021 43
2021’s Sustainability Highlights
This year, we placed a large focus on reducing our emissions, waste and overall negative environmental impact. We firmly believe that for us to achieve our ambitions, there needs to be understanding and buy-in at all levels of our operations and, coming in to 2021, we realized that there was a significant gap between the level of understanding of our offshore supervisory personnel on sustainability compared to that required to achieve our goals. To bring the level of understanding up to the required level, we designed and launched a specific training program to bridge this gap, setting a target of training 90% of employees and contractors by the end of September. This was achieved and feedback received on the training program was positive, confirming that it met the intended aims.
In addition to education, a number of practical actions were implemented to allow our crews, management and organization to effectively drive our emissions reduction initiatives in future. These included:
1. Detailed tracking of all key sustainability related information; working with our third-party provider for HSE tracking, we drove an update to their platform that included data capture for all key parameters such as scope 1, 2 and 3 emissions data, waste, and unplanned releases.
2. In house developed an engine emissions tracking and reporting tool; to provide our crews with a centralized, uniform and effective tool to track and plan for the Scope 1 emissions stemming from our operations.
3. Reporting guidelines; rolled out detailed and specific reporting guidelines to our rigs and management to ensure consistent data capture across all sustainability related information.
4. Sustainability Committee; developed and launched Sustainability Committee’s for each rig and shore-based location to ensure efficient information flow and sharing of lessons learnt.
5. P ower management plan; developed specific power management plans for each rig.
We also established an internal management group with specific responsibilities to oversee our sustainability programs and to develop recommendations for Management and Board consideration. These included an in-depth analysis that enabled a defined plan to achieve short- and long-term emissions reduction goals that are outlined in this report. While these targets have been set based on an approach that is in line with the Science Based Targets initiative (SBTi), we will not be applying for formal recognition of our targets or approach.
In 2021 we also launched pilot projects to reduce the waste coming from our operations, for example the waste coming from the catering service on board our rigs. A third-party specialist provider worked with the rig camp boss to analyze (including weighing and photographing) the daily waste produced and to look at ways to reduce through either more effective planning, reuse or changing behaviors in the way food was prepared or served. We are currently assessing the performance of this pilot prior to extending to other rigs in our fleet.
We also piloted a system to generate fresh drinking water on board the rig to eliminate the thousands of plastic bottles that are used on each of our rigs per year. A plan to roll out this successful pilot to the rigs across our fleet is currently under development.
Corporate Governance & Sustainability Management
Governance & Risk Management
The Board of Directors of Shelf Drilling regularly engages with management to discuss, review and, where appropriate, approve the Company’s sustainability-related strategy, risk management, and performance. In addition, the Audit Committee of the Board oversees the Company’s risk management programs, including Enterprise Risk Management (ERM) that fully incorporates risks associated with climate-change and other sustainability related matters. The Company’s management team, with the guidance and support of our Board, implements, monitors and, if necessary, adjusts our sustainability initiatives to best serve the long- term interests of the Company and all our stakeholders. The Board reports on the Company’s sustainability practices and progress on an annual basis through this Sustainability Report. In 2021, sustainability, ERM and Energy Transition issues were a formal part of three Board meetings and three Audit Committee meetings in addition to periodic updates on the monthly calls with the Board.
Shelf Drilling established a comprehensive ERM process in 2014 that has continued to be refined and enhanced over the years. In 2020 we integrated the outcomes of our climate change workshop that assessed the risks associated with physical, liability and transitional risks to our operations and business, in line with the recommendations of the Task Force on Climate-related Financial Disclosure (TCFD). Our ERM process was further enhanced in 2021 through the development of a centralized database and tracking system that permits each risk owner to review and update the current risks, mitigation measures and assessment on an ongoing basis. Our annual review process involves one-on-one discussions with the risk owner, our ERM coordinator and our outsourced Internal Audit partner to consider changes to the risks, risk profile and new or emerging risks for the business. The output from this update is then reviewed by our ERM steering committee, chaired by the CEO and including all Executive Management, to review and conclude on the most impactful changes to our risk universe and actions that may need to be taken as a result. The outcome of the steering committee meeting is then reviewed and discussed with the Audit Committee and Board. These outcomes are also a key factor in establishing the Internal Audit Plan which is approved by the Audit Committee at the beginning of each year.
The Board and Management regularly engage with external industry experts to ensure that we remain aware of all current or potential issues that may impact the industry and our business. In 2021, the Board engaged
SUSTAINABILITY REPORT
44 Shelf Drilling Annual Report 2021
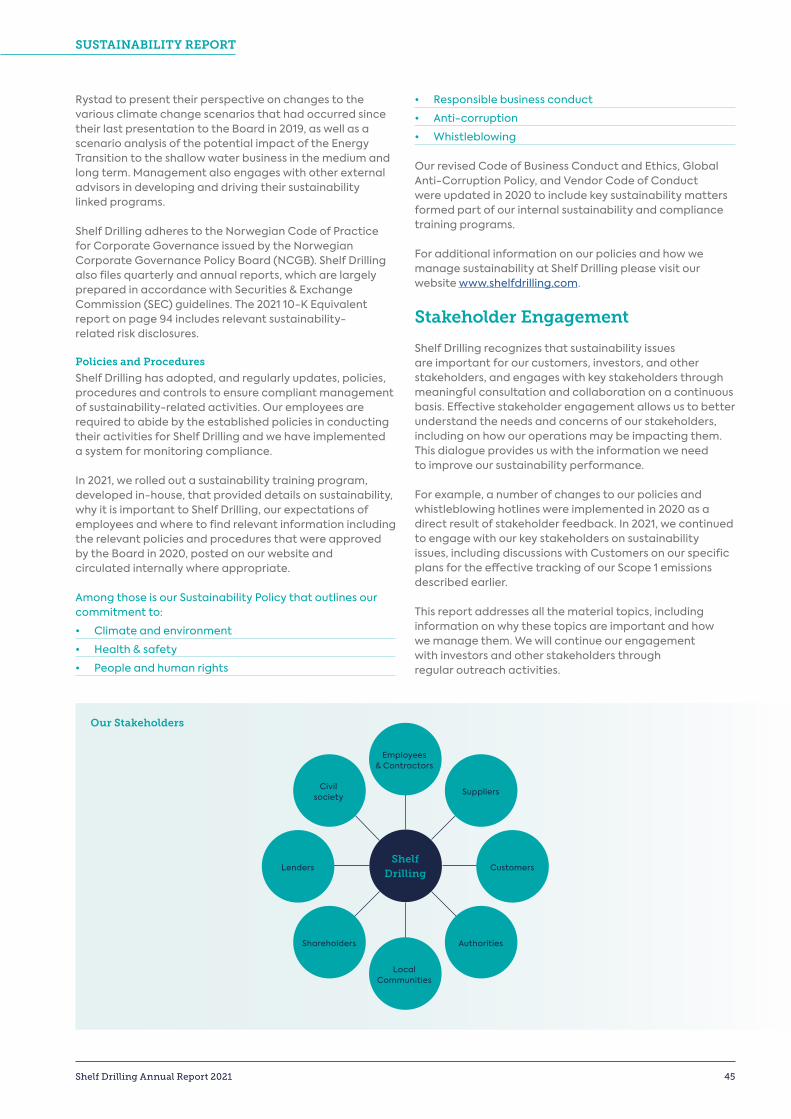
Rystad to present their perspective on changes to the various climate change scenarios that had occurred since their last presentation to the Board in 2019, as well as a scenario analysis of the potential impact of the Energy Transition to the shallow water business in the medium and long term. Management also engages with other external advisors in developing and driving their sustainability linked programs.
Shelf Drilling adheres to the Norwegian Code of Practice for Corporate Governance issued by the Norwegian Corporate Governance Policy Board (NCGB). Shelf Drilling also files quarterly and annual reports, which are largely prepared in accordance with Securities & Exchange Commission (SEC) guidelines. The 2021 10-K Equivalent report on page 94 includes relevant sustainability- related risk disclosures.
Policies and Procedures
Shelf Drilling has adopted, and regularly updates, policies, procedures and controls to ensure compliant management of sustainability-related activities. Our employees are required to abide by the established policies in conducting their activities for Shelf Drilling and we have implemented a system for monitoring compliance.
In 2021, we rolled out a sustainability training program, developed in-house, that provided details on sustainability, why it is important to Shelf Drilling, our expectations of employees and where to find relevant information including the relevant policies and procedures that were approved by the Board in 2020, posted on our website and circulated internally where appropriate.
Among those is our Sustainability Policy that outlines our commitment to:
• Climate and environment
• Health & safety
• People and human rights
• Responsible business conduct
• Anti-corruption
• Whistleblowing Our revised Code of Business Conduct and Ethics, Global Anti-Corruption Policy, and Vendor Code of Conduct were updated in 2020 to include key sustainability matters formed part of our internal sustainability and compliance training programs.
For additional information on our policies and how we manage sustainability at Shelf Drilling please visit our website www.shelfdrilling.com.
Stakeholder Engagement Shelf Drilling recognizes that sustainability issues are important for our customers, investors, and other stakeholders, and engages with key stakeholders through meaningful consultation and collaboration on a continuous basis. Effective stakeholder engagement allows us to better understand the needs and concerns of our stakeholders, including on how our operations may be impacting them. This dialogue provides us with the information we need to improve our sustainability performance. For example, a number of changes to our policies and whistleblowing hotlines were implemented in 2020 as a direct result of stakeholder feedback. In 2021, we continued to engage with our key stakeholders on sustainability issues, including discussions with Customers on our specific plans for the effective tracking of our Scope 1 emissions described earlier.
This report addresses all the material topics, including information on why these topics are important and how we manage them. We will continue our engagement with investors and other stakeholders through regular outreach activities.
ShelfDrilling
Employees& Contractors
LocalCommunities
CustomersLenders
Suppliers
Shareholders Authorities
Civilsociety
Our Stakeholders
SUSTAINABILITY REPORT
Shelf Drilling Annual Report 2021 45
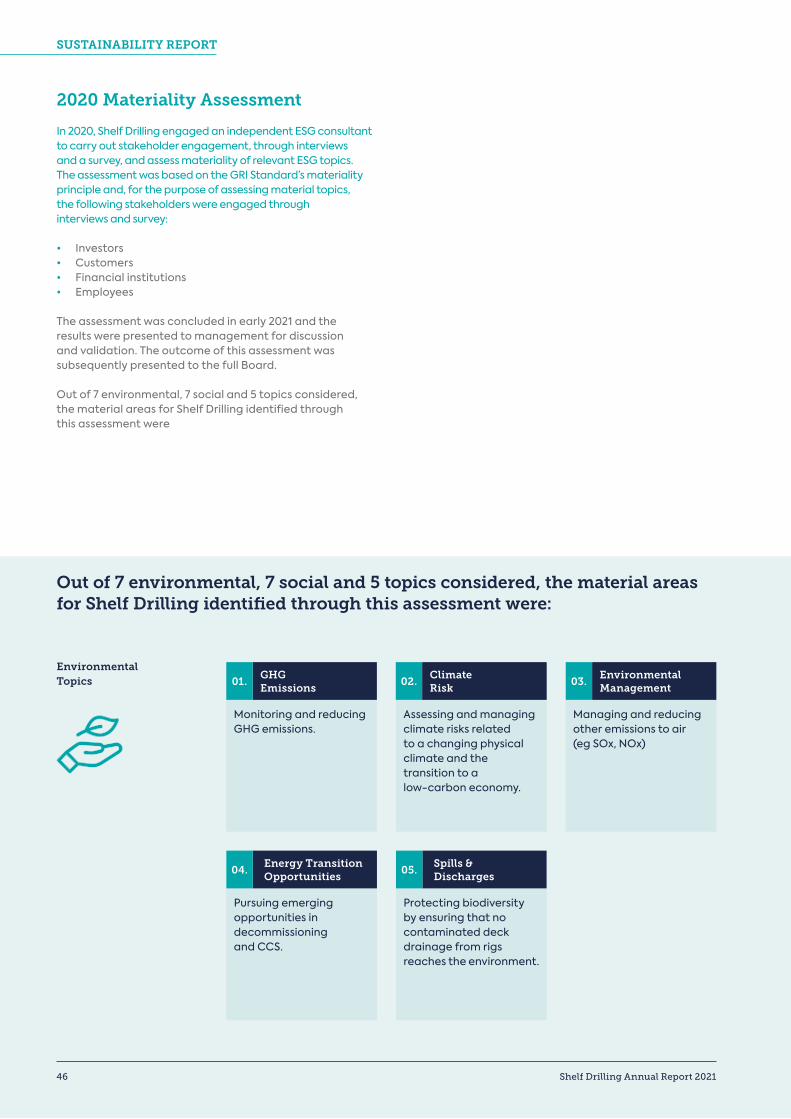
2020 Materiality Assessment In 2020, Shelf Drilling engaged an independent ESG consultant to carry out stakeholder engagement, through interviews and a survey, and assess materiality of relevant ESG topics. The assessment was based on the GRI Standard’s materiality principle and, for the purpose of assessing material topics, the following stakeholders were engaged through interviews and survey:
• Investors• Customers• Financial institutions• Employees
The assessment was concluded in early 2021 and the results were presented to management for discussion and validation. The outcome of this assessment was subsequently presented to the full Board.
Out of 7 environmental, 7 social and 5 topics considered, the material areas for Shelf Drilling identified through this assessment were
Environmental Topics
Monitoring and reducing GHG emissions.
Assessing and managing climate risks related to a changing physical climate and the transition to a low-carbon economy.
Managing and reducing other emissions to air (eg SOx, NOx)
Environmental Management
GHG Emissions
01.
Pursuing emerging opportunities in decommissioning and CCS.
Energy Transition Opportunities
04.
Protecting biodiversity by ensuring that no contaminated deck drainage from rigs reaches the environment.
Spills & Discharges
05.
02. 03.Climate Risk
Out of 7 environmental, 7 social and 5 topics considered, the material areas for Shelf Drilling identified through this assessment were:
SUSTAINABILITY REPORT
46 Shelf Drilling Annual Report 2021
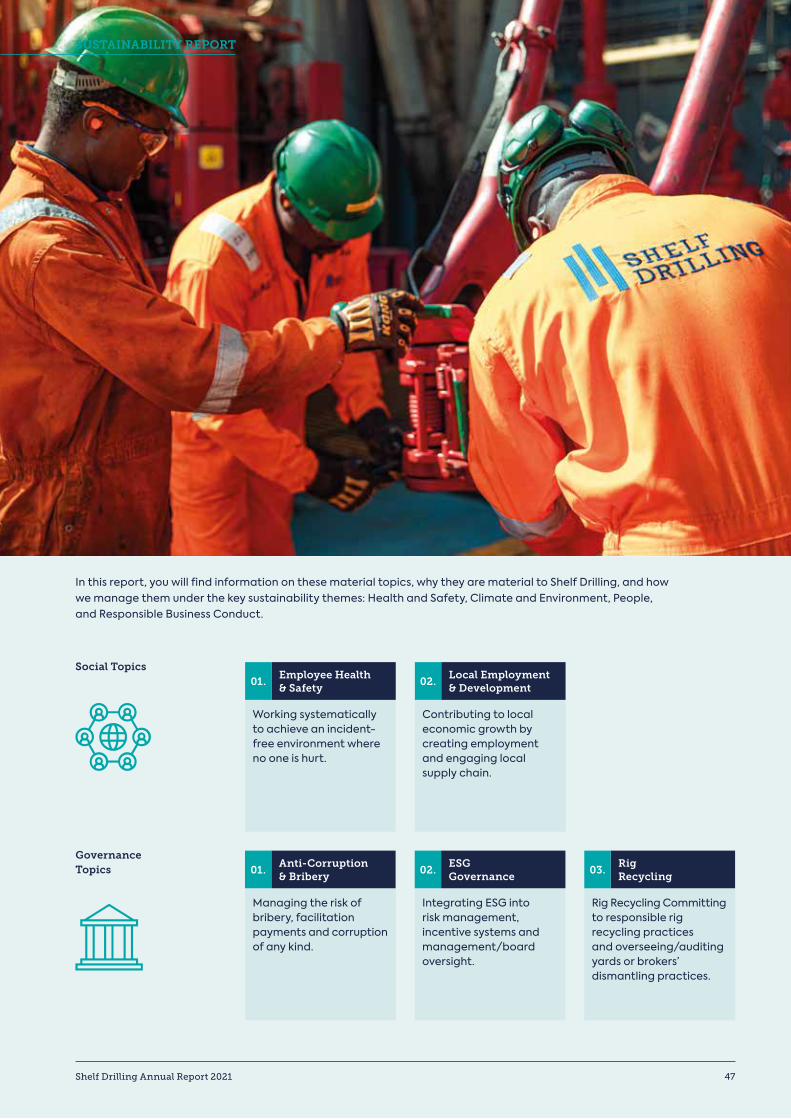
Governance Topics
Managing the risk of bribery, facilitation payments and corruption of any kind.
Integrating ESG into risk management, incentive systems and management/board oversight.
Rig Recycling Committing to responsible rig recycling practices and overseeing/auditing yards or brokers’ dismantling practices.
Rig Recycling
Anti-Corruption & Bribery
ESG Governance
01. 02. 03.
Social Topics
Contributing to local economic growth by creating employment and engaging local supply chain.
Local Employment & Development
Working systematically to achieve an incident-free environment where no one is hurt.
Employee Health & Safety
01. 02.
In this report, you will find information on these material topics, why they are material to Shelf Drilling, and how we manage them under the key sustainability themes: Health and Safety, Climate and Environment, People, and Responsible Business Conduct.
SUSTAINABILITY REPORT
Shelf Drilling Annual Report 2021 47
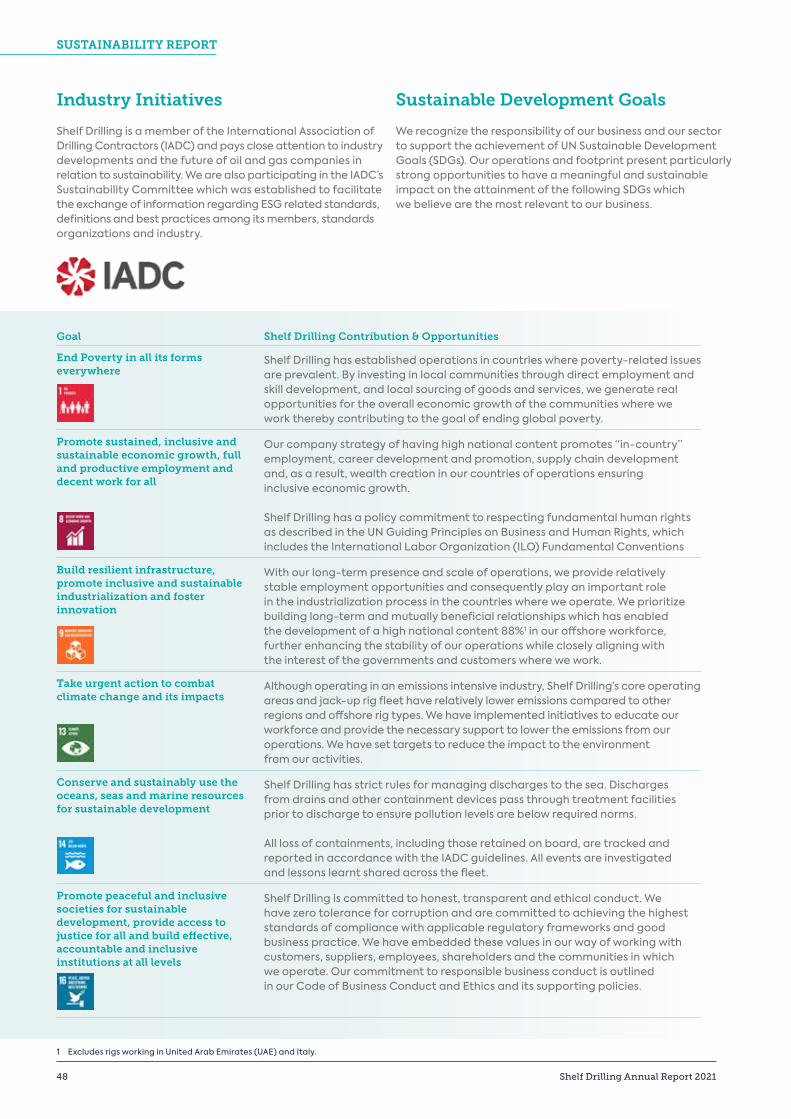
Industry Initiatives Shelf Drilling is a member of the International Association of Drilling Contractors (IADC) and pays close attention to industry developments and the future of oil and gas companies in relation to sustainability. We are also participating in the IADC’s Sustainability Committee which was established to facilitate the exchange of information regarding ESG related standards, definitions and best practices among its members, standards organizations and industry.
Sustainable Development Goals
We recognize the responsibility of our business and our sector to support the achievement of UN Sustainable Development Goals (SDGs). Our operations and footprint present particularly strong opportunities to have a meaningful and sustainable impact on the attainment of the following SDGs which we believe are the most relevant to our business.
1 Excludes rigs working in United Arab Emirates (UAE) and Italy.
Goal Shelf Drilling Contribution & Opportunities
End Poverty in all its forms everywhere
Shelf Drilling has established operations in countries where poverty-related issues are prevalent. By investing in local communities through direct employment and skill development, and local sourcing of goods and services, we generate real opportunities for the overall economic growth of the communities where we work thereby contributing to the goal of ending global poverty.
Promote sustained, inclusive and sustainable economic growth, full and productive employment and decent work for all
Our company strategy of having high national content promotes “in-country” employment, career development and promotion, supply chain development and, as a result, wealth creation in our countries of operations ensuring inclusive economic growth.
Shelf Drilling has a policy commitment to respecting fundamental human rights as described in the UN Guiding Principles on Business and Human Rights, which includes the International Labor Organization (ILO) Fundamental Conventions
Build resilient infrastructure, promote inclusive and sustainable industrialization and foster innovation
With our long-term presence and scale of operations, we provide relatively stable employment opportunities and consequently play an important role in the industrialization process in the countries where we operate. We prioritize building long-term and mutually beneficial relationships which has enabled the development of a high national content 88%1 in our offshore workforce, further enhancing the stability of our operations while closely aligning with the interest of the governments and customers where we work.
Take urgent action to combat climate change and its impacts
Although operating in an emissions intensive industry, Shelf Drilling’s core operating areas and jack-up rig fleet have relatively lower emissions compared to other regions and offshore rig types. We have implemented initiatives to educate our workforce and provide the necessary support to lower the emissions from our operations. We have set targets to reduce the impact to the environment from our activities.
Conserve and sustainably use the oceans, seas and marine resources for sustainable development
Shelf Drilling has strict rules for managing discharges to the sea. Discharges from drains and other containment devices pass through treatment facilities prior to discharge to ensure pollution levels are below required norms. All loss of containments, including those retained on board, are tracked and reported in accordance with the IADC guidelines. All events are investigated and lessons learnt shared across the fleet.
Promote peaceful and inclusive societies for sustainable development, provide access to justice for all and build effective, accountable and inclusive institutions at all levels
Shelf Drilling is committed to honest, transparent and ethical conduct. We have zero tolerance for corruption and are committed to achieving the highest standards of compliance with applicable regulatory frameworks and good business practice. We have embedded these values in our way of working with customers, suppliers, employees, shareholders and the communities in which we operate. Our commitment to responsible business conduct is outlined in our Code of Business Conduct and Ethics and its supporting policies.
SUSTAINABILITY REPORT
48 Shelf Drilling Annual Report 2021
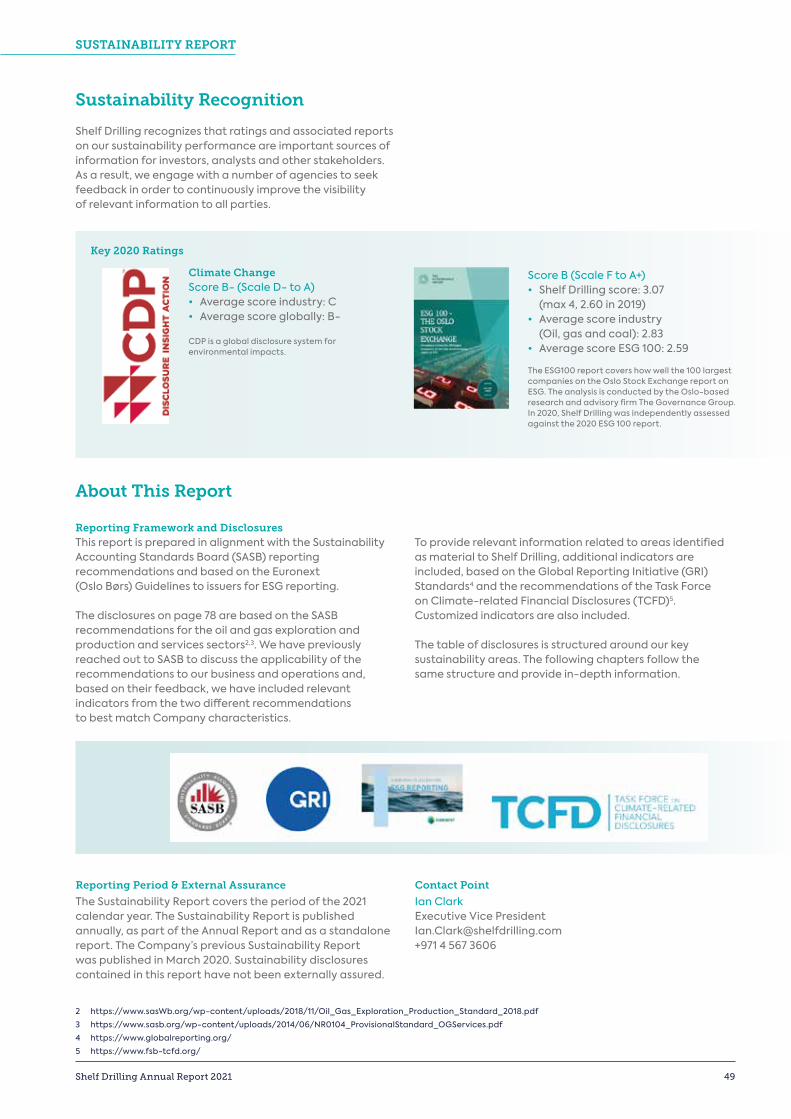
Sustainability Recognition
Shelf Drilling recognizes that ratings and associated reports on our sustainability performance are important sources of information for investors, analysts and other stakeholders. As a result, we engage with a number of agencies to seek feedback in order to continuously improve the visibility of relevant information to all parties.
About This Report
Reporting Framework and DisclosuresThis report is prepared in alignment with the Sustainability Accounting Standards Board (SASB) reporting recommendations and based on the Euronext (Oslo Børs) Guidelines to issuers for ESG reporting.
The disclosures on page 78 are based on the SASB recommendations for the oil and gas exploration and production and services sectors2,3. We have previously reached out to SASB to discuss the applicability of the recommendations to our business and operations and, based on their feedback, we have included relevant indicators from the two different recommendations to best match Company characteristics.
To provide relevant information related to areas identified as material to Shelf Drilling, additional indicators are included, based on the Global Reporting Initiative (GRI) Standards4 and the recommendations of the Task Force on Climate-related Financial Disclosures (TCFD)5. Customized indicators are also included.
The table of disclosures is structured around our key sustainability areas. The following chapters follow the same structure and provide in-depth information.
Reporting Period & External Assurance
The Sustainability Report covers the period of the 2021 calendar year. The Sustainability Report is published annually, as part of the Annual Report and as a standalone report. The Company’s previous Sustainability Report was published in March 2020. Sustainability disclosures contained in this report have not been externally assured.
Contact Point
Ian ClarkExecutive Vice President [email protected]+971 4 567 3606
2 https://www.sasWb.org/wp-content/uploads/2018/11/Oil_Gas_Exploration_Production_Standard_2018.pdf
3 https://www.sasb.org/wp-content/uploads/2014/06/NR0104_ProvisionalStandard_OGServices.pdf
4 https://www.globalreporting.org/
5 https://www.fsb-tcfd.org/
Climate ChangeScore B- (Scale D- to A)• Average score industry: C• Average score globally: B-
CDP is a global disclosure system for environmental impacts.
Score B (Scale F to A+)• Shelf Drilling score: 3.07 (max 4, 2.60 in 2019)• Average score industry
(Oil, gas and coal): 2.83• Average score ESG 100: 2.59
The ESG100 report covers how well the 100 largest companies on the Oslo Stock Exchange report on ESG. The analysis is conducted by the Oslo-based research and advisory firm The Governance Group. In 2020, Shelf Drilling was independently assessed against the 2020 ESG 100 report.
Key 2020 Ratings
SUSTAINABILITY REPORT
Shelf Drilling Annual Report 2021 49
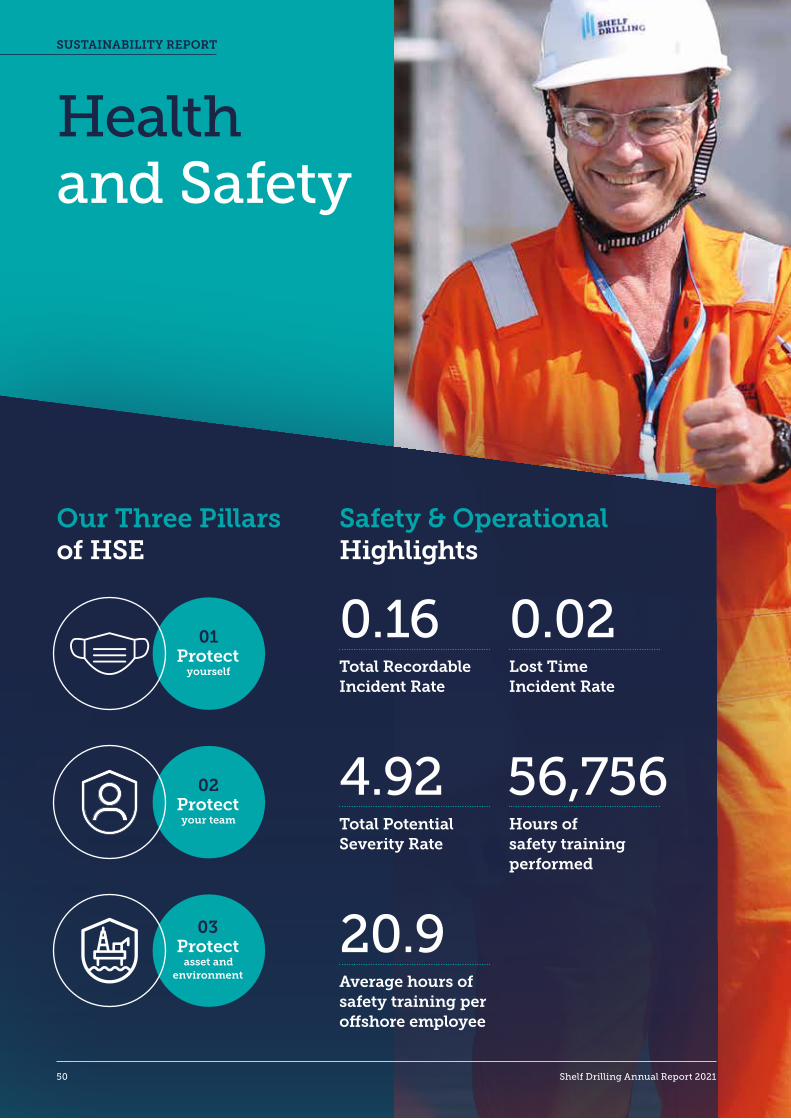
Healthand Safety
Our Three Pillars of HSE
Safety & Operational Highlights
Total Recordable Incident Rate
0.16Lost TimeIncident Rate
0.02
Total Potential Severity Rate
4.92 56,756Hours of safety training performed
Average hours of safety training per offshore employee
20.9
01Protect
yourself
02Protect your team
03Protect
asset and environment
SUSTAINABILITY REPORT
50 Shelf Drilling Annual Report 2021
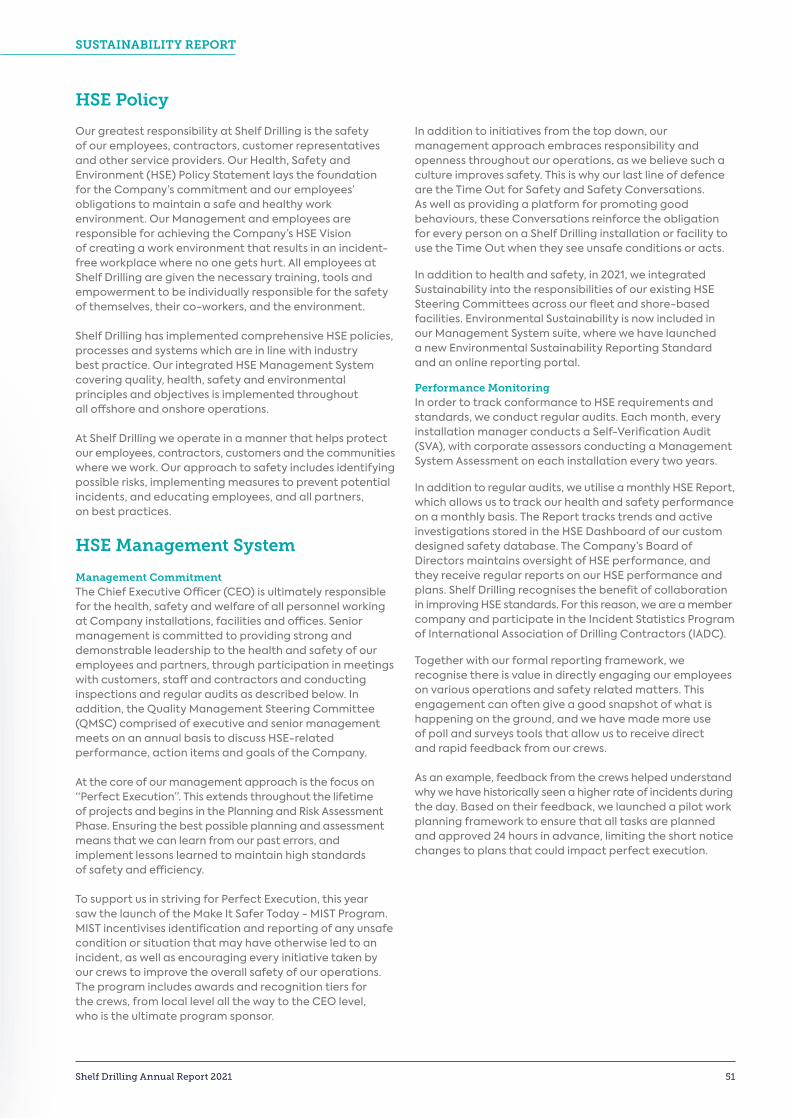
HSE Policy
Our greatest responsibility at Shelf Drilling is the safety of our employees, contractors, customer representatives and other service providers. Our Health, Safety and Environment (HSE) Policy Statement lays the foundation for the Company’s commitment and our employees’ obligations to maintain a safe and healthy work environment. Our Management and employees are responsible for achieving the Company’s HSE Vision of creating a work environment that results in an incident-free workplace where no one gets hurt. All employees at Shelf Drilling are given the necessary training, tools and empowerment to be individually responsible for the safety of themselves, their co-workers, and the environment.
Shelf Drilling has implemented comprehensive HSE policies, processes and systems which are in line with industry best practice. Our integrated HSE Management System covering quality, health, safety and environmental principles and objectives is implemented throughout all offshore and onshore operations.
At Shelf Drilling we operate in a manner that helps protect our employees, contractors, customers and the communities where we work. Our approach to safety includes identifying possible risks, implementing measures to prevent potential incidents, and educating employees, and all partners, on best practices.
HSE Management System
Management Commitment The Chief Executive Officer (CEO) is ultimately responsible for the health, safety and welfare of all personnel working at Company installations, facilities and offices. Senior management is committed to providing strong and demonstrable leadership to the health and safety of our employees and partners, through participation in meetings with customers, staff and contractors and conducting inspections and regular audits as described below. In addition, the Quality Management Steering Committee (QMSC) comprised of executive and senior management meets on an annual basis to discuss HSE-related performance, action items and goals of the Company.
At the core of our management approach is the focus on “Perfect Execution”. This extends throughout the lifetime of projects and begins in the Planning and Risk Assessment Phase. Ensuring the best possible planning and assessment means that we can learn from our past errors, and implement lessons learned to maintain high standards of safety and efficiency.
To support us in striving for Perfect Execution, this year saw the launch of the Make It Safer Today - MIST Program. MIST incentivises identification and reporting of any unsafe condition or situation that may have otherwise led to an incident, as well as encouraging every initiative taken by our crews to improve the overall safety of our operations. The program includes awards and recognition tiers for the crews, from local level all the way to the CEO level, who is the ultimate program sponsor.
In addition to initiatives from the top down, our management approach embraces responsibility and openness throughout our operations, as we believe such a culture improves safety. This is why our last line of defence are the Time Out for Safety and Safety Conversations. As well as providing a platform for promoting good behaviours, these Conversations reinforce the obligation for every person on a Shelf Drilling installation or facility to use the Time Out when they see unsafe conditions or acts.
In addition to health and safety, in 2021, we integrated Sustainability into the responsibilities of our existing HSE Steering Committees across our fleet and shore-based facilities. Environmental Sustainability is now included in our Management System suite, where we have launched a new Environmental Sustainability Reporting Standard and an online reporting portal.
Performance MonitoringIn order to track conformance to HSE requirements and standards, we conduct regular audits. Each month, every installation manager conducts a Self-Verification Audit (SVA), with corporate assessors conducting a Management System Assessment on each installation every two years.
In addition to regular audits, we utilise a monthly HSE Report, which allows us to track our health and safety performance on a monthly basis. The Report tracks trends and active investigations stored in the HSE Dashboard of our custom designed safety database. The Company’s Board of Directors maintains oversight of HSE performance, and they receive regular reports on our HSE performance and plans. Shelf Drilling recognises the benefit of collaboration in improving HSE standards. For this reason, we are a member company and participate in the Incident Statistics Program of International Association of Drilling Contractors (IADC).
Together with our formal reporting framework, we recognise there is value in directly engaging our employees on various operations and safety related matters. This engagement can often give a good snapshot of what is happening on the ground, and we have made more use of poll and surveys tools that allow us to receive direct and rapid feedback from our crews. As an example, feedback from the crews helped understand why we have historically seen a higher rate of incidents during the day. Based on their feedback, we launched a pilot work planning framework to ensure that all tasks are planned and approved 24 hours in advance, limiting the short notice changes to plans that could impact perfect execution.
SUSTAINABILITY REPORT
Shelf Drilling Annual Report 2021 51
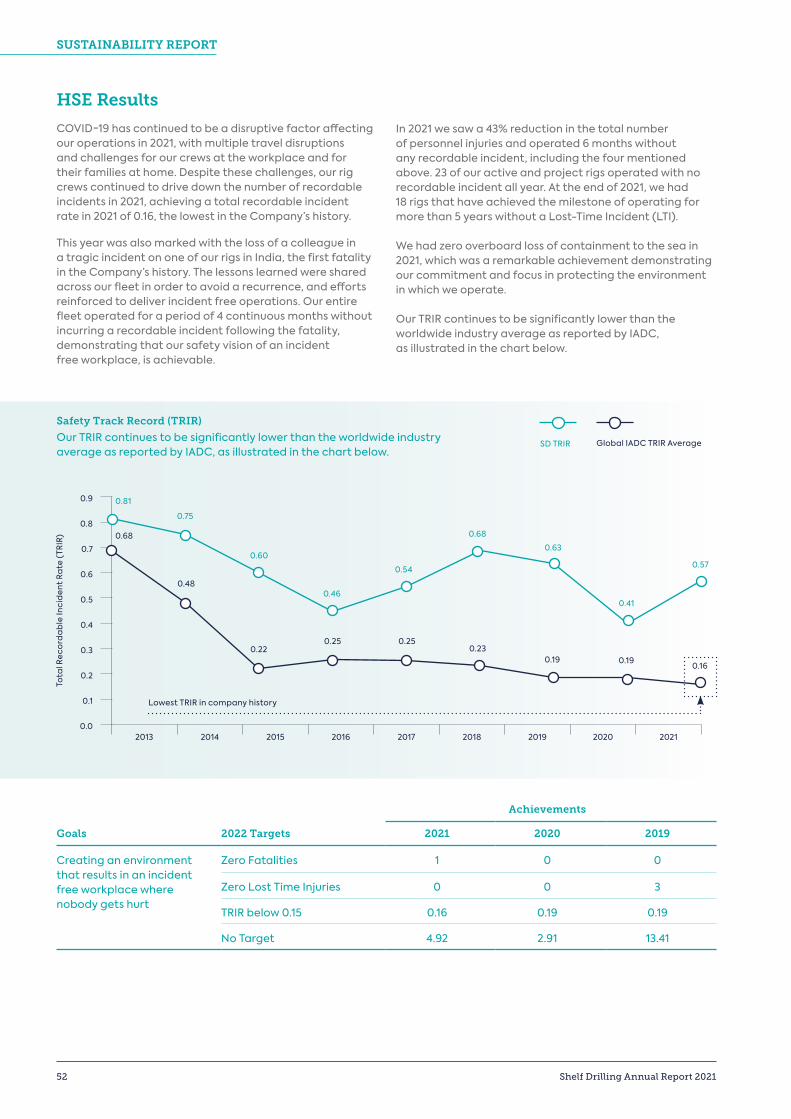
Achievements
Goals 2022 Targets 2021 2020 2019
Creating an environment that results in an incident free workplace where nobody gets hurt
Zero Fatalities 1 0 0
Zero Lost Time Injuries 0 0 3
TRIR below 0.15 0.16 0.19 0.19
No Target 4.92 2.91 13.41
HSE Results
COVID-19 has continued to be a disruptive factor affecting our operations in 2021, with multiple travel disruptions and challenges for our crews at the workplace and for their families at home. Despite these challenges, our rig crews continued to drive down the number of recordable incidents in 2021, achieving a total recordable incident rate in 2021 of 0.16, the lowest in the Company’s history.
This year was also marked with the loss of a colleague in a tragic incident on one of our rigs in India, the first fatality in the Company’s history. The lessons learned were shared across our fleet in order to avoid a recurrence, and efforts reinforced to deliver incident free operations. Our entire fleet operated for a period of 4 continuous months without incurring a recordable incident following the fatality, demonstrating that our safety vision of an incident free workplace, is achievable.
In 2021 we saw a 43% reduction in the total number of personnel injuries and operated 6 months without any recordable incident, including the four mentioned above. 23 of our active and project rigs operated with no recordable incident all year. At the end of 2021, we had 18 rigs that have achieved the milestone of operating for more than 5 years without a Lost-Time Incident (LTI).
We had zero overboard loss of containment to the sea in 2021, which was a remarkable achievement demonstrating our commitment and focus in protecting the environment in which we operate.
Our TRIR continues to be significantly lower than the worldwide industry average as reported by IADC, as illustrated in the chart below.
SD TRIR Global IADC TRIR Average
Safety Track Record (TRIR)
Our TRIR continues to be significantly lower than the worldwide industry average as reported by IADC, as illustrated in the chart below.
0.9
0.8
0.6
0.7
0.4
0.5
0.1
0.2
0.3
0.02013 2014 2015 2016 2017 2018 2019 2020 2021
Lowest TRIR in company history
0.81
0.68
0.48
0.220.25 0.25
0.230.19 0.19
0.16
0.75
0.60
0.46
0.54
0.68
0.63
0.41
0.57
Tota
l Rec
ord
ab
le In
cid
ent
Rate
(TR
IR)
SUSTAINABILITY REPORT
52 Shelf Drilling Annual Report 2021
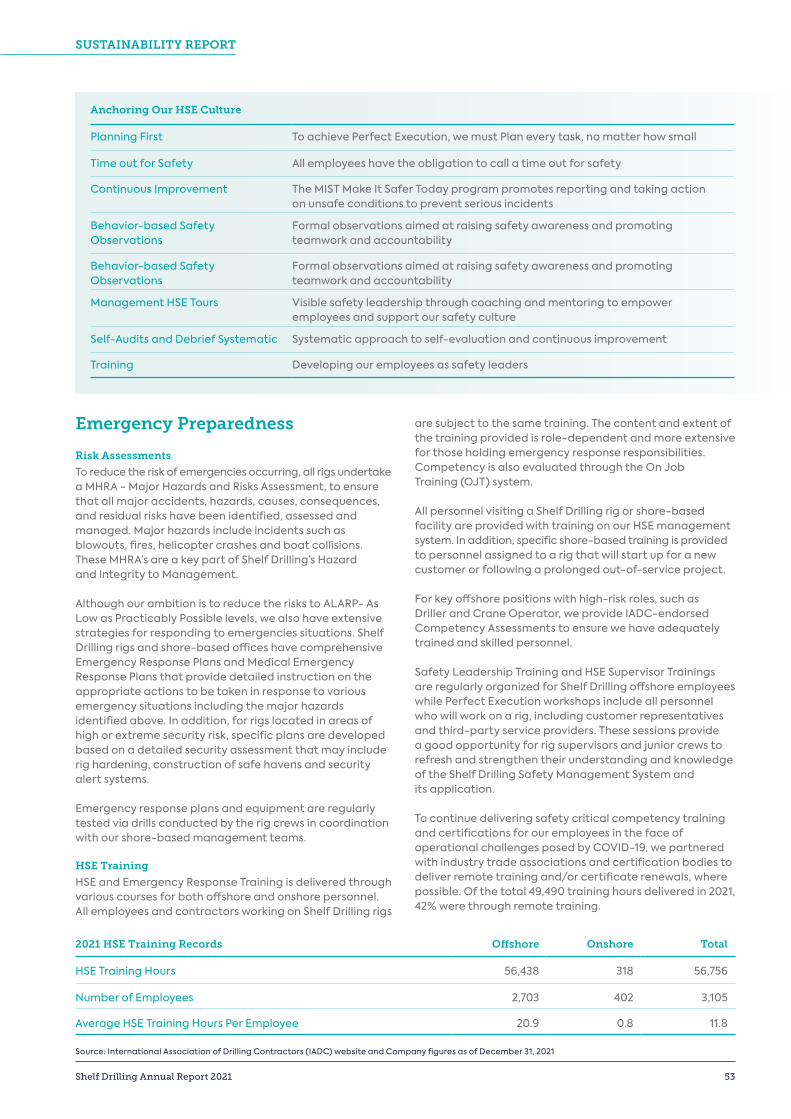
Source: International Association of Drilling Contractors (IADC) website and Company figures as of December 31, 2021
2021 HSE Training Records Offshore Onshore Total
HSE Training Hours 56,438 318 56,756
Number of Employees 2,703 402 3,105
Average HSE Training Hours Per Employee 20.9 0.8 11.8
Anchoring Our HSE Culture
Planning First To achieve Perfect Execution, we must Plan every task, no matter how small
Time out for Safety All employees have the obligation to call a time out for safety
Continuous Improvement The MIST Make It Safer Today program promotes reporting and taking action on unsafe conditions to prevent serious incidents
Behavior-based Safety Observations
Formal observations aimed at raising safety awareness and promoting teamwork and accountability
Behavior-based Safety Observations
Formal observations aimed at raising safety awareness and promoting teamwork and accountability
Management HSE Tours Visible safety leadership through coaching and mentoring to empower employees and support our safety culture
Self-Audits and Debrief Systematic Systematic approach to self-evaluation and continuous improvement
Training Developing our employees as safety leaders
Emergency Preparedness
Risk Assessments
To reduce the risk of emergencies occurring, all rigs undertake a MHRA - Major Hazards and Risks Assessment, to ensure that all major accidents, hazards, causes, consequences, and residual risks have been identified, assessed and managed. Major hazards include incidents such as blowouts, fires, helicopter crashes and boat collisions. These MHRA’s are a key part of Shelf Drilling’s Hazard and Integrity to Management.
Although our ambition is to reduce the risks to ALARP- As Low as Practicably Possible levels, we also have extensive strategies for responding to emergencies situations. Shelf Drilling rigs and shore-based offices have comprehensive Emergency Response Plans and Medical Emergency Response Plans that provide detailed instruction on the appropriate actions to be taken in response to various emergency situations including the major hazards identified above. In addition, for rigs located in areas of high or extreme security risk, specific plans are developed based on a detailed security assessment that may include rig hardening, construction of safe havens and security alert systems.
Emergency response plans and equipment are regularly tested via drills conducted by the rig crews in coordination with our shore-based management teams.
HSE Training
HSE and Emergency Response Training is delivered through various courses for both offshore and onshore personnel. All employees and contractors working on Shelf Drilling rigs
are subject to the same training. The content and extent of the training provided is role-dependent and more extensive for those holding emergency response responsibilities. Competency is also evaluated through the On Job Training (OJT) system. All personnel visiting a Shelf Drilling rig or shore-based facility are provided with training on our HSE management system. In addition, specific shore-based training is provided to personnel assigned to a rig that will start up for a new customer or following a prolonged out-of-service project.
For key offshore positions with high-risk roles, such as Driller and Crane Operator, we provide IADC-endorsed Competency Assessments to ensure we have adequately trained and skilled personnel.
Safety Leadership Training and HSE Supervisor Trainings are regularly organized for Shelf Drilling offshore employees while Perfect Execution workshops include all personnel who will work on a rig, including customer representatives and third-party service providers. These sessions provide a good opportunity for rig supervisors and junior crews to refresh and strengthen their understanding and knowledge of the Shelf Drilling Safety Management System and its application.
To continue delivering safety critical competency training and certifications for our employees in the face of operational challenges posed by COVID-19, we partnered with industry trade associations and certification bodies to deliver remote training and/or certificate renewals, where possible. Of the total 49,490 training hours delivered in 2021, 42% were through remote training.
SUSTAINABILITY REPORT
Shelf Drilling Annual Report 2021 53
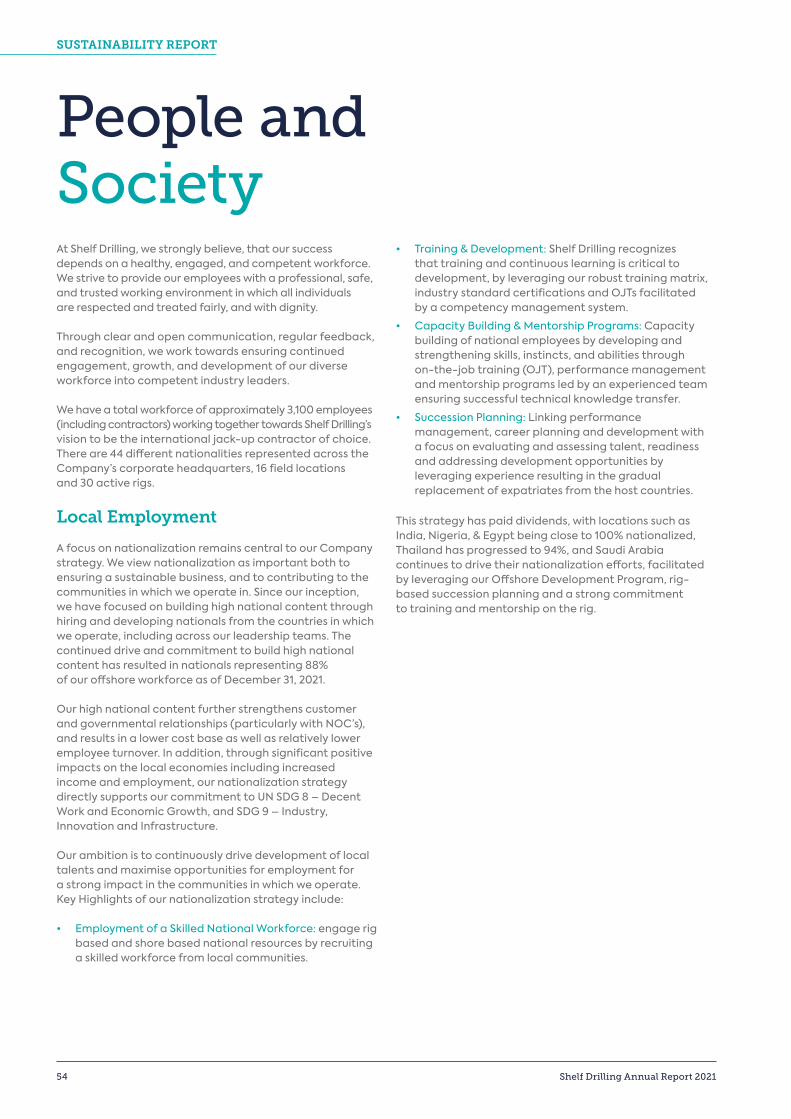
People andSocietyAt Shelf Drilling, we strongly believe, that our success depends on a healthy, engaged, and competent workforce. We strive to provide our employees with a professional, safe, and trusted working environment in which all individuals are respected and treated fairly, and with dignity.
Through clear and open communication, regular feedback, and recognition, we work towards ensuring continued engagement, growth, and development of our diverse workforce into competent industry leaders. We have a total workforce of approximately 3,100 employees (including contractors) working together towards Shelf Drilling’s vision to be the international jack-up contractor of choice. There are 44 different nationalities represented across the Company’s corporate headquarters, 16 field locations and 30 active rigs.
Local Employment
A focus on nationalization remains central to our Company strategy. We view nationalization as important both to ensuring a sustainable business, and to contributing to the communities in which we operate in. Since our inception, we have focused on building high national content through hiring and developing nationals from the countries in which we operate, including across our leadership teams. The continued drive and commitment to build high national content has resulted in nationals representing 88% of our offshore workforce as of December 31, 2021.
Our high national content further strengthens customer and governmental relationships (particularly with NOC’s), and results in a lower cost base as well as relatively lower employee turnover. In addition, through significant positive impacts on the local economies including increased income and employment, our nationalization strategy directly supports our commitment to UN SDG 8 – Decent Work and Economic Growth, and SDG 9 – Industry, Innovation and Infrastructure.
Our ambition is to continuously drive development of local talents and maximise opportunities for employment for a strong impact in the communities in which we operate.Key Highlights of our nationalization strategy include: • Employment of a Skilled National Workforce: engage rig
based and shore based national resources by recruiting a skilled workforce from local communities.
• Training & Development: Shelf Drilling recognizes that training and continuous learning is critical to development, by leveraging our robust training matrix, industry standard certifications and OJTs facilitated by a competency management system.
• Capacity Building & Mentorship Programs: Capacity building of national employees by developing and strengthening skills, instincts, and abilities through on-the-job training (OJT), performance management and mentorship programs led by an experienced team ensuring successful technical knowledge transfer.
• Succession Planning: Linking performance management, career planning and development with a focus on evaluating and assessing talent, readiness and addressing development opportunities by leveraging experience resulting in the gradual replacement of expatriates from the host countries.
This strategy has paid dividends, with locations such as India, Nigeria, & Egypt being close to 100% nationalized, Thailand has progressed to 94%, and Saudi Arabia continues to drive their nationalization efforts, facilitated by leveraging our Offshore Development Program, rig-based succession planning and a strong commitment to training and mentorship on the rig.
SUSTAINABILITY REPORT
54 Shelf Drilling Annual Report 2021
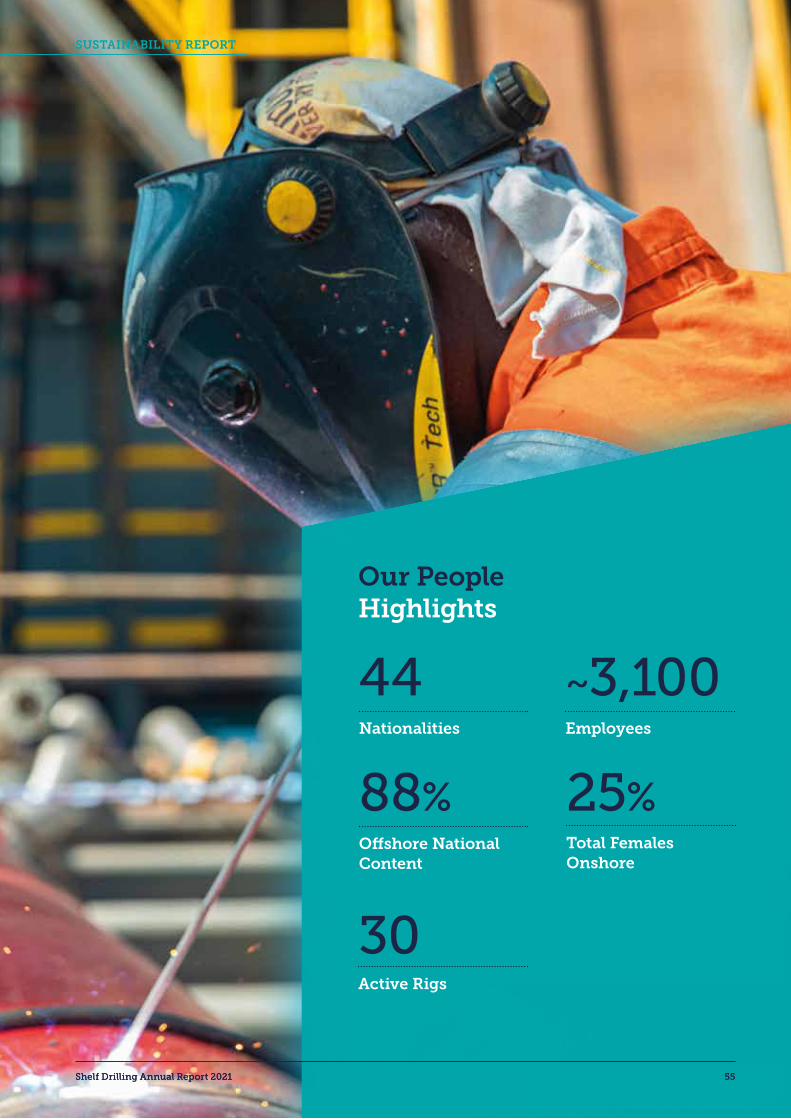
Our People Highlights
Active Rigs
30
Nationalities
44Employees
~3,100
Offshore NationalContent
88%Total FemalesOnshore
25%
SUSTAINABILITY REPORT
Shelf Drilling Annual Report 2021 55Shelf Drilling Annual Report 2021 55
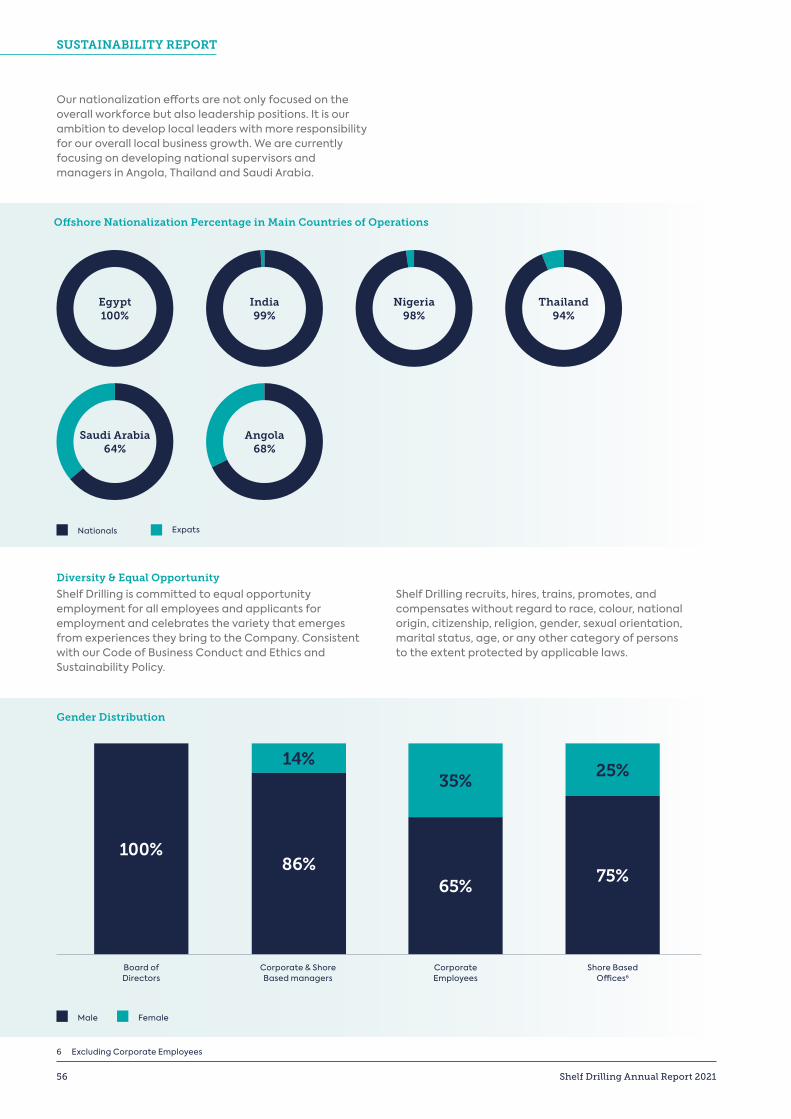
6 Excluding Corporate Employees
Diversity & Equal Opportunity
Shelf Drilling is committed to equal opportunity employment for all employees and applicants for employment and celebrates the variety that emerges from experiences they bring to the Company. Consistent with our Code of Business Conduct and Ethics and Sustainability Policy.
Shelf Drilling recruits, hires, trains, promotes, and compensates without regard to race, colour, national origin, citizenship, religion, gender, sexual orientation, marital status, age, or any other category of persons to the extent protected by applicable laws.
Gender Distribution
Board of Directors
100%
14%
86%
Corporate & Shore Based managers
35%
65%
CorporateEmployees
25%
75%
Shore Based Offices6
Male Female
Our nationalization efforts are not only focused on the overall workforce but also leadership positions. It is our ambition to develop local leaders with more responsibility for our overall local business growth. We are currently focusing on developing national supervisors and managers in Angola, Thailand and Saudi Arabia.
Offshore Nationalization Percentage in Main Countries of Operations
Nationals Expats
Nigeria98%
Thailand94%
Egypt100%
Saudi Arabia64%
India99%
Angola68%
SUSTAINABILITY REPORT
56 Shelf Drilling Annual Report 2021
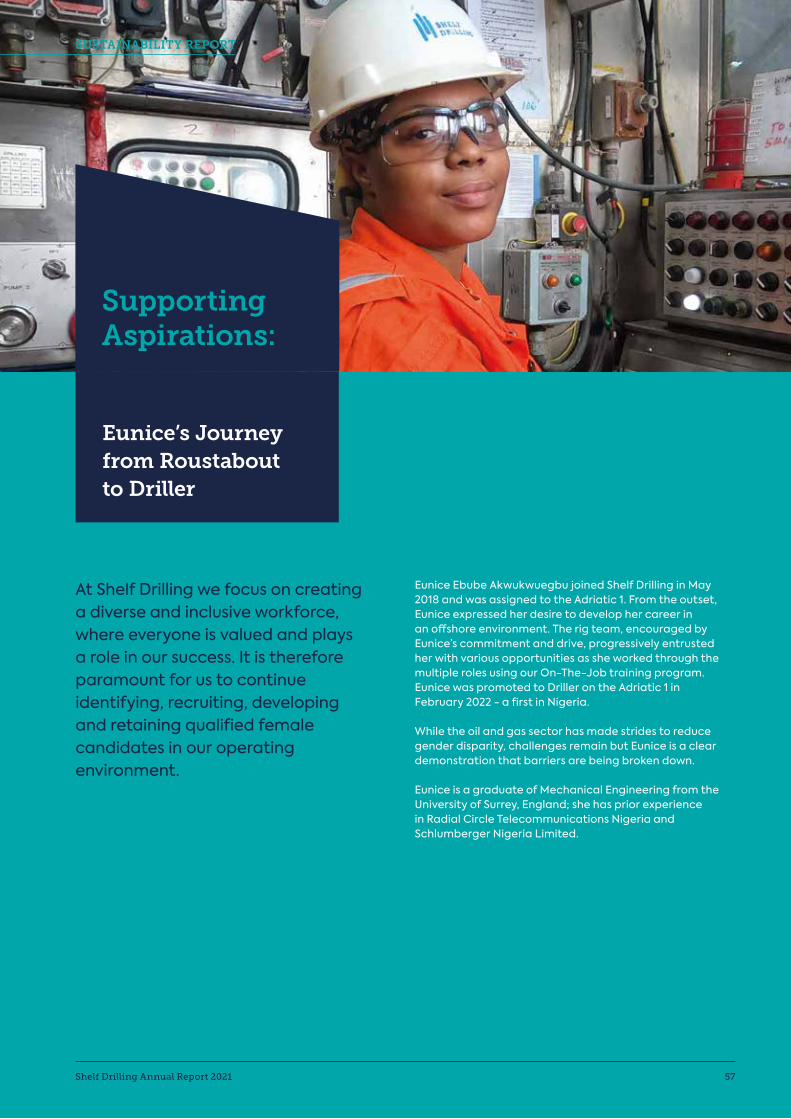
At Shelf Drilling we focus on creating a diverse and inclusive workforce, where everyone is valued and plays a role in our success. It is therefore paramount for us to continue identifying, recruiting, developing and retaining qualified female candidates in our operating environment.
Eunice Ebube Akwukwuegbu joined Shelf Drilling in May 2018 and was assigned to the Adriatic 1. From the outset, Eunice expressed her desire to develop her career in an offshore environment. The rig team, encouraged by Eunice’s commitment and drive, progressively entrusted her with various opportunities as she worked through the multiple roles using our On-The-Job training program. Eunice was promoted to Driller on the Adriatic 1 in February 2022 - a first in Nigeria. While the oil and gas sector has made strides to reduce gender disparity, challenges remain but Eunice is a clear demonstration that barriers are being broken down. Eunice is a graduate of Mechanical Engineering from the University of Surrey, England; she has prior experience in Radial Circle Telecommunications Nigeria and Schlumberger Nigeria Limited.
Supporting Aspirations:
Eunice’s Journey from Roustabout to Driller
SUSTAINABILITY REPORT
Shelf Drilling Annual Report 2021 57
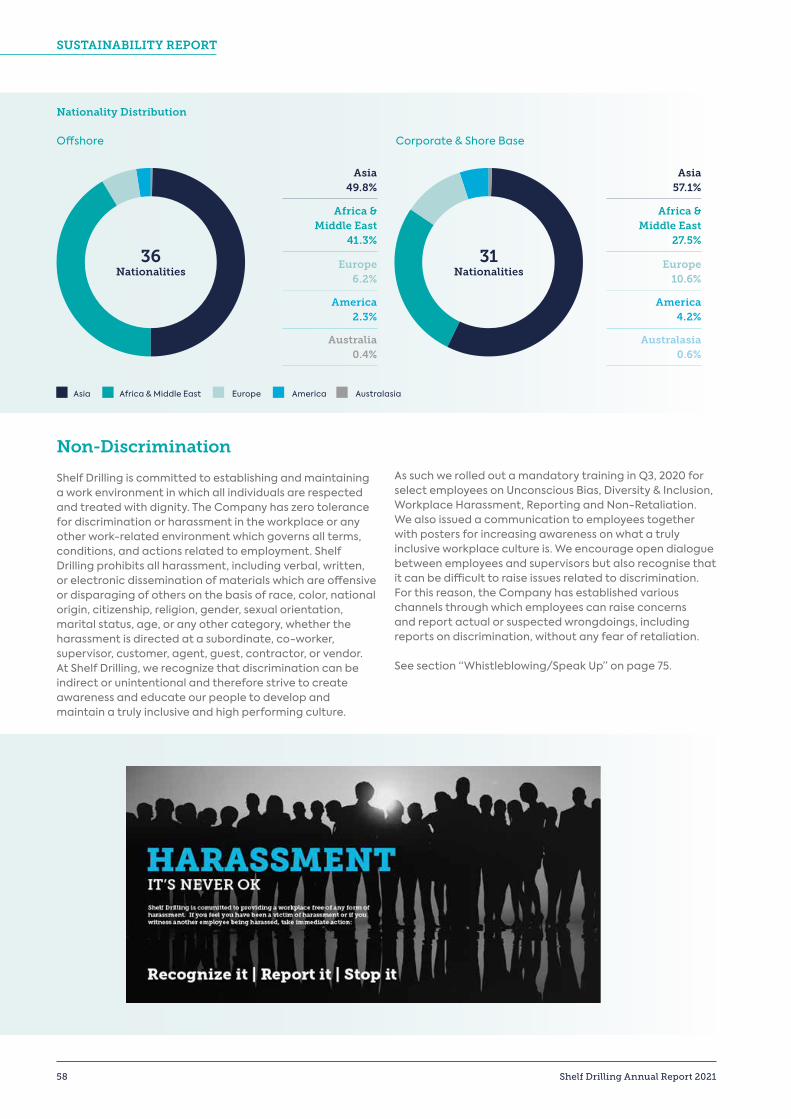
Non-Discrimination
Shelf Drilling is committed to establishing and maintaining a work environment in which all individuals are respected and treated with dignity. The Company has zero tolerance for discrimination or harassment in the workplace or any other work-related environment which governs all terms, conditions, and actions related to employment. Shelf Drilling prohibits all harassment, including verbal, written, or electronic dissemination of materials which are offensive or disparaging of others on the basis of race, color, national origin, citizenship, religion, gender, sexual orientation, marital status, age, or any other category, whether the harassment is directed at a subordinate, co-worker, supervisor, customer, agent, guest, contractor, or vendor.At Shelf Drilling, we recognize that discrimination can be indirect or unintentional and therefore strive to create awareness and educate our people to develop and maintain a truly inclusive and high performing culture.
As such we rolled out a mandatory training in Q3, 2020 for select employees on Unconscious Bias, Diversity & Inclusion, Workplace Harassment, Reporting and Non-Retaliation. We also issued a communication to employees together with posters for increasing awareness on what a truly inclusive workplace culture is. We encourage open dialogue between employees and supervisors but also recognise that it can be difficult to raise issues related to discrimination. For this reason, the Company has established various channels through which employees can raise concerns and report actual or suspected wrongdoings, including reports on discrimination, without any fear of retaliation. See section “Whistleblowing/Speak Up” on page 75.
Nationality Distribution
Offshore Corporate & Shore Base
Asia Africa & Middle East Europe America Australasia
36Nationalities
Asia 49.8%
Africa & Middle East
41.3%
Europe6.2%
America2.3%
Australia0.4%
31Nationalities
Asia 57.1%
Africa & Middle East
27.5%
Europe10.6%
America4.2%
Australasia0.6%
SUSTAINABILITY REPORT
58 Shelf Drilling Annual Report 2021
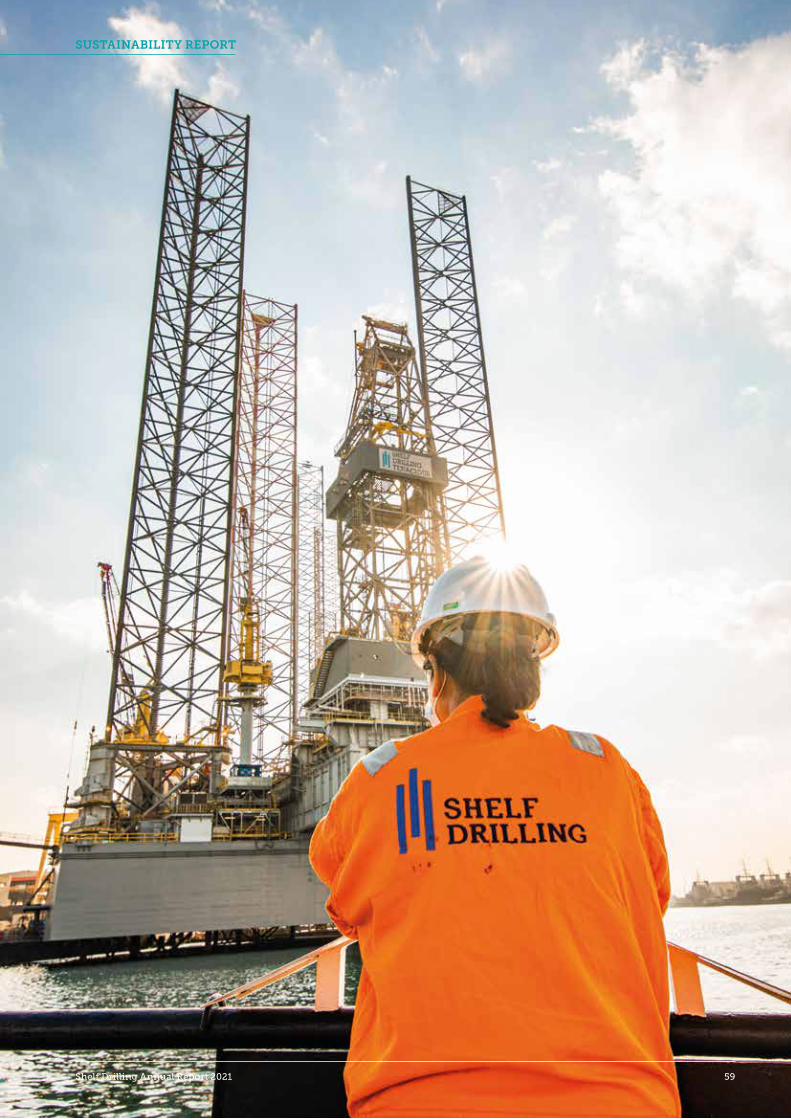
SUSTAINABILITY REPORT
Shelf Drilling Annual Report 2021 59
Labour & Human Rights
Labor Rights
Shelf Drilling respects labor rights as described in the fundamental conventions of the International Labor Organization, including freedom of association, collective bargaining, and the prevention of forced and compulsory labor, child labor and discrimination in respect of employment and occupation. We expect our business partners, suppliers and customers to respect labour rights and our Vendor Code of Conduct sets out our expectation.
We believe in management-employee collaboration and engage with relevant employee representative groups, specifically in Nigeria and also in Egypt and Italy, and encourages active ongoing dialog to ensure alignment of our collective interests. This collaboration has informed our focus on important issues that impact our employees, including non-discrimination, the right to privacy, employment contracts, protection against harassment and management-employee collaboration.
Human Rights
Shelf Drilling is committed to respecting human rights as defined in the International bill of Rights and as described in relation to businesses in the UN Guiding Principles on Business and Human Rights. We recognise that our human rights responsibilities run throughout our value chain and expect our business partners, suppliers and customers to respect human rights. We do not currently operate in territories defined as conflict areas or indigenous lands. Our Vendor Code of Conduct sets out our expectations.
We take the respect of human rights seriously and intend to ensure compliance with the new Norwegian Transparency Law, although it does not strictly apply to us. This law requires companies to carry out and report on their human rights due diligence, as well as how effective it is.
This means that in 2022, we will:• Identify a list of human rights priorities
• Institute human rights due diligence to manage these priorities, in line with the UNGPs and OECD Guidelines for Multinational Enterprises
• Report on the actions we take to manage our human rights impacts
• Ensure our staff receive business and human rights training
• Continually review our management of human rights issues
We will focus our due diligence efforts on better understanding our supply chain and the human rights risks within it. We will map our supply chain to identify the suppliers that have the largest potential negative human rights impact. Following the mapping process, we will seek to engage with these suppliers and carry out collaborative assessments of their human rights performance. Where human rights issues are identified, a root cause analysis will be undertaken to better understand how to stop the negative human rights issues. Where necessary, remedies will be provided and our practices changed, where these have led to negative impacts.
Through this process we hope to build the capacity of our suppliers so that they better understand their human rights obligations. This should allow us to more easily map our supply chain past our tier 1 suppliers into tiers 2 and 3, allowing us to have a better understanding of our true human rights impact.
SUSTAINABILITY REPORT
60 Shelf Drilling Annual Report 2021
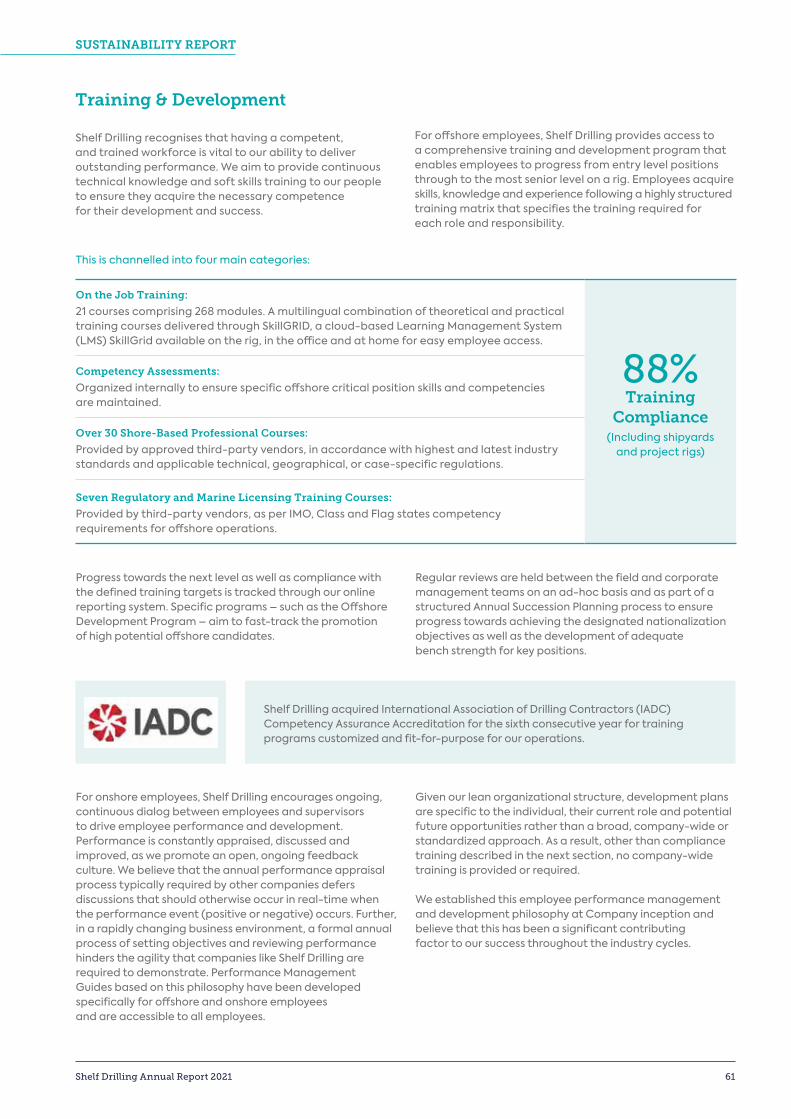
On the Job Training:
21 courses comprising 268 modules. A multilingual combination of theoretical and practical training courses delivered through SkillGRID, a cloud-based Learning Management System (LMS) SkillGrid available on the rig, in the office and at home for easy employee access.
88%Training
Compliance(Including shipyards
and project rigs)
Competency Assessments:
Organized internally to ensure specific offshore critical position skills and competencies are maintained.
Over 30 Shore-Based Professional Courses:
Provided by approved third-party vendors, in accordance with highest and latest industrystandards and applicable technical, geographical, or case-specific regulations.
Seven Regulatory and Marine Licensing Training Courses:
Provided by third-party vendors, as per IMO, Class and Flag states competencyrequirements for offshore operations.
Progress towards the next level as well as compliance with the defined training targets is tracked through our online reporting system. Specific programs – such as the Offshore Development Program – aim to fast-track the promotion of high potential offshore candidates.
Regular reviews are held between the field and corporate management teams on an ad-hoc basis and as part of a structured Annual Succession Planning process to ensure progress towards achieving the designated nationalization objectives as well as the development of adequate bench strength for key positions.
For onshore employees, Shelf Drilling encourages ongoing, continuous dialog between employees and supervisors to drive employee performance and development. Performance is constantly appraised, discussed and improved, as we promote an open, ongoing feedback culture. We believe that the annual performance appraisal process typically required by other companies defers discussions that should otherwise occur in real-time when the performance event (positive or negative) occurs. Further, in a rapidly changing business environment, a formal annual process of setting objectives and reviewing performance hinders the agility that companies like Shelf Drilling are required to demonstrate. Performance Management Guides based on this philosophy have been developed specifically for offshore and onshore employees and are accessible to all employees.
Given our lean organizational structure, development plans are specific to the individual, their current role and potential future opportunities rather than a broad, company-wide or standardized approach. As a result, other than compliance training described in the next section, no company-wide training is provided or required.
We established this employee performance management and development philosophy at Company inception and believe that this has been a significant contributing factor to our success throughout the industry cycles.
Shelf Drilling acquired International Association of Drilling Contractors (IADC) Competency Assurance Accreditation for the sixth consecutive year for training programs customized and fit-for-purpose for our operations.
Training & Development
Shelf Drilling recognises that having a competent, and trained workforce is vital to our ability to deliver outstanding performance. We aim to provide continuous technical knowledge and soft skills training to our people to ensure they acquire the necessary competence for their development and success.
For offshore employees, Shelf Drilling provides access to a comprehensive training and development program that enables employees to progress from entry level positions through to the most senior level on a rig. Employees acquire skills, knowledge and experience following a highly structured training matrix that specifies the training required for each role and responsibility.
This is channelled into four main categories:
SUSTAINABILITY REPORT
Shelf Drilling Annual Report 2021 61
Talent attraction and employee retention
We want to be able to attract and keep the best talent and to help them develop to achieve their full potential. To achieve this, in 2021 we continued to focus on developing our offshore talent through our fit-for-purpose Talent Management strategy which ensures the right people are in the right positions across the organization. With competitive compensation and benefits programs, we ensure that we continue to identify qualified high potential talents by leveraging our employee referral program with a strong focus on the development of national talent.
Retention and development initiatives in 2021: • Employee Engagement: Frequent and Direct
communication from leadership to field employees, through frequent CEO videos messages on state of the company and business updates. Increased management sites visits for direct feedback on worksite.
• Wellbeing: Continued focus on physical, emotional & psychological wellbeing.
• Mobility: Operational readiness to respond to rapid changes in the travel environment, and limit extended time away from home, for offshore employees.
• Succession Planning: Commitment to internal
promotion & development (320 promotions in 2021)
• Resourcing: Continue to identify and integrate multi-skilled talents to rapidly adapt to changes in operations requirements.
• Compensation & Benefits: Regular reviews of compensation elements and benefits to ensure competitive packages for the employees.
• New Countries Start up: In 2021 two (2) rig contracts in new locations in Angola and Congo were announced resulting in the creation of around 180 new rig based national positions. Rig Acclimatization Programs were developed and delivered for both rigs, and crews from Angola and Congo were mobilized to the UAE shipyard to gain exposure, training, and experience on the rigs prior to the operational start in their home countries.
Retention Highlights
694New employees
hired in 2021
8.1%Total voluntary
turnover
5.5%Onshore voluntary
turnover
8.5%Offshore voluntary
turnover
SUSTAINABILITY REPORT
62 Shelf Drilling Annual Report 2021
The pandemic presented industry specific challenges for our rig-based employees resulting in extended periods working offshore, standing by in the host country, or at home on prolonged field breaks.
Our rig-based and operations teams’ ability to continue to embrace adaptability, resilience, and flexibility in the face of adversity have ensured business continuity throughout 2021, often overcoming challenging situations.
Our understanding of the psychological and sociological impact of the pandemic on individuals and their families continues to unfold because of isolation, mental fatigue, family disruption and changing economic and personal circumstances.
As a Company our commitment to supporting the physical as well as the psychological and emotional wellbeing of our employees is a primary concern, and we are continuing to invest resources to create awareness about Mental Health First Aid, to adequately support our people.
The Return to Normalcy
Our PeopleThrough COVID-19:
SUSTAINABILITY REPORTSUSTAINABILITY REPORT
Shelf Drilling Annual Report 2021 63
Climate andEnvironmentShelf Drilling’s business is to provide rigs and personnel to perform the services required by our customers to drill, workover and abandon their oil and gas wells in support of their programs to reliably and safely produce oil and gas to meet the worlds energy needs. Shelf Drilling owns and operates a fleet of thirty jack-up rigs that can work in water depths up to 375 feet. Shelf Drilling recognizes the value of protecting the climate and our natural environment and operates in compliance with the relevant environmental regulations and strives to reduce any negative impact on climate and the environment from our activities. Shelf Drilling has implemented comprehensive environmental policies, processes and systems and utilizes an integrated
management system to monitor performance throughout all offshore and onshore operations.
Jack-up rigs are towed to a designated work location before the hull and all equipment are jacked out of the water where they may remain on location while performing the services required for periods lasting from days to many months. Unlike dynamically positioned semi-submersibles or drillships, jack-up rigs do not require any power to remain on station. As a result, fuel consumption and emissions are much lower than other rig types operating in deeper waters performing similar operations.
Jack-up rigs include accommodation for typically 100 to 160 personnel and will have from three to five engines to provide the power to operate drilling equipment, cranes, safety equipment and accommodation for the personnel on board.
Power requirements vary according to the type of activity being performed and the number of engines running is generally optimized to ensure sufficient reserves of power in case of unexpected events.
Drillship
Operates in water depths up to 12,000ft
Semi-submersible
Operates in water depths up to 10,000ft
Jack-up
Operates in water depths up to 500ft
Main Offshore Rig Categories
SUSTAINABILITY REPORT
64 Shelf Drilling Annual Report 2021
Climate and Environment Highlights
Tonnes Diesel Fuel Consumed
74,668
Tonnes Scope 3 CO2e Emissions
58,996
Tonnes Scope 1 CO2e Emissions
239,002
Tonnes CO2e Prevented through Recycling
13,875
SUSTAINABILITY REPORT
Shelf Drilling Annual Report 2021 65
Out of 1147 P&A wells in 2021, 1,139 have been completed by the rigs in Thailand, where the customized multi activity set up of our rigs, the performance-based culture across the whole process with our customers and third parties, have enabled us to establish Factory Style operations, delivering outstanding and ever improving performance.
In order to ensure we reduce the emissions from our operations, we recognize the need to increase understanding of climate change within our rig crews and management teams. This is why we aim to promote awareness, knowledge and innovation by educating our employees on how they can support the Company’s efforts including the minimizing and reduction of waste from our operations. Shelf Drilling looks to maximize the recycling of equipment which makes good business sense while further limiting the impact on the environment. This includes the recycling of rigs at the end of their useful life which will be done in accordance with the Company’s policy on rig recycling and relevant international standards, including the Hong Kong and Basel Conventions.
Shelf Drilling Well Type Exploration Development Work Over P&A
2019 12 251 69 159
2020 10 187 97 451
Activities Trends -17% -25% 41% 184%
2021 19 183 108 1147
Activities Trends 90% -2% 11% 154%
Power management is therefore a critical element in managing the fuel (diesel) consumption and, consequently, the Scope 1 emissions from our operations. The number of engines on-line at any time is generally set in agreement with the customer’s representative on board and is not the exclusive responsibility of the Shelf Drilling Offshore Installation Manager. Optimizing the power and corresponding emissions is therefore a collaborative arrangement between Shelf Drilling and our customers.
Maximum power requirements generally occur when the rig is drilling “intermediate hole” the section from near surface to above the reservoir. This is where the mud pumps, circulating and drilling equipment are all operating at or near their maximum ratings. These hole sections are typically only required in new wells (exploration or development) and are considered part of “greenfield” developments. “Brownfield” activity is associated with working with wells and infrastructure already in place.
This generally means going into an existing well and repairing or relocating the target zone. Plug and Abandonment operations (P&A) involve removing existing well equipment and sealing off producing zones. Power requirements and hence emissions are generally lower for brownfield and P&A operations than greenfield.
Shelf Drilling’s rig fleet is primarily engaged to perform brownfield and P&A operations as illustrated in the table below. As a consequence, the emissions from our activities are lower than if we were more involved in greenfield activity.
SUSTAINABILITY REPORT
66 Shelf Drilling Annual Report 2021
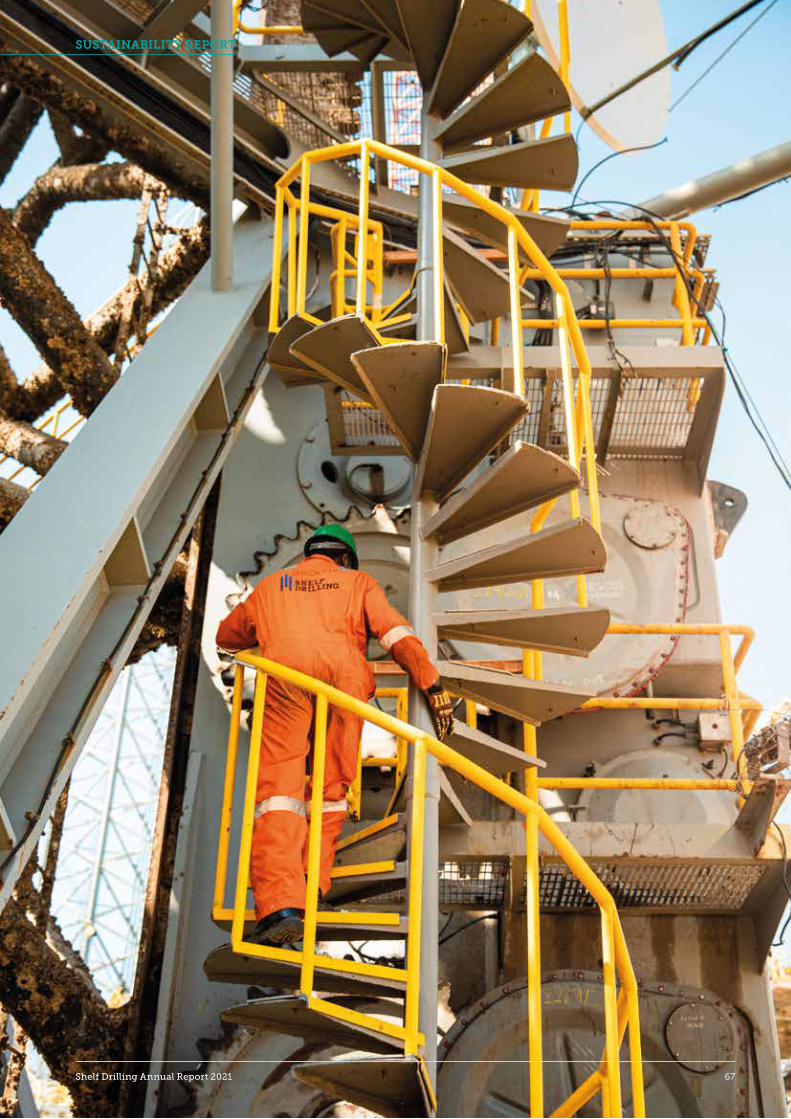
SUSTAINABILITY REPORT
Shelf Drilling Annual Report 2021 67Shelf Drilling Annual Report 2021 67
Greenhouse Gas Emissions & Environment
Shelf Drilling is committed to reducing emissions from our operations as well as their impact on the environment. Shelf Drilling sets these expectations through policies including our Sustainability Policy which sets the overall framework and expectation for all employees. The policy was approved by our Board in 2020 and is published on our website.
Specific policies exist for a number of areas such as the Emissions and Energy Conservation policy that applies to all rigs and installations which includes the requirement for the development of a rig-specific Power Management Plan to optimize power generation and reduce emissions. Environmental performance is tracked in our HSE reporting system, and a monthly HSE report is produced for Management and the Board, and any incidents are reported to the relevant authorities. In addition, sustainability related updates were integrated into the Company Management System and all supporting policies, requirements and procedures are rolled out to the field in the fourth quarter annual update. Bridging documents were prepared that highlighted the changes and communications held with rigs and shore-based management teams to ensure understanding and alignment.
Since inception, Shelf Drilling has had quarterly HSE steering committees on our rigs and shore-based offices. In 2021, we added sustainability to the responsibilities of these committees as a way of gathering and sharing lessons learned across the company and fleet. The committees were renamed to reflect the additional focus and responsibilities and guidelines developed and distributed.
A management sustainability steering committee was also established in order to develop and oversee the implementation of the goals that were presented and approved by the Board. The management committee also worked to develop the emissions reductions targets based supported by external advisors to generally follow the methodology of the SBTi.
Based on an analysis by the management committee, assigning potential savings from a number of opportunities, an ambition of reducing our 2021 average daily per rig Scope 1 emissions by 20% over the next 5 years was reviewed and approved by the Board. For 2022, we have set a target to reduce the average daily per rig Scope 1 emissions by 4% in the fourth quarter of 2022 compared to the 2021 average.
In 2021, the Environmental Sustainability Metrics & Reporting Standard was developed and rolled out. This Standard provides a detailed and comprehensive description of all sustainability related data capture for our rig crews and shore-based teams (how, where, why). This, along with the update to our HSE reporting software that was developed and implemented, will ensure accuracy, consistency and completeness of Scope 1, 2 and 3 emissions data, waste, and unplanned releases.
Effective management of power generation and fuel consumption is key to reducing our Scope 1 emissions. The behaviour of our rig crews, Supervisors and shore-based management teams is a key element to reducing our emissions. As a consequence, Shelf Drilling focused on the following activities to drive reductions in our emissions in 2022 and beyond:
• Launched a Sustainability module for our OJT on-the-job training program,
• Developed an engine emissions tracking, reporting and analysis tool,
• Rolled out the requirements for a Sustainability Steering Committee on all rigs and shore-based facilities, and
• Created a management steering committee to oversee all sustainability related actions,
and
• Established short and long-term Scope 1 emissions reduction goals
The training module was rolled out in multiple languages to our almost 3,000 employees and contractors. The target of 90% having completed the training by the end of September was achieved and current completion rate at December 31, 2021 was 96%.
While the overall fuel consumption on the rig is captured by our HSE Dashboard, this does not provide any information regarding the individual performance or consumption data for each engine on the rig - between 3 and 5 depending on the rig type and any modifications made since manufacture. The majority of the rigs in our fleet to not have an electronic engine management system, as a result there is no integrated data capture system available. In 2021 we developed a tool that enables rig crews to reliably capture the relevant engine parameters in order to understand past power consumption practices and to better plan for future requirements to reduce excess power being generated on board (with corresponding excess emissions). The tool was rolled out at the end of 2021 replacing the manual process we had established earlier. We have established ongoing training for the rig crews to use the information in a meaningful way.
Our Ambition:To reduce our 2021 average daily per rig Scope 1 emissions by 20% over the next 5 years.
SUSTAINABILITY REPORT
68 Shelf Drilling Annual Report 2021
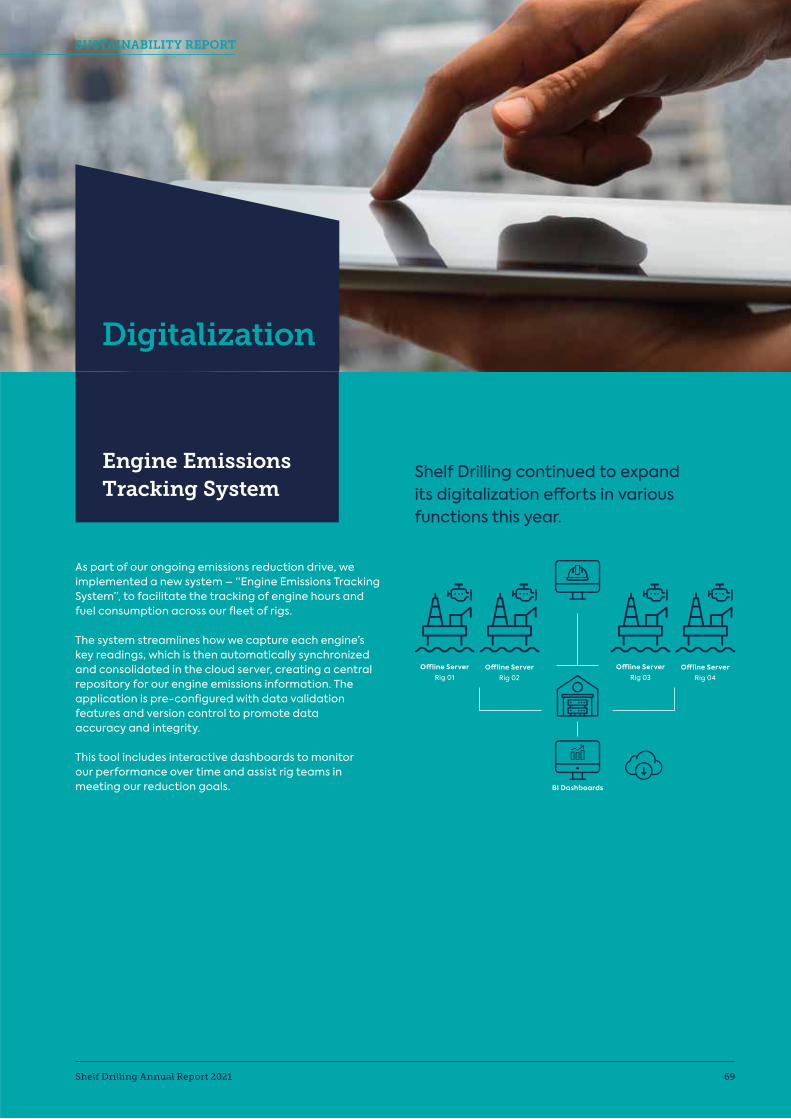
Digitalization
Engine Emissions Tracking System
Shelf Drilling continued to expand its digitalization efforts in various functions this year.
As part of our ongoing emissions reduction drive, we implemented a new system – “Engine Emissions Tracking System”, to facilitate the tracking of engine hours and fuel consumption across our fleet of rigs.
The system streamlines how we capture each engine’s key readings, which is then automatically synchronized and consolidated in the cloud server, creating a central repository for our engine emissions information. The application is pre-configured with data validation features and version control to promote data accuracy and integrity.
This tool includes interactive dashboards to monitor our performance over time and assist rig teams in meeting our reduction goals.
Offline ServerRig 03
Offline ServerRig 04
Offline ServerRig 01
Offline ServerRig 02
BI Dashboards
SUSTAINABILITY REPORT
Shelf Drilling Annual Report 2021 69
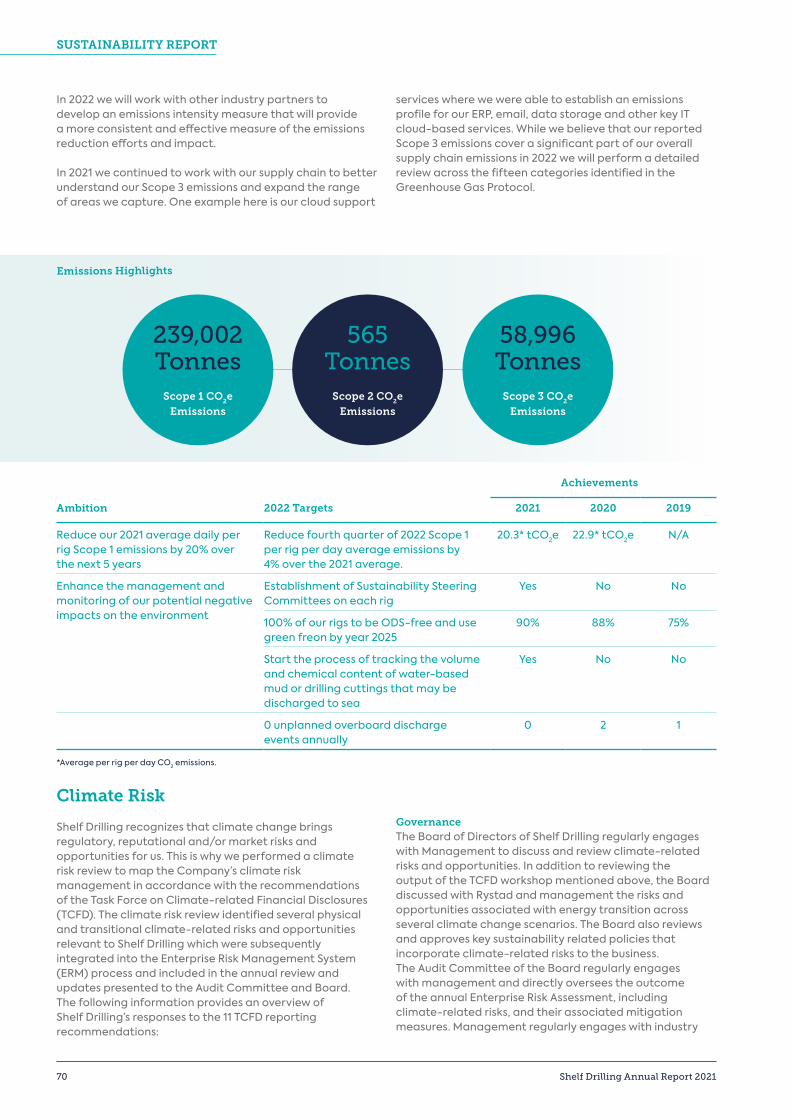
Emissions Highlights
In 2022 we will work with other industry partners to develop an emissions intensity measure that will provide a more consistent and effective measure of the emissions reduction efforts and impact.
In 2021 we continued to work with our supply chain to better understand our Scope 3 emissions and expand the range of areas we capture. One example here is our cloud support
services where we were able to establish an emissions profile for our ERP, email, data storage and other key IT cloud-based services. While we believe that our reported Scope 3 emissions cover a significant part of our overall supply chain emissions in 2022 we will perform a detailed review across the fifteen categories identified in the Greenhouse Gas Protocol.
239,002Tonnes
Scope 1 CO2e
Emissions
58,996Tonnes
Scope 3 CO2e
Emissions
565Tonnes
Scope 2 CO2e
Emissions
Achievements
Ambition 2022 Targets 2021 2020 2019
Reduce our 2021 average daily per rig Scope 1 emissions by 20% over the next 5 years
Reduce fourth quarter of 2022 Scope 1 per rig per day average emissions by 4% over the 2021 average.
20.3* tCO2e 22.9* tCO2e N/A
Enhance the management and monitoring of our potential negative impacts on the environment
Establishment of Sustainability Steering Committees on each rig
Yes No No
100% of our rigs to be ODS-free and use green freon by year 2025
90% 88% 75%
Start the process of tracking the volume and chemical content of water-based mud or drilling cuttings that may be discharged to sea
Yes No No
0 unplanned overboard discharge events annually
0 2 1
Climate Risk
Shelf Drilling recognizes that climate change brings regulatory, reputational and/or market risks and opportunities for us. This is why we performed a climate risk review to map the Company’s climate risk management in accordance with the recommendations of the Task Force on Climate-related Financial Disclosures (TCFD). The climate risk review identified several physical and transitional climate-related risks and opportunities relevant to Shelf Drilling which were subsequently integrated into the Enterprise Risk Management System (ERM) process and included in the annual review and updates presented to the Audit Committee and Board. The following information provides an overview of Shelf Drilling’s responses to the 11 TCFD reporting recommendations:
GovernanceThe Board of Directors of Shelf Drilling regularly engages with Management to discuss and review climate-related risks and opportunities. In addition to reviewing the output of the TCFD workshop mentioned above, the Board discussed with Rystad and management the risks and opportunities associated with energy transition across several climate change scenarios. The Board also reviews and approves key sustainability related policies that incorporate climate-related risks to the business. The Audit Committee of the Board regularly engages with management and directly oversees the outcome of the annual Enterprise Risk Assessment, including climate-related risks, and their associated mitigation measures. Management regularly engages with industry
*Average per rig per day CO2 emissions.
SUSTAINABILITY REPORT
70 Shelf Drilling Annual Report 2021
experts in developing recommendations for the Board on climate-related risks and opportunities, including those identified above. Management is also responsible for overseeing the mitigation measures implemented for the risks identified within the Enterprise Risk Management as well as tracking associated KPIs. Management also performs a detailed annual review of all ERM risks, including those associated with climate change. The CEO chairs the management ERM committee that includes all executive management in preparing the outcome of the annual review for presentation to the Audit Committee and Board. In preparing for the annual review that is discussed and presented to the Board, management engages with Ernst & Young as part of their outsourced internal audit engagement, bringing an external and broader industry view to the process.
Strategy The primary physical climate-related risks for Shelf Drilling are associated with more extreme weather conditions, which could include extreme temperatures in the Middle East and/or an increasing frequency of cyclones/ typhoons in India and South East Asia. Extreme weather events could lead to loss of efficiency and increased risk of accidents to personnel plus the potential for delays or accidents when moving rigs between locations or countries. Extreme weather may also result in supply chain delays as well as the potential for increased insurance premiums as the industry may be exposed to more incidents.
Transition risks include the potential for increased regulation and taxes as the world shifts to a low carbon economy. This could include the introduction of a carbon tax in the areas where we operate which could impact our operating cost or reduce the opportunity set as customers re-evaluate their projects. In addition, as investor appetite for carbon intensive industries diminishes, the cost of capital to finance our industry (customer and service sector) may become prohibitively expensive leading to a loss of opportunities.
Climate-related business opportunities for Shelf Drilling primarily consist of the potential for an increasing volume of the world’s production coming from the Middle East, an area where Shelf Drilling has a significant presence. Oil production from the Middle East is at a lower cost and lower emissions (CO2e per barrel) when compared to most other areas making this an efficient source of the world’s supply. Other opportunities include an increasing volume of P&A as an increasing number of shallow water developments cease production, especially in South-East Asia where Shelf Drilling has developed a leading position in this key market. We also anticipate in the longer term an increasing number of Carbon Capture and Storage opportunities in the areas where we operate. As a result of the opportunity set in P&A, Shelf Drilling has invested in acquiring and significantly upgrading two rigs to be uniquely positioned to provide factory-style P&A services in Thailand. These two rigs were dedicated to P&A work throughout 2021 and have exceeded the expectations that we and our customer set at the outset regarding efficient execution of the P&A programs.
In 2021, the Board discussed with Rystad Energy and management the potential impact of climate change and the energy transition on oil demand and the subsequent potential impact on jack-up rig demand across a range of scenarios. Following this review, and given our sole focus on shallow water, the areas where we operate and our leading position as a low-cost supplier of services to our customers, we see continued demand in the long-term for our services across the scenarios considered.
Risk ManagementThe risk identified during the TCFD workshops were reviewed by management and assigned a risk owner consistent with the process undertaken for all business risks within the ERM process. The risk owner and ERM coordinator identified the inherent and residual likelihood and impact of the risk along with the associated mitigation measures that were developed. These risks were then embedded in our overall ERM process where regular, and at least annual, reviews are performed as described earlier. Each risk owner has the responsibility for overseeing the mitigation measures as well as monitoring any specific measures or KPI’s that have been identified. In general, given the nature of the key risks identified, this is largely restricted to monitoring key sources of information to track developments that may indicate an increasing likelihood of the risk occurring. This monitoring is a key element of the at least annual review that is performed, assessed and ultimately presented to the Board.
As described above, all climate-related risks are fully embedded within our company ERM process with oversight by management, the Audit Committee and Board.
Metrics & TargetsIn 2021, as part of the updated CDP submission, Shelf Drilling developed various models for the risks and opportunities identified above in order to quantify the potential financial impact and cost of response.
As an example, in assessing the potential impact of extreme weather events, models were reviewed to estimate the number of days over 50 degC as well as the increasing likelihood for cyclones etc. this was then converted to a range of potential outcomes with regards to one or a number of rigs being idle or otherwise delayed as a result of these events. These models continue to be refined and we will look to develop specific measures or tracking metrics in future. In 2021 this was limited to the outputs from various studies that were commissioned on the energy transition, P&A and CCS markets.
Within this report we have provided disclosures on our Scope 1, Scope 2 and Scope 3 greenhouse gas emissions. As described previously, in 2021 we developed an engine emissions tracking and monitoring tool to record and maintain the emissions from our operations in a more accurate and efficient manner. This tool will also play a vital role in assisting our rig teams in driving to our emissions reduction targets in 2022 and beyond. We have also continued to enhance the extent of our Scope 3 data capture and further work will be conducted in the coming year to fully assess our Scope 3 emissions in line with the Green House Gas Protocols.
SUSTAINABILITY REPORT
Shelf Drilling Annual Report 2021 71
Shelf Drilling has not set specific targets to manage the climate-related risks and opportunities identified above. We will continue to monitor the risks through the ERM process described previously and will assess opportunities through the ongoing activities of our marketing team and the reports we provide to the Board.
Environmental Impact, Spills & Releases
Spills and releases can have devastating impacts on the environment and we take seriously our responsibility to reduce are negative environmental impacts, with an ambition to have zero spills and releases. Environmental impacts are defined as any element of the Company’s inputs, activities, products or services that can interact with the environment, as well as any change to the environment, whether adverse or beneficial, wholly or partially resulting from the Company’s activities, products or services. Shelf Drilling’s environmental policies are designed in alignment with the ISO 14001 standard. Our rigs as well as our office in India are certified in accordance with ISO 14001. The remaining rigs, yards and offices are also operated under the same environmental management system but have not been independently certified. All rigs operate under an International Air Pollution Prevention (IAPP) Certificate, indicating that the rig is operating within the requirements of MARPOL Annex VI. The Environmental Aspects and Impacts Register
Shelf Drilling identifies environmental hazards (aspects) associated with Company operations on both rig installations and shore-based facilities and their potential impact to the environment.
Aspects and impacts are recorded in the Environmental Aspects and Impacts Register along with measures to manage the associated risk.
The Offshore Installation Manager (OIM) is responsible for developing and maintaining the register while the HSE Manager is responsible for reviewing the registers for each installation or facility and the risks associated with individual aspects.
Biodiversity Impacts: Spills & Discharges to the Environment Shelf Drilling’s policies and procedures work to ensure that no contaminated deck drainage from Company installations reaches the environment. Activities aimed at preventing drainage include developing Deck Drainage Plans, conducting daily monitoring of decks, painting all overboard deck drain points red and keeping all containers with liquid in bunded storage areas.
Releases to Air: Shelf Drilling tracks the release of Ozone Depleting Substances (ODS) released through leaks in air conditioning systems.
In 2021, approximately 90% of our rigs were ODS-free and used green freon.
Releases to the Sea: The operations performed by our crews in executing the customer’s well program may require the use of a drilling mud or brine. Drilling mud can be either water-based or oil-based and is provided by the customer or mixed on board the rig using chemicals also provided by the customer.
Used drilling mud may either be cleaned and reused for subsequent operations or discharged to sea (for water-based mud only) or shipped back to shore for treatment or disposal by the customer. Shelf Drilling does not track the volume or chemical content of water-based mud or drilling cuttings that may be discharged to the sea, some of which may have ecological impacts.
Shelf Drilling’s policies do not allow for discharge of any water or fluids containing hydrocarbons.
Unplanned discharges of drilling mud or other fluids are recorded along with estimated volumes and reported within our HSE Management System. In 2021, we had no unplanned discharge events from the rig which resulted in a discharge to the sea, two minor loss of containment events occurred with all fluids being retained and captured on board the rig. Shelf Drilling maintains a register of all chemical products used in maintaining the rig and associated equipment. Relevant Material Safety Data Sheets are maintained for all chemicals stored or used on board our rigs along with appropriate personnel protective equipment for employees handling these products. Our environmental policies include a “green product list”, in which we identify products that should be used where possible in order to minimize potential impacts to the environment.
Waste & Water Management
Fresh water used on our rigs (for example, in cleaning and cooking) is produced from sea water using water makers installed onboard the rig. The volume of fresh water generated onboard is not recorded but 100% of the water is recycled and discharged back into the sea after it has gone through the sewage treatment plant and has been treated as per MARPOL regulation. Fresh water quality is analyzed every quarter in our laboratories. Drinking water is currently shipped from shore in plastic bottles. As an example, in Saudi Arabia, each rig in our fleet currently uses over 18,000 small plastic drinking water bottles and 275 large five-gallon water bottles per month.
In 2021 we successfully completed a pilot project to generate drinking water onboard the rig along with the relevant protocols to ensure installation and testing meets our stringent quality and testing requirements. We are currently developing a plan to extend this to other rigs in our fleet to significantly reduce the plastics used by our rigs.
Minimizing other waste from our operations remains a focus to further reduce our impact on the environment. We piloted a project to reduce the amount of waste generated by the catering service on board the rigs. This pilot is currently under evaluation prior to extending to other areas of operation to further test the feasibility.
SUSTAINABILITY REPORT
72 Shelf Drilling Annual Report 2021
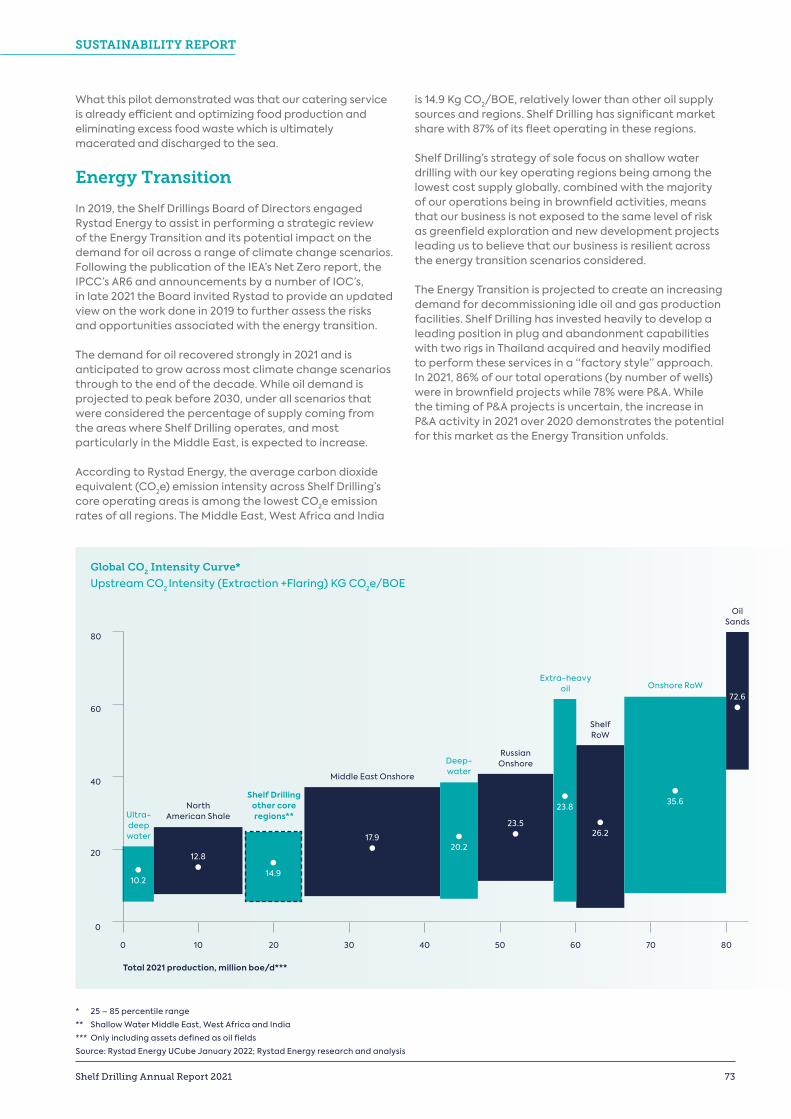
* 25 – 85 percentile range
** Shallow Water Middle East, West Africa and India
*** Only including assets defined as oil fields
Source: Rystad Energy UCube January 2022; Rystad Energy research and analysis
Global CO2 Intensity Curve*
Upstream CO2 Intensity (Extraction +Flaring) KG CO2e/BOE
What this pilot demonstrated was that our catering service is already efficient and optimizing food production and eliminating excess food waste which is ultimately macerated and discharged to the sea.
Energy Transition
In 2019, the Shelf Drillings Board of Directors engaged Rystad Energy to assist in performing a strategic review of the Energy Transition and its potential impact on the demand for oil across a range of climate change scenarios. Following the publication of the IEA’s Net Zero report, the IPCC’s AR6 and announcements by a number of IOC’s, in late 2021 the Board invited Rystad to provide an updated view on the work done in 2019 to further assess the risks and opportunities associated with the energy transition.
The demand for oil recovered strongly in 2021 and is anticipated to grow across most climate change scenarios through to the end of the decade. While oil demand is projected to peak before 2030, under all scenarios that were considered the percentage of supply coming from the areas where Shelf Drilling operates, and most particularly in the Middle East, is expected to increase.
According to Rystad Energy, the average carbon dioxide equivalent (CO2e) emission intensity across Shelf Drilling’s core operating areas is among the lowest CO2e emission rates of all regions. The Middle East, West Africa and India
is 14.9 Kg CO2/BOE, relatively lower than other oil supply sources and regions. Shelf Drilling has significant market share with 87% of its fleet operating in these regions. Shelf Drilling’s strategy of sole focus on shallow water drilling with our key operating regions being among the lowest cost supply globally, combined with the majority of our operations being in brownfield activities, means that our business is not exposed to the same level of risk as greenfield exploration and new development projects leading us to believe that our business is resilient across the energy transition scenarios considered.
The Energy Transition is projected to create an increasing demand for decommissioning idle oil and gas production facilities. Shelf Drilling has invested heavily to develop a leading position in plug and abandonment capabilities with two rigs in Thailand acquired and heavily modified to perform these services in a “factory style” approach. In 2021, 86% of our total operations (by number of wells) were in brownfield projects while 78% were P&A. While the timing of P&A projects is uncertain, the increase in P&A activity in 2021 over 2020 demonstrates the potential for this market as the Energy Transition unfolds.
Ultra-deepwater
North American Shale
Middle East Onshore
Russian Onshore
Shelf RoW
Onshore RoW
Oil Sands
Extra-heavyoil
Deep-water
Shelf Drillingother coreregions**
Total 2021 production, million boe/d***
10.2
14.9
12.8
17.9
20.2
23.5
26.2
72.6
23.8
35.6
80
60
40
20
0
80706050403020100
SUSTAINABILITY REPORT
Shelf Drilling Annual Report 2021 73
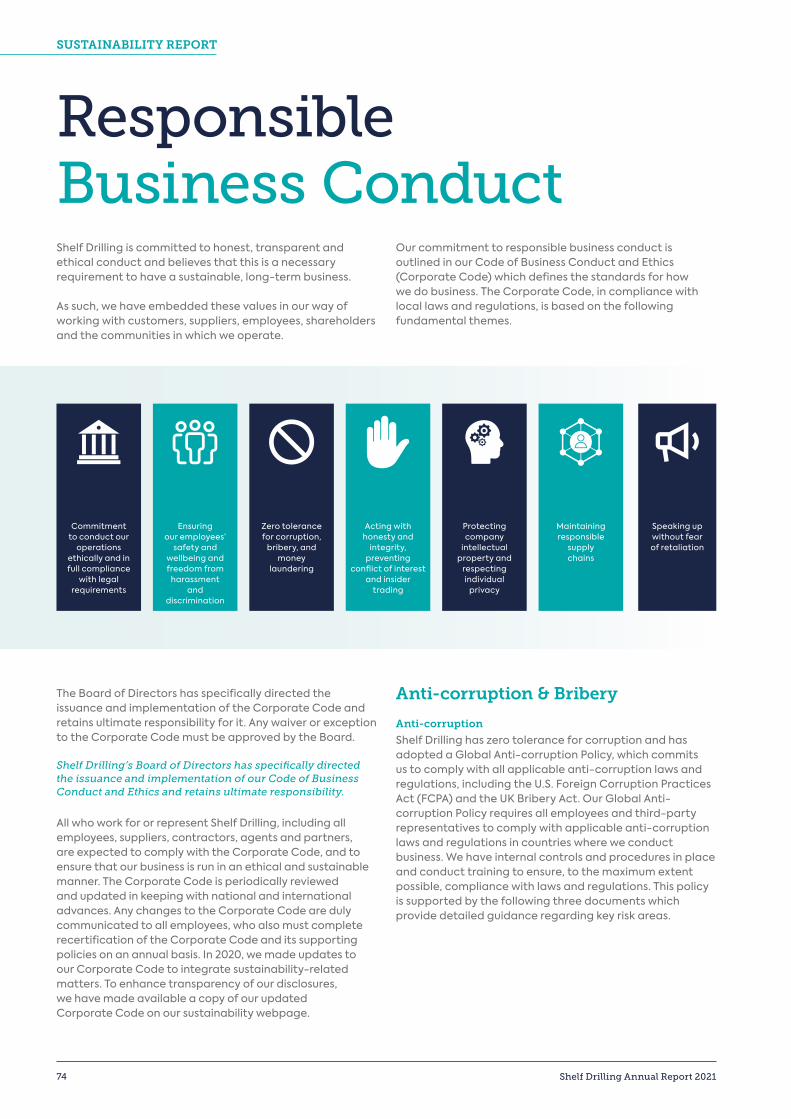
Shelf Drilling is committed to honest, transparent and ethical conduct and believes that this is a necessary requirement to have a sustainable, long-term business. As such, we have embedded these values in our way of working with customers, suppliers, employees, shareholders and the communities in which we operate.
Our commitment to responsible business conduct is outlined in our Code of Business Conduct and Ethics (Corporate Code) which defines the standards for how we do business. The Corporate Code, in compliance with local laws and regulations, is based on the following fundamental themes.
The Board of Directors has specifically directed the issuance and implementation of the Corporate Code and retains ultimate responsibility for it. Any waiver or exception to the Corporate Code must be approved by the Board.
Shelf Drilling’s Board of Directors has specifically directed the issuance and implementation of our Code of Business Conduct and Ethics and retains ultimate responsibility.
All who work for or represent Shelf Drilling, including all employees, suppliers, contractors, agents and partners, are expected to comply with the Corporate Code, and to ensure that our business is run in an ethical and sustainable manner. The Corporate Code is periodically reviewed and updated in keeping with national and international advances. Any changes to the Corporate Code are duly communicated to all employees, who also must complete recertification of the Corporate Code and its supporting policies on an annual basis. In 2020, we made updates to our Corporate Code to integrate sustainability-related matters. To enhance transparency of our disclosures, we have made available a copy of our updated Corporate Code on our sustainability webpage.
Anti-corruption & Bribery
Anti-corruption
Shelf Drilling has zero tolerance for corruption and has adopted a Global Anti-corruption Policy, which commits us to comply with all applicable anti-corruption laws and regulations, including the U.S. Foreign Corruption Practices Act (FCPA) and the UK Bribery Act. Our Global Anti-corruption Policy requires all employees and third-party representatives to comply with applicable anti-corruption laws and regulations in countries where we conduct business. We have internal controls and procedures in place and conduct training to ensure, to the maximum extent possible, compliance with laws and regulations. This policy is supported by the following three documents which provide detailed guidance regarding key risk areas.
ResponsibleBusiness Conduct
Commitment to conduct our
operationsethically and in full compliance
with legalrequirements
Ensuring our employees’
safety andwellbeing andfreedom from
harassmentand
discrimination
Zero tolerancefor corruption,
bribery, and money
laundering
Acting withhonesty and
integrity,preventing
conflict of interestand insider
trading
Protectingcompany
intellectualproperty and
respectingindividual
privacy
Maintainingresponsible
supply chains
Speaking upwithout fearof retaliation
SUSTAINABILITY REPORT
74 Shelf Drilling Annual Report 2021

Facilitating Payments
Facilitating payments are small payments to government officials whose duties are essentially ministerial or clerical in nature, for the purpose of expediting or securing the performance of routine, non-discretionary government functions. Under the Shelf Drilling Anti-Corruption Facilitating Payments Policy, facilitating payments are not permissible and are strictly prohibited, except in limited circumstances such as an imminent threat to health or safety. All emergency payments of this nature are internally reviewed and approved and accurately recorded in our records. No facilitating payments of any kind were recorded in 2021. Anti-money LaunderingThe Company does not permit its funds, assets, or property to be used in an illegal manner and therefore will not permit any money laundering or support of terrorism in any way. The Company performs appropriate background checks on business partners and affiliates and will report suspicious transactions or incidents to appropriate authorities.
Compliance Training & Awareness
In order to maintain our ethical standards, employees are required to complete annual training programs in relation to the Corporate Code, Global Anti-corruption Policy and other supporting policies. For the annual recertification, the target completion is 95% of the existing employee base with 100% completion for Managers and above. For other mandatory training courses assigned to identified employees, we aim for 100% completion.
The training program is updated regularly and consists of e-learning courses, virtual and in-person trainings, together with updates through e-mails, posters and newsletters.
In 2021, training courses on Appropriate Electronic Communications, Financial Crimes Module, Cybersecurity and Anti-bribery Compliance were rolled out for identified employees and/or vendors.
Whistleblowing/Speak Up
Shelf Drilling is committed to promoting and sustaining a culture where everybody feels comfortable reporting concerns in good faith and without fear of retaliation. Through our ongoing Speak Up initiative we encourage our employees and third-parties to ask compliance and ethics questions, raise concerns and report any actual or suspected misconduct, unethical or illegal behavior, or violations to our Corporate Code and its supporting policies or applicable laws, or seek advice on how to handle such situations.
Shelf Drilling has established various channels through which employees and third-parties can report their concerns. The employees are always encouraged to talk openly and freely with their supervisors first. Alternatively, they can reach out to the Head of Compliance and Ethics or the Executive Vice President. The Company has also made available the reporting system Shelf Drilling EthicsPoint Helpline, which enables confidential reporting of complaints, concerns and incidents either through the telephone (toll-free) or through a web-based form. The helpline is operated 24/7 by an independent third-party provider to help maintain confidentiality and, when requested, anonymity. In 2021, we further expanded and upgraded the helpline to enable reporting in multiple languages, with the addition of helplines in Angola (Portuguese) and Congo (French). The helpline is accessible by all stakeholders including suppliers, agents, and partners. A link to the helpline is also available on our website and intranet.
All incidents are reported to the Audit Committee of the Board, an investigation team is assigned, all correspondence dealt with in strictest confidence and investigation conclusions and resulting actions taken are reported back to the Audit Committee. Such actions may include, where relevant, appropriate disciplinary action. In 2021, eight new incidents were reported, all of which were duly investigated and closed after appropriate follow-up.
Shelf DrillingGlobal Anti-corruption Policy
Shelf DrillingFacilitating
Payments Policy
Shelf DrillingGift, Meal, Travel &
Entertainment Procedure
Shelf DrillingThird-party Due Diligence
Procedure
2021 Online Training Focus Areas
Module/Course Employees Trained
Recertification of Code of Business Conduct & Ethics
2,6037
Financial Crimes Module 606
Appropriate Electronic Communications
604
Cybersecurity 604
Anti-bribery Compliance 481
7 Excludes new hires in 2021.
SUSTAINABILITY REPORT
Shelf Drilling Annual Report 2021 75
Rig & Equipment Recycling & Reuse
Shelf Drilling is committed to responsible rig recycling practices in accordance with the relevant international standards, such as the Hong Kong Convention, to ensure they do not pose any unnecessary risk to human rights, human health and safety or to the environment. The rig recycling policy that was approved by the Board in 2020, is posted on our website and describes how we manage the documentation, selection and supervision of the entire recycling process.
In 2021, Shelf Drilling continued to optimize the size of our fleet. As a priority, we look to dispose of rigs for non-drilling purposes or to owners or areas that do not compete with ourselves. We closed the sale of the Shelf Drilling Journey to ADNOC that was announced in late 2020 and also sold the High Island VII for conversion to an accommodation unit following the termination of its drilling contract in the UAE. In addition, we sold for recycling four rigs that were held for sale as of the end of 2020. In three of these cases, we undertook a lengthy process to obtain the relevant paperwork for jack-up recycling that we believe were the first to be issued by the originating country. In the fourth instance this was not required as the originating country is not a signatory to the Basel Convention.
Equipment Reuse: Prior to recycling any rig, Shelf Drilling removes substantial volumes of equipment for refurbishment and reuse by our operating fleet. This can include major components such as blowout preventers to smaller components such as electric motors or valves.In addition to reusing our own equipment, we have actively sourced equipment in the second-hand market that goes through the same refurbishment process. This is a cost- effective way to maintain our fleet and results in a significantly reduced impact to the environment due to less scrapping and less demand for new equipment, for example.
In 2021, Shelf Drilling purchased over 1,000 old items with an estimated steel content of 750 tonnes. Additionally, we also reused 25,000 items from within the company weighing 8,500 tons of steel. By enabling the reuse of 9,250 tons of steel, Shelf Drilling has prevented approximately 13,875 tonnes of CO2e emissions.
Responsible Procurement
At Shelf Drilling, we strive to ensure that our supply chain reflects the same values that we do. The first step to ensuring responsible procurement and sustainability management through our supply chain is partnering with the right vendors or third-parties who are aligned with our corporate values and policies. Responsible Vendor Onboarding:
The following policies and procedures ensure responsible vendor onboarding at Shelf Drilling.
1. Vendor Code of Conduct: Shelf Drilling Vendor Code of Conduct (Vendor Code) sets out our business conduct and ethical performance requirements for all third parties, who conduct or intend to conduct business with and/or on behalf of Shelf Drilling including its agents, representatives, consultants, business partners, suppliers and any other similar parties, including, but not limited to, their directors and employees. All third-parties must comply or explain deviations with the Vendor Code’s provisions during the onboarding process. Furthermore, Shelf Drilling liaises with all third-parties to engage their own vendors/sub-contractors and ensure adherence to our Vendor Code, thereby effectively creating a cascade of ESG management through our supply chain. Our Vendor Code is available on the Company website.
2. Due Diligence and Onboarding: Shelf Drilling
conducts extensive due diligence when identifying or onboarding new vendors as outlined by various policies and procedures including the Supply Chain Procedures Manual and Third-Party Due Diligence Procedure. Depending on the nature of service and the location where it is provided, different onboarding process levels are triggered. Our vendor onboarding process has the capability of mapping 29 risks, including ESG-related risks.
3. Master Service Agreements: Depending on their type, vendors may also be required to enter into a Master Service Agreement (MSA). We have a suite of templates for different arrangements including onshore and offshore services and staff augmentation.
Shelf Drilling’s Vendor Code of Conduct sets out the core expectations from our vendors who must:
• Act with integrity in all business dealings
• Not enter into other agreements that put them in a position of conflict with their contractual or other obligations to Shelf Drilling
• Not give or accept gifts and entertainment benefits which would be considered excessive by an objective observer
• Not give or accept facilitation payments, bribes, kickbacks or any other type of improper payment
• Understand and ensure compliance with all applicable laws and regulations
• Treat all their employees ethically and fairly and show respect for human dignity and the rights of the individual
• Provide work environments that are safe for workers and minimize their impact on the environment
• Not disclose sensitive information about Shelf Drilling or the contract without our written consent
SUSTAINABILITY REPORT
76 Shelf Drilling Annual Report 2021
Tracking Compliance – HSE and Quality Audits
Shelf Drilling establishes specific HSE and/or quality standards with vendors providing goods or services to our rigs and operations. Each quarter, a number of audits are performed to ensure that these standards are being met. Vendor selection is based on our experience with the vendor in question, criticality of the service or goods provided, or issues reported by our rig teams.
Vendor Feedback Mechanism – Supplier Development
Vendors that provide personnel to our rigs are assessed by the rig supervisors, who provide feedback. Quality of service along with HSE concerns are included in the feedback and in 2020, 100% of service vendors were assessed through this process.
Contractors
In certain geographies we engage third-party labor providers for junior crew and other positions on our rigs. Prior to selection, all labor agencies go through our due diligence process outlined above, which includes commitments to treat their employees ethically and fairly as well as adhering to the International Bill of Human Rights and the ILO Fundamental Conventions. All personnel assigned to work on our rigs follow our standard HSE and job-specific training programs, regardless of whether they are contractors or direct hires.
Shipyards
Shelf Drilling is highly selective in choosing which shipyards are used for major maintenance or upgrades to rigs when taken out of service.
Shipyards are expected to follow our HSE system or bridging documents are prepared where this is not the case. Onsite teams are assigned to monitor compliance with standards.
Privacy & Data Security
We are required to manage and process information related to our employees, customers and vendors in the ordinary course of business, and our operations depend upon secure retention and the secure transmission of information over public networks. This information is subject to the continually evolving risk of intrusion, tampering, and theft. We have a dedicated cybersecurity team and program that focuses on current and emerging data security and data privacy matters.
Shelf Drilling has implemented a privacy program adopting the EU General Data Protection Regulation (GDPR) standards. The Company regularly updates its privacy policies and program to keep up to date with the existing and new privacy laws and regulations in various jurisdictions in addition to raising awareness and providing related training to our employees. In 2021, the Company carried out an assessment of its privacy and data protection framework, to update and enhance it in line with the GDPR standards. We also continue to assess and invest in the growing needs of our cybersecurity team through the allocation of skilled personnel, ongoing training, and support of the adoption and implementation of tools and technologies coupled with cybersecurity risk management frameworks. The Company rolled out an enhanced training course on cybersecurity for identified employees in 2021. There were no reported data breaches in 2021. We continue to monitor the evolving privacy regulations, particularly in the Middle East, to ensure due and timely compliance with the same. In 2022, the Company will be rolling out data privacy awareness sessions for identified employees.
SUSTAINABILITY REPORT
Shelf Drilling Annual Report 2021 77
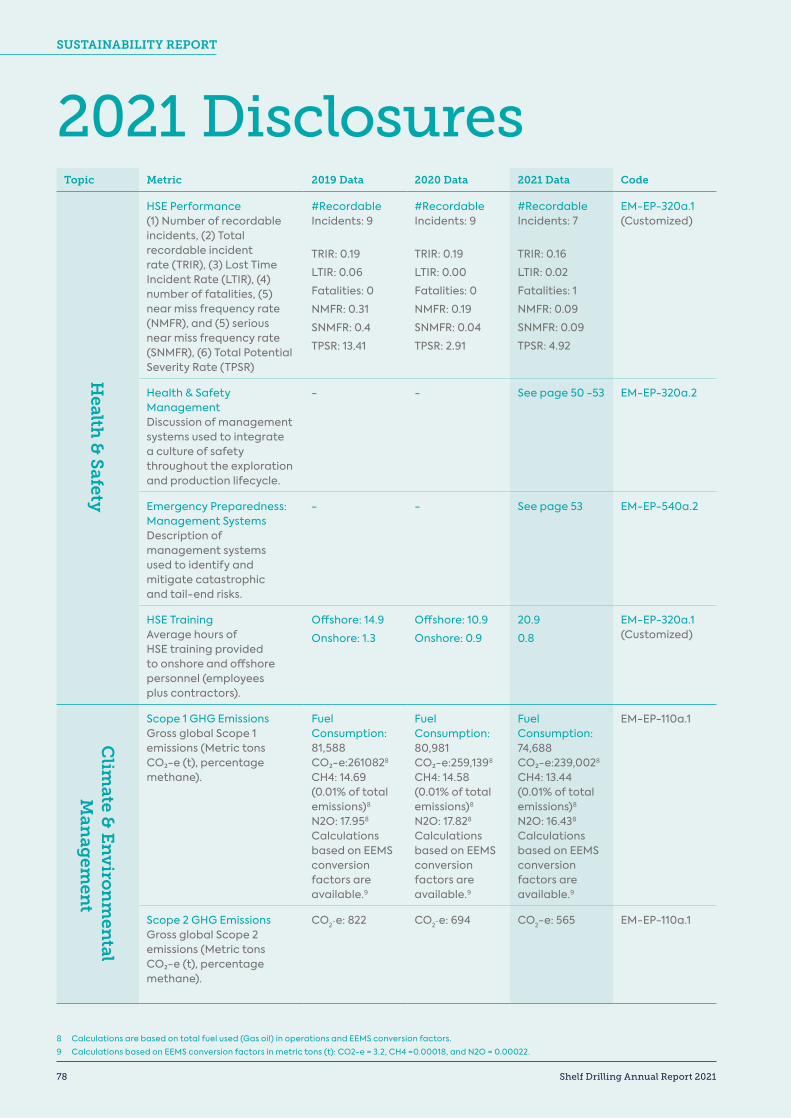
2021 DisclosuresTopic Metric 2019 Data 2020 Data 2021 Data Code
HSE Performance(1) Number of recordable incidents, (2) Total recordable incident rate (TRIR), (3) Lost Time Incident Rate (LTIR), (4) number of fatalities, (5) near miss frequency rate (NMFR), and (5) serious near miss frequency rate (SNMFR), (6) Total Potential Severity Rate (TPSR)
#RecordableIncidents: 9
TRIR: 0.19
LTIR: 0.06
Fatalities: 0
NMFR: 0.31
SNMFR: 0.4
TPSR: 13.41
#RecordableIncidents: 9
TRIR: 0.19
LTIR: 0.00
Fatalities: 0
NMFR: 0.19
SNMFR: 0.04
TPSR: 2.91
#RecordableIncidents: 7
TRIR: 0.16
LTIR: 0.02
Fatalities: 1
NMFR: 0.09
SNMFR: 0.09
TPSR: 4.92
EM-EP-320a.1(Customized)
Health & Safety ManagementDiscussion of management systems used to integrate a culture of safety throughout the exploration and production lifecycle.
- - See page 50 -53 EM-EP-320a.2
Emergency Preparedness: Management SystemsDescription of management systems used to identify and mitigate catastrophic and tail-end risks.
- - See page 53 EM-EP-540a.2
HSE TrainingAverage hours of HSE training provided to onshore and offshore personnel (employees plus contractors).
Offshore: 14.9
Onshore: 1.3
Offshore: 10.9
Onshore: 0.9
20.9
0.8
EM-EP-320a.1 (Customized)
Scope 1 GHG EmissionsGross global Scope 1 emissions (Metric tons CO₂-e (t), percentage methane).
Fuel Consumption: 81,588 CO₂-e:2610828
CH4: 14.69 (0.01% of total emissions)8
N2O: 17.958
Calculations based on EEMS conversion factors are available.9
Fuel Consumption: 80,981 CO₂-e:259,1398 CH4: 14.58 (0.01% of total emissions)8 N2O: 17.828 Calculations based on EEMS conversion factors are available.9
Fuel Consumption: 74,688 CO₂-e:239,0028 CH4: 13.44 (0.01% of total emissions)8 N2O: 16.438 Calculations based on EEMS conversion factors are available.9
EM-EP-110a.1
Scope 2 GHG EmissionsGross global Scope 2 emissions (Metric tons CO₂-e (t), percentage methane).
CO2-e: 822 CO2-e: 694 CO2-e: 565 EM-EP-110a.1
Health
& S
afetyC
limate &
En
viro
nm
ental
Man
agem
ent
8 Calculations are based on total fuel used (Gas oil) in operations and EEMS conversion factors.
9 Calculations based on EEMS conversion factors in metric tons (t): CO2-e = 3.2, CH4 =0.00018, and N2O = 0.00022.
SUSTAINABILITY REPORT
78 Shelf Drilling Annual Report 2021
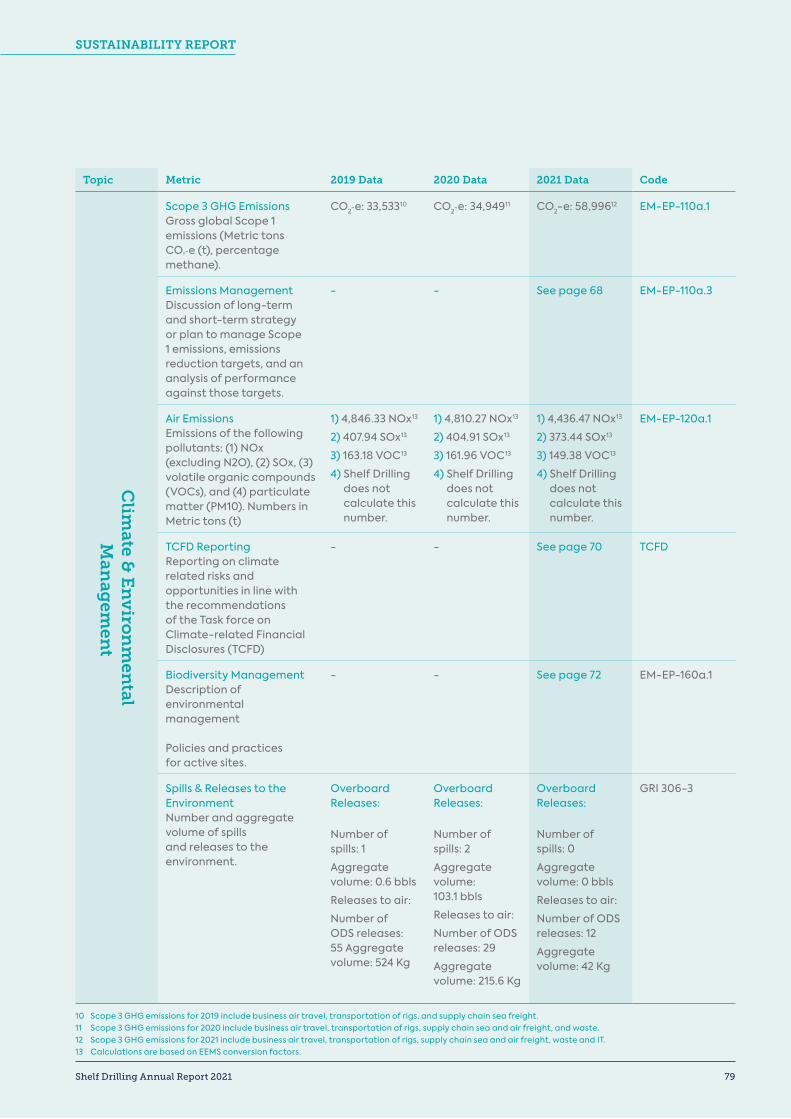
Topic Metric 2019 Data 2020 Data 2021 Data Code
Scope 3 GHG EmissionsGross global Scope 1 emissions (Metric tons CO₂-e (t), percentage methane).
CO2-e: 33,53310 CO2-e: 34,94911 CO2-e: 58,99612 EM-EP-110a.1
Emissions Management Discussion of long-term and short-term strategy or plan to manage Scope 1 emissions, emissions reduction targets, and an analysis of performance against those targets.
- - See page 68 EM-EP-110a.3
Air EmissionsEmissions of the following pollutants: (1) NOx (excluding N2O), (2) SOx, (3) volatile organic compounds (VOCs), and (4) particulate matter (PM10). Numbers in Metric tons (t)
1) 4,846.33 NOx13
2) 407.94 SOx13
3) 163.18 VOC13
4) Shelf Drilling does not calculate this number.
1) 4,810.27 NOx13
2) 404.91 SOx13
3) 161.96 VOC13
4) Shelf Drilling does not calculate this number.
1) 4,436.47 NOx13
2) 373.44 SOx13
3) 149.38 VOC13
4) Shelf Drilling does not calculate this number.
EM-EP-120a.1
TCFD ReportingReporting on climate related risks and opportunities in line with the recommendations of the Task force on Climate-related Financial Disclosures (TCFD)
- - See page 70 TCFD
Biodiversity Management Description of environmental management Policies and practices for active sites.
- - See page 72 EM-EP-160a.1
Spills & Releases to the Environment Number and aggregate volume of spills and releases to the environment.
Overboard Releases:
Number of spills: 1
Aggregate volume: 0.6 bbls
Releases to air:
Number of ODS releases: 55 Aggregate volume: 524 Kg
Overboard Releases:
Number of spills: 2
Aggregate volume: 103.1 bbls
Releases to air:
Number of ODS releases: 29
Aggregate volume: 215.6 Kg
Overboard Releases:
Number of spills: 0
Aggregate volume: 0 bbls
Releases to air:
Number of ODS releases: 12
Aggregate volume: 42 Kg
GRI 306-3
Clim
ate & E
nv
iron
men
tal M
anag
emen
t
10 Scope 3 GHG emissions for 2019 include business air travel, transportation of rigs, and supply chain sea freight.11 Scope 3 GHG emissions for 2020 include business air travel, transportation of rigs, supply chain sea and air freight, and waste.12 Scope 3 GHG emissions for 2021 include business air travel, transportation of rigs, supply chain sea and air freight, waste and IT.13 Calculations are based on EEMS conversion factors.
SUSTAINABILITY REPORT
Shelf Drilling Annual Report 2021 79
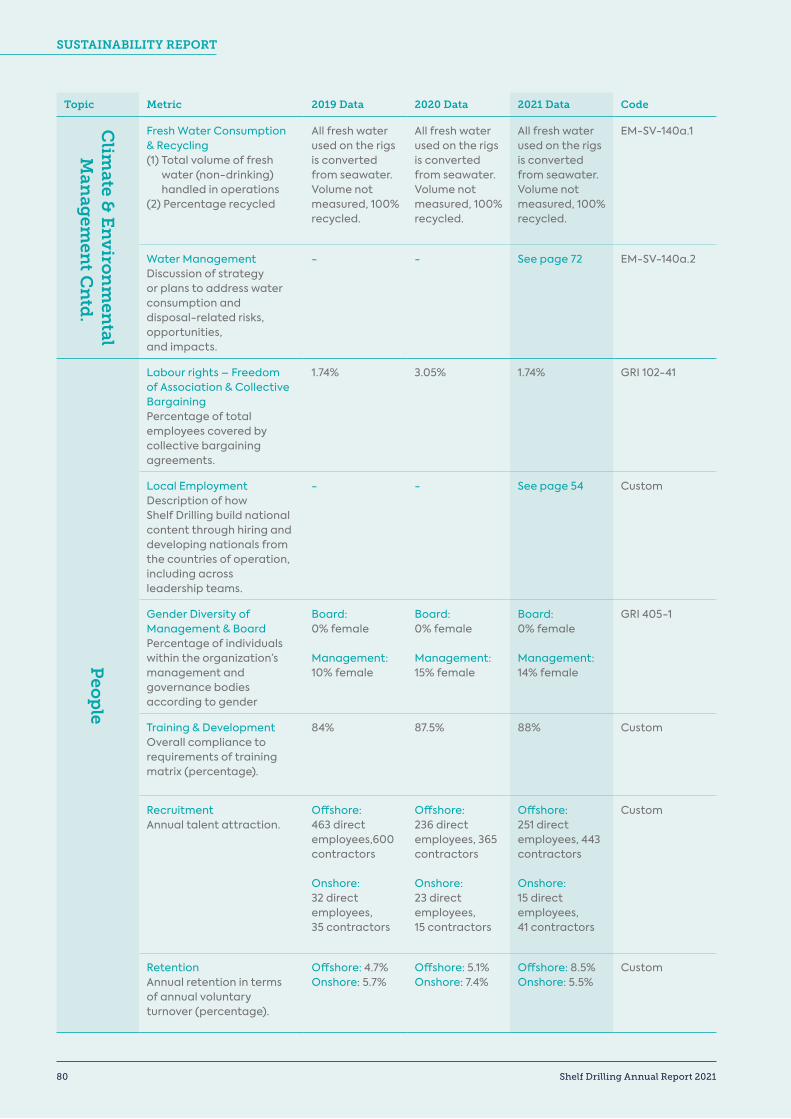
Topic Metric 2019 Data 2020 Data 2021 Data Code
Fresh Water Consumption & Recycling (1) Total volume of fresh
water (non-drinking) handled in operations
(2) Percentage recycled
All fresh water used on the rigs is converted from seawater. Volume not measured, 100% recycled.
All fresh water used on the rigs is converted from seawater. Volume not measured, 100% recycled.
All fresh water used on the rigs is converted from seawater. Volume not measured, 100% recycled.
EM-SV-140a.1
Water Management Discussion of strategy or plans to address water consumption and disposal-related risks, opportunities, and impacts.
- - See page 72 EM-SV-140a.2
Labour rights – Freedom of Association & Collective BargainingPercentage of total employees covered by collective bargaining agreements.
1.74% 3.05% 1.74% GRI 102-41
Local EmploymentDescription of how Shelf Drilling build national content through hiring and developing nationals from the countries of operation, including across leadership teams.
- - See page 54 Custom
Gender Diversity of Management & BoardPercentage of individuals within the organization’s management and governance bodies according to gender
Board: 0% female
Management: 10% female
Board: 0% female
Management: 15% female
Board: 0% female
Management: 14% female
GRI 405-1
Training & Development Overall compliance to requirements of training matrix (percentage).
84% 87.5% 88% Custom
Recruitment Annual talent attraction.
Offshore: 463 direct employees,600 contractors
Onshore: 32 direct employees, 35 contractors
Offshore: 236 direct employees, 365 contractors
Onshore: 23 direct employees, 15 contractors
Offshore: 251 direct employees, 443 contractors
Onshore: 15 direct employees, 41 contractors
Custom
RetentionAnnual retention in terms of annual voluntary turnover (percentage).
Offshore: 4.7%Onshore: 5.7%
Offshore: 5.1%Onshore: 7.4%
Offshore: 8.5%Onshore: 5.5%
Custom
Clim
ate & E
nv
iron
men
tal M
anag
emen
t Cn
td.
Peo
ple
SUSTAINABILITY REPORT
80 Shelf Drilling Annual Report 2021
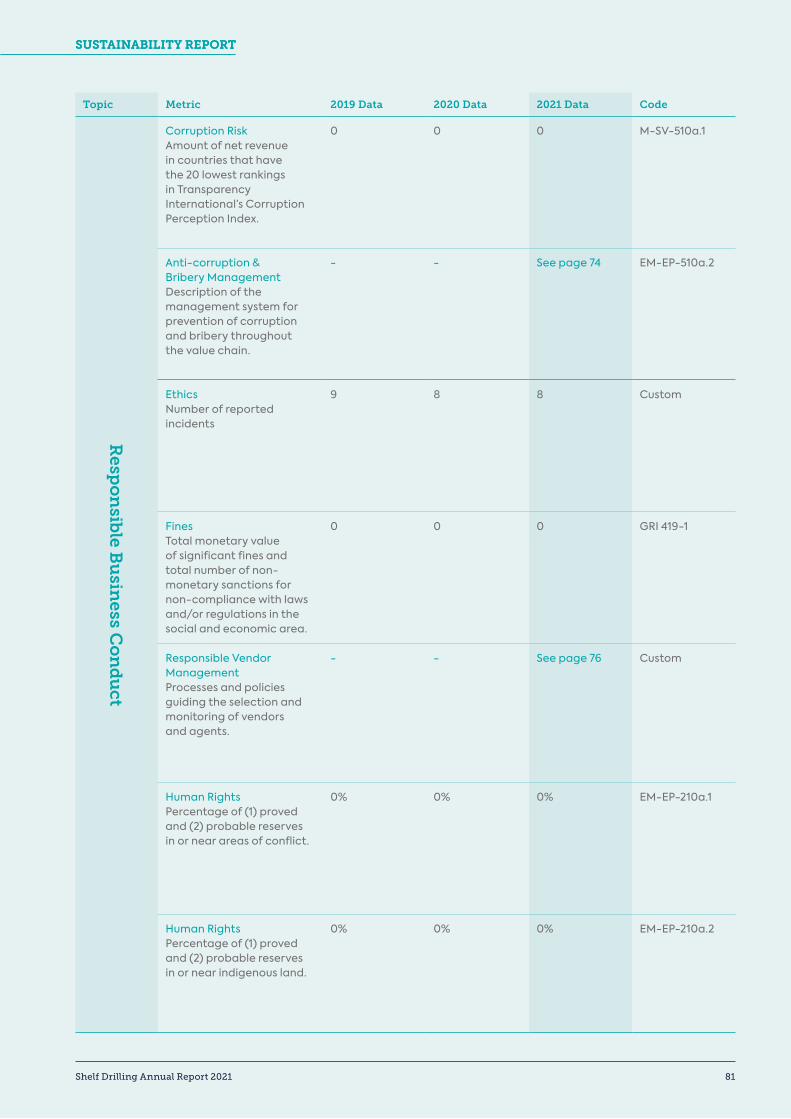
Topic Metric 2019 Data 2020 Data 2021 Data Code
Corruption RiskAmount of net revenue in countries that have the 20 lowest rankings in Transparency International’s Corruption Perception Index.
0 0 0 M-SV-510a.1
Anti-corruption & Bribery Management Description of the management system for prevention of corruption and bribery throughout the value chain.
- - See page 74 EM-EP-510a.2
EthicsNumber of reported incidents
9 8 8 Custom
FinesTotal monetary value of significant fines and total number of non-monetary sanctions for non-compliance with laws and/or regulations in the social and economic area.
0 0 0 GRI 419-1
Responsible Vendor ManagementProcesses and policies guiding the selection and monitoring of vendors and agents.
- - See page 76 Custom
Human RightsPercentage of (1) proved and (2) probable reserves in or near areas of conflict.
0% 0% 0% EM-EP-210a.1
Human RightsPercentage of (1) proved and (2) probable reserves in or near indigenous land.
0% 0% 0% EM-EP-210a.2
Resp
on
sible B
usin
ess Co
nd
uct
SUSTAINABILITY REPORTSUSTAINABILITY REPORT
Shelf Drilling Annual Report 2021 81
In this section Corporate Governance 84
Responsibility Statement 90
Glossary 92
CORPORATE GOVERNANCE & RESPONSIBILITY STATEMENT
82 Shelf Drilling Annual Report 2021
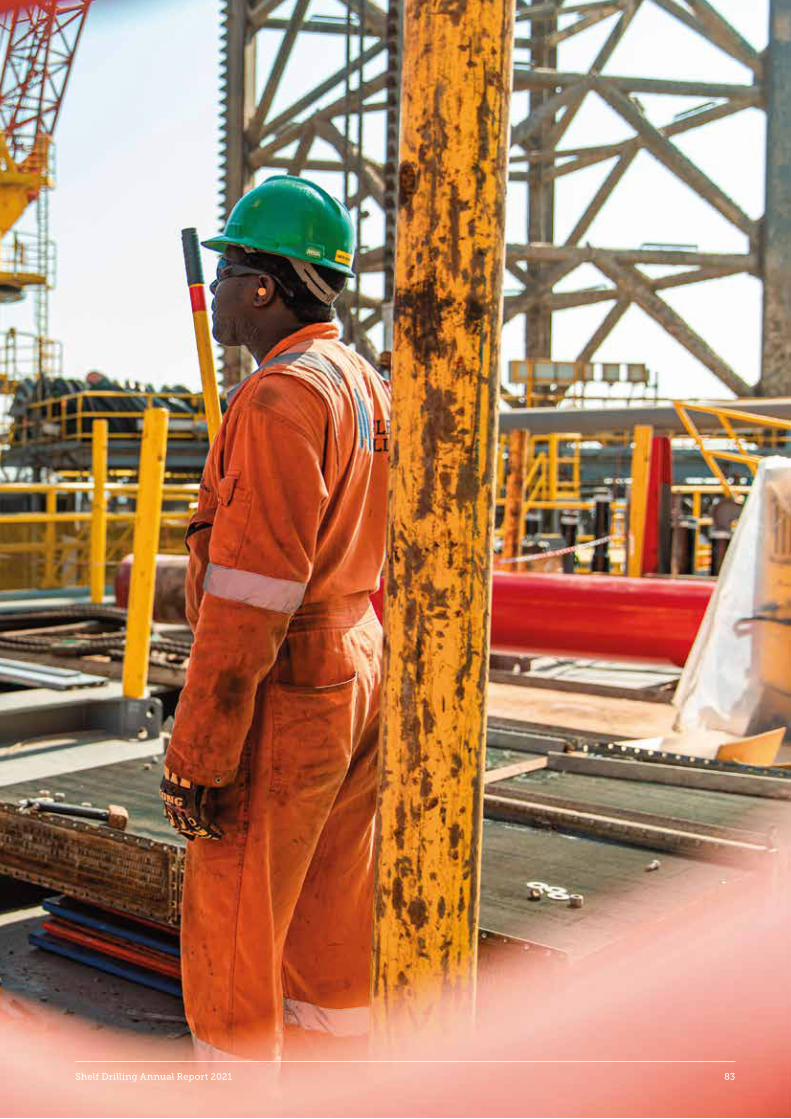
Shelf Drilling Annual Report 2021 83
CORPORATE GOVERNANCE
CorporateGovernancePursuant to the Oslo Rulebook II – Issuer Rules applicable to companies listed on Oslo Børs, where the shares of Shelf Drilling, Ltd. (“Shelf Drilling” or the “Company”) are actively traded, the Company is subject to the reporting requirements of the Norwegian Code of Practice for Corporate Governance, a copy of which is available at www.nues.no/english/.
The Company considers good corporate governance to be a prerequisite for value creation, building trust with its stakeholders, and for accessing sources of capital. Since inception, the Company has ensured a robust compliance culture across the organization which, combined with comprehensive policies, procedures, and systems, ensures reliable financial reporting and compliance with the legislation and regulations applicable to the Company and its subsidiaries. Details regarding the Company’s approach and compliance with the Norwegian Code of Practice for Corporate Governance (most recently revised on October 14, 2021) (the “Code”) are presented in sections 1 to 15 below. This report follows the same structure as used in the Code.
1. Implementation and Reporting on Corporate Governance
The board of directors of Shelf Drilling (the “Board”) aspires to comply with the recommendations set out in the Code. However, in accordance with common practice for Cayman Islands incorporated companies, there are certain deviations from the Code’s recommendations.
Further information on, and the background for, the deviations are presented in the relevant sections of this report.
2. Business
Shelf Drilling was incorporated under the laws of the Cayman Islands on August 14, 2012 and is a holding company. The operations of the Company and its subsidiaries (together the “Group”) are entirely carried out by the Company’s operating subsidiaries. The Group is a leading international shallow water offshore drilling contractor providing equipment and services for the drilling, completion, maintenance and decommissioning of oil and natural gas wells. The Group is solely focused on shallow water operations in depths of up to 375 feet and owns 30 independent-leg cantilever jack-up rigs, making us one of the world’s largest owners and operators of jack-up rigs by number of active shallow water rigs.
In accordance with common practice for Cayman Islands incorporated companies, Shelf Drilling’s objectives are not specified in the Company’s articles of association (the “Articles”), contrary to what is recommended in the Code. The Board seeks to define clear objectives, strategies, and risk profiles for the Company’s business activities such that it creates value for its shareholders in a sustainable manner, among other things by way of challenging management on proposals made to deploy capital in strategic investments and authorizing spending to established limits through the annual budget process. The Board regularly assesses the Company’s performance and adjusts plans when deviations are observed.
Shelf Drilling continuously develops strategies and plans to secure its long-term sustainability and profitability, creating value for investors while balancing this with
the interests of other stakeholders (employees, creditors, suppliers, customers, local communities, for example) and compliance with internal and external regulations. For further details please see page 6 for the section on Strategy and Competitive Strengths in the Form 10-K equivalent included in this report. The Board evaluates the Company’s objectives, strategies and risk profile on an annual basis. Further, the Board reviews the Group’s environmental, social and governance (“ESG”) policies, including the Code of Business Conduct and Ethics which, inter alia, covers the Company’s equal employment / non-discrimination policy. The Board also evaluates the climate risks and opportunities and makes regular assessments of ESG policies in order to ensure high standards. For further details about our ESG policies, please see our Sustainability Report contained in this Annual Report.
3. Equity and Dividends
Capital Structure As of December 31, 2021, the total issued share capital
of the Company amounted to $1,371,157.93, divided into 137,115,793 common shares, each with a par value of $0.01. The Board considers the Company’s capital structure to be appropriate with regard to the Company’s objectives, strategy and risk profile. The Group’s financing arrangements as of December 31, 2021 were comprised of $900 million 8.25% senior unsecured notes due 2025 and $310 million 8.875% Senior Secured First Lien Notes due in 2024.
84 Shelf Drilling Annual Report 202184 Shelf Drilling Annual Report 2021
CORPORATE GOVERNANCE
As of December 31, 2021, the Company had a total indebtedness of $1.2 billion. The Company did not distribute any dividends for the financial year ended December 31, 2021. Dividend Policy The Company’s future dividend policy is within the
discretion of the Board, who will consider issuing dividends to holders of common shares with other relevant considerations and factors, including but not limited to the Company’s working capital and capital expenditure needs, results of operations, financial condition, and investment opportunities.
Authorization to the Board In accordance with Cayman Islands law and common
practice for Cayman Islands incorporated companies and subject to the provisions of the Articles, the Board has wide powers to issue any authorised but unissued shares on such terms and conditions as it may decide, and any shares or class of shares may be issued with preferred, deferred or other special rights or such restrictions, whether with regard to dividend, voting, return on capital, or otherwise as the directors may prescribe. Accordingly, this represents a deviation from section 3 of the Code. Further, the Board also has the power to authorise the Company’s purchase of its own shares, whether for cancellation or to hold as treasury shares and the power to declare dividends. These powers are neither limited to specific purposes nor to a specified period as recommended in the Code. This represents a deviation from section 3 of the Code.
4. Equal Treatment of Shareholders
Shelf Drilling has one class of shares (“common shares”). Each common share carries one vote and all common shares carry equal rights.
In the event of an increase in share capital through the
issue of new common shares where a decision to waive the existing shareholders’ pre-emptive rights is made, the justification for such waiver will be publicly disclosed in a stock exchange announcement issued in connection with the share issuance.
Transactions in the Company’s own common shares
are carried out either through the stock exchange or at prevailing stock exchange prices to seek to facilitate equal treatment of all shareholders. In the event that
there is limited liquidity in the Company’s shares, the Company will consider other ways to ensure equal treatment of shareholders.
5. Shares and Negotiability
The common shares of Shelf Drilling are freely negotiable and there are no restrictions on any party’s ability to own, trade or vote a share in the Company.
6. General Meetings
In respect of general meetings, the Board ensures that:
• as many shareholders as possible can participate in the general meeting;
• the resolutions and any supporting documentation are sufficiently detailed and comprehensive allowing shareholders to understand and form a view on all matters to be considered at the meeting; and
• members of the Board attend the general meeting.
The Articles stipulate that the directors may, at any time
prior to the general meeting, appoint any person to act as chairman of the general meeting or, if the directors do not make any such appointment, the chairman, if any, of the Board shall preside as chairman at such general meeting. This represents a deviation from section 6 of the Code, which stipulates that “the board of directors should ensure that the general meeting is able to elect an independent chairman for the general meeting”. This is common for Cayman Islands exempted companies and simplifies the preparations for the general meeting.
The Articles do not provide for any deadline for the
shareholders to give notice of their attendance at the general meeting. The Board may still encourage shareholders to give such notice within a set deadline.
Shareholders who are unable to be present at the
general meeting will be given the opportunity to vote by proxy. The Company will in this respect provide information on the procedure and prepare a proxy form, which will be set up so that it is possible to vote on each of the items on the agenda and candidates that are nominated for election.
Shelf Drilling Annual Report 2021 85Shelf Drilling Annual Report 2021 85
Attendance by the directors at meetings during 2021 is reflected in the table below:
Board Member BoardAudit
CommitteeCompensation
CommitteeNomination Committee
Ernie Danner 10/10 8/9
David Mullen 10/10
John K. Castle 10/10 4/4 3/3
Yongjian Cong 6/9
J. William Franklin, Jr. 10/10 4/4 3/3
Dongyang Lou 7/10**
David Pittaway 10/10
John Reynolds 8/10
Benjamin Sebel 10/10*** 9/9** 4/4
Usama Trabulsi 10/10 9/9
David Williams 10/10* 9/9 3/3
CORPORATE GOVERNANCE
* 1 of which by Proxy ** 2 of which by Proxy *** 3 of which by Proxy
7. Nomination Committee The Board has established a Nomination Committee
which comprises the directors John K. Castle (Chairman), J. William Franklin, Jr. and David Williams. In line with common practice for Cayman Islands incorporated companies, the Articles do not include provisions specific to a nomination committee and the members are not independent of the Board which represents a deviation from section 7 of the Code.
All members of the Nomination Committee are independent of the Company’s executive management, but are, however members of the Board. The duties of the Nomination Committee are to review candidates and make recommendations to the Board for new directors and replacements for vacancies that may exist from time to time on the Board. The Nomination Committee’s power to nominate directors shall, in the case of directors nominated by right by certain shareholders or shareholder groups pursuant to the Articles, be limited to a determination that any such nominee is suitable to become a director of the Company.
8. Board of Directors: Composition and Independence
The Board is responsible for the overall management of the Company and may exercise all powers of the Company not reserved to its shareholders by the Articles or pursuant to Cayman Islands law. The Company is of the opinion that the composition of the Board ensures that the Board can attend to the common interests of all shareholders and that it meets Shelf Drilling’s need for expertise, capacity and diversity. The Company pays attention to ensuring that the Board functions effectively as a collegiate body.
As of December 31, 2021, the Board comprised the following persons:
• Ernie Danner / Chairman
• David Mullen / Director
• John K. Castle / Director
• J. William Franklin, Jr. / Director
• Dongyang Lou / Director
• David Pittaway / Director
• John Reynolds / Director
• Benjamin Sebel / Director
• Usama Trabulsi / Director
• David Williams / Director
Yongjian Cong left the Board with effect from June 25, 2021. Further information on each of the current directors, including information about their expertise is included on www.shelfdrilling.com and in their biographies on pages 12-15 of this annual report.
The Code recommends that the chairman of the Board is elected by the general meeting, but Mr. Danner was, in line with common practice for Cayman Islands companies, appointed by the Board and this therefore represents a deviation from the Code.
The directors Ernie Danner, Benjamin Sebel, Usama
Trabulsi and David Williams are independent of the Company’s main shareholders. Further, all of the directors are independent of the Company’s material business contacts and executive personnel is not represented on the Board, with the exception of David Mullen, the Chief Executive Officer (“CEO”) of the Company.
86 Shelf Drilling Annual Report 202186 Shelf Drilling Annual Report 2021
CORPORATE GOVERNANCE
While the CEO being on the Board represents a deviation from the Code, this is in line with established practice for the Company (since inception) and other Cayman Islands incorporated companies. The Board has implemented certain controls to ensure that no conflicts of interest arise due to his appointment to the Board. The charters of the Committees, more fully described in the next section, do not permit the CEO to be a member, ensuring independent preparation of matters for discussion by the Board.
The term of office for the directors of Shelf Drilling is not
limited to two years, as the directors are appointed for an indefinite period of time. This represents a deviation from the Code.
Directors are not required to own any shares in the
Company. As of December 31, 2021, David Mullen and Ernie Danner owned 1,098,942 and 295,347 shares, respectively, in the Company.
9. The Work of the Board of Directors
General The Board produces an annual plan for its work,
with particular focus on objectives, strategy, and implementation. The Board has implemented instructions for the Board and executive management, focusing on determining the allocation of internal responsibilities and duties. The objectives, responsibilities and functions of the Board and the CEO are in compliance with rules and standards applicable to the Group, which are described in the Company’s “Instructions for the Board of Directors”.
The Board will evaluate its performance and expertise
on an ongoing basis. Such evaluations will include the composition of the Board and the manner in which its members function, both individually and as a group, in relation to the objectives set out for its work.
Members of the Board and executive personnel must notify the Board when such members have any significant, direct or indirect, interest in a transaction carried out by the Group. Guidelines for such notification have been established to ensure that the Board is notified when a member of the Board or executive personnel has a material interest in a transaction or other matter involving the Group. The Company’s “Instructions for the Board of Directors” further states how agreements with related parties shall be handled. In the event of a not immaterial transaction between the Company and its shareholders, a shareholder’s parent company, members of the Board, executive management or closely-related parties of any such parties, the Board will arrange for a valuation to be obtained from an independent third party. All agreements with related parties will be disclosed in the annual director’s report. To the extent a matter of a material nature in which the Chairman of the Board is, or has been, personally involved, the Board considers on a case by case basis whether to implement appropriate measures to ensure that conflicts of interest do not affect the decision of the Board.
The Audit Committee The Board has elected an Audit Committee among the
members of the Board. The audit committee comprises David Williams (Chairman), Ernie Danner, Benjamin Sebel and Usama Trabulsi, all of whom are independent.
The primary purposes of the Audit Committee are
and have been to:
• Assist the Board in discharging its duties relating to the safeguarding of assets; the operation of adequate systems and internal controls; control processes; and the preparation of accurate financial reporting and statements in compliance with all applicable legal requirements, corporate governance and accounting standards
• Provide support to the Board on the risk profile and risk management of the Company
• Be responsible for the relationship with the external auditor
• Provide oversight of the internal audit activity
• Provide oversight of the compliance and whistleblowing activity
The Audit Committee reports and makes
recommendations to the Board, however, the Board retains responsibility for implementing such recommendations.
The Compensation Committee The Board has established a Compensation Committee which comprises the directors J. William Franklin, Jr. (chairman), John K. Castle and Benjamin Sebel, all of whom are independent of the Company’s executive management.
The Compensation Committee assists the Board in
its oversight of all compensation and benefits related matters of the Company and its affiliates. The Compensation Committee is responsible for evaluating and approving the compensation plans, policies, and programs of the Company.
Further, the Compensation Committee is responsible
for establishing general compensation guidelines and policies for executive employees. The Compensation Committee determines the compensation and other terms of employment for executives (including salary, bonus, equity participation, benefits and severance terms) and reviews, from time to time, the Company’s compensation strategy and compensation levels in order to ensure it is able to attract, retain and motivate executives and other employees. The Compensation Committee is also responsible for approving any equity incentive plans or arrangements and any guidelines or policies for the grant of equity incentives thereunder to employees of the Company. It oversees and periodically reviews all annual bonus, long-term incentive plans, retention plans, stock options, employee pension and welfare benefit plans and also reviews and makes recommendations to the Board regarding the compensation of directors for their services to the Board.
Shelf Drilling Annual Report 2021 87Shelf Drilling Annual Report 2021 87
The Nomination Committee Please see section 7. Nomination Committee on page 86.
10. Risk Management and Internal Control
It is ultimately the responsibility of the Board to ensure that the Company has sound and appropriate internal control systems and risk management systems and that these are proportionate to and reflect the extent and nature of the Company’s activities. Sound risk management is an important tool to create trust and enhance value creation.
Internal control should ensure effective operations and prudent management of significant risks that could prevent the Group from attaining its targets. Shelf Drilling’s internal controls and systems also cover the Company’s corporate values, ethical guidelines and principles of corporate social responsibility.
Having in place an effective internal control system
means that the Company is better suited to manage commercial risk, operational risk, the risk of breaching legislation and regulations as well as other forms of risk that may be material to the Company. As such, there is a correlation between the Company’s internal control systems and effective risk management.
The internal control system also addresses the
organization and execution of the Company’s financial reporting, and covers the Company’s corporate values, ethical guidelines and principles of corporate social responsibility.
The Company has adopted a separate code of conduct
and an HSE policy and uses its best efforts to have a comprehensive set of relevant corporate manuals and procedures, which provide detailed descriptions of procedures covering all aspects of the management of the Company’s operational business. These procedures and manuals are continually revised to reflect best practice, derived from experience or adopted through regulations. For further details please see page 33 for
the sections Health, Safety and Environment and Maintenance and Certifications, in the Form 10-K
Equivalent included in this report. Shelf Drilling complies with the laws and regulations
that apply to the Company’s operations.
The Board conducts annual reviews of the Company’s most important areas of exposure to risk and such areas’ internal control arrangements.
11. Remuneration of the Board of Directors
The remuneration of the Board reflects the Board’s responsibility, expertise and time commitment and the complexity of the Company’s activities. Further, the remuneration of the Board is not linked to the Company’s performance, and the Company does not grant share options to members of the Board.
In November 2021, Ernie Danner received 179,727
common shares of the Company in settlement of the restricted share unit (“RSU”) award of 179,727 RSUs
granted to him in November 2020 as part of his compensation as Chairman of the Board. Mr. Danner also received an award of 232,630 RSUs in November 2021 as part of his compensation as Chairman of the Board, representing an annual equity award with a targeted value of $150,000 per year. For each of the other non-executive directors, the Board also approved in November 2021 an annual equity award targeted at $50,000 in the form of 77,543 RSUs. For further details please see page F-35 Note 17 - Share-based Compensation to the Consolidated Financial Statements in the Form 10-K Equivalent included in this report.
Except for David Mullen, who acts both as CEO and
director, none of the directors, or companies with which they are associated, has taken on specific assignments for the Company in addition to their appointment as a director. If, however, any of the above-mentioned persons takes on such assignments, this will be disclosed to the Board, and remuneration for such additional duties shall be subject to Board approval.
David Mullen receives no additional compensation for his role as a director over and above that which has been agreed for his role as CEO of the Company.
12. Remuneration of Executive Personnel
Shelf Drilling is an exempted company incorporated in the Cayman Islands and is not subject to the rules of the Norwegian Public Companies Act. As a consequence, the Board has not prepared written guidelines for the remuneration of the members of the Company’s management.
However, the remuneration of executive personnel
of the Company is based on the objective to attract, retain and motivate senior management to achieve the strategic objectives of Shelf Drilling and provide value to its shareholders. The remuneration of executives, including the CEO, is benchmarked against comparable companies in the industry.
The Company provides for performance-related
remuneration of the executive management in the form of an annual bonus program, cash retention and share based long-term incentives, which are linked to the Company’s profit over time and value creation for shareholders. Such arrangements are based on quantifiable factors that the employee may influence. Performance-related remuneration is subject to a cap.
In accordance with the above, the Company does
not deviate from section 12 of the Code other than with regard to provisions that are of a Norwegian company law specific nature.
13. Information and Communications
Shelf Drilling is obligated to continuously provide its shareholders, Oslo Børs and the financial markets in general with timely and precise information about the Company and its operations. Relevant information is given in the form of annual reports, quarterly reports, press releases, notices to the stock exchange and
CORPORATE GOVERNANCE
88 Shelf Drilling Annual Report 202188 Shelf Drilling Annual Report 2021
investor presentations in accordance with what is deemed appropriate from time to time. To this end the Company has established guidelines for communication with the financial market. The Company publishes an annual, electronic financial calendar with an overview of dates for important events, such as the annual general meeting, interim financial reports and public presentations, if applicable.
The Company seeks to clarify its long-term potential, including strategies, value drivers and risk factors, and maintains an open and proactive policy for investor relations, a website designed to incorporate “sound practices”, and gives regular presentations in connection with annual and quarterly results.
The Board seeks to make suitable arrangements
for shareholders to communicate with the Company. Communications with shareholders are in compliance with the provisions of applicable laws and regulations and in accordance with the principle of equal treatment of the Company’s shareholders. Information to shareholders is published on the Company’s website. The Company has created a dedicated investor relations email ID, [email protected], for the convenience of shareholders and investors in case of any queries or requests. Investor contact and investor relations activities are conducted in accordance with relevant policies and by the investor relations team.
14. Take-Overs
The Board complies with applicable Norwegian and Cayman Islands laws and regulations regarding take-over offers. The Board has established the main principles for its actions in the event of a take-over offer.
In a take-over process, the Board will endeavour to
facilitate that the Company’s shareholders are treated equally and that there are no unnecessary interruptions to the Company’s business activities. The Board will further seek to facilitate that the shareholders are given sufficient information and time to assess the offer.
In the event of a take-over process, the Board will seek to abide by the principles of the Code. Further, the Board will, subject to its overriding fiduciary duties, ensure that the following take place: • the Board will not seek to hinder or obstruct any
takeover offer for the Company’s operations or shares unless they have valid and particular reasons for doing so;
• the Board shall not exercise mandates or pass any resolutions with the intention of obstructing the takeover offer unless this is approved by the general meeting following announcement of the offer or the Board had justifiable reasons for such actions;
• the Board shall not undertake any actions intended to give shareholders or others an unreasonable advantage at the expense of other shareholders or the Company;
• the Board shall not enter an agreement with any offer or that limits the Company’s ability to arrange other offers for the Company’s shares, unless it is
self-evident that such an agreement is in the common interest of the Company and its shareholders;
• the Board and executive management shall not institute measures with the intention of protecting the personal interests of its members at the expense of the interests of the shareholders; and
• the Board must be aware of the particular duty it has for ensuring that the values and interests of the shareholders are protected.
In the event of a take-over offer, the Board will, unless there are any reasons to the contrary, seek a valuation from an independent third party. On this basis, the Board will make a recommendation as to whether or not the shareholders should accept the offer.
The Board shall strive to ensure that neither inside
information about the Company, nor any other information that must be assumed to be relevant for shareholders in a bidding process, remains unpublished.
Shelf Drilling was not subject to any takeover bids in 2021. 15. Auditor
The Company’s independent auditor is PricewaterhouseCoopers Dubai branch (PwC). PwC has
been the Company’s auditor since its inception in 2012. Once a year, the Audit Committee of the Board reviews
the Company’s internal control procedures with the auditor, including weaknesses identified by the auditor and proposals for improvement.
In order to ensure the auditor’s independence of the
Company’s executive management, the Board has specified the executive management’s right to use the auditor for purposes other than auditing.
The auditor participates in meetings of the Audit Committee of the Board considering annual accounts, accounting principles, assessment of any important accounting estimates and other matters of importance. At these meetings, the auditor reports on any material changes in the Company’s accounting principles and key aspects of the audit, comments on any material estimates, accounting figures and judgements, and reports all material matters on which there has been a disagreement between the auditor and the executive management of the Company and/or the Audit Committee.
The Audit Committee holds a meeting with the auditor
at least once a year in which no representative of executive management is present. In order to strengthen the Board’s work on financial reporting and internal control, the auditor provides a report to the Audit Committee on the main elements of the audit of the previous financial year and reports any significant deficiency and material weakness identified in the internal control relating to the financial reporting process.
CORPORATE GOVERNANCE
Shelf Drilling Annual Report 2021 89Shelf Drilling Annual Report 2021 89
IMPORTANT NOTICE: All information in the Annual Report is as at February 28, 2022 or earlier if explicitly stated. As such, the Annual Report does not reflect any Company events or changes after February 28, 2022.
RESPONSIBILITY STATEMENT
ResponsibilityStatementWe confirm that, to the best of our knowledge, the consolidated financial statements for the year ended December 31, 2021 have been prepared in accordance with accounting principles generally accepted in the United States of America, and give a true and fair view of the assets, liabilities, financial position and results of the Company and the Group taken as a whole.
We also confirm that, to the best of our knowledge, the Board of Directors’ Report includes a true and fair review of the development and performance of the business and the position of the Company and the Group, together with a description of the principal risks and uncertainties facing the Company and the Group.
By Order of the Board of Directors of Shelf Drilling, Ltd.
February 28, 2022
Ernie DannerChairman
David MullenDirector & Chief Executive Officer
90 Shelf Drilling Annual Report 2021

RESPONSIBILITY STATEMENT
Shelf Drilling Annual Report 2021 91
GLOSSARY
GlossaryAdjusted EBITDA Adjusted earnings before interest, taxes, depreciation and amortization, which
consists of net loss plus interest expense and finance charges, net of interest income, income tax expense, depreciation, amortization of deferred costs, loss on impairment of assets, loss on disposal of assets, acquired rig reactivation costs, one-time corporate transaction costs and other specific items in certain periods, less gain on disposal of assets.
Adjusted EBITDA Margin Adjusted EBITDA divided by total revenues.
Adjusted Free Cash Flow Adjusted EBITDA less capital and deferred expenditures excluding rig acquisitions, interest expense (excluding loss on debt extinguishment), net and income tax expense.
Average Dayrate The average contract dayrate earned by marketable rigs over the reporting period excluding mobilization fees, contract preparation, capital expenditure reimbursements, demobilization, recharges, bonuses and other revenues. Average dayrate can be calculated related to historical revenues or contract backlog.
Bbls Barrels
Bbls/d Barrels per day
Board The Company’s board of directors
Capital expenditures & deferred costs
Represents rig acquisition and other fixed asset purchases, construction expenditures on newbuild rigs and certain expenditures associated with regulatory inspections, major equipment overhauls, contract preparation (including rig upgrades), mobilization and stacked rig reactivations.
Corporate Code The Company’s Code of Business Conduct and Ethics
Code / Corporate Governance Code The Norwegian Code of Practice for Corporate Governance, dated October 14, 2021.
Company Shelf Drilling, Ltd. together with its consolidated subsidiaries. Also referred to as Shelf Drilling or SHLF.
Effective Utilization The number of calendar days during which marketable rigs generate dayrate revenues divided by the maximum number of calendar days during which those rigs could have generated dayrate revenues. Effective utilization measures the dayrate revenue efficiency of the Company’s marketable rigs.
ESG Environmental, Social and Governance
Group Shelf Drilling, Ltd./Shelf Drilling/SHLF together with its consolidated subsidiaries.
HSE Health, Safety and Environment
IADC International Association of Drilling Contractors
IOCs International Oil Companies
LTM Last twelve months
LTIR The Lost Time Incident Rate which is calculated as the number of lost time incidents per 200,000 man-hours.
Marketable Rigs The total number of rigs that are operating or are available to operate, which excludes stacked rigs, rigs under non-drilling contracts and non-contracted newbuild rigs under construction.
92 Shelf Drilling Annual Report 2021
GLOSSARY
Net Debt Represents Total Debt less cash and cash equivalents.
NOCs National Oil Companies
Operating Position / Market Position Ranking of a company in terms of number of jack-ups deployed in a region, excludes owner-operators, for example ONGC in India, ADNOC in UAE.
OPITO Offshore Petroleum Industry Training Organization, which is a global, not-for-profit, training and skills body for the energy industry.
Premium Rigs / Premium Jack-ups Categorization of rigs based on specifications and capabilities, typically with 1.5 million-pound hookload capacity, 120 persons of accommodation capacity, and 350-foot water depth capability.
Rystad / Rystad Energy An independent energy research and business intelligence company.
TPSR The Total Potential Severity Rate which is calculated as the number of incidents per 200,000 man-hours.
TRIR The Total Recordable Incident Rate which is calculated as the number of recordable safety incidents per 200,000 man-hours.
Uptime The period during which the Company performs well operations without stoppage due to mechanical, procedural, or other operational events that result in non-productive well operations time. Uptime is expressed as a percentage measured daily, monthly, or yearly. Uptime performance is a key customer contracting criterion, an indication of the Company’s operational efficiency and directly related to current and future revenues and profit generation.
Form 10-K Equivalent With certain exceptions, the Form 10-K Equivalent provided as part of this Annual Report is provided pursuant to the Indenture for the Company’s 8.25% Senior Notes Due 2025 and 8.87% Senior Secured First Lien Notes Due 2024 and should be read in its entirety as it pertains to Shelf Drilling, Ltd. Except where indicated, the Consolidated Financial Statements and the Notes to the Consolidated Financial Statements are combined. References in this Form 10-K Equivalent to “Shelf,”, “SDL”, the “Company,” “Group,” “we,” “us,” “our” and words of similar meaning refer collectively to Shelf Drilling Ltd. and its consolidated subsidiaries.
Note to EBITDA/Adjusted EBITD In addition to terms under US GAAP, the Company presents non-GAAP financial measures, including EBITDA and Adjusted EBITDA. The Company believes that Adjusted EBITDA and Adjusted EBITDA Margin are useful non-GAAP financial measures because they are widely used to measure a company’s operating performance without regard to the excluded items, which can vary substantially from company to company, and are also useful to an investor in evaluating the performance of the business over time. In addition, the Company’s management uses Adjusted EBITDA and Adjusted EBITDA Margin in presentations to its Board to provide a consistent basis to measure the operating performance of the business, as a measure for planning and forecasting overall expectations, for evaluation of actual results against such expectations and in communications with shareholders, lenders, noteholders, rating agencies and others concerning the Company’s financial performance. Adjusted EBITDA and Adjusted EBITDA Margin may not be comparable to similarly titled measures employed by other companies and should not be considered in isolation or as a substitute for net income (loss) or other data prepared in accordance with US GAAP. Adjusted EBITDA and Adjusted EBITDA margin have significant limitations, including but not limited to the exclusion from these numbers of various cash requirements to operate our business.
Shelf Drilling Annual Report 2021 93
In this section Form 10-K Equivalent 94 (including consolidated financial statements and independent auditor’s report)
FORM 10-K EQUIVALENT
94 Shelf Drilling Annual Report 2021
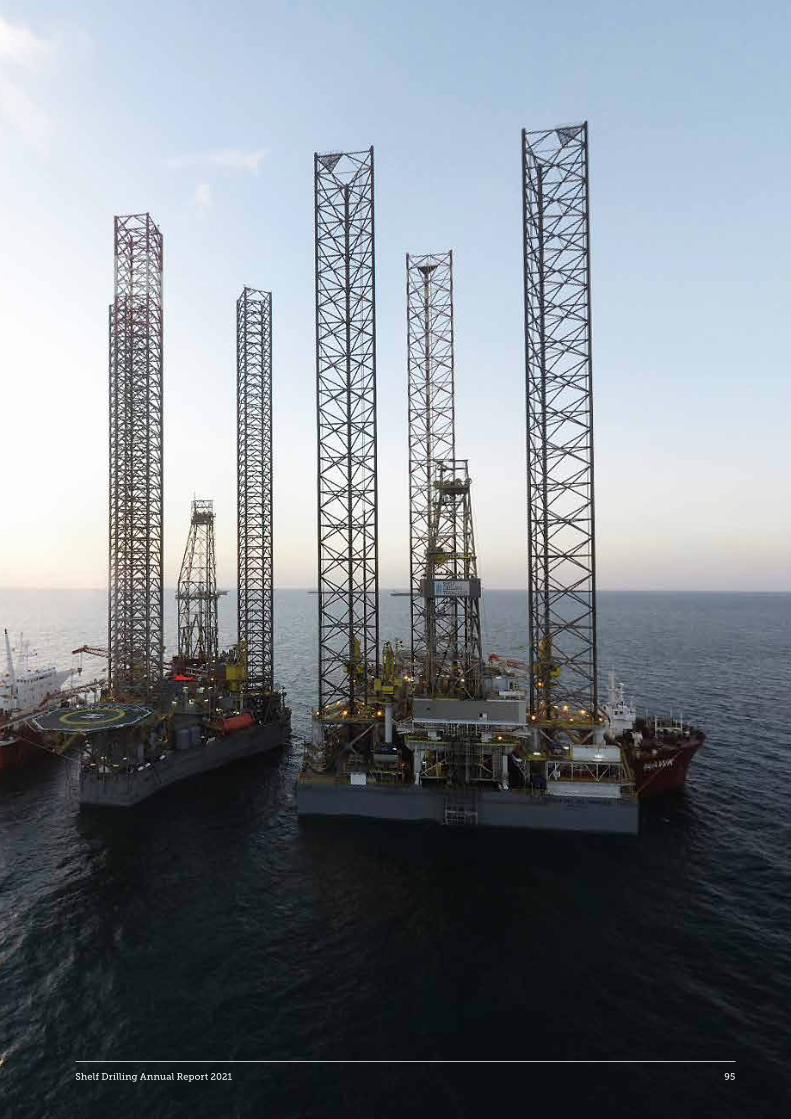
Shelf Drilling Annual Report 2021 95
SHELF DRILLING, LTD.
Form 10-K Equivalent
December 31, 2021
SHELF DRILLING, LTD.
Form 10-K Equivalent for the Year Ended December 31, 2021
CONTENTS
PART I 3
ITEM 1. BUSINESS 3
ITEM 1A. RISK FACTORS 13
ITEM 1B. UNRESOLVED STAFF COMMENTS 33
ITEM 2. PROPERTIES 33
ITEM 3. LEGAL PROCEEDINGS 34
ITEM 4. MINE SAFETY DISCLOSURES 34
PART II 35
ITEM 5. MARKET FOR REGISTRANT’S COMMON EQUITY, RELATED STOCKHOLDER MATTERS AND
ISSUER PURCHASES OF EQUITY SECURITIES 35
ITEM 6. [RESERVED] 36
ITEM 7. MANAGEMENT’S DISCUSSION AND ANALYSIS OF FINANCIAL CONDITION AND RESULTS OF
OPERATIONS 36
ITEM 7A. QUANTITATIVE AND QUALITATIVE DISCLOSURES ABOUT MARKET RISK 57
ITEM 8. FINANCIAL STATEMENTS AND SUPPLEMENTARY DATA 57
ITEM 9. CHANGES AND DISAGREEMENTS WITH ACCOUNTANTS ON ACCOUNTING AND FINANCIAL
DISCLOSURE 57
ITEM 9A. CONTROLS AND PROCEDURES 58
ITEM 9B. OTHER INFORMATION 58
ITEM 9C. DISCLOSURE REGARDING FOREIGN JURISDICTIONS THAT PREVENT INSPECTIONS. 58
PART III 58
ITEM 10. DIRECTORS, EXECUTIVE OFFICERS AND CORPORATE GOVERNANCE 58
ITEM 11. EXECUTIVE COMPENSATION 61
ITEM 12. SECURITY OWNERSHIP OF CERTAIN BENEFICIAL OWNERS AND MANAGEMENT AND
RELATED SHAREHOLDERS MATTERS 61
ITEM 13. CERTAIN RELATIONSHIPS AND RELATED TRANSACTIONS, AND DIRECTOR INDEPENDENCE. 61
ITEM 14. PRINCIPAL ACCOUNTING FEE AND SERVICES 61
PART IV 61
ITEM 15. EXHIBIT AND FINANCIAL STATEMENT SCHEDULES 61
This Form 10-K equivalent (“Form 10-K Equivalent”), with certain exceptions, is provided pursuant to the Indenture for our 8.25% Senior
Unsecured Notes Due 2025 and should be read in its entirety as it pertains to Shelf Drilling, Ltd. Except where indicated, the Consolidated
Financial Statements and the Notes to the Consolidated Financial Statements are combined. References in this Form 10-K Equivalent to “Shelf,”,
“SDL”, the “Company,” “Group,” “we,” “us,” “our” and words of similar meaning refer collectively to Shelf Drilling Ltd. and its consolidated
subsidiaries.
2
FORWARD-LOOKING STATEMENTS
Statements contained in this report that are not historical facts are forward-looking statements within the meaning of Section
27A of the Securities Act of 1933, as amended, and Section 21E of the Securities Exchange Act of 1934, as amended. Forward-
looking statements include words or phrases such as “anticipate, ” “believe, ” “estimate, ” “expect, ” “intend, ” “plan, ” “project, ”
“could, ” “may, ” “might, ” “should, ” “will” and similar words and specifically include statements regarding expected financial
performance; expected utilization, dayrates, revenues, operating expenses, contract terms, contract backlog, capital expenditures
and deferred costs, insurance, financing and funding; the timing of availability, delivery, mobilization, contract commencement or
relocation or other movement of rigs; current or future rig construction (including construction in progress and completion thereof),
enhancement, upgrade, repair or reactivation and timing thereof; the suitability of rigs for future contracts; general market, business
and industry conditions, trends and outlook; future operations; the impact of increasing regulatory complexity; expected
contributions from our acquired rigs; expense management; and the likely outcome of litigation, legal proceedings, investigations
or insurance or other claims and the timing thereof. These forward-looking statements speak only as of the date of this Form 10-K
Equivalent and we undertake no obligation to revise or update any forward-looking statement for any reason, except as required by
law. Such statements are subject to numerous risks, uncertainties and assumptions that may cause actual results to vary materially
from those indicated, including:
• the COVID-19 pandemic and its effect on demand for our services, global demand for oil and natural gas, the U.S. and
world financial markets, our financial condition, results of operations and cash flows;
• expectations, trends and outlook regarding industry and market conditions, oil and gas production and market prices,
demand for hydrocarbons, offshore activity and dayrates;
• changes in general economic, fiscal and business conditions in jurisdictions in which we operate and elsewhere;
• the decline in demand as oil and gas fossil fuels are replaced by sustainable/clean energy;
• future regulatory requirements or customer expectations to reduce carbon emissions;
• changes in worldwide rig supply and demand, competition or technology, including as a result of delivery of newbuild
rigs;
• the impact of variations in demand for our rigs, including the preferences of some of our customers for newer and/or higher
specification rigs;
• the ability of our customers to obtain permits;
• our ability to renew or extend contracts, enter into new contracts when such contracts expire or are terminated, and
negotiate the dayrates and other terms of such contracts;
• expectations, trends and outlook regarding operating revenues, operating and maintenance expense, insurance coverage,
insurance expense and deductibles, interest expense and other matters with regard to outlook and future earnings;
• the effect of disproportionate changes in our costs compared to changes in operating revenues;
• complex laws and regulations, including environmental, anti-corruption and tax laws and regulations, that can adversely
affect the cost, manner or feasibility of doing business;
• the effects and results of our strategies;
• downtime and other risks associated with offshore rig operations or rig relocations, including rig or equipment failure,
damage and other unplanned repairs;
• the expected completion of shipyard projects including the timing of rig construction or reactivation and delivery and the
return of idle rigs to operations;
• future capital expenditures and deferred costs, refurbishment, reactivation, transportation, repair and upgrade costs;
• the cost and timing of acquisitions and integration of additional rigs;
• sufficiency and availability of funds and adequate liquidity for required capital expenditures and deferred costs, working
capital, debt service and other business requirements;
• our ability to obtain financing and pursue other business opportunities may be limited by our debt levels, debt agreement
restrictions and the credit ratings assigned to our debt by independent credit rating agencies;
• the market value of our rigs and of any rigs we acquire in the future, which may decrease and/or be impaired as a result of
Company specific, industry specific or market factors;
• the level of reserves for accounts receivable and other financial assets, as appropriate;
• the proceeds and timing of asset dispositions;
• litigation, investigations, claims, disputes and other contingent liabilities and their effects on our financial condition and
results of operations;
• effects of accounting changes and adoption of accounting policies;
• our ability to attract and retain skilled personnel on commercially reasonable terms, whether due to labor regulations,
unionization or otherwise;
• the security and reliability of our technology systems and service providers;
• the effect of changes in foreign currency exchange rates;
• our incorporation under the laws of the Cayman Islands and the limited rights to relief that may be available compared to
United States (“U.S.”) U.S. laws and
• the other factors listed in “Item 1A. - Risk Factors” and elsewhere in this Form 10-K Equivalent.
3
Part I Item 1. Business.
General
Shelf Drilling, Ltd. (“SDL”) was incorporated on August 14, 2012 (“inception”) as a private corporation in the Cayman
Islands. SDL, with its majority owned subsidiaries (together, the “Company”, “we”, “us” or “our”) is a leading international shallow
water offshore contractor providing services and equipment for the drilling, completion, maintenance and decommissioning of oil
and natural gas wells. We are solely focused on shallow water operations in depths of up to 375 feet, and our fleet consists of 30
independent-leg cantilever (“ILC”) jack-up rigs as of December 31, 2021, making us one of the world’s largest owners and operators
of jack-up rigs by number of active shallow water rigs. Since June 25, 2018, SDL shares are listed on the Oslo Stock Exchange
(“OSE”) under the ticker symbol SHLF.
We furnish financial reports, including our Form 10-K Equivalent annual reports and Form 10-Q equivalent quarterly
reports, news releases and presentations free of charge on our website at www.shelfdrilling.com. Similar information can also be
found on the Euronext website at live.euronext.com. Euronext is an exchange group operating regulated markets in seven European
countries including the OSE in Norway.
Since our inception, we have applied our “fit-for-purpose” strategy to enhance the performance of our business, people and
processes, leveraging our sole focus on the shallow water segment and the decades of experience of our people with our customers,
rigs and markets where we operate. The diversified geographical focus of our jack-ups and the allocation of resources to purchase,
build or upgrade rigs are determined by the activities and needs of our customers. Currently, our main customers are national oil
companies (“NOCs”), international oil companies (“IOCs”) and independent oil and natural gas companies, who contract our rigs
for varying durations.
SDL is a holding company with no significant operations or assets other than interests in its direct and indirect subsidiaries.
All operations are conducted through Shelf Drilling Holdings, Ltd. (“SDHL”), an indirect wholly owned subsidiary of SDL. Our
corporate offices are in Dubai, United Arab Emirates (“UAE”), geographically close to our operations in the Middle East, North
Africa and the Mediterranean (together, “MENAM”), Southeast Asia, India and West Africa.
Recent events
On March 26, 2021, the Company closed a private offering of $310.0 million aggregate principal amount of 8.875% Senior
Secured Notes due November 2024 (the “8.875% Notes”) to repay and terminate the revolving credit facility, due April 2023
(“SDHL Revolver”), cash collateralize bank guarantees issued under the SDHL Revolver, to redeem and repurchase all of the
outstanding 8.75% Senior Secured Notes, due November 15, 2024 (the “8.75% Senior Secured Notes”) and for general corporate
purposes.
During the year ended December 31, 2021, the Company received several new contract awards, including new or extended
contracts in all of our key geographic areas. In May 2021, the Company secured a ten-year contract extension for the High Island
IX in Saudi Arabia. The Company added 13 rig years in additional backlog in India during 2021 as a result of several contract
extensions and new contract awards, which included moving an additional rig, the Compact Driller, into the region. In June 2021,
the Company received an award for a one-year contract with multiple option periods for the Shelf Drilling Tenacious in Angola and
secured a short-term contract for the Shelf Drilling Mentor in Congo. Both the Shelf Drilling Tenacious and Shelf Drilling Mentor
began mobilization to West Africa during the fourth quarter of 2021 and started operations in January 2022. In the same period, the
Company was awarded a five well contract for the Baltic in Nigeria for an estimated one year duration. The Company was awarded
a two-year contract extension in March 2021 for the Trident 16 in Egypt. In December 2021, the Company was awarded an 18-
month contract extension for the Key Manhattan in Italy and contract extensions for the Shelf Drilling Chaophraya and Shelf Drilling
Krathong in Thailand for 39 and 36 months, respectively.
During the year ended December 31, 2021, the Company completed the sale of Shelf Drilling Journey, High Island VII,
Trident 15, Key Hawaii, Galveston Key and Randolph Yost for total net proceeds of $81.3 million. These transactions included
opportunistic sales to improve liquidity as well as sales of stacked assets. As of December 31, 2021, the Company has no rigs
recorded as assets held for sale and 28 of the Company’s 30 rigs were under contract.
Operations
Our primary operations are providing services for the drilling, completion, maintenance and decommissioning of oil and
natural gas wells and associated services using the rigs in our fleet and related equipment. A significant portion of our revenues are
dayrates related to the provision of these services earned from our customers, including NOCs, IOCs and independent oil and natural
gas companies. Additionally, we may earn lump-sum fees relating to contract preparation, capital upgrades, mobilization,
demobilization and/or termination revenues in certain contracts. We also provide catering, additional equipment and personnel,
consumables or accommodations at the request of the customer and we may use third parties for the provision of such goods and
services. See also “Customers and Customer Contracts” below for additional discussion on our customers and revenue generating
activities.
4
Although certain of our rigs may be affected by seasonal monsoons or other weather events, generally seasonal factors do
not have a material effect on our business.
Our operating expenses consist primarily of operating and maintenance expenses, which can be classified as rig related or
shore-based. Our other significant operating expenses include depreciation, amortization of deferred costs and general and
administrative expenses. As we operate in a capital-intensive business, we may also incur significant losses related to impairment
of assets. See also “Operating Expenses, Capital Expenditures and Deferred Costs” below for additional discussion of our cost and
expenses.
We have one reportable segment, Contract Services, which reflects how we manage our business, that our fleet is mobile
and that our market is dependent upon the worldwide oil and natural gas industry.
We utilize various operational and financial measures that we believe are useful in assessing our business and performance.
Many of these measures are common to our industry and we believe they are useful in measuring our operating performance over
time. See also “Item 7. Management’s Discussion and Analysis of Financial Condition and Results of Operations” for further
discussion of our operating measures and financial measures.
We use various operational measures common to our industry to evaluate our operational performance, including:
• Contract backlog is the maximum contract dayrate revenues that can be earned from firm commitments for contract
services represented by executed definitive agreements based on the contracted operating dayrate during the contract
period less any planned out-of-service periods for regulatory inspections and surveys or other work. Contract backlog
excludes revenues resulting from mobilization and demobilization fees, capital or upgrade reimbursement, recharges,
bonuses and other revenue sources. Contract backlog may also include the maximum contract amount of revenues for
the use of our rigs as bareboat charters or as accommodation units. The contract period excludes revenues from
extension options under our contracts unless such options have been exercised. The contract operating dayrate may
differ from the amount estimated due to reduced dayrates for rig movements, adverse weather and equipment
downtime, among other factors. Actual dayrates may also include contractual adjustments based on market factors,
such as Brent crude oil or natural gas prices or cost increases. Contract backlog is a key indicator of our potential
future revenue generation.
• Total recordable incident rate (“TRIR”) is the number of recordable safety incidents per 200,000 man-hours.
• Uptime is the period during which we perform well operations without stoppage due to mechanical, procedural or
other operational events that result in non-productive well operations time. Uptime is expressed as a percentage
measured daily, monthly or yearly. Uptime performance is a key customer contracting criterion, an indication of our
operational efficiency and directly related to our current and future revenues and profit generation.
The following table includes selected operating measures as of December 31, 2021, 2020 and 2019:
As of December 31,
2021 2020 2019
Contract backlog (in millions)........................................... $ 1,679 $ 1,377 $ 2,005
The following table includes selected operating measures for the years ended December 31, 2020, 2019 and 2018:
Years ended December 31,
2021 2020 2019
TRIR.................................................................................. 0.16 0.19 0.19
Uptime............................................................................... 99.3% 99.4% 99.2%
Customers and Customer Contracts
Our contracts are typically awarded on an individual basis and vary in terms and rates depending on the operational nature
and duration of the contract, amount and type of services and equipment provided, geographic area served, market conditions and
other variables. Dayrates are negotiated directly with customers or determined through a formal bidding process and can be
influenced by the operating performance of the service provider or rig. Prior experience with a customer can be a deciding factor
in the awarding of contracts and negotiation of contract terms, as discussed further below. Brent crude oil and natural gas prices,
which are sensitive to global supply and demand, and other market factors can also impact dayrates. As is common in the industry,
our customer contracts can contain multiple dayrates, including specified dayrates for contracted operations and reduced dayrates
for rig movements, adverse weather, equipment downtime, or other instances of scheduled or non-scheduled events, including for
circumstances both within and outside of our control.
Revenues may increase or decrease largely due to changes in average dayrates and effective utilization as defined in “Item
7. Management’s Discussion and Analysis of Financial Condition and Results of Operations”. Average dayrates can be affected by
5
new contract dayrates that are lower or higher than previous dayrates and by changes in the mix of dayrates earned by different rigs
in different operating regions. Effective utilization can be affected by the timing of new contracts, contract extensions or
terminations and changes in operational uptime. Out of service periods that reduce operational uptime can include planned or
unplanned downtime such as for periodic surveys, underwater inspections, contract preparation and upgrades and the use of
alternative dayrates for waiting-on-weather periods, repairs, standby, force majeure, mobilization or other rates that apply under
certain circumstances.
We may receive additional compensation or reimbursement for contract preparation, capital upgrades, such as mechanical
or structural alterations to a rig necessary to meet customer specifications, and for mobilization costs necessary to relocate the rig
for contractual operations. Some contracts also include lump-sum demobilization revenues which are triggered if stipulated
conditions are present. These provisions vary and are based on negotiations of individual contracts with customers, which can be
influenced by the contract duration, dayrates, local market conditions and other factors.
Many contracts have extension options, which can be exercised at the option of the customer, often at previously agreed
prices and terms. Customer contracts may also be subject to suspension, termination, cancellation and delays for a variety of reasons,
including at the customers’ convenience and sole option or for other circumstances beyond our control. Contract suspension
provisions may allow customers to suspend contract activity for a predetermined or indefinite period, and in certain circumstances
may extend the contracted term for a period of time equal to the suspension period. Such suspension provisions may provide for a
reduced dayrate, or no dayrate, and may require a rig to be ready for immediate redeployment at the customer’s option. Certa in
customer contracts may outline specific termination provisions, which usually include a notice period and may also include
termination payments and fees. Termination payments, if applicable, vary from contract to contract and can include the payment of
a certain percentage of the contract dayrate for either a contractually specified number of days or the number of firm contract days
remaining on the contract. However, in certain contracts the termination fee paid can be refunded or reduced (or infrequently,
eliminated) if we are able to secure a subsequent contract for the rig with a different operator. Additionally, contracts customarily
provide for automatic or optional customer termination for cause, often without the payment of any termination fee. These
provisions can be triggered under pre-defined circumstances such as non-performance or material breach of the contract, for reasons
including but not limited to operational or safety performance issues, equipment failure and sustained downtime related to force
majeure events.
Contract terms range in length from the time necessary to drill or workover one well up to many years. We seek to secure
long-term agreements providing enhanced stability and deeper customer relationships rather than the highest possible dayrates on a
shorter-term basis. Typically, NOC contracts are for longer terms when compared to contracts with IOCs and independent oil and
natural gas companies, although in certain countries annual government budget approval cycles may limit the term of these contracts.
The type of contract can also impact the length and predictability of a contract term. “Greenfield exploration” consists of
exploration of unchartered territory, where mineral deposits are not confirmed to exist, and such projects are generally considered
an investment in developing a future production field. “Brownfield projects” consist of drilling or workover activity on producing
assets, and such projects are generally considered part of ongoing operations. Greenfield exploration tends to be shorter term and
more closely linked to prevailing commodity prices and success of exploration activities than brownfield projects, as customers are
often unwilling to make investments in unproven fields during periods of low oil prices. Decommissioning projects consist of
plugging and abandonment of mature oil and natural gas wells at the end of their lives by removing existing well equipment and
sealing off producing zones. Shallow water fields are generally mature and therefore consist of more brownfield projects than
greenfield projects and decommissioning projects in shallow water represent a growing segment of the jack-up market.
The methods through which we pursue new business opportunities vary significantly. Small IOCs and independent oil and
natural gas companies are generally less likely to require formal tender processes, while NOCs are more likely to require
participation in full tender exercises prior to awarding new contracts. We believe that extending current contracts or entering into
additional contracts with existing customers benefits both us and our customers, due to the following factors:
• Readily available rigs and crews for the customer’s work site, eliminating additional mobilization expense and risk;
• Available equipment, which meets customer specifications both from an operational and a safety perspective;
• Employees familiar with the customer’s policies and procedures and
• Simplified process for contract negotiations and related legal and administrative requirements.
We believe that our ability to maintain relationships with, and to win repeat business from, our existing customers is critical
to our stability and growth of cash flows. If an existing customer fails to renew a contract, we will seek to secure a new contract for
that rig.
Our current customer base includes Saudi Arabian Oil Company (“Saudi Aramco”), Chevron Corporation, Oil and Natural
Gas Corporation Limited, Ente Nazionale Idrocarburi S.p.A (“ENI”) and TotalEnergies SE, who contract our rigs for varying
durations.
In the year ended December 31, 2021, of the 21 contracts or extensions we entered into, 14 represented contract renewals
with the existing customer. Based on customer contracts in place as of December 31, 2021, 14 are scheduled to expire during 2022,
6
three during 2023, two in 2024 and nine in 2025 or later. As of December 31, 2021, our shortest remaining contract term was
approximately one month and the longest remaining contract term was nine years.
Customers are typically invoiced monthly, based on the dayrates applicable to the specific activities we perform on an
hourly basis, and have 30 to 60 day payment terms. Lump-sum contract preparation, capital upgrade and mobilization fees are
typically invoiced at the commencement or initial phase of the contract. Demobilization and termination fees are typically billed at
the completion of a contract if certain stipulated conditions are present. Some contracts also provide for price adjustments tied to
material changes in specific costs or variations in the average price of Brent crude oil or natural gas.
Our contracts provide for varying levels of indemnification for both us and our customers. We believe the terms of such
indemnification provisions are standard for the industry. In general, the parties assume liability for their respective personnel and
property. Our customers typically assume responsibility for, and indemnify us against, well control and subsurface risks under
dayrate contracts, which includes indemnifying us from any loss or liability resulting from pollution or contamination, including
clean-up and removal and third-party damages, arising from operations under the contract and originating below the surface of the
water, including as a result of blow-outs or cratering of the well. However, in certain cases, we may retain limited risk for damage
to customer or third-party property on our rigs and retain liability for third-party damages resulting from surface pollution or
contamination originating from our equipment. Additionally, we may have contractually agreed upon certain limits to our
indemnification rights and can be responsible for damages up to a specified maximum amount. We generally indemnify customers
for pollution that originates from our rigs that is within our control (e.g., diesel fuel or other fluids stored onboard for the use of the
rig). However, all contracts are individually negotiated, and the degrees of indemnification and/or risk retention can vary from
contract to contract, and prevailing market conditions and customer requirements, among other factors, existing when the contract
was negotiated can influence such contractual terms. In most instances in which we are indemnified for damages to the well, we
are obligated to re-drill the well at a reduced dayrate. However, in certain circumstances our customers may be financially or
otherwise unable to honor their contractual indemnity obligations to us and contractual indemnification may not prevent government
authorities or other third-parties from taking action against us or naming the Company in a lawsuit.
The interpretation and enforceability of a contractual indemnity depends upon the specific facts and circumstances
involved, as governed by applicable laws, and may ultimately need to be decided by a court or other proceeding, considering the
specific contract language, the facts and applicable laws. The law generally considers contractual indemnity for criminal fines and
penalties to be against public policy. Regardless of indemnification provisions, local jurisdiction regulations may require us to post
surety bonds, letters of credit and parent company guarantees for contract performance. In addition, certain jurisdictions in which
we operate, local customs and practice or governmental requirements necessitate the formation of joint ventures with local
participation. In certain jurisdictions, such customs and laws also effectively mandate establishment of a relationship with a local
agent or sponsor. When appropriate, we enter into agency or sponsorship agreements, in such jurisdictions. We are currently party
to five joint ventures, one in Malaysia, one in Indonesia, two in Nigeria and one in Angola. Although we may not control all aspects
of these joint ventures, we are an active participant in and are the primary beneficiary of each of these joint ventures. For more
information regarding joint ventures, see “Note 5 — Variable Interest Entities” to the Consolidated Financial Statements included
in “Item 8. Financial Statements and Supplementary Data”.
The above description of our customer contracts and indemnification provisions is a general summary of the types of such
provisions as of December 31, 2021 and does not contain sufficient details to fully understand our contractual and indemnification
risks. For additional information, including but not limited to a discussion of the risk that the indemnification provisions in our
contracts may not adequately mitigate our risks, see “Risk Management and Insurance” below and “Item 1A. Risk Factors”.
Strategy and Competitive Strengths
Our strategy is to maintain a sole focus on shallow water drilling services, leveraging decades of industry experience and
an outstanding track record to provide best-in-class operations for our customers. Our vision is to be the international jack-up
contractor of choice by delivering outstanding performance through our “fit-for-purpose” business strategy.
Our “fit-for-purpose” business strategy is focused on having the right assets in the right locations, operated by a right sized
organization with high national content and right sized policies, procedures and processes. This allows us to meet our customers’
specific needs in an efficient and cost effective manner.
We believe that the size of our fleet, coupled with the balance of premium, shallow draft and standard jack-ups, is well-
suited to provide the right asset for various customer requirements across our operating regions. Our fleet is well maintained and
our jack-up rigs have proven technologies and operating capabilities. We continuously evaluate and enhance our fleet with “smart
upgrades” where appropriate to meet specifications for the markets in which we intend them to operate. Additionally, we are able
to customize our rig equipment and operations to meet the specific technical needs of our customers, including for example the
unique specifications for plugging and abandonment of mature wells. In recent years, we have enhanced our active fleet through
the opportunistic acquisition of premium jack-up rigs complementary to our fleet and available at historically low acquisition prices.
From 2016 through 2020, we added nine premium jack-up rigs to our fleet at significantly lower prices than the historic cost of
construction for comparable newbuild rigs. Additionally, we have selectively sold rigs to improve the Company’s financial
flexibility and reduce the cost outlay for certain non-working assets and assets near the end of their useful lives. We believe our
actions to maintain and upgrade our fleet, customize our rigs to customer requirements and selectively acquire and dispose rigs
7
allows us to deploy a competitive fleet that can meet the needs of our customers. Our exclusive focus is on jack-up rig operations
in our four core operating regions of MENAM, Southeast Asia, India and West Africa, which allows us to deploy our assets to the
locations where they are needed. The concentration of our fleet of rigs in these key geographic markets allows us to maintain critical
mass and drive our significant market share in these operating regions. In addition, we have a significant presence in the Middle
East, Thailand, India and West Africa, where we believe development activities are generally characterized by low production costs,
low carbon intensity and short cycle times and will have relatively favorable rig supply and demand fundamentals in the coming
years.
We maintain a right sized organization with centralized and streamlined systems and processes geared to the specific needs
of our business and fleet. Our strategically positioned headquarters in Dubai is in close proximity to our core operating regions and
eliminates the need for numerous regional offices. Our centralized structure allows us to build local supply chain networks across
our geographies, standardize equipment across our fleet and centralize management of our supply chain and key maintenance
activities, all of which are key drivers of our industry leading low-cost structure. In addition, since our inception, we have focused
on building high national content through hiring and developing nationals from the countries in which we operate, including across
our leadership teams. These local hiring practices minimize the additional costs of bringing in expatriate workers, while enhancing
the stability of our operations and closely aligning our goals with the interest of the governments and customers where we work.
We believe that our low cost structure and high national content provide us with an advantage over our competitors.
We apply our “fit-for-purpose” business strategy in a way that is consistent with our fundamental ethical values and with
respect for individuals, the environment and society. We do this through our three strategic priorities and our three essential values.
Our three strategic priorities are as follows:
• Focus – Jack-up operations are our sole focus.
• Reliability – With safety and operational performance at the forefront of everything we do, we strive to create an
environment where no one gets hurt.
• Relationships – Our goal is to develop long-term and mutually beneficial relationships with customers and suppliers.
We provide development for our people to support their long-term career goals.
Our three essential values are as follows:
• Protect – Protect yourself, your team, your asset, and our environment.
• Lead – We conduct business ethically, with responsibility and accountability.
• Execute – We consistently deliver outstanding performance for our customers, owners, and other stakeholders.
We believe that our centralized structure and focus on jack-up rig operations has significantly contributed to the reliability
of our operations as seen through our emphasis on safety and operational performance. We had a TRIR of 0.16 for the year ended
December 31, 2021, which was 72% below the average of the International Association of Drilling Contractors (“IADC”). Our
safety track record has consistently exceeded the industry benchmark since inception. See also “Risk Management and Insurance”
below. Additionally, we achieved an average fleet uptime of 99.3% in 2021 and have consistently maintained an average fleet
uptime of at least 98.5% since our inception in 2012. Through ongoing training, appropriate incentive structures at all levels and
management oversight, we intend to continue improving our safety and operational performance as we strive to further reduce
workplace incidents.
We have well-established relationships with our customers, and we believe that our customers prefer to work with
contractors like us, who are well-established and have strong safety and operating uptime track records. We are responsive and
flexible in addressing our customers’ specific needs and seek collaborative solutions to achieve customer objectives. We also work
with our customers to improve efficiencies, which frequently results in rig operations being completed ahead of plan and ultimately
lowering the cost per well for our customers. Our ability to maintain relationships with, and to win repeat business from, our existing
customers is a competitive strength.
The members of our executive management team lead the organization with a commitment to ethical business practices,
responsibility and accountability and have been involved with the Company since our inception. Our four executive officers are
knowledgeable operations and finance executives with extensive experience in the global oil and natural gas industry with
approximately 120 years of collective industry and financial experience. They have held leadership positions at highly regarded
offshore drilling and oilfield services companies, including Schlumberger Ltd., Transocean Ltd., Noble Drilling plc and Wellstream
Holdings plc.
Our “fit-for-purpose” strategy is exemplified by our large and high-quality fleet, operated in our core geographic regions
by a right sized organization with centralized, low cost operations and high national content. We operate our business in accordance
with our strategic priories and values that focus on ethical business practices, safe and reliable operations and strong customer
relationships, which provides us with a strong competitive advantage and contributes to our contracting and operational success.
8
Risk Management and Insurance
Our operations are subject to hazards inherent in the drilling, completion, maintenance and decommissioning of shallow
water oil and natural gas wells. These hazards include, but are not limited to, blowouts, punch through, loss of control of the well,
abnormal conditions, mechanical or technological failures, seabed cratering, fires and pollution. These conditions can cause
personal injury or loss of life, pollution, damage to or destruction of the environment, property and equipment, the suspension of
operations, loss of revenues and could result in claims or investigations by regulatory bodies, customers, employees and others
affected by such events. In addition, claims for loss of oil or natural gas production and damage to formations can occur. If a
serious accident were to occur at a location where our services and equipment are being used, it could result in us being named as a
defendant in lawsuits asserting large claims and incurring costs and losses associated with such claims.
Despite our efforts to maintain high safety standards, from time-to-time, we have suffered accidents, and there is a risk that
we will experience accidents in the future. While we saw progress with a lower number of people hurt this year than any other since
inception, we were all saddened that one of our crew members died as a result of the injuries he sustained. The Company used this
tragedy to re-energize efforts towards achieving our ultimate goal where no one gets hurt. The frequency and severity of incidents,
and/or the level of any resulting compensatory payments, could adversely affect the cost of, or our ability to obtain liability, workers’
compensation and other forms of insurance and could negatively impact our operating costs and our relationships with regulatory
agencies, customers, employees and others. Such events and their impacts could have a material adverse effect on our financial
condition, results of operations and cash flows.
We maintain insurance coverage which we believe is customary in the industry, including general business liability, hull
and machinery, cargo, casualty and third-party liability insurance. Our insurance policies typically consist of twelve-month policy
periods, and the next renewal date for a substantial portion of our insurance program is scheduled for November 2022. Our insurance
policies may not be adequate to cover all losses and have deductibles, limits of liabilities and exclusions of coverage for certain
losses. Further, some pollution and environmental risks are generally not completely insurable. In addition, we may not be able to
maintain adequate insurance coverage or obtain insurance for certain risks at rates we consider reasonable and commercially
justifiable or with terms comparable to our current arrangements. Our fleet is insured for its estimated fair market value and we
periodically evaluate risk exposures, insurance limits and self-insured retentions. As of December 31, 2021, the insured value of
our fleet was $1.2 billion.
The above description of our insurance program is a general summary of the types of such policies in effect as of December
31, 2021 and does not contain sufficient details to fully understand our insurance risks. For additional information, including but
not limited to a discussion of the indemnification provisions in our customer contracts and the risk that our insurance policies may
not adequately mitigate our risks, see “Customers and Customer Contracts” above and “Item 1A. Risk Factors”.
Health, Safety and Environment
Consistent with our strategic priorities and core values, we are guided by the highest ethical standards and are firmly
committed to excellence in the fields of workplace health and safety, environmental sustainability, social responsibility and
responsible business conduct. At Shelf Drilling, the safety of our employees, contractors, customer representatives and other service
providers is our greatest responsibility. Our Health, Safety and Environment (“HSE”) Policy Statement lays the foundation for the
Company’s commitment and our employees’ obligations to maintain a safe and healthy work environment. Our Management and
employees are responsible for creating and working in an environment that results in an incident-free workplace where no one gets
hurt. All employees at Shelf Drilling are given the necessary training, tools and empowerment to be individually responsible for
the safety of themselves, their co-workers and the environment.
Shelf Drilling has implemented comprehensive HSE policies, processes and systems which are in line with industry best
practice. We place a high priority on managing the risks inherent in the offshore drilling industry and are committed to compliance
with the highest national and international health, safety, and environment (“HSE”) standards. Our integrated HSE Management
System is implemented throughout all offshore and onshore operations covering quality, health, safety and environmental principles
and objectives of our business. The system monitors our HSE performance and continuously improves the necessary safeguards to
protect our employees, assets, service providers and customers and to minimize our impact on the environment. We believe we are
an industry leader in HSE due to a commitment to develop, promote and sustain a culture which operates in a manner true to our
essential values, including to “protect yourself, protect your team, protect your asset and our environment”. We have implemented
comprehensive HSE processes, including a Corporate Operational Support Plan, Emergency Response Plans, Medical Evacuation
Response Plans and a major emergency management and safety leadership training program (based on a focused training matrix).
Senior management strives to provide strong, demonstrable leadership and commitment to HSE. Participation in specific meetings
with staff and contractors, joint management inspection visits and regular HSE audits all encourage a strong focus on HSE in the
workplace.
The anchors of our HSE culture are:
• Planning First – To achieve perfect execution, we must plan every task, no matter how small
• Time Out For Safety – All employees have the obligation to call a time out for safety
9
• Behavior-Based Safety Observations – Formal observations aimed at raising safety awareness and promoting
teamwork and accountability
• Management HSE Tours – Visible safety leadership through coaching and mentoring to empower employees and
support our safety culture
• Self-Audits and Debrief – Systematic approach to self-evaluation and continuous improvement
• Training – Developing our employees as safety leaders
In 2020, as a result of COVID-19, we implemented additional actions to help protect our employees. These included
remote working programs as well as social distancing policies at our headquarters and certain shore-based offices. Additional
quarantine and testing procedures were implemented for rig-based personnel, as well as limits on non-essential travel to the rigs.
These procedures include those required to comply with local laws and regulations and customer requirements. The Company has
rolled back some of these provisions in 2021 in accordance with local laws and regulations, including certain remote working
programs, as the need for such programs has been mitigated by vaccination, masking and testing programs. However, such programs
and practices may continue to change over time as the situation and recommendations of the global heath community continue to
evolve. Almost 100% of shore-based personnel and 98% of personnel on our offshore rigs have received at least two doses of an
approved COVID-19 vaccine. We track health, safety and environment performance on a monthly basis by way of a monthly HSE
report, tracking, trending and investigations which are stored in our “HSE dashboard” our custom designed safety database. SDL,
on behalf of all subsidiaries, is a member of the IADC and participates in its Incident Statistics Program. The Company’s total
absences due to sickness, including COVID-19, were minimal during the years ended December 31, 2021 and 2020.
Our operations are subject to numerous comprehensive environmental HSE laws and regulations in the form of
international conventions and treaties, national, state and local laws and various multi-jurisdictional regulations in force where our
rigs operate or are registered. We are also required to obtain HSE permits from governmental authorities for our operations. To
date, we have not incurred material costs to comply with environmental regulations. A failure to comply with applicable laws and
regulations may result in administrative and civil penalties, criminal sanctions, the suspension or termination of our operations or
other liabilities.
The following is a summary of certain applicable international conventions and other laws, which serve as examples of the
various laws and regulations to which we are subject. We believe that all our rigs are compliant in all material respects with all
HSE regulations to which they are subject. For a discussion on the possible effects of environmental regulation on our business,
see “Item 1A. Risk Factors”.
Greenhouse gas regulation
There is increasing attention worldwide concerning the issue of climate change and the effect of greenhouse gas emissions.
The 1992 treaty of the United Nations Framework Convention on Climate Change (“UNFCCC”) provides a foundation for the
global efforts to combat climate change. In 2005, the Kyoto Protocol to the 1992 UNFCCC became the first binding treaty under
international law to reduce greenhouse gas emissions. In 2015, the conference of the UNFCCC in Paris resulted in the creation of
the Paris Agreement. The Paris Agreement, which entered into force on November 4, 2016, requires countries to set “nationally
determined contributions” toward emissions reductions and includes a “global stocktake” or evaluation of collective progress made
toward share climate goals. The setting of nationally determined contributions and the global stocktake of progress occur every five
years beginning in 2020 and 2023, respectively. In October and November 2021, the UNFCCC met at the Glasgow Climate Change
Conference, where participating nations adopted the Glasgow Climate Pact. The pact contained various provisions such as funding
climate action in developing countries, a commitment to reducing the gap between existing emission reduction plans and the targets
needed to achieve stated goals and completion of the Paris Agreement rulebook. The rulebook provisions included reaching an
agreement governing the workings of carbon markets and concluding negotiations on the Enhanced Transparency Framework,
which provides the format for tracking and reporting targets and emissions.
While it is not possible at this time to predict how the Paris Agreement, the Glasgow Climate Pact and other new treaties
and legislations that may be enacted to address greenhouse gas emissions would impact our business, the modification of existing
laws or regulations or the adoption of new laws or regulations curtailing exploratory or developmental drilling for oil and gas could
materially adversely affect our operations by limiting drilling opportunities or imposing materially increased costs. Moreover,
incentives to conserve energy or use alternative energy sources could have a negative impact on our business if such incentives
reduce the worldwide demand for oil and natural gas or redirects resources to renewable energy alternatives.
United Nations’ International Maritime Organization (“IMO”) regulatory regime
The international conventions, laws and regulations of the IMO govern shipping and international maritime trade. IMO
regulations have been widely adopted by United Nations member countries, and in some jurisdictions in which we operate, these
regulations have been expanded upon. International conventions, laws and regulations applicable to our operations include the
International Convention for the Prevention of Pollution from Ships of 1973, as amended (“MARPOL”), the International
Convention on Civil Liability for Oil Pollution Damage of 1969, as amended (“CLC”), and the International Convention on Civil
Liability for Bunker Oil Pollution Damage of 2001, as amended (“BUNKER”) that impose compliance obligations and liability
related to the use, storage, treatment, disposal and release of petroleum products and hazardous substances. These laws govern the
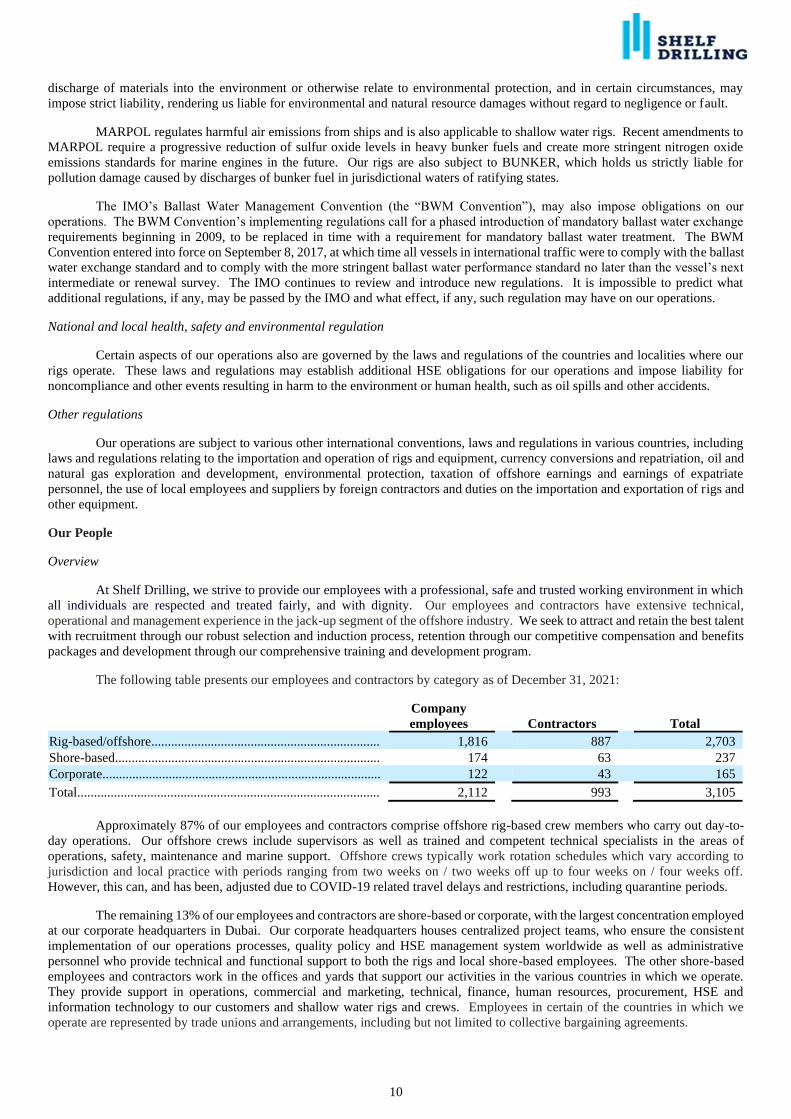
10
discharge of materials into the environment or otherwise relate to environmental protection, and in certain circumstances, may
impose strict liability, rendering us liable for environmental and natural resource damages without regard to negligence or fault.
MARPOL regulates harmful air emissions from ships and is also applicable to shallow water rigs. Recent amendments to
MARPOL require a progressive reduction of sulfur oxide levels in heavy bunker fuels and create more stringent nitrogen oxide
emissions standards for marine engines in the future. Our rigs are also subject to BUNKER, which holds us strictly liable for
pollution damage caused by discharges of bunker fuel in jurisdictional waters of ratifying states.
The IMO’s Ballast Water Management Convention (the “BWM Convention”), may also impose obligations on our
operations. The BWM Convention’s implementing regulations call for a phased introduction of mandatory ballast water exchange
requirements beginning in 2009, to be replaced in time with a requirement for mandatory ballast water treatment. The BWM
Convention entered into force on September 8, 2017, at which time all vessels in international traffic were to comply with the ballast
water exchange standard and to comply with the more stringent ballast water performance standard no later than the vessel’s next
intermediate or renewal survey. The IMO continues to review and introduce new regulations. It is impossible to predict what
additional regulations, if any, may be passed by the IMO and what effect, if any, such regulation may have on our operations.
National and local health, safety and environmental regulation
Certain aspects of our operations also are governed by the laws and regulations of the countries and localities where our
rigs operate. These laws and regulations may establish additional HSE obligations for our operations and impose liability for
noncompliance and other events resulting in harm to the environment or human health, such as oil spills and other accidents.
Other regulations
Our operations are subject to various other international conventions, laws and regulations in various countries, including
laws and regulations relating to the importation and operation of rigs and equipment, currency conversions and repatriation, oil and
natural gas exploration and development, environmental protection, taxation of offshore earnings and earnings of expatriate
personnel, the use of local employees and suppliers by foreign contractors and duties on the importation and exportation of rigs and
other equipment.
Our People
Overview
At Shelf Drilling, we strive to provide our employees with a professional, safe and trusted working environment in which
all individuals are respected and treated fairly, and with dignity. Our employees and contractors have extensive technical,
operational and management experience in the jack-up segment of the offshore industry. We seek to attract and retain the best talent
with recruitment through our robust selection and induction process, retention through our competitive compensation and benefits
packages and development through our comprehensive training and development program.
The following table presents our employees and contractors by category as of December 31, 2021:
Company
employees
Contractors
Total
Rig-based/offshore..................................................................... 1,816 887 2,703
Shore-based................................................................................ 174 63 237
Corporate.................................................................................... 122 43 165
Total........................................................................................... 2,112 993 3,105
Approximately 87% of our employees and contractors comprise offshore rig-based crew members who carry out day-to-
day operations. Our offshore crews include supervisors as well as trained and competent technical specialists in the areas of
operations, safety, maintenance and marine support. Offshore crews typically work rotation schedules which vary according to
jurisdiction and local practice with periods ranging from two weeks on / two weeks off up to four weeks on / four weeks off.
However, this can, and has been, adjusted due to COVID-19 related travel delays and restrictions, including quarantine periods.
The remaining 13% of our employees and contractors are shore-based or corporate, with the largest concentration employed
at our corporate headquarters in Dubai. Our corporate headquarters houses centralized project teams, who ensure the consistent
implementation of our operations processes, quality policy and HSE management system worldwide as well as administrative
personnel who provide technical and functional support to both the rigs and local shore-based employees. The other shore-based
employees and contractors work in the offices and yards that support our activities in the various countries in which we operate.
They provide support in operations, commercial and marketing, technical, finance, human resources, procurement, HSE and
information technology to our customers and shallow water rigs and crews. Employees in certain of the countries in which we
operate are represented by trade unions and arrangements, including but not limited to collective bargaining agreements.
11
Nationalization/Local Employment
Nationalization is one of the key tenets of our “fit-for-purpose” business strategy. Since our inception, we have focused
on building high national content through hiring and developing nationals from the countries in which we operate, including across
our leadership teams. This enables us to strengthen customer and governmental relationships, particularly with NOCs, and results
in a lower cost base as well as relatively lower employee turnover. In addition, through significant positive impacts on the local
economies including increased income and employment, our nationalization strategy directly supports our commitment to the United
Nations’ Sustainable Development Goals.
The following table shows the employee mix in our key markets as of December 31, 2021:
National employees
and contractors
MENAM........................................................................................................................ ...................................
.....
64.7% Southeast Asia......................................................................................................................... ........................... 93.6%
India........................................................................................................................ ............................................... 98.7%
West Africa..................................................................................................................................................... 95.1%
Diversity, Equal Opportunity and Labor and Human Rights
We are committed to equal opportunity employment for all employees and applicants for employment and welcome the
variety of experiences they bring to the Company. We recruit, hire, train, promote, and compensate without regard to race, color,
national origin, citizenship, religion, gender, sexual orientation, marital status, age, or any other category of persons to the extent
protected by applicable laws.
We are committed to establishing and maintaining a work environment in which all individuals are respected and treated
with dignity. We have a zero tolerance for discrimination or harassment in the workplace or any other work-related environment
which governs all terms, conditions and actions related to employment. We prohibit all harassment, including verbal, written, or
electronic dissemination of materials which are offensive or disparaging of others on the basis of race, color, national origin,
citizenship, religion, gender, sexual orientation, marital status, age, or any other category, whether the harassment is directed at a
subordinate, co-worker, supervisor, customer, agent, guest, contractor or vendor. We recognize that discrimination can be indirect
or unintentional and therefore strive to create awareness and educate our people in order to develop and maintain a truly inclusive
and high performing culture.
We respect labor rights as described in the fundamental conventions of the International Labor Organization, including
freedom of association and collective bargaining as well as freedom from forced and compulsory labor, child labor and
discrimination in respect of employment and occupation. We are committed to respecting and protecting labor rights as well as
fundamental human rights as described in the UN Guiding Principles on Business and Human Rights, both in our internal business
as well as those of our business partners, suppliers, customers and others who are directly affected by our activities. We are
committed to important issues such as non-discrimination, the right to privacy, employment contracts, protection against harassment
and management-employee collaboration. We engage with the relevant employee representative groups, which operate in certain
jurisdictions, and encourage active ongoing dialogue to ensure alignment of our collective interests.
Through our ongoing Speak Up initiative we encourage our employees and third-parties to ask compliance and ethics
questions, raise concerns and report any actual or suspected misconduct, unethical or illegal behavior, or violations to our code of
business conduct and its supporting policies or applicable laws, or seek advice on how to handle such situations. Shelf Drilling has
established various channels through which employees and third-parties, such as suppliers, agents, and business partners, can report
their concerns. The employees are always encouraged to talk openly and freely with their supervisors first or they can reach out to
the Head of Compliance and Ethics or the Executive Vice President. The Company has also made available the Shelf Drilling
EthicsPoint Helpline, which enables filing of confidential reporting of complaints, concerns and incidents either through the toll-
free multilingual telephone hotline or a web-based form. The helpline is operated 24/7 by an independent third-party provider to
help maintain confidentiality and, when requested, anonymity. A link to the helpline is also available on our website and intranet.
Training and Development
For all Company employees, we provide applicable training related to key Company policies and procedures covering
topics such as our code of business conduct, ethics, anti-corruption and conflicts of interest.
For offshore employees, we provide access to a comprehensive training and development program that enables employees
to progress from entry level positions through to the most-senior level on a rig. Employees acquire skills, knowledge and experience
following a highly structured training matrix that specifies the training required for each role and responsibility. This is channeled
into four main categories: on the job training, competency assessments, shore-based professional courses and regulatory and marine
licensing training courses. Employee progress toward the next level and compliance with defined training targets are tracked through
our online reporting system. Specific programs, such as the Offshore Development Program, aim to fast-track the promotion of
high potential offshore candidates. Regular reviews are held between the field and corporate management teams on an ad-hoc basis
12
and as part of a structured Annual Succession Planning process to ensure progress towards achieving the designated nationalization
objectives as well as the development of adequate bench strength for key positions.
For shore-based and corporate employees, development plans are specific to the individual, their current role and potential
future opportunities.
Operating Expenses, Capital Expenditures and Deferred Costs
Our business consists of providing services to our customers, often over multi-year service periods using a variety of
specialized and high-value rigs and related equipment. As such, our business is capital intensive, requiring significant expenditures
to purchase, operate, upgrade and maintain our fleet. Costs can be expensed, capitalized, or deferred depending on their specific
nature.
• Expensed – Operating costs and routine expenditures for minor asset replacements and repairs and maintenance that do not
increase the asset life or functionality are expensed as incurred. Additionally, mobilization and demobilization costs to
relocate rigs without binding commitments are expensed when incurred.
• Capitalized – Capital expenditures include the cost of acquiring or constructing our property and equipment, which
primarily consists of rigs and equipment. Expenditures for purchases, additions, improvements and substantial
enhancements, are capitalized along with other costs to bring the asset to the condition and location necessary for its
intended use. Capital expenditures are included in property and equipment and are depreciated over the estimated useful
life of the asset.
• Deferred – Certain expenditures associated with contract preparation, mobilization, regulatory inspections and major
equipment overhauls that are expected to be recoverable are deferred. Deferred costs are included in other current assets
and other long-term assets on the consolidated balance sheets and are amortized on a straight-line basis over either the firm
contract term or the period until the next planned similar expenditure is made or for a period of five years for major
equipment overhauls, as appropriate.
See “Note 2 – Significant Accounting Policies” to the Consolidated Financial Statements included in “Item 8. Financial
Statements and Supplementary Data” for further discussion of our operating expenses, deferred costs and property and equipment,
net.
In conducting our business, we incur operating costs and expenses, which consist primarily of operating and maintenance
expenses. Our operating and maintenance expenses can be classified as rig related or shore-based.
Rig-related expenses are directly related to the operation of our rigs and include:
• Rig personnel expenses – These expenses consist of compensation, transportation, and training costs, as well as
catering costs while the crews are on the rig. Such expenses vary by type of rig and from country-to-country reflecting
the number of employees, the percentage of expatriate and national employees, local market rates, unionized trade
arrangements and local regulatory requirements regarding payroll related taxes and charges, social security or similar
programs and end of service benefits.
• Rig maintenance expenses – These consist of expenses related to operating and maintaining our rigs, other than
personnel costs, such as the cost of repairs and maintenance, consumables and other costs, including the associated
freight and customs duties.
• Other rig-related expenses – These expenses include all remaining operating expenses such as insurance, professional
services, short-term equipment rentals, mobilization and demobilization costs and other miscellaneous costs.
Shore-based expenses include costs incurred by local shore-based offices in direct support of our rigs and operations in
each associated jurisdiction and include the costs of shore-based personnel and facilities.
Our general and administrative expenses primarily include expenses related to our corporate headquarters in Dubai and
personnel costs including compensation, benefits and share-based compensation related to our centralized projects teams and
administrative departments. Centralized projects teams include HSE, marine operations, engineering, electrical, maintenance,
supply chain and other technical and functional process experts. Administrative departments include executive management, legal,
finance and accounting, human resources, information technology and other support departments. Expenses also include directors’
fees, provision for credit losses, and other general and administrative costs.
13
Item 1A. Risk Factors.
Summary of Principal Risk Factors
Users of this Form 10-K Equivalent should carefully consider the following risk factors in addition to the other information
included in this document. Each of these risk factors could affect one or more of the following: our business, financial condition,
results of operations and cash flows, and could also affect an investment in our Company. Our principal risk factors include risks
related to our business and industry and risks related to our structure, which may differ from risks affecting other companies, as well
as general risk factors that affect most businesses. The following is a summary of our principal risk factors.
Risks Related to our Business and Industry
• Our business largely depends on the level of activity in the shallow water drilling industry, which is significantly affected
by volatile oil and natural gas prices that drive activity in the oil and natural gas exploration and production industry.
• The industry has been historically competitive, cyclical and subject to price competition. If we are unable to compete
successfully with our competitors, we may be materially adversely impacted.
• Public health issues, including epidemics and pandemics such as COVID-19 have had and may continue to have significant
adverse consequences including significantly reduced demand for our services, which may result in a material adverse
impact on our financial condition, results of operations and cash flows.
• Our future business performance depends on our ability to renew contracts with existing customers and secure new
contracts for our fleet of rigs.
• If customers reduce activity levels, terminate, suspend or seek to renegotiate contracts, or if market conditions dictate that
we enter into contracts with unfavorable terms or increased risks, we may be materially adversely impacted.
• Our future contracted revenue, or backlog, may not ultimately be realized.
• The duration of our contracts may subject us to certain additional risks.
• We rely on a relatively small number of customers for a substantial portion of our current and future revenues.
• Our purchase of existing jack-up rigs carries risks associated with the condition and quality of those rigs.
• Newbuild rig projects and reactivation of stacked rigs, as well as upgrade, refurbishment and repair projects are subject to
various risks, which could cause delays or cost overruns.
• If we were to commit to acquire, construct or lease rigs or reactivate any of our stacked rigs prior to obtaining a customer
contract, we could be exposed to a number of risks.
• We may be unable to successfully obtain and integrate additional rigs on economically acceptable terms, or at all, which
may adversely affect the Company and our future growth.
• We may not be able to keep pace with technological developments and make adequate capital expenditures in response to
newer and/or higher specification rigs or more fuel efficient/low-emission rigs being deployed within the industry and
therefore our fleet may not satisfy the requirements of some customers.
• Climate change, the regulation of greenhouse gases and increasing development of renewable energy alternatives could
have a negative impact on our industry, business and/or reputation.
• Compared to companies with greater resources, we may be at a competitive disadvantage.
• There may be limits to our ability to mobilize drilling rigs between geographic areas, and the duration, risks and associated
costs of such mobilizations may be material to our business.
• The fair market value of our long-lived assets, including our drilling rigs and any rigs we acquire in the future, may decrease,
which could result in impairments or cause us to incur a loss on the sale of such assets.
• Supplier capacity constraints or shortages in parts or equipment, supplier production disruptions, supplier quality and
sourcing issues or price increases could increase our operating costs, decrease our revenues and adversely impact our
operations.
• Our labor costs and the operating restrictions that apply to us could increase as a result of collective bargaining negotiations
and changes in labor laws and regulations.
• Our business involves numerous operating hazards; our insurance and contractual indemnity rights may not be adequate to
cover any losses resulting from accidents and other events and our insurance may become more expensive or may become
unavailable in the future.
• Our international operations in the shallow water drilling sector involve additional risks, which could adversely affect our
business.
• Any failure to comply with the complex laws and regulations governing international trade, including import, export, anti-
corruption, economic sanctions and embargoes could adversely affect our operations.
• We are subject to complex laws and regulations, including environmental laws and regulations that can adversely affect
the cost, manner or feasibility of doing business.
• If we or our customers are unable to acquire or renew permits and approvals required for drilling operations, we may be
forced to suspend or cease our operations, which may adversely affect our profitability.
• The imposition by customers and/or governments in certain countries related to minimum local content, or local content
programs or quotas may subject us to additional requirements and risks.
• Our existing indebtedness imposes significant operating and/or financial restrictions on us that may prevent us from
pursuing certain business opportunities and restrict our ability to operate our business.
14
• We are dependent upon cash flows from our operating subsidiaries to meet our obligations, including repayment of our
debt. Our corporate structure and operations in multiple jurisdictions may impose limitations on the transfer of funds. If
we become unable to pay our interest or debts as they become due or to obtain further credit, we may become subject to
insolvency proceedings.
• To service and refinance our indebtedness, fund our capital and liquidity needs or pay any dividends, we may not generate
sufficient cash or have access to sufficient funding.
• We rely on proper functioning of our computer and data processing systems that must be regularly updated or replaced,
and a large-scale malfunction could result in material adverse disruptions to our business.
• Developing and expanding data security and privacy requirements could increase our operating costs, and any failure by
us or our vendors to maintain the security of certain customer, employee and business-related information could result in
damage to our reputation, be costly to remediate and result in regulatory action.
• We depend heavily upon the security and reliability of our technology systems and those of our service and equipment
vendors, and such systems are subject to cyber-security risks and threats.
• Technology disputes could negatively impact our operations or increase our costs.
• Fluctuations in exchange rates and non-convertibility of currencies could result in losses to us.
• If any part of our business is moved outside of its current operative jurisdiction our overall tax exposure may change, which
may affect our alleged compliance with applicable tax laws.
Risks Related to our Structure and Ownership of our Common Stock
• We are exposed to regulatory and enforcement risks regarding taxes. U.S. tax authorities may treat us as a passive foreign
investment company, causing potential adverse U.S. federal tax consequences to our U.S. shareholders.
• Subsequent to our initial public offering in 2018, we are subject to both Cayman Islands regulatory requirements and the
requirements applicable for Companies listed on the Oslo Stock Exchange, and any subsequent changes to these
requirements, and, as such, we may be subject to review by the relevant authorities.
• Shareholder rights and responsibilities will be governed by Cayman Islands law and will differ in some respects from the
rights and responsibilities of shareholders under other jurisdictions, including Norway and the U.S., and our shareholder
rights under Cayman Islands law may not be as clearly established as shareholder rights under the laws of other jurisdictions.
• Certain of our shareholders own a significant proportion of our common shares, and their interests may conflict with those
of ours or other shareholders.
• In the recent past, we have not paid any dividends on our common shares, our ability to pay dividends is subject to certain
restrictions and the availability and timing of future dividends, if any, is uncertain, which could influence the price of our
common shares.
• Future issuances of our common shares or other securities could dilute the holdings of holders of our common shares and
could materially affect the price of our common shares, and preemptive rights are not available to holders of our common
shares.
• Future sales, or the possibility of future sales of a substantial number of our common shares could affect the market price
of our common shares.
• Exchange rate fluctuations could adversely affect the value of our common shares and dividends paid on the common
shares, if any, for an investor whose principal currency is not U.S. dollars.
• The transfer of our common shares and their underlying assets is subject to restrictions under the securities laws of the U.S.
and other jurisdictions.
• Investors could be unable to recover losses in civil proceedings in jurisdictions other than the Cayman Islands and Norway.
• Investors may face additional risks related to our common shares due to the VPS Registrar, the Registrar Agreement and
the recently implemented EU Central Securities Depository Regulation.
General Risk Factors
• We are exposed to the credit risks of our key customers and certain other third parties.
• We are dependent on our senior management team, other key employees and Directors of our Board, and the business
could be negatively impacted if we are unable to attract and retain personnel necessary for our success.
• We are dependent on the availability and retention of skilled personnel, which may be adversely affected by increases in
labor costs.
• We may be subject to litigations and disputes that could have a material adverse impact on our business, financial condition,
results of operations and cash flows.
• Any relevant change in tax laws, regulations, or treaties, and relevant interpretations thereof, for any country in which we
operate, earn income, generate losses or are considered to be a tax resident, and/or the loss of any major tax dispute, or a
successful challenge to our intercompany pricing policies or operating structures could have an adverse impact.
• We are subject to laws and regulations in several jurisdictions, and failure to properly comply with such laws and
regulations may adversely affect our operations.
• The price of our common shares could fluctuate significantly.
Please see below for a more detailed description of the risks affecting our Company.
15
Risks Related to our Business and Industry
Our business largely depends on the level of activity in the shallow water drilling industry, which is significantly affected by
volatile oil and natural gas prices that drive activity in the oil and natural gas exploration and production industry.
The level of activity of the offshore oil and natural gas industry is cyclical, volatile and impacted by oil and natural gas
prices. Oil and natural gas prices are unpredictable and are affected by numerous factors beyond our control, including the
worldwide demand for oil and natural gas and worldwide production of oil and natural gas.
Worldwide demand for oil and natural gas is impacted by:
• global economic growth and the health of the global economy, including financial instability or recessions;
• the occurrence or threat of epidemic or pandemic diseases and any related business and government responses;
• technical advances and increased adoption of alternative and renewable energy sources;
• technological improvements that improve energy efficiency and reduce consumption and the development and
exploitation of alternative fuels.
Worldwide production of oil and natural gas is impacted by:
• expectations regarding future energy prices;
• the cost of exploring for, developing, producing and delivering oil and natural gas;
• advances in exploration, development and production technologies;
• the discovery rate of new oil and gas reserves and their locations;
• increased supply of oil and gas resulting from growing onshore hydraulic fracturing activity and shale development;
• the diversification of IOCs and the shifting of budget allocations away from traditional oil and gas exploration and
development projects into renewable energy and other non-core business projects;
• the ability of the Organization of Petroleum Exporting Countries (“OPEC”) to set, comply and maintain production
levels and pricing and the level of production in non-OPEC countries;
• merger and divestiture activity among oil and gas producers;
• weather conditions, including natural disasters;
• the availability of, and access to, suitable locations from which our customers can explore and produce hydrocarbons
and available pipeline and other oil and gas transportation capacity;
• tax laws, regulations and policies or speculation regarding future laws or regulations, including the policies and
regulations of various governments regarding exploration and development of their oil and natural gas reserves;
• activities by non-governmental organizations to restrict the exploration, development and production of oil and natural
gas so as to reduce the potential harm to the environment from such activities, including emission of carbon dioxide, a
greenhouse gas and
• the worldwide political and military environment, including uncertainty or instability resulting from an escalation or
additional outbreak of armed hostilities or other crises in the Middle East, Russia or other geographic areas or further
acts of terrorism in the regions in which we operate, or elsewhere.
There is no guarantee that prices, and the corresponding demand for our services and dayrates we can charge, will improve,
remain at the current levels or not decline in the future. Significant declines in global oil and natural gas prices and sustained periods
of low prices typically cause a reduction in the exploration, development and production activities of most of our customers and
their spending on our services. Oil and natural gas companies’ capital expenditure budgets are dependent on cash flows from such
activities and are therefore sensitive to changes in energy prices and cuts in their spending curtail drilling programs, reducing the
demand for our services, the rates we can charge and the utilization of our rigs, which can have a material adverse effect on our
business, financial condition, results of operations and cash flows.
The industry has been historically competitive, cyclical and subject to price competition. If we are unable to compete successfully
with our competitors, we may be materially adversely impacted.
Historically, the shallow water drilling industry has been cyclical with periods of high demand, limited supply and high
dayrates alternating with periods of low demand, excess supply and low dayrates. Periods of low demand and excess supply
intensify competition in the industry and may result in some drilling rigs being stacked or earning substantially lower dayrates for
long periods of time. We have idled and stacked rigs in response to market conditions and may idle and stack additional rigs in the
future, and such rigs may not return to service in the near term or at all. In addition, we have in the past and may in the future enter
into lower dayrate drilling contracts in response to market conditions which reduces the revenues we earn from such contracts. The
offshore drilling industry is also influenced by volatile oil and natural gas prices that drive activity in the oil and natural gas
exploration and production industry, as discussed above. Prolonged periods of low utilization and dayrates, as well as extended
16
periods when rigs are stacked, could reduce demand for our services and materially adversely affect our revenues, financial condition,
results of operations or cash flows.
The shallow-water drilling industry in which we operate is extremely competitive with numerous industry participants, and
contracts have traditionally been awarded on a competitive bid basis. Price competition is frequently a major factor in determining
a contract award. Customers may also consider unit availability and location, operational and safety performance records and age,
condition and suitability of equipment. In addition, if our competitors enter into joint venture agreements with some of our largest
customers, this could make it more difficult for us to obtain additional contracts from these customers. Competition for offshore
rigs is typically global, as drilling rigs are mobile and may be moved from areas of low utilization and dayrates to areas of greater
activity and corresponding higher dayrates. Costs connected with relocating drilling rigs for these purposes are sometimes
substantial and are generally borne by the contractor. The over-supply of marketed jack-up rigs, which can be increased by new
rigs under construction or reactivation of stacked rigs, increases competition and can lead to lower dayrates. The inability to compete
successfully with our competitors could have a material adverse effect on our revenues, results of operations and cash flows.
Public health issues, including epidemics and pandemics such as COVID-19 have had and may continue to have significant
adverse consequences including significantly reduced demand for our services, which may result in a material adverse impact
on our financial condition, results of operations and cash flows.
The existence of the novel coronavirus (“COVID-19”) was confirmed in early 2020 and spread to countries worldwide,
causing disruptions to businesses and economic activity globally. The collapse in the demand for oil caused by this unprecedented
global health and economic crisis, coupled with oil oversupply, had a material adverse impact on the demand for our services. These
effects have included adverse effects on revenues and net income; disruptions to our operations, including restrictions on crew
change travel; customer shutdowns of oil and gas exploration, development and production; supply chain and vendor activity
disruptions; employee impacts from illness, school closures and other community response measures, which may cause prolonged
absences of personnel who may be difficult or impossible to replace; and temporary closures of our facilities or the facilities of our
customers and suppliers. Several of our contracts were early terminated, suspended, shortened or renegotiated which adversely
impacted our business.
Additionally, these market and industry conditions placed significant pressure on the liquidity and solvency of many
offshore drilling contractors, leading them to pursue restructuring transactions or reorganizations under bankruptcy laws. These
transactions could have a material impact on the capital structure and competitive dynamics among offshore drilling companies,
which could negatively impact our ability to compete in the industry.
In 2021, the impact of the global rollout of approved COVID-19 vaccines resulted in the reduction of travel restrictions
and the gradual reopening of economies. This helped drive an increase in demand for oil and natural gas and optimism for a return
to pre-pandemic normalcy.
The extent to which our operating and financial results are affected by emerging or resurgent epidemic or pandemic diseases
or viruses and continue to be affected by COVID-19 is dependent on various factors and consequences beyond our control, such as
the duration and scope of the health crisis and the related responses by businesses and governments, particularly within the
geographic locations where we operate, as well as the speed and effectiveness of these responses, including the effectiveness and
the timeliness of vaccinations and treatments. Public health issues and the volatile global economic conditions stemming from such
widespread health crisis, has aggravated and could continue to aggravate certain other risk factors affecting our business.
Our future business performance depends on our ability to renew contracts with existing customers and secure new contracts
for our fleet of rigs.
Our ability to secure contract renewals where we are the incumbent rig provider, and to win tenders for new contracts is
affected by a number of factors both within and outside of our control. Negotiations and tenders can be impacted by various factors
including market conditions, rig specifications, safety record requirements, competition and governmental approvals required by
customers. While our preference is generally to renew contracts with our existing customers, if the customer decides not to renew
its contract, we then seek to secure a new customer contract for that rig. While we actively market our rigs prior to the expiry of
their existing contracts, there can be no assurance that we will be able to renew or extend existing contracts or secure new
arrangements before the original contract lapses. Re-contracting a rig may involve participation in either a direct renegotiation with
the customer or in a new tender process.
If we are unable to renew contracts or we are not selected for new contracts, or if the contracts we enter into are delayed,
workflow may be interrupted and our business, financial condition and results of operations may be materially adversely affected.
Based on 28 customer contracts in place as of December 31, 2021, 14 are scheduled to expire before December 31, 2022, three are
scheduled to expire during 2023, with a further 11 contracts scheduled to expire at times subsequent to December 31, 2023. Failure
to renew a contract could lead to a rig being stacked and/or having to enter into a new contract at lower dayrates, shorter terms or
in other geographical areas and could materially adversely affect our revenues, financial condition, results of operations and cash
flows.
17
If customers reduce activity levels, terminate, suspend or seek to renegotiate contracts, or if market conditions dictate that we
enter into contracts with unfavorable terms or increased risks, we may be materially adversely impacted.
Customers may seek to renegotiate, suspend or terminate their contracts, and during periods of unfavorable market
conditions, including low oil and natural gas prices and over-supply of rigs, we are subject to an increased risk of our customers
taking such actions. Certain of our customers may have the right to suspend or terminate contracts without limitations. Additionally,
certain contracts may contain clauses allowing for termination due to downtime or operational problems above the contractual limits,
safety-related issues, if the drilling rig is not delivered to the customer within the specified time period or in other specified
circumstances, which may include events beyond our control. Some of these contracts may require us to pay penalties, which could
be material. Certain of our contracts provide for cancellation at the option of the customer upon payment of a penalty to us, which
may not fully compensate us for the loss of the contract. Early termination of a contract may result in a drilling rig being idle for
an extended period of time. Customers without favorable termination language may seek to renegotiate existing contracts, including
for some of the termination reasons described above. During periods of unfavorable market conditions, a customer may no longer
need a rig that is under contract or may be able to obtain a comparable rig at a lower dayrate. As a result, customers may seek to
renegotiate the terms of their existing contracts to shorten the length of the contract or lower the dayrate or customers may seek to
suspend, terminate or otherwise avoid their obligations under those contracts.
Currently, our drilling contracts are dayrate contracts, where we charge a fixed rate per day regardless of the number of
days needed to drill the well. While we plan to continue to perform services on a dayrate basis, market conditions may dictate that
we enter into contracts that provide for payment based on a footage basis, where we are paid a fixed amount for each foot drilled
regardless of the time required or the problems encountered in drilling the well, or enter into turnkey contracts whereby we agree to
drill a well to a specific depth for a fixed price and bear some of the well equipment costs. These types of contracts would expose
us to greater risk than dayrate contracts, as we would be subject to downhole geologic conditions in the well that cannot always be
accurately determined and subject us to greater risks associated with equipment and downhole tool failures. Exposure to these risks
may result in significant cost increases or may result in a decision to abandon a well project and forfeit the associated revenues.
Any successful efforts by our customers to reduce activity levels, terminate, suspend, or renegotiate contract terms and any
changes in our contracts that subject us to unfavorable terms and increased risks could have a material adverse effect on our revenues,
financial conditions, results of operations and cash flows.
Our future contracted revenue, or backlog, may not ultimately be realized.
The contract backlog relating to our rigs was approximately $1.7 billion as of December 31, 2021. The amount of contract
backlog does not necessarily indicate future earnings, and the contract backlog may be adjusted up or down depending on various
factors both within and outside of our control.
The contract drilling dayrate used in the calculation of contract backlog may be higher than the actual dayrate we ultimately
receive. Actual dayrates earned may be lower than the standard operating dayrate, and may consist of alternative dayrates such as
a waiting-on-weather rate, repair rate, standby rate, force majeure rate or moving rate. The contract drilling dayrate may also be
higher than the actual dayrate earned because of factors resulting in lost dayrate revenue, including scheduled or unscheduled rig
downtime or suspension of operations. Additionally, renegotiation of dayrates or contracts that provide for periodic adjustments of
contract dayrates, including those linked to oil or natural gas prices, may cause a difference in actual revenues as compared to
contract backlog.
The days of backlog revenue used in the calculation of contract backlog may also be higher or lower than the actual number
of days the rig earns a dayrate. The number of days can be extended due to contract extensions or the exercise by the customer of
extension options or the award of new contracts. Contract provisions that allow the customer to extend the term of the contract to
finish drilling a well in progress can also result in an increase, as this additional time is not included in the calculation of the contract
backlog. Early cancellation of existing contracts (for which we may not be entitled to compensation or notice), failure by customers
to complete existing contracts, unscheduled downtime, or the unavailability of rigs and equipment to fulfill a contract may result in
a lower than expected number of contract days.
Any changes in the dayrate and number of days used to calculate contract backlog could result in materially lower revenues
than indicated by the contract backlog.
The duration of our contracts may subject us to certain additional risks.
Our contracts with our customers contain negotiated terms, including dayrates, which are determined at the time when
contracts are negotiated. In periods of rising demand for shallow water rigs, customers with reasonably definite drilling programs
would typically prefer long-term contracts in order to maintain dayrates at a consistent level. Conversely, in periods of decreasing
demand for shallow water rigs, customers generally would prefer well-to-well or other short-term contracts that would allow the
customer to benefit from the decreasing dayrates. Additionally, oil and natural gas companies tend to reduce activity levels quickly
in response to declining oil and natural gas prices and may be unwilling to commit to long-term contracts during such periods.
Short-term contracts provide additional exposure to changing dayrates, as subsequent contracts will likely be negotiated at
new prevailing dayrates and do not provide long-term revenue stability. Long-term contracts limit our ability to benefit from rising
18
dayrates while limiting our risk to falling dayrates but provide for a longer-term source of revenues. However, revenues from long-
term contracts are not guaranteed. We may not be able to renew long-term contracts that preserve dayrates and utilization, or our
customers may seek to renegotiate lower dayrates under their existing long-term contracts with us. Unfavorable changes in dayrates
or failure to obtain new contracts or renew existing contracts could have a material adverse effect on our revenues, financial
condition, results of operations and cash flows.
Generally, short-term contracts can be less profitable as fixed costs related to contract preparation and rig movements
benefit the Company over a shorter contract period, while long-term contracts allow for a longer period over which these costs
provide benefit. Contract preparation expenses vary based on the scope and length of contract preparation required. Additionally,
if our rigs incur idle time between contracts, we typically do not remove personnel from those rigs because we utilize the crew to
prepare the rig for its next contract. Moreover, as our rigs are mobilized from one geographic location to another, the labor and
other operating and maintenance costs can vary significantly.
The oil and natural gas market can also affect our costs and the timing and amount of payments earned from contracted
dayrates may differ from actual changes in costs. Our costs tend to increase as the business environment for our services improves
and demand for oilfield equipment and skilled labor increases. During times of reduced activity, reductions in costs may not be
immediate as portions of the crew may be required to prepare our rigs for stacking, after which time the crew members are assigned
to active rigs or dismissed. In general, labor costs increase primarily due to higher compensation levels, inflation and these costs
can also be affected by exchange rate fluctuations. Equipment maintenance expenses fluctuate depending upon the type of activity
the rig is performing and the age and condition of the equipment.
Any increases in costs associated with our contracts could have a material adverse effect on our financial condition, results
of operations and cash flows.
We rely on a relatively small number of customers for a substantial portion of our current and future revenues.
Our customer base includes NOCs and IOCs, together with a small number of independent oil and gas companies. The
drilling industry is subject to the usual risks associated with having a limited number of customers. Our top three customers
accounted for 94% of contract backlog and 72% of revenues for the year ended December 31, 2021. Our business, financial
condition, results of operations and cash flows could be materially adversely affected if any of these customers were to reduce their
contractual commitments to us or suspend or withdraw their approval for us to provide services for them.
Our growth is also closely connected to the growth in activity of our customers and our results may be impacted if certain
key customers were to significantly reduce their growth strategy. Furthermore, if any of our major customers failed to compensate
us for our services, terminated contracts, failed to renew existing contracts or refuse to enter into new contracts with us, or if a
customer were unable to perform due to liquidity or solvency issues, and similar contracts with new customers were not forthcoming,
our revenues, financial condition, results of operations and cash flows would be materially adversely affected.
Our purchase of existing jack-up rigs carries risks associated with the condition and quality of those rigs.
We have acquired, and may acquire in the future, existing jack-up rigs as a way of renewing and expanding our fleet.
Unlike newbuild rigs, existing rigs typically do not carry warranties with respect to their condition. While we generally inspect any
existing rig prior to purchase, such an inspection would normally not provide us with as much knowledge of its condition as if the
rig had been built for us and operated by us during its life. Repairs and maintenance costs for existing rigs are difficult to predict
and may be more substantial than for rigs that we have operated since they were built. In addition, we may not be able to obtain
indemnification and warranties from the sellers for any rigs that we acquire. These costs could adversely affect our results of
operations and cash flows.
Newbuild rig projects and reactivation of stacked rigs, as well as upgrade, refurbishment and repair projects are subject to
various risks, which could cause delays or cost overruns.
We have in the past and could in the future increase the size of our fleet through the purchase, lease or construction of
newbuild rigs. In addition, we may choose to reactivate rigs which may be stacked in the future.
We incur upgrade, refurbishment and repair expenditures for our fleet from time to time, including when upgrades are
required by industry standards and/or by law. Such expenditures are also necessary in response to requests by customers, inspections,
regulatory or certifying authorities or when a rig is damaged. We also regularly make certain upgrades or modifications to our
drilling rigs to meet customer or contract specific requirements.
The construction or outfitting of purchased newbuild rigs or reactivation of stacked rigs and upgrade, refurbishment and
repair projects are subject to project management execution risks of delay and cost overruns inherent in any large construction
project from numerous factors, including:
• project management and execution risk;
• unexpectedly long delivery times for, unexpected costs or shortages of, key equipment, parts and materials;
• unforeseen increases in the cost of equipment, labor and raw materials, particularly steel;
19
• unforeseen design and engineering problems;
• shortages of skilled labor and other shipyard personnel necessary to perform the work;
• labor disputes and work stoppages at the shipyard;
• latent damages to or deterioration of hull, equipment and machinery in excess of engineering estimates and assumptions;
• unanticipated actual or purported change orders (scope creep);
• HSE accidents/incidents or other safety hazards;
• failure or delay of third-party service providers;
• disputes with the constructing shipyard or other suppliers;
• last minute changes to the customer’s specifications;
• failure or delay in obtaining acceptance of the rig by our customer;
• financial or other difficulties at shipyards;
• adverse weather conditions or any other force majeure events;
• inability or delay in obtaining flag-state, classification society, certificate of inspection, or other regulatory approvals or
permits and
• mobilization between the shipyard and the contract operating site, including any restrictions on the movement of personnel.
Failure to complete a newbuild, reactivation, upgrade, refurbishment or repair project on time may result in the delay,
renegotiation or cancellation of an existing contract and could put at risk the planned arrangements to commence operations on
schedule. Further, significant delays could have a negative impact on our reputation and customer relationships. We also could be
exposed to contract termination or penalties for failure to complete the project and commence operations in a timely manner. In
addition, our rigs undergoing upgrade, refurbishment or repair generally do not earn a dayrate during the period they are out of
service. Significant cost overruns or delays, loss of reputation, penalties, and failure to minimize lost dayrates could all have a
material adverse effect on our revenues, financial condition, results of operations and cash flows.
If we were to commit to acquire, construct or lease rigs or reactivate any of our stacked rigs prior to obtaining a customer contract,
we could be exposed to a number of risks.
We have in the past, and may in the future, choose to acquire a newbuild or existing rig, lease a rig or reactivate a stacked
rig speculatively, without first obtaining a customer contract. Absent a firm customer contract, we may not be able to secure
arrangements for these rigs in a timely manner on economically acceptable terms, if at all. Failure to obtain a customer contract
could result in the impairment of certain long-lived assets or expensing of costs which would typically be deferred. Failure to
contract such rigs on acceptable terms or in a timely manner could adversely affect our business, financial position, results of
operations and cash flows.
We may be unable to successfully obtain and integrate additional rigs on economically acceptable terms, or at all, which may
adversely affect the Company and our future growth.
Part of our strategy to grow the business is dependent on our ability to successfully obtain and integrate additional rigs,
including acquired newbuild and existing rigs and leasing rigs, to generate additional revenues. The consummation and timing of
obtaining additional rigs will depend upon, among other things, the availability of attractive targets in the marketplace, our ability
to negotiate acceptable agreements, our ability to obtain financing on acceptable terms and our ability to integrate any assets and
operations into our fleet. We may not be able to consummate any future acquisition or lease, which may limit our future growth,
and such agreements may not achieve the benefits we seek.
Further, obtaining and integrating additional rigs could expose us to a number of risks, for which we may be unable to
obtain sufficient indemnification and warranties to mitigate, including:
• incorrect assumptions regarding the future results of such rigs or expected cost reductions or other synergies expected to
be realized as a result of obtaining rigs;
• incorrect assumptions about the cost to operate such rigs, including repairs and maintenance costs;
• failing to integrate assets and operations successfully and timely;
• undetected defects, particularly when acquiring or leasing existing rigs for which condition and operating history may be
difficult to determine;
• diversion of management’s attention from existing operations or other priorities and
• unforeseen consequences or other external events beyond our control.
Leasing rigs may expose us to additional risks. Outfitting leased rigs may require significant operation readiness projects
to make the leased assets suitable for use, which is subject to the same risks as newbuild rigs and reactivation of stacked rigs, as
discussed above. We may make significant investments in leased assets, which are owned by the lessor, and which would only
benefit us during the term of the leases. As lease terms can be significantly shorter than the life of the leased rigs, any costs would
have to be expensed over a shorter period and, as a result, could have a greater impact on our profitability. Additionally, we may
be unable to renew such leases, exercise purchase options or negotiate the purchase of leased rigs on terms acceptable to us, or at
all. Lease agreements may also require us to maintain the leased rigs, exposing us to risks of increased repairs and maintenance
20
costs, or to expend certain costs to return the rig to the owner at the termination of the lease. These factors could materially adversely
affect our financial position, results of operations and cash flows.
We may not be able to keep pace with technological developments and make adequate capital expenditures in response to newer
and/or higher specification rigs or more fuel efficient/low-emission rigs being deployed within the industry and therefore our
fleet may not satisfy the requirements of some customers.
The market for our services is characterized by technological developments which result in improvements in the
functionality and performance of rigs and equipment. Customers may require higher specification rigs, other classes of rigs with
different capabilities or the ability to operate in different environments, such as deep water. Customers may demand the services of
newer rigs, and may in the future impose restrictions on the maximum age of contracted rigs. Additionally, in response to climate
change, more fuel efficient or low-emission rigs may be introduced or may become standard in the industry or customers may
institute stricter requirements such as specifications for rig design, emissions output or chemical usage. Customer demands for
newer, higher specification rigs might also result in a bifurcation of the market, with newer rigs operating at higher overall utilization
rates and dayrates.
Our future success and profitability will depend, in part, upon our ability to keep pace with these and other technological
developments and customer requirements. As we have a number of older rigs, we may be required to increase capital expenditure
to maintain and improve existing rigs and equipment, retire obsolete or outdated equipment earlier than previously anticipated and/or
purchase and construct newer, higher specification drilling rigs to meet the increasingly sophisticated needs of customers. To the
extent that we are unable to negotiate agreements for customer reimbursement for the cost of increasing the specification of our
drilling rigs, we could be incurring higher capital expenditures than planned. If, in response to technological developments or
changes in standards in the industry, we are not successful in acquiring new equipment or upgrading existing equipment in a timely
and cost-effective manner, we could lose business and profits. In addition, current competitors or new market entrants may develop
new technologies, services or standards that could render some of our services or equipment obsolete, which could materially
adversely affect our revenues, financial condition, results of operations and cash flows.
Climate change, the regulation of greenhouse gases and increasing development of renewable energy alternatives could have a
negative impact on our industry, business and/or reputation.
The scientific community has concluded that increasing concentrations of greenhouse gases in the Earth’s atmosphere are
producing climate changes that have significant physical effects, such as increased frequency and severity of storms, floods and
other climatic events. Such events could have a materially adverse effect on our operations, especially given that our rigs may need
to curtail operations or suffer damage during significant weather events.
Current and future regulations relating to greenhouse gases and climate change also may result in increased compliance
costs or additional operating restrictions on our business. The negative impacts of greenhouse gases and climate change have
resulted in adverse publicity for the oil and natural gas industry and could cause damage to our reputation. In addition, because our
business depends on the level of activity in the offshore oil and natural gas industry, existing or future regulations or other
agreements related to greenhouse gases and climate change, including carbon taxes or greenhouse gas fees or incentives to conserve
energy or use renewable energy alternatives, could decrease the demand for oil and natural gas or decrease exploration activity.
Any of the factors discussed above could materially adversely affect our business, reputation, financial condition, results
of operations and cash flows.
Compared to companies with greater resources, we may be at a competitive disadvantage.
Certain of our competitors in the shallow water drilling industry may have more diverse fleets and greater financial and
other resources and assets than we do. Similarly, some of these competitors may be significantly better capitalized than we are,
which may make them more able to keep pace with technological developments and make more substantial improvements in the
functions and performance of rigs and equipment than we can. In addition, such competitors may be a preferable alternative for
customers concerned about counterparty credit risks, including a partner’s ability to cover potentially significant liabilities. Further,
competitors with more diversified fleets or who have successfully acquired or upgraded their existing rigs or equipment in a more
timely and cost-effective manner than us, may be better positioned to withstand unfavorable market conditions. Additionally, we
may be at a competitive disadvantage to those competitors that are better capitalized to withstand the effects of a commodity price
down-cycle. As a result, our competitors may have competitive advantages that may adversely affect our ability to compete with
them in our efforts to contract our rigs on favorable terms, if at all, and correspondingly have a material adverse impact on our
revenues, financial condition, results of operations and cash flows.
There may be limits to our ability to mobilize drilling rigs between geographic areas, and the duration, risks and associated costs
of such mobilizations may be material to our business.
The offshore drilling market is generally a global market as drilling rigs may be moved from one area to another. However,
the ability to mobilize drilling rigs can be impacted by several factors including, but not limited to, governmental regulation and
customs practices, the significant costs and risk of damage related to moving a drilling rig, availability of suitable tow vessels to
move the rigs, weather conditions, political instability, civil unrest, military actions and the technical capability of the drilling rigs
21
to relocate and operate in various environments. Additionally, while a jack-up rig is being mobilized from one geographic market
to another, we may not be paid for the time that the jack-up rig is out of service or be reimbursed for costs attributable to such
relocation. Further, despite the ability to move rigs, not all of our rigs are designed to work in all regions, in all water depths or
over all types of seafloor conditions. We may speculatively relocate a rig to another geographic market without a customer contract,
which could result in costs that are not reimbursable by future customers, which could have a material adverse effect on our revenues,
financial condition, results of operations and cash flows.
The fair market value of our long-lived assets, including our drilling rigs and any rigs we acquire in the future, may decrease,
which could result in impairments or cause us to incur a loss on the sale of such assets.
We evaluate our property and equipment whenever events or changes in circumstances indicate that the carrying amount
of an asset may not be recoverable. We consider the general economic and business environment, industry specific indicators,
Company specific factors and conditions related to specific assets or asset groups to determine when we need to test our assets for
impairment. An impairment loss on property and equipment exists when the estimated undiscounted future cash flows expected to
result from the use of the asset and its eventual disposition are less than its carrying amount. Our largest value assets are our rigs.
The fair market value of any rigs that we own may increase or decrease depending on a number of industry and market
factors, including:
• general economic and market conditions affecting the offshore drilling industry, including the price of oil and natural gas
and competition from other offshore drilling companies;
• prevailing level of contract dayrates and industry rig utilization rates;
• types, sizes and ages of drilling rigs available in the market, including specifications and condition;
• supply and demand for drilling rigs;
• costs of newly built rigs;
• liquidity of the market for drilling rigs;
• governmental or other regulations and
• technological advances.
Such factors could cause us to record an impairment loss on a rig, which could materially adversely affect our financial
condition and results of operations. If we sell a drilling rig at a time when prices for drilling rigs have fallen, such a sale may result
in a realized loss, and lower than expected proceeds, which could materially adversely affect our financial condition, results of
operations and cash flows.
For a description of non-cash impairment losses previously recorded, see “Note 9 – Loss on Impairment of Assets” to the
Consolidated Financial Statements included in “Item 8. Financial Statements and Supplementary Data”.
Supplier capacity constraints or shortages in parts or equipment, supplier production disruptions, supplier quality and sourcing
issues or price increases could increase our operating costs, decrease our revenues and adversely impact our operations.
Our reliance on third-party suppliers, manufacturers and service providers to secure equipment used in our drilling
operations exposes us to volatility in the quality, price and availability of such items. Certain specialized parts and equipment we
use in our operations may be available only from a single or small number of suppliers. A disruption in the deliveries from such
third-party suppliers, capacity constraints, production disruptions, price increases, defects or quality-control issues, recalls or other
decreased availability or servicing of parts and equipment could adversely affect our ability to meet our commitments to customers,
resulting in uncompensated downtime, reduced dayrates or the cancellation or termination of contracts and could adversely impact
our operations and increase our costs. Any of these impacts could have a material adverse impact our revenues, results of operations
and cash flows.
Our labor costs and the operating restrictions that apply to us could increase as a result of collective bargaining negotiations
and changes in labor laws and regulations.
Some of our employees in Egypt and Nigeria are represented by unions and may, from time to time, work under collective
bargaining agreements. Employees in other countries have in the past and may in the future be represented by labor unions. In
addition, some of our contracted labor works under collective bargaining agreements. As part of the legal obligations in some of
these collective bargaining agreements, we are required to contribute certain amounts to retirement funds and are restricted in our
ability to dismiss employees. In addition, where our employees are represented by unions, we may be required to negotiate wages
with union representatives. Efforts may be made from time to time to unionize additional portions of our workforce. Negotiations
with unions relating to collective bargaining agreements and other labor related matters could result in higher personnel costs, other
increased costs or increased operating restrictions, or even labor stoppages, strikes or slowdowns.
We may be required to make significant capital expenditures to comply with laws and the applicable regulations and
standards of labor laws and regulations in the various jurisdictions in which we operate. Such laws and regulations may change
without notice, and the cost of compliance could be higher than anticipated.
22
Labor costs changes due to unions and collective bargaining agreements and the costs of complying with labor laws and
regulations could materially adversely affect our financial condition, results of operations and cash flows.
Our business involves numerous operating hazards; our insurance and contractual indemnity rights may not be adequate to
cover any losses resulting from accidents and other events and our insurance may become more expensive or may become
unavailable in the future.
Our operations are subject to the usual hazards inherent in the drilling, completion and operation of oil and natural gas
wells. These hazards include, but are not limited to blowouts, punch through, loss of control of the well, abnormal drilling conditions,
mechanical or technological failures, seabed cratering, fires and pollution and failure of our employees to comply with internal HSE
guidelines. Operations may be suspended because of machinery breakdowns, abnormal operating conditions, failure of
subcontractors to perform and personnel shortages.
In addition, our operations are subject to perils peculiar to marine operations including capsizing, grounding, collision,
sinking and loss or damage from severe weather, including monsoons. Severe weather could have a material adverse effect on our
operations, damaging our rigs from high winds, turbulent seas, or unstable sea bottom conditions.
Damage to the environment could result from our operations, particularly through blowouts, oil spillage or extensive
uncontrolled fires.
The occurrence of any of these events may result in the suspension of operations, loss of dayrate revenues, lower utilization
rates, severe damage or destruction of property and equipment, injury or death to personnel, environmental damage, increased
insurance costs, fines or penalties, personal injury and other claims by personnel, and claims or investigations by the operator,
regulatory bodies and others affected by such events. We may also be subject to fines or penalties (for which indemnification may
not be available) resulting from property, environmental, natural resource and other damage claims by governments, environmental
organizations, oil and natural gas companies and other businesses operating offshore and in coastal areas, including claims by
individuals living in or around coastal areas. Damage or destruction of our property and equipment could potentially cause us to
curtail operations for significant periods of time while repairs are completed. Any of which could have a material adverse impact
on our revenues, financial condition, results of operations and cash flows.
As is customary in the offshore drilling industry, we have undertaken to mitigate the risks of our operations through
insurance and contractual indemnities from our customers. However, insurance policies have limits and exclusions and may not
provide full coverage for, and, most of our customer contracts do not fully indemnify us from, all losses or liabilities resulting from
our operations. Further, we may experience increased costs for available insurance coverage, which may impose higher deductibles
and limit maximum aggregated recoveries, including for hurricane, monsoon, or cyclone-related damage or loss. Because insurers
in general also struggle with eliminating risks of events that lead to correlated losses through insurance pooling, such as natural
hazards, many insurers refrain from insuring these risks. The severity of correlated risks is also difficult to predict, leading to high-
priced and unfavorable insurance premiums and/or deductibles with those insurers who do offer coverage for such losses. Insurance
costs may increase in the event of ongoing patterns of adverse changes in weather or climate. Moreover, we may not be able to
maintain adequate insurance or obtain insurance coverage for certain risks in the future at rates we consider reasonable or at all, our
customers may not be willing or able to indemnify us against all these risks or we may not be able to enforce contractual indemnities
due to legal or judicial factors. Although we believe that our insurance covers many risks common to our industry, we do not have
insurance coverage or indemnification for all risks and we may not be adequately covered for certain losses. If a significant accident
or other event occurs, including but not limited to severe weather, terrorist acts, war, civil disturbances, pollution or environmental
damage, that results in a loss which is not fully covered by insurance or a recoverable indemnity from a customer, it could adversely
affect our business, financial condition, results of operations and cash flows.
Our international operations in the shallow water drilling sector involve additional risks, which could adversely affect our
business.
We operate in various regions throughout the world and as a result we may be exposed to political and other uncertainties,
including risks of:
• terrorist acts, armed hostilities, geopolitical events, military actions, war and civil disturbances, including in the Middle
East;
• acts of piracy affecting ocean-going rigs, particularly in areas that have historically been impacted by piracy, such as West
Africa and Southeast Asia;
• significant governmental influence over many aspects of local economies;
• repudiation, nullification, modification or renegotiation of contracts;
• limitations on insurance coverage, such as war risk coverage, in certain areas;
• political unrest or revolutions;
• monetary policy and foreign currency fluctuations and devaluations;
• the inability to repatriate income or capital;
• complications associated with repairing and replacing equipment in remote locations;
• import-export quotas, wage and price controls and imposition of trade barriers;
23
• regulatory or financial requirements to comply with foreign bureaucratic actions;
• changing taxation policies, including confiscatory taxation;
• other forms of government regulation and economic conditions that are beyond our control;
• corruption;
• natural disasters;
• public health threats, including pandemic events and
• claims by employees, third parties or customers.
In addition, international drilling operations are subject to various laws and regulations of the countries in which we operate,
including laws and regulations relating to:
• the equipping and operation of rigs;
• repatriation of foreign earnings;
• oil and natural gas exploration and development;
• taxation of offshore earnings and the earnings of expatriate personnel and
• use and compensation of local employees and suppliers by foreign contractors.
Some governments favor or effectively require (i) the awarding of drilling contracts to local contractors or to rig owners
that are majority-owned by their own citizens, (ii) the use of a local agent or (iii) foreign contractors to employ citizens of, or
purchase supplies from, a particular jurisdiction.
Furthermore, our business operations require authorizations from various national and local government agencies.
Obtaining these authorizations can be a complex, time-consuming process, and we cannot guarantee that we will be able to obtain
or renew the authorizations required to operate our business in a timely manner or at all. This could result in the suspension or
termination of operations or the imposition of material fines, penalties or other liabilities.
These factors may adversely affect our ability to compete in those regions. We are unable to predict future governmental
regulations which could adversely affect the international drilling industry. The actions of governments may adversely affect our
ability to compete effectively. As such, we may be unable to effectively comply with applicable laws and regulations, including
those relating to sanctions and import/export restrictions, which may result in a material adverse effect on our business, financial
condition, results of operations and cash flows.
Any failure to comply with the complex laws and regulations governing international trade, including import, export, anti-
corruption, economic sanctions and embargoes could adversely affect our operations.
The shipment of equipment and materials required for shallow water drilling operations across international borders
subjects us to extensive import and export laws and regulations governing our assets, equipment and materials, including those
enacted by the U.S. and/or countries in which we operate. Moreover, many countries control the export/import and re-export of
certain goods, services and technology and may impose related export/import recordkeeping and reporting obligations.
Governments also may impose economic sanctions and/or embargoes against certain countries, persons and other entities that may
restrict or prohibit transactions involving such countries, persons and entities.
These various jurisdictional laws and regulations regarding export/import controls and economic sanctions are complex,
constantly changing, may be unclear in some cases and may be subject to changing interpretations. They may be enacted, amended,
enforced or interpreted in a manner that could materially impact our operations. Materials shipments and rig import/export may be
delayed and denied for a variety of reasons, some of which are outside our control, and include our failure to comply with existing
legal and regulatory regimes. Delays or denials could cause unscheduled operational downtime or termination of customer contracts.
Any failure to comply with applicable legal and regulatory international trade obligations could also result in criminal and civil
penalties and sanctions, such as fines, imprisonment, debarment from government contracts, seizure of shipments and loss of
import/export privileges, which may have a material adverse effect on our business, financial condition, results of operations and
cash flows.
We operate drilling rigs in a number of countries, including in some developing economies, which can involve inherent
risks associated with fraud, bribery and corruption and where strict compliance with anti-corruption laws may conflict with local
customs and practices. As a result, we may be subject to risks under the U.S. Foreign Corrupt Practices Act, the U.K. Bribery Act
2010 and similar laws in other jurisdictions that generally prohibit companies and their intermediaries from making, offering or
authorizing improper payments to government officials for the purpose of obtaining or retaining business. We are required to do
business in accordance with applicable anti-corruption laws as well as sanctions and embargo laws and regulations (including U.S.
Department of the Treasury-Office of Foreign Assets Control requirements) and we have adopted policies and procedures, including
a code of business conduct and ethics, which are designed to promote legal and regulatory compliance with such laws and regulations.
However, either due to our acts or omissions or due to the acts or omissions of others, including our employees, agents, joint venture
partners, local sponsors or others, we may be determined to be in violation of such applicable laws and regulations or such policies
and procedures. Any such violation could result in substantial fines, sanctions, deferred settlement agreements, civil and/or criminal
penalties and curtailment of operations in certain jurisdictions and the seizure of our rigs and other assets and might, as a result,
materially adversely affect our business, financial condition, results of operations and cash flows.
24
Our customers in relevant jurisdictions could seek to impose penalties or take other actions adverse to our interests. In
addition, actual or alleged violations could damage our reputation and ability to do business and could cause investors to view us
negatively and adversely affect the market for our common shares. Furthermore, detecting, investigating and resolving actual or
alleged violations are expensive and can consume significant time and attention of senior management regardless of the merit of
any allegation. We may also be subject to competitive disadvantages to the extent that our competitors are able to secure business,
licenses or other preferential treatment by making payments to government officials and others in positions of influence or using
other methods that U.S. and other laws and regulations and our own policies prohibit us from using.
We are subject to complex laws and regulations, including environmental laws and regulations that can adversely affect the cost,
manner or feasibility of doing business.
Our operations are subject to numerous stringent HSE laws and regulations in the form of international conventions and
treaties, national, state and local laws and regulations in force in the jurisdictions in which our drilling rigs operate or are registered,
which can, directly or indirectly, significantly affect the ownership and operation of the rigs. These requirements include, but are
not limited to, MARPOL, CLC, BUNKER and various international, national and local laws and regulations that impose compliance
obligations and liability related to the use, storage, treatment, disposal and release of petroleum products, asbestos, polychlorinated
biphenyls and other hazardous substances that may be present at, or released or emitted from, our operations. Furthermore, the
IMO, at the international level, or national or regional legislatures in the jurisdictions in which we operate, including the European
Union (“EU”), may pass or promulgate new environmental laws or regulations. Compliance with such laws, regulations and
standards, where applicable, may require installation of costly equipment or operational changes and may affect the resale value or
useful life of our rigs. We are required to obtain HSE permits from governmental authorities for our operations, and we may have
difficulty in obtaining or maintaining such permits.
We may also incur additional costs in order to comply with other existing and future laws or regulatory obligations,
including, but not limited to, costs relating to air emissions, including greenhouse gases, management of ballast waters, rig
maintenance and inspection, management of solid and hazardous materials and waste, and development and implementation of
emergency procedures for, and liability and compensation schemes related to, accidents, pollution and other catastrophic events.
Laws and regulations protecting the environment have generally become more stringent over time. In the event we were
to incur additional costs to comply with existing or future laws or regulatory obligations, these costs could have a material adverse
effect on our business, financial condition, results of operations and cash flows. In addition, existing or future laws could increase
costs for our customers, our vendors or our service providers, which could result in lower demand for our services, lower dayrates,
or increasing costs.
A failure to comply with applicable laws and regulations may result in administrative and civil penalties, criminal sanctions
or the suspension or termination of operations. Environmental laws often impose strict liability, which could subject us to liability
without regard to negligence or fault. For example, in certain jurisdictions, owners, operators and bareboat-charterers may be jointly
and severally strictly liable for the discharge of oil in territorial waters, including the 200 nautical mile exclusive economic zone.
In addition, laws and regulations may impose liability on generators of hazardous substances, and as a result we could face liability
for cleanup costs at third-party disposal locations. We are required to satisfy insurance and financial responsibility requirements
for potential oil (including marine fuel) spills and other pollution incidents and the insurance may not be sufficient to cover all such
risks. Environmental claims against us could result in a material adverse effect on our business, financial condition, results of
operations and cash flows.
Although some of our rigs are separately owned by subsidiaries, under certain circumstances a parent company and all of
the rig-owning affiliates in a company under common control could be held liable for damages or debts owed by one of the affiliates,
including liabilities for oil spills under environmental laws. Therefore, it is possible that we could be subject to liability upon a
judgment against us or any one of our subsidiaries.
Our operations could cause the accidental release of oil or hazardous substances. Any releases may be large in quantity,
above the permitted limits or occur in protected or sensitive areas where public interest groups or governmental authorities have
special interests. Any releases of oil or hazardous substances could result in substantial fines and other costs and liabilities, such as
costs to upgrade rigs, clean up the releases and comply with more stringent requirements in our discharge permits, claims for natural
resource, personal injury or other damages, and material adverse publicity. Although our contracts generally provide for
indemnification from our customers for some of these costs, the inability or other failure of our customers to fulfill any
indemnification obligations they have, or the unenforceability of our contractual protections could have a material adverse effect on
our financial condition, results of operation and cash flows. Moreover, these releases may result in customers or governmental
authorities suspending or terminating our operations in the affected area.
If a major incident were to occur in our industry, such as a catastrophic oil spill or other accident subject to international
media attention, this could lead to an industry-wide regulatory response which may result in increased operating costs. Any changes
to existing laws in the jurisdictions in which we operate prompted by such a future event could increase our operating costs and
future risk of liability. In addition, we may be required to post additional surety bonds to secure performance, tax, customs and
other obligations relating to our rigs in jurisdictions where bonding requirements are already in effect and in other jurisdictions
where we may operate in the future. These requirements would increase the cost of operating in these countries.
25
Any of the above could materially adversely affect our business, reputation, financial condition, results of operations and
cash flows.
If we or our customers are unable to acquire or renew permits and approvals required for drilling operations, we may be forced
to suspend or cease our operations, which may adversely affect our profitability.
Oil and natural gas exploration and production operations require numerous permits and approvals for us and our customers
from governmental agencies in the areas in which we operate. In addition, many governmental agencies have increased regulatory
oversight and permit requirements in recent years. Obtaining and maintaining compliance with all necessary permits and approvals
may require substantial expenditures and time. If we or our customers are not able to obtain necessary permits and approvals in a
timely manner, our operations will be adversely affected. In addition, future changes to, or an adverse change in the interpretation
of, existing permit and approval requirements may delay or curtail our operations, require us to make substantial expenditures to
meet compliance requirements, or create a risk of expensive delays or loss of value if a project is unable to function as planned, any
of which could have a material adverse impact on our revenues, financial condition, results of operations and cash flows.
The imposition by customers and/or governments in certain countries related to minimum local content, or local content
programs or quotas may subject us to additional requirements and risks.
In Saudi Arabia, Saudi Aramco’s In-Kingdom Total Value Add program sets goals for suppliers to meet, among other
things, specified national content percentage targets. In the UAE, the implementation of the In-Country Value program in Abu
Dhabi is also expected to increase local content requirements for all companies contracting with ADNOC. Compliance with these,
or other similar programs, could increase the cost of doing business in such jurisdictions or could subject us to fines and penalties
or loss of contracts, which could materially adversely affect our revenues, financial condition, results of operations and cash flows.
Several countries in which we operate require foreign entities to comply with certain laws and regulations concerning
minimum local content requirements. As a result, we may be required to enter into legally binding arrangements with local entities
in those jurisdictions in order to conduct operations. In Indonesia, Malaysia, India, Nigeria, Angola and the UAE, we maintain a
series of contractual and legal agreements with local partners and/or agents, whom management believes are an integral part of the
successful operation of our business in these markets. In the future, we may enter into similar arrangements in other countries,
either due to changing laws or regulations or due to operational requirements in additional markets. If we were to lose the support
of these local participants and were unable to find suitable replacements, local regulators may curtail or terminate our operations.
In addition, the success of these local relationships depends on the reputation, creditworthiness, stability and continuity of the local
partners and/or agents with which we are working. If any of these local partners and/or agents were to become subject to
bankruptcy/insolvency proceedings or other adverse regulatory or judicial proceedings, or lose the ability to carry out the operations
for any other reason, then our business, financial condition, results of operations and cash flows could be materially adversely
impacted.
Our existing indebtedness imposes significant operating and/or financial restrictions on us that may prevent us from pursuing
certain business opportunities and restrict our ability to operate our business.
As of December 31, 2021, we had a total principal amount of indebtedness of $900.0 million of 8.25% Senior Unsecured
Notes, due February 2025 (“8.25% Senior Unsecured Notes”) and $310.0 million of 8.875% Senior Secured First Lien Notes, due
November 2024. The level of our indebtedness and the terms of the agreements governing our existing indebtedness may contain
covenants that restrict our ability to take various actions, such as to:
• incur or guarantee additional indebtedness or issue certain preferred shares;
• pay dividends or make other distributions on, or redeem or repurchase, any equity interests;
• make other restricted payments;
• make certain acquisitions or investments;
• create or incur liens;
• transfer or sell assets;
• incur restrictions on the payments of dividends or other distributions from restricted subsidiaries;
• enter into transactions with affiliates and
• consummate a merger or consolidation or sell, assign, transfer, lease or otherwise dispose of all or substantially all of our
assets or certain subsidiaries’ assets.
Our ability to comply with these covenants may be affected by many factors, both within and beyond our control, including
but not limited to our future performance, falling oil and natural gas prices, prolonged periods of low dayrates, the possible
termination or loss of contracts and reduced values of our rigs. We may not satisfy these or other covenants in our existing
indebtedness. Our failure to comply with the obligations under the agreements governing our existing indebtedness could result in
an event of default under such agreements, which could result in the acceleration of our indebtedness, in whole or in part. In addition,
our existing debt agreements contain cross-default provisions whereby acceleration or payment default by us under one of our debt
agreements, could allow creditors to declare us in default of our other existing debt or financing agreements. This could lead to an
acceleration and enforcement of such agreements by all or substantially all of our creditors.
26
These debt covenants and restrictions could also limit our ability to plan for, or react to, market conditions, meet capital
needs or otherwise restrict our activities or business plans and adversely affect our ability to finance our operations, enter into
acquisitions or to engage in other business activities that would be in our interest.
We are dependent upon cash flows from our operating subsidiaries to meet our obligations, including repayment of our debt.
Our corporate structure and operations in multiple jurisdictions may impose limitations on the transfer of funds. If we become
unable to pay our interest or debts as they become due or to obtain further credit, we may become subject to insolvency
proceedings.
We conduct operations through, and most of our assets are owned by, our operating subsidiaries. Our operating income
and cash flows are generated by these subsidiaries, and as a result, the cash generated from our subsidiaries is the principal source
of funds necessary to meet our obligations, including our debt obligations. Contract provisions or laws, as well as our subsidiaries’
financial condition, operating requirements and debt requirements may limit our ability to access cash from subsidiaries needed to
pay expenses or to meet our current or future debt service obligations. Applicable tax laws may also subject such payments by
subsidiaries to further taxation.
The inability to transfer cash from our subsidiaries may mean that, even though we may have sufficient resources on a
consolidated basis to meet our obligations, we may not be permitted to make the necessary transfers from certain legal entities and
jurisdictions to meet our debt and other obligations. The terms of certain of the agreements governing our existing indebtedness
also place restrictions on our cash balances and require us to maintain reserves of cash which could inhibit our ability to meet our
obligations.
Although our current indebtedness limits our ability to incur additional indebtedness, these restrictions are subject to a
number of qualifications and exceptions and do not apply uniformly to our subsidiaries, and under certain circumstances, debt
incurred in compliance with these restrictions could be substantial. To the extent that we incur additional indebtedness, the risks
described above associated with our substantial leverage, including the possible inability to service our debt, would increase.
If our operating subsidiaries experience sufficiently adverse changes in their financial position or results of operations, or
we otherwise become unable to pay our interest or debt principal payments as they become due, this could result in a reduction of
our long-term corporate credit ratings. These downgrades in our corporate credit ratings could raise the cost of issuing new debt.
As a consequence, we may not be able to issue additional debt in reasonable amounts and terms, or at all. Default on our existing
debt agreements and failure to obtain further credit could result in the commencement of insolvency proceedings. Any such
proceedings would have a material adverse impact on our financial condition, results of operations and cash flows. Additionally,
this could limit our ability to pursue business opportunities and could have a significant negative impact on the market prices of our
common shares.
To service and refinance our indebtedness, fund our capital and liquidity needs or pay any dividends, we may not generate
sufficient cash or have access to sufficient funding.
To service and refinance our indebtedness, fund our capital and liquidity needs or pay dividends (if any), we will require a
significant amount of cash. Our ability to raise capital is, to a certain extent, subject to economic, financial, competitive, legislative,
regulatory and other factors that are beyond our control. In addition, our business may not generate sufficient cash flows from
operations, and future borrowings or alternative financing may not be available to us on favorable terms, or at all, in an amount
sufficient to enable us to service and refinance, at or before maturity, our indebtedness, fund our capital and liquidity needs or pay
dividends (if any), which would have a material adverse effect on us.
We rely on proper functioning of our computer and data processing systems that must be regularly updated or replaced, and a
large-scale malfunction could result in material adverse disruptions to our business.
We rely primarily on globally and locally functioning information technology systems across our value chain, including
for management financial information and various other processes and transactions. Our ability to effectively manage our business
depends on the security, reliability and capacity of these systems. An attack on, or other problems with, our systems could result in
the disclosure of proprietary information about our business or confidential information concerning our customers, vendors or
employees, which could result in significant damage to our business and reputation.
We have put in place security measures designed to protect against the misappropriation or corruption of our systems,
intentional or unintentional disclosure of confidential information, or disruption of our operations. However, these security
measures may prove ineffective. Current employees have, and former employees may have, access to a significant amount of
information regarding our operations, which could be disclosed to our competitors or otherwise used to harm our business. Any
breach of our security measures could result in unauthorized access to and misappropriation of our information, corruption of data
or disruption of operations or transactions, any of which could materially adversely affect our reputation, business, financial
condition, results of operations and cash flows.
We have and will continue to expend resources, and dedicate personnel, to upgrade and maintain our information
technology systems to protect against threatened or actual security breaches. In addition, we could be required to expend significant
27
amounts to respond to unanticipated information technology issues. Failure to appropriately implement measures that could protect
against all significant risks could materially adversely affect our business, financial condition, results of operations and cash flows.
Developing and expanding data security and privacy requirements could increase our operating costs, and any failure by us or
our vendors to maintain the security of certain customer, employee and business-related information could result in damage to
our reputation, be costly to remediate and result in regulatory action.
We are required to manage and process information related to our employees, customers and vendors in the ordinary course
of business, and our operations depend upon secure retention and the secure transmission of information over public networks. This
information is subject to the continually evolving risk of intrusion, tampering, and theft. Although we maintain systems to prevent
or defend against these risks, these systems require ongoing monitoring and updating as technologies change, and security could be
compromised, personal or confidential information could be misappropriated, or system disruptions could occur. A compromise of
our security systems could adversely affect our reputation and disrupt our operations and could also result in litigation or the
imposition of penalties.
We have a dedicated cyber-security team and program that focuses on current and emerging data security and data privacy
matters. We continue to assess and invest in the growing needs of our cyber-security team through the allocation of skilled personnel,
ongoing training and support of the adoption and implementation of technologies coupled with cyber-security risk management
frameworks.
We may, from time to time, provide certain confidential, proprietary and personal information to third parties. While we
seek to obtain assurances and safeguards from these third parties to protect this information, there is a risk that the security of data
held by third parties could be breached, resulting in liability for us.
Heightened legislative and regulatory focus on data privacy and security in the EU, U.S. and elsewhere presents a growing
and fast-evolving set of legal requirements. The increasing legal and regulatory burden presents material obligations and risks to
our business, including significantly expanded compliance burdens, costs and enforcement risks. In particular, where the EU
General Data Protection Regulation (“GDPR”) applies, the penalties for breaches are significant. In addition, legislation similar to
GDPR is being considered or adopted in other jurisdictions relevant to our operations. In cases of personal information security
breaches, the costs of investigation, dealing with regulators and taking steps to mitigate or remediate its effects may also be high.
The majority of the personal information we process is that of our employees.
Any significant breach in our data security or a failure to protect private information could have a material adverse impact
on our reputation, financial condition, results of operations and cash flows.
We depend heavily upon the security and reliability of our technology systems and those of our service and equipment vendors,
and such systems are subject to cyber-security risks and threats.
We depend heavily on technologies, systems and networks that we manage, and others that are managed by our third-party
service and equipment vendors, to conduct our business and operations. Cyber-security risks and threats to such systems continue
to grow in sophisticated ways may be difficult to anticipate, detect, prevent or mitigate. If any of the security systems used by us
or our vendors for protecting against cyber-security threats prove to be insufficient, our business and financial systems could be
compromised, confidential or proprietary information in our possession could be altered, lost or stolen, or our (or our customers’)
business operations or safety procedures could be disrupted, degraded or damaged. A cyber-security breach or failure could also
result in injury (financial or otherwise) to people, loss of control of, or damage to, our (or our customers’) assets, harm to the
environment, reputational damage, breaches of laws or regulations, litigation and other legal liabilities. In addition, we may incur
significant costs to prevent, respond to or mitigate cyber-security risks or events and to defend against any investigations, litigation
or other proceedings that may follow such events. Such a failure or breach of our systems could materially adversely impact our
reputation, business, financial position, results of operations and cash flows.
Technology disputes could negatively impact our operations or increase our costs.
Rigs use proprietary technology and equipment which can involve potential infringement of a third party’s rights, including
patent rights. In the event that we or one of our suppliers or sub-suppliers become involved in a dispute over infringement rights
relating to equipment owned or used by us, we may lose access to repair services or replacement parts, or we could be required to
cease use of some equipment or forced to modify our rigs. We could also be required to pay license fees or royalties for the use of
equipment. Technology disputes involving us or our suppliers or sub-suppliers could adversely impact our financial condition,
results of operations and cash flows.
Fluctuations in exchange rates and non-convertibility of currencies could result in losses to us.
We may experience realized currency exchange losses when cash is received or expenses are paid in currencies other than
our U.S. dollar functional currency, when we do not hedge our exposure to such foreign currency or when the result of a hedge is a
28
loss. We may also incur losses as a result of an inability to collect revenues due to a shortage of convertible currency available to
the country of operation, controls over currency exchange or controls over the repatriation of income or capital.
If any part of our business is moved outside of its current operative jurisdiction our overall tax exposure may change, which may
affect our alleged compliance with applicable tax laws.
We and most of our subsidiaries are incorporated in the Cayman Islands. We also have subsidiaries in various other
jurisdictions. Our consolidated effective tax rate is dependent on where profits are earned and taxed or losses are generated, as
different countries have different tax systems and statutory tax rates. Different jurisdictions also have different tax laws and
interpretations thereof. If we move some of our operations into a new jurisdiction or acquire companies in jurisdictions in which
we do not already operate, our overall effective tax rate may be affected. Further, we may also become exposed to changes in tax
policies and amendments to tax legislation, prospectively and/or retroactively, in such jurisdictions.
There can be no assurance that the relevant tax authorities in the jurisdictions in which we operate will agree with our tax
calculations and judgements. If a relevant tax authority disputes our assumptions, judgements or calculations, we may incur
additional tax expense, interest and penalties. Any changes in our tax exposure may affect our alleged compliance with applicable
tax law, and any non-compliance could have a material adverse impact on our financial condition, results of operations and cash
flows.
Risks Related to our Structure and Ownership of our Common Stock
We are exposed to regulatory and enforcement risks regarding taxes. U.S. tax authorities may treat us as a passive foreign
investment company, causing potential adverse U.S. federal tax consequences to our U.S. shareholders.
For U.S. federal income tax purposes, a foreign corporation will be treated as a Passive Foreign Investment Company
(“PFIC”), if either (i) at least 75.0% of its gross income for any taxable year (including its proportionate share of the gross income
of any other corporation in which it owns, directly or indirectly, 25% or more (by value) of such corporation’s stock) consists of
certain types of “passive” income or (ii) at least 50.0% of the average value of the corporation’s assets (including its proportionate
share of the assets of any other corporation in which it owns, directly or indirectly, 25% or more (by value) of such corporation’s
stock) either produce or are held for the production of those types of “passive” income. Passive income for these purposes includes
certain rents and royalties, dividends, interest, net gains from the sale or exchange of investment property, and net gains from
commodities and securities transactions. Passive income does not include income derived from the performance of services.
We believe that we will not be treated as a PFIC for any relevant period as any income we receive from offshore drilling
service contracts should be treated as “services income” rather than as passive income under the PFIC rules. In addition, the assets
we own and utilize to generate this “services income” should not be considered passive assets.
Although there is significant legal authority supporting our position, including relevant statutory provisions, legislative
history, case law and various pronouncements from the U.S. Internal Revenue Service (“IRS”), there is a possibility that the IRS
may still characterize this income as “passive” income in light of a recent case characterizing income from the time chartering of
vessels as rental income rather than services income for other tax purposes. However, the IRS has subsequently formally announced
that it does not agree with the decision in that case. Despite this IRS announcement, no assurance can be given that the IRS or a
relevant court will accept our position that we are not a PFIC.
If we were to be treated as a PFIC for any relevant period, our U.S. shareholders may face adverse U.S. tax
consequences. Under the PFIC rules, a U.S. shareholder would be liable to pay U.S. federal income tax at the highest applicable
rates on ordinary income upon the receipt of certain “excess” distributions and upon any gain from the disposition of our shares,
plus certain interest and penalties. Although shareholders can make certain elections to mitigate the application of the PFIC rules,
these elections can themselves cause other adverse tax consequences to the electing shareholder.
Subsequent to our initial public offering in 2018, we are subject to both Cayman Islands regulatory requirements and the
requirements applicable for Companies listed on the Oslo Stock Exchange, and any subsequent changes to these requirements,
and, as such, we may be subject to review by the relevant authorities.
From the time of our June 25, 2018 initial public offering, we are subject to both the Cayman Islands regulatory
requirements and the requirements applicable for companies listed on the Oslo Stock Exchange. These requirements affect our
financial statements, corporate governance, communications with shareholders, transactions involving our common stock, such as
dividends and stock repurchases, and other items as per the relevant laws and regulations. Any of these documents or actions may
be subject to review by the relevant authorities. Compliance with these requirements and any subsequent changes in the
requirements or the interpretation of requirements by relevant authorities could have a material adverse impact on our business,
financial condition, results of operations and cash flows.
29
Shareholder rights and responsibilities will be governed by Cayman Islands law and will differ in some respects from the rights
and responsibilities of shareholders under other jurisdictions, including Norway and the U.S., and our shareholder rights under
Cayman Islands law may not be as clearly established as shareholder rights under the laws of other jurisdictions.
Our corporate affairs are governed by our Articles of Association (“Articles”) and by the laws governing companies
incorporated in the Cayman Islands. The rights of our shareholders and the responsibilities of members of the Board of Directors
under Cayman Islands law may not be as clearly established as under the laws of other jurisdictions. In addition, the rights of
shareholders as they relate to, for example, the exercise of shareholder rights, are governed by Cayman Islands law and our Articles
and differ from the rights of shareholders under other jurisdictions, including Norway and the U.S. The holders of our common
shares may have more difficulty in protecting their interests in the face of actions by the Board of Directors than if we were
incorporated in the U.S. or Norway. Additionally, it could be difficult for a common shareholder to prevail in a claim against us
under, or to enforce liabilities predicated upon, securities laws in jurisdictions other than the Cayman Islands.
Certain of our shareholders own a significant proportion of our common shares, and their interests may conflict with those of
ours or other shareholders.
Our largest shareholders are affiliates of Castle Harlan, Inc., Lime Rock Partners. (together, the “Sponsors”) and China
Merchants Industry Holdings Company Limited (“China Merchants”). These shareholders beneficially own, collectively, a
significant proportion of our common shares. The Company’s Articles contain certain preferential governance rights for the
Sponsors, including the right of the Sponsors to appoint and remove directors, subject to certain ownership thresholds being met.
Additionally, as of December 31, 2021, China Merchants was our largest shareholder and has representation on the Board of
Directors. Accordingly, the Sponsors and China Merchants can exercise significant influence over our affairs.
If circumstances arise where the interests of the Sponsors or China Merchants conflict with the interests of other
shareholders, the other shareholders could be disadvantaged by the ability of these large shareholders to influence actions contrary
to the other shareholders' interests. Specifically, the level of voting influence of the Sponsors may impact other shareholders' ability
as minority shareholders to have an influence on the result of special resolutions which shall be required for certain types of
transactions, such as the increase or reduction of our share capital, certain share transactions or the approval for a merger, or that
involve an actual or potential change of control of us, including transactions in which shareholders might receive a premium for
their shares over prevailing market prices.
In the recent past, we have not paid any dividends on our common shares, our ability to pay dividends is subject to certain
restrictions and the availability and timing of future dividends, if any, is uncertain, which could influence the price of our
common shares.
In recent years, we have not issued dividends to our common shareholders, and we did not distribute any dividends for the
financial year ended December 31, 2021. Agreements governing our existing indebtedness place certain restrictions on our ability
and the ability of our restricted subsidiaries to pay dividends. Consequently, the only opportunity for an investor in our common
stock to achieve a return on their investment may be to sell the common shares at a price greater than the price paid. In addition,
any amendments to our existing debt agreements or any new debt arrangements may also prohibit or further restrict our ability to
pay dividends on our common shares.
Subject to such prohibitions and restrictions, the Board of Directors will determine the amount and timing of dividends on
our common shares, if any, that we may pay in future periods. In making this determination, the Board of Directors will consider
all relevant factors, including the amount of cash available for dividends, capital expenditures, covenants, prohibitions or limitations
with respect to dividends, applicable law, general operational requirements and other variables. We cannot predict the amount or
timing of any future dividends, and if we do commence the payment of dividends, we may be unable to pay, maintain or increase
dividends over time. Therefore, investors may not be able to realize any return on their investment in our common shares for an
extended period of time, if at all.
The annual dividend yield of our common stock as compared to yields on other financial instruments, which may fluctuate
with market interest rates, could influence the market price of our common shares. As such, an increase in market interest rates will
result in higher yields on other financial instruments, which could adversely affect the price of our common shares.
Future issuances of our common shares or other securities could dilute the holdings of holders of our common shares and could
materially affect the price of our common shares, and preemptive rights are not available to holders of our common shares.
We may in the future decide to offer additional common shares or other securities in order, among other needs, to finance
new capital-intensive projects, in connection with unanticipated liabilities, as currency in merger and acquisition transactions, for
employee share-based awards, for regulatory requirements, to fund our expenses or for any other corporate purposes.
There can be no assurance that we will not decide to conduct further offerings of securities in the future. Under Cayman
Islands law and our Articles, holders of our common shares do not have preemptive rights that maintain their relative ownership
percentages prior to the issuance of any new common shares. Without preemptive rights and depending on the structure of any
future offering, certain common shareholders may not have the ability to purchase additional equity securities. Future issuances of
common shares or other securities may result in substantial dilution in the ownership percentage of, and may have the effect of
30
diluting the value of, holdings and voting interests of common shareholders. Additionally, such transactions could have an adverse
effect on market value of our common shares.
Future sales, or the possibility of future sales of a substantial number of our common shares could affect the market price of
our common shares.
We cannot predict what effect, if any, future sales of our common shares, or the availability of our common shares for
future sales, will have on the market price of our common shares. Transaction volumes of our common stock have historically been
low, and therefore our stock price may be significantly impacted by large transactions. Sales of substantial amounts of our common
shares in the public market, including by the Sponsors or China Merchants, who own a significant number of our outstanding
common stock, or the perception that such sales could occur, could adversely affect the market price of our common shares, making
it more difficult for our common shareholders to sell their common shares or us to sell equity securities in the future at a time and
price that they deem appropriate. Additionally, all common shares owned by the Sponsors are unrestricted and thus are eligible for
sale or other transfer in the public market, subject to applicable securities laws restrictions.
Exchange rate fluctuations could adversely affect the value of our common shares and dividends paid on the common shares, if
any, for an investor whose principal currency is not U.S. dollars.
Our common shares are priced and traded in Norwegian Krone (“NOK”) on the Oslo Stock Exchange. Dividends declared
by our Board of Directors, if any, would likely be denominated in our functional currency of U.S. dollars, and would be paid to the
common shareholders through DNB Bank ASA (“DNB”), being our VPS registrar (the “VPS Registrar”). Such payments would
be transacted in the bank account currency of the relevant common shareholder’s account, as previously provided to the VPS
Registrar. Common shareholders registered in the VPS who have not supplied their bank account details would not receive dividend
payments unless and until they register their bank account details for their VPS account and inform the VPS Registrar. The exchange
rate(s) applied when transacting payments of dividends to the relevant common shareholder's currency would be the VPS Registrar's
exchange rate on the payment date. Exchange rate movements of U.S. dollars would therefore affect the value of these dividends
and distributions for investors whose account currency is not U.S. dollars. Further, the market value of the commons shares as
expressed in foreign currencies will fluctuate in part as a result of foreign exchange rate fluctuations. This could affect the value of
the common shares and of any dividends paid on the common shares for an investor whose principal currency is not U.S. dollars.
The transfer of our common shares and their underlying assets is subject to restrictions under the securities laws of the U.S. and
other jurisdictions.
Our common shares or underlying assets have not been registered under the Securities Exchange Act of 1934 in the U.S.
or any U.S. state securities laws or any other jurisdiction outside of Norway and the Cayman Islands, and may not be registered in
the future. As such, our common shares or underlying assets may not be offered or sold in the U.S. except pursuant to an exemption
from the registration requirements of the Securities Exchange Act of 1934 in the U.S. and other applicable securities laws. In
addition, common shareholders residing or domiciled in the U.S. and/or other jurisdictions may not be able to participate in future
capital increases.
Investors could be unable to recover losses in civil proceedings in jurisdictions other than the Cayman Islands and Norway.
We are an exempted company, limited by shares and incorporated under the laws of the Cayman Islands. The Directors of
the Board and members of the management reside in the U.S., Saudi Arabia, Australia, China, the U.K. and the UAE. As a result,
it may be impossible for investors to effect service of process or to enforce judgments obtained in non-Cayman Islands or non-
Norwegian courts against us, our Board of Directors or our management.
Investors may face additional risks related to our common shares due to the VPS Registrar, the Registrar Agreement and the
recently implemented EU Central Securities Depository Regulation.
In connection with our June 25, 2018 initial public offering on the Oslo Stock Exchange, we have established a facility for
the registration of our offered common shares in the VPS. We have appointed DNB as our VPS Registrar in the VPS and entered
into an agreement with DNB outlining their related responsibilities (the “Registrar Agreement”).
The VPS Registrar has registered the common shares in the VPS (Euronext Securities Oslo). Following such registration,
the VPS reflects the beneficial shareholders of our registered common stock, personally or through nominee registrations. As
nominee for the common shareholders, the VPS Registrar will be the registered shareholder in our shareholders' register.
Common shareholders must exercise their organizational and economic rights through the VPS Registrar and they are not
able to exercise direct shareholder rights. There are no provisions under Cayman Islands law or under our Articles that limit the
common shareholders' in exercising their rights in respect of the common shares through the VPS Registrar. In order to exercise
their rights, common shareholders must instruct the VPS Registrar as to the voting in the shares represented by their common shares.
In order to exercise full shareholder rights, the common shareholders must transfer their holding in the VPS to a registered holding
of shares in our shareholders' register.
31
We cannot guarantee that the VPS Registrar will be able to execute its obligations under the Registrar Agreement. Any
such failure may, inter alia, limit the access for, or prevent, investors from exercising their organizational or economic rights attached
to the underlying shares. The VPS Registrar may terminate the Registrar Agreement pursuant to a prior written notice of termination.
Furthermore, the VPS Registrar may terminate the Registrar Agreement with immediate effect if we do not fulfil our payment
obligations to the VPS Registrar or commit any other material breach of the Registrar Agreement. In the event of a termination of
the Registrar Agreement, there can be no assurance that it would be possible for us to enter into a new registrar agreement on
substantially the same terms or at all. A termination of the Registrar Agreement could, therefore, materially adversely affect us and
the common shareholders. The VPS Registrar disclaims any liability for any loss attributable to circumstances beyond the VPS
Registrar's control, including, but not limited to, errors committed by others. The VPS Registrar is liable for direct losses incurred
as a result of the VPS Registrar's breach of contract. Accordingly, we and our common shareholders may not be able to completely
recover losses if the VPS Registrar does not perform its obligations under the Registrar Agreement.
The EU Central Securities Depository Regulation (“CSDR”) has recently become effective under Norwegian law through
provisions in the new Norwegian Central Securities Depository Act. As a consequence of CSDR, our current set-up with depository
receipts is no longer permitted. We have a transitional period until December 31, 2022 to change the registration form in VPS
(Euronext Securities Oslo). We have decided to seek a primary recording in VPS, with the consequence that all shareholders in the
Company will be direct owners of common shares, and not depository receipts. Any failure by us to comply with the new CSDR
regulation, including to change our registration form before December 31, 2022, will result in our securities being suspended from
trading on the Oslo Stock Exchange.
General Risk Factors
We are exposed to the credit risks of our key customers and certain other third parties.
We are subject to risks of loss resulting from non-payment or non-performance by third parties. Although we monitor and
manage credit risks, some of our customers and other parties may be highly leveraged and subject to their own operating and
regulatory risks. During more challenging market environments, we are subject to an increased risk of customers seeking to
repudiate contracts. Our customers’ ability to meet their contractual obligations may also be adversely affected by restricted credit
markets and economic downturns. As of December 31, 2021, our allowance for credit losses was $3.2 million. If one or several
key customers or other parties were to default on their obligations to us, our business, financial condition, results of operations and
cash flows could be materially adversely impacted.
We are dependent on our senior management team, other key employees and the Directors of our Board, and the business could
be negatively impacted if we are unable to attract and retain personnel necessary for our success.
Our performance is, to a large extent, dependent on highly qualified personnel, including management, other key employees
and Directors of our Board (“Key Personnel”), and our continued ability to compete effectively, implement our strategy and further
develop our business depends on our ability to attract new and qualified Key Personnel and to retain and motivate existing Key
Personnel. Attracting qualified personnel has proved increasingly important as our industry has developed and become more
advanced. An important factor contributing to our leading position and global footprint has been our ability to retain qualified
employees throughout our organizational structure.
Further, the competition for Key Personnel is intense from competitors within the oil and natural gas industry, as well as
from businesses outside this industry. We may not be able to retain our Key Personnel nor attract and retain replacements for Key
Personnel in the future, or the cost to attract and retain Key Personnel may increase. Our competitors may actively seek to recruit
management personnel or other key employees and may succeed in such efforts. Financial difficulties and other factors might have
further negative impacts on our ability to retain Key Personnel or recruit new talent.
Any loss of the services of management, other key employees, or Directors of our Board, particularly to competitors, the
inability to attract and retain highly skilled key personnel and the increased costs to replace such Key Personnel could have a material
adverse impact on our business, financial condition, results of operations and cash flows.
We are dependent on the availability and retention of skilled personnel, which may be adversely affected by increases in labor
costs.
We require highly skilled personnel to operate and provide technical services and support for our operations. Many of our
customers require specific minimum levels of experience and technical qualification for certain positions on rigs which they contract.
We are also subject to nationalization programs in various countries, whereby we must hire a certain percentage of local personnel
within a specified time period. Hiring and retaining qualified employees can be especially difficult during periods of high utilization
and demand for drilling services, when there is increasing competition for personnel. Such difficulties and increased costs to recruit
and retain qualified employees could have a material adverse effect on our results of operations and cash flows.
32
We may be subject to litigation and disputes that could have a material adverse impact on our business, financial condition,
results of operations and cash flows.
From time to time, we are involved in litigation and disputes. These matters may include, among other things, contract
disputes, personal injury claims, environmental claims or proceedings, asbestos and other toxic tort claims, employment disputes,
tax matters and other litigation that arises in the ordinary course of our business. Although we intend to defend these matters
vigorously, we cannot predict with certainty the outcome or effect of any dispute, claim or other litigation matter. We may not have
insurance for litigation or claims that may arise, or our insurance coverage may not be sufficient, insurers may not remain solvent,
other claims may exhaust some or all of the insurance available to us or insurers may interpret our insurance policies such that they
do not cover certain claim losses. Litigation may result in adverse outcomes, substantial defense costs, the diversion of
management’s resources and other impacts inherent in litigation or relating to the claims that may arise, any of which may have a
material adverse effect on our business, financial condition, results of operations and cash flows.
Any relevant change in tax laws, regulations, or treaties, and relevant interpretations thereof, for any country in which we
operate, earn income, generate losses or are considered to be a tax resident, and/or the loss of any major tax dispute, or a
successful challenge to our intercompany pricing policies or operating structures could have an adverse impact.
Our business is incorporated in the Cayman Islands and operates through our many subsidiaries in various countries
throughout the world. Our income tax exposure is based upon the relevant tax laws, regulations and treaties that apply to the various
countries in which we operate or earn income or are deemed to be a tax resident.
Our income tax returns are subject to examination and review and our effective tax rate may be impacted if:
• there are any significant changes to applicable tax laws, regulations or tax treaties, and the interpretation thereof in the
various countries in which we operate, earn income, generate losses or are deemed to be a tax resident;
• any tax authority successfully challenges our intercompany pricing policies or operating structures;
• any tax authority interprets a treaty in a manner that is adverse to our structure or previous tax positions;
• any tax authority successfully challenges the taxable presence of any of our key subsidiaries in a relevant jurisdiction or
• we lose a key tax dispute in a jurisdiction.
Transactions taking place between our companies and related companies must be carried out in accordance with arm’s
length principles in order to avoid adverse tax consequences. There can be no assurance that the tax authorities will conclude that
our transfer pricing policies are calculated using appropriate arm’s length prices for intercompany transactions. Any changes in
intercompany pricing could change our taxable income or losses in various jurisdictions, which could change our effective tax rate
and tax expense.
Any of the above factors could cause a significant change to our local statutory tax rates and/or our effective tax rate on
worldwide earnings. In addition, if a local statutory tax rate changes, we may need to revalue our deferred tax assets and liabilities
or recalculate our valuation allowances, liabilities for uncertain tax positions or other tax allowances and reserves relevant to that
jurisdiction. Additionally, if we do not generate sufficient income in jurisdictions with tax loss carryforwards or other changes are
made regarding their value or utilization, we may be required to reduce the value of these tax assets. Any of these changes could
have a material adverse impact on our financial position, results of operations and cash flows.
We are subject to laws and regulations in several jurisdictions, and failure to properly comply with such laws and regulations
may adversely affect our operations.
We are an exempted company, limited by shares on the Oslo Stock Exchange. In addition, we have established operations
in various other jurisdictions. Due to these international business activities, we are subject to laws and regulations in multiple
jurisdictions. Laws and regulations are subject to continual changes, and some legislative changes may be directly disadvantageous
to our business or could oblige us to change our operations or amend our strategy. Any failure to comply with applicable national
and/or international laws could lead to costly litigations, penalties and other sanctions, and unplanned operational and strategic
changes could increase our costs or decrease our profitability. Any of the above could have a material adverse impact on our
business, financial condition, results of operations and cash flows.
The price of our common shares could fluctuate significantly.
The trading volume and price of our common shares could fluctuate significantly. Factors both within and outside of our control
that could negatively affect the price of our common shares or result in fluctuations in the price or trading volume of our common
shares including, but not limited to, changes in our actual or projected results of operations or those of our competitors, changes in
earnings projections or failure to meet investors' and analysts' earnings expectations, investors' evaluations of the success and effects
of our strategy as well as the evaluation of the related risks, changes in general economic conditions, changes in shareholders and
other factors. Volatility in market price of securities may also occur without regard to the operating performance of a company.
The price of our common shares may therefore fluctuate based upon factors that are not specific to us, and these fluctuations may
materially affect the price of our common shares.
33
Item 1B. Unresolved Staff Comments.
Not applicable.
Item 2. Properties.
Overview
Our properties consist primarily of our mobile fleet of jack-up rigs and related equipment that is located and operates across
four core operating regions: MENAM, India, West Africa and Southeast Asia. We also own or lease office space for our corporate
headquarters in Dubai, UAE and shore-based facilities in UAE, Saudi Arabia, Bahrain, Egypt, Italy, Hungary, Indonesia, Malaysia,
Vietnam, Singapore, Thailand, Mauritius, India, Nigeria and Angola to support rig operations.
Fleet
Our fleet consists of 30 ILC jack-up rigs as of December 31, 2021. The ILC design allows each leg to be independently
raised or lowered and permits the drilling platform to be extended out from the hull to perform operations over certain types of pre-
existing platforms or structures. We believe these design features provide greater operational flexibility, safety and efficiency than
alternative designs. Many of our jack-up rigs further feature proven, reliable technology and processes, utilizing mechanical features
with generally lower operating costs compared to newer, higher-specification rigs. Within their given water depth capabilities, we
believe our jack-up rigs are well-suited for our customers’ typical shallow water operations.
We have taken steps in recent years to enhance our fleet, including our construction of newbuild rigs and acquisition of
premium jack-up rigs. From 2016 through 2021 we added nine premium jack-up rigs to our fleet at prices significantly less than
the historic cost of construction for comparable newbuild rigs, including:
• In 2016 the newbuild rig Shelf Drilling Chaophraya was delivered;
• In 2017 the newbuild rig Shelf Drilling Krathong was delivered and the Shelf Drilling Mentor, Shelf Drilling Tenacious,
and Shelf Drilling Resourceful were acquired;
• In 2018 the Shelf Drilling Scepter was acquired;
• In 2019 the Shelf Drilling Achiever and Shelf Drilling Journey were acquired and
• In 2020 the Shelf Drilling Enterprise was acquired.
The Shelf Drilling Journey was subsequently and opportunistically sold in February 2021. See “Note 7 – Assets Held for
Sale” to our Consolidated Financial Statements included in “Item 8. Financial Statements and Supplementary Data” for additional
information.
Maintenance and Certifications
Our organizational objective is to maintain our assets to provide optimal operating performance while minimizing out of
service time and total capital expenditures. Each of our rigs is subject to the maintenance and inspection regime governed by the
IMO’s Code for the Construction and Equipment of Mobile Offshore Drilling Units. Our rigs are subject to periodic testing with a
major inspection every five years under the International Association of Classification Societies Special Periodic Survey (“SPS”)
requirements. This inspection typically takes six to twelve weeks and is often scheduled between customer contracts to minimize
downtime. Our fleet is also subject to Underwater Inspections in Lieu of Drydocking (“UWILD”), intermediate surveys and annual
inspections between each SPS. The marine equipment of our fleet is certified according to international safety standards under the
International Safety Management Code and is certified by the American Bureau of Shipping classification society, enabling
universal recognition of our equipment as being qualified for international operations, however, our equipment maintenance
standards are governed by the guidelines, recommendations and standards provided by the American Petroleum Institute.
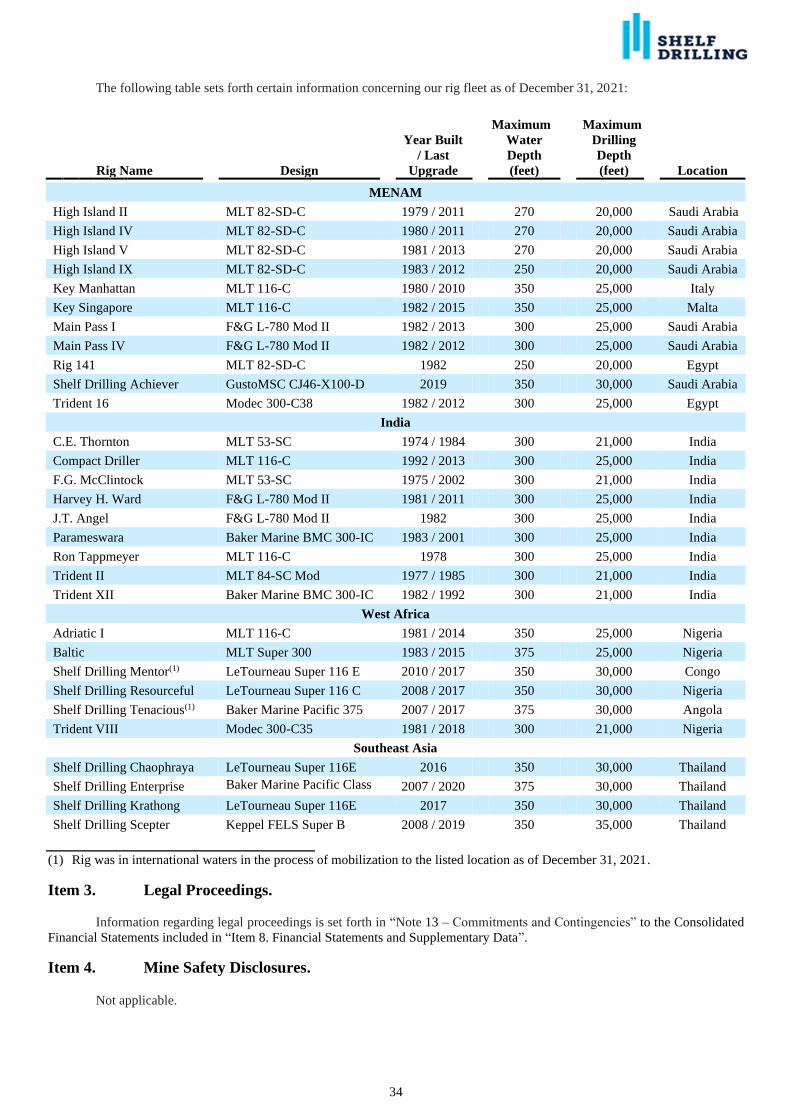
34
The following table sets forth certain information concerning our rig fleet as of December 31, 2021:
Rig Name Design
Year Built
/ Last
Upgrade
Maximum
Water
Depth
(feet)
Maximum
Drilling
Depth
(feet) Location
MENAM
High Island II MLT 82-SD-C 1979 / 2011 270 20,000 Saudi Arabia
High Island IV MLT 82-SD-C 1980 / 2011 270 20,000 Saudi Arabia
High Island V MLT 82-SD-C 1981 / 2013 270 20,000 Saudi Arabia
High Island IX MLT 82-SD-C 1983 / 2012 250 20,000 Saudi Arabia
Key Manhattan MLT 116-C 1980 / 2010 350 25,000 Italy
Key Singapore MLT 116-C 1982 / 2015 350 25,000 Malta
Main Pass I F&G L-780 Mod II 1982 / 2013 300 25,000 Saudi Arabia
Main Pass IV F&G L-780 Mod II 1982 / 2012 300 25,000 Saudi Arabia
Rig 141 MLT 82-SD-C 1982 250 20,000 Egypt
Shelf Drilling Achiever GustoMSC CJ46-X100-D 2019 350 30,000 Saudi Arabia
Trident 16 Modec 300-C38 1982 / 2012 300 25,000 Egypt
India
C.E. Thornton MLT 53-SC 1974 / 1984 300 21,000 India
Compact Driller MLT 116-C 1992 / 2013 300 25,000 India
F.G. McClintock MLT 53-SC 1975 / 2002 300 21,000 India
Harvey H. Ward F&G L-780 Mod II 1981 / 2011 300 25,000 India
J.T. Angel F&G L-780 Mod II 1982 300 25,000 India
Parameswara Baker Marine BMC 300-IC 1983 / 2001 300 25,000 India
Ron Tappmeyer MLT 116-C 1978 300 25,000 India
Trident II MLT 84-SC Mod 1977 / 1985 300 21,000 India
Trident XII Baker Marine BMC 300-IC 1982 / 1992 300 21,000 India
West Africa
Adriatic I MLT 116-C 1981 / 2014 350 25,000 Nigeria
Baltic MLT Super 300 1983 / 2015 375 25,000 Nigeria
Shelf Drilling Mentor(1) LeTourneau Super 116 E 2010 / 2017 350 30,000 Congo
Shelf Drilling Resourceful LeTourneau Super 116 C 2008 / 2017 350 30,000 Nigeria
Shelf Drilling Tenacious(1) Baker Marine Pacific 375 2007 / 2017 375 30,000 Angola
Trident VIII Modec 300-C35 1981 / 2018 300 21,000 Nigeria
Southeast Asia
Shelf Drilling Chaophraya LeTourneau Super 116E 2016 350 30,000 Thailand
Shelf Drilling Enterprise Baker Marine Pacific Class
375
2007 / 2020 375 30,000 Thailand
Shelf Drilling Krathong LeTourneau Super 116E 2017 350 30,000 Thailand
Shelf Drilling Scepter Keppel FELS Super B 2008 / 2019 350 35,000 Thailand
(1) Rig was in international waters in the process of mobilization to the listed location as of December 31, 2021.
Item 3. Legal Proceedings.
Information regarding legal proceedings is set forth in “Note 13 – Commitments and Contingencies” to the Consolidated
Financial Statements included in “Item 8. Financial Statements and Supplementary Data”.
Item 4. Mine Safety Disclosures.
Not applicable.
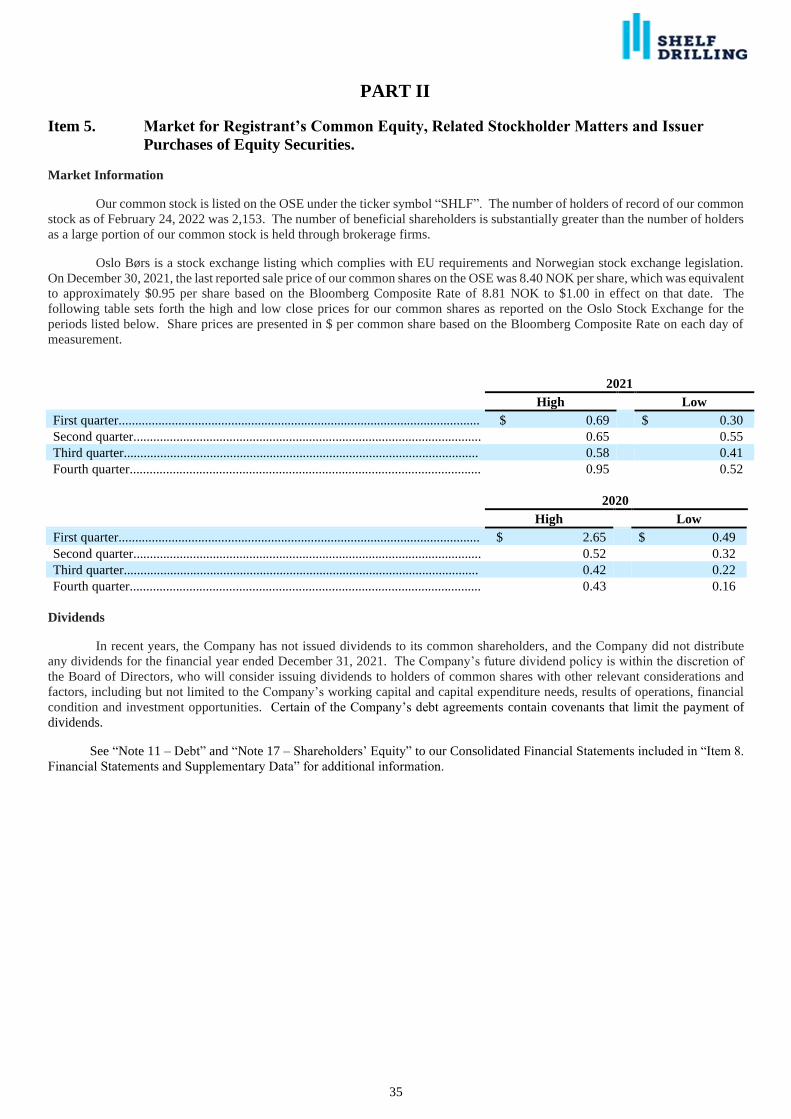
35
PART II
Item 5. Market for Registrant’s Common Equity, Related Stockholder Matters and Issuer
Purchases of Equity Securities.
Market Information
Our common stock is listed on the OSE under the ticker symbol “SHLF”. The number of holders of record of our common
stock as of February 24, 2022 was 2,153. The number of beneficial shareholders is substantially greater than the number of holders
as a large portion of our common stock is held through brokerage firms.
Oslo Børs is a stock exchange listing which complies with EU requirements and Norwegian stock exchange legislation.
On December 30, 2021, the last reported sale price of our common shares on the OSE was 8.40 NOK per share, which was equivalent
to approximately $0.95 per share based on the Bloomberg Composite Rate of 8.81 NOK to $1.00 in effect on that date. The
following table sets forth the high and low close prices for our common shares as reported on the Oslo Stock Exchange for the
periods listed below. Share prices are presented in $ per common share based on the Bloomberg Composite Rate on each day of
measurement.
2021
High Low
First quarter............................................................................................................. $ 0.69 $ 0.30
Second quarter......................................................................................................... 0.65 0.55
Third quarter........................................................................................................... 0.58 0.41
Fourth quarter.......................................................................................................... 0.95 0.52
2020
High Low
First quarter............................................................................................................. $ 2.65 $ 0.49
Second quarter......................................................................................................... 0.52 0.32
Third quarter........................................................................................................... 0.42 0.22
Fourth quarter.......................................................................................................... 0.43 0.16
Dividends
In recent years, the Company has not issued dividends to its common shareholders, and the Company did not distribute
any dividends for the financial year ended December 31, 2021. The Company’s future dividend policy is within the discretion of
the Board of Directors, who will consider issuing dividends to holders of common shares with other relevant considerations and
factors, including but not limited to the Company’s working capital and capital expenditure needs, results of operations, financial
condition and investment opportunities. Certain of the Company’s debt agreements contain covenants that limit the payment of
dividends.
See “Note 11 – Debt” and “Note 17 – Shareholders’ Equity” to our Consolidated Financial Statements included in “Item 8.
Financial Statements and Supplementary Data” for additional information.
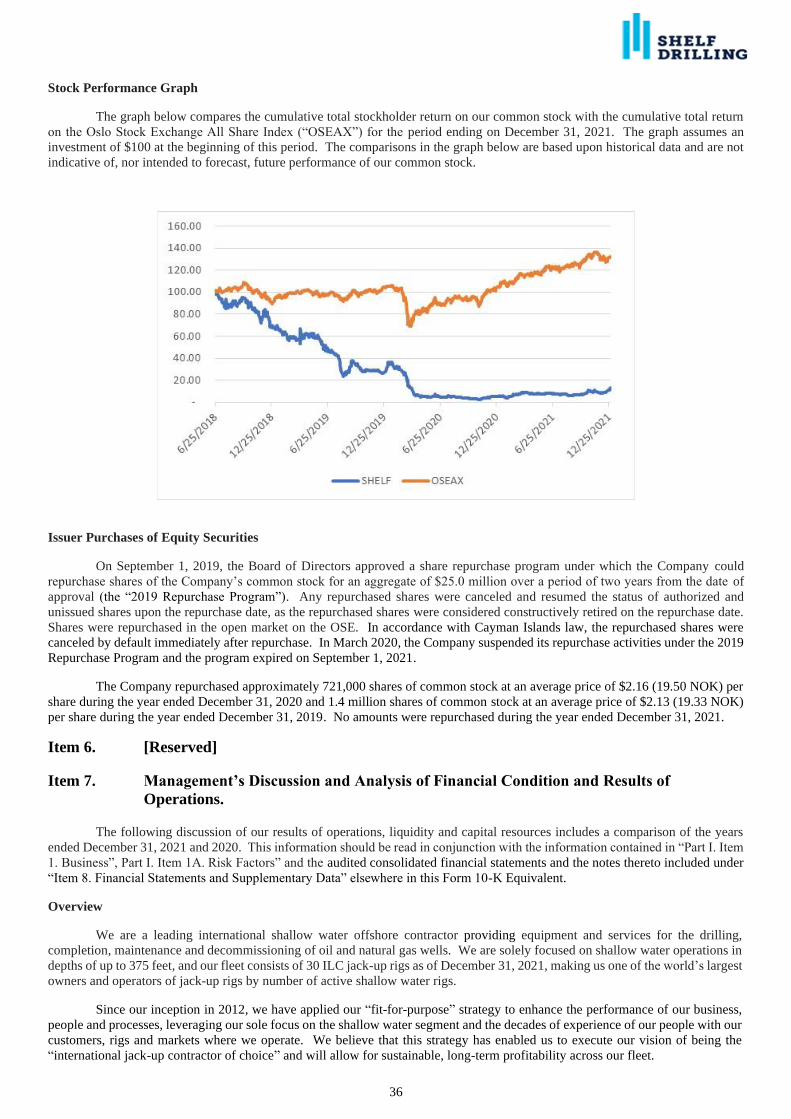
36
Stock Performance Graph
The graph below compares the cumulative total stockholder return on our common stock with the cumulative total return
on the Oslo Stock Exchange All Share Index (“OSEAX”) for the period ending on December 31, 2021. The graph assumes an
investment of $100 at the beginning of this period. The comparisons in the graph below are based upon historical data and are not
indicative of, nor intended to forecast, future performance of our common stock.
Issuer Purchases of Equity Securities
On September 1, 2019, the Board of Directors approved a share repurchase program under which the Company could
repurchase shares of the Company’s common stock for an aggregate of $25.0 million over a period of two years from the date of
approval (the “2019 Repurchase Program”). Any repurchased shares were canceled and resumed the status of authorized and
unissued shares upon the repurchase date, as the repurchased shares were considered constructively retired on the repurchase date.
Shares were repurchased in the open market on the OSE. In accordance with Cayman Islands law, the repurchased shares were
canceled by default immediately after repurchase. In March 2020, the Company suspended its repurchase activities under the 2019
Repurchase Program and the program expired on September 1, 2021.
The Company repurchased approximately 721,000 shares of common stock at an average price of $2.16 (19.50 NOK) per
share during the year ended December 31, 2020 and 1.4 million shares of common stock at an average price of $2.13 (19.33 NOK)
per share during the year ended December 31, 2019. No amounts were repurchased during the year ended December 31, 2021.
Item 6. [Reserved]
Item 7. Management’s Discussion and Analysis of Financial Condition and Results of
Operations.
The following discussion of our results of operations, liquidity and capital resources includes a comparison of the years
ended December 31, 2021 and 2020. This information should be read in conjunction with the information contained in “Part I. Item
1. Business”, Part I. Item 1A. Risk Factors” and the audited consolidated financial statements and the notes thereto included under
“Item 8. Financial Statements and Supplementary Data” elsewhere in this Form 10-K Equivalent.
Overview
We are a leading international shallow water offshore contractor providing equipment and services for the drilling,
completion, maintenance and decommissioning of oil and natural gas wells. We are solely focused on shallow water operations in
depths of up to 375 feet, and our fleet consists of 30 ILC jack-up rigs as of December 31, 2021, making us one of the world’s largest
owners and operators of jack-up rigs by number of active shallow water rigs.
Since our inception in 2012, we have applied our “fit-for-purpose” strategy to enhance the performance of our business,
people and processes, leveraging our sole focus on the shallow water segment and the decades of experience of our people with our
customers, rigs and markets where we operate. We believe that this strategy has enabled us to execute our vision of being the
“international jack-up contractor of choice” and will allow for sustainable, long-term profitability across our fleet.
37
Our fleet is well-suited to our core operating regions of MENAM, Southeast Asia, India and West Africa. These markets
are generally characterized by relatively benign operating conditions with activities concentrated in workover and development
programs on producing assets with existing infrastructure.
We have one reportable segment, Contract Services, which reflects how we manage our business and that our market is
dependent upon the worldwide oil and natural gas industry. The rigs comprising our fleet operate in a single market and are mobile.
As a result, our rigs can be deployed globally to meet the changing needs of our customers, which largely consist of NOCs, IOCs
and independent oil and gas companies.
See “Item 1. Business” for more information about our business, including discussions of our recent events; operations;
customers and customer contracts; strategy and competitive strengths; risk management and insurance; health, safety and
environment; our people and operating expenses, capital expenditures and deferred costs.
Outlook
Brent crude oil prices, the key driver in the demand for shallow water drilling activity, improved from an average of $43
per barrel in 2020 to $71 per barrel in 2021. The increase in demand for oil and gas was due to the easing of COVID-19 lockdowns,
combined with a strong economic recovery and a partial rebound of the travel industry. In recent months, low global oil inventories
and an increase in geopolitical tensions have resulted in further escalation of oil prices. Brent crude prices rose from $86 per barrel
in October 2021 to over $90 per barrel in January 2022. Supply and demand dynamics are expected to remain tight for the near to
medium term.
The global number of contracted jack-up rigs increased from 339 in January 2021 to 349 in January 2022 and marketed
utilization increased from 79% to 83% over the same period. We expect shallow water activity to show a significant increase in
2022, driven by rising oil prices and demand, which is projected to exceed pre-pandemic levels by the end of 2022.
Our liquidity position remains strong with cash and cash equivalents of $232.3 million as of December 31, 2021, with no
debt maturities until 2024. We divested six rigs in 2021, including all of our stacked rigs, for total net proceeds of $81.3 million.
As of February 2022, our fleet consists of 30 marketable rigs and 28 of these rigs are currently under contract. During the fourth
quarter of 2021, our EBITDA increased 28% sequentially, primarily due to increased revenues. We anticipate EBITDA will
continue to improve in 2022 due to expected further improvements in effective utilization. Twenty-one new contracts and contract
extensions were executed in 2021 which resulted in growth in our backlog from $1.4 billion at the end of 2020 to $1.7 billion as of
December 31, 2021. We continue to see an increase in marketing activity in all our key geographical markets with a strong pipeline
of opportunities and an improving dayrate environment.
Given the strength in the price and demand outlook for oil and gas, we have an optimistic outlook for the industry in 2022,
and believe we are well positioned as the sector continues to recover.
Operational measures
We use various operational measures common to our industry to evaluate our operational performance, including:
• Contract backlog is the maximum contract dayrate revenues that can be earned from firm commitments for contract
services represented by executed definitive agreements based on the contracted operating dayrate during the contract
period less any planned out-of-service periods for regulatory inspections and surveys or other work. Contract backlog
excludes revenues resulting from mobilization and demobilization fees, capital or upgrade reimbursement, recharges,
bonuses and other revenue sources. Contract backlog may also include the maximum contract amount of revenues for
the use of our rigs as bareboat charters or as accommodation units. The contract period excludes revenues from
extension options under our contracts unless such options have been exercised. The contract operating dayrate may
differ from the amount estimated due to reduced dayrates for rig movements, adverse weather and equipment
downtime, among other factors. Actual dayrates may also include contractual adjustments based on market factors,
such as Brent crude oil or natural gas prices or cost increases, and such adjustments are not estimated in the backlog
dayrate. Contract backlog is a key indicator of our potential future revenue generation.
• Average dayrate is the average contract dayrate earned by marketable rigs over the reporting period excluding
mobilization fees, contract preparation, capital expenditure reimbursements, demobilization, recharges, bonuses and
other revenues. Average dayrate can be calculated related to historical revenues or contract backlog.
• Contracted rigs consist of all of our rigs that are under contract, including rigs currently operating under a contract
and rigs preparing for an upcoming contract.
• Average contracted days per rig is the total remaining contracted days for all contracted rigs divided by the number
of contracted rigs.
• Total recordable incident rate (“TRIR”) is the number of recordable safety incidents per 200,000 man-hours.
• Marketable rigs consist of all of our rigs that are operating or are available to operate, but excluding stacked rigs and
rigs under contract for activities other than drilling, plug and abandonment or associated services, as applicable.
38
• Uptime is the period during which we perform well operations without stoppage due to mechanical, procedural or
other operational events that result in non-productive well operations time. Uptime is expressed as a percentage
measured daily, monthly or yearly. Uptime performance is a key customer contracting criterion, an indication of our
operational efficiency and directly related to our current and future revenues and profit generation.
• Effective utilization is the number of calendar days during which marketable rigs generate dayrate revenues divided
by the maximum number of calendar days during which those rigs could have generated dayrate revenues. Effective
utilization measures the dayrate revenue efficiency of our marketable rigs. Effective utilization varies due to changes
in operational uptime, planned downtime for periodic surveys, timing of underwater inspections, contract preparation
and upgrades, time between contracts and the use of alternative dayrates for waiting-on-weather periods, repairs,
standby, force majeure, mobilization or other rates that apply under certain circumstances. We exclude all other types
of revenues from the calculation of effective utilization.
The following table includes selected operating measures as of December 31, 2021, 2020 and 2019:
As of December 31,
2021 2020 2019
Contract backlog (in millions).......................................................... $ 1,679 $ 1,377 $ 2,005
Weighted average backlog dayrate (in thousands)............................ $ 67.7 $ 67.2 $ 69.7
Contracted rigs................................................................................... 28 29 31
Average contracted days per rig........................................................ 885 706 928
Contract backlog as of December 31, 2021 is expected to be recognized over the periods as per the following table, subject
to certain limitations and adjustments as discussed above:
2022 2023 2024 Thereafter Total
Contract backlog (in millions)...................................... $ 442 $ 275 $ 243 $ 719 $ 1,679
The following table includes selected operating measures for the years ended December 31, 2020, 2019 and 2018:
Years ended December 31,
2021 2020 2019
TRIR................................................................................................... 0.16 0.19 0.19
IADC Average TRIR........................................................................ 0.57 0.47 0.63
Weighted average actual dayrate (in thousands)................................ $ 60.5 $ 58.9 $ 64.7
Average marketable rigs................................................................... 30.6 32.1 32.6
Uptime................................................................................................ 99.3% 99.4% 99.2%
Effective utilization........................................................................... 73% 80% 71%
Financial measures
In addition to terms under U.S. generally accepted accounting principles (“GAAP”), we utilize certain non-GAAP financial
measures. We present the non-GAAP measures, which include adjusted earnings before interest, taxes, depreciation and
amortization (“Adjusted EBITDA”) and Adjusted EBITDA divided by revenues (“Adjusted EBITDA Margin”) in addition to net
income (loss), which is the most directly comparable GAAP financial measure. We believe that Adjusted EBITDA and Adjusted
EBITDA Margin are useful non-GAAP financial measures because they are widely used in our industry to measure a company’s
operating performance without regard to the excluded items, which can vary substantially from company to company, and are also
useful to an investor in evaluating the performance of the business over time. In addition, our management uses Adjusted EBITDA
and Adjusted EBITDA Margin in presentations to our Board of Directors to provide a consistent basis to measure the operating
performance of our business, as a measure for planning and forecasting overall expectations, for evaluation of actual results against
such expectations and in communications with our shareholders, lenders, noteholders, rating agencies and others concerning our
financial performance. Adjusted EBITDA and Adjusted EBITDA Margin may not be comparable to similarly titled measures
employed by other companies and should not be considered in isolation or as a substitute for net income (loss) or other data prepared
in accordance with GAAP. Adjusted EBITDA and Adjusted EBITDA margin have significant limitations, including but not limited
to the exclusion from these numbers of various cash requirements to operate our business.
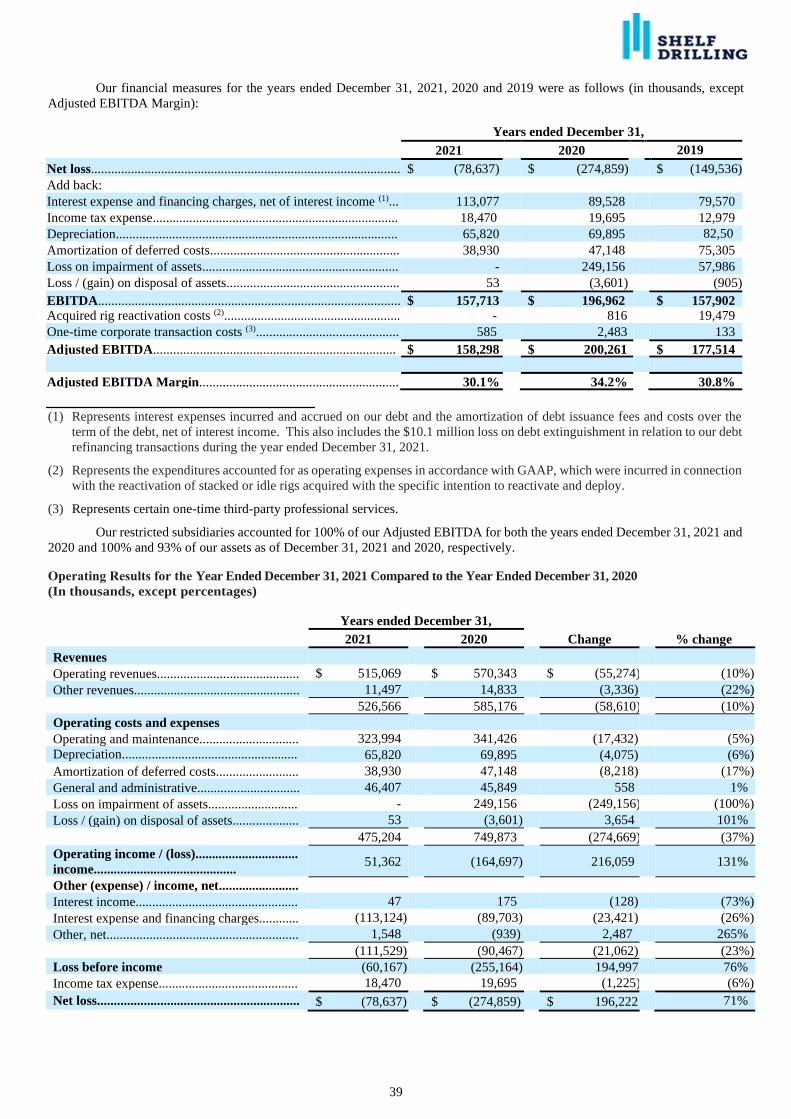
39
Our financial measures for the years ended December 31, 2021, 2020 and 2019 were as follows (in thousands, except
Adjusted EBITDA Margin):
Years ended December 31,
2021 2020 2019
Net loss............................................................................................. $ (78,637) $ (274,859) $ (149,536)
Add back:
Interest expense and financing charges, net of interest income (1)... 113,077 89,528 79,570
Income tax expense.......................................................................... 18,470 19,695 12,979
Depreciation..................................................................................... 65,820 69,895 82,50
3 Amortization of deferred costs......................................................... 38,930 47,148 75,305
Loss on impairment of assets........................................................... - 249,156 57,986
Loss / (gain) on disposal of assets.................................................... 53 (3,601) (905)
EBITDA........................................................................................... $ 157,713 $ 196,962 $ 157,902
Acquired rig reactivation costs (2)..................................................... - 816 19,479
One-time corporate transaction costs (3)........................................... 585 2,483 133
Adjusted EBITDA......................................................................... $ 158,298 $ 200,261 $ 177,514
Adjusted EBITDA Margin............................................................ 30.1% 34.2% 30.8%
(1) Represents interest expenses incurred and accrued on our debt and the amortization of debt issuance fees and costs over the
term of the debt, net of interest income. This also includes the $10.1 million loss on debt extinguishment in relation to our debt
refinancing transactions during the year ended December 31, 2021.
(2) Represents the expenditures accounted for as operating expenses in accordance with GAAP, which were incurred in connection
with the reactivation of stacked or idle rigs acquired with the specific intention to reactivate and deploy.
(3) Represents certain one-time third-party professional services.
Our restricted subsidiaries accounted for 100% of our Adjusted EBITDA for both the years ended December 31, 2021 and
2020 and 100% and 93% of our assets as of December 31, 2021 and 2020, respectively.
Operating Results for the Year Ended December 31, 2021 Compared to the Year Ended December 31, 2020
(In thousands, except percentages)
Years ended December 31,
2021 2020 Change % change
Revenues
Operating revenues........................................... $ 515,069 $ 570,343 $ (55,274) (10%)
Other revenues.................................................. 11,497 14,833 (3,336) (22%)
526,566 585,176 (58,610) (10%)
Operating costs and expenses
Operating and maintenance.............................. 323,994 341,426 (17,432) (5%)
Depreciation.....................................................
................ 65,820 69,895 (4,075) (6%)
Amortization of deferred costs......................... 38,930 47,148 (8,218) (17%)
General and administrative............................... 46,407 45,849 558 1%
Loss on impairment of assets........................... - 249,156 (249,156) (100%)
Loss / (gain) on disposal of assets.................... 53 (3,601) 3,654 101%
475,204 749,873 (274,669) (37%)
Operating income / (loss)...............................
income........................................... 51,362 (164,697) 216,059 131%
Other (expense) / income, net........................
Interest income................................................. 47 175 (128) (73%)
Interest expense and financing charges............ (113,124) (89,703) (23,421) (26%)
Other, net.......................................................... 1,548 (939) 2,487 265%
(111,529) (90,467)
-
(21,062) (23%)
Loss before income
taxes.................................
income...........................................
(60,167) (255,164) 194,997 76%
Income tax expense.......................................... 18,470 19,695 (1,225) (6%)
Net loss............................................................. $ (78,637) $ (274,859) $ 196,222 71%
40
Revenues
Total revenues for 2021 were $526.6 million compared to $585.2 million for 2020. Revenues for 2021 consisted of $515.1
million (97.8%) of operating revenues and $11.5 million (2.2%) of other revenues. In 2020, these same revenues were $570.3
million (97.5%) and $14.8 million (2.5%), respectively.
Total revenues for 2021 decreased by $58.6 million compared to the same period in 2020 primarily due to $70.6 million
related to lower effective utilization across the fleet, as four fewer rigs were operating in the 2021 period as compared to the same
period in 2020, partially offset by an increase of $12.3 million from higher average earned dayrates.
Operating and maintenance expenses
Total operating and maintenance expenses for 2021 were $324.0 million, or 61.5% of total revenue, compared to $341.4
million, or 58.3% of total revenue, in 2020. Operating and maintenance expenses in 2021 consisted of $290.5 million rig-related
expenses and $33.5 million shore-based expenses. In 2020, these expenses were $306.0 million and $35.4 million, respectively.
The decrease in total rig-related expenses of $15.5 million primarily consisted of $12.0 million lower expenses for rigs
divested in the current or prior periods, $2.9 million lower expenses related to the bareboat charter rigs with China Merchants and
$5.8 million in other rig cost savings. This was partially offset by $2.1 million in net increased expenses for rigs with different
operating periods in 2021 as compared to 2020 due to the timing of contract start dates and suspension or termination periods and
$3.1 million higher maintenance and shipyard expenses. Shore-based expenses decreased by $1.9 million for the year ended
December 31, 2021 compared to the same period in 2020 mainly due to the continued impact of cost savings measures implemented
across all field locations during 2020.
Depreciation expense
Depreciation expense in 2021 was $65.8 million compared to $69.9 million in 2020. In 2021, depreciation expense was
impacted by $8.5 million of lower depreciation on rigs and equipment which were impaired in 2020 and by $4.5 million of increased
depreciation for one rig that was placed into operation in early 2021. The Company anticipates that depreciation expense will
decrease in 2022 as compared to 2021 due to a change in accounting estimate related to the remaining useful lives of certain rigs.
Amortization of deferred costs
The amortization of deferred costs in 2021 was $38.9 million compared to $47.1 million in 2020. The decrease in
amortization for the year ended December 31, 2021 was primarily related to lower amortization of contract preparation costs and
major equipment overhauls on rigs that were impaired in 2020.
General and administrative expenses
General and administrative expenses in 2020 were $46.4 million compared to $45.8 million in 2020. The $0.6 million
increase primarily resulted from an increase in compensation and benefits expenses over the prior year, partially offset by a $2.0
million decrease in provision for bad debt due to the current year collection of aged receivables for which an allowance was recorded
in 2020.
Loss on impairment of assets
Loss on impairment of assets was $249.2 million in the year ended December 31, 2020. The loss in 2020 included
impairment on 19 of our rigs and other long-lived assets and five rigs classified as assets held for sale. There were no such
transactions during the year ended December 31, 2021.
Gain / (loss) on disposal of assets
Loss on disposal of assets was $0.1 million in the year ended December 31, 2021, compared to a gain of $3.6 million for
the same period in 2020. The decrease in the gain on disposal of assets for the year ended December 31, 2021 was primarily due
to the higher net proceeds on the rig sales in 2020, particularly for the sale of the Trident XIV, compared to smaller gains and losses
recorded on the rig sales in 2021.
Other (expense) / income, net
Other (expense) / income, net, consisting of interest expense and finance charges, interest income and other, net was an
expense of $(111.5) million in 2021 compared to $(90.5) million in 2020. During 2021, other expense consisted primarily of interest
expense and financing charges of $(113.1) million, as well as interest income of $47 thousand and other, net of $1.5 million in
income. This compares to $(89.7) million, $0.2 million and $(0.9) million in expense for those respective categories during 2020.
Interest expense and financing charges were $23.4 million higher compared to 2020, primarily due to $10.1 million in loss
on debt extinguishment related to the termination of the SDHL Revolver and the 8.75% Senior Secured Notes and $23.3 million in
41
interest on the 8.875% Notes, partially offset by $8.2 million in lower interest due to the termination of the SDHL Revolver and the
8.75% Senior Secured Notes.
Income tax expense
Income tax expense in 2021 was $18.5 million compared to $19.7 million in 2020. While the Company is exempt from
all income taxation in the Cayman Islands, a provision for income taxes is recorded based on the tax laws and rates applicable in
the jurisdictions in which the Company operates and earns income or is considered resident for income tax purposes. The
relationship between the provision for or benefit from income taxes and the income or loss before income taxes can vary
significantly from period-to-period considering, among other factors, (a) the overall level of income before income taxes, (b)
changes in the blend of income that is taxed based on gross revenues rather than income before taxes, (c) rig movements between
taxing jurisdictions, (d) changes in the Company’s rig operating structures which may alter the basis on which the Company is taxed
in a particular jurisdiction, and (e) fluctuations in foreign currency rates against the U.S. Dollar which are used to measure tax
receivables in various jurisdictions.
Income tax expense in 2021 was lower than in 2020 primarily due to a reduction in revenues and lower interest and penalties
related to uncertain tax positions applicable for the period, partially offset by an increase in tax expense primarily related to prior
year tax receivables which are measured in foreign currencies and subject to fluctuations against the U.S. Dollar.
Liquidity and Capital Resources
Sources and uses of liquidity
We had $232.3 million and $73.4 million in cash and cash equivalents as of December 31, 2021 and 2020, respectively.
Historically, we have met our liquidity needs principally from cash balances in banks, cash generated from operations and cash from
issuance of long-term debt and equity. Our primary uses of cash were payments for capital and deferred expenditures, costs related
to debt financing and debt servicing and income taxes.
On March 26, 2021, the Company closed a private offering of $310.0 million aggregate principal amount of the 8.875%
Notes. The proceeds were used to cash collateralize bank guarantees issued under the SDHL Revolver, repay all outstanding
borrowings under the SDHL Revolver, redeem and repurchase all of the outstanding 8.75% Senior Secured Notes and for general
corporate purposes.
Restricted cash consists of cash deposits held related to bank guarantees and are recorded according to the maturity date
plus expected extensions and renewals as either other current assets or other long-term assets in the consolidated balance sheets. As
of December 31, 2021, we had restricted cash of $2.8 million and $18.1 million in other current assets and other long-term assets,
respectively. As of December 31, 2020, we had restricted cash of $15.5 million and $35 thousand in other current assets and other
long-term assets, respectively. The increase in restricted cash as of December 31, 2021 as compared to December 31, 2020, was
due to the cash collateralization of bank guarantees which had been issued under the SDHL Revolver before its termination in March
2021. As of December 31, 2020, the Company owed $55.0 million and had issued bank guarantees totaling $23.6 million under the
SDHL Revolver.
At any given time, we may require a significant portion of cash on hand for working capital, capital and deferred
expenditures and other needs related to the operation of our business. We may consider establishing additional financing
arrangements with banks or other capital providers. Subject in each case to then existing market conditions and to our then-expected
liquidity needs, among other factors, we may use a portion of our existing cash balances and internally generated cash flows to
reduce debt prior to scheduled maturities through debt repurchases, either in the open market or in privately negotiated transactions
or through debt redemptions or tender offers. Any such transactions will depend on prevailing market conditions, our liquidity
requirements, contractual restrictions and other factors. We may seek to extend our maturities and/or reduce the overall principal
amount of our debt through liability management transactions, which may include exchange offers and/or recapitalizations. See
also Material Cash Requirements below.
Going concern assumption as per Oslo Børs reporting requirements
The existence of COVID-19 has caused disruptions to businesses and economic activity globally. Certain of our contracts
were terminated, shortened or renegotiated in 2020 which has adversely impacted our business. As of December 31, 2021, we have
adequate cash reserves, significantly enhanced by the sale of the Shelf Drilling Journey in February 2021 and the issuance of the
8.875% Notes in March 2021, and we are continuously managing our cash flows and cash forecasts.
As a result of these factors, management believes that we have adequate liquidity to fund our operations for the next twelve
months, and, therefore, our financial statements have been prepared under the going concern assumption. Additional capital and/or
refinancing of our existing debt may be required in the future to meet evolving business needs.
42
Discussion of Cash flows for the Year ended December 31, 2021 compared to the year ended December 31, 2020
The following table sets out certain information regarding our cash flows for the years ended December 31, 2021 and 2020:
Years ended December 31,
2021 2020
Net cash (used in) / provided by operating activities....................................................... $ (16,241) $ 54,218
Net cash provided by / (used) in investing activities........................................................ 23,568 (88,675)
Net cash provided by financing activities........................................................................ 156,928 95,121
Net increase in cash, cash equivalents and restricted cash............................................... $ 164,255 $ 60,664
Net cash (used in) / provided by operating activities
Net cash used in operating activities totaled $16.2 million in 2021 compared to net cash provided of $54.2 million 2020.
The decrease of $70.4 million in cash from operations was primarily due to a decrease in revenues in 2021 when compared to the
prior year.
During 2021 and 2020, we made cash payments of $96.0 million and $85.2 million in interest and financing charges,
respectively, included in other operating assets and liabilities, net. We also made cash payments of $16.7 million and $15.8 million
in income taxes included in other operating assets and liabilities, net during 2021 and 2020, respectively.
Net cash provided by / ( used) in investing activities
Net cash provided by investing activities totaled $23.6 million in 2021 compared to cash used of $88.7 million in 2020.
The net proceeds from disposal of assets totaled $69.4 million in 2021 compared to $7.2 million in net proceeds and $15.9 million
in deposits related to rig sales in 2020. The $46.3 million increase was primarily related to the receipt of the remaining proceeds
for the sale of the Shelf Drilling Journey, High Island VII, Trident 15, Key Hawaii, Galveston Key and Randolph Yost in 2021 as
compared to proceeds received for the two rigs divested during 2020 and deposits received in 2020 for rig sales finalized in 2021.
Cash used for capital expenditures totaled $45.9 million and $111.8 million in 2021 and 2020, respectively. The $65.9
million decrease was primarily due to the acquisition and readiness project costs for the Shelf Drilling Enterprise, which was
acquired in 2020 and commenced operations in early 2021.
Net cash provided by financing activities
Net cash provided by financing activities totaled $156.9 million in 2021 compared to $95.1 million in 2020.
The increase of $61.8 million in cash provided by financing activities was primarily due to an increase in cash proceeds
from the issuance of debt, partially offset by an increase in payments to retire long-term debt when compared to the prior year.
Net cash provided by financing activities in 2021 consisted of $304.1 million in proceeds from issuance of the 8.875%
Notes, net of discount, less $7.3 million in debt financing costs, partially offset by cash payments of $80.0 million and $55.0 million
to retire the 8.75% Senior Secured Notes and SDHL Revolver, respectively, and $4.9 million in related debt extinguishment costs.
Net cash provided by financing activities in 2020 consisted of $80.0 million in proceeds from the issuance of the 8.75% Senior
Secured Notes, less $3.2 million in debt financing costs and a net increase of $20.0 million in borrowings under the SDHL Revolver,
partially offset by $1.6 million in repurchases of common shares.
Capital expenditures and deferred costs
Capital expenditures and deferred costs include fixed asset purchases, investments associated with the construction of
newbuild rigs and certain expenditures associated with regulatory inspections, major equipment overhauls, contract preparation
(including rig upgrades), mobilization and stacked rig reactivations. Capital expenditures and deferred costs can vary from quarter-
to-quarter and year-to-year depending upon the requirements of existing and new customers, the number and scope of out-of-service
projects, the timing of regulatory surveys and inspections and the number of rig reactivations. Capital additions are included in
property and equipment and are depreciated over the estimated remaining useful life of the assets. Deferred costs are included in
other current assets and other long-term assets on the consolidated balance sheet and are amortized over the relevant periods
covering: (i) the underlying firm contract period to which the expenditures relate or (ii) the period until the next planned similar
expenditure is to be made.
43
The table below sets out our capital expenditures and deferred costs for the years ended December 31, 2021 and 2020 in
thousands):
Years ended December 31,
2021 2020
Regulatory and capital maintenance (1) ............................................................................. $ 67,321 $ 44,837
Contract preparation (2) ..................................................................................................... 28,710 14,783
Fleet spares and other (3) ................................................................................................... 15,628 6,431
$ 111,659 $ 66,051
Rig acquisitions (4) ............................................................................................................ 1,462 88,331
Total capital expenditure and deferred costs.................................................................... $ 113,121 $ 154,382
(1) Includes major overhauls, regulatory costs, general upgrades and sustaining capital expenditures.
(2) Includes specific upgrade, mobilization and preparation costs associated with a customer contract.
(3) Includes (i) acquisition and certification costs for the rig fleet spares pool which is allocated to specific rig expenditures as and
when required by that rig, which will result in an expenditure charge to that rig and a credit to fleet spares and (ii) office and
infrastructure expenditures.
(4) Includes capital expenditures and deferred costs associated with the acquisition and readiness projects for Shelf Drilling
Enterprise acquired in January 2020 and for two newbuild premium jack-up rigs acquired in May 2019.
Capital expenditures and deferred costs were $113.1 million and $154.4 million in 2021 and 2020, respectively. The
decrease of $41.3 million was primarily due to the $86.9 million decrease in rig acquisitions mainly explained by $79.4 million for
the acquisition and operations readiness of the Shelf Drilling Enterprise in 2020. This was partly offset by $36.4 million higher
regulatory, capital maintenance and contract preparation costs primarily for one rig in Angola, one rig in India and two rigs in Saudi
Arabia and $9.2 million higher spending in fleet spares and other in 2021.
The following table reconciles the cash payments related to additions to property and equipment and changes in deferred
costs, net to the total capital expenditures and deferred costs for the years ended December 31, 2021 and 2020 (in thousands):
Years ended December 31,
2021 2020
Cash payments for additions to property and equipment.................................................. $ 45,852 $ 111,817
Net change in accrued but unpaid additions to property and equipment.......................... (5,752) 744
Total capital expenditures................................................................................................. $ 40,100 $ 112,561
Changes in deferred costs, net........................................................................................... $ 34,091 $ (5,327)
Add: Amortization of deferred costs................................................................................. 38,930 47,148
Total deferred costs........................................................................................................... $ 73,021 $ 41,821
Total capital expenditure and deferred costs.................................................................... $ 113,121 $ 154,382
Material Cash Requirements
In the normal course of business, we enter into various contractual obligations that impact or could impact our liquidity.
As of December 31, 2021, our anticipated material cash requirements consisted primarily of payments related to debt servicing and
repayments, operating costs and expenses, operating lease obligations, capital expenditures and deferred costs and income taxes.
As of December 31, 2021, we had a total indebtedness of $1.2 billion which related to the 8.25% Senior Unsecured Notes
and 8.875% Notes. Interest related to each of these note issuances is payable semi-annually and principal payments begin in 2024.
See “Note 11 – Debt” to our Consolidated Financial Statements in “Item 8. Financial Statements and Supplementary Data”.
As of December 31, 2021, we had operating lease obligations outstanding of $16.2 million. See “Note 11 – Debt” to our
Consolidated Financial Statements in “Item 8. Financial Statements and Supplementary Data”.
We routinely have material spending on capital expenditures and deferred costs to support our business and we expect this
will continue. Although certain custom equipment may have long lead times, we do not typically commit to significant capital
purchases in advance.
We are currently challenging a tax assessment of $20.2 million, inclusive of interest, penalties and fees, related to one of
the Company’s operations. We have appealed the assessment and believe it is more likely than not that we will ultimately prevail.
In January 2022, we began making required monthly tax deposits calculated over a six year period related to this assessment.
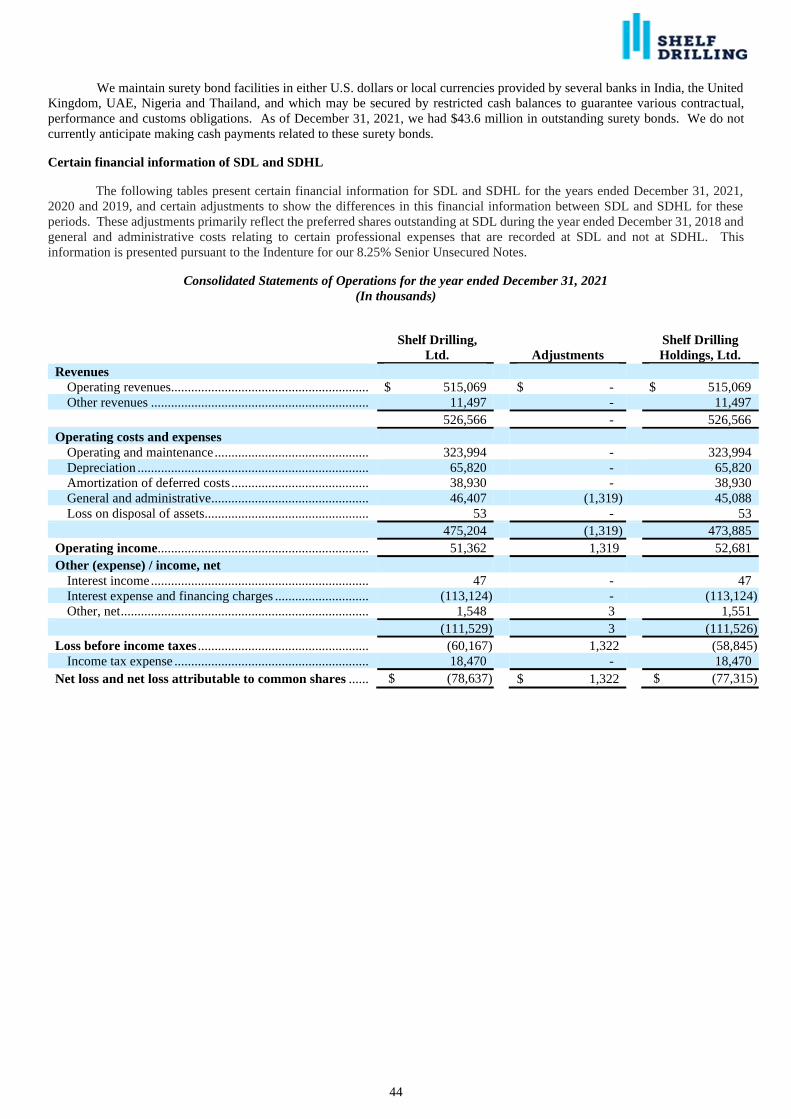
44
We maintain surety bond facilities in either U.S. dollars or local currencies provided by several banks in India, the United
Kingdom, UAE, Nigeria and Thailand, and which may be secured by restricted cash balances to guarantee various contractual,
performance and customs obligations. As of December 31, 2021, we had $43.6 million in outstanding surety bonds. We do not
currently anticipate making cash payments related to these surety bonds.
Certain financial information of SDL and SDHL
The following tables present certain financial information for SDL and SDHL for the years ended December 31, 2021,
2020 and 2019, and certain adjustments to show the differences in this financial information between SDL and SDHL for these
periods. These adjustments primarily reflect the preferred shares outstanding at SDL during the year ended December 31, 2018 and
general and administrative costs relating to certain professional expenses that are recorded at SDL and not at SDHL. This
information is presented pursuant to the Indenture for our 8.25% Senior Unsecured Notes.
Consolidated Statements of Operations for the year ended December 31, 2021
(In thousands)
Shelf Drilling,
Ltd.
Adjustments
Shelf Drilling
Holdings, Ltd.
Revenues
Operating revenues ........................................................... $ 515,069 $ - $ 515,069
Other revenues ................................................................. 11,497 - 11,497
526,566 - 526,566
Operating costs and expenses
Operating and maintenance .............................................. 323,994 - 323,994
Depreciation ..................................................................... 65,820 - 65,820
Amortization of deferred costs ......................................... 38,930 - 38,930
General and administrative ............................................... 46,407 (1,319) 45,088
Loss on disposal of assets................................................. 53 - 53
475,204 (1,319) 473,885
Operating income ............................................................... 51,362 1,319 52,681
Other (expense) / income, net
Interest income ................................................................. 47 - 47
Interest expense and financing charges ............................ (113,124) - (113,124)
Other, net .......................................................................... 1,548 3 1,551
(111,529) 3 (111,526)
Loss before income taxes ................................................... (60,167) 1,322 (58,845)
Income tax expense .......................................................... 18,470 - 18,470
Net loss and net loss attributable to common shares ...... $ (78,637)
$ 1,322 $ (77,315)
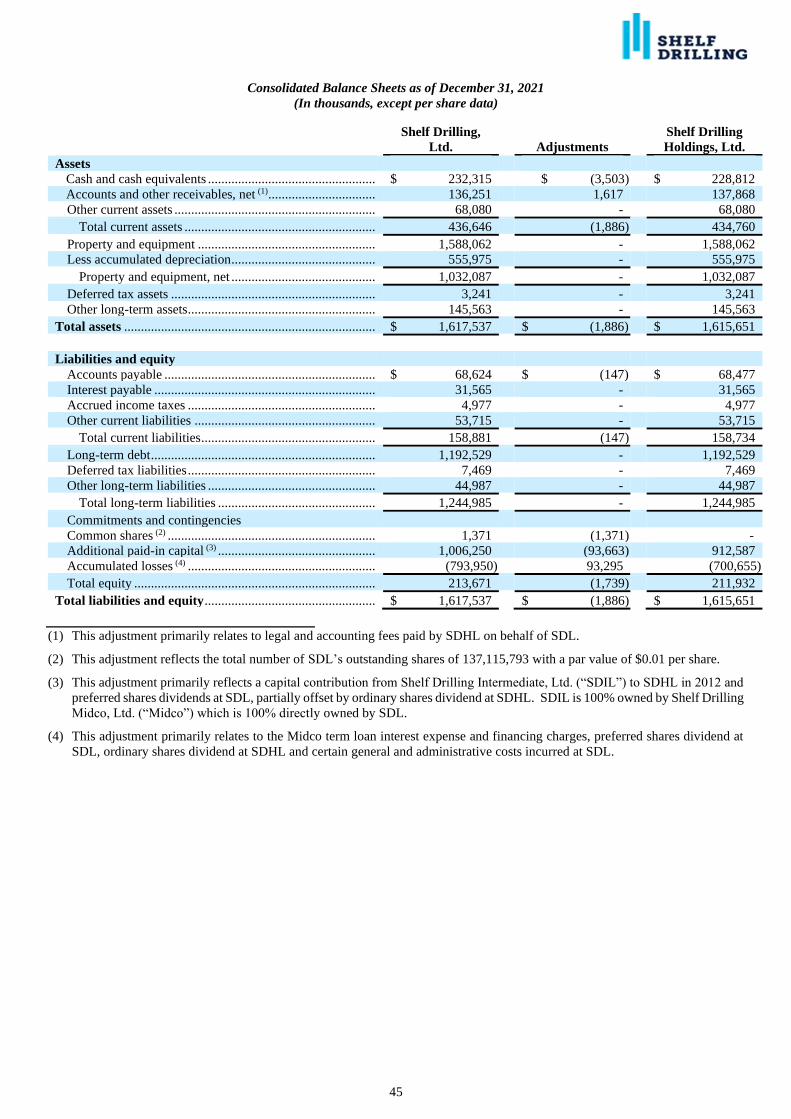
45
Consolidated Balance Sheets as of December 31, 2021
(In thousands, except per share data)
Shelf Drilling,
Ltd.
Adjustments
Shelf Drilling
Holdings, Ltd.
Assets
Cash and cash equivalents .................................................. $ 232,315 $ (3,503) $ 228,812
Accounts and other receivables, net (1) ................................ 136,251 1,617 137,868
Other current assets ............................................................ 68,080 - 68,080
Total current assets ......................................................... 436,646 (1,886) 434,760
Property and equipment ..................................................... 1,588,062 - 1,588,062
Less accumulated depreciation ........................................... 555,975 - 555,975
Property and equipment, net ........................................... 1,032,087 - 1,032,087
Deferred tax assets ............................................................. 3,241 - 3,241
Other long-term assets ........................................................ 145,563 - 145,563
Total assets ........................................................................... $ 1,617,537 $ (1,886) $ 1,615,651
Liabilities and equity
Accounts payable ............................................................... $ 68,624 $ (147) $ 68,477
Interest payable .................................................................. 31,565 - 31,565
Accrued income taxes ........................................................ 4,977 - 4,977
Other current liabilities ...................................................... 53,715 - 53,715
Total current liabilities .................................................... 158,881 (147) 158,734
Long-term debt ................................................................... 1,192,529 - 1,192,529
Deferred tax liabilities ........................................................ 7,469 - 7,469
Other long-term liabilities .................................................. 44,987 - 44,987
Total long-term liabilities ............................................... 1,244,985 - 1,244,985
Commitments and contingencies
Common shares (2) .............................................................. 1,371 (1,371) -
Additional paid-in capital (3) ............................................... 1,006,250 (93,663) 912,587
Accumulated losses (4) ........................................................ (793,950) 93,295 (700,655)
Total equity ........................................................................ 213,671 (1,739) 211,932
Total liabilities and equity ................................................... $ 1,617,537 $ (1,886) $ 1,615,651
(1) This adjustment primarily relates to legal and accounting fees paid by SDHL on behalf of SDL.
(2) This adjustment reflects the total number of SDL’s outstanding shares of 137,115,793 with a par value of $0.01 per share.
(3) This adjustment primarily reflects a capital contribution from Shelf Drilling Intermediate, Ltd. (“SDIL”) to SDHL in 2012 and
preferred shares dividends at SDL, partially offset by ordinary shares dividend at SDHL. SDIL is 100% owned by Shelf Drilling
Midco, Ltd. (“Midco”) which is 100% directly owned by SDL.
(4) This adjustment primarily relates to the Midco term loan interest expense and financing charges, preferred shares dividend at
SDL, ordinary shares dividend at SDHL and certain general and administrative costs incurred at SDL.
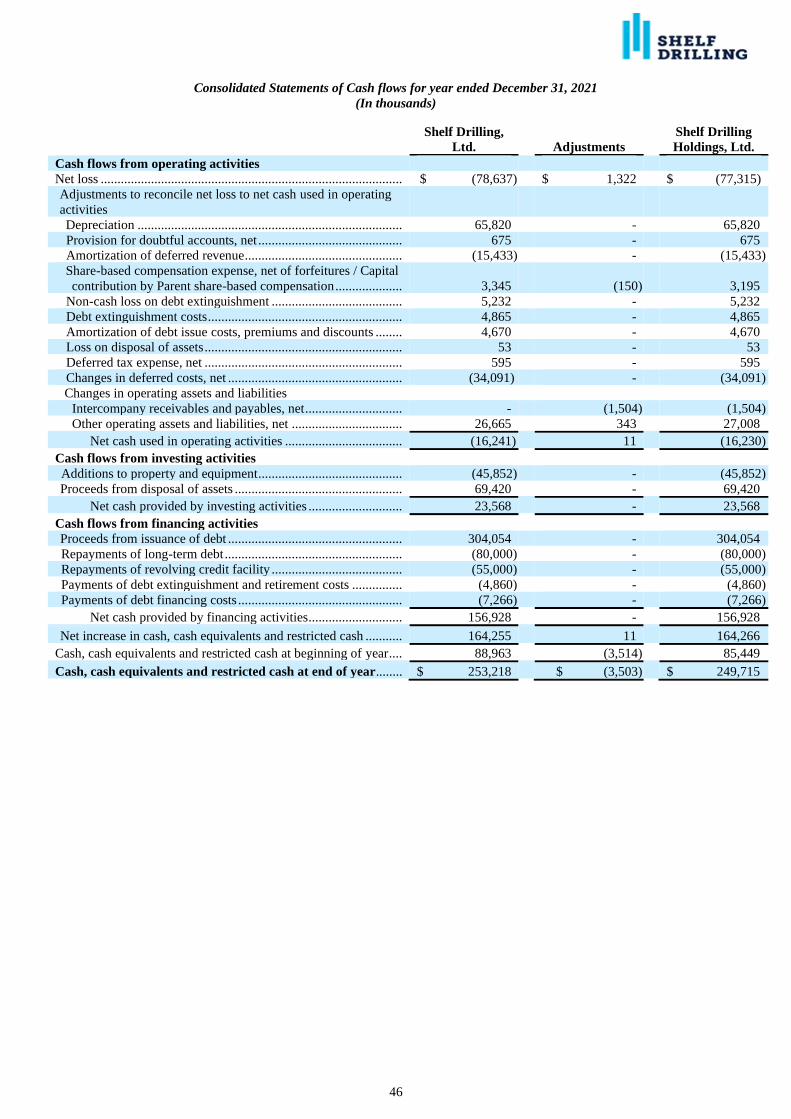
46
Consolidated Statements of Cash flows for year ended December 31, 2021
(In thousands)
Shelf Drilling,
Ltd.
Adjustments
Shelf Drilling
Holdings, Ltd.
Cash flows from operating activities
Net loss .......................................................................................... $ (78,637) $ 1,322 $ (77,315)
Adjustments to reconcile net loss to net cash used in operating
activities
Depreciation ............................................................................... 65,820 - 65,820
Provision for doubtful accounts, net ........................................... 675 - 675
Amortization of deferred revenue ............................................... (15,433) - (15,433)
Share-based compensation expense, net of forfeitures / Capital
contribution by Parent share-based compensation .................... 3,345
(150)
3,195
Non-cash loss on debt extinguishment ....................................... 5,232 - 5,232
Debt extinguishment costs .......................................................... 4,865 - 4,865
Amortization of debt issue costs, premiums and discounts ........ 4,670 - 4,670
Loss on disposal of assets ........................................................... 53 - 53
Deferred tax expense, net ........................................................... 595 - 595
Changes in deferred costs, net .................................................... (34,091) - (34,091)
Changes in operating assets and liabilities
Intercompany receivables and payables, net ............................. - (1,504) (1,504)
Other operating assets and liabilities, net ................................. 26,665 343 27,008
Net cash used in operating activities ................................... (16,241) 11 (16,230)
Cash flows from investing activities
Additions to property and equipment ........................................... (45,852) - (45,852)
Proceeds from disposal of assets .................................................. 69,420 - 69,420
Net cash provided by investing activities ............................ 23,568 - 23,568
Cash flows from financing activities
Proceeds from issuance of debt .................................................... 304,054 - 304,054
Repayments of long-term debt ..................................................... (80,000) - (80,000)
Repayments of revolving credit facility ....................................... (55,000) - (55,000)
Payments of debt extinguishment and retirement costs ............... (4,860) - (4,860)
Payments of debt financing costs ................................................. (7,266) - (7,266)
Net cash provided by financing activities ............................ 156,928 - 156,928
Net increase in cash, cash equivalents and restricted cash ........... 164,255 11 164,266
Cash, cash equivalents and restricted cash at beginning of year .... 88,963 (3,514) 85,449
Cash, cash equivalents and restricted cash at end of year........ $ 253,218 $ (3,503) $ 249,715
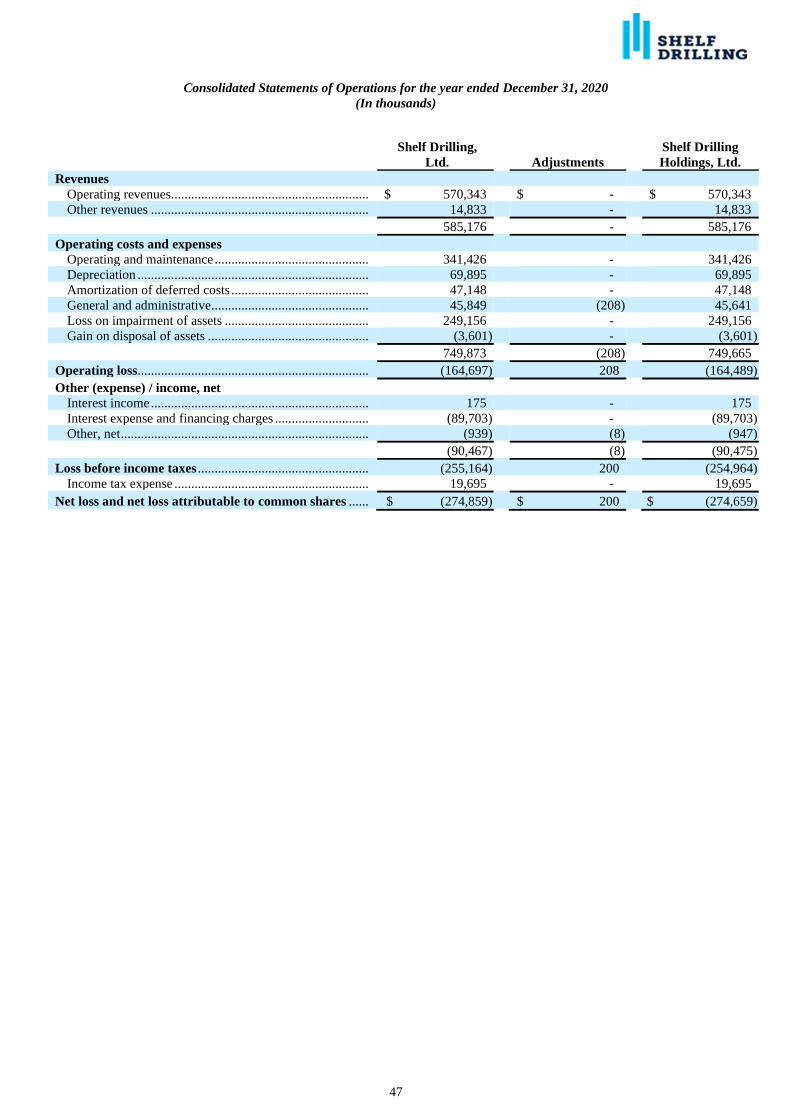
47
Consolidated Statements of Operations for the year ended December 31, 2020
(In thousands)
Shelf Drilling,
Ltd.
Adjustments
Shelf Drilling
Holdings, Ltd.
Revenues
Operating revenues ........................................................... $ 570,343 $ - $ 570,343
Other revenues ................................................................. 14,833 - 14,833
585,176 - 585,176
Operating costs and expenses
Operating and maintenance .............................................. 341,426 - 341,426
Depreciation ..................................................................... 69,895 - 69,895
Amortization of deferred costs ......................................... 47,148 - 47,148
General and administrative ............................................... 45,849 (208) 45,641
Loss on impairment of assets ........................................... 249,156 - 249,156
Gain on disposal of assets ................................................ (3,601) - (3,601)
749,873 (208) 749,665
Operating loss..................................................................... (164,697) 208 (164,489)
Other (expense) / income, net
Interest income ................................................................. 175 - 175
Interest expense and financing charges ............................ (89,703) - (89,703)
Other, net .......................................................................... (939) (8) (947)
(90,467) (8) (90,475)
Loss before income taxes ................................................... (255,164) 200 (254,964)
Income tax expense .......................................................... 19,695 - 19,695
Net loss and net loss attributable to common shares ...... $ (274,859) $ 200 $ (274,659)
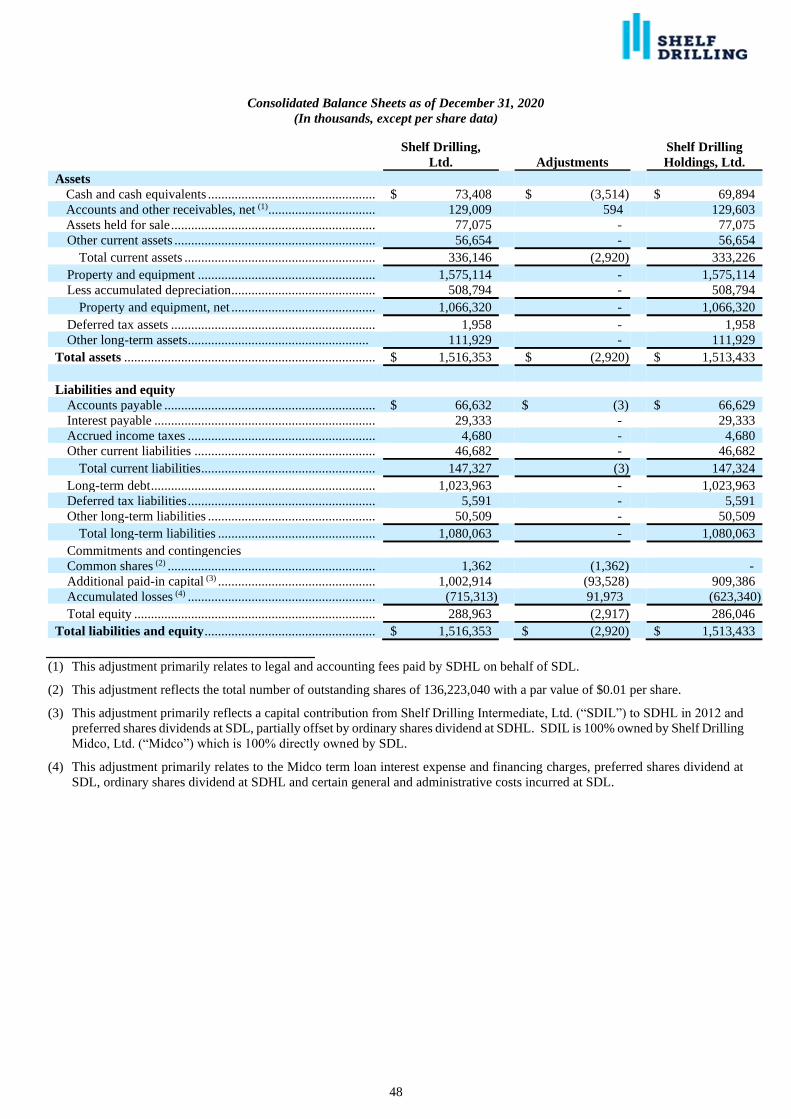
48
Consolidated Balance Sheets as of December 31, 2020
(In thousands, except per share data)
Shelf Drilling,
Ltd.
Adjustments
Shelf Drilling
Holdings, Ltd.
Assets
Cash and cash equivalents .................................................. $ 73,408 $ (3,514) $ 69,894
Accounts and other receivables, net (1) ................................ 129,009 594 129,603
Assets held for sale ............................................................. 77,075 - 77,075
Other current assets ............................................................ 56,654 - 56,654
Total current assets ......................................................... 336,146 (2,920) 333,226
Property and equipment ..................................................... 1,575,114 - 1,575,114
Less accumulated depreciation ........................................... 508,794 - 508,794
Property and equipment, net ........................................... 1,066,320 - 1,066,320
Deferred tax assets ............................................................. 1,958 - 1,958
Other long-term assets ...................................................... 111,929 - 111,929
Total assets ........................................................................... $ 1,516,353 $ (2,920) $ 1,513,433
Liabilities and equity
Accounts payable ............................................................... $ 66,632 $ (3) $ 66,629
Interest payable .................................................................. 29,333 - 29,333
Accrued income taxes ........................................................ 4,680 - 4,680
Other current liabilities ...................................................... 46,682 - 46,682
Total current liabilities .................................................... 147,327 (3) 147,324
Long-term debt ................................................................... 1,023,963 - 1,023,963
Deferred tax liabilities ........................................................ 5,591 - 5,591
Other long-term liabilities .................................................. 50,509 - 50,509
Total long-term liabilities ............................................... 1,080,063 - 1,080,063
Commitments and contingencies
Common shares (2) .............................................................. 1,362 (1,362) -
Additional paid-in capital (3) ............................................... 1,002,914 (93,528) 909,386
Accumulated losses (4) ........................................................ (715,313) 91,973 (623,340)
Total equity ........................................................................ 288,963 (2,917) 286,046
Total liabilities and equity ................................................... $ 1,516,353 $ (2,920) $ 1,513,433
(1) This adjustment primarily relates to legal and accounting fees paid by SDHL on behalf of SDL.
(2) This adjustment reflects the total number of outstanding shares of 136,223,040 with a par value of $0.01 per share.
(3) This adjustment primarily reflects a capital contribution from Shelf Drilling Intermediate, Ltd. (“SDIL”) to SDHL in 2012 and
preferred shares dividends at SDL, partially offset by ordinary shares dividend at SDHL. SDIL is 100% owned by Shelf Drilling
Midco, Ltd. (“Midco”) which is 100% directly owned by SDL.
(4) This adjustment primarily relates to the Midco term loan interest expense and financing charges, preferred shares dividend at
SDL, ordinary shares dividend at SDHL and certain general and administrative costs incurred at SDL.
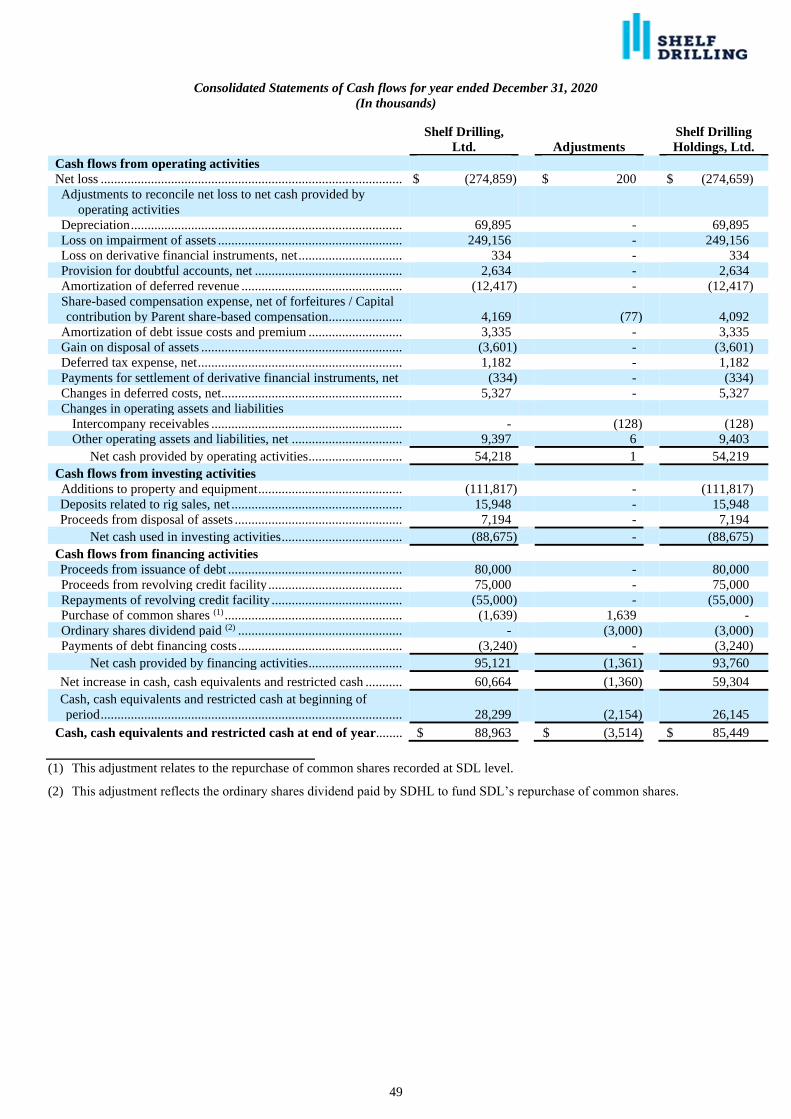
49
Consolidated Statements of Cash flows for year ended December 31, 2020
(In thousands)
Shelf Drilling,
Ltd.
Adjustments
Shelf Drilling
Holdings, Ltd.
Cash flows from operating activities
Net loss .......................................................................................... $ (274,859) $ 200 $ (274,659)
Adjustments to reconcile net loss to net cash provided by
operating activities
Depreciation ................................................................................. 69,895 - 69,895
Loss on impairment of assets ....................................................... 249,156 - 249,156
Loss on derivative financial instruments, net ............................... 334 - 334
Provision for doubtful accounts, net ............................................ 2,634 - 2,634
Amortization of deferred revenue ................................................ (12,417) - (12,417)
Share-based compensation expense, net of forfeitures / Capital
contribution by Parent share-based compensation ...................... 4,169
(77)
4,092
Amortization of debt issue costs and premium ............................ 3,335 - 3,335
Gain on disposal of assets ............................................................ (3,601) - (3,601)
Deferred tax expense, net ............................................................. 1,182 - 1,182
Payments for settlement of derivative financial instruments, net (334) - (334)
Changes in deferred costs, net ...................................................... 5,327 - 5,327
Changes in operating assets and liabilities
Intercompany receivables ......................................................... - (128) (128)
Other operating assets and liabilities, net ................................. 9,397 6 9,403
Net cash provided by operating activities ............................ 54,218 1 54,219
Cash flows from investing activities
Additions to property and equipment ........................................... (111,817) - (111,817)
Deposits related to rig sales, net ................................................... 15,948 - 15,948
Proceeds from disposal of assets .................................................. 7,194 - 7,194
Net cash used in investing activities .................................... (88,675) - (88,675)
Cash flows from financing activities
Proceeds from issuance of debt .................................................... 80,000 - 80,000
Proceeds from revolving credit facility ........................................ 75,000 - 75,000
Repayments of revolving credit facility ....................................... (55,000) - (55,000)
Purchase of common shares (1) ..................................................... (1,639) 1,639 -
Ordinary shares dividend paid (2) ................................................. - (3,000) (3,000)
Payments of debt financing costs ................................................. (3,240) - (3,240)
Net cash provided by financing activities ............................ 95,121 (1,361) 93,760
Net increase in cash, cash equivalents and restricted cash ........... 60,664 (1,360) 59,304
Cash, cash equivalents and restricted cash at beginning of
period ..........................................................................................
28,299
(2,154)
26,145
Cash, cash equivalents and restricted cash at end of year........ $ 88,963 $ (3,514) $ 85,449
(1) This adjustment relates to the repurchase of common shares recorded at SDL level.
(2) This adjustment reflects the ordinary shares dividend paid by SDHL to fund SDL’s repurchase of common shares.
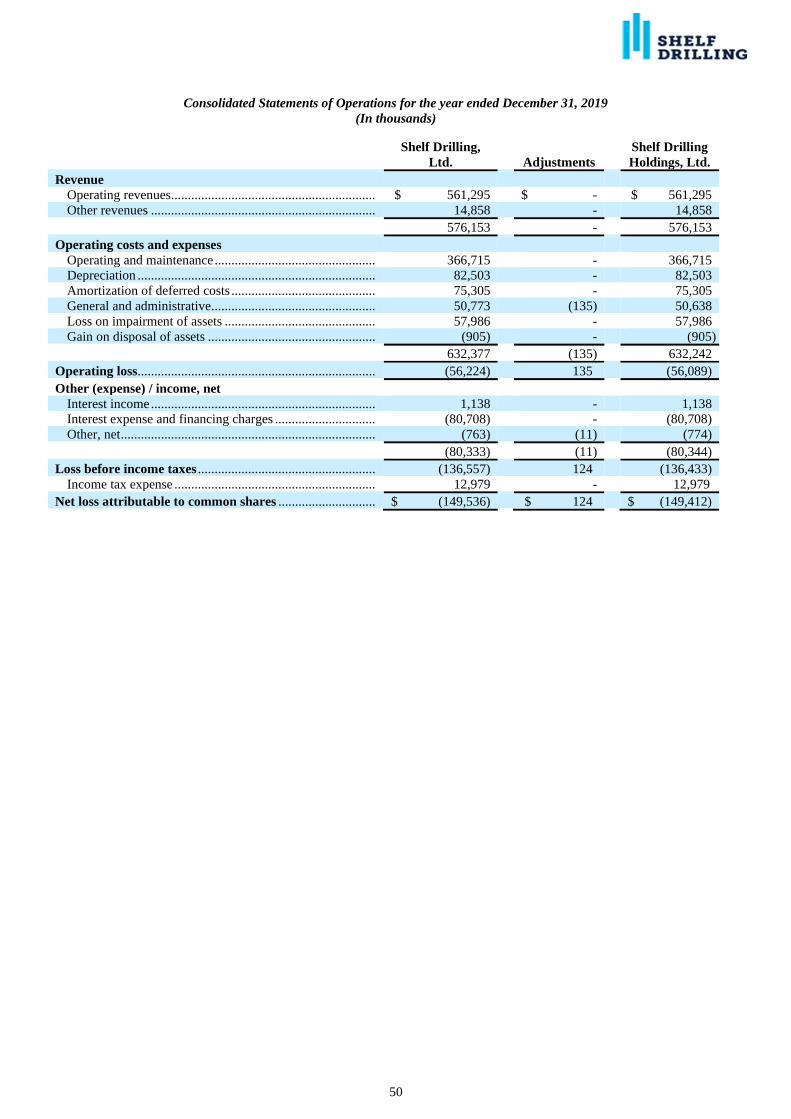
50
Consolidated Statements of Operations for the year ended December 31, 2019
(In thousands)
Shelf Drilling,
Ltd.
Adjustments
Shelf Drilling
Holdings, Ltd.
Revenue
Operating revenues ............................................................. $ 561,295 $ - $ 561,295
Other revenues ................................................................... 14,858 - 14,858
576,153 - 576,153
Operating costs and expenses
Operating and maintenance ................................................ 366,715 - 366,715
Depreciation ....................................................................... 82,503 - 82,503
Amortization of deferred costs ........................................... 75,305 - 75,305
General and administrative ................................................. 50,773 (135) 50,638
Loss on impairment of assets ............................................. 57,986 - 57,986
Gain on disposal of assets .................................................. (905) - (905)
632,377 (135) 632,242
Operating loss....................................................................... (56,224) 135 (56,089)
Other (expense) / income, net
Interest income ................................................................... 1,138 - 1,138
Interest expense and financing charges .............................. (80,708) - (80,708)
Other, net ............................................................................ (763) (11) (774)
(80,333) (11) (80,344)
Loss before income taxes ..................................................... (136,557) 124 (136,433)
Income tax expense ............................................................ 12,979 - 12,979
Net loss attributable to common shares ............................. $ (149,536) $ 124 $ (149,412)
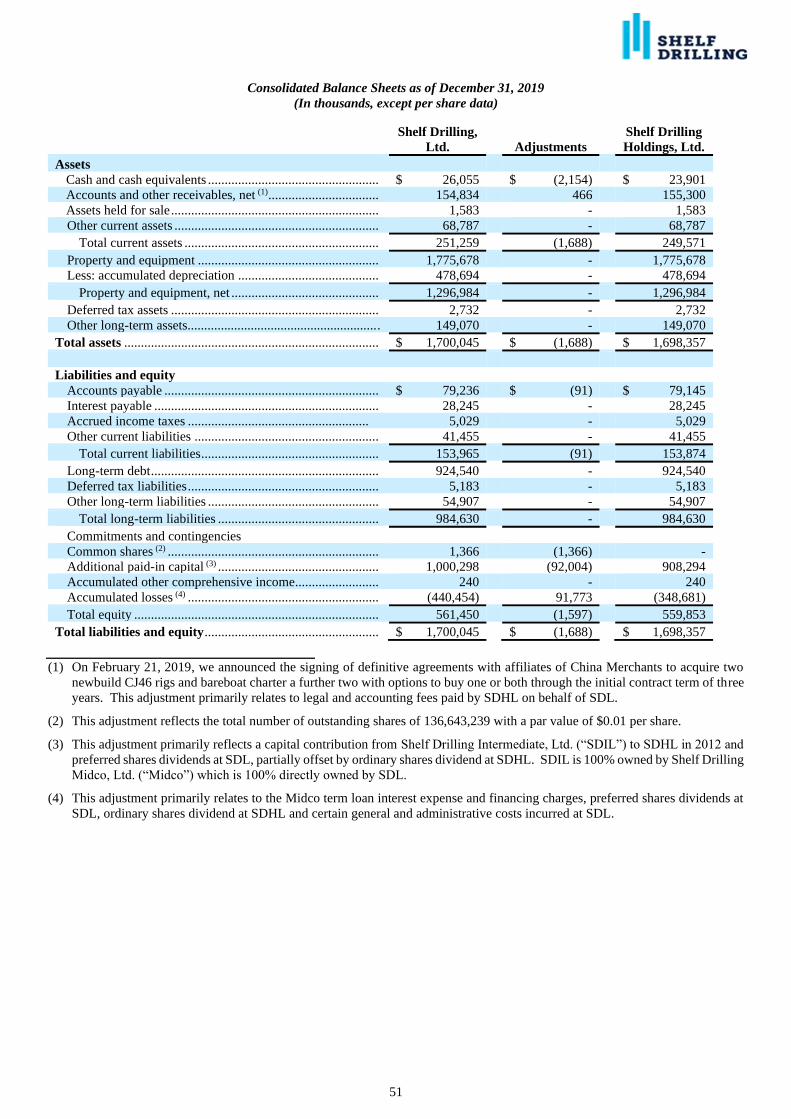
51
Consolidated Balance Sheets as of December 31, 2019
(In thousands, except per share data)
Shelf Drilling,
Ltd.
Adjustments
Shelf Drilling
Holdings, Ltd.
Assets
Cash and cash equivalents ................................................... $ 26,055 $ (2,154) $ 23,901
Accounts and other receivables, net (1) ................................. 154,834 466 155,300
Assets held for sale .............................................................. 1,583 - 1,583
Other current assets ............................................................. 68,787 - 68,787
Total current assets .......................................................... 251,259 (1,688) 249,571
Property and equipment ...................................................... 1,775,678 - 1,775,678
Less: accumulated depreciation .......................................... 478,694 - 478,694
Property and equipment, net ............................................ 1,296,984 - 1,296,984
Deferred tax assets .............................................................. 2,732 - 2,732
Other long-term assets.......................................................... 149,070 - 149,070
Total assets ............................................................................ $ 1,700,045 $ (1,688) $ 1,698,357
Liabilities and equity
Accounts payable ................................................................ $ 79,236 $ (91) $ 79,145
Interest payable ................................................................... 28,245 - 28,245
Accrued income taxes ...................................................... 5,029 - 5,029
Other current liabilities ....................................................... 41,455 - 41,455
Total current liabilities ..................................................... 153,965 (91) 153,874
Long-term debt .................................................................... 924,540 - 924,540
Deferred tax liabilities ......................................................... 5,183 - 5,183
Other long-term liabilities ................................................... 54,907 - 54,907
Total long-term liabilities ................................................ 984,630 - 984,630
Commitments and contingencies
Common shares (2) ............................................................... 1,366 (1,366) -
Additional paid-in capital (3) ................................................ 1,000,298 (92,004) 908,294
Accumulated other comprehensive income......................... 240 - 240
Accumulated losses (4) ......................................................... (440,454) 91,773 (348,681)
Total equity ......................................................................... 561,450 (1,597) 559,853
Total liabilities and equity .................................................... $ 1,700,045 $ (1,688) $ 1,698,357
(1) On February 21, 2019, we announced the signing of definitive agreements with affiliates of China Merchants to acquire two
newbuild CJ46 rigs and bareboat charter a further two with options to buy one or both through the initial contract term of three
years. This adjustment primarily relates to legal and accounting fees paid by SDHL on behalf of SDL.
(2) This adjustment reflects the total number of outstanding shares of 136,643,239 with a par value of $0.01 per share.
(3) This adjustment primarily reflects a capital contribution from Shelf Drilling Intermediate, Ltd. (“SDIL”) to SDHL in 2012 and
preferred shares dividends at SDL, partially offset by ordinary shares dividend at SDHL. SDIL is 100% owned by Shelf Drilling
Midco, Ltd. (“Midco”) which is 100% directly owned by SDL.
(4) This adjustment primarily relates to the Midco term loan interest expense and financing charges, preferred shares dividends at
SDL, ordinary shares dividend at SDHL and certain general and administrative costs incurred at SDL.
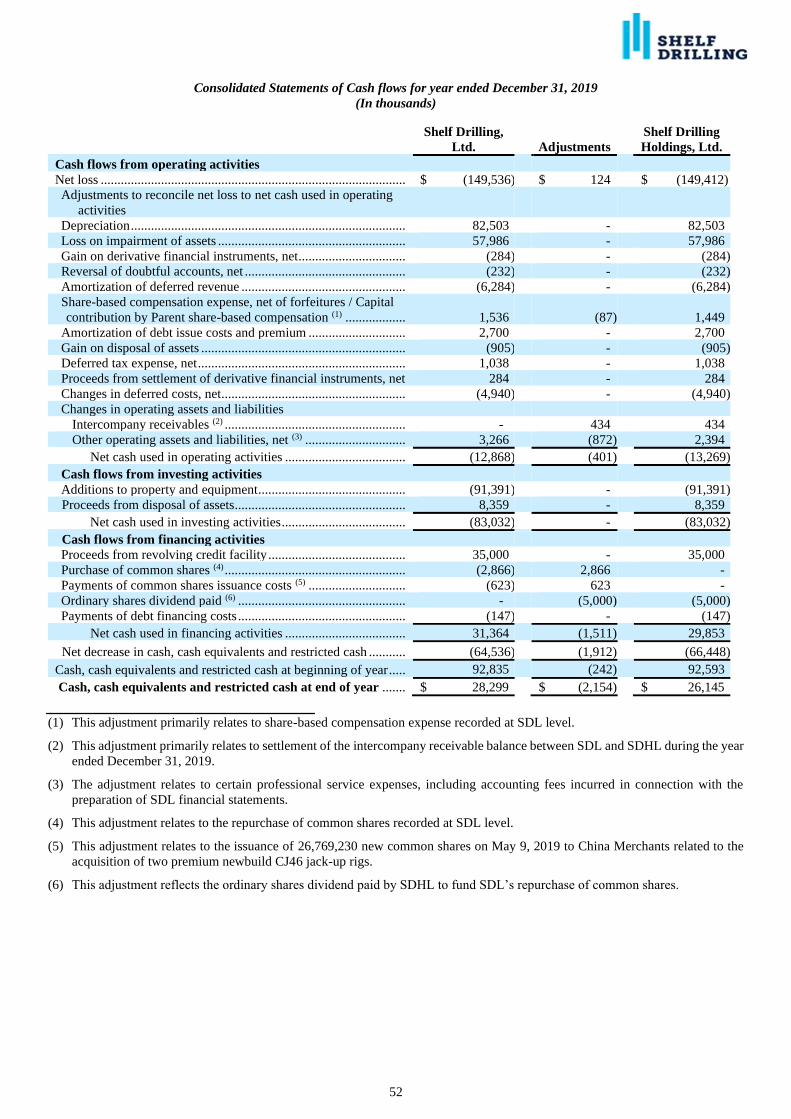
52
Consolidated Statements of Cash flows for year ended December 31, 2019
(In thousands)
Shelf Drilling,
Ltd.
Adjustments
Shelf Drilling
Holdings, Ltd.
Cash flows from operating activities
Net loss ........................................................................................... $ (149,536) $ 124 $ (149,412)
Adjustments to reconcile net loss to net cash used in operating
activities
Depreciation .................................................................................. 82,503 - 82,503
Loss on impairment of assets ........................................................ 57,986 - 57,986
Gain on derivative financial instruments, net................................ (284) - (284)
Reversal of doubtful accounts, net ................................................ (232) - (232)
Amortization of deferred revenue ................................................. (6,284) - (6,284)
Share-based compensation expense, net of forfeitures / Capital
contribution by Parent share-based compensation (1) .................. 1,536
(87)
1,449
Amortization of debt issue costs and premium ............................. 2,700 - 2,700
Gain on disposal of assets ............................................................. (905) - (905)
Deferred tax expense, net .............................................................. 1,038 - 1,038
Proceeds from settlement of derivative financial instruments, net 284 - 284
Changes in deferred costs, net ....................................................... (4,940) - (4,940)
Changes in operating assets and liabilities
Intercompany receivables (2) ...................................................... - 434 434
Other operating assets and liabilities, net (3) .............................. 3,266 (872) 2,394
Net cash used in operating activities .................................... (12,868) (401) (13,269)
Cash flows from investing activities
Additions to property and equipment ............................................ (91,391) - (91,391)
Proceeds from disposal of assets................................................... 8,359 - 8,359
Net cash used in investing activities ..................................... (83,032) - (83,032)
Cash flows from financing activities
Proceeds from revolving credit facility ......................................... 35,000 - 35,000
Purchase of common shares (4) ...................................................... (2,866) 2,866 -
Payments of common shares issuance costs (5) ............................. (623) 623 -
Ordinary shares dividend paid (6) .................................................. - (5,000) (5,000)
Payments of debt financing costs .................................................. (147) - (147)
Net cash used in financing activities .................................... 31,364 (1,511) 29,853
Net decrease in cash, cash equivalents and restricted cash ........... (64,536) (1,912) (66,448)
Cash, cash equivalents and restricted cash at beginning of year ..... 92,835 (242) 92,593
Cash, cash equivalents and restricted cash at end of year ....... $ 28,299 $ (2,154) $ 26,145
(1) This adjustment primarily relates to share-based compensation expense recorded at SDL level.
(2) This adjustment primarily relates to settlement of the intercompany receivable balance between SDL and SDHL during the year
ended December 31, 2019.
(3) The adjustment relates to certain professional service expenses, including accounting fees incurred in connection with the
preparation of SDL financial statements.
(4) This adjustment relates to the repurchase of common shares recorded at SDL level.
(5) This adjustment relates to the issuance of 26,769,230 new common shares on May 9, 2019 to China Merchants related to the
acquisition of two premium newbuild CJ46 jack-up rigs.
(6) This adjustment reflects the ordinary shares dividend paid by SDHL to fund SDL’s repurchase of common shares.
53
Off Balance Sheet Arrangements
Contingent liabilities
The majority of the contingent liabilities that we are exposed to relate to legal proceedings, certain contractual and customs
obligations secured by surety bonds and bank guarantees and uncertain tax positions. See “Note 10 — Income Taxes” and “Note
13 — Commitments and Contingencies” to our Consolidated Financial Statements in “Item 8. Financial Statements and
Supplementary Data”. As of December 31, 2021, we are not exposed to any contingent liabilities that are expected to result in a
material adverse effect on our consolidated financial position, results of operations or cash flows.
Derivative Instruments
The Board of Directors has approved policies and procedures for derivative instruments that require the approval of our
Chief Financial Officer prior to entering into any derivative instruments. From time to time, we may choose to enter into a variety
of derivative instruments in connection with the management of our exposure to fluctuations in interest rates and currency exchange
rates. We do not enter into derivative transactions for speculative purposes; however, we may enter into certain transactions that do
not meet the criteria for hedge accounting.
Off-balance Sheet Financing
We had no off-balance sheet arrangements during the years ended December 31, 2021 and 2020.
Critical Accounting Policies and Estimates
The discussion and analysis of our financial condition and results of operations are based upon our consolidated financial
statements, which have been prepared in accordance with GAAP. The preparation of the consolidated financial statements in
accordance with GAAP requires us to make estimates and assumptions that affect the reported amounts of assets, liabilities, and
disclosure of contingent assets and liabilities at the date of the consolidated financial statements and the reported amounts of
revenues and expenses during the reporting period. Certain accounting policies involve judgments and uncertainties to such an
extent that there is a reasonable likelihood that materially different amounts could have been reported under different conditions, or
if different assumptions had been used. We evaluate our estimates and assumptions on a regular basis. We base our estimates on
historical experience and various other assumptions that are believed to be reasonable under the circumstances, the results of which
form the basis for making judgments about the carrying values of assets and liabilities that are not readily apparent from other
sources. Actual results may differ from these estimates and assumptions used in the preparation of our consolidated financial
statements.
We identify our critical accounting policies as those that are significant to our results of operations, financial condition
and cash flows and that require management’s most difficult, subjective or complex estimates and judgements in matters that are
inherently uncertain. We believe that our more critical accounting policies include revenue recognition, operating expenses and
deferred costs, property and equipment, assets held for sale, leases and impairment of long-lived assets.
Our significant accounting policies are included in “Note 2 – Significant Accounting Policies” to our Consolidated
Financial Statements in “Item 8. Financial Statements and Supplementary Data”.
Revenue Recognition
The Company recognizes revenues when control of a good or service promised in a contract is transferred to a customer.
Control is obtained when a customer has the ability to direct the use of and obtain substantially all of the remaining benefits from
that good or service. The timing of revenue recognition may differ from the timing of invoicing to customers and these timing
differences result in receivables, contract assets or contract liabilities, as appropriate on the Company’s consolidated balance sheets.
The Company’s services provided under each contract is a single performance obligation satisfied over time and is
comprised of a series of distinct time increments or service periods in which we provide services. Variable consideration is only
recognized as revenues to the extent that it is probable that a significant reversal will not occur during the contract term. When
determining if variable consideration should be recognized, management considers whether there are factors outside of the
Company’s control that could result in a significant reversal of revenues as well as the likelihood and magnitude of a potential
reversal of revenue. A description of our principal revenue generating activities are as follows:
Operating Revenues
A significant portion of the Company’s revenues is generated from rigs operated by the Company through dayrates charged
to its customers for the provision of services related to drilling, completion, maintenance and decommissioning of oil and natural
gas wells. The Company’s contracts with customers contain multiple dayrates and the actual dayrate earned during a period could
vary based on the actual operations. The dayrate invoices billed to the customer are typically determined based on the varying rates
applicable to the specific activities performed on an hourly basis. Variable consideration generally relates to distinct service periods
during the contract term and is recognized in the period when services are performed to the extent it is probable that a significant
54
revenue reversal will not occur. We have applied the disclosure practical expedient in Accounting Standards Codification (“ASC”)
606-10-50-14(b) and have not disclosed variable consideration related to remaining unsatisfied performance obligations.
The Company may earn lump-sum fees relating to contract preparation, capital upgrades and mobilization in certain
contracts, which are typically invoiced at the commencement or initial phase of the contract. These activities are not considered to
be revenue generating activities distinct from the performance of services under the contract. Therefore, such revenues are recorded
as a contract liability and amortized on a straight-line basis over the firm contract term. Certain customers may also make advance
payments of dayrate revenues, which are deferred and recognized when the related dayrate services are provided. Upfront fees for
contract preparation, capital upgrades and mobilization and advance payments from customers for future services are recorded as
contract liabilities in other current liabilities and other long-term liabilities, as appropriate, in the consolidated balance sheets.
The Company may earn lump-sum fees relating to contract demobilization, which are typically invoiced at the end of the
contract and may contain provisions stipulating conditions that must be present for such revenues to be received. The Company
assesses the likelihood of receiving this revenue based on prior experience and knowledge of market conditions and other factors.
Demobilization fees are recorded when it is unconditional and probable that there will not be a material cumulative revenue reversal,
which typically occurs near the end of the contract term. Once the recognition criteria are met, the demobilization revenues are
recorded as operating revenues over the remaining firm contract term and a contract asset is recorded for any revenue recognized
prior to invoicing.
Many contracts have termination and/or extension options which can be exercised at the option of the customer. In certain
cases, the Company can charge an early termination fee if a contract is terminated by the customer. Termination revenues are
typically billed after a termination notice is received from a customer or activity related to a contract ceases. Termination revenues
are typically recognized as revenues when billed and it is probable that revenues will not be reversed. Revenues related to an
extension option are typically accounted for as a contract modification as a separate contract.
Other Revenues
Other revenues consist of amounts billed for goods and services such as catering, additional equipment and personnel,
consumables or accommodations. The Company may use third parties for the provision of such goods and services. Judgement is
involved in identifying the performance obligations in these customer contracts and determining whether the Company is a principal
or an agent in the provision of certain equipment and consumables to the customer. The Company generally is considered to be a
principal in revenue transactions when it obtains control of a good or service before it is transferred to the customer. The Company
typically acts as a principal in the provision of catering, accommodation services, additional personnel and the provision of
additional equipment and consumables directly used to provide integrated services to the customer. The Company generally acts
as an agent in the provision of other equipment and consumables for the customer.
Operating Costs and Expenses and Deferred Costs
Operating costs and expenses are generally recognized when incurred. Certain expenditures associated with contract
preparation, mobilization, regulatory inspections and major equipment overhauls are recorded as deferred costs in other current
assets or other long-term assets, as appropriate, on the consolidated balance sheets.
Deferred contract costs include certain contract preparation and upfront mobilization expenditures for rigs entering binding
services contracts. Such costs are generally considered costs to fulfil the Company’s future performance obligations under the
related contract and are therefore deferred and amortized on a straight-line basis over the firm contract term. Certain deferred
contract costs are related to contractually required inspections, and such costs are amortized on a straight-line basis over the time
period until the next scheduled inspection. See Note 4 – Revenues, Contract Liabilities and Deferred Contract Costs and Allowance
for Credit Losses. Demobilization costs which are incurred at the end of a contract and costs associated with rig preparation and of
mobilization of without a firm contract are expensed as incurred.
Non-contractual deferred costs include costs of inspections incurred to obtain regulatory certifications to operate the rigs
and periodic major overhauls of equipment. Regulatory certifications, including Special Periodic Surveys (“SPS”) and Underwater
Inspections in Lieu of Dry-docking (“UWILDs”), are deferred and amortized on a straight-line basis over the time period until the
next survey or inspection, generally 30 to 60 months. Periodic major overhauls are deferred and amortized on a straight-line basis
over a period of five years.
Property and Equipment, Net
Property and equipment is initially stated at cost. Expenditures for additions, including other costs necessary to bring the
asset to the condition and location necessary for its intended use, improvements and substantial enhancements are capitalized.
Routine expenditures for minor replacements and repairs and maintenance that do not increase the functionality or life of the asset
are expensed as incurred. Construction in progress includes interest capitalized during the period of asset construction for qualified
assets if the construction is expected to take one year or longer and the amount of interest is material. When the asset is placed into
55
service, it is transferred from construction in progress to the appropriate category under property and equipment. Property and
equipment is subject to periodic impairment testing as discussed in “Impairment of Long-Lived Assets” below.
Depreciation commences when an asset is placed into service or is substantially complete and ready for its intended use.
Depreciation is computed using the straight-line method, after allowing for salvage value where applicable, over the estimated useful
lives of the assets. Land is not depreciated. Leasehold improvements are recorded as component of property and equipment and
are depreciated over the shorter of the remaining expected lease term or the estimated useful lives of the improvements. If an
impairment loss is recognized, the adjusted carrying amount shall be depreciated over the remaining useful life of that asset.
The estimated useful lives of property and equipment are as follows:
Years
Rigs...................................................................................................................................................................... 30
Equipment and spares.......................................................................................................................................... 9 - 13
Building...................................................................................... ......................................................................... 30
Other...................................................................................... .............................................................................. 3 - 5
The Company periodically reviews and adjusts, as appropriate, the remaining useful lives and salvage values of rigs when
certain events occur that directly impact such estimates. This includes changes in operating condition, functional capability and
market and economic factors. On December 31, 2021, the Company had a change in accounting estimate, which resulted in a
change in the useful lives of 12 rigs. This change did not have a material impact on the Company’s financial statements for the year
ended December 31, 2021.
The remaining estimated average useful life of existing rigs in the Company’s fleet as of December 31, 2021 is 11 years.
When assets are sold, retired or otherwise disposed of, the cost and related accumulated depreciation are written off, net of
any proceeds received, and any gain or loss is reflected in the consolidated statements of operations.
Assets Held for Sale
Property and equipment is reclassified as asset held for sale when (a) there is a committed plan to sell the asset that is
unlikely to be subject to significant changes or termination, (b) the asset is available for immediate sale, (c) actions are initiated to
complete the sale, including an active program to locate a buyer, (d) the sale is expected to be completed within one year and (e)
the asset is being actively marketed at a price that is reasonable relative to its fair value. Assets held for sale are recorded at the
lower of carrying value or fair value less estimated costs to sell and are subject to periodic impairment testing as discussed in
“Impairment of Long-Lived Assets” below.
Leases
A lease is a contract, or part of a contract, that conveys the right to control the use of an identified asset for a period of time
in exchange for consideration. The Company has made an accounting policy election to present the lease and associated non-lease
operations as a single component based upon the predominant component. Lease classification as short-term lease, operating lease
or finance lease is made at the lease inception. The Company considers all relevant contractual provisions, including renewal and
termination options, to determine the term of the lease. Renewal or termination options that are reasonably certain of exercise by
the lessee and those controlled by the lessor are included in determining the lease term. The Company considers all relevant facts
and circumstances that create an economic incentive to exercise the option. See also Note 8 – Leases.
Short-Term Leases
The Company made an accounting policy election not to recognize a right-of-use asset and lease liability for short-term
leases with an initial term of 12 months or less, therefore these leases are not recorded on the consolidated balance sheets. Expenses
for short-term leases are recognized on a straight-line basis over the lease term under either operating and maintenance expenses or
general and administrative expenses in the consolidated statements of operations.
The Company as a Lessee
The Company recognizes lease liabilities and right-of-use assets for all operating and finance leases for which it is a lessee
at the lease commencement date. Lease liabilities are initially recognized at the present value of the future lease payments during
the expected lease term using the interest rate implicit in the lease, if that rate can be determined, or the Company’s incremental
borrowing rate. Lease liabilities are recorded, according to the payment dates as other current liabilities and other long-term
liabilities in the consolidated balance sheets. For any contract considered predominantly a lease, all non-lease components are
included in the initial measurement of the lease liability. Finance lease and operating lease liabilities are recorded separately. The
right-of-use asset is initially recognized at the amount of the initial measurement of the lease liability, plus any lease payments made
at or before the commencement date, less any lease incentives received and any initial direct costs incurred by the Company. Right-
56
of-use assets are recorded as other long-term assets in the consolidated balance sheets. Subsequent to initial recognition, the right-
of-use asset is reflected net of amortization. Right-of-use assets are subject to periodic impairment testing as discussed in
“Impairment of Long-Lived Assets” below. Costs to get a leased asset to the condition and location necessary for its intended use
are capitalized as leasehold improvements.
The Company remeasures its lease liabilities with a corresponding adjustment to the right-of-use asset due to an applicable
change in lease payments such as those due to a lease modification not accounted for as a separate contract, certain changes in the
expected term of the lease, and certain changes in assessments and contingencies. The Company has made an accounting policy
election to account for lease concessions related to the effects of the COVID-19 pandemic, as though enforceable rights and
obligations for those concessions existed in the original lease contract and, therefore, the Company will not account for these
concessions as lease modifications. The Company is instead accounting for rent reductions as a negative variable lease payment in
the period in which that payment would have become due and is accounting for temporary rent deferrals as a short-term lease
payable until the amount becomes due and payable.
Subsequent to initial recognition, the operating lease liability is increased for the interest component of the lease liability
and reduced by the lease payments made. Operating lease expenses are recognized as a single lease cost on a straight-line basis
over the lease term, which includes the interest component of the measurement of the lease liability and amortization of the right-
of-use asset. Operating lease expenses are recognized based on the type of leased asset under either operating and maintenance
expenses or general and administrative expenses in the consolidated statements of operations.
Finance lease expenses are recognized separately in the consolidated statements of operations, with the interest expense on
the lease liability recorded under interest expense and the amortization of the right-of-use asset recorded as based on the type of
leased asset under either operating and maintenance expenses or general and administrative expenses.
The Company as a Lessor
The Company’s contracts with customers contain lease components related to the underlying rigs and equipment, in addition
to service components of labor and expertise to operate the rig and equipment. The service component of operating a rig is
predominant in the Company’s contracts, therefore, the Company accounts for its revenues from contracts with customers as service
revenues with a single performance obligation. See “Revenue Recognition” above.
Impairment of Long-Lived Assets
The Company evaluates property and equipment, right-of-use assets and other long-lived assets for impairment whenever
events or changes in circumstances indicate the carrying amount of an asset may not be recoverable. Impairment indicators can
include changes in the general economic and business environment, industry specific indicators, Company specific factors or
conditions related to a specific asset or asset group. An impairment loss on an asset or asset group is recorded when the estimated
undiscounted future cash flows expected to result from the use of the asset and its eventual disposition are less than its carrying
amount. Any actual impairment loss recognized represents the excess of the asset’s carrying value over the estimated fair value.
The Company estimates the fair values of property and equipment, right-of-use assets, deferred costs and other long-lived
assets to be held and used by applying a combination of income and market approaches, using projected cash flows and estimates
of the exchange price that would be received for the assets in the principal or most advantageous market for the assets in an orderly
transaction between market participants as of the measurement date. The fair value of the Company’s asset groups using the income
approach is based on estimated cash flows expected to be realized from the use of the assets. Asset impairment evaluations are, by
nature, highly subjective. The critical estimates are significant unobservable inputs, which are based on numerous estimates and
assumptions about future operations and market conditions including but not limited to those such as projected rig utilization,
dayrates, operating, overhead and major project costs, remaining useful life, salvage value and discount rate as well as cost inflation
assumptions. The Company estimates the fair values of assets held for sale based on the expected sale price less estimated costs to
sell, which can include significant unobservable inputs. These assumptions are considered non-recurring level 3 fair value
measurements.
New Accounting Pronouncements
See “Note 3 – Recently Issued and Adopted Accounting Pronouncements” to the Consolidated Financial Statements
included in “Item 8. Financial Statements and Supplementary Data” for a discussion on recently adopted and issued accounting
pronouncements.
57
Item 7A. Quantitative and Qualitative Disclosures About Market Risk.
We are exposed to various market risks, including liquidity risk, interest rate risk, foreign currency risk and credit risk.
Liquidity risk
We manage our liquidity risk by maintaining adequate cash reserves and debt facilities, and by continuously monitoring
our actual and forecast cash flows and by matching the maturity profiles of financial assets and liabilities when possible.
Interest Rate Risk
We are exposed to interest rate risk related to the fixed rate debt under the 8.25% Senior Unsecured Notes and the 8.875%
Notes. Fixed rate debt, where the interest rate is fixed over the life of the instrument and the instrument’s maturity is greater than
one year, exposes us to changes in market interest rates if and when maturing debt is refinanced with new debt.
We have in the past and may in the future utilize interest rate swaps to manage differences in the amount, timing and
duration of the Company’s known or expected cash payments principally related to the Company’s borrowings, for which we
maintain documented policies and procedures to monitor and control the use of derivative instrument. We are not engaged in
derivative transactions for speculative or trading purposes.
Foreign Currency Risk
Our international operations expose us to currency exchange rate risk. This risk is primarily associated with compensation
costs of employees and purchasing costs from non-U.S. suppliers, which are denominated in currencies other than the U.S.
dollar. We do not have any non-U.S. dollar debt and thus are not exposed to currency risk related to debt.
Our primary currency exchange rate risk management strategy involves structuring certain customer contracts to provide
for payment from the customer in both U.S. dollars and local currency. The payment portion denominated in local currency is
based on anticipated local currency requirements over the contract term. Due to various factors, including customer acceptance,
local banking laws, other statutory requirements, local currency convertibility and the impact of inflation on local costs, actual local
currency needs may vary from those anticipated in the customer contracts, resulting in partial exposure to currency exchange rate
risk. The currency exchange effect resulting from our international operations has not historically had a material impact on our
operating results.
Further, we have in the past and may in the future utilize foreign currency forward exchange contracts (“forex contracts”)
to manage a portion of foreign exchange risk, for which we maintain documented policies and procedures to monitor and control
the use of the derivative instruments. Our forex contracts generally require us to net settle the spread between the contracted foreign
currency exchange rate and the spot rate on the contract fixing date. We are not engaged in derivative transactions for speculative
or trading purposes.
Credit Risk
Our financial instruments that potentially subject us to concentrations of credit risk are cash and cash equivalents, restricted
cash and accounts receivables. We generally maintain cash and cash equivalents and restricted cash at commercial banks with high
credit ratings.
Our trade receivables are with a variety of government owned or controlled energy companies, publicly listed integrated
oil companies or independent exploration and production companies. We perform ongoing credit evaluations of our customers,
and generally do not require material collateral. We may from time-to-time require our customers to make an advance payment or
issue a bank guarantee/letter of credit in our favor to cover the risk of non-payment under our contracts.
We determine our expected credit losses for our pools of assets with similar risk characteristics based on historical loss
information as adjusted for future expectations. Allowance for credit losses was $3.2 million and $2.6 million as of December 31,
2021 and 2020, respectively.
Item 8. Financial Statements and Supplementary Data.
The Consolidated Financial Statements as of December 31, 2021 can be found in the Exhibits section pages F-1 to F-42.
Item 9. Changes and Disagreements with Accountants on Accounting and Financial Disclosure.
None
58
Item 9A. Controls and Procedures.
We are not required to report this Item.
Item 9B. Other Information.
None
Item 9C. Disclosure Regarding Foreign Jurisdictions that Prevent Inspections.
Not applicable.
PART III
Item 10. Directors, Executive Officers and Corporate Governance.
The following table sets forth information concerning our executive officers and directors, including their ages, as of
December 31, 2021:
Name Age as of December 31, 2021 Position
Ernie Danner 67 Chairman of the Board
David Mullen 63 Director and Chief Executive Officer
John K. Castle 81 Director
J. William Franklin, Jr. 50 Director
Dongyang Lou 45 Director
David B. Pittaway 70 Director
John Reynolds 51 Director
Benjamin Sebel 51 Director
Usama Trabulsi 76 Director
David Williams 68 Director
William Hoffman 61 Executive Vice President and Chief Operating Officer
Gregory O’Brien 35 Executive Vice President and Chief Financial Officer
Ian Clark 62 Executive Vice President
Directors
Ernie Danner, Chairman of the Board
Mr. Danner joined our board of directors in October 2013 and has served as Chairman of the Board since November 2018.
Since January 2018 Mr. Danner has served as an Operating Partner of SCF Partners, a private equity firm focused on oil service
investments, which he joined in October 2012. Currently Mr. Danner serves as Chairman of the board of directors of Nine Energy
Service, Inc., a NYSE listed company providing completion services to oil and gas producers in North America and Chairman of
the board of directors of BCCK Engineering, Inc, a private company that designs, fabricates and installs natural gas processing
plants in North America. Mr. Danner also serves as Chairman of the board of directors of Pipeline Plastics LLC, a manufacturer of
HDPE pipe. Mr. Danner served as President and Chief Executive Officer of Exterran Holdings Inc. from July 2009 to October 2011
and as a member of its board of directors from 1998 to October 2011. He also served as President, Chief Executive Officer and a
director of Exterran GP LLC the general partner of Exterran Partners L.P. Exterran was a global leader in natural gas compression
products and services and a provider of equipment and solutions for processing, production, air emissions and water treatment to
the energy sector with over 10,000 employees with operations in 30 countries. Mr. Danner has a Masters of Accounting and
Bachelor of the Arts degree from Rice University.
David Mullen, Director & Chief Executive Officer
Mr. Mullen has over 35 years’ experience in the oil services business and has been our Chief Executive Officer since
October 2012. Since April 2018, Mr. Mullen has served as an Independent Director of Subsea 7 S.A. From September 2010 to
April 2011, Mr. Mullen was CEO of Wellstream Holdings PLC, a UK listed company that designed and manufactured subsea
pipeline products and included as part of the product offering, subsea services and installation. From April 2008 to August 2010,
Mr. Mullen served as Chief Executive Officer of Ocean Rig ASA, a Norwegian listed ultra-deep water drilling contractor. Prior to
Ocean Rig ASA, Mr. Mullen also spent four years as a senior leader of Transocean Ltd. As Senior Vice President of Global
Marketing, Business Development and M&A at Transocean Ltd., Mr. Mullen spearheaded marketing and strategic planning. Mr.
Mullen had a 23-year career at Schlumberger, including as President of Oilfield Services for North and South America. Mr. Mullen
59
received a B.A. in Geology & Physics from Trinity College Dublin and an M.Sc. degree in Geophysics from University College
Galway.
John K. Castle, Director
Mr. Castle joined our board of directors in November 2012 and has served as Chairman of the Nomination Committee
since February 2019. Mr. Castle has served as Chairman and Chief Executive Officer of Castle Harlan, Inc. since 1987, and as
Chairman and Chief Executive Officer of Branford Castle, Inc since 1986. Prior to forming Castle Harlan, Inc., Mr. Castle was
President and Chief Executive of investment banking firm Donaldson, Lufkin & Jenrette, Inc. Mr. Castle is a board member of
various private equity companies, and he has previously been a director of numerous private and public companies. He also served
as a Director of the Equitable Life Assurance Society of the U.S. Mr. Castle is a Life Member of the Corporation of the
Massachusetts Institute of Technology. Previously, he had served for 22 years as a Trustee of New York Medical College, including
11 of those years as Chairman of the board. Mr. Castle is a Trustee and Chairman of the Executive Committee of the St. Patrick’s
Cathedral in New York City and is a member of the Finance Council of the Archdiocese of New York. From 2000 to 2018, Mr.
Castle was a Director of Castle Harlan Australian Mezzanine Partners Pty Ltd and a Director of CHAMP Group Holdings Pty Ltd.
He has served on various visiting committees at Harvard University, including the Harvard Business School. Mr. Castle received
his Bachelor’s degree from the Massachusetts Institute of Technology, his M.B.A. as a Baker Scholar with High Distinction from
Harvard University, and has four Honorary Doctorate Degrees of Humane Letters.
J. William Franklin, Jr., Director
Mr. Franklin joined our board of directors in September 2012 and has served as Chairman of the Compensation Committee
since May 2020. He joined Lime Rock Partners in 2003 and was named a Managing Director in 2008. Currently based in Houston,
Mr. Franklin has worked in the firm’s Houston, Calgary, and Westport, Connecticut locations and has played a leadership role in
the firm’s investment efforts in the oilfield service and exploration and production sectors in North America and internationally.
Before joining Lime Rock Partners, he had experience in private equity, energy company operations, and energy finance at
Riverstone Holdings from 2000 to 2003, Simmons & Company International from 1996 to 1998, and Parker & Parsley Petroleum
Company from 1995 to 1996. Mr. Franklin currently serves on the board of directors of AccessESP, Arsenal Resources Ardyne
and OilSERV. He previously served on a number of the boards of private equity backed oil and gas related companies. He is a
graduate of the University of Texas at Austin (B.A., B.B.A.) and Harvard Business School (M.B.A.).
Dongyang Lou, Director
Mr. Lou joined our board of directors in August 2020 and is currently Chairman and Non-executive Director of CMIC
Ocean En-Tech Holding Co., Ltd. since April 2018. He is also the Chief Financial Officer of China Merchants (“CM”) Industry
Holdings Co., Ltd. Mr. Lou served as an engineer in the Chemical Engineering Office of the Institute of Standardization of Nuclear
Industry and as secretary-general for the National Technical Committee for Standardization of Radioisotopes from July 1997 to
October 2001, as an engineer in the Planning Department in China Isotope Company from October 2001 to August 2003, as a
specialist of the board of supervisors for Key Large State-Owned Enterprises under the State Council from August 2003 to August
2004, as deputy head of the board of supervisors for Key Large State-Owned Enterprises under the State Council from September
2008 to September 2012, as an assistant to the department director of the intellectual property administrative department of China
Merchants Group Limited (“CM Group”) from September 2012 to May 2015, as an assistant to the department director of the
finance department (intellectual property department) of CM Group from May 2015 to October 2015, and as a deputy department
director of the finance department (intellectual property department) of CM Group from October 2015 to November 2017. Mr. Lou
obtained a bachelor’s degree in applied chemistry from Peking University in 1997 and a master’s degree in business administration
also from Peking University in 2002.
David B. Pittaway, Director
Mr. Pittaway joined our board of directors in July 2015. Mr. Pittaway is Vice Chairman and Senior Managing Director of
Castle Harlan and has been with the firm since its founding in 1987. Prior to joining Castle Harlan, Mr. Pittaway was Vice President
for Strategic Planning and Assistant to the President of Donaldson, Lufkin & Jenrette, Inc. Before joining DLJ, he was a
management consultant in strategic planning with Bain & Company in Boston, Mass., and previously was an attorney with Morgan,
Lewis & Bockius, specializing in labor relations. He is a board member of Caribbean Restaurants, LLC and has also served on the
boards of multiple other Castle Harlan portfolio companies, including American Achievement Corporation, Statia Terminals Group
N.V., Morton’s Restaurant Group and United Malt Holdings Inc. He also serves as Vice Chairman of Branford Castle, Inc. and
Branford Chain, Inc. He is also currently a board member of The Cheesecake Factory Inc. Mr. Pittaway’s community interests
include being a former director of the Dystrophic Epidermolysis Bullosa Research of America. In addition, he served for twenty
years in the United States Army Reserve and, upon retiring as a Major, he co-founded and acts as a director of the Armed Forces
Reserve Family Assistance Fund, which provides needed support for families of American service members whose breadwinners
are serving their country in overseas conflicts. He is a graduate of the University of Kansas (B.A. with Highest Distinction), and
has both an M.B.A. with High Distinction (Baker Scholar) and a Juris Doctor degree from Harvard University.
60
John Reynolds, Director
Mr. Reynolds joined our board of directors in September 2012 and is co-founder and a Managing Director of Lime Rock
Partners. He joined Goldman Sachs in 1992 and spent six years in the Investment Research Department where he had senior analyst
responsibility for global oil service sector research and was one of the top-rated analysts in the sector. He co-founded Lime Rock
Partners in 1998. Based in Westport, Connecticut, Mr. Reynolds leads the Lime Rock Partners team’s efforts in the global oilfield
service sector. He previously served on the board of directors of Archer, Blackjewel, Eastern Drilling, EnerMech, Hercules
Offshore, IPEC, Noble Rochford Drilling, Patriot Drilling, Revelation Energy, Roxar, Sensa, Tercel Oilfield Products, Tesco
Corporation, Torch Offshore, and VEDCO Holdings. Mr. Reynolds is a graduate of Bucknell University (B.A.) and serves as a
member of its Board of Trustees.
Benjamin Sebel, Director
Mr. Sebel joined our board of directors in November 2012. He is a Senior Advisor to Branford Castle Partners and was
most recently a Managing Director at CHAMP Private Equity, having been with the firm from 2005 until 2014. Immediately prior,
Mr. Sebel was a Managing Director at Castle Harlan for seven years, and is experienced in all aspects of private equity investment
including deal origination, realizations and fundraising in both the United States and Australia. Immediately prior to joining Castle
Harlan, Mr. Sebel worked at Goldman Sachs & Co. in its Capital Markets Group. Previously, Mr. Sebel spent two years as Special
Advisor to the Hon. Nick Greiner AC, a former premier of New South Wales, and commenced his career in the Management
Consulting Services Group of PricewaterhouseCoopers (Australia), where he also qualified as a Chartered Accountant. Mr. Sebel
is currently Chairman of Rocking Horse Finance Group, Chairman of Gerard Lighting Group and an Investment Committee Member
at Commencer Capital. Mr. Sebel was formerly on the board of Riverina Fresh Pty. Ltd., ATF Services, Centric Wealth Limited,
Healthcare Australia Holdings Pty Limited, Study Group Pty Limited, United Malt Holdings, Ion Track, Inc., Associated Packaging
Technologies, Inc., Equipment Support Services, Inc. and AdobeAir, Inc. Mr. Sebel holds a Bachelor of Commerce (First Class
Honours) from the University of New South Wales, an M.B.A. from the Harvard Business School, and is a graduate of the Australian
Institute of Company Directors.
Usama Trabulsi, Director
Mr. Trabulsi joined our board of directors in August 2017 and is a Managing Member of Integrated Renewable Energy
Systems Ltd., a Saudi Arabia registered privately held limited liability company. Previously, he was the Chief Financial Controller
(Deputy Minister Portfolio) of the Ministry of Petroleum and Mineral Resources, Riyadh, Saudi Arabia for over 14 years and the
representative of the Minister of Petroleum and Mineral Resources to the Executive Committee, Auditing Committee and
Compensation Committee of Saudi Aramco for over 13 years. Mr. Trabulsi has served on the board of directors of Arabian Oil
Company from 1996 to 2003 and Arabian Oil Holdings, Inc. Japan from 2003 to 2007, in each case as the representative of the
Saudi Government. In addition, Mr. Trabulsi served as the Chairman of the board of directors of “PEMREF” Petromin-Mobil Oil
Refinery Company Ltd., a joint venture company between Petromin (the State-owned National Oil Company) and Mobil Oil
Company from 1990 to 1993. Meanwhile, Mr. Trabulsi served as Executive Vice President for Operation and Marketing of SUMED
Oil Pipelines Co., a joint venture company between Egypt, Saudi Arabia, Kuwait, UAE and Qatar. He received his B.A. in
Economics and Political Science from the King Saud University in 1965 and received his M.B.A. from Michigan State University
in 1970.
David Williams, Director
Mr. Williams joined our board of directors in August 2017 and has served as Chairman of the Audit Committee since
November 2018. He has served as the Chairman of PTL UK Topco Ltd since May 2019 and Tharsus Ltd of Newcastle upon Tyne
since 2012. Previously, Mr. Williams was the Chairman of Shepherd Group Ltd of York from 2014 until April 2020, the Chairman
of Ramco Ltd from March 2013 until January 2019, the Chairman of Frog Capital (previously known as Foursome Investments) for
13 years and the Interim Chief Executive Officer of Logstor Holdings A/S of Logstor, Denmark for two years. Prior to this, Mr.
Williams was the Chairman, then Chief Executive, of Serimax Holdings SAS of Paris from June 2004 to June 2006 and June 2006
to October 2011, respectively. He also held several positions at 3i plc from 1985 to 2003, including regional managing director.
Mr. Williams received a BSc (Hons) in Naval Architecture and Shipbuilding from the University of Newcastle upon Tyne in 1975,
has a Certified Diploma in Accountancy and Finance and received an MSc from London Business School in 1985.
Executive officers
David Mullen, Director & Chief Executive Officer
Mr. Mullen has been our Chief Executive Officer since October 2012. See “—Directors.”
William (“Kurt”) Hoffman, Executive Vice President & Chief Operating Officer
Mr. Hoffman has worked on rigs around the world and has over 40 years’ experience in the global oil and gas drilling
industry. Mr. Hoffman joined Shelf Drilling in October 2012. From August 2009 to April 2011, Mr. Hoffman was Senior Vice
President and Chief Operating Officer of Seahawk Drilling, a Houston and Gulf of Mexico-based jack-up drilling provider where
61
he was responsible for the company’s daily operations and strategic business plan implementation. From 1991 through August
2009, Mr. Hoffman spent 18 years with Noble Corporation where he held senior operational and executive roles, including Vice
President of Worldwide Marketing, Vice President of Western Hemisphere Operations and President of Noble’s engineering
services division, Triton Engineering Services. Mr. Hoffman received a B.S. degree from Southwest Texas State University.
Gregory O’Brien, Executive Vice President & Chief Financial Officer
Mr. O’Brien was appointed Executive Vice President and Chief Financial Officer in March 2016. Prior to his current role,
Mr. O’Brien served as Director, Strategic Planning since 2014, in charge of Shelf Drilling’s corporate development efforts. Mr.
O’Brien joined Shelf Drilling from Lime Rock Partners, where he focused on oilfield services and exploration & production
investment opportunities internationally. Before that, Mr. O’Brien held energy investment banking roles with J.P. Morgan and
SunTrust Robinson Humphrey. Mr. O’Brien graduated from the McIntire School of Commerce at the University of Virginia in
2008.
Ian Clark, Executive Vice President
Mr. Clark has over 40 years’ experience in the oil services business. Prior to joining Shelf Drilling in November 2012,
Mr. Clark spent 12 years with Transocean Ltd. where he most recently served as Vice President of Human Resources and as part of
its senior management team. Previous roles included Division Manager for Transocean Ltd.’s operations in Northeast Asia and also
Managing Director for Nigeria. Before joining Transocean Ltd., Mr. Clark had a 20-year career with Schlumberger in various
managerial, technical and marketing roles across Europe and Africa. Mr. Clark has a B.S. degree in Electrical and Electronic
Engineering from Heriot-Watt University in Edinburgh, Scotland and completed both the Advanced Management Program at
Harvard Business School and the Financial Times Non-Executive Director Diploma.
Item 11. Executive Compensation.
We are not required to report this Item.
Item 12. Security Ownership of Certain Beneficial Owners and Management and Related
Shareholders Matters.
We are not required to report this Item.
Item 13. Certain Relationships and Related Transactions, and Director Independence.
We are not required to report this Item.
Item 14. Principal Accounting Fee and Services.
We are not required to report this Item.
Part IV
Item 15. Exhibit and Financial Statement Schedules.
Financial Statements pages F-1 to F-42.
Material agreements governing indebtedness can be found on our website at www.shelfdrilling.com in the investor
relations section under key documents.
F-1
Shelf Drilling, Ltd.
Consolidated Financial Statements
for the years ended December 31, 2021, 2020 and 2019
F-2
SHELF DRILLING, LTD.
CONSOLIDATED FINANCIAL STATEMENTS
YEARS ENDED DECEMBER 31, 2021, 2020 AND 2019
INDEX
CONTENTS
Independent Auditor's Report F-3 Consolidated Statements of Operations F-5
Consolidated Statements of Comprehensive Income F-6 Consolidated Balance Sheets F-7 Consolidated Statements of Equity F-8 Consolidated Statements of Cash Flows F-9
Notes to the Consolidated Financial Statements F-10
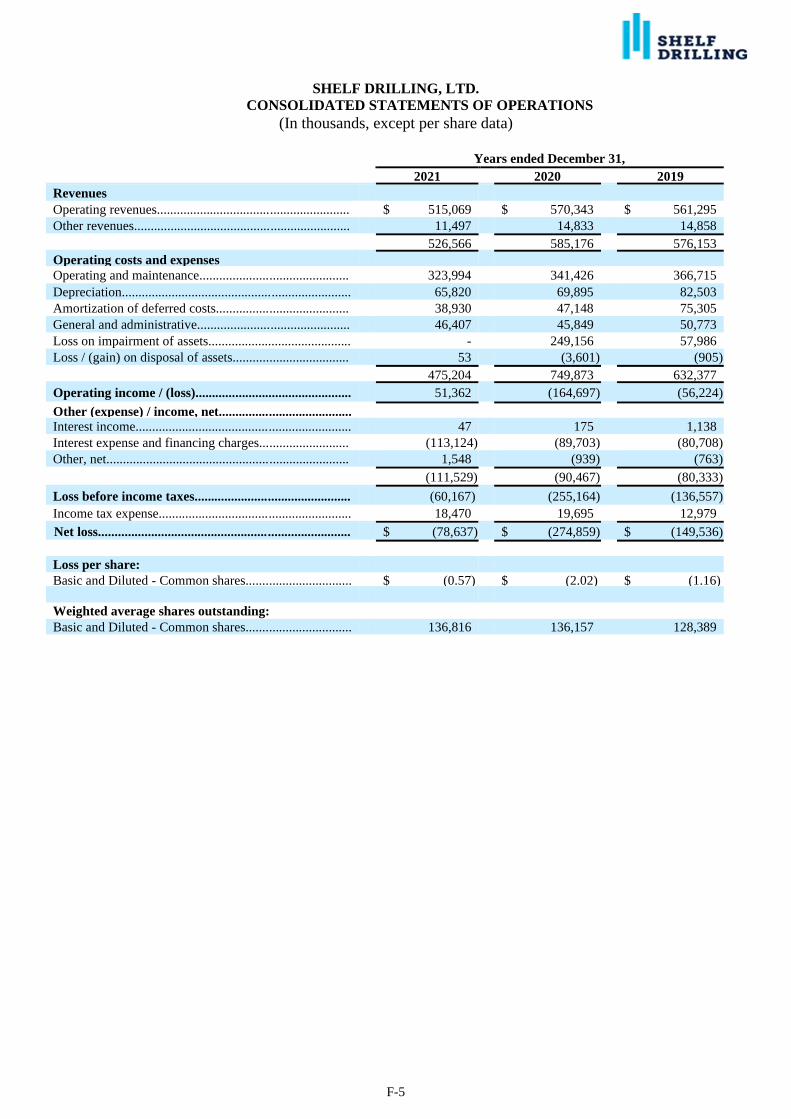
F-5
SHELF DRILLING, LTD.
CONSOLIDATED STATEMENTS OF OPERATIONS
(In thousands, except per share data)
Years ended December 31,
2021 2020 2019
Revenues
Operating revenues.......................................................... $ 515,069 $ 570,343 $ 561,295
Other revenues................................................................. 11,497 14,833 14,858
526,566 585,176 576,153
Operating costs and expenses
Operating and maintenance............................................. 323,994 341,426 366,715
Depreciation..................................................................... 65,820 69,895 82,503
Amortization of deferred costs........................................ 38,930 47,148 75,305
General and administrative.............................................. 46,407 45,849 50,773
Loss on impairment of assets........................................... - 249,156 57,986
Loss / (gain) on disposal of assets................................... 53 (3,601) (905)
475,204 749,873 632,377
Operating income / (loss)............................................... 51,362 (164,697) (56,224)
Other (expense) / income, net........................................ Interest income................................................................. 47 175 1,138
Interest expense and financing charges........................... (113,124) (89,703) (80,708)
Other, net......................................................................... 1,548 (939) (763)
(111,529) (90,467) (80,333)
Loss before income taxes............................................... (60,167) (255,164) (136,557)
Income tax expense.......................................................... 18,470 19,695 12,979
Net loss............................................................................ $ (78,637) $ (274,859) $ (149,536)
Loss per share:
Basic and Diluted - Common shares................................ $ (0.57) $ (2.02) $ (1.16)
Weighted average shares outstanding:
Basic and Diluted - Common shares................................ 136,816 136,157 128,389
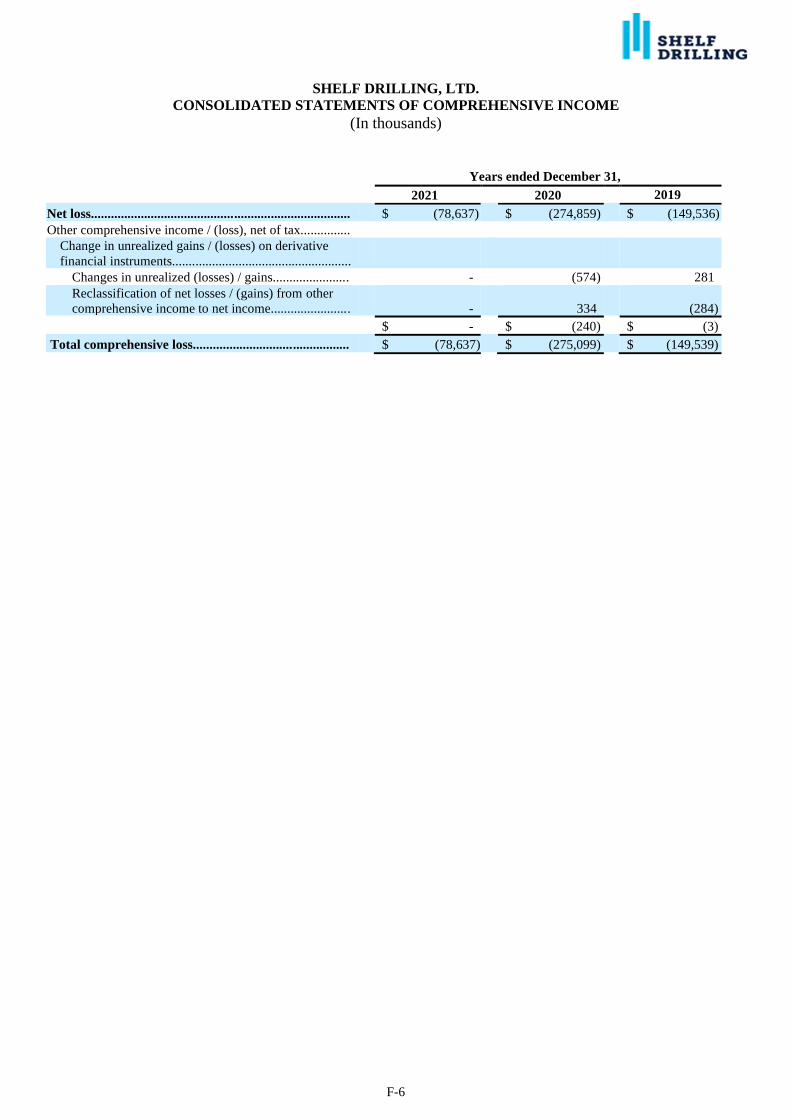
F-6
SHELF DRILLING, LTD.
CONSOLIDATED STATEMENTS OF COMPREHENSIVE INCOME
(In thousands)
Years ended December 31,
2021 2020 2019
Net loss.............................................................................. $ (78,637) $ (274,859) $ (149,536)
Other comprehensive income / (loss), net of tax...............
Change in unrealized gains / (losses) on derivative
financial instruments......................................................
Changes in unrealized (losses) / gains....................... - (574) 281
Reclassification of net losses / (gains) from other
comprehensive income to net income........................
-
334
(284)
$ - $ (240) $ (3)
Total comprehensive loss............................................... $ (78,637) $ (275,099) $ (149,539)
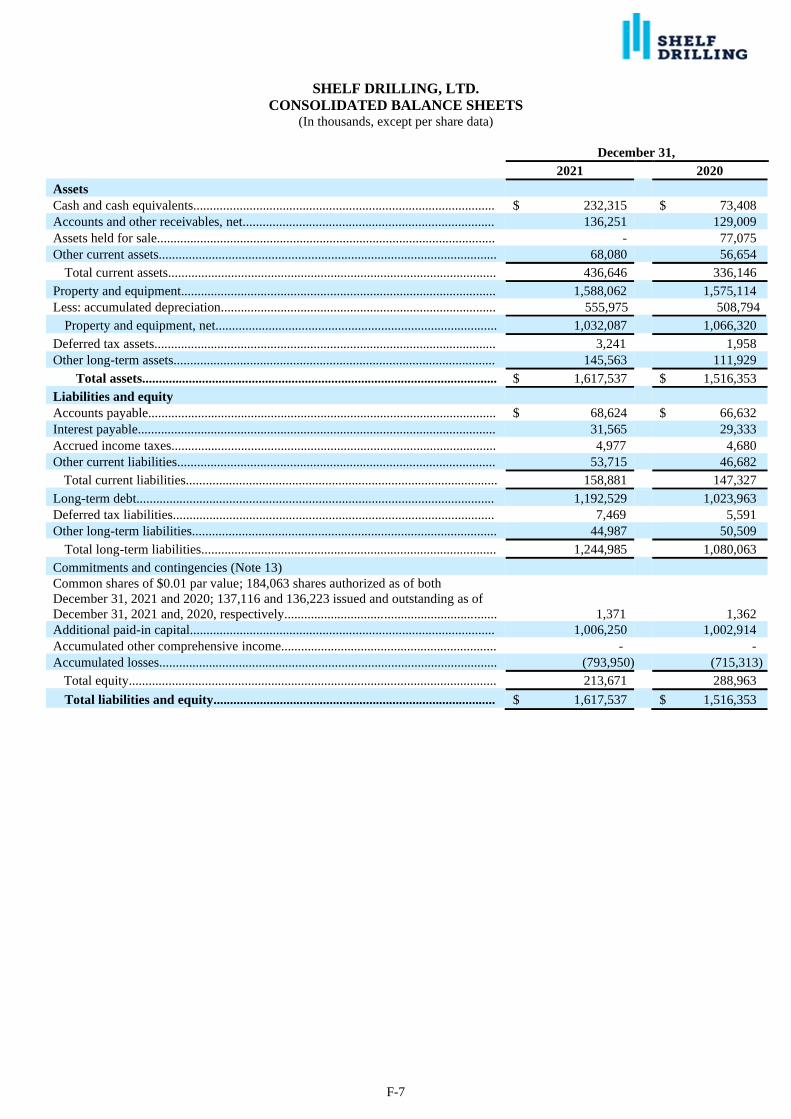
F-7
SHELF DRILLING, LTD.
CONSOLIDATED BALANCE SHEETS (In thousands, except per share data)
December 31,
2021 2020
Assets
Cash and cash equivalents........................................................................................... $ 232,315 $ 73,408
Accounts and other receivables, net............................................................................ 136,251 129,009
Assets held for sale...................................................................................................... - 77,075
Other current assets...................................................................................................... 68,080 56,654
Total current assets................................................................................................... 436,646 336,146
Property and equipment............................................................................................... 1,588,062 1,575,114
Less: accumulated depreciation................................................................................... 555,975 508,794
Property and equipment, net..................................................................................... 1,032,087 1,066,320
Deferred tax assets....................................................................................................... 3,241 1,958
Other long-term assets................................................................................................. 145,563 111,929
Total assets........................................................................................................... $ 1,617,537 $ 1,516,353
Liabilities and equity
Accounts payable......................................................................................................... $ 68,624 $ 66,632
Interest payable............................................................................................................ 31,565 29,333
Accrued income taxes.................................................................................................. 4,977 4,680
Other current liabilities................................................................................................ 53,715 46,682
Total current liabilities.............................................................................................. 158,881 147,327
Long-term debt............................................................................................................ 1,192,529 1,023,963
Deferred tax liabilities................................................................................................. 7,469 5,591
Other long-term liabilities............................................................................................ 44,987 50,509
Total long-term liabilities......................................................................................... 1,244,985 1,080,063
Commitments and contingencies (Note 13)
Common shares of $0.01 par value; 184,063 shares authorized as of both
December 31, 2021 and 2020; 137,116 and 136,223 issued and outstanding as of
December 31, 2021 and, 2020, respectively................................................................
1,371
1,362
Additional paid-in capital............................................................................................ 1,006,250 1,002,914
Accumulated other comprehensive income................................................................. - -
Accumulated losses...................................................................................................... (793,950) (715,313)
Total equity............................................................................................................... 213,671 288,963
Total liabilities and equity..................................................................................... $ 1,617,537 $ 1,516,353
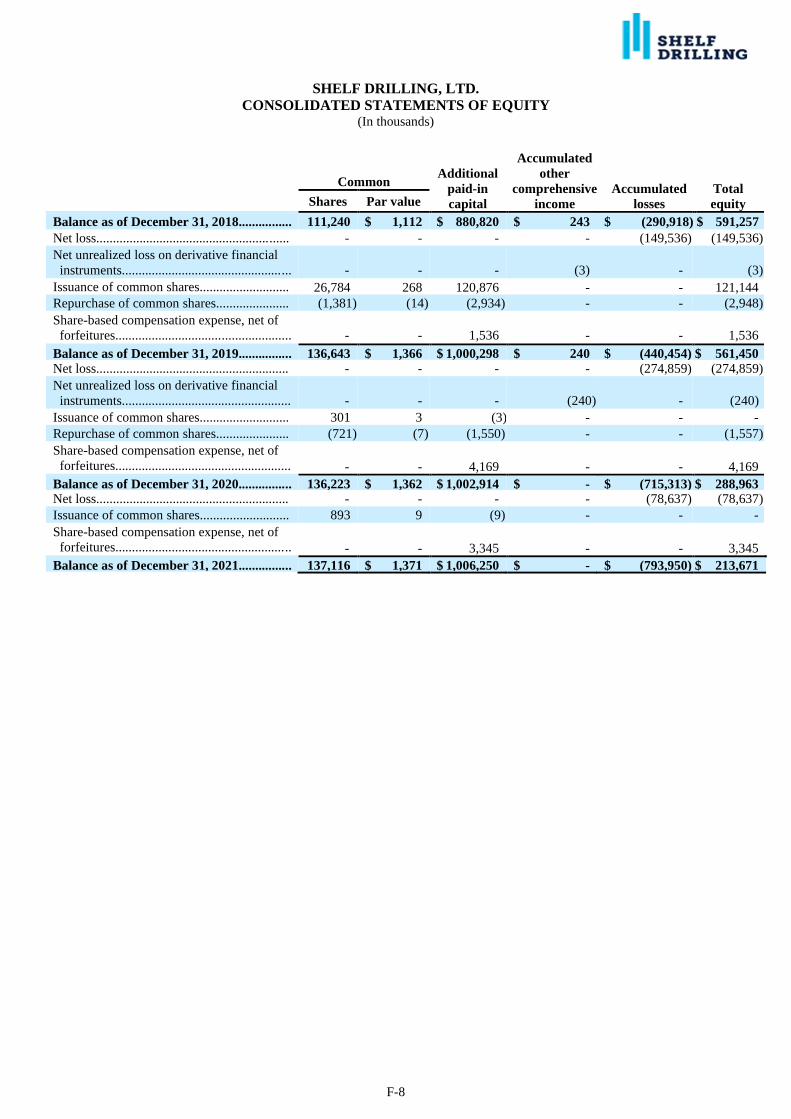
F-8
SHELF DRILLING, LTD.
CONSOLIDATED STATEMENTS OF EQUITY (In thousands)
Common Additional
paid-in
capital
Accumulated
other
comprehensive
income
Accumulated
losses
Total
equity Shares Par value
Balance as of December 31, 2018................ 111,240 $ 1,112 $ 880,820 $ 243 $ (290,918) $ 591,257
Net loss.......................................................... - - - - (149,536) (149,536)
Net unrealized loss on derivative financial
instruments...................................................
-
-
-
(3)
-
(3)
Issuance of common shares........................... 26,784 268 120,876 - - 121,144
Repurchase of common shares...................... (1,381) (14) (2,934) - - (2,948)
Share-based compensation expense, net of
forfeitures.....................................................
-
-
1,536
-
-
1,536
Balance as of December 31, 2019................ 136,643 $ 1,366 $ 1,000,298 $ 240 $ (440,454) $ 561,450
Net loss.......................................................... - - - - (274,859) (274,859)
Net unrealized loss on derivative financial
instruments...................................................
-
-
-
(240)
-
(240)
Issuance of common shares........................... 301 3 (3) - - -
Repurchase of common shares...................... (721) (7) (1,550) - - (1,557)
Share-based compensation expense, net of
forfeitures..................................................... - - 4,169 - - 4,169
Balance as of December 31, 2020................ 136,223 $ 1,362 $ 1,002,914 $ - $ (715,313) $ 288,963 Net loss.......................................................... - - - - (78,637) (78,637)
Issuance of common shares........................... 893 9 (9) - - -
Share-based compensation expense, net of
forfeitures..................................................... - - 3,345 - - 3,345
Balance as of December 31, 2021................ 137,116 $ 1,371 $ 1,006,250 $ - $ (793,950) $ 213,671
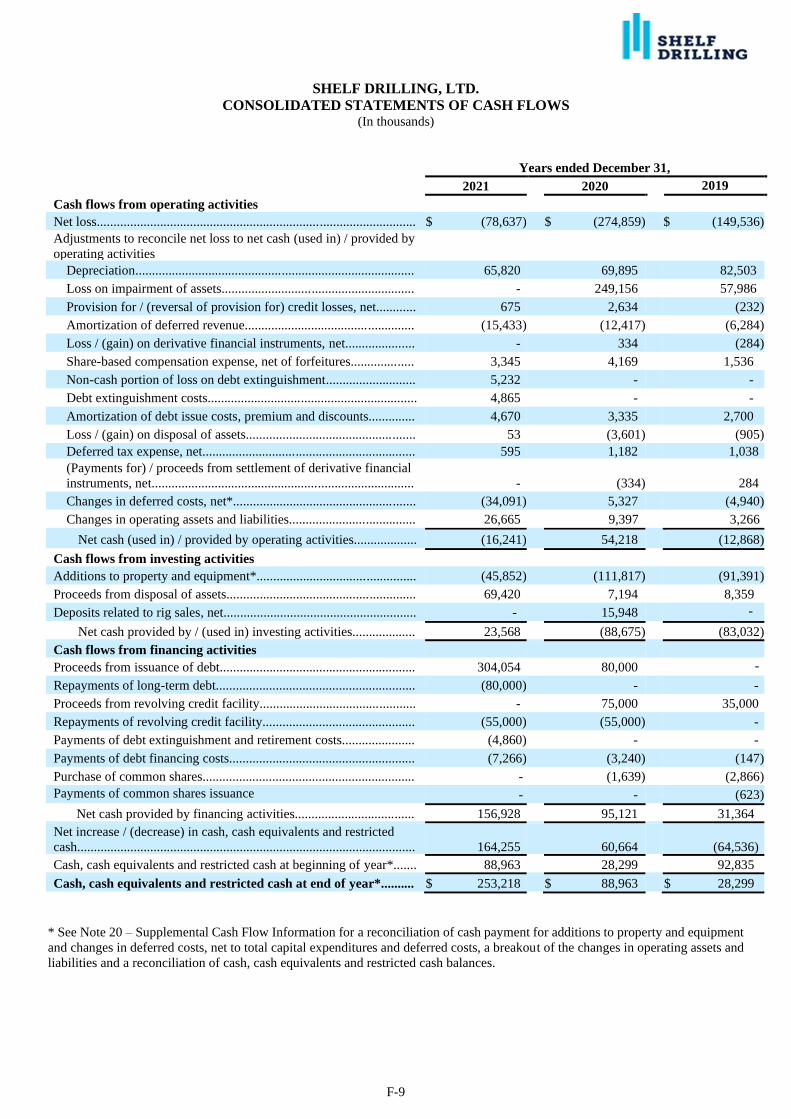
F-9
SHELF DRILLING, LTD.
CONSOLIDATED STATEMENTS OF CASH FLOWS (In thousands)
Years ended December 31,
2021 2020 2019
Cash flows from operating activities
Net loss................................................................................................ $ (78,637) $ (274,859) $ (149,536)
Adjustments to reconcile net loss to net cash (used in) / provided by
operating activities
Depreciation.................................................................................... 65,820 69,895 82,503
Loss on impairment of assets.......................................................... - 249,156 57,986
Provision for / (reversal of provision for) credit losses, net............ 675 2,634 (232)
Amortization of deferred revenue................................................... (15,433) (12,417) (6,284)
Loss / (gain) on derivative financial instruments, net..................... - 334 (284)
Share-based compensation expense, net of forfeitures................... 3,345 4,169 1,536
Non-cash portion of loss on debt extinguishment........................... 5,232 - -
Debt extinguishment costs............................................................... 4,865 - -
Amortization of debt issue costs, premium and discounts.............. 4,670 3,335 2,700
Loss / (gain) on disposal of assets................................................... 53 (3,601) (905)
Deferred tax expense, net................................................................ 595 1,182 1,038
(Payments for) / proceeds from settlement of derivative financial
instruments, net...............................................................................
-
(334)
284
Changes in deferred costs, net*....................................................... (34,091) 5,327 (4,940)
Changes in operating assets and liabilities...................................... 26,665 9,397
9,
3
9
7
3,266
Net cash (used in) / provided by operating activities................... (16,241) 54,218 (12,868)
Cash flows from investing activities
Additions to property and equipment*................................................ (45,852) (111,817)
(
1
1
1,
8
1
7
)
(91,391)
Proceeds from disposal of assets......................................................... 69,420 7,194
7
,
1
9
4
8,359
Deposits related to rig sales, net.......................................................... - 15,948
1
5,
9
4
8
-
- Net cash provided by / (used in) investing activities................... 23,568 (88,675) (83,032)
Cash flows from financing activities
Proceeds from issuance of debt........................................................... 304,054 80,000 -
- Repayments of long-term debt............................................................ (80,000) - -
Proceeds from revolving credit facility............................................... - 75,000 35,000
Repayments of revolving credit facility.............................................. (55,000) (55,000) -
Payments of debt extinguishment and retirement costs...................... (4,860) - -
Payments of debt financing costs........................................................ (7,266) (3,240) (147)
Purchase of common shares................................................................ - (1,639) (2,866)
Payments of common shares issuance
costs........................................ - - (623)
Net cash provided by financing activities.................................... 156,928 95,121 31,364
Net increase / (decrease) in cash, cash equivalents and restricted
cash......................................................................................................
164,255
60,664
(64,536)
Cash, cash equivalents and restricted cash at beginning of year*....... 88,963 28,299 92,835
Cash, cash equivalents and restricted cash at end of year*.......... $ 253,218 $ 88,963 $ 28,299
* See Note 20 – Supplemental Cash Flow Information for a reconciliation of cash payment for additions to property and equipment
and changes in deferred costs, net to total capital expenditures and deferred costs, a breakout of the changes in operating assets and
liabilities and a reconciliation of cash, cash equivalents and restricted cash balances.
SHELF DRILLING, LTD.
NOTES TO THE CONSOLIDATED FINANCIAL STATEMENTS
F-10
Note 1 — Nature of Business
Business
Shelf Drilling, Ltd. (“SDL”) was incorporated on August 14, 2012 (“inception”) as a private corporation in the Cayman
Islands. SDL with its majority owned subsidiaries (together, the “Company”, “we” or “our”) is a leading international shallow
water offshore contractor providing services and equipment for the drilling, completion, maintenance and decommissioning of oil
and natural gas wells. We are solely focused on shallow water operations in depths of up to 375 feet and our fleet consists of 30
independent-leg cantilever (“ILC”) jack-up rigs as of December 31, 2021. Since June 25, 2018, SDL shares are listed on the Oslo
Stock Exchange (“OSE”) under the ticker symbol SHLF.
SDL is a holding company with no significant operations or assets other than interests in its direct and indirect subsidiaries.
All operations are conducted through Shelf Drilling Holdings, Ltd. (“SDHL”) an indirect wholly owned subsidiary of SDL. Our
corporate offices are in Dubai, United Arab Emirates (“UAE”), geographically close to our operations in the Middle East, North
Africa and the Mediterranean (together, “MENAM”), Southeast Asia, India and West Africa. Our largest shareholders are affiliates
of Castle Harlan, Inc., Lime Rock Partners and China Merchants Industry Holdings Company Limited (“China Merchants”).
Additionally, other shareholders may have large holdings as reported in public filings in accordance with the rules of the OSE.
Note 2 — Significant Accounting Policies
Basis of Presentation
The Company has prepared its consolidated financial statements in accordance with generally accepted accounting
principles in the United States (“GAAP”). The amounts are presented in United States (“U.S.”) dollars (“$”) rounded to the nearest
thousand, unless otherwise stated.
Principles of Consolidation
The consolidated financial statements include the accounts of the Company, its wholly-owned subsidiaries and those
entities that meet the criteria for variable interest entities (“VIEs”) for which the Company is deemed to be the primary beneficiary.
Intercompany balances and transactions are eliminated in consolidation.
As of December 31, 2021, the Company’s consolidated financial statements include five entities that meet the definition
of VIEs. See Note 5 – Variable Interest Entities. As of December 31, 2021, the Company does not have investments which meet
the criteria to be reported under the equity method of accounting.
Use of Estimates
The preparation of consolidated financial statements in accordance with GAAP requires management to make estimates
and assumptions that affect the reported amounts of assets, liabilities and disclosures of contingent assets and liabilities at the date
of the consolidated financial statements and the reported amounts of revenues and expenses during the reporting period. Estimates
are used for, but are not limited to, the following: collectability of receivables, depreciable or amortizable lives of assets, term of
lease obligations, impairment of assets, provision for income taxes, valuation of share-based compensation, postemployment
benefits and contingencies. Actual results could differ from those estimates.
Fair Value Measurements
Fair value is the price that would be received to sell an asset or paid to transfer a liability in an orderly transaction between
market participants at the measurement date. The three-level hierarchy of fair value measurement, which reflects the degree to
which objective prices in external active markets are available to measure fair value, is as follows:
Level 1 — Quoted prices in active markets that are accessible at the measurement date for identical assets and liabilities.
Level 2 — Observable prices that are based on inputs not quoted on active markets but corroborated by market data.
Level 3 — Unobservable inputs are used when little or no market data is available.
Financial assets and financial liabilities are classified based on the lowest level of input that is significant to the relevant
fair value measurement. The Company’s assessment of the significance of a particular input to the fair value measurement requires
judgment and may affect the valuation of the assets and liabilities being measured and their placement within the fair value hierarchy.
Revenue Recognition
The Company recognizes revenues when control of a good or service promised in a contract is transferred to a customer.
Control is obtained when a customer has the ability to direct the use of and obtain substantially all of the remaining benefits from
SHELF DRILLING, LTD.
NOTES TO THE CONSOLIDATED FINANCIAL STATEMENTS
F-11
that good or service. The timing of revenue recognition may differ from the timing of invoicing to customers and these timing
differences result in receivables, contract assets or contract liabilities, as appropriate on the Company’s consolidated balance sheets.
The Company’s services provided under each contract is a single performance obligation satisfied over time and is
comprised of a series of distinct time increments or service periods in which we provide services. Variable consideration is only
recognized as revenues to the extent that it is probable that a significant reversal will not occur during the contract term. When
determining if variable consideration should be recognized, management considers whether there are factors outside of the
Company’s control that could result in a significant reversal of revenues as well as the likelihood and magnitude of a potential
reversal of revenue. A description of our principal revenue generating activities are as follows:
Operating Revenues
A significant portion of the Company’s revenues is generated from rigs operated by the Company through dayrates charged
to its customers for the provision of services related to drilling, completion, maintenance and decommissioning of oil and natural
gas wells. The Company’s contracts with customers contain multiple dayrates and the actual dayrate earned during a period could
vary based on the actual operations. The dayrate invoices billed to the customer are typically determined based on the varying rates
applicable to the specific activities performed on an hourly basis. Variable consideration generally relates to distinct service periods
during the contract term and is recognized in the period when services are performed to the extent it is probable that a significant
revenue reversal will not occur. We have applied the disclosure practical expedient in Accounting Standards Codification (“ASC”)
606-10-50-14(b) and have not disclosed variable consideration related to remaining unsatisfied performance obligations.
The Company may earn lump-sum fees relating to contract preparation, capital upgrades and mobilization in certain
contracts, which are typically invoiced at the commencement or initial phase of the contract. These activities are not considered to
be revenue generating activities distinct from the performance of services under the contract. Therefore, such revenues are recorded
as a contract liability and amortized on a straight-line basis over the firm contract term. Certain customers may also make advance
payments of dayrate revenues, which are deferred and recognized when the related dayrate services are provided. Upfront fees for
contract preparation, capital upgrades and mobilization and advance payments from customers for future services are recorded as
contract liabilities in other current liabilities and other long-term liabilities, as appropriate, in the consolidated balance sheets.
The Company may earn lump-sum fees relating to contract demobilization, which are typically invoiced at the end of the
contract and may contain provisions stipulating conditions that must be present for such revenues to be received. The Company
assesses the likelihood of receiving this revenue based on prior experience and knowledge of market conditions and other factors.
Demobilization fees are recorded when it is unconditional and probable that there will not be a material cumulative revenue reversal,
which typically occurs near the end of the contract term. Once the recognition criteria are met, the demobilization revenues are
recorded as operating revenues over the remaining firm contract term and a contract asset is recorded for any revenue recognized
prior to invoicing.
Many contracts have termination and/or extension options which can be exercised at the option of the customer. In certain
cases, the Company can charge an early termination fee if a contract is terminated by the customer. Termination revenues are
typically billed after a termination notice is received from a customer or activity related to a contract ceases. Termination revenues
are typically recognized as revenues when billed and it is probable that revenues will not be reversed. Revenues related to an
extension option are typically accounted for as a contract modification as a separate contract.
Other Revenues
Other revenues consist of amounts billed for goods and services such as catering, additional equipment and personnel,
consumables or accommodations. The Company may use third parties for the provision of such goods and services. Judgement is
involved in identifying the performance obligations in these customer contracts and determining whether the Company is a principal
or an agent in the provision of certain equipment and consumables to the customer. The Company generally is considered to be a
principal in revenue transactions when it obtains control of a good or service before it is transferred to the customer. The Company
typically acts as a principal in the provision of catering, accommodation services, additional personnel and the provision of
additional equipment and consumables directly used to provide integrated services to the customer. The Company generally acts
as an agent in the provision of other equipment and consumables for the customer.
Operating Costs and Expenses and Deferred Costs
Operating costs and expenses are generally recognized when incurred. Certain expenditures associated with contract
preparation, mobilization, regulatory inspections and major equipment overhauls are recorded as deferred costs in other current
assets or other long-term assets, as appropriate, on the consolidated balance sheets.
Deferred contract costs include certain contract preparation and upfront mobilization expenditures for rigs entering binding
services contracts. Such costs are generally considered costs to fulfil the Company’s future performance obligations under the
related contract and are therefore deferred and amortized on a straight-line basis over the firm contract term. Certain deferred
contract costs are related to contractually required inspections, and such costs are amortized on a straight-line basis over the time
SHELF DRILLING, LTD.
NOTES TO THE CONSOLIDATED FINANCIAL STATEMENTS
F-12
period until the next scheduled inspection. See Note 4 – Revenues, Contract Liabilities and Deferred Contract Costs and Allowance
for Credit Losses. Demobilization costs which are incurred at the end of a contract and costs associated with rig preparation and of
mobilization of without a firm contract are expensed as incurred.
Non-contractual deferred costs include costs of inspections incurred to obtain regulatory certifications to operate the rigs
and periodic major overhauls of equipment. Regulatory certifications, including Special Periodic Surveys (“SPS”) and Underwater
Inspections in Lieu of Dry-docking (“UWILDs”), are deferred and amortized on a straight-line basis over the time period until the
next survey or inspection, generally 30 to 60 months. Periodic major overhauls are deferred and amortized on a straight-line basis
over a period of five years.
Cash, Cash Equivalents and Restricted Cash
Cash and cash equivalents are comprised of cash on hand, cash in banks and highly liquid funds with an original maturity
of three months or less. Other bank deposits, if any, with maturity of less than a year are classified as short-term bank deposits
within other current assets in the consolidated balance sheets. Bank overdrafts, if any, are classified as current liabilities in the
consolidated balance sheets.
Restricted cash consists of cash deposits held related to bank guarantees. Restricted cash balances are recorded, according
to their maturity date, as either other current assets or other long-term assets in the consolidated balance sheets.
Accounts and Other Receivables, Net
The Company’s accounts and other receivables consist primarily of trade accounts receivable from the provision of
services, with original credit terms of less than one year. Accounts and other receivables are recorded in the consolidated balance
sheets at their nominal amounts, net of allowance for credit losses, or the estimated net realizable value, which approximates fair
value.
Allowance for Credit Losses
The Company applies the current expected credit losses (“CECL”) model to financial assets measured on an amortized
cost basis, primarily its trade accounts receivable, and off balance sheet exposures to credit losses. The Company determines its
expected credit losses for its pools of assets with similar risk characteristics based on historical loss information, as adjusted for
future expectations.
The Company pools its receivable assets using its internal determination of collection risk, which is based on several
factors, including the size and type of customer, the Company’s prior collections experience with the customer, and the country or
region in which the customer operates. Adjustments to the Company’s historic loss rates were made with consideration of the
increasing risk of default related to the COVID-19 pandemic and any relevant customer and oil industry specific factors, as needed.
Management reviews its assumptions each reporting period and makes adjustments as needed to reflect changes in historical loss
rates and expectations, which management believes provides a reasonable estimation of future losses. The pooling of assets and the
adjustment of historical loss rates include a high degree of judgement and actual results can differ materially from these expectations.
For other financial instruments measured on an amortized cost basis and off balance sheet credit exposures, the Company
considers quantitative and qualitative information, including historical experience and future expectations, which management
believes provide a reasonable basis for the estimation of future losses.
The Company records a provision for credit losses in its general and administrative expenses in the consolidated statements
of operations to reflect the net change in the allowance for credit losses during the period. Amounts determined to be uncollectible
are written-off against the allowance for credit losses.
Property and Equipment, Net
Property and equipment is initially stated at cost. Expenditures for additions, including other costs necessary to bring the
asset to the condition and location necessary for its intended use, improvements and substantial enhancements are capitalized.
Routine expenditures for minor replacements and repairs and maintenance that do not increase the functionality or life of the asset
are expensed as incurred. Construction in progress includes interest capitalized during the period of asset construction for qualified
assets if the construction is expected to take one year or longer and the amount of interest is material. When the asset is placed into
service, it is transferred from construction in progress to the appropriate category under property and equipment. Property and
equipment is subject to periodic impairment testing as discussed in “Impairment of Long-Lived Assets” below.
Depreciation commences when an asset is placed into service or is substantially complete and ready for its intended use.
Depreciation is computed using the straight-line method, after allowing for salvage value where applicable, over the estimated useful
lives of the assets. Land is not depreciated. Leasehold improvements are recorded as component of property and equipment and
SHELF DRILLING, LTD.
NOTES TO THE CONSOLIDATED FINANCIAL STATEMENTS
F-13
are depreciated over the shorter of the remaining expected lease term or the estimated useful lives of the improvements. If an
impairment loss is recognized, the adjusted carrying amount shall be depreciated over the remaining useful life of that asset.
The estimated useful lives of property and equipment are as follows:
Years
Rigs...................................................................................................................................................................... 30
Equipment and spares...................................................................................... .................................................... 9 - 13
Building...................................................................................... ......................................................................... 30
Other...................................................................................... .............................................................................. 3 - 5
The Company periodically reviews and adjusts, as appropriate, the remaining useful lives and salvage values of rigs when
certain events occur that directly impact such estimates. This includes changes in operating condition, functional capability and
market and economic factors. On December 31, 2021, the Company had a change in accounting estimate, which resulted in a
change in the useful lives of 12 rigs. This change did not have a material impact on the Company’s financial statements for the year
ended December 31, 2021.
The remaining estimated average useful life of existing rigs in the Company’s fleet as of December 31, 2021 is 11 years.
When assets are sold, retired or otherwise disposed of, the cost and related accumulated depreciation are written off, net of
any proceeds received, and any gain or loss is reflected in the consolidated statements of operations.
Assets Held for Sale
Property and equipment is reclassified as asset held for sale when (a) there is a committed plan to sell the asset that is
unlikely to be subject to significant changes or termination, (b) the asset is available for immediate sale, (c) actions are initiated to
complete the sale, including an active program to locate a buyer, (d) the sale is expected to be completed within one year and (e)
the asset is being actively marketed at a price that is reasonable relative to its fair value. Assets held for sale are recorded at the
lower of carrying value or fair value less estimated costs to sell and are subject to periodic impairment testing as discussed in
“Impairment of Long-Lived Assets” below.
Leases
A lease is a contract, or part of a contract, that conveys the right to control the use of an identified asset for a period of time
in exchange for consideration. The Company has made an accounting policy election to present the lease and associated non-lease
operations as a single component based upon the predominant component. Lease classification as short-term lease, operating lease
or finance lease is made at the lease inception. The Company considers all relevant contractual provisions, including renewal and
termination options, to determine the term of the lease. Renewal or termination options that are reasonably certain of exercise by
the lessee and those controlled by the lessor are included in determining the lease term. The Company considers all relevant facts
and circumstances that create an economic incentive to exercise the option. See also Note 8 – Leases.
Short-Term Leases
The Company made an accounting policy election not to recognize a right-of-use asset and lease liability for short-term
leases with an initial term of 12 months or less, therefore these leases are not recorded on the consolidated balance sheets. Expenses
for short-term leases are recognized on a straight-line basis over the lease term under either operating and maintenance expenses or
general and administrative expenses in the consolidated statements of operations.
The Company as a Lessee
The Company recognizes lease liabilities and right-of-use assets for all operating and finance leases for which it is a lessee
at the lease commencement date. Lease liabilities are initially recognized at the present value of the future lease payments during
the expected lease term using the interest rate implicit in the lease, if that rate can be determined, or the Company’s incremental
borrowing rate. Lease liabilities are recorded, according to the payment dates as other current liabilities and other long-term
liabilities in the consolidated balance sheets. For any contract considered predominantly a lease, all non-lease components are
included in the initial measurement of the lease liability. Finance lease and operating lease liabilities are recorded separately. The
right-of-use asset is initially recognized at the amount of the initial measurement of the lease liability, plus any lease payments made
at or before the commencement date, less any lease incentives received and any initial direct costs incurred by the Company. Right-
of-use assets are recorded as other long-term assets in the consolidated balance sheets. Subsequent to initial recognition, the right-
of-use asset is reflected net of amortization. Right-of-use assets are subject to periodic impairment testing as discussed in
“Impairment of Long-Lived Assets” below. Costs to get a leased asset to the condition and location necessary for its intended use
are capitalized as leasehold improvements.
SHELF DRILLING, LTD.
NOTES TO THE CONSOLIDATED FINANCIAL STATEMENTS
F-14
The Company remeasures its lease liabilities with a corresponding adjustment to the right-of-use asset due to an applicable
change in lease payments such as those due to a lease modification not accounted for as a separate contract, certain changes in the
expected term of the lease, and certain changes in assessments and contingencies. The Company has made an accounting policy
election to account for lease concessions related to the effects of the COVID-19 pandemic, as though enforceable rights and
obligations for those concessions existed in the original lease contract and, therefore, the Company will not account for these
concessions as lease modifications. The Company is instead accounting for rent reductions as a negative variable lease payment in
the period in which that payment would have become due and is accounting for temporary rent deferrals as a short-term lease
payable until the amount becomes due and payable.
Subsequent to initial recognition, the operating lease liability is increased for the interest component of the lease liability
and reduced by the lease payments made. Operating lease expenses are recognized as a single lease cost on a straight-line basis
over the lease term, which includes the interest component of the measurement of the lease liability and amortization of the right-
of-use asset. Operating lease expenses are recognized based on the type of leased asset under either operating and maintenance
expenses or general and administrative expenses in the consolidated statements of operations.
Finance lease expenses are recognized separately in the consolidated statements of operations, with the interest expense on
the lease liability recorded under interest expense and the amortization of the right-of-use asset recorded as based on the type of
leased asset under either operating and maintenance expenses or general and administrative expenses.
The Company as a Lessor
The Company’s contracts with customers contain lease components related to the underlying rigs and equipment, in addition
to service components of labor and expertise to operate the rig and equipment. The service component of operating a rig is
predominant in the Company’s contracts, therefore, the Company accounts for its revenues from contracts with customers as service
revenues with a single performance obligation. See “Revenue Recognition” above.
Impairment of Long-Lived Assets
The Company evaluates property and equipment, right-of-use assets and other long-lived assets for impairment whenever
events or changes in circumstances indicate the carrying amount of an asset may not be recoverable. Impairment indicators can
include changes in the general economic and business environment, industry specific indicators, Company specific factors or
conditions related to a specific asset or asset group. An impairment loss on an asset or asset group is recorded when the estimated
undiscounted future cash flows expected to result from the use of the asset and its eventual disposition are less than its carrying
amount. Any actual impairment loss recognized represents the excess of the asset’s carrying value over the estimated fair value.
The Company estimates the fair values of property and equipment, right-of-use assets, deferred costs and other long-lived
assets to be held and used by applying a combination of income and market approaches, using projected cash flows and estimates
of the exchange price that would be received for the assets in the principal or most advantageous market for the assets in an orderly
transaction between market participants as of the measurement date. The fair value of the Company’s asset groups using the income
approach is based on estimated cash flows expected to be realized from the use of the assets. Asset impairment evaluations are, by
nature, highly subjective. The critical estimates are significant unobservable inputs, which are based on numerous estimates and
assumptions about future operations and market conditions including but not limited to those such as projected rig utilization,
dayrates, operating, overhead and major project costs, remaining useful life, salvage value and discount rate as well as cost inflation
assumptions. The Company estimates the fair values of assets held for sale based on the expected sale price less estimated costs to
sell, which can include significant unobservable inputs. These assumptions are considered non-recurring level 3 fair value
measurements.
Income Taxes
Provision for income taxes is based on relevant tax laws and rates in effect in the countries in which the Company operates
and earns income or in which the Company is considered resident for income tax purposes. Current income tax expense reflects an
estimate of the Company’s income tax liability for the current year, including changes in prior year tax estimates as returns are filed,
and any tax audit adjustments.
Deferred income taxes reflect the “temporary differences” between the carrying amounts of assets and liabilities for
financial reporting purposes and the amounts used for income tax purposes, tax effected by applying the relevant tax rate, based on
enacted tax laws and rates applicable to the periods in which the reversal of such differences is expected to affect taxable income.
The Company records net deferred tax assets to the extent the assets will more likely than not be realized. In making such
determination, all available positive and negative evidence is considered, including scheduled reversals of deferred tax liabilities,
projected future taxable income, tax planning strategies and recent financial performance. When necessary, valuation allowances
are established to reduce deferred income tax assets to the amount expected to be realized. Liabilities for uncertain tax positions
are recorded as long-term liabilities for tax positions that have been taken that are more likely than not to ultimately be denied upon
examination or audit by tax authorities. Any interest and penalties related to uncertain tax positions are included as a component of
income tax expense.
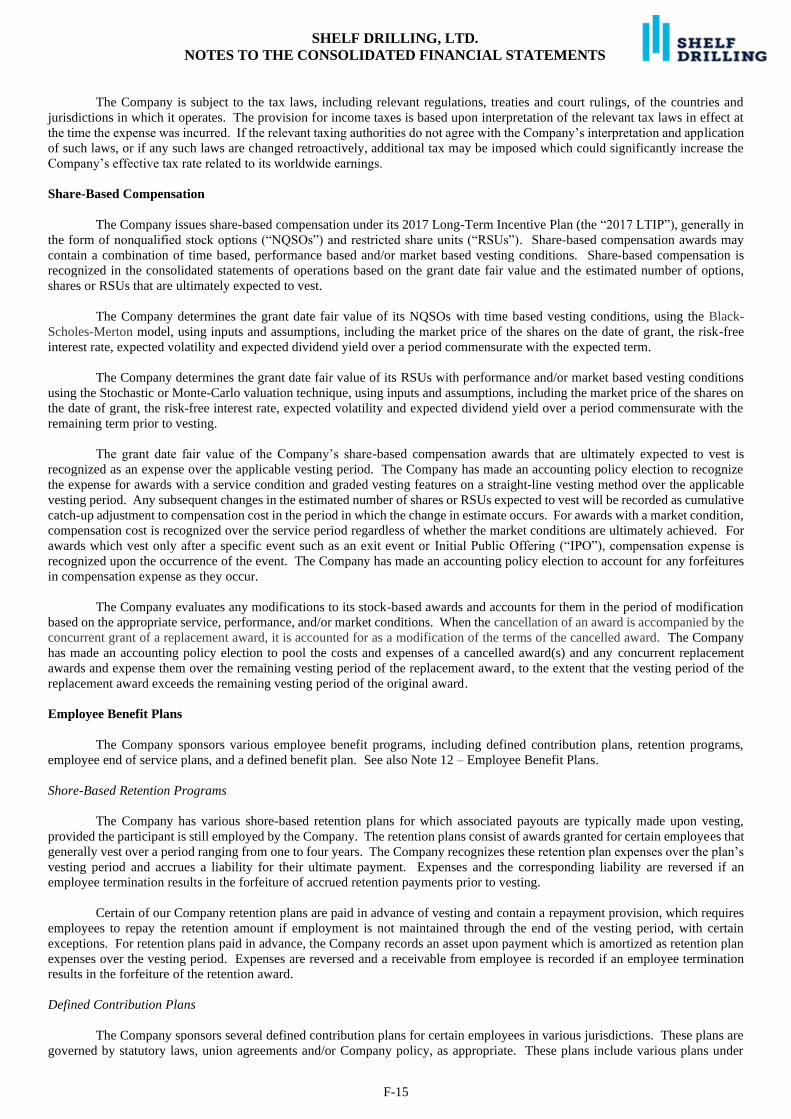
SHELF DRILLING, LTD.
NOTES TO THE CONSOLIDATED FINANCIAL STATEMENTS
F-15
The Company is subject to the tax laws, including relevant regulations, treaties and court rulings, of the countries and
jurisdictions in which it operates. The provision for income taxes is based upon interpretation of the relevant tax laws in effect at
the time the expense was incurred. If the relevant taxing authorities do not agree with the Company’s interpretation and application
of such laws, or if any such laws are changed retroactively, additional tax may be imposed which could significantly increase the
Company’s effective tax rate related to its worldwide earnings.
Share-Based Compensation
The Company issues share-based compensation under its 2017 Long-Term Incentive Plan (the “2017 LTIP”), generally in
the form of nonqualified stock options (“NQSOs”) and restricted share units (“RSUs”). Share-based compensation awards may
contain a combination of time based, performance based and/or market based vesting conditions. Share-based compensation is
recognized in the consolidated statements of operations based on the grant date fair value and the estimated number of options,
shares or RSUs that are ultimately expected to vest.
The Company determines the grant date fair value of its NQSOs with time based vesting conditions, using the Black-
Scholes-Merton model, using inputs and assumptions, including the market price of the shares on the date of grant, the risk-free
interest rate, expected volatility and expected dividend yield over a period commensurate with the expected term.
The Company determines the grant date fair value of its RSUs with performance and/or market based vesting conditions
using the Stochastic or Monte-Carlo valuation technique, using inputs and assumptions, including the market price of the shares on
the date of grant, the risk-free interest rate, expected volatility and expected dividend yield over a period commensurate with the
remaining term prior to vesting.
The grant date fair value of the Company’s share-based compensation awards that are ultimately expected to vest is
recognized as an expense over the applicable vesting period. The Company has made an accounting policy election to recognize
the expense for awards with a service condition and graded vesting features on a straight-line vesting method over the applicable
vesting period. Any subsequent changes in the estimated number of shares or RSUs expected to vest will be recorded as cumulative
catch-up adjustment to compensation cost in the period in which the change in estimate occurs. For awards with a market condition,
compensation cost is recognized over the service period regardless of whether the market conditions are ultimately achieved. For
awards which vest only after a specific event such as an exit event or Initial Public Offering (“IPO”), compensation expense is
recognized upon the occurrence of the event. The Company has made an accounting policy election to account for any forfeitures
in compensation expense as they occur.
The Company evaluates any modifications to its stock-based awards and accounts for them in the period of modification
based on the appropriate service, performance, and/or market conditions. When the cancellation of an award is accompanied by the
concurrent grant of a replacement award, it is accounted for as a modification of the terms of the cancelled award. The Company
has made an accounting policy election to pool the costs and expenses of a cancelled award(s) and any concurrent replacement
awards and expense them over the remaining vesting period of the replacement award, to the extent that the vesting period of the
replacement award exceeds the remaining vesting period of the original award.
Employee Benefit Plans
The Company sponsors various employee benefit programs, including defined contribution plans, retention programs,
employee end of service plans, and a defined benefit plan. See also Note 12 – Employee Benefit Plans.
Shore-Based Retention Programs
The Company has various shore-based retention plans for which associated payouts are typically made upon vesting,
provided the participant is still employed by the Company. The retention plans consist of awards granted for certain employees that
generally vest over a period ranging from one to four years. The Company recognizes these retention plan expenses over the plan’s
vesting period and accrues a liability for their ultimate payment. Expenses and the corresponding liability are reversed if an
employee termination results in the forfeiture of accrued retention payments prior to vesting.
Certain of our Company retention plans are paid in advance of vesting and contain a repayment provision, which requires
employees to repay the retention amount if employment is not maintained through the end of the vesting period, with certain
exceptions. For retention plans paid in advance, the Company records an asset upon payment which is amortized as retention plan
expenses over the vesting period. Expenses are reversed and a receivable from employee is recorded if an employee termination
results in the forfeiture of the retention award.
Defined Contribution Plans
The Company sponsors several defined contribution plans for certain employees in various jurisdictions. These plans are
governed by statutory laws, union agreements and/or Company policy, as appropriate. These plans include various plans under
SHELF DRILLING, LTD.
NOTES TO THE CONSOLIDATED FINANCIAL STATEMENTS
F-16
international jurisdictions. These plans include Company matching amounts, based on jurisdiction, and other Company payments,
which may be based on job category or years of service. The Company’s contributions are expensed as incurred and the Company
has no further obligations for these plans.
Employee End of Service Plans
The Company offers end of service plans to employees in certain countries in accordance with the labor laws in these
countries or Company policies. The Company makes cash payments whenever the departure of an employee triggers the
requirement to pay benefits. In certain countries for which management estimates that end of service liabilities are significant, the
Company obtains a third-party valuation to estimate the end of service benefit liability based on actuarial assumptions that include
an employee census and historical data.
Defined Benefit Plan
Certain employees are eligible for defined benefits under a Company plan and these benefits are fully vested. The
employee’s benefit amount is calculated based on the employee’s base salary and various other factors, as outlined in the plan. The
Company immediately recognizes any gains and losses from this plan and accrues a liability for the ultimate payments. Benefits
are paid in a single lump sum cash payment when a participant is no longer employed by the Company.
The plan does not have any assets, nor does the Company intend to fund the plan. Amounts expected to be paid under the
defined benefit plan are determined based on actuarial assumptions.
Debt
Premiums, discounts and debt issuance costs related to the issuance of term debt are deferred and recorded as an adjustment
to the associated debt balance on the consolidated balance sheets. These amounts are amortized to interest expense using the
effective interest method through the maturity of the related debt.
Debt issuance costs related to line-of-credit arrangements, regardless of whether there is any outstanding balance, are
recorded under other long-term assets on the consolidated balance sheets and amortized to interest expense on a straight-line basis
over the term of the line-of-credit arrangement.
In the event of early retirement of debt, any extinguishment costs and unamortized premiums, discounts and debt issuance
costs associated with the retired debt are expensed as interest expense and financing charges in the consolidated statements of
operations.
Earnings / (Loss) Per Share
Basic earnings / (loss) per share (“EPS”) is calculated by dividing the net income or loss attributable to common shares by
the weighted average number of common shares outstanding during the period, excluding contingently forfeitable unvested share-
based compensation. The two-class method is used for participating securities, as applicable.
Diluted EPS adjusts the weighted average number of common shares outstanding in the basic EPS calculation for the effect
of potential future issuances of common stock relating primarily to share-based compensation awards and other potentially dilutive
instruments using the treasury stock method.
The dilutive effect of share-based awards using the treasury stock method consists of the total awards to be issued in a
future period less an “assumed” buy back of shares. The “assumed” buy back of shares is computed using the average market price
of common stock for the relevant period as the price per share and “assumed” proceeds which includes the award’s exercise price,
if any, and the average unrecognized compensation expense of the award during the period. This calculation can result in a
significantly lower dilutive effect than the stock-based awards currently outstanding and/or in certain awards being anti-dilutive.
Anti-dilutive awards can become dilutive in future periods based on changes in the average market price of common stock and
decreases in the unrecognized compensation costs.
In periods of net losses attributable to common shareholders, all potentially dilutive securities will be anti-dilutive, and
therefore basic and diluted EPS will be the same.
Foreign Currency
The Company’s functional currency is the U.S. dollar. As is customary in the oil and natural gas industry, the majority of
the Company’s revenues are denominated in U.S. dollars.
A significant amount of the Company’s expenditures including interest expense and corporate expenses are denominated
in U.S. dollars or are effectively denominated in U.S. dollars, as the payment currency is fixed to the U.S. dollar. However, certain
SHELF DRILLING, LTD.
NOTES TO THE CONSOLIDATED FINANCIAL STATEMENTS
F-17
subsidiaries have a significant amount of their operating expenses payable in local currencies. To limit the potential risk of currency
fluctuations, when management believes that market conditions are favorable the Company may choose to enter into a series of
monthly foreign currency forward contracts as discussed in “Derivative Financial Instruments” below. As such, the Company’s
exposure to non-U.S. dollar denominated currency exchange rate fluctuations may be limited by such derivatives. All transactions
denominated in non-U.S. dollar currencies are recorded in U.S. dollars at the prevailing exchange rate. Realized transaction gains
or losses and gains and losses from the remeasurement of assets and liabilities denominated in non-U.S. dollar currencies are reported
as other, net in the consolidated statements of operations.
Derivative Financial Instruments
The Company’s derivative financial instruments consist of foreign currency forward exchange contracts (“forex contracts”)
and interest rate swaps which the Company may designate as cash flow hedges. Each derivative contract is stated in the consolidated
balance sheets at fair value. Derivatives with asset fair values are reported in other current assets or other long-term assets and
derivatives with liability fair values are reported in other current liabilities or other long-term liabilities on the consolidated balance
sheets, depending on their maturity date.
The Company has documented policies and procedures to monitor and control the use of the derivative instruments. The
Company does not engage in derivative transactions for speculative or trading purposes.
Derivative gains and losses are reflected in the consolidated statements of operations except that, to the extent the derivative
qualifies for and is designated as an accounting hedge, the gains and losses are reflected in income in the same period as offsetting
gains and losses on the qualifying hedged positions. Designated hedges are expected to be highly effective, and therefore,
adjustments to record the carrying value of the effective portion of the derivative financial instruments to their fair value are recorded
as a component of accumulated other comprehensive income / (loss) (“AOCIL”), in the consolidated balance sheets. These changes
in fair value for each designated hedge included in the assessment of hedge effectiveness will remain in AOCIL until it is reclassified
into earnings in the period or periods during which the hedged transaction affects earnings or it is determined that the forecast hedged
transaction will not occur.
Foreign Currency Forward Exchange Contracts
The Company may enter into forex contracts when management believes that market conditions are favorable to purchase
such contracts with the expectation that the contracts, when settled, will reduce the exposure to foreign currency gains and losses on
future foreign currency expenditures. The amount and duration of these contracts are based on the monthly forecast of expenditures
in which the Company conducts significant business and for which there is a financial market. These forward contracts are
derivatives and any change in fair value included in the assessment of hedge effectiveness is recognized in AOCIL. The net gains /
(losses) on forex contracts reclassified from AOCIL are recorded as operating and maintenance expense.
Interest Rate Swaps
The Company may enter into interest rate swaps to manage exposures arising from business activities that result in the
payment of future known and uncertain cash amounts, the value of which are determined by interest rates. The Company’s derivative
financial instruments are used to manage differences in the amount, timing, and duration of the Company’s known or expected cash
payments principally related to the Company’s borrowings.
The Company’s objectives in using interest rate derivatives are to add stability to interest expense and to manage its exposure to
interest rate movements. To accomplish this objective, the Company may use interest rate swaps as part of its interest rate risk
management strategy to effectively convert all or a portion of its variable-rate debt to a fixed-rate of interest. Interest rate swaps
designated as cash flow hedges of variable-rate debt involve the receipt of variable-rate amounts from a counterparty in exchange for
the Company making fixed-rate payments over the life of the agreements without exchange of the underlying notional amount. The
gains / (losses) on interest rate swaps reclassified from AOCIL are recorded as interest expense and financing charges.
Note 3 — Recently Issued and Adopted Accounting Pronouncements
Recently issued accounting standards
In March 2020, the FASB issued ASU No. 2020-04—Reference Rate Reform (Topic 848) — Facilitation of the Effects of
Reference Rate Reform on Financial Reporting, which provides relief for companies preparing for discontinuation of interest rates
such as the London Interbank Offered Rate (“LIBOR”) in 2021. The ASU provides companies with optional expedients mainly
relating to eligible contracts, hedging relationships, and other transactions affected by reference rate reform if certain criteria are
met. The key optional expedients generally allow a Company (1) to account for and present contract modifications as an event that
does not require contract remeasurement or reassessment of a previous accounting determination at the modification date, (2) to
continue hedge accounting when certain critical terms of a hedging relationship change, and (3) to make a one-time election to sell
SHELF DRILLING, LTD.
NOTES TO THE CONSOLIDATED FINANCIAL STATEMENTS
F-18
and/or reclassify certain held-to-maturity debt securities. This ASU is effective for all entities as of March 12, 2020 and can be
applied prospectively as of the beginning of the interim period that includes March 12, 2020 through December 31, 2022. As this
ASU has an open effective date until December 31, 2022, the Company will continue to evaluate the impact of this standard on our
consolidated financial statements and determine if the Company will adopt this standard.
Note 4 — Revenues, Contract Liabilities and Deferred Contract Costs and Allowance for Credit Losses
Revenues
See the consolidated statement of operations for the amounts of operating and other revenues. On December 31, 2021, the
contract with the longest expected remaining duration, excluding unexercised options, extends through June 2031. Refer to
“Revenue Recognition” and “Operating Costs and Expenses and Deferred Costs” in Note 2 – Significant Accounting Policies for
information on our accounting policies for revenue recognition and certain operating costs and expenses that are deferred and
amortized over future periods. See Note 22 – Segment and Related Information for disclosure of total revenues by country based
on the location of the service provided.
Contract liabilities and deferred contract costs
Contract liabilities
The Company recognizes a contract liability when we invoice an amount which is greater than the revenues allocated to
the related performance obligations for goods or services transferred to a customer. Contract liabilities include fees for contract
preparation, capital upgrades and mobilization and advance payments from customers for future services which are recorded as
other current liabilities and other long-term liabilities, as appropriate, in the consolidated balance sheets.
Following are the details of the contract liabilities (in thousands):
December 31,
2021 2020
Current contract liabilities............................................................................................. $ 29,036 $ 9,546
Non-current contract liabilities...................................................................................... 1,757 5,419
$ 30,793 $ 14,965
Significant changes in contract liabilities were as follows (in thousands):
Years ended December 31,
2021 2020
Balance, beginning of year............................................................................................. $ 14,965 $ 25,421
Increase due to contractual additions............................................................................. 31,261 2,786
Decrease due to amortization of deferred revenue......................................................... (15,433) (12,417)
Decrease due to application of customer deposits and other.......................................... - (825)
Balance, end of year........................................................................................................ $ 30,793 $ 14,965
Approximately $9.7 million and $11.7 million of revenues recognized during the years ended December 31, 2021 and
2020, respectively, were included in the beginning contract liabilities balance.
Expected future amortization of contract liabilities, net recorded as of December 31, 2021 is as follows (in thousands):
For the periods ending December 31,
2022......................................................................................................................... .........................................
.......3.............
$ 29,036
2023......................................................................................................................... .........................................
......4.
1,512
2024..................................................................................................................................................................
.........
245
$ 30,793
Deferred contract costs
The Company’s deferred contract costs are mainly related to contract preparation and mobilization costs. Certain non-
contractual costs such as regulatory inspections, major equipment overhauls (including rig upgrades), and stacked rig activations
are expensed, deferred or capitalized into property and equipment as appropriate and are not included in deferred contract costs.
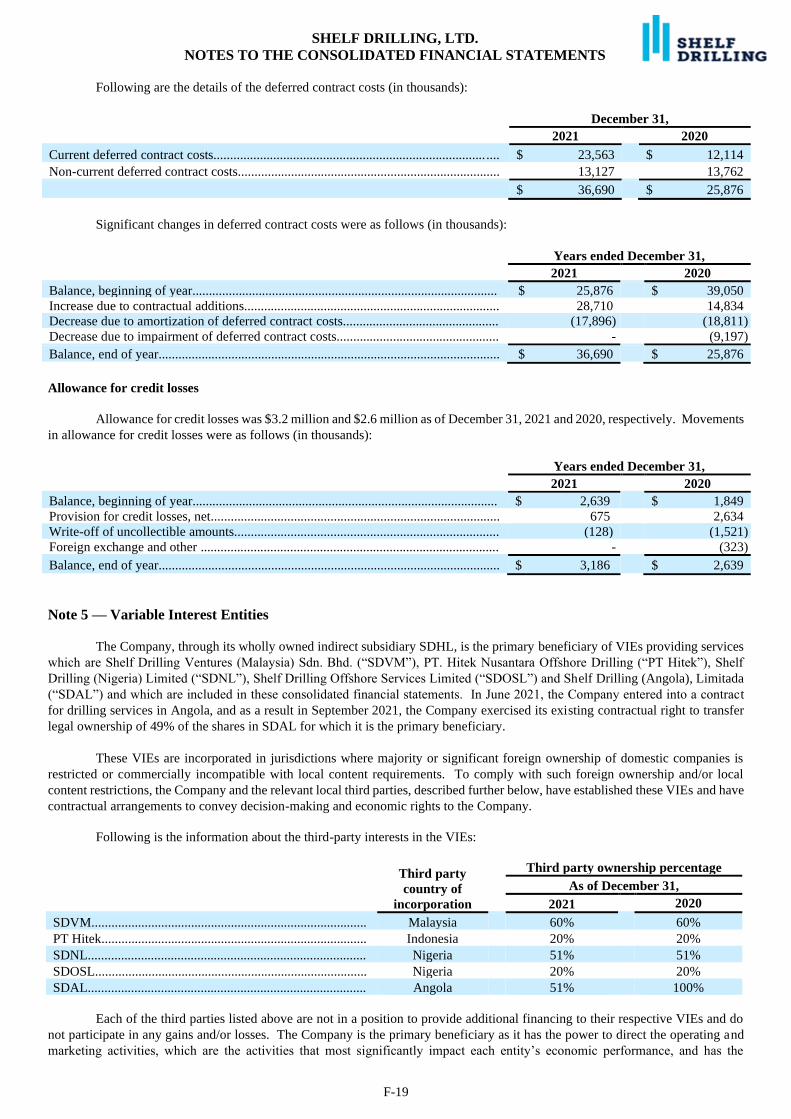
SHELF DRILLING, LTD.
NOTES TO THE CONSOLIDATED FINANCIAL STATEMENTS
F-19
Following are the details of the deferred contract costs (in thousands):
December 31,
2021 2020
Current deferred contract costs.................................................................................. .... $ 23,563 $ 12,114
Non-current deferred contract costs............................................................................... 13,127 13,762
$ 36,690 $ 25,876
Significant changes in deferred contract costs were as follows (in thousands):
Years ended December 31,
2021 2020
Balance, beginning of year............................................................................................ $ 25,876 $ 39,050
Increase due to contractual additions............................................................................. 28,710 14,834
Decrease due to amortization of deferred contract costs............................................... (17,896) (18,811)
Decrease due to impairment of deferred contract costs................................................. - (9,197)
Balance, end of year....................................................................................................... $ 36,690 $ 25,876
Allowance for credit losses
Allowance for credit losses was $3.2 million and $2.6 million as of December 31, 2021 and 2020, respectively. Movements
in allowance for credit losses were as follows (in thousands):
Years ended December 31,
2021 2020
Balance, beginning of year............................................................................................ $ 2,639 $ 1,849
Provision for credit losses, net....................................................................................... 675 2,634
Write-off of uncollectible amounts................................................................................ (128) (1,521)
Foreign exchange and other .......................................................................................... - (323)
Balance, end of year....................................................................................................... $ 3,186 $ 2,639
Note 5 — Variable Interest Entities
The Company, through its wholly owned indirect subsidiary SDHL, is the primary beneficiary of VIEs providing services
which are Shelf Drilling Ventures (Malaysia) Sdn. Bhd. (“SDVM”), PT. Hitek Nusantara Offshore Drilling (“PT Hitek”), Shelf
Drilling (Nigeria) Limited (“SDNL”), Shelf Drilling Offshore Services Limited (“SDOSL”) and Shelf Drilling (Angola), Limitada
(“SDAL”) and which are included in these consolidated financial statements. In June 2021, the Company entered into a contract
for drilling services in Angola, and as a result in September 2021, the Company exercised its existing contractual right to transfer
legal ownership of 49% of the shares in SDAL for which it is the primary beneficiary.
These VIEs are incorporated in jurisdictions where majority or significant foreign ownership of domestic companies is
restricted or commercially incompatible with local content requirements. To comply with such foreign ownership and/or local
content restrictions, the Company and the relevant local third parties, described further below, have established these VIEs and have
contractual arrangements to convey decision-making and economic rights to the Company.
Following is the information about the third-party interests in the VIEs:
Third party
country of
incorporation
Third party ownership percentage
As of December 31,
2021 2020
SDVM................................................................................... Malaysia 60% 60%
PT Hitek................................................................................ Indonesia 20% 20%
SDNL.................................................................................... Nigeria 51% 51%
SDOSL.................................................................................. Nigeria 20% 20%
SDAL.................................................................................... Angola 51% 100%
Each of the third parties listed above are not in a position to provide additional financing to their respective VIEs and do
not participate in any gains and/or losses. The Company is the primary beneficiary as it has the power to direct the operating and
marketing activities, which are the activities that most significantly impact each entity’s economic performance, and has the
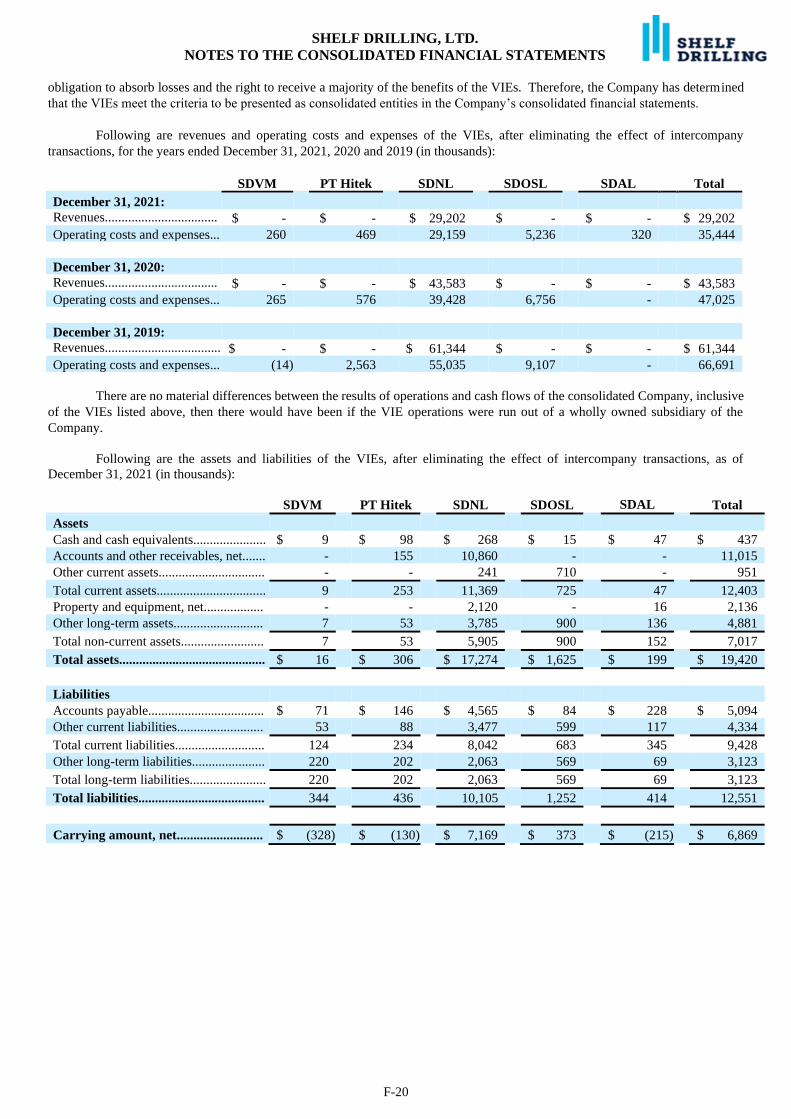
SHELF DRILLING, LTD.
NOTES TO THE CONSOLIDATED FINANCIAL STATEMENTS
F-20
obligation to absorb losses and the right to receive a majority of the benefits of the VIEs. Therefore, the Company has determined
that the VIEs meet the criteria to be presented as consolidated entities in the Company’s consolidated financial statements.
Following are revenues and operating costs and expenses of the VIEs, after eliminating the effect of intercompany
transactions, for the years ended December 31, 2021, 2020 and 2019 (in thousands):
SDVM PT Hitek SDNL SDOSL SDAL Total
December 31, 2021:
Revenues..................................
............ $ - $ - $ 29,202 $ - $ - $ 29,202
Operating costs and expenses... 260 469 29,159 5,236 320 35,444
December 31, 2020:
Revenues..................................
............ $ - $ - $ 43,583 $ - $ - $ 43,583
Operating costs and expenses... 265 576 39,428 6,756 - 47,025
December 31, 2019:
Revenues.......................................
..... $ - $ - $ 61,344 $ - $ - $ 61,344
Operating costs and expenses... (14) 2,563 55,035 9,107 - 66,691
There are no material differences between the results of operations and cash flows of the consolidated Company, inclusive
of the VIEs listed above, then there would have been if the VIE operations were run out of a wholly owned subsidiary of the
Company.
Following are the assets and liabilities of the VIEs, after eliminating the effect of intercompany transactions, as of
December 31, 2021 (in thousands):
SDVM PT Hitek SDNL SDOSL SDAL Total
Assets
Cash and cash equivalents...................... $ 9 $ 98 $ 268 $ 15 $ 47 $ 437
Accounts and other receivables, net....... - 155 10,860 - - 11,015
Other current assets................................ - - 241 710 - 951
Total current assets................................. 9 253 11,369 725 47 12,403
Property and equipment, net.................. - - 2,120 - 16 2,136
Other long-term assets........................... 7 53 3,785 900 136 4,881
Total non-current assets......................... 7 53 5,905 900 152 7,017
Total assets............................................ $ 16 $ 306 $ 17,274 $ 1,625 $ 199 $ 19,420
Liabilities
Accounts payable................................... $ 71 $ 146 $ 4,565 $ 84 $ 228 $ 5,094
Other current liabilities.......................... 53 88 3,477 599 117 4,334
Total current liabilities........................... 124 234 8,042 683 345 9,428
Other long-term liabilities...................... 220 202 2,063 569 69 3,123
Total long-term liabilities....................... 220 202 2,063 569 69 3,123
Total liabilities...................................... 344 436 10,105 1,252 414 12,551
Carrying amount, net.......................... $ (328) $ (130) $ 7,169 $ 373 $ (215) $ 6,869
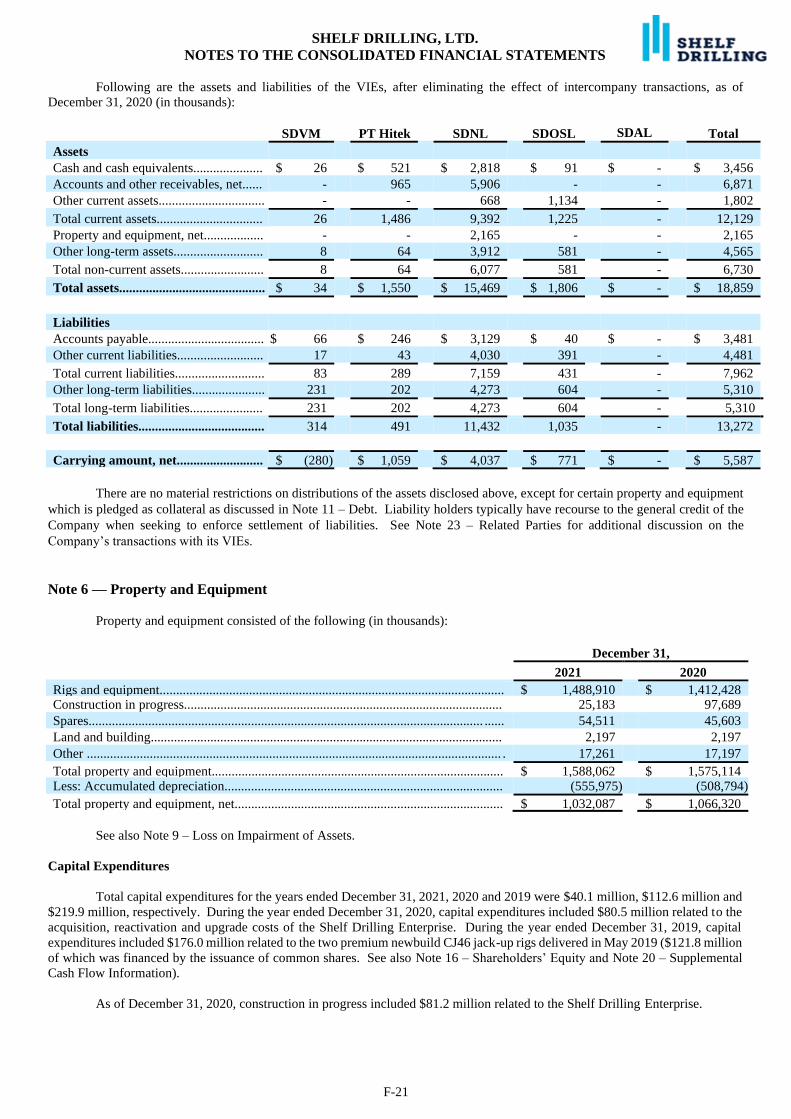
SHELF DRILLING, LTD.
NOTES TO THE CONSOLIDATED FINANCIAL STATEMENTS
F-21
Following are the assets and liabilities of the VIEs, after eliminating the effect of intercompany transactions, as of
December 31, 2020 (in thousands):
SDVM PT Hitek SDNL SDOSL SDAL Total
Assets
Cash and cash equivalents..................... $ 26 $ 521 $ 2,818 $ 91 $ - $ 3,456
Accounts and other receivables, net...... - 965 5,906 - - 6,871
Other current assets................................ - - 668 1,134 - 1,802
Total current assets................................ 26 1,486 9,392 1,225 - 12,129
Property and equipment, net.................. - - 2,165 - ¤ - 2,165
Other long-term assets........................... 8 64 3,912 581 - 4,565
Total non-current assets......................... 8 64 6,077 581 - 6,730
Total assets............................................ $ 34 $ 1,550 $ 15,469 $ 1,806 $ - $ 18,859
Liabilities
Accounts payable................................... $ 66 $ 246 $ 3,129 $ 40 $ - $ 3,481
Other current liabilities.......................... 17 43 4,030 391 - 4,481
Total current liabilities........................... 83 289 7,159 431 - 7,962
Other long-term liabilities...................... 231 202 4,273 604 - 5,310
Total long-term liabilities...................... 231 202 4,273 604 - 5,310
Total liabilities...................................... 314 491 11,432 1,035 - 13,272
Carrying amount, net.......................... $ (280) $ 1,059 $ 4,037 $ 771 $ - $ 5,587
There are no material restrictions on distributions of the assets disclosed above, except for certain property and equipment
which is pledged as collateral as discussed in Note 11 – Debt. Liability holders typically have recourse to the general credit of the
Company when seeking to enforce settlement of liabilities. See Note 23 – Related Parties for additional discussion on the
Company’s transactions with its VIEs.
Note 6 — Property and Equipment
Property and equipment consisted of the following (in thousands):
December 31,
2021 2020
Rigs and equipment........................................................................................................ $ 1,488,910 $ 1,412,428 Construction in progress................................................................................................ 25,183 97,689
Spares....................................................................................................................... ...... 54,511 45,603
Land and building.......................................................................................................... 2,197 2,197
Other ............................................................................................................................. . 17,261 17,197
Total property and equipment........................................................................................ $ 1,588,062 $ 1,575,114 Less: Accumulated depreciation.................................................................................... (555,975) (508,794)
Total property and equipment, net................................................................................. $ 1,032,087 $ 1,066,320
See also Note 9 – Loss on Impairment of Assets.
Capital Expenditures
Total capital expenditures for the years ended December 31, 2021, 2020 and 2019 were $40.1 million, $112.6 million and
$219.9 million, respectively. During the year ended December 31, 2020, capital expenditures included $80.5 million related to the
acquisition, reactivation and upgrade costs of the Shelf Drilling Enterprise. During the year ended December 31, 2019, capital
expenditures included $176.0 million related to the two premium newbuild CJ46 jack-up rigs delivered in May 2019 ($121.8 million
of which was financed by the issuance of common shares. See also Note 16 – Shareholders’ Equity and Note 20 – Supplemental
Cash Flow Information).
As of December 31, 2020, construction in progress included $81.2 million related to the Shelf Drilling Enterprise.
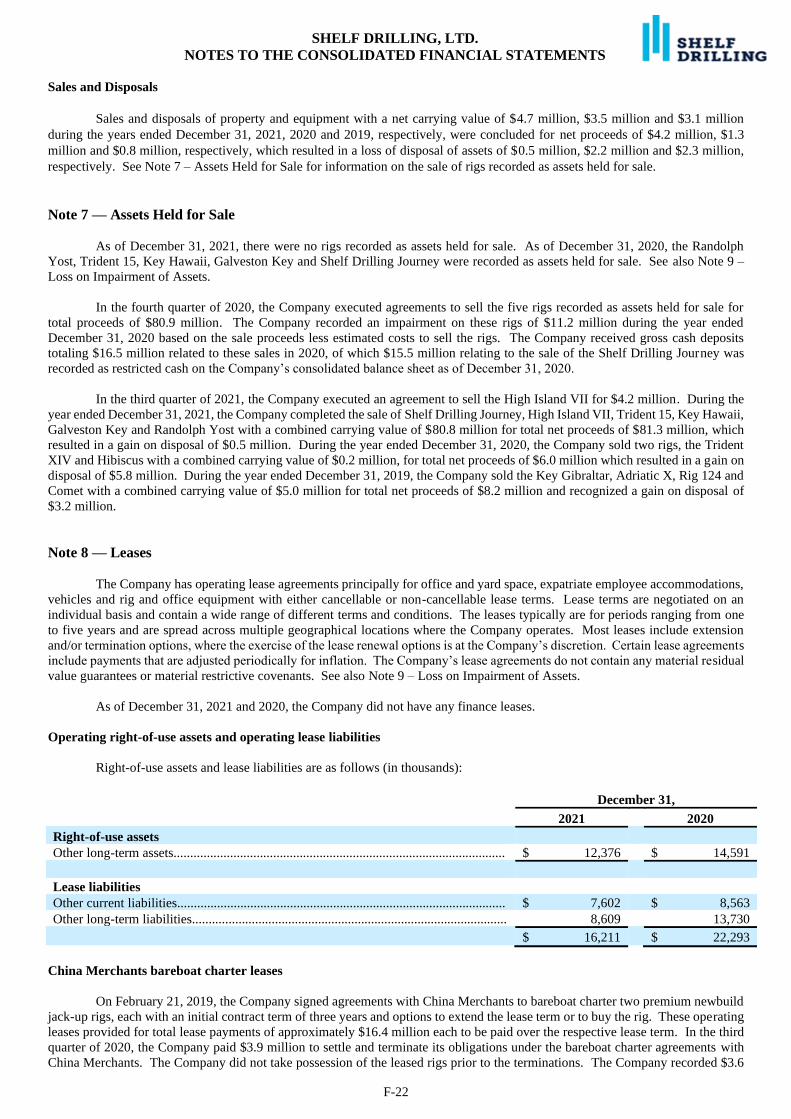
SHELF DRILLING, LTD.
NOTES TO THE CONSOLIDATED FINANCIAL STATEMENTS
F-22
Sales and Disposals
Sales and disposals of property and equipment with a net carrying value of $4.7 million, $3.5 million and $3.1 million
during the years ended December 31, 2021, 2020 and 2019, respectively, were concluded for net proceeds of $4.2 million, $1.3
million and $0.8 million, respectively, which resulted in a loss of disposal of assets of $0.5 million, $2.2 million and $2.3 million,
respectively. See Note 7 – Assets Held for Sale for information on the sale of rigs recorded as assets held for sale.
Note 7 — Assets Held for Sale
As of December 31, 2021, there were no rigs recorded as assets held for sale. As of December 31, 2020, the Randolph
Yost, Trident 15, Key Hawaii, Galveston Key and Shelf Drilling Journey were recorded as assets held for sale. See also Note 9 –
Loss on Impairment of Assets.
In the fourth quarter of 2020, the Company executed agreements to sell the five rigs recorded as assets held for sale for
total proceeds of $80.9 million. The Company recorded an impairment on these rigs of $11.2 million during the year ended
December 31, 2020 based on the sale proceeds less estimated costs to sell the rigs. The Company received gross cash deposits
totaling $16.5 million related to these sales in 2020, of which $15.5 million relating to the sale of the Shelf Drilling Journey was
recorded as restricted cash on the Company’s consolidated balance sheet as of December 31, 2020.
In the third quarter of 2021, the Company executed an agreement to sell the High Island VII for $4.2 million. During the
year ended December 31, 2021, the Company completed the sale of Shelf Drilling Journey, High Island VII, Trident 15, Key Hawaii,
Galveston Key and Randolph Yost with a combined carrying value of $80.8 million for total net proceeds of $81.3 million, which
resulted in a gain on disposal of $0.5 million. During the year ended December 31, 2020, the Company sold two rigs, the Trident
XIV and Hibiscus with a combined carrying value of $0.2 million, for total net proceeds of $6.0 million which resulted in a gain on
disposal of $5.8 million. During the year ended December 31, 2019, the Company sold the Key Gibraltar, Adriatic X, Rig 124 and
Comet with a combined carrying value of $5.0 million for total net proceeds of $8.2 million and recognized a gain on disposal of
$3.2 million.
Note 8 — Leases
The Company has operating lease agreements principally for office and yard space, expatriate employee accommodations,
vehicles and rig and office equipment with either cancellable or non-cancellable lease terms. Lease terms are negotiated on an
individual basis and contain a wide range of different terms and conditions. The leases typically are for periods ranging from one
to five years and are spread across multiple geographical locations where the Company operates. Most leases include extension
and/or termination options, where the exercise of the lease renewal options is at the Company’s discretion. Certain lease agreements
include payments that are adjusted periodically for inflation. The Company’s lease agreements do not contain any material residual
value guarantees or material restrictive covenants. See also Note 9 – Loss on Impairment of Assets.
As of December 31, 2021 and 2020, the Company did not have any finance leases.
Operating right-of-use assets and operating lease liabilities
Right-of-use assets and lease liabilities are as follows (in thousands):
December 31,
2021 2020
Right-of-use assets
Other long-term assets.................................................................................................... $ 12,376 $ 14,591
Lease liabilities
Other current liabilities................................................................................................... $ 7,602 $ 8,563
Other long-term liabilities............................................................................................... 8,609 13,730
$ 16,211 $ 22,293
China Merchants bareboat charter leases
On February 21, 2019, the Company signed agreements with China Merchants to bareboat charter two premium newbuild
jack-up rigs, each with an initial contract term of three years and options to extend the lease term or to buy the rig. These operating
leases provided for total lease payments of approximately $16.4 million each to be paid over the respective lease term. In the third
quarter of 2020, the Company paid $3.9 million to settle and terminate its obligations under the bareboat charter agreements with
China Merchants. The Company did not take possession of the leased rigs prior to the terminations. The Company recorded $3.6
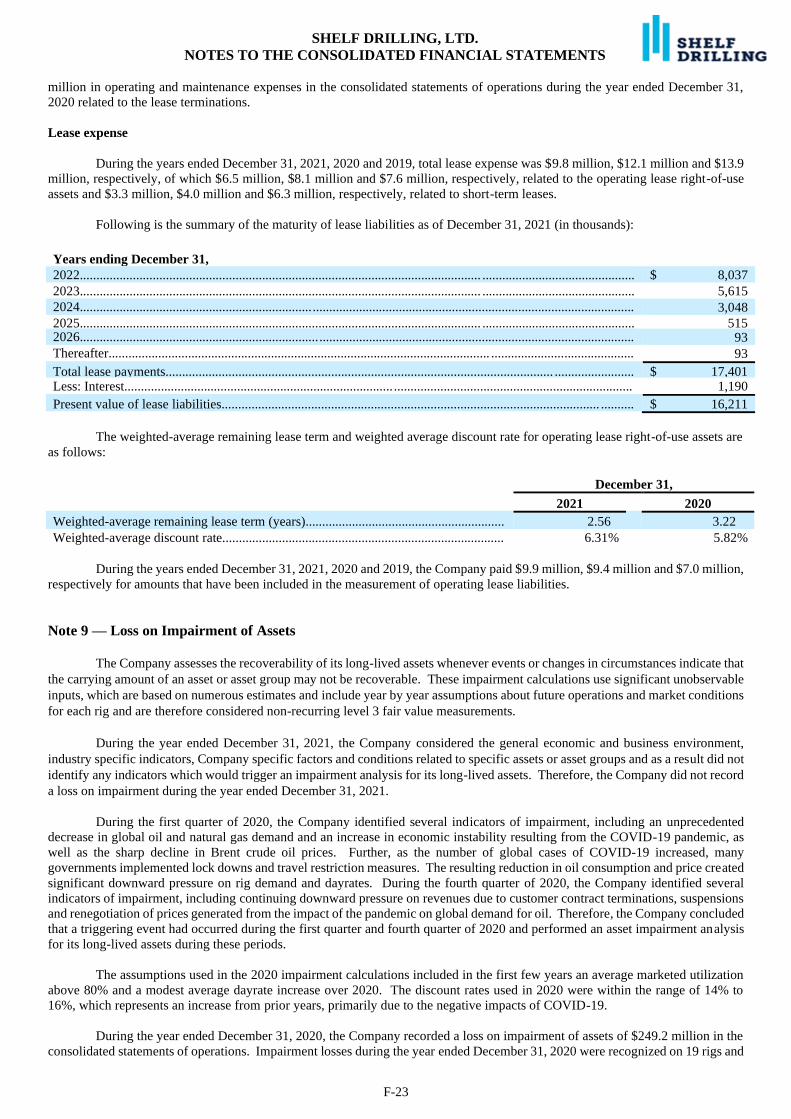
SHELF DRILLING, LTD.
NOTES TO THE CONSOLIDATED FINANCIAL STATEMENTS
F-23
million in operating and maintenance expenses in the consolidated statements of operations during the year ended December 31,
2020 related to the lease terminations.
Lease expense
During the years ended December 31, 2021, 2020 and 2019, total lease expense was $9.8 million, $12.1 million and $13.9
million, respectively, of which $6.5 million, $8.1 million and $7.6 million, respectively, related to the operating lease right-of-use
assets and $3.3 million, $4.0 million and $6.3 million, respectively, related to short-term leases.
Following is the summary of the maturity of lease liabilities as of December 31, 2021 (in thousands):
Years ending December 31,
2022......................................................................................................................... .............................................. $ 8,037
2023......................................................................................................................... .............................................. 5,615
2024.......................................................................................................................................................................
...... 3,048
2025......................................................................................................................... .............................................. 515 2026.......................................................................................................................................................................
...... 93
Thereafter................................................................................................................... ...........................................
....... 93
Total lease payments..................................................................................................................... ........................ $ 17,401 Less: Interest................................................................................. ........................................................................ 1,190
Present value of lease liabilities.................................................................................................................. .......... $ 16,211
The weighted-average remaining lease term and weighted average discount rate for operating lease right-of-use assets are
as follows:
December 31,
2021 2020
Weighted-average remaining lease term (years)............................................................ 2.56 3.22
Weighted-average discount rate..................................................................................... 6.31% 5.82%
During the years ended December 31, 2021, 2020 and 2019, the Company paid $9.9 million, $9.4 million and $7.0 million,
respectively for amounts that have been included in the measurement of operating lease liabilities.
Note 9 — Loss on Impairment of Assets
The Company assesses the recoverability of its long-lived assets whenever events or changes in circumstances indicate that
the carrying amount of an asset or asset group may not be recoverable. These impairment calculations use significant unobservable
inputs, which are based on numerous estimates and include year by year assumptions about future operations and market conditions
for each rig and are therefore considered non-recurring level 3 fair value measurements.
During the year ended December 31, 2021, the Company considered the general economic and business environment,
industry specific indicators, Company specific factors and conditions related to specific assets or asset groups and as a result did not
identify any indicators which would trigger an impairment analysis for its long-lived assets. Therefore, the Company did not record
a loss on impairment during the year ended December 31, 2021.
During the first quarter of 2020, the Company identified several indicators of impairment, including an unprecedented
decrease in global oil and natural gas demand and an increase in economic instability resulting from the COVID-19 pandemic, as
well as the sharp decline in Brent crude oil prices. Further, as the number of global cases of COVID-19 increased, many
governments implemented lock downs and travel restriction measures. The resulting reduction in oil consumption and price created
significant downward pressure on rig demand and dayrates. During the fourth quarter of 2020, the Company identified several
indicators of impairment, including continuing downward pressure on revenues due to customer contract terminations, suspensions
and renegotiation of prices generated from the impact of the pandemic on global demand for oil. Therefore, the Company concluded
that a triggering event had occurred during the first quarter and fourth quarter of 2020 and performed an asset impairment analysis
for its long-lived assets during these periods.
The assumptions used in the 2020 impairment calculations included in the first few years an average marketed utilization
above 80% and a modest average dayrate increase over 2020. The discount rates used in 2020 were within the range of 14% to
16%, which represents an increase from prior years, primarily due to the negative impacts of COVID-19.
During the year ended December 31, 2020, the Company recorded a loss on impairment of assets of $249.2 million in the
consolidated statements of operations. Impairment losses during the year ended December 31, 2020 were recognized on 19 rigs and
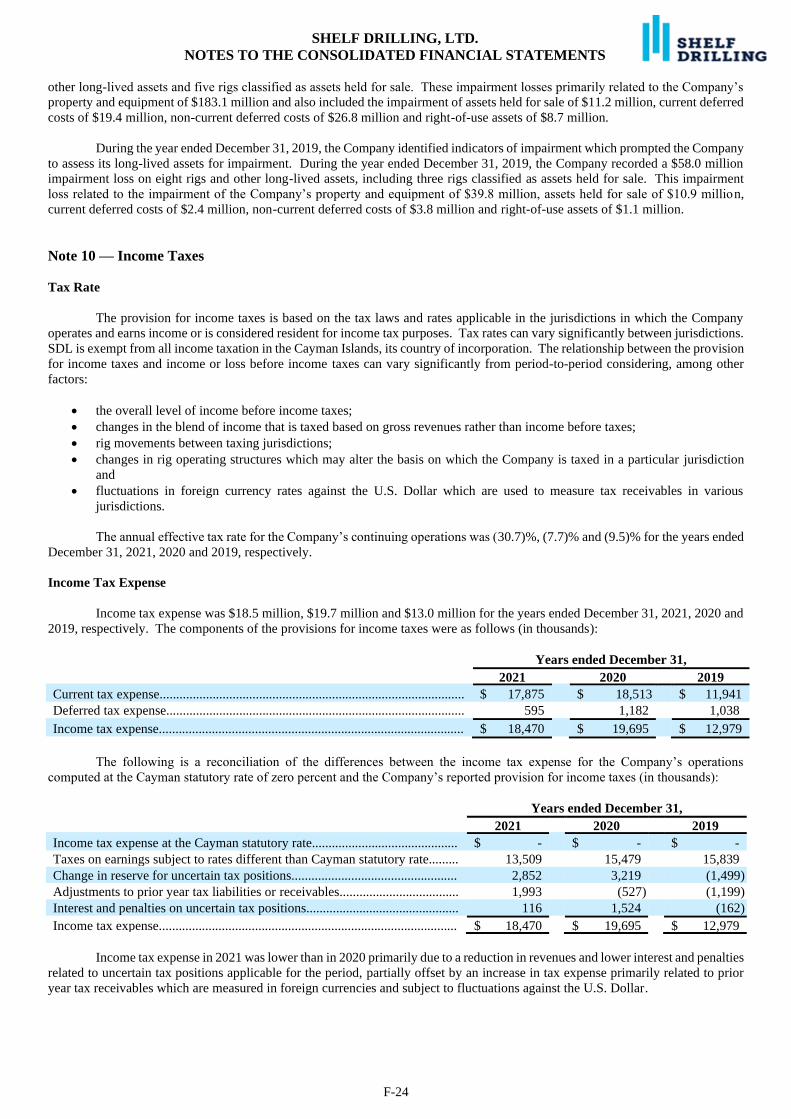
SHELF DRILLING, LTD.
NOTES TO THE CONSOLIDATED FINANCIAL STATEMENTS
F-24
other long-lived assets and five rigs classified as assets held for sale. These impairment losses primarily related to the Company’s
property and equipment of $183.1 million and also included the impairment of assets held for sale of $11.2 million, current deferred
costs of $19.4 million, non-current deferred costs of $26.8 million and right-of-use assets of $8.7 million.
During the year ended December 31, 2019, the Company identified indicators of impairment which prompted the Company
to assess its long-lived assets for impairment. During the year ended December 31, 2019, the Company recorded a $58.0 million
impairment loss on eight rigs and other long-lived assets, including three rigs classified as assets held for sale. This impairment
loss related to the impairment of the Company’s property and equipment of $39.8 million, assets held for sale of $10.9 million,
current deferred costs of $2.4 million, non-current deferred costs of $3.8 million and right-of-use assets of $1.1 million.
Note 10 — Income Taxes
Tax Rate
The provision for income taxes is based on the tax laws and rates applicable in the jurisdictions in which the Company
operates and earns income or is considered resident for income tax purposes. Tax rates can vary significantly between jurisdictions.
SDL is exempt from all income taxation in the Cayman Islands, its country of incorporation. The relationship between the provision
for income taxes and income or loss before income taxes can vary significantly from period-to-period considering, among other
factors:
• the overall level of income before income taxes;
• changes in the blend of income that is taxed based on gross revenues rather than income before taxes;
• rig movements between taxing jurisdictions;
• changes in rig operating structures which may alter the basis on which the Company is taxed in a particular jurisdiction
and
• fluctuations in foreign currency rates against the U.S. Dollar which are used to measure tax receivables in various
jurisdictions.
The annual effective tax rate for the Company’s continuing operations was (30.7)%, (7.7)% and (9.5)% for the years ended
December 31, 2021, 2020 and 2019, respectively.
Income Tax Expense
Income tax expense was $18.5 million, $19.7 million and $13.0 million for the years ended December 31, 2021, 2020 and
2019, respectively. The components of the provisions for income taxes were as follows (in thousands):
Years ended December 31,
2021 2020 2019
Current tax expense............................................................................................ $ 17,875 $ 18,513 $ 11,941
Deferred tax expense.......................................................................................... 595 1,182 1,038
Income tax expense............................................................................................ $ 18,470 $ 19,695 $ 12,979
The following is a reconciliation of the differences between the income tax expense for the Company’s operations
computed at the Cayman statutory rate of zero percent and the Company’s reported provision for income taxes (in thousands):
Years ended December 31,
2021 2020 2019
Income tax expense at the Cayman statutory rate............................................ $ - $ - $ -
Taxes on earnings subject to rates different than Cayman statutory rate......... 13,509 15,479 15,839
Change in reserve for uncertain tax positions.................................................. 2,852 3,219 (1,499)
Adjustments to prior year tax liabilities or receivables.................................... 1,993 (527) (1,199)
Interest and penalties on uncertain tax positions.............................................. 116 1,524 (162)
Income tax expense.......................................................................................... $ 18,470 $ 19,695 $ 12,979
Income tax expense in 2021 was lower than in 2020 primarily due to a reduction in revenues and lower interest and penalties
related to uncertain tax positions applicable for the period, partially offset by an increase in tax expense primarily related to prior
year tax receivables which are measured in foreign currencies and subject to fluctuations against the U.S. Dollar.
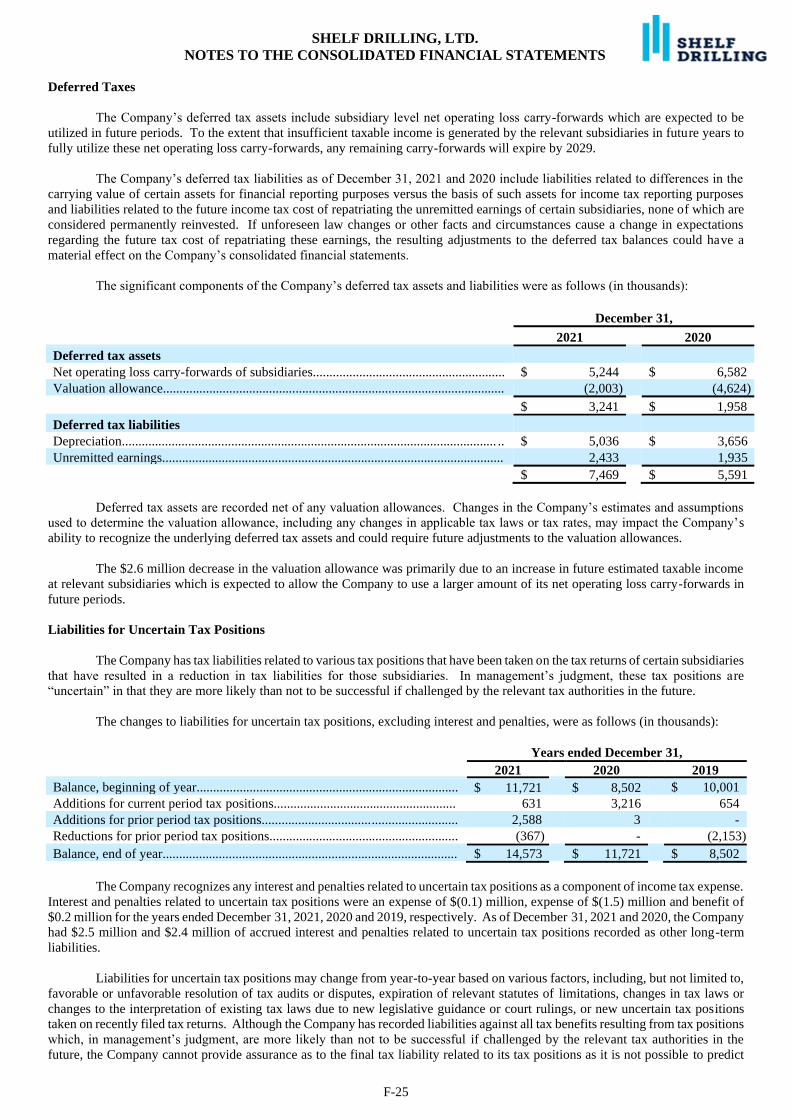
SHELF DRILLING, LTD.
NOTES TO THE CONSOLIDATED FINANCIAL STATEMENTS
F-25
Deferred Taxes
The Company’s deferred tax assets include subsidiary level net operating loss carry-forwards which are expected to be
utilized in future periods. To the extent that insufficient taxable income is generated by the relevant subsidiaries in future years to
fully utilize these net operating loss carry-forwards, any remaining carry-forwards will expire by 2029.
The Company’s deferred tax liabilities as of December 31, 2021 and 2020 include liabilities related to differences in the
carrying value of certain assets for financial reporting purposes versus the basis of such assets for income tax reporting purposes
and liabilities related to the future income tax cost of repatriating the unremitted earnings of certain subsidiaries, none of which are
considered permanently reinvested. If unforeseen law changes or other facts and circumstances cause a change in expectations
regarding the future tax cost of repatriating these earnings, the resulting adjustments to the deferred tax balances could have a
material effect on the Company’s consolidated financial statements.
The significant components of the Company’s deferred tax assets and liabilities were as follows (in thousands):
December 31,
2021 2020
Deferred tax assets
Net operating loss carry-forwards of subsidiaries.......................................................... $ 5,244 $ 6,582
Valuation allowance....................................................................................................... (2,003) (4,624)
$ 3,241 $ 1,958
Deferred tax liabilities
Depreciation................................................................................................................. .. $ 5,036 $ 3,656
Unremitted earnings....................................................................................................... 2,433 1,935
$ 7,469 $ 5,591
Deferred tax assets are recorded net of any valuation allowances. Changes in the Company’s estimates and assumptions
used to determine the valuation allowance, including any changes in applicable tax laws or tax rates, may impact the Company’s
ability to recognize the underlying deferred tax assets and could require future adjustments to the valuation allowances.
The $2.6 million decrease in the valuation allowance was primarily due to an increase in future estimated taxable income
at relevant subsidiaries which is expected to allow the Company to use a larger amount of its net operating loss carry-forwards in
future periods.
Liabilities for Uncertain Tax Positions
The Company has tax liabilities related to various tax positions that have been taken on the tax returns of certain subsidiaries
that have resulted in a reduction in tax liabilities for those subsidiaries. In management’s judgment, these tax positions are
“uncertain” in that they are more likely than not to be successful if challenged by the relevant tax authorities in the future.
The changes to liabilities for uncertain tax positions, excluding interest and penalties, were as follows (in thousands):
Years ended December 31,
2021 2020 2019
Balance, beginning of year............................................................................... $ 11,721 $ 8,502 $ 10,001
Additions for current period tax positions....................................................... 631 3,216 654
Additions for prior period tax positions........................................................... 2,588 3 -
Reductions for prior period tax positions......................................................... (367) - (2,153)
Balance, end of year......................................................................................... $ 14,573 $ 11,721 $ 8,502
The Company recognizes any interest and penalties related to uncertain tax positions as a component of income tax expense.
Interest and penalties related to uncertain tax positions were an expense of $(0.1) million, expense of $(1.5) million and benefit of
$0.2 million for the years ended December 31, 2021, 2020 and 2019, respectively. As of December 31, 2021 and 2020, the Company
had $2.5 million and $2.4 million of accrued interest and penalties related to uncertain tax positions recorded as other long-term
liabilities.
Liabilities for uncertain tax positions may change from year-to-year based on various factors, including, but not limited to,
favorable or unfavorable resolution of tax audits or disputes, expiration of relevant statutes of limitations, changes in tax laws or
changes to the interpretation of existing tax laws due to new legislative guidance or court rulings, or new uncertain tax positions
taken on recently filed tax returns. Although the Company has recorded liabilities against all tax benefits resulting from tax positions
which, in management’s judgment, are more likely than not to be successful if challenged by the relevant tax authorities in the
future, the Company cannot provide assurance as to the final tax liability related to its tax positions as it is not possible to predict
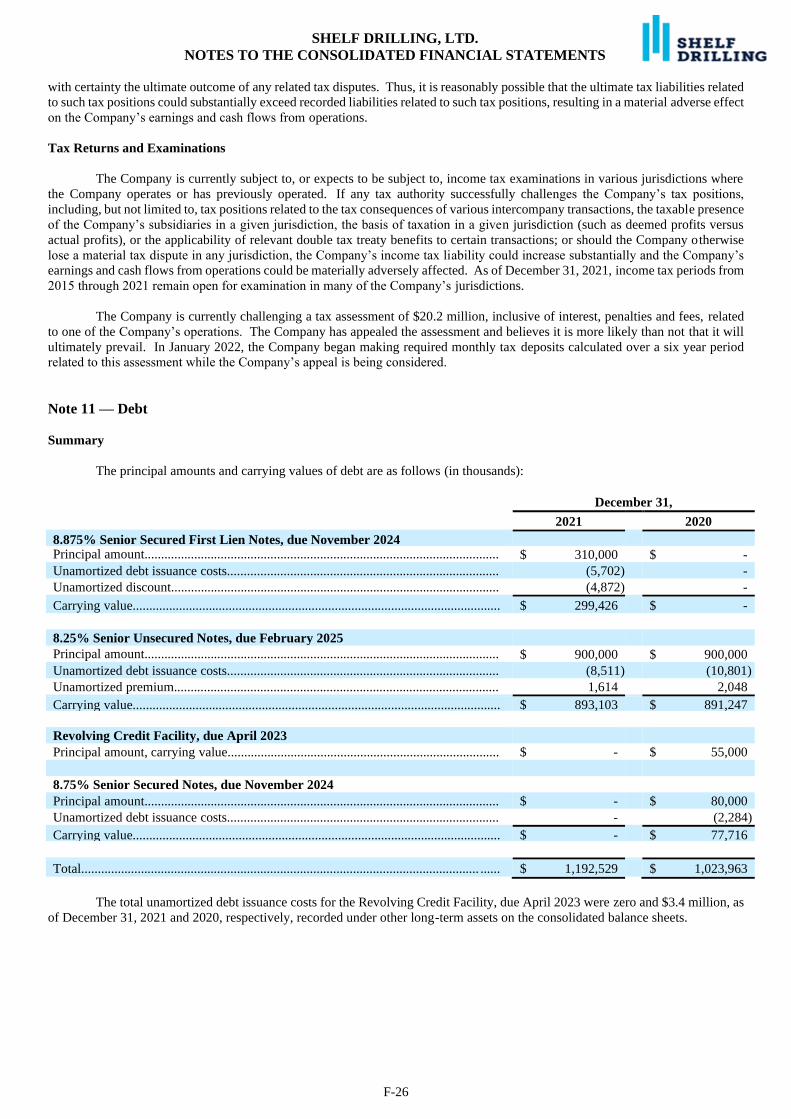
SHELF DRILLING, LTD.
NOTES TO THE CONSOLIDATED FINANCIAL STATEMENTS
F-26
with certainty the ultimate outcome of any related tax disputes. Thus, it is reasonably possible that the ultimate tax liabilities related
to such tax positions could substantially exceed recorded liabilities related to such tax positions, resulting in a material adverse effect
on the Company’s earnings and cash flows from operations.
Tax Returns and Examinations
The Company is currently subject to, or expects to be subject to, income tax examinations in various jurisdictions where
the Company operates or has previously operated. If any tax authority successfully challenges the Company’s tax positions,
including, but not limited to, tax positions related to the tax consequences of various intercompany transactions, the taxable presence
of the Company’s subsidiaries in a given jurisdiction, the basis of taxation in a given jurisdiction (such as deemed profits versus
actual profits), or the applicability of relevant double tax treaty benefits to certain transactions; or should the Company otherwise
lose a material tax dispute in any jurisdiction, the Company’s income tax liability could increase substantially and the Company’s
earnings and cash flows from operations could be materially adversely affected. As of December 31, 2021, income tax periods from
2015 through 2021 remain open for examination in many of the Company’s jurisdictions.
The Company is currently challenging a tax assessment of $20.2 million, inclusive of interest, penalties and fees, related
to one of the Company’s operations. The Company has appealed the assessment and believes it is more likely than not that it will
ultimately prevail. In January 2022, the Company began making required monthly tax deposits calculated over a six year period
related to this assessment while the Company’s appeal is being considered.
Note 11 — Debt
Summary
The principal amounts and carrying values of debt are as follows (in thousands):
December 31,
2021 2020
8.875% Senior Secured First Lien Notes, due November 2024 Principal amount...........................................................................................................
.................................................. $ 310,000 $ -
Unamortized debt issuance costs.................................................................................. (5,702) -
Unamortized discount................................................................................................... (4,872) -
Carrying value............................................................................................................... $ 299,426 $ -
8.25% Senior Unsecured Notes, due February 2025
Principal amount...........................................................................................................
.................................................. $ 900,000 $ 900,000
Unamortized debt issuance costs.................................................................................. (8,511) (10,801)
Unamortized premium.................................................................................................. 1,614 2,048
Carrying value............................................................................................................... $ 893,103 $ 891,247
Revolving Credit Facility, due April 2023
Principal amount, carrying value.................................................................................. $ - $ 55,000
8.75% Senior Secured Notes, due November 2024
Principal amount........................................................................................................... $ - $ 80,000
Unamortized debt issuance costs.................................................................................. - (2,284)
Carrying value............................................................................................................... $ - $ 77,716
Total........................................................................................................................ ...... $ 1,192,529 $ 1,023,963
The total unamortized debt issuance costs for the Revolving Credit Facility, due April 2023 were zero and $3.4 million, as
of December 31, 2021 and 2020, respectively, recorded under other long-term assets on the consolidated balance sheets.
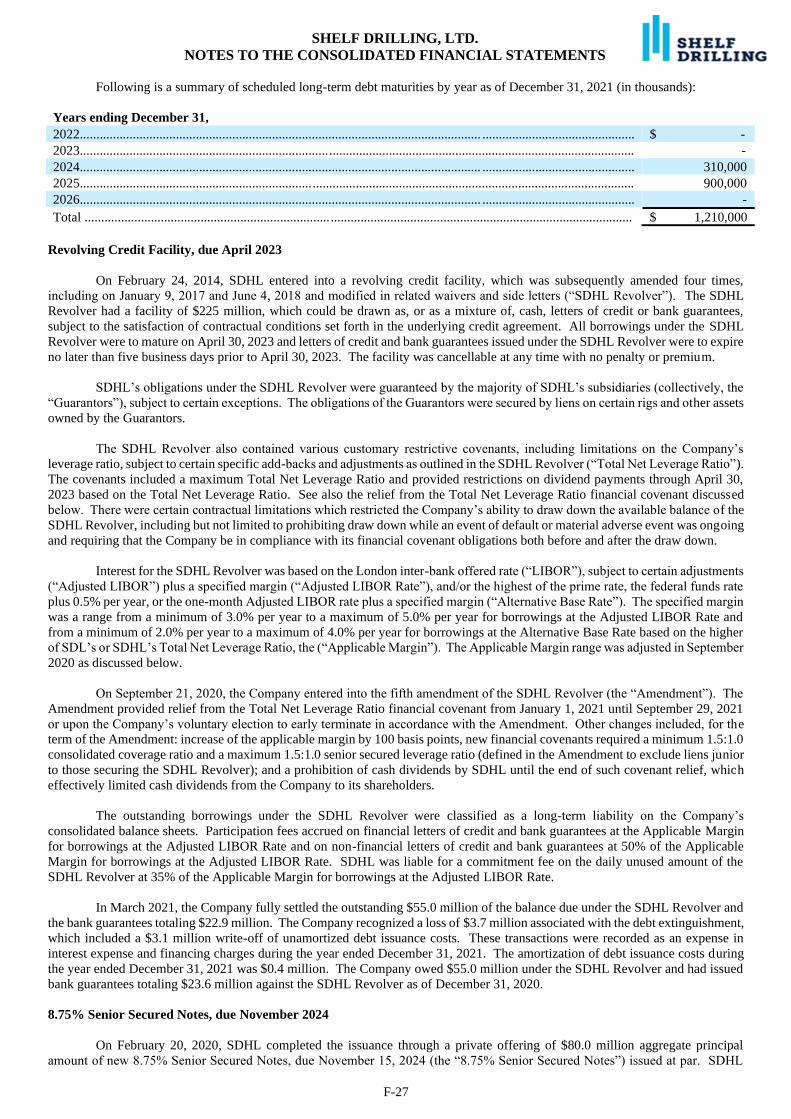
SHELF DRILLING, LTD.
NOTES TO THE CONSOLIDATED FINANCIAL STATEMENTS
F-27
Following is a summary of scheduled long-term debt maturities by year as of December 31, 2021 (in thousands):
Years ending December 31,
2022......................................................................................................................... .............................................. $ -
2023....................................................................................................................................................................... -
2024......................................................................................................................... .............................................. 310,000
2025....................................................................................................................................................................... 900,000
2026......................................................................................................................... .............................................. -
Total ..................................................................................................................................................................... $ 1,210,000
Revolving Credit Facility, due April 2023
On February 24, 2014, SDHL entered into a revolving credit facility, which was subsequently amended four times,
including on January 9, 2017 and June 4, 2018 and modified in related waivers and side letters (“SDHL Revolver”). The SDHL
Revolver had a facility of $225 million, which could be drawn as, or as a mixture of, cash, letters of credit or bank guarantees,
subject to the satisfaction of contractual conditions set forth in the underlying credit agreement. All borrowings under the SDHL
Revolver were to mature on April 30, 2023 and letters of credit and bank guarantees issued under the SDHL Revolver were to expire
no later than five business days prior to April 30, 2023. The facility was cancellable at any time with no penalty or premium.
SDHL’s obligations under the SDHL Revolver were guaranteed by the majority of SDHL’s subsidiaries (collectively, the
“Guarantors”), subject to certain exceptions. The obligations of the Guarantors were secured by liens on certain rigs and other assets
owned by the Guarantors.
The SDHL Revolver also contained various customary restrictive covenants, including limitations on the Company’s
leverage ratio, subject to certain specific add-backs and adjustments as outlined in the SDHL Revolver (“Total Net Leverage Ratio”).
The covenants included a maximum Total Net Leverage Ratio and provided restrictions on dividend payments through April 30,
2023 based on the Total Net Leverage Ratio. See also the relief from the Total Net Leverage Ratio financial covenant discussed
below. There were certain contractual limitations which restricted the Company’s ability to draw down the available balance of the
SDHL Revolver, including but not limited to prohibiting draw down while an event of default or material adverse event was ongoing
and requiring that the Company be in compliance with its financial covenant obligations both before and after the draw down.
Interest for the SDHL Revolver was based on the London inter-bank offered rate (“LIBOR”), subject to certain adjustments
(“Adjusted LIBOR”) plus a specified margin (“Adjusted LIBOR Rate”), and/or the highest of the prime rate, the federal funds rate
plus 0.5% per year, or the one-month Adjusted LIBOR rate plus a specified margin (“Alternative Base Rate”). The specified margin
was a range from a minimum of 3.0% per year to a maximum of 5.0% per year for borrowings at the Adjusted LIBOR Rate and
from a minimum of 2.0% per year to a maximum of 4.0% per year for borrowings at the Alternative Base Rate based on the higher
of SDL’s or SDHL’s Total Net Leverage Ratio, the (“Applicable Margin”). The Applicable Margin range was adjusted in September
2020 as discussed below.
On September 21, 2020, the Company entered into the fifth amendment of the SDHL Revolver (the “Amendment”). The
Amendment provided relief from the Total Net Leverage Ratio financial covenant from January 1, 2021 until September 29, 2021
or upon the Company’s voluntary election to early terminate in accordance with the Amendment. Other changes included, for the
term of the Amendment: increase of the applicable margin by 100 basis points, new financial covenants required a minimum 1.5:1.0
consolidated coverage ratio and a maximum 1.5:1.0 senior secured leverage ratio (defined in the Amendment to exclude liens junior
to those securing the SDHL Revolver); and a prohibition of cash dividends by SDHL until the end of such covenant relief, which
effectively limited cash dividends from the Company to its shareholders.
The outstanding borrowings under the SDHL Revolver were classified as a long-term liability on the Company’s
consolidated balance sheets. Participation fees accrued on financial letters of credit and bank guarantees at the Applicable Margin
for borrowings at the Adjusted LIBOR Rate and on non-financial letters of credit and bank guarantees at 50% of the Applicable
Margin for borrowings at the Adjusted LIBOR Rate. SDHL was liable for a commitment fee on the daily unused amount of the
SDHL Revolver at 35% of the Applicable Margin for borrowings at the Adjusted LIBOR Rate.
In March 2021, the Company fully settled the outstanding $55.0 million of the balance due under the SDHL Revolver and
the bank guarantees totaling $22.9 million. The Company recognized a loss of $3.7 million associated with the debt extinguishment,
which included a $3.1 million write-off of unamortized debt issuance costs. These transactions were recorded as an expense in
interest expense and financing charges during the year ended December 31, 2021. The amortization of debt issuance costs during
the year ended December 31, 2021 was $0.4 million. The Company owed $55.0 million under the SDHL Revolver and had issued
bank guarantees totaling $23.6 million against the SDHL Revolver as of December 31, 2020.
8.75% Senior Secured Notes, due November 2024
On February 20, 2020, SDHL completed the issuance through a private offering of $80.0 million aggregate principal
amount of new 8.75% Senior Secured Notes, due November 15, 2024 (the “8.75% Senior Secured Notes”) issued at par. SDHL
SHELF DRILLING, LTD.
NOTES TO THE CONSOLIDATED FINANCIAL STATEMENTS
F-28
received proceeds of $80.0 million, less $2.7 million of fees and expenses, which were recorded as debt issuance costs and were
being amortized over the life of the debt. The Company used the proceeds to replenish its liquidity following the acquisition of the
Shelf Drilling Enterprise in January 2020 and to finance the reactivation and upgrade costs associated with the deployment of the
rig in advance of its contract commencement in January 2021 in the Gulf of Thailand.
SDHL’s obligations under the 8.75% Senior Secured Notes were guaranteed by the majority of SDHL’s subsidiaries
(collectively, the “SSN Guarantors”), subject to certain exceptions. The obligations of SDHL and the SSN Guarantors were secured
by second lien security interest on certain rigs and other assets owned by the SSN Guarantors.
Interest on the 8.75% Senior Secured Notes accrued from February 20, 2020 at a rate of 8.75% and was payable
semiannually in arrears on May 15 and November 15 of each year. The effective interest rate on the 8.75% Senior Secured Notes
was 9.65%.
At any time prior to August 20, 2021, SDHL was entitled to redeem the notes, in whole or in part at a price equal to 100%
of the principal amount plus accrued and unpaid interest and a premium of at least 1%, to be calculated based on the present value
of the debt.
If SDHL experienced a change of control, as defined in the indenture governing the 8.75% Senior Secured Notes, it was
obligated to offer to repurchase the 8.75% Senior Secured Notes at an offer price in cash equal to 101% of their principal amount,
plus accrued and unpaid interest.
In March 2021, the Company fully settled the $80.0 million of 8.75% Senior Secured Notes. The Company recognized a
loss of $6.4 million associated with this debt extinguishment, which included a $4.2 million call premium and a $2.1 million write-
off of unamortized debt issuance costs. These transactions were recorded as an expense in interest expense and financing charges
during the year ended December 31, 2021. The total amortization of debt issuance costs during the year ended December 31, 2021
was $0.1 million.
8.875% Senior Secured First Lien Notes, due November 2024
On March 26, 2021, SDHL completed the issuance through a private offering of $310.0 million aggregate principal amount
of new 8.875% Senior Secured First Lien Notes, due November 15, 2024 (the “8.875% Notes”) issued at 98.082% for total gross
proceeds of $304.1 million, including a $5.9 million discount. SDHL recorded $7.0 million of fees and expenses as debt issuance
costs, which are being amortized over the life of the debt. The resulting $297.1 million net proceeds were used to repay and terminate
the SDHL Revolver, cash collateralize bank guarantees issued under the SDHL Revolver, redeem and repurchase all of the
outstanding 8.75% Senior Secured Notes and for general corporate purposes.
The obligations under the 8.875% Notes are guaranteed by SDL and the majority of the Company’s subsidiaries that
guarantee the obligations under the 8.25% Senior Unsecured Notes and are secured by a first-priority lien on substantially all of the
assets of the Company and the subsidiary guarantors.
Interest on the 8.875% Notes accrues from March 26, 2021 at a rate of 8.875% and is payable semi-annually in arrears
beginning on November 15, 2021 and on May 15 and November 15 of each year thereafter. The effective interest rate on the 8.875%
Notes is 10.28%.
At any time prior to March 15, 2022, SDHL is entitled to redeem the notes, in whole or in part at a price equal to 100% of
the principal amount plus accrued and unpaid interest and a “make-whole” premium. On or after March 15, 2022, SDHL may
redeem the 8.875% Notes, in whole or part, at the redemption prices set forth below, together with accrued and unpaid interest up
to but not including the redemption date.
Period
Redemption
Price
Between March 15, 2022 and March 15, 2023…….......................................................................................... 106.656%
Between March 15, 2023 and September 15, 2023…….................................................................................... 103.328%
On or after September 15, 2023…...................................................................................................................... 100.000%
In addition, at any time prior to March 15, 2022, the Company will be entitled at its option on one or more occasions to
redeem the 8.875% Notes, from the net cash proceeds of one or more qualified equity offerings, in an amount not to exceed 35% of
the aggregate principal amount at a redemption price of 108.875% plus accrued and unpaid interest. If a change in control occurs,
as per the terms of the 8.875% Notes, the Company must offer to repurchase the outstanding 8.875% Notes at a price equal to 101%
plus any accrued and unpaid interest.
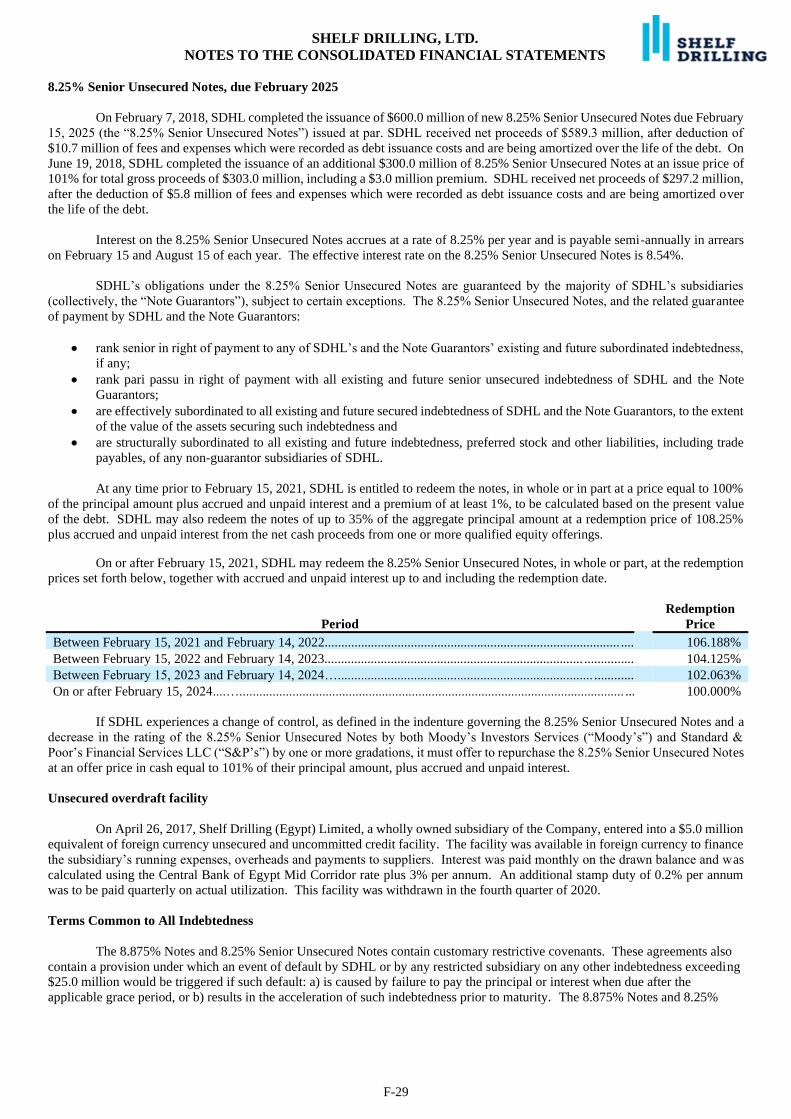
SHELF DRILLING, LTD.
NOTES TO THE CONSOLIDATED FINANCIAL STATEMENTS
F-29
8.25% Senior Unsecured Notes, due February 2025
On February 7, 2018, SDHL completed the issuance of $600.0 million of new 8.25% Senior Unsecured Notes due February
15, 2025 (the “8.25% Senior Unsecured Notes”) issued at par. SDHL received net proceeds of $589.3 million, after deduction of
$10.7 million of fees and expenses which were recorded as debt issuance costs and are being amortized over the life of the debt. On
June 19, 2018, SDHL completed the issuance of an additional $300.0 million of 8.25% Senior Unsecured Notes at an issue price of
101% for total gross proceeds of $303.0 million, including a $3.0 million premium. SDHL received net proceeds of $297.2 million,
after the deduction of $5.8 million of fees and expenses which were recorded as debt issuance costs and are being amortized over
the life of the debt.
Interest on the 8.25% Senior Unsecured Notes accrues at a rate of 8.25% per year and is payable semi-annually in arrears
on February 15 and August 15 of each year. The effective interest rate on the 8.25% Senior Unsecured Notes is 8.54%.
SDHL’s obligations under the 8.25% Senior Unsecured Notes are guaranteed by the majority of SDHL’s subsidiaries
(collectively, the “Note Guarantors”), subject to certain exceptions. The 8.25% Senior Unsecured Notes, and the related guarantee
of payment by SDHL and the Note Guarantors:
• rank senior in right of payment to any of SDHL’s and the Note Guarantors’ existing and future subordinated indebtedness,
if any;
• rank pari passu in right of payment with all existing and future senior unsecured indebtedness of SDHL and the Note
Guarantors;
• are effectively subordinated to all existing and future secured indebtedness of SDHL and the Note Guarantors, to the extent
of the value of the assets securing such indebtedness and
• are structurally subordinated to all existing and future indebtedness, preferred stock and other liabilities, including trade
payables, of any non-guarantor subsidiaries of SDHL.
At any time prior to February 15, 2021, SDHL is entitled to redeem the notes, in whole or in part at a price equal to 100%
of the principal amount plus accrued and unpaid interest and a premium of at least 1%, to be calculated based on the present value
of the debt. SDHL may also redeem the notes of up to 35% of the aggregate principal amount at a redemption price of 108.25%
plus accrued and unpaid interest from the net cash proceeds from one or more qualified equity offerings.
On or after February 15, 2021, SDHL may redeem the 8.25% Senior Unsecured Notes, in whole or part, at the redemption
prices set forth below, together with accrued and unpaid interest up to and including the redemption date.
Period
Redemption
Price
Between February 15, 2021 and February 14, 2022......................................................................................... .... 106.188%
Between February 15, 2022 and February 14, 2023.............................................................................. ............... 104.125%
Between February 15, 2023 and February 14, 2024…............................................................................. ............ 102.063%
On or after February 15, 2024....….................................................................................................................... ... 100.000%
If SDHL experiences a change of control, as defined in the indenture governing the 8.25% Senior Unsecured Notes and a
decrease in the rating of the 8.25% Senior Unsecured Notes by both Moody’s Investors Services (“Moody’s”) and Standard &
Poor’s Financial Services LLC (“S&P’s”) by one or more gradations, it must offer to repurchase the 8.25% Senior Unsecured Notes
at an offer price in cash equal to 101% of their principal amount, plus accrued and unpaid interest.
Unsecured overdraft facility
On April 26, 2017, Shelf Drilling (Egypt) Limited, a wholly owned subsidiary of the Company, entered into a $5.0 million
equivalent of foreign currency unsecured and uncommitted credit facility. The facility was available in foreign currency to finance
the subsidiary’s running expenses, overheads and payments to suppliers. Interest was paid monthly on the drawn balance and was
calculated using the Central Bank of Egypt Mid Corridor rate plus 3% per annum. An additional stamp duty of 0.2% per annum
was to be paid quarterly on actual utilization. This facility was withdrawn in the fourth quarter of 2020.
Terms Common to All Indebtedness
The 8.875% Notes and 8.25% Senior Unsecured Notes contain customary restrictive covenants. These agreements also
contain a provision under which an event of default by SDHL or by any restricted subsidiary on any other indebtedness exceeding
$25.0 million would be triggered if such default: a) is caused by failure to pay the principal or interest when due after the
applicable grace period, or b) results in the acceleration of such indebtedness prior to maturity. The 8.875% Notes and 8.25%
SHELF DRILLING, LTD.
NOTES TO THE CONSOLIDATED FINANCIAL STATEMENTS
F-30
Senior Unsecured Notes contain covenants that, among other things, limit SDHL’s ability and the ability of their restricted
subsidiaries to:
• Incur or guarantee additional indebtedness or issue certain preferred shares;
• Pay dividends or make other distributions on, or redeem or repurchase, any equity interests;
• Make other restricted payments;
• Make certain acquisitions or investments;
• Create or incur liens;
• Transfer or sell assets;
• Incur restrictions on the payments of dividends or other distributions from restricted subsidiaries;
• Enter into transactions with affiliates and
• Consummate a merger or consolidation or sell, assign, transfer, lease or otherwise dispose of all or substantially all
of the Company’s assets or certain subsidiaries’ assets.
The 8.875% Notes and 8.25% Senior Unsecured Notes also contain standard events of default. The Company was in
compliance with all covenants of its debt agreements as of December 31, 2021 and 2020.
Interest Expense
Interest expense, including the amortization of debt issuance costs, discounts and premiums, was $102.3 million, $87.0
million and $77.5 million for the years ended December 31, 2021, 2020 and 2019, respectively.
Note 12 — Employee Benefit Plans
Overview
The Company sponsors various employee benefit programs, including retention plans, defined contribution plans, end of
service plans and defined benefit plans. These plans are governed by statutory laws, union agreements and/or Company policy, as
appropriate. Eligibility under these plans may vary based on jurisdiction, years of service or other factors, as outlined in the
respective plans or Company policies. Cash payments are made by the Company immediately for certain matching contribution
programs, when a triggering event occurs, such as meeting of the vesting period for a retention plan, or after the departure of an
employee for certain postemployment benefit programs.
Shore-Based Retention Plans
The Company recorded $7.3 million, $3.7 million and $2.7 million expense for shore-based retention plans for the years
ended December 31, 2021, 2020 and 2019, respectively. Total cash payments under these retention plans are expected to be $4.6
million during 2022. The Company recorded obligations of $2.9 million and $1.4 million in other current liabilities and other long-
term liabilities, respectively, and assets for retention plans paid in advance of $2.9 million and $4.3 million in other current assets
and other long-term assets, respectively, on the consolidated balance sheet as of December 31, 2021. The Company recorded
obligations for these plans of $1.6 million and $0.9 million in other current liabilities and other long-term liabilities, respectively,
on the consolidated balance sheet as of December 31, 2020.
In November 2020, the Company granted a retention plan with payments in 2021 and 2022, calculated based on the fair
value of the Company’s common stock over a defined time period and linked to certain share-based compensation awards granted
in 2019 and 2020. This retention plan had a maximum cash payout of $4.5 million. In August 2021, the Company amended this
retention plan after the cancellation of the associated share-based compensation awards. The amended plan has fixed cash payments
totaling $3.8 million, of which $1.9 million was paid during the year ended December 31, 2021. See Note 17 – Share-based
Compensation for additional discussion of the Company’s share-based compensation plans.
In May 2021, the Company granted a new cash retention bonus plan for certain employees for a total of $9.0 million, which
is expensed over the vesting period through June 30, 2024. The total amount of $9.0 million was paid during the year ended
December 31, 2021. The plan has a repayment provision, which requires employees to repay the retention amount if employment
is not maintained through the end of the vesting period, with certain exceptions.
Defined Contribution Plans
The Company recorded $6.5 million, $7.5 million and $8.6 million expense for defined contribution plans for the years
ended December 31, 2021, 2020 and 2019, respectively.
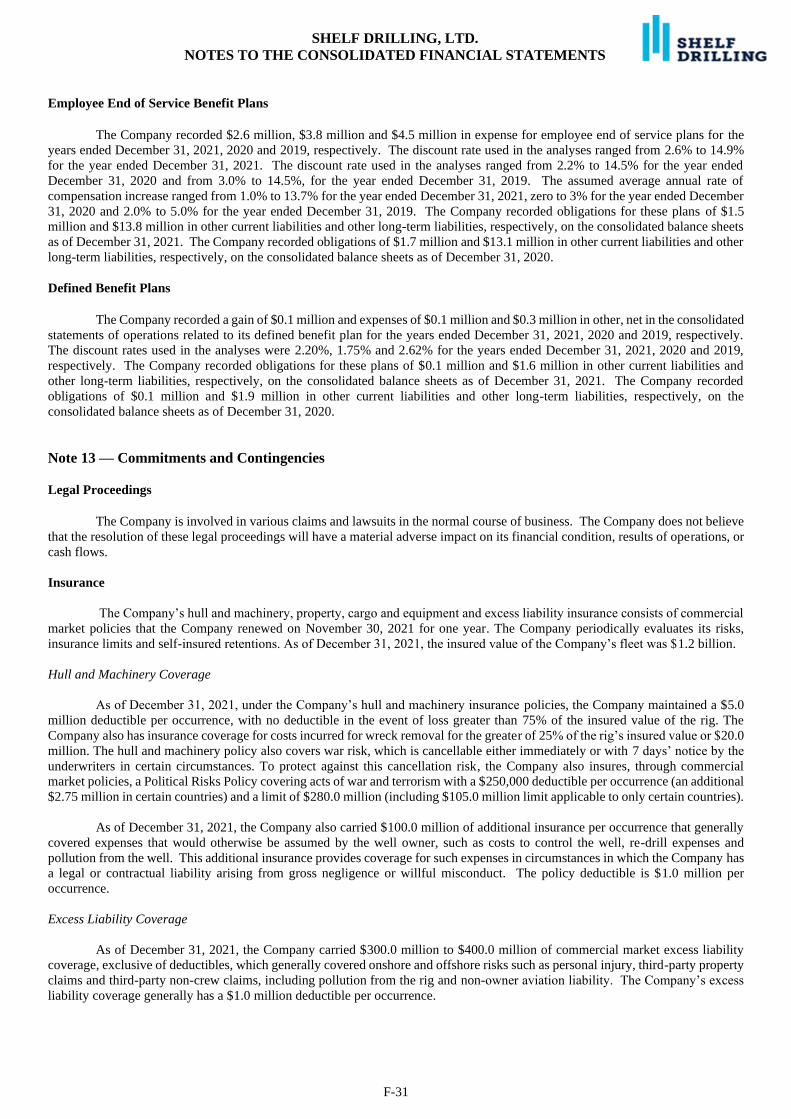
SHELF DRILLING, LTD.
NOTES TO THE CONSOLIDATED FINANCIAL STATEMENTS
F-31
Employee End of Service Benefit Plans
The Company recorded $2.6 million, $3.8 million and $4.5 million in expense for employee end of service plans for the
years ended December 31, 2021, 2020 and 2019, respectively. The discount rate used in the analyses ranged from 2.6% to 14.9%
for the year ended December 31, 2021. The discount rate used in the analyses ranged from 2.2% to 14.5% for the year ended
December 31, 2020 and from 3.0% to 14.5%, for the year ended December 31, 2019. The assumed average annual rate of
compensation increase ranged from 1.0% to 13.7% for the year ended December 31, 2021, zero to 3% for the year ended December
31, 2020 and 2.0% to 5.0% for the year ended December 31, 2019. The Company recorded obligations for these plans of $1.5
million and $13.8 million in other current liabilities and other long-term liabilities, respectively, on the consolidated balance sheets
as of December 31, 2021. The Company recorded obligations of $1.7 million and $13.1 million in other current liabilities and other
long-term liabilities, respectively, on the consolidated balance sheets as of December 31, 2020.
Defined Benefit Plans
The Company recorded a gain of $0.1 million and expenses of $0.1 million and $0.3 million in other, net in the consolidated
statements of operations related to its defined benefit plan for the years ended December 31, 2021, 2020 and 2019, respectively.
The discount rates used in the analyses were 2.20%, 1.75% and 2.62% for the years ended December 31, 2021, 2020 and 2019,
respectively. The Company recorded obligations for these plans of $0.1 million and $1.6 million in other current liabilities and
other long-term liabilities, respectively, on the consolidated balance sheets as of December 31, 2021. The Company recorded
obligations of $0.1 million and $1.9 million in other current liabilities and other long-term liabilities, respectively, on the
consolidated balance sheets as of December 31, 2020.
Note 13 — Commitments and Contingencies
Legal Proceedings
The Company is involved in various claims and lawsuits in the normal course of business. The Company does not believe
that the resolution of these legal proceedings will have a material adverse impact on its financial condition, results of operations, or
cash flows.
Insurance
The Company’s hull and machinery, property, cargo and equipment and excess liability insurance consists of commercial
market policies that the Company renewed on November 30, 2021 for one year. The Company periodically evaluates its risks,
insurance limits and self-insured retentions. As of December 31, 2021, the insured value of the Company’s fleet was $1.2 billion.
Hull and Machinery Coverage
As of December 31, 2021, under the Company’s hull and machinery insurance policies, the Company maintained a $5.0
million deductible per occurrence, with no deductible in the event of loss greater than 75% of the insured value of the rig. The
Company also has insurance coverage for costs incurred for wreck removal for the greater of 25% of the rig’s insured value or $20.0
million. The hull and machinery policy also covers war risk, which is cancellable either immediately or with 7 days’ notice by the
underwriters in certain circumstances. To protect against this cancellation risk, the Company also insures, through commercial
market policies, a Political Risks Policy covering acts of war and terrorism with a $250,000 deductible per occurrence (an additional
$2.75 million in certain countries) and a limit of $280.0 million (including $105.0 million limit applicable to only certain countries).
As of December 31, 2021, the Company also carried $100.0 million of additional insurance per occurrence that generally
covered expenses that would otherwise be assumed by the well owner, such as costs to control the well, re-drill expenses and
pollution from the well. This additional insurance provides coverage for such expenses in circumstances in which the Company has
a legal or contractual liability arising from gross negligence or willful misconduct. The policy deductible is $1.0 million per
occurrence.
Excess Liability Coverage
As of December 31, 2021, the Company carried $300.0 million to $400.0 million of commercial market excess liability
coverage, exclusive of deductibles, which generally covered onshore and offshore risks such as personal injury, third-party property
claims and third-party non-crew claims, including pollution from the rig and non-owner aviation liability. The Company’s excess
liability coverage generally has a $1.0 million deductible per occurrence.
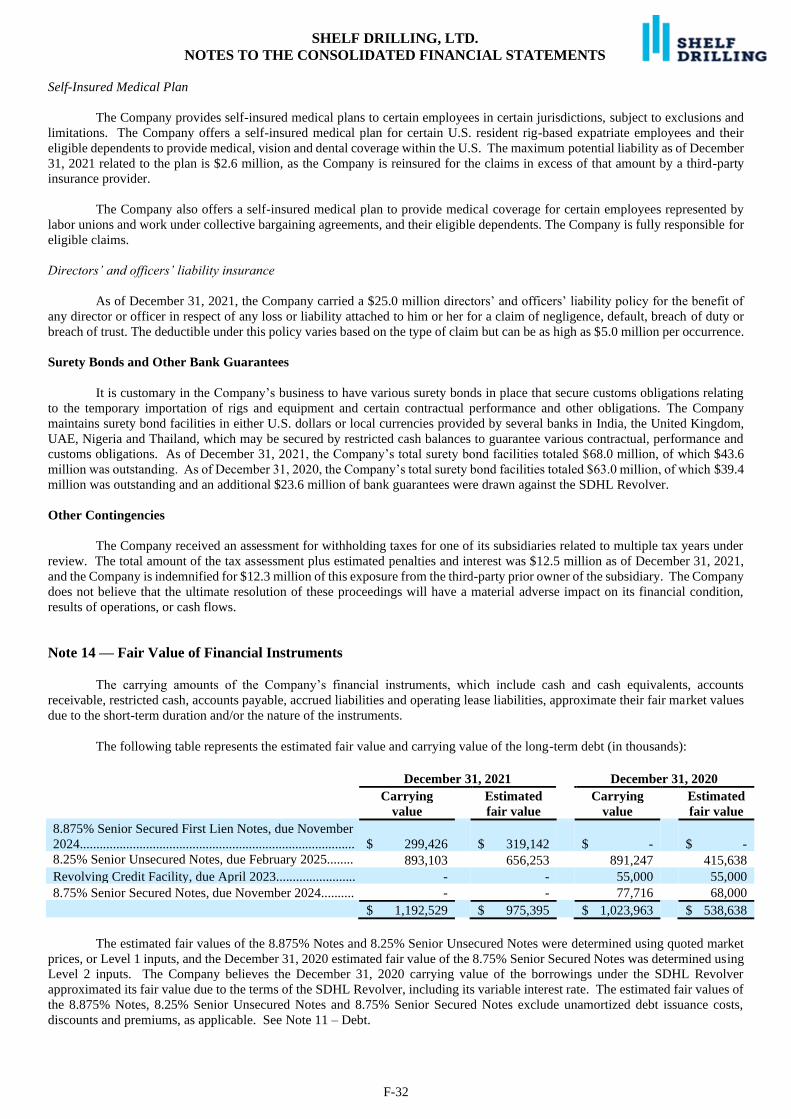
SHELF DRILLING, LTD.
NOTES TO THE CONSOLIDATED FINANCIAL STATEMENTS
F-32
Self-Insured Medical Plan
The Company provides self-insured medical plans to certain employees in certain jurisdictions, subject to exclusions and
limitations. The Company offers a self-insured medical plan for certain U.S. resident rig-based expatriate employees and their
eligible dependents to provide medical, vision and dental coverage within the U.S. The maximum potential liability as of December
31, 2021 related to the plan is $2.6 million, as the Company is reinsured for the claims in excess of that amount by a third-party
insurance provider.
The Company also offers a self-insured medical plan to provide medical coverage for certain employees represented by
labor unions and work under collective bargaining agreements, and their eligible dependents. The Company is fully responsible for
eligible claims.
Directors’ and officers’ liability insurance
As of December 31, 2021, the Company carried a $25.0 million directors’ and officers’ liability policy for the benefit of
any director or officer in respect of any loss or liability attached to him or her for a claim of negligence, default, breach of duty or
breach of trust. The deductible under this policy varies based on the type of claim but can be as high as $5.0 million per occurrence.
Surety Bonds and Other Bank Guarantees
It is customary in the Company’s business to have various surety bonds in place that secure customs obligations relating
to the temporary importation of rigs and equipment and certain contractual performance and other obligations. The Company
maintains surety bond facilities in either U.S. dollars or local currencies provided by several banks in India, the United Kingdom,
UAE, Nigeria and Thailand, which may be secured by restricted cash balances to guarantee various contractual, performance and
customs obligations. As of December 31, 2021, the Company’s total surety bond facilities totaled $68.0 million, of which $43.6
million was outstanding. As of December 31, 2020, the Company’s total surety bond facilities totaled $63.0 million, of which $39.4
million was outstanding and an additional $23.6 million of bank guarantees were drawn against the SDHL Revolver.
Other Contingencies
The Company received an assessment for withholding taxes for one of its subsidiaries related to multiple tax years under
review. The total amount of the tax assessment plus estimated penalties and interest was $12.5 million as of December 31, 2021,
and the Company is indemnified for $12.3 million of this exposure from the third-party prior owner of the subsidiary. The Company
does not believe that the ultimate resolution of these proceedings will have a material adverse impact on its financial condition,
results of operations, or cash flows.
Note 14 — Fair Value of Financial Instruments
The carrying amounts of the Company’s financial instruments, which include cash and cash equivalents, accounts
receivable, restricted cash, accounts payable, accrued liabilities and operating lease liabilities, approximate their fair market values
due to the short-term duration and/or the nature of the instruments.
The following table represents the estimated fair value and carrying value of the long-term debt (in thousands):
December 31, 2021 December 31, 2020
Carrying
value
Estimated
fair value
Carrying
value
Estimated
fair value
8.875% Senior Secured First Lien Notes, due November
2024................................................................................... $ 299,426 $ 319,142 $ - $ -
8.25% Senior Unsecured Notes, due February 2025........ 893,103 656,253 891,247 415,638
Revolving Credit Facility, due April 2023........................ - - 55,000 55,000
8.75% Senior Secured Notes, due November 2024.......... - - 77,716 68,000
$ 1,192,529 $ 975,395 $ 1,023,963 $ 538,638
The estimated fair values of the 8.875% Notes and 8.25% Senior Unsecured Notes were determined using quoted market
prices, or Level 1 inputs, and the December 31, 2020 estimated fair value of the 8.75% Senior Secured Notes was determined using
Level 2 inputs. The Company believes the December 31, 2020 carrying value of the borrowings under the SDHL Revolver
approximated its fair value due to the terms of the SDHL Revolver, including its variable interest rate. The estimated fair values of
the 8.875% Notes, 8.25% Senior Unsecured Notes and 8.75% Senior Secured Notes exclude unamortized debt issuance costs,
discounts and premiums, as applicable. See Note 11 – Debt.
SHELF DRILLING, LTD.
NOTES TO THE CONSOLIDATED FINANCIAL STATEMENTS
F-33
Derivative financial instruments were measured at fair value on a recurring basis using Level 2 inputs. See Note 18 –
Derivative Financial Instruments.
Note 15 — Interest Rate, Foreign Currency and Credit Risk
Interest Rate Risk
Financial instruments that potentially subject the Company to interest rate risk include cash and cash equivalents and
debt. Exposure to interest rate risk may occur in relation to cash and cash equivalents, as the interest income earned on these
balances changes with market interest rates. Floating rate debt, where the interest rate may be adjusted semi-annually or more
frequently over the life of the instrument, exposes the Company to short-term changes in market interest rates. Fixed rate debt,
where the interest rate is fixed over the life of the instrument and the instrument’s maturity is greater than one year, exposes the
Company to changes in market interest rates if and when voluntary refinancing or refinancing of maturing debt with new debt
occurs. The Company has in the past utilized interest rate swaps or other derivative instruments to manage interest rate risk.
Foreign Currency Risk
The Company’s functional currency is the U.S. dollar and its international operations expose it to currency exchange rate
risk. This risk is primarily associated with the compensation costs of the Company’s employees and purchasing costs from suppliers
in currencies other than the U.S. dollar.
The Company’s primary currency exchange rate risk management strategy involves customer contracts that provide for
partial payment in U.S. dollars and partial payment in local currency. The payment portion denominated in local currency is based
on anticipated local currency requirements over the contract term and local statutory requirements. Due to various factors, including
customer acceptance, local banking laws, other statutory requirements, local currency convertibility and the impact of inflation on
local costs, actual local currency needs may vary from those anticipated in the customer contracts, resulting in partial exposure to
currency exchange rate risk. In addition, the Company can utilize forex contracts to manage foreign exchange risk related to certain
currencies. See Note 18 – Derivative Financial Instruments for further discussion of the Company’s forex contracts. The currency
exchange effect resulting from the Company’s international operations generally has not had a material impact on its operating
results. The Company recognized a gain / (loss) of $0.4 million, $(1.2) million and $(0.8) million related to net foreign currency
exchange during the years ended December 31, 2021, 2020 and 2019, respectively.
Credit Risk
Financial instruments that potentially subject the Company to concentrations of credit risk are cash and cash equivalents,
which are generally maintained at commercial banks with acceptable credit ratings, and accounts and other receivables which
primarily consist of trade receivables.
The market for the Company’s services is the offshore oil and natural gas industry. The Company’s customers primarily
consist of government owned or controlled energy companies, publicly listed global integrated oil companies or independent
exploration and production companies. Periodic credit evaluations of the Company’s customers are performed and the Company
generally does not require material collateral from its customers. However, the Company may from time-to-time require its
customers to make advance payment or issue a bank guarantee/letter of credit in its favor to mitigate the risk of non-payment. The
Company determines its expected credit losses for its pools of assets with similar risk characteristics based on historical loss
information as adjusted for future expectations.
Consolidated revenues by top customer for each of the years ended December 31, 2021, 2020 and 2019 were as follows:
Years ended December 31,
2021 2020 2019
Largest customer....................................................................................... 32% 26% 29%
Second largest customer........................................................................... 27% 26% 25%
Third largest customer.............................................................................. 13% 14% 8%
Others........................................................................................................ 28% 34% 38%
100% 100% 100%
SHELF DRILLING, LTD.
NOTES TO THE CONSOLIDATED FINANCIAL STATEMENTS
F-34
Note 16 — Shareholders’ Equity
Authorized share capital and issued and outstanding shares
As of June 25, 2018, following the completion of an initial public offering on the Oslo Stock Exchange (“OSE”), the
Company was authorized to issue up to 144,063,473 common shares with a par value of $0.01 per share and 56,250,000 shares were
registered in the Norwegian Central Securities Depository (VPS) and listed on Oslo Børs ASA under the symbol “SHLF”.
On February 21, 2019, the Company entered into agreements with affiliates of China Merchants, to acquire two premium
newbuild jack-up rigs payable through the issuance of new common shares and to bareboat charter two additional premium newbuild
jack-up rigs, including an option to buy either or both of the rigs during the initial term. See also Note 6 – Property and Equipment
and Note 8 – Leases. The acquisition of the rigs closed on May 9, 2019 and as a result the Company issued 26,769,230 new common
shares with a total value of $121.8 million and incurred $0.6 million of incremental direct costs related to the share issuance. The
shares represented 19.4% of the total outstanding common shares of the Company upon issuance, making China Merchants the
Company’s largest shareholder.
On August 31, 2020, the Company’s shareholders approved a resolution to increase the Company’s authorized shares to
184,063,473 common shares with a par value of $0.01 per share.
The Company adopted the 2017 LTIP effective June 25, 2018, to provide for the issuance of share options, restricted shares,
deferred shares, share units, unrestricted shares and cash-based awards (the “awards”) to certain officers, non-employee directors
and key employees who are in a position to contribute significantly to the Company’s long-term performance and growth. In August
2021, the Board of Directors amended the 2017 LTIP to increase the maximum number of shares to be granted under the plan to
18.4 million shares from 14.4 million shares. Awards may be satisfied by newly issued shares, including shares held by a subsidiary
or by delivery of shares held in an affiliated employee benefit trust at the Company's discretion. Share-based compensation awarded
in 2019 through 2021 reduced the remaining shares reserved under the 2017 LTIP and as of December 31, 2021, 2,645,268 shares
were reserved by the Company’s Board of Directors for issuance pursuant to the 2017 LTIP. See also Note 17 – Share-based
Compensation. However, the Board of Directors may amend or alter the number of shares reserved for such purposes in future
periods.
As of December 31, 2021, 137,115,793 of the Company’s authorized common shares were outstanding and 103,815,090
shares were listed on the OSE. The remaining unlisted shares represent shares held by Castle Harlan, Inc. and Lime Rock Partners
(together, the “Sponsors”), or certain other shareholders, which have not been listed and are not currently required to be listed on
the OSE.
Share repurchase program
On September 1, 2019, the Board of Directors approved a share repurchase program under which the Company could
repurchase shares of the Company’s common stock for an aggregate of $25.0 million over a period of two years from the date of
approval (the “2019 Repurchase Program”). Any repurchased shares were canceled and resumed the status of authorized and
unissued shares upon the repurchase date, as the repurchased shares were considered constructively retired on the repurchase date.
Shares were repurchased in the open market on the OSE. In accordance with Cayman Islands law, the repurchased shares were
canceled by default immediately after repurchase. The Company made an accounting policy election to allocate the purchase price
of repurchased shares between additional paid-in-capital and retained earnings. In March 2020, the Company suspended its
repurchase activities under the 2019 Repurchase Program and the program expired on September 1, 2021.
The Company repurchased approximately 721,000 shares of common stock at an average price of $2.16 (19.50 NOK) per
share during the year ended December 31, 2020 and 1.4 million shares of common stock at an average price of $2.13 (19.33 NOK)
per share during the year ended December 31, 2019 under the 2019 Repurchase Program.
As of December 31, 2021 and 2020, the Company was in compliance with the relevant contractual requirements in our
debt agreements, as applicable, and the regulatory requirements for the Cayman Islands and the OSE related to its stock repurchases.
Shareholder rights and dividend distributions
All common shares have pari passu rights to participate in any common share dividends declared and represent the residual
claim on the Company’s assets. The Company did not pay any common share dividends during the years ended December 31,
2021, 2020 and 2019. Certain of the Company’s debt agreements contain covenants that limit the payment of dividends. See Note
11 – Debt.
The Company’s Articles of Association contain certain preferential governance rights for the Sponsors, including the right
of the Sponsors to appoint and remove directors, subject to certain ownership thresholds being met.
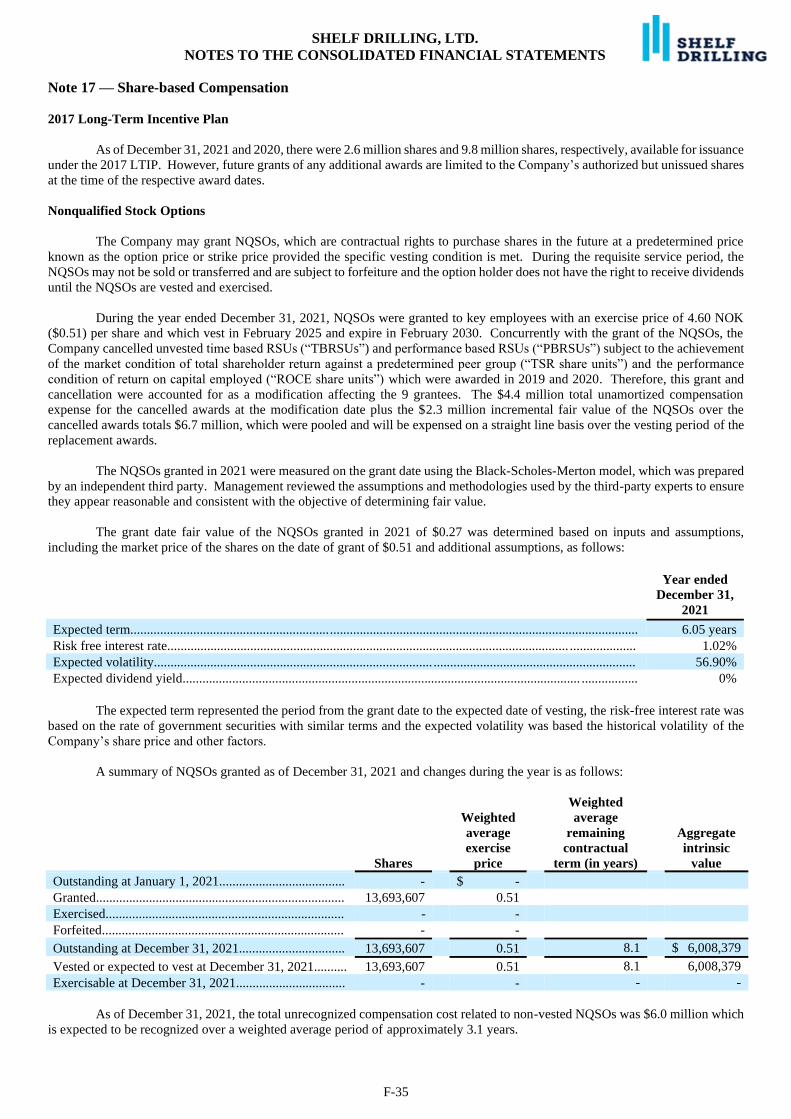
SHELF DRILLING, LTD.
NOTES TO THE CONSOLIDATED FINANCIAL STATEMENTS
F-35
Note 17 — Share-based Compensation
2017 Long-Term Incentive Plan
As of December 31, 2021 and 2020, there were 2.6 million shares and 9.8 million shares, respectively, available for issuance
under the 2017 LTIP. However, future grants of any additional awards are limited to the Company’s authorized but unissued shares
at the time of the respective award dates.
Nonqualified Stock Options
The Company may grant NQSOs, which are contractual rights to purchase shares in the future at a predetermined price
known as the option price or strike price provided the specific vesting condition is met. During the requisite service period, the
NQSOs may not be sold or transferred and are subject to forfeiture and the option holder does not have the right to receive dividends
until the NQSOs are vested and exercised.
During the year ended December 31, 2021, NQSOs were granted to key employees with an exercise price of 4.60 NOK
($0.51) per share and which vest in February 2025 and expire in February 2030. Concurrently with the grant of the NQSOs, the
Company cancelled unvested time based RSUs (“TBRSUs”) and performance based RSUs (“PBRSUs”) subject to the achievement
of the market condition of total shareholder return against a predetermined peer group (“TSR share units”) and the performance
condition of return on capital employed (“ROCE share units”) which were awarded in 2019 and 2020. Therefore, this grant and
cancellation were accounted for as a modification affecting the 9 grantees. The $4.4 million total unamortized compensation
expense for the cancelled awards at the modification date plus the $2.3 million incremental fair value of the NQSOs over the
cancelled awards totals $6.7 million, which were pooled and will be expensed on a straight line basis over the vesting period of the
replacement awards.
The NQSOs granted in 2021 were measured on the grant date using the Black-Scholes-Merton model, which was prepared
by an independent third party. Management reviewed the assumptions and methodologies used by the third-party experts to ensure
they appear reasonable and consistent with the objective of determining fair value.
The grant date fair value of the NQSOs granted in 2021 of $0.27 was determined based on inputs and assumptions,
including the market price of the shares on the date of grant of $0.51 and additional assumptions, as follows:
Year ended
December 31,
2021
Expected term......................................................................................................................................................... 6.05 years
Risk free interest rate......................................................................................................................... .................... 1.02%
Expected volatility.................................................................................... ............................................................. 56.90%
Expected dividend yield........................................................................................................................ ................. 0%
The expected term represented the period from the grant date to the expected date of vesting, the risk-free interest rate was
based on the rate of government securities with similar terms and the expected volatility was based the historical volatility of the
Company’s share price and other factors.
A summary of NQSOs granted as of December 31, 2021 and changes during the year is as follows:
Shares
Weighted
average
exercise
price
Weighted
average
remaining
contractual
term (in years)
Aggregate
intrinsic
value
Outstanding at January 1, 2021...................................... - $ -
Granted........................................................................... 13,693,607 0.51
Exercised........................................................................ - -
Forfeited......................................................................... - -
Outstanding at December 31, 2021................................ 13,693,607 0.51 8.1 $ 6,008,379
Vested or expected to vest at December 31, 2021.......... 13,693,607 0.51 8.1 6,008,379
Exercisable at December 31, 2021................................. - - - -
As of December 31, 2021, the total unrecognized compensation cost related to non-vested NQSOs was $6.0 million which
is expected to be recognized over a weighted average period of approximately 3.1 years.
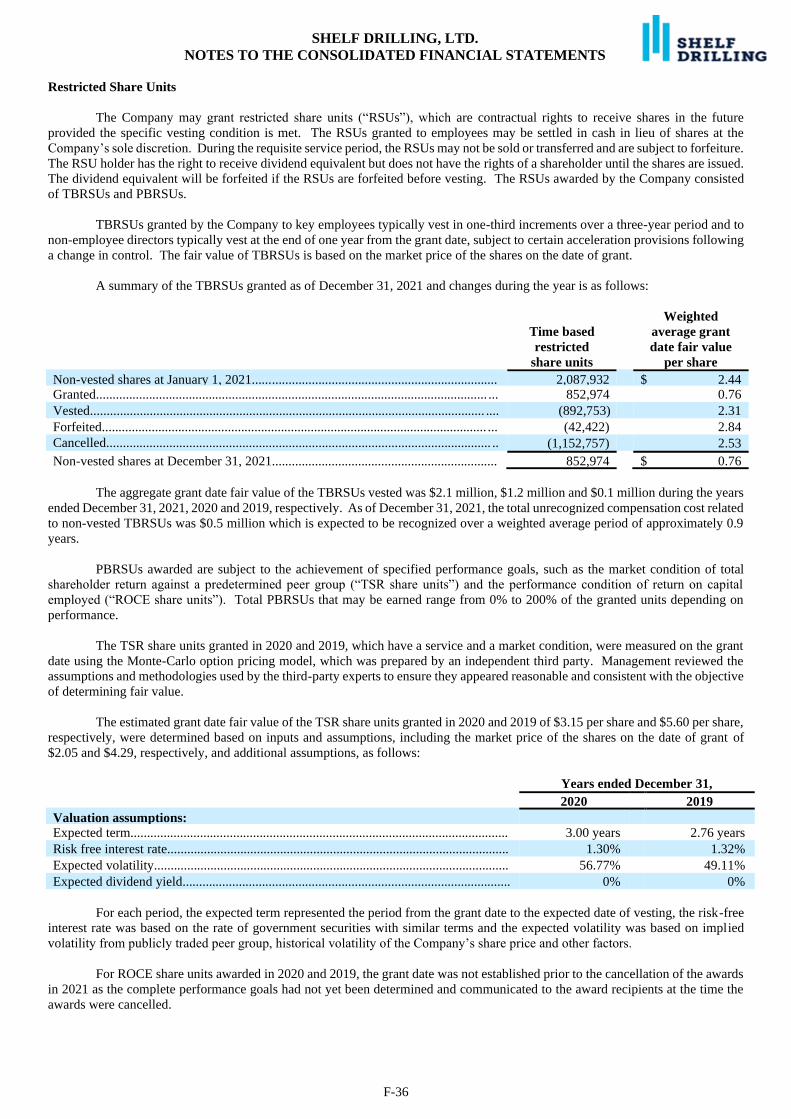
SHELF DRILLING, LTD.
NOTES TO THE CONSOLIDATED FINANCIAL STATEMENTS
F-36
Restricted Share Units
The Company may grant restricted share units (“RSUs”), which are contractual rights to receive shares in the future
provided the specific vesting condition is met. The RSUs granted to employees may be settled in cash in lieu of shares at the
Company’s sole discretion. During the requisite service period, the RSUs may not be sold or transferred and are subject to forfeiture.
The RSU holder has the right to receive dividend equivalent but does not have the rights of a shareholder until the shares are issued.
The dividend equivalent will be forfeited if the RSUs are forfeited before vesting. The RSUs awarded by the Company consisted
of TBRSUs and PBRSUs.
TBRSUs granted by the Company to key employees typically vest in one-third increments over a three-year period and to
non-employee directors typically vest at the end of one year from the grant date, subject to certain acceleration provisions following
a change in control. The fair value of TBRSUs is based on the market price of the shares on the date of grant.
A summary of the TBRSUs granted as of December 31, 2021 and changes during the year is as follows:
Time based
restricted
share units
Weighted
average grant
date fair value
per share
Non-vested shares at January 1, 2021.......................................................................... 2,087,932 $ 2.44 Granted...................................................................................................................... ... 852,974 0.76
Vested....................................................................................................................... .... (892,753) 2.31
Forfeited.................................................................................................................... ... (42,422) 2.84
Cancelled.................................................................................................................... ..
. (1,152,757) 2.53
Non-vested shares at December 31, 2021.................................................................... 852,974 $ 0.76
The aggregate grant date fair value of the TBRSUs vested was $2.1 million, $1.2 million and $0.1 million during the years
ended December 31, 2021, 2020 and 2019, respectively. As of December 31, 2021, the total unrecognized compensation cost related
to non-vested TBRSUs was $0.5 million which is expected to be recognized over a weighted average period of approximately 0.9
years.
PBRSUs awarded are subject to the achievement of specified performance goals, such as the market condition of total
shareholder return against a predetermined peer group (“TSR share units”) and the performance condition of return on capital
employed (“ROCE share units”). Total PBRSUs that may be earned range from 0% to 200% of the granted units depending on
performance.
The TSR share units granted in 2020 and 2019, which have a service and a market condition, were measured on the grant
date using the Monte-Carlo option pricing model, which was prepared by an independent third party. Management reviewed the
assumptions and methodologies used by the third-party experts to ensure they appeared reasonable and consistent with the objective
of determining fair value.
The estimated grant date fair value of the TSR share units granted in 2020 and 2019 of $3.15 per share and $5.60 per share,
respectively, were determined based on inputs and assumptions, including the market price of the shares on the date of grant of
$2.05 and $4.29, respectively, and additional assumptions, as follows:
Years ended December 31,
2020 2019
Valuation assumptions:
Expected term.................................................................................................................. 3.00 years 2.76 years
Risk free interest rate....................................................................................................... 1.30% 1.32%
Expected volatility........................................................................................................... 56.77% 49.11%
Expected dividend yield................................................................................................... 0% 0%
For each period, the expected term represented the period from the grant date to the expected date of vesting, the risk-free
interest rate was based on the rate of government securities with similar terms and the expected volatility was based on implied
volatility from publicly traded peer group, historical volatility of the Company’s share price and other factors.
For ROCE share units awarded in 2020 and 2019, the grant date was not established prior to the cancellation of the awards
in 2021 as the complete performance goals had not yet been determined and communicated to the award recipients at the time the
awards were cancelled.
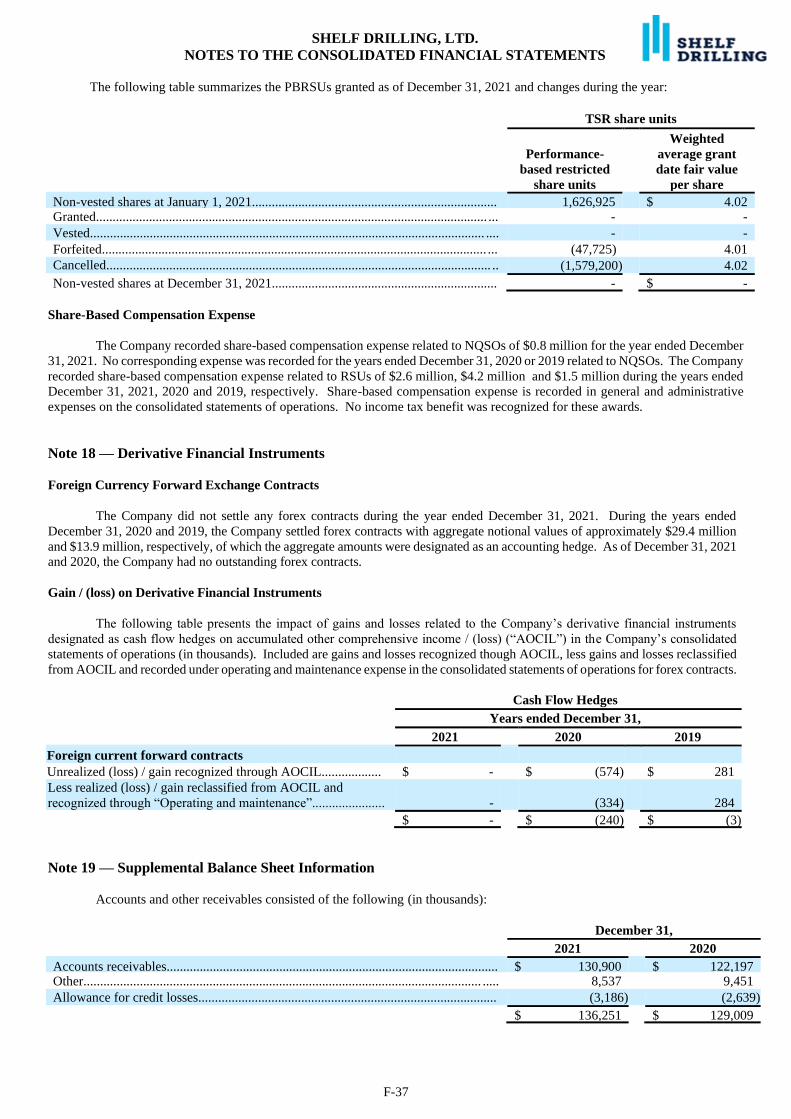
SHELF DRILLING, LTD.
NOTES TO THE CONSOLIDATED FINANCIAL STATEMENTS
F-37
The following table summarizes the PBRSUs granted as of December 31, 2021 and changes during the year:
TSR share units
Performance-
based restricted
share units
Weighted
average grant
date fair value
per share
Non-vested shares at January 1, 2021.......................................................................... 1,626,925 $ 4.02 Granted...................................................................................................................... ... - -
Vested....................................................................................................................... .... - -
Forfeited.................................................................................................................... ... (47,725) 4.01
Cancelled.................................................................................................................... ..
. (1,579,200) 4.02
Non-vested shares at December 31, 2021.................................................................... - $ -
Share-Based Compensation Expense
The Company recorded share-based compensation expense related to NQSOs of $0.8 million for the year ended December
31, 2021. No corresponding expense was recorded for the years ended December 31, 2020 or 2019 related to NQSOs. The Company
recorded share-based compensation expense related to RSUs of $2.6 million, $4.2 million and $1.5 million during the years ended
December 31, 2021, 2020 and 2019, respectively. Share-based compensation expense is recorded in general and administrative
expenses on the consolidated statements of operations. No income tax benefit was recognized for these awards.
Note 18 — Derivative Financial Instruments
Foreign Currency Forward Exchange Contracts
The Company did not settle any forex contracts during the year ended December 31, 2021. During the years ended
December 31, 2020 and 2019, the Company settled forex contracts with aggregate notional values of approximately $29.4 million
and $13.9 million, respectively, of which the aggregate amounts were designated as an accounting hedge. As of December 31, 2021
and 2020, the Company had no outstanding forex contracts.
Gain / (loss) on Derivative Financial Instruments
The following table presents the impact of gains and losses related to the Company’s derivative financial instruments
designated as cash flow hedges on accumulated other comprehensive income / (loss) (“AOCIL”) in the Company’s consolidated
statements of operations (in thousands). Included are gains and losses recognized though AOCIL, less gains and losses reclassified
from AOCIL and recorded under operating and maintenance expense in the consolidated statements of operations for forex contracts.
Cash Flow Hedges
Years ended December 31,
2021 2020 2019
Foreign current forward contracts
Unrealized (loss) / gain recognized through AOCIL.................. $ - $ (574) $ 281
Less realized (loss) / gain reclassified from AOCIL and
recognized through “Operating and maintenance”...................... - (334) 284
$ - $ (240) $ (3)
Note 19 — Supplemental Balance Sheet Information
Accounts and other receivables consisted of the following (in thousands):
December 31,
2021 2020
Accounts receivables.................................................................................................... $ 130,900 $ 122,197 Other........................................................................................................................ ..... 8,537 9,451
Allowance for credit losses.......................................................................................... (3,186) (2,639)
$ 136,251 $ 129,009
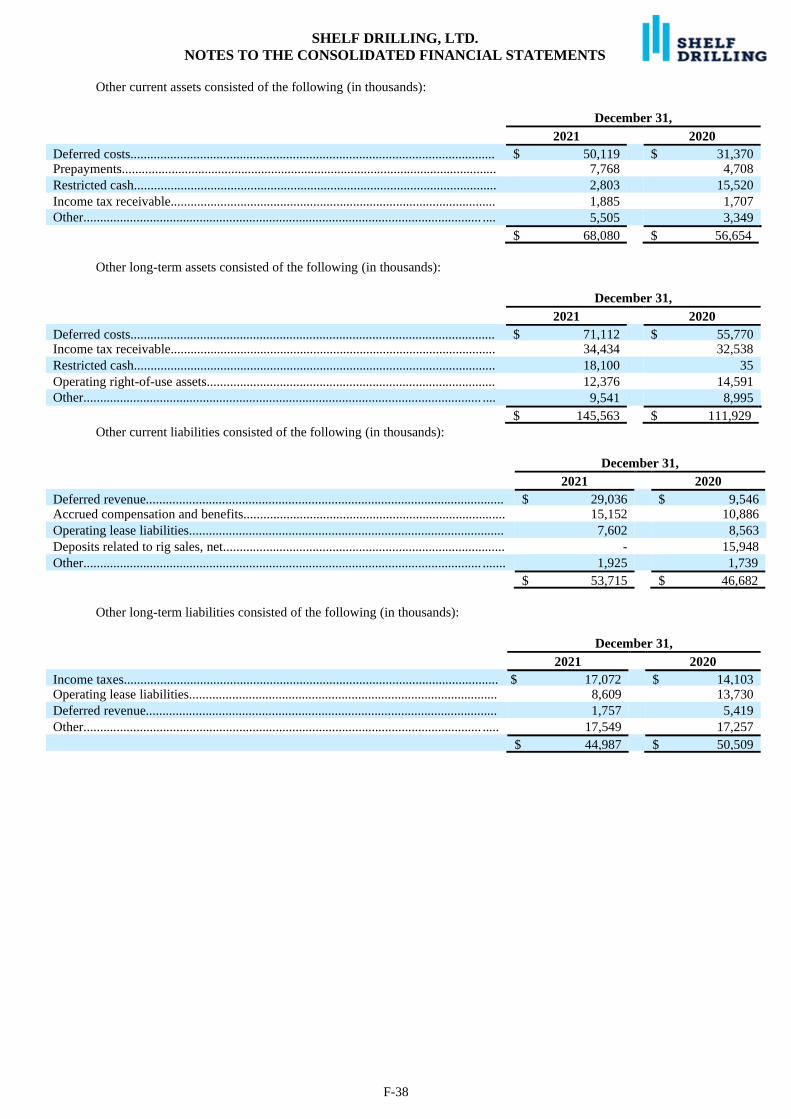
SHELF DRILLING, LTD.
NOTES TO THE CONSOLIDATED FINANCIAL STATEMENTS
F-38
Other current assets consisted of the following (in thousands):
December 31,
2021 2020
Deferred costs.............................................................................................................. $ 50,119 $ 31,370 Prepayments................................................................................................................. 7,768 4,708
Restricted cash............................................................................................................. 2,803 15,520
Income tax receivable.................................................................................................. 1,885 1,707
Other........................................................................................................................ ....
. 5,505 3,349
$ 68,080 $ 56,654
Other long-term assets consisted of the following (in thousands):
December 31,
2021 2020
Deferred costs.............................................................................................................. $ 71,112 $ 55,770 Income tax receivable.................................................................................................. 34,434 32,538
Restricted cash............................................................................................................. 18,100 35
Operating right-of-use assets....................................................................................... 12,376 14,591
Other........................................................................................................................ ....
. 9,541 8,995
$ 145,563 $ 111,929
Other current liabilities consisted of the following (in thousands):
December 31,
2021 2020
Deferred revenue............................................................................................................ $ 29,036 $ 9,546 Accrued compensation and benefits............................................................................... 15,152 10,886
Operating lease liabilities............................................................................................... 7,602 8,563
Deposits related to rig sales, net..................................................................................... - 15,948
Other........................................................................................................................ ....... 1,925 1,739
$ 53,715 $ 46,682
Other long-term liabilities consisted of the following (in thousands):
December 31,
2021 2020
Income taxes................................................................................................................. $ 17,072 $ 14,103 Operating lease liabilities............................................................................................. 8,609 13,730
Deferred revenue.......................................................................................................... 1,757 5,419
Other........................................................................................................................ ..... 17,549 17,257
$ 44,987 $ 50,509
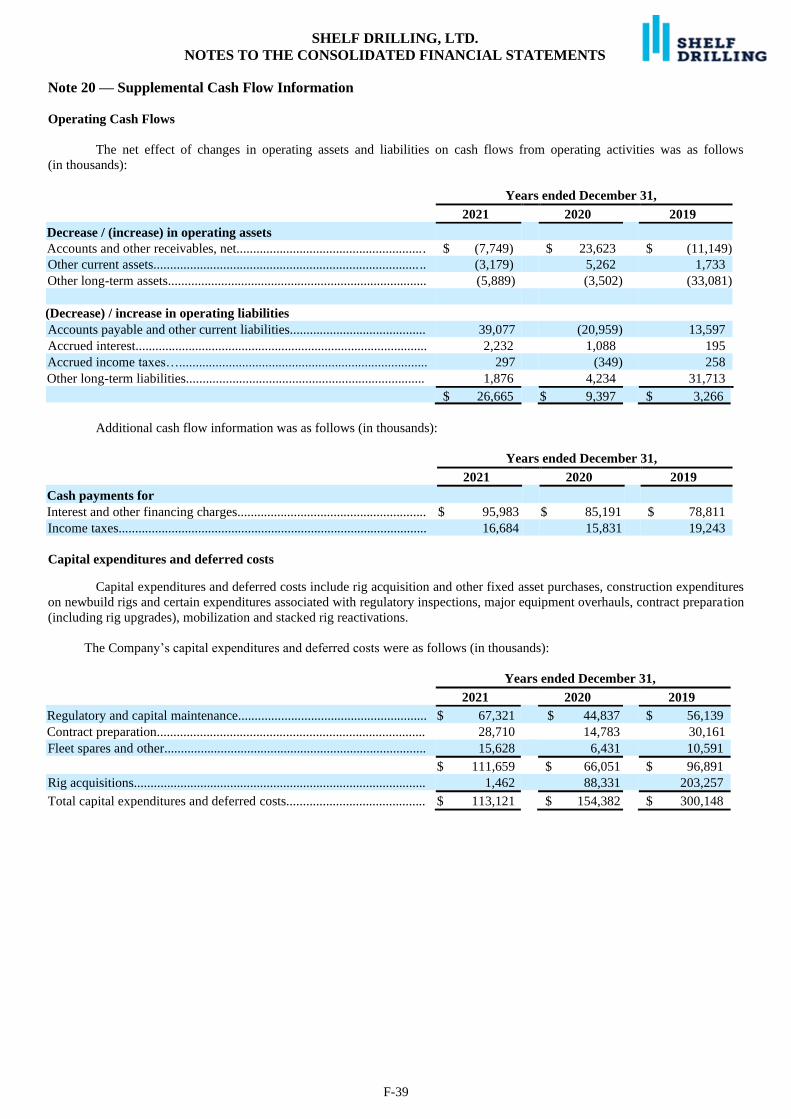
SHELF DRILLING, LTD.
NOTES TO THE CONSOLIDATED FINANCIAL STATEMENTS
F-39
Note 20 — Supplemental Cash Flow Information
Operating Cash Flows
The net effect of changes in operating assets and liabilities on cash flows from operating activities was as follows
(in thousands):
Years ended December 31,
2021 2020 2019
Decrease / (increase) in operating assets
Accounts and other receivables, net......................................................... $ (7,749) $ 23,623 $ (11,149)
Other current assets................................................................................ .. (3,179) 5,262 1,733
Other long-term assets.............................................................................. (5,889) (3,502) (33,081)
(Decrease) / increase in operating liabilities
Accounts payable and other current liabilities......................................... 39,077 (20,959) 13,597
Accrued interest........................................................................................ 2,232 1,088 195
Accrued income taxes…........................................................................... 297 (349) 258
Other long-term liabilities........................................................................ 1,876 4,234 31,713
$ 26,665 $ 9,397 $ 3,266
Additional cash flow information was as follows (in thousands):
Years ended December 31,
2021 2020 2019
Cash payments for
Interest and other financing charges......................................................... $ 95,983 $ 85,191 $ 78,811
Income taxes............................................................................................. 16,684 15,831 19,243
Capital expenditures and deferred costs
Capital expenditures and deferred costs include rig acquisition and other fixed asset purchases, construction expenditures
on newbuild rigs and certain expenditures associated with regulatory inspections, major equipment overhauls, contract preparation
(including rig upgrades), mobilization and stacked rig reactivations.
The Company’s capital expenditures and deferred costs were as follows (in thousands):
Years ended December 31,
2021 2020 2019
Regulatory and capital maintenance......................................................... $ 67,321 $ 44,837 $ 56,139
Contract preparation................................................................................. 28,710 14,783 30,161
Fleet spares and other............................................................................... 15,628 6,431 10,591
$ 111,659 $ 66,051 $ 96,891
Rig acquisitions........................................................................................ 1,462 88,331 203,257
Total capital expenditures and deferred costs.......................................... $ 113,121 $ 154,382 $ 300,148
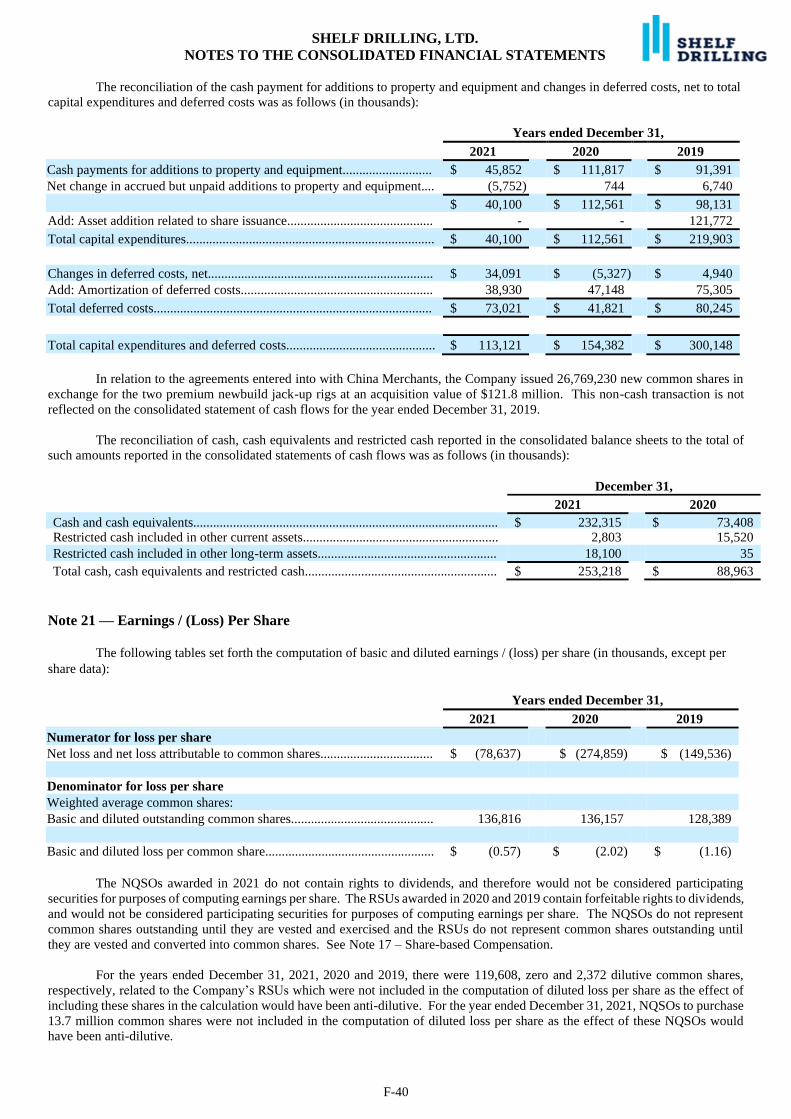
SHELF DRILLING, LTD.
NOTES TO THE CONSOLIDATED FINANCIAL STATEMENTS
F-40
The reconciliation of the cash payment for additions to property and equipment and changes in deferred costs, net to total
capital expenditures and deferred costs was as follows (in thousands):
Years ended December 31,
2021 2020 2019
Cash payments for additions to property and equipment........................... $ 45,852 $ 111,817 $ 91,391
Net change in accrued but unpaid additions to property and equipment.... (5,752) 744 6,740
$ 40,100 $ 112,561 $ 98,131
Add: Asset addition related to share issuance............................................ - - 121,772
Total capital expenditures........................................................................... $ 40,100 $ 112,561 $ 219,903
Changes in deferred costs, net.................................................................... $ 34,091 $ (5,327) $ 4,940
Add: Amortization of deferred costs.......................................................... 38,930 47,148 75,305
Total deferred costs.................................................................................... $ 73,021 $ 41,821 $ 80,245
Total capital expenditures and deferred costs............................................. $ 113,121 $ 154,382 $ 300,148
In relation to the agreements entered into with China Merchants, the Company issued 26,769,230 new common shares in
exchange for the two premium newbuild jack-up rigs at an acquisition value of $121.8 million. This non-cash transaction is not
reflected on the consolidated statement of cash flows for the year ended December 31, 2019.
The reconciliation of cash, cash equivalents and restricted cash reported in the consolidated balance sheets to the total of
such amounts reported in the consolidated statements of cash flows was as follows (in thousands):
December 31,
2021 2020
Cash and cash equivalents............................................................................................ $ 232,315 $ 73,408 Restricted cash included in other current assets........................................................... 2,803 15,520
Restricted cash included in other long-term assets...................................................... 18,100 35
Total cash, cash equivalents and restricted cash.......................................................... $ 253,218 $ 88,963
Note 21 — Earnings / (Loss) Per Share The following tables set forth the computation of basic and diluted earnings / (loss) per share (in thousands, except per
share data):
Years ended December 31,
2021 2020 2019
Numerator for loss per share
Net loss and net loss attributable to common shares.................................. $ (78,637) $ (274,859) $ (149,536)
Denominator for loss per share
Weighted average common shares:
Basic and diluted outstanding common shares........................................... 136,816 136,157 128,389
Basic and diluted loss per common share................................................... $ (0.57) $ (2.02) $ (1.16)
The NQSOs awarded in 2021 do not contain rights to dividends, and therefore would not be considered participating
securities for purposes of computing earnings per share. The RSUs awarded in 2020 and 2019 contain forfeitable rights to dividends,
and would not be considered participating securities for purposes of computing earnings per share. The NQSOs do not represent
common shares outstanding until they are vested and exercised and the RSUs do not represent common shares outstanding until
they are vested and converted into common shares. See Note 17 – Share-based Compensation.
For the years ended December 31, 2021, 2020 and 2019, there were 119,608, zero and 2,372 dilutive common shares,
respectively, related to the Company’s RSUs which were not included in the computation of diluted loss per share as the effect of
including these shares in the calculation would have been anti-dilutive. For the year ended December 31, 2021, NQSOs to purchase
13.7 million common shares were not included in the computation of diluted loss per share as the effect of these NQSOs would
have been anti-dilutive.
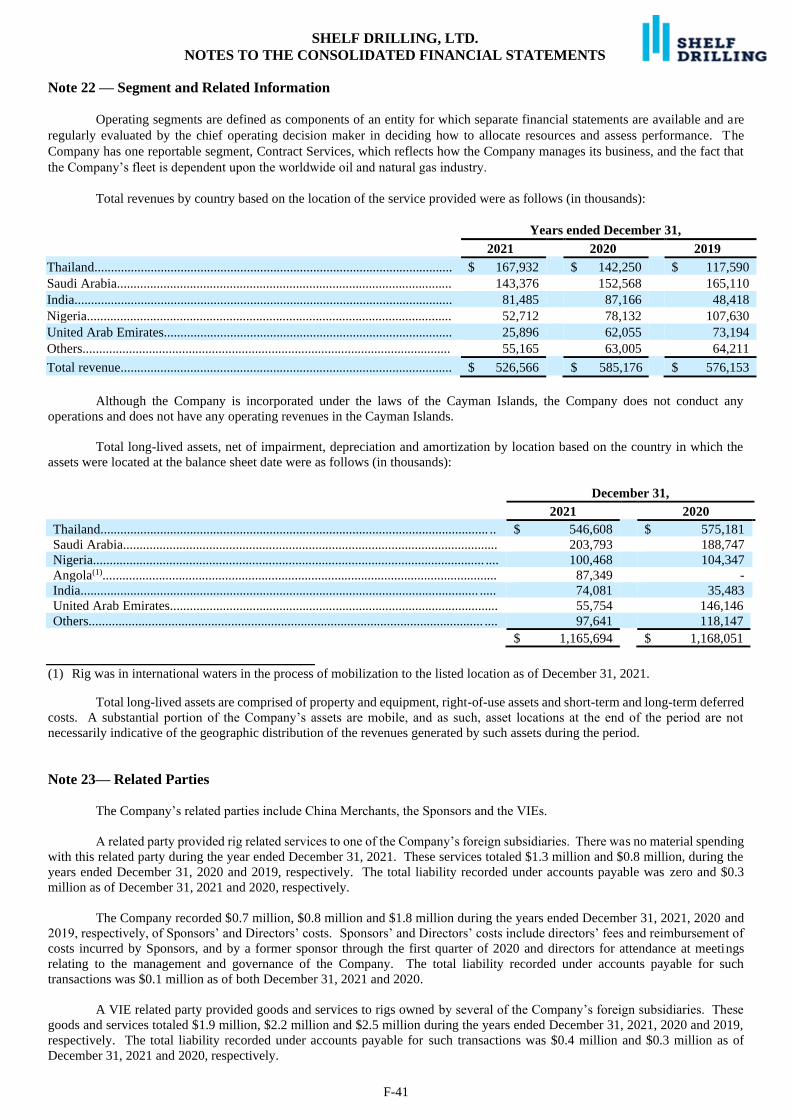
SHELF DRILLING, LTD.
NOTES TO THE CONSOLIDATED FINANCIAL STATEMENTS
F-41
Note 22 — Segment and Related Information
Operating segments are defined as components of an entity for which separate financial statements are available and are
regularly evaluated by the chief operating decision maker in deciding how to allocate resources and assess performance. The
Company has one reportable segment, Contract Services, which reflects how the Company manages its business, and the fact that
the Company’s fleet is dependent upon the worldwide oil and natural gas industry.
Total revenues by country based on the location of the service provided were as follows (in thousands):
Years ended December 31,
2021 2020 2019
Thailand............................................................................................................ $ 167,932 $ 142,250 $ 117,590
Saudi Arabia..................................................................................................... 143,376 152,568 165,110
India.................................................................................................................. 81,485 87,166 48,418
Nigeria.............................................................................................................. 52,712 78,132 107,630
United Arab Emirates....................................................................................... 25,896 62,055 73,194
Others............................................................................................................... 55,165 63,005 64,211
Total revenue.................................................................................................... $ 526,566 $ 585,176 $ 576,153
Although the Company is incorporated under the laws of the Cayman Islands, the Company does not conduct any
operations and does not have any operating revenues in the Cayman Islands.
Total long-lived assets, net of impairment, depreciation and amortization by location based on the country in which the
assets were located at the balance sheet date were as follows (in thousands):
December 31,
2021 2020
Thailand..................................................................................................................... .. $ 546,608 $ 575,181
Saudi Arabia................................................................................................................. 203,793 188,747
Nigeria...................................................................................................................... .... 100,468 104,347
Angola(1)....................................................................................................................... 87,349 -
India........................................................................................................................ ..... 74,081 35,483
United Arab Emirates................................................................................................... 55,754 146,146
Others....................................................................................................................... .... 97,641 118,147
$ 1,165,694 $ 1,168,051
(1) Rig was in international waters in the process of mobilization to the listed location as of December 31, 2021.
Total long-lived assets are comprised of property and equipment, right-of-use assets and short-term and long-term deferred
costs. A substantial portion of the Company’s assets are mobile, and as such, asset locations at the end of the period are not
necessarily indicative of the geographic distribution of the revenues generated by such assets during the period.
Note 23— Related Parties
The Company’s related parties include China Merchants, the Sponsors and the VIEs.
A related party provided rig related services to one of the Company’s foreign subsidiaries. There was no material spending
with this related party during the year ended December 31, 2021. These services totaled $1.3 million and $0.8 million, during the
years ended December 31, 2020 and 2019, respectively. The total liability recorded under accounts payable was zero and $0.3
million as of December 31, 2021 and 2020, respectively.
The Company recorded $0.7 million, $0.8 million and $1.8 million during the years ended December 31, 2021, 2020 and
2019, respectively, of Sponsors’ and Directors’ costs. Sponsors’ and Directors’ costs include directors’ fees and reimbursement of
costs incurred by Sponsors, and by a former sponsor through the first quarter of 2020 and directors for attendance at meetings
relating to the management and governance of the Company. The total liability recorded under accounts payable for such
transactions was $0.1 million as of both December 31, 2021 and 2020.
A VIE related party provided goods and services to rigs owned by several of the Company’s foreign subsidiaries. These
goods and services totaled $1.9 million, $2.2 million and $2.5 million during the years ended December 31, 2021, 2020 and 2019,
respectively. The total liability recorded under accounts payable for such transactions was $0.4 million and $0.3 million as of
December 31, 2021 and 2020, respectively.
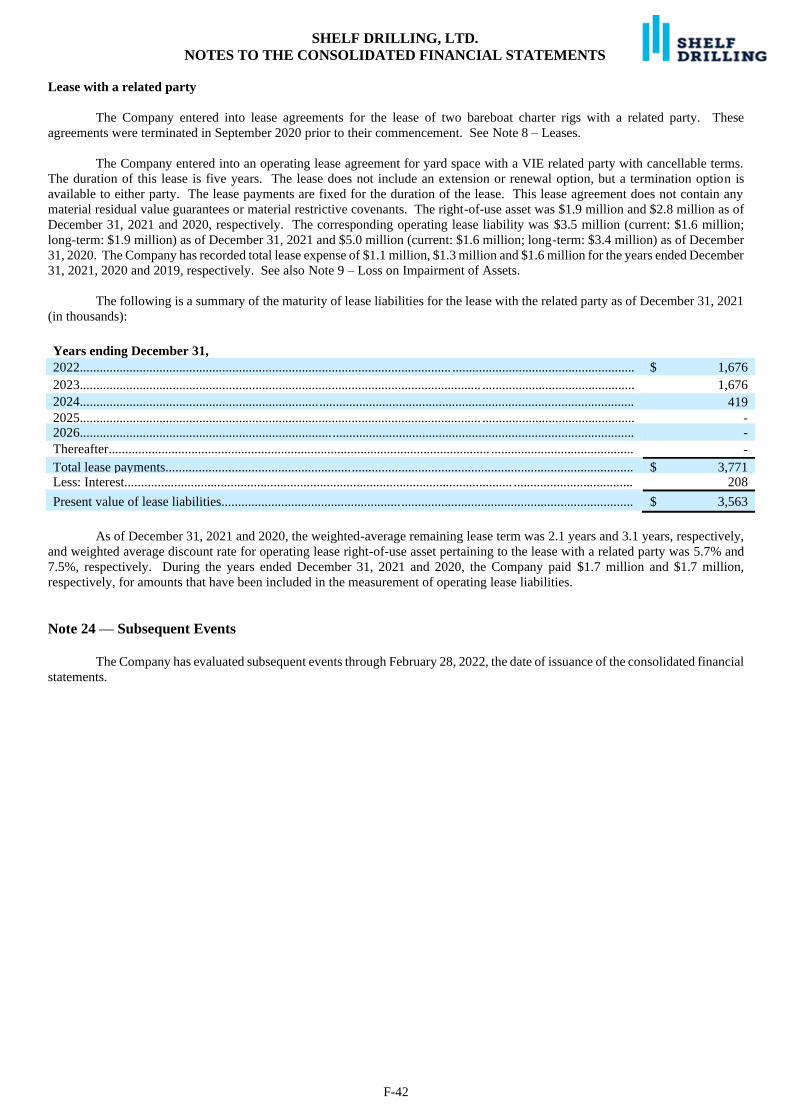
SHELF DRILLING, LTD.
NOTES TO THE CONSOLIDATED FINANCIAL STATEMENTS
F-42
Lease with a related party
The Company entered into lease agreements for the lease of two bareboat charter rigs with a related party. These
agreements were terminated in September 2020 prior to their commencement. See Note 8 – Leases.
The Company entered into an operating lease agreement for yard space with a VIE related party with cancellable terms.
The duration of this lease is five years. The lease does not include an extension or renewal option, but a termination option is
available to either party. The lease payments are fixed for the duration of the lease. This lease agreement does not contain any
material residual value guarantees or material restrictive covenants. The right-of-use asset was $1.9 million and $2.8 million as of
December 31, 2021 and 2020, respectively. The corresponding operating lease liability was $3.5 million (current: $1.6 million;
long-term: $1.9 million) as of December 31, 2021 and $5.0 million (current: $1.6 million; long-term: $3.4 million) as of December
31, 2020. The Company has recorded total lease expense of $1.1 million, $1.3 million and $1.6 million for the years ended December
31, 2021, 2020 and 2019, respectively. See also Note 9 – Loss on Impairment of Assets.
The following is a summary of the maturity of lease liabilities for the lease with the related party as of December 31, 2021
(in thousands):
Years ending December 31,
2022................................................................................................................ ....................................................... $ 1,676
2023......................................................................................................................... .............................................. 1,676
2024.......................................................................................................................................................................
......5 419
2025......................................................................................................................... .............................................. - 2026....................................................................................................................................................................... -
Thereafter................................................................................................................... ...........................................
....... -
Total lease payments............................................................................................................................................. $ 3,771 Less: Interest..................................................................................................................... .................................... 208
Present value of lease liabilities............................................................................................................................ $ 3,563
As of December 31, 2021 and 2020, the weighted-average remaining lease term was 2.1 years and 3.1 years, respectively,
and weighted average discount rate for operating lease right-of-use asset pertaining to the lease with a related party was 5.7% and
7.5%, respectively. During the years ended December 31, 2021 and 2020, the Company paid $1.7 million and $1.7 million,
respectively, for amounts that have been included in the measurement of operating lease liabilities.
Note 24 — Subsequent Events
The Company has evaluated subsequent events through February 28, 2022, the date of issuance of the consolidated financial
statements.
Shelf Drilling HQ
One JLT | Floor 12 | Jumeirah Lakes Towers P.O. Box 212201 | Dubai | UAE
www.shelfdrilling.com