Embed Size (px)
Citation preview
Annual Report
2013
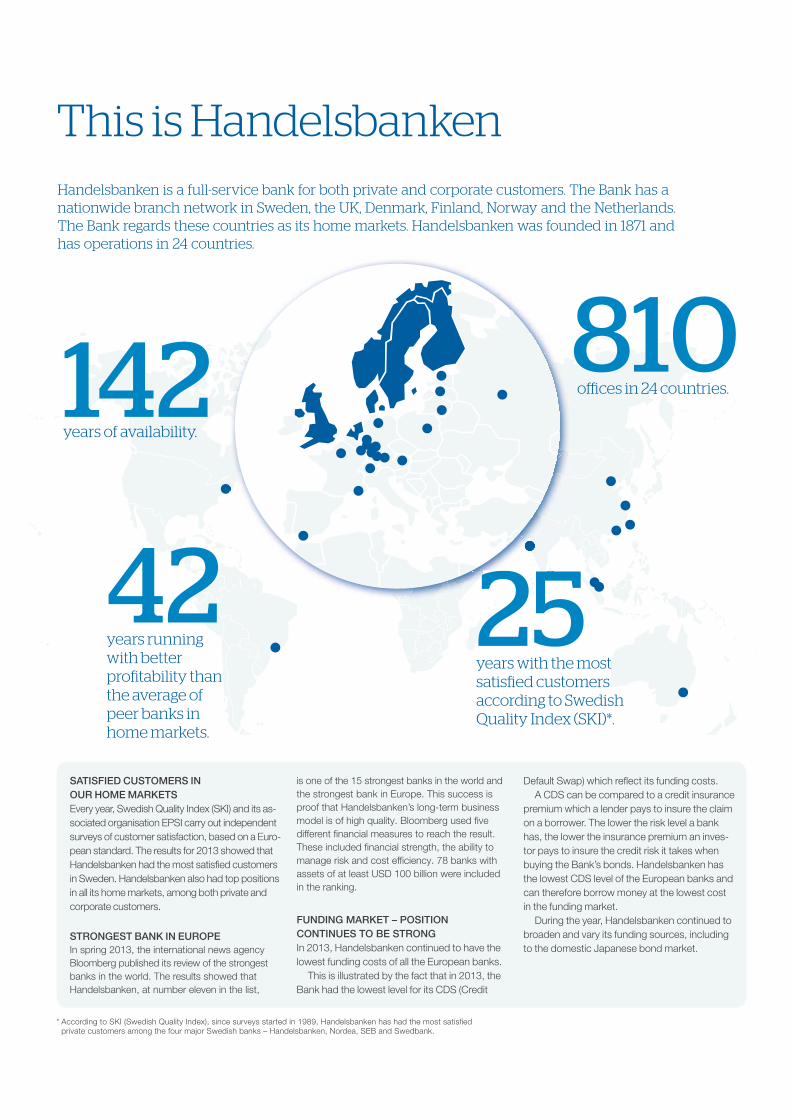
SATISFIED CUSTOMERS IN OUR HOME MARKETS Every year, Swedish Quality Index (SKI) and its as-sociated organisation EPSI carry out independent surveys of customer satisfaction, based on a Euro-pean standard. The results for 2013 showed that Handelsbanken had the most satisfied customers in Sweden. Handelsbanken also had top positions in all its home markets, among both private and corporate customers.
STRONGEST BANK IN EUROPE In spring 2013, the international news agency Bloomberg published its review of the strongest banks in the world. The results showed that Handelsbanken, at number eleven in the list,
is one of the 15 strongest banks in the world and the strongest bank in Europe. This success is proof that Handelsbanken’s long-term business model is of high quality. Bloomberg used five different financial measures to reach the result. These included financial strength, the ability to manage risk and cost efficiency. 78 banks with assets of at least USD 100 billion were included in the ranking.
FUNDING MARKET – POSITION CONTINUES TO BE STRONG In 2013, Handelsbanken continued to have the lowest funding costs of all the European banks.
This is illustrated by the fact that in 2013, the Bank had the lowest level for its CDS (Credit
Default Swap) which reflect its funding costs. A CDS can be compared to a credit insurance
premium which a lender pays to insure the claim on a borrower. The lower the risk level a bank has, the lower the insurance premium an inves-tor pays to insure the credit risk it takes when buying the Bank’s bonds. Handelsbanken has the lowest CDS level of the European banks and can therefore borrow money at the lowest cost in the funding market.
During the year, Handelsbanken continued to broaden and vary its funding sources, including to the domestic Japanese bond market.
* According to SKI (Swedish Quality Index), since surveys started in 1989, Handelsbanken has had the most satisfied private customers among the four major Swedish banks – Handelsbanken, Nordea, SEB and Swedbank.
This is HandelsbankenHandelsbanken is a full-service bank for both private and corporate customers. The Bank has a nationwide branch network in Sweden, the UK, Denmark, Finland, Norway and the Netherlands. The Bank regards these countries as its home markets. Handelsbanken was founded in 1871 and has operations in 24 countries.
years of availability.
offices in 24 countries.
years with the most satisfied customers according to Swedish Quality Index (SKI)*.
years running with better profitability than the average of peer banks in home markets.
42
142 810
25
HANDELSBANKEN | ANNUAL REPORT 2013 1
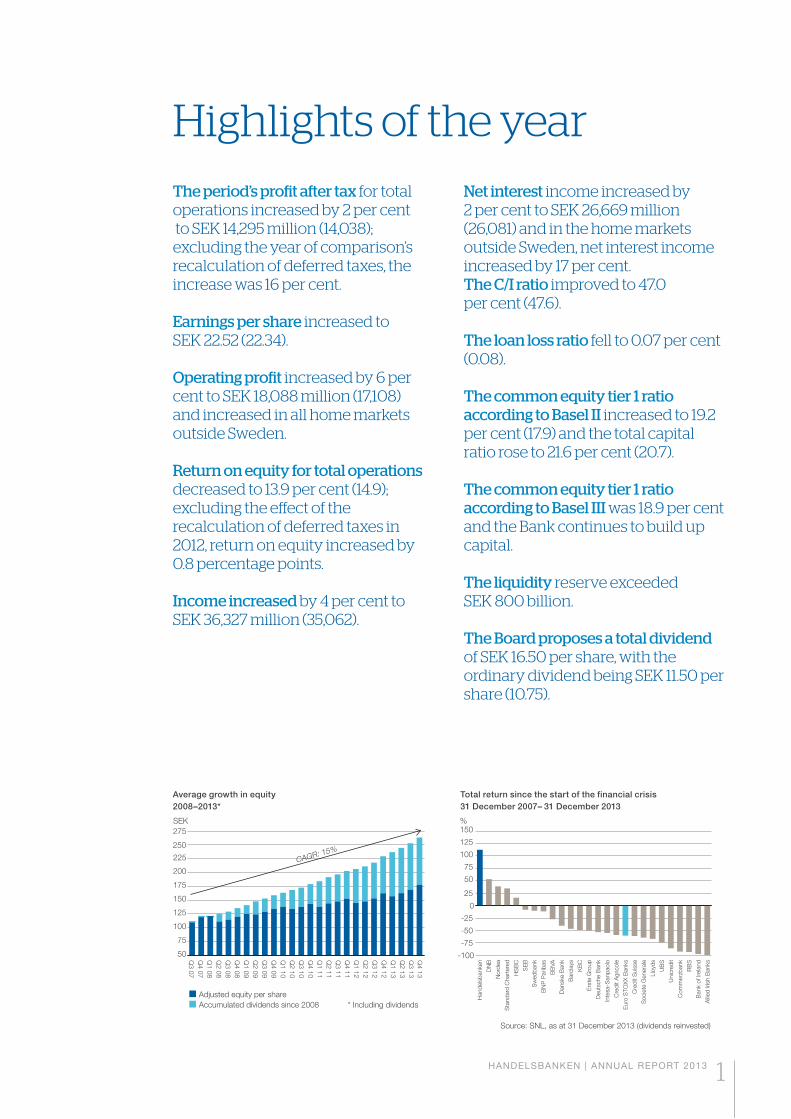
Highlights of the year
Average growth in equity 2008–2013*
Total return since the start of the financial crisis 31 December 2007 – 31 December 2013
50
75
100
125
150
175
200
225
250
275
CAGR: 15%
Adjusted equity per shareAccumulated dividends since 2008 * Including dividends
SEK
Q4 12
Q1 13
Q2 13
Q3 1
3Q
4 1
3
Q3 12
Q2 12
Q1 12
Q4 11
Q3 11
Q2 11
Q1 11
Q4 10
Q3 10
Q2 10
Q1 10
Q4 09
Q3 09
Q2 09
Q1 09
Q4 08
Q3 08
Q2 08
Q1 08
Q4 07
Q3 07
Source: SNL, as at 31 December 2013 (dividends reinvested)
%
Han
dels
bank
en
DN
B
Nor
dea
Sta
ndar
d C
hart
ered
HS
BC
SE
B
Sw
edba
nk
BN
P P
arib
as
BB
VA
Dan
ske
Ban
k
Bar
clay
s
KB
C
Ers
te G
roup
Deu
tsch
e B
ank
Inte
sa-S
anpa
olo
Cre
dit A
gric
ole
Eur
o S
TOXX
Ban
ks
Cre
dit S
uiss
e
Soc
iete
Gen
eral
e
Lloy
ds
UB
S
Uni
cred
it
Com
mer
zban
k
RB
S
Ban
k of
Irel
and
Allie
d Iri
sh B
anks
-100
-75
-50
-25
0
25
50
75
100
125
150
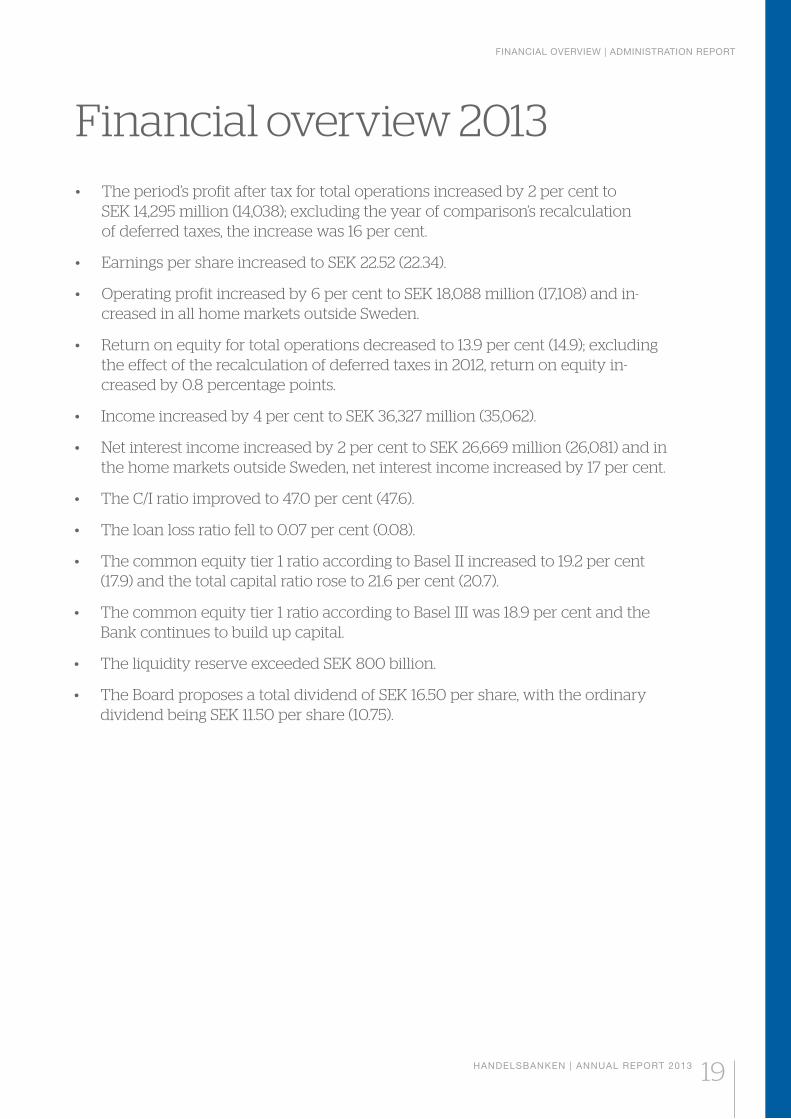
The period’s profit after tax for total operations increased by 2 per cent to SEK 14,295 million (14,038); excluding the year of comparison’s recalculation of deferred taxes, the increase was 16 per cent.
Earnings per share increased to SEK 22.52 (22.34).
Operating profit increased by 6 per cent to SEK 18,088 million (17,108) and increased in all home markets outside Sweden.
Return on equity for total operations decreased to 13.9 per cent (14.9); excluding the effect of the recalculation of deferred taxes in 2012, return on equity increased by 0.8 percentage points.
Income increased by 4 per cent to SEK 36,327 million (35,062).
Net interest income increased by 2 per cent to SEK 26,669 million (26,081) and in the home markets outside Sweden, net interest income increased by 17 per cent.The C/I ratio improved to 47.0 per cent (47.6).
The loan loss ratio fell to 0.07 per cent (0.08).
The common equity tier 1 ratio according to Basel II increased to 19.2 per cent (17.9) and the total capital ratio rose to 21.6 per cent (20.7).
The common equity tier 1 ratio according to Basel III was 18.9 per cent and the Bank continues to build up capital.
The liquidity reserve exceeded SEK 800 billion.
The Board proposes a total dividend of SEK 16.50 per share, with the ordinary dividend being SEK 11.50 per share (10.75).
2 HANDELSBANKEN | ANNUAL REPORT 2013
Brief information about
Handelsbanken’s Annual General Meeting 2014
Notice of attendanceShareholders wishing to attend the AGM must be entered in the register of shareholders kept by Euroclear Sweden AB (formerly VPC AB), by Thursday, 20 March 2014 at the latest. Notice of attendance is to be made to Handelsbanken, Corporate Governance, Kungsträdgårdsgatan 2, SE-106 70 Stockholm, Sweden, telephone +46 (0)8 701 19 84, or via the Bank’s website at handelsbanken.se/ireng by Thursday, 20 March 2014 at the latest.
To be entitled to take part in the meeting, shareholders whose shares are nominee-registered must also request a temporary entry in the register of shareholders kept by Euroclear. Shareholders must notify the nominee of this well before Thursday, 20 March 2014, when this entry must have been effected.
DividendThe Board proposes that the record day for the dividend be Monday, 31 March 2014, which means that Handelsbanken’s shares will be traded ex-dividend on Thursday, 27 March 2014. If the meeting resolves in accordance with the proposal, Euroclear expects to distribute the dividend on Thursday, 3 April 2014.
It is possible for private individuals who are domiciled in Sweden for tax purposes, to donate dividends to non-profit organisations without paying tax on them, under certain conditions. Shareholders who are interested in this must contact their bank or asset manager well in advance so that the gift can be registered prior to the AGM.
Financial calender 20145 February Annual accounts 201326 March Annual General Meeting30 April Interim report January–March 201417 July Interim report January–June 201422 October Interim report January–September 2014
Financial informationThe following reports can be downloaded or ordered from Handelsbanken’s website handelsbanken.se/ireng:
DistributionThe Annual Report can be ordered from Investor Relations, phone +46 (0)8 701 10 00 or online at handelsbanken.se/ireng where other reports as listed above are also available.
Handelsbanken’s printed annual report will be distributed to shareholders who are new for the year. A written request is then sent asking them how they wish to receive the report in future. A printed version is sent to all shareholders who reply in the affirmative.
Annual Report including Sustainability Report Handelsbanken’s Annual Report for 2013 contains the Bank’s complete Sustainability Report for 2013. The Sustainability Report is prepared in accordance with Global Reporting Initiatives (GRI) 3.0 guidelines for reporting and covers activities and results for the 2013 calendar year. Handelsbanken’s Sustainability Report meets the information requirements of level C+ and this has been confirmed by the Bank’s external auditors. Handelsbanken reports the Group’s sustainability activities annually.
The report constitutes Handelsbanken’s Communication on Progress for the UN Global Compact. Additional information regarding Handelsbanken’s sustainability activities is presented in an expanded
GRI supplement, published on the Bank’s website at handelsbanken.se/csreng.
Location: Grand Hôtel, Winter Garden, Royal entrance, Stallgatan 4, Stockholm. Time: Wednesday, 26 March 2014 at 10 a.m.
3
Contents
The Group Chief Executive’s comments Local, digital and long-term 4
ADMINISTRATION REPORTGROUP
Contents 7Concept and goal 9Goal achievement 10Our concept 12Organisation and working methods 14
Available on the customer's terms 16
Review of operations Financial overview 2013 19
Review of operations 20Five-year overview Group 22Key figures per year 24Quarterly performance 25Business segments 26Branch operations in Sweden 28Branch operations in the UK 30Branch operations in Denmark 32Branch operations in Finland 34Branch operations in Norway 36Branch operations in the Netherlands 38Handelsbanken International 40Handelsbanken Capital Markets 42Handelsbanken’s shares and shareholders 44
Sustainability, employees and the environment 46
Corporate Governance Report Corporate Governance Report 2013 49
Contents 49Corporate Governance structure 50Board members 60
Group Management and independent control functions 62
FINANCIAL REPORTS GROUP
Contents 64Income statement Group 65Statement of comprehensive income Group 66Balance sheet Group 67Statement of changes in equity 68Group 69Cash flow statement Group 70
Notes Group
ADMINISTRATION REPORT PARENT COMPANY 141
FINANCIAL REPORTS PARENT COMPANY
Contents 142
Income statement Parent company 143
Statement of comprehensive income Parent company 143
Balance sheet Parent company 144
Statement of changes in equityParent company 145
Cash flow statement Parent company 146
Five-year overview Parent company 147
Notes Parent company 149
RECOMMENDED APPROPRIATION OF PROFITS
Recommended appropriation of profits 175
AUDITOR’S REPORT
Auditor’s report 176
SUSTAINABILITY REPORT
Contents 178Sustainability at Handelsbanken 179Key figures for sustainability work 180Our concept and organisation 182Customers 184Employees 186Shareholders 189Society 190Initiatives, awards indexes and surveys 198Content and restrictions 200GRI index 201
Auditor’s report 203
CONTACT INFORMATION
Contents 205
Contact information 206
Branches and branch managers 208
Boards of subsidiaries 215
OTHER
Definitions and explanations 216Svenska Handelsbanken AB (publ) Corporate identity no.: 502007-7862 Registered office: Stockholm handelsbanken.com
This Annual Report is also available in Swedish.
THE GROUP CHIEF EXECUTIVE’S COMMENTS
4 HANDELSBANKEN | ANNUAL REPORT 2013
Local, digital and long-term
by an average of 15 per cent per year.
A LONG-TERM APPROACH AND GROWTHHandelsbanken started its operations in 1871, and since then – for 142 years – has grown branch by branch, customer by customer. We work without budgets, central sales targets, or broad, traditional marketing. In-stead, we apply a highly decentralised working model, where each branch has a high degree of autonomy on its local market. Consequently, it is our branch managers who take the majority of important business decisions in the Bank. Other units at Handelsbanken are organised to support the branches’ business in various ways.
We grow primarily by opening branches in locations where we currently have no presence. A newly opened branch needs 1–2 years before it shows positive cash flow. After this, the branch’s income usually grows much more rapidly than its expenses. In exceptional circumstances, we supplement this organic growth model by acquiring small, well-run players – if they fit in with our business model and corporate culture.
A long-term approach is characteristic of the Bank as a whole – in everything from our commitment and how we build up and nurture our customer relationships to our view of our staff. And it applies particularly to our idea of how we aim to run our Bank.
This long-term approach is the basis of our ownership structure: the Bank’s largest shareholders have long been the investment company Industrivärden – founded by Handelsbanken in 1944 – and the Bank’s employees, via the Oktogonen staff foundation. Stable, long-term owners make a stable, long-term Bank.
For a long time, Handelsbanken has created value for its sharehold-ers. For many years, Handelsbanken’s equity, including dividends paid, has grown by an average of 15 per cent per year. We have not asked our shareholders for new capital, nor have we accepted state support.
SATISFIED CUSTOMERS IN A RESPECTED BANKAt Handelsbanken we are convinced that sustainable long-term growth and shareholder value can only be achieved if we create long-term value for the Bank’s customers at the same time.
In 2013, Handelsbanken again had the most satisfied customers of the four major banks in Sweden, according to the SKI/EPSI independent re-search institute. The results also show that the gap compared to the other major banks has widened. Handelsbanken also achieved top positions in our home markets in the Nordic countries, the UK and the Netherlands, among both private and corporate customers.
For 2013, Handelsbanken was acclaimed Bank of the Year by the Swedish business magazine Privata Affärer, the third time in five years that we had won the award. The UK magazine The Banker also named us Bank of the Year for 2013.
Every year, the TNS-Sifo research company measures the reputation that various companies have among the Swedish public. For 2013, Handels-banken was one of the ten companies in Sweden with the best reputation, regardless of the sector.
THE REALLY LARGE CORPORATES’ BANK – AS WELLIn the past year, Handelsbanken has reinforced its position as the really large corporates’ bank. For the third year running we were nam ed Swedish Business Bank of the Year by Finansbarometern, an award based on opinions from senior corporate managers. The participants also named their company’s main bank. In the category for the very largest companies, over 30 per cent of respondents named Handelsbanken.
These customers appreciate our high availability – particularly the fact that the person you talk to at the branch also has a mandate to take deci-sions at the Bank. The fact that we are Scandinavia’s most international bank, with branches and offices in 24 countries globally, provides another form of availability: we are already present where our corporate customers have – or wish to start – their operations.
For medium-sized and owner-managed companies, Handelsbanken has long been the leading bank in Sweden.
Another parameter is our financial strength. Bloomberg ranks us as one of the world’s ten strongest banks – and the strongest in Europe – meaning that we never have to say no to business that we and our corporate customers wish to do.
GOOD PROFITABILITY LEADS TO GOOD TERMSThis financial strength has meant that the Bank has always had good access to its funding sources, even when the financial markets have been closed to most players.
An important reason for this is Handelsbanken’s profitability – our ability to generate strong long-term value growth, regardless of the economic situation. For many decades, Handelsbanken has reported higher profit-ability than the average of peer banks in our home markets. This profit-ability has been utilised for growth and has enabled us to show a stable balance sheet over the long term. Solid finances provide the Bank not only with good access to the market, but also with one of the absolute lowest funding costs on the market.
To increase the financial system’s resistance in our home markets, politicians and supervisory authorities have drawn up new regulations which are coming into force in stages from early 2014, to be fully imple-mented by 2018, according to current timetables.
THE GROUP CHIEF EXECUTIVE’S COMMENTS
HANDELSBANKEN | ANNUAL REPORT 2013 5
LONG TRADITION OF SUSTAINABILITYBeing financially stable is not just a business benefit for our customers and ourselves, it is also a way of assuming responsibility in the society where we operate. We grow at the rate our customers grow; we build for the long term, with low risk tolerance so that we avoid exposing society to unnec-essary strain, in the form of government support measures, for example.
Sustainability and corporate social responsibility (CSR) are also deeply rooted in Handelsbanken’s culture and working method. In addition to our internal steering documents and guidelines that govern Handels-banken’s actions, the Bank is also a member of the voluntary initiatives Global Compact and Principles of Responsible Investment (PRI), both UN initiatives directed at companies. Handelsbanken continues to support these initiatives which are in keeping with the values and principles already applying at Handelsbanken.
LOCAL AND DIGITALToday, customers can manage almost all their personal finances via one of Handelsbanken’s digital platforms. Customers can make decisions based on information obtained from a few clicks on their screen, and can then, for example, buy a mutual fund portfolio.
But people want to meet people, which is particularly true when it comes to taking a major financial decision. People want to discuss things and listen to what someone has to say – preferably someone who lives in the same town and knows the local conditions – everything from house prices to infrastructure for local companies. Someone who is familiar with things, and who can explain so you understand.
The Bank’s very low external staff turnover results in employees with long experience of the Bank and the local business environment. This builds local relations and contributes to customer meetings based on trust.
Remarkably often, customers visit our branches due to a trivial, sponta-neous need, on the spot – a simple transaction, which the customer might normally do digitally, but this time chose to do at the branch. Thus we now let these two worlds meet at the branch, to an increasing extent. The cus-tomer and our employee log on to the customer’s online banking service, and the business is completed in the customer’s own digital environment. This need to sometimes meet face-to-face, despite all the technical solu-tions, will surely change – but never disappear. So Handelsbanken will continue to develop its services both digitally and locally.
OUR HOME MARKETSToday, Handelsbanken has six home markets: Sweden, Norway, the UK, Denmark, Finland and the Netherlands. On these markets we strive to be a full-service bank with a nationwide branch network.
SwedenHandelsbanken in Sweden has grown on a market with relatively weak de-mand. In 2013, our savings business grew, both the volume of household deposits as well as our market share of mutual funds savings. Our credit volumes are also increasing.
NorwayDuring our 25 years in Norway we have grown steadily, and today Handels-banken is one of the country’s three largest banks. In 2013, we again saw growth, with volumes increasing on both the corporate and private market.
UKIn 2013 we maintained our expansion in the UK. We opened 28 branches, and to ensure that new and existing branches continue to receive strong support, a new regional bank was also established – the fourth in the UK. Handelsbanken’s business volumes in the UK continued to grow, with mortgage loans and deposits showing a particularly strong performance.
DenmarkThe Danish banking market had another difficult year, with demand being weak. In 2013, Handelsbanken again had the most satisfied customers
on this market, on both the corporate and the private side. We have also won the confidence of many good new customers, and have increased our credit volumes on the corporate and private market alike.
FinlandIn Finland, several banks were reorganised during the year, with branches being closed. Handelsbanken, on the other hand, plans to establish one or more new branches. Despite the weakness of the Finnish economy, Handelsbanken’s income has grown. Volumes for private lending have grown more rapidly than for the market as a whole.
Netherlands In our newest home market, we continued to grow; during the year, five new branches were opened, and we are now present in 18 locations, well spread across the country. In addition, during the year, SKI/EPSI conducted an independent survey of customer satisfaction with banks in the Netherlands. Here, too, Handelsbanken was the bank with the most satisfied customers – and in the Netherlands the gap between us and our competitors is wider than on any other of our home markets.
WE’VE BECOME A LITTLE BETTERWe have good reason to feel confident in our Bank and how we run it. But our pride in what we have achieved so far will never diminish our efforts to constantly become better. Our savings business is a case in point. In recent years, major efforts have been made in this area, and in 2013 they yielded clear results.
For the fourth year running, our fund management company had by far the highest net inflow. At the same time, the Bank’s mutual funds have become established among the top ratings of the Morningstar research company. Our private banking service has again been acclaimed best on the market. In Norway we have substantially advanced our position in discretionary management, and in the UK the acquisition of Heartwood was completed during the year so we can now offer UK customers very ad-vanced wealth management solutions. And these are just a few examples.
The work of further improving our offering in the savings area will continue.
MORE CHALLENGES Another constant challenge is to continuously adapt our Bank to our cus-tomers’ new requirements for where, when and how they wish to do their business with us, without compromising on what characterises Handels-banken – the aspects of simplicity, personal service and local presence.
We must simply continue to be Handelsbanken – only slightly more, slightly better than in the past, and constantly in step with new customer behaviour and business logic.
To achieve this, we must naturally also work with ourselves. Our focus on developing our staff will continue. Our gender equality work has been acclaimed with prestigious awards, but there is still a great deal to do, particularly in our employees’ day-to-day work situations.
We will also broaden our recruitment base, not only to take in new skills to meet new types of challenge, but also in terms of diversity, so that we become a Bank that even better reflects the society in which we work.
FINALLYSumming up the past year, Handelsbanken continued to grow, with in-creasing income and the most satisfied customers. Looking back on 2013, it is clear that the Bank’s healthy profit is the result of hard work by all our employees, and therefore I would like to extend my sincere thanks to them.
I would also like to take this opportunity to thank all our customers for your confidence in us.
Pär BomanStockholm, February 2014

HANDELSBANKEN | ANNUAL REPORT 2013 7
Administration Report
7
CONTENTS
Concept and goal 9
Goal achievement 10
Our concept 12
Organisation and working methods 14
Available on the customer's terms 16
FINANCIAL OVERVIEW 2013 19
REVIEW OF OPERATIONS 20
FIVE-YEAR OVERVIEW GROUP 22
KEY FIGURES PER YEAR 24
QUARTERLY PERFORMANCE 25
BUSINESS SEGMENTS 26
Branch operations in Sweden 28
Branch operations in the UK 30
Branch operations in Denmark 32
Branch operations in Finland 34
Branch operations in Norway 36
Branch operations in the Netherlands 38
Handelsbanken International 40
Handelsbanken Capital Markets 42
HANDELSBANKEN´S SHARES AND SHAREHOLDERS 44
SUSTAINABILITY, EMPLOYEES AND THE ENVIRONMENT 46
CORPORATE GOVERNANCE REPORT 2013 49
Contents Corporate Governance Report 49
Corporate Governance structure 50
Board members 60
Group Management and independent control functions 62

CONCEPT AND GOAL | ADMINISTRATION REPORT
HANDELSBANKEN | ANNUAL REPORT 2013 9
ConceptHandelsbanken is a full-service bank with a decentralised way of working, a strong local presence due to nationwide branch networks and a long-term approach to customer relations.
The Bank grows internationally by establishing its business model on selected markets.
GoalHandelsbanken’s goal is to have better profitability than the average of peer banks in its home markets.
long-term high growth in value expressed in increasing earnings per share over a business cycle.
This goal is mainly to be achieved by having more satisfied customers and lower costs than those of competitors.
High profitability is crucial, not only because it attracts shareholders to invest in the Bank, but also because it creates the conditions for growth, a high rating and low funding costs, and for the Bank’s lending capacity.
The Bank’s profitability also affects its ability to manage risks and to achieve efficient capital management.
GOAL ACHIEVEMENT | ADMINISTRATION REPORT
10 HANDELSBANKEN | ANNUAL REPORT 2013
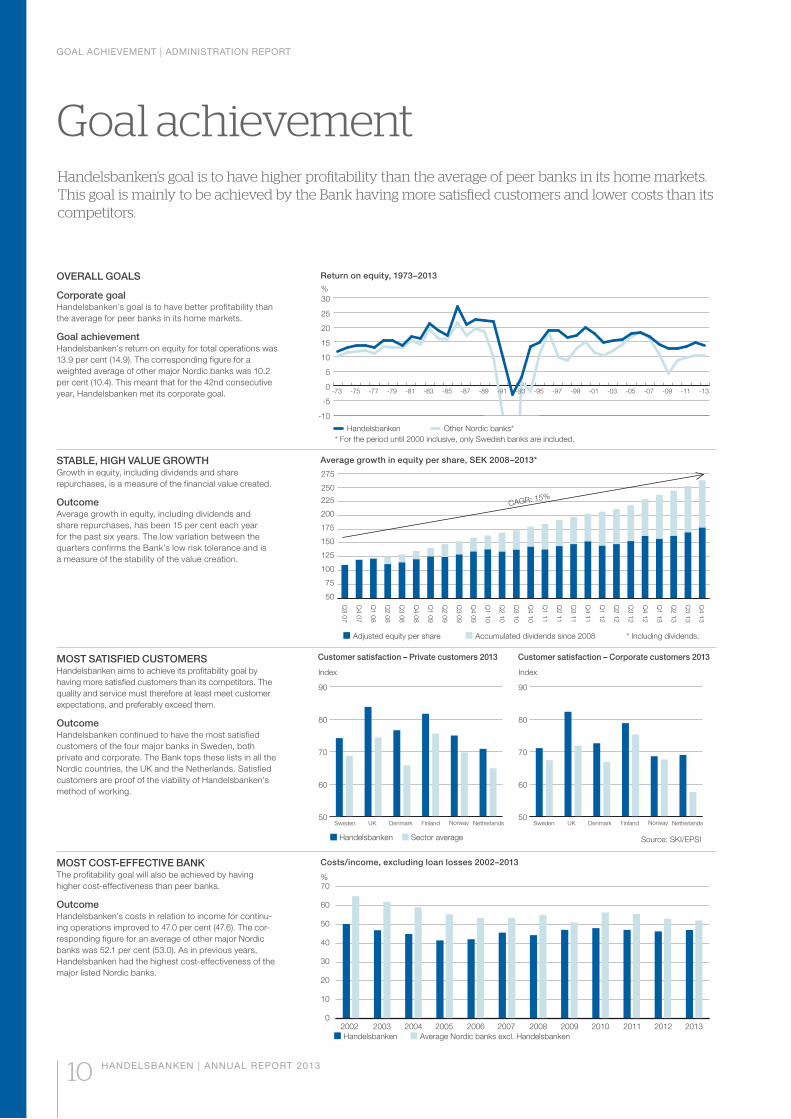
Goal achievementHandelsbanken’s goal is to have higher profitability than the average of peer banks in its home markets. This goal is mainly to be achieved by the Bank having more satisfied customers and lower costs than its competitors.
OVERALL GOALS
Corporate goalHandelsbanken’s goal is to have better profitability than the average for peer banks in its home markets.
Goal achievementHandelsbanken’s return on equity for total operations was 13.9 per cent (14.9). The corresponding figure for a weighted average of other major Nordic banks was 10.2 per cent (10.4). This meant that for the 42nd consecutive year, Handelsbanken met its corporate goal.
Return on equity, 1973–2013
STABLE, HIGH VALUE GROWTHGrowth in equity, including dividends and share repurchases, is a measure of the financial value created.
OutcomeAverage growth in equity, including dividends and share repurchases, has been 15 per cent each year for the past six years. The low variation between the quarters confirms the Bank’s low risk tolerance and is a measure of the stability of the value creation.
Average growth in equity per share, SEK 2008–2013*
MOST COST-EFFECTIVE BANKThe profitability goal will also be achieved by having higher cost-effectiveness than peer banks.
OutcomeHandelsbanken’s costs in relation to income for continu-ing operations improved to 47.0 per cent (47.6). The cor-responding figure for an average of other major Nordic banks was 52.1 per cent (53.0). As in previous years, Handelsbanken had the highest cost-effectiveness of the major listed Nordic banks.
Costs/income, excluding loan losses 2002–2013
MOST SATISFIED CUSTOMERSHandelsbanken aims to achieve its profitability goal by having more satisfied customers than its competitors. The quality and service must therefore at least meet customer expectations, and preferably exceed them.
OutcomeHandelsbanken continued to have the most satisfied customers of the four major banks in Sweden, both private and corporate. The Bank tops these lists in all the Nordic countries, the UK and the Netherlands. Satisfied customers are proof of the viability of Handelsbanken’s method of working.
-10
-5
0
5
10
15
20
25
30
-13-11-09-07-05-03-01-99-97-95-93-91-89-87-85-83-81-79-77-75-73
%
Handelsbanken Other Nordic banks** For the period until 2000 inclusive, only Swedish banks are included.
50
75
100
125
150
175
200
225
250
275
CAGR: 15%
Q4 12
Q1 13
Q2 13
Q3 1
3
Q4 1
3
Q3 12
Q2 12
Q1 12
Q4 11
Q3 11
Q2 11
Q1 11
Q4 10
Q3 10
Q2 10
Q1 10
Q4 09
Q3 09
Q2 09
Q1 09
Q4 08
Q3 08
Q2 08
Q1 08
Q4 07
Q3 07
Accumulated dividends since 2008 * Including dividends.Adjusted equity per share
%
Average Nordic banks excl. HandelsbankenHandelsbanken2003 2004 2005 2006 2007 2008 2010 2011 2013201220092002
0
10
20
30
40
50
60
70
Customer satisfaction – Private customers 2013 Customer satisfaction – Corporate customers 2013
Handelsbanken Sector average
Index Index
DenmarkSweden FinlandUK NetherlandsNorway50
60
70
80
90
50
60
70
80
90
DenmarkSweden FinlandUK NetherlandsNorway
Source: SKI/EPSI
GOAL ACHIEVEMENT | ADMINISTRATION REPORT
HANDELSBANKEN | ANNUAL REPORT 2013 11
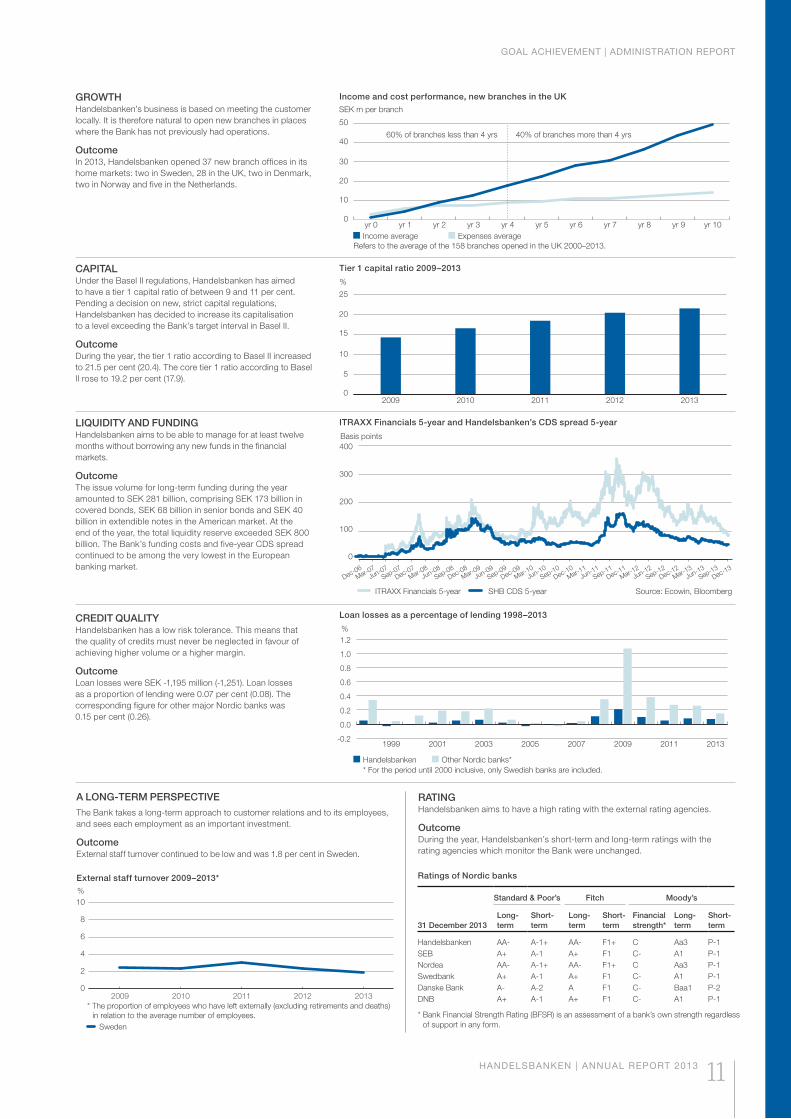
RATINGHandelsbanken aims to have a high rating with the external rating agencies.
Outcome During the year, Handelsbanken’s short-term and long-term ratings with the rating agencies which monitor the Bank were unchanged.
CAPITALUnder the Basel II regulations, Handelsbanken has aimed to have a tier 1 capital ratio of between 9 and 11 per cent. Pending a decision on new, strict capital regulations, Handelsbanken has decided to increase its capitalisation to a level exceeding the Bank’s target interval in Basel II.
OutcomeDuring the year, the tier 1 ratio according to Basel II increased to 21.5 per cent (20.4). The core tier 1 ratio according to Basel II rose to 19.2 per cent (17.9).
Tier 1 capital ratio 2009–2013
LIQUIDITY AND FUNDINGHandelsbanken aims to be able to manage for at least twelve months without borrowing any new funds in the financial markets.
Outcome The issue volume for long-term funding during the year amounted to SEK 281 billion, comprising SEK 173 billion in covered bonds, SEK 68 billion in senior bonds and SEK 40 billion in extendible notes in the American market. At the end of the year, the total liquidity reserve exceeded SEK 800 billion. The Bank’s funding costs and five-year CDS spread continued to be among the very lowest in the European banking market.
ITRAXX Financials 5-year and Handelsbanken’s CDS spread 5-year
CREDIT QUALITYHandelsbanken has a low risk tolerance. This means that the quality of credits must never be neglected in favour of achieving higher volume or a higher margin.
Outcome Loan losses were SEK -1,195 million (-1,251). Loan losses as a proportion of lending were 0.07 per cent (0.08). The corresponding figure for other major Nordic banks was 0.15 per cent (0.26).
Loan losses as a percentage of lending 1998–2013
GROWTHHandelsbanken’s business is based on meeting the customer locally. It is therefore natural to open new branches in places where the Bank has not previously had operations.
OutcomeIn 2013, Handelsbanken opened 37 new branch offices in its home markets: two in Sweden, 28 in the UK, two in Denmark, two in Norway and five in the Netherlands.
Income and cost performance, new branches in the UK
Ratings of Nordic banks
Standard & Poor’s Fitch Moody’s
31 December 2013Long-term
Short-term
Long-term
Short-term
Financial strength*
Long-term
Short-term
Handelsbanken AA- A-1+ AA- F1+ C Aa3 P-1SEB A+ A-1 A+ F1 C- A1 P-1Nordea AA- A-1+ AA- F1+ C Aa3 P-1Swedbank A+ A-1 A+ F1 C- A1 P-1Danske Bank A- A-2 A F1 C- Baa1 P-2DNB A+ A-1 A+ F1 C- A1 P-1
* Bank Financial Strength Rating (BFSR) is an assessment of a bank’s own strength regardless of support in any form.
SEK m per branch
0
10
20
30
40
50
yr 10yr 9yr 8yr 7yr 6yr 5yr 4yr 3yr 2yr 1yr 0
Refers to the average of the 158 branches opened in the UK 2000–2013.
40% of branches more than 4 yrs
Expenses averageIncome average
60% of branches less than 4 yrs
Basis points
Dec-06Dec-07
Sep-07Mar-0
7Jun-07
Mar-08Jun-08
Sep-08Dec-08
Mar-09Jun-09
Sep-09Dec-09
Mar-10Jun-10
Sep-10Dec-10
Mar-11
Mar-13
Jun-11Jun-13
Jun-12Sep-11
Dec-11Dec-12
Mar-12
Sep-12Sep-13
Dec-13
ITRAXX Financials 5-year SHB CDS 5-year Source: Ecowin, Bloomberg
0
100
200
300
400
* For the period until 2000 inclusive, only Swedish banks are included.Other Nordic banks*Handelsbanken
%
-0.2
0.0
0.2
0.4
0.6
0.8
1.0
1.2
20132011200920072005200320011999
A LONG-TERM PERSPECTIVEThe Bank takes a long-term approach to customer relations and to its employees, and sees each employment as an important investment.
Outcome External staff turnover continued to be low and was 1.8 per cent in Sweden.
External staff turnover 2009–2013*
0
2
4
6
8
10
20132012201120102009
Sweden
%
* The proportion of employees who have left externally (excluding retirements and deaths) in relation to the average number of employees.
0
5
10
15
20
25
20132012201120102009
%
OUR CONCEPT | ADMINISTRATION REPORT
12 HANDELSBANKEN | ANNUAL REPORT 2013
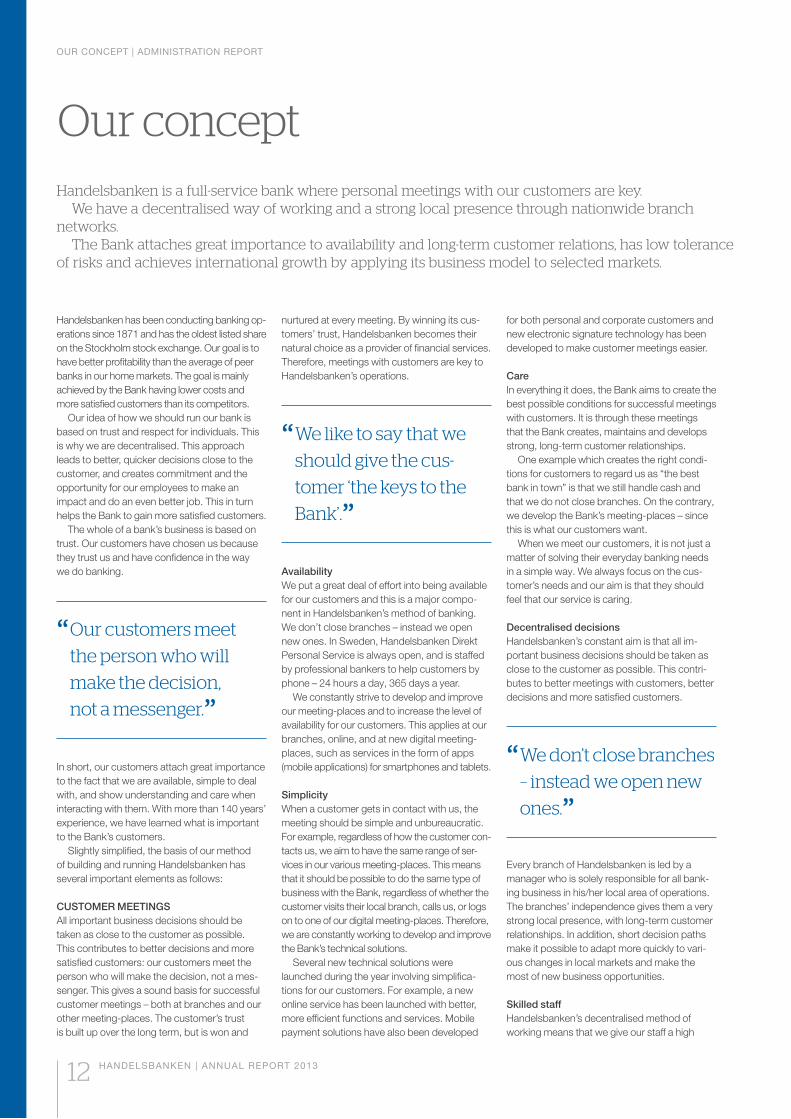
Handelsbanken is a full-service bank where personal meetings with our customers are key.
networks. The Bank attaches great importance to availability and long-term customer relations, has low tolerance
of risks and achieves international growth by applying its business model to selected markets.
Handelsbanken has been conducting banking op-erations since 1871 and has the oldest listed share on the Stockholm stock exchange. Our goal is to have better profitability than the average of peer banks in our home markets. The goal is mainly achieved by the Bank having lower costs and more satisfied customers than its competitors.
Our idea of how we should run our bank is based on trust and respect for individuals. This is why we are decentralised. This approach leads to better, quicker decisions close to the customer, and creates commitment and the opportunity for our employees to make an impact and do an even better job. This in turn helps the Bank to gain more satisfied customers.
The whole of a bank’s business is based on trust. Our customers have chosen us because they trust us and have confidence in the way we do banking.
“ the person who will
make the decision,
not a messenger.”In short, our customers attach great importance to the fact that we are available, simple to deal with, and show understanding and care when interacting with them. With more than 140 years’ experience, we have learned what is important to the Bank’s customers.
Slightly simplified, the basis of our method of building and running Handelsbanken has several important elements as follows:
CUSTOMER MEETINGSAll important business decisions should be taken as close to the customer as possible. This contributes to better decisions and more satisfied customers: our customers meet the person who will make the decision, not a mes-senger. This gives a sound basis for successful customer meetings – both at branches and our other meeting-places. The customer’s trust is built up over the long term, but is won and
nurtured at every meeting. By winning its cus-tomers’ trust, Handelsbanken becomes their natural choice as a provider of financial services. Therefore, meetings with customers are key to Handelsbanken’s operations.
“ should give the cus-
tomer ‘the keys to the
Bank’.”AvailabilityWe put a great deal of effort into being available for our customers and this is a major compo-nent in Handelsbanken’s method of banking. We don’t close branches – instead we open new ones. In Sweden, Handelsbanken Direkt Personal Service is always open, and is staffed by professional bankers to help customers by phone – 24 hours a day, 365 days a year.
We constantly strive to develop and improve our meeting-places and to increase the level of availability for our customers. This applies at our branches, online, and at new digital meeting-places, such as services in the form of apps (mobile applications) for smartphones and tablets.
SimplicityWhen a customer gets in contact with us, the meeting should be simple and unbureaucratic. For example, regardless of how the customer con-tacts us, we aim to have the same range of ser-vices in our various meeting-places. This means that it should be possible to do the same type of business with the Bank, regardless of whether the customer visits their local branch, calls us, or logs on to one of our digital meeting-places. Therefore, we are constantly working to develop and improve the Bank’s technical solutions.
Several new technical solutions were launched during the year involving simplifica-tions for our customers. For example, a new online service has been launched with better, more efficient functions and services. Mobile payment solutions have also been developed
for both personal and corporate customers and new electronic signature technology has been developed to make customer meetings easier.
CareIn everything it does, the Bank aims to create the best possible conditions for successful meetings with customers. It is through these meetings that the Bank creates, maintains and develops strong, long-term customer relationships.
One example which creates the right condi-tions for customers to regard us as “the best bank in town” is that we still handle cash and that we do not close branches. On the contrary, we develop the Bank’s meeting-places – since this is what our customers want.
When we meet our customers, it is not just a matter of solving their everyday banking needs in a simple way. We always focus on the cus-tomer’s needs and our aim is that they should feel that our service is caring.
Decentralised decisions Handelsbanken’s constant aim is that all im-portant business decisions should be taken as close to the customer as possible. This contri-butes to better meetings with customers, better decisions and more satisfied customers.
“ ones.”
Every branch of Handelsbanken is led by a manager who is solely responsible for all bank-ing business in his/her local area of operations. The branches’ independence gives them a very strong local presence, with long-term customer relationships. In addition, short decision paths make it possible to adapt more quickly to vari-ous changes in local markets and make the most of new business opportunities.
Skilled staffHandelsbanken’s decentralised method of working means that we give our staff a high
OUR CONCEPT | ADMINISTRATION REPORT
HANDELSBANKEN | ANNUAL REPORT 2013 13
degree of responsibility and authority to conduct customers’ business. This high degree of trust is based on a belief in people’s willingness and ability to constantly become more skilled in their work and in their efforts to seek and overcome new challenges.
The keys to the BankAlmost all our customer relations started at the customer’s branch, but customers meet Handelsbanken far more often on the phone, via their smartphones, tablet devices or online. The goal is for customers to be able to move freely between our various meeting-places and do their banking business when it suits them best. We like to say that we should give the customer “the keys to the Bank”.
A full range of products and servicesA vital condition for successful customer meet-ings is never to lack any product or service that a customer needs. Handelsbanken never has a niche in favour of a particular group of custom-ers, or in a specific area of products or services.
The individual customer’s unique requirements are the governing factor. Therefore, Handels-banken has a full range of products and services to meet all the financial needs of our customers.
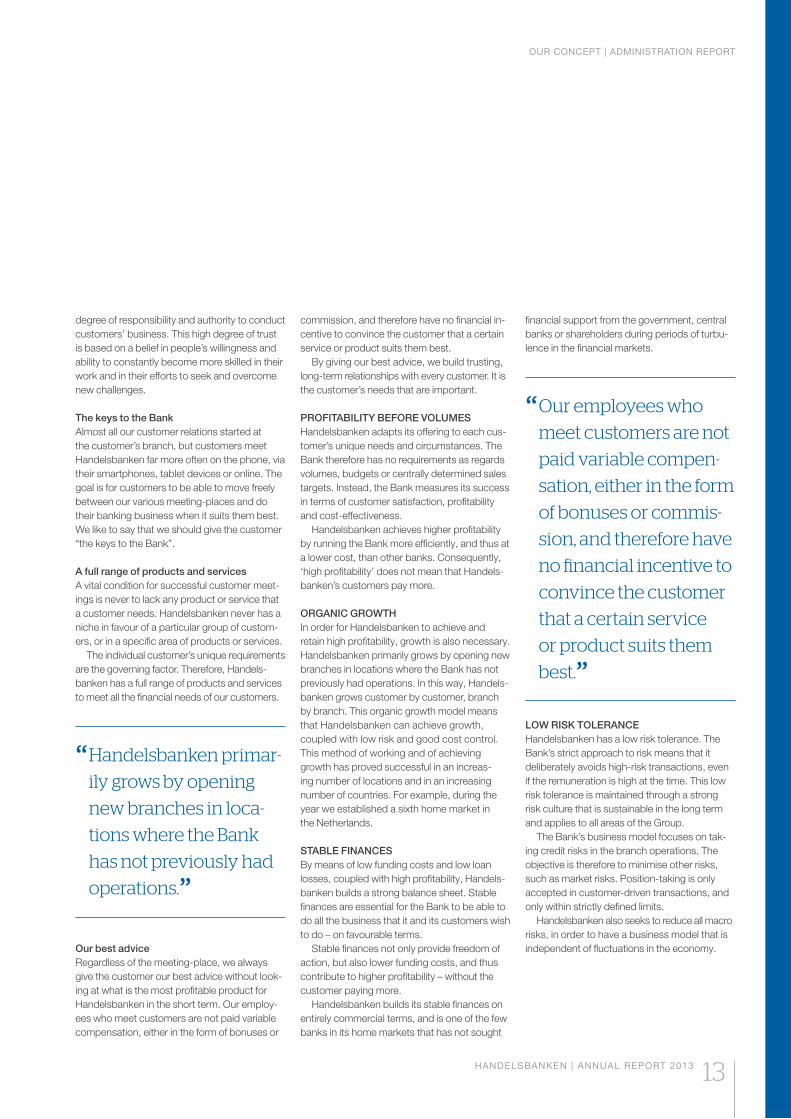
“ Handelsbanken primar-
ily grows by opening
new branches in loca-
tions where the Bank
has not previously had
operations.”
Our best adviceRegardless of the meeting-place, we always give the customer our best advice without look-ing at what is the most profitable product for Handelsbanken in the short term. Our employ-ees who meet customers are not paid variable compensation, either in the form of bonuses or
financial support from the government, central banks or shareholders during periods of turbu-lence in the financial markets.
“ meet customers are not
paid variable compen-
sation, either in the form
of bonuses or commis-
sion, and therefore have
no financial incentive to
convince the customer
that a certain service
or product suits them
best.”
LOW RISK TOLERANCEHandelsbanken has a low risk tolerance. The Bank’s strict approach to risk means that it deliberately avoids high-risk transactions, even if the remuneration is high at the time. This low risk tolerance is maintained through a strong risk culture that is sustainable in the long term and applies to all areas of the Group.
The Bank’s business model focuses on tak-ing credit risks in the branch operations. The objective is therefore to minimise other risks, such as market risks. Position-taking is only accepted in customer-driven transactions, and only within strictly defined limits.
Handelsbanken also seeks to reduce all macro risks, in order to have a business model that is independent of fluctuations in the economy.
commission, and therefore have no financial in-centive to convince the customer that a certain service or product suits them best.
By giving our best advice, we build trusting, long-term relationships with every customer. It is the customer’s needs that are important.
PROFITABILITY BEFORE VOLUMESHandelsbanken adapts its offering to each cus-tomer’s unique needs and circumstances. The Bank therefore has no requirements as regards volumes, budgets or centrally determined sales targets. Instead, the Bank measures its success in terms of customer satisfaction, profitability and cost-effectiveness.
Handelsbanken achieves higher profitability by running the Bank more efficiently, and thus at a lower cost, than other banks. Consequently, ‘high profitability’ does not mean that Handels-banken’s customers pay more.
ORGANIC GROWTHIn order for Handelsbanken to achieve and retain high profitability, growth is also necessary. Handelsbanken primarily grows by opening new branches in locations where the Bank has not previously had operations. In this way, Handels-banken grows customer by customer, branch by branch. This organic growth model means that Handelsbanken can achieve growth, coupled with low risk and good cost control. This method of working and of achieving growth has proved successful in an increas-ing number of locations and in an increasing number of countries. For example, during the year we established a sixth home market in the Netherlands.
STABLE FINANCESBy means of low funding costs and low loan losses, coupled with high profitability, Handels-banken builds a strong balance sheet. Stable finances are essential for the Bank to be able to do all the business that it and its customers wish to do – on favourable terms.
Stable finances not only provide freedom of action, but also lower funding costs, and thus contribute to higher profitability – without the customer paying more.
Handelsbanken builds its stable finances on entirely commercial terms, and is one of the few banks in its home markets that has not sought
ORGANISATION AND WORKING METHODS | ADMINISTRATION REPORT
14 HANDELSBANKEN | ANNUAL REPORT 2013
Handelsbanken is organised so as to create the best possible conditions for good meetings with customers.
Practically all important business decisions are therefore made close to our customers, at more than 800 offices worldwide.
This requires direct, effective and rapid contact with the central support functions.
BRANCH OPERATIONSHandelsbanken has six home markets: Sweden, the UK, Denmark, Finland, Norway and the Netherlands. Handelsbanken has a nationwide branch network in these countries, organised into one or more regional banks in each country.
Handelsbanken’s decentralised method of working results in a very flat organisational structure. In pace with the establishment of new home markets, the Bank strives to devolve central decision-making power, so that the deci-sions can be taken as close to the customers and the market as possible.
Almost all business matters that cannot be solved at a branch are dealt with in the country where the branch is located.
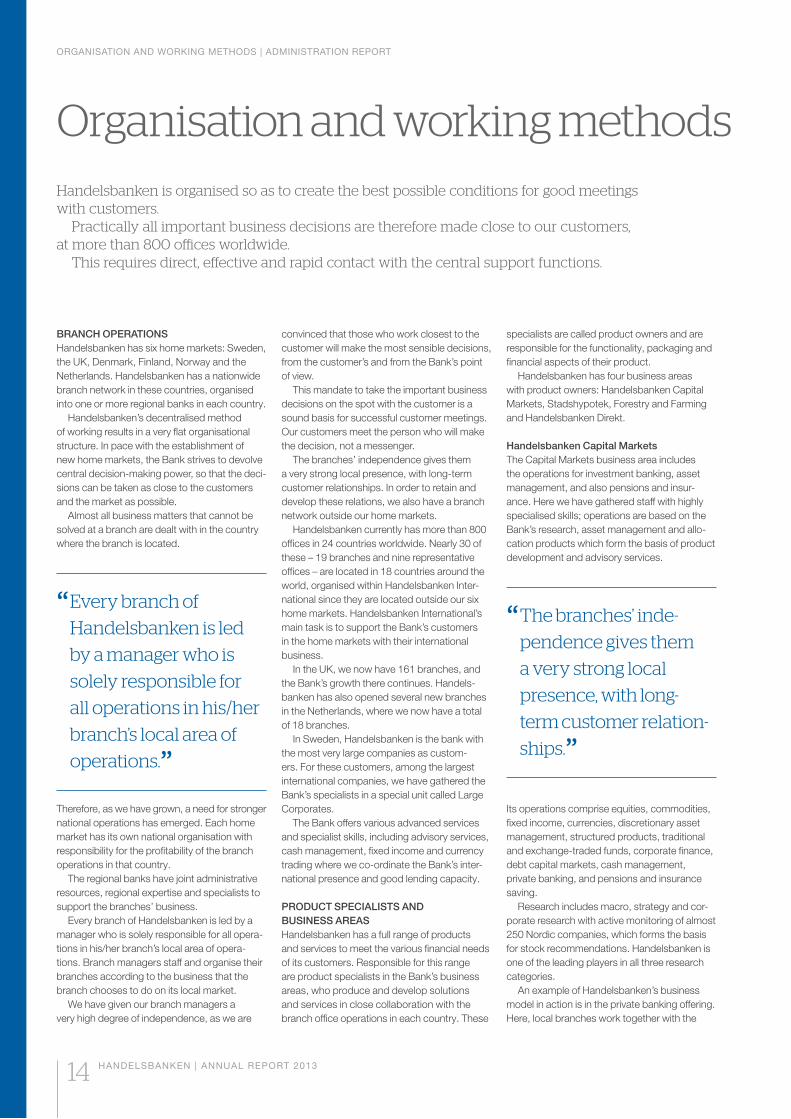
“ Every branch of
Handelsbanken is led
by a manager who is
solely responsible for
branch’s local area of
operations.”Therefore, as we have grown, a need for stronger national operations has emerged. Each home market has its own national organisation with responsibility for the profitability of the branch operations in that country.
The regional banks have joint administrative resources, regional expertise and specialists to support the branches’ business.
Every branch of Handelsbanken is led by a manager who is solely responsible for all opera-tions in his/her branch’s local area of opera-tions. Branch managers staff and organise their branches according to the business that the branch chooses to do on its local market.
We have given our branch managers a very high degree of independence, as we are
convinced that those who work closest to the customer will make the most sensible decisions, from the customer’s and from the Bank’s point of view.
This mandate to take the important business decisions on the spot with the customer is a sound basis for successful customer meetings. Our customers meet the person who will make the decision, not a messenger.
The branches’ independence gives them a very strong local presence, with long-term customer relationships. In order to retain and develop these relations, we also have a branch network outside our home markets.
Handelsbanken currently has more than 800 offices in 24 countries worldwide. Nearly 30 of these – 19 branches and nine representative offices – are located in 18 countries around the world, organised within Handelsbanken Inter-national since they are located outside our six home markets. Handelsbanken International’s main task is to support the Bank’s customers in the home markets with their international business.
In the UK, we now have 161 branches, and the Bank’s growth there continues. Handels-banken has also opened several new branches in the Netherlands, where we now have a total of 18 branches.
In Sweden, Handelsbanken is the bank with the most very large companies as custom-ers. For these customers, among the largest international companies, we have gathered the Bank’s specialists in a special unit called Large Corporates.
The Bank offers various advanced services and specialist skills, including advisory services, cash management, fixed income and currency trading where we co-ordinate the Bank’s inter-national presence and good lending capacity.
PRODUCT SPECIALISTS AND BUSINESS AREASHandelsbanken has a full range of products and services to meet the various financial needs of its customers. Responsible for this range are product specialists in the Bank’s business areas, who produce and develop solutions and services in close collaboration with the branch office operations in each country. These
specialists are called product owners and are responsible for the functionality, packaging and financial aspects of their product.
Handelsbanken has four business areas with product owners: Handelsbanken Capital Markets, Stadshypotek, Forestry and Farming and Handelsbanken Direkt.
Handelsbanken Capital MarketsThe Capital Markets business area includes the operations for investment banking, asset management, and also pensions and insur-ance. Here we have gathered staff with highly specialised skills; operations are based on the Bank’s research, asset management and allo-cation products which form the basis of product development and advisory services.
“ The branches’ inde-
pendence gives them
a very strong local
presence, with long-
term customer relation-
ships.”Its operations comprise equities, commodities, fixed income, currencies, discretionary asset management, structured products, traditional and exchange-traded funds, corporate finance, debt capital markets, cash management, private banking, and pensions and insurance saving.
Research includes macro, strategy and cor-porate research with active monitoring of almost 250 Nordic companies, which forms the basis for stock recommendations. Handelsbanken is one of the leading players in all three research categories.
An example of Handelsbanken’s business model in action is in the private banking offering. Here, local branches work together with the
ORGANISATION AND WORKING METHODS | ADMINISTRATION REPORT
HANDELSBANKEN | ANNUAL REPORT 2013 15
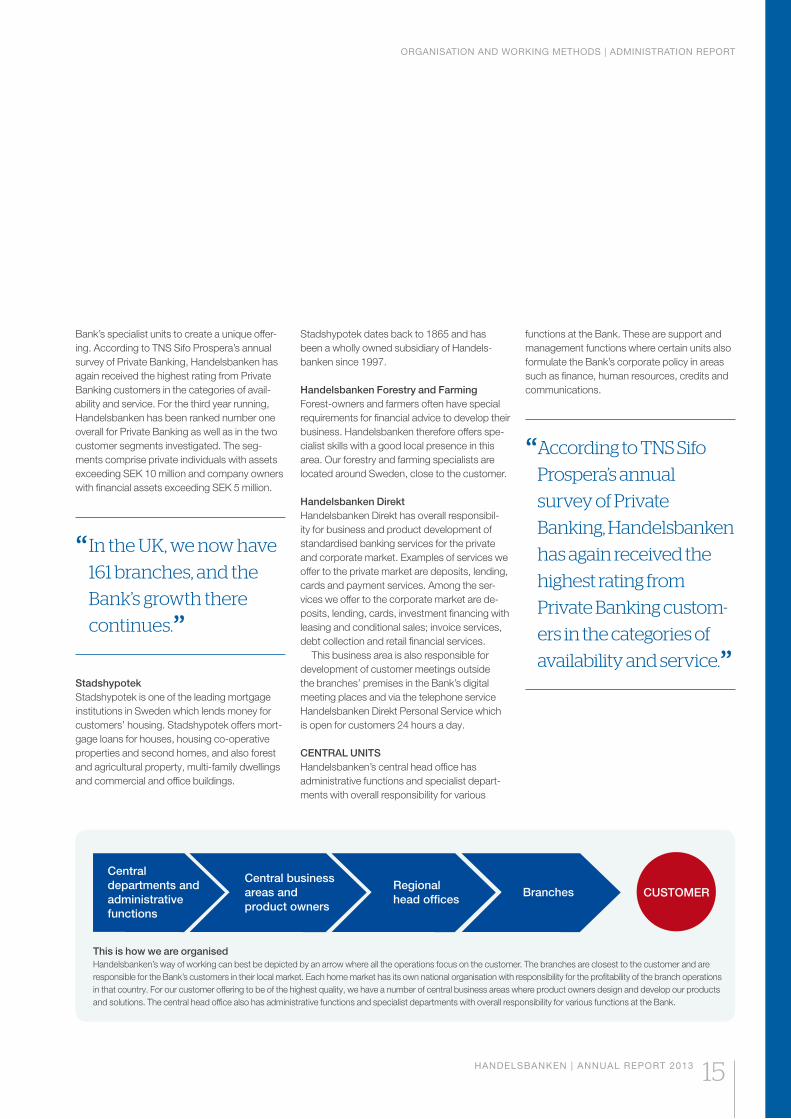
Bank’s specialist units to create a unique offer-ing. According to TNS Sifo Prospera’s annual survey of Private Banking, Handelsbanken has again received the highest rating from Private Banking customers in the categories of avail-ability and service. For the third year running, Handelsbanken has been ranked number one overall for Private Banking as well as in the two customer segments investigated. The seg-ments comprise private individuals with assets exceeding SEK 10 million and company owners with financial assets exceeding SEK 5 million.
“ In the UK, we now have
161 branches, and the
Bank’s growth there
continues.”StadshypotekStadshypotek is one of the leading mortgage institutions in Sweden which lends money for customers’ housing. Stadshypotek offers mort-gage loans for houses, housing co-operative properties and second homes, and also forest and agricultural property, multi-family dwellings and commercial and office buildings.
functions at the Bank. These are support and management functions where certain units also formulate the Bank’s corporate policy in areas such as finance, human resources, credits and communications.
“ According to TNS Sifo
Prospera’s annual
survey of Private
Banking, Handelsbanken
has again received the
highest rating from
Private Banking custom-
ers in the categories of
availability and service.”
Stadshypotek dates back to 1865 and has been a wholly owned subsidiary of Handels-banken since 1997.
Handelsbanken Forestry and FarmingForest-owners and farmers often have special requirements for financial advice to develop their business. Handelsbanken therefore offers spe-cialist skills with a good local presence in this area. Our forestry and farming specialists are located around Sweden, close to the customer.
Handelsbanken DirektHandelsbanken Direkt has overall responsibil-ity for business and product development of standardised banking services for the private and corporate market. Examples of services we offer to the private market are deposits, lending, cards and payment services. Among the ser-vices we offer to the corporate market are de-posits, lending, cards, investment financing with leasing and conditional sales; invoice services, debt collection and retail financial services.
This business area is also responsible for development of customer meetings outside the branches’ premises in the Bank’s digital meeting places and via the telephone service Handelsbanken Direkt Personal Service which is open for customers 24 hours a day.
CENTRAL UNITSHandelsbanken’s central head office has administrative functions and specialist depart-ments with overall responsibility for various
This is how we are organisedHandelsbanken’s way of working can best be depicted by an arrow where all the operations focus on the customer. The branches are closest to the customer and are responsible for the Bank’s customers in their local market. Each home market has its own national organisation with responsibility for the profitability of the branch operations in that country. For our customer offering to be of the highest quality, we have a number of central business areas where product owners design and develop our products and solutions. The central head office also has administrative functions and specialist departments with overall responsibility for various functions at the Bank.
CUSTOMER
Central departments and administrative functions
Central business areas and product owners
Regionalhead offices
Branches
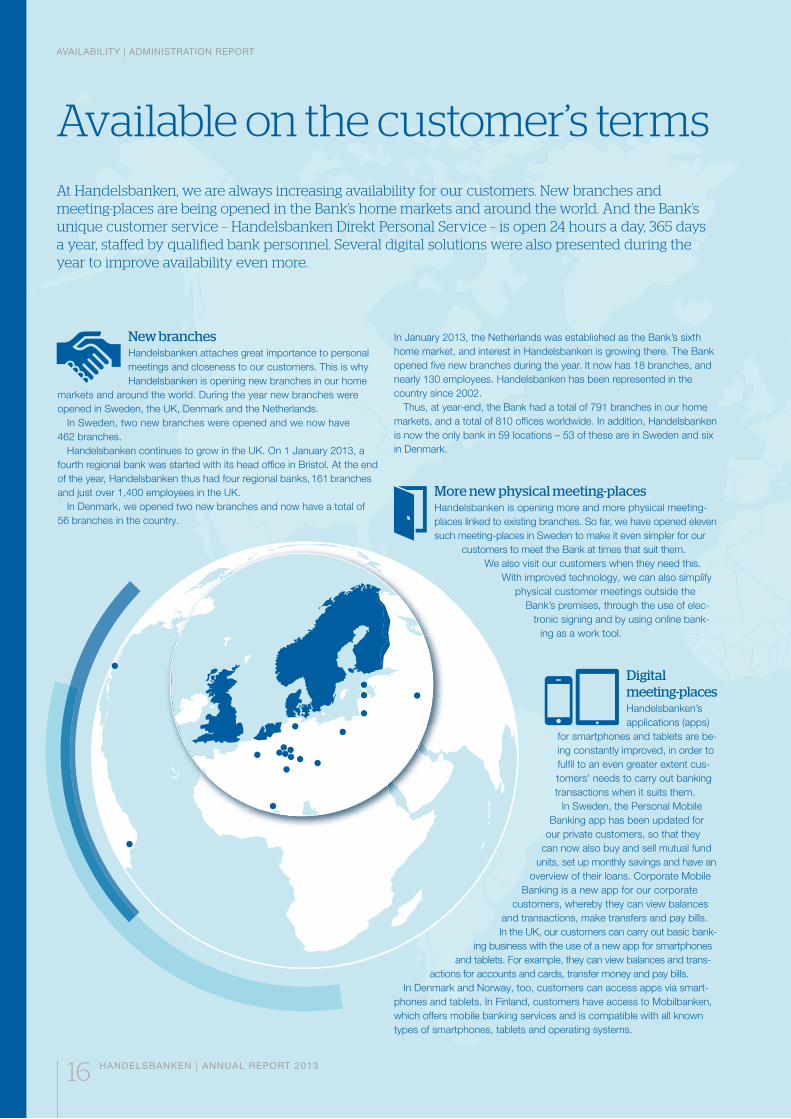
Available on the customer’s termsAt Handelsbanken, we are always increasing availability for our customers. New branches and meeting-places are being opened in the Bank’s home markets and around the world. And the Bank’s
a year, staffed by qualified bank personnel. Several digital solutions were also presented during the year to improve availability even more.
In January 2013, the Netherlands was established as the Bank’s sixth home market, and interest in Handelsbanken is growing there. The Bank opened five new branches during the year. It now has 18 branches, and nearly 130 employees. Handelsbanken has been represented in the country since 2002.
Thus, at year-end, the Bank had a total of 791 branches in our home markets, and a total of 810 offices worldwide. In addition, Handelsbanken is now the only bank in 59 locations – 53 of these are in Sweden and six in Denmark.
More new physical meeting-placesHandelsbanken is opening more and more physical meeting-places linked to existing branches. So far, we have opened eleven such meeting-places in Sweden to make it even simpler for our
customers to meet the Bank at times that suit them.We also visit our customers when they need this.
With improved technology, we can also simplify physical customer meetings outside the
Bank’s premises, through the use of elec-tronic signing and by using online bank-
ing as a work tool.
Digital meeting-places Handelsbanken’s applications (apps)
for smartphones and tablets are be-ing constantly improved, in order to fulfil to an even greater extent cus-tomers’ needs to carry out banking transactions when it suits them.
In Sweden, the Personal Mobile Banking app has been updated for
our private customers, so that they can now also buy and sell mutual fund
units, set up monthly savings and have an overview of their loans. Corporate Mobile
Banking is a new app for our corporate customers, whereby they can view balances
and transactions, make transfers and pay bills.In the UK, our customers can carry out basic bank-
ing business with the use of a new app for smartphones and tablets. For example, they can view balances and trans-
actions for accounts and cards, transfer money and pay bills.In Denmark and Norway, too, customers can access apps via smart-
phones and tablets. In Finland, customers have access to Mobilbanken, which offers mobile banking services and is compatible with all known types of smartphones, tablets and operating systems.
New branches Handelsbanken attaches great importance to personal meetings and closeness to our customers. This is why Handelsbanken is opening new branches in our home
markets and around the world. During the year new branches were opened in Sweden, the UK, Denmark and the Netherlands.
In Sweden, two new branches were opened and we now have 462 branches.
Handelsbanken continues to grow in the UK. On 1 January 2013, a fourth regional bank was started with its head office in Bristol. At the end of the year, Handelsbanken thus had four regional banks, 161 branches and just over 1,400 employees in the UK.
In Denmark, we opened two new branches and now have a total of 56 branches in the country.
AVAILABILITY | ADMINISTRATION REPORT
16 HANDELSBANKEN | ANNUAL REPORT 2013
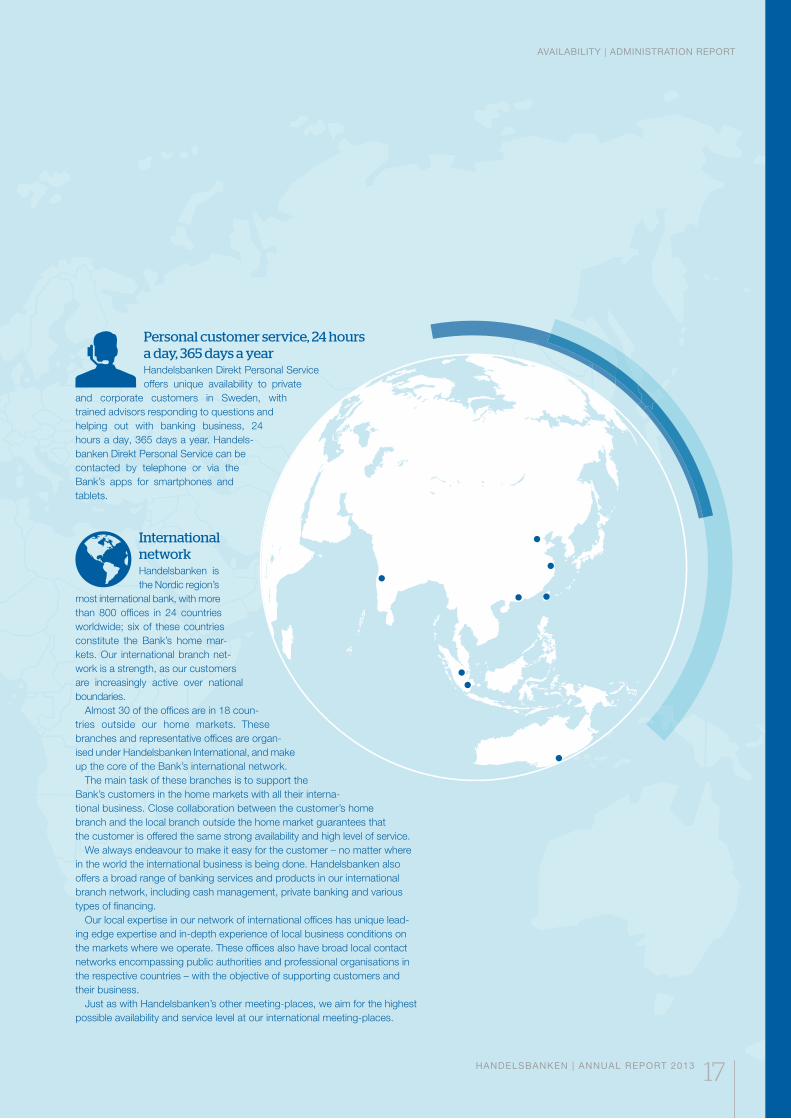
Personal customer service, 24 hours a day, 365 days a year Handelsbanken Direkt Personal Service offers unique availability to private
and corporate customers in Sweden, with trained advisors responding to questions and helping out with banking business, 24 hours a day, 365 days a year. Handels-banken Direkt Personal Service can be contacted by telephone or via the Bank’s apps for smartphones and tablets.
International networkHandelsbanken is the Nordic region’s
most international bank, with more than 800 offices in 24 countries worldwide; six of these countries constitute the Bank’s home mar-kets. Our inter national branch net-work is a strength, as our customers are increasingly active over national boundaries.
Almost 30 of the offices are in 18 coun-tries outside our home markets. These branches and representative offices are organ-ised under Handelsbanken International, and make up the core of the Bank’s international network.
The main task of these branches is to support the Bank’s customers in the home markets with all their interna-tional business. Close collaboration between the customer’s home branch and the local branch outside the home market guarantees that the customer is offered the same strong availability and high level of service.
We always endeavour to make it easy for the customer – no matter where in the world the international business is being done. Handelsbanken also offers a broad range of banking services and products in our international branch network, including cash management, private banking and various types of financing.
Our local expertise in our network of international offices has unique lead-ing edge expertise and in-depth experience of local business conditions on the markets where we operate. These offices also have broad local contact networks encompassing public authorities and professional organisations in the respective countries – with the objective of supporting customers and their business.
Just as with Handelsbanken’s other meeting-places, we aim for the highest possible availability and service level at our international meeting-places.
AVAILABILITY | ADMINISTRATION REPORT
HANDELSBANKEN | ANNUAL REPORT 2013 17

FINANCIAL OVERVIEW | ADMINISTRATION REPORT
HANDELSBANKEN | ANNUAL REPORT 2013 19
Financial overview 2013
-
-
REVIEW OF OPERATIONS | ADMINISTRATION REPORT
20 HANDELSBANKEN | ANNUAL REPORT 2013
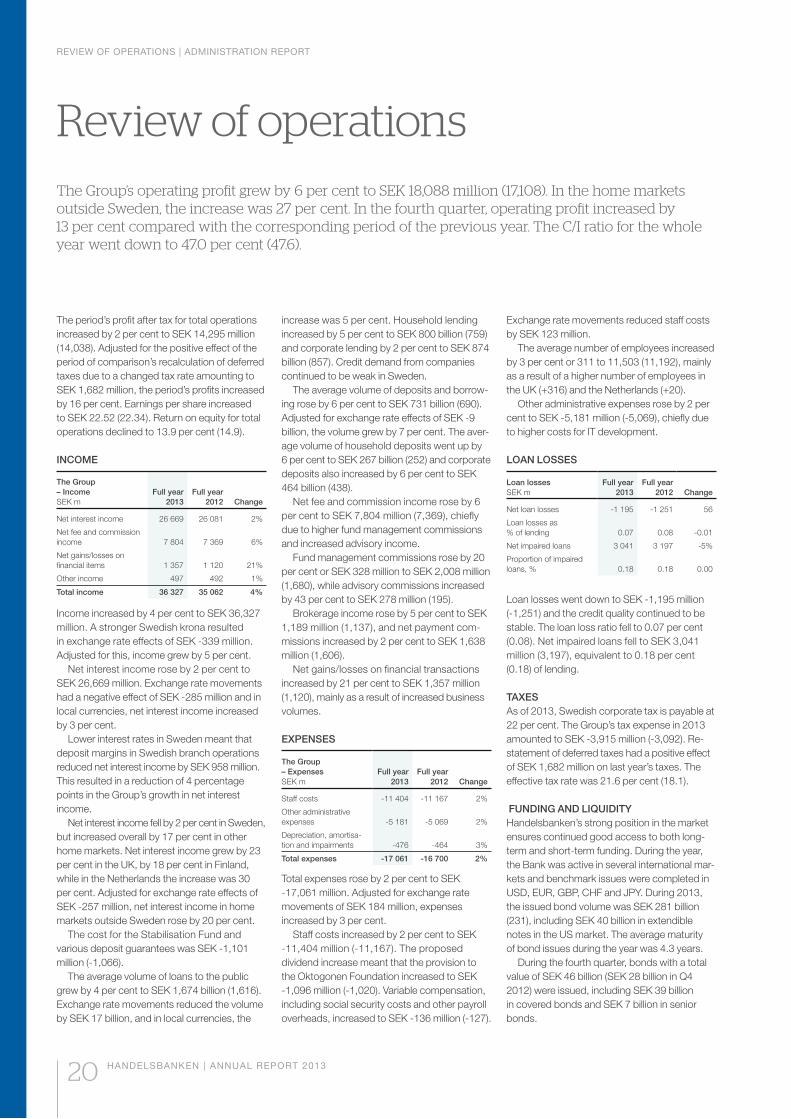
The period’s profit after tax for total operations increased by 2 per cent to SEK 14,295 million (14,038). Adjusted for the positive effect of the period of comparison’s recalculation of deferred taxes due to a changed tax rate amounting to SEK 1,682 million, the period’s profits increased by 16 per cent. Earnings per share increased to SEK 22.52 (22.34). Return on equity for total operations declined to 13.9 per cent (14.9).
INCOME
The Group – IncomeSEK m
Full year 2013
Full year 2012 Change
Net interest income 26 669 26 081 2%
Net fee and commission income 7 804 7 369 6%
Net gains/losses on financial items 1 357 1 120 21%
Other income 497 492 1%
Total income 36 327 35 062 4%
Income increased by 4 per cent to SEK 36,327 million. A stronger Swedish krona resulted in exchange rate effects of SEK -339 million. Adjusted for this, income grew by 5 per cent.
Net interest income rose by 2 per cent to SEK 26,669 million. Exchange rate movements had a negative effect of SEK -285 million and in local currencies, net interest income increased by 3 per cent.
Lower interest rates in Sweden meant that deposit margins in Swedish branch operations reduced net interest income by SEK 958 million. This resulted in a reduction of 4 percentage points in the Group’s growth in net interest income.
Net interest income fell by 2 per cent in Sweden, but increased overall by 17 per cent in other home markets. Net interest income grew by 23 per cent in the UK, by 18 per cent in Finland, while in the Netherlands the increase was 30 per cent. Adjusted for exchange rate effects of SEK -257 million, net interest income in home markets outside Sweden rose by 20 per cent.
The cost for the Stabilisation Fund and various deposit guarantees was SEK -1,101 million (-1,066).
The average volume of loans to the public grew by 4 per cent to SEK 1,674 billion (1,616). Exchange rate movements reduced the volume by SEK 17 billion, and in local currencies, the
increase was 5 per cent. Household lending increased by 5 per cent to SEK 800 billion (759) and corporate lending by 2 per cent to SEK 874 billion (857). Credit demand from companies continued to be weak in Sweden.
The average volume of deposits and borrow-ing rose by 6 per cent to SEK 731 billion (690). Adjusted for exchange rate effects of SEK -9 billion, the volume grew by 7 per cent. The aver-age volume of household deposits went up by 6 per cent to SEK 267 billion (252) and corporate deposits also increased by 6 per cent to SEK 464 billion (438).
Net fee and commission income rose by 6 per cent to SEK 7,804 million (7,369), chiefly due to higher fund management commissions and increased advisory income.
Fund management commissions rose by 20 per cent or SEK 328 million to SEK 2,008 million (1,680), while advisory commissions increased by 43 per cent to SEK 278 million (195).
Brokerage income rose by 5 per cent to SEK 1,189 million (1,137), and net payment com-missions increased by 2 per cent to SEK 1,638 million (1,606).
Net gains/losses on financial transactions increased by 21 per cent to SEK 1,357 million (1,120), mainly as a result of increased business volumes.
EXPENSES
The Group – Expenses SEK m
Full year 2013
Full year 2012 Change
Staff costs -11 404 -11 167 2%
Other administrative expenses -5 181 -5 069 2%
Depreciation, amortisa-tion and impairments -476 -464 3%
Total expenses -17 061 -16 700 2%
Total expenses rose by 2 per cent to SEK -17,061 million. Adjusted for exchange rate movements of SEK 184 million, expenses increased by 3 per cent.
Staff costs increased by 2 per cent to SEK -11,404 million (-11,167). The proposed dividend increase meant that the provision to the Oktogonen Foundation increased to SEK -1,096 million (-1,020). Variable compensation, including social security costs and other payroll overheads, increased to SEK -136 million (-127).
Exchange rate movements reduced staff costs by SEK 123 million.
The average number of employees increased by 3 per cent or 311 to 11,503 (11,192), mainly as a result of a higher number of employees in the UK (+316) and the Netherlands (+20).
Other administrative expenses rose by 2 per cent to SEK -5,181 million (-5,069), chiefly due to higher costs for IT development.
LOAN LOSSES
Loan lossesSEK m
Full year 2013
Full year 2012 Change
Net loan losses -1 195 -1 251 56
Loan losses as % of lending 0.07 0.08 -0.01
Net impaired loans 3 041 3 197 -5%
Proportion of impaired loans, % 0.18 0.18 0.00
Loan losses went down to SEK -1,195 million (-1,251) and the credit quality continued to be stable. The loan loss ratio fell to 0.07 per cent (0.08). Net impaired loans fell to SEK 3,041 million (3,197), equivalent to 0.18 per cent (0.18) of lending.
TAXESAs of 2013, Swedish corporate tax is payable at 22 per cent. The Group’s tax expense in 2013 amounted to SEK -3,915 million (-3,092). Re-statement of deferred taxes had a positive effect of SEK 1,682 million on last year’s taxes. The effective tax rate was 21.6 per cent (18.1).
FUNDING AND LIQUIDITY Handelsbanken’s strong position in the market ensures continued good access to both long-term and short-term funding. During the year, the Bank was active in several international mar-kets and benchmark issues were completed in USD, EUR, GBP, CHF and JPY. During 2013, the issued bond volume was SEK 281 billion (231), including SEK 40 billion in extendible notes in the US market. The average maturity of bond issues during the year was 4.3 years.
During the fourth quarter, bonds with a total value of SEK 46 billion (SEK 28 billion in Q4 2012) were issued, including SEK 39 billion in covered bonds and SEK 7 billion in senior bonds.
REVIEW OF OPERATIONS | ADMINISTRATION REPORT
HANDELSBANKEN | ANNUAL REPORT 2013 21
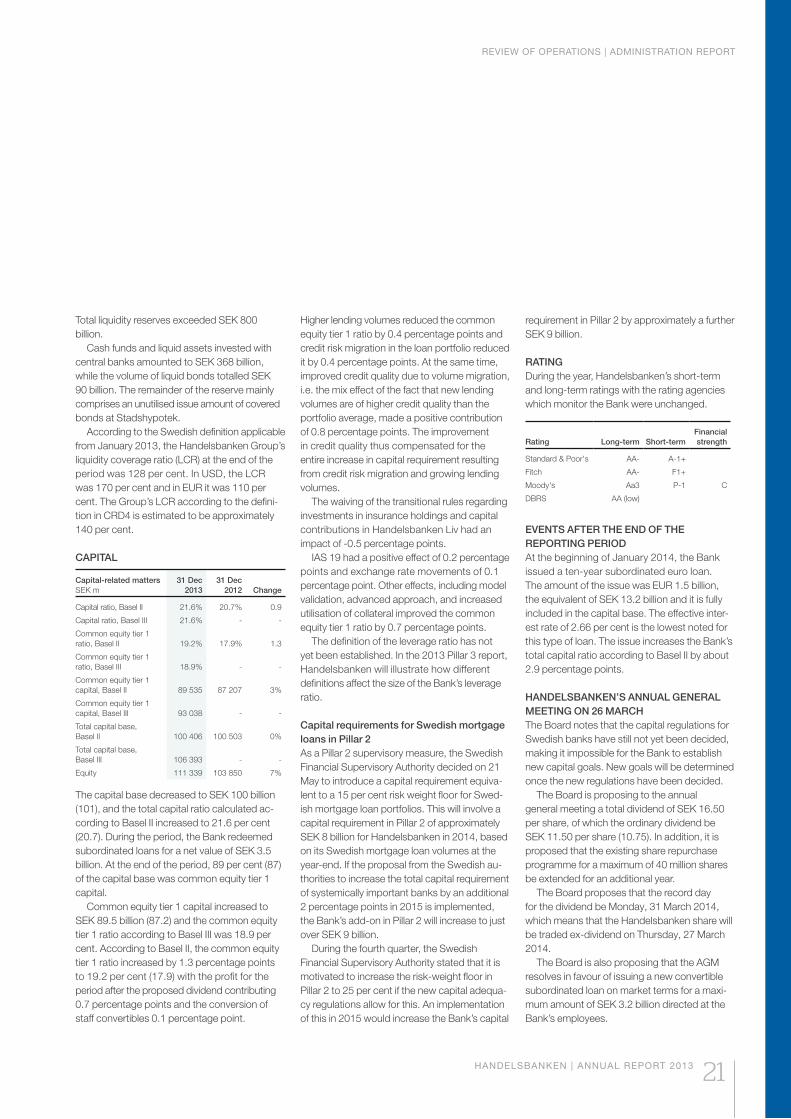
Total liquidity reserves exceeded SEK 800 billion.
Cash funds and liquid assets invested with central banks amounted to SEK 368 billion, while the volume of liquid bonds totalled SEK 90 billion. The remainder of the reserve mainly comprises an unutilised issue amount of covered bonds at Stadshypotek.
According to the Swedish definition applicable from January 2013, the Handelsbanken Group’s liquidity coverage ratio (LCR) at the end of the period was 128 per cent. In USD, the LCR was 170 per cent and in EUR it was 110 per cent. The Group’s LCR according to the defini-tion in CRD4 is estimated to be approximately 140 per cent.
CAPITAL
Capital-related mattersSEK m
31 Dec 2013
31 Dec 2012 Change
Capital ratio, Basel II 21.6% 20.7% 0.9
Capital ratio, Basel III 21.6% - -
Common equity tier 1 ratio, Basel II 19.2% 17.9% 1.3
Common equity tier 1 ratio, Basel III 18.9% - -
Common equity tier 1 capital, Basel II 89 535 87 207 3%
Common equity tier 1 capital, Basel III 93 038 - -
Total capital base, Basel II 100 406 100 503 0%
Total capital base, Basel III 106 393 - -
Equity 111 339 103 850 7%
The capital base decreased to SEK 100 billion (101), and the total capital ratio calculated ac-cording to Basel II increased to 21.6 per cent (20.7). During the period, the Bank redeemed subordinated loans for a net value of SEK 3.5 billion. At the end of the period, 89 per cent (87) of the capital base was common equity tier 1 capital.
Common equity tier 1 capital increased to SEK 89.5 billion (87.2) and the common equity tier 1 ratio according to Basel III was 18.9 per cent. According to Basel II, the common equity tier 1 ratio increased by 1.3 percentage points to 19.2 per cent (17.9) with the profit for the period after the proposed dividend contributing 0.7 percentage points and the conversion of staff convertibles 0.1 percentage point.
Higher lending volumes reduced the common equity tier 1 ratio by 0.4 percentage points and credit risk migration in the loan portfolio reduced it by 0.4 percentage points. At the same time, improved credit quality due to volume migration, i.e. the mix effect of the fact that new lending volumes are of higher credit quality than the portfolio average, made a positive contribution of 0.8 percentage points. The improvement in credit quality thus compensated for the entire increase in capital requirement resulting from credit risk migration and growing lending volumes.
The waiving of the transitional rules regarding investments in insurance holdings and capital contributions in Handelsbanken Liv had an impact of -0.5 percentage points.
IAS 19 had a positive effect of 0.2 percentage points and exchange rate movements of 0.1 percentage point. Other effects, including model validation, advanced approach, and increased utilisation of collateral improved the common equity tier 1 ratio by 0.7 percentage points.
The definition of the leverage ratio has not yet been established. In the 2013 Pillar 3 report, Handelsbanken will illustrate how different definitions affect the size of the Bank’s leverage ratio.
Capital requirements for Swedish mortgage loans in Pillar 2As a Pillar 2 supervisory measure, the Swedish Financial Supervisory Authority decided on 21 May to introduce a capital requirement equiva-lent to a 15 per cent risk weight floor for Swed-ish mortgage loan portfolios. This will involve a capital requirement in Pillar 2 of approximately SEK 8 billion for Handelsbanken in 2014, based on its Swedish mortgage loan volumes at the year-end. If the proposal from the Swedish au-thorities to increase the total capital requirement of systemically important banks by an additional 2 percentage points in 2015 is implemented, the Bank’s add-on in Pillar 2 will increase to just over SEK 9 billion.
During the fourth quarter, the Swedish Financial Supervisory Authority stated that it is motivated to increase the risk-weight floor in Pillar 2 to 25 per cent if the new capital adequa-cy regulations allow for this. An implementation of this in 2015 would increase the Bank’s capital
requirement in Pillar 2 by approximately a further SEK 9 billion.
RATINGDuring the year, Handelsbanken’s short-term and long-term ratings with the rating agencies which monitor the Bank were unchanged.
Rating Long-term Short-termFinancial strength
Standard & Poor's AA- A-1+
Fitch AA- F1+
Moody's Aa3 P-1 C
DBRS AA (low)
EVENTS AFTER THE END OF THE REPORTING PERIODAt the beginning of January 2014, the Bank issued a ten-year subordinated euro loan. The amount of the issue was EUR 1.5 billion, the equivalent of SEK 13.2 billion and it is fully included in the capital base. The effective inter-est rate of 2.66 per cent is the lowest noted for this type of loan. The issue increases the Bank’s total capital ratio according to Basel II by about 2.9 percentage points.
HANDELSBANKEN’S ANNUAL GENERAL MEETING ON 26 MARCHThe Board notes that the capital regulations for Swedish banks have still not yet been decided, making it impossible for the Bank to establish new capital goals. New goals will be determined once the new regulations have been decided.
The Board is proposing to the annual general meeting a total dividend of SEK 16.50 per share, of which the ordinary dividend be SEK 11.50 per share (10.75). In addition, it is proposed that the existing share repurchase programme for a maximum of 40 million shares be extended for an additional year.
The Board proposes that the record day for the dividend be Monday, 31 March 2014, which means that the Handelsbanken share will be traded ex-dividend on Thursday, 27 March 2014.
The Board is also proposing that the AGM resolves in favour of issuing a new convertible subordinated loan on market terms for a maxi-mum amount of SEK 3.2 billion directed at the Bank’s employees.
FIVE-YEAR OVERVIEW GROUP | ADMINISTRATION REPORT
22 HANDELSBANKEN | ANNUAL REPORT 2013
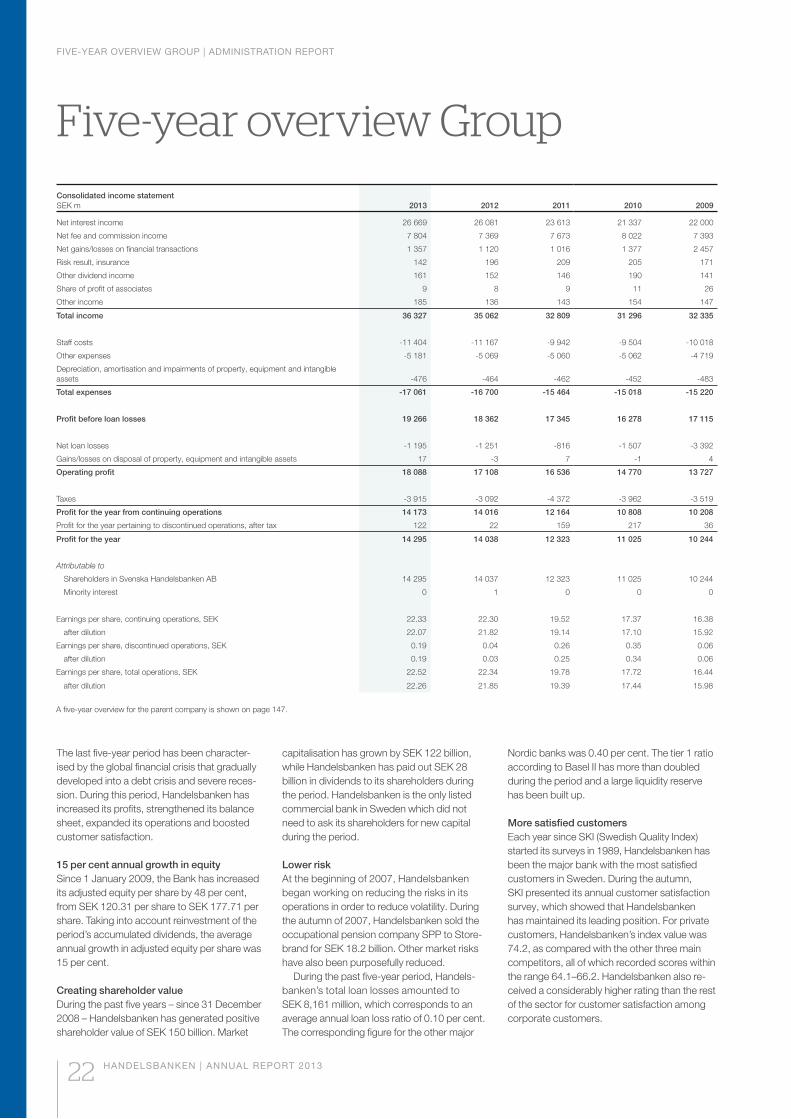
The last five-year period has been character-ised by the global financial crisis that gradually developed into a debt crisis and severe reces-sion. During this period, Handelsbanken has increased its profits, strengthened its balance sheet, expanded its operations and boosted customer satisfaction.
15 per cent annual growth in equity Since 1 January 2009, the Bank has increased its adjusted equity per share by 48 per cent, from SEK 120.31 per share to SEK 177.71 per share. Taking into account reinvestment of the period’s accumulated dividends, the average annual growth in adjusted equity per share was 15 per cent.
Creating shareholder value During the past five years – since 31 December 2008 – Handelsbanken has generated positive shareholder value of SEK 150 billion. Market
capitalisation has grown by SEK 122 billion, while Handelsbanken has paid out SEK 28 billion in dividends to its shareholders during the period. Handelsbanken is the only listed commercial bank in Sweden which did not need to ask its shareholders for new capital during the period.
Lower risk At the beginning of 2007, Handelsbanken began working on reducing the risks in its operations in order to reduce volatility. During the autumn of 2007, Handelsbanken sold the occupational pension company SPP to Store-brand for SEK 18.2 billion. Other market risks have also been purposefully reduced.
During the past five-year period, Handels-banken’s total loan losses amounted to SEK 8,161 million, which corresponds to an average annual loan loss ratio of 0.10 per cent. The corresponding figure for the other major
Nordic banks was 0.40 per cent. The tier 1 ratio according to Basel II has more than doubled during the period and a large liquidity reserve has been built up.
More satisfied customers Each year since SKI (Swedish Quality Index) started its surveys in 1989, Handelsbanken has been the major bank with the most satisfied customers in Sweden. During the autumn, SKI presented its annual customer satisfaction survey, which showed that Handelsbanken has maintained its leading position. For private customers, Handelsbanken’s index value was 74.2, as compared with the other three main competitors, all of which recorded scores within the range 64.1–66.2. Handelsbanken also re-ceived a considerably higher rating than the rest of the sector for customer satisfaction among corporate customers.
Consolidated income statementSEK m 2013 2012 2011 2010 2009
Net interest income 26 669 26 081 23 613 21 337 22 000
Net fee and commission income 7 804 7 369 7 673 8 022 7 393
Net gains/losses on financial transactions 1 357 1 120 1 016 1 377 2 457
Risk result, insurance 142 196 209 205 171
Other dividend income 161 152 146 190 141
Share of profit of associates 9 8 9 11 26
Other income 185 136 143 154 147
Total income 36 327 35 062 32 809 31 296 32 335
Staff costs -11 404 -11 167 -9 942 -9 504 -10 018
Other expenses -5 181 -5 069 -5 060 -5 062 -4 719
Depreciation, amortisation and impairments of property, equipment and intangible assets -476 -464 -462 -452 -483
Total expenses -17 061 -16 700 -15 464 -15 018 -15 220
Profit before loan losses 19 266 18 362 17 345 16 278 17 115
Net loan losses -1 195 -1 251 -816 -1 507 -3 392
Gains/losses on disposal of property, equipment and intangible assets 17 -3 7 -1 4
Operating profit 18 088 17 108 16 536 14 770 13 727
Taxes -3 915 -3 092 -4 372 -3 962 -3 519
Profit for the year from continuing operations 14 173 14 016 12 164 10 808 10 208
Profit for the year pertaining to discontinued operations, after tax 122 22 159 217 36
Profit for the year 14 295 14 038 12 323 11 025 10 244
Attributable to
Shareholders in Svenska Handelsbanken AB 14 295 14 037 12 323 11 025 10 244
Minority interest 0 1 0 0 0
Earnings per share, continuing operations, SEK 22.33 22.30 19.52 17.37 16.38
after dilution 22.07 21.82 19.14 17.10 15.92
Earnings per share, discontinued operations, SEK 0.19 0.04 0.26 0.35 0.06
after dilution 0.19 0.03 0.25 0.34 0.06
Earnings per share, total operations, SEK 22.52 22.34 19.78 17.72 16.44
after dilution 22.26 21.85 19.39 17.44 15.98
A five-year overview for the parent company is shown on page 147.
FIVE-YEAR OVERVIEW GROUP | ADMINISTRATION REPORT
HANDELSBANKEN | ANNUAL REPORT 2013 23
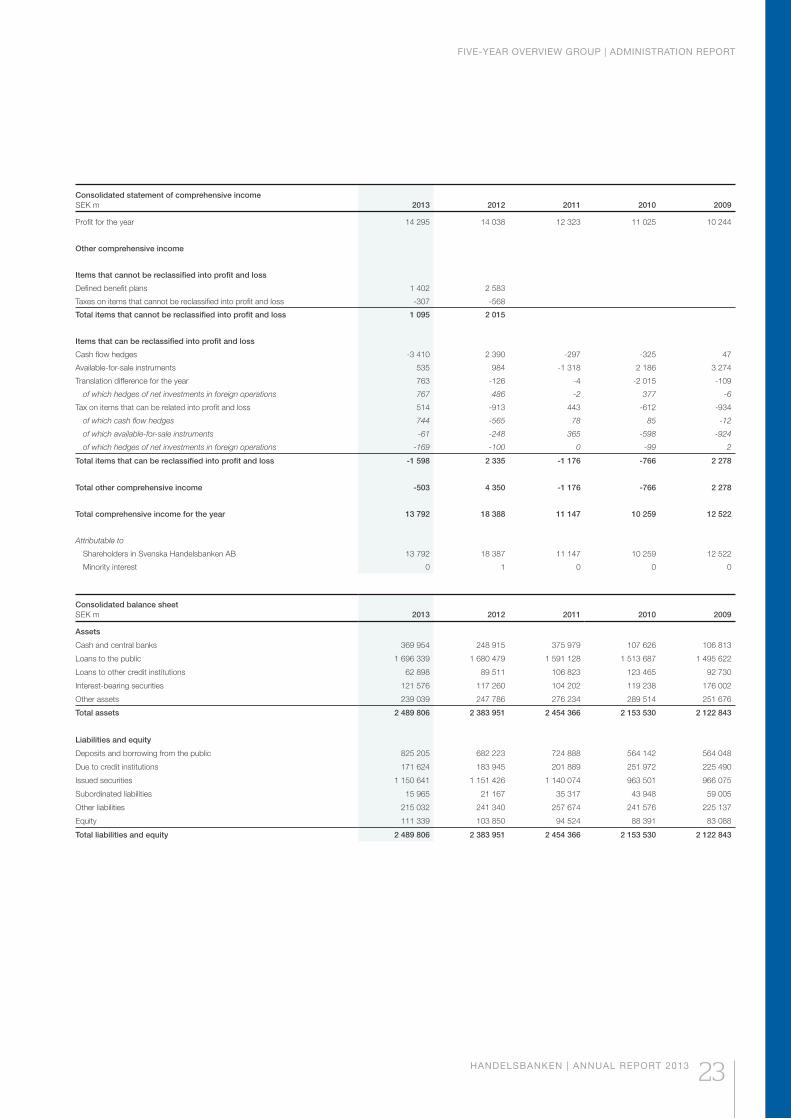
Consolidated statement of comprehensive incomeSEK m 2013 2012 2011 2010 2009
Profit for the year 14 295 14 038 12 323 11 025 10 244
Other comprehensive income
Items that cannot be reclassified into profit and loss
Defined benefit plans 1 402 2 583
Taxes on items that cannot be reclassified into profit and loss -307 -568
Total items that cannot be reclassified into profit and loss 1 095 2 015
Items that can be reclassified into profit and loss
Cash flow hedges -3 410 2 390 -297 -325 47
Available-for-sale instruments 535 984 -1 318 2 186 3 274
Translation difference for the year 763 -126 -4 -2 015 -109
of which hedges of net investments in foreign operations 767 486 -2 377 -6
Tax on items that can be related into profit and loss 514 -913 443 -612 -934
of which cash flow hedges 744 -565 78 85 -12
of which available-for-sale instruments -61 -248 365 -598 -924
of which hedges of net investments in foreign operations -169 -100 0 -99 2
Total items that can be reclassified into profit and loss -1 598 2 335 -1 176 -766 2 278
Total other comprehensive income -503 4 350 -1 176 -766 2 278
Total comprehensive income for the year 13 792 18 388 11 147 10 259 12 522
Attributable to
Shareholders in Svenska Handelsbanken AB 13 792 18 387 11 147 10 259 12 522
Minority interest 0 1 0 0 0
Consolidated balance sheetSEK m 2013 2012 2011 2010 2009
Assets
Cash and central banks 369 954 248 915 375 979 107 626 106 813
Loans to the public 1 696 339 1 680 479 1 591 128 1 513 687 1 495 622
Loans to other credit institutions 62 898 89 511 106 823 123 465 92 730
Interest-bearing securities 121 576 117 260 104 202 119 238 176 002
Other assets 239 039 247 786 276 234 289 514 251 676
Total assets 2 489 806 2 383 951 2 454 366 2 153 530 2 122 843
Liabilities and equity
Deposits and borrowing from the public 825 205 682 223 724 888 564 142 564 048
Due to credit institutions 171 624 183 945 201 889 251 972 225 490
Issued securities 1 150 641 1 151 426 1 140 074 963 501 966 075
Subordinated liabilities 15 965 21 167 35 317 43 948 59 005
Other liabilities 215 032 241 340 257 674 241 576 225 137
Equity 111 339 103 850 94 524 88 391 83 088
Total liabilities and equity 2 489 806 2 383 951 2 454 366 2 153 530 2 122 843
KEY FIGURES PER YEAR | ADMINISTRATION REPORT
24 HANDELSBANKEN | ANNUAL REPORT 2013
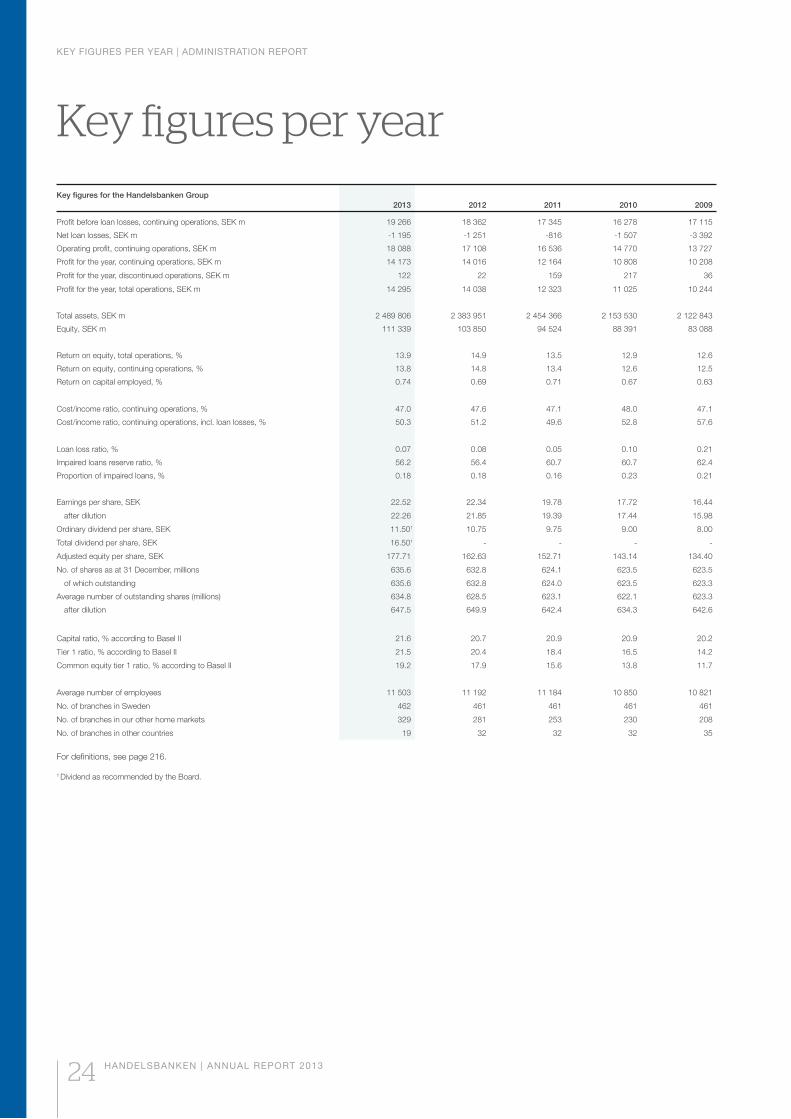
Key figures for the Handelsbanken Group2013 2012 2011 2010 2009
Profit before loan losses, continuing operations, SEK m 19 266 18 362 17 345 16 278 17 115
Net loan losses, SEK m -1 195 -1 251 -816 -1 507 -3 392
Operating profit, continuing operations, SEK m 18 088 17 108 16 536 14 770 13 727
Profit for the year, continuing operations, SEK m 14 173 14 016 12 164 10 808 10 208
Profit for the year, discontinued operations, SEK m 122 22 159 217 36
Profit for the year, total operations, SEK m 14 295 14 038 12 323 11 025 10 244
Total assets, SEK m 2 489 806 2 383 951 2 454 366 2 153 530 2 122 843
Equity, SEK m 111 339 103 850 94 524 88 391 83 088
Return on equity, total operations, % 13.9 14.9 13.5 12.9 12.6
Return on equity, continuing operations, % 13.8 14.8 13.4 12.6 12.5
Return on capital employed, % 0.74 0.69 0.71 0.67 0.63
Cost/income ratio, continuing operations, % 47.0 47.6 47.1 48.0 47.1
Cost/income ratio, continuing operations, incl. loan losses, % 50.3 51.2 49.6 52.8 57.6
Loan loss ratio, % 0.07 0.08 0.05 0.10 0.21
Impaired loans reserve ratio, % 56.2 56.4 60.7 60.7 62.4
Proportion of impaired loans, % 0.18 0.18 0.16 0.23 0.21
Earnings per share, SEK 22.52 22.34 19.78 17.72 16.44
after dilution 22.26 21.85 19.39 17.44 15.98
Ordinary dividend per share, SEK 11.501 10.75 9.75 9.00 8.00
Total dividend per share, SEK 16.501 - - - -
Adjusted equity per share, SEK 177.71 162.63 152.71 143.14 134.40
No. of shares as at 31 December, millions 635.6 632.8 624.1 623.5 623.5
of which outstanding 635.6 632.8 624.0 623.5 623.3
Average number of outstanding shares (millions) 634.8 628.5 623.1 622.1 623.3
after dilution 647.5 649.9 642.4 634.3 642.6
Capital ratio, % according to Basel II 21.6 20.7 20.9 20.9 20.2
Tier 1 ratio, % according to Basel II 21.5 20.4 18.4 16.5 14.2
Common equity tier 1 ratio, % according to Basel II 19.2 17.9 15.6 13.8 11.7
Average number of employees 11 503 11 192 11 184 10 850 10 821
No. of branches in Sweden 462 461 461 461 461
No. of branches in our other home markets 329 281 253 230 208
No. of branches in other countries 19 32 32 32 35
For definitions, see page 216.
1 Dividend as recommended by the Board.
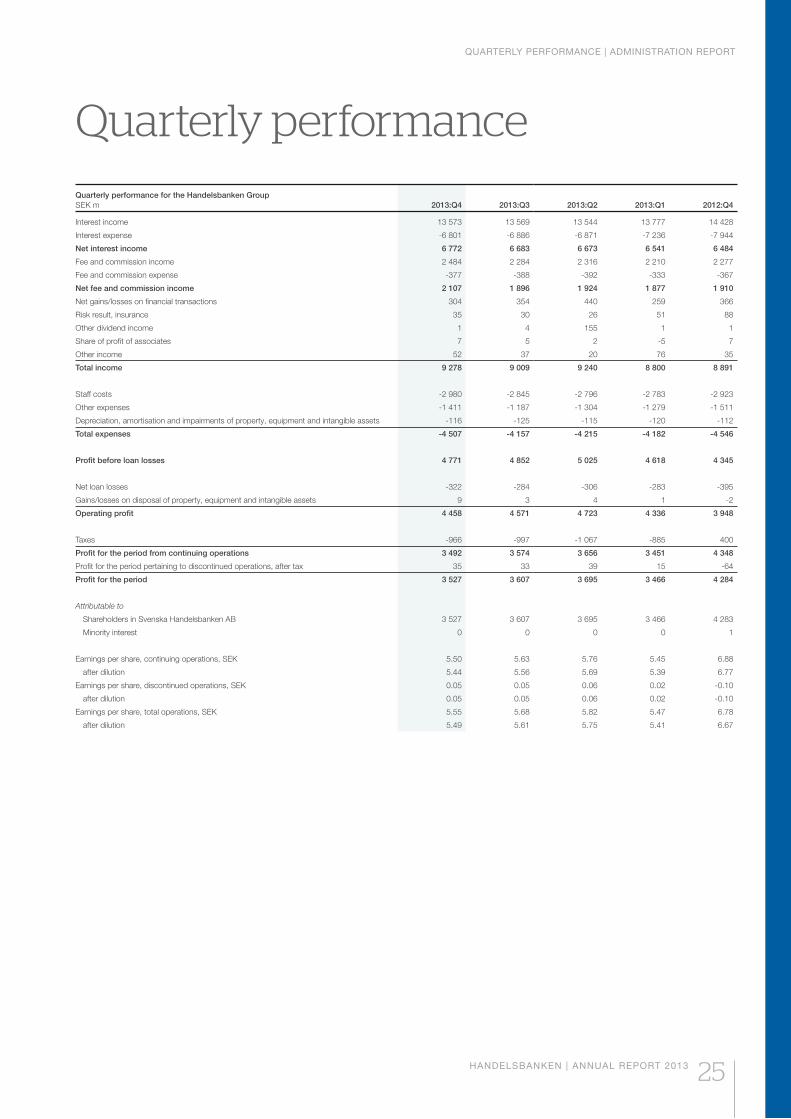
QUARTERLY PERFORMANCE | ADMINISTRATION REPORT
HANDELSBANKEN | ANNUAL REPORT 2013 25
Quarterly performance for the Handelsbanken GroupSEK m 2013:Q4 2013:Q3 2013:Q2 2013:Q1 2012:Q4
Interest income 13 573 13 569 13 544 13 777 14 428
Interest expense -6 801 -6 886 -6 871 -7 236 -7 944
Net interest income 6 772 6 683 6 673 6 541 6 484
Fee and commission income 2 484 2 284 2 316 2 210 2 277
Fee and commission expense -377 -388 -392 -333 -367
Net fee and commission income 2 107 1 896 1 924 1 877 1 910
Net gains/losses on financial transactions 304 354 440 259 366
Risk result, insurance 35 30 26 51 88
Other dividend income 1 4 155 1 1
Share of profit of associates 7 5 2 -5 7
Other income 52 37 20 76 35
Total income 9 278 9 009 9 240 8 800 8 891
Staff costs -2 980 -2 845 -2 796 -2 783 -2 923
Other expenses -1 411 -1 187 -1 304 -1 279 -1 511
Depreciation, amortisation and impairments of property, equipment and intangible assets -116 -125 -115 -120 -112
Total expenses -4 507 -4 157 -4 215 -4 182 -4 546
Profit before loan losses 4 771 4 852 5 025 4 618 4 345
Net loan losses -322 -284 -306 -283 -395
Gains/losses on disposal of property, equipment and intangible assets 9 3 4 1 -2
Operating profit 4 458 4 571 4 723 4 336 3 948
Taxes -966 -997 -1 067 -885 400
Profit for the period from continuing operations 3 492 3 574 3 656 3 451 4 348
Profit for the period pertaining to discontinued operations, after tax 35 33 39 15 -64
Profit for the period 3 527 3 607 3 695 3 466 4 284
Attributable to
Shareholders in Svenska Handelsbanken AB 3 527 3 607 3 695 3 466 4 283
Minority interest 0 0 0 0 1
Earnings per share, continuing operations, SEK 5.50 5.63 5.76 5.45 6.88
after dilution 5.44 5.56 5.69 5.39 6.77
Earnings per share, discontinued operations, SEK 0.05 0.05 0.06 0.02 -0.10
after dilution 0.05 0.05 0.06 0.02 -0.10
Earnings per share, total operations, SEK 5.55 5.68 5.82 5.47 6.78
after dilution 5.49 5.61 5.75 5.41 6.67
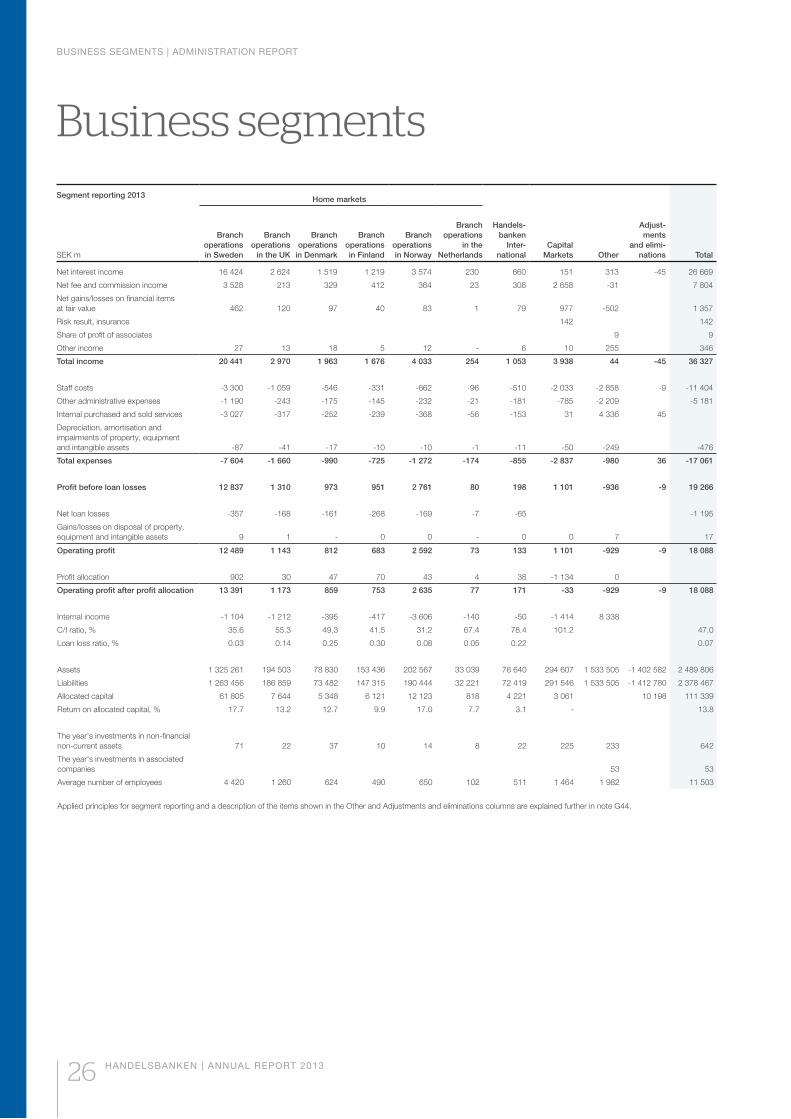
BUSINESS SEGMENTS | ADMINISTRATION REPORT
HANDELSBANKEN | ANNUAL REPORT 2013
Segment reporting 2013
SEK m
Home markets
CapitalMarkets Other
Adjust-ments
and elimi-nations Total
Branch operationsin Sweden
Branch operations
in the UK
Branch operations
in Denmark
Branch operationsin Finland
Branch operationsin Norway
Branch operations
in the Netherlands
Handels-banken
Inter-national
Net interest income 16 424 2 624 1 519 1 219 3 574 230 660 151 313 -45 26 669
Net fee and commission income 3 528 213 329 412 364 23 308 2 658 -31 7 804
Net gains/losses on financial items at fair value 462 120 97 40 83 1 79 977 -502 1 357
Risk result, insurance 142 142
Share of profit of associates 9 9
Other income 27 13 18 5 12 - 6 10 255 346
Total income 20 441 2 970 1 963 1 676 4 033 254 1 053 3 938 44 -45 36 327
Staff costs -3 300 -1 059 -546 -331 -662 -96 -510 -2 033 -2 858 -9 -11 404
Other administrative expenses -1 190 -243 -175 -145 -232 -21 -181 -785 -2 209 -5 181
Internal purchased and sold services -3 027 -317 -252 -239 -368 -56 -153 31 4 336 45
Depreciation, amortisation and impairments of property, equipment and intangible assets -87 -41 -17 -10 -10 -1 -11 -50 -249 -476
Total expenses -7 604 -1 660 -990 -725 -1 272 -174 -855 -2 837 -980 36 -17 061
Profit before loan losses 12 837 1 310 973 951 2 761 80 198 1 101 -936 -9 19 266
Net loan losses -357 -168 -161 -268 -169 -7 -65 -1 195
Gains/losses on disposal of property, equipment and intangible assets 9 1 - 0 0 - 0 0 7 17
Operating profit 12 489 1 143 812 683 2 592 73 133 1 101 -929 -9 18 088
Profit allocation 902 30 47 70 43 4 38 -1 134 0
Operating profit after profit allocation 13 391 1 173 859 753 2 635 77 171 -33 -929 -9 18 088
Internal income -1 104 -1 212 -395 -417 -3 606 -140 -50 -1 414 8 338
C/I ratio, % 35.6 55.3 49.3 41.5 31.2 67.4 78.4 101.2 47.0
Loan loss ratio, % 0.03 0.14 0.25 0.30 0.08 0.05 0.22 0.07
Assets 1 325 261 194 503 78 830 153 436 202 567 33 039 76 640 294 607 1 533 505 -1 402 582 2 489 806
Liabilities 1 263 456 186 859 73 482 147 315 190 444 32 221 72 419 291 546 1 533 505 -1 412 780 2 378 467
Allocated capital 61 805 7 644 5 348 6 121 12 123 818 4 221 3 061 10 198 111 339
Return on allocated capital, % 17.7 13.2 12.7 9.9 17.0 7.7 3.1 - 13.8
The year's investments in non-financial non-current assets 71 22 37 10 14 8 22 225 233 642
The year's investments in associated companies 53 53
Average number of employees 4 420 1 260 624 490 650 102 511 1 464 1 982 11 503
Applied principles for segment reporting and a description of the items shown in the Other and Adjustments and eliminations columns are explained further in note G44.
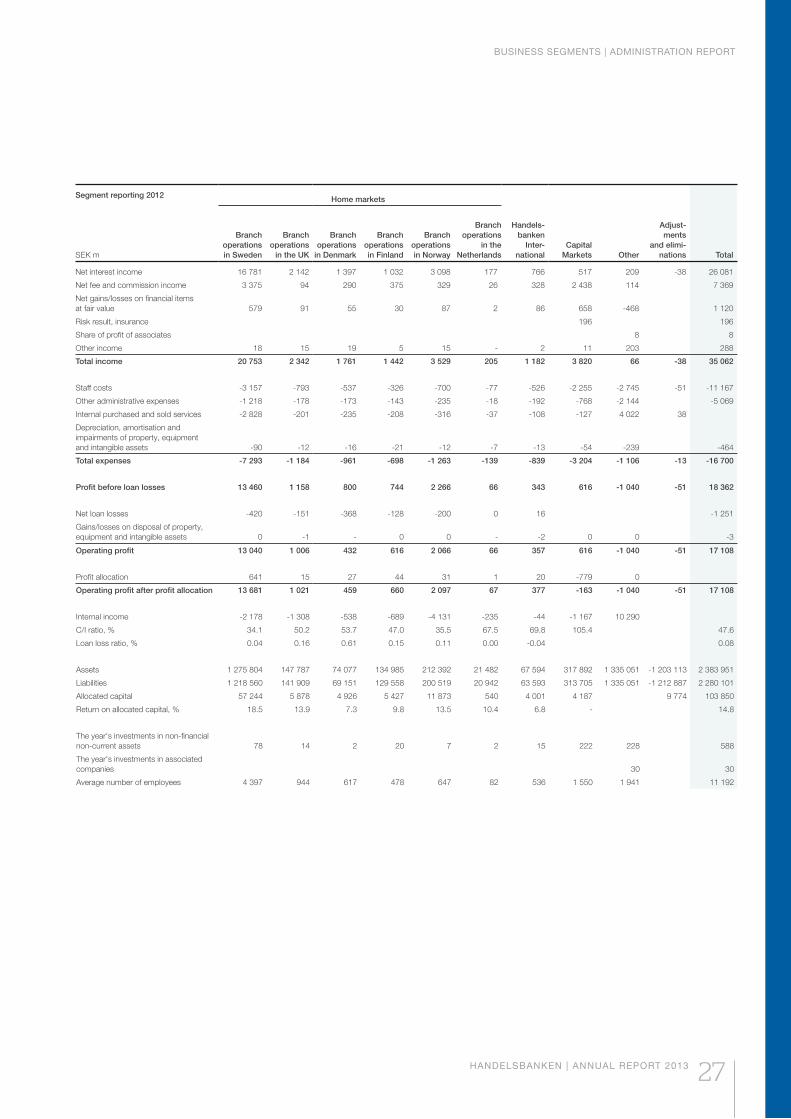
BUSINESS SEGMENTS | ADMINISTRATION REPORT
HANDELSBANKEN | ANNUAL REPORT 2013
Segment reporting 2012
SEK m
Home markets
CapitalMarkets Other
Adjust-ments
and elimi-nations Total
Branch operationsin Sweden
Branch operations
in the UK
Branch operations
in Denmark
Branch operationsin Finland
Branch operationsin Norway
Branch operations
in the Netherlands
Handels-banken
Inter-national
Net interest income 16 781 2 142 1 397 1 032 3 098 177 766 517 209 -38 26 081
Net fee and commission income 3 375 94 290 375 329 26 328 2 438 114 7 369
Net gains/losses on financial items at fair value 579 91 55 30 87 2 86 658 -468 1 120
Risk result, insurance 196 196
Share of profit of associates 8 8
Other income 18 15 19 5 15 - 2 11 203 288
Total income 20 753 2 342 1 761 1 442 3 529 205 1 182 3 820 66 -38 35 062
Staff costs -3 157 -793 -537 -326 -700 -77 -526 -2 255 -2 745 -51 -11 167
Other administrative expenses -1 218 -178 -173 -143 -235 -18 -192 -768 -2 144 -5 069
Internal purchased and sold services -2 828 -201 -235 -208 -316 -37 -108 -127 4 022 38
Depreciation, amortisation and impairments of property, equipment and intangible assets -90 -12 -16 -21 -12 -7 -13 -54 -239 -464
Total expenses -7 293 -1 184 -961 -698 -1 263 -139 -839 -3 204 -1 106 -13 -16 700
Profit before loan losses 13 460 1 158 800 744 2 266 66 343 616 -1 040 -51 18 362
Net loan losses -420 -151 -368 -128 -200 0 16 -1 251
Gains/losses on disposal of property, equipment and intangible assets 0 -1 - 0 0 - -2 0 0 -3
Operating profit 13 040 1 006 432 616 2 066 66 357 616 -1 040 -51 17 108
Profit allocation 641 15 27 44 31 1 20 -779 0
Operating profit after profit allocation 13 681 1 021 459 660 2 097 67 377 -163 -1 040 -51 17 108
Internal income -2 178 -1 308 -538 -689 -4 131 -235 -44 -1 167 10 290
C/I ratio, % 34.1 50.2 53.7 47.0 35.5 67.5 69.8 105.4 47.6
Loan loss ratio, % 0.04 0.16 0.61 0.15 0.11 0.00 -0.04 0.08
Assets 1 275 804 147 787 74 077 134 985 212 392 21 482 67 594 317 892 1 335 051 -1 203 113 2 383 951
Liabilities 1 218 560 141 909 69 151 129 558 200 519 20 942 63 593 313 705 1 335 051 -1 212 887 2 280 101
Allocated capital 57 244 5 878 4 926 5 427 11 873 540 4 001 4 187 9 774 103 850
Return on allocated capital, % 18.5 13.9 7.3 9.8 13.5 10.4 6.8 - 14.8
The year's investments in non-financial non-current assets 78 14 2 20 7 2 15 222 228 588
The year's investments in associated companies 30 30
Average number of employees 4 397 944 617 478 647 82 536 1 550 1 941 11 192
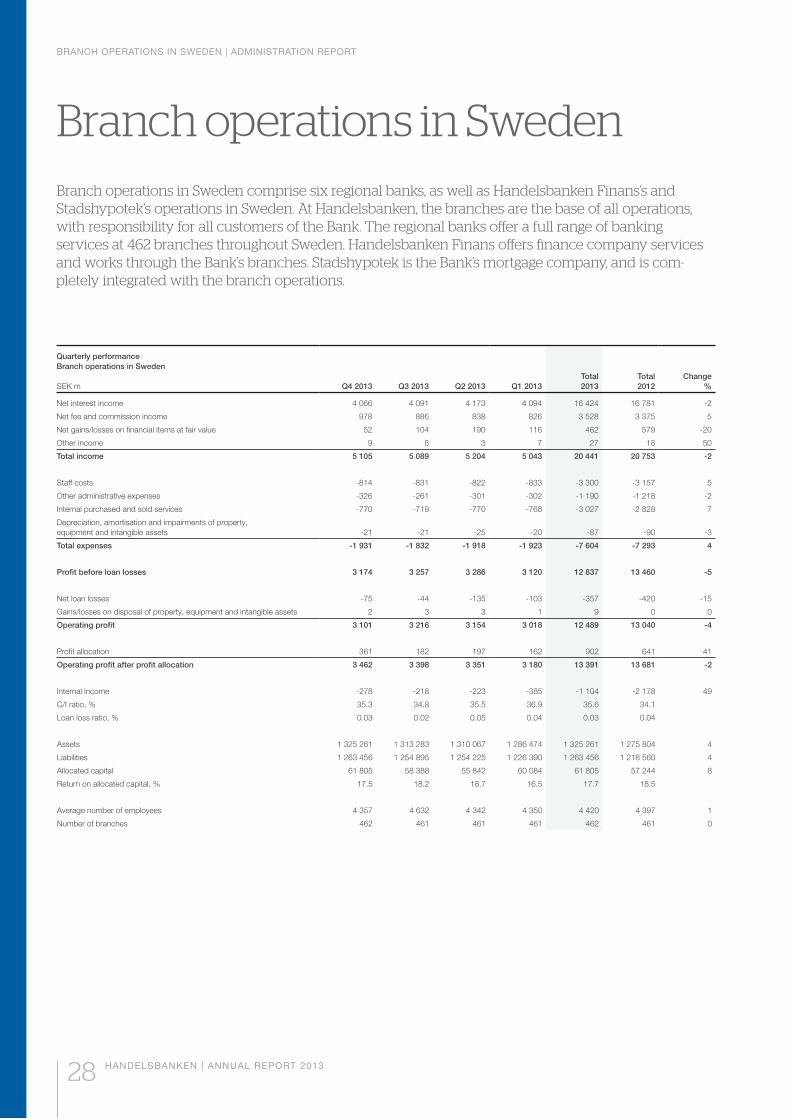
BRANCH OPERATIONS IN SWEDEN | ADMINISTRATION REPORT
28 HANDELSBANKEN | ANNUAL REPORT 2013
Quarterly performanceBranch operations in Sweden
SEK m Q4 2013 Q3 2013 Q2 2013 Q1 2013Total 2013
Total 2012
Change %
Net interest income 4 066 4 091 4 173 4 094 16 424 16 781 -2
Net fee and commission income 978 886 838 826 3 528 3 375 5
Net gains/losses on financial items at fair value 52 104 190 116 462 579 -20
Other income 9 8 3 7 27 18 50
Total income 5 105 5 089 5 204 5 043 20 441 20 753 -2
Staff costs -814 -831 -822 -833 -3 300 -3 157 5
Other administrative expenses -326 -261 -301 -302 -1 190 -1 218 -2
Internal purchased and sold services -770 -719 -770 -768 -3 027 -2 828 7
Depreciation, amortisation and impairments of property, equipment and intangible assets -21 -21 -25 -20 -87 -90 -3
Total expenses -1 931 -1 832 -1 918 -1 923 -7 604 -7 293 4
Profit before loan losses 3 174 3 257 3 286 3 120 12 837 13 460 -5
Net loan losses -75 -44 -135 -103 -357 -420 -15
Gains/losses on disposal of property, equipment and intangible assets 2 3 3 1 9 0 0
Operating profit 3 101 3 216 3 154 3 018 12 489 13 040 -4
Profit allocation 361 182 197 162 902 641 41
Operating profit after profit allocation 3 462 3 398 3 351 3 180 13 391 13 681 -2
Internal income -278 -218 -223 -385 -1 104 -2 178 49
C/I ratio, % 35.3 34.8 35.5 36.9 35.6 34.1
Loan loss ratio, % 0.03 0.02 0.05 0.04 0.03 0.04
Assets 1 325 261 1 313 283 1 310 067 1 286 474 1 325 261 1 275 804 4
Liabilities 1 263 456 1 254 895 1 254 225 1 226 390 1 263 456 1 218 560 4
Allocated capital 61 805 58 388 55 842 60 084 61 805 57 244 8
Return on allocated capital, % 17.5 18.2 18.7 16.5 17.7 18.5
Average number of employees 4 357 4 632 4 342 4 350 4 420 4 397 1
Number of branches 462 461 461 461 462 461 0
-
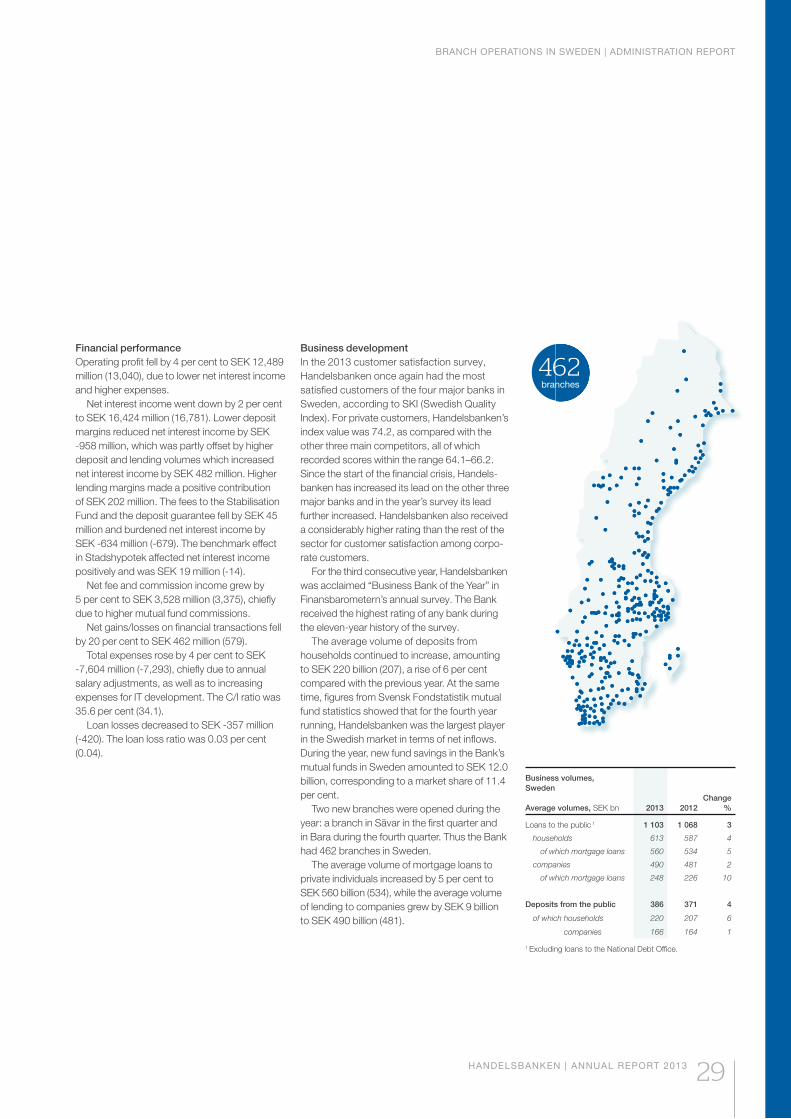
BRANCH OPERATIONS IN SWEDEN | ADMINISTRATION REPORT
HANDELSBANKEN | ANNUAL REPORT 2013 29
branches
Business volumes, Sweden Average volumes, SEK bn 2013 2012
Change %
Loans to the public 1 1 103 1 068 3
households 613 587 4
of which mortgage loans 560 534 5
companies 490 481 2
of which mortgage loans 248 226 10
Deposits from the public 386 371 4
of which households 220 207 6
companies 166 164 1
1 Excluding loans to the National Debt Office.
Financial performanceOperating profit fell by 4 per cent to SEK 12,489 million (13,040), due to lower net interest income and higher expenses.
Net interest income went down by 2 per cent to SEK 16,424 million (16,781). Lower deposit margins reduced net interest income by SEK -958 million, which was partly offset by higher deposit and lending volumes which increased net interest income by SEK 482 million. Higher lending margins made a positive contribution of SEK 202 million. The fees to the Stabilisation Fund and the deposit guarantee fell by SEK 45 million and burdened net interest income by SEK -634 million (-679). The benchmark effect in Stadshypotek affected net interest income positively and was SEK 19 million (-14).
Net fee and commission income grew by 5 per cent to SEK 3,528 million (3,375), chiefly due to higher mutual fund commissions.
Net gains/losses on financial transactions fell by 20 per cent to SEK 462 million (579).
Total expenses rose by 4 per cent to SEK -7,604 million (-7,293), chiefly due to annual salary adjustments, as well as to increasing expenses for IT development. The C/I ratio was 35.6 per cent (34.1).
Loan losses decreased to SEK -357 million (-420). The loan loss ratio was 0.03 per cent (0.04).
Business developmentIn the 2013 customer satisfaction survey, Handels banken once again had the most satisfied customers of the four major banks in Sweden, according to SKI (Swedish Quality Index). For private customers, Handelsbanken’s index value was 74.2, as compared with the other three main competitors, all of which recorded scores within the range 64.1–66.2. Since the start of the financial crisis, Handels-banken has increased its lead on the other three major banks and in the year’s survey its lead further increased. Handelsbanken also received a considerably higher rating than the rest of the sector for customer satisfaction among corpo-rate customers.
For the third consecutive year, Handelsbanken was acclaimed “Business Bank of the Year” in Finansbarometern’s annual survey. The Bank received the highest rating of any bank during the eleven-year history of the survey.
The average volume of deposits from house holds continued to increase, amounting to SEK 220 billion (207), a rise of 6 per cent compared with the previous year. At the same time, figures from Svensk Fondstatistik mutual fund statistics showed that for the fourth year running, Handelsbanken was the largest player in the Swedish market in terms of net inflows. During the year, new fund savings in the Bank’s mutual funds in Sweden amounted to SEK 12.0 billion, corresponding to a market share of 11.4 per cent.
Two new branches were opened during the year: a branch in Sävar in the first quarter and in Bara during the fourth quarter. Thus the Bank had 462 branches in Sweden.
The average volume of mortgage loans to private individuals increased by 5 per cent to SEK 560 billion (534), while the average volume of lending to companies grew by SEK 9 billion to SEK 490 billion (481).
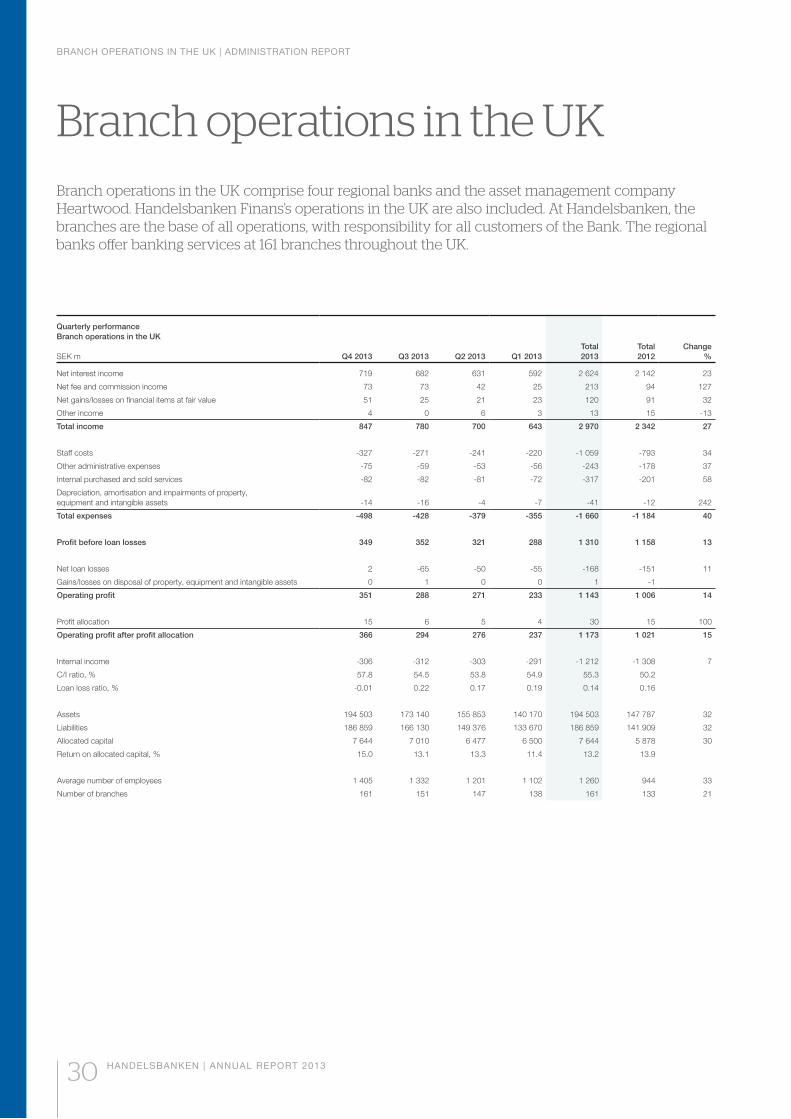
BRANCH OPERATIONS IN THE UK | ADMINISTRATION REPORT
30 HANDELSBANKEN | ANNUAL REPORT 2013
Quarterly performanceBranch operations in the UK
SEK m Q4 2013 Q3 2013 Q2 2013 Q1 2013Total 2013
Total 2012
Change %
Net interest income 719 682 631 592 2 624 2 142 23
Net fee and commission income 73 73 42 25 213 94 127
Net gains/losses on financial items at fair value 51 25 21 23 120 91 32
Other income 4 0 6 3 13 15 -13
Total income 847 780 700 643 2 970 2 342 27
Staff costs -327 -271 -241 -220 -1 059 -793 34
Other administrative expenses -75 -59 -53 -56 -243 -178 37
Internal purchased and sold services -82 -82 -81 -72 -317 -201 58
Depreciation, amortisation and impairments of property, equipment and intangible assets -14 -16 -4 -7 -41 -12 242
Total expenses -498 -428 -379 -355 -1 660 -1 184 40
Profit before loan losses 349 352 321 288 1 310 1 158 13
Net loan losses 2 -65 -50 -55 -168 -151 11
Gains/losses on disposal of property, equipment and intangible assets 0 1 0 0 1 -1
Operating profit 351 288 271 233 1 143 1 006 14
Profit allocation 15 6 5 4 30 15 100
Operating profit after profit allocation 366 294 276 237 1 173 1 021 15
Internal income -306 -312 -303 -291 -1 212 -1 308 7
C/I ratio, % 57.8 54.5 53.8 54.9 55.3 50.2
Loan loss ratio, % -0.01 0.22 0.17 0.19 0.14 0.16
Assets 194 503 173 140 155 853 140 170 194 503 147 787 32
Liabilities 186 859 166 130 149 376 133 670 186 859 141 909 32
Allocated capital 7 644 7 010 6 477 6 500 7 644 5 878 30
Return on allocated capital, % 15.0 13.1 13.3 11.4 13.2 13.9
Average number of employees 1 405 1 332 1 201 1 102 1 260 944 33
Number of branches 161 151 147 138 161 133 21
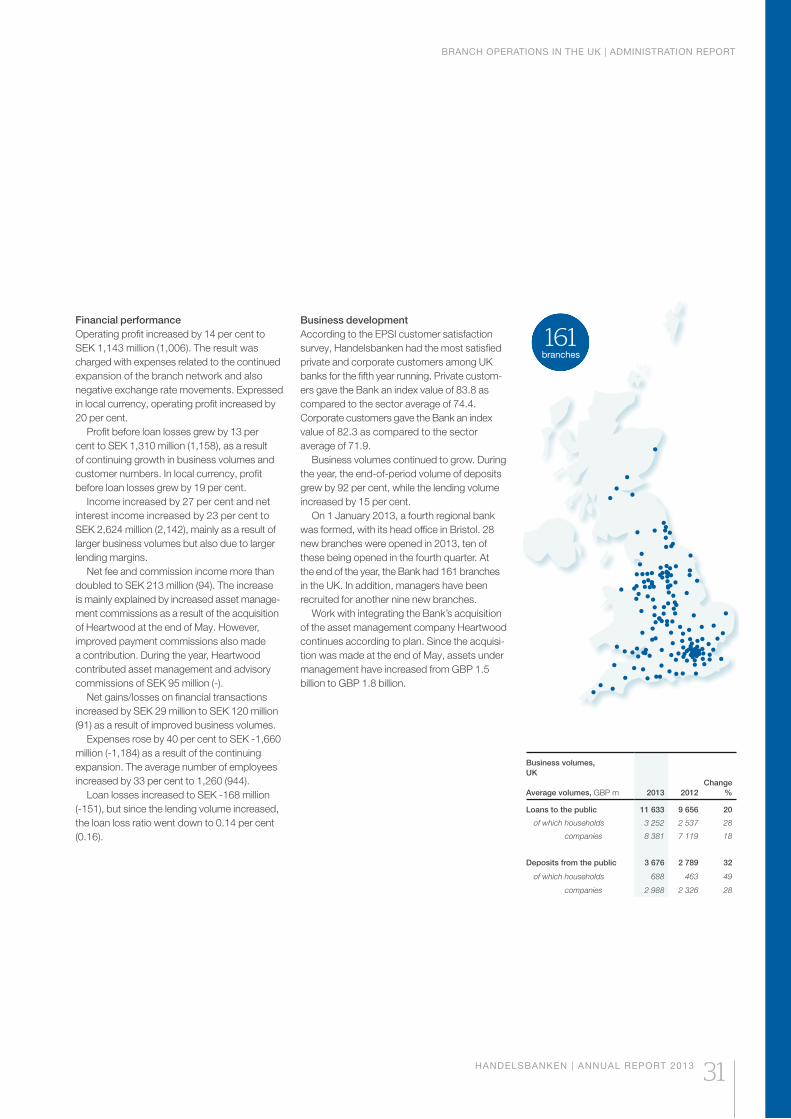
BRANCH OPERATIONS IN THE UK | ADMINISTRATION REPORT
HANDELSBANKEN | ANNUAL REPORT 2013 31
branches
Business volumes, UK Average volumes, GBP m 2013 2012
Change %
Loans to the public 11 633 9 656 20
of which households 3 252 2 537 28
companies 8 381 7 119 18
Deposits from the public 3 676 2 789 32
of which households 688 463 49
companies 2 988 2 326 28
Financial performanceOperating profit increased by 14 per cent to SEK 1,143 million (1,006). The result was charged with expenses related to the continued expansion of the branch network and also negative exchange rate movements. Expressed in local currency, operating profit increased by 20 per cent.
Profit before loan losses grew by 13 per cent to SEK 1,310 million (1,158), as a result of continuing growth in business volumes and customer numbers. In local currency, profit before loan losses grew by 19 per cent.
Income increased by 27 per cent and net interest income increased by 23 per cent to SEK 2,624 million (2,142), mainly as a result of larger business volumes but also due to larger lending margins.
Net fee and commission income more than doubled to SEK 213 million (94). The increase is mainly explained by increased asset manage-ment commissions as a result of the acquisition of Heartwood at the end of May. However, improved payment commissions also made a contribution. During the year, Heartwood contributed asset management and advisory commissions of SEK 95 million (-).
Net gains/losses on financial transactions increased by SEK 29 million to SEK 120 million (91) as a result of improved business volumes.
Expenses rose by 40 per cent to SEK -1,660 million (-1,184) as a result of the continuing expansion. The average number of employees increased by 33 per cent to 1,260 (944).
Loan losses increased to SEK -168 million (-151), but since the lending volume increased, the loan loss ratio went down to 0.14 per cent (0.16).
Business developmentAccording to the EPSI customer satisfaction survey, Handelsbanken had the most satisfied private and corporate customers among UK banks for the fifth year running. Private custom-ers gave the Bank an index value of 83.8 as compared to the sector average of 74.4. Corporate customers gave the Bank an index value of 82.3 as compared to the sector average of 71.9.
Business volumes continued to grow. During the year, the end-of-period volume of deposits grew by 92 per cent, while the lending volume increased by 15 per cent.
On 1 January 2013, a fourth regional bank was formed, with its head office in Bristol. 28 new branches were opened in 2013, ten of these being opened in the fourth quarter. At the end of the year, the Bank had 161 branches in the UK. In addition, managers have been recruited for another nine new branches.
Work with integrating the Bank’s acquisition of the asset management company Heartwood continues according to plan. Since the acquisi-tion was made at the end of May, assets under management have increased from GBP 1.5 billion to GBP 1.8 billion.
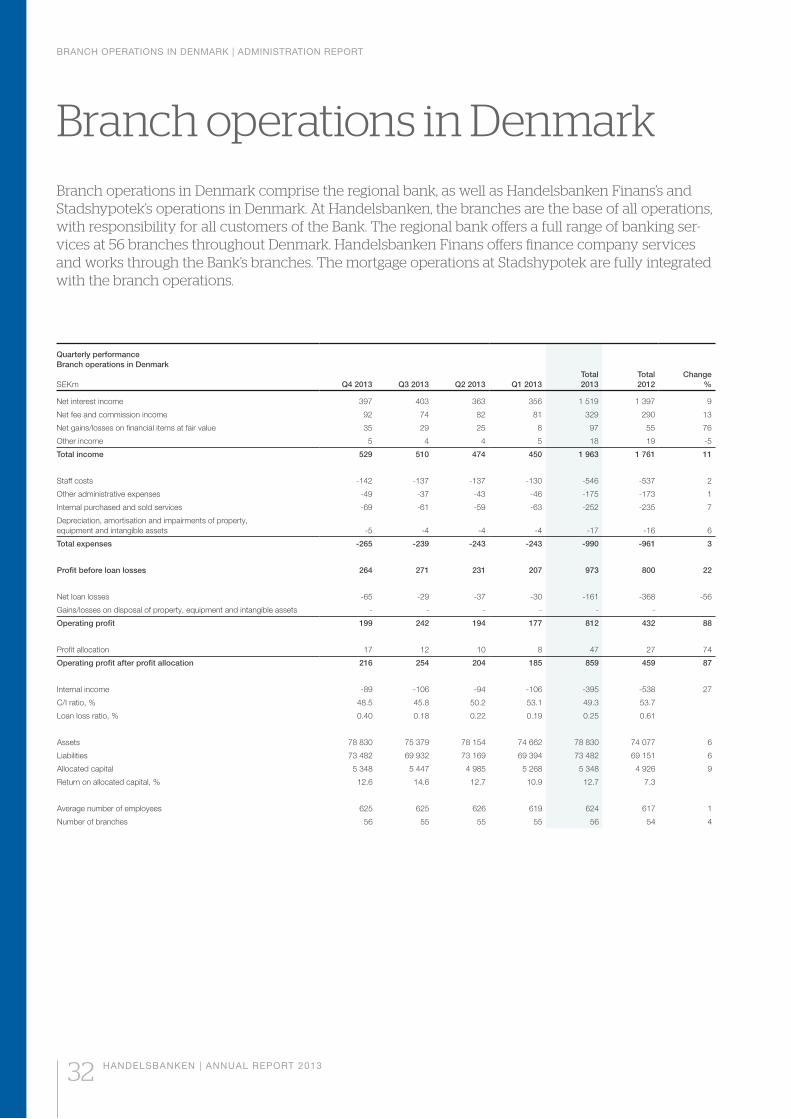
BRANCH OPERATIONS IN DENMARK | ADMINISTRATION REPORT
32 HANDELSBANKEN | ANNUAL REPORT 2013
Quarterly performanceBranch operations in Denmark
SEKm Q4 2013 Q3 2013 Q2 2013 Q1 2013Total 2013
Total 2012
Change %
Net interest income 397 403 363 356 1 519 1 397 9
Net fee and commission income 92 74 82 81 329 290 13
Net gains/losses on financial items at fair value 35 29 25 8 97 55 76
Other income 5 4 4 5 18 19 -5
Total income 529 510 474 450 1 963 1 761 11
Staff costs -142 -137 -137 -130 -546 -537 2
Other administrative expenses -49 -37 -43 -46 -175 -173 1
Internal purchased and sold services -69 -61 -59 -63 -252 -235 7
Depreciation, amortisation and impairments of property, equipment and intangible assets -5 -4 -4 -4 -17 -16 6
Total expenses -265 -239 -243 -243 -990 -961 3
Profit before loan losses 264 271 231 207 973 800 22
Net loan losses -65 -29 -37 -30 -161 -368 -56
Gains/losses on disposal of property, equipment and intangible assets - - - - - -
Operating profit 199 242 194 177 812 432 88
Profit allocation 17 12 10 8 47 27 74
Operating profit after profit allocation 216 254 204 185 859 459 87
Internal income -89 -106 -94 -106 -395 -538 27
C/I ratio, % 48.5 45.8 50.2 53.1 49.3 53.7
Loan loss ratio, % 0.40 0.18 0.22 0.19 0.25 0.61
Assets 78 830 75 379 78 154 74 662 78 830 74 077 6
Liabilities 73 482 69 932 73 169 69 394 73 482 69 151 6
Allocated capital 5 348 5 447 4 985 5 268 5 348 4 926 9
Return on allocated capital, % 12.6 14.6 12.7 10.9 12.7 7.3
Average number of employees 625 625 626 619 624 617 1
Number of branches 56 55 55 55 56 54 4
-
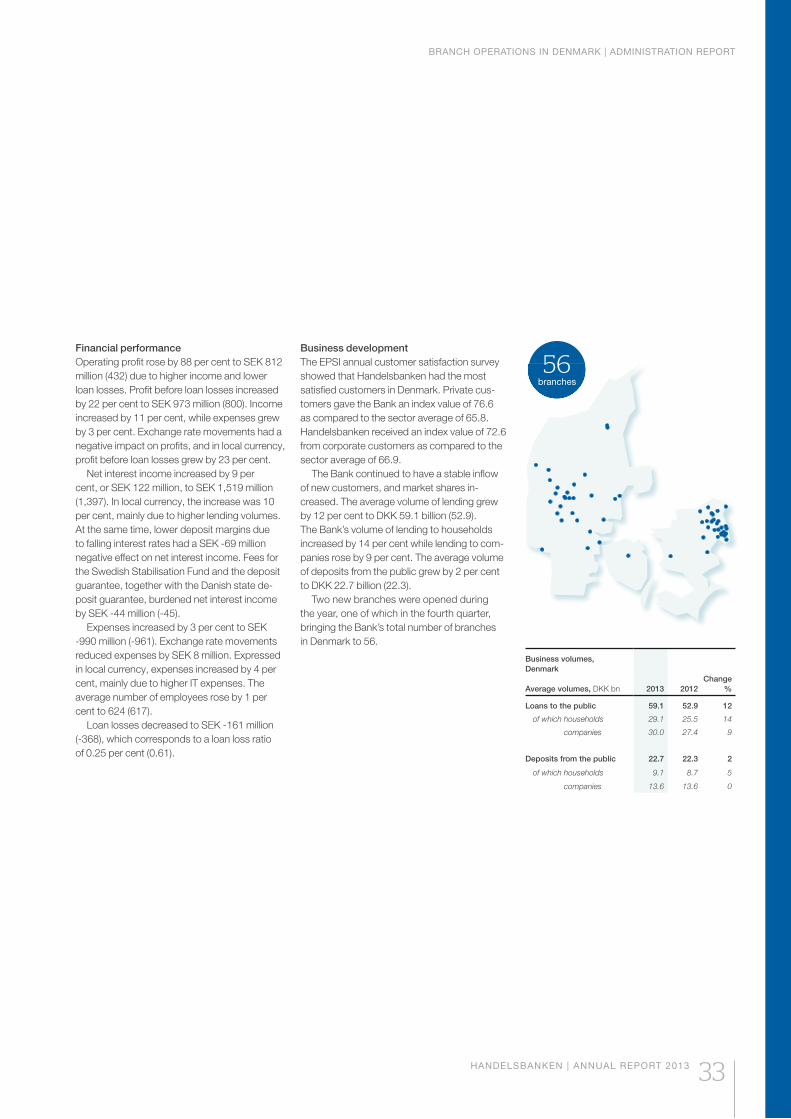
BRANCH OPERATIONS IN DENMARK | ADMINISTRATION REPORT
HANDELSBANKEN | ANNUAL REPORT 2013 33
branches
Business volumes, Denmark
Average volumes, DKK bn 2013 2012Change
%
Loans to the public 59.1 52.9 12
of which households 29.1 25.5 14
companies 30.0 27.4 9
Deposits from the public 22.7 22.3 2
of which households 9.1 8.7 5
companies 13.6 13.6 0
Financial performanceOperating profit rose by 88 per cent to SEK 812 million (432) due to higher income and lower loan losses. Profit before loan losses increased by 22 per cent to SEK 973 million (800). Income increased by 11 per cent, while expenses grew by 3 per cent. Exchange rate movements had a negative impact on profits, and in local currency, profit before loan losses grew by 23 per cent.
Net interest income increased by 9 per cent, or SEK 122 million, to SEK 1,519 million (1,397). In local currency, the increase was 10 per cent, mainly due to higher lending volumes. At the same time, lower deposit margins due to falling interest rates had a SEK -69 million negative effect on net interest income. Fees for the Swedish Stabilisation Fund and the deposit guarantee, together with the Danish state de-posit guarantee, burdened net interest income by SEK -44 million (-45).
Expenses increased by 3 per cent to SEK -990 million (-961). Exchange rate movements reduced expenses by SEK 8 million. Expressed in local currency, expenses increased by 4 per cent, mainly due to higher IT expenses. The average number of employees rose by 1 per cent to 624 (617).
Loan losses decreased to SEK -161 million (-368), which corresponds to a loan loss ratio of 0.25 per cent (0.61).
Business developmentThe EPSI annual customer satisfaction survey showed that Handelsbanken had the most satisfied customers in Denmark. Private cus-tomers gave the Bank an index value of 76.6 as compared to the sector average of 65.8. Handelsbanken received an index value of 72.6 from corporate customers as compared to the sector average of 66.9.
The Bank continued to have a stable inflow of new customers, and market shares in-creased. The average volume of lending grew by 12 per cent to DKK 59.1 billion (52.9). The Bank’s volume of lending to households increased by 14 per cent while lending to com-panies rose by 9 per cent. The average volume of deposits from the public grew by 2 per cent to DKK 22.7 billion (22.3).
Two new branches were opened during the year, one of which in the fourth quarter, bringing the Bank’s total number of branches in Denmark to 56.
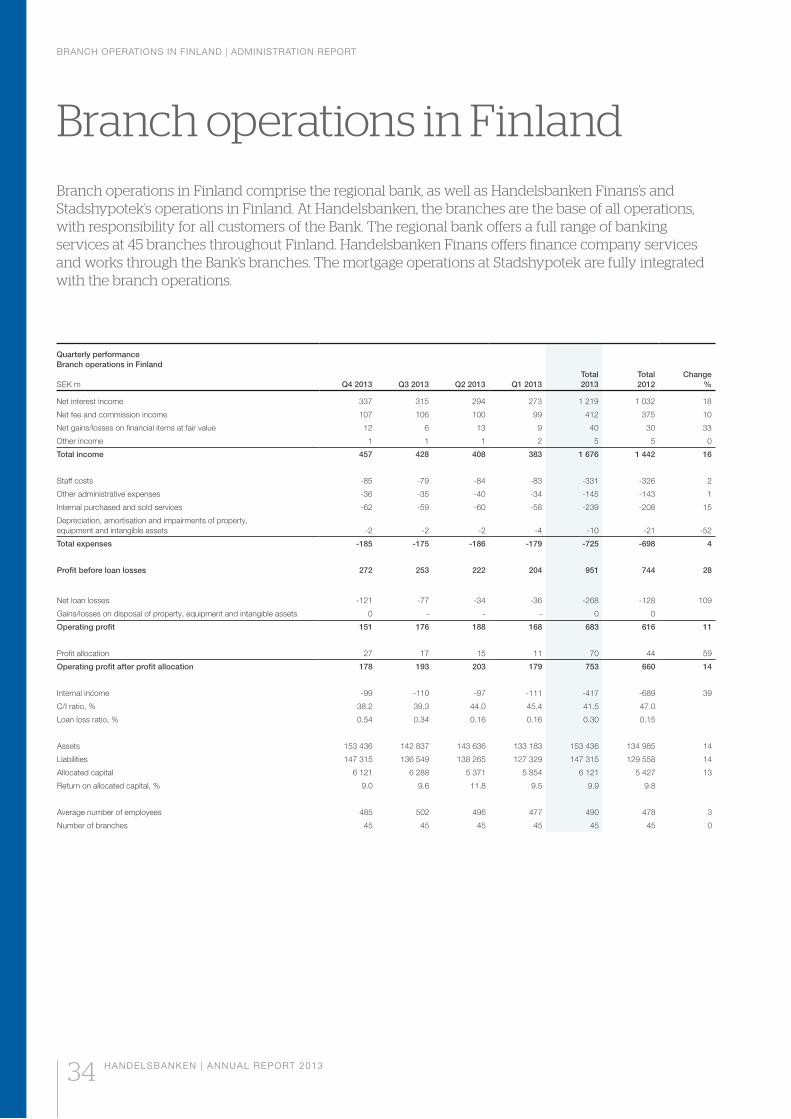
BRANCH OPERATIONS IN FINLAND | ADMINISTRATION REPORT
34 HANDELSBANKEN | ANNUAL REPORT 2013
Quarterly performanceBranch operations in Finland
SEK m Q4 2013 Q3 2013 Q2 2013 Q1 2013Total 2013
Total 2012
Change %
Net interest income 337 315 294 273 1 219 1 032 18
Net fee and commission income 107 106 100 99 412 375 10
Net gains/losses on financial items at fair value 12 6 13 9 40 30 33
Other income 1 1 1 2 5 5 0
Total income 457 428 408 383 1 676 1 442 16
Staff costs -85 -79 -84 -83 -331 -326 2
Other administrative expenses -36 -35 -40 -34 -145 -143 1
Internal purchased and sold services -62 -59 -60 -58 -239 -208 15
Depreciation, amortisation and impairments of property, equipment and intangible assets -2 -2 -2 -4 -10 -21 -52
Total expenses -185 -175 -186 -179 -725 -698 4
Profit before loan losses 272 253 222 204 951 744 28
Net loan losses -121 -77 -34 -36 -268 -128 109
Gains/losses on disposal of property, equipment and intangible assets 0 - - - 0 0
Operating profit 151 176 188 168 683 616 11
Profit allocation 27 17 15 11 70 44 59
Operating profit after profit allocation 178 193 203 179 753 660 14
Internal income -99 -110 -97 -111 -417 -689 39
C/I ratio, % 38.2 39.3 44.0 45.4 41.5 47.0
Loan loss ratio, % 0.54 0.34 0.16 0.16 0.30 0.15
Assets 153 436 142 837 143 636 133 183 153 436 134 985 14
Liabilities 147 315 136 549 138 265 127 329 147 315 129 558 14
Allocated capital 6 121 6 288 5 371 5 854 6 121 5 427 13
Return on allocated capital, % 9.0 9.6 11.8 9.5 9.9 9.8
Average number of employees 485 502 496 477 490 478 3
Number of branches 45 45 45 45 45 45 0
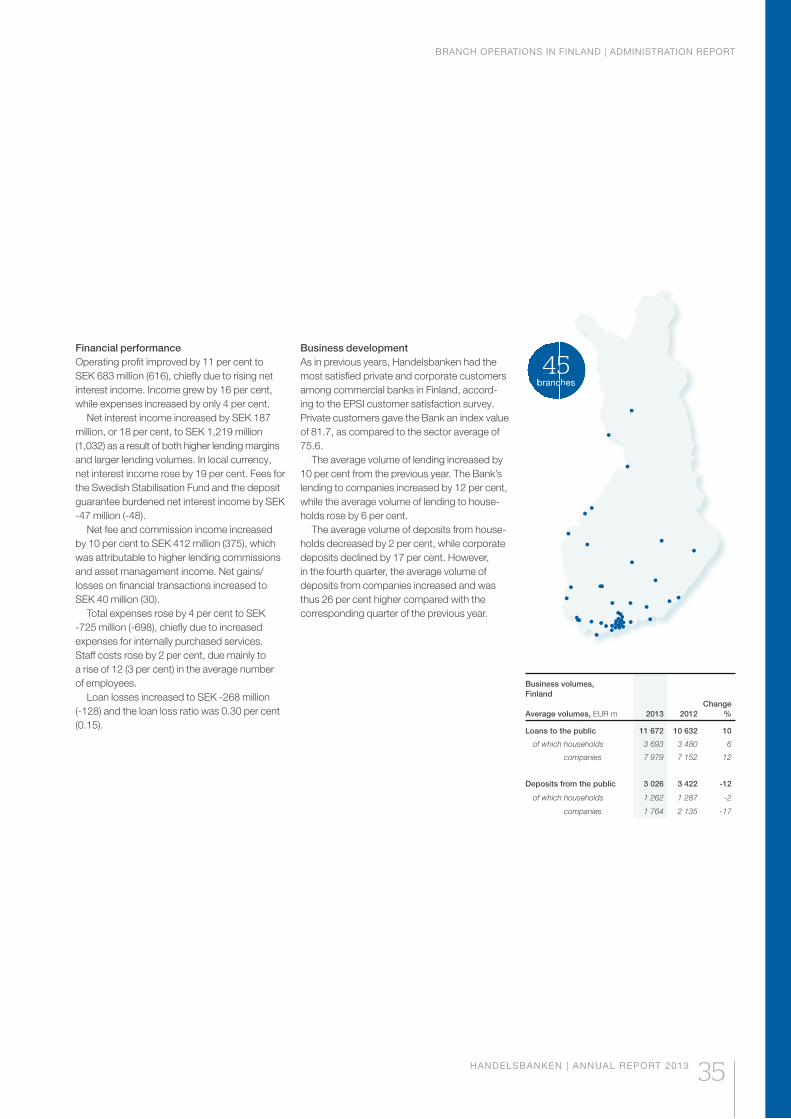
BRANCH OPERATIONS IN FINLAND | ADMINISTRATION REPORT
HANDELSBANKEN | ANNUAL REPORT 2013 35
45branches
Business volumes, Finland
Average volumes, EUR m 2013 2012Change
%
Loans to the public 11 672 10 632 10
of which households 3 693 3 480 6
companies 7 979 7 152 12
Deposits from the public 3 026 3 422 -12
of which households 1 262 1 287 -2
companies 1 764 2 135 -17
5ches
Financial performanceOperating profit improved by 11 per cent to SEK 683 million (616), chiefly due to rising net interest income. Income grew by 16 per cent, while expenses increased by only 4 per cent.
Net interest income increased by SEK 187 million, or 18 per cent, to SEK 1,219 million (1,032) as a result of both higher lending margins and larger lending volumes. In local currency, net interest income rose by 19 per cent. Fees for the Swedish Stabilisation Fund and the deposit guarantee burdened net interest income by SEK -47 million (-48).
Net fee and commission income increased by 10 per cent to SEK 412 million (375), which was attributable to higher lending commissions and asset management income. Net gains/losses on financial transactions increased to SEK 40 million (30).
Total expenses rose by 4 per cent to SEK -725 million (-698), chiefly due to increased expenses for internally purchased services. Staff costs rose by 2 per cent, due mainly to a rise of 12 (3 per cent) in the average number of employees.
Loan losses increased to SEK -268 million (-128) and the loan loss ratio was 0.30 per cent (0.15).
Business developmentAs in previous years, Handelsbanken had the most satisfied private and corporate customers among commercial banks in Finland, accord-ing to the EPSI customer satisfaction survey. Private customers gave the Bank an index value of 81.7, as compared to the sector average of 75.6.
The average volume of lending increased by 10 per cent from the previous year. The Bank’s lending to companies increased by 12 per cent, while the average volume of lending to house-holds rose by 6 per cent.
The average volume of deposits from house-holds decreased by 2 per cent, while corporate deposits declined by 17 per cent. However, in the fourth quarter, the average volume of deposits from companies increased and was thus 26 per cent higher compared with the corresponding quarter of the previous year.
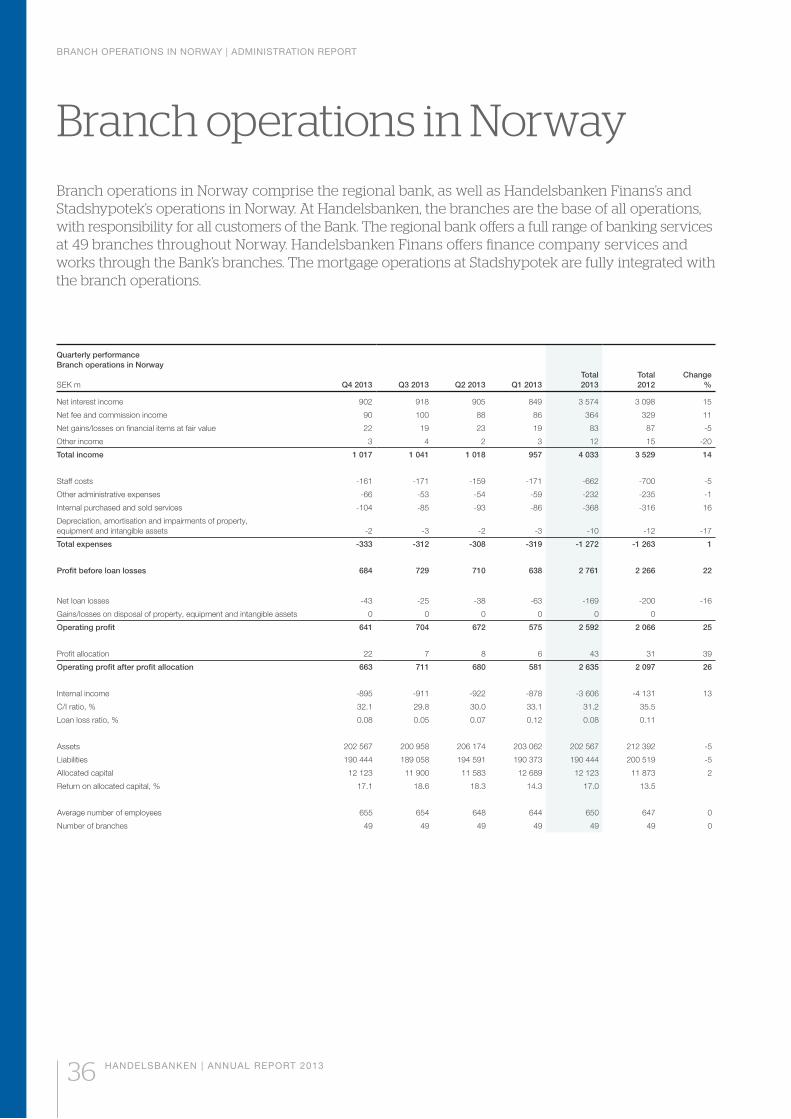
BRANCH OPERATIONS IN NORWAY | ADMINISTRATION REPORT
HANDELSBANKEN | ANNUAL REPORT 2013
Quarterly performanceBranch operations in Norway
SEK m Q4 2013 Q3 2013 Q2 2013 Q1 2013Total 2013
Total 2012
Change %
Net interest income 902 918 905 849 3 574 3 098 15
Net fee and commission income 90 100 88 86 364 329 11
Net gains/losses on financial items at fair value 22 19 23 19 83 87 -5
Other income 3 4 2 3 12 15 -20
Total income 1 017 1 041 1 018 957 4 033 3 529 14
Staff costs -161 -171 -159 -171 -662 -700 -5
Other administrative expenses -66 -53 -54 -59 -232 -235 -1
Internal purchased and sold services -104 -85 -93 -86 -368 -316 16
Depreciation, amortisation and impairments of property, equipment and intangible assets -2 -3 -2 -3 -10 -12 -17
Total expenses -333 -312 -308 -319 -1 272 -1 263 1
Profit before loan losses 684 729 710 638 2 761 2 266 22
Net loan losses -43 -25 -38 -63 -169 -200 -16
Gains/losses on disposal of property, equipment and intangible assets 0 0 0 0 0 0
Operating profit 641 704 672 575 2 592 2 066 25
Profit allocation 22 7 8 6 43 31 39
Operating profit after profit allocation 663 711 680 581 2 635 2 097 26
Internal income -895 -911 -922 -878 -3 606 -4 131 13
C/I ratio, % 32.1 29.8 30.0 33.1 31.2 35.5
Loan loss ratio, % 0.08 0.05 0.07 0.12 0.08 0.11
Assets 202 567 200 958 206 174 203 062 202 567 212 392 -5
Liabilities 190 444 189 058 194 591 190 373 190 444 200 519 -5
Allocated capital 12 123 11 900 11 583 12 689 12 123 11 873 2
Return on allocated capital, % 17.1 18.6 18.3 14.3 17.0 13.5
Average number of employees 655 654 648 644 650 647 0
Number of branches 49 49 49 49 49 49 0
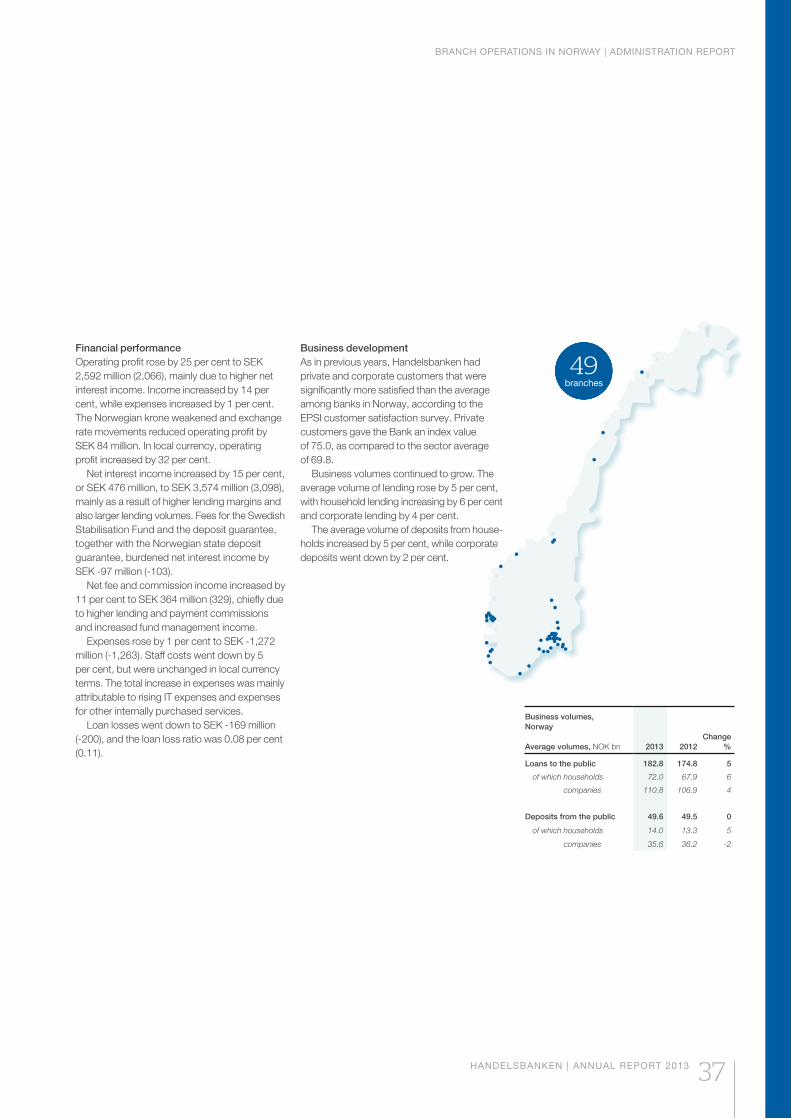
BRANCH OPERATIONS IN NORWAY | ADMINISTRATION REPORT
HANDELSBANKEN | ANNUAL REPORT 2013
49branches
Business volumes, Norway
Average volumes, NOK bn 2013 2012Change
%
Loans to the public 182.8 174.8 5
of which households 72.0 67.9 6
companies 110.8 106.9 4
Deposits from the public 49.6 49.5 0
of which households 14.0 13.3 5
companies 35.6 36.2 -2
Financial performanceOperating profit rose by 25 per cent to SEK 2,592 million (2,066), mainly due to higher net interest income. Income increased by 14 per cent, while expenses increased by 1 per cent. The Norwegian krone weakened and exchange rate movements reduced operating profit by SEK 84 million. In local currency, operating profit increased by 32 per cent.
Net interest income increased by 15 per cent, or SEK 476 million, to SEK 3,574 million (3,098), mainly as a result of higher lending margins and also larger lending volumes. Fees for the Swedish Stabilisation Fund and the deposit guarantee, together with the Norwegian state deposit guarantee, burdened net interest income by SEK -97 million (-103).
Net fee and commission income increased by 11 per cent to SEK 364 million (329), chiefly due to higher lending and payment commissions and increased fund management income.
Expenses rose by 1 per cent to SEK -1,272 million (-1,263). Staff costs went down by 5 per cent, but were unchanged in local currency terms. The total increase in expenses was mainly attributable to rising IT expenses and expenses for other internally purchased services.
Loan losses went down to SEK -169 million (-200), and the loan loss ratio was 0.08 per cent (0.11).
Business developmentAs in previous years, Handelsbanken had private and corporate customers that were significantly more satisfied than the average among banks in Norway, according to the EPSI customer satisfaction survey. Private customers gave the Bank an index value of 75.0, as compared to the sector average of 69.8.
Business volumes continued to grow. The average volume of lending rose by 5 per cent, with household lending increasing by 6 per cent and corporate lending by 4 per cent.
The average volume of deposits from house-holds increased by 5 per cent, while corporate deposits went down by 2 per cent.
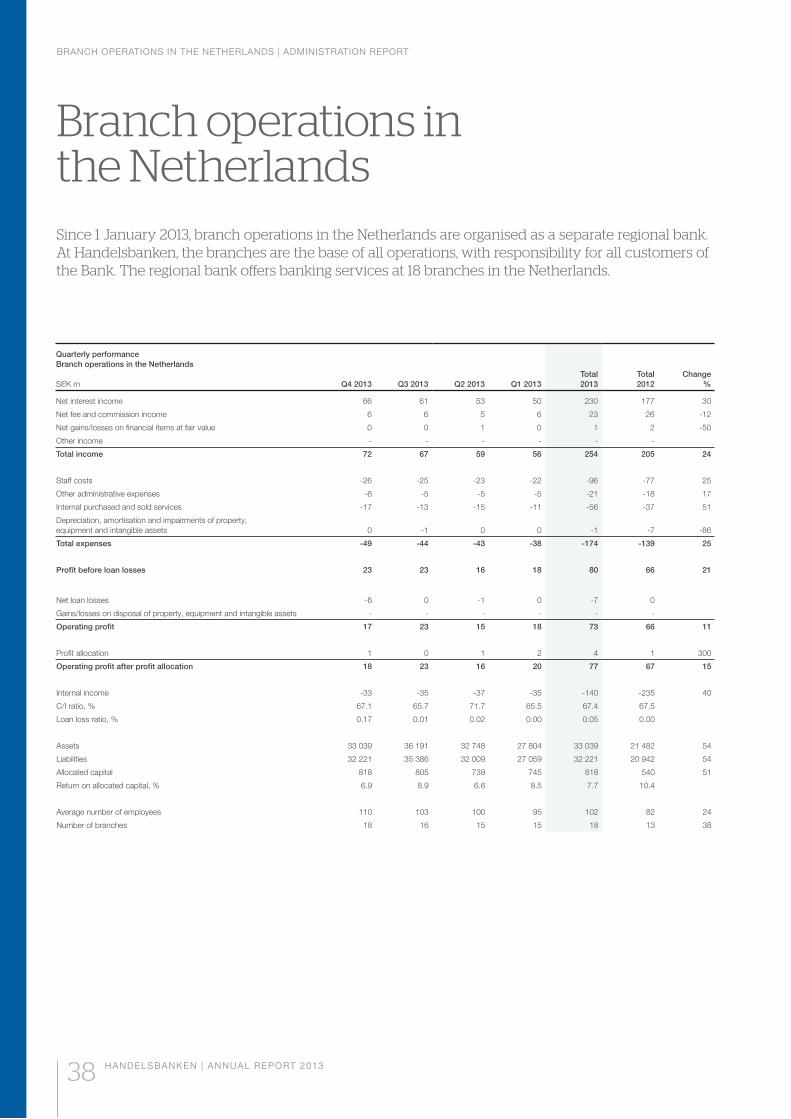
BRANCH OPERATIONS IN THE NETHERLANDS | ADMINISTRATION REPORT
38 HANDELSBANKEN | ANNUAL REPORT 2013
Quarterly performanceBranch operations in the Netherlands
SEK m Q4 2013 Q3 2013 Q2 2013 Q1 2013Total 2013
Total 2012
Change %
Net interest income 66 61 53 50 230 177 30
Net fee and commission income 6 6 5 6 23 26 -12
Net gains/losses on financial items at fair value 0 0 1 0 1 2 -50
Other income - - - - - -
Total income 72 67 59 56 254 205 24
Staff costs -26 -25 -23 -22 -96 -77 25
Other administrative expenses -6 -5 -5 -5 -21 -18 17
Internal purchased and sold services -17 -13 -15 -11 -56 -37 51
Depreciation, amortisation and impairments of property, equipment and intangible assets 0 -1 0 0 -1 -7 -86
Total expenses -49 -44 -43 -38 -174 -139 25
Profit before loan losses 23 23 16 18 80 66 21
Net loan losses -6 0 -1 0 -7 0
Gains/losses on disposal of property, equipment and intangible assets - - - - - -
Operating profit 17 23 15 18 73 66 11
Profit allocation 1 0 1 2 4 1 300
Operating profit after profit allocation 18 23 16 20 77 67 15
Internal income -33 -35 -37 -35 -140 -235 40
C/I ratio, % 67.1 65.7 71.7 65.5 67.4 67.5
Loan loss ratio, % 0.17 0.01 0.02 0.00 0.05 0.00
Assets 33 039 36 191 32 748 27 804 33 039 21 482 54
Liabilities 32 221 35 386 32 009 27 059 32 221 20 942 54
Allocated capital 818 805 739 745 818 540 51
Return on allocated capital, % 6.9 8.9 6.6 8.5 7.7 10.4
Average number of employees 110 103 100 95 102 82 24
Number of branches 18 16 15 15 18 13 38
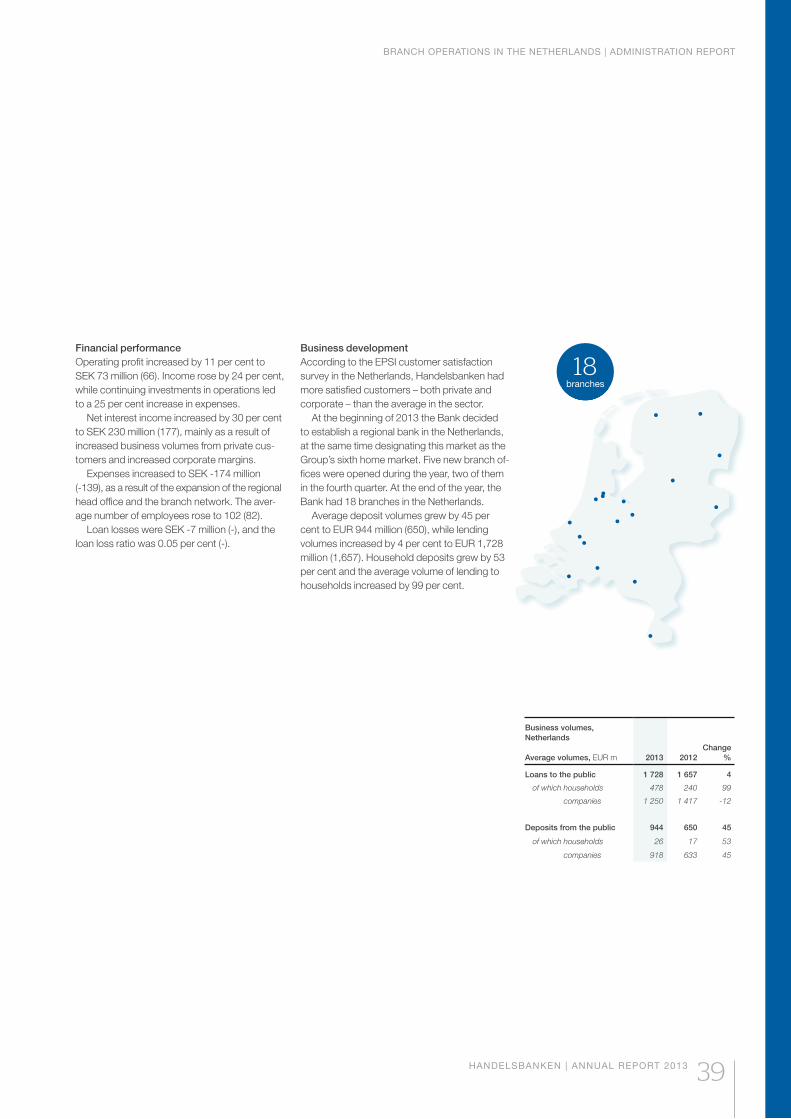
BRANCH OPERATIONS IN THE NETHERLANDS | ADMINISTRATION REPORT
HANDELSBANKEN | ANNUAL REPORT 2013 39
Business volumes, Netherlands
Average volumes, EUR m 2013 2012Change
%
Loans to the public 1 728 1 657 4
of which households 478 240 99
companies 1 250 1 417 -12
Deposits from the public 944 650 45
of which households 26 17 53
companies 918 633 45
18branches
Financial performanceOperating profit increased by 11 per cent to SEK 73 million (66). Income rose by 24 per cent, while continuing investments in operations led to a 25 per cent increase in expenses.
Net interest income increased by 30 per cent to SEK 230 million (177), mainly as a result of increased business volumes from private cus-tomers and increased corporate margins.
Expenses increased to SEK -174 million (-139), as a result of the expansion of the regional head office and the branch network. The aver-age number of employees rose to 102 (82).
Loan losses were SEK -7 million (-), and the loan loss ratio was 0.05 per cent (-).
Business developmentAccording to the EPSI customer satisfaction survey in the Netherlands, Handelsbanken had more satisfied customers – both private and corporate – than the average in the sector.
At the beginning of 2013 the Bank decided to establish a regional bank in the Netherlands, at the same time designating this market as the Group’s sixth home market. Five new branch of-fices were opened during the year, two of them in the fourth quarter. At the end of the year, the Bank had 18 branches in the Netherlands.
Average deposit volumes grew by 45 per cent to EUR 944 million (650), while lending volumes increased by 4 per cent to EUR 1,728 million (1,657). Household deposits grew by 53 per cent and the average volume of lending to households increased by 99 per cent.
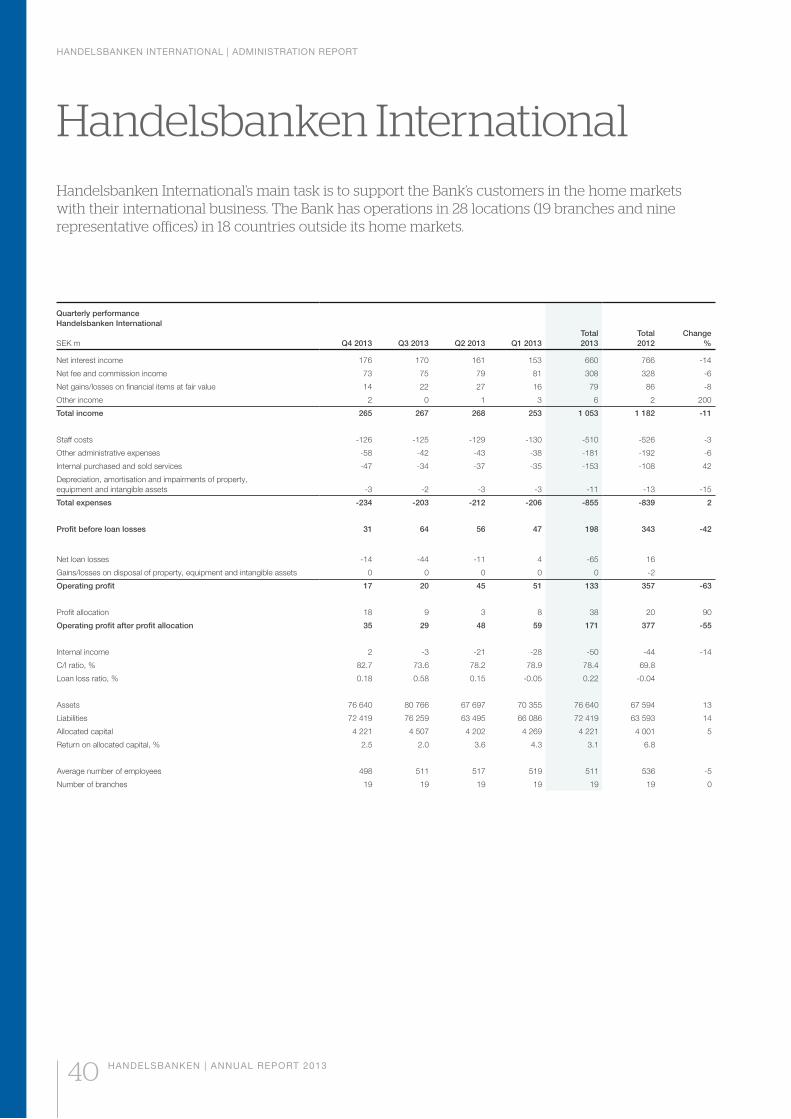
HANDELSBANKEN INTERNATIONAL | ADMINISTRATION REPORT
40 HANDELSBANKEN | ANNUAL REPORT 2013
Quarterly performanceHandelsbanken International
SEK m Q4 2013 Q3 2013 Q2 2013 Q1 2013Total 2013
Total 2012
Change %
Net interest income 176 170 161 153 660 766 -14
Net fee and commission income 73 75 79 81 308 328 -6
Net gains/losses on financial items at fair value 14 22 27 16 79 86 -8
Other income 2 0 1 3 6 2 200
Total income 265 267 268 253 1 053 1 182 -11
Staff costs -126 -125 -129 -130 -510 -526 -3
Other administrative expenses -58 -42 -43 -38 -181 -192 -6
Internal purchased and sold services -47 -34 -37 -35 -153 -108 42
Depreciation, amortisation and impairments of property, equipment and intangible assets -3 -2 -3 -3 -11 -13 -15
Total expenses -234 -203 -212 -206 -855 -839 2
Profit before loan losses 31 64 56 47 198 343 -42
Net loan losses -14 -44 -11 4 -65 16
Gains/losses on disposal of property, equipment and intangible assets 0 0 0 0 0 -2
Operating profit 17 20 45 51 133 357 -63
Profit allocation 18 9 3 8 38 20 90
Operating profit after profit allocation 35 29 48 59 171 377 -55
Internal income 2 -3 -21 -28 -50 -44 -14
C/I ratio, % 82.7 73.6 78.2 78.9 78.4 69.8
Loan loss ratio, % 0.18 0.58 0.15 -0.05 0.22 -0.04
Assets 76 640 80 766 67 697 70 355 76 640 67 594 13
Liabilities 72 419 76 259 63 495 66 086 72 419 63 593 14
Allocated capital 4 221 4 507 4 202 4 269 4 221 4 001 5
Return on allocated capital, % 2.5 2.0 3.6 4.3 3.1 6.8
Average number of employees 498 511 517 519 511 536 -5
Number of branches 19 19 19 19 19 19 0
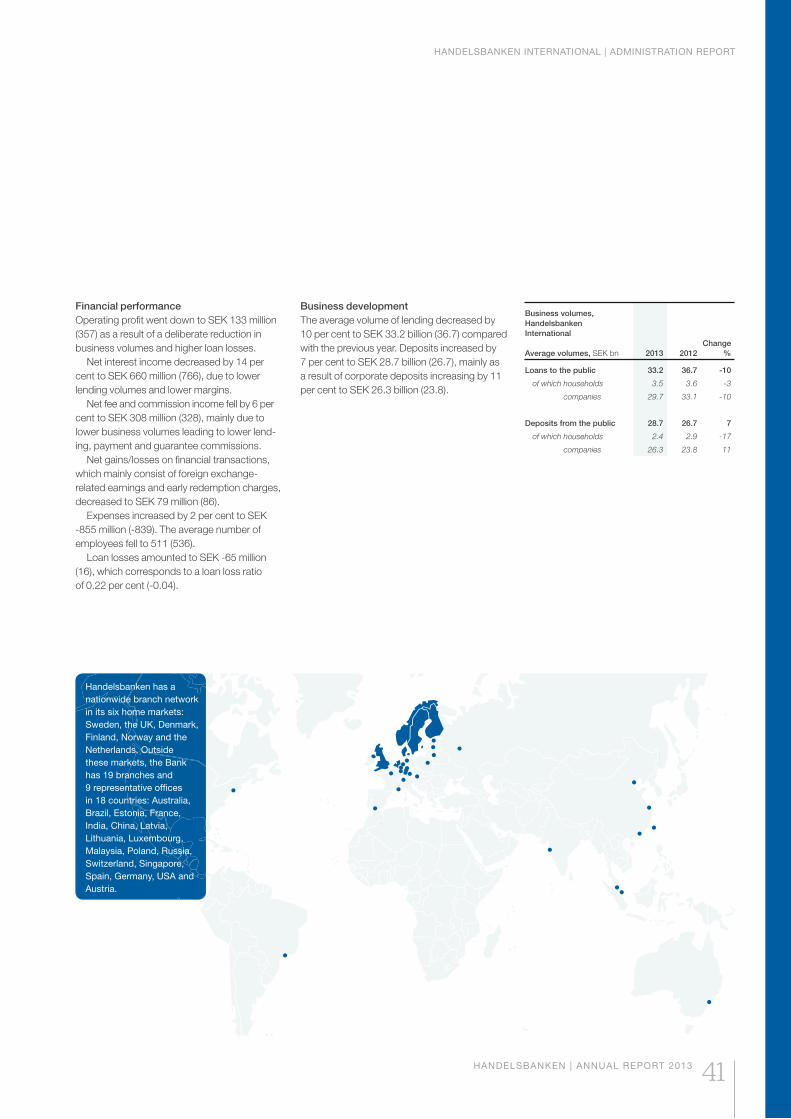
HANDELSBANKEN INTERNATIONAL | ADMINISTRATION REPORT
HANDELSBANKEN | ANNUAL REPORT 2013 41
Business volumes, Handelsbanken International Average volumes, SEK bn 2013 2012
Change %
Loans to the public 33.2 36.7 -10
of which households 3.5 3.6 -3
companies 29.7 33.1 -10
Deposits from the public 28.7 26.7 7
of which households 2.4 2.9 -17
companies 26.3 23.8 11
Handelsbanken has a nationwide branch network in its six home markets: Sweden, the UK, Denmark, Finland, Norway and the Netherlands. Outside these markets, the Bank has 19 branches and 9 representative offices in 18 countries: Australia, Brazil, Estonia, France, India, China, Latvia, Lithuania, Luxembourg, Malaysia, Poland, Russia, Switzerland, Singapore, Spain, Germany, USA and Austria.
Financial performanceOperating profit went down to SEK 133 million (357) as a result of a deliberate reduction in business volumes and higher loan losses.
Net interest income decreased by 14 per cent to SEK 660 million (766), due to lower lending volumes and lower margins.
Net fee and commission income fell by 6 per cent to SEK 308 million (328), mainly due to lower business volumes leading to lower lend-ing, payment and guarantee commissions.
Net gains/losses on financial transactions, which mainly consist of foreign exchange-related earnings and early redemption charges, decreased to SEK 79 million (86).
Expenses increased by 2 per cent to SEK -855 million (-839). The average number of employees fell to 511 (536).
Loan losses amounted to SEK -65 million (16), which corresponds to a loan loss ratio of 0.22 per cent (-0.04).
Business developmentThe average volume of lending decreased by 10 per cent to SEK 33.2 billion (36.7) compared with the previous year. Deposits increased by 7 per cent to SEK 28.7 billion (26.7), mainly as a result of corporate deposits increasing by 11 per cent to SEK 26.3 billion (23.8).
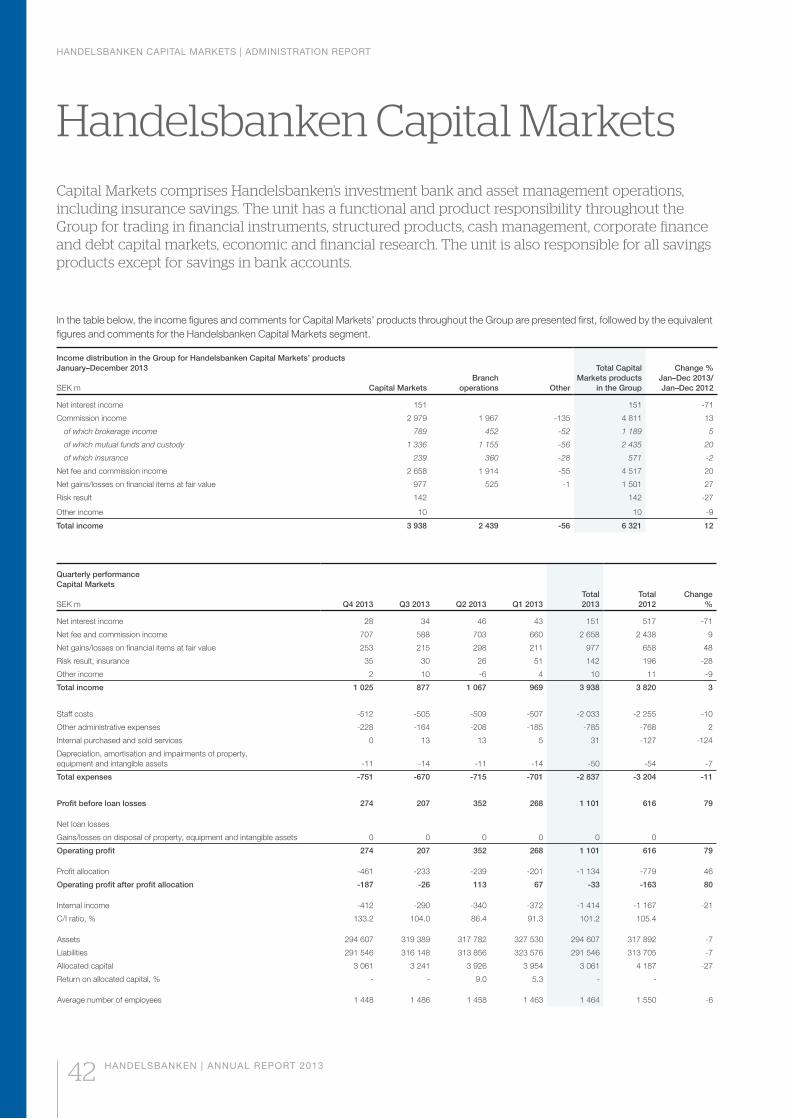
HANDELSBANKEN CAPITAL MARKETS | ADMINISTRATION REPORT
42 HANDELSBANKEN | ANNUAL REPORT 2013
In the table below, the income figures and comments for Capital Markets’ products throughout the Group are presented first, followed by the equivalent figures and comments for the Handelsbanken Capital Markets segment.
Income distribution in the Group for Handelsbanken Capital Markets’ products January–December 2013
SEK m Capital MarketsBranch
operations Other
Total Capital Markets products
in the Group
Change % Jan–Dec 2013/Jan–Dec 2012
Net interest income 151 151 -71
Commission income 2 979 1 967 -135 4 811 13
of which brokerage income 789 452 -52 1 189 5
of which mutual funds and custody 1 336 1 155 -56 2 435 20
of which insurance 239 360 -28 571 -2
Net fee and commission income 2 658 1 914 -55 4 517 20
Net gains/losses on financial items at fair value 977 525 -1 1 501 27
Risk result 142 142 -27
Other income 10 10 -9
Total income 3 938 2 439 -56 6 321 12
Quarterly performanceCapital Markets
SEK m Q4 2013 Q3 2013 Q2 2013 Q1 2013Total 2013
Total 2012
Change %
Net interest income 28 34 46 43 151 517 -71
Net fee and commission income 707 588 703 660 2 658 2 438 9
Net gains/losses on financial items at fair value 253 215 298 211 977 658 48
Risk result, insurance 35 30 26 51 142 196 -28
Other income 2 10 -6 4 10 11 -9
Total income 1 025 877 1 067 969 3 938 3 820 3
Staff costs -512 -505 -509 -507 -2 033 -2 255 -10
Other administrative expenses -228 -164 -208 -185 -785 -768 2
Internal purchased and sold services 0 13 13 5 31 -127 -124
Depreciation, amortisation and impairments of property, equipment and intangible assets -11 -14 -11 -14 -50 -54 -7
Total expenses -751 -670 -715 -701 -2 837 -3 204 -11
Profit before loan losses 274 207 352 268 1 101 616 79
Net loan losses
Gains/losses on disposal of property, equipment and intangible assets 0 0 0 0 0 0
Operating profit 274 207 352 268 1 101 616 79
Profit allocation -461 -233 -239 -201 -1 134 -779 46
Operating profit after profit allocation -187 -26 113 67 -33 -163 80
Internal income -412 -290 -340 -372 -1 414 -1 167 -21
C/I ratio, % 133.2 104.0 86.4 91.3 101.2 105.4
Assets 294 607 319 389 317 782 327 530 294 607 317 892 -7
Liabilities 291 546 316 148 313 856 323 576 291 546 313 705 -7
Allocated capital 3 061 3 241 3 926 3 954 3 061 4 187 -27
Return on allocated capital, % - - 9.0 5.3 - -
Average number of employees 1 448 1 486 1 458 1 463 1 464 1 550 -6
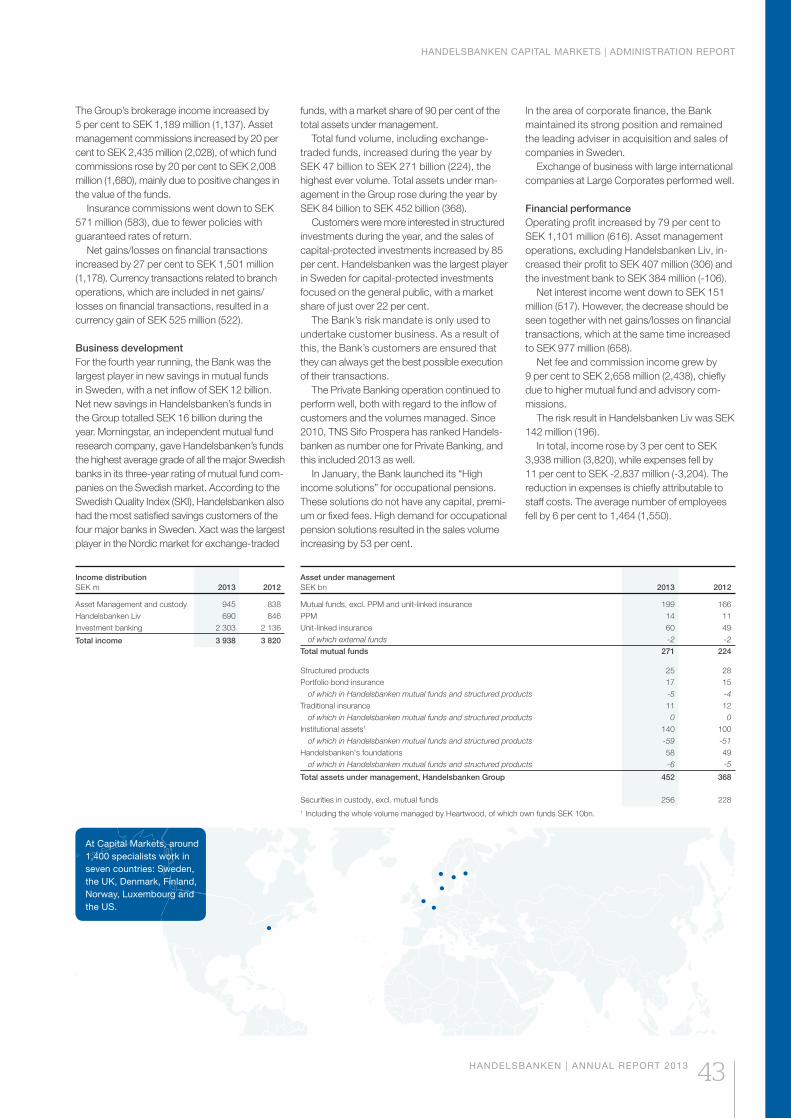
HANDELSBANKEN CAPITAL MARKETS | ADMINISTRATION REPORT
HANDELSBANKEN | ANNUAL REPORT 2013 43
Income distributionSEK m 2013 2012
Asset Management and custody 945 838Handelsbanken Liv 690 846Investment banking 2 303 2 136
Total income 3 938 3 820
Asset under managementSEK bn 2013 2012
Mutual funds, excl. PPM and unit-linked insurance 199 166PPM 14 11Unit-linked insurance 60 49
of which external funds -2 -2
Total mutual funds 271 224
Structured products 25 28Portfolio bond insurance 17 15
of which in Handelsbanken mutual funds and structured products -5 -4
Traditional insurance 11 12of which in Handelsbanken mutual funds and structured products 0 0
Institutional assets1 140 100of which in Handelsbanken mutual funds and structured products -59 -51
Handelsbanken's foundations 58 49of which in Handelsbanken mutual funds and structured products -6 -5
Total assets under management, Handelsbanken Group 452 368
Securities in custody, excl. mutual funds 256 2281 Including the whole volume managed by Heartwood, of which own funds SEK 10bn.
At Capital Markets, around 1,400 specialists work in seven countries: Sweden, the UK, Denmark, Finland, Norway, Luxembourg and the US.
The Group’s brokerage income increased by 5 per cent to SEK 1,189 million (1,137). Asset management commissions increased by 20 per cent to SEK 2,435 million (2,028), of which fund commissions rose by 20 per cent to SEK 2,008 million (1,680), mainly due to positive changes in the value of the funds.
Insurance commissions went down to SEK 571 million (583), due to fewer policies with guaranteed rates of return.
Net gains/losses on financial transactions increased by 27 per cent to SEK 1,501 million (1,178). Currency transactions related to branch operations, which are included in net gains/losses on financial transactions, resulted in a currency gain of SEK 525 million (522).
Business developmentFor the fourth year running, the Bank was the largest player in new savings in mutual funds in Sweden, with a net inflow of SEK 12 billion. Net new savings in Handelsbanken’s funds in the Group totalled SEK 16 billion during the year. Morningstar, an independent mutual fund research company, gave Handelsbanken’s funds the highest average grade of all the major Swedish banks in its three-year rating of mutual fund com-panies on the Swedish market. According to the Swedish Quality Index (SKI), Handelsbanken also had the most satisfied savings customers of the four major banks in Sweden. Xact was the largest player in the Nordic market for exchange-traded
funds, with a market share of 90 per cent of the total assets under management.
Total fund volume, including exchange- traded funds, increased during the year by SEK 47 billion to SEK 271 billion (224), the highest ever volume. Total assets under man-agement in the Group rose during the year by SEK 84 billion to SEK 452 billion (368).
Customers were more interested in structured investments during the year, and the sales of capital-protected investments increased by 85 per cent. Handelsbanken was the largest player in Sweden for capital-protected investments focused on the general public, with a market share of just over 22 per cent.
The Bank’s risk mandate is only used to undertake customer business. As a result of this, the Bank’s customers are ensured that they can always get the best possible execution of their transactions.
The Private Banking operation continued to perform well, both with regard to the inflow of customers and the volumes managed. Since 2010, TNS Sifo Prospera has ranked Handels-banken as number one for Private Banking, and this included 2013 as well.
In January, the Bank launched its “High income solutions” for occupational pensions. These solutions do not have any capital, premi-um or fixed fees. High demand for occupational pension solutions resulted in the sales volume increasing by 53 per cent.
In the area of corporate finance, the Bank maintained its strong position and remained the leading adviser in acquisition and sales of companies in Sweden.
Exchange of business with large international companies at Large Corporates performed well.
Financial performanceOperating profit increased by 79 per cent to SEK 1,101 million (616). Asset management operations, excluding Handelsbanken Liv, in-creased their profit to SEK 407 million (306) and the investment bank to SEK 384 million (-106).
Net interest income went down to SEK 151 million (517). However, the decrease should be seen together with net gains/losses on financial transactions, which at the same time increased to SEK 977 million (658).
Net fee and commission income grew by 9 per cent to SEK 2,658 million (2,438), chiefly due to higher mutual fund and advisory com-missions.
The risk result in Handelsbanken Liv was SEK 142 million (196).
In total, income rose by 3 per cent to SEK 3,938 million (3,820), while expenses fell by 11 per cent to SEK -2,837 million (-3,204). The reduction in expenses is chiefly attributable to staff costs. The average number of employees fell by 6 per cent to 1,464 (1,550).
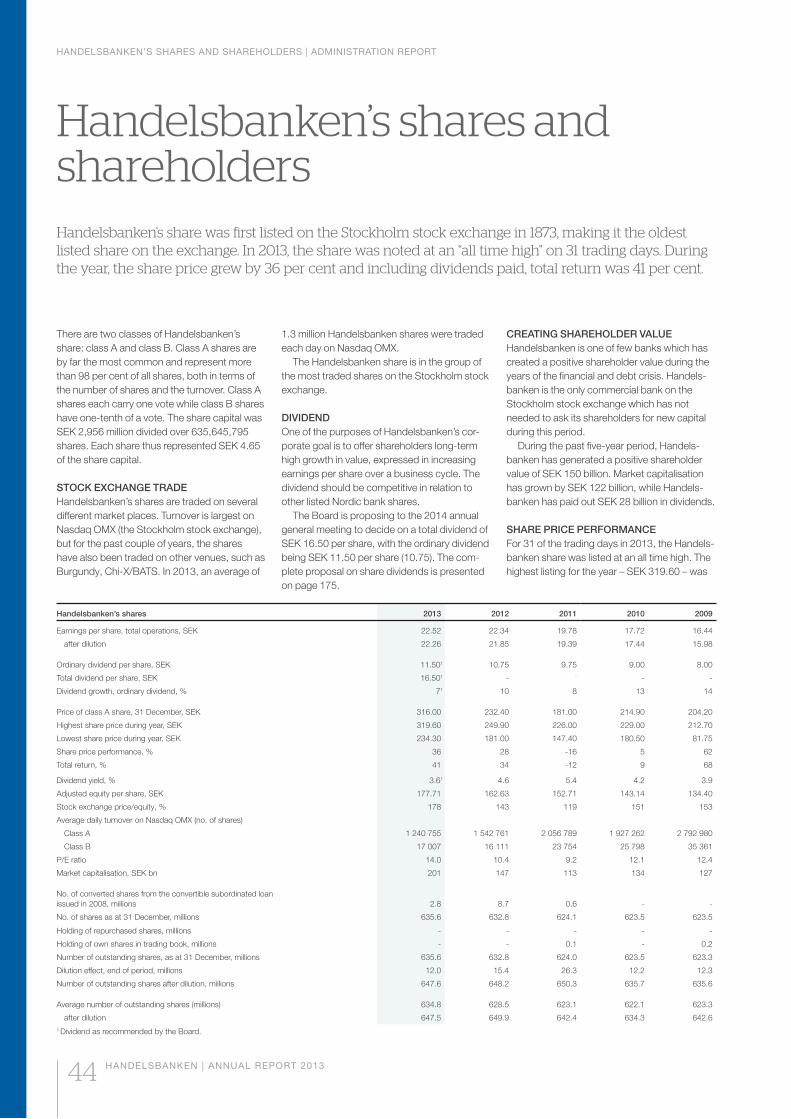
HANDELSBANKEN’S SHARES AND SHAREHOLDERS | ADMINISTRATION REPORT
44 HANDELSBANKEN | ANNUAL REPORT 2013
Handelsbanken’s shares 2013 2012 2011 2010 2009
Earnings per share, total operations, SEK 22.52 22.34 19.78 17.72 16.44
after dilution 22.26 21.85 19.39 17.44 15.98
Ordinary dividend per share, SEK 11.501 10.75 9.75 9.00 8.00
Total dividend per share, SEK 16.501 - - - -
Dividend growth, ordinary dividend, % 71 10 8 13 14
Price of class A share, 31 December, SEK 316.00 232.40 181.00 214.90 204.20
Highest share price during year, SEK 319.60 249.90 226.00 229.00 212.70
Lowest share price during year, SEK 234.30 181.00 147.40 180.50 81.75
Share price performance, % 36 28 -16 5 62
Total return, % 41 34 -12 9 68
Dividend yield, % 3.61 4.6 5.4 4.2 3.9
Adjusted equity per share, SEK 177.71 162.63 152.71 143.14 134.40
Stock exchange price/equity, % 178 143 119 151 153
Average daily turnover on Nasdaq OMX (no. of shares)
Class A 1 240 755 1 542 761 2 056 789 1 927 262 2 792 980
Class B 17 007 16 111 23 754 25 798 35 361
P/E ratio 14.0 10.4 9.2 12.1 12.4
Market capitalisation, SEK bn 201 147 113 134 127
No. of converted shares from the convertible subordinated loan issued in 2008, millions 2.8 8.7 0.6 - -
No. of shares as at 31 December, millions 635.6 632.8 624.1 623.5 623.5
Holding of repurchased shares, millions - - - - -
Holding of own shares in trading book, millions - - 0.1 - 0.2
Number of outstanding shares, as at 31 December, millions 635.6 632.8 624.0 623.5 623.3
Dilution effect, end of period, millions 12.0 15.4 26.3 12.2 12.3
Number of outstanding shares after dilution, millions 647.6 648.2 650.3 635.7 635.6
Average number of outstanding shares (millions) 634.8 628.5 623.1 622.1 623.3
after dilution 647.5 649.9 642.4 634.3 642.61 Dividend as recommended by the Board.
There are two classes of Handelsbanken’s share: class A and class B. Class A shares are by far the most common and represent more than 98 per cent of all shares, both in terms of the number of shares and the turnover. Class A shares each carry one vote while class B shares have one-tenth of a vote. The share capital was SEK 2,956 million divided over 635,645,795 shares. Each share thus represented SEK 4.65 of the share capital.
STOCK EXCHANGE TRADEHandelsbanken’s shares are traded on several different market places. Turnover is largest on Nasdaq OMX (the Stockholm stock exchange), but for the past couple of years, the shares have also been traded on other venues, such as Burgundy, Chi-X/BATS. In 2013, an average of
1.3 million Handelsbanken shares were traded each day on Nasdaq OMX.
The Handelsbanken share is in the group of the most traded shares on the Stockholm stock exchange.
DIVIDENDOne of the purposes of Handelsbanken’s cor-porate goal is to offer shareholders long-term high growth in value, expressed in increasing earnings per share over a business cycle. The dividend should be competitive in relation to other listed Nordic bank shares.
The Board is proposing to the 2014 annual general meeting to decide on a total dividend of SEK 16.50 per share, with the ordinary dividend being SEK 11.50 per share (10.75). The com-plete proposal on share dividends is presented on page 175.
CREATING SHAREHOLDER VALUEHandelsbanken is one of few banks which has created a positive shareholder value during the years of the financial and debt crisis. Handels-banken is the only commercial bank on the Stockholm stock exchange which has not needed to ask its shareholders for new capital during this period.
During the past five-year period, Handels-banken has generated a positive shareholder value of SEK 150 billion. Market capitalisation has grown by SEK 122 billion, while Handels-banken has paid out SEK 28 billion in dividends.
SHARE PRICE PERFORMANCEFor 31 of the trading days in 2013, the Handels-banken share was listed at an all time high. The highest listing for the year – SEK 319.60 – was
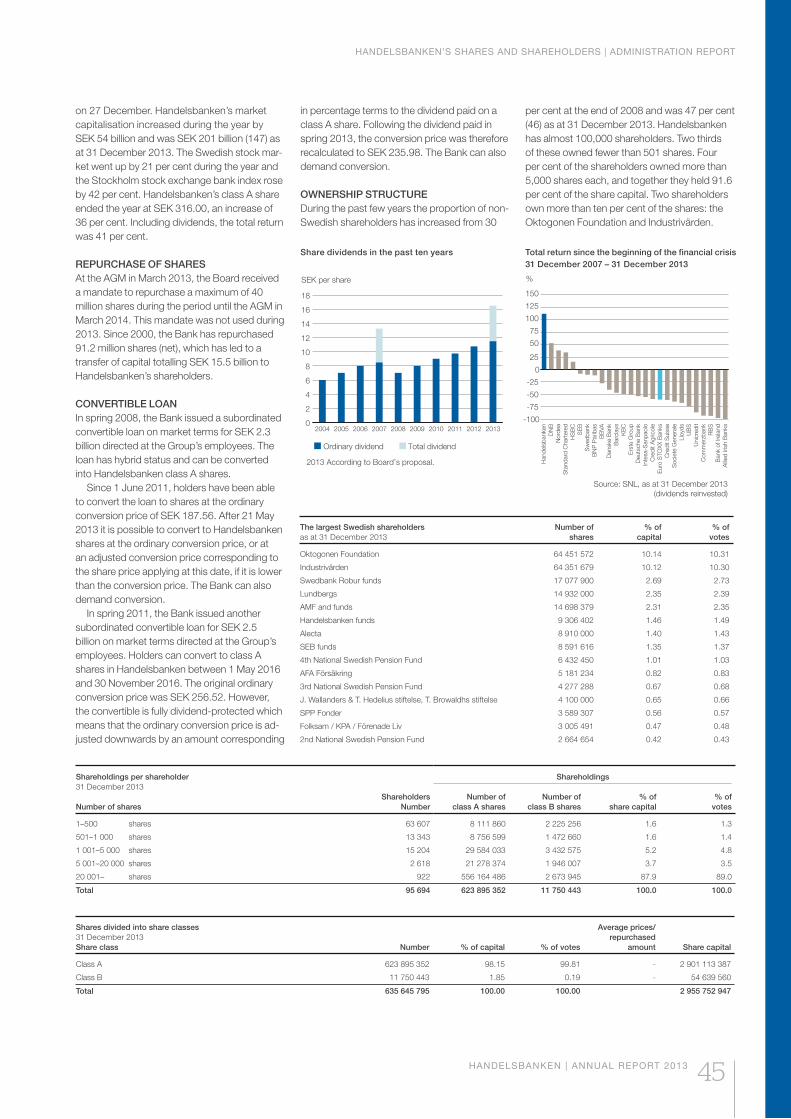
HANDELSBANKEN’S SHARES AND SHAREHOLDERS | ADMINISTRATION REPORT
HANDELSBANKEN | ANNUAL REPORT 2013 45
Share dividends in the past ten years
0
2
4
6
8
10
12
14
16
18
2013201220112010200920082007200620052004
SEK per share
Total dividend Ordinary dividend
2013 According to Board’s proposal.
Source: SNL, as at 31 December 2013(dividends reinvested)
%
Han
dels
bank
enD
NB
Nor
dea
Sta
ndar
d C
hart
ered
HS
BC
SE
BS
wed
bank
BN
P P
arib
asB
BVA
Dan
ske
Ban
kB
arcl
ays
KB
CE
rste
Gro
upD
euts
che
Ban
kIn
tesa
-San
paol
oC
redi
t Agr
icol
eE
uro
STO
XX B
anks
Cre
dit S
uiss
eS
ocie
te G
ener
ale
Lloy
dsU
BS
Uni
cred
itC
omm
erzb
ank
RB
SB
ank
of Ir
elan
dA
llied
Irish
Ban
ks
-100
-75
-50
-25
0
25
50
75
100
125
150
Shares divided into share classes31 December 2013Share class Number % of capital % of votes
Average prices/repurchased
amount Share capital
Class A 623 895 352 98.15 99.81 - 2 901 113 387
Class B 11 750 443 1.85 0.19 - 54 639 560
Total 635 645 795 100.00 100.00 2 955 752 947
Shareholdings per shareholder31 December 2013
Number of sharesShareholders
Number
Shareholdings
Number ofclass A shares
Number ofclass B shares
% ofshare capital
% ofvotes
1–500 shares 63 607 8 111 860 2 225 256 1.6 1.3
501–1 000 shares 13 343 8 756 599 1 472 660 1.6 1.4
1 001–5 000 shares 15 204 29 584 033 3 432 575 5.2 4.8
5 001–20 000 shares 2 618 21 278 374 1 946 007 3.7 3.5
20 001– shares 922 556 164 486 2 673 945 87.9 89.0
Total 95 694 623 895 352 11 750 443 100.0 100.0
The largest Swedish shareholdersas at 31 December 2013
Number of shares
% ofcapital
% ofvotes
Oktogonen Foundation 64 451 572 10.14 10.31
Industrivärden 64 351 679 10.12 10.30
Swedbank Robur funds 17 077 900 2.69 2.73
Lundbergs 14 932 000 2.35 2.39
AMF and funds 14 698 379 2.31 2.35
Handelsbanken funds 9 306 402 1.46 1.49
Alecta 8 910 000 1.40 1.43
SEB funds 8 591 616 1.35 1.37
4th National Swedish Pension Fund 6 432 450 1.01 1.03
AFA Försäkring 5 181 234 0.82 0.83
3rd National Swedish Pension Fund 4 277 288 0.67 0.68
J. Wallanders & T. Hedelius stiftelse, T. Browaldhs stiftelse 4 100 000 0.65 0.66
SPP Fonder 3 589 307 0.56 0.57
Folksam / KPA / Förenade Liv 3 005 491 0.47 0.48
2nd National Swedish Pension Fund 2 664 654 0.42 0.43
Total return since the beginning of the financial crisis 31 December 2007 – 31 December 2013
in percentage terms to the dividend paid on a class A share. Following the dividend paid in spring 2013, the conversion price was therefore recalculated to SEK 235.98. The Bank can also demand conversion.
OWNERSHIP STRUCTUREDuring the past few years the proportion of non-Swedish shareholders has increased from 30
per cent at the end of 2008 and was 47 per cent (46) as at 31 December 2013. Handelsbanken has almost 100,000 shareholders. Two thirds of these owned fewer than 501 shares. Four per cent of the shareholders owned more than 5,000 shares each, and together they held 91.6 per cent of the share capital. Two shareholders own more than ten per cent of the shares: the Oktogonen Foundation and Industrivärden.
on 27 December. Handelsbanken’s market capitalisation increased during the year by SEK 54 billion and was SEK 201 billion (147) as at 31 December 2013. The Swedish stock mar-ket went up by 21 per cent during the year and the Stockholm stock exchange bank index rose by 42 per cent. Handelsbanken’s class A share ended the year at SEK 316.00, an increase of 36 per cent. Including dividends, the total return was 41 per cent.
REPURCHASE OF SHARESAt the AGM in March 2013, the Board received a mandate to repurchase a maximum of 40 million shares during the period until the AGM in March 2014. This mandate was not used during 2013. Since 2000, the Bank has repurchased 91.2 million shares (net), which has led to a transfer of capital totalling SEK 15.5 billion to Handelsbanken’s shareholders.
CONVERTIBLE LOANIn spring 2008, the Bank issued a subordinated convertible loan on market terms for SEK 2.3 billion directed at the Group’s employees. The loan has hybrid status and can be converted into Handelsbanken class A shares.
Since 1 June 2011, holders have been able to convert the loan to shares at the ordinary conversion price of SEK 187.56. After 21 May 2013 it is possible to convert to Handelsbanken shares at the ordinary conversion price, or at an adjusted conversion price corresponding to the share price applying at this date, if it is lower than the conversion price. The Bank can also demand conversion.
In spring 2011, the Bank issued another subordinated convertible loan for SEK 2.5 billion on market terms directed at the Group’s employees. Holders can convert to class A shares in Handelsbanken between 1 May 2016 and 30 November 2016. The original ordinary conversion price was SEK 256.52. However, the convertible is fully dividend-protected which means that the ordinary conversion price is ad-justed downwards by an amount corresponding
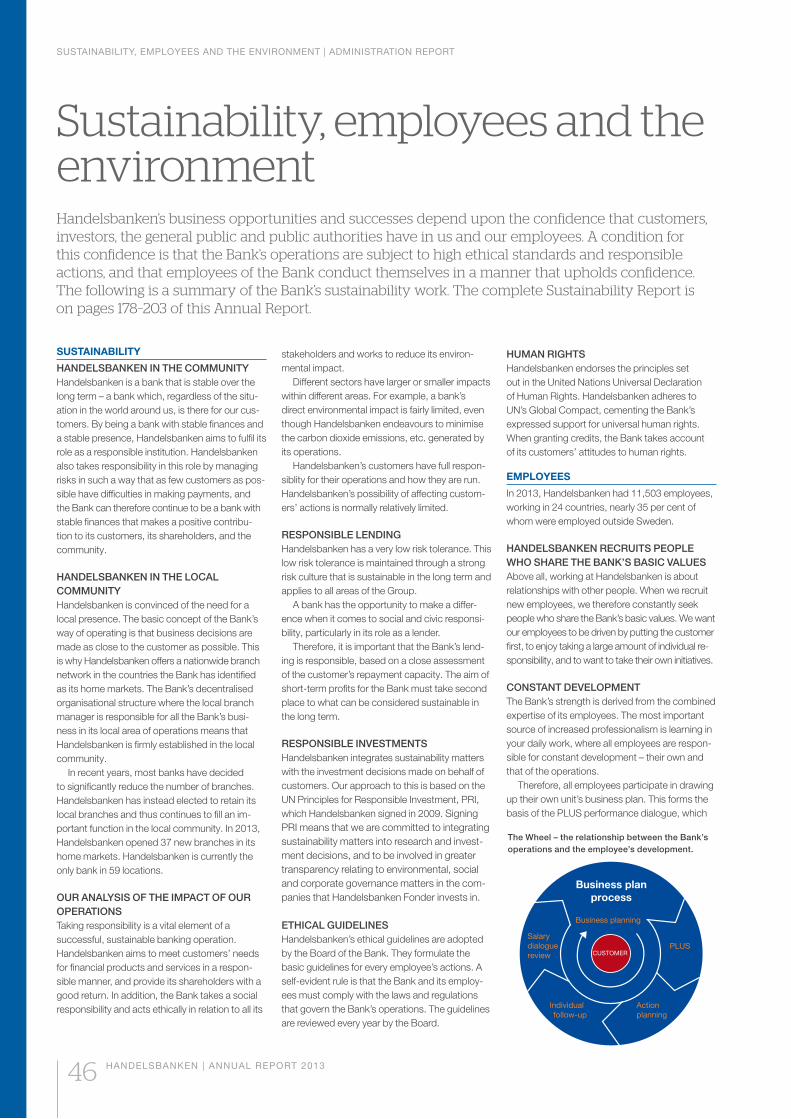
SUSTAINABILITY, EMPLOYEES AND THE ENVIRONMENT | ADMINISTRATION REPORT
HANDELSBANKEN | ANNUAL REPORT 2013
SUSTAINABILITY
HANDELSBANKEN IN THE COMMUNITYHandelsbanken is a bank that is stable over the long term – a bank which, regardless of the situ-ation in the world around us, is there for our cus-tomers. By being a bank with stable finances and a stable presence, Handelsbanken aims to fulfil its role as a responsible institution. Handelsbanken also takes responsibility in this role by managing risks in such a way that as few customers as pos-sible have difficulties in making payments, and the Bank can therefore continue to be a bank with stable finances that makes a positive contribu-tion to its customers, its shareholders, and the community.
HANDELSBANKEN IN THE LOCAL COMMUNITY Handelsbanken is convinced of the need for a local presence. The basic concept of the Bank’s way of operating is that business decisions are made as close to the customer as possible. This is why Handelsbanken offers a nationwide branch network in the countries the Bank has identified as its home markets. The Bank’s decentralised organisational structure where the local branch manager is responsible for all the Bank’s busi-ness in its local area of operations means that Handelsbanken is firmly established in the local community.
In recent years, most banks have decided to significantly reduce the number of branches. Handels banken has instead elected to retain its local branches and thus continues to fill an im-portant function in the local community. In 2013, Handels banken opened 37 new branches in its home markets. Handelsbanken is currently the only bank in 59 locations.
OUR ANALYSIS OF THE IMPACT OF OUR OPERATIONSTaking responsibility is a vital element of a successful, sustainable banking operation. Handelsbanken aims to meet customers’ needs for financial products and services in a respon-sible manner, and provide its shareholders with a good return. In addition, the Bank takes a social responsibility and acts ethically in relation to all its
stakeholders and works to reduce its environ-mental impact.
Different sectors have larger or smaller impacts within different areas. For example, a bank’s direct environmental impact is fairly limited, even though Handelsbanken endeavours to minimise the carbon dioxide emissions, etc. generated by its operations.
Handelsbanken’s customers have full respon-siblity for their operations and how they are run. Handelsbanken’s possibility of affecting custom-ers’ actions is normally relatively limited.
RESPONSIBLE LENDINGHandelsbanken has a very low risk tolerance. This low risk tolerance is maintained through a strong risk culture that is sustainable in the long term and applies to all areas of the Group.
A bank has the opportunity to make a differ-ence when it comes to social and civic responsi-bility, particularly in its role as a lender.
Therefore, it is important that the Bank’s lend-ing is responsible, based on a close assessment of the customer’s repayment capacity. The aim of short-term profits for the Bank must take second place to what can be considered sustainable in the long term.
RESPONSIBLE INVESTMENTSHandelsbanken integrates sustainability matters with the investment decisions made on behalf of customers. Our approach to this is based on the UN Principles for Responsible Investment, PRI, which Handelsbanken signed in 2009. Signing PRI means that we are committed to integrating sustainability matters into research and invest-ment decisions, and to be involved in greater transparency relating to environmental, social and corporate governance matters in the com-panies that Handelsbanken Fonder invests in.
ETHICAL GUIDELINESHandelsbanken’s ethical guidelines are adopted by the Board of the Bank. They formulate the basic guidelines for every employee’s actions. A self-evident rule is that the Bank and its employ-ees must comply with the laws and regulations that govern the Bank’s operations. The guidelines are reviewed every year by the Board.
HUMAN RIGHTSHandelsbanken endorses the principles set out in the United Nations Universal Declaration of Human Rights. Handelsbanken adheres to UN’s Global Compact, cementing the Bank’s expressed support for universal human rights. When granting credits, the Bank takes account of its customers’ attitudes to human rights.
EMPLOYEES
In 2013, Handelsbanken had 11,503 employees, working in 24 countries, nearly 35 per cent of whom were employed outside Sweden.
HANDELSBANKEN RECRUITS PEOPLE WHO SHARE THE BANK’S BASIC VALUES Above all, working at Handelsbanken is about relationships with other people. When we recruit new employees, we therefore constantly seek people who share the Bank’s basic values. We want our employees to be driven by putting the customer first, to enjoy taking a large amount of individual re-sponsibility, and to want to take their own initiatives.
CONSTANT DEVELOPMENT The Bank’s strength is derived from the combined expertise of its employees. The most important source of increased professionalism is learning in your daily work, where all employees are respon-sible for constant development – their own and that of the operations.
Therefore, all employees participate in drawing up their own unit’s business plan. This forms the basis of the PLUS performance dialogue, which
PLUS
Actionplanning
Individual follow-up
Business planning
Business planprocess
Salarydialoguereview CUSTOMER
The Wheel – the relationship between the Bank’s operations and the employee’s development.
SUSTAINABILITY, EMPLOYEES AND THE ENVIRONMENT | ADMINISTRATION REPORT
HANDELSBANKEN | ANNUAL REPORT 2013
every employee has with his/her line manager at least once a year.
After this, each employee puts together an action plan setting out the goals to be attained and the conditions necessary for this. At the end of the year, the employee has a salary dialogue re-view with his/her line manager, based on a follow-up of the action plan that has been carried out.
INTERNAL LABOUR MARKET AND MANAGEMENT SUCCESSION Since the corporate culture and the Bank’s values are so vital for Handelsbanken’s success, internal recruitment is important. Internal mobility con-tributes to the working method and culture being spread to all parts of the Bank and all countries.
External staff turnover in the Group was 2.9 per cent (3.6) during the year.
Managers at Handelsbanken must be exempla-ry ambassadors for the Bank’s corporate culture, which explains why most managers are recruited internally. In 2013, 98 per cent (98) of all managers in Sweden were recruited internally. For the Group as a whole, the corresponding figure is 90 per cent (93), including those markets where the Bank established operations relatively recently.
One of the most vital tasks for managers at the Bank is to identify, encourage and develop new managers.
FOR GENDER EQUALITY – AGAINST DISCRIMINATION At Handelsbanken, there must be no discrimina-tion on grounds such as gender, gender identity or expression, ethnicity, religion or other beliefs, disability, sexual orientation or age.
Incidents of discrimination concerning em-ployees are normally managed in the operations through the local personnel functions, but cases reported to the national discrimination ombudsman or corresponding official body are followed up at Group level. No such cases were reported in 2013.
Handelsbanken aims to be an equal oppor-tunities company where women and men have the same opportunities, chances and power to shape the Bank and their own professional career. Gender equality is about making the most of all of Handelsbanken’s potential.
In all countries where Handelsbanken operates, the Bank must produce a gender equality plan which supports the Group’s equality goals. The gender equality plan is to be based on Handels-banken’s fundamental values and the laws and guidelines applying in the country concerned.
At the year-end, 44 per cent (43) of the Bank’s managers in Sweden were women. The proportion of women among the total number of employees in Sweden was 54 per cent (54).
In the Group as a whole, 38 per cent (37) of managers were women. The proportion of women among the total number of employees in the Group was 52 per cent (52).
The Bank’s work with gender equality is con-tinuing, with various measures aimed at making Handelsbanken a gender-equal company. Train-ing is carried out for managers, staff at person-nel functions and trade union representatives in order to increase awareness of how social and
cultural norms affect attitudes and behaviour in everyday life.
Focus on rectifying unwarranted pay differen-tials between women and men continued in 2013. Personnel functions and trade union representatives have organised joint meetings with salary-setting managers to provide them with further support in the work towards gender equality in salaries.
WORK ENVIRONMENT AND HEALTH Handelsbanken’s overall goal with its work en-vironment work focuses on employees enjoying good health, developing on a personal level and functioning in an optimal way. This is a long-term goal that includes factors such as clear and honest communication, having the skills and competence and the right conditions needed to perform tasks and deal with work-related situa-tions, having pride and confidence in one’s work, respecting others, and being respected oneself.
In co-operation with staff and employee representatives, managers are responsible for developing a healthy and safe workplace in ac-cordance with the Bank’s work environment goal.
In Sweden, managers with delegated respon-sibility for the work environment must, in col-laboration with work environment representatives and employees, compile a work environment status report at least once a year. This includes the employees’ physical and psychosocial environment. The results are discussed within each unit at the Bank, and any measures decided upon must be integrated into the business plan/operational plan.
WORKING CONDITIONS AND UNION RIGHTS All employees of Handelsbanken have the right to organise and join a union or employee organisation. Handelsbanken’s traditional good relationship with unions is a valuable component of Handelsbanken’s culture. All employees in Denmark, Finland, France, Luxembourg, Norway, Sweden and Austria, comprising almost 85 per cent of the Bank’s employees, are covered by col-lective bargaining agreements. In these countries, employees who are not members of a union are also covered by the terms of the collective agree-ment. The number of employees has increased in countries which traditionally have a low rate of membership of collective bargaining agreements. For this reason, the proportion of employees who are covered by a collective bargaining agreement has fallen slightly.
There is an ongoing dialogue between union representatives and managers concerning opera-tions – such as when changes and new services are to be launched – where valuable information is exchanged at the very early stages. As well as matters which are dealt with in a dialogue with the union organisations in each country, Handelsbanken’s European Work Council (EWC) functions as a forum for joint and cross-border questions within the Handelsbanken Group. The EWC consists of representatives from nine countries: Denmark, Finland, Luxembourg, the Netherlands, Norway, Poland, the UK, Sweden and Germany.
OKTOGONEN – THE BANK’S PROFIT-SHARING SCHEME A condition for achieving the Bank’s financial goal of achieving better profitability than the average of peer banks in its home markets is that employees outperform their peers in the rest of the sector. Therefore, the Board considers it reasonable that employees should receive a share of any extra profits. Every year but two since 1973, the Board has decided to allocate part of the Bank’s profits to a profit-sharing scheme for its employees. The funds are managed by the Oktogonen Foundation.
All employees receive an equal part of the allocated amount and the scheme includes all employees in the Bank’s home markets. In recent years, employees in Hong Kong, Luxembourg, Poland, Singapore and Taipei have also been included in Oktogonen.
ENVIRONMENTAL PERFORMANCE
HANDELSBANKEN’S DIRECT ENVIRONMENTAL IMPACT A bank’s direct environmental impact is fairly limited. Handelsbanken’s direct environmental impact derives mainly from its consumption of en-ergy, materials, equipment, travel and transport. For several years, the Bank has measured and re-ported the carbon dioxide (CO2) emissions gener-ated by its own operations as the result of its use of transport and its consumption of electricity and heat energy. For all the Bank’s regional banks in the Nordic countries, the UK and the Netherlands and also central units, carbon dioxide emissions from the operations’ total electricity consumption totalled 2,971 tonnes for 2013.
For the Swedish operations, in addition to elec-tricity consumption, we also measure transport, business travel and heating/cooling of properties owned by Handelsbanken in Sweden, which totalled 4,094 tonnes of CO2 for 2013. Emissions of CO2 in Sweden have gone down by six per cent compared with 2012. The amount of CO2 emissions from electricity consumption has fallen but CO2 emissions related to business travel have increased in Sweden. Handelsbanken strives to minimise the (CO2) emissions generated in its operations.
In Sweden, the Bank has increasingly opted to buy green electricity compared to previous years. The share of this power is 92 per cent for the Nor-dic countries overall and 99 per cent for Sweden.
HANDELSBANKEN’S INDIRECT ENVIRONMENTAL IMPACT By joining the UN’s Global Compact, Handels-banken undertakes to describe how it works with environmental matters, etc. In addition to the Bank’s own consumption of resources, this mainly concerns the indirect environmental impact via lending and asset management.
READ MORE Additional information about how the Bank works with sustainability issues is given in the Bank’s Sustainability Report on pages 178–203 of the Annual Report, as well as on the Bank’s website at handelsbanken.se/csreng.
HANDELSBANKEN | ANNUAL REPORT 2013 49
Corporate Governance Report
Handelsbanken is a Swedish public limited company, whose shares are listed on Nasdaq OMX Stockholm. The shareholders ultimately make the decisions about Handelsbanken’s governance. Here the Board submits its Corporate Governance Report for 2013. Handels-banken applies the Swedish Code of Corporate Governance.
FRAMEWORK FOR CONTROL 55
Internal control for operations 55
Internal Audit 55
Compliance 55
Risk Control 55
POLICY DOCUMENTS 56
PRINCIPLES FOR COMPENSATION AT HANDELSBANKEN 58
Fundamental principles for compensation 58
Principles for compensation to senior management 58
Variable compensation 58
THE BOARD’S REPORT ON INTERNAL CONTROL REGARDING FINANCIAL REPORTING 59
Control environment 59
Risk assessment 59
Control activities 59
Information and communication 59
Follow-up 59
BOARD MEMBERS 60
GROUP MANAGEMENT AND INDEPENDENT CONTROL F UNCTIONS 62
CONTENTS
CORPORATE GOVERNANCE STRUCTURE 50
CORPORATE GOVERNANCE AT HANDELSBANKEN 52
Comments about corporate governance in banks 52
PRINCIPLES OF CORPORATE GOVERNANCE AT HANDELSBANKEN 52
SHAREHOLDERS AND SHAREHOLDERS’ MEETINGS 52
Rights of shareholders 52
Major shareholders 53
Annual general meeting 2013 53
Nomination committee 53
Auditors 53
THE BOARD 53
Composition of the Board 53
Independence of Board members 53
Regulations governing the Board’s work 54
Chairman of the Board 54
Committee work 54
The Board’s work in 2013 54
THE BANK’S MANAGEMENT 55
Group Chief Executive 55
Group Management and Group Management structure 55
49
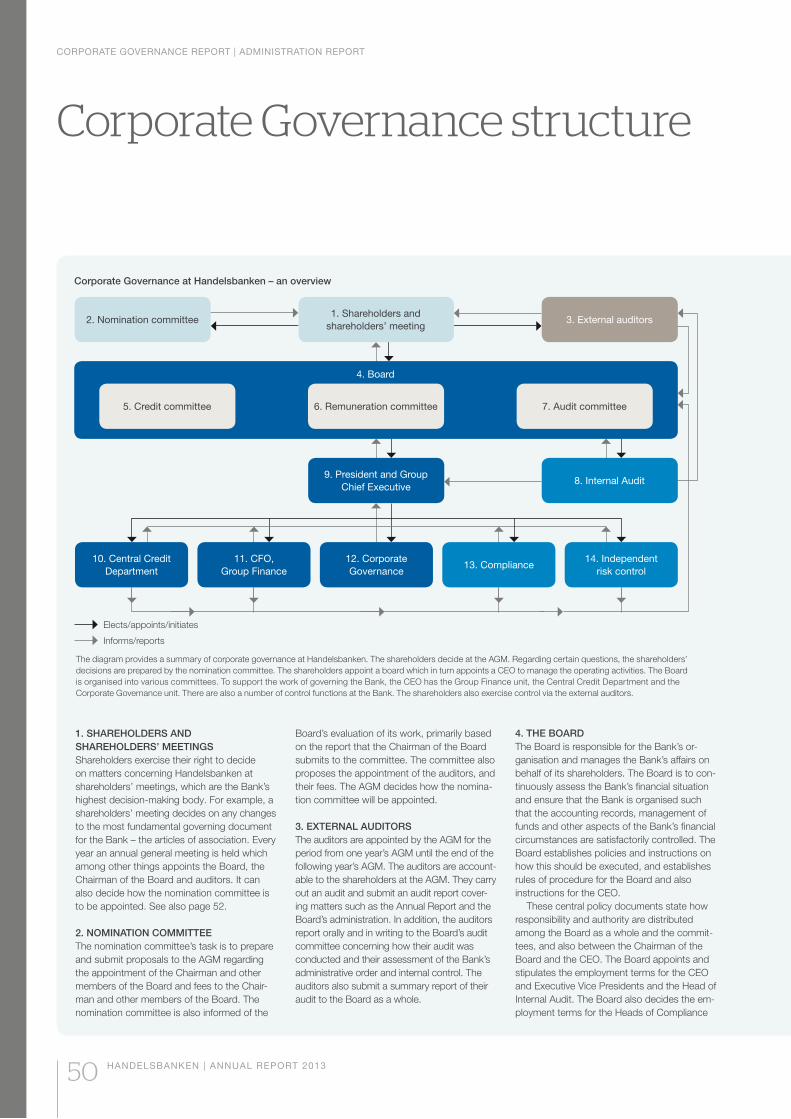
CORPORATE GOVERNANCE REPORT | ADMINISTRATION REPORT
50 HANDELSBANKEN | ANNUAL REPORT 2013
Corporate Governance structure
Corporate Governance at Handelsbanken – an overview
Elects/appoints/initiates
Informs/reports
8. Internal Audit
4. Board
2. Nomination committee 3. External auditors
9. President and Group Chief Executive
12. Corporate Governance
1. Shareholders and shareholders’ meeting
5. Credit committee 6. Remuneration committee 7. Audit committee
The diagram provides a summary of corporate governance at Handelsbanken. The shareholders decide at the AGM. Regarding certain questions, the shareholders’ decisions are prepared by the nomination committee. The shareholders appoint a board which in turn appoints a CEO to manage the operating activities. The Board is organised into various committees. To support the work of governing the Bank, the CEO has the Group Finance unit, the Central Credit Department and the Corporate Governance unit. There are also a number of control functions at the Bank. The shareholders also exercise control via the external auditors.
1. SHAREHOLDERS AND SHAREHOLDERS’ MEETINGSShareholders exercise their right to decide on matters concerning Handelsbanken at shareholders’ meetings, which are the Bank’s highest decision-making body. For example, a shareholders’ meeting decides on any changes to the most fundamental governing document for the Bank – the articles of association. Every year an annual general meeting is held which among other things appoints the Board, the Chairman of the Board and auditors. It can also decide how the nomination committee is to be appointed. See also page 52.
2. NOMINATION COMMITTEEThe nomination committee’s task is to prepare and submit proposals to the AGM regarding the appointment of the Chairman and other members of the Board and fees to the Chair-man and other members of the Board. The nomination committee is also informed of the
Board’s evaluation of its work, primarily based on the report that the Chairman of the Board submits to the committee. The committee also proposes the appointment of the auditors, and their fees. The AGM decides how the nomina-tion committee will be appointed.
3. EXTERNAL AUDITORSThe auditors are appointed by the AGM for the period from one year’s AGM until the end of the following year’s AGM. The auditors are account-able to the shareholders at the AGM. They carry out an audit and submit an audit report cover-ing matters such as the Annual Report and the Board’s administration. In addition, the auditors report orally and in writing to the Board’s audit committee concerning how their audit was conducted and their assessment of the Bank’s administrative order and internal control. The auditors also submit a summary report of their audit to the Board as a whole.
4. THE BOARDThe Board is responsible for the Bank’s or-ganisation and manages the Bank’s affairs on behalf of its shareholders. The Board is to con-tinuously assess the Bank’s financial situation and ensure that the Bank is organised such that the accounting records, management of funds and other aspects of the Bank’s financial circumstances are satisfactorily controlled. The Board establishes policies and instructions on how this should be executed, and establishes rules of procedure for the Board and also instructions for the CEO.
These central policy documents state how responsibility and authority are distributed among the Board as a whole and the commit-tees, and also between the Chairman of the Board and the CEO. The Board appoints and stipulates the employment terms for the CEO and Executive Vice Presidents and the Head of Internal Audit. The Board also decides the em-ployment terms for the Heads of Compliance
11. CFO, Group Finance
13. Compliance10. Central Credit
Department14. Independent
risk control
CORPORATE GOVERNANCE REPORT | ADMINISTRATION REPORT
HANDELSBANKEN | ANNUAL REPORT 2013 51
and Risk Control. The Chairman is responsible for evaluating the Board’s work and informs the nomination committee of the results of the evaluation.
5. CREDIT COMMITTEEThe Board’s credit committee decides on credit cases where the amount exceeds the decision limit which the Central Board has delegated to another unit. Cases of special importance are decided by the whole Board. The credit committee comprises the Chairman of the Board, the Vice Chairmen, the chairman of the audit committee, the CEO, three Board members appointed by the Board and the Head of the Central Credit Department. A representative from the unit within the Bank to which the credit case applies presents the case to the credit committee.
6. REMUNERATION COMMITTEEThe Board’s remuneration committee regularly evaluates the employment conditions for the Bank’s senior management in the light of prevailing market terms for their peers in other companies. The committee’s tasks include preparing the Board’s proposals to the AGM concerning guidelines for compensation to senior management, monitoring and evaluat-ing the application of these guidelines, and preparing the Board’s decisions on compensa-tion principles, compensation and other terms of employment for senior management, as well as for the heads of Compliance, Internal Audit and Risk Control. The committee also makes an independent assessment of Handelsbank-en’s compensation policy and compensation system. The remuneration committee consists of the Chairman of the Board and two members appointed by the Board.
7. AUDIT COMMITTEEThe Board’s audit committee monitors the Bank’s financial reporting by examining crucial accounting matters and other factors that may affect the qualitative content of the financial reports. The committee also monitors the ef-fectiveness of the Bank’s and Group’s internal control, internal audit and risk management, as well as the external auditors’ impartiality and independence. It evaluates the audit work and assists the nomination committee in appointing auditors. The audit committee comprises the Chairman of the Board and two other mem-bers appointed by the Board. One of these two members is the committee’s chairman.
8. INTERNAL AUDITInternal Audit performs an independent, impartial audit of the operations and financial reporting of the Handelsbanken Group. A central task for Internal Audit is to assess and verify processes for risk management, internal control and corporate governance. Audit-ing is performed according to internationally accepted norms. The Head of Internal Audit is appointed by the Board and reports regularly to the audit committee, orally and in writing, and also submits an annual summary report to the whole Board.
9. PRESIDENT AND GROUP CHIEF EXECUTIVE (CEO)The CEO is appointed by the Board to lead Handelsbanken’s day-to-day operations. In addition to instructions from the Board, the CEO is obliged to comply with the provi-sions of the Swedish Companies Act and a number of other statutes concerning the Bank’s accounting, management of funds and operational control.
10. CENTRAL CREDIT DEPARTMENTThe Central Credit Department is responsible for formulating and maintaining the Bank’s credit policy, credit process and for prepar-ing every major credit case that the Board’s credit committee or the whole Board decides on. The Head of Credits presents all cases to the CEO and Chairman of the Board before they are presented for a decision by the credit committee or the Board. The Head of Credits reports to the CEO and is a member of the Board’s credit committee. The Head of Credits also reports to the Board about loan losses and risks in the credit portfolio.
11. CFO, GROUP FINANCEGroup Finance is responsible for control systems, reporting, book-keeping, accounting and taxes. It is also responsible for the Group’s liquidity, funding and capital, and for the Group’s overall risk management for all risks except credit risk and compliance risk. For a detailed description of this risk management, see note G2 on pages 78–101.
12. CORPORATE GOVERNANCEThe Corporate Governance unit ensures that decisions made at shareholders’ meetings and by the Board, as well as changes in legislation, regulations and corporate governance code, are implemented in policy documents from the
Board and guidelines and instructions from the CEO, with the aim of stipulating responsibilities and authorities internally at the Bank.
13. COMPLIANCEThe Compliance function is responsible for ensuring that laws, regulations and internal rules, as well as accepted business practices or norms, are complied with in the operations conducted by the Handelsbanken Group. The function must act as a support to business operations and follow up the application of the applicable regulations, check these regulations and inform the units concerned about risks that may arise in the operations as a result of inadequate compliance, assist in identifying and assessing such risks and assist in draft-ing internal regulations. Compliance officers have been appointed for all business areas, regional banks and central units, as well as for all countries where the Bank operates. The Central Compliance unit has functional respon-sibility for compliance. The Head of Central Compliance reports regularly to the CEO and the audit committee in matters regarding compliance.
14. INDEPENDENT RISK CONTROLThe centrally located independent risk control function is responsible for monitoring and reporting all the Group’s material risks at an aggregate level. This responsibility comprises credit, counterparty and market risks (interest rate, exchange rate, equity price and com-modity price risk), operational risks, liquidity risks and insurance risks, as well as risks associated with the Group’s compensation system. Risk Control identifies, measures and analyses Group risk. It reports continually to the CEO and on a regular basis to the audit committee and the remuneration committee. The Board is also informed of the material risks in the operations. The Head of Risk Control also provides regular information to the CFO. The management of the individual risks is the task of the operating unit that is responsible for the customer or counterparty (account manager) or responsible for conducting a certain transaction (business manager). Risk Control reports directly to the CEO and acts independently and is separate from the con-trolled operations.
READ MORE ON OUR WEBSITEMore information about Handelsbanken’s corporate governance is available at handelsbanken.se/ireng. The site includes the following information:
onwards
CORPORATE GOVERNANCE REPORT | ADMINISTRATION REPORT
52 HANDELSBANKEN | ANNUAL REPORT 2013
CORPORATE GOVERNANCE AT HANDELSBANKENThe aim of good corporate governance is ensur-ing that companies are run in a manner which is as fit for purpose as possible on behalf of their shareholders. It is also important for other inter-ested parties such as customers, bond investors and regulatory authorities.
Handelsbanken applies the Swedish Code of Corporate Governance with only one deviation relating to the composition of the remuneration committee. Committee member Jan Johansson is not independent of the Bank and its management but the Board’s assessment is that Jan Johansson’s skills and experience in the field of compensation matters should be utilised by the Bank and this justi-fies the deviation from the provisions of the Code.
According to the Code, information must be submitted regarding the material shareholdings of the CEO and his close relatives, or other part-ownership in companies with which the Bank has significant business relations. Pär Boman has no material shareholdings. Regardless of this, it is Handelsbanken’s view that the provisions of the Code are not applicable to the Bank, since regulations on banking secrecy prevent Handels-banken from naming corporate customers.
A central part of governance of Handels-banken comprises managing the risks that arise in operations. Risk management is described in detail in a separate risk section in the Annual Report, note G2 on pages 78–101 and also in this Corporate Governance Report.
Comments about corporate governance in banksThe operations of Swedish banks are regulated by law, and banking operations may only be run with a licence from the Swedish Financial Super-visory Authority.
The regulations for banking operations are very extensive, and are not described in detail in this report.* Handelsbanken’s main principle is that operations outside Sweden are subject both to Swedish regulations and to the host country’s regulations, if these are stricter or require devia-tions from Swedish rules.
The Swedish Financial Supervisory Authority extensively supervises the Bank’s operations in Sweden and in all countries where the Bank runs branches, in other words, when the foreign operation is part of the Swedish legal entity Sven-ska Handelsbanken AB. Equivalent authorities in
other countries exercise limited supervision over the branches’ operations and full supervision over the Bank’s subsidiaries outside Sweden. The supervisory authorities in the Nordic countries, the UK and Germany are co-ordinated in a supervisory group for Handelsbanken, led by the Swedish Financial Supervisory Authority.
In addition to laws and ordinances, the Swed-ish supervision is based on regulations and general guidelines from the Swedish Financial Supervisory Authority. The Supervisory Authority requires extensive reporting on various matters such as the Bank’s organisation, decision-making structure, internal control, terms and conditions for the Bank’s customers and information to private customers.
The Supervisory Authority’s work also includes systematically visiting various parts of the Bank. The purpose of this is to follow up the Bank’s actual compliance with the terms and conditions of granted licenses and other detailed regula-tions. It subsequently reports its observations to the Bank’s management and, in some cases, to the Bank’s Board.
PRINCIPLES OF CORPORATE GOVERNANCE AT HANDELSBANKEN The Bank’s main tools for corporate governance are on the one hand the documents adopted by the Board, for example the Board’s rules of procedure, instructions to the CEO and the Head of Central Audit and policy documents regarding the Bank’s operations (see also pages 56–58), and on the other hand the instructions and guidelines issued by the CEO. These documents are revised every year but can be adjusted more often when necessary. However, the foundation of functioning corporate governance is not only formal documents but also the Bank’s corporate goal, working methods, compensation system and corporate culture.
The Bank’s corporate goal is to have better profitability than the average of peer banks in its home markets. This is mainly to be achieved through more satisfied customers and by being more cost-effective than competitors. One of the purposes of this goal is to offer shareholders long-term high growth in value expressed in increasing earnings per share over a business cycle.
Handelsbanken is a full-service bank with a decentralised working method, a strong local presence due to nationwide branch networks and a long-term approach to customer relations. The Bank has applied this basic concept consistently for several decades. The Bank’s decentralised working model involves strong trust in employ-ees’ willingness and ability to take responsibility. This working model which has been unchanged for a long time has resulted in the Bank’s very strong corporate culture.
The salary and pension systems, combined with the Oktogonen profit-sharing system, are other ways of boosting the corporate culture by promoting long-term employment. Allocations to the Oktogonen system are made if Handelsbank-en’s profitability is better than the average of peer banks. The allocated funds are managed by the Oktogonen Foundation. The profit-sharing sys-tem contributes to the employees’ interests being in agreement with the Bank’s corporate goals of profitability and cost-effectiveness. In this way, cost-awareness and caution will also become
part of Handelsbanken’s corporate culture. Handelsbanken wishes to recruit young em-
ployees for long-term employment at the Bank by offering development opportunities that make the Bank self-sufficient in terms of skilled employees and managers.
This long-term approach also applies to the way in which the Bank relates to its customers. It is manifested in, for example, the ambition of always giving the customer the best possible advice – without looking at what is most profitable for the Bank in the short term. Employees feel a sense of security in that they can always offer a customer the Bank’s best advice without affecting their com-pensation. This enables the Bank to build long-term relationships with both customers and employees.
SHAREHOLDERS AND SHAREHOLDERS’ MEETINGS Rights of shareholdersHandelsbanken has more than 95,000 share-holders. They have the right to decide on matters related to the company at the AGM or extraordi-nary meetings of shareholders. Handelsbanken has two classes of shares: class A and class B. Class A shares are by far the most common and represent more than 98 per cent of all outstand-ing shares. Class A shares each carry one vote, while class B shares carry one-tenth of a vote each. Handelsbanken’s articles of associa-tion state that at shareholders’ meetings, no shareholder is allowed to exercise voting rights representing more than 10 per cent of the total number of votes in the Bank.
Shareholders who wish to have a matter considered by the AGM must submit a written request to the Board sufficiently far in advance so that the matter can be included in the notice of the meeting. The Bank’s website contains information as to when this request must have reached the Board.
At the AGM, the Bank’s shareholders make various decisions of major importance to the Bank’s governance. Shareholders’ decisions include:
who should be the Bank’s auditors
sheet
from liability for the past financial year
management.
The shareholders at a shareholders’ meeting can also make decisions on the Bank’s articles of association. The articles of association constitute the fundamental governing document for the Bank. They specify which operations the Bank is to conduct, the amount of the share capital, the right of shareholders to participate at sharehold-ers’ meetings and the items to be presented at the AGM. The articles of association state that the number of board members must be at least 8 and at most 15. They are elected for one year at a time.
Information in preparation for meetings is published on the Bank’s website: handelsbanken.se/ireng. Minutes of previous meetings are also available there.
* The most important statutes include the Swedish Banking and Financing Business Act (SFS 2004:297), the Swedish Companies Act (SFS 2005:551), the Act on Capital Adequacy and Large Exposures (SFS 2006:1371) and extensive legislation on securities and insurance operations. The Swedish Financial Supervisory Authority’s regulatory code includes general guidelines regarding governance and control of financial undertakings (FFFS 2005:1), regulations and general guidelines on capital adequacy and large expo-sures (FFFS 2007:1), regulations governing investment services and activities (FFFS 2007:16) and regulations and general guidelines concerning measures against money laundering and financing of terrorism (FFFS 2009:1). During 2014, new regulations are expected to be introduced, such as a law on capital adequacy and new regulations from the Swedish Financial Supervi-sory Authority regarding governance, risk management and control in credit institutions. For a more detailed list of laws and regulations referring to operations subject to a licence, see handelsbanken.se/ireng.
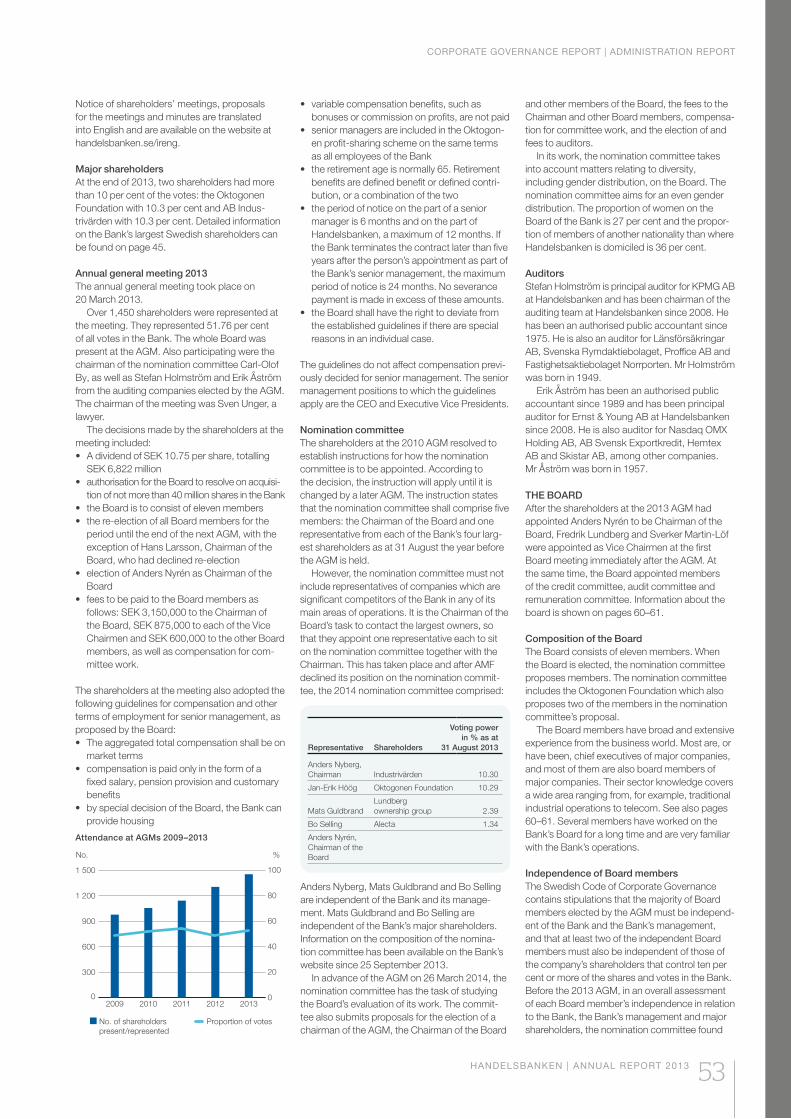
CORPORATE GOVERNANCE REPORT | ADMINISTRATION REPORT
HANDELSBANKEN | ANNUAL REPORT 2013 53
Notice of shareholders’ meetings, proposals for the meetings and minutes are translated into English and are available on the website at handelsbanken.se/ireng.
Major shareholdersAt the end of 2013, two shareholders had more than 10 per cent of the votes: the Oktogonen Foundation with 10.3 per cent and AB Indus-trivärden with 10.3 per cent. Detailed information on the Bank’s largest Swedish shareholders can be found on page 45.
Annual general meeting 2013The annual general meeting took place on 20 March 2013.
Over 1,450 shareholders were represented at the meeting. They represented 51.76 per cent of all votes in the Bank. The whole Board was present at the AGM. Also participating were the chairman of the nomination committee Carl-Olof By, as well as Stefan Holmström and Erik Åström from the auditing companies elected by the AGM. The chairman of the meeting was Sven Unger, a lawyer.
The decisions made by the shareholders at the meeting included:
SEK 6,822 million -
tion of not more than 40 million shares in the Bank
period until the end of the next AGM, with the exception of Hans Larsson, Chairman of the Board, who had declined re-election
Board
follows: SEK 3,150,000 to the Chairman of the Board, SEK 875,000 to each of the Vice Chairmen and SEK 600,000 to the other Board members, as well as compensation for com-mittee work.
The shareholders at the meeting also adopted the following guidelines for compensation and other terms of employment for senior management, as proposed by the Board:
market terms
fixed salary, pension provision and customary benefits
provide housing
bonuses or commission on profits, are not paid-
en profit-sharing scheme on the same terms as all employees of the Bank
benefits are defined benefit or defined contri-bution, or a combination of the two
manager is 6 months and on the part of Handelsbanken, a maximum of 12 months. If the Bank terminates the contract later than five years after the person’s appointment as part of the Bank’s senior management, the maximum period of notice is 24 months. No severance payment is made in excess of these amounts.
the established guidelines if there are special reasons in an individual case.
The guidelines do not affect compensation previ-ously decided for senior management. The senior management positions to which the guidelines apply are the CEO and Executive Vice Presidents.
Nomination committeeThe shareholders at the 2010 AGM resolved to establish instructions for how the nomination committee is to be appointed. According to the decision, the instruction will apply until it is changed by a later AGM. The instruction states that the nomination committee shall comprise five members: the Chairman of the Board and one representative from each of the Bank’s four larg-est shareholders as at 31 August the year before the AGM is held.
However, the nomination committee must not include representatives of companies which are significant competitors of the Bank in any of its main areas of operations. It is the Chairman of the Board’s task to contact the largest owners, so that they appoint one representative each to sit on the nomination committee together with the Chairman. This has taken place and after AMF declined its position on the nomination commit-tee, the 2014 nomination committee comprised:
Representative Shareholders
Voting power in % as at
31 August 2013
Anders Nyberg, Chairman Industrivärden 10.30
Jan-Erik Höög Oktogonen Foundation 10.29
Mats GuldbrandLundberg ownership group 2.39
Bo Selling Alecta 1.34
Chairman of the Board
Anders Nyberg, Mats Guldbrand and Bo Selling are independent of the Bank and its manage-ment. Mats Guldbrand and Bo Selling are independent of the Bank’s major shareholders. Information on the composition of the nomina-tion committee has been available on the Bank’s website since 25 September 2013.
In advance of the AGM on 26 March 2014, the nomination committee has the task of studying the Board’s evaluation of its work. The commit-tee also submits proposals for the election of a chairman of the AGM, the Chairman of the Board
and other members of the Board, the fees to the Chairman and other Board members, compensa-tion for committee work, and the election of and fees to auditors.
In its work, the nomination committee takes into account matters relating to diversity, including gender distribution, on the Board. The nomination committee aims for an even gender distribution. The proportion of women on the Board of the Bank is 27 per cent and the propor-tion of members of another nationality than where Handelsbanken is domiciled is 36 per cent.
Auditors Stefan Holmström is principal auditor for KPMG AB at Handelsbanken and has been chairman of the auditing team at Handelsbanken since 2008. He has been an authorised public accountant since 1975. He is also an auditor for Länsförsäkringar AB, Svenska Rymdaktiebolaget, Proffice AB and Fastighetsaktiebolaget Norrporten. Mr Holmström was born in 1949.
Erik Åström has been an authorised public accountant since 1989 and has been principal auditor for Ernst & Young AB at Handelsbanken since 2008. He is also auditor for Nasdaq OMX Holding AB, AB Svensk Exportkredit, Hemtex AB and Skistar AB, among other companies. Mr Åström was born in 1957.
THE BOARDAfter the shareholders at the 2013 AGM had
Board, Fredrik Lundberg and Sverker Martin-Löf were appointed as Vice Chairmen at the first Board meeting immediately after the AGM. At the same time, the Board appointed members of the credit committee, audit committee and remuneration committee. Information about the board is shown on pages 60–61.
Composition of the BoardThe Board consists of eleven members. When the Board is elected, the nomination committee proposes members. The nomination committee includes the Oktogonen Foundation which also proposes two of the members in the nomination committee’s proposal.
The Board members have broad and extensive experience from the business world. Most are, or have been, chief executives of major companies, and most of them are also board members of major companies. Their sector knowledge covers a wide area ranging from, for example, traditional industrial operations to telecom. See also pages 60–61. Several members have worked on the Bank’s Board for a long time and are very familiar with the Bank’s operations.
Independence of Board membersThe Swedish Code of Corporate Governance contains stipulations that the majority of Board members elected by the AGM must be independ-ent of the Bank and the Bank’s management, and that at least two of the independent Board members must also be independent of those of the company’s shareholders that control ten per cent or more of the shares and votes in the Bank. Before the 2013 AGM, in an overall assessment of each Board member’s independence in relation to the Bank, the Bank’s management and major shareholders, the nomination committee found
Attendance at AGMs 2009–2013
0
300
600
900
1 200
1 500
20132012201120102009
%
0
20
40
60
80
100
No. of shareholders present/represented
Proportion of votes
No.
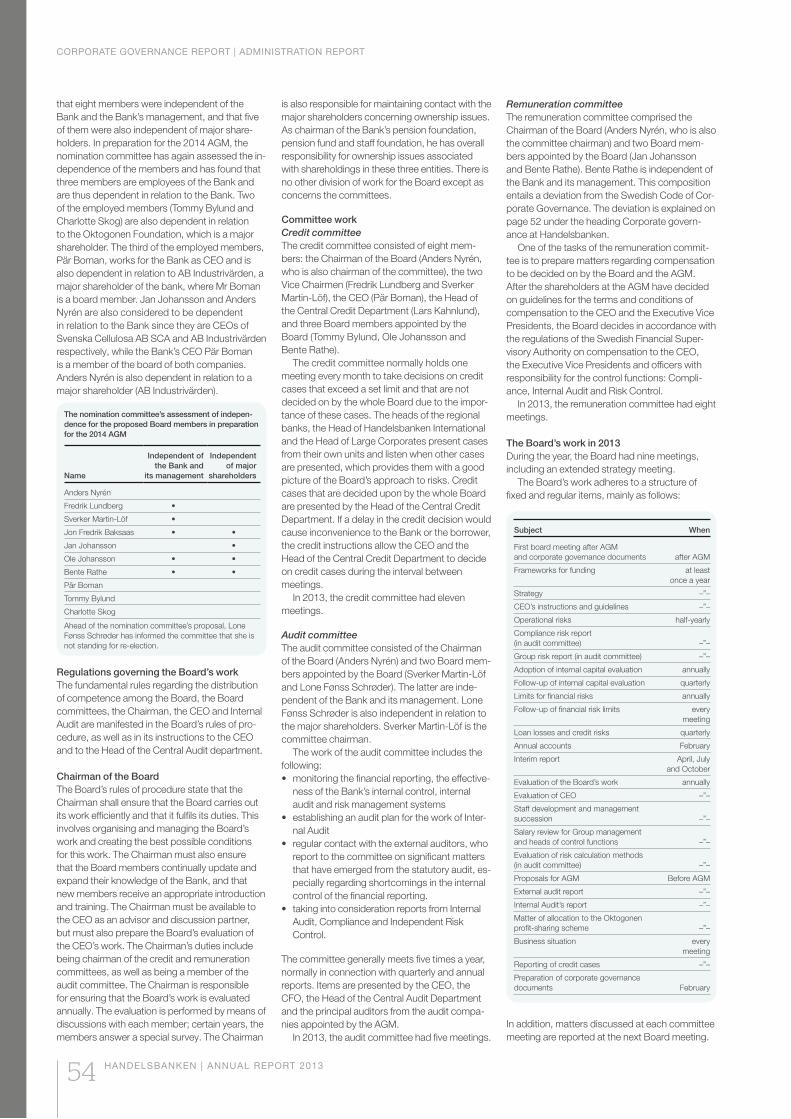
CORPORATE GOVERNANCE REPORT | ADMINISTRATION REPORT
54 HANDELSBANKEN | ANNUAL REPORT 2013
that eight members were independent of the Bank and the Bank’s management, and that five of them were also independent of major share-holders. In preparation for the 2014 AGM, the nomination committee has again assessed the in-dependence of the members and has found that three members are employees of the Bank and are thus dependent in relation to the Bank. Two of the employed members (Tommy Bylund and Charlotte Skog) are also dependent in relation to the Oktogonen Foundation, which is a major shareholder. The third of the employed members, Pär Boman, works for the Bank as CEO and is also dependent in relation to AB Industrivärden, a major shareholder of the bank, where Mr Boman is a board member. Jan Johansson and Anders
in relation to the Bank since they are CEOs of Svenska Cellulosa AB SCA and AB Industrivärden respectively, while the Bank’s CEO Pär Boman is a member of the board of both companies.
major shareholder (AB Industrivärden).
The nomination committee’s assessment of indepen-dence for the proposed Board members in preparation for the 2014 AGM
Name
Independent of the Bank and
its management
Independent of major
shareholders
Fredrik Lundberg
Sverker Martin-Löf
Jon Fredrik Baksaas
Jan Johansson
Ole Johansson
Bente Rathe
Pär Boman
Tommy Bylund
Charlotte Skog
Ahead of the nomination committee’s proposal, Lone Fønss Schrøder has informed the committee that she is not standing for re-election.
Regulations governing the Board’s workThe fundamental rules regarding the distribution of competence among the Board, the Board committees, the Chairman, the CEO and Internal Audit are manifested in the Board’s rules of pro-cedure, as well as in its instructions to the CEO and to the Head of the Central Audit department.
Chairman of the BoardThe Board’s rules of procedure state that the Chairman shall ensure that the Board carries out its work efficiently and that it fulfils its duties. This involves organising and managing the Board’s work and creating the best possible conditions for this work. The Chairman must also ensure that the Board members continually update and expand their knowledge of the Bank, and that new members receive an appropriate introduction and training. The Chairman must be available to the CEO as an advisor and discussion partner, but must also prepare the Board’s evaluation of the CEO’s work. The Chairman’s duties include being chairman of the credit and remuneration committees, as well as being a member of the audit committee. The Chairman is responsible for ensuring that the Board’s work is evaluated annually. The evaluation is performed by means of discussions with each member; certain years, the members answer a special survey. The Chairman
is also responsible for maintaining contact with the major shareholders concerning ownership issues. As chairman of the Bank’s pension foundation, pension fund and staff foundation, he has overall responsibility for ownership issues associated with shareholdings in these three entities. There is no other division of work for the Board except as concerns the committees.
Committee workCredit committeeThe credit committee consisted of eight mem-
who is also chairman of the committee), the two Vice Chairmen (Fredrik Lundberg and Sverker Martin-Löf), the CEO (Pär Boman), the Head of the Central Credit Department (Lars Kahnlund), and three Board members appointed by the Board (Tommy Bylund, Ole Johansson and Bente Rathe).
The credit committee normally holds one meeting every month to take decisions on credit cases that exceed a set limit and that are not decided on by the whole Board due to the impor-tance of these cases. The heads of the regional banks, the Head of Handelsbanken International and the Head of Large Corporates present cases from their own units and listen when other cases are presented, which provides them with a good picture of the Board’s approach to risks. Credit cases that are decided upon by the whole Board are presented by the Head of the Central Credit Department. If a delay in the credit decision would cause inconvenience to the Bank or the borrower, the credit instructions allow the CEO and the Head of the Central Credit Department to decide on credit cases during the interval between meetings.
In 2013, the credit committee had eleven meetings.
Audit committeeThe audit committee consisted of the Chairman
-bers appointed by the Board (Sverker Martin-Löf and Lone Fønss Schrøder). The latter are inde-pendent of the Bank and its management. Lone Fønss Schrøder is also independent in relation to the major shareholders. Sverker Martin-Löf is the committee chairman.
The work of the audit committee includes the following:
-ness of the Bank’s internal control, internal audit and risk management systems
-nal Audit
report to the committee on significant matters that have emerged from the statutory audit, es-pecially regarding shortcomings in the internal control of the financial reporting.
Audit, Compliance and Independent Risk Control.
The committee generally meets five times a year, normally in connection with quarterly and annual reports. Items are presented by the CEO, the CFO, the Head of the Central Audit Department and the principal auditors from the audit compa-nies appointed by the AGM.
In 2013, the audit committee had five meetings.
Remuneration committeeThe remuneration committee comprised the
the committee chairman) and two Board mem-bers appointed by the Board (Jan Johansson and Bente Rathe). Bente Rathe is independent of the Bank and its management. This composition entails a deviation from the Swedish Code of Cor-porate Governance. The deviation is explained on page 52 under the heading Corporate govern-ance at Handelsbanken.
One of the tasks of the remuneration commit-tee is to prepare matters regarding compensation to be decided on by the Board and the AGM. After the shareholders at the AGM have decided on guidelines for the terms and conditions of compensation to the CEO and the Executive Vice Presidents, the Board decides in accordance with the regulations of the Swedish Financial Super-visory Authority on compensation to the CEO, the Executive Vice Presidents and officers with responsibility for the control functions: Compli-ance, Internal Audit and Risk Control.
In 2013, the remuneration committee had eight meetings.
The Board’s work in 2013During the year, the Board had nine meetings, including an extended strategy meeting.
The Board’s work adheres to a structure of fixed and regular items, mainly as follows:
Subject When
First board meeting after AGMand corporate governance documents after AGM
Frameworks for funding at leastonce a year
Strategy –”–
CEO’s instructions and guidelines –”–
Operational risks half-yearly
Compliance risk report (in audit committee) –”–
Group risk report (in audit committee) –”–
Adoption of internal capital evaluation annually
Follow-up of internal capital evaluation quarterly
Limits for financial risks annually
Follow-up of financial risk limits every meeting
Loan losses and credit risks quarterly
Annual accounts February
Interim report April, July and October
Evaluation of the Board’s work annually
Evaluation of CEO –”–
Staff development and management succession –”–
Salary review for Group management and heads of control functions –”–
Evaluation of risk calculation methods (in audit committee) –”–
Proposals for AGM Before AGM
External audit report –”–
Internal Audit’s report –”–
Matter of allocation to the Oktogonen profit-sharing scheme –”–
Business situation every meeting
Reporting of credit cases –”–
Preparation of corporate governance documents February
In addition, matters discussed at each committee meeting are reported at the next Board meeting.
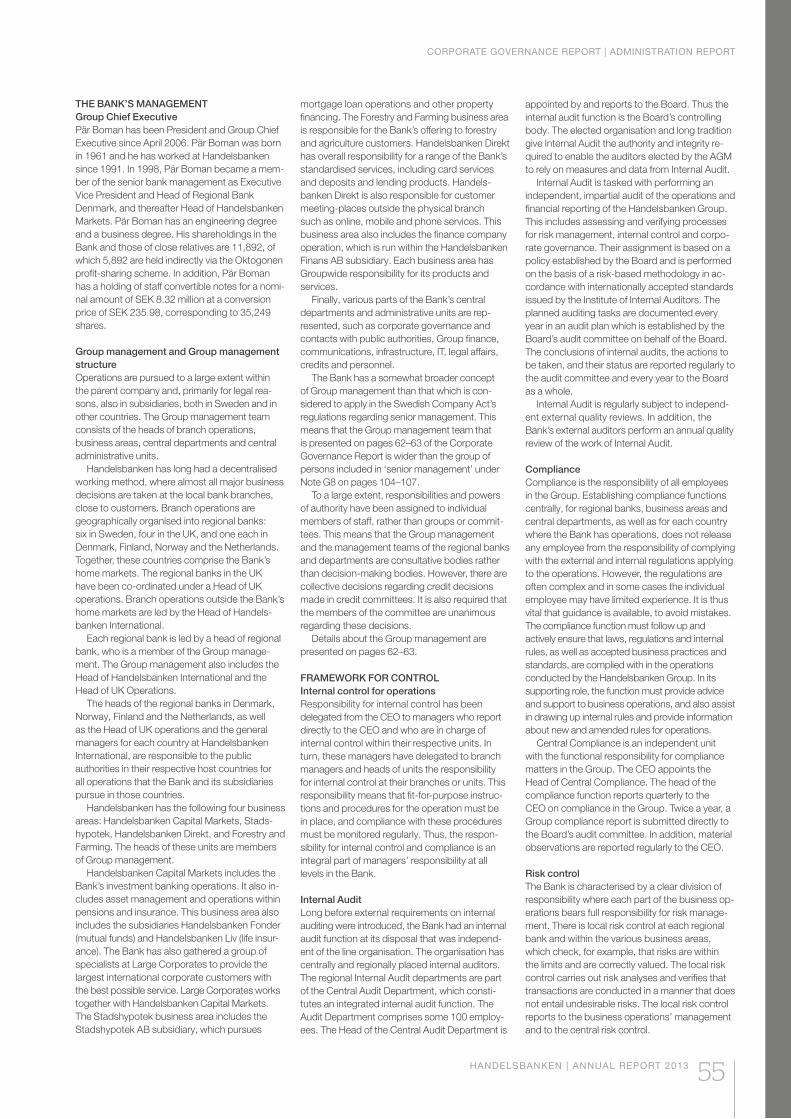
CORPORATE GOVERNANCE REPORT | ADMINISTRATION REPORT
HANDELSBANKEN | ANNUAL REPORT 2013 55
THE BANK’S MANAGEMENT Group Chief ExecutivePär Boman has been President and Group Chief Executive since April 2006. Pär Boman was born in 1961 and he has worked at Handelsbanken since 1991. In 1998, Pär Boman became a mem-ber of the senior bank management as Executive Vice President and Head of Regional Bank Denmark, and thereafter Head of Handelsbanken Markets. Pär Boman has an engineering degree and a business degree. His shareholdings in the Bank and those of close relatives are 11,892, of which 5,892 are held indirectly via the Oktogonen profit-sharing scheme. In addition, Pär Boman has a holding of staff convertible notes for a nomi-nal amount of SEK 8.32 million at a conversion price of SEK 235.98, corresponding to 35,249 shares.
Group management and Group management structureOperations are pursued to a large extent within the parent company and, primarily for legal rea-sons, also in subsidiaries, both in Sweden and in other countries. The Group management team consists of the heads of branch operations, business areas, central departments and central administrative units.
Handelsbanken has long had a decentralised working method, where almost all major business decisions are taken at the local bank branches, close to customers. Branch operations are geographically organised into regional banks: six in Sweden, four in the UK, and one each in Denmark, Finland, Norway and the Netherlands. Together, these countries comprise the Bank’s home markets. The regional banks in the UK have been co-ordinated under a Head of UK operations. Branch operations outside the Bank’s home markets are led by the Head of Handels-banken International.
Each regional bank is led by a head of regional bank, who is a member of the Group manage-ment. The Group management also includes the Head of Handelsbanken International and the Head of UK Operations.
The heads of the regional banks in Denmark, Norway, Finland and the Netherlands, as well as the Head of UK operations and the general managers for each country at Handelsbanken International, are responsible to the public authorities in their respective host countries for all operations that the Bank and its subsidiaries pursue in those countries.
Handelsbanken has the following four business areas: Handelsbanken Capital Markets, Stads-hypotek, Handelsbanken Direkt, and Forestry and Farming. The heads of these units are members of Group management.
Handelsbanken Capital Markets includes the Bank’s investment banking operations. It also in-cludes asset management and operations within pensions and insurance. This business area also includes the subsidiaries Handelsbanken Fonder (mutual funds) and Handelsbanken Liv (life insur-ance). The Bank has also gathered a group of specialists at Large Corporates to provide the largest international corporate customers with the best possible service. Large Corporates works together with Handelsbanken Capital Markets. The Stadshypotek business area includes the Stadshypotek AB subsidiary, which pursues
mortgage loan operations and other property financing. The Forestry and Farming business area is responsible for the Bank’s offering to forestry and agriculture customers. Handelsbanken Direkt has overall responsibility for a range of the Bank’s standardised services, including card services and deposits and lending products. Handels-banken Direkt is also responsible for customer meeting-places outside the physical branch such as online, mobile and phone services. This business area also includes the finance company operation, which is run within the Handelsbanken Finans AB subsidiary. Each business area has Groupwide responsibility for its products and services.
Finally, various parts of the Bank’s central departments and administrative units are rep-resented, such as corporate governance and contacts with public authorities, Group finance, communications, infrastructure, IT, legal affairs, credits and personnel.
The Bank has a somewhat broader concept of Group management than that which is con-sidered to apply in the Swedish Company Act’s regulations regarding senior management. This means that the Group management team that is presented on pages 62–63 of the Corporate Governance Report is wider than the group of persons included in ‘senior management’ under Note G8 on pages 104–107.
To a large extent, responsibilities and powers of authority have been assigned to individual members of staff, rather than groups or commit-tees. This means that the Group management and the management teams of the regional banks and departments are consultative bodies rather than decision-making bodies. However, there are collective decisions regarding credit decisions made in credit committees. It is also required that the members of the committee are unanimous regarding these decisions.
Details about the Group management are presented on pages 62–63.
FRAMEWORK FOR CONTROLInternal control for operationsResponsibility for internal control has been delegated from the CEO to managers who report directly to the CEO and who are in charge of internal control within their respective units. In turn, these managers have delegated to branch managers and heads of units the responsibility for internal control at their branches or units. This responsibility means that fit-for-purpose instruc-tions and procedures for the operation must be in place, and compliance with these procedures must be monitored regularly. Thus, the respon-sibility for internal control and compliance is an integral part of managers’ responsibility at all levels in the Bank.
Internal AuditLong before external requirements on internal auditing were introduced, the Bank had an internal audit function at its disposal that was independ-ent of the line organisation. The organisation has centrally and regionally placed internal auditors. The regional Internal Audit departments are part of the Central Audit Department, which consti-tutes an integrated internal audit function. The Audit Department comprises some 100 employ-ees. The Head of the Central Audit Department is
appointed by and reports to the Board. Thus the internal audit function is the Board’s controlling body. The elected organisation and long tradition give Internal Audit the authority and integrity re-quired to enable the auditors elected by the AGM to rely on measures and data from Internal Audit.
Internal Audit is tasked with performing an independent, impartial audit of the operations and financial reporting of the Handelsbanken Group. This includes assessing and verifying processes for risk management, internal control and corpo-rate governance. Their assignment is based on a policy established by the Board and is performed on the basis of a risk-based methodology in ac-cordance with internationally accepted standards issued by the Institute of Internal Auditors. The planned auditing tasks are documented every year in an audit plan which is established by the Board’s audit committee on behalf of the Board. The conclusions of internal audits, the actions to be taken, and their status are reported regularly to the audit committee and every year to the Board as a whole.
Internal Audit is regularly subject to independ-ent external quality reviews. In addition, the Bank’s external auditors perform an annual quality review of the work of Internal Audit.
ComplianceCompliance is the responsibility of all employees in the Group. Establishing compliance functions centrally, for regional banks, business areas and central departments, as well as for each country where the Bank has operations, does not release any employee from the responsibility of complying with the external and internal regulations applying to the operations. However, the regulations are often complex and in some cases the individual employee may have limited experience. It is thus vital that guidance is available, to avoid mistakes. The compliance function must follow up and actively ensure that laws, regulations and internal rules, as well as accepted business practices and standards, are complied with in the operations conducted by the Handelsbanken Group. In its supporting role, the function must provide advice and support to business operations, and also assist in drawing up internal rules and provide information about new and amended rules for operations.
Central Compliance is an independent unit with the functional responsibility for compliance matters in the Group. The CEO appoints the Head of Central Compliance. The head of the compliance function reports quarterly to the CEO on compliance in the Group. Twice a year, a Group compliance report is submitted directly to the Board’s audit committee. In addition, material observations are reported regularly to the CEO.
Risk control The Bank is characterised by a clear division of responsibility where each part of the business op-erations bears full responsibility for risk manage-ment. There is local risk control at each regional bank and within the various business areas, which check, for example, that risks are within the limits and are correctly valued. The local risk control carries out risk analyses and verifies that transactions are conducted in a manner that does not entail undesirable risks. The local risk control reports to the business operations’ management and to the central risk control.
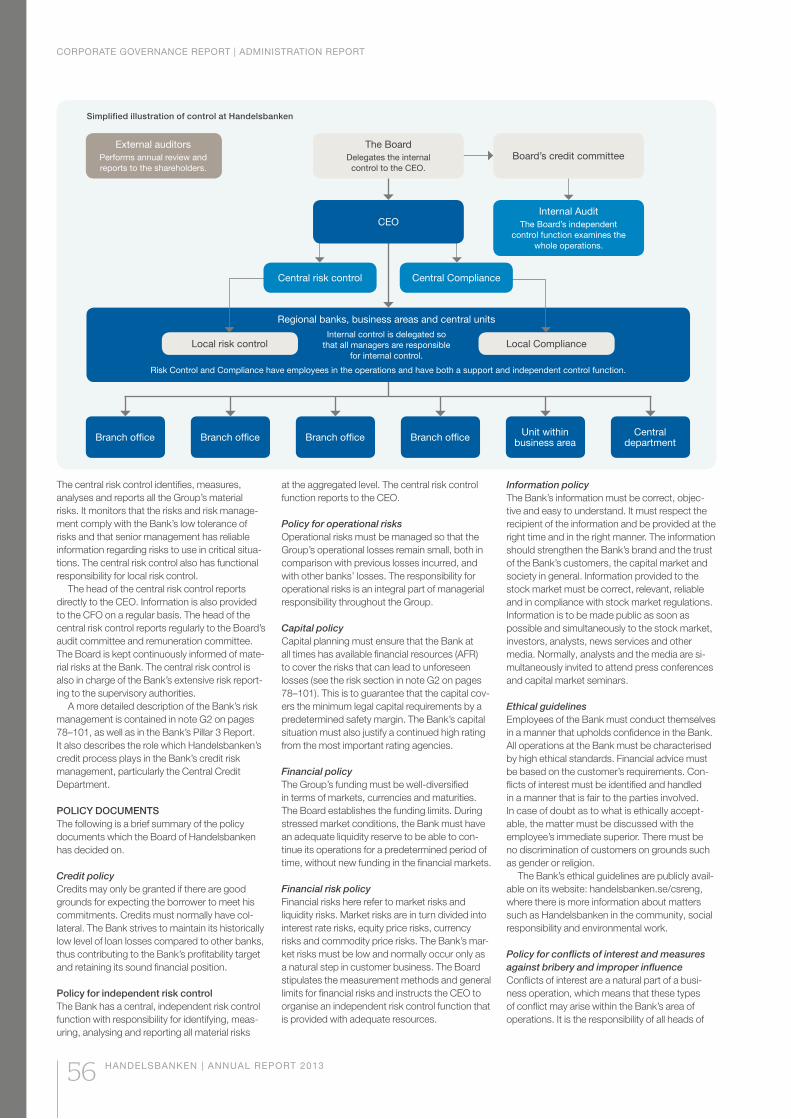
CORPORATE GOVERNANCE REPORT | ADMINISTRATION REPORT
56 HANDELSBANKEN | ANNUAL REPORT 2013
The central risk control identifies, measures, analyses and reports all the Group’s material risks. It monitors that the risks and risk manage-ment comply with the Bank’s low tolerance of risks and that senior management has reliable information regarding risks to use in critical situa-tions. The central risk control also has functional responsibility for local risk control.
The head of the central risk control reports directly to the CEO. Information is also provided to the CFO on a regular basis. The head of the central risk control reports regularly to the Board’s audit committee and remuneration committee. The Board is kept continuously informed of mate-rial risks at the Bank. The central risk control is also in charge of the Bank’s extensive risk report-ing to the supervisory authorities.
A more detailed description of the Bank’s risk management is contained in note G2 on pages 78–101, as well as in the Bank’s Pillar 3 Report. It also describes the role which Handelsbanken’s credit process plays in the Bank’s credit risk management, particularly the Central Credit Department.
POLICY DOCUMENTSThe following is a brief summary of the policy documents which the Board of Handelsbanken has decided on.
Credit policyCredits may only be granted if there are good grounds for expecting the borrower to meet his commitments. Credits must normally have col-lateral. The Bank strives to maintain its historically low level of loan losses compared to other banks, thus contributing to the Bank’s profitability target and retaining its sound financial position.
Policy for independent risk controlThe Bank has a central, independent risk control function with responsibility for identifying, meas-uring, analysing and reporting all material risks
at the aggregated level. The central risk control function reports to the CEO.
Policy for operational risksOperational risks must be managed so that the Group’s operational losses remain small, both in comparison with previous losses incurred, and with other banks’ losses. The responsibility for operational risks is an integral part of managerial responsibility throughout the Group.
Capital policyCapital planning must ensure that the Bank at all times has available financial resources (AFR) to cover the risks that can lead to unforeseen losses (see the risk section in note G2 on pages 78–101). This is to guarantee that the capital cov-ers the minimum legal capital requirements by a predetermined safety margin. The Bank’s capital situation must also justify a continued high rating from the most important rating agencies.
Financial policyThe Group’s funding must be well-diversified in terms of markets, currencies and maturities. The Board establishes the funding limits. During stressed market conditions, the Bank must have an adequate liquidity reserve to be able to con-tinue its operations for a predetermined period of time, without new funding in the financial markets.
Financial risk policyFinancial risks here refer to market risks and liquidity risks. Market risks are in turn divided into interest rate risks, equity price risks, currency risks and commodity price risks. The Bank’s mar-ket risks must be low and normally occur only as a natural step in customer business. The Board stipulates the measurement methods and general limits for financial risks and instructs the CEO to organise an independent risk control function that is provided with adequate resources.
Information policyThe Bank’s information must be correct, objec-tive and easy to understand. It must respect the recipient of the information and be provided at the right time and in the right manner. The information should strengthen the Bank’s brand and the trust of the Bank’s customers, the capital market and society in general. Information provided to the stock market must be correct, relevant, reliable and in compliance with stock market regulations. Information is to be made public as soon as possible and simultaneously to the stock market, investors, analysts, news services and other media. Normally, analysts and the media are si-multaneously invited to attend press conferences and capital market seminars.
Ethical guidelinesEmployees of the Bank must conduct themselves in a manner that upholds confidence in the Bank. All operations at the Bank must be characterised by high ethical standards. Financial advice must be based on the customer’s requirements. Con-flicts of interest must be identified and handled in a manner that is fair to the parties involved. In case of doubt as to what is ethically accept-able, the matter must be discussed with the employee’s immediate superior. There must be no discrimination of customers on grounds such as gender or religion.
The Bank’s ethical guidelines are publicly avail-able on its website: handelsbanken.se/csreng, where there is more information about matters such as Handelsbanken in the community, social responsibility and environmental work.
Policy for conflicts of interest and measures against bribery and improper influenceConflicts of interest are a natural part of a busi-ness operation, which means that these types of conflict may arise within the Bank’s area of operations. It is the responsibility of all heads of
Simplified illustration of control at Handelsbanken
Branch office Branch office Branch office Branch office Unit within business area
Central department
Local risk control Local Compliance
The BoardDelegates the internal
control to the CEO.
External auditorsPerforms annual review and reports to the shareholders.
CEO
Board’s credit committee
Internal AuditThe Board’s independent
control function examines the whole operations.
Central risk control Central Compliance
Regional banks, business areas and central unitsInternal control is delegated so
that all managers are responsible for internal control.
Risk Control and Compliance have employees in the operations and have both a support and independent control function.
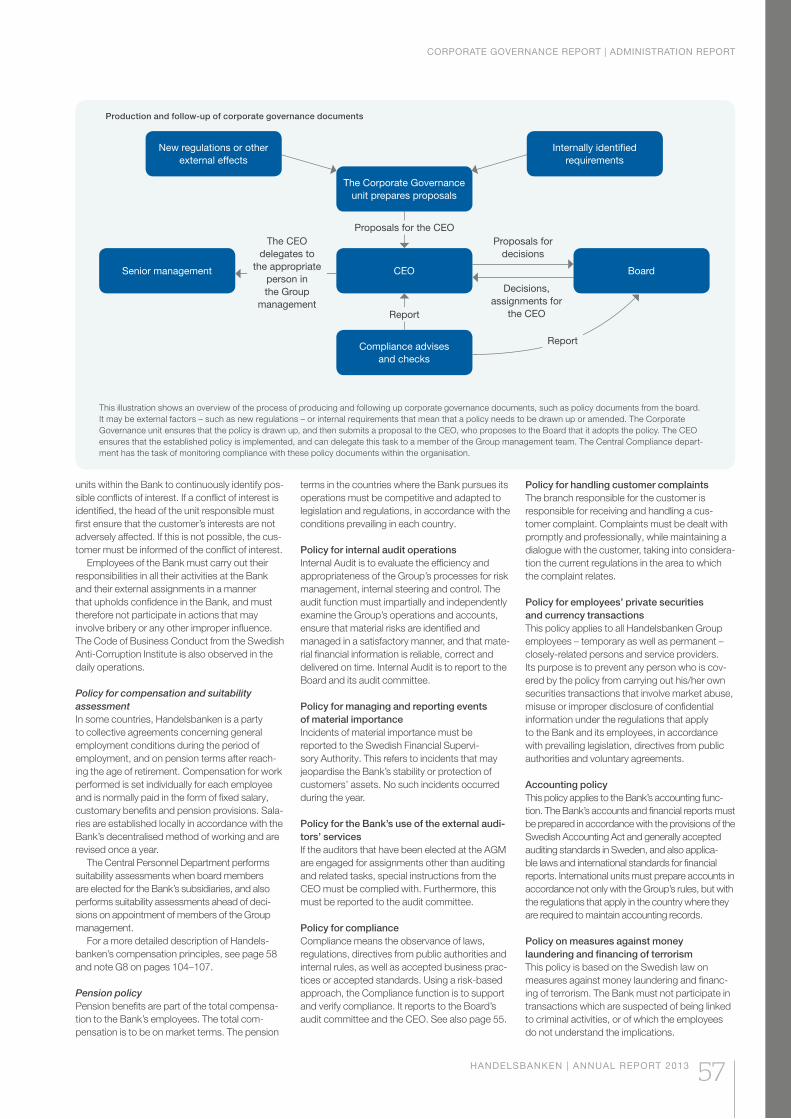
CORPORATE GOVERNANCE REPORT | ADMINISTRATION REPORT
HANDELSBANKEN | ANNUAL REPORT 2013 57
units within the Bank to continuously identify pos-sible conflicts of interest. If a conflict of interest is identified, the head of the unit responsible must first ensure that the customer’s interests are not adversely affected. If this is not possible, the cus-tomer must be informed of the conflict of interest.
Employees of the Bank must carry out their responsibilities in all their activities at the Bank and their external assignments in a manner that upholds confidence in the Bank, and must therefore not participate in actions that may involve bribery or any other improper influence. The Code of Business Conduct from the Swedish Anti-Corruption Institute is also observed in the daily operations.
Policy for compensation and suitability assessmentIn some countries, Handelsbanken is a party to collective agreements concerning general employment conditions during the period of employment, and on pension terms after reach-ing the age of retirement. Compensation for work performed is set individually for each employee and is normally paid in the form of fixed salary, customary benefits and pension provisions. Sala-ries are established locally in accordance with the Bank’s decentralised method of working and are revised once a year.
The Central Personnel Department performs suitability assessments when board members are elected for the Bank’s subsidiaries, and also performs suitability assessments ahead of deci-sions on appointment of members of the Group management.
For a more detailed description of Handels-banken’s compensation principles, see page 58 and note G8 on pages 104–107.
Pension policyPension benefits are part of the total compensa-tion to the Bank’s employees. The total com-pensation is to be on market terms. The pension
terms in the countries where the Bank pursues its operations must be competitive and adapted to legislation and regulations, in accordance with the conditions prevailing in each country.
Policy for internal audit operationsInternal Audit is to evaluate the efficiency and appropriateness of the Group’s processes for risk management, internal steering and control. The audit function must impartially and independently examine the Group’s operations and accounts, ensure that material risks are identified and managed in a satisfactory manner, and that mate-rial financial information is reliable, correct and delivered on time. Internal Audit is to report to the Board and its audit committee.
Policy for managing and reporting events of material importance Incidents of material importance must be reported to the Swedish Financial Supervi-sory Authority. This refers to incidents that may jeopardise the Bank’s stability or protection of customers’ assets. No such incidents occurred during the year.
Policy for the Bank’s use of the external audi-tors’ servicesIf the auditors that have been elected at the AGM are engaged for assignments other than auditing and related tasks, special instructions from the CEO must be complied with. Furthermore, this must be reported to the audit committee.
Policy for complianceCompliance means the observance of laws, regulations, directives from public authorities and internal rules, as well as accepted business prac-tices or accepted standards. Using a risk-based approach, the Compliance function is to support and verify compliance. It reports to the Board’s audit committee and the CEO. See also page 55.
Policy for handling customer complaintsThe branch responsible for the customer is responsible for receiving and handling a cus-tomer complaint. Complaints must be dealt with promptly and professionally, while maintaining a dialogue with the customer, taking into considera-tion the current regulations in the area to which the complaint relates.
Policy for employees’ private securities and currency transactionsThis policy applies to all Handelsbanken Group employees – temporary as well as permanent – closely-related persons and service providers. Its purpose is to prevent any person who is cov-ered by the policy from carrying out his/her own securities transactions that involve market abuse, misuse or improper disclosure of confidential information under the regulations that apply to the Bank and its employees, in accordance with prevailing legislation, directives from public authorities and voluntary agreements.
Accounting policyThis policy applies to the Bank’s accounting func-tion. The Bank’s accounts and financial reports must be prepared in accordance with the provisions of the Swedish Accounting Act and generally accepted auditing standards in Sweden, and also applica-ble laws and international standards for financial reports. International units must prepare accounts in accordance not only with the Group’s rules, but with the regulations that apply in the country where they are required to maintain accounting records.
Policy on measures against money laundering and financing of terrorismThis policy is based on the Swedish law on measures against money laundering and financ-ing of terrorism. The Bank must not participate in transactions which are suspected of being linked to criminal activities, or of which the employees do not understand the implications.
New regulations or other external effects
Internally identified requirements
The Corporate Governance unit prepares proposals
Compliance advises and checks
CEO BoardSenior management
The CEO delegates to
the appropriate person in the Group
management
Proposals for decisions
Report
Proposals for the CEO
Report
Decisions, assignments for
the CEO
Production and follow-up of corporate governance documents
This illustration shows an overview of the process of producing and following up corporate governance documents, such as policy documents from the board. It may be external factors – such as new regulations – or internal requirements that mean that a policy needs to be drawn up or amended. The Corporate Governance unit ensures that the policy is drawn up, and then submits a proposal to the CEO, who proposes to the Board that it adopts the policy. The CEO ensures that the established policy is implemented, and can delegate this task to a member of the Group management team. The Central Compliance depart-ment has the task of monitoring compliance with these policy documents within the organisation.
CORPORATE GOVERNANCE REPORT | ADMINISTRATION REPORT
58 HANDELSBANKEN | ANNUAL REPORT 2013
Policy for agreements relating to the engagement of third partiesWhen the Bank outsources operations which are subject to a license, or other operations with a natural link to the Bank’s operations, this is regulated by the policy for agreements relating to the engagement of third parties.
The Bank or its subsidiaries are always responsible for the outsourced operations being run in accordance with the licenses linked to the operation.
PRINCIPLES FOR COMPENSATION AT HANDELSBANKENThe Bank’s principles for compensation to em-ployees are long established. In general, Handels-banken has low tolerance of risk and considers that fixed compensation contributes to healthy operations. This is, therefore, the main principle. Variable compensation is to be applied with cau-tion, and is only paid to a limited extent. As of 1 March 2011, the Swedish Financial Supervisory Authority’s regulations governing compensation systems in credit institutions, investment firms and fund management companies with a licence for discretionary portfolio management (FFFS 2011:1) apply, these being a development of the previous guidelines. The regulations include special rules for employees who receive variable compensation and who can affect the level of risk in a financial institution. The regulations also contain provisions on deferred compensation.
The following is an overall presentation of the Bank’s fundamental principles for fixed and vari-able compensation. Other information concerning compensation paid by the Bank in accordance with the current regulations is presented in note G8 on pages 104–107. This note also provides information about amounts for salaries, pensions and other benefits, and loans to senior manage-ment.
Fundamental principles for compensationIn Sweden and certain other countries, the Bank is party to collective agreements on general terms and conditions of employment during the employment period and on terms and conditions of pensions after employees have reached retire-ment age.
The aim of the Bank’s policy on salaries is to increase the Bank’s competitiveness and profitability, to enable the Bank to attract, retain and develop skilled staff, and to ensure good skills development and management succes-sion planning. Good profitability and productivity performance at the Bank create the neces-sary conditions for salary growth for the Bank’s employees.
Compensation for work performed is set indi-vidually for each employee, and is paid in the form of a fixed salary, customary salary benefits and a pension provision. At Handelsbanken, salary-set-ting takes place at local level. Salaries are set in salary reviews between the employee and his/her line manager. These principles have been applied for many years with great success. They mean that managers at all levels participate regularly in the salary process, and take responsibility for the Bank’s salary policy and the growth in their own unit’s staff costs.
Salaries are based on factors known in advance: the nature and level of difficulty of the work, skills, performance and results achieved, leadership (for managers who are responsible for the career development of employees), supply and demand on the market, and performance as an ambas-sador for the Bank’s corporate culture.
The principle of only having a fixed salary applies to more than 97 per cent of the Group’s employees, and is applied without exception to senior management, all staff who decide on the Bank’s granting of credits, and employees in the Bank’s control functions.
Principles for compensation to senior management The shareholders at the AGM decide on guide-lines for compensation to the CEO and the Ex-ecutive Vice Presidents (EVPs). For the guidelines from the AGM for 2013, see the section “Annual general meeting 2013” on page 53.
At Handelsbanken, the Board decides on compensation to the CEO and the EVPs, a total of 18 individuals (as at 31 December 2013). The Board also determines compensation for officers with main responsibility for the control functions: Compliance, Internal Audit and Risk Control.
Compensation to the CEO and EVPs is paid only in the form of fixed salary, customary benefits such as a company car, and pension provi-sions. Following a special decision by the Board, Handelsbanken can provide housing as part of the compensation. No variable compensation is paid, nor are there any agreements on termina-tion benefits. The period of notice on the part of a senior manager is 6 months, and on the part of Handelsbanken a maximum of 12 months or, if the Bank terminates the employment contract later than five years after the person becomes a member of the senior management, the period of notice is a maximum of 24 months.
For senior managers who remain in their posi-tions after reaching standard retirement age, a mutual period of notice of no more than 6 months applies.
Senior managers receive allocations in Handels-banken’s profit-sharing system, Oktogonen, on the same terms as all other employees of the Bank.
Note G8 on pages 104–107 provides further in-formation about remuneration to senior managers.
External fees, such as fees for serving on the boards of other companies on behalf of the Bank, must be paid in to the Bank.
Ahead of the 2014 AGM, the Board is propos-ing guidelines for compensation and other terms of employment that are essentially unchanged, but have one further condition, which means that Handelsbanken must indemnify senior manag-ers in the event of an administrative sanctioning charge being imposed on them under the new regulations that are proposed to come into force in 2014. The guidelines do not affect compensa-tion previously decided for senior management. The senior management positions to which the guidelines apply are the CEO and the EVPs.
Variable compensationAt Handelsbanken, the Board decides on the compensation policy. The main principle of the policy is that compensation is paid in the form of
fixed remuneration. However, the policy allows for variable compensation, but for this a special decision is required by the CEO. The heads of the areas concerned, as well as those responsible for Risk Control and Compliance, have taken part in the remuneration committee’s preparation of the Board’s compensation policy.
Variable compensation occurs to a very limited extent and only in the Handelsbanken Capital Markets business area and in the British subsidi-ary, Heartwood. Nor is variable compensation paid to the Bank’s management or to any em-ployee who makes decisions on credits or limits. Employees who, alone or together with others, are entitled to decide on credit risk, market risk, liquidity risk, commodity risk, currency risk or interest rate risk limits, as well as employees who, by deciding on credits or product terms and conditions, can affect the Bank’s risk profile, can have only fixed compensation.
Variable compensation at Handelsbanken must be designed so that it does not encour-age unhealthy risk-taking, is within the limits of the Bank’s risk tolerance, taking into account a reasonable balance between fixed and variable compensation. The financial result on which the variable compensation is based must also be risk-adjusted. Handelsbanken’s compensation policy is also described in note G8 on pages 104–107. Among other things, the policy pre-scribes that only employees within units whose profits derive from commissions or intermediary transactions that take place without the Bank be-ing subject to risk, are entitled to receive variable compensation. Variable compensation is paid in cash, and the disbursement of at least 40 per cent of variable compensation of SEK 100,000 or more must be deferred by at least three years. Deferred compensation can be removed or lowered and will not be paid to the person with the entitlement until after the end of the deferment period. No employee may receive variable com-pensation of more than 150 per cent of his/her fixed compensation. The total variable compen-sation paid in the Group cannot be more than 100 per cent of the combined fixed compensation for the individuals who are eligible to receive variable compensation.
During 2014, new regulations are expected to come into force, prohibiting variable compensa-tion of amounts exceeding 100 per cent of the fixed compensation, unless the annual general meeting consents to higher variable compensa-tion. Handelsbanken will be adapting its rules for variable compensation to the new regulations, and does not intend to seek the consent of the AGM for higher variable compensation.
HANDELSBANKEN | ANNUAL REPORT 2013 59
CORPORATE GOVERNANCE REPORT | ADMINISTRATION REPORT
HANDELSBANKEN | ANNUAL REPORT 2013 59
The Board’s report on internal control regarding financial reporting
The presentation of Handelsbanken’s internal control process for financial reporting is based on the framework developed by the Committee of Sponsoring Organizations of the Treadway Commission (COSO). The process was designed to ensure compliance with the Bank’s principles for financial reporting and internal control, and to ensure that the financial reporting has been pre-pared pursuant to the law, applicable accounting standards, and other requirements related to listed companies.
Control environmentThe control environment described above in this Corporate Governance Report is fundamental to Handelsbanken’s internal control of financial reporting: organisational structure, division of re-sponsibilities, guidelines and steering documents.
Risk assessment is another part of the internal control process and comprises identification and management of the risks that may affect financial reporting, as well as the control activities aimed at preventing, detecting and correcting errors and deviations.
Risk assessmentThe annual self-evaluations carried out at regional banks, subsidiaries and central departments are an essential part of the Bank’s risk assessment. Risks related to financial reporting are part of this total analysis.
In a self-evaluation, the employee defines the events that constitute potential risks to the operation and then estimates the probability and consequences of each risk. Particular focus is placed on the risk of fraud and the risk of loss or embezzlement of assets. A plan of action is then drawn up, based on the self-evaluation. Other aspects of Handelsbanken’s risk management are detailed in note G2 on pages 78–101.
Control activitiesVarious control activities are incorporated in the entire financial reporting process.
Group Finance is responsible for consolidated accounts, consolidated financial reports and for financial and administrative control systems. The unit’s responsibilities also include the Group’s liquidity, the internal bank, the capital base, risk calculations, tax analysis and Groupwide reporting to public authorities. The unit must also ensure that the staff concerned are aware of and have access to instructions of significance to the financial reporting.
Reported amounts and analyses of income statements and balance sheets are reconciled and checked regularly within the accounting and control organisation.
Heads of accounting and control at regional banks, subsidiaries, central departments and international units are responsible for ensuring that the control activities in the financial reporting for their respective units are fit-for-purpose – i.e. that they are designed to prevent, detect and cor-rect errors and deviations, and are in compliance with internal guidelines and instructions. At each quarterly closing of accounts, the units certify that the prescribed periodic checks and reconciliation of accounts have been carried out.
There is a valuation committee which is part of Group Finance with the task of supporting deci-sion-making relating to valuation and accounting matters. The committee deals with valuation of financial assets and liabilities, including deriva-tives at fair value and also financial guarantees. The committee must ensure that the valuation complies with external regulations, internal guide-lines and current market practices.
High information security is a precondition for good internal control of financial reporting, thus there are regulations and guidelines to ensure
availability, accuracy, confidentiality and trace-ability of information in the business systems.
As part of the quality control work for financial reporting, the Board has set up an audit commit-tee consisting of the Chairman of the Board and two Board members. The committee processes crucial accounting matters and the financial re-ports produced by the Bank. The committee also supervises the efficiency of the internal control, internal auditing and risk management systems for financial reporting. See the section under the ‘Committee work’ heading on page 54 for more details.
Information and communicationThe Bank has information and communication paths with the aim of achieving completeness and correctness in its financial reports. The Group’s general accounting instructions and special procedures for producing financial reports are communicated to the staff concerned via the Group’s intranet. The system used for financial reporting encompasses the entire Group.
Follow-upInternal Audit, Compliance and the centrally lo-cated independent risk control function, and also the accounting/control units, monitor compliance with internal policies, instructions and other policy documents. Monitoring takes place at central level, but also locally in regional banks, subsidiar-ies, central departments and international units. The policy for Internal Audit established by the Board states that it must examine internal gov-ernance and control. Internal Audit is described in more detail on page 55. The Group’s information and communication paths are monitored continu-ally to ensure that they are fit-for-purpose for the financial reporting.
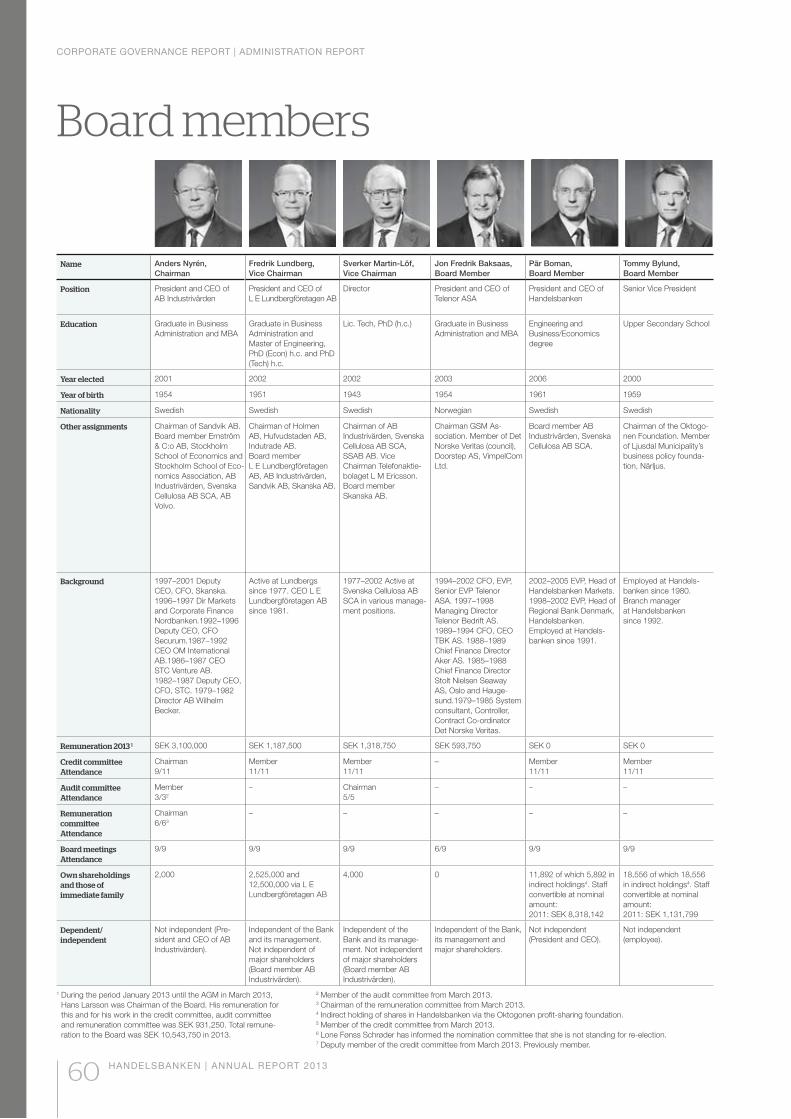
CORPORATE GOVERNANCE REPORT | ADMINISTRATION REPORT
60 HANDELSBANKEN | ANNUAL REPORT 2013
Board members
Name Anders Nyrén, Chairman
Fredrik Lundberg, Vice Chairman
Sverker Martin-Löf, Vice Chairman
Jon Fredrik Baksaas, Board Member
Pär Boman, Board Member
Tommy Bylund, Board Member
Position President and CEO of AB Industrivärden
President and CEO of L E Lundbergföretagen AB
Director President and CEO of Telenor ASA
President and CEO of Handelsbanken
Senior Vice President
Education Graduate in Business Administration and MBA
Graduate in Business Administration and Master of Engineering, PhD (Econ) h.c. and PhD (Tech) h.c.
Lic. Tech, PhD (h.c.) Graduate in Business Administration and MBA
Engineering and Business/Economics degree
Upper Secondary School
Year elected 2001 2002 2002 2003 2006 2000
Year of birth 1954 1951 1943 1954 1961 1959
Nationality Swedish Swedish Swedish Norwegian Swedish Swedish
Other assignments Chairman of Sandvik AB. Board member Ernström & C:o AB, Stockholm School of Economics and Stockholm School of Eco-nomics Association, AB Industrivärden, Svenska Cellulosa AB SCA, AB Volvo.
Chairman of Holmen AB, Hufvudstaden AB, Indutrade AB. Board member L E Lundbergföretagen AB, AB Industrivärden, Sandvik AB, Skanska AB.
Chairman of AB Industri värden, Svenska Cellulosa AB SCA, SSAB AB. Vice Chairman Telefonaktie-bolaget L M Ericsson. Board member Skanska AB.
Chairman GSM As-sociation. Member of Det Norske Veritas (council), Door step AS, VimpelCom Ltd.
Board member AB Industrivärden, Svenska Cellulosa AB SCA.
Chairman of the Oktogo-nen Foundation. Member of Ljusdal Municipality’s business policy founda-tion, Närljus.
Background 1997–2001 Deputy CEO, CFO, Skanska. 1996–1997 Dir Markets and Corporate Finance Nordbanken.1992–1996 Deputy CEO, CFO Securum.1987–1992 CEO OM International AB.1986–1987 CEO STC Venture AB. 1982–1987 Deputy CEO, CFO, STC. 1979–1982 Director AB Wilhelm Becker.
Active at Lundbergs since 1977. CEO L E Lundbergföretagen AB since 1981.
1977–2002 Active at Svenska Cellulosa AB SCA in various manage-ment positions.
1994–2002 CFO, EVP, Senior EVP Telenor ASA. 1997–1998 Managing Director Telenor Bedrift AS. 1989–1994 CFO, CEO TBK AS. 1988–1989 Chief Finance Director Aker AS. 1985–1988 Chief Finance Director Stolt Nielsen Seaway AS, Oslo and Hauge-sund.1979–1985 System consultant, Controller, Contract Co-ordinator Det Norske Veritas.
2002–2005 EVP, Head of Handelsbanken Markets. 1998–2002 EVP, Head of Regional Bank Denmark, Handelsbanken. Employed at Handels-banken since 1991.
Employed at Handels-banken since 1980. Branch manager at Handelsbanken since 1992.
Remuneration 2013 1 SEK 3,100,000 SEK 1,187,500 SEK 1,318,750 SEK 593,750 SEK 0 SEK 0
Credit committee Attendance
Chairman 9/11
Member 11/11
Member 11/11
– Member 11/11
Member 11/11
Audit committee Attendance
Member3/32
– Chairman 5/5
– – –
Remuneration committee Attendance
Chairman6/63
– – – – –
Board meetings Attendance
9/9 9/9 9/9 6/9 9/9 9/9
Own shareholdings and those of immediate family
2,000 2,525,000 and 12,500,000 via L E Lundbergföretagen AB
4,000 0 11,892 of which 5,892 in indirect holdings4. Staff convertible at nominal amount: 2011: SEK 8,318,142
18,556 of which 18,556 in indirect holdings4. Staff convertible at nominal amount: 2011: SEK 1,131,799
Dependent/ independent
Not independent (Pre-sident and CEO of AB Industrivärden).
Independent of the Bank and its management. Not independent of major shareholders (Board member AB Industrivärden).
Independent of the Bank and its manage-ment. Not independent of major shareholders (Board member AB Industrivärden).
Independent of the Bank, its management and major shareholders.
Not independent (President and CEO).
Not independent (employee).
1 During the period January 2013 until the AGM in March 2013, Hans Larsson was Chairman of the Board. His remuneration for this and for his work in the credit committee, audit committee and remuneration committee was SEK 931,250. Total remune-ration to the Board was SEK 10,543,750 in 2013.
2 Member of the audit committee from March 2013.3 Chairman of the remuneration committee from March 2013.4 Indirect holding of shares in Handelsbanken via the Oktogonen profit-sharing foundation.5 Member of the credit committee from March 2013.6 Lone Fønss Schrøder has informed the nomination committee that she is not standing for re-election.7 Deputy member of the credit committee from March 2013. Previously member.
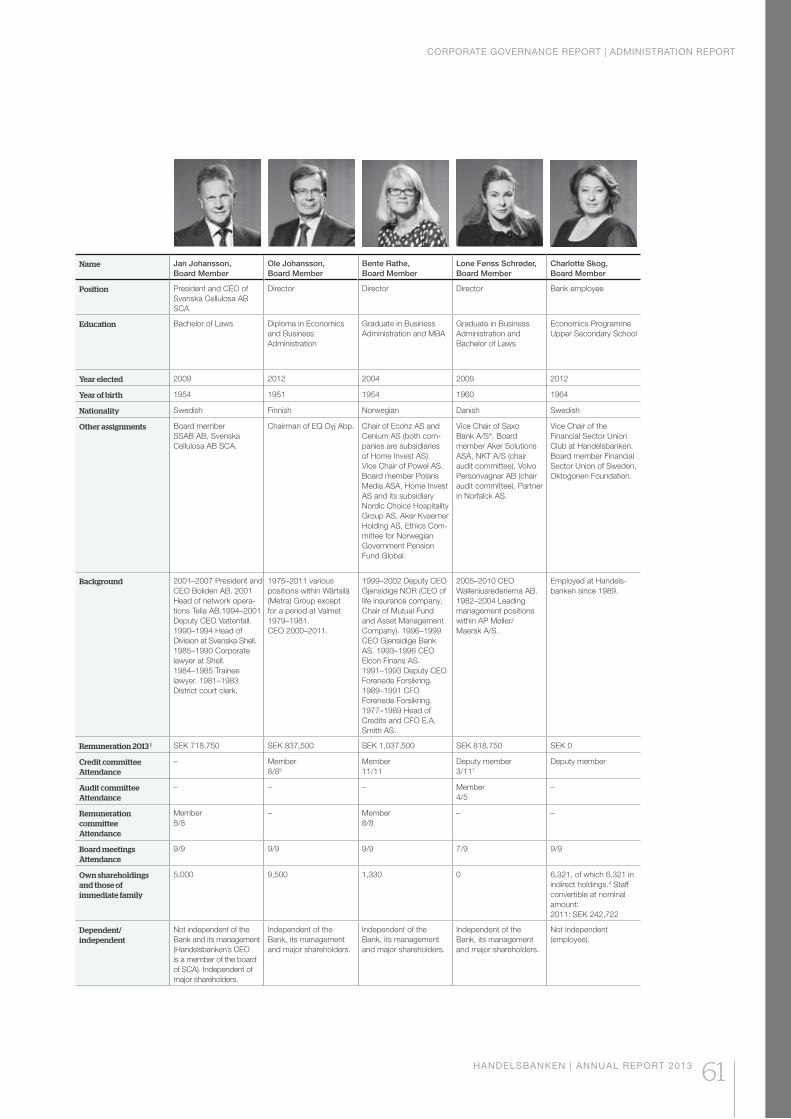
CORPORATE GOVERNANCE REPORT | ADMINISTRATION REPORT
HANDELSBANKEN | ANNUAL REPORT 2013 61
Name Jan Johansson, Board Member
Ole Johansson, Board Member
Bente Rathe, Board Member
Lone Fønss Schrøder, Board Member
Charlotte Skog, Board Member
Position President and CEO of Svenska Cellulosa AB SCA
Director Director Director Bank employee
Education Bachelor of Laws Diploma in Economics and Business Administration
Graduate in Business Administration and MBA
Graduate in Business Administration and Bachelor of Laws
Economics Programme Upper Secondary School
Year elected 2009 2012 2004 2009 2012
Year of birth 1954 1951 1954 1960 1964
Nationality Swedish Finnish Norwegian Danish Swedish
Other assignments Board member SSAB AB, Svenska Cellulosa AB SCA.
Chairman of EQ Oyj Abp. Chair of Ecohz AS and Cenium AS (both com-panies are subsidiaries of Home Invest AS). Vice Chair of Powel AS. Board member Polaris Media ASA, Home Invest AS and its subsidiary Nordic Choice Hospitality Group AS, Aker Kvaerner Holding AS, Ethics Com-mittee for Norwegian Government Pension Fund Global.
Vice Chair of Saxo Bank A/S6. Board member Aker Solutions ASA, NKT A/S (chair audit committee), Volvo Personvagnar AB (chair audit committee). Partner in Norfalck AS.
Vice Chair of the Financial Sector Union Club at Handelsbanken. Board member Financial Sector Union of Sweden,Oktogonen Foundation.
Background 2001–2007 President and CEO Boliden AB. 2001 Head of network opera-tions Telia AB.1994–2001 Deputy CEO Vattenfall. 1990–1994 Head of Division at Svenska Shell. 1985–1990 Corporate lawyer at Shell. 1984–1985 Trainee lawyer. 1981–1983 District court clerk.
1975–2011 various positions within Wärtsilä (Metra) Group except for a period at Valmet 1979–1981. CEO 2000–2011.
1999–2002 Deputy CEO Gjensidige NOR (CEO of life insurance company, Chair of Mutual Fund and Asset Management Company). 1996–1999 CEO Gjensidige Bank AS. 1993–1996 CEO Elcon Finans AS. 1991–1993 Deputy CEO Forenede Forsikring. 1989–1991 CFO Forenede Forsikring. 1977–1989 Head of Credits and CFO E.A. Smith AS.
2005–2010 CEO Walleniusrederierna AB. 1982–2004 Leading management positions within AP Møller/ Maersk A/S.
Employed at Handels-banken since 1989.
Remuneration 2013 1 SEK 718,750 SEK 837,500 SEK 1,037,500 SEK 818,750 SEK 0
Credit committee Attendance
– Member8/85
Member 11/11
Deputy member 3/117
Deputy member
Audit committee Attendance
– – – Member 4/5
–
Remuneration committee Attendance
Member 8/8
– Member 8/8
– –
Board meetings Attendance
9/9 9/9 9/9 7/9 9/9
Own shareholdings and those of immediate family
5,000 9,500 1,330 0 6,321, of which 6,321 in indirect holdings.4 Staff convertible at nominal amount: 2011: SEK 242,722
Dependent/ independent
Not independent of the Bank and its management (Handelsbanken’s CEO is a member of the board of SCA). Independent of major shareholders.
Independent of the Bank, its management and major shareholders.
Independent of the Bank, its management and major shareholders.
Independent of the Bank, its management and major shareholders.
Not independent (employee).
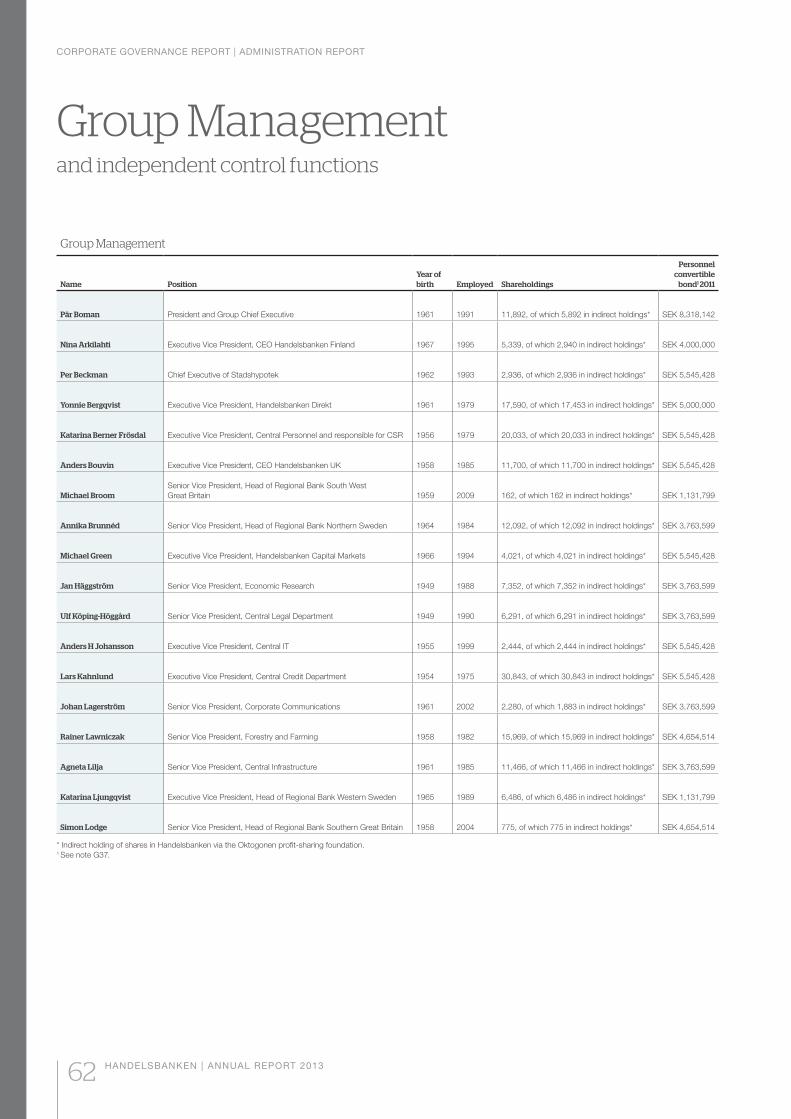
corporate governance report | administration report
62 handelsbanken | annual report 2013
Group Management
Name PositionYear of birth Employed Shareholdings
Personnel convertible
bond1 2011
Pär Boman President and Group Chief Executive 1961 1991 11,892, of which 5,892 in indirect holdings* SEK 8,318,142
Nina Arkilahti Executive Vice President, CEO Handelsbanken Finland 1967 1995 5,339, of which 2,940 in indirect holdings* SEK 4,000,000
Per Beckman Chief Executive of Stadshypotek 1962 1993 2,936, of which 2,936 in indirect holdings* SEK 5,545,428
Yonnie Bergqvist Executive Vice President, Handelsbanken Direkt 1961 1979 17,590, of which 17,453 in indirect holdings* SEK 5,000,000
Katarina Berner Frösdal Executive Vice President, Central Personnel and responsible for CSR 1956 1979 20,033, of which 20,033 in indirect holdings* SEK 5,545,428
Anders Bouvin Executive Vice President, CEO Handelsbanken UK 1958 1985 11,700, of which 11,700 in indirect holdings* SEK 5,545,428
Michael BroomSenior Vice President, Head of Regional Bank South West Great Britain 1959 2009 162, of which 162 in indirect holdings* SEK 1,131,799
Annika Brunnéd Senior Vice President, Head of Regional Bank Northern Sweden 1964 1984 12,092, of which 12,092 in indirect holdings* SEK 3,763,599
Michael Green Executive Vice President, Handelsbanken Capital Markets 1966 1994 4,021, of which 4,021 in indirect holdings* SEK 5,545,428
Jan Häggström Senior Vice President, Economic Research 1949 1988 7,352, of which 7,352 in indirect holdings* SEK 3,763,599
Ulf Köping-Höggård Senior Vice President, Central Legal Department 1949 1990 6,291, of which 6,291 in indirect holdings* SEK 3,763,599
Anders H Johansson Executive Vice President, Central IT 1955 1999 2,444, of which 2,444 in indirect holdings* SEK 5,545,428
Lars Kahnlund Executive Vice President, Central Credit Department 1954 1975 30,843, of which 30,843 in indirect holdings* SEK 5,545,428
Johan Lagerström Senior Vice President, Corporate Communications 1961 2002 2,280, of which 1,883 in indirect holdings* SEK 3,763,599
Rainer Lawniczak Senior Vice President, Forestry and Farming 1958 1982 15,969, of which 15,969 in indirect holdings* SEK 4,654,514
Agneta Lilja Senior Vice President, Central Infrastructure 1961 1985 11,466, of which 11,466 in indirect holdings* SEK 3,763,599
Katarina Ljungqvist Executive Vice President, Head of Regional Bank Western Sweden 1965 1989 6,486, of which 6,486 in indirect holdings* SEK 1,131,799
Simon Lodge Senior Vice President, Head of Regional Bank Southern Great Britain 1958 2004 775, of which 775 in indirect holdings* SEK 4,654,514
* Indirect holding of shares in Handelsbanken via the Oktogonen profit-sharing foundation.1 See note G37.
Group Managementand independent control functions
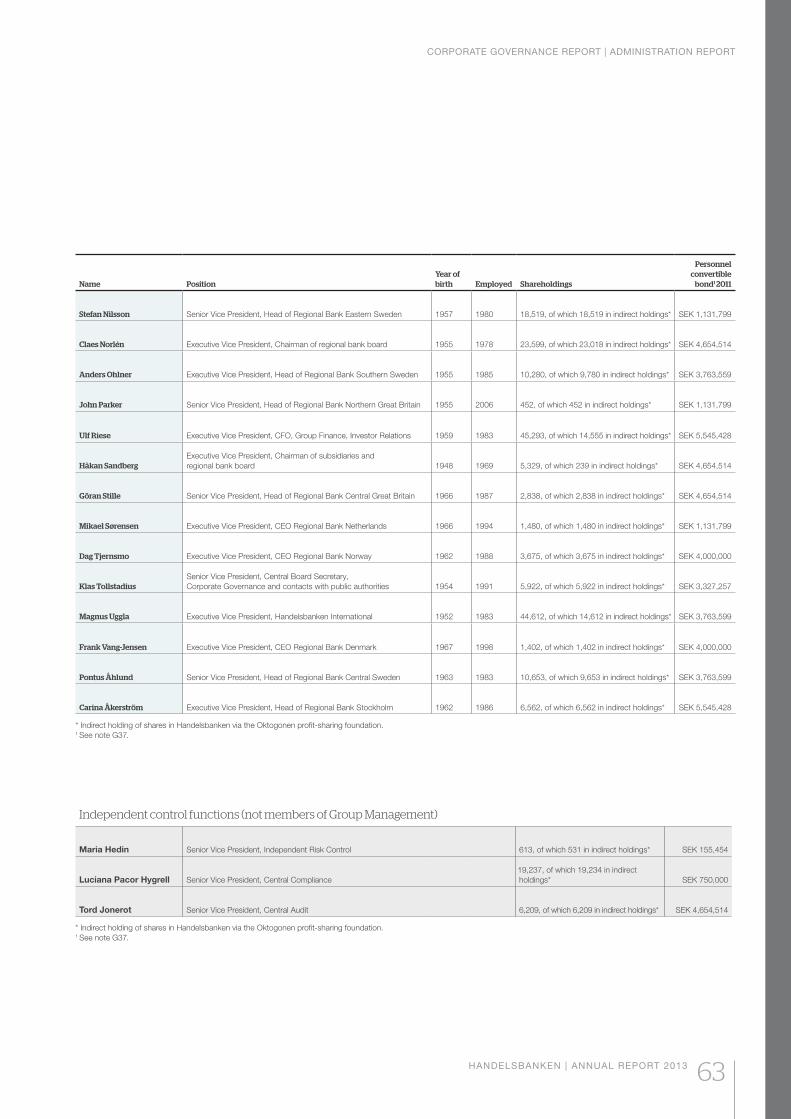
corporate governance report | administration report
handelsbanken | annual report 2013 63
Name PositionYear of birth Employed Shareholdings
Personnel convertible
bond1 2011
Stefan Nilsson Senior Vice President, Head of Regional Bank Eastern Sweden 1957 1980 18,519, of which 18,519 in indirect holdings* SEK 1,131,799
Claes Norlén Executive Vice President, Chairman of regional bank board 1955 1978 23,599, of which 23,018 in indirect holdings* SEK 4,654,514
Anders Ohlner Executive Vice President, Head of Regional Bank Southern Sweden 1955 1985 10,280, of which 9,780 in indirect holdings* SEK 3,763,559
John Parker Senior Vice President, Head of Regional Bank Northern Great Britain 1955 2006 452, of which 452 in indirect holdings* SEK 1,131,799
Ulf Riese Executive Vice President, CFO, Group Finance, Investor Relations 1959 1983 45,293, of which 14,555 in indirect holdings* SEK 5,545,428
Håkan SandbergExecutive Vice President, Chairman of subsidiaries and regional bank board 1948 1969 5,329, of which 239 in indirect holdings* SEK 4,654,514
Göran Stille Senior Vice President, Head of Regional Bank Central Great Britain 1966 1987 2,838, of which 2,838 in indirect holdings* SEK 4,654,514
Mikael Sørensen Executive Vice President, CEO Regional Bank Netherlands 1966 1994 1,480, of which 1,480 in indirect holdings* SEK 1,131,799
Dag Tjernsmo Executive Vice President, CEO Regional Bank Norway 1962 1988 3,675, of which 3,675 in indirect holdings* SEK 4,000,000
Klas TollstadiusSenior Vice President, Central Board Secretary, Corporate Governance and contacts with public authorities 1954 1991 5,922, of which 5,922 in indirect holdings* SEK 3,327,257
Magnus Uggla Executive Vice President, Handelsbanken International 1952 1983 44,612, of which 14,612 in indirect holdings* SEK 3,763,599
Frank Vang-Jensen Executive Vice President, CEO Regional Bank Denmark 1967 1998 1,402, of which 1,402 in indirect holdings* SEK 4,000,000
Pontus Åhlund Senior Vice President, Head of Regional Bank Central Sweden 1963 1983 10,653, of which 9,653 in indirect holdings* SEK 3,763,599
Carina Åkerström Executive Vice President, Head of Regional Bank Stockholm 1962 1986 6,562, of which 6,562 in indirect holdings* SEK 5,545,428
* Indirect holding of shares in Handelsbanken via the Oktogonen profit-sharing foundation.1 See note G37.
Independent control functions (not members of Group Management)
Maria Hedin Senior Vice President, Independent Risk Control 613, of which 531 in indirect holdings* SEK 155,454
Luciana Pacor Hygrell Senior Vice President, Central Compliance 19,237, of which 19,234 in indirect holdings* SEK 750,000
Tord Jonerot Senior Vice President, Central Audit 6,209, of which 6,209 in indirect holdings* SEK 4,654,514
* Indirect holding of shares in Handelsbanken via the Oktogonen profit-sharing foundation.1 See note G37.
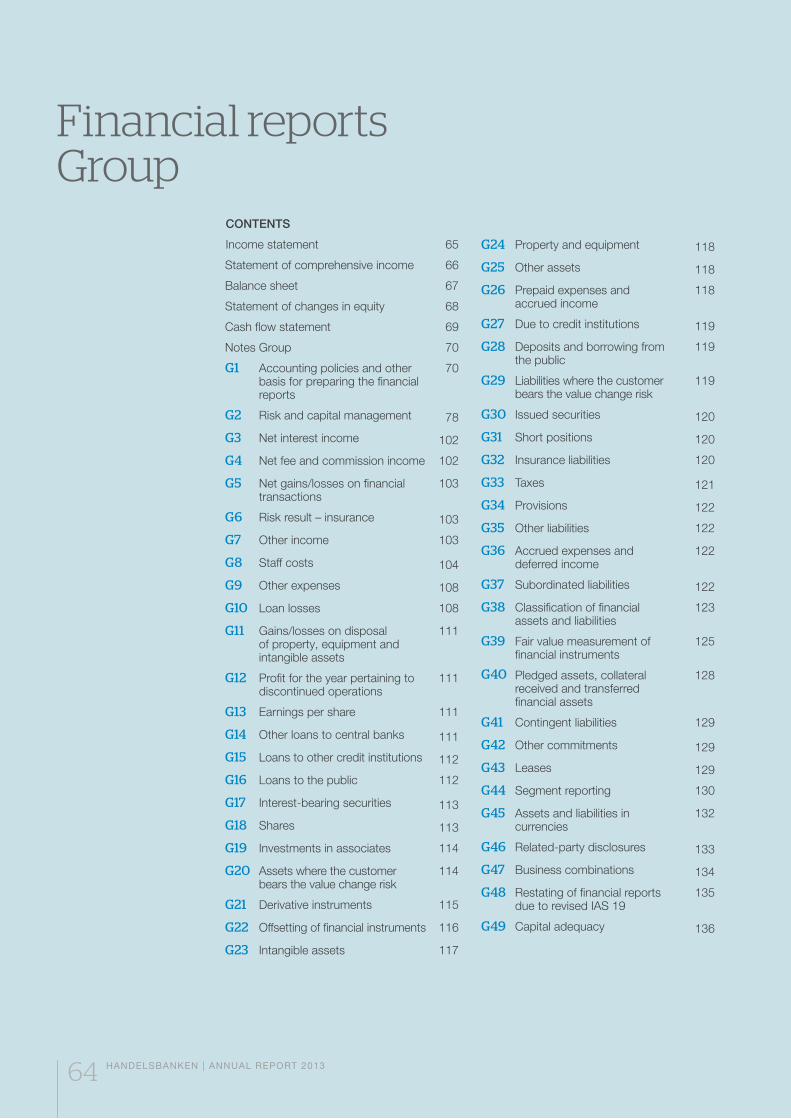
64 HANDELSBANKEN | ANNUAL REPORT 2013
Financial reports Group
64 HANDELSBANKEN | ANNUAL REPORT 2013
CONTENTS
Income statement 65
Statement of comprehensive income 66
Balance sheet 67
Statement of changes in equity 68
Cash flow statement 69
Notes Group 70
G1 Accounting policies and other basis for preparing the financial reports
70
G2 Risk and capital management 78
G3 Net interest income 102
G4 Net fee and commission income 102
G5 Net gains/losses on financial transactions
103
G6 Risk result – insurance 103
G7 Other income 103
G8 Staff costs 104
G9 Other expenses 108
G10 Loan losses 108
G11 Gains/losses on disposal of property, equipment and intangible assets
111
G12 Profit for the year pertaining to discontinued operations
111
G13 Earnings per share 111
G14 Other loans to central banks 111
G15 Loans to other credit institutions 112
G16 Loans to the public 112
G17 Interest-bearing securities 113
G18 Shares 113
G19 Investments in associates 114
G20 Assets where the customer bears the value change risk
114
G21 Derivative instruments 115
G22 Offsetting of financial instruments 116
G23 Intangible assets 117
G24 Property and equipment 118
G25 Other assets 118
G26 Prepaid expenses and accrued income
118
G27 Due to credit institutions 119
G28 Deposits and borrowing from the public
119
G29 Liabilities where the customer bears the value change risk
119
G30 Issued securities 120
G31 Short positions 120
G32 Insurance liabilities 120
G33 Taxes 121
G34 Provisions 122
G35 Other liabilities 122
G36 Accrued expenses and deferred income
122
G37 Subordinated liabilities 122
G38 Classification of financial assets and liabilities
123
G39 Fair value measurement of financial instruments
125
G40 Pledged assets, collateral received and transferred financial assets
128
G41 Contingent liabilities 129
G42 Other commitments 129
G43 Leases 129
G44 Segment reporting 130
G45 Assets and liabilities in currencies
132
G46 Related-party disclosures 133
G47 Business combinations 134
G48 Restating of financial reports due to revised IAS 19
135
G49 Capital adequacy 136
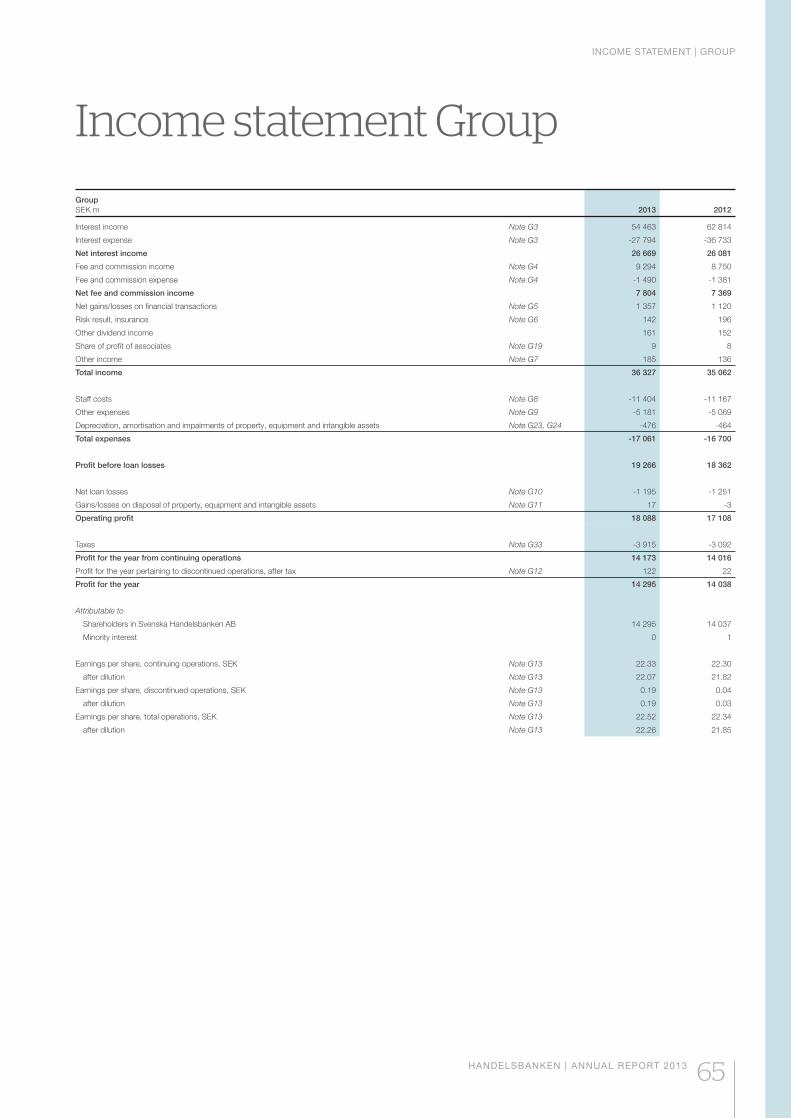
INCOME STATEMENT | GROUP
HANDELSBANKEN | ANNUAL REPORT 2013 65
Income statement Group
GroupSEK m 2013 2012
Interest income Note G3 54 463 62 814
Interest expense Note G3 -27 794 -36 733
Net interest income 26 669 26 081
Fee and commission income Note G4 9 294 8 750
Fee and commission expense Note G4 -1 490 -1 381
Net fee and commission income 7 804 7 369
Net gains/losses on financial transactions Note G5 1 357 1 120
Risk result, insurance Note G6 142 196
Other dividend income 161 152
Share of profit of associates Note G19 9 8
Other income Note G7 185 136
Total income 36 327 35 062
Staff costs Note G8 -11 404 -11 167
Other expenses Note G9 -5 181 -5 069
Depreciation, amortisation and impairments of property, equipment and intangible assets Note G23, G24 -476 -464
Total expenses -17 061 -16 700
Profit before loan losses 19 266 18 362
Net loan losses Note G10 -1 195 -1 251
Gains/losses on disposal of property, equipment and intangible assets Note G11 17 -3
Operating profit 18 088 17 108
Taxes Note G33 -3 915 -3 092
Profit for the year from continuing operations 14 173 14 016
Profit for the year pertaining to discontinued operations, after tax Note G12 122 22
Profit for the year 14 295 14 038
Attributable to
Shareholders in Svenska Handelsbanken AB 14 295 14 037
Minority interest 0 1
Earnings per share, continuing operations, SEK Note G13 22.33 22.30
after dilution Note G13 22.07 21.82
Earnings per share, discontinued operations, SEK Note G13 0.19 0.04
after dilution Note G13 0.19 0.03
Earnings per share, total operations, SEK Note G13 22.52 22.34
after dilution Note G13 22.26 21.85
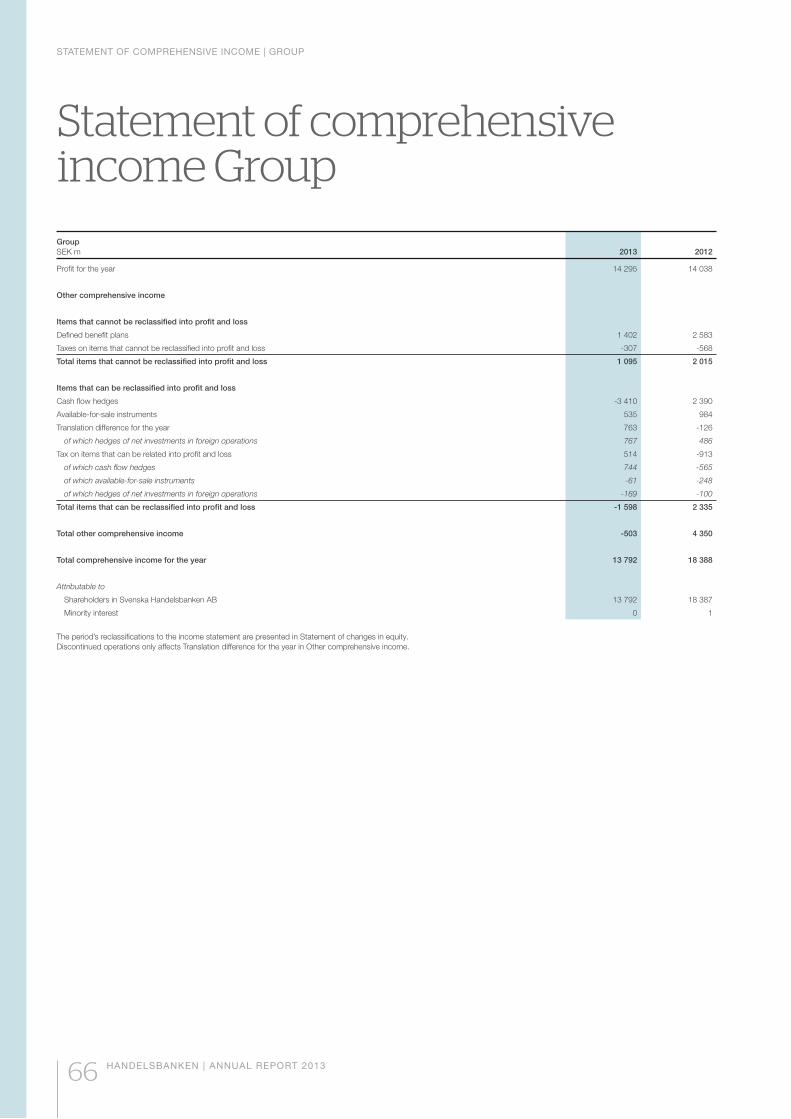
STATEMENT OF COMPREHENSIVE INCOME | GROUP
66 HANDELSBANKEN | ANNUAL REPORT 2013
Statement of comprehensive income Group
Group SEK m 2013 2012
Profit for the year 14 295 14 038
Other comprehensive income
Items that cannot be reclassified into profit and loss
Defined benefit plans 1 402 2 583
Taxes on items that cannot be reclassified into profit and loss -307 -568
Total items that cannot be reclassified into profit and loss 1 095 2 015
Items that can be reclassified into profit and loss
Cash flow hedges -3 410 2 390
Available-for-sale instruments 535 984
Translation difference for the year 763 -126
of which hedges of net investments in foreign operations 767 486
Tax on items that can be related into profit and loss 514 -913
of which cash flow hedges 744 -565
of which available-for-sale instruments -61 -248
of which hedges of net investments in foreign operations -169 -100
Total items that can be reclassified into profit and loss -1 598 2 335
Total other comprehensive income -503 4 350
Total comprehensive income for the year 13 792 18 388
Attributable to
Shareholders in Svenska Handelsbanken AB 13 792 18 387
Minority interest 0 1
The period’s reclassifications to the income statement are presented in Statement of changes in equity.Discontinued operations only affects Translation difference for the year in Other comprehensive income.
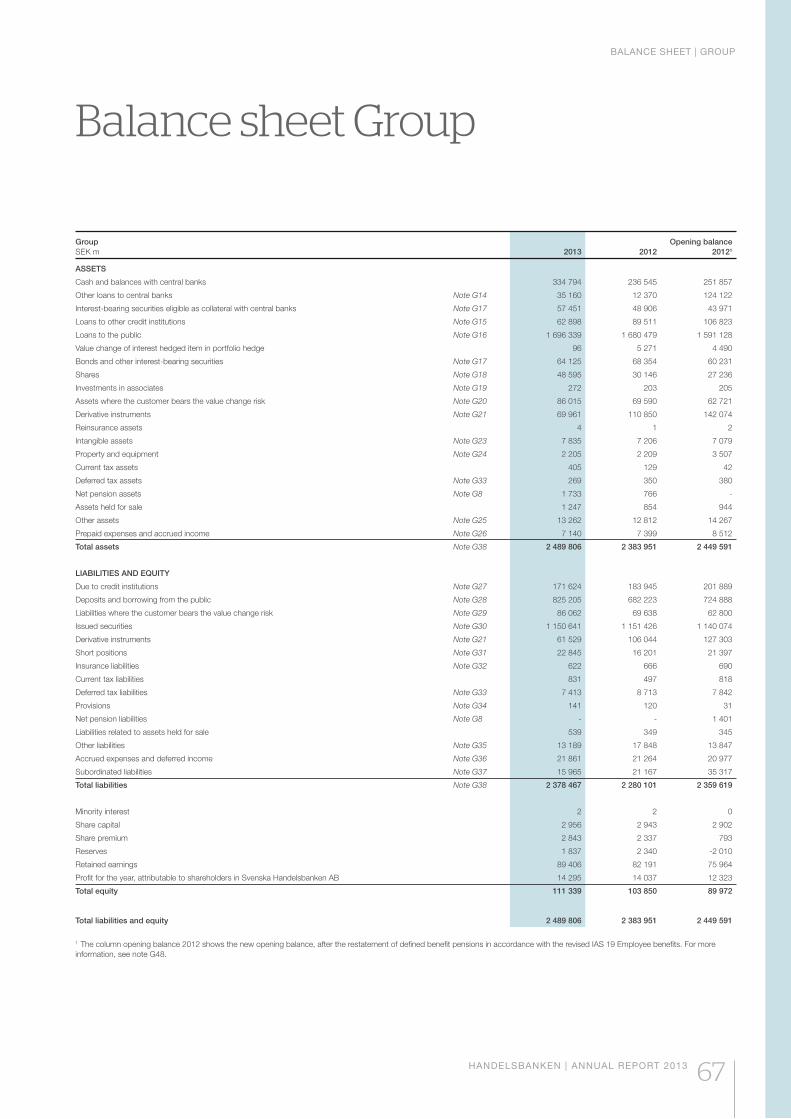
BALANCE SHEET | GROUP
HANDELSBANKEN | ANNUAL REPORT 2013 67
Balance sheet Group
Group SEK m 2013 2012
Opening balance20121
ASSETS
Cash and balances with central banks 334 794 236 545 251 857
Other loans to central banks Note G14 35 160 12 370 124 122
Interest-bearing securities eligible as collateral with central banks Note G17 57 451 48 906 43 971
Loans to other credit institutions Note G15 62 898 89 511 106 823
Loans to the public Note G16 1 696 339 1 680 479 1 591 128
Value change of interest hedged item in portfolio hedge 96 5 271 4 490
Bonds and other interest-bearing securities Note G17 64 125 68 354 60 231
Shares Note G18 48 595 30 146 27 236
Investments in associates Note G19 272 203 205
Assets where the customer bears the value change risk Note G20 86 015 69 590 62 721
Derivative instruments Note G21 69 961 110 850 142 074
Reinsurance assets 4 1 2
Intangible assets Note G23 7 835 7 206 7 079
Property and equipment Note G24 2 205 2 209 3 507
Current tax assets 405 129 42
Deferred tax assets Note G33 269 350 380
Net pension assets Note G8 1 733 766 -
Assets held for sale 1 247 854 944
Other assets Note G25 13 262 12 812 14 267
Prepaid expenses and accrued income Note G26 7 140 7 399 8 512
Total assets Note G38 2 489 806 2 383 951 2 449 591
LIABILITIES AND EQUITY
Due to credit institutions Note G27 171 624 183 945 201 889
Deposits and borrowing from the public Note G28 825 205 682 223 724 888
Liabilities where the customer bears the value change risk Note G29 86 062 69 638 62 800
Issued securities Note G30 1 150 641 1 151 426 1 140 074
Derivative instruments Note G21 61 529 106 044 127 303
Short positions Note G31 22 845 16 201 21 397
Insurance liabilities Note G32 622 666 690
Current tax liabilities 831 497 818
Deferred tax liabilities Note G33 7 413 8 713 7 842
Provisions Note G34 141 120 31
Net pension liabilities Note G8 - - 1 401
Liabilities related to assets held for sale 539 349 345
Other liabilities Note G35 13 189 17 848 13 847
Accrued expenses and deferred income Note G36 21 861 21 264 20 977
Subordinated liabilities Note G37 15 965 21 167 35 317
Total liabilities Note G38 2 378 467 2 280 101 2 359 619
Minority interest 2 2 0
Share capital 2 956 2 943 2 902
Share premium 2 843 2 337 793
Reserves 1 837 2 340 -2 010
Retained earnings 89 406 82 191 75 964
Profit for the year, attributable to shareholders in Svenska Handelsbanken AB 14 295 14 037 12 323
Total equity 111 339 103 850 89 972
Total liabilities and equity 2 489 806 2 383 951 2 449 591
1 The column opening balance 2012 shows the new opening balance, after the restatement of defined benefit pensions in accordance with the revised IAS 19 Employee benefits. For more information, see note G48.
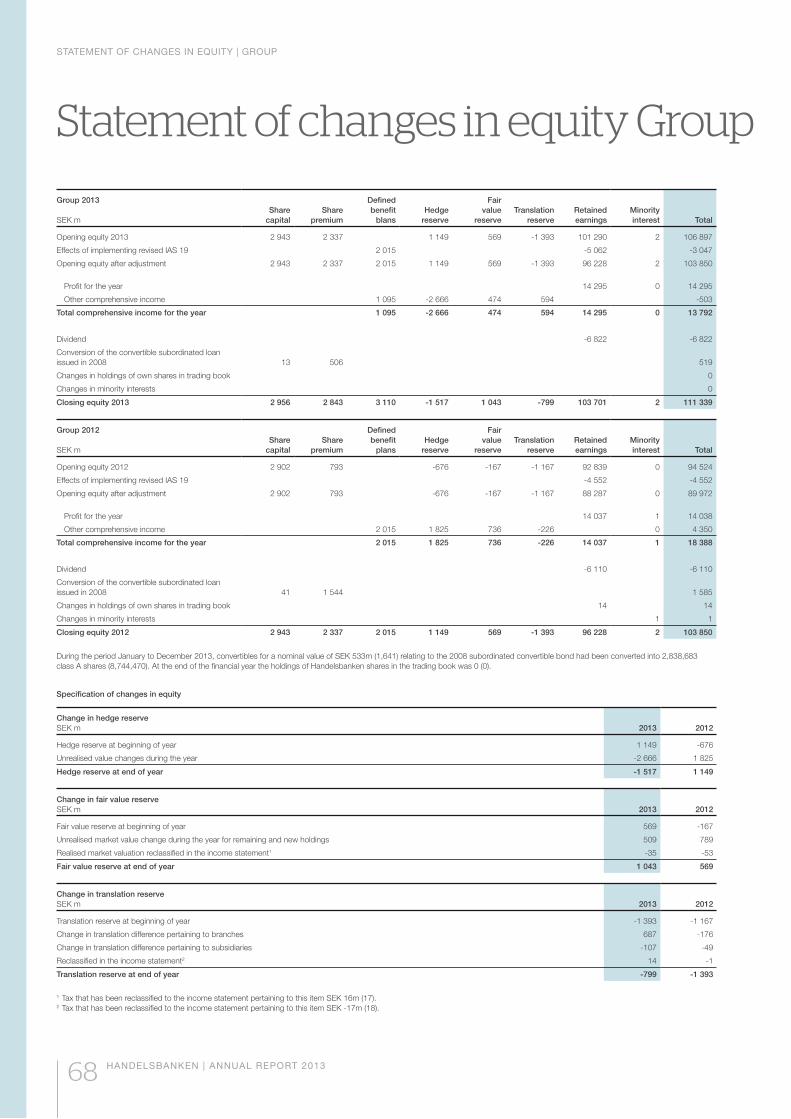
STATEMENT OF CHANGES IN EQUITY | GROUP
68 HANDELSBANKEN | ANNUAL REPORT 2013
Statement of changes in equity Group
Group 2013
SEK mShare
capitalShare
premium
Definedbenefit
blansHedge
reserve
Fair value
reserveTranslation
reserveRetainedearnings
Minorityinterest Total
Opening equity 2013 2 943 2 337 1 149 569 -1 393 101 290 2 106 897
Effects of implementing revised IAS 19 2 015 -5 062 -3 047
Opening equity after adjustment 2 943 2 337 2 015 1 149 569 -1 393 96 228 2 103 850
Profit for the year 14 295 0 14 295
Other comprehensive income 1 095 -2 666 474 594 -503
Total comprehensive income for the year 1 095 -2 666 474 594 14 295 0 13 792
Dividend -6 822 -6 822
Conversion of the convertible subordinated loan issued in 2008 13 506 519
Changes in holdings of own shares in trading book 0
Changes in minority interests 0
Closing equity 2013 2 956 2 843 3 110 -1 517 1 043 -799 103 701 2 111 339
Group 2012
SEK mShare
capitalShare
premium
Definedbenefit
plansHedge
reserve
Fair value
reserveTranslation
reserveRetainedearnings
Minorityinterest Total
Opening equity 2012 2 902 793 -676 -167 -1 167 92 839 0 94 524
Effects of implementing revised IAS 19 -4 552 -4 552
Opening equity after adjustment 2 902 793 -676 -167 -1 167 88 287 0 89 972
Profit for the year 14 037 1 14 038
Other comprehensive income 2 015 1 825 736 -226 0 4 350
Total comprehensive income for the year 2 015 1 825 736 -226 14 037 1 18 388
Dividend -6 110 -6 110
Conversion of the convertible subordinated loan issued in 2008 41 1 544 1 585
Changes in holdings of own shares in trading book 14 14
Changes in minority interests 1 1
Closing equity 2012 2 943 2 337 2 015 1 149 569 -1 393 96 228 2 103 850
During the period January to December 2013, convertibles for a nominal value of SEK 533m (1,641) relating to the 2008 subordinated convertible bond had been converted into 2,838,683 class A shares (8,744,470). At the end of the financial year the holdings of Handelsbanken shares in the trading book was 0 (0).
Specification of changes in equity
Change in hedge reserveSEK m 2013 2012
Hedge reserve at beginning of year 1 149 -676
Unrealised value changes during the year -2 666 1 825
Hedge reserve at end of year -1 517 1 149
Change in fair value reserveSEK m 2013 2012
Fair value reserve at beginning of year 569 -167
Unrealised market value change during the year for remaining and new holdings 509 789
Realised market valuation reclassified in the income statement1 -35 -53
Fair value reserve at end of year 1 043 569
Change in translation reserveSEK m 2013 2012
Translation reserve at beginning of year -1 393 -1 167
Change in translation difference pertaining to branches 687 -176
Change in translation difference pertaining to subsidiaries -107 -49
Reclassified in the income statement2 14 -1
Translation reserve at end of year -799 -1 393
1 Tax that has been reclassified to the income statement pertaining to this item SEK 16m (17).2 Tax that has been reclassified to the income statement pertaining to this item SEK -17m (18).
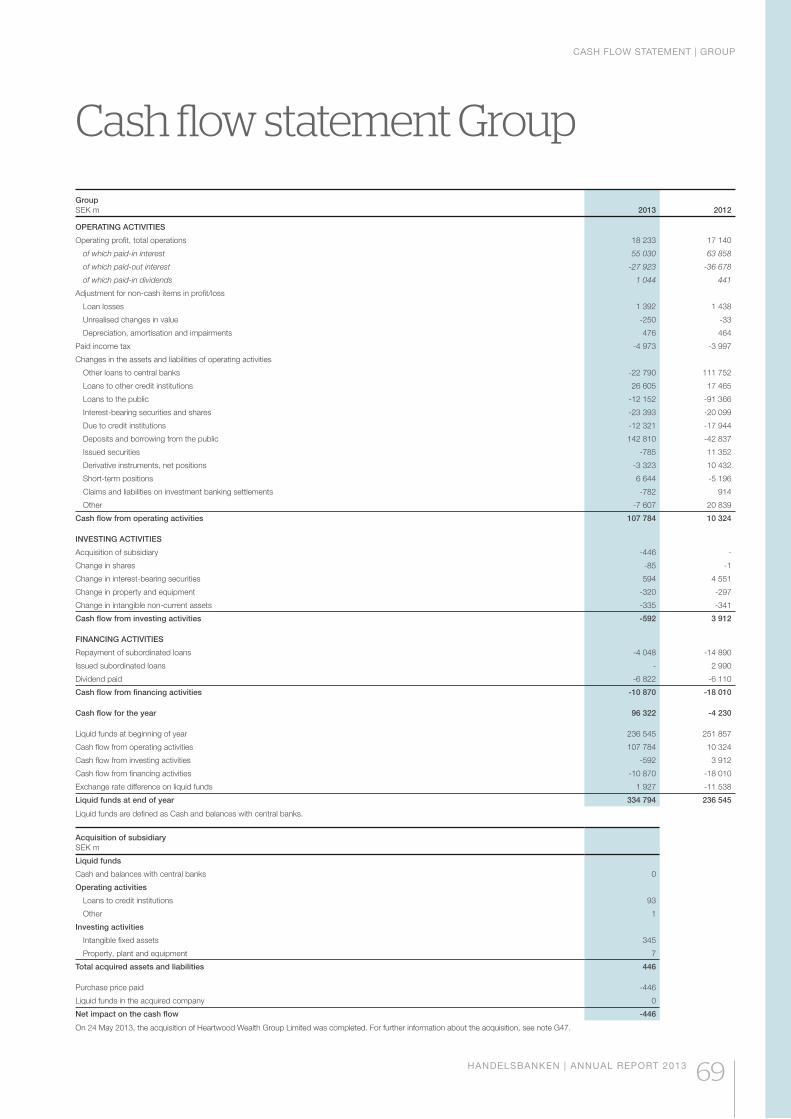
CASH FLOW STATEMENT | GROUP
HANDELSBANKEN | ANNUAL REPORT 2013 69
Cash flow statement Group
Group SEK m 2013 2012
OPERATING ACTIVITIES
Operating profit, total operations 18 233 17 140
of which paid-in interest 55 030 63 858
of which paid-out interest -27 923 -36 678
of which paid-in dividends 1 044 441
Adjustment for non-cash items in profit/loss
Loan losses 1 392 1 438
Unrealised changes in value -250 -33
Depreciation, amortisation and impairments 476 464
Paid income tax -4 973 -3 997
Changes in the assets and liabilities of operating activities
Other loans to central banks -22 790 111 752
Loans to other credit institutions 26 605 17 465
Loans to the public -12 152 -91 366
Interest-bearing securities and shares -23 393 -20 099
Due to credit institutions -12 321 -17 944
Deposits and borrowing from the public 142 810 -42 837
Issued securities -785 11 352
Derivative instruments, net positions -3 323 10 432
Short-term positions 6 644 -5 196
Claims and liabilities on investment banking settlements -782 914
Other -7 607 20 839
Cash flow from operating activities 107 784 10 324
INVESTING ACTIVITIES
Acquisition of subsidiary -446 -
Change in shares -85 -1
Change in interest-bearing securities 594 4 551
Change in property and equipment -320 -297
Change in intangible non-current assets -335 -341
Cash flow from investing activities -592 3 912
FINANCING ACTIVITIES
Repayment of subordinated loans -4 048 -14 890
Issued subordinated loans - 2 990
Dividend paid -6 822 -6 110
Cash flow from financing activities -10 870 -18 010
Cash flow for the year 96 322 -4 230
Liquid funds at beginning of year 236 545 251 857
Cash flow from operating activities 107 784 10 324
Cash flow from investing activities -592 3 912
Cash flow from financing activities -10 870 -18 010
Exchange rate difference on liquid funds 1 927 -11 538
Liquid funds at end of year 334 794 236 545
Liquid funds are defined as Cash and balances with central banks.
Acquisition of subsidiarySEK m
Liquid funds
Cash and balances with central banks 0
Operating activities
Loans to credit institutions 93
Other 1
Investing activities
Intangible fixed assets 345
Property, plant and equipment 7
Total acquired assets and liabilities 446
Purchase price paid -446
Liquid funds in the acquired company 0
Net impact on the cash flow -446
On 24 May 2013, the acquisition of Heartwood Wealth Group Limited was completed. For further information about the acquisition, see note G47.
NOTES | GROUP
70 HANDELSBANKEN | ANNUAL REPORT 2013
Notes GroupG1 Accounting policies and other basis for preparing the financial reports
1. STATEMENT OF COMPLIANCE The consolidated accounts have been prepared in accordance with international financial reporting standards (IFRSs) and interpretations of these standards as adopted by the EU. In addition, the accounting policies also follow the Annual Accounts Act for Credit Institutions and Securities Companies (1995:1559), and the regulations and general guidelines issued by the Swedish Financial Supervisory Authority, FFFS 2008:25, Annual reports in credit institutions and securities companies. RFR 1 Supplementary ac-counting rules for groups as well as statements from the Swedish Financial Reporting Board are also applied in the consolidated accounts.
The parent company’s accounting policies are shown in note P1.
Issuing and adoption of annual report The annual report and consolidated accounts were approved for issue by the Board on 4 February 2014 and will be adopted by the AGM on 26 March 2014.
2. CHANGED ACCOUNTING POLICIES ETC. On 1 January 2013, the revised IAS 19 Em-ployee benefits came into effect for application within the EU. This has led to effects on how Handelsbanken reports defined benefit pension plans since the “corridor” method for account-ing of actuarial gains and losses has been removed. In addition, the previous assumption for the return on plan assets has been replaced by an estimated yield equivalent to the discount rate for the pension liability. This impacts the calculation of the pension cost reported in the income statement. Accumulated actuarial gains and losses have been reported in the transition against retained earnings. The resulting value changes in obligations and assets are reported in other comprehensive income. This change in policy has resulted in the Group’s opening equity at the beginning of 2013 decreasing by SEK 3,047 million. The comparative figures for 2012 have been adjusted and were communi-cated in a press release on 15 April 2013. The ad-justed comparison figures are shown in note G48.
IFRS 13 Fair Value Measurement also came into effect for application in the EU on 1 Janu-ary 2013. The standard deals with common principles for fair value measurement of most of the assets and liabilities at fair value in the accounts. IFRS 13 clarifies some of the principles for measuring credit risk components in model valuation of financial instruments. In the model valuation of derivatives, the Bank already takes a conservative approach where material positive
differences between the value calculated at initial recognition and the transaction price are amortised over the life of the derivative. In ad-dition, independent valuations of the total credit risk component in outstanding mark-to-model method OTC derivatives are performed on a regular basis. Changes in credit risk are recog-nised in profit/loss to the extent that the overall effect exceeds non-recognised day-1 effects. See also section 8 and note G39. The application of IFRS 13 has not had any effect on the income statements or balance sheet. However, the new standard contains more extensive requirements for disclosures of fair value measurement. Disclosures of fair value measurement of financial instruments are provided in section 8 and note G39. According to IFRS 13, information must also be provided annually starting with the 2013 annual report regarding fair value measurement of certain non-financial items. This information is shown in note G24.
As of the 2013 financial year, new disclosures are made concerning the set-off of financial assets and liabilities, in compliance with IFRS 7, Financial instruments. See note G22 for disclo-sures which came into effect for application in the EU on 1 January 2013.
The revised IAS 1 Presentation of financial statements, which came into effect for applica-tion in the EU on 1 January 2013, has affected the Bank’s presentation of other comprehensive income since items which will later be reclassified to the income statement are reported separately from the items which are not reclassified.
In other respects, the accounting policies, classifications and calculation methods applied by the Group during the financial year agree in all essentials with the policies applied in the 2012 annual report.
Future amendments to regulations As of the 2014 financial year, IFRS 10 Conso-lidated Financial Statements, IFRS 11 Joint Arrangements and IFRS 12 Disclosures of Interest in Other Entities will come into effect for application in the EU. The new regulations mean that the current stipulations in IAS 27 and SIC 12 concerning when a company is to be consoli-dated in the consolidated annual accounts are being replaced by a number of assessment criteria for when an entity controls another entity. One of the effects of the new regulations is that fund units owned by the bank through unit-linked insurance contracts will not be included in the assessment of whether controlling influence of a mutual fund company applies. If the new regulations had applied at the end of the financial year, the balance-sheet items Assets/Liabilities where the customer bears the value change risk would have been SEK 5,085 million less. The application of the new regulations does not affect the income statement, nor is it expected to have
a significant effect on the capital adequacy. IASB is currently revising a number of existing
standards. Of these future regulatory changes, IFRS 9 Financial Instruments, which is to replace IAS 39 Financial Instruments: Recognition and Measurement, is expected to have the greatest effect on Handelsbanken’s financial reports. Since most of the work with IFRS 9 remains to be done, the Bank is refraining from estimating how the financial reports will be affected or when application of the new regulations will start.
None of the other changes in the accounting regulations issued for application are assessed to have a material impact on Handelsbanken’s financial reports, capital adequacy, large expo-sures or other circumstances according to the applicable regulatory requirements.
3. BASIS OF CONSOLIDATION AND PRESENTATION Subsidiaries All companies directly or indirectly controlled by Handelsbanken (subsidiaries) have been fully consolidated. Control is normally presumed to exist if Handelsbanken owns more than 50 per cent of the voting power at shareholders’ meet-ings or the equivalent.
Subsidiaries are consolidated according to the acquisition method. This means that the acquisi-tion of a subsidiary is regarded as a transac-tion where the Group acquires the company’s identifiable assets and assumes its liabilities and obligations. In the case of business combina-tions, an acquisition balance sheet is prepared, where identifiable assets and liabilities are valued at fair value at the time of acquisition. The cost of the business combination comprises the fair value of all assets, liabilities and issued equity instruments provided as payment for the net assets in the subsidiary. Any surplus due to the cost of the business combination exceeding the identifiable net assets on the acquisition balance sheet is recognised as goodwill in the Group’s balance sheet. The subsidiary’s financial reports are included in the consolidated accounts starting on the acquisition date until the date on which control ceases. Intra-group transactions and balances are eliminated when preparing the Group’s financial reports.
Where the accounting policies applied for an individual subsidiary do not correspond to the policies applied in the Group, an adjustment is made to the consolidated accounts when consolidating the subsidiary.
Mutual funds in which the Bank, due to unit-linked insurance agreements or in some other way, owns more than 50 per cent of the shares are consolidated in their entirety in the balance sheet under Assets/Liabilities where the customer bears the value change risk.
NOTES | GROUP
HANDELSBANKEN | ANNUAL REPORT 2013 71
Associated companies Companies in which Handelsbanken has a significant influence are reported as associates. A significant influence normally exists when the share of voting power in the company is at least 20 per cent and at most 50 per cent. Associates are reported in the consolidated accounts in accordance with the equity method. This means that the holding is initially reported at cost. The carrying amount is increased or decreased to recognise the Group’s share of the associated company’s profits or losses after the date of ac-quisition. Any dividends from associates are de-ducted from the carrying amount of the holding. Shares of the profit of associates are reported as Share of profit of associates on a separate line in the Group’s income statement.
Discontinued operations and held-for-sale assets Non-current assets or a group of assets (dispos-al group) are classified as held for sale when the carrying amount will be mainly recovered through sale and when the sale is highly probable. After classification as an asset held for sale, special valuation principles are applied. These principles essentially mean that, with the exception of items such as financial assets and liabilities, assets held for sale and disposal groups are measured at the lower of the carrying amount and fair value less costs to sell. Thus, property, plant and equipment or intangible assets held for sale are not depreciated or amortised. Any impairment losses and subsequent revaluations are recog-nised directly in the income statement. Gains are not recognised if they exceed accumulated impairment loss. Assets and liabilities held for sale are reported as a separate line item in the Group’s balance sheet until the time of sale.
Independent operations of a material nature which can be clearly differentiated from the Group’s other operations and which are clas-sified as held for sale using the above policies are recognised as discontinued operations. Subsidiaries acquired solely for resale are also recognised as discontinued operations. In recognition as a discontinued operation, the operation’s profit is reported on a separate line in the income statement, separate from other profit/loss items. Profit or loss from discontinued operations comprises the after-tax profit or loss of discontinued operations, the profit or loss after tax that arises when valuing the assets held for sale/disposal groups that are included in discon-tinued operations at fair value less costs to sell, and realised profit or loss from the disposal of discontinued operations.
4. SEGMENT REPORTING The segment reporting presents income and expenses split into business segments. A busi-ness segment is a part of the Group that runs operations which generate external or internal income and expenses and of which the profit/loss is regularly assessed and followed up by the company management as part of corporate gov-ernance. As part of segment reporting, income
and expenses are also stated per geographical area in which the Group operates. The principles for segment reporting are described further in note G44.
5. ASSETS AND LIABILITIES IN FOREIGN CURRENCIES The Group’s presentation currency is Swedish kronor. The functional currency for the Group’s operations outside Sweden usually differs from the Group’s presentation currency. The currency used in the economic environment where the operations are primarily conducted is regarded as the functional currency.
Transactions in foreign currency are translated to the functional currency on the transaction date. Monetary items and assets and liabilities at fair value are valued at the functional currency’s spot price at the end of the balance sheet date. Translation differences arising from non-mone-tary items classified as available-for-sale financial assets are recognised as a component of Other comprehensive income and accumulated in equity. Exchange rate differences arising when translating monetary items comprising part of a net investment in a foreign operation are recognised in the same way. Other exchange rate differences are recognised in the income statement.
Translation of foreign operations to the Group’s presentation currency When translating the foreign units’ (including branches’) balance sheets and income state-ments from the functional currency, the current method has been used. This means that assets and liabilities are translated at the closing day rate. Equity is translated at the rate applicable at the time of investment or earning. The income statement has been translated at the average annual rate. Exchange differences are recog-nised as a component of Other comprehensive income and are included in the translation reserve in equity.
6. RECOGNITION OF ASSETS AND LIABILITIES Purchases and sales of equities and money market and capital market instruments on the spot market are recognised on the trade date. The same applies to derivatives. Other financial assets and liabilities are normally recognised on the settlement date. Financial assets are removed from the balance sheet when the contractual rights to the cash flows originat-ing from the asset expire or when all risks and rewards related to the asset are transferred to another party. A financial liability is removed from the balance sheet when the obligation ceases or is cancelled.
When accounting for business combinations, the acquired operations are recognised in the Group’s accounts from the acquisition date. The acquisition date is the date when controlling influ-ence of the acquired entity starts. The acquisition date may differ from the date when the transac-tion is legally established.
Financial assets and liabilities are set off in the balance sheet if the Bank has a contractual right and intention to settle with a net amount. Further information about set-off of financial assets and liabilities is provided in note G22.
The policies for recognising assets and liabilities in the balance sheet are of special importance when accounting for repurchase transactions, securities loans and leases. See the separate sections on these issues below.
7. CLASSIFICATION OF FINANCIAL ASSETS AND LIABILITIES For the purposes of measurement, in compliance with IAS 39, all financial assets are placed in the following valuation categories: 1. loans and receivables 2. assets held to maturity 3. assets at fair value through profit or loss
designated at fair value through profit or loss
4. available-for-sale assets.
Financial liabilities are classified as follows: 1. liabilities at fair value through profit or loss
designated at fair value through profit or loss
2. other financial liabilities.
The classification in the balance sheet is inde-pendent of the measurement category. Thus, different measurement principles may be applied for assets and liabilities carried on the same line in the balance sheet. A classification into meas-urement categories of the financial assets and liabilities which are recognised on the balance sheet is shown in note G38.
Upon initial recognition, all financial assets and liabilities are designated at fair value. For assets and liabilities at fair value through profit or loss, the transaction costs are recognised directly in profit or loss at the time of acquisition. For other financial instruments, the transaction costs are included in the acquisition value.
Loans and receivables Unlisted interest-bearing assets are classified as Loans and receivables. Loans and receivables are carried at amortised cost, i.e. the discounted present value of all future cash flows relating to the instrument where the discount rate is the asset’s effective interest rate at the time of acquisition. Loans and receivables are subject to impairment testing when indications of an impair-ment loss are present. See section 9 for more details. The impairment loss is recognised in the income statement. Thus, loans and receiva-bles are recognised at their net amount, after deduction for probable and actual loan losses. Early redemption fees for loans and receivables which are repaid before maturity are recognised immediately in the income statement under Net gains/losses on financial transactions.
NOTES | GROUP
72 HANDELSBANKEN | ANNUAL REPORT 2013
Assets held to maturity Interest-bearing assets which the Group intends and has the capacity to hold to maturity are reported in the Assets held to maturity category. Assets that are classified to be held to maturity are carried at amortised cost. Assets held to maturity are subject to impairment testing when there are indications of an impairment loss. See section 9 for more details.
Assets and liabilities held for trading Assets and liabilities held for trading consist of listed financial instruments and derivatives. Financial instruments held for trading are recog-nised at fair value in the balance sheet. Interest, dividends and other value changes related to these instruments are recognised in the income statement under Net gains/losses on financial transactions.
Financial assets and liabilities which upon initial recognition were classified at fair value in the income statement The option of classifying financial instruments at fair value through the income statement has been applied for financial assets and liabilities that are not held for trading but for which the internal management and valuation is based on fair values (for example, assets and liabilities re-sulting from unit-linked insurance contracts). This valuation principle has also been applied to avoid inconsistencies when valuing assets and liabili-ties which are counter-positions of each other and which are managed on a portfolio basis. The option of recognising assets and liabilities at fair value in profit or loss has been applied for finan-cial instruments that are reported in the balance sheet under Interest-bearing securities eligible as collateral with central banks, Loans to the public, Bonds and other interest-bearing securities, Shares and Assets/liabilities where the customer bears the value change risk.
Changes in the fair value of financial instru-ments that are measured at fair value are repor-ted in the income statement under Net gains/losses on financial transactions. Interest related to lending which upon initial recognition was categorised at fair value in the income statement is recognised in Net interest income.
Available-for-sale financial assets The majority of the Group’s holdings of financial instruments for which there is an active market but which are not held for trading are classified as available-for-sale financial assets.
Financial assets which have been classified as available for sale are recognised at fair value in the balance sheet. Changes in market value of the assets are recognised as a component of Other comprehensive income and are included in the fair value reserve in equity. Changes in fair value are not recognised in the income statement until the asset has been realised or an impairment loss has occurred. Interest related to this category of assets is recognised directly in net interest income in the income statement. Exchange rate effects relating to monetary
assets which are available for sale are reported in Net gains/losses on financial transactions. Impairment testing of available-for-sale financial assets is performed when there is an indica-tion of impairment; see section 9 concerning impairment losses for financial assets. Dividends on shares designated as available for sale are continuously recognised in profit or loss as Other dividend income.
Reclassification of financial instruments During the financial year 2008, Handelsbanken reclassified some portfolios of interest-bearing securities. The regulations in IAS 39 only allow for reclassification of certain financial assets and only under exceptional circumstances. No further reclassification has been performed since the reclassification in 2008. The impact of the reclassification is described in note G38.
Repurchase transactions Repurchase transactions, or repo transactions, refer to agreements where the parties simulta-neously agree on the sale of specific securities and the repurchase of these securities at a pre-determined price. Securities sold in a repo transaction remain on the balance sheet during the life of the transaction. The sold instrument is also reported off the balance sheet as collateral pledged. Depending on the counterparty, pay-ment received is recognised under Due to credit institutions or as Deposits and borrowing from the public. Securities bought in a repo transac-tion are accounted for in the corresponding way, i.e. they are not recognised in the balance sheet during the life of the transaction. Depend-ing on the counterparty, the payment made is recognised under Other loans to central banks, Loans to other credit institutions or Loans to the public. Collateral received which are sold on under repurchase agreements are reported as off-balance sheet commitments.
Securities loans Lent securities remain in the balance sheet and are also reported off balance as Pledged assets. Borrowed securities are not recognised in the balance sheet unless they are sold, in which case a value corresponding to the sold instrument’s fair value is recognised as a liability. Borrowed securities which are lent to a third party are reported as off-balance sheet commitments.
Financial guarantees and loan commitments Financial guarantees are contracts that require the issuer to make specified payments to reimburse the holder for a loss incurred because a specified debtor fails to make payment when due in accordance with the terms of a debt instrument, for example a credit guarantee. The fair value of an issued guarantee is the same as the premium received when it was issued. Upon initial recognition, the premium received for the guarantee is recognised as deferred income in the balance sheet. The guarantee is subse-quently measured at the higher of the amor-tised premium or the amount that represents
the expected cost of settling the obligation to which the guarantee gives rise. In addition, the total guaranteed amount relating to guarantees issued is reported off balance as a contingent liability. A utilised guarantee is reported as a probable or actual loan loss, depending on the circumstances.
The premiums for purchased financial guar-antees are recognised as decreased interest income in net interest income if the debt instru-ment to which the guarantee refers is recognised there. Other premiums for purchased guaran-tees are recognised in Net fee and commission income.
Loan commitments are reported off-balance until the settlement date of the loan. Fees received for loan commitments are accrued in net fee and commission income over the maturity of the commitment unless it is highly probable that the commitment will be fulfilled, in which case the fee received is included in the effective interest rate of the loan.
Combined financial instruments Clearly separable financial components of assets and liabilities (such as derivatives) are normally accounted for separately in the balance sheet. This is the case, for example, for issues of equity-linked bonds and other structured products where the derivative is reported separately from the host contract at fair value in the income statement.
Combined financial instruments held for trad-ing and combined financial instruments where the economic characteristics and risks of the instrument’s various components are similar (such as variable rate lending with an interest rate cap) are not accounted for separately. The inherent value of the option to convert in issued convertible debt instruments is recognised separately in equity. The value of the equity component is determined at the time of issue as the difference between the fair value of the con-vertible instrument in its entirety reduced by the fair value of the liability component. The carrying amount of the equity component is not adjusted during the life of the convertible instrument. The liability component is recognised at fair value in the balance sheet at the time of issue. After initial recognition, the liability component is carried at amortised cost at the original effective interest rate.
8. PRINCIPLES FOR FAIR VALUE MEASUREMENT OF FINANCIAL ASSETS AND LIABILITIESFair value is defined as the price that would be received to sell an asset or paid to transfer a liability in an orderly transaction between inde-pendent market participants.
For financial instruments traded on an active market, the fair value is the same as the quoted market price. An active market is one where quoted prices are readily and regularly available from a regulated market, execution venue, reliable news service or equivalent, and where the price information received can be verified by
NOTES | GROUP
HANDELSBANKEN | ANNUAL REPORT 2013 73
means of regularly occurring transactions. The current market price is generally the same as the current bid price for financial assets or the current ask price for financial liabilities. For groups of financial instruments which are managed on the basis of the Bank’s net exposure to market risk, the current market price is presumed to be the same as the price which would be received or paid if the net position were divested.
For financial instruments where there is no reliable information about market prices, fair value is established using valuation models. The valuation models used are based on input data which essentially can be verified using market observations such as market interest rates and share prices. If necessary, an adjustment is made for other variables which a market partici-pant would be expected to take into considera-tion when setting a price. The assumptions used in the valuation are based on internally generated experience and are continuously examined by the risk organisation. The result is compared with the actual outcome so as to identify any need for adaptations of assumptions and forecasting models.
Interest-bearing securities Interest-bearing securities issued by govern-ments and Swedish mortgage bonds are valued using current market prices. Corporate bonds are valued using valuation techniques based on market yields for the corresponding maturity adjusted for credit and liquidity risk. The values are regularly examined in order to ensure that the valuation reflects the current market price. The examinations are mainly performed by obtaining prices from several independent price sources and by reconciliation with recently performed transactions in the same or equivalent instru-ments.
Shares Shares listed on an active market are valued at market price. When valuing listed shares, the choice of model is determined by what is deemed appropriate for the individual instrument.
Holdings of unlisted securities mainly consist of various types of jointly owned operations relat-ed to the Bank’s core business. In general, such holdings are valued at the Bank’s share of the company’s net asset value. For unlisted shares for which the company agreement regulates the price at which the shares can be divested, the holdings are valued at the divestment price determined in advance. In all material respects, unlisted shares are classified as available for sale. Value changes for these holdings are thus reported in other comprehensive income.
When valuing unlisted shares in private equity funds, valuation principles adopted by the European Venture Capital & Private Equity Association (EVCA) are used. In these models, the market value of the investments is derived from a relative valuation of comparable listed companies in the same sector. Adjustments are made for profit/loss items that prevent compari-son between the investment and the compared
company and the value of the investment is then determined on the basis of profit multiples such as P/E and EV/EBITA. Value changes and capital gains on holdings in private equity funds which comprise part of the investment assets in the insurance operations are not reported directly in the income statement but are included in the ba-sis for calculating the yield split in the insurance operations. See section 12 for more information.
Derivatives Derivatives which are traded on an active market are valued at market price. Most of the Group’s derivative contracts, including interest rate swaps and various types of linear currency derivatives, are valued using valuation models based on market rates and other market prices. The valuation of non-linear derivative contracts that are not actively traded is also based on a reasonable assumption of market-based input data such as volatility.
When performing model valuation for de-rivatives, in some cases there are differences between the transaction price and the value measured by a valuation model upon initial recognition. Such differences occur when the applied valuation model does not fully capture all the components that affect the value of the derivative. Material unrealised results due to positive differences between the transaction price and the value measured by a valuation model (day -1 effect) are not recognised in profit/loss upon initial recognition, but are amortised over the life of the derivative. In addition, the Bank makes an independent valuation of the total credit risk component (own credit risk as well as counterparty risk) in outstanding model-valued derivatives. Changes in fair value due to changed credit risk are recognised in profit/loss to the extent that the overall effect exceeds non-recognised day -1 effects.
Lending classified to be measured at fair value Lending that is classified to be measured at fair value through the income statement is valued at the present value of expected future cash flows. When performing the calculation the market rate is adjusted for credit risk. The credit risk premium is assumed to be the same as the original margin as long as there is no proof that the counterpar-ty’s repayment capacity has significantly deterio-rated. Information about repayment capacity is obtained from the Bank’s internal rating system. Value changes of loans at fair value are reported in net gains/losses on financial transactions.
Assets and liabilities where the customer bears the value change risk Assets where the customer bears the value change risk mainly comprise shares in unit-linked insurance contracts and mutual funds which are consolidated in the Group accounts. These shares are valued using the fund’s current market value (NAV). Each asset corresponds to a liability where the customer bears the value change risk. The valuation of these liabilities reflects the valua-
tion of the assets. Since the policyholders/share-holders have prior rights to the assets, there is no motive to adjust the valuation for credit risk.
9. LOAN LOSSES AND IMPAIRMENT OF FINANCIAL ASSETS Loans and receivables recognised at amortised cost All units with customer and credit responsibility in the Handelsbanken Group regularly perform individual assessments of the need for recognis-ing impairment losses for loans and receivables that are recognised at amortised cost. Impair-ment testing is performed where there are objec-tive circumstances indicating that the recover-able amount of the loan is less than its carrying amount. Objective evidence could, according to the circumstances, be late or non-payment, changed credit rating, or a decline in the market value of the collateral.
When performing impairment testing, the recoverable value of the loan is calculated by dis-counting the estimated future cash flows related to the loan and any collateral (including guaran-tees) by the effective interest rate of the loan. If the collateral is a listed asset, the valuation of the collateral is based on the quoted price; otherwise the valuation is based on the yield value or the market value estimated in some other manner. Collateral in the form of property mortgages is valued in the same way as repossessed real property. An impairment loss is recognised if the estimated recoverable value is less than the car-rying amount and is recognised as a Loan loss in the income statement. A reported loan loss reduces the carrying amount of the loan in the balance sheet, either directly (actual loss) or by a provision account for loan losses (probable loss).
In addition to this individual assessment of loans, a collective assessment is made of individually measured loans with the purpose of identifying the need to recognise an impairment loss that cannot yet be allocated to individual loans. The analysis is based on a distribution of individually valued loans in terms of the risk class. An impairment loss is recognised if this is justifiable taking into account changes in the risk classification and expected loss. Impairment losses which have been recognised for a group of loans are transferred to impairment losses for individual loans as soon as there is available information about the impairment in value at an individual level. A group impairment test is also performed for homogeneous groups of smaller loans with a similar risk profile.
Loan losses for the period comprise actual losses and probable losses on credits granted, minus recoveries and reversals of previous impairment losses recognised for probable loan losses. Actual loan losses may refer to entire loans or parts of loans and are recog-nised when there is no realistic possibility of recovery. This is the case, for example, when a trustee in bankruptcy has estimated bankruptcy dividends, when a scheme of arrangement has been accepted, or a concession has been ex-tended in some other way. An amount forgiven
NOTES | GROUP
74 HANDELSBANKEN | ANNUAL REPORT 2013
in connection with reconstruction of a loan or group of loans is always classified as an actual loss. If the customer is following a payment plan for a loan which was previously classified as an actual loan loss, the amount of the loss is subject to new testing. Recoveries comprise reversed amounts on loan losses previously reported as actual losses. Information about probable and actual losses is contained in note G10.
Interest rate effects arising due to discount-ing effects when the period until the expected payment is decreasing result in a reversal of previously provisioned amounts which are recog-nised as interest income in accordance with the effective interest method.
Disclosures concerning impaired loans Information concerning impaired loans is pro-vided gross, before a provision for probable loan losses, and net, after a provision for probable loan losses. Loans are defined as impaired if it is not probable that all contracted cash flows will be fulfilled. The full amount of all loans which have been classified as impaired are carried as impaired loans even if parts of the loan are covered by collateral. Loans which have been written off as actual loan losses are not included in impaired loans.
Valuation of repossessed property to protect claims Upon initial recognition, repossessed property is recognised at fair value in the balance sheet. In subsequent valuation, repossessed real property and equipment (including repossessed lease assets) which is expected to be divested in the near future is valued at the lower of the carrying amount and fair value less costs to sell. Other property taken over is reported as investment properties at fair value in profit/loss. Unlisted shareholdings taken over to protect claims are recognised as available-for-sale financial assets.
Impairment losses on available-for-sale financial assets Impairment losses on available-for-sale financial assets are recognised when there is objective evidence that one or more events of default have occurred with an impact on the expected future cash flows for the asset. For interest-bearing financial assets, examples of events of default that may indicate an impairment loss are a probable future bankruptcy, evidence of considerable financial difficulties on the part of the issuer, or evidence of permanent changes in the market where the asset is traded. For equity instruments, a permanent or consider-able decline in the fair value is an indication of the need to recognise an impairment loss. When recognising an impairment loss, the part of the cumulative loss that was previously recognised in the fair value reserve in equity is recognised in the income statement.
Previously recognised impairment losses on interest-bearing securities classified as available-for-sale financial assets are reversed in the income statement if the fair value of the asset has
increased since the impairment loss was recog-nised and the increase can be objectively related to an event occurring after the impairment loss was recognised. Previous impairment losses on equity instruments classified as available-for-sale financial instruments are not reversed.
10. HEDGE ACCOUNTING The Group applies different methods for hedge accounting, depending on the purpose of the hedge. Derivatives – mainly interest rate swaps and currency swaps – are used as hedging instruments. In addition, when hedging cur-rency risks related to net investments in foreign operations, liabilities in the functional currency of the respective foreign operation are used as a hedging instrument. As part of the Group’s hedging strategies, the value changes of a hedging instrument are sometimes divided into separate components and included in more than one hedge relationship. Therefore, one and the same hedging instrument can hedge different risks. Division of hedging instruments is only done if the hedged risks can clearly be identified, the efficiency can be reliably measured, and the total value change of the hedging instrument is included in a hedge relationship.
Fair value hedges are used to protect the Group against undesirable impact on profit/loss due to changes in the market prices of reported assets or liabilities. Hedged risks in hedging packages at fair value comprise the interest rate and currency risk on lending and funding at fixed interest rates. The hedging instruments in these hedging relationships consist of interest rate and currency swaps. In the case of fair value hedges, the hedge instrument and hedged risk are both recognised at fair value. Changes in value are recognised directly in the income statement under Net gains/losses on financial transactions. When fair value hedges are prematurely termi-nated, the accrued value change on the hedged item is amortised in Net gains/losses on financial transactions.
Fair value hedges are applied for individual assets and liabilities and for portfolios of financial instruments. The hedged risk in these portfolio hedges is the interest rate risk for lending where the original interest rate was fixed for three months and interest rate caps for lending with an original fixed-interest period of three months. The hedging instruments for these portfolio hedges are interest rate swaps and interest rate options (caps). In portfolio hedges at fair value, the part of the portfolio’s value that is exposed to the hedged risk is measured at market value. The value of the hedged item in hedged portfolios is reported as a separate line item in the balance sheet in conjunction with Loans to the public. Accumulated value changes on portfolio hedges which have been terminated prematurily are reported in the balance sheet under Other as-sets and are amortised in Net gains/losses on financial transactions over the remaining time to maturity of the portfolio.
Cash flow hedges are applied to manage exposures to variations in cash flows relating to
changes in the floating interest rates on lending and funding. The expected maturity for this type of lending and funding is normally much longer than the fixing period, which is very short. Cash flow hedging is also used to hedge currency risk in future cash flows deriving from fixed-rate funding. Interest rate swaps which are hedging instruments in cash flow hedges are measured at fair value. If the swap’s value change is effec-tive – that is, it corresponds to future cash flows related to the hedged item – it is recognised as a component of Other comprehensive income and in the hedge reserve in equity. Ineffective compo-nents of the swap’s value change are recognised in the income statement under Net gains/losses on financial transactions.
Hedging of net investments in foreign units is applied to protect the Group from exchange rate differences due to operations abroad. Currency swaps and loans in foreign currencies are used as hedging instruments. The hedged item in these hedges is made up of net investments in the form of direct investments, as well as claims on foreign operations that are not expected to be settled in the foreseeable future. Loans in foreign currency that hedge net investments in foreign operations are recognised in the Group at the exchange rate on the balance sheet date. The effective part of the exchange rate differences for such loans is recognised as a component of Other comprehensive income and in the translation reserve in equity. The effective part of changes in value in currency swaps that hedge exchange rate risk in claims on foreign operations is recognised in the same manner. The ineffective components of hedges of net investments in foreign operations are recognised in the income statement under Net gains/losses on financial transactions.
11. LEASES The Group’s leases are defined as either finance or operating leases. A finance lease substantially transfers all the risks and rewards incidental to legal ownership of the leased asset from the lessor to the lessee. Other leases are operating leases. All leases where the Group is the lessor have been defined as financial leases. Lease agreements of this kind are accounted for as loans in the balance sheet, initially for an amount corresponding to the net investment. Lease fees received are recognised on a continual basis as interest income/repayments. Impairment testing on financial lease agreements is performed according to the same principles as for other lending which is reported at amortised cost.
Operating lease contracts are not reported in the balance sheet. Expenses relating to operating leases where the Group is the lessee are recognised on a straight-line basis as other expenses.
12. INSURANCE OPERATIONS The Group’s insurance operations are run through the subsidiary Handelsbanken Liv. Products consist mainly of legal life insurance in the form of traditional life insurance, unit-linked
NOTES | GROUP
HANDELSBANKEN | ANNUAL REPORT 2013 75
insurance and risk insurance in the form of health insurance and waiver of premium.
Classification and unbundling of insurance contracts Contracts that include significant insurance risk are classified in the consolidated accounts as insurance contracts. Contracts that do not transfer significant insurance risk are classified in their entirety as investment contracts. Generally, this means that insurance policies with repay-ment cover are classified as investment contracts and other contracts are classified as insurance contracts. Insurance contracts consisting of both insurance components and savings (financial components) are split and recognised separately in accordance with the principles described below.
Accounting for insurance components in insurance contracts Premium income and insurance claims paid for insurance contracts are recognised in the income statement as a net amount under the item Risk result – insurance. The change in the Group’s insurance liability is also reported under this item.
Premiums received which have not yet been recognised as income are carried as a liability for paid-in premiums under Insurance liabilities in the balance sheet. The balance-sheet item Insurance liabilities also includes liabilities for sickness annuities, life annuities and other out-standing claims. The insurance liability is valued by discounting the expected future cash flows relating to insurance contracts entered into. The valuation is based on assumptions concerning interest, longevity, health and future charges. The assumptions concerning longevity vary depending on when the policy was taken out and takes into account expected future increases in longevity. The assumptions concerning fees also depend on when the policy was taken out. Prin-cipally, this means a fee that is proportional to the premium and a fee that is proportional to the life insurance provisions. Applied assumptions on the insured’s future health are based on internally acquired experience and vary depending on the product. Interest rate assumptions are based on current market rates and depend on the maturity of the liability. The Group’s insurance liabilities are subject to regular review, at least annually, to ensure that the reported insurance liability is sufficient to cover expected future claims. If necessary, an additional provision is made. The difference is recognised in the income statement.
Accounting for investment contracts and financial components of insurance contracts In-payments and out-payments referring to cus-tomers’ savings capital originating in investment contracts and financial components of insurance contracts are recognised directly over the bal-ance sheet as deposits and withdrawals.
The financial components of traditional life insurance policies that are separated from the insurance contract are recognised in the balance sheet as borrowing from the public. These liabili-
ties are valued at the higher of the guaranteed amount and the current value of the insurance contract. The guaranteed amount earns interest at the guarantee rate of interest and corresponds to the amortised cost of the insurance contract. The current value of the insurance contract is equal to the value of the assets managed on behalf of the policyholders, and earns interest with a return that is based on the total return for the assets with a deduction for any yield split. The yield split implies that the insurer is allocated a contracted part of the total return if this return exceeds the guaranteed return during the calen-dar year. The calculation is performed annually and is accumulated for each individual insurance contract. This means that the conditional bonus is reduced in those cases where the yield in an individual year is less than the guaranteed inter-est rate and vice versa. The share that accrues to the Group under the yield split model is reported as Fee and commission income. If the yield is less than the guaranteed yield per contract, the difference is recognised in the income statement under Net gains/losses on financial transactions.
Assets and liabilities arising from unit-linked in-surance contracts are recognised at fair value in the balance sheet as Assets and Liabilities where the customer bears the value change risk.
Premium fees and administrative charges for investment contracts and financial compo-nents of insurance contracts are accrued and recognised in the income statement under Fee and commission income. Acquisition costs are recognised directly in the income statement.
Reinsurance The reinsurer’s share of the Group’s insurance liabilities is recognised as Reinsurance assets in the balance sheet.
13. INTANGIBLE ASSETS Recognition in the balance sheet An intangible asset is an identifiable non-mon-etary asset without physical form. An intangible asset is only recognised in the balance sheet if the probable future economic benefits attribut-able to the asset will flow to the Group and the cost can be reliably measured. This means that internally generated values in the form of goodwill, trademarks, customer databases and similar are not recognised as assets in the bal-ance sheet.
Investments in software developed by the Bank are carried as an expense on a current basis to the extent that the expenditure refers to maintenance of existing business operations or software. In the case of development of new software, or developing existing software for new business operations, the expenditure incurred is capitalised from the time when it is probable that economic benefit that can be reliably measured will arise. Expenditure arising from borrowing costs is capitalised from the date on which the decision was made to capitalise expenditure for development of intangible assets.
When accounting for business combinations, the acquisition price is allocated to the value of
acquired identifiable assets, liabilities and con-tingent liabilities in the acquired business. These assets may also include intangible assets that would not have been recognised in the balance sheet if they had been acquired separately or internally generated. The part of the acquisition price in a business combination that cannot be allocated to identifiable assets and liabilities is recognised as goodwill.
Goodwill and intangible assets with an indefinite useful life Goodwill and other intangible assets with an indefinite useful life are recorded at cost less possible impairment losses. These assets are tested annually for impairment when preparing the annual report or when there is an indication that the asset is impaired. Impairment testing is performed by calculating the recoverable amount of the assets, i.e. the higher of the value in use and the fair value less costs to sell. As long as the recoverable amount exceeds the carrying amount, no impairment loss needs to be recog-nised. Impairment losses are recognised directly in the income statement.
Since it is not possible to differentiate cash flows arising from goodwill from cash flows arising from other assets, impairment testing of goodwill takes place at the level of cash-generating unit. A cash-generating unit is the smallest identifiable group of assets that gener-ates cash inflows that are largely independent of the cash inflows from other assets or groups of assets. Goodwill which is followed up internally at a higher level than the cash-generating unit is tested at the higher level but never lower than the business segment level. Material assess-ments and assumptions in impairment testing of goodwill are described in note G23. Previously recognised goodwill impairment losses are not reversed.
Intangible assets with a finite useful life Intangible assets for which it is possible to establish an estimated useful life are amortised. Currently this means that customer contracts are amortised over 20 years and that internally developed software is amortised over five years. Brand names which are subject to amortisation are amortised over five years. The amortisation is on a straight-line basis over the useful life of the asset. The amortisation period is tested on an in-dividual basis at the time of new acquisition and also continually if there are indications that the useful life may have changed. Intangible assets with a finite useful life are tested for impairment when there is an indication that the asset may be impaired. The impairment test is performed according to the same principles as for intangible assets with an indefinite useful life, i.e. by calcu-lating the recoverable amount of the asset.
14. PROPERTY AND EQUIPMENT The Group’s tangible non-current assets consist of property and equipment. With the exception of real property that constitutes investment as-sets in the insurance business, and repossessed
NOTES | GROUP
76 HANDELSBANKEN | ANNUAL REPORT 2013
properties to protect claims, these assets are recorded at cost of acquisition less accumulated depreciation and impairment losses.
Depreciation is based on the estimated useful lives of the assets. A linear depreciation plan is usually applied. The estimated useful lives are tested annually. The tangible assets that consist of components with different estimated useful lives are sub-divided into different categories with separate depreciation plans. Such deprecia-tion of components is normally only applied for real property. Only components of the property whose acquisition costs are substantial in rela-tion to the total acquisition cost are separately depreciated. The remaining parts of the real property (building structure) are depreciated as a whole over their expected useful life. Currently, the useful life for the building structure is 100 years, for water and drains 35 years, for roofs 30 years, for frontage, heating, ventilation and electricity 25 years, for lifts 20 years and for building fixtures and fittings ten years. Personal computers and other IT equipment are usually depreciated over three years and investments in bank vaults and similar investments in premises over ten years. Other equipment is normally depreciated over five years.
Impairment testing of property and equipment is carried out when there is an indication that the value of the asset has decreased. Impairment loss is recognised in cases where the recovera-ble amount is less than the carrying amount. Any impairment losses are recognised immediately in the income statement. An impairment charge is reversed if there is an indication that there is no longer any impairment loss and there has been a change in the assumptions underlying the estimated recoverable amount.
15. PROVISIONS Provisions consist of recognised expected nega-tive outflows of resources from the Group and which are uncertain in terms of timing or amount. Provisions are reported when the Group, as a consequence of past events, has a legal or constructive obligation, and it is probable that an outflow of resources will be required to settle the obligation. For recognition it must be possible to estimate the amount reliably. The amount recognised as a provision corresponds to the best estimate of the expenditure required to set-tle the obligation at the balance sheet date. The expected future date of the settlement is taken into account in the estimate.
16. EQUITY Equity comprises the following components.
Share premium reserve The share premium reserve comprises the op-tions component of issued convertible notes and the amount that in the issue of shares and con-version of convertible debt securities exceeds the quotient value of the shares issued.
Hedge reserve Unrealised changes in value on derivative instruments which comprise hedge instruments in cash flow hedges are reported in the hedge reserve.
Fair value reserve The fair value reserve comprises unrealised changes in value on financial assets classified as available for sale.
Translation reserve The translation reserve comprises unrealised for-eign exchange effects arising due to translation of foreign units to the currency of the consoli-dated accounts.
Defined benefit pension plansRevaluations of the pension obligations and pension assets are reported in the item Defined benefit pension plans.
Retained earnings Retained earnings comprise the profits gener-ated from the current and previous financial years. Dividends and repurchase of own shares are reported as deductions from Retained earn-ings.
Minority interest The minority interest consists of the portion of the Group’s net assets that is not directly or indi-rectly owned by holders of the parent company’s ordinary shares. The minority interest is recorded as a separate component of equity.
Accounting for own shares Repurchased own shares are not carried as assets but are offset against Retained earnings under Equity.
17. INCOME Income is recognised in the income statement when it is probable that future economic benefits will be gained and these benefits can be reliably measured. The following general principles apply to recognition of income for various types of fees and charges:
are performed, such as management fees in asset management, are recognised as income at the rate these services are delivered. In practice, these are on a straight-line basis.
are recognised as income when the service has been performed. Examples of such fees are brokerage and payment commission.
interest of a financial instrument are accrued in cases where the instrument is valued at am-ortised cost in accordance with the effective interest method. For financial instruments at fair value, such fees are recognised as income immediately.
Net interest income Interest income and interest expense are recognised as Net interest income in the income statement, with the exception of interest flows deriving from financial instruments held for trad-ing. Net interest income also includes interest deriving from derivative instruments that hedge items whose interest flows are recognised in Net interest income. In addition to interest income and interest expense, net interest income in-cludes fees for state guarantees, such as deposit guarantees and the stability fee.
In order to arrive at a net interest income figure which is free from interest deriving from financial assets and liabilities held for trading and to gain an overall view of the activity in the trading book, interest income and interest expense relating to financial assets and liabilities held for trading is recognised under Net gains/losses on financial transactions.
Net fee and commission income Income and expense for various kinds of services are recognised in the income statement under Fee and commission income and Fee and com-mission expense, respectively. This means that brokerage income and various types of manage-ment fees are recognised as commissions. Other forms of income recognised as commission are payment commissions and card fees, premiums referring to financial guarantees issued, as well as commissions from insurance operations. Positive yield split in the insurance operations is also recognised as commission. Guarantee commissions that are comparable to interest and such fees that constitute integrated components of financial instruments and therefore included when calculating the effective interest, are recog-nised as interest income and not commission.
Net gains/losses on financial transactions Net gains/losses on financial transactions include all items with an impact on profit or loss which arise when measuring financial assets and liabilities at fair value in the income statement and when financial assets and liabilities are realised. Specifically, the items reported here are:
settlement of financial assets and liabilities
liabilities which upon initial recognition were classified as Assets at fair value, through the income statement, excluding the component of change in value recognised as interest
financial assets and liabilities classified as held for trading
trading, with the exception of interest originat-ing from derivatives that are hedging instru-ments whose interest flows are reported in Net interest income
as held for trading
NOTES | GROUP
HANDELSBANKEN | ANNUAL REPORT 2013 77
risk in assets and liabilities which are hedged items in fair value hedges, and amortisation of unrealised value changes for hedges which have been prematurely terminated
comprise hedging instruments in fair value hedges
derivatives which comprise hedging instru-ments in cash flow hedges
hedging instruments which are hedging net investments in foreign operations
-tions, i.e. the losses arising when the yield on financial assets in the insurance business is less than the change in guaranteed yield.
Dividend received Dividends on shares classified as available for sale are recognised in profit and loss as Other dividend income. Dividends on shares classified as financial assets held for trading are recognised in the income statement as Net gains/losses on financial transactions. Dividends on shares in associates are not included in the Dividends item in the income statement. The accounting for shares in the profits of associates is described in section 3.
18. EMPLOYEE BENEFITS Staff costs Staff costs consist of salaries, pension costs and other forms of direct staff costs including social security costs, special payroll tax on pension costs and other forms of payroll overheads. Any remuneration in connection with terminated employment is recognised as a liability when the agreement is reached and amortised over the remaining employment period.
Accounting for pensions Post-employment benefits consist of defined contribution plans and defined benefit plans. Benefit plans under which the Group pays fixed contributions into a separate legal entity, and subsequently has no legal or constructive obligation to pay further contributions if the legal entity does not hold sufficient assets to fulfil its obligations to the employee, are accounted for as defined contribution plans. Premiums paid for defined contribution plans are recognised in the income statement as staff costs as they arise.
Other post-employment benefit plans are accounted for as defined benefit plans.
For defined benefit pension plans, the pen-sion payable is based on the salary and period of employment, implying that the employer bears all the material risks for fulfilling the pen-sion commitment. For the majority of defined benefit plans, the Group has kept plan assets separate in pension foundations and a pension fund. For defined benefit plans, the plan as-
sets minus the defined benefit obligations are reported as a net asset in the balance sheet. Actuarial gains and losses on the pension obli-gation and return which exceeds the calculated return on the plan assets are reported in other comprehensive income.
The pension cost recognised for defined benefit plans is the net of the following items, which are included in staff costs: + Accrued pension rights for the year, i.e. the
year’s proportion of the calculated final total pension payment. The calculation of accrued pension rights is based on an estimated final salary and is subject to actuarial assumptions.
+ Interest expense for the year due to the increase in the present value of the pension liability during the year since the period up to payment has decreased. The interest rate applied in calculating interest expense for the year is the current corporate bond rate (the rate at the start of the year) for maturities cor-responding to the period remaining until the pension liability is due to be disbursed.
- Estimated yield (interest) on the plan assets. Interest on the plan assets is reported in profit/loss using the same interest rate as when establishing the year’s interest expense.
+ The estimated cost of special payroll tax is accrued using the same principles as for the underlying pension cost.
Calculation of costs and obligations resulting from the Group’s defined benefit plans depend on several assessments and assumptions which may have a considerable impact on the amounts reported. A more detailed description of these assumptions and assessments is provided in section 20 and in note G8.
19. TAXES The tax expense for the period consists of current tax and deferred tax. Current tax refers to taxes relating to the period’s taxable result. Deferred tax is tax referring to temporary differ-ences between the carrying amount of an asset or liability and its taxable value. Deferred taxes are valued at the tax rate which is deemed to be applicable when the item is realised. Deferred tax claims related to deductible temporary differenc-es and loss carry forwards are only recognised if it is probable that they will be utilised. Deferred tax liabilities are carried at nominal value.
Tax is recognised in the income statement or in other comprehensive income depending on where the underlying transaction is reported.
20. ESTIMATES AND KEY ASSUMPTIONS In certain cases, the application of the Group’s accounting policies means that assessments must be made that have a material impact on amounts reported. The amounts reported are also affected in a number of cases by assump-tions about the future. Such assumptions always imply a risk for adjustment of the reported value of assets and liabilities. The assessments and
assumptions applied always reflect the manage-ment’s best and fairest assessments and are continually subject to examination and validation. Below follows a report of the assessments and assumptions that have had a material impact on the financial reports. Information on key assump-tions is also described in the relevant notes.
Actuarial calculation of defined benefit pension plans Calculation of the Group’s expense and obliga-tions for defined benefit pensions is based on a number of actuarial, demographic and financial assumptions that have a significant impact on the recognised amounts. Note G8 contains a list of the assumptions used when calculating this year’s provision. The calculation of defined bene-fit obligations for employees in Sweden is based on DUS06, which are assumptions on longevity that are generally accepted in the market, based on statistics produced by Insurance Sweden. The assumptions on future salary increases and inflation are based on the anticipated long-term trend. The discount rate is based on first-class corporate bonds. In this context, covered mortgage bonds are considered to be corporate bonds. The maturity is the same as the remain-ing period to payment.
Note G8 provides a sensitivity analysis of the Group’s defined benefit obligation for all major actuarial assumptions. This shows how the obli-gation would have been affected by reasonable possible changes in these assumptions.
Assessment of need to recognise an impairment loss for loans and receivables The value of the Group’s loans is tested regularly and individually for each loan. If necessary, the loan is written down to the assessed recoverable amount. The estimated recoverable amount is based on an assessment of the counterparty’s financial repayment capacity and assumptions on the realisable value of any collateral. The final outcome may deviate from the original provisions for loan losses. The assessments and assump-tions used are subject to regular examinations by the internal credit organisation. See also note G2 for a detailed description of internal risk control and how the Bank manages credit risk.
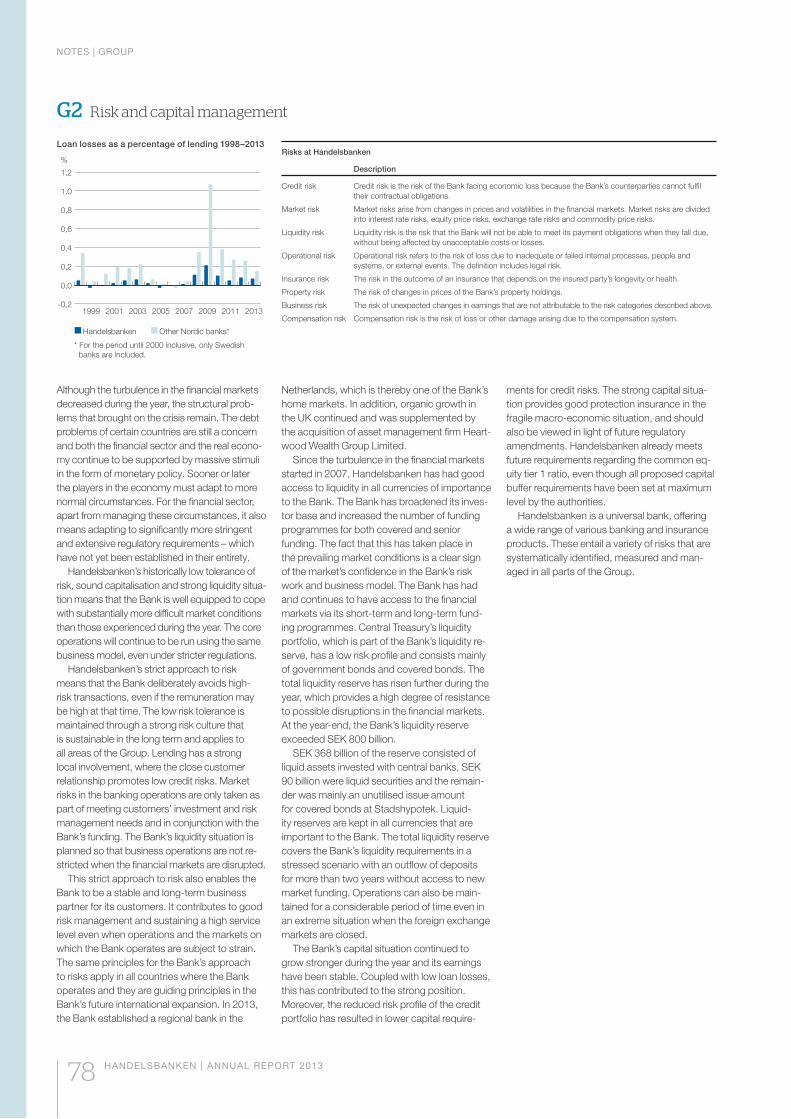
NOTES | GROUP
78 HANDELSBANKEN | ANNUAL REPORT 2013
G2 Risk and capital management
Loan losses as a percentage of lending 1998–2013Risks at Handelsbanken
Description
Credit risk Credit risk is the risk of the Bank facing economic loss because the Bank’s counterparties cannot fulfil their contractual obligations.
Market risk Market risks arise from changes in prices and volatilities in the financial markets. Market risks are divided into interest rate risks, equity price risks, exchange rate risks and commodity price risks.
Liquidity risk Liquidity risk is the risk that the Bank will not be able to meet its payment obligations when they fall due, without being affected by unacceptable costs or losses.
Operational risk Operational risk refers to the risk of loss due to inadequate or failed internal processes, people and systems, or external events. The definition includes legal risk.
Insurance risk The risk in the outcome of an insurance that depends on the insured party’s longevity or health.
Property risk The risk of changes in prices of the Bank’s property holdings.
Business risk The risk of unexpected changes in earnings that are not attributable to the risk categories described above.
Compensation risk Compensation risk is the risk of loss or other damage arising due to the compensation system.
Although the turbulence in the financial markets decreased during the year, the structural prob-lems that brought on the crisis remain. The debt problems of certain countries are still a concern and both the financial sector and the real econo-my continue to be supported by massive stimuli in the form of monetary policy. Sooner or later the players in the economy must adapt to more normal circumstances. For the financial sector, apart from managing these circumstances, it also means adapting to significantly more stringent and extensive regulatory requirements – which have not yet been established in their entirety.
Handelsbanken’s historically low tolerance of risk, sound capitalisation and strong liquidity situa-tion means that the Bank is well equipped to cope with substantially more difficult market conditions than those experienced during the year. The core operations will continue to be run using the same business model, even under stricter regulations.
Handelsbanken’s strict approach to risk means that the Bank deliberately avoids high-risk transactions, even if the remuneration may be high at that time. The low risk tolerance is maintained through a strong risk culture that is sustainable in the long term and applies to all areas of the Group. Lending has a strong local involvement, where the close customer relationship promotes low credit risks. Market risks in the banking operations are only taken as part of meeting customers’ investment and risk management needs and in conjunction with the Bank’s funding. The Bank’s liquidity situation is planned so that business operations are not re-stricted when the financial markets are disrupted.
This strict approach to risk also enables the Bank to be a stable and long-term business partner for its customers. It contributes to good risk management and sustaining a high service level even when operations and the markets on which the Bank operates are subject to strain. The same principles for the Bank’s approach to risks apply in all countries where the Bank operates and they are guiding principles in the Bank’s future international expansion. In 2013, the Bank established a regional bank in the
Netherlands, which is thereby one of the Bank’s home markets. In addition, organic growth in the UK continued and was supplemented by the acquisition of asset management firm Heart-wood Wealth Group Limited.
Since the turbulence in the financial markets started in 2007, Handelsbanken has had good access to liquidity in all currencies of importance to the Bank. The Bank has broadened its inves-tor base and increased the number of funding programmes for both covered and senior funding. The fact that this has taken place in the prevailing market conditions is a clear sign of the market’s confidence in the Bank’s risk work and business model. The Bank has had and continues to have access to the financial markets via its short-term and long-term fund-ing programmes. Central Treasury’s liquidity portfolio, which is part of the Bank’s liquidity re-serve, has a low risk profile and consists mainly of government bonds and covered bonds. The total liquidity reserve has risen further during the year, which provides a high degree of resistance to possible disruptions in the financial markets. At the year-end, the Bank’s liquidity reserve exceeded SEK 800 billion.
SEK 368 billion of the reserve consisted of liquid assets invested with central banks, SEK 90 billion were liquid securities and the remain-der was mainly an unutilised issue amount for covered bonds at Stadshypotek. Liquid-ity reserves are kept in all currencies that are important to the Bank. The total liquidity reserve covers the Bank’s liquidity requirements in a stressed scenario with an outflow of deposits for more than two years without access to new market funding. Operations can also be main-tained for a considerable period of time even in an extreme situation when the foreign exchange markets are closed.
The Bank’s capital situation continued to grow stronger during the year and its earnings have been stable. Coupled with low loan losses, this has contributed to the strong position. Moreover, the reduced risk profile of the credit portfolio has resulted in lower capital require-
ments for credit risks. The strong capital situa-tion provides good protection insurance in the fragile macro-economic situation, and should also be viewed in light of future regulatory amendments. Handelsbanken already meets future requirements regarding the common eq-uity tier 1 ratio, even though all proposed capital buffer requirements have been set at maximum level by the authorities.
Handelsbanken is a universal bank, offering a wide range of various banking and insurance products. These entail a variety of risks that are systematically identified, measured and man-aged in all parts of the Group.
-0,2
0,0
0,2
0,4
0,6
0,8
1,0
1,2
20132011200920072005200320011999
%
Handelsbanken Other Nordic banks*
* For the period until 2000 inclusive, only Swedish banks are included.
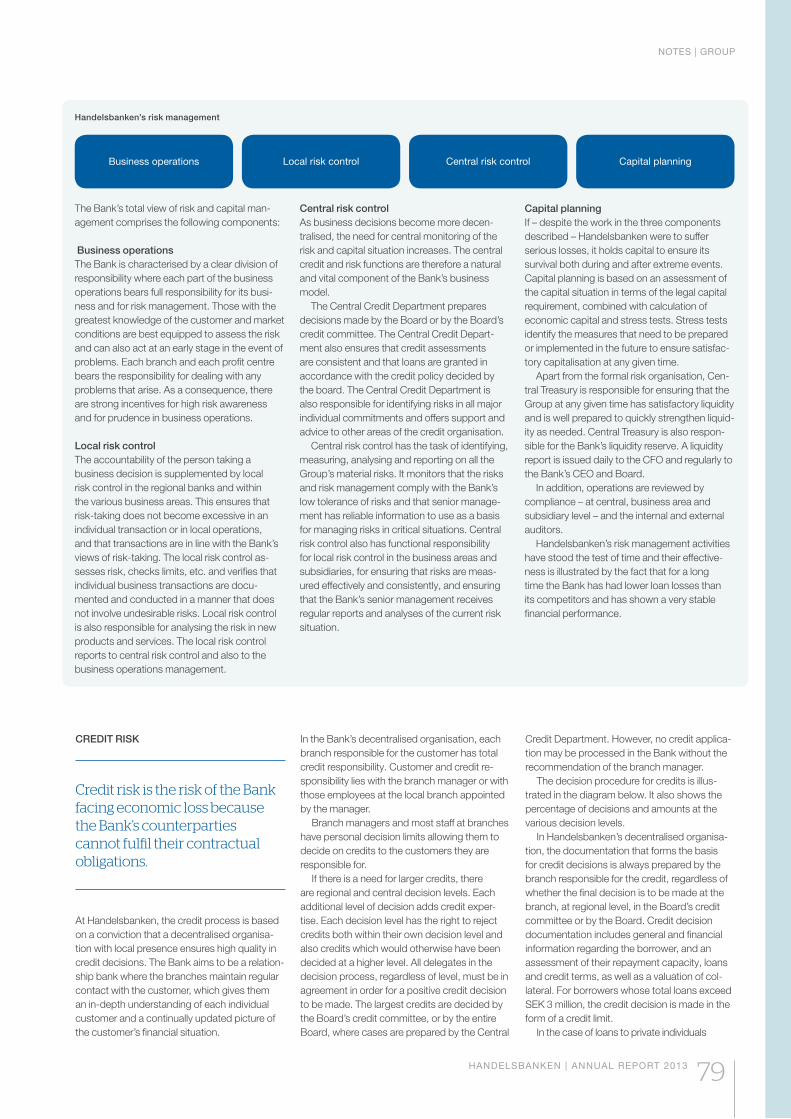
NOTES | GROUP
HANDELSBANKEN | ANNUAL REPORT 2013 79
The Bank’s total view of risk and capital man-agement comprises the following components:
Business operations The Bank is characterised by a clear division of responsibility where each part of the business operations bears full responsibility for its busi-ness and for risk management. Those with the greatest knowledge of the customer and market conditions are best equipped to assess the risk and can also act at an early stage in the event of problems. Each branch and each profit centre bears the responsibility for dealing with any problems that arise. As a consequence, there are strong incentives for high risk awareness and for prudence in business operations.
Local risk controlThe accountability of the person taking a business decision is supplemented by local risk control in the regional banks and within the various business areas. This ensures that risk-taking does not become excessive in an individual transaction or in local operations, and that transactions are in line with the Bank’s views of risk-taking. The local risk control as-sesses risk, checks limits, etc. and verifies that individual business transactions are docu-mented and conducted in a manner that does not involve undesirable risks. Local risk control is also responsible for analysing the risk in new products and services. The local risk control reports to central risk control and also to the business operations management.
Central risk control As business decisions become more decen-tralised, the need for central monitoring of the risk and capital situation increases. The central credit and risk functions are therefore a natural and vital component of the Bank’s business model.
The Central Credit Department prepares decisions made by the Board or by the Board’s credit committee. The Central Credit Depart-ment also ensures that credit assessments are consistent and that loans are granted in accordance with the credit policy decided by the board. The Central Credit Department is also responsible for identifying risks in all major individual commitments and offers support and advice to other areas of the credit organisation.
Central risk control has the task of identifying, measuring, analysing and reporting on all the Group’s material risks. It monitors that the risks and risk management comply with the Bank’s low tolerance of risks and that senior manage-ment has reliable information to use as a basis for managing risks in critical situations. Central risk control also has functional responsibility for local risk control in the business areas and subsidiaries, for ensuring that risks are meas-ured effectively and consistently, and ensuring that the Bank’s senior management receives regular reports and analyses of the current risk situation.
Capital planningIf – despite the work in the three components described – Handelsbanken were to suffer serious losses, it holds capital to ensure its survival both during and after extreme events. Capital planning is based on an assessment of the capital situation in terms of the legal capital requirement, combined with calculation of economic capital and stress tests. Stress tests identify the measures that need to be prepared or implemented in the future to ensure satisfac-tory capitalisation at any given time.
Apart from the formal risk organisation, Cen-tral Treasury is responsible for ensuring that the Group at any given time has satisfactory liquidity and is well prepared to quickly strengthen liquid-ity as needed. Central Treasury is also respon-sible for the Bank’s liquidity reserve. A liquidity report is issued daily to the CFO and regularly to the Bank’s CEO and Board.
In addition, operations are reviewed by compliance – at central, business area and subsidiary level – and the internal and external auditors.
Handelsbanken’s risk management activities have stood the test of time and their effective-ness is illustrated by the fact that for a long time the Bank has had lower loan losses than its competitors and has shown a very stable financial performance.
Handelsbanken’s risk management
Business operations Local risk control Central risk control Capital planning
CREDIT RISK
Credit risk is the risk of the Bank facing economic loss because the Bank’s counterparties cannot fulfil their contractual obligations.
At Handelsbanken, the credit process is based on a conviction that a decentralised organisa-tion with local presence ensures high quality in credit decisions. The Bank aims to be a relation-ship bank where the branches maintain regular contact with the customer, which gives them an in-depth understanding of each individual customer and a continually updated picture of the customer’s financial situation.
In the Bank’s decentralised organisation, each branch responsible for the customer has total credit responsibility. Customer and credit re-sponsibility lies with the branch manager or with those employees at the local branch appointed by the manager.
Branch managers and most staff at branches have personal decision limits allowing them to decide on credits to the customers they are responsible for.
If there is a need for larger credits, there are regional and central decision levels. Each additional level of decision adds credit exper-tise. Each decision level has the right to reject credits both within their own decision level and also credits which would otherwise have been decided at a higher level. All delegates in the decision process, regardless of level, must be in agreement in order for a positive credit decision to be made. The largest credits are decided by the Board’s credit committee, or by the entire Board, where cases are prepared by the Central
Credit Department. However, no credit applica-tion may be processed in the Bank without the recommendation of the branch manager.
The decision procedure for credits is illus-trated in the diagram below. It also shows the percentage of decisions and amounts at the various decision levels.
In Handelsbanken’s decentralised organisa-tion, the documentation that forms the basis for credit decisions is always prepared by the branch responsible for the credit, regardless of whether the final decision is to be made at the branch, at regional level, in the Board’s credit committee or by the Board. Credit decision documentation includes general and financial information regarding the borrower, and an assessment of their repayment capacity, loans and credit terms, as well as a valuation of col-lateral. For borrowers whose total loans exceed SEK 3 million, the credit decision is made in the form of a credit limit.
In the case of loans to private individuals
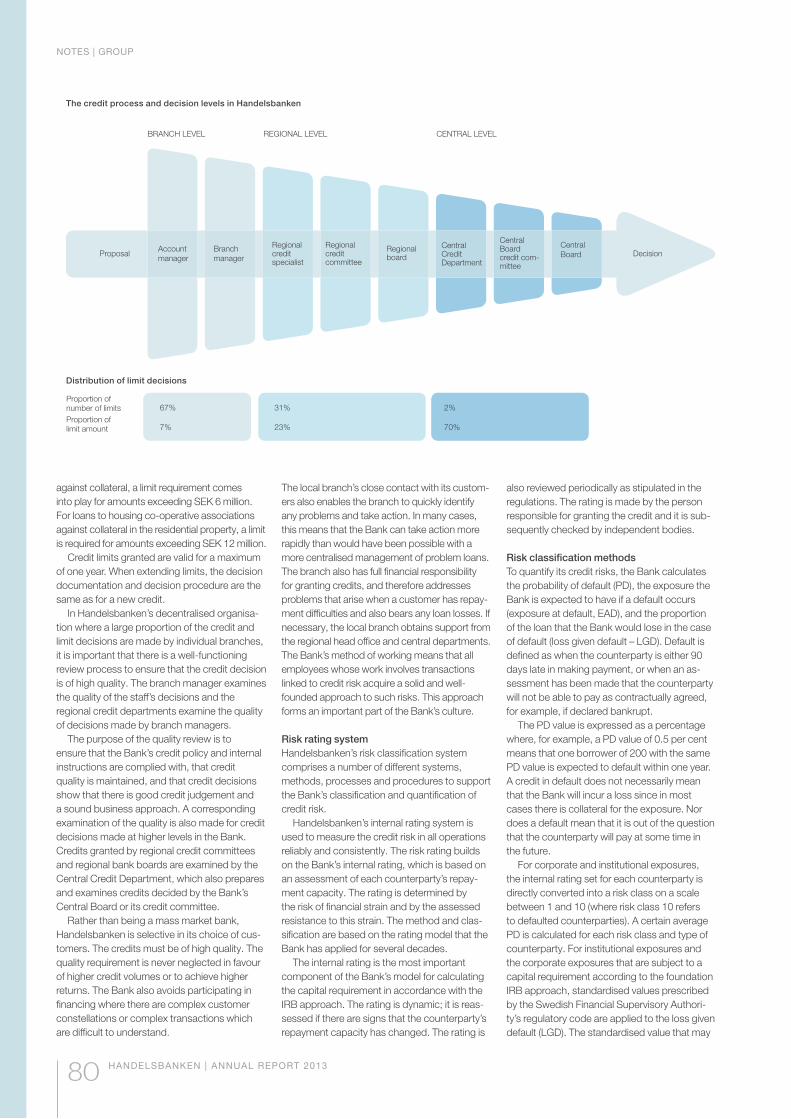
NOTES | GROUP
80 HANDELSBANKEN | ANNUAL REPORT 2013
against collateral, a limit requirement comes into play for amounts exceeding SEK 6 million. For loans to housing co-operative associations against collateral in the residential property, a limit is required for amounts exceeding SEK 12 million.
Credit limits granted are valid for a maximum of one year. When extending limits, the decision documentation and decision procedure are the same as for a new credit.
In Handelsbanken’s decentralised organisa-tion where a large proportion of the credit and limit decisions are made by individual branches, it is important that there is a well-functioning review process to ensure that the credit decision is of high quality. The branch manager examines the quality of the staff’s decisions and the regional credit departments examine the quality of decisions made by branch managers.
The purpose of the quality review is to ensure that the Bank’s credit policy and internal instructions are complied with, that credit quality is maintained, and that credit decisions show that there is good credit judgement and a sound business approach. A corresponding examination of the quality is also made for credit decisions made at higher levels in the Bank. Credits granted by regional credit committees and regional bank boards are examined by the Central Credit Department, which also prepares and examines credits decided by the Bank’s Central Board or its credit committee.
Rather than being a mass market bank, Handelsbanken is selective in its choice of cus-tomers. The credits must be of high quality. The quality requirement is never neglected in favour of higher credit volumes or to achieve higher returns. The Bank also avoids participating in financing where there are complex customer constellations or complex transactions which are difficult to understand.
The local branch’s close contact with its custom-ers also enables the branch to quickly identify any problems and take action. In many cases, this means that the Bank can take action more rapidly than would have been possible with a more centralised management of problem loans. The branch also has full financial responsibility for granting credits, and therefore addresses problems that arise when a customer has repay-ment difficulties and also bears any loan losses. If necessary, the local branch obtains support from the regional head office and central departments. The Bank’s method of working means that all employees whose work involves transactions linked to credit risk acquire a solid and well-founded approach to such risks. This approach forms an important part of the Bank’s culture.
Risk rating system Handelsbanken’s risk classification system comprises a number of different systems, methods, processes and procedures to support the Bank’s classification and quantification of credit risk.
Handelsbanken’s internal rating system is used to measure the credit risk in all operations reliably and consistently. The risk rating builds on the Bank’s internal rating, which is based on an assessment of each counterparty’s repay-ment capacity. The rating is determined by the risk of financial strain and by the assessed resistance to this strain. The method and clas-sification are based on the rating model that the Bank has applied for several decades.
The internal rating is the most important component of the Bank’s model for calculating the capital requirement in accordance with the IRB approach. The rating is dynamic; it is reas-sessed if there are signs that the counterparty’s repayment capacity has changed. The rating is
also reviewed periodically as stipulated in the regulations. The rating is made by the person responsible for granting the credit and it is sub-sequently checked by independent bodies.
Risk classification methodsTo quantify its credit risks, the Bank calculates the probability of default (PD), the exposure the Bank is expected to have if a default occurs (exposure at default, EAD), and the proportion of the loan that the Bank would lose in the case of default (loss given default – LGD). Default is defined as when the counterparty is either 90 days late in making payment, or when an as-sessment has been made that the counterparty will not be able to pay as contractually agreed, for example, if declared bankrupt.
The PD value is expressed as a percentage where, for example, a PD value of 0.5 per cent means that one borrower of 200 with the same PD value is expected to default within one year. A credit in default does not necessarily mean that the Bank will incur a loss since in most cases there is collateral for the exposure. Nor does a default mean that it is out of the question that the counterparty will pay at some time in the future.
For corporate and institutional exposures, the internal rating set for each counterparty is directly converted into a risk class on a scale between 1 and 10 (where risk class 10 refers to defaulted counterparties). A certain average PD is calculated for each risk class and type of counterparty. For institutional exposures and the corporate exposures that are subject to a capital requirement according to the foundation IRB approach, standardised values prescribed by the Swedish Financial Supervisory Authori-ty’s regulatory code are applied to the loss given default (LGD). The standardised value that may
The credit process and decision levels in Handelsbanken
Distribution of limit decisions
Proportion of number of limits 67% 31% 2%
Proportion of limit amount 7% 23% 70%
BRANCH LEVEL REGIONAL LEVEL CENTRAL LEVEL
ProposalAccount manager
Branch manager
Regional credit specialist
Regional credit committee
Regional board
Central Credit Department
Central Board credit com-mittee
Central Board Decision
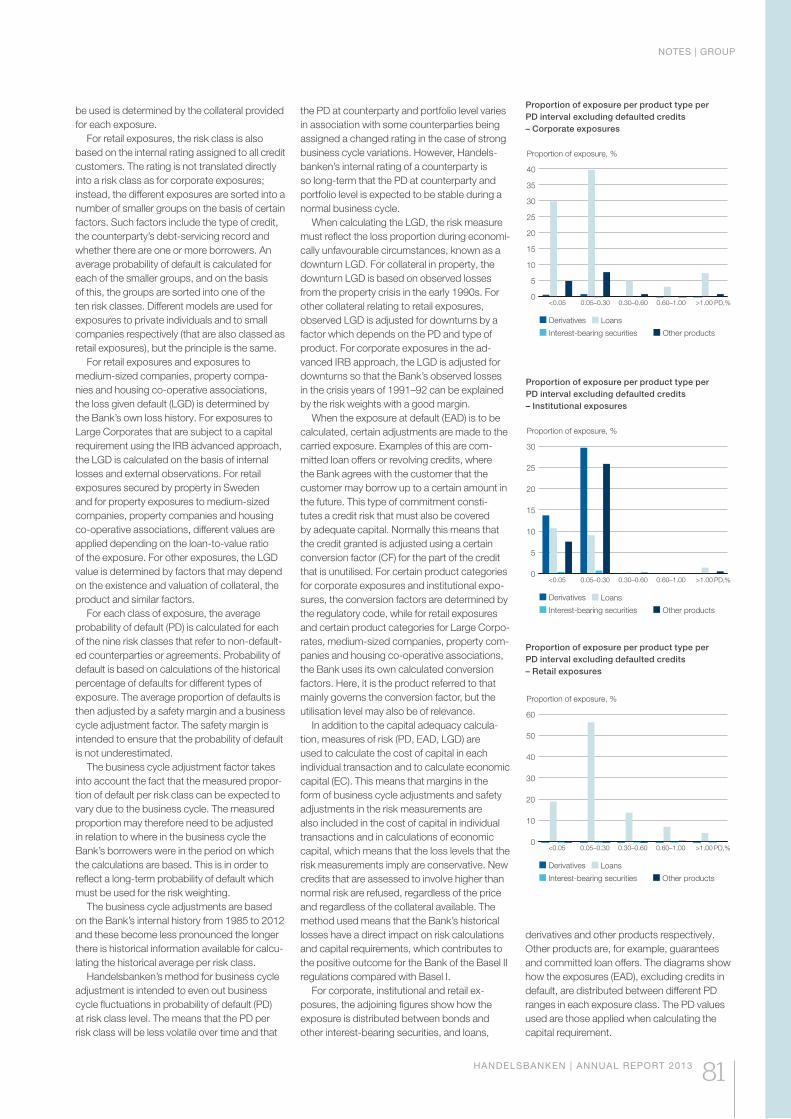
NOTES | GROUP
HANDELSBANKEN | ANNUAL REPORT 2013 81
Proportion of exposure per product type per PD interval excluding defaulted credits – Corporate exposures
Proportion of exposure per product type per PD interval excluding defaulted credits – Institutional exposures
0
5
10
15
20
25
30
35
40
>1.000.60–1.000.30–0.600.05–0.30<0.05 PD,%
Derivatives Loans
Interest-bearing securities Other products
Proportion of exposure, %
0
5
10
15
20
25
30
>1.000.60–1.000.30–0.600.05–0.30<0.05 PD,%
Proportion of exposure, %
Derivatives Loans
Interest-bearing securities Other products
Proportion of exposure per product type per PD interval excluding defaulted credits – Retail exposures
PD,%0
10
20
30
40
50
60
>1.000.60–1.000.30–0.600.05–0.30<0.05
Proportion of exposure, %
Derivatives Loans
Interest-bearing securities Other products
be used is determined by the collateral provided for each exposure.
For retail exposures, the risk class is also based on the internal rating assigned to all credit customers. The rating is not translated directly into a risk class as for corporate exposures; instead, the different exposures are sorted into a number of smaller groups on the basis of certain factors. Such factors include the type of credit, the counterparty’s debt-servicing record and whether there are one or more borrowers. An average probability of default is calculated for each of the smaller groups, and on the basis of this, the groups are sorted into one of the ten risk classes. Different models are used for exposures to private individuals and to small companies respectively (that are also classed as retail exposures), but the principle is the same.
For retail exposures and exposures to medium-sized companies, property compa-nies and housing co-operative associations, the loss given default (LGD) is determined by the Bank’s own loss history. For exposures to Large Corporates that are subject to a capital requirement using the IRB advanced approach, the LGD is calculated on the basis of internal losses and external observations. For retail exposures secured by property in Sweden and for property exposures to medium-sized companies, property companies and housing co-operative associations, different values are applied depending on the loan-to-value ratio of the exposure. For other exposures, the LGD value is determined by factors that may depend on the existence and valuation of collateral, the product and similar factors.
For each class of exposure, the average probability of default (PD) is calculated for each of the nine risk classes that refer to non-default-ed counterparties or agreements. Probability of default is based on calculations of the historical percentage of defaults for different types of exposure. The average proportion of defaults is then adjusted by a safety margin and a business cycle adjustment factor. The safety margin is intended to ensure that the probability of default is not underestimated.
The business cycle adjustment factor takes into account the fact that the measured propor-tion of default per risk class can be expected to vary due to the business cycle. The measured proportion may therefore need to be adjusted in relation to where in the business cycle the Bank’s borrowers were in the period on which the calculations are based. This is in order to reflect a long-term probability of default which must be used for the risk weighting.
The business cycle adjustments are based on the Bank’s internal history from 1985 to 2012 and these become less pronounced the longer there is historical information available for calcu-lating the historical average per risk class.
Handelsbanken’s method for business cycle adjustment is intended to even out business cycle fluctuations in probability of default (PD) at risk class level. The means that the PD per risk class will be less volatile over time and that
the PD at counterparty and portfolio level varies in association with some counterparties being assigned a changed rating in the case of strong business cycle variations. However, Handels-banken’s internal rating of a counterparty is so long-term that the PD at counterparty and portfolio level is expected to be stable during a normal business cycle.
When calculating the LGD, the risk measure must reflect the loss proportion during economi-cally unfavourable circumstances, known as a downturn LGD. For collateral in property, the downturn LGD is based on observed losses from the property crisis in the early 1990s. For other collateral relating to retail exposures, observed LGD is adjusted for downturns by a factor which depends on the PD and type of product. For corporate exposures in the ad-vanced IRB approach, the LGD is adjusted for downturns so that the Bank’s observed losses in the crisis years of 1991–92 can be explained by the risk weights with a good margin.
When the exposure at default (EAD) is to be calculated, certain adjustments are made to the carried exposure. Examples of this are com-mitted loan offers or revolving credits, where the Bank agrees with the customer that the customer may borrow up to a certain amount in the future. This type of commitment consti-tutes a credit risk that must also be covered by adequate capital. Normally this means that the credit granted is adjusted using a certain conversion factor (CF) for the part of the credit that is unutilised. For certain product categories for corporate exposures and institutional expo-sures, the conversion factors are determined by the regulatory code, while for retail exposures and certain product categories for Large Corpo-rates, medium-sized companies, property com-panies and housing co-operative associations, the Bank uses its own calculated conversion factors. Here, it is the product referred to that mainly governs the conversion factor, but the utilisation level may also be of relevance.
In addition to the capital adequacy calcula-tion, measures of risk (PD, EAD, LGD) are used to calculate the cost of capital in each individual transaction and to calculate economic capital (EC). This means that margins in the form of business cycle adjustments and safety adjustments in the risk measurements are also included in the cost of capital in individual transactions and in calculations of economic capital, which means that the loss levels that the risk measurements imply are conservative. New credits that are assessed to involve higher than normal risk are refused, regardless of the price and regardless of the collateral available. The method used means that the Bank’s historical losses have a direct impact on risk calculations and capital requirements, which contributes to the positive outcome for the Bank of the Basel II regulations compared with Basel I.
For corporate, institutional and retail ex-posures, the adjoining figures show how the exposure is distributed between bonds and other interest-bearing securities, and loans,
derivatives and other products respectively. Other products are, for example, guarantees and committed loan offers. The diagrams show how the exposures (EAD), excluding credits in default, are distributed between different PD ranges in each exposure class. The PD values used are those applied when calculating the capital requirement.
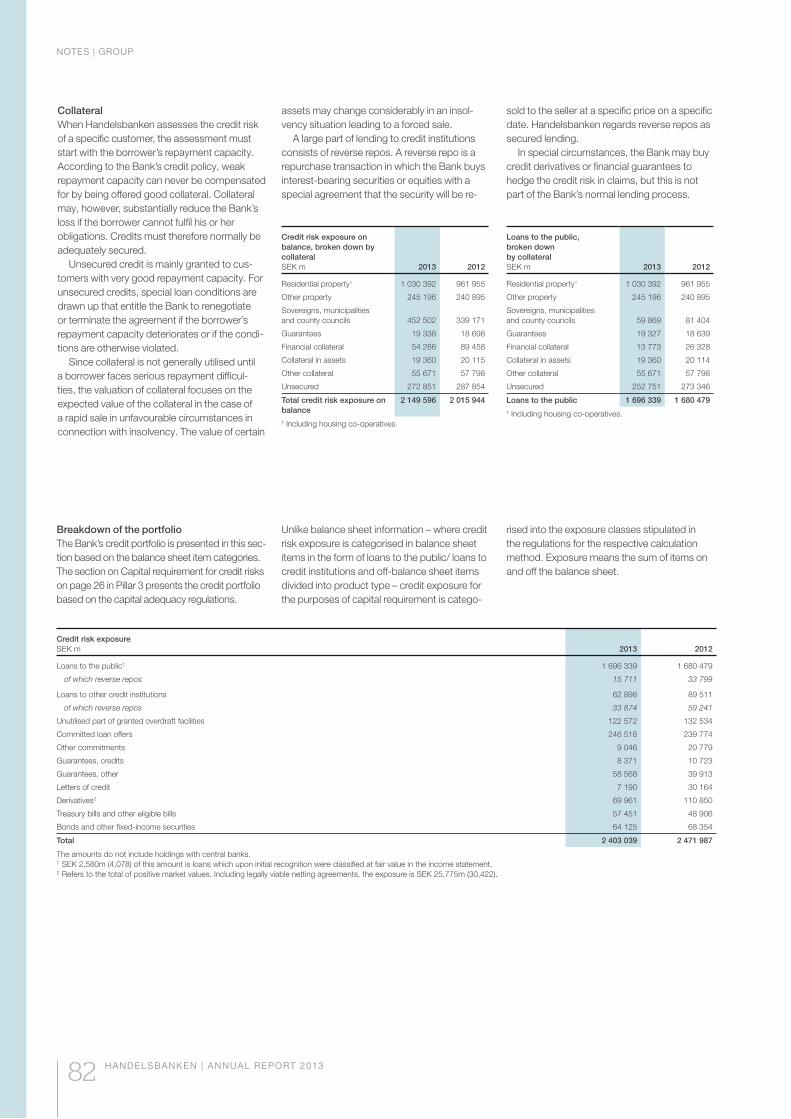
NOTES | GROUP
82 HANDELSBANKEN | ANNUAL REPORT 2013
Collateral When Handelsbanken assesses the credit risk of a specific customer, the assessment must start with the borrower’s repayment capacity. According to the Bank’s credit policy, weak repayment capacity can never be compensated for by being offered good collateral. Collateral may, however, substantially reduce the Bank’s loss if the borrower cannot fulfil his or her obligations. Credits must therefore normally be adequately secured.
Unsecured credit is mainly granted to cus-tomers with very good repayment capacity. For unsecured credits, special loan conditions are drawn up that entitle the Bank to renegotiate or terminate the agreement if the borrower’s repayment capacity deteriorates or if the condi-tions are otherwise violated.
Since collateral is not generally utilised until a borrower faces serious repayment difficul-ties, the valuation of collateral focuses on the expected value of the collateral in the case of a rapid sale in unfavourable circumstances in connection with insolvency. The value of certain
Credit risk exposure on balance, broken down by collateralSEK m 2013 2012
Residential property1 1 030 392 961 955
Other property 245 196 240 895
Sovereigns, municipalities and county councils 452 502 339 171
Guarantees 19 338 18 698
Financial collateral 54 286 89 458
Collateral in assets 19 360 20 115
Other collateral 55 671 57 798
Unsecured 272 851 287 854
Total credit risk exposure on balance
2 149 596 2 015 944
¹ Including housing co-operatives.
Loans to the public, broken down by collateralSEK m 2013 2012
Residential property1 1 030 392 961 955
Other property 245 196 240 895
Sovereigns, municipalities and county councils 59 869 81 404
Guarantees 19 327 18 639
Financial collateral 13 773 26 328
Collateral in assets 19 360 20 114
Other collateral 55 671 57 798
Unsecured 252 751 273 346
Loans to the public 1 696 339 1 680 479
¹ Including housing co-operatives.
assets may change considerably in an insol-vency situation leading to a forced sale.
A large part of lending to credit institutions consists of reverse repos. A reverse repo is a repurchase transaction in which the Bank buys interest-bearing securities or equities with a special agreement that the security will be re-
sold to the seller at a specific price on a specific date. Handelsbanken regards reverse repos as secured lending.
In special circumstances, the Bank may buy credit derivatives or financial guarantees to hedge the credit risk in claims, but this is not part of the Bank’s normal lending process.
Breakdown of the portfolioThe Bank’s credit portfolio is presented in this sec-tion based on the balance sheet item categories. The section on Capital requirement for credit risks on page 26 in Pillar 3 presents the credit portfolio based on the capital adequacy regulations.
Unlike balance sheet information – where credit risk exposure is categorised in balance sheet items in the form of loans to the public/ loans to credit institutions and off-balance sheet items divided into product type – credit exposure for the purposes of capital requirement is catego-
rised into the exposure classes stipulated in the regulations for the respective calculation method. Exposure means the sum of items on and off the balance sheet.
Credit risk exposureSEK m 2013 2012
Loans to the public1 1 696 339 1 680 479
of which reverse repos 15 711 33 799
Loans to other credit institutions 62 898 89 511
of which reverse repos 33 874 59 241
Unutilised part of granted overdraft facilities 122 572 132 534
Committed loan offers 246 518 239 774
Other commitments 9 046 20 779
Guarantees, credits 8 371 10 723
Guarantees, other 58 568 39 913
Letters of credit 7 190 30 164
Derivatives2 69 961 110 850
Treasury bills and other eligible bills 57 451 48 906
Bonds and other fixed-income securities 64 125 68 354
Total 2 403 039 2 471 987
The amounts do not include holdings with central banks.1 SEK 2,580m (4,078) of this amount is loans which upon initial recognition were classified at fair value in the income statement.2 Refers to the total of positive market values. Including legally viable netting agreements, the exposure is SEK 25,775m (30,422).
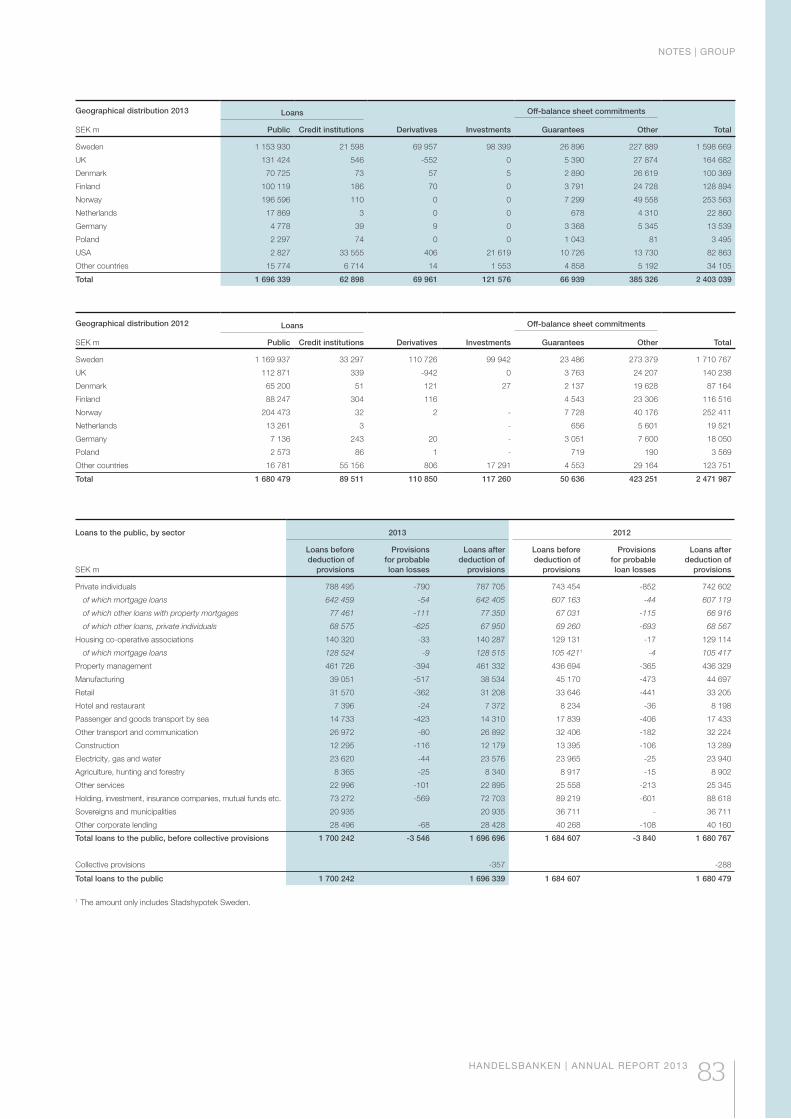
NOTES | GROUP
HANDELSBANKEN | ANNUAL REPORT 2013 83
Geographical distribution 2013 Loans Off-balance sheet commitments
SEK m Public Credit institutions Derivatives Investments Guarantees Other Total
Sweden 1 153 930 21 598 69 957 98 399 26 896 227 889 1 598 669
UK 131 424 546 -552 0 5 390 27 874 164 682
Denmark 70 725 73 57 5 2 890 26 619 100 369
Finland 100 119 186 70 0 3 791 24 728 128 894
Norway 196 596 110 0 0 7 299 49 558 253 563
Netherlands 17 869 3 0 0 678 4 310 22 860
Germany 4 778 39 9 0 3 368 5 345 13 539
Poland 2 297 74 0 0 1 043 81 3 495
USA 2 827 33 555 406 21 619 10 726 13 730 82 863
Other countries 15 774 6 714 14 1 553 4 858 5 192 34 105
Total 1 696 339 62 898 69 961 121 576 66 939 385 326 2 403 039
Geographical distribution 2012 Loans Off-balance sheet commitments
SEK m Public Credit institutions Derivatives Investments Guarantees Other Total
Sweden 1 169 937 33 297 110 726 99 942 23 486 273 379 1 710 767
UK 112 871 339 -942 0 3 763 24 207 140 238
Denmark 65 200 51 121 27 2 137 19 628 87 164
Finland 88 247 304 116 4 543 23 306 116 516
Norway 204 473 32 2 - 7 728 40 176 252 411
Netherlands 13 261 3 - 656 5 601 19 521
Germany 7 136 243 20 - 3 051 7 600 18 050
Poland 2 573 86 1 - 719 190 3 569
Other countries 16 781 55 156 806 17 291 4 553 29 164 123 751
Total 1 680 479 89 511 110 850 117 260 50 636 423 251 2 471 987
Loans to the public, by sector 2013 2012
SEK m
Loans beforededuction of
provisions
Provisionsfor probableloan losses
Loans afterdeduction of
provisions
Loans beforededuction of
provisions
Provisionsfor probableloan losses
Loans afterdeduction of
provisions
Private individuals 788 495 -790 787 705 743 454 -852 742 602
of which mortgage loans 642 459 -54 642 405 607 163 -44 607 119
of which other loans with property mortgages 77 461 -111 77 350 67 031 -115 66 916
of which other loans, private individuals 68 575 -625 67 950 69 260 -693 68 567
Housing co-operative associations 140 320 -33 140 287 129 131 -17 129 114
of which mortgage loans 128 524 -9 128 515 105 4211 -4 105 417
Property management 461 726 -394 461 332 436 694 -365 436 329
Manufacturing 39 051 -517 38 534 45 170 -473 44 697
Retail 31 570 -362 31 208 33 646 -441 33 205
Hotel and restaurant 7 396 -24 7 372 8 234 -36 8 198
Passenger and goods transport by sea 14 733 -423 14 310 17 839 -406 17 433
Other transport and communication 26 972 -80 26 892 32 406 -182 32 224
Construction 12 295 -116 12 179 13 395 -106 13 289
Electricity, gas and water 23 620 -44 23 576 23 965 -25 23 940
Agriculture, hunting and forestry 8 365 -25 8 340 8 917 -15 8 902
Other services 22 996 -101 22 895 25 558 -213 25 345
Holding, investment, insurance companies, mutual funds etc. 73 272 -569 72 703 89 219 -601 88 618
Sovereigns and municipalities 20 935 20 935 36 711 - 36 711
Other corporate lending 28 496 -68 28 428 40 268 -108 40 160
Total loans to the public, before collective provisions 1 700 242 -3 546 1 696 696 1 684 607 -3 840 1 680 767
Collective provisions -357 -288
Total loans to the public 1 700 242 1 696 339 1 684 607 1 680 479
1 The amount only includes Stadshypotek Sweden.

NOTES | GROUP
84 HANDELSBANKEN | ANNUAL REPORT 2013
Credit risk concentrationsHandelsbanken’s branches focus strongly on establishing long-term relationships with cus-tomers of sound creditworthiness. If a branch identifies a good customer, it should be able to do business with this customer, irrespective of whether the Bank as a whole has major expo-sure to the business sector that the customer represents. In granting credit the Bank thus has no built-in restrictions to having relatively exten-sive exposures in individual sectors. The Bank monitors and calculates concentration risks continually for various business sectors, geo-graphic areas and individual major exposures. Concentration risks are identified in the Bank’s calculation of economic capital for credit risks and in the stress tests conducted in the internal capital adequacy assessment. This ensures that Handelsbanken has sufficient capital, taking into account concentration risks. If the concentra-tion risks are judged to be excessive, the Bank has the opportunity and capacity to reduce them using various risk mitigation measures.
In addition to mortgage loans and lend-ing to housing co-operative associations, Handelsbanken has considerable lending
operations for property management (SEK 462 billion). Property management refers here to all companies assessed for credit purposes as “property companies”. It is common for groups of companies operating in other industries to have subsidiaries managing the properties in which the group conducts business, and such property companies are also considered here to belong to the property management. However, the underlying credit risk in such cases is not only property-related.
A large proportion of property lending is to government-owned property companies, municipal housing companies and other housing-related operations where the borrow-ers consistently have strong, stable cash flows and thus very high creditworthiness. A large part of lending to the property sector is therefore to companies with a very low probability of default and low LTVs. The Bank’s exposure to the prop-erty sector is specified in the tables below.
The proportion of exposures to property counterparties with a poorer rating than the Bank’s risk class 5 (normal risk) is very low. 98 (96) per cent of total property lending in Sweden is in risk class 5 or better. The corresponding
figures for property lending in the UK, Denmark, Finland, Norway and the Netherlands are 96 (94) per cent, 99 (91) per cent, 92 (99) per cent, 93 (95) per cent and 100 per cent respectively. For counterparties in poorer risk classes than normal, the majority are in risk classes 6 or 7 with only small volumes in the higher risk classes 8 and 9.
In the past few years, Handelsbanken has seen major credit growth in the UK as a result of a planned expansion of the branch network. A relatively large part of the growth has been in property-related credits. This has occurred during a period of poor performance in the UK property market. A strict credit policy often makes it easier to assess creditworthiness in a poorer economic climate since it is easier to identify potential problems. In its expansion, Handelsbanken has had the same strict require-ments on repayment capacity and collateral quality as in its other home markets. The result of this is a high concentration of customers in good risk classes and a loan loss ratio in line with other home markets.
Specification Loans to the public – Property management
SEK m
2013 2012
Loans beforededuction of
provisions
Provisionsfor probableloan losses
Loans afterdeduction of
provisions
Loans beforededuction of
provisions
Provisionsfor probableloan losses
Loans afterdeduction of
provisions
Loans in Sweden
State-owned property companies 7 798 - 7 798 9 213 - 9 213
Municipal-owned property companies 15 430 - 15 430 14 468 - 14 468
Residential property companies 73 571 -15 73 556 72 894 -13 72 881
of which mortgage loans 57 726 -1 57 725 52 759 -3 52 756
Other property management 151 410 -110 151 300 145 066 -129 144 937
of which mortgage loans 75 969 -3 75 966 61 097 -5 61 092
Total loans in Sweden 248 209 -125 248 084 241 641 -142 241 499
Loans outside Sweden
UK 81 129 -69 81 060 69 699 -20 69 679
Denmark 12 108 -117 11 991 10 623 -96 10 527
Finland 23 612 - 23 612 19 481 -10 19 471
Norway 76 457 -60 76 397 80 549 -74 80 475
Netherlands1 12 633 - 12 633
Other countries 7 578 -23 7 555 14 701 -23 14 678
Total loans outside Sweden 213 517 -269 213 248 195 053 -223 194 830
Total loans – property management 461 726 -394 461 332 436 694 -365 436 329
1 Regional bank as of 1 January 2013.
Specification Loans to the public – Property management
SEK m
2013 2012
Total
Companies owned by
government and municipa-
lity/property lending gua-
ranteed by go-vernment and
municipality
Multi-family dwellings/residential
property
Commercial properties and other collateral Unsecured Total
Companies owned by
government and municipa-
lity/property lending gua-
ranteed by go-vernment and
municipality
Multi-family dwellings/residential
property
Commercial properties and other collateral Unsecured
Sweden 248 209 24 744 89 037 111 582 22 846 241 641 25 252 80 983 105 039 30 367
UK 81 129 0 34 724 41 475 4 930 69 699 9 29 339 36 623 3 728
Denmark 12 108 0 6 290 3 813 2 005 10 623 1 5 368 3 911 1 343
Finland 23 612 8 549 2 974 10 452 1 637 19 481 6 624 2 492 8 982 1 383
Norway 76 457 964 13 626 52 671 9 196 80 549 24 17 146 49 518 13 861
Netherlands 12 633 0 3 682 8 046 905
Other countries 7 578 532 828 5 645 573 14 701 694 1 801 10 670 1 536
Total 461 726 34 789 151 161 233 684 42 092 436 694 32 604 137 129 214 743 52 218
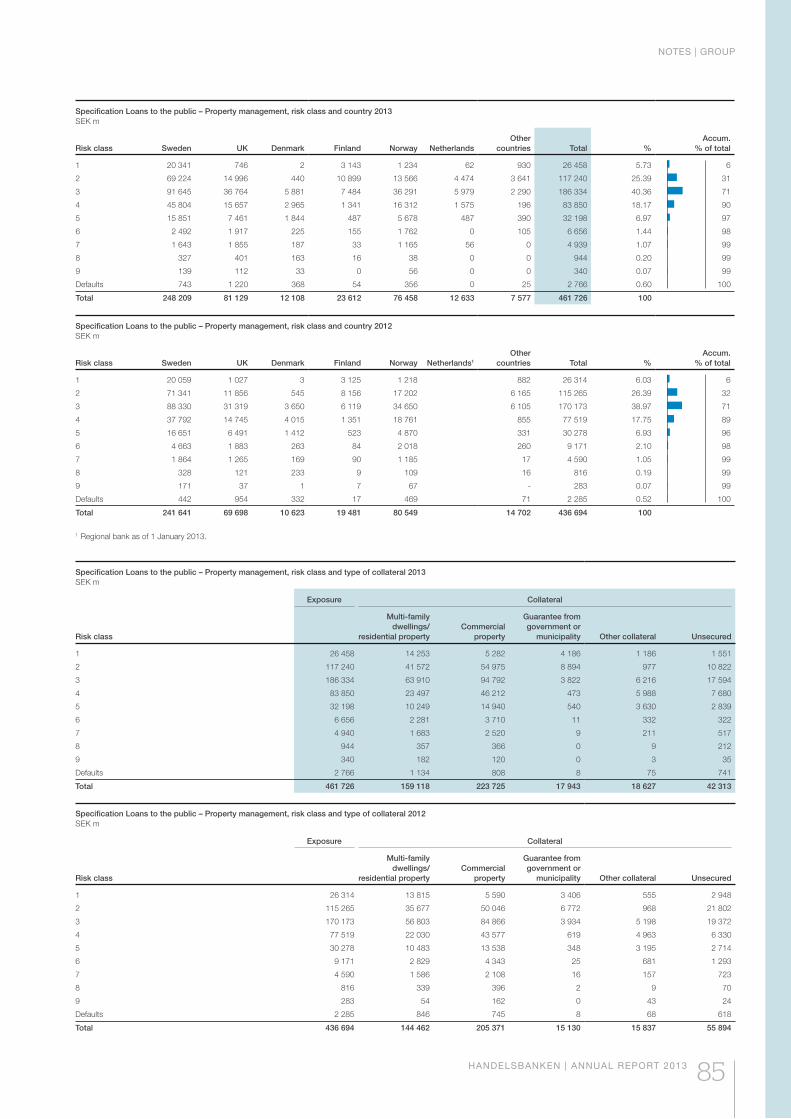
NOTES | GROUP
HANDELSBANKEN | ANNUAL REPORT 2013 85
Specification Loans to the public – Property management, risk class and country 2013SEK m
Risk class Sweden UK Denmark Finland Norway NetherlandsOther
countries Total %Accum.
% of total
1 20 341 746 2 3 143 1 234 62 930 26 458 5.73 6
2 69 224 14 996 440 10 899 13 566 4 474 3 641 117 240 25.39 31
3 91 645 36 764 5 881 7 484 36 291 5 979 2 290 186 334 40.36 71
4 45 804 15 657 2 965 1 341 16 312 1 575 196 83 850 18.17 90
5 15 851 7 461 1 844 487 5 678 487 390 32 198 6.97 97
6 2 492 1 917 225 155 1 762 0 105 6 656 1.44 98
7 1 643 1 855 187 33 1 165 56 0 4 939 1.07 99
8 327 401 163 16 38 0 0 944 0.20 99
9 139 112 33 0 56 0 0 340 0.07 99
Defaults 743 1 220 368 54 356 0 25 2 766 0.60 100
Total 248 209 81 129 12 108 23 612 76 458 12 633 7 577 461 726 100
Specification Loans to the public – Property management, risk class and country 2012 SEK m
Risk class Sweden UK Denmark Finland Norway Netherlands1
Other countries Total %
Accum. % of total
1 20 059 1 027 3 3 125 1 218 882 26 314 6.03 6
2 71 341 11 856 545 8 156 17 202 6 165 115 265 26.39 32
3 88 330 31 319 3 650 6 119 34 650 6 105 170 173 38.97 71
4 37 792 14 745 4 015 1 351 18 761 855 77 519 17.75 89
5 16 651 6 491 1 412 523 4 870 331 30 278 6.93 96
6 4 663 1 883 263 84 2 018 260 9 171 2.10 98
7 1 864 1 265 169 90 1 185 17 4 590 1.05 99
8 328 121 233 9 109 16 816 0.19 99
9 171 37 1 7 67 - 283 0.07 99
Defaults 442 954 332 17 469 71 2 285 0.52 100
Total 241 641 69 698 10 623 19 481 80 549 14 702 436 694 100
1 Regional bank as of 1 January 2013.
Specification Loans to the public – Property management, risk class and type of collateral 2012 SEK m
Exposure Collateral
Risk class
Multi-family dwellings/
residential propertyCommercial
property
Guarantee from government or
municipality Other collateral Unsecured
1 26 314 13 815 5 590 3 406 555 2 948
2 115 265 35 677 50 046 6 772 968 21 802
3 170 173 56 803 84 866 3 934 5 198 19 372
4 77 519 22 030 43 577 619 4 963 6 330
5 30 278 10 483 13 538 348 3 195 2 714
6 9 171 2 829 4 343 25 681 1 293
7 4 590 1 586 2 108 16 157 723
8 816 339 396 2 9 70
9 283 54 162 0 43 24
Defaults 2 285 846 745 8 68 618
Total 436 694 144 462 205 371 15 130 15 837 55 894
Specification Loans to the public – Property management, risk class and type of collateral 2013 SEK m
Exposure Collateral
Risk class
Multi-family dwellings/
residential propertyCommercial
property
Guarantee from government or
municipality Other collateral Unsecured
1 26 458 14 253 5 282 4 186 1 186 1 551
2 117 240 41 572 54 975 8 894 977 10 822
3 186 334 63 910 94 792 3 822 6 216 17 594
4 83 850 23 497 46 212 473 5 988 7 680
5 32 198 10 249 14 940 540 3 630 2 839
6 6 656 2 281 3 710 11 332 322
7 4 940 1 683 2 520 9 211 517
8 944 357 366 0 9 212
9 340 182 120 0 3 35
Defaults 2 766 1 134 808 8 75 741
Total 461 726 159 118 223 725 17 943 18 627 42 313
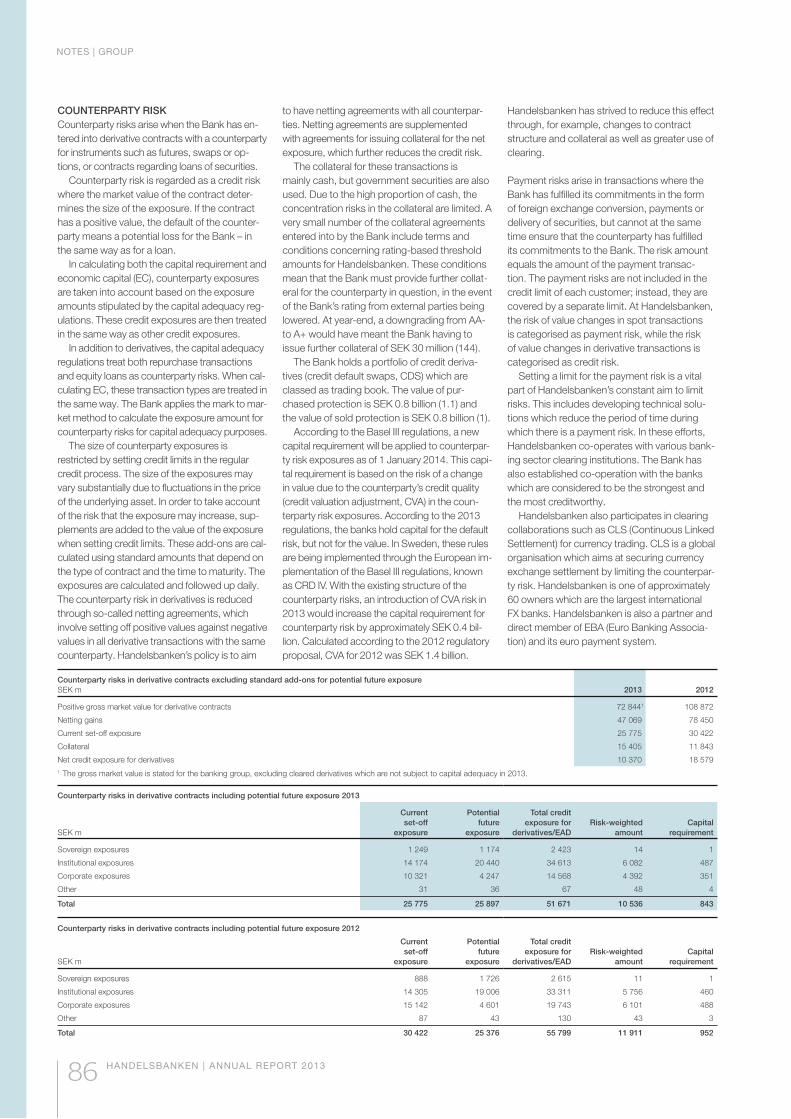
NOTES | GROUP
86 HANDELSBANKEN | ANNUAL REPORT 2013
COUNTERPARTY RISK Counterparty risks arise when the Bank has en-tered into derivative contracts with a counterparty for instruments such as futures, swaps or op-tions, or contracts regarding loans of securities.
Counterparty risk is regarded as a credit risk where the market value of the contract deter-mines the size of the exposure. If the contract has a positive value, the default of the counter-party means a potential loss for the Bank – in the same way as for a loan.
In calculating both the capital requirement and economic capital (EC), counterparty exposures are taken into account based on the exposure amounts stipulated by the capital adequacy reg-ulations. These credit exposures are then treated in the same way as other credit exposures.
In addition to derivatives, the capital adequacy regulations treat both repurchase transactions and equity loans as counterparty risks. When cal-culating EC, these transaction types are treated in the same way. The Bank applies the mark to mar-ket method to calculate the exposure amount for counterparty risks for capital adequacy purposes.
The size of counterparty exposures is restricted by setting credit limits in the regular credit process. The size of the exposures may vary substantially due to fluctuations in the price of the underlying asset. In order to take account of the risk that the exposure may increase, sup-plements are added to the value of the exposure when setting credit limits. These add-ons are cal-culated using standard amounts that depend on the type of contract and the time to maturity. The exposures are calculated and followed up daily. The counterparty risk in derivatives is reduced through so-called netting agreements, which involve setting off positive values against negative values in all derivative transactions with the same counterparty. Handelsbanken’s policy is to aim
to have netting agreements with all counterpar-ties. Netting agreements are supplemented with agreements for issuing collateral for the net exposure, which further reduces the credit risk.
The collateral for these transactions is mainly cash, but government securities are also used. Due to the high proportion of cash, the concentration risks in the collateral are limited. A very small number of the collateral agreements entered into by the Bank include terms and conditions concerning rating-based threshold amounts for Handelsbanken. These conditions mean that the Bank must provide further collat-eral for the counterparty in question, in the event of the Bank’s rating from external parties being lowered. At year-end, a downgrading from AA- to A+ would have meant the Bank having to issue further collateral of SEK 30 million (144).
The Bank holds a portfolio of credit deriva-tives (credit default swaps, CDS) which are classed as trading book. The value of pur-chased protection is SEK 0.8 billion (1.1) and the value of sold protection is SEK 0.8 billion (1).
According to the Basel III regulations, a new capital requirement will be applied to counterpar-ty risk exposures as of 1 January 2014. This capi-tal requirement is based on the risk of a change in value due to the counterparty’s credit quality (credit valuation adjustment, CVA) in the coun-terparty risk exposures. According to the 2013 regulations, the banks hold capital for the default risk, but not for the value. In Sweden, these rules are being implemented through the European im-plementation of the Basel III regulations, known as CRD IV. With the existing structure of the counterparty risks, an introduction of CVA risk in 2013 would increase the capital requirement for counterparty risk by approximately SEK 0.4 bil-lion. Calculated according to the 2012 regulatory proposal, CVA for 2012 was SEK 1.4 billion.
Handelsbanken has strived to reduce this effect through, for example, changes to contract structure and collateral as well as greater use of clearing.
Payment risks arise in transactions where the Bank has fulfilled its commitments in the form of foreign exchange conversion, payments or delivery of securities, but cannot at the same time ensure that the counterparty has fulfilled its commitments to the Bank. The risk amount equals the amount of the payment transac-tion. The payment risks are not included in the credit limit of each customer; instead, they are covered by a separate limit. At Handelsbanken, the risk of value changes in spot transactions is categorised as payment risk, while the risk of value changes in derivative transactions is categorised as credit risk.
Setting a limit for the payment risk is a vital part of Handelsbanken’s constant aim to limit risks. This includes developing technical solu-tions which reduce the period of time during which there is a payment risk. In these efforts, Handelsbanken co-operates with various bank-ing sector clearing institutions. The Bank has also established co-operation with the banks which are considered to be the strongest and the most creditworthy.
Handelsbanken also participates in clearing collaborations such as CLS (Continuous Linked Settlement) for currency trading. CLS is a global organisation which aims at securing currency exchange settlement by limiting the counterpar-ty risk. Handelsbanken is one of approximately 60 owners which are the largest international FX banks. Handelsbanken is also a partner and direct member of EBA (Euro Banking Associa-tion) and its euro payment system.
Counterparty risks in derivative contracts including potential future exposure 2013
SEK m
Current set-off
exposure
Potential future
exposure
Total credit exposure for
derivatives/EADRisk-weighted
amountCapital
requirement
Sovereign exposures 1 249 1 174 2 423 14 1
Institutional exposures 14 174 20 440 34 613 6 082 487
Corporate exposures 10 321 4 247 14 568 4 392 351
Other 31 36 67 48 4
Total 25 775 25 897 51 671 10 536 843
Counterparty risks in derivative contracts including potential future exposure 2012
SEK m
Current set-off
exposure
Potential future
exposure
Total credit exposure for
derivatives/EADRisk-weighted
amountCapital
requirement
Sovereign exposures 888 1 726 2 615 11 1
Institutional exposures 14 305 19 006 33 311 5 756 460
Corporate exposures 15 142 4 601 19 743 6 101 488
Other 87 43 130 43 3
Total 30 422 25 376 55 799 11 911 952
Counterparty risks in derivative contracts excluding standard add-ons for potential future exposure SEK m 2013 2012
Positive gross market value for derivative contracts 72 8441 108 872
Netting gains 47 069 78 450
Current set-off exposure 25 775 30 422
Collateral 15 405 11 843
Net credit exposure for derivatives 10 370 18 5791 The gross market value is stated for the banking group, excluding cleared derivatives which are not subject to capital adequacy in 2013.
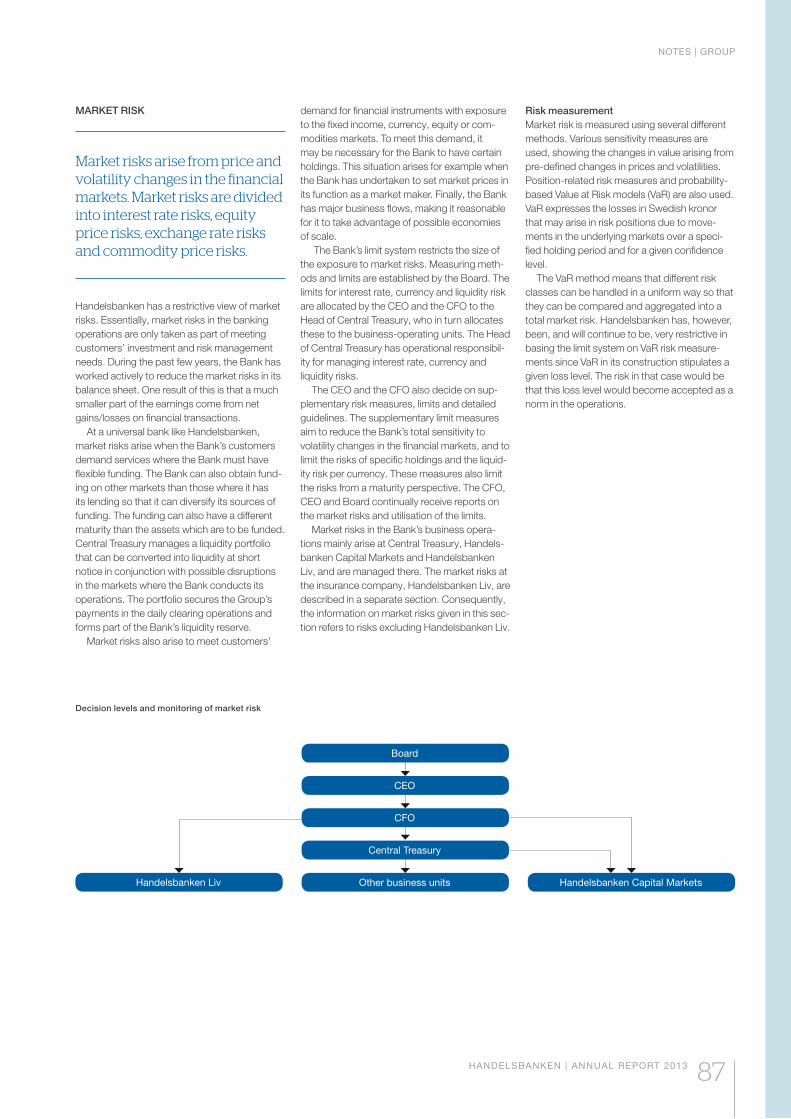
NOTES | GROUP
HANDELSBANKEN | ANNUAL REPORT 2013 87
MARKET RISK
Market risks arise from price and volatility changes in the financial markets. Market risks are divided into interest rate risks, equity price risks, exchange rate risks and commodity price risks.
Handelsbanken has a restrictive view of market risks. Essentially, market risks in the banking operations are only taken as part of meeting customers’ investment and risk management needs. During the past few years, the Bank has worked actively to reduce the market risks in its balance sheet. One result of this is that a much smaller part of the earnings come from net gains/losses on financial transactions.
At a universal bank like Handelsbanken, market risks arise when the Bank’s customers demand services where the Bank must have flexible funding. The Bank can also obtain fund-ing on other markets than those where it has its lending so that it can diversify its sources of funding. The funding can also have a different maturity than the assets which are to be funded. Central Treasury manages a liquidity portfolio that can be converted into liquidity at short notice in conjunction with possible disruptions in the markets where the Bank conducts its operations. The portfolio secures the Group’s payments in the daily clearing operations and forms part of the Bank’s liquidity reserve.
Market risks also arise to meet customers’
demand for financial instruments with exposure to the fixed income, currency, equity or com-modities markets. To meet this demand, it may be necessary for the Bank to have certain holdings. This situation arises for example when the Bank has undertaken to set market prices in its function as a market maker. Finally, the Bank has major business flows, making it reasonable for it to take advantage of possible economies of scale.
The Bank’s limit system restricts the size of the exposure to market risks. Measuring meth-ods and limits are established by the Board. The limits for interest rate, currency and liquidity risk are allocated by the CEO and the CFO to the Head of Central Treasury, who in turn allocates these to the business-operating units. The Head of Central Treasury has operational responsibil-ity for managing interest rate, currency and liquidity risks.
The CEO and the CFO also decide on sup-plementary risk measures, limits and detailed guidelines. The supplementary limit measures aim to reduce the Bank’s total sensitivity to volatility changes in the financial markets, and to limit the risks of specific holdings and the liquid-ity risk per currency. These measures also limit the risks from a maturity perspective. The CFO, CEO and Board continually receive reports on the market risks and utilisation of the limits.
Market risks in the Bank’s business opera-tions mainly arise at Central Treasury, Handels-banken Capital Markets and Handelsbanken Liv, and are managed there. The market risks at the insurance company, Handelsbanken Liv, are described in a separate section. Consequently, the information on market risks given in this sec-tion refers to risks excluding Handelsbanken Liv.
Risk measurementMarket risk is measured using several different methods. Various sensitivity measures are used, showing the changes in value arising from pre-defined changes in prices and volatilities. Position-related risk measures and probability-based Value at Risk models (VaR) are also used. VaR expresses the losses in Swedish kronor that may arise in risk positions due to move-ments in the underlying markets over a speci-fied holding period and for a given confidence level.
The VaR method means that different risk classes can be handled in a uniform way so that they can be compared and aggregated into a total market risk. Handelsbanken has, however, been, and will continue to be, very restrictive in basing the limit system on VaR risk measure-ments since VaR in its construction stipulates a given loss level. The risk in that case would be that this loss level would become accepted as a norm in the operations.
Decision levels and monitoring of market risk
Handelsbanken Capital Markets
Board
CEO
CFO
Central Treasury
Handels banken Liv Other business units

NOTES | GROUP
88 HANDELSBANKEN | ANNUAL REPORT 2013
Risk at Handelsbanken measured as VaRFor the portfolios classified as the trading book at Handelsbanken Capital Markets and Central Treasury, VaR is calculated for the individual risk classes and at portfolio level with a 99 per cent confidence level and a one-day holding period.
Since VaR is based on model assumptions, the model is continually verified to check that it is up-to-date. For that reason VaR is regularly evaluated using back testing. The result is reported quarterly to the CFO, the CEO and the Board. These tests verify the number of days
when the loss exceeded the estimated VaR. Back testing is performed on both the actual outcome and on the hypothetical outcome. The latter measures the outcome if the portfolio had been unchanged during the holding period.
A VaR model with a 99 per cent confidence level implies that the outcome will be worse than measured VaR on two to three occasions every year. If the number of observed occasions exceeds the expected number, there is a risk that the model underestimates the actual risk. On two occasions in 2013 the hypothetical
outcome was worse than the VaR. This is in line with what a VaR model with a confidence level of 99 per cent implies.
The VaR model does not identify risks as-sociated with extreme market fluctuations. The calculations are therefore supplemented with regular stress tests where the portfolios are tested against scenarios based on all events in the financial markets since 1994. The results of these stress tests are also reported to the CEO, CFO and the Board on a regular basis.
VaR and hypothetical outcome for trading book 2013, Handelsbanken Capital Markets and Central Treasury
-50
-40
-30
-20
-10
0
10
20
30
40
50
DecNovOctSepAugJulJunMayAprilMarFebJan
Hypothetical outcome Value at Risk
Worst outcome in stress test for trading book, Handelsbanken Capital Markets and Central Treasury
SEK m 2013 2012
Average 26 38
Maximum 69 70
Minimum 12 18
Year-end 28 28
INTEREST RATE RISKInterest rate risk mainly arises at Handelsbank-en Capital Markets, Central Treasury and in the lending operations.
In the latter, the interest rate risk arises as a result of the lending partly having longer interest-rate fixing periods than the funding. In bond funding, the reverse may also apply, i.e. that the interest-rate fixing period on the bonds is longer than the interest-rate fixing period for the lending that the bonds are funding. Interest rate is mainly managed by means of interest rate swaps. In general, interest rate risk expo-sure is in markets which are characterised by good liquidity.
Interest rate risk is measured at the Bank in several ways. VaR and other risk meas-
urements, supplemented by various stress scenarios, are used for Handelsbanken Capital Markets’ portfolios and at Central Treasury. Yield curve twist risks – which are measured and followed up on a regular basis – show the development of the risks in the case of hypo-thetical changes in various yield curves. The non-linear interest rate risk, for example, part of the risk in interest rate options, is measured and a limit set with pre-defined stress scenarios expressed in matrices. This means that the risk is measured as changes in underlying market interest rates and volatilities.
For other units and for the aggregate interest rate risk in the Group, the interest rate risk is measured as the effect on fair value of a major instantaneous parallel shift of all interest rates.
At year-end, the Bank’s total interest rate risk in the case of a one percentage point parallel upward or downward shift in the yield curve, measured as the worst outcome, was SEK -992 million (-701). This risk measure includes both interest-bearing items at market value and not at market value, and it is therefore not appropri-ate to assess the effects on the balance sheet and income statement. The risk measure does not take into account the equity held by the Bank nor the Bank’s opportunities to adapt to changed interest rate levels.
The net interest income effect when interest rates change is measured as the change in net interest income over a 12-month period in the case of a general increase of market rates by one percentage point. This effect reflects the
VaR for trading book, Handelsbanken Capital Markets and Central Treasury
Total Equities Fixed income Currency Commodities
SEK m 2013 2012 2013 2012 2013 2012 2013 2012 2013 2012
Average 18 15 3 2 18 15 2 3 1 1
Maximum 42 26 6 5 40 31 5 8 4 7
Minimum 9 7 1 0 9 8 0 1 0 0
Year-end 14 11 1 2 14 11 1 4 2 1
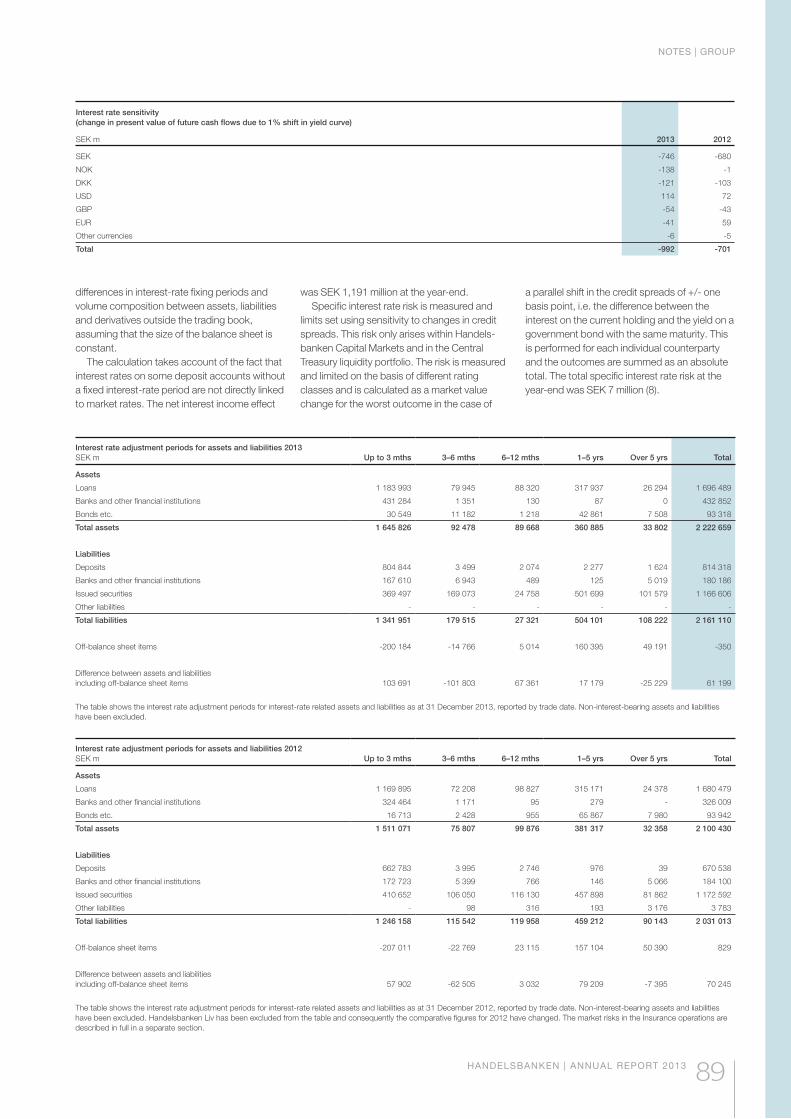
NOTES | GROUP
HANDELSBANKEN | ANNUAL REPORT 2013 89
Interest rate adjustment periods for assets and liabilities 2013SEK m Up to 3 mths 3–6 mths 6–12 mths 1–5 yrs Over 5 yrs Total
Assets
Loans 1 183 993 79 945 88 320 317 937 26 294 1 696 489
Banks and other financial institutions 431 284 1 351 130 87 0 432 852
Bonds etc. 30 549 11 182 1 218 42 861 7 508 93 318
Total assets 1 645 826 92 478 89 668 360 885 33 802 2 222 659
Liabilities
Deposits 804 844 3 499 2 074 2 277 1 624 814 318
Banks and other financial institutions 167 610 6 943 489 125 5 019 180 186
Issued securities 369 497 169 073 24 758 501 699 101 579 1 166 606
Other liabilities - - - - - -
Total liabilities 1 341 951 179 515 27 321 504 101 108 222 2 161 110
Off-balance sheet items -200 184 -14 766 5 014 160 395 49 191 -350
Difference between assets and liabilities including off-balance sheet items 103 691 -101 803 67 361 17 179 -25 229 61 199
The table shows the interest rate adjustment periods for interest-rate related assets and liabilities as at 31 December 2013, reported by trade date. Non-interest-bearing assets and liabilities have been excluded.
Interest rate adjustment periods for assets and liabilities 2012SEK m Up to 3 mths 3–6 mths 6–12 mths 1–5 yrs Over 5 yrs Total
Assets
Loans 1 169 895 72 208 98 827 315 171 24 378 1 680 479
Banks and other financial institutions 324 464 1 171 95 279 - 326 009
Bonds etc. 16 713 2 428 955 65 867 7 980 93 942
Total assets 1 511 071 75 807 99 876 381 317 32 358 2 100 430
Liabilities
Deposits 662 783 3 995 2 746 976 39 670 538
Banks and other financial institutions 172 723 5 399 766 146 5 066 184 100
Issued securities 410 652 106 050 116 130 457 898 81 862 1 172 592
Other liabilities - 98 316 193 3 176 3 783
Total liabilities 1 246 158 115 542 119 958 459 212 90 143 2 031 013
Off-balance sheet items -207 011 -22 769 23 115 157 104 50 390 829
Difference between assets and liabilities including off-balance sheet items 57 902 -62 505 3 032 79 209 -7 395 70 245
The table shows the interest rate adjustment periods for interest-rate related assets and liabilities as at 31 December 2012, reported by trade date. Non-interest-bearing assets and liabilities have been excluded. Handelsbanken Liv has been excluded from the table and consequently the comparative figures for 2012 have changed. The market risks in the Insurance operations are described in full in a separate section.
Interest rate sensitivity(change in present value of future cash flows due to 1% shift in yield curve)
SEK m 2013 2012
SEK -746 -680
NOK -138 -1
DKK -121 -103
USD 114 72
GBP -54 -43
EUR -41 59
Other currencies -6 -5
Total -992 -701
differences in interest-rate fixing periods and volume composition between assets, liabilities and derivatives outside the trading book, assuming that the size of the balance sheet is constant.
The calculation takes account of the fact that interest rates on some deposit accounts without a fixed interest-rate period are not directly linked to market rates. The net interest income effect
was SEK 1,191 million at the year-end.Specific interest rate risk is measured and
limits set using sensitivity to changes in credit spreads. This risk only arises within Handels-banken Capital Markets and in the Central Treasury liquidity portfolio. The risk is measured and limited on the basis of different rating classes and is calculated as a market value change for the worst outcome in the case of
a parallel shift in the credit spreads of +/- one basis point, i.e. the difference between the interest on the current holding and the yield on a government bond with the same maturity. This is performed for each individual counterparty and the outcomes are summed as an absolute total. The total specific interest rate risk at the year-end was SEK 7 million (8).
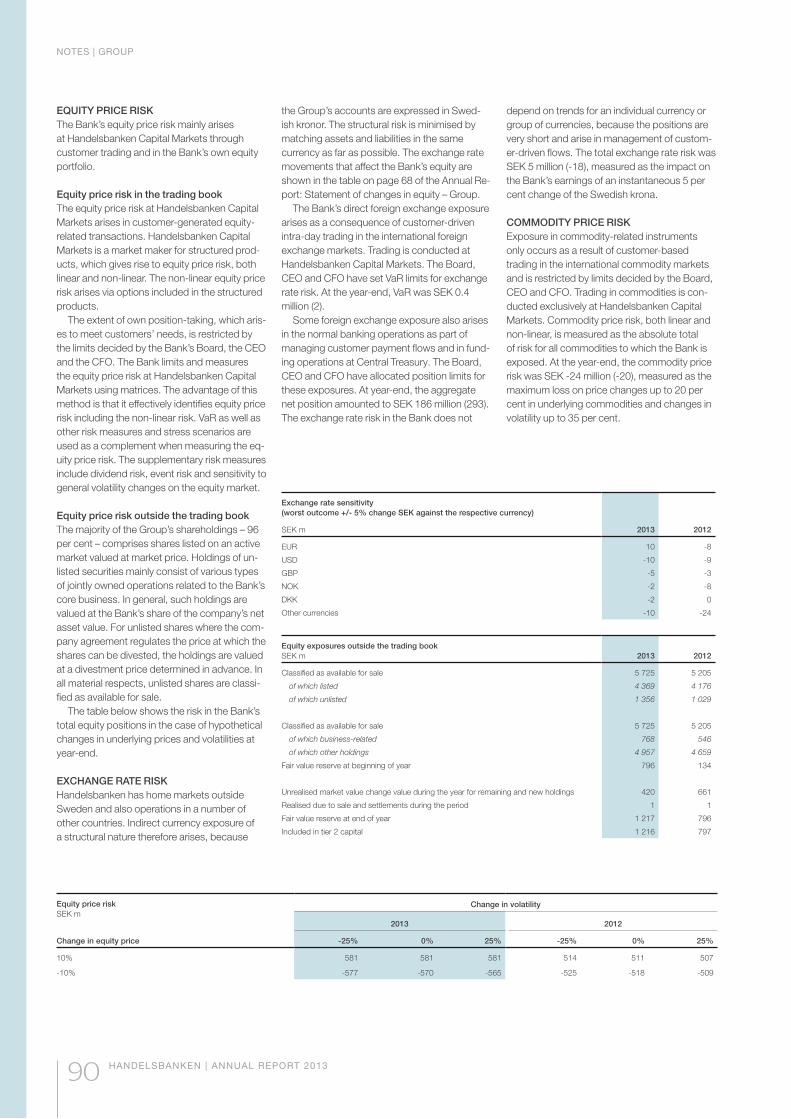
NOTES | GROUP
90 HANDELSBANKEN | ANNUAL REPORT 2013
EQUITY PRICE RISK The Bank’s equity price risk mainly arises at Handelsbanken Capital Markets through customer trading and in the Bank’s own equity portfolio.
Equity price risk in the trading bookThe equity price risk at Handelsbanken Capital Markets arises in customer-generated equity-related transactions. Handelsbanken Capital Markets is a market maker for structured prod-ucts, which gives rise to equity price risk, both linear and non-linear. The non-linear equity price risk arises via options included in the structured products.
The extent of own position-taking, which aris-es to meet customers’ needs, is restricted by the limits decided by the Bank’s Board, the CEO and the CFO. The Bank limits and measures the equity price risk at Handelsbanken Capital Markets using matrices. The advantage of this method is that it effectively identifies equity price risk including the non-linear risk. VaR as well as other risk measures and stress scenarios are used as a complement when measuring the eq-uity price risk. The supplementary risk measures include dividend risk, event risk and sensitivity to general volatility changes on the equity market.
Equity price risk outside the trading bookThe majority of the Group’s shareholdings – 96 per cent – comprises shares listed on an active market valued at market price. Holdings of un-listed securities mainly consist of various types of jointly owned operations related to the Bank’s core business. In general, such holdings are valued at the Bank’s share of the company’s net asset value. For unlisted shares where the com-pany agreement regulates the price at which the shares can be divested, the holdings are valued at a divestment price determined in advance. In all material respects, unlisted shares are classi-fied as available for sale.
The table below shows the risk in the Bank’s total equity positions in the case of hypothetical changes in underlying prices and volatilities at year-end.
EXCHANGE RATE RISKHandelsbanken has home markets outside Sweden and also operations in a number of other countries. Indirect currency exposure of a structural nature therefore arises, because
the Group’s accounts are expressed in Swed-ish kronor. The structural risk is minimised by matching assets and liabilities in the same currency as far as possible. The exchange rate movements that affect the Bank’s equity are shown in the table on page 68 of the Annual Re-port: Statement of changes in equity – Group.
The Bank’s direct foreign exchange exposure arises as a consequence of customer-driven intra-day trading in the international foreign exchange markets. Trading is conducted at Handelsbanken Capital Markets. The Board, CEO and CFO have set VaR limits for exchange rate risk. At the year-end, VaR was SEK 0.4 million (2).
Some foreign exchange exposure also arises in the normal banking operations as part of managing customer payment flows and in fund-ing operations at Central Treasury. The Board, CEO and CFO have allocated position limits for these exposures. At year-end, the aggregate net position amounted to SEK 186 million (293). The exchange rate risk in the Bank does not
depend on trends for an individual currency or group of currencies, because the positions are very short and arise in management of custom-er-driven flows. The total exchange rate risk was SEK 5 million (-18), measured as the impact on the Bank’s earnings of an instantaneous 5 per cent change of the Swedish krona.
COMMODITY PRICE RISKExposure in commodity-related instruments only occurs as a result of customer-based trading in the international commodity markets and is restricted by limits decided by the Board, CEO and CFO. Trading in commodities is con-ducted exclusively at Handelsbanken Capital Markets. Commodity price risk, both linear and non-linear, is measured as the absolute total of risk for all commodities to which the Bank is exposed. At the year-end, the commodity price risk was SEK -24 million (-20), measured as the maximum loss on price changes up to 20 per cent in underlying commodities and changes in volatility up to 35 per cent.
Exchange rate sensitivity(worst outcome +/- 5% change SEK against the respective currency)
SEK m 2013 2012
EUR 10 -8
USD -10 -9
GBP -5 -3
NOK -2 -8
DKK -2 0
Other currencies -10 -24
Equity exposures outside the trading bookSEK m 2013 2012
Classified as available for sale 5 725 5 205
of which listed 4 369 4 176
of which unlisted 1 356 1 029
Classified as available for sale 5 725 5 205
of which business-related 768 546
of which other holdings 4 957 4 659
Fair value reserve at beginning of year 796 134
Unrealised market value change value during the year for remaining and new holdings 420 661
Realised due to sale and settlements during the period 1 1
Fair value reserve at end of year 1 217 796
Included in tier 2 capital 1 216 797
Equity price riskSEK m
Change in volatility
2013 2012
Change in equity price -25% 0% 25% -25% 0% 25%
10% 581 581 581 514 511 507
-10% -577 -570 -565 -525 -518 -509
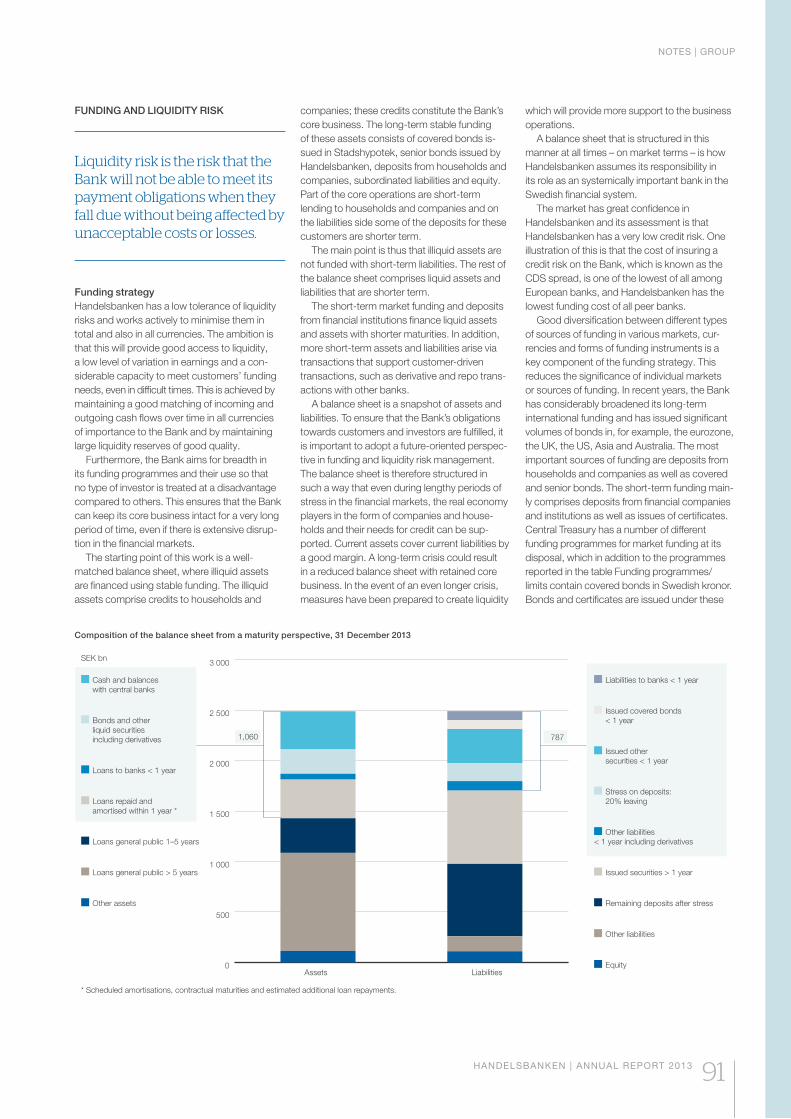
NOTES | GROUP
HANDELSBANKEN | ANNUAL REPORT 2013 91
0
500
1 000
1 500
2 000
2 500
3 000SEK bn
Cash and balances with central banks
Bonds and other liquid securities including derivatives
Loans to banks < 1 year
Loans repaid and amortised within 1 year *
Loans general public 1–5 years
Loans general public > 5 years
Other assets
Liabilities to banks < 1 year
Issued covered bonds < 1 year
Issued other securities < 1 year
Stress on deposits: 20% leaving
Other liabilities < 1 year including derivatives
Issued securities > 1 year
Remaining deposits after stress
Other liabilities
Equity
1,060 787
Assets Liabilities
* Scheduled amortisations, contractual maturities and estimated additional loan repayments.
Composition of the balance sheet from a maturity perspective, 31 December 2013
FUNDING AND LIQUIDITY RISK
Liquidity risk is the risk that the Bank will not be able to meet its payment obligations when they fall due without being affected by unacceptable costs or losses.
Funding strategyHandelsbanken has a low tolerance of liquidity risks and works actively to minimise them in total and also in all currencies. The ambition is that this will provide good access to liquidity, a low level of variation in earnings and a con-siderable capacity to meet customers’ funding needs, even in difficult times. This is achieved by maintaining a good matching of incoming and outgoing cash flows over time in all currencies of importance to the Bank and by maintaining large liquidity reserves of good quality.
Furthermore, the Bank aims for breadth in its funding programmes and their use so that no type of investor is treated at a disadvantage compared to others. This ensures that the Bank can keep its core business intact for a very long period of time, even if there is extensive disrup-tion in the financial markets.
The starting point of this work is a well-matched balance sheet, where illiquid assets are financed using stable funding. The illiquid assets comprise credits to households and
companies; these credits constitute the Bank’s core business. The long-term stable funding of these assets consists of covered bonds is-sued in Stadshypotek, senior bonds issued by Handelsbanken, deposits from households and companies, subordinated liabilities and equity. Part of the core operations are short-term lending to households and companies and on the liabilities side some of the deposits for these customers are shorter term.
The main point is thus that illiquid assets are not funded with short-term liabilities. The rest of the balance sheet comprises liquid assets and liabilities that are shorter term.
The short-term market funding and deposits from financial institutions finance liquid assets and assets with shorter maturities. In addition, more short-term assets and liabilities arise via transactions that support customer-driven transactions, such as derivative and repo trans-actions with other banks.
A balance sheet is a snapshot of assets and liabilities. To ensure that the Bank’s obligations towards customers and investors are fulfilled, it is important to adopt a future-oriented perspec-tive in funding and liquidity risk management. The balance sheet is therefore structured in such a way that even during lengthy periods of stress in the financial markets, the real economy players in the form of companies and house-holds and their needs for credit can be sup-ported. Current assets cover current liabilities by a good margin. A long-term crisis could result in a reduced balance sheet with retained core business. In the event of an even longer crisis, measures have been prepared to create liquidity
which will provide more support to the business operations.
A balance sheet that is structured in this manner at all times – on market terms – is how Handelsbanken assumes its responsibility in its role as an systemically important bank in the Swedish financial system.
The market has great confidence in Handelsbanken and its assessment is that Handelsbanken has a very low credit risk. One illustration of this is that the cost of insuring a credit risk on the Bank, which is known as the CDS spread, is one of the lowest of all among European banks, and Handelsbanken has the lowest funding cost of all peer banks.
Good diversification between different types of sources of funding in various markets, cur-rencies and forms of funding instruments is a key component of the funding strategy. This reduces the significance of individual markets or sources of funding. In recent years, the Bank has considerably broadened its long-term international funding and has issued significant volumes of bonds in, for example, the eurozone, the UK, the US, Asia and Australia. The most important sources of funding are deposits from households and companies as well as covered and senior bonds. The short-term funding main-ly comprises deposits from financial companies and institutions as well as issues of certificates. Central Treasury has a number of different funding programmes for market funding at its disposal, which in addition to the programmes reported in the table Funding programmes/limits contain covered bonds in Swedish kronor. Bonds and certificates are issued under these
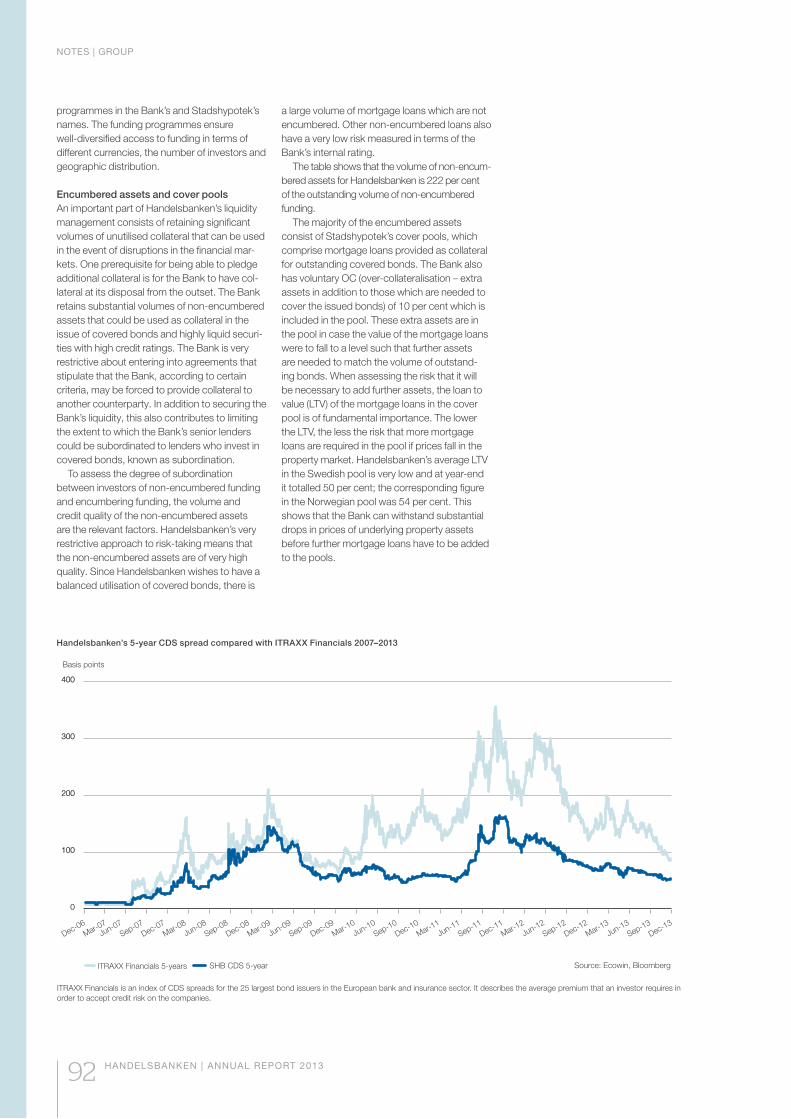
NOTES | GROUP
92 HANDELSBANKEN | ANNUAL REPORT 2013
programmes in the Bank’s and Stadshypotek’s names. The funding programmes ensure well-diversified access to funding in terms of different currencies, the number of investors and geographic distribution.
Encumbered assets and cover poolsAn important part of Handelsbanken’s liquidity management consists of retaining significant volumes of unutilised collateral that can be used in the event of disruptions in the financial mar-kets. One prerequisite for being able to pledge additional collateral is for the Bank to have col-lateral at its disposal from the outset. The Bank retains substantial volumes of non-encumbered assets that could be used as collateral in the issue of covered bonds and highly liquid securi-ties with high credit ratings. The Bank is very restrictive about entering into agreements that stipulate that the Bank, according to certain criteria, may be forced to provide collateral to another counterparty. In addition to securing the Bank’s liquidity, this also contributes to limiting the extent to which the Bank’s senior lenders could be subordinated to lenders who invest in covered bonds, known as subordination.
To assess the degree of subordination between investors of non-encumbered funding and encumbering funding, the volume and credit quality of the non-encumbered assets are the relevant factors. Handelsbanken’s very restrictive approach to risk-taking means that the non-encumbered assets are of very high quality. Since Handelsbanken wishes to have a balanced utilisation of covered bonds, there is
a large volume of mortgage loans which are not encumbered. Other non-encumbered loans also have a very low risk measured in terms of the Bank’s internal rating.
The table shows that the volume of non-encum-bered assets for Handelsbanken is 222 per cent of the outstanding volume of non-encumbered funding.
The majority of the encumbered assets consist of Stadshypotek’s cover pools, which comprise mortgage loans provided as collateral for outstanding covered bonds. The Bank also has voluntary OC (over-collateralisation – extra assets in addition to those which are needed to cover the issued bonds) of 10 per cent which is included in the pool. These extra assets are in the pool in case the value of the mortgage loans were to fall to a level such that further assets are needed to match the volume of outstand-ing bonds. When assessing the risk that it will be necessary to add further assets, the loan to value (LTV) of the mortgage loans in the cover pool is of fundamental importance. The lower the LTV, the less the risk that more mortgage loans are required in the pool if prices fall in the property market. Handelsbanken’s average LTV in the Swedish pool is very low and at year-end it totalled 50 per cent; the corresponding figure in the Norwegian pool was 54 per cent. This shows that the Bank can withstand substantial drops in prices of underlying property assets before further mortgage loans have to be added to the pools.
Handelsbanken’s 5-year CDS spread compared with ITRAXX Financials 2007–2013
0
100
200
300
400
0
100
200
300
400
Dec-06Dec-07
Sep-07Mar-0
7Jun-07
Mar-08Jun-08
Sep-08Dec-08
Mar-09Jun-09
Sep-09Dec-09
Mar-10Jun-10
Sep-10Dec-10
Mar-11Jun-11
Sep-11Dec-11
Mar-12Jun-12
Sep-12Dec-12
Mar-13Jun-13
Sep-13Dec-13
ITRAXX Financials 5-years SHB CDS 5-year Source: Ecowin, Bloomberg
Basis points
ITRAXX Financials is an index of CDS spreads for the 25 largest bond issuers in the European bank and insurance sector. It describes the average premium that an investor requires in order to accept credit risk on the companies.
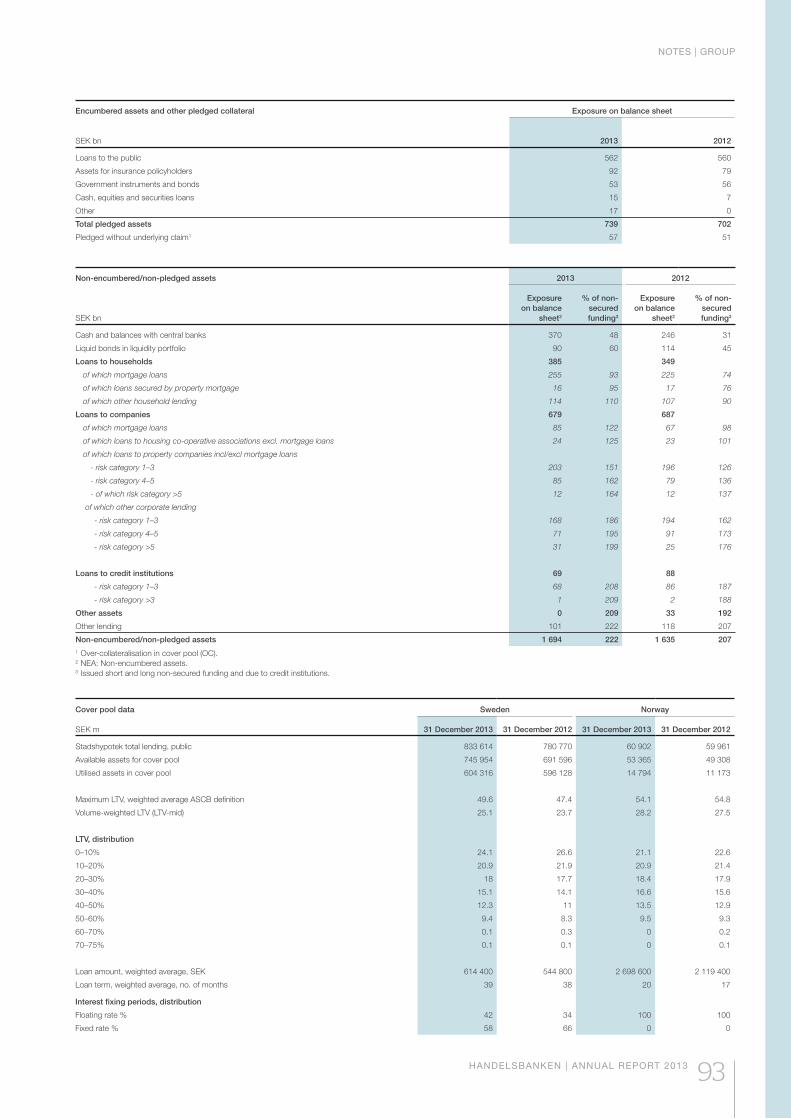
NOTES | GROUP
HANDELSBANKEN | ANNUAL REPORT 2013 93
Encumbered assets and other pledged collateral
SEK bn
Exposure on balance sheet
2013 2012
Loans to the public 562 560
Assets for insurance policyholders 92 79
Government instruments and bonds 53 56
Cash, equities and securities loans 15 7
Other 17 0
Total pledged assets 739 702
Pledged without underlying claim1 57 51
Non-encumbered/non-pledged assets
SEK bn
2013 2012
Exposure on balance
sheet2
% of non-secured funding3
Exposure on balance
sheet2
% of non-secured funding3
Cash and balances with central banks 370 48 246 31
Liquid bonds in liquidity portfolio 90 60 114 45
Loans to households 385 349
of which mortgage loans 255 93 225 74
of which loans secured by property mortgage 16 95 17 76
of which other household lending 114 110 107 90
Loans to companies 679 687
of which mortgage loans 85 122 67 98
of which loans to housing co-operative associations excl. mortgage loans 24 125 23 101
of which loans to property companies incl/excl mortgage loans
- risk category 1–3 203 151 196 126
- risk category 4–5 85 162 79 136
- of which risk category >5 12 164 12 137
of which other corporate lending
- risk category 1–3 168 186 194 162
- risk category 4–5 71 195 91 173
- risk category >5 31 199 25 176
Loans to credit institutions 69 88
- risk category 1–3 68 208 86 187
- risk category >3 1 209 2 188
Other assets 0 209 33 192
Other lending 101 222 118 207
Non-encumbered/non-pledged assets 1 694 222 1 635 2071 Over-collateralisation in cover pool (OC).2 NEA: Non-encumbered assets.3 Issued short and long non-secured funding and due to credit institutions.
Cover pool data
SEK m
Sweden Norway
31 December 2013 31 December 2012 31 December 2013 31 December 2012
Stadshypotek total lending, public 833 614 780 770 60 902 59 961
Available assets for cover pool 745 954 691 596 53 365 49 308
Utilised assets in cover pool 604 316 596 128 14 794 11 173
Maximum LTV, weighted average ASCB definition 49.6 47.4 54.1 54.8
Volume-weighted LTV (LTV-mid) 25.1 23.7 28.2 27.5
LTV, distribution
0–10% 24.1 26.6 21.1 22.6
10–20% 20.9 21.9 20.9 21.4
20–30% 18 17.7 18.4 17.9
30–40% 15.1 14.1 16.6 15.6
40–50% 12.3 11 13.5 12.9
50–60% 9.4 8.3 9.5 9.3
60–70% 0.1 0.3 0 0.2
70–75% 0.1 0.1 0 0.1
Loan amount, weighted average, SEK 614 400 544 800 2 698 600 2 119 400
Loan term, weighted average, no. of months 39 38 20 17
Interest fixing periods, distribution
Floating rate % 42 34 100 100
Fixed rate % 58 66 0 0
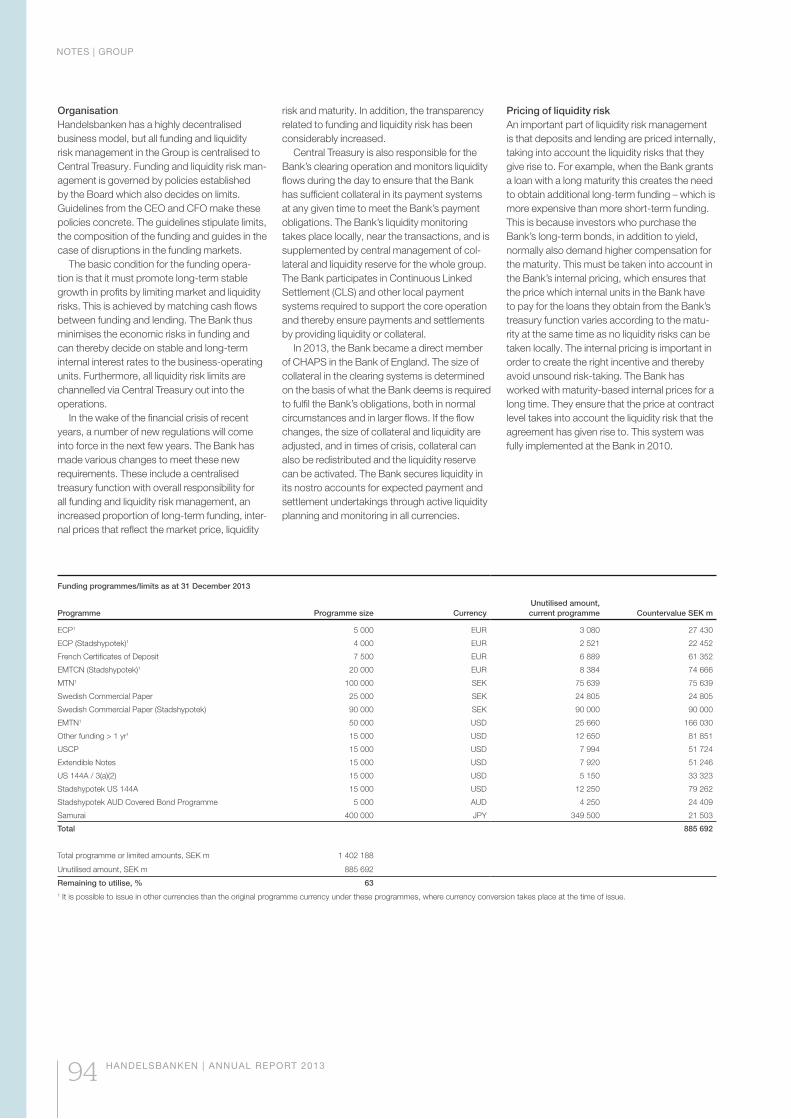
NOTES | GROUP
94 HANDELSBANKEN | ANNUAL REPORT 2013
OrganisationHandelsbanken has a highly decentralised business model, but all funding and liquidity risk management in the Group is centralised to Central Treasury. Funding and liquidity risk man-agement is governed by policies established by the Board which also decides on limits. Guidelines from the CEO and CFO make these policies concrete. The guidelines stipulate limits, the composition of the funding and guides in the case of disruptions in the funding markets.
The basic condition for the funding opera-tion is that it must promote long-term stable growth in profits by limiting market and liquidity risks. This is achieved by matching cash flows between funding and lending. The Bank thus minimises the economic risks in funding and can thereby decide on stable and long-term internal interest rates to the business-operating units. Furthermore, all liquidity risk limits are channelled via Central Treasury out into the operations.
In the wake of the financial crisis of recent years, a number of new regulations will come into force in the next few years. The Bank has made various changes to meet these new requirements. These include a centralised treasury function with overall responsibility for all funding and liquidity risk management, an increased proportion of long-term funding, inter-nal prices that reflect the market price, liquidity
risk and maturity. In addition, the transparency related to funding and liquidity risk has been considerably increased.
Central Treasury is also responsible for the Bank’s clearing operation and monitors liquidity flows during the day to ensure that the Bank has sufficient collateral in its payment systems at any given time to meet the Bank’s payment obligations. The Bank’s liquidity monitoring takes place locally, near the transactions, and is supplemented by central management of col-lateral and liquidity reserve for the whole group. The Bank participates in Continuous Linked Settlement (CLS) and other local payment systems required to support the core operation and thereby ensure payments and settlements by providing liquidity or collateral.
In 2013, the Bank became a direct member of CHAPS in the Bank of England. The size of collateral in the clearing systems is determined on the basis of what the Bank deems is required to fulfil the Bank’s obligations, both in normal circumstances and in larger flows. If the flow changes, the size of collateral and liquidity are adjusted, and in times of crisis, collateral can also be redistributed and the liquidity reserve can be activated. The Bank secures liquidity in its nostro accounts for expected payment and settlement undertakings through active liquidity planning and monitoring in all currencies.
Pricing of liquidity riskAn important part of liquidity risk management is that deposits and lending are priced internally, taking into account the liquidity risks that they give rise to. For example, when the Bank grants a loan with a long maturity this creates the need to obtain additional long-term funding – which is more expensive than more short-term funding. This is because investors who purchase the Bank’s long-term bonds, in addition to yield, normally also demand higher compensation for the maturity. This must be taken into account in the Bank’s internal pricing, which ensures that the price which internal units in the Bank have to pay for the loans they obtain from the Bank’s treasury function varies according to the matu-rity at the same time as no liquidity risks can be taken locally. The internal pricing is important in order to create the right incentive and thereby avoid unsound risk-taking. The Bank has worked with maturity-based internal prices for a long time. They ensure that the price at contract level takes into account the liquidity risk that the agreement has given rise to. This system was fully implemented at the Bank in 2010.
Funding programmes/limits as at 31 December 2013
Programme Programme size CurrencyUnutilised amount, current programme Countervalue SEK m
ECP1 5 000 EUR 3 080 27 430
ECP (Stadshypotek)1 4 000 EUR 2 521 22 452
French Certificates of Deposit 7 500 EUR 6 889 61 352
EMTCN (Stadshypotek)1 20 000 EUR 8 384 74 666
MTN1 100 000 SEK 75 639 75 639
Swedish Commercial Paper 25 000 SEK 24 805 24 805
Swedish Commercial Paper (Stadshypotek) 90 000 SEK 90 000 90 000
EMTN1 50 000 USD 25 660 166 030
Other funding > 1 yr1 15 000 USD 12 650 81 851
USCP 15 000 USD 7 994 51 724
Extendible Notes 15 000 USD 7 920 51 246
US 144A / 3(a)(2) 15 000 USD 5 150 33 323
Stadshypotek US 144A 15 000 USD 12 250 79 262
Stadshypotek AUD Covered Bond Programme 5 000 AUD 4 250 24 409
Samurai 400 000 JPY 349 500 21 503
Total 885 692
Total programme or limited amounts, SEK m 1 402 188
Unutilised amount, SEK m 885 692
Remaining to utilise, % 631 It is possible to issue in other currencies than the original programme currency under these programmes, where currency conversion takes place at the time of issue.
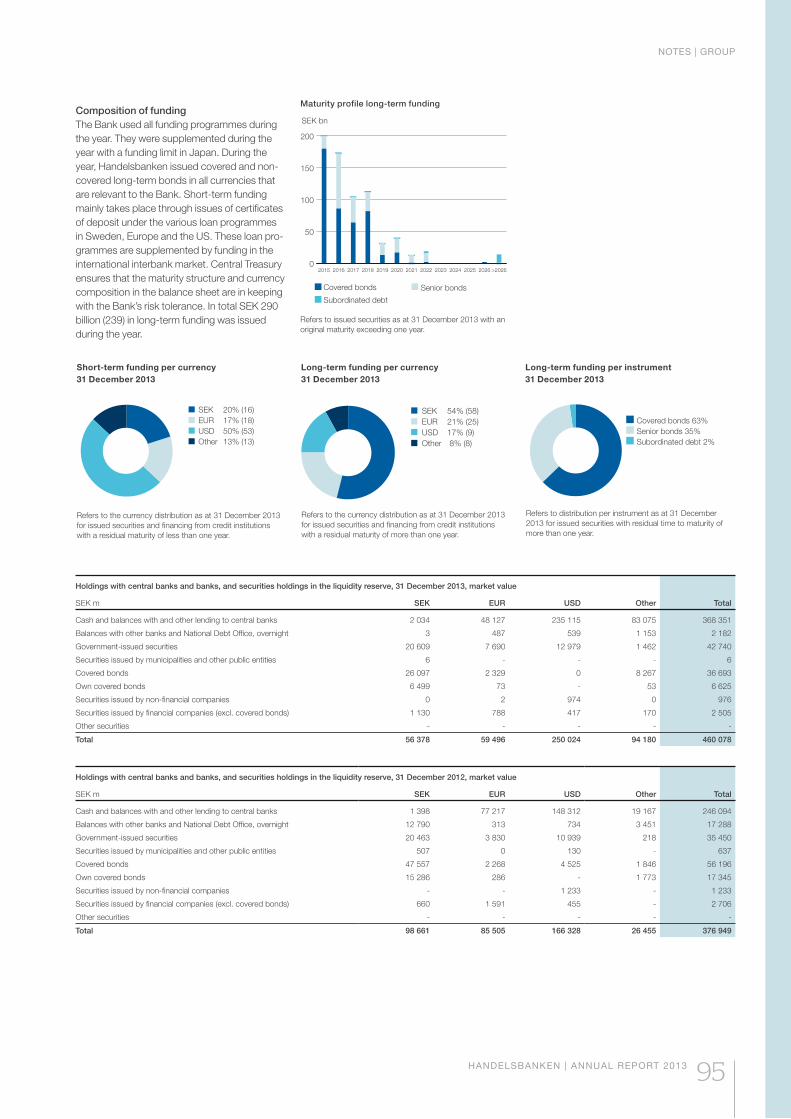
NOTES | GROUP
HANDELSBANKEN | ANNUAL REPORT 2013 95
Holdings with central banks and banks, and securities holdings in the liquidity reserve, 31 December 2013, market value
SEK m SEK EUR USD Other Total
Cash and balances with and other lending to central banks 2 034 48 127 235 115 83 075 368 351
Balances with other banks and National Debt Office, overnight 3 487 539 1 153 2 182
Government-issued securities 20 609 7 690 12 979 1 462 42 740
Securities issued by municipalities and other public entities 6 - - - 6
Covered bonds 26 097 2 329 0 8 267 36 693
Own covered bonds 6 499 73 - 53 6 625
Securities issued by non-financial companies 0 2 974 0 976
Securities issued by financial companies (excl. covered bonds) 1 130 788 417 170 2 505
Other securities - - - - -
Total 56 378 59 496 250 024 94 180 460 078
Holdings with central banks and banks, and securities holdings in the liquidity reserve, 31 December 2012, market value
SEK m SEK EUR USD Other Total
Cash and balances with and other lending to central banks 1 398 77 217 148 312 19 167 246 094
Balances with other banks and National Debt Office, overnight 12 790 313 734 3 451 17 288
Government-issued securities 20 463 3 830 10 939 218 35 450
Securities issued by municipalities and other public entities 507 0 130 - 637
Covered bonds 47 557 2 268 4 525 1 846 56 196
Own covered bonds 15 286 286 - 1 773 17 345
Securities issued by non-financial companies - - 1 233 - 1 233
Securities issued by financial companies (excl. covered bonds) 660 1 591 455 - 2 706
Other securities - - - - -
Total 98 661 85 505 166 328 26 455 376 949
Composition of fundingThe Bank used all funding programmes during the year. They were supplemented during the year with a funding limit in Japan. During the year, Handelsbanken issued covered and non-covered long-term bonds in all currencies that are relevant to the Bank. Short-term funding mainly takes place through issues of certificates of deposit under the various loan programmes in Sweden, Europe and the US. These loan pro-grammes are supplemented by funding in the international interbank market. Central Treasury ensures that the maturity structure and currency composition in the balance sheet are in keeping with the Bank’s risk tolerance. In total SEK 290 billion (239) in long-term funding was issued during the year.
Refers to the currency distribution as at 31 December 2013 for issued securities and financing from credit institutions with a residual maturity of less than one year.
SEK 20% (16)EUR 17% (18)USD 50% (53)Other 13% (13)
Short-term funding per currency 31 December 2013
Refers to the currency distribution as at 31 December 2013 for issued securities and financing from credit institutions with a residual maturity of more than one year.
SEK 54% (58)EUR 21% (25)USD 17% (9)Other 8% (8)
Long-term funding per currency 31 December 2013
Refers to distribution per instrument as at 31 December 2013 for issued securities with residual time to maturity of more than one year.
Covered bonds 63%Senior bonds 35%Subordinated debt 2%
Long-term funding per instrument 31 December 2013
Maturity profile long-term funding
0
50
100
150
200
>2026202620252024202320222021202020192018201720162015
Covered bonds Senior bonds
Subordinated debt
SEK bn
Refers to issued securities as at 31 December 2013 with an original maturity exceeding one year.
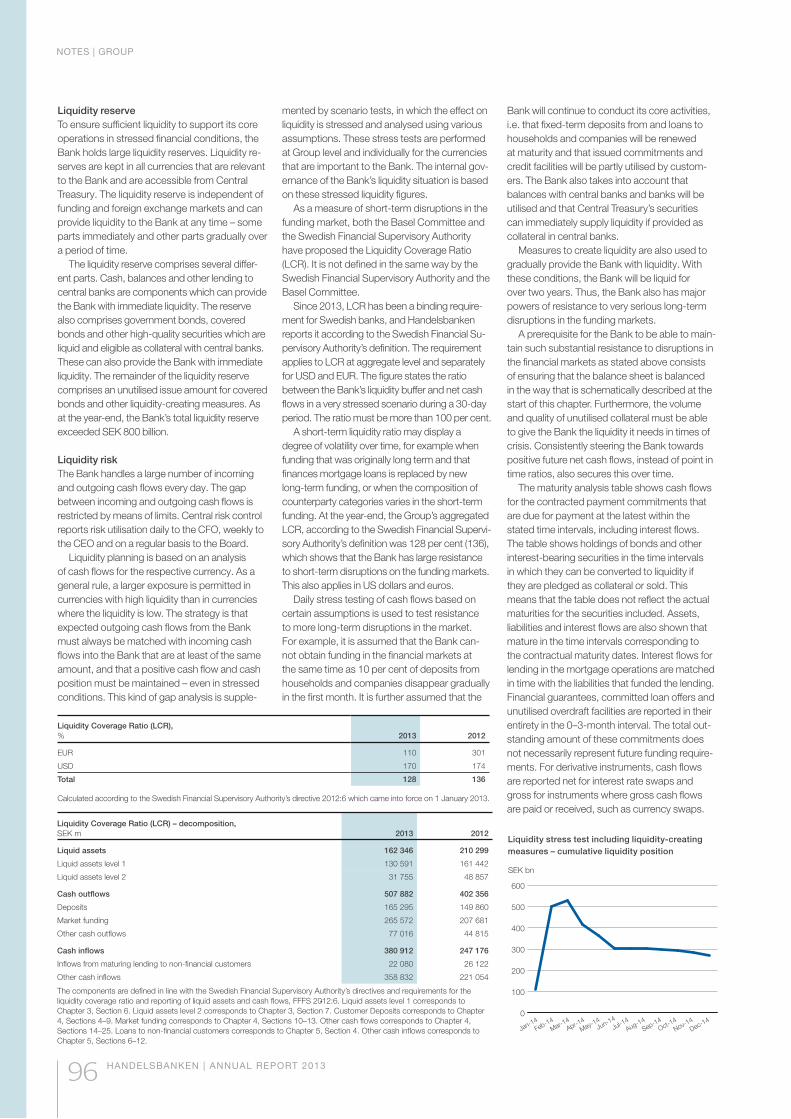
NOTES | GROUP
96 HANDELSBANKEN | ANNUAL REPORT 2013
mented by scenario tests, in which the effect on liquidity is stressed and analysed using various assumptions. These stress tests are performed at Group level and individually for the currencies that are important to the Bank. The internal gov-ernance of the Bank’s liquidity situation is based on these stressed liquidity figures.
As a measure of short-term disruptions in the funding market, both the Basel Committee and the Swedish Financial Supervisory Authority have proposed the Liquidity Coverage Ratio (LCR). It is not defined in the same way by the Swedish Financial Supervisory Authority and the Basel Committee.
Since 2013, LCR has been a binding require-ment for Swedish banks, and Handelsbanken reports it according to the Swedish Financial Su-pervisory Authority’s definition. The requirement applies to LCR at aggregate level and separately for USD and EUR. The figure states the ratio between the Bank’s liquidity buffer and net cash flows in a very stressed scenario during a 30-day period. The ratio must be more than 100 per cent.
A short-term liquidity ratio may display a degree of volatility over time, for example when funding that was originally long term and that finances mortgage loans is replaced by new long-term funding, or when the composition of counterparty categories varies in the short-term funding. At the year-end, the Group’s aggregated LCR, according to the Swedish Financial Supervi-sory Authority’s definition was 128 per cent (136), which shows that the Bank has large resistance to short-term disruptions on the funding markets. This also applies in US dollars and euros.
Daily stress testing of cash flows based on certain assumptions is used to test resistance to more long-term disruptions in the market. For example, it is assumed that the Bank can-not obtain funding in the financial markets at the same time as 10 per cent of deposits from households and companies disappear gradually in the first month. It is further assumed that the
Bank will continue to conduct its core activities, i.e. that fixed-term deposits from and loans to households and companies will be renewed at maturity and that issued commitments and credit facilities will be partly utilised by custom-ers. The Bank also takes into account that balances with central banks and banks will be utilised and that Central Treasury’s securities can immediately supply liquidity if provided as collateral in central banks.
Measures to create liquidity are also used to gradually provide the Bank with liquidity. With these conditions, the Bank will be liquid for over two years. Thus, the Bank also has major powers of resistance to very serious long-term disruptions in the funding markets.
A prerequisite for the Bank to be able to main-tain such substantial resistance to disruptions in the financial markets as stated above consists of ensuring that the balance sheet is balanced in the way that is schematically described at the start of this chapter. Furthermore, the volume and quality of unutilised collateral must be able to give the Bank the liquidity it needs in times of crisis. Consistently steering the Bank towards positive future net cash flows, instead of point in time ratios, also secures this over time.
The maturity analysis table shows cash flows for the contracted payment commitments that are due for payment at the latest within the stated time intervals, including interest flows. The table shows holdings of bonds and other interest-bearing securities in the time intervals in which they can be converted to liquidity if they are pledged as collateral or sold. This means that the table does not reflect the actual maturities for the securities included. Assets, liabilities and interest flows are also shown that mature in the time intervals corresponding to the contractual maturity dates. Interest flows for lending in the mortgage operations are matched in time with the liabilities that funded the lending. Financial guarantees, committed loan offers and unutilised overdraft facilities are reported in their entirety in the 0–3-month interval. The total out-standing amount of these commitments does not necessarily represent future funding require-ments. For derivative instruments, cash flows are reported net for interest rate swaps and gross for instruments where gross cash flows are paid or received, such as currency swaps.
0
100
200
300
400
500
600
SEK bn
Jan-14Feb-14
Mar-14Apr-1
4May-1
4Jun-14
Jul-14Aug-14
Sep-14Oct-1
4Nov-1
4Dec-14
Liquidity stress test including liquidity-creating measures – cumulative liquidity position
Liquidity reserveTo ensure sufficient liquidity to support its core operations in stressed financial conditions, the Bank holds large liquidity reserves. Liquidity re-serves are kept in all currencies that are relevant to the Bank and are accessible from Central Treasury. The liquidity reserve is independent of funding and foreign exchange markets and can provide liquidity to the Bank at any time – some parts immediately and other parts gradually over a period of time.
The liquidity reserve comprises several differ-ent parts. Cash, balances and other lending to central banks are components which can provide the Bank with immediate liquidity. The reserve also comprises government bonds, covered bonds and other high-quality securities which are liquid and eligible as collateral with central banks. These can also provide the Bank with immediate liquidity. The remainder of the liquidity reserve comprises an unutilised issue amount for covered bonds and other liquidity-creating measures. As at the year-end, the Bank’s total liquidity reserve exceeded SEK 800 billion.
Liquidity riskThe Bank handles a large number of incoming and outgoing cash flows every day. The gap between incoming and outgoing cash flows is restricted by means of limits. Central risk control reports risk utilisation daily to the CFO, weekly to the CEO and on a regular basis to the Board.
Liquidity planning is based on an analysis of cash flows for the respective currency. As a general rule, a larger exposure is permitted in currencies with high liquidity than in currencies where the liquidity is low. The strategy is that expected outgoing cash flows from the Bank must always be matched with incoming cash flows into the Bank that are at least of the same amount, and that a positive cash flow and cash position must be maintained – even in stressed conditions. This kind of gap analysis is supple-
Liquidity Coverage Ratio (LCR), % 2013 2012
EUR 110 301
USD 170 174
Total 128 136
Calculated according to the Swedish Financial Supervisory Authority’s directive 2012:6 which came into force on 1 January 2013.
Liquidity Coverage Ratio (LCR) – decomposition, SEK m 2013 2012
Liquid assets 162 346 210 299
Liquid assets level 1 130 591 161 442
Liquid assets level 2 31 755 48 857
Cash outflows 507 882 402 356
Deposits 165 295 149 860
Market funding 265 572 207 681
Other cash outflows 77 016 44 815
Cash inflows 380 912 247 176
Inflows from maturing lending to non-financial customers 22 080 26 122
Other cash inflows 358 832 221 054
The components are defined in line with the Swedish Financial Supervisory Authority’s directives and requirements for the liquidity coverage ratio and reporting of liquid assets and cash flows, FFFS 2012:6. Liquid assets level 1 corresponds to Chapter 3, Section 6. Liquid assets level 2 corresponds to Chapter 3, Section 7. Customer Deposits corresponds to Chapter 4, Sections 4–9. Market funding corresponds to Chapter 4, Sections 10–13. Other cash flows corresponds to Chapter 4, Sections 14–25. Loans to non-financial customers corresponds to Chapter 5, Section 4. Other cash inflows corresponds to Chapter 5, Sections 6–12.
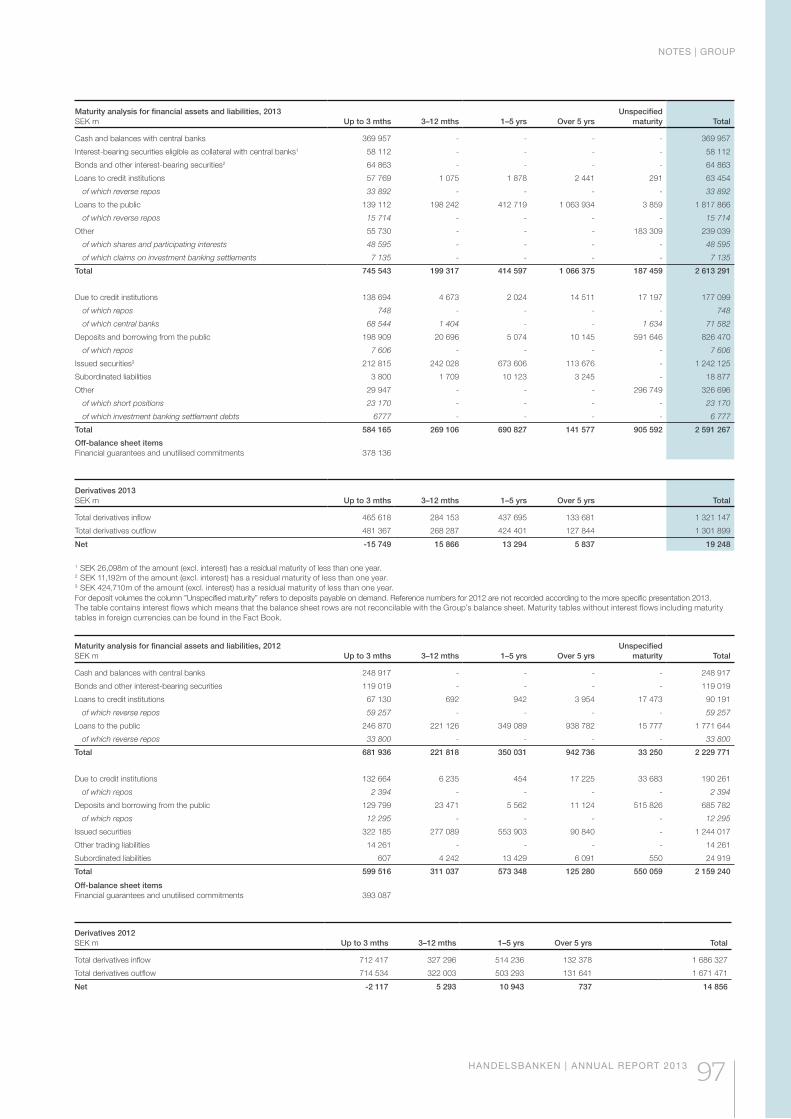
NOTES | GROUP
HANDELSBANKEN | ANNUAL REPORT 2013 97
Maturity analysis for financial assets and liabilities, 2013SEK m Up to 3 mths 3–12 mths 1–5 yrs Over 5 yrs
Unspecified maturity Total
Cash and balances with central banks 369 957 - - - - 369 957
Interest-bearing securities eligible as collateral with central banks1 58 112 - - - - 58 112
Bonds and other interest-bearing securities2 64 863 - - - - 64 863
Loans to credit institutions 57 769 1 075 1 878 2 441 291 63 454
of which reverse repos 33 892 - - - - 33 892
Loans to the public 139 112 198 242 412 719 1 063 934 3 859 1 817 866
of which reverse repos 15 714 - - - - 15 714
Other 55 730 - - - 183 309 239 039
of which shares and participating interests 48 595 - - - - 48 595
of which claims on investment banking settlements 7 135 - - - - 7 135
Total 745 543 199 317 414 597 1 066 375 187 459 2 613 291
Due to credit institutions 138 694 4 673 2 024 14 511 17 197 177 099
of which repos 748 - - - - 748
of which central banks 68 544 1 404 - - 1 634 71 582
Deposits and borrowing from the public 198 909 20 696 5 074 10 145 591 646 826 470
of which repos 7 606 - - - - 7 606
Issued securities3 212 815 242 028 673 606 113 676 - 1 242 125
Subordinated liabilities 3 800 1 709 10 123 3 245 - 18 877
Other 29 947 - - - 296 749 326 696
of which short positions 23 170 - - - - 23 170
of which investment banking settlement debts 6777 - - - - 6 777
Total 584 165 269 106 690 827 141 577 905 592 2 591 267
Off-balance sheet itemsFinancial guarantees and unutilised commitments 378 136
Derivatives 2013SEK m Up to 3 mths 3–12 mths 1–5 yrs Over 5 yrs Total
Total derivatives inflow 465 618 284 153 437 695 133 681 1 321 147
Total derivatives outflow 481 367 268 287 424 401 127 844 1 301 899
Net -15 749 15 866 13 294 5 837 19 248
1 SEK 26,098m of the amount (excl. interest) has a residual maturity of less than one year.2 SEK 11,192m of the amount (excl. interest) has a residual maturity of less than one year.3 SEK 424,710m of the amount (excl. interest) has a residual maturity of less than one year.For deposit volumes the column ”Unspecified maturity” refers to deposits payable on demand. Reference numbers for 2012 are not recorded according to the more specific presentation 2013.The table contains interest flows which means that the balance sheet rows are not reconcilable with the Group’s balance sheet. Maturity tables without interest flows including maturity tables in foreign currencies can be found in the Fact Book.
Maturity analysis for financial assets and liabilities, 2012SEK m Up to 3 mths 3–12 mths 1–5 yrs Over 5 yrs
Unspecified maturity Total
Cash and balances with central banks 248 917 - - - - 248 917
Bonds and other interest-bearing securities 119 019 - - - - 119 019
Loans to credit institutions 67 130 692 942 3 954 17 473 90 191
of which reverse repos 59 257 - - - - 59 257
Loans to the public 246 870 221 126 349 089 938 782 15 777 1 771 644
of which reverse repos 33 800 - - - - 33 800
Total 681 936 221 818 350 031 942 736 33 250 2 229 771
Due to credit institutions 132 664 6 235 454 17 225 33 683 190 261
of which repos 2 394 - - - - 2 394
Deposits and borrowing from the public 129 799 23 471 5 562 11 124 515 826 685 782
of which repos 12 295 - - - - 12 295
Issued securities 322 185 277 089 553 903 90 840 - 1 244 017
Other trading liabilities 14 261 - - - - 14 261
Subordinated liabilities 607 4 242 13 429 6 091 550 24 919
Total 599 516 311 037 573 348 125 280 550 059 2 159 240
Off-balance sheet itemsFinancial guarantees and unutilised commitments 393 087
Derivatives 2012SEK m Up to 3 mths 3–12 mths 1–5 yrs Over 5 yrs Total
Total derivatives inflow 712 417 327 296 514 236 132 378 1 686 327
Total derivatives outflow 714 534 322 003 503 293 131 641 1 671 471
Net -2 117 5 293 10 943 737 14 856
NOTES | GROUP
98 HANDELSBANKEN | ANNUAL REPORT 2013
RISKS IN THE INSURANCE OPERATIONS
The risks in the insurance business mainly comprise market risks and insurance risks.
Market riskHandelsbanken Liv conducts life insurance operations with traditional management, unit-linked insurance and portfolio bond insurance. For unit-linked and portfolio bond insurance, the customer chooses the investment option and bears the market risk. In traditional insur-ance with guaranteed interest, Handelsbanken Liv bears the risk of the financial guarantees en-tailed by the insurance terms not being fulfilled.
The financial guarantee means that the com-pany makes a capital contribution at the value of the insurance contract at specific points in time when the value is less than the guaranteed value of the insurance. Any capital contributions are realised at the year-end or when there is an insurance event.
Handelsbanken Liv’s board establishes the annual investment guidelines for the company, and this is the ultimate controlling document for allocation of the company’s investment assets relating to traditionally managed insurance. The purpose of the investment guidelines is to provide instructions on how the assets are to be invested given the undertakings to the policyholders and the statutory requirements of the Swedish Insurance Business Act and the applicable regulations of the Swedish Financial Supervisory Authority.
Handelsbanken Liv has a low risk tolerance. The goal of the asset management is to secure the company’s obligations to the policyholders.
Market risk at Handelsbanken Liv arises in the management of investment assets for the traditional insurance and from the fact that valu-ation of the company’s obligations is sensitive to interest rate changes.
The total market risk at Handelsbanken Liv is calculated using Value at Risk (VaR) with a 99.5 per cent confidence level and a holding period of one quarter. In addition, the company’s solvency ratio, the so-called traffic-light model and cover of liabilities are checked accord-ing to statutory requirements. The market risk management model used by Handelsbanken Liv weights the risk of a capital contribution at insurance contract level together with the risk of a capital contribution at company level due to the increased present value of future guaranteed amounts. Market risk is measured in terms of the overall sensitivity of the capital contribu-tions to market disruptions. The risk exposure is checked daily against a limit stipulated by the Board of Handelsbanken. The larger of the value of contributions to policyholders or contributions due to solvency constitutes the risk utilisation. Sub-categories of financial risk are interest rate
risk, equity risk, credit risk, property risk and cur-rency risk. The main risk at Handelsbanken Liv is interest rate risk. At year-end, VaR was SEK 893 million (995).
Liquidity risk in the insurance operations is the risk that the company will not be able to meet its payment obligations when they fall due, or that the company will not be able to sell secu-rities at acceptable prices. This risk is limited by most of the investment assets being invested in listed securities with good liquidity.
Insurance riskInsurance companies set their premiums based on assumptions regarding the size of costs for future insurance events. Insurance risk is the risk that the actual and assumed insurance costs differ. The ultimate controlling document is the insurance risk policy issued by the board of Handelsbanken Liv, specifying the amounts within which insurance policies may be issued.
Insurance risk at Handelsbanken Liv is related to the following events:
event of the death of the insured person
insured person living, e.g. pension disburse-ments
work incapacity
An insurance policy may contain combinations of these four events.
Most of Handelsbanken Liv’s policies are taken out by small companies and private indi-viduals. There is no risk concentration in terms of insurance risk, other than that most of the policies are taken out in Sweden.
Increased longevity in Sweden has an impact on the life insurance company’s future com-mitments. The effect is positive for mortality insurance, but for life insurance it could become an economic burden for the company since average life expectancy is rising and pension disbursements must then be made over a longer period. Since 2009, Handelsbanken Liv has used life expectancy assumptions according to DUS06, which is the industry standard. If mortality continued to decline and in general were to be 10 per cent lower than the company’s assumptions, the present value of the expected increased cost would be SEK 56 million, for the older section of the group who have lifelong payouts. Most of Handelsbanken Liv’s insurance policies with mortality risk are, however, priced annually. This means that the company can unilaterally change the premium from year to year. Thus, an incorrect mortality assumption can be changed with rapid effect.
Changes in morbidity occur much more rapidly than changes in mortality, which may con-tribute to variations in the risk result. The result therefore depends both on how many insured persons fall ill and how many recover in relation to the assumptions applied. Sickness/disability
insurance products are generally designed in such a way that the premium can be changed annually, thus allowing the company to com-pensate for changes in morbidity. The sickness/disability result for 2013 is SEK 67 million, where SEK 70 million is attributable to sickness cases reported during the year, SEK -19 million to exist-ing sickness cases which are being closed and the remaining SEK 16 million to sickness cases which have occurred but not yet been reported.
The insurance operations report their market, insurance and operational risks to the insur-ance company’s board and chief executive, to Handelsbanken’s central risk control and to the Bank’s CFO and CEO. The risk situation is also reported regularly to the Board of the Bank.
Solvency IIDuring the past few years, Handelsbanken Liv has worked actively on adapting its operations to future new regulatory demands and this will continue during 2014. The full introduction of the Solvency II regulations is expected in 2016 when the directive will also be implemented in Swedish law. As of January 2014 parts of the regulations are being introduced into the super-visory authorities’ practical supervision work. For example, new stipulations on calculating discounting curves for solvency, a traffic-light model and cover of liabilities will come into force.
One overall purpose of the regulations is to strengthen protection for insurance policyhold-ers by linking the solvency requirement and thereby the capital requirement more clearly to how the insurance companies identify, measure and manage all risks.
OPERATIONAL RISK
Operational risk refers to the risk of loss due to inadequate or failed internal processes, people and systems, or external events. The definition includes legal risk.
Handelsbanken has a low tolerance of opera-tional risks and works actively to identify and manage operational risks. This work is sup-ported by the Bank’s strict attitude to risk, but also by the strong focus on cost-effectiveness, since deficiencies in administrative order can easily lead to unnecessary costs.
Operational errors and deficiencies are therefore reduced as far as possible. This applies to minor but frequent events and major events which could cause major unexpected losses. The Bank’s management performs frequent, active follow-ups of operational risk through the organisation for risk control. Operational risks which may lead to the most serious conse-quences are the subject of special attention.
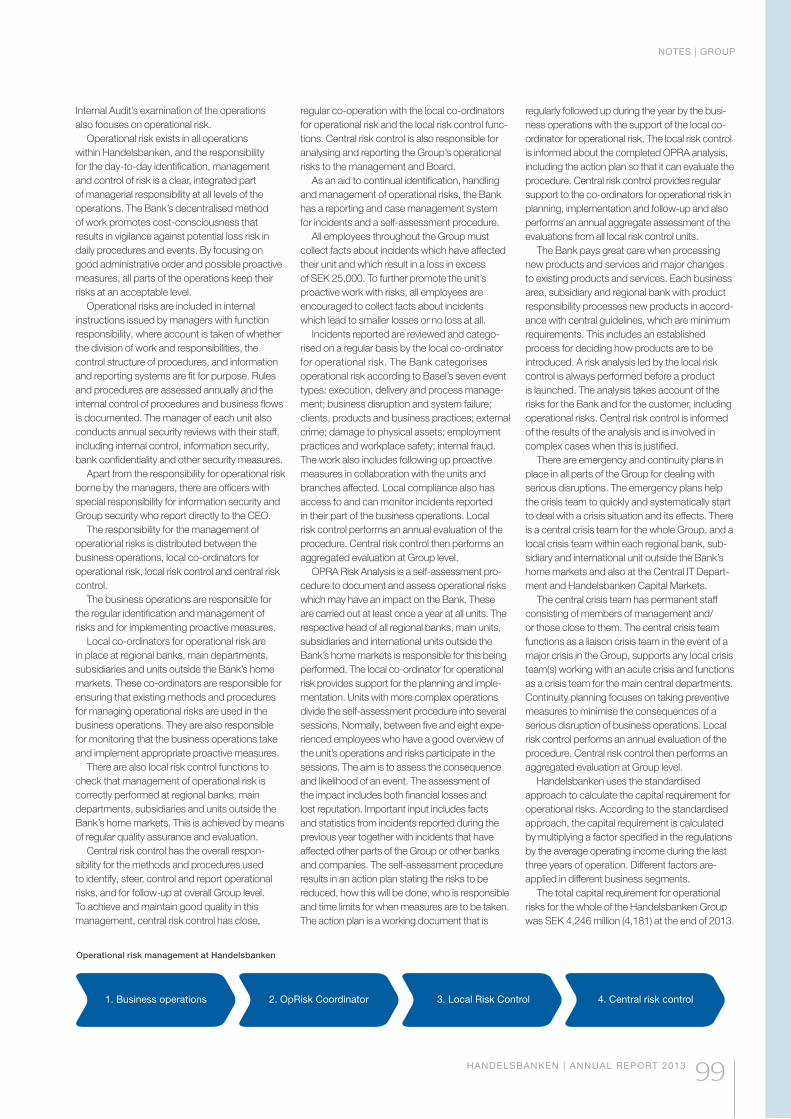
NOTES | GROUP
HANDELSBANKEN | ANNUAL REPORT 2013 99
1. Business operations 2. OpRisk Coordinator 3. Local Risk Control 4. Central risk control
Operational risk management at Handelsbanken
Internal Audit’s examination of the operations also focuses on operational risk.
Operational risk exists in all operations within Handelsbanken, and the responsibility for the day-to-day identification, management and control of risk is a clear, integrated part of managerial responsibility at all levels of the operations. The Bank’s decentralised method of work promotes cost-consciousness that results in vigilance against potential loss risk in daily procedures and events. By focusing on good administrative order and possible proactive measures, all parts of the operations keep their risks at an acceptable level.
Operational risks are included in internal instructions issued by managers with function responsibility, where account is taken of whether the division of work and responsibilities, the control structure of procedures, and information and reporting systems are fit for purpose. Rules and procedures are assessed annually and the internal control of procedures and business flows is documented. The manager of each unit also conducts annual security reviews with their staff, including internal control, information security, bank confidentiality and other security measures.
Apart from the responsibility for operational risk borne by the managers, there are officers with special responsibility for information security and Group security who report directly to the CEO.
The responsibility for the management of operational risks is distributed between the business operations, local co-ordinators for operational risk, local risk control and central risk control.
The business operations are responsible for the regular identification and management of risks and for implementing proactive measures.
Local co-ordinators for operational risk are in place at regional banks, main departments, subsidiaries and units outside the Bank’s home markets. These co-ordinators are responsible for ensuring that existing methods and procedures for managing operational risks are used in the business operations. They are also responsible for monitoring that the business operations take and implement appropriate proactive measures.
There are also local risk control functions to check that management of operational risk is correctly performed at regional banks, main departments, subsidiaries and units outside the Bank’s home markets. This is achieved by means of regular quality assurance and evaluation.
Central risk control has the overall respon-sibility for the methods and procedures used to identify, steer, control and report operational risks, and for follow-up at overall Group level. To achieve and maintain good quality in this management, central risk control has close,
regular co-operation with the local co-ordinators for operational risk and the local risk control func-tions. Central risk control is also responsible for analysing and reporting the Group’s operational risks to the management and Board.
As an aid to continual identification, handling and management of operational risks, the Bank has a reporting and case management system for incidents and a self-assessment procedure.
All employees throughout the Group must collect facts about incidents which have affected their unit and which result in a loss in excess of SEK 25,000. To further promote the unit’s proactive work with risks, all employees are encouraged to collect facts about incidents which lead to smaller losses or no loss at all.
Incidents reported are reviewed and catego-rised on a regular basis by the local co-ordinator for operational risk. The Bank categorises oper ational risk according to Basel’s seven event types: execution, delivery and process manage-ment; business disruption and system failure; clients, products and business practices; external crime; damage to physical assets; employment practices and workplace safety; internal fraud. The work also includes following up proactive measures in collaboration with the units and branches affected. Local compliance also has access to and can monitor incidents reported in their part of the business operations. Local risk control performs an annual evaluation of the procedure. Central risk control then performs an aggregated evaluation at Group level.
OPRA Risk Analysis is a self-assessment pro-cedure to document and assess operational risks which may have an impact on the Bank. These are carried out at least once a year at all units. The respective head of all regional banks, main units, subsidiaries and international units outside the Bank’s home markets is responsible for this being performed. The local co-ordinator for operational risk provides support for the planning and imple-mentation. Units with more complex operations divide the self-assessment procedure into several sessions. Normally, between five and eight expe-rienced employees who have a good overview of the unit’s operations and risks participate in the sessions. The aim is to assess the consequence and likelihood of an event. The assessment of the impact includes both financial losses and lost reputation. Important input includes facts and statistics from incidents reported during the previous year together with incidents that have affected other parts of the Group or other banks and companies. The self-assessment procedure results in an action plan stating the risks to be reduced, how this will be done, who is responsible and time limits for when measures are to be taken. The action plan is a working document that is
regularly followed up during the year by the busi-ness operations with the support of the local co-ordinator for operational risk. The local risk control is informed about the completed OPRA analysis, including the action plan so that it can evaluate the procedure. Central risk control provides regular support to the co-ordinators for operational risk in planning, implementation and follow-up and also performs an annual aggregate assessment of the evaluations from all local risk control units.
The Bank pays great care when processing new products and services and major changes to existing products and services. Each business area, subsidiary and regional bank with product responsibility processes new products in accord-ance with central guidelines, which are minimum requirements. This includes an established process for deciding how products are to be introduced. A risk analysis led by the local risk control is always performed before a product is launched. The analysis takes account of the risks for the Bank and for the customer, including operational risks. Central risk control is informed of the results of the analysis and is involved in complex cases when this is justified.
There are emergency and continuity plans in place in all parts of the Group for dealing with serious disruptions. The emergency plans help the crisis team to quickly and systematically start to deal with a crisis situation and its effects. There is a central crisis team for the whole Group, and a local crisis team within each regional bank, sub-sidiary and international unit outside the Bank’s home markets and also at the Central IT Depart-ment and Handelsbanken Capital Markets.
The central crisis team has permanent staff consisting of members of management and/or those close to them. The central crisis team functions as a liaison crisis team in the event of a major crisis in the Group, supports any local crisis team(s) working with an acute crisis and functions as a crisis team for the main central departments. Continuity planning focuses on taking preventive measures to minimise the consequences of a serious disruption of business operations. Local risk control performs an annual evaluation of the procedure. Central risk control then performs an aggregated evaluation at Group level.
Handelsbanken uses the standardised approach to calculate the capital requirement for operational risks. According to the standardised approach, the capital requirement is calculated by multiplying a factor specified in the regulations by the average operating income during the last three years of operation. Different factors are-applied in different business segments.
The total capital requirement for operational risks for the whole of the Handelsbanken Group was SEK 4,246 million (4,181) at the end of 2013.
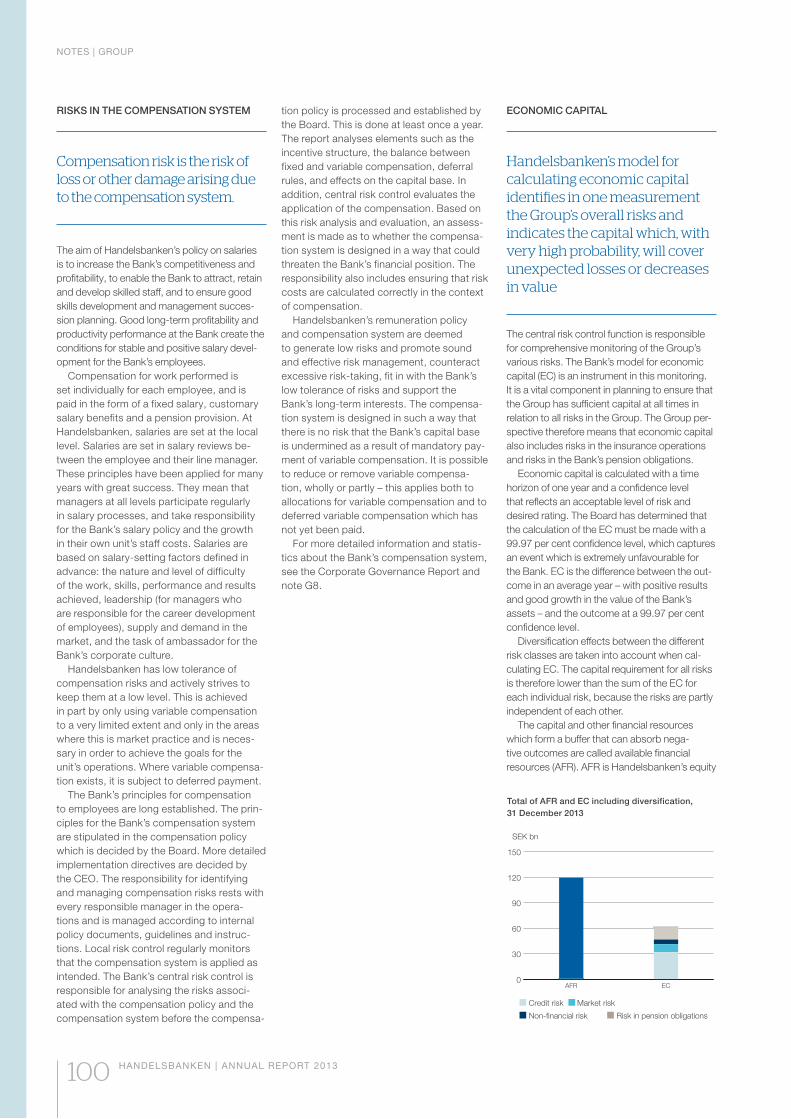
NOTES | GROUP
100 HANDELSBANKEN | ANNUAL REPORT 2013
RISKS IN THE COMPENSATION SYSTEM
Compensation risk is the risk of loss or other damage arising due to the compensation system.
The aim of Handelsbanken’s policy on salaries is to increase the Bank’s competitiveness and profitability, to enable the Bank to attract, retain and develop skilled staff, and to ensure good skills development and management succes-sion planning. Good long-term profitability and productivity performance at the Bank create the conditions for stable and positive salary devel-opment for the Bank’s employees.
Compensation for work performed is set individually for each employee, and is paid in the form of a fixed salary, customary salary benefits and a pension provision. At Handelsbanken, salaries are set at the local level. Salaries are set in salary reviews be-tween the employee and their line manager. These principles have been applied for many years with great success. They mean that managers at all levels participate regularly in salary processes, and take responsibility for the Bank’s salary policy and the growth in their own unit’s staff costs. Salaries are based on salary-setting factors defined in advance: the nature and level of difficulty of the work, skills, performance and results achieved, leadership (for managers who are responsible for the career development of employees), supply and demand in the market, and the task of ambassador for the Bank’s corporate culture.
Handelsbanken has low tolerance of compensation risks and actively strives to keep them at a low level. This is achieved in part by only using variable compensation to a very limited extent and only in the areas where this is market practice and is neces-sary in order to achieve the goals for the unit’s operations. Where variable compensa-tion exists, it is subject to deferred payment.
The Bank’s principles for compensation to employees are long established. The prin-ciples for the Bank’s compensation system are stipulated in the compensation policy which is decided by the Board. More detailed implementation directives are decided by the CEO. The responsibility for identifying and managing compensation risks rests with every responsible manager in the opera-tions and is managed according to internal policy documents, guidelines and instruc-tions. Local risk control regularly monitors that the compensation system is applied as intended. The Bank’s central risk control is responsible for analysing the risks associ-ated with the compensation policy and the compensation system before the compensa-
tion policy is processed and established by the Board. This is done at least once a year. The report analyses elements such as the incentive structure, the balance between fixed and variable compensation, deferral rules, and effects on the capital base. In addition, central risk control evaluates the application of the compensation. Based on this risk analysis and evaluation, an assess-ment is made as to whether the compensa-tion system is designed in a way that could threaten the Bank’s financial position. The responsibility also includes ensuring that risk costs are calculated correctly in the context of compensation.
Handelsbanken’s remuneration policy and compensation system are deemed to generate low risks and promote sound and effective risk management, counteract excessive risk-taking, fit in with the Bank’s low tolerance of risks and support the Bank’s long-term interests. The compensa-tion system is designed in such a way that there is no risk that the Bank’s capital base is undermined as a result of mandatory pay-ment of variable compensation. It is possible to reduce or remove variable compensa-tion, wholly or partly – this applies both to allocations for variable compensation and to deferred variable compensation which has not yet been paid.
For more detailed information and statis-tics about the Bank’s compensation system, see the Corporate Governance Report and note G8.
ECONOMIC CAPITAL
Handelsbanken’s model for calculating economic capital identifies in one measurement the Group’s overall risks and indicates the capital which, with very high probability, will cover unexpected losses or decreases in value
The central risk control function is responsible for comprehensive monitoring of the Group’s various risks. The Bank’s model for economic capital (EC) is an instrument in this monitoring. It is a vital component in planning to ensure that the Group has sufficient capital at all times in relation to all risks in the Group. The Group per-spective therefore means that economic capital also includes risks in the insurance operations and risks in the Bank’s pension obligations.
Economic capital is calculated with a time horizon of one year and a confidence level that reflects an acceptable level of risk and desired rating. The Board has determined that the calculation of the EC must be made with a 99.97 per cent confidence level, which captures an event which is extremely unfavourable for the Bank. EC is the difference between the out-come in an average year – with positive results and good growth in the value of the Bank’s assets – and the outcome at a 99.97 per cent confidence level.
Diversification effects between the different risk classes are taken into account when cal-culating EC. The capital requirement for all risks is therefore lower than the sum of the EC for each individual risk, because the risks are partly independent of each other.
The capital and other financial resources which form a buffer that can absorb nega-tive outcomes are called available financial resources (AFR). AFR is Handelsbanken’s equity
Total of AFR and EC including diversification, 31 December 2013
0
30
60
90
120
150
ECAFR
SEK bn
Credit risk Market risk
Non-financial risk Risk in pension obligations
HANDELSBANKEN | ANNUAL REPORT 2013 101
with the addition of other financial values on and off the balance sheet, available to cover losses with a one-year time horizon.
In risk and capital management, the Group applies a shareholder perspective. The eco-nomic capital model provides an overall view of the Group which makes it possible to optimise the risk and capital situation from the sharehold-er’s perspective. The outcome of the calcula-tions plays an important role when new transac-tions or structural changes are considered.
Credit risk is calculated using simulated out-comes of default for all the Group’s counterpar-ties and exposures.
Market risks comprise the risk of assets classed as trading book, interest rate risk in the banking operations, market risks in the insur-ance operations and the risk of value losses in the Bank’s own share portfolio.
The risk in the pension obligations mainly consists of the risk of a decrease in the values that exist for securing the Bank’s pension obligations. Most of the pension obligations are in Sweden and are secured there in a pension foundation and insured in an occupational pen-sion fund.
The non-financial risks are operational risk, business risk, property risk and insurance risk. Business risk is related to unexpected variations in earnings in the business area in question. This may arise if, for example, demand or competi-tion changes unexpectedly, thus resulting in lower volumes and narrower margins. Property risk captures the risk of a fall in the value of the properties which the Bank owns.
At year-end, EC was SEK 61 billion (57), of which credit risks accounted for the main part of the total risks. The Board stipulates that the AFR/EC ratio should be at least 120 per cent. The ratio was 197 per cent (213) at year-end, which illustrates that the Bank is well-capitalised in relation to its overall risks. The Swedish Finan-cial Supervisory Authority has come to the same conclusion in its overall capital assessment of the Bank.
The risk and capital situation reported is a snapshot picture, even though the risk calcula-tions include safety margins for business cycle fluctuations. To perform a final assessment of the Group’s capital adequacy requirements, account must also be taken of the stress and scenario analysis carried out as part of the Bank’s capital planning.
CAPITAL PLANNING
Handelsbanken’s capital planning aims to ensure that the Group has adequate financial resources available at all times and that the capital is of optimal composition.
The capital planning unit is responsible for assessment of the Bank’s total capital require-ment. The capital requirement is a function of the Group’s risks, expected development, the regulations and target ratios, Handelsbanken’s model for economic capital and also of stress tests. The Bank’s capital requirement is reported weekly to the CFO, regularly to the CEO, and at least quarterly to the Board.
The targets for the Bank’s capital are deter-mined regularly by the Board on the basis of stress tests of regulatory capital and EC. The Board stipulates that the tier 1 ratio in Basel II, which is the relevant measurement for manage-ment of the Bank according to the 2013 rules, must be between 9 and 11 per cent.
In view of the anticipated new rules with increased capital requirements, the Bank has opted to increase its capitalisation above the target interval. An adjusted target for capital can be established when the Swedish application of the new regulations has been decided.
As part of proactive capital planning, there is a contingency and action plan with specific measures that can be taken if the Bank needs to improve its capital position. The purpose of the contingency and action planning is to ensure that there is a warning system that identifies potential threats at an early stage and that the Group is prepared to take rapid action, if necessary.
A long-term capital plan is drawn up annually, which is designed to give a comprehensive overview of the Group’s current capital situation, a forecast of expected capital performance, and the outcome in various scenarios. These scenarios are designed to substantially differ from expected events and thus harmonise with the Group’s low risk tolerance. The capital plan also contains proposals for how to maintain the capital situation at a satisfactory level in a strongly negative business environment, from both a regulatory and shareholder perspective.
The capital planning is divided into short-term and mid- to long-term forecasting. The part of capital planning that comprises short-term forecasts up to two years ahead principally focuses on assessing existing performance and the development of the capital requirement. This forecasting is necessary to enable continual adaptation of the size and composition of the capital base.
Capital planning is performed through an ongoing analysis of changes in volume, risk and performance, and by monitoring events that may affect capital requirements and capital level. Short-term forecasting includes all sub-components that make up the Group’s capital base. This work also includes conducting various sensitivity analyses, with a short-term perspective, of the expected change in the capital adequacy requirement and capital base. The Bank can thus be prepared to alter the size and composition of the capital base if required – for example, through market operations.
The result of the short-term analysis forms the basis of any capital operations performed and is continually reported to the CFO and, if necessary, to the CEO and Board. The analysis is based on a prudent basic scenario, with decision points in the near future for how the ex-isting earnings capacity can cope with various changes in volume, as well as what effects arise from potential capital operations.
The part of capital planning that comprises mid- to long-term forecasts aims to ensure compliance with statutory capital adequacy requirements and that the Group’s AFR at all times covers by a good margin all risks calcu-lated according to the economic capital model.
The objective is to forecast the expected performance and judge whether the Bank’s resistance is satisfactory in various scenarios. The planning horizon is at least five years and takes account of the Group’s overall business performance trend.
Scenario and stress tests are also continu-ously performed. A basic scenario forms the foundation of the capital forecast. This scenario is obtained from expected performance in the next five years regarding profit, volume growth, financial assumptions such as loan losses, and performance of the equity, property and fixed income markets. The basic scenario is then compared to the outcomes in a number of business cycle and crisis scenarios. The stress scenarios have been established following analysis of the historical links between the im-pacts of different macroeconomic variables on the financial markets and have been selected by using the scenarios expected to have the most severe impact on Handelsbanken.
The result of the internal capital adequacy as-sessment is reported quarterly to the Board.
At the end of 2013, the tier 1 ratio according to Basel II was 21.5 per cent, since the Bank, pending a decision concerning capital regula-tions, has decided to increase its capitalisation to a level exceeding the Bank’s target interval in Basel II of 9–11 per cent. The ratio between AFR and EC was 197 per cent at the same date.
The Bank’s strong position is further em-phasised by the result of the various forward-looking stress scenarios which are carried out, showing that Handelsbanken’s long-term capi-tal situation is very stable from both a financial and regulatory perspective.
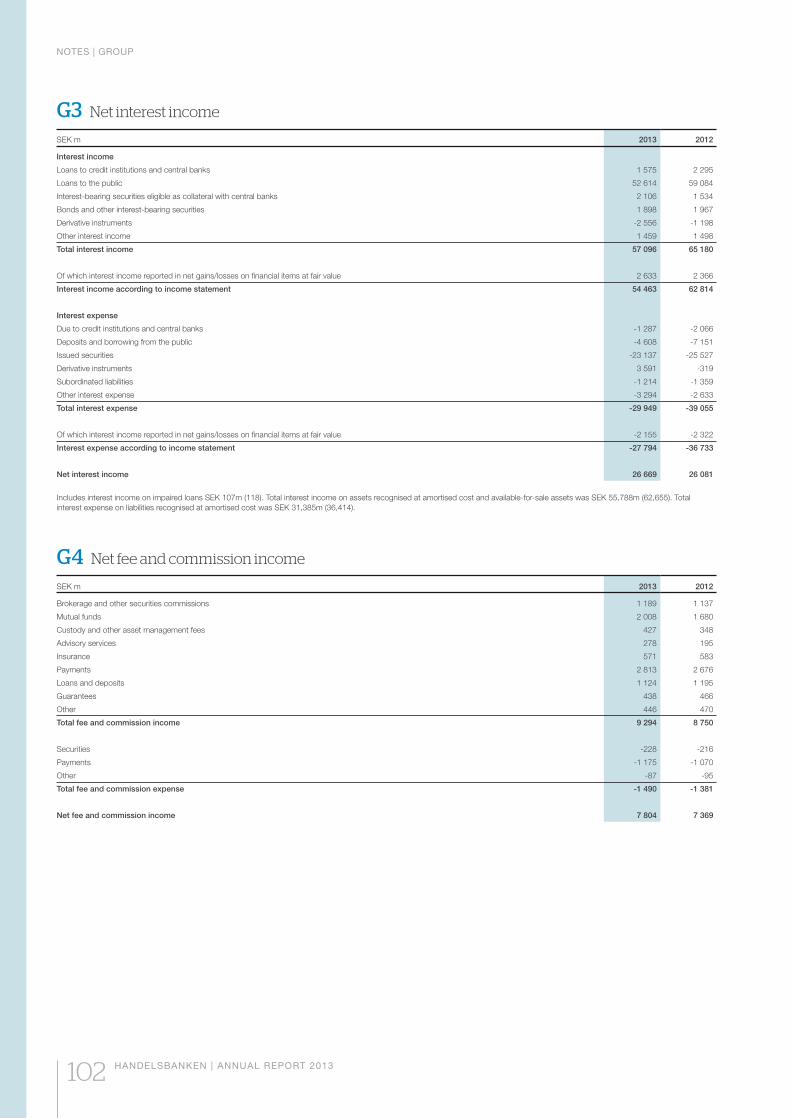
NOTES | GROUP
102 HANDELSBANKEN | ANNUAL REPORT 2013
G3 Net interest income
SEK m 2013 2012
Interest income
Loans to credit institutions and central banks 1 575 2 295
Loans to the public 52 614 59 084
Interest-bearing securities eligible as collateral with central banks 2 106 1 534
Bonds and other interest-bearing securities 1 898 1 967
Derivative instruments -2 556 -1 198
Other interest income 1 459 1 498
Total interest income 57 096 65 180
Of which interest income reported in net gains/losses on financial items at fair value 2 633 2 366
Interest income according to income statement 54 463 62 814
Interest expense
Due to credit institutions and central banks -1 287 -2 066
Deposits and borrowing from the public -4 608 -7 151
Issued securities -23 137 -25 527
Derivative instruments 3 591 -319
Subordinated liabilities -1 214 -1 359
Other interest expense -3 294 -2 633
Total interest expense -29 949 -39 055
Of which interest income reported in net gains/losses on financial items at fair value -2 155 -2 322
Interest expense according to income statement -27 794 -36 733
Net interest income 26 669 26 081
Includes interest income on impaired loans SEK 107m (118). Total interest income on assets recognised at amortised cost and available-for-sale assets was SEK 55,788m (62,655). Total interest expense on liabilities recognised at amortised cost was SEK 31,385m (36,414).
G4 Net fee and commission income
SEK m 2013 2012
Brokerage and other securities commissions 1 189 1 137
Mutual funds 2 008 1 680
Custody and other asset management fees 427 348
Advisory services 278 195
Insurance 571 583
Payments 2 813 2 676
Loans and deposits 1 124 1 195
Guarantees 438 466
Other 446 470
Total fee and commission income 9 294 8 750
Securities -228 -216
Payments -1 175 -1 070
Other -87 -95
Total fee and commission expense -1 490 -1 381
Net fee and commission income 7 804 7 369
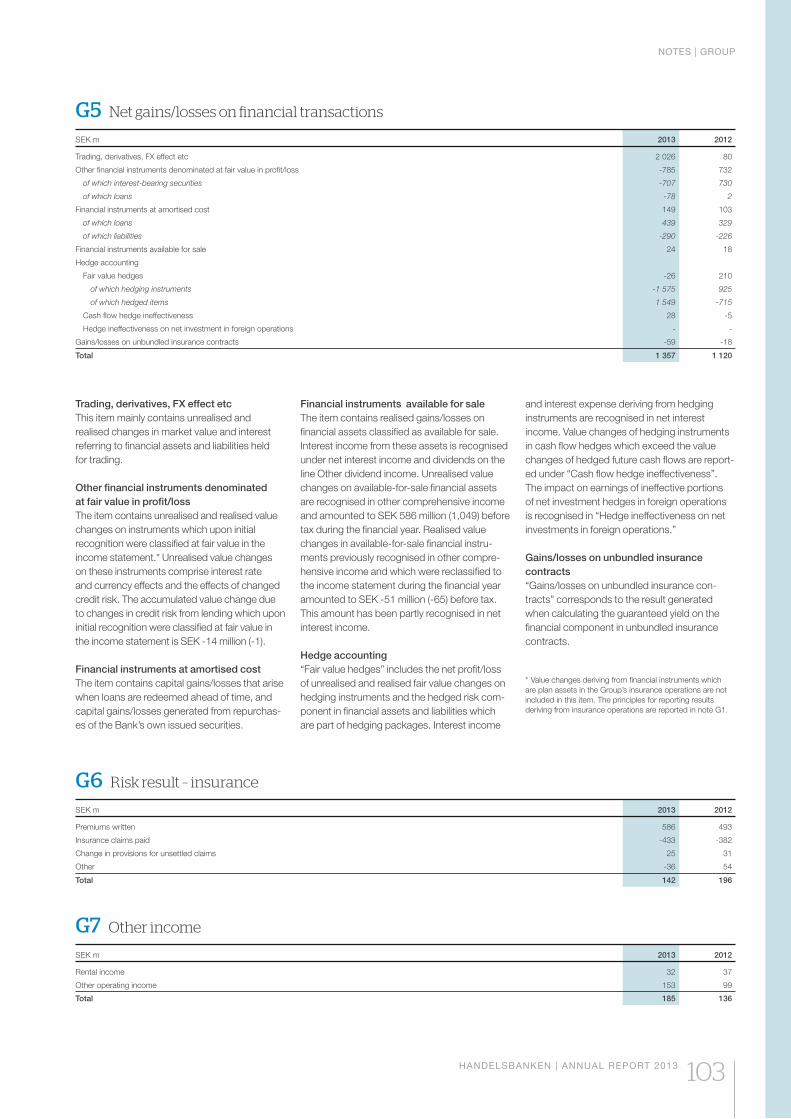
NOTES | GROUP
HANDELSBANKEN | ANNUAL REPORT 2013 103
G5 Net gains/losses on financial transactions
SEK m 2013 2012
Trading, derivatives, FX effect etc 2 026 80
Other financial instruments denominated at fair value in profit/loss -785 732
of which interest-bearing securities -707 730
of which loans -78 2
Financial instruments at amortised cost 149 103
of which loans 439 329
of which liabilities -290 -226
Financial instruments available for sale 24 18
Hedge accounting
Fair value hedges -26 210
of which hedging instruments -1 575 925
of which hedged items 1 549 -715
Cash flow hedge ineffectiveness 28 -5
Hedge ineffectiveness on net investment in foreign operations - -
Gains/losses on unbundled insurance contracts -59 -18
Total 1 357 1 120
Trading, derivatives, FX effect etcThis item mainly contains unrealised and realised changes in market value and interest referring to financial assets and liabilities held for trading.
Other financial instruments denominated at fair value in profit/lossThe item contains unrealised and realised value changes on instruments which upon initial recognition were classified at fair value in the income statement.* Unrealised value changes on these instruments comprise interest rate and currency effects and the effects of changed credit risk. The accumulated value change due to changes in credit risk from lending which upon initial recognition were classified at fair value in the income statement is SEK -14 million (-1).
Financial instruments at amortised costThe item contains capital gains/losses that arise when loans are redeemed ahead of time, and capital gains/losses generated from repurchas-es of the Bank’s own issued securities.
Financial instruments available for saleThe item contains realised gains/losses on financial assets classified as available for sale. Interest income from these assets is recognised under net interest income and dividends on the line Other dividend income. Unrealised value changes on available-for-sale financial assets are recognised in other comprehensive income and amounted to SEK 586 million (1,049) before tax during the financial year. Realised value changes in available-for-sale financial instru-ments previously recognised in other compre-hensive income and which were reclassified to the income statement during the financial year amounted to SEK -51 million (-65) before tax. This amount has been partly recognised in net interest income.
Hedge accounting“Fair value hedges” includes the net profit/loss of unrealised and realised fair value changes on hedging instruments and the hedged risk com-ponent in financial assets and liabilities which are part of hedging packages. Interest income
and interest expense deriving from hedging instruments are recognised in net interest income. Value changes of hedging instruments in cash flow hedges which exceed the value changes of hedged future cash flows are report-ed under “Cash flow hedge ineffectiveness”. The impact on earnings of ineffective portions of net investment hedges in foreign operations is recognised in “Hedge ineffectiveness on net investments in foreign operations.”
Gains/losses on unbundled insurance contracts“Gains/losses on unbundled insurance con-tracts” corresponds to the result generated when calculating the guaranteed yield on the financial component in unbundled insurance contracts.
* Value changes deriving from financial instruments which are plan assets in the Group’s insurance operations are not included in this item. The principles for reporting results deriving from insurance operations are reported in note G1.
G6 Risk result – insurance
SEK m 2013 2012
Premiums written 586 493
Insurance claims paid -433 -382
Change in provisions for unsettled claims 25 31
Other -36 54
Total 142 196
G7 Other income
SEK m 2013 2012
Rental income 32 37
Other operating income 153 99
Total 185 136
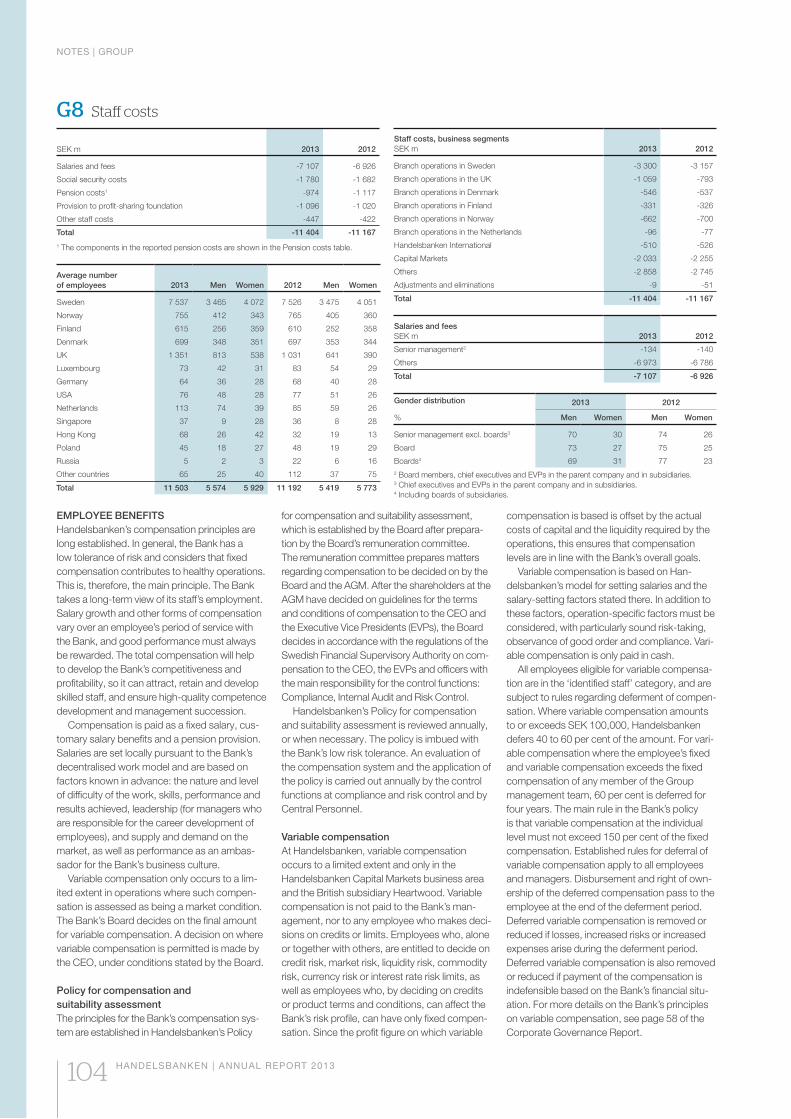
NOTES | GROUP
104 HANDELSBANKEN | ANNUAL REPORT 2013
G8 Staff costs
SEK m 2013 2012
Salaries and fees -7 107 -6 926
Social security costs -1 780 -1 682
Pension costs1 -974 -1 117
Provision to profit-sharing foundation -1 096 -1 020
Other staff costs -447 -422
Total -11 404 -11 167
1 The components in the reported pension costs are shown in the Pension costs table.
Average number of employees 2013 Men Women 2012 Men Women
Sweden 7 537 3 465 4 072 7 526 3 475 4 051
Norway 755 412 343 765 405 360
Finland 615 256 359 610 252 358
Denmark 699 348 351 697 353 344
UK 1 351 813 538 1 031 641 390
Luxembourg 73 42 31 83 54 29
Germany 64 36 28 68 40 28
USA 76 48 28 77 51 26
Netherlands 113 74 39 85 59 26
Singapore 37 9 28 36 8 28
Hong Kong 68 26 42 32 19 13
Poland 45 18 27 48 19 29
Russia 5 2 3 22 6 16
Other countries 65 25 40 112 37 75
Total 11 503 5 574 5 929 11 192 5 419 5 773
Staff costs, business segmentsSEK m 2013 2012
Branch operations in Sweden -3 300 -3 157
Branch operations in the UK -1 059 -793
Branch operations in Denmark -546 -537
Branch operations in Finland -331 -326
Branch operations in Norway -662 -700
Branch operations in the Netherlands -96 -77
Handelsbanken International -510 -526
Capital Markets -2 033 -2 255
Others -2 858 -2 745
Adjustments and eliminations -9 -51
Total -11 404 -11 167
Salaries and feesSEK m 2013 2012
Senior management2 -134 -140
Others -6 973 -6 786
Total -7 107 -6 926
Gender distribution 2013 2012
% Men Women Men Women
Senior management excl. boards3 70 30 74 26
Board 73 27 75 25
Boards4 69 31 77 232 Board members, chief executives and EVPs in the parent company and in subsidiaries.3 Chief executives and EVPs in the parent company and in subsidiaries.4 Including boards of subsidiaries.
EMPLOYEE BENEFITSHandelsbanken’s compensation principles are long established. In general, the Bank has a low tolerance of risk and considers that fixed compensation contributes to healthy operations. This is, therefore, the main principle. The Bank takes a long-term view of its staff’s employment. Salary growth and other forms of compensation vary over an employee’s period of service with the Bank, and good performance must always be rewarded. The total compensation will help to develop the Bank’s competitiveness and profitability, so it can attract, retain and develop skilled staff, and ensure high-quality competence development and management succession.
Compensation is paid as a fixed salary, cus-tomary salary benefits and a pension provision. Salaries are set locally pursuant to the Bank’s decentralised work model and are based on factors known in advance: the nature and level of difficulty of the work, skills, performance and results achieved, leadership (for managers who are responsible for the career development of employees), and supply and demand on the market, as well as performance as an ambas-sador for the Bank’s business culture.
Variable compensation only occurs to a lim-ited extent in operations where such compen-sation is assessed as being a market condition. The Bank’s Board decides on the final amount for variable compensation. A decision on where variable compensation is permitted is made by the CEO, under conditions stated by the Board.
Policy for compensation and suitability assessmentThe principles for the Bank’s compensation sys-tem are established in Handelsbanken’s Policy
for compensation and suitability assessment, which is established by the Board after prepara-tion by the Board’s remuneration committee. The remuneration committee prepares matters regarding compensation to be decided on by the Board and the AGM. After the shareholders at the AGM have decided on guidelines for the terms and conditions of compensation to the CEO and the Executive Vice Presidents (EVPs), the Board decides in accordance with the regulations of the Swedish Financial Supervisory Authority on com-pensation to the CEO, the EVPs and officers with the main responsibility for the control functions: Compliance, Internal Audit and Risk Control.
Handelsbanken’s Policy for compensation and suitability assessment is reviewed annually, or when necessary. The policy is imbued with the Bank’s low risk tolerance. An evaluation of the compensation system and the application of the policy is carried out annually by the control functions at compliance and risk control and by Central Personnel.
Variable compensation At Handelsbanken, variable compensation occurs to a limited extent and only in the Handelsbanken Capital Markets business area and the British subsidiary Heartwood. Variable compensation is not paid to the Bank’s man-agement, nor to any employee who makes deci-sions on credits or limits. Employees who, alone or together with others, are entitled to decide on credit risk, market risk, liquidity risk, commodity risk, currency risk or interest rate risk limits, as well as employees who, by deciding on credits or product terms and conditions, can affect the Bank’s risk profile, can have only fixed compen-sation. Since the profit figure on which variable
compensation is based is offset by the actual costs of capital and the liquidity required by the operations, this ensures that compensation levels are in line with the Bank’s overall goals.
Variable compensation is based on Han-delsbanken’s model for setting salaries and the salary-setting factors stated there. In addition to these factors, operation-specific factors must be considered, with particularly sound risk-taking, observance of good order and compliance. Vari-able compensation is only paid in cash.
All employees eligible for variable compensa-tion are in the ‘identified staff’ category, and are subject to rules regarding deferment of compen-sation. Where variable compensation amounts to or exceeds SEK 100,000, Handelsbanken defers 40 to 60 per cent of the amount. For vari-able compensation where the employee’s fixed and variable compensation exceeds the fixed compensation of any member of the Group management team, 60 per cent is deferred for four years. The main rule in the Bank’s policy is that variable compensation at the individual level must not exceed 150 per cent of the fixed compensation. Established rules for deferral of variable compensation apply to all employees and managers. Disbursement and right of own-ership of the deferred compensation pass to the employee at the end of the deferment period. Deferred variable compensation is removed or reduced if losses, increased risks or increased expenses arise during the deferment period. Deferred variable compensation is also removed or reduced if payment of the compensation is indefensible based on the Bank’s financial situ-ation. For more details on the Bank’s principles on variable compensation, see page 58 of the Corporate Governance Report.
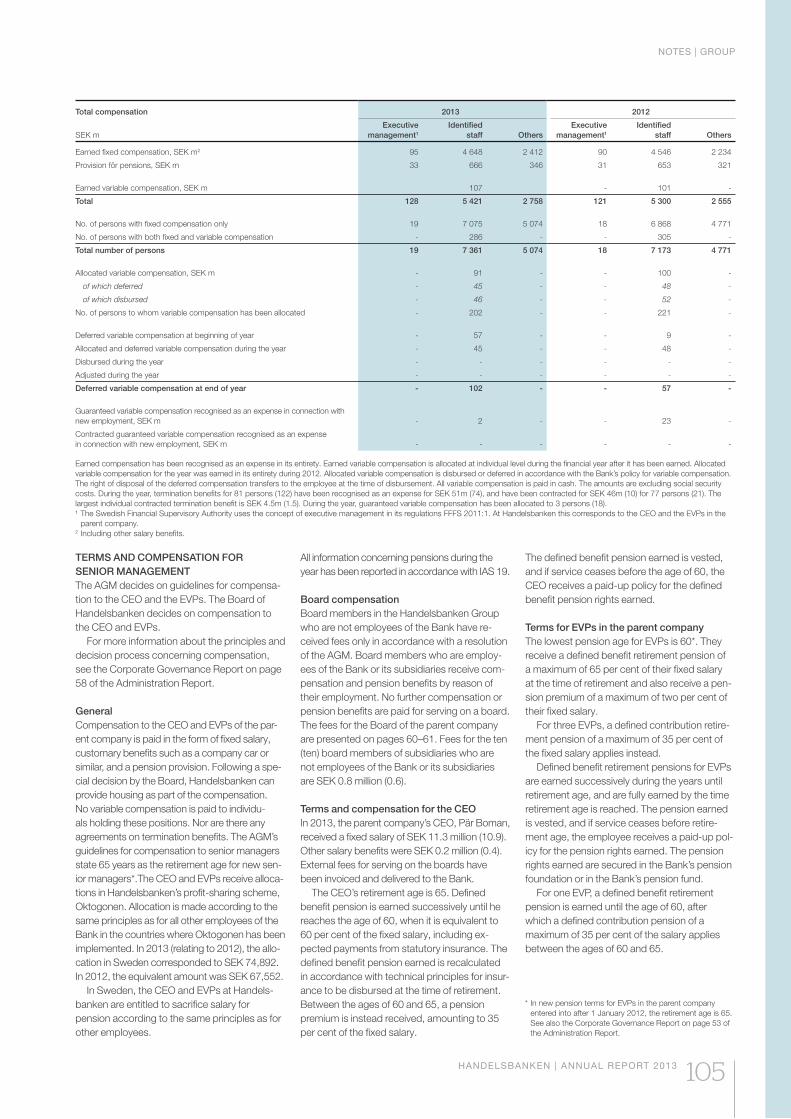
NOTES | GROUP
HANDELSBANKEN | ANNUAL REPORT 2013 105
Total compensation 2013 2012
SEK mExecutive
management1
Identified staff Others
Executive management1
Identified staff Others
Earned fixed compensation, SEK m2 95 4 648 2 412 90 4 546 2 234
Provision för pensions, SEK m 33 666 346 31 653 321
Earned variable compensation, SEK m 107 - 101 -
Total 128 5 421 2 758 121 5 300 2 555
No. of persons with fixed compensation only 19 7 075 5 074 18 6 868 4 771
No. of persons with both fixed and variable compensation - 286 - - 305 -
Total number of persons 19 7 361 5 074 18 7 173 4 771
Allocated variable compensation, SEK m - 91 - - 100 -
of which deferred - 45 - - 48 -
of which disbursed - 46 - - 52 -
No. of persons to whom variable compensation has been allocated - 202 - - 221 -
Deferred variable compensation at beginning of year - 57 - - 9 -
Allocated and deferred variable compensation during the year - 45 - - 48 -
Disbursed during the year - - - - - -
Adjusted during the year - - - - - -
Deferred variable compensation at end of year - 102 - - 57 -
Guaranteed variable compensation recognised as an expense in connection with new employment, SEK m - 2 - - 23 -
Contracted guaranteed variable compensation recognised as an expense in connection with new employment, SEK m - - - - - -
Earned compensation has been recognised as an expense in its entirety. Earned variable compensation is allocated at individual level during the financial year after it has been earned. Allocated variable compensation for the year was earned in its entirety during 2012. Allocated variable compensation is disbursed or deferred in accordance with the Bank’s policy for variable compensation. The right of disposal of the deferred compensation transfers to the employee at the time of disbursement. All variable compensation is paid in cash. The amounts are excluding social security costs. During the year, termination benefits for 81 persons (122) have been recognised as an expense for SEK 51m (74), and have been contracted for SEK 46m (10) for 77 persons (21). The largest individual contracted termination benefit is SEK 4.5m (1.5). During the year, guaranteed variable compensation has been allocated to 3 persons (18).¹ The Swedish Financial Supervisory Authority uses the concept of executive management in its regulations FFFS 2011:1. At Handelsbanken this corresponds to the CEO and the EVPs in the
parent company.2 Including other salary benefits.
* In new pension terms for EVPs in the parent company entered into after 1 January 2012, the retirement age is 65. See also the Corporate Governance Report on page 53 of the Administration Report.
TERMS AND COMPENSATION FOR SENIOR MANAGEMENTThe AGM decides on guidelines for compensa-tion to the CEO and the EVPs. The Board of Handelsbanken decides on compensation to the CEO and EVPs.
For more information about the principles and decision process concerning compensation, see the Corporate Governance Report on page 58 of the Administration Report.
GeneralCompensation to the CEO and EVPs of the par-ent company is paid in the form of fixed salary, customary benefits such as a company car or similar, and a pension provision. Following a spe-cial decision by the Board, Handelsbanken can provide housing as part of the compensation. No variable compensation is paid to individu-als holding these positions. Nor are there any agreements on termination benefits. The AGM’s guidelines for compensation to senior managers state 65 years as the retirement age for new sen-ior managers*.The CEO and EVPs receive alloca-tions in Handelsbanken’s profit-sharing scheme, Oktogonen. Allocation is made according to the same principles as for all other employees of the Bank in the countries where Oktogonen has been implemented. In 2013 (relating to 2012), the allo-cation in Sweden corresponded to SEK 74,892. In 2012, the equivalent amount was SEK 67,552.
In Sweden, the CEO and EVPs at Handels-banken are entitled to sacrifice salary for pension according to the same principles as for other employees.
All information concerning pensions during the year has been reported in accordance with IAS 19.
Board compensationBoard members in the Handelsbanken Group who are not employees of the Bank have re-ceived fees only in accordance with a resolution of the AGM. Board members who are employ-ees of the Bank or its subsidiaries receive com-pensation and pension benefits by reason of their employment. No further compensation or pension benefits are paid for serving on a board. The fees for the Board of the parent company are presented on pages 60–61. Fees for the ten (ten) board members of subsidiaries who are not employees of the Bank or its subsidiaries are SEK 0.8 million (0.6).
Terms and compensation for the CEO In 2013, the parent company’s CEO, Pär Boman, received a fixed salary of SEK 11.3 million (10.9). Other salary benefits were SEK 0.2 million (0.4). External fees for serving on the boards have been invoiced and delivered to the Bank.
The CEO’s retirement age is 65. Defined benefit pension is earned successively until he reaches the age of 60, when it is equivalent to 60 per cent of the fixed salary, including ex-pected payments from statutory insurance. The defined benefit pension earned is recalculated in accordance with technical principles for insur-ance to be disbursed at the time of retirement. Between the ages of 60 and 65, a pension premium is instead received, amounting to 35 per cent of the fixed salary.
The defined benefit pension earned is vested, and if service ceases before the age of 60, the CEO receives a paid-up policy for the defined benefit pension rights earned.
Terms for EVPs in the parent companyThe lowest pension age for EVPs is 60*. They receive a defined benefit retirement pension of a maximum of 65 per cent of their fixed salary at the time of retirement and also receive a pen-sion premium of a maximum of two per cent of their fixed salary.
For three EVPs, a defined contribution retire-ment pension of a maximum of 35 per cent of the fixed salary applies instead.
Defined benefit retirement pensions for EVPs are earned successively during the years until retirement age, and are fully earned by the time retirement age is reached. The pension earned is vested, and if service ceases before retire-ment age, the employee receives a paid-up pol-icy for the pension rights earned. The pension rights earned are secured in the Bank’s pension foundation or in the Bank’s pension fund.
For one EVP, a defined benefit retirement pension is earned until the age of 60, after which a defined contribution pension of a maximum of 35 per cent of the salary applies between the ages of 60 and 65.
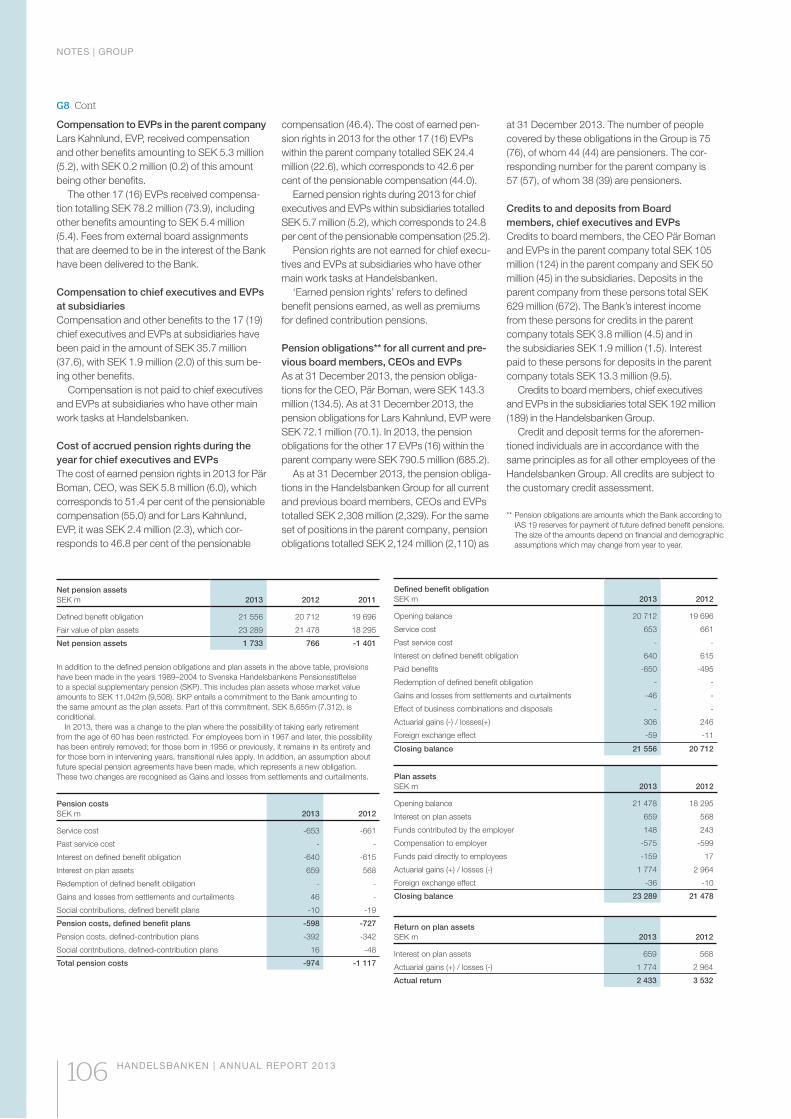
NOTES | GROUP
106 HANDELSBANKEN | ANNUAL REPORT 2013
G8 Cont
Net pension assetsSEK m 2013 2012 2011
Defined benefit obligation 21 556 20 712 19 696
Fair value of plan assets 23 289 21 478 18 295
Net pension assets 1 733 766 -1 401
In addition to the defined pension obligations and plan assets in the above table, provisions have been made in the years 1989–2004 to Svenska Handelsbankens Pensionsstiftelse to a special supplementary pension (SKP). This includes plan assets whose market value amounts to SEK 11,042m (9,508). SKP entails a commitment to the Bank amounting to the same amount as the plan assets. Part of this commitment, SEK 8,655m (7,312), is conditional. In 2013, there was a change to the plan where the possibility of taking early retirement from the age of 60 has been restricted. For employees born in 1967 and later, this possibility has been entirely removed; for those born in 1956 or previously, it remains in its entirety and for those born in intervening years, transitional rules apply. In addition, an assumption about future special pension agreements have been made, which represents a new obligation. These two changes are recognised as Gains and losses from settlements and curtailments.
Pension costsSEK m 2013 2012
Service cost -653 -661
Past service cost - -
Interest on defined benefit obligation -640 -615
Interest on plan assets 659 568
Redemption of defined benefit obligation - -
Gains and losses from settlements and curtailments 46 -
Social contributions, defined benefit plans -10 -19
Pension costs, defined benefit plans -598 -727
Pension costs, defined-contribution plans -392 -342
Social contributions, defined-contribution plans 16 -48
Total pension costs -974 -1 117
Defined benefit obligationSEK m 2013 2012
Opening balance 20 712 19 696
Service cost 653 661
Past service cost - -
Interest on defined benefit obligation 640 615
Paid benefits -650 -495
Redemption of defined benefit obligation - -
Gains and losses from settlements and curtailments -46 -
Effect of business combinations and disposals - -
Actuarial gains (-) / losses(+) 306 246
Foreign exchange effect -59 -11
Closing balance 21 556 20 712
Plan assetsSEK m 2013 2012
Opening balance 21 478 18 295
Interest on plan assets 659 568
Funds contributed by the employer 148 243
Compensation to employer -575 -599
Funds paid directly to employees -159 17
Actuarial gains (+) / losses (-) 1 774 2 964
Foreign exchange effect -36 -10
Closing balance 23 289 21 478
Return on plan assetsSEK m 2013 2012
Interest on plan assets 659 568
Actuarial gains (+) / losses (-) 1 774 2 964
Actual return 2 433 3 532
** Pension obligations are amounts which the Bank according to IAS 19 reserves for payment of future defined benefit pensions. The size of the amounts depend on financial and demographic assumptions which may change from year to year.
Compensation to EVPs in the parent companyLars Kahnlund, EVP, received compensation and other benefits amounting to SEK 5.3 million (5.2), with SEK 0.2 million (0.2) of this amount being other benefits.
The other 17 (16) EVPs received compensa-tion totalling SEK 78.2 million (73.9), including other benefits amounting to SEK 5.4 million (5.4). Fees from external board assignments that are deemed to be in the interest of the Bank have been delivered to the Bank.
Compensation to chief executives and EVPs at subsidiariesCompensation and other benefits to the 17 (19) chief executives and EVPs at subsidiaries have been paid in the amount of SEK 35.7 million (37.6), with SEK 1.9 million (2.0) of this sum be-ing other benefits.
Compensation is not paid to chief executives and EVPs at subsidiaries who have other main work tasks at Handelsbanken.
Cost of accrued pension rights during the year for chief executives and EVPsThe cost of earned pension rights in 2013 for Pär Boman, CEO, was SEK 5.8 million (6.0), which corresponds to 51.4 per cent of the pensionable compensation (55.0) and for Lars Kahnlund, EVP, it was SEK 2.4 million (2.3), which cor-responds to 46.8 per cent of the pensionable
compensation (46.4). The cost of earned pen-sion rights in 2013 for the other 17 (16) EVPs within the parent company totalled SEK 24.4 million (22.6), which corresponds to 42.6 per cent of the pensionable compensation (44.0).
Earned pension rights during 2013 for chief executives and EVPs within subsidiaries totalled SEK 5.7 million (5.2), which corresponds to 24.8 per cent of the pensionable compensation (25.2).
Pension rights are not earned for chief execu-tives and EVPs at subsidiaries who have other main work tasks at Handelsbanken.
‘Earned pension rights’ refers to defined benefit pensions earned, as well as premiums for defined contribution pensions.
Pension obligations** for all current and pre-vious board members, CEOs and EVPsAs at 31 December 2013, the pension obliga-tions for the CEO, Pär Boman, were SEK 143.3 million (134.5). As at 31 December 2013, the pension obligations for Lars Kahnlund, EVP were SEK 72.1 million (70.1). In 2013, the pension obligations for the other 17 EVPs (16) within the parent company were SEK 790.5 million (685.2).
As at 31 December 2013, the pension obliga-tions in the Handelsbanken Group for all current and previous board members, CEOs and EVPs totalled SEK 2,308 million (2,329). For the same set of positions in the parent company, pension obligations totalled SEK 2,124 million (2,110) as
at 31 December 2013. The number of people covered by these obligations in the Group is 75 (76), of whom 44 (44) are pensioners. The cor-responding number for the parent company is 57 (57), of whom 38 (39) are pensioners.
Credits to and deposits from Board members, chief executives and EVPs Credits to board members, the CEO Pär Boman and EVPs in the parent company total SEK 105 million (124) in the parent company and SEK 50 million (45) in the subsidiaries. Deposits in the parent company from these persons total SEK 629 million (672). The Bank’s interest income from these persons for credits in the parent company totals SEK 3.8 million (4.5) and in the subsidiaries SEK 1.9 million (1.5). Interest paid to these persons for deposits in the parent company totals SEK 13.3 million (9.5).
Credits to board members, chief executives and EVPs in the subsidiaries total SEK 192 million (189) in the Handelsbanken Group.
Credit and deposit terms for the aforemen-tioned individuals are in accordance with the same principles as for all other employees of the Handelsbanken Group. All credits are subject to the customary credit assessment.
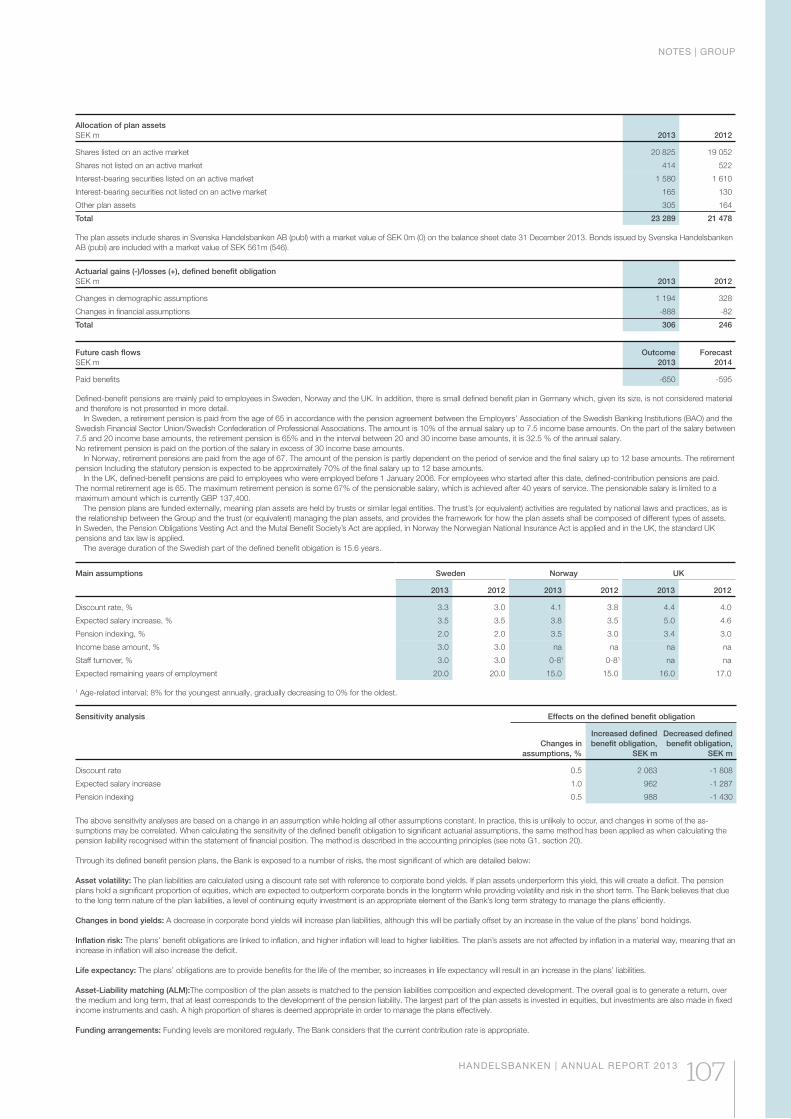
NOTES | GROUP
HANDELSBANKEN | ANNUAL REPORT 2013 107
Main assumptions Sweden Norway UK
2013 2012 2013 2012 2013 2012
Discount rate, % 3.3 3.0 4.1 3.8 4.4 4.0
Expected salary increase, % 3.5 3.5 3.8 3.5 5.0 4.6
Pension indexing, % 2.0 2.0 3.5 3.0 3.4 3.0
Income base amount, % 3.0 3.0 na na na na
Staff turnover, % 3.0 3.0 0-81 0-81 na na
Expected remaining years of employment 20.0 20.0 15.0 15.0 16.0 17.0
1 Age-related interval; 8% for the youngest annually, gradually decreasing to 0% for the oldest.
Sensitivity analysis Effects on the defined benefit obligation
Changes in assumptions, %
Increased defined benefit obligation,
SEK m
Decreased defined benefit obligation,
SEK m
Discount rate 0.5 2 063 -1 808
Expected salary increase 1.0 962 -1 287
Pension indexing 0.5 988 -1 430
The above sensitivity analyses are based on a change in an assumption while holding all other assumptions constant. In practice, this is unlikely to occur, and changes in some of the as-sumptions may be correlated. When calculating the sensitivity of the defined benefit obligation to significant actuarial assumptions, the same method has been applied as when calculating the pension liability recognised within the statement of financial position. The method is described in the accounting principles (see note G1, section 20).
Through its defined benefit pension plans, the Bank is exposed to a number of risks, the most significant of which are detailed below:
Asset volatility: The plan liabilities are calculated using a discount rate set with reference to corporate bond yields. If plan assets underperform this yield, this will create a deficit. The pension plans hold a significant proportion of equities, which are expected to outperform corporate bonds in the longterm while providing volatility and risk in the short term. The Bank believes that due to the long term nature of the plan liabilities, a level of continuing equity investment is an appropriate element of the Bank’s long term strategy to manage the plans efficiently.
Changes in bond yields: A decrease in corporate bond yields will increase plan liabilities, although this will be partially offset by an increase in the value of the plans’ bond holdings.
Inflation risk: The plans’ benefit obligations are linked to inflation, and higher inflation will lead to higher liabilities. The plan’s assets are not affected by inflation in a material way, meaning that an increase in inflation will also increase the deficit.
Life expectancy: The plans’ obligations are to provide benefits for the life of the member, so increases in life expectancy will result in an increase in the plans’ liabilities.
Asset-Liability matching (ALM):The composition of the plan assets is matched to the pension liabilities composition and expected development. The overall goal is to generate a return, over the medium and long term, that at least corresponds to the development of the pension liability. The largest part of the plan assets is invested in equities, but investments are also made in fixed income instruments and cash. A high proportion of shares is deemed appropriate in order to manage the plans effectively.
Funding arrangements: Funding levels are monitored regularly. The Bank considers that the current contribution rate is appropriate.
Allocation of plan assetsSEK m 2013 2012
Shares listed on an active market 20 825 19 052
Shares not listed on an active market 414 522
Interest-bearing securities listed on an active market 1 580 1 610
Interest-bearing securities not listed on an active market 165 130
Other plan assets 305 164
Total 23 289 21 478
The plan assets include shares in Svenska Handelsbanken AB (publ) with a market value of SEK 0m (0) on the balance sheet date 31 December 2013. Bonds issued by Svenska Handelsbanken AB (pubi) are included with a market value of SEK 561m (546).
Actuarial gains (-)/losses (+), defined benefit obligationSEK m 2013 2012
Changes in demographic assumptions 1 194 328
Changes in financial assumptions -888 -82
Total 306 246
Future cash flowsSEK m
Outcome 2013
Forecast 2014
Paid benefits -650 -595
Defined-benefit pensions are mainly paid to employees in Sweden, Norway and the UK. In addition, there is small defined benefit plan in Germany which, given its size, is not considered material and therefore is not presented in more detail. In Sweden, a retirement pension is paid from the age of 65 in accordance with the pension agreement between the Employers’ Association of the Swedish Banking Institutions (BAO) and the Swedish Financial Sector Union/Swedish Confederation of Professional Associations. The amount is 10% of the annual salary up to 7.5 income base amounts. On the part of the salary between 7.5 and 20 income base amounts, the retirement pension is 65% and in the interval between 20 and 30 income base amounts, it is 32.5 % of the annual salary. No retirement pension is paid on the portion of the salary in excess of 30 income base amounts. In Norway, retirement pensions are paid from the age of 67. The amount of the pension is partly dependent on the period of service and the final salary up to 12 base amounts. The retirement pension Including the statutory pension is expected to be approximately 70% of the final salary up to 12 base amounts. In the UK, defined-benefit pensions are paid to employees who were employed before 1 January 2006. For employees who started after this date, defined-contribution pensions are paid. The normal retirement age is 65. The maximum retirement pension is some 67% of the pensionable salary, which is achieved after 40 years of service. The pensionable salary is limited to a maximum amount which is currently GBP 137,400. The pension plans are funded externally, meaning plan assets are held by trusts or similar legal entities. The trust’s (or equivalent) activities are regulated by national laws and practices, as is the relationship between the Group and the trust (or equivalent) managing the plan assets, and provides the framework for how the plan assets shall be composed of different types of assets. In Sweden, the Pension Obligations Vesting Act and the Mutal Benefit Society’s Act are applied, in Norway the Norwegian National Insurance Act is applied and in the UK, the standard UK pensions and tax law is applied. The average duration of the Swedish part of the defined benefit obigation is 15.6 years.
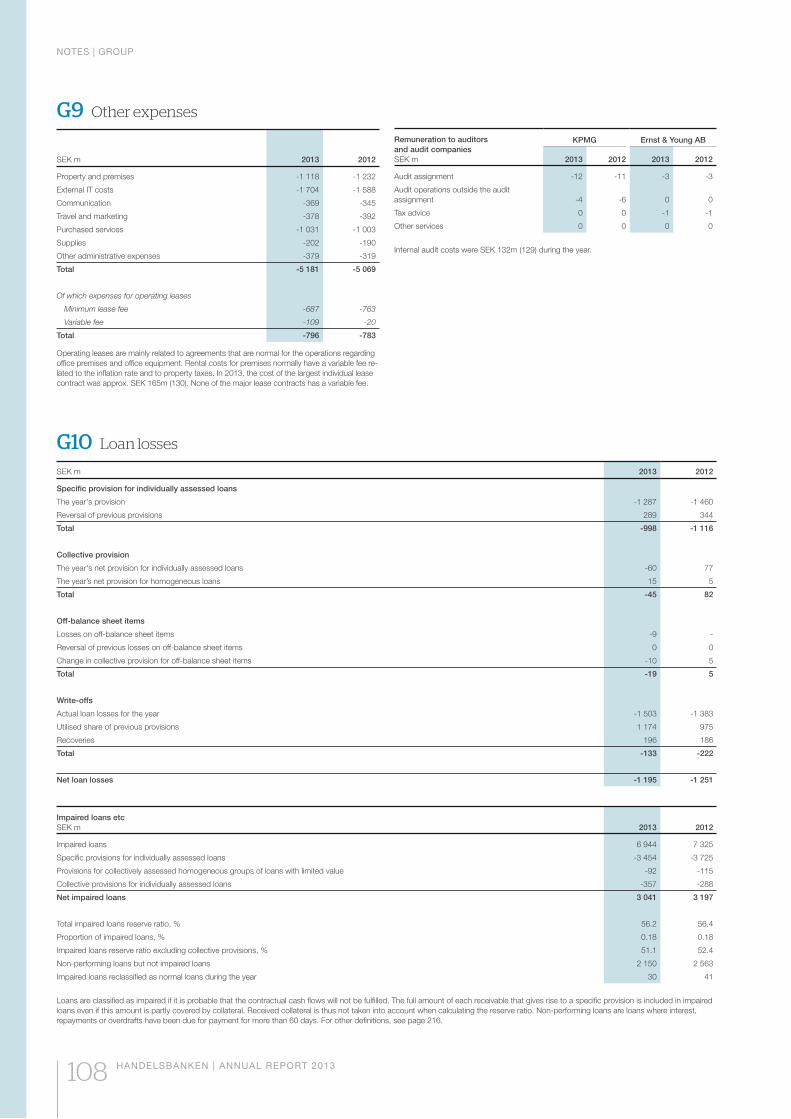
NOTES | GROUP
108 HANDELSBANKEN | ANNUAL REPORT 2013
G9 Other expenses
SEK m 2013 2012
Property and premises -1 118 -1 232
External IT costs -1 704 -1 588
Communication -369 -345
Travel and marketing -378 -392
Purchased services -1 031 -1 003
Supplies -202 -190
Other administrative expenses -379 -319
Total -5 181 -5 069
Of which expenses for operating leases
Minimum lease fee -687 -763
Variable fee -109 -20
Total -796 -783
Operating leases are mainly related to agreements that are normal for the operations regarding office premises and office equipment. Rental costs for premises normally have a variable fee re-lated to the inflation rate and to property taxes. In 2013, the cost of the largest individual lease contract was approx. SEK 165m (130). None of the major lease contracts has a variable fee.
Remuneration to auditors and audit companiesSEK m
KPMG Ernst & Young AB
2013 2012 2013 2012
Audit assignment -12 -11 -3 -3
Audit operations outside the audit assignment -4 -6 0 0
Tax advice 0 0 -1 -1
Other services 0 0 0 0
Internal audit costs were SEK 132m (129) during the year.
G10 Loan losses
SEK m 2013 2012
Specific provision for individually assessed loans
The year's provision -1 287 -1 460
Reversal of previous provisions 289 344
Total -998 -1 116
Collective provision
The year's net provision for individually assessed loans -60 77
The year’s net provision for homogeneous loans 15 5
Total -45 82
Off-balance sheet items
Losses on off-balance sheet items -9 -
Reversal of previous losses on off-balance sheet items 0 0
Change in collective provision for off-balance sheet items -10 5
Total -19 5
Write-offs
Actual loan losses for the year -1 503 -1 383
Utilised share of previous provisions 1 174 975
Recoveries 196 186
Total -133 -222
Net loan losses -1 195 -1 251
Impaired loans etc SEK m 2013 2012
Impaired loans 6 944 7 325
Specific provisions for individually assessed loans -3 454 -3 725
Provisions for collectively assessed homogeneous groups of loans with limited value -92 -115
Collective provisions for individually assessed loans -357 -288
Net impaired loans 3 041 3 197
Total impaired loans reserve ratio, % 56.2 56.4
Proportion of impaired loans, % 0.18 0.18
Impaired loans reserve ratio excluding collective provisions, % 51.1 52.4
Non-performing loans but not impaired loans 2 150 2 563
Impaired loans reclassified as normal loans during the year 30 41
Loans are classified as impaired if it is probable that the contractual cash flows will not be fulfilled. The full amount of each receivable that gives rise to a specific provision is included in impaired loans even if this amount is partly covered by collateral. Received collateral is thus not taken into account when calculating the reserve ratio. Non-performing loans are loans where interest, repayments or overdrafts have been due for payment for more than 60 days. For other definitions, see page 216.
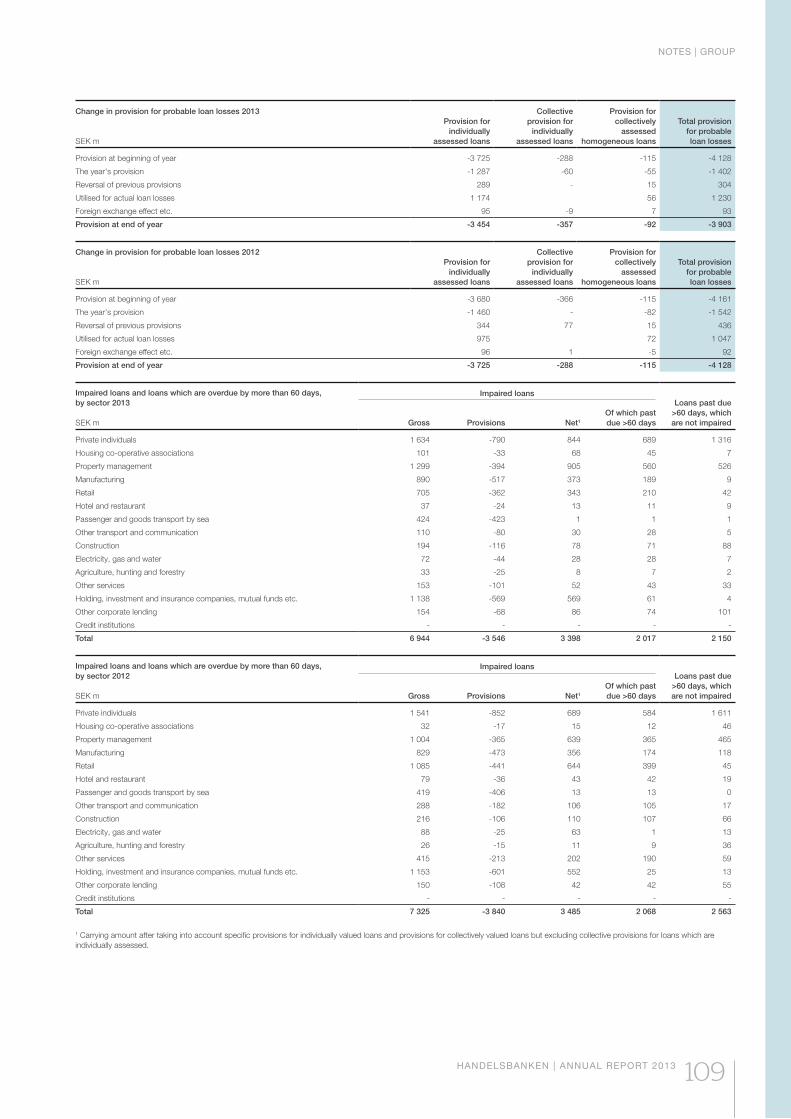
NOTES | GROUP
HANDELSBANKEN | ANNUAL REPORT 2013 109
Change in provision for probable loan losses 2013
SEK m
Provision forindividually
assessed loans
Collective provision for
individuallyassessed loans
Provision forcollectively
assessedhomogeneous loans
Total provisionfor probableloan losses
Provision at beginning of year -3 725 -288 -115 -4 128
The year's provision -1 287 -60 -55 -1 402
Reversal of previous provisions 289 - 15 304
Utilised for actual loan losses 1 174 56 1 230
Foreign exchange effect etc. 95 -9 7 93
Provision at end of year -3 454 -357 -92 -3 903
Change in provision for probable loan losses 2012
SEK m
Provision forindividually
assessed loans
Collective provision for
individuallyassessed loans
Provision forcollectively
assessedhomogeneous loans
Total provisionfor probableloan losses
Provision at beginning of year -3 680 -366 -115 -4 161
The year's provision -1 460 - -82 -1 542
Reversal of previous provisions 344 77 15 436
Utilised for actual loan losses 975 72 1 047
Foreign exchange effect etc. 96 1 -5 92
Provision at end of year -3 725 -288 -115 -4 128
Impaired loans and loans which are overdue by more than 60 days, by sector 2013
SEK m
Impaired loansLoans past due
>60 days, which are not impairedGross Provisions Net1
Of which past due >60 days
Private individuals 1 634 -790 844 689 1 316
Housing co-operative associations 101 -33 68 45 7
Property management 1 299 -394 905 560 526
Manufacturing 890 -517 373 189 9
Retail 705 -362 343 210 42
Hotel and restaurant 37 -24 13 11 9
Passenger and goods transport by sea 424 -423 1 1 1
Other transport and communication 110 -80 30 28 5
Construction 194 -116 78 71 88
Electricity, gas and water 72 -44 28 28 7
Agriculture, hunting and forestry 33 -25 8 7 2
Other services 153 -101 52 43 33
Holding, investment and insurance companies, mutual funds etc. 1 138 -569 569 61 4
Other corporate lending 154 -68 86 74 101
Credit institutions - - - - -
Total 6 944 -3 546 3 398 2 017 2 150
Impaired loans and loans which are overdue by more than 60 days, by sector 2012
SEK m
Impaired loansLoans past due
>60 days, which are not impairedGross Provisions Net1
Of which past due >60 days
Private individuals 1 541 -852 689 584 1 611
Housing co-operative associations 32 -17 15 12 46
Property management 1 004 -365 639 365 465
Manufacturing 829 -473 356 174 118
Retail 1 085 -441 644 399 45
Hotel and restaurant 79 -36 43 42 19
Passenger and goods transport by sea 419 -406 13 13 0
Other transport and communication 288 -182 106 105 17
Construction 216 -106 110 107 66
Electricity, gas and water 88 -25 63 1 13
Agriculture, hunting and forestry 26 -15 11 9 36
Other services 415 -213 202 190 59
Holding, investment and insurance companies, mutual funds etc. 1 153 -601 552 25 13
Other corporate lending 150 -108 42 42 55
Credit institutions - - - - -
Total 7 325 -3 840 3 485 2 068 2 563
1 Carrying amount after taking into account specific provisions for individually valued loans and provisions for collectively valued loans but excluding collective provisions for loans which are individually assessed.
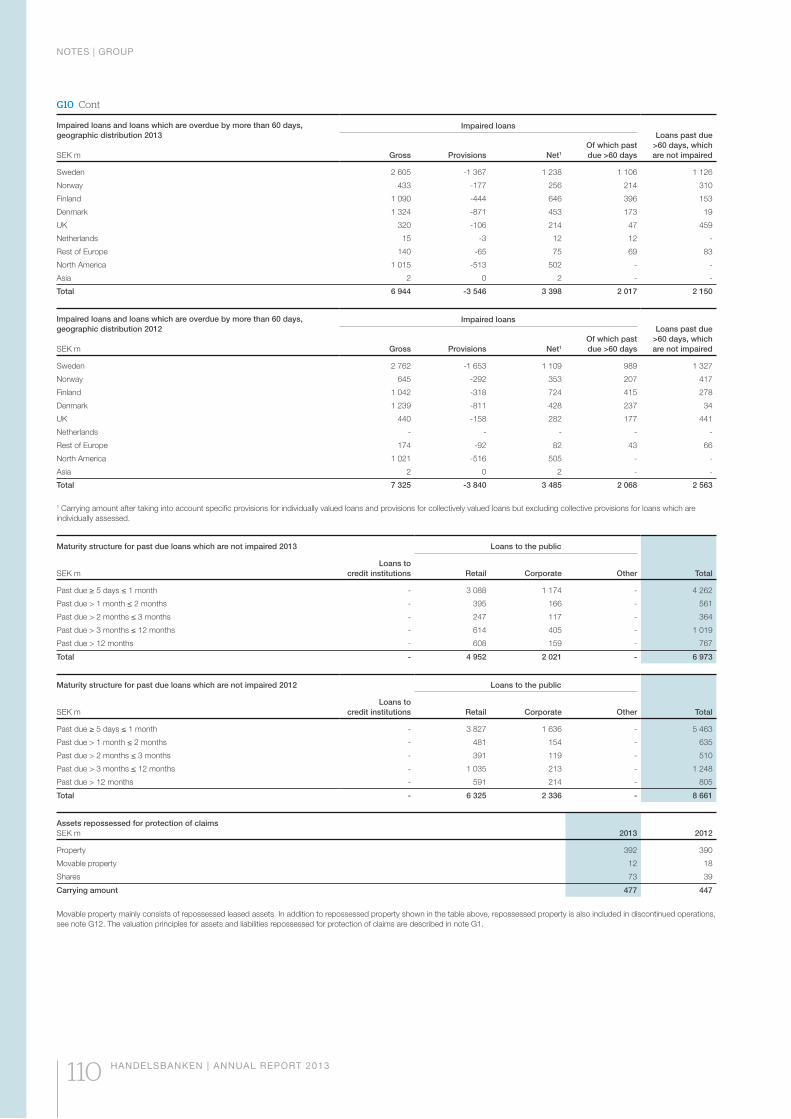
NOTES | GROUP
110 HANDELSBANKEN | ANNUAL REPORT 2013
G10 Cont
Impaired loans and loans which are overdue by more than 60 days, geographic distribution 2013
SEK m
Impaired loansLoans past due
>60 days, which are not impairedGross Provisions Net1
Of which past due >60 days
Sweden 2 605 -1 367 1 238 1 106 1 126
Norway 433 -177 256 214 310
Finland 1 090 -444 646 396 153
Denmark 1 324 -871 453 173 19
UK 320 -106 214 47 459
Netherlands 15 -3 12 12 -
Rest of Europe 140 -65 75 69 83
North America 1 015 -513 502 - -
Asia 2 0 2 - -
Total 6 944 -3 546 3 398 2 017 2 150
Impaired loans and loans which are overdue by more than 60 days, geographic distribution 2012
SEK m
Impaired loansLoans past due
>60 days, which are not impairedGross Provisions Net1
Of which past due >60 days
Sweden 2 762 -1 653 1 109 989 1 327
Norway 645 -292 353 207 417
Finland 1 042 -318 724 415 278
Denmark 1 239 -811 428 237 34
UK 440 -158 282 177 441
Netherlands - - - - -
Rest of Europe 174 -92 82 43 66
North America 1 021 -516 505 - -
Asia 2 0 2 - -
Total 7 325 -3 840 3 485 2 068 2 563
1 Carrying amount after taking into account specific provisions for individually valued loans and provisions for collectively valued loans but excluding collective provisions for loans which are individually assessed.
Maturity structure for past due loans which are not impaired 2013 Loans to the public
SEK mLoans to
credit institutions Retail Corporate Other Total
Past due ≥ 5 days ≤ 1 month - 3 088 1 174 - 4 262
Past due > 1 month ≤ 2 months - 395 166 - 561
Past due > 2 months ≤ 3 months - 247 117 - 364
Past due > 3 months ≤ 12 months - 614 405 - 1 019
Past due > 12 months - 608 159 - 767
Total - 4 952 2 021 - 6 973
Maturity structure for past due loans which are not impaired 2012 Loans to the public
SEK mLoans to
credit institutions Retail Corporate Other Total
Past due ≥ 5 days ≤ 1 month - 3 827 1 636 - 5 463
Past due > 1 month ≤ 2 months - 481 154 - 635
Past due > 2 months ≤ 3 months - 391 119 - 510
Past due > 3 months ≤ 12 months - 1 035 213 - 1 248
Past due > 12 months - 591 214 - 805
Total - 6 325 2 336 - 8 661
Assets repossessed for protection of claimsSEK m 2013 2012
Property 392 390
Movable property 12 18
Shares 73 39
Carrying amount 477 447
Movable property mainly consists of repossessed leased assets. In addition to repossessed property shown in the table above, repossessed property is also included in discontinued operations, see note G12. The valuation principles for assets and liabilities repossessed for protection of claims are described in note G1.
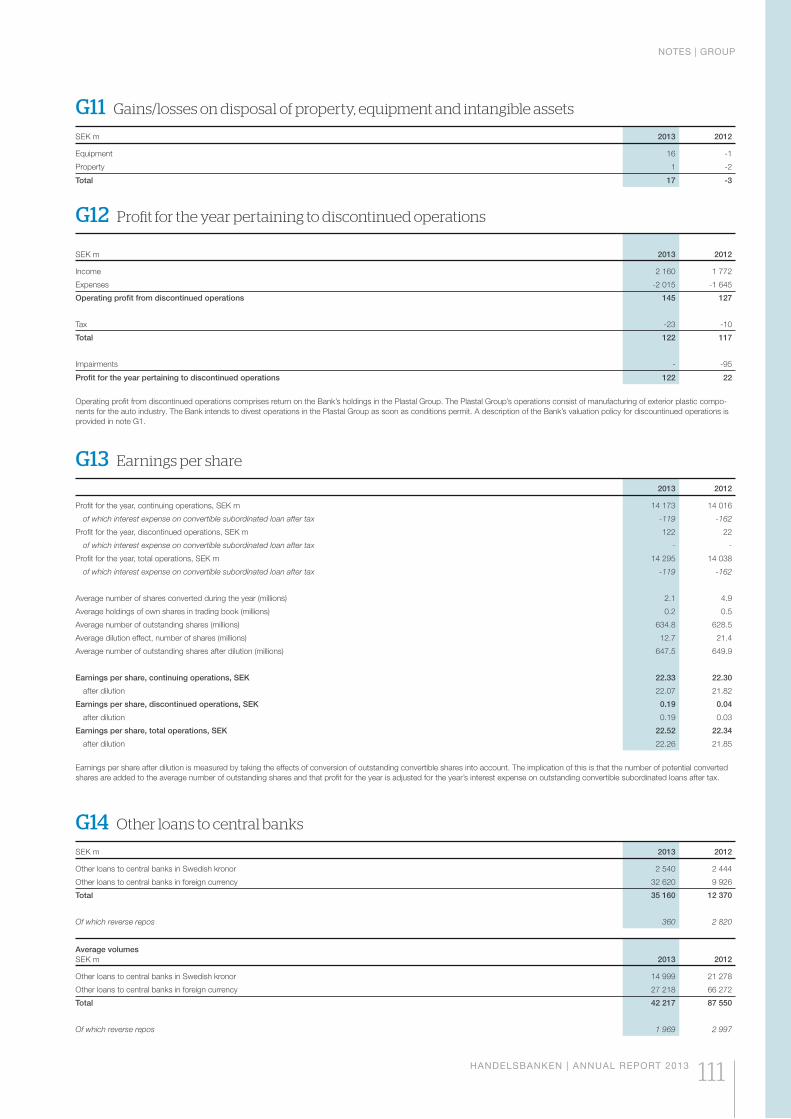
NOTES | GROUP
HANDELSBANKEN | ANNUAL REPORT 2013 111
G11 Gains/losses on disposal of property, equipment and intangible assets
SEK m 2013 2012
Equipment 16 -1
Property 1 -2
Total 17 -3
G12 Profit for the year pertaining to discontinued operations
SEK m 2013 2012
Income 2 160 1 772
Expenses -2 015 -1 645
Operating profit from discontinued operations 145 127
Tax -23 -10
Total 122 117
Impairments - -95
Profit for the year pertaining to discontinued operations 122 22
Operating profit from discontinued operations comprises return on the Bank’s holdings in the Plastal Group. The Plastal Group’s operations consist of manufacturing of exterior plastic compo-nents for the auto industry. The Bank intends to divest operations in the Plastal Group as soon as conditions permit. A description of the Bank’s valuation policy for discountinued operations is provided in note G1.
G13 Earnings per share
2013 2012
Profit for the year, continuing operations, SEK m 14 173 14 016
of which interest expense on convertible subordinated loan after tax -119 -162
Profit for the year, discontinued operations, SEK m 122 22
of which interest expense on convertible subordinated loan after tax - -
Profit for the year, total operations, SEK m 14 295 14 038
of which interest expense on convertible subordinated loan after tax -119 -162
Average number of shares converted during the year (millions) 2.1 4.9
Average holdings of own shares in trading book (millions) 0.2 0.5
Average number of outstanding shares (millions) 634.8 628.5
Average dilution effect, number of shares (millions) 12.7 21.4
Average number of outstanding shares after dilution (millions) 647.5 649.9
Earnings per share, continuing operations, SEK 22.33 22.30
after dilution 22.07 21.82
Earnings per share, discontinued operations, SEK 0.19 0.04
after dilution 0.19 0.03
Earnings per share, total operations, SEK 22.52 22.34
after dilution 22.26 21.85
Earnings per share after dilution is measured by taking the effects of conversion of outstanding convertible shares into account. The implication of this is that the number of potential converted shares are added to the average number of outstanding shares and that profit for the year is adjusted for the year’s interest expense on outstanding convertible subordinated loans after tax.
G14 Other loans to central banks
SEK m 2013 2012
Other loans to central banks in Swedish kronor 2 540 2 444
Other loans to central banks in foreign currency 32 620 9 926
Total 35 160 12 370
Of which reverse repos 360 2 820
Average volumes SEK m 2013 2012
Other loans to central banks in Swedish kronor 14 999 21 278
Other loans to central banks in foreign currency 27 218 66 272
Total 42 217 87 550
Of which reverse repos 1 969 2 997
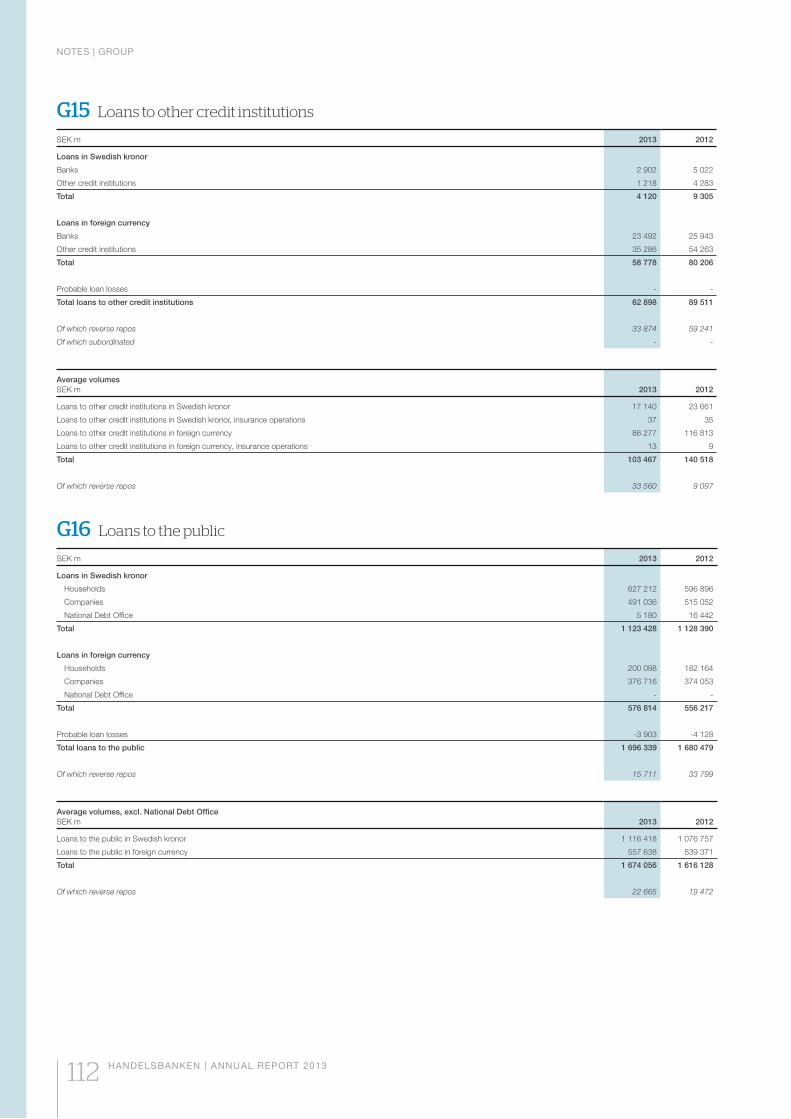
NOTES | GROUP
112 HANDELSBANKEN | ANNUAL REPORT 2013
G15 Loans to other credit institutions
SEK m 2013 2012
Loans in Swedish kronor
Banks 2 902 5 022
Other credit institutions 1 218 4 283
Total 4 120 9 305
Loans in foreign currency
Banks 23 492 25 943
Other credit institutions 35 286 54 263
Total 58 778 80 206
Probable loan losses - -
Total loans to other credit institutions 62 898 89 511
Of which reverse repos 33 874 59 241
Of which subordinated - -
Average volumesSEK m 2013 2012
Loans to other credit institutions in Swedish kronor 17 140 23 661
Loans to other credit institutions in Swedish kronor, insurance operations 37 35
Loans to other credit institutions in foreign currency 86 277 116 813
Loans to other credit institutions in foreign currency, insurance operations 13 9
Total 103 467 140 518
Of which reverse repos 33 560 9 097
G16 Loans to the public
SEK m 2013 2012
Loans in Swedish kronor
Households 627 212 596 896
Companies 491 036 515 052
National Debt Office 5 180 16 442
Total 1 123 428 1 128 390
Loans in foreign currency
Households 200 098 182 164
Companies 376 716 374 053
National Debt Office - -
Total 576 814 556 217
Probable loan losses -3 903 -4 128
Total loans to the public 1 696 339 1 680 479
Of which reverse repos 15 711 33 799
Average volumes, excl. National Debt OfficeSEK m 2013 2012
Loans to the public in Swedish kronor 1 116 418 1 076 757
Loans to the public in foreign currency 557 638 539 371
Total 1 674 056 1 616 128
Of which reverse repos 22 665 19 472
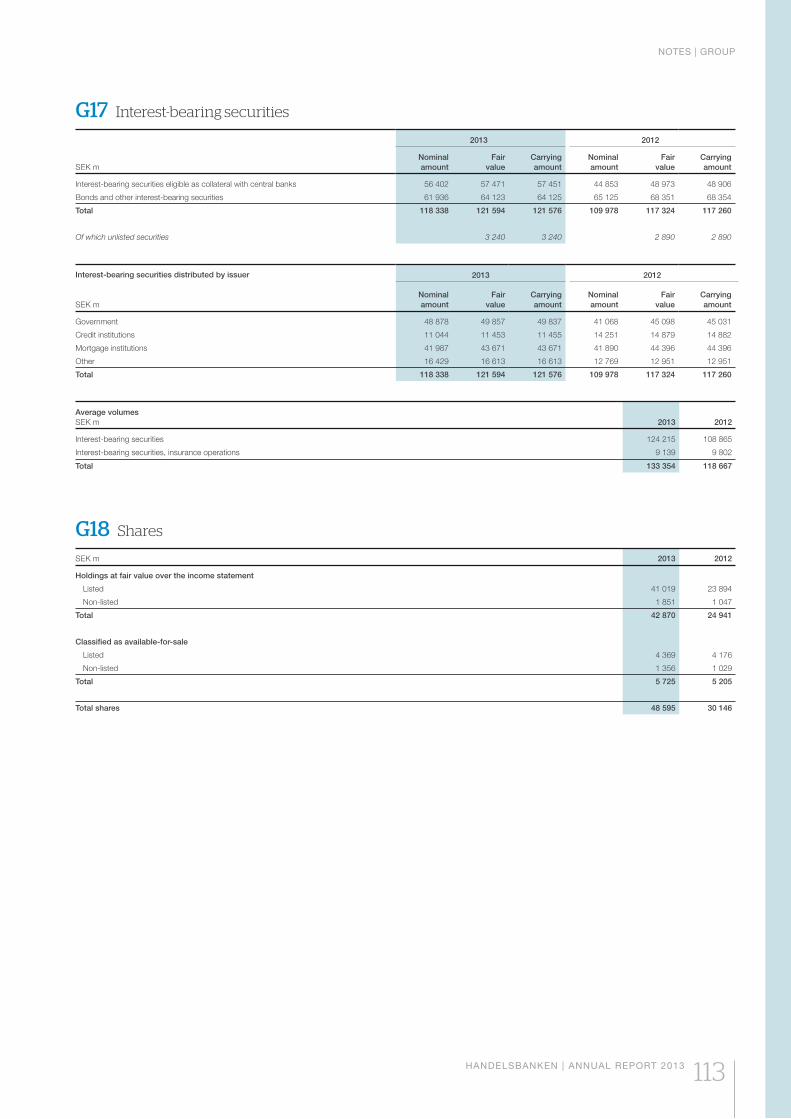
NOTES | GROUP
HANDELSBANKEN | ANNUAL REPORT 2013 113
G17 Interest-bearing securities
SEK m
2013 2012
Nominal amount
Fair value
Carryingamount
Nominal amount
Fair value
Carryingamount
Interest-bearing securities eligible as collateral with central banks 56 402 57 471 57 451 44 853 48 973 48 906
Bonds and other interest-bearing securities 61 936 64 123 64 125 65 125 68 351 68 354
Total 118 338 121 594 121 576 109 978 117 324 117 260
Of which unlisted securities 3 240 3 240 2 890 2 890
Interest-bearing securities distributed by issuer
SEK m
2013 2012
Nominal amount
Fair value
Carryingamount
Nominal amount
Fair value
Carryingamount
Government 48 878 49 857 49 837 41 068 45 098 45 031
Credit institutions 11 044 11 453 11 455 14 251 14 879 14 882
Mortgage institutions 41 987 43 671 43 671 41 890 44 396 44 396
Other 16 429 16 613 16 613 12 769 12 951 12 951
Total 118 338 121 594 121 576 109 978 117 324 117 260
Average volumesSEK m 2013 2012
Interest-bearing securities 124 215 108 865
Interest-bearing securities, insurance operations 9 139 9 802
Total 133 354 118 667
G18 Shares
SEK m 2013 2012
Holdings at fair value over the income statement
Listed 41 019 23 894
Non-listed 1 851 1 047
Total 42 870 24 941
Classified as available-for-sale
Listed 4 369 4 176
Non-listed 1 356 1 029
Total 5 725 5 205
Total shares 48 595 30 146
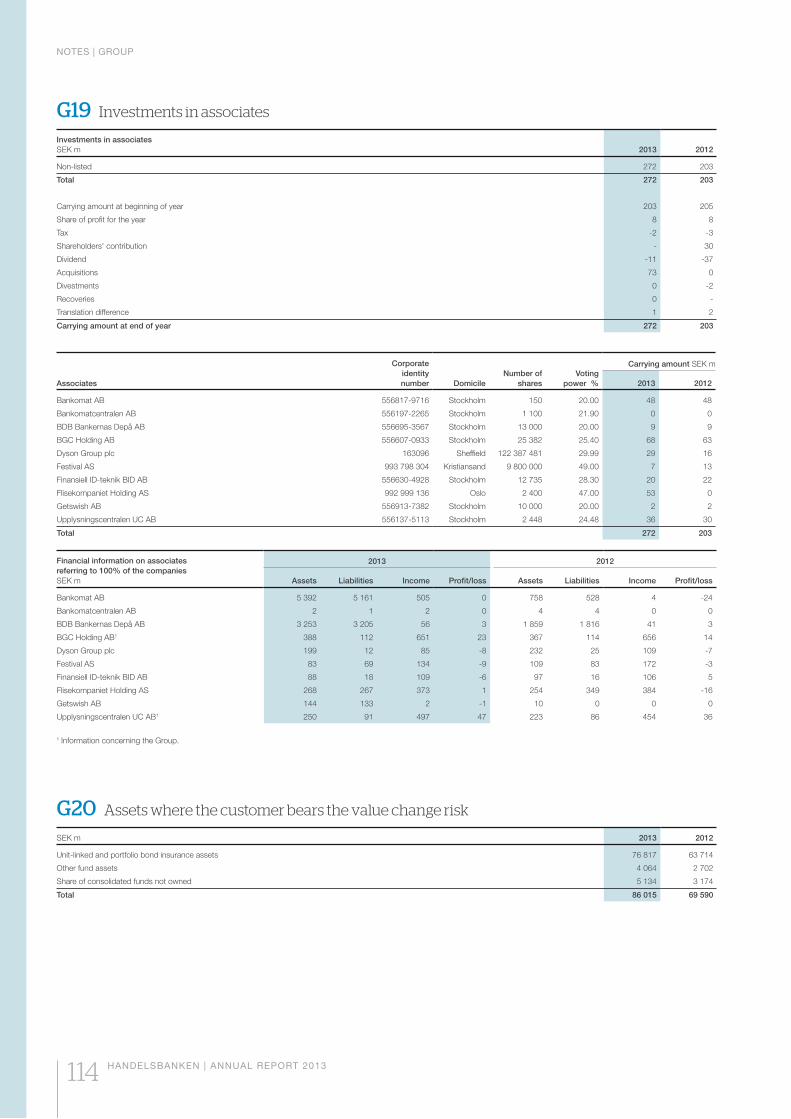
NOTES | GROUP
114 HANDELSBANKEN | ANNUAL REPORT 2013
G19 Investments in associates
Investments in associates SEK m 2013 2012
Non-listed 272 203
Total 272 203
Carrying amount at beginning of year 203 205
Share of profit for the year 8 8
Tax -2 -3
Shareholders' contribution - 30
Dividend -11 -37
Acquisitions 73 0
Divestments 0 -2
Recoveries 0 -
Translation difference 1 2
Carrying amount at end of year 272 203
Associates
Corporate identitynumber Domicile
Number of shares
Voting power %
Carrying amount SEK m
2013 2012
Bankomat AB 556817-9716 Stockholm 150 20.00 48 48
Bankomatcentralen AB 556197-2265 Stockholm 1 100 21.90 0 0
BDB Bankernas Depå AB 556695-3567 Stockholm 13 000 20.00 9 9
BGC Holding AB 556607-0933 Stockholm 25 382 25.40 68 63
Dyson Group plc 163096 Sheffield 122 387 481 29.99 29 16
Festival AS 993 798 304 Kristiansand 9 800 000 49.00 7 13
Finansiell ID-teknik BID AB 556630-4928 Stockholm 12 735 28.30 20 22
Flisekompaniet Holding AS 992 999 136 Oslo 2 400 47.00 53 0
Getswish AB 556913-7382 Stockholm 10 000 20.00 2 2
Upplysningscentralen UC AB 556137-5113 Stockholm 2 448 24.48 36 30
Total 272 203
Financial information on associates referring to 100% of the companiesSEK m
2013 2012
Assets Liabilities Income Profit/loss Assets Liabilities Income Profit/loss
Bankomat AB 5 392 5 161 505 0 758 528 4 -24
Bankomatcentralen AB 2 1 2 0 4 4 0 0
BDB Bankernas Depå AB 3 253 3 205 56 3 1 859 1 816 41 3
BGC Holding AB1 388 112 651 23 367 114 656 14
Dyson Group plc 199 12 85 -8 232 25 109 -7
Festival AS 83 69 134 -9 109 83 172 -3
Finansiell ID-teknik BID AB 88 18 109 -6 97 16 106 5
Flisekompaniet Holding AS 268 267 373 1 254 349 384 -16
Getswish AB 144 133 2 -1 10 0 0 0
Upplysningscentralen UC AB1 250 91 497 47 223 86 454 36
1 Information concerning the Group.
G20 Assets where the customer bears the value change risk
SEK m 2013 2012
Unit-linked and portfolio bond insurance assets 76 817 63 714
Other fund assets 4 064 2 702
Share of consolidated funds not owned 5 134 3 174
Total 86 015 69 590
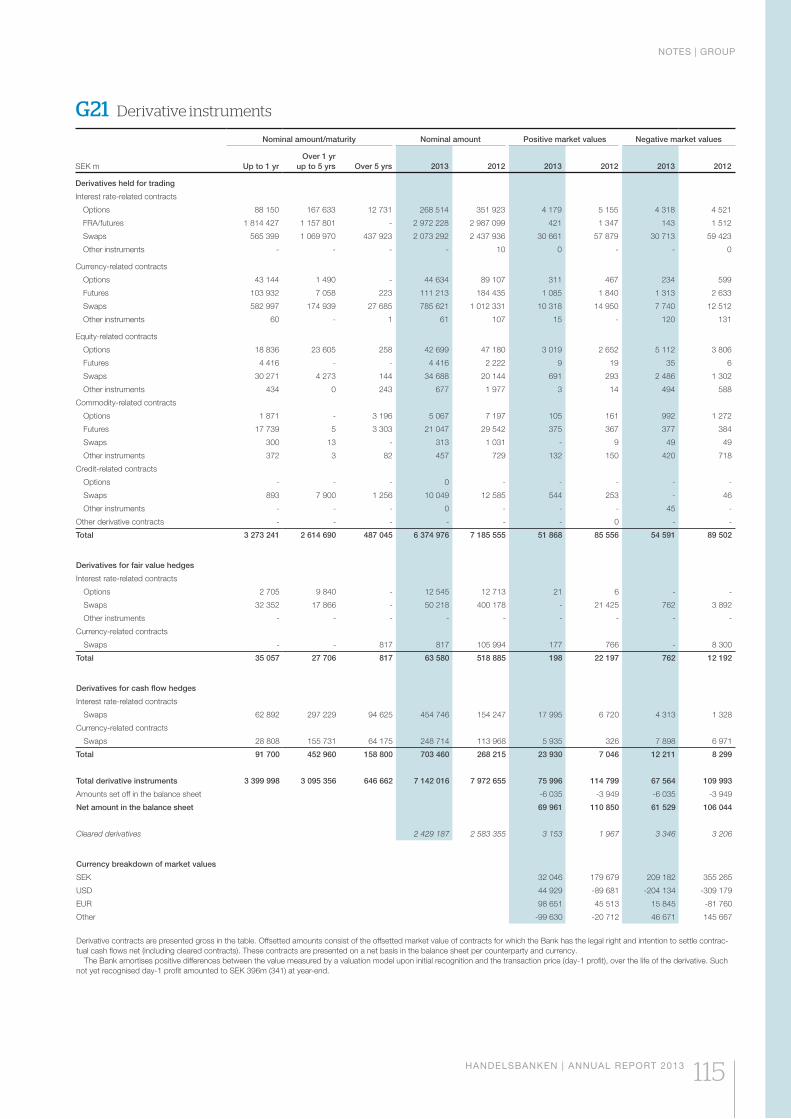
NOTES | GROUP
HANDELSBANKEN | ANNUAL REPORT 2013 115
G21 Derivative instruments
Nominal amount/maturity Nominal amount Positive market values Negative market values
SEK m Up to 1 yrOver 1 yr
up to 5 yrs Over 5 yrs 2013 2012 2013 2012 2013 2012
Derivatives held for trading
Interest rate-related contracts
Options 88 150 167 633 12 731 268 514 351 923 4 179 5 155 4 318 4 521
FRA/futures 1 814 427 1 157 801 - 2 972 228 2 987 099 421 1 347 143 1 512
Swaps 565 399 1 069 970 437 923 2 073 292 2 437 936 30 661 57 879 30 713 59 423
Other instruments - - - - 10 0 - - 0
Currency-related contracts
Options 43 144 1 490 - 44 634 89 107 311 467 234 599
Futures 103 932 7 058 223 111 213 184 435 1 085 1 840 1 313 2 633
Swaps 582 997 174 939 27 685 785 621 1 012 331 10 318 14 950 7 740 12 512
Other instruments 60 - 1 61 107 15 - 120 131
Equity-related contracts
Options 18 836 23 605 258 42 699 47 180 3 019 2 652 5 112 3 806
Futures 4 416 - - 4 416 2 222 9 19 35 6
Swaps 30 271 4 273 144 34 688 20 144 691 293 2 486 1 302
Other instruments 434 0 243 677 1 977 3 14 494 588
Commodity-related contracts
Options 1 871 - 3 196 5 067 7 197 105 161 992 1 272
Futures 17 739 5 3 303 21 047 29 542 375 367 377 384
Swaps 300 13 - 313 1 031 - 9 49 49
Other instruments 372 3 82 457 729 132 150 420 718
Credit-related contracts
Options - - - 0 - - - - -
Swaps 893 7 900 1 256 10 049 12 585 544 253 - 46
Other instruments - - - 0 - - - 45 -
Other derivative contracts - - - - - - 0 - -
Total 3 273 241 2 614 690 487 045 6 374 976 7 185 555 51 868 85 556 54 591 89 502
Derivatives for fair value hedges
Interest rate-related contracts
Options 2 705 9 840 - 12 545 12 713 21 6 - -
Swaps 32 352 17 866 - 50 218 400 178 - 21 425 762 3 892
Other instruments - - - - - - - - -
Currency-related contracts
Swaps - - 817 817 105 994 177 766 - 8 300
Total 35 057 27 706 817 63 580 518 885 198 22 197 762 12 192
Derivatives for cash flow hedges
Interest rate-related contracts
Swaps 62 892 297 229 94 625 454 746 154 247 17 995 6 720 4 313 1 328
Currency-related contracts
Swaps 28 808 155 731 64 175 248 714 113 968 5 935 326 7 898 6 971
Total 91 700 452 960 158 800 703 460 268 215 23 930 7 046 12 211 8 299
Total derivative instruments 3 399 998 3 095 356 646 662 7 142 016 7 972 655 75 996 114 799 67 564 109 993
Amounts set off in the balance sheet -6 035 -3 949 -6 035 -3 949
Net amount in the balance sheet 69 961 110 850 61 529 106 044
Cleared derivatives 2 429 187 2 583 355 3 153 1 967 3 346 3 206
Currency breakdown of market values
SEK 32 046 179 679 209 182 355 265
USD 44 929 -89 681 -204 134 -309 179
EUR 98 651 45 513 15 845 -81 760
Other -99 630 -20 712 46 671 145 667
Derivative contracts are presented gross in the table. Offsetted amounts consist of the offsetted market value of contracts for which the Bank has the legal right and intention to settle contrac-tual cash flows net (including cleared contracts). These contracts are presented on a net basis in the balance sheet per counterparty and currency. The Bank amortises positive differences between the value measured by a valuation model upon initial recognition and the transaction price (day-1 profit), over the life of the derivative. Such not yet recognised day-1 profit amounted to SEK 396m (341) at year-end.
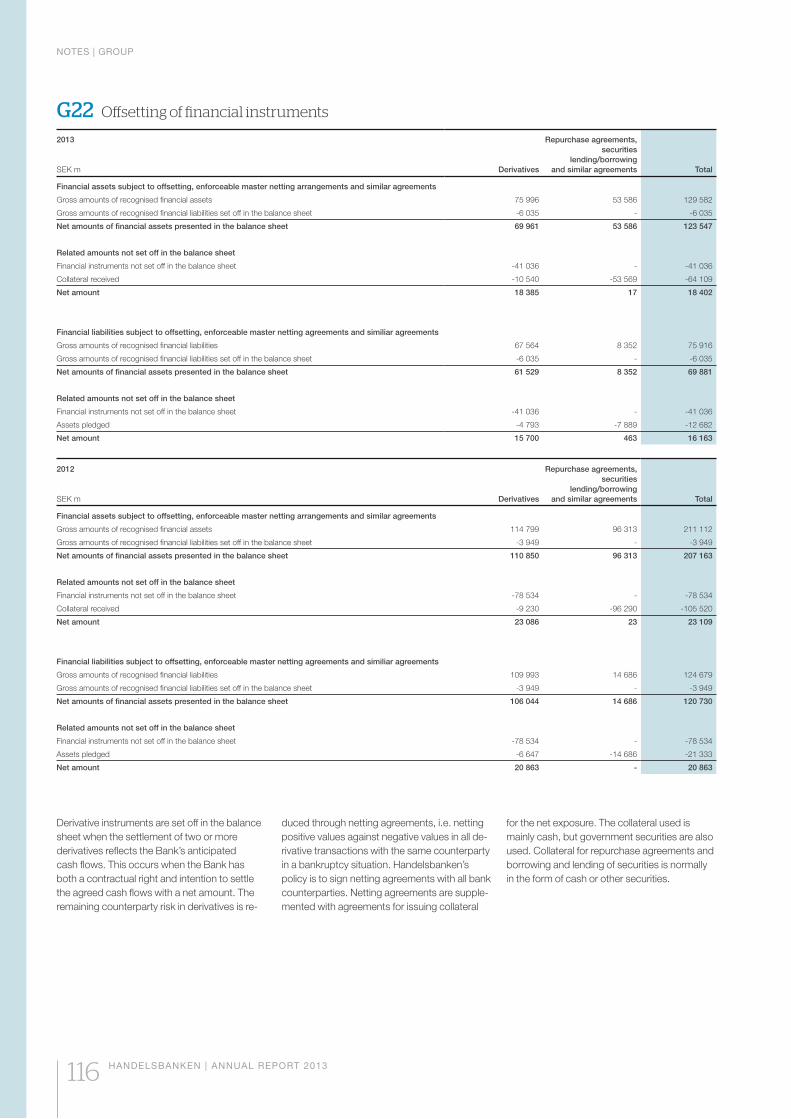
NOTES | GROUP
116 HANDELSBANKEN | ANNUAL REPORT 2013
G22 Offsetting of financial instruments
2013
SEK m Derivatives
Repurchase agreements,securities
lending/borrowingand similar agreements Total
Financial assets subject to offsetting, enforceable master netting arrangements and similar agreements
Gross amounts of recognised financial assets 75 996 53 586 129 582
Gross amounts of recognised financial liabilities set off in the balance sheet -6 035 - -6 035
Net amounts of financial assets presented in the balance sheet 69 961 53 586 123 547
Related amounts not set off in the balance sheet
Financial instruments not set off in the balance sheet -41 036 - -41 036
Collateral received -10 540 -53 569 -64 109
Net amount 18 385 17 18 402
Financial liabilities subject to offsetting, enforceable master netting agreements and similiar agreements
Gross amounts of recognised financial liabilities 67 564 8 352 75 916
Gross amounts of recognised financial liabilities set off in the balance sheet -6 035 - -6 035
Net amounts of financial assets presented in the balance sheet 61 529 8 352 69 881
Related amounts not set off in the balance sheet
Financial instruments not set off in the balance sheet -41 036 - -41 036
Assets pledged -4 793 -7 889 -12 682
Net amount 15 700 463 16 163
2012
SEK m Derivatives
Repurchase agreements,securities
lending/borrowingand similar agreements Total
Financial assets subject to offsetting, enforceable master netting arrangements and similar agreements
Gross amounts of recognised financial assets 114 799 96 313 211 112
Gross amounts of recognised financial liabilities set off in the balance sheet -3 949 - -3 949
Net amounts of financial assets presented in the balance sheet 110 850 96 313 207 163
Related amounts not set off in the balance sheet
Financial instruments not set off in the balance sheet -78 534 - -78 534
Collateral received -9 230 -96 290 -105 520
Net amount 23 086 23 23 109
Financial liabilities subject to offsetting, enforceable master netting agreements and similiar agreements
Gross amounts of recognised financial liabilities 109 993 14 686 124 679
Gross amounts of recognised financial liabilities set off in the balance sheet -3 949 - -3 949
Net amounts of financial assets presented in the balance sheet 106 044 14 686 120 730
Related amounts not set off in the balance sheet
Financial instruments not set off in the balance sheet -78 534 - -78 534
Assets pledged -6 647 -14 686 -21 333
Net amount 20 863 - 20 863
Derivative instruments are set off in the balance sheet when the settlement of two or more derivatives reflects the Bank’s anticipated cash flows. This occurs when the Bank has both a contractual right and intention to settle the agreed cash flows with a net amount. The remaining counterparty risk in derivatives is re-
duced through netting agreements, i.e. netting positive values against negative values in all de-rivative transactions with the same counterparty in a bankruptcy situation. Handelsbanken’s policy is to sign netting agreements with all bank counterparties. Netting agreements are supple-mented with agreements for issuing collateral
for the net exposure. The collateral used is mainly cash, but government securities are also used. Collateral for repurchase agreements and borrowing and lending of securities is normally in the form of cash or other securities.
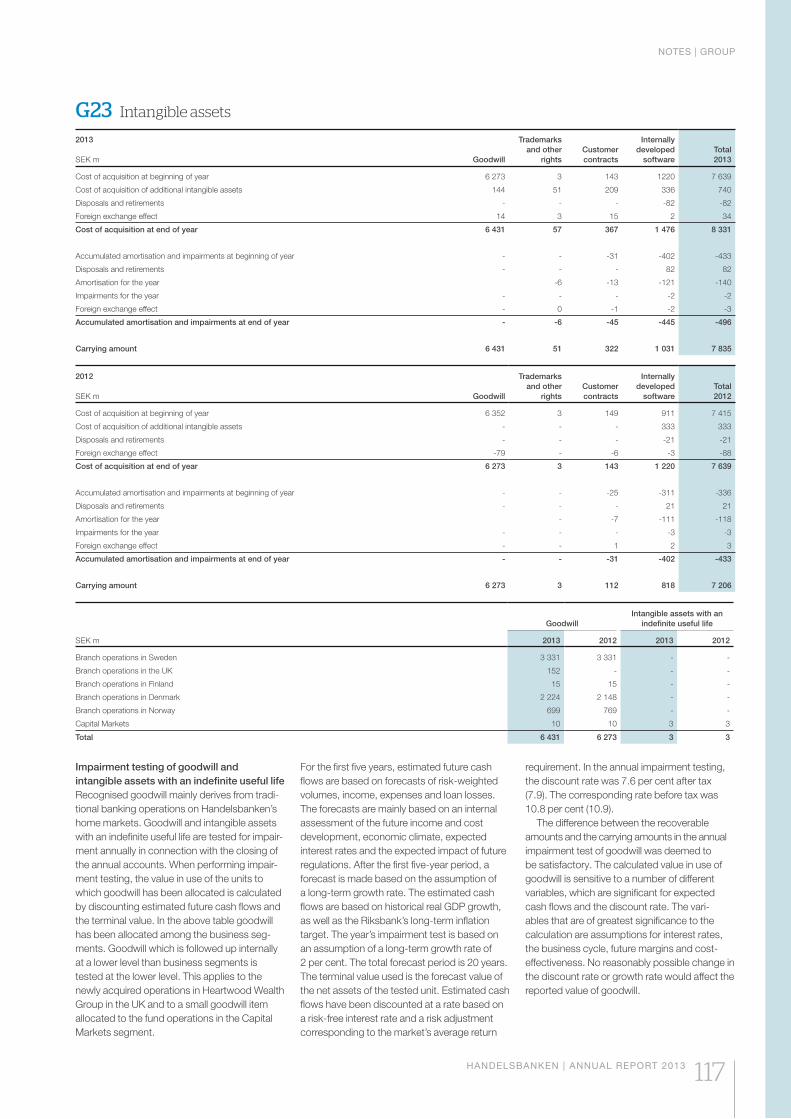
NOTES | GROUP
HANDELSBANKEN | ANNUAL REPORT 2013 117
G23 Intangible assets
2013 SEK m Goodwill
Trademarksand other
rightsCustomercontracts
Internallydeveloped
softwareTotal 2013
Cost of acquisition at beginning of year 6 273 3 143 1220 7 639
Cost of acquisition of additional intangible assets 144 51 209 336 740
Disposals and retirements - - - -82 -82
Foreign exchange effect 14 3 15 2 34
Cost of acquisition at end of year 6 431 57 367 1 476 8 331
Accumulated amortisation and impairments at beginning of year - - -31 -402 -433
Disposals and retirements - - - 82 82
Amortisation for the year -6 -13 -121 -140
Impairments for the year - - - -2 -2
Foreign exchange effect - 0 -1 -2 -3
Accumulated amortisation and impairments at end of year - -6 -45 -445 -496
Carrying amount 6 431 51 322 1 031 7 835
2012 SEK m Goodwill
Trademarksand other
rightsCustomercontracts
Internallydeveloped
softwareTotal 2012
Cost of acquisition at beginning of year 6 352 3 149 911 7 415
Cost of acquisition of additional intangible assets - - - 333 333
Disposals and retirements - - - -21 -21
Foreign exchange effect -79 - -6 -3 -88
Cost of acquisition at end of year 6 273 3 143 1 220 7 639
Accumulated amortisation and impairments at beginning of year - - -25 -311 -336
Disposals and retirements - - - 21 21
Amortisation for the year - -7 -111 -118
Impairments for the year - - - -3 -3
Foreign exchange effect - - 1 2 3
Accumulated amortisation and impairments at end of year - - -31 -402 -433
Carrying amount 6 273 3 112 818 7 206
SEK m
GoodwillIntangible assets with an
indefinite useful life
2013 2012 2013 2012
Branch operations in Sweden 3 331 3 331 - -
Branch operations in the UK 152 - - -
Branch operations in Finland 15 15 - -
Branch operations in Denmark 2 224 2 148 - -
Branch operations in Norway 699 769 - -
Capital Markets 10 10 3 3
Total 6 431 6 273 3 3
Impairment testing of goodwill and intangible assets with an indefinite useful lifeRecognised goodwill mainly derives from tradi-tional banking operations on Handelsbanken’s home markets. Goodwill and intangible assets with an indefinite useful life are tested for impair-ment annually in connection with the closing of the annual accounts. When performing impair-ment testing, the value in use of the units to which goodwill has been allocated is calculated by discounting estimated future cash flows and the terminal value. In the above table goodwill has been allocated among the business seg-ments. Goodwill which is followed up internally at a lower level than business segments is tested at the lower level. This applies to the newly acquired operations in Heartwood Wealth Group in the UK and to a small goodwill item allocated to the fund operations in the Capital Markets segment.
For the first five years, estimated future cash flows are based on forecasts of risk-weighted volumes, income, expenses and loan losses. The forecasts are mainly based on an internal assessment of the future income and cost development, economic climate, expected interest rates and the expected impact of future regulations. After the first five-year period, a forecast is made based on the assumption of a long-term growth rate. The estimated cash flows are based on historical real GDP growth, as well as the Riksbank’s long-term inflation target. The year’s impairment test is based on an assumption of a long-term growth rate of 2 per cent. The total forecast period is 20 years. The terminal value used is the forecast value of the net assets of the tested unit. Estimated cash flows have been discounted at a rate based on a risk-free interest rate and a risk adjustment corresponding to the market’s average return
requirement. In the annual impairment testing, the discount rate was 7.6 per cent after tax (7.9). The corresponding rate before tax was 10.8 per cent (10.9).
The difference between the recoverable amounts and the carrying amounts in the annual impairment test of goodwill was deemed to be satisfactory. The calculated value in use of goodwill is sensitive to a number of different variables, which are significant for expected cash flows and the discount rate. The vari-ables that are of greatest significance to the calculation are assumptions for interest rates, the business cycle, future margins and cost-effectiveness. No reasonably possible change in the discount rate or growth rate would affect the reported value of goodwill.
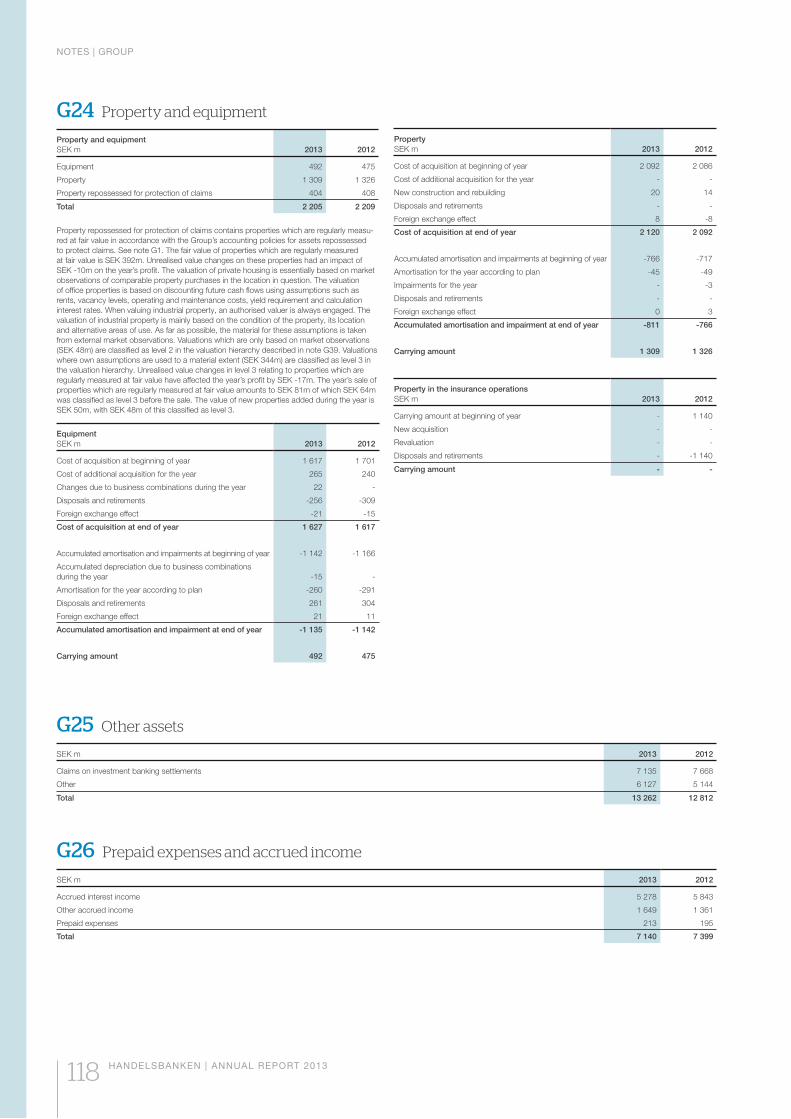
NOTES | GROUP
118 HANDELSBANKEN | ANNUAL REPORT 2013
G24 Property and equipment
Property and equipmentSEK m 2013 2012
Equipment 492 475
Property 1 309 1 326
Property repossessed for protection of claims 404 408
Total 2 205 2 209
Property repossessed for protection of claims contains properties which are regularly measu-red at fair value in accordance with the Group’s accounting policies for assets repossessed to protect claims. See note G1. The fair value of properties which are regularly measured at fair value is SEK 392m. Unrealised value changes on these properties had an impact of SEK -10m on the year’s profit. The valuation of private housing is essentially based on market observations of comparable property purchases in the location in question. The valuation of office properties is based on discounting future cash flows using assumptions such as rents, vacancy levels, operating and maintenance costs, yield requirement and calculation interest rates. When valuing industrial property, an authorised valuer is always engaged. The valuation of industrial property is mainly based on the condition of the property, its location and alternative areas of use. As far as possible, the material for these assumptions is taken from external market observations. Valuations which are only based on market observations (SEK 48m) are classified as level 2 in the valuation hierarchy described in note G39. Valuations where own assumptions are used to a material extent (SEK 344m) are classified as level 3 in the valuation hierarchy. Unrealised value changes in level 3 relating to properties which are regularly measured at fair value have affected the year’s profit by SEK -17m. The year’s sale of properties which are regularly measured at fair value amounts to SEK 81m of which SEK 64m was classified as level 3 before the sale. The value of new properties added during the year is SEK 50m, with SEK 48m of this classified as level 3.
EquipmentSEK m 2013 2012
Cost of acquisition at beginning of year 1 617 1 701
Cost of additional acquisition for the year 265 240
Changes due to business combinations during the year 22 -
Disposals and retirements -256 -309
Foreign exchange effect -21 -15
Cost of acquisition at end of year 1 627 1 617
Accumulated amortisation and impairments at beginning of year -1 142 -1 166
Accumulated depreciation due to business combinations during the year -15 -
Amortisation for the year according to plan -260 -291
Disposals and retirements 261 304
Foreign exchange effect 21 11
Accumulated amortisation and impairment at end of year -1 135 -1 142
Carrying amount 492 475
PropertySEK m 2013 2012
Cost of acquisition at beginning of year 2 092 2 086
Cost of additional acquisition for the year - -
New construction and rebuilding 20 14
Disposals and retirements - -
Foreign exchange effect 8 -8
Cost of acquisition at end of year 2 120 2 092
Accumulated amortisation and impairments at beginning of year -766 -717
Amortisation for the year according to plan -45 -49
Impairments for the year - -3
Disposals and retirements - -
Foreign exchange effect 0 3
Accumulated amortisation and impairment at end of year -811 -766
Carrying amount 1 309 1 326
Property in the insurance operationsSEK m 2013 2012
Carrying amount at beginning of year - 1 140
New acquisition - -
Revaluation - -
Disposals and retirements - -1 140
Carrying amount - -
G25 Other assets
SEK m 2013 2012
Claims on investment banking settlements 7 135 7 668
Other 6 127 5 144
Total 13 262 12 812
G26 Prepaid expenses and accrued income
SEK m 2013 2012
Accrued interest income 5 278 5 843
Other accrued income 1 649 1 361
Prepaid expenses 213 195
Total 7 140 7 399
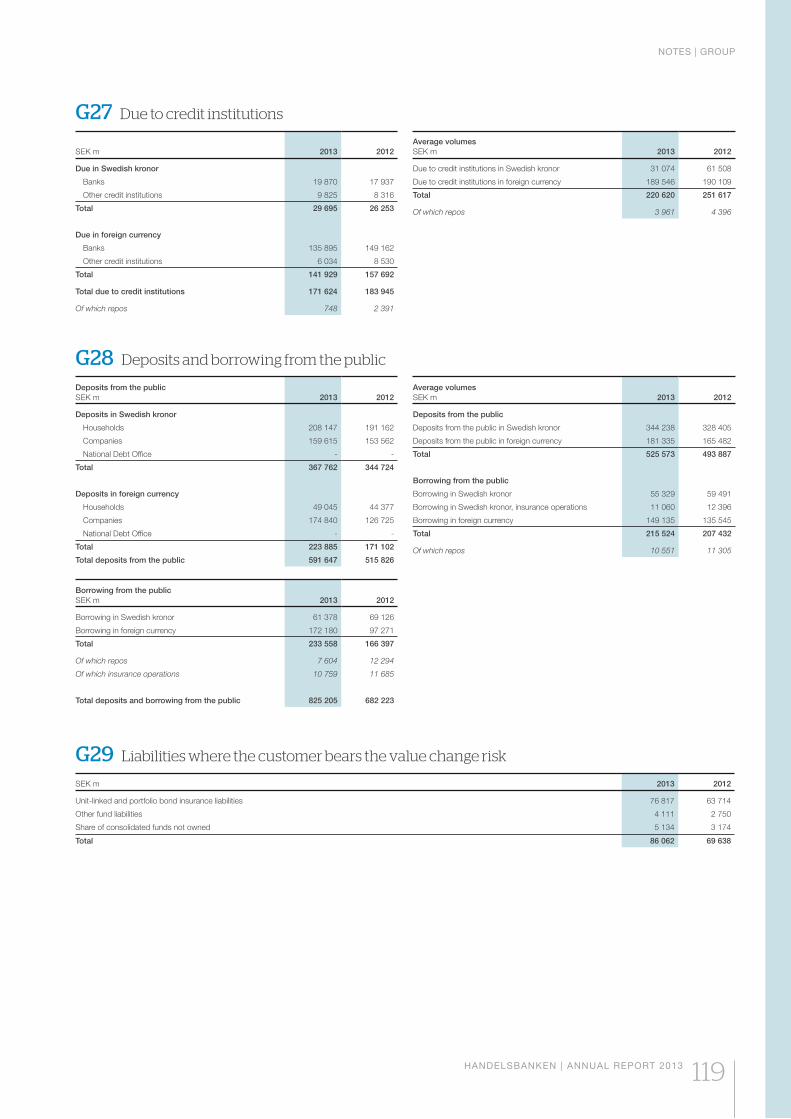
NOTES | GROUP
HANDELSBANKEN | ANNUAL REPORT 2013 119
G27 Due to credit institutions
SEK m 2013 2012
Due in Swedish kronor
Banks 19 870 17 937
Other credit institutions 9 825 8 316
Total 29 695 26 253
Due in foreign currency
Banks 135 895 149 162
Other credit institutions 6 034 8 530
Total 141 929 157 692
Total due to credit institutions 171 624 183 945
Of which repos 748 2 391
Average volumesSEK m 2013 2012
Due to credit institutions in Swedish kronor 31 074 61 508
Due to credit institutions in foreign currency 189 546 190 109
Total 220 620 251 617
Of which repos 3 961 4 396
G28 Deposits and borrowing from the public
Deposits from the publicSEK m 2013 2012
Deposits in Swedish kronor
Households 208 147 191 162
Companies 159 615 153 562
National Debt Office - -
Total 367 762 344 724
Deposits in foreign currency
Households 49 045 44 377
Companies 174 840 126 725
National Debt Office - -
Total 223 885 171 102
Total deposits from the public 591 647 515 826
Borrowing from the publicSEK m 2013 2012
Borrowing in Swedish kronor 61 378 69 126
Borrowing in foreign currency 172 180 97 271
Total 233 558 166 397
Of which repos 7 604 12 294
Of which insurance operations 10 759 11 685
Total deposits and borrowing from the public 825 205 682 223
Average volumesSEK m 2013 2012
Deposits from the public
Deposits from the public in Swedish kronor 344 238 328 405
Deposits from the public in foreign currency 181 335 165 482
Total 525 573 493 887
Borrowing from the public
Borrowing in Swedish kronor 55 329 59 491
Borrowing in Swedish kronor, insurance operations 11 060 12 396
Borrowing in foreign currency 149 135 135 545
Total 215 524 207 432
Of which repos 10 551 11 305
G29 Liabilities where the customer bears the value change risk
SEK m 2013 2012
Unit-linked and portfolio bond insurance liabilities 76 817 63 714
Other fund liabilities 4 111 2 750
Share of consolidated funds not owned 5 134 3 174
Total 86 062 69 638
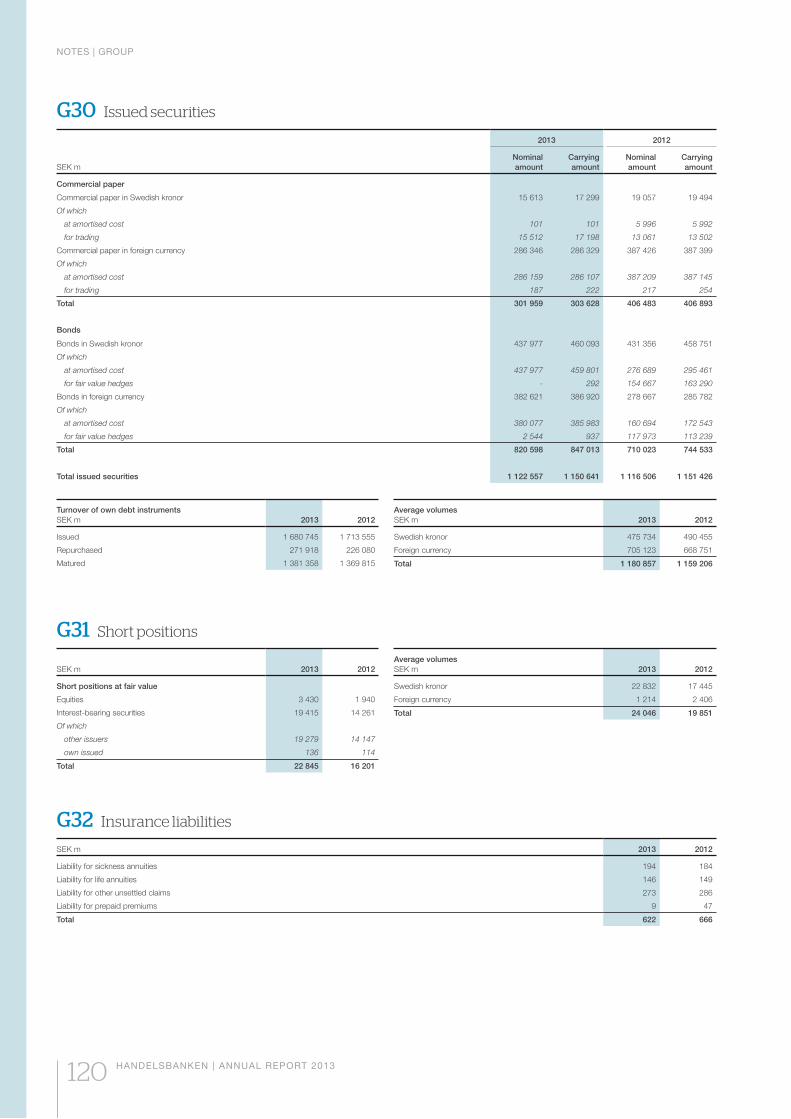
NOTES | GROUP
120 HANDELSBANKEN | ANNUAL REPORT 2013
Average volumesSEK m 2013 2012
Swedish kronor 475 734 490 455
Foreign currency 705 123 668 751
Total 1 180 857 1 159 206
Turnover of own debt instrumentsSEK m 2013 2012
Issued 1 680 745 1 713 555
Repurchased 271 918 226 080
Matured 1 381 358 1 369 815
G30 Issued securities
SEK m
2013 2012
Nominalamount
Carryingamount
Nominalamount
Carryingamount
Commercial paper
Commercial paper in Swedish kronor 15 613 17 299 19 057 19 494
Of which
at amortised cost 101 101 5 996 5 992
for trading 15 512 17 198 13 061 13 502
Commercial paper in foreign currency 286 346 286 329 387 426 387 399
Of which
at amortised cost 286 159 286 107 387 209 387 145
for trading 187 222 217 254
Total 301 959 303 628 406 483 406 893
Bonds
Bonds in Swedish kronor 437 977 460 093 431 356 458 751
Of which
at amortised cost 437 977 459 801 276 689 295 461
for fair value hedges - 292 154 667 163 290
Bonds in foreign currency 382 621 386 920 278 667 285 782
Of which
at amortised cost 380 077 385 983 160 694 172 543
for fair value hedges 2 544 937 117 973 113 239
Total 820 598 847 013 710 023 744 533
Total issued securities 1 122 557 1 150 641 1 116 506 1 151 426
G31 Short positions
SEK m 2013 2012
Short positions at fair value
Equities 3 430 1 940
Interest-bearing securities 19 415 14 261
Of which
other issuers 19 279 14 147
own issued 136 114
Total 22 845 16 201
Average volumesSEK m 2013 2012
Swedish kronor 22 832 17 445
Foreign currency 1 214 2 406
Total 24 046 19 851
G32 Insurance liabilities
SEK m 2013 2012
Liability for sickness annuities 194 184
Liability for life annuities 146 149
Liability for other unsettled claims 273 286
Liability for prepaid premiums 9 47
Total 622 666
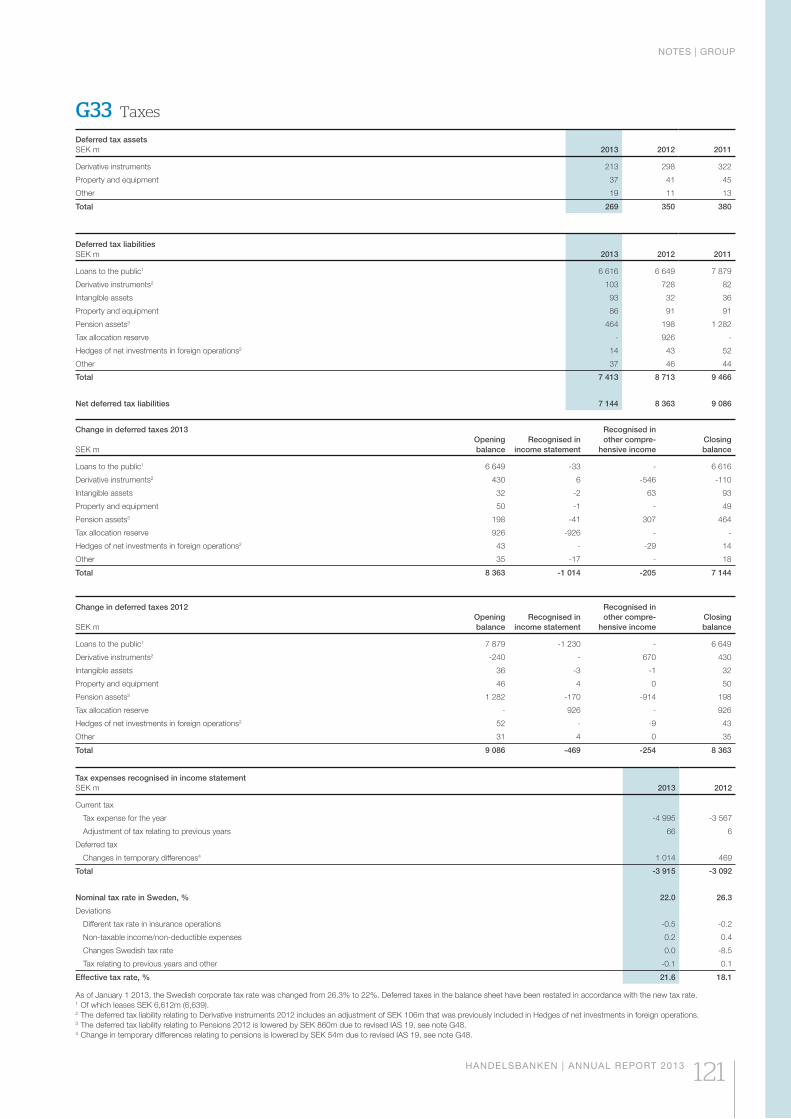
NOTES | GROUP
HANDELSBANKEN | ANNUAL REPORT 2013 121
G33 Taxes
Deferred tax assetsSEK m 2013 2012 2011
Derivative instruments 213 298 322
Property and equipment 37 41 45
Other 19 11 13
Total 269 350 380
Deferred tax liabilitiesSEK m 2013 2012 2011
Loans to the public1 6 616 6 649 7 879
Derivative instruments2 103 728 82
Intangible assets 93 32 36
Property and equipment 86 91 91
Pension assets3 464 198 1 282
Tax allocation reserve - 926 -
Hedges of net investments in foreign operations2 14 43 52
Other 37 46 44
Total 7 413 8 713 9 466
Net deferred tax liabilities 7 144 8 363 9 086
Change in deferred taxes 2013
SEK mOpeningbalance
Recognised inincome statement
Recognised in other compre-
hensive incomeClosingbalance
Loans to the public1 6 649 -33 - 6 616
Derivative instruments2 430 6 -546 -110
Intangible assets 32 -2 63 93
Property and equipment 50 -1 - 49
Pension assets3 198 -41 307 464
Tax allocation reserve 926 -926 - -
Hedges of net investments in foreign operations2 43 - -29 14
Other 35 -17 - 18
Total 8 363 -1 014 -205 7 144
Change in deferred taxes 2012
SEK mOpeningbalance
Recognised inincome statement
Recognised in other compre-
hensive incomeClosingbalance
Loans to the public1 7 879 -1 230 - 6 649
Derivative instruments2 -240 - 670 430
Intangible assets 36 -3 -1 32
Property and equipment 46 4 0 50
Pension assets3 1 282 -170 -914 198
Tax allocation reserve - 926 - 926
Hedges of net investments in foreign operations2 52 - -9 43
Other 31 4 0 35
Total 9 086 -469 -254 8 363
Tax expenses recognised in income statementSEK m 2013 2012
Current tax
Tax expense for the year -4 995 -3 567
Adjustment of tax relating to previous years 66 6
Deferred tax
Changes in temporary differences4 1 014 469
Total -3 915 -3 092
Nominal tax rate in Sweden, % 22.0 26.3
Deviations
Different tax rate in insurance operations -0.5 -0.2
Non-taxable income/non-deductible expenses 0.2 0.4
Changes Swedish tax rate 0.0 -8.5
Tax relating to previous years and other -0.1 0.1
Effective tax rate, % 21.6 18.1
As of January 1 2013, the Swedish corporate tax rate was changed from 26.3% to 22%. Deferred taxes in the balance sheet have been restated in accordance with the new tax rate.1 Of which leases SEK 6,612m (6,639).2 The deferred tax liability relating to Derivative instruments 2012 includes an adjustment of SEK 106m that was previously included in Hedges of net investments in foreign operations.3 The deferred tax liability relating to Pensions 2012 is lowered by SEK 860m due to revised IAS 19, see note G48.4 Change in temporary differences relating to pensions is lowered by SEK 54m due to revised IAS 19, see note G48.
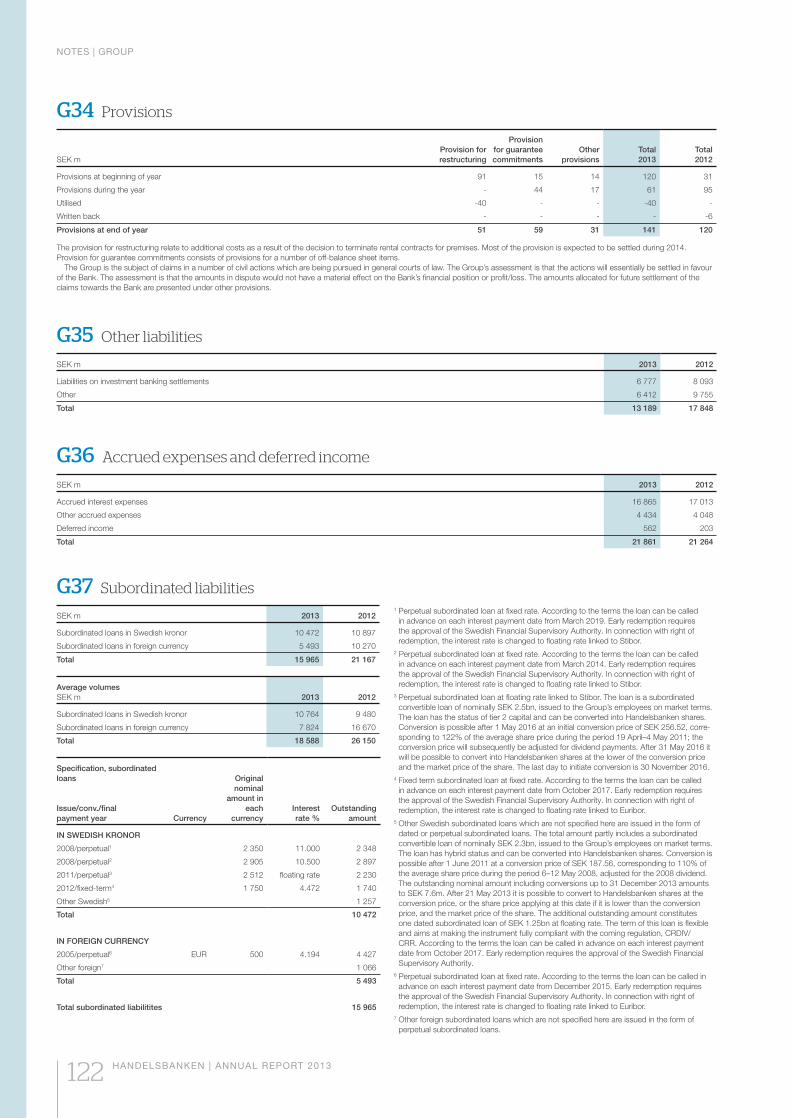
NOTES | GROUP
122 HANDELSBANKEN | ANNUAL REPORT 2013
G35 Other liabilities
SEK m 2013 2012
Liabilities on investment banking settlements 6 777 8 093
Other 6 412 9 755
Total 13 189 17 848
G36 Accrued expenses and deferred income
SEK m 2013 2012
Accrued interest expenses 16 865 17 013
Other accrued expenses 4 434 4 048
Deferred income 562 203
Total 21 861 21 264
G37 Subordinated liabilities
SEK m 2013 2012
Subordinated loans in Swedish kronor 10 472 10 897
Subordinated loans in foreign currency 5 493 10 270
Total 15 965 21 167
Average volumes SEK m 2013 2012
Subordinated loans in Swedish kronor 10 764 9 480
Subordinated loans in foreign currency 7 824 16 670
Total 18 588 26 150
Specification, subordinated loans
Issue/conv./final payment year Currency
Originalnominal
amount ineach
currencyInterestrate %
Outstandingamount
IN SWEDISH KRONOR
2008/perpetual1 2 350 11.000 2 348
2008/perpetual2 2 905 10.500 2 897
2011/perpetual3 2 512 floating rate 2 230
2012/fixed-term4 1 750 4.472 1 740
Other Swedish5 1 257
Total 10 472
IN FOREIGN CURRENCY
2005/perpetual6 EUR 500 4.194 4 427
Other foreign7 1 066
Total 5 493
Total subordinated liabilitites 15 965
1 Perpetual subordinated loan at fixed rate. According to the terms the loan can be called in advance on each interest payment date from March 2019. Early redemption requires the approval of the Swedish Financial Supervisory Authority. In connection with right of redemption, the interest rate is changed to floating rate linked to Stibor.
2 Perpetual subordinated loan at fixed rate. According to the terms the loan can be called in advance on each interest payment date from March 2014. Early redemption requires the approval of the Swedish Financial Supervisory Authority. In connection with right of redemption, the interest rate is changed to floating rate linked to Stibor.
3 Perpetual subordinated loan at floating rate linked to Stibor. The loan is a subordinated convertible loan of nominally SEK 2.5bn, issued to the Group’s employees on market terms. The loan has the status of tier 2 capital and can be converted into Handelsbanken shares. Conversion is possible after 1 May 2016 at an initial conversion price of SEK 256.52, corre-sponding to 122% of the average share price during the period 19 April–4 May 2011; the conversion price will subsequently be adjusted for dividend payments. After 31 May 2016 it will be possible to convert into Handelsbanken shares at the lower of the conversion price and the market price of the share. The last day to initiate conversion is 30 November 2016.
4 Fixed term subordinated loan at fixed rate. According to the terms the loan can be called in advance on each interest payment date from October 2017. Early redemption requires the approval of the Swedish Financial Supervisory Authority. In connection with right of redemption, the interest rate is changed to floating rate linked to Euribor.
5 Other Swedish subordinated loans which are not specified here are issued in the form of dated or perpetual subordinated loans. The total amount partly includes a subordinated convertible loan of nominally SEK 2.3bn, issued to the Group’s employees on market terms. The loan has hybrid status and can be converted into Handelsbanken shares. Conversion is possible after 1 June 2011 at a conversion price of SEK 187.56, corresponding to 110% of the average share price during the period 6–12 May 2008, adjusted for the 2008 dividend. The outstanding nominal amount including conversions up to 31 December 2013 amounts to SEK 7.6m. After 21 May 2013 it is possible to convert to Handelsbanken shares at the conversion price, or the share price applying at this date if it is lower than the conversion price, and the market price of the share. The additional outstanding amount constitutes one dated subordinated loan of SEK 1.25bn at floating rate. The term of this loan is flexible and aims at making the instrument fully compliant with the coming regulation, CRDIV/CRR. According to the terms the loan can be called in advance on each interest payment date from October 2017. Early redemption requires the approval of the Swedish Financial Supervisory Authority.
6 Perpetual subordinated loan at fixed rate. According to the terms the loan can be called in advance on each interest payment date from December 2015. Early redemption requires the approval of the Swedish Financial Supervisory Authority. In connection with right of redemption, the interest rate is changed to floating rate linked to Euribor.
7 Other foreign subordinated loans which are not specified here are issued in the form of perpetual subordinated loans.
G34 Provisions
SEK mProvision forrestructuring
Provisionfor guaranteecommitments
Otherprovisions
Total 2013
Total 2012
Provisions at beginning of year 91 15 14 120 31
Provisions during the year - 44 17 61 95
Utilised -40 - - -40 -
Written back - - - - -6
Provisions at end of year 51 59 31 141 120
The provision for restructuring relate to additional costs as a result of the decision to terminate rental contracts for premises. Most of the provision is expected to be settled during 2014. Provision for guarantee commitments consists of provisions for a number of off-balance sheet items. The Group is the subject of claims in a number of civil actions which are being pursued in general courts of law. The Group’s assessment is that the actions will essentially be settled in favour of the Bank. The assessment is that the amounts in dispute would not have a material effect on the Bank’s financial position or profit/loss. The amounts allocated for future settlement of the claims towards the Bank are presented under other provisions.
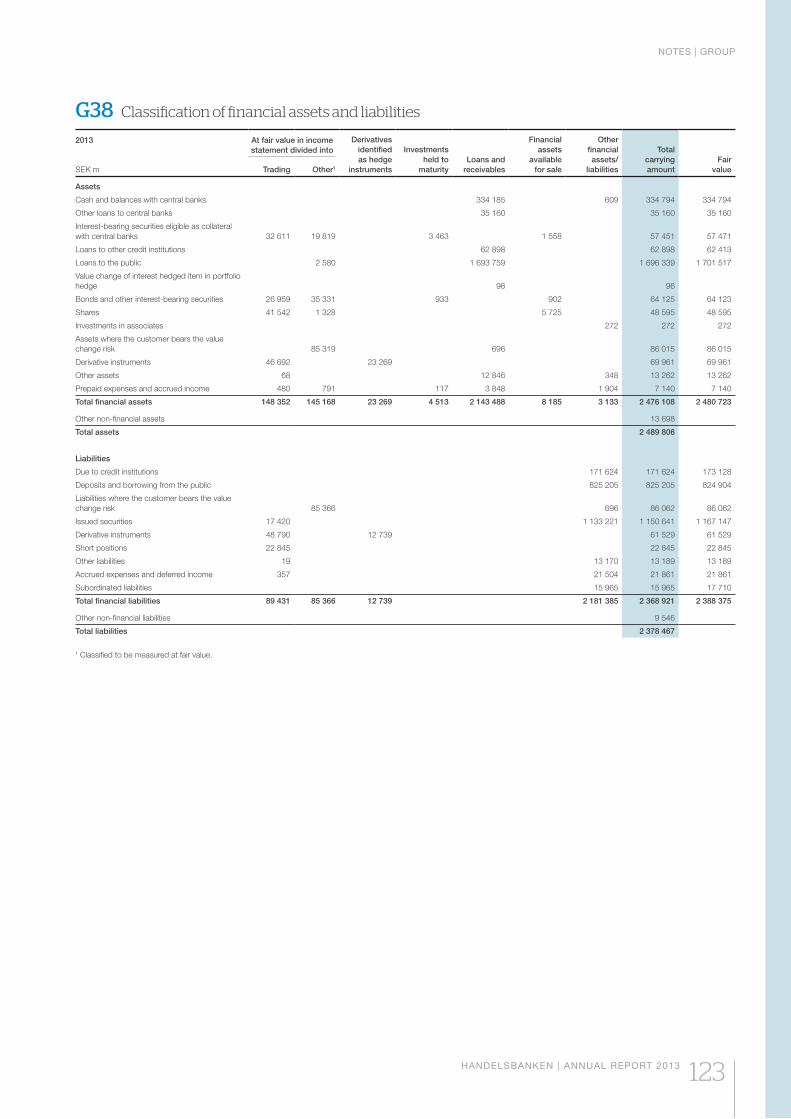
NOTES | GROUP
HANDELSBANKEN | ANNUAL REPORT 2013 123
G38 Classification of financial assets and liabilities
2013 At fair value in income statement divided into
Derivativesidentified as hedge
instruments
Investmentsheld to
maturityLoans and
receivables
Financial assets
available for sale
Otherfinancialassets/
liabilities
Totalcarryingamount
Fair valueSEK m Trading Other1
Assets
Cash and balances with central banks 334 185 609 334 794 334 794
Other loans to central banks 35 160 35 160 35 160
Interest-bearing securities eligible as collateral with central banks 32 611 19 819 3 463 1 558 57 451 57 471
Loans to other credit institutions 62 898 62 898 62 413
Loans to the public 2 580 1 693 759 1 696 339 1 701 517
Value change of interest hedged item in portfolio hedge 96 96
Bonds and other interest-bearing securities 26 959 35 331 933 902 64 125 64 123
Shares 41 542 1 328 5 725 48 595 48 595
Investments in associates 272 272 272
Assets where the customer bears the value change risk 85 319 696 86 015 86 015
Derivative instruments 46 692 23 269 69 961 69 961
Other assets 68 12 846 348 13 262 13 262
Prepaid expenses and accrued income 480 791 117 3 848 1 904 7 140 7 140
Total financial assets 148 352 145 168 23 269 4 513 2 143 488 8 185 3 133 2 476 108 2 480 723
Other non-financial assets 13 698
Total assets 2 489 806
Liabilities
Due to credit institutions 171 624 171 624 173 128
Deposits and borrowing from the public 825 205 825 205 824 904
Liabilities where the customer bears the value change risk 85 366 696 86 062 86 062
Issued securities 17 420 1 133 221 1 150 641 1 167 147
Derivative instruments 48 790 12 739 61 529 61 529
Short positions 22 845 22 845 22 845
Other liabilities 19 13 170 13 189 13 189
Accrued expenses and deferred income 357 21 504 21 861 21 861
Subordinated liabilities 15 965 15 965 17 710
Total financial liabilities 89 431 85 366 12 739 2 181 385 2 368 921 2 388 375
Other non-financial liabilities 9 546
Total liabilities 2 378 467
1 Classified to be measured at fair value.
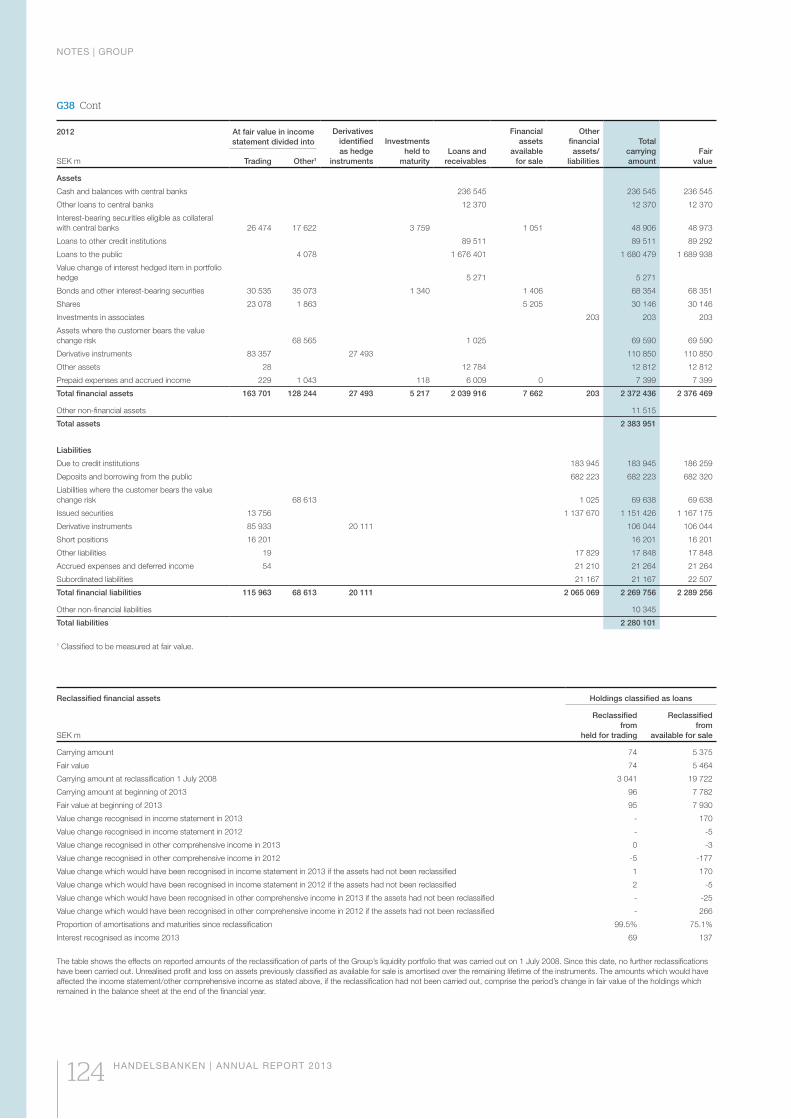
NOTES | GROUP
124 HANDELSBANKEN | ANNUAL REPORT 2013
2012 At fair value in income statement divided into
Derivativesidentified as hedge
instruments
Investmentsheld to
maturityLoans and
receivables
Financial assets
available for sale
Otherfinancialassets/
liabilities
Totalcarryingamount
Fair valueSEK m Trading Other1
Assets
Cash and balances with central banks 236 545 236 545 236 545
Other loans to central banks 12 370 12 370 12 370
Interest-bearing securities eligible as collateral with central banks 26 474 17 622 3 759 1 051 48 906 48 973
Loans to other credit institutions 89 511 89 511 89 292
Loans to the public 4 078 1 676 401 1 680 479 1 689 938
Value change of interest hedged item in portfolio hedge 5 271 5 271
Bonds and other interest-bearing securities 30 535 35 073 1 340 1 406 68 354 68 351
Shares 23 078 1 863 5 205 30 146 30 146
Investments in associates 203 203 203
Assets where the customer bears the value change risk 68 565 1 025 69 590 69 590
Derivative instruments 83 357 27 493 110 850 110 850
Other assets 28 12 784 12 812 12 812
Prepaid expenses and accrued income 229 1 043 118 6 009 0 7 399 7 399
Total financial assets 163 701 128 244 27 493 5 217 2 039 916 7 662 203 2 372 436 2 376 469
Other non-financial assets 11 515
Total assets 2 383 951
Liabilities
Due to credit institutions 183 945 183 945 186 259
Deposits and borrowing from the public 682 223 682 223 682 320
Liabilities where the customer bears the value change risk 68 613 1 025 69 638 69 638
Issued securities 13 756 1 137 670 1 151 426 1 167 175
Derivative instruments 85 933 20 111 106 044 106 044
Short positions 16 201 16 201 16 201
Other liabilities 19 17 829 17 848 17 848
Accrued expenses and deferred income 54 21 210 21 264 21 264
Subordinated liabilities 21 167 21 167 22 507
Total financial liabilities 115 963 68 613 20 111 2 065 069 2 269 756 2 289 256
Other non-financial liabilities 10 345
Total liabilities 2 280 101
1 Classified to be measured at fair value.
G38 Cont
Reclassified financial assets Holdings classified as loans
SEK m
Reclassifiedfrom
held for trading
Reclassifiedfrom
available for sale
Carrying amount 74 5 375
Fair value 74 5 464
Carrying amount at reclassification 1 July 2008 3 041 19 722
Carrying amount at beginning of 2013 96 7 782
Fair value at beginning of 2013 95 7 930
Value change recognised in income statement in 2013 - 170
Value change recognised in income statement in 2012 - -5
Value change recognised in other comprehensive income in 2013 0 -3
Value change recognised in other comprehensive income in 2012 -5 -177
Value change which would have been recognised in income statement in 2013 if the assets had not been reclassified 1 170
Value change which would have been recognised in income statement in 2012 if the assets had not been reclassified 2 -5
Value change which would have been recognised in other comprehensive income in 2013 if the assets had not been reclassified - -25
Value change which would have been recognised in other comprehensive income in 2012 if the assets had not been reclassified - 266
Proportion of amortisations and maturities since reclassification 99.5% 75.1%
Interest recognised as income 2013 69 137
The table shows the effects on reported amounts of the reclassification of parts of the Group’s liquidity portfolio that was carried out on 1 July 2008. Since this date, no further reclassifications have been carried out. Unrealised profit and loss on assets previously classified as available for sale is amortised over the remaining lifetime of the instruments. The amounts which would have affected the income statement/other comprehensive income as stated above, if the reclassification had not been carried out, comprise the period’s change in fair value of the holdings which remained in the balance sheet at the end of the financial year.
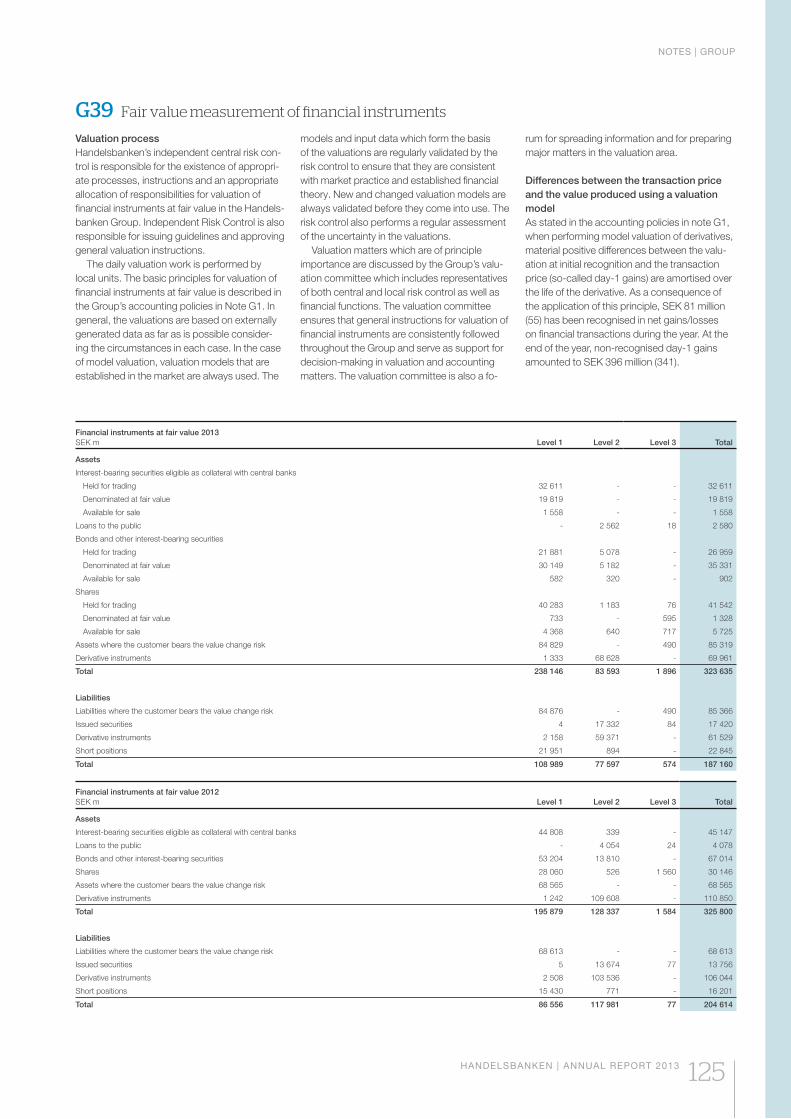
NOTES | GROUP
HANDELSBANKEN | ANNUAL REPORT 2013 125
Financial instruments at fair value 2013SEK m Level 1 Level 2 Level 3 Total
Assets
Interest-bearing securities eligible as collateral with central banks
Held for trading 32 611 - - 32 611
Denominated at fair value 19 819 - - 19 819
Available for sale 1 558 - - 1 558
Loans to the public - 2 562 18 2 580
Bonds and other interest-bearing securities
Held for trading 21 881 5 078 - 26 959
Denominated at fair value 30 149 5 182 - 35 331
Available for sale 582 320 - 902
Shares
Held for trading 40 283 1 183 76 41 542
Denominated at fair value 733 - 595 1 328
Available for sale 4 368 640 717 5 725
Assets where the customer bears the value change risk 84 829 - 490 85 319
Derivative instruments 1 333 68 628 - 69 961
Total 238 146 83 593 1 896 323 635
Liabilities
Liabilities where the customer bears the value change risk 84 876 - 490 85 366
Issued securities 4 17 332 84 17 420
Derivative instruments 2 158 59 371 - 61 529
Short positions 21 951 894 - 22 845
Total 108 989 77 597 574 187 160
Financial instruments at fair value 2012SEK m Level 1 Level 2 Level 3 Total
Assets
Interest-bearing securities eligible as collateral with central banks 44 808 339 - 45 147
Loans to the public - 4 054 24 4 078
Bonds and other interest-bearing securities 53 204 13 810 - 67 014
Shares 28 060 526 1 560 30 146
Assets where the customer bears the value change risk 68 565 - - 68 565
Derivative instruments 1 242 109 608 - 110 850
Total 195 879 128 337 1 584 325 800
Liabilities
Liabilities where the customer bears the value change risk 68 613 - - 68 613
Issued securities 5 13 674 77 13 756
Derivative instruments 2 508 103 536 - 106 044
Short positions 15 430 771 - 16 201
Total 86 556 117 981 77 204 614
Valuation processHandelsbanken’s independent central risk con-trol is responsible for the existence of appropri-ate processes, instructions and an appropriate allocation of responsibilities for valuation of financial instruments at fair value in the Handels-banken Group. Independent Risk Control is also responsible for issuing guidelines and approving general valuation instructions.
The daily valuation work is performed by local units. The basic principles for valuation of financial instruments at fair value is described in the Group’s accounting policies in Note G1. In general, the valuations are based on externally generated data as far as is possible consider-ing the circumstances in each case. In the case of model valuation, valuation models that are established in the market are always used. The
G39 Fair value measurement of financial instruments
models and input data which form the basis of the valuations are regularly validated by the risk control to ensure that they are consistent with market practice and established financial theory. New and changed valuation models are always validated before they come into use. The risk control also performs a regular assessment of the uncertainty in the valuations.
Valuation matters which are of principle importance are discussed by the Group’s valu-ation committee which includes representatives of both central and local risk control as well as financial functions. The valuation committee ensures that general instructions for valuation of financial instruments are consistently followed throughout the Group and serve as support for decision-making in valuation and accounting matters. The valuation committee is also a fo-
rum for spreading information and for preparing major matters in the valuation area.
Differences between the transaction price and the value produced using a valuation modelAs stated in the accounting policies in note G1, when performing model valuation of derivatives, material positive differences between the valu-ation at initial recognition and the transaction price (so-called day-1 gains) are amortised over the life of the derivative. As a consequence of the application of this principle, SEK 81 million (55) has been recognised in net gains/losses on financial transactions during the year. At the end of the year, non-recognised day-1 gains amounted to SEK 396 million (341).
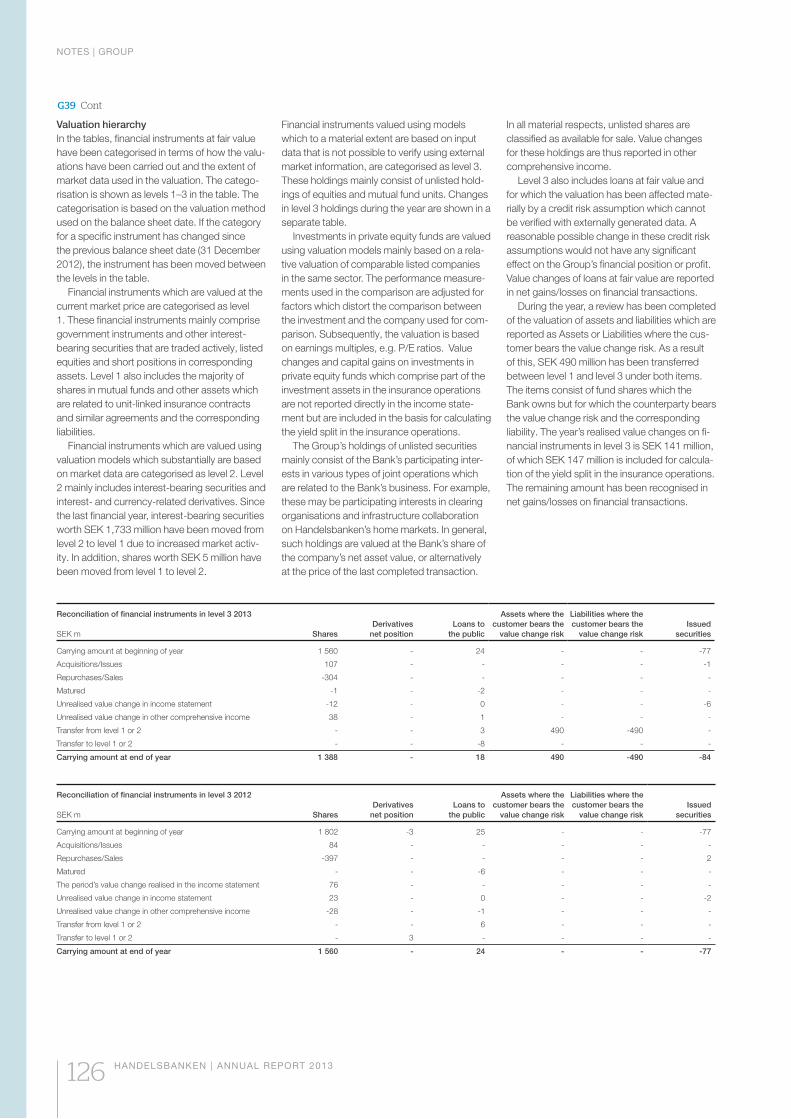
NOTES | GROUP
126 HANDELSBANKEN | ANNUAL REPORT 2013
Valuation hierarchyIn the tables, financial instruments at fair value have been categorised in terms of how the valu-ations have been carried out and the extent of market data used in the valuation. The catego-risation is shown as levels 1–3 in the table. The categorisation is based on the valuation method used on the balance sheet date. If the category for a specific instrument has changed since the previous balance sheet date (31 December 2012), the instrument has been moved between the levels in the table.
Financial instruments which are valued at the current market price are categorised as level 1. These financial instruments mainly comprise government instruments and other interest-bearing securities that are traded actively, listed equities and short positions in corresponding assets. Level 1 also includes the majority of shares in mutual funds and other assets which are related to unit-linked insurance contracts and similar agreements and the corresponding liabilities.
Financial instruments which are valued using valuation models which substantially are based on market data are categorised as level 2. Level 2 mainly includes interest-bearing securities and interest- and currency-related derivatives. Since the last financial year, interest-bearing securities worth SEK 1,733 million have been moved from level 2 to level 1 due to increased market activ-ity. In addition, shares worth SEK 5 million have been moved from level 1 to level 2.
Financial instruments valued using models which to a material extent are based on input data that is not possible to verify using external market information, are categorised as level 3. These holdings mainly consist of unlisted hold-ings of equities and mutual fund units. Changes in level 3 holdings during the year are shown in a separate table.
Investments in private equity funds are valued using valuation models mainly based on a rela-tive valuation of comparable listed companies in the same sector. The performance measure-ments used in the comparison are adjusted for factors which distort the comparison between the investment and the company used for com-parison. Subsequently, the valuation is based on earnings multiples, e.g. P/E ratios. Value changes and capital gains on investments in private equity funds which comprise part of the investment assets in the insurance operations are not reported directly in the income state-ment but are included in the basis for calculating the yield split in the insurance operations.
The Group’s holdings of unlisted securities mainly consist of the Bank’s participating inter-ests in various types of joint operations which are related to the Bank’s business. For example, these may be participating interests in clearing organisations and infrastructure collaboration on Handelsbanken’s home markets. In general, such holdings are valued at the Bank’s share of the company’s net asset value, or alternatively at the price of the last completed transaction.
In all material respects, unlisted shares are classified as available for sale. Value changes for these holdings are thus reported in other comprehensive income.
Level 3 also includes loans at fair value and for which the valuation has been affected mate-rially by a credit risk assumption which cannot be verified with externally generated data. A reasonable possible change in these credit risk assumptions would not have any significant effect on the Group’s financial position or profit. Value changes of loans at fair value are reported in net gains/losses on financial transactions.
During the year, a review has been completed of the valuation of assets and liabilities which are reported as Assets or Liabilities where the cus-tomer bears the value change risk. As a result of this, SEK 490 million has been transferred between level 1 and level 3 under both items. The items consist of fund shares which the Bank owns but for which the counterparty bears the value change risk and the corresponding liability. The year’s realised value changes on fi-nancial instruments in level 3 is SEK 141 million, of which SEK 147 million is included for calcula-tion of the yield split in the insurance operations. The remaining amount has been recognised in net gains/losses on financial transactions.
Reconciliation of financial instruments in level 3 2013 SEK m Shares
Derivativesnet position
Loans tothe public
Assets where the customer bears the
value change risk
Liabilities where the customer bears the
value change riskIssued
securities
Carrying amount at beginning of year 1 560 - 24 - - -77
Acquisitions/Issues 107 - - - - -1
Repurchases/Sales -304 - - - - -
Matured -1 - -2 - - -
Unrealised value change in income statement -12 - 0 - - -6
Unrealised value change in other comprehensive income 38 - 1 - - -
Transfer from level 1 or 2 - - 3 490 -490 -
Transfer to level 1 or 2 - - -8 - - -
Carrying amount at end of year 1 388 - 18 490 -490 -84
Reconciliation of financial instruments in level 3 2012 SEK m Shares
Derivativesnet position
Loans tothe public
Assets where the customer bears the
value change risk
Liabilities where the customer bears the
value change riskIssued
securities
Carrying amount at beginning of year 1 802 -3 25 - - -77
Acquisitions/Issues 84 - - - - -
Repurchases/Sales -397 - - - - 2
Matured - - -6 - - -
The period’s value change realised in the income statement 76 - - - - -
Unrealised value change in income statement 23 - 0 - - -2
Unrealised value change in other comprehensive income -28 - -1 - - -
Transfer from level 1 or 2 - - 6 - - -
Transfer to level 1 or 2 - 3 - - - -
Carrying amount at end of year 1 560 - 24 - - -77
G39 Cont
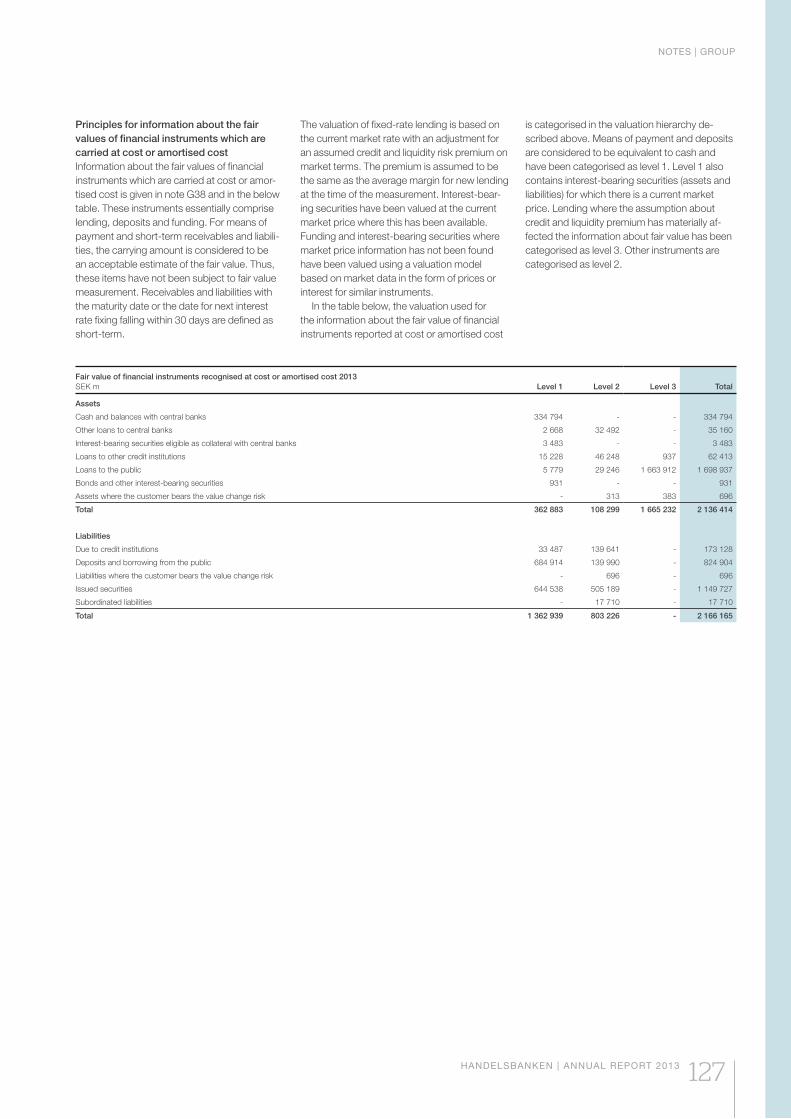
NOTES | GROUP
HANDELSBANKEN | ANNUAL REPORT 2013 127
Fair value of financial instruments recognised at cost or amortised cost 2013SEK m Level 1 Level 2 Level 3 Total
Assets
Cash and balances with central banks 334 794 - - 334 794
Other loans to central banks 2 668 32 492 - 35 160
Interest-bearing securities eligible as collateral with central banks 3 483 - - 3 483
Loans to other credit institutions 15 228 46 248 937 62 413
Loans to the public 5 779 29 246 1 663 912 1 698 937
Bonds and other interest-bearing securities 931 - - 931
Assets where the customer bears the value change risk - 313 383 696
Total 362 883 108 299 1 665 232 2 136 414
Liabilities
Due to credit institutions 33 487 139 641 - 173 128
Deposits and borrowing from the public 684 914 139 990 - 824 904
Liabilities where the customer bears the value change risk - 696 - 696
Issued securities 644 538 505 189 - 1 149 727
Subordinated liabilities - 17 710 - 17 710
Total 1 362 939 803 226 - 2 166 165
Principles for information about the fair values of financial instruments which are carried at cost or amortised costInformation about the fair values of financial instruments which are carried at cost or amor-tised cost is given in note G38 and in the below table. These instruments essentially comprise lending, deposits and funding. For means of payment and short-term receivables and liabili-ties, the carrying amount is considered to be an acceptable estimate of the fair value. Thus, these items have not been subject to fair value measurement. Receivables and liabilities with the maturity date or the date for next interest rate fixing falling within 30 days are defined as short-term.
The valuation of fixed-rate lending is based on the current market rate with an adjustment for an assumed credit and liquidity risk premium on market terms. The premium is assumed to be the same as the average margin for new lending at the time of the measurement. Interest-bear-ing securities have been valued at the current market price where this has been available. Funding and interest-bearing securities where market price information has not been found have been valued using a valuation model based on market data in the form of prices or interest for similar instruments.
In the table below, the valuation used for the information about the fair value of financial instruments reported at cost or amortised cost
is categorised in the valuation hierarchy de-scribed above. Means of payment and deposits are considered to be equivalent to cash and have been categorised as level 1. Level 1 also contains interest-bearing securities (assets and liabilities) for which there is a current market price. Lending where the assumption about credit and liquidity premium has materially af-fected the information about fair value has been categorised as level 3. Other instruments are categorised as level 2.
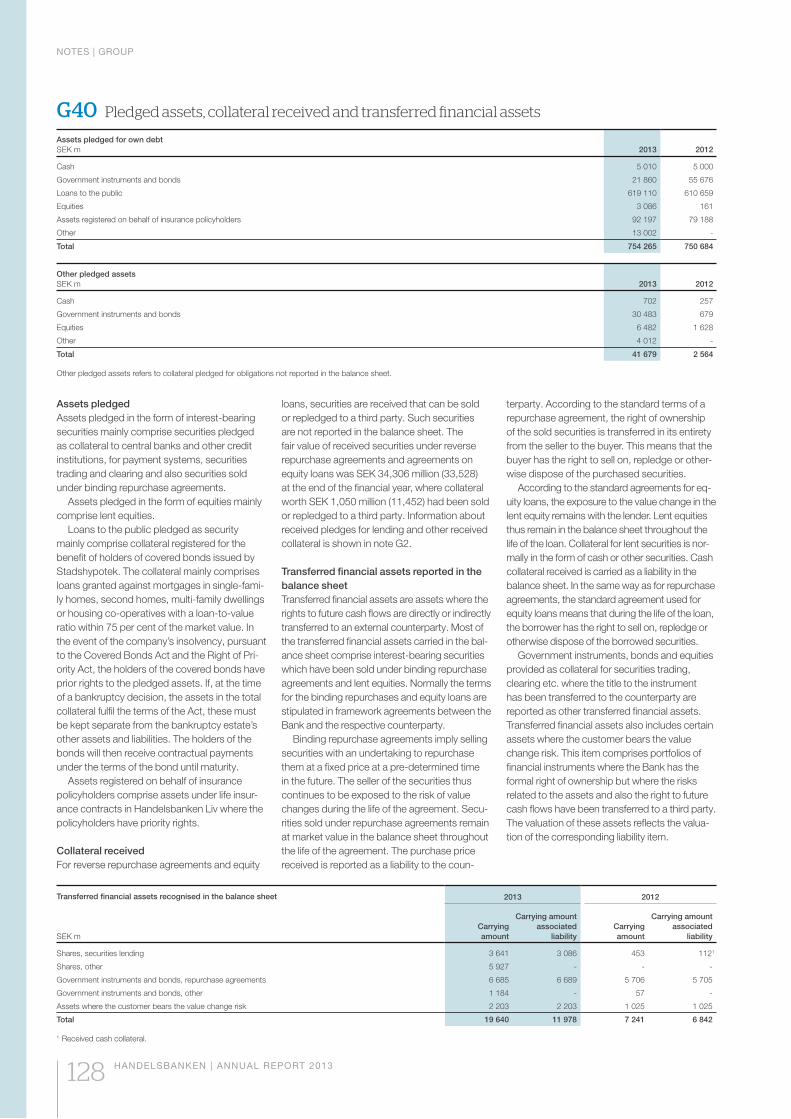
NOTES | GROUP
128 HANDELSBANKEN | ANNUAL REPORT 2013
G40 Pledged assets, collateral received and transferred financial assets
Assets pledged for own debtSEK m 2013 2012
Cash 5 010 5 000
Government instruments and bonds 21 860 55 676
Loans to the public 619 110 610 659
Equities 3 086 161
Assets registered on behalf of insurance policyholders 92 197 79 188
Other 13 002 -
Total 754 265 750 684
Other pledged assetsSEK m 2013 2012
Cash 702 257
Government instruments and bonds 30 483 679
Equities 6 482 1 628
Other 4 012 -
Total 41 679 2 564
Other pledged assets refers to collateral pledged for obligations not reported in the balance sheet.
Assets pledgedAssets pledged in the form of interest-bearing securities mainly comprise securities pledged as collateral to central banks and other credit institutions, for payment systems, securities trading and clearing and also securities sold under binding repurchase agreements.
Assets pledged in the form of equities mainly comprise lent equities.
Loans to the public pledged as security mainly comprise collateral registered for the benefit of holders of covered bonds issued by Stadshypotek. The collateral mainly comprises loans granted against mortgages in single-fami-ly homes, second homes, multi-family dwellings or housing co-operatives with a loan-to-value ratio within 75 per cent of the market value. In the event of the company’s insolvency, pursuant to the Covered Bonds Act and the Right of Pri-ority Act, the holders of the covered bonds have prior rights to the pledged assets. If, at the time of a bankruptcy decision, the assets in the total collateral fulfil the terms of the Act, these must be kept separate from the bankruptcy estate’s other assets and liabilities. The holders of the bonds will then receive contractual payments under the terms of the bond until maturity.
Assets registered on behalf of insurance policyholders comprise assets under life insur-ance contracts in Handelsbanken Liv where the policyholders have priority rights.
Collateral receivedFor reverse repurchase agreements and equity
loans, securities are received that can be sold or repledged to a third party. Such securities are not reported in the balance sheet. The fair value of received securities under reverse repurchase agreements and agreements on equity loans was SEK 34,306 million (33,528) at the end of the financial year, where collateral worth SEK 1,050 million (11,452) had been sold or repledged to a third party. Information about received pledges for lending and other received collateral is shown in note G2.
Transferred financial assets reported in the balance sheetTransferred financial assets are assets where the rights to future cash flows are directly or indirectly transferred to an external counterparty. Most of the transferred financial assets carried in the bal-ance sheet comprise interest-bearing securities which have been sold under binding repurchase agreements and lent equities. Normally the terms for the binding repurchases and equity loans are stipulated in framework agreements between the Bank and the respective counterparty.
Binding repurchase agreements imply selling securities with an undertaking to repurchase them at a fixed price at a pre-determined time in the future. The seller of the securities thus continues to be exposed to the risk of value changes during the life of the agreement. Secu-rities sold under repurchase agreements remain at market value in the balance sheet throughout the life of the agreement. The purchase price received is reported as a liability to the coun-
terparty. According to the standard terms of a repurchase agreement, the right of ownership of the sold securities is transferred in its entirety from the seller to the buyer. This means that the buyer has the right to sell on, repledge or other-wise dispose of the purchased securities.
According to the standard agreements for eq-uity loans, the exposure to the value change in the lent equity remains with the lender. Lent equities thus remain in the balance sheet throughout the life of the loan. Collateral for lent securities is nor-mally in the form of cash or other securities. Cash collateral received is carried as a liability in the balance sheet. In the same way as for repurchase agreements, the standard agreement used for equity loans means that during the life of the loan, the borrower has the right to sell on, repledge or otherwise dispose of the borrowed securities.
Government instruments, bonds and equities provided as collateral for securities trading, clearing etc. where the title to the instrument has been transferred to the counterparty are reported as other transferred financial assets. Transferred financial assets also includes certain assets where the customer bears the value change risk. This item comprises portfolios of financial instruments where the Bank has the formal right of ownership but where the risks related to the assets and also the right to future cash flows have been transferred to a third party. The valuation of these assets reflects the valua-tion of the corresponding liability item.
Transferred financial assets recognised in the balance sheet
SEK m
2013 2012
Carryingamount
Carrying amount associated
liabilityCarryingamount
Carrying amount associated
liability
Shares, securities lending 3 641 3 086 453 1121
Shares, other 5 927 - - -
Government instruments and bonds, repurchase agreements 6 685 6 689 5 706 5 705
Government instruments and bonds, other 1 184 - 57 -
Assets where the customer bears the value change risk 2 203 2 203 1 025 1 025
Total 19 640 11 978 7 241 6 842
1 Received cash collateral.
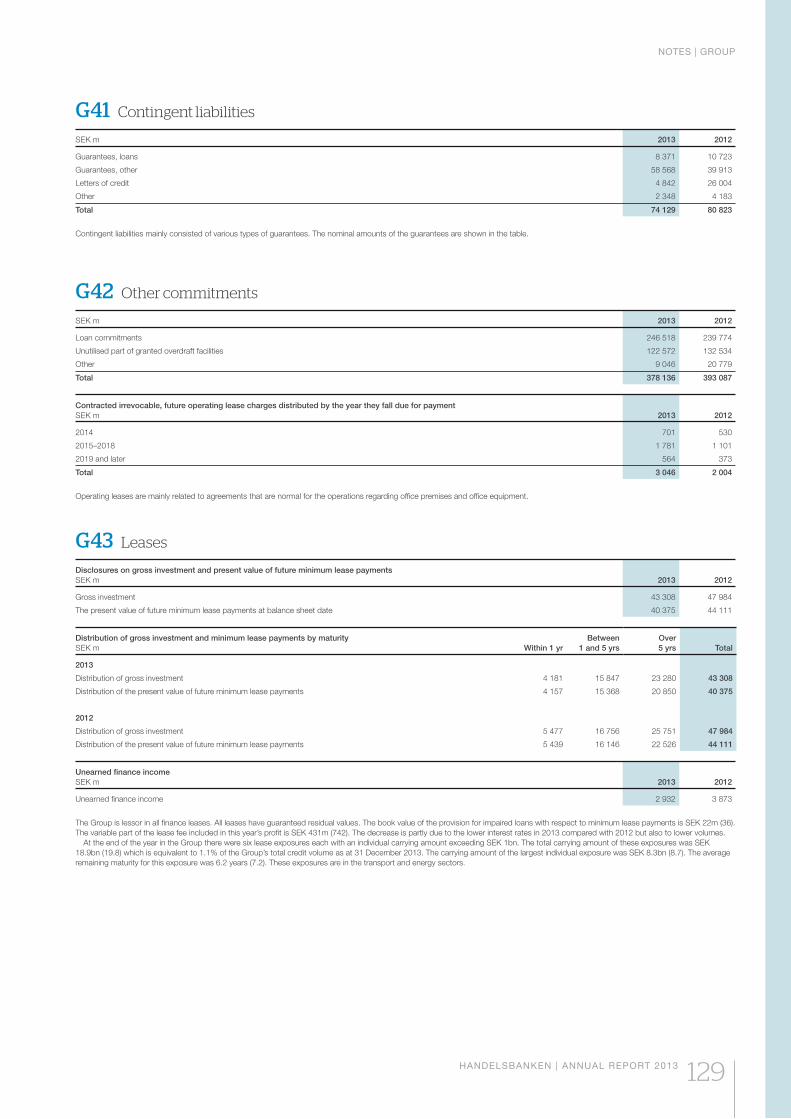
NOTES | GROUP
HANDELSBANKEN | ANNUAL REPORT 2013 129
G41 Contingent liabilities
SEK m 2013 2012
Guarantees, loans 8 371 10 723
Guarantees, other 58 568 39 913
Letters of credit 4 842 26 004
Other 2 348 4 183
Total 74 129 80 823
Contingent liabilities mainly consisted of various types of guarantees. The nominal amounts of the guarantees are shown in the table.
G42 Other commitments
SEK m 2013 2012
Loan commitments 246 518 239 774
Unutilised part of granted overdraft facilities 122 572 132 534
Other 9 046 20 779
Total 378 136 393 087
Contracted irrevocable, future operating lease charges distributed by the year they fall due for paymentSEK m 2013 2012
2014 701 530
2015–2018 1 781 1 101
2019 and later 564 373
Total 3 046 2 004
Operating leases are mainly related to agreements that are normal for the operations regarding office premises and office equipment.
G43 Leases
Disclosures on gross investment and present value of future minimum lease paymentsSEK m 2013 2012
Gross investment 43 308 47 984
The present value of future minimum lease payments at balance sheet date 40 375 44 111
Distribution of gross investment and minimum lease payments by maturitySEK m Within 1 yr
Between1 and 5 yrs
Over5 yrs Total
2013
Distribution of gross investment 4 181 15 847 23 280 43 308
Distribution of the present value of future minimum lease payments 4 157 15 368 20 850 40 375
2012
Distribution of gross investment 5 477 16 756 25 751 47 984
Distribution of the present value of future minimum lease payments 5 439 16 146 22 526 44 111
Unearned finance income SEK m 2013 2012
Unearned finance income 2 932 3 873
The Group is lessor in all finance leases. All leases have guaranteed residual values. The book value of the provision for impaired loans with respect to minimum lease payments is SEK 22m (36). The variable part of the lease fee included in this year’s profit is SEK 431m (742). The decrease is partly due to the lower interest rates in 2013 compared with 2012 but also to lower volumes. At the end of the year in the Group there were six lease exposures each with an individual carrying amount exceeding SEK 1bn. The total carrying amount of these exposures was SEK 18.9bn (19.8) which is equivalent to 1.1% of the Group’s total credit volume as at 31 December 2013. The carrying amount of the largest individual exposure was SEK 8.3bn (8.7). The average remaining maturity for this exposure was 6.2 years (7.2). These exposures are in the transport and energy sectors.
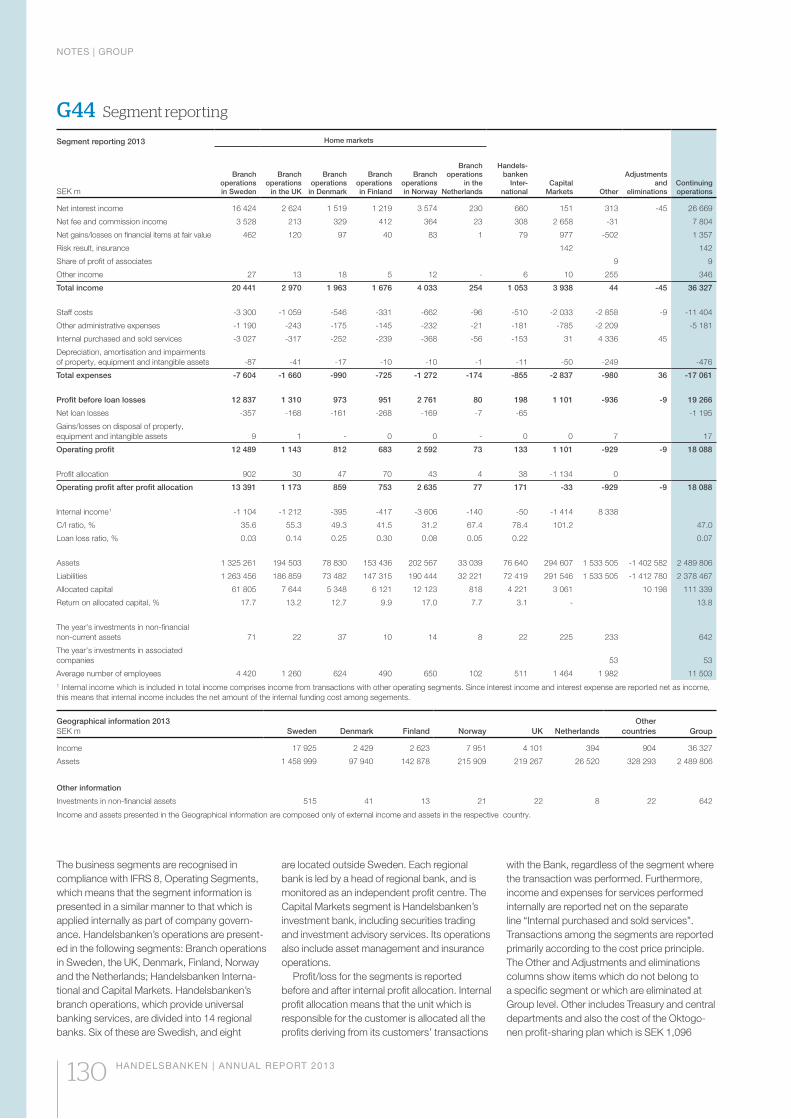
NOTES | GROUP
130 HANDELSBANKEN | ANNUAL REPORT 2013
G44 Segment reporting
Segment reporting 2013
SEK m
Home markets
Branchoperationsin Sweden
Branchoperations
in the UK
Branchoperations
in Denmark
Branchoperationsin Finland
Branchoperationsin Norway
Branchoperations
in the Netherlands
Handels-banken
Inter-national
Capital Markets Other
Adjustmentsand
eliminationsContinuingoperations
Net interest income 16 424 2 624 1 519 1 219 3 574 230 660 151 313 -45 26 669
Net fee and commission income 3 528 213 329 412 364 23 308 2 658 -31 7 804
Net gains/losses on financial items at fair value 462 120 97 40 83 1 79 977 -502 1 357
Risk result, insurance 142 142
Share of profit of associates 9 9
Other income 27 13 18 5 12 - 6 10 255 346
Total income 20 441 2 970 1 963 1 676 4 033 254 1 053 3 938 44 -45 36 327
Staff costs -3 300 -1 059 -546 -331 -662 -96 -510 -2 033 -2 858 -9 -11 404
Other administrative expenses -1 190 -243 -175 -145 -232 -21 -181 -785 -2 209 -5 181
Internal purchased and sold services -3 027 -317 -252 -239 -368 -56 -153 31 4 336 45
Depreciation, amortisation and impairments of property, equipment and intangible assets -87 -41 -17 -10 -10 -1 -11 -50 -249 -476
Total expenses -7 604 -1 660 -990 -725 -1 272 -174 -855 -2 837 -980 36 -17 061
Profit before loan losses 12 837 1 310 973 951 2 761 80 198 1 101 -936 -9 19 266
Net loan losses -357 -168 -161 -268 -169 -7 -65 -1 195
Gains/losses on disposal of property, equipment and intangible assets 9 1 - 0 0 - 0 0 7 17
Operating profit 12 489 1 143 812 683 2 592 73 133 1 101 -929 -9 18 088
Profit allocation 902 30 47 70 43 4 38 -1 134 0
Operating profit after profit allocation 13 391 1 173 859 753 2 635 77 171 -33 -929 -9 18 088
Internal income1 -1 104 -1 212 -395 -417 -3 606 -140 -50 -1 414 8 338
C/I ratio, % 35.6 55.3 49.3 41.5 31.2 67.4 78.4 101.2 47.0
Loan loss ratio, % 0.03 0.14 0.25 0.30 0.08 0.05 0.22 0.07
Assets 1 325 261 194 503 78 830 153 436 202 567 33 039 76 640 294 607 1 533 505 -1 402 582 2 489 806
Liabilities 1 263 456 186 859 73 482 147 315 190 444 32 221 72 419 291 546 1 533 505 -1 412 780 2 378 467
Allocated capital 61 805 7 644 5 348 6 121 12 123 818 4 221 3 061 10 198 111 339
Return on allocated capital, % 17.7 13.2 12.7 9.9 17.0 7.7 3.1 - 13.8
The year's investments in non-financial non-current assets 71 22 37 10 14 8 22 225 233 642
The year's investments in associated companies 53 53
Average number of employees 4 420 1 260 624 490 650 102 511 1 464 1 982 11 5031 Internal income which is included in total income comprises income from transactions with other operating segments. Since interest income and interest expense are reported net as income, this means that internal income includes the net amount of the internal funding cost among segements.
Geographical information 2013SEK m Sweden Denmark Finland Norway UK Nether lands
Other countries Group
Income 17 925 2 429 2 623 7 951 4 101 394 904 36 327
Assets 1 458 999 97 940 142 878 215 909 219 267 26 520 328 293 2 489 806
Other information
Investments in non-financial assets 515 41 13 21 22 8 22 642
Income and assets presented in the Geographical information are composed only of external income and assets in the respective country.
The business segments are recognised in compliance with IFRS 8, Operating Segments, which means that the segment information is presented in a similar manner to that which is applied internally as part of company govern-ance. Handelsbanken’s operations are present-ed in the following segments: Branch operations in Sweden, the UK, Denmark, Finland, Norway and the Netherlands; Handelsbanken Interna-tional and Capital Markets. Handelsbanken’s branch operations, which provide universal banking services, are divided into 14 regional banks. Six of these are Swedish, and eight
are located outside Sweden. Each regional bank is led by a head of regional bank, and is monitored as an independent profit centre. The Capital Markets segment is Handelsbanken’s investment bank, including securities trading and investment advisory services. Its operations also include asset management and insurance operations.
Profit/loss for the segments is reported before and after internal profit allocation. Internal profit allocation means that the unit which is responsible for the customer is allocated all the profits deriving from its customers’ transactions
with the Bank, regardless of the segment where the transaction was performed. Furthermore, income and expenses for services performed internally are reported net on the separate line “Internal purchased and sold services”. Transactions among the segments are reported primarily according to the cost price principle. The Other and Adjustments and eliminations columns show items which do not belong to a specific segment or which are eliminated at Group level. Other includes Treasury and central departments and also the cost of the Oktogo-nen profit-sharing plan which is SEK 1,096
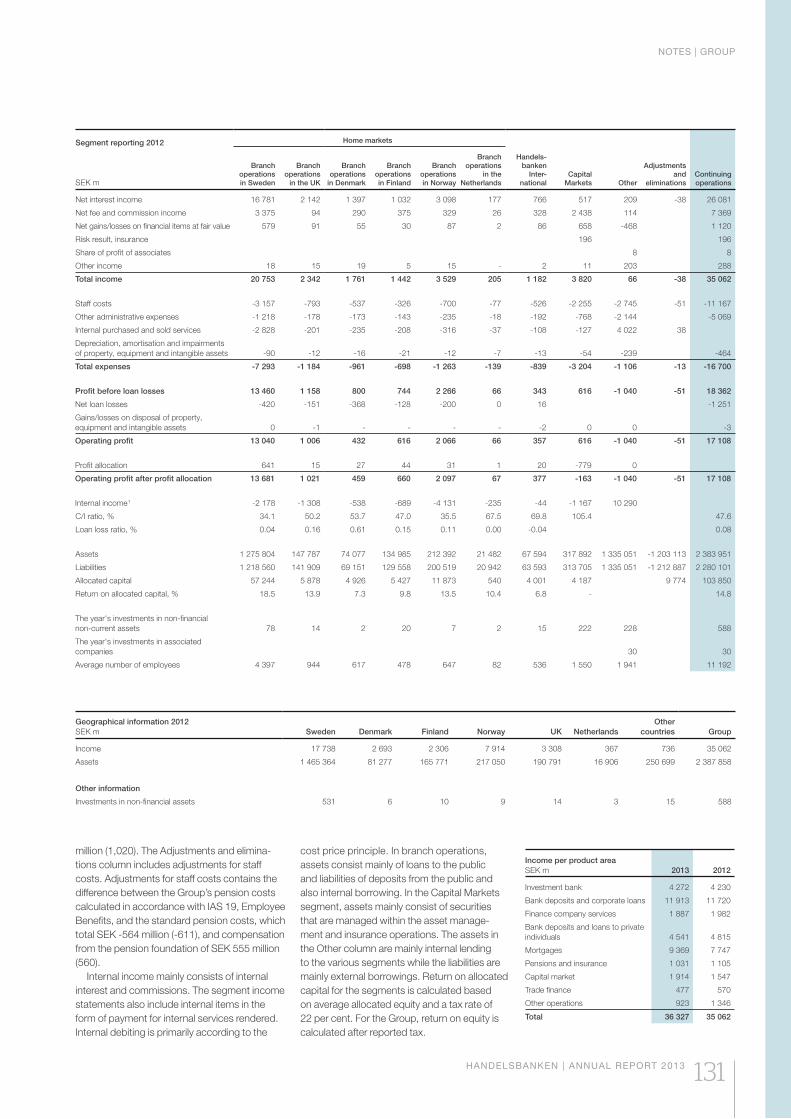
NOTES | GROUP
HANDELSBANKEN | ANNUAL REPORT 2013 131
Income per product areaSEK m 2013 2012
Investment bank 4 272 4 230
Bank deposits and corporate loans 11 913 11 720
Finance company services 1 887 1 982
Bank deposits and loans to private individuals 4 541 4 815
Mortgages 9 369 7 747
Pensions and insurance 1 031 1 105
Capital market 1 914 1 547
Trade finance 477 570
Other operations 923 1 346
Total 36 327 35 062
Segment reporting 2012
SEK m
Home markets
Branchoperationsin Sweden
Branchoperations
in the UK
Branchoperations
in Denmark
Branchoperationsin Finland
Branchoperationsin Norway
Branchoperations
in the Netherlands
Handels-banken
Inter-national
Capital Markets Other
Adjustmentsand
eliminationsContinuingoperations
Net interest income 16 781 2 142 1 397 1 032 3 098 177 766 517 209 -38 26 081
Net fee and commission income 3 375 94 290 375 329 26 328 2 438 114 7 369
Net gains/losses on financial items at fair value 579 91 55 30 87 2 86 658 -468 1 120
Risk result, insurance 196 196
Share of profit of associates 8 8
Other income 18 15 19 5 15 - 2 11 203 288
Total income 20 753 2 342 1 761 1 442 3 529 205 1 182 3 820 66 -38 35 062
Staff costs -3 157 -793 -537 -326 -700 -77 -526 -2 255 -2 745 -51 -11 167
Other administrative expenses -1 218 -178 -173 -143 -235 -18 -192 -768 -2 144 -5 069
Internal purchased and sold services -2 828 -201 -235 -208 -316 -37 -108 -127 4 022 38
Depreciation, amortisation and impairments of property, equipment and intangible assets -90 -12 -16 -21 -12 -7 -13 -54 -239 -464
Total expenses -7 293 -1 184 -961 -698 -1 263 -139 -839 -3 204 -1 106 -13 -16 700
Profit before loan losses 13 460 1 158 800 744 2 266 66 343 616 -1 040 -51 18 362
Net loan losses -420 -151 -368 -128 -200 0 16 -1 251
Gains/losses on disposal of property, equipment and intangible assets 0 -1 - - - - -2 0 0 -3
Operating profit 13 040 1 006 432 616 2 066 66 357 616 -1 040 -51 17 108
Profit allocation 641 15 27 44 31 1 20 -779 0
Operating profit after profit allocation 13 681 1 021 459 660 2 097 67 377 -163 -1 040 -51 17 108
Internal income1 -2 178 -1 308 -538 -689 -4 131 -235 -44 -1 167 10 290
C/I ratio, % 34.1 50.2 53.7 47.0 35.5 67.5 69.8 105.4 47.6
Loan loss ratio, % 0.04 0.16 0.61 0.15 0.11 0.00 -0.04 0.08
Assets 1 275 804 147 787 74 077 134 985 212 392 21 482 67 594 317 892 1 335 051 -1 203 113 2 383 951
Liabilities 1 218 560 141 909 69 151 129 558 200 519 20 942 63 593 313 705 1 335 051 -1 212 887 2 280 101
Allocated capital 57 244 5 878 4 926 5 427 11 873 540 4 001 4 187 9 774 103 850
Return on allocated capital, % 18.5 13.9 7.3 9.8 13.5 10.4 6.8 - 14.8
The year's investments in non-financial non-current assets 78 14 2 20 7 2 15 222 228 588
The year's investments in associated companies 30 30
Average number of employees 4 397 944 617 478 647 82 536 1 550 1 941 11 192
Geographical information 2012SEK m Sweden Denmark Finland Norway UK Nether lands
Other countries Group
Income 17 738 2 693 2 306 7 914 3 308 367 736 35 062
Assets 1 465 364 81 277 165 771 217 050 190 791 16 906 250 699 2 387 858
Other information
Investments in non-financial assets 531 6 10 9 14 3 15 588
million (1,020). The Adjustments and elimina-tions column includes adjustments for staff costs. Adjustments for staff costs contains the difference between the Group’s pension costs calculated in accordance with IAS 19, Employee Benefits, and the standard pension costs, which total SEK -564 million (-611), and compensation from the pension foundation of SEK 555 million (560).
Internal income mainly consists of internal interest and commissions. The segment income statements also include internal items in the form of payment for internal services rendered. Internal debiting is primarily according to the
cost price principle. In branch operations, assets consist mainly of loans to the public and liabilities of deposits from the public and also internal borrowing. In the Capital Markets segment, assets mainly consist of securities that are managed within the asset manage-ment and insurance operations. The assets in the Other column are mainly internal lending to the various segments while the liabilities are mainly external borrowings. Return on allocated capital for the segments is calculated based on average allocated equity and a tax rate of 22 per cent. For the Group, return on equity is calculated after reported tax.
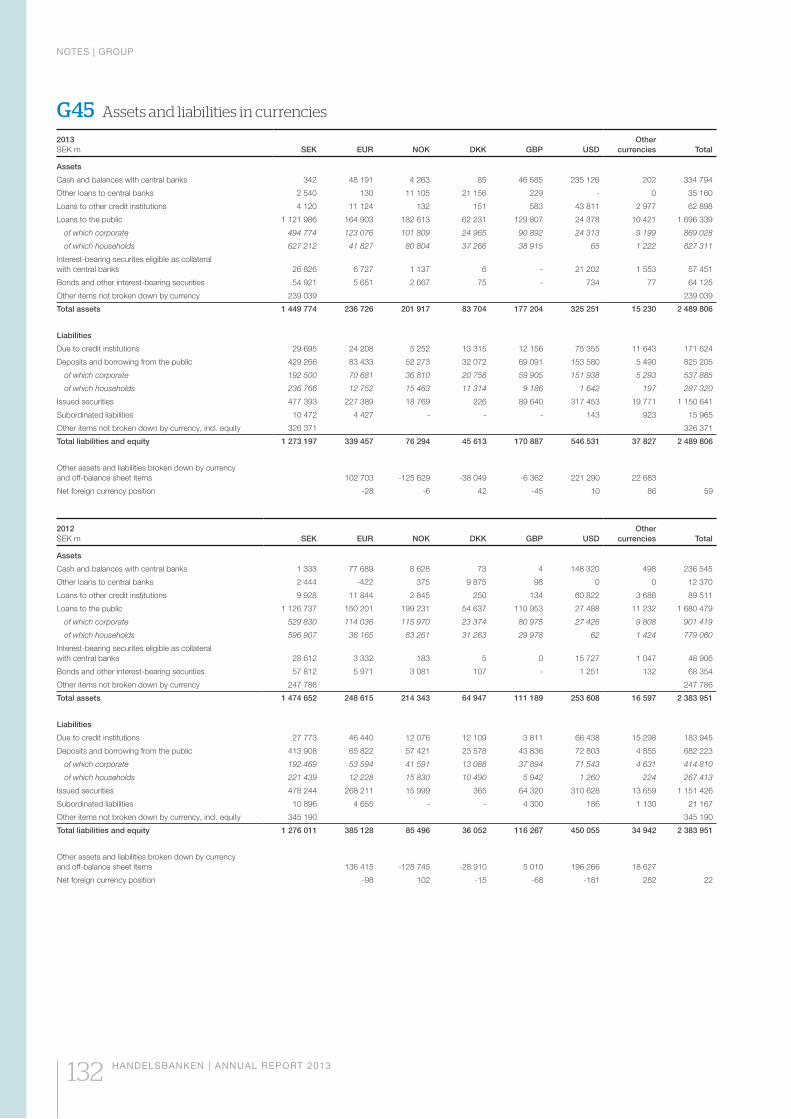
NOTES | GROUP
132 HANDELSBANKEN | ANNUAL REPORT 2013
G45 Assets and liabilities in currencies
2013SEK m SEK EUR NOK DKK GBP USD
Other currencies Total
Assets
Cash and balances with central banks 342 48 191 4 263 85 46 585 235 126 202 334 794
Other loans to central banks 2 540 130 11 105 21 156 229 - 0 35 160
Loans to other credit institutions 4 120 11 124 132 151 583 43 811 2 977 62 898
Loans to the public 1 121 986 164 903 182 613 62 231 129 807 24 378 10 421 1 696 339
of which corporate 494 774 123 076 101 809 24 965 90 892 24 313 9 199 869 028
of which households 627 212 41 827 80 804 37 266 38 915 65 1 222 827 311
Interest-bearing securites eligible as collateral with central banks 26 826 6 727 1 137 6 - 21 202 1 553 57 451
Bonds and other interest-bearing securities 54 921 5 651 2 667 75 - 734 77 64 125
Other items not broken down by currency 239 039 239 039
Total assets 1 449 774 236 726 201 917 83 704 177 204 325 251 15 230 2 489 806
Liabilities
Due to credit institutions 29 695 24 208 5 252 13 315 12 156 75 355 11 643 171 624
Deposits and borrowing from the public 429 266 83 433 52 273 32 072 69 091 153 580 5 490 825 205
of which corporate 192 500 70 681 36 810 20 758 59 905 151 938 5 293 537 885
of which households 236 766 12 752 15 463 11 314 9 186 1 642 197 287 320
Issued securities 477 393 227 389 18 769 226 89 640 317 453 19 771 1 150 641
Subordinated liabilities 10 472 4 427 - - - 143 923 15 965
Other items not broken down by currency, incl. equity 326 371 326 371
Total liabilities and equity 1 273 197 339 457 76 294 45 613 170 887 546 531 37 827 2 489 806
Other assets and liabilities broken down by currency and off-balance sheet items 102 703 -125 629 -38 049 -6 362 221 290 22 683
Net foreign currency position -28 -6 42 -45 10 86 59
2012SEK m SEK EUR NOK DKK GBP USD
Other currencies Total
Assets
Cash and balances with central banks 1 333 77 689 8 628 73 4 148 320 498 236 545
Other loans to central banks 2 444 -422 375 9 875 98 0 0 12 370
Loans to other credit institutions 9 928 11 844 2 845 250 134 60 822 3 688 89 511
Loans to the public 1 126 737 150 201 199 231 54 637 110 953 27 488 11 232 1 680 479
of which corporate 529 830 114 036 115 970 23 374 80 975 27 426 9 808 901 419
of which households 596 907 36 165 83 261 31 263 29 978 62 1 424 779 060
Interest-bearing securites eligible as collateral with central banks 28 612 3 332 183 5 0 15 727 1 047 48 906
Bonds and other interest-bearing securities 57 812 5 971 3 081 107 - 1 251 132 68 354
Other items not broken down by currency 247 786 247 786
Total assets 1 474 652 248 615 214 343 64 947 111 189 253 608 16 597 2 383 951
Liabilities
Due to credit institutions 27 773 46 440 12 076 12 109 3 811 66 438 15 298 183 945
Deposits and borrowing from the public 413 908 65 822 57 421 23 578 43 836 72 803 4 855 682 223
of which corporate 192 469 53 594 41 591 13 088 37 894 71 543 4 631 414 810
of which households 221 439 12 228 15 830 10 490 5 942 1 260 224 267 413
Issued securities 478 244 268 211 15 999 365 64 320 310 628 13 659 1 151 426
Subordinated liabilities 10 896 4 655 - - 4 300 186 1 130 21 167
Other items not broken down by currency, incl. equity 345 190 345 190
Total liabilities and equity 1 276 011 385 128 85 496 36 052 116 267 450 055 34 942 2 383 951
Other assets and liabilities broken down by currency and off-balance sheet items 136 415 -128 745 -28 910 5 010 196 266 18 627
Net foreign currency position -98 102 -15 -68 -181 282 22
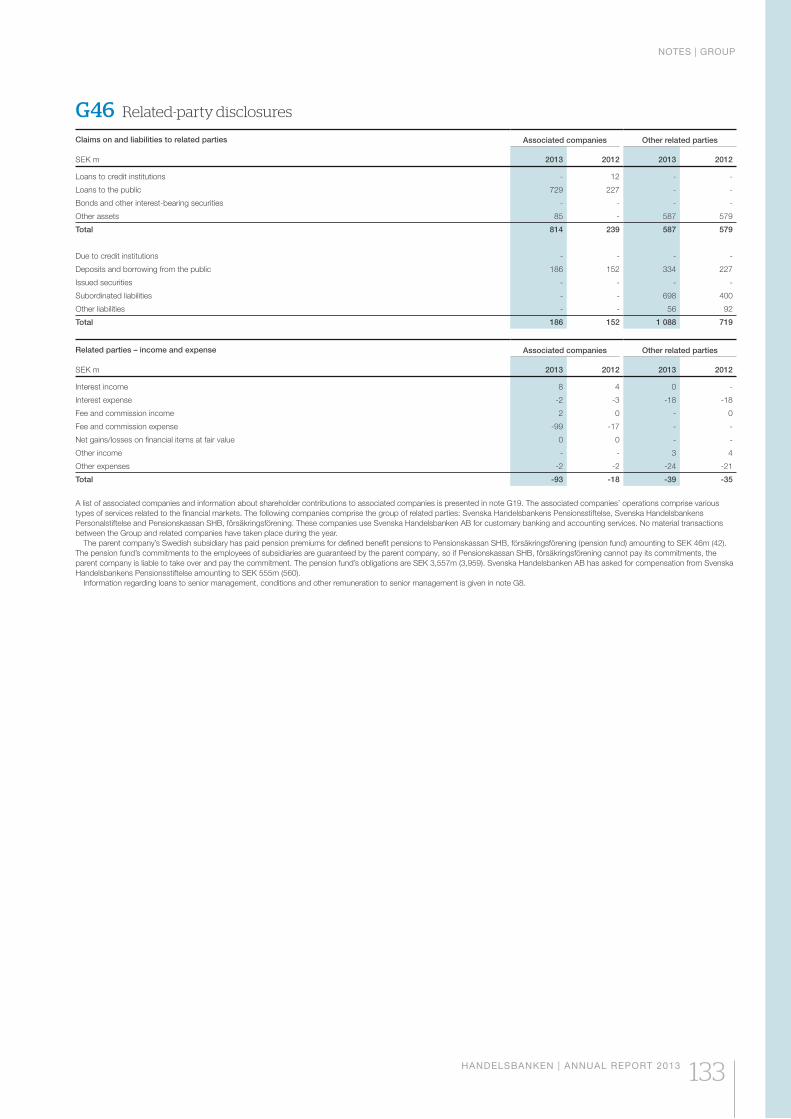
NOTES | GROUP
HANDELSBANKEN | ANNUAL REPORT 2013 133
G46 Related-party disclosures
Claims on and liabilities to related parties SEK m
Associated companies Other related parties
2013 2012 2013 2012
Loans to credit institutions - 12 - -
Loans to the public 729 227 - -
Bonds and other interest-bearing securities - - - -
Other assets 85 - 587 579
Total 814 239 587 579
Due to credit institutions - - - -
Deposits and borrowing from the public 186 152 334 227
Issued securities - - - -
Subordinated liabilities - - 698 400
Other liabilities - - 56 92
Total 186 152 1 088 719
Related parties – income and expense SEK m
Associated companies Other related parties
2013 2012 2013 2012
Interest income 8 4 0 -
Interest expense -2 -3 -18 -18
Fee and commission income 2 0 - 0
Fee and commission expense -99 -17 - -
Net gains/losses on financial items at fair value 0 0 - -
Other income - - 3 4
Other expenses -2 -2 -24 -21
Total -93 -18 -39 -35
A list of associated companies and information about shareholder contributions to associated companies is presented in note G19. The associated companies’ operations comprise various types of services related to the financial markets. The following companies comprise the group of related parties: Svenska Handelsbankens Pensionsstiftelse, Svenska Handelsbankens Personal stiftelse and Pensionskassan SHB, försäkringsförening. These companies use Svenska Handelsbanken AB for customary banking and accounting services. No material transactions between the Group and related companies have taken place during the year. The parent company’s Swedish subsidiary has paid pension premiums for defined benefit pensions to Pensionskassan SHB, försäkringsförening (pension fund) amounting to SEK 46m (42). The pension fund’s commitments to the employees of subsidiaries are guaranteed by the parent company, so if Pensionskassan SHB, försäkringsförening cannot pay its commitments, the parent company is liable to take over and pay the commitment. The pension fund’s obligations are SEK 3,557m (3,959). Svenska Handelsbanken AB has asked for compensation from Svenska Handelsbankens Pensionsstiftelse amounting to SEK 555m (560). Information regarding loans to senior management, conditions and other remuneration to senior management is given in note G8.
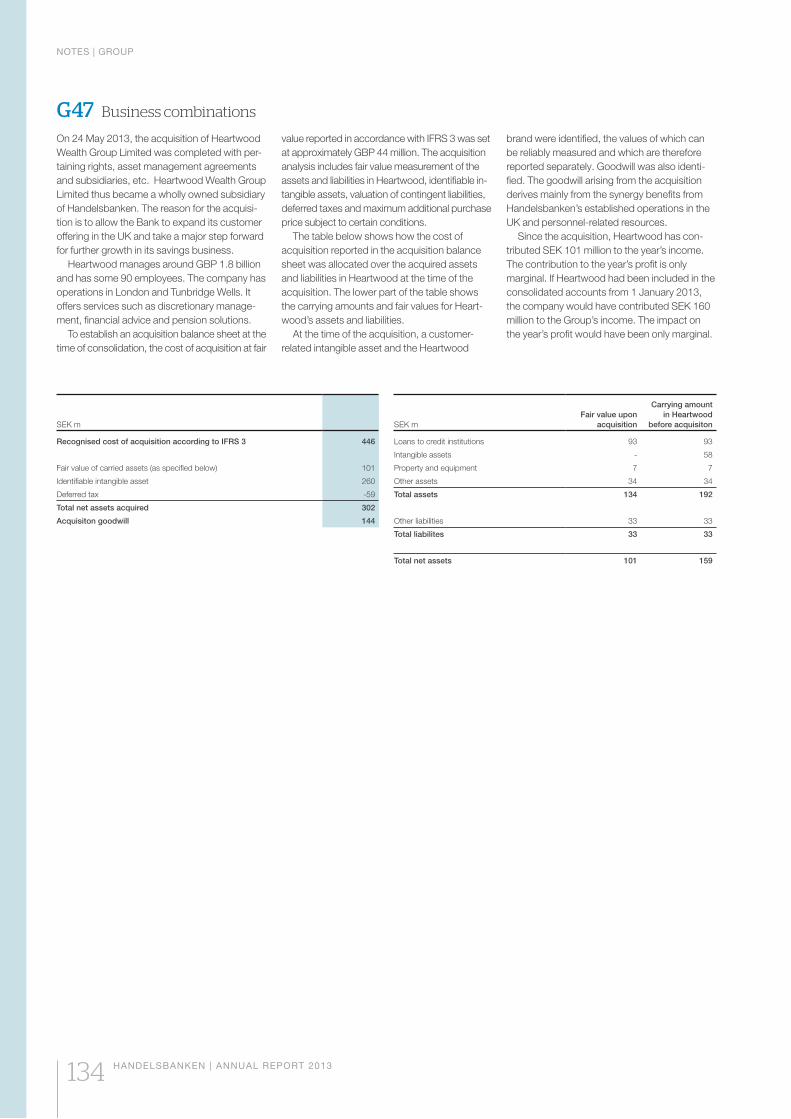
NOTES | GROUP
134 HANDELSBANKEN | ANNUAL REPORT 2013
G47 Business combinations
SEK m
Recognised cost of acquisition according to IFRS 3 446
Fair value of carried assets (as specified below) 101
Identifiable intangible asset 260
Deferred tax -59
Total net assets acquired 302
Acquisiton goodwill 144
SEK mFair value upon
acquisition
Carrying amountin Heartwood
before acquisiton
Loans to credit institutions 93 93
Intangible assets - 58
Property and equipment 7 7
Other assets 34 34
Total assets 134 192
Other liabilities 33 33
Total liabilites 33 33
Total net assets 101 159
On 24 May 2013, the acquisition of Heartwood Wealth Group Limited was completed with per-taining rights, asset management agreements and subsidiaries, etc. Heartwood Wealth Group Limited thus became a wholly owned subsidiary of Handelsbanken. The reason for the acquisi-tion is to allow the Bank to expand its customer offering in the UK and take a major step forward for further growth in its savings business.
Heartwood manages around GBP 1.8 billion and has some 90 employees. The company has operations in London and Tunbridge Wells. It offers services such as discretionary manage-ment, financial advice and pension solutions.
To establish an acquisition balance sheet at the time of consolidation, the cost of acquisition at fair
value reported in accordance with IFRS 3 was set at approximately GBP 44 million. The acquisition analysis includes fair value measurement of the assets and liabilities in Heartwood, identifiable in-tangible assets, valuation of contingent liabilities, deferred taxes and maximum additional purchase price subject to certain conditions.
The table below shows how the cost of acquisition reported in the acquisition balance sheet was allocated over the acquired assets and liabilities in Heartwood at the time of the acquisition. The lower part of the table shows the carrying amounts and fair values for Heart-wood’s assets and liabilities.
At the time of the acquisition, a customer-related intangible asset and the Heartwood
brand were identified, the values of which can be reliably measured and which are therefore reported separately. Goodwill was also identi-fied. The goodwill arising from the acquisition derives mainly from the synergy benefits from Handelsbanken’s established operations in the UK and personnel-related resources.
Since the acquisition, Heartwood has con-tributed SEK 101 million to the year’s income. The contribution to the year’s profit is only marginal. If Heartwood had been included in the consolidated accounts from 1 January 2013, the company would have contributed SEK 160 million to the Group’s income. The impact on the year’s profit would have been only marginal.
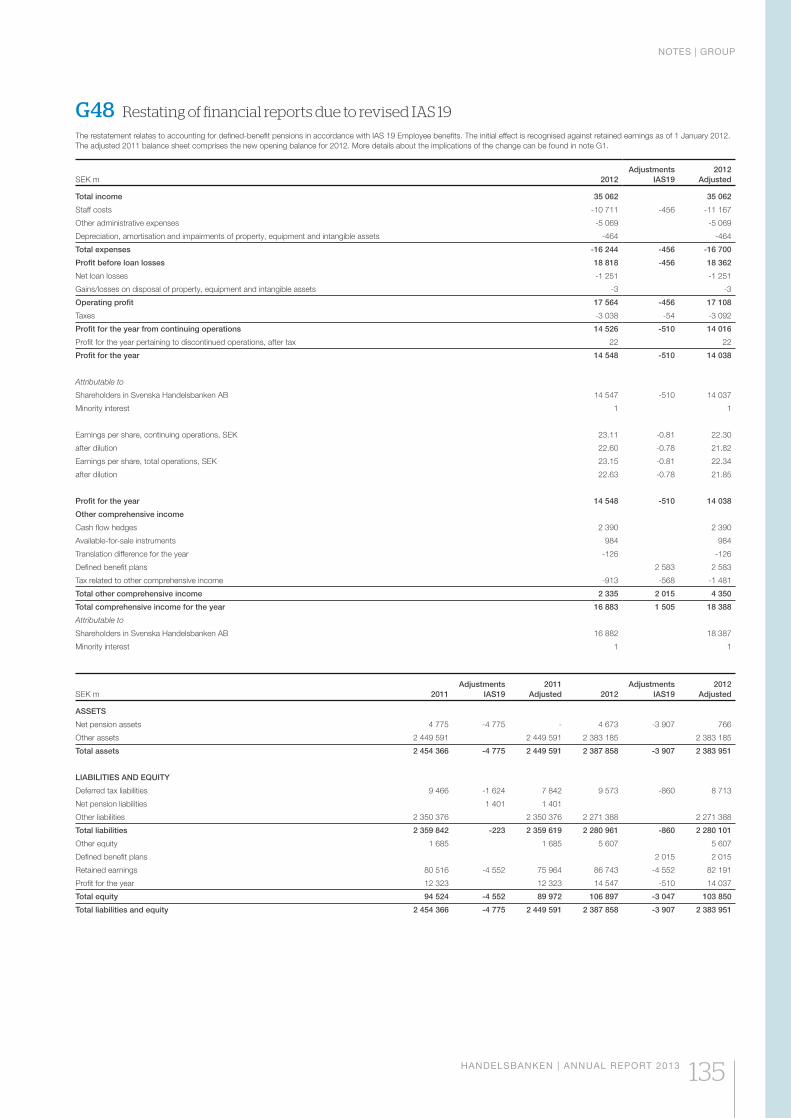
NOTES | GROUP
HANDELSBANKEN | ANNUAL REPORT 2013 135
G48 Restating of financial reports due to revised IAS 19
The restatement relates to accounting for defined-benefit pensions in accordance with IAS 19 Employee benefits. The initial effect is recognised against retained earnings as of 1 January 2012. The adjusted 2011 balance sheet comprises the new opening balance for 2012. More details about the implications of the change can be found in note G1.
SEK m 2012Adjustments
IAS192012
Adjusted
Total income 35 062 35 062
Staff costs -10 711 -456 -11 167
Other administrative expenses -5 069 -5 069
Depreciation, amortisation and impairments of property, equipment and intangible assets -464 -464
Total expenses -16 244 -456 -16 700
Profit before loan losses 18 818 -456 18 362
Net loan losses -1 251 -1 251
Gains/losses on disposal of property, equipment and intangible assets -3 -3
Operating profit 17 564 -456 17 108
Taxes -3 038 -54 -3 092
Profit for the year from continuing operations 14 526 -510 14 016
Profit for the year pertaining to discontinued operations, after tax 22 22
Profit for the year 14 548 -510 14 038
Attributable to
Shareholders in Svenska Handelsbanken AB 14 547 -510 14 037
Minority interest 1 1
Earnings per share, continuing operations, SEK 23.11 -0.81 22.30
after dilution 22.60 -0.78 21.82
Earnings per share, total operations, SEK 23.15 -0.81 22.34
after dilution 22.63 -0.78 21.85
Profit for the year 14 548 -510 14 038
Other comprehensive income
Cash flow hedges 2 390 2 390
Available-for-sale instruments 984 984
Translation difference for the year -126 -126
Defined benefit plans 2 583 2 583
Tax related to other comprehensive income -913 -568 -1 481
Total other comprehensive income 2 335 2 015 4 350
Total comprehensive income for the year 16 883 1 505 18 388
Attributable to
Shareholders in Svenska Handelsbanken AB 16 882 18 387
Minority interest 1 1
SEK m 2011Adjustments
IAS192011
Adjusted 2012Adjustments
IAS192012
Adjusted
ASSETS
Net pension assets 4 775 -4 775 - 4 673 -3 907 766
Other assets 2 449 591 2 449 591 2 383 185 2 383 185
Total assets 2 454 366 -4 775 2 449 591 2 387 858 -3 907 2 383 951
LIABILITIES AND EQUITY
Deferred tax liabilities 9 466 -1 624 7 842 9 573 -860 8 713
Net pension liabilities 1 401 1 401
Other liabilities 2 350 376 2 350 376 2 271 388 2 271 388
Total liabilities 2 359 842 -223 2 359 619 2 280 961 -860 2 280 101
Other equity 1 685 1 685 5 607 5 607
Defined benefit plans 2 015 2 015
Retained earnings 80 516 -4 552 75 964 86 743 -4 552 82 191
Profit for the year 12 323 12 323 14 547 -510 14 037
Total equity 94 524 -4 552 89 972 106 897 -3 047 103 850
Total liabilities and equity 2 454 366 -4 775 2 449 591 2 387 858 -3 907 2 383 951
NOTES | GROUP
136 HANDELSBANKEN | ANNUAL REPORT 2013
G49 Capital adequacy
CAPITAL POLICYThe Bank aims to maintain a robust capital level which meets the risk entailed in the Group’s operations and which exceeds the minimum re-quirements prescribed by legislation. A healthy capital level is needed to manage situations of financial strain and also for other events such as acquisitions and major growth in volumes.
LEGAL CAPITAL REQUIREMENTAccording to the new capital adequacy regulations, Basel II, which were introduced in Sweden on 1 February 2007 through the Act (2006:1371) on Capital Adequacy and Large Exposures of Credit Institutions and Securi-ties Companies, the Bank must maintain a capital base at least corresponding to the sum of the capital requirements for credit risks, market risks and operational risks. In addi-tion to maintaining capital according to the minimum requirement, the Bank must make an internal capital adequacy assessment. Handelsbanken’s capital policy – most recently adopted during 2012 – states the guidelines for the internal capital adequacy assessment. The Bank must also comply with a capital require-ment at the financial conglomerate level in accordance with the Financial Conglomerates (Special Supervision) Act (2006:531). See below for more information about capital adequacy for the financial conglomerate. During 2013, the Bank met the statutory minimum level for its capital base by a good margin. More detailed information about the Bank’s capital base and capital requirement is available in note G2, Risk and capital management, and in the document entitled “Handelsbanken’s risk and capital management – information according to Pillar 3” (see handelsbanken.se/ireng).
DESCRIPTION OF THE BANKING GROUPThe banking group consists of the parent compa-ny, subsidiaries and associated companies that are included in the consolidated group accounts, as shown in the table on page 137. Companies that are included in the group accounts but are excluded from the banking group are shown in the table on page 137. For capital adequacy purposes all companies are fully consolidated; in the group accounts, associated companies are consolidated using the equity method.
DESCRIPTION OF THE CAPITAL BASE FOR THE BANKING GROUPThe capital base consists of tier 1 capital and tier 2 capital. The tier 1 capital consists of the equity and issued tier 1 capital contributions in the com-panies which are part of the banking group where Handelsbanken AB is the parent institution. The tier 2 capital mainly consists of perpetual and dated subordinated loans. Certain reductions are subsequently made from the capital base. The reductions are made from the tier 1 capital, from the tier 2 capital and from the capital base as a whole. Only capital from companies within
the banking group is included in the capital base. For the Bank’s risk management, it is important that in risk terms, both the Group and the bank-ing group can be viewed as one unit. To enable efficient risk management in the Group, capital may need to be re-allocated among the various companies in the Group. In general, Handels-banken is able to re-allocate capital among the Group companies, to the extent that is permitted by legislation, for example capital adequacy re-quirements and restrictions in corporate law. The Bank sees no other material or legal obstacles to a rapid transfer of funds from the capital base, or repayment of liabilities between the parent company and its subsidiaries.
Tier 1 capitalThe tier 1 capital consists mainly of equity in the banking group. Since the Group’s insurance companies are not part of the banking group, retained earnings in these companies are not included in the tier 1 capital. With the consent of the Swedish Financial Supervisory Authority, certain types of perpetual subordinated loans may be included in the tier 1 capital (so-called tier 1 capital contributions). The proportion that may be included net after reduction items depends on the contractual terms of the instru-ments issued. In total, tier 1 capital contributions can comprise at most 50 per cent of the overall tier 1 capital. Tier 1 capital contributions which are not convertible into shares, or which can be redeemed by the Bank at nominal value, can comprise at most 35 per cent. Innovative tier 1 capital contributions, which contain an increase of the interest margin (a step-up), may comprise at most 15 per cent. The total scope for issuing tier 1 capital contributions was SEK 78.9 billion at the end of 2013, including an amount of SEK 52.1 billion for tier 1 capital contributions which are not convertible into shares, or which can be redeemed by the Bank at nominal value. The scope for issuing innovative tier 1 capital contributions was SEK 19.2 billion.
Of the total of the Bank’s issued tier 1 capital contributions, SEK 5.3 billion are regular tier 1 capital contributions and SEK 5.3 billion are so-called enhanced tier 1 capital contributions. Regular tier 1 capital contributions issued by the Bank up to and including 2007 give the Bank the right to convert the instrument into equity to avoid being forced to enter into liquidation. For enhanced tier 1 capital contributions issued since 2008, the Bank has the right to convert the instruments into equity at an earlier stage to avoid breaching regulatory requirements. In the case of liquidation, both types of instruments will be classified as liabilities, including the part that was previously converted into equity, and will then have the same residual claim to the assets of the company. This claim is subordi-nate to the claims of all other creditors. Only shareholders have a poorer claim to the assets of the company. For enhanced tier 1 capital contributions, the Bank has an unconditional
right to suspend coupon payments, in other words, payment of interest can be suspended at any time. If there are no distributable funds, coupon payments must be suspended for both types of instrument.
All tier 1 capital contributions are issued under the previous regulatory framework. The entire amount is therefore included according to the transitional arrangements in FFFS 2010:10.
The items to be excluded from tier 1 capital are mainly goodwill and other intangible assets, as well as unrealised gains on shares classi-fied as available-for-sale. Deferred tax assets and write-ups of properties also reduce the tier 1 capital. Neutrality adjustments are made for interest-bearing instruments classified as available-for-sale and for the effect of cash flow hedges on equity. Due to the changed capital adequacy regulations applying from 31 Decem-ber 2011, a deduction must be made for value adjustments for all less liquid positions meas-ured at fair value. The previous regulations only included illiquid positions in the trading book.
Tier 2 capitalThe tier 2 capital contains subordinated loans, reductions relating to write-ups of property and unrealised gains on shares classified as available-for-sale. The gross amount of tier 2 capital must never exceed the tier 1 capital. A further restriction is that the maximum amount of the dated subordinated loans which can be included in the capital base is 50 per cent of the total tier 1 capital. Holdings of various types of subordinated liabilities are included within the regulatory restrictions. For more details of the terms of outstanding subordinated loans, see note G37 Subordinated Liabilities.
Deductions from tier 1 and tier 2 capitalInstitutions with permission to use internal ratings-based models (IRB institutions) must make a deduction for the difference between expected loan losses under the IRB model and the provisions for probable loan losses if the ex-pected loan losses exceed the provisions made. Deductions must also be made for capital con-tributions in certain financial companies where there is an associated company relationship, if the share of the capital exceeds 10 per cent, or if the total contributions exceed 10 per cent of the company’s capital. Half of these deductions must be made from the tier 1 capital and half from the tier 2 capital.
Deductions from the total capital baseA deduction must be made from the total capital base for the net value of recognised surpluses in pension assets. However, the deduction may be reduced by an amount corresponding to the Bank’s right to reimbursement for pension costs from Handelsbanken’s pension foundation. The total capital base must also be reduced by contributions to insurance companies provided before 20 June 2006. From 2013, half of these
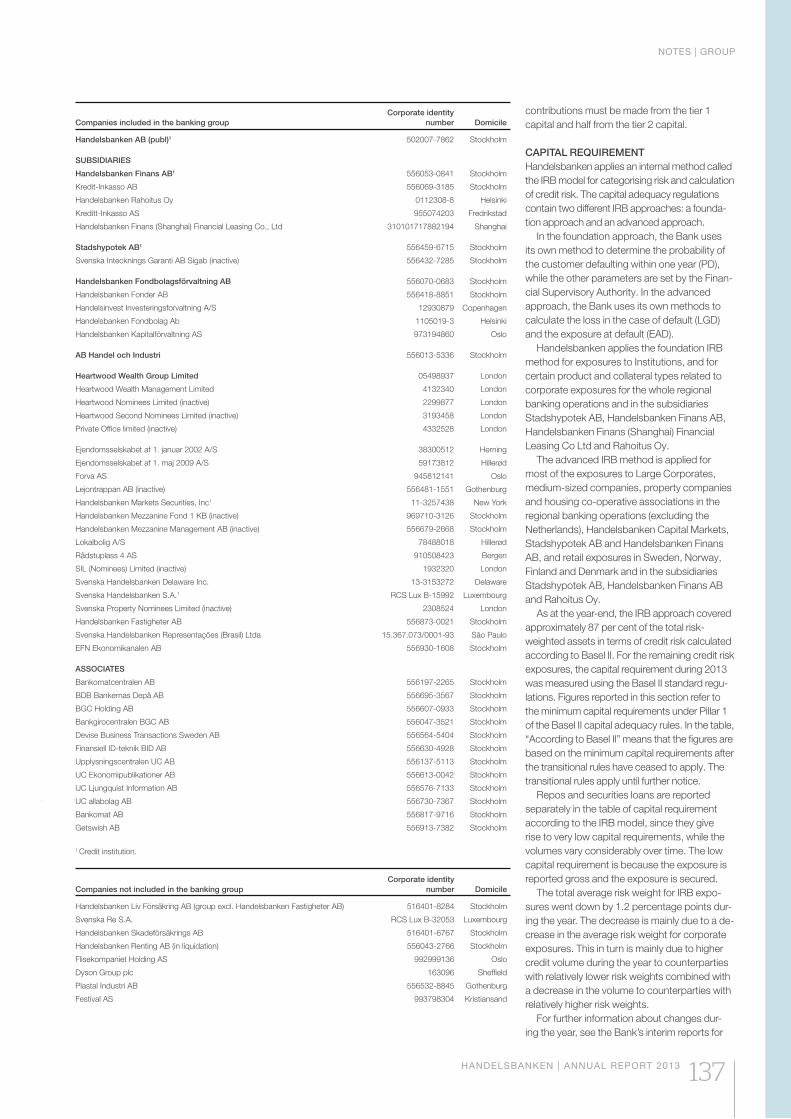
NOTES | GROUP
HANDELSBANKEN | ANNUAL REPORT 2013 137
Companies included in the banking groupCorporate identity
number Domicile
Handelsbanken AB (publ)1 502007-7862 Stockholm
SUBSIDIARIES
Handelsbanken Finans AB1 556053-0841 Stockholm
Kredit-Inkasso AB 556069-3185 Stockholm
Handelsbanken Rahoitus Oy 0112308-8 Helsinki
Kreditt-Inkasso AS 955074203 Fredrikstad
Handelsbanken Finans (Shanghai) Financial Leasing Co., Ltd 310101717882194 Shanghai
Stadshypotek AB1 556459-6715 Stockholm
Svenska Intecknings Garanti AB Sigab (inactive) 556432-7285 Stockholm
Handelsbanken Fondbolagsförvaltning AB 556070-0683 Stockholm
Handelsbanken Fonder AB 556418-8851 Stockholm
Handelsinvest Investeringsforvaltning A/S 12930879 Copenhagen
Handelsbanken Fondbolag Ab 1105019-3 Helsinki
Handelsbanken Kapitalförvaltning AS 973194860 Oslo
AB Handel och Industri 556013-5336 Stockholm
Heartwood Wealth Group Limited 05498937 London
Heartwood Wealth Management Limited 4132340 London
Heartwood Nominees Limited (inactive) 2299877 London
Heartwood Second Nominees Limited (inactive) 3193458 London
Private Office limited (inactive) 4332528 London
Ejendomsselskabet af 1. januar 2002 A/S 38300512 Herning
Ejendomsselskabet af 1. maj 2009 A/S 59173812 Hillerød
Forva AS 945812141 Oslo
Lejontrappan AB (inactive) 556481-1551 Gothenburg
Handelsbanken Markets Securities, Inc1 11-3257438 New York
Handelsbanken Mezzanine Fond 1 KB (inactive) 969710-3126 Stockholm
Handelsbanken Mezzanine Management AB (inactive) 556679-2668 Stockholm
Lokalbolig A/S 78488018 Hillerød
Rådstuplass 4 AS 910508423 Bergen
SIL (Nominees) Limited (inactive) 1932320 London
Svenska Handelsbanken Delaware Inc. 13-3153272 Delaware
Svenska Handelsbanken S.A.1 RCS Lux B-15992 Luxembourg
Svenska Property Nominees Limited (inactive) 2308524 London
Handelsbanken Fastigheter AB 556873-0021 Stockholm
Svenska Handelsbanken Representações (Brasil) Ltda 15.367.073/0001-93 São Paulo
EFN Ekonomikanalen AB 556930-1608 Stockholm
ASSOCIATES
Bankomatcentralen AB 556197-2265 Stockholm
BDB Bankernas Depå AB 556695-3567 Stockholm
BGC Holding AB 556607-0933 Stockholm
Bankgirocentralen BGC AB 556047-3521 Stockholm
Devise Business Transactions Sweden AB 556564-5404 Stockholm
Finansiell ID-teknik BID AB 556630-4928 Stockholm
Upplysningscentralen UC AB 556137-5113 Stockholm
UC Ekonomipublikationer AB 556613-0042 Stockholm
UC Ljungquist Information AB 556576-7133 Stockholm
UC allabolag AB 556730-7367 Stockholm
Bankomat AB 556817-9716 Stockholm
Getswish AB 556913-7382 Stockholm
1 Credit institution.
Companies not included in the banking groupCorporate identity
number Domicile
Handelsbanken Liv Försäkring AB (group excl. Handelsbanken Fastigheter AB) 516401-8284 Stockholm
Svenska Re S.A. RCS Lux B-32053 Luxembourg
Handelsbanken Skadeförsäkrings AB 516401-6767 Stockholm
Handelsbanken Renting AB (in liquidation) 556043-2766 Stockholm
Flisekompaniet Holding AS 992999136 Oslo
Dyson Group plc 163096 Sheffield
Plastal Industri AB 556532-8845 Gothenburg
Festival AS 993798304 Kristiansand
contributions must be made from the tier 1 capital and half from the tier 2 capital.
CAPITAL REQUIREMENTHandelsbanken applies an internal method called the IRB model for categorising risk and calculation of credit risk. The capital adequacy regulations contain two different IRB approaches: a founda-tion approach and an advanced approach.
In the foundation approach, the Bank uses its own method to determine the probability of the customer defaulting within one year (PD), while the other parameters are set by the Finan-cial Supervisory Authority. In the advanced approach, the Bank uses its own methods to calculate the loss in the case of default (LGD) and the exposure at default (EAD).
Handelsbanken applies the foundation IRB method for exposures to Institutions, and for certain product and collateral types related to corporate exposures for the whole regional banking operations and in the subsidiaries Stadshypotek AB, Handelsbanken Finans AB, Handelsbanken Finans (Shanghai) Financial Leasing Co Ltd and Rahoitus Oy.
The advanced IRB method is applied for most of the exposures to Large Corporates, medium-sized companies, property companies and housing co-operative associations in the regional banking operations (excluding the Netherlands), Handelsbanken Capital Markets, Stadshypotek AB and Handelsbanken Finans AB, and retail exposures in Sweden, Norway, Finland and Denmark and in the subsidiaries Stadshypotek AB, Handelsbanken Finans AB and Rahoitus Oy.
As at the year-end, the IRB approach covered approximately 87 per cent of the total risk-weighted assets in terms of credit risk calculated according to Basel II. For the remaining credit risk exposures, the capital requirement during 2013 was measured using the Basel II standard regu-lations. Figures reported in this section refer to the minimum capital requirements under Pillar 1 of the Basel II capital adequacy rules. In the table, “According to Basel II” means that the figures are based on the minimum capital requirements after the transitional rules have ceased to apply. The transitional rules apply until further notice.
Repos and securities loans are reported separately in the table of capital requirement according to the IRB model, since they give rise to very low capital requirements, while the volumes vary considerably over time. The low capital requirement is because the exposure is reported gross and the exposure is secured.
The total average risk weight for IRB expo-sures went down by 1.2 percentage points dur-ing the year. The decrease is mainly due to a de-crease in the average risk weight for corporate exposures. This in turn is mainly due to higher credit volume during the year to counterparties with relatively lower risk weights combined with a decrease in the volume to counterparties with relatively higher risk weights.
For further information about changes dur-ing the year, see the Bank’s interim reports for
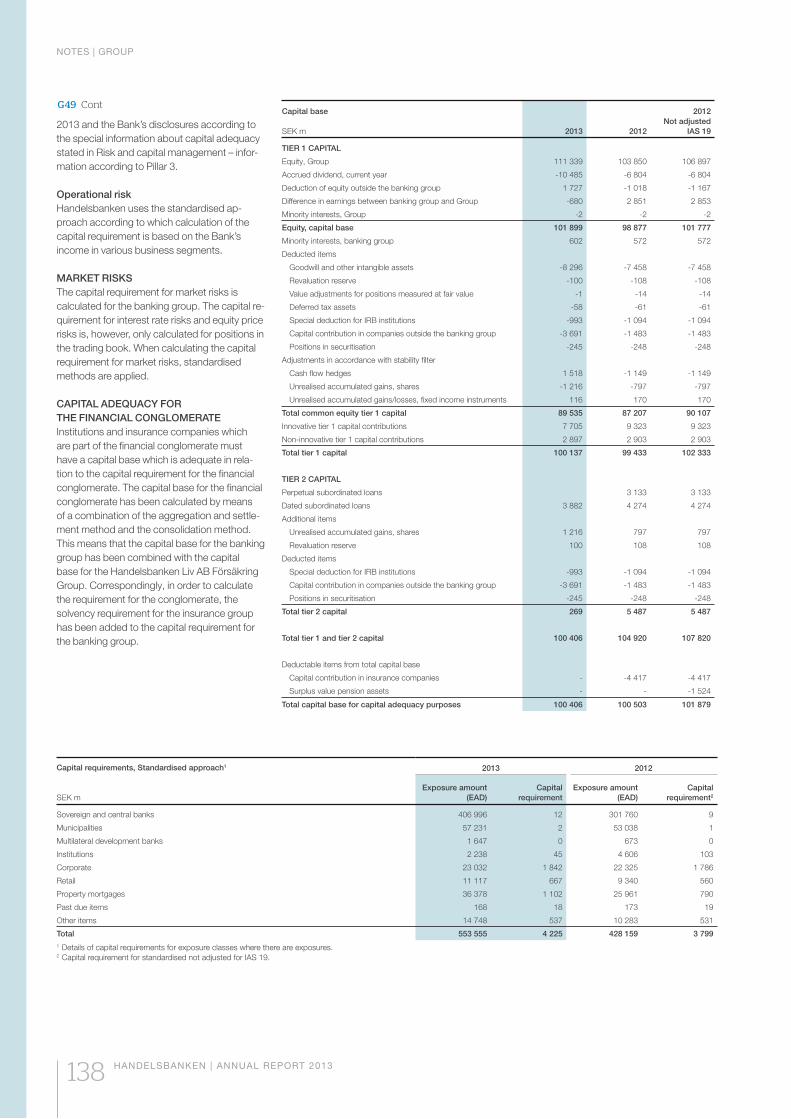
NOTES | GROUP
138 HANDELSBANKEN | ANNUAL REPORT 2013
G49 Cont
Capital requirements, Standardised approach1
SEK m
2013 2012
Exposure amount (EAD)
Capital requirement
Exposure amount (EAD)
Capital requirement2
Sovereign and central banks 406 996 12 301 760 9
Municipalities 57 231 2 53 038 1
Multilateral development banks 1 647 0 673 0
Institutions 2 238 45 4 606 103
Corporate 23 032 1 842 22 325 1 786
Retail 11 117 667 9 340 560
Property mortgages 36 378 1 102 25 961 790
Past due items 168 18 173 19
Other items 14 748 537 10 283 531
Total 553 555 4 225 428 159 3 7991 Details of capital requirements for exposure classes where there are exposures.2 Capital requirement for standardised not adjusted for IAS 19.
2013 and the Bank’s disclosures according to the special information about capital adequacy stated in Risk and capital management – infor-mation according to Pillar 3.
Operational riskHandelsbanken uses the standardised ap-proach according to which calculation of the capital requirement is based on the Bank’s income in various business segments.
MARKET RISKSThe capital requirement for market risks is calculated for the banking group. The capital re-quirement for interest rate risks and equity price risks is, however, only calculated for positions in the trading book. When calculating the capital requirement for market risks, standardised methods are applied.
CAPITAL ADEQUACY FOR THE FINANCIAL CONGLOMERATEInstitutions and insurance companies which are part of the financial conglomerate must have a capital base which is adequate in rela-tion to the capital requirement for the financial conglomerate. The capital base for the financial conglomerate has been calculated by means of a combination of the aggregation and settle-ment method and the consolidation method. This means that the capital base for the banking group has been combined with the capital base for the Handelsbanken Liv AB Försäkring Group. Correspondingly, in order to calculate the requirement for the conglomerate, the solvency requirement for the insurance group has been added to the capital requirement for the banking group.
Capital base
SEK m 2013 2012
2012 Not adjusted
IAS 19
TIER 1 CAPITAL
Equity, Group 111 339 103 850 106 897
Accrued dividend, current year -10 485 -6 804 -6 804
Deduction of equity outside the banking group 1 727 -1 018 -1 167
Difference in earnings between banking group and Group -680 2 851 2 853
Minority interests, Group -2 -2 -2
Equity, capital base 101 899 98 877 101 777
Minority interests, banking group 602 572 572
Deducted items
Goodwill and other intangible assets -8 296 -7 458 -7 458
Revaluation reserve -100 -108 -108
Value adjustments for positions measured at fair value -1 -14 -14
Deferred tax assets -58 -61 -61
Special deduction for IRB institutions -993 -1 094 -1 094
Capital contribution in companies outside the banking group -3 691 -1 483 -1 483
Positions in securitisation -245 -248 -248
Adjustments in accordance with stability filter
Cash flow hedges 1 518 -1 149 -1 149
Unrealised accumulated gains, shares -1 216 -797 -797
Unrealised accumulated gains/losses, fixed income instruments 116 170 170
Total common equity tier 1 capital 89 535 87 207 90 107
Innovative tier 1 capital contributions 7 705 9 323 9 323
Non-innovative tier 1 capital contributions 2 897 2 903 2 903
Total tier 1 capital 100 137 99 433 102 333
TIER 2 CAPITAL
Perpetual subordinated loans 3 133 3 133
Dated subordinated loans 3 882 4 274 4 274
Additional items
Unrealised accumulated gains, shares 1 216 797 797
Revaluation reserve 100 108 108
Deducted items
Special deduction for IRB institutions -993 -1 094 -1 094
Capital contribution in companies outside the banking group -3 691 -1 483 -1 483
Positions in securitisation -245 -248 -248
Total tier 2 capital 269 5 487 5 487
Total tier 1 and tier 2 capital 100 406 104 920 107 820
Deductable items from total capital base
Capital contribution in insurance companies - -4 417 -4 417
Surplus value pension assets - - -1 524
Total capital base for capital adequacy purposes 100 406 100 503 101 879
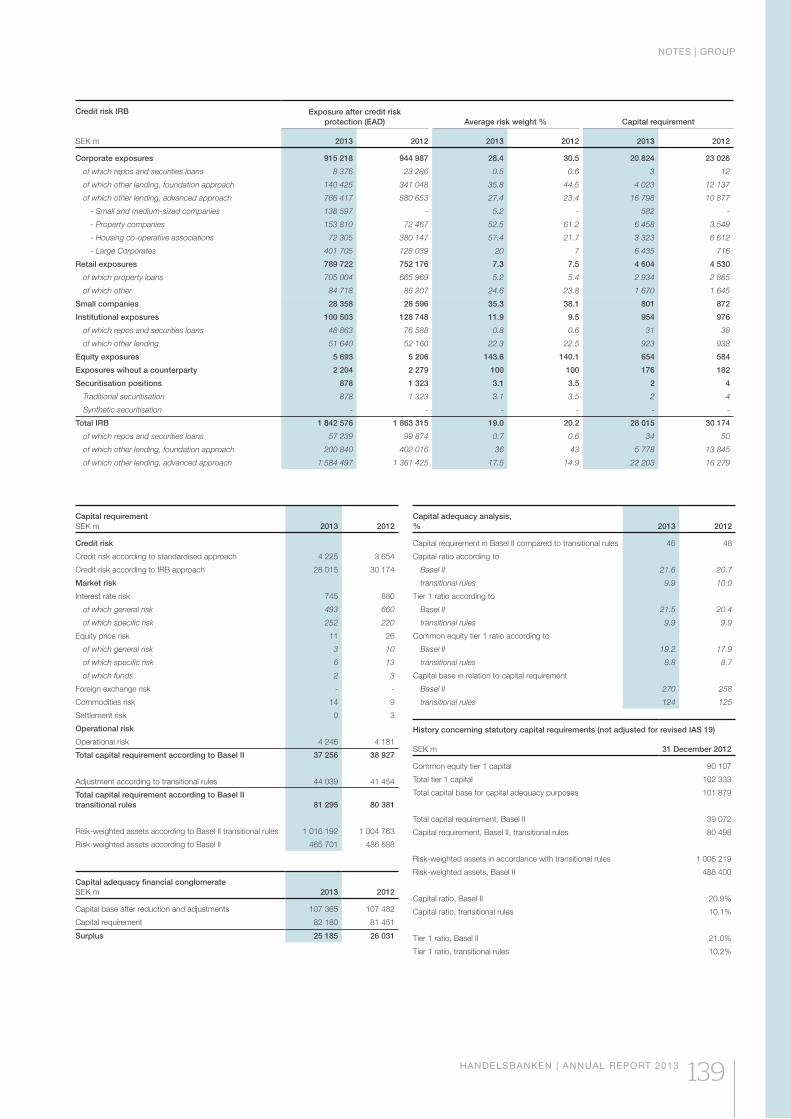
NOTES | GROUP
HANDELSBANKEN | ANNUAL REPORT 2013 139
Capital requirementSEK m 2013 2012
Credit risk
Credit risk according to standardised approach 4 225 3 654
Credit risk according to IRB approach 28 015 30 174
Market risk
Interest rate risk 745 880
of which general risk 493 660
of which specific risk 252 220
Equity price risk 11 26
of which general risk 3 10
of which specific risk 6 13
of which funds 2 3
Foreign exchange risk - -
Commodities risk 14 9
Settlement risk 0 3
Operational risk
Operational risk 4 246 4 181
Total capital requirement according to Basel II 37 256 38 927
Adjustment according to transitional rules 44 039 41 454
Total capital requirement according to Basel II transitional rules 81 295 80 381
Risk-weighted assets according to Basel II transitional rules 1 016 192 1 004 763
Risk-weighted assets according to Basel II 465 701 486 588
Capital adequacy financial conglomerateSEK m 2013 2012
Capital base after reduction and adjustments 107 365 107 482
Capital requirement 82 180 81 451
Surplus 25 185 26 031
Capital adequacy analysis, % 2013 2012
Capital requirement in Basel II compared to transitional rules 46 48
Capital ratio according to
Basel II 21.6 20.7
transitional rules 9.9 10.0
Tier 1 ratio according to
Basel II 21.5 20.4
transitional rules 9.9 9.9
Common equity tier 1 ratio according to
Basel II 19.2 17.9
transitional rules 8.8 8.7
Capital base in relation to capital requirement
Basel II 270 258
transitional rules 124 125
History concerning statutory capital requirements (not adjusted for revised IAS 19)
SEK m 31 December 2012
Common equity tier 1 capital 90 107
Total tier 1 capital 102 333
Total capital base for capital adequacy purposes 101 879
Total capital requirement, Basel II 39 072
Capital requirement, Basel II, transitional rules 80 498
Risk-weighted assets in accordance with transitional rules 1 006 219
Risk-weighted assets, Basel II 488 400
Capital ratio, Basel II 20.9%
Capital ratio, transitional rules 10.1%
Tier 1 ratio, Basel II 21.0%
Tier 1 ratio, transitional rules 10.2%
Credit risk IRB
SEK m
Exposure after credit risk protection (EAD) Average risk weight % Capital requirement
2013 2012 2013 2012 2013 2012
Corporate exposures 915 218 944 987 28.4 30.5 20 824 23 026
of which repos and securities loans 8 376 23 286 0.5 0.6 3 12
of which other lending, foundation approach 140 425 341 048 35.8 44.5 4 023 12 137
of which other lending, advanced approach 766 417 580 653 27.4 23.4 16 798 10 877
- Small and medium-sized companies 138 597 - 5.2 - 582 -
- Property companies 153 810 72 467 52.5 61.2 6 458 3 549
- Housing co-operative associations 72 305 380 147 57.4 21.7 3 323 6 612
- Large Corporates 401 705 128 039 20 7 6 435 716
Retail exposures 789 722 752 176 7.3 7.5 4 604 4 530
of which property loans 705 004 665 969 5.2 5.4 2 934 2 885
of which other 84 718 86 207 24.6 23.8 1 670 1 645
Small companies 28 358 28 596 35.3 38.1 801 872
Institutional exposures 100 503 128 748 11.9 9.5 954 976
of which repos and securities loans 48 863 76 588 0.8 0.6 31 38
of which other lending 51 640 52 160 22.3 22.5 923 938
Equity exposures 5 693 5 206 143.6 140.1 654 584
Exposures wihout a counterparty 2 204 2 279 100 100 176 182
Securitisation positions 878 1 323 3.1 3.5 2 4
Traditional securitisation 878 1 323 3.1 3.5 2 4
Synthetic securitisation - - - - - -
Total IRB 1 842 576 1 863 315 19.0 20.2 28 015 30 174
of which repos and securities loans 57 239 99 874 0.7 0.6 34 50
of which other lending, foundation approach 200 840 402 016 36 43 5 778 13 845
of which other lending, advanced approach 1 584 497 1 361 425 17.5 14.9 22 203 16 279

Parent company
ADMINISTRATION REPORT | PARENT COMPANY
HANDELSBANKEN | ANNUAL REPORT 2013 141
Administration report Parent company
Performance in the parent companyThe parent company’s accounts cover parts of the operations that, in organisational terms, are included in branch operations within and outside Sweden, Capital Markets, and central departments and administrative functions. Although most of Handelsbanken’s business comes from the local branches and is co-ordinated by them, in legal terms a sizeable part of business volumes are outside the parent company in wholly-owned subsidiaries – particularly in the Stadshypotek AB mortgage institution. Thus, the performance of the parent company is not equivalent to the performance of business operations in the Group as a whole. The performance of business operations is therefore better illustrated by the administration report for the Group. To obtain a comprehensive and more representative picture of Handels-banken’s position, results and performance, see the Group’s administration report.
During the financial year, the parent com-pany’s operating profit decreased by 12 per cent to SEK 16,380 million (18,602). The year’s profit rose by 39 per cent to SEK 16,028 million (11,552). Net interest income decreased by 3 per cent to SEK 15,962 million (16,431) and net fee and commission income by 1 per cent to SEK 5,649 million (5,724). The parent com-pany’s equity increased to SEK 90,758 million (82,232). For the parent company’s five-year overview, see page 147.
Risk managementHandelsbanken has a low risk tolerance that is maintained through a strong risk culture which is sustainable in the long term and applies to all areas of the Group. For a more detailed descrip-tion of the Bank’s exposure to risks, and the management of these, see note G2.
Principles for compensation to senior man-agementHandelsbanken’s principles for compensation to senior management are set out in note G8 and in the principles for compensation to senior management section of the Corporate Govern-ance Report, see page 58.
Recommended appropriation of profitsThe Board proposes a total dividend of SEK 16.50 per share, with the ordinary dividend being SEK 11.50 per share (10.75). The Board’s recommendation for distribution of profits is shown on page 175.
The Handelsbanken share
Shares divided into share classes31 December 2013
Share class Number% of
capital% of
votes
Class A 623 895 352 98.15 99.81
Class B 11 750 443 1.85 0.19
Total 635 645 795 100 100
Two shareholders own more than ten per cent of the shares: Industrivärden and the Oktogonen Foundation. Detailed information on the Bank’s largest Swedish shareholders can be found on page 45.
Handelsbanken’s articles of association state that at shareholders’ meetings, no shareholder is allowed to exercise voting rights representing more than ten per cent of the total number of votes in the Bank. For more information regard-ing shareholders’ rights, see page 52.
At the AGM in March 2013, the Board received a mandate to repurchase a maximum of 40 million shares during the period until the AGM in March 2014. This mandate was not used during 2013. More detailed information on this can be found on page 45.
OtherHandelsbanken continually works with meas-ures to minimise the Bank’s direct and indirect impact on the environment. For more informa-tion regarding the Bank’s environmental activi-ties, see page 196.
Handelsbanken strives for its decentralised work method and belief in the individual to permeate its operations. For a more detailed description of the Bank’s work method and staff development, see page 186.
ADMINISTRATION REPORT | PARENT COMPANY
142 HANDELSBANKEN | ANNUAL REPORT 2013
Financial reports Parent company
142 HANDELSBANKEN | ANNUAL REPORT 2013
CONTENTS
Income statement 143
Statement of comprehensive income 143
Balance sheet 144
Statement of changes in equity 145
Cash flow statement 146
Five-year overview 147
Notes Parent company 149
P1 Accounting policies 149
P2 Risk and capital management 150
P3 Net interest income 152
P4 Dividends received 153
P5 Net fee and commission income
153
P6 Net gains/losses on financial transactions
153
P7 Other operating income 153
P8 Staff costs 154
P9 Other administrative expenses
154
P10 Loan losses 155
P11 Appropriations 157
P12 Loans to credit institutions 157
P13 Loans to the public 158
P14 Interest-bearing securities 158
P15 Shares 158
P16 Shares in subsidiaries and investments in associates
159
P17 Derivative instruments 160
P18 Offsetting of financial instruments 161
P19 Intangible assets 162
P20 Property and equipment 162
P21 Other assets 163
P22 Prepaid expenses and accrued income
163
P23 Due to credit institutions 163
P24 Deposits and borrowing from the public
163
P25 Issued securities 164
P26 Short positions 164
P27 Taxes 165
P28 Provisions 165
P29 Other liabilities 165
P30 Accrued expenses and deferred income
165
P31 Subordinated liabilities 166
P32 Untaxed reserves 166
P33 Classification of financial assets and liabilities 167
P34 Fair value measurement of financial instruments 168
P35 Pledged assets, collateral received and transferred financial assets
170
P36 Contingent liabilities 170
P37 Other commitments 170
P38 Pension obligations 171
P39 Assets and liabilities in currencies
171
P40 Related-party disclosures 172
P41 Capital adequacy 173
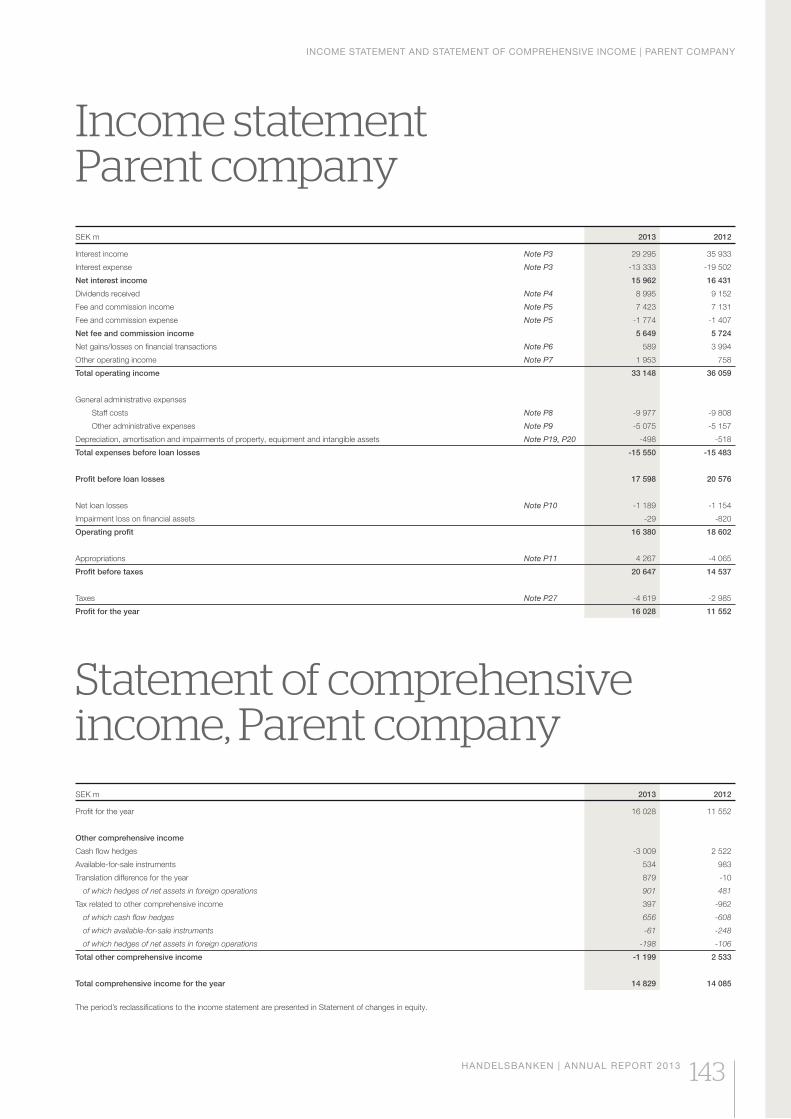
INCOME STATEMENT AND STATEMENT OF COMPREHENSIVE INCOME | PARENT COMPANY
HANDELSBANKEN | ANNUAL REPORT 2013 143
Income statement Parent company
Statement of comprehensive income, Parent company
SEK m 2013 2012
Interest income Note P3 29 295 35 933
Interest expense Note P3 -13 333 -19 502
Net interest income 15 962 16 431
Dividends received Note P4 8 995 9 152
Fee and commission income Note P5 7 423 7 131
Fee and commission expense Note P5 -1 774 -1 407
Net fee and commission income 5 649 5 724
Net gains/losses on financial transactions Note P6 589 3 994
Other operating income Note P7 1 953 758
Total operating income 33 148 36 059
General administrative expenses
Staff costs Note P8 -9 977 -9 808
Other administrative expenses Note P9 -5 075 -5 157
Depreciation, amortisation and impairments of property, equipment and intangible assets Note P19, P20 -498 -518
Total expenses before loan losses -15 550 -15 483
Profit before loan losses 17 598 20 576
Net loan losses Note P10 -1 189 -1 154
Impairment loss on financial assets -29 -820
Operating profit 16 380 18 602
Appropriations Note P11 4 267 -4 065
Profit before taxes 20 647 14 537
Taxes Note P27 -4 619 -2 985
Profit for the year 16 028 11 552
SEK m 2013 2012
Profit for the year 16 028 11 552
Other comprehensive income
Cash flow hedges -3 009 2 522
Available-for-sale instruments 534 983
Translation difference for the year 879 -10
of which hedges of net assets in foreign operations 901 481
Tax related to other comprehensive income 397 -962
of which cash flow hedges 656 -608
of which available-for-sale instruments -61 -248
of which hedges of net assets in foreign operations -198 -106
Total other comprehensive income -1 199 2 533
Total comprehensive income for the year 14 829 14 085
The period’s reclassifications to the income statement are presented in Statement of changes in equity.
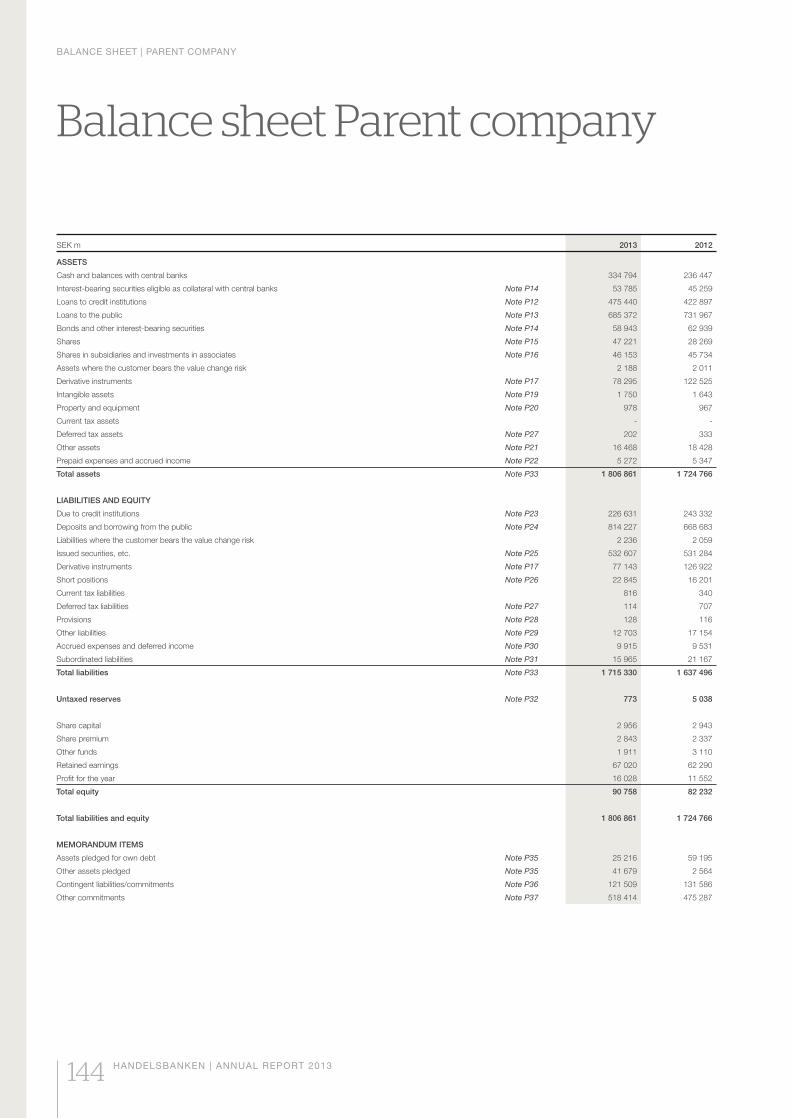
BALANCE SHEET | PARENT COMPANY
144 HANDELSBANKEN | ANNUAL REPORT 2013
Balance sheet Parent company
SEK m 2013 2012
ASSETS
Cash and balances with central banks 334 794 236 447
Interest-bearing securities eligible as collateral with central banks Note P14 53 785 45 259
Loans to credit institutions Note P12 475 440 422 897
Loans to the public Note P13 685 372 731 967
Bonds and other interest-bearing securities Note P14 58 943 62 939
Shares Note P15 47 221 28 269
Shares in subsidiaries and investments in associates Note P16 46 153 45 734
Assets where the customer bears the value change risk 2 188 2 011
Derivative instruments Note P17 78 295 122 525
Intangible assets Note P19 1 750 1 643
Property and equipment Note P20 978 967
Current tax assets - -
Deferred tax assets Note P27 202 333
Other assets Note P21 16 468 18 428
Prepaid expenses and accrued income Note P22 5 272 5 347
Total assets Note P33 1 806 861 1 724 766
LIABILITIES AND EQUITY
Due to credit institutions Note P23 226 631 243 332
Deposits and borrowing from the public Note P24 814 227 668 683
Liabilities where the customer bears the value change risk 2 236 2 059
Issued securities, etc. Note P25 532 607 531 284
Derivative instruments Note P17 77 143 126 922
Short positions Note P26 22 845 16 201
Current tax liabilities 816 340
Deferred tax liabilities Note P27 114 707
Provisions Note P28 128 116
Other liabilities Note P29 12 703 17 154
Accrued expenses and deferred income Note P30 9 915 9 531
Subordinated liabilities Note P31 15 965 21 167
Total liabilities Note P33 1 715 330 1 637 496
Untaxed reserves Note P32 773 5 038
Share capital 2 956 2 943
Share premium 2 843 2 337
Other funds 1 911 3 110
Retained earnings 67 020 62 290
Profit for the year 16 028 11 552
Total equity 90 758 82 232
Total liabilities and equity 1 806 861 1 724 766
MEMORANDUM ITEMS
Assets pledged for own debt Note P35 25 216 59 195
Other assets pledged Note P35 41 679 2 564
Contingent liabilities/commitments Note P36 121 509 131 586
Other commitments Note P37 518 414 475 287
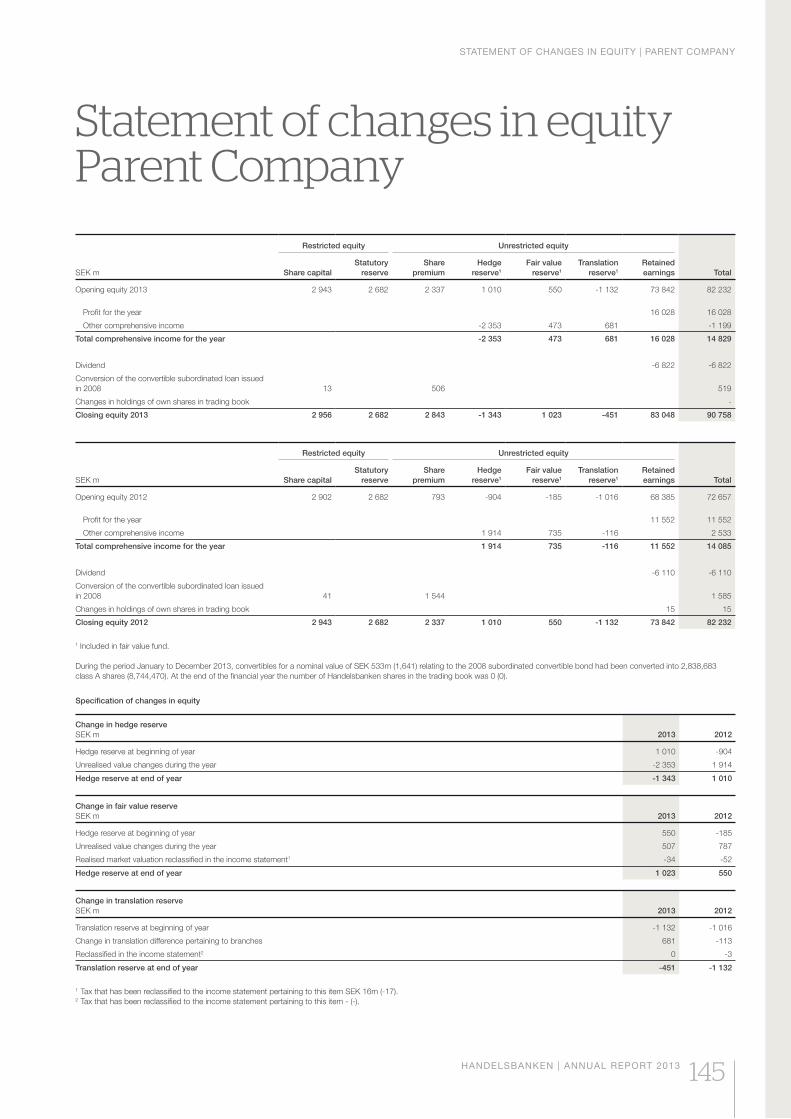
STATEMENT OF CHANGES IN EQUITY | PARENT COMPANY
HANDELSBANKEN | ANNUAL REPORT 2013 145
Statement of changes in equity Parent Company
Restricted equity Unrestricted equity
SEK m Share capitalStatutory
reserveShare
premiumHedge
reserve1
Fair valuereserve1
Translationreserve1
Retainedearnings Total
Opening equity 2013 2 943 2 682 2 337 1 010 550 -1 132 73 842 82 232
Profit for the year 16 028 16 028
Other comprehensive income -2 353 473 681 -1 199
Total comprehensive income for the year -2 353 473 681 16 028 14 829
Dividend -6 822 -6 822
Conversion of the convertible subordinated loan issued in 2008 13 506 519
Changes in holdings of own shares in trading book -
Closing equity 2013 2 956 2 682 2 843 -1 343 1 023 -451 83 048 90 758
Restricted equity Unrestricted equity
SEK m Share capitalStatutory
reserveShare
premiumHedge
reserve1
Fair valuereserve1
Translationreserve1
Retainedearnings Total
Opening equity 2012 2 902 2 682 793 -904 -185 -1 016 68 385 72 657
Profit for the year 11 552 11 552
Other comprehensive income 1 914 735 -116 2 533
Total comprehensive income for the year 1 914 735 -116 11 552 14 085
Dividend -6 110 -6 110
Conversion of the convertible subordinated loan issued in 2008 41 1 544 1 585
Changes in holdings of own shares in trading book 15 15
Closing equity 2012 2 943 2 682 2 337 1 010 550 -1 132 73 842 82 232
1 Included in fair value fund.
During the period January to December 2013, convertibles for a nominal value of SEK 533m (1,641) relating to the 2008 subordinated convertible bond had been converted into 2,838,683 class A shares (8,744,470). At the end of the financial year the number of Handelsbanken shares in the trading book was 0 (0).
Specification of changes in equity
Change in hedge reserveSEK m 2013 2012
Hedge reserve at beginning of year 1 010 -904
Unrealised value changes during the year -2 353 1 914
Hedge reserve at end of year -1 343 1 010
Change in fair value reserveSEK m 2013 2012
Hedge reserve at beginning of year 550 -185
Unrealised value changes during the year 507 787
Realised market valuation reclassified in the income statement1 -34 -52
Hedge reserve at end of year 1 023 550
Change in translation reserveSEK m 2013 2012
Translation reserve at beginning of year -1 132 -1 016
Change in translation difference pertaining to branches 681 -113
Reclassified in the income statement2 0 -3
Translation reserve at end of year -451 -1 132
1 Tax that has been reclassified to the income statement pertaining to this item SEK 16m (-17).2 Tax that has been reclassified to the income statement pertaining to this item - (-).
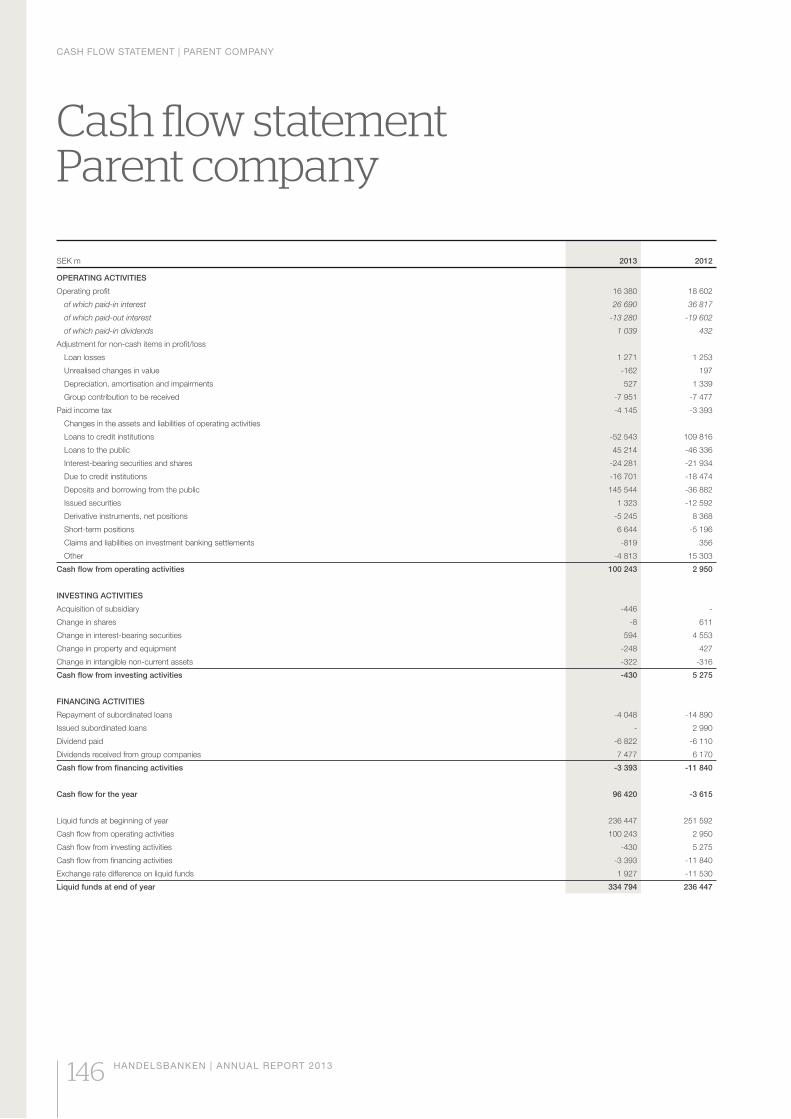
CASH FLOW STATEMENT | PARENT COMPANY
146 HANDELSBANKEN | ANNUAL REPORT 2013
Cash flow statement Parent company
SEK m 2013 2012
OPERATING ACTIVITIES
Operating profit 16 380 18 602
of which paid-in interest 26 690 36 817
of which paid-out interest -13 280 -19 602
of which paid-in dividends 1 039 432
Adjustment for non-cash items in profit/loss
Loan losses 1 271 1 253
Unrealised changes in value -162 197
Depreciation, amortisation and impairments 527 1 339
Group contribution to be received -7 951 -7 477
Paid income tax -4 145 -3 393
Changes in the assets and liabilities of operating activities
Loans to credit institutions -52 543 109 816
Loans to the public 45 214 -46 336
Interest-bearing securities and shares -24 281 -21 934
Due to credit institutions -16 701 -18 474
Deposits and borrowing from the public 145 544 -36 882
Issued securities 1 323 -12 592
Derivative instruments, net positions -5 245 8 368
Short-term positions 6 644 -5 196
Claims and liabilities on investment banking settlements -819 356
Other -4 813 15 303
Cash flow from operating activities 100 243 2 950
INVESTING ACTIVITIES
Acquisition of subsidiary -446 -
Change in shares -8 611
Change in interest-bearing securities 594 4 553
Change in property and equipment -248 427
Change in intangible non-current assets -322 -316
Cash flow from investing activities -430 5 275
FINANCING ACTIVITIES
Repayment of subordinated loans -4 048 -14 890
Issued subordinated loans - 2 990
Dividend paid -6 822 -6 110
Dividends received from group companies 7 477 6 170
Cash flow from financing activities -3 393 -11 840
Cash flow for the year 96 420 -3 615
Liquid funds at beginning of year 236 447 251 592
Cash flow from operating activities 100 243 2 950
Cash flow from investing activities -430 5 275
Cash flow from financing activities -3 393 -11 840
Exchange rate difference on liquid funds 1 927 -11 530
Liquid funds at end of year 334 794 236 447

FIVE-YEAR OVERVIEW | PARENT COMPANY
HANDELSBANKEN | ANNUAL REPORT 2013 147
Five-year overview Parent company
Income statementSEK m 2013 2012 2011 2010 2009
Net interest income 15 962 16 431 15 684 14 549 14 584
Dividends received 8 995 9 152 5 733 2 749 6 687
Net fee and commission income 5 649 5 724 6 026 6 455 5 995
Net gains/losses on financial transactions 589 3 994 458 790 2 453
Other operating income 1 953 758 640 624 597
Total operating income 33 148 36 059 28 541 25 167 30 316
General administrative expenses
Staff costs -9 977 -9 808 -9 247 -8 838 -8 938
Other administrative expenses -5 075 -5 157 -4 723 -4 775 -4 450
Depreciation, amortisation and impairments of property, equipment and intangible assets -498 -518 -538 -533 -574
Total expenses before loan losses -15 550 -15 483 -14 508 -14 146 -13 962
Profit before loan losses 17 598 20 576 14 033 11 021 16 354
Net loan losses -1 189 -1 154 -1 081 -1 466 -3 781
Impairment loss on financial assets -29 -820 -375 -470 -30
Operating profit 16 380 18 602 12 577 9 085 12 543
Appropriations 4 267 -4 065 106 108 1 100
Profit before tax 20 647 14 537 12 683 9 193 13 643
Taxes -4 619 -2 985 -3 470 -2 548 -2 784
Profit for the year 16 028 11 552 9 213 6 645 10 859
Dividend for the year 10 4881 6 804 6 085 5 611 4 988
1 As proposed by the Board.
Statement of comprehensive income SEK m 2013 2012 2011 2010 2009
Profit for the year 16 028 11 552 9 213 6 645 10 859
Other comprehensive income
Cash flow hedges -3 009 2 522 -264 -186 13
Available-for-sale instruments 534 983 -1 319 2 188 3 277
Translation difference for the year 879 -10 36 -1 462 51
of which hedges of net asssets in foreign operations 901 481 - - -
Tax related to other comprehensive income 397 -962 435 -549 -927
of which cash flow hedges 656 -608 70 49 -3
of which available-for-sale instruments -61 -248 365 -598 -924
of which hedges of net assets in foreign operations -198 -106 - - -
Total other comprehensive income -1 199 2 533 -1 112 -9 2 414
Total comprehensive income for the year 14 829 14 085 8 101 6 636 13 273
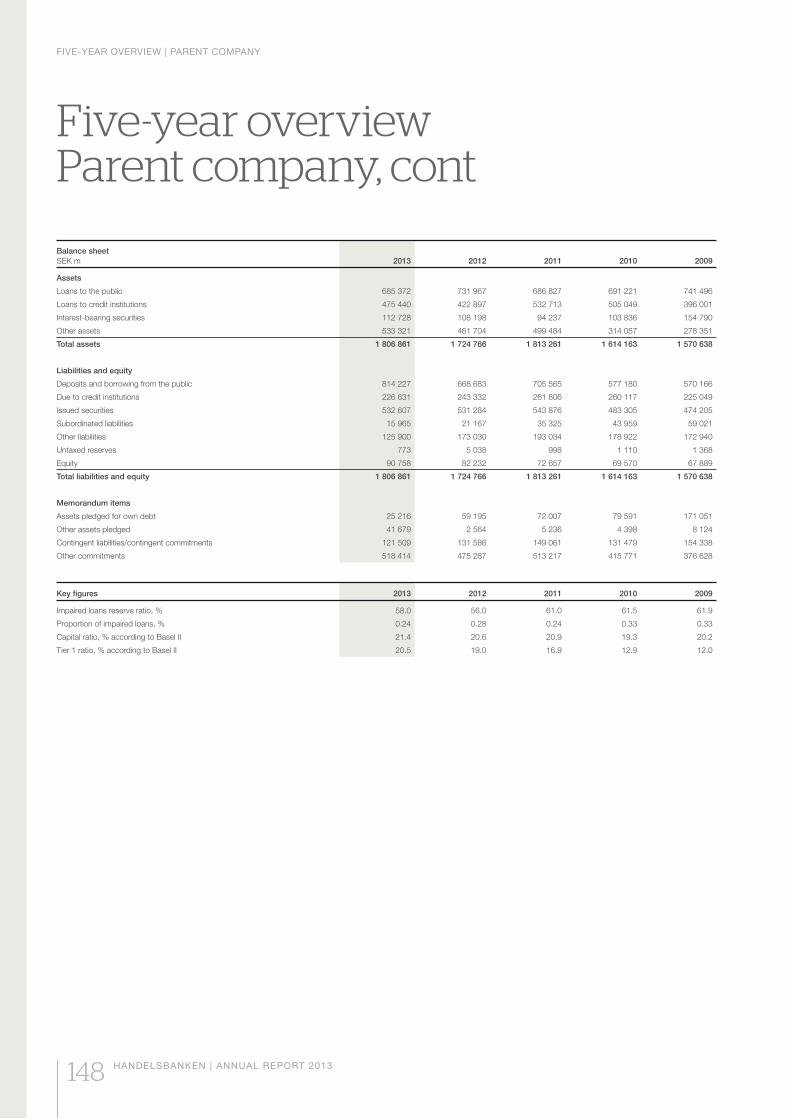
FIVE-YEAR OVERVIEW | PARENT COMPANY
148 HANDELSBANKEN | ANNUAL REPORT 2013
Five-year overview Parent company, cont
Balance sheetSEK m 2013 2012 2011 2010 2009
Assets
Loans to the public 685 372 731 967 686 827 691 221 741 496
Loans to credit institutions 475 440 422 897 532 713 505 049 396 001
Interest-bearing securities 112 728 108 198 94 237 103 836 154 790
Other assets 533 321 461 704 499 484 314 057 278 351
Total assets 1 806 861 1 724 766 1 813 261 1 614 163 1 570 638
Liabilities and equity
Deposits and borrowing from the public 814 227 668 683 705 565 577 180 570 166
Due to credit institutions 226 631 243 332 261 806 260 117 225 049
Issued securities 532 607 531 284 543 876 483 305 474 205
Subordinated liabilities 15 965 21 167 35 325 43 959 59 021
Other liabilities 125 900 173 030 193 034 178 922 172 940
Untaxed reserves 773 5 038 998 1 110 1 368
Equity 90 758 82 232 72 657 69 570 67 889
Total liabilities and equity 1 806 861 1 724 766 1 813 261 1 614 163 1 570 638
Memorandum items
Assets pledged for own debt 25 216 59 195 72 007 79 591 171 051
Other assets pledged 41 679 2 564 5 236 4 398 8 124
Contingent liabilities/contingent commitments 121 509 131 586 149 061 131 479 154 338
Other commitments 518 414 475 287 513 217 415 771 376 628
Key figures 2013 2012 2011 2010 2009
Impaired loans reserve ratio, % 58.0 56.0 61.0 61.5 61.9
Proportion of impaired loans, % 0.24 0.28 0.24 0.33 0.33
Capital ratio, % according to Basel II 21.4 20.6 20.9 19.3 20.2
Tier 1 ratio, % according to Basel II 20.5 19.0 16.9 12.9 12.0
NOTES | PARENT COMPANY
HANDELSBANKEN | ANNUAL REPORT 2013 149
Notes Parent company
P1 Accounting policies
Statement of compliance The parent company’s annual report is pre-pared in accordance with the Swedish Annual Accounts Act for Credit Institutions and Securi-ties Companies (1995:1559) and the regulations and general guidelines issued by the Swedish Financial Supervisory Authority, FFFS 2008:25, Annual reports in credit institutions and securities companies. In accordance with the transitional rules in FFFS 2013:24 Regulations amending the Swedish Financial Supervisory Authority’s regulations and general guidelines (FFFS 2008:25) concerning annual reports in credit institutions and securities companies, these amendment regulations will be applied in advance of the prescribed date. The parent company also applies the Swedish Financial Reporting Board’s recommendation RFR 2 Accounting for legal entities and statements. In compliance with the Supervisory Authority’s general guidelines, the parent company applies statutory IFRS. This means that the international accounting standards and interpretations of these standards as adopted by the EU have been applied to the extent that is possible within the framework of national laws and directives and the connection between accounting and taxation.
The relationship between the parent com-pany’s and the Group’s accounting policies The parent company’s accounting policies mainly correspond with those of the Group. The following reports only on the areas where the parent company’s policies differ from those of the Group. In all other respects, reference is made to the accounting policies in note G1.
Changed accounting policies The parent company’s accounting policies are in all material respects the same as those applied in the 2012 financial year.
Presentation The parent company applies the presentation models for the income statement and balance sheet in compliance with the Annual Accounts Act for Credit Institutions and Securities Com-panies and the Swedish Financial Supervisory Authority’s regulations. This mainly implies the following differences relative to the presentation by the Group:
available upon demand that are reported in the consolidated balance sheet under Other loans to central banks, are reported as Loans to credit institutions in the parent company’s balance sheet.
-ported in the parent company as commission expenses
-rate line in the parent company’s income statement
equipment and intangible non-current assets in the parent company is reported as other income/expense
conjunction with the parent company’s bal-ance sheet
share and tax liability in the Group are repor-ted as a separate balance sheet item in the parent company.
Assets and liabilities in foreign currencies Loans in the parent company which are hedging net investments in foreign operations are meas-ured at the historical rate of exchange.
Held-for-sale assets and discontinued operations Net profit after tax from discontinued operations is not recognised separately in the parent com-pany’s income statement. Nor are held-for-sale assets presented separately in the balance sheet.
Shares in subsidiaries and associated companies Shares in subsidiaries and associated compa-nies are measured at cost. Dividends on shares in subsidiaries and associated companies are recognised as income in profit or loss under Dividends received.
Financial guarantees Financial guarantees in the form of guarantees in favour of subsidiaries and associated com-panies are recognised in the parent company as a provision in the balance sheet where the parent company has an existing commitment and payment will probably be required to settle this commitment.
Intangible assets In the parent company, acquisition assets and other intangible assets with an indefinite useful
life are amortised in compliance with the provi-sions of the above-mentioned Annual Accounts Act. According to experience, the customer relations that the acquisitions have led to are very long, and consequently the useful life of goodwill on acquisitions. The amortisation period has been set at 20 years.
Dividends The item Dividends received comprises all divi-dends received in the parent company including dividends from subsidiaries and associated companies, and group contributions received. Anticipated dividend is recognised only if the parent company has the right to decide the amount of the dividend and the decision has been taken before the financial reports were published.
Accounting for pensions The parent company does not apply the provisions of IAS 19 concerning accounting for defined benefit plans. Instead, pension costs are calculated on an actuarial basis in the parent company in accordance with the provisions of the Act on Safeguarding Pension Obligations and the Swedish Financial Supervisory Author-ity’s regulations. This mainly means that there are differences regarding how the discount rate is established and that the calculation of the future commitment does not take into account assumptions of future salary increases. The recognised net cost of pensions is calculated as disbursed pensions, pension premiums and an allocation to the pension foundation, with a deduction for any compensation from the pen-sion foundation. The net pension cost for the year is reported under Staff costs in the parent company’s income statement.
Excess amounts as a result of the value of the plan assets exceeding the estimated defined benefit obligations are not recognised as an asset in the parent company’s balance sheet. Deficits are recognised as a liability.
The pension fund’s commitments to the employees of subsidiaries are guaranteed by the parent company so if the pension fund cannot pay its commitments, the Bank is liable to take over and pay the commitment.
Taxes In the parent company, untaxed reserves are recognised as a separate item in the balance sheet. Untaxed reserves comprise one compo-nent consisting of deferred tax liabilities and one component consisting of equity.
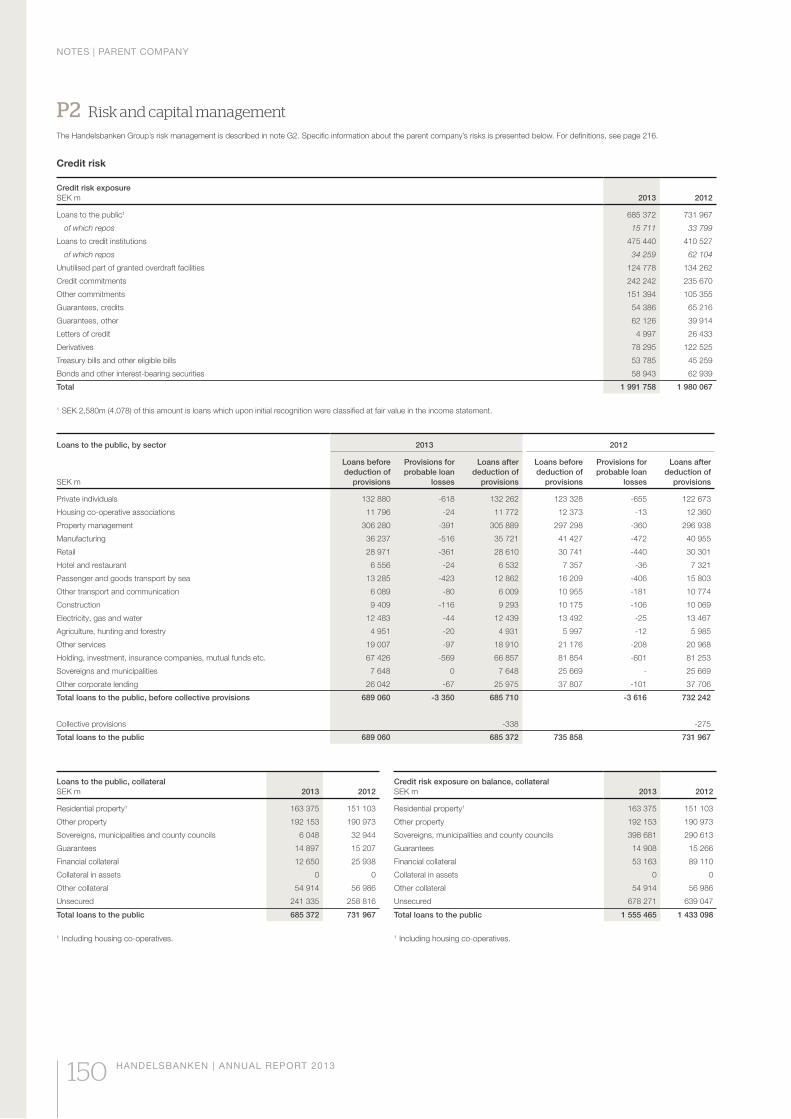
NOTES | PARENT COMPANY
150 HANDELSBANKEN | ANNUAL REPORT 2013
P2 Risk and capital management
The Handelsbanken Group’s risk management is described in note G2. Specific information about the parent company’s risks is presented below. For definitions, see page 216.
Credit risk
Credit risk exposureSEK m 2013 2012
Loans to the public1 685 372 731 967
of which repos 15 711 33 799
Loans to credit institutions 475 440 410 527
of which repos 34 259 62 104
Unutilised part of granted overdraft facilities 124 778 134 262
Credit commitments 242 242 235 670
Other commitments 151 394 105 355
Guarantees, credits 54 386 65 216
Guarantees, other 62 126 39 914
Letters of credit 4 997 26 433
Derivatives 78 295 122 525
Treasury bills and other eligible bills 53 785 45 259
Bonds and other interest-bearing securities 58 943 62 939
Total 1 991 758 1 980 067
1 SEK 2,580m (4,078) of this amount is loans which upon initial recognition were classified at fair value in the income statement.
Loans to the public, by sector 2013 2012
SEK m
Loans before deduction of
provisions
Provisions for probable loan
losses
Loans after deduction of
provisions
Loans before deduction of
provisions
Provisions for probable loan
losses
Loans after deduction of
provisions
Private individuals 132 880 -618 132 262 123 328 -655 122 673
Housing co-operative associations 11 796 -24 11 772 12 373 -13 12 360
Property management 306 280 -391 305 889 297 298 -360 296 938
Manufacturing 36 237 -516 35 721 41 427 -472 40 955
Retail 28 971 -361 28 610 30 741 -440 30 301
Hotel and restaurant 6 556 -24 6 532 7 357 -36 7 321
Passenger and goods transport by sea 13 285 -423 12 862 16 209 -406 15 803
Other transport and communication 6 089 -80 6 009 10 955 -181 10 774
Construction 9 409 -116 9 293 10 175 -106 10 069
Electricity, gas and water 12 483 -44 12 439 13 492 -25 13 467
Agriculture, hunting and forestry 4 951 -20 4 931 5 997 -12 5 985
Other services 19 007 -97 18 910 21 176 -208 20 968
Holding, investment, insurance companies, mutual funds etc. 67 426 -569 66 857 81 854 -601 81 253
Sovereigns and municipalities 7 648 0 7 648 25 669 - 25 669
Other corporate lending 26 042 -67 25 975 37 807 -101 37 706
Total loans to the public, before collective provisions 689 060 -3 350 685 710 -3 616 732 242
Collective provisions -338 -275
Total loans to the public 689 060 685 372 735 858 731 967
Loans to the public, collateralSEK m 2013 2012
Residential property1 163 375 151 103
Other property 192 153 190 973
Sovereigns, municipalities and county councils 6 048 32 944
Guarantees 14 897 15 207
Financial collateral 12 650 25 938
Collateral in assets 0 0
Other collateral 54 914 56 986
Unsecured 241 335 258 816
Total loans to the public 685 372 731 967
1 Including housing co-operatives.
Credit risk exposure on balance, collateralSEK m 2013 2012
Residential property1 163 375 151 103
Other property 192 153 190 973
Sovereigns, municipalities and county councils 398 681 290 613
Guarantees 14 908 15 266
Financial collateral 53 163 89 110
Collateral in assets 0 0
Other collateral 54 914 56 986
Unsecured 678 271 639 047
Total loans to the public 1 555 465 1 433 098
1 Including housing co-operatives.
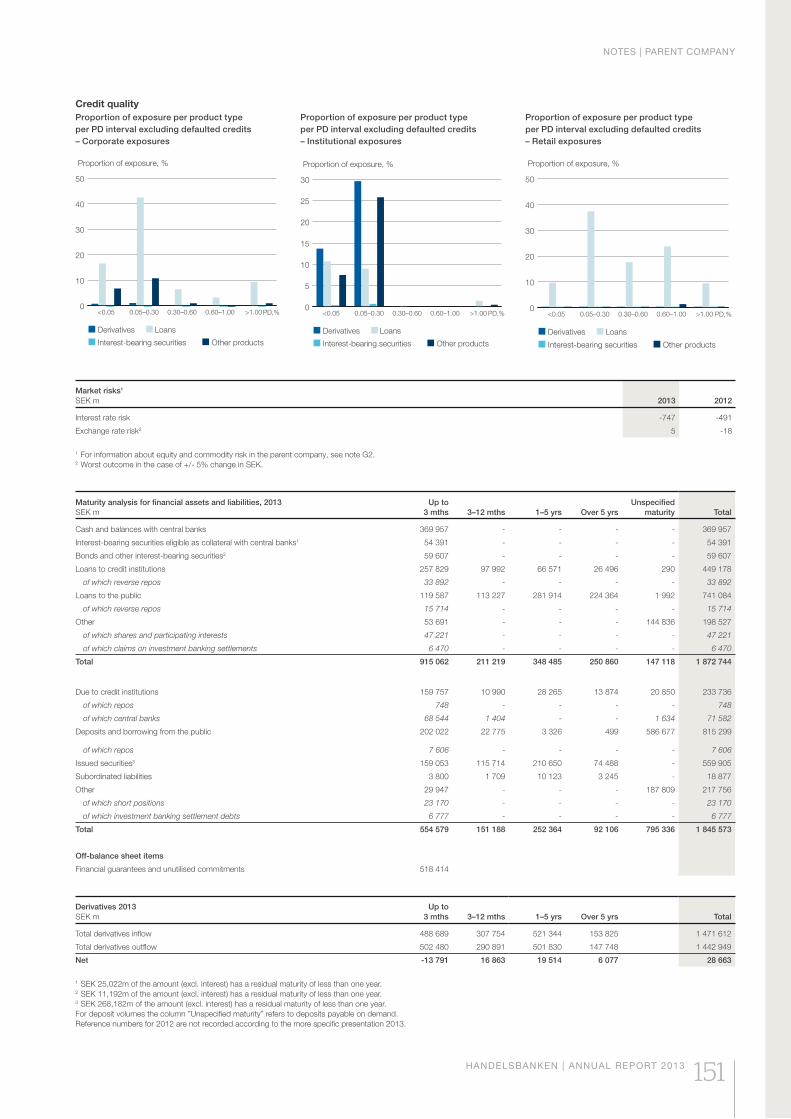
NOTES | PARENT COMPANY
HANDELSBANKEN | ANNUAL REPORT 2013 151
Credit qualityProportion of exposure per product type per PD interval excluding defaulted credits – Corporate exposures
Proportion of exposure per product type per PD interval excluding defaulted credits – Institutional exposures
Proportion of exposure per product type per PD interval excluding defaulted credits – Retail exposures
0
10
20
30
40
50
>1.000.60–1.000.30–0.600.05–0.30<0.05
Derivatives Loans
Interest-bearing securities Other products
Proportion of exposure, %
PD,%
Market risks1
SEK m 2013 2012
Interest rate risk -747 -491
Exchange rate risk2 5 -18
1 For information about equity and commodity risk in the parent company, see note G2.2 Worst outcome in the case of +/- 5% change in SEK.
Maturity analysis for financial assets and liabilities, 2013SEK m
Up to 3 mths 3–12 mths 1–5 yrs Over 5 yrs
Unspecified maturity Total
Cash and balances with central banks 369 957 - - - - 369 957
Interest-bearing securities eligible as collateral with central banks1 54 391 - - - - 54 391
Bonds and other interest-bearing securities2 59 607 - - - - 59 607
Loans to credit institutions 257 829 97 992 66 571 26 496 290 449 178
of which reverse repos 33 892 - - - - 33 892
Loans to the public 119 587 113 227 281 914 224 364 1 992 741 084
of which reverse repos 15 714 - - - - 15 714
Other 53 691 - - - 144 836 198 527
of which shares and participating interests 47 221 - - - - 47 221
of which claims on investment banking settlements 6 470 - - - - 6 470
Total 915 062 211 219 348 485 250 860 147 118 1 872 744
Due to credit institutions 159 757 10 990 28 265 13 874 20 850 233 736
of which repos 748 - - - - 748
of which central banks 68 544 1 404 - - 1 634 71 582
Deposits and borrowing from the public 202 022 22 775 3 326 499 586 677 815 299
of which repos 7 606 - - - - 7 606
Issued securities3 159 053 115 714 210 650 74 488 - 559 905
Subordinated liabilities 3 800 1 709 10 123 3 245 - 18 877
Other 29 947 - - - 187 809 217 756
of which short positions 23 170 - - - - 23 170
of which investment banking settlement debts 6 777 - - - - 6 777
Total 554 579 151 188 252 364 92 106 795 336 1 845 573
Off-balance sheet items
Financial guarantees and unutilised commitments 518 414
Derivatives 2013SEK m
Up to 3 mths 3–12 mths 1–5 yrs Over 5 yrs Total
Total derivatives inflow 488 689 307 754 521 344 153 825 1 471 612
Total derivatives outflow 502 480 290 891 501 830 147 748 1 442 949
Net -13 791 16 863 19 514 6 077 28 663
1 SEK 25,022m of the amount (excl. interest) has a residual maturity of less than one year.2 SEK 11,192m of the amount (excl. interest) has a residual maturity of less than one year.3 SEK 268,182m of the amount (excl. interest) has a residual maturity of less than one year.For deposit volumes the column ”Unspecified maturity” refers to deposits payable on demand.Reference numbers for 2012 are not recorded according to the more specific presentation 2013.
0
10
20
30
40
50
>1.000.60–1.000.30–0.600.05–0.30<0.05 PD,%
Derivatives Loans
Interest-bearing securities Other products
Proportion of exposure, %
0
5
10
15
20
25
30
>1.000.60–1.000.30–0.600.05–0.30<0.05 PD,%
Derivatives Loans
Interest-bearing securities Other products
Proportion of exposure, %
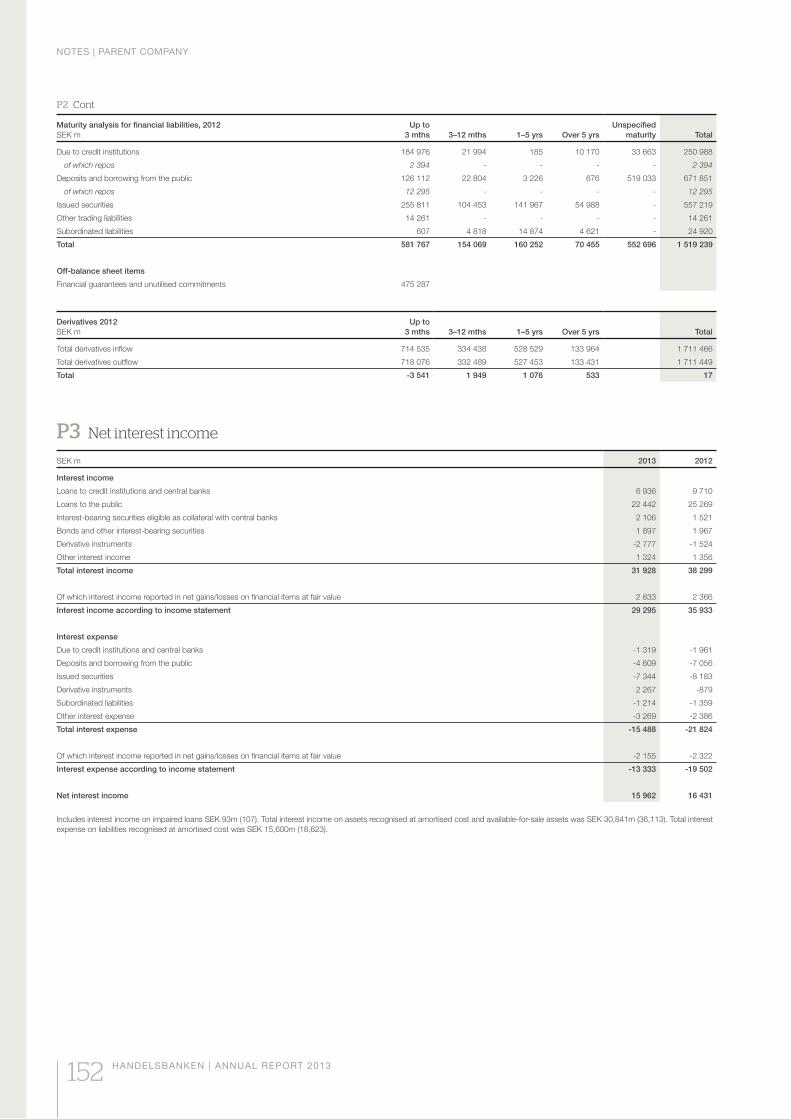
NOTES | PARENT COMPANY
152 HANDELSBANKEN | ANNUAL REPORT 2013
Maturity analysis for financial liabilities, 2012SEK m
Up to 3 mths 3–12 mths 1–5 yrs Over 5 yrs
Unspecified maturity Total
Due to credit institutions 184 976 21 994 185 10 170 33 663 250 988
of which repos 2 394 - - - - 2 394
Deposits and borrowing from the public 126 112 22 804 3 226 676 519 033 671 851
of which repos 12 295 - - - - 12 295
Issued securities 255 811 104 453 141 967 54 988 - 557 219
Other trading liabilities 14 261 - - - - 14 261
Subordinated liabilities 607 4 818 14 874 4 621 - 24 920
Total 581 767 154 069 160 252 70 455 552 696 1 519 239
Off-balance sheet items
Financial guarantees and unutilised commitments 475 287
Derivatives 2012SEK m
Up to 3 mths 3–12 mths 1–5 yrs Over 5 yrs Total
Total derivatives inflow 714 535 334 438 528 529 133 964 1 711 466
Total derivatives outflow 718 076 332 489 527 453 133 431 1 711 449
Total -3 541 1 949 1 076 533 17
P2 Cont
P3 Net interest income
SEK m 2013 2012
Interest income
Loans to credit institutions and central banks 6 936 9 710
Loans to the public 22 442 25 269
Interest-bearing securities eligible as collateral with central banks 2 106 1 521
Bonds and other interest-bearing securities 1 897 1 967
Derivative instruments -2 777 -1 524
Other interest income 1 324 1 356
Total interest income 31 928 38 299
Of which interest income reported in net gains/losses on financial items at fair value 2 633 2 366
Interest income according to income statement 29 295 35 933
Interest expense
Due to credit institutions and central banks -1 319 -1 961
Deposits and borrowing from the public -4 609 -7 056
Issued securities -7 344 -8 183
Derivative instruments 2 267 -879
Subordinated liabilities -1 214 -1 359
Other interest expense -3 269 -2 386
Total interest expense -15 488 -21 824
Of which interest income reported in net gains/losses on financial items at fair value -2 155 -2 322
Interest expense according to income statement -13 333 -19 502
Net interest income 15 962 16 431
Includes interest income on impaired loans SEK 93m (107). Total interest income on assets recognised at amortised cost and available-for-sale assets was SEK 30,841m (36,113). Total interest expense on liabilities recognised at amortised cost was SEK 15,600m (18,623).
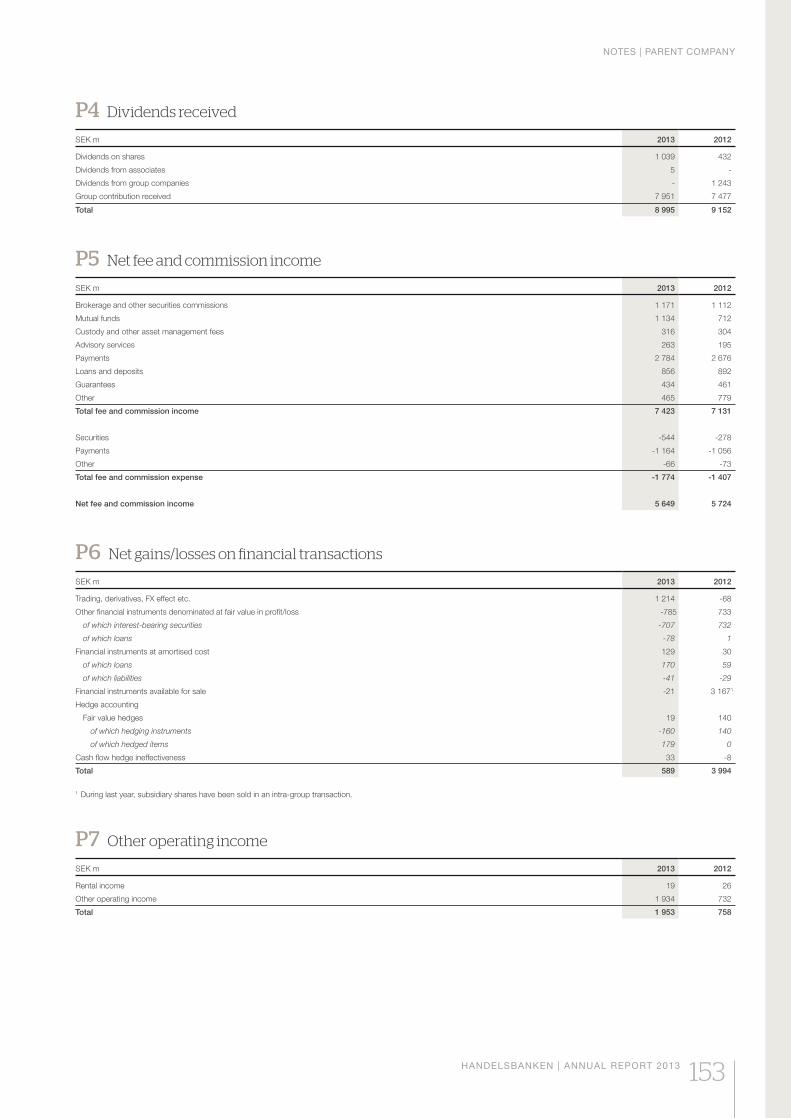
NOTES | PARENT COMPANY
HANDELSBANKEN | ANNUAL REPORT 2013 153
P4 Dividends received
SEK m 2013 2012
Dividends on shares 1 039 432
Dividends from associates 5 -
Dividends from group companies - 1 243
Group contribution received 7 951 7 477
Total 8 995 9 152
P5 Net fee and commission income
SEK m 2013 2012
Brokerage and other securities commissions 1 171 1 112
Mutual funds 1 134 712
Custody and other asset management fees 316 304
Advisory services 263 195
Payments 2 784 2 676
Loans and deposits 856 892
Guarantees 434 461
Other 465 779
Total fee and commission income 7 423 7 131
Securities -544 -278
Payments -1 164 -1 056
Other -66 -73
Total fee and commission expense -1 774 -1 407
Net fee and commission income 5 649 5 724
P6 Net gains/losses on financial transactions
SEK m 2013 2012
Trading, derivatives, FX effect etc. 1 214 -68
Other financial instruments denominated at fair value in profit/loss -785 733
of which interest-bearing securities -707 732
of which loans -78 1
Financial instruments at amortised cost 129 30
of which loans 170 59
of which liabilities -41 -29
Financial instruments available for sale -21 3 1671
Hedge accounting
Fair value hedges 19 140
of which hedging instruments -160 140
of which hedged items 179 0
Cash flow hedge ineffectiveness 33 -8
Total 589 3 994
1 During last year, subsidiary shares have been sold in an intra-group transaction.
P7 Other operating income
SEK m 2013 2012
Rental income 19 26
Other operating income 1 934 732
Total 1 953 758
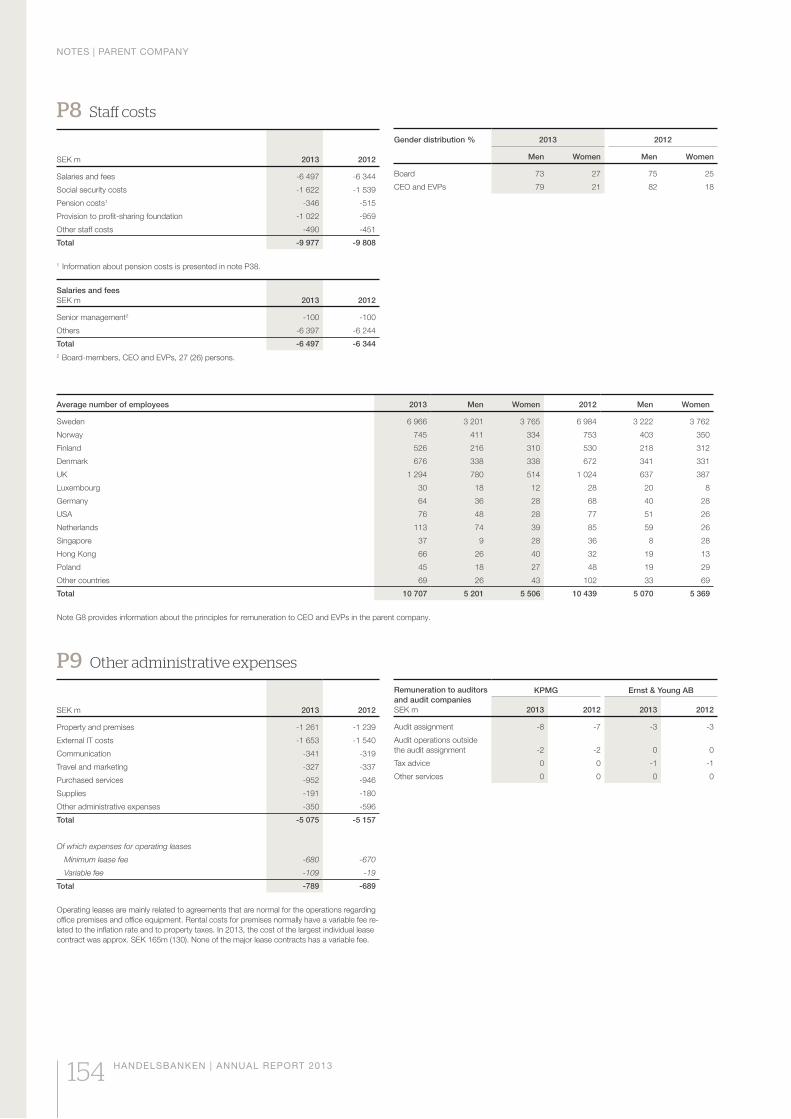
NOTES | PARENT COMPANY
154 HANDELSBANKEN | ANNUAL REPORT 2013
P8 Staff costs
SEK m 2013 2012
Salaries and fees -6 497 -6 344
Social security costs -1 622 -1 539
Pension costs1 -346 -515
Provision to profit-sharing foundation -1 022 -959
Other staff costs -490 -451
Total -9 977 -9 808
1 Information about pension costs is presented in note P38.
Salaries and fees SEK m 2013 2012
Senior management2 -100 -100
Others -6 397 -6 244
Total -6 497 -6 3442 Board-members, CEO and EVPs, 27 (26) persons.
Average number of employees 2013 Men Women 2012 Men Women
Sweden 6 966 3 201 3 765 6 984 3 222 3 762
Norway 745 411 334 753 403 350
Finland 526 216 310 530 218 312
Denmark 676 338 338 672 341 331
UK 1 294 780 514 1 024 637 387
Luxembourg 30 18 12 28 20 8
Germany 64 36 28 68 40 28
USA 76 48 28 77 51 26
Netherlands 113 74 39 85 59 26
Singapore 37 9 28 36 8 28
Hong Kong 66 26 40 32 19 13
Poland 45 18 27 48 19 29
Other countries 69 26 43 102 33 69
Total 10 707 5 201 5 506 10 439 5 070 5 369
Note G8 provides information about the principles for remuneration to CEO and EVPs in the parent company.
P9 Other administrative expenses
SEK m 2013 2012
Property and premises -1 261 -1 239
External IT costs -1 653 -1 540
Communication -341 -319
Travel and marketing -327 -337
Purchased services -952 -946
Supplies -191 -180
Other administrative expenses -350 -596
Total -5 075 -5 157
Of which expenses for operating leases
Minimum lease fee -680 -670
Variable fee -109 -19
Total -789 -689
Operating leases are mainly related to agreements that are normal for the operations regarding office premises and office equipment. Rental costs for premises normally have a variable fee re-lated to the inflation rate and to property taxes. In 2013, the cost of the largest individual lease contract was approx. SEK 165m (130). None of the major lease contracts has a variable fee.
Gender distribution % 2013 2012
Men Women Men Women
Board 73 27 75 25
CEO and EVPs 79 21 82 18
Remuneration to auditors and audit companiesSEK m
KPMG Ernst & Young AB
2013 2012 2013 2012
Audit assignment -8 -7 -3 -3
Audit operations outside the audit assignment -2 -2 0 0
Tax advice 0 0 -1 -1
Other services 0 0 0 0
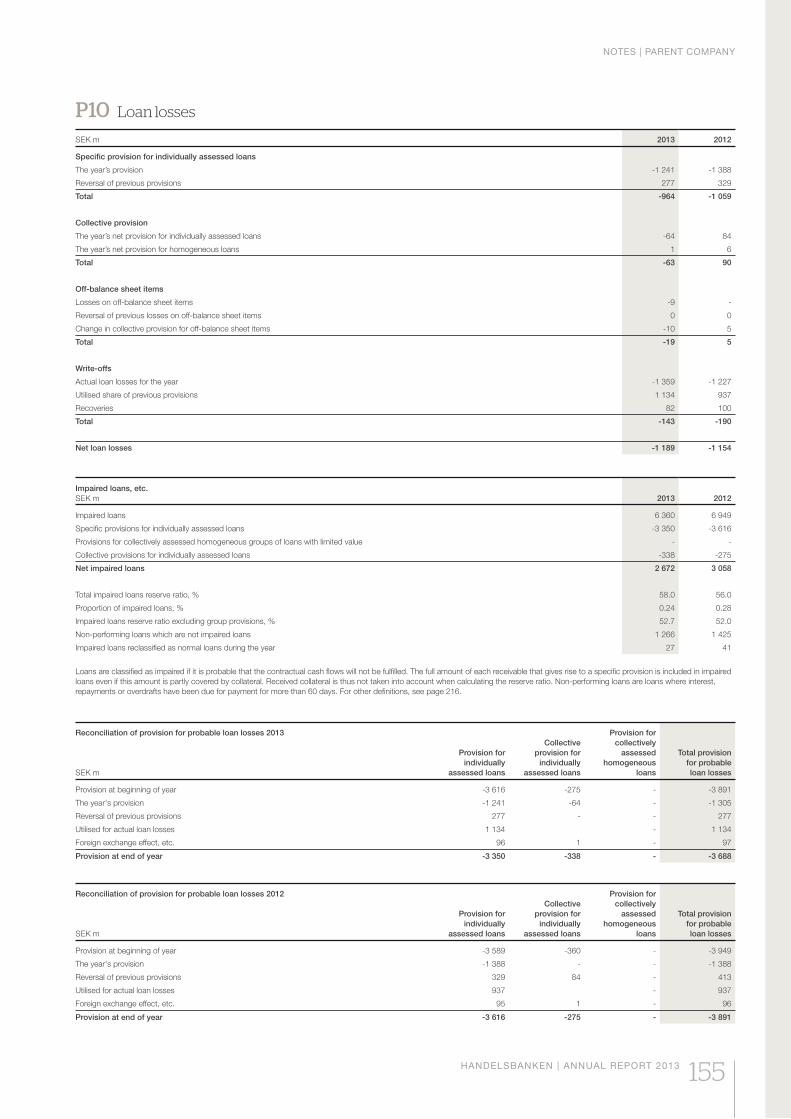
NOTES | PARENT COMPANY
HANDELSBANKEN | ANNUAL REPORT 2013 155
P10 Loan losses
SEK m 2013 2012
Specific provision for individually assessed loans
The year’s provision -1 241 -1 388
Reversal of previous provisions 277 329
Total -964 -1 059
Collective provision
The year’s net provision for individually assessed loans -64 84
The year’s net provision for homogeneous loans 1 6
Total -63 90
Off-balance sheet items
Losses on off-balance sheet items -9 -
Reversal of previous losses on off-balance sheet items 0 0
Change in collective provision for off-balance sheet items -10 5
Total -19 5
Write-offs
Actual loan losses for the year -1 359 -1 227
Utilised share of previous provisions 1 134 937
Recoveries 82 100
Total -143 -190
Net loan losses -1 189 -1 154
Impaired loans, etc.SEK m 2013 2012
Impaired loans 6 360 6 949
Specific provisions for individually assessed loans -3 350 -3 616
Provisions for collectively assessed homogeneous groups of loans with limited value - -
Collective provisions for individually assessed loans -338 -275
Net impaired loans 2 672 3 058
Total impaired loans reserve ratio, % 58.0 56.0
Proportion of impaired loans, % 0.24 0.28
Impaired loans reserve ratio excluding group provisions, % 52.7 52.0
Non-performing loans which are not impaired loans 1 266 1 425
Impaired loans reclassified as normal loans during the year 27 41
Loans are classified as impaired if it is probable that the contractual cash flows will not be fulfilled. The full amount of each receivable that gives rise to a specific provision is included in impaired loans even if this amount is partly covered by collateral. Received collateral is thus not taken into account when calculating the reserve ratio. Non-performing loans are loans where interest, repayments or overdrafts have been due for payment for more than 60 days. For other definitions, see page 216.
Reconciliation of provision for probable loan losses 2013
SEK m
Provision forindividually
assessed loans
Collective provision for
individuallyassessed loans
Provision forcollectively
assessedhomogeneous
loans
Total provisionfor probableloan losses
Provision at beginning of year -3 616 -275 - -3 891
The year's provision -1 241 -64 - -1 305
Reversal of previous provisions 277 - - 277
Utilised for actual loan losses 1 134 - 1 134
Foreign exchange effect, etc. 96 1 - 97
Provision at end of year -3 350 -338 - -3 688
Reconciliation of provision for probable loan losses 2012
SEK m
Provision forindividually
assessed loans
Collective provision for
individuallyassessed loans
Provision forcollectively
assessedhomogeneous
loans
Total provisionfor probableloan losses
Provision at beginning of year -3 589 -360 - -3 949
The year's provision -1 388 - - -1 388
Reversal of previous provisions 329 84 - 413
Utilised for actual loan losses 937 - 937
Foreign exchange effect, etc. 95 1 - 96
Provision at end of year -3 616 -275 - -3 891
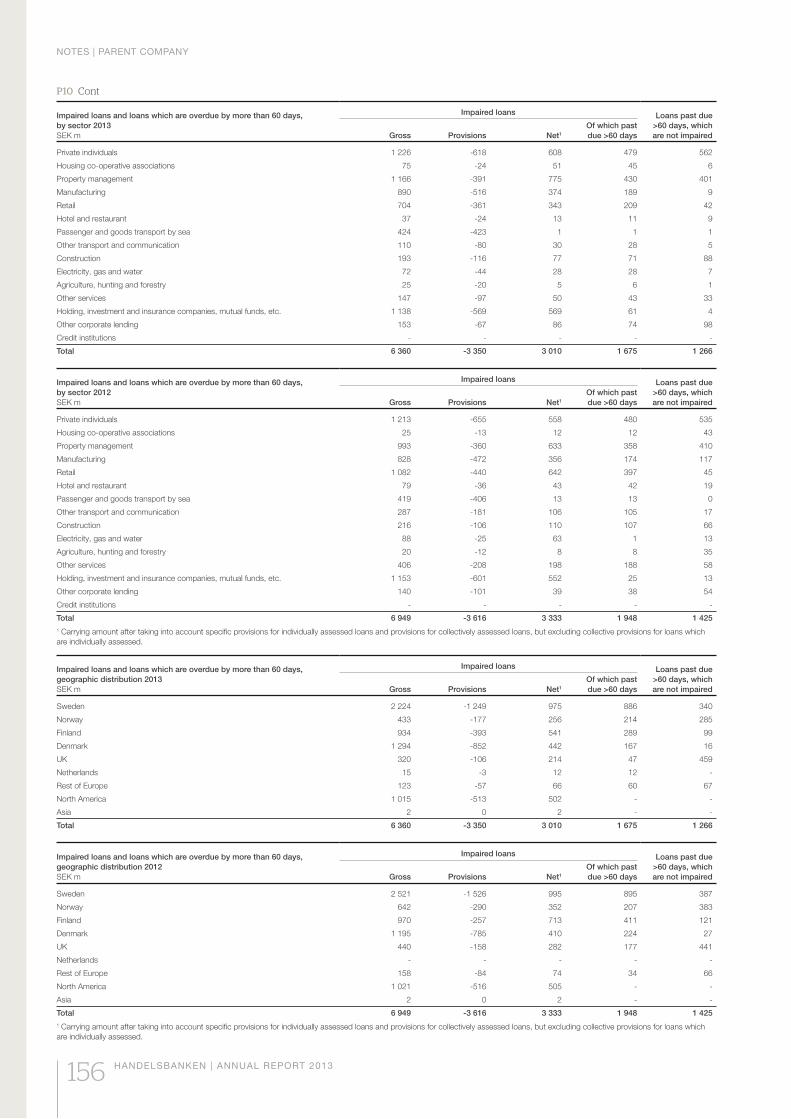
NOTES | PARENT COMPANY
156 HANDELSBANKEN | ANNUAL REPORT 2013
P10 Cont
Impaired loans and loans which are overdue by more than 60 days, by sector 2013SEK m
Impaired loans Loans past due >60 days, which are not impairedGross Provisions Net1
Of which past due >60 days
Private individuals 1 226 -618 608 479 562
Housing co-operative associations 75 -24 51 45 6
Property management 1 166 -391 775 430 401
Manufacturing 890 -516 374 189 9
Retail 704 -361 343 209 42
Hotel and restaurant 37 -24 13 11 9
Passenger and goods transport by sea 424 -423 1 1 1
Other transport and communication 110 -80 30 28 5
Construction 193 -116 77 71 88
Electricity, gas and water 72 -44 28 28 7
Agriculture, hunting and forestry 25 -20 5 6 1
Other services 147 -97 50 43 33
Holding, investment and insurance companies, mutual funds, etc. 1 138 -569 569 61 4
Other corporate lending 153 -67 86 74 98
Credit institutions - - - - -
Total 6 360 -3 350 3 010 1 675 1 266
Impaired loans and loans which are overdue by more than 60 days, by sector 2012SEK m
Impaired loans Loans past due >60 days, which are not impairedGross Provisions Net1
Of which past due >60 days
Private individuals 1 213 -655 558 480 535
Housing co-operative associations 25 -13 12 12 43
Property management 993 -360 633 358 410
Manufacturing 828 -472 356 174 117
Retail 1 082 -440 642 397 45
Hotel and restaurant 79 -36 43 42 19
Passenger and goods transport by sea 419 -406 13 13 0
Other transport and communication 287 -181 106 105 17
Construction 216 -106 110 107 66
Electricity, gas and water 88 -25 63 1 13
Agriculture, hunting and forestry 20 -12 8 8 35
Other services 406 -208 198 188 58
Holding, investment and insurance companies, mutual funds, etc. 1 153 -601 552 25 13
Other corporate lending 140 -101 39 38 54
Credit institutions - - - - -
Total 6 949 -3 616 3 333 1 948 1 4251 Carrying amount after taking into account specific provisions for individually assessed loans and provisions for collectively assessed loans, but excluding collective provisions for loans which are individually assessed.
Impaired loans and loans which are overdue by more than 60 days, geographic distribution 2013SEK m
Impaired loans Loans past due >60 days, which are not impairedGross Provisions Net1
Of which past due >60 days
Sweden 2 224 -1 249 975 886 340
Norway 433 -177 256 214 285
Finland 934 -393 541 289 99
Denmark 1 294 -852 442 167 16
UK 320 -106 214 47 459
Netherlands 15 -3 12 12 -
Rest of Europe 123 -57 66 60 67
North America 1 015 -513 502 - -
Asia 2 0 2 - -
Total 6 360 -3 350 3 010 1 675 1 266
Impaired loans and loans which are overdue by more than 60 days, geographic distribution 2012SEK m
Impaired loans Loans past due >60 days, which are not impairedGross Provisions Net1
Of which past due >60 days
Sweden 2 521 -1 526 995 895 387
Norway 642 -290 352 207 383
Finland 970 -257 713 411 121
Denmark 1 195 -785 410 224 27
UK 440 -158 282 177 441
Netherlands - - - - -
Rest of Europe 158 -84 74 34 66
North America 1 021 -516 505 - -
Asia 2 0 2 - -
Total 6 949 -3 616 3 333 1 948 1 4251 Carrying amount after taking into account specific provisions for individually assessed loans and provisions for collectively assessed loans, but excluding collective provisions for loans which are individually assessed.
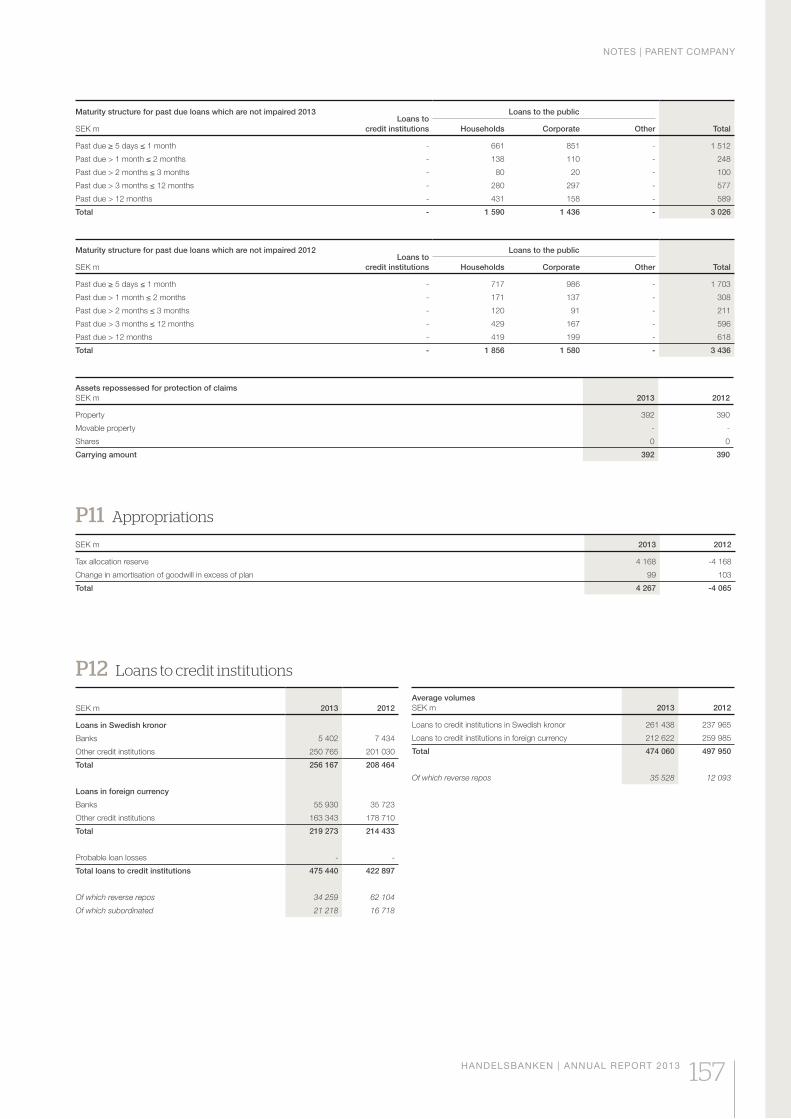
NOTES | PARENT COMPANY
HANDELSBANKEN | ANNUAL REPORT 2013 157
Maturity structure for past due loans which are not impaired 2013Loans to
credit institutions
Loans to the public
TotalSEK m Households Corporate Other
Past due ≥ 5 days ≤ 1 month - 661 851 - 1 512
Past due > 1 month ≤ 2 months - 138 110 - 248
Past due > 2 months ≤ 3 months - 80 20 - 100
Past due > 3 months ≤ 12 months - 280 297 - 577
Past due > 12 months - 431 158 - 589
Total - 1 590 1 436 - 3 026
Maturity structure for past due loans which are not impaired 2012Loans to
credit institutions
Loans to the public
TotalSEK m Households Corporate Other
Past due ≥ 5 days ≤ 1 month - 717 986 - 1 703
Past due > 1 month ≤ 2 months - 171 137 - 308
Past due > 2 months ≤ 3 months - 120 91 - 211
Past due > 3 months ≤ 12 months - 429 167 - 596
Past due > 12 months - 419 199 - 618
Total - 1 856 1 580 - 3 436
Assets repossessed for protection of claimsSEK m 2013 2012
Property 392 390
Movable property - -
Shares 0 0
Carrying amount 392 390
P11 Appropriations
SEK m 2013 2012
Tax allocation reserve 4 168 -4 168
Change in amortisation of goodwill in excess of plan 99 103
Total 4 267 -4 065
P12 Loans to credit institutions
SEK m 2013 2012
Loans in Swedish kronor
Banks 5 402 7 434
Other credit institutions 250 765 201 030
Total 256 167 208 464
Loans in foreign currency
Banks 55 930 35 723
Other credit institutions 163 343 178 710
Total 219 273 214 433
Probable loan losses - -
Total loans to credit institutions 475 440 422 897
Of which reverse repos 34 259 62 104
Of which subordinated 21 218 16 718
Average volumesSEK m 2013 2012
Loans to credit institutions in Swedish kronor 261 438 237 965
Loans to credit institutions in foreign currency 212 622 259 985
Total 474 060 497 950
Of which reverse repos 35 528 12 093
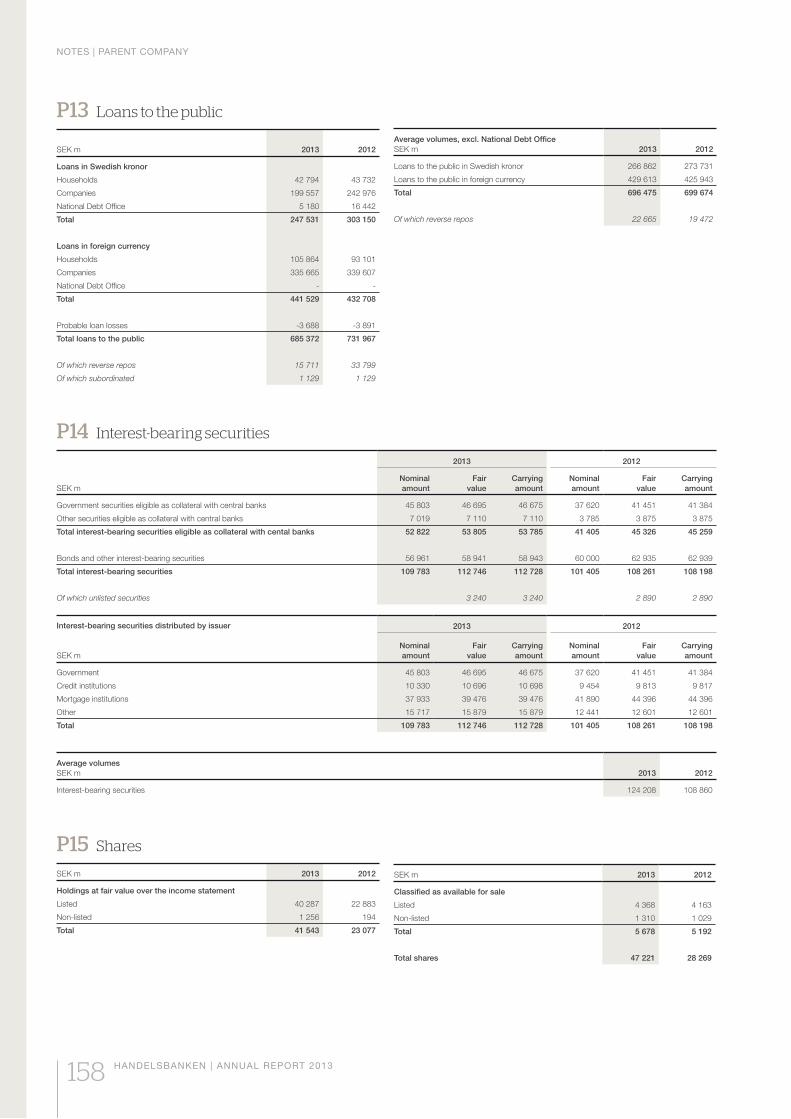
NOTES | PARENT COMPANY
158 HANDELSBANKEN | ANNUAL REPORT 2013
P13 Loans to the public
SEK m 2013 2012
Loans in Swedish kronor
Households 42 794 43 732
Companies 199 557 242 976
National Debt Office 5 180 16 442
Total 247 531 303 150
Loans in foreign currency
Households 105 864 93 101
Companies 335 665 339 607
National Debt Office - -
Total 441 529 432 708
Probable loan losses -3 688 -3 891
Total loans to the public 685 372 731 967
Of which reverse repos 15 711 33 799
Of which subordinated 1 129 1 129
P14 Interest-bearing securities
SEK m
2013 2012
Nominalamount
Fairvalue
Carryingamount
Nominalamount
Fairvalue
Carryingamount
Government securities eligible as collateral with central banks 45 803 46 695 46 675 37 620 41 451 41 384
Other securities eligible as collateral with central banks 7 019 7 110 7 110 3 785 3 875 3 875
Total interest-bearing securities eligible as collateral with cental banks 52 822 53 805 53 785 41 405 45 326 45 259
Bonds and other interest-bearing securities 56 961 58 941 58 943 60 000 62 935 62 939
Total interest-bearing securities 109 783 112 746 112 728 101 405 108 261 108 198
Of which unlisted securities 3 240 3 240 2 890 2 890
Interest-bearing securities distributed by issuer
SEK m
2013 2012
Nominalamount
Fairvalue
Carryingamount
Nominalamount
Fairvalue
Carryingamount
Government 45 803 46 695 46 675 37 620 41 451 41 384
Credit institutions 10 330 10 696 10 698 9 454 9 813 9 817
Mortgage institutions 37 933 39 476 39 476 41 890 44 396 44 396
Other 15 717 15 879 15 879 12 441 12 601 12 601
Total 109 783 112 746 112 728 101 405 108 261 108 198
Average volumesSEK m 2013 2012
Interest-bearing securities 124 208 108 860
P15 Shares
SEK m 2013 2012
Holdings at fair value over the income statement
Listed 40 287 22 883
Non-listed 1 256 194
Total 41 543 23 077
SEK m 2013 2012
Classified as available for sale
Listed 4 368 4 163
Non-listed 1 310 1 029
Total 5 678 5 192
Total shares 47 221 28 269
Average volumes, excl. National Debt OfficeSEK m 2013 2012
Loans to the public in Swedish kronor 266 862 273 731
Loans to the public in foreign currency 429 613 425 943
Total 696 475 699 674
Of which reverse repos 22 665 19 472
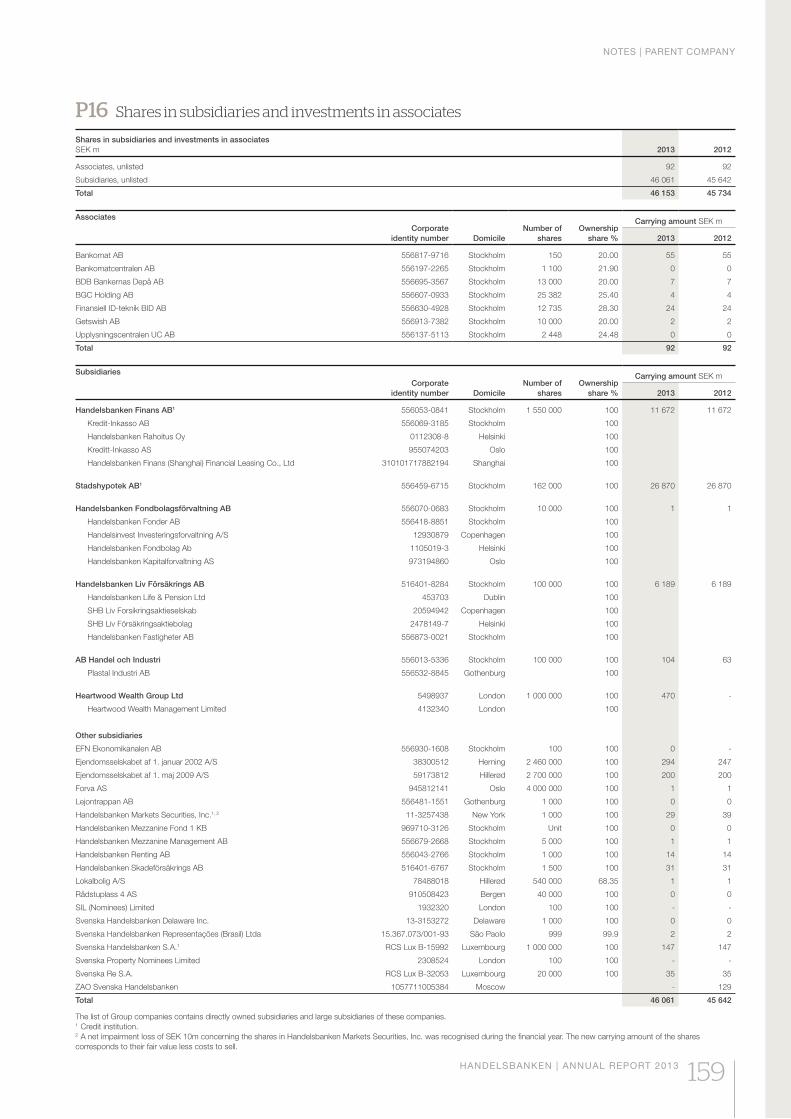
NOTES | PARENT COMPANY
HANDELSBANKEN | ANNUAL REPORT 2013 159
P16 Shares in subsidiaries and investments in associates
Shares in subsidiaries and investments in associatesSEK m 2013 2012
Associates, unlisted 92 92
Subsidiaries, unlisted 46 061 45 642
Total 46 153 45 734
AssociatesCorporate
identity number DomicileNumber of
sharesOwnership
share %
Carrying amount SEK m
2013 2012
Bankomat AB 556817-9716 Stockholm 150 20.00 55 55
Bankomatcentralen AB 556197-2265 Stockholm 1 100 21.90 0 0
BDB Bankernas Depå AB 556695-3567 Stockholm 13 000 20.00 7 7
BGC Holding AB 556607-0933 Stockholm 25 382 25.40 4 4
Finansiell ID-teknik BID AB 556630-4928 Stockholm 12 735 28.30 24 24
Getswish AB 556913-7382 Stockholm 10 000 20.00 2 2
Upplysningscentralen UC AB 556137-5113 Stockholm 2 448 24.48 0 0
Total 92 92
SubsidiariesCorporate
identity number DomicileNumber of
sharesOwnership
share %
Carrying amount SEK m
2013 2012
Handelsbanken Finans AB1 556053-0841 Stockholm 1 550 000 100 11 672 11 672
Kredit-Inkasso AB 556069-3185 Stockholm 100
Handelsbanken Rahoitus Oy 0112308-8 Helsinki 100
Kreditt-Inkasso AS 955074203 Oslo 100
Handelsbanken Finans (Shanghai) Financial Leasing Co., Ltd 310101717882194 Shanghai 100
Stadshypotek AB1 556459-6715 Stockholm 162 000 100 26 870 26 870
Handelsbanken Fondbolagsförvaltning AB 556070-0683 Stockholm 10 000 100 1 1
Handelsbanken Fonder AB 556418-8851 Stockholm 100
Handelsinvest Investeringsforvaltning A/S 12930879 Copenhagen 100
Handelsbanken Fondbolag Ab 1105019-3 Helsinki 100
Handelsbanken Kapitalforvaltning AS 973194860 Oslo 100
Handelsbanken Liv Försäkrings AB 516401-8284 Stockholm 100 000 100 6 189 6 189
Handelsbanken Life & Pension Ltd 453703 Dublin 100
SHB Liv Forsikringsaktieselskab 20594942 Copenhagen 100
SHB Liv Försäkringsaktiebolag 2478149-7 Helsinki 100
Handelsbanken Fastigheter AB 556873-0021 Stockholm 100
AB Handel och Industri 556013-5336 Stockholm 100 000 100 104 63
Plastal Industri AB 556532-8845 Gothenburg 100
Heartwood Wealth Group Ltd 5498937 London 1 000 000 100 470 -
Heartwood Wealth Management Limited 4132340 London 100
Other subsidiaries
EFN Ekonomikanalen AB 556930-1608 Stockholm 100 100 0 -
Ejendomsselskabet af 1. januar 2002 A/S 38300512 Herning 2 460 000 100 294 247
Ejendomsselskabet af 1. maj 2009 A/S 59173812 Hillerød 2 700 000 100 200 200
Forva AS 945812141 Oslo 4 000 000 100 1 1
Lejontrappan AB 556481-1551 Gothenburg 1 000 100 0 0
Handelsbanken Markets Securities, Inc.1, 2 11-3257438 New York 1 000 100 29 39
Handelsbanken Mezzanine Fond 1 KB 969710-3126 Stockholm Unit 100 0 0
Handelsbanken Mezzanine Management AB 556679-2668 Stockholm 5 000 100 1 1
Handelsbanken Renting AB 556043-2766 Stockholm 1 000 100 14 14
Handelsbanken Skadeförsäkrings AB 516401-6767 Stockholm 1 500 100 31 31
Lokalbolig A/S 78488018 Hillerød 540 000 68.35 1 1
Rådstuplass 4 AS 910508423 Bergen 40 000 100 0 0
SIL (Nominees) Limited 1932320 London 100 100 - -
Svenska Handelsbanken Delaware Inc. 13-3153272 Delaware 1 000 100 0 0
Svenska Handelsbanken Representações (Brasil) Ltda 15.367.073/001-93 São Paolo 999 99.9 2 2
Svenska Handelsbanken S.A.1 RCS Lux B-15992 Luxembourg 1 000 000 100 147 147
Svenska Property Nominees Limited 2308524 London 100 100 - -
Svenska Re S.A. RCS Lux B-32053 Luxembourg 20 000 100 35 35
ZAO Svenska Handelsbanken 1057711005384 Moscow - 129
Total 46 061 45 642
The list of Group companies contains directly owned subsidiaries and large subsidiaries of these companies.1 Credit institution.2 A net impairment loss of SEK 10m concerning the shares in Handelsbanken Markets Securities, Inc. was recognised during the financial year. The new carrying amount of the shares corresponds to their fair value less costs to sell.
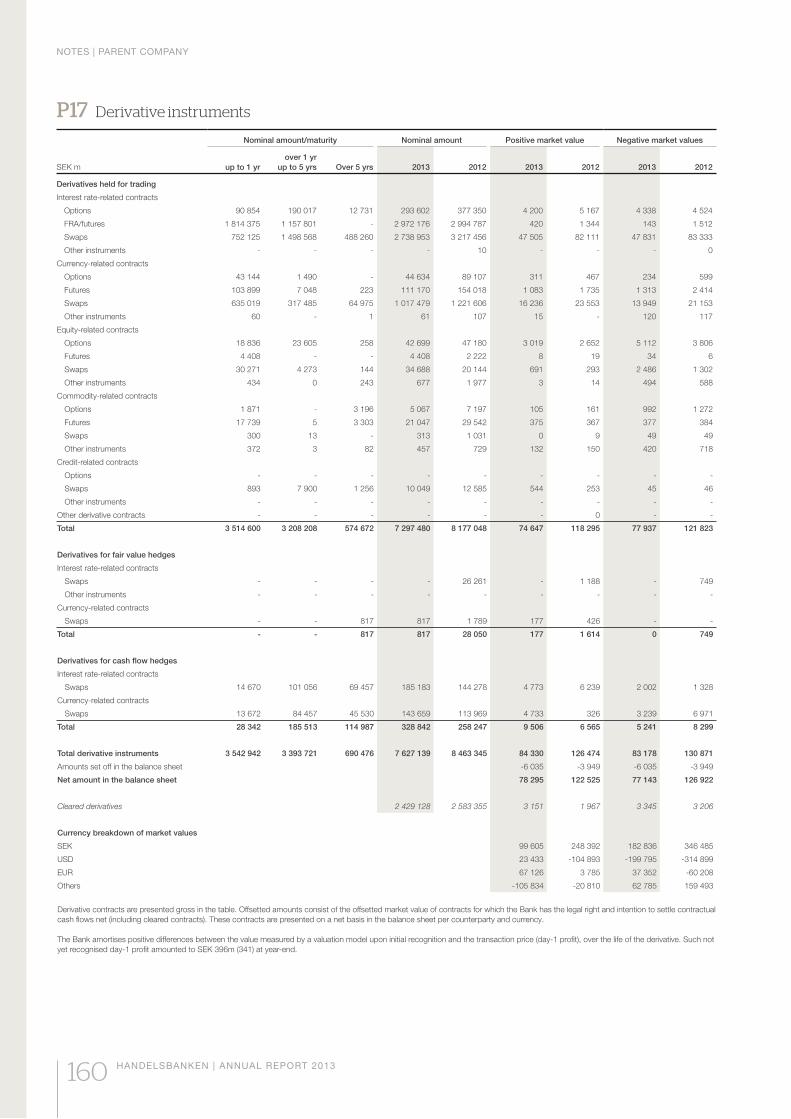
NOTES | PARENT COMPANY
160 HANDELSBANKEN | ANNUAL REPORT 2013
P17 Derivative instruments
SEK m
Nominal amount/maturity Nominal amount Positive market value Negative market values
up to 1 yrover 1 yr
up to 5 yrs Over 5 yrs 2013 2012 2013 2012 2013 2012
Derivatives held for trading
Interest rate-related contracts
Options 90 854 190 017 12 731 293 602 377 350 4 200 5 167 4 338 4 524
FRA/futures 1 814 375 1 157 801 - 2 972 176 2 994 787 420 1 344 143 1 512
Swaps 752 125 1 498 568 488 260 2 738 953 3 217 456 47 505 82 111 47 831 83 333
Other instruments - - - - 10 - - - 0
Currency-related contracts
Options 43 144 1 490 - 44 634 89 107 311 467 234 599
Futures 103 899 7 048 223 111 170 154 018 1 083 1 735 1 313 2 414
Swaps 635 019 317 485 64 975 1 017 479 1 221 606 16 236 23 553 13 949 21 153
Other instruments 60 - 1 61 107 15 - 120 117
Equity-related contracts
Options 18 836 23 605 258 42 699 47 180 3 019 2 652 5 112 3 806
Futures 4 408 - - 4 408 2 222 8 19 34 6
Swaps 30 271 4 273 144 34 688 20 144 691 293 2 486 1 302
Other instruments 434 0 243 677 1 977 3 14 494 588
Commodity-related contracts
Options 1 871 - 3 196 5 067 7 197 105 161 992 1 272
Futures 17 739 5 3 303 21 047 29 542 375 367 377 384
Swaps 300 13 - 313 1 031 0 9 49 49
Other instruments 372 3 82 457 729 132 150 420 718
Credit-related contracts
Options - - - - - - - - -
Swaps 893 7 900 1 256 10 049 12 585 544 253 45 46
Other instruments - - - - - - - - -
Other derivative contracts - - - - - - 0 - -
Total 3 514 600 3 208 208 574 672 7 297 480 8 177 048 74 647 118 295 77 937 121 823
Derivatives for fair value hedges
Interest rate-related contracts
Swaps - - - - 26 261 - 1 188 - 749
Other instruments - - - - - - - - -
Currency-related contracts
Swaps - - 817 817 1 789 177 426 - -
Total - - 817 817 28 050 177 1 614 0 749
Derivatives for cash flow hedges
Interest rate-related contracts
Swaps 14 670 101 056 69 457 185 183 144 278 4 773 6 239 2 002 1 328
Currency-related contracts
Swaps 13 672 84 457 45 530 143 659 113 969 4 733 326 3 239 6 971
Total 28 342 185 513 114 987 328 842 258 247 9 506 6 565 5 241 8 299
Total derivative instruments 3 542 942 3 393 721 690 476 7 627 139 8 463 345 84 330 126 474 83 178 130 871
Amounts set off in the balance sheet -6 035 -3 949 -6 035 -3 949
Net amount in the balance sheet 78 295 122 525 77 143 126 922
Cleared derivatives 2 429 128 2 583 355 3 151 1 967 3 345 3 206
Currency breakdown of market values
SEK 99 605 248 392 182 836 346 485
USD 23 433 -104 893 -199 795 -314 899
EUR 67 126 3 785 37 352 -60 208
Others -105 834 -20 810 62 785 159 493
Derivative contracts are presented gross in the table. Offsetted amounts consist of the offsetted market value of contracts for which the Bank has the legal right and intention to settle contractual cash flows net (including cleared contracts). These contracts are presented on a net basis in the balance sheet per counterparty and currency.
The Bank amortises positive differences between the value measured by a valuation model upon initial recognition and the transaction price (day-1 profit), over the life of the derivative. Such not yet recognised day-1 profit amounted to SEK 396m (341) at year-end.
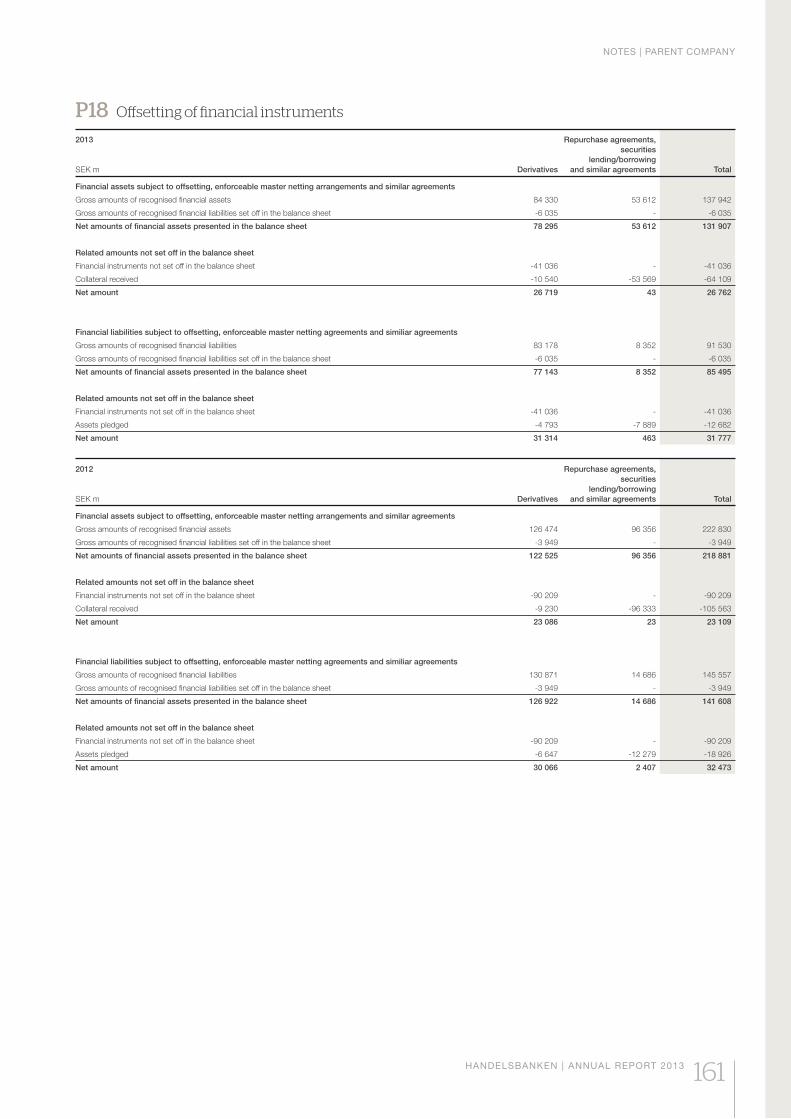
NOTES | PARENT COMPANY
HANDELSBANKEN | ANNUAL REPORT 2013 161
P18 Offsetting of financial instruments
2013
SEK m Derivatives
Repurchase agreements,securities
lending/borrowingand similar agreements Total
Financial assets subject to offsetting, enforceable master netting arrangements and similar agreements
Gross amounts of recognised financial assets 84 330 53 612 137 942
Gross amounts of recognised financial liabilities set off in the balance sheet -6 035 - -6 035
Net amounts of financial assets presented in the balance sheet 78 295 53 612 131 907
Related amounts not set off in the balance sheet
Financial instruments not set off in the balance sheet -41 036 - -41 036
Collateral received -10 540 -53 569 -64 109
Net amount 26 719 43 26 762
Financial liabilities subject to offsetting, enforceable master netting agreements and similiar agreements
Gross amounts of recognised financial liabilities 83 178 8 352 91 530
Gross amounts of recognised financial liabilities set off in the balance sheet -6 035 - -6 035
Net amounts of financial assets presented in the balance sheet 77 143 8 352 85 495
Related amounts not set off in the balance sheet
Financial instruments not set off in the balance sheet -41 036 - -41 036
Assets pledged -4 793 -7 889 -12 682
Net amount 31 314 463 31 777
2012
SEK m Derivatives
Repurchase agreements,securities
lending/borrowingand similar agreements Total
Financial assets subject to offsetting, enforceable master netting arrangements and similar agreements
Gross amounts of recognised financial assets 126 474 96 356 222 830
Gross amounts of recognised financial liabilities set off in the balance sheet -3 949 - -3 949
Net amounts of financial assets presented in the balance sheet 122 525 96 356 218 881
Related amounts not set off in the balance sheet
Financial instruments not set off in the balance sheet -90 209 - -90 209
Collateral received -9 230 -96 333 -105 563
Net amount 23 086 23 23 109
Financial liabilities subject to offsetting, enforceable master netting agreements and similiar agreements
Gross amounts of recognised financial liabilities 130 871 14 686 145 557
Gross amounts of recognised financial liabilities set off in the balance sheet -3 949 - -3 949
Net amounts of financial assets presented in the balance sheet 126 922 14 686 141 608
Related amounts not set off in the balance sheet
Financial instruments not set off in the balance sheet -90 209 - -90 209
Assets pledged -6 647 -12 279 -18 926
Net amount 30 066 2 407 32 473
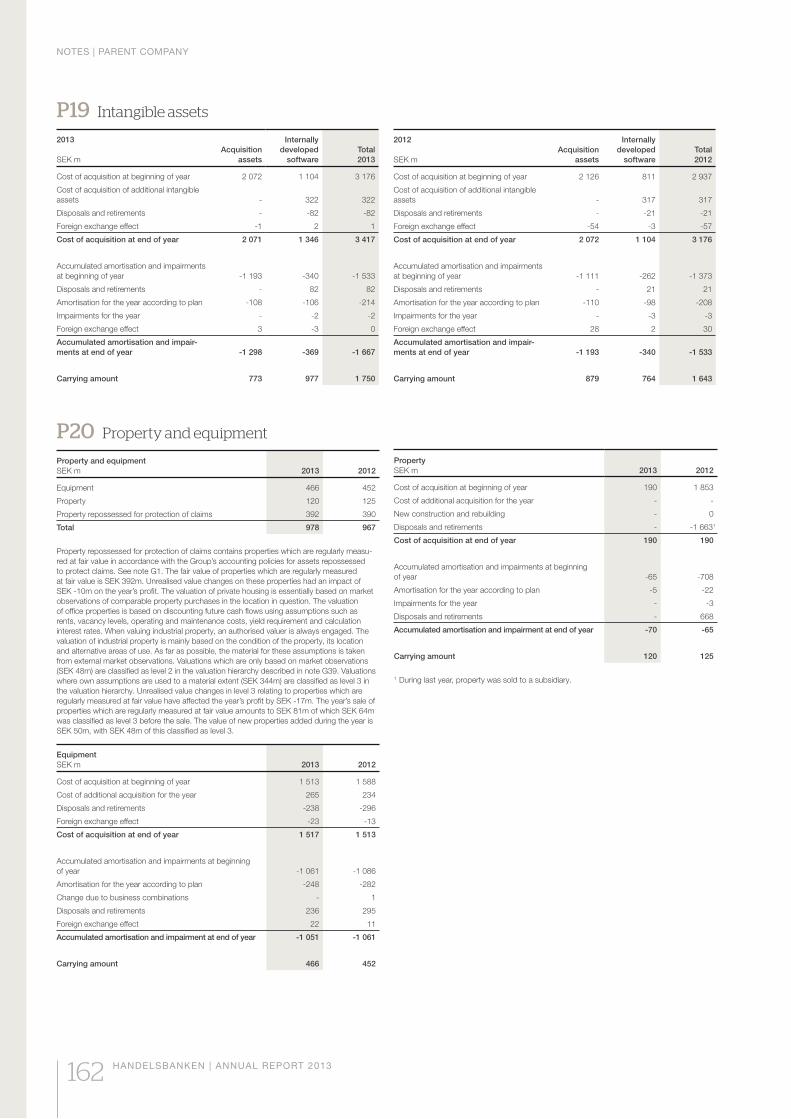
NOTES | PARENT COMPANY
162 HANDELSBANKEN | ANNUAL REPORT 2013
P19 Intangible assets
2013
SEK mAcquisition
assets
Internally developed
softwareTotal 2013
Cost of acquisition at beginning of year 2 072 1 104 3 176
Cost of acquisition of additional intangible assets - 322 322
Disposals and retirements - -82 -82
Foreign exchange effect -1 2 1
Cost of acquisition at end of year 2 071 1 346 3 417
Accumulated amortisation and impairments at beginning of year -1 193 -340 -1 533
Disposals and retirements - 82 82
Amortisation for the year according to plan -108 -106 -214
Impairments for the year - -2 -2
Foreign exchange effect 3 -3 0
Accumulated amortisation and impair-ments at end of year -1 298 -369 -1 667
Carrying amount 773 977 1 750
P20 Property and equipment
Property and equipment SEK m 2013 2012
Equipment 466 452
Property 120 125
Property repossessed for protection of claims 392 390
Total 978 967
Property repossessed for protection of claims contains properties which are regularly measu-red at fair value in accordance with the Group’s accounting policies for assets repossessed to protect claims. See note G1. The fair value of properties which are regularly measured at fair value is SEK 392m. Unrealised value changes on these properties had an impact of SEK -10m on the year’s profit. The valuation of private housing is essentially based on market observations of comparable property purchases in the location in question. The valuation of office properties is based on discounting future cash flows using assumptions such as rents, vacancy levels, operating and maintenance costs, yield requirement and calculation interest rates. When valuing industrial property, an authorised valuer is always engaged. The valuation of industrial property is mainly based on the condition of the property, its location and alternative areas of use. As far as possible, the material for these assumptions is taken from external market observations. Valuations which are only based on market observations (SEK 48m) are classified as level 2 in the valuation hierarchy described in note G39. Valuations where own assumptions are used to a material extent (SEK 344m) are classified as level 3 in the valuation hierarchy. Unrealised value changes in level 3 relating to properties which are regularly measured at fair value have affected the year’s profit by SEK -17m. The year’s sale of properties which are regularly measured at fair value amounts to SEK 81m of which SEK 64m was classified as level 3 before the sale. The value of new properties added during the year is SEK 50m, with SEK 48m of this classified as level 3.
Equipment SEK m 2013 2012
Cost of acquisition at beginning of year 1 513 1 588
Cost of additional acquisition for the year 265 234
Disposals and retirements -238 -296
Foreign exchange effect -23 -13
Cost of acquisition at end of year 1 517 1 513
Accumulated amortisation and impairments at beginning of year -1 061 -1 086
Amortisation for the year according to plan -248 -282
Change due to business combinations - 1
Disposals and retirements 236 295
Foreign exchange effect 22 11
Accumulated amortisation and impairment at end of year -1 051 -1 061
Carrying amount 466 452
2012
SEK mAcquisition
assets
Internally developed
softwareTotal 2012
Cost of acquisition at beginning of year 2 126 811 2 937
Cost of acquisition of additional intangible assets - 317 317
Disposals and retirements - -21 -21
Foreign exchange effect -54 -3 -57
Cost of acquisition at end of year 2 072 1 104 3 176
Accumulated amortisation and impairments at beginning of year -1 111 -262 -1 373
Disposals and retirements - 21 21
Amortisation for the year according to plan -110 -98 -208
Impairments for the year - -3 -3
Foreign exchange effect 28 2 30
Accumulated amortisation and impair-ments at end of year -1 193 -340 -1 533
Carrying amount 879 764 1 643
Property SEK m 2013 2012
Cost of acquisition at beginning of year 190 1 853
Cost of additional acquisition for the year - -
New construction and rebuilding - 0
Disposals and retirements - -1 6631
Cost of acquisition at end of year 190 190
Accumulated amortisation and impairments at beginning of year -65 -708
Amortisation for the year according to plan -5 -22
Impairments for the year - -3
Disposals and retirements - 668
Accumulated amortisation and impairment at end of year -70 -65
Carrying amount 120 125
1 During last year, property was sold to a subsidiary.
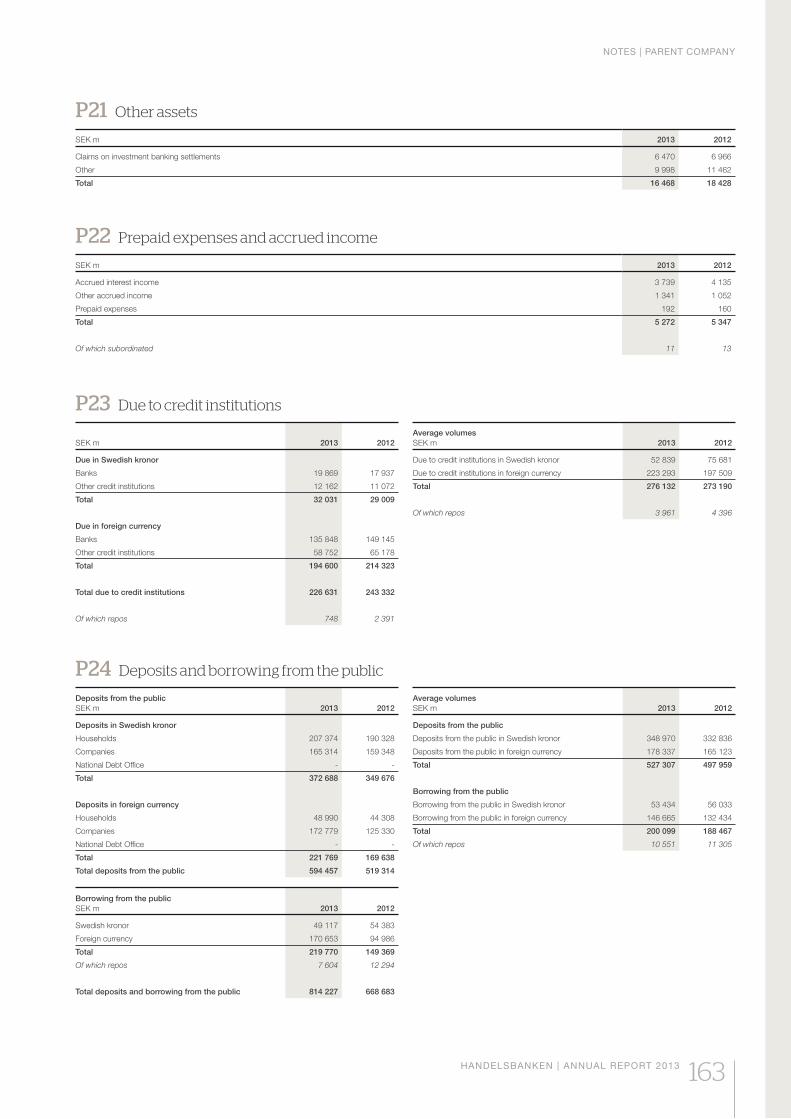
NOTES | PARENT COMPANY
HANDELSBANKEN | ANNUAL REPORT 2013 163
P21 Other assets
SEK m 2013 2012
Claims on investment banking settlements 6 470 6 966
Other 9 998 11 462
Total 16 468 18 428
P23 Due to credit institutions
SEK m 2013 2012
Due in Swedish kronor
Banks 19 869 17 937
Other credit institutions 12 162 11 072
Total 32 031 29 009
Due in foreign currency
Banks 135 848 149 145
Other credit institutions 58 752 65 178
Total 194 600 214 323
Total due to credit institutions 226 631 243 332
Of which repos 748 2 391
P24 Deposits and borrowing from the public
Deposits from the public SEK m 2013 2012
Deposits in Swedish kronor
Households 207 374 190 328
Companies 165 314 159 348
National Debt Office - -
Total 372 688 349 676
Deposits in foreign currency
Households 48 990 44 308
Companies 172 779 125 330
National Debt Office - -
Total 221 769 169 638
Total deposits from the public 594 457 519 314
Borrowing from the publicSEK m 2013 2012
Swedish kronor 49 117 54 383
Foreign currency 170 653 94 986
Total 219 770 149 369
Of which repos 7 604 12 294
Total deposits and borrowing from the public 814 227 668 683
P22 Prepaid expenses and accrued income
SEK m 2013 2012
Accrued interest income 3 739 4 135
Other accrued income 1 341 1 052
Prepaid expenses 192 160
Total 5 272 5 347
Of which subordinated 11 13
Average volumesSEK m 2013 2012
Due to credit institutions in Swedish kronor 52 839 75 681
Due to credit institutions in foreign currency 223 293 197 509
Total 276 132 273 190
Of which repos 3 961 4 396
Average volumesSEK m 2013 2012
Deposits from the public
Deposits from the public in Swedish kronor 348 970 332 836
Deposits from the public in foreign currency 178 337 165 123
Total 527 307 497 959
Borrowing from the public
Borrowing from the public in Swedish kronor 53 434 56 033
Borrowing from the public in foreign currency 146 665 132 434
Total 200 099 188 467
Of which repos 10 551 11 305
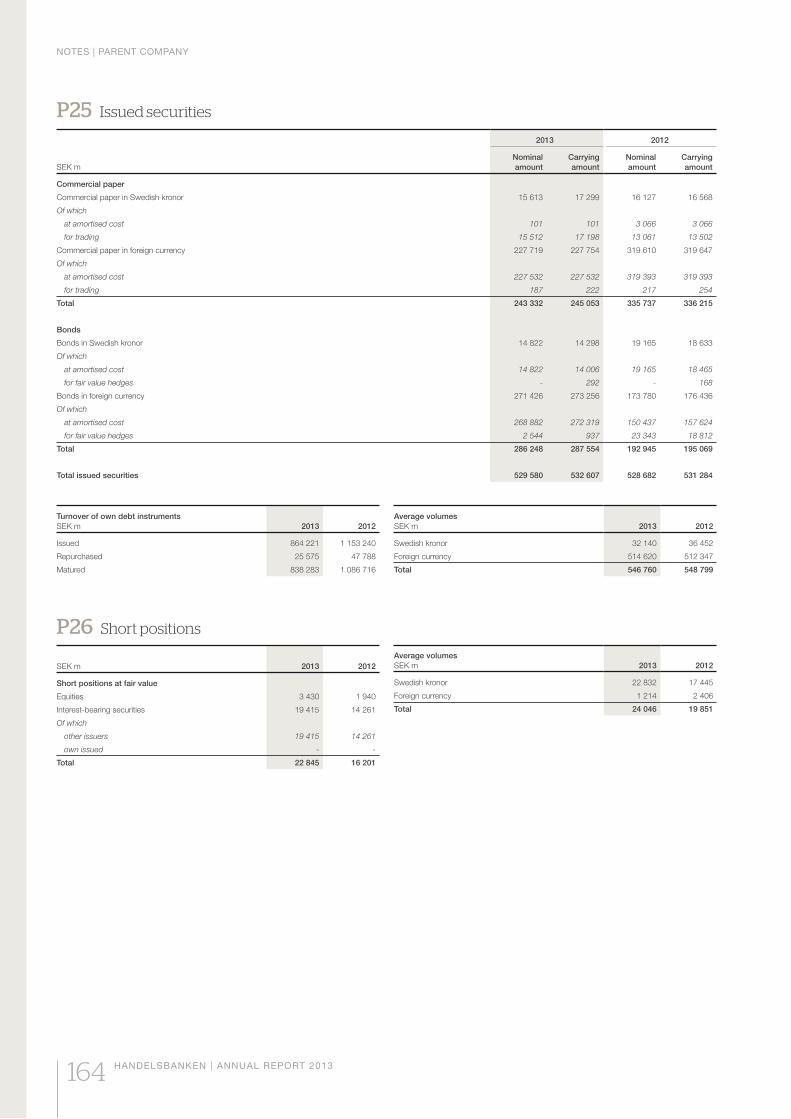
NOTES | PARENT COMPANY
164 HANDELSBANKEN | ANNUAL REPORT 2013
P25 Issued securities
2013 2012
SEK mNominal amount
Carrying amount
Nominal amount
Carrying amount
Commercial paper
Commercial paper in Swedish kronor 15 613 17 299 16 127 16 568
Of which
at amortised cost 101 101 3 066 3 066
for trading 15 512 17 198 13 061 13 502
Commercial paper in foreign currency 227 719 227 754 319 610 319 647
Of which
at amortised cost 227 532 227 532 319 393 319 393
for trading 187 222 217 254
Total 243 332 245 053 335 737 336 215
Bonds
Bonds in Swedish kronor 14 822 14 298 19 165 18 633
Of which
at amortised cost 14 822 14 006 19 165 18 465
for fair value hedges - 292 - 168
Bonds in foreign currency 271 426 273 256 173 780 176 436
Of which
at amortised cost 268 882 272 319 150 437 157 624
for fair value hedges 2 544 937 23 343 18 812
Total 286 248 287 554 192 945 195 069
Total issued securities 529 580 532 607 528 682 531 284
Turnover of own debt instrumentsSEK m 2013 2012
Issued 864 221 1 153 240
Repurchased 25 575 47 788
Matured 838 283 1 086 716
Average volumesSEK m 2013 2012
Swedish kronor 32 140 36 452
Foreign currency 514 620 512 347
Total 546 760 548 799
P26 Short positions
SEK m 2013 2012
Short positions at fair value
Equities 3 430 1 940
Interest-bearing securities 19 415 14 261
Of which
other issuers 19 415 14 261
own issued - -
Total 22 845 16 201
Average volumes SEK m 2013 2012
Swedish kronor 22 832 17 445
Foreign currency 1 214 2 406
Total 24 046 19 851
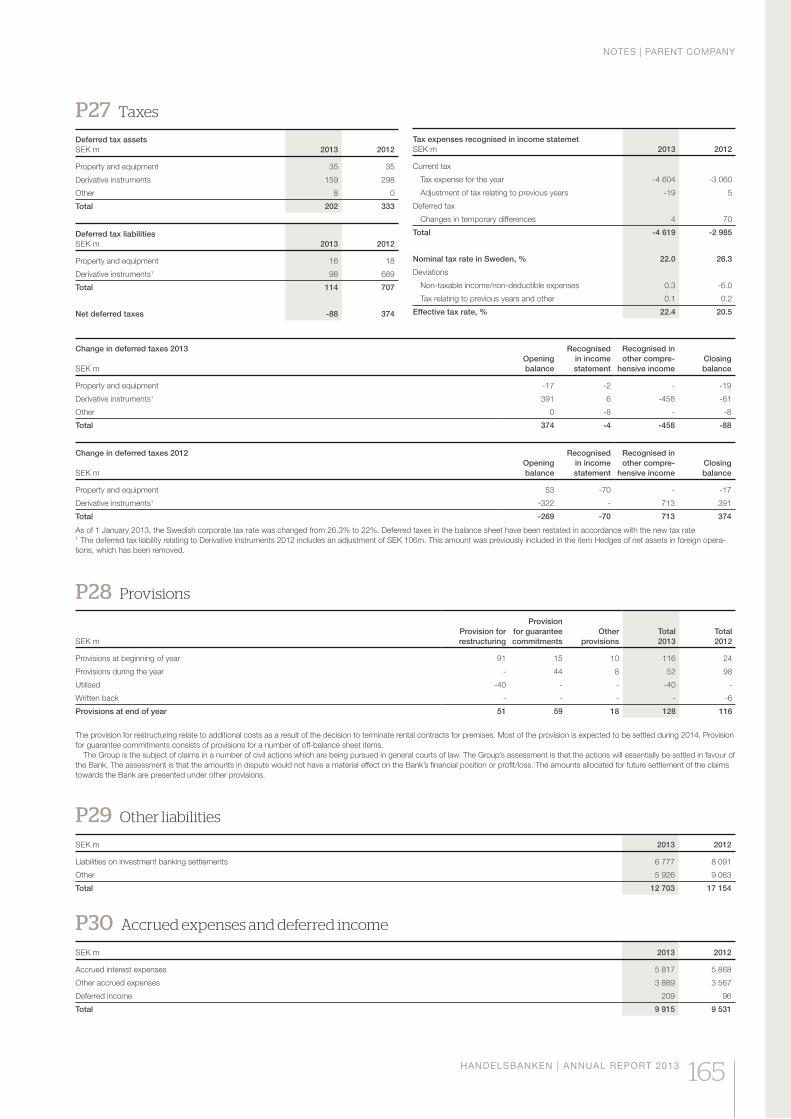
NOTES | PARENT COMPANY
HANDELSBANKEN | ANNUAL REPORT 2013 165
P27 Taxes
Deferred tax assets SEK m 2013 2012
Property and equipment 35 35
Derivative instruments 159 298
Other 8 0
Total 202 333
Deferred tax liabilities SEK m 2013 2012
Property and equipment 16 18
Derivative instruments1 98 689
Total 114 707
Net deferred taxes -88 374
Change in deferred taxes 2013
SEK mOpeningbalance
Recognisedin incomestatement
Recognised in other compre-
hensive incomeClosingbalance
Property and equipment -17 -2 - -19
Derivative instruments1 391 6 -458 -61
Other 0 -8 - -8
Total 374 -4 -458 -88
Change in deferred taxes 2012
SEK mOpeningbalance
Recognisedin incomestatement
Recognised in other compre-
hensive incomeClosingbalance
Property and equipment 53 -70 - -17
Derivative instruments1 -322 - 713 391
Total -269 -70 713 374
As of 1 January 2013, the Swedish corporate tax rate was changed from 26.3% to 22%. Deferred taxes in the balance sheet have been restated in accordance with the new tax rate1 The deferred tax liability relating to Derivative instruments 2012 includes an adjustment of SEK 106m. This amount was previously included in the item Hedges of net assets in foreign opera-tions, which has been removed.
Tax expenses recognised in income statemet SEK m 2013 2012
Current tax
Tax expense for the year -4 604 -3 060
Adjustment of tax relating to previous years -19 5
Deferred tax
Changes in temporary differences 4 70
Total -4 619 -2 985
Nominal tax rate in Sweden, % 22.0 26.3
Deviations
Non-taxable income/non-deductible expenses 0.3 -6.0
Tax relating to previous years and other 0.1 0.2
Effective tax rate, % 22.4 20.5
P28 Provisions
SEK mProvision forrestructuring
Provisionfor guaranteecommitments
Otherprovisions
Total 2013
Total 2012
Provisions at beginning of year 91 15 10 116 24
Provisions during the year - 44 8 52 98
Utilised -40 - - -40 -
Written back - - - - -6
Provisions at end of year 51 59 18 128 116
The provision for restructuring relate to additional costs as a result of the decision to terminate rental contracts for premises. Most of the provision is expected to be settled during 2014. Provision for guarantee commitments consists of provisions for a number of off-balance sheet items. The Group is the subject of claims in a number of civil actions which are being pursued in general courts of law. The Group’s assessment is that the actions will essentially be settled in favour of the Bank. The assessment is that the amounts in dispute would not have a material effect on the Bank’s financial position or profit/loss. The amounts allocated for future settlement of the claims towards the Bank are presented under other provisions.
P29 Other liabilities
SEK m 2013 2012
Liabilities on investment banking settlements 6 777 8 091
Other 5 926 9 063
Total 12 703 17 154
P30 Accrued expenses and deferred income
SEK m 2013 2012
Accrued interest expenses 5 817 5 868
Other accrued expenses 3 889 3 567
Deferred income 209 96
Total 9 915 9 531
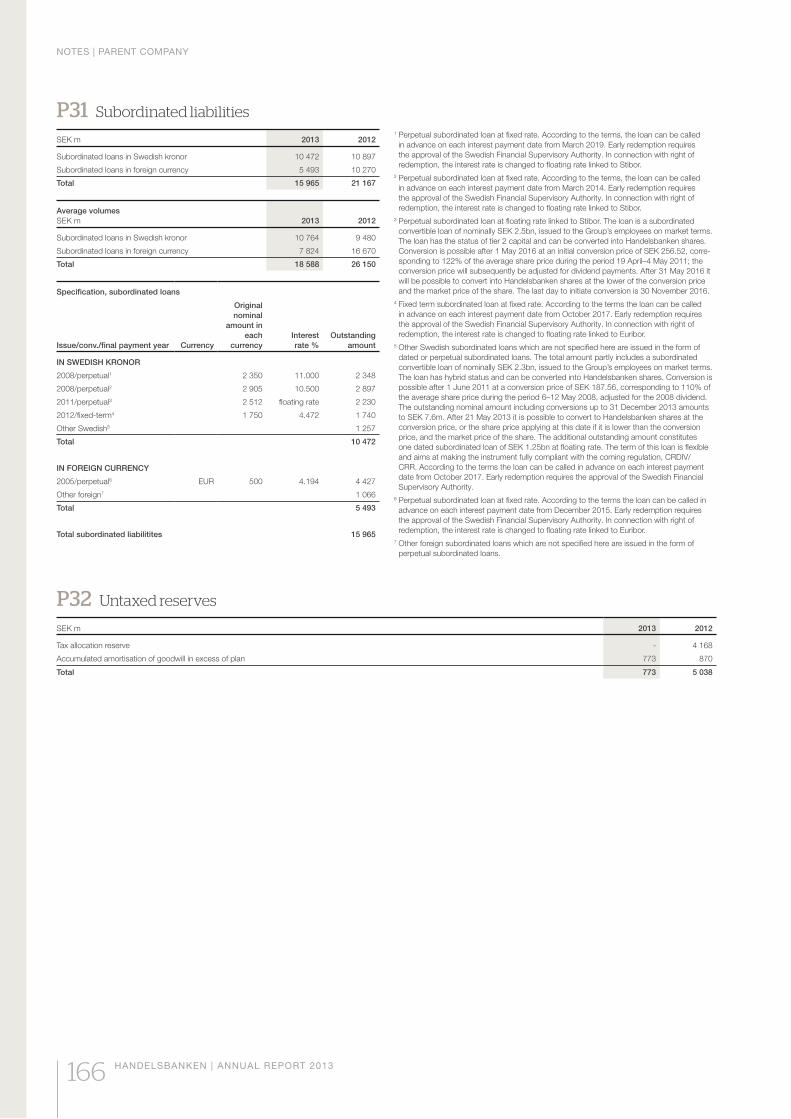
NOTES | PARENT COMPANY
166 HANDELSBANKEN | ANNUAL REPORT 2013
P31 Subordinated liabilities
SEK m 2013 2012
Subordinated loans in Swedish kronor 10 472 10 897
Subordinated loans in foreign currency 5 493 10 270
Total 15 965 21 167
Average volumesSEK m 2013 2012
Subordinated loans in Swedish kronor 10 764 9 480
Subordinated loans in foreign currency 7 824 16 670
Total 18 588 26 150
Specification, subordinated loans
Originalnominal
amount ineach
currencyInterestrate %
OutstandingamountIssue/conv./final payment year Currency
IN SWEDISH KRONOR
2008/perpetual1 2 350 11.000 2 348
2008/perpetual2 2 905 10.500 2 897
2011/perpetual3 2 512 floating rate 2 230
2012/fixed-term4 1 750 4.472 1 740
Other Swedish5 1 257
Total 10 472
IN FOREIGN CURRENCY
2005/perpetual6 EUR 500 4.194 4 427
Other foreign7 1 066
Total 5 493
Total subordinated liabilitites 15 965
1 Perpetual subordinated loan at fixed rate. According to the terms, the loan can be called in advance on each interest payment date from March 2019. Early redemption requires the approval of the Swedish Financial Supervisory Authority. In connection with right of redemption, the interest rate is changed to floating rate linked to Stibor.
2 Perpetual subordinated loan at fixed rate. According to the terms, the loan can be called in advance on each interest payment date from March 2014. Early redemption requires the approval of the Swedish Financial Supervisory Authority. In connection with right of redemption, the interest rate is changed to floating rate linked to Stibor.
3 Perpetual subordinated loan at floating rate linked to Stibor. The loan is a subordinated convertible loan of nominally SEK 2.5bn, issued to the Group’s employees on market terms. The loan has the status of tier 2 capital and can be converted into Handelsbanken shares. Conversion is possible after 1 May 2016 at an initial conversion price of SEK 256.52, corre-sponding to 122% of the average share price during the period 19 April–4 May 2011; the conversion price will subsequently be adjusted for dividend payments. After 31 May 2016 it will be possible to convert into Handelsbanken shares at the lower of the conversion price and the market price of the share. The last day to initiate conversion is 30 November 2016.
4 Fixed term subordinated loan at fixed rate. According to the terms the loan can be called in advance on each interest payment date from October 2017. Early redemption requires the approval of the Swedish Financial Supervisory Authority. In connection with right of redemption, the interest rate is changed to floating rate linked to Euribor.
5 Other Swedish subordinated loans which are not specified here are issued in the form of dated or perpetual subordinated loans. The total amount partly includes a subordinated convertible loan of nominally SEK 2.3bn, issued to the Group’s employees on market terms. The loan has hybrid status and can be converted into Handelsbanken shares. Conversion is possible after 1 June 2011 at a conversion price of SEK 187.56, corresponding to 110% of the average share price during the period 6–12 May 2008, adjusted for the 2008 dividend. The outstanding nominal amount including conversions up to 31 December 2013 amounts to SEK 7.6m. After 21 May 2013 it is possible to convert to Handelsbanken shares at the conversion price, or the share price applying at this date if it is lower than the conversion price, and the market price of the share. The additional outstanding amount constitutes one dated subordinated loan of SEK 1.25bn at floating rate. The term of this loan is flexible and aims at making the instrument fully compliant with the coming regulation, CRDIV/CRR. According to the terms the loan can be called in advance on each interest payment date from October 2017. Early redemption requires the approval of the Swedish Financial Supervisory Authority.
6 Perpetual subordinated loan at fixed rate. According to the terms the loan can be called in advance on each interest payment date from December 2015. Early redemption requires the approval of the Swedish Financial Supervisory Authority. In connection with right of redemption, the interest rate is changed to floating rate linked to Euribor.
7 Other foreign subordinated loans which are not specified here are issued in the form of perpetual subordinated loans.
P32 Untaxed reserves
SEK m 2013 2012
Tax allocation reserve - 4 168
Accumulated amortisation of goodwill in excess of plan 773 870
Total 773 5 038
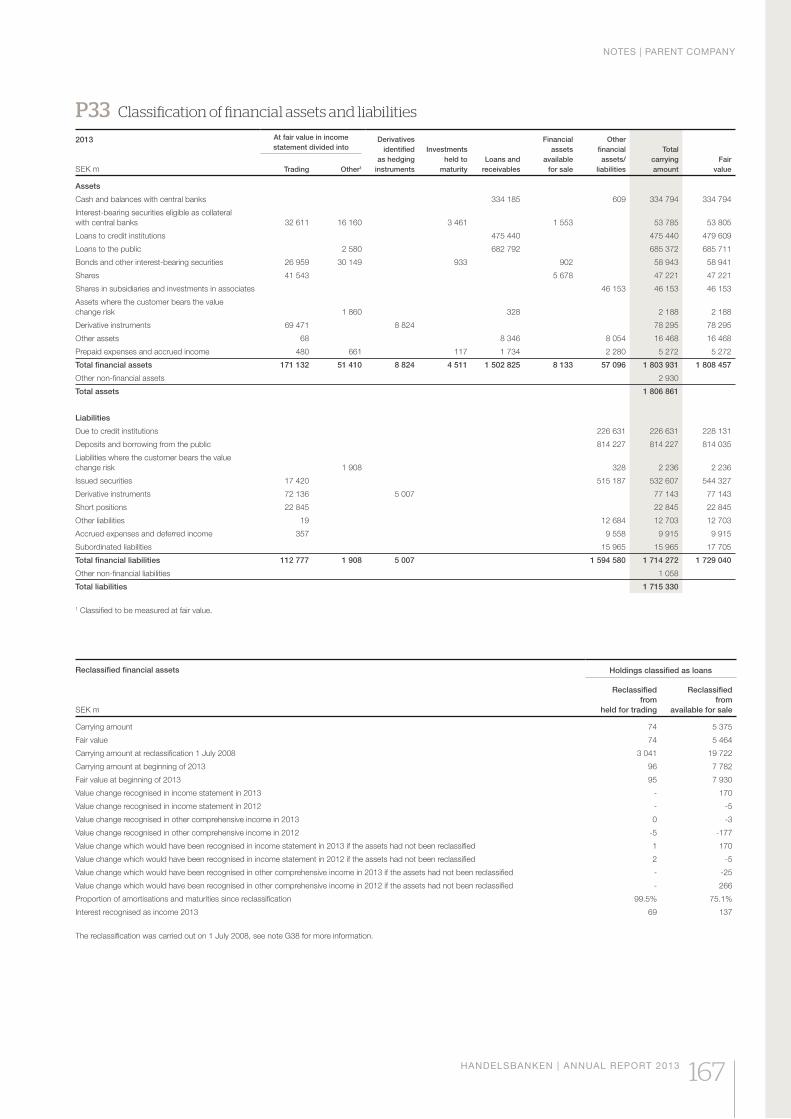
NOTES | PARENT COMPANY
HANDELSBANKEN | ANNUAL REPORT 2013 167
P33 Classification of financial assets and liabilities
2013 At fair value in income statement divided into
Derivativesidentified
as hedginginstruments
Investmentsheld to
maturityLoans and
receivables
Financial assets
available for sale
Otherfinancialassets/
liabilities
Totalcarryingamount
Fair valueSEK m Trading Other1
Assets
Cash and balances with central banks 334 185 609 334 794 334 794
Interest-bearing securities eligible as collateral with central banks 32 611 16 160 3 461 1 553 53 785 53 805
Loans to credit institutions 475 440 475 440 479 609
Loans to the public 2 580 682 792 685 372 685 711
Bonds and other interest-bearing securities 26 959 30 149 933 902 58 943 58 941
Shares 41 543 5 678 47 221 47 221
Shares in subsidiaries and investments in associates 46 153 46 153 46 153
Assets where the customer bears the value change risk 1 860 328 2 188 2 188
Derivative instruments 69 471 8 824 78 295 78 295
Other assets 68 8 346 8 054 16 468 16 468
Prepaid expenses and accrued income 480 661 117 1 734 2 280 5 272 5 272
Total financial assets 171 132 51 410 8 824 4 511 1 502 825 8 133 57 096 1 803 931 1 808 457
Other non-financial assets 2 930
Total assets 1 806 861
Liabilities
Due to credit institutions 226 631 226 631 228 131
Deposits and borrowing from the public 814 227 814 227 814 035
Liabilities where the customer bears the value change risk 1 908 328 2 236 2 236
Issued securities 17 420 515 187 532 607 544 327
Derivative instruments 72 136 5 007 77 143 77 143
Short positions 22 845 22 845 22 845
Other liabilities 19 12 684 12 703 12 703
Accrued expenses and deferred income 357 9 558 9 915 9 915
Subordinated liabilities 15 965 15 965 17 705
Total financial liabilities 112 777 1 908 5 007 1 594 580 1 714 272 1 729 040
Other non-financial liabilities 1 058
Total liabilities 1 715 330
1 Classified to be measured at fair value.
Reclassified financial assets
SEK m
Holdings classified as loans
Reclassifiedfrom
held for trading
Reclassifiedfrom
available for sale
Carrying amount 74 5 375
Fair value 74 5 464
Carrying amount at reclassification 1 July 2008 3 041 19 722
Carrying amount at beginning of 2013 96 7 782
Fair value at beginning of 2013 95 7 930
Value change recognised in income statement in 2013 - 170
Value change recognised in income statement in 2012 - -5
Value change recognised in other comprehensive income in 2013 0 -3
Value change recognised in other comprehensive income in 2012 -5 -177
Value change which would have been recognised in income statement in 2013 if the assets had not been reclassified 1 170
Value change which would have been recognised in income statement in 2012 if the assets had not been reclassified 2 -5
Value change which would have been recognised in other comprehensive income in 2013 if the assets had not been reclassified - -25
Value change which would have been recognised in other comprehensive income in 2012 if the assets had not been reclassified - 266
Proportion of amortisations and maturities since reclassification 99.5% 75.1%
Interest recognised as income 2013 69 137
The reclassification was carried out on 1 July 2008, see note G38 for more information.
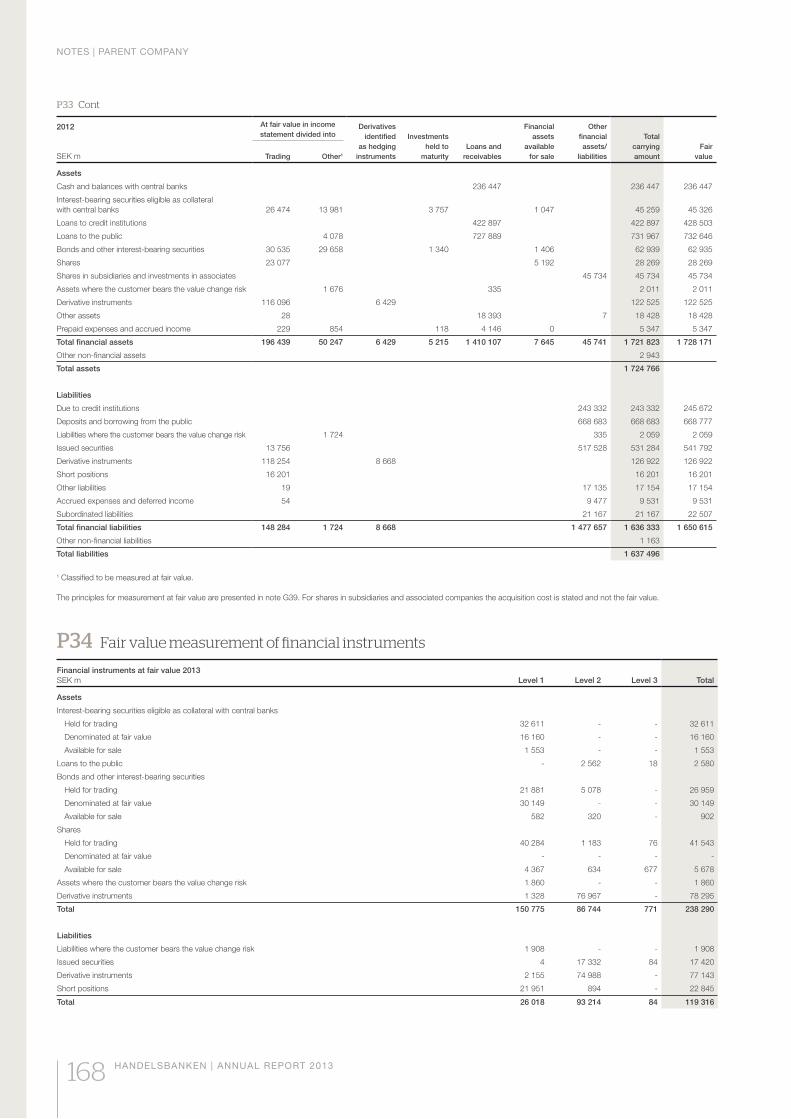
NOTES | PARENT COMPANY
168 HANDELSBANKEN | ANNUAL REPORT 2013
2012 At fair value in income statement divided into
Derivativesidentified
as hedginginstruments
Investmentsheld to
maturityLoans and
receivables
Financial assets
available for sale
Otherfinancialassets/
liabilities
Totalcarryingamount
Fair valueSEK m Trading Other1
Assets
Cash and balances with central banks 236 447 236 447 236 447
Interest-bearing securities eligible as collateral with central banks 26 474 13 981 3 757 1 047 45 259 45 326
Loans to credit institutions 422 897 422 897 428 503
Loans to the public 4 078 727 889 731 967 732 646
Bonds and other interest-bearing securities 30 535 29 658 1 340 1 406 62 939 62 935
Shares 23 077 5 192 28 269 28 269
Shares in subsidiaries and investments in associates 45 734 45 734 45 734
Assets where the customer bears the value change risk 1 676 335 2 011 2 011
Derivative instruments 116 096 6 429 122 525 122 525
Other assets 28 18 393 7 18 428 18 428
Prepaid expenses and accrued income 229 854 118 4 146 0 5 347 5 347
Total financial assets 196 439 50 247 6 429 5 215 1 410 107 7 645 45 741 1 721 823 1 728 171
Other non-financial assets 2 943
Total assets 1 724 766
Liabilities
Due to credit institutions 243 332 243 332 245 672
Deposits and borrowing from the public 668 683 668 683 668 777
Liabilities where the customer bears the value change risk 1 724 335 2 059 2 059
Issued securities 13 756 517 528 531 284 541 792
Derivative instruments 118 254 8 668 126 922 126 922
Short positions 16 201 16 201 16 201
Other liabilities 19 17 135 17 154 17 154
Accrued expenses and deferred income 54 9 477 9 531 9 531
Subordinated liabilities 21 167 21 167 22 507
Total financial liabilities 148 284 1 724 8 668 1 477 657 1 636 333 1 650 615
Other non-financial liabilities 1 163
Total liabilities 1 637 496
1 Classified to be measured at fair value.
The principles for measurement at fair value are presented in note G39. For shares in subsidiaries and associated companies the acquisition cost is stated and not the fair value.
P33 Cont
P34 Fair value measurement of financial instruments
Financial instruments at fair value 2013SEK m Level 1 Level 2 Level 3 Total
Assets
Interest-bearing securities eligible as collateral with central banks
Held for trading 32 611 - - 32 611
Denominated at fair value 16 160 - - 16 160
Available for sale 1 553 - - 1 553
Loans to the public - 2 562 18 2 580
Bonds and other interest-bearing securities
Held for trading 21 881 5 078 - 26 959
Denominated at fair value 30 149 - - 30 149
Available for sale 582 320 - 902
Shares
Held for trading 40 284 1 183 76 41 543
Denominated at fair value - - - -
Available for sale 4 367 634 677 5 678
Assets where the customer bears the value change risk 1 860 - - 1 860
Derivative instruments 1 328 76 967 - 78 295
Total 150 775 86 744 771 238 290
Liabilities
Liabilities where the customer bears the value change risk 1 908 - - 1 908
Issued securities 4 17 332 84 17 420
Derivative instruments 2 155 74 988 - 77 143
Short positions 21 951 894 - 22 845
Total 26 018 93 214 84 119 316
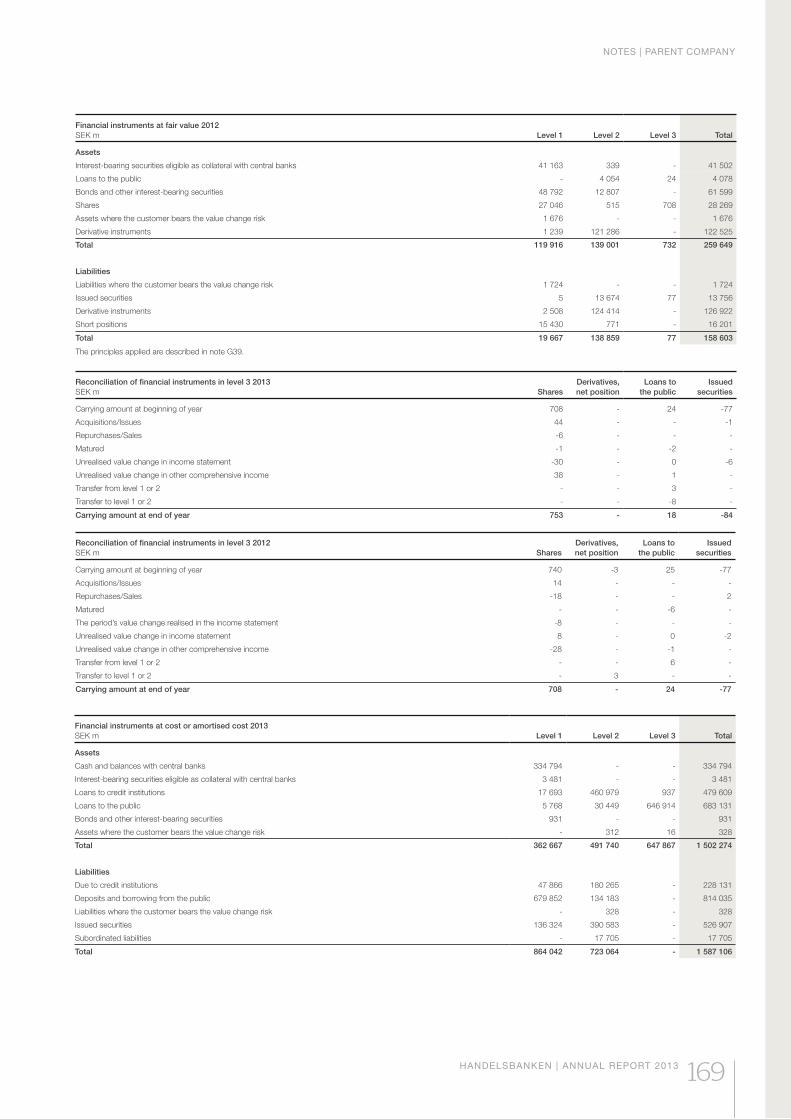
NOTES | PARENT COMPANY
HANDELSBANKEN | ANNUAL REPORT 2013 169
Financial instruments at fair value 2012SEK m Level 1 Level 2 Level 3 Total
Assets
Interest-bearing securities eligible as collateral with central banks 41 163 339 - 41 502
Loans to the public - 4 054 24 4 078
Bonds and other interest-bearing securities 48 792 12 807 - 61 599
Shares 27 046 515 708 28 269
Assets where the customer bears the value change risk 1 676 - - 1 676
Derivative instruments 1 239 121 286 - 122 525
Total 119 916 139 001 732 259 649
Liabilities
Liabilities where the customer bears the value change risk 1 724 - - 1 724
Issued securities 5 13 674 77 13 756
Derivative instruments 2 508 124 414 - 126 922
Short positions 15 430 771 - 16 201
Total 19 667 138 859 77 158 603
The principles applied are described in note G39.
Reconciliation of financial instruments in level 3 2013SEK m Shares
Derivatives,net position
Loans tothe public
Issued securities
Carrying amount at beginning of year 708 - 24 -77
Acquisitions/Issues 44 - - -1
Repurchases/Sales -6 - - -
Matured -1 - -2 -
Unrealised value change in income statement -30 - 0 -6
Unrealised value change in other comprehensive income 38 - 1 -
Transfer from level 1 or 2 - - 3 -
Transfer to level 1 or 2 - - -8 -
Carrying amount at end of year 753 - 18 -84
Reconciliation of financial instruments in level 3 2012SEK m Shares
Derivatives,net position
Loans tothe public
Issued securities
Carrying amount at beginning of year 740 -3 25 -77
Acquisitions/Issues 14 - - -
Repurchases/Sales -18 - - 2
Matured - - -6 -
The period’s value change realised in the income statement -8 - - -
Unrealised value change in income statement 8 - 0 -2
Unrealised value change in other comprehensive income -28 - -1 -
Transfer from level 1 or 2 - - 6 -
Transfer to level 1 or 2 - 3 - -
Carrying amount at end of year 708 - 24 -77
Financial instruments at cost or amortised cost 2013SEK m Level 1 Level 2 Level 3 Total
Assets
Cash and balances with central banks 334 794 - - 334 794
Interest-bearing securities eligible as collateral with central banks 3 481 - - 3 481
Loans to credit institutions 17 693 460 979 937 479 609
Loans to the public 5 768 30 449 646 914 683 131
Bonds and other interest-bearing securities 931 - - 931
Assets where the customer bears the value change risk - 312 16 328
Total 362 667 491 740 647 867 1 502 274
Liabilities
Due to credit institutions 47 866 180 265 - 228 131
Deposits and borrowing from the public 679 852 134 183 - 814 035
Liabilities where the customer bears the value change risk - 328 - 328
Issued securities 136 324 390 583 - 526 907
Subordinated liabilities - 17 705 - 17 705
Total 864 042 723 064 - 1 587 106
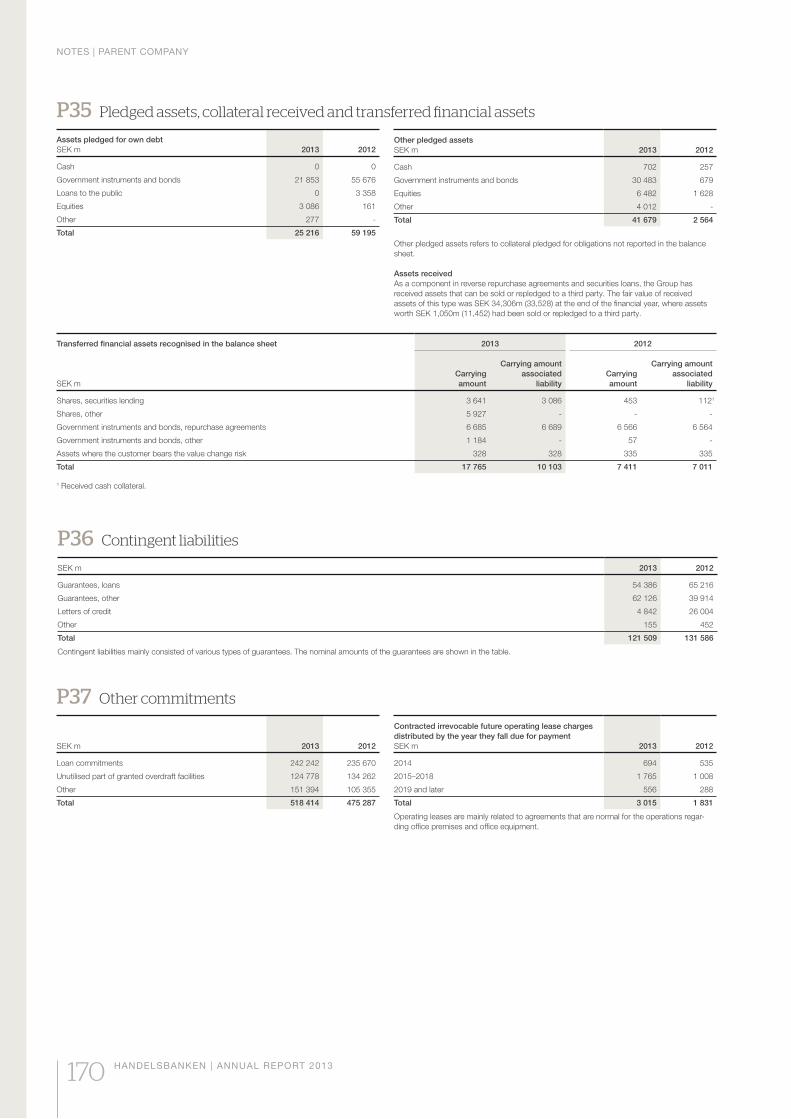
NOTES | PARENT COMPANY
170 HANDELSBANKEN | ANNUAL REPORT 2013
P35 Pledged assets, collateral received and transferred financial assets
Assets pledged for own debt SEK m 2013 2012
Cash 0 0
Government instruments and bonds 21 853 55 676
Loans to the public 0 3 358
Equities 3 086 161
Other 277 -
Total 25 216 59 195
P36 Contingent liabilities
SEK m 2013 2012
Guarantees, loans 54 386 65 216
Guarantees, other 62 126 39 914
Letters of credit 4 842 26 004
Other 155 452
Total 121 509 131 586
Contingent liabilities mainly consisted of various types of guarantees. The nominal amounts of the guarantees are shown in the table.
P37 Other commitments
SEK m 2013 2012
Loan commitments 242 242 235 670
Unutilised part of granted overdraft facilities 124 778 134 262
Other 151 394 105 355
Total 518 414 475 287
Contracted irrevocable future operating lease charges distributed by the year they fall due for paymentSEK m 2013 2012
2014 694 535
2015–2018 1 765 1 008
2019 and later 556 288
Total 3 015 1 831
Operating leases are mainly related to agreements that are normal for the operations regar-ding office premises and office equipment.
Other pledged assets SEK m 2013 2012
Cash 702 257
Government instruments and bonds 30 483 679
Equities 6 482 1 628
Other 4 012 -
Total 41 679 2 564
Other pledged assets refers to collateral pledged for obligations not reported in the balance sheet.
Assets receivedAs a component in reverse repurchase agreements and securities loans, the Group has received assets that can be sold or repledged to a third party. The fair value of received assets of this type was SEK 34,306m (33,528) at the end of the financial year, where assets worth SEK 1,050m (11,452) had been sold or repledged to a third party.
Transferred financial assets recognised in the balance sheet
SEK m
2013 2012
Carryingamount
Carrying amount associated
liabilityCarryingamount
Carrying amount associated
liability
Shares, securities lending 3 641 3 086 453 1121
Shares, other 5 927 - - -
Government instruments and bonds, repurchase agreements 6 685 6 689 6 566 6 564
Government instruments and bonds, other 1 184 - 57 -
Assets where the customer bears the value change risk 328 328 335 335
Total 17 765 10 103 7 411 7 011
1 Received cash collateral.
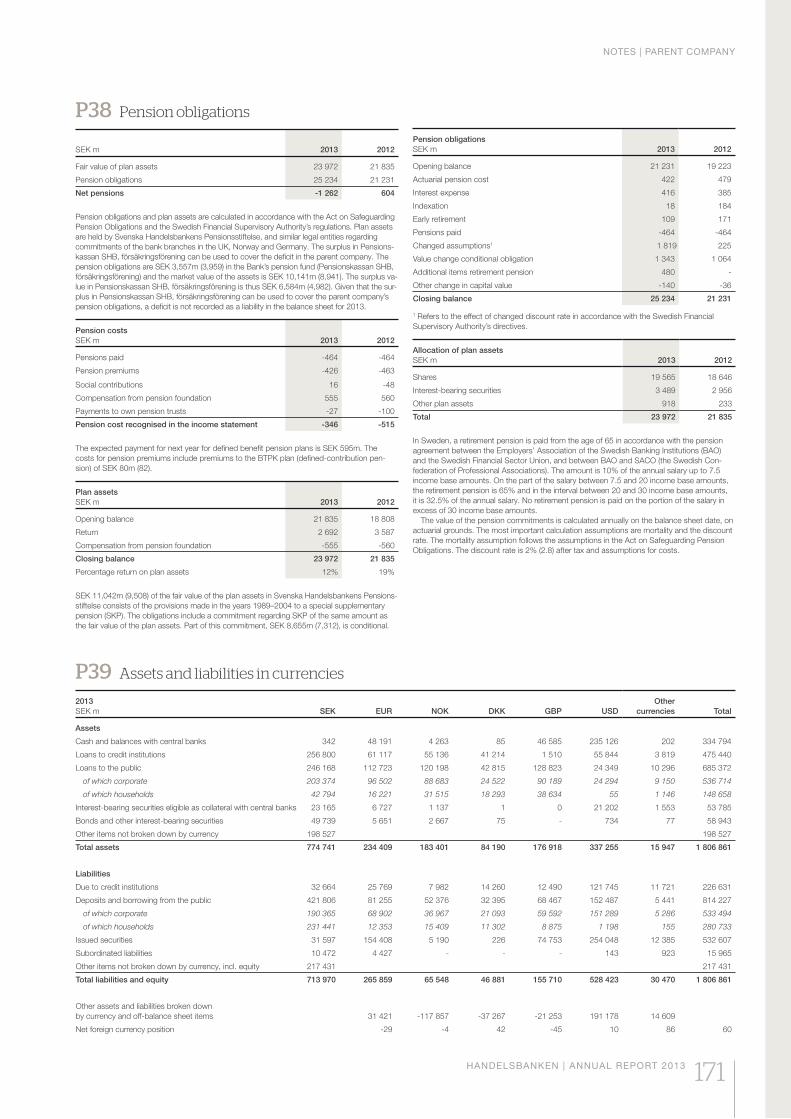
NOTES | PARENT COMPANY
HANDELSBANKEN | ANNUAL REPORT 2013 171
P38 Pension obligations
SEK m 2013 2012
Fair value of plan assets 23 972 21 835
Pension obligations 25 234 21 231
Net pensions -1 262 604
Pension obligations and plan assets are calculated in accordance with the Act on Safeguarding Pension Obligations and the Swedish Financial Supervisory Authority’s regulations. Plan assets are held by Svenska Handelsbankens Pensionsstiftelse, and similar legal entities regarding commitments of the bank branches in the UK, Norway and Germany. The surplus in Pensions-kassan SHB, försäkringsförening can be used to cover the deficit in the parent company. The pension obligations are SEK 3,557m (3,959) in the Bank’s pension fund (Pensionskassan SHB, försäkringsförening) and the market value of the assets is SEK 10,141m (8,941). The surplus va-lue in Pensionskassan SHB, försäkringsförening is thus SEK 6,584m (4,982). Given that the sur-plus in Pensionskassan SHB, försäkringsförening can be used to cover the parent company’s pension obligations, a deficit is not recorded as a liability in the balance sheet for 2013.
Pension costsSEK m 2013 2012
Pensions paid -464 -464
Pension premiums -426 -463
Social contributions 16 -48
Compensation from pension foundation 555 560
Payments to own pension trusts -27 -100
Pension cost recognised in the income statement -346 -515
The expected payment for next year for defined benefit pension plans is SEK 595m. The costs for pension premiums include premiums to the BTPK plan (defined-contribution pen-sion) of SEK 80m (82).
Plan assetsSEK m 2013 2012
Opening balance 21 835 18 808
Return 2 692 3 587
Compensation from pension foundation -555 -560
Closing balance 23 972 21 835
Percentage return on plan assets 12% 19%
SEK 11,042m (9,508) of the fair value of the plan assets in Svenska Handelsbankens Pensions-stiftelse consists of the provisions made in the years 1989–2004 to a special supplementary pension (SKP). The obligations include a commitment regarding SKP of the same amount as the fair value of the plan assets. Part of this commitment, SEK 8,655m (7,312), is conditional.
Pension obligations SEK m 2013 2012
Opening balance 21 231 19 223
Actuarial pension cost 422 479
Interest expense 416 385
Indexation 18 184
Early retirement 109 171
Pensions paid -464 -464
Changed assumptions1 1 819 225
Value change conditional obligation 1 343 1 064
Additional items retirement pension 480 -
Other change in capital value -140 -36
Closing balance 25 234 21 231
1 Refers to the effect of changed discount rate in accordance with the Swedish Financial Supervisory Authority’s directives.
Allocation of plan assetsSEK m 2013 2012
Shares 19 565 18 646
Interest-bearing securities 3 489 2 956
Other plan assets 918 233
Total 23 972 21 835
In Sweden, a retirement pension is paid from the age of 65 in accordance with the pension agreement between the Employers’ Association of the Swedish Banking Institutions (BAO) and the Swedish Financial Sector Union, and between BAO and SACO (the Swedish Con-federation of Professional Associations). The amount is 10% of the annual salary up to 7.5 income base amounts. On the part of the salary between 7.5 and 20 income base amounts, the retirement pension is 65% and in the interval between 20 and 30 income base amounts, it is 32.5% of the annual salary. No retirement pension is paid on the portion of the salary in excess of 30 income base amounts. The value of the pension commitments is calculated annually on the balance sheet date, on actuarial grounds. The most important calculation assumptions are mortality and the discount rate. The mortality assumption follows the assumptions in the Act on Safeguarding Pension Obligations. The discount rate is 2% (2.8) after tax and assumptions for costs.
P39 Assets and liabilities in currencies
2013SEK m SEK EUR NOK DKK GBP USD
Othercurrencies Total
Assets
Cash and balances with central banks 342 48 191 4 263 85 46 585 235 126 202 334 794
Loans to credit institutions 256 800 61 117 55 136 41 214 1 510 55 844 3 819 475 440
Loans to the public 246 168 112 723 120 198 42 815 128 823 24 349 10 296 685 372
of which corporate 203 374 96 502 88 683 24 522 90 189 24 294 9 150 536 714
of which households 42 794 16 221 31 515 18 293 38 634 55 1 146 148 658
Interest-bearing securities eligible as collateral with central banks 23 165 6 727 1 137 1 0 21 202 1 553 53 785
Bonds and other interest-bearing securities 49 739 5 651 2 667 75 - 734 77 58 943
Other items not broken down by currency 198 527 198 527
Total assets 774 741 234 409 183 401 84 190 176 918 337 255 15 947 1 806 861
Liabilities
Due to credit institutions 32 664 25 769 7 982 14 260 12 490 121 745 11 721 226 631
Deposits and borrowing from the public 421 806 81 255 52 376 32 395 68 467 152 487 5 441 814 227
of which corporate 190 365 68 902 36 967 21 093 59 592 151 289 5 286 533 494
of which households 231 441 12 353 15 409 11 302 8 875 1 198 155 280 733
Issued securities 31 597 154 408 5 190 226 74 753 254 048 12 385 532 607
Subordinated liabilities 10 472 4 427 - - - 143 923 15 965
Other items not broken down by currency, incl. equity 217 431 217 431
Total liabilities and equity 713 970 265 859 65 548 46 881 155 710 528 423 30 470 1 806 861
Other assets and liabilities broken down by currency and off-balance sheet items 31 421 -117 857 -37 267 -21 253 191 178 14 609
Net foreign currency position -29 -4 42 -45 10 86 60
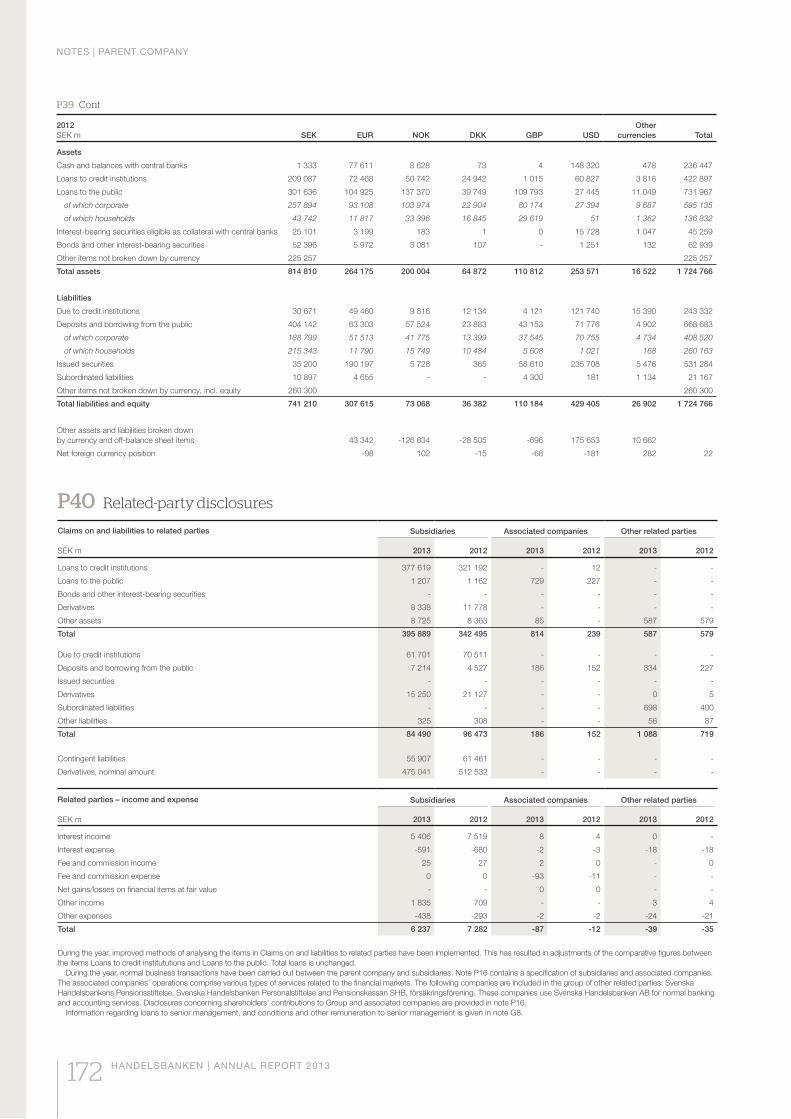
NOTES | PARENT COMPANY
172 HANDELSBANKEN | ANNUAL REPORT 2013
2012SEK m SEK EUR NOK DKK GBP USD
Othercurrencies Total
Assets
Cash and balances with central banks 1 333 77 611 8 628 73 4 148 320 478 236 447
Loans to credit institutions 209 087 72 468 50 742 24 942 1 015 60 827 3 816 422 897
Loans to the public 301 636 104 925 137 370 39 749 109 793 27 445 11 049 731 967
of which corporate 257 894 93 108 103 974 22 904 80 174 27 394 9 687 595 135
of which households 43 742 11 817 33 396 16 845 29 619 51 1 362 136 832
Interest-bearing securities eligible as collateral with central banks 25 101 3 199 183 1 0 15 728 1 047 45 259
Bonds and other interest-bearing securities 52 396 5 972 3 081 107 - 1 251 132 62 939
Other items not broken down by currency 225 257 225 257
Total assets 814 810 264 175 200 004 64 872 110 812 253 571 16 522 1 724 766
Liabilities
Due to credit institutions 30 671 49 460 9 816 12 134 4 121 121 740 15 390 243 332
Deposits and borrowing from the public 404 142 63 303 57 524 23 883 43 153 71 776 4 902 668 683
of which corporate 188 799 51 513 41 775 13 399 37 545 70 755 4 734 408 520
of which households 215 343 11 790 15 749 10 484 5 608 1 021 168 260 163
Issued securities 35 200 190 197 5 728 365 58 610 235 708 5 476 531 284
Subordinated liabilities 10 897 4 655 - - 4 300 181 1 134 21 167
Other items not broken down by currency, incl. equity 260 300 260 300
Total liabilities and equity 741 210 307 615 73 068 36 382 110 184 429 405 26 902 1 724 766
Other assets and liabilities broken down by currency and off-balance sheet items 43 342 -126 834 -28 505 -696 175 653 10 662
Net foreign currency position -98 102 -15 -68 -181 282 22
P39 Cont
P40 Related-party disclosures
Claims on and liabilities to related parties
SEK m
Subsidiaries Associated companies Other related parties
2013 2012 2013 2012 2013 2012
Loans to credit institutions 377 619 321 192 - 12 - -
Loans to the public 1 207 1 162 729 227 - -
Bonds and other interest-bearing securities - - - - - -
Derivatives 8 338 11 778 - - - -
Other assets 8 725 8 363 85 - 587 579
Total 395 889 342 495 814 239 587 579
Due to credit institutions 61 701 70 511 - - - -
Deposits and borrowing from the public 7 214 4 527 186 152 334 227
Issued securities - - - - - -
Derivatives 15 250 21 127 - - 0 5
Subordinated liabilities - - - - 698 400
Other liabilities 325 308 - - 56 87
Total 84 490 96 473 186 152 1 088 719
Contingent liabilities 55 907 61 461 - - - -
Derivatives, nominal amount 475 041 512 532 - - - -
Related parties – income and expense
SEK m
Subsidiaries Associated companies Other related parties
2013 2012 2013 2012 2013 2012
Interest income 5 406 7 519 8 4 0 -
Interest expense -591 -680 -2 -3 -18 -18
Fee and commission income 25 27 2 0 - 0
Fee and commission expense 0 0 -93 -11 - -
Net gains/losses on financial items at fair value - - 0 0 - -
Other income 1 835 709 - - 3 4
Other expenses -438 -293 -2 -2 -24 -21
Total 6 237 7 282 -87 -12 -39 -35
During the year, improved methods of analysing the items in Claims on and liabilities to related parties have been implemented. This has resulted in adjustments of the comparative figures between the items Loans to credit institututions and Loans to the public. Total loans is unchanged. During the year, normal business transactions have been carried out between the parent company and subsidiaries. Note P16 contains a specification of subsidiaries and associated companies. The associated companies’ operations comprise various types of services related to the financial markets. The following companies are included in the group of other related parties: Svenska Handelsbankens Pensionsstiftelse, Svenska Handelsbanken Personalstiftelse and Pensionskassan SHB, försäkringsförening. These companies use Svenska Handelsbanken AB for normal banking and accounting services. Disclosures concerning shareholders’ contributions to Group and associated companies are provided in note P16. Information regarding loans to senior management, and conditions and other remuneration to senior management is given in note G8.
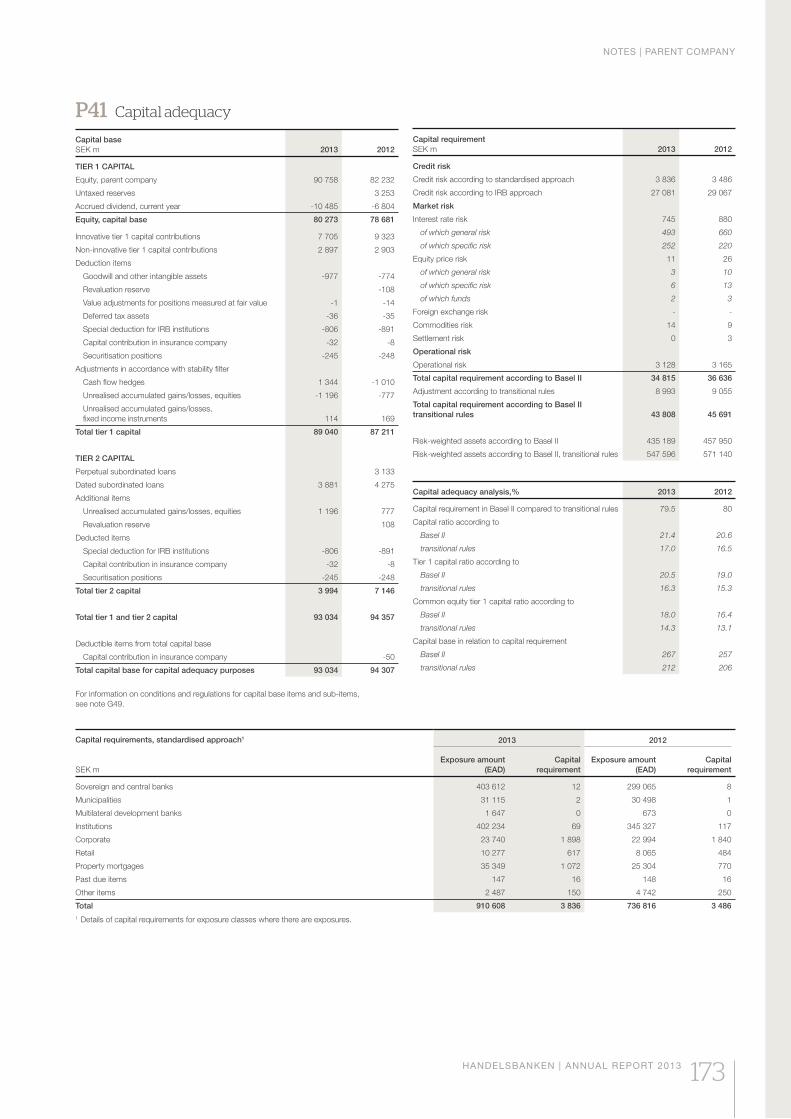
NOTES | PARENT COMPANY
HANDELSBANKEN | ANNUAL REPORT 2013 173
P41 Capital adequacy
Capital base SEK m 2013 2012
TIER 1 CAPITAL
Equity, parent company 90 758 82 232
Untaxed reserves 3 253
Accrued dividend, current year -10 485 -6 804
Equity, capital base 80 273 78 681
Innovative tier 1 capital contributions 7 705 9 323
Non-innovative tier 1 capital contributions 2 897 2 903
Deduction items
Goodwill and other intangible assets -977 -774
Revaluation reserve -108
Value adjustments for positions measured at fair value -1 -14
Deferred tax assets -36 -35
Special deduction for IRB institutions -806 -891
Capital contribution in insurance company -32 -8
Securitisation positions -245 -248
Adjustments in accordance with stability filter
Cash flow hedges 1 344 -1 010
Unrealised accumulated gains/losses, equities -1 196 -777
Unrealised accumulated gains/losses, fixed income instruments 114 169
Total tier 1 capital 89 040 87 211
TIER 2 CAPITAL
Perpetual subordinated loans 3 133
Dated subordinated loans 3 881 4 275
Additional items
Unrealised accumulated gains/losses, equities 1 196 777
Revaluation reserve 108
Deducted items
Special deduction for IRB institutions -806 -891
Capital contribution in insurance company -32 -8
Securitisation positions -245 -248
Total tier 2 capital 3 994 7 146
Total tier 1 and tier 2 capital 93 034 94 357
Deductible items from total capital base
Capital contribution in insurance company -50
Total capital base for capital adequacy purposes 93 034 94 307
For information on conditions and regulations for capital base items and sub-items, see note G49.
Capital requirementSEK m 2013 2012
Credit risk
Credit risk according to standardised approach 3 836 3 486
Credit risk according to IRB approach 27 081 29 067
Market risk
Interest rate risk 745 880
of which general risk 493 660
of which specific risk 252 220
Equity price risk 11 26
of which general risk 3 10
of which specific risk 6 13
of which funds 2 3
Foreign exchange risk - -
Commodities risk 14 9
Settlement risk 0 3
Operational risk
Operational risk 3 128 3 165
Total capital requirement according to Basel II 34 815 36 636
Adjustment according to transitional rules 8 993 9 055
Total capital requirement according to Basel II transitional rules 43 808 45 691
Risk-weighted assets according to Basel II 435 189 457 950
Risk-weighted assets according to Basel II, transitional rules 547 596 571 140
Capital adequacy analysis,% 2013 2012
Capital requirement in Basel II compared to transitional rules 79.5 80
Capital ratio according to
Basel II 21.4 20.6
transitional rules 17.0 16.5
Tier 1 capital ratio according to
Basel II 20.5 19.0
transitional rules 16.3 15.3
Common equity tier 1 capital ratio according to
Basel II 18.0 16.4
transitional rules 14.3 13.1
Capital base in relation to capital requirement
Basel II 267 257
transitional rules 212 206
Capital requirements, standardised approach1
SEK m
2013 2012
Exposure amount (EAD)
Capital requirement
Exposure amount (EAD)
Capital requirement
Sovereign and central banks 403 612 12 299 065 8
Municipalities 31 115 2 30 498 1
Multilateral development banks 1 647 0 673 0
Institutions 402 234 69 345 327 117
Corporate 23 740 1 898 22 994 1 840
Retail 10 277 617 8 065 484
Property mortgages 35 349 1 072 25 304 770
Past due items 147 16 148 16
Other items 2 487 150 4 742 250
Total 910 608 3 836 736 816 3 4861 Details of capital requirements for exposure classes where there are exposures.
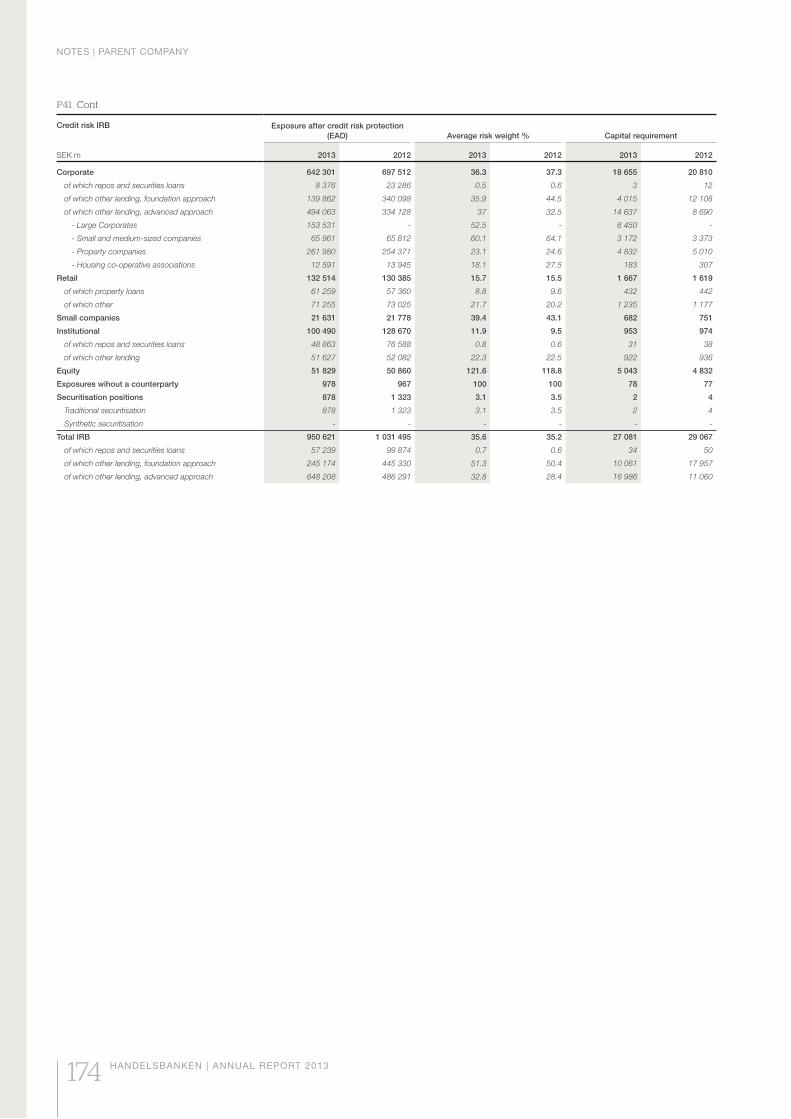
NOTES | PARENT COMPANY
174 HANDELSBANKEN | ANNUAL REPORT 2013
Credit risk IRB
SEK m
Exposure after credit risk protection (EAD) Average risk weight % Capital requirement
2013 2012 2013 2012 2013 2012
Corporate 642 301 697 512 36.3 37.3 18 655 20 810
of which repos and securities loans 8 376 23 286 0.5 0.6 3 12
of which other lending, foundation approach 139 862 340 098 35.9 44.5 4 015 12 108
of which other lending, advanced approach 494 063 334 128 37 32.5 14 637 8 690
- Large Corporates 153 531 - 52.5 - 6 450 -
- Small and medium-sized companies 65 961 65 812 60.1 64.1 3 172 3 373
- Property companies 261 980 254 371 23.1 24.6 4 832 5 010
- Housing co-operative associations 12 591 13 945 18.1 27.5 183 307
Retail 132 514 130 385 15.7 15.5 1 667 1 619
of which property loans 61 259 57 360 8.8 9.6 432 442
of which other 71 255 73 025 21.7 20.2 1 235 1 177
Small companies 21 631 21 778 39.4 43.1 682 751
Institutional 100 490 128 670 11.9 9.5 953 974
of which repos and securities loans 48 863 76 588 0.8 0.6 31 38
of which other lending 51 627 52 082 22.3 22.5 922 936
Equity 51 829 50 860 121.6 118.8 5 043 4 832
Exposures wihout a counterparty 978 967 100 100 78 77
Securitisation positions 878 1 323 3.1 3.5 2 4
Traditional securitisation 878 1 323 3.1 3.5 2 4
Synthetic securitisation - - - - - -
Total IRB 950 621 1 031 495 35.6 35.2 27 081 29 067
of which repos and securities loans 57 239 99 874 0.7 0.6 34 50
of which other lending, foundation approach 245 174 445 330 51.3 50.4 10 061 17 957
of which other lending, advanced approach 648 208 486 291 32.8 28.4 16 986 11 060
P41 Cont
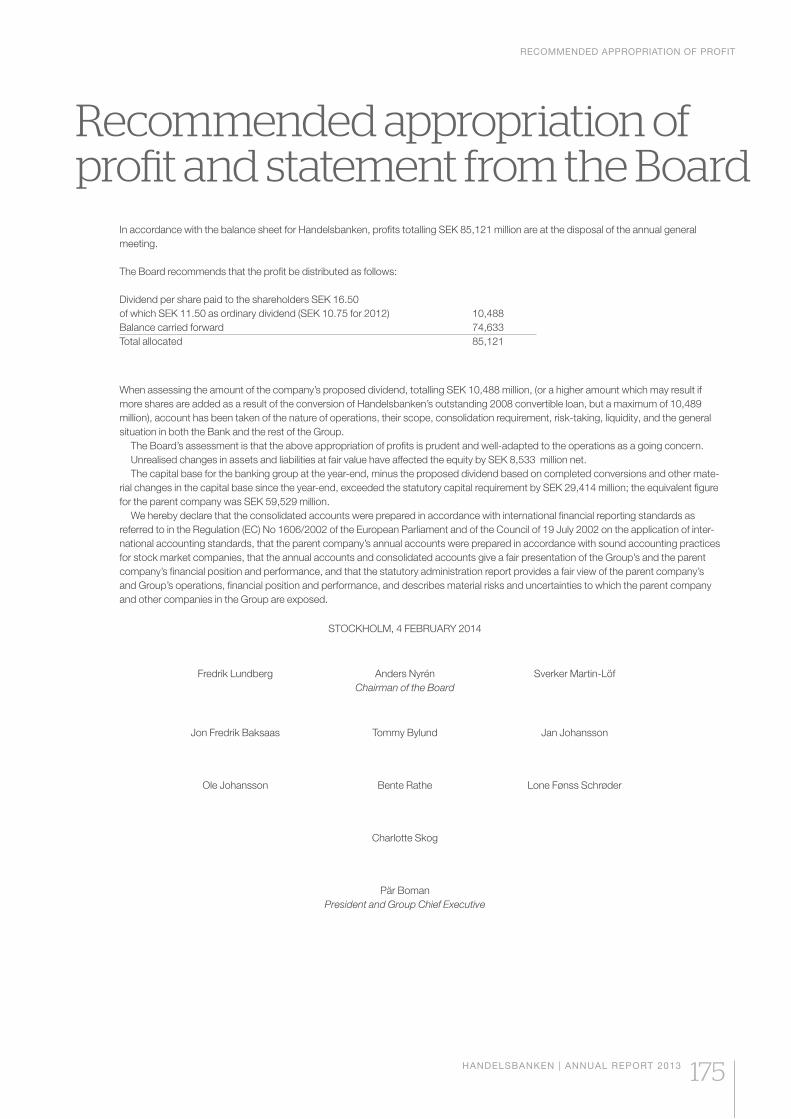
RECOMMENDED APPROPRIATION OF PROFIT
HANDELSBANKEN | ANNUAL REPORT 2013 175
STOCKHOLM, 4 FEBRUARY 2014
Fredrik Lundberg Anders NyrénChairman of the Board
Sverker Martin-Löf
Jon Fredrik Baksaas Tommy Bylund Jan Johansson
Ole Johansson Bente Rathe Lone Fønss Schrøder
Charlotte Skog
Pär BomanPresident and Group Chief Executive
Recommended appropriation of profit and statement from the Board
In accordance with the balance sheet for Handelsbanken, profits totalling SEK 85,121 million are at the disposal of the annual general meeting. The Board recommends that the profit be distributed as follows:
Dividend per share paid to the shareholders SEK 16.50 of which SEK 11.50 as ordinary dividend (SEK 10.75 for 2012) 10,488Balance carried forward 74,633Total allocated 85,121
When assessing the amount of the company’s proposed dividend, totalling SEK 10,488 million, (or a higher amount which may result if more shares are added as a result of the conversion of Handelsbanken’s outstanding 2008 convertible loan, but a maximum of 10,489 million), account has been taken of the nature of operations, their scope, consolidation requirement, risk-taking, liquidity, and the general situation in both the Bank and the rest of the Group.
The Board’s assessment is that the above appropriation of profits is prudent and well-adapted to the operations as a going concern.Unrealised changes in assets and liabilities at fair value have affected the equity by SEK 8,533 million net.The capital base for the banking group at the year-end, minus the proposed dividend based on completed conversions and other mate-
rial changes in the capital base since the year-end, exceeded the statutory capital requirement by SEK 29,414 million; the equivalent figure for the parent company was SEK 59,529 million.
We hereby declare that the consolidated accounts were prepared in accordance with international financial reporting standards as referred to in the Regulation (EC) No 1606/2002 of the European Parliament and of the Council of 19 July 2002 on the application of inter-national accounting standards, that the parent company’s annual accounts were prepared in accordance with sound accounting practices for stock market companies, that the annual accounts and consolidated accounts give a fair presentation of the Group’s and the parent company’s financial position and performance, and that the statutory administration report provides a fair view of the parent company’s and Group’s operations, financial position and performance, and describes material risks and uncertainties to which the parent company and other companies in the Group are exposed.

AUDITOR’S REPORT
176 HANDELSBANKEN | ANNUAL REPORT 2013
Auditor’s reportTo the annual meeting of the shareholders of Svenska Handelsbanken AB (publ)Corporate identity number 502007-7862
REPORT ON THE ANNUAL ACCOUNTS AND THE CONSOLIDATED ACCOUNTSWe have audited the annual accounts and the consolidated accounts of Svenska Handelsbanken AB (publ) for the year 2013, included in the printed version of this document on pages 7–175.
Responsibilities of the Board of Directors and the Chief Executive for the annual accounts and the consolidated accountsThe Board of Directors and the Chief Executive are responsible for the preparation and fair presentation of the annual accounts in accordance with the Annual Accounts Act of Credit Institutions and Securities Companies, and for the fair presentation of the consolidated accounts in accordance with the International Financial Reporting Standards, as adopted by the EU, and the Annual Accounts Act of Credit Institutions and Securities Companies, and for such internal control as the Board of Directors and the Chief Executive determine is necessary to enable the preparation of annual accounts and the consolidated accounts that are free from material misstatement, whether due to fraud or error.
Auditor’s responsibilityOur responsibility is to express an opinion on these annual accounts and consolidated accounts based on our audit. We conducted our audit in accordance with International Standards on Auditing and generally accepted auditing standards in Sweden. Those standards require that we comply with ethical requirements and plan and perform the audit to obtain reasonable assurance about whether the annual accounts and the consolidated accounts are free from material misstatements. During the year, the Bank’s internal audit department has continuously examined the internal controls and accounts. We have received the reports that have been prepared.
An audit involves performing procedures to obtain audit evidence about the amounts and disclosures in the annual accounts and the consolidated accounts. The procedures selected depend on the auditor’s judgment, including the assessment of the risks of material misstatement of the annual accounts and the consolidated accounts, whether due to fraud or error. In making those risk assessments, the auditor considers internal control relevant to the company’s preparation and fair presentation of the annual accounts and the consolidated accounts in order to design audit procedures that are appropriate in the circumstances, but not for the purpose of expressing an opinion on the effectiveness of the company’s internal control. An audit also includes evaluating the appropriateness of accounting policies used and the reasonableness of accounting estimates made by the Board of Directors and the Chief Executive, as well as evaluating the overall presentation of the annual accounts and the consolidated accounts.
We believe that the audit evidence we have obtained is sufficient and appropriate to provide a basis for our audit opinions.
OpinionsIn our opinion, the annual accounts have been prepared in accordance with the Annual Accounts Act of Credit Institutions and Securities Companies and present fairly, in all material respects, the financial position of the parent company as of 31 December 2013 and of its financial performance and cash flows for the year then ended in accordance with the Annual Accounts Act of Credit Institutions and Securities Companies. The consolidated accounts have been prepared in accordance with the Annual Accounts Act of Credit Institutions and Securities Companies, and present fairly, in all material respects, the financial position of the group as of 31 December 2013 and of its financial performance and cash flows for the year then ended in accordance with the International Financial Reporting Standards, as adopted by the EU, and the Annual Accounts Act of Credit Institutions and Securities Companies. A Corporate Governance Report has been prepared. The Board of Directors’ report and the Corporate Governance Report are consistent with the other parts of the annual accounts and the consolidated accounts.
We therefore recommend that the annual meeting of shareholders adopt the income statement and balance sheet of the parent company and the group.
AUDITOR’S REPORT
HANDELSBANKEN | ANNUAL REPORT 2013 177
REPORT ON OTHER LEGAL AND REGULATORY REQUIREMENTSIn addition to our audit of the annual accounts and the consolidated accounts, we have also audited the proposed appropriations of the company’s profit or loss and the administration of the Board of Directors and the Chief Executive of Svenska Handelsbanken AB (publ) for the year 2013.
Responsibilities of the Board of Directors and the Chief ExecutiveThe Board of Directors is responsible for the proposal for appropriations of the company’s profit or loss, and the Board of Directors and the Chief Executive are responsible for administration under the Companies Act and the Banking and Financing Business Act.
Auditor’s responsibilityOur responsibility is to express an opinion with reasonable assurance on the proposed appropriations of the company’s profit or loss and on the administration based on our audit. We conducted the audit in accordance with generally accepted auditing standards in Sweden.
As a basis for our opinion on the Board of Directors’ proposed appropriations of the company’s profit or loss, we examined the Board of Directors’ reasoned statement and a selection of supporting evidence in order to be able to assess whether the proposal is in accordance with the Companies Act.
As a basis for our opinion concerning discharge from liability, in addition to our audit of the annual accounts and the consolidated accounts, we examined significant decisions, actions taken and circumstances of the company in order to determine whether any member of the Board of Directors or the Chief Executive is liable to the company. We also examined whether any member of the Board of Directors or the Chief Executive has, in any other way, acted in contravention of the Companies Act, the Banking and Financing Business Act, the Annual Accounts Act of Credit Institutions and Securities Companies, or the Articles of Association.
We believe that the audit evidence we have obtained is sufficient and appropriate to provide a basis for our opinions.
OpinionsWe recommend to the annual meeting of shareholders that the profit be appropriated in accordance with the proposal in the Board of Directors’ report and that the members of the Board of Directors and the Chief Executive be discharged from liability for the financial year.
STOCKHOLM, 14 FEBRUARY 2014
KPMG AB Ernst & Young AB Stefan Holmström Erik Åström Authorised Public Accountant Authorised Public Accountant
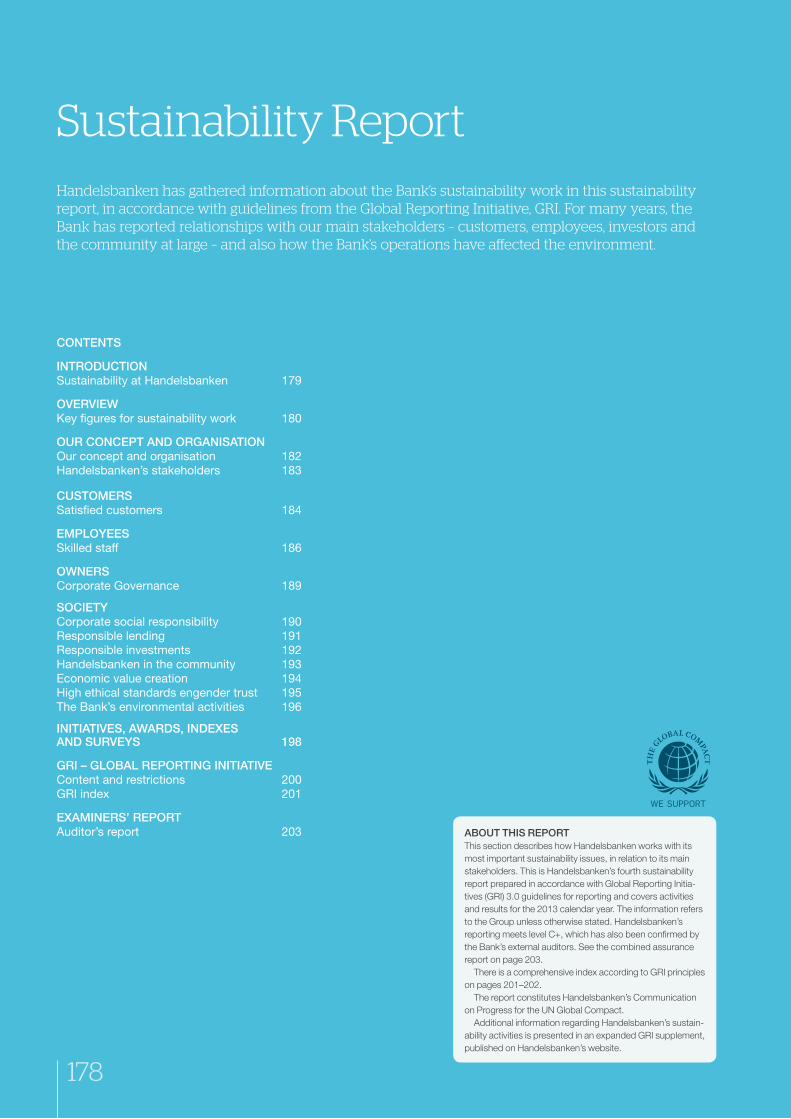
178 HANDELSBANKEN | ANNUAL REPORT 2013
Sustainability ReportHandelsbanken has gathered information about the Bank’s sustainability work in this sustainability report, in accordance with guidelines from the Global Reporting Initiative, GRI. For many years, the Bank has reported relationships with our main stakeholders – customers, employees, investors and the community at large – and also how the Bank’s operations have affected the environment.
CONTENTS
INTRODUCTION Sustainability at Handelsbanken 179
OVERVIEWKey figures for sustainability work 180
OUR CONCEPT AND ORGANISATIONOur concept and organisation 182Handelsbanken’s stakeholders 183
CUSTOMERS Satisfied customers 184
EMPLOYEESSkilled staff 186
OWNERSCorporate Governance 189
SOCIETYCorporate social responsibility 190Responsible lending 191Responsible investments 192Handelsbanken in the community 193Economic value creation 194High ethical standards engender trust 195The Bank’s environmental activities 196
INITIATIVES, AWARDS, INDEXES AND SURVEYS 198
GRI – GLOBAL REPORTING INITIATIVEContent and restrictions 200GRI index 201
EXAMINERS’ REPORTAuditor’s report 203 ABOUT THIS REPORT
This section describes how Handelsbanken works with its most important sustainability issues, in relation to its main stakeholders. This is Handelsbanken’s fourth sustainability report prepared in accordance with Global Reporting Initia-tives (GRI) 3.0 guidelines for reporting and covers activities and results for the 2013 calendar year. The information refers to the Group unless otherwise stated. Handelsbanken’s reporting meets level C+, which has also been confirmed by the Bank’s external auditors. See the combined assurance report on page 203.
There is a comprehensive index according to GRI principles on pages 201–202.
The report constitutes Handelsbanken’s Communication on Progress for the UN Global Compact.
Additional information regarding Handelsbanken’s sustain-ability activities is presented in an expanded GRI supplement, published on Handelsbanken’s website.
178
INTRODUCTION | SUSTAINABILITY REPORT
HANDELSBANKEN | ANNUAL REPORT 2013 179
Sustainability at Handelsbanken
Handelsbanken is a bank that is stable over the long term – a bank which, regardless of the situation in the world around us, is there for our customers.
Handelsbanken has six home markets: Swe-den, the UK, Denmark, Finland, Norway and the Netherlands. Handelsbanken has a nationwide branch network in these countries, organised into one or more regional banks in each country. The Bank is also opening new offices in other markets, to support the Bank’s customers in the home markets with their international business.
Handelsbanken has a strong local presence in its home markets. Handelsbanken’s high cost-effectiveness allows the Bank to retain a local pres-ence and thus continue to fulfil an important func-tion in local communities, including places where other banks have closed their local branches.
The Bank has an organic growth model that has proved successful in an increasing number of locations and an increasing number of countries. Our growth model creates high availability and satisfied customers, and means that the Bank can achieve growth, coupled with low risk and good cost control. This, together with the Bank’s cautious view of risk and its tradition of prudent financial reserves, makes it a stable, responsible Bank over the long term.
HOW WE WORK WITH SUSTAINABILITYHandelsbanken’s corporate goal is to have better profitability than the average of peer banks in our home markets. In addition, Handelsbanken aims to act as a responsible institution in society.
It is therefore logical for the Bank to work with sustainability issues, which entail a voluntary responsibility for how the Bank’s operations affect the community from an economic, social, ethical and environmental perspective. For Handels-banken, sustainability also means being an at-tractive employer and a stable market player that makes a positive contribution to the community and its development.
SERVICES FOR THE PUBLIC GOODBy delivering financial services, Handelsbanken, together with other players in the financial sector, comprises an important component in the basic infrastructure of society.
A bank’s fundamental tasks are, on the one hand, to manage the money of those who wish to post-pone their spending and save their money, and on the other to lend money to companies and house-
holds that wish to spend and invest today. Together, banks must also maintain an efficient, functioning payment system, as well as managing risk.
OUR ANALYSIS OF THE IMPACT OF OUR OPERATIONSTaking responsibility is a vital element of a success-ful, sustainable banking operation. Handelsbanken must meet its customers’ needs for financial products and services in a responsible manner, and provide its shareholders with a good return. The Bank also takes a social responsibility, acts ethically in relation to all its stakeholders and works to minimise the Bank’s environmental impact.
Different sectors have larger or smaller impacts within different areas. For example, a bank’s direct environmental impact is fairly limited, even though Handelsbanken endeavours to minimise the carbon dioxide emissions, etc. generated by its operations.
Handelsbanken’s customers have full respon-siblity for their operations and how they are run. Handelsbanken’s possibility of affecting custom-ers’ actions is normally relatively limited.
RESPONSIBLE LENDINGA bank has the opportunity to make a difference when it comes to social and civic responsibility, particularly in its role as a lender.
It is important that the Bank’s lending is responsi-ble, based on a close assessment of the customer’s repayment capacity. A weak repayment capacity can never be accepted with the argument that the customer is prepared to pay a high interest rate. The aim of short-term profits for the Bank must take sec-ond place to what can be considered sustainable in the long term. This is one reason why Handelsbank-en does not apply performance- or volume-based bonuses, or other forms of variable compensation, either for the Bank’s senior management or for any other employee who takes decisions on credits, or who can affect the Bank’s risk profile in any other way. Nor does the Bank make any budgets, or have any volume or market share targets.
OUR LONG TRADITION OF SUSTAINABILITY WORKSustainability has long been a well-integrated part of the Handelsbanken concept of how successful banking operations can be run in a sustainable way.
Handelsbanken is an international group with operations in 24 countries. No matter where in the world we work, Handelsbanken always
puts the customer first, focusing on long-term, sustainable customer relationships.
Every day the Bank’s 11,500+ employees work to ensure that our customers are satisfied, that our income is increasing more rapidly than our expenses, and that there is good administrative order in our operations.
Handelsbanken takes responsibility by manag-ing risks in such a way that as few customers as possible have difficulties in making payments, and we can therefore remain a bank with stable finances that makes a positive contribution to its customers, its shareholders, and the community in general.
Handelsbanken’s good profitability, which is mainly explained by the Bank’s good cost-effec-tiveness, also benefits the community as whole; Handelsbanken has been one of the largest payers of corporate tax in Sweden for many years and the largest payer to the Swedish Stabilisation Fund for the financial system.
THE MOST FUNDAMENTAL CRITERION FOR SUSTAINABILITYThe latest global financial crisis has shown clearly that, for a bank, the most fundamental criterion for sustainability is survival. A bank must be run in such a way that it is always able to fund its opera-tions, so that it can survive unaided.
This means that a bank’s top priority must be to maintain the confidence of its customers, its bond investors, the supervisory authorities and its shareholders. Such confidence is based on the assumption that the bank’s operations are sound. It is therefore vital that corporate social respon-sibility is an integral part of all Handelsbanken’s operations.
In times of financial turbulence, it becomes even clearer that banks which have acted respon-sibly have a competitive edge, for example in terms of their ability to fund themselves on the international capital market and to attract talented staff.
Private customers, too, attach great impor-tance to the fact that a bank has acted respon-sibly. During the financial crisis, having funds on an account with a secure bank was seen as an increasingly attractive option.
Handelsbanken’s business opportunities and successes depend upon the confidence that customers, investors, the general public and public authorities have in us and our employees. A condition for this confidence is that the Bank’s operations are subject to high ethical standards and responsible actions, and that employees of the Bank conduct themselves in a manner that upholds confidence.
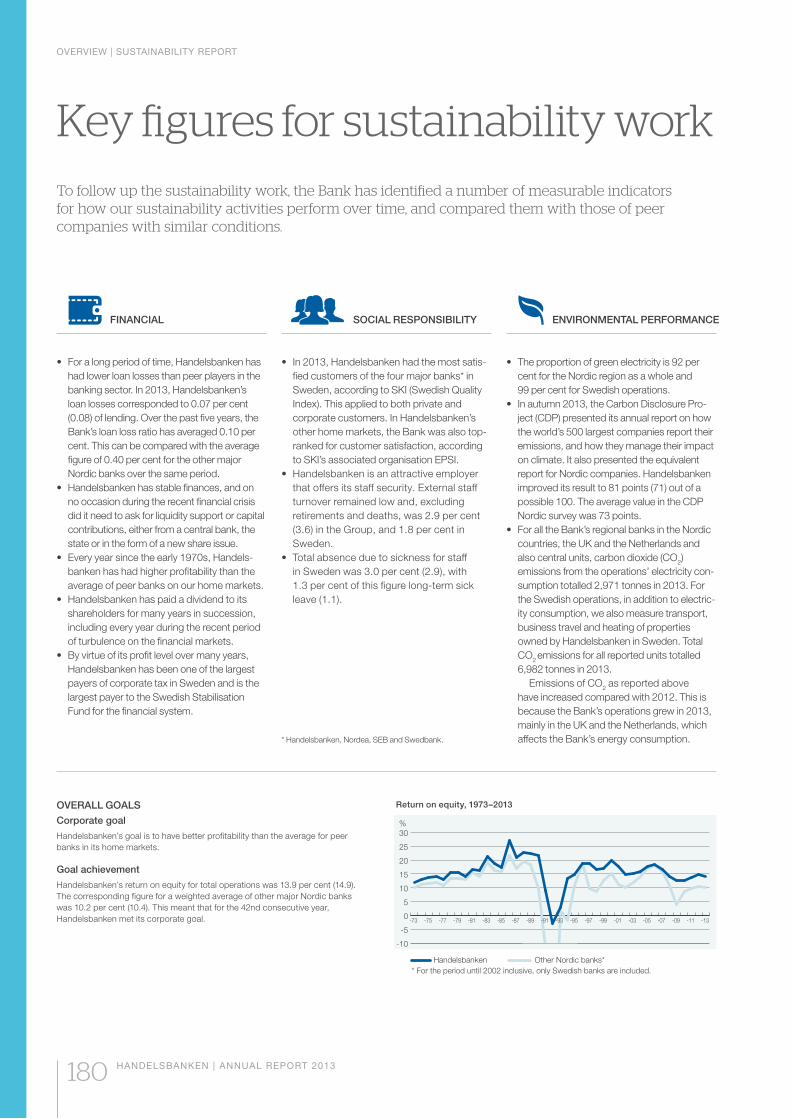
OVERVIEW | SUSTAINABILITY REPORT
180 HANDELSBANKEN | ANNUAL REPORT 2013
Key figures for sustainability workTo follow up the sustainability work, the Bank has identified a number of measurable indicators for how our sustainability activities perform over time, and compared them with those of peer companies with similar conditions.
OVERALL GOALSCorporate goal
Handelsbanken’s goal is to have better profitability than the average for peer banks in its home markets.
Goal achievement
Handelsbanken’s return on equity for total operations was 13.9 per cent (14.9). The corresponding figure for a weighted average of other major Nordic banks was 10.2 per cent (10.4). This meant that for the 42nd consecutive year, Handelsbanken met its corporate goal.
-10
-5
0
5
10
15
20
25
30
-13-11-09-07-05-03-01-99-97-95-93-91-89-87-85-83-81-79-77-75-73
%
Handelsbanken Other Nordic banks** For the period until 2002 inclusive, only Swedish banks are included.
Return on equity, 1973–2013
* Handelsbanken, Nordea, SEB and Swedbank.
FINANCIAL SOCIAL RESPONSIBILITY ENVIRONMENTAL PERFORMANCE
had lower loan losses than peer players in the banking sector. In 2013, Handelsbanken’s loan losses corresponded to 0.07 per cent (0.08) of lending. Over the past five years, the Bank’s loan loss ratio has averaged 0.10 per cent. This can be compared with the average figure of 0.40 per cent for the other major Nordic banks over the same period.
no occasion during the recent financial crisis did it need to ask for liquidity support or capital contributions, either from a central bank, the state or in the form of a new share issue.
-banken has had higher profitability than the average of peer banks on our home markets.
shareholders for many years in succession, including every year during the recent period of turbulence on the financial markets.
Handelsbanken has been one of the largest payers of corporate tax in Sweden and is the largest payer to the Swedish Stabilisation Fund for the financial system.
-fied customers of the four major banks* in Sweden, according to SKI (Swedish Quality Index). This applied to both private and corporate customers. In Handelsbanken’s other home markets, the Bank was also top-ranked for customer satisfaction, according to SKI’s associated organisation EPSI.
that offers its staff security. External staff turnover remained low and, excluding retirements and deaths, was 2.9 per cent (3.6) in the Group, and 1.8 per cent in Sweden.
in Sweden was 3.0 per cent (2.9), with 1.3 per cent of this figure long-term sick leave (1.1).
cent for the Nordic region as a whole and 99 per cent for Swedish operations.
-ject (CDP) presented its annual report on how the world’s 500 largest companies report their emissions, and how they manage their impact on climate. It also presented the equivalent report for Nordic companies. Handelsbanken improved its result to 81 points (71) out of a possible 100. The average value in the CDP Nordic survey was 73 points.
countries, the UK and the Netherlands and also central units, carbon dioxide (CO2) emissions from the operations’ electricity con-sumption totalled 2,971 tonnes in 2013. For the Swedish operations, in addition to electric-ity consumption, we also measure transport, business travel and heating of properties owned by Handelsbanken in Sweden. Total CO2 emissions for all reported units totalled 6,982 tonnes in 2013.
Emissions of CO2 as reported above have increased compared with 2012. This is because the Bank’s operations grew in 2013, mainly in the UK and the Netherlands, which affects the Bank’s energy consumption.
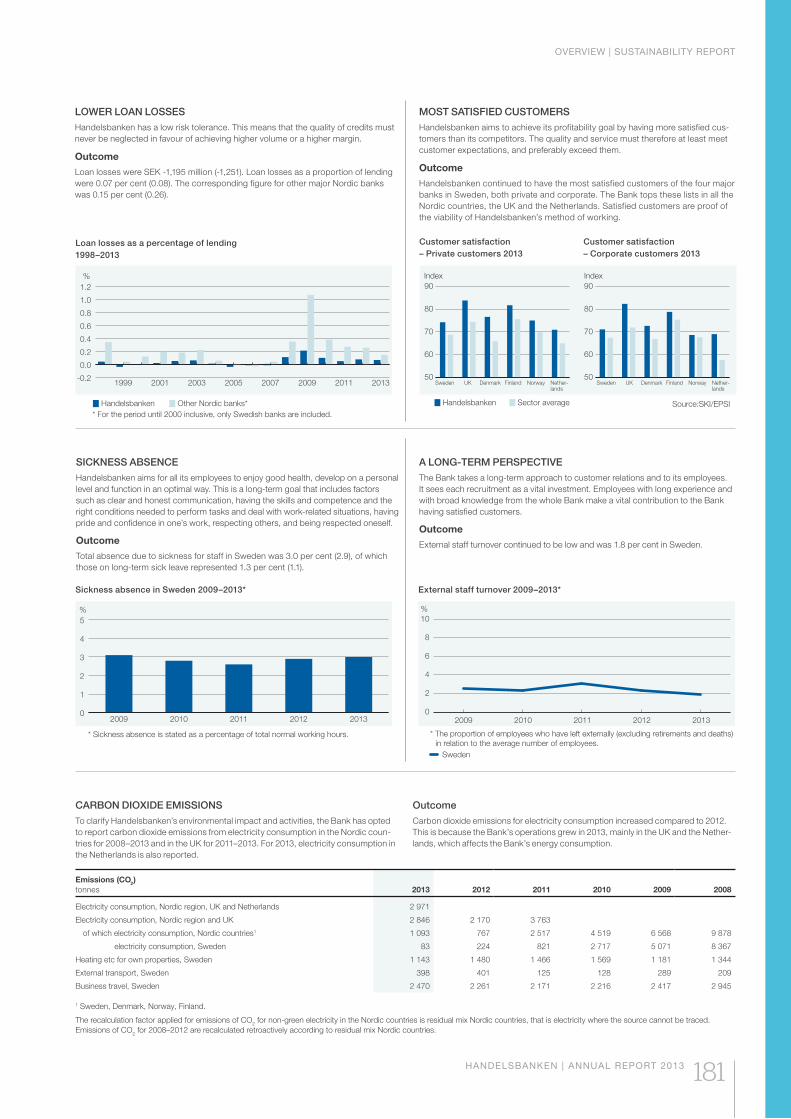
OVERVIEW | SUSTAINABILITY REPORT
HANDELSBANKEN | ANNUAL REPORT 2013 181
CARBON DIOXIDE EMISSIONSTo clarify Handelsbanken’s environmental impact and activities, the Bank has opted to report carbon dioxide emissions from electricity consumption in the Nordic coun-tries for 2008–2013 and in the UK for 2011–2013. For 2013, electricity consumption in the Netherlands is also reported.
Outcome Carbon dioxide emissions for electricity consumption increased compared to 2012. This is because the Bank’s operations grew in 2013, mainly in the UK and the Nether-lands, which affects the Bank’s energy consumption.
Loan losses as a percentage of lending 1998–2013
%
Handelsbanken Other Nordic banks** For the period until 2000 inclusive, only Swedish banks are included.
-0.2
0.0
0.2
0.4
0.6
0.8
1.0
1.2
20132011200920072005200320011999
Handelsbanken Sector average
Index Index
DenmarkSweden FinlandUK Norway Nether-lands
50
60
70
80
90
50
60
70
80
90
DenmarkSweden FinlandUK Norway Nether-lands
LOWER LOAN LOSSESHandelsbanken has a low risk tolerance. This means that the quality of credits must never be neglected in favour of achieving higher volume or a higher margin.
Outcome
Loan losses were SEK -1,195 million (-1,251). Loan losses as a proportion of lending were 0.07 per cent (0.08). The corresponding figure for other major Nordic banks was 0.15 per cent (0.26).
MOST SATISFIED CUSTOMERSHandelsbanken aims to achieve its profitability goal by having more satisfied cus-tomers than its competitors. The quality and service must therefore at least meet customer expectations, and preferably exceed them.
Outcome
Handelsbanken continued to have the most satisfied customers of the four major banks in Sweden, both private and corporate. The Bank tops these lists in all the Nordic countries, the UK and the Netherlands. Satisfied customers are proof of the viability of Handelsbanken’s method of working.
A LONG-TERM PERSPECTIVEThe Bank takes a long-term approach to customer relations and to its employees. It sees each recruitment as a vital investment. Employees with long experience and with broad knowledge from the whole Bank make a vital contribution to the Bank having satisfied customers.
Outcome
External staff turnover continued to be low and was 1.8 per cent in Sweden.
SICKNESS ABSENCEHandelsbanken aims for all its employees to enjoy good health, develop on a personal level and function in an optimal way. This is a long-term goal that includes factors such as clear and honest communication, having the skills and competence and the right conditions needed to perform tasks and deal with work-related situations, having pride and confidence in one’s work, respecting others, and being respected oneself.
Outcome
Total absence due to sickness for staff in Sweden was 3.0 per cent (2.9), of which those on long-term sick leave represented 1.3 per cent (1.1).
External staff turnover 2009–2013*
%
0
2
4
6
8
10
20132012201120102009
* The proportion of employees who have left externally (excluding retirements and deaths) in relation to the average number of employees.
Sweden
Sickness absence in Sweden 2009–2013*
%
0
1
2
3
4
5
20132012201120102009
* Sickness absence is stated as a percentage of total normal working hours.
Customer satisfaction – Private customers 2013
Customer satisfaction – Corporate customers 2013
Emissions (CO2)tonnes 2013 2012 2011 2010 2009 2008
Electricity consumption, Nordic region, UK and Netherlands 2 971
Electricity consumption, Nordic region and UK 2 846 2 170 3 763
of which electricity consumption, Nordic countries1 1 093 767 2 517 4 519 6 568 9 878
electricity consumption, Sweden 83 224 821 2 717 5 071 8 367
Heating etc for own properties, Sweden 1 143 1 480 1 466 1 569 1 181 1 344
External transport, Sweden 398 401 125 128 289 209
Business travel, Sweden 2 470 2 261 2 171 2 216 2 417 2 945
1 Sweden, Denmark, Norway, Finland.
The recalculation factor applied for emissions of CO2 for non-green electricity in the Nordic countries is residual mix Nordic countries, that is electricity where the source cannot be traced. Emissions of CO2 for 2008–2012 are recalculated retroactively according to residual mix Nordic countries.
Source:SKI/EPSI
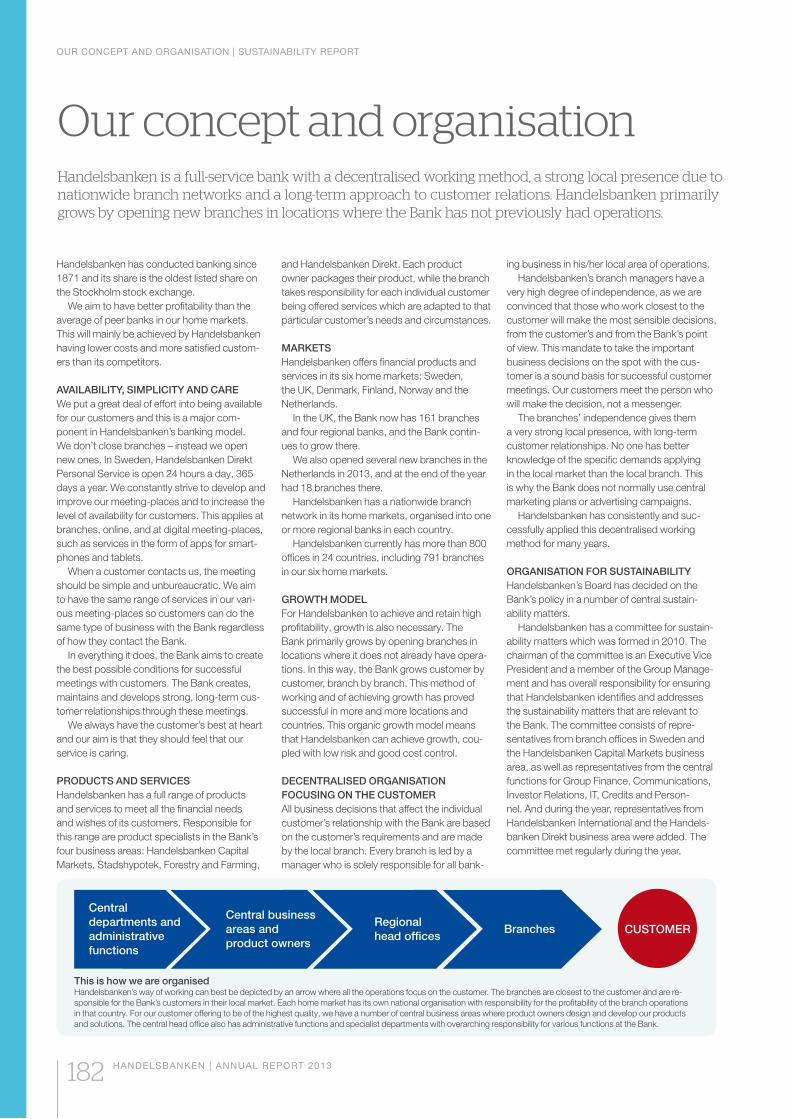
OUR CONCEPT AND ORGANISATION | SUSTAINABILITY REPORT
182 HANDELSBANKEN | ANNUAL REPORT 2013
Our concept and organisationHandelsbanken is a full-service bank with a decentralised working method, a strong local presence due to nationwide branch networks and a long-term approach to customer relations. Handelsbanken primarily grows by opening new branches in locations where the Bank has not previously had operations.
Handelsbanken has conducted banking since 1871 and its share is the oldest listed share on the Stockholm stock exchange.
We aim to have better profitability than the average of peer banks in our home markets. This will mainly be achieved by Handelsbanken having lower costs and more satisfied custom-ers than its competitors.
AVAILABILITY, SIMPLICITY AND CAREWe put a great deal of effort into being available for our customers and this is a major com-ponent in Handelsbanken’s banking model. We don’t close branches – instead we open new ones. In Sweden, Handelsbanken Direkt Personal Service is open 24 hours a day, 365 days a year. We constantly strive to develop and improve our meeting-places and to increase the level of availability for customers. This applies at branches, online, and at digital meeting-places, such as services in the form of apps for smart-phones and tablets.
When a customer contacts us, the meeting should be simple and unbureaucratic. We aim to have the same range of services in our vari-ous meeting-places so customers can do the same type of business with the Bank regardless of how they contact the Bank.
In everything it does, the Bank aims to create the best possible conditions for successful meetings with customers. The Bank creates, maintains and develops strong, long-term cus-tomer relationships through these meetings.
We always have the customer’s best at heart and our aim is that they should feel that our service is caring.
PRODUCTS AND SERVICESHandelsbanken has a full range of products and services to meet all the financial needs and wishes of its customers. Responsible for this range are product specialists in the Bank’s four business areas: Handelsbanken Capital Markets, Stadshypotek, Forestry and Farming,
and Handelsbanken Direkt. Each product owner packages their product, while the branch takes responsibility for each individual customer being offered services which are adapted to that particular customer’s needs and circumstances.
MARKETSHandelsbanken offers financial products and services in its six home markets: Sweden, the UK, Denmark, Finland, Norway and the Netherlands.
In the UK, the Bank now has 161 branches and four regional banks, and the Bank contin-ues to grow there.
We also opened several new branches in the Netherlands in 2013, and at the end of the year had 18 branches there.
Handelsbanken has a nationwide branch network in its home markets, organised into one or more regional banks in each country.
Handelsbanken currently has more than 800 offices in 24 countries, including 791 branches in our six home markets.
GROWTH MODELFor Handelsbanken to achieve and retain high profitability, growth is also necessary. The Bank primarily grows by opening branches in locations where it does not already have opera-tions. In this way, the Bank grows customer by customer, branch by branch. This method of working and of achieving growth has proved successful in more and more locations and countries. This organic growth model means that Handelsbanken can achieve growth, cou-pled with low risk and good cost control.
DECENTRALISED ORGANISATION FOCUSING ON THE CUSTOMERAll business decisions that affect the individual customer’s relationship with the Bank are based on the customer’s requirements and are made by the local branch. Every branch is led by a manager who is solely responsible for all bank-
This is how we are organisedHandelsbanken’s way of working can best be depicted by an arrow where all the operations focus on the customer. The branches are closest to the customer and are re-sponsible for the Bank’s customers in their local market. Each home market has its own national organisation with responsibility for the profitability of the branch operations in that country. For our customer offering to be of the highest quality, we have a number of central business areas where product owners design and develop our products and solutions. The central head office also has administrative functions and specialist departments with overarching responsibility for various functions at the Bank.
CUSTOMER
Central departments and administrative functions
Central business areas and product owners
Regionalhead offices
Branches
ing business in his/her local area of operations. Handelsbanken’s branch managers have a
very high degree of independence, as we are convinced that those who work closest to the customer will make the most sensible decisions, from the customer’s and from the Bank’s point of view. This mandate to take the important business decisions on the spot with the cus-tomer is a sound basis for successful customer meetings. Our customers meet the person who will make the decision, not a messenger.
The branches’ independence gives them a very strong local presence, with long-term customer relationships. No one has better knowledge of the specific demands applying in the local market than the local branch. This is why the Bank does not normally use central marketing plans or advertising campaigns.
Handelsbanken has consistently and suc-cessfully applied this decentralised working method for many years.
ORGANISATION FOR SUSTAINABILITYHandelsbanken’s Board has decided on the Bank’s policy in a number of central sustain-ability matters.
Handelsbanken has a committee for sustain-ability matters which was formed in 2010. The chairman of the committee is an Executive Vice President and a member of the Group Manage-ment and has overall responsibility for ensuring that Handelsbanken identifies and addresses the sustainability matters that are relevant to the Bank. The committee consists of repre-sentatives from branch offices in Sweden and the Handelsbanken Capital Markets business area, as well as representatives from the central functions for Group Finance, Communications, Investor Relations, IT, Credits and Person-nel. And during the year, representatives from Handelsbanken International and the Handels-banken Direkt business area were added. The committee met regularly during the year.
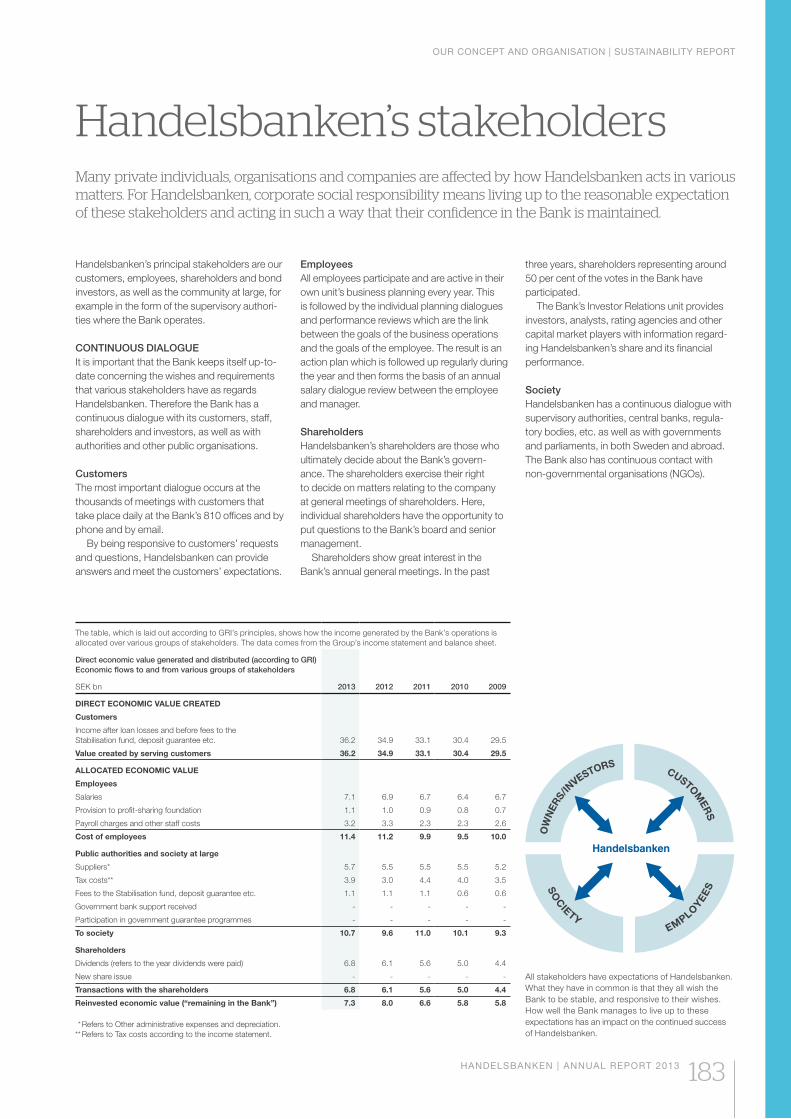
OUR CONCEPT AND ORGANISATION | SUSTAINABILITY REPORT
HANDELSBANKEN | ANNUAL REPORT 2013 183
Handelsbanken’s stakeholdersMany private individuals, organisations and companies are affected by how Handelsbanken acts in various matters. For Handelsbanken, corporate social responsibility means living up to the reasonable expectation of these stakeholders and acting in such a way that their confidence in the Bank is maintained.
Handelsbanken’s principal stakeholders are our customers, employees, shareholders and bond investors, as well as the community at large, for example in the form of the supervisory authori-ties where the Bank operates.
CONTINUOUS DIALOGUEIt is important that the Bank keeps itself up-to-date concerning the wishes and requirements that various stakeholders have as regards Handelsbanken. Therefore the Bank has a continuous dialogue with its customers, staff, shareholders and investors, as well as with authorities and other public organisations.
Customers The most important dialogue occurs at the thousands of meetings with customers that take place daily at the Bank’s 810 offices and by phone and by email.
By being responsive to customers’ requests and questions, Handelsbanken can provide answers and meet the customers’ expectations.
EmployeesAll employees participate and are active in their own unit’s business planning every year. This is followed by the individual planning dialogues and performance reviews which are the link between the goals of the business operations and the goals of the employee. The result is an action plan which is followed up regularly during the year and then forms the basis of an annual salary dialogue review between the employee and manager.
Shareholders Handelsbanken’s shareholders are those who ultimately decide about the Bank’s govern-ance. The shareholders exercise their right to decide on matters relating to the company at general meetings of shareholders. Here, individual shareholders have the opportunity to put questions to the Bank’s board and senior management.
Shareholders show great interest in the Bank’s annual general meetings. In the past
three years, shareholders representing around 50 per cent of the votes in the Bank have participated.
The Bank’s Investor Relations unit provides investors, analysts, rating agencies and other capital market players with information regard-ing Handelsbanken’s share and its financial performance.
SocietyHandelsbanken has a continuous dialogue with supervisory authorities, central banks, regula-tory bodies, etc. as well as with governments and parliaments, in both Sweden and abroad. The Bank also has continuous contact with non-governmental organisations (NGOs).
O
WN
ERS/
INVESTORS
CUSTOMER
S
S
OC
IETY EMPLO
YEES
All stakeholders have expectations of Handelsbanken. What they have in common is that they all wish the Bank to be stable, and responsive to their wishes. How well the Bank manages to live up to these expectations has an impact on the continued success of Handelsbanken.
The table, which is laid out according to GRI’s principles, shows how the income generated by the Bank’s operations is allocated over various groups of stakeholders. The data comes from the Group’s income statement and balance sheet.
Direct economic value generated and distributed (according to GRI) Economic flows to and from various groups of stakeholders
SEK bn 2013 2012 2011 2010 2009
DIRECT ECONOMIC VALUE CREATED
Customers
Income after loan losses and before fees to the Stabilisation fund, deposit guarantee etc. 36.2 34.9 33.1 30.4 29.5
Value created by serving customers 36.2 34.9 33.1 30.4 29.5
ALLOCATED ECONOMIC VALUE
Employees
Salaries 7.1 6.9 6.7 6.4 6.7
Provision to profit-sharing foundation 1.1 1.0 0.9 0.8 0.7
Payroll charges and other staff costs 3.2 3.3 2.3 2.3 2.6
Cost of employees 11.4 11.2 9.9 9.5 10.0
Public authorities and society at large
Suppliers* 5.7 5.5 5.5 5.5 5.2
Tax costs** 3.9 3.0 4.4 4.0 3.5
Fees to the Stabilisation fund, deposit guarantee etc. 1.1 1.1 1.1 0.6 0.6
Government bank support received - - - - -
Participation in government guarantee programmes - - - - -
To society 10.7 9.6 11.0 10.1 9.3
Shareholders
Dividends (refers to the year dividends were paid) 6.8 6.1 5.6 5.0 4.4
New share issue - - - - -
Transactions with the shareholders 6.8 6.1 5.6 5.0 4.4
Reinvested economic value (“remaining in the Bank”) 7.3 8.0 6.6 5.8 5.8
* Refers to Other administrative expenses and depreciation.** Refers to Tax costs according to the income statement.
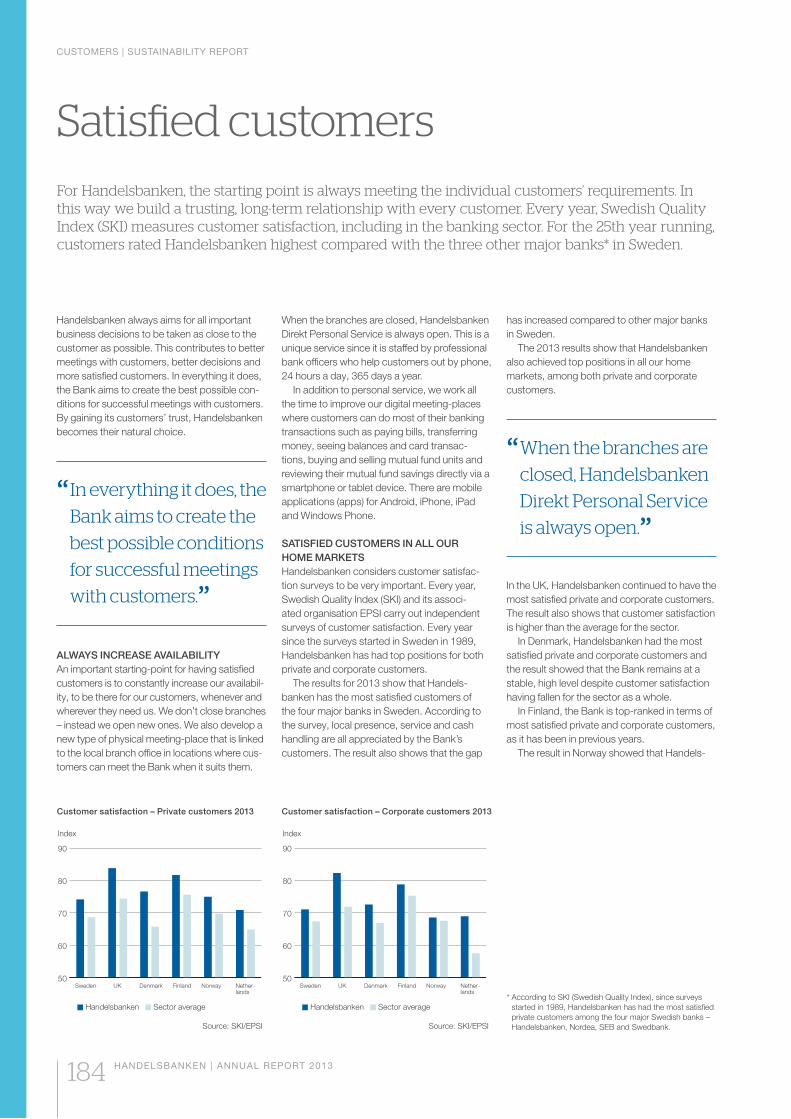
CUSTOMERS | SUSTAINABILITY REPORT
184 HANDELSBANKEN | ANNUAL REPORT 2013
Satisfied customersFor Handelsbanken, the starting point is always meeting the individual customers’ requirements. In this way we build a trusting, long-term relationship with every customer. Every year, Swedish Quality Index (SKI) measures customer satisfaction, including in the banking sector. For the 25th year running, customers rated Handelsbanken highest compared with the three other major banks* in Sweden.
Handelsbanken always aims for all important business decisions to be taken as close to the customer as possible. This contributes to better meetings with customers, better decisions and more satisfied customers. In everything it does, the Bank aims to create the best possible con-ditions for successful meetings with customers. By gaining its customers’ trust, Handelsbanken becomes their natural choice.
“ In everything it does, the
Bank aims to create the
best possible conditions
for successful meetings
with customers.”
ALWAYS INCREASE AVAILABILITY An important starting-point for having satisfied customers is to constantly increase our availabil-ity, to be there for our customers, whenever and wherever they need us. We don’t close branches – instead we open new ones. We also develop a new type of physical meeting-place that is linked to the local branch office in locations where cus-tomers can meet the Bank when it suits them.
When the branches are closed, Handelsbanken Direkt Personal Service is always open. This is a unique service since it is staffed by professional bank officers who help customers out by phone, 24 hours a day, 365 days a year.
In addition to personal service, we work all the time to improve our digital meeting-places where customers can do most of their banking transactions such as paying bills, transferring money, seeing balances and card transac-tions, buying and selling mutual fund units and reviewing their mutual fund savings directly via a smartphone or tablet device. There are mobile applications (apps) for Android, iPhone, iPad and Windows Phone.
SATISFIED CUSTOMERS IN ALL OUR HOME MARKETSHandelsbanken considers customer satisfac-tion surveys to be very important. Every year, Swedish Quality Index (SKI) and its associ-ated organisation EPSI carry out independent surveys of customer satisfaction. Every year since the surveys started in Sweden in 1989, Handelsbanken has had top positions for both private and corporate customers.
The results for 2013 show that Handels-banken has the most satisfied customers of the four major banks in Sweden. According to the survey, local presence, service and cash handling are all appreciated by the Bank’s customers. The result also shows that the gap
has increased compared to other major banks in Sweden.
The 2013 results show that Handelsbanken also achieved top positions in all our home markets, among both private and corporate customers.
“ When the branches are
closed, Handelsbanken
Direkt Personal Service
is always open.”
In the UK, Handelsbanken continued to have the most satisfied private and corporate customers. The result also shows that customer satisfaction is higher than the average for the sector.
In Denmark, Handelsbanken had the most satisfied private and corporate customers and the result showed that the Bank remains at a stable, high level despite customer satisfaction having fallen for the sector as a whole.
In Finland, the Bank is top-ranked in terms of most satisfied private and corporate customers, as it has been in previous years.
The result in Norway showed that Handels-
Customer satisfaction – Private customers 2013
50
60
70
80
90
DenmarkSweden FinlandUK Norway Nether-lands
Handelsbanken Sector average
Index
Source: SKI/EPSI
Customer satisfaction – Corporate customers 2013
50
60
70
80
90
Handelsbanken Sector average
Index
DenmarkSweden FinlandUK Norway Nether-lands
Source: SKI/EPSI
* According to SKI (Swedish Quality Index), since surveys started in 1989, Handelsbanken has had the most satisfied private customers among the four major Swedish banks – Handelsbanken, Nordea, SEB and Swedbank.
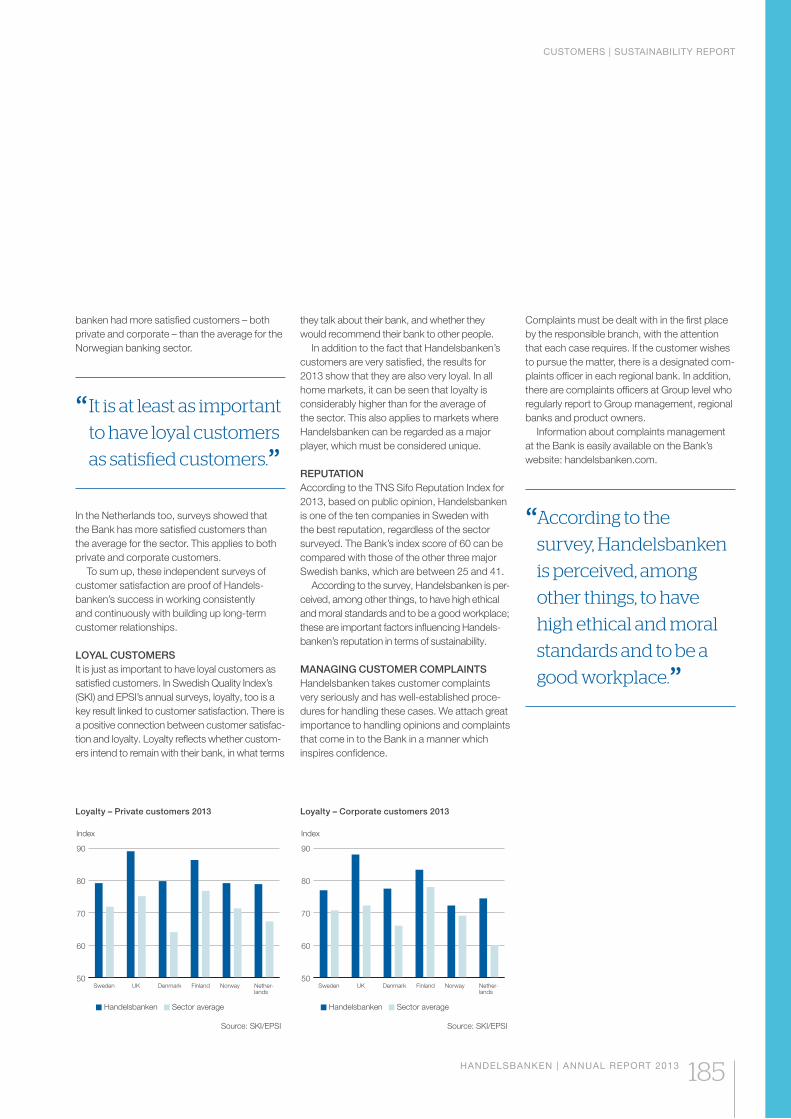
CUSTOMERS | SUSTAINABILITY REPORT
HANDELSBANKEN | ANNUAL REPORT 2013 185
banken had more satisfied customers – both private and corporate – than the average for the Norwegian banking sector.
“ It is at least as important
to have loyal customers
as satisfied customers.”In the Netherlands too, surveys showed that the Bank has more satisfied customers than the average for the sector. This applies to both private and corporate customers.
To sum up, these independent surveys of customer satisfaction are proof of Handels-banken’s success in working consistently and continuously with building up long-term customer relationships.
LOYAL CUSTOMERSIt is just as important to have loyal customers as satisfied customers. In Swedish Quality Index’s (SKI) and EPSI’s annual surveys, loyalty, too is a key result linked to customer satisfaction. There is a positive connection between customer satisfac-tion and loyalty. Loyalty reflects whether custom-ers intend to remain with their bank, in what terms
they talk about their bank, and whether they would recommend their bank to other people.
In addition to the fact that Handelsbanken’s customers are very satisfied, the results for 2013 show that they are also very loyal. In all home markets, it can be seen that loyalty is considerably higher than for the average of the sector. This also applies to markets where Handelsbanken can be regarded as a major player, which must be considered unique.
REPUTATIONAccording to the TNS Sifo Reputation Index for 2013, based on public opinion, Handelsbanken is one of the ten companies in Sweden with the best reputation, regardless of the sector surveyed. The Bank’s index score of 60 can be compared with those of the other three major Swedish banks, which are between 25 and 41.
According to the survey, Handelsbanken is per-ceived, among other things, to have high ethical and moral standards and to be a good workplace; these are important factors influencing Handels-banken’s reputation in terms of sustainability.
MANAGING CUSTOMER COMPLAINTSHandelsbanken takes customer complaints very seriously and has well-established proce-dures for handling these cases. We attach great importance to handling opinions and complaints that come in to the Bank in a manner which inspires confidence.
Complaints must be dealt with in the first place by the responsible branch, with the attention that each case requires. If the customer wishes to pursue the matter, there is a desig nated com-plaints officer in each regional bank. In addition, there are complaints officers at Group level who regularly report to Group management, regional banks and product owners.
Information about complaints management at the Bank is easily available on the Bank’s website: handelsbanken.com.
“ According to the
survey, Handelsbanken
is perceived, among
other things, to have
high ethical and moral
standards and to be a
good workplace.”
Loyalty – Private customers 2013
50
60
70
80
90
Handelsbanken Sector average
Index
DenmarkSweden FinlandUK Norway Nether-lands
Source: SKI/EPSI
Loyalty – Corporate customers 2013
50
60
70
80
90
Handelsbanken Sector average
Index
DenmarkSweden FinlandUK Norway Nether-lands
Source: SKI/EPSI
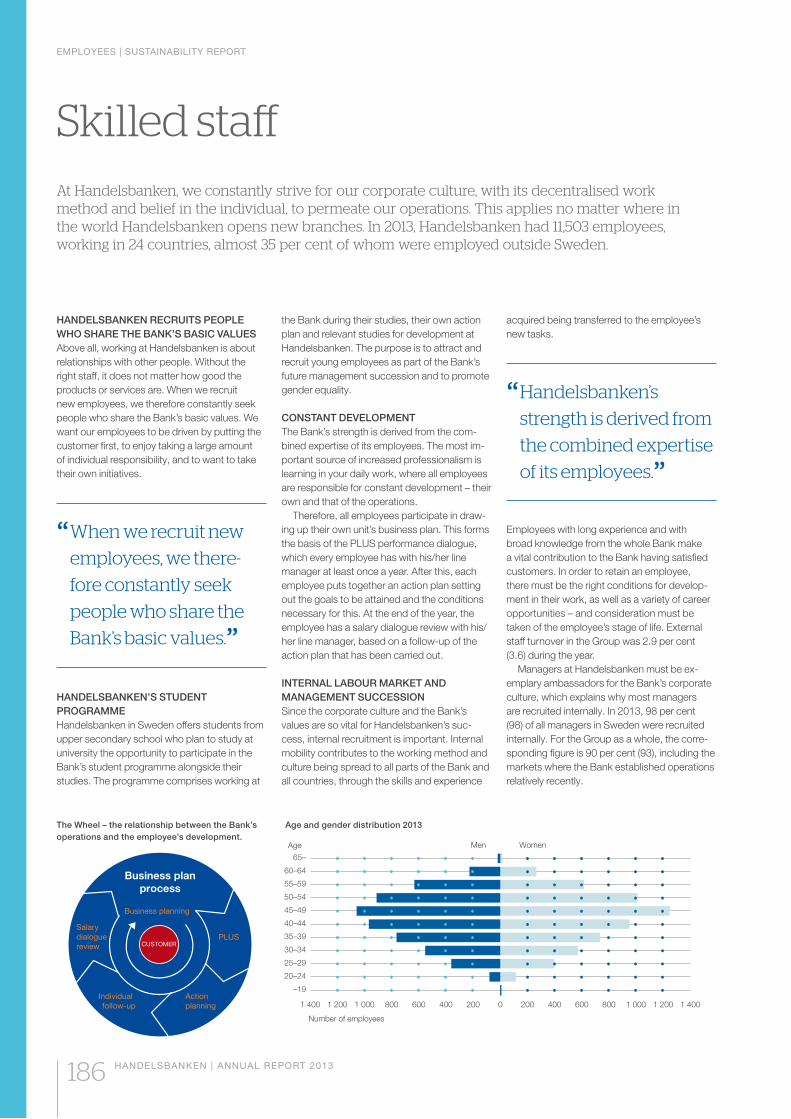
EMPLOYEES | SUSTAINABILITY REPORT
186 HANDELSBANKEN | ANNUAL REPORT 2013
Skilled staffAt Handelsbanken, we constantly strive for our corporate culture, with its decentralised work method and belief in the individual, to permeate our operations. This applies no matter where in the world Handelsbanken opens new branches. In 2013, Handelsbanken had 11,503 employees, working in 24 countries, almost 35 per cent of whom were employed outside Sweden.
HANDELSBANKEN RECRUITS PEOPLE WHO SHARE THE BANK’S BASIC VALUES Above all, working at Handelsbanken is about relationships with other people. Without the right staff, it does not matter how good the products or services are. When we recruit new employees, we therefore constantly seek people who share the Bank’s basic values. We want our employees to be driven by putting the customer first, to enjoy taking a large amount of individual responsibility, and to want to take their own initiatives.
“ When we recruit new
employees, we there-
fore constantly seek
people who share the
Bank’s basic values.”HANDELSBANKEN’S STUDENT PROGRAMMEHandelsbanken in Sweden offers students from upper secondary school who plan to study at university the opportunity to participate in the Bank’s student programme alongside their studies. The programme comprises working at
the Bank during their studies, their own action plan and relevant studies for development at Handelsbanken. The purpose is to attract and recruit young employees as part of the Bank’s future management succession and to promote gender equality.
CONSTANT DEVELOPMENTThe Bank’s strength is derived from the com-bined expertise of its employees. The most im-portant source of increased professionalism is learning in your daily work, where all employees are responsible for constant development – their own and that of the operations.
Therefore, all employees participate in draw-ing up their own unit’s business plan. This forms the basis of the PLUS performance dialogue, which every employee has with his/her line manager at least once a year. After this, each employee puts together an action plan setting out the goals to be attained and the conditions necessary for this. At the end of the year, the employee has a salary dialogue review with his/her line manager, based on a follow-up of the action plan that has been carried out.
INTERNAL LABOUR MARKET AND MANAGEMENT SUCCESSIONSince the corporate culture and the Bank’s values are so vital for Handelsbanken’s suc-cess, internal recruitment is important. Internal mobility contributes to the working method and culture being spread to all parts of the Bank and all countries, through the skills and experience
acquired being transferred to the employee’s new tasks.
“ Handelsbanken’s
strength is derived from
the combined expertise
of its employees.”Employees with long experience and with broad knowledge from the whole Bank make a vital contribution to the Bank having satisfied customers. In order to retain an employee, there must be the right conditions for develop-ment in their work, as well as a variety of career opportunities – and consideration must be taken of the employee’s stage of life. External staff turnover in the Group was 2.9 per cent (3.6) during the year.
Managers at Handelsbanken must be ex-emplary ambassadors for the Bank’s corporate culture, which explains why most managers are recruited internally. In 2013, 98 per cent (98) of all managers in Sweden were recruited internally. For the Group as a whole, the corre-sponding figure is 90 per cent (93), including the markets where the Bank established operations relatively recently.
Age and gender distribution 2013
200 400 600 800 1 000 1 200 1 4001 400 1 200 1 000 800 600 400 200 0
–19
20–24
25–29
30–34
35–39
40–44
45–49
50–54
55–59
60–64
65–
Number of employees
WomenMenAge
PLUS
Actionplanning
Individual follow-up
Business planning
Business planprocess
Salarydialoguereview CUSTOMER
The Wheel – the relationship between the Bank’s operations and the employee’s development.
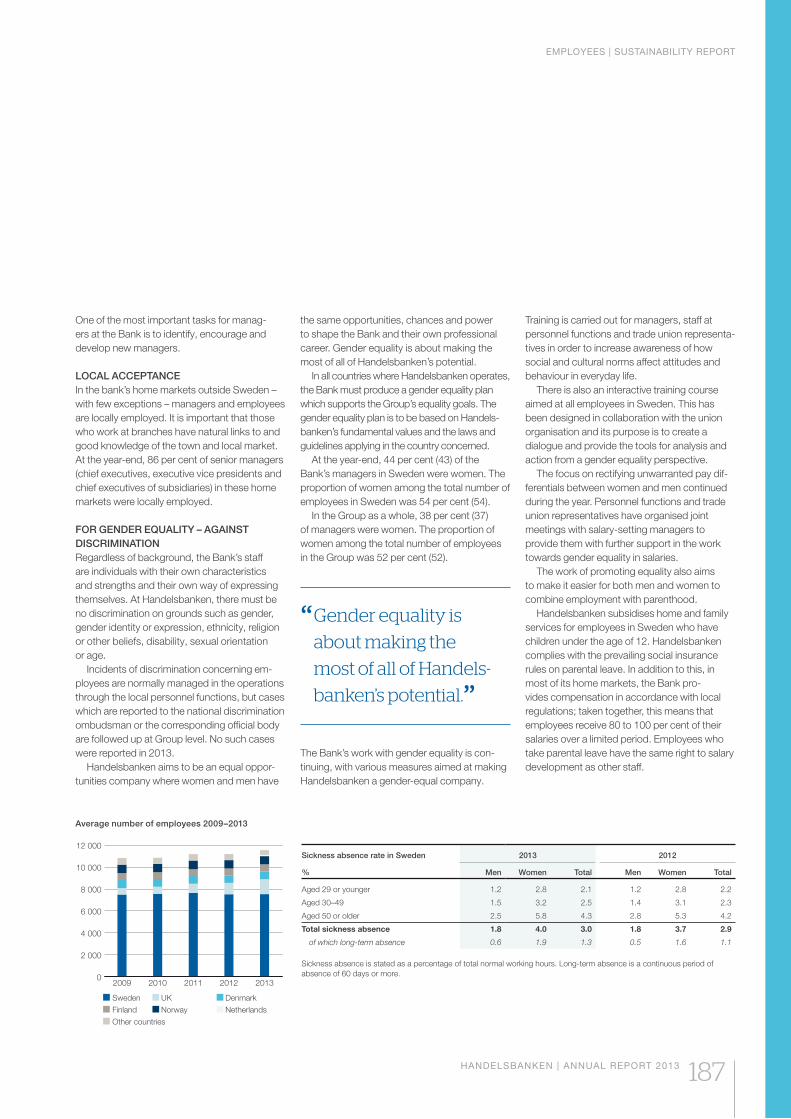
EMPLOYEES | SUSTAINABILITY REPORT
HANDELSBANKEN | ANNUAL REPORT 2013 187
Sickness absence rate in Sweden 2013 2012
% Men Women Total Men Women Total
Aged 29 or younger 1.2 2.8 2.1 1.2 2.8 2.2
Aged 30–49 1.5 3.2 2.5 1.4 3.1 2.3
Aged 50 or older 2.5 5.8 4.3 2.8 5.3 4.2
Total sickness absence 1.8 4.0 3.0 1.8 3.7 2.9
of which long-term absence 0.6 1.9 1.3 0.5 1.6 1.1
Sickness absence is stated as a percentage of total normal working hours. Long-term absence is a continuous period of absence of 60 days or more.
One of the most important tasks for manag-ers at the Bank is to identify, encourage and develop new managers.
LOCAL ACCEPTANCEIn the bank’s home markets outside Sweden – with few exceptions – managers and employees are locally employed. It is important that those who work at branches have natural links to and good knowledge of the town and local market. At the year-end, 86 per cent of senior managers (chief executives, executive vice presidents and chief executives of subsidiaries) in these home markets were locally employed.
FOR GENDER EQUALITY – AGAINST DISCRIMINATIONRegardless of background, the Bank’s staff are individuals with their own characteristics and strengths and their own way of expressing themselves. At Handelsbanken, there must be no discrimination on grounds such as gender, gender identity or expression, ethnicity, religion or other beliefs, disability, sexual orientation or age.
Incidents of discrimination concerning em-ployees are normally managed in the operations through the local personnel functions, but cases which are reported to the national discrimination ombudsman or the corresponding official body are followed up at Group level. No such cases were reported in 2013.
Handelsbanken aims to be an equal oppor-tunities company where women and men have
the same opportunities, chances and power to shape the Bank and their own professional career. Gender equality is about making the most of all of Handelsbanken’s potential.
In all countries where Handelsbanken operates, the Bank must produce a gender equality plan which supports the Group’s equality goals. The gender equality plan is to be based on Handels-banken’s fundamental values and the laws and guidelines applying in the country concerned.
At the year-end, 44 per cent (43) of the Bank’s managers in Sweden were women. The proportion of women among the total number of employees in Sweden was 54 per cent (54).
In the Group as a whole, 38 per cent (37) of managers were women. The proportion of women among the total number of employees in the Group was 52 per cent (52).
“ Gender equality is
about making the
most of all of Handels-
banken’s potential.”The Bank’s work with gender equality is con-tinuing, with various measures aimed at making Handelsbanken a gender-equal company.
Sweden
Norway Netherlands
Other countries
Finland
0
2 000
4 000
6 000
8 000
10 000
12 000
20132012201120102009
UK Denmark
Average number of employees 2009–2013
Training is carried out for managers, staff at personnel functions and trade union representa-tives in order to increase awareness of how social and cultural norms affect attitudes and behaviour in everyday life.
There is also an interactive training course aimed at all employees in Sweden. This has been designed in collaboration with the union organisation and its purpose is to create a dialogue and provide the tools for analysis and action from a gender equality perspective.
The focus on rectifying unwarranted pay dif-ferentials between women and men continued during the year. Personnel functions and trade union representatives have organised joint meetings with salary-setting managers to provide them with further support in the work towards gender equality in salaries.
The work of promoting equality also aims to make it easier for both men and women to combine employment with parenthood.
Handelsbanken subsidises home and family services for employees in Sweden who have children under the age of 12. Handelsbanken complies with the prevailing social insurance rules on parental leave. In addition to this, in most of its home markets, the Bank pro-vides compensation in accordance with local regulations; taken together, this means that employees receive 80 to 100 per cent of their salaries over a limited period. Employees who take parental leave have the same right to salary development as other staff.
EMPLOYEES | SUSTAINABILITY REPORT
188 HANDELSBANKEN | ANNUAL REPORT 2013
WORK ENVIRONMENT AND HEALTHHandelsbanken’s overall goal with its work environment work focuses on employees enjoying good health, developing on a personal level and functioning in an optimal way. This is a long-term goal that includes factors such as clear and honest communication, having the skills and competence and the right conditions needed to perform tasks and deal with work-related situations, having pride and confidence in one’s work, respecting others, and being respected oneself.
All employees are responsible for creating a positive working environment at Handelsbanken. In co-operation with staff and employee repre-sentatives, managers are responsible for devel-oping a healthy and safe workplace in accord-ance with the Bank’s work environment goal.
In Sweden, managers who have been as-signed responsibility for the work environment must, in collaboration with work environment representatives and other staff, compile a work environment status report at least once a year. This includes the employees’ physical and psychosocial environment. The results are discussed within each unit at the Bank, and any measures decided upon must be integrated into the business plan/operational plan.
Health promotion and work environment activities are components of the long-term pro-cess, called Sustainable Health, to create the conditions for good physical and mental health in the workplace.
In connection with crisis situations, for many years, Handelsbanken has had a support pro-gramme with the help of external partners.
Employees are offered a wide choice and large number of subsidised group and individual healthcare and health promotion activities. Handelsbanken has had a sports association since 1919. With 4,000 members, the associa-tion is one of the largest of its kind in Sweden.
To stimulate interest in art and crafts the Bank also has an Art Association with just over 3,500 members. It is the largest art association in Sweden.
WORKING CONDITIONS AND UNION RIGHTSAll employees of Handelsbanken have the right to organise and join a union or employee organisation. Handelsbanken’s traditional good relationship with unions is a valuable compo-nent of Handelsbanken’s culture. All employees in Denmark, Finland, France, Luxembourg, Norway, Sweden and Austria, comprising almost 85 per cent of the Bank’s employees, are covered by collective bargaining agree-ments. In these countries, employees who are not members of a union are also covered by the terms of the collective agreement. The number
of employees has increased in countries which traditionally have a low rate of membership of collective bargaining agreements. For this reason, the proportion of employees who are covered by a collective bargaining agreement has fallen slightly.
Various matters in Sweden, such as organi-sational changes, are regulated in Handels-banken’s co-determination agreement with the Financial Sector Union of Sweden’s local bodies and in the collective agreement between the Employers’ Association of the Swedish Banking Institutions (BAO) and Jusek, the Swedish Association of Graduates in Business Administration and Economics and the Swedish Association of Graduate Engineers.
There is an ongoing dialogue between union representatives and managers concerning operations – such as when changes and new services are to be launched – where valuable in-formation is exchanged at the very early stages. In addition to the matters which are dealt with in a dialogue with the union organisations in each country, there is also Handelsbanken’s European Work Council (EWC), which functions as a forum for joint and cross-border questions within the Handelsbanken Group. The EWC consists of representatives from nine countries: Denmark, Finland, Luxembourg, the Nether-lands, Norway, Poland, the UK, Sweden and Germany.
“ Handelsbanken has
had a sports association
since 1919. With 4,000
members, the associa-
tion is one of the largest
of its kind in Sweden.”STAFF MAGAZINEHandelsbanken’s staff magazine, Remissan, started in 1948 and is a publication which is made by and for the employees of the Bank. Remissan’s task is to create a sense of com-munity, belonging and commitment among the employees, and to reflect Handelsbanken’s culture throughout the Group. The magazine is published in Swedish and English.
PENSIONS AND OTHER CONDITIONSHandelsbanken aims to be an attractive em-ployer. The Bank therefore offers various types
of competitive benefits, for both permanent and temporary employees in the Group.
Pension benefits are part of the total com-pensation to employees of Handelsbanken. The pension terms in the countries where the Bank pursues its operations must be competitive and adapted to legislation and regulations, in accordance with the local conditions prevailing in each country.
An occupational pension plan can include a retirement pension, disability pension and surviving family member protection. The pen-sion benefits which can be offered to employees of Handelsbanken are defined benefit, defined contribution or a combination of the two.
In the Bank’s home markets, employees are offered credits on favourable terms. These cred-its are mainly granted for housing purposes. The terms differ between countries depending on the local conditions, and in Norway and Sweden, this is a taxable benefit.
OKTOGONEN – THE BANK’S PROFIT-SHARING SCHEMEA condition for achieving the Bank’s financial goal of achieving better profitability than peer banks in its home markets is that employees outperform their peers in the rest of the sector. Therefore, the Board considers it reasonable that employees should receive a share of any extra profits. Every year but two since 1973, Handelsbanken has allocated part of the Bank’s profits to a profit-sharing scheme for its employ-ees. The funds are managed by the Oktogonen Foundation.
Allocations are subject to the Handelsbanken Group achieving its goal of higher return on equity than a weighted average of compara-ble listed Nordic, UK and Dutch banks. If this is satisfied, one third of the extra profits can be allocated to the employees. The allocated amount is limited to 15 per cent of the dividends to shareholders. If the Bank reduces the divi-dend paid out to its shareholders, no allocation can be made to the profit-sharing foundation. All employees receive an equal part of the allocated amount and the scheme includes all employ-ees in the Bank’s home markets. In recent years, employees in Hong Kong, Luxembourg, Poland, Singapore and Taipei have also been included in Oktogonen.
Some 97 per cent of the Group’s employees are now covered by Oktogonen. The profit-sharing scheme is long-term, as payments can-not be made until the year when an employee reaches the age of 60.
One of the fundamental concepts in manag-ing the foundation is that the funds are invested in shares in Handelsbanken.
The Oktogonen Foundation has two repre-sentatives on Handels banken’s Board.
OWNERS | SUSTAINABILITY REPORT
HANDELSBANKEN | ANNUAL REPORT 2013 189
Corporate GovernanceA Swedish bank’s operations are regulated by Swedish law, and banking operations may only be run with a licence from the Swedish Financial Supervisory Authority.
Handelsbanken applies Swedish regulations in its operations, both in and outside Sweden. The main principle is that outside Sweden, the host country’s regulations are also applied, if these are stricter or deviate in other respects.
Handelsbanken’s corporate governance report is based on a shareholder perspective. There are, however, also other stakeholders with an interest in Handelsbanken’s corporate governance, upon whose confidence the Bank is dependent. These include customers, em-ployees, shareholders, bond investors and the community in general.
“ Handelsbanken’s strong
corporate culture is of
major importance in
the governance of the
Bank.”PRINCIPLES FOR CORPORATE GOVERNANCE AT HANDELSBANKENHandelsbanken has developed a strong cor-porate culture for how banking work should be
carried out. The Bank has a decentralised work-ing method with a high degree of autonomy ex-tending throughout the organisational structure. This corporate culture is described in detail in an internal document called Our Way, which sets out the Bank’s goals, business concept and working method. All employees receive a personal copy of Our Way.
Handelsbanken’s strong corporate culture is of major importance in the governance of the Bank. It works in parallel with and perme-ates the principles, strategies, limits and target figures stated in policy documents and instruc-tions.
Handelsbanken’s Board has decided on the Bank’s policy in a number of central sustain-ability issues, in particular by adopting ethical guidelines for the Handelsbanken Group which comprise matters such as economic crime, relations with customers, conflicts of interest, confidentiality and the environment.
Internal controlThe responsibility for internal control and the Bank’s compliance is an integral part of manag-ers’ responsibility at all levels in the Bank. This responsibility means that fit-for-purpose instruc-tions and procedures for the operation must be in place, and compliance with these procedures is monitored regularly.
The compliance function offers advice and support in regulatory matters and follows up
compliance within the Bank. Internal control and compliance work are subject to internal and external risk-based auditing.
Sustainability issues, too, are part of the responsibility of all managers within the Group. According to the Bank’s procedures, planning and personal development dialogues (PLUS) must also be held with managers and in these discussions, the manager’s work with sustain-ability matters is followed up.
“ Sustainability issues,
too, are part of the
responsibility of all
managers within the
Group.”
A SELECTION OF POLICY DOCUMENTS ESTABLISHED BY THE BOARD:
A SELECTION OF CODES OF CONDUCT IN THE PERSONNEL AREA:
MORE INFORMATIONFor more information, please see the Bank’s full corporate governance report, which can be found on pages 49–63 of the Annual Report.
More information about Handelsbanken’s corporate governance is available at handelsbanken.se/ireng. The site includes the following information:
2007 onwards
2004 onwards.
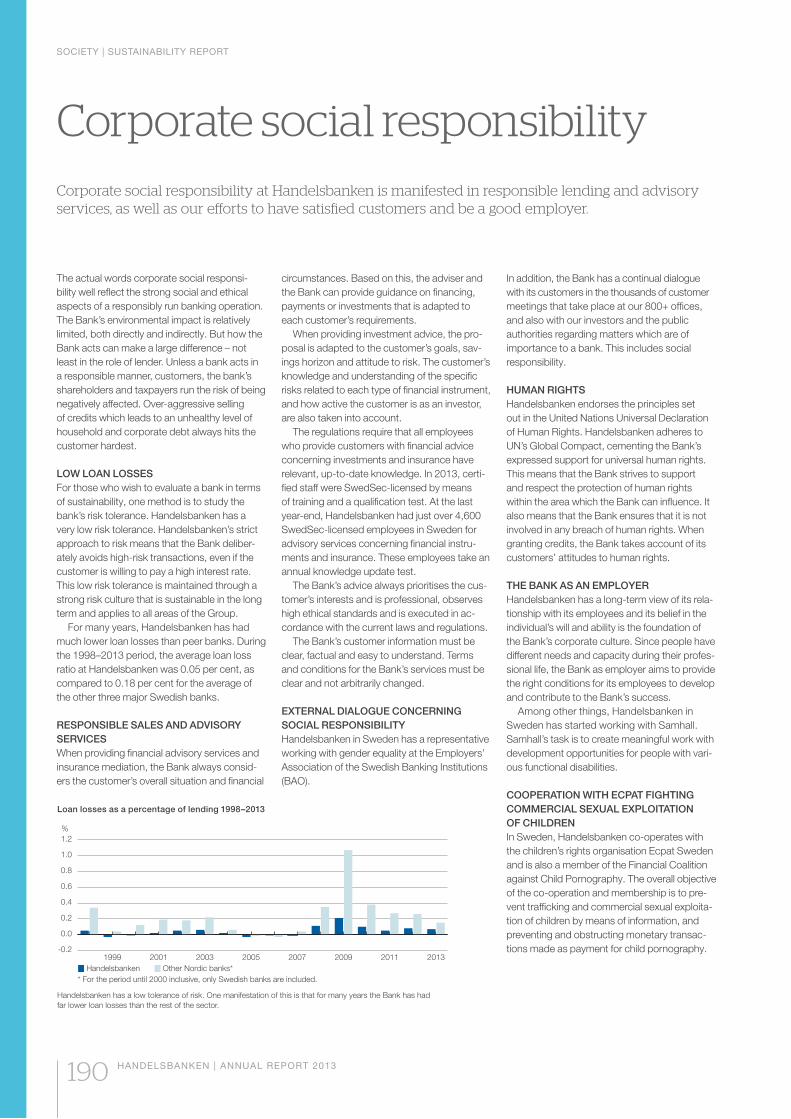
SOCIETY | SUSTAINABILITY REPORT
190 HANDELSBANKEN | ANNUAL REPORT 2013
-0.2
0.0
0.2
0.4
0.6
0.8
1.0
1.2
20132011200920072005200320011999Handelsbanken Other Nordic banks*
%
* For the period until 2000 inclusive, only Swedish banks are included.
Corporate social responsibilityCorporate social responsibility at Handelsbanken is manifested in responsible lending and advisory services, as well as our efforts to have satisfied customers and be a good employer.
The actual words corporate social responsi-bility well reflect the strong social and ethical aspects of a responsibly run banking operation. The Bank’s environmental impact is relatively limited, both directly and indirectly. But how the Bank acts can make a large difference – not least in the role of lender. Unless a bank acts in a responsible manner, customers, the bank’s shareholders and taxpayers run the risk of being negatively affected. Over-aggressive selling of credits which leads to an unhealthy level of household and corporate debt always hits the customer hardest.
LOW LOAN LOSSESFor those who wish to evaluate a bank in terms of sustainability, one method is to study the bank’s risk tolerance. Handelsbanken has a very low risk tolerance. Handelsbanken’s strict approach to risk means that the Bank deliber-ately avoids high-risk transactions, even if the customer is willing to pay a high interest rate. This low risk tolerance is maintained through a strong risk culture that is sustainable in the long term and applies to all areas of the Group.
For many years, Handelsbanken has had much lower loan losses than peer banks. During the 1998–2013 period, the average loan loss ratio at Handelsbanken was 0.05 per cent, as compared to 0.18 per cent for the average of the other three major Swedish banks.
RESPONSIBLE SALES AND ADVISORY SERVICESWhen providing financial advisory services and insurance mediation, the Bank always consid-ers the customer’s overall situation and financial
circumstances. Based on this, the adviser and the Bank can provide guidance on financing, payments or investments that is adapted to each customer’s requirements.
When providing investment advice, the pro-posal is adapted to the customer’s goals, sav-ings horizon and attitude to risk. The customer’s knowledge and understanding of the specific risks related to each type of financial instrument, and how active the customer is as an investor, are also taken into account.
The regulations require that all employees who provide customers with financial advice concerning investments and insurance have relevant, up-to-date knowledge. In 2013, certi-fied staff were SwedSec-licensed by means of training and a qualification test. At the last year-end, Handelsbanken had just over 4,600 SwedSec-licensed employees in Sweden for advisory services concerning financial instru-ments and insurance. These employees take an annual knowledge update test.
The Bank’s advice always prioritises the cus-tomer’s interests and is professional, observes high ethical standards and is executed in ac-cordance with the current laws and regulations.
The Bank’s customer information must be clear, factual and easy to understand. Terms and conditions for the Bank’s services must be clear and not arbitrarily changed.
EXTERNAL DIALOGUE CONCERNING SOCIAL RESPONSIBILITYHandelsbanken in Sweden has a representative working with gender equality at the Employers’ Association of the Swedish Banking Institutions (BAO).
In addition, the Bank has a continual dialogue with its customers in the thousands of customer meetings that take place at our 800+ offices, and also with our investors and the public authorities regarding matters which are of importance to a bank. This includes social responsibility.
HUMAN RIGHTSHandelsbanken endorses the principles set out in the United Nations Universal Declaration of Human Rights. Handelsbanken adheres to UN’s Global Compact, cementing the Bank’s expressed support for universal human rights.This means that the Bank strives to support and respect the protection of human rights within the area which the Bank can influence. It also means that the Bank ensures that it is not involved in any breach of human rights. When granting credits, the Bank takes account of its customers’ attitudes to human rights.
THE BANK AS AN EMPLOYERHandelsbanken has a long-term view of its rela-tionship with its employees and its belief in the individual’s will and ability is the foundation of the Bank’s corporate culture. Since people have different needs and capacity during their profes-sional life, the Bank as employer aims to provide the right conditions for its employees to develop and contribute to the Bank’s success.
Among other things, Handelsbanken in Sweden has started working with Samhall. Samhall’s task is to create meaningful work with development opportunities for people with vari-ous functional disabilities.
COOPERATION WITH ECPAT FIGHTING COMMERCIAL SEXUAL EXPLOITATION OF CHILDRENIn Sweden, Handelsbanken co-operates with the children’s rights organisation Ecpat Sweden and is also a member of the Financial Coalition against Child Pornography. The overall objective of the co-operation and membership is to pre-vent trafficking and commercial sexual exploita-tion of children by means of information, and preventing and obstructing monetary transac-tions made as payment for child porno graphy.
Loan losses as a percentage of lending 1998–2013
Handelsbanken has a low tolerance of risk. One manifestation of this is that for many years the Bank has had far lower loan losses than the rest of the sector.
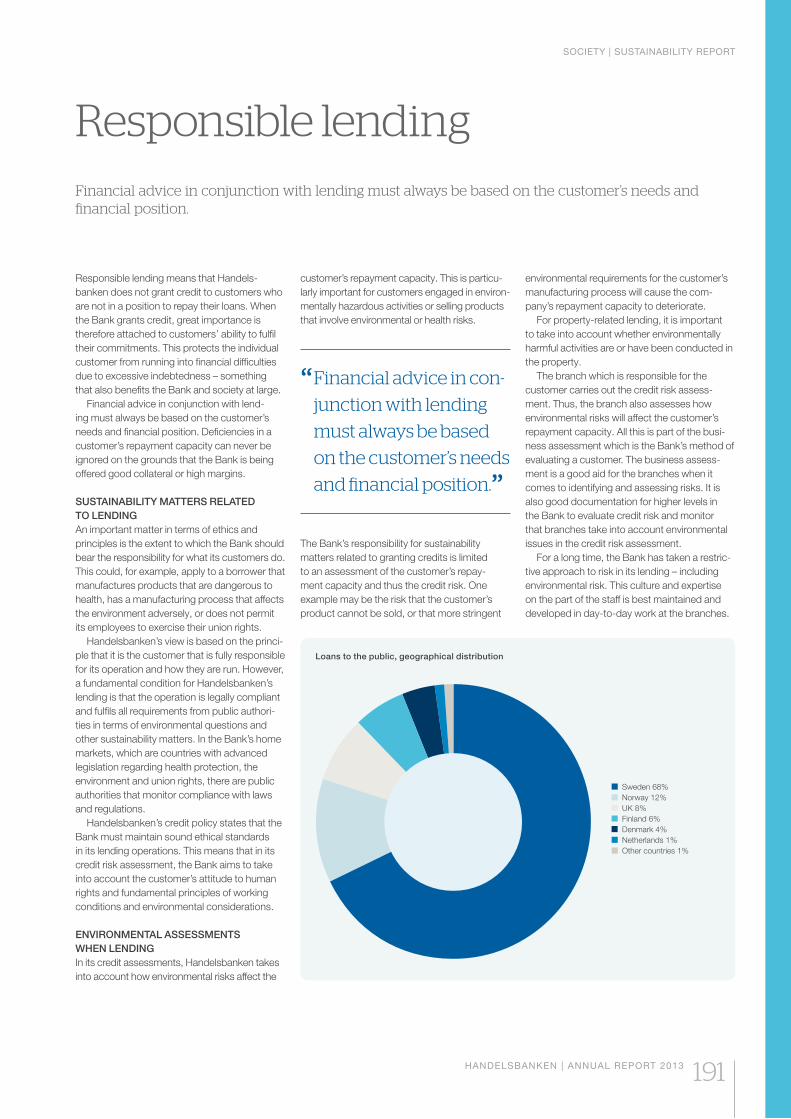
SOCIETY | SUSTAINABILITY REPORT
HANDELSBANKEN | ANNUAL REPORT 2013 191
Responsible lendingFinancial advice in conjunction with lending must always be based on the customer’s needs and financial position.
Responsible lending means that Handels-banken does not grant credit to customers who are not in a position to repay their loans. When the Bank grants credit, great importance is therefore attached to customers’ ability to fulfil their commitments. This protects the individual customer from running into financial difficulties due to excessive indebtedness – something that also benefits the Bank and society at large.
Financial advice in conjunction with lend-ing must always be based on the customer’s needs and financial position. Deficiencies in a customer’s repayment capacity can never be ignored on the grounds that the Bank is being offered good collateral or high margins.
SUSTAINABILITY MATTERS RELATED TO LENDINGAn important matter in terms of ethics and principles is the extent to which the Bank should bear the responsibility for what its customers do. This could, for example, apply to a borrower that manufactures products that are dangerous to health, has a manufacturing process that affects the environment adversely, or does not permit its employees to exercise their union rights.
Handelsbanken’s view is based on the princi-ple that it is the customer that is fully responsible for its operation and how they are run. However, a fundamental condition for Handelsbanken’s lending is that the operation is legally compliant and fulfils all requirements from public authori-ties in terms of environmental questions and other sustainability matters. In the Bank’s home markets, which are countries with advanced legislation regarding health protection, the environment and union rights, there are public authorities that monitor compliance with laws and regulations.
Handelsbanken’s credit policy states that the Bank must maintain sound ethical standards in its lending operations. This means that in its credit risk assessment, the Bank aims to take into account the customer’s attitude to human rights and fundamental principles of working conditions and environmental considerations.
ENVIRONMENTAL ASSESSMENTS WHEN LENDINGIn its credit assessments, Handelsbanken takes into account how environmental risks affect the
customer’s repayment capacity. This is particu-larly important for customers engaged in environ-mentally hazardous activities or selling products that involve environmental or health risks.
“ Financial advice in con-
junction with lending
must always be based
on the customer’s needs
and financial position.”The Bank’s responsibility for sustainability matters related to granting credits is limited to an assessment of the customer’s repay-ment capacity and thus the credit risk. One example may be the risk that the customer’s product cannot be sold, or that more stringent
environmental requirements for the customer’s manufacturing process will cause the com-pany’s repayment capacity to deteriorate.
For property-related lending, it is important to take into account whether environmentally harmful activities are or have been conducted in the property.
The branch which is responsible for the customer carries out the credit risk assess-ment. Thus, the branch also assesses how environmental risks will affect the customer’s repayment capacity. All this is part of the busi-ness assessment which is the Bank’s method of evaluating a customer. The business assess-ment is a good aid for the branches when it comes to identifying and assessing risks. It is also good documentation for higher levels in the Bank to evaluate credit risk and monitor that branches take into account environmental issues in the credit risk assessment.
For a long time, the Bank has taken a restric-tive approach to risk in its lending – including environmental risk. This culture and expertise on the part of the staff is best maintained and developed in day-to-day work at the branches.
Loans to the public, geographical distribution
Sweden 68%Norway 12%UK 8%Finland 6%Denmark 4%Netherlands 1%Other countries 1%
SOCIETY | SUSTAINABILITY REPORT
192 HANDELSBANKEN | ANNUAL REPORT 2013
Responsible investmentsHandelsbanken integrates sustainability matters with investment decisions which we make on behalf of our customers. This is a condition for creating long-term value growth. This work is based on the UN Principles for Responsible Investment, PRI.
A responsible attitude is essential to long-term value creation on capital markets. Investing our customers’ assets in a responsible manner is therefore a vital prerequisite for achieving our goal of generating a strong long-term return in Handelsbanken’s mutual funds.
Global Compact – a UN initiative which has established a number of principles, relating to human rights, labour rights, corruption and environmental damage – also acts as guidance for the Bank in its work with responsible invest-ments.
Handelsbanken integrates sustainability matters with the investment decisions made on behalf of customers. Our approach to this work is based on the UN Principles for Responsible Investment, PRI, which Handelsbanken signed in 2009. These principles now guide the way in which asset managers and capital owners work with sustainability issues. Signing PRI means that we are committed to integrating sustain-ability matters into research and investment decisions, and to be involved in greater trans-parency relating to environmental, social and corporate governance matters in the compa-nies that Handelsbanken Fonder invests in.
CORPORATE GOVERNANCE IN HANDELSBANKEN’S FUNDSThe Bank’s fund management company, Handelsbanken Fonder, exercises its owner-ship role in the companies in which its mutual funds own shares, on behalf of the unit-holders. It exercises its ownership role with the goal that the value of the companies, and thus the value
of the funds, has optimal performance in the long term. This occurs, for example, in matters concerning the composition of the companies’ boards and the procedure prior to and at share-holders’ meetings. Ahead of annual general meetings in 2013, Handelsbanken Fonder participated in nine nomination committees. In addition, Handelsbanken Fonder voted at 55 annual general meetings.
RESPONSIBLE INVESTMENTS AT HANDELSBANKEN LIVThe Bank’s insurance company, Handels-banken Liv, has investment guidelines based on Global Compact and the UN Principles for Responsible Investment, PRI. Responsible asset management is a condition both for long-term value creation and for meeting customer demand. When Handelsbanken Liv selects and evaluates asset managers, funds and fund management companies for traditional insur-ance and unit-linked insurance, account must be taken of Global Compact and PRI.
ANALYSIS AND ACTIONAll holdings in the funds and portfolios managed by Handelsbanken Fonder are regularly reviewed, with Global Compact as one of the starting points. These international standards and con-ventions form the foundation of Handelsbanken Fonder’s policy for responsible investments.
This analysis is part of the fund management but is also carried out with the help of external experts on responsible investment. Thus, we are able to follow up deviations from these standards, for example by having a dialogue with the company in question. Depending on how this dialogue evolves, we decide on pos-sible future action.
Our integrated work method means that we readily discuss sustainability issues as part of the ongoing dialogue we have with the companies that we invest in. The dialogue takes the form of regular meetings with company management and other representatives of the companies. In 2013, analysts and portfolio managers at Handels-banken Fonder held one or more meetings with around 1,300 corporate management teams or corporate representatives worldwide. In 2013, Handelsbanken Fonder specifically broached the subject of deviations from international standards and conventions with some 20 companies.
Handelsbanken Fonder does not invest in
companies which are involved in manufacturing or selling prohibited weapons as defined ac-cording to international legislation. This applies, for example, to cluster weapons and landmines.
FUNDS WITH SPECIAL CRITERIAHandelsbanken Fonder also offers funds which observe special criteria in their investment strategy. Sweden Index Criteria and Global Index Criteria exclude companies which operate in certain sectors which can be considered con-troversial. These funds continued to see a good inflow of capital in 2013. Together with some other products with a sustainability profile aimed at institutional investors, these funds have total assets of SEK 15 billion.
INVESTMENTS IN COMMODITIESAs a rule, financial investments in commodities take place through the purchase of financial instruments such as derivatives, often on the futures market. This market exists mainly so that producers and purchasers of various commodi-ties can reduce the effect of price changes, but it also provides investors with the opportunity to benefit from movements in commodity prices.
Although supply and demand for the underly-ing physical commodity ultimately determine the price, some maintain that investments in futures create price bubbles. One area is agricultural commodities, where opinions differ. It is important for Handelsbanken to follow this debate and participate where these matters are discussed.
HANDELSBANKEN PARTICIPATES IN SUSTAINABLE VALUE CREATIONTogether with a number of major Swedish institutional investors, in 2013, Handelsbanken Asset Management took part in the Sustainable Value Creation initiative. In a survey, the 100 companies on Nasdaq OMX Stockholm with the highest market capitalisation were asked a series of questions regarding guidelines, im-plementation and governance of sustainability issues. The aim was to provide the companies with a better understanding of the issues that are relevant to investors, and to provide sup-port for the development of communications and reporting. The project members will, in various ways, each use the companies’ survey responses as a basis for their dialogues and investment decisions as owners.
1. Incorporate environmental, social and corporate governance (ESG) issues into investment analysis and decision-making processes
2. Be active owners and incorporate ESG issues into our ownership policies and practices
3. Seek appropriate disclosure on ESG issues by the entities in which we invest
4. Promote acceptance and application of the principles within the investment industry
5. Work together to enhance our effectiveness in implementing the principles
6. Each report on our activities and progress towards implementing the principles
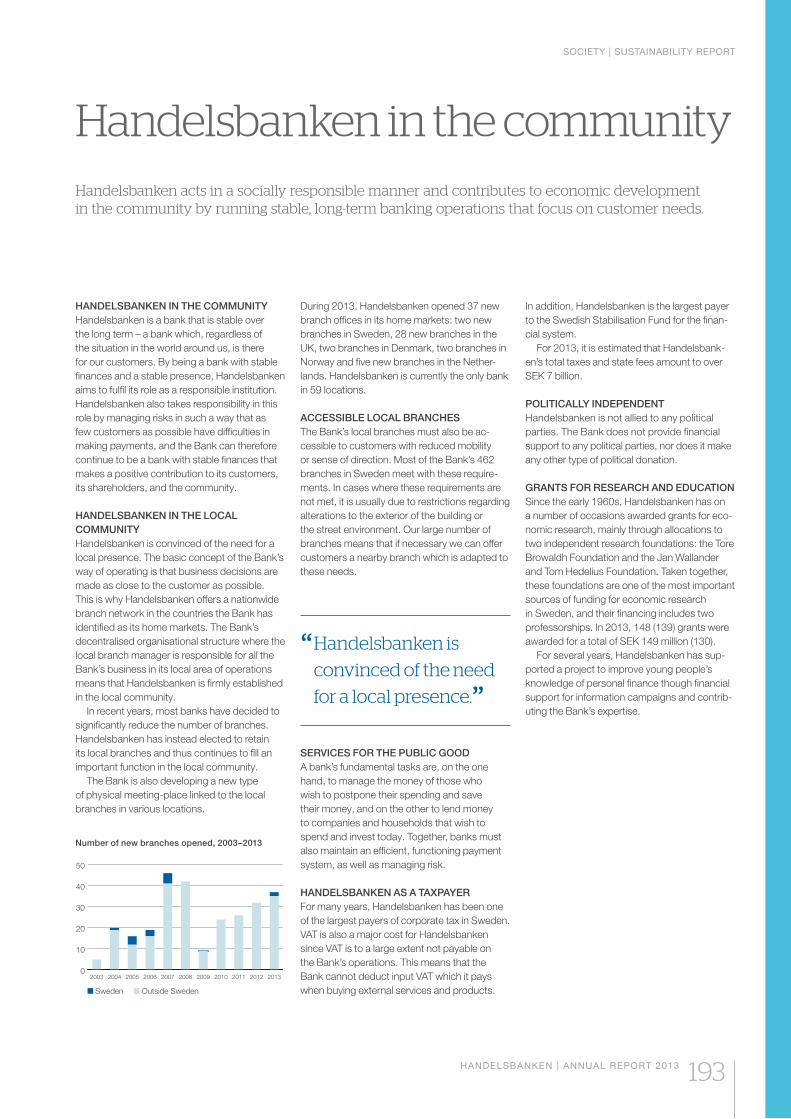
SOCIETY | SUSTAINABILITY REPORT
HANDELSBANKEN | ANNUAL REPORT 2013 193
Handelsbanken in the communityHandelsbanken acts in a socially responsible manner and contributes to economic development in the community by running stable, long-term banking operations that focus on customer needs.
HANDELSBANKEN IN THE COMMUNITYHandelsbanken is a bank that is stable over the long term – a bank which, regardless of the situation in the world around us, is there for our customers. By being a bank with stable finances and a stable presence, Handelsbanken aims to fulfil its role as a responsible institution. Handelsbanken also takes responsibility in this role by managing risks in such a way that as few customers as possible have difficulties in making payments, and the Bank can therefore continue to be a bank with stable finances that makes a positive contribution to its customers, its shareholders, and the community.
HANDELSBANKEN IN THE LOCAL COMMUNITYHandelsbanken is convinced of the need for a local presence. The basic concept of the Bank’s way of operating is that business decisions are made as close to the customer as possible. This is why Handelsbanken offers a nationwide branch network in the countries the Bank has identified as its home markets. The Bank’s decentralised organisational structure where the local branch manager is responsible for all the Bank’s business in its local area of operations means that Handelsbanken is firmly established in the local community.
In recent years, most banks have decided to significantly reduce the number of branches. Handelsbanken has instead elected to retain its local branches and thus continues to fill an important function in the local community.
The Bank is also developing a new type of physical meeting-place linked to the local branches in various locations.
During 2013, Handelsbanken opened 37 new branch offices in its home markets: two new branches in Sweden, 28 new branches in the UK, two branches in Denmark, two branches in Norway and five new branches in the Nether-lands. Handelsbanken is currently the only bank in 59 locations.
ACCESSIBLE LOCAL BRANCHESThe Bank’s local branches must also be ac-cessible to customers with reduced mobility or sense of direction. Most of the Bank’s 462 branches in Sweden meet with these require-ments. In cases where these requirements are not met, it is usually due to restrictions regarding alterations to the exterior of the building or the street environment. Our large number of branches means that if necessary we can offer customers a nearby branch which is adapted to these needs.
“ Handelsbanken is
convinced of the need
for a local presence.”SERVICES FOR THE PUBLIC GOOD A bank’s fundamental tasks are, on the one hand, to manage the money of those who wish to postpone their spending and save their money, and on the other to lend money to companies and households that wish to spend and invest today. Together, banks must also maintain an efficient, functioning payment system, as well as managing risk.
HANDELSBANKEN AS A TAXPAYERFor many years, Handelsbanken has been one of the largest payers of corporate tax in Sweden. VAT is also a major cost for Handelsbanken since VAT is to a large extent not payable on the Bank’s operations. This means that the Bank cannot deduct input VAT which it pays when buying external services and products.
In addition, Handelsbanken is the largest payer to the Swedish Stabilisation Fund for the finan-cial system.
For 2013, it is estimated that Handelsbank-en’s total taxes and state fees amount to over SEK 7 billion.
POLITICALLY INDEPENDENTHandelsbanken is not allied to any political parties. The Bank does not provide financial support to any political parties, nor does it make any other type of political donation.
GRANTS FOR RESEARCH AND EDUCATIONSince the early 1960s, Handelsbanken has on a number of occasions awarded grants for eco-nomic research, mainly through allocations to two independent research foundations: the Tore Browaldh Foundation and the Jan Wallander and Tom Hedelius Foundation. Taken together, these foundations are one of the most important sources of funding for economic research in Sweden, and their financing includes two professorships. In 2013, 148 (139) grants were awarded for a total of SEK 149 million (130).
For several years, Handelsbanken has sup-ported a project to improve young people’s knowledge of personal finance though financial support for information campaigns and contrib-uting the Bank’s expertise.
Sweden Outside Sweden
0
10
20
30
40
50
20132012201120102009200820072006200520042003
Number of new branches opened, 2003–2013
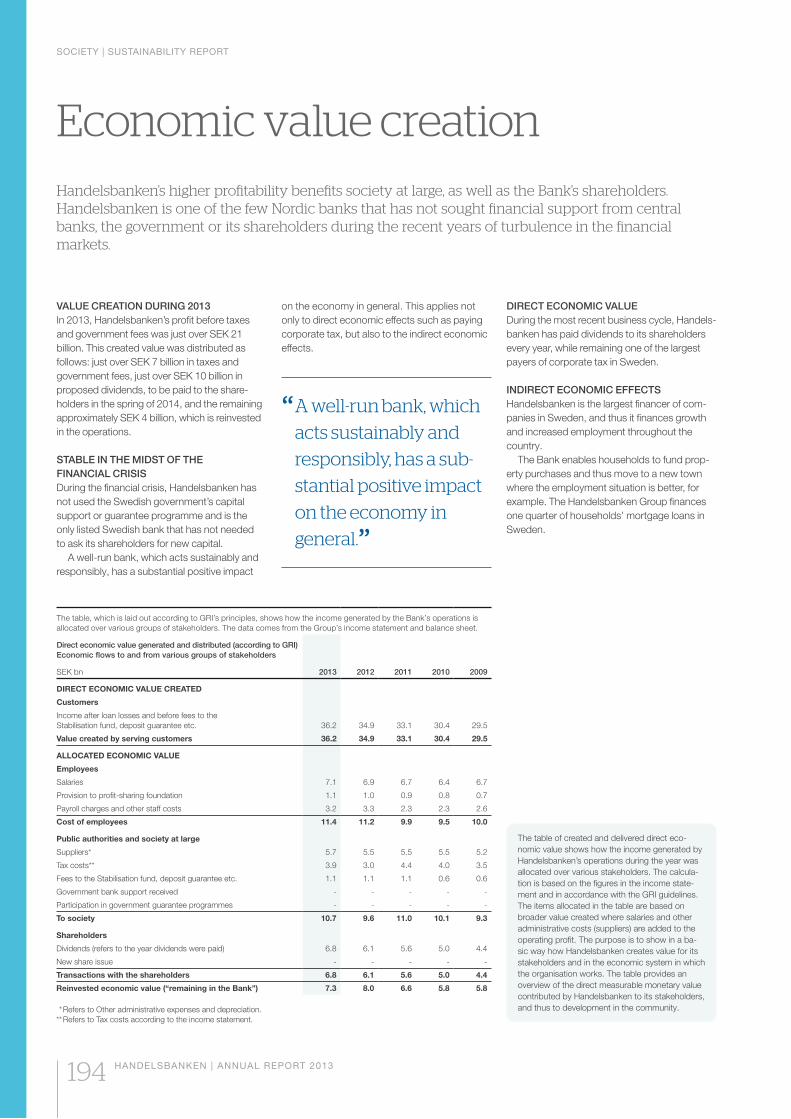
SOCIETY | SUSTAINABILITY REPORT
194 HANDELSBANKEN | ANNUAL REPORT 2013
Economic value creationHandelsbanken’s higher profitability benefits society at large, as well as the Bank’s shareholders. Handelsbanken is one of the few Nordic banks that has not sought financial support from central banks, the government or its shareholders during the recent years of turbulence in the financial markets.
VALUE CREATION DURING 2013In 2013, Handelsbanken’s profit before taxes and government fees was just over SEK 21 billion. This created value was distributed as follows: just over SEK 7 billion in taxes and government fees, just over SEK 10 billion in proposed dividends, to be paid to the share-holders in the spring of 2014, and the remaining approximately SEK 4 billion, which is reinvested in the operations.
STABLE IN THE MIDST OF THE FINANCIAL CRISISDuring the financial crisis, Handelsbanken has not used the Swedish government’s capital support or guarantee programme and is the only listed Swedish bank that has not needed to ask its shareholders for new capital.
A well-run bank, which acts sustainably and responsibly, has a substantial positive impact
on the economy in general. This applies not only to direct economic effects such as paying corporate tax, but also to the indirect economic effects.
“ A well-run bank, which
acts sustainably and
responsibly, has a sub-
stantial positive impact
on the economy in
general.”
DIRECT ECONOMIC VALUEDuring the most recent business cycle, Handels-banken has paid dividends to its shareholders every year, while remaining one of the largest payers of corporate tax in Sweden.
INDIRECT ECONOMIC EFFECTSHandelsbanken is the largest financer of com-panies in Sweden, and thus it finances growth and increased employment throughout the country.
The Bank enables households to fund prop-erty purchases and thus move to a new town where the employment situation is better, for example. The Handelsbanken Group finances one quarter of households’ mortgage loans in Sweden.
The table of created and delivered direct eco-nomic value shows how the income generated by Handelsbanken’s operations during the year was allocated over various stakeholders. The calcula-tion is based on the figures in the income state-ment and in accordance with the GRI guidelines. The items allocated in the table are based on broader value created where salaries and other administrative costs (suppliers) are added to the operating profit. The purpose is to show in a ba-sic way how Handelsbanken creates value for its stakeholders and in the economic system in which the organisation works. The table provides an overview of the direct measurable monetary value contributed by Handelsbanken to its stakeholders, and thus to development in the community.
The table, which is laid out according to GRI’s principles, shows how the income generated by the Bank’s operations is allocated over various groups of stakeholders. The data comes from the Group’s income statement and balance sheet.
Direct economic value generated and distributed (according to GRI) Economic flows to and from various groups of stakeholders
SEK bn 2013 2012 2011 2010 2009
DIRECT ECONOMIC VALUE CREATED
Customers
Income after loan losses and before fees to the Stabilisation fund, deposit guarantee etc. 36.2 34.9 33.1 30.4 29.5
Value created by serving customers 36.2 34.9 33.1 30.4 29.5
ALLOCATED ECONOMIC VALUE
Employees
Salaries 7.1 6.9 6.7 6.4 6.7
Provision to profit-sharing foundation 1.1 1.0 0.9 0.8 0.7
Payroll charges and other staff costs 3.2 3.3 2.3 2.3 2.6
Cost of employees 11.4 11.2 9.9 9.5 10.0
Public authorities and society at large
Suppliers* 5.7 5.5 5.5 5.5 5.2
Tax costs** 3.9 3.0 4.4 4.0 3.5
Fees to the Stabilisation fund, deposit guarantee etc. 1.1 1.1 1.1 0.6 0.6
Government bank support received - - - - -
Participation in government guarantee programmes - - - - -
To society 10.7 9.6 11.0 10.1 9.3
Shareholders
Dividends (refers to the year dividends were paid) 6.8 6.1 5.6 5.0 4.4
New share issue - - - - -
Transactions with the shareholders 6.8 6.1 5.6 5.0 4.4
Reinvested economic value (“remaining in the Bank”) 7.3 8.0 6.6 5.8 5.8
* Refers to Other administrative expenses and depreciation.** Refers to Tax costs according to the income statement.
SOCIETY | SUSTAINABILITY REPORT
HANDELSBANKEN | ANNUAL REPORT 2013 195
High ethical standards engender trustHandelsbanken has ethical guidelines stating that operations must be characterised by high ethical standards.
ETHICAL GUIDELINES AT HANDELSBANKENHandelsbanken’s ethical guidelines are adopted by the Board of the Bank. They formulate the basic guidelines for every employee’s actions.
Employees who are in doubt when applying the Bank’s ethical guidelines and dealing with related issues must contact their immediate superior to find out what is ethically acceptable.
A self-evident rule is that the Bank and its employees must comply with the laws and regulations that govern the Bank’s operations. If the individual has poorer protection from local laws and regulations than Swedish laws, regula-tions and principles, Handelsbanken applies the latter.
The guidelines are reviewed every year by the Board. The starting point here is any changes to the relevant legislation, but also changes in external expectations, the Bank’s experience of regular internal work and observations from the Bank’s comprehensive internal control.
MEASURES AGAINST MONEY LAUNDERING AND FINANCING OF TERRORISM To prevent banks being used for money laundering and financing of terrorism, there are special rules which apply in large parts of the world. This means, for example, that the Bank is obliged to have good knowledge of its custom-ers and their banking transactions both at the time the business relationship starts and during the period it lasts. Transactions, ownership structures and business arrangements which are perceived as being unusual and where the Bank does not understand the background are examined.
The Bank’s instructions, procedures, train-ing and system support in the area of money laundering are intended to support employ-ees so that good knowledge of customers is achieved. In this way, the Bank can avoid participating in transactions which are sus-pected of being linked to criminal activities, or of which the employees do not understand the implications.
CONFLICTS OF INTEREST AND CORRUPTION Conflicts of interest occur daily in society and the financial sector is no exception. Regardless of where they work in the Bank, employees
must comply with the Bank’s regulations regard-ing conflicts of interest and in connection with this identify conflicts of interest whenever they arise and as far as possible ensure that they are avoided. It is also important that the employees comply with the Bank’s regulations regarding bribery and improper influence so that they avoid becoming dependent on a customer or supplier to the Bank or have improper influence on a customer. In addition to the applicable legislation, employees must follow the Bank’s own regulations in this area and the recommen-dations issued by the Swedish Anti-Corruption Institute. Handelsbanken has identified a suspec ted case of corruption during the year which the Bank is currently investigating.
The regulations must be followed in all con-texts, including gifts, entertainment and other events. Employees’ business travel must always be paid for by the Bank.
CONDUCT OF EMPLOYEESHandelsbanken employees
suspected of taking improper advantage of knowledge about the financial markets which they obtain in the course of their work
laws and observe the Bank’s own rules for employees’ private securities and currency transactions
private affairs, refrain from business transac-tions that violate the Bank’s rules or current legislation
-mitments that could seriously jeopardise their personal financial position
in which they, or persons closely related to them, have a personal interest. This also ap-plies to companies to which these employees or persons closely related to them have a commitment
Department if they suspect irregularities at the Bank
the Bank and obtain approval. These rules also apply to secondary occupations and certain posts in clubs, societies and the like.
THE BANK AS A CUSTOMERHandelsbanken purchases goods and services from Swedish and international suppliers. Ethi-cal considerations are just as important for the Bank in its role as customer as when it supplies services and products. To avoid incurring obligations to suppliers, the Bank also has rules regarding receiving and giving personal gifts and for business entertaining.
Environmental considerations are also included in all decisions on purchases. When making purchasing decisions, the Bank must make enquiries as to whether suppliers:
bribes.
In order to ensure quality when making purchas-ing decisions, the Bank has drawn up a check-list. This list will be implemented during 2014.
The Bank maintains an ongoing dialogue with its suppliers to promote and improve our environmental activities.
Handelsbanken’s ethical guidelines are also complied with when the Bank itself is a customer.
HANDELSBANKEN’S ETHICAL GUIDELINES COVER THE FOLLOWING AREAS:
READ MOREThe Bank’s ethical guidelines are available on its website handelsbanken.se/ireng.
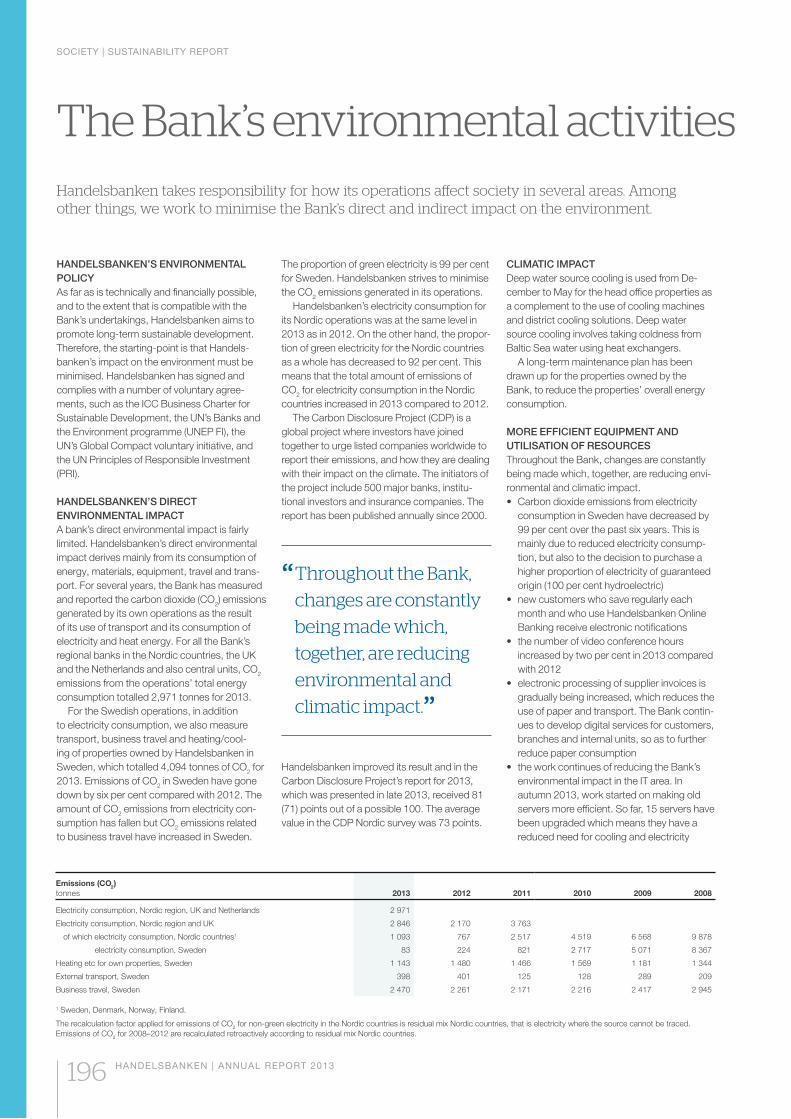
SOCIETY | SUSTAINABILITY REPORT
196 HANDELSBANKEN | ANNUAL REPORT 2013
The Bank’s environmental activitiesHandelsbanken takes responsibility for how its operations affect society in several areas. Among other things, we work to minimise the Bank’s direct and indirect impact on the environment.
HANDELSBANKEN’S ENVIRONMENTAL POLICYAs far as is technically and financially possible, and to the extent that is compatible with the Bank’s undertakings, Handelsbanken aims to promote long-term sustainable development. Therefore, the starting-point is that Handels-banken’s impact on the environment must be minimised. Handelsbanken has signed and complies with a number of voluntary agree-ments, such as the ICC Business Charter for Sustainable Development, the UN’s Banks and the Environment programme (UNEP FI), the UN’s Global Compact voluntary initiative, and the UN Principles of Responsible Investment (PRI).
HANDELSBANKEN’S DIRECT ENVIRONMENTAL IMPACTA bank’s direct environmental impact is fairly limited. Handelsbanken’s direct environmental impact derives mainly from its consumption of energy, materials, equipment, travel and trans-port. For several years, the Bank has measured and reported the carbon dioxide (CO2) emissions generated by its own operations as the result of its use of transport and its consumption of electricity and heat energy. For all the Bank’s regional banks in the Nordic countries, the UK and the Netherlands and also central units, CO2 emissions from the operations’ total energy consumption totalled 2,971 tonnes for 2013.
For the Swedish operations, in addition to electricity consumption, we also measure transport, business travel and heating/cool-ing of properties owned by Handelsbanken in Sweden, which totalled 4,094 tonnes of CO2 for 2013. Emissions of CO2 in Sweden have gone down by six per cent compared with 2012. The amount of CO2 emissions from electricity con-sumption has fallen but CO2 emissions related to business travel have increased in Sweden.
The proportion of green electricity is 99 per cent for Sweden. Handelsbanken strives to minimise the CO2 emissions generated in its operations.
Handelsbanken’s electricity consumption for its Nordic operations was at the same level in 2013 as in 2012. On the other hand, the propor-tion of green electricity for the Nordic countries as a whole has decreased to 92 per cent. This means that the total amount of emissions of CO2 for electricity consumption in the Nordic countries increased in 2013 compared to 2012.
The Carbon Disclosure Project (CDP) is a global project where investors have joined together to urge listed companies worldwide to report their emissions, and how they are dealing with their impact on the climate. The initiators of the project include 500 major banks, institu-tional investors and insurance companies. The report has been published annually since 2000.
“ Throughout the Bank,
changes are constantly
being made which,
together, are reducing
environmental and
climatic impact.”Handelsbanken improved its result and in the Carbon Disclosure Project’s report for 2013, which was presented in late 2013, received 81 (71) points out of a possible 100. The average value in the CDP Nordic survey was 73 points.
CLIMATIC IMPACTDeep water source cooling is used from De-cember to May for the head office properties as a complement to the use of cooling machines and district cooling solutions. Deep water source cooling involves taking coldness from Baltic Sea water using heat exchangers.
A long-term maintenance plan has been drawn up for the properties owned by the Bank, to reduce the properties’ overall energy consumption.
MORE EFFICIENT EQUIPMENT AND UTILISATION OF RESOURCESThroughout the Bank, changes are constantly being made which, together, are reducing envi-ronmental and climatic impact.
consumption in Sweden have decreased by 99 per cent over the past six years. This is mainly due to reduced electricity consump-tion, but also to the decision to purchase a higher proportion of electricity of guaranteed origin (100 per cent hydroelectric)
month and who use Handelsbanken Online Banking receive electronic notifications
increased by two per cent in 2013 compared with 2012
gradually being increased, which reduces the use of paper and transport. The Bank contin-ues to develop digital services for customers, branches and internal units, so as to further reduce paper consumption
environmental impact in the IT area. In autumn 2013, work started on making old servers more efficient. So far, 15 servers have been upgraded which means they have a reduced need for cooling and electricity
Emissions (CO2)tonnes 2013 2012 2011 2010 2009 2008
Electricity consumption, Nordic region, UK and Netherlands 2 971
Electricity consumption, Nordic region and UK 2 846 2 170 3 763
of which electricity consumption, Nordic countries1 1 093 767 2 517 4 519 6 568 9 878
electricity consumption, Sweden 83 224 821 2 717 5 071 8 367
Heating etc for own properties, Sweden 1 143 1 480 1 466 1 569 1 181 1 344
External transport, Sweden 398 401 125 128 289 209
Business travel, Sweden 2 470 2 261 2 171 2 216 2 417 2 945
1 Sweden, Denmark, Norway, Finland.
The recalculation factor applied for emissions of CO2 for non-green electricity in the Nordic countries is residual mix Nordic countries, that is electricity where the source cannot be traced. Emissions of CO2 for 2008–2012 are recalculated retroactively according to residual mix Nordic countries.
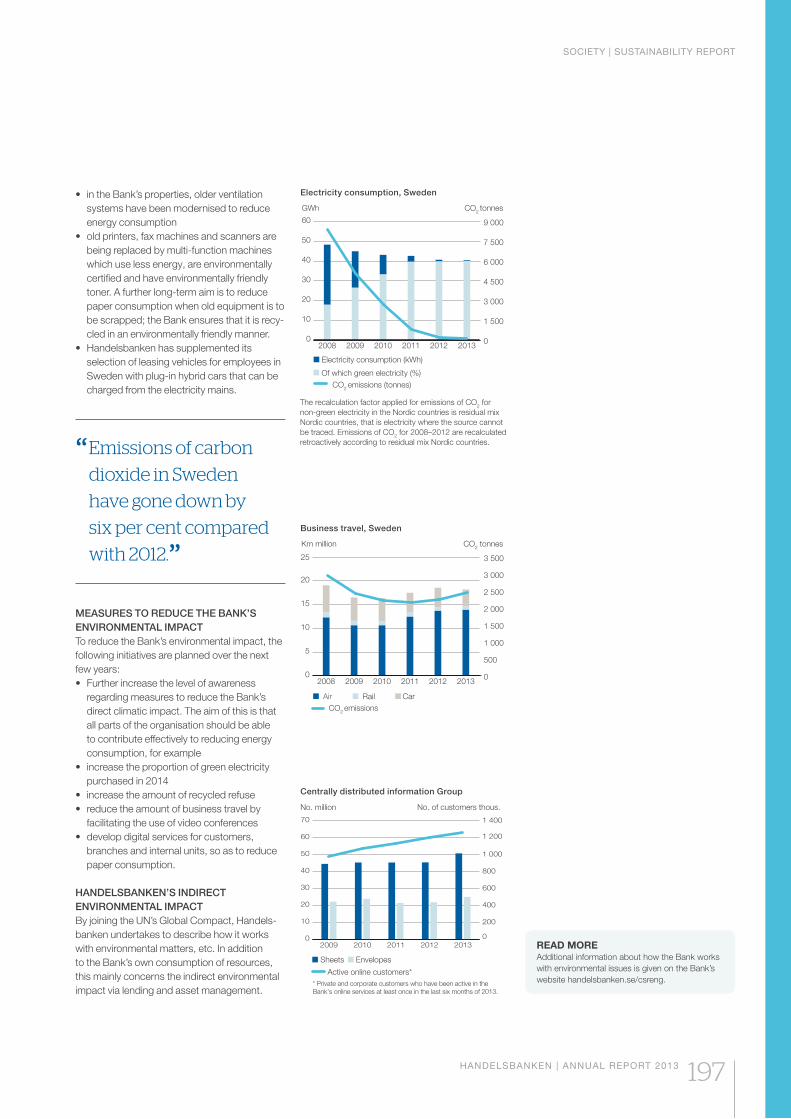
SOCIETY | SUSTAINABILITY REPORT
HANDELSBANKEN | ANNUAL REPORT 2013 197
systems have been modernised to reduce energy consumption
being replaced by multi-function machines which use less energy, are environmentally certified and have environmentally friendly toner. A further long-term aim is to reduce paper consumption when old equipment is to be scrapped; the Bank ensures that it is recy-cled in an environmentally friendly manner.
selection of leasing vehicles for employees in Sweden with plug-in hybrid cars that can be charged from the electricity mains.
“ Emissions of carbon
dioxide in Sweden
have gone down by
six per cent compared
with 2012.”MEASURES TO REDUCE THE BANK’S ENVIRONMENTAL IMPACTTo reduce the Bank’s environmental impact, the following initiatives are planned over the next few years:
regarding measures to reduce the Bank’s direct climatic impact. The aim of this is that all parts of the organisation should be able to contribute effectively to reducing energy consumption, for example
purchased in 2014
facilitating the use of video conferences
branches and internal units, so as to reduce paper consumption.
HANDELSBANKEN’S INDIRECT ENVIRONMENTAL IMPACTBy joining the UN’s Global Compact, Handels-banken undertakes to describe how it works with environmental matters, etc. In addition to the Bank’s own consumption of resources, this mainly concerns the indirect environmental impact via lending and asset management.
0
5
10
15
20
25
201320122011201020092008 0
500
1 000
1 500
2 000
2 500
3 000
3 500
Km million CO2 tonnes
AirCO2 emissions
Rail Car
Business travel, Sweden
0
10
20
30
40
50
60
70
20132012201120102009
No. million No. of customers thous.
0
200
400
600
800
1 000
1 200
1 400
Sheets Envelopes
Active online customers** Private and corporate customers who have been active in the Bank’s online services at least once in the last six months of 2013.
Centrally distributed information Group
READ MOREAdditional information about how the Bank works with environmental issues is given on the Bank’s website handelsbanken.se/csreng.
0
10
20
30
40
50
60
201320122011201020092008
GWh CO2 tonnes
0
1 500
3 000
4 500
6 000
7 500
9 000
Electricity consumption (kWh)
CO2 emissions (tonnes)Of which green electricity (%)
Electricity consumption, Sweden
The recalculation factor applied for emissions of CO2 for non-green electricity in the Nordic countries is residual mix Nordic countries, that is electricity where the source cannot be traced. Emissions of CO2 for 2008–2012 are recalculated retroactively according to residual mix Nordic countries.
Initiatives, awards, indexes and surveysHandelsbanken works both within and outside the financial industry in various initiatives which are intended to increase the level of awareness relating to sustainability and corporate social responsibility.
INITIATIVES
Global CompactIn 2009, Handelsbanken signed the UN’s Global Compact, cementing the support the Bank has expressed for universal human rights and corporate social responsibility. Global Compact
is an initiative aimed at companies and advocates ten principles based on international conventions. These principles, which were established in 2000, include human rights, labour laws, the environment and anti-corruption.
ICCThe International Chamber of Commerce (ICC) has developed a business charter, with the aim
of guiding the world’s companies in their efforts to fulfil their environmental commitments. These commitments are in compliance with national and international guidelines and standards for environ-mentally aware governance. Handelsbanken has signed the charter and complied with it since the 1990s.
PRIPRI (United Nations backed Principles for
Responsible Investment Initiatives) was launched in 2006. It is a network of investors that work together with the UN to implement principles for responsible investment. Its aim is to promote responsible actions among institutional investors and to work for increased openness and awareness of environmen-tal, social and corporate governance issues in the companies in which these players invest. Handels-banken became a signatory to the principles in 2009. A total of around 1,200 capital owners, asset managers and other stakeholders have signed the principles.
UNEP FIThe UN Environmental Programme has a special organisation that works with how the capital markets can promote the adoption of best environmental and sustainability
practice. Some 200 financial institutions which support the initiative contribute to research into and knowledge of how sustainability issues can be integrated into financial decisions.
Handelsbanken has been a member of UNEP FI since the mid-1990s.
Ecpat In 2009, Handelsbanken, together with the Swedish Bankers’ Associ- ation, started cooperating with Ecpat. The overall objective of the cooper - ation is to prevent commercial sexual
exploitation of children by preventing and obstruct- ing monetary transactions made as payment for child pornography.
Ecpat Sweden is part of Ecpat International, which has member organisations in more than 70 countries. Ecpat is working to prevent and stop all forms of commercial sexual exploitation of children, child pornography and child sex tourism.
Financial Coalition Against Child PornographyHandelsbanken has been a member of the Swedish Financial Coalition Against
Child Pornography (the Financial Coalition) since 2009. The Financial Coalition works to impede and prevent trade related to child pornography, based on the overall crime-prevention goal of stopping child sexual abuse. With the intention of preventing this trade from being conducted through the financial systems, a unique co operation has been developed between public authorities, the private sector and the non-profit sector. The fact that the Financial Coalition’s members impede the opportunity of using the financial systems for this kind of crime, helps to make it more complicated and limit its distribution.
Economic research Since the early 1960s, Handelsbanken has on a number of occasions awarded grants for economic research, mainly through allocations to two inde-pendent research foundations: the Jan Wallander and Tom Hedelius Foundation and the Tore Brow-aldh Foundation.
Taken together, these foundations are one of the most important sources of funding for economic research in Sweden, and their financing includes two professorships. In 2013, 148 (139) grants were awarded for a total of SEK 149 million (130).
At the end of 2013, the foundations’ combined capital totalled some SEK 5,000 million.
Personal finances for young peopleHandelsbanken supports initiatives that improve young people’s knowledge of personal finance by supporting information campaigns and contributing know-how. Ung Privatekonomi (“Young Personal Finances”) is a school information project that teaches Swedish upper secondary school students and teachers about personal finances and savings.
Collaboration with universities and colleges Handelsbanken has a number of collaborations with universities and colleges, and these are an important part of its long-term employer branding work. Through these collaborations Handelsbanken establishes contact with target groups that are important in terms of recruitment. This is based on co-operation with and commitment from local personnel departments, as well as employees and managers from branches and internal units.
Handelsbanken’s student programme Handelsbanken in Sweden offers students from upper secondary school who plan to study at uni-versity the opportunity to participate in the Bank’s student programme alongside their studies. The programme comprises working at the Bank during their studies, their own action plan and relevant studies for development at Handelsbanken. The purpose is to attract and recruit young employees as part of the Bank’s future management succes-sion and to promote gender equality.
The Technology LeapSince the autumn of 2013, Handelsbanken has tak-en part in the Technology Leap (Teknik språnget). The Technology Leap is run by the Royal Swedish Academy of Engineering Sciences (IVA), on behalf of the Swedish National Agency for Education. The Technology Leap is an initiative, the aim of which is to give young people who have graduated from upper secondary school natural sciences and tech-nology programmes an insight into the engineering profession. Over a four-month period, the young people are offered work experience aimed at inspir-ing them to apply for technology degree courses in the future.
INITIATIVES, AWARDS, INDEXES AND SURVEYS | SUSTAINABILITY REPORT
198 HANDELSBANKEN | ANNUAL REPORT 2013
AWARDS
Bank of the Year 2013Handelsbanken has been acclaimed Bank of the Year for 2013 by the business magazine Privata Affärer. With the citation “The big bank which also
looks after the small needs of its customers,” the Bank accepted the award for the third time in five years. This prize – which is by far the most important banking award in Sweden – has been awarded since 1991. It is based on the magazine’s many readers’ opinions of the various banks in Sweden, with a jury then picking the best bank.
Business Bank of the Year 2013For the third consecutive year, Handels banken
was acclaimed Business Bank of the Year in Finans-barometern’s annual survey. Handelsbanken received the highest rating of any bank during the entire eleven-year history of the survey when assessments of customer satisfaction, electronic services, quality of advisory services, price, service level, attitude and the range of products and services were taken into account.
Small Enterprise Bank of the Year 2013, SwedenFor the second consec- utive year, Handels-
banken has been acclaimed Small Enterprise Bank of the Year in Sweden in Finansbarometern’s annual survey. Handelsbanken received the highest rating given to any bank in this survey when assessments of customer satisfaction, electronic services, quality of advisory services, price, service level, attitude and the range of products and services were taken into account.
UniversumEmployees
During the year, the re- search company Universum performed three different surveys in which Handels- banken received very high ratings. When Universum
ranked Sweden’s Ideal Employer 2013, Handels-banken came in eighth place, which is the best in the banking sector. This result was based on factors such as “internal identity” (i.e. employees’ views on their employers’ reputation and image), job charac- teristics, people and corporate culture, as well as compensation and opportunities to advance. Employees also graded how satisfied they were in overall terms, and how inclined they were to remain with their employer.
Business studentsHandelsbanken achieved sixth place in the Corpo-rate Barometer 2013, a survey carried out by the Universum research company; it was thus the best in its sector among business students in Sweden. The survey’s participants responded to questions on ideal employers, and graded these according to the following criteria: reputation and image; job char-acteristics; people and corporate culture; as well as compensation and opportunities to advance.
Young professionalsIn Universum’s Career Barometer survey, Sweden’s ‘young professionals’ named their ideal employ-ers. ‘Young professionals’ refers to people under 40 with an academic background and one to eight years’ experience of working life. Among professionals working with finance Handels-banken achieved ninth place, and was thus the highest-ranked Swedish bank. In this survey, too, participants answered questions about what is a good employer based on the following criteria: reputation and image; job characteristics; people and corporate culture; compensation and opportu-nities to advance.
Anna’s Gender Equality Prize 2012In 2012, Handelsbanken was awarded
Anna’s Gender Equality Prize for the work it has systematically and purposefully pursued for many years in promoting equal rights and opportunities for women and men. Anna’s Gender Equality Prize was founded in 1993, and since then has been awarded every year in Sweden to an individual, a company, a club, a project or a working group for good efforts towards increased equality in the bank-ing and finance sector. The prize is awarded by the Central Equality and Diversity Committee, formed by the Employers’ Association of the Swedish Banking Institutions (BAO) and the Financial Sector Union of Sweden.
INDEXES AND SURVEYS
Handelsbanken is scrutinised and assessed by both customers and financial market players. The outcome, and the assessment of the Bank that results from this, shows how well Handelsbanken is living up to their expectations.
Ethibel Sustainability IndexThe Brussels-based Ethibel provides the financial market with information on companies’
CSR work. Its analyses are carried out by the Vigeo research company, and based on these results, Ethibel creates a universe that forms a platform for sustainability products and responsible investments. The Svenska Handelsbanken class A share has been included in the Ethibel Excellence Investment Register since 2004, and is also included in the ESI Excellence index, which is based on this universe.
OMX GES Sustainability Together with the GES
Investment Services research company, OMX has launched a number of sustainability indexes that
provide investors with a universe of companies that are fulfilling sustainability requirements. Handels-banken has qualified for the OMX GES Sustain-ability Sweden index, as well as the OMX GES Sustainability Nordic index.
Both indexes are based on a ranking of how well companies are working with environmental, social and governance (ESG) issues. The companies that receive the highest scores qualify for the indexes.
STOXX Europe Sustainability IndexHandelsbanken is included in the STOXX Europe Sustainability Index. The companies included in the index were selected in an analysis process pro-vided by Bank Sarasin. Companies are assessed in terms of environmental, social and corporate governance criteria.
FTSE4GoodHandelsbanken has been selected to be included in the international FTSE4Good Index 2013. The research analysis is
provided by Eiris, one of the leading research houses for analysis of corporate social responsibil-ity. Investors and owners use the FTSE4Good Index to identify companies that fulfil globally recognised standards for corporate social responsibility. The index is independent and based on analyses of companies’ work with environmen-tal matters, human rights and the other areas that come under corporate social responsibility. Handelsbanken has been included in the index since 2001.
Satisfied customersIn 2013, Handelsbanken had the most satisfied customers of the major banks in Sweden. This applies to both private and corporate customers. The Bank tops these lists in
all its home markets. Svenskt Kvalitetsindex (SKI) is a system for compiling, analysing and distributing information about customers’ expectations, perceived quality and evaluation of goods and services. Helping to run SKI is the international organisation EPSI Rating (European Performance Satisfaction Index), which conducts comparable surveys in over 20 countries. Research and development related to the surveys is conducted regularly at SIQ (the Swedish Institute for Quality) and the Stockholm School of Economics.
Sustainable Value CreationSince 2009, Handelsbanken Asset Management,
together with other major Swedish investors, has taken part in the Sustainable Value Creation project. For the participants, the aim of the project has been to highlight the importance of Swedish companies working with sustainability issues in a structured manner.
In its capacity as one of the 100 largest listed Swedish companies, Handelsbanken has itself responded to the survey on its work.
INITIATIVES, AWARDS, INDEXES AND SURVEYS | SUSTAINABILITY REPORT
HANDELSBANKEN | ANNUAL REPORT 2013 199
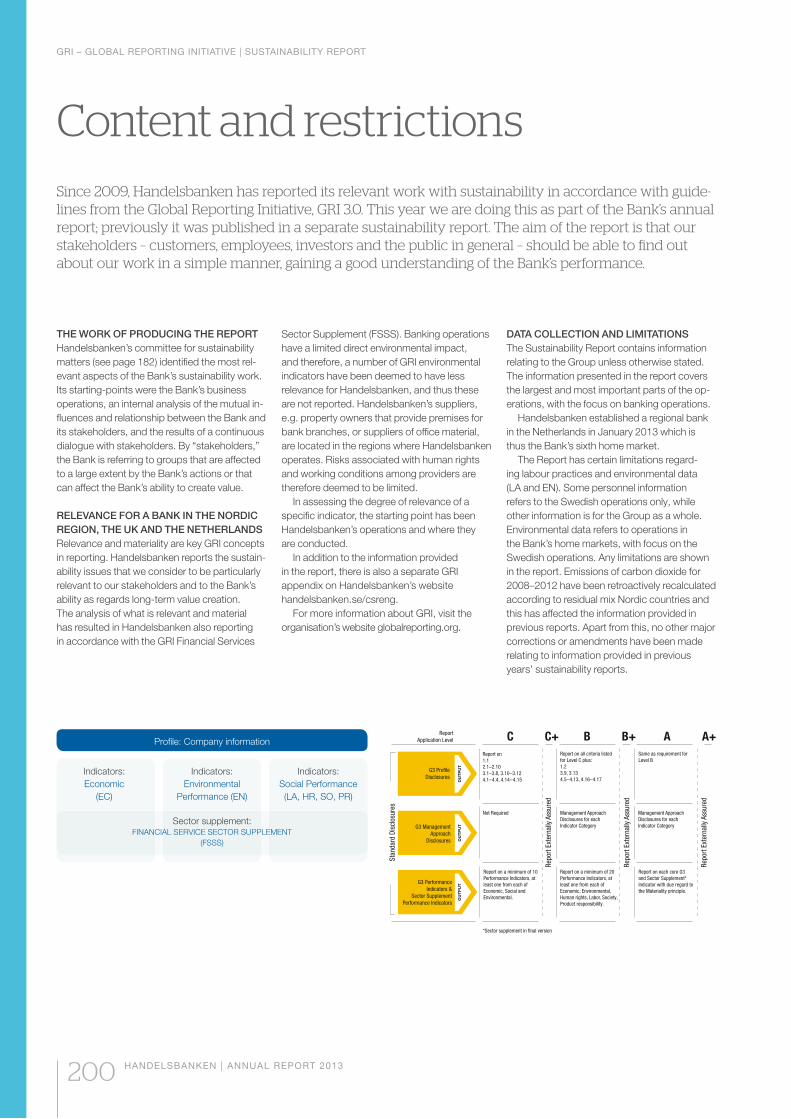
GRI – GLOBAL REPORTING INITIATIVE | SUSTAINABILITY REPORT
200 HANDELSBANKEN | ANNUAL REPORT 2013
Content and restrictions Since 2009, Handelsbanken has reported its relevant work with sustainability in accordance with guide-lines from the Global Reporting Initiative, GRI 3.0. This year we are doing this as part of the Bank’s annual report; previously it was published in a separate sustainability report. The aim of the report is that our stakeholders – customers, employees, investors and the public in general – should be able to find out about our work in a simple manner, gaining a good understanding of the Bank’s performance.
THE WORK OF PRODUCING THE REPORTHandelsbanken’s committee for sustainability matters (see page 182) identified the most rel-evant aspects of the Bank’s sustainability work. Its starting-points were the Bank’s business operations, an internal analysis of the mutual in-fluences and relationship between the Bank and its stakeholders, and the results of a continuous dialogue with stakeholders. By “stakeholders,” the Bank is referring to groups that are affected to a large extent by the Bank’s actions or that can affect the Bank’s ability to create value.
RELEVANCE FOR A BANK IN THE NORDIC REGION, THE UK AND THE NETHERLANDSRelevance and materiality are key GRI concepts in reporting. Handelsbanken reports the sustain - ability issues that we consider to be particularly relevant to our stakeholders and to the Bank’s ability as regards long-term value creation. The analysis of what is relevant and material has resulted in Handelsbanken also reporting in accordance with the GRI Financial Services
Sector Supplement (FSSS). Banking operations have a limited direct environmental impact, and therefore, a number of GRI environmental indicators have been deemed to have less relevance for Handelsbanken, and thus these are not reported. Handelsbanken’s suppliers, e.g. property owners that provide premises for bank branches, or suppliers of office material, are located in the regions where Handelsbanken operates. Risks associated with human rights and working conditions among providers are therefore deemed to be limited.
In assessing the degree of relevance of a specific indicator, the starting point has been Handelsbanken’s operations and where they are conducted.
In addition to the information provided in the report, there is also a separate GRI appendix on Handelsbanken’s website handelsbanken.se/csreng.
For more information about GRI, visit the organisation’s website globalreporting.org.
DATA COLLECTION AND LIMITATIONS The Sustainability Report contains information relating to the Group unless otherwise stated. The information presented in the report covers the largest and most important parts of the op-erations, with the focus on banking operations.
Handelsbanken established a regional bank in the Netherlands in January 2013 which is thus the Bank’s sixth home market.
The Report has certain limitations regard-ing labour practices and environmental data (LA and EN). Some personnel information refers to the Swedish operations only, while other information is for the Group as a whole. Environmental data refers to operations in the Bank’s home markets, with focus on the Swedish operations. Any limitations are shown in the report. Emissions of carbon dioxide for 2008–2012 have been retroactively recalculated according to residual mix Nordic countries and this has affected the information provided in previous reports. Apart from this, no other major corrections or amendments have been made relating to information provided in previous years’ sustainability reports.
Profile: Company information
Sector supplement:FINANCIAL SERVICE SECTOR SUPPLEMENT
(FSSS)
Indicators:Economic
(EC)
Indicators:Environmental
Performance (EN)
Indicators:Social Performance(LA, HR, SO, PR)
C
Stan
dard
Dis
clos
ures
Repo
rt Ex
tern
ally
Ass
ured
Repo
rt Ex
tern
ally
Ass
ured
Repo
rt Ex
tern
ally
Ass
ured
C+ B B+ A A+ReportApplication Level
G3 ProfileDisclosures
G3 ManagementApproach
Disclosures
G3 PerformanceIndicators &
Sector SupplementPerformance Indicators
Report on1.12.1–2.103.1–3.8, 3.10–3.124.1–4.4, 4.14–4.15
Not Required
*Sector supplement in final version
Report on a minimum of 10 Performance Indicators, at least one from each of Economic, Social and Environmental.
Report on a minimum of 20 Performance Indicators, at least one from each of Economic, Environmental, Human rights, Labor, Society, Product responsibility.
Report on all criteria listed for Level C plus:1.23.9, 3.134.5–4.13, 4.16–4.17
Same as requirement for Level B
Management Approach Disclosures for each Indicator Category
Management Approach Disclosures for each Indicator Category
Report on each core G3 and Sector Supplement* Indicator with due regard to the Materiality principle.
OU
TP
UT
OU
TP
UT
OU
TP
UT
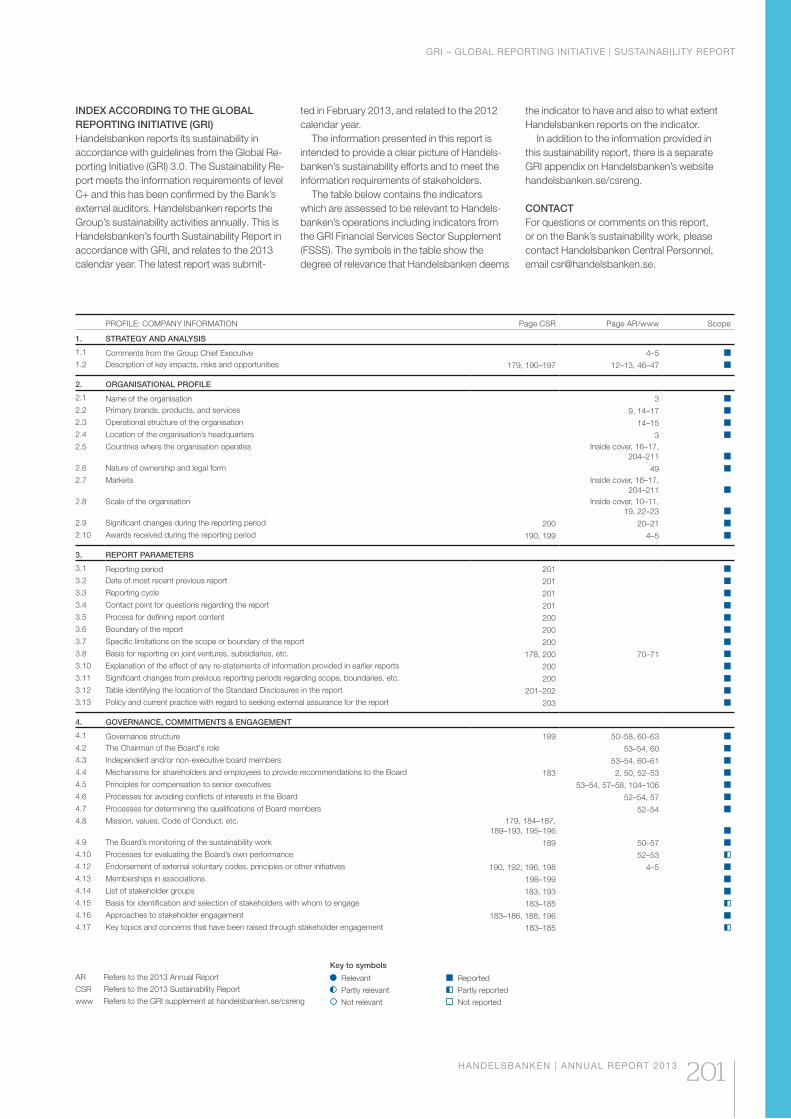
GRI – GLOBAL REPORTING INITIATIVE | SUSTAINABILITY REPORT
HANDELSBANKEN | ANNUAL REPORT 2013 201
INDEX ACCORDING TO THE GLOBAL REPORTING INITIATIVE (GRI)Handelsbanken reports its sustainability in accordance with guidelines from the Global Re-porting Initiative (GRI) 3.0. The Sustainability Re-port meets the information requirements of level C+ and this has been confirmed by the Bank’s external auditors. Handelsbanken reports the Group’s sustainability activities annually. This is Handelsbanken’s fourth Sustainability Report in accordance with GRI, and relates to the 2013 calendar year. The latest report was submit-
ted in February 2013, and related to the 2012 calendar year.
The information presented in this report is intended to provide a clear picture of Handels-banken’s sustainability efforts and to meet the information requirements of stakeholders.
The table below contains the indicators which are assessed to be relevant to Handels-banken’s operations including indicators from the GRI Financial Services Sector Supplement (FSSS). The symbols in the table show the degree of relevance that Handelsbanken deems
the indicator to have and also to what extent Handelsbanken reports on the indicator.
In addition to the information provided in this sustainability report, there is a separate GRI appendix on Handelsbanken’s website handelsbanken.se/csreng.
CONTACTFor questions or comments on this report, or on the Bank’s sustainability work, please contact Handelsbanken Central Personnel, email [email protected].
PROFILE: COMPANY INFORMATION Page CSR Page AR/www Scope
1. STRATEGY AND ANALYSIS
1.1 Comments from the Group Chief Executive 4–51.2 Description of key impacts, risks and opportunities 179, 190–197 12–13, 46–47
2. ORGANISATIONAL PROFILE
2.1 Name of the organisation 32.2 Primary brands, products, and services 9, 14–172.3 Operational structure of the organisation 14–152.4 Location of the organisation’s headquarters 32.5 Countries where the organisation operates Inside cover, 16–17,
204–2112.6 Nature of ownership and legal form 492.7 Markets Inside cover, 16–17,
204–2112.8 Scale of the organisation Inside cover, 10–11,
19, 22–232.9 Significant changes during the reporting period 200 20–212.10 Awards received during the reporting period 190, 199 4–5
3. REPORT PARAMETERS
3.1 Reporting period 2013.2 Date of most recent previous report 2013.3 Reporting cycle 2013.4 Contact point for questions regarding the report 2013.5 Process for defining report content 2003.6 Boundary of the report 2003.7 Specific limitations on the scope or boundary of the report 2003.8 Basis for reporting on joint ventures, subsidiaries, etc. 178, 200 70–713.10 Explanation of the effect of any re-statements of information provided in earlier reports 2003.11 Significant changes from previous reporting periods regarding scope, boundaries, etc. 2003.12 Table identifying the location of the Standard Disclosures in the report 201–2023.13 Policy and current practice with regard to seeking external assurance for the report 203
4. GOVERNANCE, COMMITMENTS & ENGAGEMENT
4.1 Governance structure 189 50–58, 60–634.2 The Chairman of the Board's role 53–54, 604.3 Independent and/or non-executive board members 53–54, 60–614.4 Mechanisms for shareholders and employees to provide recommendations to the Board 183 2, 50, 52–534.5 Principles for compensation to senior executives 53–54, 57–58, 104–1064.6 Processes for avoiding conflicts of interests in the Board 52–54, 574.7 Processes for determining the qualifications of Board members 52–544.8 Mission, values, Code of Conduct, etc. 179, 184–187,
189–193, 195–1964.9 The Board’s monitoring of the sustainability work 189 50–574.10 Processes for evaluating the Board’s own performance 52–534.12 Endorsement of external voluntary codes, principles or other initiatives 190, 192, 196, 198 4–54.13 Memberships in associations 198–1994.14 List of stakeholder groups 183, 1934.15 Basis for identification and selection of stakeholders with whom to engage 183–1854.16 Approaches to stakeholder engagement 183–186, 188, 1964.17 Key topics and concerns that have been raised through stakeholder engagement 183–185
Key to symbols
AR Refers to the 2013 Annual Report Relevant ReportedCSR Refers to the 2013 Sustainability Report Partly relevant Partly reportedwww Refers to the GRI supplement at handelsbanken.se/csreng Not relevant Not reported
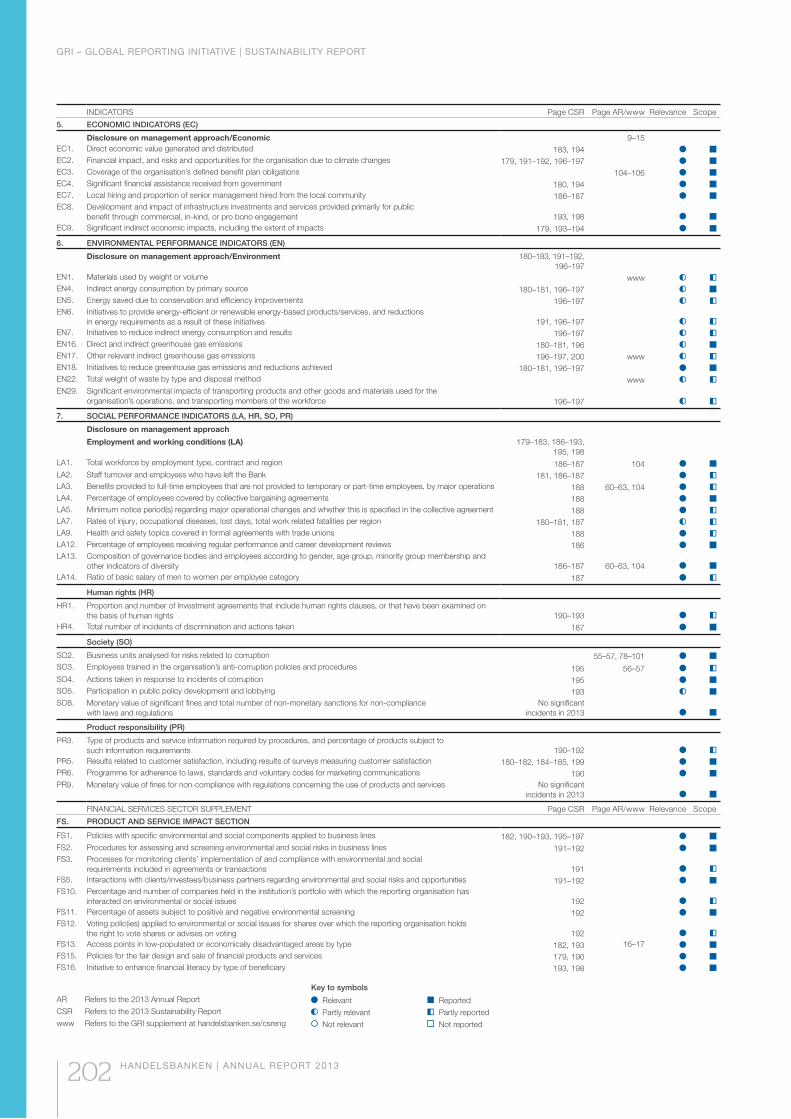
GRI – GLOBAL REPORTING INITIATIVE | SUSTAINABILITY REPORT
202 HANDELSBANKEN | ANNUAL REPORT 2013
INDICATORS Page CSR Page AR/www Relevance Scope
5. ECONOMIC INDICATORS (EC)
Disclosure on management approach/Economic 9–15EC1. Direct economic value generated and distributed 183, 194EC2. Financial impact, and risks and opportunities for the organisation due to climate changes 179, 191–192, 196–197EC3. Coverage of the organisation’s defined benefit plan obligations 104–106EC4. Significant financial assistance received from government 180, 194EC7. Local hiring and proportion of senior management hired from the local community 186–187EC8. Development and impact of infrastructure investments and services provided primarily for public
benefit through commercial, in-kind, or pro bono engagement 193, 198EC9. Significant indirect economic impacts, including the extent of impacts 179, 193–194
6. ENVIRONMENTAL PERFORMANCE INDICATORS (EN)
Disclosure on management approach/Environment 180–183, 191–192, 196–197
EN1. Materials used by weight or volume wwwEN4. Indirect energy consumption by primary source 180–181, 196–197EN5. Energy saved due to conservation and efficiency improvements 196–197EN6. Initiatives to provide energy-efficient or renewable energy-based products/services, and reductions
in energy requirements as a result of these initiatives 191, 196–197EN7. Initiatives to reduce indirect energy consumption and results 196–197EN16. Direct and indirect greenhouse gas emissions 180–181, 196EN17. Other relevant indirect greenhouse gas emissions 196–197, 200 wwwEN18. Initiatives to reduce greenhouse gas emissions and reductions achieved 180–181, 196–197EN22. Total weight of waste by type and disposal method wwwEN29. Significant environmental impacts of transporting products and other goods and materials used for the
organisation’s operations, and transporting members of the workforce 196–197
7. SOCIAL PERFORMANCE INDICATORS (LA, HR, SO, PR)
Disclosure on management approach
Employment and working conditions (LA) 179–183, 186–193, 195, 198
LA1. Total workforce by employment type, contract and region 186–187 104LA2. Staff turnover and employees who have left the Bank 181, 186–187LA3. Benefits provided to full-time employees that are not provided to temporary or part-time employees, by major operations 188 60–63, 104LA4. Percentage of employees covered by collective bargaining agreements 188LA5. Minimum notice period(s) regarding major operational changes and whether this is specified in the collective agreement 188LA7. Rates of injury, occupational diseases, lost days, total work related fatalities per region 180–181, 187LA9. Health and safety topics covered in formal agreements with trade unions 188LA12. Percentage of employees receiving regular performance and career development reviews 186LA13. Composition of governance bodies and employees according to gender, age group, minority group membership and
other indicators of diversity 186–187 60–63, 104LA14. Ratio of basic salary of men to women per employee category 187
Human rights (HR)
HR1. Proportion and number of Investment agreements that include human rights clauses, or that have been examined on the basis of human rights 190–193
HR4. Total number of incidents of discrimination and actions taken 187
Society (SO)
SO2. Business units analysed for risks related to corruption 55–57, 78–101SO3. Employees trained in the organisation’s anti-corruption policies and procedures 195 56–57SO4. Actions taken in response to incidents of corruption 195SO5. Participation in public policy development and lobbying 193SO8. Monetary value of significant fines and total number of non-monetary sanctions for non-compliance
with laws and regulationsNo significant
incidents in 2013
Product responsibility (PR)
PR3. Type of products and service information required by procedures, and percentage of products subject to such information requirements 190–192
PR5. Results related to customer satisfaction, including results of surveys measuring customer satisfaction 180–182, 184–185, 199PR6. Programme for adherence to laws, standards and voluntary codes for marketing communications 190PR9. Monetary value of fines for non-compliance with regulations concerning the use of products and services No significant
incidents in 2013
FINANCIAL SERVICES SECTOR SUPPLEMENT Page CSR Page AR/www Relevance Scope
FS. PRODUCT AND SERVICE IMPACT SECTION
FS1. Policies with specific environmental and social components applied to business lines 182, 190–193, 195–197FS2. Procedures for assessing and screening environmental and social risks in business lines 191–192FS3. Processes for monitoring clients’ implementation of and compliance with environmental and social
requirements included in agreements or transactions 191FS5. Interactions with clients/investees/business partners regarding environmental and social risks and opportunities 191–192FS10. Percentage and number of companies held in the institution’s portfolio with which the reporting organisation has
interacted on environmental or social issues 192FS11. Percentage of assets subject to positive and negative environmental screening 192FS12. Voting polic(ies) applied to environmental or social issues for shares over which the reporting organisation holds
the right to vote shares or advises on voting 192FS13. Access points in low-populated or economically disadvantaged areas by type 182, 193 16–17FS15. Policies for the fair design and sale of financial products and services 179, 190FS16. Initiative to enhance financial literacy by type of beneficiary 193, 198
Key to symbols
AR Refers to the 2013 Annual Report Relevant ReportedCSR Refers to the 2013 Sustainability Report Partly relevant Partly reportedwww Refers to the GRI supplement at handelsbanken.se/csreng Not relevant Not reported
EXAMINERS' REPORT | SUSTAINABILITY REPORT
HANDELSBANKEN | ANNUAL REPORT 2013 203
Auditor’s Combined Assurance Report on Svenska Handelsbanken AB (publ) Sustainability Report
INTRODUCTIONWe have been engaged by the Executive Management of Svenska Handelsbanken AB (publ) to undertake an examination of Svenska Handelsbanken AB (publ) Sustainability Report for the year 2013. The Sustainability Report also includes a separate GRI Appendix, Handelsbanken’s GRI Appendix 2013 at www.handelsbanken.se/csreng. The Company has defined the scope of the Sustainability Report on page 3 in the Annual Report 2013.
RESPONSIBILITIES OF THE BOARD OF DIRECTORS AND THE EXECUTIVE MANAGEMENT FOR THE SUSTAINABILITY REPORT The Board of Directors and the Executive Management are responsible for ongoing activities regarding sustainable development, and for the preparation and presentation of the Sustainability Report in accordance with the applicable criteria, as explained on page 201 in the Sustainability Report, and are the parts of the Sustainability Reporting Guidelines G3, published by The Global Reporting Initiative (GRI), which are applicable to the Sustainability Report.
RESPONSIBILITIES OF THE AUDITOR Our responsibility is to express a conclusion on the Sustainability Report based on the proce-dures we have performed.
We conducted our engagement in accord-ance with RevR 6 Assurance of Sustainability Reports issued by FAR. The engagement includes a limited assurance engagement on the complete Sustainability Report and audit of certain information as specified below. The objective of an audit is to obtain reasonable assurance that the information is free of material misstatements.
The Bank’s internal audit department has continuously examined the internal control and the Sustainability Report. We have received the reports that have been prepared.
A reasonable assurance engagement includes examining, on a test basis, evidence supporting the quantitative and qualitative in-formation in the Sustainability Report. A limited assurance engagement is mainly focused on making inquiries of personnel responsible for sustainability issues, and applying analytical and other limited assurance procedures. Hence, the conclusion based on our limited assurance procedures does not comprise the same level of assurance as the conclusion of our reasonable assurance procedures. Since this assurance engagement is combined, our conclusions regarding the reasonable assurance and the limited assurance will be presented in separate sections.
Our reasonable assurance engagement includes the following:
“Loan losses as a percentage of lending 1998–2013”, “Customer satisfaction, private customers and corporate customers 2013”
consumption
The criteria on which our procedures are based are the parts of the Sustainability Reporting Guidelines G3, published by The Global Report-ing Initiative (GRI), which are applicable to the Sustainability Report. We consider these criteria suitable for the preparation of the Sustainability Report.
We believe that the evidence we have ob-tained is sufficient and appropriate to provide a basis for our conclusions below.
CONCLUSIONSBased on the limited assurance procedures we have performed, nothing has come to our attention that causes us to believe that the Sus-tainability Report is not prepared, in all material respects, in accordance with the above stated criteria.
In our opinion the information in the Sustain-ability Report which has been subject to our reasonable assurance procedures has, in all material respects, been prepared in accordance with the above stated criteria.
Stockholm, February 14, 2014
KPMG AB
Stefan Holmström Åse BäckströmAuthorised Public Expert Member of FARAccountant
To the readers of Svenska Handelsbanken AB (publ) Sustainability Report 2013.
205
Contact information
Regional head offices Regional Bank Northern Sweden 207Regional Bank Central Sweden 207Regional Bank Stockholm 207Regional Bank Eastern Sweden 207Regional Bank Western Sweden 207Regional Bank Southern Sweden 207Regional Bank Northern Great Britain 207Regional Bank Central Great Britain 207Regional Bank South West Great Britain 207Regional Bank Southern Great Britain 207Regional Bank Denmark 207Regional Bank Finland 207Regional Bank Norway 207Regional Bank Netherlands 207Handelsbanken International 207
BRANCHES AND BRANCH MANAGERSBranches in Sweden 208Branches in the UK 211Branches in Denmark 213Branches in Finland 213Branches in Norway 214Branches in the Netherlands 214Offices outside the Nordic countries, the UK and the Netherlands 215
Boards of subsidiaries 215
CONTENTS
CONTACT INFORMATIONCentral Head Office Sweden 206
Central Head Office UK 206
Central departments and units at the Head Office in Sweden
Central Personnel 206Central IT 206Central Credits 206Central Infrastructure 206Group Finance 206Central Legal Department 206Corporate Communications 206Corporate Governance and contacts with public authorities 206
Independent control functionsIndependent Risk Control 206Central Compliance 206Central Audit 206
Business areasHandelsbanken Capital Markets 206Handelsbanken Direkt 206Handelsbanken Forestry and Farming 206
SubsidiariesEFN 206Handel och Industri 206Handelsbanken Finans 206Handelsbanken Fonder 206Handelsbanken Liv 206Heartwood 206Stadshypotek 206
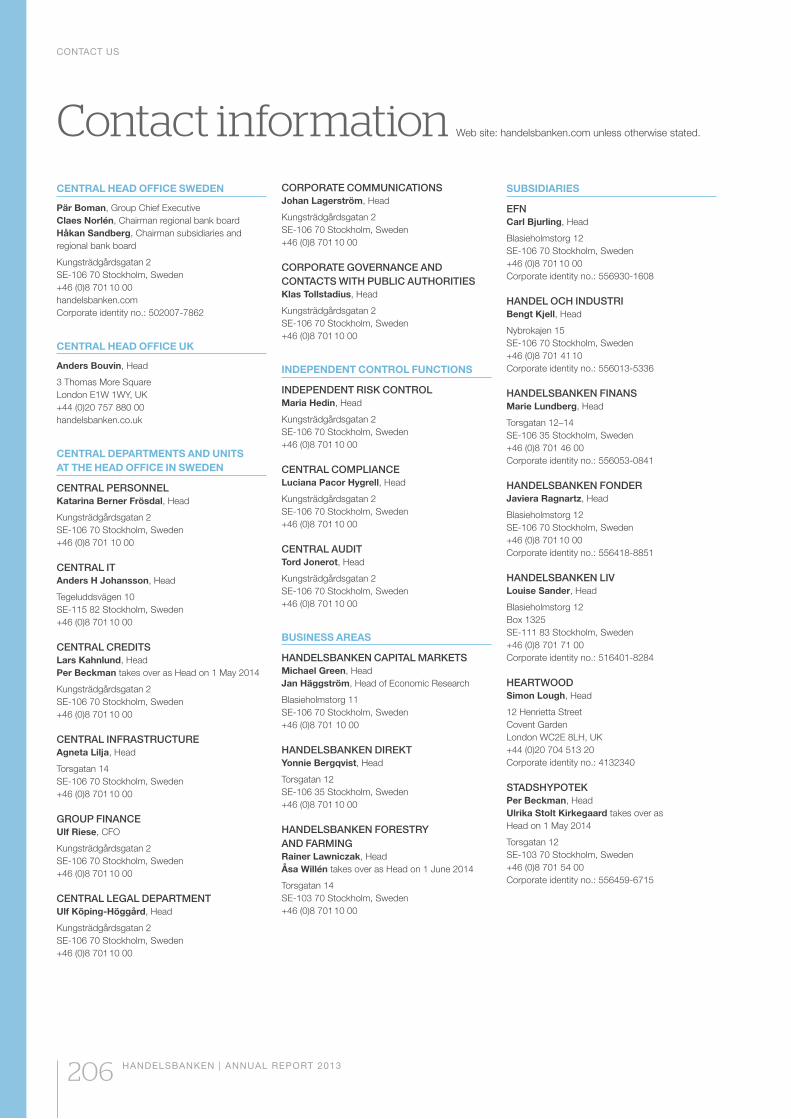
CONTACT US
206 HANDELSBANKEN | ANNUAL REPORT 2013
CENTRAL HEAD OFFICE SWEDEN
Pär Boman, Group Chief ExecutiveClaes Norlén, Chairman regional bank boardHåkan Sandberg, Chairman subsidiaries and regional bank board
Kungsträdgårdsgatan 2SE-106 70 Stockholm, Sweden+46 (0)8 701 10 00handelsbanken.comCorporate identity no.: 502007-7862
CENTRAL HEAD OFFICE UK
Anders Bouvin, Head
3 Thomas More SquareLondon E1W 1WY, UK+44 (0)20 757 880 00handelsbanken.co.uk
CENTRAL DEPARTMENTS AND UNITS AT THE HEAD OFFICE IN SWEDEN
CENTRAL PERSONNELKatarina Berner Frösdal, Head
Kungsträdgårdsgatan 2SE-106 70 Stockholm, Sweden+46 (0)8 701 10 00
CENTRAL ITAnders H Johansson, Head
Tegeluddsvägen 10SE-115 82 Stockholm, Sweden+46 (0)8 701 10 00
CENTRAL CREDITSLars Kahnlund, Head Per Beckman takes over as Head on 1 May 2014
Kungsträdgårdsgatan 2SE-106 70 Stockholm, Sweden+46 (0)8 701 10 00
CENTRAL INFRASTRUCTUREAgneta Lilja, Head
Torsgatan 14SE-106 70 Stockholm, Sweden+46 (0)8 701 10 00
GROUP FINANCEUlf Riese, CFO
Kungsträdgårdsgatan 2SE-106 70 Stockholm, Sweden+46 (0)8 701 10 00
CENTRAL LEGAL DEPARTMENTUlf Köping-Höggård, Head
Kungsträdgårdsgatan 2SE-106 70 Stockholm, Sweden+46 (0)8 701 10 00
CORPORATE COMMUNICATIONSJohan Lagerström, Head
Kungsträdgårdsgatan 2SE-106 70 Stockholm, Sweden+46 (0)8 701 10 00
CORPORATE GOVERNANCE AND CONTACTS WITH PUBLIC AUTHORITIESKlas Tollstadius, Head
Kungsträdgårdsgatan 2SE-106 70 Stockholm, Sweden+46 (0)8 701 10 00
INDEPENDENT CONTROL FUNCTIONS
INDEPENDENT RISK CONTROLMaria Hedin, Head
Kungsträdgårdsgatan 2SE-106 70 Stockholm, Sweden+46 (0)8 701 10 00
CENTRAL COMPLIANCELuciana Pacor Hygrell, Head
Kungsträdgårdsgatan 2SE-106 70 Stockholm, Sweden+46 (0)8 701 10 00
CENTRAL AUDIT Tord Jonerot, Head
Kungsträdgårdsgatan 2SE-106 70 Stockholm, Sweden+46 (0)8 701 10 00
BUSINESS AREAS
HANDELSBANKEN CAPITAL MARKETSMichael Green, HeadJan Häggström, Head of Economic Research
Blasieholmstorg 11SE-106 70 Stockholm, Sweden+46 (0)8 701 10 00
HANDELSBANKEN DIREKT Yonnie Bergqvist, Head
Torsgatan 12SE-106 35 Stockholm, Sweden+46 (0)8 701 10 00
HANDELSBANKEN FORESTRY AND FARMING Rainer Lawniczak, Head Åsa Willén takes over as Head on 1 June 2014
Torsgatan 14SE-103 70 Stockholm, Sweden+46 (0)8 701 10 00
SUBSIDIARIES
EFNCarl Bjurling, Head
Blasieholmstorg 12SE-106 70 Stockholm, Sweden +46 (0)8 701 10 00Corporate identity no.: 556930-1608
HANDEL OCH INDUSTRIBengt Kjell, Head
Nybrokajen 15 SE-106 70 Stockholm, Sweden +46 (0)8 701 41 10Corporate identity no.: 556013-5336
HANDELSBANKEN FINANSMarie Lundberg, Head
Torsgatan 12–14SE-106 35 Stockholm, Sweden+46 (0)8 701 46 00Corporate identity no.: 556053-0841
HANDELSBANKEN FONDERJaviera Ragnartz, Head
Blasieholmstorg 12SE-106 70 Stockholm, Sweden+46 (0)8 701 10 00Corporate identity no.: 556418-8851
HANDELSBANKEN LIVLouise Sander, Head
Blasieholmstorg 12Box 1325SE-111 83 Stockholm, Sweden+46 (0)8 701 71 00Corporate identity no.: 516401-8284
HEARTWOODSimon Lough, Head
12 Henrietta StreetCovent GardenLondon WC2E 8LH, UK+44 (0)20 704 513 20 Corporate identity no.: 4132340
STADSHYPOTEKPer Beckman, Head Ulrika Stolt Kirkegaard takes over as Head on 1 May 2014
Torsgatan 12SE-103 70 Stockholm, Sweden+46 (0)8 701 54 00Corporate identity no.: 556459-6715
Contact information Web site: handelsbanken.com unless otherwise stated.
CONTACT US
HANDELSBANKEN | ANNUAL REPORT 2013 207
REGIONAL HEAD OFFICES
REGIONAL BANK NORTHERN SWEDENAnnika Brunnéd, Head
Storgatan 48Box 1002SE-901 20 Umeå, Sweden+46 (0)90 15 45 60
REGIONAL BANK CENTRAL SWEDENPontus Åhlund, Head
Nygatan 20Box 196SE-801 03 Gävle, Sweden+46 (0)26 17 20 60
REGIONAL BANK STOCKHOLMCarina Åkerström, Head
Kungsträdgårdsgatan 2SE-106 70 Stockholm, Sweden+46 (0)8 701 10 00
REGIONAL BANK EASTERN SWEDENStefan Nilsson, Head
Nygatan 20Box 421SE-581 04 Linköping, Sweden+46 (0)13 28 91 00
REGIONAL BANK WESTERN SWEDENKatarina Ljungqvist, Head
Östra Hamngatan 23 ASE-405 40 Gothenburg, Sweden+46 (0)31 774 80 00
REGIONAL BANK SOUTHERN SWEDENAnders Ohlner, Head
Södergatan 10SE-205 40 Malmö, Sweden+46 (0)40 24 56 00
REGIONAL BANK NORTHERN GREAT BRITAINJohn Parker, Head
4M BuildingMalaga AvenueManchester AirportManchester, M90 3RR, UK+44 (0)16 160 202 00handelsbanken.co.uk
REGIONAL BANK CENTRAL GREAT BRITAINGöran Stille, Head
Two Colmore Square38 Colmore Circus, 3rd floorQueenswayBirmingham B4 6BN, UK+44 (0)12 121 291 74 handelsbanken.co.uk
REGIONAL BANK SOUTH WEST GREAT BRITAINMichael Broom, Head
1100 Parkway NorthStoke GiffordBristol BS34 8YU, UK+44 (0)11 793 110 08handelsbanken.co.uk
REGIONAL BANK SOUTHERN GREAT BRITAINSimon Lodge, Head
3 Thomas More SquareLondon E1W 1WY, UK+44 (0)20 757 880 00handelsbanken.co.uk
REGIONAL BANK DENMARKFrank Vang-Jensen, Head
Havneholmen 29DK-1561 Copenhagen V, Denmark+45 (0)46 79 12 00handelsbanken.dk
REGIONAL BANK FINLANDNina Arkilahti, Head
Aleksanderkatu 11FI-00100 Helsinki, Finland+358 (0)10 444 11handelsbanken.fi
REGIONAL BANK NORWAYDag Tjernsmo, Head
Tjuvholmen Allé 11Postboks 1342 VikaNO-0113 Oslo, Norway+47 (0)22 39 70 00handelsbanken.no
REGIONAL BANK NETHERLANDSMikael Sørensen, Head
WTC Schipol AirportSchiphol Boulevard 135NL-1118 BG Schiphol, Netherlands+31 (0)204 127 600handelsbanken.nl
HANDELSBANKEN INTERNATIONALMagnus Uggla, Head
Torsgatan 14SE-106 70 Stockholm, Sweden+46 (0)8 701 10 00
BRANCHES AND BRANCH MANAGERS
208 HANDELSBANKEN | ANNUAL REPORT 2013
(E)*= employee representative
REGIONAL BANK NORTHERN SWEDEN
BoardBob Persson Östersund, Chairman
Hans Jonsson Umeå
Gunnar Liljedahl Luleå
Agneta Marell Umeå
Annika Brunnéd Umeå
Inger Nordström Härnösand, (E)*
Head of regional bankAnnika Brunnéd Umeå
REGIONAL BANK CENTRAL SWEDEN
BoardUlf Bergkvist Insjön, Chairman
Torsten Engwall Gävle
Peter Larsson Sandviken
Monica Oldenstedt Västerås
Åke Rydén Sveg
Anders Wiklander Sundsvall
Pontus Åhlund Gävle
Monica Morén Hedemora, (E)*
Head of regional bankPontus Åhlund Gävle
Branches and branch managers
Branch/branch managerAlfta Dan Silvroth
Arboga Larry Andersson
Arbrå Pär Lindh
Avesta Ruben Bergdahl
Bergby Susanne Persson
Bergsjö Rose-Marie Hildingsson
Bjursås Anders Rapp
Björbo Jenny Åkerström
Bollnäs Thomas Frykberg
Borlänge Caroline Cedergren
Bräcke Mikael Mellström
Delsbo Örjan Källman
Edsbyn Annika Wikström
Enköping Lars Olsson
Fagersta Mikael Johansson Holst
Falun Anders Forsgren
Fellingsbro Daniel Wallin
Fränsta Micaela Morén
Frövi Mikael Jansson
Furudal Margrethe Westerberg
Gagnef Anders Rehn
Gnarp Niclas Södergren
Grangärde Johanna Sallander
Grängesberg Mia Karlsson
Gällö Karin Evertsson
Gävle City Svante Larsson
Hallstavik Catarina Lyshag
Heby Maria Oscarsson
Hede Mattias Sundt
Hedemora Håkan Arvidsson
Hedesunda Pernilla Strömberg
Hudiksvall Thony Nylund
Insjön Oskar Ahlzén
Järvsö Ove Larsson
Kilafors Sten Morin
Knivsta Agneta Sturesson
Kolbäck Eva Klang
Kopparberg Lena Ragnarsson Vöks
Kungsör Stefan Granholm
Kvissleby Per Pettersson
Köping Peter Fällman
Leksand Anders Ekström
Lima Lena Eggens
Lindesberg Maria Ekdahl
Ljusdal Tommy Bylund
Ljusne Anna Ekström
Ludvika Carina Lundefors
Malung Martin Sellberg
Matfors Johan Billström
Mockfjärd Bengt Korning
Mora Henrik Ragnarsson
Norberg Håkan Bjurling
Norrtälje Bo Schotte
Ockelbo Karin Eriksson
Orsa Anette Skoglund
Rimbo Iréne Widnersson
Rättvik Maria Holmberg
Sala Robert Karlsson
Sandviken Pia Källarbo
Skinnskatteberg Niclas Zidén
Skultuna Johan Gustavsson
Skutskär Magnus Sjökvist
Skärplinge Stefan Holmquist
Skönsberg Urban Strömbom
Stora Tuna Anette Köpman
Storvik Helene Hedin
Sundsvall Owe Sundin
Sveg Jörgen Andersson
Svenstavik Bengt Nilzén
Säter Patrik Nylén
Söderhamn Joakim Frithiof
Sörberge Ulrika Bolt
Tierp Micael Lindström
Timrå Amanda Eriksson
Torsåker Toni Soppela
Uppsala
City Johan Lindblom
Eriksberg Magnus Sundqvist
Industriområde Baruch Grauman
Luthagen Birger Kristiansson
Vansbro Fredrik Hallqvist
Västanfors Andreas Byrén
Västerås
City Per Karlsson
Emausgatan Therese Massaro Kvarnryd
Köpingsvägen Mats Söderlund
Stora Gatan Håkan Janson
Ånge Andreas Abraham
Österbybruk Kristina Carlsson
Östervåla Helena Kolström
Östhammar Anna Lydell Bjälmén
Branch/branch managerArvidsjaur Ann-Louise Högberg
Backe Linnea Olsson
Bjurholm Linda Öhrman
Bjästa Kathrin Nordenberg
Björna Veronica Egnor
Boden Ann-Christin Söderberg Rånman
Bredbyn Anna Englund
Bureå Helen Sundström
Burträsk Joakim Löfbom
Byske Sören Markström
Domsjö Patrise Halsius
Dorotea Fredrik Sjöbom
Föllinge Bodil Edfeldt Olsson
Gammelstad Susanne Rudeklint
Gällivare Björn Nyström
Hammarstrand Lars-Göran Fahlén
Hammerdal David Sjödin
Haparanda Tomas Björnfot
Holmsund Marina Lindgren
Hoting Berith Minasdotter
Husum Veronica Egnor
Härnösand Åsa Starfelt Nilsson
Jokkmokk Ulrica Kvickström
Junsele Annica Olofsson
Järpen Pär Jakobsson
Kalix Ulla-Britt Söderberg
Kiruna Andreas Karlsson
Kramfors Susanne Moström
Krokom Ulf Hellström
Liden Tobias Wiklund
Lit Magnus Noren
Lugnvik Tommy Sjölund
Luleå
Storgatan Jörgen Ericsson
Örnäset Lisbeth Aidanpää
Lycksele Henrik Johansson
Lövånger Kjell-Ove Lövgren
Malå Ewa Lundqvist
Mörsil Astrid Larsson Lindh
Nordingrå Tommy Sjölund
Nordmaling Mats Ågren
Norsjö Greger Holmström
Näsåker Mari Tarander Jakobsson
Offerdal Jörgen Nordqvist
Pajala Per-Anders Juntti
Piteå Stefan Uddström
Ramsele Jan-Åke Sjömäling
Robertsfors Jenny Berglund
Råneå Maria Mörk
Skellefteå Hans Albert Lindgren
Sollefteå Sofia Bodin
Sorsele Fredrik Karlsson
Storuman Fredrik Karlsson
Strömsund Lars-Erik Olsén
Sävar Andreas Fors
Trehörningsjö Gunilla Näslund
Ullånger Tommy Sjölund
Umeå
City Anders Sundström
Teg Thomas Rönnberg
Västra Henrik Lundström
Vilhelmina Karin Svensson
Vindeln Anna Johansson
Vännäs Helene Hedman
Ånäset Jenny Berglund
Åre Jenny Strand
Åsele Anna Andersson
Älvsbyn Eva Berggren
Örnsköldsvik Lars Norlinder
Östersund Petter Dahlin
Överkalix Maria Fältmark
Övertorneå Asta Blombäck
BRANCHES AND BRANCH MANAGERS
HANDELSBANKEN | ANNUAL REPORT 2013 209
(E)*= employee representative
REGIONAL BANK STOCKHOLM
BoardStefan Wigren Bromma, Chairman
Ingalill Berglund Solna
Carl-Olof By Saltsjöbaden
Jörgen Centerman Stockholm
Jan-Erik Lindstedt Stockholm
Ulf Lundahl Lidingö
Carina Åkerström Stockholm
Anne Reis Stockholm, (E)*
Head of regional bankCarina Åkerström Stockholm
REGIONAL BANK EASTERN SWEDEN
BoardJan Cedwall Nyköping, Chairman
Santhe Dahl Växjö
Jan-Eric Nilsson Djursholm
Sten Peterson Katrineholm
Kenneth Synnersten Västerås
Stefan Nilsson Linköping
Alf Åke Dratzén Visby, (E)*
Head of regional bankStefan Nilsson Linköping
Branch/branch managerAlviks Torg Johan Lurén
Arlanda Sky City Carl-Fredrik Boija
Birger Jarlsgatan Daniel Spangenberg
Brommaplan Peter Lindh
Bålsta Ann-Sofie Sivander
Dalarö Kristina Jansenberger
Djursholm Sune Werkell
Ekerö Mathias Lindmark
Farsta Ulrika Kallur
Fleminggatan Tomas Wistedt
Fridhemsplan Ann Lilja
Frihamnen Johanna Lagerbäck
Gamla stan Carl-Magnus Gustafsson
Globen Daniel Andersson
Gustav Adolfs Torg Anders Lindegren
Götgatsbacken Maria Wedholm
Hallunda Göran Rönngren
Hammarby Stefan Zettergren
Haninge Pernilla Eldestrand
Hornsberg Jan Larsson
Hornsgatan Lars Holm
Huddinge Jenny Lööw Borsos
Humlegården AnneMarie Dahlstedt
Hägersten Anders Friman
Hässelby Gård Anders Stenberg
Högalid Per Lindholm
Högdalen Maria Sjöstedt
Jakobsberg Marie Lindström
Järna Ellinor Lindblom
Karlaplan Johan Hilmersson
Karlavägen Mats-Jörgen Hansson
Kista Hans Lundin
Kungsholmstorg Jan Wallin
Kungsträdgården Peter Einarsson
Kungsängen Stina Marklund
Kärrtorp Karl-Erik Bäckman
Lidingö
Centrum Elisabeth Hiljebäck
Larsberg Mikael Gustafson
Näset Magnus Blomqvist
Marieberg Lotta Adestam
Marievik David Haqvinsson
Märsta Magnus Hedlund
Mörby Centrum Peder Wiberg
Nacka Forum Jörgen Nilsson
Norrmalmstorg Johan Nordström
Norrtull Kjell Andersson
Nynäshamn Anders Hagman
Näsby Park Cecilia Sonntag
Odengatan Catarina Thunstedt
Odenplan Susanne Signell
Renstiernas gata Cecilia Hallqvist
Rotebro Katarina Fridén
S:t Eriksplan Marika Hedblom
Salem Torsten Johansson
Saltsjö-Boo Malin Meijer
Sigtuna Christer Bengtsson
Skanstull Mikael Wenngren
Skärholmen Anki Lenksjö
Sköndal Jessica Nirvin
Sollentuna Fredrik Andersson
Solna
Frösunda Ulf Eliasson
Solna Lisa Spangenberg
Solna strand Lena Schaumburger
Spånga Anders Nygren
Stockholm Sergel Maria Hellberg
Strandvägen Mats Ernborg
Stureplan Peter Sturesson
Stuvsta Mats Nordling
Sundbyberg Per Anders Tranberg
Sveavägen Malin Bergström
Södertälje Bengt Bohman
Tessinparken Lars Eberson
Torsgatan Lena Stenmark
Trångsund Pia Bergkvist
Tullinge Lena Lövkvist
Tyresö Susanne Norman-Taube
Täby Centrum Johan Grahn
Ulvsunda Tina Nylén
Upplands Väsby Urban Wolters
Vallentuna Fredrik Enander
Vanadisplan Stefan Sjöstedt, Acting
Vasagatan Christer Örtegren
Vaxholm Maria Lindberg
Vällingby Kajsen Hansson
Värmdö Niklas Eklund
Värtavägen Anna Gustafsson
Västerhaninge Göran Hartog
Västermalm Ulrika Staffas Nordqvist
Åkersberga Christer Lövholm
Årsta Anna Karlsson
Älvsjö Anna Blomstergren
Ängby Blackeberg Marcus Lundgren
Ösmo Anna Persson
Östermalmstorg Marion Ulander
Östra station Elisabeth Croon
Meeting-placesAlviks Torg
Äppelviken Johan Lurén
Högdalen
Stureby Maria Sjöstedt
Solna
Arenastaden Lisa Spangenberg
Täby Centrum
Arninge Johan Grahn
Ängby Blackeberg
Ängbyplan Marcus Lundgren
Branch/branch managerAlvesta Maj-Lis Pettersson
Anderstorp Sten Berglund
Bankeryd Åsa A Olsson
Borensberg Malin Svanberg
Borgholm Conny Johansson
Eksjö Karin Jönsson
Emmaboda Johan Lorentzon
Eskilstuna
Fristadstorget Vacant
Östermalm Bo Vallin
Finspång Carina Karlsson
Fjugesta Anders Hedvall
Flen Lotta Peppas
Fårösund Britt Nordstöm
Färjestaden Ida Petersson
Gislaved Per Risberg
Gnesta Mårten Larsson
Hallsberg Yvonne Bülow
Hemse Lars Cramér
Hultsfred Monica Carlenskog
Huskvarna Mats Andersson
Högsby Jonas Petersson
Jönköping Claes Ericson
Kalmar
Kalmar Hansa Christin Abrahamsson
Kvarnholmen Ola Tyrberg
Katrineholm Göran Bjerke
Klintehamn Linda Ewald
Kumla Thomas Ljungberg
Lammhult Christina Blomstrand
Landsbro Kent Lind
Linköping
City Staffan Krause
Tornby Mats Borgsjö
Mjölby Michael Rimstedt
Motala Anders Hättström
Mönsterås Ann Robertsson
Mörbylånga Susann Svenzén
Mörlunda Marie Jonsson
Norrköping
Drottninggatan Hans Widmark
Eneby Marie Kellgren
Fjärilsgatan Lars Blomqvist
Nybro Eric Elmlid
Nyköping Jens Fransson
Nässjö Cecilia Antonsson
Oskarshamn Jenny Nilsson
Pålsboda Anders Lindfors
Rörvik Christina Blomstrand
Slite Catarina Bylund
Strängnäs Thomas Wedholm
Sävsjö Cecilia Tahlin
Söderköping Marika Ronnerheim
Tingsryd Peter Andersson
Torsås Jeanette Karlström
Tranås Patrik Rosengren
Trosa Anna-Karin Borg
Vadstena Christine Wallstén
Vaggeryd Inger Ågren
Vetlanda Jörgen Asp
Vimmerby Hans Will
Virserum Monica Johansson
Visby
Adelsgatan Niclas Boklund
Öster Carl Oscar Sjöström
Vislanda Camilla Ivarsson
Värnamo Jonas Flink
Västervik Michael Skännestig
Växjö Jonas Ahlqvist
Ålem Ann Robertsson
Åseda Mattias König
Åtvidaberg Erik Torbrand
Örebro
Ekersgatan Kristina Dahl
Stortorget Kenneth Vallin
Våghustorget Bengt Gunnarsson
Meeting-placesNorrköping Drottninggatan
Östra Husby Hans Widmark
Strängnäs
Mariefred Thomas Wedholm
BRANCHES AND BRANCH MANAGERS
210 HANDELSBANKEN | ANNUAL REPORT 2013
(E)*= employee representative
REGIONAL BANK WESTERN SWEDEN
BoardLennart Mankert Gothenburg, Chairman
Stig-Arne Blom Ulricehamn
Peter Claesson Gothenburg
Thomas Dafgård Axvall
Carin Kindbom Västra Frölunda
Claes Larsson Gothenburg
Håkan Larsson Gothenburg
Vilhelm Schottenius Varberg
M. Johan Widerberg Gothenburg
Katarina Ljungqvist Västra Frölunda
Lena Lindén Karlstad, (E)*
Head of regional bankKatarina Ljungqvist Västra Frölunda
Branch/branch managerAle Torg Anna-Lisa Jansson
Alingsås Staffan Svantesson
Arvika Stefan Lindberg
Bollebygd Malin Lignell
Borås
Hulta Kenneth Källerman
Stora Torget Ingela Forsberg
Viared Thomas Bogsjö
Falkenberg Kristian Gårdenfelt
Falköping Magnus Kvarnmarker
Filipstad Ida Sandgren
Finnerödja Olle Jonsson
Fristad Anders Roos
Färgelanda Stefan Widlund
Gällstad Janne Pehrsson
Gothenburg
Almedal Jan Gottberg
Avenyn Håkan Jarbeck
Backa-Ringön Deborah Moberg
City Peter Romedahl
Eriksberg Kent Larsson
Frölunda Fredrik Wiklund
Första Långgatan Anders Olausson
Gårda Jens Persson
Hisings Kärra Paula Johannesson
Hjällbo Börje Ström
Högsbo Marie Magnusson
Kortedala Per Stolpe
Landala Fredrik Olsson
Lilla Bommen Marie Kaptein
Lindholmen Gabriella Berndtsson
Majorna Kajsa Mägi
Odinsgatan Annika Löfberg
Sisjön Christian Pennert
Torslanda Jonas Sandberg
Volvo Jonas Almhöjd
Örgryte Patrik Niklasson
Övre Husargatan Christian Nielsen
Hagfors Pär Skogfeldt
Herrljunga Susanne Bender
Hjo Thomas Waller
Karlskoga Johan Dahl
Karlstad
Stora Torget Ulrik Wedelin
Våxnäs Sara Brask
Kristinehamn Fredrik Ekenberg
Kungsbacka Mats Rollof
Kungälv Lena Gillholm
Landvetter Hanna Samuelsson
Lerum Ola Forsman
Lidköping Nina Ahlén
Lilla Edet Ingela Karlsson
Mariestad Torbjörn Läth
Mellerud Claes Hernvall
Mölndal Martin Henriksson
Mölnlycke Ann Sundvisson
Partille Anna Ekstrand
Skara Anna-Lena Andersson
Skövde Martin Drebin
Sollebrunn Peter Kornesjö
Stenungsund Anette Pettersson
Strömstad Johan Rosengren, Acting
Sunne Maria Hannebo
Surte Allison Åsblom
Svenljunga Hans Qvist
Säffle Dennis Göransson
Tibro Hanna Rosing
Tidaholm Martin Ekman, Acting
Torsby Pär Olsson
Tranemo Christina Ljung
Trollhättan Mats Johansson
Uddevalla Stefan Widlund
Ulricehamn Janne Pehrsson
Vara Maj Rudell
Varberg Jonas Lagerqvist
Vårgårda Ann Björn
Vänersborg Jan-Olof Strand
Åmål Cecilia Blom
Årjäng Peter Johansson
Älvängen Anette Winther
Meeting-placesGothenburg Frölunda
Långedrag Fredrik Wiklund
Kungsbacka
Kungsporten Mats Rollof
REGIONAL BANK SOUTHERN SWEDEN
BoardCharlotta Falvin Genarp, Chair
Bengt Kjell Helsingborg
Claes Lindqvist Viken
Johan Mattsson Tomelilla
Mikael Roos Malmö
Anders Ohlner Malmö
Pia Håkansson Ystad, (E)*
Head of regional bankAnders Ohlner Malmö
Branch/branch managerArlöv Rickard Ohlsson
Bara Cecilia Leijgård
Broby Catharina Munkberg
Båstad Lars-Olof Ottosson
Eslöv Mats Jonsson
Halmstad Magnus Landbring
Helsingborg
Norr Olof Enander
Stortorget Göran Pelvén
Söderport Maria Brygg
Hässleholm Rebecca Thörnqvist
Höganäs Gunilla Voss
Höllviken Ebba Olsson
Höör Magnus Holmer
Karlshamn Helén Olofsson
Karlskrona Hedvig Stache
Kivik Pontus Hansson
Klippan Jonas Bondesson
Knislinge Catharina Munkberg
Kristianstad Thomas Johansson
Kävlinge Sara Malterling
Laholm Fredrik Johnson
Landskrona Per-Ove Kamlund
Ljungby Thomas Eldh
Ljungbyhed Jonas Bondesson
Lomma Erik Hultgren
Lund
City Peter Andersson
Ideon Nils Möllerberg
Malmö
Amiralsgatan Göran Camitz
City Erik Bredberg
Fosie Anders Persson
Fridhem Marie Brunstam
Hyllie Anna Harrison Barthold
Köpenhamnsvägen Peter Ivarsson
Limhamn Bengt Rosendahl
Lundavägen Bengt Nyquist
Triangeln Annila Hansson
Värnhem Annika Bäckström
Västra Hamnen Mårten Edlund
Markaryd Maria Larsson
Olofström Catharina Lydell
Osby Henrica Lorentsson
Ronneby Magnus Jurvin
Simrishamn Andreas Jeppsson
Sjöbo Thomas Hansson
Skanör Björn Andersson
Skurup Jonas Sjöberg
Staffanstorp Magnus Anderberg
Svedala Cecilia Leijgård
Sölvesborg Magnus Gardell
Sösdala Karin Eriksson
Tomelilla Pål Andersson
Trelleborg Marianne Nilsson
Tyringe Marie Persson-Lärka
Veberöd Hans-Åke Mårtensson
Vellinge Susanne Linné Nilsson
Vittsjö Henrica Lorentsson
Vollsjö Thomas Hansson
Ystad Mia Kristell
Åhus Daniel N Högstedt
Älmhult Fredrik Roghner
Ängelholm Irene Andersson
Meeting-placesHöganäs
Viken Gunilla Voss
Lund City
Hjärup Peter Andersson
Sölvesborg
Bromölla Magnus Gardell
BRANCHES AND BRANCH MANAGERS
HANDELSBANKEN | ANNUAL REPORT 2013 211
REGIONAL BANK NORTHERN GREAT BRITAIN
The operations are part of Svenska Handelsbanken, London branch.
BoardHåkan Sandberg Stockholm, Chairman
Anders Bouvin London, CEO of Handelsbanken UK
Olof Lindstrand Lidingö
John Parker Manchester
Head of regional bankJohn Parker Manchester
Branch/branch managerAberdeen Neil Clark
Altrincham Ian Noke
Barnsley Suzanne Minifie
Beverley Ian Gatenby
Blackburn Philip Skupski
Bolton Sean Greenhalgh
Bradford Andrew Lowther
Burnley David Kovacs
Carlisle Jason Smith
Castleford Ian Mason
Chester Chris Burgoyne
Chesterfield Phil Walker
Darlington Mike Airey
Doncaster Neil Ebden
Durham Rory Gibson
Edinburgh Michael Mullins
Glasgow George Shanks
Grimsby Anthony Winn
Halifax Angela Dowd
Harrogate Richard Lally
Heswall Richard Malley
Hexham David Wilson, Acting
Huddersfield Tony Jones
Hull Neil Harrison
Ilkley Sue Toulson
Kendal Richard Lancaster
Lancaster Kevin Sanderson
Leeds
The Embankment David Brady
Headingley Stephen Hill
Wellington Street James Cornell
Liverpool Keith Lowe
Lytham Christopher Strahan
Manchester
Spinningfields Joe McGrath
Trinity Way John Burke
Middlesbrough John Martinson
Morpeth David Elliot
Newcastle
Grey Street Tom Ramshaw
Saville Row Mike Brunskill
Perth Alexander McDougall
Preston David Warbrick
Rotherham Mike Harrison
Scarborough Nick Sharples
Sheffield
Riverside Stephen Tweedle
Tudor Square Patrick McGarry
Stirling David Beggs
Stockport Andrew Buckley
Stockton-on-Tees David Filby
Sunderland Granville Kelly
Wakefield Ian Mason, Acting
Warrington Lesley Cozens
Wetherby Adam von Emloh
Wigan Alan Bowers
York Christopher Ibbotson
Branch/branch managerBanbury Paul Graham
Bedford Mick Valerio
Birmingham
Newhall St David Hastings
Temple Row Tony Hall
Bromsgrove Stephen Ellis
Burton-on-Trent Ian Morris
Bury St Edmunds Nigel Foyster
Cambridge Richard Waters
Colwyn Bay Gareth Jones
Crewe Adrian Smith
Coventry Paul Belfield
Derby Shaun Hill
Ipswich Andrew Pike
Leamington Spa Paul Brooksbank
Leicester Simon Bradley
Lincoln David Thompson
Loughborough Simon Grant
Luton Paul Drummond
Mansfield Darryn Evans
Milton Keynes Derek Bell
Northampton David Rundle
Norwich Ian Hall
Nottingham
City Gate Andrew Tomlinson
West Bridgford Ian Davys
Peterborough Julian Turner
Rugby Andy McCabe
Shrewsbury Chris Hyde
Solihull Richard Baker
Stafford Mike Smith
Stoke-on-Trent Paul Stokes
Tamworth Christine Banks
Wolverhampton Steven Lewis
Worcester Philip Dutton
Wrexham Vicky Davies
.
REGIONAL BANK CENTRAL GREAT BRITAIN
The operations are part of Svenska Handelsbanken, London branch.
BoardAnders Bouvin London, Chairman, CEO of Handelsbanken UK
Olof Lindstrand Lidingö
Håkan Sandberg Stockholm
Göran Stille Birmingham
Head of regional bankGöran Stille Birmingham
.
BRANCHES AND BRANCH MANAGERS
212 HANDELSBANKEN | ANNUAL REPORT 2013
REGIONAL BANK SOUTHERN GREAT BRITAIN
The operations are part of Svenska Handelsbanken, London branch.
BoardHåkan Sandberg Stockholm, Chairman
Anders Bouvin London, CEO of Handelsbanken UK
Olof Lindstrand Lidingö
Simon Lodge London
Head of regional bankSimon Lodge London
Branch/branch managerBishop’s Stortford Steve Cooper
Brighton Simon Howe
Bromley Chris Pye
Canterbury David Kiernan
Chatham Gavin Coleman
Chelmsford Mark Earlam
Chiswick Dermot Jordan
Clapham Neil Higgs
Colchester Alan Barnard
Crawley Simon Briggs
Croydon Vacant
Dartford Trevor Adams
Ealing Chris Ttouli
Enfield Adrian Bennett
Epsom Phil Hunt
Hampstead Denis McCarthy
Harrow Paul Jarman
Hertford Debbie Chilton
Kensington Tom Fuller
Kingston Peter Wylde
London
Holborn Sean McManus
London Bridge David Boaden
Marylebone Andrew Rowlands
Moorgate Paul Chapman
West End Roy Budgett
Maidstone Jeremy Brett
Queen’s Park Steve MacDonald
Redhill Clive Martin
Richmond Mark Lobo
Romford David Roe
Sevenoaks Nick Brooker
St Albans Anthony Fogden
Southend-on-Sea John Brooks
Tunbridge Wells Nick Green
Uxbridge Steve Howarth
Watford Andrew Samarasinghe
Wimbledon Barry Sexton
.
REGIONAL BANK SOUTH WEST GREAT BRITAIN
The operations are part of Svenska Handelsbanken, London branch.
BoardAnders Bouvin London, Chairman, CEO of Handelsbanken UK
Michael Broom Bristol
Olof Lindstrand Lidingö
Håkan Sandberg Stockholm
Head of regional bankMichael Broom Bristol
Branch/branch managerAylesbury Derek Beards
Ascot Richard Payton
Barnstaple Peter Larcombe
Basingstoke Vacant
Bath Chris Johnson
Bodmin Phil Kerkin
Bournemouth Jeremy Tollworthy
Bridgend Mark Standley
Bristol
Clifton Martin Bidgood
Parkway Roger Bell
Queen Square Ian Dibble
Camberley Mark Clinkskel
Cardiff Neil Humphreys
Cheltenham Di Pitts
Chichester Chris Golding
Dorchester Andrew Denning
Exeter Darren Galliford
Gloucester Simon Cropper
Guildford Neil Truman
Hereford Craig Wyer
High Wycombe Vacant
Newbury Geoff Dann
Newport Martin Leech
Oxford David Woodhead
Plymouth Phill Harvey
Poole Dave Shering
Portsmouth Richard Gillard
Reading Graham Beith
Salisbury Graham Renshaw
Slough Sarah Dean, Acting
Southampton Craig Ward
Swansea Steve Smith
Swindon Shaun Bradshaw
Taunton Peter Kirby
Truro Denise Major
Weston-super-Mare Martin Fey
Yeovil Jim Durrant
BRANCHES AND BRANCH MANAGERS
HANDELSBANKEN | ANNUAL REPORT 2013 213
(E)*= employee representative
REGIONAL BANK DENMARK
The operations are part of Svenska Handelsbanken, Copenhagen branch.
BoardClaes Norlén Stockholm, Chairman
Ulrik Kolding Hartvig Roskilde
Steen Winther-Petersen Copenhagen
John Vestergaard Ikast
Lise Westphal Emdrup
Frank Vang-Jensen Gentofte
Helle Rank Aalborg, (E)*
CEO of regional bankFrank Vang-Jensen Copenhagen
Branch/branch managerAalborg
City Ole Dahl Nielsen
Syd Morten O. Hedemann
Allerød Mads Christian Heidemann
Amager Dorte Jellestad
Aulum Gerda Kviesgaard
Ballerup Steen Hansen
Birkerød Jesper Borglykke
Brande Henrik Overgaard
Charlottenlund Allan Kandrup
Copenhagen
City Gorm Bjørkmann
Østerbro Bjarne Albrechtsen
Large Corporates Knud Jacobsen
Vest Jan Arup
Esbjerg Morten Andersen
Farum Jens Karlsson
Fredensborg Kjeld Aunstrup
Fredericia Brian Sørensen
Frederiksberg
Frederiksberg Henrik Bengtsson
Frederiksberg Vest Jesper Christensen
Frederikssund Michael Tøgersen
Frederiksværk Alan Nielsen
Give Martin Skovgaard Larsen
Grindsted Lars Balle Olsen
Hammerum Jakob Rousing Sloth
Helsinge Steen Malmqvist
Helsingør Dan-Gösta Larsen
Herlev Flemming Jensen
Herning
City Niels Viggo Malle
Fredhøj Bruno Hansen
Hillerød
Hillerød Steen Hirschsprung
Vest Lisbeth Arenfeldt
Holstebro Henrik Kristiansen
Horsens John Jørgensen
Ikast Arnth Stougaard
Karup Vibeke Hestbek
Kgs. Lyngby Preben Bjerrekær
Kibæk Preben Staal
Kolding Jesper Andersen
Køge Brian Jakobsen
Lemvig Peter Tornbo
Lynge Kristian Løvgreen-Hansen
Odense Klaus Rydal
Roskilde Stig Teilman
Sdr. Felding Kristian Hansen
Silkeborg Stefan Brochmann
Slagelse Henrik Kragh
Slangerup Jørgen Torm
Stenløse Dennis Grouleff
Struer Poul Bakkegaard
Sunds Allan Eg
Vejle Carsten Hjortflod
Viborg Jens Rahbek
Videbæk Anja Lyhne
Vildbjerg Frank Jensen
Århus
Århus City Esben Kjeldsen
Århus Syd Arne Vestergaard Knudsen
openhagen branch.
REGIONAL BANK FINLAND
The operations are part of Svenska Handelsbanken, Helsinki branch.
BoardStig Gustavson Helsinki, Chairman
Claes Norlén Stockholm, Vice Chairman
Bjarne Mitts Helsinki
Leena Niemistö Helsinki
Elmar Paananen Helsinki
Andreas Tallberg Kirkonummi
Seija Turunen Helsinki
Nina Arkilahti Espoo
Tiina Pöyhönen Kuopio, (E)*
CEO of regional bankNina Arkilahti Helsinki
Branch/branch managerEspoo
Leppävaara Nina Lukka
Matinkylä Outi Vesanto
Tapiola Hannu Oksanen
Helsinki
Aleksi Tuija Nuutinen
Dianapuisto Ilari Tyrkkö
Hakaniemi Jussi Nikkanen
Itäkeskus Outi Vainikka
Kamppi Riitta Hallila
Munkkivuori Jouni Linnavuori
Pasila Maria Kaisa Ylimäinen
Hyvinkää Risto Mäkeläinen
Hämeenlinna Pauli Ranta
Imatra Pekka Lankinen
Joensuu Mauri Kujanen
Jyväskylä Jarkko Käki
Jävenpää Ilkka Arenius
Kerava Kimmo Heiskanen
Kirkkonummi Päivi Toppari
Kokkola Esa Alkio
Kotka Hannu Huostila
Kouvola Henri Lilja
Kuopio Simo Sarkkinen
Lahti Matti Nieminen
Lappeenranta Martti Mäkelä
Lohja Arto Finérus
Mikkeli Jouko Kervinen
Oulu Timo Väisänen
Pietarsaari Jörgen Blomqvist
Pori Sami-Pekka Ylikoski
Porvoo Annika Bergvall
Raisio Maaria Rahikainen
Rauma Sami-Pekka Ylikoski, Acting
Rovaniemi Pekka Pistokoski
Salo Teemu Alanko
Seinäjoki Jorma Soukka
Tammisaari Hannu Oksanen
Tampere
Kauppakatu Tarja Suvisalmi
Kyttälä Kari Koivisto
Tornio Roger Keisu
Turku
Hämeenkatu Risto Vihula
Kauppatori Josefiina Vornanen
Vaasa Frej Björses
Vantaa
Aviapolis Tero Juotasniemi
Myyrmäki Matti Sulamaa
Tikkurila Stephan Björkell
sinki branch.
BRANCHES AND BRANCH MANAGERS
214 HANDELSBANKEN | ANNUAL REPORT 2013
REGIONAL BANK NORWAY
The operations are part of Svenska Handelsbanken, Oslo branch.
BoardBjørn Flatgård Kolbotn, Chairman
Claes Norlén Stockholm, Vice Chairman
Hans Anfinn Eide Helland Sandnes
Rebekka Glasser Herlofsen Oslo
Dag Tangevald-Jensen Oslo
Dag Tjernsmo Oslo
Kjell Arild Andersen Bergen, (E)*
CEO of regional bankDag Tjernsmo Oslo
Branch/branch managerArendal Petter Anker Rasch
Asker Turid Williksen
Bergen
Fana Monica Vågen
Fyllingsdalen Gottlieb Gullaksen
Kokstad Jarle Hundven
Minde Åse Fluge Nordgreen
Sentrum Tore Svein Nese
Strandgaten Erik Ramsdal
Vest Mette Skauge
Åsane Thomas Rasmussen
Bodø Tore Halvorsen
Bryne Rolf Inge Knutsen
Drammen Toril Garntangen
Fredrikstad Tove Anita R Torp
Halden Roar Elsness
Hamar Hans Skjelbreid
Haugesund Knut Børge Lunde
Jessheim Inger Kyhen
Kolbotn Terje Andersen
Kongsberg Kristin Franck
Kristiansand Vidar Akselsen
Larvik Bodil Hansen
Lillehammer Lars Erik Jevanord
Lillestrøm Paal Tollefsen
Lysaker Glenn Steinbø
Mo i Rana Jonny I Bohlin
Molde Jan Fredrik Fogth, Acting
Moss Willy Fossum
Oslo
Grev Wedels plass Thomas B. Tresselt
Large Corporates Sven Ove Oksvik
Majorstuen Bjørn Erik Røv
Nydalen Bente Bjerkvold
Olav Vs gate Harald Søreide
Bryn Eirik Arnesen
Skøyen Thomas Stousland
Sandefjord Hans Jørgen Ormar
Sandnes Sindre Bergsagel
Sandvika Kirsti Jensås
Sarpsborg Tormod Sørum
Ski Geir Anders Sundnes
Skien Jan Egil Hafredal
Sotra Lisbeth Turøy
Stavanger
Sentrum Lynn Sperb
Straen Ole Henry Slette
Tromsø Yngve Haldorsen
Trondheim
Heimdal Fredrik Lillemyr
Søndregate Ola Grøtte
Tønsberg Per Skustad
Ålesund Steinar Krøvel
slo branch.
(E)*= employee representative
REGIONAL BANK NETHERLANDS
The operations are part of Svenska Handelsbanken AB, Netherlands branch.
BoardHåkan Sandberg Stockholm, Chairman
Anders Bouvin London
Olof Lindstrand Lidingö
Mikael Sørensen Haarlem
CEO of regional bankMikael Sørensen Haarlem
Branch/branch managerAmersfoort Robert van der Kolk
Amsterdam
Centrum Jasper Klok
Zuid Daniël van Til
Barendrecht Peter Bot
Bergen op Zoom Patrick van Zon
Breda Ton Schröder
Den Haag Roderick Mastenbroek
Eindhoven Marco van Tongeren
Emmen Marc Bruin
Groningen Erwin van der Steur
Het Gooi Lars Vissers
Leeuwarden Tammo Oosterhof
Maastricht Tim Neu
Rotterdam Hans Troost
Schiphol Edwin Boonk
Twente Martijn Peters
Utrecht Michiel van Loon
Zwolle Wery Hegge
lands branch.
BOARD SUBSIDIARIES
HANDELSBANKEN | ANNUAL REPORT 2013 215
(E)*= employee representative
** For the complete name of the company, see note P16.
BOARD SUBSIDIARIES**
EFNBoardJohan Lagerström Täby, Chairman
Magnus Berglund Saltsjöbaden
Michael Green Västra Frölunda
Ulf Köping-Höggård Lidingö
Carina Åkerström Stockholm
Chief Executive Carl Bjurling Enskede
HANDEL OCH INDUSTRI Board M. Johan Widerberg Göteborg, Chairman
Olof Lindstrand Lidingö
Bo Annvik Hovås
Chief Executive Bengt Kjell Stockholm
HANDELSBANKEN FINANSBoardYonnie Bergqvist Täby, Chairman
Kai Jokitullpo Stockholm
Göran Holgerson Gnesta
Peter Gustafsson Farsta, (E)*
Chief Executive Marie Lundberg Stockholm
HANDELSBANKEN FONDERBoard Olof Lindstrand Stockholm, Chairman
Michael Bertorp Stockholm
Gunnar Båtelsson Sandviken
Åsa Magnusson Linköping
Lena Munkhammar Solna
Ann-Christine Frilund Gustavsberg, (E)*
Chief Executive Javiera Ragnartz Stockholm
HANDELSBANKEN LIV BoardThommy Mossinger Stockholm, Chairman
Joakim Jansson Sundbyberg
Lennart Söderberg Täby
Anna Hjelmberg Järfälla, (E)*
Chief Executive Louise Sander Danderyd
HEARTWOODBoardIan White Stockport, Chairman
Simon Lough London
Tracey Davidson London
Nolan Carter Oxfordshire
Karen Fryer Croydon
Simon Dixon Battle
STADSHYPOTEK BoardHåkan Sandberg Stockholm, Chairman
Yonnie Bergqvist Täby
Olof Lindstrand Lidingö
Thommy Mossinger Stockholm
Michael Bertorp Stockholm
Camilla Persson Farsta, (E)*
Chief Executive Per Beckman Lidingö
OFFICES OUTSIDE THE NORDIC COUNTRIES, THE UK AND THE NETHERLANDS
Operations are conducted in Svenska Handelsbanken with branches in each country except for Luxembourg, where operations are conducted both as a subsidiary and a branch. As of January 2014, the Bank’s subsidiary in Luxemburg was merged with the parent company which will conduct the operations in the existing branch.
Branch/branch manager
Austria General Manager Christian Prinz zu Solms-Lich
Vienna Christian Prinz zu Solms-Lich
China General Manager Mikael Westerback
Hong Kong Johan Andrén
Shanghai Mikael Westerback
EstoniaGeneral Manager Annika Nordström
Tallinn Annika Nordström
FranceGeneral Manager Björn Torsteinsrud
Nice Anna Jansson-Clauzier
Paris Jesper Hellström
GermanyGeneral Manager Elisa Saarinen
Düsseldorf Thomas Kuhn
Essen Thomas Kuhn
Frankfurt Marie Jöhnk
Hamburg Kerstin Fuchs
Mannheim Hans Jürgen Ding
Munich Andreas Stein
Stuttgart Hans Jürgen Ding
Latvia General Manager Dzintars Salavs
Riga Dzintars Salavs
LithuaniaGeneral Manager Håkan Molin
Vilnius Håkan Molin
LuxembourgGeneral Manager Jörgen Oldensand
Luxembourg Jörgen Oldensand
PolandGeneral Manager Harri Tuohimaa
Warsaw Harri Tuohimaa
Singapore General Manager Jan B Djerf
Singapore Jan B Djerf
USA General Manager Rolf Marquardt
New York Rolf Marquardt
Representative offices
BeijingRepresentative Jason Wang
Kuala LumpurRepresentative Abhinash Murukesvan
MarbellaRepresentative Jessika Kroon
Representative Vibeke Toustrup Bonne
MoscowRepresentative Viktor Tsoy
MumbaiRepresentative Ashish Gupta
São PaoloRepresentative Carl-Gustav Moberg
SydneyRepresentative Robert Karlsson
TaipeiRepresentative Amy Chen
ZurichRepresentative Torben Kragh
DEFINITIONS AND EXPLANATIONS
216 HANDELSBANKEN | ANNUAL REPORT 2013
Definitions and explanationsADJUSTED SHAREHOLDERS’ EQUITY PER SHAREEquity at the end of the year reduced by the equity effect of cash flow hedges and the minority share of shareholders’ equity. Adjusted equity is then divided by the number of ordinary shares at the year-end reduced by buybacks. Where applicable, the dilution effect is taken into account.
CAPITAL BASEThe capital base is the sum of tier 1 and tier 2 capital. To obtain the total capital base for capi-tal adequacy purposes, deductions are made for capital contributions in insurance companies and reported surplus values of pension assets. For a more detailed description of the capital base, see note G49.
CAPITAL RATIOThe total capital base for capital adequacy pur-poses in relation to risk-weighted volume.
C/I RATIOTotal expenses in relation to total income.
COMMON EQUITY TIER 1 CAPITALTotal tier 1 capital excluding tier 1 capital con-tributions.
COMMON EQUITY TIER 1 CAPITAL RATIOCore tier 1 capital in relation to risk-weighted volume.
DIVIDEND YIELDDividend per share divided by the share price at year-end.
EARNINGS PER SHAREThe profit for the year attributable to holders of ordinary shares divided by the average number of outstanding shares. Where applicable, the dilution effect is taken into account.
IMPAIRED LOANSLoans are classified as impaired loans if con-tracted cash flows are not likely to be fulfilled. The full amount of all claims which give rise to a specific provision are included in impaired loans even if parts are covered by collateral.
ITRAXXITRAXX Financials is an index of CDS spreads for the 25 largest bond issuers in the European
bank and insurance sector. It describes the aver age premium that an investor requires in order to accept credit risk on the companies.
LOAN LOSS RATIOLoan losses and changes in value of repos-sessed property in relation to loans to the public and credit institutions (excluding banks) at the beginning of the year, and also repossessed property and credit guarantees.
P/E RATIOThe share price at year-end divided by earnings per share.
PREMIUMS WRITTENA concept used within the Bank’s insurance op-erations denoting mainly the total of premiums paid in during the year.
PROPORTION OF IMPAIRED LOANSNet impaired loans in relation to total loans to the public and credit institutions (excluding banks). Impaired loans are reported without deduction for the collateral that is security for the claim.
RETURN ON EQUITYThe year’s profit in relation to average equity. Average equity is adjusted for value changes on financial assets classified as available for sale and derivatives in cash flow hedges and a weighted average of new share issues, divi-dends and repurchase of own shares.
RETURN ON TOTAL ASSETSOperating profit in relation to average total assets.
RISK RESULTA concept used in the Bank’s insurance op-e rations. The difference between the fees the company charges to cover the insurance risks (mortality, life expectancy, disability and accident) and the actual cost of the insurance claims.
RISK-WEIGHTED VOLUMEThe total risk-weighted amount from each credit risk exposure. The risk-weighted amount is the same as the risk weight of the exposure multiplied by its exposure amount. The risk weight is based on a number of factors, such as the repayment capacity and debt-servicing of the counterparty, type of product and the value of any collateral.
SOLVENCY RATIOA concept used in the Bank’s insurance operations. The solvency ratio is the avail-able solvency margin divided by the required solvency margin and is a measure of the margin the company has to meet its commitments. The ratio for a demutualised, profit-distributing life insurance company cannot be compared with the ratio for a mutual life insurance company.
TIER 1 CAPITALTier 1 capital is one of the components of the capital base and comprises equity and tier 1 capital contributions. Deductions are made for, inter alia, dividends generated, goodwill and other intangible assets and also the difference between an expected loss and provisions made for probable loan losses. Profits generated in the Group’s insurance company are not included in the tier 1 capital. For a more detailed description of the capital base, see note G49.
TIER 1 CAPITAL CONTRIBUTIONTier 1 capital contributions (hybrid loans) com-prise subordinated loans that may be included in the tier 1 capital with the consent of the Swedish Financial Supervisory Authority.
TIER 1 RATIOTotal tier 1 capital in relation to risk-weighted volume.
TIER 2 CAPITALTier 2 capital is one of the components of the capital base and mainly consists of perpetual and fixed-term subordinated loans. Deductions are made for, inter alia, the difference between an expected loss and provisions made for prob-able loan losses. For a more detailed description of the capital base, see note G49.
TOTAL RETURNThe total of the year’s change in share price and paid dividend per share divided by the share price at the end of the previous year.
YIELD SPLITWhen the total yield exceeds the rate guaran-teed by the insurance company, the company will receive 10 per cent of the total yield as its share in the yield split.

handelsbanken.com | +46 8-701 10 00 | SE-106 70 Stockholm, Sweden


