Embed Size (px)
Citation preview
Annual Report 2016-17
0
ANNUAL REPORT2016-2017
STATE POLLUTION CONTROL BOARD, ODISHAA/118, NILAKANTHA NAGAR, UNIT-VIII
BHUBANESWAR
1
SPCB, Odisha (450 Copies)
Published By:State Pollution Control Board, OdishaBhubaneswar –751012
Printed By:______________________________________________________
2
CONTENTS
Highlights of Activities
Chapter-I Introduction
Chapter-II Constitution of the State Board
Chapter-III Constitution of Committees
Chapter-IV Board Meeting
Chapter-V Activities
Chapter-VI Legal Matters
Chapter-VII Finance and Accounts
Chapter-VIII Other Important Activities
Annexures
(I) Organisational Chart
(II) Rate Chart for Sampling &Analysis of Env. Samples
(III) Staff Strength

i
i
HIGHLIGHTS OF ACTIVITIES OF THE STATE POLLUTION CONTROL BOARD, ODISHA
he State Pollution Control Board (SPCB), Odisha was constituted on July, 1983 and was entrusted with the responsibility of implementing the Environmental Acts, particularly the Water (Prevention and Control of Pollution) Act, 1974, the
Water (Prevention and Control of Pollution) Cess Act, 1977, the Air (Prevention and Control of Pollution) Act, 1981 and the Environment (Protection) Act, 1986. Several Rules addressing specific environmental problems like Hazardous waste management, Bio-medical waste management, Solid waste management, e-Waste Management, Plastic Waste Management, Environmental Impact Assessment etc. have been brought out under the Environment (Protection) Act. The SPCB also executes and ensures proper implementation of the Environmental Policies of the Union and the State Government. The activities of the SPCB broadly cover the following:
Planning comprehensive programs towards prevention, control or abatement of pollution and enforcing the environmental laws.
Advising the State Government on any matter concerning prevention and control of water and air pollution.
Environmental Monitoring and Research.
Creating public awareness.
The achievements and activities of the Board during April’2016 to March’2017 are as follows.
Industrial Pollution Abatement and Control through Consent Administration Improvement in compliance to pollution control norms, guidelines and regulations has been witnessed consistently through vigorous surveillance, regular inspections and monitoring, stipulation of a series of guidelines and directives.
(i) The Board has constituted different technical committees for considering consent applications of various projects for establishment.
(ii) Implementation of the on-line consent management system (from receipt of application to consent order) for all industries, mines and on-line authorization management for Hazardous Waste, Solid Waste and Health care establishment.
(iii) Implementation of GPRS based real time data transmission system with Y-Cable for online stack, ambient air quality and waste water monitoring network round the clock for highly polluting large scale industries and mines in order to keep the regulator and industries alert. So far online monitoring and data transmission system has been installed in 139 industries and 22 mines.
(iv) The Fly Ash Resource Centre (FARC) has been setup in the State Pollution Control Board for promoting safe management and utilization of fly ash in the State. This center has prepared guidelines on utilization of fly ash in various sectors and it is also co-coordinating among the Users and Thermal Power Plants. In addition, FARC is also organizing Workshops and Interaction meet among the stakeholders for enhancing fly ash
T
ii
utilization. During this year, the utilization of fly ash was 67.82%, against 59.43% during the preceding year, i.e. 2015-16.
(v) Initiatives have been taken to facilitate bulk utilization of other industrial solid wastes like dolochar, phospho-gypsum, blast furnace slag, anode butt, ferro-manganese sludge in different sectors like brick making, road construction, cement manufacturing and power generation etc.
(vi) Health care establishments having 100 beds and above have been brought under the Consent administration as per the provisions of Water (Prevention & Control of Pollution) Act, 1974 in order to dispose highly contaminated waste water in an environmentally sound manner.
(vii) To study the cause of high ambient temperature and design remedial measures the Board has instituted Heat Island study for Angul-Talcher area through IIT, Delhi. Similar study for Ib Valley-Jharsuguda area has been instituted by DFID in association with SPCB. The study is being conducted by TERI, Delhi. Both the institutes have submitted the draft final reports which are under evaluation.
(viii) In order to augment the capacity of the Board in the area of coastal environmental monitoring the World Bank assisted Integrated Coastal Zone Management Project (ICZMP) is being implemented. Office of the Pilot Executing Agency (PEA) of the Board has been operating in Central Laboratory Building, Patia, Bhubaneswar. The coastal water over a stretch of about 80 km from Paradeep to Dhamra is being monitored and PEA has collected 1114 samples during the reporting period for analysis of 40 parameters.
(ix) The Centre for Management of Coastal Eco-system (CMCE) building at Paradeep has been operating since 16.05.2016. It is the first Govt. building in the State of Odisha to receive the coveted Platinum Rating LEED (Leadership in Energy & Environment Design) Certification from the prestigious U.S. Green Building Council (USGBC), duly certified by Green Building Certification Inc. (GBCI), Washington, DC.
(x) The Sea Worthy Vessel with an in-built Laboratory, procured under the ICZM Project has been registered with Mercantile Marine Department (MMD) of DG Shipping, Government of India.
(xi) Due to efforts of the Board to control dust nuisance in Paradeep Port, advance dust suppression facilities such as Fog Cannons and Wheel Washing System have been introduced for suppression of fugitive dust emissions for stack piles, haulage roads and other working areas resulting reduction of dust nuisance.
(xii) The Board has granted consent with stipulations of appropriate pollution control measures to 906 Industries, hotels, mineral stack yards, mineral processing units, railway sidings, stone crushers, brick kilns and DG Sets (as stand by) etc. for their Establishment.
(xiii) Consent to operate has been granted to 2780 industries, mines, hotels, hospitals, mineral stack yards, mineral processing units, railway sidings,
iii
stone crushers, brick kilns, DG Sets (as stand by), housing projects and mineral based industries etc. during the reporting period.
(xiv) The Board has issued 497 Show Cause Notices, 290 Refusals and 92 Closure Directions to defaulting units.
(xv) All the Urban Local Bodies have been directed to seek consent and submit time bound action plan for construction of sewage treatment plant.
(xvi) The Board has conducted 30 public hearings for major industrial / mining / development projects, requiring environmental clearance from Govt. of India.
(xvii) 3458 industrial wastewater samples, samples from 1251 stack emissions, 2217 ambient air samples and 18 solid waste/ hazardous waste/soil samples from different industrial premises have been collected and analysed.
(xviii) Under the provisions of the Water (Prevention and Control of Pollution) Cess Act, 1977 the Board has assessed an amount of 6,60,85,310.58/- from various industries and urban local bodies of the state. An amount of 6,72,96,052.69/- has been collected during the financial year 2016-17.
Ministry of Environment, Forest and Climate Change (MoEF & CC), Govt. of India has been remitted with 7, 23,21,650/- and 5,24,27,576/- was reimbursed to the Board by MoEF & CC during the reporting period.
Regulation of Hazardous Waste Management
The Hazardous and Other Wastes (Management and Trans-boundary Movement) Rules, 2016 has come in to force on 04.04.2016. The Board has granted authorization to 95 hazardous waste generating units under the said Rules for collection, storage, treatment and disposal of hazardous wastes. 159 Industries/mines have taken membership agreement with the Common Hazardous Waste Treatment, Storage & Disposal facility (CHWTSDF) developedat Kanchichuvan, Jajpur operated by M/s. Ramky Enviro Engineers Limited, Hyderabad.
Implementation of the Batteries (Management & Handling) Rules, 2001
The Board has received 84 half yearly returns during April’2016-September’2016 and 19 half yearly returns during October’2016-March’ 2017 for smooth management and handling of batteries (Lead – Acid) by Battery units under the provisions of aforesaid Rules.
Management of Bio-Medical Waste
The Board has granted authorization to 868 Health care facilities (HCF) under the provisions of the aforesaid Rules with conditions for proper management, handling, treatment and disposal of biomedical wastes. Show cause notices to 365 units and refusal of authorization to 33 HCEs have been issued for improper management of biomedical wastes.
iv
Management of Plastic Waste
The Board is consistently vigilant on carry bag manufacturing units for their compliance with the statutory provisions of the Plastic Waste Management. The Plastic Waste Management Rules, 2016 has become effective from 18.03.2016. So far 08 plastic carry bag manufacturing units have valid authorization and no plastic carry bag manufacturing units have been registered with the Board during the reporting period.
Management of E-Waste
The E-waste Management Rules, 2016 has become effective from 01.10.2016 and under the said Rules no individual E-waste collection centre is allowed to collect E-waste. The captive collection centres of Producer / Dismantler/ Recycler/ Refurbishers are only allowed to collect E-waste. The Board has granted authorization to 03 captive E-waste collection centres for collection of electronic waste. Out of them, only one namely M/s. Saniclean (P) Ltd., Khordha has been registered as collection-cum-dismantling unit in Odisha.
Management of Municipal Solid Waste
The Solid Waste Management Rules, 2016 has become effective from 08.04.2016 for management of municipal solid waste which includes authorization, processing & disposal of solid wastes. The Board has not granted authorization to any Urban Local Body during the reporting period.
Legal Activities
The Board has filed /counter filed 310 cases and 269 cases have been disposed during the reporting period.
Right to Information
Under the Right to Information Act, 2005, the Board has disposed 547 no. of applications by providing information. 756 no. of applications were received.
Disposal of Public Complaints
The Board has addressed 472 Public Complaints on various environmental issues during April’2016-March’2017, out of 633 received.
Planning and Monitoring
For prevention and control of pollution, the Board has undertaken following activities..
Board is regularly monitoring the river water quality at 79 stations on 09 major river systems of the State namely Mahanadi, Brahmani, Baitarani, Rushikulya, Subernarekha, Nagavali, Budhabalanga, Kolab and Vansadhara. Water quality is assessed in respect of 36 water quality parameters. Besides these, water quality of Taladanda Canal at six locations, religious ponds such as Bindusagar of Bhubaneswar at its four bathing ghats and Narendra, Markanda, Parbati Sagar, Indradyumna, Swetaganga of Puri town, lakes such as Chilika (two locations) & Anshupa (four locations) and coastal water quality at Puri, Gopalpur and Paradeep on the Bay of Bengal has also been monitored.
v
Bio-monitoring at 25 stations of 08 major rivers i.e. Mahanadi, Brahmani, Rushikulya, Subernarekha, Budhabalanga, Kerandi, Vansadhara and Nagavali has been monitored to assess the biological health of these river systems.
To assess the impacts of mass bathing during Kartika Purnima on the water quality of Mahanadi and Kathajodi rivers, water quality monitoring at eight major bathing ghats of these rivers in Cuttack city are conducted.
Survey on ground water and surface water quality around phosphatic fertilizer plants of Paradeep has been undertaken by the Board. Surface water samples form different locations of Atharabanki creek around two fertilizer plants and ground water samples from the test wells of both the plants and 02 locations from outside the plants have been monitored at regular intervals to assess fluoride contamination in the area.
Water quality of Ganda Nallah and Kharasrota river has also been monitored at seven stations at regular intervals to assess the impacts of waste water discharge from the Industrial Units in Kalinganagar area.
Water quality of Damasala river at five stations in Sukinda chromite area has been monitored at regular intervals to assess the hexavalent chromium content in river water.
Surface water quality in and around M/s Vedant Aluminium Limited, Jharsuguda has been monitored at sixteen stations to assess the fluoride contamination in the area.
Wastewater quality at 11 stations distributed over Cuttack, Bhubaneswar, Puri, Talcher, Dhenkanal and Rourkela has been monitored on regular basis.
Monitoring of ground water quality at 15 stations of 03 towns i.e. Cuttack, Bhubaneswar and Puri has also been conducted in respect of 32 water quality parameters.
The Board has analyzed 3458 industrial samples & 4932 samples under NWMP, NRCP, SWMP and other projects during this period.
Impact of idol immersion on the water quality during different festivals has been investigated in rivers and ponds by Regional Offices of the Board. No significant impact on water bodies was observed due to implementation of guidelines of Central Pollution Control Board on safe idol immersion practices.
Ambient air quality at 34 stations of 16 important towns and industrial areas of Angul, Talcher, Balasore, Berhampur, Bhubaneswar, Cuttack, Jharsuguda, Kalinganagar, Keonjhar, Konark, Paradeep, Puri, Rayagada, Rourkela, Rajgangpur and Sambalpur has been monitored by the Board under National Ambient Air Quality Monitoring Programme (NAMP)/ State Ambient Air Quality Monitoring Programme (SAMP). Ambient air quality in 13 towns at 25 Stations has been assessed in respect of 04 parameters namely PM
10, PM
2.5,
Sulphur Dioxide (SO2) and Nitrogen Oxides (NO
X). Whereas at 09 stations in
Bhubaneswar, Puri and Konark, ambient air quality has been assessed in respect of 07 parameters like PM
10, PM
2.5, SO
2, NO
X, NH
3, O
3and Pb.
To assess the impact of bursting of fire crackers during Deepawali, the ambient air quality with respect to parameters like SO
2, NO
X, PM
10& PM
2.5 has
been monitored in pre and on the day of Deepawali at 41 locations in 13 towns/ cities i.e Angul, Balasore, Berhampur, Bhubaneswar, Cuttack,
vi
Jharsuguda, Kalinganagar, Keonjhar, Paradeep, Puri, Rayagada, Rourkela and Sambalpur.
In total 2217 industrial ambient air samples, 10,588 samples under NAMP & SAMP and 312 other ambient air samples including those collected during festive occasions have been analyzed during the reporting period.
Study on noise levels during celebrations of Dashera at 49 locations & Deepawali at 50 locations has been conducted in 13 cities/towns such as Angul, Balasore, Berhampur, Bhubnaeswar, Cuttack, Jharsuguda, Kalinganagar, Keonjhar, Paradeep, Puri, Rayagada, Rourkela and Sambalpur covering Industrial, Commercial, Residential and Silence Zones during day and night time. Performance evaluation of 124 sound limiters of different band parties has been conducted in respect of noise [limited to 65 dB (A)].
The Board has taken up the following initiatives for Ease of Doing Businessin the State.
Online Consent and Authorization Management System & the certificates are available in public domain.
Mobile App for online Consent Management System and App available in Google Play Store.
Application Disposal Time for consent reduced from 120 days to 30 days with commitment under Odisha Right to Public Service Act, 2012 (ORTPS Act 2012).
Consent to operate validity period increased from one year to five years for Red and ten years for Orange category industries.
Auto-Renewal and Auto-Revalidation of Consent based on self- certification.
Frequency of Inspection reduced for industries. Synchronized-Inspection with Central Inspection Coordination Group
(CICG). The Board has empanelled 13 consultants dealing with environment
related activities during the reporting period.
Board’s Publications
The Board has published the following Book & Reports during April’2016-March’2017. “Water Quality of Major Rivers of Odisha”. Three volumes of Newsletters Paribesh Samachar i.e. (January–March. 2016,
April-June, 2016, July – December, 2016). Environmental Status Report of Paradeep, Gahirmatha – Bhitarkanika &
Dhamra coastal stretches of Odisha (from May’2013 to March’2015) in Bay of Bengal.
Report card of “Estuarine- Sea Eco system of Paradeep 2015”. Status Report on Critically Polluted Area, Ib Valley – Jharsuguda Area. Status Report on Critically Polluted Area, Angul - Talcher Area.
Awareness Programmes
For creation of awareness amongst the general public, the Board regularly publishes advertisements relating to environmental issues in different periodicals / newspapers / souvenirs.
vii
The Earth Day is being celebrated on 22nd April’ 2016 by Regional Offices in collaboration with District level environment committee.
The Board observed the World Environment Day on 5th June’2016 at its Head Office, Bhubaneswar and 12 Regional Offices to create awareness on environmental protection. Messages on protection of environment were given to the public through meetings, mass campaigns, paintings, debates& plantations etc.
The 33rd Foundation Day of the Board was observed on 14th September’ 2016 at Jayadev Bhawan, Bhubaneswar in presence of distinguished guests and delegates followed by release of Newsletter & Books.The Chief Speaker,Prof. U.C. Mohanty, Emeritus Professor, School of Earth, Ocean & Climate Sciences, Indian Institute of Technology, Bhubaneswar delivered Prof. M. K. Rout Memorial Lecture - Climate Change and Sustainable Development on the occasion.
The Board has instituted pollution control excellence / appreciation awards to encourage the Industries, Mines and Health care facilities for adoption of pollution control measures.
The International Coastal Clean-up Day was observed by the Board on the sea beach of Puri, Chandbali, Gopalpur & Paradeep on 17th September, 2016 for creation of mass awareness on the protection and management of environment involving District Administration, different NGOs & volunteers.
The National Pollution Prevention Day was observed by the Board on 2nd
December,2016 at Bhubaneswar & Rourkela by conducting mass rally,meeting & workshop etc..
During Deepawali festival mobile vehicles with staff move in & around Bhubaneswar and Cuttack for creating awareness among the public on the effect of crackers on air pollution & noise pollution.
During Holi festival, public awareness was made to use natural colors in order to make it safe.
Human Resource Development
The Board has conducted various programmes by the Centre of Excellence for imparting training to various stakeholders on pollution control and environment protection and also deputed its officials on exposure training and to acquire knowledge in the above field. .
The Board has imparted Training on “Water/Air quality parameters monitoring & analysis and impact of pollutants on Human Health” to 55 medical students of All India Institute of Medical Science, Bhubaneswar, 08 M.Sc., Forestry students of OUAT, Bhubaneswar & 05 Engineering students of KIST, Bhubaneswar in its Central Laboratory.
91 Police personnel from various districts of Odisha were imparted training on“Vehicular Pollution and its effect on Human Health”.
Annual Report 2016-17
1
CHAPTER – I
INTRODUCTION
1.1 CONSTITUTION OF THE BOARD
The Odisha State Prevention and Control of Pollution Board was constituted in pursuance of sub-section (1) of section 4 of the Water (Prevention and Control of Pollution) (Amendment) Act, 1974, vide Notification No. 1481-VII-HI-11/83 (Vol. II)-S.T.E., dt. 15.7.1983 in the erstwhile Department of Science, Technology & Environment, Government of Odisha. The Board was re-designated as State Pollution Control Board, Odisha vide Govt. Notification No. Env.-E (F)/8/89/1882 F&E, dt.16.07.1999.
1.2 FUNCTIONS AND RESPONSIBILITIES OF THE BOARD
The constitution and functions of the Board are clearly spelt out in the Water (Prevention and Control of Pollution) Act, 1974 and the Air (Prevention and Control of Pollution) Act, 1981. The Board is entrusted with the responsibility of implementation of Environmental Laws, particularly the Water (Prevention and Control of Pollution) Act, 1974, the Air (Prevention and Control of Pollution) Act, 1981, the Water (Prevention & Control of Pollution) Cess Act, 1977 and the Environment (Protection) Act, 1986 and a number of Rules and Notifications issued thereunder as amended from time to time.
Responsibilities of the Board, however, can broadly be classified into the following four main categories:
1. To plan a comprehensive programme for prevention, control or abatement of pollution and enforce the environmental laws
2. To advise the State Government on any matter concerning prevention and control of water and air pollution
3. To conduct Environmental Monitoring and Research4. To create public awareness
In addition, the Board is also expected to execute and ensure proper implementation of the Environmental Policies of the Union and the State Government.
1.3 ENVIRONMENTAL LAWS
The major Acts and Rules / Notifications issued thereunder, with which the Board is entrusted for implementation and execution, are as follows:
1. The Water (Prevention and Control of Pollution) Act, 1974
2. The Water (Prevention and Control of Pollution) Cess Act, 1977
3. The Air (Prevention and Control of Pollution) Act, 1981
4. The Environment (Protection) Act, 1986
5. The Public Liability Insurance Act, 1991
6. The Hazardous Waste (Management, Handling and Transboundary Movement) Rules, 2008 amended as the Hazardous and Other Wastes (Management and Transboundary Movement) Rules, 2016.
Annual Report 2016-17
2
7. The Manufacture, Use, Import, Export and Storage of Hazardous Microorganisms, Genetically Engineered Organisms or Cells Rules, 1989
8. The Manufacture, Storage and Import of Hazardous Chemical Rules, 1989
9. The Chemical Accidents (Emergency Planning, Preparedness and Response) Rules, 1996
10. The Biomedical Waste (Management and Handling) Rules, 1998 amended asthe Biomedical Waste Management Rules, 2016.
11. The Municipal Solid Waste (Management and Handling) Rules, 2000amended as the Solid Waste Management Rules, 2016.
12. The Noise Pollution (Regulation and Control) Rules, 2000
13. The Ozone Depleting Substance (Regulation and Control) Rules, 2000
14. The Batteries (Management and Handling) Rules, 2001
15. The Environment Audit Notification, 1993
16. The Fly-ash Utilization Notification,1999
17. The Environment Impact Assessment Notification, 2006
18. The Plastic Waste (Management and Handling)(Amendment)Rules, 2011amended as the Plastic Waste Management Rules, 2016
19. The E-Waste (Management and Handling) Rules, 2011 amended as the E-Waste (Management) Rules, 2016.
20. The Construction & Demolition Waste Rules, 2016.
1.4 LOCATIONS AND MAILING ADDRESSES OF BOARD’S OFFICES
Headquarters of the State Pollution Control Board, Odisha is located at Paribesh Bhawan, A/118, Nilakantha Nagar, Bhubaneswar in Khordha District. The Board has established its state-of-art Central Laboratory at B-59/2 & 59/3, Chandaka Industrial Estate, Patia, Bhubaneswar.
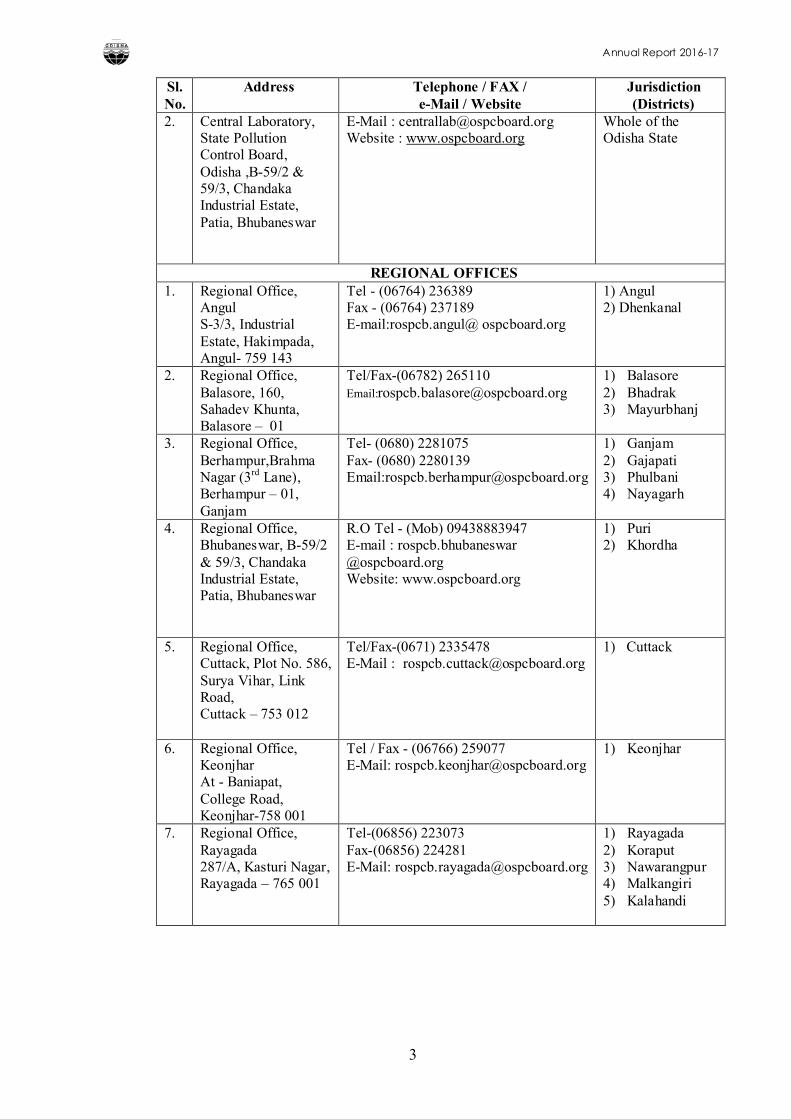
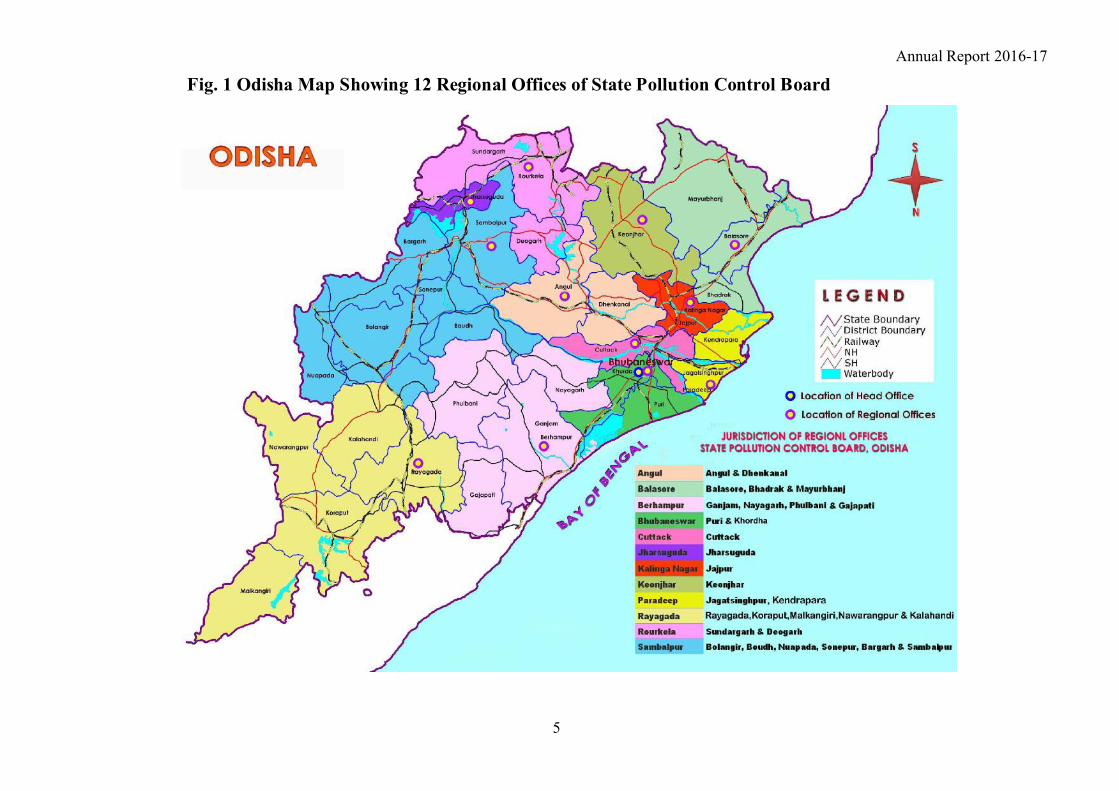
The jurisdictions, various functions, role, responsibilities and powers of Regional Officers of all the 12 Regional Offices have been defined vide Office Order No. 16908, dtd.19.09.2013. The mailing addresses, Telephone/Fax Nos., E-mail/website and jurisdiction of the Head Office, the Central Laboratory and Regional Offices are given in Table-1. The locations of twelve Regional Offices of State Pollution Control Board are illustrated in Odisha Map in Fig. 1. Table – 1: Address, Telephone / Fax, e-mail / Website and Jurisdiction of State Pollution Control Board, Odisha
Sl. No.
Address Telephone / FAX /e-Mail / Website
Jurisdiction (Districts)
HEAD OFFICE
1. State Pollution Control Board, Odisha, Paribesh Bhawan, A/118, Nilakantha Nagar, Unit-8, Bhubaneswar-751 012
(0674) 2561909, 2562847Fax- (0674) 2562827, 2560955E-Mail:[email protected] : www.ospcboard.org
Whole of the Odisha State
Annual Report 2016-17
3
Sl. No.
Address Telephone / FAX /e-Mail / Website
Jurisdiction (Districts)
2. Central Laboratory,State Pollution Control Board, Odisha ,B-59/2 & 59/3, Chandaka Industrial Estate, Patia, Bhubaneswar
E-Mail : [email protected] : www.ospcboard.org
Whole of the Odisha State
REGIONAL OFFICES1. Regional Office,
AngulS-3/3, Industrial Estate, Hakimpada, Angul- 759 143
Tel - (06764) 236389Fax - (06764) 237189E-mail:rospcb.angul@ ospcboard.org
1) Angul 2) Dhenkanal
2. Regional Office, Balasore, 160, Sahadev Khunta, Balasore – 01
Tel/Fax-(06782) 265110Email:[email protected]
1) Balasore 2) Bhadrak 3) Mayurbhanj
3. Regional Office, Berhampur,Brahma Nagar (3rd Lane), Berhampur – 01, Ganjam
Tel- (0680) 2281075Fax- (0680) 2280139Email:[email protected]
1) Ganjam 2) Gajapati 3) Phulbani4) Nayagarh
4. Regional Office, Bhubaneswar, B-59/2 & 59/3, Chandaka Industrial Estate, Patia, Bhubaneswar
R.O Tel - (Mob) 09438883947E-mail : rospcb.bhubaneswar @ospcboard.orgWebsite: www.ospcboard.org
1) Puri 2) Khordha
5. Regional Office, Cuttack, Plot No. 586, Surya Vihar, Link Road, Cuttack – 753 012
Tel/Fax-(0671) 2335478E-Mail : [email protected]
1) Cuttack
6. Regional Office,KeonjharAt - Baniapat, College Road, Keonjhar-758 001
Tel / Fax - (06766) 259077 E-Mail: [email protected]
1) Keonjhar
7. Regional Office, Rayagada287/A, Kasturi Nagar, Rayagada – 765 001
Tel-(06856) 223073Fax-(06856) 224281E-Mail: [email protected]
1) Rayagada2) Koraput 3) Nawarangpur 4) Malkangiri 5) Kalahandi
Annual Report 2016-17
4
Sl. No.
Address Telephone / FAX /e-Mail / Website
Jurisdiction (Districts)
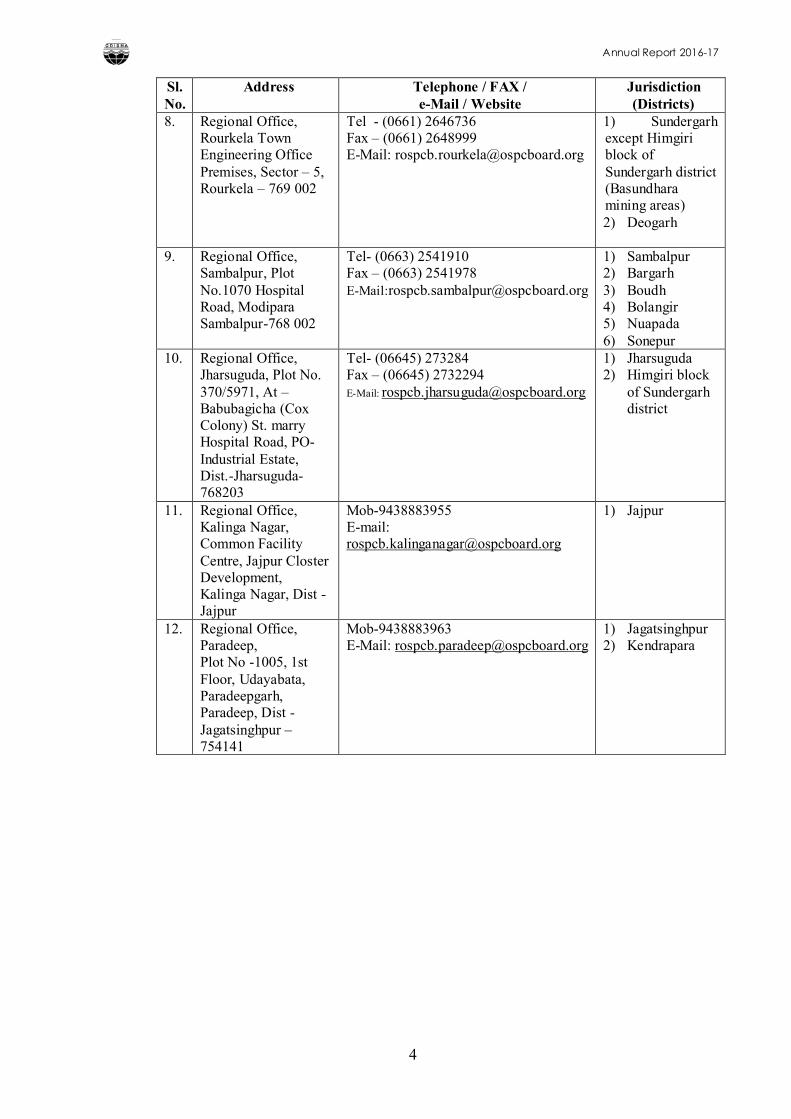
8. Regional Office, Rourkela Town Engineering Office Premises, Sector – 5, Rourkela – 769 002
Tel - (0661) 2646736Fax – (0661) 2648999E-Mail: [email protected]
1) Sundergarh except Himgiri block of Sundergarh district (Basundhara mining areas)2) Deogarh
9. Regional Office, Sambalpur, Plot No.1070 Hospital Road, ModiparaSambalpur-768 002
Tel- (0663) 2541910Fax – (0663) 2541978E-Mail:[email protected]
1) Sambalpur2) Bargarh 3) Boudh4) Bolangir5) Nuapada6) Sonepur
10. Regional Office, Jharsuguda, Plot No. 370/5971, At –Babubagicha (Cox Colony) St. marry Hospital Road, PO-Industrial Estate, Dist.-Jharsuguda-768203
Tel- (06645) 273284Fax – (06645) 2732294E-Mail: [email protected]
1) Jharsuguda 2) Himgiri block
of Sundergarhdistrict
11. Regional Office, Kalinga Nagar, Common Facility Centre, Jajpur Closter Development, Kalinga Nagar, Dist -Jajpur
Mob-9438883955E-mail: [email protected]
1) Jajpur
12. Regional Office, Paradeep, Plot No -1005, 1st Floor, Udayabata, Paradeepgarh, Paradeep, Dist -Jagatsinghpur –754141
Mob-9438883963E-Mail: [email protected]
1) Jagatsinghpur2) Kendrapara
Annual Report 2016-17
5
Fig. 1 Odisha Map Showing 12 Regional Offices of State Pollution Control Board
Annual Report 2016-17
6
CHAPTER – II
CONSTITUTION OF THE STATE BOARD
2.1 As per the provisions of sub-section 2 of section 4 of the Water (Prevention and Control of Pollution) Act, 1974 and under sub-section 2 of section 5 of the Air (Prevention and Control of Pollution) Act, 1981, theState Board shall consist of the following members, namely:
i. A Chairman (either whole-time or part-time as the State Government may think fit), being a person having special knowledge or practical experience in respect of matters relating to environment protection or a person having knowledge and experience in administrating institutions dealing with the matters aforesaid, to be nominated by the State Government;
ii. Such number of officials, not exceeding five, to be nominated by the State Government to represent that Government;
iii. Such number of persons, not exceeding five, to be nominated by the State Government from amongst the members of the local authorities functioning within the State;
iv. Such number of officials, not exceeding three, to be nominated by the State Government to represent the interest of agriculture, fishery or industry or trade or any other interest which, in the opinion of the State Government, ought to be represented;
v. Two persons to represent the companies or corporations owned, controlled or managed by the State Government, to be nominated by that Government;
vi. A full time Member Secretary, possessing qualifications, knowledge and experience of scientific, engineering or management aspects of pollution control, to be appointed by the State Government
2.2 In exercise of the powers conferred under Sub-Section (1) of Section 4 of the Water (Prevention & Control of Pollution) Act, 1974 and Section 5 of the Air (Prevention & Control of Pollution) Act, 1981, Government in theForest & Environment Department, Odisha constituted the present Board vide Notification No. 19568-Env-II-22/2015-F&E dated 6th November, 2015 for a period of three years with the following members.
A.Chairman
Chairman, State Pollution Control Board, Odisha.
Sri R.Balakrishnan, IAS (30.11.2015 contd.)
B. Official Members
1. Secretary to Government, H & UD Department, Government of Odisha or his nominee, not below the rank of Joint Secretary
Annual Report 2016-17
7
2. Secretary to Government, Industries Department, Government of Odisha or his nominee, not below the rank of Joint Secretary
3. Secretary to Government, Steel and Mines Department, Government of Odisha or his nominee, not below the rank of Joint Secretary
4. Director (Environment), Forest & Environment Department, Government of Odisha or his nominee
5. Director, Factories & Boilers, Government of Odisha or his nominee
C. Members Representating Local Authorities
1. Chairman / Executive Officer, Paradeep Municipality
2. Chairman / Executive Officer, Jharsuguda Municipality
3. Chairman / Executive Officer, Talcher Municipality
4. Chairman / Executive Officer, Barbil Municipality
D. Non-Official Members
1. Prof. Damodar Acharya, Former Vice Chancellor, BPUT & Former Chairman, AICTE
2. Dr. Subhasish Tripathy, Prof. of School of Earth, Ocean & Climate Sciences, IIT Bhubaneswar
3. Dr. Satyaban Jena, Professor of Chemistry, Utkal University,Vani Vihar, Bhubaneswar
E. Members Representating Companies & Corporations
1. Managing Director, Odisha Mining Corporation Ltd, Bhubaneswar
2. Managing Director, Industrial Infrastructure Development Corporation (IDCO), Bhubaneswar
F. Member Secretary
Member Secretary, State Pollution Control Board, Odisha.
Sri Debidutta Biswal, I.F.S (29.07.2016 contd.)
Annual Report 2016-17
8
CHAPTER - III
CONSTITUTION OF COMMITTEES
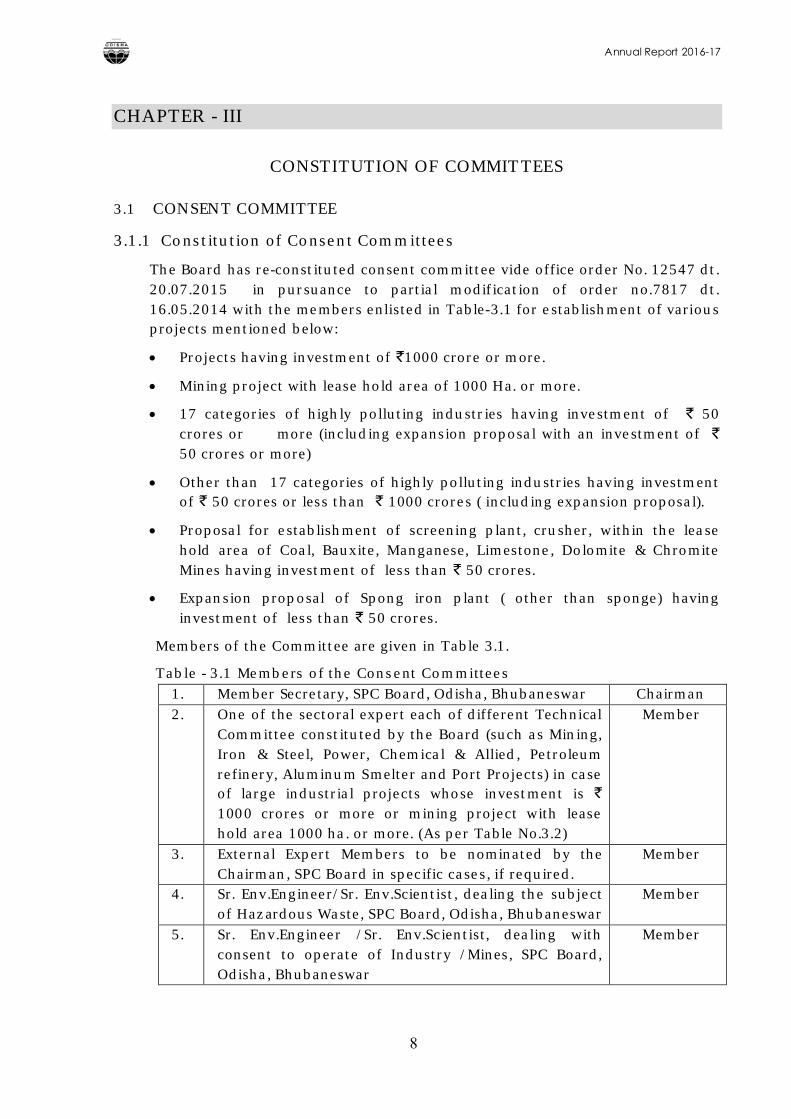
3.1 CONSENT COMMITTEE
3.1.1 Constitution of Consent Committees
The Board has re-constituted consent committee vide office order No. 12547 dt. 20.07.2015 in pursuance to partial modification of order no.7817 dt. 16.05.2014 with the members enlisted in Table-3.1 for establishment of variousprojects mentioned below:
Projects having investment of 1000 crore or more.
Mining project with lease hold area of 1000 Ha. or more.
17 categories of highly polluting industries having investment of 50 crores or more (including expansion proposal with an investment of 50 crores or more)
Other than 17 categories of highly polluting industries having investment of 50 crores or less than 1000 crores ( including expansion proposal).
Proposal for establishment of screening plant, crusher, within the lease hold area of Coal, Bauxite, Manganese, Limestone, Dolomite & Chromite Mines having investment of less than 50 crores.
Expansion proposal of Spong iron plant ( other than sponge) having investment of less than 50 crores.
Members of the Committee are given in Table 3.1.
Table - 3.1 Members of the Consent Committees1. Member Secretary, SPC Board, Odisha, Bhubaneswar Chairman2. One of the sectoral expert each of different Technical
Committee constituted by the Board (such as Mining, Iron & Steel, Power, Chemical & Allied, Petroleum refinery, Aluminum Smelter and Port Projects) in case of large industrial projects whose investment is 1000 crores or more or mining project with lease hold area 1000 ha. or more. (As per Table No.3.2)
Member
3. External Expert Members to be nominated by the Chairman, SPC Board in specific cases, if required.
Member
4. Sr. Env.Engineer/Sr. Env.Scientist, dealing the subject of Hazardous Waste, SPC Board, Odisha, Bhubaneswar
Member
5. Sr. Env.Engineer /Sr. Env.Scientist, dealing with consent to operate of Industry /Mines, SPC Board, Odisha, Bhubaneswar
Member
Annual Report 2016-17
9
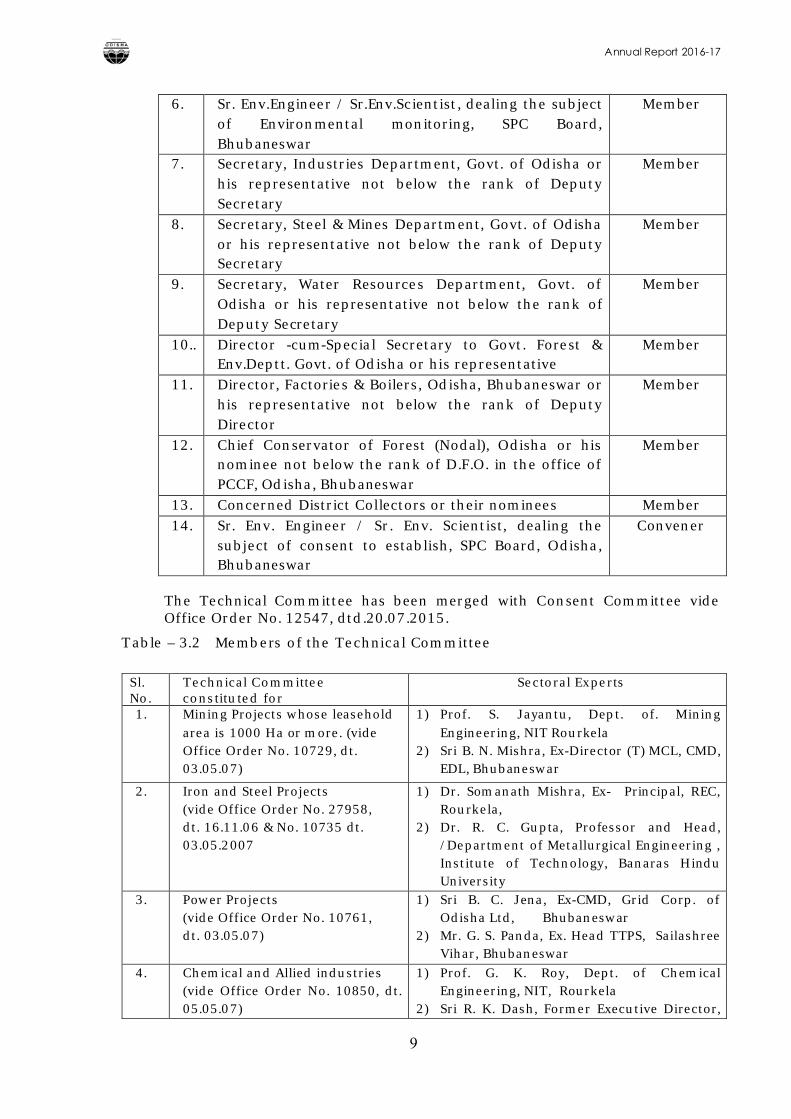
6. Sr. Env.Engineer / Sr.Env.Scientist, dealing the subject of Environmental monitoring, SPC Board, Bhubaneswar
Member
7. Secretary, Industries Department, Govt. of Odisha or his representative not below the rank of Deputy Secretary
Member
8. Secretary, Steel & Mines Department, Govt. of Odisha or his representative not below the rank of Deputy Secretary
Member
9. Secretary, Water Resources Department, Govt. of Odisha or his representative not below the rank of Deputy Secretary
Member
10.. Director -cum-Special Secretary to Govt. Forest & Env.Deptt. Govt. of Odisha or his representative
Member
11. Director, Factories & Boilers, Odisha, Bhubaneswar or his representative not below the rank of Deputy Director
Member
12. Chief Conservator of Forest (Nodal), Odisha or his nominee not below the rank of D.F.O. in the office of PCCF, Odisha, Bhubaneswar
Member
13. Concerned District Collectors or their nominees Member14. Sr. Env. Engineer / Sr. Env. Scientist, dealing the
subject of consent to establish, SPC Board, Odisha, Bhubaneswar
Convener
The Technical Committee has been merged with Consent Committee vide Office Order No. 12547, dtd.20.07.2015.
Table – 3.2 Members of the Technical Committee
Sl. No.
Technical Committee constituted for
Sectoral Experts
1. Mining Projects whose leasehold area is 1000 Ha or more. (vide Office Order No. 10729, dt. 03.05.07)
1) Prof. S. Jayantu, Dept. of. Mining Engineering, NIT Rourkela
2) Sri B. N. Mishra, Ex-Director (T) MCL, CMD, EDL, Bhubaneswar
2. Iron and Steel Projects (vide Office Order No. 27958, dt. 16.11.06 & No. 10735 dt. 03.05.2007
1) Dr. Somanath Mishra, Ex- Principal, REC, Rourkela,
2) Dr. R. C. Gupta, Professor and Head, /Department of Metallurgical Engineering , Institute of Technology, Banaras Hindu University
3. Power Projects (vide Office Order No. 10761,dt. 03.05.07)
1) Sri B. C. Jena, Ex-CMD, Grid Corp. of Odisha Ltd, Bhubaneswar
2) Mr. G. S. Panda, Ex. Head TTPS, Sailashree Vihar, Bhubaneswar
4. Chemical and Allied industries (vide Office Order No. 10850, dt. 05.05.07)
1) Prof. G. K. Roy, Dept. of Chemical Engineering, NIT, Rourkela
2) Sri R. K. Dash, Former Executive Director,
Annual Report 2016-17
10
PPL & OCFL,VIM 484 (near post office) Sailashree Vihar, Bhubaneswar
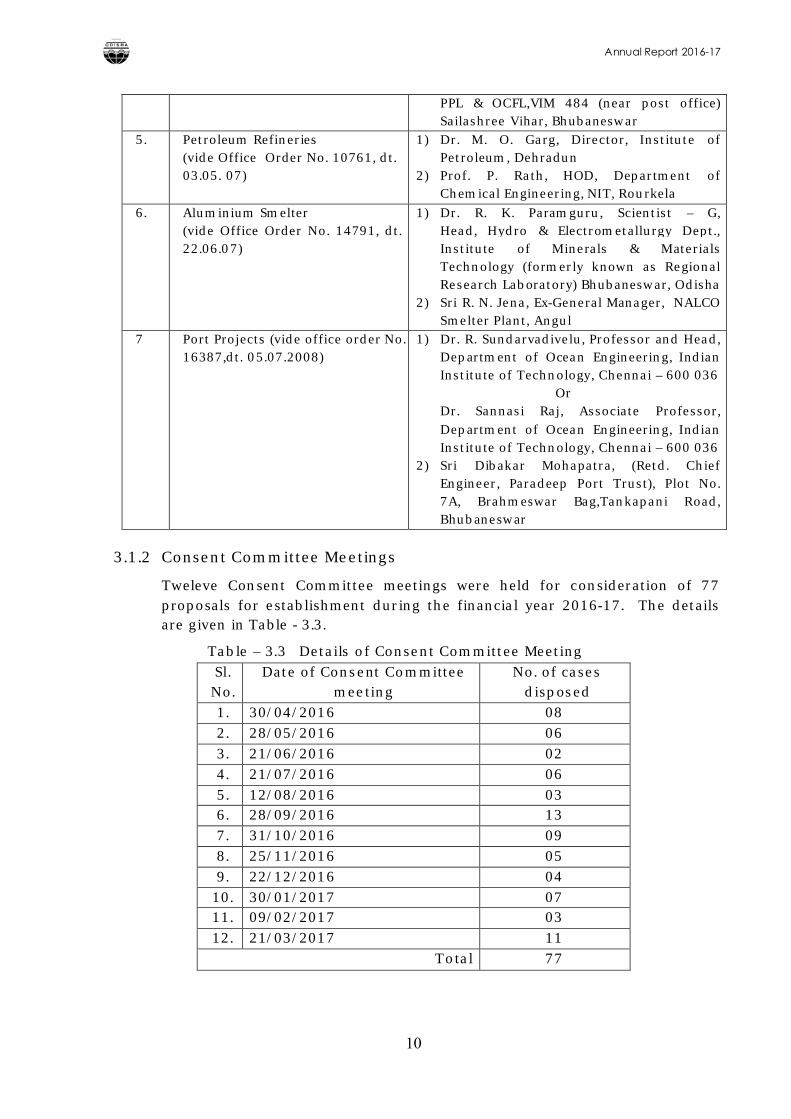
5. Petroleum Refineries (vide Office Order No. 10761, dt. 03.05. 07)
1) Dr. M. O. Garg, Director, Institute of Petroleum, Dehradun
2) Prof. P. Rath, HOD, Department of Chemical Engineering, NIT, Rourkela
6. Aluminium Smelter(vide Office Order No. 14791, dt. 22.06.07)
1) Dr. R. K. Paramguru, Scientist – G, Head, Hydro & Electrometallurgy Dept., Institute of Minerals & Materials Technology (formerly known as Regional Research Laboratory) Bhubaneswar, Odisha
2) Sri R. N. Jena, Ex-General Manager, NALCO Smelter Plant, Angul
7 Port Projects (vide office order No. 16387,dt. 05.07.2008)
1) Dr. R. Sundarvadivelu, Professor and Head, Department of Ocean Engineering, Indian Institute of Technology, Chennai – 600 036
OrDr. Sannasi Raj, Associate Professor, Department of Ocean Engineering, Indian Institute of Technology, Chennai – 600 036
2) Sri Dibakar Mohapatra, (Retd. Chief Engineer, Paradeep Port Trust), Plot No. 7A, Brahmeswar Bag,Tankapani Road, Bhubaneswar
3.1.2 Consent Committee Meetings
Tweleve Consent Committee meetings were held for consideration of 77 proposals for establishment during the financial year 2016-17. The details are given in Table - 3.3.
Table – 3.3 Details of Consent Committee MeetingSl. No.
Date of Consent Committee meeting
No. of cases disposed
1. 30/04/2016 082. 28/05/2016 063. 21/06/2016 024. 21/07/2016 065. 12/08/2016 036. 28/09/2016 137. 31/10/2016 098. 25/11/2016 059. 22/12/2016 04
10. 30/01/2017 0711. 09/02/2017 0312. 21/03/2017 11
Total 77
Annual Report 2016-17
11
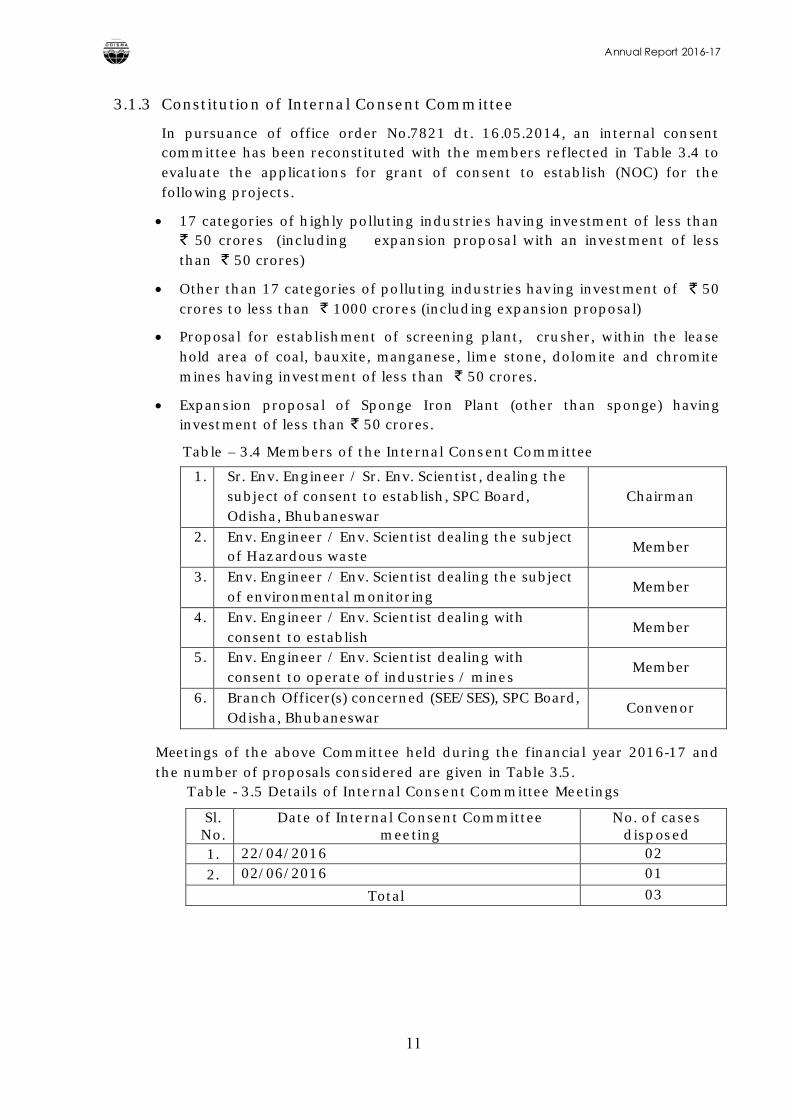
3.1.3 Constitution of Internal Consent Committee
In pursuance of office order No.7821 dt. 16.05.2014, an internal consent committee has been reconstituted with the members reflected in Table 3.4 to evaluate the applications for grant of consent to establish (NOC) for the following projects.
17 categories of highly polluting industries having investment of less than 50 crores (including expansion proposal with an investment of less
than 50 crores)
Other than 17 categories of polluting industries having investment of 50 crores to less than 1000 crores (including expansion proposal)
Proposal for establishment of screening plant, crusher, within the lease hold area of coal, bauxite, manganese, lime stone, dolomite and chromite mines having investment of less than 50 crores.
Expansion proposal of Sponge Iron Plant (other than sponge) having investment of less than 50 crores.
Table – 3.4 Members of the Internal Consent Committee
1. Sr. Env. Engineer / Sr. Env. Scientist, dealing the subject of consent to establish, SPC Board, Odisha, Bhubaneswar
Chairman
2. Env. Engineer / Env. Scientist dealing the subject of Hazardous waste
Member
3. Env. Engineer / Env. Scientist dealing the subject of environmental monitoring
Member
4. Env. Engineer / Env. Scientist dealing with consent to establish
Member
5. Env. Engineer / Env. Scientist dealing with consent to operate of industries / mines
Member
6. Branch Officer(s) concerned (SEE/SES), SPC Board, Odisha, Bhubaneswar
Convenor
Meetings of the above Committee held during the financial year 2016-17 and the number of proposals considered are given in Table 3.5.
Table - 3.5 Details of Internal Consent Committee Meetings
Sl. No.
Date of Internal Consent Committee meeting
No. of cases disposed
1. 22/04/2016 02
2. 02/06/2016 01
Total 03
Annual Report 2016-17
12
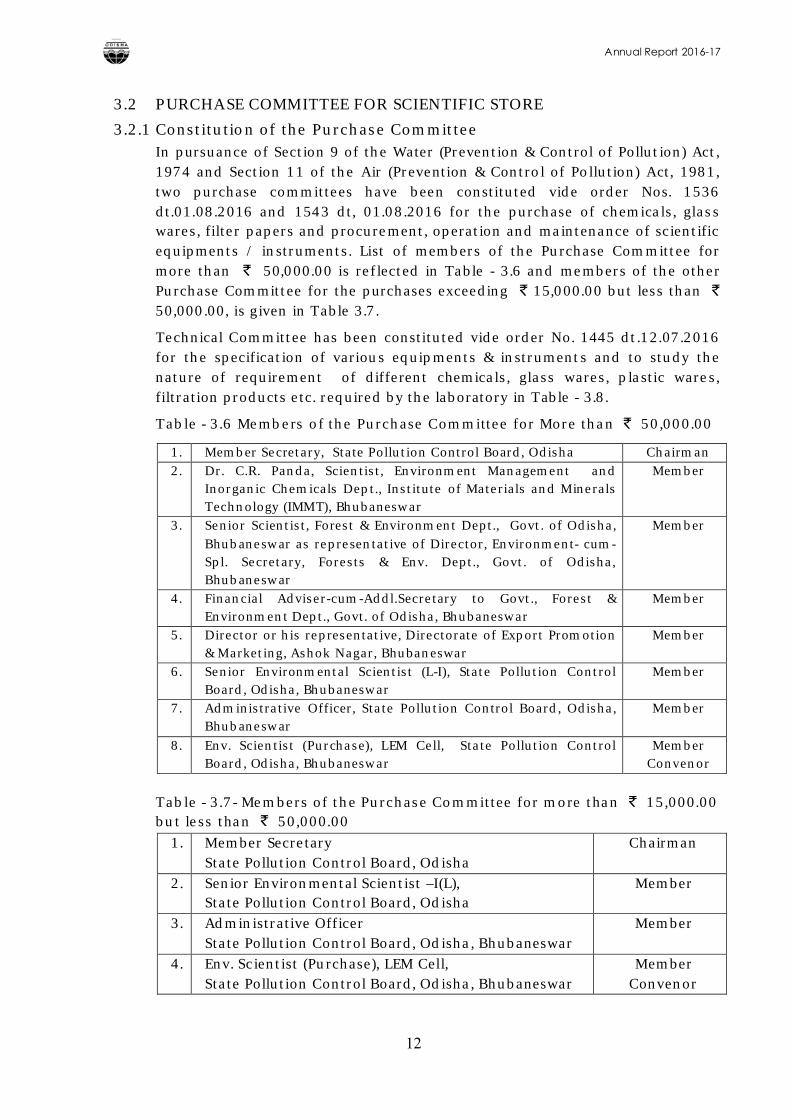
3.2 PURCHASE COMMITTEE FOR SCIENTIFIC STORE
3.2.1 Constitution of the Purchase CommitteeIn pursuance of Section 9 of the Water (Prevention & Control of Pollution) Act, 1974 and Section 11 of the Air (Prevention & Control of Pollution) Act, 1981, two purchase committees have been constituted vide order Nos. 1536dt.01.08.2016 and 1543 dt, 01.08.2016 for the purchase of chemicals, glass wares, filter papers and procurement, operation and maintenance of scientific equipments / instruments. List of members of the Purchase Committee for more than 50,000.00 is reflected in Table - 3.6 and members of the other Purchase Committee for the purchases exceeding 15,000.00 but less than 50,000.00, is given in Table 3.7.
Technical Committee has been constituted vide order No. 1445 dt.12.07.2016for the specification of various equipments & instruments and to study the nature of requirement of different chemicals, glass wares, plastic wares, filtration products etc. required by the laboratory in Table - 3.8.
Table - 3.6 Members of the Purchase Committee for More than 50,000.00
1. Member Secretary, State Pollution Control Board, Odisha Chairman2. Dr. C.R. Panda, Scientist, Environment Management and
Inorganic Chemicals Dept., Institute of Materials and Minerals Technology (IMMT), Bhubaneswar
Member
3. Senior Scientist, Forest & Environment Dept., Govt. of Odisha, Bhubaneswar as representative of Director, Environment- cum-Spl. Secretary, Forests & Env. Dept., Govt. of Odisha, Bhubaneswar
Member
4. Financial Adviser-cum-Addl.Secretary to Govt., Forest & Environment Dept., Govt. of Odisha, Bhubaneswar
Member
5. Director or his representative, Directorate of Export Promotion & Marketing, Ashok Nagar, Bhubaneswar
Member
6. Senior Environmental Scientist (L-I), State Pollution Control Board, Odisha, Bhubaneswar
Member
7. Administrative Officer, State Pollution Control Board, Odisha, Bhubaneswar
Member
8. Env. Scientist (Purchase), LEM Cell, State Pollution Control Board, Odisha, Bhubaneswar
MemberConvenor
Table - 3.7- Members of the Purchase Committee for more than 15,000.00 but less than 50,000.00
1. Member SecretaryState Pollution Control Board, Odisha
Chairman
2. Senior Environmental Scientist –I(L), State Pollution Control Board, Odisha
Member
3. Administrative OfficerState Pollution Control Board, Odisha, Bhubaneswar
Member
4. Env. Scientist (Purchase), LEM Cell, State Pollution Control Board, Odisha, Bhubaneswar
MemberConvenor
Annual Report 2016-17
13
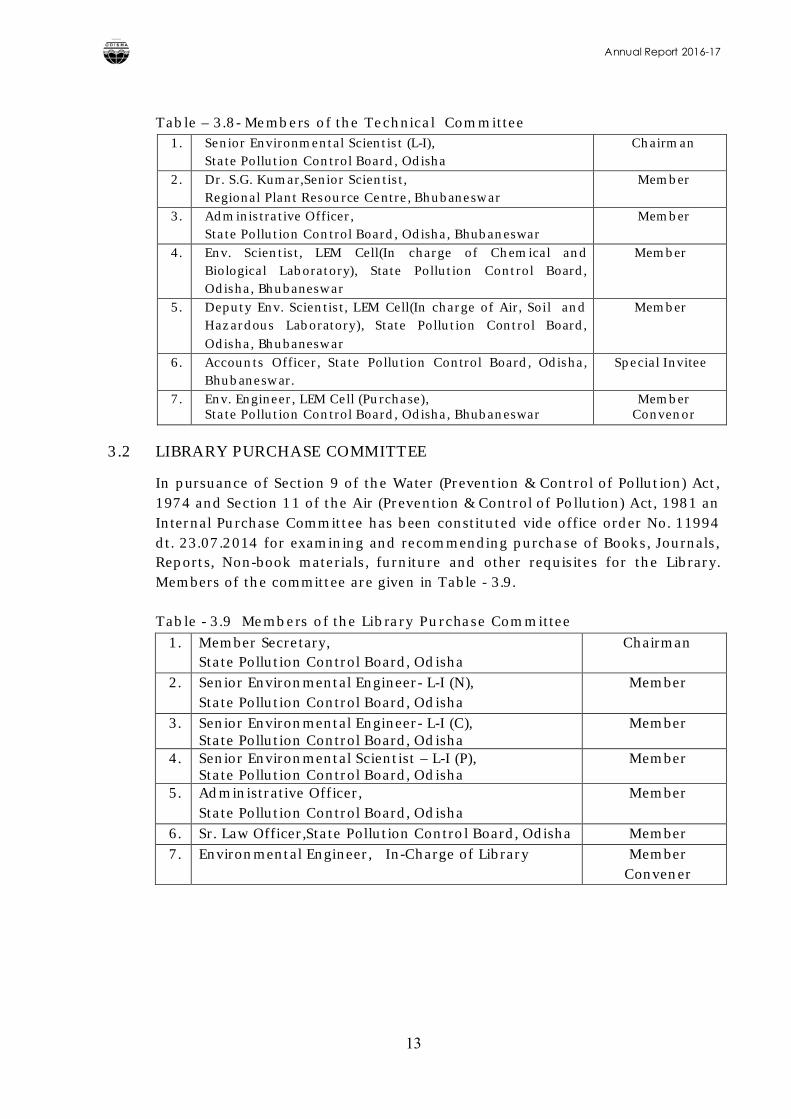
Table – 3.8- Members of the Technical Committee 1. Senior Environmental Scientist (L-I),
State Pollution Control Board, OdishaChairman
2. Dr. S.G. Kumar,Senior Scientist,Regional Plant Resource Centre, Bhubaneswar
Member
3. Administrative Officer,State Pollution Control Board, Odisha, Bhubaneswar
Member
4. Env. Scientist, LEM Cell(In charge of Chemical and Biological Laboratory), State Pollution Control Board, Odisha, Bhubaneswar
Member
5. Deputy Env. Scientist, LEM Cell(In charge of Air, Soil and Hazardous Laboratory), State Pollution Control Board, Odisha, Bhubaneswar
Member
6. Accounts Officer, State Pollution Control Board, Odisha, Bhubaneswar.
Special Invitee
7. Env. Engineer, LEM Cell (Purchase), State Pollution Control Board, Odisha, Bhubaneswar
MemberConvenor
3.2 LIBRARY PURCHASE COMMITTEE
In pursuance of Section 9 of the Water (Prevention & Control of Pollution) Act, 1974 and Section 11 of the Air (Prevention & Control of Pollution) Act, 1981 an Internal Purchase Committee has been constituted vide office order No. 11994 dt. 23.07.2014 for examining and recommending purchase of Books, Journals, Reports, Non-book materials, furniture and other requisites for the Library. Members of the committee are given in Table - 3.9.
Table - 3.9 Members of the Library Purchase Committee
1. Member Secretary, State Pollution Control Board, Odisha
Chairman
2. Senior Environmental Engineer- L-I (N), State Pollution Control Board, Odisha
Member
3. Senior Environmental Engineer- L-I (C), State Pollution Control Board, Odisha
Member
4. Senior Environmental Scientist – L-I (P), State Pollution Control Board, Odisha
Member
5. Administrative Officer, State Pollution Control Board, Odisha
Member
6. Sr. Law Officer,State Pollution Control Board, Odisha Member7. Environmental Engineer, In-Charge of Library Member
Convener
Annual Report 2016-17
14
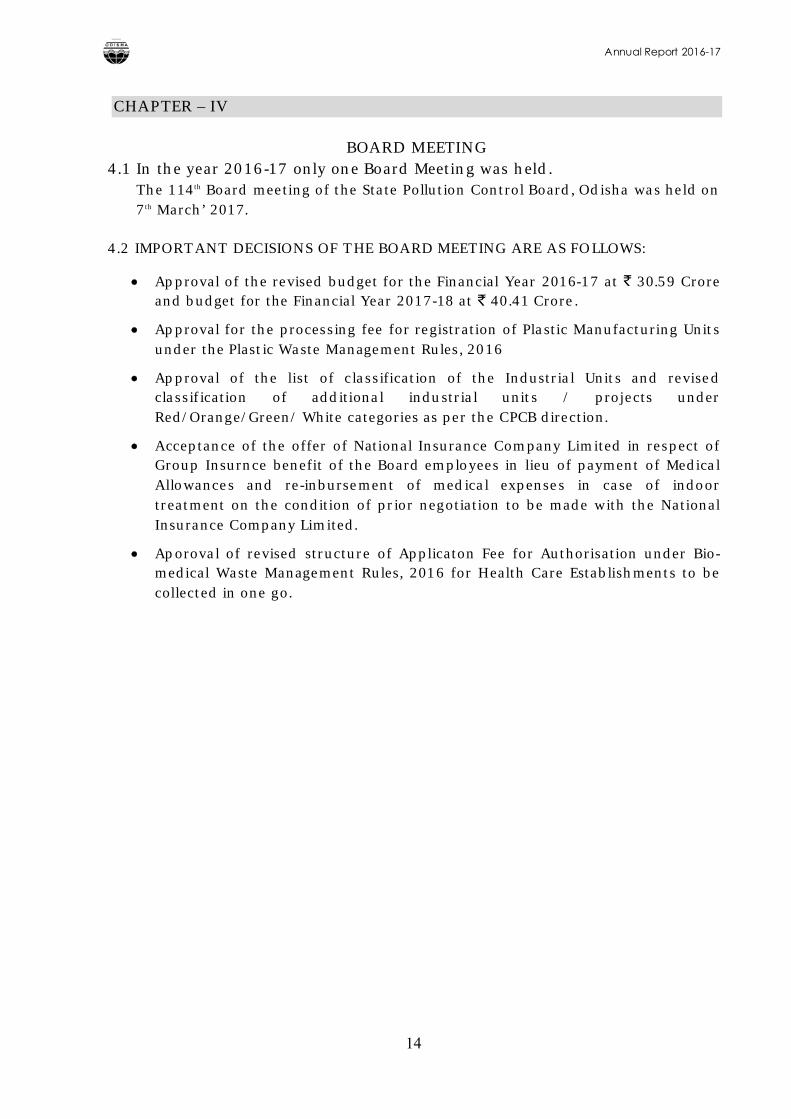
CHAPTER – IV
BOARD MEETING4.1 In the year 2016-17 only one Board Meeting was held.
The 114th Board meeting of the State Pollution Control Board, Odisha was held on 7th March’ 2017.
4.2 IMPORTANT DECISIONS OF THE BOARD MEETING ARE AS FOLLOWS:
Approval of the revised budget for the Financial Year 2016-17 at 30.59 Croreand budget for the Financial Year 2017-18 at 40.41 Crore.
Approval for the processing fee for registration of Plastic Manufacturing Units under the Plastic Waste Management Rules, 2016
Approval of the list of classification of the Industrial Units and revised classification of additional industrial units / projects under Red/Orange/Green/ White categories as per the CPCB direction.
Acceptance of the offer of National Insurance Company Limited in respect of Group Insurnce benefit of the Board employees in lieu of payment of Medical Allowances and re-inbursement of medical expenses in case of indoor treatment on the condition of prior negotiation to be made with the National Insurance Company Limited.
Aporoval of revised structure of Applicaton Fee for Authorisation under Bio-medical Waste Management Rules, 2016 for Health Care Establishments to be collected in one go.
Annual Report 2016-17
15
CHAPTER – V
ACTIVITIES
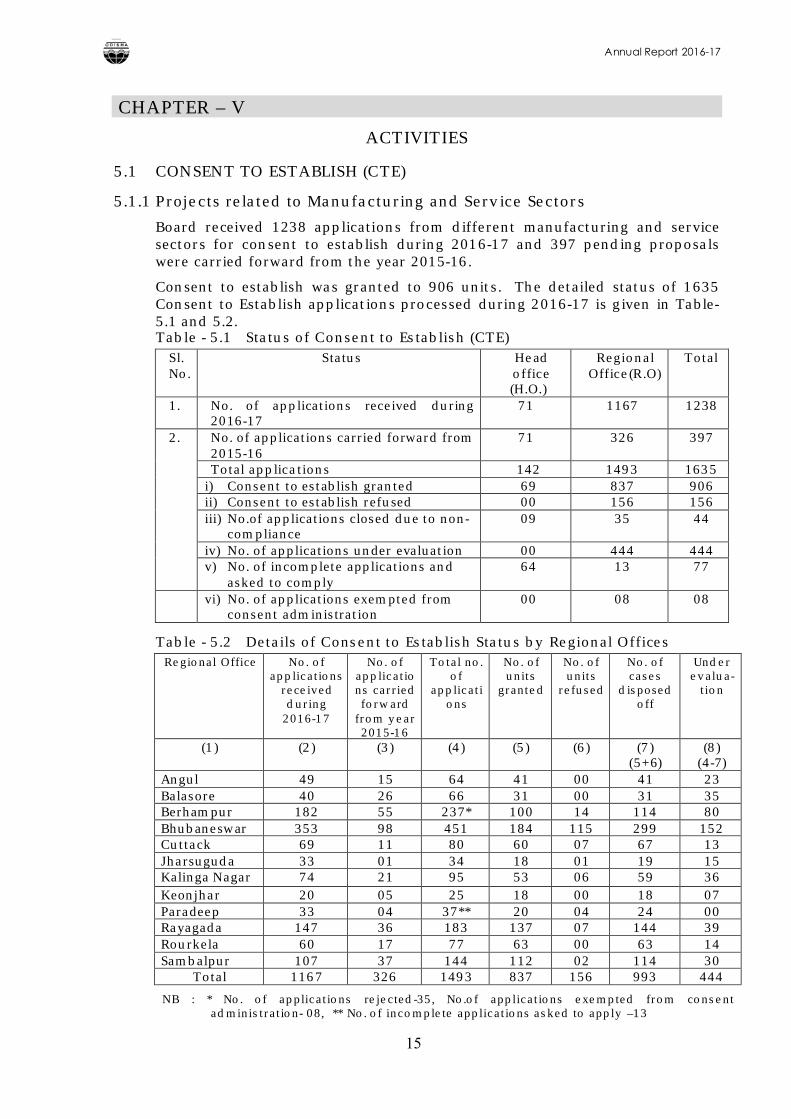
5.1 CONSENT TO ESTABLISH (CTE)
5.1.1 Projects related to Manufacturing and Service Sectors
Board received 1238 applications from different manufacturing and service sectors for consent to establish during 2016-17 and 397 pending proposals were carried forward from the year 2015-16.
Consent to establish was granted to 906 units. The detailed status of 1635Consent to Establish applications processed during 2016-17 is given in Table-5.1 and 5.2.Table - 5.1 Status of Consent to Establish (CTE)
Sl. No.
Status Head office(H.O.)
Regional Office(R.O)
Total
1. No. of applications received during 2016-17
71 1167 1238
2. No. of applications carried forward from 2015-16
71 326 397
Total applications 142 1493 1635i) Consent to establish granted 69 837 906ii) Consent to establish refused 00 156 156iii) No.of applications closed due to non-
compliance09 35 44
iv) No. of applications under evaluation 00 444 444v) No. of incomplete applications and
asked to comply 64 13 77
vi) No. of applications exempted from consent administration
00 08 08
Table - 5.2 Details of Consent to Establish Status by Regional Offices Regional Office No. of
applications received during
2016-17
No. of applications carried forward
from year 2015-16
Total no. of
applications
No. ofunits
granted
No. of units
refused
No. of cases
disposed off
Under evalua-
tion
(1) (2) (3) (4) (5) (6) (7)(5+6)
(8)(4-7)
Angul 49 15 64 41 00 41 23Balasore 40 26 66 31 00 31 35Berhampur 182 55 237* 100 14 114 80Bhubaneswar 353 98 451 184 115 299 152Cuttack 69 11 80 60 07 67 13Jharsuguda 33 01 34 18 01 19 15Kalinga Nagar 74 21 95 53 06 59 36Keonjhar 20 05 25 18 00 18 07Paradeep 33 04 37** 20 04 24 00Rayagada 147 36 183 137 07 144 39Rourkela 60 17 77 63 00 63 14Sambalpur 107 37 144 112 02 114 30
Total 1167 326 1493 837 156 993 444
NB : * No. of applications rejected-35, No.of applications exempted from consent administration- 08, ** No. of incomplete applications asked to apply –13
Annual Report 2016-17
16
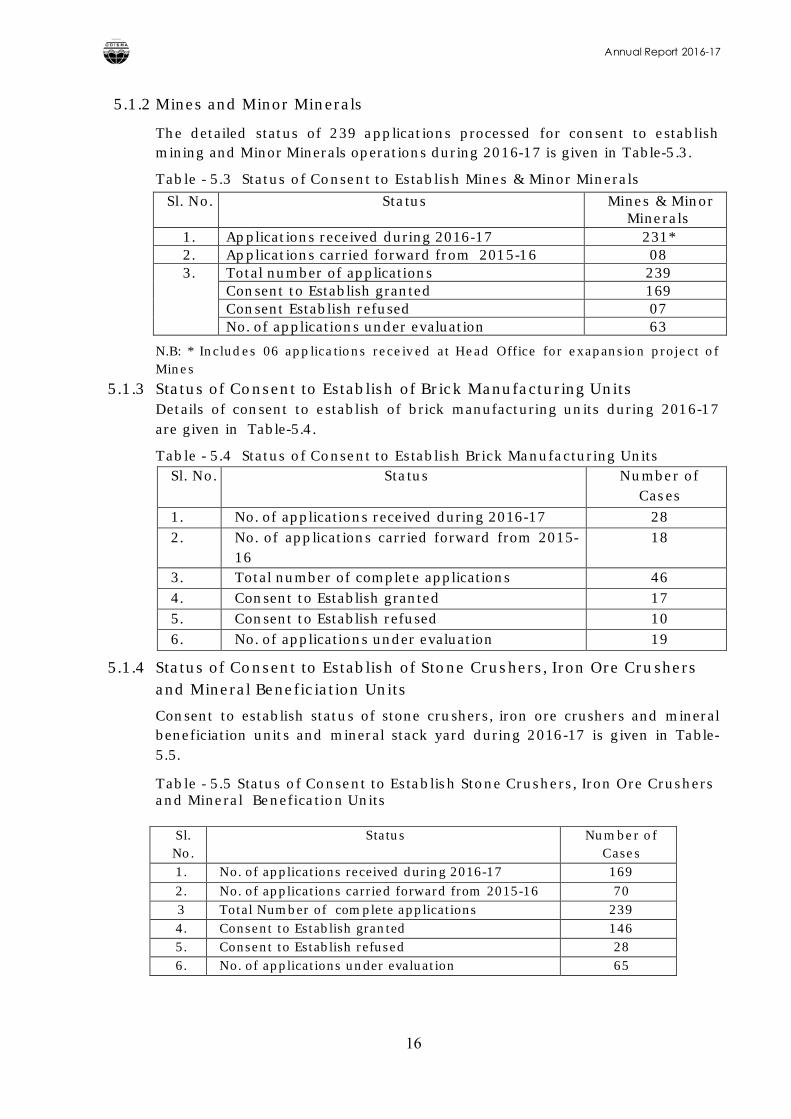
5.1.2 Mines and Minor Minerals
The detailed status of 239 applications processed for consent to establish mining and Minor Minerals operations during 2016-17 is given in Table-5.3.
Table - 5.3 Status of Consent to Establish Mines & Minor Minerals
Sl. No. Status Mines & Minor Minerals
1. Applications received during 2016-17 231*2. Applications carried forward from 2015-16 083. Total number of applications 239
Consent to Establish granted 169Consent Establish refused 07No. of applications under evaluation 63
N.B: * Includes 06 applications received at Head Office for exapansion project of Mines
5.1.3 Status of Consent to Establish of Brick Manufacturing Units Details of consent to establish of brick manufacturing units during 2016-17 are given in Table-5.4.
Table - 5.4 Status of Consent to Establish Brick Manufacturing Units Sl. No. Status Number of
Cases
1. No. of applications received during 2016-17 282. No. of applications carried forward from 2015-
1618
3. Total number of complete applications 464. Consent to Establish granted 175. Consent to Establish refused 106. No. of applications under evaluation 19
5.1.4 Status of Consent to Establish of Stone Crushers, Iron Ore Crushers and Mineral Beneficiation Units
Consent to establish status of stone crushers, iron ore crushers and mineral beneficiation units and mineral stack yard during 2016-17 is given in Table-5.5.
Table - 5.5 Status of Consent to Establish Stone Crushers, Iron Ore Crushers and Mineral Benefication Units
Sl. No.
Status Number of Cases
1. No. of applications received during 2016-17 169
2. No. of applications carried forward from 2015-16 703 Total Number of complete applications 2394. Consent to Establish granted 1465. Consent to Establish refused 286. No. of applications under evaluation 65
Annual Report 2016-17
17
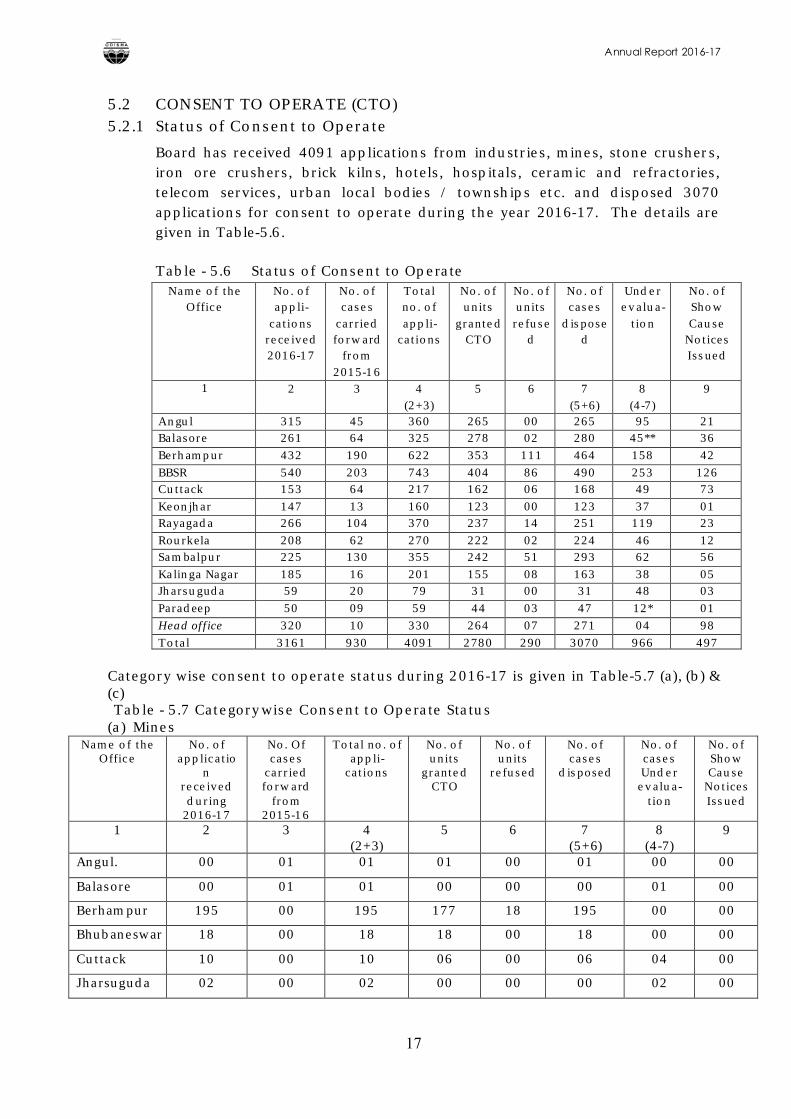
5.2 CONSENT TO OPERATE (CTO)5.2.1 Status of Consent to Operate
Board has received 4091 applications from industries, mines, stone crushers, iron ore crushers, brick kilns, hotels, hospitals, ceramic and refractories, telecom services, urban local bodies / townships etc. and disposed 3070 applications for consent to operate during the year 2016-17. The details are given in Table-5.6.
Table - 5.6 Status of Consent to Operate Name of the
Office No. of appli-
cations received 2016-17
No. of cases
carried forward
from2015-16
Total no. of appli-
cations
No. of units
grantedCTO
No. of units refuse
d
No. of cases
disposed
Under evalua-
tion
No. of Show Cause
Notices Issued
1 2 3 4(2+3)
5 6 7(5+6)
8(4-7)
9
Angul 315 45 360 265 00 265 95 21Balasore 261 64 325 278 02 280 45** 36
Berhampur 432 190 622 353 111 464 158 42
BBSR 540 203 743 404 86 490 253 126Cuttack 153 64 217 162 06 168 49 73
Keonjhar 147 13 160 123 00 123 37 01Rayagada 266 104 370 237 14 251 119 23
Rourkela 208 62 270 222 02 224 46 12Sambalpur 225 130 355 242 51 293 62 56
Kalinga Nagar 185 16 201 155 08 163 38 05Jharsuguda 59 20 79 31 00 31 48 03
Paradeep 50 09 59 44 03 47 12* 01
Head office 320 10 330 264 07 271 04 98
Total 3161 930 4091 2780 290 3070 966 497
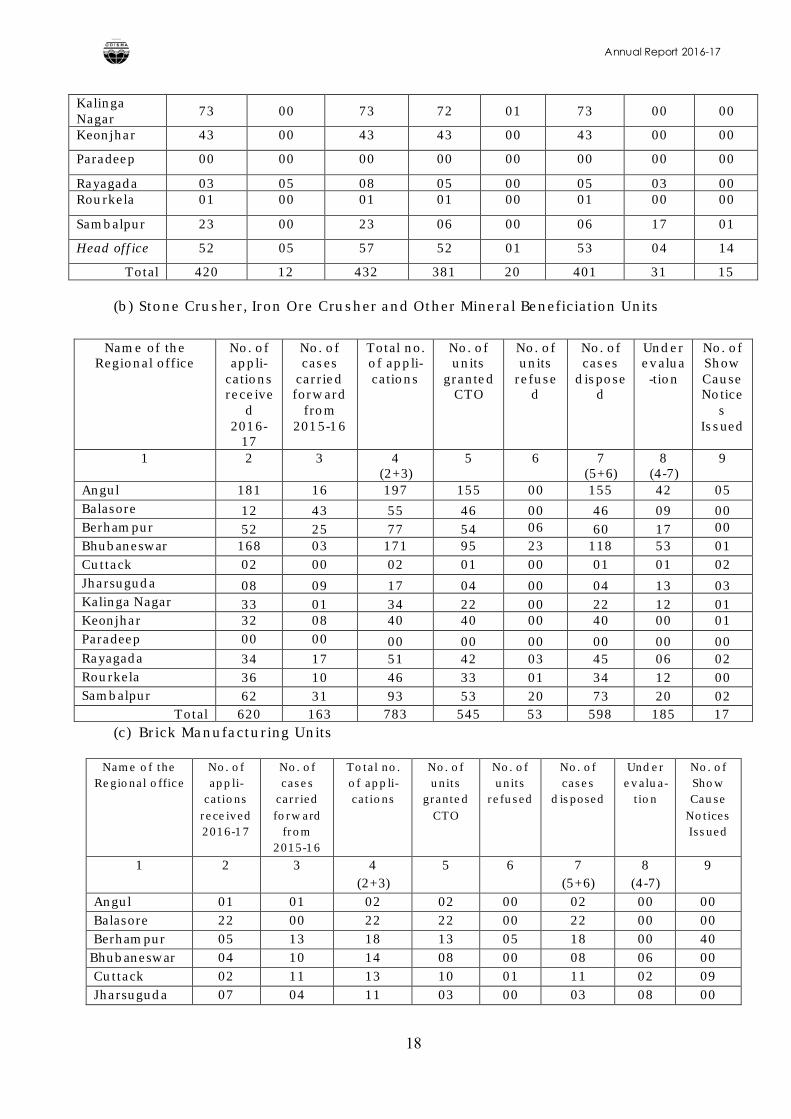
Category wise consent to operate status during 2016-17 is given in Table-5.7 (a), (b) & (c) Table - 5.7 Categorywise Consent to Operate Status
(a) MinesName of the
Office No. of
application
received during
2016-17
No. Of cases
carried forward
from2015-16
Total no. of appli-
cations
No. of units
grantedCTO
No. of units
refused
No. of cases
disposed
No. of cases Under evalua-
tion
No. of Show Cause
Notices Issued
1 2 3 4(2+3)
5 6 7(5+6)
8(4-7)
9
Angul. 00 01 01 01 00 01 00 00
Balasore 00 01 01 00 00 00 01 00
Berhampur 195 00 195 177 18 195 00 00
Bhubaneswar 18 00 18 18 00 18 00 00
Cuttack 10 00 10 06 00 06 04 00
Jharsuguda 02 00 02 00 00 00 02 00
Annual Report 2016-17
18
Kalinga Nagar
73 00 73 72 01 73 00 00
Keonjhar 43 00 43 43 00 43 00 00
Paradeep 00 00 00 00 00 00 00 00
Rayagada 03 05 08 05 00 05 03 00Rourkela 01 00 01 01 00 01 00 00
Sambalpur 23 00 23 06 00 06 17 01
Head office 52 05 57 52 01 53 04 14
Total 420 12 432 381 20 401 31 15
(b) Stone Crusher, Iron Ore Crusher and Other Mineral Beneficiation Units
Name of the Regional office
No. of appli-
cations receive
d2016-
17
No. of cases
carried forward
from2015-16
Total no. of appli-cations
No. of units
grantedCTO
No. of units
refused
No. of cases
disposed
Under evalua-tion
No. of Show Cause Notice
s Issued
1 2 3 4(2+3)
5 6 7(5+6)
8(4-7)
9
Angul 181 16 197 155 00 155 42 05Balasore 12 43 55 46 00 46 09 00Berhampur 52 25 77 54 06 60 17 00Bhubaneswar 168 03 171 95 23 118 53 01Cuttack 02 00 02 01 00 01 01 02Jharsuguda 08 09 17 04 00 04 13 03Kalinga Nagar 33 01 34 22 00 22 12 01Keonjhar 32 08 40 40 00 40 00 01Paradeep 00 00 00 00 00 00 00 00Rayagada 34 17 51 42 03 45 06 02Rourkela 36 10 46 33 01 34 12 00Sambalpur 62 31 93 53 20 73 20 02
Total 620 163 783 545 53 598 185 17(c) Brick Manufacturing Units
Name of the Regional office
No. of appli-
cations received 2016-17
No. of cases
carried forward
from2015-16
Total no. of appli-cations
No. of units
grantedCTO
No. of units
refused
No. of cases
disposed
Under evalua-
tion
No. of Show Cause
Notices Issued
1 2 3 4(2+3)
5 6 7(5+6)
8(4-7)
9
Angul 01 01 02 02 00 02 00 00Balasore 22 00 22 22 00 22 00 00Berhampur 05 13 18 13 05 18 00 40Bhubaneswar 04 10 14 08 00 08 06 00Cuttack 02 11 13 10 01 11 02 09Jharsuguda 07 04 11 03 00 03 08 00
Annual Report 2016-17
19
Kalinga Nagar 01 00 01 01 00 01 00 00Keonjhar 00 00 00 00 00 00 00 00Paradeep 04 00 04 03 00 03 01 00Rayagada . 00 01 01 00 01 01 00 00Rourkela 09 03 12 12 00 12 00 00Sambalpur 02 01 03 03 00 03 00 00
Total 57 44 101 77 7 84 17 49
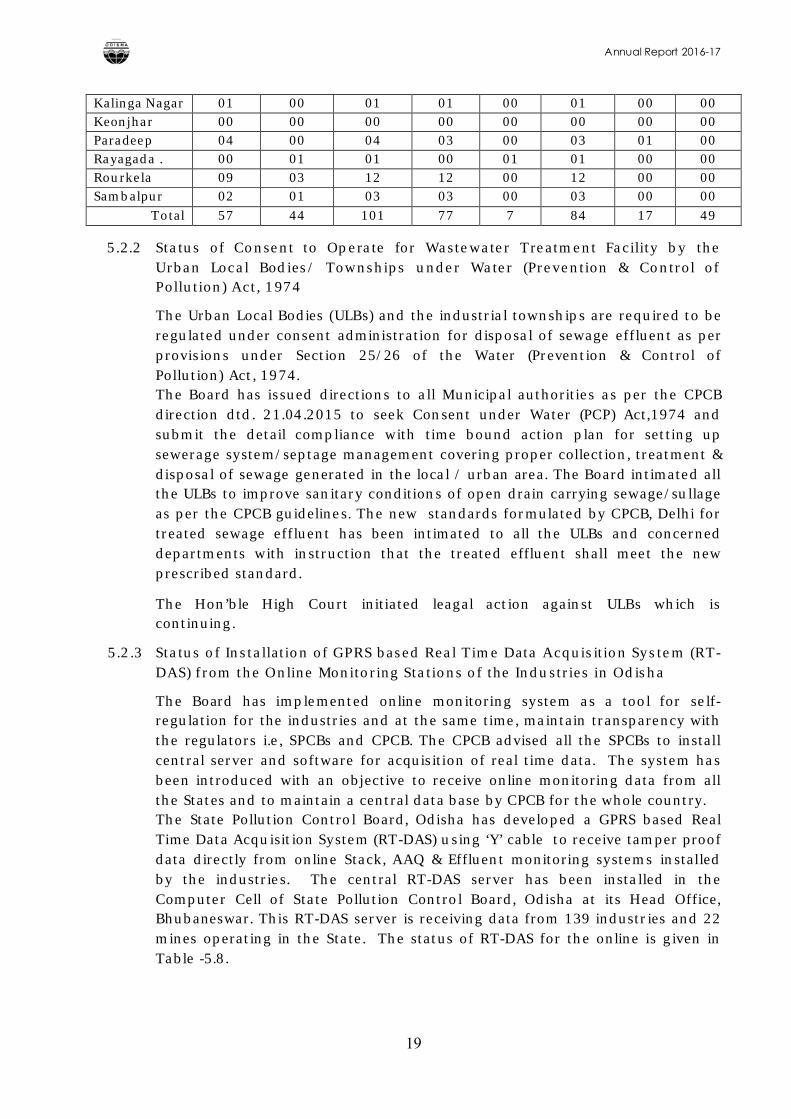
5.2.2 Status of Consent to Operate for Wastewater Treatment Facility by the Urban Local Bodies/ Townships under Water (Prevention & Control of Pollution) Act, 1974
The Urban Local Bodies (ULBs) and the industrial townships are required to be regulated under consent administration for disposal of sewage effluent as per provisions under Section 25/26 of the Water (Prevention & Control of Pollution) Act, 1974. The Board has issued directions to all Municipal authorities as per the CPCB direction dtd. 21.04.2015 to seek Consent under Water (PCP) Act,1974 and submit the detail compliance with time bound action plan for setting up sewerage system/septage management covering proper collection, treatment & disposal of sewage generated in the local / urban area. The Board intimated all the ULBs to improve sanitary conditions of open drain carrying sewage/sullage as per the CPCB guidelines. The new standards formulated by CPCB, Delhi for treated sewage effluent has been intimated to all the ULBs and concerned departments with instruction that the treated effluent shall meet the new prescribed standard.
The Hon’ble High Court initiated leagal action against ULBs which is continuing.
5.2.3 Status of Installation of GPRS based Real Time Data Acquisition System (RT-DAS) from the Online Monitoring Stations of the Industries in Odisha
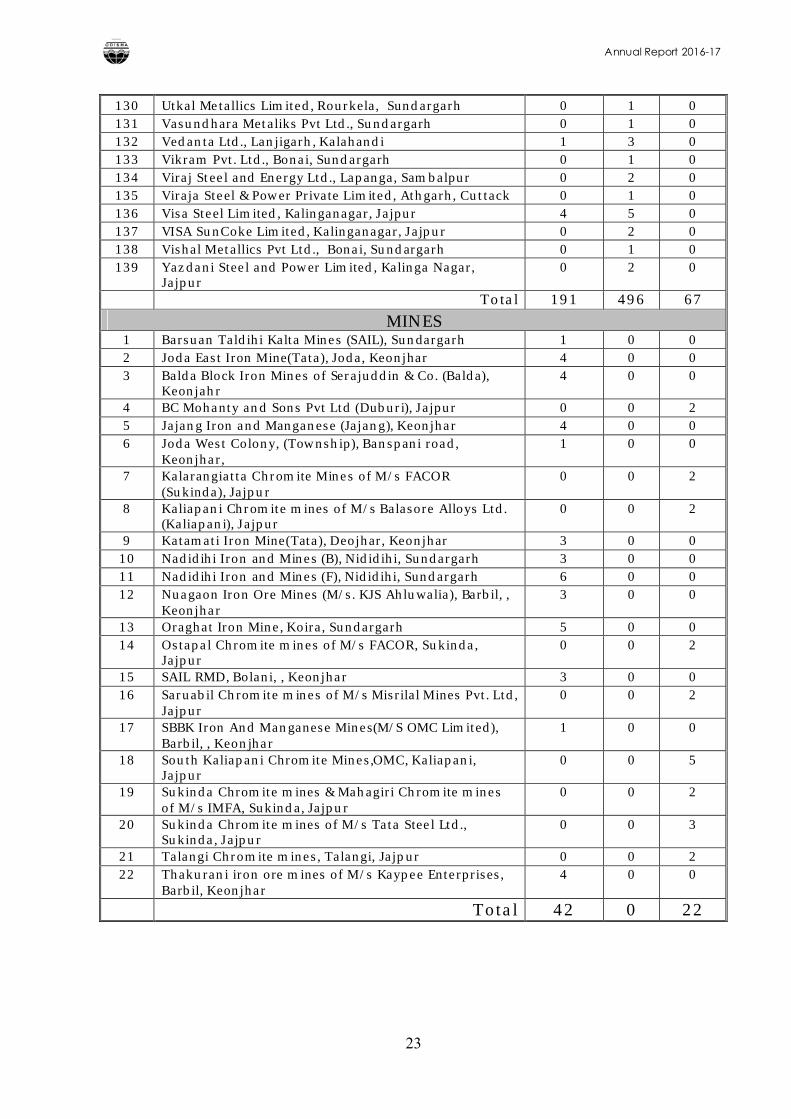
The Board has implemented online monitoring system as a tool for self-regulation for the industries and at the same time, maintain transparency with the regulators i.e, SPCBs and CPCB. The CPCB advised all the SPCBs to install central server and software for acquisition of real time data. The system has been introduced with an objective to receive online monitoring data from all the States and to maintain a central data base by CPCB for the whole country.The State Pollution Control Board, Odisha has developed a GPRS based Real Time Data Acquisition System (RT-DAS) using ‘Y’ cable to receive tamper proof data directly from online Stack, AAQ & Effluent monitoring systems installed by the industries. The central RT-DAS server has been installed in the Computer Cell of State Pollution Control Board, Odisha at its Head Office, Bhubaneswar. This RT-DAS server is receiving data from 139 industries and 22mines operating in the State. The status of RT-DAS for the online is given in Table -5.8.
Annual Report 2016-17
20
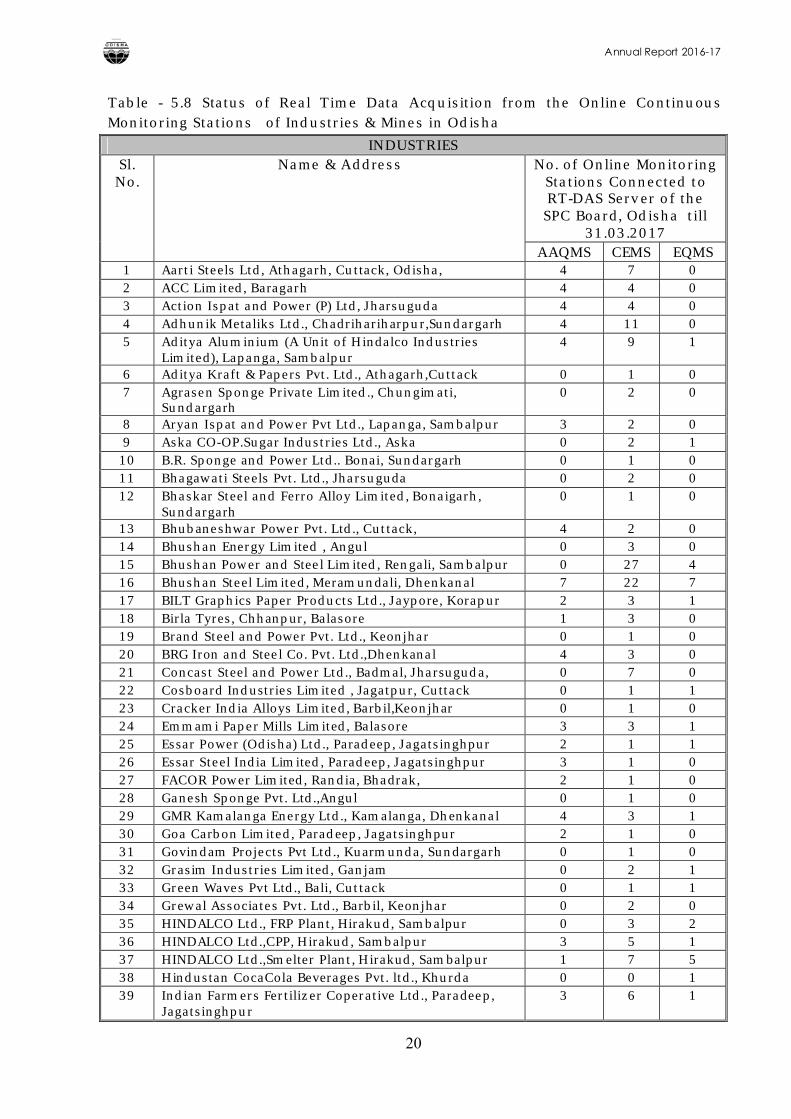
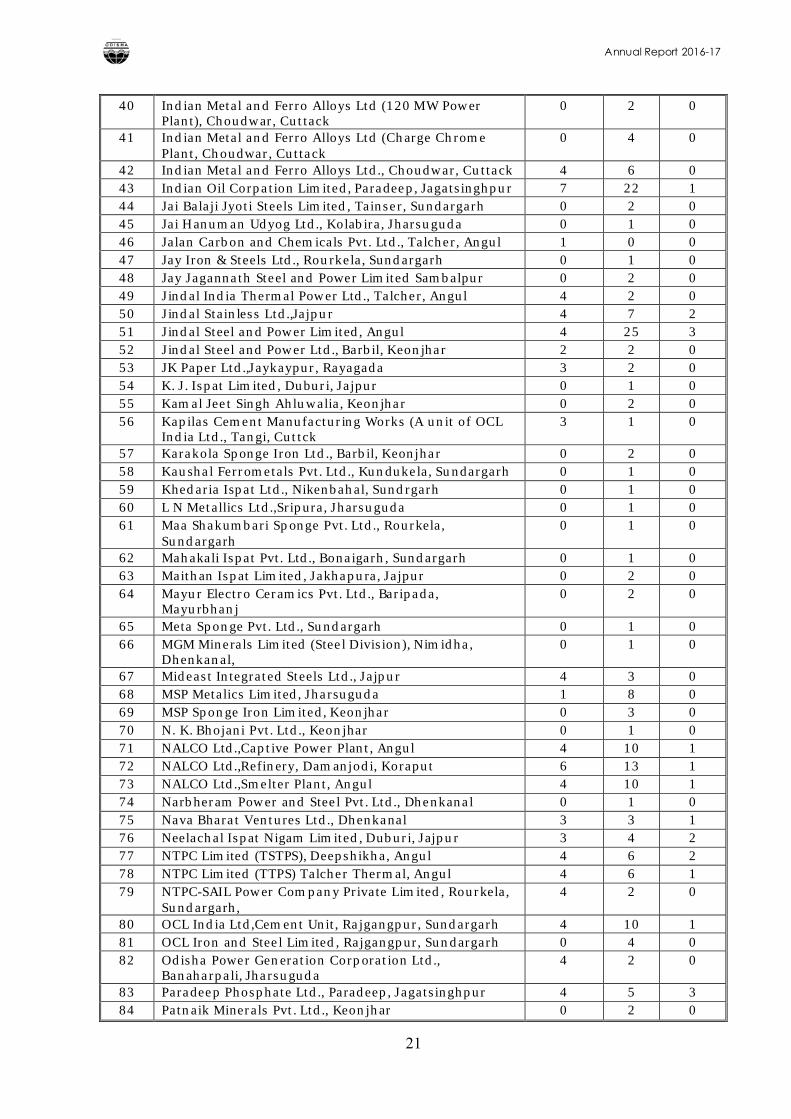
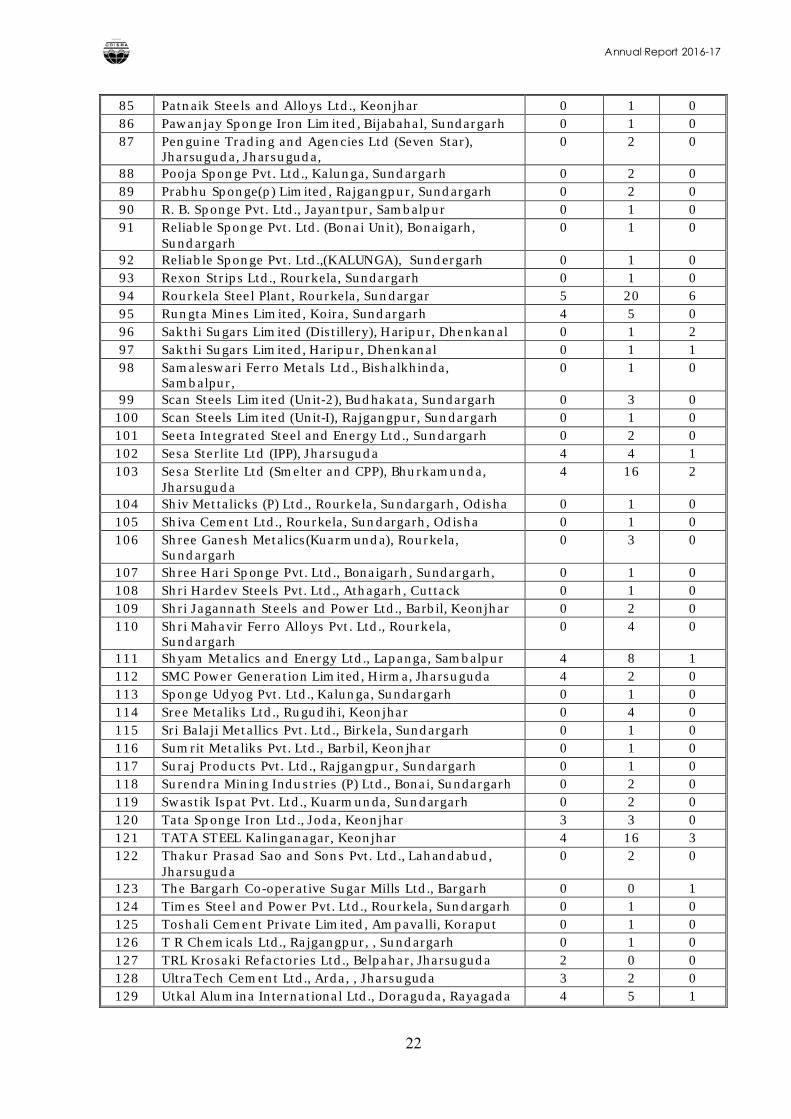
Table - 5.8 Status of Real Time Data Acquisition from the Online ContinuousMonitoring Stations of Industries & Mines in Odisha
INDUSTRIESSl. No.
Name & Address No. of Online Monitoring Stations Connected to RT-DAS Server of the SPC Board, Odisha till
31.03.2017AAQMS CEMS EQMS
1 Aarti Steels Ltd, Athagarh, Cuttack, Odisha, 4 7 02 ACC Limited, Baragarh 4 4 03 Action Ispat and Power (P) Ltd, Jharsuguda 4 4 04 Adhunik Metaliks Ltd., Chadrihariharpur,Sundargarh 4 11 05 Aditya Aluminium (A Unit of Hindalco Industries
Limited), Lapanga, Sambalpur4 9 1
6 Aditya Kraft & Papers Pvt. Ltd., Athagarh,Cuttack 0 1 07 Agrasen Sponge Private Limited., Chungimati,
Sundargarh 0 2 0
8 Aryan Ispat and Power Pvt Ltd., Lapanga, Sambalpur 3 2 09 Aska CO-OP.Sugar Industries Ltd., Aska 0 2 110 B.R. Sponge and Power Ltd.. Bonai, Sundargarh 0 1 011 Bhagawati Steels Pvt. Ltd., Jharsuguda 0 2 012 Bhaskar Steel and Ferro Alloy Limited, Bonaigarh,
Sundargarh 0 1 0
13 Bhubaneshwar Power Pvt. Ltd., Cuttack, 4 2 014 Bhushan Energy Limited , Angul 0 3 015 Bhushan Power and Steel Limited, Rengali, Sambalpur 0 27 416 Bhushan Steel Limited, Meramundali, Dhenkanal 7 22 717 BILT Graphics Paper Products Ltd., Jaypore, Korapur 2 3 118 Birla Tyres, Chhanpur, Balasore 1 3 019 Brand Steel and Power Pvt. Ltd., Keonjhar 0 1 020 BRG Iron and Steel Co. Pvt. Ltd.,Dhenkanal 4 3 021 Concast Steel and Power Ltd., Badmal, Jharsuguda, 0 7 022 Cosboard Industries Limited , Jagatpur, Cuttack 0 1 123 Cracker India Alloys Limited, Barbil,Keonjhar 0 1 024 Emmami Paper Mills Limited, Balasore 3 3 125 Essar Power (Odisha) Ltd., Paradeep, Jagatsinghpur 2 1 126 Essar Steel India Limited, Paradeep, Jagatsinghpur 3 1 027 FACOR Power Limited, Randia, Bhadrak, 2 1 028 Ganesh Sponge Pvt. Ltd.,Angul 0 1 029 GMR Kamalanga Energy Ltd., Kamalanga, Dhenkanal 4 3 130 Goa Carbon Limited, Paradeep, Jagatsinghpur 2 1 031 Govindam Projects Pvt Ltd., Kuarmunda, Sundargarh 0 1 032 Grasim Industries Limited, Ganjam 0 2 133 Green Waves Pvt Ltd., Bali, Cuttack 0 1 134 Grewal Associates Pvt. Ltd., Barbil, Keonjhar 0 2 035 HINDALCO Ltd., FRP Plant, Hirakud, Sambalpur 0 3 236 HINDALCO Ltd.,CPP, Hirakud, Sambalpur 3 5 137 HINDALCO Ltd.,Smelter Plant, Hirakud, Sambalpur 1 7 538 Hindustan CocaCola Beverages Pvt. ltd., Khurda 0 0 139 Indian Farmers Fertilizer Coperative Ltd., Paradeep,
Jagatsinghpur3 6 1
Annual Report 2016-17
21
40 Indian Metal and Ferro Alloys Ltd (120 MW Power Plant), Choudwar, Cuttack
0 2 0
41 Indian Metal and Ferro Alloys Ltd (Charge Chrome Plant, Choudwar, Cuttack
0 4 0
42 Indian Metal and Ferro Alloys Ltd., Choudwar, Cuttack 4 6 043 Indian Oil Corpation Limited, Paradeep, Jagatsinghpur 7 22 144 Jai Balaji Jyoti Steels Limited, Tainser, Sundargarh 0 2 045 Jai Hanuman Udyog Ltd., Kolabira, Jharsuguda 0 1 046 Jalan Carbon and Chemicals Pvt. Ltd., Talcher, Angul 1 0 047 Jay Iron & Steels Ltd., Rourkela, Sundargarh 0 1 048 Jay Jagannath Steel and Power Limited Sambalpur 0 2 049 Jindal India Thermal Power Ltd., Talcher, Angul 4 2 050 Jindal Stainless Ltd.,Jajpur 4 7 251 Jindal Steel and Power Limited, Angul 4 25 352 Jindal Steel and Power Ltd., Barbil, Keonjhar 2 2 053 JK Paper Ltd.,Jaykaypur, Rayagada 3 2 054 K. J. Ispat Limited, Duburi, Jajpur 0 1 055 Kamal Jeet Singh Ahluwalia, Keonjhar 0 2 056 Kapilas Cement Manufacturing Works (A unit of OCL
India Ltd., Tangi, Cuttck3 1 0
57 Karakola Sponge Iron Ltd., Barbil, Keonjhar 0 2 058 Kaushal Ferrometals Pvt. Ltd., Kundukela, Sundargarh 0 1 059 Khedaria Ispat Ltd., Nikenbahal, Sundrgarh 0 1 060 L N Metallics Ltd.,Sripura, Jharsuguda 0 1 061 Maa Shakumbari Sponge Pvt. Ltd., Rourkela,
Sundargarh0 1 0
62 Mahakali Ispat Pvt. Ltd., Bonaigarh, Sundargarh 0 1 063 Maithan Ispat Limited, Jakhapura, Jajpur 0 2 064 Mayur Electro Ceramics Pvt. Ltd., Baripada,
Mayurbhanj0 2 0
65 Meta Sponge Pvt. Ltd., Sundargarh 0 1 066 MGM Minerals Limited (Steel Division), Nimidha,
Dhenkanal,0 1 0
67 Mideast Integrated Steels Ltd., Jajpur 4 3 068 MSP Metalics Limited, Jharsuguda 1 8 069 MSP Sponge Iron Limited, Keonjhar 0 3 070 N. K. Bhojani Pvt. Ltd., Keonjhar 0 1 071 NALCO Ltd.,Captive Power Plant, Angul 4 10 172 NALCO Ltd.,Refinery, Damanjodi, Koraput 6 13 173 NALCO Ltd.,Smelter Plant, Angul 4 10 174 Narbheram Power and Steel Pvt. Ltd., Dhenkanal 0 1 075 Nava Bharat Ventures Ltd., Dhenkanal 3 3 176 Neelachal Ispat Nigam Limited, Duburi, Jajpur 3 4 277 NTPC Limited (TSTPS), Deepshikha, Angul 4 6 278 NTPC Limited (TTPS) Talcher Thermal, Angul 4 6 179 NTPC-SAIL Power Company Private Limited, Rourkela,
Sundargarh, 4 2 0
80 OCL India Ltd,Cement Unit, Rajgangpur, Sundargarh 4 10 181 OCL Iron and Steel Limited, Rajgangpur, Sundargarh 0 4 082 Odisha Power Generation Corporation Ltd.,
Banaharpali, Jharsuguda4 2 0
83 Paradeep Phosphate Ltd., Paradeep, Jagatsinghpur 4 5 384 Patnaik Minerals Pvt. Ltd., Keonjhar 0 2 0
Annual Report 2016-17
22
85 Patnaik Steels and Alloys Ltd., Keonjhar 0 1 086 Pawanjay Sponge Iron Limited, Bijabahal, Sundargarh 0 1 087 Penguine Trading and Agencies Ltd (Seven Star),
Jharsuguda, Jharsuguda,0 2 0
88 Pooja Sponge Pvt. Ltd., Kalunga, Sundargarh 0 2 089 Prabhu Sponge(p) Limited, Rajgangpur, Sundargarh 0 2 090 R. B. Sponge Pvt. Ltd., Jayantpur, Sambalpur 0 1 091 Reliable Sponge Pvt. Ltd. (Bonai Unit), Bonaigarh,
Sundargarh0 1 0
92 Reliable Sponge Pvt. Ltd.,(KALUNGA), Sundergarh 0 1 093 Rexon Strips Ltd., Rourkela, Sundargarh 0 1 094 Rourkela Steel Plant, Rourkela, Sundargar 5 20 695 Rungta Mines Limited, Koira, Sundargarh 4 5 096 Sakthi Sugars Limited (Distillery), Haripur, Dhenkanal 0 1 297 Sakthi Sugars Limited, Haripur, Dhenkanal 0 1 198 Samaleswari Ferro Metals Ltd., Bishalkhinda,
Sambalpur, 0 1 0
99 Scan Steels Limited (Unit-2), Budhakata, Sundargarh 0 3 0100 Scan Steels Limited (Unit-I), Rajgangpur, Sundargarh 0 1 0101 Seeta Integrated Steel and Energy Ltd., Sundargarh 0 2 0102 Sesa Sterlite Ltd (IPP), Jharsuguda 4 4 1103 Sesa Sterlite Ltd (Smelter and CPP), Bhurkamunda,
Jharsuguda4 16 2
104 Shiv Mettalicks (P) Ltd., Rourkela, Sundargarh, Odisha 0 1 0105 Shiva Cement Ltd., Rourkela, Sundargarh, Odisha 0 1 0106 Shree Ganesh Metalics(Kuarmunda), Rourkela,
Sundargarh0 3 0
107 Shree Hari Sponge Pvt. Ltd., Bonaigarh, Sundargarh, 0 1 0108 Shri Hardev Steels Pvt. Ltd., Athagarh, Cuttack 0 1 0109 Shri Jagannath Steels and Power Ltd., Barbil, Keonjhar 0 2 0110 Shri Mahavir Ferro Alloys Pvt. Ltd., Rourkela,
Sundargarh0 4 0
111 Shyam Metalics and Energy Ltd., Lapanga, Sambalpur 4 8 1112 SMC Power Generation Limited, Hirma, Jharsuguda 4 2 0113 Sponge Udyog Pvt. Ltd., Kalunga, Sundargarh 0 1 0114 Sree Metaliks Ltd., Rugudihi, Keonjhar 0 4 0115 Sri Balaji Metallics Pvt. Ltd., Birkela, Sundargarh 0 1 0116 Sumrit Metaliks Pvt. Ltd., Barbil, Keonjhar 0 1 0117 Suraj Products Pvt. Ltd., Rajgangpur, Sundargarh 0 1 0118 Surendra Mining Industries (P) Ltd., Bonai, Sundargarh 0 2 0119 Swastik Ispat Pvt. Ltd., Kuarmunda, Sundargarh 0 2 0120 Tata Sponge Iron Ltd., Joda, Keonjhar 3 3 0121 TATA STEEL Kalinganagar, Keonjhar 4 16 3122 Thakur Prasad Sao and Sons Pvt. Ltd., Lahandabud,
Jharsuguda0 2 0
123 The Bargarh Co-operative Sugar Mills Ltd., Bargarh 0 0 1124 Times Steel and Power Pvt. Ltd., Rourkela, Sundargarh 0 1 0125 Toshali Cement Private Limited, Ampavalli, Koraput 0 1 0126 T R Chemicals Ltd., Rajgangpur, , Sundargarh 0 1 0127 TRL Krosaki Refactories Ltd., Belpahar, Jharsuguda 2 0 0128 UltraTech Cement Ltd., Arda, , Jharsuguda 3 2 0129 Utkal Alumina International Ltd., Doraguda, Rayagada 4 5 1
Annual Report 2016-17
23
130 Utkal Metallics Limited, Rourkela, Sundargarh 0 1 0131 Vasundhara Metaliks Pvt Ltd., Sundargarh 0 1 0132 Vedanta Ltd., Lanjigarh, Kalahandi 1 3 0133 Vikram Pvt. Ltd., Bonai, Sundargarh 0 1 0134 Viraj Steel and Energy Ltd., Lapanga, Sambalpur 0 2 0135 Viraja Steel & Power Private Limited, Athgarh, Cuttack 0 1 0136 Visa Steel Limited, Kalinganagar, Jajpur 4 5 0137 VISA SunCoke Limited, Kalinganagar, Jajpur 0 2 0138 Vishal Metallics Pvt Ltd., Bonai, Sundargarh 0 1 0139 Yazdani Steel and Power Limited, Kalinga Nagar,
Jajpur0 2 0
Total 191 496 67
MINES1 Barsuan Taldihi Kalta Mines (SAIL), Sundargarh 1 0 02 Joda East Iron Mine(Tata), Joda, Keonjhar 4 0 03 Balda Block Iron Mines of Serajuddin & Co. (Balda),
Keonjahr4 0 0
4 BC Mohanty and Sons Pvt Ltd (Duburi), Jajpur 0 0 25 Jajang Iron and Manganese (Jajang), Keonjhar 4 0 06 Joda West Colony, (Township), Banspani road,
Keonjhar, 1 0 0
7 Kalarangiatta Chromite Mines of M/s FACOR (Sukinda), Jajpur
0 0 2
8 Kaliapani Chromite mines of M/s Balasore Alloys Ltd. (Kaliapani), Jajpur
0 0 2
9 Katamati Iron Mine(Tata), Deojhar, Keonjhar 3 0 010 Nadidihi Iron and Mines (B), Nididihi, Sundargarh 3 0 011 Nadidihi Iron and Mines (F), Nididihi, Sundargarh 6 0 012 Nuagaon Iron Ore Mines (M/s. KJS Ahluwalia), Barbil, ,
Keonjhar3 0 0
13 Oraghat Iron Mine, Koira, Sundargarh 5 0 014 Ostapal Chromite mines of M/s FACOR, Sukinda,
Jajpur0 0 2
15 SAIL RMD, Bolani, , Keonjhar 3 0 016 Saruabil Chromite mines of M/s Misrilal Mines Pvt. Ltd,
Jajpur0 0 2
17 SBBK Iron And Manganese Mines(M/S OMC Limited), Barbil, , Keonjhar
1 0 0
18 South Kaliapani Chromite Mines,OMC, Kaliapani, Jajpur
0 0 5
19 Sukinda Chromite mines & Mahagiri Chromite mines of M/s IMFA, Sukinda, Jajpur
0 0 2
20 Sukinda Chromite mines of M/s Tata Steel Ltd., Sukinda, Jajpur
0 0 3
21 Talangi Chromite mines, Talangi, Jajpur 0 0 222 Thakurani iron ore mines of M/s Kaypee Enterprises,
Barbil, Keonjhar 4 0 0
Total 42 0 22
Annual Report 2016-17
24
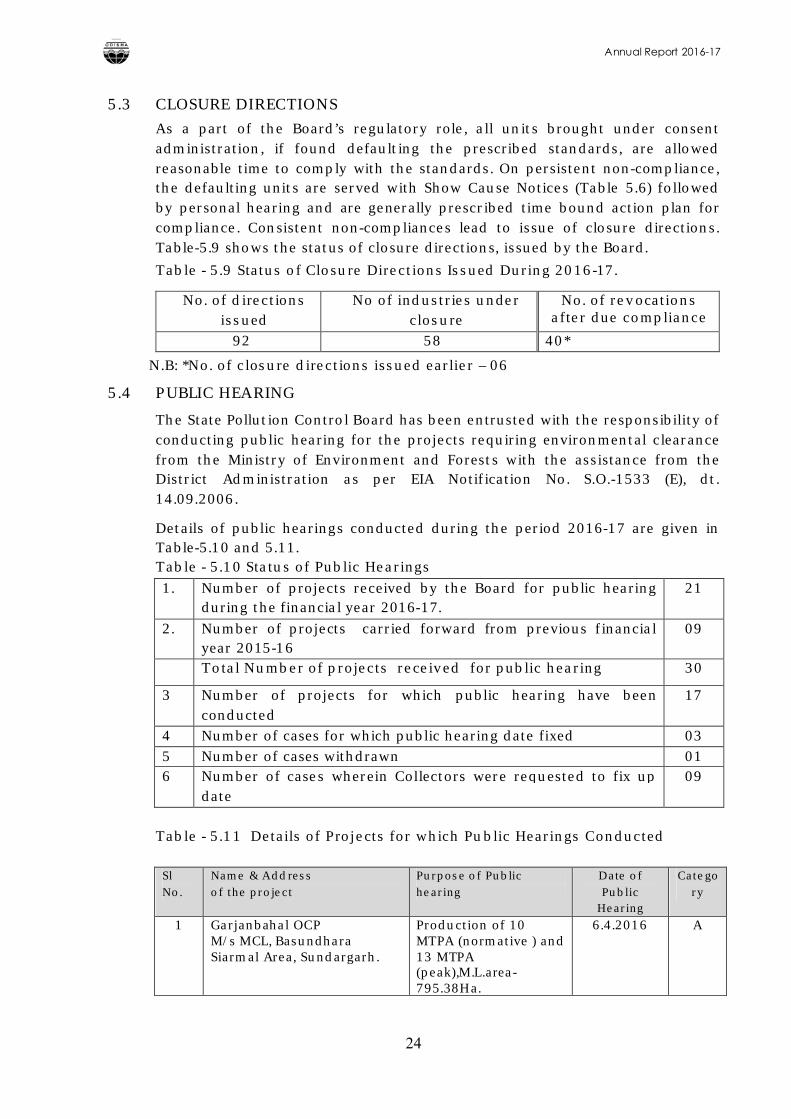
5.3 CLOSURE DIRECTIONS
As a part of the Board’s regulatory role, all units brought under consent administration, if found defaulting the prescribed standards, are allowed reasonable time to comply with the standards. On persistent non-compliance, the defaulting units are served with Show Cause Notices (Table 5.6) followed by personal hearing and are generally prescribed time bound action plan for compliance. Consistent non-compliances lead to issue of closure directions. Table-5.9 shows the status of closure directions, issued by the Board.
Table - 5.9 Status of Closure Directions Issued During 2016-17.
N.B: *No. of closure directions issued earlier – 06
5.4 PUBLIC HEARING
The State Pollution Control Board has been entrusted with the responsibility of conducting public hearing for the projects requiring environmental clearance from the Ministry of Environment and Forests with the assistance from the District Administration as per EIA Notification No. S.O.-1533 (E), dt. 14.09.2006.
Details of public hearings conducted during the period 2016-17 are given in Table-5.10 and 5.11.Table - 5.10 Status of Public Hearings
1. Number of projects received by the Board for public hearing during the financial year 2016-17.
21
2. Number of projects carried forward from previous financial year 2015-16
09
Total Number of projects received for public hearing 30
3 Number of projects for which public hearing have been conducted
17
4 Number of cases for which public hearing date fixed 035 Number of cases withdrawn 016 Number of cases wherein Collectors were requested to fix up
date09
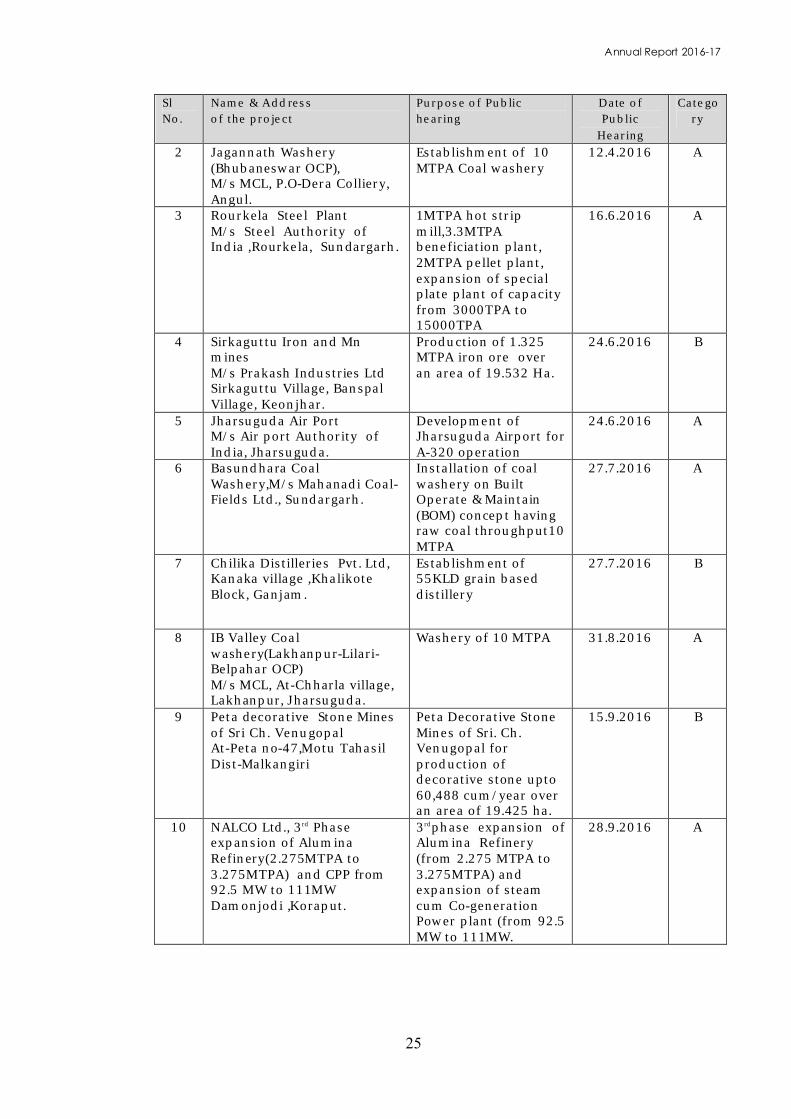
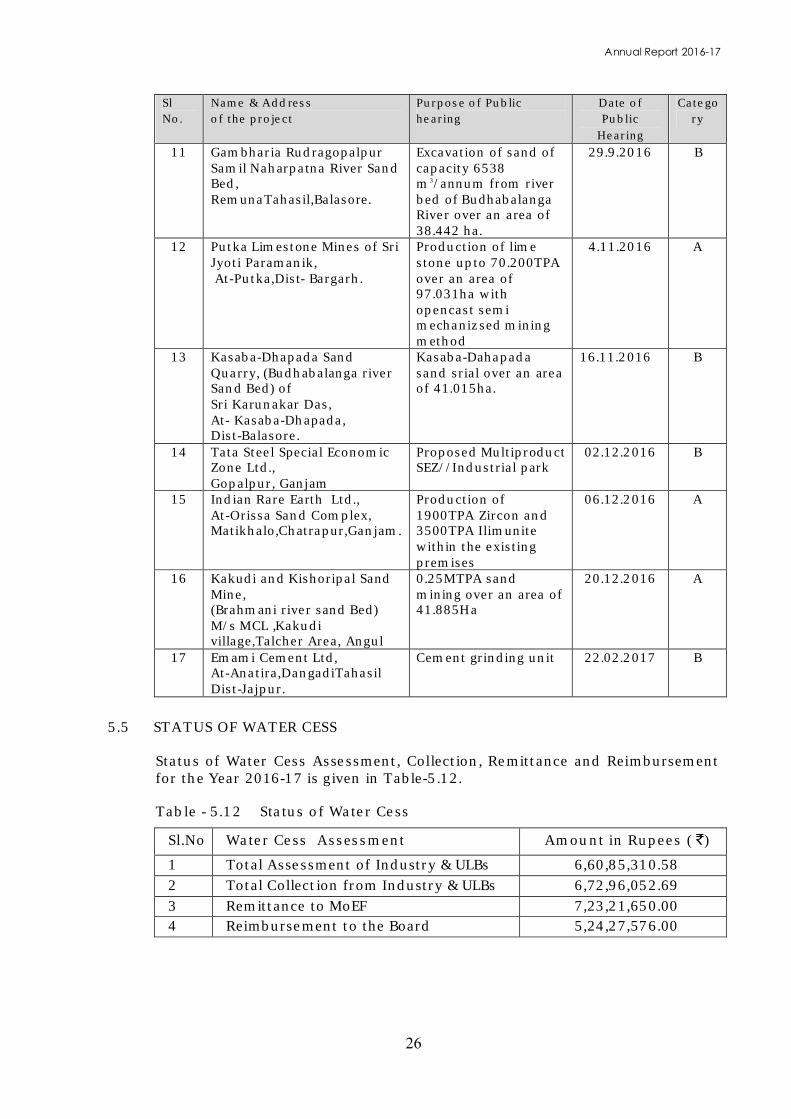
Table - 5.11 Details of Projects for which Public Hearings Conducted
Sl No.
Name & Addressof the project
Purpose of Public hearing
Date of Public
Hearing
Category
1 Garjanbahal OCPM/s MCL, BasundharaSiarmal Area, Sundargarh.
Production of 10 MTPA (normative ) and 13 MTPA (peak),M.L.area-795.38Ha.
6.4.2016 A
No. of directions issued
No of industries under closure
No. of revocations after due compliance
92 58 40*
Annual Report 2016-17
25
Sl No.
Name & Addressof the project
Purpose of Public hearing
Date of Public
Hearing
Category
2 Jagannath Washery(Bhubaneswar OCP),M/s MCL, P.O-Dera Colliery, Angul.
Establishment of 10 MTPA Coal washery
12.4.2016 A
3 Rourkela Steel PlantM/s Steel Authority of India ,Rourkela, Sundargarh.
1MTPA hot strip mill,3.3MTPA beneficiation plant,2MTPA pellet plant, expansion of special plate plant of capacity from 3000TPA to 15000TPA
16.6.2016 A
4 Sirkaguttu Iron and Mn mines M/s Prakash Industries LtdSirkaguttu Village, Banspal Village, Keonjhar.
Production of 1.325 MTPA iron ore over an area of 19.532 Ha.
24.6.2016 B
5 Jharsuguda Air PortM/s Air port Authority of India, Jharsuguda.
Development of Jharsuguda Airport for A-320 operation
24.6.2016 A
6 Basundhara Coal Washery,M/s Mahanadi Coal-Fields Ltd., Sundargarh.
Installation of coal washery on Built Operate & Maintain (BOM) concept having raw coal throughput10 MTPA
27.7.2016 A
7 Chilika Distilleries Pvt. Ltd,Kanaka village ,Khalikote Block, Ganjam.
Establishment of 55KLD grain based distillery
27.7.2016 B
8 IB Valley Coal washery(Lakhanpur-Lilari-Belpahar OCP)M/s MCL, At-Chharla village, Lakhanpur, Jharsuguda.
Washery of 10 MTPA 31.8.2016 A
9 Peta decorative Stone Minesof Sri Ch. VenugopalAt-Peta no-47,Motu TahasilDist-Malkangiri
Peta Decorative Stone Mines of Sri. Ch. Venugopal for production of decorative stone upto 60,488 cum/year over an area of 19.425 ha.
15.9.2016 B
10 NALCO Ltd., 3rd Phase expansion of Alumina Refinery(2.275MTPA to3.275MTPA) and CPP from 92.5 MW to 111MWDamonjodi ,Koraput.
3rdphase expansion of Alumina Refinery (from 2.275 MTPA to 3.275MTPA) and expansion of steam cum Co-generation Power plant (from 92.5 MW to 111MW.
28.9.2016 A
Annual Report 2016-17
26
Sl No.
Name & Addressof the project
Purpose of Public hearing
Date of Public
Hearing
Category
11 Gambharia RudragopalpurSamil Naharpatna River Sand Bed,RemunaTahasil,Balasore.
Excavation of sand of capacity 6538 m3/annum from river bed of Budhabalanga River over an area of 38.442 ha.
29.9.2016 B
12 Putka Limestone Mines of Sri Jyoti Paramanik,At-Putka,Dist- Bargarh.
Production of lime stone upto 70.200TPA over an area of 97.031ha with opencast semi mechanizsed mining method
4.11.2016 A
13 Kasaba-Dhapada Sand Quarry, (Budhabalanga river Sand Bed) of Sri Karunakar Das,At- Kasaba-Dhapada,Dist-Balasore.
Kasaba-Dahapada sand srial over an area of 41.015ha.
16.11.2016 B
14 Tata Steel Special Economic Zone Ltd., Gopalpur, Ganjam
Proposed Multiproduct SEZ//Industrial park
02.12.2016 B
15 Indian Rare Earth Ltd.,At-Orissa Sand Complex,Matikhalo,Chatrapur,Ganjam.
Production of 1900TPA Zircon and 3500TPA Ilimunite within the existing premises
06.12.2016 A
16 Kakudi and Kishoripal Sand Mine,(Brahmani river sand Bed)M/s MCL ,Kakudivillage,Talcher Area, Angul
0.25MTPA sand mining over an area of 41.885Ha
20.12.2016 A
17 Emami Cement Ltd,At-Anatira,DangadiTahasilDist-Jajpur.
Cement grinding unit 22.02.2017 B
5.5 STATUS OF WATER CESS
Status of Water Cess Assessment, Collection, Remittance and Reimbursement for the Year 2016-17 is given in Table-5.12.
Table - 5.12 Status of Water Cess
Sl.No Water Cess Assessment Amount in Rupees ( )
1 Total Assessment of Industry & ULBs 6,60,85,310.582 Total Collection from Industry & ULBs 6,72,96,052.693 Remittance to MoEF 7,23,21,650.004 Reimbursement to the Board 5,24,27,576.00
Annual Report 2016-17
27
5.6 ENFORCEMENT UNDER THE ENVIRONMENT (P) ACT, 1986
5.6.1 Implementation of the Hazardous & Other Wastes (Management andTransboundary Movement) Rules, 2016.
Ministry of Environment, Forest and Climate Change, Govt. of India in
supersession of Hazardous Waste (Management, Handling & Transboundary
Movement) Rules, 2008 has notified the Hazardous and Other Wastes
(Management and Transboundary Movement) Rules,2016 on 4th April, 2016.
These rules apply to the management of hazardous and other waste as
specified in the Sehedules to these rules.
The important features of the new rule are as Follows:
New Rule has introduced the concept of ‘Actual user’ i.e. an occupier who
procures and processes hazardous and other wastes for reuse, recycling,
recovery, pre-processing, utilization including co-processing.
New Rules has also introduced ‘Other wastes’ import or export.
The provision of Rule-11 of Hazardous Waste (Management, Handling &
Transboundary Movement) Rules, 2008 has been replaced by Rule-9 in
Hazardous and other wastes (Management & Transboundary Movement) Rules,
2016 which gives a clear guideline for disposal of applications for utilization
of hazardous and other wastes as a resource or after pre-processing either for
co-processing or for any other use inside the premises of the generator.
Format of authorization application in Form-1 and Authorization order in
Form-2 has also been revised and simplified.
A public notice has been issued in ‘The Samaj’, ‘The Dharitri’ and ‘The New
Indian Express’ addressing the industries handling hazardous wastes to apply
online as per the provision of Hazardous and other wastes (Management &
Transboundary Movement) Rules, 2016.
5.6.1.1.Authorisation
The Authorization status of hazardous waste generating industries during 2016-17 is given in Table 5.13.
Table 5.13 Authorization Status of Hazardous Waste
Sl. No. Authorization status Number(i) Total no. of applications received 151*
(ii) No. of units granted authorisation 95
(iii) No. of units being issued Show Cause Notices 25
[
Annual Report 2016-17
28
(iv) No. of units refused 02(v) No. of closure direction issued 01
(vi) No. of direction issued 03(vii) Total No. of applications disposed 126
N.B: *Includes 25 No. of incomplete applications.
5.6.1.2 Utilization and Disposal of Hazardous Waste
The SPCB, Odisha has taken special initiatives to enhance the utilization of the major hazardous waste generated from Aluminium Smelter plants and Steel Plants. Further, the Board has enforced the provision of Rule-09 of the Hazardous and other Wastes (Management & Transboundary Movement) Rules, 2016 to streamline the utilization of major hazardous waste like L. D. Sludge, Vanadium sludge, Aluminium Dross, Spent Pot Lining, Used Anode Butt etc. and to prevent reprocessing without compliance to this rule. The Board has taken lot of initiation to conduct joint trial run of the hazardous waste reprocessing units in collaboration with CPCB, New Delhi and its Zonal Office, Kolkata. This is intended to recover more resources from the hazardous wastes.
(A) Authorization Status of Actual Users of Hazardous Waste
During the financial year 2016-17, the following industries were granted authorization for recycling/ re-processing of different hazardous waste under Hazardous and Other Wastes (Management & Transboundary Movement) Rules, 2016.
List of Actual Users
Sl. No.
Name & Address of the Actual Users Authorized by SPCB, Odisha
Quantity of Hazardous Waste
Validity
1 Chemical & Metallurgical Co., Shed No. S/III-24, Industrial Estate, Kalunga, Rourkela
Used Oil-720 KL/A 31.03.2021
2 N. S. Chemicals, Plot No.-E/72, Chhend Colony, Rourkela, Sundargarh
Used Oil-936 KL/A 31.03.2020
3 Ratna Industries, At- Jamunanki, Po-Kuarmunda, Dist-Sundargarh-770039. Used Oil-750 KL/A
31.03.2020
4 Raj Lubricants, At/ P.O- Januganj, Dist-Balasore, Odisha
Used Oil-1500 KL/A
31.03.2019
5 Susim Enterprises, At- 154/F & G, New Industrial Estate, Jagatpur, Dist- Cuttack, Odisha
Used Oil-1200 KL/A
31.03.2019
6 Gouri Shankar Lubricants, At- Gurujang, Po- Talcher, Dist- Angul, Odisha – 759100
Used Oil-600 KL/A 31.03.2022
7 Asian Petro Chemicals, At- Asanabahali, Po.-Barada, Gundichapada, Dist-Dhenkanal
Used Oil -960 KL/A
31.03.2021
8 Shree Durga Petrochemicals, Plot No. 89A, New Industrial Estate, Phase-II, Jagatpur, Dist - Cuttack, Odisha - 754021
Used lubricating oil / Transformer
oil2160 KL/A
31.03.2022
Annual Report 2016-17
29
9 Swaraj Lubricants, At- Gobinda, Po-Haldipada, Dist-Balasore, Odisha
Used Oil -1500 KL/A &
Waste Oil-6000 KL/A
31.03.2018
10 Purbanchal Petroleum Private Limited, At - Kalagada, Po - Jadupur, Dist -Kendrapara, Odisha - 754213
Used Oil/Spent Oil :3650KL/A
&Waste Oil : 12045
KL/A
31-03-2021
11 Shriya Metals & Chemicals, At-Khairbandh, PO- Ranto Birkera, PS-Bramhanitarang, Dist - Sundargarh, Odisha – 770037
Waste Oil-7350 KL/A
31.03.2018
12 N. C. Oil Refinery Pvt. Ltd.Vill- Sova, Po-Osakana, Balikuda,Dist- Jagatsinghpur, Odisha
Waste Oil-3500 KL/A
31.03.2018
13 Agrawal Rasayan, At/PO-Jayantpur, P.S: Jujumura, Dist- Sambalpur, Odisha
Waste Oil-2400 KL/A
31.03.2017
14 Dhan Shree Smelters, At- Plot No. 154/C & D, New Industrial Estate, Jagatpur, Dist-Cuttack, Odisha
Lead acid battery plates and other
lead scraps 1800 T/A
31.03.2019
15 East Coast Biotech Project, At - Paniora (Near Sungranite Exports Ltd.), PO-Palaspur, Dist- Khurda, Odisha
Zinc Skimming / Zinc Ash / Zinc
Dross : 3000 T/A
31.03.2019
16 Omm Cee Business, At- IDCO Plot N0. 3, Sanabramanitarang, Industrial Estate, Kalunga, Dist - Sundargarh, Odisha
Used Anode Butt -3300 T/A
31-03-2020
17 Metacast International, At/Po - Katapali, Dist-Sambalpur, Odisha
Used Anode Butt, 10,080 T/A
27-07-2019
18 Metakani Resources, At/Po- Kabrapali, Dist - Sambalpur, Odisha
Used Anode Butt, 47040 T/A 31-03-2018
19 Hindalco Industries Limited, Hirakud Complex, Hirakud-768 016, Dist-Sambalpur, Odisha
Aluminium Dross3960 T/A
31-03-201820 A K Enterprises, Plot No. - 7, Khordha
Industrial Estate, Dist - Khordha, OdishaAluminium Dross
8400 T/A 31-03-201821 Gaurav Aluminium, At-/Po- Hirma, Dist –
Jharsuguda, OdishaAluminium Dross
12000 T/A 31-03-201822 Hirakud Metallics, Nuakhurigaon, Po-
Sason, Dist-Sambalpur Aluminium Dross
15000 T/A16.07.2017
23 Shree Sai Metallik, At – Jamunalia, PO -Badaposhi, VIA – Naranpur, Dist-Keonjhar, Odisha
Aluminium Dross9960 T/A
16.07.2017
24 Green Energy Resources, Shanti Nagar Road, Near Furniture Point, Budharaja, Sambalpur
Spent Pot Lining (SPL) to
manufacture Carbon Fuel -
25200 T/A
31.03.2020
25 Subhra Chemicals, Plot No.10, Old Industrial Estate, Jagatpur, Cuttack
Spent Pot Lining (SPL)
Carbon Portion4,320 T/4 Months
Lr. no.4461,dtd. 22-03-
20174 months w.e.f
the date of first batch of procurement
Annual Report 2016-17
30
26 Suraj Products Ltd., At- Barapali, Post - Kesharmal,Rajgangpur, Dist - Sundargarh, Odisha
Flue Gas Dust / Gas Cleaning Plant (GCP) Sludge of LD Furnace / Electric Arc Furnace (EAF) / Blast Furnace of
Steel Plant / Captive Blast
Furnace 68500 T/A
GCP Sludge of Ferro Alloy Plant
2400 T/A
31.03.2019
(B) Common Facility for Disposal of Hazardous Wastes
A Common Hazardous Waste Treatment, Storage and Disposal Facility (CHWTSDF) has been established during financial year 2010-11 at Kanchichuan, Jajpur, Odisha operated by M/s Ramky Enviro Engineers Ltd., Hyderabad with consented capacity of 25,000 T/A for secured landfill, 12,000 T/A of waste treatment & stabilisation and 3,000 T/A of incinerable hazardous waste storage. So far, 159 no. of Industries / Mines have taken membership agreement with Common Hazardous Waste Treatment, Storage and Disposal Facility (CHWTSDF). The status of disposal of hazardous waste at CHWTSDF is as follows:
Hazardous waste received from various Industries/Mines by CHWTSDF - 38,522.027 T
i. Landfill after treatment - 31,369.905 Tii. Direct Landfill - 7,061.310 T
(C ) Remediation of Contaminated sites
Central pollution Control Board (CPCB), New Delhi vide letter No. F. No: B-29016/59(1)/HWMD/NCEF (1&3)/2014/2716, dtd. 05-08-2014 had communicated the Board indicating the details of project to be undertaken for remediation of two identified contaminated sites (Mercury contaminated site of M/s Jayshree Chemicals, Ganjam and Chromium contaminated site at M/s Orichem Ltd., Angul) located in the state of Odisha under National Clean Energy Fund (NCEF) project of Ministry of Environment, Forest & Climate change, Govt. of India.
CPCB has engaged a consultant namely M/s ERM India Pvt. Ltd. to undertake the remediation project which broadly divided into 2 phases: Phase-1- to prepare a detailed project report based on assessment of levels and nature of contaminants in surface/ sub-surface, ground water and soils in and around the contaminated site and by conducting reassessment studies; Phase-2-actual remediation work, validation of work and preparation of post-remediation monitoring plan.
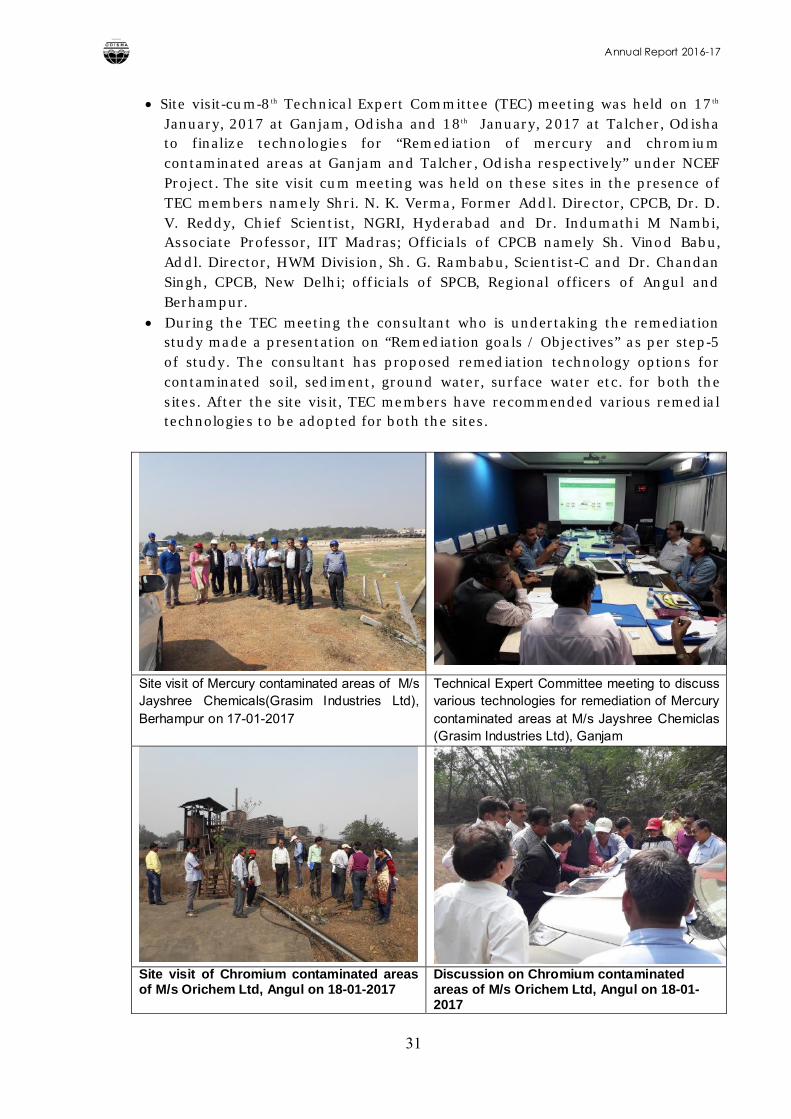
Annual Report 2016-17
31
Site visit-cum-8th Technical Expert Committee (TEC) meeting was held on 17th
January, 2017 at Ganjam, Odisha and 18th January, 2017 at Talcher, Odisha to finalize technologies for “Remediation of mercury and chromium contaminated areas at Ganjam and Talcher, Odisha respectively” under NCEF Project. The site visit cum meeting was held on these sites in the presence of TEC members namely Shri. N. K. Verma, Former Addl. Director, CPCB, Dr. D. V. Reddy, Chief Scientist, NGRI, Hyderabad and Dr. Indumathi M Nambi, Associate Professor, IIT Madras; Officials of CPCB namely Sh. Vinod Babu, Addl. Director, HWM Division, Sh. G. Rambabu, Scientist-C and Dr. Chandan Singh, CPCB, New Delhi; officials of SPCB, Regional officers of Angul and Berhampur.
During the TEC meeting the consultant who is undertaking the remediation study made a presentation on “Remediation goals / Objectives” as per step-5 of study. The consultant has proposed remediation technology options for contaminated soil, sediment, ground water, surface water etc. for both the sites. After the site visit, TEC members have recommended various remedial technologies to be adopted for both the sites.
Site visit of Mercury contaminated areas of M/s Jayshree Chemicals(Grasim Industries Ltd), Berhampur on 17-01-2017
Technical Expert Committee meeting to discuss various technologies for remediation of Mercury contaminated areas at M/s Jayshree Chemiclas (Grasim Industries Ltd), Ganjam
Site visit of Chromium contaminated areas of M/s Orichem Ltd, Angul on 18-01-2017
Discussion on Chromium contaminated areas of M/s Orichem Ltd, Angul on 18-01-2017
Annual Report 2016-17
32
5.6.2 Implementation of Manufacture, storage and Import of Hazardous Chemical Rules, 1989 and amendments thereofThe Board has not received any application for import of Hazardous Chemicals to the State during 2016-17.
5.6.3. Implementation of Public Liability Insurance Act, 1991As per provisions of the Public Liability Insurance Act, 1991, the industries handling hazardous substances above the regulatory quantity are required to take insurance policy for providing immediate relief to the victims in case of chemical accidents. Efforts have been made to create awareness among the concerned industries to take such insuarances. In total 43 no. of industries have taken insurance policies under PLI Act, 1991.
5.6.4. Implementation of Batteries (M & H) Rule, 2001 The Board has received 84 no. of half yearly returns from April' 2016 to Sep' 2016 and 19 no. of half yearly returns from Oct' 2016 to March' 2017from battery units. These returns have been received from Manufacturer, Re-conditioner, Assembler, Dealer, Bulk Consumer, Auctioneer, Importer & Recycler.
5.6.5 Implementation of the Biomedical Waste Management Rules, 2016
Biomedical wastes generated in different Health Care Establishments (HCEs)need to be disposed off safely without any adverse impacts on human health and environment. It is the prime responsibility of every occupier of the HCEgenerating Biomedical Wastes (BMWs) to ensure requisite management and disposal of wastes as per the Biomedical Waste Management Rules, 2016. The important features of the Rule is given below: Every occupier generating biomedical waste is required to obtain
authorization from the State Pollution Control Board and ensure proper management of the Biomedical Waste.
The Rules have introduced 4 categories of Biomedical Waste i.e. Yellow, Red, White & Blue.
Format of Accident Reporting in Form-I, Authorization application in Form-II, Authorization order in Form-III & Annual Report in Form-IV have been revised.
Validity period for authorization for bedded health care facility and operator of a common facility is synchronized with the validity of consents and one time for non-bedded occupiers.
5.6.5.1 Inventorisation of Health Care EstablishmentsThe Board has brought 2193 no. of HCEs under the authorization administration under the Biomedical Waste Management Rules 2016 and the district wise distribution of such HCEs with respect to bed strength is given in Table- 5.14.
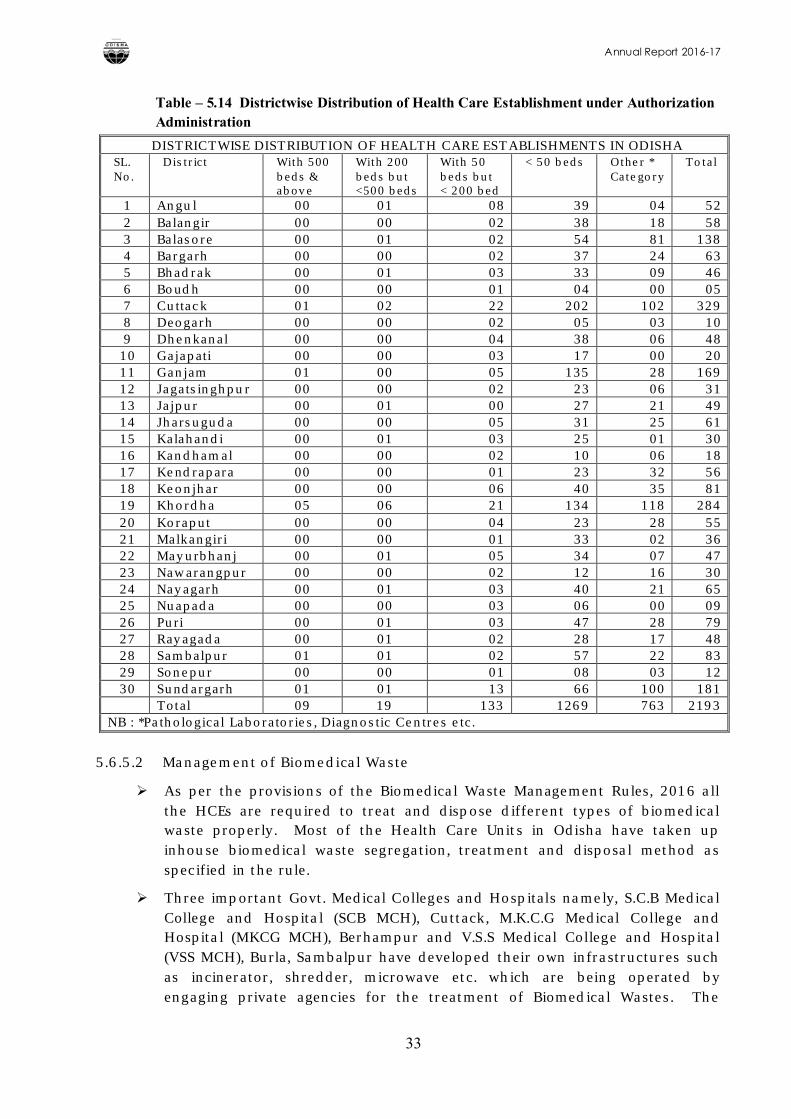
Annual Report 2016-17
33
Table – 5.14 Districtwise Distribution of Health Care Establishment under Authorization Administration
DISTRICTWISE DISTRIBUTION OF HEALTH CARE ESTABLISHMENTS IN ODISHASL. No.
District With 500 beds & above
With 200 beds but <500 beds
With 50 beds but < 200 bed
< 50 beds Other * Category
Total
1 Angul 00 01 08 39 04 522 Balangir 00 00 02 38 18 583 Balasore 00 01 02 54 81 1384 Bargarh 00 00 02 37 24 635 Bhadrak 00 01 03 33 09 466 Boudh 00 00 01 04 00 057 Cuttack 01 02 22 202 102 3298 Deogarh 00 00 02 05 03 109 Dhenkanal 00 00 04 38 06 4810 Gajapati 00 00 03 17 00 2011 Ganjam 01 00 05 135 28 16912 Jagatsinghpur 00 00 02 23 06 3113 Jajpur 00 01 00 27 21 4914 Jharsuguda 00 00 05 31 25 6115 Kalahandi 00 01 03 25 01 3016 Kandhamal 00 00 02 10 06 1817 Kendrapara 00 00 01 23 32 5618 Keonjhar 00 00 06 40 35 8119 Khordha 05 06 21 134 118 28420 Koraput 00 00 04 23 28 5521 Malkangiri 00 00 01 33 02 3622 Mayurbhanj 00 01 05 34 07 4723 Nawarangpur 00 00 02 12 16 3024 Nayagarh 00 01 03 40 21 6525 Nuapada 00 00 03 06 00 0926 Puri 00 01 03 47 28 7927 Rayagada 00 01 02 28 17 4828 Sambalpur 01 01 02 57 22 8329 Sonepur 00 00 01 08 03 1230 Sundargarh 01 01 13 66 100 181
Total 09 19 133 1269 763 2193NB : *Pathological Laboratories, Diagnostic Centres etc.
5.6.5.2 Management of Biomedical Waste
As per the provisions of the Biomedical Waste Management Rules, 2016 all the HCEs are required to treat and dispose different types of biomedical waste properly. Most of the Health Care Units in Odisha have taken up inhouse biomedical waste segregation, treatment and disposal method as specified in the rule.
Three important Govt. Medical Colleges and Hospitals namely, S.C.B Medical College and Hospital (SCB MCH), Cuttack, M.K.C.G Medical College and Hospital (MKCG MCH), Berhampur and V.S.S Medical College and Hospital (VSS MCH), Burla, Sambalpur have developed their own infrastructures such as incinerator, shredder, microwave etc. which are being operated by engaging private agencies for the treatment of Biomedical Wastes. The
Annual Report 2016-17
34
agencies are: M/s. Medi-Aid Marketing Services - engaged by SCB MCH, MKCG MCH and M/s. Biotech Solution- engaged by VSS MCH. These two facilities arealso being shared by other nearby small Government HCEs.
The Common Biomedical Waste Treatment Disposal Facility (CBWTDF) namelyM/s Saniclean Pvt. Ltd., at Tangiapada, Khordha is taking care of segregated biomedical waste of hospitals in Cuttack city, Bhubaneswar city, Jagatpur, Choudwar, Duburi, Jatni, Paradeep & Khordha town. In addition, M/s. Medi-Aid Marketing Services is operating the biomedical waste management facility of Rourkela Govt. Hospital campus, Rourkela on Public Private Partnership mode. All the above private agencies have been authorized by the Board for the purpose.
Out of 2193 HCEs, 500 units are utilizing the services of aforesaid common facilities.
5.6.5.3 Status of Authorisation Application of Health Care Establishments
The authorisation application status of the HCEs during 2016-17 is presented in Table-5.15
Table - 5.15 Authorisation Status of HCEs During 2016-17Sl.
No.Status of HCEs
1 No. of applications received during 2016-17 11672 No. of cases carried over from year 2015-16 7193 Total no. of applications received 18864 No. of HCEs granted authorisation 8685 No. of HCEs refused authorisation 336 Total No. of applications disposed 9017 No. HCEs under evaluation / Incomplete application 7888 No. of HCEs violating the Rules 1059 No. of HCEs issued show cause notices 365*
10 No. of HCEs inspection conducted 1395N.B: * Includes HCEs operating without authorization.
5.6.6. Implementation of the Solid Waste Management Rules, 2016
Ministry of Environment, Forest and Climate Change, Govt. of India in supersession of Municipal Solid Waste (Management & Handling) Rules, 2000 has notified the Solid Waste Management Rules, 2016 under Environment (Protection) Act, 1986 on 8th April, 2016. Applicability of the Rules extended beyond Municipal Area, outgrowths in Urban agglomerations, sensus towns, notified industrial townships, areas under the control of Indian Railways, Airports, Airbase, Port and Harbours, Defence establishments, Special Economic zones, State and Central Govt. Organizations, Places of Pilgrims, Religious and Historical importance.
As per the Rules, the Urban Local Bodies (ULBs) are required to take action for proper management of municipal solid wastes, seek authorization for setting up and operation of waste processing and disposal facilities from the Board and
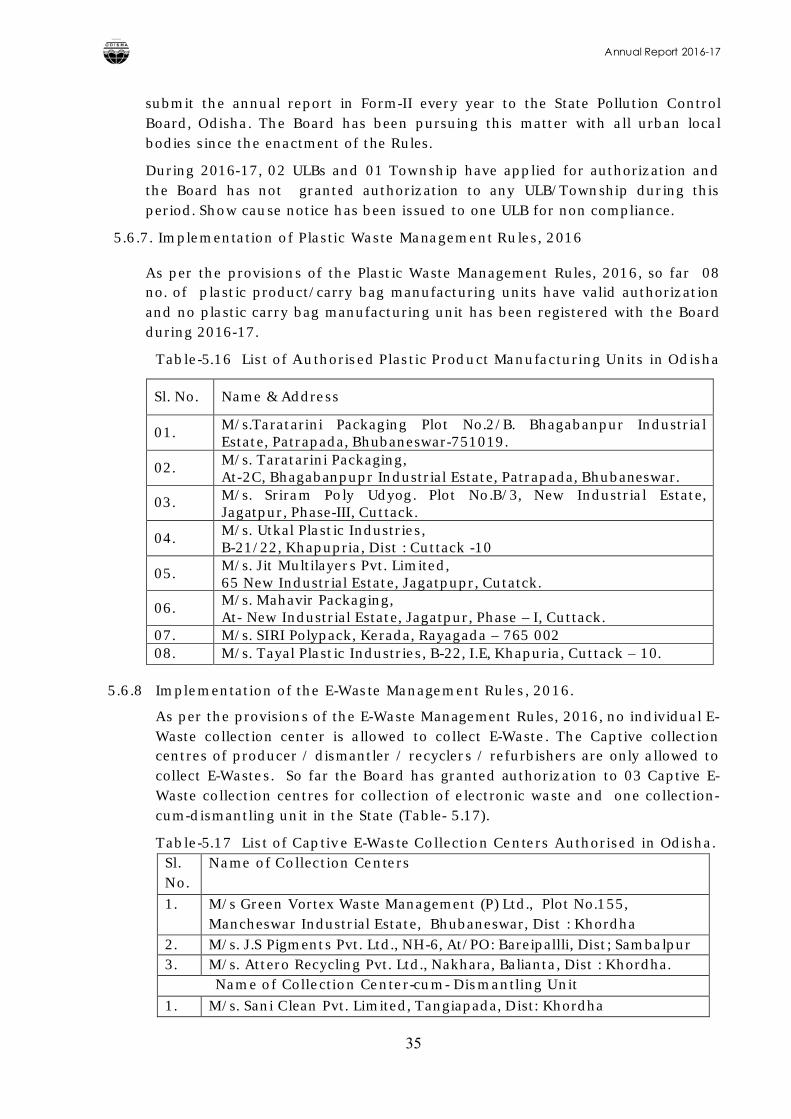
Annual Report 2016-17
35
submit the annual report in Form-II every year to the State Pollution Control Board, Odisha. The Board has been pursuing this matter with all urban local bodies since the enactment of the Rules.
During 2016-17, 02 ULBs and 01 Township have applied for authorization and the Board has not granted authorization to any ULB/Township during this period. Show cause notice has been issued to one ULB for non compliance.
5.6.7. Implementation of Plastic Waste Management Rules, 2016
As per the provisions of the Plastic Waste Management Rules, 2016, so far 08no. of plastic product/carry bag manufacturing units have valid authorization and no plastic carry bag manufacturing unit has been registered with the Boardduring 2016-17.
Table-5.16 List of Authorised Plastic Product Manufacturing Units in Odisha
Sl. No. Name & Address
01. M/s.Taratarini Packaging Plot No.2/B. Bhagabanpur IndustrialEstate, Patrapada, Bhubaneswar-751019.
02. M/s. Taratarini Packaging, At-2C, Bhagabanpupr Industrial Estate, Patrapada, Bhubaneswar.
03. M/s. Sriram Poly Udyog. Plot No.B/3, New Industrial Estate, Jagatpur, Phase-III, Cuttack.
04. M/s. Utkal Plastic Industries,B-21/22, Khapupria, Dist : Cuttack -10
05. M/s. Jit Multilayers Pvt. Limited, 65 New Industrial Estate, Jagatpupr, Cutatck.
06. M/s. Mahavir Packaging,At- New Industrial Estate, Jagatpur, Phase – I, Cuttack.
07. M/s. SIRI Polypack, Kerada, Rayagada – 765 00208. M/s. Tayal Plastic Industries, B-22, I.E, Khapuria, Cuttack – 10.
5.6.8 Implementation of the E-Waste Management Rules, 2016.
As per the provisions of the E-Waste Management Rules, 2016, no individual E-Waste collection center is allowed to collect E-Waste. The Captive collection centres of producer / dismantler / recyclers / refurbishers are only allowed to collect E-Wastes. So far the Board has granted authorization to 03 Captive E-Waste collection centres for collection of electronic waste and one collection-cum-dismantling unit in the State (Table- 5.17).
Table-5.17 List of Captive E-Waste Collection Centers Authorised in Odisha.Sl. No.
Name of Collection Centers
1. M/s Green Vortex Waste Management (P) Ltd., Plot No.155, Mancheswar Industrial Estate, Bhubaneswar, Dist : Khordha
2. M/s. J.S Pigments Pvt. Ltd., NH-6, At/PO: Bareipallli, Dist; Sambalpur3. M/s. Attero Recycling Pvt. Ltd., Nakhara, Balianta, Dist : Khordha. Name of Collection Center-cum- Dismantling Unit
1. M/s. Sani Clean Pvt. Limited, Tangiapada, Dist: Khordha
Annual Report 2016-17
36
The details of addresses of the collection centres are given in the Board’s website: www.ospcboard.org. The Bank, Educational Institutes, Electronic items producers, Telecomunication service providers have been requested to channelize E-Waste through authorized collection center or registred dismantlers/recyclers.
5.6.9. Construction and Demolition Waste Management Rules, 2016
Ministry of Environment, Forest and Climate Change, Govt. of India has notified Construction and Demolition Waste Management Rules, 2016 on 29th
March, 2016.This Rule shall be applicable to every waste resulting from construction, re-modeling, repair and demolition of any civil structure of individual or organisation or authority who generates construction and demolition waste such as building materials, debris & rubble etc.
The authorities of Revenue Department, Housing & Urban Development Department, Works Department and Town Planning, Government of Odisha have been requested to take appropriate action towards wide publicity of theRules to create awareness amongst the local authorities and sensitize the general public about their responsibilities in handling such type of waste.
All the construction and demolition waste generators have been requested through public notice in Daily News Papers to go through the aforesaid Rules which is available at the SPC Board website www.ospcboard.org and Ministry website www.moef.nic.in. Furthermore, the operators of the waste processing facilities have been asked to apply for authorization from State Pollution Control Board.
5.7 MONITORING NETWORK FOR WATER AND AIR QUALITY5.7.1 National Water Quality Monitoring Programme (NWMP)
Inland Surface Water
The Board is monitoring the water quality of nine major river systems viz. Mahanadi, Brahmani, Baitarani, Rushikulya, Nagavali, Subarnarekha, Budhabalanga, Kolab and Vansadhara at 64 stations under the CPCB assisted National Water Quality Monitoring Programme (NWMP); one station on Brahmani river and one station on Baitarani river under National River Conservation Programme (NRCP). Besides these, the Board is also monitoring the water quality at five stations of Mahanadi river system, five stations of Brahmani river system, two stations of Baitarani river system and one station of Budhabalanga river from its own resources under the State Water Quality Monitoring Programme (SWMP).
Board is also monitoring the water quality of other surface water bodies such as Taladanda Canal, Religious ponds in Puri and Bhubaneswar, Chilka and Anshupa lake and coastal water at Puri, Gopalpur and Paradeep under NWMP. Details of monitoring stations are presented in Table-5.18.
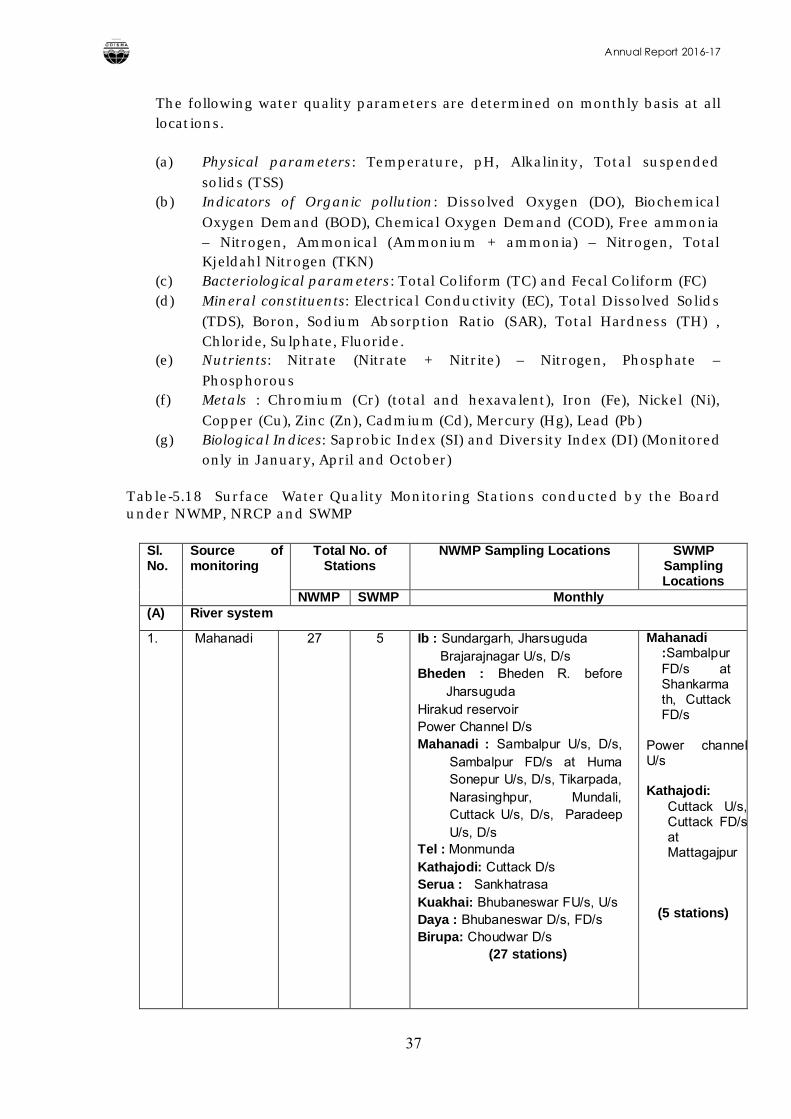
Annual Report 2016-17
37
The following water quality parameters are determined on monthly basis at all locations.
(a) Physical parameters: Temperature, pH, Alkalinity, Total suspended solids (TSS)
(b) Indicators of Organic pollution: Dissolved Oxygen (DO), Biochemical Oxygen Demand (BOD), Chemical Oxygen Demand (COD), Free ammonia – Nitrogen, Ammonical (Ammonium + ammonia) – Nitrogen, Total Kjeldahl Nitrogen (TKN)
(c) Bacteriological parameters: Total Coliform (TC) and Fecal Coliform (FC)(d) Mineral constituents: Electrical Conductivity (EC), Total Dissolved Solids
(TDS), Boron, Sodium Absorption Ratio (SAR), Total Hardness (TH) , Chloride, Sulphate, Fluoride.
(e) Nutrients: Nitrate (Nitrate + Nitrite) – Nitrogen, Phosphate –Phosphorous
(f) Metals : Chromium (Cr) (total and hexavalent), Iron (Fe), Nickel (Ni), Copper (Cu), Zinc (Zn), Cadmium (Cd), Mercury (Hg), Lead (Pb)
(g) Biological Indices: Saprobic Index (SI) and Diversity Index (DI) (Monitored only in January, April and October)
Table-5.18 Surface Water Quality Monitoring Stations conducted by the Board under NWMP, NRCP and SWMP
Sl. No.
Source of monitoring
Total No. of Stations
NWMP Sampling Locations SWMP Sampling Locations
NWMP SWMP Monthly(A) River system
1. Mahanadi 27 5 Ib : Sundargarh, Jharsuguda Brajarajnagar U/s, D/sBheden : Bheden R. before
JharsugudaHirakud reservoirPower Channel D/sMahanadi : Sambalpur U/s, D/s,
Sambalpur FD/s at Huma Sonepur U/s, D/s, Tikarpada, Narasinghpur, Mundali, Cuttack U/s, D/s, Paradeep U/s, D/s
Tel : MonmundaKathajodi: Cuttack D/sSerua : SankhatrasaKuakhai: Bhubaneswar FU/s, U/sDaya : Bhubaneswar D/s, FD/sBirupa: Choudwar D/s
(27 stations)
Mahanadi :Sambalpur FD/s at Shankarmath, Cuttack FD/s
Power channel U/s
Kathajodi:Cuttack U/s, Cuttack FD/s at Mattagajpur
(5 stations)
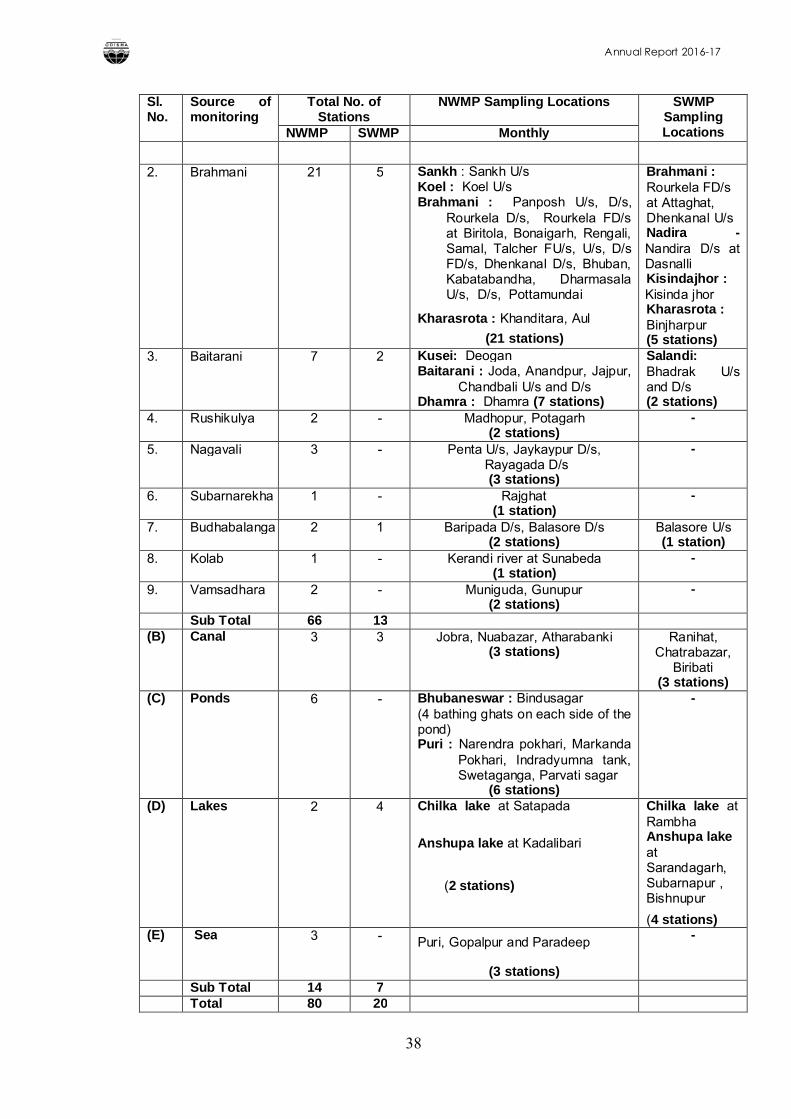
Annual Report 2016-17
38
Sl. No.
Source of monitoring
Total No. of Stations
NWMP Sampling Locations SWMP Sampling LocationsNWMP SWMP Monthly
2. Brahmani 21 5 Sankh : Sankh U/s Koel : Koel U/sBrahmani : Panposh U/s, D/s,
Rourkela D/s, Rourkela FD/s at Biritola, Bonaigarh, Rengali, Samal, Talcher FU/s, U/s, D/s FD/s, Dhenkanal D/s, Bhuban, Kabatabandha, Dharmasala U/s, D/s, Pottamundai
Kharasrota : Khanditara, Aul
(21 stations)
Brahmani : Rourkela FD/s at Attaghat, Dhenkanal U/sNadira -Nandira D/s at DasnalliKisindajhor : Kisinda jhorKharasrota : Binjharpur(5 stations)
3. Baitarani 7 2 Kusei: DeoganBaitarani : Joda, Anandpur, Jajpur,
Chandbali U/s and D/sDhamra : Dhamra (7 stations)
Salandi: Bhadrak U/s and D/s(2 stations)
4. Rushikulya 2 - Madhopur, Potagarh(2 stations)
-
5. Nagavali 3 - Penta U/s, Jaykaypur D/s,Rayagada D/s(3 stations)
-
6. Subarnarekha 1 - Rajghat(1 station)
-
7. Budhabalanga 2 1 Baripada D/s, Balasore D/s(2 stations)
Balasore U/s(1 station)
8. Kolab 1 - Kerandi river at Sunabeda(1 station)
-
9. Vamsadhara 2 - Muniguda, Gunupur(2 stations)
-
Sub Total 66 13(B) Canal 3 3 Jobra, Nuabazar, Atharabanki
(3 stations)Ranihat,
Chatrabazar, Biribati
(3 stations)(C) Ponds 6 - Bhubaneswar : Bindusagar
(4 bathing ghats on each side of the pond)Puri : Narendra pokhari, Markanda
Pokhari, Indradyumna tank, Swetaganga, Parvati sagar
(6 stations)
-
(D) Lakes 2 4 Chilka lake at Satapada
Anshupa lake at Kadalibari
(2 stations)
Chilka lake at Rambha Anshupa lakeat Sarandagarh, Subarnapur , Bishnupur
(4 stations)(E) Sea 3 - Puri, Gopalpur and Paradeep
(3 stations)
-
Sub Total 14 7Total 80 20
Annual Report 2016-17
39
(A) RIVER WATER QUALITY MONITORING PROGRAM
The annual average and range values of the criteria parameters such as pH, DO, BOD and TC, obtained during the year 2016 for the river water quality monitoring stations listed under Table-5.18 are given in Table-5.20. Water quality in respect of other parameters is given in Table-5.21. Spatial variation of BOD, DO and TC are presented in Figs.2-8.
From the point of view of assessment of the river water quality on the basis of its use to which the river is put by the community, the water quality should conform to either Class-B (outdoor bathing) or Class-C (drinking water source with conventional treatment followed by the disinfection). Water quality data given in Table-5.20 indicate that out of the four critical parameters such as pH, DO, BOD and TC, parameters like pH and DO at most of the stations remained within the criteria limits, whereas BOD and/or TC have exceeded the criteria limits at several places. Non-compliance has been observed at 49 stations for TC alone and 11 stations for both BOD & TC (Table-5.19). The probable cause of downgrading the water quality from its desired use, are of organic origin. A major contribution towards this is from the discharge of untreated domestic water from the townships to the nearby water bodies.
Table-5.19 Water quality status of river monitoring stations during 2016
Sl. No.
River System Total no. of Monitoring Stations
Conforming Stations
Non-conforming stationsBoth
BOD & TC
BOD alone
TC alone
1 Mahanadi 32 11 6 - 15
2 Brahmani 26 4 3 - 19
3 Baitarani 9 - - - 9
4. Rushikulya 2 1 - - 1
5. Nagavali 3 - 1 - 2
6. Subarnarekha 1 1 - - -
7. Budhabalanga 3 - 1 - 2
8 Kolab 1 - - - 1
9. Vamsadhara 2 2 - - -
Total 79 19 11 - 49
Water quality with respect to other parameters at all the monitoring stations
except at Paradeep D/s, Potagarh, Chandbali and Dhamra remain within the
criteria limit for Class - C water quality as laid down under IS : 2296-1982
(Tolerance limits for inland surface water bodies). Water quality at Paradeep
D/s, Potagarh, Chandbali and Dhamra are greatly influenced by the tidal effect
as these stations are very close to the river muhans.
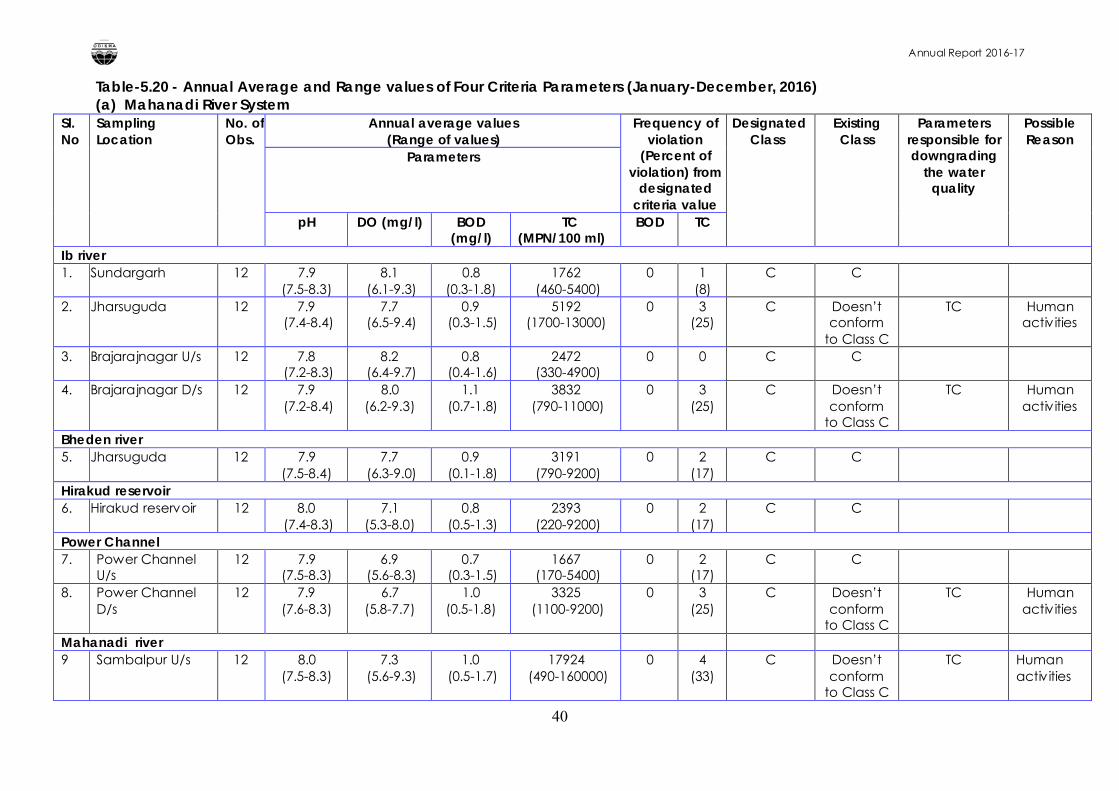
Annual Report 2016-17
40
Table-5.20 - Annual Average and Range values of Four Criteria Parameters (January-December, 2016) (a) Mahanadi River System
Sl. No
Sampling Location
No. of Obs.
Annual average values(Range of values)
Frequency of violation
(Percent of violation) from
designated criteria value
Designated Class
Existing Class
Parameters responsible for downgrading
the water quality
Possible Reason
Parameters
pH DO (mg/l) BOD (mg/l)
TC (MPN/100 ml)
BOD TC
Ib river1. Sundargarh 12 7.9
(7.5-8.3)8.1
(6.1-9.3)0.8
(0.3-1.8)1762
(460-5400)0 1
(8)C C
2. Jharsuguda 12 7.9(7.4-8.4)
7.7(6.5-9.4)
0.9(0.3-1.5)
5192 (1700-13000)
0 3(25)
C Doesn’t conform
to Class C
TC Human activities
3. Brajarajnagar U/s 12 7.8(7.2-8.3)
8.2(6.4-9.7)
0.8(0.4-1.6)
2472(330-4900)
0 0 C C
4. Brajarajnagar D/s 12 7.9(7.2-8.4)
8.0 (6.2-9.3)
1.1(0.7-1.8)
3832(790-11000)
0 3(25)
C Doesn’t conform
to Class C
TC Human activities
Bheden river5. Jharsuguda 12 7.9
(7.5-8.4)7.7
(6.3-9.0)0.9
(0.1-1.8)3191
(790-9200)0 2
(17)C C
Hirakud reservoir6. Hirakud reservoir 12 8.0
(7.4-8.3)7.1
(5.3-8.0)0.8
(0.5-1.3)2393
(220-9200)0 2
(17)C C
Power Channel7. Power Channel
U/s12 7.9
(7.5-8.3)6.9
(5.6-8.3)0.7
(0.3-1.5)1667
(170-5400)0 2
(17)C C
8. Power Channel D/s
12 7.9(7.6-8.3)
6.7 (5.8-7.7)
1.0 (0.5-1.8)
3325(1100-9200)
0 3(25)
C Doesn’t conform
to Class C
TC Human activities
Mahanadi river9 Sambalpur U/s 12 8.0
(7.5-8.3)7.3
(5.6-9.3)1.0
(0.5-1.7)17924
(490-160000)0 4
(33)C Doesn’t
conform to Class C
TC Human activities
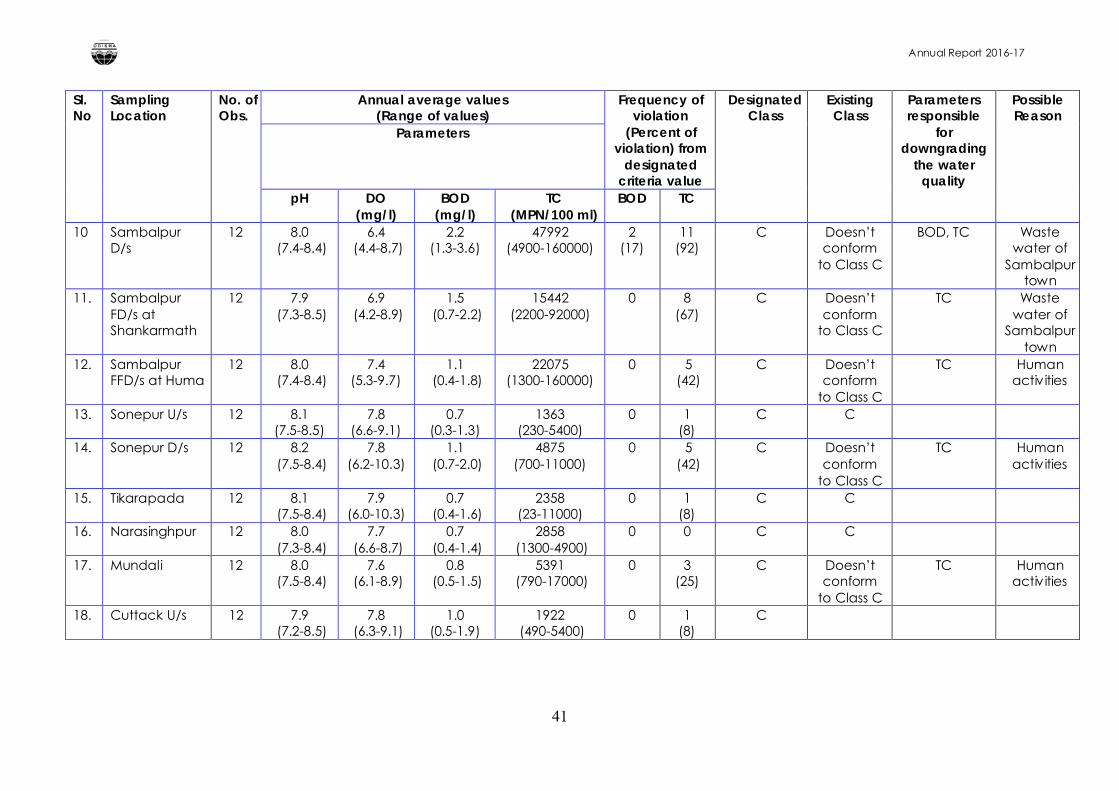
Annual Report 2016-17
41
Sl. No
Sampling Location
No. of Obs.
Annual average values(Range of values)
Frequency of violation
(Percent of violation) from
designated criteria value
Designated Class
Existing Class
Parameters responsible
for downgrading
the water quality
Possible Reason
Parameters
pH DO (mg/l)
BOD (mg/l)
TC (MPN/100 ml)
BOD TC
10 Sambalpur D/s
12 8.0(7.4-8.4)
6.4(4.4-8.7)
2.2 (1.3-3.6)
47992 (4900-160000)
2(17)
11(92)
C Doesn’t conform
to Class C
BOD, TC Waste water of
Sambalpur town
11. Sambalpur FD/s at Shankarmath
12 7.9(7.3-8.5)
6.9(4.2-8.9)
1.5(0.7-2.2)
15442 (2200-92000)
0 8(67)
C Doesn’t conform
to Class C
TC Waste water of
Sambalpur town
12. Sambalpur FFD/s at Huma
12 8.0(7.4-8.4)
7.4 (5.3-9.7)
1.1(0.4-1.8)
22075 (1300-160000)
0 5(42)
C Doesn’t conform
to Class C
TC Human activities
13. Sonepur U/s 12 8.1 (7.5-8.5)
7.8 (6.6-9.1)
0.7 (0.3-1.3)
1363 (230-5400)
0 1(8)
C C
14. Sonepur D/s 12 8.2(7.5-8.4)
7.8 (6.2-10.3)
1.1(0.7-2.0)
4875 (700-11000)
0 5(42)
C Doesn’t conform
to Class C
TC Human activities
15. Tikarapada 12 8.1(7.5-8.4)
7.9 (6.0-10.3)
0.7(0.4-1.6)
2358(23-11000)
0 1(8)
C C
16. Narasinghpur 12 8.0(7.3-8.4)
7.7(6.6-8.7)
0.7(0.4-1.4)
2858(1300-4900)
0 0 C C
17. Mundali 12 8.0(7.5-8.4)
7.6(6.1-8.9)
0.8(0.5-1.5)
5391(790-17000)
0 3(25)
C Doesn’t conform
to Class C
TC Human activities
18. Cuttack U/s 12 7.9(7.2-8.5)
7.8(6.3-9.1)
1.0 (0.5-1.9)
1922(490-5400)
0 1(8)
C
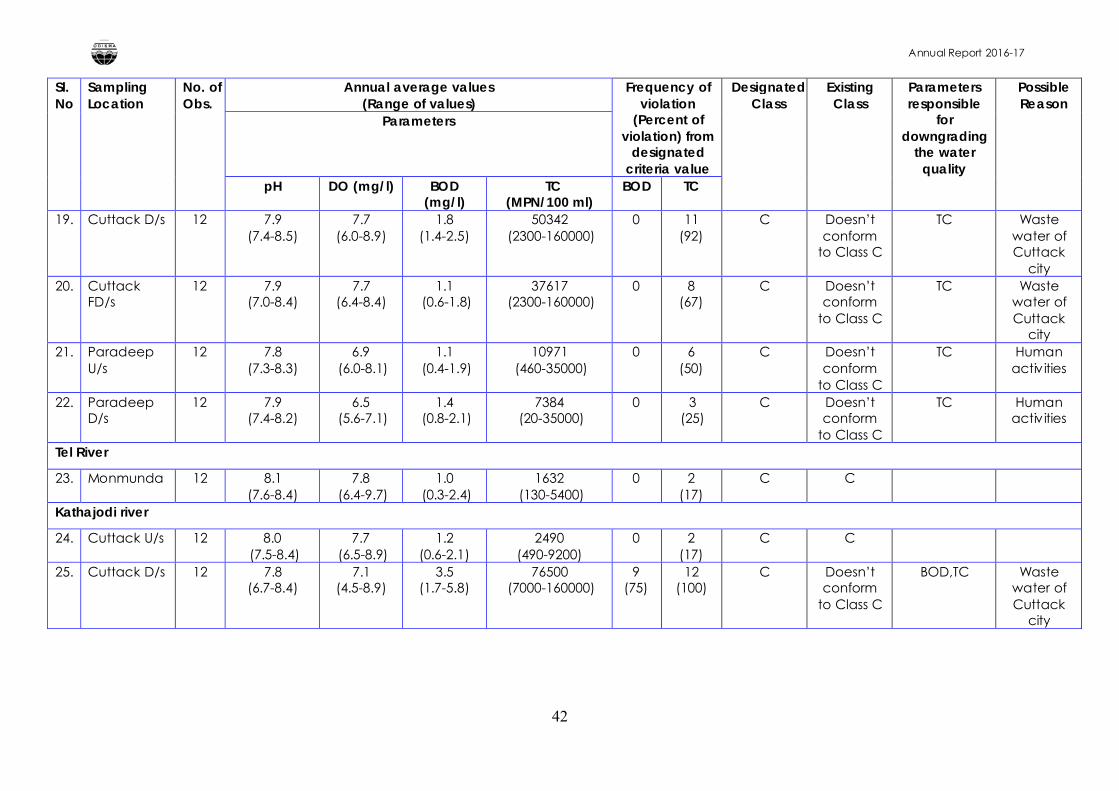
Annual Report 2016-17
42
Sl. No
Sampling Location
No. of Obs.
Annual average values(Range of values)
Frequency of violation
(Percent of violation) from
designated criteria value
Designated Class
Existing Class
Parameters responsible
for downgrading
the water quality
Possible Reason
Parameters
pH DO (mg/l) BOD (mg/l)
TC (MPN/100 ml)
BOD TC
19. Cuttack D/s 12 7.9 (7.4-8.5)
7.7 (6.0-8.9)
1.8 (1.4-2.5)
50342(2300-160000)
0 11(92)
C Doesn’t conform
to Class C
TC Waste water of Cuttack
city20. Cuttack
FD/s12 7.9
(7.0-8.4)7.7
(6.4-8.4)1.1
(0.6-1.8)37617
(2300-160000)0 8
(67)C Doesn’t
conform to Class C
TC Waste water of Cuttack
city21. Paradeep
U/s 12 7.8
(7.3-8.3)6.9
(6.0-8.1)1.1
(0.4-1.9)10971
(460-35000)0 6
(50)C Doesn’t
conform to Class C
TC Human activities
22. Paradeep D/s
12 7.9 (7.4-8.2)
6.5(5.6-7.1)
1.4(0.8-2.1)
7384(20-35000)
0 3(25)
C Doesn’t conform
to Class C
TC Human activities
Tel River
23. Monmunda 12 8.1 (7.6-8.4)
7.8(6.4-9.7)
1.0(0.3-2.4)
1632(130-5400)
0 2(17)
C C
Kathajodi river
24. Cuttack U/s 12 8.0(7.5-8.4)
7.7(6.5-8.9)
1.2 (0.6-2.1)
2490 (490-9200)
0 2(17)
C C
25. Cuttack D/s 12 7.8 (6.7-8.4)
7.1 (4.5-8.9)
3.5 (1.7-5.8)
76500(7000-160000)
9(75)
12(100)
C Doesn’t conform
to Class C
BOD,TC Waste water of Cuttack
city
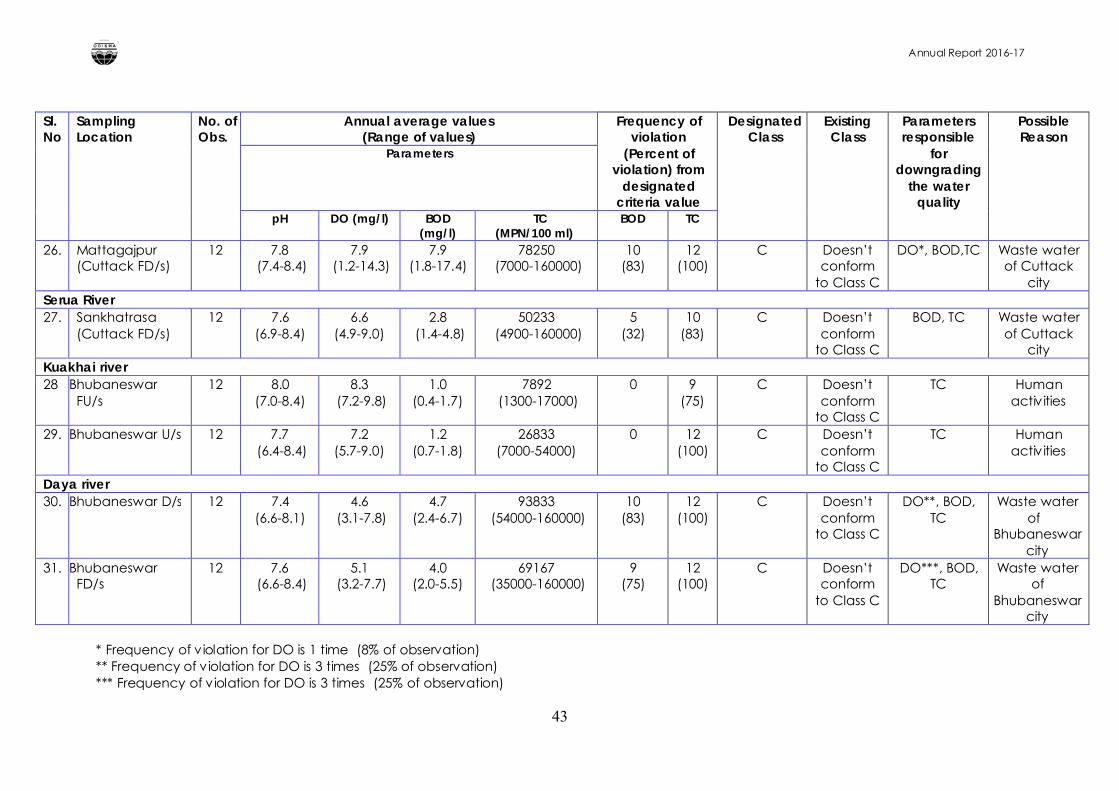
Annual Report 2016-17
43
Sl. No
Sampling Location
No. of Obs.
Annual average values(Range of values)
Frequency of violation
(Percent of violation) from
designated criteria value
Designated Class
Existing Class
Parameters responsible
for downgrading
the water quality
Possible Reason
Parameters
pH DO (mg/l) BOD (mg/l)
TC (MPN/100 ml)
BOD TC
26. Mattagajpur (Cuttack FD/s)
12 7.8(7.4-8.4)
7.9(1.2-14.3)
7.9 (1.8-17.4)
78250(7000-160000)
10(83)
12(100)
C Doesn’t conform
to Class C
DO*, BOD,TC Waste water of Cuttack
citySerua River27. Sankhatrasa
(Cuttack FD/s)12 7.6
(6.9-8.4)6.6
(4.9-9.0)2.8
(1.4-4.8)50233
(4900-160000)5
(32)10
(83)C Doesn’t
conform to Class C
BOD, TC Waste water of Cuttack
cityKuakhai river28 Bhubaneswar
FU/s12 8.0
(7.0-8.4)8.3
(7.2-9.8)1.0
(0.4-1.7)7892
(1300-17000)0 9
(75)C Doesn’t
conform to Class C
TC Human activities
29. Bhubaneswar U/s 12 7.7(6.4-8.4)
7.2 (5.7-9.0)
1.2 (0.7-1.8)
26833 (7000-54000)
0 12(100)
C Doesn’t conform
to Class C
TC Human activities
Daya river30. Bhubaneswar D/s 12 7.4
(6.6-8.1)4.6
(3.1-7.8)4.7
(2.4-6.7)93833
(54000-160000)10
(83)12
(100)C Doesn’t
conform to Class C
DO**, BOD, TC
Waste water of
Bhubaneswar city
31. Bhubaneswar FD/s
12 7.6(6.6-8.4)
5.1(3.2-7.7)
4.0 (2.0-5.5)
69167(35000-160000)
9(75)
12(100)
C Doesn’t conform
to Class C
DO***, BOD, TC
Waste water of
Bhubaneswar city
* Frequency of violation for DO is 1 time (8% of observation)** Frequency of violation for DO is 3 times (25% of observation)*** Frequency of violation for DO is 3 times (25% of observation)
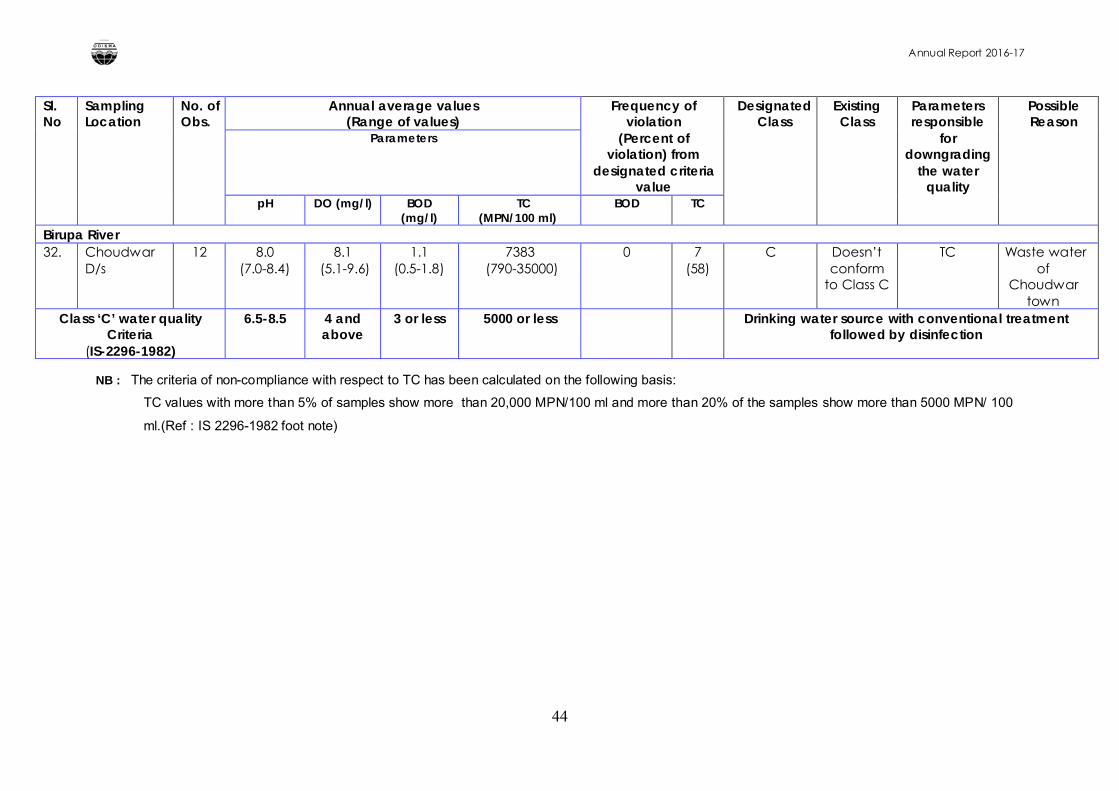
Annual Report 2016-17
44
Sl. No
Sampling Location
No. of Obs.
Annual average values(Range of values)
Frequency of violation
(Percent of violation) from
designated criteria value
Designated Class
Existing Class
Parameters responsible
for downgrading
the water quality
Possible Reason
Parameters
pH DO (mg/l) BOD (mg/l)
TC (MPN/100 ml)
BOD TC
Birupa River32. Choudwar
D/s 12 8.0
(7.0-8.4)8.1
(5.1-9.6)1.1
(0.5-1.8)7383
(790-35000)0 7
(58)C Doesn’t
conform to Class C
TC Waste water of
Choudwar town
Class ‘C’ water quality Criteria
(IS-2296-1982)
6.5-8.5 4 and above
3 or less 5000 or less Drinking water source with conventional treatment followed by disinfection
NB : The criteria of non-compliance with respect to TC has been calculated on the following basis:
TC values with more than 5% of samples show more than 20,000 MPN/100 ml and more than 20% of the samples show more than 5000 MPN/ 100
ml.(Ref : IS 2296-1982 foot note)
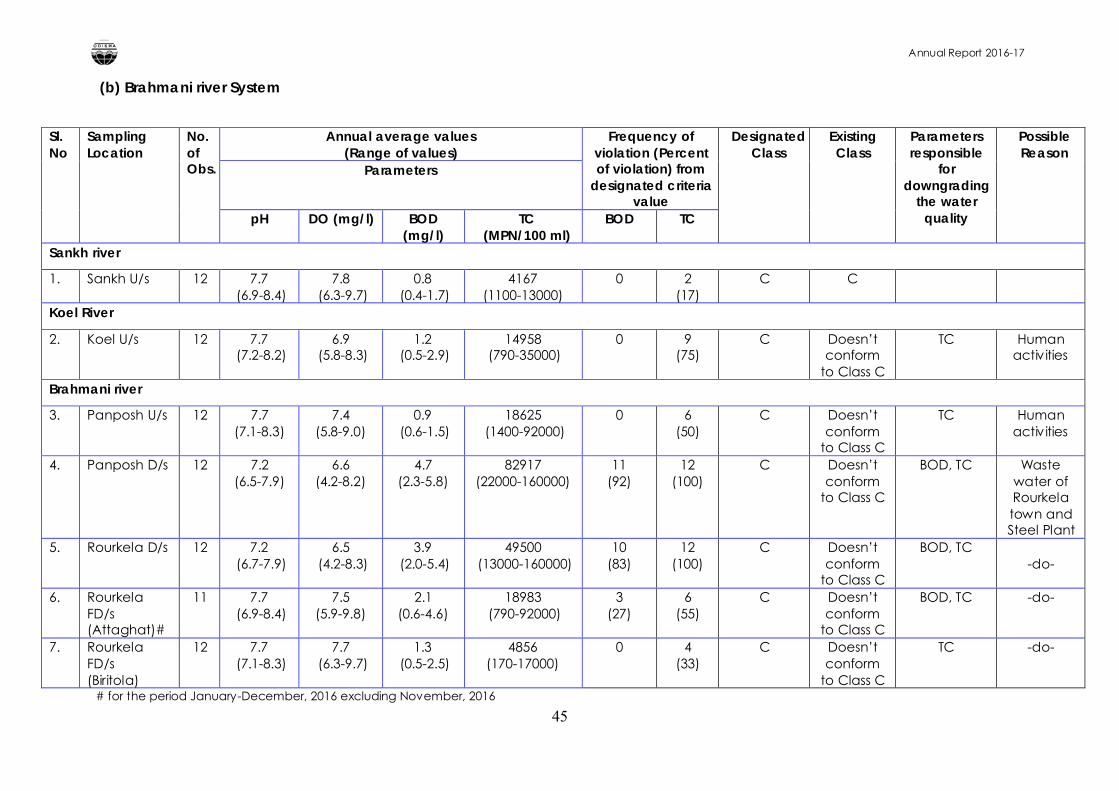
Annual Report 2016-17
45
(b) Brahmani river System
Sl. No
Sampling Location
No. of Obs.
Annual average values(Range of values)
Frequency of violation (Percent of violation) from
designated criteria value
Designated Class
Existing Class
Parameters responsible
for downgrading
the water quality
Possible Reason
Parameters
pH DO (mg/l) BOD (mg/l)
TC (MPN/100 ml)
BOD TC
Sankh river
1. Sankh U/s 12 7.7(6.9-8.4)
7.8(6.3-9.7)
0.8(0.4-1.7)
4167 (1100-13000)
0 2(17)
C C
Koel River
2. Koel U/s 12 7.7(7.2-8.2)
6.9(5.8-8.3)
1.2(0.5-2.9)
14958(790-35000)
0 9(75)
C Doesn’t conform
to Class C
TC Human activities
Brahmani river
3. Panposh U/s 12 7.7 (7.1-8.3)
7.4 (5.8-9.0)
0.9(0.6-1.5)
18625(1400-92000)
0 6(50)
C Doesn’t conform
to Class C
TC Human activities
4. Panposh D/s 12 7.2 (6.5-7.9)
6.6 (4.2-8.2)
4.7 (2.3-5.8)
82917 (22000-160000)
11(92)
12(100)
C Doesn’t conform
to Class C
BOD, TC Waste water of Rourkela town and Steel Plant
5. Rourkela D/s 12 7.2(6.7-7.9)
6.5(4.2-8.3)
3.9(2.0-5.4)
49500(13000-160000)
10(83)
12(100)
C Doesn’t conform
to Class C
BOD, TC-do-
6. Rourkela FD/s(Attaghat)#
11 7.7(6.9-8.4)
7.5 (5.9-9.8)
2.1 (0.6-4.6)
18983(790-92000)
3(27)
6(55)
C Doesn’t conform
to Class C
BOD, TC -do-
7. Rourkela FD/s (Biritola)
12 7.7(7.1-8.3)
7.7(6.3-9.7)
1.3(0.5-2.5)
4856 (170-17000)
0 4(33)
C Doesn’t conform
to Class C
TC -do-
# for the period January-December, 2016 excluding November, 2016
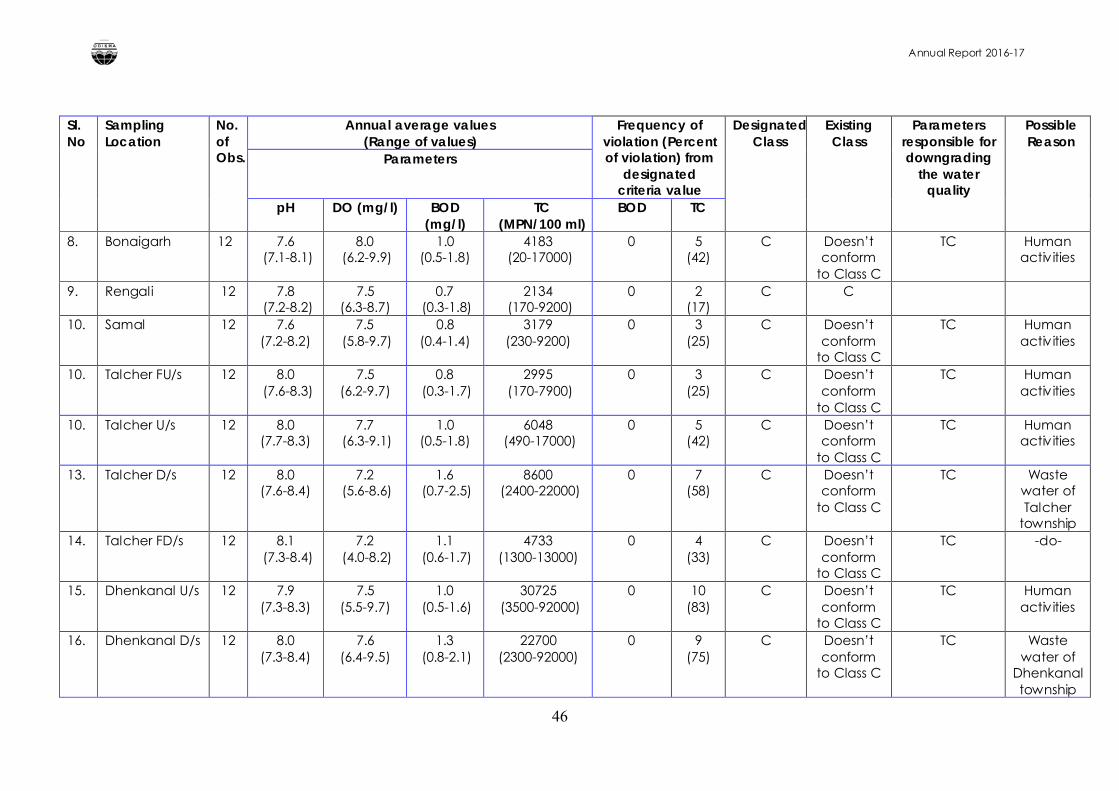
Annual Report 2016-17
46
Sl. No
Sampling Location
No. of Obs.
Annual average values(Range of values)
Frequency of violation (Percent of violation) from
designated criteria value
Designated Class
Existing Class
Parameters responsible for downgrading
the water quality
Possible Reason
Parameters
pH DO (mg/l) BOD (mg/l)
TC (MPN/100 ml)
BOD TC
8. Bonaigarh 12 7.6(7.1-8.1)
8.0(6.2-9.9)
1.0 (0.5-1.8)
4183(20-17000)
0 5(42)
C Doesn’t conform
to Class C
TC Human activities
9. Rengali 12 7.8(7.2-8.2)
7.5 (6.3-8.7)
0.7(0.3-1.8)
2134(170-9200)
0 2(17)
C C
10. Samal 12 7.6 (7.2-8.2)
7.5(5.8-9.7)
0.8 (0.4-1.4)
3179 (230-9200)
0 3(25)
C Doesn’t conform
to Class C
TC Human activities
10. Talcher FU/s 12 8.0(7.6-8.3)
7.5 (6.2-9.7)
0.8(0.3-1.7)
2995(170-7900)
0 3(25)
C Doesn’t conform
to Class C
TC Human activities
10. Talcher U/s 12 8.0 (7.7-8.3)
7.7(6.3-9.1)
1.0 (0.5-1.8)
6048(490-17000)
0 5(42)
C Doesn’t conform
to Class C
TC Human activities
13. Talcher D/s 12 8.0 (7.6-8.4)
7.2(5.6-8.6)
1.6(0.7-2.5)
8600(2400-22000)
0 7(58)
C Doesn’t conform
to Class C
TC Waste water of Talcher
township 14. Talcher FD/s 12 8.1
(7.3-8.4)7.2
(4.0-8.2)1.1
(0.6-1.7)4733
(1300-13000)0 4
(33)C Doesn’t
conform to Class C
TC -do-
15. Dhenkanal U/s 12 7.9(7.3-8.3)
7.5 (5.5-9.7)
1.0(0.5-1.6)
30725(3500-92000)
0 10(83)
C Doesn’t conform
to Class C
TC Human activities
16. Dhenkanal D/s 12 8.0 (7.3-8.4)
7.6 (6.4-9.5)
1.3(0.8-2.1)
22700 (2300-92000)
0 9(75)
C Doesn’t conform
to Class C
TC Waste water of
Dhenkanal township
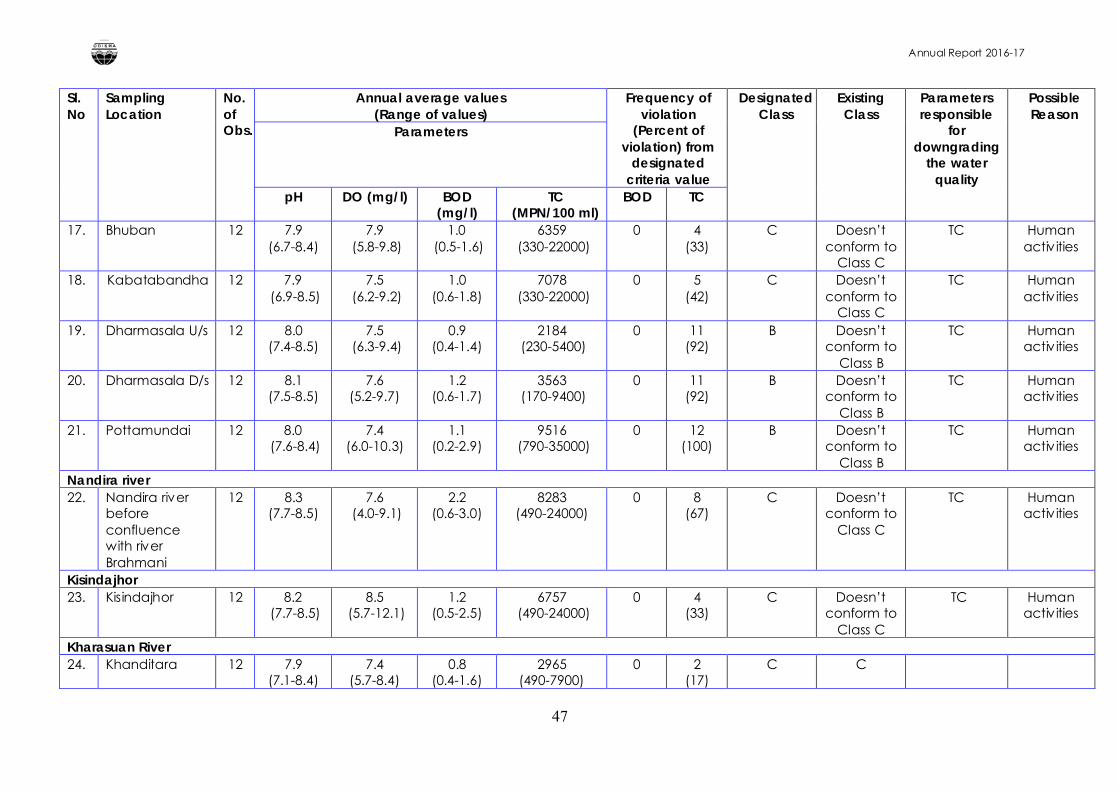
Annual Report 2016-17
47
Sl. No
Sampling Location
No. of Obs.
Annual average values(Range of values)
Frequency of violation
(Percent of violation) from
designated criteria value
Designated Class
Existing Class
Parameters responsible
for downgrading
the water quality
Possible Reason
Parameters
pH DO (mg/l) BOD (mg/l)
TC (MPN/100 ml)
BOD TC
17. Bhuban 12 7.9 (6.7-8.4)
7.9(5.8-9.8)
1.0(0.5-1.6)
6359(330-22000)
0 4(33)
C Doesn’t conform to
Class C
TC Human activities
18. Kabatabandha 12 7.9(6.9-8.5)
7.5(6.2-9.2)
1.0 (0.6-1.8)
7078(330-22000)
0 5(42)
C Doesn’t conform to
Class C
TC Human activities
19. Dharmasala U/s 12 8.0 (7.4-8.5)
7.5(6.3-9.4)
0.9 (0.4-1.4)
2184(230-5400)
0 11(92)
B Doesn’t conform to
Class B
TC Human activities
20. Dharmasala D/s 12 8.1 (7.5-8.5)
7.6 (5.2-9.7)
1.2 (0.6-1.7)
3563(170-9400)
0 11(92)
B Doesn’t conform to
Class B
TC Human activities
21. Pottamundai 12 8.0(7.6-8.4)
7.4 (6.0-10.3)
1.1 (0.2-2.9)
9516(790-35000)
0 12(100)
B Doesn’t conform to
Class B
TC Human activities
Nandira river22. Nandira river
before confluence with river Brahmani
12 8.3 (7.7-8.5)
7.6(4.0-9.1)
2.2 (0.6-3.0)
8283 (490-24000)
0 8(67)
C Doesn’t conform to
Class C
TC Human activities
Kisindajhor23. Kisindajhor 12 8.2
(7.7-8.5)8.5
(5.7-12.1)1.2
(0.5-2.5)6757
(490-24000)0 4
(33)C Doesn’t
conform to Class C
TC Human activities
Kharasuan River24. Khanditara 12 7.9
(7.1-8.4)7.4
(5.7-8.4)0.8
(0.4-1.6)2965
(490-7900)0 2
(17)C C
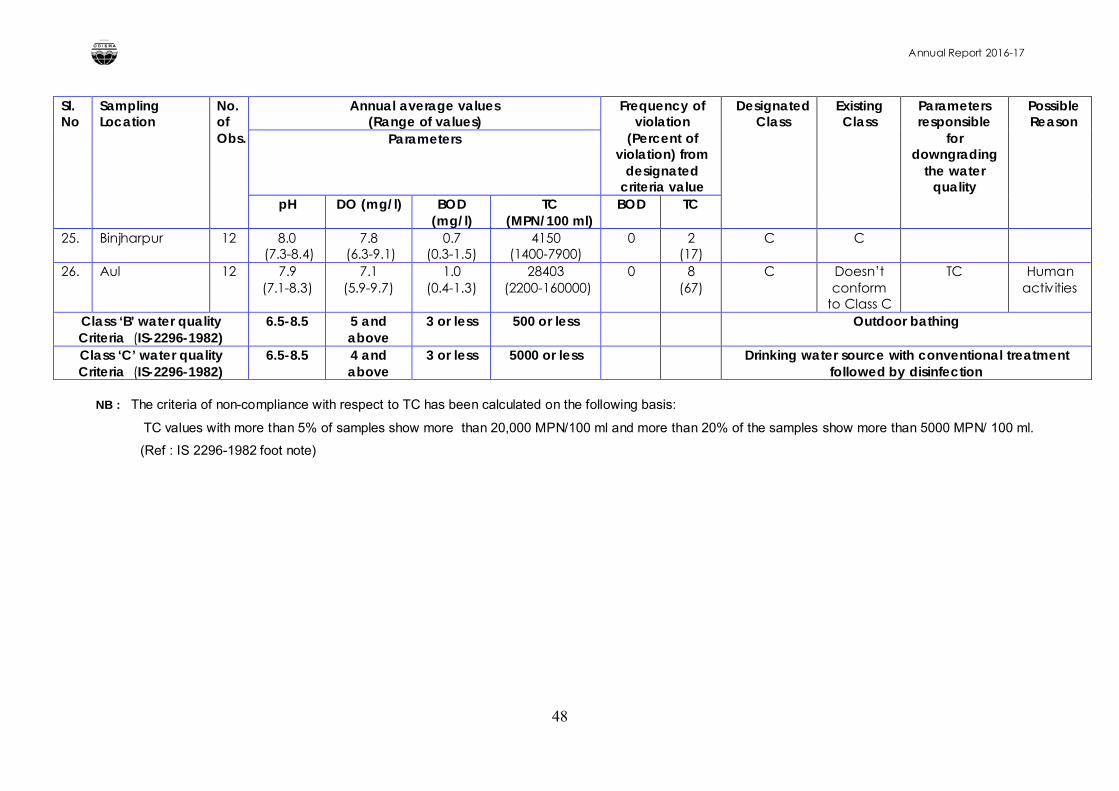
Annual Report 2016-17
48
Sl. No
Sampling Location
No. of Obs.
Annual average values(Range of values)
Frequency of violation
(Percent of violation) from
designated criteria value
Designated Class
Existing Class
Parameters responsible
for downgrading
the water quality
PossibleReason
Parameters
pH DO (mg/l) BOD (mg/l)
TC (MPN/100 ml)
BOD TC
25. Binjharpur 12 8.0(7.3-8.4)
7.8(6.3-9.1)
0.7 (0.3-1.5)
4150 (1400-7900)
0 2(17)
C C
26. Aul 12 7.9 (7.1-8.3)
7.1 (5.9-9.7)
1.0 (0.4-1.3)
28403(2200-160000)
0 8(67)
C Doesn’t conform
to Class C
TC Human activities
Class ‘B’ water quality Criteria (IS-2296-1982)
6.5-8.5 5 and above
3 or less 500 or less Outdoor bathing
Class ‘C’ water quality Criteria (IS-2296-1982)
6.5-8.5 4 and above
3 or less 5000 or less Drinking water source with conventional treatment followed by disinfection
NB : The criteria of non-compliance with respect to TC has been calculated on the following basis:
TC values with more than 5% of samples show more than 20,000 MPN/100 ml and more than 20% of the samples show more than 5000 MPN/ 100 ml.
(Ref : IS 2296-1982 foot note)
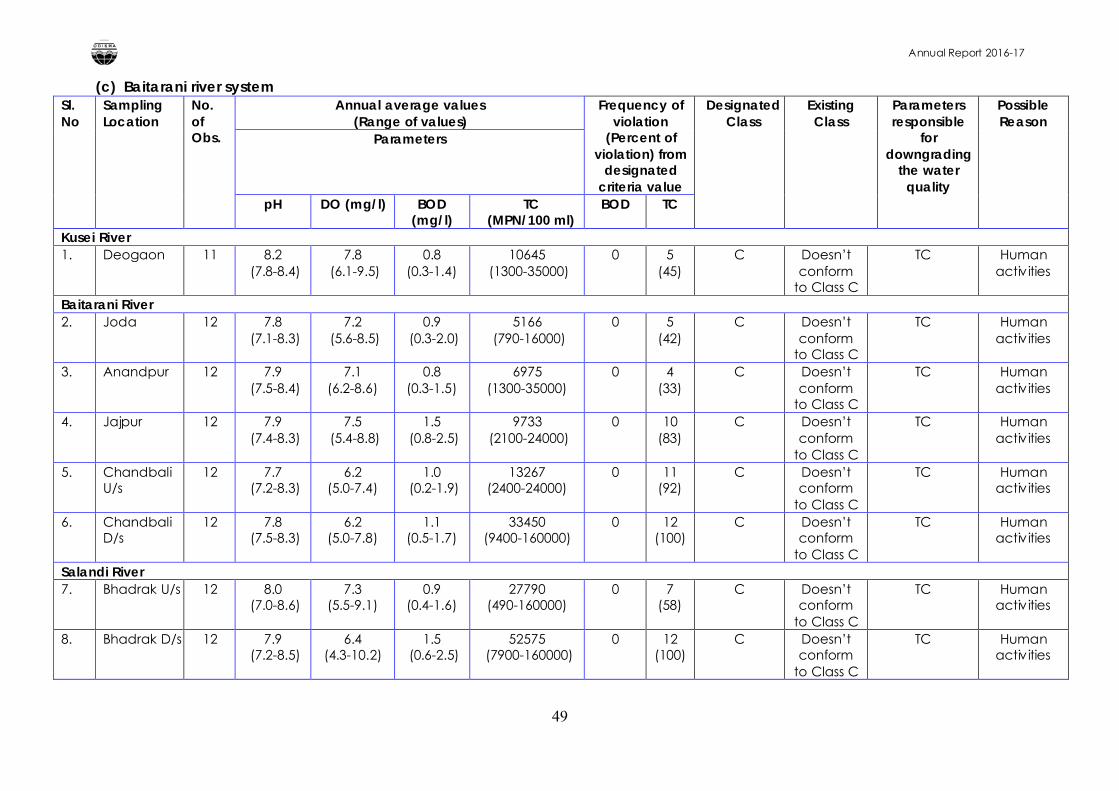
Annual Report 2016-17
49
(c) Baitarani river system Sl. No
Sampling Location
No. of Obs.
Annual average values(Range of values)
Frequency of violation
(Percent of violation) from
designated criteria value
Designated Class
Existing Class
Parameters responsible
for downgrading
the water quality
Possible Reason
Parameters
pH DO (mg/l) BOD (mg/l)
TC (MPN/100 ml)
BOD TC
Kusei River1. Deogaon 11 8.2
(7.8-8.4)7.8
(6.1-9.5)0.8
(0.3-1.4)10645
(1300-35000)0 5
(45)C Doesn’t
conform to Class C
TC Human activities
Baitarani River2. Joda 12 7.8
(7.1-8.3)7.2
(5.6-8.5)0.9
(0.3-2.0)5166
(790-16000)0 5
(42)C Doesn’t
conform to Class C
TC Human activities
3. Anandpur 12 7.9(7.5-8.4)
7.1 (6.2-8.6)
0.8 (0.3-1.5)
6975 (1300-35000)
0 4(33)
C Doesn’t conform
to Class C
TC Human activities
4. Jajpur 12 7.9(7.4-8.3)
7.5(5.4-8.8)
1.5(0.8-2.5)
9733(2100-24000)
0 10(83)
C Doesn’t conform
to Class C
TC Human activities
5. Chandbali U/s
12 7.7(7.2-8.3)
6.2 (5.0-7.4)
1.0(0.2-1.9)
13267 (2400-24000)
0 11(92)
C Doesn’t conform
to Class C
TC Human activities
6. Chandbali D/s
12 7.8(7.5-8.3)
6.2 (5.0-7.8)
1.1 (0.5-1.7)
33450 (9400-160000)
0 12(100)
C Doesn’t conform
to Class C
TC Human activities
Salandi River7. Bhadrak U/s 12 8.0
(7.0-8.6)7.3
(5.5-9.1)0.9
(0.4-1.6)27790
(490-160000)0 7
(58)C Doesn’t
conform to Class C
TC Human activities
8. Bhadrak D/s 12 7.9(7.2-8.5)
6.4 (4.3-10.2)
1.5(0.6-2.5)
52575(7900-160000)
0 12(100)
C Doesn’t conform
to Class C
TC Human activities
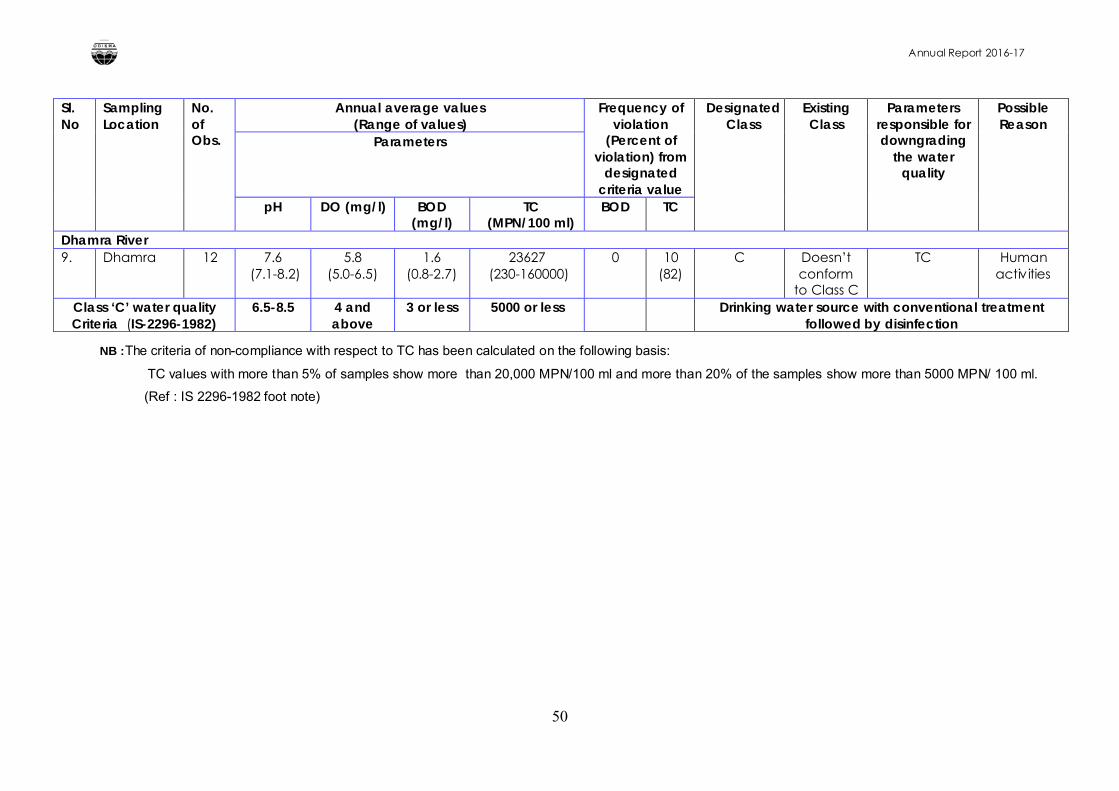
Annual Report 2016-17
50
Sl. No
Sampling Location
No. of Obs.
Annual average values(Range of values)
Frequency of violation
(Percent of violation) from
designated criteria value
Designated Class
Existing Class
Parameters responsible for downgrading
the water quality
Possible Reason
Parameters
pH DO (mg/l) BOD (mg/l)
TC (MPN/100 ml)
BOD TC
Dhamra River9. Dhamra 12 7.6
(7.1-8.2)5.8
(5.0-6.5)1.6
(0.8-2.7)23627
(230-160000)0 10
(82)C Doesn’t
conform to Class C
TC Human activities
Class ‘C’ water quality Criteria (IS-2296-1982)
6.5-8.5 4 and above
3 or less 5000 or less Drinking water source with conventional treatment followed by disinfection
NB :The criteria of non-compliance with respect to TC has been calculated on the following basis:
TC values with more than 5% of samples show more than 20,000 MPN/100 ml and more than 20% of the samples show more than 5000 MPN/ 100 ml.
(Ref : IS 2296-1982 foot note)
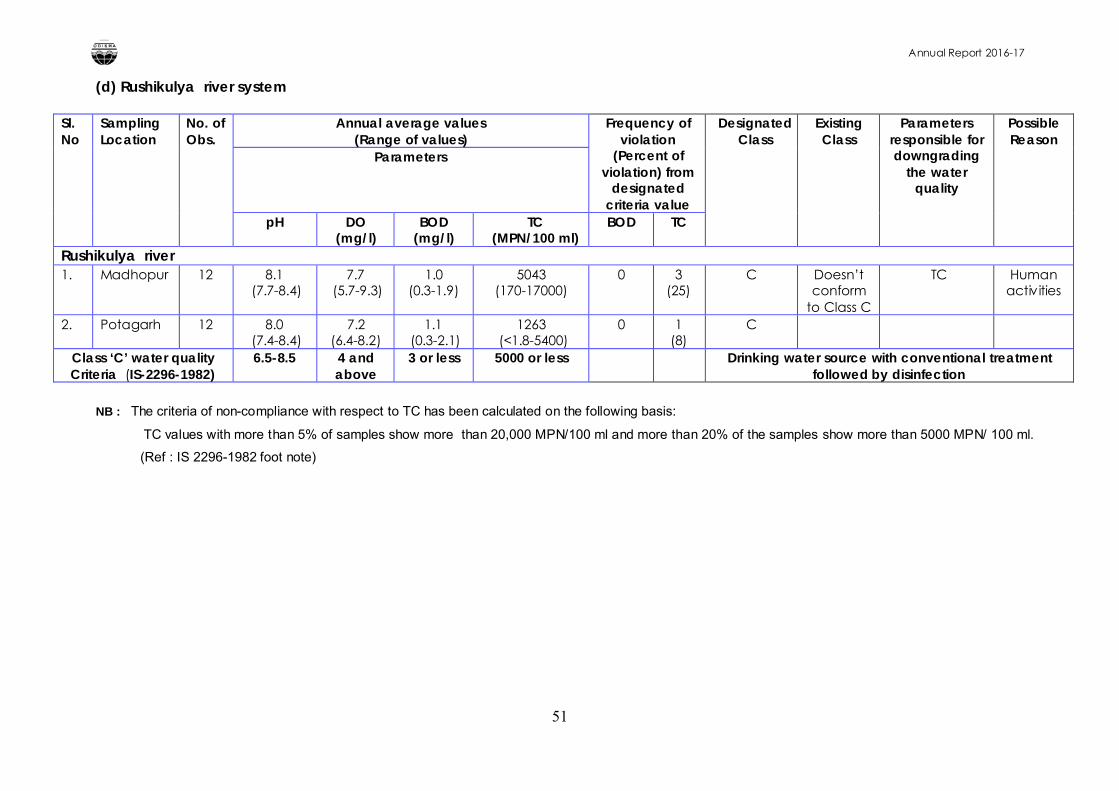
Annual Report 2016-17
51
(d) Rushikulya river system
Sl. No
Sampling Location
No. of Obs.
Annual average values(Range of values)
Frequency of violation
(Percent of violation) from
designated criteria value
Designated Class
Existing Class
Parametersresponsible for downgrading
the water quality
Possible Reason
Parameters
pH DO (mg/l)
BOD (mg/l)
TC (MPN/100 ml)
BOD TC
Rushikulya river1. Madhopur 12 8.1
(7.7-8.4)7.7
(5.7-9.3)1.0
(0.3-1.9)5043
(170-17000)0 3
(25)C Doesn’t
conform to Class C
TC Human activities
2. Potagarh 12 8.0(7.4-8.4)
7.2 (6.4-8.2)
1.1(0.3-2.1)
1263(<1.8-5400)
0 1(8)
C
Class ‘C’ water quality Criteria (IS-2296-1982)
6.5-8.5 4 and above
3 or less 5000 or less Drinking water source with conventional treatment followed by disinfection
NB : The criteria of non-compliance with respect to TC has been calculated on the following basis:
TC values with more than 5% of samples show more than 20,000 MPN/100 ml and more than 20% of the samples show more than 5000 MPN/ 100 ml.
(Ref : IS 2296-1982 foot note)
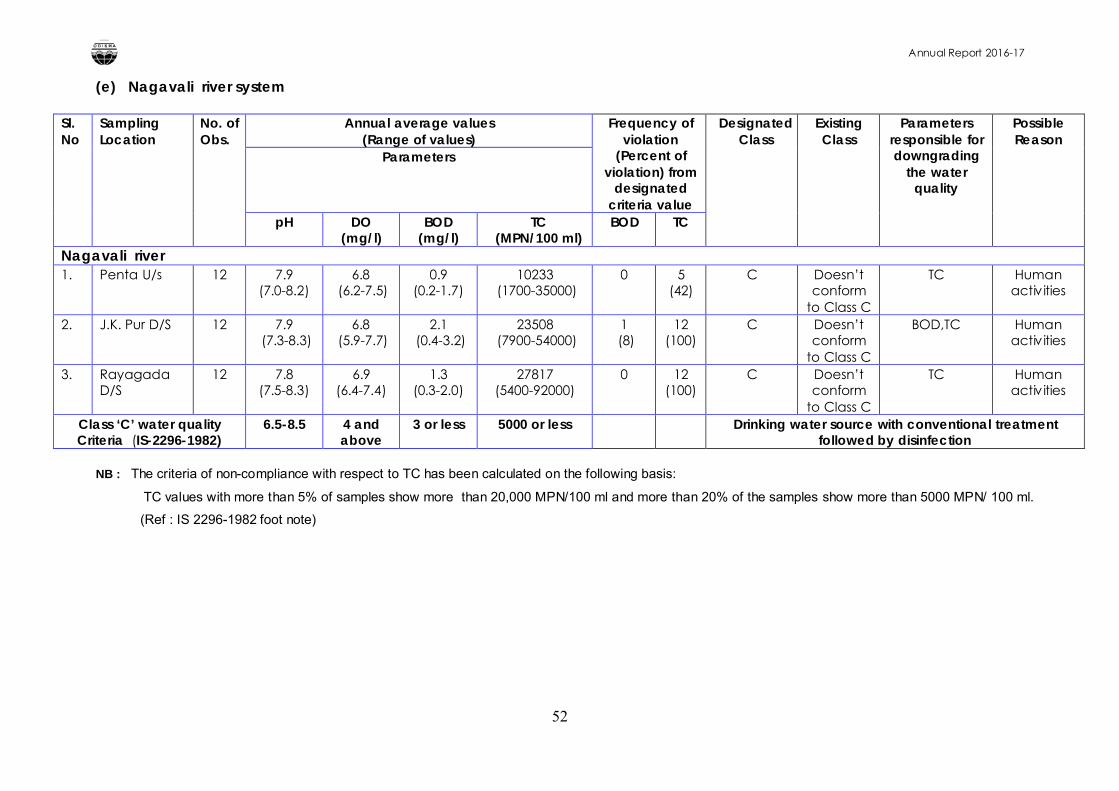
Annual Report 2016-17
52
(e) Nagavali river system
Sl. No
Sampling Location
No. of Obs.
Annual average values(Range of values)
Frequency of violation
(Percent of violation) from
designated criteria value
Designated Class
Existing Class
Parameters responsible for downgrading
the water quality
Possible Reason
Parameters
pH DO (mg/l)
BOD (mg/l)
TC (MPN/100 ml)
BOD TC
Nagavali river1. Penta U/s 12 7.9
(7.0-8.2)6.8
(6.2-7.5)0.9
(0.2-1.7)10233
(1700-35000)0 5
(42)C Doesn’t
conform to Class C
TC Human activities
2. J.K. Pur D/S 12 7.9(7.3-8.3)
6.8(5.9-7.7)
2.1(0.4-3.2)
23508(7900-54000)
1(8)
12(100)
C Doesn’t conform
to Class C
BOD,TC Human activities
3. Rayagada D/S
12 7.8 (7.5-8.3)
6.9 (6.4-7.4)
1.3 (0.3-2.0)
27817 (5400-92000)
0 12(100)
C Doesn’t conform
to Class C
TC Human activities
Class ‘C’ water quality Criteria (IS-2296-1982)
6.5-8.5 4 and above
3 or less 5000 or less Drinking water source with conventional treatment followed by disinfection
NB : The criteria of non-compliance with respect to TC has been calculated on the following basis:
TC values with more than 5% of samples show more than 20,000 MPN/100 ml and more than 20% of the samples show more than 5000 MPN/ 100 ml.
(Ref : IS 2296-1982 foot note)
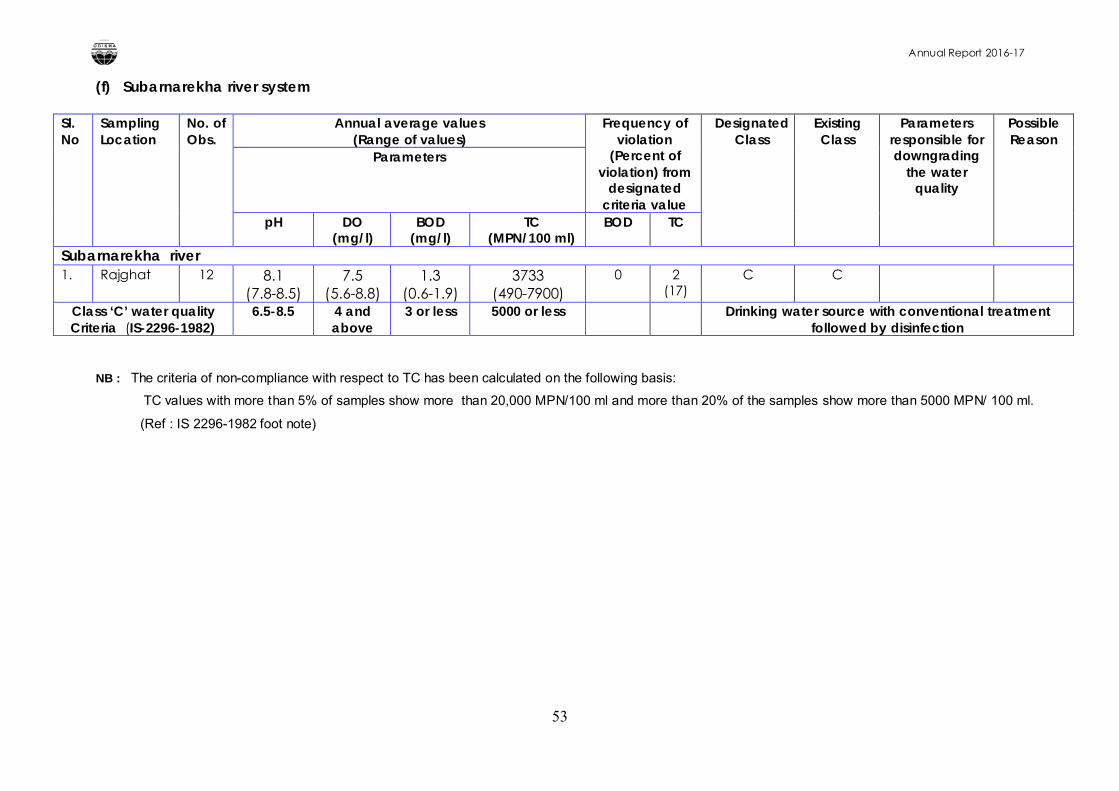
Annual Report 2016-17
53
(f) Subarnarekha river system
Sl. No
Sampling Location
No. of Obs.
Annual average values(Range of values)
Frequency of violation
(Percent of violation) from
designated criteria value
Designated Class
Existing Class
Parameters responsible for downgrading
the water quality
Possible Reason
Parameters
pH DO (mg/l)
BOD (mg/l)
TC (MPN/100 ml)
BOD TC
Subarnarekha river1. Rajghat 12 8.1
(7.8-8.5)7.5
(5.6-8.8)1.3
(0.6-1.9)3733
(490-7900)0 2
(17)C C
Class ‘C’ water quality Criteria (IS-2296-1982)
6.5-8.5 4 and above
3 or less 5000 or less Drinking water source with conventional treatment followed by disinfection
NB : The criteria of non-compliance with respect to TC has been calculated on the following basis:
TC values with more than 5% of samples show more than 20,000 MPN/100 ml and more than 20% of the samples show more than 5000 MPN/ 100 ml.
(Ref : IS 2296-1982 foot note)
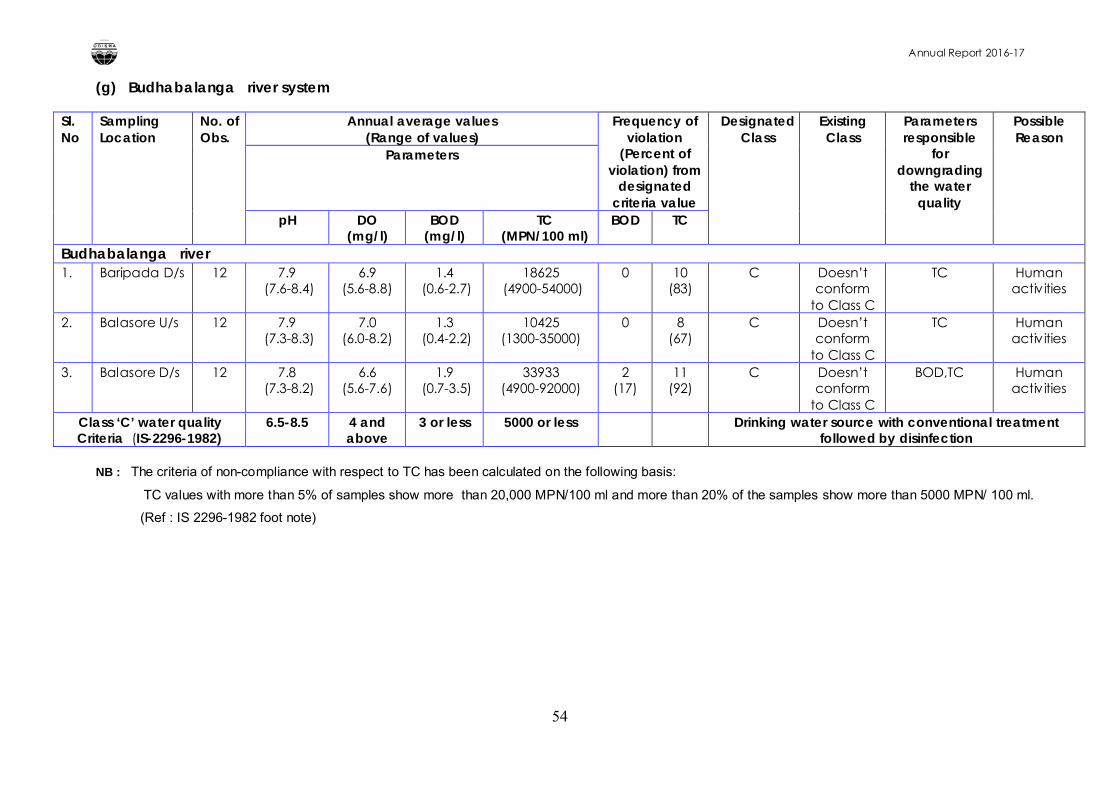
Annual Report 2016-17
54
(g) Budhabalanga river system
Sl. No
Sampling Location
No. of Obs.
Annual average values(Range of values)
Frequency of violation
(Percent of violation) from
designated criteria value
Designated Class
Existing Class
Parameters responsible
fordowngrading
the water quality
Possible Reason
Parameters
pH DO (mg/l)
BOD (mg/l)
TC (MPN/100 ml)
BOD TC
Budhabalanga river1. Baripada D/s 12 7.9
(7.6-8.4)6.9
(5.6-8.8)1.4
(0.6-2.7)18625
(4900-54000)0 10
(83)C Doesn’t
conform to Class C
TC Human activities
2. Balasore U/s 12 7.9(7.3-8.3)
7.0 (6.0-8.2)
1.3(0.4-2.2)
10425 (1300-35000)
0 8(67)
C Doesn’t conform
to Class C
TC Human activities
3. Balasore D/s 12 7.8(7.3-8.2)
6.6 (5.6-7.6)
1.9(0.7-3.5)
33933 (4900-92000)
2(17)
11(92)
C Doesn’t conform
to Class C
BOD,TC Human activities
Class ‘C’ water quality Criteria (IS-2296-1982)
6.5-8.5 4 and above
3 or less 5000 or less Drinking water source with conventional treatment followed by disinfection
NB : The criteria of non-compliance with respect to TC has been calculated on the following basis:
TC values with more than 5% of samples show more than 20,000 MPN/100 ml and more than 20% of the samples show more than 5000 MPN/ 100 ml.
(Ref : IS 2296-1982 foot note)
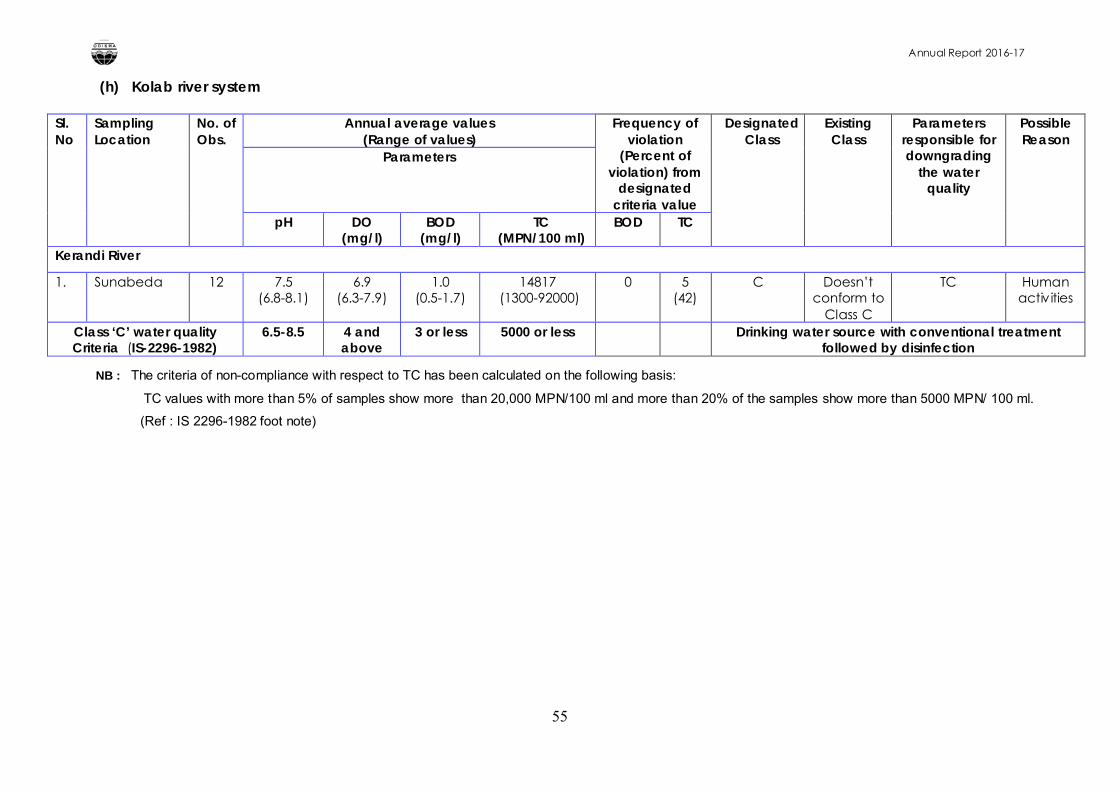
Annual Report 2016-17
55
(h) Kolab river system
Sl. No
Sampling Location
No. of Obs.
Annual average values(Range of values)
Frequency of violation
(Percent of violation) from
designated criteria value
Designated Class
Existing Class
Parameters responsible for downgrading
the water quality
Possible Reason
Parameters
pH DO (mg/l)
BOD (mg/l)
TC (MPN/100 ml)
BOD TC
Kerandi River
1. Sunabeda 12 7.5 (6.8-8.1)
6.9 (6.3-7.9)
1.0 (0.5-1.7)
14817(1300-92000)
0 5(42)
C Doesn’t conform to
Class C
TC Human activities
Class ‘C’ water quality Criteria (IS-2296-1982)
6.5-8.5 4 and above
3 or less 5000 or less Drinking water source with conventional treatment followed by disinfection
NB : The criteria of non-compliance with respect to TC has been calculated on the following basis:
TC values with more than 5% of samples show more than 20,000 MPN/100 ml and more than 20% of the samples show more than 5000 MPN/ 100 ml.
(Ref : IS 2296-1982 foot note)
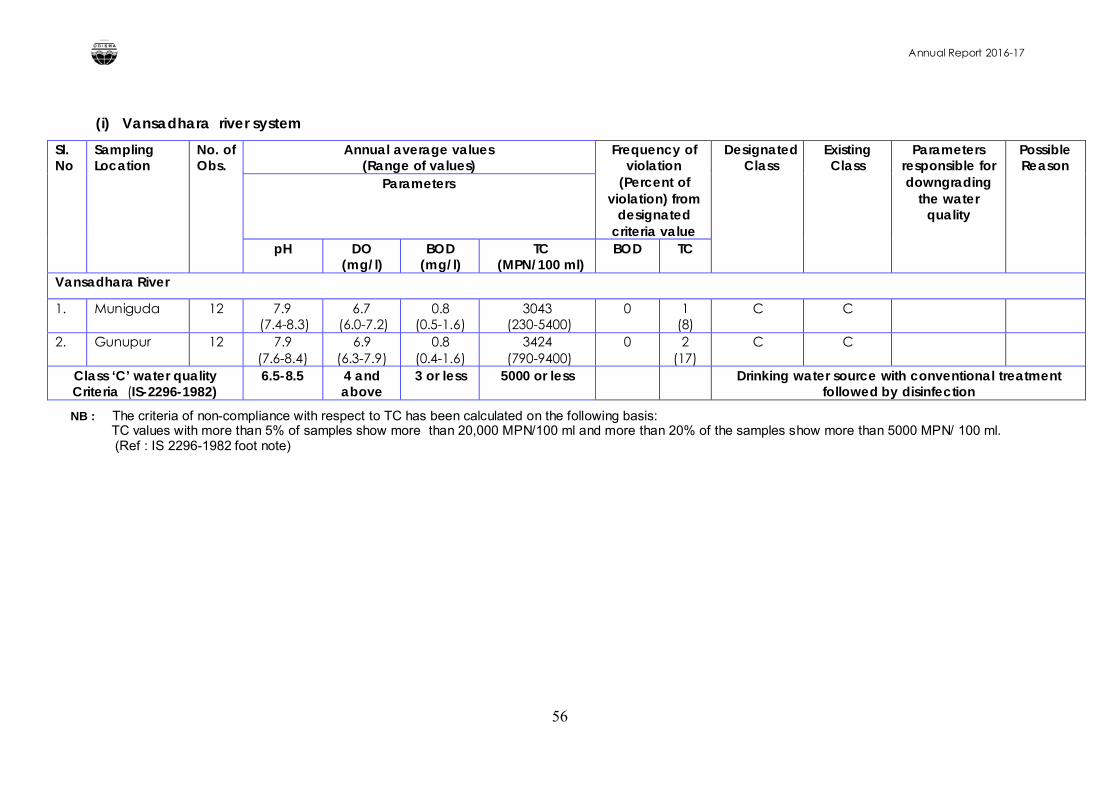
Annual Report 2016-17
56
(i) Vansadhara river system
Sl. No
Sampling Location
No. of Obs.
Annual average values(Range of values)
Frequency of violation
(Percent of violation) from
designated criteria value
Designated Class
Existing Class
Parameters responsible for downgrading
the water quality
Possible Reason
Parameters
pH DO (mg/l)
BOD (mg/l)
TC (MPN/100 ml)
BOD TC
Vansadhara River
1. Muniguda 12 7.9(7.4-8.3)
6.7(6.0-7.2)
0.8 (0.5-1.6)
3043(230-5400)
0 1(8)
C C
2. Gunupur 12 7.9 (7.6-8.4)
6.9 (6.3-7.9)
0.8 (0.4-1.6)
3424(790-9400)
0 2(17)
C C
Class ‘C’ water quality Criteria (IS-2296-1982)
6.5-8.5 4 and above
3 or less 5000 or less Drinking water source with conventional treatment followed by disinfection
Table-3 Water quality with respect to other parameters (2014)NB : The criteria of non-compliance with respect to TC has been calculated on the following basis: TC values with more than 5% of samples show more than 20,000 MPN/100 ml and more than 20% of the samples show more than 5000 MPN/ 100 ml. (Ref : IS 2296-1982 foot note)
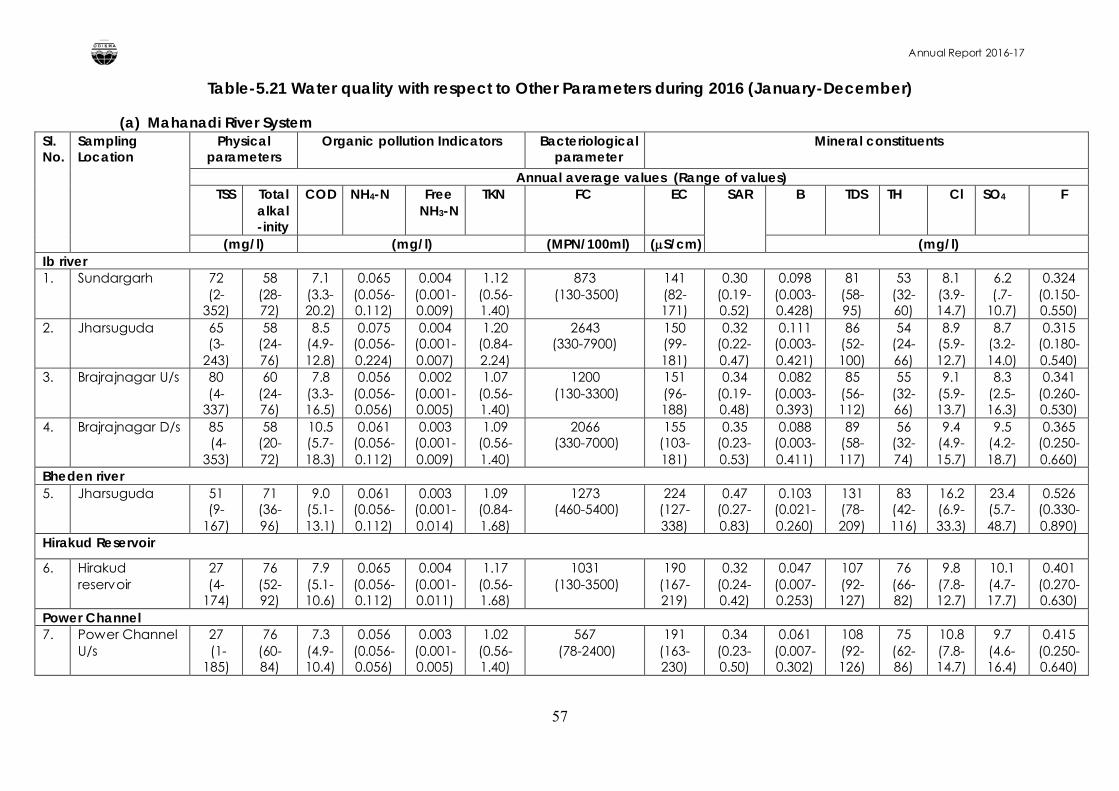
Annual Report 2016-17
57
Table-5.21 Water quality with respect to Other Parameters during 2016 (January-December)
(a) Mahanadi River SystemSl. No.
Sampling Location
Physical parameters
Organic pollution Indicators Bacteriological parameter
Mineral constituents
Annual average values (Range of values)TSS Total
alkal-inity
COD NH4-N Free NH3-N
TKN FC EC SAR B TDS TH Cl SO4 F
(mg/l) (mg/l) (MPN/100ml) (S/cm) (mg/l)Ib river1. Sundargarh 72
(2-352)
58 (28-72)
7.1 (3.3-20.2)
0.065 (0.056-0.112)
0.004 (0.001-0.009)
1.12 (0.56-1.40)
873(130-3500)
141 (82-171)
0.30 (0.19-0.52)
0.098 (0.003-0.428)
81 (58-95)
53 (32-60)
8.1 (3.9-14.7)
6.2 (.7-
10.7)
0.324 (0.150-0.550)
2. Jharsuguda 65 (3-
243)
58 (24-76)
8.5 (4.9-12.8)
0.075 (0.056-0.224)
0.004 (0.001-0.007)
1.20 (0.84-2.24)
2643 (330-7900)
150 (99-181)
0.32 (0.22-0.47)
0.111 (0.003-0.421)
86 (52-100)
54 (24-66)
8.9 (5.9-12.7)
8.7 (3.2-14.0)
0.315 (0.180-0.540)
3. Brajrajnagar U/s 80 (4-
337)
60 (24-76)
7.8 (3.3-16.5)
0.056 (0.056-0.056)
0.002 (0.001-0.005)
1.07 (0.56-1.40)
1200(130-3300)
151 (96-188)
0.34 (0.19-0.48)
0.082 (0.003-0.393)
85 (56-112)
55 (32-66)
9.1 (5.9-13.7)
8.3 (2.5-16.3)
0.341 (0.260-0.530)
4. Brajrajnagar D/s 85(4-
353)
58 (20-72)
10.5 (5.7-18.3)
0.061 (0.056-0.112)
0.003 (0.001-0.009)
1.09 (0.56-1.40)
2066(330-7000)
155 (103-181)
0.35 (0.23-0.53)
0.088 (0.003-0.411)
89 (58-117)
56 (32-74)
9.4 (4.9-15.7)
9.5 (4.2-18.7)
0.365 (0.250-0.660)
Bheden river5. Jharsuguda 51
(9-167)
71 (36-96)
9.0 (5.1-13.1)
0.061 (0.056-0.112)
0.003 (0.001-0.014)
1.09 (0.84-1.68)
1273(460-5400)
224 (127-338)
0.47 (0.27-0.83)
0.103 (0.021-0.260)
131 (78-209)
83 (42-116)
16.2 (6.9-33.3)
23.4 (5.7-48.7)
0.526 (0.330-0.890)
Hirakud Reservoir
6. Hirakud reservoir
27 (4-
174)
76 (52-92)
7.9 (5.1-10.6)
0.065 (0.056-0.112)
0.004 (0.001-0.011)
1.17 (0.56-1.68)
1031(130-3500)
190 (167-219)
0.32 (0.24-0.42)
0.047 (0.007-0.253)
107 (92-127)
76 (66-82)
9.8 (7.8-12.7)
10.1 (4.7-17.7)
0.401 (0.270-0.630)
Power Channel7. Power Channel
U/s27(1-
185)
76 (60-84)
7.3 (4.9-10.4)
0.056 (0.056-0.056)
0.003 (0.001-0.005)
1.02 (0.56-1.40)
567(78-2400)
191 (163-230)
0.34 (0.23-0.50)
0.061 (0.007-0.302)
108 (92-126)
75 (62-86)
10.8 (7.8-14.7)
9.7 (4.6-16.4)
0.415 (0.250-0.640)
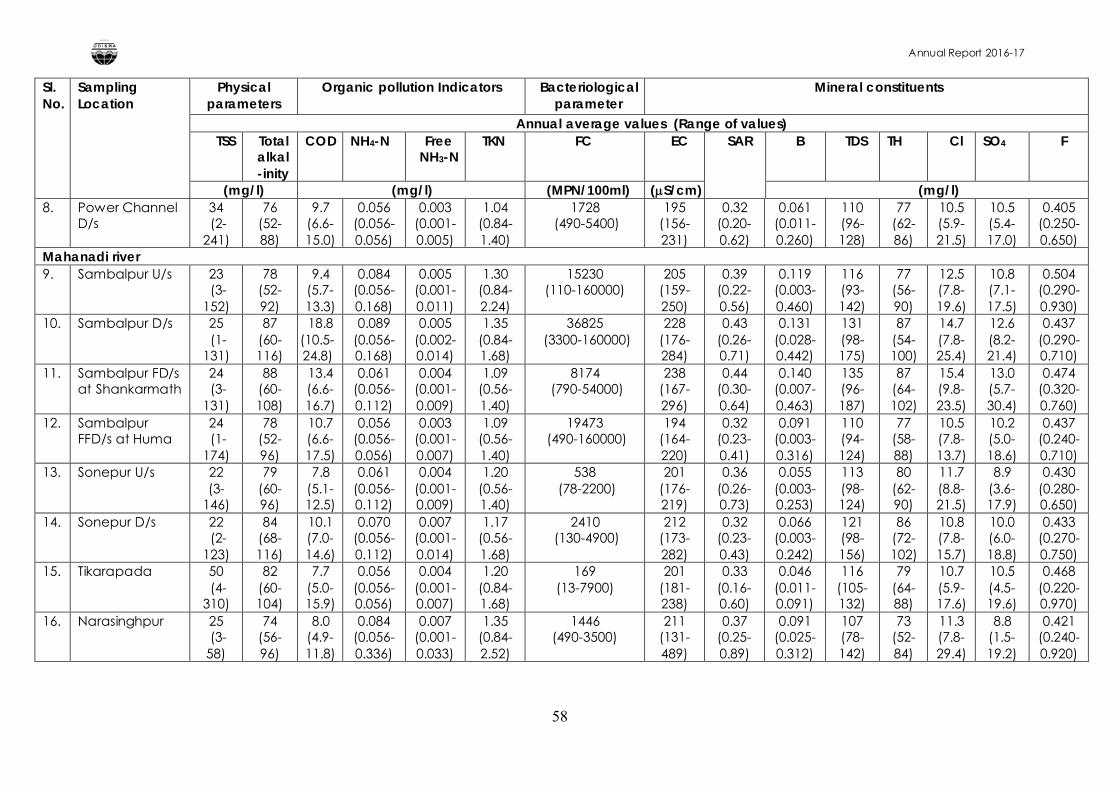
Annual Report 2016-17
58
Sl. No.
Sampling Location
Physical parameters
Organic pollution Indicators Bacteriological parameter
Mineral constituents
Annual average values (Range of values)TSS Total
alkal-inity
COD NH4-N Free NH3-N
TKN FC EC SAR B TDS TH Cl SO4 F
(mg/l) (mg/l) (MPN/100ml) (S/cm) (mg/l)8. Power Channel
D/s34(2-
241)
76 (52-88)
9.7 (6.6-15.0)
0.056 (0.056-0.056)
0.003 (0.001-0.005)
1.04 (0.84-1.40)
1728(490-5400)
195 (156-231)
0.32 (0.20-0.62)
0.061 (0.011-0.260)
110 (96-128)
77 (62-86)
10.5 (5.9-21.5)
10.5 (5.4-17.0)
0.405 (0.250-0.650)
Mahanadi river9. Sambalpur U/s 23
(3-152)
78 (52-92)
9.4 (5.7-13.3)
0.084 (0.056-0.168)
0.005 (0.001-0.011)
1.30 (0.84-2.24)
15230 (110-160000)
205 (159-250)
0.39 (0.22-0.56)
0.119 (0.003-0.460)
116 (93-142)
77 (56-90)
12.5 (7.8-19.6)
10.8 (7.1-17.5)
0.504 (0.290-0.930)
10. Sambalpur D/s 25(1-
131)
87 (60-116)
18.8 (10.5-24.8)
0.089 (0.056-0.168)
0.005 (0.002-0.014)
1.35 (0.84-1.68)
36825(3300-160000)
228 (176-284)
0.43 (0.26-0.71)
0.131 (0.028-0.442)
131 (98-175)
87 (54-100)
14.7 (7.8-25.4)
12.6 (8.2-21.4)
0.437 (0.290-0.710)
11. Sambalpur FD/s at Shankarmath
24(3-
131)
88 (60-108)
13.4 (6.6-16.7)
0.061 (0.056-0.112)
0.004 (0.001-0.009)
1.09 (0.56-1.40)
8174(790-54000)
238 (167-296)
0.44 (0.30-0.64)
0.140 (0.007-0.463)
135 (96-187)
87 (64-102)
15.4 (9.8-23.5)
13.0 (5.7-30.4)
0.474 (0.320-0.760)
12. Sambalpur FFD/s at Huma
24(1-
174)
78 (52-96)
10.7 (6.6-17.5)
0.056 (0.056-0.056)
0.003 (0.001-0.007)
1.09 (0.56-1.40)
19473(490-160000)
194 (164-220)
0.32 (0.23-0.41)
0.091 (0.003-0.316)
110 (94-124)
77 (58-88)
10.5 (7.8-13.7)
10.2 (5.0-18.6)
0.437 (0.240-0.710)
13. Sonepur U/s 22 (3-
146)
79 (60-96)
7.8 (5.1-12.5)
0.061 (0.056-0.112)
0.004 (0.001-0.009)
1.20 (0.56-1.40)
538(78-2200)
201 (176-219)
0.36 (0.26-0.73)
0.055 (0.003-0.253)
113 (98-124)
80 (62-90)
11.7 (8.8-21.5)
8.9 (3.6-17.9)
0.430 (0.280-0.650)
14. Sonepur D/s 22(2-
123)
84 (68-116)
10.1 (7.0-14.6)
0.070 (0.056-0.112)
0.007 (0.001-0.014)
1.17 (0.56-1.68)
2410(130-4900)
212 (173-282)
0.32 (0.23-0.43)
0.066 (0.003-0.242)
121 (98-156)
86 (72-102)
10.8 (7.8-15.7)
10.0 (6.0-18.8)
0.433 (0.270-0.750)
15. Tikarapada 50(4-
310)
82 (60-104)
7.7 (5.0-15.9)
0.056 (0.056-0.056)
0.004 (0.001-0.007)
1.20 (0.84-1.68)
169 (13-7900)
201 (181-238)
0.33 (0.16-0.60)
0.046 (0.011-0.091)
116 (105-132)
79 (64-88)
10.7 (5.9-17.6)
10.5 (4.5-19.6)
0.468 (0.220-0.970)
16. Narasinghpur 25(3-
58)
74 (56-96)
8.0 (4.9-11.8)
0.084 (0.056-0.336)
0.007 (0.001-0.033)
1.35 (0.84-2.52)
1446 (490-3500)
211 (131-489)
0.37 (0.25-0.89)
0.091 (0.025-0.312)
107 (78-142)
73 (52-84)
11.3 (7.8-29.4)
8.8 (1.5-19.2)
0.421 (0.240-0.920)
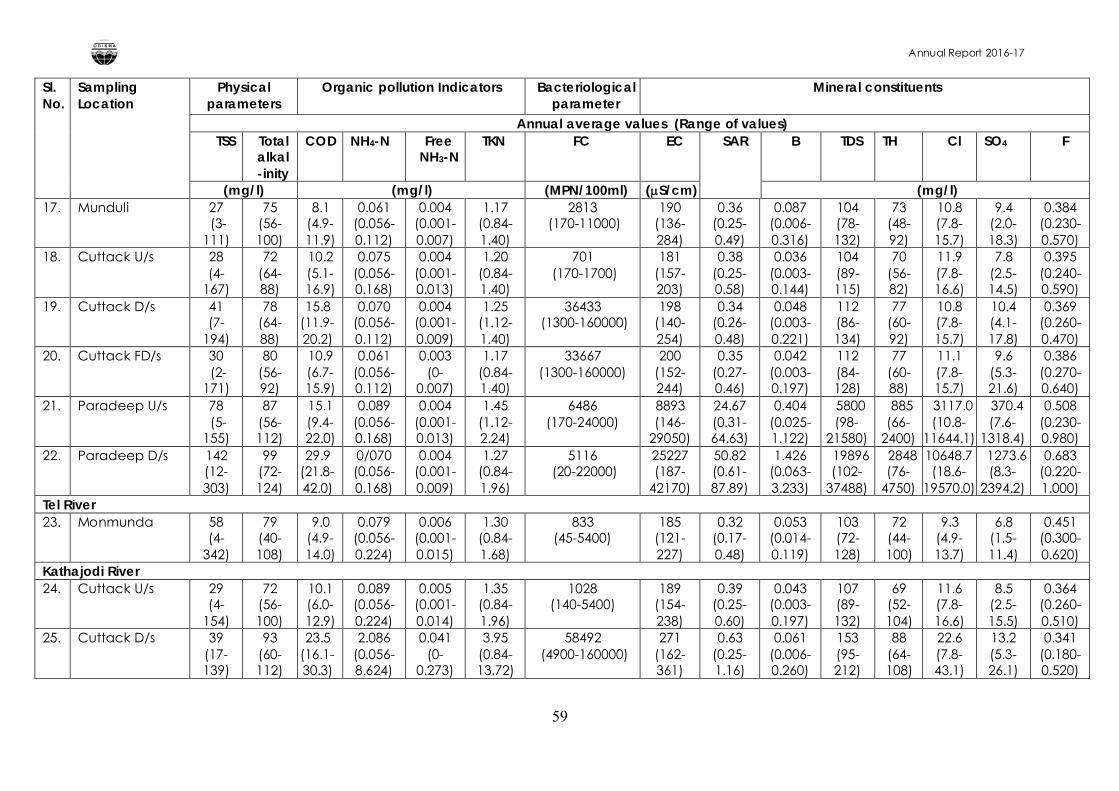
Annual Report 2016-17
59
Sl. No.
Sampling Location
Physical parameters
Organic pollution Indicators Bacteriological parameter
Mineral constituents
Annual average values (Range of values)TSS Total
alkal-inity
COD NH4-N Free NH3-N
TKN FC EC SAR B TDS TH Cl SO4 F
(mg/l) (mg/l) (MPN/100ml) (S/cm) (mg/l)17. Munduli 27
(3-111)
75 (56-100)
8.1 (4.9-11.9)
0.061 (0.056-0.112)
0.004 (0.001-0.007)
1.17 (0.84-1.40)
2813(170-11000)
190 (136-284)
0.36 (0.25-0.49)
0.087 (0.006-0.316)
104 (78-132)
73 (48-92)
10.8 (7.8-15.7)
9.4 (2.0-18.3)
0.384 (0.230-0.570)
18. Cuttack U/s 28 (4-
167)
72 (64-88)
10.2 (5.1-16.9)
0.075 (0.056-0.168)
0.004 (0.001-0.013)
1.20 (0.84-1.40)
701(170-1700)
181 (157-203)
0.38 (0.25-0.58)
0.036 (0.003-0.144)
104 (89-115)
70 (56-82)
11.9 (7.8-16.6)
7.8 (2.5-14.5)
0.395 (0.240-0.590)
19. Cuttack D/s 41 (7-
194)
78 (64-88)
15.8 (11.9-20.2)
0.070 (0.056-0.112)
0.004 (0.001-0.009)
1.25 (1.12-1.40)
36433(1300-160000)
198 (140-254)
0.34 (0.26-0.48)
0.048 (0.003-0.221)
112 (86-134)
77 (60-92)
10.8 (7.8-15.7)
10.4 (4.1-17.8)
0.369 (0.260-0.470)
20. Cuttack FD/s 30(2-
171)
80 (56-92)
10.9 (6.7-15.9)
0.061 (0.056-0.112)
0.003 (0-
0.007)
1.17 (0.84-1.40)
33667 (1300-160000)
200 (152-244)
0.35 (0.27-0.46)
0.042 (0.003-0.197)
112 (84-128)
77 (60-88)
11.1 (7.8-15.7)
9.6 (5.3-21.6)
0.386 (0.270-0.640)
21. Paradeep U/s 78(5-
155)
87 (56-112)
15.1 (9.4-22.0)
0.089 (0.056-0.168)
0.004 (0.001-0.013)
1.45 (1.12-2.24)
6486 (170-24000)
8893 (146-
29050)
24.67 (0.31-64.63)
0.404 (0.025-1.122)
5800 (98-
21580)
885 (66-
2400)
3117.0 (10.8-
11644.1)
370.4 (7.6-
1318.4)
0.508 (0.230-0.980)
22. Paradeep D/s 142 (12-303)
99 (72-124)
29.9 (21.8-42.0)
0/070 (0.056-0.168)
0.004 (0.001-0.009)
1.27 (0.84-1.96)
5116(20-22000)
25227 (187-
42170)
50.82 (0.61-87.89)
1.426 (0.063-3.233)
19896 (102-
37488)
2848(76-
4750)
10648.7 (18.6-
19570.0)
1273.6 (8.3-
2394.2)
0.683 (0.220-1.000)
Tel River23. Monmunda 58
(4-342)
79 (40-108)
9.0 (4.9-14.0)
0.079 (0.056-0.224)
0.006 (0.001-0.015)
1.30 (0.84-1.68)
833 (45-5400)
185 (121-227)
0.32 (0.17-0.48)
0.053 (0.014-0.119)
103 (72-128)
72 (44-100)
9.3 (4.9-13.7)
6.8 (1.5-11.4)
0.451 (0.300-0.620)
Kathajodi River24. Cuttack U/s 29
(4-154)
72 (56-100)
10.1 (6.0-12.9)
0.089 (0.056-0.224)
0.005 (0.001-0.014)
1.35 (0.84-1.96)
1028 (140-5400)
189 (154-238)
0.39 (0.25-0.60)
0.043 (0.003-0.197)
107 (89-132)
69 (52-104)
11.6 (7.8-16.6)
8.5 (2.5-15.5)
0.364 (0.260-0.510)
25. Cuttack D/s 39 (17-139)
93 (60-112)
23.5 (16.1-30.3)
2.086 (0.056-8.624)
0.041 (0-
0.273)
3.95 (0.84-13.72)
58492(4900-160000)
271 (162-361)
0.63 (0.25-1.16)
0.061 (0.006-0.260)
153 (95-212)
88 (64-108)
22.6 (7.8-43.1)
13.2 (5.3-26.1)
0.341 (0.180-0.520)
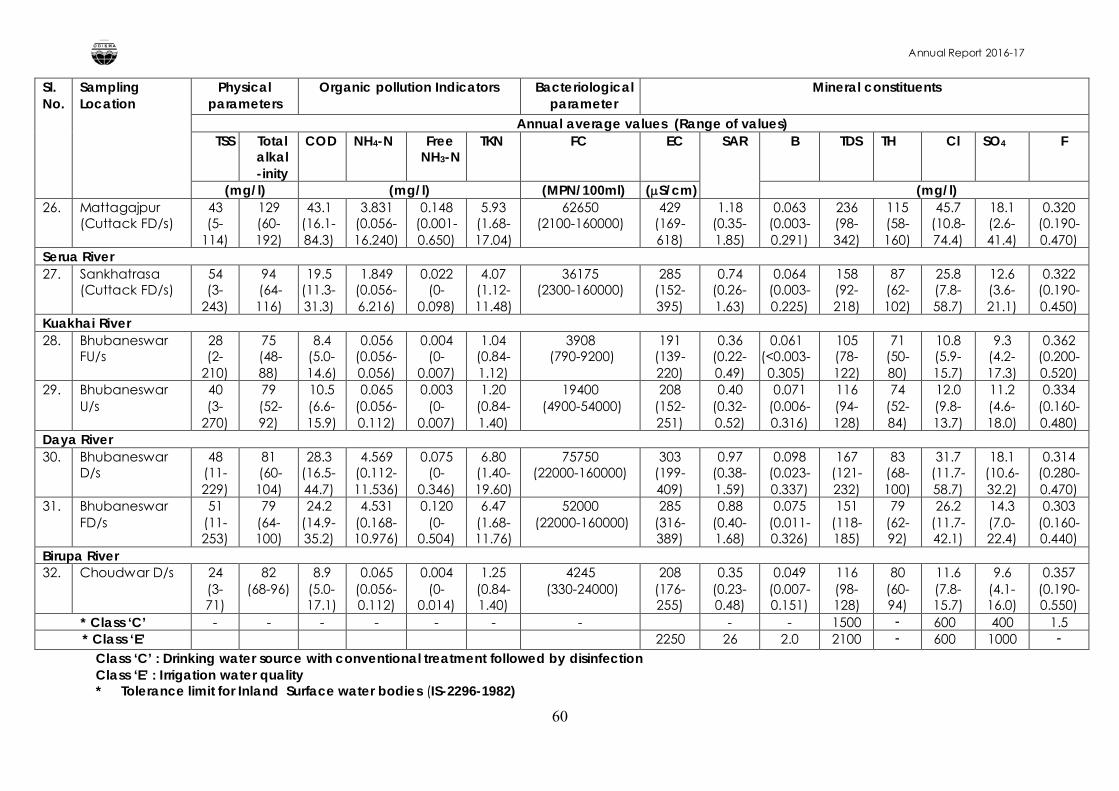
Annual Report 2016-17
60
Sl. No.
Sampling Location
Physical parameters
Organic pollution Indicators Bacteriological parameter
Mineral constituents
Annual average values (Range of values)TSS Total
alkal-inity
COD NH4-N Free NH3-N
TKN FC EC SAR B TDS TH Cl SO4 F
(mg/l) (mg/l) (MPN/100ml) (S/cm) (mg/l)26. Mattagajpur
(Cuttack FD/s)43 (5-
114)
129 (60-192)
43.1 (16.1-84.3)
3.831 (0.056-16.240)
0.148 (0.001-0.650)
5.93 (1.68-17.04)
62650 (2100-160000)
429 (169-618)
1.18 (0.35-1.85)
0.063 (0.003-0.291)
236 (98-342)
115 (58-160)
45.7 (10.8-74.4)
18.1 (2.6-41.4)
0.320 (0.190-0.470)
Serua River27. Sankhatrasa
(Cuttack FD/s)54 (3-
243)
94(64-116)
19.5 (11.3-31.3)
1.849 (0.056-6.216)
0.022 (0-
0.098)
4.07 (1.12-11.48)
36175 (2300-160000)
285 (152-395)
0.74 (0.26-1.63)
0.064 (0.003-0.225)
158 (92-218)
87 (62-102)
25.8 (7.8-58.7)
12.6 (3.6-21.1)
0.322 (0.190-0.450)
Kuakhai River28. Bhubaneswar
FU/s28 (2-
210)
75(48-88)
8.4 (5.0-14.6)
0.056 (0.056-0.056)
0.004 (0-
0.007)
1.04 (0.84-1.12)
3908(790-9200)
191 (139-220)
0.36 (0.22-0.49)
0.061 (<0.003-0.305)
105 (78-122)
71 (50-80)
10.8 (5.9-15.7)
9.3 (4.2-17.3)
0.362 (0.200-0.520)
29. BhubaneswarU/s
40 (3-
270)
79(52-92)
10.5 (6.6-15.9)
0.065 (0.056-0.112)
0.003 (0-
0.007)
1.20 (0.84-1.40)
19400(4900-54000)
208 (152-251)
0.40 (0.32-0.52)
0.071 (0.006-0.316)
116 (94-128)
74 (52-84)
12.0 (9.8-13.7)
11.2 (4.6-18.0)
0.334 (0.160-0.480)
Daya River30. Bhubaneswar
D/s 48
(11-229)
81(60-104)
28.3 (16.5-44.7)
4.569 (0.112-11.536)
0.075 (0-
0.346)
6.80 (1.40-19.60)
75750 (22000-160000)
303 (199-409)
0.97 (0.38-1.59)
0.098 (0.023-0.337)
167 (121-232)
83 (68-100)
31.7 (11.7-58.7)
18.1 (10.6-32.2)
0.314 (0.280-0.470)
31. Bhubaneswar FD/s
51 (11-253)
79 (64-100)
24.2 (14.9-35.2)
4.531 (0.168-10.976)
0.120 (0-
0.504)
6.47 (1.68-11.76)
52000(22000-160000)
285 (316-389)
0.88 (0.40-1.68)
0.075 (0.011-0.326)
151 (118-185)
79 (62-92)
26.2 (11.7-42.1)
14.3 (7.0-22.4)
0.303 (0.160-0.440)
Birupa River32. Choudwar D/s 24
(3-71)
82 (68-96)
8.9 (5.0-17.1)
0.065 (0.056-0.112)
0.004 (0-
0.014)
1.25 (0.84-1.40)
4245(330-24000)
208 (176-255)
0.35 (0.23-0.48)
0.049 (0.007-0.151)
116 (98-128)
80 (60-94)
11.6 (7.8-15.7)
9.6 (4.1-16.0)
0.357 (0.190-0.550)
* Class ‘C’ - - - - - - - - - 1500 - 600 400 1.5* Class ‘E’ 2250 26 2.0 2100 - 600 1000 -
Class ‘C’ : Drinking water source with conventional treatment followed by disinfectionClass ‘E’ : Irrigation water quality* Tolerance limit for Inland Surface water bodies (IS-2296-1982)
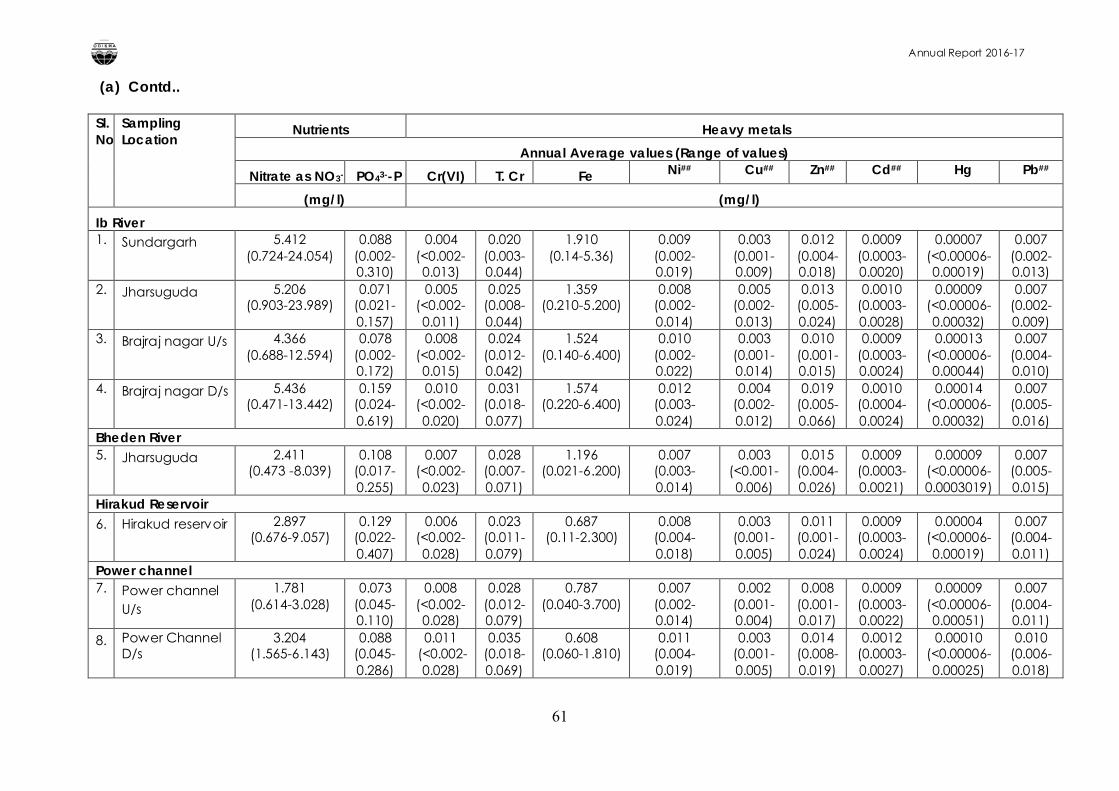
Annual Report 2016-17
61
(a) Contd..
Sl. No.
Sampling Location
Nutrients Heavy metals
Annual Average values (Range of values)
Nitrate as NO3- PO43--P Cr(VI) T. Cr Fe Ni## Cu## Zn## Cd## Hg Pb##
(mg/l) (mg/l)
Ib River1. Sundargarh 5.412
(0.724-24.054)0.088
(0.002-0.310)
0.004 (<0.002-0.013)
0.020 (0.003-0.044)
1.910(0.14-5.36)
0.009 (0.002-0.019)
0.003 (0.001-0.009)
0.012 (0.004-0.018)
0.0009 (0.0003-0.0020)
0.00007 (<0.00006-0.00019)
0.007 (0.002-0.013)
2. Jharsuguda 5.206(0.903-23.989)
0.071 (0.021-0.157)
0.005 (<0.002-0.011)
0.025 (0.008-0.044)
1.359(0.210-5.200)
0.008 (0.002-0.014)
0.005 (0.002-0.013)
0.013 (0.005-0.024)
0.0010 (0.0003-0.0028)
0.00009 (<0.00006-0.00032)
0.007 (0.002-0.009)
3. Brajraj nagar U/s 4.366(0.688-12.594)
0.078 (0.002-0.172)
0.008 (<0.002-0.015)
0.024 (0.012-0.042)
1.524(0.140-6.400)
0.010 (0.002-0.022)
0.003 (0.001-0.014)
0.010 (0.001-0.015)
0.0009 (0.0003-0.0024)
0.00013 (<0.00006-0.00044)
0.007 (0.004-0.010)
4. Brajraj nagar D/s 5.436(0.471-13.442)
0.159 (0.024-0.619)
0.010 (<0.002-0.020)
0.031 (0.018-0.077)
1.574(0.220-6.400)
0.012(0.003-0.024)
0.004 (0.002-0.012)
0.019 (0.005-0.066)
0.0010 (0.0004-0.0024)
0.00014 (<0.00006-0.00032)
0.007 (0.005-0.016)
Bheden River5. Jharsuguda 2.411
(0.473 -8.039)0.108
(0.017-0.255)
0.007 (<0.002-0.023)
0.028 (0.007-0.071)
1.196(0.021-6.200)
0.007 (0.003-0.014)
0.003 (<0.001-0.006)
0.015 (0.004-0.026)
0.0009 (0.0003-0.0021)
0.00009 (<0.00006-0.0003019)
0.007 (0.005-0.015)
Hirakud Reservoir6. Hirakud reservoir 2.897
(0.676-9.057)0.129
(0.022-0.407)
0.006 (<0.002-0.028)
0.023 (0.011-0.079)
0.687(0.11-2.300)
0.008 (0.004-0.018)
0.003 (0.001-0.005)
0.011 (0.001-0.024)
0.0009 (0.0003-0.0024)
0.00004 (<0.00006-0.00019)
0.007 (0.004-0.011)
Power channel7. Power channel
U/s
1.781(0.614-3.028)
0.073 (0.045-0.110)
0.008(<0.002-0.028)
0.028 (0.012-0.079)
0.787(0.040-3.700)
0.007 (0.002-0.014)
0.002 (0.001-0.004)
0.008 (0.001-0.017)
0.0009 (0.0003-0.0022)
0.00009 (<0.00006-0.00051)
0.007 (0.004-0.011)
8. Power Channel D/s
3.204(1.565-6.143)
0.088 (0.045-0.286)
0.011(<0.002-0.028)
0.035 (0.018-0.069)
0.608(0.060-1.810)
0.011 (0.004-0.019)
0.003 (0.001-0.005)
0.014 (0.008-0.019)
0.0012 (0.0003-0.0027)
0.00010 (<0.00006-0.00025)
0.010 (0.006-0.018)
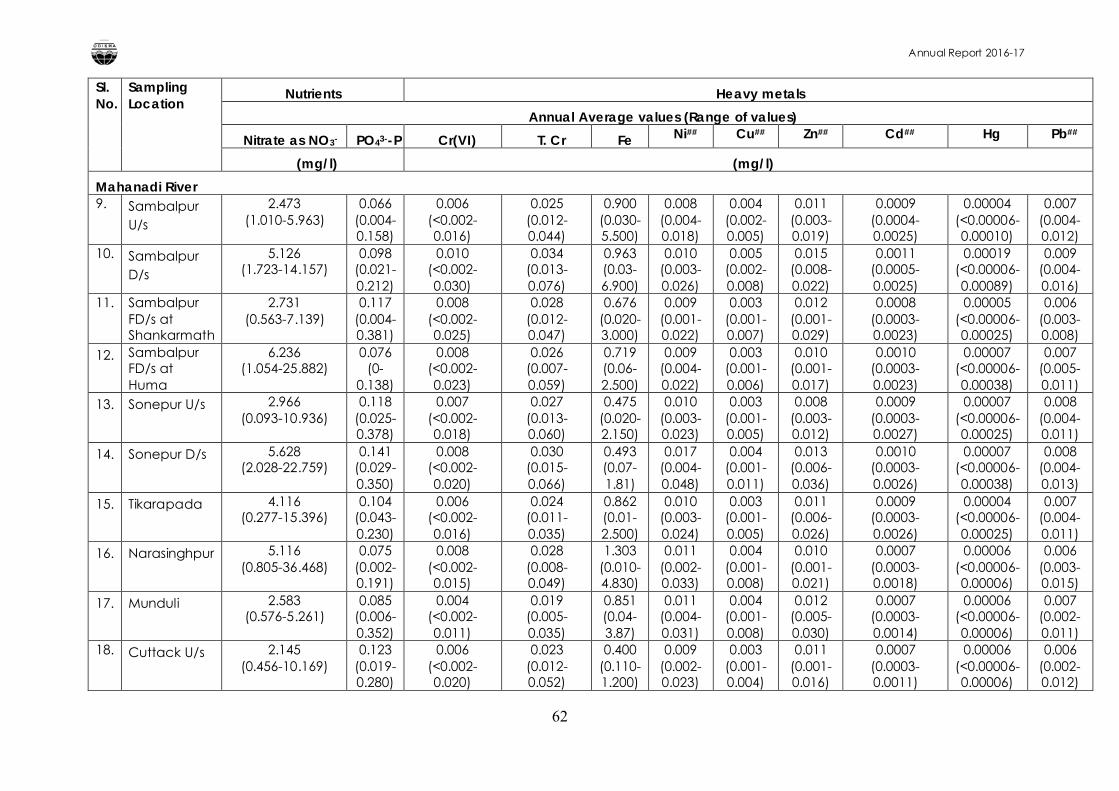
Annual Report 2016-17
62
Sl. No.
Sampling Location
Nutrients Heavy metals
Annual Average values (Range of values)
Nitrate as NO3- PO43--P Cr(VI) T. Cr Fe Ni## Cu## Zn## Cd## Hg Pb##
(mg/l) (mg/l)
Mahanadi River9. Sambalpur
U/s
2.473(1.010-5.963)
0.066 (0.004-0.158)
0.006 (<0.002-0.016)
0.025 (0.012-0.044)
0.900 (0.030-5.500)
0.008 (0.004-0.018)
0.004 (0.002-0.005)
0.011 (0.003-0.019)
0.0009 (0.0004-0.0025)
0.00004 (<0.00006-0.00010)
0.007 (0.004-0.012)
10. Sambalpur D/s
5.126(1.723-14.157)
0.098 (0.021-0.212)
0.010 (<0.002-0.030)
0.034 (0.013-0.076)
0.963 (0.03-6.900)
0.010 (0.003-0.026)
0.005 (0.002-0.008)
0.015 (0.008-0.022)
0.0011 (0.0005-0.0025)
0.00019 (<0.00006-0.00089)
0.009 (0.004-0.016)
11. Sambalpur FD/s at Shankarmath
2.731(0.563-7.139)
0.117 (0.004-0.381)
0.008(<0.002-0.025)
0.028 (0.012-0.047)
0.676 (0.020-3.000)
0.009 (0.001-0.022)
0.003 (0.001-0.007)
0.012 (0.001-0.029)
0.0008 (0.0003-0.0023)
0.00005 (<0.00006-0.00025)
0.006 (0.003-0.008)
12. Sambalpur FD/s at Huma
6.236(1.054-25.882)
0.076 (0-
0.138)
0.008 (<0.002-0.023)
0.026 (0.007-0.059)
0.719 (0.06-2.500)
0.009 (0.004-0.022)
0.003 (0.001-0.006)
0.010 (0.001-0.017)
0.0010 (0.0003-0.0023)
0.00007 (<0.00006-0.00038)
0.007 (0.005-0.011)
13. Sonepur U/s 2.966(0.093-10.936)
0.118 (0.025-0.378)
0.007 (<0.002-0.018)
0.027 (0.013-0.060)
0.475 (0.020-2.150)
0.010 (0.003-0.023)
0.003 (0.001-0.005)
0.008 (0.003-0.012)
0.0009 (0.0003-0.0027)
0.00007 (<0.00006-0.00025)
0.008 (0.004-0.011)
14. Sonepur D/s 5.628(2.028-22.759)
0.141 (0.029-0.350)
0.008 (<0.002-0.020)
0.030 (0.015-0.066)
0.493 (0.07-1.81)
0.017 (0.004-0.048)
0.004 (0.001-0.011)
0.013 (0.006-0.036)
0.0010 (0.0003-0.0026)
0.00007 (<0.00006-0.00038)
0.008 (0.004-0.013)
15. Tikarapada 4.116(0.277-15.396)
0.104 (0.043-0.230)
0.006 (<0.002-0.016)
0.024 (0.011-0.035)
0.862 (0.01-2.500)
0.010 (0.003-0.024)
0.003 (0.001-0.005)
0.011 (0.006-0.026)
0.0009 (0.0003-0.0026)
0.00004 (<0.00006-0.00025)
0.007 (0.004-0.011)
16. Narasinghpur 5.116(0.805-36.468)
0.075 (0.002-0.191)
0.008 (<0.002-0.015)
0.028 (0.008-0.049)
1.303 (0.010-4.830)
0.011 (0.002-0.033)
0.004 (0.001-0.008)
0.010 (0.001-0.021)
0.0007 (0.0003-0.0018)
0.00006 (<0.00006-0.00006)
0.006 (0.003-0.015)
17. Munduli 2.583(0.576-5.261)
0.085 (0.006-0.352)
0.004 (<0.002-0.011)
0.019 (0.005-0.035)
0.851 (0.04-3.87)
0.011 (0.004-0.031)
0.004 (0.001-0.008)
0.012 (0.005-0.030)
0.0007 (0.0003-0.0014)
0.00006 (<0.00006-0.00006)
0.007 (0.002-0.011)
18. Cuttack U/s 2.145(0.456-10.169)
0.123 (0.019-0.280)
0.006 (<0.002-0.020)
0.023 (0.012-0.052)
0.400 (0.110-1.200)
0.009 (0.002-0.023)
0.003 (0.001-0.004)
0.011 (0.001-0.016)
0.0007 (0.0003-0.0011)
0.00006 (<0.00006-0.00006)
0.006 (0.002-0.012)
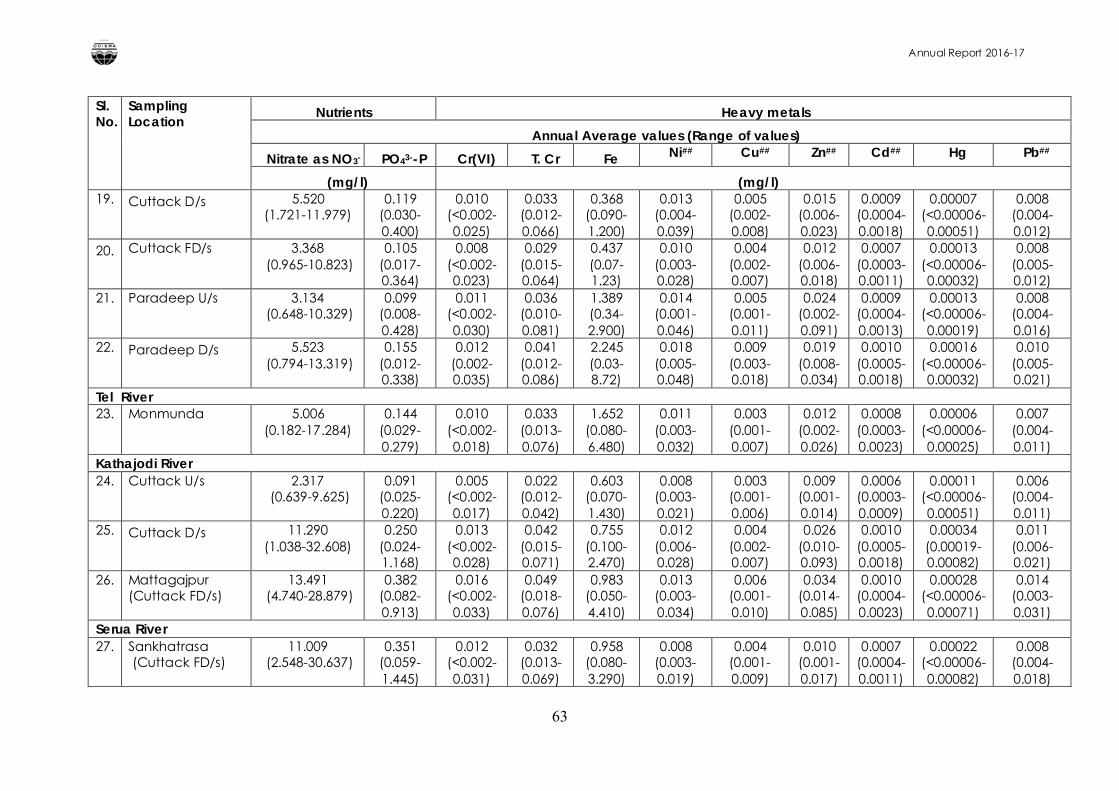
Annual Report 2016-17
63
Sl. No.
Sampling Location
Nutrients Heavy metals
Annual Average values (Range of values)
Nitrate as NO3- PO43--P Cr(VI) T. Cr Fe Ni## Cu## Zn## Cd## Hg Pb##
(mg/l) (mg/l)19. Cuttack D/s 5.520
(1.721-11.979)0.119
(0.030-0.400)
0.010(<0.002-0.025)
0.033 (0.012-0.066)
0.368 (0.090-1.200)
0.013 (0.004-0.039)
0.005 (0.002-0.008)
0.015 (0.006-0.023)
0.0009 (0.0004-0.0018)
0.00007 (<0.00006-0.00051)
0.008 (0.004-0.012)
20. Cuttack FD/s 3.368(0.965-10.823)
0.105 (0.017-0.364)
0.008(<0.002-0.023)
0.029 (0.015-0.064)
0.437 (0.07-1.23)
0.010 (0.003-0.028)
0.004 (0.002-0.007)
0.012 (0.006-0.018)
0.0007 (0.0003-0.0011)
0.00013 (<0.00006-0.00032)
0.008 (0.005-0.012)
21. Paradeep U/s 3.134(0.648-10.329)
0.099 (0.008-0.428)
0.011 (<0.002-0.030)
0.036 (0.010-0.081)
1.389 (0.34-2.900)
0.014 (0.001-0.046)
0.005 (0.001-0.011)
0.024 (0.002-0.091)
0.0009 (0.0004-0.0013)
0.00013 (<0.00006-0.00019)
0.008 (0.004-0.016)
22. Paradeep D/s 5.523(0.794-13.319)
0.155 (0.012-0.338)
0.012 (0.002-0.035)
0.041 (0.012-0.086)
2.245 (0.03-8.72)
0.018 (0.005-0.048)
0.009 (0.003-0.018)
0.019 (0.008-0.034)
0.0010 (0.0005-0.0018)
0.00016 (<0.00006-0.00032)
0.010 (0.005-0.021)
Tel River23. Monmunda 5.006
(0.182-17.284)0.144
(0.029-0.279)
0.010 (<0.002-0.018)
0.033 (0.013-0.076)
1.652 (0.080-6.480)
0.011 (0.003-0.032)
0.003 (0.001-0.007)
0.012 (0.002-0.026)
0.0008 (0.0003-0.0023)
0.00006 (<0.00006-0.00025)
0.007 (0.004-0.011)
Kathajodi River24. Cuttack U/s 2.317
(0.639-9.625)0.091
(0.025-0.220)
0.005 (<0.002-0.017)
0.022 (0.012-0.042)
0.603 (0.070-1.430)
0.008 (0.003-0.021)
0.003 (0.001-0.006)
0.009 (0.001-0.014)
0.0006 (0.0003-0.0009)
0.00011 (<0.00006-0.00051)
0.006 (0.004-0.011)
25. Cuttack D/s 11.290 (1.038-32.608)
0.250 (0.024-1.168)
0.013 (<0.002-0.028)
0.042 (0.015-0.071)
0.755 (0.100-2.470)
0.012 (0.006-0.028)
0.004 (0.002-0.007)
0.026 (0.010-0.093)
0.0010 (0.0005-0.0018)
0.00034 (0.00019-0.00082)
0.011 (0.006-0.021)
26. Mattagajpur (Cuttack FD/s)
13.491(4.740-28.879)
0.382 (0.082-0.913)
0.016 (<0.002-0.033)
0.049 (0.018-0.076)
0.983 (0.050-4.410)
0.013 (0.003-0.034)
0.006 (0.001-0.010)
0.034 (0.014-0.085)
0.0010 (0.0004-0.0023)
0.00028 (<0.00006-0.00071)
0.014 (0.003-0.031)
Serua River27. Sankhatrasa
(Cuttack FD/s)11.009
(2.548-30.637)0.351
(0.059-1.445)
0.012 (<0.002-0.031)
0.032 (0.013-0.069)
0.958 (0.080-3.290)
0.008 (0.003-0.019)
0.004 (0.001-0.009)
0.010 (0.001-0.017)
0.0007 (0.0004-0.0011)
0.00022 (<0.00006-0.00082)
0.008 (0.004-0.018)
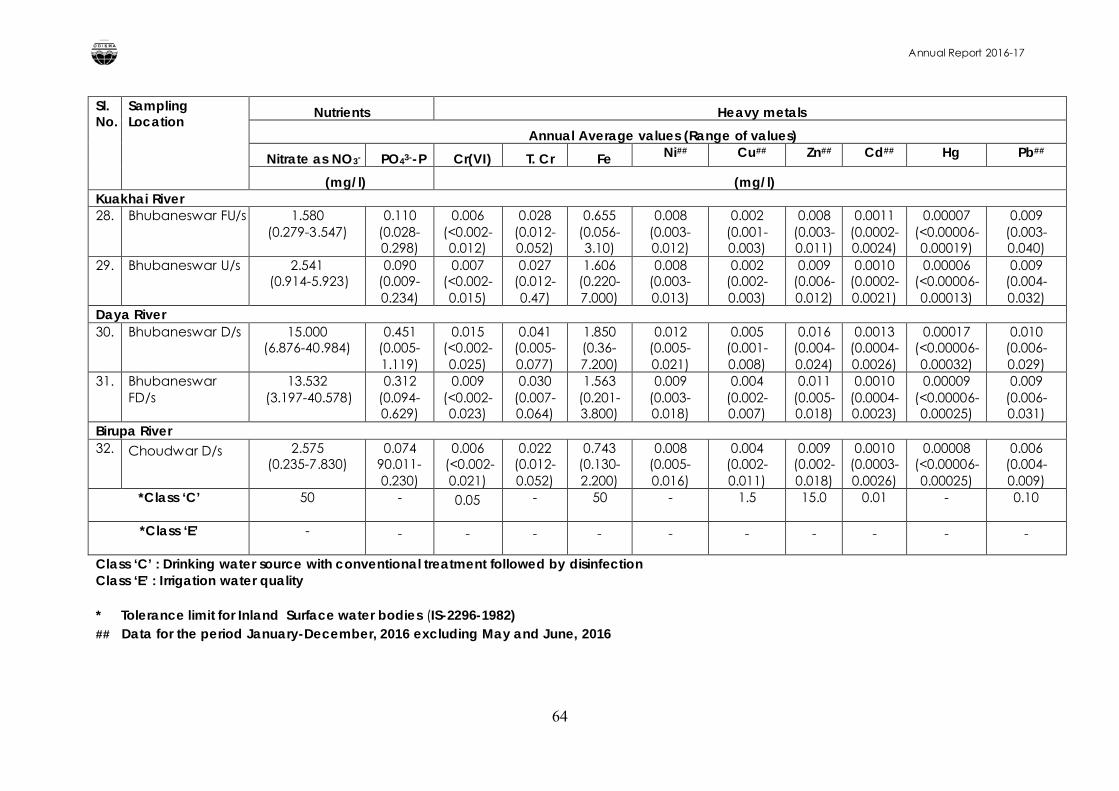
Annual Report 2016-17
64
Sl. No.
Sampling Location
Nutrients Heavy metals
Annual Average values (Range of values)
Nitrate as NO3- PO43--P Cr(VI) T. Cr Fe Ni## Cu## Zn## Cd## Hg Pb##
(mg/l) (mg/l)Kuakhai River28. Bhubaneswar FU/s 1.580
(0.279-3.547)0.110
(0.028-0.298)
0.006 (<0.002-0.012)
0.028 (0.012-0.052)
0.655 (0.056-3.10)
0.008 (0.003-0.012)
0.002 (0.001-0.003)
0.008 (0.003-0.011)
0.0011 (0.0002-0.0024)
0.00007 (<0.00006-0.00019)
0.009 (0.003-0.040)
29. Bhubaneswar U/s 2.541(0.914-5.923)
0.090 (0.009-0.234)
0.007 (<0.002-0.015)
0.027 (0.012-0.47)
1.606 (0.220-7.000)
0.008 (0.003-0.013)
0.002 (0.002-0.003)
0.009 (0.006-0.012)
0.0010 (0.0002-0.0021)
0.00006 (<0.00006-0.00013)
0.009 (0.004-0.032)
Daya River30. Bhubaneswar D/s 15.000
(6.876-40.984)0.451
(0.005-1.119)
0.015 (<0.002-0.025)
0.041 (0.005-0.077)
1.850 (0.36-7.200)
0.012 (0.005-0.021)
0.005 (0.001-0.008)
0.016 (0.004-0.024)
0.0013 (0.0004-0.0026)
0.00017 (<0.00006-0.00032)
0.010 (0.006-0.029)
31. Bhubaneswar FD/s
13.532(3.197-40.578)
0.312 (0.094-0.629)
0.009 (<0.002-0.023)
0.030 (0.007-0.064)
1.563 (0.201-3.800)
0.009 (0.003-0.018)
0.004 (0.002-0.007)
0.011 (0.005-0.018)
0.0010 (0.0004-0.0023)
0.00009 (<0.00006-0.00025)
0.009 (0.006-0.031)
Birupa River32. Choudwar D/s 2.575
(0.235-7.830)0.074
90.011-0.230)
0.006(<0.002-0.021)
0.022 (0.012-0.052)
0.743 (0.130-2.200)
0.008 (0.005-0.016)
0.004 (0.002-0.011)
0.009 (0.002-0.018)
0.0010 (0.0003-0.0026)
0.00008 (<0.00006-0.00025)
0.006 (0.004-0.009)
*Class ‘C’ 50 - 0.05 - 50 - 1.5 15.0 0.01 - 0.10
*Class ‘E’ - - - - - - - - - - -
Class ‘C’ : Drinking water source with conventional treatment followed by disinfectionClass ‘E’ : Irrigation water quality
* Tolerance limit for Inland Surface water bodies (IS-2296-1982)## Data for the period January-December, 2016 excluding May and June, 2016
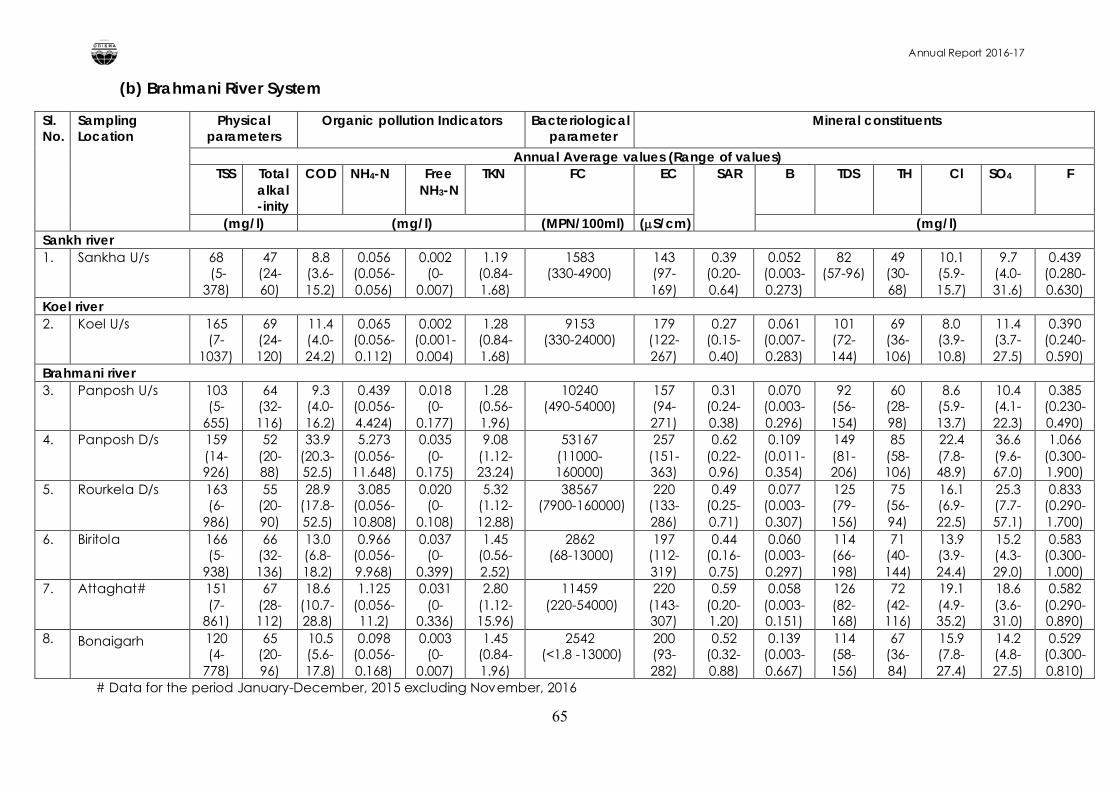
Annual Report 2016-17
65
(b) Brahmani River System
Sl. No.
Sampling Location
Physical parameters
Organic pollution Indicators Bacteriological parameter
Mineral constituents
Annual Average values (Range of values)TSS Total
alkal-inity
COD NH4-N Free NH3-N
TKN FC EC SAR B TDS TH Cl SO4 F
(mg/l) (mg/l) (MPN/100ml) (S/cm) (mg/l)Sankh river1. Sankha U/s 68
(5-378)
47 (24-60)
8.8 (3.6-15.2)
0.056 (0.056-0.056)
0.002 (0-
0.007)
1.19 (0.84-1.68)
1583 (330-4900)
143 (97-169)
0.39 (0.20-0.64)
0.052 (0.003-0.273)
82 (57-96)
49 (30-68)
10.1 (5.9-15.7)
9.7 (4.0-31.6)
0.439 (0.280-0.630)
Koel river2. Koel U/s 165
(7-1037)
69 (24-120)
11.4 (4.0-24.2)
0.065 (0.056-0.112)
0.002 (0.001-0.004)
1.28 (0.84-1.68)
9153 (330-24000)
179 (122-267)
0.27 (0.15-0.40)
0.061 (0.007-0.283)
101 (72-144)
69 (36-106)
8.0 (3.9-10.8)
11.4 (3.7-27.5)
0.390 (0.240-0.590)
Brahmani river3. Panposh U/s 103
(5-655)
64 (32-116)
9.3 (4.0-16.2)
0.439 (0.056-4.424)
0.018 (0-
0.177)
1.28 (0.56-1.96)
10240 (490-54000)
157 (94-271)
0.31 (0.24-0.38)
0.070 (0.003-0.296)
92 (56-154)
60 (28-98)
8.6 (5.9-13.7)
10.4 (4.1-22.3)
0.385 (0.230-0.490)
4. Panposh D/s 159 (14-926)
52 (20-88)
33.9 (20.3-52.5)
5.273 (0.056-11.648)
0.035 (0-
0.175)
9.08 (1.12-23.24)
53167 (11000-160000)
257 (151-363)
0.62 (0.22-0.96)
0.109 (0.011-0.354)
149 (81-206)
85 (58-106)
22.4 (7.8-48.9)
36.6 (9.6-67.0)
1.066 (0.300-1.900)
5. Rourkela D/s 163 (6-
986)
55 (20-90)
28.9 (17.8-52.5)
3.085 (0.056-10.808)
0.020 (0-
0.108)
5.32 (1.12-12.88)
38567(7900-160000)
220 (133-286)
0.49 (0.25-0.71)
0.077 (0.003-0.307)
125 (79-156)
75 (56-94)
16.1 (6.9-22.5)
25.3 (7.7-57.1)
0.833 (0.290-1.700)
6. Biritola 166 (5-
938)
66 (32-136)
13.0 (6.8-18.2)
0.966 (0.056-9.968)
0.037 (0-
0.399)
1.45 (0.56-2.52)
2862(68-13000)
197 (112-319)
0.44 (0.16-0.75)
0.060 (0.003-0.297)
114 (66-198)
71 (40-144)
13.9(3.9-24.4)
15.2 (4.3-29.0)
0.583 (0.300-1.000)
7. Attaghat# 151 (7-
861)
67 (28-112)
18.6 (10.7-28.8)
1.125 (0.056-11.2)
0.031 (0-
0.336)
2.80 (1.12-15.96)
11459(220-54000)
220 (143-307)
0.59 (0.20-1.20)
0.058 (0.003-0.151)
126 (82-168)
72 (42-116)
19.1 (4.9-35.2)
18.6 (3.6-31.0)
0.582 (0.290-0.890)
8. Bonaigarh 120 (4-
778)
65 (20-96)
10.5 (5.6-17.8)
0.098 (0.056-0.168)
0.003 (0-
0.007)
1.45 (0.84-1.96)
2542(<1.8 -13000)
200 (93-282)
0.52 (0.32-0.88)
0.139 (0.003-0.667)
114 (58-156)
67 (36-84)
15.9 (7.8-27.4)
14.2 (4.8-27.5)
0.529 (0.300-0.810)
# Data for the period January-December, 2015 excluding November, 2016
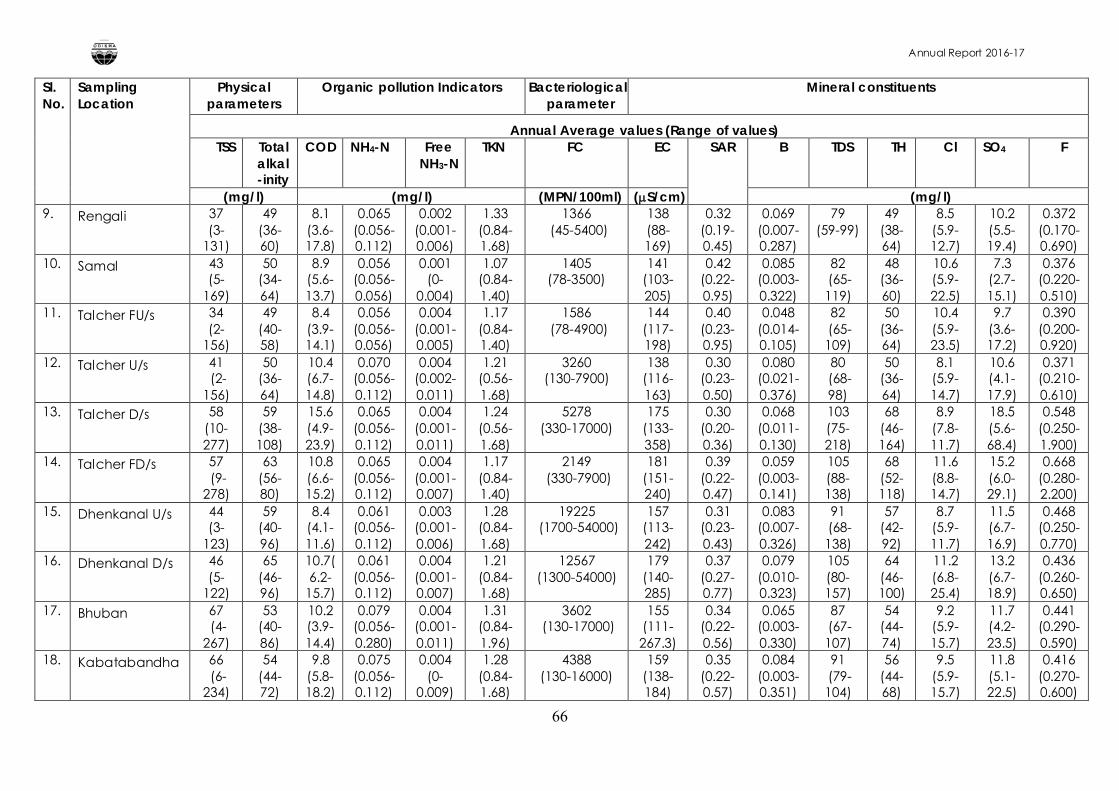
Annual Report 2016-17
66
Sl. No.
Sampling Location
Physical parameters
Organic pollution Indicators Bacteriological parameter
Mineral constituents
Annual Average values (Range of values)TSS Total
alkal-inity
COD NH4-N Free NH3-N
TKN FC EC SAR B TDS TH Cl SO4 F
(mg/l) (mg/l) (MPN/100ml) (S/cm) (mg/l)9. Rengali 37
(3-131)
49 (36-60)
8.1 (3.6-17.8)
0.065 (0.056-0.112)
0.002 (0.001-0.006)
1.33 (0.84-1.68)
1366(45-5400)
138 (88-169)
0.32 (0.19-0.45)
0.069 (0.007-0.287)
79 (59-99)
49 (38-64)
8.5 (5.9-12.7)
10.2 (5.5-19.4)
0.372 (0.170-0.690)
10. Samal 43 (5-
169)
50 (34-64)
8.9 (5.6-13.7)
0.056 (0.056-0.056)
0.001 (0-
0.004)
1.07 (0.84-1.40)
1405 (78-3500)
141 (103-205)
0.42 (0.22-0.95)
0.085 (0.003-0.322)
82(65-119)
48 (36-60)
10.6 (5.9-22.5)
7.3 (2.7-15.1)
0.376 (0.220-0.510)
11. Talcher FU/s 34 (2-
156)
49 (40-58)
8.4 (3.9-14.1)
0.056 (0.056-0.056)
0.004 (0.001-0.005)
1.17 (0.84-1.40)
1586(78-4900)
144 (117-198)
0.40 (0.23-0.95)
0.048 (0.014-0.105)
82(65-109)
50 (36-64)
10.4 (5.9-23.5)
9.7 (3.6-17.2)
0.390 (0.200-0.920)
12. Talcher U/s 41(2-
156)
50 (36-64)
10.4 (6.7-14.8)
0.070 (0.056-0.112)
0.004 (0.002-0.011)
1.21 (0.56-1.68)
3260 (130-7900)
138 (116-163)
0.30 (0.23-0.50)
0.080 (0.021-0.376)
80(68-98)
50 (36-64)
8.1 (5.9-14.7)
10.6 (4.1-17.9)
0.371 (0.210-0.610)
13. Talcher D/s 58 (10-277)
59 (38-108)
15.6 (4.9-23.9)
0.065 (0.056-0.112)
0.004 (0.001-0.011)
1.24 (0.56-1.68)
5278 (330-17000)
175 (133-358)
0.30 (0.20-0.36)
0.068 (0.011-0.130)
103 (75-218)
68 (46-164)
8.9 (7.8-11.7)
18.5 (5.6-68.4)
0.548 (0.250-1.900)
14. Talcher FD/s 57(9-
278)
63 (56-80)
10.8 (6.6-15.2)
0.065 (0.056-0.112)
0.004 (0.001-0.007)
1.17 (0.84-1.40)
2149(330-7900)
181 (151-240)
0.39 (0.22-0.47)
0.059 (0.003-0.141)
105 (88-138)
68 (52-118)
11.6 (8.8-14.7)
15.2 (6.0-29.1)
0.668 (0.280-2.200)
15. Dhenkanal U/s 44 (3-
123)
59 (40-96)
8.4 (4.1-11.6)
0.061 (0.056-0.112)
0.003 (0.001-0.006)
1.28 (0.84-1.68)
19225(1700-54000)
157 (113-242)
0.31 (0.23-0.43)
0.083 (0.007-0.326)
91(68-138)
57 (42-92)
8.7 (5.9-11.7)
11.5 (6.7-16.9)
0.468 (0.250-0.770)
16. Dhenkanal D/s 46 (5-
122)
65 (46-96)
10.7(6.2-
15.7)
0.061 (0.056-0.112)
0.004 (0.001-0.007)
1.21 (0.84-1.68)
12567 (1300-54000)
179 (140-285)
0.37 (0.27-0.77)
0.079 (0.010-0.323)
105 (80-157)
64 (46-100)
11.2 (6.8-25.4)
13.2 (6.7-18.9)
0.436 (0.260-0.650)
17. Bhuban 67(4-
267)
53 (40-86)
10.2 (3.9-14.4)
0.079 (0.056-0.280)
0.004 (0.001-0.011)
1.31 (0.84-1.96)
3602(130-17000)
155 (111-267.3)
0.34 (0.22-0.56)
0.065 (0.003-0.330)
87(67-107)
54 (44-74)
9.2 (5.9-15.7)
11.7 (4.2-23.5)
0.441 (0.290-0.590)
18. Kabatabandha 66(6-
234)
54 (44-72)
9.8 (5.8-18.2)
0.075 (0.056-0.112)
0.004 (0-
0.009)
1.28 (0.84-1.68)
4388 (130-16000)
159 (138-184)
0.35 (0.22-0.57)
0.084 (0.003-0.351)
91(79-104)
56 (44-68)
9.5 (5.9-15.7)
11.8 (5.1-22.5)
0.416 (0.270-0.600)
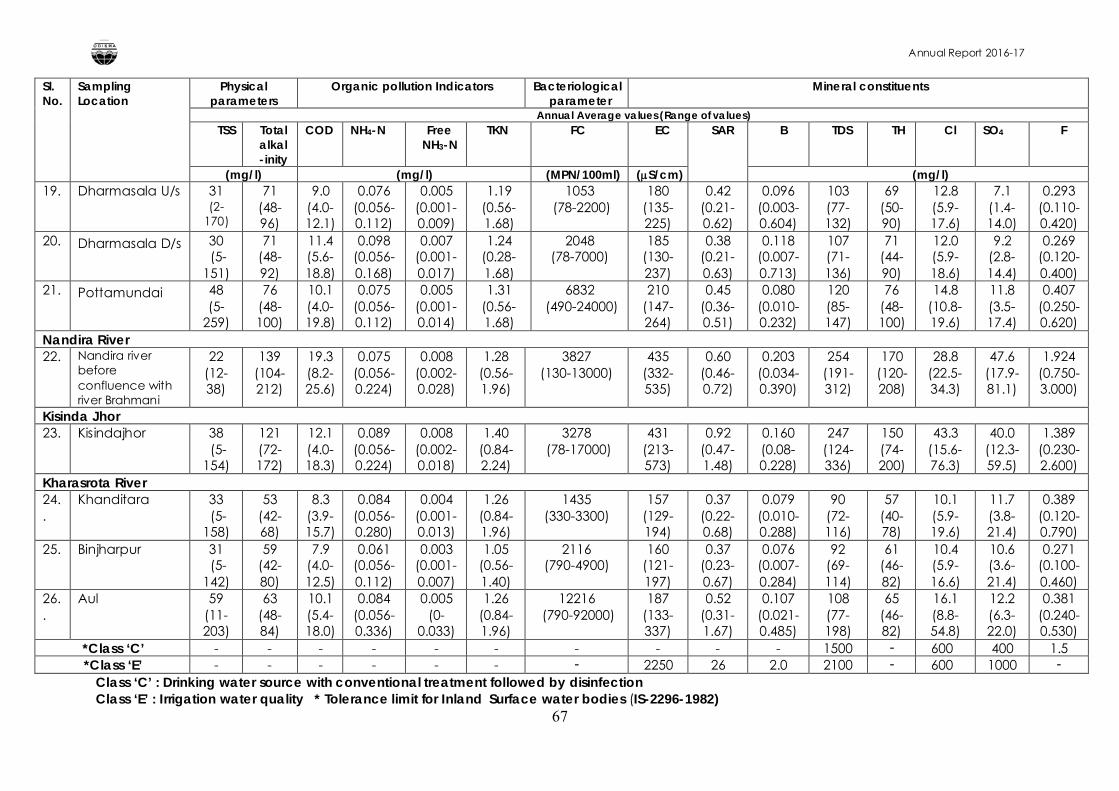
Annual Report 2016-17
67
Sl. No.
Sampling Location
Physical parameters
Organic pollution Indicators Bacteriological parameter
Mineral constituents
Annual Average values (Range of values)TSS Total
alkal-inity
COD NH4-N Free NH3-N
TKN FC EC SAR B TDS TH Cl SO4 F
(mg/l) (mg/l) (MPN/100ml) (S/cm) (mg/l)19. Dharmasala U/s 31
(2-170)
71 (48-96)
9.0 (4.0-12.1)
0.076 (0.056-0.112)
0.005 (0.001-0.009)
1.19 (0.56-1.68)
1053(78-2200)
180 (135-225)
0.42 (0.21-0.62)
0.096 (0.003-0.604)
103 (77-132)
69 (50-90)
12.8 (5.9-17.6)
7.1 (1.4-14.0)
0.293 (0.110-0.420)
20. Dharmasala D/s 30(5-
151)
71 (48-92)
11.4 (5.6-18.8)
0.098 (0.056-0.168)
0.007 (0.001-0.017)
1.24 (0.28-1.68)
2048 (78-7000)
185 (130-237)
0.38 (0.21-0.63)
0.118 (0.007-0.713)
107 (71-136)
71 (44-90)
12.0 (5.9-18.6)
9.2 (2.8-14.4)
0.269 (0.120-0.400)
21. Pottamundai 48 (5-
259)
76 (48-100)
10.1 (4.0-19.8)
0.075 (0.056-0.112)
0.005 (0.001-0.014)
1.31 (0.56-1.68)
6832(490-24000)
210 (147-264)
0.45 (0.36-0.51)
0.080 (0.010-0.232)
120 (85-147)
76 (48-100)
14.8 (10.8-19.6)
11.8 (3.5-17.4)
0.407 (0.250-0.620)
Nandira River22. Nandira river
before confluence with river Brahmani
22 (12-38)
139 (104-212)
19.3 (8.2-25.6)
0.075 (0.056-0.224)
0.008 (0.002-0.028)
1.28 (0.56-1.96)
3827 (130-13000)
435 (332-535)
0.60 (0.46-0.72)
0.203 (0.034-0.390)
254 (191-312)
170 (120-208)
28.8 (22.5-34.3)
47.6 (17.9-81.1)
1.924 (0.750-3.000)
Kisinda Jhor23. Kisindajhor 38
(5-154)
121 (72-172)
12.1 (4.0-18.3)
0.089 (0.056-0.224)
0.008 (0.002-0.018)
1.40 (0.84-2.24)
3278(78-17000)
431 (213-573)
0.92 (0.47-1.48)
0.160 (0.08-0.228)
247 (124-336)
150 (74-200)
43.3 (15.6-76.3)
40.0 (12.3-59.5)
1.389 (0.230-2.600)
Kharasrota River24..
Khanditara 33(5-
158)
53 (42-68)
8.3 (3.9-15.7)
0.084 (0.056-0.280)
0.004 (0.001-0.013)
1.26 (0.84-1.96)
1435(330-3300)
157 (129-194)
0.37 (0.22-0.68)
0.079 (0.010-0.288)
90 (72-116)
57 (40-78)
10.1 (5.9-19.6)
11.7 (3.8-21.4)
0.389 (0.120-0.790)
25. Binjharpur 31(5-
142)
59 (42-80)
7.9 (4.0-12.5)
0.061 (0.056-0.112)
0.003 (0.001-0.007)
1.05 (0.56-1.40)
2116 (790-4900)
160 (121-197)
0.37 (0.23-0.67)
0.076 (0.007-0.284)
92 (69-114)
61 (46-82)
10.4 (5.9-16.6)
10.6 (3.6-21.4)
0.271 (0.100-0.460)
26..
Aul 59 (11-203)
63 (48-84)
10.1 (5.4-18.0)
0.084 (0.056-0.336)
0.005 (0-
0.033)
1.26 (0.84-1.96)
12216(790-92000)
187 (133-337)
0.52 (0.31-1.67)
0.107 (0.021-0.485)
108 (77-198)
65 (46-82)
16.1 (8.8-54.8)
12.2 (6.3-22.0)
0.381 (0.240-0.530)
*Class ‘C’ - - - - - - - - - - 1500 - 600 400 1.5*Class ‘E’ - - - - - - - 2250 26 2.0 2100 - 600 1000 -
Class ‘C’ : Drinking water source with conventional treatment followed by disinfectionClass ‘E’ : Irrigation water quality * Tolerance limit for Inland Surface water bodies (IS-2296-1982)
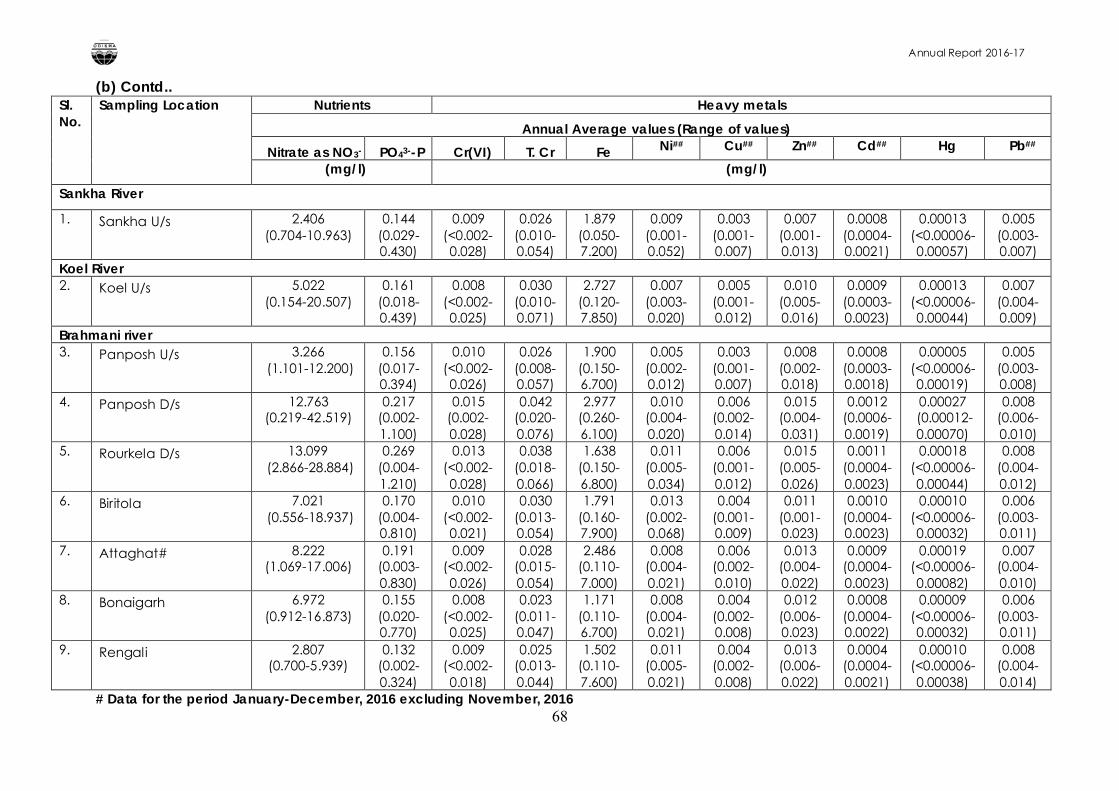
Annual Report 2016-17
68
(b) Contd.. Sl. No.
Sampling Location Nutrients Heavy metals
Annual Average values (Range of values)
Nitrate as NO3- PO43--P Cr(VI) T. Cr Fe Ni## Cu## Zn## Cd## Hg Pb##
(mg/l) (mg/l)
Sankha River
1. Sankha U/s 2.406 (0.704-10.963)
0.144 (0.029-0.430)
0.009 (<0.002-0.028)
0.026 (0.010-0.054)
1.879 (0.050-7.200)
0.009 (0.001-0.052)
0.003 (0.001-0.007)
0.007 (0.001-0.013)
0.0008 (0.0004-0.0021)
0.00013 (<0.00006-0.00057)
0.005 (0.003-0.007)
Koel River2. Koel U/s 5.022
(0.154-20.507)0.161
(0.018-0.439)
0.008 (<0.002-0.025)
0.030 (0.010-0.071)
2.727 (0.120-7.850)
0.007 (0.003-0.020)
0.005 (0.001-0.012)
0.010 (0.005-0.016)
0.0009 (0.0003-0.0023)
0.00013 (<0.00006-0.00044)
0.007 (0.004-0.009)
Brahmani river3. Panposh U/s 3.266
(1.101-12.200)0.156
(0.017-0.394)
0.010 (<0.002-0.026)
0.026 (0.008-0.057)
1.900 (0.150-6.700)
0.005 (0.002-0.012)
0.003 (0.001-0.007)
0.008 (0.002-0.018)
0.0008 (0.0003-0.0018)
0.00005 (<0.00006-0.00019)
0.005 (0.003-0.008)
4. Panposh D/s 12.763 (0.219-42.519)
0.217 (0.002-1.100)
0.015 (0.002-0.028)
0.042 (0.020-0.076)
2.977 (0.260-6.100)
0.010 (0.004-0.020)
0.006 (0.002-0.014)
0.015 (0.004-0.031)
0.0012 (0.0006-0.0019)
0.00027(0.00012-0.00070)
0.008 (0.006-0.010)
5. Rourkela D/s 13.099(2.866-28.884)
0.269 (0.004-1.210)
0.013 (<0.002-0.028)
0.038 (0.018-0.066)
1.638 (0.150-6.800)
0.011 (0.005-0.034)
0.006 (0.001-0.012)
0.015 (0.005-0.026)
0.0011 (0.0004-0.0023)
0.00018 (<0.00006-0.00044)
0.008 (0.004-0.012)
6. Biritola 7.021(0.556-18.937)
0.170 (0.004-0.810)
0.010 (<0.002-0.021)
0.030 (0.013-0.054)
1.791 (0.160-7.900)
0.013 (0.002-0.068)
0.004 (0.001-0.009)
0.011 (0.001-0.023)
0.0010 (0.0004-0.0023)
0.00010 (<0.00006-0.00032)
0.006 (0.003-0.011)
7. Attaghat# 8.222 (1.069-17.006)
0.191 (0.003-0.830)
0.009 (<0.002-0.026)
0.028 (0.015-0.054)
2.486 (0.110-7.000)
0.008 (0.004-0.021)
0.006 (0.002-0.010)
0.013 (0.004-0.022)
0.0009 (0.0004-0.0023)
0.00019 (<0.00006-0.00082)
0.007 (0.004-0.010)
8. Bonaigarh 6.972 (0.912-16.873)
0.155 (0.020-0.770)
0.008 (<0.002-0.025)
0.023 (0.011-0.047)
1.171 (0.110-6.700)
0.008 (0.004-0.021)
0.004 (0.002-0.008)
0.012 (0.006-0.023)
0.0008 (0.0004-0.0022)
0.00009 (<0.00006-0.00032)
0.006 (0.003-0.011)
9. Rengali 2.807 (0.700-5.939)
0.132 (0.002-0.324)
0.009 (<0.002-0.018)
0.025 (0.013-0.044)
1.502 (0.110-7.600)
0.011 (0.005-0.021)
0.004 (0.002-0.008)
0.013 (0.006-0.022)
0.0004 (0.0004-0.0021)
0.00010 (<0.00006-0.00038)
0.008 (0.004-0.014)
# Data for the period January-December, 2016 excluding November, 2016
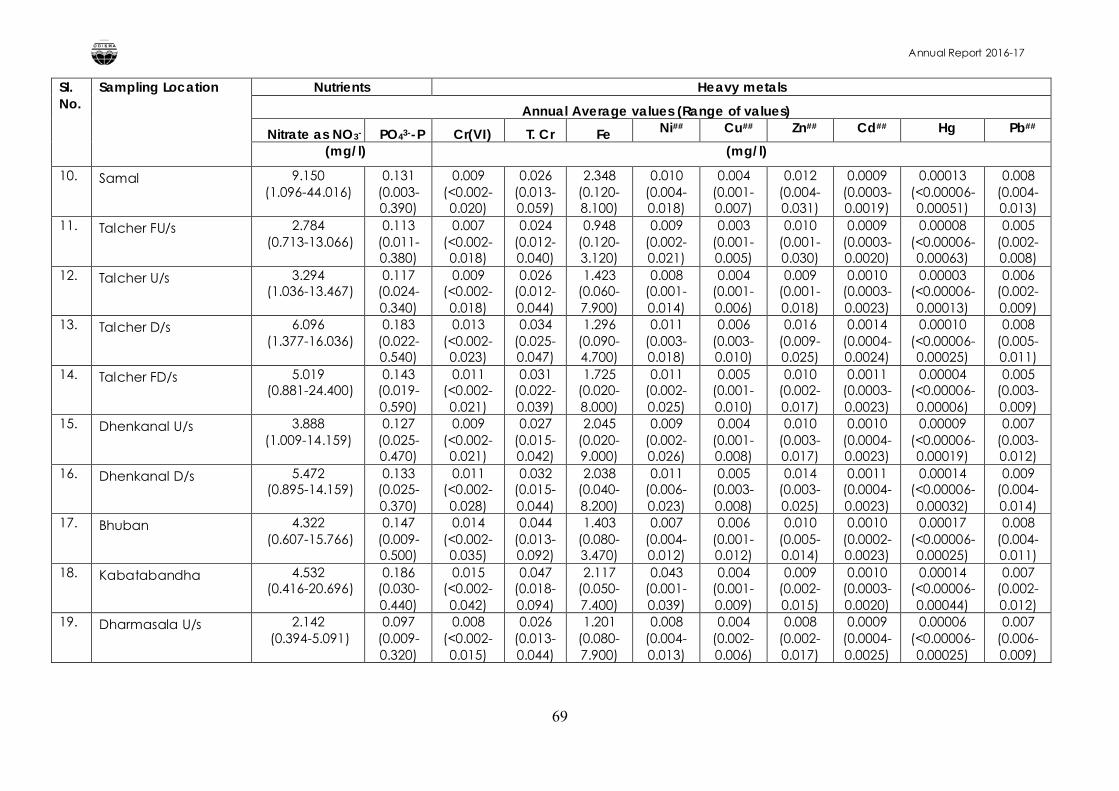
Annual Report 2016-17
69
Sl. No.
Sampling Location Nutrients Heavy metals
Annual Average values (Range of values)
Nitrate as NO3- PO43--P Cr(VI) T. Cr Fe Ni## Cu## Zn## Cd## Hg Pb##
(mg/l) (mg/l)
10. Samal 9.150 (1.096-44.016)
0.131 (0.003-0.390)
0.009 (<0.002-0.020)
0.026 (0.013-0.059)
2.348 (0.120-8.100)
0.010 (0.004-0.018)
0.004 (0.001-0.007)
0.012 (0.004-0.031)
0.0009 (0.0003-0.0019)
0.00013 (<0.00006-0.00051)
0.008 (0.004-0.013)
11. Talcher FU/s 2.784(0.713-13.066)
0.113 (0.011-0.380)
0.007 (<0.002-0.018)
0.024 (0.012-0.040)
0.948 (0.120-3.120)
0.009 (0.002-0.021)
0.003 (0.001-0.005)
0.010 (0.001-0.030)
0.0009 (0.0003-0.0020)
0.00008 (<0.00006-0.00063)
0.005 (0.002-0.008)
12. Talcher U/s 3.294(1.036-13.467)
0.117 (0.024-0.340)
0.009 (<0.002-0.018)
0.026 (0.012-0.044)
1.423 (0.060-7.900)
0.008 (0.001-0.014)
0.004 (0.001-0.006)
0.009 (0.001-0.018)
0.0010 (0.0003-0.0023)
0.00003 (<0.00006-0.00013)
0.006 (0.002-0.009)
13. Talcher D/s 6.096(1.377-16.036)
0.183 (0.022-0.540)
0.013 (<0.002-0.023)
0.034 (0.025-0.047)
1.296 (0.090-4.700)
0.011 (0.003-0.018)
0.006 (0.003-0.010)
0.016 (0.009-0.025)
0.0014 (0.0004-0.0024)
0.00010 (<0.00006-0.00025)
0.008 (0.005-0.011)
14. Talcher FD/s 5.019(0.881-24.400)
0.143 (0.019-0.590)
0.011 (<0.002-0.021)
0.031 (0.022-0.039)
1.725 (0.020-8.000)
0.011 (0.002-0.025)
0.005 (0.001-0.010)
0.010 (0.002-0.017)
0.0011 (0.0003-0.0023)
0.00004 (<0.00006-0.00006)
0.005 (0.003-0.009)
15. Dhenkanal U/s 3.888 (1.009-14.159)
0.127 (0.025-0.470)
0.009 (<0.002-0.021)
0.027 (0.015-0.042)
2.045 (0.020-9.000)
0.009 (0.002-0.026)
0.004 (0.001-0.008)
0.010 (0.003-0.017)
0.0010 (0.0004-0.0023)
0.00009 (<0.00006-0.00019)
0.007 (0.003-0.012)
16. Dhenkanal D/s 5.472(0.895-14.159)
0.133 (0.025-0.370)
0.011 (<0.002-0.028)
0.032 (0.015-0.044)
2.038 (0.040-8.200)
0.011 (0.006-0.023)
0.005 (0.003-0.008)
0.014 (0.003-0.025)
0.0011 (0.0004-0.0023)
0.00014 (<0.00006-0.00032)
0.009 (0.004-0.014)
17. Bhuban 4.322(0.607-15.766)
0.147 (0.009-0.500)
0.014 (<0.002-0.035)
0.044 (0.013-0.092)
1.403 (0.080-3.470)
0.007 (0.004-0.012)
0.006 (0.001-0.012)
0.010 (0.005-0.014)
0.0010 (0.0002-0.0023)
0.00017(<0.00006-0.00025)
0.008 (0.004-0.011)
18. Kabatabandha 4.532(0.416-20.696)
0.186 (0.030-0.440)
0.015 (<0.002-0.042)
0.047 (0.018-0.094)
2.117 (0.050-7.400)
0.043 (0.001-0.039)
0.004 (0.001-0.009)
0.009 (0.002-0.015)
0.0010 (0.0003-0.0020)
0.00014(<0.00006-0.00044)
0.007 (0.002-0.012)
19. Dharmasala U/s 2.142(0.394-5.091)
0.097 (0.009-0.320)
0.008 (<0.002-0.015)
0.026 (0.013-0.044)
1.201 (0.080-7.900)
0.008 (0.004-0.013)
0.004 (0.002-0.006)
0.008 (0.002-0.017)
0.0009 (0.0004-0.0025)
0.00006 (<0.00006-0.00025)
0.007 (0.006-0.009)
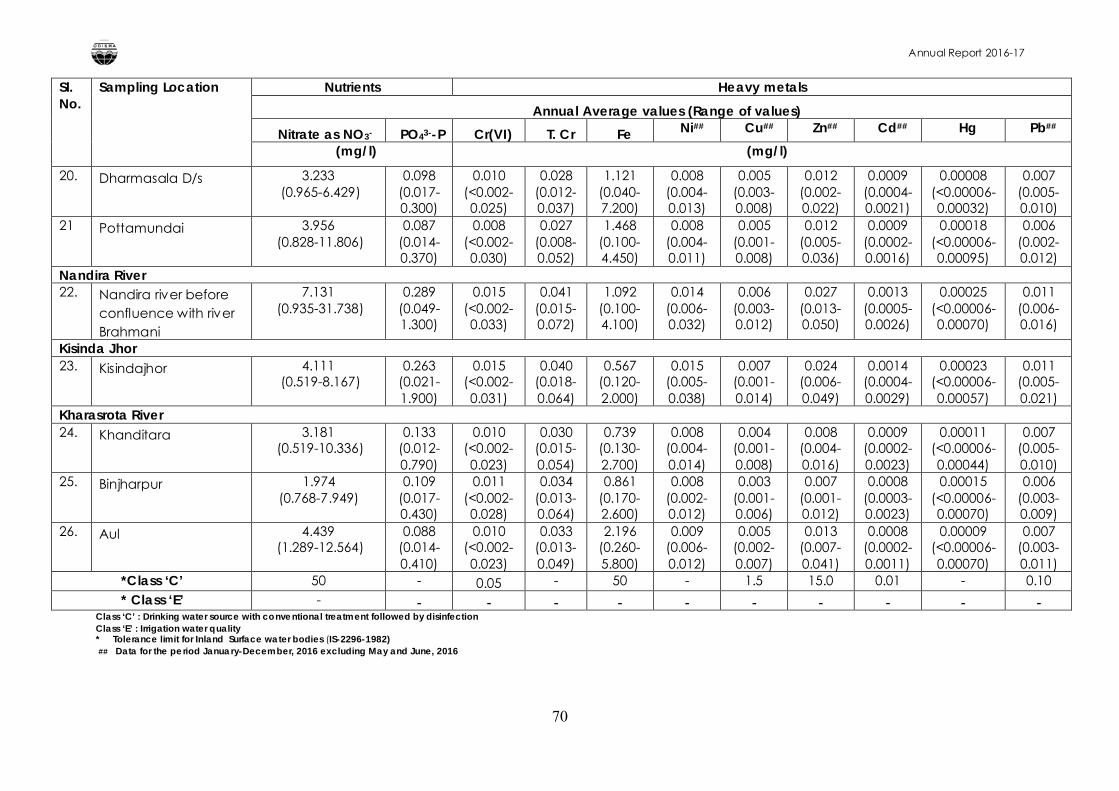
Annual Report 2016-17
70
Sl. No.
Sampling Location Nutrients Heavy metals
Annual Average values (Range of values)
Nitrate as NO3- PO43--P Cr(VI) T. Cr Fe Ni## Cu## Zn## Cd## Hg Pb##
(mg/l) (mg/l)
20. Dharmasala D/s 3.233(0.965-6.429)
0.098 (0.017-0.300)
0.010 (<0.002-0.025)
0.028 (0.012-0.037)
1.121 (0.040-7.200)
0.008 (0.004-0.013)
0.005 (0.003-0.008)
0.012 (0.002-0.022)
0.0009 (0.0004-0.0021)
0.00008 (<0.00006-0.00032)
0.007 (0.005-0.010)
21 Pottamundai 3.956(0.828-11.806)
0.087 (0.014-0.370)
0.008 (<0.002-0.030)
0.027 (0.008-0.052)
1.468 (0.100-4.450)
0.008 (0.004-0.011)
0.005 (0.001-0.008)
0.012 (0.005-0.036)
0.0009 (0.0002-0.0016)
0.00018 (<0.00006-0.00095)
0.006 (0.002-0.012)
Nandira River22. Nandira river before
confluence with river Brahmani
7.131(0.935-31.738)
0.289 (0.049-1.300)
0.015 (<0.002-0.033)
0.041 (0.015-0.072)
1.092 (0.100-4.100)
0.014 (0.006-0.032)
0.006 (0.003-0.012)
0.027 (0.013-0.050)
0.0013 (0.0005-0.0026)
0.00025 (<0.00006-0.00070)
0.011 (0.006-0.016)
Kisinda Jhor23. Kisindajhor 4.111
(0.519-8.167)0.263
(0.021-1.900)
0.015 (<0.002-0.031)
0.040 (0.018-0.064)
0.567 (0.120-2.000)
0.015 (0.005-0.038)
0.007 (0.001-0.014)
0.024 (0.006-0.049)
0.0014 (0.0004-0.0029)
0.00023 (<0.00006-0.00057)
0.011 (0.005-0.021)
Kharasrota River24. Khanditara 3.181
(0.519-10.336)0.133
(0.012-0.790)
0.010 (<0.002-0.023)
0.030 (0.015-0.054)
0.739 (0.130-2.700)
0.008 (0.004-0.014)
0.004 (0.001-0.008)
0.008 (0.004-0.016)
0.0009 (0.0002-0.0023)
0.00011 (<0.00006-0.00044)
0.007 (0.005-0.010)
25. Binjharpur 1.974 (0.768-7.949)
0.109 (0.017-0.430)
0.011 (<0.002-0.028)
0.034 (0.013-0.064)
0.861 (0.170-2.600)
0.008 (0.002-0.012)
0.003 (0.001-0.006)
0.007 (0.001-0.012)
0.0008 (0.0003-0.0023)
0.00015 (<0.00006-0.00070)
0.006 (0.003-0.009)
26. Aul 4.439(1.289-12.564)
0.088 (0.014-0.410)
0.010 (<0.002-0.023)
0.033 (0.013-0.049)
2.196 (0.260-5.800)
0.009 (0.006-0.012)
0.005 (0.002-0.007)
0.013 (0.007-0.041)
0.0008 (0.0002-0.0011)
0.00009 (<0.00006-0.00070)
0.007 (0.003-0.011)
*Class ‘C’ 50 - 0.05 - 50 - 1.5 15.0 0.01 - 0.10* Class ‘E’ - - - - - - - - - - -
Class ‘C’ : Drinking water source with conventional treatment followed by disinfectionClass ‘E’ : Irrigation water quality* Tolerance limit for Inland Surface water bodies (IS-2296-1982) ## Data for the period January-December, 2016 excluding May and June, 2016
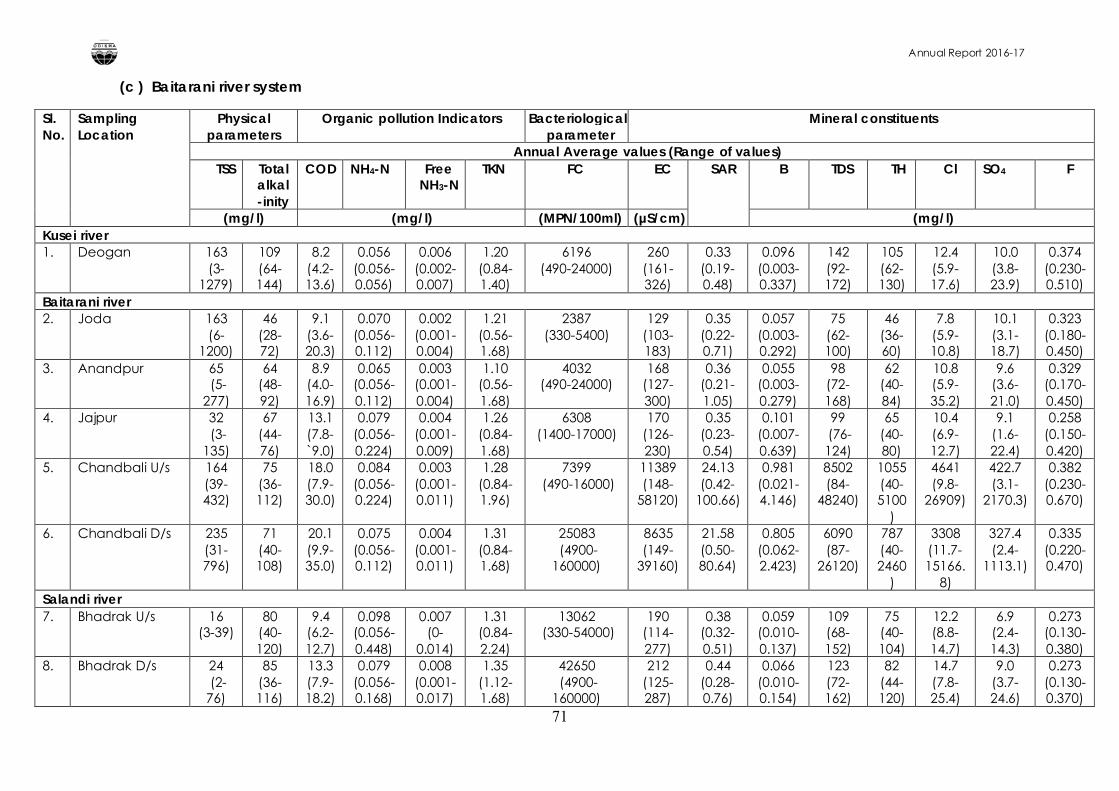
Annual Report 2016-17
71
(c ) Baitarani river system
Sl. No.
Sampling Location
Physical parameters
Organic pollution Indicators Bacteriological parameter
Mineral constituents
Annual Average values (Range of values)TSS Total
alkal-inity
COD NH4-N Free NH3-N
TKN FC EC SAR B TDS TH Cl SO4 F
(mg/l) (mg/l) (MPN/100ml) (µS/cm) (mg/l)Kusei river1. Deogan 163
(3-1279)
109 (64-144)
8.2 (4.2-13.6)
0.056 (0.056-0.056)
0.006 (0.002-0.007)
1.20 (0.84-1.40)
6196 (490-24000)
260 (161-326)
0.33 (0.19-0.48)
0.096 (0.003-0.337)
142 (92-172)
105 (62-130)
12.4 (5.9-17.6)
10.0 (3.8-23.9)
0.374 (0.230-0.510)
Baitarani river2. Joda 163
(6-1200)
46 (28-72)
9.1 (3.6-20.3)
0.070 (0.056-0.112)
0.002 (0.001-0.004)
1.21 (0.56-1.68)
2387 (330-5400)
129 (103-183)
0.35 (0.22-0.71)
0.057 (0.003-0.292)
75 (62-100)
46 (36-60)
7.8 (5.9-10.8)
10.1 (3.1-18.7)
0.323 (0.180-0.450)
3. Anandpur 65(5-
277)
64 (48-92)
8.9 (4.0-16.9)
0.065 (0.056-0.112)
0.003 (0.001-0.004)
1.10 (0.56-1.68)
4032 (490-24000)
168 (127-300)
0.36 (0.21-1.05)
0.055 (0.003-0.279)
98 (72-168)
62 (40-84)
10.8 (5.9-35.2)
9.6 (3.6-21.0)
0.329 (0.170-0.450)
4. Jajpur 32(3-
135)
67 (44-76)
13.1 (7.8-`9.0)
0.079 (0.056-0.224)
0.004 (0.001-0.009)
1.26 (0.84-1.68)
6308 (1400-17000)
170 (126-230)
0.35 (0.23-0.54)
0.101 (0.007-0.639)
99(76-124)
65 (40-80)
10.4 (6.9-12.7)
9.1 (1.6-22.4)
0.258 (0.150-0.420)
5. Chandbali U/s 164 (39-432)
75 (36-112)
18.0 (7.9-30.0)
0.084 (0.056-0.224)
0.003 (0.001-0.011)
1.28 (0.84-1.96)
7399(490-16000)
11389 (148-
58120)
24.13 (0.42-
100.66)
0.981 (0.021-4.146)
8502 (84-
48240)
1055 (40-5100
)
4641 (9.8-
26909)
422.7 (3.1-
2170.3)
0.382 (0.230-0.670)
6. Chandbali D/s 235 (31-796)
71 (40-108)
20.1 (9.9-35.0)
0.075 (0.056-0.112)
0.004 (0.001-0.011)
1.31 (0.84-1.68)
25083(4900-
160000)
8635 (149-
39160)
21.58 (0.50-80.64)
0.805 (0.062-2.423)
6090 (87-
26120)
787 (40-2460
)
3308 (11.7-15166.
8)
327.4 (2.4-
1113.1)
0.335 (0.220-0.470)
Salandi river7. Bhadrak U/s 16
(3-39)80
(40-120)
9.4 (6.2-12.7)
0.098 (0.056-0.448)
0.007 (0-
0.014)
1.31 (0.84-2.24)
13062(330-54000)
190 (114-277)
0.38 (0.32-0.51)
0.059 (0.010-0.137)
109 (68-152)
75 (40-104)
12.2 (8.8-14.7)
6.9 (2.4-14.3)
0.273 (0.130-0.380)
8. Bhadrak D/s 24(2-
76)
85 (36-116)
13.3 (7.9-18.2)
0.079 (0.056-0.168)
0.008 (0.001-0.017)
1.35 (1.12-1.68)
42650(4900-
160000)
212 (125-287)
0.44 (0.28-0.76)
0.066 (0.010-0.154)
123 (72-162)
82 (44-120)
14.7 (7.8-25.4)
9.0 (3.7-24.6)
0.273 (0.130-0.370)
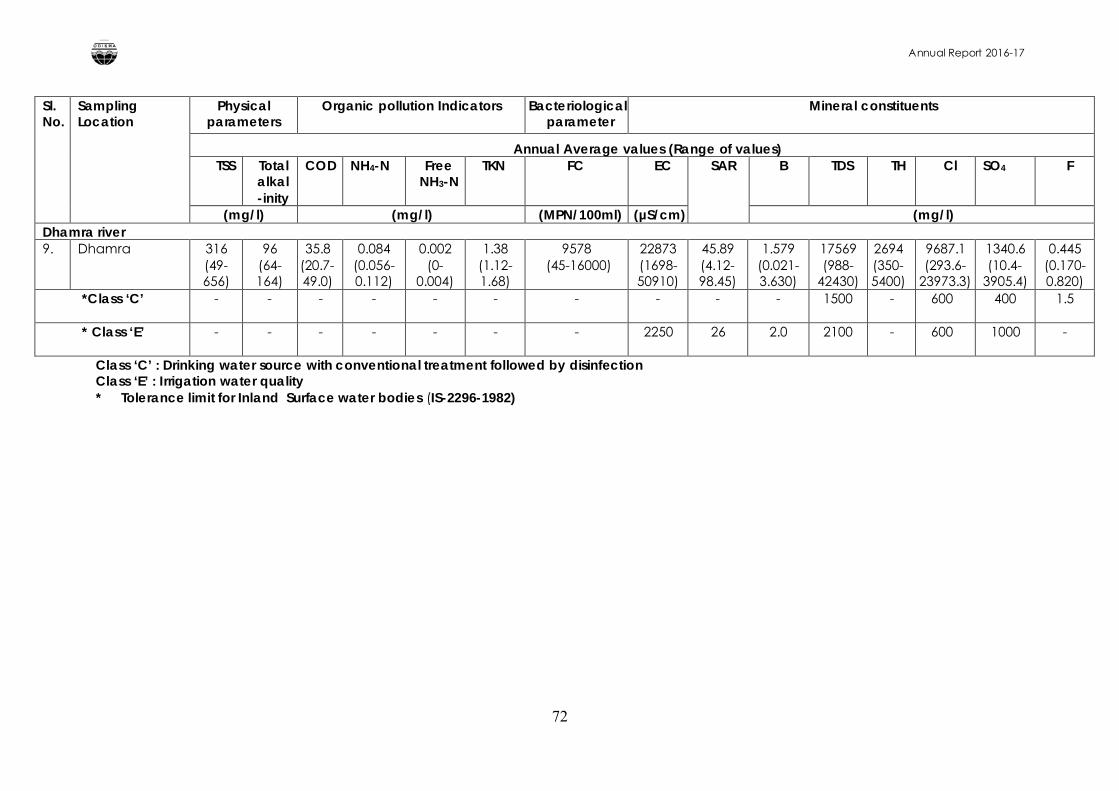
Annual Report 2016-17
72
Sl. No.
Sampling Location
Physical parameters
Organic pollution Indicators Bacteriological parameter
Mineral constituents
Annual Average values (Range of values)TSS Total
alkal-inity
COD NH4-N Free NH3-N
TKN FC EC SAR B TDS TH Cl SO4 F
(mg/l) (mg/l) (MPN/100ml) (µS/cm) (mg/l)Dhamra river9. Dhamra 316
(49-656)
96 (64-164)
35.8 (20.7-49.0)
0.084 (0.056-0.112)
0.002 (0-
0.004)
1.38 (1.12-1.68)
9578(45-16000)
22873 (1698-50910)
45.89 (4.12-98.45)
1.579 (0.021-3.630)
17569 (988-
42430)
2694 (350-5400)
9687.1 (293.6-
23973.3)
1340.6 (10.4-
3905.4)
0.445 (0.170-0.820)
*Class ‘C’ - - - - - - - - - - 1500 - 600 400 1.5
* Class ‘E’ - - - - - - - 2250 26 2.0 2100 - 600 1000 -
Class ‘C’ : Drinking water source with conventional treatment followed by disinfectionClass ‘E’ : Irrigation water quality* Tolerance limit for Inland Surface water bodies (IS-2296-1982)
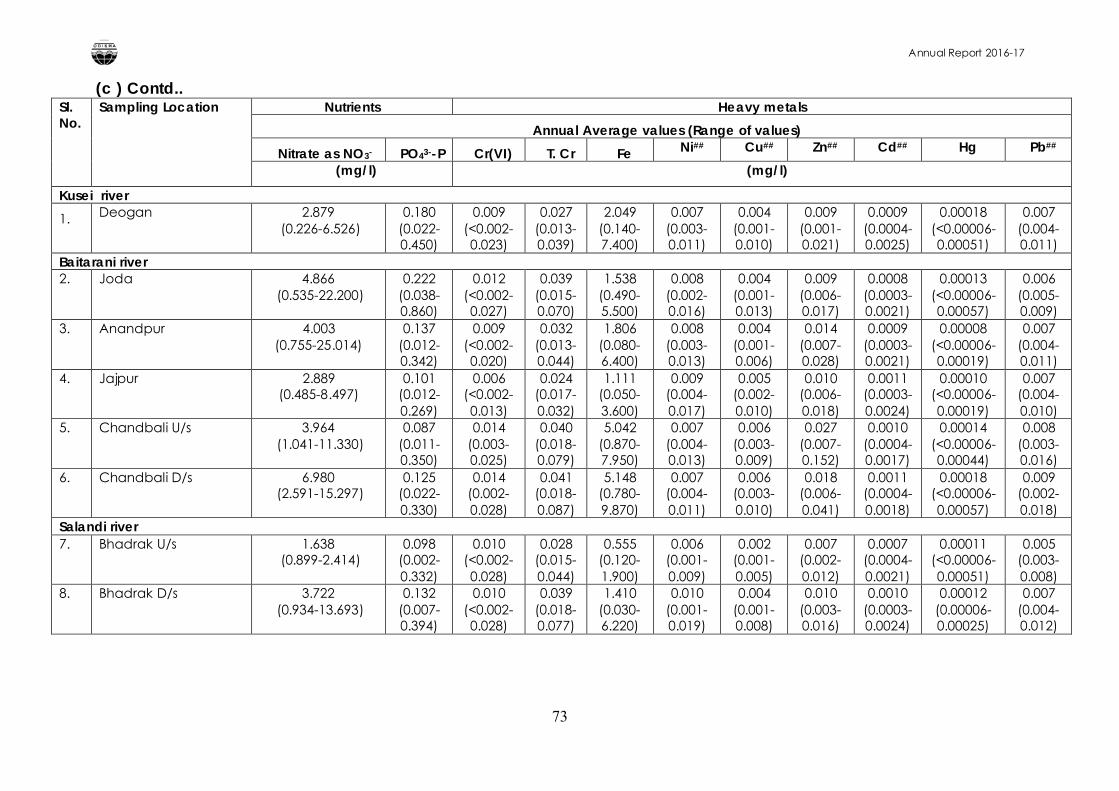
Annual Report 2016-17
73
(c ) Contd..Sl. No.
Sampling Location Nutrients Heavy metals
Annual Average values (Range of values)
Nitrate as NO3- PO43--P Cr(VI) T. Cr Fe Ni## Cu## Zn## Cd## Hg Pb##
(mg/l) (mg/l)
Kusei river
1. Deogan 2.879(0.226-6.526)
0.180 (0.022-0.450)
0.009 (<0.002-0.023)
0.027 (0.013-0.039)
2.049 (0.140-7.400)
0.007 (0.003-0.011)
0.004 (0.001-0.010)
0.009 (0.001-0.021)
0.0009 (0.0004-0.0025)
0.00018 (<0.00006-0.00051)
0.007 (0.004-0.011)
Baitarani river2. Joda 4.866
(0.535-22.200)0.222
(0.038-0.860)
0.012 (<0.002-0.027)
0.039 (0.015-0.070)
1.538 (0.490-5.500)
0.008 (0.002-0.016)
0.004 (0.001-0.013)
0.009 (0.006-0.017)
0.0008 (0.0003-0.0021)
0.00013 (<0.00006-0.00057)
0.006 (0.005-0.009)
3. Anandpur 4.003 (0.755-25.014)
0.137 (0.012-0.342)
0.009 (<0.002-0.020)
0.032 (0.013-0.044)
1.806 (0.080-6.400)
0.008 (0.003-0.013)
0.004 (0.001-0.006)
0.014 (0.007-0.028)
0.0009 (0.0003-0.0021)
0.00008 (<0.00006-0.00019)
0.007 (0.004-0.011)
4. Jajpur 2.889 (0.485-8.497)
0.101 (0.012-0.269)
0.006 (<0.002-0.013)
0.024 (0.017-0.032)
1.111 (0.050-3.600)
0.009 (0.004-0.017)
0.005 (0.002-0.010)
0.010 (0.006-0.018)
0.0011 (0.0003-0.0024)
0.00010 (<0.00006-0.00019)
0.007 (0.004-0.010)
5. Chandbali U/s 3.964(1.041-11.330)
0.087 (0.011-0.350)
0.014 (0.003-0.025)
0.040 (0.018-0.079)
5.042 (0.870-7.950)
0.007 (0.004-0.013)
0.006 (0.003-0.009)
0.027 (0.007-0.152)
0.0010 (0.0004-0.0017)
0.00014 (<0.00006-0.00044)
0.008 (0.003-0.016)
6. Chandbali D/s 6.980(2.591-15.297)
0.125 (0.022-0.330)
0.014 (0.002-0.028)
0.041 (0.018-0.087)
5.148 (0.780-9.870)
0.007 (0.004-0.011)
0.006 (0.003-0.010)
0.018 (0.006-0.041)
0.0011 (0.0004-0.0018)
0.00018 (<0.00006-0.00057)
0.009 (0.002-0.018)
Salandi river7. Bhadrak U/s 1.638
(0.899-2.414)0.098
(0.002-0.332)
0.010 (<0.002-0.028)
0.028 (0.015-0.044)
0.555 (0.120-1.900)
0.006 (0.001-0.009)
0.002 (0.001-0.005)
0.007 (0.002-0.012)
0.0007 (0.0004-0.0021)
0.00011 (<0.00006-0.00051)
0.005 (0.003-0.008)
8. Bhadrak D/s 3.722(0.934-13.693)
0.132 (0.007-0.394)
0.010 (<0.002-0.028)
0.039 (0.018-0.077)
1.410 (0.030-6.220)
0.010 (0.001-0.019)
0.004 (0.001-0.008)
0.010 (0.003-0.016)
0.0010 (0.0003-0.0024)
0.00012 (0.00006-0.00025)
0.007 (0.004-0.012)
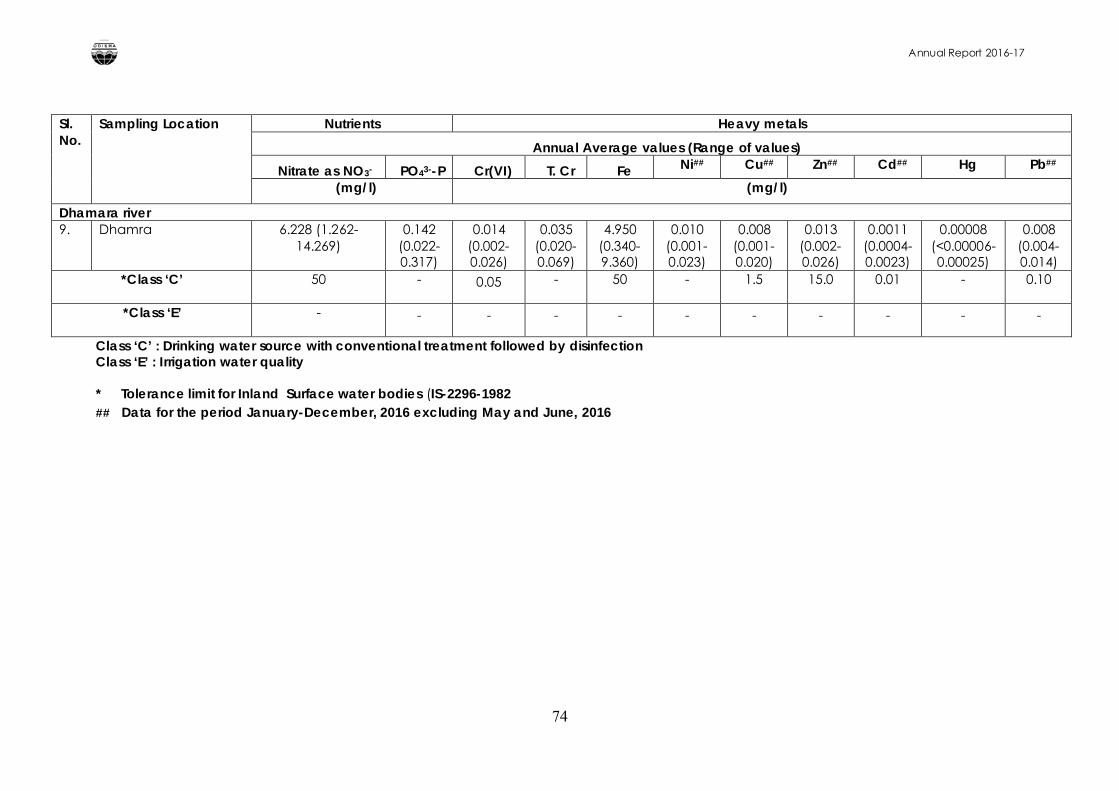
Annual Report 2016-17
74
Sl. No.
Sampling Location Nutrients Heavy metals
Annual Average values (Range of values)
Nitrate as NO3- PO43--P Cr(VI) T. Cr Fe Ni## Cu## Zn## Cd## Hg Pb##
(mg/l) (mg/l)
Dhamara river9. Dhamra 6.228 (1.262-
14.269)0.142
(0.022-0.317)
0.014 (0.002-0.026)
0.035 (0.020-0.069)
4.950 (0.340-9.360)
0.010 (0.001-0.023)
0.008 (0.001-0.020)
0.013 (0.002-0.026)
0.0011 (0.0004-0.0023)
0.00008 (<0.00006-0.00025)
0.008 (0.004-0.014)
*Class ‘C’ 50 - 0.05 - 50 - 1.5 15.0 0.01 - 0.10
*Class ‘E’ - - - - - - - - - - -
Class ‘C’ : Drinking water source with conventional treatment followed by disinfectionClass ‘E’ : Irrigation water quality
* Tolerance limit for Inland Surface water bodies (IS-2296-1982## Data for the period January-December, 2016 excluding May and June, 2016
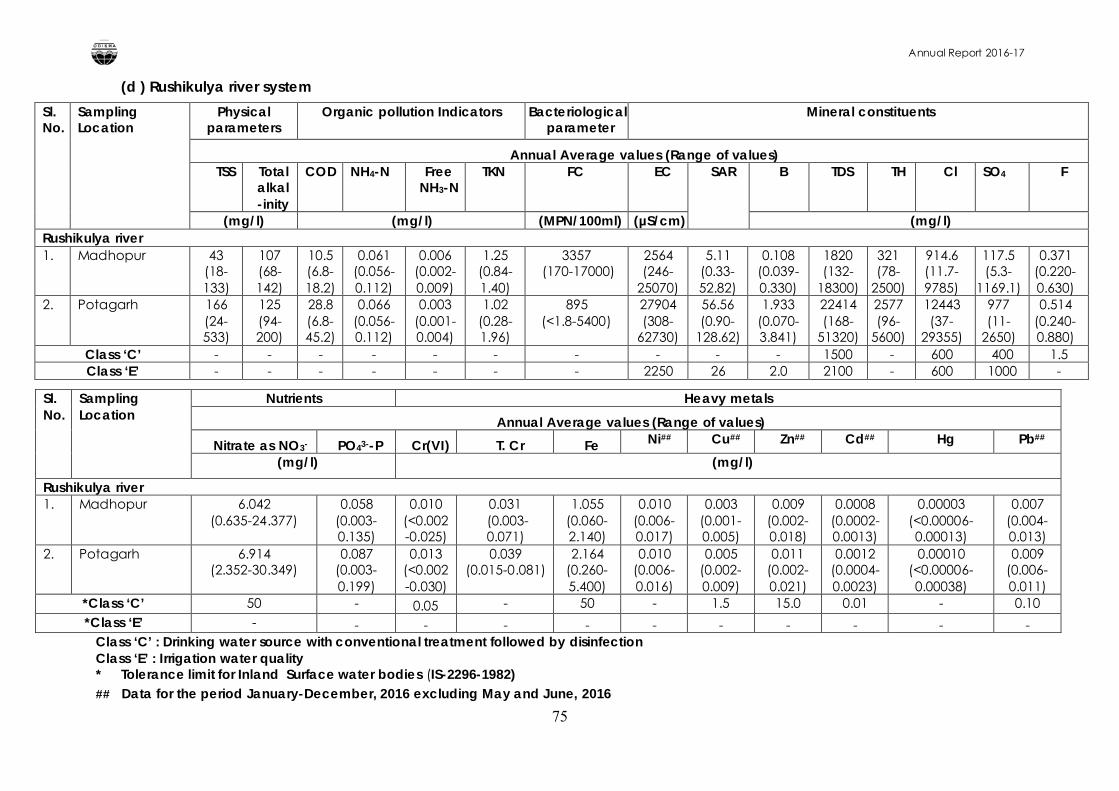
Annual Report 2016-17
75
(d ) Rushikulya river system
Sl. No.
Sampling Location
Physical parameters
Organic pollution Indicators Bacteriological parameter
Mineral constituents
Annual Average values (Range of values)TSS Total
alkal-inity
COD NH4-N Free NH3-N
TKN FC EC SAR B TDS TH Cl SO4 F
(mg/l) (mg/l) (MPN/100ml) (µS/cm) (mg/l)Rushikulya river1. Madhopur 43
(18-133)
107 (68-142)
10.5 (6.8-18.2)
0.061 (0.056-0.112)
0.006 (0.002-0.009)
1.25 (0.84-1.40)
3357(170-17000)
2564 (246-
25070)
5.11 (0.33-52.82)
0.108 (0.039-0.330)
1820 (132-
18300)
321 (78-
2500)
914.6 (11.7-9785)
117.5 (5.3-
1169.1)
0.371 (0.220-0.630)
2. Potagarh 166 (24-533)
125 (94-200)
28.8 (6.8-45.2)
0.066 (0.056-0.112)
0.003 (0.001-0.004)
1.02 (0.28-1.96)
895 (<1.8-5400)
27904 (308-
62730)
56.56 (0.90-
128.62)
1.933 (0.070-3.841)
22414 (168-
51320)
2577 (96-
5600)
12443 (37-
29355)
977 (11-
2650)
0.514 (0.240-0.880)
Class ‘C’ - - - - - - - - - - 1500 - 600 400 1.5Class ‘E’ - - - - - - - 2250 26 2.0 2100 - 600 1000 -
Sl. No.
Sampling Location
Nutrients Heavy metals
Annual Average values (Range of values)
Nitrate as NO3- PO43--P Cr(VI) T. Cr Fe Ni## Cu## Zn## Cd## Hg Pb##
(mg/l) (mg/l)
Rushikulya river1. Madhopur 6.042
(0.635-24.377)0.058
(0.003-0.135)
0.010 (<0.002-0.025)
0.031(0.003-0.071)
1.055 (0.060-2.140)
0.010 (0.006-0.017)
0.003 (0.001-0.005)
0.009 (0.002-0.018)
0.0008 (0.0002-0.0013)
0.00003 (<0.00006-0.00013)
0.007 (0.004-0.013)
2. Potagarh 6.914 (2.352-30.349)
0.087 (0.003-0.199)
0.013 (<0.002-0.030)
0.039 (0.015-0.081)
2.164 (0.260-5.400)
0.010 (0.006-0.016)
0.005 (0.002-0.009)
0.011(0.002-0.021)
0.0012 (0.0004-0.0023)
0.00010 (<0.00006-0.00038)
0.009 (0.006-0.011)
*Class ‘C’ 50 - 0.05 - 50 - 1.5 15.0 0.01 - 0.10*Class ‘E’ - - - - - - - - - - -
Class ‘C’ : Drinking water source with conventional treatment followed by disinfectionClass ‘E’ : Irrigation water quality* Tolerance limit for Inland Surface water bodies (IS-2296-1982) ## Data for the period January-December, 2016 excluding May and June, 2016
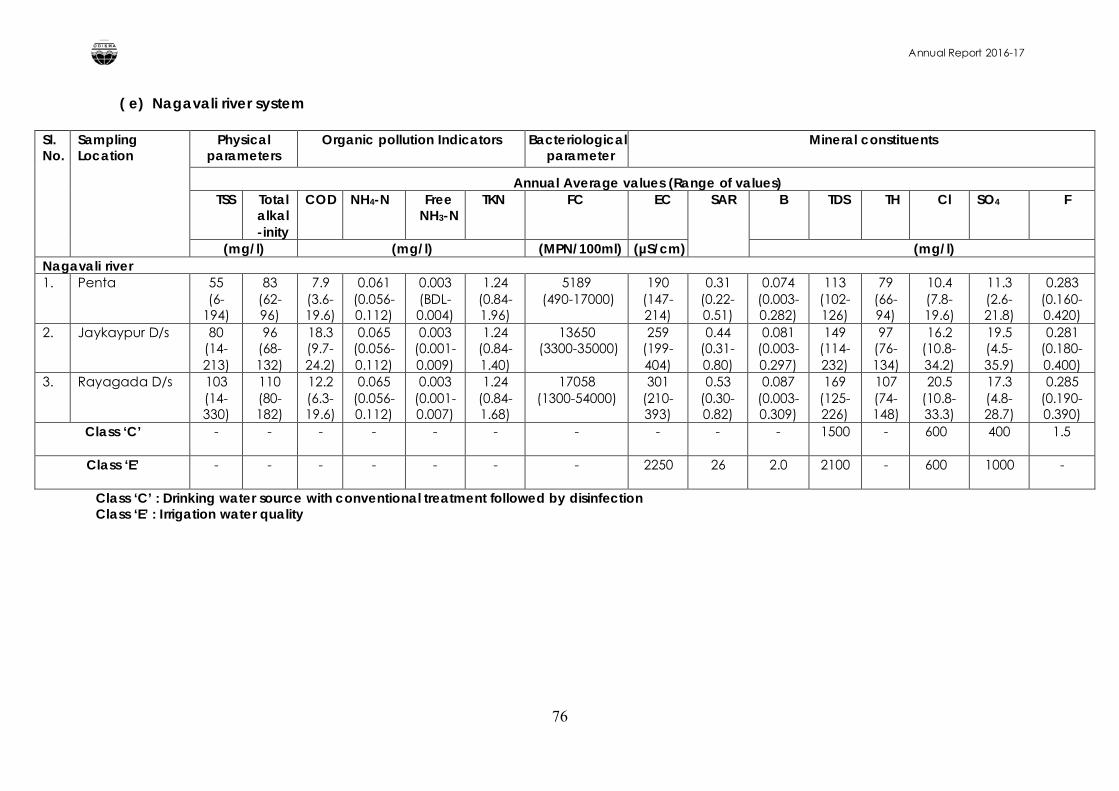
Annual Report 2016-17
76
( e) Nagavali river system
Sl. No.
Sampling Location
Physical parameters
Organic pollution Indicators Bacteriological parameter
Mineral constituents
Annual Average values (Range of values)TSS Total
alkal-inity
COD NH4-N Free NH3-N
TKN FC EC SAR B TDS TH Cl SO4 F
(mg/l) (mg/l) (MPN/100ml) (µS/cm) (mg/l)Nagavali river1. Penta 55
(6-194)
83 (62-96)
7.9 (3.6-19.6)
0.061 (0.056-0.112)
0.003 (BDL-0.004)
1.24 (0.84-1.96)
5189(490-17000)
190 (147-214)
0.31 (0.22-0.51)
0.074 (0.003-0.282)
113 (102-126)
79 (66-94)
10.4 (7.8-19.6)
11.3 (2.6-21.8)
0.283 (0.160-0.420)
2. Jaykaypur D/s 80 (14-213)
96 (68-132)
18.3 (9.7-24.2)
0.065 (0.056-0.112)
0.003 (0.001-0.009)
1.24 (0.84-1.40)
13650(3300-35000)
259 (199-404)
0.44 (0.31-0.80)
0.081 (0.003-0.297)
149 (114-232)
97 (76-134)
16.2 (10.8-34.2)
19.5 (4.5-35.9)
0.281 (0.180-0.400)
3. Rayagada D/s 103 (14-330)
110 (80-182)
12.2 (6.3-19.6)
0.065 (0.056-0.112)
0.003 (0.001-0.007)
1.24 (0.84-1.68)
17058 (1300-54000)
301 (210-393)
0.53 (0.30-0.82)
0.087 (0.003-0.309)
169 (125-226)
107 (74-148)
20.5 (10.8-33.3)
17.3 (4.8-28.7)
0.285 (0.190-0.390)
Class ‘C’ - - - - - - - - - - 1500 - 600 400 1.5
Class ‘E’ - - - - - - - 2250 26 2.0 2100 - 600 1000 -
Class ‘C’ : Drinking water source with conventional treatment followed by disinfectionClass ‘E’ : Irrigation water quality
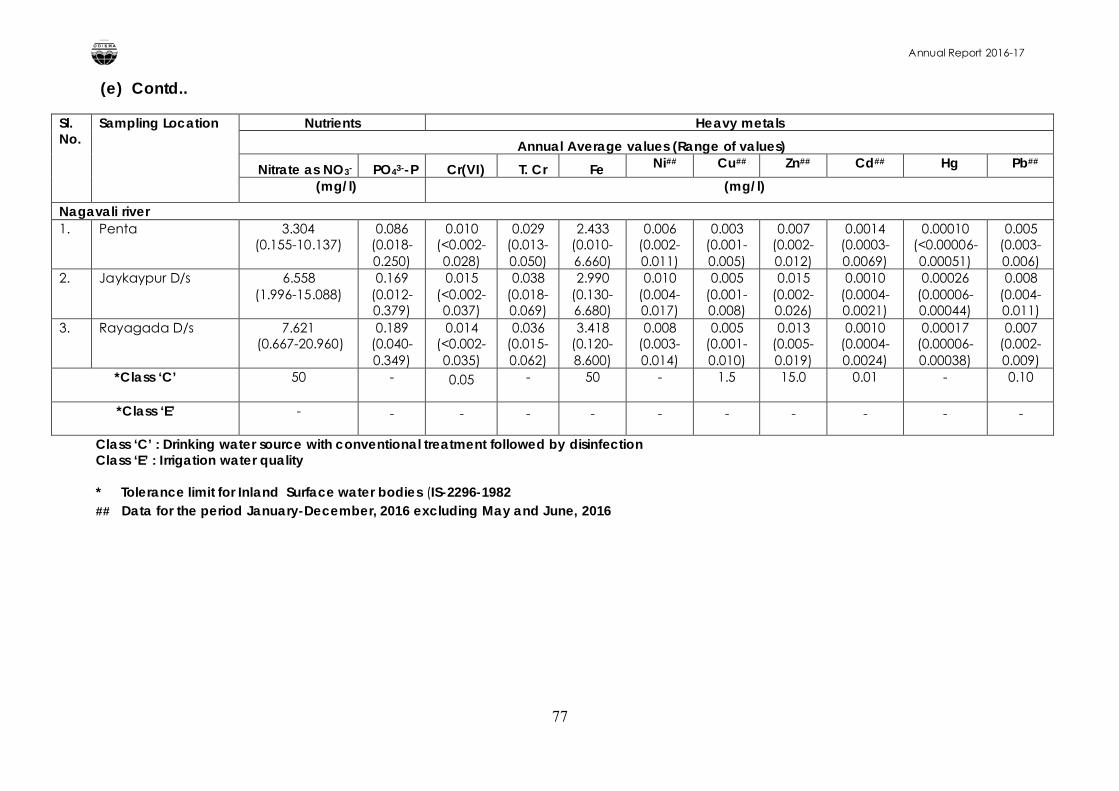
Annual Report 2016-17
77
(e) Contd..
Sl. No.
Sampling Location Nutrients Heavy metals
Annual Average values (Range of values)
Nitrate as NO3- PO43--P Cr(VI) T. Cr Fe Ni## Cu## Zn## Cd## Hg Pb##
(mg/l) (mg/l)
Nagavali river1. Penta 3.304
(0.155-10.137)0.086
(0.018-0.250)
0.010 (<0.002-0.028)
0.029 (0.013-0.050)
2.433 (0.010-6.660)
0.006 (0.002-0.011)
0.003 (0.001-0.005)
0.007 (0.002-0.012)
0.0014 (0.0003-0.0069)
0.00010 (<0.00006-0.00051)
0.005 (0.003-0.006)
2. Jaykaypur D/s 6.558 (1.996-15.088)
0.169 (0.012-0.379)
0.015 (<0.002-0.037)
0.038 (0.018-0.069)
2.990 (0.130-6.680)
0.010 (0.004-0.017)
0.005 (0.001-0.008)
0.015 (0.002-0.026)
0.0010 (0.0004-0.0021)
0.00026 (0.00006-0.00044)
0.008 (0.004-0.011)
3. Rayagada D/s 7.621(0.667-20.960)
0.189 (0.040-0.349)
0.014 (<0.002-0.035)
0.036 (0.015-0.062)
3.418 (0.120-8.600)
0.008 (0.003-0.014)
0.005 (0.001-0.010)
0.013 (0.005-0.019)
0.0010 (0.0004-0.0024)
0.00017 (0.00006-0.00038)
0.007 (0.002-0.009)
*Class ‘C’ 50 - 0.05 - 50 - 1.5 15.0 0.01 - 0.10
*Class ‘E’ - - - - - - - - - - -
Class ‘C’ : Drinking water source with conventional treatment followed by disinfectionClass ‘E’ : Irrigation water quality
* Tolerance limit for Inland Surface water bodies (IS-2296-1982## Data for the period January-December, 2016 excluding May and June, 2016
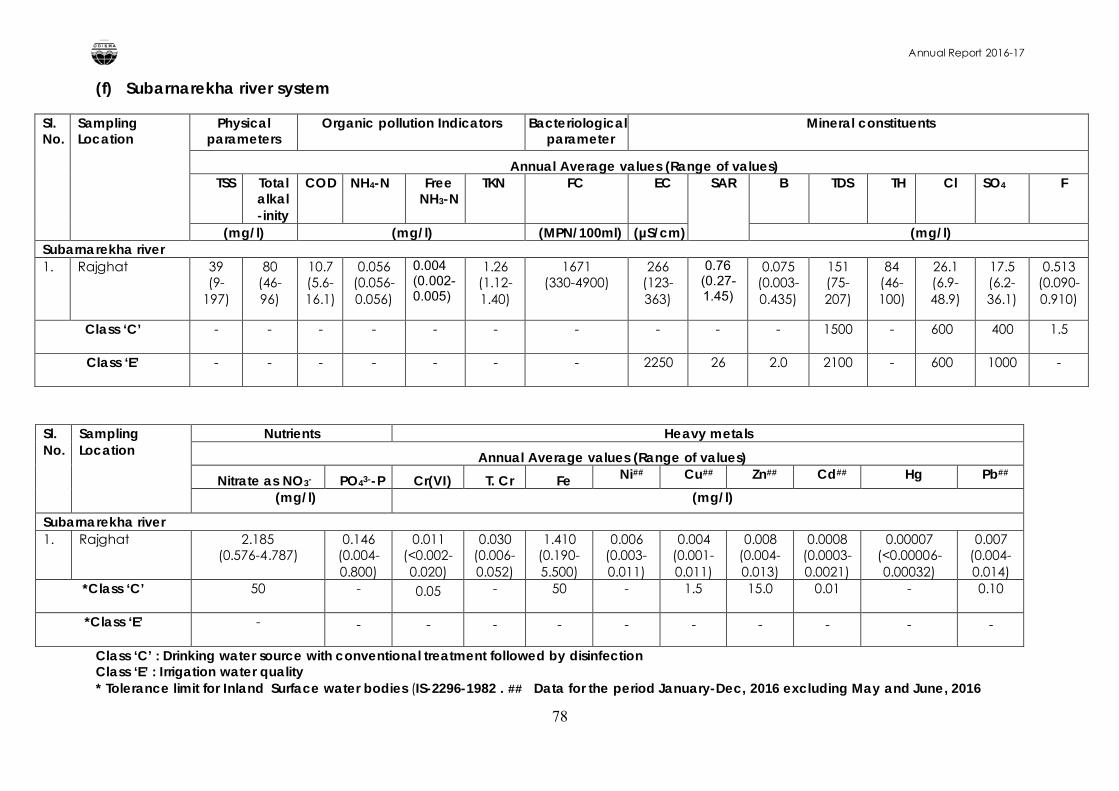
Annual Report 2016-17
78
(f) Subarnarekha river system
Sl. No.
Sampling Location
Physical parameters
Organic pollution Indicators Bacteriological parameter
Mineral constituents
Annual Average values (Range of values)TSS Total
alkal-inity
COD NH4-N Free NH3-N
TKN FC EC SAR B TDS TH Cl SO4 F
(mg/l) (mg/l) (MPN/100ml) (µS/cm) (mg/l)Subarnarekha river1. Rajghat 39
(9-197)
80 (46-96)
10.7 (5.6-16.1)
0.056 (0.056-0.056)
0.004 (0.002-0.005)
1.26 (1.12-1.40)
1671(330-4900)
266 (123-363)
0.76 (0.27-1.45)
0.075 (0.003-0.435)
151 (75-207)
84 (46-100)
26.1 (6.9-48.9)
17.5 (6.2-36.1)
0.513 (0.090-0.910)
Class ‘C’ - - - - - - - - - - 1500 - 600 400 1.5
Class ‘E’ - - - - - - - 2250 26 2.0 2100 - 600 1000 -
Sl. No.
Sampling Location
Nutrients Heavy metals
Annual Average values (Range of values)
Nitrate as NO3- PO43--P Cr(VI) T. Cr Fe Ni## Cu## Zn## Cd## Hg Pb##
(mg/l) (mg/l)
Subarnarekha river1. Rajghat 2.185
(0.576-4.787)0.146
(0.004-0.800)
0.011 (<0.002-0.020)
0.030 (0.006-0.052)
1.410 (0.190-5.500)
0.006 (0.003-0.011)
0.004 (0.001-0.011)
0.008 (0.004-0.013)
0.0008 (0.0003-0.0021)
0.00007 (<0.00006-0.00032)
0.007 (0.004-0.014)
*Class ‘C’ 50 - 0.05 - 50 - 1.5 15.0 0.01 - 0.10
*Class ‘E’ - - - - - - - - - - -
Class ‘C’ : Drinking water source with conventional treatment followed by disinfectionClass ‘E’ : Irrigation water quality* Tolerance limit for Inland Surface water bodies (IS-2296-1982 . ## Data for the period January-Dec, 2016 excluding May and June, 2016
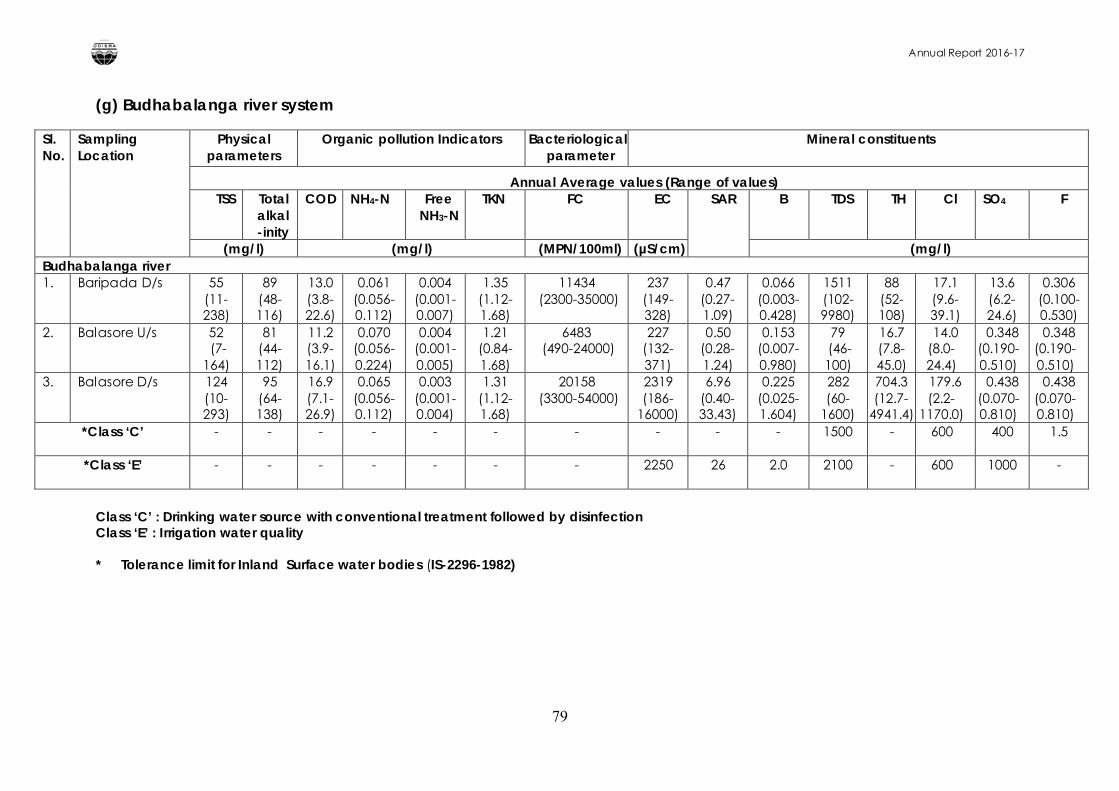
Annual Report 2016-17
79
(g) Budhabalanga river system
Sl. No.
Sampling Location
Physical parameters
Organic pollution Indicators Bacteriological parameter
Mineral constituents
Annual Average values (Range of values)TSS Total
alkal-inity
COD NH4-N Free NH3-N
TKN FC EC SAR B TDS TH Cl SO4 F
(mg/l) (mg/l) (MPN/100ml) (µS/cm) (mg/l)Budhabalanga river1. Baripada D/s 55
(11-238)
89 (48-116)
13.0 (3.8-22.6)
0.061 (0.056-0.112)
0.004 (0.001-0.007)
1.35 (1.12-1.68)
11434(2300-35000)
237 (149-328)
0.47 (0.27-1.09)
0.066 (0.003-0.428)
1511 (102-9980)
88 (52-108)
17.1 (9.6-39.1)
13.6 (6.2-24.6)
0.306 (0.100-0.530)
2. Balasore U/s 52(7-
164)
81 (44-112)
11.2 (3.9-16.1)
0.070 (0.056-0.224)
0.004 (0.001-0.005)
1.21 (0.84-1.68)
6483(490-24000)
227 (132-371)
0.50 (0.28-1.24)
0.153 (0.007-0.980)
79(46-100)
16.7 (7.8-45.0)
14.0 (8.0-24.4)
0.348 (0.190-0.510)
0.348 (0.190-0.510)
3. Balasore D/s 124 (10-293)
95 (64-138)
16.9 (7.1-26.9)
0.065 (0.056-0.112)
0.003 (0.001-0.004)
1.31 (1.12-1.68)
20158(3300-54000)
2319 (186-
16000)
6.96 (0.40-33.43)
0.225 (0.025-1.604)
282 (60-
1600)
704.3 (12.7-
4941.4)
179.6 (2.2-
1170.0)
0.438 (0.070-0.810)
0.438 (0.070-0.810)
*Class ‘C’ - - - - - - - - - - 1500 - 600 400 1.5
*Class ‘E’ - - - - - - - 2250 26 2.0 2100 - 600 1000 -
Class ‘C’ : Drinking water source with conventional treatment followed by disinfectionClass ‘E’ : Irrigation water quality
* Tolerance limit for Inland Surface water bodies (IS-2296-1982)
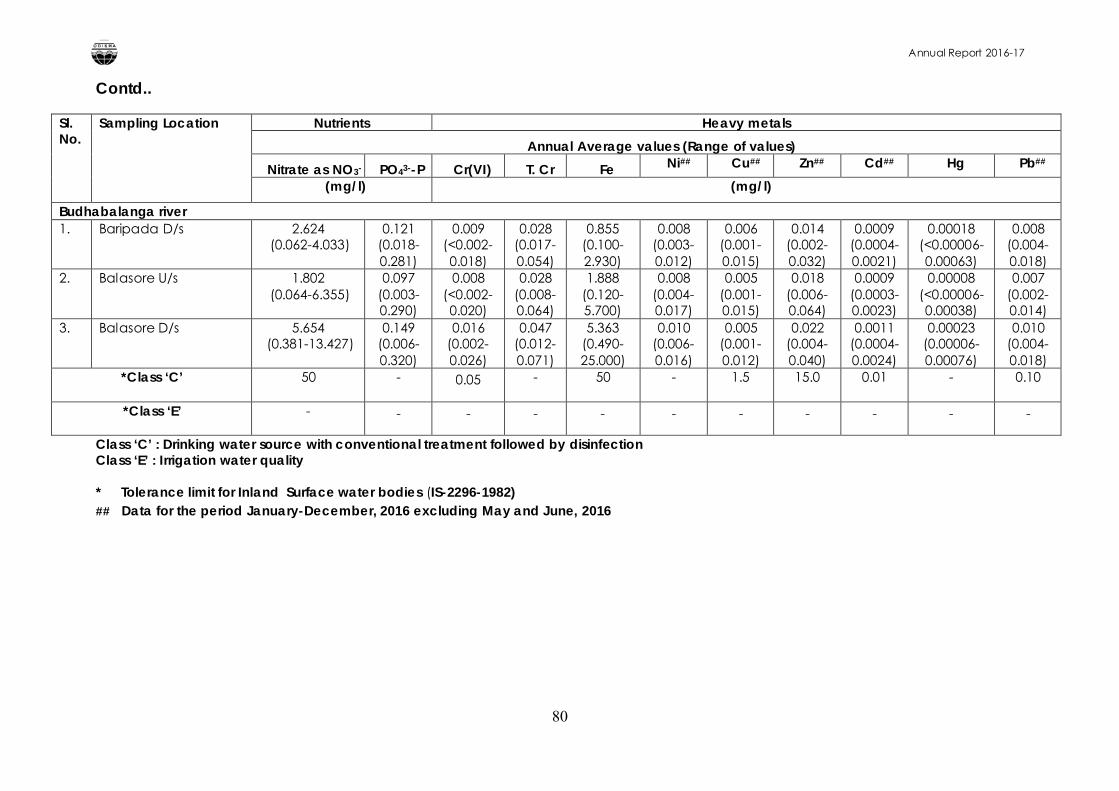
Annual Report 2016-17
80
Contd..
Sl. No.
Sampling Location Nutrients Heavy metals
Annual Average values (Range of values)
Nitrate as NO3- PO43--P Cr(VI) T. Cr Fe Ni## Cu## Zn## Cd## Hg Pb##
(mg/l) (mg/l)
Budhabalanga river1. Baripada D/s 2.624
(0.062-4.033)0.121
(0.018-0.281)
0.009 (<0.002-0.018)
0.028 (0.017-0.054)
0.855 (0.100-2.930)
0.008 (0.003-0.012)
0.006 (0.001-0.015)
0.014 (0.002-0.032)
0.0009 (0.0004-0.0021)
0.00018 (<0.00006-0.00063)
0.008 (0.004-0.018)
2. Balasore U/s 1.802(0.064-6.355)
0.097 (0.003-0.290)
0.008 (<0.002-0.020)
0.028 (0.008-0.064)
1.888 (0.120-5.700)
0.008 (0.004-0.017)
0.005 (0.001-0.015)
0.018 (0.006-0.064)
0.0009 (0.0003-0.0023)
0.00008 (<0.00006-0.00038)
0.007 (0.002-0.014)
3. Balasore D/s 5.654(0.381-13.427)
0.149 (0.006-0.320)
0.016 (0.002-0.026)
0.047 (0.012-0.071)
5.363 (0.490-25.000)
0.010 (0.006-0.016)
0.005 (0.001-0.012)
0.022 (0.004-0.040)
0.0011 (0.0004-0.0024)
0.00023 (0.00006-0.00076)
0.010 (0.004-0.018)
*Class ‘C’ 50 - 0.05 - 50 - 1.5 15.0 0.01 - 0.10
*Class ‘E’ - - - - - - - - - - -
Class ‘C’ : Drinking water source with conventional treatment followed by disinfectionClass ‘E’ : Irrigation water quality
* Tolerance limit for Inland Surface water bodies (IS-2296-1982) ## Data for the period January-December, 2016 excluding May and June, 2016
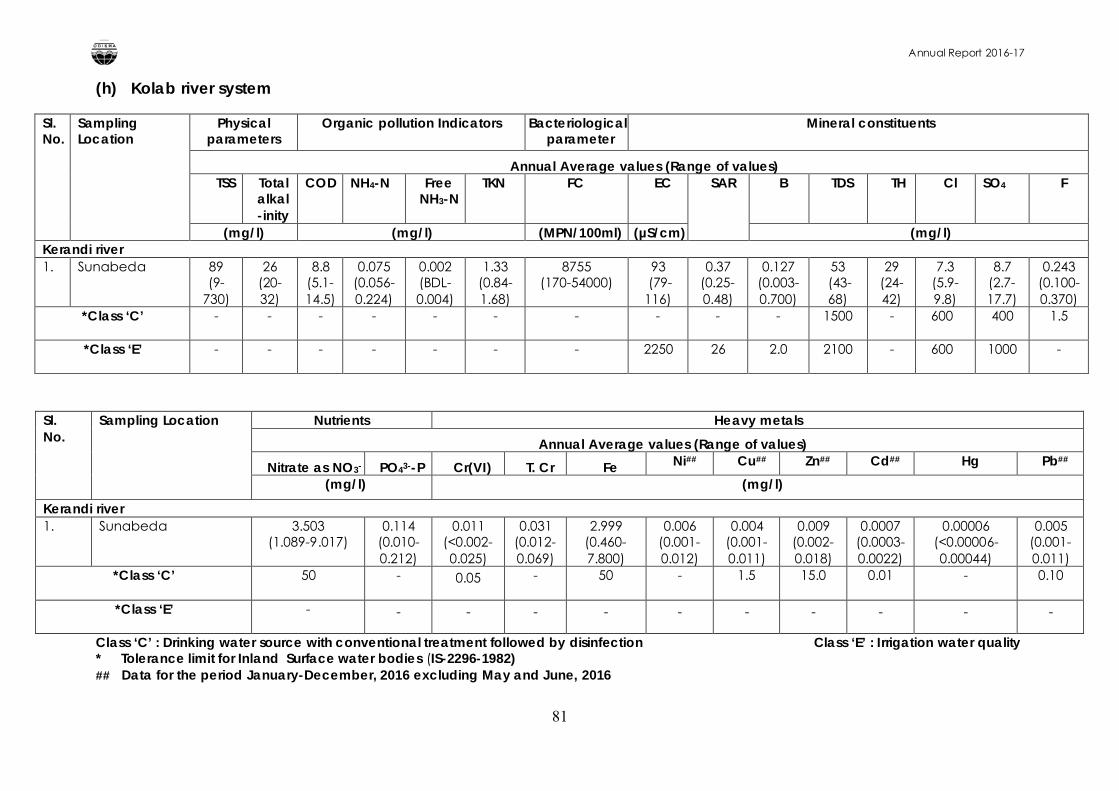
Annual Report 2016-17
81
(h) Kolab river system
Sl. No.
Sampling Location
Physical parameters
Organic pollution Indicators Bacteriological parameter
Mineral constituents
Annual Average values (Range of values)TSS Total
alkal-inity
COD NH4-N Free NH3-N
TKN FC EC SAR B TDS TH Cl SO4 F
(mg/l) (mg/l) (MPN/100ml) (µS/cm) (mg/l)Kerandi river1. Sunabeda 89
(9-730)
26 (20-32)
8.8 (5.1-14.5)
0.075 (0.056-0.224)
0.002 (BDL-0.004)
1.33 (0.84-1.68)
8755 (170-54000)
93(79-
116)
0.37 (0.25-0.48)
0.127 (0.003-0.700)
53(43-68)
29 (24-42)
7.3 (5.9-9.8)
8.7 (2.7-17.7)
0.243 (0.100-0.370)
*Class ‘C’ - - - - - - - - - - 1500 - 600 400 1.5
*Class ‘E’ - - - - - - - 2250 26 2.0 2100 - 600 1000 -
Sl. No.
Sampling Location Nutrients Heavy metals
Annual Average values (Range of values)
Nitrate as NO3- PO43--P Cr(VI) T. Cr Fe Ni## Cu## Zn## Cd## Hg Pb##
(mg/l) (mg/l)
Kerandi river1. Sunabeda 3.503
(1.089-9.017)0.114
(0.010-0.212)
0.011 (<0.002-0.025)
0.031 (0.012-0.069)
2.999 (0.460-7.800)
0.006 (0.001-0.012)
0.004 (0.001-0.011)
0.009 (0.002-0.018)
0.0007 (0.0003-0.0022)
0.00006 (<0.00006-0.00044)
0.005 (0.001-0.011)
*Class ‘C’ 50 - 0.05 - 50 - 1.5 15.0 0.01 - 0.10
*Class ‘E’ - - - - - - - - - - -
Class ‘C’ : Drinking water source with conventional treatment followed by disinfection Class ‘E’ : Irrigation water quality* Tolerance limit for Inland Surface water bodies (IS-2296-1982) ## Data for the period January-December, 2016 excluding May and June, 2016
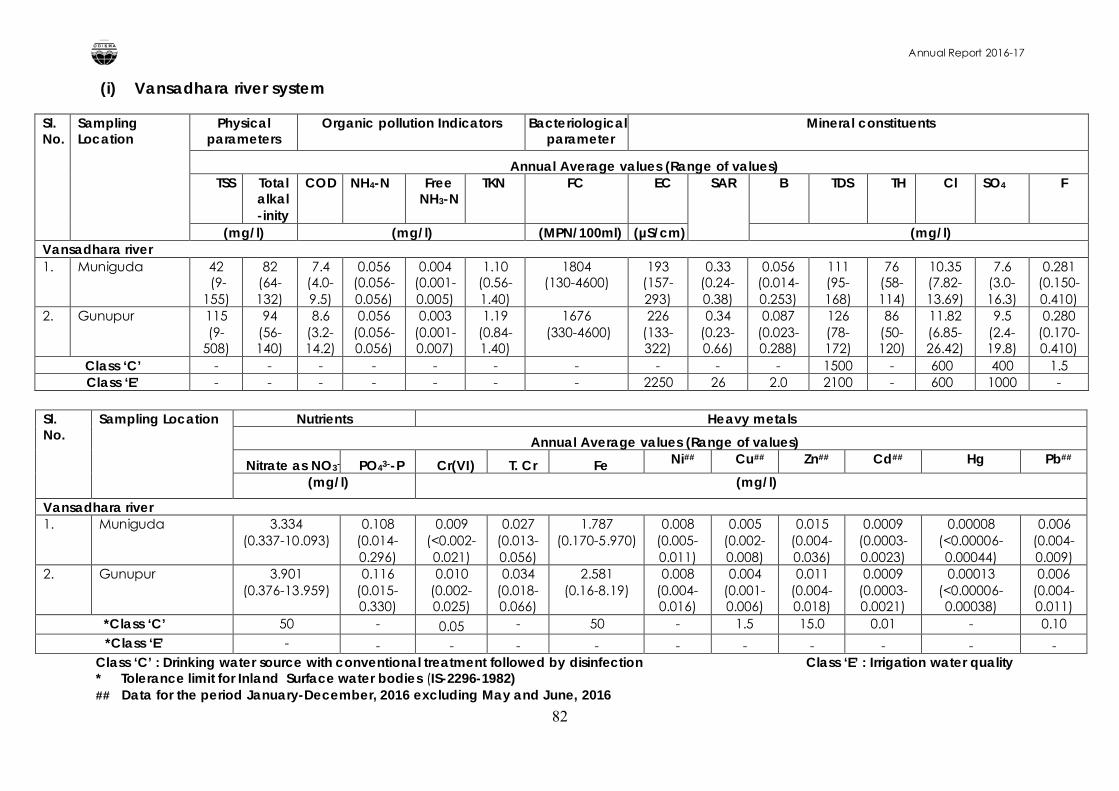
Annual Report 2016-17
82
(i) Vansadhara river system
Sl. No.
Sampling Location
Physical parameters
Organic pollution Indicators Bacteriological parameter
Mineral constituents
Annual Average values (Range of values)TSS Total
alkal-inity
COD NH4-N Free NH3-N
TKN FC EC SAR B TDS TH Cl SO4 F
(mg/l) (mg/l) (MPN/100ml) (µS/cm) (mg/l)Vansadhara river1. Muniguda 42
(9-155)
82 (64-132)
7.4 (4.0-9.5)
0.056 (0.056-0.056)
0.004 (0.001-0.005)
1.10 (0.56-1.40)
1804 (130-4600)
193 (157-293)
0.33 (0.24-0.38)
0.056 (0.014-0.253)
111 (95-168)
76 (58-114)
10.35 (7.82-13.69)
7.6 (3.0-16.3)
0.281 (0.150-0.410)
2. Gunupur 115 (9-
508)
94 (56-140)
8.6 (3.2-14.2)
0.056 (0.056-0.056)
0.003 (0.001-0.007)
1.19 (0.84-1.40)
1676(330-4600)
226 (133-322)
0.34 (0.23-0.66)
0.087 (0.023-0.288)
126 (78-172)
86 (50-120)
11.82 (6.85-26.42)
9.5 (2.4-19.8)
0.280 (0.170-0.410)
Class ‘C’ - - - - - - - - - - 1500 - 600 400 1.5Class ‘E’ - - - - - - - 2250 26 2.0 2100 - 600 1000 -
Sl. No.
Sampling Location Nutrients Heavy metals
Annual Average values (Range of values)
Nitrate as NO3- PO43--P Cr(VI) T. Cr Fe Ni## Cu## Zn## Cd## Hg Pb##
(mg/l) (mg/l)
Vansadhara river1. Muniguda 3.334
(0.337-10.093)0.108
(0.014-0.296)
0.009 (<0.002-0.021)
0.027 (0.013-0.056)
1.787(0.170-5.970)
0.008 (0.005-0.011)
0.005 (0.002-0.008)
0.015 (0.004-0.036)
0.0009 (0.0003-0.0023)
0.00008 (<0.00006-0.00044)
0.006 (0.004-0.009)
2. Gunupur 3.901(0.376-13.959)
0.116 (0.015-0.330)
0.010 (0.002-0.025)
0.034 (0.018-0.066)
2.581(0.16-8.19)
0.008 (0.004-0.016)
0.004 (0.001-0.006)
0.011 (0.004-0.018)
0.0009 (0.0003-0.0021)
0.00013 (<0.00006-0.00038)
0.006(0.004-0.011)
*Class ‘C’ 50 - 0.05 - 50 - 1.5 15.0 0.01 - 0.10*Class ‘E’ - - - - - - - - - - -
Class ‘C’ : Drinking water source with conventional treatment followed by disinfection Class ‘E’ : Irrigation water quality* Tolerance limit for Inland Surface water bodies (IS-2296-1982)## Data for the period January-December, 2016 excluding May and June, 2016
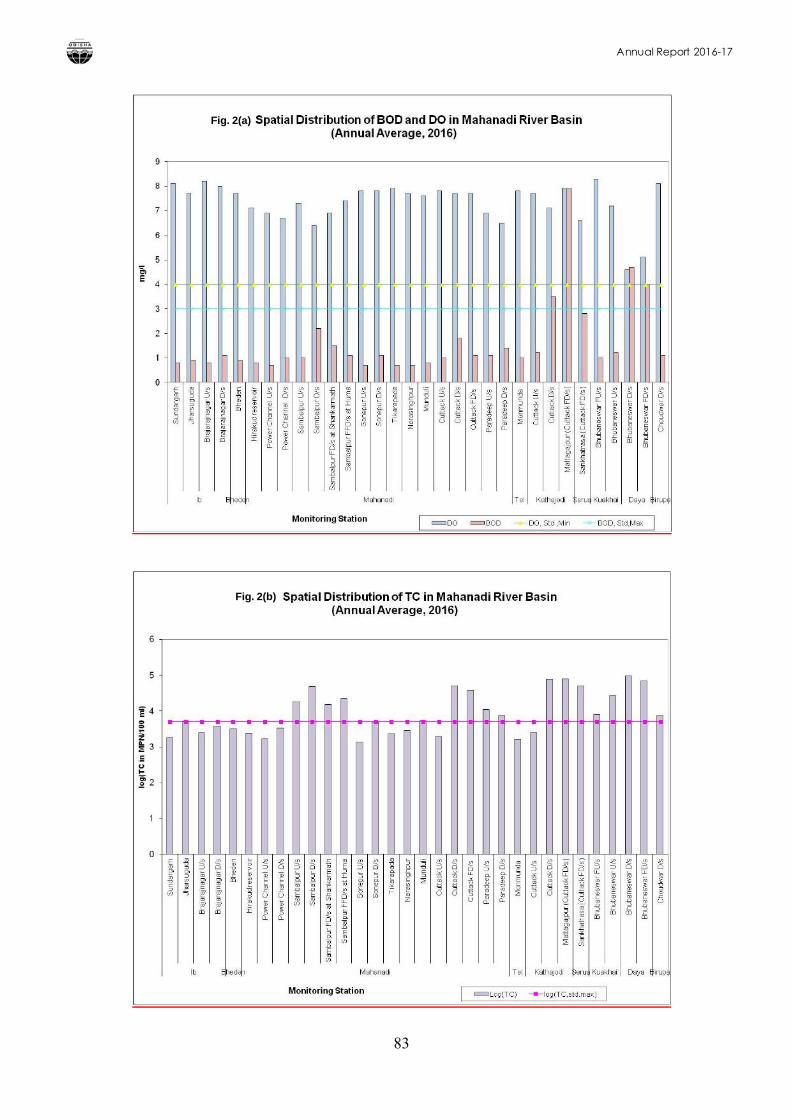
Annual Report 2016-17
83
Fig. 2(a)
Fig. 2(b)
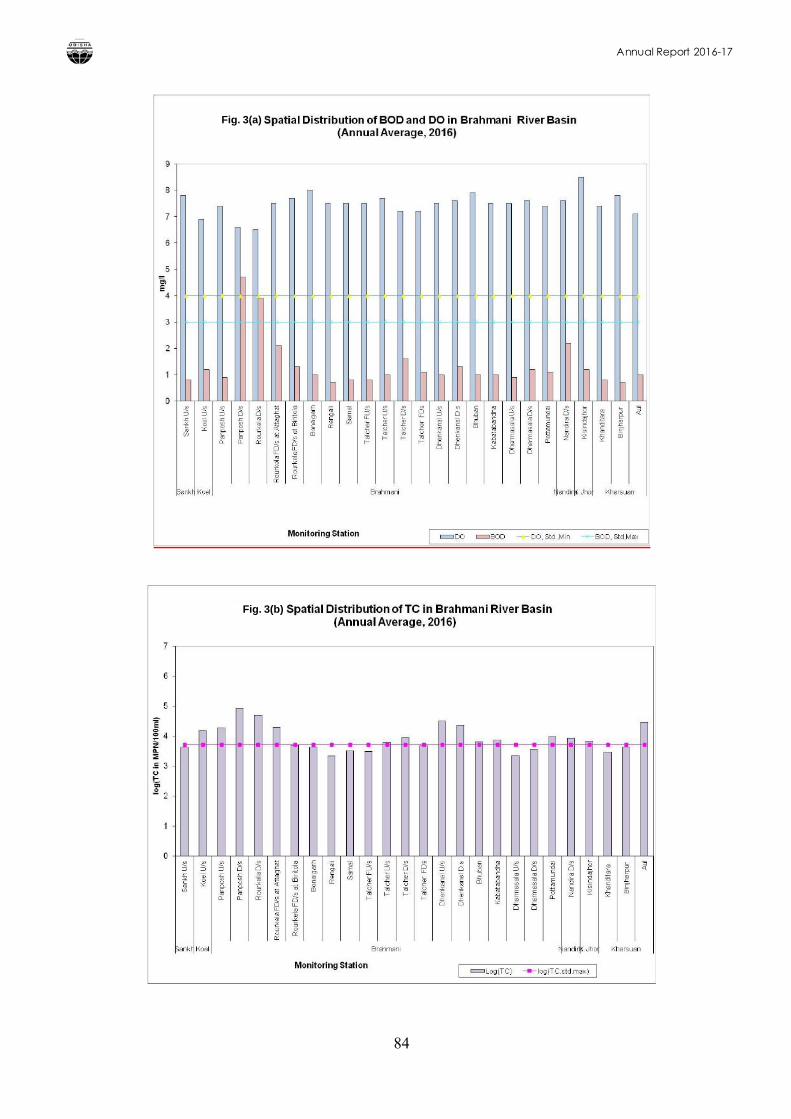
Annual Report 2016-17
84
Fig. 3(b)
Fig. 3(a)
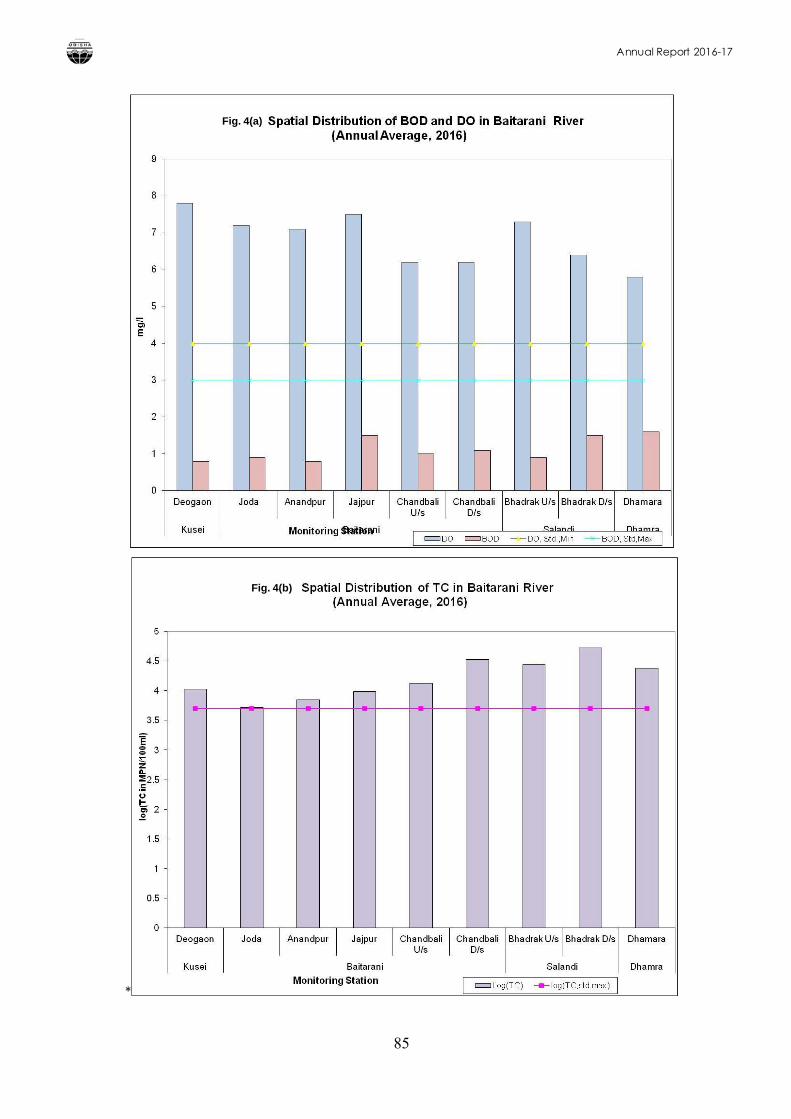
Annual Report 2016-17
85
*
Fig. 4(a)
Fig. 4(b)
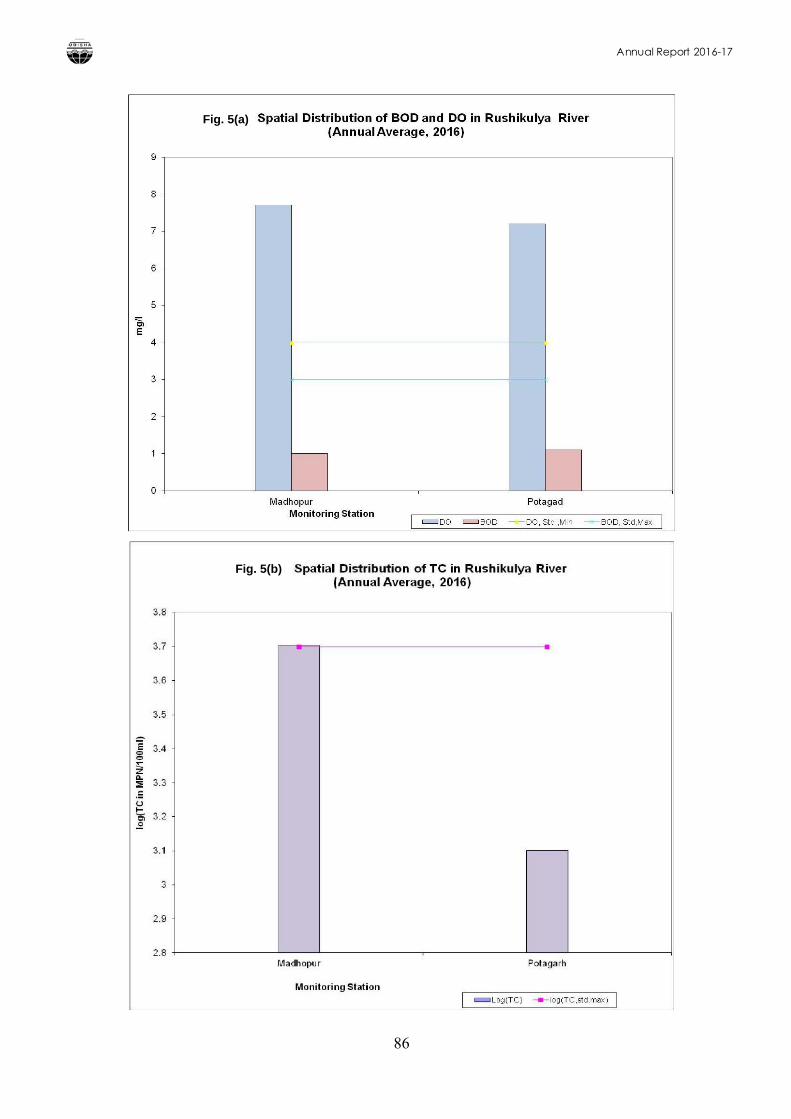
Annual Report 2016-17
86
Fig. 5(a)
Fig. 5(b)
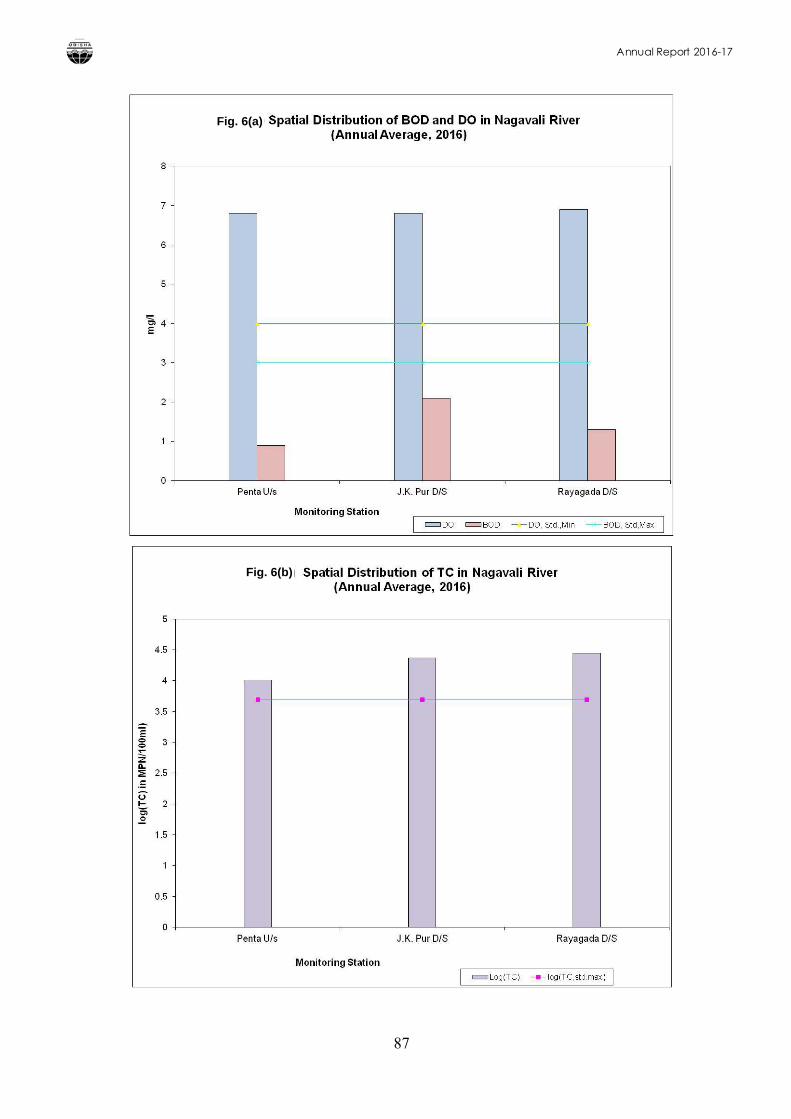
Annual Report 2016-17
87
Fig. 6(b)
Fig. 6(a)
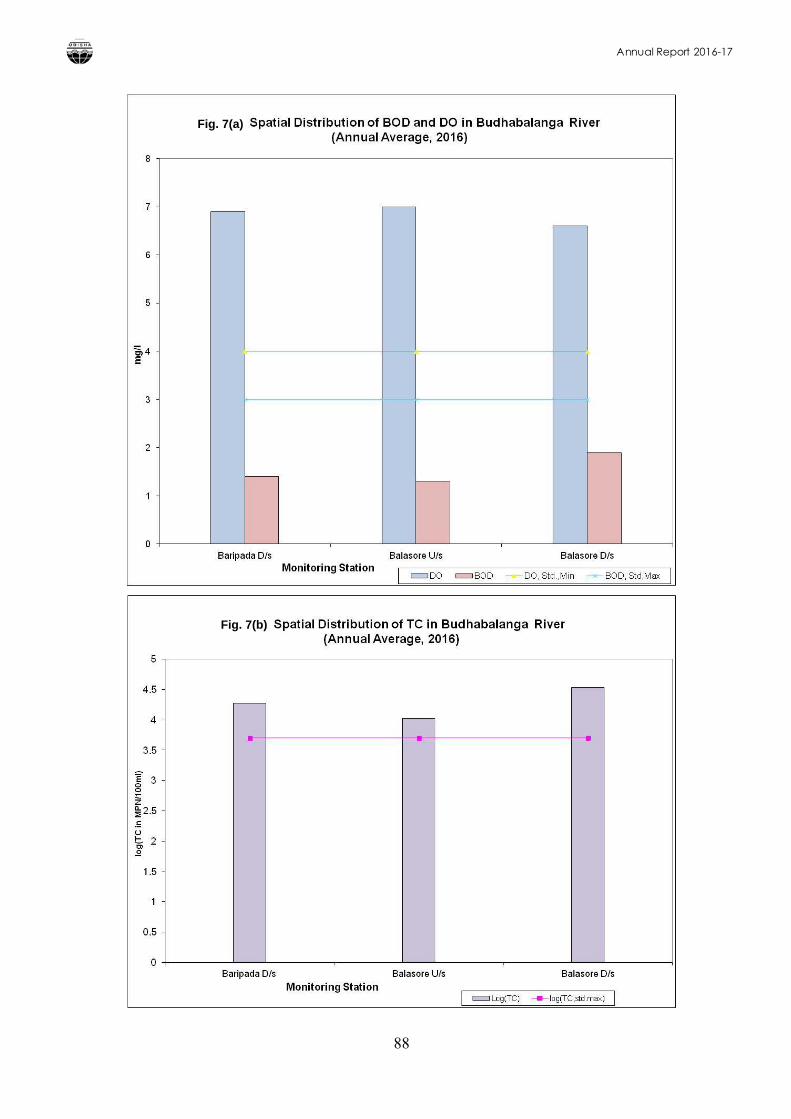
Annual Report 2016-17
88
Fig. 7(a)
Fig. 7(b)
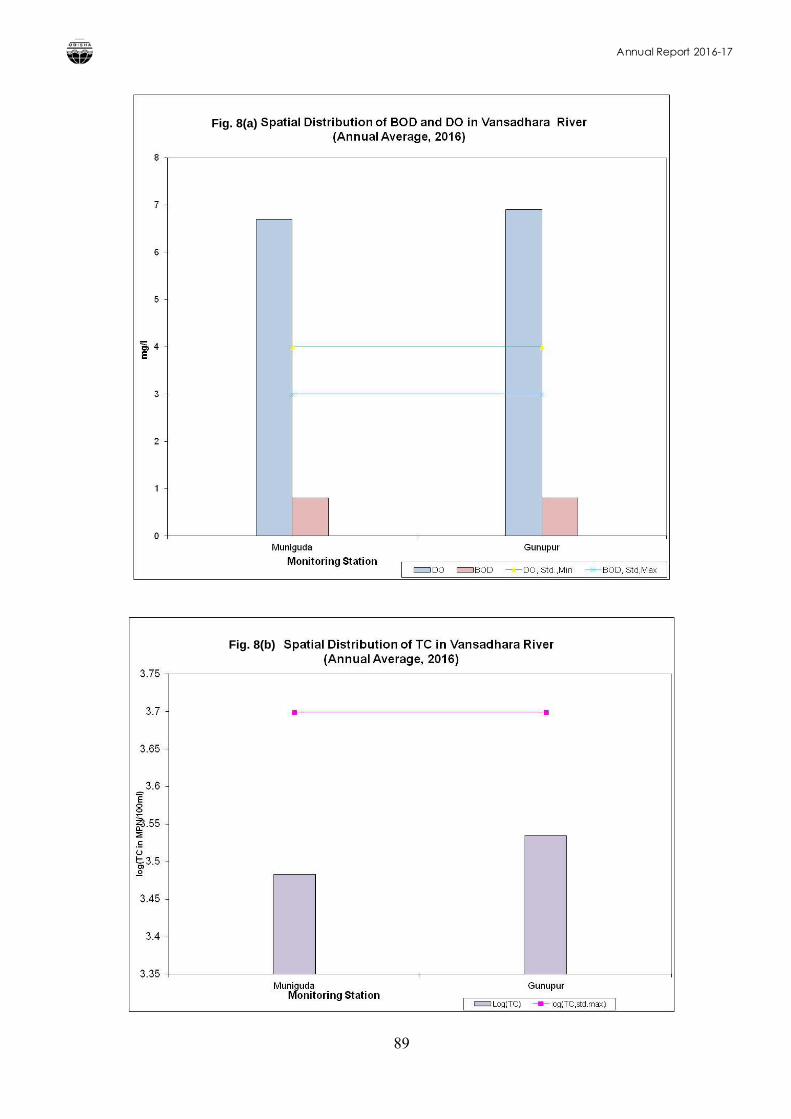
Annual Report 2016-17
89
Fig. 8(b)
Fig. 8(a)
Annual Report 2016-17
90
(B) TALADANDA CANAL
Taladanda canal originates from Mahanadi river at Jobra of Cuttack, passes through
the city and finally culminates at Paradeep. The canal was constructed for the
purpose of navigation and/ or irrigation of a part of Mahanadi delta of Cuttack and
Jagatsinghpur districts. Besides this, the canal is also a source of fresh water for
industries and the port at Paradeep. The canal water is also used for bathing and
other domestic activities all along its stretch.
Board monitors the water quality of Taldanda canal within Cuttack city at five
locations viz. Jobra, Ranihat, Chhatrabazar, Nuabazar, Biribati and one station at
Atharabanki of Paradeep. The water quality data at these five stations with respect to
critical parameters such as pH, DO, BOD, TC, FC, EC, SAR and B during 2016 are
given in Table-5.22 and compared with the tolerance limits for Bathing water quality
prescribed under E (P) Rule, 1986 and Class- B (Outdoor bathing) and Class- E
(Irrigation) Inland surface water quality prescribed by Bureau of Indian Standards
(IS: 2296-1982). The water quality of Taladanda canal at these locations remained
well within the tolerance limit prescribed for Class-E inland surface water bodies.
However, so far the bathing water quality is concerned, total coliform organisms and
fecal coliform organisms remain above the prescribed limit for Class- B at all the
monitoring stations during the period of study in 2016, whereas BOD values do not
remain within the tolerance limit at Ranihat and Nuabazar. DO values do not meet
the prescribed limit at Atharabanki..
Water quality for other parameters given in Table-5.23 remain well within the
tolerance limit for Class - C water quality.
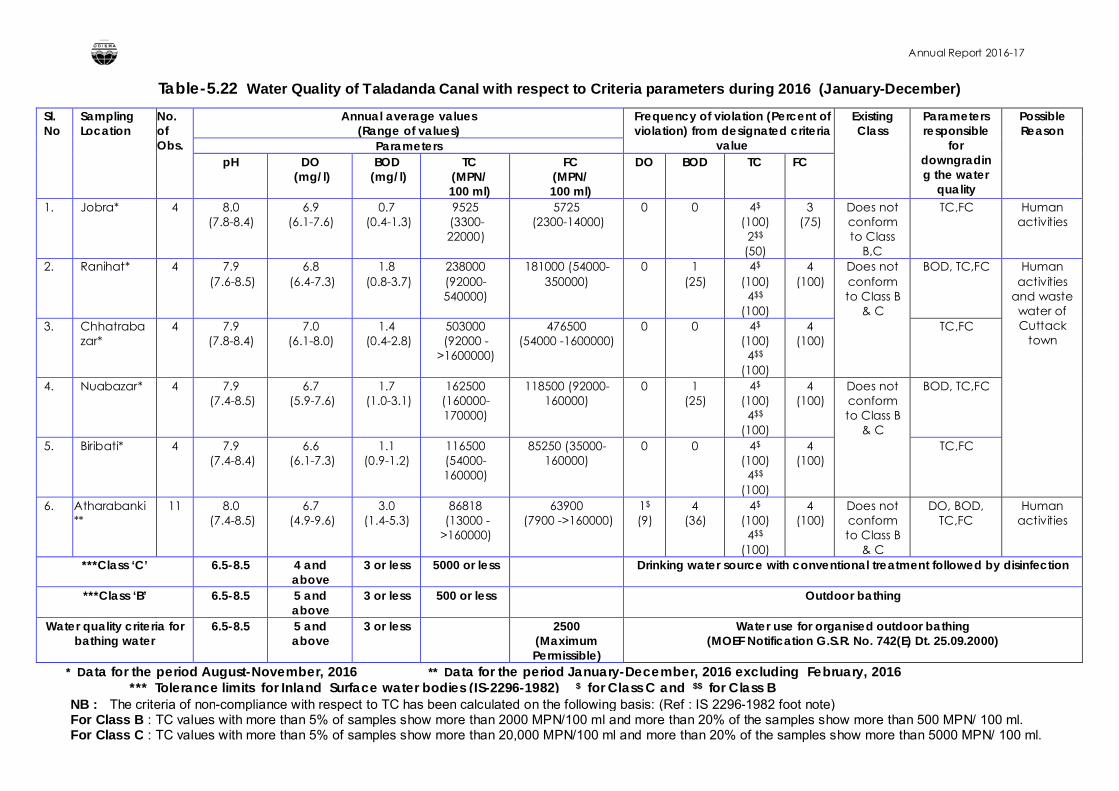
Annual Report 2016-17
91
Table-5.22 Water Quality of Taladanda Canal with respect to Criteria parameters during 2016 (January-December)
* Data for the period August-November, 2016 ** Data for the period January-December, 2016 excluding February, 2016 *** Tolerance limits for Inland Surface water bodies (IS-2296-1982) $ for Class C and $$ for Class B
Sl. No
Sampling Location
No. of Obs.
Annual average values(Range of values)
Frequency of violation (Percent of violation) from designated criteria
value
Existing Class
Parameters responsible
for downgrading the water
quality
Possible Reason
ParameterspH DO
(mg/l)BOD
(mg/l)TC
(MPN/100 ml)
FC (MPN/100 ml)
DO BOD TC FC
1. Jobra* 4 8.0 (7.8-8.4)
6.9 (6.1-7.6)
0.7(0.4-1.3)
9525(3300-22000)
5725(2300-14000)
0 0 4$
(100)2$$
(50)
3(75)
Does not conform to Class
B,C
TC,FC Human activities
2. Ranihat* 4 7.9(7.6-8.5)
6.8(6.4-7.3)
1.8(0.8-3.7)
238000 (92000-540000)
181000 (54000-350000)
0 1(25)
4$
(100)4$$
(100)
4(100)
Does not conform to Class B
& C
BOD, TC,FC Human activities
and waste water of Cuttack
town3. Chhatraba
zar*4 7.9
(7.8-8.4)7.0
(6.1-8.0)1.4
(0.4-2.8)503000 (92000 -
>1600000)
476500 (54000 -1600000)
0 0 4$
(100)4$$
(100)
4(100)
TC,FC
4. Nuabazar* 4 7.9(7.4-8.5)
6.7(5.9-7.6)
1.7(1.0-3.1)
162500 (160000-170000)
118500 (92000-160000)
0 1(25)
4$
(100)4$$
(100)
4(100)
Does not conform to Class B
& C
BOD, TC,FC
5. Biribati* 4 7.9(7.4-8.4)
6.6(6.1-7.3)
1.1 (0.9-1.2)
116500 (54000-160000)
85250 (35000-160000)
0 0 4$
(100)4$$
(100)
4(100)
TC,FC
6. Atharabanki**
11 8.0(7.4-8.5)
6.7(4.9-9.6)
3.0 (1.4-5.3)
86818(13000 -
>160000)
63900(7900 ->160000)
1$
(9)4
(36)4$
(100)4$$
(100)
4(100)
Does not conform to Class B
& C
DO, BOD, TC,FC
Human activities
***Class ‘C’ 6.5-8.5 4 and above
3 or less 5000 or less Drinking water source with conventional treatment followed by disinfection
***Class ‘B’ 6.5-8.5 5 and above
3 or less 500 or less Outdoor bathing
Water quality criteria for bathing water
6.5-8.5 5 and above
3 or less 2500(Maximum Permissible)
Water use for organised outdoor bathing (MOEF Notification G.S.R. No. 742(E) Dt. 25.09.2000)
NB : The criteria of non-compliance with respect to TC has been calculated on the following basis: (Ref : IS 2296-1982 foot note)For Class B : TC values with more than 5% of samples show more than 2000 MPN/100 ml and more than 20% of the samples show more than 500 MPN/ 100 ml.For Class C : TC values with more than 5% of samples show more than 20,000 MPN/100 ml and more than 20% of the samples show more than 5000 MPN/ 100 ml.
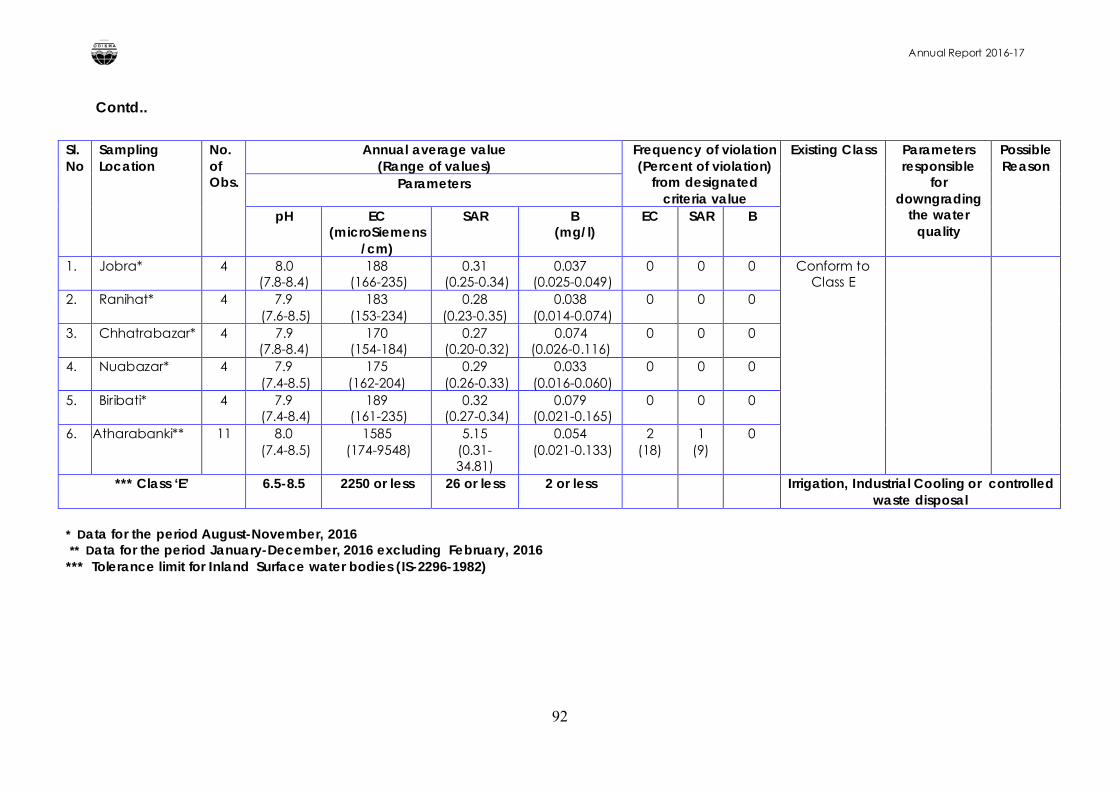
Annual Report 2016-17
92
Contd..
* Data for the period August-November, 2016 ** Data for the period January-December, 2016 excluding February, 2016
*** Tolerance limit for Inland Surface water bodies (IS-2296-1982)
Sl. No
Sampling Location
No. of Obs.
Annual average value(Range of values)
Frequency of violation (Percent of violation)
from designated criteria value
Existing Class Parameters responsible
for downgrading
the water quality
Possible Reason
Parameters
pH EC(microSiemens
/cm)
SAR B(mg/l)
EC SAR B
1. Jobra* 4 8.0 (7.8-8.4)
188(166-235)
0.31(0.25-0.34)
0.037(0.025-0.049)
0 0 0 Conform to Class E
2. Ranihat* 4 7.9(7.6-8.5)
183(153-234)
0.28 (0.23-0.35)
0.038(0.014-0.074)
0 0 0
3. Chhatrabazar* 4 7.9 (7.8-8.4)
170(154-184)
0.27(0.20-0.32)
0.074 (0.026-0.116)
0 0 0
4. Nuabazar* 4 7.9(7.4-8.5)
175 (162-204)
0.29(0.26-0.33)
0.033(0.016-0.060)
0 0 0
5. Biribati* 4 7.9(7.4-8.4)
189(161-235)
0.32(0.27-0.34)
0.079(0.021-0.165)
0 0 0
6. Atharabanki** 11 8.0(7.4-8.5)
1585(174-9548)
5.15 (0.31-34.81)
0.054(0.021-0.133)
2(18)
1(9)
0
*** Class ‘E’ 6.5-8.5 2250 or less 26 or less 2 or less Irrigation, Industrial Cooling or controlled waste disposal
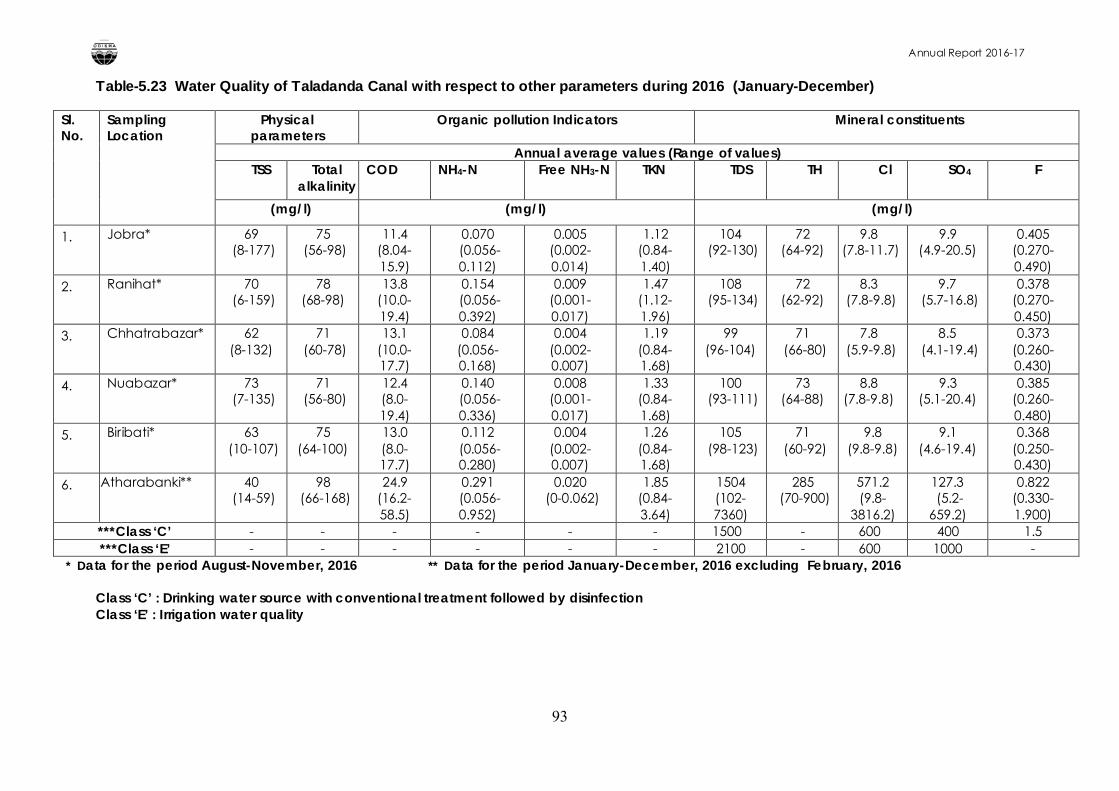
Annual Report 2016-17
93
Table-5.23 Water Quality of Taladanda Canal with respect to other parameters during 2016 (January-December)
Sl. No.
Sampling Location
Physical parameters
Organic pollution Indicators Mineral constituents
Annual average values (Range of values)TSS Total
alkalinityCOD NH4-N Free NH3-N TKN TDS TH Cl SO4 F
(mg/l) (mg/l) (mg/l)
1. Jobra* 69(8-177)
75(56-98)
11.4 (8.04-15.9)
0.070(0.056-0.112)
0.005 (0.002-0.014)
1.12 (0.84-1.40)
104(92-130)
72 (64-92)
9.8(7.8-11.7)
9.9 (4.9-20.5)
0.405 (0.270-0.490)
2. Ranihat* 70(6-159)
78 (68-98)
13.8 (10.0-19.4)
0.154(0.056-0.392)
0.009 (0.001-0.017)
1.47 (1.12-1.96)
108(95-134)
72 (62-92)
8.3(7.8-9.8)
9.7(5.7-16.8)
0.378 (0.270-0.450)
3. Chhatrabazar* 62 (8-132)
71(60-78)
13.1 (10.0-17.7)
0.084 (0.056-0.168)
0.004 (0.002-0.007)
1.19 (0.84-1.68)
99 (96-104)
71(66-80)
7.8(5.9-9.8)
8.5(4.1-19.4)
0.373 (0.260-0.430)
4. Nuabazar* 73(7-135)
71(56-80)
12.4 (8.0-19.4)
0.140(0.056-0.336)
0.008 (0.001-0.017)
1.33 (0.84-1.68)
100(93-111)
73 (64-88)
8.8 (7.8-9.8)
9.3 (5.1-20.4)
0.385 (0.260-0.480)
5. Biribati* 63(10-107)
75 (64-100)
13.0 (8.0-17.7)
0.112(0.056-0.280)
0.004 (0.002-0.007)
1.26 (0.84-1.68)
105(98-123)
71(60-92)
9.8 (9.8-9.8)
9.1 (4.6-19.4)
0.368 (0.250-0.430)
6. Atharabanki** 40(14-59)
98(66-168)
24.9 (16.2-58.5)
0.291(0.056-0.952)
0.020(0-0.062)
1.85 (0.84-3.64)
1504 (102-7360)
285(70-900)
571.2 (9.8-
3816.2)
127.3(5.2-
659.2)
0.822 (0.330-1.900)
***Class ‘C’ - - - - - - 1500 - 600 400 1.5***Class ‘E’ - - - - - - 2100 - 600 1000 -
* Data for the period August-November, 2016 ** Data for the period January-December, 2016 excluding February, 2016
Class ‘C’ : Drinking water source with conventional treatment followed by disinfectionClass ‘E’ : Irrigation water quality
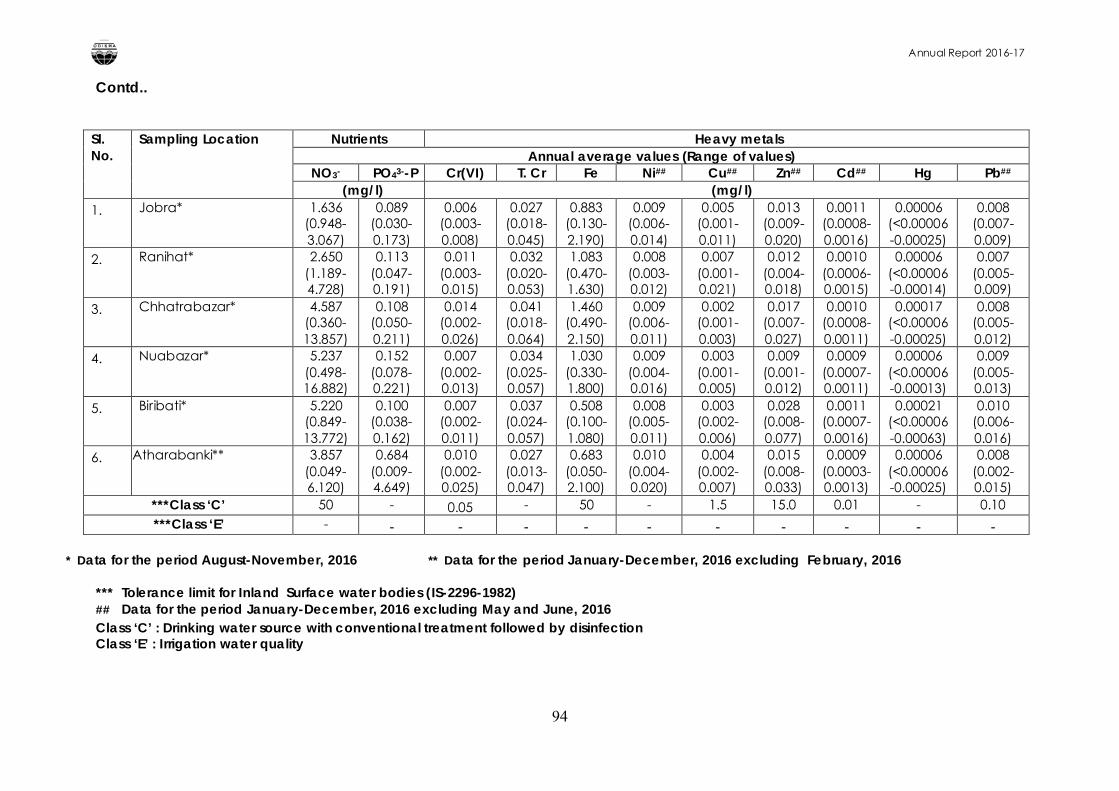
Annual Report 2016-17
94
Contd..
Sl. No.
Sampling Location Nutrients Heavy metals Annual average values (Range of values)
NO3- PO43--P Cr(VI) T. Cr Fe Ni## Cu## Zn## Cd## Hg Pb##
(mg/l) (mg/l)1. Jobra* 1.636
(0.948-3.067)
0.089 (0.030-0.173)
0.006 (0.003-0.008)
0.027 (0.018-0.045)
0.883 (0.130-2.190)
0.009 (0.006-0.014)
0.005 (0.001-0.011)
0.013 (0.009-0.020)
0.0011 (0.0008-0.0016)
0.00006 (<0.00006-0.00025)
0.008 (0.007-0.009)
2. Ranihat* 2.650 (1.189-4.728)
0.113 (0.047-0.191)
0.011 (0.003-0.015)
0.032 (0.020-0.053)
1.083 (0.470-1.630)
0.008 (0.003-0.012)
0.007 (0.001-0.021)
0.012 (0.004-0.018)
0.0010 (0.0006-0.0015)
0.00006 (<0.00006-0.00014)
0.007 (0.005-0.009)
3. Chhatrabazar* 4.587 (0.360-13.857)
0.108 (0.050-0.211)
0.014 (0.002-0.026)
0.041 (0.018-0.064)
1.460 (0.490-2.150)
0.009 (0.006-0.011)
0.002 (0.001-0.003)
0.017 (0.007-0.027)
0.0010 (0.0008-0.0011)
0.00017 (<0.00006-0.00025)
0.008 (0.005-0.012)
4. Nuabazar* 5.237 (0.498-16.882)
0.152 (0.078-0.221)
0.007 (0.002-0.013)
0.034 (0.025-0.057)
1.030 (0.330-1.800)
0.009 (0.004-0.016)
0.003 (0.001-0.005)
0.009 (0.001-0.012)
0.0009 (0.0007-0.0011)
0.00006 (<0.00006-0.00013)
0.009 (0.005-0.013)
5. Biribati* 5.220 (0.849-13.772)
0.100 (0.038-0.162)
0.007 (0.002-0.011)
0.037 (0.024-0.057)
0.508 (0.100-1.080)
0.008 (0.005-0.011)
0.003 (0.002-0.006)
0.028 (0.008-0.077)
0.0011 (0.0007-0.0016)
0.00021 (<0.00006-0.00063)
0.010 (0.006-0.016)
6. Atharabanki** 3.857 (0.049-6.120)
0.684 (0.009-4.649)
0.010 (0.002-0.025)
0.027 (0.013-0.047)
0.683 (0.050-2.100)
0.010 (0.004-0.020)
0.004 (0.002-0.007)
0.015 (0.008-0.033)
0.0009 (0.0003-0.0013)
0.00006 (<0.00006-0.00025)
0.008 (0.002-0.015)
***Class ‘C’ 50 - 0.05 - 50 - 1.5 15.0 0.01 - 0.10***Class ‘E’ - - - - - - - - - - -
* Data for the period August-November, 2016 ** Data for the period January-December, 2016 excluding February, 2016
*** Tolerance limit for Inland Surface water bodies (IS-2296-1982)## Data for the period January-December, 2016 excluding May and June, 2016 Class ‘C’ : Drinking water source with conventional treatment followed by disinfectionClass ‘E’ : Irrigation water quality
Annual Report 2016-17
95
( C) PONDS
Board monitors the water quality of Bindusagar pond, a religious pond in
Bhubaneswar and five religious ponds such as Narendra, Indradyumna, Markanda,
Swetaganga and Parvati sagar in Puri town. Water quality of these ponds with
respect to criteria parameters such as pH, DO, BOD, TC and FC during 2016 are
given in Table-5.24 (a) & (b). As these ponds are mostly used for religious bathing
purposes, water quality data are compared with the bathing water quality (Class-
B). It is seen from the data that BOD, Total and Fecal Coliform values are much
above the tolerance limits for the designated Class ‘B’ and indicate organic source
of pollution of the pond. Frequent occurrence of very high DO content (above
saturation level) of the pond water indicate the presence of high algal population.
Water quality with respect to other parameters are given in Table-5.25 (a) & (b)
which remained within the tolerance limits for Class ‘C’.
(D) LAKES
Water quality of Chilka and Anshupa lakes monitored by the Board during 2016
are given in Table-5.26 and 5.27.
As Chilka is a brackish water lake and the predominant activities at the
monitoring stations such as Rambha and Satapada are contact water sports and
commercial fishing, the water quality criteria parameters are compared with Class
SW-II as described under MOEF Notification G.S.R. No. 742(E) Dt. 25.09.2000. From
the data it is seen that fecal coliform organism occasionally remained above the
prescribed limit.
To assess the water quality of Anshupa, a sweet water lake, criteria parameters
were selected under Class-D Inland surface water bodies as the predominant
activity in Anshupa lake is fish propagation. From the data it is seen that the
criteria parameters such as free ammonia and electrical conductivity remained
well within the tolerance limit for Class- D.
(E) SEA
Water quality of coastal water at Puri, Gopalpur and Paradeep monitored by the
Board during 2016 are given in Table-5.28 and 5.29. From the data it is observed
that the criteria parameters at Goplapur and Paradeep remained within the
prescribed limit for harbour water (Class SW-IV). Further, fecal coliform organism
in coastal water at Puri, Gopalpur and Paradeep remained above the prescribed
limit for Bathing, Contact Water Sports and Commercial Fishing (SW-II).
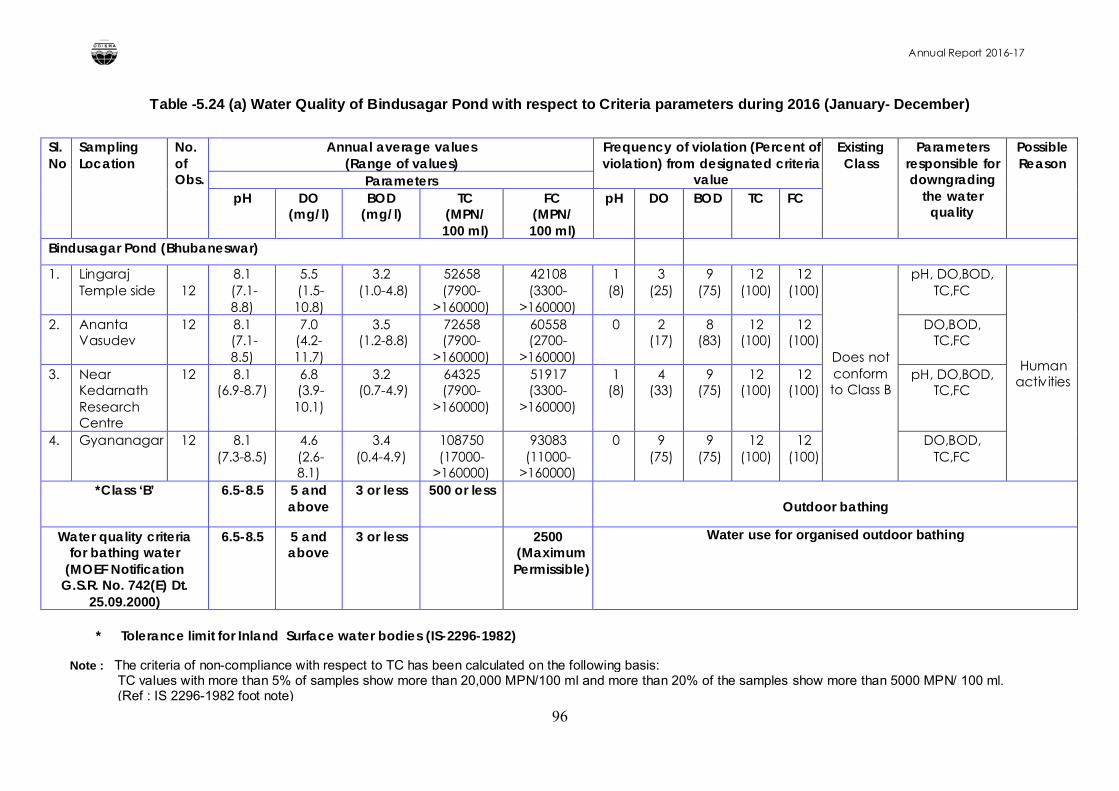
Annual Report 2016-17
96
Table -5.24 (a) Water Quality of Bindusagar Pond with respect to Criteria parameters during 2016 (January- December)
* Tolerance limit for Inland Surface water bodies (IS-2296-1982)
Sl. No
Sampling Location
No. of Obs.
Annual average values(Range of values)
Frequency of violation (Percent of violation) from designated criteria
value
Existing Class
Parameters responsible for downgrading
the water quality
Possible Reason
ParameterspH DO
(mg/l)BOD
(mg/l)TC
(MPN/100 ml)
FC (MPN/100 ml)
pH DO BOD TC FC
Bindusagar Pond (Bhubaneswar)
1. Lingaraj Temple side 12
8.1(7.1-8.8)
5.5(1.5-10.8)
3.2(1.0-4.8)
52658 (7900-
>160000)
42108 (3300-
>160000)
1(8)
3(25)
9(75)
12(100)
12(100)
Does not conform to Class B
pH, DO,BOD, TC,FC
Human activities
2. Ananta Vasudev
12 8.1(7.1-8.5)
7.0 (4.2-11.7)
3.5(1.2-8.8)
72658 (7900-
>160000)
60558 (2700-
>160000)
0 2(17)
8(83)
12(100)
12(100)
DO,BOD, TC,FC
3. Near Kedarnath Research Centre
12 8.1 (6.9-8.7)
6.8(3.9-10.1)
3.2(0.7-4.9)
64325 (7900-
>160000)
51917 (3300-
>160000)
1(8)
4(33)
9(75)
12(100)
12(100)
pH, DO,BOD, TC,FC
4. Gyananagar 12 8.1 (7.3-8.5)
4.6(2.6-8.1)
3.4 (0.4-4.9)
108750 (17000-
>160000)
93083 (11000-
>160000)
0 9(75)
9(75)
12(100)
12(100)
DO,BOD, TC,FC
*Class ‘B’ 6.5-8.5 5 and above
3 or less 500 or lessOutdoor bathing
Water quality criteria for bathing water
(MOEF Notification G.S.R. No. 742(E) Dt.
25.09.2000)
6.5-8.5 5 and above
3 or less 2500(Maximum Permissible)
Water use for organised outdoor bathing
Note : The criteria of non-compliance with respect to TC has been calculated on the following basis:TC values with more than 5% of samples show more than 20,000 MPN/100 ml and more than 20% of the samples show more than 5000 MPN/ 100 ml.(Ref : IS 2296-1982 foot note)
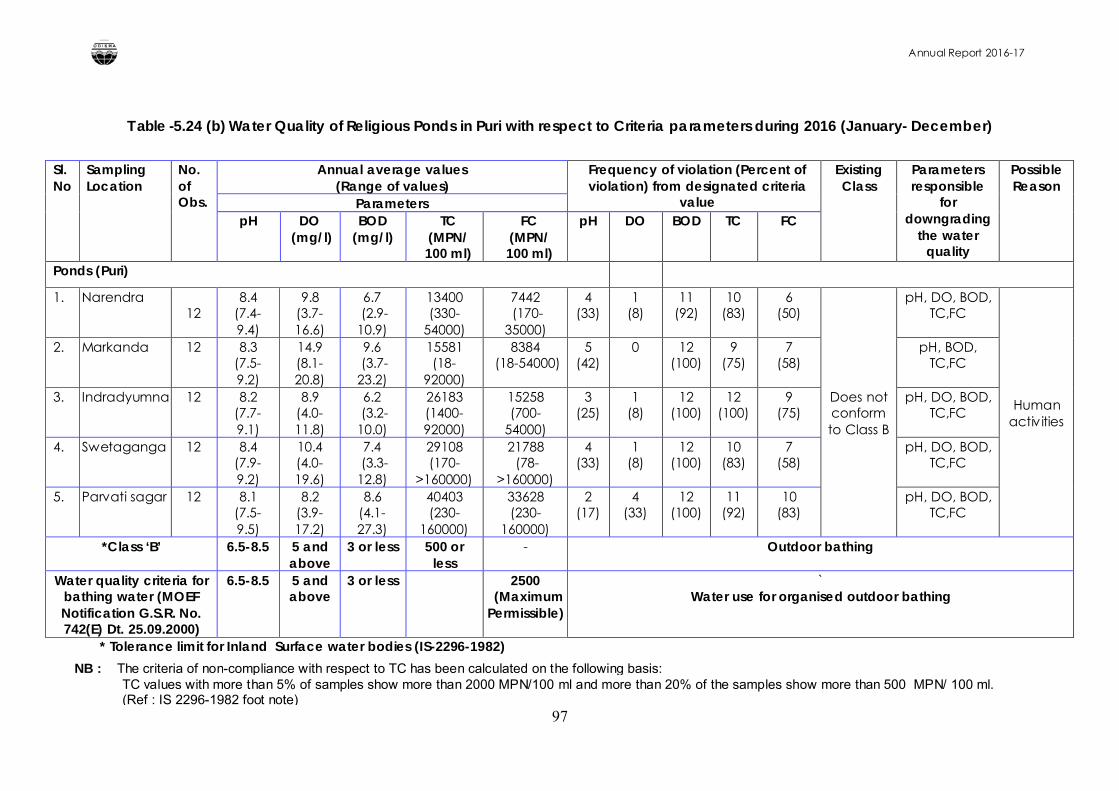
Annual Report 2016-17
97
Table -5.24 (b) Water Quality of Religious Ponds in Puri with respect to Criteria parameters during 2016 (January- December)
* Tolerance limit for Inland Surface water bodies (IS-2296-1982)
Sl. No
Sampling Location
No. of Obs.
Annual average values(Range of values)
Frequency of violation (Percent of violation) from designated criteria
value
Existing Class
Parameters responsible
for downgrading
the water quality
Possible Reason
ParameterspH DO
(mg/l)BOD
(mg/l)TC
(MPN/100 ml)
FC (MPN/100 ml)
pH DO BOD TC FC
Ponds (Puri)
1. Narendra 12
8.4 (7.4-9.4)
9.8 (3.7-16.6)
6.7(2.9-
10.9)
13400 (330-
54000)
7442(170-
35000)
4(33)
1(8)
11(92)
10(83)
6(50)
Does not conform to Class B
pH, DO, BOD, TC,FC
Human activities
2. Markanda 12 8.3 (7.5-9.2)
14.9 (8.1-20.8)
9.6(3.7-
23.2)
15581 (18-
92000)
8384(18-54000)
5(42)
0 12(100)
9(75)
7(58)
pH, BOD, TC,FC
3. Indradyumna 12 8.2 (7.7-9.1)
8.9 (4.0-11.8)
6.2(3.2-
10.0)
26183 (1400-92000)
15258 (700-
54000)
3(25)
1(8)
12(100)
12(100)
9(75)
pH, DO, BOD, TC,FC
4. Swetaganga 12 8.4 (7.9-9.2)
10.4 (4.0-19.6)
7.4(3.3-
12.8)
29108 (170-
>160000)
21788(78-
>160000)
4(33)
1(8)
12(100)
10(83)
7(58)
pH, DO, BOD, TC,FC
5. Parvati sagar 12 8.1 (7.5-9.5)
8.2 (3.9-17.2)
8.6 (4.1-27.3)
40403 (230-
160000)
33628 (230-
160000)
2(17)
4(33)
12(100)
11(92)
10(83)
pH, DO, BOD, TC,FC
*Class ‘B’ 6.5-8.5 5 and above
3 or less 500 or less
- Outdoor bathing
Water quality criteria for bathing water (MOEF Notification G.S.R. No. 742(E) Dt. 25.09.2000)
6.5-8.5 5 and above
3 or less 2500(Maximum
Permissible)
`Water use for organised outdoor bathing
NB : The criteria of non-compliance with respect to TC has been calculated on the following basis:TC values with more than 5% of samples show more than 2000 MPN/100 ml and more than 20% of the samples show more than 500 MPN/ 100 ml.(Ref : IS 2296-1982 foot note)
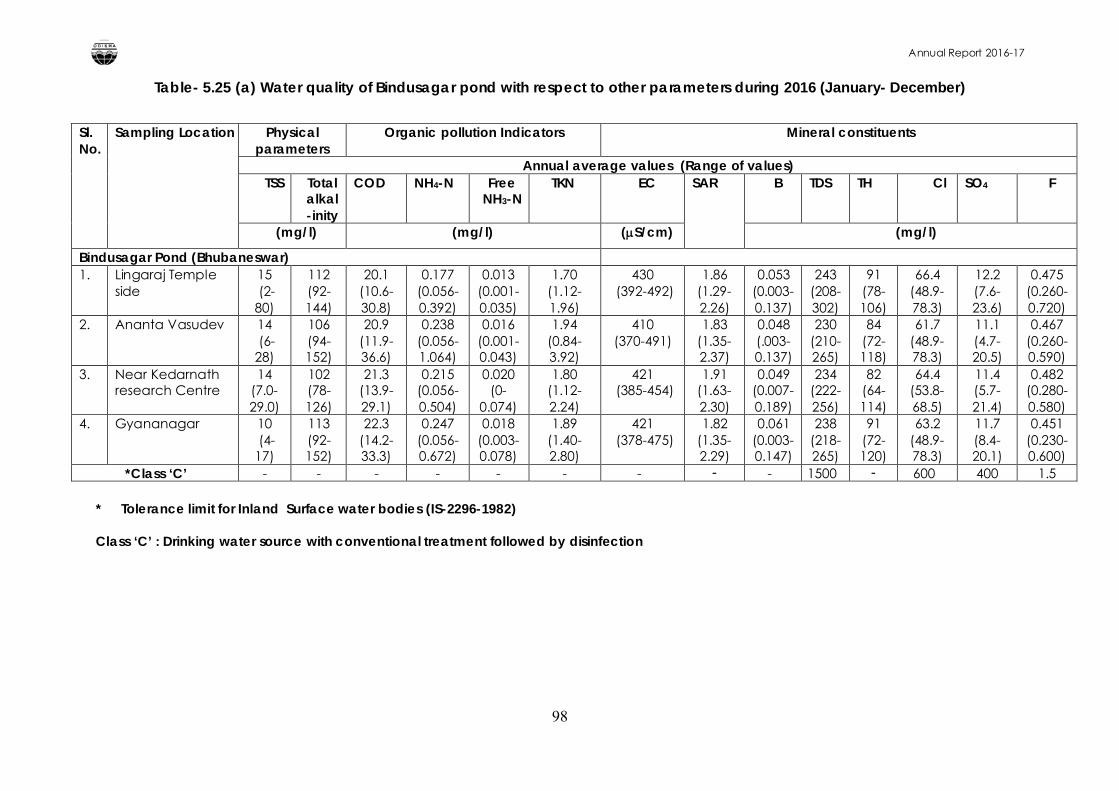
Annual Report 2016-17
98
Table- 5.25 (a) Water quality of Bindusagar pond with respect to other parameters during 2016 (January- December)
Sl. No.
Sampling Location Physical parameters
Organic pollution Indicators Mineral constituents
Annual average values (Range of values)TSS Total
alkal-inity
COD NH4-N Free NH3-N
TKN EC SAR B TDS TH Cl SO4 F
(mg/l) (mg/l) (S/cm) (mg/l)
Bindusagar Pond (Bhubaneswar)1. Lingaraj Temple
side15(2-
80)
112 (92-144)
20.1 (10.6-30.8)
0.177 (0.056-0.392)
0.013 (0.001-0.035)
1.70 (1.12-1.96)
430(392-492)
1.86 (1.29-2.26)
0.053 (0.003-0.137)
243 (208-302)
91 (78-106)
66.4 (48.9-78.3)
12.2 (7.6-23.6)
0.475 (0.260-0.720)
2. Ananta Vasudev 14(6-
28)
106 (94-152)
20.9(11.9-36.6)
0.238 (0.056-1.064)
0.016 (0.001-0.043)
1.94 (0.84-3.92)
410 (370-491)
1.83 (1.35-2.37)
0.048 (.003-0.137)
230 (210-265)
84 (72-118)
61.7 (48.9-78.3)
11.1 (4.7-20.5)
0.467 (0.260-0.590)
3. Near Kedarnath research Centre
14 (7.0-29.0)
102 (78-126)
21.3 (13.9-29.1)
0.215 (0.056-0.504)
0.020 (0-
0.074)
1.80 (1.12-2.24)
421(385-454)
1.91 (1.63-2.30)
0.049 (0.007-0.189)
234 (222-256)
82 (64-114)
64.4 (53.8-68.5)
11.4 (5.7-21.4)
0.482 (0.280-0.580)
4. Gyananagar 10(4-
17)
113 (92-152)
22.3 (14.2-33.3)
0.247 (0.056-0.672)
0.018 (0.003-0.078)
1.89 (1.40-2.80)
421(378-475)
1.82 (1.35-2.29)
0.061 (0.003-0.147)
238 (218-265)
91 (72-120)
63.2 (48.9-78.3)
11.7 (8.4-20.1)
0.451 (0.230-0.600)
*Class ‘C’ - - - - - - - - - 1500 - 600 400 1.5
* Tolerance limit for Inland Surface water bodies (IS-2296-1982)
Class ‘C’ : Drinking water source with conventional treatment followed by disinfection
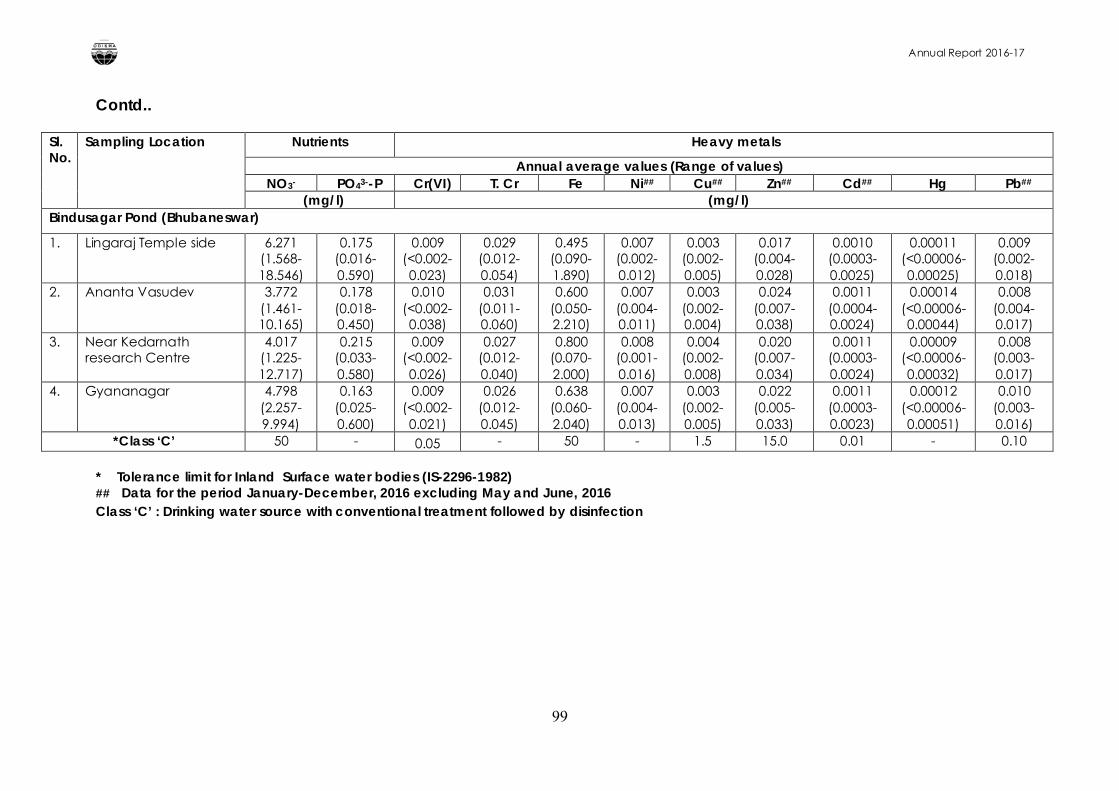
Annual Report 2016-17
99
Contd..
Sl. No.
Sampling Location Nutrients Heavy metals
Annual average values (Range of values)NO3- PO43--P Cr(VI) T. Cr Fe Ni## Cu## Zn## Cd## Hg Pb##
(mg/l) (mg/l)Bindusagar Pond (Bhubaneswar)
1. Lingaraj Temple side 6.271 (1.568-18.546)
0.175 (0.016-0.590)
0.009 (<0.002-0.023)
0.029 (0.012-0.054)
0.495 (0.090-1.890)
0.007 (0.002-0.012)
0.003 (0.002-0.005)
0.017 (0.004-0.028)
0.0010 (0.0003-0.0025)
0.00011 (<0.00006-0.00025)
0.009 (0.002-0.018)
2. Ananta Vasudev 3.772 (1.461-10.165)
0.178 (0.018-0.450)
0.010 (<0.002-0.038)
0.031 (0.011-0.060)
0.600 (0.050-2.210)
0.007 (0.004-0.011)
0.003 (0.002-0.004)
0.024 (0.007-0.038)
0.0011 (0.0004-0.0024)
0.00014 (<0.00006-0.00044)
0.008 (0.004-0.017)
3. Near Kedarnath research Centre
4.017 (1.225-12.717)
0.215 (0.033-0.580)
0.009 (<0.002-0.026)
0.027 (0.012-0.040)
0.800 (0.070-2.000)
0.008 (0.001-0.016)
0.004 (0.002-0.008)
0.020 (0.007-0.034)
0.0011 (0.0003-0.0024)
0.00009 (<0.00006-0.00032)
0.008 (0.003-0.017)
4. Gyananagar 4.798 (2.257-9.994)
0.163 (0.025-0.600)
0.009 (<0.002-0.021)
0.026 (0.012-0.045)
0.638 (0.060-2.040)
0.007 (0.004-0.013)
0.003 (0.002-0.005)
0.022 (0.005-0.033)
0.0011 (0.0003-0.0023)
0.00012 (<0.00006-0.00051)
0.010 (0.003-0.016)
*Class ‘C’ 50 - 0.05 - 50 - 1.5 15.0 0.01 - 0.10
* Tolerance limit for Inland Surface water bodies (IS-2296-1982)## Data for the period January-December, 2016 excluding May and June, 2016 Class ‘C’ : Drinking water source with conventional treatment followed by disinfection
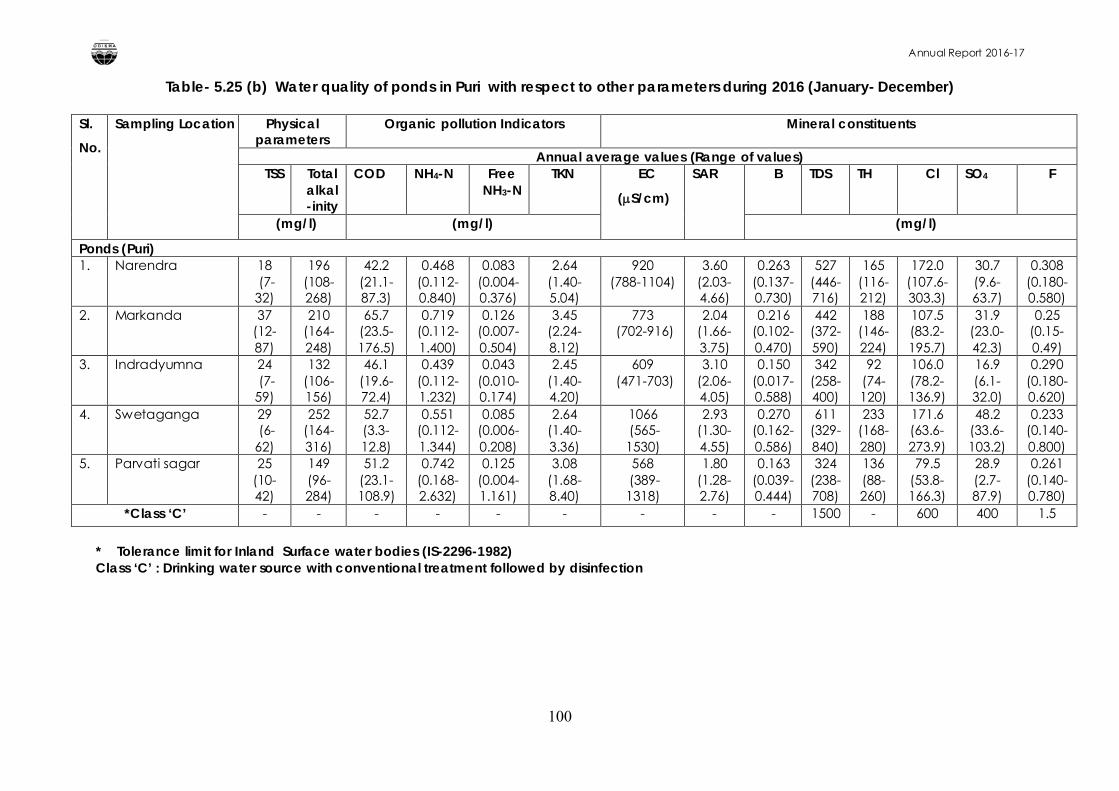
Annual Report 2016-17
100
Table- 5.25 (b) Water quality of ponds in Puri with respect to other parameters during 2016 (January- December)
Sl.
No.
Sampling Location Physical parameters
Organic pollution Indicators Mineral constituents
Annual average values (Range of values)TSS Total
alkal-inity
COD NH4-N Free NH3-N
TKN EC
(S/cm)
SAR B TDS TH Cl SO4 F
(mg/l) (mg/l) (mg/l)
Ponds (Puri)1. Narendra 18
(7-32)
196 (108-268)
42.2 (21.1-87.3)
0.468 (0.112-0.840)
0.083 (0.004-0.376)
2.64 (1.40-5.04)
920 (788-1104)
3.60 (2.03-4.66)
0.263 (0.137-0.730)
527 (446-716)
165 (116-212)
172.0 (107.6-303.3)
30.7 (9.6-63.7)
0.308 (0.180-0.580)
2. Markanda 37 (12-87)
210 (164-248)
65.7 (23.5-176.5)
0.719 (0.112-1.400)
0.126 (0.007-0.504)
3.45 (2.24-8.12)
773(702-916)
2.04 (1.66-3.75)
0.216 (0.102-0.470)
442 (372-590)
188 (146-224)
107.5 (83.2-195.7)
31.9 (23.0-42.3)
0.25 (0.15-0.49)
3. Indradyumna 24(7-
59)
132 (106-156)
46.1 (19.6-72.4)
0.439 (0.112-1.232)
0.043 (0.010-0.174)
2.45 (1.40-4.20)
609(471-703)
3.10 (2.06-4.05)
0.150 (0.017-0.588)
342 (258-400)
92 (74-120)
106.0 (78.2-136.9)
16.9 (6.1-32.0)
0.290 (0.180-0.620)
4. Swetaganga 29(6-
62)
252 (164-316)
52.7 (3.3-12.8)
0.551 (0.112-1.344)
0.085 (0.006-0.208)
2.64 (1.40-3.36)
1066(565-1530)
2.93 (1.30-4.55)
0.270 (0.162-0.586)
611 (329-840)
233 (168-280)
171.6 (63.6-273.9)
48.2 (33.6-103.2)
0.233 (0.140-0.800)
5. Parvati sagar 25 (10-42)
149 (96-284)
51.2 (23.1-108.9)
0.742 (0.168-2.632)
0.125 (0.004-1.161)
3.08 (1.68-8.40)
568(389-1318)
1.80 (1.28-2.76)
0.163 (0.039-0.444)
324 (238-708)
136 (88-260)
79.5 (53.8-166.3)
28.9 (2.7-87.9)
0.261 (0.140-0.780)
*Class ‘C’ - - - - - - - - - 1500 - 600 400 1.5
* Tolerance limit for Inland Surface water bodies (IS-2296-1982)Class ‘C’ : Drinking water source with conventional treatment followed by disinfection
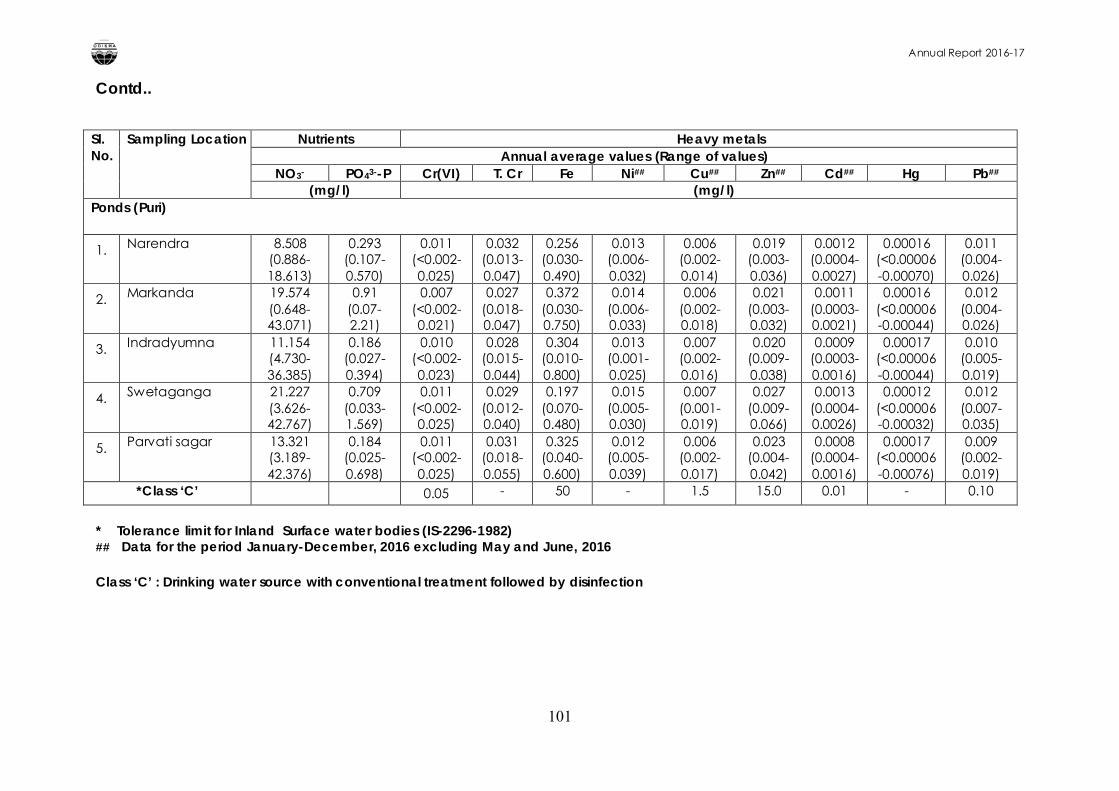
Annual Report 2016-17
101
Contd..
Sl. No.
Sampling Location Nutrients Heavy metals Annual average values (Range of values)
NO3- PO43--P Cr(VI) T. Cr Fe Ni## Cu## Zn## Cd## Hg Pb##
(mg/l) (mg/l)Ponds (Puri)
1. Narendra 8.508 (0.886-18.613)
0.293 (0.107-0.570)
0.011 (<0.002-0.025)
0.032 (0.013-0.047)
0.256 (0.030-0.490)
0.013 (0.006-0.032)
0.006 (0.002-0.014)
0.019 (0.003-0.036)
0.0012 (0.0004-0.0027)
0.00016 (<0.00006-0.00070)
0.011 (0.004-0.026)
2. Markanda 19.574 (0.648-43.071)
0.91 (0.07-2.21)
0.007 (<0.002-0.021)
0.027 (0.018-0.047)
0.372 (0.030-0.750)
0.014 (0.006-0.033)
0.006 (0.002-0.018)
0.021 (0.003-0.032)
0.0011 (0.0003-0.0021)
0.00016 (<0.00006-0.00044)
0.012 (0.004-0.026)
3. Indradyumna 11.154 (4.730-36.385)
0.186 (0.027-0.394)
0.010 (<0.002-0.023)
0.028 (0.015-0.044)
0.304 (0.010-0.800)
0.013 (0.001-0.025)
0.007 (0.002-0.016)
0.020 (0.009-0.038)
0.0009 (0.0003-0.0016)
0.00017 (<0.00006-0.00044)
0.010 (0.005-0.019)
4. Swetaganga 21.227 (3.626-42.767)
0.709 (0.033-1.569)
0.011 (<0.002-0.025)
0.029 (0.012-0.040)
0.197 (0.070-0.480)
0.015 (0.005-0.030)
0.007 (0.001-0.019)
0.027 (0.009-0.066)
0.0013 (0.0004-0.0026)
0.00012 (<0.00006-0.00032)
0.012 (0.007-0.035)
5. Parvati sagar 13.321 (3.189-42.376)
0.184 (0.025-0.698)
0.011 (<0.002-0.025)
0.031 (0.018-0.055)
0.325 (0.040-0.600)
0.012 (0.005-0.039)
0.006 (0.002-0.017)
0.023 (0.004-0.042)
0.0008 (0.0004-0.0016)
0.00017 (<0.00006-0.00076)
0.009 (0.002-0.019)
*Class ‘C’ 0.05 - 50 - 1.5 15.0 0.01 - 0.10
* Tolerance limit for Inland Surface water bodies (IS-2296-1982)## Data for the period January-December, 2016 excluding May and June, 2016
Class ‘C’ : Drinking water source with conventional treatment followed by disinfection
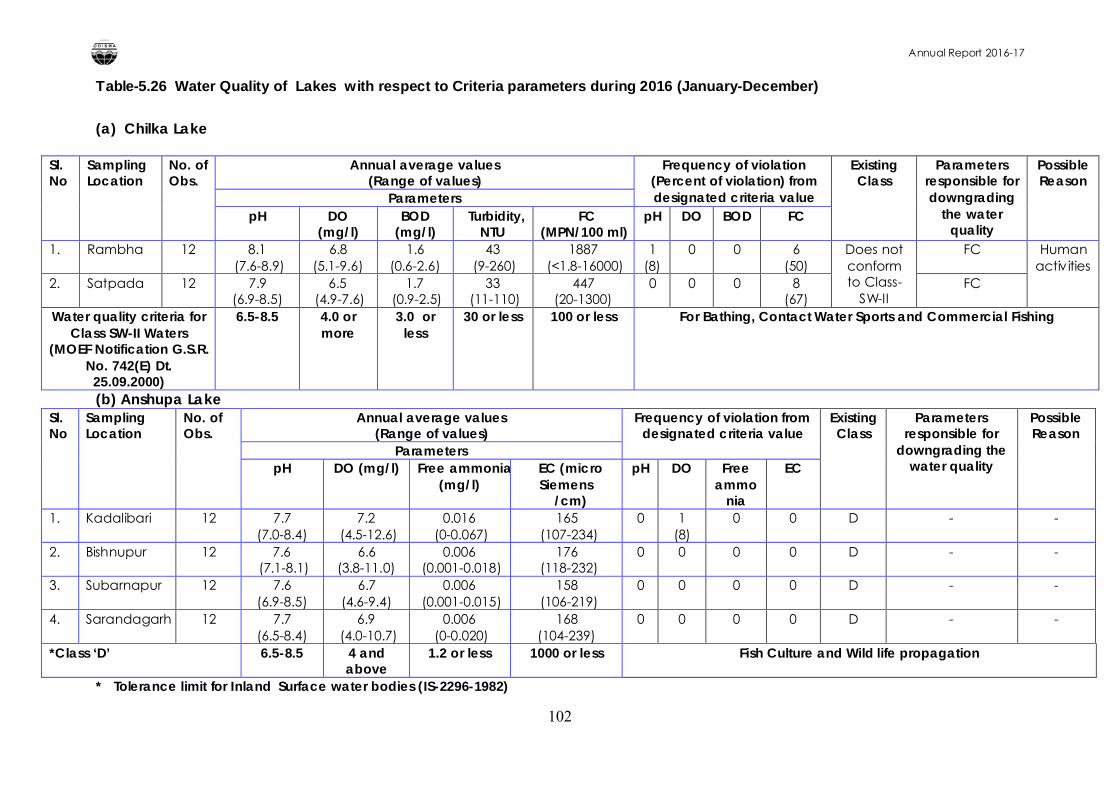
Annual Report 2016-17
102
Table-5.26 Water Quality of Lakes with respect to Criteria parameters during 2016 (January-December)
(a) Chilka Lake
Sl. No
Sampling Location
No. of Obs.
Annual average values(Range of values)
Frequency of violation (Percent of violation) from designated criteria value
Existing Class
Parameters responsible for downgrading
the water quality
Possible Reason
ParameterspH DO
(mg/l)BOD
(mg/l)Turbidity,
NTUFC
(MPN/100 ml)pH DO BOD FC
1. Rambha 12 8.1(7.6-8.9)
6.8 (5.1-9.6)
1.6 (0.6-2.6)
43(9-260)
1887(<1.8-16000)
1(8)
0 0 6(50)
Does not conform to Class-
SW-II
FC Human activities
2. Satpada 12 7.9 (6.9-8.5)
6.5(4.9-7.6)
1.7(0.9-2.5)
33(11-110)
447 (20-1300)
0 0 0 8(67)
FC
Water quality criteria for Class SW-II Waters
(MOEF Notification G.S.R. No. 742(E) Dt. 25.09.2000)
6.5-8.5 4.0 or more
3.0 or less
30 or less 100 or less For Bathing, Contact Water Sports and Commercial Fishing
(b) Anshupa LakeSl. No
Sampling Location
No. of Obs.
Annual average values(Range of values)
Frequency of violation from designated criteria value
Existing Class
Parameters responsible for
downgrading the water quality
Possible Reason
ParameterspH DO (mg/l) Free ammonia
(mg/l) EC (micro Siemens
/cm)
pH DO Free ammo
nia
EC
1. Kadalibari 12 7.7 (7.0-8.4)
7.2(4.5-12.6)
0.016(0-0.067)
165(107-234)
0 1(8)
0 0 D - -
2. Bishnupur 12 7.6(7.1-8.1)
6.6 (3.8-11.0)
0.006(0.001-0.018)
176(118-232)
0 0 0 0 D - -
3. Subarnapur 12 7.6 (6.9-8.5)
6.7 (4.6-9.4)
0.006(0.001-0.015)
158(106-219)
0 0 0 0 D - -
4. Sarandagarh 12 7.7 (6.5-8.4)
6.9(4.0-10.7)
0.006(0-0.020)
168 (104-239)
0 0 0 0 D - -
*Class ‘D’ 6.5-8.5 4 and above
1.2 or less 1000 or less Fish Culture and Wild life propagation
* Tolerance limit for Inland Surface water bodies (IS-2296-1982)
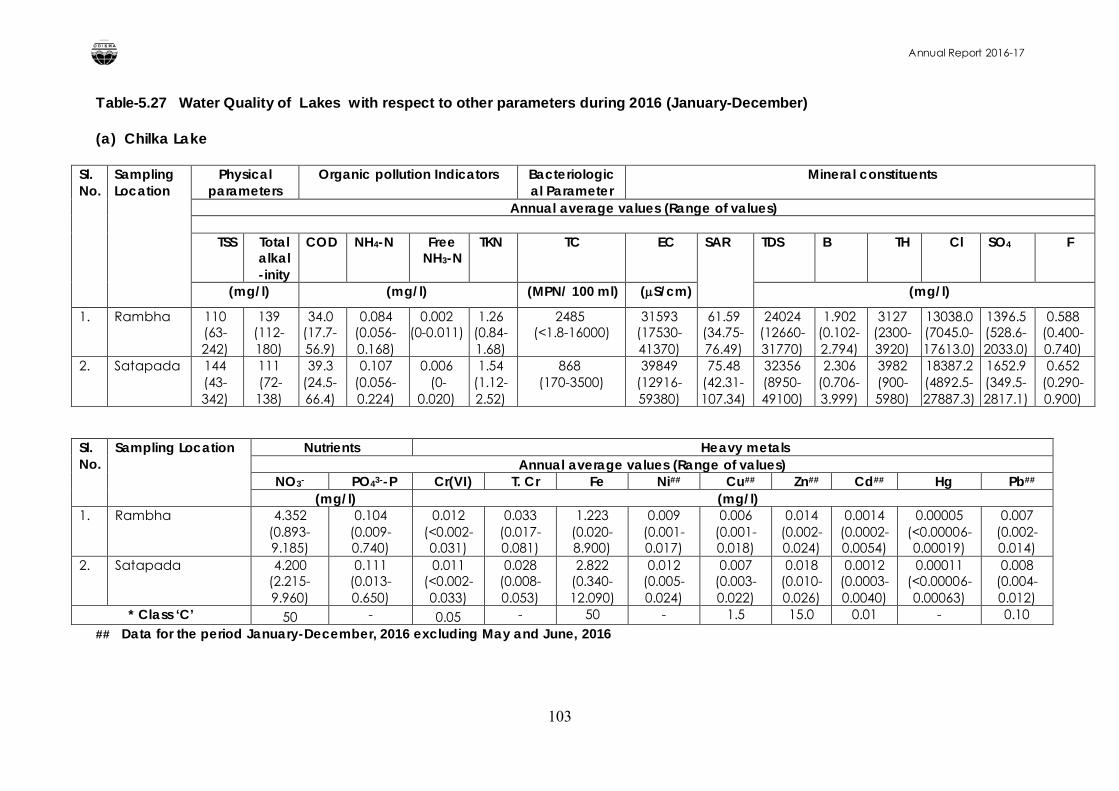
Annual Report 2016-17
103
Table-5.27 Water Quality of Lakes with respect to other parameters during 2016 (January-December)
(a) Chilka Lake
Sl. No.
Sampling Location
Physical parameters
Organic pollution Indicators Bacteriological Parameter
Mineral constituents
Annual average values (Range of values)
TSS Total alkal-inity
COD NH4-N Free NH3-N
TKN TC EC SAR TDS B TH Cl SO4 F
(mg/l) (mg/l) (MPN/ 100 ml) (S/cm) (mg/l)
1. Rambha 110 (63-242)
139 (112-180)
34.0 (17.7-56.9)
0.084 (0.056-0.168)
0.002 (0-0.011)
1.26 (0.84-1.68)
2485(<1.8-16000)
31593 (17530-41370)
61.59 (34.75-76.49)
24024 (12660-31770)
1.902 (0.102-2.794)
3127 (2300-3920)
13038.0 (7045.0-17613.0)
1396.5 (528.6-2033.0)
0.588 (0.400-0.740)
2. Satapada 144 (43-342)
111(72-138)
39.3 (24.5-66.4)
0.107 (0.056-0.224)
0.006(0-
0.020)
1.54 (1.12-2.52)
868(170-3500)
39849 (12916-59380)
75.48 (42.31-107.34)
32356 (8950-49100)
2.306 (0.706-3.999)
3982 (900-5980)
18387.2 (4892.5-27887.3)
1652.9 (349.5-2817.1)
0.652 (0.290-0.900)
Sl. No.
Sampling Location Nutrients Heavy metals Annual average values (Range of values)
NO3- PO43--P Cr(VI) T. Cr Fe Ni## Cu## Zn## Cd## Hg Pb##
(mg/l) (mg/l)1. Rambha 4.352
(0.893-9.185)
0.104 (0.009-0.740)
0.012 (<0.002-0.031)
0.033 (0.017-0.081)
1.223 (0.020-8.900)
0.009 (0.001-0.017)
0.006 (0.001-0.018)
0.014 (0.002-0.024)
0.0014 (0.0002-0.0054)
0.00005 (<0.00006-0.00019)
0.007 (0.002-0.014)
2. Satapada 4.200 (2.215-9.960)
0.111 (0.013-0.650)
0.011 (<0.002-0.033)
0.028 (0.008-0.053)
2.822 (0.340-12.090)
0.012 (0.005-0.024)
0.007 (0.003-0.022)
0.018 (0.010-0.026)
0.0012 (0.0003-0.0040)
0.00011 (<0.00006-0.00063)
0.008 (0.004-0.012)
* Class ‘C’ 50 - 0.05 - 50 - 1.5 15.0 0.01 - 0.10## Data for the period January-December, 2016 excluding May and June, 2016
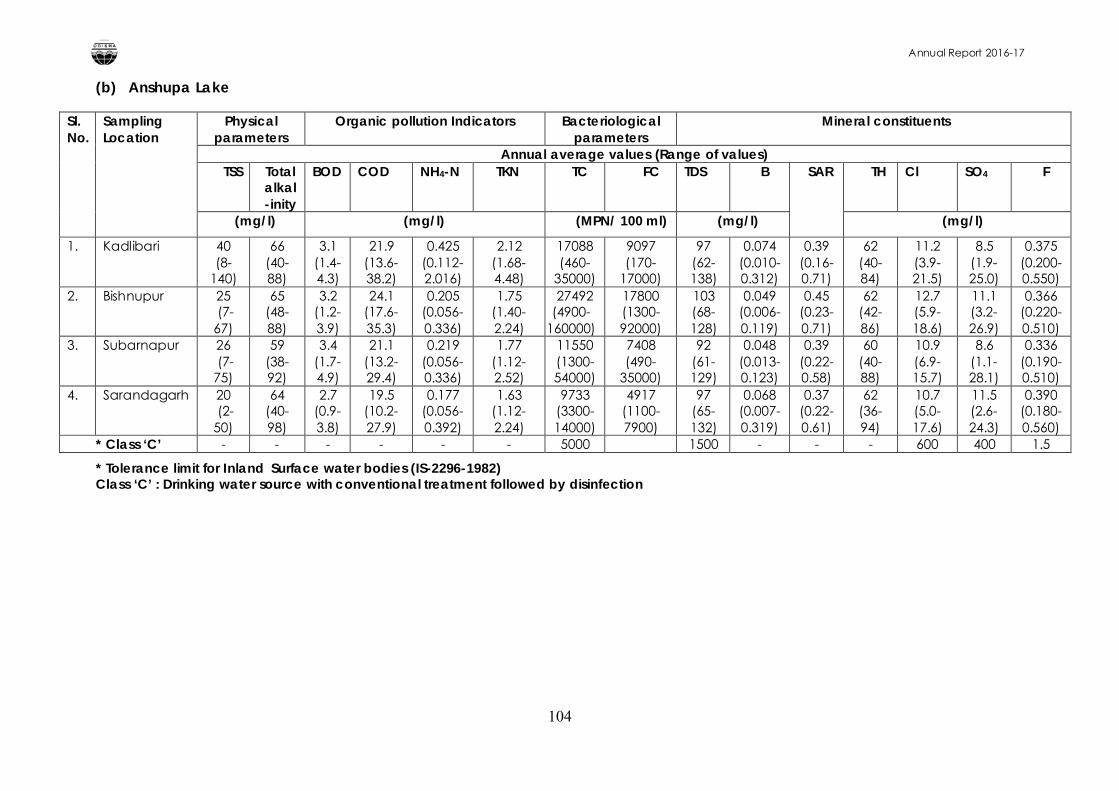
Annual Report 2016-17
104
(b) Anshupa Lake
Sl. No.
Sampling Location
Physical parameters
Organic pollution Indicators Bacteriological parameters
Mineral constituents
Annual average values (Range of values)TSS Total
alkal-inity
BOD COD NH4-N TKN TC FC TDS B SAR TH Cl SO4 F
(mg/l) (mg/l) (MPN/ 100 ml) (mg/l) (mg/l)
1. Kadlibari 40 (8-
140)
66 (40-88)
3.1 (1.4-4.3)
21.9 (13.6-38.2)
0.425 (0.112-2.016)
2.12 (1.68-4.48)
17088 (460-
35000)
9097 (170-
17000)
97 (62-138)
0.074 (0.010-0.312)
0.39 (0.16-0.71)
62 (40-84)
11.2 (3.9-21.5)
8.5 (1.9-25.0)
0.375 (0.200-0.550)
2. Bishnupur 25(7-
67)
65 (48-88)
3.2 (1.2-3.9)
24.1 (17.6-35.3)
0.205 (0.056-0.336)
1.75 (1.40-2.24)
27492 (4900-
160000)
17800 (1300-92000)
103 (68-128)
0.049 (0.006-0.119)
0.45 (0.23-0.71)
62 (42-86)
12.7 (5.9-18.6)
11.1 (3.2-26.9)
0.366 (0.220-0.510)
3. Subarnapur 26(7-
75)
59 (38-92)
3.4 (1.7-4.9)
21.1 (13.2-29.4)
0.219 (0.056-0.336)
1.77 (1.12-2.52)
11550 (1300-54000)
7408 (490-
35000)
92 (61-129)
0.048 (0.013-0.123)
0.39 (0.22-0.58)
60 (40-88)
10.9 (6.9-15.7)
8.6 (1.1-28.1)
0.336 (0.190-0.510)
4. Sarandagarh 20(2-
50)
64 (40-98)
2.7 (0.9-3.8)
19.5 (10.2-27.9)
0.177 (0.056-0.392)
1.63 (1.12-2.24)
9733 (3300-14000)
4917 (1100-7900)
97 (65-132)
0.068 (0.007-0.319)
0.37 (0.22-0.61)
62 (36-94)
10.7 (5.0-17.6)
11.5 (2.6-24.3)
0.390 (0.180-0.560)
* Class ‘C’ - - - - - - 5000 1500 - - - 600 400 1.5
* Tolerance limit for Inland Surface water bodies (IS-2296-1982)Class ‘C’ : Drinking water source with conventional treatment followed by disinfection
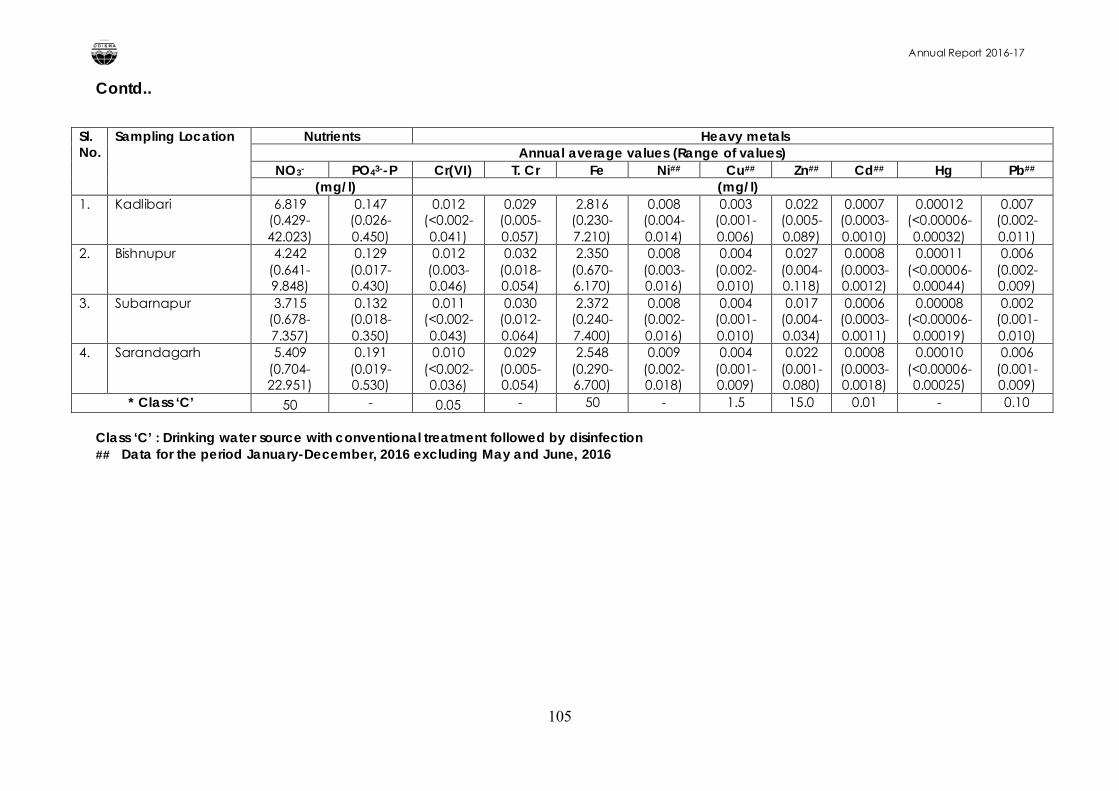
Annual Report 2016-17
105
Contd..
Sl. No.
Sampling Location Nutrients Heavy metals Annual average values (Range of values)
NO3- PO43--P Cr(VI) T. Cr Fe Ni## Cu## Zn## Cd## Hg Pb##
(mg/l) (mg/l)1. Kadlibari 6.819
(0.429-42.023)
0.147 (0.026-0.450)
0.012 (<0.002-0.041)
0.029 (0.005-0.057)
2.816 (0.230-7.210)
0.008 (0.004-0.014)
0.003 (0.001-0.006)
0.022 (0.005-0.089)
0.0007 (0.0003-0.0010)
0.00012 (<0.00006-0.00032)
0.007 (0.002-0.011)
2. Bishnupur 4.242 (0.641-9.848)
0.129 (0.017-0.430)
0.012 (0.003-0.046)
0.032 (0.018-0.054)
2.350 (0.670-6.170)
0.008 (0.003-0.016)
0.004 (0.002-0.010)
0.027 (0.004-0.118)
0.0008 (0.0003-0.0012)
0.00011 (<0.00006-0.00044)
0.006 (0.002-0.009)
3. Subarnapur 3.715 (0.678-7.357)
0.132 (0.018-0.350)
0.011 (<0.002-0.043)
0.030 (0.012-0.064)
2.372 (0.240-7.400)
0.008 (0.002-0.016)
0.004 (0.001-0.010)
0.017 (0.004-0.034)
0.0006 (0.0003-0.0011)
0.00008 (<0.00006-0.00019)
0.002 (0.001-0.010)
4. Sarandagarh 5.409 (0.704-22.951)
0.191 (0.019-0.530)
0.010 (<0.002-0.036)
0.029 (0.005-0.054)
2.548 (0.290-6.700)
0.009 (0.002-0.018)
0.004 (0.001-0.009)
0.022 (0.001-0.080)
0.0008 (0.0003-0.0018)
0.00010 (<0.00006-0.00025)
0.006 (0.001-0.009)
* Class ‘C’ 50 - 0.05 - 50 - 1.5 15.0 0.01 - 0.10
Class ‘C’ : Drinking water source with conventional treatment followed by disinfection## Data for the period January-December, 2016 excluding May and June, 2016
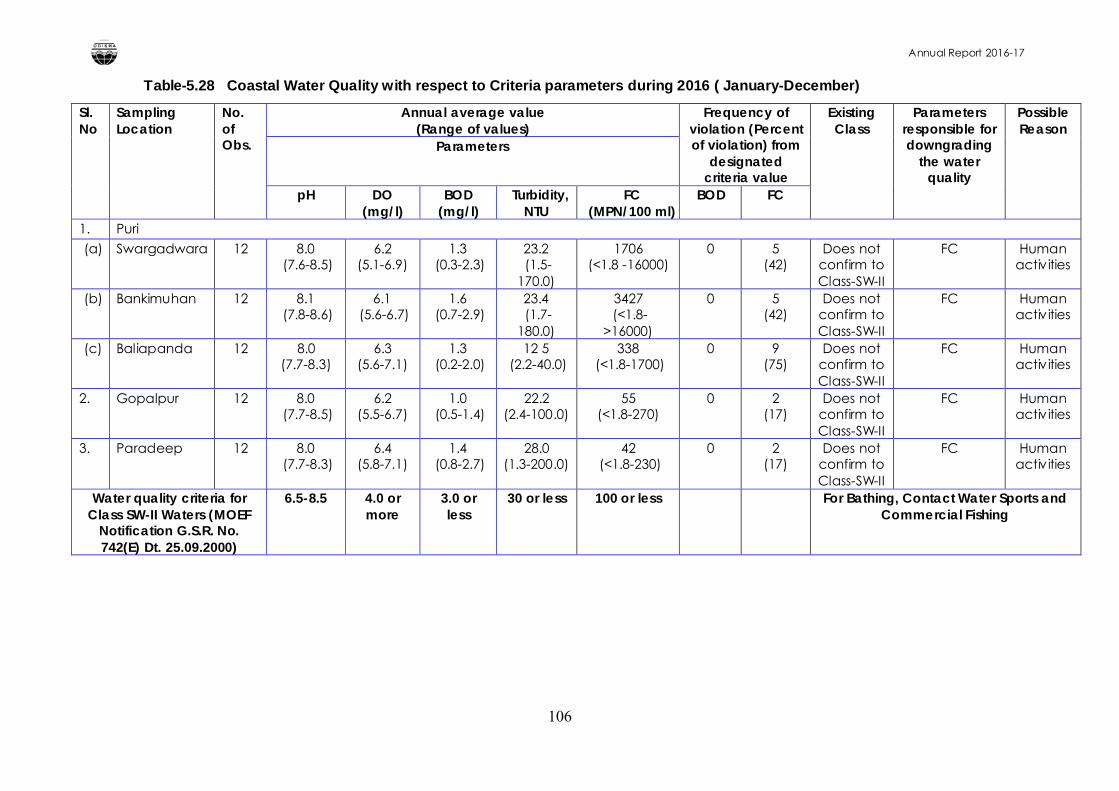
Annual Report 2016-17
106
Table-5.28 Coastal Water Quality with respect to Criteria parameters during 2016 ( January-December)
Sl. No
Sampling Location
No. of Obs.
Annual average value(Range of values)
Frequency of violation (Percent of violation) from
designated criteria value
Existing Class
Parameters responsible for downgrading
the water quality
Possible Reason
Parameters
pH DO (mg/l)
BOD (mg/l)
Turbidity, NTU
FC (MPN/100 ml)
BOD FC
1. Puri
(a) Swargadwara 12 8.0(7.6-8.5)
6.2 (5.1-6.9)
1.3(0.3-2.3)
23.2(1.5-
170.0)
1706 (<1.8 -16000)
0 5(42)
Does not confirm to Class-SW-II
FC Human activities
(b) Bankimuhan 12 8.1(7.8-8.6)
6.1(5.6-6.7)
1.6(0.7-2.9)
23.4(1.7-
180.0)
3427(<1.8-
>16000)
0 5(42)
Does not confirm to Class-SW-II
FC Human activities
(c) Baliapanda 12 8.0 (7.7-8.3)
6.3 (5.6-7.1)
1.3(0.2-2.0)
12 5(2.2-40.0)
338(<1.8-1700)
0 9(75)
Does not confirm to Class-SW-II
FC Human activities
2. Gopalpur 12 8.0(7.7-8.5)
6.2 (5.5-6.7)
1.0(0.5-1.4)
22.2 (2.4-100.0)
55 (<1.8-270)
0 2(17)
Does not confirm to Class-SW-II
FC Human activities
3. Paradeep 12 8.0(7.7-8.3)
6.4 (5.8-7.1)
1.4(0.8-2.7)
28.0 (1.3-200.0)
42(<1.8-230)
0 2(17)
Does not confirm to Class-SW-II
FC Human activities
Water quality criteria for Class SW-II Waters (MOEF
Notification G.S.R. No. 742(E) Dt. 25.09.2000)
6.5-8.5 4.0 or more
3.0 or less
30 or less 100 or less For Bathing, Contact Water Sports and Commercial Fishing
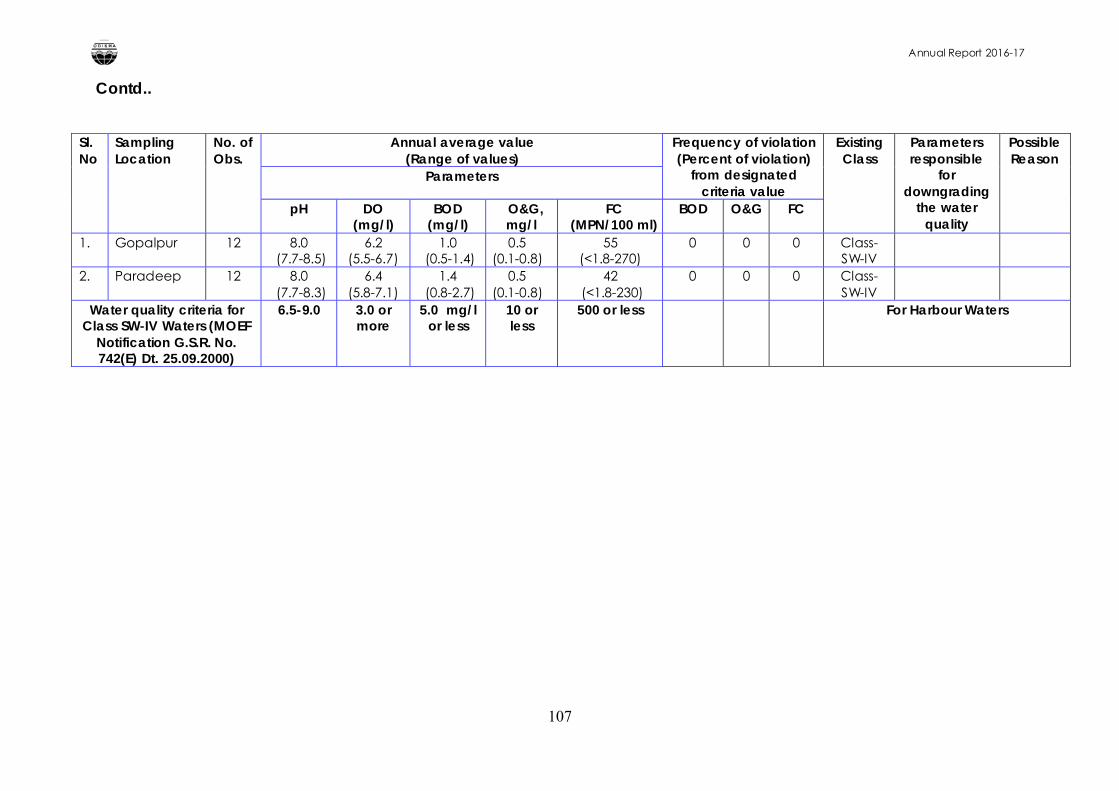
Annual Report 2016-17
107
Contd..
Sl. No
Sampling Location
No. of Obs.
Annual average value(Range of values)
Frequency of violation (Percent of violation)
from designated criteria value
Existing Class
Parameters responsible
for downgrading
the water quality
PossibleReason
Parameters
pH DO (mg/l)
BOD (mg/l)
O&G, mg/l
FC (MPN/100 ml)
BOD O&G FC
1. Gopalpur 12 8.0(7.7-8.5)
6.2 (5.5-6.7)
1.0(0.5-1.4)
0.5(0.1-0.8)
55 (<1.8-270)
0 0 0 Class-SW-IV
2. Paradeep 12 8.0(7.7-8.3)
6.4 (5.8-7.1)
1.4(0.8-2.7)
0.5(0.1-0.8)
42(<1.8-230)
0 0 0 Class-SW-IV
Water quality criteria for Class SW-IV Waters (MOEF
Notification G.S.R. No. 742(E) Dt. 25.09.2000)
6.5-9.0 3.0 or more
5.0 mg/l or less
10 or less
500 or less For Harbour Waters
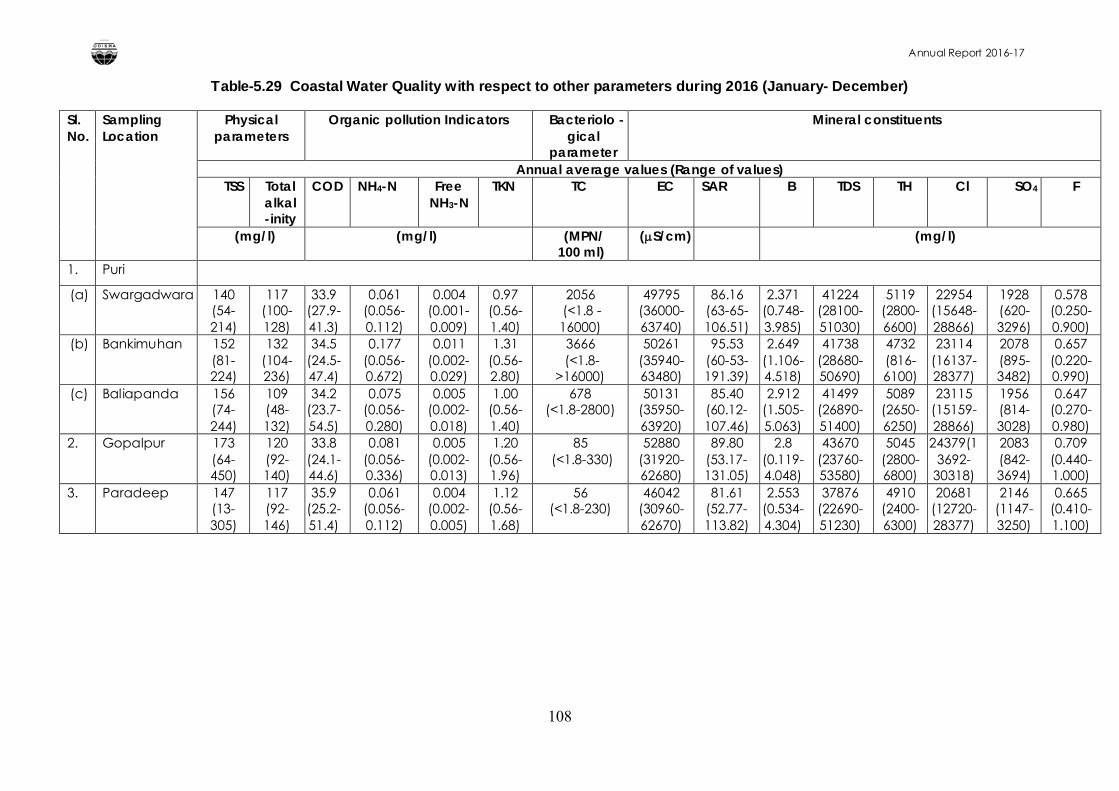
Annual Report 2016-17
108
Table-5.29 Coastal Water Quality with respect to other parameters during 2016 (January- December)
Sl. No.
Sampling Location
Physical parameters
Organic pollution Indicators Bacteriolo -gical
parameter
Mineral constituents
Annual average values (Range of values)TSS Total
alkal-inity
COD NH4-N Free NH3-N
TKN TC EC SAR B TDS TH Cl SO4 F
(mg/l) (mg/l) (MPN/100 ml)
(S/cm) (mg/l)
1. Puri
(a) Swargadwara 140 (54-214)
117 (100-128)
33.9 (27.9-41.3)
0.061 (0.056-0.112)
0.004 (0.001-0.009)
0.97 (0.56-1.40)
2056(<1.8 -16000)
49795 (36000-63740)
86.16 (63-65-106.51)
2.371 (0.748-3.985)
41224 (28100-51030)
5119 (2800-6600)
22954 (15648-28866)
1928 (620-3296)
0.578 (0.250-0.900)
(b) Bankimuhan 152 (81-224)
132 (104-236)
34.5 (24.5-47.4)
0.177 (0.056-0.672)
0.011 (0.002-0.029)
1.31 (0.56-2.80)
3666(<1.8-
>16000)
50261 (35940-63480)
95.53 (60-53-191.39)
2.649 (1.106-4.518)
41738 (28680-50690)
4732 (816-6100)
23114 (16137-28377)
2078 (895-3482)
0.657 (0.220-0.990)
(c) Baliapanda 156 (74-244)
109 (48-132)
34.2 (23.7-54.5)
0.075 (0.056-0.280)
0.005 (0.002-0.018)
1.00 (0.56-1.40)
678 (<1.8-2800)
50131 (35950-63920)
85.40 (60.12-107.46)
2.912 (1.505-5.063)
41499 (26890-51400)
5089 (2650-6250)
23115 (15159-28866)
1956 (814-3028)
0.647 (0.270-0.980)
2. Gopalpur 173 (64-450)
120 (92-140)
33.8 (24.1-44.6)
0.081 (0.056-0.336)
0.005 (0.002-0.013)
1.20 (0.56-1.96)
85(<1.8-330)
52880 (31920-62680)
89.80 (53.17-131.05)
2.8 (0.119-4.048)
43670 (23760-53580)
5045 (2800-6800)
24379(13692-
30318)
2083 (842-3694)
0.709 (0.440-1.000)
3. Paradeep 147 (13-305)
117 (92-146)
35.9 (25.2-51.4)
0.061 (0.056-0.112)
0.004 (0.002-0.005)
1.12 (0.56-1.68)
56 (<1.8-230)
46042 (30960-62670)
81.61 (52.77-113.82)
2.553 (0.534-4.304)
37876 (22690-51230)
4910 (2400-6300)
20681 (12720-28377)
2146 (1147-3250)
0.665 (0.410-1.100)
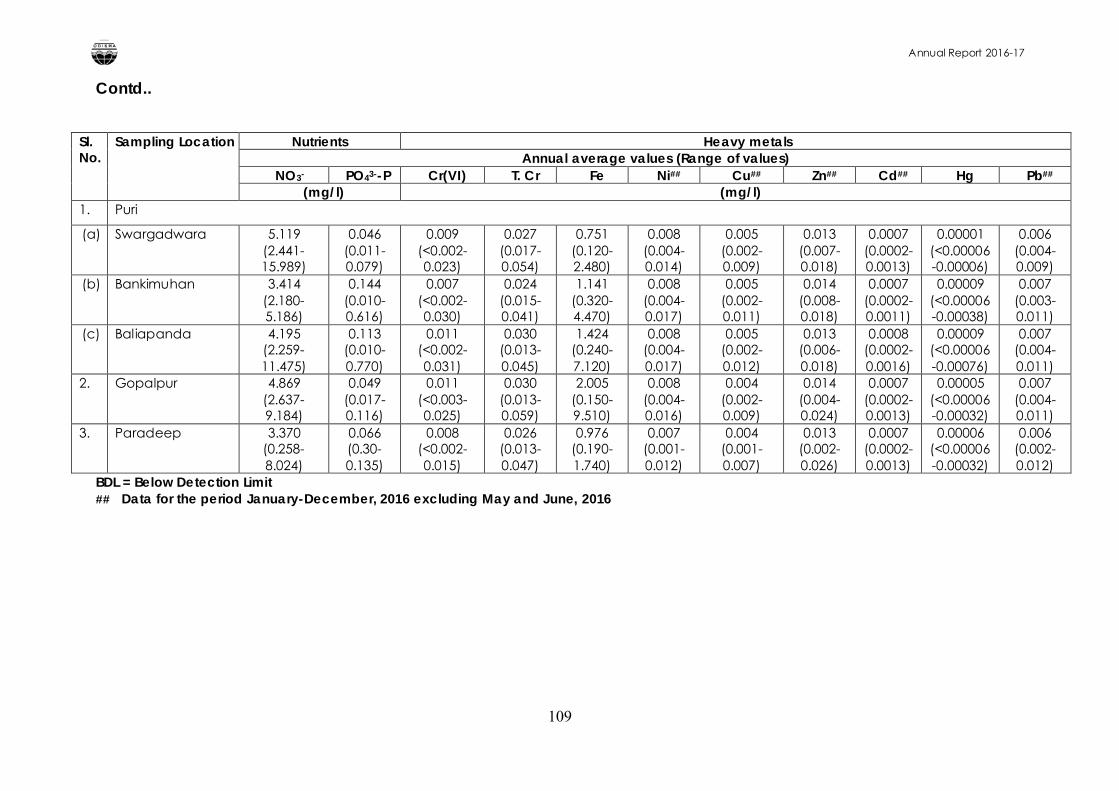
Annual Report 2016-17
109
Contd..
Sl. No.
Sampling Location Nutrients Heavy metals Annual average values (Range of values)
NO3- PO43--P Cr(VI) T. Cr Fe Ni## Cu## Zn## Cd## Hg Pb##
(mg/l) (mg/l)1. Puri
(a) Swargadwara 5.119 (2.441-15.989)
0.046 (0.011-0.079)
0.009 (<0.002-0.023)
0.027 (0.017-0.054)
0.751 (0.120-2.480)
0.008 (0.004-0.014)
0.005 (0.002-0.009)
0.013 (0.007-0.018)
0.0007 (0.0002-0.0013)
0.00001 (<0.00006-0.00006)
0.006 (0.004-0.009)
(b) Bankimuhan 3.414(2.180-5.186)
0.144 (0.010-0.616)
0.007 (<0.002-0.030)
0.024 (0.015-0.041)
1.141 (0.320-4.470)
0.008 (0.004-0.017)
0.005 (0.002-0.011)
0.014 (0.008-0.018)
0.0007 (0.0002-0.0011)
0.00009 (<0.00006-0.00038)
0.007 (0.003-0.011)
(c) Baliapanda 4.195 (2.259-11.475)
0.113 (0.010-0.770)
0.011 (<0.002-0.031)
0.030 (0.013-0.045)
1.424 (0.240-7.120)
0.008 (0.004-0.017)
0.005 (0.002-0.012)
0.013 (0.006-0.018)
0.0008 (0.0002-0.0016)
0.00009 (<0.00006-0.00076)
0.007 (0.004-0.011)
2. Gopalpur 4.869 (2.637-9.184)
0.049(0.017-0.116)
0.011 (<0.003-0.025)
0.030 (0.013-0.059)
2.005 (0.150-9.510)
0.008 (0.004-0.016)
0.004 (0.002-0.009)
0.014 (0.004-0.024)
0.0007 (0.0002-0.0013)
0.00005 (<0.00006-0.00032)
0.007 (0.004-0.011)
3. Paradeep 3.370 (0.258-8.024)
0.066 (0.30-0.135)
0.008 (<0.002-0.015)
0.026 (0.013-0.047)
0.976 (0.190-1.740)
0.007 (0.001-0.012)
0.004 (0.001-0.007)
0.013 (0.002-0.026)
0.0007 (0.0002-0.0013)
0.00006 (<0.00006-0.00032)
0.006 (0.002-0.012)
BDL = Below Detection Limit## Data for the period January-December, 2016 excluding May and June, 2016
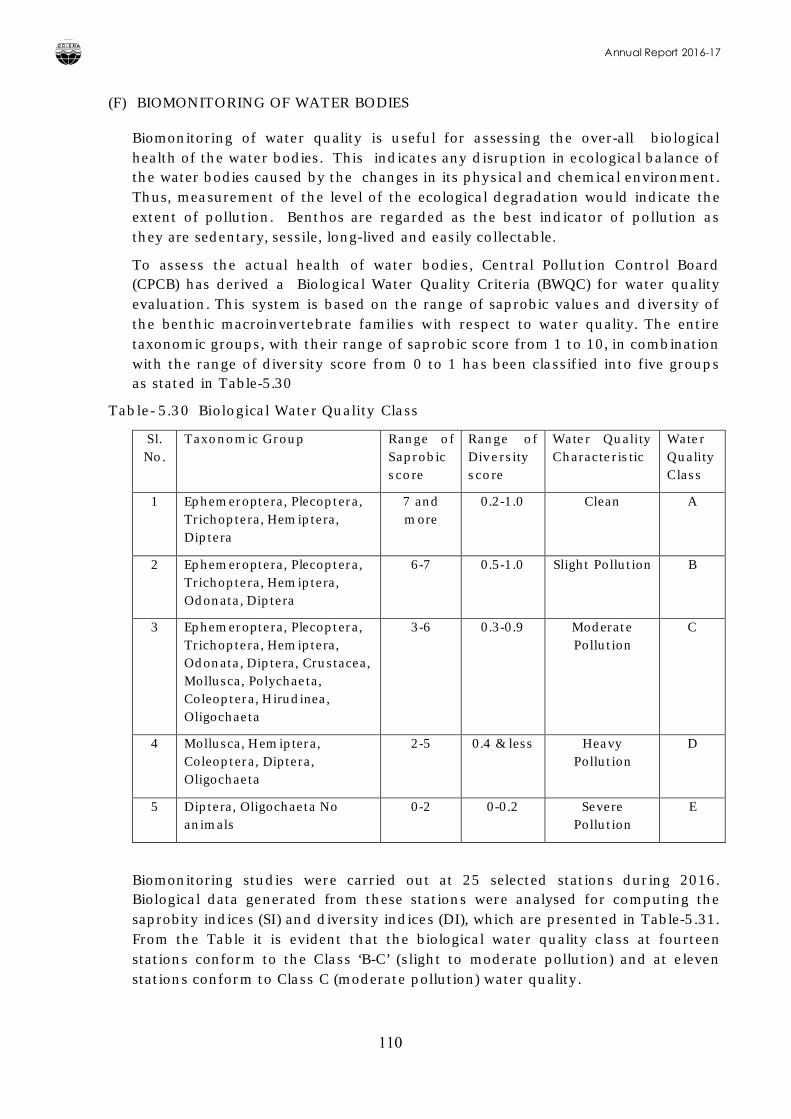
Annual Report 2016-17
110
(F) BIOMONITORING OF WATER BODIES
Biomonitoring of water quality is useful for assessing the over-all biological health of the water bodies. This indicates any disruption in ecological balance of the water bodies caused by the changes in its physical and chemical environment. Thus, measurement of the level of the ecological degradation would indicate the extent of pollution. Benthos are regarded as the best indicator of pollution as they are sedentary, sessile, long-lived and easily collectable.
To assess the actual health of water bodies, Central Pollution Control Board (CPCB) has derived a Biological Water Quality Criteria (BWQC) for water quality evaluation. This system is based on the range of saprobic values and diversity of the benthic macroinvertebrate families with respect to water quality. The entire taxonomic groups, with their range of saprobic score from 1 to 10, in combination with the range of diversity score from 0 to 1 has been classified into five groups as stated in Table-5.30
Table- 5.30 Biological Water Quality Class
Sl. No.
Taxonomic Group Range of Saprobic score
Range of Diversity score
Water Quality Characteristic
Water Quality Class
1 Ephemeroptera, Plecoptera, Trichoptera, Hemiptera, Diptera
7 and more
0.2-1.0 Clean A
2 Ephemeroptera, Plecoptera, Trichoptera, Hemiptera, Odonata, Diptera
6-7 0.5-1.0 Slight Pollution B
3 Ephemeroptera, Plecoptera, Trichoptera, Hemiptera, Odonata, Diptera, Crustacea, Mollusca, Polychaeta, Coleoptera, Hirudinea, Oligochaeta
3-6 0.3-0.9 Moderate Pollution
C
4 Mollusca, Hemiptera, Coleoptera, Diptera, Oligochaeta
2-5 0.4 & less Heavy Pollution
D
5 Diptera, Oligochaeta No animals
0-2 0-0.2 Severe Pollution
E
Biomonitoring studies were carried out at 25 selected stations during 2016. Biological data generated from these stations were analysed for computing the saprobity indices (SI) and diversity indices (DI), which are presented in Table-5.31. From the Table it is evident that the biological water quality class at fourteen stations conform to the Class ‘B-C’ (slight to moderate pollution) and at eleven stations conform to Class C (moderate pollution) water quality.
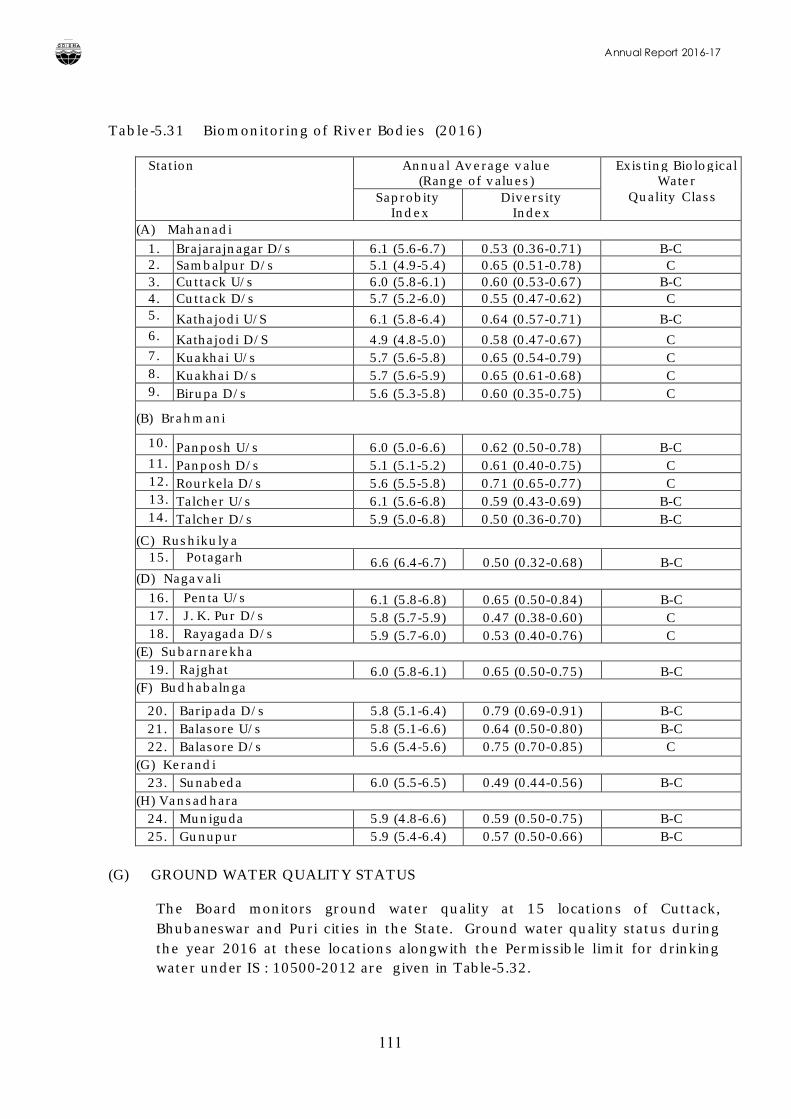
Annual Report 2016-17
111
Table-5.31 Biomonitoring of River Bodies (2016)
Station Annual Average value(Range of values)
Existing Biological Water
Quality ClassSaprobityIndex
Diversity Index
(A) Mahanadi
1. Brajarajnagar D/s 6.1 (5.6-6.7) 0.53 (0.36-0.71) B-C2. Sambalpur D/s 5.1 (4.9-5.4) 0.65 (0.51-0.78) C3. Cuttack U/s 6.0 (5.8-6.1) 0.60 (0.53-0.67) B-C4. Cuttack D/s 5.7 (5.2-6.0) 0.55 (0.47-0.62) C5. Kathajodi U/S 6.1 (5.8-6.4) 0.64 (0.57-0.71) B-C6. Kathajodi D/S 4.9 (4.8-5.0) 0.58 (0.47-0.67) C7. Kuakhai U/s 5.7 (5.6-5.8) 0.65 (0.54-0.79) C8. Kuakhai D/s 5.7 (5.6-5.9) 0.65 (0.61-0.68) C9. Birupa D/s 5.6 (5.3-5.8) 0.60 (0.35-0.75) C
(B) Brahmani
10. Panposh U/s 6.0 (5.0-6.6) 0.62 (0.50-0.78) B-C11. Panposh D/s 5.1 (5.1-5.2) 0.61 (0.40-0.75) C12. Rourkela D/s 5.6 (5.5-5.8) 0.71 (0.65-0.77) C13. Talcher U/s 6.1 (5.6-6.8) 0.59 (0.43-0.69) B-C14. Talcher D/s 5.9 (5.0-6.8) 0.50 (0.36-0.70) B-C
(C) Rushikulya15. Potagarh 6.6 (6.4-6.7) 0.50 (0.32-0.68) B-C
(D) Nagavali
16. Penta U/s 6.1 (5.8-6.8) 0.65 (0.50-0.84) B-C17. J. K. Pur D/s 5.8 (5.7-5.9) 0.47 (0.38-0.60) C18. Rayagada D/s 5.9 (5.7-6.0) 0.53 (0.40-0.76) C
(E) Subarnarekha19. Rajghat 6.0 (5.8-6.1) 0.65 (0.50-0.75) B-C
(F) Budhabalnga
20. Baripada D/s 5.8 (5.1-6.4) 0.79 (0.69-0.91) B-C21. Balasore U/s 5.8 (5.1-6.6) 0.64 (0.50-0.80) B-C22. Balasore D/s 5.6 (5.4-5.6) 0.75 (0.70-0.85) C
(G) Kerandi23. Sunabeda 6.0 (5.5-6.5) 0.49 (0.44-0.56) B-C
(H) Vansadhara24. Muniguda 5.9 (4.8-6.6) 0.59 (0.50-0.75) B-C25. Gunupur 5.9 (5.4-6.4) 0.57 (0.50-0.66) B-C
(G) GROUND WATER QUALITY STATUS
The Board monitors ground water quality at 15 locations of Cuttack, Bhubaneswar and Puri cities in the State. Ground water quality status during the year 2016 at these locations alongwith the Permissible limit for drinking water under IS : 10500-2012 are given in Table-5.32.
Annual Report 2016-17
112
pH of ground water at Jharpada in Bhubaneswar during April is found to be beyond the permissible range of 6.5-8.5. Whereas, pH value at Jagatpur Industrial area in Cuttack, Khandagiri in Bhubaneswar and Secretariate-Governor House area in Bhubaneswar during April is observed to be very close to the lower limit of permissible range. However, pH at all other places remained well within the permissible range.
Ground water in Puri area is mostly of hard category (Hardness > 120 mg/l) at Badadanda, Mousima Mandir and Sea beach site, whereas, at Baliapanda, it is of moderate hard category (hardness within 60-120 mg/l. In Bhubaneswar and Cuttack cities, the water quality varies from soft (Hardness <75 mg/l) to hard category (>120 mg/l).
Iron concentration in ground water samples at most places exceeds the Permissible limit for drinking water i.e. 0.3 mg/l.
Frequent occurrence of total coliform and fecal coliform bacteria above the permissible limit (should be absent in 100 ml sample) are observed in the ground water at most of the monitored locations.
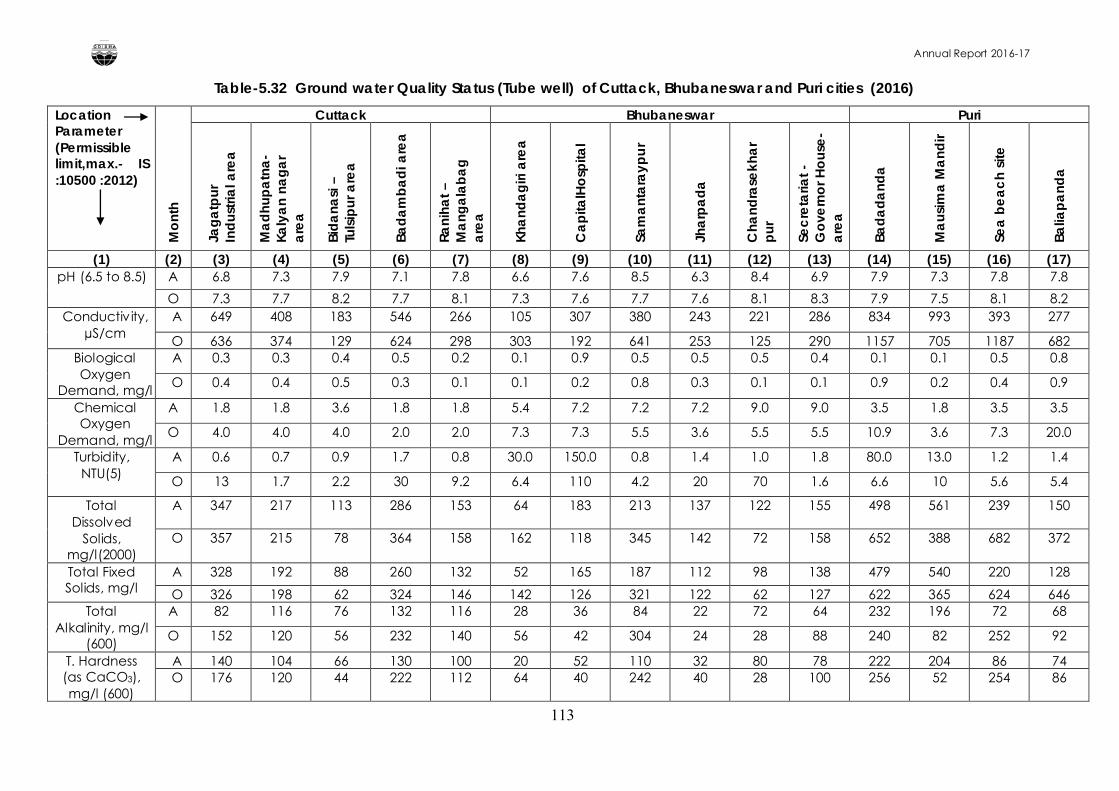
Annual Report 2016-17
113
Table-5.32 Ground water Quality Status (Tube well) of Cuttack, Bhubaneswar and Puri cities (2016)
LocationParameter(Permissible limit,max.- IS :10500 :2012)
Mo
nth
Cuttack Bhubaneswar Puri
Jag
atp
ur
Ind
ustri
al a
rea
Ma
dhu
pa
tna
-Ka
lya
n na
ga
r a
rea
Bid
ana
si –
Tuls
ipur
are
a
Bad
am
ba
di a
rea
Rani
hat –
Ma
nga
lab
ag
a
rea
Kha
nda
giri
are
a
Ca
pita
lHo
spita
l
Sam
ant
ara
ypu
r
Jha
rpa
da
Cha
ndra
sekh
ar
pur
Sec
reta
riat -
Go
vern
or H
ous
e-
are
a
Bad
ad
and
a
Ma
usim
a M
and
ir
Sea
be
ac
h si
te
Balia
pa
nda
(1) (2) (3) (4) (5) (6) (7) (8) (9) (10) (11) (12) (13) (14) (15) (16) (17)pH (6.5 to 8.5) A 6.8 7.3 7.9 7.1 7.8 6.6 7.6 8.5 6.3 8.4 6.9 7.9 7.3 7.8 7.8
O 7.3 7.7 8.2 7.7 8.1 7.3 7.6 7.7 7.6 8.1 8.3 7.9 7.5 8.1 8.2Conductivity,
µS/cmA 649 408 183 546 266 105 307 380 243 221 286 834 993 393 277
O 636 374 129 624 298 303 192 641 253 125 290 1157 705 1187 682Biological Oxygen
Demand, mg/l
A 0.3 0.3 0.4 0.5 0.2 0.1 0.9 0.5 0.5 0.5 0.4 0.1 0.1 0.5 0.8
O 0.4 0.4 0.5 0.3 0.1 0.1 0.2 0.8 0.3 0.1 0.1 0.9 0.2 0.4 0.9
Chemical Oxygen
Demand, mg/l
A 1.8 1.8 3.6 1.8 1.8 5.4 7.2 7.2 7.2 9.0 9.0 3.5 1.8 3.5 3.5
O 4.0 4.0 4.0 2.0 2.0 7.3 7.3 5.5 3.6 5.5 5.5 10.9 3.6 7.3 20.0
Turbidity, NTU(5)
A 0.6 0.7 0.9 1.7 0.8 30.0 150.0 0.8 1.4 1.0 1.8 80.0 13.0 1.2 1.4
O 13 1.7 2.2 30 9.2 6.4 110 4.2 20 70 1.6 6.6 10 5.6 5.4
Total Dissolved
Solids, mg/l(2000)
A 347 217 113 286 153 64 183 213 137 122 155 498 561 239 150
O 357 215 78 364 158 162 118 345 142 72 158 652 388 682 372
Total Fixed Solids, mg/l
A 328 192 88 260 132 52 165 187 112 98 138 479 540 220 128
O 326 198 62 324 146 142 126 321 122 62 127 622 365 624 646Total
Alkalinity, mg/l (600)
A 82 116 76 132 116 28 36 84 22 72 64 232 196 72 68
O 152 120 56 232 140 56 42 304 24 28 88 240 82 252 92
T. Hardness (as CaCO3), mg/l (600)
A 140 104 66 130 100 20 52 110 32 80 78 222 204 86 74O 176 120 44 222 112 64 40 242 40 28 100 256 52 254 86
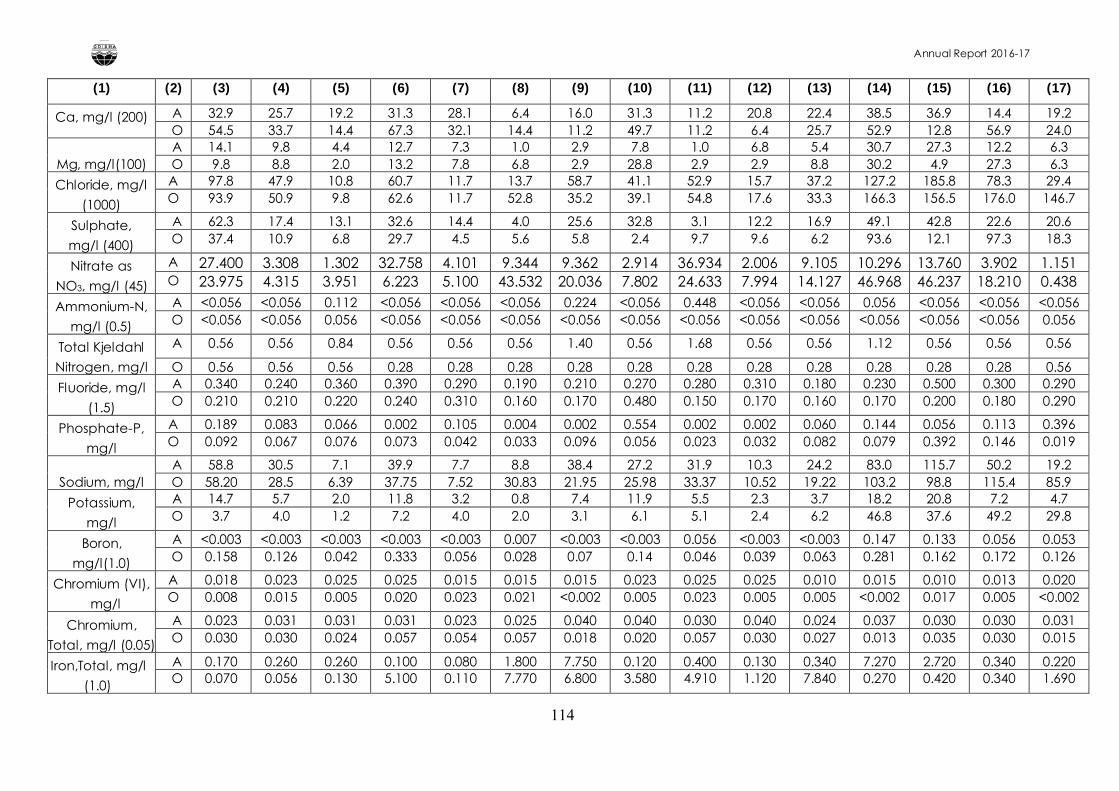
Annual Report 2016-17
114
(1) (2) (3) (4) (5) (6) (7) (8) (9) (10) (11) (12) (13) (14) (15) (16) (17)
Ca, mg/l (200) A 32.9 25.7 19.2 31.3 28.1 6.4 16.0 31.3 11.2 20.8 22.4 38.5 36.9 14.4 19.2O 54.5 33.7 14.4 67.3 32.1 14.4 11.2 49.7 11.2 6.4 25.7 52.9 12.8 56.9 24.0
Mg, mg/l(100)A 14.1 9.8 4.4 12.7 7.3 1.0 2.9 7.8 1.0 6.8 5.4 30.7 27.3 12.2 6.3O 9.8 8.8 2.0 13.2 7.8 6.8 2.9 28.8 2.9 2.9 8.8 30.2 4.9 27.3 6.3
Chloride, mg/l
(1000)
A 97.8 47.9 10.8 60.7 11.7 13.7 58.7 41.1 52.9 15.7 37.2 127.2 185.8 78.3 29.4O 93.9 50.9 9.8 62.6 11.7 52.8 35.2 39.1 54.8 17.6 33.3 166.3 156.5 176.0 146.7
Sulphate,
mg/l (400)
A 62.3 17.4 13.1 32.6 14.4 4.0 25.6 32.8 3.1 12.2 16.9 49.1 42.8 22.6 20.6O 37.4 10.9 6.8 29.7 4.5 5.6 5.8 2.4 9.7 9.6 6.2 93.6 12.1 97.3 18.3
Nitrate as
NO3, mg/l (45)
A 27.400 3.308 1.302 32.758 4.101 9.344 9.362 2.914 36.934 2.006 9.105 10.296 13.760 3.902 1.151O 23.975 4.315 3.951 6.223 5.100 43.532 20.036 7.802 24.633 7.994 14.127 46.968 46.237 18.210 0.438
Ammonium-N,
mg/l (0.5)
A <0.056 <0.056 0.112 <0.056 <0.056 <0.056 0.224 <0.056 0.448 <0.056 <0.056 0.056 <0.056 <0.056 <0.056O <0.056 <0.056 0.056 <0.056 <0.056 <0.056 <0.056 <0.056 <0.056 <0.056 <0.056 <0.056 <0.056 <0.056 0.056
Total Kjeldahl
Nitrogen, mg/l
A 0.56 0.56 0.84 0.56 0.56 0.56 1.40 0.56 1.68 0.56 0.56 1.12 0.56 0.56 0.56
O 0.56 0.56 0.56 0.28 0.28 0.28 0.28 0.28 0.28 0.28 0.28 0.28 0.28 0.28 0.56
Fluoride, mg/l
(1.5)
A 0.340 0.240 0.360 0.390 0.290 0.190 0.210 0.270 0.280 0.310 0.180 0.230 0.500 0.300 0.290O 0.210 0.210 0.220 0.240 0.310 0.160 0.170 0.480 0.150 0.170 0.160 0.170 0.200 0.180 0.290
Phosphate-P,
mg/l
A 0.189 0.083 0.066 0.002 0.105 0.004 0.002 0.554 0.002 0.002 0.060 0.144 0.056 0.113 0.396O 0.092 0.067 0.076 0.073 0.042 0.033 0.096 0.056 0.023 0.032 0.082 0.079 0.392 0.146 0.019
Sodium, mg/lA 58.8 30.5 7.1 39.9 7.7 8.8 38.4 27.2 31.9 10.3 24.2 83.0 115.7 50.2 19.2O 58.20 28.5 6.39 37.75 7.52 30.83 21.95 25.98 33.37 10.52 19.22 103.2 98.8 115.4 85.9
Potassium,
mg/l
A 14.7 5.7 2.0 11.8 3.2 0.8 7.4 11.9 5.5 2.3 3.7 18.2 20.8 7.2 4.7O 3.7 4.0 1.2 7.2 4.0 2.0 3.1 6.1 5.1 2.4 6.2 46.8 37.6 49.2 29.8
Boron,
mg/l(1.0)
A <0.003 <0.003 <0.003 <0.003 <0.003 0.007 <0.003 <0.003 0.056 <0.003 <0.003 0.147 0.133 0.056 0.053O 0.158 0.126 0.042 0.333 0.056 0.028 0.07 0.14 0.046 0.039 0.063 0.281 0.162 0.172 0.126
Chromium (VI),
mg/l
A 0.018 0.023 0.025 0.025 0.015 0.015 0.015 0.023 0.025 0.025 0.010 0.015 0.010 0.013 0.020O 0.008 0.015 0.005 0.020 0.023 0.021 <0.002 0.005 0.023 0.005 0.005 <0.002 0.017 0.005 <0.002
Chromium,
Total, mg/l (0.05)
A 0.023 0.031 0.031 0.031 0.023 0.025 0.040 0.040 0.030 0.040 0.024 0.037 0.030 0.030 0.031O 0.030 0.030 0.024 0.057 0.054 0.057 0.018 0.020 0.057 0.030 0.027 0.013 0.035 0.030 0.015
Iron,Total, mg/l
(1.0)
A 0.170 0.260 0.260 0.100 0.080 1.800 7.750 0.120 0.400 0.130 0.340 7.270 2.720 0.340 0.220O 0.070 0.056 0.130 5.100 0.110 7.770 6.800 3.580 4.910 1.120 7.840 0.270 0.420 0.340 1.690
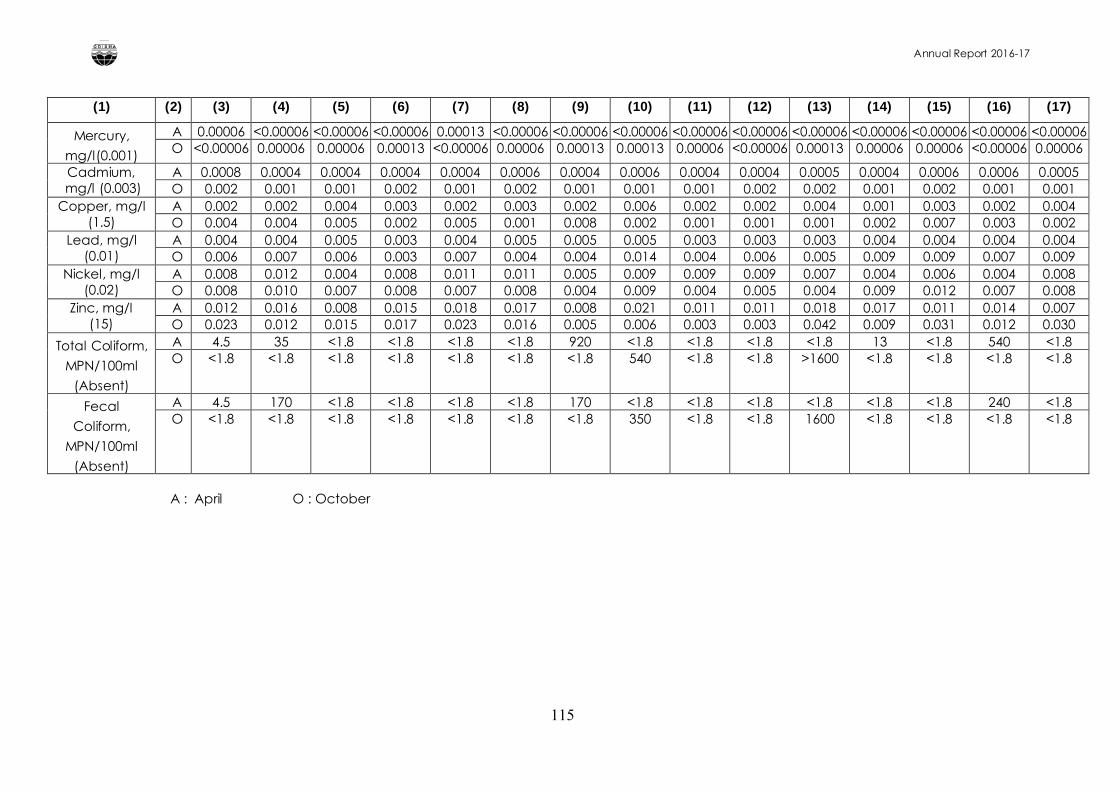
Annual Report 2016-17
115
(1) (2) (3) (4) (5) (6) (7) (8) (9) (10) (11) (12) (13) (14) (15) (16) (17)
Mercury,
mg/l(0.001)
A 0.00006 <0.00006 <0.00006 <0.00006 0.00013 <0.00006 <0.00006 <0.00006 <0.00006 <0.00006 <0.00006 <0.00006 <0.00006 <0.00006 <0.00006O <0.00006 0.00006 0.00006 0.00013 <0.00006 0.00006 0.00013 0.00013 0.00006 <0.00006 0.00013 0.00006 0.00006 <0.00006 0.00006
Cadmium,mg/l (0.003)
A 0.0008 0.0004 0.0004 0.0004 0.0004 0.0006 0.0004 0.0006 0.0004 0.0004 0.0005 0.0004 0.0006 0.0006 0.0005O 0.002 0.001 0.001 0.002 0.001 0.002 0.001 0.001 0.001 0.002 0.002 0.001 0.002 0.001 0.001
Copper, mg/l (1.5)
A 0.002 0.002 0.004 0.003 0.002 0.003 0.002 0.006 0.002 0.002 0.004 0.001 0.003 0.002 0.004O 0.004 0.004 0.005 0.002 0.005 0.001 0.008 0.002 0.001 0.001 0.001 0.002 0.007 0.003 0.002
Lead, mg/l (0.01)
A 0.004 0.004 0.005 0.003 0.004 0.005 0.005 0.005 0.003 0.003 0.003 0.004 0.004 0.004 0.004O 0.006 0.007 0.006 0.003 0.007 0.004 0.004 0.014 0.004 0.006 0.005 0.009 0.009 0.007 0.009
Nickel, mg/l(0.02)
A 0.008 0.012 0.004 0.008 0.011 0.011 0.005 0.009 0.009 0.009 0.007 0.004 0.006 0.004 0.008O 0.008 0.010 0.007 0.008 0.007 0.008 0.004 0.009 0.004 0.005 0.004 0.009 0.012 0.007 0.008
Zinc, mg/l(15)
A 0.012 0.016 0.008 0.015 0.018 0.017 0.008 0.021 0.011 0.011 0.018 0.017 0.011 0.014 0.007O 0.023 0.012 0.015 0.017 0.023 0.016 0.005 0.006 0.003 0.003 0.042 0.009 0.031 0.012 0.030
Total Coliform,
MPN/100ml
(Absent)
A 4.5 35 <1.8 <1.8 <1.8 <1.8 920 <1.8 <1.8 <1.8 <1.8 13 <1.8 540 <1.8O <1.8 <1.8 <1.8 <1.8 <1.8 <1.8 <1.8 540 <1.8 <1.8 >1600 <1.8 <1.8 <1.8 <1.8
Fecal
Coliform,
MPN/100ml
(Absent)
A 4.5 170 <1.8 <1.8 <1.8 <1.8 170 <1.8 <1.8 <1.8 <1.8 <1.8 <1.8 240 <1.8O <1.8 <1.8 <1.8 <1.8 <1.8 <1.8 <1.8 350 <1.8 <1.8 1600 <1.8 <1.8 <1.8 <1.8
A : April O : October
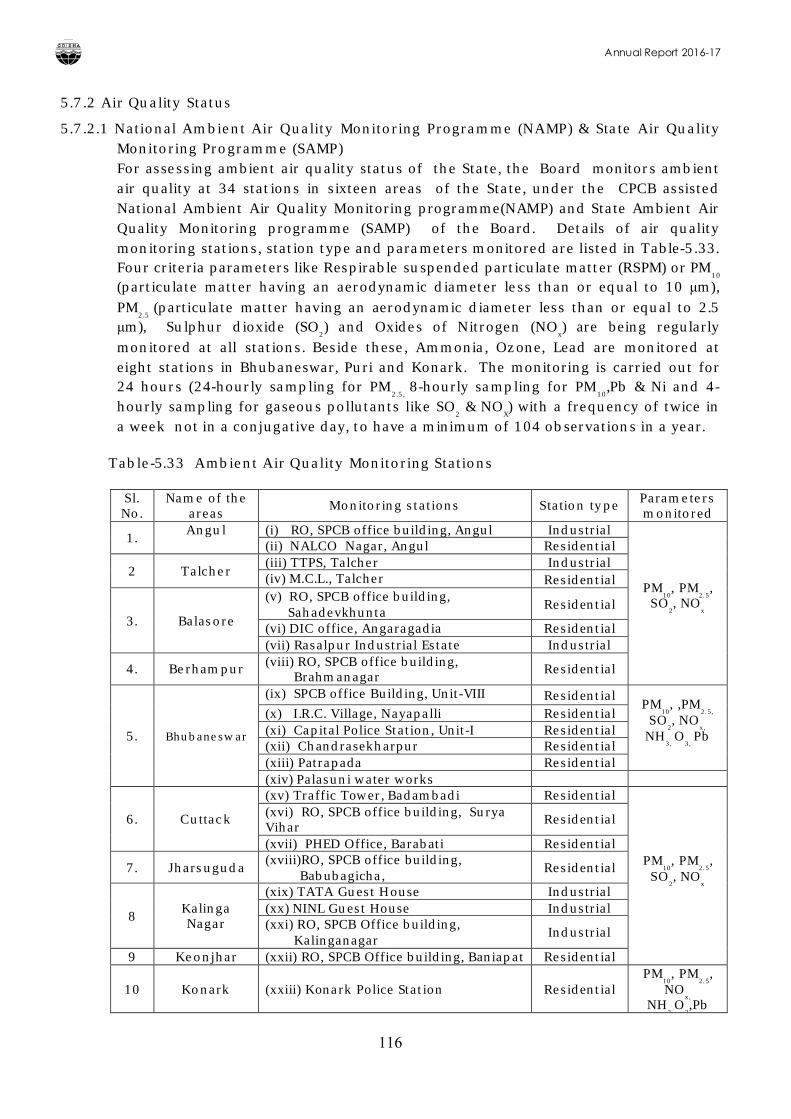
Annual Report 2016-17
116
5.7.2 Air Quality Status
5.7.2.1 National Ambient Air Quality Monitoring Programme (NAMP) & State Air Quality Monitoring Programme (SAMP)For assessing ambient air quality status of the State, the Board monitors ambient air quality at 34 stations in sixteen areas of the State, under the CPCB assisted National Ambient Air Quality Monitoring programme(NAMP) and State Ambient Air Quality Monitoring programme (SAMP) of the Board. Details of air quality monitoring stations, station type and parameters monitored are listed in Table-5.33. Four criteria parameters like Respirable suspended particulate matter (RSPM) or PM
10
(particulate matter having an aerodynamic diameter less than or equal to 10 μm),PM
2.5 (particulate matter having an aerodynamic diameter less than or equal to 2.5
μm), Sulphur dioxide (SO2) and Oxides of Nitrogen (NO
x) are being regularly
monitored at all stations. Beside these, Ammonia, Ozone, Lead are monitored at eight stations in Bhubaneswar, Puri and Konark. The monitoring is carried out for 24 hours (24-hourly sampling for PM
2.5, 8-hourly sampling for PM
10,Pb & Ni and 4-
hourly sampling for gaseous pollutants like SO2
& NOX) with a frequency of twice in
a week not in a conjugative day, to have a minimum of 104 observations in a year.
Table-5.33 Ambient Air Quality Monitoring Stations
Sl. No.
Name of the areas
Monitoring stations Station type Parameters monitored
1.Angul (i) RO, SPCB office building, Angul Industrial
PM10, PM
2.5,
SO2, NO
x
(ii) NALCO Nagar, Angul Residential
2 Talcher(iii) TTPS, Talcher Industrial(iv) M.C.L., Talcher Residential
3. Balasore
(v) RO, SPCB office building, Sahadevkhunta
Residential
(vi) DIC office, Angaragadia Residential(vii) Rasalpur Industrial Estate Industrial
4. Berhampur (viii) RO, SPCB office building, Brahmanagar
Residential
5. Bhubaneswar
(ix) SPCB office Building, Unit-VIII ResidentialPM
10, ,PM
2.5,
SO2, NO
x,
NH3,
O3,
Pb
(x) I.R.C. Village, Nayapalli Residential(xi) Capital Police Station, Unit-I Residential(xii) Chandrasekharpur Residential(xiii) Patrapada Residential(xiv) Palasuni water works
6. Cuttack
(xv) Traffic Tower, Badambadi Residential
PM10, PM
2.5,
SO2, NO
x
(xvi) RO, SPCB office building, Surya Vihar
Residential
(xvii) PHED Office, Barabati Residential
7. Jharsuguda(xviii)RO, SPCB office building,
Babubagicha,Residential
8Kalinga Nagar
(xix) TATA Guest House Industrial(xx) NINL Guest House Industrial(xxi) RO, SPCB Office building,
KalinganagarIndustrial
9 Keonjhar (xxii) RO, SPCB Office building, Baniapat Residential
10 Konark (xxiii) Konark Police Station ResidentialPM
10, PM
2.5,
NOx,
NH3,O
3,Pb
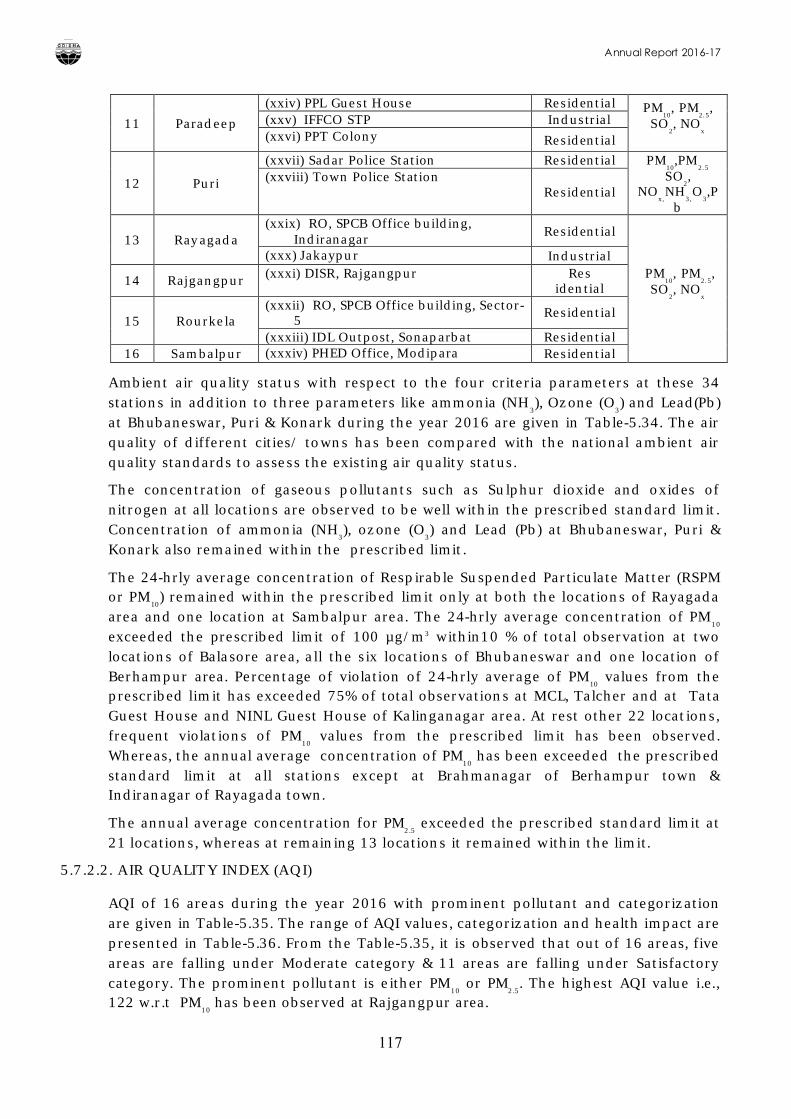
Annual Report 2016-17
117
11 Paradeep
(xxiv) PPL Guest House Residential PM10, PM
2.5,
SO2, NO
x(xxv) IFFCO STP Industrial(xxvi) PPT Colony Residential
12 Puri
(xxvii) Sadar Police Station Residential PM10,PM
2.5
SO2,
NOx,NH
3,O
3,P
b
(xxviii) Town Police StationResidential
13 Rayagada(xxix) RO, SPCB Office building,
IndiranagarResidential
PM10, PM
2.5,
SO2, NO
x
(xxx) Jakaypur Industrial
14 Rajgangpur (xxxi) DISR, Rajgangpur Residential
15 Rourkela(xxxii) RO, SPCB Office building, Sector-
5Residential
(xxxiii) IDL Outpost, Sonaparbat Residential16 Sambalpur (xxxiv) PHED Office, Modipara Residential
Ambient air quality status with respect to the four criteria parameters at these 34 stations in addition to three parameters like ammonia (NH
3), Ozone (O
3) and Lead(Pb)
at Bhubaneswar, Puri & Konark during the year 2016 are given in Table-5.34. The air quality of different cities/ towns has been compared with the national ambient air quality standards to assess the existing air quality status.
The concentration of gaseous pollutants such as Sulphur dioxide and oxides of nitrogen at all locations are observed to be well within the prescribed standard limit. Concentration of ammonia (NH
3), ozone (O
3) and Lead (Pb) at Bhubaneswar, Puri &
Konark also remained within the prescribed limit.
The 24-hrly average concentration of Respirable Suspended Particulate Matter (RSPM or PM
10) remained within the prescribed limit only at both the locations of Rayagada
area and one location at Sambalpur area. The 24-hrly average concentration of PM10
exceeded the prescribed limit of 100 µg/m3 within10 % of total observation at two locations of Balasore area, all the six locations of Bhubaneswar and one location of Berhampur area. Percentage of violation of 24-hrly average of PM
10values from the
prescribed limit has exceeded 75% of total observations at MCL, Talcher and at Tata Guest House and NINL Guest House of Kalinganagar area. At rest other 22 locations, frequent violations of PM
10values from the prescribed limit has been observed.
Whereas, the annual average concentration of PM10
has been exceeded the prescribed standard limit at all stations except at Brahmanagar of Berhampur town & Indiranagar of Rayagada town.
The annual average concentration for PM2.5
exceeded the prescribed standard limit at 21 locations, whereas at remaining 13 locations it remained within the limit.
5.7.2.2. AIR QUALITY INDEX (AQI)
AQI of 16 areas during the year 2016 with prominent pollutant and categorization are given in Table-5.35. The range of AQI values, categorization and health impact are presented in Table-5.36. From the Table-5.35, it is observed that out of 16 areas, five areas are falling under Moderate category & 11 areas are falling under Satisfactory category. The prominent pollutant is either PM
10or PM
2.5. The highest AQI value i.e.,
122 w.r.t PM10
has been observed at Rajgangpur area.
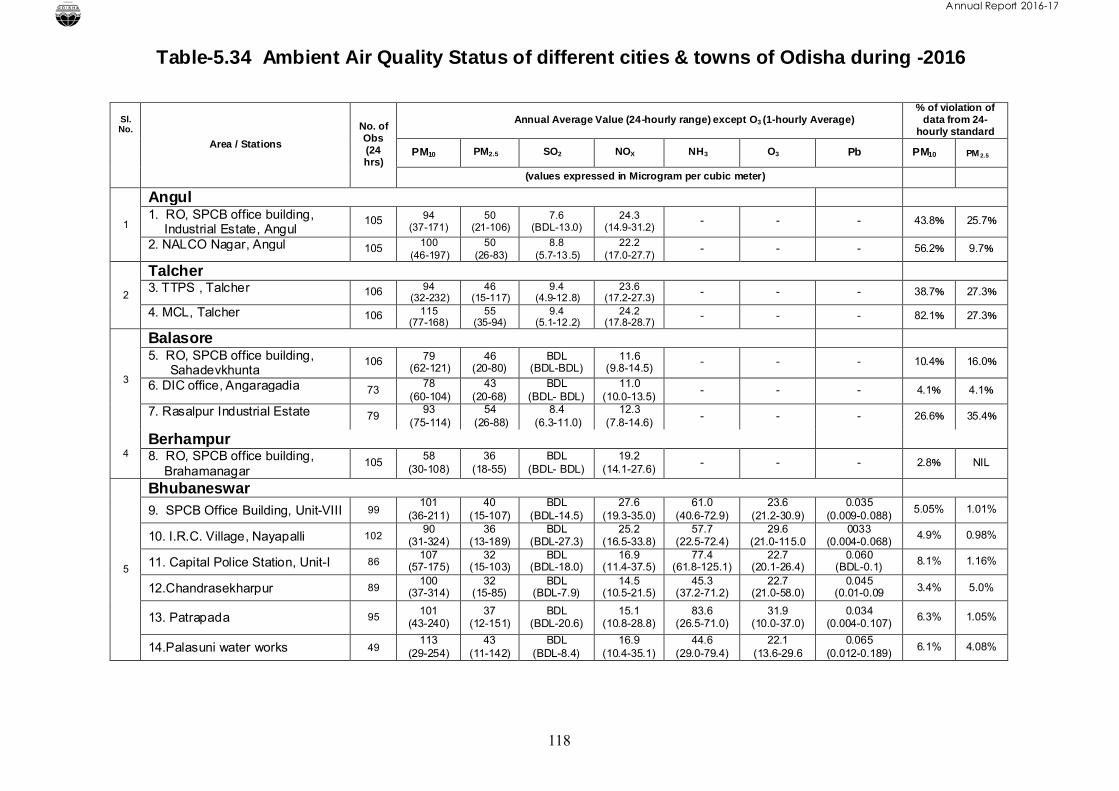
Annual Report 2016-17
118
Table-5.34 Ambient Air Quality Status of different cities & towns of Odisha during -2016
Sl. No.
Area / Stations
No. of Obs(24 hrs)
Annual Average Value (24-hourly range) except O3 (1-hourly Average)% of violation of
data from 24-hourly standard
PM10 PM2.5 SO2 NOX NH3 O3 Pb PM10 PM 2.5
(values expressed in Microgram per cubic meter)
1
Angul 1. RO, SPCB office building,
Industrial Estate, Angul105 94
(37-171)50
(21-106)7.6
(BDL-13.0)24.3
(14.9-31.2)- - - 43.8% 25.7%
2. NALCO Nagar, Angul 105 100 (46-197)
50 (26-83)
8.8 (5.7-13.5)
22.2 (17.0-27.7)
- - - 56.2% 9.7%
2
Talcher3. TTPS , Talcher 106 94
(32-232)46
(15-117)9.4
(4.9-12.8)23.6
(17.2-27.3)- - - 38.7% 27.3%
4. MCL, Talcher 106 115 (77-168)
55 (35-94)
9.4 (5.1-12.2)
24.2 (17.8-28.7)
- - - 82.1% 27.3%
3
Balasore5. RO, SPCB office building,
Sahadevkhunta106 79
(62-121)46
(20-80)BDL
(BDL-BDL)11.6
(9.8-14.5)- - - 10.4% 16.0%
6. DIC office, Angaragadia 7378
(60-104)43
(20-68)BDL
(BDL- BDL)11.0
(10.0-13.5)- - - 4.1% 4.1%
7. Rasalpur Industrial Estate 7993
(75-114)54
(26-88)8.4
(6.3-11.0)12.3
(7.8-14.6)- - - 26.6% 35.4%
4Berhampur8. RO, SPCB office building,
Brahamanagar105
58(30-108)
36(18-55)
BDL(BDL- BDL)
19.2(14.1-27.6)
- - - 2.8% NIL
5
Bhubaneswar9. SPCB Office Building, Unit-VIII 99
101(36-211)
40(15-107)
BDL(BDL-14.5)
27.6(19.3-35.0)
61.0(40.6-72.9)
23.6(21.2-30.9)
0.035(0.009-0.088)
5.05% 1.01%
10. I.R.C. Village, Nayapalli 10290
(31-324)36
(13-189)BDL
(BDL-27.3)25.2
(16.5-33.8)57.7
(22.5-72.4)29.6
(21.0-115.00033
(0.004-0.068)4.9% 0.98%
11. Capital Police Station, Unit-I 86107
(57-175)32
(15-103)BDL
(BDL-18.0)16.9
(11.4-37.5)77.4
(61.8-125.1)22.7
(20.1-26.4)0.060
(BDL-0.1) 8.1% 1.16%
12.Chandrasekharpur 89100
(37-314)32
(15-85)BDL
(BDL-7.9)14.5
(10.5-21.5)45.3
(37.2-71.2)22.7
(21.0-58.0)0.045
(0.01-0.09 3.4% 5.0%
13. Patrapada 95101
(43-240)37
(12-151)BDL
(BDL-20.6)15.1
(10.8-28.8)83.6
(26.5-71.0)31.9
(10.0-37.0)0.034
(0.004-0.107)6.3% 1.05%
14.Palasuni water works 49113
(29-254)43
(11-142)BDL
(BDL-8.4)16.9
(10.4-35.1)44.6
(29.0-79.4)22.1
(13.6-29.60.065
(0.012-0.189)6.1% 4.08%
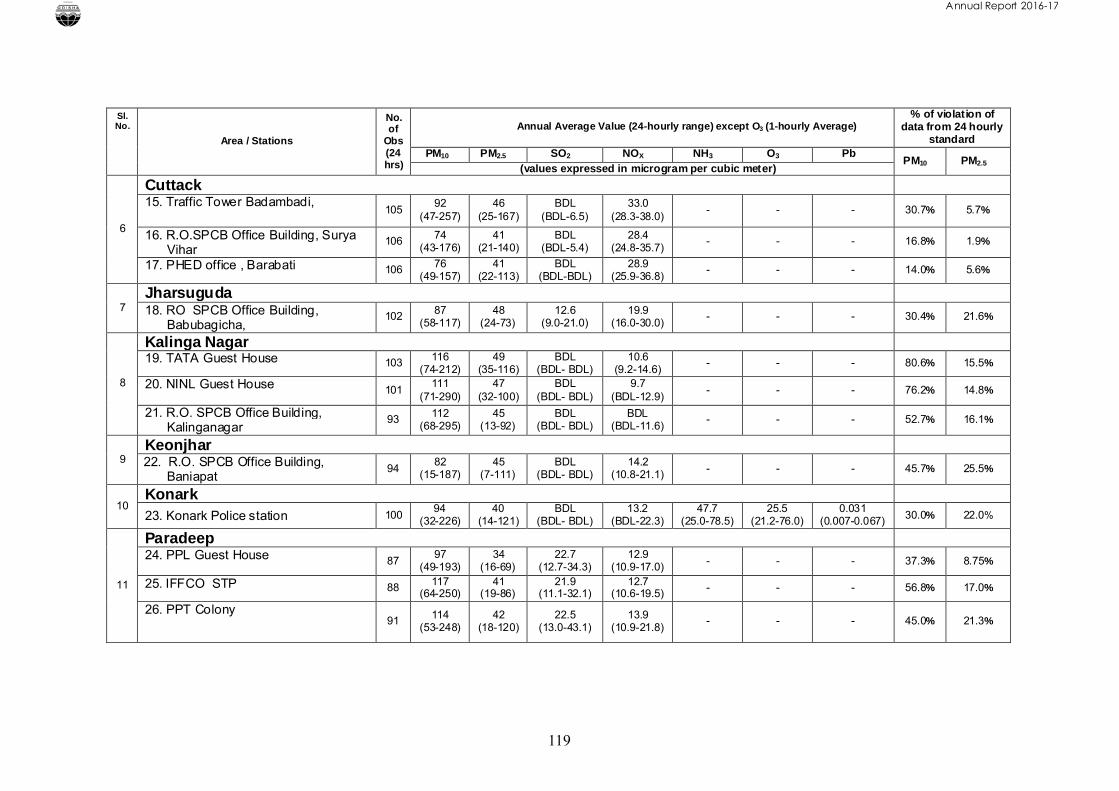
Annual Report 2016-17
119
Sl. No.
Area / Stations
No. of
Obs(24 hrs)
Annual Average Value (24-hourly range) except O3 (1-hourly Average)% of violation of
data from 24 hourly standard
PM10 PM2.5 SO2 NOX NH3 O3 PbPM10 PM2.5
(values expressed in microgram per cubic meter)
6
Cuttack15. Traffic Tower Badambadi,
10592
(47-257)46
(25-167)BDL
(BDL-6.5)33.0
(28.3-38.0)- - - 30.7% 5.7%
16. R.O.SPCB Office Building, Surya Vihar
106 74 (43-176)
41 (21-140)
BDL (BDL-5.4)
28.4 (24.8-35.7)
- - - 16.8% 1.9%
17. PHED office , Barabati 106 76 (49-157)
41 (22-113)
BDL (BDL-BDL)
28.9 (25.9-36.8)
- - - 14.0% 5.6%
7Jharsuguda18. RO SPCB Office Building,
Babubagicha,102 87
(58-117)48
(24-73)12.6
(9.0-21.0)19.9
(16.0-30.0)- - - 30.4% 21.6%
8
Kalinga Nagar19. TATA Guest House 103 116
(74-212)49
(35-116)BDL
(BDL- BDL)10.6
(9.2-14.6)- - - 80.6% 15.5%
20. NINL Guest House 101111
(71-290)47
(32-100)BDL
(BDL- BDL)9.7
(BDL-12.9)- - - 76.2% 14.8%
21. R.O. SPCB Office Building, Kalinganagar
93 112 (68-295)
45 (13-92)
BDL(BDL- BDL)
BDL(BDL-11.6)
- - - 52.7% 16.1%
9Keonjhar22. R.O. SPCB Office Building,
Baniapat94
82 (15-187)
45 (7-111)
BDL(BDL- BDL)
14.2 (10.8-21.1) - - - 45.7% 25.5%
10Konark23. Konark Police station 100
94(32-226)
40(14-121)
BDL(BDL- BDL)
13.2(BDL-22.3)
47.7(25.0-78.5)
25.5(21.2-76.0)
0.031(0.007-0.067) 30.0% 22.0%
11
Paradeep24. PPL Guest House 87
97 (49-193)
34 (16-69)
22.7 (12.7-34.3)
12.9 (10.9-17.0) - - - 37.3% 8.75%
25. IFFCO STP 88 117 (64-250)
41 (19-86)
21.9 (11.1-32.1)
12.7 (10.6-19.5) - - - 56.8% 17.0%
26. PPT Colony91 114
(53-248)42
(18-120)22.5
(13.0-43.1)13.9
(10.9-21.8)- - - 45.0% 21.3%
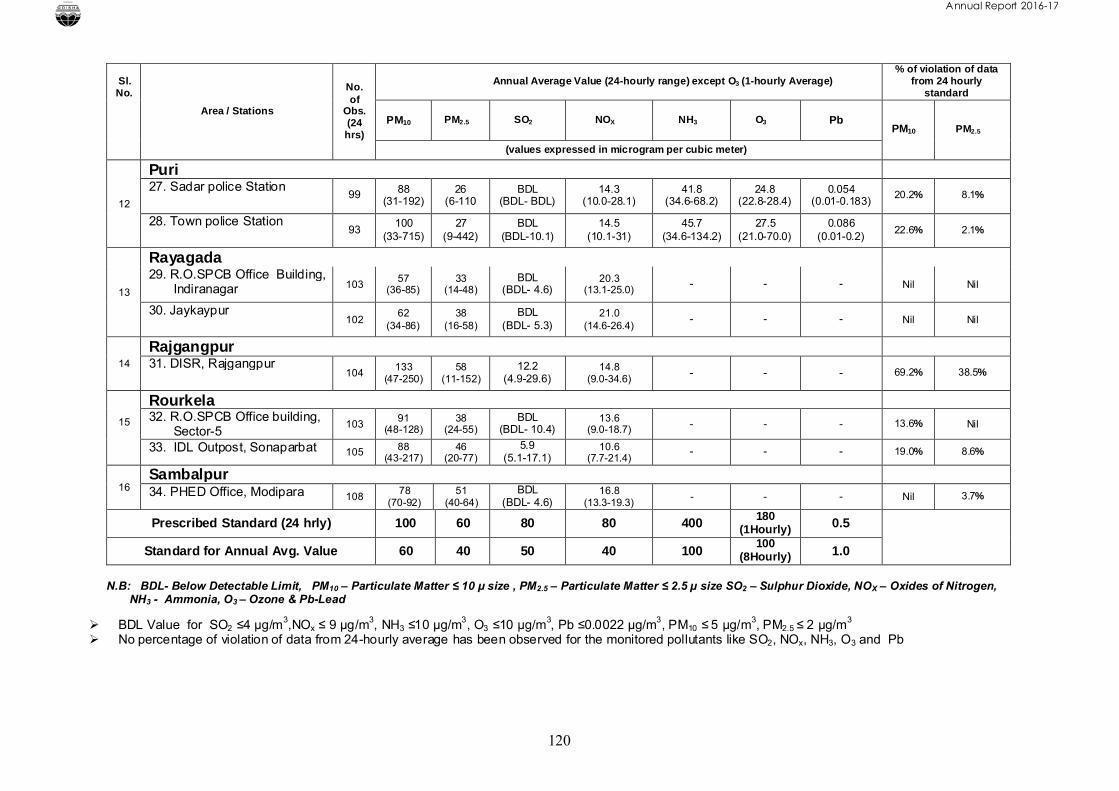
Annual Report 2016-17
120
N.B: BDL- Below Detectable Limit, PM10 – Particulate Matter ≤ 10 µ size , PM2.5 – Particulate Matter ≤ 2.5 µ size SO2 – Sulphur Dioxide, NOX – Oxides of Nitrogen, NH3 - Ammonia, O3 – Ozone & Pb-Lead
BDL Value for SO2 ≤4 µg/m3,NOx ≤ 9 µg/m3, NH3 ≤10 µg/m3, O3 ≤10 µg/m3, Pb ≤0.0022 µg/m3, PM10 ≤ 5 µg/m3, PM2.5 ≤ 2 µg/m3
No percentage of violation of data from 24-hourly average has been observed for the monitored pollutants like SO2, NOx, NH3, O3 and Pb
Sl. No.
Area / Stations
No. of
Obs. (24 hrs)
Annual Average Value (24-hourly range) except O3 (1-hourly Average)% of violation of data
from 24 hourly standard
PM10 PM2.5 SO2 NOX NH3 O3 PbPM10 PM2.5
(values expressed in microgram per cubic meter)
12
Puri27. Sadar police Station
99 88(31-192)
26(6-110
BDL(BDL- BDL)
14.3(10.0-28.1)
41.8(34.6-68.2)
24.8(22.8-28.4)
0.054(0.01-0.183)
20.2% 8.1%
28. Town police Station93
100 (33-715)
27 (9-442)
BDL(BDL-10.1)
14.5 (10.1-31)
45.7 (34.6-134.2)
27.5 (21.0-70.0)
0.086(0.01-0.2)
22.6% 2.1%
13
Rayagada29. R.O.SPCB Office Building,
Indiranagar 10357
(36-85)33
(14-48)BDL
(BDL- 4.6)20.3
(13.1-25.0)- - - Nil Nil
30. Jaykaypur102
62(34-86)
38(16-58)
BDL(BDL- 5.3)
21.0(14.6-26.4)
- - - Nil Nil
14
Rajgangpur31. DISR, Rajgangpur
104133
(47-250)58
(11-152)12.2
(4.9-29.6)14.8
(9.0-34.6)- - - 69.2% 38.5%
15
Rourkela 32. R.O.SPCB Office building,
Sector-5103
91(48-128)
38(24-55)
BDL(BDL- 10.4)
13.6(9.0-18.7) - - - 13.6% Nil
33. IDL Outpost, Sonaparbat 105 88(43-217)
46(20-77)
5.9(5.1-17.1)
10.6(7.7-21.4)
- - - 19.0% 8.6%
16Sambalpur34. PHED Office, Modipara 108
78(70-92)
51(40-64)
BDL(BDL- 4.6)
16.8(13.3-19.3)
- - - Nil 3.7%
Prescribed Standard (24 hrly) 100 60 80 80 400180
(1Hourly) 0.5
Standard for Annual Avg. Value 60 40 50 40 100100
(8Hourly) 1.0
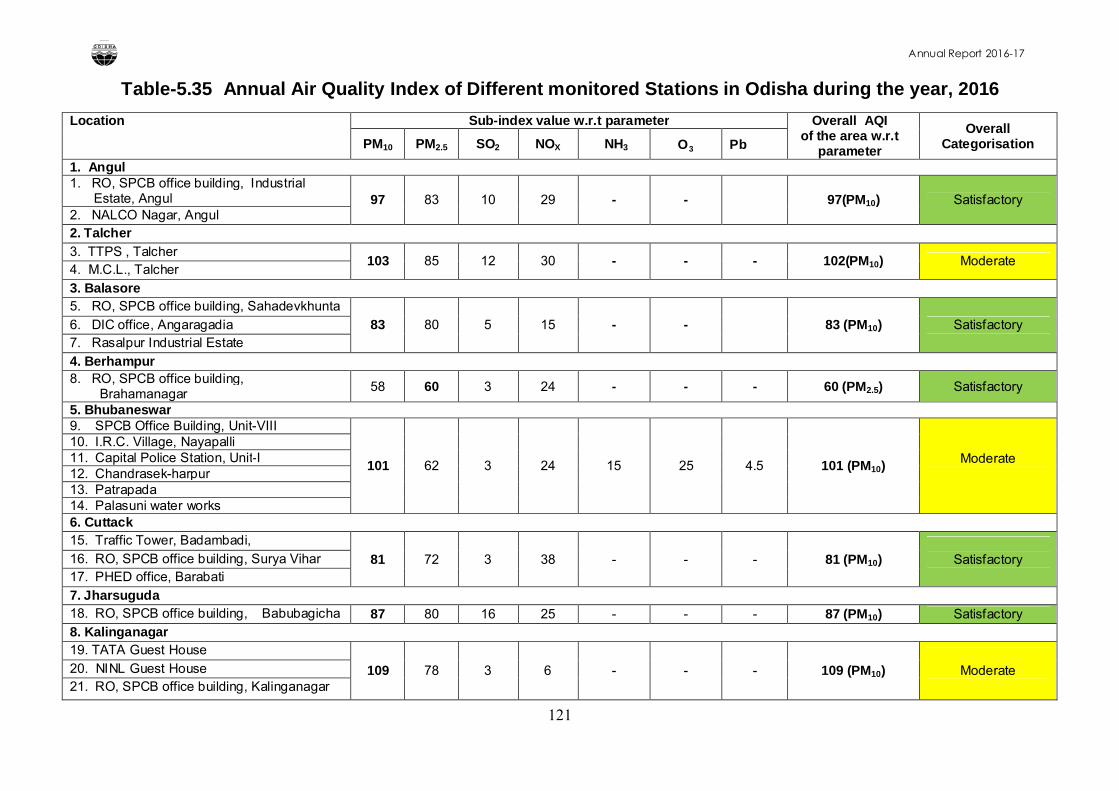
Annual Report 2016-17
121
Table-5.35 Annual Air Quality Index of Different monitored Stations in Odisha during the year, 2016
Location Sub-index value w.r.t parameter Overall AQIof the area w.r.t
parameter
OverallCategorisationPM10 PM2.5 SO2 NOX NH3 O3 Pb
1. Angul 1. RO, SPCB office building, Industrial
Estate, Angul 97 83 10 29 - - 97(PM10) Satisfactory2. NALCO Nagar, Angul2. Talcher
3. TTPS , Talcher103 85 12 30 - - - 102(PM10) Moderate
4. M.C.L., Talcher
3. Balasore5. RO, SPCB office building, Sahadevkhunta
83 80 5 15 - - 83 (PM10) Satisfactory6. DIC office, Angaragadia7. Rasalpur Industrial Estate
4. Berhampur8. RO, SPCB office building,
Brahamanagar 58 60 3 24 - - - 60 (PM2.5) Satisfactory
5. Bhubaneswar9. SPCB Office Building, Unit-VIII
101 62 3 24 15 25 4.5 101 (PM10)Moderate
10. I.R.C. Village, Nayapalli11. Capital Police Station, Unit-I12. Chandrasek-harpur13. Patrapada14. Palasuni water works6. Cuttack15. Traffic Tower, Badambadi,
81 72 3 38 - - - 81 (PM10) Satisfactory16. RO, SPCB office building, Surya Vihar17. PHED office, Barabati
7. Jharsuguda18. RO, SPCB office building, Babubagicha 87 80 16 25 - - - 87 (PM10) Satisfactory8. Kalinganagar19. TATA Guest House
109 78 3 6 - - - 109 (PM10) Moderate20. NINL Guest House21. RO, SPCB office building, Kalinganagar
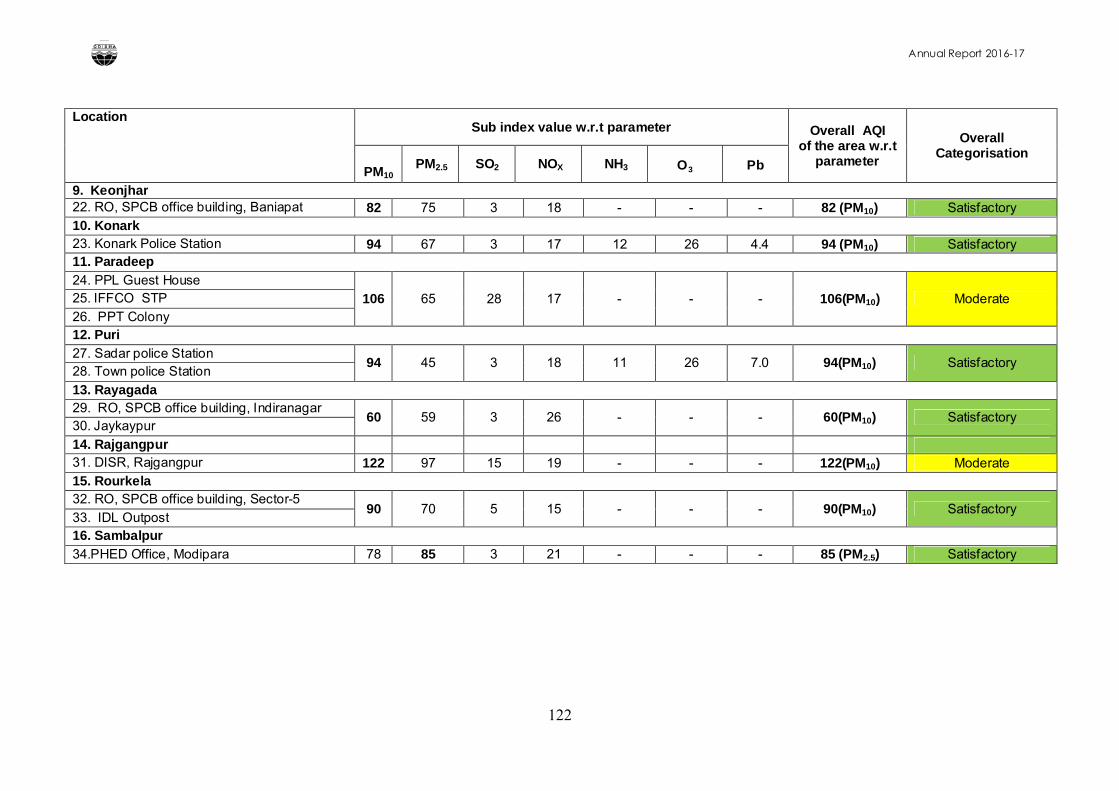
Annual Report 2016-17
122
LocationSub index value w.r.t parameter Overall AQI
of the area w.r.tparameter
OverallCategorisation
PM10 PM2.5 SO2 NOX NH3 O3 Pb
9. Keonjhar22. RO, SPCB office building, Baniapat 82 75 3 18 - - - 82 (PM10) Satisfactory10. Konark 23. Konark Police Station 94 67 3 17 12 26 4.4 94 (PM10) Satisfactory11. Paradeep
24. PPL Guest House
106 65 28 17 - - - 106(PM10) Moderate25. IFFCO STP
26. PPT Colony12. Puri
27. Sadar police Station94 45 3 18 11 26 7.0 94(PM10) Satisfactory
28. Town police Station
13. Rayagada29. RO, SPCB office building, Indiranagar
60 59 3 26 - - - 60(PM10) Satisfactory30. Jaykaypur
14. Rajgangpur31. DISR, Rajgangpur 122 97 15 19 - - - 122(PM10) Moderate15. Rourkela32. RO, SPCB office building, Sector-5
90 70 5 15 - - - 90(PM10) Satisfactory 33. IDL Outpost16. Sambalpur
34.PHED Office, Modipara 78 85 3 21 - - - 85 (PM2.5) Satisfactory
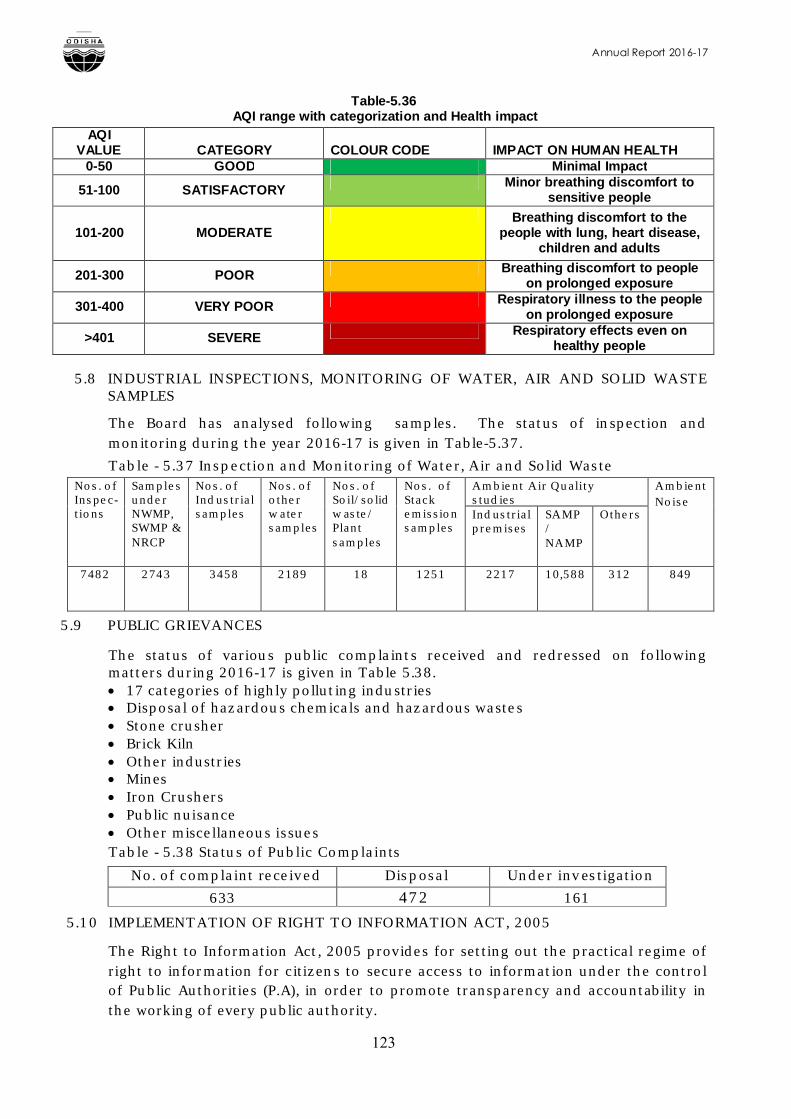
Annual Report 2016-17
123
Table-5.36 AQI range with categorization and Health impact
5.8 INDUSTRIAL INSPECTIONS, MONITORING OF WATER, AIR AND SOLID WASTE SAMPLES
The Board has analysed following samples. The status of inspection andmonitoring during the year 2016-17 is given in Table-5.37.
Table - 5.37 Inspection and Monitoring of Water, Air and Solid Waste Nos. of Inspec-tions
Samples under NWMP, SWMP & NRCP
Nos. of Industrial samples
Nos. of other water samples
Nos. of Soil/solid waste/ Plant samples
Nos. of Stack emission samples
Ambient Air Quality studies
Ambient Noise
Industrial premises
SAMP /NAMP
Others
7482 2743 3458 2189 18 1251 2217 10,588 312 849
5.9 PUBLIC GRIEVANCES
The status of various public complaints received and redressed on following matters during 2016-17 is given in Table 5.38. 17 categories of highly polluting industries Disposal of hazardous chemicals and hazardous wastes Stone crusher Brick Kiln Other industries Mines Iron Crushers Public nuisance Other miscellaneous issues Table - 5.38 Status of Public Complaints
No. of complaint received Disposal Under investigation
633 472 161
5.10 IMPLEMENTATION OF RIGHT TO INFORMATION ACT, 2005
The Right to Information Act, 2005 provides for setting out the practical regime of right to information for citizens to secure access to information under the control of Public Authorities (P.A), in order to promote transparency and accountability in the working of every public authority.
AQI VALUE CATEGORY COLOUR CODE IMPACT ON HUMAN HEALTH
0-50 GOOD Minimal Impact
51-100 SATISFACTORYMinor breathing discomfort to
sensitive people
101-200 MODERATEBreathing discomfort to the
people with lung, heart disease, children and adults
201-300 POOR Breathing discomfort to people on prolonged exposure
301-400 VERY POOR Respiratory illness to the people on prolonged exposure
>401 SEVERE Respiratory effects even on healthy people
Annual Report 2016-17
124
According to Section 6 of this Act, any person who desires to obtain any information under this Act can apply in Form A specifying the particulars of the information sought by him or her in writing or electronically in English or in local official language. The application should be accompanied with the requisite fee, prescribed under the Act.
As per the Act, the State Pollution Control Board, Odisha is providing available information as and when sought through proper application. Shri P.C Rauta, Environmental Engineer of the Board has been declared as the Public Information Officer under the provisions of the Act. 756 no. of requests were received under RTI during 2016-17 (Table-5.39). The total amount collected for RTI requests during 2016-17 is 36,369/- .
Table - 5.39 Status of Applications under RTI ActSL. No. Details of the Application Nos.01. No. of Applications received during the year 75602. No. of Applications on which Information
provided547
03 No. of Applications on which information rejected
73
04. No. of requests transferred to other public Authorities
86
Annual Report 2016-17
125
CHAPTER - VI
LEGAL MATTERS
6.1 STATUS OF LEGAL CASES
The Board initiates legal action against those units which fail to adopt adequate pollution control measures entailing violation of norms and directives, in spite of repeated persuasion and after having received adequate opportunity.
The Board has filed/counter filed 310 cases and out of this 269 cases have been disposed off by the respective Courts during 2016-2017. The details of cases filed by the Board alongwith the status of public interest litigations and writ petitions filed in different Courts are presented in Table-6.1.
Table - 6.1 Details of Cases Filed by the BoardSl.No
Name of the Court No. of Cases
Filed/Counter filed
Disposal
A Lower Court (SDJM)1. The Water (PCP) Act Nil Nil2. The Air (PCP) Act Nil Nil3. The Environment (Protection) Act Nil NilB High Court1. PIL 25 172. Writ 146 119C Supreme Court1. PIL 02 Nil2. Writ Nil NilD Other Court1. Civil Suit Nil Nil2. Consumer Dispute Cases Nil 243. Lokpal Cases Nil NilE. N.H.R.C. / O.H.R.C. 33
(NHRC-17+ OHRC-16)
24(NHRC-07+OHRC-17)
1. Cases U/S-133 of CrPC Nil Nil2. Cases before the State Appellate
Authority Nil Nil
3. Cases before the National Green Tribunal
104 85
Total 310 269
Annual Report 2016-17
126
6.2 IMPORTANT LEGAL DECISIONS6.2.1 SUPREME COURT OF INDIA
The Hon’ble Apex Court vide their judgment dtd.22.02.2017 directed all the State Pollution Control Boards to issue notices to industrial units (which require consent to operate) to make their primary effluent treatment plant fully operational within three months. On the expiry period of three months, the SPCBs are mandated to carry out inspection to verify whether or not the industrial units have functional primary effluent treatment plant. The industrial units, which have not been able to make their primary effluent treatment plant fully operational within the statutory period shall be restrained from any further industrial activities. In the said judgment some direction has also been issued for functional common effluent treatment plants by the Urban Development and Local Bodies.
6.2.2 NATIONAL GREEN TRIBUNAL.
1. The Hon’ble NGT, EZB, Kolkata while adjudicating the brick kiln units operating in the State of Odisha vide O.A. No. 111/2015/EZ (Joydeep Mukherjee –Vrs-Odisha Pollution Control Board & Anr) vide their order dtd.07.04.2016 have categorized the defaulter brick kiln units operating in the State of Odisha without consent of this Board into two groups ,viz. Category- C i.e., those who had obtained consent to operate at some point of time, but continued to operate without renewal after expiry of its term and Category – D, i.e. those brick kilns which are operating without any consent at all times from the inception and fixed Environmental Compensation of Rupees 1 lakh upon those belonging to Category C and Rupees 1.5 lakh penalty was imposed upon those belonging to Category D and directed for depositing the said amount before the Board.
2. The Hon’ble NGT, EZB, Kolkata while adjudicating the Hotel units in the State of Odisha operating without consent of the Board in O.A. No. 53/2015/EZ (Biranchi Narayan Mohapatra –Vrs- State of Odisha & Others) vide their order dtd. 23.09.2016 have categorized the defaulter Hotels as Category ‘A’ & Category ‘B’and fixed the environmental compensation of Rs. 1 lakh for those falling in Category ‘A’ and Rs. 50,000/- for Category ‘B’. Category-‘A’ shall include those hotels which never obtained any consent from the PCB and had operated the hotel units illegally and Category-‘B’ shall include those hotels which had earlier possessed consent but expiry of the validity periods, it was never renewed and continued to operate even thereafter. The Environmental Compensation fixed above shall be deposited in the Board.
3. The Hon’ble NGT, PB, New Delhi while adjudicating the stone crusher cases of M/s. BVSR Construction Pvt. Ltd in the district of Ganjam in Appeal No. 97/2013-M.C.Rao –Vrs- Member Secretary, OSPCB & others have directed the Project Proponent to pay environmental compensation of Rs. 5,00,000/-(Rupees Five Lakhs) to the Collector, Gajapati district within 30 days of the order. The said
amount would be used towards upgradation of the local Community Health Centre at Kashinagar with 5 additional beds will thereby increase to 21. The Collector will make a plan for health care to spend Rs. 5 Lakhs urgently and a compliance report regarding the same be filed before the Tribunal by 1st February 2017.
Annual Report 2016-17
127
4. Sri Gadadhar Samal has approached the Hon’ble NGT, EZB, Kolkata in OA No.119/2016/EZ alleging pollution caused by M/s. Talcher Thermal Power Station (NTPC) at Talcher mainly with a prayer to direct the SPCB not to renew the consent to operate order and direct constitution of an independent fact finding committee to assess the impact of pollution caused by the above unit. The Hon’ble NGT, EZB, Kolkata vide their order dtd.01.09.2016 while issuing notice to the Respondents have directed this Board to inspect the area in question and verify the allegations stated in the application and submit a reportin this regard etc.. In compliance to the said order, the Regional Office at Angul has carried out inspection of the unit and the report has been submitted to the Hon’ble Tribunal. Finally the Hon’ble Tribunal in their judgment dtd.29.03.2017 has dismissed the OA observing that the allegations contained in the OA are evidently not based on correct facts and also observed that “we do not find any reason as to why we should doubt the correctness of the report of the State PCB which is an independent statutory authority”.
5. Sri Biswaranjan Paramguru, Advocate, Supreme Court of India has filed OA No.225/2014 before the Hon’ble NGT, PB, New Delhi regarding alleged pollution caused by M/s. Hindalco Industries Ltd., Hirakud, Sambalpur. Pursuant to direction of Hon’ble NGT, joint inspection was carried out by the Board along with the Zonal Office, CPCB and the said report was submitted before the Hon’ble NGT, PB, New Delhi. During course of hearing, the applicant has raised question regarding veracity of the joint inspection report and prayed for fresh inspection, but the Hon’ble NGT has accepted the submission and vide their order dtd.23.01.2017 directed the applicant to deposit Rs.5,000/- as cost before the Board. In compliance to the said direction, the applicant has submitted the Bank Draft. The said matter is still pending for hearing.
6. The Hon’ble NGT, EZB, Kolkata while adjudicating OA No.124/2015/EZ – Biranchi Narayan Mahapatra vs. State of Odisha & Others vide their order dtd.02.08.2016 have directed this Board to take necessary steps to ensure that all distilleries and fermentation units, including country liquor manufacturing units, in the State of Odisha are brought within its consent management as provided under law. In compliance to the said direction the Board have brought the fermentation industry including manufacturer of yeast, beer, distillation of alcohol (Extra Neutral Alcohol) with wastewater discharge up to 100 KLD, under Orange Category industry.
7. The Hon’ble NGT, EZB, Kolkata while adjudicating the alleged pollution caused by stone quarries in Soro area of Balasore district vide their order dtd.01.02.2016 have observed the Resolution No.13266 dtd.11.08.2010 of the Board exempting the minor minerals having lease area of less than 5.0 ha. from obtaining consent of the Board under Water (PCP) Act, 1974 and Air (PCP) Act, 1981 contrary to law and set aside and quash the same with a direction to the Board to bring all the minor minerals irrespective of lease hold area under consent administration of the Board. The matter was placed before the Board in its 113rd meeting held on 11.03.2016 and a Resolution No.5803 dtd.30.03.2016 has been issued bringing all the minor mineral mines irrespective of the lease hold area under consent administration of the Board.
Annual Report 2016-17
128
8. The Hon’ble NGT, PB, New Delhi while adjudicating OA No.24/2011 – Samir Mehta Vs. Union of India & Others vide their order dtd.7.2.17 have directed all the SPCBs which have received environmental compensation, penalty or any other charges in furtherance to the orders of the Tribunal shall file complete and comprehensive plan with regard to how they proposed to utilize the amount so received for the purpose of prevention and control of pollution and improvement in the environment of the respective states. In the said order direction have also been issued to all Boards who have received the amount of environmental compensation / penalty to remit / pay to the CPCB 25% of the amount received by them. Accordingly, the Board has deposited Rs.59, 67,500.00 (Rupees fifty nine lakh sixty seven thousand and five hundred only) i.e. 25% of the total amount of Rs.2,38,70,000.00 (Rupees two crore thirty eight lakhs and seventy thousand only) and submitted the same through affidavit dtd.23.02.2017 before the Hon’ble NGT.
6.2.3 Notification:The State Government in the F&E Deptt. vide their notification No.21224 dtd.17.11.2016 and No.21218 dtd.17.11.2016 have been pleased to constitute the Appellate Authority under the Chairmanship of Shri Justice C.R.Dash, sitting Judge of Orissa High Court under the provisions of Section 31 of the Air (PCP) Act, 1981 and Section 28 of the Water (PCP) Act, 1974 to hear appeals preferred against the order made by the SPC Board, Odisha.
6.2.4 Other activities / informationIn compliance to the direction dtd.19.08.2016 in WPC No.12216/2016 –Manabhanjan Champatiray vs. State of Odisha & Others, the Personal Hearing has been taken by the Member Secretary on dtd.20.02.2017 at 05.30 PM involving the petitioners as well as quarries owners of the stone quary situated at village Jariput and Jayamangalpur in Khordha district and disposed off the matter by a reasoned order vide Office Order No.2719 dtd.25.02.17.
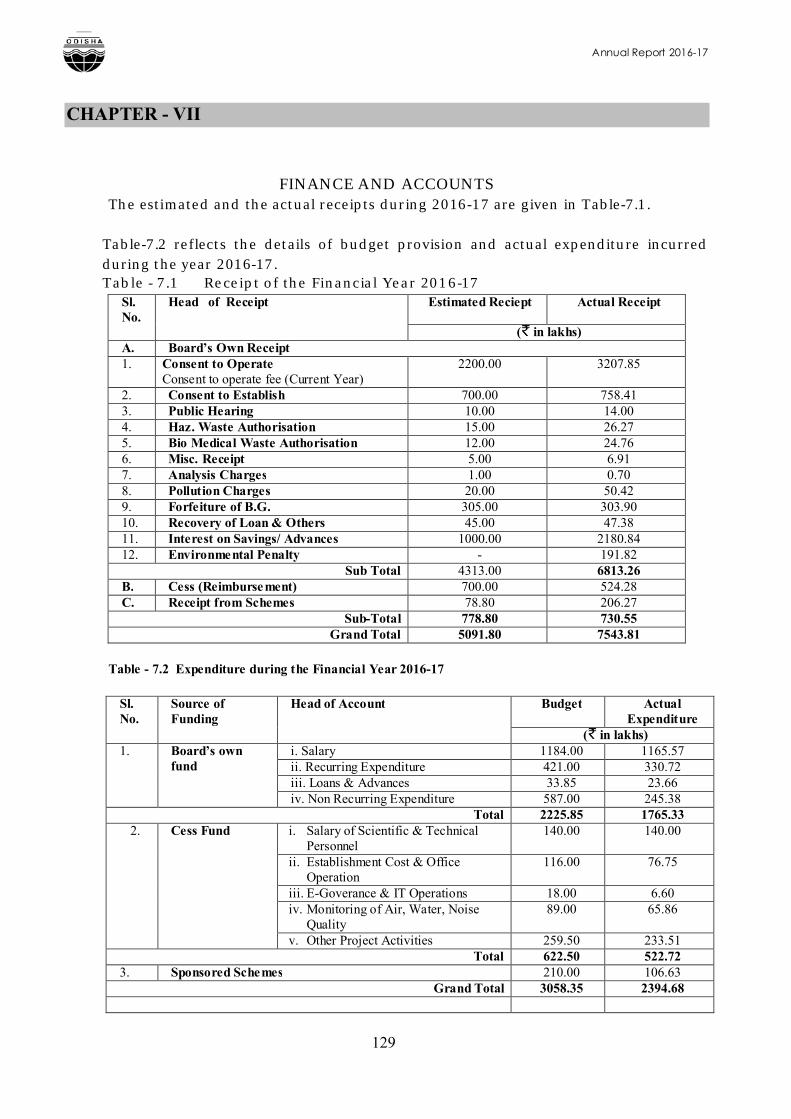
Annual Report 2016-17
129
CHAPTER - VII
FINANCE AND ACCOUNTSThe estimated and the actual receipts during 2016-17 are given in Table-7.1.
Table-7.2 reflects the details of budget provision and actual expenditure incurred during the year 2016-17.Table - 7.1 Receipt of the Financial Year 2016-17
Sl. No.
Head of Receipt Estimated Reciept Actual Receipt
( in lakhs)A. Board’s Own Receipt1. Consent to Operate
Consent to operate fee (Current Year)2200.00 3207.85
2. Consent to Establish 700.00 758.413. Public Hearing 10.00 14.004. Haz. Waste Authorisation 15.00 26.275. Bio Medical Waste Authorisation 12.00 24.766. Misc. Receipt 5.00 6.917. Analysis Charges 1.00 0.708. Pollution Charges 20.00 50.429. Forfeiture of B.G. 305.00 303.9010. Recovery of Loan & Others 45.00 47.3811. Interest on Savings/ Advances 1000.00 2180.8412. Environmental Penalty - 191.82
Sub Total 4313.00 6813.26B. Cess (Reimbursement) 700.00 524.28C. Receipt from Schemes 78.80 206.27
Sub-Total 778.80 730.55Grand Total 5091.80 7543.81
Table - 7.2 Expenditure during the Financial Year 2016-17
Sl. No.
Source of Funding
Head of Account Budget Actual Expenditure
( in lakhs)1. Board’s own
fundi. Salary 1184.00 1165.57ii. Recurring Expenditure 421.00 330.72iii. Loans & Advances 33.85 23.66iv. Non Recurring Expenditure 587.00 245.38
Total 2225.85 1765.332. Cess Fund i. Salary of Scientific & Technical
Personnel140.00 140.00
ii. Establishment Cost & Office Operation
116.00 76.75
iii. E-Goverance & IT Operations 18.00 6.60iv. Monitoring of Air, Water, Noise
Quality89.00 65.86
v. Other Project Activities 259.50 233.51Total 622.50 522.72
3. Sponsored Schemes 210.00 106.63Grand Total 3058.35 2394.68
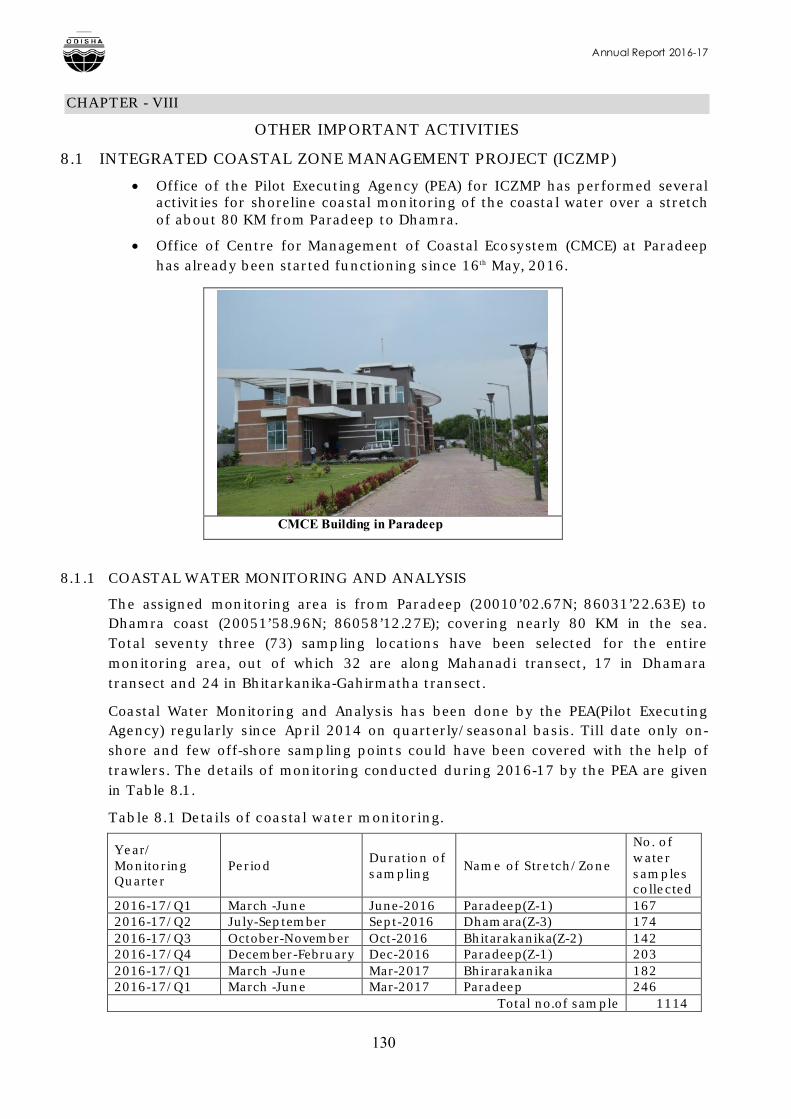
Annual Report 2016-17
130
CHAPTER - VIII
OTHER IMPORTANT ACTIVITIES
8.1 INTEGRATED COASTAL ZONE MANAGEMENT PROJECT (ICZMP)
Office of the Pilot Executing Agency (PEA) for ICZMP has performed several activities for shoreline coastal monitoring of the coastal water over a stretch of about 80 KM from Paradeep to Dhamra.
Office of Centre for Management of Coastal Ecosystem (CMCE) at Paradeep has already been started functioning since 16th May, 2016.
8.1.1 COASTAL WATER MONITORING AND ANALYSIS
The assigned monitoring area is from Paradeep (20010’02.67N; 86031’22.63E) to Dhamra coast (20051’58.96N; 86058’12.27E); covering nearly 80 KM in the sea. Total seventy three (73) sampling locations have been selected for the entire monitoring area, out of which 32 are along Mahanadi transect, 17 in Dhamara transect and 24 in Bhitarkanika-Gahirmatha transect.
Coastal Water Monitoring and Analysis has been done by the PEA(Pilot Executing Agency) regularly since April 2014 on quarterly/seasonal basis. Till date only on-shore and few off-shore sampling points could have been covered with the help of trawlers. The details of monitoring conducted during 2016-17 by the PEA are given in Table 8.1.
Table 8.1 Details of coastal water monitoring.
Year/Monitoring Quarter
PeriodDuration of sampling
Name of Stretch/Zone
No. of water samples collected
2016-17/Q1 March -June June-2016 Paradeep(Z-1) 1672016-17/Q2 July-September Sept-2016 Dhamara(Z-3) 1742016-17/Q3 October-November Oct-2016 Bhitarakanika(Z-2) 1422016-17/Q4 December-February Dec-2016 Paradeep(Z-1) 2032016-17/Q1 March -June Mar-2017 Bhirarakanika 1822016-17/Q1 March -June Mar-2017 Paradeep 246
Total no.of sample 1114
CMCE Building in Paradeep
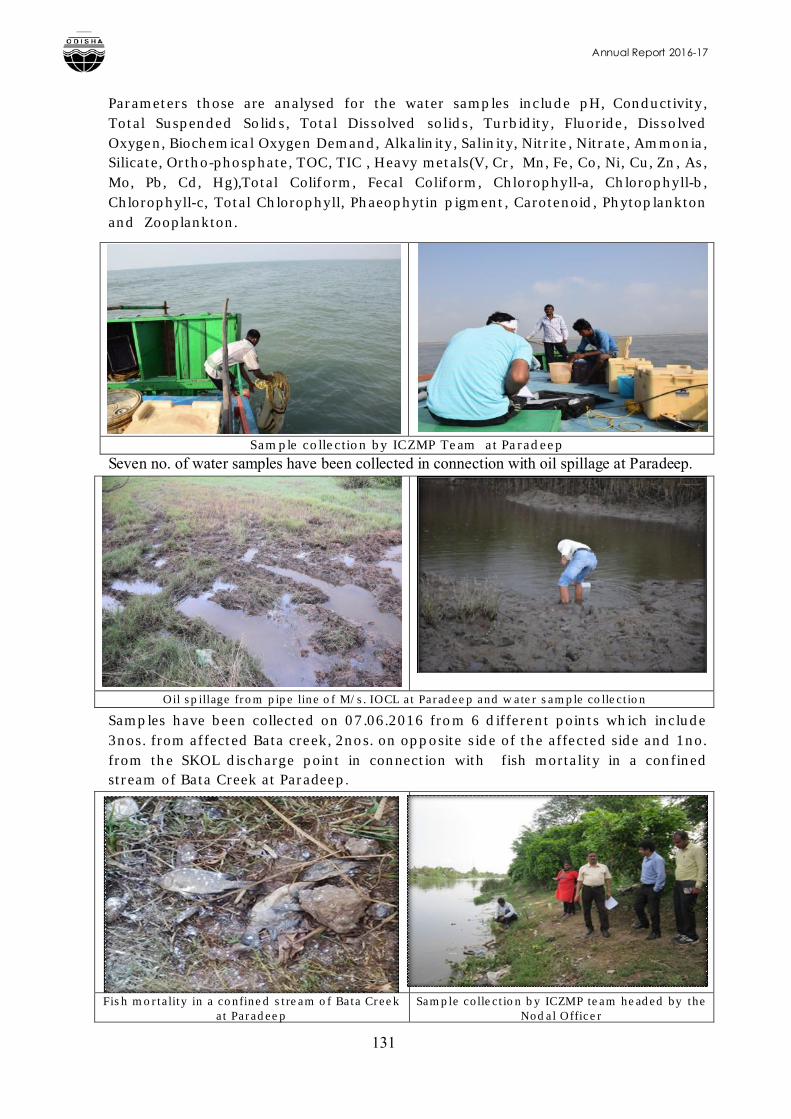
Annual Report 2016-17
131
Parameters those are analysed for the water samples include pH, Conductivity, Total Suspended Solids, Total Dissolved solids, Turbidity, Fluoride, Dissolved Oxygen, Biochemical Oxygen Demand, Alkalinity, Salinity, Nitrite, Nitrate, Ammonia, Silicate, Ortho-phosphate, TOC, TIC , Heavy metals(V, Cr, Mn, Fe, Co, Ni, Cu, Zn, As, Mo, Pb, Cd, Hg),Total Coliform, Fecal Coliform, Chlorophyll-a, Chlorophyll-b, Chlorophyll-c, Total Chlorophyll, Phaeophytin pigment, Carotenoid, Phytoplanktonand Zooplankton.
Sample collection by ICZMP Team at Paradeep
Seven no. of water samples have been collected in connection with oil spillage at Paradeep.
Oil spillage from pipe line of M/s. IOCL at Paradeep and water sample collection
Samples have been collected on 07.06.2016 from 6 different points which include 3nos. from affected Bata creek, 2nos. on opposite side of the affected side and 1no. from the SKOL discharge point in connection with fish mortality in a confined stream of Bata Creek at Paradeep.
Fish mortality in a confined stream of Bata Creek at Paradeep
Sample collection by ICZMP team headed by the Nodal Officer
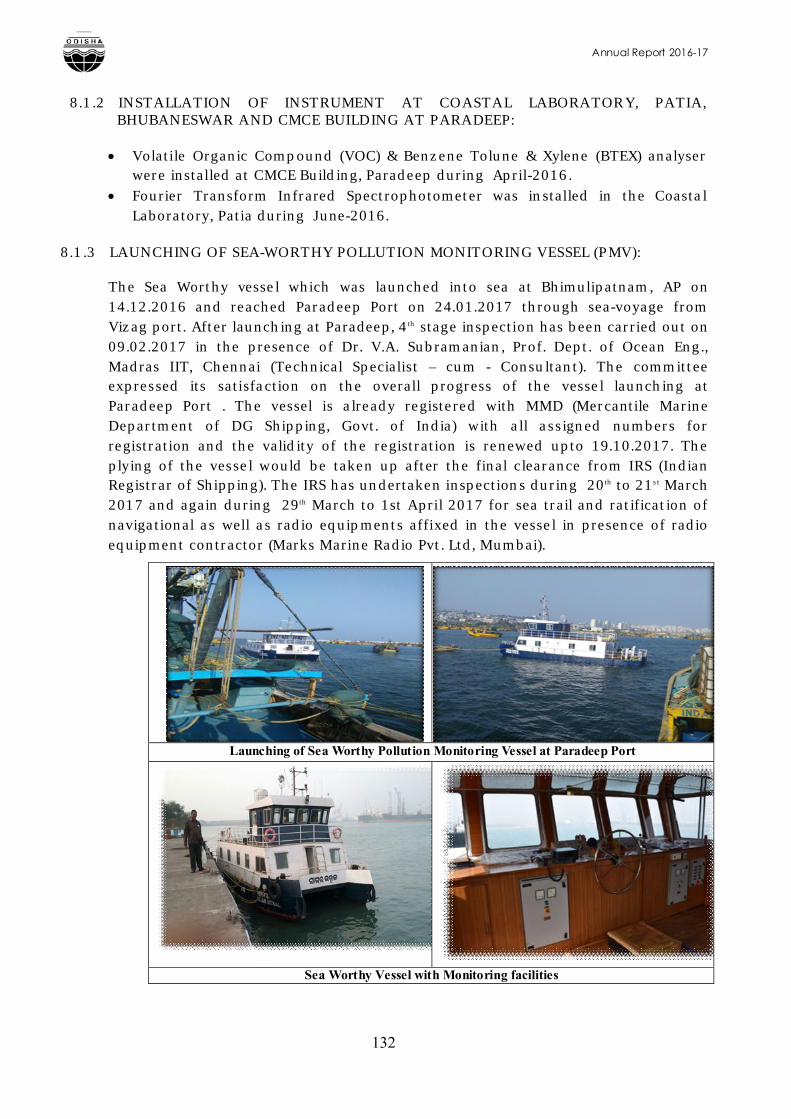
Annual Report 2016-17
132
8.1.2 INSTALLATION OF INSTRUMENT AT COASTAL LABORATORY, PATIA, BHUBANESWAR AND CMCE BUILDING AT PARADEEP:
Volatile Organic Compound (VOC) & Benzene Tolune & Xylene (BTEX) analyser were installed at CMCE Building, Paradeep during April-2016.
Fourier Transform Infrared Spectrophotometer was installed in the Coastal Laboratory, Patia during June-2016.
8.1.3 LAUNCHING OF SEA-WORTHY POLLUTION MONITORING VESSEL (PMV):
The Sea Worthy vessel which was launched into sea at Bhimulipatnam, AP on 14.12.2016 and reached Paradeep Port on 24.01.2017 through sea-voyage from Vizag port. After launching at Paradeep, 4th stage inspection has been carried out on 09.02.2017 in the presence of Dr. V.A. Subramanian, Prof. Dept. of Ocean Eng., Madras IIT, Chennai (Technical Specialist – cum - Consultant). The committee expressed its satisfaction on the overall progress of the vessel launching at Paradeep Port . The vessel is already registered with MMD (Mercantile Marine Department of DG Shipping, Govt. of India) with all assigned numbers for registration and the validity of the registration is renewed upto 19.10.2017. The plying of the vessel would be taken up after the final clearance from IRS (Indian Registrar of Shipping). The IRS has undertaken inspections during 20th to 21st March 2017 and again during 29th March to 1st April 2017 for sea trail and ratification of navigational as well as radio equipments affixed in the vessel in presence of radio equipment contractor (Marks Marine Radio Pvt. Ltd, Mumbai).
Launching of Sea Worthy Pollution Monitoring Vessel at Paradeep Port
Sea Worthy Vessel with Monitoring facilities
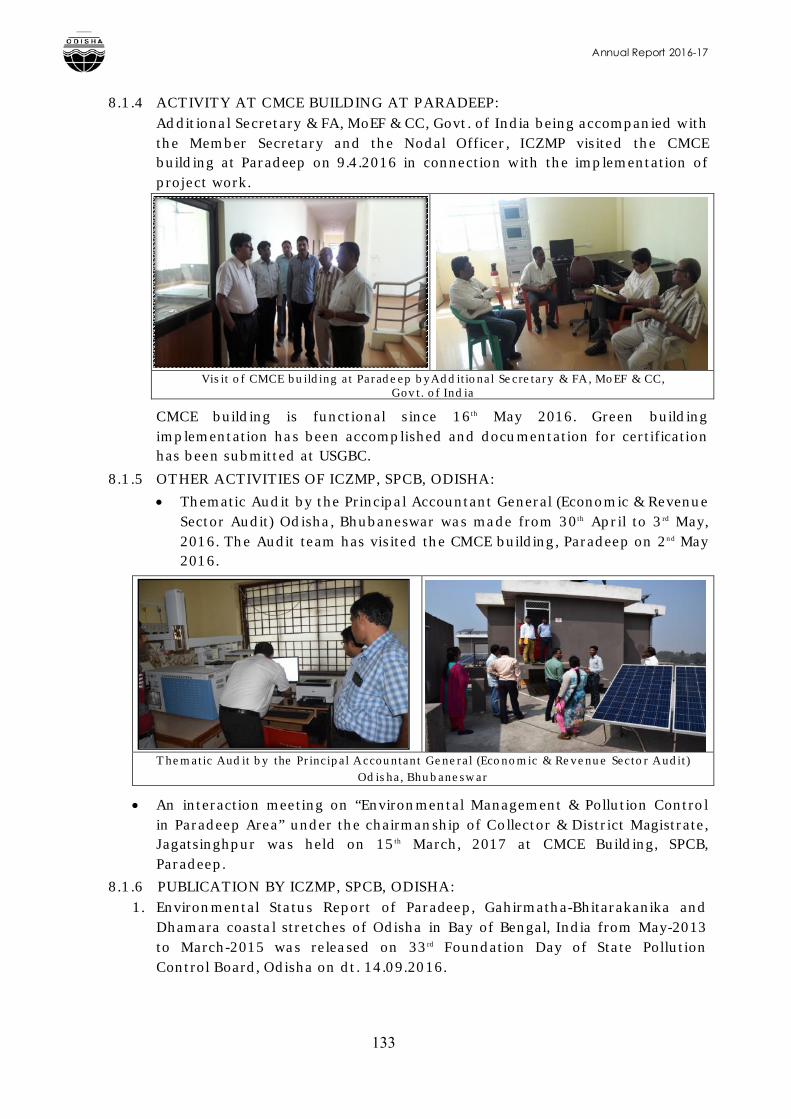
Annual Report 2016-17
133
8.1.4 ACTIVITY AT CMCE BUILDING AT PARADEEP:Additional Secretary & FA, MoEF & CC, Govt. of India being accompanied with the Member Secretary and the Nodal Officer, ICZMP visited the CMCE building at Paradeep on 9.4.2016 in connection with the implementation of project work.
Visit of CMCE building at Paradeep byAdditional Secretary & FA, MoEF & CC, Govt. of India
CMCE building is functional since 16th May 2016. Green building implementation has been accomplished and documentation for certification has been submitted at USGBC.
8.1.5 OTHER ACTIVITIES OF ICZMP, SPCB, ODISHA:
Thematic Audit by the Principal Accountant General (Economic & Revenue Sector Audit) Odisha, Bhubaneswar was made from 30th April to 3rd May, 2016. The Audit team has visited the CMCE building, Paradeep on 2nd May 2016.
Thematic Audit by the Principal Accountant General (Economic & Revenue Sector Audit) Odisha, Bhubaneswar
An interaction meeting on “Environmental Management & Pollution Control in Paradeep Area” under the chairmanship of Collector & District Magistrate, Jagatsinghpur was held on 15th March, 2017 at CMCE Building, SPCB, Paradeep.
8.1.6 PUBLICATION BY ICZMP, SPCB, ODISHA:1. Environmental Status Report of Paradeep, Gahirmatha-Bhitarakanika and
Dhamara coastal stretches of Odisha in Bay of Bengal, India from May-2013 to March-2015 was released on 33rd Foundation Day of State Pollution Control Board, Odisha on dt. 14.09.2016.
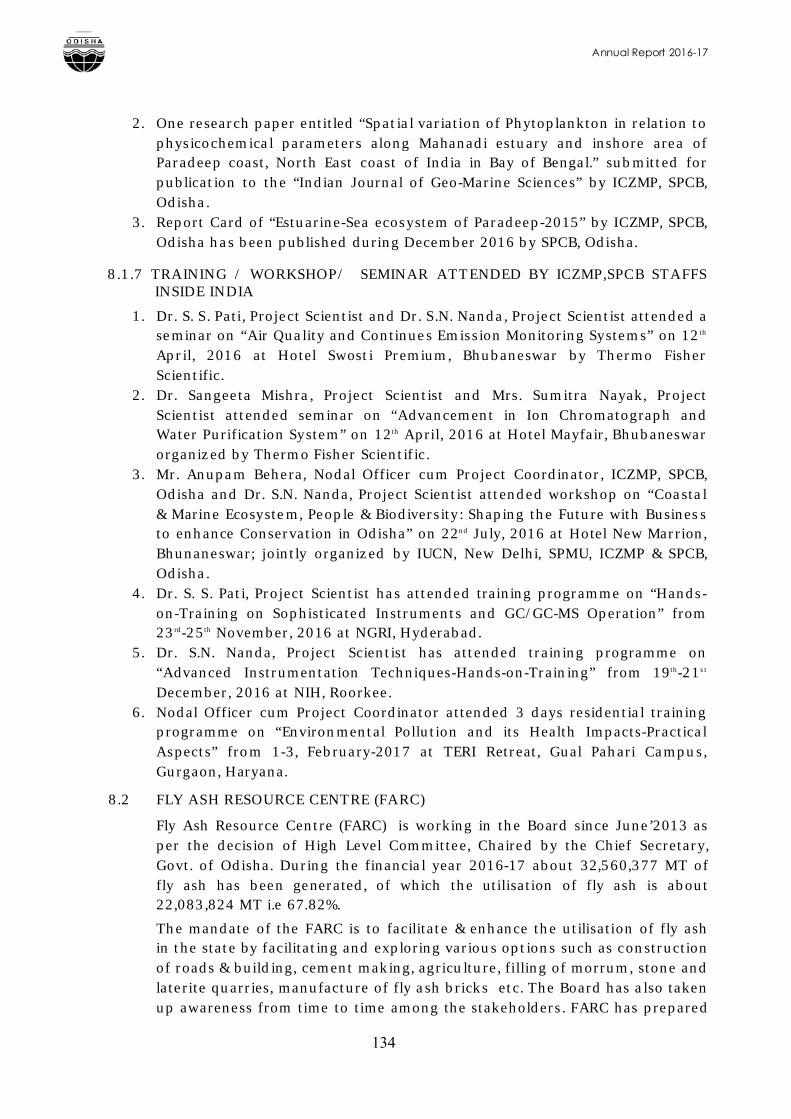
Annual Report 2016-17
134
2. One research paper entitled “Spatial variation of Phytoplankton in relation to physicochemical parameters along Mahanadi estuary and inshore area of Paradeep coast, North East coast of India in Bay of Bengal.” submitted for publication to the “Indian Journal of Geo-Marine Sciences” by ICZMP, SPCB, Odisha.
3. Report Card of “Estuarine-Sea ecosystem of Paradeep-2015” by ICZMP, SPCB, Odisha has been published during December 2016 by SPCB, Odisha.
8.1.7 TRAINING / WORKSHOP/ SEMINAR ATTENDED BY ICZMP,SPCB STAFFS INSIDE INDIA
1. Dr. S. S. Pati, Project Scientist and Dr. S.N. Nanda, Project Scientist attended a seminar on “Air Quality and Continues Emission Monitoring Systems” on 12th
April, 2016 at Hotel Swosti Premium, Bhubaneswar by Thermo Fisher Scientific.
2. Dr. Sangeeta Mishra, Project Scientist and Mrs. Sumitra Nayak, Project Scientist attended seminar on “Advancement in Ion Chromatograph and Water Purification System” on 12th April, 2016 at Hotel Mayfair, Bhubaneswar organized by Thermo Fisher Scientific.
3. Mr. Anupam Behera, Nodal Officer cum Project Coordinator, ICZMP, SPCB, Odisha and Dr. S.N. Nanda, Project Scientist attended workshop on “Coastal & Marine Ecosystem, People & Biodiversity: Shaping the Future with Business to enhance Conservation in Odisha” on 22nd July, 2016 at Hotel New Marrion, Bhunaneswar; jointly organized by IUCN, New Delhi, SPMU, ICZMP & SPCB, Odisha.
4. Dr. S. S. Pati, Project Scientist has attended training programme on “Hands-on-Training on Sophisticated Instruments and GC/GC-MS Operation” from 23rd-25th November, 2016 at NGRI, Hyderabad.
5. Dr. S.N. Nanda, Project Scientist has attended training programme on “Advanced Instrumentation Techniques-Hands-on-Training” from 19th-21st
December, 2016 at NIH, Roorkee.6. Nodal Officer cum Project Coordinator attended 3 days residential training
programme on “Environmental Pollution and its Health Impacts-Practical Aspects” from 1-3, February-2017 at TERI Retreat, Gual Pahari Campus, Gurgaon, Haryana.
8.2 FLY ASH RESOURCE CENTRE (FARC)
Fly Ash Resource Centre (FARC) is working in the Board since June’2013 as per the decision of High Level Committee, Chaired by the Chief Secretary, Govt. of Odisha. During the financial year 2016-17 about 32,560,377 MT of fly ash has been generated, of which the utilisation of fly ash is about22,083,824 MT i.e 67.82%.
The mandate of the FARC is to facilitate & enhance the utilisation of fly ash in the state by facilitating and exploring various options such as constructionof roads & building, cement making, agriculture, filling of morrum, stone and laterite quarries, manufacture of fly ash bricks etc. The Board has also takenup awareness from time to time among the stakeholders. FARC has prepared
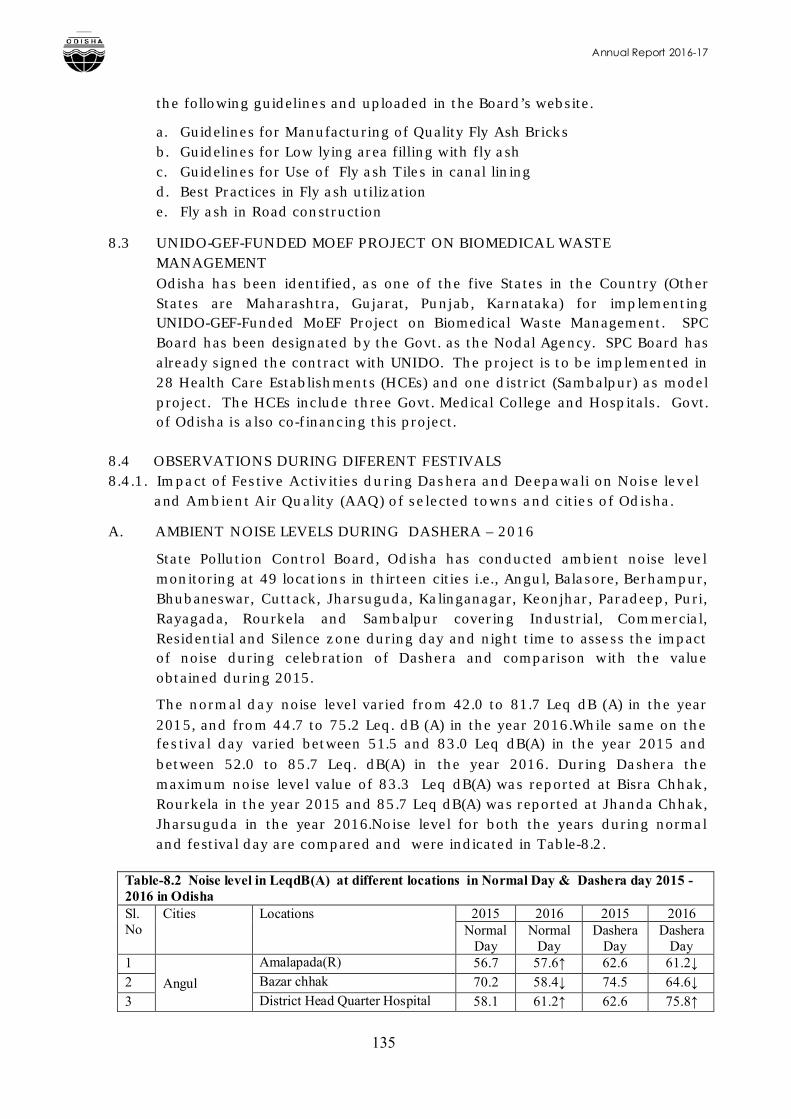
Annual Report 2016-17
135
the following guidelines and uploaded in the Board’s website.
a. Guidelines for Manufacturing of Quality Fly Ash Bricks b. Guidelines for Low lying area filling with fly ashc. Guidelines for Use of Fly ash Tiles in canal liningd. Best Practices in Fly ash utilizatione. Fly ash in Road construction
8.3 UNIDO-GEF-FUNDED MOEF PROJECT ON BIOMEDICAL WASTE MANAGEMENTOdisha has been identified, as one of the five States in the Country (Other States are Maharashtra, Gujarat, Punjab, Karnataka) for implementing UNIDO-GEF-Funded MoEF Project on Biomedical Waste Management. SPC Board has been designated by the Govt. as the Nodal Agency. SPC Board has already signed the contract with UNIDO. The project is to be implemented in 28 Health Care Establishments (HCEs) and one district (Sambalpur) as modelproject. The HCEs include three Govt. Medical College and Hospitals. Govt. of Odisha is also co-financing this project.
8.4 OBSERVATIONS DURING DIFERENT FESTIVALS 8.4.1. Impact of Festive Activities during Dashera and Deepawali on Noise level and Ambient Air Quality (AAQ) of selected towns and cities of Odisha.
A. AMBIENT NOISE LEVELS DURING DASHERA – 2016
State Pollution Control Board, Odisha has conducted ambient noise level monitoring at 49 locations in thirteen cities i.e., Angul, Balasore, Berhampur, Bhubaneswar, Cuttack, Jharsuguda, Kalinganagar, Keonjhar, Paradeep, Puri, Rayagada, Rourkela and Sambalpur covering Industrial, Commercial, Residential and Silence zone during day and night time to assess the impact of noise during celebration of Dashera and comparison with the value obtained during 2015.
The normal day noise level varied from 42.0 to 81.7 Leq dB (A) in the year 2015, and from 44.7 to 75.2 Leq. dB (A) in the year 2016.While same on the festival day varied between 51.5 and 83.0 Leq dB(A) in the year 2015 and between 52.0 to 85.7 Leq. dB(A) in the year 2016. During Dashera the maximum noise level value of 83.3 Leq dB(A) was reported at Bisra Chhak, Rourkela in the year 2015 and 85.7 Leq dB(A) was reported at Jhanda Chhak, Jharsuguda in the year 2016.Noise level for both the years during normal and festival day are compared and were indicated in Table-8.2.
Table-8.2 Noise level in LeqdB(A) at different locations in Normal Day & Dashera day 2015 -2016 in OdishaSl. No
Cities Locations 2015 2016 2015 2016Normal
DayNormal
DayDashera
DayDashera
Day1
Angul
Amalapada(R) 56.7 57.6↑ 62.6 61.2↓2 Bazar chhak 70.2 58.4↓ 74.5 64.6↓3 District Head Quarter Hospital 58.1 61.2↑ 62.6 75.8↑
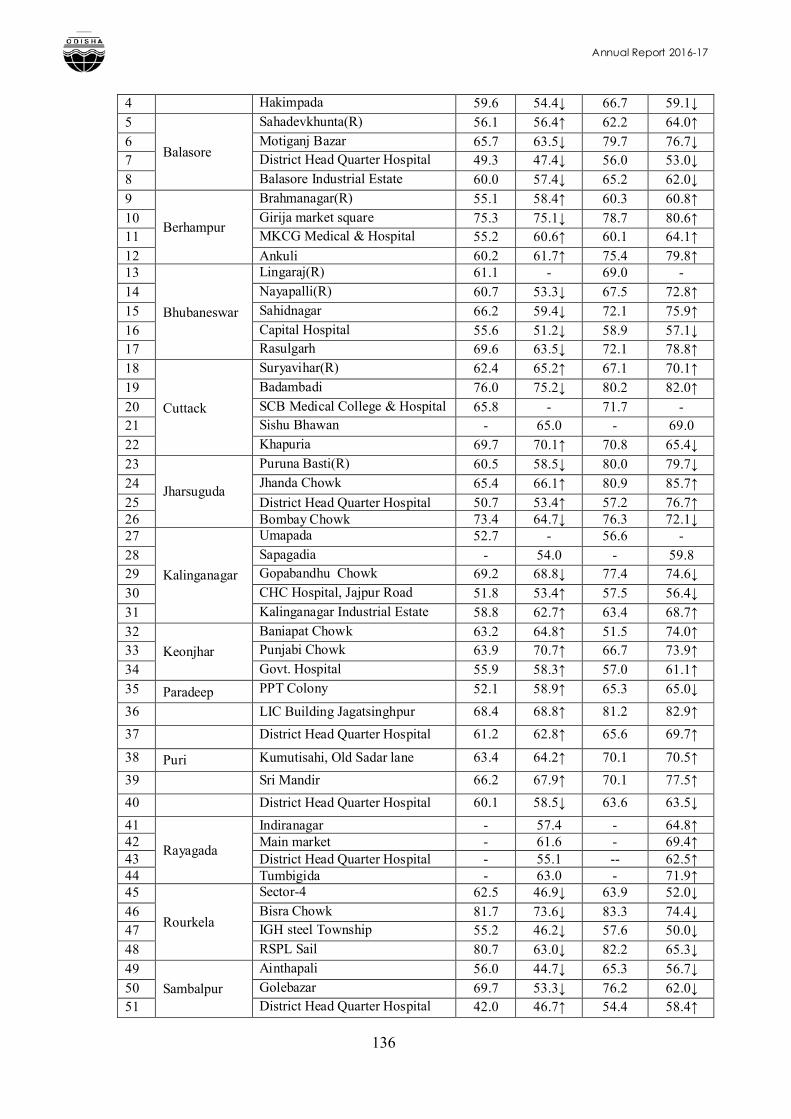
Annual Report 2016-17
136
4 Hakimpada 59.6 54.4↓ 66.7 59.1↓5
Balasore
Sahadevkhunta(R) 56.1 56.4↑ 62.2 64.0↑6 Motiganj Bazar 65.7 63.5↓ 79.7 76.7↓7 District Head Quarter Hospital 49.3 47.4↓ 56.0 53.0↓8 Balasore Industrial Estate 60.0 57.4↓ 65.2 62.0↓9
Berhampur
Brahmanagar(R) 55.1 58.4↑ 60.3 60.8↑10 Girija market square 75.3 75.1↓ 78.7 80.6↑11 MKCG Medical & Hospital 55.2 60.6↑ 60.1 64.1↑12 Ankuli 60.2 61.7↑ 75.4 79.8↑13
Bhubaneswar
Lingaraj(R) 61.1 - 69.0 -14 Nayapalli(R) 60.7 53.3↓ 67.5 72.8↑15 Sahidnagar 66.2 59.4↓ 72.1 75.9↑16 Capital Hospital 55.6 51.2↓ 58.9 57.1↓17 Rasulgarh 69.6 63.5↓ 72.1 78.8↑18
Cuttack
Suryavihar(R) 62.4 65.2↑ 67.1 70.1↑19 Badambadi 76.0 75.2↓ 80.2 82.0↑20 SCB Medical College & Hospital 65.8 - 71.7 -21 Sishu Bhawan - 65.0 - 69.022 Khapuria 69.7 70.1↑ 70.8 65.4↓23
Jharsuguda
Puruna Basti(R) 60.5 58.5↓ 80.0 79.7↓24 Jhanda Chowk 65.4 66.1↑ 80.9 85.7↑25 District Head Quarter Hospital 50.7 53.4↑ 57.2 76.7↑26 Bombay Chowk 73.4 64.7↓ 76.3 72.1↓27
Kalinganagar
Umapada 52.7 - 56.6 -28 Sapagadia - 54.0 - 59.829 Gopabandhu Chowk 69.2 68.8↓ 77.4 74.6↓30 CHC Hospital, Jajpur Road 51.8 53.4↑ 57.5 56.4↓31 Kalinganagar Industrial Estate 58.8 62.7↑ 63.4 68.7↑32
Keonjhar
Baniapat Chowk 63.2 64.8↑ 51.5 74.0↑33 Punjabi Chowk 63.9 70.7↑ 66.7 73.9↑34 Govt. Hospital 55.9 58.3↑ 57.0 61.1↑35 Paradeep PPT Colony 52.1 58.9↑ 65.3 65.0↓
36 LIC Building Jagatsinghpur 68.4 68.8↑ 81.2 82.9↑
37 District Head Quarter Hospital 61.2 62.8↑ 65.6 69.7↑
38 Puri Kumutisahi, Old Sadar lane 63.4 64.2↑ 70.1 70.5↑
39 Sri Mandir 66.2 67.9↑ 70.1 77.5↑
40 District Head Quarter Hospital 60.1 58.5↓ 63.6 63.5↓
41
Rayagada
Indiranagar - 57.4 - 64.8↑42 Main market - 61.6 - 69.4↑43 District Head Quarter Hospital - 55.1 -- 62.5↑44 Tumbigida - 63.0 - 71.9↑45
Rourkela
Sector-4 62.5 46.9↓ 63.9 52.0↓46 Bisra Chowk 81.7 73.6↓ 83.3 74.4↓47 IGH steel Township 55.2 46.2↓ 57.6 50.0↓48 RSPL Sail 80.7 63.0↓ 82.2 65.3↓49
Sambalpur
Ainthapali 56.0 44.7↓ 65.3 56.7↓50 Golebazar 69.7 53.3↓ 76.2 62.0↓51 District Head Quarter Hospital 42.0 46.7↑ 54.4 58.4↑
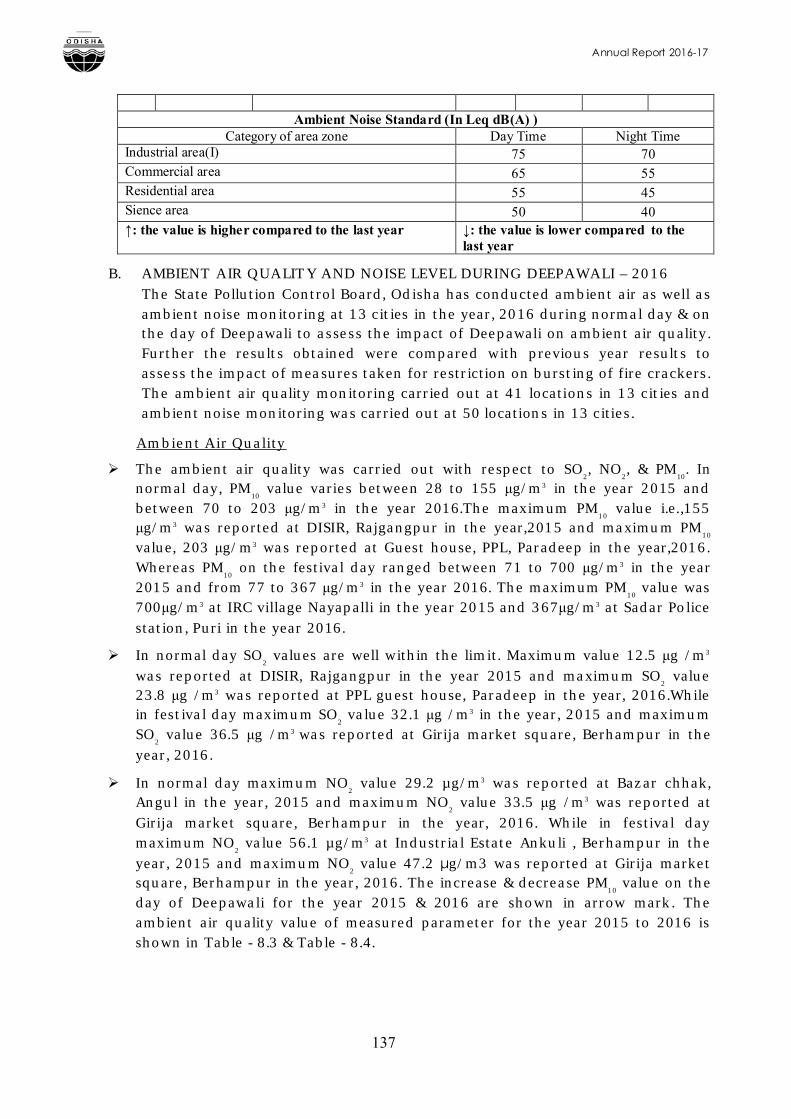
Annual Report 2016-17
137
Ambient Noise Standard (In Leq dB(A) )Category of area zone Day Time Night Time
Industrial area(I) 75 70Commercial area 65 55Residential area 55 45Sience area 50 40↑: the value is higher compared to the last year ↓: the value is lower compared to the
last year
B. AMBIENT AIR QUALITY AND NOISE LEVEL DURING DEEPAWALI – 2016The State Pollution Control Board, Odisha has conducted ambient air as well as ambient noise monitoring at 13 cities in the year, 2016 during normal day & on the day of Deepawali to assess the impact of Deepawali on ambient air quality. Further the results obtained were compared with previous year results to assess the impact of measures taken for restriction on bursting of fire crackers. The ambient air quality monitoring carried out at 41 locations in 13 cities and ambient noise monitoring was carried out at 50 locations in 13 cities.
Ambient Air Quality
The ambient air quality was carried out with respect to SO2, NO
2, & PM
10. In
normal day, PM10
value varies between 28 to 155 μg/m3 in the year 2015 and between 70 to 203 μg/m3 in the year 2016.The maximum PM
10value i.e.,155
μg/m3 was reported at DISIR, Rajgangpur in the year,2015 and maximum PM10
value, 203 μg/m3 was reported at Guest house, PPL, Paradeep in the year,2016. Whereas PM
10on the festival day ranged between 71 to 700 μg/m3 in the year
2015 and from 77 to 367 μg/m3 in the year 2016. The maximum PM10
value was 700μg/m3 at IRC village Nayapalli in the year 2015 and 367μg/m3 at Sadar Police station, Puri in the year 2016.
In normal day SO2
values are well within the limit. Maximum value 12.5 μg /m3
was reported at DISIR, Rajgangpur in the year 2015 and maximum SO2
value 23.8 μg /m3 was reported at PPL guest house, Paradeep in the year, 2016.While in festival day maximum SO
2value 32.1 μg /m3 in the year, 2015 and maximum
SO2
value 36.5 μg /m3 was reported at Girija market square, Berhampur in the year, 2016.
In normal day maximum NO2
value 29.2 µg/m3 was reported at Bazar chhak, Angul in the year, 2015 and maximum NO
2value 33.5 μg /m3 was reported at
Girija market square, Berhampur in the year, 2016. While in festival day maximum NO
2value 56.1 µg/m3 at Industrial Estate Ankuli , Berhampur in the
year, 2015 and maximum NO2
value 47.2 μg/m3 was reported at Girija market square, Berhampur in the year, 2016. The increase & decrease PM
10value on the
day of Deepawali for the year 2015 & 2016 are shown in arrow mark. The ambient air quality value of measured parameter for the year 2015 to 2016 is shown in Table - 8.3 & Table - 8.4.
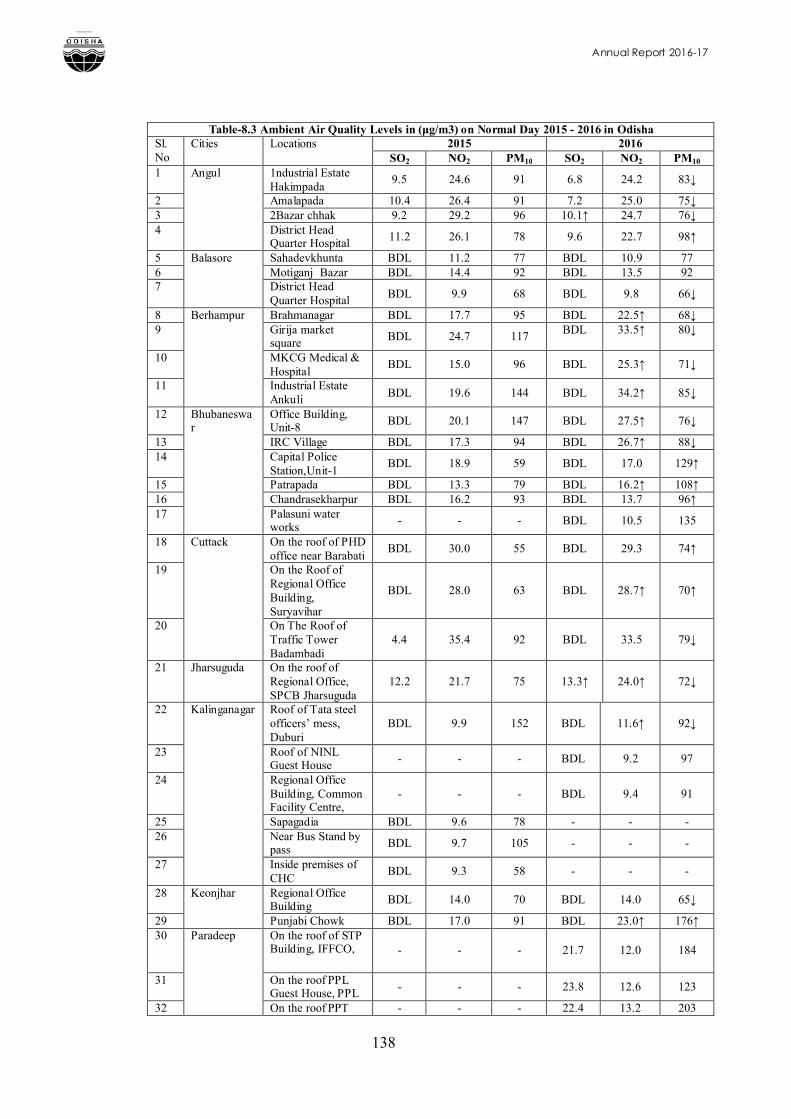
Annual Report 2016-17
138
Table-8.3 Ambient Air Quality Levels in (μg/m3) on Normal Day 2015 - 2016 in OdishaSl. No
Cities Locations 2015 2016SO2 NO2 PM10 SO2 NO2 PM10
1 Angul 1ndustrial Estate Hakimpada
9.5 24.6 91 6.8 24.2 83↓
2 Amalapada 10.4 26.4 91 7.2 25.0 75↓3 2Bazar chhak 9.2 29.2 96 10.1↑ 24.7 76↓4 District Head
Quarter Hospital11.2 26.1 78 9.6 22.7 98↑
5 Balasore Sahadevkhunta BDL 11.2 77 BDL 10.9 776 Motiganj Bazar BDL 14.4 92 BDL 13.5 927 District Head
Quarter HospitalBDL 9.9 68 BDL 9.8 66↓
8 Berhampur Brahmanagar BDL 17.7 95 BDL 22.5↑ 68↓9 Girija market
squareBDL 24.7 117
BDL 33.5↑ 80↓
10 MKCG Medical & Hospital
BDL 15.0 96 BDL 25.3↑ 71↓
11 Industrial Estate Ankuli
BDL 19.6 144 BDL 34.2↑ 85↓
12 Bhubaneswar
Office Building, Unit-8
BDL 20.1 147 BDL 27.5↑ 76↓
13 IRC Village BDL 17.3 94 BDL 26.7↑ 88↓14 Capital Police
Station,Unit-1BDL 18.9 59 BDL 17.0 129↑
15 Patrapada BDL 13.3 79 BDL 16.2↑ 108↑16 Chandrasekharpur BDL 16.2 93 BDL 13.7 96↑17 Palasuni water
works- - - BDL 10.5 135
18 Cuttack On the roof of PHD office near Barabati
BDL 30.0 55 BDL 29.3 74↑
19 On the Roof ofRegional OfficeBuilding, Suryavihar
BDL 28.0 63 BDL 28.7↑ 70↑
20 On The Roof ofTraffic TowerBadambadi
4.4 35.4 92 BDL 33.5 79↓
21 Jharsuguda On the roof ofRegional Office,SPCB Jharsuguda
12.2 21.7 75 13.3↑ 24.0↑ 72↓
22 Kalinganagar Roof of Tata steel officers’ mess, Duburi
BDL 9.9 152 BDL 11.6↑ 92↓
23 Roof of NINL Guest House
- - - BDL 9.2 97
24 Regional Office Building, Common Facility Centre,
- - - BDL 9.4 91
25 Sapagadia BDL 9.6 78 - - -26 Near Bus Stand by
passBDL 9.7 105 - - -
27 Inside premises of CHC
BDL 9.3 58 - - -
28 Keonjhar Regional OfficeBuilding
BDL 14.0 70 BDL 14.0 65↓
29 Punjabi Chowk BDL 17.0 91 BDL 23.0↑ 176↑30 Paradeep On the roof of STP
Building, IFFCO, - - - 21.7 12.0 184
31 On the roof PPLGuest House, PPL
- - - 23.8 12.6 123
32 On the roof PPT - - - 22.4 13.2 203
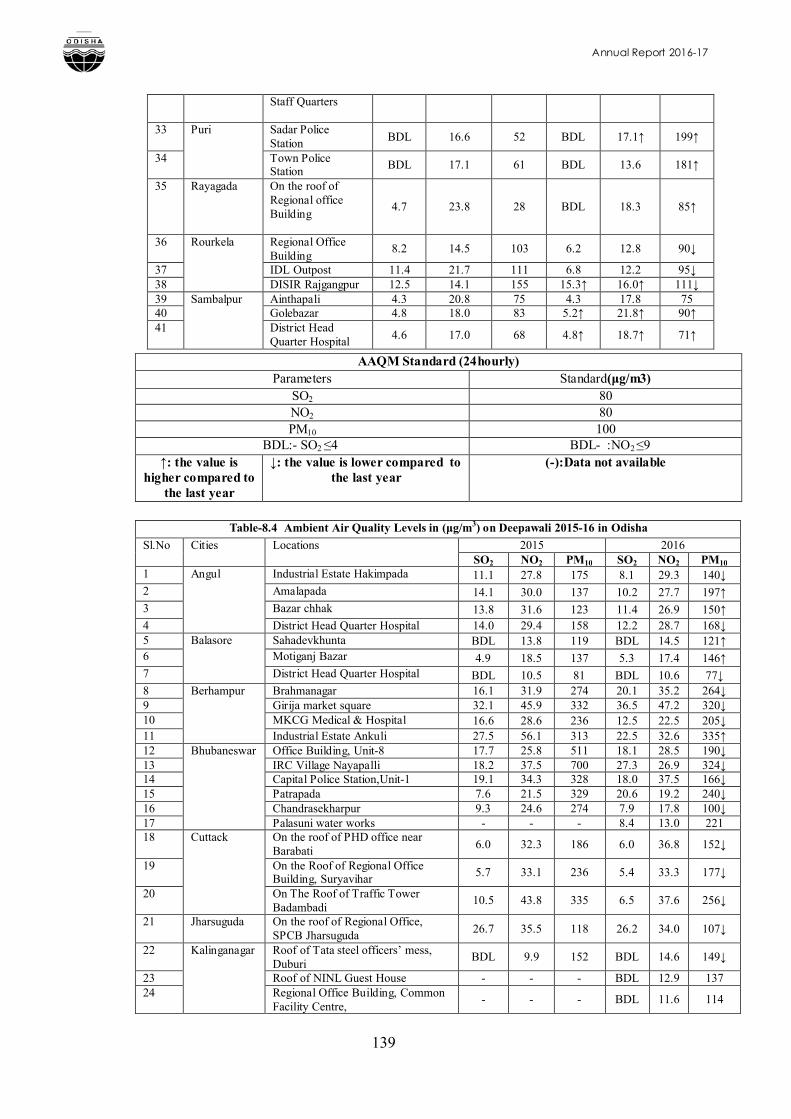
Annual Report 2016-17
139
Staff Quarters
33 Puri Sadar Police Station
BDL 16.6 52 BDL 17.1↑ 199↑
34 Town Police Station
BDL 17.1 61 BDL 13.6 181↑
35 Rayagada On the roof ofRegional officeBuilding
4.7 23.8 28 BDL 18.3 85↑
36 Rourkela Regional Office Building
8.2 14.5 103 6.2 12.8 90↓
37 IDL Outpost 11.4 21.7 111 6.8 12.2 95↓38 DISIR Rajgangpur 12.5 14.1 155 15.3↑ 16.0↑ 111↓39 Sambalpur Ainthapali 4.3 20.8 75 4.3 17.8 7540 Golebazar 4.8 18.0 83 5.2↑ 21.8↑ 90↑41 District Head
Quarter Hospital4.6 17.0 68 4.8↑ 18.7↑ 71↑
AAQM Standard (24hourly) Parameters Standard(μg/m3)
SO2 80NO2 80PM10 100
BDL:- SO2 ≤4 BDL- :NO2 ≤9↑: the value is
higher compared to the last year
↓: the value is lower compared to the last year
(-):Data not available
Table-8.4 Ambient Air Quality Levels in (μg/m3) on Deepawali 2015-16 in Odisha
Sl.No Cities Locations 2015 2016SO2 NO2 PM10 SO2 NO2 PM10
1 Angul Industrial Estate Hakimpada 11.1 27.8 175 8.1 29.3 140↓2 Amalapada 14.1 30.0 137 10.2 27.7 197↑3 Bazar chhak 13.8 31.6 123 11.4 26.9 150↑4 District Head Quarter Hospital 14.0 29.4 158 12.2 28.7 168↓5 Balasore Sahadevkhunta BDL 13.8 119 BDL 14.5 121↑6 Motiganj Bazar 4.9 18.5 137 5.3 17.4 146↑7 District Head Quarter Hospital BDL 10.5 81 BDL 10.6 77↓8 Berhampur Brahmanagar 16.1 31.9 274 20.1 35.2 264↓9 Girija market square 32.1 45.9 332 36.5 47.2 320↓10 MKCG Medical & Hospital 16.6 28.6 236 12.5 22.5 205↓11 Industrial Estate Ankuli 27.5 56.1 313 22.5 32.6 335↑12 Bhubaneswar Office Building, Unit-8 17.7 25.8 511 18.1 28.5 190↓13 IRC Village Nayapalli 18.2 37.5 700 27.3 26.9 324↓14 Capital Police Station,Unit-1 19.1 34.3 328 18.0 37.5 166↓15 Patrapada 7.6 21.5 329 20.6 19.2 240↓16 Chandrasekharpur 9.3 24.6 274 7.9 17.8 100↓17 Palasuni water works - - - 8.4 13.0 22118 Cuttack On the roof of PHD office near
Barabati6.0 32.3 186 6.0 36.8 152↓
19 On the Roof of Regional OfficeBuilding, Suryavihar
5.7 33.1 236 5.4 33.3 177↓
20 On The Roof of Traffic TowerBadambadi
10.5 43.8 335 6.5 37.6 256↓
21 Jharsuguda On the roof of Regional Office,SPCB Jharsuguda
26.7 35.5 118 26.2 34.0 107↓
22 Kalinganagar Roof of Tata steel officers’ mess, Duburi
BDL 9.9 152 BDL 14.6 149↓
23 Roof of NINL Guest House - - - BDL 12.9 13724 Regional Office Building, Common
Facility Centre,- - - BDL 11.6 114
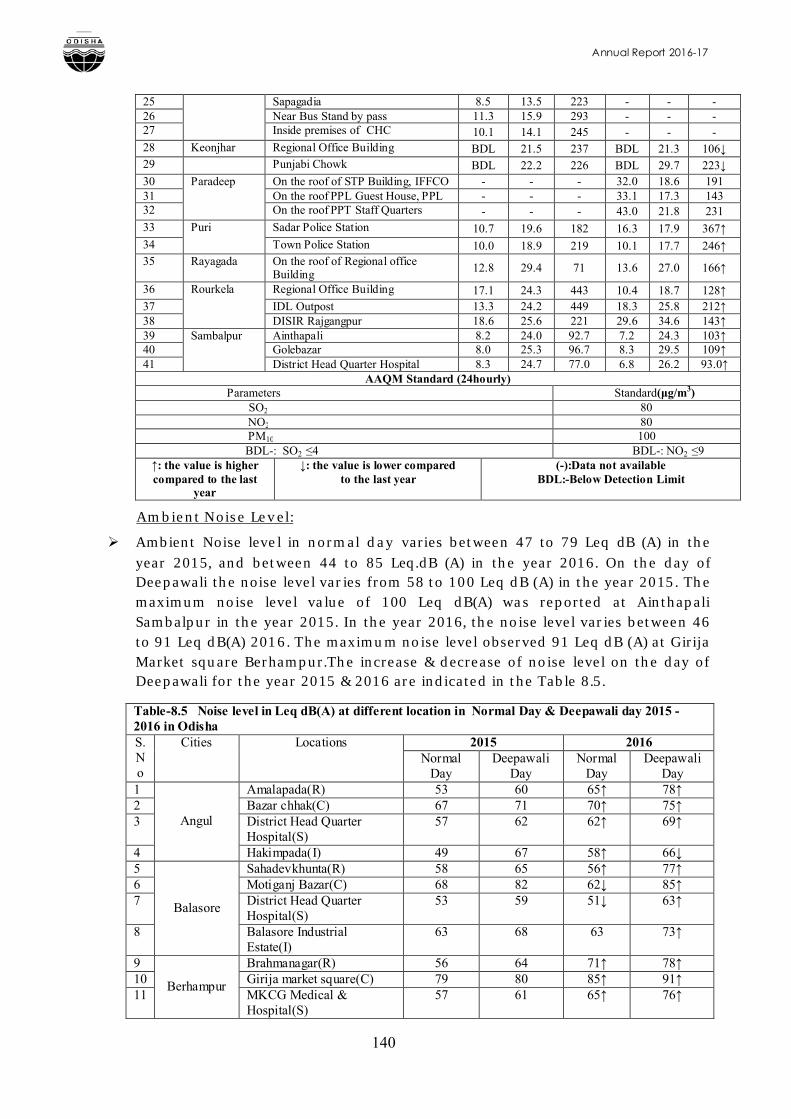
Annual Report 2016-17
140
25 Sapagadia 8.5 13.5 223 - - -26 Near Bus Stand by pass 11.3 15.9 293 - - -27 Inside premises of CHC 10.1 14.1 245 - - -28 Keonjhar Regional Office Building BDL 21.5 237 BDL 21.3 106↓29 Punjabi Chowk BDL 22.2 226 BDL 29.7 223↓30 Paradeep On the roof of STP Building, IFFCO - - - 32.0 18.6 19131 On the roof PPL Guest House, PPL - - - 33.1 17.3 14332 On the roof PPT Staff Quarters - - - 43.0 21.8 23133 Puri Sadar Police Station 10.7 19.6 182 16.3 17.9 367↑34 Town Police Station 10.0 18.9 219 10.1 17.7 246↑35 Rayagada On the roof of Regional office
Building12.8 29.4 71 13.6 27.0 166↑
36 Rourkela Regional Office Building 17.1 24.3 443 10.4 18.7 128↑37 IDL Outpost 13.3 24.2 449 18.3 25.8 212↑38 DISIR Rajgangpur 18.6 25.6 221 29.6 34.6 143↑39 Sambalpur Ainthapali 8.2 24.0 92.7 7.2 24.3 103↑40 Golebazar 8.0 25.3 96.7 8.3 29.5 109↑41 District Head Quarter Hospital 8.3 24.7 77.0 6.8 26.2 93.0↑
AAQM Standard (24hourly) Parameters Standard(μg/m3) SO2 80 NO2 80 PM10 100 BDL-: SO2 ≤4 BDL-: NO2 ≤9
↑: the value is higher compared to the last
year
↓: the value is lower comparedto the last year
(-):Data not availableBDL:-Below Detection Limit
Ambient Noise Level:
Ambient Noise level in normal day varies between 47 to 79 Leq dB (A) in the year 2015, and between 44 to 85 Leq.dB (A) in the year 2016. On the day of Deepawali the noise level varies from 58 to 100 Leq dB (A) in the year 2015. The maximum noise level value of 100 Leq dB(A) was reported at Ainthapali Sambalpur in the year 2015. In the year 2016, the noise level varies between 46 to 91 Leq dB(A) 2016. The maximum noise level observed 91 Leq dB (A) at Girija Market square Berhampur.The increase & decrease of noise level on the day of Deepawali for the year 2015 & 2016 are indicated in the Table 8.5.
Table-8.5 Noise level in Leq dB(A) at different location in Normal Day & Deepawali day 2015 -2016 in OdishaS.No
Cities Locations 2015 2016Normal
DayDeepawali
DayNormal
DayDeepawali
Day1
Angul
Amalapada(R) 53 60 65↑ 78↑2 Bazar chhak(C) 67 71 70↑ 75↑3 District Head Quarter
Hospital(S)57 62 62↑ 69↑
4 Hakimpada(I) 49 67 58↑ 66↓5
Balasore
Sahadevkhunta(R) 58 65 56↑ 77↑6 Motiganj Bazar(C) 68 82 62↓ 85↑7 District Head Quarter
Hospital(S)53 59 51↓ 63↑
8 Balasore Industrial Estate(I)
63 68 63 73↑
9
Berhampur
Brahmanagar(R) 56 64 71↑ 78↑10 Girija market square(C) 79 80 85↑ 91↑11 MKCG Medical &
Hospital(S)57 61 65↑ 76↑
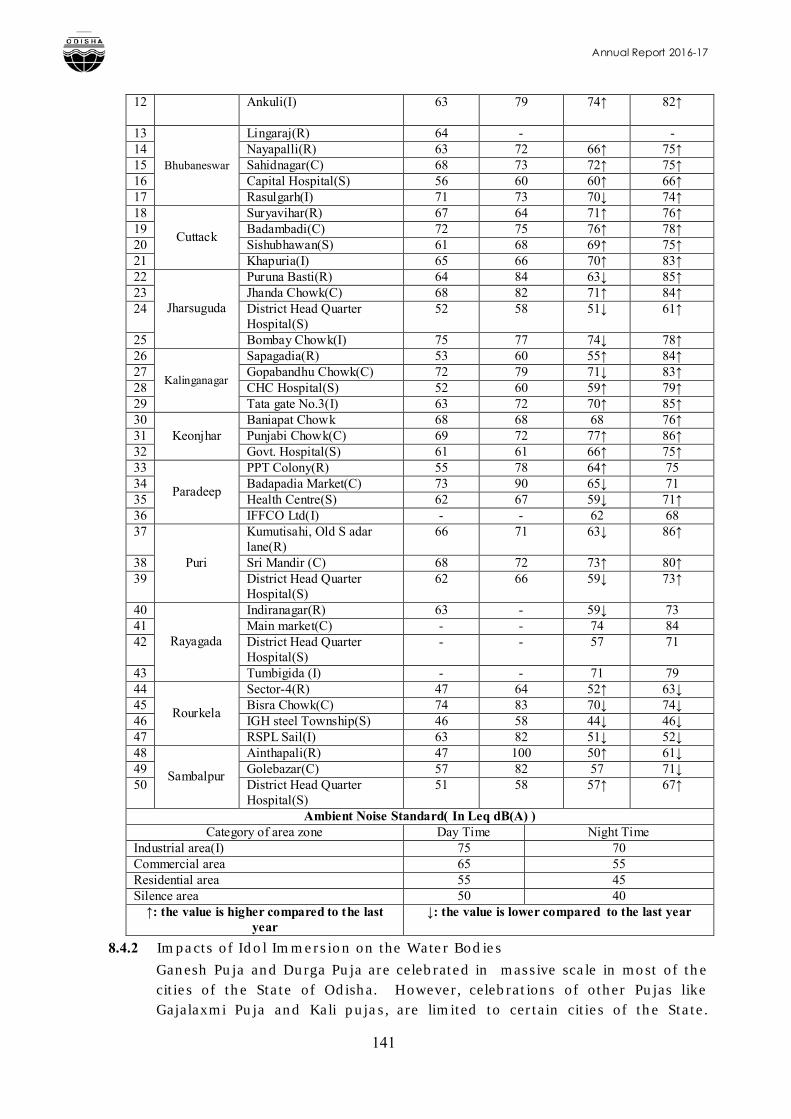
Annual Report 2016-17
141
12 Ankuli(I) 63 79 74↑ 82↑
13
Bhubaneswar
Lingaraj(R) 64 - -14 Nayapalli(R) 63 72 66↑ 75↑15 Sahidnagar(C) 68 73 72↑ 75↑16 Capital Hospital(S) 56 60 60↑ 66↑17 Rasulgarh(I) 71 73 70↓ 74↑18
Cuttack
Suryavihar(R) 67 64 71↑ 76↑19 Badambadi(C) 72 75 76↑ 78↑20 Sishubhawan(S) 61 68 69↑ 75↑21 Khapuria(I) 65 66 70↑ 83↑22
Jharsuguda
Puruna Basti(R) 64 84 63↓ 85↑23 Jhanda Chowk(C) 68 82 71↑ 84↑24 District Head Quarter
Hospital(S)52 58 51↓ 61↑
25 Bombay Chowk(I) 75 77 74↓ 78↑26
Kalinganagar
Sapagadia(R) 53 60 55↑ 84↑27 Gopabandhu Chowk(C) 72 79 71↓ 83↑28 CHC Hospital(S) 52 60 59↑ 79↑29 Tata gate No.3(I) 63 72 70↑ 85↑30
KeonjharBaniapat Chowk 68 68 68 76↑
31 Punjabi Chowk(C) 69 72 77↑ 86↑32 Govt. Hospital(S) 61 61 66↑ 75↑33
Paradeep
PPT Colony(R) 55 78 64↑ 7534 Badapadia Market(C) 73 90 65↓ 7135 Health Centre(S) 62 67 59↓ 71↑36 IFFCO Ltd(I) - - 62 6837
Puri
Kumutisahi, Old S adar lane(R)
66 71 63↓ 86↑
38 Sri Mandir (C) 68 72 73↑ 80↑39 District Head Quarter
Hospital(S)62 66 59↓ 73↑
40
Rayagada
Indiranagar(R) 63 - 59↓ 7341 Main market(C) - - 74 8442 District Head Quarter
Hospital(S)- - 57 71
43 Tumbigida (I) - - 71 7944
Rourkela
Sector-4(R) 47 64 52↑ 63↓45 Bisra Chowk(C) 74 83 70↓ 74↓46 IGH steel Township(S) 46 58 44↓ 46↓47 RSPL Sail(I) 63 82 51↓ 52↓48
Sambalpur
Ainthapali(R) 47 100 50↑ 61↓49 Golebazar(C) 57 82 57 71↓50 District Head Quarter
Hospital(S)51 58 57↑ 67↑
Ambient Noise Standard( In Leq dB(A) )Category of area zone Day Time Night Time
Industrial area(I) 75 70Commercial area 65 55Residential area 55 45Silence area 50 40
↑: the value is higher compared to the last year
↓: the value is lower compared to the last year
8.4.2 Impacts of Idol Immersion on the Water Bodies
Ganesh Puja and Durga Puja are celebrated in massive scale in most of the cities of the State of Odisha. However, celebrations of other Pujas like Gajalaxmi Puja and Kali pujas, are limited to certain cities of the State.
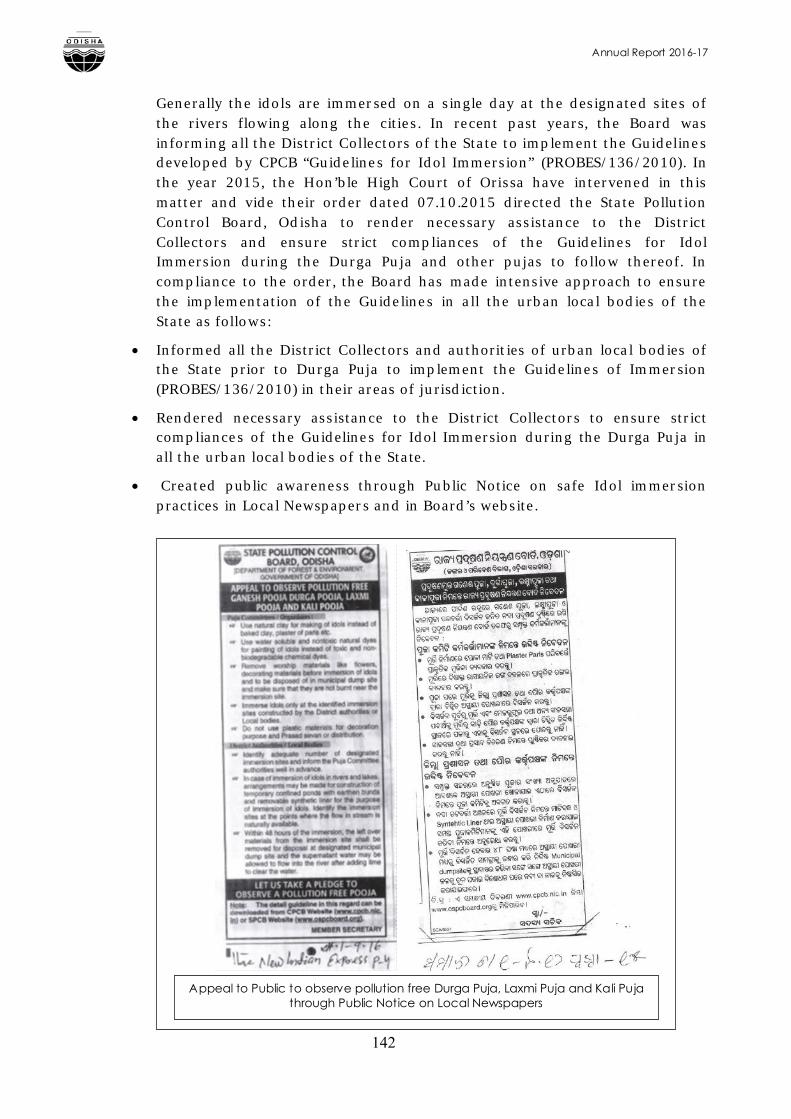
Annual Report 2016-17
142
Generally the idols are immersed on a single day at the designated sites of the rivers flowing along the cities. In recent past years, the Board was informing all the District Collectors of the State to implement the Guidelines developed by CPCB “Guidelines for Idol Immersion” (PROBES/136/2010). In the year 2015, the Hon’ble High Court of Orissa have intervened in this matter and vide their order dated 07.10.2015 directed the State Pollution Control Board, Odisha to render necessary assistance to the District Collectors and ensure strict compliances of the Guidelines for Idol Immersion during the Durga Puja and other pujas to follow thereof. In compliance to the order, the Board has made intensive approach to ensure the implementation of the Guidelines in all the urban local bodies of the State as follows:
Informed all the District Collectors and authorities of urban local bodies of the State prior to Durga Puja to implement the Guidelines of Immersion (PROBES/136/2010) in their areas of jurisdiction.
Rendered necessary assistance to the District Collectors to ensure strict compliances of the Guidelines for Idol Immersion during the Durga Puja in all the urban local bodies of the State.
Created public awareness through Public Notice on safe Idol immersion practices in Local Newspapers and in Board’s website.
Appeal to Public to observe pollution free Durga Puja, Laxmi Puja and Kali Puja through Public Notice on Local Newspapers
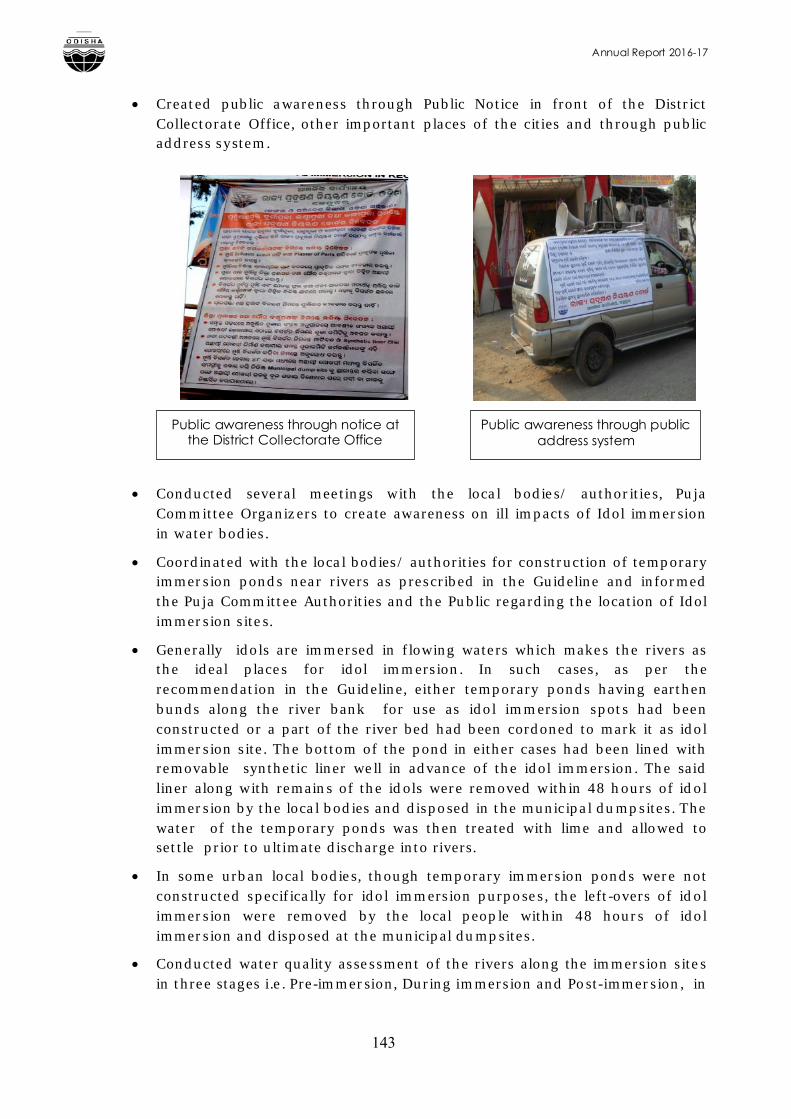
Annual Report 2016-17
143
Created public awareness through Public Notice in front of the District Collectorate Office, other important places of the cities and through public address system.
Conducted several meetings with the local bodies/ authorities, Puja Committee Organizers to create awareness on ill impacts of Idol immersion in water bodies.
Coordinated with the local bodies/ authorities for construction of temporary immersion ponds near rivers as prescribed in the Guideline and informed the Puja Committee Authorities and the Public regarding the location of Idol immersion sites.
Generally idols are immersed in flowing waters which makes the rivers as the ideal places for idol immersion. In such cases, as per the recommendation in the Guideline, either temporary ponds having earthen bunds along the river bank for use as idol immersion spots had been constructed or a part of the river bed had been cordoned to mark it as idol immersion site. The bottom of the pond in either cases had been lined with removable synthetic liner well in advance of the idol immersion. The said liner along with remains of the idols were removed within 48 hours of idol immersion by the local bodies and disposed in the municipal dumpsites. The water of the temporary ponds was then treated with lime and allowed to settle prior to ultimate discharge into rivers.
In some urban local bodies, though temporary immersion ponds were not constructed specifically for idol immersion purposes, the left-overs of idol immersion were removed by the local people within 48 hours of idol immersion and disposed at the municipal dumpsites.
Conducted water quality assessment of the rivers along the immersion sites in three stages i.e. Pre-immersion, During immersion and Post-immersion, in
Public awareness through notice at the District Collectorate Office
Public awareness through public address system
Annual Report 2016-17
144
Class-I cities (having population more than one lakh) viz., Bhubaneswar, Cuttack and Puri cities where the pujas are celebrated in massive scale.
Water quality status was assessed with respect to the physico-chemical parameters as recommended in the Guideline, such as, pH, Dissolved Oxygen (DO), Biochemical Oxygen Demand (BOD), Chemical Oxygen Demand (COD), Conductivity (EC), Turbidity, Total Dissolved Solids (TDS), Total Solids (TS), and metals (cadmium, chromium, iron, lead, zinc and copper.
Water quality status is evaluated by comparing with the tolerance limits for Class A (Drinking water source without conventional treatment but after disinfection) and Class C (Drinking water source with conventional treatment followed by disinfection) inland surface water quality. The variation in concentration of different parameters at the immersion sites are compared with the values at the upstream and downstream of immersion sites to assess the impact of idol immersion.
Observation from the Water Quality Data
During immersion period, parameters like turbidity and total solids increase at the immersion sites in comparison to the upstream and downstream stations which may be ascribed to the increase in suspended materials on the water body during immersion of idols.
Dumping of puja materials and left-overs into the water body disrupts the oxygen level of water body and therefore lowering of dissolved oxygen (DO) at the immersion site was observed. Simultaneous increase in BOD and COD values at the immersion site on the day of idol immersion were also observed. As after 48 hours actions had been taken to remove the puja left-overs from the river body, BOD and COD values has been significantly reduced at the immersion sites during the post immersion period. Further, continuous high flow of water in the river rejuvenates itself the upstream water quality.
During immersion period, increase in the conductivity and total dissolved solid at the immersion site in comparison to the upstream and downstream stations may be ascribed to the leaching of dissolved materials form the puja materials and idols immersed in the water body.
Variation in concentrations of heavy metals such as cadmium, lead, copper and hexavalent chromium during the period of study was not significant.
However, significant increase in water quality parameters like DO, BOD, COD, EC, TDS and TS in the temporary idol immersion ponds were observed in comparison to its upstream station in during–immersion period. As the left-overs of the idol immersion were removed from the idol immersion ponds in subsequent days of idol immersion, the values of DO, BOD, COD, EC, TDS and TS parameters has been decreased significantly in post-immersion monitoring period.
Annual Report 2016-17
145
In the temporary idol immersion ponds, the concentration of heavy metals such as cadmium, chromium, iron, lead, zinc and copper in both during-immersion and post-immersion period remain much below the tolerance limit for most beneficial uses of water. This may be correlated to the very slow leaching process of heavy metals from the synthetic paints and other materials used in the idols in natural conditions of water bodies.
Further, because of the preventive measures taken by the district administration not to allow the water of idol immersion ponds to flow into the river, water quality of downstream stations during-immersion and Post-immersion periods remained well within the tolerance limits of the designated use.
From the study, it may be concluded that all the parameters specified for the study remained within the tolerance limit for designated class of the river i.e. Class-C (Drinking water source with conventional treatment followed by disinfection) even after immersion of idols. Concentration of heavy metals such as cadmium, chromium, iron, lead, zinc and copper remain much below the tolerance limits and no significant impact is exerted on the heavy metal concentration of the water bodies due to immersion of idols. Such observation may be ascribed to the heavy flow in river during that period. Though some of the physical and chemical parameters like Turbidity, electrical conductivity, TDS and BOD show higher values during-immersion period in comparison to the pre-and post-immersion period, but still remained much below the tolerance limit. Further, immersion of idols in the temporary immersion ponds has minimized the probability of contamination of the main course of river water.
8.4.3 Impacts of Mass Bathing during Kartika Purnima on the Water Quality of Mahanadi and Kathajodi River (Cuttack Stretch)
The Kartika Purnima is a holy festival of Odisha which is observed by mass bathing/ lighting Dwipa with prayers in rivers. To assess the impact of mass bathing during Kartika Purnima on water quality of river Mahanadi and Kathajodi along the Cuttack city, State Pollution Control Board, Odisha had conducted a water quality monitoring at the major bathing ghats on Pre-, Post- & During- the day of Kartika Purnima, 2016. Water quality was assessed with respect to the physico-chemical parameters like pH, Dissolved oxygen (DO), Biochemical oxygen demand (BOD), chemical oxygen demand (COD), total suspended solids (TSS) and bacteriological parameters e.g. total coliform (TC) and fecal coliform (FC). The water quality analysis reveals that there is no significant impact on the physico-chemical parameters due to mass bathing. However, there is significant impact on the bacteriological quality. Water quality with respect to total coliform and fecal coliform at the major bathing ghats of Mahanadi river and Kathajodi rivers on Pre (Dt.07.11.2016), on the day of Kartika Purnima (Dt. 15.11.2016) & Post (Dt.24.11.2016), are given in Table- 8.6.
Annual Report 2016-17
146
Table-8.6 Bacteriological water quality of bathing ghats of Mahanadi river and Kathajodi rivers on Pre-, During- and Post-Kartika Purnima Sampling location TC (MPN/100 ml) FC (MPN/100 ml)
Pre During Post Pre During PostDt. 07.11.16 Dt. 15.11.16 Dt.24.11.16 Dt. 07.11.16 Dt. 15.11.16 Dt. 24.11.16
(a) Mahanadi RiverNaraj 3500 4900 230 2400 3300 78Chahata ghat >160000 >160000 11000 >160000 >160000 4900Gadgadia ghat 92000 >160000 13000 54000 >160000 7900Jobra 11000 35000 35000 4900 24000 24000Kanheipur 9200 14000 11000 700 7000 4900(a) Kathajodi RiverPuri ghatKhan nagar 24000 54000 4900 7900 54000 4900Urali 2400 3500 2200 1300 1300 1100Tolerance limit for Class B (IS-2296-1982) / E (P) Rule, 1986 *
500 2500* (Permissible)
* MoEF Notification G.S.R. No. 742(E) Dt. 25th September, 2000
From the above Table, it is observed that the coliform bacteria are much above the prescribed limit for bathing water.
8.5 OTHER ONGOING PROJECTS8.5.1 Survey and monitoring of ground and surface water quality with respect
to Fluoride content around Phosphatic Fertilizer units, Paradeep
The Board has conducted a survey on ground water and surface water quality around phosphatic fertilizer plants of Paradeep e.g. M/s Indian Farmers Fertiliser Corporation (IFFCO) and M/s Paradeep Phosphates Ltd. (PPL). During 2016, surface water samples were collected from Atharabanki creek from different locations around these two fertilizer plants. Ground water samples were collected from the test wells of both the plants and from two locations outside the plant. The fluoride concentration in Atharabanki creek at the upstream of the fertilizer plants varies within 0.5-2.0 mg/l. As the flow of Atharabanki creek depends upon the tidal condition of the sea, it is not unidirectional, and therefore, wide fluctuation in fluoride content is observed in Atharabanki creek water. The fluoride concentration in Atharabanki creek varies within 0.5- 6.6 mg/l. In creek water at Bhimbhoi colony it varies within 2.8-4.6 mg/l, near entrance gate to Paradeep Port Township varies within 3.4-6.6 mg/l, near conveyor belt of IFFCO varies within 3.0-5.8 mg/l. However, the Fluoride concentration in the creek water near fishing jetty varies within 0.82-2.4 mg/l. The test wells around M/s IFFCO exhibit fluoride concentration within 0.2-1.7 mg/l, whereas, those around M/s PPL exhibit fluoride concentration 0.34-2.4 mg/l. Fluoride content in ground water samples collected from outside of the plant area i.e. at Badapadia, varies within 1.2-2.3 mg/l, whereas in Musadiha, the fluoride concentration varies within 0.55-1.6 mg/l.
8.5.2 Studies related to Pollution Control and Planning The Board has engaged M/s. National Environmental Engineering and Research Institute (NEERI), Nagpur for the “Preparation of Regional Environmental Management Plan based on Carrying Capacity Study for
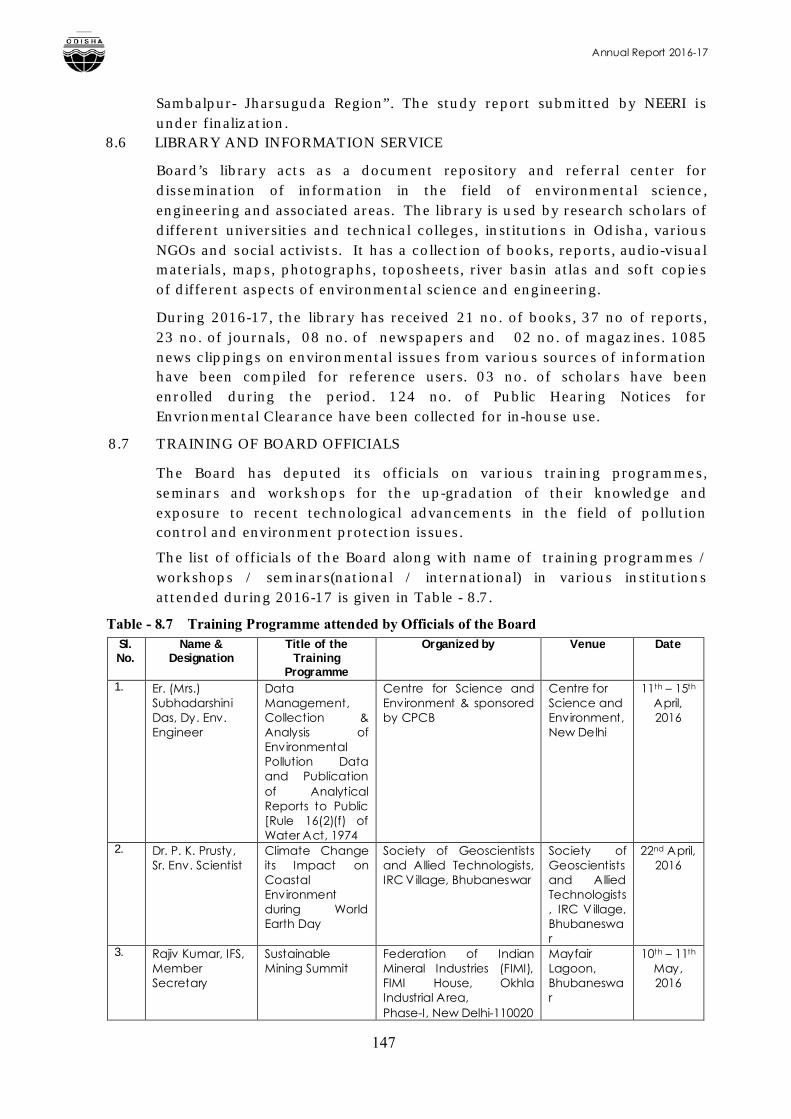
Annual Report 2016-17
147
Sambalpur- Jharsuguda Region”. The study report submitted by NEERI is under finalization.
8.6 LIBRARY AND INFORMATION SERVICE
Board’s library acts as a document repository and referral center for dissemination of information in the field of environmental science,engineering and associated areas. The library is used by research scholars of different universities and technical colleges, institutions in Odisha, various NGOs and social activists. It has a collection of books, reports, audio-visual materials, maps, photographs, toposheets, river basin atlas and soft copies of different aspects of environmental science and engineering.
During 2016-17, the library has received 21 no. of books, 37 no of reports, 23 no. of journals, 08 no. of newspapers and 02 no. of magazines. 1085 news clippings on environmental issues from various sources of information have been compiled for reference users. 03 no. of scholars have been enrolled during the period. 124 no. of Public Hearing Notices for Envrionmental Clearance have been collected for in-house use.
8.7 TRAINING OF BOARD OFFICIALS
The Board has deputed its officials on various training programmes, seminars and workshops for the up-gradation of their knowledge and exposure to recent technological advancements in the field of pollution control and environment protection issues.
The list of officials of the Board along with name of training programmes / workshops / seminars(national / international) in various institutions attended during 2016-17 is given in Table - 8.7.
Table - 8.7 Training Programme attended by Officials of the Board Sl. No.
Name & Designation
Title of the Training
Programme
Organized by Venue Date
1. Er. (Mrs.) Subhadarshini Das, Dy. Env. Engineer
Data Management, Collection &Analysis of Environmental Pollution Data and Publication of Analytical Reports to Public [Rule 16(2)(f) of Water Act, 1974
Centre for Science and Environment & sponsored by CPCB
Centre for Science and Environment, New Delhi
11th – 15th
April, 2016
2. Dr. P. K. Prusty, Sr. Env. Scientist
Climate Change its Impact on Coastal Environment during World Earth Day
Society of Geoscientists and Allied Technologists, IRC V illage, Bhubaneswar
Society of Geoscientists and Allied Technologists, IRC V illage, Bhubaneswar
22nd April, 2016
3. Rajiv Kumar, IFS, Member Secretary
Sustainable Mining Summit
Federation of Indian Mineral Industries (FIMI), FIMI House, Okhla Industrial Area,Phase-I, New Delhi-110020
Mayfair Lagoon, Bhubaneswar
10th – 11th
May, 2016
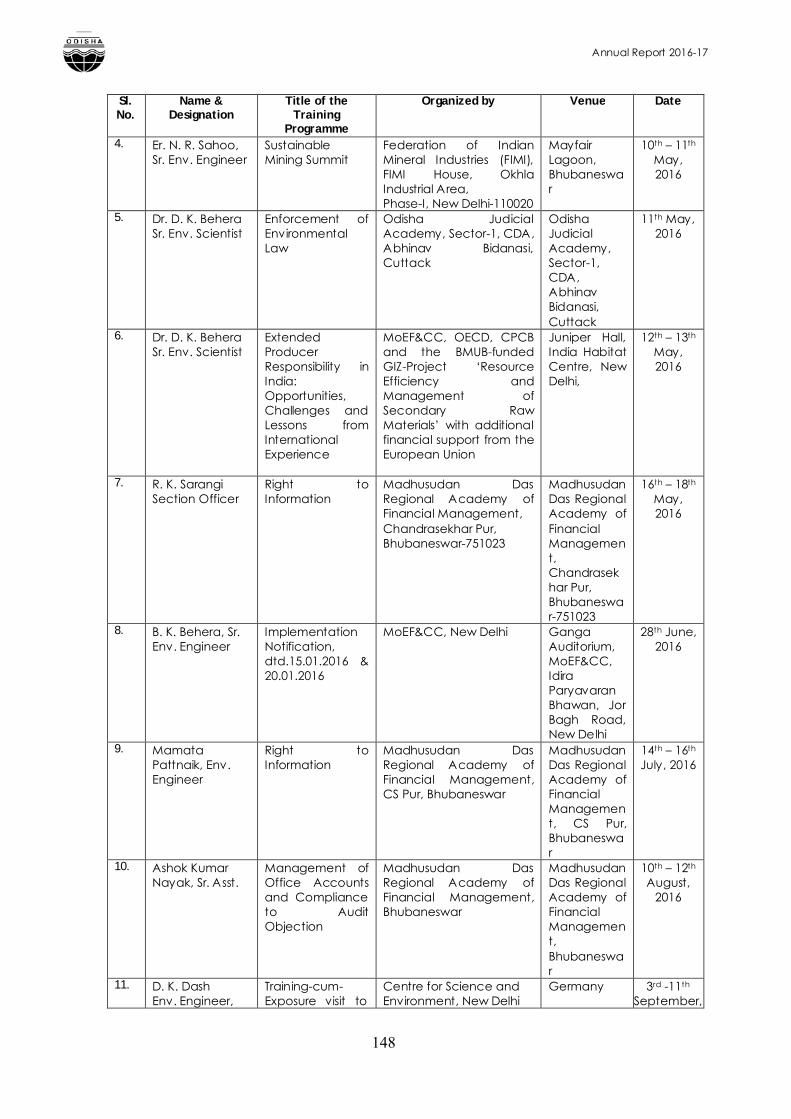
Annual Report 2016-17
148
Sl. No.
Name & Designation
Title of the Training
Programme
Organized by Venue Date
4. Er. N. R. Sahoo, Sr. Env. Engineer
Sustainable Mining Summit
Federation of Indian Mineral Industries (FIMI), FIMI House, Okhla Industrial Area,Phase-I, New Delhi-110020
Mayfair Lagoon, Bhubaneswar
10th – 11th
May, 2016
5. Dr. D. K. BeheraSr. Env. Scientist
Enforcement of Environmental Law
Odisha Judicial Academy, Sector-1, CDA, Abhinav Bidanasi, Cuttack
Odisha Judicial Academy, Sector-1, CDA, Abhinav Bidanasi, Cuttack
11th May, 2016
6. Dr. D. K. BeheraSr. Env. Scientist
Extended Producer Responsibility in India: Opportunities, Challenges and Lessons from International Experience
MoEF&CC, OECD, CPCB and the BMUB-funded GIZ-Project ‘Resource Efficiency and Management of Secondary Raw Materials’ with additional financial support from the European Union
Juniper Hall, India Habitat Centre, New Delhi,
12th – 13th
May, 2016
7. R. K. SarangiSection Officer
Right to Information
Madhusudan Das Regional Academy of Financial Management,Chandrasekhar Pur,Bhubaneswar-751023
Madhusudan Das Regional Academy of Financial Management,Chandrasekhar Pur,Bhubaneswar-751023
16th – 18th
May, 2016
8. B. K. Behera, Sr. Env. Engineer
Implementation Notification, dtd.15.01.2016 & 20.01.2016
MoEF&CC, New Delhi Ganga Auditorium, MoEF&CC, Idira Paryavaran Bhawan, Jor Bagh Road, New Delhi
28th June, 2016
9. Mamata Pattnaik, Env. Engineer
Right to Information
Madhusudan Das Regional Academy of Financial Management, CS Pur, Bhubaneswar
Madhusudan Das Regional Academy of Financial Management, CS Pur, Bhubaneswar
14th – 16th
July, 2016
10. Ashok Kumar Nayak, Sr. Asst.
Management of Office Accounts and Compliance to Audit Objection
Madhusudan Das Regional Academy of Financial Management, Bhubaneswar
Madhusudan Das Regional Academy of Financial Management, Bhubaneswar
10th – 12th
August, 2016
11. D. K. DashEnv. Engineer,
Training-cum-Exposure visit to
Centre for Science and Environment, New Delhi
Germany 3rd -11th
September,
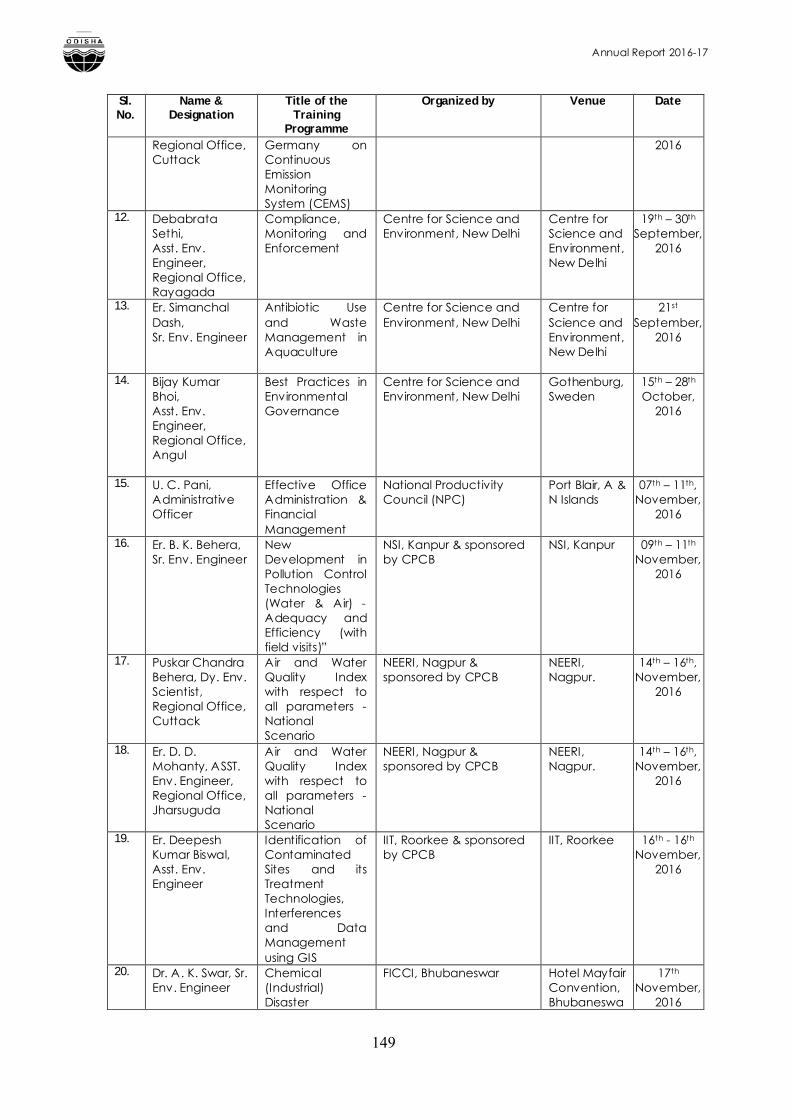
Annual Report 2016-17
149
Sl. No.
Name & Designation
Title of the Training
Programme
Organized by Venue Date
Regional Office, Cuttack
Germany on Continuous Emission Monitoring System (CEMS)
2016
12. Debabrata Sethi, Asst. Env. Engineer, Regional Office, Rayagada
Compliance, Monitoring and Enforcement
Centre for Science and Environment, New Delhi
Centre for Science and Environment, New Delhi
19th – 30th
September, 2016
13. Er. Simanchal Dash,Sr. Env. Engineer
Antibiotic Use and Waste Management in Aquaculture
Centre for Science and Environment, New Delhi
Centre for Science and Environment, New Delhi
21st
September, 2016
14. Bijay Kumar Bhoi, Asst. Env. Engineer, Regional Office, Angul
Best Practices in Environmental Governance
Centre for Science and Environment, New Delhi
Gothenburg, Sweden
15th – 28th
October, 2016
15. U. C. Pani, Administrative Officer
Effective Office Administration & Financial Management
National Productivity Council (NPC)
Port Blair, A & N Islands
07th – 11th, November,
2016
16. Er. B. K. Behera, Sr. Env. Engineer
New Development in Pollution Control Technologies (Water & Air) -Adequacy and Efficiency (with field visits)”
NSI, Kanpur & sponsored by CPCB
NSI, Kanpur 09th – 11th November,
2016
17. Puskar Chandra Behera, Dy. Env. Scientist, Regional Office, Cuttack
Air and Water Quality Index with respect to all parameters -National Scenario
NEERI, Nagpur & sponsored by CPCB
NEERI, Nagpur.
14th – 16th, November,
2016
18. Er. D. D. Mohanty, ASST. Env. Engineer, Regional Office, Jharsuguda
Air and Water Quality Index with respect to all parameters -National Scenario
NEERI, Nagpur & sponsored by CPCB
NEERI, Nagpur.
14th – 16th, November,
2016
19. Er. Deepesh Kumar Biswal, Asst. Env. Engineer
Identification of Contaminated Sites and its Treatment Technologies, Interferences and Data Management using GIS
IIT, Roorkee & sponsored by CPCB
IIT, Roorkee 16th - 16th
November, 2016
20. Dr. A. K. Swar, Sr. Env. Engineer
Chemical (Industrial) Disaster
FICCI, Bhubaneswar Hotel Mayfair Convention, Bhubaneswa
17th
November, 2016
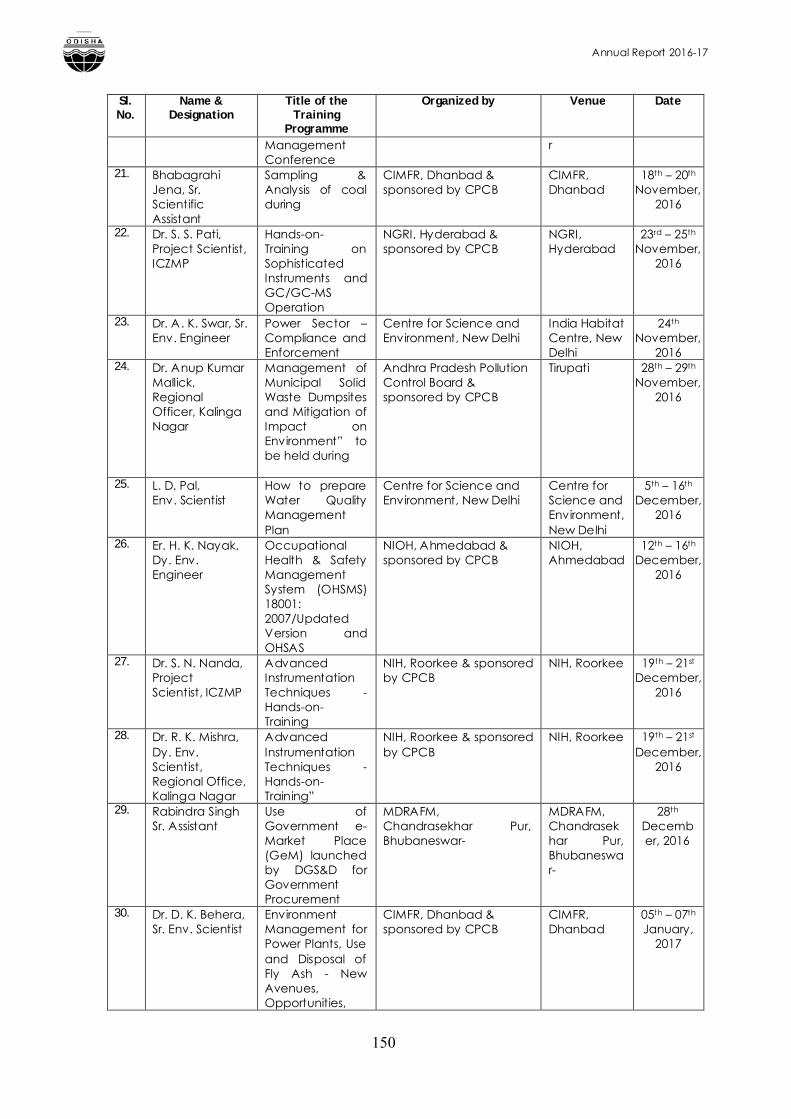
Annual Report 2016-17
150
Sl. No.
Name & Designation
Title of the Training
Programme
Organized by Venue Date
Management Conference
r
21. Bhabagrahi Jena, Sr. Scientific Assistant
Sampling & Analysis of coal during
CIMFR, Dhanbad & sponsored by CPCB
CIMFR, Dhanbad
18th – 20th November,
2016
22. Dr. S. S. Pati, Project Scientist, ICZMP
Hands-on-Training on Sophisticated Instruments and GC/GC-MS Operation
NGRI, Hyderabad & sponsored by CPCB
NGRI, Hyderabad
23rd – 25th November,
2016
23. Dr. A. K. Swar, Sr. Env. Engineer
Power Sector –Compliance and Enforcement
Centre for Science and Environment, New Delhi
India Habitat Centre, New Delhi
24th
November, 2016
24. Dr. Anup Kumar Mallick, Regional Officer, Kalinga Nagar
Management of Municipal Solid Waste Dumpsites and Mitigation of Impact on Environment” to be held during
Andhra Pradesh Pollution Control Board & sponsored by CPCB
Tirupati 28th – 29th November,
2016
25. L. D. Pal, Env. Scientist
How to prepare Water Quality Management Plan
Centre for Science and Environment, New Delhi
Centre for Science and Environment, New Delhi
5th – 16th
December, 2016
26. Er. H. K. Nayak, Dy. Env. Engineer
Occupational Health & Safety Management System (OHSMS) 18001: 2007/Updated Version and OHSAS
NIOH, Ahmedabad & sponsored by CPCB
NIOH, Ahmedabad
12th – 16th December,
2016
27. Dr. S. N. Nanda, Project Scientist, ICZMP
Advanced Instrumentation Techniques -Hands-on-Training
NIH, Roorkee & sponsored by CPCB
NIH, Roorkee 19th – 21st December,
2016
28. Dr. R. K. Mishra, Dy. Env. Scientist, Regional Office, Kalinga Nagar
Advanced Instrumentation Techniques -Hands-on-Training”
NIH, Roorkee & sponsored by CPCB
NIH, Roorkee 19th – 21st December,
2016
29. Rabindra SinghSr. Assistant
Use of Government e-Market Place (GeM) launched by DGS&D for Government Procurement
MDRAFM, Chandrasekhar Pur, Bhubaneswar-
MDRAFM, Chandrasekhar Pur, Bhubaneswar-
28th December, 2016
30. Dr. D. K. Behera, Sr. Env. Scientist
Environment Management for Power Plants, Use and Disposal of Fly Ash - New Avenues, Opportunities,
CIMFR, Dhanbad & sponsored by CPCB
CIMFR, Dhanbad
05th – 07th January,
2017
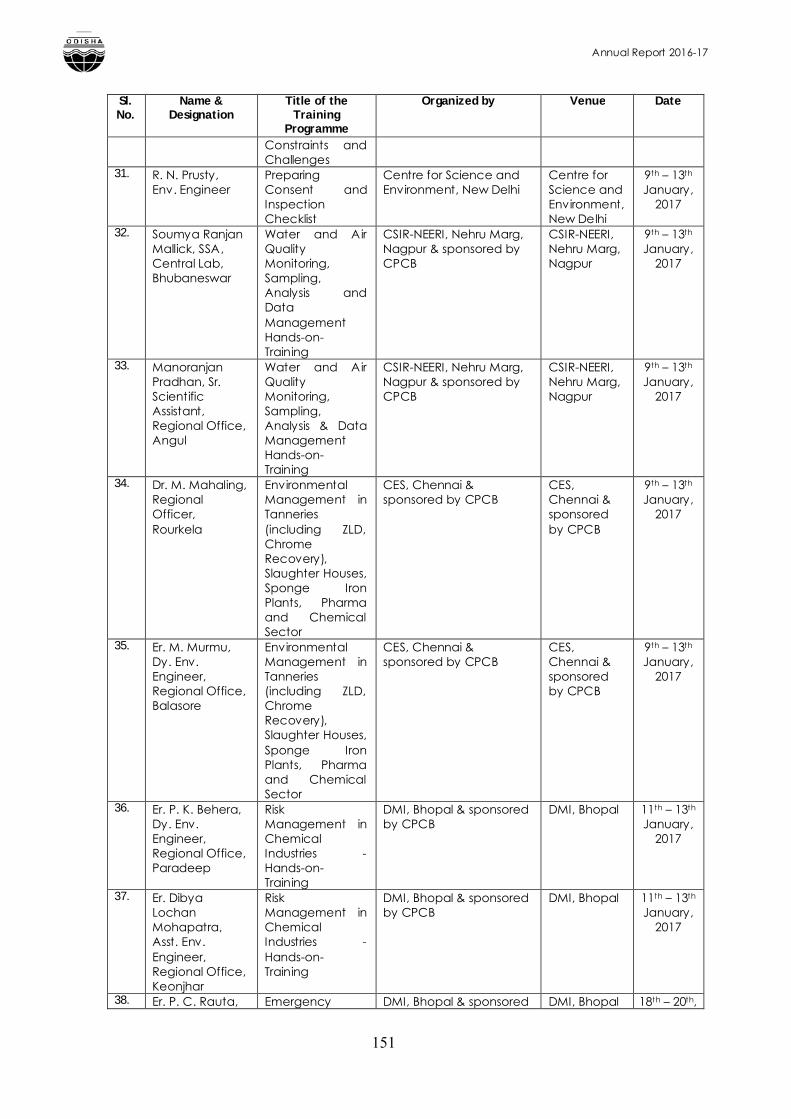
Annual Report 2016-17
151
Sl. No.
Name & Designation
Title of the Training
Programme
Organized by Venue Date
Constraints and Challenges
31. R. N. Prusty,Env. Engineer
Preparing Consent and Inspection Checklist
Centre for Science and Environment, New Delhi
Centre for Science and Environment, New Delhi
9th – 13th
January, 2017
32. Soumya Ranjan Mallick, SSA, Central Lab, Bhubaneswar
Water and Air Quality Monitoring, Sampling, Analysis and Data Management Hands-on-Training
CSIR-NEERI, Nehru Marg, Nagpur & sponsored by CPCB
CSIR-NEERI, Nehru Marg, Nagpur
9th – 13th January,
2017
33. Manoranjan Pradhan, Sr. Scientific Assistant, Regional Office, Angul
Water and Air Quality Monitoring, Sampling, Analysis & Data Management Hands-on-Training
CSIR-NEERI, Nehru Marg, Nagpur & sponsored by CPCB
CSIR-NEERI, Nehru Marg, Nagpur
9th – 13th January,
2017
34. Dr. M. Mahaling, Regional Officer, Rourkela
Environmental Management in Tanneries (including ZLD, Chrome Recovery), Slaughter Houses, Sponge Iron Plants, Pharma and Chemical Sector
CES, Chennai & sponsored by CPCB
CES, Chennai & sponsored by CPCB
9th – 13th January,
2017
35. Er. M. Murmu, Dy. Env. Engineer, Regional Office, Balasore
Environmental Management in Tanneries (including ZLD, Chrome Recovery), Slaughter Houses, Sponge Iron Plants, Pharma and Chemical Sector
CES, Chennai & sponsored by CPCB
CES, Chennai & sponsored by CPCB
9th – 13th January,
2017
36. Er. P. K. Behera, Dy. Env. Engineer, Regional Office, Paradeep
Risk Management in Chemical Industries -Hands-on-Training
DMI, Bhopal & sponsored by CPCB
DMI, Bhopal 11th – 13th January,
2017
37. Er. Dibya Lochan Mohapatra, Asst. Env. Engineer, Regional Office, Keonjhar
Risk Management in Chemical Industries -Hands-on-Training
DMI, Bhopal & sponsored by CPCB
DMI, Bhopal 11th – 13th January,
2017
38. Er. P. C. Rauta, Emergency DMI, Bhopal & sponsored DMI, Bhopal 18th – 20th,
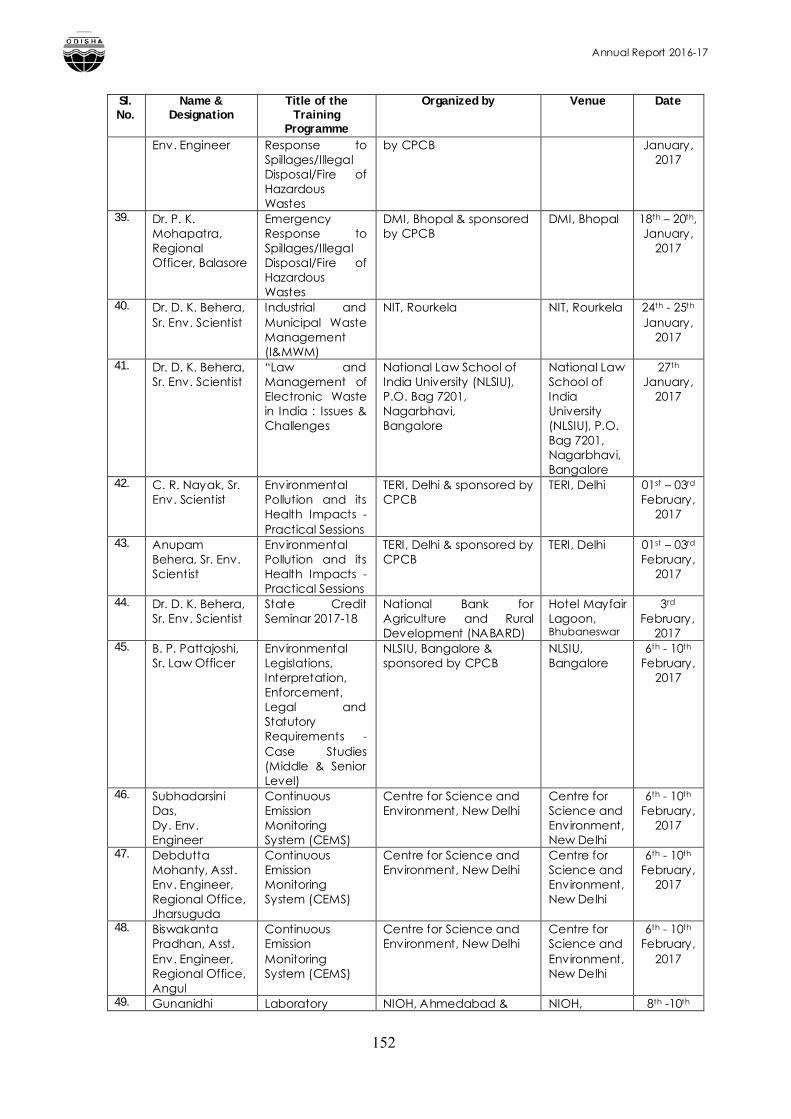
Annual Report 2016-17
152
Sl. No.
Name & Designation
Title of the Training
Programme
Organized by Venue Date
Env. Engineer Response to Spillages/Illegal Disposal/Fire of Hazardous Wastes
by CPCB January, 2017
39. Dr. P. K. Mohapatra, Regional Officer, Balasore
Emergency Response to Spillages/Illegal Disposal/Fire of Hazardous Wastes
DMI, Bhopal & sponsored by CPCB
DMI, Bhopal 18th – 20th, January,
2017
40. Dr. D. K. Behera, Sr. Env. Scientist
Industrial and Municipal Waste Management (I&MWM)
NIT, Rourkela NIT, Rourkela 24th - 25th
January, 2017
41. Dr. D. K. Behera, Sr. Env. Scientist
“Law and Management of Electronic Waste in India : Issues & Challenges
National Law School of India University (NLSIU), P.O. Bag 7201, Nagarbhavi,Bangalore
National Law School of India University (NLSIU), P.O. Bag 7201, Nagarbhavi,Bangalore
27th
January, 2017
42. C. R. Nayak, Sr. Env. Scientist
Environmental Pollution and its Health Impacts -Practical Sessions
TERI, Delhi & sponsored by CPCB
TERI, Delhi 01st – 03rd February,
2017
43. Anupam Behera, Sr. Env. Scientist
Environmental Pollution and its Health Impacts -Practical Sessions
TERI, Delhi & sponsored by CPCB
TERI, Delhi 01st – 03rd February,
2017
44. Dr. D. K. Behera, Sr. Env. Scientist
State Credit Seminar 2017-18
National Bank for Agriculture and Rural Development (NABARD)
Hotel Mayfair Lagoon, Bhubaneswar
3rd February,
201745. B. P. Pattajoshi,
Sr. Law OfficerEnvironmental Legislations, Interpretation, Enforcement, Legal and Statutory Requirements -Case Studies (Middle & Senior Level)
NLSIU, Bangalore & sponsored by CPCB
NLSIU, Bangalore
6th - 10th
February, 2017
46. Subhadarsini Das,Dy. Env. Engineer
Continuous Emission Monitoring System (CEMS)
Centre for Science and Environment, New Delhi
Centre for Science and Environment, New Delhi
6th - 10th
February, 2017
47. Debdutta Mohanty, Asst. Env. Engineer, Regional Office, Jharsuguda
Continuous Emission Monitoring System (CEMS)
Centre for Science and Environment, New Delhi
Centre for Science and Environment, New Delhi
6th - 10th
February, 2017
48. Biswakanta Pradhan, Asst. Env. Engineer, Regional Office, Angul
Continuous Emission Monitoring System (CEMS)
Centre for Science and Environment, New Delhi
Centre for Science and Environment, New Delhi
6th - 10th
February, 2017
49. Gunanidhi Laboratory NIOH, Ahmedabad & NIOH, 8th -10th
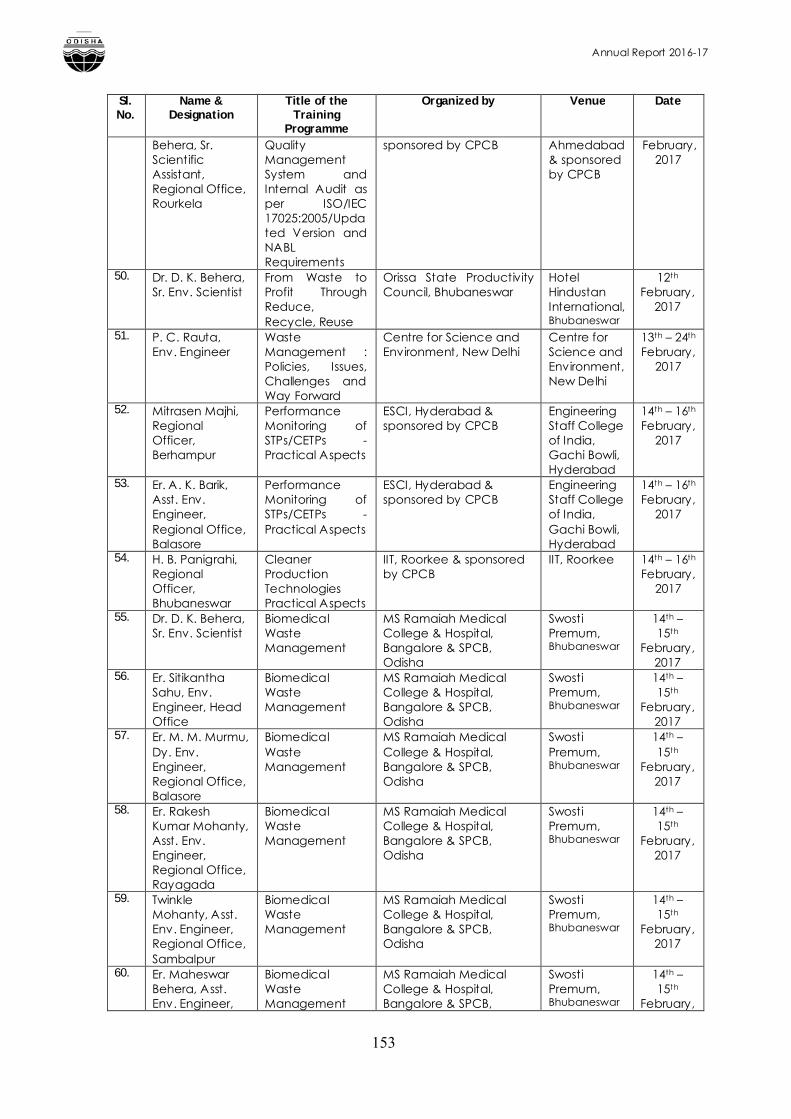
Annual Report 2016-17
153
Sl. No.
Name & Designation
Title of the Training
Programme
Organized by Venue Date
Behera, Sr. Scientific Assistant, Regional Office, Rourkela
Quality Management System and Internal Audit as per ISO/IEC 17025:2005/Updated Version and NABL Requirements
sponsored by CPCB Ahmedabad & sponsored by CPCB
February, 2017
50. Dr. D. K. Behera, Sr. Env. Scientist
From Waste to Profit Through Reduce, Recycle, Reuse
Orissa State Productivity Council, Bhubaneswar
Hotel Hindustan International,Bhubaneswar
12th
February, 2017
51. P. C. Rauta,Env. Engineer
Waste Management : Policies, Issues, Challenges and Way Forward
Centre for Science and Environment, New Delhi
Centre for Science and Environment, New Delhi
13th – 24th
February, 2017
52. Mitrasen Majhi, Regional Officer, Berhampur
Performance Monitoring of STPs/CETPs -Practical Aspects
ESCI, Hyderabad & sponsored by CPCB
Engineering Staff College of India, Gachi Bowli, Hyderabad
14th – 16th
February, 2017
53. Er. A. K. Barik, Asst. Env. Engineer, Regional Office, Balasore
Performance Monitoring of STPs/CETPs -Practical Aspects
ESCI, Hyderabad & sponsored by CPCB
Engineering Staff College of India, Gachi Bowli, Hyderabad
14th – 16th
February, 2017
54. H. B. Panigrahi, Regional Officer, Bhubaneswar
Cleaner Production Technologies Practical Aspects
IIT, Roorkee & sponsored by CPCB
IIT, Roorkee 14th – 16th
February, 2017
55. Dr. D. K. Behera, Sr. Env. Scientist
Biomedical Waste Management
MS Ramaiah Medical College & Hospital, Bangalore & SPCB, Odisha
Swosti Premum, Bhubaneswar
14th –15th
February, 2017
56. Er. Sitikantha Sahu, Env. Engineer, Head Office
Biomedical Waste Management
MS Ramaiah Medical College & Hospital, Bangalore & SPCB, Odisha
Swosti Premum, Bhubaneswar
14th –15th
February, 2017
57. Er. M. M. Murmu, Dy. Env. Engineer, Regional Office, Balasore
Biomedical Waste Management
MS Ramaiah Medical College & Hospital, Bangalore & SPCB, Odisha
Swosti Premum, Bhubaneswar
14th –15th
February, 2017
58. Er. Rakesh Kumar Mohanty, Asst. Env. Engineer, Regional Office, Rayagada
Biomedical Waste Management
MS Ramaiah Medical College & Hospital, Bangalore & SPCB, Odisha
Swosti Premum, Bhubaneswar
14th –15th
February, 2017
59. Twinkle Mohanty, Asst. Env. Engineer, Regional Office, Sambalpur
Biomedical Waste Management
MS Ramaiah Medical College & Hospital, Bangalore & SPCB, Odisha
Swosti Premum, Bhubaneswar
14th –15th
February, 2017
60. Er. Maheswar Behera, Asst. Env. Engineer,
Biomedical Waste Management
MS Ramaiah Medical College & Hospital, Bangalore & SPCB,
Swosti Premum, Bhubaneswar
14th –15th
February,
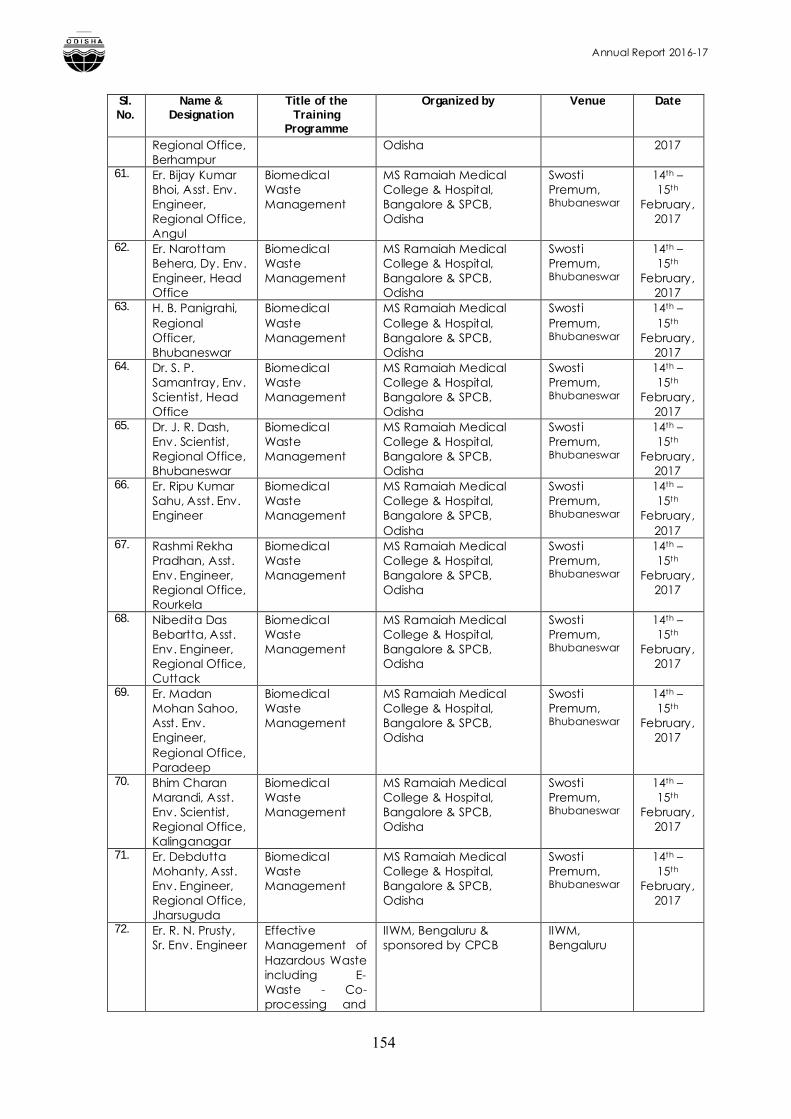
Annual Report 2016-17
154
Sl. No.
Name & Designation
Title of the Training
Programme
Organized by Venue Date
Regional Office, Berhampur
Odisha 2017
61. Er. Bijay Kumar Bhoi, Asst. Env. Engineer, Regional Office, Angul
Biomedical Waste Management
MS Ramaiah Medical College & Hospital, Bangalore & SPCB, Odisha
Swosti Premum, Bhubaneswar
14th –15th
February, 2017
62. Er. Narottam Behera, Dy. Env. Engineer, Head Office
Biomedical Waste Management
MS Ramaiah Medical College & Hospital, Bangalore & SPCB, Odisha
Swosti Premum, Bhubaneswar
14th –15th
February, 2017
63. H. B. Panigrahi, Regional Officer, Bhubaneswar
Biomedical Waste Management
MS Ramaiah Medical College & Hospital, Bangalore & SPCB, Odisha
Swosti Premum, Bhubaneswar
14th –15th
February, 2017
64. Dr. S. P. Samantray, Env. Scientist, Head Office
Biomedical Waste Management
MS Ramaiah Medical College & Hospital, Bangalore & SPCB, Odisha
Swosti Premum, Bhubaneswar
14th –15th
February, 2017
65. Dr. J. R. Dash, Env. Scientist, Regional Office, Bhubaneswar
Biomedical Waste Management
MS Ramaiah Medical College & Hospital, Bangalore & SPCB, Odisha
Swosti Premum, Bhubaneswar
14th –15th
February, 2017
66. Er. Ripu Kumar Sahu, Asst. Env. Engineer
Biomedical Waste Management
MS Ramaiah Medical College & Hospital, Bangalore & SPCB, Odisha
Swosti Premum, Bhubaneswar
14th –15th
February, 2017
67. Rashmi Rekha Pradhan, Asst. Env. Engineer, Regional Office, Rourkela
Biomedical Waste Management
MS Ramaiah Medical College & Hospital, Bangalore & SPCB, Odisha
Swosti Premum, Bhubaneswar
14th –15th
February, 2017
68. Nibedita Das Bebartta, Asst. Env. Engineer, Regional Office, Cuttack
Biomedical Waste Management
MS Ramaiah Medical College & Hospital, Bangalore & SPCB, Odisha
Swosti Premum, Bhubaneswar
14th –15th
February, 2017
69. Er. Madan Mohan Sahoo, Asst. Env. Engineer, Regional Office, Paradeep
Biomedical Waste Management
MS Ramaiah Medical College & Hospital, Bangalore & SPCB, Odisha
Swosti Premum, Bhubaneswar
14th –15th
February, 2017
70. Bhim Charan Marandi, Asst. Env. Scientist, Regional Office, Kalinganagar
Biomedical Waste Management
MS Ramaiah Medical College & Hospital, Bangalore & SPCB, Odisha
Swosti Premum, Bhubaneswar
14th –15th
February, 2017
71. Er. Debdutta Mohanty, Asst. Env. Engineer, Regional Office, Jharsuguda
Biomedical Waste Management
MS Ramaiah Medical College & Hospital, Bangalore & SPCB, Odisha
Swosti Premum, Bhubaneswar
14th –15th
February, 2017
72. Er. R. N. Prusty, Sr. Env. Engineer
Effective Management of Hazardous Waste including E-Waste - Co-processing and
IIWM, Bengaluru & sponsored by CPCB
IIWM, Bengaluru
Annual Report 2016-17
155
Sl. No.
Name & Designation
Title of the Training
Programme
Organized by Venue Date
Co-incineration -Hazardous Waste Rules”
73. Er. N. R. Sahoo, Sr. Env. Engineer
Global Warming, Climate Change and Disaster Management Future Perspective
PGIMER, Chandigarh & sponsored by CPCB
PGIMER, Chandigarh
February, 2017
74. H. N. Nayak, Regional Officer, Sambalpur
Global Warming, Climate Change and Disaster Management Future Perspective
PGIMER, Chandigarh & sponsored by CPCB
PGIMER, Chandigarh
February, 2017
75. Er. Soumendra Nath Mohanty, Asst. Env. Engineer, Regional Office, Kalinga Nagar
Short Term Course “Advanced Treatment and Recycling of Urban and Industrial Wastewater”
IIT Kharagpur, West Bengal
Indian Institute of Technology Kharagpur
6th – 10th March,
2017
76. Dr. D. K. Behera, Sr. Env. Scientist
International Conference on “Combating Air Pollution”
Indian Medical Association (HQS), IMA House, Indraprastha Marg, New Delhi-110002
Indian Medical Association (HQS), IMA House, Indraprastha Marg, New Delhi-110002
6th – 10th March,
2017
77. Anusha Ekka, AES, Regional Office, Balasore
Workshop of Water Quality and its Management
National Institute of Hydrology, Roorkee & sponsored by CPCB
National Institute of Hydrology, Roorkee
20th – 24th March,
2017
78. Dr. D. K. Behera, Sr. Env. Scientist
Workshop on Solid and Hazardous Waste Management
PG Dept. of Environmental Science, Sambalpur University, Burla, Sambalpur
PG Dept. of Environmental Science, Sambalpur University, Burla, Sambalpur
23rd
March, 2017
79. Debidutta Biswal, IFSMember Secretary
International Conference on Environment (Climate Change / Paris Agreement, Air and Water Pollution and Municipal Solid Waste)
National Green Tribunal (NGT) during
Vigyan Bhawan, New Delhi
25th –26th
March, 2017
80. Dr. P. K. Prusty, Sr. Env. Scientist
International Conference on Environment (Climate Change / Paris Agreement, Air and Water
National Green Tribunal (NGT) during
Vigyan Bhawan, New Delhi
25th –26th
March, 2017
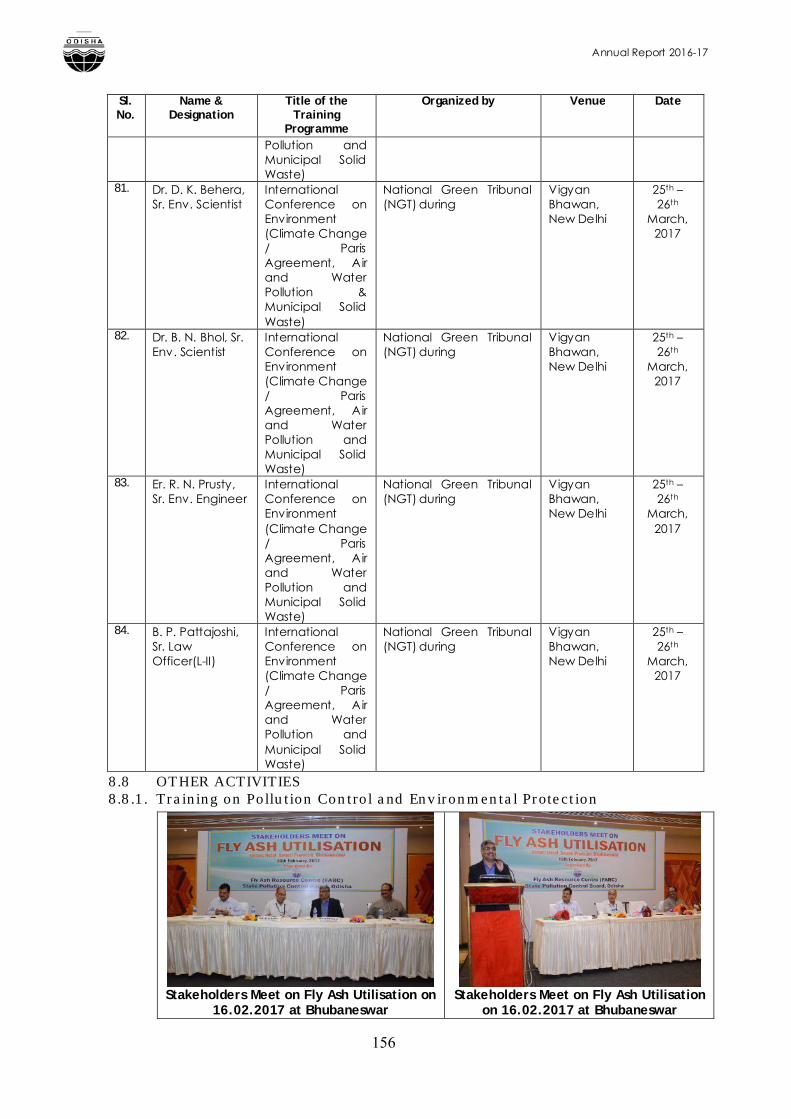
Annual Report 2016-17
156
Sl. No.
Name & Designation
Title of the Training
Programme
Organized by Venue Date
Pollution and Municipal Solid Waste)
81. Dr. D. K. Behera, Sr. Env. Scientist
International Conference on Environment (Climate Change / Paris Agreement, Air and Water Pollution &Municipal Solid Waste)
National Green Tribunal (NGT) during
Vigyan Bhawan, New Delhi
25th –26th
March, 2017
82. Dr. B. N. Bhol, Sr. Env. Scientist
International Conference on Environment (Climate Change / Paris Agreement, Air and Water Pollution and Municipal Solid Waste)
National Green Tribunal (NGT) during
Vigyan Bhawan, New Delhi
25th –26th
March, 2017
83. Er. R. N. Prusty, Sr. Env. Engineer
International Conference on Environment (Climate Change / Paris Agreement, Air and Water Pollution and Municipal Solid Waste)
National Green Tribunal (NGT) during
Vigyan Bhawan, New Delhi
25th –26th
March, 2017
84. B. P. Pattajoshi, Sr. Law Officer(L-II)
International Conference on Environment (Climate Change / Paris Agreement, Air and Water Pollution and Municipal Solid Waste)
National Green Tribunal (NGT) during
Vigyan Bhawan, New Delhi
25th –26th
March, 2017
8.8 OTHER ACTIVITIES8.8.1. Training on Pollution Control and Environmental Protection
Stakeholders Meet on Fly Ash Utilisation on 16.02.2017 at Bhubaneswar
Stakeholders Meet on Fly Ash Utilisation on 16.02.2017 at Bhubaneswar
Annual Report 2016-17
157
The Board has established a Center of Excellence on Training on Pollution Control and Environmental Protection issues by organizing participatory training programmes for various executives for effective implementation of various Acts and Rules promulgated for pollution control and protection of environment. The Centre of Excellence has successfully conducted 13 no. of training programmes for different stakeholders mostly on Fly Ash utilization and Management, Water Quality& River Pollution, Environment Protection etc.
The details of the training programmes/ workshop / seminor conducted bythe Board are given in Table – 8.8.
Table – 8.8 Training Programmes conducted by Centre of ExcellenceSl. No. Title of Training /
Workshop / Seminar Duration Venue Organised /
Sponsored by 1. Meeting on use of fly ash
in the ongoing projects29th April,
2016Pal Heights,
BhubaneswarSPC Board
2. Conference on Climate Change & Industry
27th May, 2016
Hotel Mayfair Convention,
Bhubaneswar
SPC Board & Confederation of
Indian Industry (CII), Odisha
State Office, 8, Forest Park,
Bhubaneswar-751009
3. Observation of World Env. Day, 2016
5th June, 2016
Bhubaneswar SPC Board & AD Scale Media &
Communication4. Workshop on
Environmental Governance Through 5S System
16th July, 2016
Hotel The New Marrion,
Bhubaneswar
Skasha Consultancy Pvt.
Ltd., Bhubaneswar in
collaboration with SPC Board,
Odisha5. Workshop on Fly Ash
utilization in Manufacture of Construction Materials
26th July, 2016
Nalco Mines & Refinery Complex,
Damanjodi
SPC Board & Nalco,
Damanjodi6. Workshop on Biomedical
Waste Management Rules, 2016
5th August, 2016
Lecture Theater, VIMSAR, Burla,
Sambalpur
SPC Board & VIMSAR, Burla,
Sambalpur7. Workshop on Biomedical
Waste Management Rules, 2016
2nd
November, 2016
Lecture Theater of Principal, SCB
Medical College & Hospital, Cuttack
SPC Board & SCB Medical College
& Hospital, Cuttack
8. Stakeholder Workshop on Environmental Hazards of Electronic Waste Under Digital India Initiative
7th
December, 2016
Hotel The New Marion,
Bhubaneswar
MeitY, SPCB, Odisha, BMC,
NASSCOM Foundation, MAIT
& CEAMA
9. Workshop on Biomedical Waste Management Rules, 2016
18th January, 2017
Lecture Theater ofPrincipal, MKCG
Medical College & Hospital,
Berhampur
SPC Board & MKCG Medical
College & Hospital,
Berhampur
Annual Report 2016-17
158
Sl. No. Title of Training / Workshop / Seminar
Duration Venue Organised / Sponsored by
10. State Level Consultative Workshop on Standard Operating Procedures (SOP) and Training Materials for Health Care Waste Management-UNIDO Project
13th
February, 2017
Hotel Swosti Premium,
Bhubaneswar
State Pollution Control Board,
Odisha, Bhubaneswar & M. S. Ramaiah
Medical College, Bangalore
11. Training of Trainers (TOT) Workshop on Bio-Medical Waste Management-UNIDO Project
14th – 15th
February, 2017
Hotel Swosti Premium,
Bhubaneswar
State Pollution Control Board,
Odisha, Bhubaneswar & M. S. Ramaiah
Medical College, Bangalore
12. Stakeholders Meet on Fly Ash Utilization
16th
February, 2017
Hotel Swosti Premium,
Bhubaneswar
Fly Ash Resource Centre (FARC),State Pollution Control Board,
Odisha, Bhubaneswar
13. Two Days National Seminar on “Environmental Protection : Socio-Legal Issues and Challenges” during
25th - 26th
March, 2017PG Department of Law, Sambalpur University, Jyoti
Vihar, Burla, Sambalpur
SPC Board, Odisha & PG
Department of Law, Sambalpur
University, Jyoti Vihar,
Burla, Sambalpur
8.8.2 Human Resource Development The Board has imparted Training on “Water/Air quality parameters
monitoring & analysis and impact of pollutants on Human Health” to 55 medical students of All India Institute of Medical Science, Bhubaneswar, 08 M.Sc., Forestry students of OUAT, Bhubaneswar & 05 Engineering students of KIST, Bhubaneswar in its Central Laboratory.
91 Police personnel from various districts of Odisha were imparted training on “Vehicular Pollution and its effect on Human Health”.
8.8.3 Observation of Important Days Earth Day The earth day is being celeberated on 22nd April, 2016 by Regional Offices in collaboration with District Level Environment Committee. World Environment DayAll Regional Offices of the Board celebrated the World Environment Day on 5th June,2016 by conducting street rallies, meetings, painting & debate competitions and plantations. The local people, responsible citizens, college/ school students and representatives from print & electronic media attended the programme.The photographs of some of the events and activities are illustrated below :
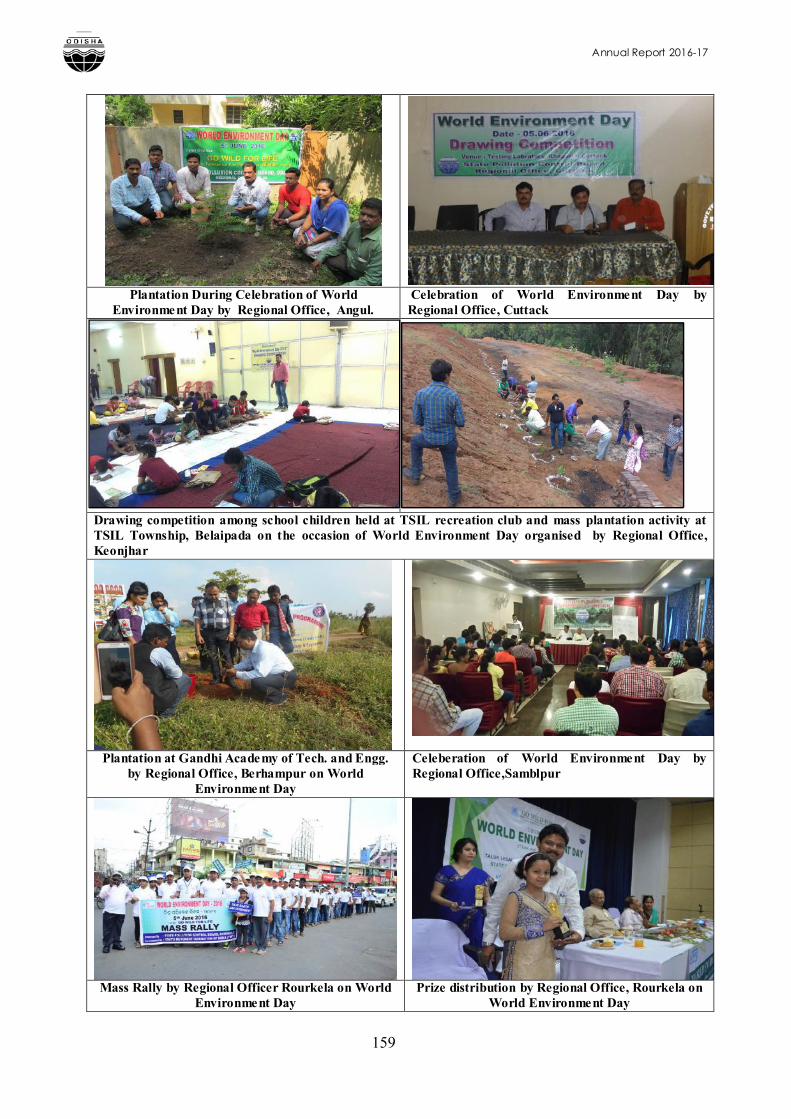
Annual Report 2016-17
159
Plantation During Celebration of World Environment Day by Regional Office, Angul.
Celebration of World Environment Day by Regional Office, Cuttack
Drawing competition among school children held at TSIL recreation club and mass plantation activity at TSIL Township, Belaipada on the occasion of World Environment Day organised by Regional Office, Keonjhar
Plantation at Gandhi Academy of Tech. and Engg. by Regional Office, Berhampur on World
Environment Day
Celeberation of World Environment Day by Regional Office,Samblpur
Mass Rally by Regional Officer Rourkela on World Environment Day
Prize distribution by Regional Office, Rourkela on World Environment Day
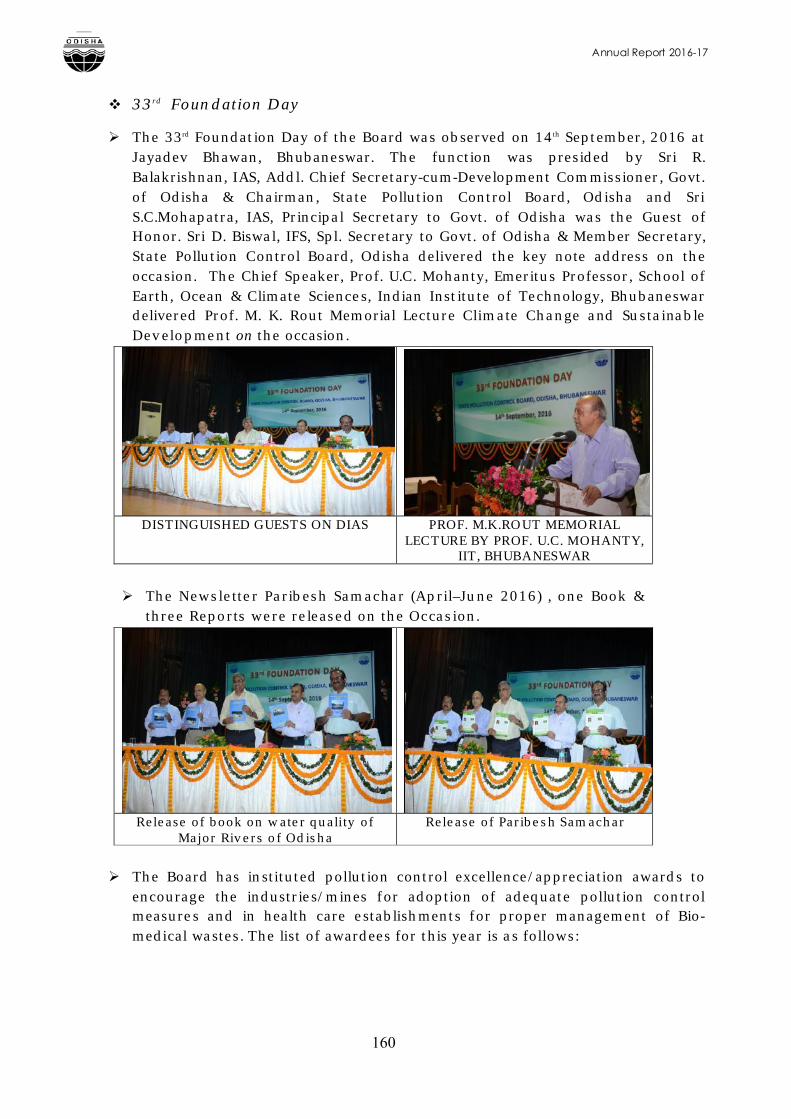
Annual Report 2016-17
160
33rd Foundation Day
The 33rd Foundation Day of the Board was observed on 14th September, 2016 at Jayadev Bhawan, Bhubaneswar. The function was presided by Sri R. Balakrishnan, IAS, Addl. Chief Secretary-cum-Development Commissioner, Govt. of Odisha & Chairman, State Pollution Control Board, Odisha and Sri S.C.Mohapatra, IAS, Principal Secretary to Govt. of Odisha was the Guest of Honor. Sri D. Biswal, IFS, Spl. Secretary to Govt. of Odisha & Member Secretary, State Pollution Control Board, Odisha delivered the key note address on the occasion. The Chief Speaker, Prof. U.C. Mohanty, Emeritus Professor, School of Earth, Ocean & Climate Sciences, Indian Institute of Technology, Bhubaneswardelivered Prof. M. K. Rout Memorial Lecture Climate Change and Sustainable Development on the occasion.
DISTINGUISHED GUESTS ON DIAS PROF. M.K.ROUT MEMORIAL LECTURE BY PROF. U.C. MOHANTY,
IIT, BHUBANESWAR
The Newsletter Paribesh Samachar (April–June 2016) , one Book & three Reports were released on the Occasion.
Release of book on water quality of Major Rivers of Odisha
Release of Paribesh Samachar
The Board has instituted pollution control excellence/appreciation awards to encourage the industries/mines for adoption of adequate pollution control measures and in health care establishments for proper management of Bio-medical wastes. The list of awardees for this year is as follows:

Annual Report 2016-17
161
1. Industries : Pollution Control Excellence Award - M/s. Indian Metal & Ferro Alloys Ltd., IMFA, Choudwar Pollution Control Appreciation Award – a. M/s. Bhushan Steel Limited, Meramandali, Dhenkanal, b. M/s. Kapilash Cement Manufacturing Works, Unit of OCL India Limited,
2. Mines: Pollution Control Excellence Award - M/s. Balda Block Iron Mines of M/s. Serajuddin & CO., Balda, Balda-Kalimati & Nayagarh, Dist: Keonjhar.Pollution Control Appreciation Award – (a). M/s. Joda East Iron Mines of M/s. Tata Steel Limited, Joda, Keonjhar. (b). M/s. Unchabali Iron & Manganese Mines, Smt. Indrani Patnaik, Boneikela, Dist: Keonjhar.
POLLUTION CONTROL EXCELLENCE AWARDS IN INDUSTRIES & MINES CATEGORIES
M/s. Indian Metal & Ferro Alloys Ltd., Choudwar
M/S. Balda Block Iron Mines of M/s. Serajuddin & Co., Balda, Keonjhar
POLLUTION CONTROL APPRECIATION AWARDS IN INDUSTRIES & MINES CATEGORIES
M/s. Bhushan Steel Limited, Meramandali, M/s. Kapilash Cement Manufacturing Works, Cuttack
M/s.Joda East Iron Mines ofM/s. Tata Steel Ltd., Joda
M/S. Unchabali Iron & Manganese Mines, Boneikela
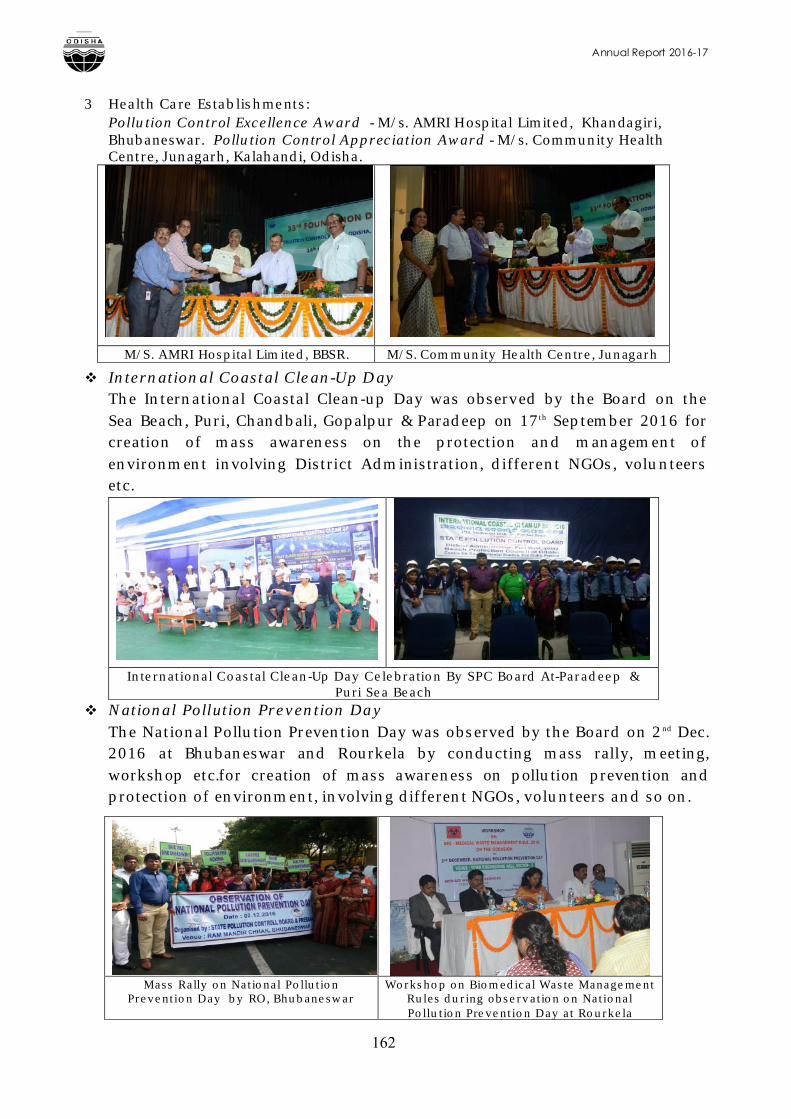
Annual Report 2016-17
162
3 Health Care Establishments:Pollution Control Excellence Award - M/s. AMRI Hospital Limited, Khandagiri, Bhubaneswar. Pollution Control Appreciation Award - M/s. Community Health Centre, Junagarh, Kalahandi, Odisha.
M/S. AMRI Hospital Limited, BBSR. M/S. Community Health Centre, Junagarh
International Coastal Clean-Up DayThe International Coastal Clean-up Day was observed by the Board on the Sea Beach, Puri, Chandbali, Gopalpur & Paradeep on 17th September 2016 for creation of mass awareness on the protection and management of environment involving District Administration, different NGOs, volunteers etc.
International Coastal Clean-Up Day Celebration By SPC Board At-Paradeep & Puri Sea Beach
National Pollution Prevention Day The National Pollution Prevention Day was observed by the Board on 2nd Dec. 2016 at Bhubaneswar and Rourkela by conducting mass rally, meeting, workshop etc.for creation of mass awareness on pollution prevention and protection of environment, involving different NGOs, volunteers and so on.
Mass Rally on National Pollution Prevention Day by RO, Bhubaneswar
Workshop on Biomedical Waste Management Rules during observation on National Pollution Prevention Day at Rourkela
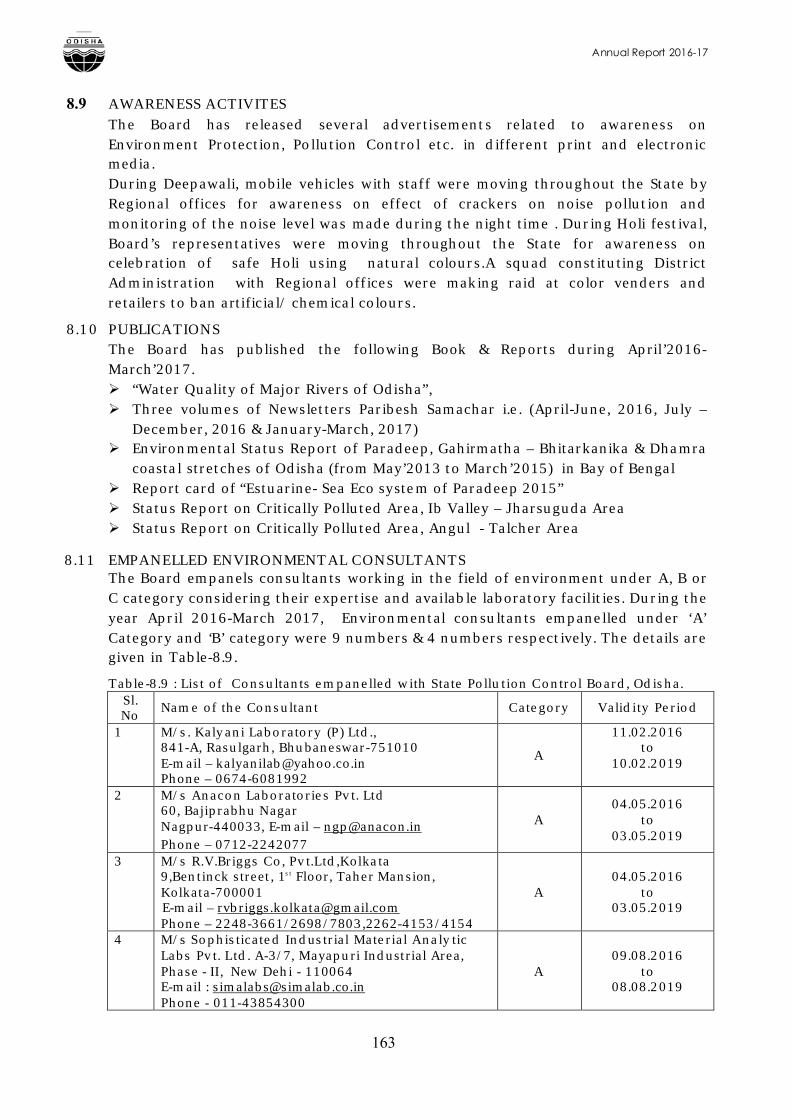
Annual Report 2016-17
163
8.9 AWARENESS ACTIVITESThe Board has released several advertisements related to awareness on Environment Protection, Pollution Control etc. in different print and electronicmedia.During Deepawali, mobile vehicles with staff were moving throughout the State byRegional offices for awareness on effect of crackers on noise pollution and monitoring of the noise level was made during the night time . During Holi festival, Board’s representatives were moving throughout the State for awareness on celebration of safe Holi using natural colours.A squad constituting District Administration with Regional offices were making raid at color venders and retailers to ban artificial/ chemical colours.
8.10 PUBLICATIONSThe Board has published the following Book & Reports during April’2016-March’2017. “Water Quality of Major Rivers of Odisha”, Three volumes of Newsletters Paribesh Samachar i.e. (April-June, 2016, July –
December, 2016 & January-March, 2017) Environmental Status Report of Paradeep, Gahirmatha – Bhitarkanika & Dhamra
coastal stretches of Odisha (from May’2013 to March’2015) in Bay of Bengal Report card of “Estuarine- Sea Eco system of Paradeep 2015” Status Report on Critically Polluted Area, Ib Valley – Jharsuguda Area Status Report on Critically Polluted Area, Angul - Talcher Area
8.11 EMPANELLED ENVIRONMENTAL CONSULTANTSThe Board empanels consultants working in the field of environment under A, B or C category considering their expertise and available laboratory facilities. During the year April 2016-March 2017, Environmental consultants empanelled under ‘A’ Category and ‘B’ category were 9 numbers & 4 numbers respectively. The details are given in Table-8.9.
Table-8.9 : List of Consultants empanelled with State Pollution Control Board, Odisha. Sl. No
Name of the Consultant Category Validity Period
1 M/s. Kalyani Laboratory (P) Ltd.,841-A, Rasulgarh, Bhubaneswar-751010E-mail – [email protected] – 0674-6081992
A
11.02.2016to
10.02.2019
2 M/s Anacon Laboratories Pvt. Ltd 60, Bajiprabhu Nagar Nagpur-440033, E-mail – [email protected] – 0712-2242077
A04.05.2016
to 03.05.2019
3 M/s R.V.Briggs Co, Pvt.Ltd,Kolkata9,Bentinck street, 1st Floor, Taher Mansion,Kolkata-700001E-mail – [email protected] – 2248-3661/2698/7803,2262-4153/4154
A04.05.2016
to 03.05.2019
4 M/s Sophisticated Industrial Material Analytic Labs Pvt. Ltd. A-3/7, Mayapuri Industrial Area, Phase - II, New Dehi - 110064E-mail : [email protected] - 011-43854300
A09.08.2016
to08.08.2019
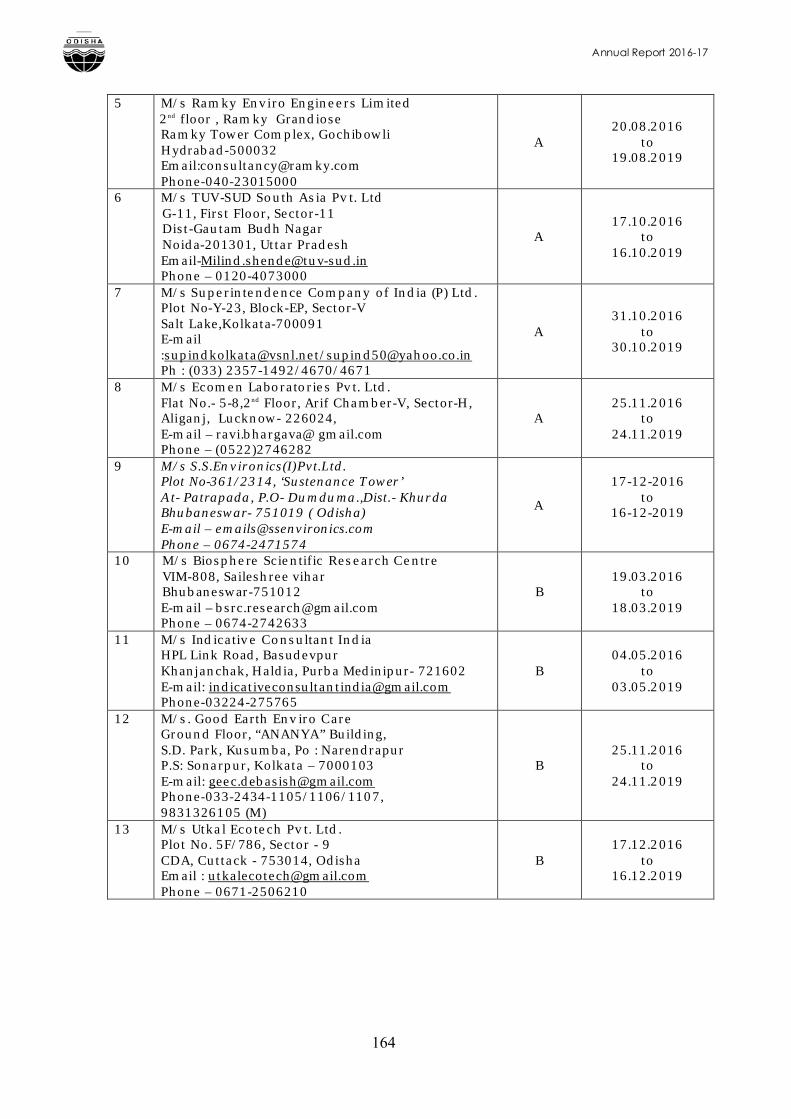
Annual Report 2016-17
164
5 M/s Ramky Enviro Engineers Limited 2nd floor , Ramky Grandiose
Ramky Tower Complex, Gochibowli Hydrabad-500032
Email:[email protected]
A20.08.2016
to 19.08.2019
6 M/s TUV-SUD South Asia Pvt. Ltd G-11, First Floor, Sector-11Dist-Gautam Budh NagarNoida-201301, Uttar [email protected] – 0120-4073000
A17.10.2016
to16.10.2019
7 M/s Superintendence Company of India (P) Ltd.Plot No-Y-23, Block-EP, Sector-VSalt Lake,Kolkata-700091E-mail :[email protected]/[email protected] : (033) 2357-1492/4670/4671
A31.10.2016
to 30.10.2019
8 M/s Ecomen Laboratories Pvt. Ltd.Flat No.- 5-8,2nd Floor, Arif Chamber-V, Sector-H, Aliganj, Lucknow- 226024, E-mail – ravi.bhargava@ gmail.comPhone – (0522)2746282
A25.11.2016
to 24.11.2019
9 M/s S.S.Environics(I)Pvt.Ltd.Plot No-361/2314, ‘Sustenance Tower’At- Patrapada, P.O- Dumduma.,Dist.- Khurda Bhubaneswar- 751019 ( Odisha)E-mail – [email protected] – 0674-2471574
A
17-12-2016 to
16-12-2019
10 M/s Biosphere Scientific Research CentreVIM-808, Saileshree viharBhubaneswar-751012E-mail – [email protected] – 0674-2742633
B19.03.2016
to18.03.2019
11 M/s Indicative Consultant IndiaHPL Link Road, BasudevpurKhanjanchak, Haldia, Purba Medinipur- 721602E-mail: [email protected] Phone-03224-275765
B04.05.2016
to 03.05.2019
12 M/s. Good Earth Enviro CareGround Floor, “ANANYA” Building,S.D. Park, Kusumba, Po : NarendrapurP.S: Sonarpur, Kolkata – 7000103E-mail: [email protected]/1106/1107, 9831326105 (M)
B25.11.2016
to24.11.2019
13 M/s Utkal Ecotech Pvt. Ltd.Plot No. 5F/786, Sector - 9CDA, Cuttack - 753014, OdishaEmail : [email protected] – 0671-2506210
B17.12.2016
to 16.12.2019
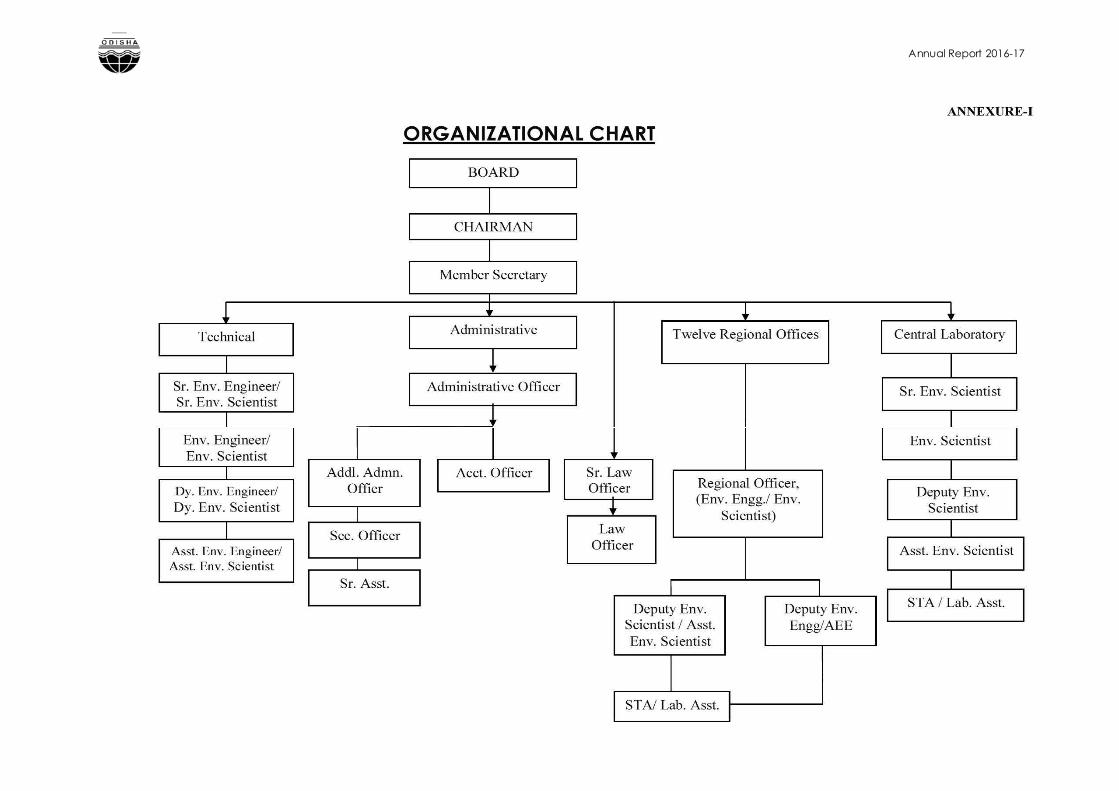
Annual Report 2016-17
165
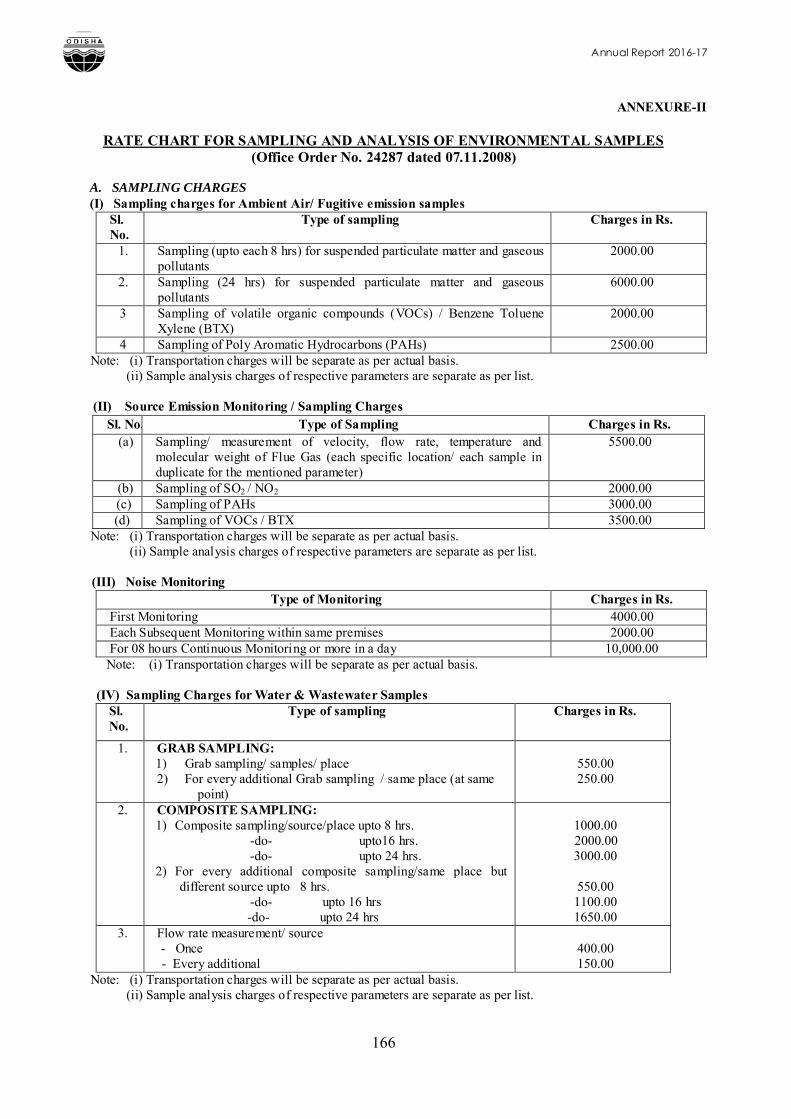
Annual Report 2016-17
166
ANNEXURE-II
RATE CHART FOR SAMPLING AND ANALYSIS OF ENVIRONMENTAL SAMPLES(Office Order No. 24287 dated 07.11.2008)
A. SAMPLING CHARGES (I) Sampling charges for Ambient Air/ Fugitive emission samples
Sl. No.
Type of sampling Charges in Rs.
1. Sampling (upto each 8 hrs) for suspended particulate matter and gaseous pollutants
2000.00
2. Sampling (24 hrs) for suspended particulate matter and gaseous pollutants
6000.00
3 Sampling of volatile organic compounds (VOCs) / Benzene Toluene Xylene (BTX)
2000.00
4 Sampling of Poly Aromatic Hydrocarbons (PAHs) 2500.00Note: (i) Transportation charges will be separate as per actual basis.
(ii) Sample analysis charges of respective parameters are separate as per list.
(II) Source Emission Monitoring / Sampling Charges
Note: (i) Transportation charges will be separate as per actual basis. (ii) Sample analysis charges of respective parameters are separate as per list.
(III) Noise Monitoring Type of Monitoring Charges in Rs.
First Monitoring 4000.00Each Subsequent Monitoring within same premises 2000.00For 08 hours Continuous Monitoring or more in a day 10,000.00
Note: (i) Transportation charges will be separate as per actual basis.
(IV) Sampling Charges for Water & Wastewater SamplesSl. No.
Type of sampling Charges in Rs.
1. GRAB SAMPLING:1) Grab sampling/ samples/ place2) For every additional Grab sampling / same place (at same
point)
550.00250.00
2. COMPOSITE SAMPLING:1) Composite sampling/source/place upto 8 hrs. -do- upto16 hrs. -do- upto 24 hrs.2) For every additional composite sampling/same place but
different source upto 8 hrs. -do- upto 16 hrs
-do- upto 24 hrs
1000.00 2000.00
3000.00
550.001100.001650.00
3. Flow rate measurement/ source - Once
- Every additional400.00150.00
Note: (i) Transportation charges will be separate as per actual basis. (ii) Sample analysis charges of respective parameters are separate as per list.
Sl. No. Type of Sampling Charges in Rs.(a) Sampling/ measurement of velocity, flow rate, temperature and
molecular weight of Flue Gas (each specific location/ each sample in duplicate for the mentioned parameter)
5500.00
(b) Sampling of SO2 / NO2 2000.00 (c) Sampling of PAHs 3000.00(d) Sampling of VOCs / BTX 3500.00
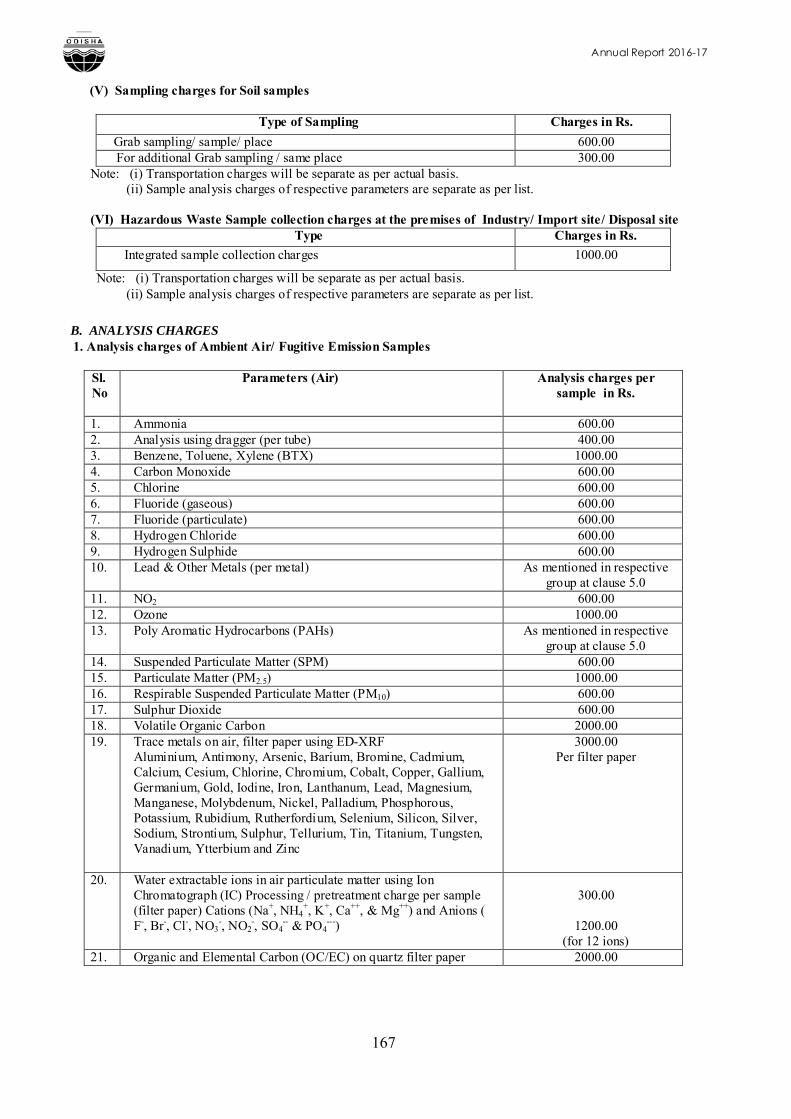
Annual Report 2016-17
167
(V) Sampling charges for Soil samples
Type of Sampling Charges in Rs.
Grab sampling/ sample/ place 600.00 For additional Grab sampling / same place 300.00
Note: (i) Transportation charges will be separate as per actual basis. (ii) Sample analysis charges of respective parameters are separate as per list.
(VI) Hazardous Waste Sample collection charges at the premises of Industry/ Import site/ Disposal siteType Charges in Rs.
Integrated sample collection charges 1000.00
Note: (i) Transportation charges will be separate as per actual basis. (ii) Sample analysis charges of respective parameters are separate as per list.
B. ANALYSIS CHARGES 1. Analysis charges of Ambient Air/ Fugitive Emission Samples
Sl.No
Parameters (Air) Analysis charges per sample in Rs.
1. Ammonia 600.002. Analysis using dragger (per tube) 400.003. Benzene, Toluene, Xylene (BTX) 1000.004. Carbon Monoxide 600.005. Chlorine 600.006. Fluoride (gaseous) 600.007. Fluoride (particulate) 600.008. Hydrogen Chloride 600.009. Hydrogen Sulphide 600.0010. Lead & Other Metals (per metal) As mentioned in respective
group at clause 5.011. NO2 600.0012. Ozone 1000.0013. Poly Aromatic Hydrocarbons (PAHs) As mentioned in respective
group at clause 5.014. Suspended Particulate Matter (SPM) 600.0015. Particulate Matter (PM2.5) 1000.0016. Respirable Suspended Particulate Matter (PM10) 600.0017. Sulphur Dioxide 600.0018. Volatile Organic Carbon 2000.0019. Trace metals on air, filter paper using ED-XRF
Aluminium, Antimony, Arsenic, Barium, Bromine, Cadmium, Calcium, Cesium, Chlorine, Chromium, Cobalt, Copper, Gallium, Germanium, Gold, Iodine, Iron, Lanthanum, Lead, Magnesium, Manganese, Molybdenum, Nickel, Palladium, Phosphorous, Potassium, Rubidium, Rutherfordium, Selenium, Silicon, Silver, Sodium, Strontium, Sulphur, Tellurium, Tin, Titanium, Tungsten, Vanadium, Ytterbium and Zinc
3000.00Per filter paper
20. Water extractable ions in air particulate matter using Ion Chromatograph (IC) Processing / pretreatment charge per sample (filter paper) Cations (Na+, NH4
+, K+, Ca++, & Mg++) and Anions ( F-, Br-, Cl-, NO3
-, NO2-, SO4
-- & PO4---)
300.00
1200.00(for 12 ions)
21. Organic and Elemental Carbon (OC/EC) on quartz filter paper 2000.00
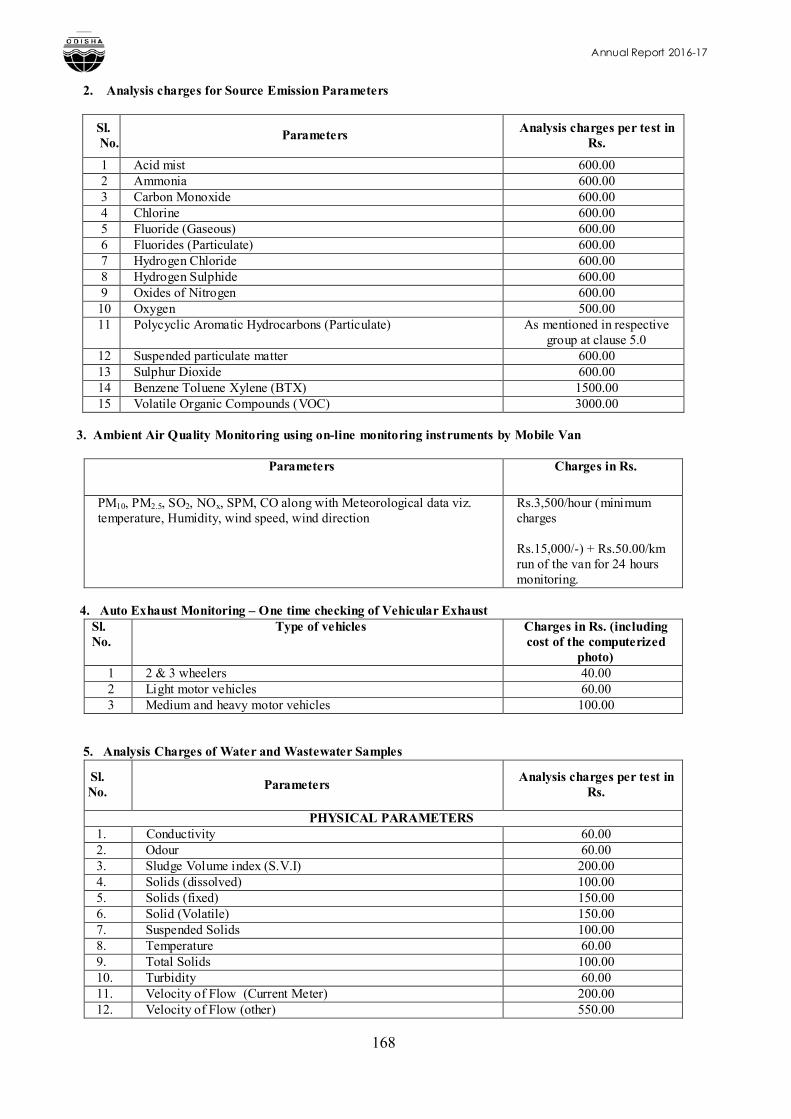
Annual Report 2016-17
168
2. Analysis charges for Source Emission Parameters
Sl.No.
Parameters Analysis charges per test in Rs.
1 Acid mist 600.002 Ammonia 600.003 Carbon Monoxide 600.004 Chlorine 600.005 Fluoride (Gaseous) 600.006 Fluorides (Particulate) 600.007 Hydrogen Chloride 600.008 Hydrogen Sulphide 600.009 Oxides of Nitrogen 600.0010 Oxygen 500.0011 Polycyclic Aromatic Hydrocarbons (Particulate) As mentioned in respective
group at clause 5.012 Suspended particulate matter 600.0013 Sulphur Dioxide 600.0014 Benzene Toluene Xylene (BTX) 1500.0015 Volatile Organic Compounds (VOC) 3000.00
3. Ambient Air Quality Monitoring using on-line monitoring instruments by Mobile Van
Parameters Charges in Rs.
PM10, PM2.5, SO2, NOx, SPM, CO along with Meteorological data viz. temperature, Humidity, wind speed, wind direction
Rs.3,500/hour (minimum charges
Rs.15,000/-) + Rs.50.00/km run of the van for 24 hours monitoring.
4. Auto Exhaust Monitoring – One time checking of Vehicular Exhaust Sl. No.
Type of vehicles Charges in Rs. (including cost of the computerized
photo)1 2 & 3 wheelers 40.002 Light motor vehicles 60.003 Medium and heavy motor vehicles 100.00
5. Analysis Charges of Water and Wastewater Samples
Sl.No. Parameters
Analysis charges per test in Rs.
PHYSICAL PARAMETERS1. Conductivity 60.002. Odour 60.003. Sludge Volume index (S.V.I) 200.004. Solids (dissolved) 100.005. Solids (fixed) 150.006. Solid (Volatile) 150.007. Suspended Solids 100.008. Temperature 60.009. Total Solids 100.0010. Turbidity 60.0011. Velocity of Flow (Current Meter) 200.0012. Velocity of Flow (other) 550.00
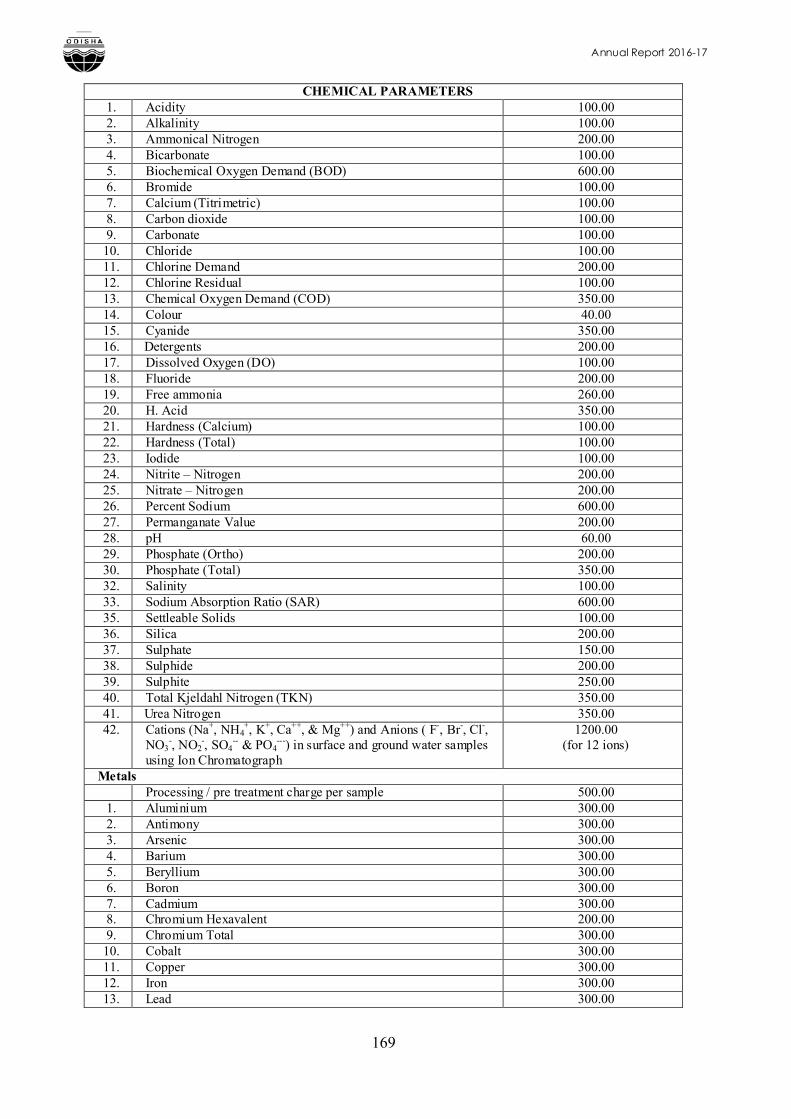
Annual Report 2016-17
169
CHEMICAL PARAMETERS1. Acidity 100.002. Alkalinity 100.003. Ammonical Nitrogen 200.004. Bicarbonate 100.005. Biochemical Oxygen Demand (BOD) 600.006. Bromide 100.007. Calcium (Titrimetric) 100.008. Carbon dioxide 100.009. Carbonate 100.0010. Chloride 100.0011. Chlorine Demand 200.0012. Chlorine Residual 100.0013. Chemical Oxygen Demand (COD) 350.0014. Colour 40.0015. Cyanide 350.0016. Detergents 200.0017. Dissolved Oxygen (DO) 100.0018. Fluoride 200.0019. Free ammonia 260.0020. H. Acid 350.0021. Hardness (Calcium) 100.0022. Hardness (Total) 100.0023. Iodide 100.0024. Nitrite – Nitrogen 200.0025. Nitrate – Nitrogen 200.0026. Percent Sodium 600.0027. Permanganate Value 200.0028. pH 60.0029. Phosphate (Ortho) 200.0030. Phosphate (Total) 350.0032. Salinity 100.0033. Sodium Absorption Ratio (SAR) 600.0035. Settleable Solids 100.0036. Silica 200.0037. Sulphate 150.0038. Sulphide 200.0039. Sulphite 250.0040. Total Kjeldahl Nitrogen (TKN) 350.0041. Urea Nitrogen 350.0042. Cations (Na+, NH4
+, K+, Ca++, & Mg++) and Anions ( F-, Br-, Cl-, NO3
-, NO2-, SO4
-- & PO4---) in surface and ground water samples
using Ion Chromatograph
1200.00(for 12 ions)
MetalsProcessing / pre treatment charge per sample 500.00
1. Aluminium 300.002. Antimony 300.003. Arsenic 300.004. Barium 300.005. Beryllium 300.006. Boron 300.007. Cadmium 300.008. Chromium Hexavalent 200.009. Chromium Total 300.0010. Cobalt 300.0011. Copper 300.0012. Iron 300.0013. Lead 300.00
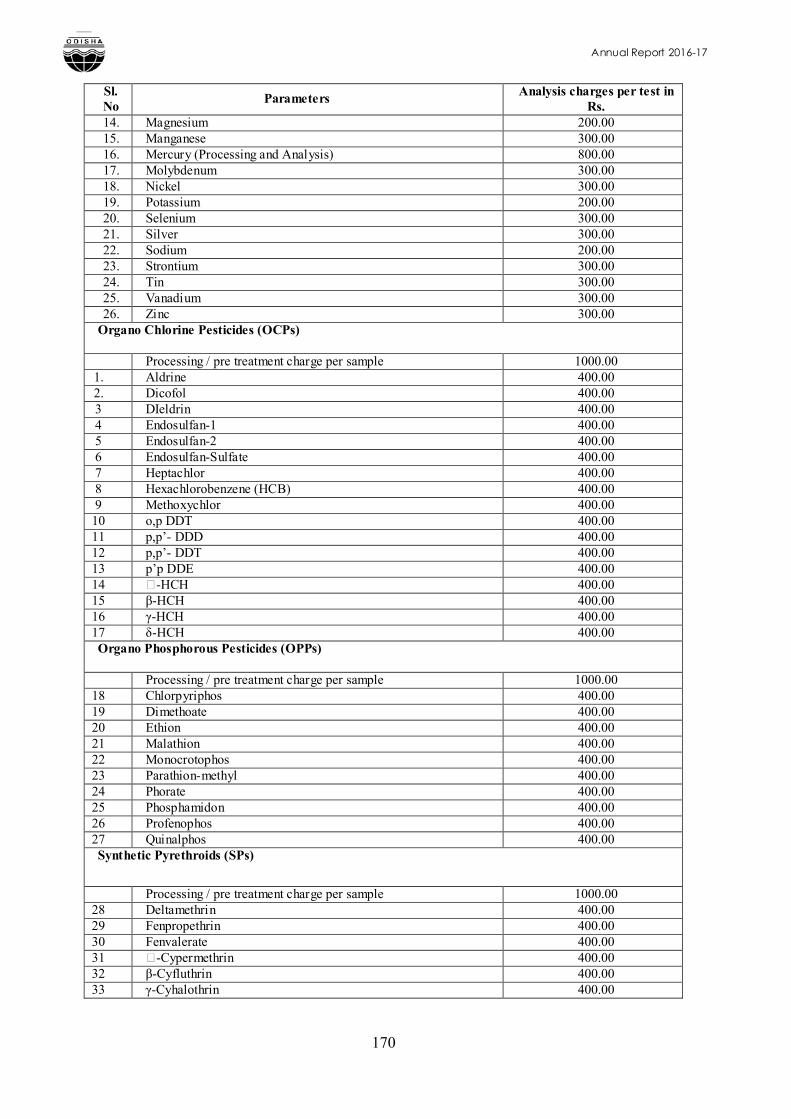
Annual Report 2016-17
170
Sl.No
Parameters Analysis charges per test in Rs.
14. Magnesium 200.0015. Manganese 300.0016. Mercury (Processing and Analysis) 800.0017. Molybdenum 300.0018. Nickel 300.0019. Potassium 200.0020. Selenium 300.0021. Silver 300.0022. Sodium 200.0023. Strontium 300.0024. Tin 300.0025. Vanadium 300.0026. Zinc 300.00
Organo Chlorine Pesticides (OCPs)
Processing / pre treatment charge per sample 1000.001. Aldrine 400.002. Dicofol 400.003 DIeldrin 400.004 Endosulfan-1 400.005 Endosulfan-2 400.006 Endosulfan-Sulfate 400.007 Heptachlor 400.008 Hexachlorobenzene (HCB) 400.009 Methoxychlor 400.0010 o,p DDT 400.0011 p,p’- DDD 400.0012 p,p’- DDT 400.0013 p’p DDE 400.0014 �-HCH 400.0015 β-HCH 400.0016 γ-HCH 400.0017 δ-HCH 400.00Organo Phosphorous Pesticides (OPPs)
Processing / pre treatment charge per sample 1000.0018 Chlorpyriphos 400.0019 Dimethoate 400.0020 Ethion 400.0021 Malathion 400.0022 Monocrotophos 400.0023 Parathion-methyl 400.0024 Phorate 400.0025 Phosphamidon 400.0026 Profenophos 400.0027 Quinalphos 400.00Synthetic Pyrethroids (SPs)
Processing / pre treatment charge per sample 1000.0028 Deltamethrin 400.0029 Fenpropethrin 400.0030 Fenvalerate 400.0031 �-Cypermethrin 400.0032 β-Cyfluthrin 400.0033 γ-Cyhalothrin 400.00
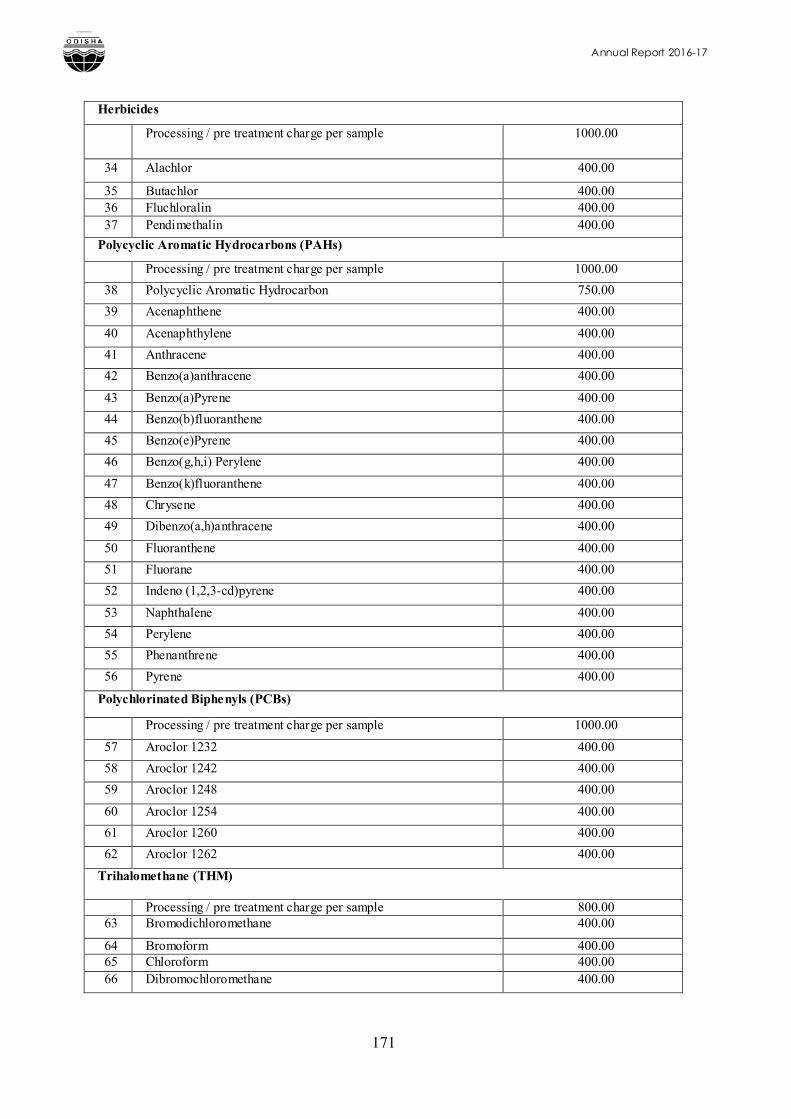
Annual Report 2016-17
171
Herbicides
Processing / pre treatment charge per sample 1000.00
34 Alachlor 400.00
35 Butachlor 400.0036 Fluchloralin 400.0037 Pendimethalin 400.00
Polycyclic Aromatic Hydrocarbons (PAHs)
Processing / pre treatment charge per sample 1000.00
38 Polycyclic Aromatic Hydrocarbon 750.00
39 Acenaphthene 400.00
40 Acenaphthylene 400.00
41 Anthracene 400.00
42 Benzo(a)anthracene 400.00
43 Benzo(a)Pyrene 400.00
44 Benzo(b)fluoranthene 400.00
45 Benzo(e)Pyrene 400.00
46 Benzo(g,h,i) Perylene 400.00
47 Benzo(k)fluoranthene 400.00
48 Chrysene 400.00
49 Dibenzo(a,h)anthracene 400.00
50 Fluoranthene 400.00
51 Fluorane 400.00
52 Indeno (1,2,3-cd)pyrene 400.00
53 Naphthalene 400.00
54 Perylene 400.00
55 Phenanthrene 400.00
56 Pyrene 400.00
Polychlorinated Biphenyls (PCBs)
Processing / pre treatment charge per sample 1000.00
57 Aroclor 1232 400.00
58 Aroclor 1242 400.00
59 Aroclor 1248 400.00
60 Aroclor 1254 400.00
61 Aroclor 1260 400.00
62 Aroclor 1262 400.00
Trihalomethane (THM)
Processing / pre treatment charge per sample 800.0063 Bromodichloromethane 400.00
64 Bromoform 400.0065 Chloroform 400.0066 Dibromochloromethane 400.00
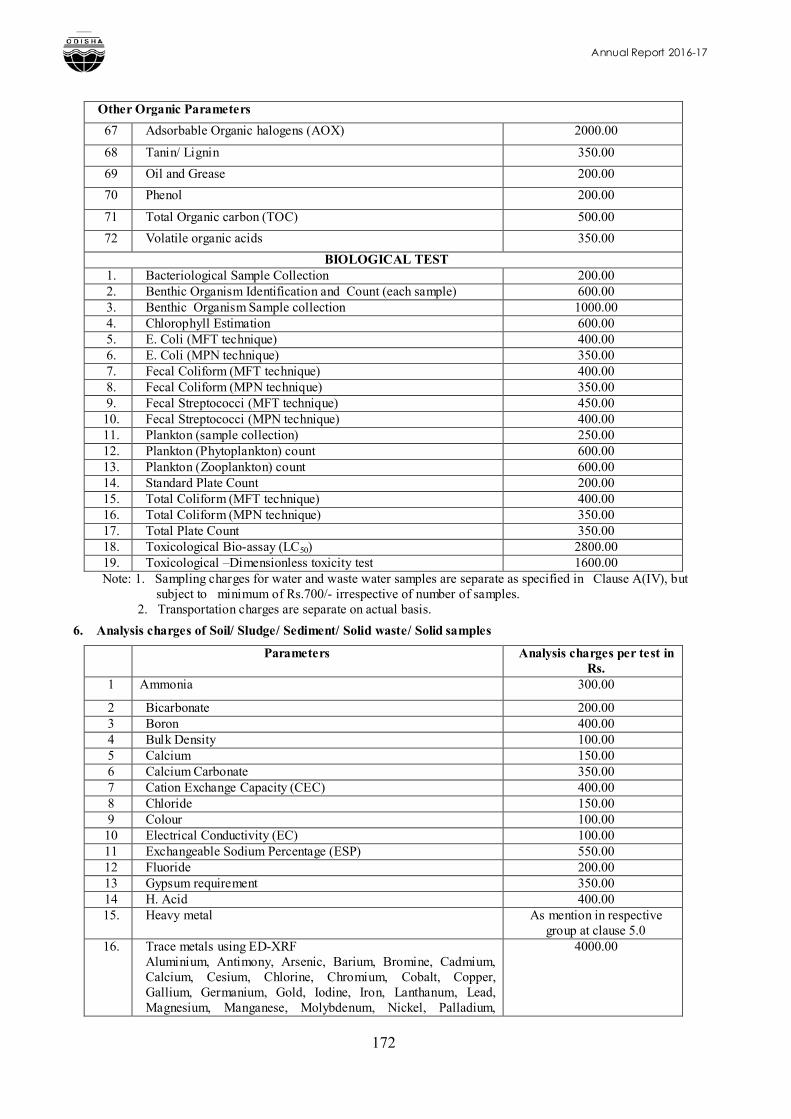
Annual Report 2016-17
172
Other Organic Parameters
67 Adsorbable Organic halogens (AOX) 2000.00
68 Tanin/ Lignin 350.00
69 Oil and Grease 200.00
70 Phenol 200.00
71 Total Organic carbon (TOC) 500.00
72 Volatile organic acids 350.00
BIOLOGICAL TEST1. Bacteriological Sample Collection 200.002. Benthic Organism Identification and Count (each sample) 600.003. Benthic Organism Sample collection 1000.004. Chlorophyll Estimation 600.005. E. Coli (MFT technique) 400.006. E. Coli (MPN technique) 350.007. Fecal Coliform (MFT technique) 400.008. Fecal Coliform (MPN technique) 350.009. Fecal Streptococci (MFT technique) 450.0010. Fecal Streptococci (MPN technique) 400.0011. Plankton (sample collection) 250.0012. Plankton (Phytoplankton) count 600.0013. Plankton (Zooplankton) count 600.0014. Standard Plate Count 200.0015. Total Coliform (MFT technique) 400.0016. Total Coliform (MPN technique) 350.0017. Total Plate Count 350.0018. Toxicological Bio-assay (LC50) 2800.0019. Toxicological –Dimensionless toxicity test 1600.00Note: 1. Sampling charges for water and waste water samples are separate as specified in Clause A(IV), but
subject to minimum of Rs.700/- irrespective of number of samples. 2. Transportation charges are separate on actual basis.
6. Analysis charges of Soil/ Sludge/ Sediment/ Solid waste/ Solid samples
Parameters Analysis charges per test in Rs.
1 Ammonia 300.00
2 Bicarbonate 200.003 Boron 400.004 Bulk Density 100.005 Calcium 150.006 Calcium Carbonate 350.007 Cation Exchange Capacity (CEC) 400.008 Chloride 150.009 Colour 100.0010 Electrical Conductivity (EC) 100.0011 Exchangeable Sodium Percentage (ESP) 550.0012 Fluoride 200.0013 Gypsum requirement 350.0014 H. Acid 400.0015. Heavy metal As mention in respective
group at clause 5.016. Trace metals using ED-XRF
Aluminium, Antimony, Arsenic, Barium, Bromine, Cadmium, Calcium, Cesium, Chlorine, Chromium, Cobalt, Copper, Gallium, Germanium, Gold, Iodine, Iron, Lanthanum, Lead, Magnesium, Manganese, Molybdenum, Nickel, Palladium,
4000.00
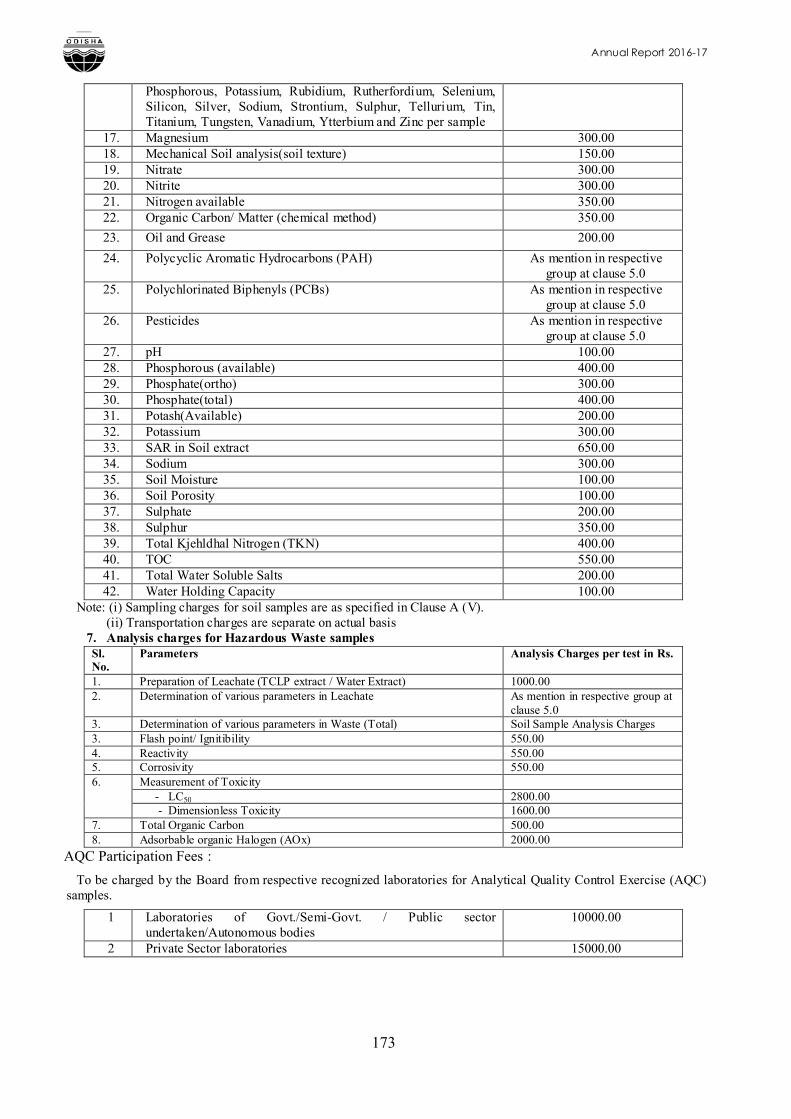
Annual Report 2016-17
173
Phosphorous, Potassium, Rubidium, Rutherfordium, Selenium, Silicon, Silver, Sodium, Strontium, Sulphur, Tellurium, Tin, Titanium, Tungsten, Vanadium, Ytterbium and Zinc per sample
17. Magnesium 300.0018. Mechanical Soil analysis(soil texture) 150.0019. Nitrate 300.0020. Nitrite 300.0021. Nitrogen available 350.0022. Organic Carbon/ Matter (chemical method) 350.00
23. Oil and Grease 200.00
24. Polycyclic Aromatic Hydrocarbons (PAH) As mention in respective group at clause 5.0
25. Polychlorinated Biphenyls (PCBs) As mention in respective group at clause 5.0
26. Pesticides As mention in respective group at clause 5.0
27. pH 100.0028. Phosphorous (available) 400.0029. Phosphate(ortho) 300.0030. Phosphate(total) 400.0031. Potash(Available) 200.0032. Potassium 300.0033. SAR in Soil extract 650.0034. Sodium 300.0035. Soil Moisture 100.0036. Soil Porosity 100.0037. Sulphate 200.0038. Sulphur 350.0039. Total Kjehldhal Nitrogen (TKN) 400.0040. TOC 550.0041. Total Water Soluble Salts 200.0042. Water Holding Capacity 100.00
Note: (i) Sampling charges for soil samples are as specified in Clause A (V). (ii) Transportation charges are separate on actual basis 7. Analysis charges for Hazardous Waste samples
Sl.No.
Parameters Analysis Charges per test in Rs.
1. Preparation of Leachate (TCLP extract / Water Extract) 1000.002. Determination of various parameters in Leachate As mention in respective group at
clause 5.03. Determination of various parameters in Waste (Total) Soil Sample Analysis Charges3. Flash point/ Ignitibility 550.004. Reactivity 550.005. Corrosivity 550.006. Measurement of Toxicity
- LC50 2800.00 - Dimensionless Toxicity 1600.00
7. Total Organic Carbon 500.008. Adsorbable organic Halogen (AOx) 2000.00
AQC Participation Fees :
To be charged by the Board from respective recognized laboratories for Analytical Quality Control Exercise (AQC) samples.
1 Laboratories of Govt./Semi-Govt. / Public sector undertaken/Autonomous bodies
10000.00
2 Private Sector laboratories 15000.00
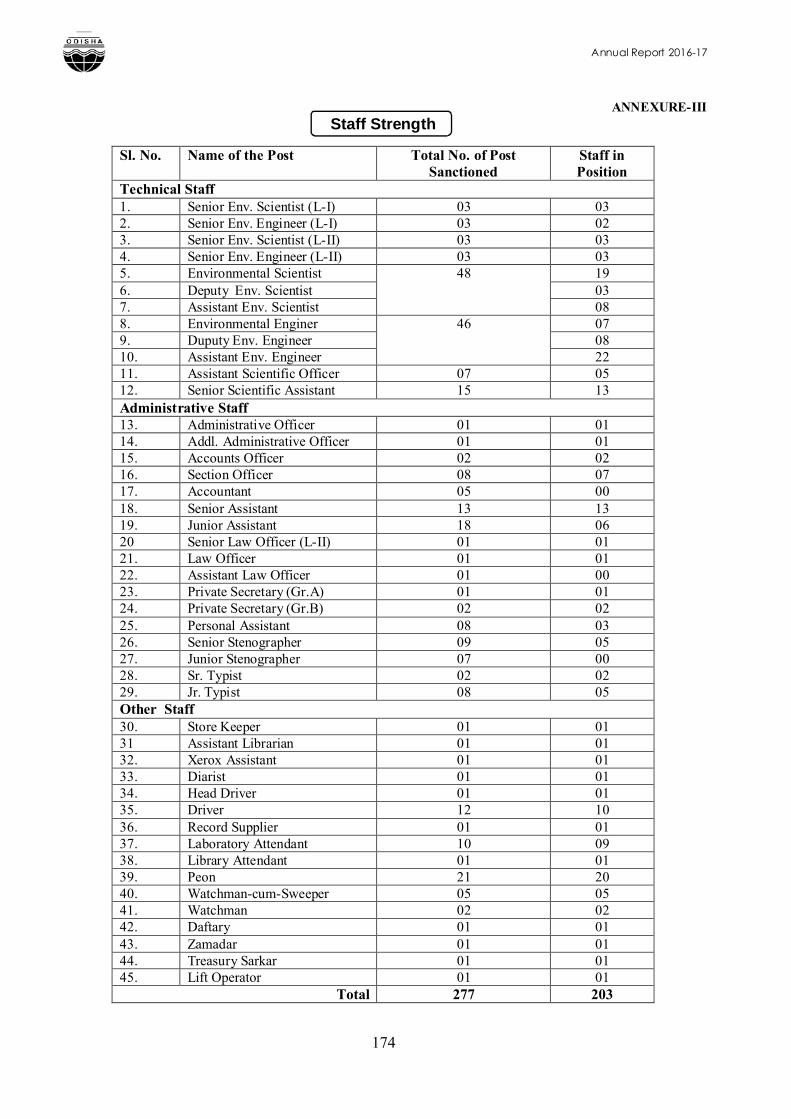
Annual Report 2016-17
174
ANNEXURE-IIIStaff Strength
Sl. No. Name of the Post Total No. of Post Sanctioned
Staff in Position
Technical Staff1. Senior Env. Scientist (L-I) 03 032. Senior Env. Engineer (L-I) 03 023. Senior Env. Scientist (L-II) 03 034. Senior Env. Engineer (L-II) 03 035. Environmental Scientist 48 196. Deputy Env. Scientist 037. Assistant Env. Scientist 088. Environmental Enginer 46 079. Duputy Env. Engineer 0810. Assistant Env. Engineer 2211. Assistant Scientific Officer 07 0512. Senior Scientific Assistant 15 13Administrative Staff13. Administrative Officer 01 0114. Addl. Administrative Officer 01 0115. Accounts Officer 02 0216. Section Officer 08 0717. Accountant 05 0018. Senior Assistant 13 1319. Junior Assistant 18 0620 Senior Law Officer (L-II) 01 0121. Law Officer 01 0122. Assistant Law Officer 01 0023. Private Secretary (Gr.A) 01 0124. Private Secretary (Gr.B) 02 0225. Personal Assistant 08 0326. Senior Stenographer 09 0527. Junior Stenographer 07 0028. Sr. Typist 02 0229. Jr. Typist 08 05Other Staff30. Store Keeper 01 0131 Assistant Librarian 01 0132. Xerox Assistant 01 0133. Diarist 01 0134. Head Driver 01 0135. Driver 12 1036. Record Supplier 01 0137. Laboratory Attendant 10 0938. Library Attendant 01 0139. Peon 21 2040. Watchman-cum-Sweeper 05 0541. Watchman 02 0242. Daftary 01 0143. Zamadar 01 0144. Treasury Sarkar 01 0145. Lift Operator 01 01
Total 277 203


