Embed Size (px)
Citation preview
Anopheles gambiae Immune Responsesto Human and Rodent PlasmodiumParasite SpeciesYuemei Dong
1, Ruth Aguilar
1, Zhiyong Xi
1, Emma Warr
1, Emmanuel Mongin
2,3, George Dimopoulos
1*
1 W. Harry Feinstone Department of Molecular Microbiology and Immunology, Bloomberg School of Public Health, Johns Hopkins University, Baltimore, Maryland, United
States, 2 Department of Human Genetics and Genome Quebec Innovation Centre, McGill University, Montreal, Quebec, Canada, 3 European Molecular Biology Laboratory,
European Bioinformatics Institute, The Wellcome Trust Genome Campus, Hinxton, Cambridge, United Kingdom
Transmission of malaria is dependent on the successful completion of the Plasmodium lifecycle in the Anopheles vector.Major obstacles are encountered in the midgut tissue, where most parasites are killed by the mosquito’s immunesystem. In the present study, DNA microarray analyses have been used to compare Anopheles gambiae responses toinvasion of the midgut epithelium by the ookinete stage of the human pathogen Plasmodium falciparum and therodent experimental model pathogen P. berghei. Invasion by P. berghei had a more profound impact on the mosquitotranscriptome, including a variety of functional gene classes, while P. falciparum elicited a broader immune response atthe gene transcript level. Ingestion of human malaria-infected blood lacking invasive ookinetes also induced a varietyof immune genes, including several anti-Plasmodium factors. Twelve selected genes were assessed for effect oninfection with both parasite species and bacteria using RNAi gene silencing assays, and seven of these genes werefound to influence mosquito resistance to both parasite species. An MD2-like receptor, AgMDL1, and an immunolectin,FBN39, showed specificity in regulating only resistance to P. falciparum, while the antimicrobial peptide gambicin anda novel putative short secreted peptide, IRSP5, were more specific for defense against the rodent parasite P. berghei.While all the genes that affected Plasmodium development also influenced mosquito resistance to bacterial infection,four of the antimicrobial genes had no effect on Plasmodium development. Our study shows that the impact of P.falciparum and P. berghei infection on A. gambiae biology at the gene transcript level is quite diverse, and the defenseagainst the two Plasmodium species is mediated by antimicrobial factors with both universal and Plasmodium-speciesspecific activities. Furthermore, our data indicate that the mosquito is capable of sensing infected blood constituents inthe absence of invading ookinetes, thereby inducing anti-Plasmodium immune responses.
Citation: Dong Y, Aguilar R, Xi Z, Warr E, Mongin E, et al. (2006) Anopheles gambiae immune responses to human and rodent Plasmodium parasite species. PLoS Pathog 2(6):e52. DOI: 10.1371/journal.ppat.0020052
Introduction
The transmission of the malarial parasite Plasmodium by thevector mosquito Anopheles gambiae is enabled by hematophagy,which is essential for egg production. Within 24 h afteringestion of infected blood, the Plasmodium gametocytes arefertilized and develop into motile ookinetes, which invade andtraverse themosquitomidgut epithelium to reach its basal side,where they develop into oocysts.Plasmodium encounters severalobstacles at each of its developmental stages and spatialtransitions within the mosquito. One of the major barriers isthe midgut epithelium, within which Plasmodium is attacked bythe mosquito’s immune system. These defense reactionsinvolve a variety of immune components that reduce theparasite population by several-fold and have mainly beendescribed at the stage of ookinete invasion and beyond [1].
Survival of ookinetes in the midgut epithelium has beenshown to depend on the action of agonists and antagonists.Recent studies have identified two infection-inducible puta-tive pattern recognition receptors, Tep1 and LRIM1, that canmediate killing of ookinetes in the midgut epithelium; incontrast, two c-type lectins, CTL4 and CTLMA2, can protectthe ookinetes from destruction [2]. Other known factors withactivity against the midgut stages of Plasmodium include nitricoxide, the antimicrobial peptides gambicin and cecropin, andan apolipophorin precursor RFABG [3–7]. Recent studies
have linked the A. gambiae NF-kappaB–like transcriptionfactor REL2 and adaptor protein IMD to the defense againstP. berghei and thereby established a role for the putative IMDpathway in anti-Plasmodium defense [8]. Plasmodium infectionwill also affect a variety of other biological processes inaddition to those linked to the immune response [7].Activation of immune gene transcription has also been
documented prior to ookinete invasion, suggesting that otherconstituents of malaria-infected blood are sensed by theimmune surveillance system and can thereby elicit immune
Editor: Alan Sher, National Institutes of Health, United States of America
Received September 13, 2005; Accepted April 24, 2006; Published June 9, 2006
DOI: 10.1371/journal.ppat.0020052
Copyright: � 2006 Dong et al. This is an open-access article distributed under theterms of the Creative Commons Attribution License, which permits unrestricteduse, distribution, and reproduction in any medium, provided the original authorand source are credited.
Abbreviations: AGBP, bacteria recognition family; AgMDL, Anopheles gambiaeMD2-like protein; CTL, C-type lectin family; CTRP, circumsporozoite- and TRAP-related protein; dsRNA, double-strand RNA; FBN, fibrinogen domain immunolectinfamily; GALE, gal-lectin family; GNBP, Gram-negative bacteria binding proteinfamily; KS, Kolmogorov-Smirnov; LRRD, leucine-rich repeat domain protein family;ML, MD2-like; PBS, phosphate-buffered saline; PGRP, peptidoglycan recognitionprotein family; Tep, thioester-containing protein family; wt, wild-type
* To whom correspondence should be addressed. E-mail: [email protected]
PLoS Pathogens | www.plospathogens.org June 2006 | Volume 2 | Issue 6 | e520513
responses [9]. The ingestedmalaria-infected blood differs fromnoninfected blood in a number of ways, including the presenceof blood-stage and gametocyte-stage Plasmodium and theirmetabolites, and of vertebrate infection-responsive molecules,as well as higher free-radical concentrations [10,11]. Thesebiochemical and cellular factors can be expected to influence avariety of biological processes in the mosquito, including theactivation of immune responses [3]. Midgut invasion byookinetes is accompanied by apoptosis of the invadedepithelial cells, which are expelled into the lumen [12].
Most studies addressing A. gambiae responses to Plasmodiuminfection have utilized the rodent Plasmodium berghei modelsystem, which is more amenable to experimental manipulationthan is the human parasite P. falciparum. However, A. gambiae isnot the natural vector of P. berghei, for which it is significantlymore permissive than for P. falciparum: P. berghei frequentlyproduces more than 300 oocysts on the midgut epithelium,while P. falciparum rarely produces more than two to fiveoocysts, either under laboratory conditions or in nature [13,14].At present, the dependence of these infection levels on themosquito’s immune responses or other factors is not known. Atthe cellular level, the ookinete invasion route and midgutepithelial response appear to be similar for the two parasitespecies, but the process may proceed more rapidly for P.falciparum at some stages because of its ;3 8C higher temper-ature of infection [15,16]. The mosquito’s immune system ismost likely predominantly devoted to combating the bacterialand fungal pathogens present in its external environment andintestinal flora, and it is unclear whether defense mechanismshave evolved that are specific for Plasmodium [17,18].
We have used an experimental design involving wild-type(wt) and transgenic mutant parasite strains of both P.falciparum and P. berghei species to analyze and compare A.gambiae responses, at the global transcript level, to theinvading ookinetes of both human and rodent parasitespecies and to human malaria-infected blood lacking invasiveookinetes. A similar strategy has been used previously [7] to
analyze midgut transcriptomic responses to P. berghei ooki-nete invasion; however, this previous study was more broadlyfocused on midgut responses relating to a variety ofbiological processes rather than the specific immuneresponses to the parasite. We have furthermore comparedthe anti-Plasmodium immune responses with those actingagainst bacteria with RNAi gene-silencing assays. Our analysisprovides insight into the species specificity of the immunedefense against Plasmodium and its relationship to themosquito’s antibacterial defense system.
Results
Responses to Invasion of the Midgut Epithelium by P.falciparum and P. berghei OokinetesOokinete-stage Plasmodium invades the mosquito midgut
epithelium over a 10-h period beginning about 20 h afteringestion of infected blood. The peak of P. berghei (21 8C) andP. falciparum (24 8C) ookinete invasion occurs at 24–26 h afteringestion [17,19]. To assess the impact of ookinete midgutinvasion on the mosquito transcriptome, we compared geneexpression in the gut and carcass tissues of mosquitoes thathad fed on a wt Plasmodium-infected blood and those that hadfed on blood infected with an invasion-incapable circum-sporozoite- and TRAP-related protein (CTRP) knockout(CTRP�) Plasmodium mutants. The experimental strategy usedto assay the mosquito responses to ookinete invasion andinfected blood is presented in Figure 1A. Identical assays withwt Plasmodium and CTRP knockout mutants were conductedwith P. falciparum and P. berghei, allowing comparison of themosquito responses to midgut invasion by ookinetes of thetwo parasite species. The entire predicted A. gambiae tran-scriptome was screened in these assays using a 60-meroligonucleotide microarray (Agilent Technologies, Palo Alto,California, United States). The gene regulation thresholdcutoff was determined to be 1.74-fold, which corresponds to0.8 in log2 scale, according to [20].P. falciparum ookinete invasion triggered the regulation of
471 genes in the midgut and carcass tissues, corresponding to;3.4% of the mosquito transcriptome; P. berghei ookineteinvasion elicited changes in the expression of 1,102 genes,corresponding to 8.1% of the mosquito transcriptome. Themosquito midgut and carcass responses to P. falciparum and P.berghei ookinete invasion were remarkably divergent, withonly limited overlap in gene expression (Figure 1B–1D); forexample, the overlap in transcriptional responses to the twoparasite species in the midgut involved only 16 induced andfive repressed genes. Midgut invasion by the P. falciparumookinetes elicited less profound gene regulation than P.ber-ghei. Specifically, P. falciparum induced 265 genes and re-pressed 65 genes in the midgut, while P. berghei invasionproduced alterations in more than three times as many genes,inducing 623 and repressing 292 (Figure 1B–D).P. falciparum induced more putative immune genes in the
mosquito midgut than did P. berghei (48 versus 35; Figure 1Cand 1D). It is possible that a proportion of the P. bergheiinduced genes is implicated in as-yet-unknown defensemechanisms and has therefore not been assigned to theimmunity class. In general, fewer genes were induced orrepressed in the carcass by ookinete invasion of the midgut(141 for P. falciparum versus 187 for P. berghei; Figure 1B–D).Quantitative RT-PCR assays of the expression patterns of 15
PLoS Pathogens | www.plospathogens.org June 2006 | Volume 2 | Issue 6 | e520514
Anopheles Anti-Plasmodium Defense
Synopsis
The malarial parasite Plasmodium has to traverse the gut wall of theAnopheles mosquito in order to complete its lifecycle and to betransmitted between hosts. At the midgut stage of infection, themosquito activates immune responses to eliminate most invadingparasites. The features of these immune responses are not very wellunderstood and have mainly been examined using the rodentparasite model P. berghei. Here the authors investigated therelationship between the Anopheles gambiae responses againstthe human pathogen P. falciparum, the rodent parasite P. berghei,and bacterial infections, at both the gene expression and functionallevels. The mosquito responses against these pathogens were quitediverse, and the defense against the two malaria parasite speciesinvolved both common and species-specific components. Malaria-infected blood was sufficient to activate anti-Plasmodium immuneresponses, even in the absence of midgut invasion. Through thismechanism, the mosquito can initiate its defense against Plasmo-dium prior to invasion of the gut. Mosquito genes that couldnegatively influence Plasmodium development were also capable ofregulating the resistance to bacterial infection, but several of theantibacterial genes had no effect on Plasmodium; thus, the mosquitoapparently utilizes its antibacterial defense systems against themalaria parasite.
control genes, under several experimental conditions, vali-dated microarray assays (Figure S1; Table S4; Protocol S1).
Responses to Malaria-Infected Blood in the Absence ofMidgut InvasionThe impact on the mosquito midgut and carcass tran-
scriptomes of P. falciparum–infected blood that lackedinvasive ookinetes was investigated by comparing geneexpression between mosquitoes that had fed on bloodinfected with the CTRP knockout mutant P. falciparum strain(incapable of ookinete invasion; used as experimental sample)and mosquitoes fed on non-Plasmodium–infected blood (usedas a reference sample) at 24 h after ingestion, when ookineteinvasion of the midgut normally takes place (Figure 1A). Themosquitoes were clearly capable of sensing and discriminat-ing between infected blood and non-infected blood.Ingestion of CTRP knockout–infected blood elicited
changes in the expression of as many as 1,896 genes in themidgut and carcass tissues, corresponding to approximately14% of the A. gambiae transcriptome (Figure 1B–1D; Tables S1and S2). The magnitude of the gene regulation in the midgutin response to P. falciparum CTRP knockout mutant-infectedblood was comparable to that induced by P. berghei ookineteinvasion (844 versus 915 genes). Six times as many genes(1,052) were affected in the carcass tissues as were regulatedby P. berghei ookinete invasion (187). The 487 induced and 357repressed genes in the midgut tissue represented a variety offunctional classes, including 51 putative immune genes.
Molecular Immune ResponsesInvasion of the midgut epithelium by P. falciparum and P.
berghei ookinetes as well as infected blood containing non-invasive ookinetes induced putative immune-related genes.Genes that showed significant up- or down-regulation (atleast 1.74-fold) in at least one experiment were grouped intoclusters according to the specificity of their regulation for themidgut tissue and/or carcass. We divided these 157 transcriptsinto seven groups based on their expression patterns andtissue specificity (Table 1).
Figure 1. Experimental Design and Global Gene Expression Patterns at
the Different Conditions of Infection
(A) Model outlining the experimental design for assessing responses tothe invading ookinetes (indicated as P.f. ookinete [P.f. o.] and P.b.ookinete [P.b. o.] in (B) and (C) by comparing transcription betweenmosquitoes fed on blood infected with a wt Plasmodium strain and thosefed on blood infected with the invasion-incapable mutant Plasmodiumstrain CTRP�. Responses to infected blood (indicated as P.f. blood in [B]and [C]) in the absence of ookinete invasion were assessed by comparinggene expression between mosquitoes fed on blood infected with the P.falciparum invasion-incapable mutant and mosquitoes fed on non-infected (no Plasmodium) blood.(B) Gene regulation in midgut and carcass tissues triggered by P.falciparum ookinete invasion (P.f. ookinete), P. berghei ookinete invasion(P.b. ookinete), and P. falciparum strain CTRP�-infected blood lackinginvasive ookinetes (P.f. blood). Colored arrows indicate genes that areup- or down-regulated in the various unique and overlapping sections.(C) Proportions and numbers of genes belonging to distinct functionalclasses which were up- or down-regulated by the various stimuli in thegut and carcass tissues. DIV: diverse; R/T/T: replication, transcription,translation; MET: metabolism; TRP: transport; CY/ST: cytoskeletal,structural; PR/DI: proteolysis, digestion; MIT: mitochondrial; RE/ST:oxidoreductive, stress-related; APO: apoptosis; P/A: putative immunityand apoptosis. Gene functions were predicted based on Gene Ontologydata and manual sequence homology searches.(D) Same as in (C), but also including genes of diverse functions (DIV) andunknown functions (UKN).DOI: 10.1371/journal.ppat.0020052.g001
PLoS Pathogens | www.plospathogens.org June 2006 | Volume 2 | Issue 6 | e520515
Anopheles Anti-Plasmodium Defense
Table 1. Grouping of Putative Immune Genes into Seven Distinct Groups, According to their Regulatory Significance in the Midgut andCarcass Tissue
Group Functional
Class
Name P.f.
Gut
P.b.
Gut
P.f.CTRP
Gut
P.f.
Carc
P.b.
Carc
P.f.CTRP
Carc
E.c. S.a. RNAi
P.f.
RNAi
P.b.
RNAi
E.c.
RNAi
S.a.
Group 1 PRR E20083:AgMDL1 1.7 �1.0 �0.6 0.6 0.2 0.0 1.5 0.3 (�)* NS (�)* (�)*
E16963:AgMDL2 1.4 �1.5 �0.5 1.1
E16857:TEP1 2.1 �0.3 0.3 0.6 0.2 1.5 2.3 �0.7 (�)* (�)* E* E*
E21216:TEP4 0.9 0.4 0.5 0.1 0.1 1.9 1.7 1.6 NS (�)* (�)*
E16853:TEP6 1.1 �0.2 �0.2 0.1 0.5 0.5 0.2 �0.6
E13026:TEP12 1.3 �0.3 �0.2 0.6 0.2 0.5 0.3 �0.7
E19727:TEP14 1.4 0.1 �0.1 0.2 0.1 0.5 1.8 �0.4
E19522:TEP15 1.4 �0.3 �0.9 0.0 �0.5 1.0 1.8 1.0
E21282:TEP16 1.8 0.1 �0.5 0.3 0.0 1.8 1.8 �0.5
E29396:FBN51 1.6 0.9 0.7 �0.8 0.6 �0.4 �1.2
E11252:FBN8 1.9 �0.4 0.1 0.4 0.8 0.1 �0.1 �0.1 (�)* (�)* (�)* (�)*
E11248:FBN9 1.6 0.0 0.8 0.2 0.0 1.7 2.5 0.7 (�)* (�)* (�)* (�)*
E21822:LRRD7 3.0 �1.0 1.1 2.2 �1.1 (�)* (�)* (�)* (�)*
E19113:LRRD4 1.7 �0.2 0.7 �0.1 �0.3 2.2 0.9 0.5
E15066:LRRD5 2.2 �0.7 0.1 �0.6 0.0
E14959:LRRD8 1.3 �0.6 �0.3 0.9 �0.6
E19115:LRRD9 1.7 0.4 �0.2 �0.2 2.3 1.5 �0.2
E06959:AGBP1 1.8 �1.2 �0.8 0.7 NS NS (�)*
E12234:CTLGA3 1.5 0.2 0.2 0.4 0.1 2.2 �0.8
SPC E20941:SP PPO ACTIVATE 1.8 0.2 �0.7 �1.1 2.3 �0.3
E13584:SP 14D2 CLIPB1 1.5 0.1 0.2 0.1 �0.8 0.7 2.1 �0.2
E23726:SP CLIPB4 0.9 0.9 0.5 0.1 �0.5 2.0 0.8 0.4
E12706:SP CLIPA9 1.4 0.7 0.5 0.3 �0.4 1.6 1.8 �0.4
E12642:SP CLIPB13 1.1 �0.4 �0.5 0.0 �0.3 0.3 1.7
E15815:SP CLIPB15 1.2 �0.3 0.1 0.3 0.3 0.9 1.8 �0.2
E11374:SP SNAKE-LIKE 1.6 �1.0 1.1 0.0 0.2
E20158:SP CLIP1 1.8 �0.7 �0.3 0.3 0.4 1.3 1.9 �0.2 (�)* (�)* (�)* (�)*
E08842:SP CLIP2 1.0 0.0 0.6 �0.2 �0.4 1.7 0.9 1.0
E21812:SERPIN2 1.2 �0.2 0.2 0.4 �0.3 0.9 2.1
E18532:PACIFASTIN 1.4 0.2 0.4 0.0 0.3 2.7 1.8 0.3
M E02437:PPO3 1.1 �1.0 �0.1 0.0 0.5 �0.2 �0.8 �0.5
E14433:DCE LIKE1 0.9 0.3 �0.2 0.2 �0.4 0.3 0.8 �0.2
E20450:DCCE2 2.8 1.9 0.2 �0.3 1.6 1.8 �0.1
AMP E21028:IRSP1 3.1 �1.5 �0.8 (�)* (�)* (�)* (�)*
E19220:IRSP2 2.3 �0.4 �2.2 1.3 0.4 �2.1 0.6 1.1 NS NS (�)* (�)*
E09630:IRSP3 2.3 0.0
E19451:IRSP5 2.9 �1.6 2.7 0.6 NS (�)* (�)* NS
E17888:LYSOZYME1 2.9 0.8 �0.2 �1.8
E18395:LYSOZYME4 1.3 �0.5 �0.1 0.0 0.7
DIV E10802:CUT4 0.9 0.1 0.0 �0.4 �1.1
E13822:CUT5 1.2 1.0 �0.4 �1.0 �0.9
E26190:CUT9 0.8 �0.3 0.1 0.4
E21949:TRANSFERRIN 1.4 �0.1 0.4 �0.4 �0.8 3.3 1.5 0.4
E28106:APOD 1.4 �0.8 �0.1 0.5 �0.4 0.5 1.9 �0.4 (�)* (�)* (�)* (�)*
E08856:F SPONDIN 2.7 �1.0 �0.2 �0.2 �0.8 1.1 2.4 �0.4
Group 2 PRR E20281:FBN18 0.2 1.1 �0.2 0.3 0.9 �0.6 �0.7 �0.4
E08964:FBNa2 0.2 1.1 �0.6 �0.2 0.9 0.9 0.3 �0.4
E20316:FNBN33 0.0 1.0 0.5 0.0 �0.1 0.5 0.5 �0.2
E11478:FBN-LIPASE �0.4 1.0 0.2 0.2 0.3 0.4 0.0 �0.4
E15624:GALE5a 0.2 1.1 �0.1 0.3 0.2 �0.4 0.2 0.1
E28711:GALE5b �0.2 1.6 �0.2 �0.1 0.3 �0.2 �0.6 0.6
E17035:GNBPB3 �0.2 0.9 0.3 �0.1 0.8 �2.1 �1.0 �0.6
E16221:GNBPB4 �0.2 1.0 0.0 �0.3 �0.1
E07504:LRRD1 �0.1 1.6 �0.1 �0.5 �0.3
E17816:LRRD2 �0.1 0.8 0.4 0.2 0.3 1.0 �0.5
E14905:LRRD10a 0.0 1.3 �0.2 0.0 0.3 �0.8 0.1 �1.2
E15569:LRRD10b 0.0 1.0 0.1 �0.4 �0.2
E11337:LRRD11 �0.2 1.0 �0.6 �1.0 �0.7
E11311:LRRD14 �0.2 1.1 �0.2 0.0 0.3 �0.5 1.4 0.0
E19036:LRRD17 0.9 �0.1 0.2 0.0
E15763:LRRD20 �0.1 1.2 0.3 1.3 �1.4
E29002:PGRPLC 1–3 0.1 1.2 �0.3 0.4 �0.3
E12978:PGRP AMIDASE 0.0 0.8 1.4 �0.1 0.0 �0.5 0.1 0.2 NS NS (�)*
E12979:PGRPS3 0.0 1.4 1.0 0.2 �0.1 1.7 �0.3 �1.3
E22427:SRB1 SR BI 0.2 1.4 �0.5 �0.3 �0.9
E12288:SCRBQ2 0.4 1.2 0.6 0.1 0.3 0.6 �0.2 �0.6
PLoS Pathogens | www.plospathogens.org June 2006 | Volume 2 | Issue 6 | e520516
Anopheles Anti-Plasmodium Defense
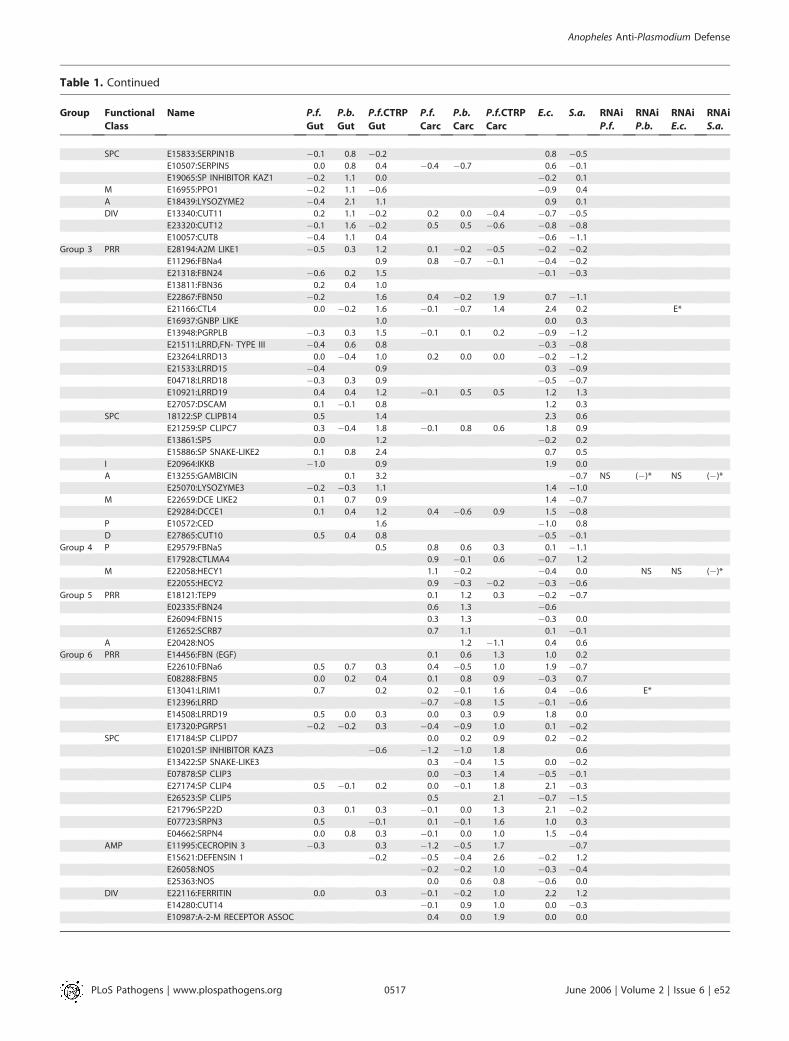
Table 1. Continued
Group Functional
Class
Name P.f.
Gut
P.b.
Gut
P.f.CTRP
Gut
P.f.
Carc
P.b.
Carc
P.f.CTRP
Carc
E.c. S.a. RNAi
P.f.
RNAi
P.b.
RNAi
E.c.
RNAi
S.a.
SPC E15833:SERPIN1B �0.1 0.8 �0.2 0.8 �0.5
E10507:SERPIN5 0.0 0.8 0.4 �0.4 �0.7 0.6 �0.1
E19065:SP INHIBITOR KAZ1 �0.2 1.1 0.0 �0.2 0.1
M E16955:PPO1 �0.2 1.1 �0.6 �0.9 0.4
A E18439:LYSOZYME2 �0.4 2.1 1.1 0.9 0.1
DIV E13340:CUT11 0.2 1.1 �0.2 0.2 0.0 �0.4 �0.7 �0.5
E23320:CUT12 �0.1 1.6 �0.2 0.5 0.5 �0.6 �0.8 �0.8
E10057:CUT8 �0.4 1.1 0.4 �0.6 �1.1
Group 3 PRR E28194:A2M LIKE1 �0.5 0.3 1.2 0.1 �0.2 �0.5 �0.2 �0.2
E11296:FBNa4 0.9 0.8 �0.7 �0.1 �0.4 �0.2
E21318:FBN24 �0.6 0.2 1.5 �0.1 �0.3
E13811:FBN36 0.2 0.4 1.0
E22867:FBN50 �0.2 1.6 0.4 �0.2 1.9 0.7 �1.1
E21166:CTL4 0.0 �0.2 1.6 �0.1 �0.7 1.4 2.4 0.2 E*
E16937:GNBP LIKE 1.0 0.0 0.3
E13948:PGRPLB �0.3 0.3 1.5 �0.1 0.1 0.2 �0.9 �1.2
E21511:LRRD,FN- TYPE III �0.4 0.6 0.8 �0.3 �0.8
E23264:LRRD13 0.0 �0.4 1.0 0.2 0.0 0.0 �0.2 �1.2
E21533:LRRD15 �0.4 0.9 0.3 �0.9
E04718:LRRD18 �0.3 0.3 0.9 �0.5 �0.7
E10921:LRRD19 0.4 0.4 1.2 �0.1 0.5 0.5 1.2 1.3
E27057:DSCAM 0.1 �0.1 0.8 1.2 0.3
SPC 18122:SP CLIPB14 0.5 1.4 2.3 0.6
E21259:SP CLIPC7 0.3 �0.4 1.8 �0.1 0.8 0.6 1.8 0.9
E13861:SP5 0.0 1.2 �0.2 0.2
E15886:SP SNAKE-LIKE2 0.1 0.8 2.4 0.7 0.5
I E20964:IKKB �1.0 0.9 1.9 0.0
A E13255:GAMBICIN 0.1 3.2 �0.7 NS (�)* NS (�)*
E25070:LYSOZYME3 �0.2 �0.3 1.1 1.4 �1.0
M E22659:DCE LIKE2 0.1 0.7 0.9 1.4 �0.7
E29284:DCCE1 0.1 0.4 1.2 0.4 �0.6 0.9 1.5 �0.8
P E10572:CED 1.6 �1.0 0.8
D E27865:CUT10 0.5 0.4 0.8 �0.5 �0.1
Group 4 P E29579:FBNa5 0.5 0.8 0.6 0.3 0.1 �1.1
E17928:CTLMA4 0.9 �0.1 0.6 �0.7 1.2
M E22058:HECY1 1.1 �0.2 �0.4 0.0 NS NS (�)*
E22055:HECY2 0.9 �0.3 �0.2 �0.3 �0.6
Group 5 PRR E18121:TEP9 0.1 1.2 0.3 �0.2 �0.7
E02335:FBN24 0.6 1.3 �0.6
E26094:FBN15 0.3 1.3 �0.3 0.0
E12652:SCRB7 0.7 1.1 0.1 �0.1
A E20428:NOS 1.2 �1.1 0.4 0.6
Group 6 PRR E14456:FBN (EGF) 0.1 0.6 1.3 1.0 0.2
E22610:FBNa6 0.5 0.7 0.3 0.4 �0.5 1.0 1.9 �0.7
E08288:FBN5 0.0 0.2 0.4 0.1 0.8 0.9 �0.3 0.7
E13041:LRIM1 0.7 0.2 0.2 �0.1 1.6 0.4 �0.6 E*
E12396:LRRD �0.7 �0.8 1.5 �0.1 �0.6
E14508:LRRD19 0.5 0.0 0.3 0.0 0.3 0.9 1.8 0.0
E17320:PGRPS1 �0.2 �0.2 0.3 �0.4 �0.9 1.0 0.1 �0.2
SPC E17184:SP CLIPD7 0.0 0.2 0.9 0.2 �0.2
E10201:SP INHIBITOR KAZ3 �0.6 �1.2 �1.0 1.8 0.6
E13422:SP SNAKE-LIKE3 0.3 �0.4 1.5 0.0 �0.2
E07878:SP CLIP3 0.0 �0.3 1.4 �0.5 �0.1
E27174:SP CLIP4 0.5 �0.1 0.2 0.0 �0.1 1.8 2.1 �0.3
E26523:SP CLIP5 0.5 2.1 �0.7 �1.5
E21796:SP22D 0.3 0.1 0.3 �0.1 0.0 1.3 2.1 �0.2
E07723:SRPN3 0.5 �0.1 0.1 �0.1 1.6 1.0 0.3
E04662:SRPN4 0.0 0.8 0.3 �0.1 0.0 1.0 1.5 �0.4
AMP E11995:CECROPIN 3 �0.3 0.3 �1.2 �0.5 1.7 �0.7
E15621:DEFENSIN 1 �0.2 �0.5 �0.4 2.6 �0.2 1.2
E26058:NOS �0.2 �0.2 1.0 �0.3 �0.4
E25363:NOS 0.0 0.6 0.8 �0.6 0.0
DIV E22116:FERRITIN 0.0 0.3 �0.1 �0.2 1.0 2.2 1.2
E14280:CUT14 �0.1 0.9 1.0 0.0 �0.3
E10987:A-2-M RECEPTOR ASSOC 0.4 0.0 1.9 0.0 0.0
PLoS Pathogens | www.plospathogens.org June 2006 | Volume 2 | Issue 6 | e520517
Anopheles Anti-Plasmodium Defense
Groups 1, 2, and 3 consisted of 45 genes that were inducedin the midgut by P. falciparum ookinete invasion, 29 genesinduced by P. berghei ookinete invasion, and 25 genes inducedby ingested infected blood lacking invasive ookinetes (theCTRP mutant), respectively. While P. falciparum ookineteinvasion induced almost twice as many immune genes as didthe other two infection conditions, the distribution offunctional classes was quite similar among the three groups.Almost half of the genes in each group encoded putativepattern recognition receptors that belong to the MD2-likeprotein family (AgMDL), the fibrinogen domain immunolec-tin family (FBN), the thioester-containing protein family(Tep), the Gram-negative bacteria binding protein family(GNBP), the peptidoglycan recognition protein family (PGRP),the C-type lectin family (CTL), gal-lectin family (GALE), thescavenger receptor family, the leucine-rich repeat domainprotein family (LRRD), and the bacteria recognition family(AGBP) [18,21–29]. We suggest that some of these proteins arerequired for the recognition of Plasmodium and subsequentactivation of defense reactions. Other transcripts in groups 1–3 encoded immunity-related serine proteases and serineprotease inhibitors that are most likely involved in immunesignal amplification cascades. Several transcripts encodingenzymes involved in melanization reactions were induced in
the midgut. Finally, lysozymes and the mosquito-specificantimicrobial peptide gambicin (E13255) were induced.Groups 4, 5, and 6 consisted of immune genes that were
induced in the carcass tissues, and group 7 consisted of avariety of immune genes that were mostly repressed underthe various experimental conditions.The proportion of genes induced in invaded cells may be
larger than that seen for the entire midgut tissue, because arelatively small number of cells is invaded by ookinetes; wetherefore suspect that we might have missed genes that arehighly expressed in invaded cells but are diluted out by therest of the midgut. Hemocytes that are attached to the midgutwall but difficult to separate by dissection have been shown toexpress Tepl, LRIM1, and other effectors that act againstPlasmodium in the midgut [2,30]. Some of the gene activationthat we detected in infected midgut samples is therefore likelyto be derived from hemocytes. Preliminary studies have shownthat as many as 30 of the 157 putative immune genes listed inTable 1 are highly expressed in hemocytes (Strand andDimopoulos, unpublished data). Many of the immune genesidentified here have also been found to be induced in themidguts of A. gambiae refractory L3–5 and susceptible G3 and4A-RR strain mosquitoes upon P. berghei infection [7,17,31].Our analyses identified several novel infection-responsive
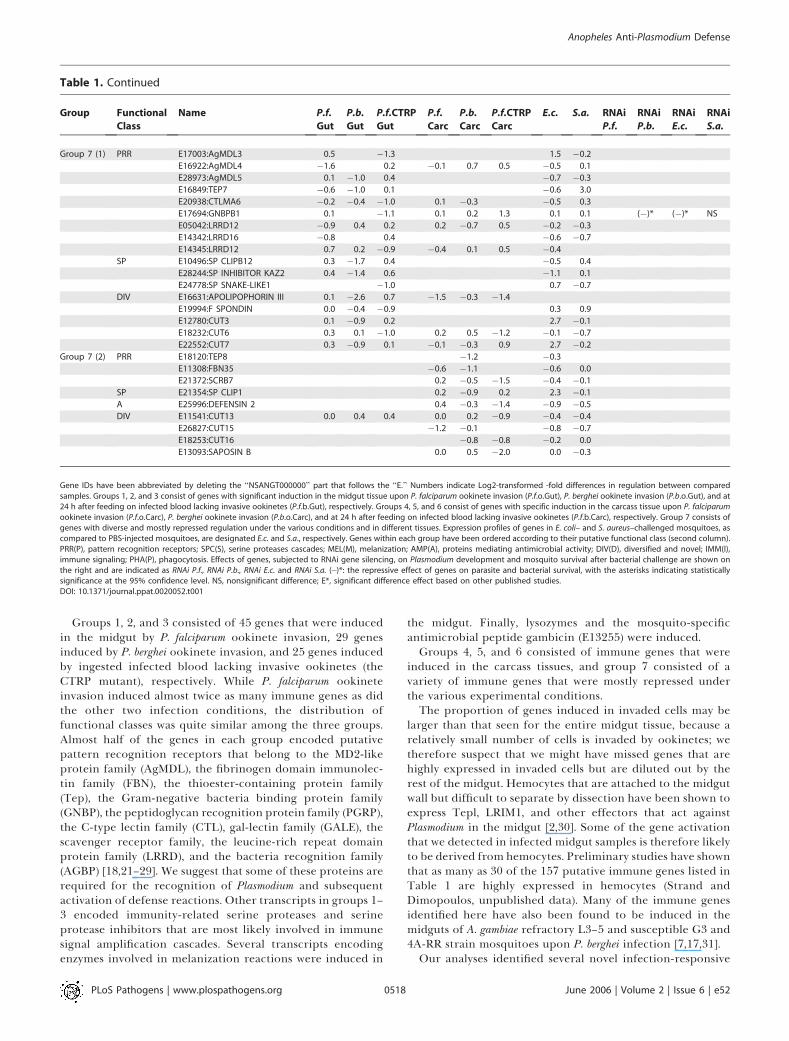
Table 1. Continued
Group Functional
Class
Name P.f.
Gut
P.b.
Gut
P.f.CTRP
Gut
P.f.
Carc
P.b.
Carc
P.f.CTRP
Carc
E.c. S.a. RNAi
P.f.
RNAi
P.b.
RNAi
E.c.
RNAi
S.a.
Group 7 (1) PRR E17003:AgMDL3 0.5 �1.3 1.5 �0.2
E16922:AgMDL4 �1.6 0.2 �0.1 0.7 0.5 �0.5 0.1
E28973:AgMDL5 0.1 �1.0 0.4 �0.7 �0.3
E16849:TEP7 �0.6 �1.0 0.1 �0.6 3.0
E20938:CTLMA6 �0.2 �0.4 �1.0 0.1 �0.3 �0.5 0.3
E17694:GNBPB1 0.1 �1.1 0.1 0.2 1.3 0.1 0.1 (�)* (�)* NS
E05042:LRRD12 �0.9 0.4 0.2 0.2 �0.7 0.5 �0.2 �0.3
E14342:LRRD16 �0.8 0.4 �0.6 �0.7
E14345:LRRD12 0.7 0.2 �0.9 �0.4 0.1 0.5 �0.4
SP E10496:SP CLIPB12 0.3 �1.7 0.4 �0.5 0.4
E28244:SP INHIBITOR KAZ2 0.4 �1.4 0.6 �1.1 0.1
E24778:SP SNAKE-LIKE1 �1.0 0.7 �0.7
DIV E16631:APOLIPOPHORIN III 0.1 �2.6 0.7 �1.5 �0.3 �1.4
E19994:F SPONDIN 0.0 �0.4 �0.9 0.3 0.9
E12780:CUT3 0.1 �0.9 0.2 2.7 �0.1
E18232:CUT6 0.3 0.1 �1.0 0.2 0.5 �1.2 �0.1 �0.7
E22552:CUT7 0.3 �0.9 0.1 �0.1 �0.3 0.9 2.7 �0.2
Group 7 (2) PRR E18120:TEP8 �1.2 �0.3
E11308:FBN35 �0.6 �1.1 �0.6 0.0
E21372:SCRB7 0.2 �0.5 �1.5 �0.4 �0.1
SP E21354:SP CLIP1 0.2 �0.9 0.2 2.3 �0.1
A E25996:DEFENSIN 2 0.4 �0.3 �1.4 �0.9 �0.5
DIV E11541:CUT13 0.0 0.4 0.4 0.0 0.2 �0.9 �0.4 �0.4
E26827:CUT15 �1.2 �0.1 �0.8 �0.7
E18253:CUT16 �0.8 �0.8 �0.2 0.0
E13093:SAPOSIN B 0.0 0.5 �2.0 0.0 �0.3
Gene IDs have been abbreviated by deleting the ‘‘NSANGT000000’’ part that follows the ‘‘E.’’ Numbers indicate Log2-transformed -fold differences in regulation between comparedsamples. Groups 1, 2, and 3 consist of genes with significant induction in the midgut tissue upon P. falciparum ookinete invasion (P.f.o.Gut), P. berghei ookinete invasion (P.b.o.Gut), and at24 h after feeding on infected blood lacking invasive ookinetes (P.f.b.Gut), respectively. Groups 4, 5, and 6 consist of genes with specific induction in the carcass tissue upon P. falciparumookinete invasion (P.f.o.Carc), P. berghei ookinete invasion (P.b.o.Carc), and at 24 h after feeding on infected blood lacking invasive ookinetes (P.f.b.Carc), respectively. Group 7 consists ofgenes with diverse and mostly repressed regulation under the various conditions and in different tissues. Expression profiles of genes in E. coli– and S. aureus–challenged mosquitoes, ascompared to PBS-injected mosquitoes, are designated E.c. and S.a., respectively. Genes within each group have been ordered according to their putative functional class (second column).PRR(P), pattern recognition receptors; SPC(S), serine proteases cascades; MEL(M), melanization; AMP(A), proteins mediating antimicrobial activity; DIV(D), diversified and novel; IMM(I),immune signaling; PHA(P), phagocytosis. Effects of genes, subjected to RNAi gene silencing, on Plasmodium development and mosquito survival after bacterial challenge are shown onthe right and are indicated as RNAi P.f., RNAi P.b., RNAi E.c. and RNAi S.a. (�)*: the repressive effect of genes on parasite and bacterial survival, with the asterisks indicating statisticallysignificance at the 95% confidence level. NS, nonsignificant difference; E*, significant difference effect based on other published studies.DOI: 10.1371/journal.ppat.0020052.t001
PLoS Pathogens | www.plospathogens.org June 2006 | Volume 2 | Issue 6 | e520518
Anopheles Anti-Plasmodium Defense
genes that we suggest are components of the mosquito’simmune system; these are discussed in detail in the Support-ing Information (Protocol S1). Data concerning other bio-logical processes in the mosquito that are affected byookinete invasion of the midgut and ingestion of malaria-infected blood are detailed in the Supporting Information(Protocol S1).
Determinants of Mosquito Resistance to InfectionWe assume that the mosquito’s immune response is largely
regulated at the level of mRNA abundance [2,7,17,32]. Basedon this assumption, we predict that many of the infection-stimulated immunity-related genes are necessary to defendagainst Plasmodium. We took an RNAi-based reverse geneticapproach to test the role these induced genes played infighting a Plasmodium infection. Transcripts of selected geneswere targeted with double-strand RNAs (dsRNAs) prior toexperimental infection with the pathogens to assess thepotential effects of the transcript depletion on the infectionphenotype. Nineteen genes were selected on the basis of their
expression patterns and putative functions in innate im-munity, as predicted by their sequences. The efficiency ofRNAi-mediated transcript depletion was verified by quanti-tative real-time RT-PCR (Table S6 in Results S1). These 19genes encode putative pattern recognition receptors(AgMDL1, TEP1, TEP4, FBN8, FBN9, FBN39 [E21380]),LRRD7, AGPB1, PGRP-AMIDASE, GNBPB1; the serineprotease SPCLIP1; the antimicrobial peptide gambicin; thehemocyanin HECY1, the apolipoprotein APOD; the kinino-gen KIN1; and four short secreted peptides, IRSP1, IRPS2,IRSP3, and IRSP5. Two genes were tested but did not displayany significant effects (KIN1 [E14131] and IRSP3 [E09630])(unpublished data). Tep1 was used as a positive control assilencing of Tep1 in a susceptible G3 A. gambiae strain resultsin an up to 7-fold increase in P. berghei infection [30]. Allgenes were used in challenge experiments with P. berghei whileonly a subset of genes were tested with P. falciparum because ofthe difficulty of performing these experiments. Detailedinformation on the genes selected for gene silencing assaysis presented in the Supporting Information (Protocol S1).
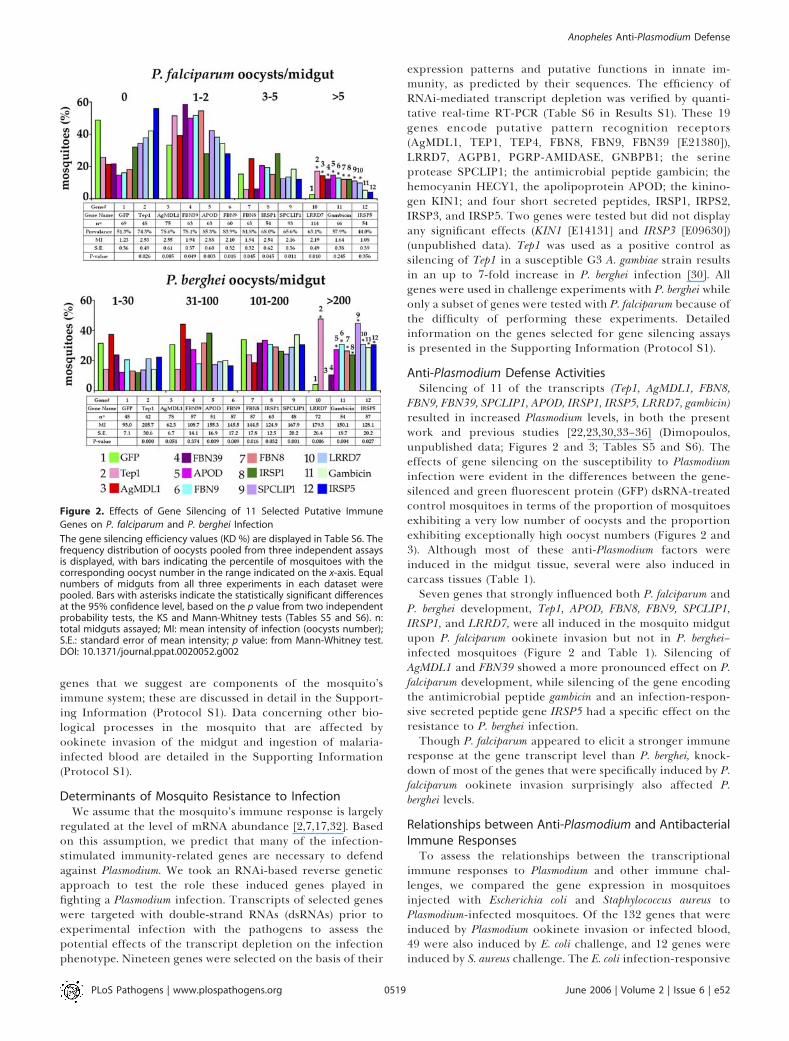
Anti-Plasmodium Defense ActivitiesSilencing of 11 of the transcripts (Tep1, AgMDL1, FBN8,
FBN9, FBN39, SPCLIP1, APOD, IRSP1, IRSP5, LRRD7, gambicin)resulted in increased Plasmodium levels, in both the presentwork and previous studies [22,23,30,33–36] (Dimopoulos,unpublished data; Figures 2 and 3; Tables S5 and S6). Theeffects of gene silencing on the susceptibility to Plasmodiuminfection were evident in the differences between the gene-silenced and green fluorescent protein (GFP) dsRNA-treatedcontrol mosquitoes in terms of the proportion of mosquitoesexhibiting a very low number of oocysts and the proportionexhibiting exceptionally high oocyst numbers (Figures 2 and3). Although most of these anti-Plasmodium factors wereinduced in the midgut tissue, several were also induced incarcass tissues (Table 1).Seven genes that strongly influenced both P. falciparum and
P. berghei development, Tep1, APOD, FBN8, FBN9, SPCLIP1,IRSP1, and LRRD7, were all induced in the mosquito midgutupon P. falciparum ookinete invasion but not in P. berghei–infected mosquitoes (Figure 2 and Table 1). Silencing ofAgMDL1 and FBN39 showed a more pronounced effect on P.falciparum development, while silencing of the gene encodingthe antimicrobial peptide gambicin and an infection-respon-sive secreted peptide gene IRSP5 had a specific effect on theresistance to P. berghei infection.Though P. falciparum appeared to elicit a stronger immune
response at the gene transcript level than P. berghei, knock-down of most of the genes that were specifically induced by P.falciparum ookinete invasion surprisingly also affected P.berghei levels.
Relationships between Anti-Plasmodium and AntibacterialImmune ResponsesTo assess the relationships between the transcriptional
immune responses to Plasmodium and other immune chal-lenges, we compared the gene expression in mosquitoesinjected with Escherichia coli and Staphylococcus aureus toPlasmodium-infected mosquitoes. Of the 132 genes that wereinduced by Plasmodium ookinete invasion or infected blood,49 were also induced by E. coli challenge, and 12 genes wereinduced by S. aureus challenge. The E. coli infection-responsive
Figure 2. Effects of Gene Silencing of 11 Selected Putative Immune
Genes on P. falciparum and P. berghei Infection
The gene silencing efficiency values (KD %) are displayed in Table S6. Thefrequency distribution of oocysts pooled from three independent assaysis displayed, with bars indicating the percentile of mosquitoes with thecorresponding oocyst number in the range indicated on the x-axis. Equalnumbers of midguts from all three experiments in each dataset werepooled. Bars with asterisks indicate the statistically significant differencesat the 95% confidence level, based on the p value from two independentprobability tests, the KS and Mann-Whitney tests (Tables S5 and S6). n:total midguts assayed; MI: mean intensity of infection (oocysts number);S.E.: standard error of mean intensity; p value: from Mann-Whitney test.DOI: 10.1371/journal.ppat.0020052.g002
PLoS Pathogens | www.plospathogens.org June 2006 | Volume 2 | Issue 6 | e520519
Anopheles Anti-Plasmodium Defense
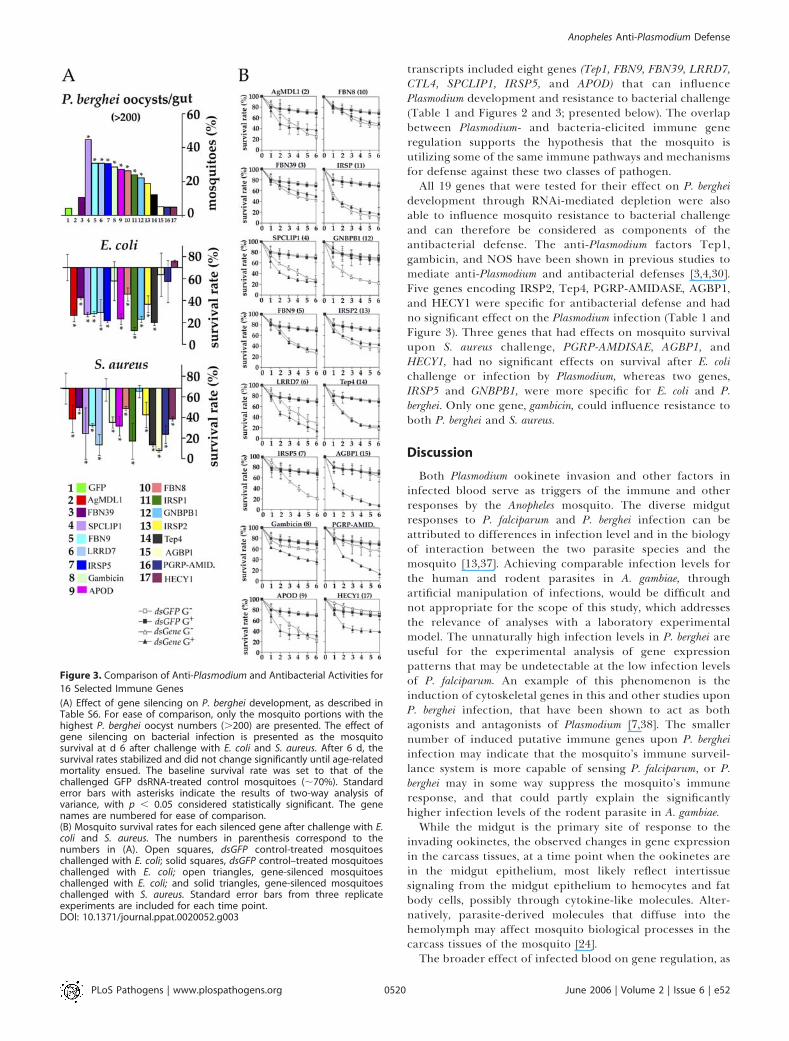
transcripts included eight genes (Tep1, FBN9, FBN39, LRRD7,CTL4, SPCLIP1, IRSP5, and APOD) that can influencePlasmodium development and resistance to bacterial challenge(Table 1 and Figures 2 and 3; presented below). The overlapbetween Plasmodium- and bacteria-elicited immune generegulation supports the hypothesis that the mosquito isutilizing some of the same immune pathways and mechanismsfor defense against these two classes of pathogen.All 19 genes that were tested for their effect on P. berghei
development through RNAi-mediated depletion were alsoable to influence mosquito resistance to bacterial challengeand can therefore be considered as components of theantibacterial defense. The anti-Plasmodium factors Tep1,gambicin, and NOS have been shown in previous studies tomediate anti-Plasmodium and antibacterial defenses [3,4,30].Five genes encoding IRSP2, Tep4, PGRP-AMIDASE, AGBP1,and HECY1 were specific for antibacterial defense and hadno significant effect on the Plasmodium infection (Table 1 andFigure 3). Three genes that had effects on mosquito survivalupon S. aureus challenge, PGRP-AMDISAE, AGBP1, andHECY1, had no significant effects on survival after E. colichallenge or infection by Plasmodium, whereas two genes,IRSP5 and GNBPB1, were more specific for E. coli and P.berghei. Only one gene, gambicin, could influence resistance toboth P. berghei and S. aureus.
Discussion
Both Plasmodium ookinete invasion and other factors ininfected blood serve as triggers of the immune and otherresponses by the Anopheles mosquito. The diverse midgutresponses to P. falciparum and P. berghei infection can beattributed to differences in infection level and in the biologyof interaction between the two parasite species and themosquito [13,37]. Achieving comparable infection levels forthe human and rodent parasites in A. gambiae, throughartificial manipulation of infections, would be difficult andnot appropriate for the scope of this study, which addressesthe relevance of analyses with a laboratory experimentalmodel. The unnaturally high infection levels in P. berghei areuseful for the experimental analysis of gene expressionpatterns that may be undetectable at the low infection levelsof P. falciparum. An example of this phenomenon is theinduction of cytoskeletal genes in this and other studies uponP. berghei infection, that have been shown to act as bothagonists and antagonists of Plasmodium [7,38]. The smallernumber of induced putative immune genes upon P. bergheiinfection may indicate that the mosquito’s immune surveil-lance system is more capable of sensing P. falciparum, or P.berghei may in some way suppress the mosquito’s immuneresponse, and that could partly explain the significantlyhigher infection levels of the rodent parasite in A. gambiae.While the midgut is the primary site of response to the
invading ookinetes, the observed changes in gene expressionin the carcass tissues, at a time point when the ookinetes arein the midgut epithelium, most likely reflect intertissuesignaling from the midgut epithelium to hemocytes and fatbody cells, possibly through cytokine-like molecules. Alter-natively, parasite-derived molecules that diffuse into thehemolymph may affect mosquito biological processes in thecarcass tissues of the mosquito [24].The broader effect of infected blood on gene regulation, as
Figure 3. Comparison of Anti-Plasmodium and Antibacterial Activities for
16 Selected Immune Genes
(A) Effect of gene silencing on P. berghei development, as described inTable S6. For ease of comparison, only the mosquito portions with thehighest P. berghei oocyst numbers (.200) are presented. The effect ofgene silencing on bacterial infection is presented as the mosquitosurvival at d 6 after challenge with E. coli and S. aureus. After 6 d, thesurvival rates stabilized and did not change significantly until age-relatedmortality ensued. The baseline survival rate was set to that of thechallenged GFP dsRNA-treated control mosquitoes (;70%). Standarderror bars with asterisks indicate the results of two-way analysis ofvariance, with p , 0.05 considered statistically significant. The genenames are numbered for ease of comparison.(B) Mosquito survival rates for each silenced gene after challenge with E.coli and S. aureus. The numbers in parenthesis correspond to thenumbers in (A). Open squares, dsGFP control-treated mosquitoeschallenged with E. coli; solid squares, dsGFP control–treated mosquitoeschallenged with E. coli; open triangles, gene-silenced mosquitoeschallenged with E. coli; and solid triangles, gene-silenced mosquitoeschallenged with S. aureus. Standard error bars from three replicateexperiments are included for each time point.DOI: 10.1371/journal.ppat.0020052.g003
PLoS Pathogens | www.plospathogens.org June 2006 | Volume 2 | Issue 6 | e520520
Anopheles Anti-Plasmodium Defense
compared to ookinete invasion of the midgut, can beattributed to the exposure of all the midgut cells to theinfected blood components, while only a subset of cells areinvaded by the ookinetes, and indicates the extensivequalitative differences between infected and noninfectedblood [10,11]. The capacity to mount an immune response toinfected blood, in the absence of ookinete invasion, is likelybeneficial in controlling Plasmodium infection. This strategywould allow for enrichment of anti-Plasmodium factors priorto epithelial invasion. P. falciparum glycosylphosphatidylino-sitols in malaria-infected blood have been shown to act aspotent elicitors of immune responses [3,11]. It is also possiblethat the immune response acts against parasite stages in themidgut lumen prior to invasion. For example, the antimicro-bial peptide gene Gambicin, which is induced by infectedblood in the absence of invasion, has been shown to be highly
expressed in the cardia tissue of the anterior midgut, which isnot invaded by Plasmodium [4] (Dimopoulos lab, unpublisheddata). From the cardia, gambicin and other effectors may beblended into the blood meal, where they can limit bacterialgrowth and attack Plasmodium in the midgut lumen.A recent study by Vlachou and coworkers utilized an
expressed sequence tag (EST)–based cDNA microarraycomprising approximately 8,000 A. gambiae genes to assaymidgut gene expression responses to P. berghei ookineteinvasion [7]. Surprisingly, of the 914 P. berghei regulated genesidentified in the present study and the 346 regulated geneswith accession numbers from the previous study, only 25genes showed similar regulation in the two studies. Thesedifferences can presumably be attributed to the differences inthe two experimental systems: we utilized different A. gambiaeand P. berghei strains, and a different type of microarray [2].Even small differences in rearing and infection conditionscould also have affected the responses [7,31]. A previous studyhas also documented significant differences in transcriptionalinfection responses between different A. gambiae lab strainsupon challenge with the same pathogens [31]. A. gambiaemostlikely possesses a variety of anti-Plasmodium defense mecha-nisms, and different strains may differ in their usage of thesedefenses. For instance, one genetically selected A. gambiaestrain melanotically encapsulates the invading ookinetes,while another selected strain lyses the ookinetes in themidgut epithelium [39,40].The high proportion of tested genes that had an effect on
Plasmodium and bacterial infection in this study can beexplained by the targeted selection of putative immune geneswith a bias towards P. falciparum infection-induced tran-scripts. RNAi gene-silencing assays in A. gambiae are based onthe direct injection of gene-specific dsRNAs into thehemolymph, which is in direct contact with the fatbody,midgut, hemocytes, and other tissues [41]. The genes weexamined are expressed in different tissues and even indifferent cell types within the same tissues [42]. Consequently,the gene knockdown phenotypes may to some extent alsoreflect the efficacy of dsRNA uptake and gene silencing ofdifferent tissues and cell types in addition to specific genefunctions. Several anti-Plasmodium genes were expressed incarcass tissues and hemocytes (Strand and Dimopoulos,unpublished data) (Table 1) [2,30]. These factors are likelyto be present in the hemolymph, from which they are able toattack the midgut-stage Plasmodia on the basal side of themidgut or even within the epithelium by diffusion throughthe basal labyrinth, which is a channel system extending intothe cells [43]. The extensive overlap between gene effects onP. falciparum and on P. berghei development suggest that themosquito’s defense mechanisms are quite universal fordifferent Plasmodium species, although species-specific de-fense mechanisms also exist.Silencing of putative anti-Plasmodium factors resulted in an
increase in P. falciparum levels of up to 6-fold; in terms ofmean oocyst numbers, this increased level is significantlylower than the infection level of P. berghei in non–gene-silenced mosquitoes (Figure 2; Tables S5 and S6). The lowerinfection level of the human parasite species is thereforeattributable to nonimmunity related factors or, alternativelybut less likely, to immune factors that were not identified ortested in the present study. It is not yet clear how many of thedifferent anti-Plasmodium factors function together in the
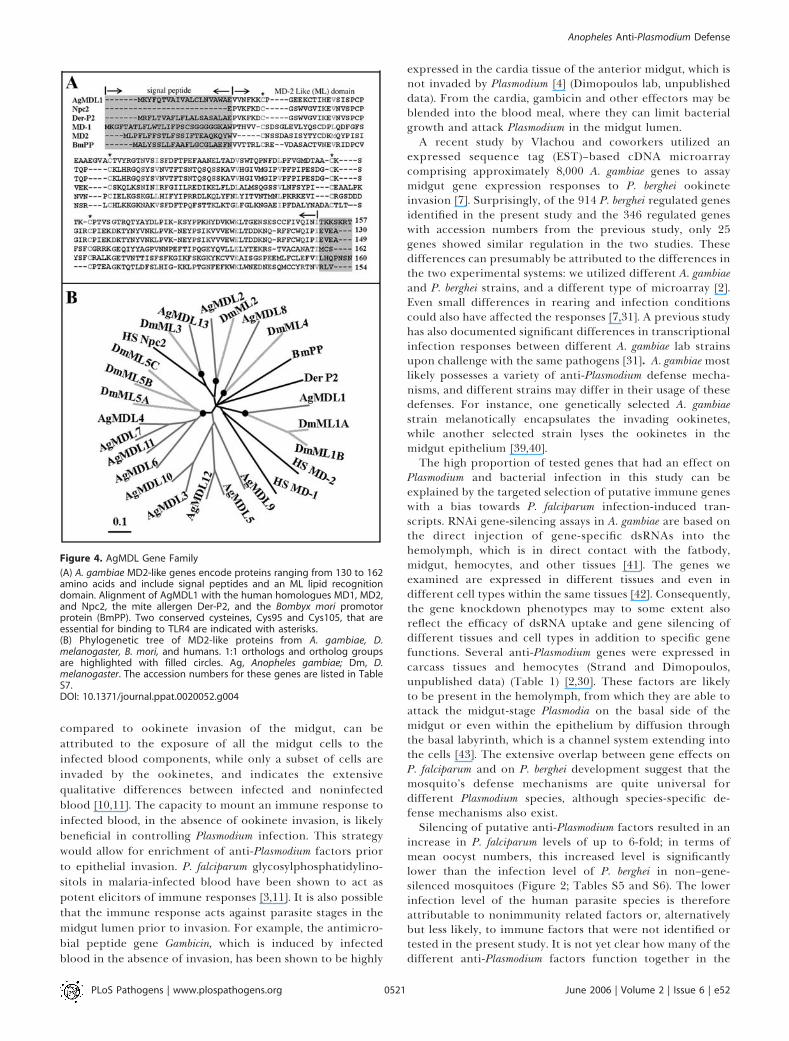
Figure 4. AgMDL Gene Family
(A) A. gambiae MD2-like genes encode proteins ranging from 130 to 162amino acids and include signal peptides and an ML lipid recognitiondomain. Alignment of AgMDL1 with the human homologues MD1, MD2,and Npc2, the mite allergen Der-P2, and the Bombyx mori promotorprotein (BmPP). Two conserved cysteines, Cys95 and Cys105, that areessential for binding to TLR4 are indicated with asterisks.(B) Phylogenetic tree of MD2-like proteins from A. gambiae, D.melanogaster, B. mori, and humans. 1:1 orthologs and ortholog groupsare highlighted with filled circles. Ag, Anopheles gambiae; Dm, D.melanogaster. The accession numbers for these genes are listed in TableS7.DOI: 10.1371/journal.ppat.0020052.g004
PLoS Pathogens | www.plospathogens.org June 2006 | Volume 2 | Issue 6 | e520521
Anopheles Anti-Plasmodium Defense
same mechanism or pathway, and which may be actingindependently. Some of the tested genes may participate inanti-Plasmodium defense but not be essential because theirfunction is redundant with that of other immune genes. Theinfection phenotype of such genes after RNAi knockdownwill therefore not differ from that in untreated mosquitoes.Genes with differential effects on infection with differentpathogens, such as gambicin and AgMDL1, could reasonably beexpected to act in different defense mechanisms. Futureanalyses will address the relations and hierarchies of theseanti-Plasmodium factors in the fight against malaria. Ofparticular interest is the anti–P. falciparum–specific activityof the novel mosquito immune factor AgMDL1, which may actas an immune pathway activator similarly to its vertebratehomologue (Figure 4 and Protocol S1) [21,28].
The genes displaying anti-Plasmodium activity also influ-enced the mosquito’s resistance to bacterial infection, whileseveral genes with an effect on resistance to bacterialinfection did not influence Plasmodium development. Thesefindings suggest the mosquito is mainly employing itsantimicrobial defense system in the fight against malaria.Although certain immune gene allele frequencies have beencorrelated with Plasmodium exposure in the field, there is littlereason to believe that the mosquito would have undergonemajor adaptations to malaria and evolved highly specific anti-Plasmodium defense mechanisms [44,45]. In nature, bacteriaand fungi are most likely the major pathogens to which themosquitoes are continuously exposed. In contrast, exposureto Plasmodium is seasonal and usually very low-level, rarelyexceeding 25% of the infected mosquitoes in a givenpopulation [46]. A recent study has linked the A. gambiaeanti-Plasmodium defense to the REL2F factor, which alsomediates activation of the defense against S. aureus [8]. Up-regulation of the antibacterial-specific genes IRSP2, Tep4,PGRP-AMIDASE, AGBP1, and HECY1 after Plasmodium infec-tion may be attributed to concomitant microbial infections ofthe midgut epithelium; it is very likely that the ookineteinvasion of the epithelium facilitates exposure to bacteriaand bacterial components such as lipopolysaccharide andpeptidoglycan (Table 1). Through this mode of geneinduction, the bacteria may participate in boosting themosquito’s anti-Plasmodium defense. Previous studies haveshown that antibiotic-treated mosquitoes, with significantlyreduced microbial midgut flora, express lower levels ofimmune genes and are more susceptible to Plasmodiuminfection [19,47]. Conversely, mosquitoes that have beenchallenged with bacteria are more resistant to Plasmodiuminfection [48].
This study suggests that P. berghei is a useful malaria modelfor studying anti-Plasmodium gene function but may be lessrelevant as a model for studying transcriptional immuneresponses to ookinete invasion of the midgut epithelium. Acomprehensive understanding of the interactions betweenAnopheles and Plasmodium can lead to the development of newstrategies for controlling malaria, based on the mosquito’sown defense against the parasite [49].
Materials and Methods
Mosquito rearing and infection assays. A. gambiae Keele strainmosquitoes were maintained on sugar solution at 27 8C and 70%humidity with a 12-h light/dark cycle according to standard rearingprocedures [50]. For microarray assays, the carcasses and midguts
from approximately 40 mosquitoes were dissected on ice 24 h afteringestion of blood infected with the wt Anka 2.34 or CTRP� P. bergheistrain, or the wt NF54 or CTRP� P. falciparum strain, or noninfectedhuman blood. P. falciparum gametocyte cultures were prepared aspreviously described, and mosquitoes were fed on cultures through amembrane feeder at 27 8C and then maintained at 24 8C [51]. P. bergheiinfections were done at 21 8C as previously described [7]. Mosquitomidguts were dissected at 7–8 d after feeding and stained with 0.2%mercurochrome. Oocyst numbers per midgut were determined usinga light-contrast microscope (Olympus, Tokyo, Japan). P. bergheiinfections with gene-silenced (RNAi) mosquitoes were performedwith a transgenic GFP P. berghei strain and infection phenotypes weredetermined as previously described [7]. For preparation of bacteriallychallenged samples for microarray analyses, 4-d-old female mosqui-toes were first injected with approximately 20,000 heat-inactivated E.coli or S. aureus and approximately 20 whole mosquitoes werecollected 4 h after challenge [52]. For bacterial challenge of gene-silenced (RNAi) mosquitoes, E. coli and S. aureus were cultured in LBbroth overnight, then washed three times with phosphate-bufferedsaline (PBS) before being resuspended in PBS. Approximately 27,000live E. coli or 55,000 S. aureus in a 50-nl PBS suspension were injectedinto the mosquito hemolymph 4 d after the dsRNA injections. RNAwas extracted from dissected tissues or whole mosquitoes by using theRNeasy kit (Qiagen, Valencia, California, United States). Quantifica-tion of RNA was performed using a Biophotometer (Eppendorf,Hamburg, Germany) spectrophotometer, and quality assessment wasdetermined by RNA Nano LabChip analysis on an Agilent Bio-analyzer 2100.
Probe sequence design and microarray construction. The release2a A. gambiae sequences were retrieved from Ensembl (http://www.ensembl.org/Anopheles_gambiae). These sequences were predictedusing a combination of ab initio, EST, and protein similarity–basedmethods [53–55]. The transcripts were annotated with the EnsMartutility (http://www.ensmbl.org/ensmart) [56,57]. Oligonucleotides (60mer) for the 14,180 predicted A. gambiae transcripts that corre-sponded to 13,118 genes were designed using the Oligo Pickysoftware according to the software developer’s instructions [58].Oligonucleotide sequences were designed to be complementary toregions within 1 kb of the 39 untranslated region of transcripts andhad a minimal sequence identity overlap with nontarget transcriptsequences. Microarrays were constructed through in situ synthesis ofoligonucleotides on glass slides by Agilent Technologies.
Microarray analysis. Fluorochrome-labeled cRNA probes weresynthesized from 2–3 lg of RNA using the Agilent Technologies low-input linear amplification RNA labeling kit according to themanufacturer’s instructions. Probe quantity was determined with aBiophotometer spectrophotometer, and 16-h hybridizations wereperformed with the Agilent Technologies in situ hybridization kitaccording to the manufacturer’s instructions. After washes, theprescribed microarrays were instantaneously dried with pressurizedair. Microarrays were scanned with an Axon GenePix 4200AL scannerusing a 10 lm pixel size (Axon Instruments, Union City, California,United States). Laser power was set to 100%, and the photomultipliertube voltage was adjusted to maximize effective dynamic range andminimize pixel saturation. The spot size, location, and quality weredetermined using GenePix software Pro 6.0 algorithms, and potentialmisidentifications of spot locations and quality were correctedmanually. Scan images were analyzed, and Cy5 and Cy3 signal andratio values were obtained using Genepix software. The minimumsignal intensity was set to 200 fluorescent units, and the signal-to-background ratio cutoff was set to 2.0 for both Cy5 and Cy3 channels.Three or four biological replicates were performed for eachexperimental set. The background-subtracted median fluorescentvalues for good spots (no bad, missing, absent, or not-found flags)were normalized according to a LOWESS normalization method, andCy5/Cy3 ratios from replicate assays were subjected to t tests at asignificance level of p � 0.05 using TIGR MIDAS and MeV software[59]. For genes with significant p values in one experimental set, theexpression values from other experimental sets were included whenthe direction of regulation in all the replicate assays was the same andwithin a regulation range of � 0.5-fold. Expression data from allreplicate assays were averaged with the GEPAS microarray prepro-cessing software prior to logarithm (base 2) transformation [60]. Self–self hybridizations were used to determine a cutoff value for thesignificance of gene regulation of 0.8 in log2 scale, which correspondsto 1.74-fold regulation according to previously established method-ology [20]. The false discovery rate was therefore 0.027% (threestandard deviations). Microarray-assayed gene expression of 15 geneswas further validated with quantitative RT-PCR and showed a highdegree of correlation (Pearson correlation coefficient p¼0.86; best-fit
PLoS Pathogens | www.plospathogens.org June 2006 | Volume 2 | Issue 6 | e520522
Anopheles Anti-Plasmodium Defense
linear-regression R2 ¼ 0.75; and the slope of the regression line m ¼0.996) for 15 tested genes (Figure S1).
Real-time quantitative PCR. RNA samples were treated with TurboDNase (Ambion, Austin, Texas, United States) and reverse-tran-scribed using Superscript III (Invitrogen, Carlsbad, California, UnitedStates) with random hexamers. Real-time quantification was per-formed using the QuantiTect SYBR Green PCR Kit (Qiagen) and ABIDetection System ABI Prism 7000 (Applied Biosystems, Foster City,California, United States). All PCR reactions were performed intriplicate. Specificity of the PCR reactions was assessed by analysis ofmelting curves for each data point. The ribosomal protein S7 genewas used for normalization of cDNA templates. Primer sequences arelisted in Table S3.
RNAi gene-silencing assays. Sense and antisense RNAs weresynthesized from PCR-amplified gene fragments using the T7Megascript kit (Ambion). The sequences of the primers are listed inTable S3. About 69 nl of dsRNAs (3 lg/ll) in water was introducedinto the thorax of cold-anesthetized 4-d-old female mosquitoes usinga nano-injector (Nanoject; Drummond Scientific, Broomall, Pennsyl-vania, United States) with a glass capillary needle according toestablished methodology [41]. For gene-silencing assays, 80 4-d-oldfemale mosquitoes were injected, in parallel, with GFP dsRNA as acontrol group or with target gene–specific dsRNA for the exper-imental group. Gene silencing was verified 3 to 4 d after dsRNAinjection by real-time quantitative RT-PCR, done in triplicate, withthe A. gambiae ribosomal S7 gene as the internal control fornormalization (Table S6). The primers for silencing verification arelisted in Table S3. For Plasmodium infection assays, 3–4 d after dsRNAinjection, at least 50 control (GFP dsRNA–injected) and 50experimental (gene dsRNA–injected) mosquitoes were fed on thesame P. berghei–GFP strain–infected mouse or the same NF54 P.falciparum culture; 24 h later, the unfed mosquitoes were removed [7].Mosquito midguts were dissected at 7–8 d after feeding and stainedwith 0.2% mercurochrome. Oocyst numbers per midgut weredetermined using a light-contrast microscope (Olympus). Infectionphenotypes of the transgenic GFP P. berghei–infected mosquitoes weredetermined as previously described [7]. The mean number of oocystsper midgut was calculated for each tested gene and for GFP dsRNA–injected control mosquitoes. The results for equal numbers ofmidguts from all three independent biological replicates werepooled. Because of the lower P. falciparum infection levels, theKolmogorov-Smirnov (KS) test was used to check the shape of theoocyst levels’ distribution. When the KS test indicated a nonnormaldistribution, the rank of sum (Mann-Whitney) test was used todetermine the statistical significance (Tables S5 and S6). For bacteriainfection assays, 3–4 d after dsRNA injection, at least 50 of eachcontrol and experimental mosquitoes were injected with the same E.coli or S. aureus cultures. Dead mosquitoes were counted and removeddaily for 7 d after bacterial challenge. Two-way analysis of variancewas used to assess the significance of the gene-silencing effect onmosquito survival after challenge, with p , 0.05 deemed statisticallysignificant. The RNAi gene-silencing assays were done as blinded testswith coded dsRNA samples. The effects on gene silencing aredisplayed in Table S6 as percentile of knockdown efficiency.
Phylogenetic analysis. Full-length or partial predicted sequences ofMD2 homologues were aligned using the Clustal X program (ftp://ftp-igbmc.u-strasbg.fr/pub/ClustalX), and cladograms wereconstructed by neighbor-joining analysis and displayed throughTreeview (http://darwin.zoology.gla.ac.uk/;rpage/treeviewx/download.html). AgMDL sequences were retrieved from Ensembl[53], and D. melanogaster MD2-like proteins (DmML) were retrievedfrom Flybase (http://flybase.bio.indiana.edu). DmMLs were namedaccording to [21]. Genes were only considered as 1:1 orthologues ifthe relevant bootstrap values were higher than 800 (1,000 iterations).
Supporting Information
Figure S1. Validation of Microarray-Assayed Gene Expression withReal-Time Quantitative RT-PCR
The mean values for the expression data (log2 ratio) for 15 genesfrom three midgut assays (P.f. ookinete, P.b. ookinete, P.f. blood)obtained by microarray analysis were plotted against the correspond-ing mean expression values obtained with real-time RT-PCR fromtwo biological replicates of each experiment. The Pearson correlationcoefficient (p¼0.86), the best-fit linear-regression analysis (R2¼0.75),and the slope of the regression line (m¼ 0.996) demonstrated a highdegree of correlation of the magnitude of regulation between the twoassays. The individual values for all these genes are presented in TableS4.
Found at DOI: 10.1371/journal.ppat.0020052.sg001 (87 KB DOC).
Protocol S1. Additional Information on Novel Immune Genes,Transcript Responses to Plasmodium Infection, and the Genes Selectedfor RNAi Screening
Found at DOI: 10.1371/journal.ppat.0020052.sd001 (414 KB DOC).
Table S1. Log2-Transformed Expression Ratios of Anopheles gambiaeGenes Showing .1.74-Fold Regulation (0.8 in log2) under at LeastOne Experimental Condition in the Midgut
Expression values of the following microarray assays are presented. PfGUT, Pf wt gut/Pf CTRP� gut; Pb GUT, Pb wt gut/Pb CTRP� gut; PfCTRP, Pf CTRP� gut/blood-fed gut; Pf CARC, Pf wt carcass/Pf CTRP�
carcass; Pb CARC, Pb wt carcass/Pb CTRP� carcass; Pf CTRPCARC, PfCTRP� carcass/blood-fed carcass.
Found at DOI: 10.1371/journal.ppat.0020052.st001 (266 KB XLS).
Table S2. Log2-Transformed Expression Ratios of Anopheles gambiaeGenes Showing .1.74-Fold Regulation (0.8 in log2) under at LeastOne Experimental Condition in Carcass Tissues
Expression values of the following microarray assays are presented. PfGUT, Pf wt gut/Pf CTRP� gut; Pb GUT, Pb wt gut/Pb CTRP� gut; PfCTRP, Pf CTRP� gut/blood-fed gut; Pf CARC, Pf wt carcass/Pf CTRP�
carcass; Pb CARC, Pb wt carcass/Pb CTRP� carcass; Pf CTRPCARC, PfCTRP� carcass/blood-fed carcass.
Found at DOI: 10.1371/journal.ppat.0020052.st002 (189 KB XLS).
Table S3. Primers Used to Produce PCR Amplicons for dsRNASynthesis, Real-Time QRT-PCR for Microarray Validation, andVerification of Gene Silencing
Underlined letters indicated the T7 promoter sequence. The samepair of forward and reverse primers was used for both dsRNAsynthesis and QRT-PCR validation of microarray expression data. Forthe RT-PCR verification of gene silencing, the different veriF primersand reverse primers were used.
Found at DOI: 10.1371/journal.ppat.0020052.st003 (80 KB DOC).
Table S4. Correlation of Microarray Expression Data with Real-TimeQRT-PCR
Comparison of the expression data from real-time quantitative RT-PCR (QRT) and DNA microarrays (Arrays) for 15 genes. For QRT-PCR, data were obtained from two biological and three technicalreplicates. The mean value for the regulation and standard error ofthe mean (SE) for the reactions were obtained from both QRT-PCRand array data. Pearson correlation (P) indicated the consistencybetween the two methods. N/A indicates the absence of microarraydata.
Found at DOI: 10.1371/journal.ppat.0020052.st004 (49 KB DOC).
Table S5. Effect of Gene Silencing on P. falciparum Infection (OocystNumbers)
Plasmodium falciparum oocyst loads in midguts of gene knockdowns(KD) and their controls (GFP). The efficiency of gene KD (%) ispresented in Table S6. The KD and GFP control mosquitoes in eachdataset were fed on the same P. falciparum gametocyte culture. Theresults of equal numbers of midguts from all three experiments ineach dataset were pooled. The total midgut numbers (midguts #),mean and standard error of oocyst numbers (Mean 6 SE), range ofoocyst numbers (range), n-fold difference of the mean oocystnumbers between gene KD and control (GFP) mosquitoes, and thep value from two independent probability tests (KS and Mann-Whitney test) are presented. Zero oocysts are also included forcalculation of mean oocyst numbers. The repressive (�) effects ofgenes on parasite survival are shown in parentheses, with the asterisksindicating statistical significant at the 95% confidence level. NSindicates not significantly different. For calculation of mean oocystnumbers, midguts with zero oocysts were included.
Found at DOI: 10.1371/journal.ppat.0020052.st005 (58 KB DOC).
Table S6. Effect of Gene Silencing on P. berghei Infection (OocystNumbers)
P. berghei oocyst loads in midguts of gene knockdowns (KD) and theircontrols (GFP). The KD and GFP mosquitoes in each dataset were fedon the same infected mouse. Data represent a pool of at least threeindependent randomly selected experiments with equal numbers ofmidguts. The efficiency of gene KD (%) on average, the total midgutnumbers (midguts #), mean, and standard error of oocyst numbers
PLoS Pathogens | www.plospathogens.org June 2006 | Volume 2 | Issue 6 | e520523
Anopheles Anti-Plasmodium Defense
(Mean 6 SE), range of oocyst numbers (range), n-fold difference ofthe mean oocyst numbers between gene KD and control (GFP)mosquitoes, and the p value from Kolmogorov-Smirnov test andMann-Whitney test are presented. The repressive (�) effects of geneson parasite survival are shown in parentheses, with asterisksindicating the statistical significance at the 95% confidence level.NS indicates not significantly different. For calculation of meanoocyst numbers, midguts with zero oocysts were excluded.
Found at DOI: 10.1371/journal.ppat.0020052.st006 (89 KB DOC).
Table S7. List of Selected ML Proteins for Phylogenetic Analysis
Found at DOI: 10.1371/journal.ppat.0020052.st007 (45 KB DOC).
Acknowledgments
We thank Drs. Carolina Barillas-Mury, George K. Chrisophides, FotisC. Kafatos, Elena A. Levashina, and Liangbiao Zheng for fruitfuldiscussions. We thank Dr. Thomas J. Templeton and Dr. Johannes T.Dessens for providing the Plasmodium CTRP disruption mutant strain,the Johns Hopkins Array Core Facility for providing the microarrayequipment, and the Johns Hopkins Malaria Research Instituteinsectary and parasitology core facilities for assistance with mosquitorearing and infections. We thank Dr. Richard E. Thompson at the
Biostatistics Center at the Department of Biostatistics, Johns HopkinsSchool of Public Health, for advice on data analysis and interpreta-tion. We thank Dr. Deborah McClellan at the Editing Referral Service,William H. Welch Medical Library, Johns Hopkins University Schoolof Medicine.
Author contributions. YD conducted Plasmodium and bacterialinfection assays, RNAi assays, and real-time quantitative PCR assays.RA provided technical assistance with RNAi assays. EM predicted andannotated the Anopheles gambiae transcriptome from the availablegenome sequence as of September 2004. EW performed gene-silencing assays with GNBPB1. ZX performed bacteria infection geneexpression assays. GD designed microarray oligonucleotide sequencesand performed microarray hybridization assays and was mainlyresponsible for the experimental design.
Funding. This work has been supported by the National Institutesof Health/National Institute of Allergy and Infectious Disease1R01AI061576-01A1 and 1 R01 AI059492-01A1, the Ellison MedicalFoundation, the World Health Organization/TDR, a Johns HopkinsSchool of Public Health Faculty Innovation Grant, the Johns HopkinsMalaria Research Institute, and a Marjorie Gilbert Award.
Competing interests. The authors have declared that no competinginterests exist.
References1. Osta MA, Christophides GK, Vlachou D, Kafatos FC (2004) Innate
immunity in the malaria vector Anopheles gambiae: Comparative andfunctional genomics. J Exp Biol 207: 2551–2563.
2. Osta MA, Christophides GK, Kafatos FC (2004) Effects of mosquito geneson Plasmodium development. Science 303: 2030–2032.
3. Luckhart S, Vodovotz Y, Cui L, Rosenberg R (1998) The mosquito Anophelesstephensi limits malaria parasite development with inducible synthesis ofnitric oxide. Proc Natl Acad Sci U S A 95: 5700–5705.
4. Vizioli J, Bulet P, Hoffmann JA, Kafatos FC, Muller HM, et al. (2001)Gambicin: A novel immune responsive antimicrobial peptide from themalaria vector Anopheles gambiae. Proc Natl Acad Sci U S A 98: 12630–12635.
5. Kim W, Koo H, Richman AM, Seeley D, Vizioli J, et al. (2004) Ectopicexpression of a cecropin transgene in the human malaria vector mosquitoAnopheles gambiae (Diptera: Culicidae): Effects on susceptibility to Plasmo-dium. J Med Entomol 41: 447–455.
6. Vizioli J, Bulet P, Charlet M, Lowenberger C, Blass C, et al. (2000) Cloningand analysis of a cecropin gene from the malaria vector mosquito, Anophelesgambiae. Insect Mol Biol 9: 75–84.
7. Vlachou D, Schlegelmilch T, Christophides GK, Kafatos FC (2005) Func-tional genomic analysis of midgut epithelial responses in Anopheles duringPlasmodium invasion. Curr Biol 15: 1185–1195.
8. Meister S, Kanzok SM, Zheng XL, Luna C, Li TR, et al. (2005) Immunesignaling pathways regulating bacterial and malaria parasite infection ofthe mosquito Anopheles gambiae. Proc Natl Acad Sci U S A 102: 11420–11425.
9. Tahar R, Boudin C, Thiery I, Bourgouin C (2002) Immune response ofAnopheles gambiae to the early sporogonic stages of the human malariaparasite Plasmodium falciparum. EMBO J 21: 6673–6680.
10. Becker K, Tilley L, Vennerstrom JL, Roberts D, Rogerson S, et al. (2004)Oxidative stress in malaria parasite-infected erythrocytes: Host-parasiteinteractions. Int J Parasitol 34: 163–189.
11. Lim J, Gowda DC, Krishnegowda G, Luckhart S (2005) Induction of nitricoxide synthase in Anopheles stephensi by Plasmodium falciparum: Mechanism ofsignaling and the role of parasite glycosylphosphatidylinositols. InfectImmun 73: 2778–2789.
12. Han YS, Thompson J, Kafatos FC, Barillas-Mury C (2000) Molecularinteractions between Anopheles stephensi midgut cells and Plasmodium berghei:The time bomb theory of ookinete invasion of mosquitoes. EMBO J 19:6030–6040.
13. Sinden RE, Alavi Y, Raine JD (2004) Mosquito–malaria interactions: Areappraisal of the concepts of susceptibility and refractoriness. InsectBiochem Mol Biol 34: 625–629.
14. Ghosh A, Edwards MJ, Jacobs-Lorena M (2000) The journey of the malariaparasite in the mosquito: Hopes for the new century. Parasitol Today 16:196–201.
15. Aguilar R, Dong Y, Warr E, Dimopoulos G (2005) Anopheles infectionresponses: Laboratory models versus field malaria transmission systems.Acta Trop 95: 285–291.
16. Gupta L, Kumar S, Han YS, Pimenta PF, Barillas-Mury C (2005) Midgutepithelial responses of different mosquito–Plasmodium combinations: Theactin cone zipper repair mechanism in Aedes aegypti. Proc Natl Acad Sci U SA 102: 4010–4015.
17. Dimopoulos G, Christophides GK, Meister S, Schultz J, White KP, et al.(2002) Genome expression analysis of Anopheles gambiae: Responses to injury,bacterial challenge, and malaria infection. Proc Natl Acad Sci U S A 99:8814–8819.
18. Christophides GK, Zdobnov E, Barillas-Mury C, Birney E, Blandin S, et al.
(2002) Immunity-related genes and gene families in Anopheles gambiae.Science 298: 159–165.
19. Beier JC (1998) Malaria parasite development in mosquitoes. Annu RevEntomol 43: 519–543.
20. Yang IV, Chen E, Hasseman JP, Liang W, Frank BC, et al. (2002) Within thefold: Assessing differential expression measures and reproducibility inmicroarray assays. Genome Biol 3: research0062.
21. Inohara N, Nunez G (2002) ML—a conserved domain involved in innateimmunity and lipid metabolism. Trends Biochem Sci 27: 219–221.
22. Zdobnov EM, von Mering C, Letunic I, Torrents D, Suyama M, et al. (2002)Comparative genome and proteome analysis of Anopheles gambiae andDrosophila melanogaster. Science 298: 149–159.
23. Levashina EA, Moita LF, Blandin S, Vriend G, Lagueux M, et al. (2001)Conserved role of a complement-like protein in phagocytosis revealed bydsRNA knockout in cultured cells of the mosquito, Anopheles gambiae. Cell104: 709–718.
24. Dimopoulos G, Richman A, Muller HM, Kafatos FC (1997) Molecularimmune responses of the mosquito Anopheles gambiae to bacteria andmalaria parasites. Proc Natl Acad Sci U S A 94: 11508–11513.
25. Dziarski R (2004) Peptidoglycan recognition proteins (PGRPs). MolImmunol 40: 877–886.
26. Kobe B, Deisenhofer J (1994) The leucine-rich repeat: A versatile bindingmotif. Trends Biochem Sci 19: 415–421.
27. Davies G, Henrissat B (1995) Structures and mechanisms of glycosylhydrolases. Structure 3: 853–859.
28. Nagai Y, Akashi S, Nagafuku M, Ogata M, Iwakura Y, et al. (2002) Essentialrole of MD2 in LPS responsiveness and TLR4 distribution. Nat Immunol 3:667–672.
29. Gobert V, Gottar M, Matskevich AA, Rutschmann S, Royet J, et al. (2003)Dual activation of the Drosophila toll pathway by two pattern recognitionreceptors. Science 302: 2126–2130.
30. Blandin S, Shiao SH, Moita LF, Janse CJ, Waters AP, et al. (2004)Complement-like protein TEP1 is a determinant of vectorial capacity inthe malaria vector Anopheles gambiae. Cell 116: 661–670.
31. Kumar S, Christophides GK, Cantera R, Charles B, Han YS, et al. (2003) Therole of reactive oxygen species on Plasmodium melanotic encapsulation inAnopheles gambiae. Proc Natl Acad Sci U S A 100: 14139–14144.
32. Eisen MB, Spellman PT, Brown PO, Botstein D (1998) Cluster analysis anddisplay of genome-wide expression patterns. Proc Natl Acad Sci U S A 95:14863–14868.
33. Shi L, Paskewitz SM (2004) Identification and molecular characterization oftwo immune-responsive chitinase-like proteins from Anopheles gambiae.Insect Mol Biol 13: 387–398.
34. Concha MI, Smith VJ, Castro K, Bastias A, Romero A, et al. (2004)Apolipoproteins A-I and A-II are potentially important effectors of innateimmunity in the teleost fish Cyprinus carpio. Eur J Biochem 271: 2984–2990.
35. Whitten MM, Tew IF, Lee BL, Ratcliffe NA (2004) A novel role for an insectapolipoprotein (apolipophorin III) in beta-1,3-glucan pattern recognitionand cellular encapsulation reactions. J Immunol 172: 2177–2185.
36. Miller SI, Ernst RK, Bader MW (2005) LPS, TLR4 and infectious diseasediversity. Nat Rev Microbiol 3: 36–46.
37. Sinden RE (2004) A proteomic analysis of malaria biology: Integration ofold literature and new technologies. Int J Parasitol 34: 1441–1450.
38. Xu X, Dong Y, Abraham EG, Kocan A, Srinivasan P, et al. (2005)Transcriptome analysis of Anopheles stephensi–Plasmodium berghei interac-tions. Mol Biochem Parasitol 142: 76–87.
PLoS Pathogens | www.plospathogens.org June 2006 | Volume 2 | Issue 6 | e520524
Anopheles Anti-Plasmodium Defense
39. Collins FH, Sakai RK, Vernick KD, Paskewitz S, Seeley DC, et al. (1986)Genetic selection of a Plasmodium-refractory strain of the malaria vectorAnopheles gambiae. Science 234: 607–610.
40. Vernick KD, Fujioka H, Seeley DC, Tandler B, Aikawa M, et al. (1995)Plasmodium gallinaceum: A refractory mechanism of ookinete killing in themosquito, Anopheles gambiae. Exp Parasitol 80: 583–595.
41. Blandin S, Moita LF, Kocher T, Wilm M, Kafatos FC, et al. (2002) Reversegenetics in the mosquito Anopheles gambiae: Targeted disruption of theDefensin gene. EMBO Rep 3: 852–856.
42. Dimopoulos G, Seeley D, Wolf A, Kafatos FC (1998) Malaria infection of themosquito Anopheles gambiae activates immune-responsive genes duringcritical transition stages of the parasite life cycle. EMBO J 17: 6115–6123.
43. Brown MR, Raikhel AS, Lea AO (1985) Ultrastructure of midgut endocrinecells in the adult mosquito, Aedes aegypti. Tissue Cell 17: 709–721.
44. Luckhart S, Li K, Dunton R, Lewis EE, Crampton AL, et al. (2003) Anophelesgambiae immune gene variants associated with natural Plasmodium infection.Mol Biochem Parasitol 128: 83–86.
45. Morlais I, Poncon N, Simard F, Cohuet A, Fontenille D (2004) Intraspecificnucleotide variation in Anopheles gambiae: New insights into the biology ofmalaria vectors. Am J Trop Med Hyg 71: 795–802.
46. Shiff CJ, Minjas JN, Hall T, Hunt RH, Lyimo S, et al. (1995) Malariainfection potential of anopheline mosquitoes sampled by light trappingindoors in coastal Tanzanian villages. Med Vet Entomol 9: 256–262.
47. Richman AM, Bulet P, Hetru C, Barillas-Mury C, Hoffmann JA, et al. (1996)Inducible immune factors of the vector mosquito Anopheles gambiae:Biochemical purification of a defensin antibacterial peptide and molecularcloning of preprodefensin cDNA. Insect Mol Biol 5: 203–210.
48. Lowenberger CA, Kamal S, Chiles J, Paskewitz S, Bulet P, et al. (1999)Mosquito–Plasmodium interactions in response to immune activation of thevector. Exp Parasitol 91: 59–69.
49. Christophides GK (2005) Transgenic mosquitoes and malaria transmission.Cell Microbiol 7: 325–333.
50. Benedict MQ (1997) Care and maintenance of anopheline mosquitoes. In:Crampton JM, Beard CB, Louis C, editors. The molecular biology of diseasevectors: A methods manual. London: Champman & Hall. pp. 3–12.
51. Carter R, Ranford-Cartwright L, Alano P (1993) The culture andpreparation of gametocytes of Plasmodium falciparum for immunochemical,molecular, and mosquito infectivity studies. Methods Mol Biol 21: 67–88.
52. Aguilar R, Jedlicka AE, Mintz M, Mahairaki V, Scott AL, et al. (2005) Globalgene expression analysis of Anopheles gambiae responses to microbialchallenge. Insect Biochem Mol Biol 35: 709–719.
53. Birney E, Andrews TD, Bevan P, Caccamo M, Chen Y, et al. (2004) Anoverview of Ensembl. Genome Res 14: 925–928.
54. Curwen V, Eyras E, Andrews TD, Clarke L, Mongin E, et al. (2004) TheEnsembl automatic gene annotation system. Genome Res 14: 942–950.
55. Stalker J, Gibbins B, Meidl P, Smith J, Spooner W, et al. (2004) The Ensemblweb site: Mechanics of a genome browser. Genome Res 14: 951–955.
56. Hammond MP, Birney E (2004) Genome information resources—develop-ments at Ensembl. Trends Genet 20: 268–272.
57. Kasprzyk A, Keefe D, Smedley D, London D, Spooner W, et al. (2004)EnsMart: A generic system for fast and flexible access to biological data.Genome Res 14: 160–169.
58. Chou HH, Hsia AP, Mooney DL, Schnable PS (2004) Picky: Oligomicroarray design for large genomes. Bioinformatics 20: 2893–2902.
59. Dudoit S, Gentleman RC, Quackenbush J (2003) Open source software forthe analysis of microarray data. Biotechniques (Suppl): 45–51.
60. Herrero J, Al-Shahrour F, Diaz-Uriarte R, Mateos A, Vaquerizas JM, et al.(2003) GEPAS: A web-based resource for microarray gene expression dataanalysis. Nucleic Acids Res 31: 3461–3467.
PLoS Pathogens | www.plospathogens.org June 2006 | Volume 2 | Issue 6 | e520525
Anopheles Anti-Plasmodium Defense


