Embed Size (px)
Citation preview

Antibody Based Strategies For Multiplexed Diagnostics
by
Krupa Arun Navalkar
A Dissertation Presented in Partial Fulfillment
of the Requirements for the Degree
Doctor of Philosophy
Approved April 2014 by the
Graduate Supervisory Committee:
Stephen Albert Johnston, Co-Chair
Phillip Stafford, Co-Chair
Kathryn Sykes
Bertram Jacobs
ARIZONA STATE UNIVERSITY
August 2014

All rights reserved
INFORMATION TO ALL USERSThe quality of this reproduction is dependent upon the quality of the copy submitted.
In the unlikely event that the author did not send a complete manuscriptand there are missing pages, these will be noted. Also, if material had to be removed,
a note will indicate the deletion.
Microform Edition © ProQuest LLC.All rights reserved. This work is protected against
unauthorized copying under Title 17, United States Code
ProQuest LLC.789 East Eisenhower Parkway
P.O. Box 1346Ann Arbor, MI 48106 - 1346
UMI 3625036Published by ProQuest LLC (2014). Copyright in the Dissertation held by the Author.
UMI Number: 3625036

i
ABSTRACT
Peptide microarrays are to proteomics as sequencing is to genomics. As
microarrays become more content-rich, higher resolution proteomic studies will parallel
deep sequencing of nucleic acids. Antigen-antibody interactions can be studied at a much
higher resolution using microarrays than was possible only a decade ago. My dissertation
focuses on testing the feasibility of using either the Immunosignature platform, based on
non-natural peptide sequences, or a pathogen peptide microarray, which uses
bioinformatically-selected peptides from pathogens for creating sensitive diagnostics.
Both diagnostic applications use relatively little serum from infected individuals, but each
approaches diagnosis of disease differently. The first project compares pathogen epitope
peptide (life-space) and non-natural (random-space) peptide microarrays while using
them for the early detection of Coccidioidomycosis (Valley Fever). The second project
uses NIAID category A, B and C priority pathogen epitope peptides in a multiplexed
microarray platform to assess the feasibility of using epitope peptides to simultaneously
diagnose multiple exposures using a single assay. Cross-reactivity is a consistent feature
of several antigen-antibody based immunodiagnostics. This work utilizes microarray
optimization and bioinformatic approaches to distill the underlying disease specific
antibody signature pattern. Circumventing inherent cross-reactivity observed in antibody
binding to peptides was crucial to achieve the goal of this work to accurately
distinguishing multiple exposures simultaneously.

ii
DEDICATION
To my family and friends

iii
ACKNOWLEDGMENTS
I am deeply indebted to Dr. Stephen Albert Johnston and Dr. Phillip Stafford for
having mentored me throughout my dissertation and for the wonderful opportunity of
optimizing peptide microarray based infectious disease diagnostics. I am grateful to them
for their tireless efforts at steering my dissertation to its fruition and for never failing to
help address empirical phenomenon encountered through this work.
I would like to thank my committee members Dr. Kathryn Sykes and Dr. Bertram
Jacobs for helping broaden the scope of my work. I wish to also thank previous
committee members, Dr. Mitchell Magee and Dr. Jeffrey Touchman for being part of my
committee. Dr. Mitchell Magee was involved in the initial phases of the Valley Fever
peptide microarray diagnostic project and introduced me to the corpus of prior research
performed on the subject.
I would like to thank our collaborators Dr. John Galgiani for contributing
valuable, well-characterized, Valley Fever patient sera from the Valley Fever Center for
Excellence at University of Arizona. I would also like to thank Dr. Ian Lipkin at
Columbia University for providing Herpes virus infected human patient sera. I would like
to thank Dr. Anders Sjöstedt, Umeå University for having kindly contributed Francisella
tularensis subsp. holarctica (LVS) vaccine recipient human serum samples. I am grateful
to Lawrence Livermore National Laboratory for providing infected patient sera for West
Nile virus and Malaria infections originally acquired by them from SeraCare.
I am grateful to Dr. Rebecca Halperin for helping design the analysis strategy for
the pathogen proteome peptide array. She was kind enough to implement my suggestions
regarding di-peptide inversions in her program GuiTope. I am grateful to Dr. Bart

iv
Legutki for his scientific input and suggestions throughout my dissertation. I am grateful
to Kevin Brown for writing programs to query and retrieve outputs from B-cell epitope
prediction algorithms hosted on the Immune Epitope Database (IEDB) website. I wish to
thank John Lainson for helping design the ‘VF-diagnostic’ sub-array and for processing
sera for the project on random peptide Immunosignature microarrays. I thank Elizabeth
Lambert, Mara Gardner and Dr. Bart Legutki for processing patient serum samples on the
random peptide microarrays as per protocol. I thank Sara Matsumoto and Daniel Wrapp
for helping analyze microarray slide image data and Jameson Berry for processing an
Influenza PR8 ELISA.
I wish to thank all my lab members Preston Hunter, Dr. Kurt Whittemore, Dr.
Nidhi Gupta, Pattie Madjidi, Penny Gwynne, Dr. Andrey Loskutov, Loren Howell, Tien
Olson, Lori Phillips, Felicia Craciunescu, Lu Wang, Dr. Luhui Shen, Dr. Zhan-gong
Zhao and Dr. Chris Diehnelt for always being willing to help. I wish to thank Dr. Neal
Woodbury for providing critical suggestions on the Valley Fever publication and the
DTRA-1 project.
This dissertation would not have been possible without the funding support from
the Chemical Biological Technologies Directorate contract HDTRA-11-1-0010 from the
Department of Defense Chemical and Biological Defense program through the Defense
Threat Reduction Agency (DTRA) to Dr. Stephen Albert Johnston.
I am grateful to Mrs. Renate Mittelmann, Dr. Rosemary Renaut, Dr. Zdzislaw
Jackiewicz and Dr. Scott Bingham for always guiding me throughout my time at ASU. I
am grateful to always have the continuing support of my family and friends.

v
TABLE OF CONTENTS
Page
LIST OF TABLES........................................................................................................ xiii
LIST OF FIGURES...................................................................................................... xvii
PREFACE..................................................................................................………….xxviii
CHAPTER
1. INTRODUCTION ....................................................................................................... 1
Project Overview .................................................................................................. 1
Peptide Microarray As Clinical Diagnostics ........................................................ 1
Advantages Of Using Peptide Microarrays.......................................................... 2
Project I: Valley Fever Immunosignaturing Diagnostic ...................................... 4
Multiplexed Diagnostics For Human Pathogens And Bio-Threat Agents ........ 10
Cross-Reactive Components Of The Humoral Antibody Response To An
Infection .............................................................................................................. 14
Project II: Multiplexed Priority Pathogen Proteome Peptide Array .................. 16
2. APPLICATION OF IMMUNOSIGNATURES TO DIAGNOSIS OF VALLEY
FEVER. .............................................................................................. 18
Abstract ............................................................................................................... 18
Background ......................................................................................................... 18
Methods ............................................................................................................... 18
Results ................................................................................................................. 19
Conclusion ........................................................................................................... 19

vi
CHAPTER Page
Abbreviations ...................................................................................................... 19
Introduction ......................................................................................................... 20
Methods ............................................................................................................... 23
Serum Samples Used In This Study ................................................................... 23
Confounding Infection Samples ......................................................................... 23
Valley Fever And Normal Donor Serum Samples Used In This Study ............ 24
Blinded Test Patient Sample Set ........................................................................ 25
Microarray Production And Processing ............................................................. 26
Statistical Classification Of Disease Groups ...................................................... 26
Statistical Classification Of Confounding Infections ........................................ 27
Results ................................................................................................................. 28
Valley Fever Immunosignature Is Distinct From That Of Other Infections ..... 28
Valley Fever Immunosignature Is Distinct From That Of Uninfected Individuals
............................................................................................................................. 30
Creating A 96 Peptide VF Diagnostic Microarray ............................................ 31
Performance Of A 96 Peptide VF-Diagnostic Microarray ................................ 35
Discussion ........................................................................................................... 38
Acknowledgements ............................................................................................. 41
Grant acknowledgements ................................................................................... 42
Supplementary Data ............................................................................................ 43

vii
CHAPTER Page
3. COMPARISON OF NON-NATURAL MIMOTOPE VERSUS EPITOPE PEPTIDES
IN DIAGNOSING VALLEY FEVER .............................................. 47
Abstract ............................................................................................................... 47
Abbreviations ...................................................................................................... 48
Introduction ......................................................................................................... 48
Methods ............................................................................................................... 52
Serum Samples Used In This Study ................................................................... 52
Microarray Production And Processing ............................................................. 54
Pre-Processing Of Data For Analysis ................................................................. 56
Statistical Analysis .............................................................................................. 56
GuiTope Analysis ............................................................................................... 57
Results ................................................................................................................. 58
Comparing Classification Accuracy And Sensitivity Of Life Space Versus
Random Peptides ................................................................................................ 58
Bioinformatic Rationale Underlying The Sensitivity Of Random (96) Vs. Life-
Space (83) Epitope Peptides ............................................................................... 61
Specificity And Robustness Of Random (96) Vs. Life-Space (83) VF Epitope
Peptides ............................................................................................................... 63
Discussion ........................................................................................................... 73
Acknowledgements ............................................................................................. 78
Grant Acknowledgements .................................................................................. 78

viii
CHAPTER Page
4. MULTI PATHOGEN PEPTIDE BASED SEROLOGICAL DIAGNOSTIC ...... 109
Abstract ............................................................................................................. 109
Keywords .......................................................................................................... 110
Abbreviations .................................................................................................... 110
Introduction ....................................................................................................... 110
Methods ............................................................................................................. 113
Serum Samples And Rationale For Choosing Pathogens To Be Represented113
Microarray Production And Processing ........................................................... 119
Data Analysis .................................................................................................... 120
Receiver Operating Characteristics (ROC) Curve Calculation ....................... 122
Results ............................................................................................................... 122
Physical optimization of pathogen proteome peptide (PPP) array .................. 122
Comparison 1: The Effect Of Temperature On Antibody-Peptide Association123
Reducing Cross-Reactivity On Array By Reducing Peptide Density On Array
Surface ............................................................................................................... 127
Comparison 2: Slide Surface ............................................................................ 129
Comparison 3: Time Of Incubation Of Sera. ................................................... 134
Comparison 4: Spacing Of Peptides Affecting Polyclonal Antibody Capture.137
Comparison 5: Dilution Of Primary Patient Sera 1:5000 Patient Serum Dilution
........................................................................................................................... 139
Discussion ......................................................................................................... 142

ix
CHAPTER Page
Grant Acknowledgements ................................................................................ 149
Acknowledgements ........................................................................................... 149
Supplementary Figures And Tables ................................................................. 150
5. DE-CONVOLUTING ANTIBODY CROSS-REACTIVITY OBSERVED ON A
PATHOGEN PROTEOME PEPTIDE MICROARRAY ............... 158
Abstract ............................................................................................................. 158
Abbreviations .................................................................................................... 159
Keywords .......................................................................................................... 159
Introduction ....................................................................................................... 160
Methods ............................................................................................................. 163
Serum Samples And Monoclonal Antibodies Used In This Study ................. 163
Microarray Production And Processing ........................................................... 164
Statistical Analysis And Software Used........................................................... 166
Influenza PR8 Whole Virus ELISA Protocol .................................................. 167
Results ............................................................................................................... 168
Redundancy Observed Within Priority Pathogen Proteomes Represented On PPP
Array .................................................................................................................. 168
Redundancy Observed Within Priority Pathogen Peptides Represented On PPP
Array .................................................................................................................. 171
Redundancy Observed Within Peptides On The PPP Array And Pathogen
Proteomes .......................................................................................................... 173

x
CHAPTER Page
Monoclonal Antibody Binding On The PPP Array ......................................... 176
Simultaneous Detection Of Priority Pathogen And Common Exposure Pathogen
Signature............................................................................................................ 178
Cross-Reactivity Observed On Pathogen Peptide Array From Evolutionarily
Related Pathogen Exposures ............................................................................ 183
Simulating An Artificial Infection Using Multiple Monoclonal Antibodies .. 185
Influenza Antibody Reactivity Observed In Individuals Responding To Non-
Influenza Virus Exposures ................................................................................ 191
Defining The Umbrella Of Antibody Reactivity Observed On The Pathogen Array
........................................................................................................................... 198
Discussion ......................................................................................................... 201
Grant Acknowledgement .................................................................................. 206
Acknowledgement ............................................................................................ 206
Supplementary Information .............................................................................. 207
6. CONCLUSION ....................................................................................................... 209
Coccidioidomycosis .......................................................................................... 209
Development Of A Microarray Diagnostic That Exceeds Existing Diagnostic
Standards ........................................................................................................... 210
Bioinformatic Analysis Of Pathogen Proteomes Toward The Development Of A
Multiplexed Life-Space Peptide Microarray Diagnostic ................................. 212

xi
CHAPTER Page
Designing A Multiplexed Pathogen Proteome Peptide Microarray – Future
Directions .......................................................................................................... 213
Cross-Reactivity Attributable To Common Exposures And Vaccinations ..... 227
REFERENCES .......................................................................................................... 256
APPENDIX
APPENDIX I: COCCIDIOIDES SPHERULES IN SERA ....................................... 231
INTERFERENCE IN MICROARRAYS – SUPPLEMENTAL FIGURES AND
TABLES FOR CHAPTER 2 ........................................................... 253
Hypothesis ......................................................................................................... 260
Bibliography ...................................................................................................... 262
APPENDIX II: SUPPLEMENTAL DATA FOR CHAPTER 3 – VALLEY FEVER
EPITOPE PEPTIDES......................................................................264
Bibliography ...................................................................................................... 287
APPENDIX III: SUPPLEMENTAL DATA FOR CHAPTER 4 .............................. 288
1.) F. Tularensis Vaccine Project: Overcoming ELISA Limitations Using The
Pathogen Proteome Peptide (PPP) Array ......................................................... 289
2.) ASFV Vaccine Project: Mapping Humoral Response From Genetic
Immunization Using The PPP Array ................................................................ 292
Immunization Protocol # AR000158 ................................................... 297
Immunization Protocol # AR000302 ................................................... 305

xii
APPENDIX Page
3.) IVTT Bead Protein Array–Rapid Screening Of Immunogenic/
Immunodominant Proteins ............................................................................... 308
Sonication Printing Protocols ................................................................ 308
Slide 1: 400787 ...................................................................................... 309
Slide 2: 400940 ...................................................................................... 310
Slide 4: 400941 ...................................................................................... 311
Acknowledgements ................................................................................ 319
Bibliography ........................................................................................... 321
APPENDIX IV .......................................................................................................... 323
INSTITUTIONAL REVIEW BOARD (IRB) APPROVAL ..................................... 323
APPENDIX V .......................................................................................................... 330
INSTITUTIONAL ANIMAL CARE & USE COMMITTEE ................................... 330
BIOGRAPHICAL SKETCH ...................................................................................... 339

xiii
LIST OF TABLES
Table Page
Table 2- 1 Patient Sample Cohorts Per Infection Utilized In This Study ......................... 23
Table 2- 2 Diagnosis (IDCF) Of 55 Unique Patient Samples From The VF Training
Cohort ............................................................................................................................... 24
Table 2- 3 Diagnosis (IDCF) Of 67 Blinded Samples From The VF Test Cohort. .......... 25
Table 2- 4 Classification Results From Samples Shown In Figure 2- 1, Naïve Bayes Was
Used To Simultaneously Classify The 108 Patients Into Their Respective Groups Using
Hold Out (70% Train, 30% Test, 20 Iterations) Cross-Validation To Estimate Error. .... 28
Table 2- 5 Naïve Bayes Classification Results From The VF Training Cohort On The
10K Peptide Microarray Using The 96 Predictor Peptides. Holdout Splits All Data
Randomly Into 70% Train/30% Predict. Results Are From 20 Iterations Of Random
Holdouts. ........................................................................................................................... 35
Table 2- 6 Naïve Bayes Classification Results From 96 Peptide VF Diagnostic Array.
Top Panel: 96 Peptide Diagnostic-Array Data Was Tested For Performance On A
Blinded Cohort Of False-Negative VF Patients. Middle Panel: Performance Using All
Possible Patient Samples Including Test And Training Samples. Bottom Panel:
Performance Using Only The Training Dataset................................................................ 36
Supplementary Table 2- 1 Non-VF Infection Samples, ELISA Data From SeraCare ..... 43
Table 3- 1 Naïve Bayes Classification Result On VF Test Dataset Using Random Vs Life
Space Peptides. ................................................................................................................. 60

xiv
Table Page
Table 3- 2 Naïve Bayes Classification Results Using Igg And Igm Signals From VF 96
Random Predictor Peptides And 83 VF Epitope Peptides ................................................ 63
Table 3- 3 Summary Of Guitope Matches Between 96-Random VF Predictor Peptides
And 4 VF Antigens ........................................................................................................... 69
Supplementary Table 3- 1 Sample Characteristics Of The Training Set For Valley Fever
Study. ................................................................................................................................ 79
Supplementary Table 3- 2 Sample Characteristics Of The 67 Blinded Test Sera From 25
Patients. ............................................................................................................................. 79
Supplementary Table 3- 3 Individual Patient Characteristics From The Un-Blinded Test
Set. .................................................................................................................................... 80
Supplementary Table 3- 4 Summary Of Guitope Results With Inversion Weight =1 From
Alignment Of 96-Random Peptides To 4 Immunodominant Antigens Of C.Immitis ...... 81
Supplementary Table 3- 5 Summary Of Guitope Results With Inversion Weight =0 From
Alignment Of 96-Random Peptides To 4 Immunodominant Antigens Of C.Immitis ...... 98
Table 4- 1 Peptide Selection Strategy For PPP Array ................................................... 114
Table 4- 2 Predicted & Empirical Epitopes (IEDB-Bepipred) [Accessed On: 30th
November, 2011] ............................................................................................................ 116
Table 4- 3 Number Of Peptides Per Priority Pathogen Proteome .................................. 117
Table 4- 4 Duplicate 5-Mers – 16-Mers Within The 4337 Peptides From The PPP Array
And 10K Non-Natural Sequence Peptide Immunosignature Array ................................ 118

xv
Table Page
Table 4- 5 AUC Derived From ROC Summary Of Incubating Samples On Aminosilane
Slides At Varying Temperatures, Time Of Primary Antibody Incubation Is Held Constant
At 1 Hour. ....................................................................................................................... 125
Table 4- 6 ROC-AUC For Comparing Slide Surfaces Aminosilane Versus NSB-9 ...... 129
Table 4- 7 ROC-AUC Obtained For 2 Infections On NSB9 Slide Surface At Varying
Temperatures................................................................................................................... 134
Table 4- 8 ROC-AUC During Varying Incubation Times On NSB-9 Surface .............. 137
Table 4- 9 ROC-AUC After Combining NSB9 And NSB-27 (1:500) Data................... 139
Table 4-10 ROC-AUC Of Detection Of 2 Infections At Limiting Concentrations Of
Antigen And Antibody .................................................................................................... 140
Supplementary Table 4- 1 Guitope Match Data (Score Cut=3) .................................... 155
Table 5- 1 ROC Summary Displaying Accuracy Of Diagnosing The Cognate Infection
On Three Platforms ......................................................................................................... 181
Table 5- 2 Summary Of The Worst AUC-ROC Changes Between Array Iterations, After
The Addition Of Influenza Peptides In PPP(15), PPP (No. Of Pathogens Represented As
Peptides On Array). ........................................................................................................ 182
Table 5- 3 SVM (LOOCV) Results From PPP-15 Using The N-Mer Analysis For
Classification................................................................................................................... 200
Supplementary Table 5- 1 Monoclonal And Polyclonal Antibodies Used On PPP Array
......................................................................................................................................... 207

xvi
Table Page
Table 6- 1 Unique 5-Mers And 9-Mers In-Common Between Pathogens Tested On The
Andresen Assay .............................................................................................................. 221
Table 6- 2 Five Mers In Common Between ASFV And Vaccinia Proteomes (Orange)
And Several Herpes Viruses (Yellow). ........................................................................... 224
Table 6- 3 Amino Acid Frequencies In Proteomes Of Priority Pathogens And Common
Pathogens ........................................................................................................................ 225
Table A1- 1 Summary Of Spherules-Like Objects Observed In VF Infected Individuals
Sera When Incubated On Aminosilane Surface VF Diagnostic Sub-Arrays. ................. 258
Table A3- 1 Difference Between Immunization Groups And Naïve Sera Using PPP Array
Data ................................................................................................................................. 291
Table A3- 2 Summary Of Statistical Differences Between Groups A, B And Control
Group C Post-ASFV Challenge. ..................................................................................... 304
Table A3- 3 T-Test P-Value From Samples On Day 70 Post-Immunization And Boost,
Pre-Challenge As Captured Using ASFV And Vaccinia Peptides On PPP Array ......... 306
Table A3- 4 Signal Captured From Slides Included In The Printing Protocol Comparison
In Fluorescence Intensity Units (FIU). ........................................................................... 315

xvii
LIST OF FIGURES
Figure Page
Figure 2- 1 Hierarchical Clustering Of Informative Peptides Across Five Diseases. ...... 29
Figure 2- 2 Hierarchical Clustering Of Valley Fever Immunosignature Apart From
Uninfected Individuals. ..................................................................................................... 30
Figure 2- 3 Signal Intensity (Y-Axis) For 96 Peptides From The 10,000 Peptide
Microarray That Distinguish Both VF And Influenza Vaccine Recipients. ..................... 32
Figure 2- 4 Heat Map Showing Normalized Average Signals From The 96 Predictor
Peptides As In Figure 2- 2, But Displaying The Cohort Separation. ................................ 34
Figure 2- 5 Limits Of Detection Graphed From A Post-Hoc Power Calculation. ............ 37
Figure 3- 1 The Clinical Problem In Valley Fever Diagnosis. ......................................... 50
Figure 3- 2 VF Patient Signal Average Intensity Data Per CF-Titer. ............................... 59
Figure 3- 3 Sensitivity Of Assay - Number Of Unique N-Mers (2-6 Amino Acid Short
Sequences) Between The 96-Random And 83-Lifespace Peptides In Common With The
VF Pathogen Proteome (Panel A) And The Randomly Generated VF Proteome (Panel B).
........................................................................................................................................... 62
Figure 3- 4 Cross-Reactivity Observed On Vf-Diagnostic Array Hypothetically
Explained Using The Number Of Unique 5-Mers In Common (Y-Axis) Between Random
(Blue Bars) And Life Space (Red Bars) Peptides And Pathogen Proteomes (X-Axis). ... 67
Figure 3- 5 Specificity Of Assay - Number Of Unique N-Mers (2-6 Amino Acid Short
Sequences) Between The 96-Random And 83-Lifespace Peptides In Common With The
LVS Proteome (Panel A) And The Randomly Generated LVS Proteome (Panel B). ...... 68

xviii
Figure Page
Figure 3- 6 Guitope Analysis Comparing 96-Random Peptide VF Predictors With Each
Of The 4 VF Proteins Tiled For The 83 Life-Space Epitope Peptides. ............................ 71
Figure 3- 7 VF Predictor Random Peptides (96) Overlapping 83 Life-Space Peptides
From Valley Fever. ........................................................................................................... 72
Figure 3- 8 BLAST Alignment Map Depicting VF-Protein Coverage Of 96-Random
Peptides Through Positive Hits From GuiTope. ............................................................... 73
Figure 4- 1 The Effect Of Incubation Temperature On Various Samples Tested On The
Pathogen Array. .............................................................................................................. 124
Figure 4-2 Estimating Cross-Reactivity - Histograms Displaying Signal Intensities From
Arrays With Or Without Monoclonal Antibody Epitopes. ............................................. 126
Figure 4- 3 Biotinylation For Comparing The Spot Morphology And Dynamic Range Of
Signal From Three Slide Surfaces, Aminosilane (AS), NSB-9 And NSB-27. ............... 128
Figure 4- 4 Box-Plots Showing Antibody Binding Distribution As Observed On NSB-9
Versus Aminosilane (AS) Slides. ................................................................................... 131
Figure 4- 5 Histograms Displaying Cognate Peptide Reactivity On Aminosilane (AS)
And NSB-9 Slides. .......................................................................................................... 133
Figure 4-6 Cognate Pathogen Peptide Reactivity Is Enhanced At 16 Hour In Comparison
To After 1 Hour Of Serum Incubation. ........................................................................... 136
Figure 4- 7 ROC Curve AUC Summarizing Ability To Distinguish One Infection From
Another On The PPP Array Under Longer Incubation ................................................... 138

xix
Figure Page
Figure 4- 8 Effect Of Incubation Time, Temperature And Slide Surface On Information
Content Of Array. ........................................................................................................... 141
Supplementary Figure 4- 1 Histograms Displaying Array Data For 6 Monoclonal
Antibodies On NSB-9 Slides .......................................................................................... 150
Supplementary Figure 4- 2 Change In Signal Distribution And Cognate Versus Non-
Cognate Reactivity Of p53Ab1 Monoclonal Incubated On NSB-9 Slides For 1, 16, 24
And 36 Hours Respectively. ........................................................................................... 151
Supplementary Figure 4- 3 Average Signal Intensity Observed For Various Infections On
NSB-9 Slides At 16 Hour Incubation, 23°C And Serum Dilution Of 1:500 .................. 152
Supplementary Figure 4- 4 Structural (Anti-LPS, Anti-VEE) And Polyclonal Antibodies
(FT03, Rco1, Rco2, Rco3, Rco4) On Array. .................................................................. 153
Supplementary Figure 4- 5 Capturing The Memory Immune Response From Exposure
And Distinguishing Time Of Exposure – Vaccinia Vaccination .................................... 154
Figure 5- 1 BLAST Matrix Depicting Homology Between Pathogens Chosen To Be
Represented On The Pathogen Proteome Peptide (PPP) Microarray. ............................ 170
Figure 5- 2 Pathogen Space Is Extremely Conserved On A 5-Mer Peptide Motif Level.
......................................................................................................................................... 173
Figure 5- 3 Circular Connectogram Displaying 5-Mer Level Overlap Between Peptides
Represented On The Pathogen Array And Their Respective Proteomes ....................... 176
Figure 5- 4 Monoclonal Antibody Binding Observed On PPP-14 Array (p53Ab1) ...... 178
xx
Figure Page
Figure 5- 5 P-Value Score Chart For 1 WNV Infected Individual’s Sera On 3 Different
Array Platforms. .............................................................................................................. 179
Figure 5- 6 Cross-Reactivity Displayed On Three Versions Of PPP Arrays From One
HSV-2 Infected Individual’s Sera. .................................................................................. 184
Figure 5- 7 Median Signal Intensities On A Log10 Scale For 8 Monoclonal Antibody
Epitopes (Blue Bars) Versus Signals From All Other Peptides On The Array (Green
Bars) And PR8 Influenza Peptides (Red Bars). Error Bars Represent Standard Error, P-
Value Cut-Off = 0.125. ................................................................................................... 187
Figure 5- 8 Monoclonal Antibody Mix On Pathogen Arrays. ........................................ 190
Figure 5- 9 Influenza Reactivity Observed In Individuals With Non-Influenza Exposures.
......................................................................................................................................... 192
Figure 5- 10 WNV Patients Sera Processed At Three Dilutions On PPP-15. ............... 196
Figure 5- 11 VF Patient Sera Processed At Three Dilutions On PPP-14. ...................... 197
Figure 6- 1 Schema For Designing A Multiplexed Pathogen Proteome Peptide
Microarray....................................................................................................................... 214
Figure 6- 2 Blast Matrix Depicting Proteome Level Overlap Between The Four Main
Races Of Dengue Virus (Reference Proteomes) And WNV-I And II And JEV ............ 215
Figure 6- 3 Blastmatrix Showing Torch Assay Pathogen Proteome Overlap. .............. 217
Figure 6- 4 Pathogen Proteome Level Overlap For Pathogens Represented In A
Multiplexed 900 Peptide Microarray Showing Cross-Reactivity In Andresen Et Al
(2009). ............................................................................................................................. 220

xxi
Figure Page
Figure 6- 5 Blast Matrix Depicting Proteome Level Overlap Between Herpes Viruses
(Herpesviridae) And Other Pox-Viruses ASFV (Asfarviridae) And Vaccinia
(Orthopoxviridae) ........................................................................................................... 222
Figure 6- 6 Commonality On A 5-Mer Sequence Level Between Priority Pathogen
Proteomes And Common Pathogen Proteomes Such As Herpes Viruses And Influenza
Vaccine Proteomes (Highlighted In The Legend In Yellow). ........................................ 229
Figure A1- 1 A Screenshot Of A Spherule-Like Object (Slide No. CNS00209) As Captured
Using Genepix Pro On The VF Diagnostic Sub-Array (Slide Surface:
Aminosilane)…………………………………………………………………………….256
Figure A1- 2 A Screenshot Of A Spherule-Like Object (Slide No. CNS00209) As
Captured Within Genepix On The VF Diagnostic Sub-Array (Slide Surface:
Aminosilane) ................................................................................................................... 257
Figure A2-1 IgG Antibody Reactivity Captured On VF Epitope Peptides (83) From
False-Negative CF-Titer=0 Patients Sera (N=54).Each Line On The Graph Represents
Antibody Response From One VF Sample. .................................................................... 267
Figure A2-2 IgM Antibody Reactivity Captured On VF Epitope Peptides (83) From
False-Negative CF-Titer=0 Patients Sera (N=54) Each Line On The Graph Represents
Antibody Response From One VF Sample. .................................................................... 268
Figure A2-3 IgG Antibody Reactivity Captured On VF Epitope Peptides (83) From CF-
Titer=1 Patients Sera (N=9). Each Line On The Graph Represents Antibody Response
From One VF Sample. .................................................................................................... 269

xxii
Figure Page
Figure A2-4 IgM Antibody Reactivity Captured On VF Epitope Peptides (83) From CF-
Titer=1 Patients Sera (N=9). Each Line On The Graph Represents Antibody Response
From One VF Sample. .................................................................................................... 270
Figure A2-5 IgG Antibody Reactivity Captured On VF Epitope Peptides (83) From CF-
Titer=2 Patients Sera (N=15). Each Line On The Graph Represents Antibody Response
From One VF Sample. .................................................................................................... 271
Figure A2-6 IgM Antibody Reactivity Captured On VF Epitope Peptides (83) From CF-
Titer=2 Patients Sera (N=15). Each Line On The Graph Represents Antibody Response
From One VF Sample. .................................................................................................... 272
Figure A2-7 IgG Antibody Reactivity Captured On VF Epitope Peptides (83) From CF-
Titer=4 Patients Sera (N=8). Each Line On The Graph Represents Antibody Response
From One VF Sample. .................................................................................................... 273
Figure A2-8 IgM Antibody Reactivity Captured On VF Epitope Peptides (83) From CF-
Titer=4 Patients Sera (N=8). Each Line On The Graph Represents Antibody Response
From One VF Sample. .................................................................................................... 274
Figure A2-9 IgG Antibody Reactivity Captured On VF Epitope Peptides (83) From CF-
Titer=8 Patients Sera (N=4). Each Line On The Graph Represents Antibody Response
From One VF Sample. .................................................................................................... 275
Figure A2-10 IgM Antibody Reactivity Captured On VF Epitope Peptides (83) From CF-
Titer=8 Patients Sera (N=4). Each Line On The Graph Represents Antibody Response
From One VF Sample. .................................................................................................... 276

xxiii
Figure Page
Figure A2-11 IgG Antibody Reactivity Captured On VF Epitope Peptides (83) From CF-
Titer=16 Patients Sera (N=10). Each Line On The Graph Represents Antibody Response
From One VF Sample. .................................................................................................... 277
Figure A2-12 IgM Antibody Reactivity Captured On VF Epitope Peptides (83) From CF-
Titer=16 Patients Sera (N=10). Each Line On The Graph Represents Antibody Response
From One VF Sample. .................................................................................................... 278
Figure A2-13 IgG Antibody Reactivity Captured On VF Epitope Peptides (83) From CF-
Titer=32 Patients Sera (N=12). Each Line On The Graph Represents Antibody Response
From One VF Sample. .................................................................................................... 279
Figure A2-14 IgM Antibody Reactivity Captured On VF Epitope Peptides (83) From CF-
Titer=32 Patients Sera (N=12). Each Line On The Graph Represents Antibody Response
From One VF Sample. .................................................................................................... 280
Figure A2-15 IgG Antibody Reactivity Captured On VF Epitope Peptides (83) From CF-
Titer=64 Patients Sera (N=5). Each Line On The Graph Represents Antibody Response
From One VF Sample. .................................................................................................... 281
Figure A2-16 IgM Antibody Reactivity Captured On VF Epitope Peptides (83) From CF-
Titer=64 Patients Sera (N=5). Each Line On The Graph Represents Antibody Response
From One VF Sample. .................................................................................................... 282
Figure A2-17 IgG Antibody Reactivity Captured On VF Epitope Peptides (83) From CF-
Titer=128 Patients Sera (N=3). Each Line On The Graph Represents Antibody Response
From One VF Sample. .................................................................................................... 283
xxiv
Figure Page
Figure A2-18 IgM Antibody Reactivity Captured On VF Epitope Peptides (83) From CF-
Titer=128 Patients Sera (N=3). Each Line On The Graph Represents Antibody Response
From One VF Sample. .................................................................................................... 284
Figure A2-19 IgG Antibody Reactivity Captured On VF Epitope Peptides (83) From CF-
Titer=256 Patients Sera (N=2). Each Line On The Graph Represents Antibody Response
From One VF Sample. .................................................................................................... 285
Figure A2-20 IgM Antibody Reactivity Captured On VF Epitope Peptides (83) From CF-
Titer=256 Patients Sera (N=2). Each Line On The Graph Represents Antibody Response
From One VF Sample. .................................................................................................... 286
Figure A3- 1 Box Plots Of Immune Response From Individual Rats Per Group (X-Axis)
As Captured On 862 F. Tularensis (Schus4) Peptides Printed On An Array. The Raw
(Un-Normalized) Fluorescence Intensity Units (FIU) Are Plotted On The Y-Axis On A
Log Scale. The Line At The Center Of Every Box Represents The Median Signal
Intensity For That Individual Rat. ................................................................................... 290
Figure A3- 2 A Simultaneous Comparison Of Infectious (French Cohort) Versus Genetic-
Immunization (UK Cohort) Antibody Responses As Captured By 299 ASFV Peptides On
PPP Array........................................................................................................................ 294
Figure A3- 3 Average Signal Captured By PPP Array For 4 Groups Of ASFV Genetic
Immunization Are Depicted With Every Animal’s Antibody Response Represented Per
Bar On The X-Axis. ........................................................................................................ 296

xxv
Figure Page
Figure A3- 4 Humoral Immune Response As Measured On PPP Array From Group A, B,
C Pigs Sera Post-Challenge With ASFV ........................................................................ 299
Figure A3- 5 Signal Intensities From ASFV Peptides Averaged Per ASFV Protein As
Measured On The PPP Array From Group A, B And C Samples Post-ASFV Challenge.
......................................................................................................................................... 300
Figure A3- 6 Average Signal Intensities In FIU (Y-Axis) From Various Stages (X-Axis)
In Two Separate Immunization And Challenge Regimes............................................... 301
Figure A3- 7 Peptides Tiling Vp30 (ASFV127) An Immunodominant Antigen Of ASFV
Displaying Individual (X-Axis) Responses From Sera On PPP Array........................... 302
Figure A3- 8 Peptides Tiling Vp72 (ASFV113) An Immunodominant Antigen Of ASFV,
Displaying Individual (X-Axis) Responses From Sera On PPP Array........................... 303
Figure A3- 9 Signal Intensities Averaged Per ASFV Protein (N=12) Tested In The Form
Of Peptides On The PPP Microarray. ............................................................................. 307
Figure A3- 10 Plate Map For 0.5 mm Pitch Sonication Printing Protocol. .................... 311
Figure A3- 11 Plate Map For 0.75 mm Pitch Sonication Printing Protocol. .................. 312
Figure A3-12 Anti-GFP Antibody Reactivity Captured From Translated Proteins On
IVTT Bead Protein Array. .............................................................................................. 314

xxvi
PREFACE
This dissertation examines fundamental aspects of antibody behavior through the
observation of their interaction with peptide targets. Historically, immunodiagnostics
have fulfilled their role in healthcare by the measurement of the interaction between
patient antibodies and select targets, whether auto-antigens, or viral, bacterial, or fungal
antigens. The sensitivity and specificity of diagnostics is linked to the selection of ligand,
and the quality of the measuring assay. The need for high sensitivity originates from the
need to detect outbreaks, new zoonosis and animal-to-human disease transfer,
epidemiology, and early detection of disease. The need for high specificity originates
from the need to discriminate closely related pathogens, or detection of new disease in
endemic regions, or areas of numerous commonly acquired infections. In this tome, there
was a directed effort to cover a broad landscape of questions that directly address the
performance of diagnostics for infectious disease, biochemically, informatically, and
practically.
Chapter 2 demonstrates a diagnostic application of the Immunosignature non-
natural sequence peptide microarray for diagnosing a single infection, Valley Fever (VF),
Coccidioidomycosis. The introduction to this chapter explores the unmet need for a more
sensitive diagnostic for Valley Fever false-negative individuals. The Valley Fever patient
sera were kindly contributed by Dr. John Galgiani from the Valley Fever Center for
Excellence at the University of Arizona. The work described here includes experimental
data from 3 sets of non-natural Immunosignature microarrays, and compares the results.
Experiments were done to assess whether or not Valley Fever could be distinguished
from other fungal infections such as Aspergillus fumigatus and other confounding

xxvii
community acquired pneumonias such as those cause by Mycoplasma pneumoniae,
Chlamydia pneumoniae. Upon establishing a unique signature pattern for Valley fever,
the sensitivity of this Immunosignaturing assay was tested using serum from patients
obtained in the early stages of the infection in the form of independent training and test
serum sample sets. A set of 96 predictor peptides were selected for their high sensitivity
and tested independently on a smaller ‘VF-diagnostic’ chip to verify sensitivity.
Chapter 3 evaluates the diagnostic accuracy of using natural antigen epitopes
peptides versus 96 non-natural VF predictor peptides as diagnostics. These 96 non-
natural predictor peptides were selected very early in the development of
Immunosignatures. Although pathogen epitope proteins and never-born/non-natural
proteins are bioinformatically compared in literature, this is the first study completing
this comparison in a diagnostic context. From our data, the 96 non-natural VF predictor
peptides showed higher accuracy at classifying all stages of VF infection over VF-epitope
peptides.
Chapter 4 highlights the challenges involved when evolving a single pathogen
diagnostic assay into a multiplexed immunodiagnostic. The assay was developed for
simultaneous detection of 5 or more NIAID category A, B, C priority pathogens in
fulfillment of a project supported by the Chemical Biological Technologies Directorate
contract HDTRA-11-1-0010 from the Department of Defense Chemical and Biological
Defense program through the Defense Threat Reduction Agency (DTRA) to Dr. Stephen
Albert Johnston. My role in this undertaking was to evaluate the feasibility of selecting
pathogen epitopes, both those known to bind empirically, and those predicted to bind
from the IEDB (Immune Epitope DataBase). Based on our analysis I designed the

xxviii
pathogen proteome peptide (PPP) microarray to represent immunodominant antigens for
larger pathogen proteomes and complete proteomes for smaller viruses. I examined the
behavior of serum from infected individuals on these peptides while dissecting the effects
of temperature and time of incubation, concentration of primary, competitors, inter-
peptide spacing on the array surface, peptide linkers, dual and single color scanning, and
mathematical normalization methods. We developed an assay capable of distinguishing 4
priority pathogen infections apart with >90% AUC-ROC (Area under a receiver operator
characteristics curve). Chapter 5 summarizes the bioinformatic efforts implemented to
circumvent cross-reactivity observed on the multiplexed PPP pathogen epitope peptide
microarray platform. We interpreted the cross-reactivity observed on the PPP array using
an antibody ‘Umbrella Approach’ for bioinformatically re-attributing observed cross-
reactivity.
The first appendix covers the observation and characterization of globular VF
spherule-like globular objects within infected individual’s sera. Given the paucity of VF
diagnostics, this observation might serve to enable diagnostics in this area. The presence
of such spherule like circulating antigen-antibody complexes might pose significant
interference on the peptide microarray’s ability to capture antibodies bound to spherules
as noted in other antigen based diagnostics. The second appendix includes data from VF
epitope peptides for four immunodominant antigens showing binding of patient sera at
various IDCF titers (incremental stages) of the infection. The third appendix summarizes
the ASFV (Pirbright, UK) and Francisella tularensis (University of New Mexico)
projects. These were applications requiring use of a more sensitive technology such as the
PPP array as compared to standard ELISA assays to monitoring the antibody response

xxix
from various genetic immunization regimes. Serum samples for these two projects were
contributed by Dr. Kathryn Sykes. My contribution to the Bead Protein Array project
originally conceived and developed by Dr. Kathryn Sykes was to experimentally
optimize this protein microarray system for screening of infectious or vaccinated sera
using IVTT synthesized proteins on beads.

1
CHAPTER 1
INTRODUCTION
Project Overview
Through this work we explore the use of peptide microarray platforms towards
diagnostic applications of infectious diseases. In the first phase, of this study we use a
non-natural sequence peptide microarray platform for diagnosing a single, specific
infection, Valley Fever caused by Coccidioides. In the second phase, in contrast we used
a natural sequence peptide array as a multiplexed array platform capable of
simultaneously discerning 5 or more infections. While most of the work presented in this
dissertation has diagnostic applications, it answers several fundamental questions about
antigen-antibody kinetics as observed in the context of an infectious response.
Peptide microarray as clinical diagnostics
Peptides are useful reagents for characterizing the humoral immune response to
disease. Antibodies respond to a number of different types of antigens including linear
and non-linear proteinaceous targets, polysaccharides and glycopeptides, phosphorylated
proteins, and other biological molecules. Peptides can simulate the physico-chemical
structure of many of these targets (mimotopes), creating a systematic one-stop-solution
for probing antibody behavior. Technologies that rely on proteins as probes are varied
[1]: bead based immunoassay (Luminex, Austin, TX), mass spectrometry (Ciphergen,
Fremont, CA), surface plasmon resonance (Biacore, www.biacore.com), protein
microarrays (Zeptosens-Witterswil, Switzerland; ProtoArray-Life Technologies), electro-

2
osmotic micro-fluidic LabChip (Calipertech, Hopkinton, MA), surface acoustic waves
based micro-fluidic assays (Advalytix, Brunnthal, Germany), micro-cantilever
measurement (Protiveris, Rockville, MD), but most widely used have been peptide
microarrays: PEPperPRINT-Heidelberg, Germany; CombiMatrix-Mukilteo, WA;
Immunosignaturing [2]. Microarrays enable thousands of peptides to be assayed
simultaneously under identical assay processing conditions. Many groups have developed
pathogen antigen based peptide microarrays diagnostics for specific infections such as
Tuberculosis [3,4], Echinococcus spps. [5] and SARS [6,7]. The antibody response
mapping strategy as outlined by these groups involves testing patient sera in comparison
to normal donor sera. Using tiled regions of proteins, researchers have precisely
identified small portions of proteins that correspond to the eliciting antigen [8].
Immunosignaturing is a novel microarray platform as compared to pathogen antigen
based peptide microarrays because it uses non-natural peptides to capture antibody
response [2,9,10]. This technology has led to fundamental breakthroughs in
understanding antigen-antibody interactions that could potentially be used for medical
diagnostics [11-13].
Advantages of using peptide microarrays
A significant advantage of using peptide microarrays is their ability to partition
and measure separately, specific portions of an antibody response. The resolution of these
responses captured on peptide microarrays can be traced down to the eliciting antigen
fragments. In comparison, protein based ELISA’s or protein microarrays merely allow

3
capturing a cumulative sum of antibodies against entire proteins. Unlike certain protein
microarrays another advantage of using peptide microarrays is the minimal test sample
preparation and lack of complex blocking steps required during sample processing. For
example, in Escherichia coli based in-vitro translation and transcription (IVTT) protein
microarrays, test sera is blocked using E. coli lysate to exclude false-positive reactivity to
E.coli proteins within the IVTT protein mixture [14]. E.coli reside within the human gut
microbiome comprising a 100 trillion microorganisms [15] classified under phyla:
Bateriodetes, Firmicutes and Actinobacteria [16]. Golby et al. [17] observed preliminary
evidence for B-cell development in human fetal intestinal cells using
immunohistochemistry studies. Additionally, recent evidence in mice suggests that
bacteria within the gut microbiome might be capable of influencing B-cell development
and immune response in the mouse intestine [18]. Given that the antibody response to E.
coli residing in the intestine might be part of the primary immune response in humans, it
would not be advisable to exclude this anti-E.coli protein lysate signature when
attempting to capture pathogen specific antibody reactivity using microarrays. Peptide
microarrays do not require biasing the observable infectious antibody response by
including such high complexity sample preparation steps. Additional advantages of
peptide microarrays are their ability to tile continuous fragments of proteins to
characterize monoclonal antibody reactivity with higher resolution than is possible with
protein microarrays. Peptides are easier and less expensive to produce in comparison to
proteins through IVTT. Considering these significant advantages, it would be prudent to

4
apply peptide microarrays to diagnose and distill the complex immune response observed
in chronic infectious diseases such as Valley fever.
Project I: Valley Fever Immunosignaturing diagnostic
Coccidioidomycosis (Valley Fever) is caused by a dimorphic fungus that grows in
the southwestern desert regions of United States and Central and South Americas. The
two genotypically variant strains are C. immitis found in California and C. posadasii
found outside California. The disease is caused by inhalation of the spores called
Arthroconidia and manifests initially with pneumonia-like symptoms due to the mode of
entry being lungs. The disease is most prevalent in the states of Arizona, California,
Nevada and New Mexico and infects more than an estimated 150,000 [19] people in the
United States every year.
Symptomatically, Valley Fever (VF) infection is very difficult to diagnose in the
early stages as several of its symptoms are confounded with those of most community
acquired pneumonias (CAP) such as tuberculosis. Approximately 60% [20] of Valley
Fever cases are from the state of Arizona and therefore the Arizona Department of Health
Services (ADHS) initiated an enhanced surveillance scheme for Valley Fever. ADHS
conducted an interview based survey of 493 patients out of the 4,832 total patients
diagnosed with Valley Fever in 2007 as part of their enhanced surveillance initiative [20].
They outlined several reasons for delays in the diagnosis of Valley Fever. Patients wait
for 44 days on an average before seeking care. Another reason for delay was also lack of
uniform awareness about the disease and treatment modalities among both physicians as

5
well as patients. From the physician’s perspective this might be due to the commonality
of symptoms elicited by Valley Fever in comparison with other community acquired
pneumonias. On an average Valley Fever patients visited physicians about 3 times before
they were even tested for Valley Fever. If patients are made aware of the possibility of
being infected due to living in an endemic region, they would perhaps not wait so long
before seeking medical care and would even request being tested for Valley Fever. Valley
Fever alone is known to account for $86 million in hospital charges in Arizona in the year
2007 [20].
As per the CDC Summary of Notifiable Diseases in 2011 [21], 22,634 total cases
of coccidioidomycosis were reported. Partly this number is much smaller than the
estimated 150,000, as, in Arizona, one third [20] of the physicians were not aware that
Valley Fever is a reportable disease and this might be the case with physicians from other
non-endemic locations as well [22]. Also, a majority of the cases that are reported belong
to the 40% in whom the infection does not self-resolve, thereby obscuring data from the
remaining 60% people exposed. As per the CDC, 30-60% [23] of people living in regions
endemic for Valley Fever will have been exposed to it. The total population of the 4 main
states endemic for Valley Fever, namely: Arizona, California, New Mexico and Nevada
obtained from US Census Bureau figures is approximately 49.4 million [24]. Just 30% of
this value, 14.8 million people, as per CDC estimates would be exposed to Valley Fever
in these endemic states.
Current diagnostics available for this disease primarily use antibody based in-
direct methodologies such as immunodiffusion, whereby, the patients’ serum is tested for

6
the presence of IgM and IgG antibodies to major Coccidioidal antigens CF and TP. The
problem with this technique is false negatives: approximately 5% [25] of patients [both
immuno-compromised and immuno-competent] suffering from Valley Fever do not show
detectable levels or even presence of antibody in their sera. A good prognosis in
Coccidioidomycosis is when a person elicits a cell mediated immune response against the
infection [26,27]. Sixty percent of the patients, in whom the infection is contained within
the lungs or resolves by itself, show almost non-detectable antibody levels (by ELISA or
Immunodiffusion) to Coccidioidal antigens. But Coccidiodes may only be contained in
these patients’ lungs instead of being completely destroyed by their immune system and
so the infection might recur when the patient is later in an immunocompromised state
[26]. An antibody mediated (humoral) response is usually seen in individuals in whom
the infection does not resolve on its own and instead disseminates.
An alternative to this is direct detection via culturing the organism in the
laboratory from the patients’ body fluids. However, this involves the potential risk of
exposing the technicians to the infectious form of this fungal pathogen. Since Valley
Fever is primarily a lung infection, a chest x-ray showing either a cavity or a patch of
infection in the lung is followed by a nasopharyngeal wash or surgical computed
tomogram [CT] guided lung biopsy to retrieve a sample for culturing and Hematoxylin-
Eosin staining. Both culturing and CT guided biopsies are technically cumbersome
procedures. In an effort to avoid these invasive and potentially risky procedures, we
propose utilizing the peptide microarray platform to ascertain a specific signature pattern
for the early detection of Valley fever separating it from other CAPs such as tuberculosis.

7
This would help detect the infection in the 60% of people in whom the primary infection
resolves without showing detectable antibody levels in their serum, but might latently
recur. If patients knew they were exposed, they could make informed decisions with their
physicians about clinical procedures requiring suppression of the immune system.
The current alternative commercial diagnostic efforts include using nucleic acid
amplification of Coccidioidal DNA from sputum samples through Polymerase Chain
Reaction [28], microarray based whole genome level Comparative Genomic
Hybridization (aCGH) technology [29] and utilizing the BacT/ALERT® [30] automated
microbial detection media system. All these technologies do not detect early infection
and have also not been proven to detect latent infection. The immunosignature, non-
natural peptide microarray technology [9] might surpass both these limitations, paving
the way towards accurate and early diagnosis of Valley Fever.
The scope of my dissertation is to ascertain the humoral immune response pattern
that is specific for Coccidioidomycosis from IgG and IgM antibody interaction in VF
patient sera with randomly generated (non-natural, Chapter 2) and epitope (from
Coccidioides, Chapter 3) antigen peptides spotted on a peptide microarray platform.
Experiments designed to examine presence and absence of classes of Coccidioides
specific immunoglobulins were conducted in order to completely characterize the
spectrum of patient sera we would be likely to encounter in a clinical setting. Chapter 3
compares the diagnostic performance of non-natural sequence (random-space) VF-
predictor peptides with VF-antigen epitope peptides (life-space) to evaluate the feasibility
of using either life versus random space diagnostic peptide reagents. Several efforts to

8
chemically characterize and classify random (never-born proteins) apart from natural
protein sequences have been conducted in-silico [31,32]. A side by side comparison of
non-natural versus life-space epitopes within a diagnostic context has not been previously
reported. Through data from this work, a bioinformatic modulation to the Smith-
Waterman [33] local sequence-alignment algorithm termed ‘di-peptide inversion’ was
suggested and implemented within GuiTope [34], an alignment program from our lab.
This significantly improved GuiTope’s accuracy at finding alignments between natural
VF pathogen proteins and the non-natural sequence antibody capturing VF-predictor
peptides from the immunosignaturing platform. Platform optimization expertise obtained
through this project was applied to the second project involving creation of a multiplexed
peptide microarray platform for simultaneous detection of multiple priority pathogen
infections.
Cross-reactivity observed in peptide microarrays
Antigen-antibody cross-reactivity is a salient feature of all immunodiagnostics
and peptide microarrays are no exception to this rule [35]. Unlike single pathogen
diagnostic peptide microarrays distinguishing infectious sera from uninfected sera, Felger
et al. [5] tested their Echinococcus specific peptide microarray platform against other
symptomatically confounding nematode infections. The peptide array was developed to
discriminate between Echinococcus species: multilocularis and granulosus. 45 peptides
from 6 proteins of the pathogens showed 94% specificity and 57% sensitivity, but overall
these peptides were not effective at differentiating between the two species. Andresen et

9
al. [36] tested a 900 peptide microarray for simultaneous distinction of viral infections
from phylogenetically related Herpes & Hepatitis C virus genotypes. CMV and EBV
patient sera showed appropriate reactivity on their assay but Hepatitis C virus infected
sera showed broad cross-reactivity.
Another cross-reactive result obtained when using peptide microarrays was by
Maeurer et al. [3] on their 7446 peptide microarray representing 12-mer overlapping 15-
mer (total length) peptides from 61 Mycobacterium tuberculosis proteins. The authors
observed 3 patterns of patient serum IgG reactivity to peptides on the array including a
set of 89, TB-specific peptides, capable of distinguishing TB-positive from TB-negative
individuals. Additionally, they observed 24 TB-sensitive peptides exclusively reacting
with TB positive patient sera but not with normal TB sero-negative sera. And, a set of 13
peptides from M. tuberculosis exclusively recognized by only normal TB-negative
(Quantiferon assay negative) individuals’ sera but are not recognized by TB positive
patients sera. When performing a BLAST search of these 13 peptides for possible
matches with the human proteome, several potential matches were identified due to
sequence level similarities. A working hypothesis is that the innate overlap between the
host (human) and pathogen proteomes create natural self (host)-reactive targets that react
to identical sequences found in pathogens. Whether this could be interpreted as low level
auto-immunity or these antibody reactivities are due to mimotopes from other
environmental non-pathogenic Mycobacteria as originally proposed by the authors, is
speculative in the absence of previous immune exposure history from these patients.
Obtaining orthogonally characterized sera with detailed annotation regarding previous

10
vaccinations/infection histories would have benefitted such a study by helping resolve
cross-reactivity observed to M. tuberculosis peptides from uninfected individuals.
Lo et al. [6] attempted to circumvent potential cross-reactivity observed on
peptide microarrays between phylogenetically related pathogens by selecting 27 peptides
that were specific only to the SARS-CoV (Severe Acute Respiratory Syndrome-
Coronavirus) and not to other Coronaviruses or the human and mouse proteomes on a
sequence level (BLAST analysis). This array was only tested against SARS infected
versus not infected patients and not against serum from other closely related
Coronaviruses to prove the specificity of their SARS specific peptides and justify using
informatics intervention during peptide selection. Such an approach, of making single
pathogen specific diagnostics using peptide microarrays is typically adopted to
circumvent possible cross-reactivity on these assays. Due to high cross-reactivity
observed in peptide microarray data, none of these groups have attempted multiplexing
the diagnosis of more than one infection on the same chip/ microarray platform.
Multiplexed diagnostics for human pathogens and bio-threat agents
Serum based multiplexed diagnostics are implemented using technologies such as
multiplexed ELISA’s, protein and peptide microarrays and microsphere immunoassay
(MIA). A commercial example of a multiplexed ELISA is the ToRCH screen for
measuring antibody reactivity in pregnant mothers against 7 vertically transmitted
infections [37]. The infections tested are Toxoplasma gondii, Rubella virus,
Cytomegalovirus (CMV), Herpes simplex virus (HSV) type 1 and 2, Varicella zoster

11
virus (VZV), Chlamydia trachomatis with variable IgG sensitivity per pathogen ranging
from 46% (HSV2) to 97% (VZV) and specificity ranging from 88% (T. gondii) to 100%
(VZV, Rubella, CMV).
Apart from clinical diagnostic applications, multiplexed diagnostics are also
needed for biothreat agents. Biothreat surveillance is important not only from a national
perspective but also more pertinent to armed forces personnel being deployed in unsafe
territories. Microbial biothreat pathogen lists from various regulatory organizations help
prioritize exposure to pathogens based on their weapon potential and the severity of
symptoms they are capable of causing in their hosts. The National Institute of Allergy
and Infectious Diseases (NIAID) category A, B, C priority pathogen list [38] includes
primarily deadly encephalitis viruses and pathogens with a high weaponization potential
such as Bacillus anthracis in category A. Category B includes pathogens acquired of
transmitted via food or water and Category C includes pathogens causing newly emergent
infectious diseases. Over time these might get re-classified depending on their
weaponization potential or change in virulence to increase severity of symptoms. Other
priority pathogen lists are from U.S. Department of Health and Human Services (HHS)
and U.S. Department of Agriculture (USDA) [39]. Some priority pathogens from the
NIAID list overlap with the HHS and USDA lists, but the USDA list primarily has
zoonotic pathogens potentially capable of infecting humans such as the African Swine
Fever Virus (ASFV) virus [40]. The preliminary evidence for this indication came from a
pyro-sequencing study where Loh et al. [40] found ASFV-like sequences in human
serum from individuals having an acute febrile illness (AFI) in the Middle East and in

12
multiple sewage samples from Barcelona, Spain. Although the source of the sewage
samples could not be identified specifically as being from human or animal origin, the
geographic distance between these two observations was alarming enough to add ASFV
to the HHS & USDA priority pathogen lists.
The CDC recently developed a Luminex based microsphere immunoassay (MIA)
simultaneously distinguishing 13 viruses listed as biothreat agents from viral families of,
Bunyaviridae (LaCrosse encephalitis-LAC), Togaviridae (Eastern equine encephalitis-
EEE, Western equine encephalitis-WEE, Venezuelan equine encephalitis-VEE,
Chikungunya-CHIK, Mayaro-MAY, Ross river virus-RR) and Flaviviridae (West Nile
virus-WNV, Japanese encephalitis virus-JEV, Dengue-DEN, Yellow fever virus-YFV,
St. Louis encephalitis-SLE, Powassan-POW) [41]. Using the LogitBoost algorithm their
cross-validated average error rate was 8.3%. In their assay, Luminex Microplex
(Luminex Corporation, Austin, TX) carboxylated microspheres are coated with
commercially available anti-virus monoclonal antibodies. Viruses are generated by either
inoculating suckling mouse brains or expressed in-vitro using recombinant vectors in
monkey kidney fibroblast-like COS-1 cells. The viruses are then incubated with the
monoclonal anti-viral antibody coated microspheres to allow capturing and surface
presentation and generate a sandwich ELISA once incubated with the patient sera. The
drawback on this assay is its requirement of unstable reagents with a shelf-life of 6
months the handling of which needs to be monitored due to them being biothreat agents.
These drawbacks hinder the deployability of this assay to local reference laboratories,
requiring that samples be shipped to CDC for evaluation, delaying diagnosis. Peptide

13
microarrays on the other hand are more stable, they can be stored at room temperature
[42] and have a shelf-life after printing can be >1 year [43,44] making them easily
deployable to even local reference laboratories, utilize a fraction of the sample used in
MIA’s (1:500 vs. 1:20) and represent only short sequences of biothreat agent proteomes,
assay processing not needing supervision. The detection limit of technologies such as
Luminex assays is 1-10 pg/ml [45].
Alternative biothreat detection technologies such as multiplexed PCR’s and
assays using B-cells as sensors (CANARY) [46] fall under the category of direct
detection of pathogen instead of detecting the immune response raised by them in hosts.
The LLMDA – Lawrence Livermore Microbial Detection Array [47,48], PathChip [49],
GreeneChip [50] and ViroChip [51] are examples of multiplexed PCR’s. The LLMDA
contains 388,000 probes containing 38,000 viral sequences from ~2200 viral species and
3500 bacteria sequences representing approximately 900 different bacterial species. The
PathChip contains approximately 170K probes and is capable of recognizing all known
viral pathogens. The diagnostic accuracy of this assay from testing 290 pediatric nasal
wash samples was 85.9% for Rhinoviruses or Enteroviruses and for 98.6% Parainfluenza
virus 2.
An antigen detection B-cell based sensor named CANARY- cellular analysis and
notification of antigen risks and yields [46] for rapid identification of pathogens can
detect as little as 50 CFU/50 µL of Yersinia pestis, 1000 CFU of Bacillus anthracis in 1
ml of extraction medium, 500 CFU/50 µL of Escherichia coli (O157:H7) in contaminated
lettuce (25 g), 500 PFU/50 µL of Vaccinia virus and 5X10⁵ PFU/50 µL of Venezualan
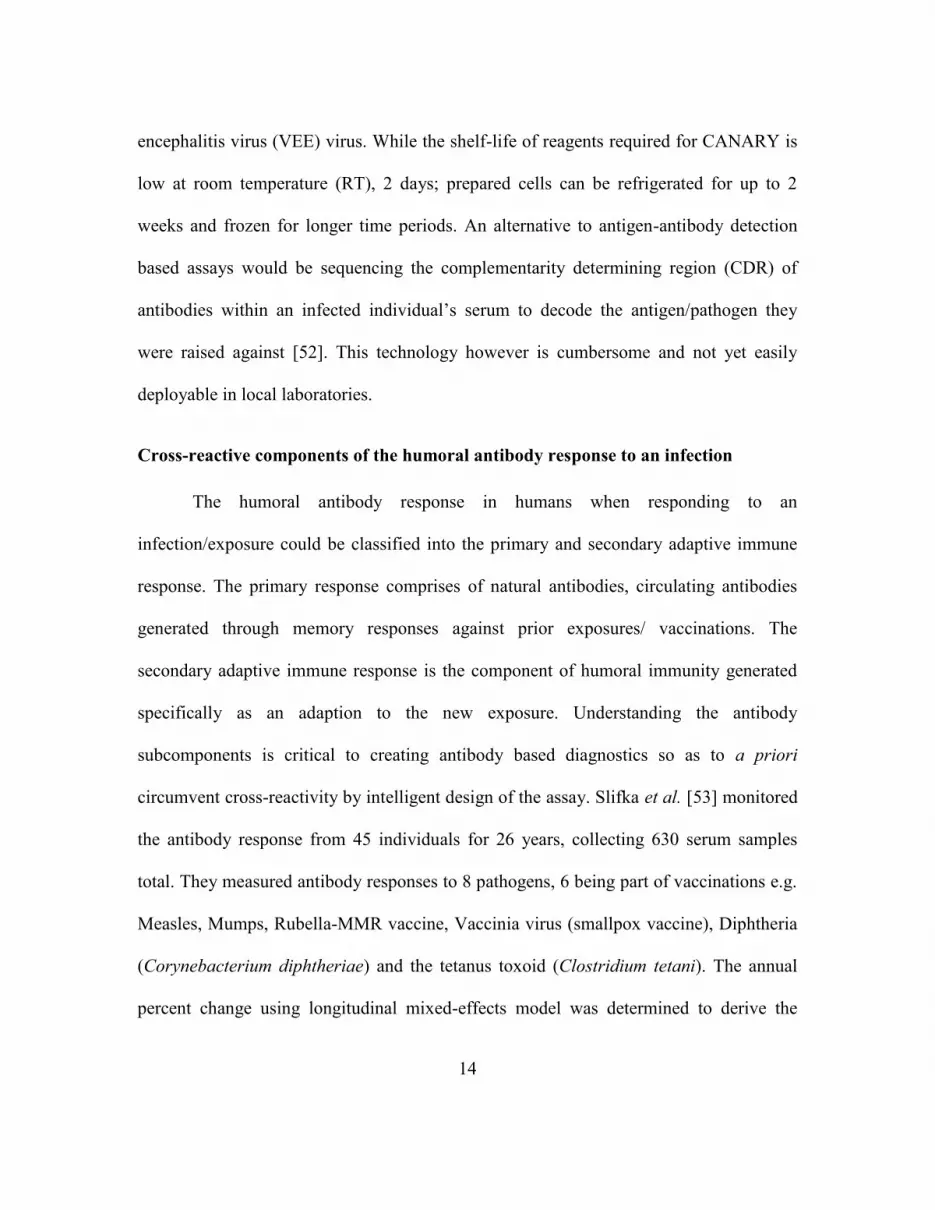
14
encephalitis virus (VEE) virus. While the shelf-life of reagents required for CANARY is
low at room temperature (RT), 2 days; prepared cells can be refrigerated for up to 2
weeks and frozen for longer time periods. An alternative to antigen-antibody detection
based assays would be sequencing the complementarity determining region (CDR) of
antibodies within an infected individual’s serum to decode the antigen/pathogen they
were raised against [52]. This technology however is cumbersome and not yet easily
deployable in local laboratories.
Cross-reactive components of the humoral antibody response to an infection
The humoral antibody response in humans when responding to an
infection/exposure could be classified into the primary and secondary adaptive immune
response. The primary response comprises of natural antibodies, circulating antibodies
generated through memory responses against prior exposures/ vaccinations. The
secondary adaptive immune response is the component of humoral immunity generated
specifically as an adaption to the new exposure. Understanding the antibody
subcomponents is critical to creating antibody based diagnostics so as to a priori
circumvent cross-reactivity by intelligent design of the assay. Slifka et al. [53] monitored
the antibody response from 45 individuals for 26 years, collecting 630 serum samples
total. They measured antibody responses to 8 pathogens, 6 being part of vaccinations e.g.
Measles, Mumps, Rubella-MMR vaccine, Vaccinia virus (smallpox vaccine), Diphtheria
(Corynebacterium diphtheriae) and the tetanus toxoid (Clostridium tetani). The annual
percent change using longitudinal mixed-effects model was determined to derive the

15
antibody-half life (in years). Tetanus toxin and Diphtheria toxin had short half-lives (11
& 19 years respectively). The half-lives of the remaining exposures ranged from 50 years
for Varicella zoster virus to 11,552 years for Epstein Barr virus (EBV). They concluded
that most childhood prophylactic vaccine exposures left behind circulating antibodies that
could be detected throughout the life of these individuals tested with negligible change in
the concentration over time. In addition to these vaccinations, Palese et al. [54]
demonstrated through longitudinal characterization of the influenza antibodies within 40
individual’s sera monitored for 20 years obtained through the Framingham Heart Study
that the neutralizing antibody titers against several influenza virus strains increased over
time. Apart from influenza they measured CMV antibodies and noted negligible change
in anti-CMV titers within exposed individuals.
The population prevalence estimates between 1999-2004 (age: 6-49 years) of
CMV in United States is 50.9%, with sero-positivity in certain counties such as Los
Angeles being higher at 69.7%.; and that among certain ethnic minorities such as
Mexican American individuals residing in LA being 79.7% [55]. Palese et al. chose to
measure the antibody reactivity to CMV due to the antigenic stability of this virus as
compared to influenza and its higher prevalence within the general population. Other
pathogens showing notable sero-prevalence within the population are Varicella (96%),
Rubella (91.2%), Mumps (90%), Measles (95.9%), HSV-2 (17.3%), HSV-1 (58.1%),
Hepatitis A virus (35.9%), Toxoplasma gondii (11%) [55]. Given the high prevalence of
these exposures and their ability to leave behind a memory response with circulating
antibodies observed throughout an individual’s lifetime, developing a sensitive diagnostic

16
capable of distinguishing all known human pathogens simultaneously becomes
challenging. Sensitive technologies such as peptide microarrays are capable of measuring
these interfering memory antibody responses, leading to interference observed with the
signature of a given infection. Such as effort would require the use of data analysis
techniques allowing for discerning more than one exposure simultaneously so as to
distinguish the inseparable matrix of prior exposure related antibody reactivity versus the
most current exposure and compensate for cross-reactivity observed on these platforms.
Project II: Multiplexed priority pathogen proteome peptide array
This work is aligned with a DTRA (Defense Threat Reduction Agency) funded
project (Grant# HDTRA1-11-1-0010) which involves development of a scalable
technology so as to monitor the exposure of military personnel to NIAID Category A, B,
C Priority biothreat pathogens. The first task of this proposed work involves generation
of a 100K random peptide silicon chip, the proprietary technology for which could later
be used if needed to create a 1 million peptide feature chip so as to represent all known
human pathogen proteomes. The second milestone required the production and
evaluation of a 10K peptide prototype pathogen proteome array capable of distinguishing
between five or more infectious bio-threat agents simultaneously in a multiplexed assay.
This work required testing the feasibility of such a system, designing peptide candidates
to be tested on the microarray, thermodynamically and physically optimizing array
configuration and testing the platform, bioinformatically assessing the expected versus
actually observed peptide antigen-antibody cross-reactivity from sera for evolutionarily

17
related and unrelated bio-threat agents. The pathogens selected to be represented on the
array were based on infectious serum availability. Their epitope selection strategy and
thermodynamic considerations while optimizing the assay to reduce cross-reactivity are
explained in greater detail in Chapter 4. An analysis pipeline specific to the multiplexed
pathogen proteome peptide array was created by combining eight statistical metrics. A
novel aspect of this work was observing a reduction in assay accuracy after adding
influenza peptides along-side priority pathogen peptides. The addition of Influenza
peptides required a change in the data-analysis strategy adopted previously and is detailed
in Chapter 5. The antibody cross-reactivity observed after including influenza peptides
required mapping the ‘umbrellas of antibody reactivity’ down to an n-mer (peptide sub-
sequence) level in an attempt to circumvent cross-reactivity and detect the cognate
infection.

18
CHAPTER 2
APPLICATION OF IMMUNOSIGNATURES TO DIAGNOSIS OF VALLEY FEVER.
Abstract
Background
Valley Fever (VF, Coccidioidomycosis) infection is difficult to diagnose based on
symptoms in part because of the similarity to community-acquired pneumonias (CAP).
Confirmatory diagnostics detect IgM and IgG antibodies against Coccidioidal antigens
via Immunodiffusion (ID). However, the false negative rate using ID can be 50-70% and
5% of symptomatic patients never show detectable antibody levels at all. Here we test
the capability of the immunosignature diagnostic to resolve the false negative diagnostic
problem for VF. Immunosignatures are developed from arrays of non-natural-sequence
peptides. Blood antibodies bind to the arrays to create disease specific signatures.
Methods
A 10,000 peptide array was used to determine if VF infection produced signatures
distinct from 3 other infections. A similar array was used to distinguish VF infection
from non-infection in a training/test set format. The signature peptides from the 10,000
peptide array were used to design a smaller VF-specific array of 96 select peptides. The
performance of the 10,000 peptide array and the 96 peptide array were compared to the
ID diagnostic standard.

19
Results
The 10,000 peptide array classified the VF samples from the other 3 infections with 98%
accuracy. The array was also able to classify all the VF, ID negative patients versus non-
infected controls with 100% sensitivity in a blinded test set. The sensitivity of ID on the
test set was 28%. In comparison the 96 peptide array performed with 82% sensitivity on
the same sample sets.
Conclusion
The immunosignature diagnostic can be used to simultaneously distinguish VF infections
from a fungal and two other bacterial infections. The same array can diagnose with 100%
sensitivity the clinically important ID negative patients. A smaller 96 peptide array was
less specific in diagnosing the ID negative patients. We conclude that by training using a
clinically confounding sample set a robust immunosignature diagnostic could be
developed to be used in combination, or possibly in lieu of, the existing diagnostics.
Abbreviations
BSL, Biosafety level; CAP, community acquired pneumonia; CF, Complement Fixation;
CNS, Central Nervous System; CT, Computed Tomography; EIA, Enzyme
Immunoassay; ID, Immunodiffusion; IDCF, Complement fixation antibodies detected by
Immunodiffusion; IDTP, Tube precipitin antibodies detected by Immunodiffusion; KNN,
K-nearest neighbors; LVS, Live Vaccine Strain; subsp, Sub-species; LDA, Linear
Discriminate Analysis; LOOCV, Leave One Out Cross Validation; NPV, Negative

20
predictive value; PPV, Positive predictive value; TP, Tube Precipitation; TB,
Tuberculosis; VF, Valley Fever.
Introduction
Coccidioidomycosis, commonly known as Valley Fever (VF), is caused by a
fungus Coccidioides immitis (California strain) or C. posadasii found in the arid soil of
the southwestern desert regions of United States and South America. Human disease is
caused by inhalation of the arthroconidia (spores) of the fungus, and presents primarily
with flu-like symptoms or, progressively, pneumonia. VF affects an estimated 150,000
[19] people in US every year, primarily in the states of Arizona [56], California [57],
Nevada, New Mexico and Utah. A major problem in the management of the disease is
the failure of detection (sensitivity) in 30% of the infected individuals. We have tested
whether a new diagnostic technology, immunosignatures, could address this problem.
Sixty percent [26] of the VF exposed individuals are either asymptomatic or have
mild symptoms with the infection usually being self-limiting. The remaining 40% [58] of
exposed individuals demonstrate symptoms such as skin rash and respiratory ailment
lasting from months to years. In 5-10% [26,59] of these, infection disseminates, affecting
other organs, skin, bones and nervous system. Individuals from non-Caucasian ethnicities
[19] such as African Americans, Filipino and Asians and 65 years or older, pregnant
women and patients with immunocompromised immune systems are more susceptible to
VF and particularly the disseminated form of the disease. As per Arizona Department of
Health Services (ADHS), VF patients visit physicians on average three times before they

21
are tested for VF, more so if patients visiting AZ from non-endemic regions are
diagnosed by physicians unacquainted with diseases of the American Southwest [60].
VF alone is known to account for $86 million in hospital charges in Arizona in the year
2007 [60], and an unestimated amount in states outside AZ.
The confirmatory diagnostic test for VF is an immunodiffusion (ID) assay
detecting antibodies against antigens within fungal coccidioidin causing complement
fixation (CF) and tube precipitation (TP). Coccidioidin is a culture filtrate of the
mycelial form of C. immitis, the heat treated portion of which is used to detect IgM
antibodies, and the untreated portion is used to detect IgG antibodies [61]. The
sensitivity of IDCF is 77% and IDTP is between 75-91% [62]. An alternative is to
culture the organism from body fluids or tissue, but a concern is infection of technicians
[63]. Although, culture is a preliminary diagnostic for pneumonias, the sensitivity of this
approach for VF ranges from 23-100% depending on clinical status [64]. The recovery
rate of this pathogen through culture ranges from 0.4% from blood to 8.3% from
respiratory tract specimens [65]. As noted the most clinically pressing issue is the low
sensitivity of these diagnostics as primary tests.
We propose utilizing the immunosignature diagnostic technology [11] to address
some or all the limitations of current diagnosis of VF, particularly as a diagnosis for
patients misclassified at the first test.The immunosignature technology utilizes a high-
density array of non-life-space peptides to provide mimics of epitopes, for even
discontinuous epitopes or non-protein antigens. In this report the arrays consist of 10,000
peptides whose sequences were chosen from random sequence space. The peptides are

22
20 amino acids long with 17 variable positions and 3 constant at the attachment end. As
opposed to single antigen ELISA-based assays, the disease-specific signature signal in an
immunosignature comes from multiple peptides that form a distinct, disease-specific
pattern of antibody binding. Most antibody based immunological tests examine the
presence of new antibodies in infected individuals.
An immunosignature can actually display both, the presence of new antibodies
relative to infection or chronic disease, but also any suppression of antibodies (measured
as loss of signal) that were commonly present in healthy controls reflecting memory
responses to vaccinations and common pathogen exposures. An immunosignature, unlike
many genetic or immunological tests, is both sample sparing and robust to sample
handling [66]. Because the sensitivity of an immunosignature is higher than that of
ELISA-based serological tests [10,11], and disease discrimination is possible on the same
array across multiple infectious diseases, we asked whether the platform was suited to be
used as a VF, disease-specific diagnostic. VF diagnosis frequently results in false
negatives, resulting in late recognition of the disease [67-69], adversely affecting patient
outcomes. We therefore proposed a series of tests to characterize whether an
immunosignature assay performs better than existing diagnostics for detecting VF. We
postulate this assay would detect VF earlier and with a greater sensitivity and at lower
cost than conventional methods. Here we report testing this possibility. The ability of
immunosignatures to distinguish VF from 3 other infections was tested. The same array
was used to test the ability to discern ID negative patients from non-infected controls.
The effect of reducing the number of peptides to a smaller array was also evaluated.

23
Methods
Serum samples used in this study
All patient sera used in this study are listed in Table 2- 1.
Table 2- 1 Patient sample cohorts per infection utilized in this study
No. Infection No. of patients No. of samples
Confounding infection pilot study
1 Aspergillus 20 20
2 Chlamydia 20 20
3 Mycoplasma 19 19
4 Normal 31 31
5 VF-Training set 18 18
Valley fever patient sera with non-VF controls
1 VF-Training set (U of A) 35 55
2 VF-Test set (U of A) 25 67
3 Normal individuals (ASU) 41 41
4
Influenza vaccinees (2006-
2007-seasonal vaccine) (ASU) 7 7
Confounding infection samples
For the experiment testing different infections, patient sera representing 19
Aspergillus fumigatus, 19 Mycoplasma pneumoniae and 19 Chlamydia pneumoniae were
processed alongside 18 VF and 31 normal sera on the 10,000 peptide microarray. The A.
fumigatus, M. pneumoniae and C. pneumoniae samples were acquired from SeraCare
Life Sciences (Gaithersburg, MD) and were tested by commercial ELISA tests for
presence of antibodies to respective infections by SeraCare (Supplementary Table 2- 1).

24
Valley Fever and normal donor serum samples used in this study
A training cohort of 55 samples and a blinded test set of 67 samples were
obtained as de-identified human patient sera from John Galgiani at the University of
Arizona (IRB# FWA00004218). Non-disease sera included 7 influenza vaccine (2006-
2007) recipient sera ‘pre-vaccine’ and ‘post-vaccine’ plus 41 locally obtained healthy
donor samples (ASU IRB 0905004024) which were used to ensure specificity.
Following submission of our classification results to J. Galgiani, the test set was un-
blinded and revealed to contain 25 patients with two or more serum samples collected
longitudinally per patient during subsequent clinic visits. For each patient in the test
cohort the initial sample was measured as having a zero-titer (negative) on IDCF but
sero-converted at a later date as the infection progressed. All samples were serologically
characterized by J. Galgiani’s laboratory for IDCF and IDTP titers. Table 2- 2 and Table
2- 3 describe the patients CF titer distribution in training and test cohorts respectively.
Table 2- 2 Diagnosis (IDCF) of 55 unique patient samples from the VF training cohort
CF
Titer
#
Samples
0 6
1 4
2 8
4 5
8 3
16 8
32 11
64 5
128 3
256 2

25
Table 2- 3 Diagnosis (IDCF) of 67 blinded samples from the VF test cohort.
CF
Titer
# Samples
(# patients)
0 48 (25)
1 5 (4)
2 7 (7)
4 3 (3)
8 1 (1)
16 2 (2)
32 1 (1)
Blinded test patient sample set
The test sample set includes 25 patients with two or more serum samples per
individual, for a total of 67 samples. 24 of these symptomatic patients had an IDCF titer
of zero and were given a negative diagnosis for VF after their first clinic visit. All 24
patients returned to the clinic for a follow-up appointment between 7 and 27 days and
blood samples were drawn for the second time at which point 12 of them were still sero-
negative on the IDCF test. Of the 12 IDCF negative patients only 6 returned for the third
follow up visit due to continued symptoms and 6 others returned either for monitoring of
increasing CF titers or re-testing due to a positive IDTP result. The time interval for the
third visit ranged between 4 and 159 days after the second visit. Four of these patients’
samples were drawn again between 96 and 147 days at which time a verified IDCF titer
was observed in 2 patients who were given a positive VF diagnosis. One symptomatic
patient returned for a fifth visit and remained negative on both the IDCF and IDTP tests
113 days later despite being symptomatic for Valley Fever.

26
Microarray production and processing
The 10,000 (10K) non-natural sequence peptide immunosignature array and the
96 peptide ‘VF diagnostic’ arrays were produced and processed as described in Legutki
and Stafford et al. [2,11]. Briefly, the peptides are spotted onto standard slides using a
piezo-electric printer. The average spot diameter is ~140µm. The slides are washed with
buffer and the serum (diluted 500-fold in buffer) is applied to the array for 1hr. It is then
washed with buffer and the antibody binding pattern determined by incubation with a
secondary to human IgG antibody. The 16-bit 10µm TIFF images from the Agilent ‘C’
scanner were aligned using GenePix 6.0 software (Axon Instruments, Union City, CA)
and the data files imported into GeneSpring 7.3.1 (Agilent, Santa Clara, CA) and R [70]
for further analysis. Each training patient sample was processed in triplicate on the 10K
array. The 10K array data was median-normalized per chip and per feature. Any array
with a Pearson Correlation Coefficient less than 0.80 across technical replicates was re-
processed. Patient samples were excluded from further analyses if they consistently
produced extremely high background and/or consistently failed to provide reproducible
results across technical replicates, suggesting serum degradation.
Statistical classification of disease groups
The statistical classification of disease groups was done using Naïve Bayes from
the R ‘klaR’ package [71] combined with the Leave one out cross validation (LOOCV)
and Holdout algorithm as implemented in the R package ‘DMwR’ [72]. Testing the
classifier was done using a data-holdout experiment where training and test datasets are

27
combined and 70% of randomly chosen data is used to train and predict on the remaining
30% dataset. This procedure is repeated 20-times to ensure every sample was predicted
more than once by training on multiple combinations of other samples.. The evaluation
of diagnostic metrics such as sensitivity, specificity, positive predictive value (PPV),
negative predictive value (NPV) and accuracy of the CF-Titer test based on its
performance on our specific patient sample set are reported alongside for comparison
purposes.
Statistical classification of confounding infections
To assess if the random peptide microarray could specifically distinguish multiple
confounding infections, samples were processed on the 10K random peptide array under
similar assay conditions as before. Six different slide batches were used to process these
sera and ComBat normalization was applied to median normalized data to eliminate
differences between samples due to batch effects. [73,74] 243 random peptides capable
of distinguishing between the five classes namely, VF, Aspergillus, Mycoplasma,
Chlamydia and Normal were selected using Fisher’s exact association test as
implemented in GeneSpring GX 7.3.1. Since a physically separate training and test
dataset were missing for this analysis, the stringent holdout cross-validation as
implemented in R package ‘DMwR’ was applied to the training dataset as described
previously [72].
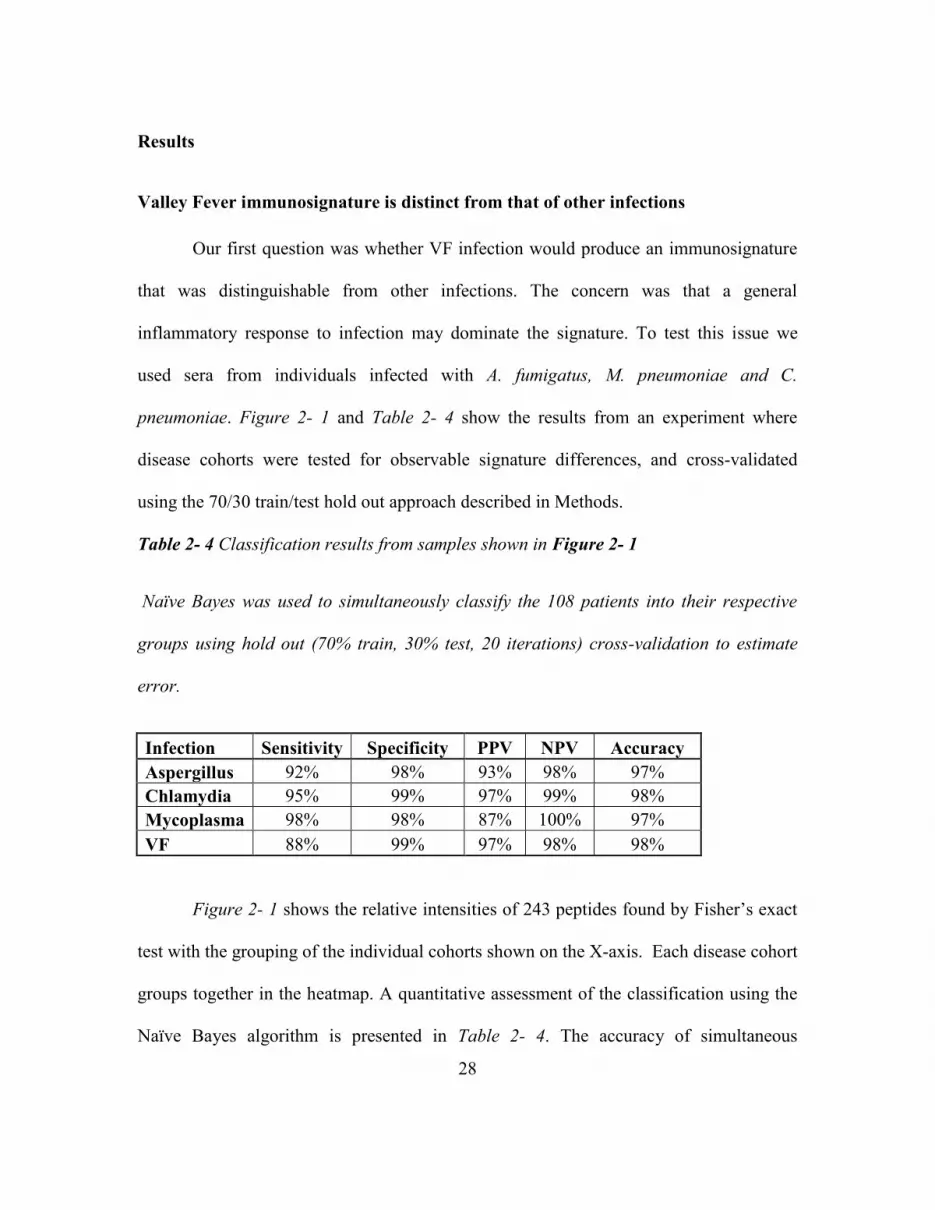
28
Results
Valley Fever immunosignature is distinct from that of other infections
Our first question was whether VF infection would produce an immunosignature
that was distinguishable from other infections. The concern was that a general
inflammatory response to infection may dominate the signature. To test this issue we
used sera from individuals infected with A. fumigatus, M. pneumoniae and C.
pneumoniae. Figure 2- 1 and Table 2- 4 show the results from an experiment where
disease cohorts were tested for observable signature differences, and cross-validated
using the 70/30 train/test hold out approach described in Methods.
Table 2- 4 Classification results from samples shown in Figure 2- 1
Naïve Bayes was used to simultaneously classify the 108 patients into their respective
groups using hold out (70% train, 30% test, 20 iterations) cross-validation to estimate
error.
Infection Sensitivity Specificity PPV NPV Accuracy
Aspergillus 92% 98% 93% 98% 97%
Chlamydia 95% 99% 97% 99% 98%
Mycoplasma 98% 98% 87% 100% 97%
VF 88% 99% 97% 98% 98%
Figure 2- 1 shows the relative intensities of 243 peptides found by Fisher’s exact
test with the grouping of the individual cohorts shown on the X-axis. Each disease cohort
groups together in the heatmap. A quantitative assessment of the classification using the
Naïve Bayes algorithm is presented in Table 2- 4. The accuracy of simultaneous

29
classification was 97% for Aspergillus and Mycoplasma and 98% for Chlamydia and VF.
These results support the conclusion that a VF specific signature can be distinguished
from other potentially confounding infections.
Figure 2- 1 Hierarchical clustering of informative peptides across five diseases.
Peptides (Y-axis) are colored by intensity with blue corresponding to low intensity, red to
high intensity. Patients (X-axis) are grouped by their corresponding peptide values with
Aspergillus (black), Mycoplasma (red), Chlamydia (green), Normal (blue) and Valley
Fever (brown) grouping by cohort as computed by GeneSpring 7.3.1 (Agilent, Santa
Clara, CA). Peptides were selected by Fisher’s exact test.

30
Valley Fever immunosignature is distinct from that of uninfected individuals
We examined antibody signature responses of 45 out of the 55 total VF clinical
samples shown in Table 2- 2 on the 10K peptide microarray and identified 1586 peptides
from a 1-way ANOVA (5% FWER-family wise error correction) with a threshold of
p<1x10-14 indicating significance between the 45 VF training samples and 34 non-disease
controls and 7 flu-vaccine recipients both pre-vaccine and 21 days post-vaccine. The
influenza signature was included to exclude a potential common confounding signal.
This signature is presented as a heatmap in Figure 2- 2.
Figure 2- 2 Hierarchical clustering of Valley Fever Immunosignature apart from
uninfected individuals.

31
1586 peptides from a 1-way ANOVA between VF and uninfected individuals are plotted
on the Y-axis. Coloring is based on signal intensities obtained from relative binding on
the 10K array with blue representing low relative intensity and red representing high
signal intensity. Each column represents one individuals’ Immunosignature with VF
patients (red) and uninfected individuals (blue) including influenza pre-vaccine (green)
and post-vaccine sera (magenta).
There are three distinct clusters within groups of non-VF normals as highlighted
in Figure 2-2 above the status color legend. The first and third clusters within non-VF
individuals include influenza vaccine recipient sera showing mild overlapping VF
signature. This may be due to these samples being obtained from endemic donors. Note
that the differences between non-VF and VF samples include reactivity that is higher in
non-VF than the VF samples. Using 70% of the sample to define a classification
immunosignature and then testing the classifier on the 30% withheld and averaging the
performance of repeating this 20 times, the infected from non-infected samples are
classified with 100% accuracy.
Creating a 96 peptide VF diagnostic microarray
Under some circumstances it may be useful to use the 10K array as a discovery
platform for informative peptides and then create a smaller, diagnostic-specific array. To
test this idea we selected 96 peptides from the 1586 peptide signature described above
and using pattern matching algorithms within GeneSpring GX. We used 96 peptides as
this is the number easily handled on standard microtiter plates. 48 peptides were chosen

32
based on the criteria of capturing consistently high antibody signal across ID titers in the
VF samples and low antibody signal in the flu vaccine samples. The other 48 were
chosen based on the criteria of consistently low antibody signal in the VF samples but
high in the flu vaccine samples. The patterns of performance are depicted in Figure 2- 3
in a line-plot showing the values for each of the 96 peptides across patients (X-axis)
whose signals were averaged by their CF titer. The Y-axis shows the median normalized
signal intensities represented on a logarithmic scale.
Figure 2- 3 Signal intensity (y-axis) for 96 peptides from the 10,000 peptide microarray
that distinguish both VF and influenza vaccine recipients.
X-axis indicates signal response averaged across patients for each CF-titer. Far right
are signals averaged for the flu vaccine recipients and normal donors. These data

33
originate from the full 10,000 peptide array. 48 peptides that capture high antibody
binding in VF patients and low signals in normal/influenza vaccine recipients are colored
in red. 48 peptides showing higher signals in normal/ influenza vaccine recipients and
low signals for VF patients are colored in blue. Consistency is seen across the Valley
Fever patients, and a reversal in signal is seen for non-VF patients.
To test the robustness of these signature peptides, we performed a permuted T-test
by randomly reassigning the patient identifiers on the samples. The best p-value then
obtainable was p<2.8X10⁻³, 9 orders of magnitude larger than when patients were
correctly labeled. It is therefore, unlikely, that the selected peptides were obtained by
random chance. Figure 2- 4 shows a heatmap representation of these same 96 peptides,
averaged per CF-titer or flu vaccine status. Hierarchical clustering was used to cluster
patient groups (X-axis, individual columns) and peptides (Y-axis, individual rows), with
colors within cells representing high (red) to low (blue) intensities from the microarray.
The horizontal red bar represents VF patients signal intensities (averaged by CF-Titer),
blue bar represents the averaged signals from seven influenza vaccine recipients, cyan
represents the averaged vaccine recipient’s signature response 3 days prior to receiving
the vaccine and yellow indicates the 34 averaged normal donor signatures. Table 2- 5
lists the performance of pairwise comparisons using 70% training/30% test, averaged
over 20 reiterations. The best performance was in distinguishing VF infection from non-
infection (100% sensitivity, 97% specificity) and the worst was VF infection versus flu
vaccines (100% sensitivity, 82% specificity). Based on this performance in the context
of the 10K array, these 96 predictor peptides were re-synthesized (Sigma GenoSys, St.

34
Louis, MO) and printed on a smaller array to test the performance of the VF focused
array.
Figure 2- 4 Heat map showing normalized average signals from the 96 predictor
peptides as in Figure 2- 2, but displaying the cohort separation.
Data averaged per CF titer and patient group for 45 VF patients (Red bars), 34 healthy
controls (yellow bar), 7 pre-2006 influenza vaccine recipients (cyan bar) and 21-day post

35
vaccine (dark blue bar) (x axis). T-test identified 96 peptides (y-axis) highly significant
for distinguishing VF and healthy controls.
Table 2- 5 Naïve Bayes classification results from the VF training cohort on the 10K
peptide microarray using the 96 predictor peptides. Holdout splits all data randomly
into 70% train/30% predict. Results are from 20 iterations of random holdouts.
Dataset used: Training
(Holdout expt.) Sensitivity Specificity PPV NPV Accuracy
VF, Normal 100% 97% 97% 100% 98%
VF, Influenza Vaccine 100% 91% 99% 100% 99%
VF, Normal, Influenza
Vaccine 100% 96% 96% 100% 98%
0 (CF-Titer), Influenza
Vaccine 100% 82% 76% 100% 88%
LOOCV, noHoldOut (all
data) 100% 92% 92% 100% 96%
For comparison:
CF-Titer (IDCF results) 87% 100% 100% 50% 88%
Performance of a 96 peptide VF-diagnostic microarray
The diagnostic capability of the VF-diagnostic sub-array was tested using a
smaller set of training and non-VF control samples. Upon verification, the complete
training and blinded test samples (67 blinded samples, 13 non-VF controls) were
processed on the VF-diagnostic 96 peptide sub-array under similar conditions as the 10K
array. Table 2- 6 shows the resulting classification performance. Of particular note is the
performance against the CF Titer=0 samples. While the VF diagnostic peptide set clearly
had higher sensitivity compared to the ID assay, there was a substantial drop in the

36
specificity compared to the ID assay and the performance of those peptides in the 10K
array.
Table 2- 6 Naïve Bayes classification results from 96 peptide VF diagnostic array. Top
Panel: 96 peptide diagnostic-array data was tested for performance on a blinded cohort
of false-negative VF patients. Middle Panel: Performance using all possible patient
samples including test and training samples. Bottom Panel: Performance using only the
training dataset.
Dataset used: Test Sensitivity Specificity PPV NPV Accuracy
CF-Titer (IDCF results) 28% 100% 100% 13% 35%
CF-Titer = 0 100% 43% 92% 100% 93%
All data (0 & other titers) 99% 43% 94% 75% 93%
Dataset used: Training & Test
Holdout 20 iterations Sensitivity Specificity PPV NPV Accuracy
CF Titer (IDCF results) 52% 100% 100% 19% 57%
CF-Titer = 0 91% 85% 96% 70% 90%
All data (0 & other titers) 82% 92% 99% 37% 83%
Dataset used: Training
LOOCV Sensitivity Specificity PPV NPV Accuracy
CF-Titer (IDCF results) 87% 100% 100% 50% 88%
CF-Titer = 0 100% 67% 75% 100% 83%
All data (0 & other titers) 100% 67% 96% 100% 96%
To examine the difference in performance of the different arrays, we examined
the detection limits for each peptide in the context of the actual fold change values as
measured from patient samples. Figure 2- 5 is a graph combining real fold-change values
for every peptide (vertical bars) plotted against the detection limit (delta, represented by
the black curve) and the p-value obtained from a t-test between the VF vs. normal cohorts

37
(red circles). The smaller the delta (black curve), the more sensitive the peptide is to a
signal and, consequently, the smaller the fold change needed to exceed this limit. Of note
are Panels B and C which compare the performance differences between 96 VF-
diagnostic peptides within the context of the 10,000 peptide arrays and the same peptides
that were resynthesized and independently printed on the VF-diagnostic arrays. This
comparison demonstrates the higher performance of the 96 peptides in the context of the
10K array.
Figure 2- 5 Limits of detection graphed from a post-hoc power calculation.
The black curve in each figure represents the ± delta (minimum detectable fold-change)
calculated from the statistical precision of each peptide independently. The probes along
the X-axis are sorted by the calculated power, thus forming a smooth curve. Delta was

38
calculated using α=1/Number of peptides/microarray, β=0.20 and N = number of
patients per group. The vertical bars (Y axis) represent the log2 ratio between healthy
and VF-infected patients with red bars indicating a peptide selected to predict VF, and
blue bars representing peptides selected for detection of non-VF condition. The red
circles on top of certain bars specify statistically significant fold changes at p-
value<0.01. Panel A: 10,440 random peptides (Training dataset) using VF and healthy
controls. Panel B: 96 VF predictor peptides (Training dataset) within the 10K
microarray. Panel C: 96 resynthesized VF predictor peptides (Training dataset) ‘VF-
diagnostic’ assay. Panel D: 96 VF predictor peptides (Test dataset) ‘VF-diagnostic’
assay.
Discussion
Our objectives in this study were to determine if the immunosignature diagnostic
had the potential to address the clinical problem of detecting infection in IDCF-titer=0
patients, and if so what was the best array format. We first demonstrated that VF
infection as assayed on the 10K array has a distinct immunosignature relative to 2
bacterial and one other fungal infection. We then showed using a 70% training/30% test
format that the 10K array could accurately discriminate VF infection samples from non-
VF infection and flu vaccinees. 1586 peptides were statistically significantly different
between the classes. A portion of the signature was from peptides that had less reactivity
in the VF infection samples than the non-infection controls. 96 peptides from the 1586
that had good signature performance in the context of the 10K array were resynthesized

39
and used to create a smaller VF diagnostic subarray. When tested against the VF
infection and control samples this array demonstrated increased sensitivity (100%) than
the conventional IDCF assay, but poorer specificity. Individual statistical analysis of the
96 peptides demonstrated that all performed better in the context of the 10K array than
the subarray format.
We had previously published studies demonstrating that influenza virus infection
in mice [75] and the flu vaccine in humans [11] could be distinguished from normal
controls by immunosignatures. Here we extend this list showing that the
immunosignatures of two different species of bacteria and two fungi are distinct. Only
283 peptides of the 10K array were required to simultaneously distinguish the 4
infections with >97% accuracy. Development of the immunosignature diagnostic for
clinical application will require further validation testing against other common agents of
community acquired pneumonias and infections causing flu-like symptoms.
As noted, for VF a clinically important issue is the people that report with
symptoms caused by VF infection but are not detected as sero-positive by the standard
immunological tests, the CF titer=0 patients. Using the 10K immunosignature array we
demonstrated that there were 1586 peptides that were reproducibly different between VF
infection samples and non-VF samples. The non-VF samples included ones that had
received the flu vaccine as an effort to exclude flu infection signatures. Noteworthy is
that a large portion of this signature was composed of peptides that had lower signal in
the VF-infection sample than the non-infection. We have noted this phenomenum before
[2,11,13]. This type of reactivity would not be easily detected in standard ELISA-like
40
assays. We pose that this may be due to the infection causing suppression or elimination
of B-cells producing antibodies that are normally present in most people.
A reasonable strategy for developing immunosignatures would be to use the large
10K array as a discovery format and then produce subarrays with smaller number of
peptides for the clinical diagnostic. The advantages of the smaller arrays would be that
they may be less expensive to manufacture since fewer peptides would be required, the
peptides could be of higher quality and they may be simpler to read. To test this
approach we chose 96 peptides from the 1586 10K signature and pattern matching
analysis between disease and non-disease groups. 48 were chosen which were
consistently high in VF infection samples but low in flu vaccine samples and 48 with the
converse signature. From a practical perspective, 96 is convenient as it is the basic unit
used in peptide synthesis and spotting the arrays. The peptides were selected based on
their consistent signal over all titers, including the CF=0, of the standard ID assay. We
did not determine if signatures that distinguish the titers could be selected to monitor VF
progression. The implication is that the antibody reactivity that these peptides measure is
independent of that measured in the ID assay.
This VF diagnostic sub array was tested in a blinded test against the VF infection
and non-infection samples. The infection samples include the CF titer=0 samples. While
this subarray was significantly more sensitive than the IDCF assay, it was also less
specific. This increase in sensitivity but loss of specificity was evident in the CF titer=0
samples. The implication is that this subarray at least would need to be used in
combination with the standard ID to obtain maximum specificity and sensitivity.

41
Interestingly, the sub-array performed less well than the 10K array. This may in
part be due to the selection criteria for the 96 peptides which were against the flu vaccine
samples. Peptides selected against a wider assortment of non-VF infection samples could
perform better. It may also be that the additional peptides on the 10K array distribute the
antibody response to infection in a finer resolution allowing high sensitivity and
specificity. The 10K format, as demonstrated here for 3 other infections, may have the
advantage of being used to discriminate multiple infections on the same platform.
We have demonstrated that the immunosignature platform has clinical diagnostic
potential relative to VF infection. It can address the clinical problem of the CF titer=0
infections, either on the 10K format or the sub-array format in combination with the
standard ID assay. There are ~50M people in the VF endemic region, with an estimated
30% being exposed over time to the infectious agent. However, since most people have
little if any symptoms, it is unlikely a diagnostic would be used generally to screen for
VF infection. There is an existing standard antifungal treatment (Fluconazole) and a new
one in development (Nikkomycin). An improved diagnostic could at least identify
symptomatic patients more accurately for having VF infections and may allow more
effective use of treatments.
Acknowledgements
The authors wish to thank Dr. John Galgiani for providing IDCF characterized
Valley Fever patient samples from the Valley Fever Center for Excellence and for advice
on the diagnostic constraints in this infection. We thank John Lainson for contact printing

42
of experimental peptide microarrays. We would also like to thank Elizabeth Lambert,
Mara Gardner, John Lainson and Bart Legutki for processing patient serum samples on
the 10K (v1) random peptide arrays as per stipulated protocol and experimental layout.
We thank Neal Woodbury for critical suggestions to the manuscript. The arrays
described are available through the Peptide Array Core at www.peptidearraycore.com
Grant acknowledgements
This work was partially supported by Startup funds from the Arizona State
Technology Research Infrastructure Fund to SAJ. This work was supported by the
Chemical Biological Technologies Directorate contracts HDTRA-11-1-0010 from the
Department of Defense Chemical and Biological Defense program through the Defense
Threat Reduction Agency (DTRA) to SAJ.
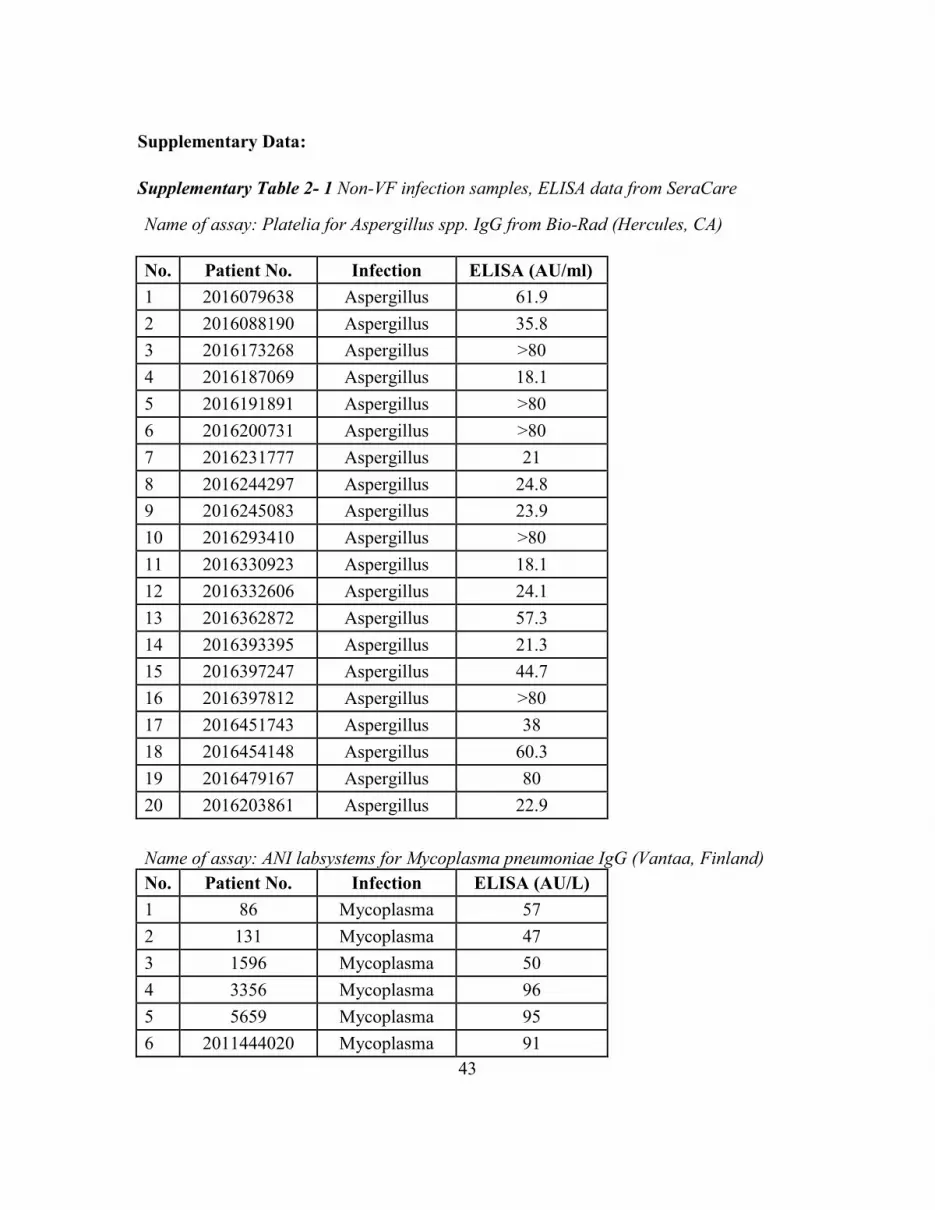
43
Supplementary Data:
Supplementary Table 2- 1 Non-VF infection samples, ELISA data from SeraCare
Name of assay: Platelia for Aspergillus spp. IgG from Bio-Rad (Hercules, CA)
No. Patient No. Infection ELISA (AU/ml)
1 2016079638 Aspergillus 61.9
2 2016088190 Aspergillus 35.8
3 2016173268 Aspergillus >80
4 2016187069 Aspergillus 18.1
5 2016191891 Aspergillus >80
6 2016200731 Aspergillus >80
7 2016231777 Aspergillus 21
8 2016244297 Aspergillus 24.8
9 2016245083 Aspergillus 23.9
10 2016293410 Aspergillus >80
11 2016330923 Aspergillus 18.1
12 2016332606 Aspergillus 24.1
13 2016362872 Aspergillus 57.3
14 2016393395 Aspergillus 21.3
15 2016397247 Aspergillus 44.7
16 2016397812 Aspergillus >80
17 2016451743 Aspergillus 38
18 2016454148 Aspergillus 60.3
19 2016479167 Aspergillus 80
20 2016203861 Aspergillus 22.9
Name of assay: ANI labsystems for Mycoplasma pneumoniae IgG (Vantaa, Finland)
No. Patient No. Infection ELISA (AU/L)
1 86 Mycoplasma 57
2 131 Mycoplasma 47
3 1596 Mycoplasma 50
4 3356 Mycoplasma 96
5 5659 Mycoplasma 95
6 2011444020 Mycoplasma 91

44
7 2016061010 Mycoplasma 115
8 2016062204 Mycoplasma 68
9 2016065663 Mycoplasma 209
10 2016065745 Mycoplasma 71
11 2016065862 Mycoplasma 131
12 2016080956 Mycoplasma 108
13 2016084956 Mycoplasma 153
14 2016085828 Mycoplasma 84
15 2016086204 Mycoplasma 99
16 2016088339 Mycoplasma 179
17 2016088435 Mycoplasma 111
18 2016090988 Mycoplasma 141
19 2016091115 Mycoplasma 309
20 2016092572 Mycoplasma 79
No. Patient No. Infection ELISA (S/CO) Name of assay
1 9245819 Chlamydia 5.456 Trinity Biotech EIA
(Ireland)
2 9245824 Chlamydia 4.186 Trinity Biotech EIA
3 9245825 Chlamydia 4.211 Trinity Biotech EIA
4 9245826 Chlamydia 5.873 Trinity Biotech EIA
5 9245827 Chlamydia 6.434 Trinity Biotech EIA
6 9245829 Chlamydia 4.868 Trinity Biotech EIA
7 9245830 Chlamydia 5.579 Trinity Biotech EIA
8 9245833 Chlamydia 1.3 Trinity Biotech EIA
9 2013298347 Chlamydia 43 (UA/L)
NovaLisa from
NovaTec for
Chlamydia
pneumoniae IgG
(Germany)
10 2013352672 Chlamydia 42 (UA/L)
NovaLisa from
NovaTec for
Chlamydia
pneumoniae IgG
11 2016328813 Chlamydia 46 (UA/L)
NovaLisa from
NovaTec for
Chlamydia

45
pneumoniae IgG
12 2016343255 Chlamydia 41 (UA/L)
NovaLisa from
NovaTec for
Chlamydia
pneumoniae IgG
13 BM200809 Chlamydia 2.077 Trinity Biotech EIA
14 BM201051 Chlamydia 2.048 Trinity Biotech EIA
15 BM201105 Chlamydia 1.815 Trinity Biotech EIA
16 BM201340 Chlamydia 3.168 Trinity Biotech EIA
17 BM202017 Chlamydia 1.815 Trinity Biotech EIA
18 BM202083 Chlamydia 2.851 Trinity Biotech EIA
19 BM205162 Chlamydia 1.124 Trinity Biotech EIA
20 BM205163 Chlamydia 1.192 Trinity Biotech EIA
Name of assay: Complement fixation antibodies detected using Immunodiffusion
(IDCF) measured by Dr. John Galgiani's lab
No. Patient No. Infection CF-Titer/ IDCF
1 VF0-1077 Valley fever 0
2 VF0-1176 Valley fever 0
3 VF1-1153 Valley fever 1
4 VF1-142 Valley fever 1
5 VF1-178 Valley fever 1
6 VF1-432 Valley fever 1
7 VF2-1304 Valley fever 2
8 VF2-1344 Valley fever 2
9 VF2-1346 Valley fever 2
10 VF2-2 Valley fever 2
11 VF16-1 Valley fever 16
12 VF16-1142 Valley fever 16
13 VF16-399 Valley fever 16
14 VF32-1280 Valley fever 32
15 VF64-262 Valley fever 64
16 VF64-556 Valley fever 64

46
17 VF128-1012 Valley fever 128
18 VF256-793 Valley fever 256

47
CHAPTER 3
COMPARISON OF NON-NATURAL MIMOTOPE VERSUS EPITOPE PEPTIDES IN
DIAGNOSING VALLEY FEVER
Abstract
Peptide-based diagnostics are not in widespread use not because of poor
sensitivity but because of diminished specificity. Numerous reports suggest that protein-
based rather than peptide-based detection is more specific. We examined two different
approaches to peptide-based diagnostics using Valley Fever (VF) as the model. Although
the pathogen was discovered more than a century ago, a sensitive diagnostic is not
available. We present a case study where two different approaches were used: the first, a
standard overlapping VF-epitope peptide array representing immunodominant
Coccidioides antigens. Second, a set of random sequence peptides that function as
mimotopes and partial epitopes was used. Such a comparison within a diagnostic context
has not been previously reported. My results indicate that non-natural (random) sequence
peptides show higher accuracy at classifying all stages of VF infection over VF-epitope
peptides in a microarray format. The epitope peptide array did provide better
performance than the standard immunodiffusion array, but when directly compared to the
random sequence peptides, reported lower overall accuracy. This study hints at novel
aspects associated with antibody recognition on an amino acid level and suggests
methods for improving the accuracy of peptide microarray based diagnostic
immunoassays not previously considered.

48
Abbreviations
CAP, Community Acquired Pneumonias; CF, Complement Fixation; CT, Computed
Tomography; CNS, Central Nervous System; EIA, Enzyme Immunoassay; FPR, False
Positive Rate; ID, Immunodiffusion; IDCF, Complement fixation antibodies detected by
Immunodiffusion; IDTP, Tube precipitin antibodies detected by Immunodiffusion; LDA,
Linear Discriminate Analysis; KNN, K-nearest neighbors; LOOCV, Leave One Out
Cross Validation; LVS, Live Vaccine Strain; NPV, Negative Predictive Value; PPV,
Positive Predictive Value; TP, Tube Precipitation; TB, Tuberculosis; VF, Valley Fever.
Introduction
Superficial fungal infections affecting nails and skin afflict approximately 1.7
billion people worldwide and this number is much higher as compared to the 1.5 million
people per year mortality due to invasive fungal infections [76]. Valley Fever (VF) is
caused by a dimorphic fungus, Coccidioides, prevalent in the southwestern Sonoran
desert region of the United States and in certain areas of South America. The pathogen is
known to cause both superficial as well as invasive disease in infected individuals.
Diagnosis and treatment of VF is surrounded by several delays, due to diagnostic
challenges as well as clinical inadequacies. Figure 3- 1 is a flowchart describing the
clinical insufficiencies hindering early diagnosis of VF infection as highlighted by an
Arizona Department of Health Services (ADHS) survey [20]. Additionally, the diagnostic
delays involve very low recovery rates of this pathogen, 0.4% [n=5,026] from blood and
8.3% [n=10,372] from respiratory tract specimens [3.2% overall i.e. from blood,

49
respiratory tract, urinary tract, bone marrow, cerebrospinal fluid, other sterile and non-
sterile body sites; n=55,788] as ascertained from a retrospective analysis of fungal culture
specimens submitted to a lab in Phoenix (endemic for VF) by Sussland et al. [77]. The
sensitivity of serum based assays such as Enzyme Immunoassay (EIA) is 83-87%, that of
complement fixation and tube-precipitation antibodies detected by Immunodiffusion
(IDCF,IDTP) is 71-73% and that of complement fixation by itself is low between 56-75%
[78,79]. We demonstrated in our previous study [80] that Immunosignatures [2,10-12]
using non-natural sequence peptide microarray technology could be successfully applied
to resolve the diagnostic challenges surrounding VF serum based diagnosis. The random
peptide ‘VF-diagnostic’ microarray platform accurately classified 63 longitudinal
samples from 25 symptomatic yet clinically false-negative (IDCF=0 titer) patients as
having valley fever. The confirmatory assay, IDCF’s sensitivity on this specific training
and initially blinded test dataset used in the previous assay was 52% and specificity
100%. Despite being a difficult sample set, the non-natural sequence peptide microarray
out-performed IDCF with an overall cross-validated (holdout) sensitivity of 82% and
specificity of 92%. In this work we sought to test an alternative diagnostic approach
using epitope peptides representing immunodominant VF antigens. This article compares
the diagnostic performance of non-natural (random) sequence predictor peptides for VF
and that from VF-epitope (life-space) peptides representing four immunodominant VF
antigens. In doing so, it evaluates a central hypothesis of whether randomly generated;
non-natural sequence predictor peptides from Immunosignatures are more or less

50
effective at accurately capturing all stages of VF infection with more sensitivity and
specificity than pathogen antigen peptides in a similar microarray.
Figure 3- 1 The clinical problem in Valley fever diagnosis.
A diagnostic peptide microarray composed of 96 random peptides was created as
part of a prior study [80] to enable sensitive diagnosis of VF in patients that were initially
characterized as false-negatives by the IDCF titer gold-standard diagnostic assay.
Briefly, a well characterized VF patient serum sample training set was tested on a 10,000
random peptide microarray to select the 96 VF predictor peptides for the smaller sub-
array. These 96 random peptides were selected for specificity in discriminating VF
patient samples from both non-VF disease and healthy controls in the training set.

51
Influenza vaccinee sera were included as a confounding infection. Encouraged by higher
sensitivity obtained on this smaller sub-array for predominantly false negative samples
(IDCF=0), we sought to test whether using antigen epitope peptides from C. immitis
might deliver an equally sensitive and perhaps more specific diagnostic than that obtained
by using non-natural (random-sequence) predictor peptides. To this effect, we chose to
represent four immunodominant VF antigens that are potential vaccine candidates in the
form of six amino acid overlapping peptides. These antigens are chitinase-F (CF) [81],
Antigen-2 [82], Expression Library Immunization-Antigen1 (ELI-Ag1) [83] and
Coccidioides immitis specific antigen (CSA) [84] from Coccidioides immitis (strain-RS).
The CF antigen is considered the main immune stimulating antigen as measured by the
IDCF assay [61]. IDCF detects antibodies to several protein antigens present within an
untreated (by heat), autolyzed, mycelial culture filtrate. In this study, a side by side
comparison of the diagnostic capability of these 96 VF specific non-natural peptides was
made with 83 antigen epitope peptides representing four VF immunodominant antigens.
Additional bioinformatic analyses were conducted to ascertain the reasons underlying
high sensitivity and specificity of the 96 non-natural VF predictor peptides.
When classifying non-natural proteins versus natural antigen proteins, one of the
several metrics used for classification is the amino acid frequency of sequences being
compared [31]. Within these groups of characteristic metrics, a di-peptide frequency
pattern is typically used to automatically annotate proteomes by classifying protein
sequences and informatically attributing function based on di-peptide complexity [85]. In
order to ascertain why the 96 non-natural peptides function as VF predictors, a di-peptide

52
and short-sequence (2-mer to 6-mer) composition analysis is performed. For the purpose
of this study, instead of the di-peptide frequency, the total possible di-peptides in
common between 96-random and 83-life space epitope peptides versus VF proteome is
calculated. Additionally we use an amino acid sequence similarity based alignment
program named GuiTope [34] to compare the 96 non-natural VF predictor peptides to the
four VF protein antigens in an effort to de-convolute the mechanism enabling randomly
generated non-natural sequence peptide predictors to sensitively detect VF. GuiTope is a
program that aligns non-natural sequence peptides to natural sequence proteins based on
sequence level amino acid physico-chemical and structural similarity in an effort to map
back to the original antigen from observed antibody binding on a microarray. It includes
the novel feature of aligning sequences by taking into consideration di-peptide inversions
within random peptides which was a phenomenon first observed while analyzing the data
presented in this article and led to statistically significant improvement in GuiTope’s
epitope discovery accuracy.
Methods
Serum samples used in this study
A training and blinded test serum sample set were collected under the University
of Arizona’s IRB# FWA00004218 and received by The Center for Innovations in
Medicine at Arizona State University under their IRB# 0905004024 allowing unfettered
data analysis of this material. Most patients sample within the training and blinded test
set were initially characterized as being false negative on the CF-titer (IDCF) assay.

53
Supplementary Table 3- 1 describes the CF titer distribution in the samples from the
training cohort. A training sample set consisting of 55 longitudinal samples from 35 VF
symptomatic individuals including some 0 CF-titer early time point sera from 6
individuals that later sero-converted was acquired from the University of Arizona. The
accuracy of diagnosis using IDCF for the training set sera was 88%, with sensitivity =
87%, specificity = 100%, PPV (Positive predictive value) = 100% and NPV (Negative
predictive value) = 50%. Supplementary Table 3- 2 describes the CF titer distribution in
the samples from the initially blinded test cohort. A blinded test sample set was acquired
containing 67 serum samples of which 48 which were later revealed to be sero-negative
on IDCF. These test group sera were from 25 patients with two or more serum samples
per individual collected longitudinally during their disease progression. Supplementary
Table 3- 3 summarizes the individual sample characteristics of patients sera included
within the test set. The accuracy of diagnosis using IDCF for the test set sera was 35%,
with sensitivity = 28%, specificity = 100%, PPV = 13% and NPV = 35%. The overall
accuracy of both training and test dataset samples using IDCF for diagnosis was 57%
(sensitivity= 52%, specificity= 100%, PPV= 19% and NPV= 57%).
For the exploratory non-natural feature selection training portion of the
experiment, 45 out of the total 55 training sera were processed to ensure adequate
representation of all CF-titers (progressive stages of infection) on a 10,000 random
peptide Immunosignature microarray. Additionally, blood samples were processed from
48 otherwise healthy male and female individuals of various ages along with 7 influenza
vaccinee’s who supplied blood 3 days prior (‘pre’) to receiving the 2006/2007 influenza

54
vaccine and 21 days later (‘post’), and the data from their antibody reactivity’s to the
10,000 peptides were classified as ‘non-disease’ for training purposes. 96-random VF
predictor peptides were selected out of 10K peptides from this exploratory assay as
explained in the prior publication [80].
All VF training and blinded test samples were processed on the smaller diagnostic
array containing the selected 96-random and 83-life space epitope peptides in triplicate.
Thirteen non-disease samples, including sera from healthy volunteers as well as influenza
vaccinee samples were processed on the smaller diagnostic array. To measure the
specificity of the smaller diagnostic array, we processed 10 Fransicella tularensis (LVS-
Live Vaccine Strain) vaccinated individuals sera obtained from Dr. Anders Sjöstedt’s lab
from Umeå University. This serum was part of a time course study and the samples
selected for processing were the ones that were collected 28-30 days post receiving the
LVS vaccine.
Microarray production and processing
The 96 random peptides as well as 83 life space peptides were synthesized by
Sigma (St.Louis, MO) and printed as described in Legutki et al. [11] Every 17 amino
acid peptide was designed to have an N-terminal CSG linker and printed on aminosilane-
coated glass slides which were activated with sulfo-SMCC (Pierce, Rockland, MD). All
peptides were printed in triplicate next to each other in a two array printings per slide
format. Arrays were printed using a Nanoprint 60 (ArrayIt, Santa Clara, CA) at 60%

55
relative humidity at 23°C. Patient serum from training and test sets were processed on
this smaller microarray in duplicate.
Microarray slides were pre-washed with a solution containing 7.33% acetonitrile,
33% isopropanol and 0.55% TFA to remove any unbound peptides. Slides were blocked
in 1X PBS, 3% BSA, 0.05% Tween 20, 0.014% β-mercaptohexanol for 1hr at 25oC. Sera
samples were diluted 1:500 in the Incubation buffer containing 3% BSA, 1X PBS, 0.05%
Tween 20, and allowed to bind to the microarray for 1 hour at 37°C in 100 µl total
volume per array on a Tecan 4800 Pro Hybridization Station (Tecan, Salzburg, Austria).
Slides were washed in-between primary and secondary antibody incubation steps for 30
seconds with 1X tris-buffered saline (TBS), 0.05% Tween 20 pH 7.2. Patient IgG
antibodies were detected using 5nM, DyLight-549 conjugated Goat anti-Human, IgG Fc
(γ) fragment specific secondary antibody and 5nM, Dylight-649 conjugated Goat anti-
Human, IgM (5µ) fragment specific antibody from Jackson ImmunoResearch
Laboratories, Inc., West Grove, PA diluted in the incubation buffer. These slides were
scanned using the Agilent ‘C’ Scanner (Agilent Technologies, Santa Clara, CA) at 532
nm and 647 nm excitation wavelengths under 100% PMT and 100% laser power with a
10 µm image resolution. Both red and green channel TIFF images were simultaneously
aligned per individual array, using the GenePix software (Axon Instruments, Union City,
CA) and the data files imported into GeneSpring 7.3.1 (Agilent, Santa Clara, CA) for
further analysis.

56
Pre-processing of data for analysis
Data are collected in the form of .gpr files. Each .gpr file contains the peptide
name and the foreground intensity for each measured peptide for both IgG (green, 545nm
channel) and IgM (red, 647nm channel). Data were loaded into GeneSpring GX 7.3.1 for
analysis. Since the diagnostic array included two color data, a Lowess normalization was
completed in GeneSpring whereby the ratio between the signal and control channels was
used for classification. Any array with a Pearson Correlation Coefficient less than 0.80
across technical replicates was re-processed. Upon reprocessing if the Pearson correlation
between replicates did not improve, that patient’s sample was excluded from further
analysis.
Statistical analysis
Classification was performed using the Naïve Bayes algorithm as implemented in
the klaR [71] package in R. Due to the unbalanced nature of this dataset, the holdout
algorithm was used to balance the groups, from the R package DMwR as published in the
book, Data Mining with R [72]. This helped overcome in-accurate estimation of
specificity due to lesser non-disease samples. The holdout experiment was done by
combining the training and test dataset and is a more rigorous cross-validation technique
whereby 70% of randomly selected total data was used for training and prediction was
made on the remaining 30% data. This was done for 20 iterations so as to predict the
class of every sample more than once and get a better assessment of diagnostic metrics
such as sensitivity, specificity, negative predictive value (NPV), positive predictive value

57
(PPV) and accuracy. The results for both standard train and test (without cross-
validation) and holdout are included side-by-side for every comparison.
GuiTope analysis
Previous work done by Halperin et al. [34] showed an unusual property of
antibody recognition of near-epitope sequences. Two amino acids in a row could be
swapped in position with no decrease in the apparent binding affinity. This occurred
often enough in a broad analysis of monoclonals and polyclonals on Immunosignature
random peptide microarrays, and phage display datasets from MimoDB [86] that
Halperin and colleagues embedded an allowance for this in a program for analysis of
peptide alignments called GuiTope [34]. The current article is the first report displaying
the use of this program for finding mimotopes within non-natural peptides through
antibody binding observed from VF patient sera.
The protein sequences of the four immunodominant VF antigens were uploaded
as a .fasta format file into the Protein section of GuiTope. The 96 non-natural space
peptide sequences were uploaded into the peptide input section. In the library section, the
original 10K random peptide library was uploaded from which the 96-random peptides
were selected as VF predictors. These 96 selected random peptides were excluded from
the library section. This was done so as to calculate the false-positive rate (FPR) by
calculating the score for an equal number of library peptides as the selected VF-
predictors (96) for multiple iterations (1000) and assessing the probability of finding
another peptide in the library that had a higher similarity to the four VF proteins, above

58
that calculated for the 96-selected. The default amino acid distance matrix, Grantham
1974 [87] was used but the amino acid frequencies of the query proteins and query 96-
random peptides were pasted into the appropriate sections under the Generate Matrix tab.
Under the parameters tab, the inversion weight was set to 1 or 0 to either include or
exclude the di-peptide inversion modulation to the Smith-Waterman maximal gapless
local alignment algorithm [33]. A new distance matrix was generated after taking into
consideration the amino acid frequencies for the query protein and peptide. The sampling
iterations under the ‘Graphical output’ tab was set to 1000, which is the number of times
96 other peptides would be selected at random from the 10K library to compare scores
for the selected 96-peptides and generate the FPR.
Results
Comparing classification accuracy and sensitivity of life space versus random
peptides
A comparison between pathogen epitope peptides and non-natural sequence
peptides within a peptide microarray diagnostic had not been previously reported in the
literature. We examined the signature response captured by 83 valley fever antigen
epitope peptides and compared that to the antibody response captured by 96 non-natural
VF-diagnostic peptides as depicted in Figure 3- 2.

59
Figure 3- 2 VF patient signal average intensity data per CF-titer.
The Y-axis displays the average raw (non-normalized) signal in fluorescence intensity
units (FIU) captured by 83 VF antigen life-space peptides in Panel A and 96 non-natural
(random) peptides in panel B. Error bar depict standard error. The X-axis displays
signal intensities as averaged by CF-titer (IDCF) with ‘n’ reflecting the number of
patients in the training and test groups combined per CF-titer.
IgG antibody averaged signals in panel A captured by tiled VF-antigen peptides
do not show incremental correlation with increasing CF-titer until the CF-titer reaches
1:256. At every CF-titer, except 1:256, the 96-random peptides capture higher amount of
antibodies on average as compared to the life-space peptides. The 96-random VF
predictor peptides might thus have more potential for accurately measuring symptomatic
yet false-negative patient sera mis-classified by the IDCF test. Table 3- 1 summarizes the
Naïve Bayes classification result from false negative (CF-titer=0) patients within the VF
dataset and compares the performance of the 83 life-space peptides versus 96-random
peptides.

60
Table 3- 1 Naïve Bayes classification result on VF test dataset using random vs life space
peptides.
IgG Peptides Sensitivity Specificity PPV NPV Accuracy
0 (CF-
Titer)
Random
(96) 100% 43% 92% 100% 93%
Life space
(83) 96% 71% 96% 71% 93%
IgM Peptides Sensitivity Specificity PPV NPV Accuracy
0 (CF-
Titer)
Random
(96) 94% 43% 92% 50% 87%
Life space
(83) 88% 57% 93% 40% 84%
Holdout exp (70- 30), 20 iterations
IgG Peptides Sensitivity Specificity PPV NPV Accuracy
0 (CF-
Titer)
Random
(96) 91% 85% 96% 70% 90%
Life space
(83) 86% 71% 93% 52% 83%
IgM Peptides Sensitivity Specificity PPV NPV Accuracy
0 (CF-
Titer)
Random
(96) 99% 58% 86% 96% 88%
Life space
(83) 80% 68% 91% 46% 78%
The random peptides are more sensitive at diagnosing valley fever than the life
space peptides. The top half of this table represents the IgG (green-channel) and IgM
(red-channel) sensitivity from generating a Naïve Bayes model by training on the training

61
dataset and testing on a physically separate test dataset. The bottom half of the table
represents a more rigorous assessment of these metrics by performing the holdout cross-
validation for 20 iterations and using 70% randomly selected training samples to train
and predict the remaining 30% of data. The results presented are averaged for multiple
predictions per sample for all 20 iterations. The resulting values are more accurate
estimates to be expected from this assay when testing with additional clinical samples in
the future. Random peptides detect false-negative symptomatic patient sera more
accurately as compared to life space epitope peptides. As might be expected early in an
infectious response the IgM responses offer higher sensitivity (98.96%, random
peptides).
Bioinformatic rationale underlying the sensitivity of random (96) vs. life-space (83)
epitope peptides
A linear B-cell antibody epitope ranges from 4-12 amino acids in length as
previously delineated through peptide microarray analysis [88]. Sun et al. [89]
determined from 161 Protein Data Bank (PDB) antigen-antibody pair structures that in
conformational epitopes, antibody paratopes associate with antigens in short non-
contiguous segments, 2-5 amino acids in length. The reasons underlying higher
sensitivity and specificity of random predictor peptides in comparison to pathogen
epitope peptides could be bioinformatically ascertained by comparing the level of short
sequence overlap between the two groups of predictor peptides and the VF proteome.
Figure 3- 3 depicts the number of unique n-mers between the 96-random and 83-lifespace

62
peptides in common with the VF pathogen proteome (panel A) and the randomly
generated VF proteome (panel B).
Figure 3- 3 Sensitivity of assay - Number of unique n-mers (2-6 amino acid short
sequences) between the 96-random and 83-lifespace peptides in common with the VF
pathogen proteome (panel A) and the randomly generated VF proteome (panel B).
The Y-axis shows the number of 2-6 mers in common between groups of peptides and
pathogen proteomes as a continuous line graph with n-mer groups displayed on the X-
axis.
The bioinformatically in-silico generated artificial VF proteome uses amino acid
alphabets in an unbiased random manner to match the number and length per protein
within the natural Coccidioides immitis strain-RS proteome. The total possible
combinations of di-peptides using 20 amino acids is 400 and the 96-random peptides
represent 360 out of those 400 possibilities. The 83 life-space peptides only represent 303
out of the 400 possible di-peptide combinations. The number of overlapping 6-mers in

63
common between the life-space peptides and the natural VF-proteome increase but this
extent of overlap is not by random chance as depicted by the artificially generated VF
proteome. The number of 6-mers identical between the 96-random peptides and both the
natural and artificially generated VF-proteome is low and show the true randomness of
these 96 VF-predictor non-natural peptides.
Specificity and robustness of random (96) vs. life-space (83) VF epitope peptides
In an effort to assess the specificity of this assay, we statistically classified all CF-
titer (non-zero) VF patient sera to test whether the peptide microarray could distinguish
all progressing stages of VF infection apart from uninfected sera (normal donors,
influenza vaccinees). Additionally, we processed sera from Francisella tularensis (LVS)
vaccinated individuals 28-30 days post-vaccine. When Francisella tularensis infects the
lungs, symptoms resemble those of respiratory distress similar to those observed in VF
[90]. To measure specificity against a confounding exposure, the 10 LVS samples were
randomly split between the training and the test samples (5 per group). Separate
classifications were done for 2 groups (VF vs. non-VF – Part A, without LVS sera) or 3
groups (VF vs. non-VF vs. LVS – Part B) (Table 3- 2). The assay performance metrics
for IDCF are included for side-by-side comparison in Part A.
Table 3- 2 Naïve Bayes classification results using IgG and IgM signals from VF 96
random predictor peptides and 83 VF epitope peptides
A.) Groups: VF, Normals (No LVS)
IgG Peptides Sensitivity Specificity PPV NPV Accuracy
All (CF-Titer) Random (96) 99% 43% 94% 75% 93%
Life space 96% 50% 94% 57% 91%

64
(83)
IgM Peptides Sensitivity Specificity PPV NPV Accuracy
All (CF-Titer) Random (96) 99% 25% 92% 67% 91%
Life space
(83) 90% 50% 94% 36% 85%
CF-Titer IDCF results 28% 100% 100% 13% 35%
Holdout experiment (70-30), 20 iterations
IgG Peptides Sensitivity Specificity PPV NPV Accuracy
All (CF-Titer) Random (96) 82% 92% 99% 37% 83%
Life space
(83) 79% 73% 96% 30% 78%
IgM Peptides Sensitivity Specificity PPV NPV Accuracy
All (CF-Titer) Random (96) 93% 74% 97% 55% 91%
Life space
(83) 84% 68% 96% 34%
82%
CF-Titer IDCF results 52% 100% 100% 19% 57%
B.) Groups: VF, LVS, Normals
IgG Peptides Sensitivity Specificity PPV NPV Accuracy
All (CF-Titer) Random (96) 99% 50% 92% 86% 91%
Life space
(83) 96% 62% 93% 73% 90%
IgM Peptides Sensitivity Specificity PPV NPV Accuracy
All (CF-Titer) Random (96) 99% 46% 90% 86% 90%
Life space
(83) 87% 54% 91% 44% 81%
Holdout experiment (70-30), 20 iterations
IgG Peptides Sensitivity Specificity PPV NPV Accuracy
All (CF-Titer) Random (96) 79% 87% 97% 44% 80%
Life space
(83) 91% 73% 94% 62%
87%
IgM Peptides Sensitivity Specificity PPV NPV Accuracy
All (CF-Titer) Random (96) 93% 70% 93% 67% 89%
Life space 83% 75% 94% 48% 81%

65
(83)
A - Model classifying between 2 groups VF and Non-VF (Normal)
B - Model classifying between 3 groups VF, Non-VF and LVS
Holdout experiment - combine training and test set data, Train on randomly selected
70% data and test on remaining 30% (20 iterations)
Naïve Bayes (no holdout) yielded 99% sensitivity using both IgG and IgM signals
from 96-random predictor peptides when including the LVS samples (Table 3- 2, Part B).
In comparison, the 83 life-space epitope VF peptides showed 96% sensitivity when using
IgG signals and 87% when using IgM signals. The holdout experiment was performed so
as to reduce biased estimates of specificity due to comparatively lower number of non-
disease patient sera tested on this assay in comparison to VF patient sera. The specificity
at distinguishing VF apart from normal by non-natural 96-random VF predictor peptides
through the holdout analysis for IgG is 92% (Table 3- 2, Part A) in comparison to 73%
(Table 3- 2, Part A) from 83 VF life-space epitope peptides. This was unexpected given
our original hypothesis of expecting higher specificity from VF life-space epitope
peptides as compared to non-natural sequence peptides (96-Random). When testing the
classification (holdout) of these same VF and normal samples in the context of LVS, the
specificity of non-natural peptides capturing IgG reactivity within this assay dropped
from 92% (Table 3- 2, Part A) to 87% (Table 3- 2, Part B) merely because the platform
was not originally trained or designed to distinguish between these specific disease
groups. This 87% specificity though is still higher than that demonstrated by life-space

66
VF epitope peptides (73%). The sensitivity (91%) and accuracy (87%) of life-space
peptides was higher than non-natural peptides when including the LVS group (Table 3- 2,
Part B).
As often seen in assays involving antigen-antibody interactions [3,5], some
peptide-level cross-reactivity was observed from the LVS vaccinees towards some
random and life-space peptides selected to distinguish Valley Fever from influenza and
healthy controls. The cross-reactivity of these VF predictor peptides to antibodies from
individuals exposed to LVS might be partially explained due to the number of
overlapping 5-mers between them and the pathogen proteomes tested in this analysis
(Figure 3- 4).

67
Figure 3- 4 Cross-reactivity observed on VF-diagnostic array hypothetically explained
using the number of unique 5-mers in common (Y-axis) between random (blue bars) and
life space (red bars) peptides and pathogen proteomes (X-axis).
Influenza/A/Wisconsin and New Caledonia and Influenza/B/Malaysia strains
were included in the 2006-2007 seasonal Influenza vaccine. The extent of identical
overlapping 5-mers between the Valley Fever proteome and both the random and life-
space peptides is much higher compared to Influenza or Fransicella proteomes. The
extent of overlap may also be partially affected by the significantly different size of these
pathogen proteomes, with C. immitis having 10,440 proteins and F. tularensis str. SchuS4
having 1,556 proteins and F. tularensis str. LVS having 1,754 proteins while only 12
0
100
200
300
400
500
600
700
800
900
1000
96_Random
83_LifeSpace

68
proteins represent the Influenza proteomes. The 96-random peptides performed with
higher specificity in being able to distinguish VF from non-VF patients and LVS
vaccinees as compared to VF epitope peptides (life-space). Figure 3- 5 shows the number
of unique n-mers (2-6 amino acids) between the 96-random and 83-lifespace peptides in
common with the LVS proteome (panel A) and the randomly generated LVS proteome
(panel B).
Figure 3- 5 Specificity of assay - Number of unique n-mers (2-6 amino acid short
sequences) between the 96-random and 83-lifespace peptides in common with the LVS
proteome (panel A) and the randomly generated LVS proteome (panel B).
The Y-axis shows the number of 2-6 mers in common between groups of peptides and
pathogen proteomes as a continuous line graph with n-mer groups displayed on the X-
axis.
The extent of 5-mer and 6-mer overlap between random peptides and the LVS
proteome whose signature they were not designed to capture is low as compared to that

69
observed between the two peptide groups and VF proteome in Figure 3, Panel A. This
explains why the specificity of non-natural (96-Random) peptides at distinguishing a
previously un-trained on exposure (LVS) was higher than that of VF epitope peptides
(life-space).
Bioinformatic rationale underlying the specificity of random (96) vs. life-space (83)
epitope peptides
A comparison between the 96-random peptides and the 4 immunodominant VF
antigens was done using GuiTope. Using the protein BLAST program [91] very few
alignments were found between the VF proteins and 96-random peptides. Table 3- 3 and
Figure 3- 6 summarize the positive matches between 96-random peptides and 4 VF
antigen proteins.
Table 3- 3 Summary of GuiTope matches between 96-Random VF predictor peptides and
4 VF antigens
Score cutoff: 6.56 Moving Average: 15
Sampling Iterations: 1000 Subtracting Mean Lib Scores? Checked
Part A.) Inversions = 1
Name
Ran
k
Max
Score
Max Score
Position
(amino
acid) FPR
Length
(aa)
No. of
Guitope
Matches
CF-CIMG_02795 1 7.32 249 0 427 82
CSA-CIMG_01181 2 6.64 40 0 146 46
Eli-Ag1-CIMG_10032 3 6.34 159 0 224 62
AG2-CIMG_09696 4 5.44 145 0.001 194 43
Part B.) Inversions = 0

70
Name
Ran
k
Max
Score
Max Score
Position
(amino
acid) FPR
Length
(aa)
No. of
Guitope
Matches
CF-CIMG_02795 1 6.37 362 0 427 51
CSA-CIMG_01181 2 6.33 60 0 146 23
Eli-Ag1-CIMG_10032 3 4.68 210 0.0013 224 39
AG2-CIMG_09696 4 4.55 74 0.0015 194 16
The number of positive hits obtained when using the di-peptide inversion
modulation in addition to the Smith-Waterman [33] positional search algorithm is higher
than those obtained without including di-peptide inversions. The individual peptide
positive hits per protein are summarized in Supplementary Table 3- 4 with inversions and
Supplementary Table 3- 5 without inversions.

71
Figure 3- 6 GuiTope analysis comparing 96-random peptide VF predictors with each of
the 4 VF proteins tiled for the 83 life-space epitope peptides.
The X-axis shows amino acid position on the protein and Y-axis shows the GuiTope score
calculated after library subtraction. Panel A shows the score distribution per amino acid
residue when Inversion weight is set to a maximum value of 1 and Panel B shows the
detection rate when the di-peptide inversion algorithm is not used to find peptide vs.
protein matches for the same dataset (inversion weight=0).
When inspecting the raw signal data averaged per peptide (83 life-space) per CF-
titer (Figure 3- 7), as expected, earlier in the infection (CF-titer=0), the IgM antibody
response is much higher than the IgG antibody level.

72
Figure 3- 7 VF predictor random peptides (96) overlapping 83 life-space peptides from
Valley fever.
The un-normalized IgG and IgM antibody signals (X-axis) from VF patients as captured
by the 83 life-space peptides (Y-axis) are displayed. Patient signals are averaged based
on the individual patient’s CF-titer (cyan= 0-titer, brown = IDCF-titer 1 etc.) per life-
space peptide. The red line is a moving average representing the trend observed in these
data. The pink line displays the overall coverage of GuiTope matches between 96-
random peptides and 4 VF protein antigens.

73
Figure 3- 8 BLAST alignment map depicting VF-protein coverage of 96-random peptides
through positive hits from GuiTope.
Figure 3- 8 shows the BLAST alignment map per antigen depicting positive
GuiTope hits between 96-random peptides and matching short protein sequences on the 4
VF antigens. Some regions have multiple positive hits with several different peptides
within the 96-random VF predictor peptides. These bioinformatics analysis might begin
to explain why non-natural sequence peptides are capable of capturing disease specific
antibody reactivity.
Discussion
We generated a sub-array for testing the diagnostic performance of 96-random
non-natural sequence VF predictor peptides versus 83 life-space epitope peptides from
VF. The 96-random peptides selected for this comparison were previously empirically
tested to be good predictors for capturing VF specific antibody reactivity [80]. The
current comparison is presented to ascertain whether non-natural peptides or life-space

74
peptides would be most useful in distinguishing infections such as Valley Fever in a
microarray diagnostic format. We tested VF patient sera for IgG and IgM antibody
against VF. As expected for a chronic infection, we observed higher IgM antibody early
in patients that were sero-negative on the gold-standard IDCF assay. We then tested this
array’s ability to distinguish VF patient sera (including false-negatives; IDCF=0) from
normal using 55 sera with various CF-titers from an orthogonally characterized training
set and 63 sera from an initially blinded test set. VF patients were distinguished from
non-VF individuals using either the 96-random or 83 life-space epitope peptides by Naïve
Bayes. The sensitivity of these two groups of peptides was assessed using 0-titer samples
and comparing against non-VF sera. The specificity of diagnosing every stage of the
infection was assessed by using incremental CF-titer samples suggestive of progression
versus non-VF sera. In both comparisons, random peptides performed more accurately
compared to life-space epitope peptides. The higher accuracy obtained might be partially
attributable to the 96-random peptides having a higher diversity of di-peptides as
compared to 83 life-space peptides. More diversity of di-peptides within random
peptides could translate to more combinations of di-peptide antibody contact points
presented by random peptides. A comparison of the 96-random VF predictor peptides
versus the four life-space VF antigens using GuiTope explains why these 96 non-natural
sequence peptides perform with higher accuracy when distinguishing VF. Using di-
peptide inversions there are 233 unique short-sequence matches (129 matches without
inversions) between the 96 random VF predictor peptides and VF antigens allowing

75
random peptides to compete for antibodies originally generated against VF epitope
peptides.
Cross-reactivity is an inherent problem observed in antigen-antibody assays with
VF specific assays not being an exception to this rule [92]. Kuberski et al. [93]
recommended using the cross-reactivity observed on a Histoplasma antigen assay from
VF infected individuals samples for VF diagnosis. By comparing a previously un-trained
on exposure capable of presenting confounding symptoms, we assessed the specificity
and robustness of both non-natural and epitope peptides. Since the random peptides were
not originally trained to distinguish between VF and LVS, as expected the specificity
dropped from 92% (without LVS group) to 87% (with LVS, Naïve Bayes, holdout, Table
3- 2 - Part A and B). This highlights an important problem in the biomarker field
whereby during the initial training phase of assay development, if the diagnostic system
is not trained a priori to rule out similar confounding infections, the sensitivity of the
assay might not be easily affected but the specificity will change significantly. Ideally,
for testing the specificity of such an assay one would compare clinically confounding
infections that cause similar symptoms or are presented by pathogens that operate under
similar mechanisms of pathogenicity (e.g. invasive mycoses). Additional appropriate
confounding infections for training and feature selection would be Community Acquired
Pneumonias (CAP) such as tuberculosis (TB), and invasive mycoses such as
Blastomyces, Histoplasma and Crytococcus.
A CF-Titer of 1:2 or 1:4 suggests a better prognosis, whereas a titer of 1:16 or
greater (up to 1:256) is indicative of disseminated disease. Several patient case histories

76
of zero CF-Titer or a titer not suggestive of dissemination i.e. under 1:16 have been
documented to show meningeal dissemination [67]. Approximately 1% of patient
samples post-dissemination are false negative on the IDCF assay [94]. While this is not
an alarming statistic, it is nevertheless important when the dissemination is meningeal.
Early detection is crucial to better prognosis for patients with meningeal VF [95]. The
blinded test set also included a CSF sample that was false negative on the CF-titer assay
but was accurately diagnosed as being sero-positive for VF on the random peptide sub-
array. Thus, the immunosignature technology, due to its higher positive predictive value
(PPV), may be able to assess disease progression, especially in cases of meningeal
dissemination despite a negative IDCF (confirmatory test) result.
From a survey of 39,500 infected valley fever patient sera Smith et al. [96]
determined that within the first week, complement fixation antibodies measured by the
IDCF assay were detected in approximately 10% of patients and were significantly
reduced a month later. This is correlated by the measurably lower amount of antibody
captured by the life-space epitope peptides (as measured by average intensity) as
compared to random peptides (Figure 3-2, panel A). Pappagianis et al. (2011) recently
demonstrated in-vitro that early treatment with anti-fungal agents like Fluconazole,
results in reduced or absent production of the chitinase antigen in Coccidioidal cultures
[97]. They thereby correlated early intervention with anti-fungals such as Fluconazole in
some patients causing a reduction in IDCF detectable levels of IgG antibodies
predominantly to the chitinase antigen. This, in their opinion, results in delaying patient
diagnosis and therefore they recommend that primary pulmonary infections not be treated

77
with the antifungal before being tested and monitored for Valley Fever. A similar trend
in the reduction of galactomannan antigenemia in invasive Aspergillosis post anti-fungal
intervention with Fluconazole was not mis-construed as being detrimental due to reduced
diagnosis on assay [98]. In fact, a decrease in antigenemia correlated with survival and
an increase despite anti-fungal intervention correlated with morbidity in infected
individuals. These problems in diagnosis are typically observed in single correlates of
infection. Technologies such as immunosignatures may surpass limitations posed by
such single correlates for diagnosis due to being strengthened by multiple predictors
while assessing infection.
The 96 non-natural peptides have a higher number of 5-mer sequence overlap
with the VF proteome (686 identical 5-mers in common) as compared to the F. tularensis
(LVS) proteome (162 identical 5-mers in common). As per Lund et al., 85% of antibody
structures characterized in the Protein Data Bank (PDB) database are associated with 5-
mers epitope sequences [99]. Figure 3-7 and Figure 3-8 partially explain the 96 non-
natural peptides ability to capture VF-specific antibodies through their coverage of 83
VF-epitopes and the 4 immunodominant VF-antigens they represent, respectively.
Current methods of diagnosis are quite course and rely on single markers such as CF titer.
Graybill and colleagues [100] noted that CF titer did not change significantly during
treatment, where patient symptoms had greatly improved. With a larger panel of sensors
(peptides), a more complete picture of the status of the humoral immune response can be
observed, without the risk of relying on the abundance or antibody response to a single
antigen. High information-content technologies like Immunosignatures can enable more

78
subtle modulation of antifungal interventions, relieving the patient of the burden of side
effects. This work presents encouraging evidence suggesting that non-natural sequence
peptides might serve as more accurate molecular beacons for VF diagnosis than life-
space pathogen epitopes.
Acknowledgements
The authors wish to thank Dr. John Galgiani for providing us the well-
characterized IDCF tested Valley Fever patient serum set from the Valley Fever Center
for Excellence. We thank John Lainson for contact printing of the peptide microarrays
used in this work. We would also like to thank Elizabeth Lambert, Mara Gardner, John
Lainson and Dr. Bart Legutki for processing patient serum samples on the 10K (v1)
random peptide arrays as per stipulated protocol and experimental layout. We are grateful
to Dr. Anders Sjöstedt, Umeå University for having kindly contributed the Fransicella
tularensis (LVS) vaccine recipient samples. We would like to thank Josh Richer for
developing a python script that calculates n-mers in common among several .fasta format
files.
Grant acknowledgements
This work was partially supported by Startup funds from the Arizona State
Technology Research Infrastructure Fund to SAJ. This work was also supported by the
Chemical Biological Technologies Directorate contracts HDTRA-11-1-0010 from the
Department of Defense Chemical and Biological Defense program through the Defense
Threat Reduction Agency (DTRA) to SAJ.

79
Supplementary Tables:
Supplementary Table 3- 1 Sample characteristics of the training set for Valley fever
study.
IDCF
Titer
# Samples
0 6
1 4
2 8
4 5
8 3
16 8
32 11
64 5
128 3
256 2
Note: 55 sera from 35 patients within the training dataset. The IDCF titer and number of
patients with that titer are shown in columns 1 and 2.
Supplementary Table 3- 2 Sample characteristics of the 67 blinded test sera from 25
patients.
IDCF # Samples
0 48
1 5
2 7
4 3
8 1
16 2
32 1
Note: These samples were initially blinded by the clinic.

80
Supplementary Table 3- 3 Individual patient characteristics from the un-blinded test set.
Tube # Patient # CF titer TP titer Date diff. False Negative
CF results # Blood draws
1 109 0 0 0 1 1
2 109 2 0 25 2
3 109 0 0 26 CSF 1 CSF
4 116 0 0 0 1 1
5 116 4 0 7 2
7 123 4 0 0 1
8 123 0 0 27 1 2
9 138 0 0 0 1 1
11 138 1 0 44 2
12 162 0 0 0 1 1
14 162 16 1 71 2
15 184 0 0 0 1 1
16 184 2 0 18 2
18 188 0 0 0 1 1
19 188 0 1 24 1 2
20 188 0 0 84 1 3
21 216 0 0 0 1 1
23 216 2 0 12 2
25 232 0 0 84 1 1
26 232 0 0 42 1 2
27 232 0 1 10 1 3
28 236 0 0 0 1 1
30 236 2 0 41 2
31 251 0 0 0 1 1
32 251 0 0 41 1 2
33 251 0 0 90 1 3
35 251 16 0 96 4
36 288 0 0 0 1 1
37 288 1 0 44 2
38 288 0 0 159 1 3
40 290 0 0 0 1 1
41 290 0 1 23 1 2
42 290 0 0 88 1 3
43 363 0 0 0 1 1
44 363 2 0 8 2
45 383 0 0 0 1 1
46 383 0 0 85 1 2
47 383 1 0 14 3

81
49 391 0 0 0 1 1
50 391 0 1 18 1 2
51 401 0 0 0 1 1
52 401 0 0 30 1 2
54 401 0 1 4 3
55 407 0 0 0 1 1
56 407 32 0 71 2
57 412 0 0 0 1 1
58 412 1 0 49 2
60 412 1 0 94 3
61 413 0 0 0 1 1
62 413 0 1 10 1 2
63 437 0 0 0 1 1
65 437 4 0 45 2
66 437 2 0 80 3
67 437 0 0 98 1 4
68 472 0 0 0 1 1
70 472 2 0 18 2
71 473 0 0 0 1 1
73 473 0 1 7 1 2
74 487 0 0 0 1 1
75 487 0 0 40 1 2
76 487 0 1 49 1 3
77 487 0 1 147 1 4
79 487 0 0 113 1 5
80 503 0 0 0 1 1
81 503 0 0 20 1 2
82 503 0 0 36 1 3
84 503 8 0 113 4
Note: False negative CF-titer results are coded as 1 for each sample tested. The
accession numbers of these patients were left out of this table to de-identify them further
for this work.
Supplementary Table 3- 4 Summary of GuiTope results with inversion weight =1 from
alignment of 96-random peptides to 4 immunodominant antigens of C.immitis
Library subtracted, moving average=15

82
Match data for score cut 6.56 for protein :
CF-CIMG_02795
************** FORWARD PEPTIDES **************************
No. SEQUENCE
SCOR
E
ALIGN
LENGT
H
PRO
POS
PEP
POS
PRO
WINDOW
PEP
WINDOW
1
RVMFEGFQ
GKGPNYLQ
VGSC 6.757 5 14 15 LvqaS LqvgS
2
MQWHSNY
MMKRPYNP
ELGSC 6.671 9 23 8 MpnsypvPE MmkrpynPE
3
QVDWTRWR
KPKNEMAW
KGSC 6.903 11 45 2
VnWaiygrgh
N
VdWtrwrkpk
N
4
GFMLFGGN
PLEYAWYA
HGSC 6.872 9 45 10 vnwAiYgrG leyAwYahG
5
RTMNTALW
IIPLTWALW
GSC 7.893 5 47 14 WAiyG WAlwG
6
LYTSEQMTF
YGGRDDEIG
SC 8.235 7 49 9 iYGrghn fYGgrdd
7
NRKNKGHA
YRDGHNIQL
GSC 7.386 8 50 9 YgrGHNpQ YrdGHNiQ
8
RIIRWSPGQ
DAKFQDQN
GSC 7.943 12 52 4
RghnpQDlK
adq
RwspgQDaK
fqd
9
MAIQGMNI
YTWFTDRI
MGSC 10.485 18 61 2
AdQfthIlyaF
anirpsg
AiQgmnIytw
Ftdrimgs
10
MTRRWKTF
PHEIEDRIKG
SC 7.065 6 73 14 nirpsg drikgs
11
YDVMLSQP
NPVSWMRF
PGSC 7.599 17 79 2
eVyLSdtwad
tdkhyPG
dVmLSqpnp
vswmrfPG
12
YFWLDVNY
DEWTAVVD 7.804 12 79 5
eVylsdtwAdt
D
dVnydewtAv
vD

83
QGSC
13
TKRIHKWPQ
DAYRIRRGG
SC 7.76 6 91 5 khyPgD hkwPqD
14
TMIHMQRV
KPRKLTNY
VGSC 7.4 4 104 15 NvyG NyvG
15
MRPRHAMP
NIKEYMLSP
GSC 9.201 6 109 10 IKqmyL IKeymL
16
PNPWLEWM
HMLLWNNQ
DGSC
8.2050
01 13 109 5
ikqMylLkkN
Nrn
lewMhmLlw
NNqd
17
EFTWMLNK
NNEMHRHP
PGSC 8.319 7 113 4 ylLkKNN wmLnKNN
18
WFNERKRA
QLYEVGEFT
GSC 7.787 17 118 3
NnRnlktLlsi
GgwTyS
NeRkraqLye
vGefTgS
19
HMRAMNPF
KPHTNIGRW
GSC
7.5320
01 5 135 6 pnFKt npFKp
20
ARWKKKSH
FHRGKKKM
FGSC
8.7289
99 8 142 7 SteegrKK ShfhrgKK
21
HRGKKAPD
FQVGYLKA
DGSC 10.442 15 145 1
egrKKfaDtsl
klmK
hrgKKapDfq
vgylK
22
RKFKKRRH
WHFPKFPK
WGSC 8.31 13 147 1
RKkfadtslkl
mK
RKfkkrrhwhf
pK
23
FDMLFKDS
YIWGMTIMF
GSC 7.937 12 157 4
LmKDlgfdG
idI
LfKDsyiwG
mtI
24
HEGLEGDQ
TIYQFMIEY
GSC
6.9889
99 10 159 1 kdlgfdgidI heglegdqtI
25
KGDFGAEW
GRWRKWVT
KGSC 7.392 4 162 2 GfdG GdfG
26
VTGTEGQW
DGYPLWHL
FGSC 7.423 5 169 8 dweYP wdgYP

84
27
DQWMTMR
VKFRDWVQ
LIGSC 7.391 9 181 12 DfVlLlkaC DwVqLigsC
28
YSWDAINW
RGKAYPVE
TGSC 7.844 11 191 4 eAldaysakhP dAinwrgkayP
29
KARWNGRN
MTAPVYWR
NGSC 7.75 7 198 1 akhpNGk karwNGr
30
YANRGNGK
KVHWLLFY
QGSC
8.9990
01 13 198 2
AkhpNGKK
fllti
AnrgNGKKv
hwll
31
MYYFPDTG
GQPDGSMW
NGSC 7.591 12 207 1 lltiaspaGpqn
myyfpdtgGq
pd
32
FNLGWKVQ
GKLDMSAP
KGSC 8.642 8 208 11 LtiasPaG LdmsaPkG
33
KQKLPHWY
RRLDRPVTV
GSC 8.394 12 221 1
KlKLaemdk
yLD
KqKLphwyrr
LD
34
TRQLAPYFD
WHNYSIAIG
SC
8.6259
99 13 231 7
ldfWnlmayd
fsg
yfdWhnysiai
gs
35
DKFHYWMY
MLYGINDKI
GSC 10.083 19 232 1
DfwnlmaYdf
sGswDKvsg
DkfhywmYm
lyGinDKigs
36
EVERGDMN
WLTISVNNA
GSC
8.4070
01 5 232 6 DfwnL DmnwL
37
WAEKPKIK
NWLGRQKL
GGSC 7 11 234 9
wnLmaydfs
GS
nwLgrqklgG
S
38
GFNQWFSID
NWLHTAQW
GSC 8.596 10 234 10 wnLmaydfsg nwLhtaqwgs
39
YKMDWSIA
FQIMHFDVS
GSC 11.234 11 234 9
wnlMayDfS
GS
fqiMhfDvSG
S
40
RPPIRLRDV
LNDHYEVR
GSC 7.092 10 235 10 nlmaYdfsGS lndhYevrGS
41 RLCKNKTFC 8.001 8 237 12 maydfsGS fyaqweGS

85
WGFYAQWE
GSC
42
HGPDWTIHP
FPGLWVFD
GSC 7.614 7 237 13 maydfsg lwvfdgs
43
IALFDPTKW
PEHHQYFA
GSC 7.919 9 237 1 mAydfsgsW iAlfdptkW
44
VYEMWYNT
SANIDQDHR
GSC
6.8819
99 10 237 4
MaYdfSgsw
D
MwYntSani
D
45
MFDYSPWW
EMYSYGVL
PGSC 8.917 11 239 2
yDfSgsWdk
vS
fDySpwWem
yS
46
NTAEADWG
TESTWSMH
RGSC 8.568 9 242 11 Sgswdkvsg Stwsmhrgs
47
HHRTHRPK
DGHVQWM
HVGSC 7.391 6 245 14 WdkVsg WmhVgs
48
IHKTEHWIS
TNADDWRA
GSC 8.196 6 245 14 wdkvsg dwrags
49
QDLLDYHLS
DFVLFAHM
GSC 9.332 11 246 2
DkvsgHmSn
vf DlldyHlSdfv
50
VKGKLSNV
PSWFNHFHS
GSC 9.226 8 248 1 VsGhmSNV VkGklSNV
51
LSVISGMHS
EWPVLWLF
GSC 9.548 8 248 4 vSGhmSnv iSGmhSew
52
YSGHRHNV
PEIDMRQQF
GSC 8.232 8 248 1 vSGHmsNV ySGHrhNV
53
KYIGEHPVF
ESTEYRQGG
SC 6.672 5 255 8 VFpST VFeST
54
MYDAATNF
FMDSKGVR
KGSC 8.877 8 267 9 FssdKaVk FmdsKgVr
55
TPTDHIRSA
AARHKYLIG 7.499 15 275 4
DyIkagvpan
KivlG
DhIrsaaarhK
yliG

86
SC
56
QKAPNKFE
HNVINAHN
WGSC
7.8569
99 5 282 3 paNKi apNKf
57
KLVLQWAV
HMRKWNA
MDGSC 9.563 18 285 1
KiVLgmply
gRafastDG
KlVLqwavh
mRkwnamD
G
58
MTFHGYMV
RGSRGDIID
GSC 9.089 11 293 5 ygrafaStdgI gymvrgSrgdI
59
SLDGVARS
WPGGYGEG
HGSC 8.418 14 299 1
StDGigtSfn
GvgG
SlDGvarSwp
GgyG
60
GEDDTMQR
SYNWYQTN
VGSC 6.584 8 301 4 DgigtSfN DtmqrSyN
61
YMEAHKTY
NKQISRGVS
GSC 7.036 5 310 15 vggGS gvsGS
62
ISVETQWVP
LHDTGWDQ
GSC 8.628 11 314 2
SwEngvwdy
kD
SvEtqwvplh
D
63
YAENGAWD
VRVYSSAN
QGSC 9.904 8 316 3 ENGvWDyk ENGaWDvr
64
TNATWHYY
SINLMYQAQ
GSC
6.6629
99 15 317 2
NgvWdYkd
mpqqgaq
NatWhYysinl
myqa
65
PKMRDRIQ
WTPVFTELQ
GSC 8.318 15 322 3
ykDmpQqga
qvTELe
mrDriQwtpvf
TELq
66
DRQQLEGTL
VERFERLW
GSC
6.8520
01 14 328 6
qGaqVtelEdi
aaS
eGtlVerfErlw
gS
67
KKQSAWGL
WVAELNYM
HGSC 7.268 13 329 7
GaqVtELedi
aaS
GlwVaELny
mhgS
68
KYSNQKIW
ASYDSAPSR
GSC 7.739 9 347 4 NkryliSYD NqkiwaSYD
69
NGKDNVSID
YLHTRLGIG
SC 7.956 8 348 3 Krylisyd Kdnvsidy

87
70
DTFWQFEK
YPEYNMHM
DGSC 7.546 12 355 1
DTvkiagKka
EY
DTfwqfeKyp
EY
71
TEYSLTPEK
VEYYAWEG
GSC 8.248 13 359 5
iagkKaEYitk
nG
ltpeKvEYya
weG
72
KSITDRGQK
TWWEWRR
NGSC 6.934 4 376 11 mWwe wWew
73
YLSTSMEQE
QEQVHGNW
GSC 7.346 15 385 4
TgnEslvgtV
vnglG
TsmEqeqeqV
hgnwG
74
RWFVGSMN
GQNPVGTFS
GSC 8.828 9 386 8 gneslVGTv ngqnpVGTf
75
GRWLGEPN
VQAGPTFFP
GSC 7.641 12 390 3
lvGtvvnglGg
T
wlGepnvqaG
pT
76
VKPVDFMG
RYGQLHNF
EGSC 8.166 14 395 4
VnglGgtGkL
eqrE
VdfmGryGq
LhnfE
77
TLAPWQGL
KIWERQVPN
GSC 7.757 9 401 6 tGkleqren qGlkiwerq
78
SYKQYHIGR
HIDLESLEG
SC
7.2020
01 14 403 6
kleqrenelSyp
eS
higrhidleSleg
S
79
DSNKNEEN
QTDRSQYDS
GSC 8.612 15 406 3
qrenElsypeS
vYDn
nkneEnqtdrS
qYDs
80
IHQFEVTRQ
QHEYSPFDG
SC 7.888 7 406 8 qrenElS rqqhEyS
81
RKGNVPRT
ARLFSVEW
WGSC 7.753 5 422 2 KngmP KgnvP
82
PVENKGRTS
THGFILWHG
SC 6.841 6 422 4 knGmpS nkGrtS
Match data for score cut 6.56 for protein :
CSA-CIMG_01181

88
************** FORWARD PEPTIDES **************************
No. SEQUENCE
SC
OR
E
ALIGN
LENGT
H
PRO
POS
PEP
POS
PRO
WINDOW
PEP
WINDOW
1
KYIGEHPVFES
TEYRQGGSC
7.01
6 5 15 7 vpFtS pvFeS
2
RWFVGSMNG
QNPVGTFSGS
C
7.23
6 5 15 13 VpftS VgtfS
3
PKMRDRIQWT
PVFTELQGSC
7.18
2 4 15 11 vpFT pvFT
4
VYEMWYNTS
ANIDQDHRGS
C
6.84
9 10 25 8 sttdlsyDth tsanidqDhr
5
QDLLDYHLSD
FVLFAHMGSC
7.37
5 18 27 1
tDLsydthyD
dpslAlsG
qDLldyhlsDf
vlfAhmG
6
NSWNQEYTD
HVVYHGMFG
SC
8.20
9 19 30 2
SydthYdDps
lalsgvtcs
SwnqeYtDhv
vyhgmfgsc
7
SYKQYHIGRHI
DLESLEGSC
7.20
4 6 30 1 SYdthy SYkqyh
8
ISVETQWVPL
HDTGWDQGS
C
7.23
7 8 32 12 DThyDdpS DTgwDqgS
9
ETNRWHRNR
QGYLAHSTGS
C
8.09
100
1 15 34 6
Hyddpslalsg
vtcs
Hrnrqgylahst
gsc
10
TNATWHYYSI
NLMYQAQGS
C
6.96
3 15 34 6
HYddpsLals
gvtcs
HYysinLmyq
aqgsc
11
YDVMLSQPNP
VSWMRFPGSC
6.83
8 11 35 1
YDdpslalsg
V
YDvmlsqpnp
V
12
TRQLAPYFDW
HNYSIAIGSC
10.2
67 10 35 10 yddpSlAlsg whnySiAigs
13
NRKNKGHAY
RDGHNIQLGS
C
7.15
8 9 36 11 DdpslaLsg DghniqLgs
14
MYYFPDTGGQ
PDGSMWNGS
C
6.70
9 8 37 12 DpSlalsg DgSmwngs
15
YKMDWSIAFQ
IMHFDVSGSC
6.94
2 6 37 4 DpSlAl DwSiAf

89
16
LSVISGMHSE
WPVLWLFGSC
8.89
1 8 39 1 slalSGvt lsviSGmh
17
RTMNTALWIIP
LTWALWGSC
7.19
4 5 40 15 lalsg alwgs
18
VQERMHNRT
WKRFGGSMG
SC
8.32
7 6 43 15 sgvtcs gsmgsc
19
FDMLFKDSYI
WGMTIMFGSC
8.20
500
1 9 48 7 sdgdnGMit dsyiwGMti
20
EVERGDMNW
LTISVNNAGSC
9.78
8 14 50 5
GDngmiTkg
yNtAG
GDmnwlTisv
NnAG
21
GEDDTMQRSY
NWYQTNVGS
C
6.96
9 11 50 1
GdngmitkgY
N
GeddtmqrsY
N
22
SKTRSLSHAH
QMPASWFGSC 7 11 56 3
TkgyntAgei
P TrslshAhqmP
23
HMRAMNPFKP
HTNIGRWGSC
6.57
3 9 57 9 KgyntaGei KphtniGrw
24
GFNQWFSIDN
WLHTAQWGS
C
7.61
5 13 58 1
GyNtageIpN
ypH
GfNqwfsIdN
wlH
25
MFDYSPWWE
MYSYGVLPGS
C
7.03
1 15 59 4
YntagEipnY
phvgG
YspwwEmys
YgvlpG
26
RVMFEGFQGK
GPNYLQVGSC
9.44
5 10 63 9
GeiPNYphV
G
GkgPNYlqV
G
27
RKFKKRRHW
HFPKFPKWGS
C
6.69
6 9 64 10 eiPnyPhvG hfPkfPkwG
28
MQWHSNYM
MKRPYNPELG
SC
9.48
9 7 66 12 PnyPhvG PynPelG
29
RKGNVPRTAR
LFSVEWWGSC
10.6
53 16 67 4
NyPhvggaFt
VEtWnS
NvPrtarlFsV
EwWgS
30
DTFWQFEKYP
EYNMHMDGS
C 7.33 7 67 12 nypHvgG ynmHmdG
31
GRWLGEPNVQ
AGPTFFPGSC
7.32
2 9 69 7 PhVggafTv PnVqagpTf
32
YSWDAINWR
GKAYPVETGS
C
8.88
6 8 72 10 GgAftVET GkAypVET

90
33
YAENGAWDV
RVYSSANQGS
C
12.3
19 16 73 5
GAftVetwnS
pNcGkC
GAwdVrvys
SaNqGsC
34
QKAPNKFEHN
VINAHNWGSC
6.58
3 14 75 7
FtvetwNspN
cGkC
FehnviNahN
wGsC
35
IHKTEHWISTN
ADDWRAGSC
7.16
8 7 78 5 EtWnSpN EhWiStN
36
YFWLDVNYD
EWTAVVDQG
SC
7.32
2 11 78 10
EtwnspncGk
C
EwtavvdqGs
C
37
TMIHMQRVKP
RKLTNYVGSC
8.17
9 8 87 9 KcyKvTyn KprKlTny
38
HRGKKAPDFQ
VGYLKADGSC
6.64
1 8 89 9 ykVtYnak fqVgYlka
39
NRAKHRHWL
FPDKDHNLGS
C
9.50
7 14 96 6
ktifltaiDHsn
sg
rhwlfpdkDH
nlgs
40
INRHGDWNQH
FQIPKHPGSC
7.67
9 9 107 8 NsgFnIaKk NqhFqIpKh
41
ARWKKKSHF
HRGKKKMFGS
C
6.95
4 10 108 7
SgFniaKKs
M
ShFhrgKKk
M
42
MYDAATNFF
MDSKGVRKGS
C
7.23
7 7 110 7 fniakks nffmdsk
43
MAIQGMNIYT
WFTDRIMGSC
6.73
6 10 112 1 iAkksMdvlT mAiqgMniyT
44
KSITDRGQKT
WWEWRRNGS
C
7.21
099
9 5 120 3 lTngr iTdrg
45
LYTSEQMTFY
GGRDDEIGSC 7.82 7 123 12 GRaeElG GRddEiG
46
DRQQLEGTLV
ERFERLWGSC
10.1
22 18 124 2
RaeelGrikvt
yEevasS
RqqleGtlverf
ErlwgS
Match data for score cut 6.56 for protein :
Eli-Ag1-CIMG_10032
************** FORWARD PEPTIDES **************************
No. SEQUENCE SCORE
ALIGN
LENGT
H
PRO
POS
PEP
POS
PRO
WINDOW
PEP
WINDOW

91
1
QDLLDYHLS
DFVLFAHM
GSC 11.818 10 1 6 mHLSgiVfaf yHLSdfVlfa
2
FDMLFKDS
YIWGMTIMF
GSC 6.879 10 3 10 lsGivfaFsS iwGmtimFgS
3
YKKMYFRR
WQPTARLS
RGSC 7.137 9 21 6 FRlvdPppR FRrwqPtaR
4
YFWLDVNY
DEWTAVVD
QGSC 7.189 5 21 2 FrLvd FwLdv
5
YSGHRHNV
PEIDMRQQF
GSC 6.567 9 24 11 vDppprgfS iDmrqqfgS
6
VQERMHNR
TWKRFGGS
MGSC 6.562 10 37 8 trfpcgGqSM rtwkrfGgSM
7
PVENKGRTS
THGFILWHG
SC 7.219 6 47 4 sKsRTS nKgRTS
8
SKTRSLSHA
HQMPASWF
GSC 11.149 7 48 1 ksrtSvS sktrSlS
9
TEYSLTPEK
VEYYAWEG
GSC 6.562 6 51 1 TsvSLT TeySLT
10
YKMDWSIA
FQIMHFDVS
GSC 7.267 11 58 3
lempIAlemg
H
mdwsIAfqim
H
11
ISQQMVLH
MRYAPELL
GGSC 6.902 9 58 7 LeMpiAlEm LhMryApEl
12
MAIQGMNI
YTWFTDRI
MGSC
7.9699
99 6 62 1 iAlemg mAiqgm
13
LSVISGMHS
EWPVLWLF
GSC
9.5919
99 14 64 4
lemgHdqtaV
qvLl
isgmHsewpV
lwLf
14
HEGLEGDQ
TIYQFMIEY
GSC 12.15 13 69 7
DQTavQvlla
lGS
DQTiyQfmie
yGS
15 DKFHYWMY 6.665 13 73 7 vqvLlalgshp mymLygindk

92
MLYGINDKI
GSC
GS iGS
16
HHRTHRPK
DGHVQWM
HVGSC
8.1079
99 8 74 12 qvllalGS vqwmhvGS
17
TRQLAPYFD
WHNYSIAIG
SC 7.772 5 77 15 lAlGS iAiGS
18
ETNRWHRN
RQGYLAHS
TGSC 8.791 7 79 13 LgshpGS LahstGS
19
VKGKLSNV
PSWFNHFHS
GSC 6.671 12 79 5
LgshPgsnfni
t
LsnvPswfnhf
h
20
ASNSHHRPP
KLHNFYPH
GSC 7.209 4 82 16 hpGS phGS
21
KARWNGRN
MTAPVYWR
NGSC 9.49 10 88 8 NiTlvptfRq
NmTapvywR
n
22
PKMRDRIQ
WTPVFTELQ
GSC
7.3809
99 8 92 11 vptfrqvG pvftelqG
23
QRSWFSGK
EPKFQRIWK
GSC 7.645 9 93 10 PtFrqvglG PkFqriwkG
24
RVMFEGFQ
GKGPNYLQ
VGSC 6.898 7 93 12 PtfrQVG PnylQVG
25
FNLGWKVQ
GKLDMSAP
KGSC
7.7529
99 15 95 5
frqvGlgDfcl
PsvS
wkvqGklDm
saPkgS
26
WAEKPKIK
NWLGRQKL
GGSC
8.1849
99 6 96 13 RQvglG RQklgG
27
VYEMWYNT
SANIDQDHR
GSC 6.736 11 106 8 pSvslDeqrlG tSaniDqdhrG
28
YLSTSMEQE
QEQVHGNW
GSC 9.074 16 107 3
SvSldeqrlgV
kpvdG
StSmeqeqeq
VhgnwG
29
NGKDNVSID
YLHTRLGIG 7.101 11 107 7
SvsldeqRLG
v SidylhtRLGi

93
SC
30
NSWNQEYT
DHVVYHGM
FGSC 7.049 15 109 2
Sldeqrlgvkp
vdGM
Swnqeytdhvv
yhGM
31
VKPVDFMG
RYGQLHNF
EGSC 10.087 7 117 1 VKPVDgM VKPVDfM
32
EVERGDMN
WLTISVNNA
GSC 11.996 12 121 5
dgMNatlqv
VtN
gdMNwltisV
nN
33
INRHGDWN
QHFQIPKHP
GSC 8.169 9 121 5 dgmNatlQv gdwNqhfQi
34
RTMNTALW
IIPLTWALW
GSC 9.139 9 123 3 MNatLqvvt MNtaLwiip
35
MYYFPDTG
GQPDGSMW
NGSC 10.358 11 131 7
TnGdPnGgl
yN
TgGqPdGsm
wN
36
NRKNKGHA
YRDGHNIQL
GSC 7.036 10 133 11
gdpNggLyn
C dghNiqLgsC
37
LYTSEQMTF
YGGRDDEIG
SC
6.6410
01 9 139 1 LYncadiTF LYtseqmTF
38
YSWDAINW
RGKAYPVE
TGSC
7.2769
99 20 140 1
YncadItfsstte
ytvpsSC
YswdaInwrg
kaypvetgSC
39
ISVETQWVP
LHDTGWDQ
GSC 7.56 8 149 2 StteytVP SvetqwVP
40
KYIGEHPVF
ESTEYRQGG
SC
8.7830
01 9 151 12 TEYtvpsSC TEYrqggSC
41
MRPRHAMP
NIKEYMLSP
GSC 7.238 6 152 12 EYtvps EYmlsp
42
RPPIRLRDV
LNDHYEVR
GSC 7.327 8 152 13 eYtVpsSC hYeVrgSC
43
KGDFGAEW
GRWRKWVT
KGSC 7.754 7 153 14 ytvpsSC wvtkgSC

94
44
KQKLPHWY
RRLDRPVTV
GSC 7.34 6 154 15 tvpsSC vtvgSC
45
RLCKNKTFC
WGFYAQWE
GSC
7.1720
01 5 159 3 CKNgT CKNkT
46
RKGNVPRT
ARLFSVEW
WGSC 12.072 14 160 2
KngtgvTAtp
FSgE
KgnvprTArl
FSvE
47
LANVLYRE
QTRPNATER
GSC 6.604 13 160 7
kngTgvtATp
fsg
reqTrpnATer
gs
48
EFTWMLNK
NNEMHRHP
PGSC 7.471 13 160 7
kngtgvtatPfs
g
nknnemhrhP
pgs
49
HGPDWTIHP
FPGLWVFD
GSC 7.806 11 162 2
GtgvTatPFs
G
GpdwTihPFp
G
50
YDVMLSQP
NPVSWMRF
PGSC 7.291 4 169 16 pfsg fpgs
51
GRWLGEPN
VQAGPTFFP
GSC 7.291 4 169 16 pfsg fpgs
52
DSNKNEEN
QTDRSQYDS
GSC 7.795 16 177 4
rNanesTpng
QpqrGn
kNeenqTdrs
QydsGs
53
YAENGAWD
VRVYSSAN
QGSC
7.3279
99 6 182 13 StpNgq SsaNqg
54
YMEAHKTY
NKQISRGVS
GSC 11.146 13 183 7
TpNgQpqR
GnSGS
TyNkQisRG
vSGS
55
RWFVGSMN
GQNPVGTFS
GSC
9.7984
99 12 185 8
NGQpqrGns
gsg
NGQnpvGtfs
gs
56
KSITDRGQK
TWWEWRR
NGSC 7.435 5 189 15 qRgnS rRngS
57
TLAPWQGL
KIWERQVPN
GSC 6.768 6 189 14 QrgNsg QvpNgs
58 HMRAMNPF 6.626 5 190 15 rgnsg grwgs

95
KPHTNIGRW
GSC
59
MFDYSPWW
EMYSYGVL
PGSC 7.046 15 200 3
niaghlEtatw
GVLg
dyspwwEmy
syGVLp
60
GFNQWFSID
NWLHTAQW
GSC
9.9959
99 12 200 7
nIaghLeTAt
WG
sIdnwLhTAq
WG
61
NTAEADWG
TESTWSMH
RGSC 7.695 7 206 9 etaTWgv tesTWsm
62
GFMLFGGN
PLEYAWYA
HGSC 7.391 10 214 1
GaivvGGva
L GfmlfGGnpL
Match data for score cut 6.56 for protein :
AG2-CIMG_09696
************** FORWARD PEPTIDES **************************
No. SEQUENCE
SCOR
E
ALIGN
LENGT
H
PRO
POS
PEP
POS
PRO
WINDOW
PEP
WINDOW
1
MQWHSNY
MMKRPYNP
ELGSC 8.671 8 1 1 MQfshali MQwhsnym
2
RTMNTALW
IIPLTWALW
GSC 6.791 11 7 9 lIaLvaAglaS iIpLtwAlwgS
3
KGDFGAEW
GRWRKWVT
KGSC 6.622 6 31 4 FvealG FgaewG
4
HEGLEGDQ
TIYQFMIEY
GSC 8.102 7 35 3 lgndgcT glegdqT
5
MAIQGMNI
YTWFTDRI
MGSC 7.222 11 41 10 TrlTDfkchcs
TwfTDrimgs
c
6
INRHGDWN
QHFQIPKHP
GSC
6.8359
99 16 42 3
RltDfkcHcsk
PelPG
RhgDwnqHf
qiPkhPG
7
YKMDWSIA
FQIMHFDVS 7.175 9 43 12 ltdfkchcs mhfdvsgsc

96
GSC
8
EVERGDMN
WLTISVNNA
GSC 7.333 15 63 1
veEacpldaris
vsN
evErgdmnwlt
isvN
9
RKGNVPRT
ARLFSVEW
WGSC
8.4790
01 12 68 6
PldARisvsni
v
PrtARlfsvew
w
10
TPTDHIRSA
AARHKYLIG
SC 7.951 7 68 2 PlDariS PtDhirS
11
QDLLDYHLS
DFVLFAHM
GSC
7.8309
99 12 69 2 ldarisvSniVv dlldyhlSdfVl
12
YFWLDVNY
DEWTAVVD
QGSC 8.695 16 69 4
LDarisvsniV
VDQcS
LDvnydewta
VVDQgS
13
YKKMYFRR
WQPTARLS
RGSC 6.596 4 71 13 ARiS ARlS
14
HRGKKAPD
FQVGYLKA
DGSC 7.04 12 73 9
isVsnivvDqc
s
fqVgylkaDgs
c
15
TNATWHYY
SINLMYQAQ
GSC 7.318 8 75 8 vSnivvdQ ySinlmyQ
16
DTFWQFEK
YPEYNMHM
DGSC
8.8300
01 8 77 13 NivvDqcs NmhmDgsc
17
HGPDWTIHP
FPGLWVFD
GSC 7.701 7 78 14 iVvDqcs wVfDgsc
18
YDVMLSQP
NPVSWMRF
PGSC 7.545 11 79 1
vvdqcSkagv
p
ydvmlSqpnp
v
19
YSGHRHNV
PEIDMRQQF
GSC 6.96 4 88 8 VPie VPei
20
PKMRDRIQ
WTPVFTELQ
GSC
6.6939
99 8 90 7 IeipPVdT IqwtPVfT
21
IALFDPTKW
PEHHQYFA
GSC
7.6719
99 11 92 1
IppvDtTaaP
E
IalfDpTkwP
E

97
22
GRWLGEPN
VQAGPTFFP
GSC 7.902 12 102 6
EPsetAePTa
eP
EPnvqAgPTf
fP
23
LANVLYRE
QTRPNATER
GSC 7.252 9 112 8 EpTeeptaE EqTrpnatE
24
TEYSLTPEK
VEYYAWEG
GSC 7.158 14 114 1
TEeptaeptaE
ptA
TEysltpekvE
yyA
25
KYIGEHPVF
ESTEYRQGG
SC
8.0820
01 13 131 5
hePteEpTav
ptG
ehPvfEsTeyr
qG
26
ISVETQWVP
LHDTGWDQ
GSC 6.588 11 134 4 teeptavptgt etqwvplhdtg
27
KARWNGRN
MTAPVYWR
NGSC 7.157 9 138 10 TAvptgtgG TApvywrnG
28
MYYFPDTG
GQPDGSMW
NGSC 6.643 6 140 4 vPtgtG fPdtgG
29
SLDGVARS
WPGGYGEG
HGSC 10.264 15 140 5
VptgtgGGvp
tGtGS
VarswpGGyg
eGhGS
30
RWFVGSMN
GQNPVGTFS
GSC 11.723 15 140 4
VptgtGggvp
tgtgs
VgsmnGqnp
vgtfsg
31
VTGTEGQW
DGYPLWHL
FGSC 7.705 17 143 2
gtggGvptGtg
sftvtG
tgteGqwdGy
plwhlfG
32
YSWDAINW
RGKAYPVE
TGSC 6.97 10 145 10
GggvPtgTG
S GkayPveTGS
33
ETNRWHRN
RQGYLAHS
TGSC 6.922 9 146 11 GgvptgTGS GylahsTGS
34
MYYFPDTG
GQPDGSMW
NGSC 6.643 6 148 4 vPtgtG fPdtgG
35
LYTSEQMTF
YGGRDDEIG
SC 7.173 11 150 3 TgtgsftvtGR
TseqmtfygG
R
36 NTAEADWG 7.82 11 150 8 tgtgsftvtgr gtestwsmhrg

98
TESTWSMH
RGSC
37
KQKLPHWY
RRLDRPVTV
GSC 6.976 4 156 15 tvtG vtvG
38
IHKTEHWIS
TNADDWRA
GSC 7.934 11 164 9
STpAefpgA
GS
STnAddwrA
GS
39
YAENGAWD
VRVYSSAN
QGSC 7.23 6 172 5 agsnVR gawdVR
40
MTFHGYMV
RGSRGDIID
GSC 7.785 11 173 5
GsnVRaSvG
gI
GymVRgSrG
dI
41
YMEAHKTY
NKQISRGVS
GSC
6.9819
99 5 177 14 RasvG RgvsG
42
ISQQMVLH
MRYAPELL
GGSC 6.93 7 183 11 iAaaLLG yApeLLG
43
KKQSAWGL
WVAELNYM
HGSC 7.933 9 186 5 AllglaAyL AwglwvAeL
Supplementary Table 3- 5 Summary of GuiTope results with inversion weight =0 from
alignment of 96-random peptides to 4 immunodominant antigens of C.immitis
Library subtracted, moving average=15
Match data for score cut 6.56 for protein :
CF-CIMG_02795
************** FORWARD PEPTIDES **************************
No. SEQUENCE
SCOR
E
ALIGN
LENGTH
PRO
POS
PEP
POS
PRO
WINDOW
PEP
WINDOW
1
ARWKKKSH
FHRGKKKM
FGSC 6.67 7 144 10 eeGrKKf hrGkKKm
2
KARWNGRN
MTAPVYWR 7.437 19 363 1
KAeyitkNg
mgggmWwe
KArwngrN
mtapvyWrn

99
NGSC sS gS
3
HMRAMNPF
KPHTNIGRW
GSC 6.584 10 122 8 lKtllsIGgW fKphtnIGrW
4
KQKLPHWY
RRLDRPVTV
GSC 8.394 12 221 1
KlKLaemdk
yLD
KqKLphwyr
rLD
5
KSITDRGQK
TWWEWRRN
GSC 6.762 3 377 11 WWE WWE
6
QVDWTRWR
KPKNEMAW
KGSC 6.903 11 45 2
VnWaiygrg
hN
VdWtrwrkp
kN
7
NRKNKGHA
YRDGHNIQL
GSC 7.386 8 50 9 YgrGHNpQ YrdGHNiQ
8
HHRTHRPKD
GHVQWMHV
GSC 6.709 7 52 3 RgHnPqD RtHrPkD
9
VKGKLSNVP
SWFNHFHSG
SC 9.226 8 248 1 VsGhmSNV VkGklSNV
10
MTRRWKTFP
HEIEDRIKGS
C 6.9 13 137 5
fKTpasteEg
RkK
wKTfpheiEd
RiK
11
MRPRHAMP
NIKEYMLSP
GSC
8.294
999 12 201 8
PNgKkflLti
aS
PNiKeymLs
pgS
12
TPTDHIRSAA
ARHKYLIGS
C 7.499 15 275 4
DyIkagvpan
KivlG
DhIrsaaarhK
yliG
13
KYSNQKIWA
SYDSAPSRG
SC 7.739 9 347 4 NkryliSYD NqkiwaSYD
14
YMEAHKTY
NKQISRGVS
GSC 6.956 10 276 1
YikAgvpaN
K
YmeAhktyN
K
15
HRGKKAPDF
QVGYLKAD
GSC 7.162 4 361 3 GKKA GKKA
16
RTMNTALWI
IPLTWALWG
SC 7.893 5 47 14 WAiyG WAlwG
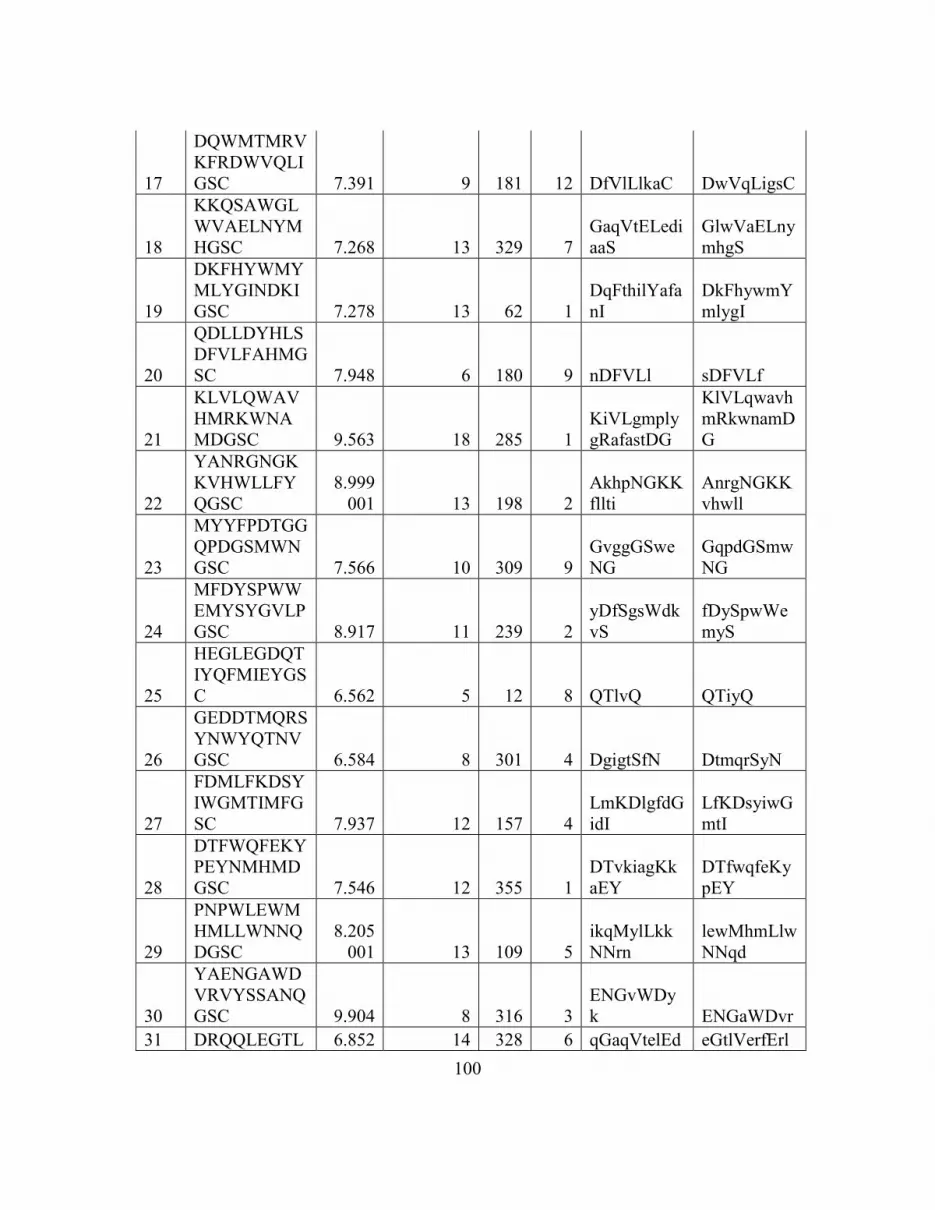
100
17
DQWMTMRV
KFRDWVQLI
GSC 7.391 9 181 12 DfVlLlkaC DwVqLigsC
18
KKQSAWGL
WVAELNYM
HGSC 7.268 13 329 7
GaqVtELedi
aaS
GlwVaELny
mhgS
19
DKFHYWMY
MLYGINDKI
GSC 7.278 13 62 1
DqFthilYafa
nI
DkFhywmY
mlygI
20
QDLLDYHLS
DFVLFAHMG
SC 7.948 6 180 9 nDFVLl sDFVLf
21
KLVLQWAV
HMRKWNA
MDGSC 9.563 18 285 1
KiVLgmply
gRafastDG
KlVLqwavh
mRkwnamD
G
22
YANRGNGK
KVHWLLFY
QGSC
8.999
001 13 198 2
AkhpNGKK
fllti
AnrgNGKK
vhwll
23
MYYFPDTGG
QPDGSMWN
GSC 7.566 10 309 9
GvggGSwe
NG
GqpdGSmw
NG
24
MFDYSPWW
EMYSYGVLP
GSC 8.917 11 239 2
yDfSgsWdk
vS
fDySpwWe
myS
25
HEGLEGDQT
IYQFMIEYGS
C 6.562 5 12 8 QTlvQ QTiyQ
26
GEDDTMQRS
YNWYQTNV
GSC 6.584 8 301 4 DgigtSfN DtmqrSyN
27
FDMLFKDSY
IWGMTIMFG
SC 7.937 12 157 4
LmKDlgfdG
idI
LfKDsyiwG
mtI
28
DTFWQFEKY
PEYNMHMD
GSC 7.546 12 355 1
DTvkiagKk
aEY
DTfwqfeKy
pEY
29
PNPWLEWM
HMLLWNNQ
DGSC
8.205
001 13 109 5
ikqMylLkk
NNrn
lewMhmLlw
NNqd
30
YAENGAWD
VRVYSSANQ
GSC 9.904 8 316 3
ENGvWDy
k ENGaWDvr
31 DRQQLEGTL 6.852 14 328 6 qGaqVtelEd eGtlVerfErl

101
VERFERLWG
SC
001 iaaS wgS
32
YKMDWSIAF
QIMHFDVSG
SC
11.23
4 11 234 9
wnlMayDfS
GS
fqiMhfDvS
GS
33
LSVISGMHS
EWPVLWLF
GSC 9.047 12 18 2
SsmSsMpns
yPV
SviSgMhse
wPV
34
GFMLFGGNP
LEYAWYAH
GSC 6.872 9 45 10 vnwAiYgrG leyAwYahG
35
SLDGVARSW
PGGYGEGHG
SC 8.418 14 299 1
StDGigtSfn
GvgG
SlDGvarSw
pGgyG
36
KYIGEHPVF
ESTEYRQGG
SC 6.672 5 255 8 VFpST VFeST
37
YDVMLSQPN
PVSWMRFPG
SC 7.599 17 79 2
eVyLSdtwa
dtdkhyPG
dVmLSqpnp
vswmrfPG
38
SYKQYHIGR
HIDLESLEGS
C 6.564 13 2 4
rflIGalltLqt
L
qyhIGrhidLe
sL
39
YSWDAINW
RGKAYPVET
GSC
7.599
999 11 352 1
iSyDtvkiaG
K
ySwDainwr
GK
40
WFNERKRA
QLYEVGEFT
GSC 7.787 17 118 3
NnRnlktLlsi
GgwTyS
NeRkraqLye
vGefTgS
41
VKPVDFMG
RYGQLHNFE
GSC 8.166 14 395 4
VnglGgtGk
LeqrE
VdfmGryGq
LhnfE
42
NGKDNVSID
YLHTRLGIG
SC 7.931 8 122 11 LkTlLsIG LhTrLgIG
43
YSGHRHNVP
EIDMRQQFG
SC 8.232 8 248 1 vSGHmsNV ySGHrhNV
44
EFTWMLNK
NNEMHRHPP
GSC 8.319 7 113 4 ylLkKNN wmLnKNN
45
RVMFEGFQG
KGPNYLQVG 6.755 10 359 7 iaGKkaeYit
fqGKgpnYl
q
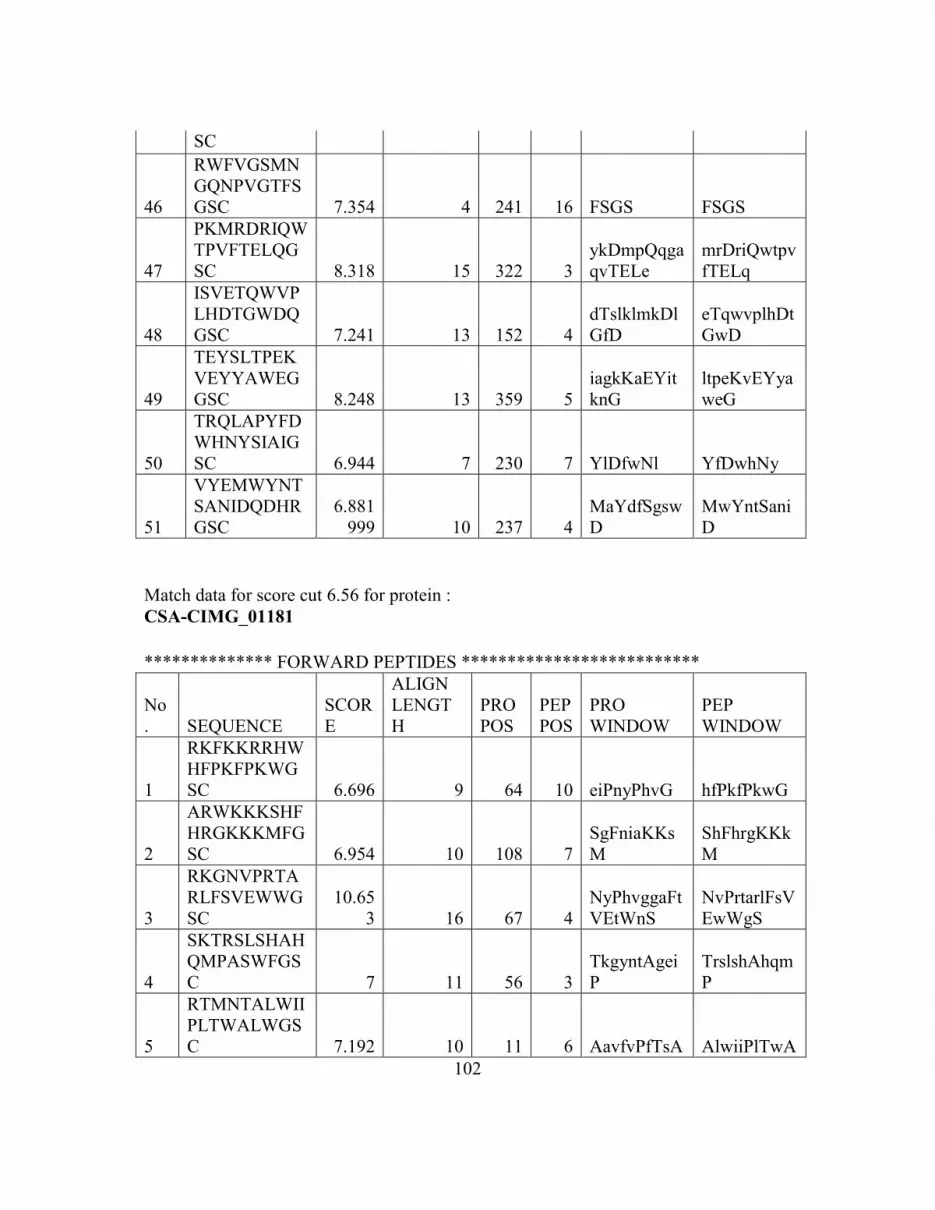
102
SC
46
RWFVGSMN
GQNPVGTFS
GSC 7.354 4 241 16 FSGS FSGS
47
PKMRDRIQW
TPVFTELQG
SC 8.318 15 322 3
ykDmpQqga
qvTELe
mrDriQwtpv
fTELq
48
ISVETQWVP
LHDTGWDQ
GSC 7.241 13 152 4
dTslklmkDl
GfD
eTqwvplhDt
GwD
49
TEYSLTPEK
VEYYAWEG
GSC 8.248 13 359 5
iagkKaEYit
knG
ltpeKvEYya
weG
50
TRQLAPYFD
WHNYSIAIG
SC 6.944 7 230 7 YlDfwNl YfDwhNy
51
VYEMWYNT
SANIDQDHR
GSC
6.881
999 10 237 4
MaYdfSgsw
D
MwYntSani
D
Match data for score cut 6.56 for protein :
CSA-CIMG_01181
************** FORWARD PEPTIDES **************************
No
. SEQUENCE
SCOR
E
ALIGN
LENGT
H
PRO
POS
PEP
POS
PRO
WINDOW
PEP
WINDOW
1
RKFKKRRHW
HFPKFPKWG
SC 6.696 9 64 10 eiPnyPhvG hfPkfPkwG
2
ARWKKKSHF
HRGKKKMFG
SC 6.954 10 108 7
SgFniaKKs
M
ShFhrgKKk
M
3
RKGNVPRTA
RLFSVEWWG
SC
10.65
3 16 67 4
NyPhvggaFt
VEtWnS
NvPrtarlFsV
EwWgS
4
SKTRSLSHAH
QMPASWFGS
C 7 11 56 3
TkgyntAgei
P
TrslshAhqm
P
5
RTMNTALWII
PLTWALWGS
C 7.192 10 11 6 AavfvPfTsA AlwiiPlTwA

103
6
QKAPNKFEH
NVINAHNWG
SC 6.583 14 75 7
FtvetwNspN
cGkC
FehnviNahN
wGsC
7
MYDAATNFF
MDSKGVRKG
SC 6.77 8 93 2 YnAkTiFl YdAaTnFf
8
IHKTEHWIST
NADDWRAGS
C 7.168 7 78 5 EtWnSpN EhWiStN
9
EVERGDMN
WLTISVNNA
GSC 9.788 14 50 5
GDngmiTkg
yNtAG
GDmnwlTis
vNnAG
10
MFDYSPWWE
MYSYGVLPG
SC 7.031 15 59 4
YntagEipnY
phvgG
YspwwEmy
sYgvlpG
11
LYTSEQMTF
YGGRDDEIGS
C 7.82 7 123 12 GRaeElG GRddEiG
12
GEDDTMQRS
YNWYQTNV
GSC 6.969 11 50 1
Gdngmitkg
YN
GeddtmqrsY
N
13
YAENGAWD
VRVYSSANQ
GSC
12.31
9 16 73 5
GAftVetwn
SpNcGkC
GAwdVrvys
SaNqGsC
14
GFNQWFSIDN
WLHTAQWGS
C 7.615 13 58 1
GyNtageIpN
ypH
GfNqwfsId
NwlH
15
NSWNQEYTD
HVVYHGMFG
SC 6.918 8 30 2 SydthYdD SwnqeYtD
16
YKMDWSIAF
QIMHFDVSGS
C 6.942 6 37 4 DpSlAl DwSiAf
17
MAIQGMNIY
TWFTDRIMG
SC 6.736 10 112 1 iAkksMdvlT
mAiqgMniy
T
18
YSWDAINWR
GKAYPVETG
SC 8.886 8 72 10 GgAftVET GkAypVET
19
MQWHSNYM
MKRPYNPEL
GSC 8.238 10 52 6
NgMitkgYN
t
NyMmkrpY
Np
20 RVMFEGFQG 9.445 10 63 9 GeiPNYphV GkgPNYlqV

104
KGPNYLQVG
SC
G G
21
INRHGDWNQ
HFQIPKHPGS
C 7.679 9 107 8 NsgFnIaKk NqhFqIpKh
22
ISVETQWVPL
HDTGWDQGS
C 7.237 8 32 12 DThyDdpS DTgwDqgS
23
TRQLAPYFD
WHNYSIAIGS
C 6.68 8 35 10 yddpSlAl whnySiAi
Match data for score cut 6.56 for protein :
Eli-Ag1-CIMG_10032
************** FORWARD PEPTIDES **************************
No
. SEQUENCE
SCOR
E
ALIGN
LENGT
H
PRO
POS
PEP
POS
PRO
WINDOW
PEP
WINDOW
1
KARWNGRN
MTAPVYWRN
GSC 7.759 10 161 5 NGtgvTAtpf
NGrnmTAp
vy
2
RKGNVPRTA
RLFSVEWWG
SC 7.586 14 160 2
KngtgvTAtp
FSgE
KgnvprTArl
FSvE
3
KSITDRGQKT
WWEWRRNG
SC 6.694 4 54 2 SlTD SiTD
4
KGDFGAEWG
RWRKWVTK
GSC
6.640
999 13 208 6
AtWGvlgai
VvgG
AeWGrwrk
wVtkG
5
SKTRSLSHAH
QMPASWFGS
C 8.974 6 15 5 SLStAH SLShAH
6
YMEAHKTYN
KQISRGVSGS
C
11.14
6 13 183 7
TpNgQpqR
GnSGS
TyNkQisRG
vSGS
7
RLCKNKTFC
WGFYAQWE
GSC
7.172
001 5 159 3 CKNgT CKNkT
8
PVENKGRTST
HGFILWHGSC 7.219 6 47 4 sKsRTS nKgRTS

105
9
RTMNTALWII
PLTWALWGS
C 8.551 17 198 2
TsNiAghleta
TWgvlG
TmNtAlwiip
lTWalwG
10
DKFHYWMY
MLYGINDKIG
SC 6.665 13 73 7
vqvLlalgshp
GS
mymLygind
kiGS
11
QDLLDYHLS
DFVLFAHMG
SC 8.154 8 1 6 mHLSgiVf yHLSdfVl
12
YLSTSMEQE
QEQVHGNW
GSC 7.191 6 190 14 rGNsGS hGNwGS
13
EVERGDMN
WLTISVNNA
GSC 7.045 16 97 1
qVglGDfclp
svSlde
eVerGDmn
wltiSvnn
14
WAEKPKIKN
WLGRQKLGG
SC 6.622 7 110 11 LdeQrLG LgrQkLG
15
YKKMYFRR
WQPTARLSR
GSC 7.137 9 21 6 FRlvdPppR FRrwqPtaR
16
MYYFPDTGG
QPDGSMWNG
SC
10.35
8 11 131 7
TnGdPnGgl
yN
TgGqPdGs
mwN
17
MFDYSPWWE
MYSYGVLPG
SC 7.046 15 200 3
niaghlEtatw
GVLg
dyspwwEmy
syGVLp
18
LYTSEQMTF
YGGRDDEIGS
C
6.641
001 9 139 1 LYncadiTF LYtseqmTF
19
HEGLEGDQTI
YQFMIEYGSC 12.15 13 69 7
DQTavQvll
alGS
DQTiyQfmi
eyGS
20
FDMLFKDSYI
WGMTIMFGS
C 6.879 10 3 10 lsGivfaFsS
iwGmtimFg
S
21
NTAEADWGT
ESTWSMHRG
SC
6.794
999 15 143 5
ADitfsSTtey
tvpS
ADwgteST
wsmhrgS
22
HGPDWTIHPF
PGLWVFDGS
C 7.806 11 162 2
GtgvTatPFs
G
GpdwTihPF
pG
23
GFNQWFSIDN
WLHTAQWGS
9.995
999 12 200 7
nIaghLeTAt
WG
sIdnwLhTA
qWG

106
C
24
NSWNQEYTD
HVVYHGMFG
SC 6.658 7 148 2 SsttEYT SwnqEYT
25
YKMDWSIAF
QIMHFDVSGS
C 7.267 11 58 3
lempIAlemg
H
mdwsIAfqi
mH
26
LSVISGMHSE
WPVLWLFGS
C 7.292 7 75 13 VLlalGS VLwlfGS
27
GFMLFGGNP
LEYAWYAHG
SC 7.391 10 214 1
GaivvGGva
L
GfmlfGGnp
L
28
KYIGEHPVFE
STEYRQGGSC
8.783
001 9 151 12 TEYtvpsSC TEYrqggSC
29
VKPVDFMGR
YGQLHNFEG
SC
10.08
7 7 117 1 VKPVDgM VKPVDfM
30
NGKDNVSID
YLHTRLGIGS
C 7.101 11 107 7
SvsldeqRLG
v SidylhtRLGi
31
ISQQMVLHM
RYAPELLGGS
C 6.902 9 58 7 LeMpiAlEm LhMryApEl
32
TLAPWQGLKI
WERQVPNGS
C 6.643 15 119 4
PvdGmnatlq
vVtNG
PwqGlkiwer
qVpNG
33
RVMFEGFQG
KGPNYLQVG
SC 6.898 7 93 12 PtfrQVG PnylQVG
34
RPPIRLRDVL
NDHYEVRGS
C 7.327 8 152 13 eYtVpsSC hYeVrgSC
35
INRHGDWNQ
HFQIPKHPGS
C 8.047 9 77 11 lalgsHPGS fqipkHPGS
36
ISVETQWVPL
HDTGWDQGS
C 6.771 13 14 1
ISlsTahfrLv
Dp
ISveTqwvp
LhDt
37
TEYSLTPEKV
EYYAWEGGS
C 6.562 6 51 1 TsvSLT TeySLT
38 TRQLAPYFD 7.772 5 77 15 lAlGS iAiGS

107
WHNYSIAIGS
C
39
VYEMWYNTS
ANIDQDHRG
SC 6.736 11 106 8
pSvslDeqrl
G
tSaniDqdhr
G
Match data for score cut 6.56 for protein :
AG2-CIMG_09696
************** FORWARD PEPTIDES **************************
No
. SEQ
SCOR
E
ALIGN
LENGT
H
PRO
POS
PEP
POS
PRO
WINDOW
PEP
WINDOW
1
ETNRWHRNR
QGYLAHSTG
SC 6.922 9 146 11 GgvptgTGS GylahsTGS
2
RTMNTALWII
PLTWALWGS
C 6.791 11 7 9 lIaLvaAglaS
iIpLtwAlwg
S
3
KKQSAWGL
WVAELNYM
HGSC
7.236
001 9 12 5 AaGLasAqL
AwGLwvAe
L
4
IHKTEHWIST
NADDWRAGS
C 7.934 11 164 9
STpAefpgA
GS
STnAddwrA
GS
5
QDLLDYHLS
DFVLFAHMG
SC 6.597 6 69 4 LDariS LDyhlS
6
EVERGDMN
WLTISVNNA
GSC 7.257 5 73 12 ISVsN ISVnN
7
YKKMYFRR
WQPTARLSR
GSC 6.596 4 71 13 ARiS ARlS
8
SLDGVARSW
PGGYGEGHG
SC
10.26
4 15 140 5
VptgtgGGv
ptGtGS
VarswpGGy
geGhGS
9
IALFDPTKWP
EHHQYFAGS
C
7.671
999 11 92 1
IppvDtTaaP
E
IalfDpTkwP
E
10
GRWLGEPNV
QAGPTFFPGS 7.902 12 102 6
EPsetAePTa
eP
EPnvqAgPT
ffP

108
C
11
YSWDAINWR
GKAYPVETG
SC 6.97 10 145 10
GggvPtgTG
S
GkayPveTG
S
12
MTFHGYMVR
GSRGDIIDGS
C 7.785 11 173 5
GsnVRaSv
GgI
GymVRgSr
GdI
13
ISQQMVLHM
RYAPELLGGS
C 6.93 7 183 11 iAaaLLG yApeLLG
14
INRHGDWNQ
HFQIPKHPGS
C
6.835
999 16 42 3
RltDfkcHcs
kPelPG
RhgDwnqHf
qiPkhPG
15
PKMRDRIQW
TPVFTELQGS
C
6.693
999 8 90 7 IeipPVdT IqwtPVfT
16
YFWLDVNYD
EWTAVVDQG
SC 8.695 16 69 4
LDarisvsniV
VDQcS
LDvnydewta
VVDQgS
109
CHAPTER 4
MULTI PATHOGEN PEPTIDE BASED SEROLOGICAL DIAGNOSTIC
Abstract
Pathogen detection is vital for successful detection of sudden outbreaks with
diffuse symptoms. It is important to detect pathogens with high specificity. While DNA
detection conforms to the requirement of high specificity, sufficient pathogen must
remain in the patient to ensure positive signals. Host-based immunological detection
should overcome this limitation, as well as provide information on the hosts’ health
status, unlike pathogen based PCR. To enable the broadest possible panel of
immunological tests that are highly accurate, such that a new outbreak (SARS) or an
intentional bio-threat release could be rapidly located, one requires a larger, more
complex detection panel, such as one representing all NIAID priority pathogens. While a
peptide microarray tiling all possible pathogen proteins may seem like a promising
platform for such a detection panel, we tested the concept and found non-obvious
problems that appeared, and possible solutions. We developed a pathogen peptide
microarray using tiled peptides. Results suggest a profound lack of specificity, but
illuminated several possible sources for cross-reactivity. We modified a number of assay
conditions to minimize cross-reactivity and provide a comparison study of six different
pathogen exposures. We eventually improved our assay from <50% specificity to
simultaneous detection accuracy with >90% AUC-ROC on a 4K peptide microarray. The
array is composed of peptides from fourteen priority pathogens. The basic platform
could be further developed as a surveillance tool or as an epidemiological probe for

110
monitoring outbreaks, but more importantly, several fundamental biochemical conditions
were optimized specifically for multiplexed host-based immune detection.
Keywords
Multiplexed, peptide microarray, multi-pathogen, specificity, peptide cross-reactivity,
epitope, diagnostic assay, immunosignature, antibody.
Abbreviations
BLAST, Basic local alignment search tool; Cytomegalovirus, CMV; Epstein Barr virus,
EBV; Hepatitis C virus, HCV; HSV1, Herpes simplex virus 1; HSV2, Herpes simplex
virus 2; Human Immunodeficiency virus, HIV; ROC-AUC, Receiver operator
characteristics – area under the curve; Severe acute respiratory syndrome, SARS;
ToRCH, Toxoplasma gondii+Rubella+CMV+HSV1 & HSV2.
Introduction
Peptide microarray-based diagnostics have been used for diseases such as
tuberculosis [3,4], Echinococcus spps. [5] and SARS [6,7]. The antibody response
mapping strategy as outlined through these research efforts involve testing patient sera
relative to normal donor sera. List et al [5] diverged from this accepted methodology and
tested their Echinococcus specific peptide microarray platform against other
symptomatically confounding nematode infections. Due to the relatively high cross-
reactivity observed in peptide epitope arrays, none of these groups have attempted
multiplexing the diagnosis of more than one infection from unrelated pathogens on the

111
same microarray. The goal of the present project was to test the feasibility of creating a
functional multiplexed pathogen proteome peptide epitope array.
Cross-reactivity is a generic feature of any antigen-antibody detection system
[101,102]. Polyreactivity is a feature of certain viral infections such as Hepatitis viruses,
HIV and Epstein Barr virus (EBV) [103]. Ulrich et al. [92] attempted to use Yersinia
pestis protein microarrays to distinguish infections of Y. pestis as well as seven other
species of gram-negative bacteria vs. Bacillus anthracis. The authors acknowledged
detection of cross-reacting antibodies to Y. pestis proteins from these unrelated pathogen
exposures but rather than see this as a lack of specificity, instead used it as a fingerprint
for detecting those unrelated infections. They attributed this cross-reactivity to sequence-
level similarities between different unrelated bacterial proteins.
Following the success of creating multiplexed ToRCH [104] protein assays that
use crude whole pathogen protein extracts from five vertically transmitted pathogens,
namely, Toxoplasma gondii, Rubella, Cytomegalovirus and Herpes simplex virus 1 and
2, Andresen et al. [36] created a peptide microarray containing 900 peptides for
distinguishing Hepatitis C virus, EBV, Cytomegalovirus (CMV), Herpes simplex virus 1
(HSV1) and HSV2. Individual patients infected with CMV and EBV showed reactivity
to their cognate peptides but the authors noted broad cross-reactivity from HSV1 and
HSV2 infected patients making it impossible to serologically discriminate between these
viruses using antibody-binding data from multiplexed peptide arrays. From this work we
expected to observe inconsistent patterns of antibody binding per patient and infection on
our multiplexed array.

112
Similarly confounding results were obtained by List et al. [5], when they
attempted to discriminate between Echinococcus species: multilocularis and granulosus
using 45 peptides from 6 proteins of the pathogens. One of the best performing peptides
out of 45 selected had 94% specificity and 57% sensitivity at detecting Echinococcosis
apart from other nematode infections, but was ineffective at differentiating between the
two species. Maeurer et al. [3] on their 7446 peptide microarray representing 61
Mycobacterium tuberculosis proteins found positive antibody reactivities from TB
negative (Quantiferon assay negative) individuals’ sera. Whether this could be
interpreted as cross-reactivity attributable to non-pathogenic Mycobacterium species or to
autoimmunity is speculative in the absence of immune histories from these patients.
Auto-immunity has been documented to be a side effect from several common infections
such as measles, mumps and chicken pox [103]. Chow et al. [6] attempted to circumvent
this issue by selecting 27 peptides that were restricted to the SARS-CoV (Severe Acute
Respiratory Syndrome-Coronavirus) but without any portion of other Coronaviruses or
human or mouse proteomes. This array was only tested against SARS infected versus
uninfected patients, not against serum from other closely related Coronaviruses but it
implied that informatics should be used to filter peptide selection.
In our study we developed a multiplexed pathogen peptide array representing 14
priority pathogens such that either the complete proteomes of small viruses or a few
immunodominant antigens for large bacteria and viruses were tiled contiguously.
Surprisingly there was a pronounced lack of specificity in initial assays. In order to
reduce cross-reactivity, we subsequently optimized physical assay conditions to capture
113
specific reactivity from infected sera and reduce signals from non-targets. First, we
examined the effect of the surface density of the peptides by changing the spacing of the
linker that attaches peptide to the glass slide. Next, we examined detecting antibody
concentrations, then the temperature of incubation and finally we tested a number of
competitors for the primary sera incubation step. The literature for antigen-antibody
thermodynamics [105] and protein and peptide microarray optimization [3,5,6,8,36],
suggests that incubating serum samples longer (as in an ELISA) might allow the system
to approach equilibrium and better discriminate antibody affinities. The patient serum
samples we used to train this system are characterized using alternative immunoassays
(ELISA or immunodiffusion) representing exposures to Coccidioides spps. (Valley
Fever-VF), Fransicella tularensis - attenuated live vaccine strain (LVS), Vaccinia (small
pox), African Swine Fever Virus (ASFV, a non-human pathogen), Plasmodium (Malaria)
and West Nile Virus (WNV).
Methods
Serum samples and rationale for choosing pathogens to be represented
Human patient serum samples from five Vaccinia vaccine recipients and five non-
disease individuals were collected under the ASU IRB 0905004024, “Blood Collection
for Immunological Studies”. Fransicella tularensis subsp. holarctica live vaccine strain
(LVS) vaccinated individuals’ sera from 11 individuals were received from Dr. Anders
Sjöstedt’s laboratory at Umeå University, Sweden under the same IRB approval.
Samples used were 28-30 days post-vaccination. VF infected patient sera was received

114
from Dr. John Galgiani at the University of Arizona (IRB# FWA00004218, 122
samples). Two Plasmodium and 6 WNV infected sera was obtained from SeraCare Life
Sciences (Milford, MA). Four ASFV infected porcine sera with 2 uninfected control pig
sera were obtained from Dr. Linda Dixon at The Pirbright Institute, UK under the USDA
import license # 111099 by Dr. Kathryn Sykes. The choice of pathogens to be
represented on the assay was based on serum sample availability for testing NIAID
Category A, B and C priority pathogens [38]. The majority of pathogens chosen were
small encephalitis viruses along with other priority pathogens with larger proteomes.
Table 4- 1 displays the distribution of peptides per pathogen on the pathogen proteome
peptide (PPP) array.
Table 4- 1 Peptide selection strategy for PPP array
Type of
Pathogen
Pathogen Name
(NIAID Priority
Pathogens list
category)
Number of
Proteins in
Proteome
Proteins
Selected
Number
of
Peptides
% Coverage
(Proteome)
Viruses
Japanese
encephalitis virus
(B)
13 all 203 100%
Equine
encephalitis virus
(B)
2 all 223 100%
Venezuelan
encephalitis virus
(B)
2 all 215 100%
Machupo Virus
(A) 4 all 181 100%
Junin Virus (A) 4 all 199 100%
Guanarito Virus
(A) 4 all 204 100%
Lassa Virus (A) 4 all 205 100%
West Nile Virus I 13 + 13 all 194 + 120 100%

115
+ II (B)
African Swine
Fever Virus
(USDA
Veterinary
services select
agent)
188 12 [106-
108] 299 6.38%
Vaccinia Virus –
Western Reserve
(A)
223 32 [109-
111] 567 14.34%
Bacteria
Francisella
tularensis SCHU
S4 (A)
1604 45
[112,113] 862 2.80%
Bacillus anthracis
(A) 5715 1 [114-116] 44 0.05%
Protist
Plasmodium vivax
(Infections
observed in
deployed
populations)
5051 17 [117] 708 0.31%
Fungi Coccidioides
immitis (C) 10454
4 [81-
83,118,119] 83 0.03%
Three approaches were considered for selecting the epitopes to be represented on
the array. The first approach utilized the Immune Epitope Database’s (IEDB) collection
of empirically mapped epitopes that yielded 4,124 total B-cell epitopes representing the
14 priority pathogens. The distribution of these epitopes was severely skewed for some
pathogens. The second approach relied on utilizing information from the six [120-123],
B-cell linear epitope prediction algorithms provided through IEDB. Each one of these
algorithms gives weight to a certain characteristic of the peptide sequence, e.g. the Chou
& Fasman Beta turn prediction algorithm, predicts whether a portion of the protein could
have a trans-membrane domain due to presence of beta-turns in their structure. The
Bepipred algorithm includes propensity scaling of the amino acids based on their

116
probability of occurring in an antigenic site in addition to a Hidden Markov model
(HMM) approach to systematically identifying cryptic sites. This resulted in ~24,000
peptide epitopes predicted from the 11 out of 14 pathogen proteomes under
consideration. A summary of both these approaches is depicted in Table 4- 2.
Table 4- 2 Predicted & Empirical epitopes (IEDB-Bepipred) [Accessed on: 30th
November, 2011]
Organism
# Predicted Epitopes
(Bepipred)
# Epitopes in
IEDB database
Total proteins in
Proteome
Bacillus anthracis 18486 3174 5289
Francisella
tularensis (SchuS4) 4365 797 1604
ASFV 723 128 128
Junin virus 98 4 4
Machupo virus 96 4 4
Guanarito virus 98 4 4
Lassa fever virus 86 4 4
West Nile virus I &
II 137 2 10 + 10
JEV 70 1 10
VEE 136 3 2
EEE 137 3 2
Total 24432 4124 7071
The third approach involved tiling the whole proteome of the pathogen into
contiguous 17-mers. This is easily achievable for several of the encephalitis viruses
having smaller proteomes, containing at most 2-10 proteins in their proteome. Bacteria
and fungi have much larger proteomes and would result in more 17-mer peptides than the
physical limit allowed on this platform. As summarized in Table 4-3 the 14 pathogen
proteomes under consideration have 12,744 total proteins and would amount in 344,316

117
contiguous 17-mer peptides. Our current piezo printed array can accommodate only
20,000 peptides per slide.
Table 4- 3 Number of peptides per priority pathogen proteome
Organism
Total proteins
in Proteome Amino acids total
# of contiguous non-
overlapping 17-mers
Bacillus anthracis 5289 1460522 85913
Francisella
tularensis
(SchuS4) 1604 497951 29291
Vaccinia virus 223 57833 3402
Plasmodium vivax
(Sal-I) 5390 3748088 220476
ASFV (Georgia
2007/1) 188 55884 3287
Junin virus 4 3353 197
Machupo virus 4 3363 198
Guanarito virus 4 3332 196
Lassa fever virus 4 3377 199
West Nile virus I
& II 10 + 10
WNV-I: 3433 +
WNV-II: 3430 202 + 202
JEV 10 3432 202
VEE 2 3748 221
EEE 2 5612 330
Total 12744 5853358 344316
We therefore chose to represent complete viral proteomes for small viruses and
partial proteomes for larger pathogens representing tiled empirically classified
immunodominant proteins (Table 4- 1). We hypothesized that including only
immunodominant antigens would be sufficient to help distinguish that infection from
others on the array. The peptides were filtered so as not to include any duplicate 16 or
17-mers. Any duplication in a sequence between amino acid lengths 5 through 15 was

118
noted so as to map possible binding events observed due to short peptide sequence
identity (Table 4- 4). The n-mer level overlap observed when using natural sequence
epitopes is much higher than that observed by chance in a randomly generated peptide
library containing the same number of peptides and in comparison to two separate
randomly generated, non-natural sequence 10K Immunosignature peptide libraries (Table
4- 4). The peptides were then printed onto glass slides and all assay conditions such as
time and temperature of serum sample incubation, slide surface, blocking buffer were
systematically optimized to reduce cross-reactivity.
Table 4- 4 Duplicate 5-mers – 16-mers within the 4337 peptides from the PPP array and
10K non-natural sequence peptide Immunosignature array
n-mer
size
# n-mers observed more
than once in pathogen
peptides
#n-mer observed more
than once in random
sequence peptides
10K(v2) 10K(v1)
16-mer 211 2 2 0
15-mer 345 5 16 0
14-mer 522 8 141 0
13-mer 763 13 378 5
12-mer 1061 19 635 12
11-mer 1435 27 908 32
10-mer 1903 37 1123 45
9-mer 2482 62 1389 61
8-mer 3467 358 1659 114
7-mer 4673 694 2167 584
6-mer 6737 1819 5143 3912
5-mer 9171 3143 9530 8309

119
Microarray production and processing
An N-terminal CRH (cysteine-arginine-histidine) linker sequence was added to
the 17mer pathogen peptides. A total of 4337 peptides were purchased from Sigma
Genosys (St. Louis, MO). Array printing was performed at AMI (Applied Microarrays,
Tempe, AZ) using non-contact piezo printing. Slides were either Schott Nexterion
(Gena, Germany) aminosilane-coated slides which provide ~1nm spacing between
covalently-attached peptides, or Postech NSB slides (Seoul, Korea). The NSB slides
were either NSB-9 (3nm spacing between peptides) or NSB-27 (6nm spacing between
peptides). All slide surfaces were coated with sulfo-SMCC linker (Pierce, Rockland,
MD) and peptides were conjugated to the surface using maleimide conjugation chemistry
at 70% humidity. Identical arrays were printed on the top and bottom half of each slide,
and each peptide was printed twice within an array.
Microarray slides were pre-washed with a solution containing 7.33% acetonitrile,
33% isopropanol and 0.55% TFA to remove unbound peptide. Slides were blocked in 1X
PBS, 3% BSA, 0.05% Tween 20, 0.014% β-mercaptohexanol for 1hr at 25oC. Sera
samples were diluted 1:500 or 1:5000 in Incubation buffer containing 3% BSA, 1X PBS,
0.05% Tween 20, and allowed to bind to the microarray for varying time points including
1 or 16 hour at either 23°C or 37°C in 200 µl total volume per array. A Tecan 4800 Pro
Hybridization Station (Tecan, Salzburg, Austria) was used for array incubation and
primary sera was detected using Alexa Fluor-647 conjugated Goat anti-Human, IgG Fc
(γ) fragment specific secondary antibody from Jackson ImmunoResearch (West Grove,
PA). The slides were scanned using Agilent C scanner (Santa Clara, CA) at 635nm

120
excitation wavelength with 100% PMT and high laser power at 10 µm image resolution.
The 16-bit TIFF images were aligned using GenePix 6.0 software (Axon Instruments,
Union City, CA) and the data files imported into GeneSpring 7.3.1 (Agilent, Santa Clara,
CA) and Matlab (version R2012a, MathWorks, Natick, MA) for further analysis. Every
patient’s serum sample was processed in duplicate and since every peptide was printed
twice within a sub-array, it gave 4 measurements from the same peptide upon combining
both technical replicates. Any sample with a Pearson Correlation Coefficient less than
0.85 across technical replicates was re-processed. Upon meeting the quality criteria, all
technical replicates for a given individual patient were averaged for further data analysis.
Data analysis
Median spot signal intensities were imported into Matlab (Natick, MA) for further
analysis. Spots flagged as bad based on visual inspection were treated as missing data,
and values of replicate spots were averaged. The global median background intensity
was subtracted from each slide. The background subtracted median spot signals are
referred to as the peptide signals in subsequent analysis. Analysis of patient data used
eight statistical metrics for scoring pathogen peptides, average signal, T-test, and
Pearson’s Correlation were the most predictive. Each pathogen on the array is not
represented by equal numbers of peptides. The proportion of peptides per array and per
pathogen was noted for each assessment.
Analysis methods:

121
1) Average signal method: the arithmetic mean signal intensity of the peptides
belonging to each pathogen is used to generate a rank order, without incorporating
standard deviation or number of peptides/pathogen.
2) T-test p-value method: the p-value from a one-sided t-test between the signal
intensities of the peptides belonging to each pathogen compared to the rest of the
peptides on the array, assuming variance is unequal.
3) Pearson Correlation method: correlation is calculated between a vector
containing the signal intensities for a patient and a binary vector composed of 1’s
(representing a signal within the cognate pathogen) and 0’s (everywhere else).
4) Signal – log(P-value) method: The mean signal for each patient’s peptides
multiplied by the negative of the log10 p-value across the patient vs. all other
peptides on the array.
5) Signal to noise method: The average peptide signal for each pathogen group is
divided by the standard deviation of the peptide signal across those groups.
6) Median Signal method: A nonparametric rank based on the median of the signal
of peptides within a pathogen. Highest rank is the designated call.
7) Mean ranks method: Per sample, peptides are ranked by signal intensity and the
mean of the rank is calculated per pathogen.
8) Wilcoxon Mann Whitnet Rank sum method: Non-parametric version of T-test
across patient peptides and all other peptides on the array.
122
In the NSB-9 and NSB-27 combined analysis, the geometric mean of the average signal
or t-test p-value were used, while the arithmetic mean of the Pearson correlations from
each platform were used.
Receiver Operating Characteristics (ROC) curve calculation
Receiver Operating Characteristics (ROC) [124] curves were calculated using the
‘perfcurve’ function in Matlab. A ROC curve is a plot of the True Positive Rate (TPR)
against the False Positive Rate (FPR). The area under the ROC curve (AUC) represents
the probability that a positive example (in this case the score for the correct pathogen) has
a higher score than a negative example (in this case the score for another pathogen).
Results
Physical optimization of pathogen proteome peptide (PPP) array
Basic peptide microarray assay conditions such as the blocking and incubation
buffer and the concentration of the secondary antibody were previously optimized for
other peptide microarray assays[11]. These were the starting conditions and provided
extremely low specificity when testing multiple infectious sera. The temperature and
incubation time had been optimized for Immunosignature arrays, so these conditions may
not be optimal for the analysis of antibody binding to cognate linear epitopes [105]. The
first condition tested was the effect of temperature.

123
Comparison 1: The effect of temperature on antibody-peptide association
The Aminosilane slide surface was used and temperature of incubating serum
sample or monoclonal antibody was varied (23°C vs. 37°C). The primary sera incubation
time was held constant at 1 hour with 1:500 serum dilution or 5nM monoclonal antibody
concentration processed. Figure 4- 1 represents the average signal intensities of peptides
per pathogen group of proteins from Aminosilane slides at the end of one hour
incubation. Serum samples from one LVS vaccinee, one VF patient, one Normal donor
and monoclonal antibody p53Ab1 were tested. Red bars represent data from slides
processed at 37°C and blue bars from slides processed at 23°C. The monoclonal
antibody against human P53 protein (p53Ab1) identified its cognate epitope, a peptide
containing the 5-mer ‘RHSVV’ and some other peptides containing the same 5-mer. LVS
and VF exposed polyclonal sera had more non-specific binding to other pathogen
peptides as compared to cognate pathogen peptides FTT or VF (highlighted with red
boxes). The LVS serum is showing higher reactivity to Lassa, Guanarito and Machupo
virus peptides as compared to FTT, cognate peptides. The VF infected individual’s serum
is showing higher reactivity to FTT, Junin and Lassa virus peptides alongwith showing
reactivity to VF cognate antigen peptides.

124
Figure 4- 1 The effect of incubation temperature on various samples tested on the
pathogen array.
The average signal intensities for peptides per pathogen proteins are represented using
bar graphs with red bars representing signals from slides processed at 37°C and blue
bars from slides processed at 23°C. Panel A shows the antibody reactivity from a F.
tularensis LVS vaccinated individual on the PPP array with FTT peptide (cognate)
signals highlighted in the red box. Panel B shows the antibody response from a VF
infected individual with a red box highlighting VF specific peptide signals (cognate).
Panel C shows the antibody reactivity from a Normal individual’s serum sample. Panel D

125
shows a monoclonal antibody (p53Ab1) binding its epitope peptide containing sequence
‘RHSVV’ (red box) and few other peptides, containing the epitope sub-sequence.
We observed statistically significant discrimination between cognate and non-
cognate peptide groups at 23°C, so further analysis was conducted at this temperature.
Table 4- 5 summarizes the AUC obtained from this analysis.
Table 4- 5 AUC derived from ROC summary of incubating samples on Aminosilane
slides at varying temperatures, time of primary antibody incubation is held constant at 1
hour.
Surface: Aminosilane, Primary antibody incubated for 1 hour at 37°C
Infection (No. of
patients)
Mean
Signal
T-test p-
value
Pearson
Correlation
Valley fever (1) 0.98 0.98 0.98
LVS (1) 0.13 0.03 0.03
p53Ab1 (1) 1.00 1.00 1.00
Surface: Aminosilane, Primary antibody incubated for 1 hour at 23°C
Infection (No. of
patients)
Mean
Signal
T-test p-
value
Pearson
Correlation
Valley fever (1) 0.98 0.98 0.98
LVS (1) 0.25 0.02 0.03
p53Ab1 (1) 1.00 1.00 1.00
In an effort to estimate cross-reactivity, well-characterized monoclonal antibodies
(anti-FLAG and anti-p53Ab1) were processed on aminosilane arrays with and without
the epitope peptides for the monoclonals being tested. Figure 4-2 shows the signal
intensities from binding observed on arrays at the end of 1 hour of primary incubation at
23°C. Even in the absence of the epitope peptide, the monoclonal antibodies bound

126
pathogen peptides that either naturally contained the partial monoclonal epitope or a
mimotope of their cognate site. The monoclonal antibodies show reduced binding to the
non-cognate peptides when the epitope peptide was present suggesting higher affinity for
the cognate sequence.
Figure 4-2 Estimating cross-reactivity - Histograms displaying signal intensities from
arrays with or without monoclonal antibody epitopes.
The Y-axis shows the number of peptides at a given signal intensity displayed on the X-
axis in all four panels. Panels A and B display the binding of the FLAG tag monoclonal
antibody on arrays without and with cognate epitope peptides respectively. Panels C and
D display the binding of p53Ab1 monoclonal antibody on PPP arrays without and with

127
cognate epitope peptides respectively. Panels A and C show data from arrays without the
monoclonal antibody epitope and panels B and D show data from arrays containing the
monoclonal epitope.
Reducing cross-reactivity on array by reducing peptide density on array surface
To reduce non-cognate peptide binding due to high peptide density on the surface,
we tested NanoSurface Biosciences [125] NSB-9 and NSB-27 slide surfaces. The
primary amine groups on these surfaces are spaced 3nm and 6nm apart, respectively, as
compared to aminosilane slides where space between amine groups is approximately
1nm. In order to determine spot morphology on these alternate slide surfaces as
compared to Aminosilane, peptides were biotinylated using NHS ester-coupled biotin
from Thermo Scientific (Rockford, IL). This approach was designed to be used to semi-
quantitatively assess the quality of spotting within various slide print batches of a given
Immunosignature array [126]. Free amine groups on the peptides were bound with biotin,
and Alexafluor 647-conjugated streptavidin bound only biotinylated sites (Figure 4- 3).
The NSB-9 slides show lower dynamic range of signal intensity of peptide compared to
aminosilane, due to the higher distance between peptides than AS. The higher distance of
primary amine groups on NSB-27 slides contributed to lower dynamic range of signal
than both NSB-9 and AS slides. The spot morphology of NSB-27 slides was not optimal
and hence for the initial comparison with Aminosilane only NSB-9 slides were used.

128
Figure 4- 3 Biotinylation for comparing the spot morphology and dynamic range of
signal from three slide surfaces, Aminosilane (AS), NSB-9 and NSB-27.
The histograms display the binding of streptavidin conjugated Alexafluor 647 on the
three different slide surfaces. The images inset are screen shots of the three surfaces
showing spot morphology.
Six monoclonal antibodies were processed for estimating binding specificity on
NSB-9 slides for 1 hour at 23°C: anti-FLAG, anti-V5, anti-cMyc, anti-p53Ab1, anti-
p53ab8 and anti-Leu Enkephalin. All antibodies other than anti-Leu-Enkephalin bound
their cognate epitopes along with other peptides that partially contained the epitope sub-
sequence or mimics of it. (Supplementary Figure 4- 1)

129
Comparison 2: Slide surface
A comparison was made between Aminosilane vs. NSB-9 slides to decide which slide
surface to use for printed PPP arrays to test polyclonal infectious sera. The primary serum
incubation time was held constant at 1 hour and 23°C and 1:500 dilution of primary.
The samples processed for the previous comparison were now processed on NSB-9 slide
surface. Table 4- 6 summarizes the results from comparing three samples on both
Aminosilane and NSB-9 slides. A moderate improvement in ROC-AUC for detecting the
LVS sample is observed on NSB-9 slides as compared to Aminosilane. This observation
would need to be tested with additional samples for the two infection groups to be
confirmed.
Table 4- 6 ROC-AUC for comparing slide surfaces Aminosilane versus NSB-9
Surface: Aminosilane, Primary antibody incubated for 1 hour at 23°C
Infection (No. of patients) Mean Signal T-test p-value Pearson Correlation
Valley fever (1) 0.98 0.98 0.98
LVS (1) 0.19 0.02 0.04
p53Ab1 (1) 1.00 1.00 1.00
Surface: NSB-9, Primary antibody incubated for 1 hour at 23°C
Infection (No. of patients) Mean Signal T-test p-value Pearson Correlation
Valley fever (1) 0.98 0.15 0.96
LVS (1) 0.47 0.13 0.09
p53Ab1 (1) 1.00 0.55 1.00
Note: The normal sample from the previous comparison was excluded when re-
calculating the ROC-AUC for the previous set of AS slides and while calculating it for
NSB-9 slides as a more relevant comparison would be between infectious groups.

130
In addition to the samples processed to match those used in comparison 1, the
anti-FLAG tag antibody was processed under identical conditions for this comparison.
Figure 4- 4 summarizes the box-plots from antibody binding distribution as observed on
NSB-9 and Aminosilane slides. The top left panel showing anti-FLAG epitope specific
monoclonal antibody reactivity show lesser non-cognate peptide reactivity on NSB-9
slides as compared to on AS. The top right panel, showing anti-P53Ab1 antibody
binding, displays higher cognate epitope binding observed on NSB-9 slides as compared
to on AS. However, both bottom panels showing polyclonal exposure specific response
from VF infected and LVS vaccinated individuals’ sera does not show significantly
higher cognate pathogen peptide binding than that observed on other non-cognate
pathogen peptides. The LVS sample processed on NSB-9 slides shows higher median
binding of both cognate as well as non-cognate groups of pathogen peptides than that
observed on AS slides. The VF sample tested shows moderately higher binding to
cognate peptides as compared to non-cognate peptides on AS slides.

131
Figure 4- 4 Box-plots showing antibody binding distribution as observed on NSB-9
versus Aminosilane (AS) slides.
The top two panels show the binding observed on the array using two monoclonal
antibodies, anti-FLAG tag and anti-P53Ab1. The bottom two panels show the antibody
binding distribution to cognate pathogen versus non-cognate peptides for one exposed
individual each from VF and F. Tularensis (LVS). The antibody binding distribution of
peptides is plotted along the X-axis, while the Y-axis is discontinuous and compares

132
signal intensity data from NSB-9 versus AS for every sample processed. The antibody
binding distribution from cognate pathogen peptides or monoclonal antibody epitope
peptides are plotted as a separate distribution and highlighted in red next to the antibody
binding observed from the remaining peptides on the array (blue dots).
Additional sera from both these infectious groups would need to be processed to
evaluate this antagonistic observation per infection. However, given that the monoclonal
antibodies show better specificity on NSB-9 slides, they were used for all further
comparisons. Figure 4- 5 supplements this observation by showing the exact position of
cognate peptides (highlighted in black) within the overall antibody binding distribution
observed on AS and NSB-9 slides for the same samples. The LVS sample (top right
panel) shows a significant change with higher cognate reactivity distribution on NSB-9
slides as compared to AS.

133
Figure 4- 5 Histograms displaying cognate peptide reactivity on Aminosilane (AS) and
NSB-9 slides.
The X axis shows the number of peptides sorted based on signal intensities depicted on
the Y-axis. The coloring is based on an arbitrary scale in Matlab. The cognate peptides
for two monoclonal antibodies and one sample each of LVS and VF are highlighted in
black.
Three VF infected individuals and three F. tularensis (LVS) vaccinee sera were
used to verify the previous observation of improvement in LVS cognate reactivity on
NSB-9 slides. The 37°C comparison is included to ensure the 23°C criterion established
previously for AS is also valid for NSB-9 slides. Table 4- 7 summarizes the ROC-AUC
of distinguishing VF vs. LVS on NSB9 slides at varying temperatures.

134
Table 4- 7 ROC-AUC obtained for 2 infections on NSB9 slide surface at varying
temperatures
Time of incubation held constant at 1 hour, temperature 23°C vs. 37°C
Surface: NSB9, Primary incubated for 1 hour, 37°C
Infection (No. of
patients)
Mean
Signal
T-test p-
value
Pearson
Correlation
VF(3) 0.90 0.10 0.66
F. tularensis(3) 0.21 0.36 0.24
Surface: NSB9, Primary incubated for 1 hour, 23°C
Infection (No. of
patients)
Mean
Signal
T-test p-
value
Pearson
Correlation
VF(3) 0.85 0.10 0.73
F. tularensis(3) 0.23 0.24 0.25
The NSB-9 (Table 4- 7) slides show moderate improvement in detecting
F.tularensis (LVS) exposure as compared to aminosilane slides (Table 4-5). Following
this methodical analysis, we then tested the effect of incubation time of sera on the PPP
array.
Comparison 3: Time of Incubation of sera.
Single antigen ELISA’s, show high specificity at capturing appropriate antibody
reactivity. Longer times of incubation were tested to mimic ELISA like binding
conditions (overnight incubation). Supplementary Figure 4- 2 demonstrates the change in
binding over varying incubation times of a monoclonal antibody against TP53 to its
cognate epitope peptide on the array. Binding to a number of non-cognate peptides
containing the identical ‘RHSVV’ recognition sequence of this monoclonal or other

135
mimics such as ‘RHSVI’ or ‘RHSII’ at the end of 1 hour of incubation is higher than that
observed at the end of 36 hours. It appears that by 16 hours the monoclonal antibody
binding its cognate epitope peptide starts tending towards equilibrium. At 24 and 36 hour
time points, the antibody likely degrades as observed through progressively lower signals
for one of the two epitope peptides on the array. Additionally, three VF infected and LVS
vaccinated patient sera were used as before to compare incubation of the antibody for 1
hour versus 16 hours (factors held constant: slide surface-NSB-9, 23°C, 1:500 serum
dilution)
Figure 4-6 displays histograms for one LVS and VF exposed individual each out
of the three tested per group, showing data from all peptides on NSB-9 slides colored by
an arbitrary scale in Matlab. The cognate pathogen peptides FTT or VF are highlighted in
black. Incubating the primary antibody for a longer duration of 16 hours increases the
overall binding observed on the assay (cognate and non-cognate). Higher cognate
pathogen peptide reactivity is observed at 16 hour serum incubations for all six sera as
depicted by data in Table 4-8.

136
Figure 4-6 Cognate pathogen peptide reactivity is enhanced at 16 hour in comparison to
after 1 hour of serum incubation.
Histograms displaying raw signal intensities on the Y-axis and number of peptides on the
X-axis sorted based on signal intensity. The top panel displays one LVS and bottom panel
displays one VF exposed individuals sera binding the PPP array after 1 hour and 16
hour (red) respectively in paired panels next to each other. The distribution of cognate
pathogen peptides (VF or LVS) is highlighted in black.

137
Table 4- 8 ROC-AUC during varying incubation times on NSB-9 surface
Surface: NSB9, Primary incubated for 1 hour, 23°C (reproduced
for comparison from Table 4-4)
Infection (No. of
patients)
Mean
Signal
T-test p-
value
Pearson
Correlation
VF (3) 0.85 0.10 0.73
F. tularensis (3) 0.23 0.24 0.25
Surface: NSB9, Primary incubated for 16 hour, 23°C
Infection (No. of
patients)
Mean
Signal
T-test p-
value
Pearson
Correlation
VF (3) 0.89 0.16 0.84
F. tularensis (3) 0.28 0.21 0.35
From observing this moderate improvement in cognate peptide binding at 23°C after 16
hours of incubation, we continued to process additional infectious sera on the PPP array
under these conditions.
Comparison 4: Spacing of peptides affecting polyclonal antibody capture.
We tested the concentration of deposited peptide on the surface and the effect it had on
antigen presentation and the specificity of antibody association on the array. To do this
we used NSB-9 and NSB-27 slides along with serum incubation conditions optimized in
the previous comparison. The incubation time for infectious sera was held constant at 16
hours, 23°C with 1:500 serum dilution.
Figure 4- 7 summarizes the ROC-AUC of detecting 6 different infections apart on
both NSB-9 and NSB-27 slide surfaces at longer incubation times (16 hour) and 23°C.

138
NSB-9 slides showed greater detection accuracy for VF and Malaria samples as
compared to NSB-27. F tularensis (LVS) samples however were detected with greater
accuracy using NSB-27 slides.
Figure 4- 7 ROC curve AUC summarizing ability to distinguish one infection from
another on the PPP array under longer incubation
The NSB-27 slides showed inconsistent spot morphology and poorer replicate
correlations due to the interaction between printing conditions (volume and peptide
concentration held constant throughout) and the 6nm distant primary amines. We
expected this higher distance between individual peptides to improve specificity on the
assay. This higher spacing likely affected its reproducibility; therefore, NSB-27 slides

139
were excluded from further analysis except to test limiting conditions of antigen
presentation and antibody dilution in the next comparison. A score combination approach
which combined the scores for the eight statistical metrics obtained from NSB-9 (1:500)
and NSB-27 (1:500) slides was also tested, but did not yield significantly higher accuracy
as depicted in Table 4- 9 as compared to results in Figure 4- 7, panel A. This approach of
combining multiple observations is typically utilized when analyzing Surface Plasmon
Resonance (SPR) data. The NSB-9 and NSB-27 data were treated as replicates when
completing this analysis.
Table 4- 9 ROC-AUC after combining NSB9 and NSB-27 (1:500) data
Infection (No. of patients)
Mean
Signal
T-test p-
value
Pearson
Correlation
Valley fever(3) 0.82 0.14 0.84
Francisella tularensis-LVS
(3) 0.38 0.31 0.35
ASFV (4) 0.97 0.60 1.00
WNV (5) 0.51 0.99 0.77
Vaccinia (5) 0.89 0.42 0.85
Malaria (2) 0.05 0.04 0.02
Comparison 5: Dilution of primary patient sera 1:5000 patient serum dilution
In order to test the robustness of this system and estimate physical conditions
under which it would fail to detect the appropriate pathogen infection, the assay was
processed under limiting conditions of peptide antigen and antibody from
infected/exposed sera. Doing this exercise gives us an estimate of likely assay conditions
or sample related problems (degradation) to be tested in the event of failure. We used
NSB-27 slides to test limiting conditions of antigen presentation for this assay and diluted

140
the serum 10 fold higher than is recommended for use on piezo-printed peptide glass
microarray based Immunosignature platforms [11]. Table 4-10 summarizes the ROC-
AUC of distinguishing VF from LVS under these limiting conditions. Processing patient
sera under these conditions did not significantly reduce the detection ability of this assay
using the pathogen mean signal metric as can be observed from comparing Figure 4- 7,
Panel B and Table 4-10. The p-value score and Pearson Correlation scores however were
significantly lower as compared to those observed from NSB-27 slides processed at 1:500
serum dilution (Figure 4- 7, Panel B).
Table 4-10 ROC-AUC of detection of 2 infections at limiting concentrations of antigen
and antibody
Surface: NSB27, Primary (1:5000) incubated for 16 hour,
23°C
Infection
(# patients)
Mean
Signal
T-test p-
value
Pearson
Correlation
VF (3) 0.63 0.13 0.15
F.
tularensis(3) 0.51 0.55 0.76
In summary, the information content obtained from such a multiplexed assay is
dependent on several thermodynamic parameters and physical assay conditions tested
above. Figure 4- 8 demonstrates this concept by displaying the average signal intensities
of peptides per pathogen groups of proteins between aminosilane (top panel) and NSB-9
and NSB-27 slides (bottom panel). One VF infected individuals’ serum is visualized
under different thermodynamic conditions. Kinetic factors being tested here are amount
of antigen presented on the surface (AS-dense, NSB9 and NSB27-less dense),

141
temperature (23°C vs. 37°C) and time of incubation of primary antibody (1 hour vs. 16
hours). Longer incubation times on the NSB9 surface at 23°C (blue bars, panel B)
showed highest resolution of cognate VF peptide reactivity (highlighted with red box).
The graph shows data for one Valley Fever-infected individual but is representative of
the effect of optimizing these parameters for all infections studied in this work.
Figure 4- 8 Effect of incubation time, temperature and slide surface on information
content of array.
Each bar represents the signal from peptides composing a given pathogen protein. Signal
intensities to VF peptides averaged as proteins highlighted using a red box. Panel A
142
depicts the signal intensities as captured by pathogen peptides on the entire PPP
microarray printed on Aminosilane slides. Panel B depicts the signal intensities as
captured by pathogen peptides on the entire PPP microarray printed on NSB-9 and NSB-
27 slides. Blue bars represent one VF infected individual’s serum sample processed on
Aminosilane or NSB-9 slide at 23°C. The red bars in Panel A represent this same VF
infected individual’s serum sample binding PPP peptides at 37°C on Aminosilane slide
surface. The red bars in Panel B represent this VF patient’s serum binding PPP array
printed on NSB-27 slides.
Discussion
We have demonstrated that biochemical parameters associated with peptides
spotted onto a glass microarray can be optimized to reduce the cross-reactivity observed
in a multiplexed microarray. A peptide array representing epitope peptides from 14
priority pathogens was created and examined for accuracy of simultaneously
distinguishing multiple exposures. Three bioinformatic peptide selection strategies were
explored but empirical evidence from other research groups [3,6,36] suggested it was
ambiguous whether using bioinformatic selection would be beneficial only when testing
single pathogen and not as useful when simultaneously detecting multiple pathogen
exposures. The hypothesis tested in this work was whether antigens previously shown to
be immunoreactive would be sufficient to identify the infection among the pathogens
represented on the peptide array. To this effect we represented complete proteomes for
smaller viruses and partial proteomes for larger pathogens. The proteins tiled as peptides

143
for larger pathogens were immunodominant antigens from protein microarray
experiments and those listed as B-cell epitopes in IEDB. We used well -characterized
monoclonal antibodies and ELISA or immunodiffusion characterized infectious sera to
assess cross-reactivity on our multiplexed platform.
Likely parameters that should affect antibody binding such as temperature,
peptide spacing, and duration of incubation, were tested and optimized. The selected
parameters (23°C, 16 hour incubation, NSB-9 slide surface) were empirically determined
based on improvement in the accuracy of simultaneous detection. Additionally, eight
statistical analyses were tested for their ability to distinguish infections. The three most
predictive analytical methods were average signal from groups of pathogen peptides, p-
value across pathogens (groups of peptide) and Pearson’s Correlation score (within and
across pathogen peptide groups). Four out of the six inefections/exposures tested
resolved on one of these three statistical metrics with >90% ROC-AUC. While no
statistical method worked best for all infections, these four could be detected with greater
than 80% ROC-AUC on the Pearson’s Correlation score metric. Different infections
resolved to a varying extent using the eight metrics tested. VF, Fransicella (LVS) and
ASFV resolved on the Mean signal pathogen scoring scale while WNV and Vaccinia
resolved best on the P-value scale. Malaria did not resolve well on any of the eight
metrics tested.
Temperature, longer patient serum incubation times and concentration of antigen
presented on the surface had a significant impact on the information content obtained
from the assay. Prior work on antigen-antibody interactions using surface plasmon

144
resonance (SPR) demonstrates a reduction in the association and dissociation rate
constants during antibody affinity maturation [127]. A longer incubation time should
allow the binding to overcome mass transport limitations and approach equilibrium so
that the binding observed better correlates with affinity [128]. The immune response to
an infection/exposure has an initial natural antibody component and a latter adaptive
(specific to the infection) component [129]. These natural antibodies are poly-reactive
and often not high-affinity unlike those generated later in the infection post affinity
maturation [103]. Longer incubations result in dissociation from non-cognate peptides
and support association of slow on-rate or mass-action limited high affinity antibodies
with cognate peptides.
The statistical method by which different infections were detected may rely on the
extent of peptide diversity required to accurately capture a given infection in the presence
of other pathogen peptides. The P-value scale tends to resolve infections such as WNV,
whose complete proteome is represented on the array in the form of 17-mer peptides.
The probability of detecting the infection (e.g. WNV) improves with comprehensively
mapping the entire proteome. Exposures such as Vaccinia vaccination resolved on the P-
value scale suggesting that perhaps a minimum amount of proteome coverage is required
(14.3% of Vaccinia proteome represented) for accurate detection. Fransicella tularensis
(LVS) vaccine (2.8% of proteome represented), VF (0.03%) and Malaria (0.31%) did not
resolve on the P-value scale. Additional testing using patient samples for pathogen
proteomes completely represented on the array would be required to verify this trend.
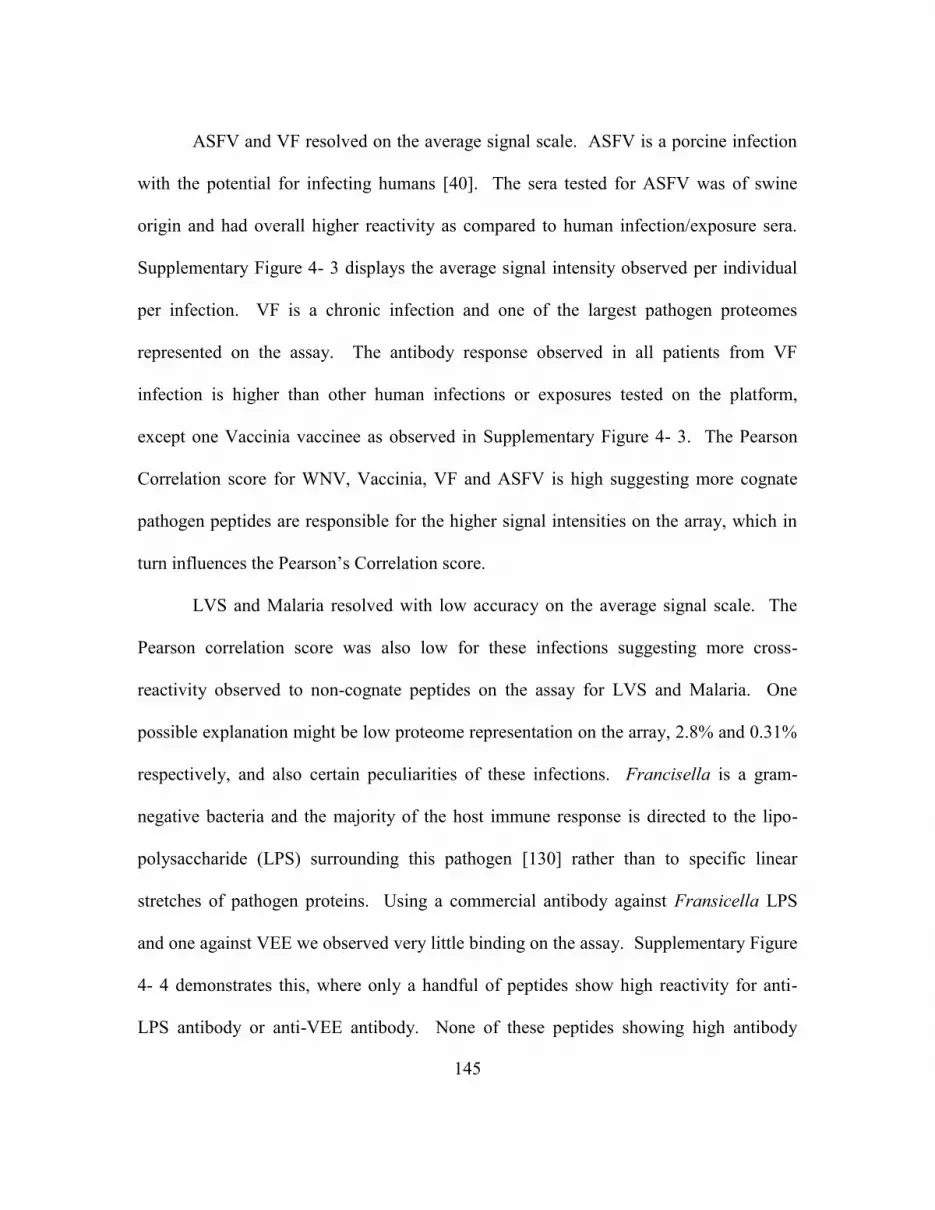
145
ASFV and VF resolved on the average signal scale. ASFV is a porcine infection
with the potential for infecting humans [40]. The sera tested for ASFV was of swine
origin and had overall higher reactivity as compared to human infection/exposure sera.
Supplementary Figure 4- 3 displays the average signal intensity observed per individual
per infection. VF is a chronic infection and one of the largest pathogen proteomes
represented on the assay. The antibody response observed in all patients from VF
infection is higher than other human infections or exposures tested on the platform,
except one Vaccinia vaccinee as observed in Supplementary Figure 4- 3. The Pearson
Correlation score for WNV, Vaccinia, VF and ASFV is high suggesting more cognate
pathogen peptides are responsible for the higher signal intensities on the array, which in
turn influences the Pearson’s Correlation score.
LVS and Malaria resolved with low accuracy on the average signal scale. The
Pearson correlation score was also low for these infections suggesting more cross-
reactivity observed to non-cognate peptides on the assay for LVS and Malaria. One
possible explanation might be low proteome representation on the array, 2.8% and 0.31%
respectively, and also certain peculiarities of these infections. Francisella is a gram-
negative bacteria and the majority of the host immune response is directed to the lipo-
polysaccharide (LPS) surrounding this pathogen [130] rather than to specific linear
stretches of pathogen proteins. Using a commercial antibody against Fransicella LPS
and one against VEE we observed very little binding on the assay. Supplementary Figure
4- 4 demonstrates this, where only a handful of peptides show high reactivity for anti-
LPS antibody or anti-VEE antibody. None of these peptides showing high antibody

146
binding are cognate peptides belonging to FTT or VEE peptide groups. Peptides
belonging to the pathogen being compared are highlighted with arrows on the histogram
and are marked in red. Additionally, histograms of polyclonal sera generated by
immunizing naïve special pathogen free mice with peptides are also depicted (FT03,
Rco1, Rco2, Rco3 and Rco4). Three out of five polyclonal sera recognized the cognate
peptides used for immunization accurately with high signal intensity. Two of these
immunized peptides were not recognized but other peptides representing partial
mimotopes (Supplementary Table 4-1) had higher signal intensities on the array than the
cognate peptides demonstrating the possibility of generating cross-reactive antibodies
even on immunizing with a 20-amino acid peptide.
Plasmodium infected erythrocytes produce surface antigens to which IgG
response is observed in infected individuals [131]. Additionally, pathogen specific
antibody (IgG and IgM) may remain bound to circulating antigens [132-135] and the
sample used to assess this reactivity on our assay is serum without the infected RBC’s.
No additional pre-treatment to dissociate circulating immune-complexes from sera were
applied in our protocol. It is likely that for infections like malaria, that produce
circulating immune complexes, pre-treatment of plasma from blood collected in anti-
coagulant tubes and treated with heat to dissociate circulating antigen and RBC bound
antibodies might be necessary before separating the plasma for detecting anti-
Plasmodium antibodies [136]. From these data, to best ensure capturing cognate
pathogen reactivity it would be optimal, to represent the complete pathogen proteome in
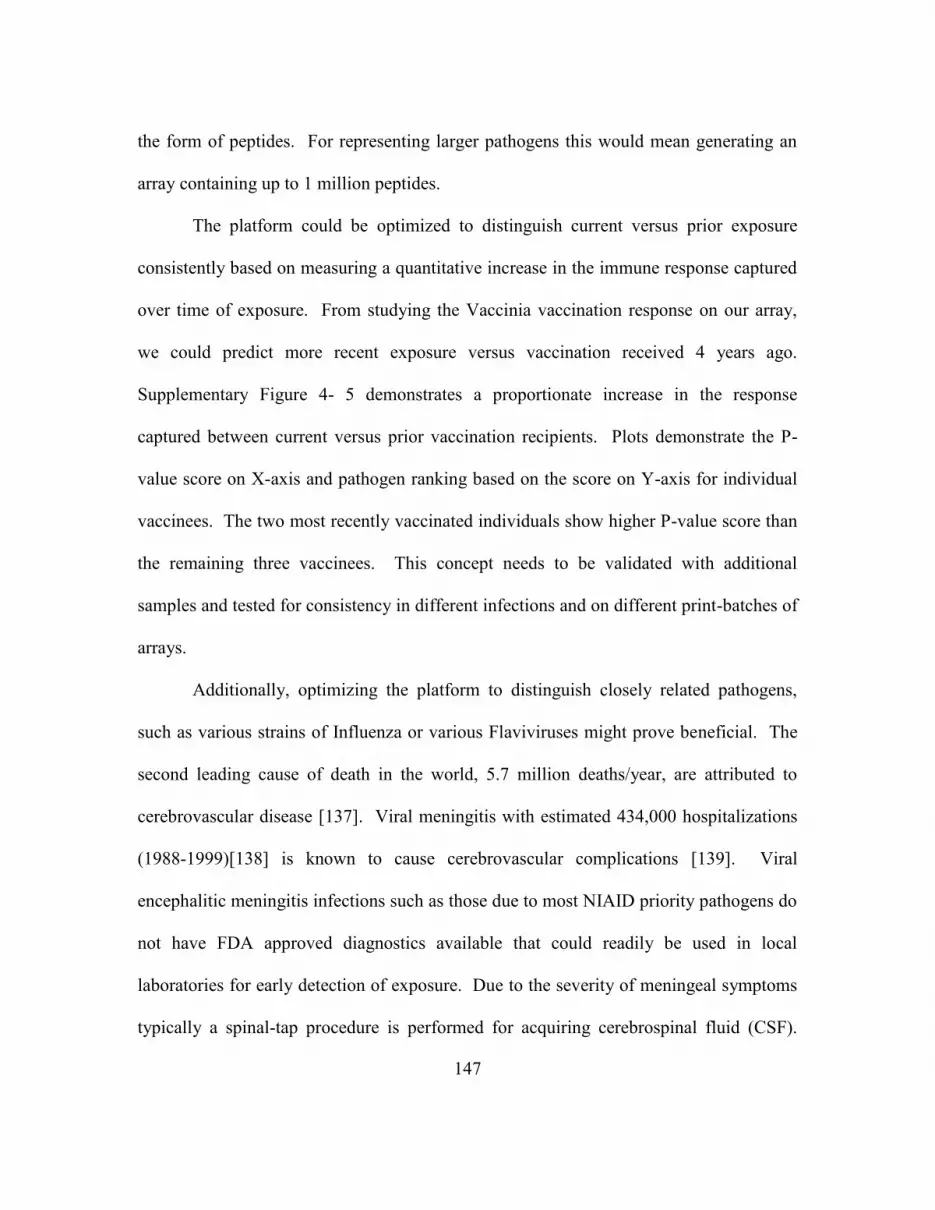
147
the form of peptides. For representing larger pathogens this would mean generating an
array containing up to 1 million peptides.
The platform could be optimized to distinguish current versus prior exposure
consistently based on measuring a quantitative increase in the immune response captured
over time of exposure. From studying the Vaccinia vaccination response on our array,
we could predict more recent exposure versus vaccination received 4 years ago.
Supplementary Figure 4- 5 demonstrates a proportionate increase in the response
captured between current versus prior vaccination recipients. Plots demonstrate the P-
value score on X-axis and pathogen ranking based on the score on Y-axis for individual
vaccinees. The two most recently vaccinated individuals show higher P-value score than
the remaining three vaccinees. This concept needs to be validated with additional
samples and tested for consistency in different infections and on different print-batches of
arrays.
Additionally, optimizing the platform to distinguish closely related pathogens,
such as various strains of Influenza or various Flaviviruses might prove beneficial. The
second leading cause of death in the world, 5.7 million deaths/year, are attributed to
cerebrovascular disease [137]. Viral meningitis with estimated 434,000 hospitalizations
(1988-1999)[138] is known to cause cerebrovascular complications [139]. Viral
encephalitic meningitis infections such as those due to most NIAID priority pathogens do
not have FDA approved diagnostics available that could readily be used in local
laboratories for early detection of exposure. Due to the severity of meningeal symptoms
typically a spinal-tap procedure is performed for acquiring cerebrospinal fluid (CSF).

148
This CSF is then used for PCR-based direct detection of the pathogen. To avoid these
invasive procedures we recommend utilizing a pathogen proteome based peptide
microarray, which would yield the infecting pathogen using as little as 1 µl of blood [66].
Given that most encephalitis viral proteomes are small (2-12 proteins in proteome), it
would be possible to represent all known encephalitis viruses on a higher density peptide
array.
Cross-reactivity on peptide microarray platforms such as the one presented is
predominantly linear under the conditions optimized and easy to re-attribute to the
original antigen. Natural pathogen proteome specific peptide space is fairly conserved
and redundant [140]. The cross-reactivity observed from monoclonal antibody binding
can be re-attributed to either the partial epitope or a linear mimotope similar to the
cognate epitope. Similar analysis can be attempted on polyclonal patient sera to de-
convolute and re-attribute cross-reactivity to the cognate antigen responsible for
infection/exposure. Although epitope-based peptide microarrays are of great utility, they
also require physical optimization and rigorous bioinformatic analysis to reattribute
cross-reactivity. Based on the decreased monoclonal cross-reactivity when the epitope
peptide is present on the array, we would expect including proteomes for commonly
exposed pathogens might absorb antibodies from prior exposures to them and thus reduce
non-cognate binding. Given that complete medical histories and prior exposures for the
patients tested are generally unknown, adding more pathogens might help
comprehensively map the antibody response for individuals.

149
Grant Acknowledgements
This work was supported by the Chemical Biological Technologies Directorate contract
HDTRA-11-1-0010 from the Department of Defense Chemical and Biological Defense
program through the Defense Threat Reduction Agency (DTRA) to SAJ.
Acknowledgements
The authors wish to thank Kevin Brown for writing programs to query the IEDB
algorithms for B-cell epitope prediction. We are grateful to Lawrence Livermore National
Laboratory for providing us with infected patient sera for West Nile virus and Malaria
originally acquired from SeraCare.

150
Supplementary Figures and Tables:
Supplementary Figure 4- 1 Histograms displaying array data for 6 monoclonal
antibodies on NSB-9 slides
The X-axis demonstrates the signal intensity obtained from the assay and Y-axis
represents the number of peptides displaying a given signal intensity. Every plot
represents one monoclonal antibody’s reactivity as observed on the pathogen array.

151
Supplementary Figure 4- 2 Change in signal distribution and cognate versus non-
cognate reactivity of p53Ab1 monoclonal incubated on NSB-9 slides for 1, 16, 24 and 36
hours respectively.
The X-axis demonstrates the signal intensity obtained from the assay and Y-axis
represents the number of peptides displaying a given signal intensity. Every plot displays
the reactivity of p53Ab1 monoclonal antibody on the array under incremental times of
incubation. The signal intensity of its cognate epitope is depicted on the histogram using
an arrow to demarcate its position within the histogram of peptide signal intensities.

152
Supplementary Figure 4- 3 Average signal intensity observed for various infections on
NSB-9 slides at 16 hour incubation, 23°C and serum dilution of 1:500

153
The X-axis represents number of patients tested per infection group and Y-axis displays
average signal intensities. The Y-axis for ASFV control (un-infected) and infected groups
is different as compared to that for human infections merely to display all data.
Supplementary Figure 4- 4 Structural (anti-LPS, anti-VEE) and polyclonal antibodies
(FT03, Rco1, Rco2, Rco3, Rco4) on array.
The X-axis represents signal intensities observed on array, Y-axis represents the number
of peptides displaying a given signal intensity. The position of cognate epitopes is
highlighted in red on the histogram.

154
Supplementary Figure 4- 5 Capturing the memory immune response from exposure and
distinguishing time of exposure – Vaccinia vaccination
The X-axis depicts the p-value score for the cognate group of pathogen peptides (VACWR
- Vaccinia) versus all other groups of pathogen peptides on the array. The Y-axis
displays the ranks of pathogen groups basis p-values from top to bottom. The graph is
colored on an arbitrary scale correlating to the range of p-values. The P-value score is
calculated basis how significantly a group of pathogen peptides contributes to signal
intensities observed on the array.

155
Supplementary Table 4- 1 Guitope match data (score cut=3)
KANWFDFKTFNQMTQVWGSC
FT03
***** FORWARD PEPTIDES *****
SEQ
SC
OR
E
ALIGN
LENGT
H
PRO
POS
PEP
POS
PRO
WIND
OW
PEP
WIND
OW UniqueID
CRHNIEASQLA
EVRSYCYHA
5.5
21 10 11 8
nQmtq
VwgsC
sQlaeV
rsyC
JEV[E](341-
357)
CSGEQKLISEE
DLEQKLISE
4.3
6 2 19 1 sc cs
anti-cMyc
(9E10)
MMIFRNDFEW
LKIHKTRGSC
6.1
76 8 13 13
mtqvw
GSC
ihktrGS
C
FT04-
Control
CRHDTLKNLQ
QDLHQYFKGK
4.4
89 6 7 6 fKtfnQ lKnlqQ
PVX_09768
0(1000-
1016)
CRHMSQAIAA
VSQDRCKNIT
3.9
29 4 12 3 qMtQ hMsQ
FTT0083(10
3-119)
CRHKAEECTC
NNGSCSLKTS
6.1
19 3 18 13 GSC GSC
ASFV132(4
5-61)
TIPAHNIFWILYFSIGTGSC
Rco3
***** FORWARD PEPTIDES *****
SEQ
SC
OR
E
ALIGN
LENGT
H
PRO
POS
PEP
POS
PRO
WIND
OW
PEP
WIND
OW UniqueID
CRHILLASKHD
LMKQKCLKG
4.3
14 5 10 4 ILyfS ILlaS
Lassa-
Lprot(352-
368)
CSGKWDEPGN
NVYGCIKQMY
4.3
6 2 19 1 sc cs
CF-
VF_02795-
(97-113)
CRHPTHRHLK
GEACPLPHKL
3.4
54 3 3 4 PaH PtH
Machupo-
Gly(456-
472)
CRHWKAVEKS
VAMKHLTSFK
4.7
54 4 11 16 Lyfs Ltsf
JEV[C](69-
85)
CRHIPHTIAGP
KSKHNRREG
3.7
3 2 5 15 HN HN
JEV[NS1](1
037-1053)
CRHGRGEQQI
NHHWHKSGSS
4.0
01 3 5 9 hni qin
WNV-I-NY-
99[E](677-
693);WNV-

156
II-
956[E](673-
689)
CRHKKADITSK
VNHVKEKTS
3.9
73 3 5 13 hni nhv
PVX_09770
0(783-799)
CRHGHPVSRG
TAKLRWLVER
4.6
01 4 14 8 SiGT SrGT
WNV-I-NY-
99[NS5](258
0-
2596);WNV-
II-
956[NS5](25
77-2593)
CRHLLWGGFP
WVSLGYSQTE
5.4
42 5 12 11 yfSiG wvSlG
FTT0614(13
7-153)
CRHALTFKAC
DHIMKSGDLK
4.0
62 5 15 13 Igtgs Imksg
VACWR148
(222-238)
CRHVRHTHSK
HKYHCICPMK
3.1
07 3 17 7 TgS ThS
EEE[GP2](6
9-85)
CRHYSSTWHQ
DANHPYRTWN
5.4
55 3 4 12 Ahn Anh
WNV-II-
956[NS5](28
15-2831)
CRHPHFVQHS
YTVQCKCRST
3.3
82 4 17 12 TgsC TvqC
PVX_00099
5(341-357)
CSGYGGFLYG
GFLYGGFLAA
4.3
6 2 19 1 sc cs
anti-Leu-
Enkaphalin
clone
1193/220
CRHERSHPEIW
HHLSTLIKQ
5.4
5 6 9 10 wilyfS iwhhlS
Machupo-
Lprot(422-
438)
CRHMDEYVQE
LKGLIRKHIP
3.6
36 7 10 14 ilyfsIg lirkhIp
Machupo-
Lprot(1-17)
CSGYGGFYGG
FYGGFYGGFA
4.3
6 2 19 1 sc cs Peptide 9449
CRHVERCYLQ
ALSVCNKVKG
3.6
22 2 11 8 ly yl
Junin-
Lprot(322-
338)
CRHIHAMTPER
VQRLKASRP
3.5
82 2 4 5 ah ha
VEE[GP2](1
599-1615)
CRHTQEKFEM
GWKAWGKSIL
4.3
48 4 13 8 FsiG FemG
JEV[NS1](9
01-917)
EFWDKEWHTR
ADWPVWDGS
6.1
19 3 18 18 GSC GSC
Rco2-
Control

157
C
CRHGVMVEGV
FHTLWHTTKG
3.3
92 4 5 12 Hnif Htlw
WNV-I-NY-
99[NS3](154
4-
1560);WNV-
II-
956[NS3](15
40-1556)
CRHSESHSPQE
VCEKYCSWG
4.9
75 5 12 16 YfSiG YcSwG
ASFV006(1
27-143)
CRHPSESDLEY
SWLNLAAHH
5.0
76 4 2 16 ipAH laAH
Lassa-
Lprot(1538-
1554)
CRHILGFYHLK
HKPPKKKCK
4.7
48 4 12 7 yfsi fyhl
ASFV194(1
9-35)
CRHYGRCTRT
RHSKRSRRSV
3.6
98 3 18 5 GsC GrC
JEV[preM(2
19);M(220)](
205-221)
CRHVAKAEEA
KKEADNAKVA
3.1
48 3 4 14 AhN AdN
PVX_09768
0(647-663)
CRHSLMHWDL
ETQAPKNSIN
6.5
08 6 1 12 TipahN
Tqapk
N
FTT1775(47
7-493)
CRHKGCTLKIE
GEYAYGWLR
3.6
48 2 9 18 Wi Wl
FTT0191(13
7-153)
CRHTALHFLN
AMSKVRKDIQ
3.2
06 3 11 6 LyF LhF
JEV[RNAPo
l](3208-
3224)
CRHCHQGINN
KLTAHEVKLQ
5.2
43 6 2 12 ipAHni ltAHev
Lassa-
Lprot(221-
237)
CRHEIDRIYKTI
KQYHESRK
3.9
97 5 11 8 lYfsI iYktI
VACWR130
(222-238)
Table displaying alignment matches of high signal intensity peptides with immunized
cognate peptides (FT03, Rco3) using alignment program GuiTope [34]. Setting a low
cut-off score = 3, so as to capture discontinuous and short epitope matches.

158
CHAPTER 5
DE-CONVOLUTING ANTIBODY CROSS-REACTIVITY OBSERVED ON A
PATHOGEN PROTEOME PEPTIDE MICROARRAY
Abstract
Multiplexed proteomic microarray platforms have been unsuccessful at
distinguishing infections apart due to antigen-antibody cross-reactivity on the assay.
Given the specificity of antigen antibody interactions and diagnostic success of single
pathogen based ELISA assays, using epitope peptide microarrays might appear to be a
logical transition. Previous studies have failed to address cross-reactivity observed on
multiplexed pathogen proteome based microarrays. We developed a multiplexed,
pathogen proteome peptide (PPP) microarray designed to distinguish four priority
pathogens apart. Despite optimizing microarray processing conditions on the PPP array to
reduce cross-reactivity, we observed non-obvious antibody binding between unrelated
pathogen peptides. We investigated the underlying factors that impact specificity and
report several biochemical and computational aspects that affect and, if resolved, could
enhance the accuracy of multiplexed epitope microarrays. A confounding aspect in
mapping infection is observing cross-reactivity on the array from identical 5-7 amino acid
long sequences in common between unrelated pathogen peptides. Secondly, the presence
of common pathogen epitopes, such as Influenza virus, reduces the specificity of the
remaining non-influenza pathogen peptides on a multiplexed assay. The primary goal of
this work is to assess the limitations of the PPP array while simultaneously distinguishing

159
priority pathogen and common pathogen exposures. Third, to circumvent cross-reactivity
we developed an alternative data analysis strategy which uses a pattern of common short-
sequence motifs in the cross-reactive response to accurately detect an infection. We
utilized peptide sequence identity on a 2-mer to 7-mer repetitive epitope level to analyze
data and discern groups of peptide n-mer motifs that we refer to as an ‘umbrella of
antibody reactivity’. We classified the original infection/exposure by reading a pattern of
antibody reactivity after averaging the signal intensity for these individual n-mer
umbrellas. In doing so, we attempt to mathematically re-appropriate antibody cross-
reactivity observed on the platform to the actual pathogen causing the infection. This
approach could be applied to historical peptide microarray data, likely considered
unusable due to cross-reactivity, thus rescuing a number of important research projects.
Abbreviations
ASFV, African Swine Fever Virus; BLAST, Basic local alignment search tool; CMG,
Comparative microbial genomics; FIU, Fluorescence intensity units; HIV, Human
Immunodeficiency Virus; HCV, Hepatitis C Virus; JEV, Japanese Encephalitis Virus;
NIAID, National Institute of Allergy and Infectious Diseases; PPP, Pathogen proteome
peptide; WNV, West Nile Virus.
Keywords
Multiplexed, peptide microarray, multi-pathogen, specificity, peptide cross-reactivity,
epitope, diagnostic assay, immunosignature, antibody.

160
Introduction
Pathogen protein sequences are extremely conserved. While it may not be
immediately apparent on the protein level, it definitely is on an n-mer (short-peptide)
level [140]. A B-cell antibody epitope ranges from 4-12 amino acids in length [88].
Mapping this level of n-mer commonality is crucial to understand cross-reactive
observations when developing immunoassays. Previous work done by our group [141]
explored the feasibility of using a life space peptide array representing epitopes for 14
NIAID category A, B, C priority pathogens to distinguish those infections on a single
multiplexed platform. From six infectious sera tested on that platform, four infections
were distinguished with >90% AUC-ROC (area under a receiver-operator characteristics
curve) simultaneously. These four groups of infectious sera were from exposures to,
Coccidioides spps. (Valley Fever), African Swine Fever Virus (ASFV), West Nile Virus
(WNV) and Vaccinia, the smallpox vaccine. The platform failed to correctly distinguish
Malaria and Francisella tularensis LVS-live vaccine strain sera. In this paper, we
examine the effect of a change in chemical diversity of the platform on the interaction
and local competition between antibodies and peptides on the microarray. This work
addresses the peptide-antibody cross-reactivity observed on a multiplexed assay using
bioinformatic solutions to eliminate confounding effects of cross reactivity on pathogen
identification.
The humoral antibody response to an infection consists of multiple components
including but not limited to natural antibodies, highly neutralizing antibodies specific to
the infection or exposure, poly-reactive antibodies and cross-reactive antibodies [129].

161
The persistent presence of cross-reactive antibodies has been documented through
numerous studies in infections such as Influenza, Dengue, HIV, HCV and Malaria [142].
The advent of advanced indirect (antibody based) pathogen surveillance assays, has
resulted in discovering pre-existing reactivity to Influenza virus strains such as the swine-
origin H1N1 [143] and Japanese encephalitis virus (JEV) [144] in previously unexposed
populations. Cross-reactivity is an inherent feature of all antigen-antibody reactions
partly due to plausible conformational and structural reasons highlighted in literature
[101]. In some instances cross-reactivity is beneficial, due to offering cross-protection for
example, neutralization of the pandemic swine (2009 H1N1) and avian (1997, H5N1)
origin influenza viruses due to a memory response from seasonal influenza vaccine
strains [145-147]. When developing a single pathogen based diagnostic serological assay,
explaining cross-reactivity captured on the assay from other unrelated pathogens is
difficult. Ulrich et al [92] encountered this problem while developing a Yersinia pestis
(gram-negative) specific proteome protein microarray. They observed cross-reactivity on
Y.pestis proteins from rabbit sera experimentally infected with seven other genetically un-
related gram-negative bacteria and Bacillus anthracis a gram-positive. They used the
signature pattern of cross-reactivity from other infections observed on their Y. pestis
protein microarray to distinguish the cross-reactive pattern per pathogen.
Cross-reactions are observed on serology based assays within genetically related
strains of a given virus, for example, within Dengue strains 1, 2, 3 and 4 and also within
viruses belonging to the same family, Flaviviridae- between Dengue and JEV [148,149].
Cross-reactivity has been documented on multiplexed diagnostic assays such as the

162
ToRCH assay that simultaneously measures antibodies from five vertically transmitted
pathogens. The assay sensitivity when measuring antibodies against genetically distinct
Toxoplasma gondii and Rubella versus Herpesviruses: Cytomegalovirus (CMV), Herpes
Simplex virus 1 (HSV-1) and HSV-2 using ToRCH is variable per infection ranging from
46-97% and specificity between 88-100% [37]. Cross-reactivity in antigen-antibody
diagnostics could be explained as being observed due to short n-mer identity on a 5-mer
to 11-mer amino acid level between unrelated pathogen proteomes. Based on this
rationale, Kanduc and Kobinger et al. map the redundancy between pathogens and the
human (host) proteome, for developing better pathogen targeted vaccines that could
potentially generate lesser self-reactive antibodies [140,150,151].
In this study, we tested how incrementally adding common exposure pathogen
peptides on the PPP array affected its ability to discern priority infection antibody
response. The original platform contained 12 pathogen epitopes (PPP-12) from either
immunodominant antigens for larger pathogens or complete proteomes for smaller
viruses. To test the effect of change in chemical diversity, we made two incremental sets
of arrays, one in which we added ASFV and Vaccinia peptides (PPP-14) and another in
which we added Influenza peptides (PPP-15). ASFV and Vaccinia viruses are both
double stranded DNA viruses closely related to Herpes viruses. These pathogen peptide
groups were added due to recent availability of sera and to measure the effect of adding
peptides that are potentially capable of capturing Herpes virus cross-reactivity. The
addition of ASFV and Vaccinia peptides did not have a detrimental effect on the PPP
array’s ability to distinguish multiple infections. By adding influenza peptides, we

163
evaluate the effect of including a common exposure yet priority pathogen on the array.
Due to the frequency of human exposures to various influenza strains [152], we expected
to observe a distinct separation of memory influenza specific antibody response and
priority pathogen reactivity, leading to more specific priority pathogen detection. The
addition of influenza peptides on the array however, reduced the assay’s ability to
distinguish priority pathogen infections. The most parsimonious explanation for this
observation might be that the influenza peptides likely competed for antibody reactivity
to other priority pathogen peptides. This competition reduced the pathogen specific
response apparent on arrays without influenza peptides. This observed cross-reactivity to
influenza peptides from all infectious sera led us to developing an improved
bioinformatics approach to mathematically reattribute cross-reactivity. While doing so we
used the cross-reactivity observed due to the addition of influenza peptides on the
multiplexed assay to distinguish priority pathogen infections apart.
Methods
Serum samples and monoclonal antibodies used in this study
Human patient serum samples from Influenza and Vaccinia vaccine recipients and
healthy non-disease individuals were collected under the ASU IRB 0905004024, “Blood
Collection for Immunological Studies”. Fransicella tularensis subsp. holarctica live
vaccine strain (LVS) vaccinated individuals’ sera was received from Dr. Anders
Sjöstedt’s laboratory at Umeå University, Sweden. They are part of a time course study;
samples used were 28-30 days post-receiving the LVS vaccine. Valley fever infected

164
patient sera was received from Dr. John Galgiani at the University of Arizona (IRB#
FWA00004218). Plasmodium vivax and West Nile virus infected sera was obtained from
SeraCare Life Sciences (Milford, MA). All monoclonal antibodies used in this
publication are listed in Supplementary Table 5- 1.
Microarray production and processing
Pathogen proteome peptide microarrays were produced as described in Chapter 4.
Briefly, peptides were obtained from Sigma Genosys (St.Louis, MO) and printed on
NSB-9 aminosilane slides from NSB Postech (Los Alamitos, CA). All slide surfaces were
coated with sulfo-SMCC linker (Pierce, Rockford, IL) and peptides were conjugated to
the surface using maleimide conjugation chemistry. Each peptide was printed twice on a
two-up array by Applied Microarrays Inc. (Tempe, AZ) using piezo electric printing.
The following pathogen peptides were represented on the PPP array:
a.) PPP-12: Array representing 12 pathogens (3546 peptides) - Francisella tularesis
[Tularemia-LVS], Coccicioides immitis [Valley fever], West nile virus (WNV)
[strain: I & II], Japanese encephalitis virus (JEV), Plasmodium vivax [Malaria],
Venezualan Equine Encephalitis, Eastern Equine Encephalitis, Bacillus anthracis,
Machupo virus, Junin virus, Guanarito virus, Lassa virus and monoclonal
antibody epitope peptide controls.
b.) PPP-14: Array representing 14 pathogens (4337 peptides) - PPP(12) peptides +
African swine fever virus [ASFV] and Vaccinia [strain: Western Reserve]
peptides.

165
c.) PPP-15: Array representing 15 pathogens (4693 peptides) - PPP(14) + 283
Influenza PR8 (H1N1) peptides
Microarray slides were pre-washed with a solution containing 7.33% acetonitrile,
33% isopropanol and 0.55% TFA to remove unbound peptides. Slides were blocked in
1X PBS, 3% BSA, 0.05% Tween 20, 0.014% β-mercaptohexanol for 1hr at 25oC. Sera
samples were diluted 1:500 in the Incubation buffer containing 3% BSA, 1X PBS, 0.05%
Tween 20, and allowed to bind to the microarray for 16 hours at 23°C in 100 µl total
volume per pathogen peptide array. The optimum thermodynamic parameters chosen for
processing these pathogen arrays were based on empirical data from our previous work
[141]. A Tecan 4800 Pro Hybridization Station (Tecan, Salzburg, Austria) was used for
array incubation and primary sera was detected using Alexa Fluor-647 conjugated Goat
anti-Human, IgG Fc (γ) fragment specific secondary antibody from Jackson
ImmunoResearch (West Grove, PA).
The slides were scanned using Agilent C scanner (Santa Clara, CA) at 635 nm
excitation wavelength with 100% PMT and laser power at 10 µm image resolution. The
16-bit TIFF images were aligned using GenePix 6.0 software (Axon Instruments, Union
City, CA) and the data files imported into GeneSpring 7.3.1 (Agilent, Santa Clara, CA)
and Matlab (Natick, MA) for further analysis. Every patient’s serum sample was
processed in duplicate and since every peptide was printed twice within a sub-array, it
gave 4 measurements from the same peptide upon combining both technical replicates.
Any array with a Pearson Correlation Coefficient less than 0.85 across technical

166
replicates was re-processed. Upon meeting the quality criteria, all technical replicates for
a given individual patient were averaged for further data analysis.
Statistical analysis and software used
The arrays were initially analyzed using Matlab (Natick, MA) code written from
our previous work [141]. Short sub-sequence n-mer analysis was performed using a
regular expression search program published in Richer et al. [153]. The algorithm was
designed to find short identical sub-sequences in common within the peptides represented
on a microarray. From a peptide sequence library, the algorithm divides all peptides into
all possible subsequences within user input length ranges, 2-19 amino acids for a 20-mer
peptide length array. The signal intensity associated with each one of these peptide sub-
sequences is extracted from the original peptide sequence they belong to and averaged
together per sub-sequence, provided there are at least 2 replicates per sub-sequence full-
filling signal intensity criteria. These list of subsequences with signal intensities
associated with them are ranked and sorted based on their signal intensity and
subsequences below user input signal intensity cut-off (<500 FIU-Fluorescence intensity
units) are excluded. This list of significant sub-sequences, are obtained per individual
sample and the number of n-mers in common per infection and per individual are
estimated using a custom python script. The mathematical pattern containing this
information is used to classify the sample into an infectious group using leave one out
cross-validated (LOOCV), Support Vector Machine (SVM) algorithm from the e1071
library in R. The number of n-mer sub-sequences in common between individual serum

167
samples or individual pathogens was calculated using a custom python script. Using these
numbers the Connectograms in Figures 2 and 3 are constructed using Circos online [154].
The pathogen proteome BLAST matrices are generated using CMG-biotools [155].
Influenza PR8 whole virus ELISA protocol
Nunc Maxisorp microtiter ELISA plates were coated by incubating overnight at
4°C with purified UV-inactivated Influenza H1N1 A/PR/8/34 (PR8) virus commercially
available through Advanced Biotechnologies Inc. (Cat. No.: 10-2/3-500, Lot: 8J0006) at
100 ng/well. Additional plates were coated with 5% non-fat milk in TBST (19.98mM
Tris, 136mMNaCl, pH 7.4 with 0.05% Tween 20) as control for background binding and
the same serum samples were processed on them simultaneously. The non-specific
absorbance obtained from these plates was then subtracted from that obtained from PR8
coated plates. As a positive control for secondary binding, 1:500 diluted pooled naïve
mouse (C57BL6J) and uninfected pooled human sera was applied in 2 wells each, per
plate. All control sera and antigens were diluted in the carbonate/bicarbonate buffer
(15mM Na2CO3, 35mM NaHCO3). As a secondary antibody negative control, 3 wells per
plate were coated overnight with the antigen and blocked to be detected directly with the
anti-human secondary antibody and three with the anti-mouse secondary antibody per
plate. These absorbance values were then averaged and subtracted from their respective
human or mouse sera wells as background absorbance due to secondary antibody. All
plates were washed between steps three times each using TBST. The plates were then
blocked with 5% non-fat milk and incubated for 1 hour at 37°C. For the assay, serum

168
samples were serially twofold diluted in PBST and incubated on the plates for 1 hour at
37°C starting at 1:50 dilution up to 1:800. The bound serum antibodies were detected
using the appropriate species specific secondary antibodies diluted 1:1000 in PBST. Anti-
mouse IgG (H+L)-HRP conjugated (Bethyl Laboratories, Montgomery, TX; Cat.
No.:A90-216P) for mouse sera and anti-human IgG (H+L)-HRP conjugated (Vector
laboratories, Burlingham, CA; Cat. No. PI-3000) for human sera, were incubated for 1
hour at 37°C. Bound secondary antibody was detected by adding 100 µL of the substrate
for HRP, ABTS (KPL, Gaithersburg, MD) and incubating for 30 minutes at 37°C. This
colorimetric reaction was stopped using SDS (1%, 50 µL per well) and absorbance’s
were read using the SpectraMax 190 absorbance microplate reader (Molecular Devices,
Sunnyvale, CA) at 405nm.
Results
Redundancy observed within priority pathogen proteomes represented on PPP
array
We first sought to quantitatively measure the degree of sequence redundancy
present in the pathogen proteomes. Figure 5-1 is a BLAST (Basic local alignment search
tool) matrix generated using the CMG-biotools [155] proteome comparison workbench.
The figure represents 289 comparisons (17X17) of pathogen proteomes represented on
the PPP array. Every cell of this BLAST matrix represents a summary of BLAST queries
with a 50% homology restriction applied to between 2 (EEE and VEE proteomes) and
10,454 proteins (Coccidioides immitis proteome) summarizing the results of

169
approximately 543 million BLAST searches between 23,311 total proteins. The epitope
peptides used as positive control on the assay are intentionally included in this analysis to
display no overlap at a stringent restriction of 50% identity in at least 50% alignment
match of the two proteins being compared. As is expected Flaviviruses, WNV strains I
and II and JEV are 76.9% homologous represented by bright green cells in the matrix.
The Arenaviruses (Junin, Machupo, Lassa and Guanarito) are homologous amongst
themselves as are the equine encephalitis viruses (EEE and VEE). The last row of this
matrix depicts homology within the proteome and larger proteome pathogens such as
Bacillus anthracis (Sterne) have up to 258 redundant homologous proteins within their
proteome. In summary, on a proteome level, there is not much apparent homology
between phylogenetically distant priority pathogens, at least under these criteria.

170
Figure 5- 1 BLAST matrix depicting homology between pathogens chosen to be
represented on the pathogen proteome peptide (PPP) microarray.

171
A BLAST hit within this program is considered homologous (green) if at least 50% of the
two protein sequences are aligned and 50% of the amino acids within the alignment are
identical. The last row at the bottom of this matrix depicts homology within a given
pathogen proteome under the strict homology criteria (gray to red scale).
Redundancy observed within priority pathogen peptides represented on PPP array
Homology calculated between full length proteins would be insufficient to explain
the observed cross reactivity between evolutionarily distant priority pathogen proteomes.
Therefore, we explored sequence identity on a finer scale, examining sequence motifs in
the range of common epitope lengths. The numbers of identical 5 to 10-mers in common
between pathogen proteomes represented on the pathogen array and common pathogens
such as Herpes and Influenza were calculated using a Python script from a suite of
programs published in Richer et al. [153]. The overlap between pathogens based on
shared sequence motifs is illustrated as a connectogram in Figure 5- 2.

172

173
Figure 5- 2 Pathogen space is extremely conserved on a 5-mer peptide motif level.
Every pathogen has a unique color and the size of the ribbon is proportional to the level
of overlap between those pathogens on either a 5 amino acid sequence (5-mer) or 10
amino acid sequence (10-mer) levels. The extent of overlap appears to diminish as
epitope length increases with 10-mers having the least overlap suggesting short sequence
motifs might be responsible for driving cross-reactivity. The code for designations on the
circle is given in a table on the left.
Redundancy observed within peptides on the PPP array and pathogen proteomes
Having established that a number of identical short motifs are conserved between
unrelated pathogens, we sought to characterize the motifs present on the PPP array. The
implication from this analysis would be to a priori expect cross-reactivity to non-cognate
pathogen peptides due to identical n-mers in common between the infecting pathogens
proteome and several other pathogen peptides on the array. The peptides were selected
for inclusion on the PPP so as not to represent any duplicate 16 & 17-mers. Any
duplication in sequence between amino acid lengths 5 through 15 was noted so as to map
possible cross-reactive binding between unrelated pathogen peptides. Distribution of
common 5-mers between pathogen proteomes and peptides on the PPP is presented in
Figure 5- 3 as a connectogram. The size of the ribbon between two groups is correlated
to the extent of overlap between those groups. A distinct pattern of common motifs
radiates outward from each pathogen. This analysis indicates that multiple 5-mers are
commonly present between complete pathogen proteomes and unrelated pathogen
peptides on the array. As depicted in Figure 5- 3, it may be possible using this

174
information to predict a priori cross reactivity between Valley Fever (Coccidioides
immitis) infected individual’s serum antibodies to Francisella tularensis and Plasmodium
vivax peptides on the PPP array. Taken together this suggests that the unique pattern of
potentially cross-reactive n-mers may be used to identify the priority pathogen exposure.

175

176
Figure 5- 3 Circular connectogram displaying 5-mer level overlap between peptides
represented on the pathogen array and their respective proteomes
Every pathogen has a unique color and the size of the ribbon is proportional to the level
of overlap between those pathogens peptides and other pathogen proteomes on a 5 amino
acid sequence (5-mer). The code for designations on the circle is given in a table on the
left.
Monoclonal antibody binding on the PPP array
The sequence analysis indicates that common short motifs might be responsible
for antibody cross-reactivity observed on the PPP array. To test this hypothesis, we
tested the binding of individual well characterized monoclonal antibodies on the
platform. These monoclonals bound specifically to their cognate linear epitope peptide
along with other peptides having amino acid sequence similarities as demonstrated in
Figure 5- 4. As listed in the top panel of Figure 5- 4, the p53Ab1 monoclonal antibody
recognizes the linear peptide sequence ‘RHSVV’ with high affinity (estimated kD
<100pM) [2]. Additionally, on the array, it binds other unrelated peptides that either have
the exact 5-mer epitope or have a structural analog of it such as, ‘RHSII’ and ‘RHSVI’ as
listed in table. This group of antibody reactivity could thus be classified as one ‘umbrella
of reactivity’ due to one antibody binding all these related peptides and will be referred to
as such, throughout the Chapter. This result was verified with 4 other monoclonal
antibodies namely, p53Ab8, cMyc, FLAG, V5-tag and support the hypothesis that the
presence of short motifs in unrelated pathogen peptides might drive cross-reactivity.

177

178
Figure 5- 4 Monoclonal antibody binding observed on PPP-14 array (p53Ab1)
The top panel lists the median signal intensity obtained for peptides binding the
monoclonal antibody p53Ab1 alongside their sequence. The alignment of consensus
sequence within these peptides is depicted in the last column. The bottom panel shows the
amino acid structure and properties of a mimotope peptide within Lassa virus that has an
analog of p53Ab1’s original recognition sequence ‘RHSVV’.
Simultaneous detection of priority pathogen and common exposure pathogen
signature
Within a population, individuals are always exposed to common pathogens that
may confound diagnosis of a priority pathogen through manifesting similar symptoms or
increased lethality during co-infection [156]. For this reason, we sought to test the
multiplexed PPP array’s ability to distinguish more than one infection/exposure in the
same individual’s serum sample. The hypothesis was that the array would be capable of
simultaneous detection of common pathogen signature (e.g. Influenza, Herpes) and
priority pathogen signature. To test this concept we added 283 peptides representing
100% of the Influenza-A/PuertoRico/8/1934 (H1N1) proteome. Given the high frequency
of influenza exposures in human populations [157] and maintenance of long term
memory responses to various influenza strains [54], we expected to be able to separate
influenza and priority pathogen reactivity on the array simultaneously. Adding influenza
peptides to the existing 14 pathogen peptides (PPP-14) reduced the specificity of the PPP
array to distinguish between pathogens.

179
Figure 5- 5 P-value score chart for 1 WNV infected individual’s sera on 3 different array
platforms.
The X-axis depicts the P-value score for group of pathogen peptides versus all other
peptides on the array and the Y-axis displays the ranks of these pathogens based on the
P-value score. The group labeled ‘Other’ represents signals from antibody binding to
internal control monoclonal antibody epitopes peptides. The p-value cut-off for PPP-12
is 0.0003 and that for PPP-14 and PPP-15 is 0.0002. The p-values of WNV group of
peptides calculated on all 3 arrays are displayed within the graph.
The addition of influenza peptides altered antibody binding to cognate infection
pathogen peptides for all infections being tested. This can be observed in Figure 5- 5
showing p-value score based pathogen rank plots. The 3 panels of Figure 5- 5 show
change in antibody binding for one WNV virus infected individual on 3 different arrays,
merely representing the trend observed in this dataset for all infectious samples tested.

180
The first panel shows this WNV infected individual’s antibody binding as observed on an
array representing peptides for 12 priority pathogens, not including Influenza, ASFV and
Vaccinia. The p-value score of WNV group of peptides is 3.60 x 10⁻⁸, statistically
significantly higher as compared to the p-value score of the remaining pathogen groups
of peptides. The p-value score of Lassa (0.00014) and JEV (0.00012), other encephalitis
viruses are above the p-value score cut-off = 0.0003 for this platform, displaying cross-
reactivity on the assay. These p-values however are much lower as compared to that of
WNV showing a clear separation of WNV specific antibody reactivity. Panel 2 shows
this same individuals’ antibody binding profile on an array that included ASFV and
Vaccinia, but not influenza peptides. The addition of Vaccinia and ASFV peptides
capable of capturing other poxvirus (such as Herpes) related antibody response, appears
to improve the assay’s capability of detecting the priority pathogen antibody response.
The p-value score of WNV group of peptides is 1.26 x 10⁻¹⁰, and while cross-reactivity to
JEV (9.25 x 10⁻⁵) is retained and above p-value cut-off 0.0002, the p-value of WNV is
significantly lower than that of JEV. Panel 3 displays how the change in antibody binding
on the array after the addition of influenza peptides diminishes the platform’s ability to
distinguish the WNV signature. The p-value score of WNV group of peptides is 0.05,
with Vaccinia (VACWR) group of peptides being ranked highest at p-value 0.0005 below
cut-off 0.0002. Using existing analysis techniques that involved ranking groups of
pathogen peptides through eight statistical metrics did not resolve any of the priority
pathogen signature responses including WNV on arrays containing influenza peptides. A
summary of results from all three versions of arrays is depicted in Table 5- 1 and all the

181
scoring metric transitions between these three array versions are summarized in Table 5-
2. This observation warranted a bioinformatic intervention to re-appropriate cross-
reactivity observed on the assay regardless of change in the platforms’ chemical
diversity.
Table 5- 1 ROC summary displaying accuracy of diagnosing the cognate infection on
three platforms
Infection
(No. of
patients)
PPP (12
pathogens,
no
ASFV,VA
CWR,PR8
)
Mean
Sig.
T-test
p-val.
Signal
*-
log(P-
val)
Signal
to
Noise
Median
Signal
Mean
Ranks
Wilc
oxon
Pearson
Correlation
Valley
fever (6) 0.94 0.24 0.41 0.43 0.77 0.38 0.20 0.80
WNV (5) 0.58 0.95 0.86 0.44 0.63 0.87 0.95 0.69
Malaria (3) 0.52 0.04 0.06 0.20 0.36 0.14 0.17 0.23
LVS-
Francisella
tularensis
(5)
0.37 0.48 0.41 0.15 0.23 0.37 0.47 0.57
Infection
(No. of
patients)
PPP (14
pathogens,
added
ASFV,
VACWR)
Mean
Sig.
T-test
p-val.
Signal
*-
log(P-
val)
Signal
to
Noise
Median
Signal
Mean
Ranks
Wilc
oxon
Pearson
Correlation
Valley
fever (3) 0.91 0.24 0.46 0.38 0.73 0.35 0.17 0.85
ASFV (4) 0.96 0.46 0.89 0.90 0.96 0.73 0.92 0.98

182
WNV (6) 0.68 0.97 0.94 0.34 0.62 0.89 0.96 0.80
Vaccinia
(5) 0.81 0.93 0.95 0.39 0.78 0.73 0.91 0.89
Malaria (3) 0.37 0.35 0.11 0.41 0.08 0.38 0.44 0.54
LVS-
Francisella
tularensis
(5)
0.45 0.33 0.32 0.22 0.27 0.25 0.24 0.40
Infection
(No. of
patients)
PPP (15
pathogens,
added
PR8,
ASFV,
VACWR)
Mean
Sig.
T-test
p-val.
Signal
*-
log(P-
val.)
Signal
to
Noise
Median
Signal
Mean
Ranks
Wilc
oxon
Pearson
Correlation
Valley
fever (3) 0.90 0.19 0.30 0.20 0.18 0.30 0.31 0.92
ASFV (4) 0.99 0.64 0.96 0.69 0.98 0.94 0.84 0.99
WNV (6) 0.57 0.59 0.61 0.47 0.61 0.49 0.38 0.57
Vaccinia
(5) 0.89 0.36 0.56 0.67 0.88 0.63 0.44 0.80
Malaria (3) 0.43 0.18 0.17 0.17 0.39 0.29 0.35 0.38
LVS-
Francisella
tularensis
(3)
0.29 0.58 0.46 0.25 0.19 0.49 0.46 0.54
Influenza(5
) 0.84 0.96 0.97 0.33 0.66 0.96 0.97 0.99
Table 5- 2 Summary of the worst AUC-ROC changes between array iterations, after the
addition of Influenza peptides in PPP (15), PPP (no. of pathogens represented as
peptides on array).
Infection (no. of patients)
PPP
(12)
PPP
(14)
PPP
(15) Statistical metric

183
Valley fever (3) 0.94 0.91 0.90 Mean Signal
WNV (6) 0.95 0.97 0.59 T-test p-value
Vaccinia (5) NA* 0.93 0.36 T-test p-value
Francisella tularensis
(LVS) (6) 0.37 0.45 0.29 Mean Signal
Malaria (3) 0.23 0.54 0.38
Pearson
Correlation
Cross-reactivity observed on pathogen peptide array from evolutionarily related
pathogen exposures
Cross-reactivity is not limited to the inclusion of influenza peptides. Two out of
the five tested Vaccinia vaccinees showed reactivity to both ASFV and Vaccinia
peptides. Given that both these pathogens are double stranded DNA viruses and belong to
evolutionarily related viral families, Asfarviridae and Poxviridae, one might expect
significant commonality in peptide motifs. Cross-reactivity is also observed between
Herpes virus infected individuals (human sera) and ASFV/Vaccinia peptides as
demonstrated in Figure 5-6.
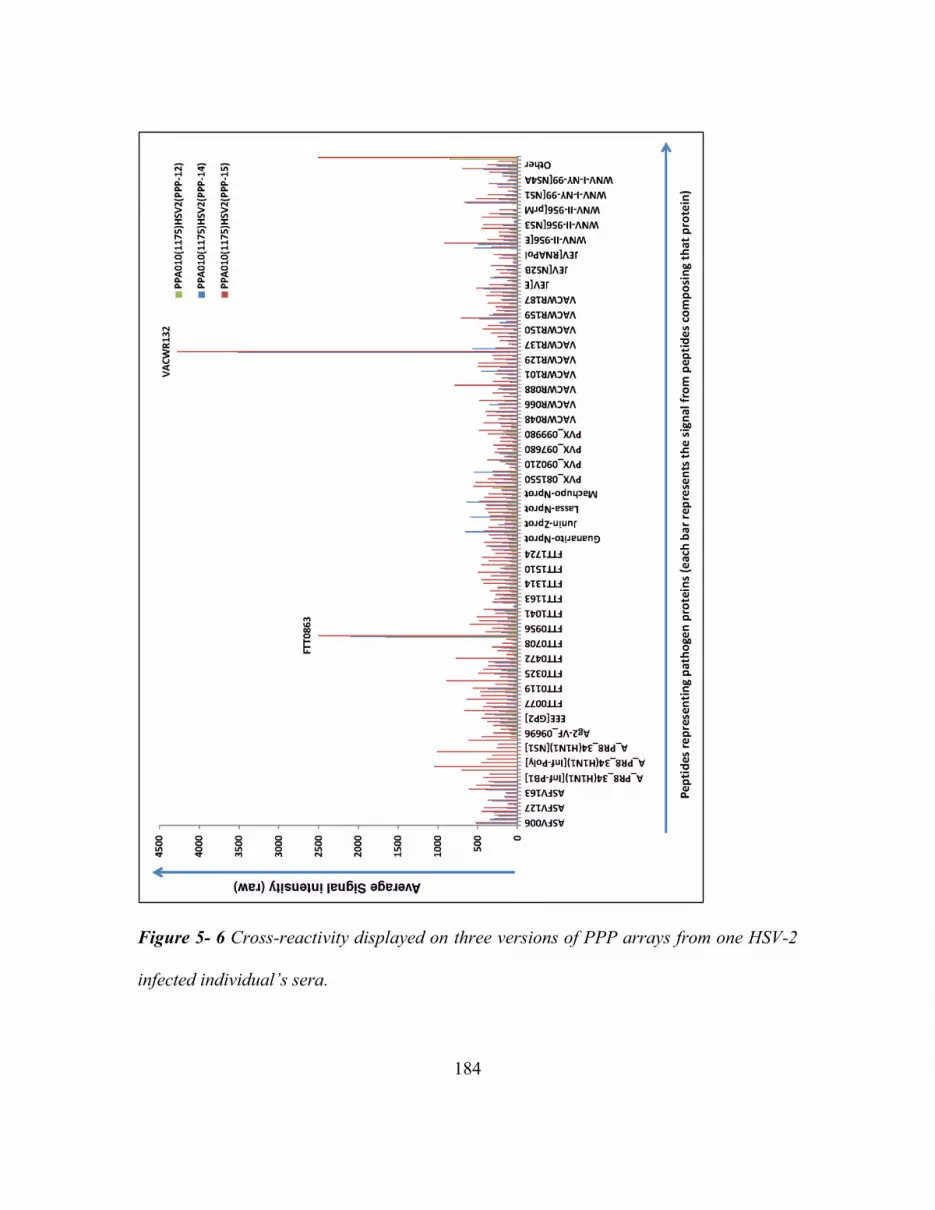
184
Figure 5- 6 Cross-reactivity displayed on three versions of PPP arrays from one HSV-2
infected individual’s sera.

185
The Y-axis shows the scale of non-normalized signal intensity from averaging signal of
peptides per pathogen protein (X-axis). The green bars display signal from peptides
averaged per protein from the 12 pathogen peptide array. Blue bars represent signal
from the 14 pathogen peptide array and Red bars represent signal intensities from the 15
pathogen peptide array containing influenza peptides.
ASFV is a swine infection and has currently not been documented as being
transmitted to humans. Though ASFV-like genetic sequences have been isolated from
febrile patient’s sera in the Middle East and several sewage sources [40]. It is highly
unlikely the sera we tested represents past exposure to ASFV. Therefore the reactivity on
ASFV peptides is almost assuredly due to cross-reactivity. The prior exposure and
vaccination history of both Vaccinia vaccines and herpes virus infected sera is
unavailable. It is therefore, not possible to exclude prior Vaccinia vaccination in Herpes
infected sera or Herpes exposure in Vaccinia vaccines. To test whether antibody cross-
reactivity between related pathogens poses a significant diagnostic problem, we tested
four Herpes virus infected patient sera on the arrays which do not have herpes virus
peptides represented. We observed cross-reactivity to ASFV and Vaccinia peptides
(Figure 5-6) which was expected given that they are both dsDNA viruses like Herpes
[40].
Simulating an artificial infection using multiple monoclonal antibodies
In order to de-convolute cross-reactivity observed from infected sera on PPP-15
arrays containing influenza peptides a mix of monoclonal antibodies was processed on all

186
three versions and array signals obtained. The monoclonal antibody mix experiment was
done to mimic a polyclonal infection specific immune response, except where the linear
epitope peptides expected to capture those antibodies were known a priori. The
experiment included eight pre-characterized linear epitope binding monoclonal antibodies
as listed in Supplementary Table 5- 1. In addition to the eight monoclonals, three
influenza polyclonals against immunodominant antigens hemagglutinin (HA),
neuraminidase (NA) and nucleoprotein (NP) were added in samples denoted as ‘with
Influenza (INF)’ to study the effect of having a memory influenza antibody component
within non-influenza infectious sera. Figure 5- 7 illustrates the median signal intensity
for three peptide groups on three array versions with or without the influenza antibody
component.

187
Figure 5- 7 Median signal intensities on a log10 scale for 8 monoclonal antibody
epitopes (blue bars) versus signals from all other peptides on the array (green bars) and
PR8 influenza peptides (red bars). Error bars represent standard error, P-value cut-off =
0.125.
* Significant between arrays with and without influenza peptides for monoclonal
antibody mix experiment without an influenza antibody component on a one-tailed,
paired t-test (p-value=0.02)
* Significant between arrays with and without influenza peptides for monoclonal
antibody mix experiment with an influenza antibody component on a one-tailed, paired t-
test (p-value=0.02)
The blue bars represent the binding observed on the eight linear monoclonal antibody
epitope peptides. Signals from all the remaining peptides on the array are represented by

188
green bars and influenza PR8 peptides on PPP-15 array containing them are represented
by red bars.
The remaining peptides (non-monoclonal pathogen epitopes) on the array (green
bars) have 19%, 3-mers in common with the immunogens used to generate the 8
monoclonal antibodies. These 3-mers might represent potential antibody contact points
which explains the cross-reactivity observed on some non-monoclonal epitope peptides
on each version of the array (green-bars). This number of n-mers in common between the
remaining peptides and monoclonal antibody immunogens reduces as expected to 1.8%
in common when searching for 4-mers. Despite the addition of influenza polyclonal
antibodies within the monoclonal antibody mix, a clear bifurcation of influenza specific
and monoclonal specific antibody responses can be measured on PPP-15 array. A
surprising observation, during this analysis was the binding observed on influenza
peptides from monoclonal antibodies despite no influenza polyclonals added with the
monoclonal antibody mix (PPP-15, MAbMix_NoINF). This as well could be partially
explained by the number of 3-mers in common between influenza peptides and
monoclonal antibody immunogens (22%). Additionally, the amount of antibody
reactivity captured from monoclonal antibodies on PPP-15 was statistically significantly
lower as compared to that observed on PPP-14. This observable change in median signal
intensities corresponds to a significant change in antibody binding distribution on the
three array versions as observed from the antibody binding histograms of this data in
Figure 5-8. The peptides for each monoclonal antibody are highlighted using arrows

189
demarcating their position within the histograms. This suggests cross-reactivity occurs on
a short n-mer amino acid level to partial epitopes within unrelated peptides.
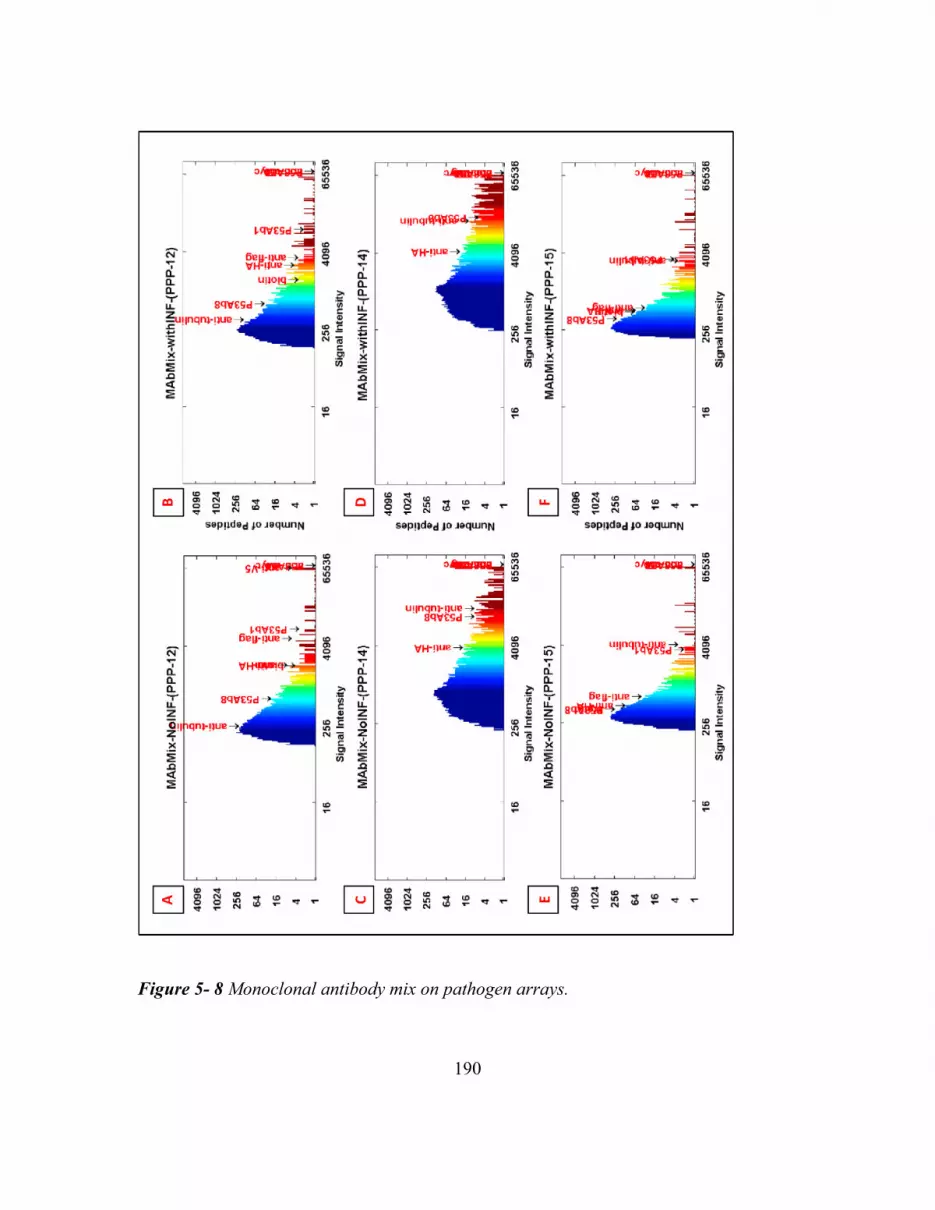
190
Figure 5- 8 Monoclonal antibody mix on pathogen arrays.

191
Histograms showing the distribution of signal intensities due to monoclonal antibodies
binding peptides on three PPP arrays. The Y-axis shows the number of peptides at a
given signal intensity (red=high signal, blue=low signal) whose range is displayed on the
X-axis. The positions within these histograms showing cognate monoclonal antibody
binding epitope peptides, is highlighted with arrows. (PPP-12 has 12 pathogen peptides
excluding Influenza, ASFV and Vaccinia peptides; PPP-14 has 14 pathogen peptides
excluding influenza peptides; PPP-15 has 15 pathogen peptides including influenza).
Influenza antibody reactivity observed in individuals responding to non-influenza
virus exposures
Due to a high level of homology among all influenza virus proteomes,
representing the Influenza PR8 proteome in the form of peptides, inadvertently also
represents multiple human vaccine strains. Figure 5- 9 summarizes the analysis
performed to de-convolute influenza peptide related cross-reactivity observed on the PPP
array.

192
Figure 5- 9 Influenza reactivity observed in individuals with non-influenza exposures.

193
A. Influenza PR8 proteome homology with other human influenza vaccine virus
proteomes (60 to 100% homologous) B. Box-Cox plot displaying pre-existing reactivity
observed in special pathogen free naïve mice (D0) Influenza Pre (blue) versus 40 days
(D40) post infection (red) on 283 influenza PR8 peptides from pathogen proteome
peptide array. The line in the center of the box represents the median signal intensity. C.
PR8 ELISA (blue bars), a measure of antibody reactivity observed in naïve mice (D0 =
Day 0) along with reactivity from same sera on day 40 (red bars). D. Reactivity of serum
antibodies in a whole virus (PR8) ELISA for some human donors whose serum antibodies
strongly bound PR8 epitope peptides on the pathogen array (green bars). Averaged
values from 3 replicates per ELISA measurement are shown and error bars in panels B
and D represent standard deviation. The Y axes represent relative fluorescence on array
in panel B and absorbance at 405 nm in panels C & D. The data reported in panels C
and D is from 1:50 serum dilution for both mouse and human sera.
Figure 5- 9, Panel A is a BLAST matrix obtained through CMG-biotools
representing the extent of proteome overlap between Influenza PR8 and human vaccine
strains. The matrix represents 49 comparisons (7X7) of pathogen proteomes. Every cell
of the BLAST matrix represents BLAST queries with a 50% homology cut-off between a
total of 72 proteins summarizing the results of 4,418 BLAST searches. The 2006-2009
human influenza vaccine strains were 60%-100% homologous with PR8. In order to
determine if influenza peptides could compete for non-influenza infection specific
antibody response, some patient sera with sufficient volumes available were tested for
cross-reactivity using a whole PR8 virus ELISA. We hypothesize that the change in

194
antibody binding observed from non-influenza infections might be due to competition for
antibodies between influenza peptides and cognate priority pathogen’s peptides. To test
this hypothesis without potentially confounding vaccination history from human sera,
specific pathogen free (SPF) Naïve mouse sera were collected before and 40 days after
PR8 infection and their antibody response was measured on both the PPP-15 microarray
(Figure 5- 9, Panel B) and PR8 ELISA (Figure 5- 9, Panel C). All mice tested including
Naïve, showed pre-PR8 exposure antibody cross-reactivity to Influenza PR8 in the
ELISA and on the pathogen proteome array. Using Gnotobiotic mice instead of SPF mice
might show lesser PR8 reactivity pre-exposure; however, this does not exclude the ability
of influenza peptides to non-specifically capture antibody reactivity not related to PR8
exposure.
Figure 5- 9, Panel D shows antibody cross-reactivity as measured by an ELISA
from infected human sera (green bars) having non-influenza pathogen exposures. The
blue bars represent un-infected pre and post-vaccine sera from one 2006-2007 seasonal
influenza vaccinee (ND43) and one Francisella tularensis Live vaccine strain (LVS)
recipient sera collected in 2009 (LVS93). The probability that LVS93 might have either
received or been exposed to the strains in 2006-2007 seasonal Influenza vaccine cannot
be excluded. The Influenza vaccine (ND43) pre and post-vaccine serum was included to
demonstrate the specificity of the PR8 ELISA. This individual had received the 2006-
2007 seasonal influenza vaccine which included another H1N1-like virus A/New
Caledonia/20/99 strain, 90.9% homologous to the PR8 strain. ND43’s pre and post-
vaccine sera did not show significant antibody reactivity on the A/Puerto Rico/8/1934

195
H1N1 ELISA. This was not an end-point ELISA because it was performed as an
alternative measurement of the cross-reactivity observed from non-influenza infection on
the PPP array. Average absorbance values were calculated for the most descriptive
dilution. The remaining dilutions till 1:800 were processed to observe a linear trend in
data so as to verify the observations from 1:50 diluted sera. The sensitivity of a peptide
microarray is higher as compared to that of an ELISA [158]. Therefore, the 1:50 dilution
was more informative on an ELISA as compared to the 1:500 used for the peptide
microarray. Additionally, arrays were processed using 1:50 and 1:100 serum dilution to
estimate if concentrating the serum amount would overcome the influenza peptide
directed cross-reactivity. The assumption was that increasing the concentration of sera
would saturate the influenza peptides sufficiently to reduce competition, thereby,
allowing priority pathogen specific antibodies to bind their appropriate target peptides.
The two serum concentrations tested, 1:50 and 1:100, however were not sufficient to
improve the ability of priority pathogen peptides to capture additional reactivity. Figure
5- 10 shows two WNV infected individuals sera in panels A and B at the default standard
1:500 serum dilution versus 1:50 and 1:100. The arrays were processed under
thermodynamic conditions previously optimized for this platform to reduce cross-
reactivity, primary sera incubated for 16 hours at 23°C. At both higher concentrations the
average antibody reactivity captured by influenza peptides and several other non-cognate
infection pathogen groups is higher than the average antibody reactivity captured by
cognate WNV peptides. A similar experiment was repeated using arrays without
influenza peptides to observe the antibody reactivity at varying concentrations of serum

196
dilution. The average signal response from pathogen groups of peptides for three VF
infected individuals is depicted in panels A, B, and C of Figure 5- 11 at the standard
1:500 versus 1:50 and 1:100 serum dilution. As depicted in the figure at 1:500 serum
dilution, two out of three individuals’ VF reactivity is higher than that of other pathogen
groups of peptides. This suggests that the 1:500 serum dilution as previously optimized
for this assay is appropriate to allow cognate pathogen antibodies to bind their target
pathogen peptides under thermodynamic conditions optimized for this assay.
Figure 5- 10 WNV Patients sera processed at three dilutions on PPP-15.
The average signal per pathogen groups of peptides is plotted on the Y-axis. Two WNV
infected individuals sera at varying antibody dilutions are presented in panels A and B.
The average signal per pathogen groups of peptides is plotted with WNV group antibody
signal highlighted in red and Influenza PR8 group antibody signal highlighted in green.

197
Figure 5- 11 VF Patient sera processed at three dilutions on PPP-14.
Three VF infected individuals at varying antibody dilutions as listed in the figure are
plotted in panels A, B and C. The average signal per pathogen group of peptides is
plotted on the Y-axis with signal from 83 VF epitope peptides averaged together and
highlighted in red.
Taken together these observations indicate that, increasing the concentration of
serum on the platform is not sufficient to retrieve cognate infection reactivity from
competing influenza peptides. Including influenza peptides might compete for the
antibody response captured by priority pathogen peptides on the PPP array. Antibody
binding data obtained from arrays containing influenza peptides would be impossible to

198
re-attribute to the original infection using the eight statistical metrics developed for data
analysis likely requiring bioinformatic intervention.
Defining the umbrella of antibody reactivity observed on the pathogen array
Using standard statistical metrics previously designed for this assay, the pathogen
peptide ranking system failed to classify priority pathogen infection on an array including
influenza peptides. The cross-reactivity observed on this assay might be likely
attributable to short, identical amino acid sequences in common between influenza
peptides and other priority pathogen peptides. As attempted earlier by Ulrich et al. [92],
we utilized the pattern of cross-reactivity due to short, identical amino acid sequences in
common between unrelated pathogens to re-attribute cross-reactivity observed towards
influenza peptides. A regular expression search algorithm developed by Richer et al.
[153] was used to select the most statistically significant n-mers per individual patient
based on averaging signal intensities above background (>500 FIU).

199
Table 5- 3 displays the results from using the pattern of number of 2-7mer
epitopes in common between individual patients classified using SVM with leave one out
cross-validation (LOOCV). The classification method is applied to all three versions of
the array. Panel C shows the recovery from cross-reactivity and incorrect infection
assignment when using SVM to classify samples based on n-mer commonality.

200
Table 5- 3 SVM (LOOCV) results from PPP-15 using the n-mer analysis for
classification
A.) Infections tested on
PPP-12
Total
samples
No. correctly
classified
%Correctly
classified
Malaria 3 0 0
ASFV NA
Not
processed, no
peptides NA
WNV 5 4 80
LVS 5 1 20
Vaccinia NA
Not
processed, no
peptides NA
VF 6 6 100
B.) Infections tested on
PPP-14
Total
samples
No. correctly
classified
%Correctly
classified
Malaria 2 0 0
ASFV 4 4 100
WNV 6 6 100
LVS 5 1 20
Vaccinia 5 4 80
VF 3 2 67
C.) Infections tested on
PPP-15
Total
samples
tested
No. correctly
classified
%Correctly
classified
Malaria 3 1 33
ASFV 4 4 100
WNV 6 5 83
LVS 3 1 33
Vaccinia 5 5 100
VF 3 3 100
Influenza 5 5 100

201
Due to comparing the count of unique 2-mers, 3-mers through 7-mers in common
within individual patients, the fundamental assumption of independence among features
required for using machine learning algorithms like SVM is not violated. The n-mers in
one individual are compared to the n-mers in another completely independent individual.
Using n-mer umbrella classification arrays containing influenza virus peptides, PPP-15,
showed 100% correct classification for ASFV, Vaccinia, VF and Influenza samples. This
method was able to partially recover the accuracy of this assay to detect WNV, 5/6 sera
correctly detected 83% correct. The WNV infected patient serum set contained one
patient whose sera was part of a longitudinal seroconversion panel from SeraCare (PWN-
901) [159]. On day 0 time point of this panel when the patient was still sero-negative on 2
different standard WNV EIA tests (Focus IgG, IgM and PANBIO IgG, IgM) for IgG &
IgM and the Taqman RNA was <30 copies/ml, it was accurately detected on the PPP-15
array as having WNV using n-mer umbrella classification. This demonstrates the utility
of such an n-mer approach in sensitively classifying disease. LVS and Malaria sera tested
however could not be accurately detected (1/3 sera correctly classified).
Discussion
My goal in this study was to increase the accuracy of the multiplexed PPP array
and test its limitations. For de-convoluting whether or not the addition of common
exposure pathogen peptides on PPP array improves the accuracy of detection of the
priority pathogen, three versions of arrays were made with incremental addition of
common exposure pathogen peptides. Initially we created a pathogen proteome peptide

202
array representing 12 priority NIAID categories A, B, C pathogens (PPP-12) and tested
sera from 4 exposures (VF, WNV, Malaria and F. tularensis LVS) to discern the
predictive potential of such a system. VF and WNV out of the four exposures tested
could be successfully distinguished using cognate peptides from those pathogens. We
added ASFV and Vaccinia peptides to this existing array (PPP-14) and re-tested its
accuracy at discerning 6 exposures apart. VF, ASFV, WNV, and Vaccinia could be
distinguished with AUC-ROC >90%. There was moderate improvement in the AUC for
F. tularensis and Malaria exposures as compared to the previous 12 pathogen peptide
platform. It was estimated that the addition of Vaccinia and ASFV pathogen peptides
represented sufficient double stranded DNA virus related peptides to be able to capture
Herpes virus related reactivity. The hypothesis was that the addition of common pathogen
peptides might improve the accuracy of distinguishing priority pathogen exposure. This
was tested by processing Herpes virus infected patient sera on the array to observe cross-
reactivity with ASFV and Vaccinia and several other pathogen peptides on the array
despite not directly representing any Herpes virus specific peptides. To test this concept
further, PR8 influenza peptides were added to this 14 pathogen array (PPP-15) given that
the H1N1 PR8 strain overlaps significantly with other human influenza virus vaccine
strains. The addition of influenza peptides significantly reduced the ROC-AUC of
detecting priority pathogen specific antibody response on the multiplexed PPP array.
The arrays without influenza peptides showed the best ROC-AUC classification
accuracy. The addition of influenza peptides to the array resulted in adversely affecting
the detection capability of the platform for exposures such as WNV, Vaccinia, F.

203
tularensis and Malaria. VF, ASFV and Influenza reactivity was not adversely affected by
the addition of Influenza peptides. Cross-reactivity to influenza within VF, WNV, LVS
exposure patient sera was confirmed on a PR8 ELISA. Several special pathogen free
naïve mice also showed PR8 cross-reactive antibodies in an ELISA before being
experimentally infected with PR8. Since antibodies cross-reactive to influenza were
found to be present in un-related pathogen exposures, it was deemed best to avoid
including influenza peptides within a priority pathogen array so as to maintain its ability
to discern multiple priority pathogen infections apart. One strategy to improve the assay’s
detection ability was to remove cross-reacting common pathogen representing peptides.
An alternative strategy would be to develop a bioinformatic analysis pipeline that would
discern the appropriate cognate infection while circumventing the cross-reactivity
observed on the assay.
In order to delineate whether or not changing the peptide diversity on the array
lead to significantly different antibody binding, an artificial infection sera, including eight
well-characterized monoclonal antibodies, was processed on each array. Change in
peptide diversity significantly altered the binding pattern observed on the platform
between PPP-12, 14 and 15 as depicted by Figure 5-8 panels A, C and E. Monoclonal
antibodies to linear peptide epitopes not directly related to influenza epitopes appeared to
bind influenza PR8 peptides. The presence or absence of influenza polyclonal antibody
component within the mix of 8 monoclonal antibodies did not have a statistically
significant contribution to directing the binding observed on the assay in contrast to the
effect observed by adding or removing influenza peptides.

204
One explanation for the observed change in binding after adding influenza
peptides could be that on an amino acid frequency level, influenza, unlike any other
pathogen represented on the assay has a greater frequency of the negatively charged,
glutamic acid within their proteome. And while this difference in amino acid frequencies
might not be significantly high, it appears to be enough to redirect other pathogen
antibody reactivity and even unrelated monoclonal antibodies to influenza peptides. The
charge on an antigen is known to increase non-specific cross-reactive binding in
immunoassays [160]. Herpes viruses, for example, have more Arginine’s (positively
charged amino acid) in their proteome as compared to any other priority pathogen tested
on this array. For the purpose of this study though, it is empirically evident that exclusion
of influenza peptides from a multiplexed assay designed to distinguish multiple priority
pathogen infections might be an appropriate strategy to accurately detect priority
pathogen infection.
A bioinformatic strategy was implemented to trace the original groups of
antibodies generating the signature response on the array, thereby de-convoluting the
cross-reactivity observed. We ignored existing peptide annotations obtained from amino
acid position within pathogen proteomes and instead re-analyzed the datasets based on
signal intensities of ‘umbrellas of antibody reactivity’. The ultimate goal was to generate
an algorithm capable of bioinformatically discerning the umbrellas of antibody reactivity
observed on the assay despite apparent cross-reactivity allowing distinction of the correct
infection/antigen (exposure) regardless of changes in the platforms peptide diversity. This
strategy aims to delineate the antibody n-mer umbrella of reactivity per infection,

205
measuring how many n-mers overlap within individual patients and using those set of
infection specific umbrella patterns to de-convolute the original infection. This strategy
of counting the number of occurrences of a given n-mer or string to create a mathematical
signature which could then be used to classify data is typically used in natural language
processing for example, when creating e-mail spam-filters [161]. The signature response
represents the number of n-mers in common per patient with a given infection versus all
other infections. All individuals having a given infection have a specific pattern of
overlapping n-mers in common with individuals having other infections and thus based
on the extent of overlapping n-mers, get classified into a specific infection group. The
antibodies from infected individuals and therefore, high signal intensity peptides they
bind on PPP array as well as n-mer umbrellas observed within individuals sera having a
given exposure are not always the same for all individuals having that exposure. This
individual variation in immune response for one infection could be explained by the
observation that immunizing animals experimentally with the same antigen yields
antibodies reacting to different epitopes within that antigen per individual animal within
the group [162].
Representing the complete proteome of a pathogen ensures accurate detection on
the assay. While this trend has been observed for small viruses such as WNV and
Influenza on PPP array, it is yet to be tested for larger pathogens in a multiplexed format.
The assay has tremendous utility if all known encephalitis viruses are represented on it,
as it would reduce the need for central nervous system infection diagnosis requiring
invasive procedures such as lumbar puncture. Given the limited diagnostic algorithms

206
applied to this data, it might be best to avoid inclusion of common pathogens such as
influenza alongside priority pathogens. In conclusion, the addition of influenza virus
peptides, to the PPP array does not improve its diagnostic ability.
Grant Acknowledgement
This work was supported by the Chemical Biological Technologies Directorate
contracts HDTRA-11-1-0010 from the Department of Defense Chemical and Biological
Defense program through the Defense Threat Reduction Agency (DTRA) to SAJ.
Acknowledgement
The authors wish to thank Lawrence Livermore National Laboratory for providing
infected patient sera for West Nile virus and Malaria infections originally acquired from
SeraCare. We thank Dr. Ian Lipkin at Columbia University for contributing Herpes virus
infected patient serum samples. We thank Dr. John Galgiani from the Valley Fever
Center for Excellence for providing VF infected IDCF characterized longitudinal patient
samples. We thank Sara Matsumoto and Daniel Wrapp for helping analyze microarray
slide image data and Jameson Berry for processing an ELISA.

207
Supplementary Information
Supplementary Table 5- 1 Monoclonal and polyclonal antibodies used on PPP array
Antib
ody
Name
Protein
Target
Ab
Clon
e
Epitope Epit
ope
Len
gth
(aa)
Sourc
e
Cat # Hos
t
Spe
cies
Isoty
pe
Monoclonal antibodies to linear epitopes
FLAG
KAX71_P
ANIM
Potassium
channel
toxin
alpha-KTx
7.1
F-
tag-
01 DYKDDDDK 8
Novus
Biolog
icals
NB500
-554
Mou
se IgG1
P53Ab
1
P53_HUM
AN
Cellular
tumor
antigen
p53
pAb2
40 RHSVV 5
Millip
ore
CBL40
4
Mou
se IgG1
[Leu5]
-
Enkep
halin
PDYN_H
UMAN
Proenkeph
alin-B
1193/
220 YGGFL 5
AbD
Serote
c
4140-
0159
Mou
se IgG1
P53Ab
8
P53_HUM
AN
Cellular
tumor
antigen
p53
P53A
b8 SDLWKL 6
Therm
o
MA1-
19055
Mou
se
IgG2
b
DM1
A
TBA1A_H
UMAN
Tubulin
alpha-1A
chain
DM1
A AALEKD 6
Millip
ore 05-829
Mou
se
IgG1
kapp
a
Biotin
BiotinMim
ic -
SGGGPCHPQ
FPRCYA 15
Santa
Cruz
Biotec
h
sc-
101339
Mou
se IgG1

208
cMyc
MYC_HU
MAN Myc
proto-
oncogene
protein
9E-
10
EQKLISEED
L 10
AbD
Serote
c
MCA2
200G
Mou
se IgG1
V5
V_SV5
Non-
structural
protein V
SV5-
Pk2
GKPIPNPLL
GLDST 14
AbD
Serote
c
MCA2
892
Mou
se IgG1
Influenza polyclonal antibodies
HA
Influenza
A
PR8(H1N1
) HA
IC5-
4F8 native HA 565
BEI
Resou
rces
NR454
2
Mou
se
IgG3
.k
NA
Influenza
A
PR8(H1N1
) NA
NA2-
1C1 NA-tetramer 454
BEI
Resou
rces
NR454
0
Mou
se
IgG1
.k
NP
Influenza
A
Okada(H2
N2)
nucleoprot
ein C43
nucleoprotein
498
Abca
m
ab1281
93
Mou
se
IgG2
a

209
CHAPTER 6
CONCLUSION
Coccidioidomycosis
The first cases of Valley Fever (VF) were observed in agricultural workers from
central California in 1890’s. In 1892, a physician named Alejandro Posada, diagnosed the
cutaneous inflammation in an Argentinian soldier originally misdiagnosed as cancer as
instead emanating from an infectious source, Coccidioides [163,164]. The infection
initiates post exposure of hosts to spores namely, Arthoconidia. The weaponization
potential of Coccidioides (Lethal Dose LD50, 300 arthroconidia in non-human primates)
is greater than that of Bacillus anthracis (LD50, 8000 spores in monkeys), which was
why it was included in the NIAID Priority pathogen list [165]. Johnson et al. [63]
estimated that a single arthroconidia was sufficient to cause in infection in mice. Between
1 to 10, arthroconidia are sufficient to establish infection in humans [166]. Once infected
the arthroconidia convert into spherules with sizes ranging from 3 µm [167-169] to 200
µm [170] with the largest recorded at 262 µm [171]. The size of the spherule depends on
the immune status of the host, with observable differences in C57BL/6 VF susceptible
mice versus resistant mice to Coccidioides, Swiss-Webster [169]. Galgiani et al.
documented that spherules sizes observed in-vitro (80-100 µm) were smaller than those
observed in vivo [172]. The size of B and T cells typically ranges between 7-10 µm in
diameter and that of antigen presenting cells such as dendritic cells and macrophages is
between 10-22 µm [173] rendering them partially ineffective when responding to larger

210
spherules. Given that the immune machinery of hosts is severely overwhelmed by this
pathogen, early detection of disease is crucial to facilitate appropriate anti-fungal
treatment. Newer drugs like Nikkomycin Z have shown promising results in murine
models by eradicating infections if given 5 days post-exposure [174] and also in dogs
[175].
The recovery rate of this fungus from blood unlike Mycobacterium tuberculosis is
very low, 0.4% i.e. 20 out of a total of 5,026 samples (6-year retrospective study);
making direct pathogen detection based diagnostics less sensitive [65]. To date,
depending on the site of primary infection and symptoms manifested due to this disease,
the presumptive differential diagnosis can include everything on the spectrum from
cancer (fungal granuloma/swollen lymph nodes), arthritis (joint pain), community
acquired pneumonias such as tuberculosis (lung nodule/patch, respiratory distress),
psychological distress/ depression (meningitis) to chronic fatigue syndrome (chronic
muscular pain). Early detection of VF infection would also help obviate unnecessary
costs associated with incorrect differential diagnosis.
Development of a microarray diagnostic that exceeds existing diagnostic standards
Developing higher sensitivity assays often comes at the cost of specificity. After
selecting random peptide features for the valley fever diagnostic sub-array, we learnt that
using as broad a training dataset representing as many confounding conditions during
feature selection was crucial to maintaining high assay specificity. The ‘VF-diagnostic’
sub-array (Chapter 2) is a 100% sensitive diagnostic and could be used in combination

211
with the higher specificity immunodiffusion (IDCF) and enzyme immunoassays (EIA)
for differential diagnosis of disease [164]. The comparison of natural epitopes to non-
natural mimotopes has been reviewed on multiple occasions both structurally and
informatically [31,89,176]. Chapter 3 shows an empirical comparison of life-space
epitopes versus non-natural sequence peptides in the context of a diagnostic assay. Life-
space VF epitope peptides show higher specificity when distinguishing VF from LVS and
normal, but random peptides show higher sensitivity. An interesting aspect of this work
was the di-peptide modulation suggested to improve the accuracy of the Smith-Waterman
[33] local alignment algorithm in a sequence alignment program, GuiTope [34]. This
observation was made when de-convoluting why random VF predictor peptides
performed with higher sensitivity than VF epitope peptides. GuiTope found several short
sequence motifs in common between random peptides and VF antigens. The frequencies
of di-peptides within a given protein, have been used to classify them into functional
protein families [85], for designing tumor homing peptides, anti-cancer peptides
[177,178] and designing cell penetrating peptides [179]. Rubenstein et al. [180] and Sun
et al. [89] while characterizing epitopes noticed cooperativeness of certain di-peptide
pairs as being observed at a higher frequency within epitopes as compared to non-epitope
regions on antigens. Inverse-docking also known as ‘target fishing’ has been
informatically viable when applied in molecular docking software for searching ‘target-
like’ structures [181]. The high binding associated with short sequences having di-peptide
inversions in common between life-space VF antigens and VF-predictor random peptides
is empirical proof of the viability of the inverse-docking approach.

212
Bioinformatic analysis of pathogen proteomes toward the development of a
multiplexed life-space peptide microarray diagnostic
While creating a multiplexed pathogen proteome peptide array (Chapter 4), our
work assessed the various informatics strategies applied for epitope mapping. A T-cell
epitope typically ranges in length from 8-12 amino acids [182] and linear B-cell epitopes
range from 4-12 amino acids [88]. A conformational B-cell epitope is estimated to
contain 3-mer (60%) to 5-mer (85%) linear stretches involved in epitope-paratope
binding [99]. While selecting the epitopes to be represented on the multiplexed PPP
array, for larger pathogens we represented protein antigens predicted to be surface
proteins (ASFV) or empirically documented to be immunodominant (IEDB). For some
small viruses such as WNV, we represented the whole viral proteome. Given that the
human population has >3000 different MHC alleles [183], it might be prudent to
represent every pathogen using their whole proteome to enable accurately capturing
individual variance in antibody response to an infection. Whole proteome based protein
microarray experiments performed by Felgner et al. document that a small portion of the
pathogen’s proteome is immunoreactive (~26%, Vaccinia) [109]. Due to the fine
resolution obtained when using peptide microarrays as compared to using protein
microarrays, it is very likely that no a priori selection of immunodominant or surface
antigens was necessary. This concept however might need additional testing using larger
patient serum sets and pathogen peptide groups to specifically compare whole proteomes
peptides versus partial proteome peptides ability to capture infection specific immune
response in a side by side comparison. In our comparison, the immunodominant antigen

213
peptides (partial proteome) were sufficient and capable of capturing and distinguishing
infection specific response from other pathogen peptides. The multiplexed pathogen
proteome array was capable of distinguishing 4 priority pathogen infections (VF, WNV,
Vaccinia, and ASFV) apart simultaneously despite moderate cross-reactivity with greater
than 90% ROC- AUC accuracy.
Designing a multiplexed pathogen proteome peptide microarray – Future directions
Although there was substantial measurable (and in many cases predictable) cross-
reactivity between host antibodies and peptide antigens, there were a number of non-
obvious causes for this observation on the PPP array. Given the amount of cross-
reactivity observed, the discussion addresses a number of methods, both bioinformatic
and biochemical, to ameliorate this seemingly intractable specificity problem. Antigen-
antibody interactions observed on a multiplexed PPP array are a function of both the
human patient sample being tested as well as the extensive overlap between natural
pathogen sequences. The workarounds illustrate some important and quite fundamental
aspects of physical characteristics of peptides, their presentation on the assay, and the
intricate ways in which antibodies interact with them.
While creating the multiplexed pathogen proteome peptide (PPP) array we printed
the 15 pathogen peptides in no specific physical order together in a single array (Chapter
4). Under thermodynamically optimized conditions to reduce cross-reactivity the array
functioned with greater than 90% ROC-AUC at distinguishing 4 infections apart (VF,
WNV, Vaccinia, and ASFV) simultaneously while it had 14 pathogen peptides. Upon

214
adding influenza peptides, the array’s ability to distinguish between influenza versus
priority pathogen infection diminished. From this experience we concluded that creating
multiplexed assays using pathogen epitope peptides and circumventing the cross-
reactivity observed to common pathogen peptides would require bioinformatic
intervention in array design as depicted in Figure 6- 1.
Figure 6- 1 Schema for designing a multiplexed pathogen proteome peptide microarray
Initially, a pathogen proteome level comparison between all pathogens of interest
to be included on the array would be necessary to estimate an obvious overlap based on
protein sequences within phylogenetically related and unrelated pathogens (BLAST).

215
Using such an analysis, the cross-reactivity observed in Japanese, Dengue virus infected
individuals to JEV could be explained [149]. Figure 6- 2 is a blast matrix generated by
comparing the proteomes of various Flaviviruses using CMG-biotools [155]. 7 proteomes
(7 X 7=49 comparisons, 96 total proteins) are compared through 7,886 BLAST searches
using the 50% identity and 50% length match between compared fragments homology
criteria. Between Japanese encephalitis virus, West Nile virus and Dengue viruses there is
a significant proteome level overlap ranging from 12% to 100% and this might explain
some of the cross-reactivity observed on immunoassays between these Flaviviruses
[148].
Figure 6- 2 Blast matrix depicting proteome level overlap between the four main races of
Dengue virus (reference proteomes) and WNV-I and II and JEV

216
A BLAST hit within the CMG-biotools program is considered significant (green) if at
least 50% of the two protein sequences being compared are aligned and 50% of amino
acids within the alignment are identical. The last row at the bottom of this matrix depicts
homology within a given pathogen proteome under the strict BLAST search match
criteria (grey to red scale).
If significant overlap is observed between pathogen proteomes, those pathogen
peptides could either be excluded from being multiplexed together or they could be
printed on a physically separate sub-array such as that depicted in the 24-sub array format
in Figure 6- 1. Additionally, each individual pathogen’s peptides could be printed
separately within a sub-array on a single glass slide representing up to 24 pathogen
proteomes. Alternatively, multiple pathogen peptides could be multiplexed together
based on lack of obvious proteome level overlap allowing representation of more than 24
pathogens on a single chip. In summary, when detecting Flaviviruses using pathogen
epitope peptides, it might be advisable to print them on separate sub-arrays and process
patient sera on them separately.
Another example where a proteome level overlap analysis would be sufficient to
explain lower specificity (46 - 97%) observed on an immunoassay is on the ToRCH assay
[37].

217
Figure 6- 3 Blastmatrix showing ToRCH assay pathogen proteome overlap.
Proteomes included: Toxoplasma gondii, Rubella, Chlamydia trachomatis, HSV-1, HSV-
2, HSV-3 and CMV. A BLAST hit within the CMG-biotools program is considered
significant (green) if at least 50% of the two protein sequences being compared are
aligned and 50% of amino acids within the alignment are identical. The last row at the
bottom of this matrix depicts homology within a given pathogen proteome under the strict
BLAST search match criteria (grey to red scale).

218
Figure 6- 3 summarizes 86 million BLAST searches generated from pathogen
proteomes represented on the ToRCH assay using the Blastmatrix program in CMG-
biotools [155]. The figure summarizes a BLAST comparison of 9275 total proteins in 7
proteomes (7x7=49 comparisons). From this comparison given that HSV-1 and HSV-2
show greater than 94.7% proteome level overlap (50% identity, 50% length match
criteria), it might be prudent to include them on separate sub-arrays to avoid cross-
reactivity. Despite printing pathogen proteomes showing a high level of proteome level
overlap on separate sub-arrays, it is likely that infected individual’s sera might still
display cross-reactivity to both sub-arrays. While they may still display cross-reactivity,
the peptides of one pathogen will not be able to compete for reactivity from antibodies
generated against another pathogen sharing multiple identical short peptides. A new data
analysis pipeline would need to be developed from training on well-characterized serum
samples to evaluate the extent of expected cross-reactivity. A probabilistic model based
on log-odds ratios might need to be developed as has been done for the LLMDA
(Lawrence Livermore Microbial detection array) [47,184] to estimate which infection,
HSV-1 or HSV-2 or both is more likely based on prior empirical observations from sera
for both infections respectively and co-infections processed on such an array.
If there is no obvious overlap observed through a BLAST matrix analysis then an
n-mer level analysis of overlap should be conducted on both a peptide level and between
peptides and pathogen proteomes if representing partial proteomes. Given that B-cell
linear epitopes range from 4-12 amino acids in length and a conformational epitope
shows 3-mer to 5-mer contiguous contact points within the antibody paratope as
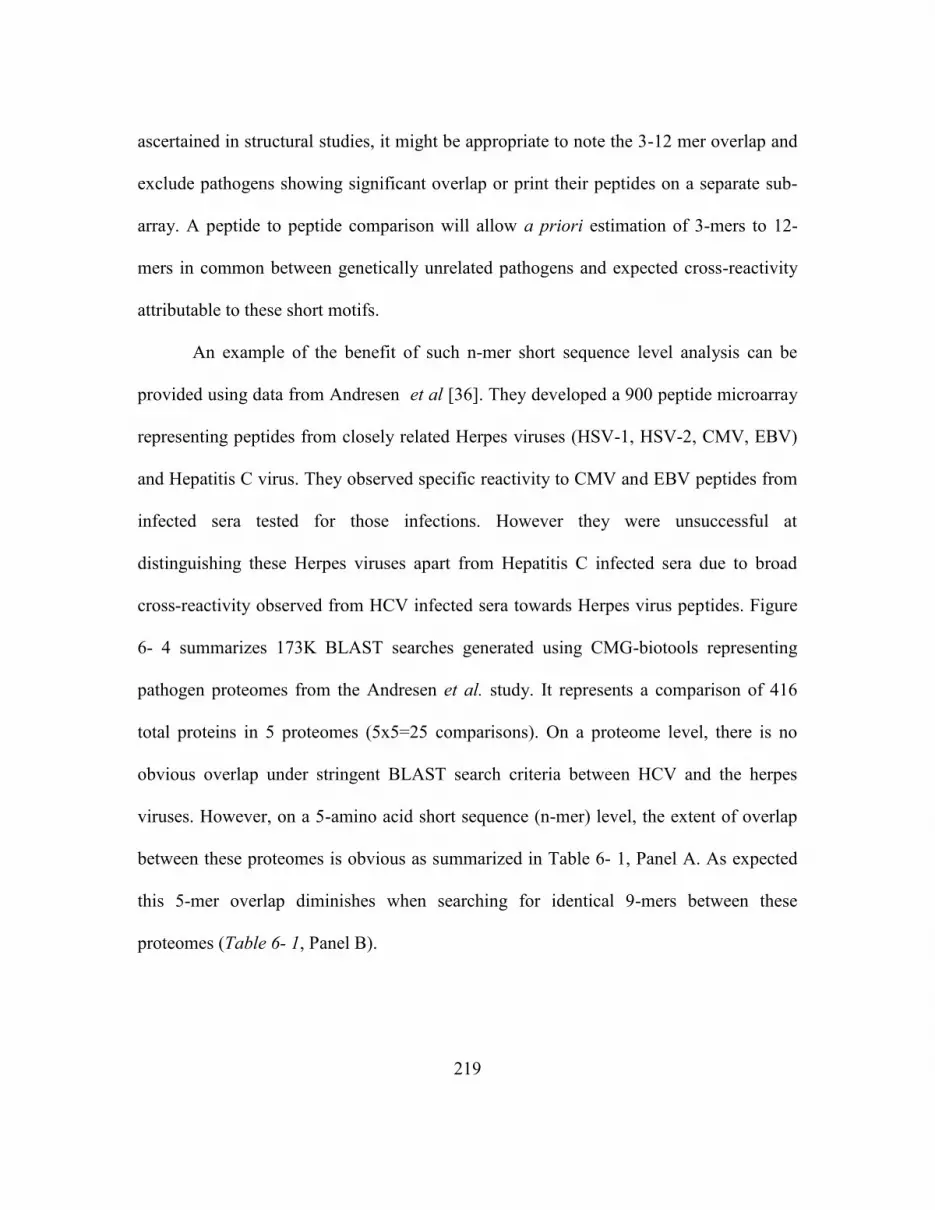
219
ascertained in structural studies, it might be appropriate to note the 3-12 mer overlap and
exclude pathogens showing significant overlap or print their peptides on a separate sub-
array. A peptide to peptide comparison will allow a priori estimation of 3-mers to 12-
mers in common between genetically unrelated pathogens and expected cross-reactivity
attributable to these short motifs.
An example of the benefit of such n-mer short sequence level analysis can be
provided using data from Andresen et al [36]. They developed a 900 peptide microarray
representing peptides from closely related Herpes viruses (HSV-1, HSV-2, CMV, EBV)
and Hepatitis C virus. They observed specific reactivity to CMV and EBV peptides from
infected sera tested for those infections. However they were unsuccessful at
distinguishing these Herpes viruses apart from Hepatitis C infected sera due to broad
cross-reactivity observed from HCV infected sera towards Herpes virus peptides. Figure
6- 4 summarizes 173K BLAST searches generated using CMG-biotools representing
pathogen proteomes from the Andresen et al. study. It represents a comparison of 416
total proteins in 5 proteomes (5x5=25 comparisons). On a proteome level, there is no
obvious overlap under stringent BLAST search criteria between HCV and the herpes
viruses. However, on a 5-amino acid short sequence (n-mer) level, the extent of overlap
between these proteomes is obvious as summarized in Table 6- 1, Panel A. As expected
this 5-mer overlap diminishes when searching for identical 9-mers between these
proteomes (Table 6- 1, Panel B).

220
Figure 6- 4 Pathogen proteome level overlap for pathogens represented in a multiplexed
900 peptide microarray showing cross-reactivity in Andresen et al (2009).
The pathogen proteomes included in this comparison are HSV-1, HSV-2, CMV, EBV and
Hepatitis C. A BLAST hit within the CMG-biotools program is considered significant
(green) if at least 50% of the two protein sequences being compared are aligned and
50% of amino acids within the alignment are identical. The last row at the bottom of this
matrix depicts homology within a given pathogen proteome under the strict BLAST
search match criteria (grey to red scale).

221
Table 6- 1 Unique 5-mers and 9-mers in-common between pathogens tested on the
Andresen assay
A.) Unique 5-mers in
common HSV2 EBV
CMV-
HSV5 Hepatitis C HSV1
HSV2 36488 2212 2795 173 18833
EBV 2212 38977 2556 144 2116
CMV-HSV5 2795 2556 58960 169 2703
Hepatitis C 173 144 169 3151 167
HSV1 18833 2116 2703 167 36444
B.) Unique 9-mers in
common HSV2 EBV
CMV-
HSV5 Hepatitis C HSV1
HSV2 38159 26 15 0 12186
EBV 26 39939 11 0 24
CMV-HSV5 15 11 60809 0 15
Hepatitis C 0 0 0 3154 0
HSV1 12186 24 15 0 37715
From our own pathogen proteome peptide (PPP) array data, we observed cross-
reactivity to ASFV and Vaccinia peptides from Herpes virus infected individuals
(Chapter 5). We also noted ASFV peptide cross-reactivity from Vaccinia vaccine
recipient sera. This cross-reactivity to ASFV and Vaccinia peptides from herpes virus
infections could not be explained on a proteome level overlap as depicted in Figure 6- 5.
The Blastmatrix generated using CMG-biotools [155] compares proteomes of the 8
known variants of herpes simplex virus with Vaccinia and ASFV representing 1294 total
proteins comparisons (11X11) summarizing 1.49 million BLAST searches. The stringent

222
homology cut-off of 50% identity and 50% length match between query sequences was
applied. HSV-1 and 2 showed 94.7% identity, HSV-3 showed 4.9% and 4.2% identity
with HSV-1 and 2 respectively. The two HSV-6 strains showed 65.4% identity among
themselves and HSV-6 and HSV-7 showed 28.3% (HSV-6 strain: U1102) and 32.6%
(HSV-6 strain: Z29) identity. On a pathogen proteome protein level there is no overlap
between ASFV and Vaccinia proteomes with Herpes virus proteomes.
Figure 6- 5 Blast matrix depicting proteome level overlap between Herpes viruses
(Herpesviridae) and other pox-viruses ASFV (Asfarviridae) and Vaccinia
(Orthopoxviridae)
A BLAST hit within the CMG-biotools program is considered significant (green) if at
least 50% of the two protein sequences being compared are aligned and 50% of amino

223
acids within the alignment are identical. The last row at the bottom of this matrix depicts
homology within a given pathogen proteome under the strict BLAST search match
criteria (grey to red scale).
This cross-reactivity could however be explained by annotating the high number
of 5-mers in common between these double stranded DNA viruses belonging to distinct
viral families. Table 6- 2 summarizes the number of 5-mer identical epitopes in common
between ASFV, Vaccinia and all eight Herpes virus strains. Cells in the table are colored
with red if the value is greater than 1000 identical 5-mers in common. On a 5 amino acid
peptide motif level the number of identical unique 5-mers in common between all herpes
viruses and ASFV ranged from 1,043 to 1,716. There are 1,140 to 1,846 identical 5-mers
in common between Vaccinia and herpes viruses. Between ASFV and Vaccinia there are
2,161 identical 5-mers in common. This implies that the probability of humoral
antibodies generated against one herpes virus infection showing cross-reactivity with an
identical 5-mer epitope within an ASFV or Vaccinia peptides is plausible.
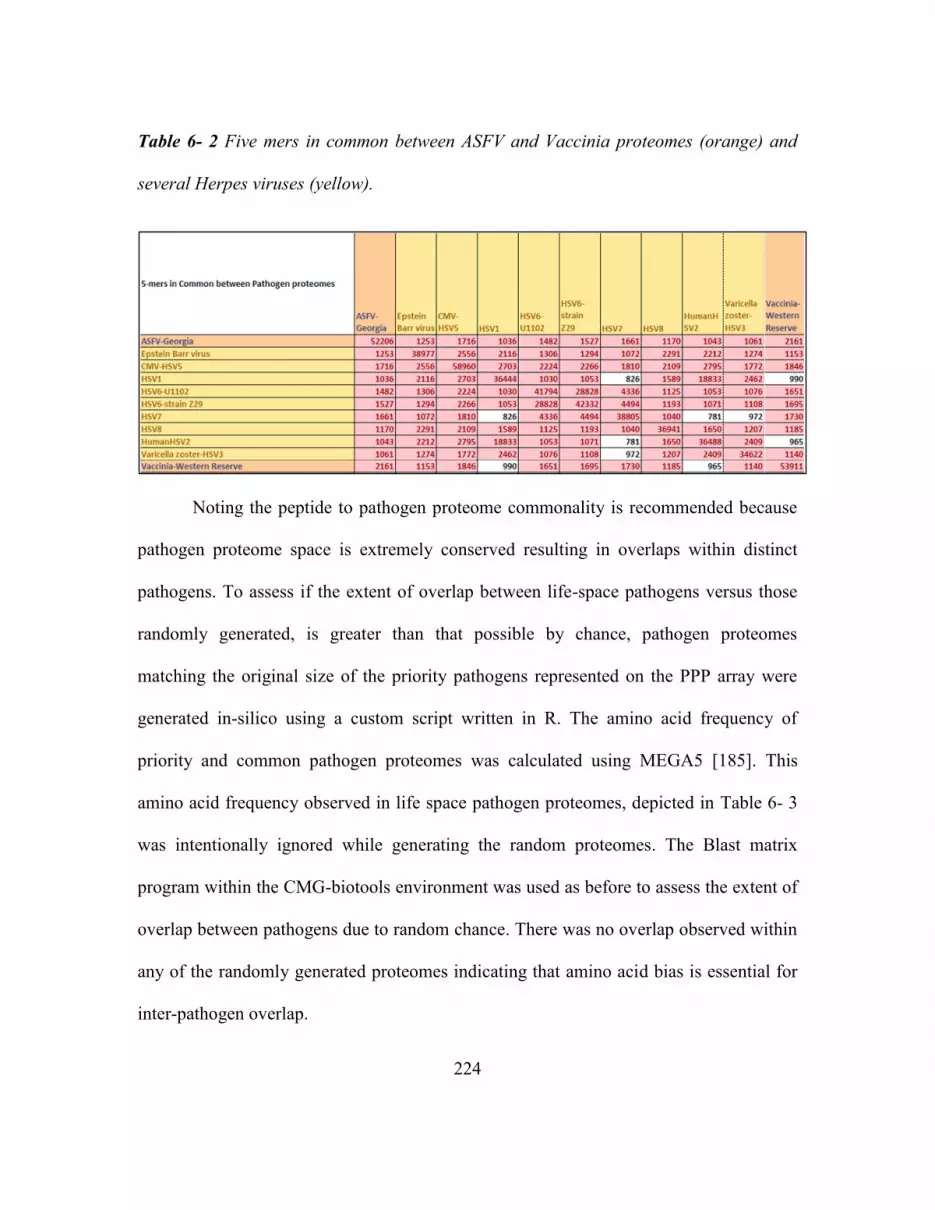
224
Table 6- 2 Five mers in common between ASFV and Vaccinia proteomes (orange) and
several Herpes viruses (yellow).
Noting the peptide to pathogen proteome commonality is recommended because
pathogen proteome space is extremely conserved resulting in overlaps within distinct
pathogens. To assess if the extent of overlap between life-space pathogens versus those
randomly generated, is greater than that possible by chance, pathogen proteomes
matching the original size of the priority pathogens represented on the PPP array were
generated in-silico using a custom script written in R. The amino acid frequency of
priority and common pathogen proteomes was calculated using MEGA5 [185]. This
amino acid frequency observed in life space pathogen proteomes, depicted in Table 6- 3
was intentionally ignored while generating the random proteomes. The Blast matrix
program within the CMG-biotools environment was used as before to assess the extent of
overlap between pathogens due to random chance. There was no overlap observed within
any of the randomly generated proteomes indicating that amino acid bias is essential for
inter-pathogen overlap.

225
Table 6- 3 Amino acid frequencies in proteomes of priority pathogens and common
pathogens

226

227
When representing partial proteomes for larger pathogens, while certain peptide
sequences may be excluded from the array they might be represented through another
unrelated pathogen’s peptides. If an infected individuals sera shows antibody reactivity
against these excluded motifs due to them being presented by the pathogen to their
immune system, that might result in cross-reactivity. For antibody association on peptide
microarrays short sequence identities are sufficient, but so is the context of presentation
(surrounding sequence). The surrounding context within a peptide might be inhibitory to
antibody association. If the context is not inhibitory, then from our experience with
monoclonal antibody binding (e.g. p53Ab1) we have observed non-cognate reactivity. An
analysis to estimate commonality between the peptides chosen to be represented on the
assay and all pathogen proteomes of interest for the assay can help decide whether that
pathogen’s peptides might need to be presented in a separate sub-array to avoid
competition between peptides for antibodies.
Cross-reactivity attributable to common exposures and vaccinations:
Certain pathogen proteomes might have to be excluded when multiplexing
priority pathogens on an epitope peptide microarray format to avoid observing residual
memory antibodies from vaccinations or common infections. Miller et al. [54] have
demonstrated through their longitudinal study characterizing Influenza A and
Cytomegalovirus (CMV) serum antibody in 40 individuals for 20 years that influenza
antibodies capable of neutralizing the virus increase during the lifetime of an individual.
CMV antibody titers on the other hand remained stable in the 15 out of 40 individuals

228
that tested positive for CMV in the first assessment. The duration of circulating
antibodies to common exposure pathogens such as Varicella and Epstein Barr virus
(EBV) or common vaccinations such as Measles, Mumps, Rubella (MMR vaccine),
Vaccinia (small-pox vaccine), Clostridium tetani (Tetanus) and Corynebacterium
diphtheriae (Diphtheria) measured by Slifka and colleagues [53] ranged with half-lives
from 50 to 200 years and were short-lived for Tetanus (11 years) and Diphtheria (19
years). Herpes simplex viruses are ubiquitous human pathogens that have a worldwide
sero-prevalence in the population of up to 90% [186-188].

229
Figure 6- 6 Commonality on a 5-mer sequence level between priority pathogen
proteomes and common pathogen proteomes such as Herpes viruses and influenza
vaccine proteomes (highlighted in the legend in yellow).
In context to the priority pathogens represented on the PPP array, Figure 6- 6
represents the number of unique 5-mer sequences in common between the priority
pathogen peptides and common pathogens. The common pathogen proteomes included
for this analysis were eight herpes viruses and influenza vaccine strains (2006-2009) not
intentionally represented on the array. The connectogram was generated using an online

230
tool, Circos [154]. The size of the ribbon represents the number of 5-mer sequences in
common between peptides represented on the array and pathogen proteomes of priority
and common pathogens. While the extent of overlap between common pathogens
apparent on a 5-mer level is less in comparison to that observed between some unrelated
priority pathogens it might be sufficient to drive competition on the assay.
Thus, when developing extremely sensitive multiplexed pathogen specific assays
the contribution and presence of these circulating antibodies to persistent common
pathogens; common vaccinations and homologous pathogens cannot be neglected. To
summarize this with respect to a multiplexed peptide microarray platform, the antibody
response observed post exposure to a new priority pathogen could potentially have 3
primary components. An adaptive immune response specific to the priority pathogen, a
component representing specific reactivity to epitopes not represented on the array and a
component representing non-specific, residual reactivity from prior exposure to a
homologous or unrelated pathogen either part of a vaccination or persistent chronic
infection.

231
REFERENCES
1. Stafford P (2007) Biochips as Pathways to Drug Discovery. In: Carmen A, Hardiman
G, editors. Drug Discovery Series. pp. 281-320.
2. Stafford P, Halperin R, Legutki JB, Magee DM, Galgiani J, et al. (2012) Physical
Characterization of the "Immunosignaturing Effect". Molecular & Cellular Proteomics
11.
3. Gaseitsiwe S, Valentini D, Mahdavifar S, Magalhaes I, Hoft DF, et al. (2008) Pattern
Recognition in Pulmonary Tuberculosis Defined by High Content Peptide Microarray
Chip Analysis Representing 61 Proteins from M. tuberculosis. Plos One 3.
4. Nahtman T, Jernberg A, Mahdavifar S, Zerweck J, Schutkowski M, et al. (2007)
Validation of peptide epitope microarray experiments and extraction of quality data.
Journal of Immunological Methods 328: 1-13.
5. List C, Qi WH, Maag E, Gottstein B, Muller N, et al. (2010) Serodiagnosis of
Echinococcus spp. Infection: Explorative Selection of Diagnostic Antigens by Peptide
Microarray. Plos Neglected Tropical Diseases 4.
6. Chow SCS, Ho CYS, Tam TTY, Wu C, Cheung T, et al. (2006) Specific epitopes of
the structural and hypothetical proteins elicit variable humoral responses in SARS
patients. Journal of Clinical Pathology 59: 468-476.
7. Guo JP, Petric M, Campbell W, McGeer PL (2004) SARS corona virus peptides
recognized by antibodies in the sera of convalescent cases. Virology 324: 251-256.
8. Andresen H, Zarse K, Grotzinger C, Hollidt JM, Ehrentreich-Forster E, et al. (2006)
Development of peptide microarrays for epitope mapping of antibodies against the
human TSH receptor. Journal of Immunological Methods 315: 11-18.
9. Johnston SA, Stafford P (2010) Compound arrays for sample profiling. In: office
UPaT, editor. USA: The Arizona Board of Regents, A body corporate of the state of
Arizona for and on behalf of Arizona State University [US/US]; 699 S. Mill Avenue The
Brickyard, Suite 601 Room 691 AA Tempe, Arizona 85281 (US) (For All Designated
States Except US).

232
10. Sykes KF, Legutki JB, Stafford P (2013) Immunosignaturing: a critical review.
Trends in Biotechnology 31: 45-51.
11. Legutki JB, Magee DM, Stafford P, Johnston SA (2010) A general method for
characterization of humoral immunity induced by a vaccine or infection. Vaccine 28.
12. Restrepo L, Stafford P, Magee DM, Johnston SA (2011) Application of
Immunosignatures to the Assessment of Alzheimer's Disease. Annals of Neurology 70:
286-295.
13. Kukreja M, Johnston S, Stafford P (2012) Immunosignaturing microarrays
distinguish antibody profiles of related pancreatic diseases. Journal of Proteomics and
Bioinformatics S6:001.
14. Vigil A, Chen C, Jain A, Nakajima-Sasaki R, Jasinskas A, et al. (2011) Profiling the
Humoral Immune Response of Acute and Chronic Q Fever by Protein Microarray.
Molecular & Cellular Proteomics 10.
15. Rup L (2012) The Human Microbiome Project. Indian Journal of Microbiology 52:
315-315.
16. Mariat D, Firmesse O, Levenez F, Guimaraes VD, Sokol H, et al. (2009) The
Firmicutes/Bacteroidetes ratio of the human microbiota changes with age. Bmc
Microbiology 9.
17. Golby S, Hackett M, Boursier L, Dunn-Walters D, Thiagamoorthy S, et al. (2002) B
cell development and proliferation of mature B cells in human fetal intestine. Journal of
Leukocyte Biology 72: 279-284.
18. Wesemann DR, Portuguese AJ, Meyers RM, Gallagher MP, Cluff-Jones K, et al.
(2013) Microbial colonization influences early B-lineage development in the gut lamina
propria. advance online publication.
19. Galgiani JN, Ampel NM, Blair JE, Catanzaro A, Johnson RH, et al. (2005)
Coccidioidomycosis. Clinical infectious diseases 41: 1217.

233
20. Arizona Department of Health Services-Valley Fever Annual Report 2007.
21. Adams DA, Gallagher KM, Jajosky RA, Kriseman J, Sharp P, et al. (2013) Summary
of Notifiable Diseases — United States, 2011.
22. Panackal AA, Hajjeh RA, Cetron MS, Warnock DW (2002) Fungal infections among
returning travelers. Clinical Infectious Diseases 35: 1088-1095.
23. CDC Coccidioidomycosis webpage.
24. US Census Bureau.
25. Parish JM, Blair JE (2008) Coccidioidomycosis. Mayo Clinic proceedings 83: 343.
26. DiCaudo DJ (2006) Coccidioidomycosis: A review and update. Journal of the
American Academy of Dermatology 55: 929.
27. Cox RA, Magee DM (1998) Protective immunity in coccidioidomycosis. Research in
Immunology 149: 417-428.
28. Cordeiro RD, Brilhante RSN, Rocha MFG, Moura FEA, de Camargo ZP, et al.
(2007) Rapid diagnosis of coccidioidomycosis by nested PCR assay of sputum. Clinical
Microbiology and Infection 13: 449-451.
29. Duarte-Escalante E, Frías-De-León MG, Zúñiga G, Martínez-Herrera E, Acosta-
Altamirano G, et al. (2014) Molecular markers in the epidemiology and diagnosis of
coccidioidomycosis. 31: 49-53.
30. Munson E, Endes T, Vaughan K, Block T, Hryciuk JE (2009) Two cases of recovery
of dimorphic pathogenic fungi via conventional BacT/ALERT microbial detection
system media. Mycopathologia 167: 191.
31. De Lucrezia D, Slanzi D, Poli I, Polticelli F, Minervini G (2012) Do Natural Proteins
Differ from Random Sequences Polypeptides? Natural vs. Random Proteins
Classification Using an Evolutionary Neural Network. Plos One 7.

234
32. Minervini G, Evangelista G, Villanova L, Slanzi D, De Lucrezia D, et al. (2009)
Massive non-natural proteins structure prediction using grid technologies. Bmc
Bioinformatics 10.
33. Smith TF, Waterman MS (1981) Identification of common molecular subsequences.
Journal of Molecular Biology 147: 195-197.
34. Halperin RF, Stafford P, Emery JS, Navalkar KA, Johnston SA (2012) GuiTope: an
application for mapping random-sequence peptides to protein sequences. Bmc
Bioinformatics 13.
35. Miller JJ, Valdes R (1992) Methods for calculating cross-reactivity in Immunoassays.
Journal of Clinical Immunoassay 15: 97-107.
36. Andresen H, Grotzinger C (2009) Deciphering the Antibodyome - Peptide Arrays for
Serum Antibody Biomarker Diagnostics. Current Proteomics 6: 1-12.
37. Ardizzoni A, Capuccini B, Baschieri MC, Orsi CF, Rumpianesi F, et al. (2009) A
protein microarray immunoassay for the serological evaluation of the antibody response
in vertically transmitted infections. European Journal of Clinical Microbiology &
Infectious Diseases 28: 1067-1075.
38. Diseases NIoAaI (2013) NIAID Category A, B, and C Priority Pathogens.
39. Registry NSA HHS and USDA Select Agents and Toxins List.
40. Loh J, Zhao GY, Presti RM, Holtz LR, Finkbeiner SR, et al. (2009) Detection of
Novel Sequences Related to African Swine Fever Virus in Human Serum and Sewage.
Journal of Virology 83: 13019-13025.
41. Basile AJ, Horiuchi K, Panella AJ, Laven J, Kosoy O, et al. (2013) Multiplex
Microsphere Immunoassays for the Detection of IgM and IgG to Arboviral Diseases. Plos
One 8.

235
42. Ngo Y, Advani R, Valentini D, Gaseitsiwe S, Mahdavifar S, et al. (2009)
Identification and testing of control peptides for antigen microarrays. Journal of
Immunological Methods 343: 68-78.
43. Panse S, Dong L, Burian A, Carus R, Schutkowski M, et al. (2004) Profiling of
generic anti-phosphopeptide antibodies and kinases with peptide microarrays using
radioactive and fluorescence-based assays. Molecular Diversity 8: 291-299.
44. Choi J-j, Kim C, Park H (2009) Peptide Nucleic Acid-Based Array for Detecting and
Genotyping Human Papillomaviruses. Journal of Clinical Microbiology 47: 1785-1790.
45. Luminex C xMAP® Technology Technical Note: Overcoming the Cost and
Performance Limitations of ELISA with xMAP® Technology. The Thomas Joos
laboratory at Natural and Medical Sciences Institute (NMI) at the University of
Tuebingen.
46. Rider TH, Petrovick MS, Nargi FE, Harper JD, Schwoebel ED, et al. (2003) A B cell-
based sensor for rapid identification of pathogens. Science 301: 213-215.
47. Erlandsson L, Rosenstierne MW, McLoughlin K, Jaing C, Fomsgaard A (2011) The
Microbial Detection Array Combined with Random Phi29-Amplification Used as a
Diagnostic Tool for Virus Detection in Clinical Samples. Plos One 6.
48. Gardner SN, Jaing CJ, McLoughlin KS, Slezak TR (2010) A microbial detection
array (MDA) for viral and bacterial detection. Bmc Genomics 11.
49. Simoes EAF, Patel C, Sung W-K, Lee CWH, Loh KH, et al. (2013) Pathogen Chip
for Respiratory Tract Infections. Journal of Clinical Microbiology 51: 945-953.
50. Quan P-L, Palacios G, Jabado OJ, Conlan S, Hirschberg DL, et al. (2007) Detection
of respiratory viruses and subtype identification of influenza a viruses by
GreeneChipResp oligonucleotide microarray. Journal of Clinical Microbiology 45: 2359-
2364.
51. Miller S, Chen E, Naccache S, Pinsky BA, Chiu C (2010) Virochip Analysis Utility
of a Pan Viral Microarray for Identification of Viral Causes of Acute Clinical Illness and
Outbreak Investigations. Journal of Molecular Diagnostics 12: 883-883.

236
52. Glanville J, Zhai W, Berka J, Telman D, Huerta G, et al. (2009) Precise determination
of the diversity of a combinatorial antibody library gives insight into the human
immunoglobulin repertoire. Proceedings of the National Academy of Sciences of the
United States of America 106: 20216-20221.
53. Amanna IJ, Carlson NE, Slifka MK (2007) Duration of humoral immunity to
common viral and vaccine antigens. New England Journal of Medicine 357: 1903-1915.
54. Miller MS, Gardner TJ, Krammer F, Aguado LC, Tortorella D, et al. (2013)
Neutralizing Antibodies Against Previously Encountered Influenza Virus Strains Increase
over Time: A Longitudinal Analysis. Science Translational Medicine 5.
55. Kruszon-Moran Deanna, Porter Kathryn S, McQuillan Geraldine, Goud Billioux
Veena, Kim-Farley Robert, et al. (2012) Infectious disease prevalence in Los Angeles
County–A comparison to national estimates, 1999–2004. Hyattsville, MD: NCHS data
brief, no 90. National Center for Health Statistics.
56. Kaitlin B, Tsang C, Tabnak F, Chiller T (March 29, 2013) Increase in Reported
Coccidioidomycosis-United States, 1998-2011.: Morbidity and Mortality Weekly Report
(MMWR), Centers for Disease Control and Prevention. pp. 217-221.
57. (February 13, 2009 / 58(05);105-109) Increase in Coccidioidomycosis-California,
2000-2007.: Morbidity and Mortality Weekly Report (MMWR)-Weekly.
58. Tamerius JD, Comrie AC (2011) Coccidioidomycosis Incidence in Arizona Predicted
by Seasonal Precipitation. Plos One 6.
59. Galgiani JN (1999) Coccidioidomycosis: A Regional Disease of National Importance:
Rethinking Approaches for Control. Annals of Internal Medicine 130: 293.
60. Becker-Merok A, Nikolaisen C, Nossent HC (2006) B-lymphocyte activating factor
in systemic lupus erythematosus and rheumatoid arthritis in relation to autoantibody
levels, disease measures and time. Lupus 15: 570 - 576.
61. Mark D. Lindsley DWW, Christine J. Morrison (2006) Serological and Molecular
Diagnosis of Fungal Infections. In: Detrick BH, Robert G. Folds, James D., editor.

237
Manual of Molecular and Clinical Laboratory Immunology. 7th ed. Washington, DC,
USA: ASM Press. pp. 569-605.
62. Pappagianis D (2001) Serologic studies in Coccidioidomycosis. Seminars in
Respiratory Infections 16: 242-250.
63. Stevens DA, Clemons KV, Levine HB, Pappagianis D, Baron EJ, et al. (2009) Expert
Opinion: What To Do When There Is Coccidioides Exposure in a Laboratory. Clinical
Infectious Diseases 49: 919-923.
64. Ditomasso JP, Ampel NM, Sobonya RE, Bloom JW (1994) Bronchoscopic diagnosis
of pulmonary Coccidioidomycosis - Comparison of cytology, culture and transbronchial
biopsy. Diagnostic Microbiology and Infectious Disease 18: 83-87.
65. Saubolle MA (2007) Laboratory aspects in the diagnosis of coccidioidomycosis.
Coccidioidomycosis: Sixth International Symposium 1111: 301-314.
66. Chase BA, Johnston SA, Legutki JB (2012) Evaluation of Biological Sample
Preparation for Immunosignature-Based Diagnostics. Clinical and Vaccine Immunology
19.
67. Mathisen G, Shelub A, Truong J, Wigen C (2010) Coccidioidal Meningitis Clinical
Presentation and Management in the Fluconazole Era. Medicine 89: 251-284.
68. Drake KW, Adam RD (2009) Coccidioidal meningitis and brain abscesses Analysis
of 71 cases at a referral center. Neurology 73: 1780-1786.
69. E B, JS D, WL H, RD M (1981) Coccidioidal Meningitis. An analysis of thirty one
cases and review of the literature. Medicine 60: 139-172.
70. Ihaka R, Gentleman R (1996) R: A Language for Data Analysis and Graphics. 5:
299-314.
71. Weihs C, Ligges U, Luebke K, Raabe N (2005) klaR Analyzing German Business
Cycles. Berlin: Springer-Verlag.

238
72. Torgo L (2010) Data Mining with R: Learning with Case Studies: Chapman and
Hall/CRC.
73. Johnson WE, Li C, Rabinovic A (2007) Adjusting batch effects in microarray
expression data using empirical Bayes methods. Biostatistics 8: 118-127.
74. Chen C, Grennan K, Badner J, Zhang D, Gershon E, et al. (2011) Removing Batch
Effects in Analysis of Expression Microarray Data: An Evaluation of Six Batch
Adjustment Methods. Plos One 6.
75. Legutki JB, Johnston SA (2013) Immunosignatures can predict vaccine efficacy.
Proceedings of the National Academy of Sciences of the United States of America 110:
18614-18619.
76. Brown GD, Denning DW, Gow NAR, Levitz SM, Netea MG, et al. (2012) Hidden
Killers: Human Fungal Infections. Science Translational Medicine 4.
77. Saubolle MA, McKellar PP, Sussland D (2007) Epidemiologic, clinical, and
diagnostic aspects of coccidioidomycosis. Journal of Clinical Microbiology 45: 26-30.
78. Polage CR, Billetdeaux E, Litwin CM, Petti CA (2006) Revisiting the sensitivity of
serologic testing in culture positive coccidioidomycosis. Abstracts of the General
Meeting of the American Society for Microbiology 106: 244-245.
79. Blair JE, Coakley B, Santelli AC, Hentz JG, Wengenack NL (2006) Serologic testing
for symptomatic coccidioidomycosis in immunocompetent and immunosuppressed hosts.
Mycopathologia 162: 317-324.
80. Navalkar KA, Johnston SA, Stafford P, Galgiani J, Magee DM (2014) Application of
Immunosignaturing to diagnosis of Valley Fever. In: Center for Innovations in Medicine
TBI, Arizona State University, Tempe, AZ, Center for Personalized Diagnostics TBI,
Arizona State University, Tempe, AZ, Valley Fever Center for Excellence UoA, Tucson,
AZ, editors. [manuscript in submission] ed.
81. Yang MC, Magee DM, Cox RA (1997) Mapping of a Coccidioides immitis-specific
epitope that reacts with complement-fixing antibody. Infection and Immunity 65: 4068-
4074.

239
82. Zhu YF, Tryon V, Magee DM, Cox RA (1997) Identification of a Coccidioides
immitis antigen 2 domain that expresses B-cell-reactive epitopes. Infection and Immunity
65: 3376-3380.
83. Ivey FD, Magee DM, Woitaske MD, Johnston SA, Cox RA (2003) Identification of a
protective antigen of Coccidioides immitis by expression library immunization. Vaccine
21: 4359-4367.
84. Pan SC, Cole GT (1995) Molecular and Biochemical-characterization of a
Coccidioides immitis-specific antigen. Infection and Immunity 63: 3994-4002.
85. Petrilli P (1993) Classification of protein sequences by their dipeptide composition.
Computer Applications in the Biosciences 9: 205-209.
86. Huang J, Ru B, Zhu P, Nie F, Yang J, et al. (2012) MimoDB 2.0: a mimotope
database and beyond. Nucleic Acids Research 40: D271-D277.
87. Grantham R (1974) AMINO-ACID DIFFERENCE FORMULA TO HELP
EXPLAIN PROTEIN EVOLUTION. Science 185: 862-864.
88. Buus S, Rockberg J, Forsstrom B, Nilsson P, Uhlen M, et al. (2012) High-resolution
Mapping of Linear Antibody Epitopes Using Ultrahigh-density Peptide Microarrays.
Molecular & Cellular Proteomics 11: 1790-1800.
89. Sun J, Xu T, Wang S, Li G, Wu D, et al. (2011) Does difference exist between
epitope and non-epitope residues?Analysis of the physicochemical and structural
properties on conformational epitopes from B-cell protein antigens. Immunome Research
7.
90. Centers for Disease Control and Prevention: Tularemia webpage.
91. Altschul SF, Wootton JC, Gertz EM, Agarwala R, Morgulis A, et al. (2005) Protein
database searches using compositionally adjusted substitution matrices. Febs Journal 272:
5101-5109.

240
92. Keasey SL, Schmid KE, Lee MS, Meegan J, Tomas P, et al. (2009) Extensive
Antibody Cross-reactivity among Infectious Gram-negative Bacteria Revealed by
Proteome Microarray Analysis. Molecular & Cellular Proteomics 8: 924-935.
93. Kuberski T, Myers R, Wheat LJ, Durkin M, Connolly P, et al. (2007) Diagnosis of
coccidioidomycosis by antigen detection using cross-reaction with a histoplasma antigen.
Clinical Infectious Diseases 44: 50-54.
94. RH J, S B (2008) Coccidioidomycosis Infectious Disease. In: Hospenthal D, Rinaldi
M, editors. Diagnosis and Treatment of Human Mycoses. Totowa, NJ.: Humana Press
Inc. pp. 295-315.
95. Blair JE (2009) Coccidioidal meningitis: Update on epidemiology, clinical features,
diagnosis, and management. Current Infectious Disease Reports 11: 289-295.
96. Smith CE, Saito MT, Simons SA (1956) Pattern of 39,500 serologic tests in
Coccidioidomycosis. Jama-Journal of the American Medical Association 160: 546-552.
97. Thompson GR, Lunetta JM, Johnson SM, Taylor S, Bays D, et al. (2011) Early
Treatment With Fluconazole May Abrogate the Development of IgG Antibodies in
Coccidioidomycosis. Clinical infectious diseases 53: e20-e24.
98. Marr KA, Balajee SA, McLaughlin L, Tabouret M, Bentsen C, et al. (2004) Detection
of galactomannan antigenemia by enzyme immunoassay for the diagnosis of invasive
aspergillosis: Variables that affect performance. Journal of Infectious Diseases 190: 641-
649.
99. Kringelum JV, Nielsen M, Padkjaer SB, Lund O (2013) Structural analysis of B-cell
epitopes in antibody:protein complexes. Molecular Immunology 53: 24-34.
100. Graybill JR, Stevens DA, Galgiani JN, Dismukes WE, Cloud GA (1990)
Itraconazole treatment of Coccidioidomycosis. American Journal of Medicine 89: 282-
290.
101. Notkins AL (2004) Polyreactivity of antibody molecules. Trends in Immunology 25:
174-179.

241
102. Halperin RF, Stafford P, Johnston SA (2011) Exploring Antibody Recognition of
Sequence Space through Random-Sequence Peptide Microarrays. Molecular & Cellular
Proteomics 10.
103. Mouquet H, Nussenzweig MC (2012) Polyreactive antibodies in adaptive immune
responses to viruses. Cellular and Molecular Life Sciences 69: 1435-1445.
104. Mezzasoma L, Bacarese-Hamilton T, Di Cristina M, Rossi R, Bistoni F, et al. (2002)
Antigen microarrays for serodiagnosis of infectious diseases. Clinical Chemistry 48: 121-
130.
105. Reverberi R, Reverberi L (2007) Factors affecting the antigen-antibody reaction.
Blood Transfusion 5: 227-240.
106. Barderas MG, Rodriguez F, Gomez-Puertas P, Aviles M, Beitia F, et al. (2001)
Antigenic and immunogenic properties of a chimera of two immunodominant African
swine fever virus proteins. Archives of Virology 146: 1681-1691.
107. GomezPuertas P, Rodriguez F, Oviedo JM, RamiroIbanez F, RuizGonzalvo F, et al.
(1996) Neutralizing antibodies to different proteins of African swine fever virus inhibit
both virus attachment and internalization. Journal of Virology 70: 5689-5694.
108. Neilan JG, Zsak L, Lu Z, Burrage TG, Kutish GF, et al. (2004) Neutralizing
antibodies to African swine fever virus proteins p30, p54, and p72 are not sufficient for
antibody-mediated protection. Virology 319: 337-342.
109. Davies DH, Molina DM, Wrammert J, Miller J, Hirst S, et al. (2007) Proteome-wide
analysis of the serological response to vaccinia and smallpox. Proteomics 7: 1678-1686.
110. Benhnia MR-E-I, McCausland MM, Su H-P, Singh K, Hoffmann J, et al. (2008)
Redundancy and Plasticity of Neutralizing Antibody Responses Are Cornerstone
Attributes of the Human Immune Response to the Smallpox Vaccine. Journal of Virology
82: 3751-3768.
111. Davies DH, Wyatt LS, Newman FK, Earl PL, Chun S, et al. (2008) Antibody
profiling by proteome microarray reveals the immunogenicity of the attenuated smallpox

242
vaccine modified vaccinia virus Ankara is comparable to that of Dryvax. Journal of
Virology 82: 652-663.
112. Sundaresh S, Randall A, Unal B, Petersen JM, Belisle JT, et al. (2007) From protein
microarrays to diagnostic antigen discovery: a study of the pathogen Francisella
tularensis. Bioinformatics 23: I508-I518.
113. Eyles JE, Unal B, Hartley MG, Newstead SL, Flick-Smith H, et al. (2007)
Immunodominant Francisella tularensis antigens identified using proteome microarray.
©Crown Copyright 2007 Dstl. 7: 2172-2183.
114. Baillie L, Townend T, Walker N, Eriksson U, Williamson D (2004) Characterization
of the human immune response to the UK anthrax vaccine. Fems Immunology and
Medical Microbiology 42: 267-270.
115. Crowe SR, Ash LL, Engler RJM, Ballard JD, Harley JB, et al. (2010) Select Human
Anthrax Protective Antigen Epitope-Specific Antibodies Provide Protection from Lethal
Toxin Challenge. Journal of Infectious Diseases 202: 251-260.
116. Gubbins MJ, Schmidt L, Tsang RS, Berry JD, Kabani A, et al. (2007) Development
of a Competitive Enzyme Linked Immunosorbent Assay to Identify Epitope Specific
Antibodies in Recipients of the U.S. Licensed Anthrax Vaccine. Journal of Immunoassay
and Immunochemistry 28: 213-225.
117. Chen JH, Jung JW, Wang Y, Ha KS, Lu F, et al. (2010) Immunoproteomics
Profiling of Blood Stage Plasmodium vivax Infection by High-Throughput Screening
Assays. Journal of Proteome Research 9: 6479-6489.
118. Cole GT, Kruse D, Seshan KR (1991) Antigen complex of Coccidioides immitis
which elicits a precipitin antibody-response in patients. Infection and Immunity 59: 2434-
2446.
119. Cox RA, Magee DM (2004) Coccidioidomycosis: Host response and vaccine
development. Clinical Microbiology Reviews 17: 804-+.

243
120. Emini EA, Hughes JV, Perlow DS, Boger J (1985) Induction of Hepatitis-A virus-
neutralizing antibody by a virus-specific synthetic peptide. Journal of Virology 55: 836-
839.
121. Parker JMR, Guo D, Hodges RS (1986) New Hydrophilicity scale derived from
High-performance liquid-chromatography peptide retention data - Correlation of
predicted surface residues with antigenicity and X-ray-derived accessible sites.
Biochemistry 25: 5425-5432.
122. Kolaskar AS, Tongaonkar PC (1990) A Semiempirical method for prediction of
antigenic determinants of protein antigens. Febs Letters 276: 172-174.
123. Karplus PA, Schulz GE (1985) Prediction of chain flexibility in proteins - A tool for
the selection of peptide antigens. Naturwissenschaften 72: 212-213.
124. Zweig MH, Campbell G (1993) RECEIVER-OPERATING CHARACTERISTIC
(ROC) PLOTS - A FUNDAMENTAL EVALUATION TOOL IN CLINICAL
MEDICINE. Clinical Chemistry 39: 561-577.
125. Oh SJ, Ju JM, Kim BC, Ko E, Hong BJ, et al. (2005) DNA microarrays on a
dendron-modified surface improve significantly the detection of single nucleotide
variations in the p53 gene. Nucleic Acids Research 33.
126. Halperin R (2011) Characterization and Analysis of a Novel Platform for Profiling
the Antibody Response In: University AS, editor. Tempe, AZ.
127. Sagawa T, Oda M, Ishimura M, Furukawa K, Azuma T (2003) Thermodynamic and
kinetic aspects of antibody evolution during the immune response to hapten. Molecular
Immunology 39: 801-808.
128. Kusnezow W, Syagailo YV, Rueffer S, Baudenstiel N, Gauer C, et al. (2006)
Optimal design of microarray immunoassays to compensate for kinetic limitations -
Theory and experiment. Molecular & Cellular Proteomics 5: 1681-1696.
129. Warter L, Appanna R, Fink K (2012) Human poly- and cross-reactive anti-viral
antibodies and their impact on protection and pathology. Immunologic Research 53: 148-
161.

244
130. Waag DM, McKee KT, Sandstrom G, Pratt LLK, Bolt CR, et al. (1995) Cell-
mediated and Humoral immune-responses after vaccination of human volunteers with the
Live Vaccine Strain of Francisella tularensis. Clinical and Diagnostic Laboratory
Immunology 2: 143-148.
131. Saeed M, Roeffen W, Alexander N, Drakeley CJ, Targett GAT, et al. (2008)
Plasmodium falciparum Antigens on the Surface of the Gametocyte-Infected Erythrocyte.
Plos One 3.
132. Yoshinoya S, Cox RA, Pope RM (1980) Circulating immune-complexes in
Coccidioidomycosis - Detection and Characterization. Journal of Clinical Investigation
66: 655-663.
133. Sigounas G, Kolaitis N, Monelltorrens E, Notkins AL (1994) Polyreactive IgM
antibodies in the circulation are masked by Antigen-binding. Journal of Clinical
Immunology 14: 375-381.
134. Chumpitazi B, Lepers JP, Rason M, Meunier A, Boudin C, et al. (1993) Circulating
stable antigens at higher levels down-regulate antibody-responses to Plasmodium
falciparum. Parasitology Research 79: 163-167.
135. de Dominguez N, Rodriguez-Acosta A (2000) A 33-35 kDa circulating antigen from
Plasmodium falciparum. Folia Parasitol (Praha) 47: 267-272.
136. Durkin M, Estok L, Hospenthal D, Crum-Cianflone N, Swartzentruber S, et al.
(2009) Detection of Coccidioides Antigenemia following Dissociation of Immune
Complexes. Clinical and Vaccine Immunology 16: 1453-1456.
137. Mathers C, Fat DM, Boerma JT, World Health O (2008) The global burden of
disease : 2004 update. Geneva, Switzerland: World Health Organization.
138. Khetsuriani N, Quiroz ES, Holman RC, Anderson LJ (2003) Viral meningitis-
associated hospitalizations in the United States, 1988-1999. Neuroepidemiology 22: 345-
352.
139. Chow FC, Marra CM, Cho TA (2011) Cerebrovascular disease in central nervous
system infections. Semin Neurol 31: 286-306.

245
140. Kusalik A, Trost B, Bickis M, Fasano C, Capone G, et al. (2009) Codon number
shapes peptide redundancy in the universal proteome composition. Peptides 30: 1940-
1944.
141. Navalkar KA, Johnston SA, Stafford P, Halperin R (2014) Multi-pathogen peptide
based serological diagnostic. In: Center for Innovations in Medicine TBI, Arizona State
University, editor. [manuscript in preparation] ed. Tempe, Arizona.
142. Balakrishnan T, Bela-Ong DB, Toh YX, Flamand M, Devi S, et al. (2011) Dengue
Virus Activates Polyreactive, Natural IgG B Cells after Primary and Secondary Infection.
Plos One 6.
143. Greenbaum JA, Kotturi MF, Kim Y, Oseroff C, Vaughan K, et al. (2009) Pre-
existing immunity against swine-origin H1N1 influenza viruses in the general human
population. Proceedings of the National Academy of Sciences of the United States of
America 106: 20365-20370.
144. Konishi E (2009) Status of natural infection with Japanese encephalitis virus in
Japan: Prevalence of antibodies to the nonstructural 1 protein among humans and horses.
Vaccine 27: 7129-7130.
145. Fange Y, Banner D, Kelvin AA, Huang SSH, Paige CJ, et al. (2012) Seasonal H1N1
Influenza Virus Infection Induces Cross-Protective Pandemic H1N1 Virus Immunity
through a CD8-Independent, B Cell-Dependent Mechanism. Journal of Virology 86:
2229-2238.
146. Throsby M, van den Brink E, Jongeneelen M, Poon LLM, Alard P, et al. (2008)
Heterosubtypic Neutralizing Monoclonal Antibodies Cross-Protective against H5N1 and
H1N1 Recovered from Human IgM(+) Memory B Cells. Plos One 3.
147. Whittle JRR, Zhang RJ, Khurana S, King LR, Manischewitz J, et al. (2011) Broadly
neutralizing human antibody that recognizes the receptor-binding pocket of influenza
virus hemagglutinin. Proceedings of the National Academy of Sciences of the United
States of America 108: 14216-14221.
148. Vaughan K, Greenbaum J, Blythe M, Peters B, Sette A (2010) Meta-analysis of All
Immune Epitope Data in the Flavivirus Genus: Inventory of Current Immune Epitope

246
Data Status in the Context of Virus Immunity and Immunopathology. Viral Immunology
23: 259-284.
149. Yamada KI, Takasaki T, Nawa M, Yabe S, Kurane I (2003) Antibody responses
determined for Japanese dengue fever patients by neutralization and hemagglutination
inhibition assays demonstrate cross-reactivity between dengue and Japanese encephalitis
viruses. Clinical and Diagnostic Laboratory Immunology 10: 725-728.
150. Kanduc D, Stufano A, Lucchese G, Kusalik A (2008) Massive peptide sharing
between viral and human proteomes. Peptides 29: 1755-1766.
151. Patel A, Dong JC, Trost B, Richardson JS, Tohme S, et al. (2012) Pentamers Not
Found in the Universal Proteome Can Enhance Antigen Specific Immune Responses and
Adjuvant Vaccines. PLoS ONE 7: e43802.
152. FluView: 2012-2013 Influenza Season Surveillance Summary (CDC) Centers for
disease control and prevention.
153. Richer J, Stafford P, Johnston SA (2014) Epitope identification from fixed-
complexity random-sequence peptide microarrays. In: Center for Innovations in Medicine
TBI, Arizona State University., editor. [Manuscript in preparation] ed. Tempe, Arizona.
154. Krzywinski M, Schein J, Birol I, Connors J, Gascoyne R, et al. (2009) Circos: An
information aesthetic for comparative genomics. Genome Research 19: 1639-1645.
155. Vesth T, Lagesen K, Acar Ö, Ussery D (2013) CMG-Biotools, a Free Workbench
for Basic Comparative Microbial Genomics. PLoS ONE 8: e60120.
156. Mina MJ, Klugman KP, McCullers JA (2013) Live Attenuated Influenza Vaccine,
But Not Pneumococcal Conjugate Vaccine, Protects Against Increased Density and
Duration of Pneumococcal Carriage After Influenza Infection in Pneumococcal
Colonized Mice. Journal of Infectious Diseases 208: 1281-1285.
157. Roy S, Patil D, Dahake R, Mukherjee S, Athlekar SV, et al. (2012) Prevalence of
influenza virus among the paediatric population in Mumbai during 2007-2009. Indian
Journal of Medical Microbiology 30: 155-158.

247
158. Prim D, Rebeaud F, Cosandey V, Marti R, Passeraub P, et al. (2013) ADIBO-Based
"Click" Chemistry for Diagnostic Peptide Micro-Array Fabrication: Physicochemical and
Assay Characteristics. Molecules 18: 9833-9849.
159. West Nile virus seroconversion panel No. PWN901. Fisher Scientific. SeraCare Life
Sciences Inc.
160. Chamczuk AJ, Ursell M, O'Connor P, Jackowski G, Moscarello MA (2002) A rapid
ELISA-based serum assay for myelin basic protein in multiple sclerosis. Journal of
Immunological Methods 262: 21-27.
161. Narayanan S, Jurafsky D (1998) Bayesian models of human sentence processing. In:
Gernsbacher MA, Derry SJE, editors. Proceedings of 20th Annual Conference of the
Cognitive Science Society. University of Wisconsin-Madison: Lawrence Erlbaum
Associates. pp. 752-757.
162. Hjelm B, Forsström B, Löfblom J, Rockberg J, Uhlén M (2012) Parallel
Immunizations of Rabbits Using the Same Antigen Yield Antibodies with Similar, but
Not Identical, Epitopes. PLoS ONE 7: e45817.
163. Hirschmann JV (2007) The early history of coccidioidomycosis: 1892-1945.
Clinical Infectious Diseases 44: 1202-1207.
164. Lalkhen AG, McCluskey A (2008) Clinical tests: sensitivity and specificity.
Continuing Education in Anaesthesia, Critical Care & Pain 8: 221-223.
165. Casadevall A, Pirofski L-A (2006) The weapon potential of human pathogenic
fungi. Medical Mycology 44: 689-696.
166. Clemons KV, Capilla J, Stevens DA (2007) Experimental animal models of
coccidioidomycosis. Coccidioidomycosis: Sixth International Symposium 1111: 208-224.
167. Tager M, Liebow AA (1942) Intranasal and intraperitoneal infection of the mouse
with Coccidioides immitis. Yale Jour Biol and Med 15: 41-60.

248
168. Tarbet JE, Wright ET, Newcomer VD (1952) Experimental Coccidioidal
Granuloma-Developmental stages of Sporangia in mice. American Journal of Pathology
28: 901-917.
169. Shubitz LF, Dial SM, Perrill R, Casement R, Galgiani JN (2008) Vaccine-Induced
Cellular Immune Responses Differ from Innate Responses in Susceptible and Resistant
Strains of Mice Infected with Coccidioides posadasii. Infection and Immunity 76: 5553-
5564.
170. Taxy JB, Kodros S (2005) Musculoskeletal coccidioidomycosis - Unusual sites of
disease in a nonendemic area. American Journal of Clinical Pathology 124: 693-696.
171. Schenken JR, Palik EE (1942) Coccidioidomycosis in states other than California,
with report of a case in Louisiana. Archives of Pathology 34: 484-494.
172. Dionne SO, Podany AB, Ruiz YW, Ampel NM, Galgiani JN, et al. (2006) Spherules
derived from Coccidioides posadasii promote human dendritic cell maturation and
activation. Infection and Immunity 74: 2415-2422.
173. Smith DM, Simon JK, Baker JR, Jr. (2013) Applications of nanotechnology for
immunology. Nature Reviews Immunology 13: 592-605.
174. Shubitz LF, Trinh HT, Perrill RH, Thompson CM, Hanan NJ, et al. (2014) Modeling
Nikkomycin Z Dosing and Pharmacology in Murine Pulmonary Coccidioidomycosis
Preparatory to Human Phase II Trials. Journal of Infectious Diseases.
175. Shubitz LF, Roy ME, Nix DE, Galgiani JN (2013) Efficacy of Nikkomycin Z for
respiratory coccidioidomycosis in naturally infected dogs. Medical Mycology 51: 747-
754.
176. Munteanu CR, Gonzalez-Diaz H, Borges F, de Magalhaes AL (2008)
Natural/random protein classification models based on star network topological indices.
Journal of Theoretical Biology 254: 775-783.
177. Sharma A, Kapoor P, Gautam A, Chaudhary K, Kumar R, et al. (2013)
Computational approach for designing tumor homing peptides. Scientific Reports 3.

249
178. Tyagi A, Kapoor P, Kumar R, Chaudhary K, Gautam A, et al. (2013) In Silico
Models for Designing and Discovering Novel Anticancer Peptides. Scientific Reports 3.
179. Gautam A, Chaudhary K, Kumar R, Sharma A, Kapoor P, et al. (2013) In silico
approaches for designing highly effective cell penetrating peptides. Journal of
Translational Medicine 11.
180. Rubinstein ND, Mayrose I, Halperin D, Yekutieli D, Gershoni JM, et al. (2008)
Computational characterization of B-cell epitopes. Molecular Immunology 45: 3477-
3489.
181. Yuriev E, Ramsland PA (2013) Latest developments in molecular docking: 2010-
2011 in review. Journal of Molecular Recognition 26: 215-239.
182. Binkowski TA, Marino SR, Joachimiak A (2012) Predicting HLA Class I Non-
Permissive Amino Acid Residues Substitutions. Plos One 7.
183. Flower DR (2013) Designing immunogenic peptides. Nature Chemical Biology 9:
748-752.
184. Jaing C, Gardner S, McLoughlin K, Thissen JB, Slezak T (2011) Detection of
Adventitious Viruses from Biologicals Using a Broad-Spectrum Microbial Detection
Array. PDA Journal of Pharmaceutical Science and Technology 65: 668-674.
185. Tamura K, Peterson D, Peterson N, Stecher G, Nei M, et al. (2011) MEGA5:
Molecular Evolutionary Genetics Analysis Using Maximum Likelihood, Evolutionary
Distance, and Maximum Parsimony Methods. Molecular Biology and Evolution 28:
2731-2739.
186. Bradley H, Markowitz LE, Gibson T, McQuillan GM (2013) Seroprevalence of
Herpes Simplex Virus Types 1 and 2—United States, 1999–2010. Journal of Infectious
Diseases.
187. Chayavichitsilp P, Buckwalter JV, Krakowski AC, Friedlander SF (2009) Herpes
Simplex. Pediatrics in Review 30: 119-130.

250
188. Smith JS, Robinson NJ (2002) Age-Specific Prevalence of Infection with Herpes
Simplex Virus Types 2 and 1: A Global Review. Journal of Infectious Diseases 186: S3-
S28.
189. Weiner MH (1983) Antigenemia detected in Human Coccidioidomycosis. Journal of
Clinical Microbiology 18: 136-142.
190. Galgiani JN, Grace GM, Lundergan LL (1991) New serologic tests for early
detection of Coccidioidomycosis. Journal of Infectious Diseases 163: 671-674.
191. Johnson SM, Simmons KA, Pappagianis D (2004) Amplification of coccidioidal
DNA in clinical specimens by PCR. Journal of Clinical Microbiology 42: 1982-1985.
192. Ascioglu S, Rex JH, de Pauw B, Bennett JE, Bille J, et al. (2002) Defining
opportunistic invasive fungal infections in immunocompromised patients with cancer and
hematopoietic stem cell transplants: An international consensus. Clinical Infectious
Diseases 34: 7-14.
193. Telenti A, Roberts GD (1989) Fungal Blood Cultures. European Journal of Clinical
Microbiology & Infectious Diseases 8: 825-831.
194. Rempe S, Sachdev MS, Bhakta R, Pineda-Roman M, Vaz A, et al. (2007)
Coccidioides immitis fungemia: Clinical features and survival in 33 adult patients. Heart
& Lung 36: 64-71.
195. Keckich DW, Blair JE, Vikram HR (2010) Coccidioides Fungemia in Six Patients,
with a Review of the Literature. Mycopathologia 170: 107-115.
196. Idriss MH, Khalil A, Elston D (2013) The diagnostic value of fungal fluorescence in
onychomycosis. Journal of Cutaneous Pathology 40: 385-390.
197. Plewig G, Marples RR (1970) Regional Differences of Cell sizes in Human Stratum
Corneum Part I. Journal of Investigative Dermatology 54: 13-&.
198. Fetsch PA, Abati A (2001) Immunocytochemistry in effusion cytology - A
contemporary review. Cancer Cytopathology 93: 293-308.

251
199. Pass HI, Stevens EJ, Oie H, Tsokos MG, Abati AD, et al. (1995) Characteristics of
nine newly-derived mesothelioma cell lines. Annals of Thoracic Surgery 59: 835-844.
200. Kaplan W (1967) Application of the fluorescent antibody technique to the diagnosis
and study of coccidioidomycosis. Proceedings of the Second Symposium on
Coccidioidomycosis, 8-10 December, 1965, Phoenix, Ariz: 227-231.
201. Graham AR (1983) Fungal Autofluorescence with Ultraviolet illumination.
American Journal of Clinical Pathology 79: 231-234.
202. Elston DM (2001) Fluorescence of fungi in superficial and deep fungal infections.
BMC Microbiology 1: 1-4.
203. Rao S, Rajkumar A, Ehtesham M, Prathiba D (2008) Autofluorescence: A screening
test for mycotic infection in tissues. Indian Journal of Pathology and Microbiology 51:
215-217.
204. Jiang CY, Magee DM, Ivey FD, Cox RA (2002) Role of signal sequence in vaccine-
induced protection against experimental coccidioidomycosis. Infection and Immunity 70:
3539-3545.
205. Cenci S, Sitia R (2007) Managing and exploiting stress in the antibody factory. Febs
Letters 581: 3652-3657.
206. Chen Y, Cai J, Xu Q, Chen ZW (2004) Atomic force bio-analytics of polymerization
and aggregation of phycoerythrin-conjugated immunoglobulin G molecules. Molecular
Immunology 41: 1247-1252.
207. Henry N, Parce JW, McConnell HM (1978) Visualization of specific antibody and
C1q binding to hapten-sensitized lipid vesicles. Proceedings of the National Academy of
Sciences of the United States of America 75: 3933-3937.
208. Chan KH, To KKW, Hung IFN, Zhang AJX, Chan JFW, et al. (2011) Differences in
Antibody Responses of Individuals with Natural Infection and Those Vaccinated against
Pandemic H1N1 2009 Influenza. Clinical and Vaccine Immunology 18: 867-873.

252
209. Cretich M, Damin F, Longhi R, Gotti C, Galati C, et al. (2010) Peptide Microarrays
on Coated Silicon Slides for Highly Sensitive Antibody Detection. Small Molecule
Microarrays: Methods and Protocols 669: 147-160.
210. Whitlock GC, Robida MD, Judy BM, Qazi O, Brown KA, et al. (2011) Protective
antigens against glanders identified by expression library immunization. Frontiers in
Microbiology 2.
211. Borca MV, Irusta P, Carrillo C, Afonso CL, Burrage T, et al. (1994) African swine
fever virus structural protein p72 contains a conformational neutralizing epitope.
Virology 201: 413-418.
212. Pedelacq JD, Cabantous S, Tran T, Terwilliger TC, Waldo GS (2006) Engineering
and characterization of a superfolder green fluorescent protein. Nature Biotechnology 24:
79-88.
213. Sykes KF, Johnston SA (1999) Linear expression elements: a rapid, in vivo, method
to screen for gene functions. Nature Biotechnology 17: 355-359.
214. Montor WR, Huang J, Hu YH, Hainsworth E, Lynch S, et al. (2009) Genome-Wide
Study of Pseudomonas aeruginosa Outer Membrane Protein Immunogenicity Using Self-
Assembling Protein Microarrays. Infection and Immunity 77: 4877-4886.

253
APPENDIX I
COCCIDIOIDES SPHERULES IN SERA
INTERFERENCE IN MICROARRAYS – SUPPLEMENTAL FIGURES AND TABLES
FOR CHAPTER 2

254
The recovery of culturable Coccidioides spherules from blood is 0.4% (n=5,026;
0.4% = 20 samples) as per a retrospective study from processing 55,788 samples in a
diagnostic lab in Phoenix (endemic for Coccidioides) [77]. The highest recovery rate of
this pathogen through culturing techniques is directly from the primary site of infection,
i.e. respiratory tract specimens is 8.3% (n=10,372; 8.3% = 861 samples). Coccidioidal
antigenemia to galactomannan [136] or coccidiodes specific antigens [189,190] has been
detected in patient sera through ELISA’s for antigens and DNA using PCR [191].
Fungemia [192] is a common feature of several fungal infections, but only observed in
the disseminated form of Coccidioidomycosis [193]. The prognosis of these patients is
poor with mortality rates up to 73% [194] Till date, 113 cases showing fungemia have
been reported in literature as reviewed by Blair et al. in 2010 [195]. The detection of
fungemia in Coccidioidomycosis is impeded due to physician’s not ordering the fungal
blood culture assay or the assay not being performed in clinical laboratories with
modifications providing higher recovery rates from blood [193]. One such modification is
the lysis centrifugation system whereby, whole blood is lysed and centrifuged so that the
microorganisms are released from polymorphonuclear leukocytes and the sediment is
cultured on appropriate fungal culture media [193].
The spherules of Coccidioides range in size from 3 µm to the largest recorded in
literature from a patient, 262 µm [171]. The following observation is the first report on
Coccidioidal spherules-like objects observed in Valley Fever (VF) infected patient sera
and the probable interference they might impose on antibody detecting peptide
microarrays. Coccidioidal antigenemia in sera is reported to interfere with antigen

255
detection based assays yielding lower true positives. For example, in the MiraVista
Diagnostic Coccidioidal anti-galactomannan antibodies were used to detect antigenemia
in EDTA and heat treated sera (73.1% positive) versus untreated sera (28.6% true
positives detected). In context to the peptide microarray, if Coccidioidal spherules
capture VF infected individuals antibody, a protocol change allowing dissociation of
circulating antigen-antibody complexes without degrading antibodies from VF infected
sera might enhance detection of antibodies on our assay.
I noted the presence of brightly fluorescent spherule-like globular objects when
processing patient sera from VF infected individuals (Figure A1- 1, Figure A1- 2). A
summary of these incidental observations is presented in Table A1- 1. The diameter of
these N=15 spherule-like globules observed from 12 patient sera falls within the range
observed in clinical samples with the exception of the larger spherules (290 to
486µm).The size of these objects made it unlikely that they were T or B cells (7-10µm),
Dendritic cells or Macrophages (10-22µm) Neutrophils (8-15µm) and Eosinophils (10-
12µm) [173] or auto-fluorescent human skin cells [196] from the stratum-corneum (34-
44µm) [197]. The spherule-like objects likely showed high fluorescence in both red
(IgM-Median fluorescence intensity units (FIU) range: 6,237.5 to 50,358) and green
channels (IgG-Median FIU range: 1,040 to 11,711). These images were obtained during
routine scanning of 1:500 diluted patient sera which was incubated on the VF diagnostic
peptide sub-array and detected using anti-human secondary antibodies. Such globular
objects were not observed on slides when processing any other infected sera (West Nile
Virus (WNV) infected human sera, F.tularensis Live Vaccine Strain (LVS) vaccinated

256
human sera, Normal human sera, African Swine Fever Virus (ASFV) infected swine sera,
Influenza PR8 strain infected mouse sera, Vaccinia-Western Reserve strain vaccinated
human sera) under similar microarray processing conditions.
Figure A1- 1 A screenshot of a spherule-like object (Slide No. CNS00209) as captured
using GenePix Pro on the VF diagnostic sub-array (slide surface: Aminosilane).
The distribution of signal in fluorescence intensity (FIU) within the encircled area
selected is depicted at a wavelength of 649 nm.

257
Figure A1- 2 A screenshot of a spherule-like object (Slide No. CNS00209) as captured
within GenePix on the VF diagnostic sub-array (slide surface: Aminosilane)
The distribution of signal in fluorescence intensity units (FIU) within the encircled area
selected is depicted at a wavelength of 549 nm.

258
Table A1- 1 Summary of Spherules-like objects observed in VF infected individuals sera
when incubated on aminosilane surface VF diagnostic sub-arrays.
Signals depicted in Fluorescence intensity units (FIU).
No. Patient
No.
Slide
Num
ber
Area-
GenePix
estimate(
µm2)
GenePix
estimated
Diameter
(µm)
Mean
Signal
FIU
(649nm)
Mean
Signal
FIU
(549nm)
Spherule-
like
objects
1 BL55
(0-407)
CNS0
0206 78400 316
39527 3184
2 32-555
CNS0
0146 21800 167
13817 3016
3 BL58
(1-412)
CNS0
0208 44000 237
31604 3842
4 BL58
(1-412)
CNS0
0208 21800 167
21461 3034
5 BL57
(0-412)
CNS0
0209 96400 350
47544 11011
6 BL58
(1-412)
CNS0
0209 29200 193
26146 2568
7 BL61
(0-413)
CNS0
0210 29200 193
22687 2814
8 BL62
(0-413)
CNS0
0213 73600 306
25863 3040
9 BL68
(0-472)
CNS0
0216 166100 460
25608 2690
10 32-
1280
CNS0
0149 53600 261
16971 2935
11 BL49
(0-391)
CNS0
0201 151700 440
34247 6707

259
12 BL49
(0-391)
CNS0
0201 185600 486
24104 11521
13 2-7
CNS0
0123 35200 212
11996 1602
14 64-607
CNS0
0152 66400 291
25537 3474
15 BL52
(0-401)
CNS0
0205 38500 221
32862 13208
Several aspects of processing peptide microarrays are identical to pre-processing
conditions applied in Immunohistochemistry (IHC). For example, the peptide microarray
slide surface used in this analysis was Aminosilane activated with SMCC (primary
amines present on surface at a density of one free primary amine group ~ per 1nm). In
IHC cytospin protocols, cells are fixed on silanated glass slides [198]. The patient sera in
this assay was diluted 1:500 in the standard microarray incubation buffer and incubated
on the array at 37°C for 1 hour using the Tecan Pro automated hybridization station. In
IHC a short fixing protocol involves fixing the cellular material on plain glass slides for
30 minutes to 1 hour at room temperature [198,199] or on a 37°C slide warmer.
Fluorescent dye labeled anti-pathogen antibodies have been used for direct detection and
differentiation of Coccidioides from other fungal pathogens in microscopy and IHC
techniques [200]. The direct detection technique involves fixing the pathogen on a glass
slide and detecting the pathogen with fluorescent dye labeled anti-pathogen serum. The
indirect detection technique involves fixing the pathogen on a glass slide, incubating
patient serum on it and detecting the pathogen bound patient serum using an anti-host
fluorescently labeled antibody. The peptide microarray slides were scanned on a Perkin

260
Elmer ProScan Array HT microarray scanner (Melville, NY) in two channels, 633 nm
(Red wavelength) and 543 nm (Green wavelength) at 10µm resolution. This scanner
scans slides from the top, slide-facing surface. The secondary anti-host (human) IgM and
IgG antibodies are conjugated to fluorescent dyes, Dylight 649 and Dylight 549
respectively. The microarray images included in this Appendix are from the PerkinElmer
scanner, but were also scanned using the Agilent ‘C’ scanner (Santa Clara, CA). The
Agilent microarray scanner scans the back of the slide with excitation at 633 nm (Red)
and 532 nm (Green) with 10µm resolution.
Hypothesis
In the red and green wavelength, we might be detecting fluorescence from the
secondary anti-human IgM (5µ) and anti-human IgG (Fcɣ) antibody detecting the Fc
portion of pre-bound IgM and IgG antibodies from the patient’s serum, on the spherule-
like object. The fluorescence intensity estimated by GenePix in both red and green
wavelengths is much higher than background fluorescence observed from these slides.
This hypothesis could be tested by either culturing the pathogen from patient sera
listed in Table A1- 1 or checking for fungal auto-fluorescence using UV illumination in
fluorescence microscopy (serum sediment). Fungi including Coccidioides spherules are
known to auto-fluoresce upon UV illumination in the green wavelength [201,202]. This
fungal auto-fluorescence has been used for diagnosis with a sensitivity of 97.8% and
specificity of 100% (n=64) to distinguish Aspergillus, Candida and Zygomycetes cases
in Hematoxylin and Eosin stained tissue sections from several tissue sites by Rao et al

261
[203]. A more sensitive confirmation could be made utilizing PCR to confirm the
presence of DNA from Coccidioides in centrifuged patient serum sediment [191] Given
the paucity of accurate VF diagnostics and variability of symptoms, any approach
enabling direct detection of VF is useful and is therefore documented in this report.

262
Bibliography
1. Saubolle MA, McKellar PP, Sussland D. 2007. Epidemiologic, clinical, and
diagnostic aspects of coccidioidomycosis. Journal of Clinical Microbiology
45:26-30.
2. Durkin M, Estok L, Hospenthal D, Crum-Cianflone N, Swartzentruber S, Hackett
E, Wheat LJ. 2009. Detection of Coccidioides Antigenemia following
Dissociation of Immune Complexes. Clinical and Vaccine Immunology 16:1453-
1456.
3. Weiner MH. 1983. Antigenemia detected in Human Coccidioidomycosis. Journal
of Clinical Microbiology 18:136-142.
4. Galgiani JN, Grace GM, Lundergan LL. 1991. New serologic tests for early
detection of Coccidioidomycosis. Journal of Infectious Diseases 163:671-674.
5. Johnson SM, Simmons KA, Pappagianis D. 2004. Amplification of coccidioidal
DNA in clinical specimens by PCR. Journal of Clinical Microbiology 42:1982-
1985.
6. Ascioglu S, Rex JH, de Pauw B, Bennett JE, Bille J, Crokaert F, Denning DW,
Donnelly JP, Edwards JE, Erjavec Z, Fiere D, Lortholary O, Maertens J, Meis JF,
Patterson TF, Ritter J, Selleslag D, Shah PM, Stevens DA, Walsh TJ, Invasive
Fungal Infections C. 2002. Defining opportunistic invasive fungal infections in
immunocompromised patients with cancer and hematopoietic stem cell
transplants: An international consensus. Clinical Infectious Diseases 34:7-14.
7. Telenti A, Roberts GD. 1989. Fungal Blood Cultures. European Journal of
Clinical Microbiology & Infectious Diseases 8:825-831.
8. Rempe S, Sachdev MS, Bhakta R, Pineda-Roman M, Vaz A, Carlson RW. 2007.
Coccidioides immitis fungemia: Clinical features and survival in 33 adult patients.
Heart & Lung 36:64-71.

263
9. Keckich DW, Blair JE, Vikram HR. 2010. Coccidioides Fungemia in Six Patients,
with a Review of the Literature. Mycopathologia 170:107-115.
10. Schenken JR, Palik EE. 1942. Coccidioidomycosis in states other than California,
with report of a case in Louisiana. Archives of Pathology 34:484-494.
11. Smith DM, Simon JK, Baker JR, Jr. 2013. Applications of nanotechnology for
immunology. Nature Reviews Immunology 13:592-605.
12. Idriss MH, Khalil A, Elston D. 2013. The diagnostic value of fungal fluorescence
in onychomycosis. Journal of Cutaneous Pathology 40:385-390.
13. Plewig G, Marples RR. 1970. Regional Differences of Cell sizes in Human
Stratum Corneum Part I. Journal of Investigative Dermatology 54:13-&.
14. Fetsch PA, Abati A. 2001. Immunocytochemistry in effusion cytology - A
contemporary review. Cancer Cytopathology 93:293-308.
15. Pass HI, Stevens EJ, Oie H, Tsokos MG, Abati AD, Fetsch PA, Mew DJY,
Pogrebniak HW, Matthews WJ. 1995. Characteristics of nine newly-derived
mesothelioma cell lines. Annals of Thoracic Surgery 59:835-844.
16. Kaplan W. 1967. Application of the fluorescent antibody technique to the
diagnosis and study of coccidioidomycosis. Proceedings of the Second
Symposium on Coccidioidomycosis, 8-10 December, 1965, Phoenix, Ariz.:227-
231.
17. Graham AR. 1983. Fungal Autofluorescence with Ultraviolet illumination.
American Journal of Clinical Pathology 79:231-234.
18. Elston DM. 2001. Fluorescence of fungi in superficial and deep fungal infections.
BMC Microbiology 1:1-4.
19. Rao S, Rajkumar A, Ehtesham M, Prathiba D. 2008. Autofluorescence: A
screening test for mycotic infection in tissues. Indian Journal of Pathology and
Microbiology 51:215-217.

264
APPENDIX II
SUPPLEMENTAL DATA FOR CHAPTER 3 – VALLEY FEVER EPITOPE
PEPTIDES

265
The raw IgG and IgM antibody reactivities in FIU (Y-axis) captured by 83 life
space epitope peptides representing 4 Valley Fever (VF) immuno-dominant antigens is
plotted per peptide (X-axis) in these graphs. The 4 antigens were chitinase F (CF) [81],
Expression Library Immunization Eli-Ag1 [83], Antigen 2 [82] and Coccidioides specific
antigen (CSA) [84]. These data show the trend (bright red line) in humoral immune
responses at various stages of Valley Fever infection from CF-Titer=0 (primary) to CF-
titer=256 (dissemination). The advantage of using peptide microarrays is their ability to
separate each component of the humoral immune response to an infection/exposure. This
high resolution is advantageous while evaluating whether or not certain VF proteins offer
protection and could potentially be used as vaccine candidates against VF. For example,
the signal sequence of Ag2 (amino acids 1-18) is known to be protective in BALBc (VF
susceptible) mice upon immunization and challenge [204]. In our data as well, some VF
patients display a high IgG antibody response to Ag2 peptides at the same amino acid
positions (1-17, 13-29 and 25-41) in primary infection (CF-titer = 1, Figure A2-3).
At all CF-titers (0, 1, 2, 4, 8, 16, 32, 64, 128, 256) the IgM graphs show higher
binding than IgG data at multiple epitope sites displaying the breadth of IgM response.
The IgM response might also be broad because IgM is a much larger molecule (36nm x
4nm- planar disk) [205] as compared to IgG (20-40nm) [206,207] and is reactive to many
VF epitope peptides in this solid phase assay (antigen peptide attached to solid slide
surface). From our own experimental data however, we know that the specificity when
using IgM data is lower than that obtained using IgG data for distinguishing VF versus
normal (Table 3-2, Panel A) or VF versus non-VF (normal and LVS, Table 3-2, Panel B).

266
Thus it would be unlikely that IgM array data alone might be sufficient for diagnosis.
This concept would need to be tested on a larger peptide microarray (>96 peptides).

267
Figure A2-1 IgG antibody reactivity captured on VF epitope peptides (83) from false-
negative CF-titer=0 patients sera (N=54).Each line on the graph represents antibody
response from one VF sample.

268
Figure A2-2 IgM antibody reactivity captured on VF epitope peptides (83) from false-
negative CF-titer=0 patients sera (N=54) Each line on the graph represents antibody
response from one VF sample.

269
Figure A2-3 IgG antibody reactivity captured on VF epitope peptides (83) from CF-
titer=1 patients sera (N=9). Each line on the graph represents antibody response from
one VF sample.

270
Figure A2-4 IgM antibody reactivity captured on VF epitope peptides (83) from CF-
titer=1 patients sera (N=9). Each line on the graph represents antibody response from
one VF sample.

271
Figure A2-5 IgG antibody reactivity captured on VF epitope peptides (83) from CF-
titer=2 patients sera (N=15). Each line on the graph represents antibody response from
one VF sample.

272
Figure A2-6 IgM antibody reactivity captured on VF epitope peptides (83) from CF-
titer=2 patients sera (N=15). Each line on the graph represents antibody response from
one VF sample.

273
Figure A2-7 IgG antibody reactivity captured on VF epitope peptides (83) from CF-
titer=4 patients sera (N=8). Each line on the graph represents antibody response from
one VF sample.

274
Figure A2-8 IgM antibody reactivity captured on VF epitope peptides (83) from CF-
titer=4 patients sera (N=8). Each line on the graph represents antibody response from
one VF sample.

275
Figure A2-9 IgG antibody reactivity captured on VF epitope peptides (83) from CF-
titer=8 patients sera (N=4). Each line on the graph represents antibody response from
one VF sample.

276
Figure A2-10 IgM antibody reactivity captured on VF epitope peptides (83) from CF-
titer=8 patients sera (N=4). Each line on the graph represents antibody response from
one VF sample.

277
Figure A2-11 IgG antibody reactivity captured on VF epitope peptides (83) from CF-
titer=16 patients sera (N=10). Each line on the graph represents antibody response from
one VF sample.

278
Figure A2-12 IgM antibody reactivity captured on VF epitope peptides (83) from CF-
titer=16 patients sera (N=10). Each line on the graph represents antibody response from
one VF sample.

279
Figure A2-13 IgG antibody reactivity captured on VF epitope peptides (83) from CF-
titer=32 patients sera (N=12). Each line on the graph represents antibody response from
one VF sample.

280
Figure A2-14 IgM antibody reactivity captured on VF epitope peptides (83) from CF-
titer=32 patients sera (N=12). Each line on the graph represents antibody response from
one VF sample.

281
Figure A2-15 IgG antibody reactivity captured on VF epitope peptides (83) from CF-
titer=64 patients sera (N=5). Each line on the graph represents antibody response from
one VF sample.

282
Figure A2-16 IgM antibody reactivity captured on VF epitope peptides (83) from CF-
titer=64 patients sera (N=5). Each line on the graph represents antibody response from
one VF sample.

283
Figure A2-17 IgG antibody reactivity captured on VF epitope peptides (83) from CF-
titer=128 patients sera (N=3). Each line on the graph represents antibody response from
one VF sample.

284
Figure A2-18 IgM antibody reactivity captured on VF epitope peptides (83) from CF-
titer=128 patients sera (N=3). Each line on the graph represents antibody response from
one VF sample.

285
Figure A2-19 IgG antibody reactivity captured on VF epitope peptides (83) from CF-
titer=256 patients sera (N=2). Each line on the graph represents antibody response from
one VF sample.

286
Figure A2-20 IgM antibody reactivity captured on VF epitope peptides (83) from CF-
titer=256 patients sera (N=2). Each line on the graph represents antibody response from
one VF sample.

287
Bibliography
1. Yang MC, Magee DM, Cox RA. 1997. Mapping of a Coccidioides immitis-
specific epitope that reacts with complement-fixing antibody. Infection and
Immunity 65:4068-4074.
2. Ivey FD, Magee DM, Woitaske MD, Johnston SA, Cox RA. 2003. Identification
of a protective antigen of Coccidioides immitis by expression library
immunization. Vaccine 21:4359-4367.
3. Zhu YF, Tryon V, Magee DM, Cox RA. 1997. Identification of a Coccidioides
immitis antigen 2 domain that expresses B-cell-reactive epitopes. Infection and
Immunity 65:3376-3380.
4. Pan SC, Cole GT. 1995. Molecular and Biochemical-characterization of a
Coccidioides immitis-specific antigen. Infection and Immunity 63:3994-4002.
5. Jiang CY, Magee DM, Ivey FD, Cox RA. 2002. Role of signal sequence in
vaccine-induced protection against experimental coccidioidomycosis. Infection
and Immunity 70:3539-3545.
6. Cenci S, Sitia R. 2007. Managing and exploiting stress in the antibody factory.
Febs Letters 581:3652-3657.
7. Chen Y, Cai J, Xu Q, Chen ZW. 2004. Atomic force bio-analytics of
polymerization and aggregation of phycoerythrin-conjugated immunoglobulin G
molecules. Molecular Immunology 41:1247-1252.
8. Henry N, Parce JW, McConnell HM. 1978. Visualization of specific antibody and
C1q binding to hapten-sensitized lipid vesicles. Proceedings of the National
Academy of Sciences of the United States of America 75:3933-3937.

288
APPENDIX III
SUPPLEMENTAL DATA FOR CHAPTER 4

289
1.) F. tularensis Vaccine Project: Overcoming ELISA limitations using the pathogen proteome
peptide (PPP) array
The pathogen proteome peptide (PPP) array was used to discern the antibody response
generated from Francisella tularensis vaccinated rat sera. The study involved serum samples
from the following 4 groups of immunized rats provided by our collaborators at the University of
New Mexico as part of their Tularemia vaccine development consortium (TVDC) project:
Group 1 – Naïve rats
Group 2 – Francisella tularensis Live Vaccine Strain (LVS) vaccinated
Group 3 – O-Antigen mutant Francisella tularensis SchuS4 strain vaccinated
Group 4 – Immunized with 23 SchuS4 Proteins [Only 1 protein out of these 23 was
represented on the PPP array, in the form of 30 non-contiguous peptides. The PPP array
carried 862 Francisella tularensis SchuS4 peptides in total].
We anticipated significant differences in the antibody responses among these 4 groups
based on observations through similar studies [208]. However, this serum set did not show
statistically significant difference between Naïve (Group1) versus Vaccinated (Groups 2, 3, 4)
when tested by ELISA. The limit of detection (LOD) of antibodies on peptide microarrays is
between 0.5 to 2ng/ml, many-fold lower than an ELISA’s LOD, 7ng/ml [158,209]. Therefore, I
attempted to use a more sensitive technology to be able to measure subtle differences in immune
responses between these 4 different groups. I hypothesized that pathogen specific peptides fixed
in a microarray format, such as the PPP array, would enable smaller differences in the immune
response to be detected. As a proof of concept, Figure A3- 1 shows the antibody response
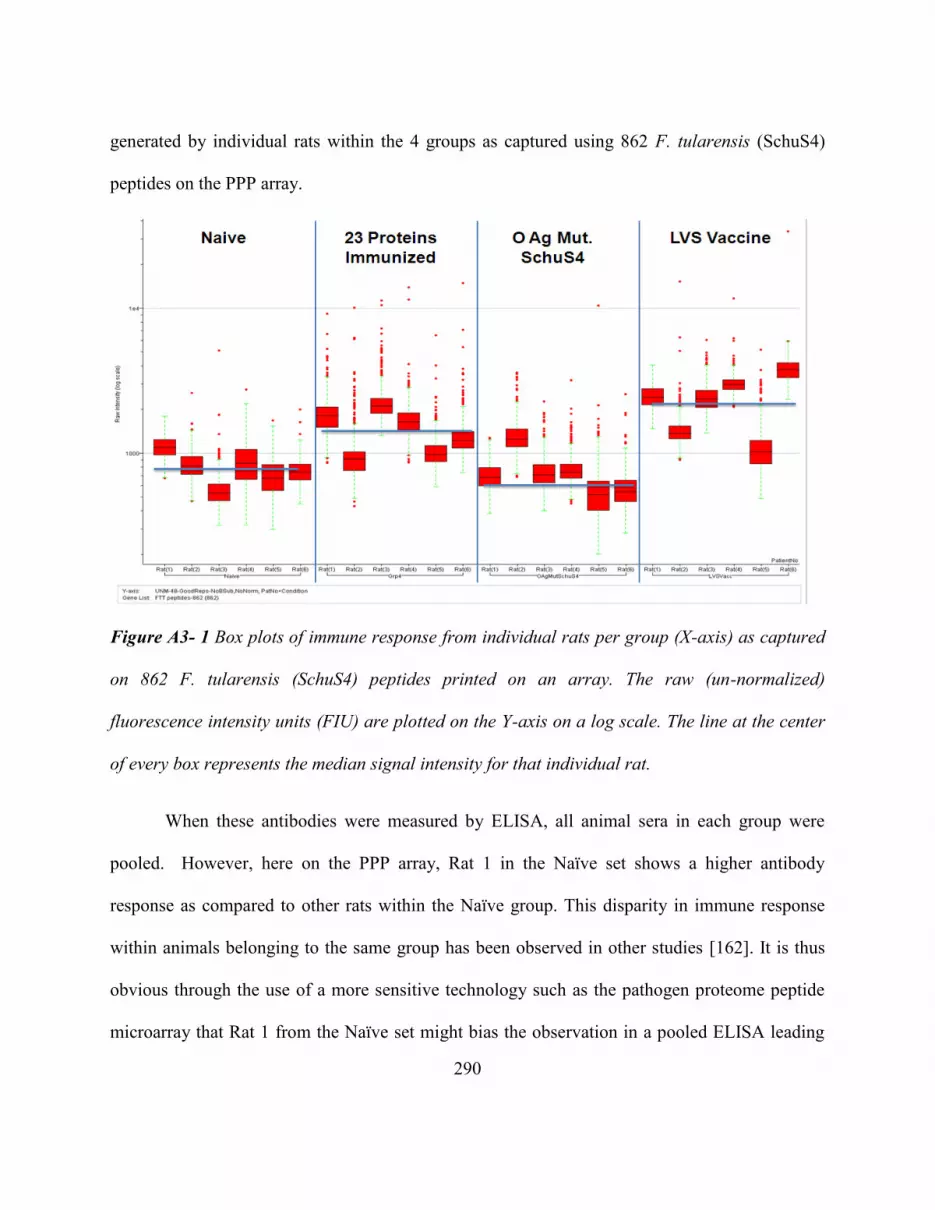
290
generated by individual rats within the 4 groups as captured using 862 F. tularensis (SchuS4)
peptides on the PPP array.
Figure A3- 1 Box plots of immune response from individual rats per group (X-axis) as captured
on 862 F. tularensis (SchuS4) peptides printed on an array. The raw (un-normalized)
fluorescence intensity units (FIU) are plotted on the Y-axis on a log scale. The line at the center
of every box represents the median signal intensity for that individual rat.
When these antibodies were measured by ELISA, all animal sera in each group were
pooled. However, here on the PPP array, Rat 1 in the Naïve set shows a higher antibody
response as compared to other rats within the Naïve group. This disparity in immune response
within animals belonging to the same group has been observed in other studies [162]. It is thus
obvious through the use of a more sensitive technology such as the pathogen proteome peptide
microarray that Rat 1 from the Naïve set might bias the observation in a pooled ELISA leading

291
to non-observable differences between the 4 groups. This assay could thus be used to trace
underlying reasons for lower statistical differences between groups when pooling sera due to
single outliers such as Naïve Rat 1 from Group 1. An appropriate analysis to estimate whether or
not the response from the treated group is indeed statistically significantly different due to the
treatment (vaccination or genetic immunization) as compared to Naïve would be to calculate the
statistical differences between the mean responses of Naïve versus treated both with and without
the outlier. Table A3- 1 summarizes the statistical differences between Naïve versus the 3
immunization groups using data from PPP array FTT peptides. As expected, the whole pathogen
vaccine LVS shows the most significant difference when compared to Naïve. However the
average antibody response observed on vaccinating with the O antigen mutant SchuS4 strain
(group 3) was lower than that of Naïve rats. In comparison the 23 protein immunization also
shows a significant p-value over Naïve above cut-off 0.001. Protection data post-challenge might
be more indicative of the impact of these three vaccination strategies on these groups of animals.
Table A3- 1 Difference between immunization groups and Naïve sera using PPP array data
Groups
Mean
Signal
(FIU)
Standard
Deviation Variance
p-value (single
tailed, two-
sample
unequal
variance)
Group 1 - Naïve 300 227 51565
Group 2 - LVS Vaccine 701 694 481871 6.61E-305
Group 3 - O Ag
Mutant SchuS4 207 245 60038 7.08E-89
Group 4 - 23 protein
immunization 419 596 355696 8.57E-41
p-value cut off = 1/n = 1/862 FTT peptides = 0.00116

292
A more informative set of peptides for completing this comparison should be ones
representing the whole proteome of F. tularensis (SchuS4 and LVS). This would allow a
comparison of antibody responses from individual animals vaccinated with the complete
pathogens (LVS-Group2 or SchuS4-Group3) versus those that were immunized using 23
proteins from F. tularensis (SchuS4)-Group4. These peptides should be printed on an array by
themselves instead of within the context of other pathogen peptides. This would reduce
competition on the array from other unrelated pathogen peptides for capturing Francisella
specific antibodies as observed from the addition of influenza peptides to the PPP array in
Chapter 5.
Conclusion: The pathogen proteome peptide microarray can be used to segregate minor
differences in the immune response generated from individuals within the same group.
Additionally it also allows for more sensitive differences in antibody response between
immunization groups beyond those observable through an ELISA.
2.) ASFV Vaccine project: Mapping humoral response from genetic immunization using the
PPP array
The African Swine fever virus (ASFV) is a double stranded DNA virus from the family
Asfarviridae. The disease infects wart-hogs, bush-pigs, domesticated pigs and ticks.
Phylogenetically it is very closely related to the human infection causing viruses from
Herpesviridae and Poxviridae (Variola-smallpox) families [40]. The swine sera were obtained
from Dr. Linda Dixon at the Institute of Animal Health (IAH), Pirbright, UK and the primary
goal of that project was to create a vaccine protective in domestic pigs against ASFV. It is a

293
priority pathogen of interest on the U.S Department of Agriculture (USDA) list [39] due to its
ability to potentially infect humans [40].
The following double vaccinia boosted, sera from 4 groups of six inbred pigs/group was
obtained from IAH, Pirbright as follows:
Group 1: Randomly selected antigens 1-20 + Vp30, Vp72
Group 2: Randomly selected antigens 21-40 + Vp30, Vp72
Group 3: 12 known surface antigens (including Vp30, Vp72)
Group 4: Vp30, Vp72
The above sera are part of a Genetic Immunization Screen (#2) to optimize the expression
library immunization (ELI) [210] protocol for pigs. These animals were not challenged with the
virulent strain of ASFV post-genetic immunization. Vp30 and Vp72 proteins in group 4 are
immunodominant antigens of ASFV, as established by conventional ELISA and Western blot
assays [107,211]. Immunization with these antigens produces neutralizing antibodies against the
virus [108]. These proteins were included in every group as a genetic immunization control and
their reactivity was measured in all sera by ELISA.
We selected 299 peptides to print on the PPP array that represent antigens from group 3
and group 4. Peptides representing all proteins in group 1 and group 2 would comprise 1000
additional peptides required to complete this analysis. As an initial proof of concept that the
peptide microarray is capable of accurately capturing ASFV specific antibody responses post-
genetic immunization, Figure A3- 2 displays the range of immune responses per individual
animal using Box-Cox plots. Data for groups 1 through 4 immunized animals in comparison to
one Day 0 sera from group 1 and the special pathogen free (SPF) out-bred ASFV infected and

294
uninfected pigs within the French cohort is plotted. The immune response mounted in all 4
groups of genetically immunized animals as captured by 299 peptides is equivalent to that
mounted in a real infection (French cohort) and captured by the antigens in group 3. All 4 groups
were immunized using Vp30 and Vp72 which were included as peptides on the array, in addition
to 20 other antigens in groups 1 and 2 and 12 additional antigens in group 3.
Figure A3- 2 A simultaneous comparison of infectious (French cohort) versus genetic-
immunization (UK cohort) antibody responses as captured by 299 ASFV peptides on PPP array.
The box-plot depicts raw (un-normalized) fluorescence intensity units (FIU) plotted per
individual animal on the Y-axis using a log scale. The French cohort represents a separate
experiment involving ASFV infected and uninfected out-bred pigs. One day zero (D0), pre-

295
immunization sample and all day final – post-immunization (DF) samples from the UK cohort
are presented on the X-axis.
The Day 0 sample from swine no. 393 of group 1 had a higher antibody response even
pre-immunization as expected than that of the 2 uninfected negative control SPF pigs in the
French cohort. It was processed on the array to test whether it would be worthwhile to subtract
the pre-immunization response of individual out-bred pigs (UK cohort) from their post-
immunized samples. The medians of antibody responses capture by the 299 ASFV peptides from
group 3 and 4 protein immunized animals were comparably higher (except Day Final-DF pig 421
from group 4) than the immune response observed from an infection (French cohort).
Apart from Vp30 and Vp72, none of the 20 distinct antigens of group 1 or 2 were
represented on the PPP array. As mentioned in Chapter 4, Supplementary Figure 4-3, the overall
reactivity captured on PPP arrays from ASFV sera despite dilution (1:500) was much higher than
that observed from any of the human exposures tested (VF, WNV, LVS, Vaccinia). Figure A3- 3
shows a similar trend when using genetically immunized sera from groups 1 through 4. The
average signal obtained per individual swine sera in all 4 groups on the PPP array seems roughly
proportional to the number of antigens they were exposed to per genetic immunization group (22
constructs each in groups 1 & 2, 14 constructs in group 3 and 2 in group 4). The extent of cross-
reactivity observed from this assay to non-ASFV peptides was high due to the total antibody
response captured despite processing these arrays under optimized thermodynamic conditions to
reduce cross-reactivity (incubating sera for 16 hours at 23°C).

296
Figure A3- 3 Average signal captured by PPP array for 4 groups of ASFV genetic immunization
are depicted with every animal’s antibody response represented per bar on the X-axis.
The background subtracted average raw (un-normalized) signal intensity data is plotted on the
Y-axis. One Day 0 – pre-immunization (D0_393) and all Day Final – post-genetic immunization
(DF) pig sera are depicted in these bar graphs.
Once conditions for the genetic immunization of pigs were established through this
experiment, and it was confirmed that the immunization led to both T-cell (Pirbright) and B-cell
responses (ELISAs, PPP array-CIM), they were applied to the next two immunization regimes.
Both immunization protocols contained a boosting step using recombinant Vaccinia viruses
(rVV), each expressing an ASFV gene. A group of such recombinant Vaccinia viruses were then
combined into a single inoculum and delivered to the animals 2 and 3 weeks post the gene gun
immunization. Each recombinant Vaccinia virus containing one ASFV antigen was present at
109pfu/dose. Each pig received 2 x 10⁹ pfu/100µL dose of rVV. A summary of the steps involved
in these genetic immunization regimes are as follows:

297
1. Day 0 & 2/3: Double prime + CPG adjuvant (left & right ear-5 gene gun shots)
2. 2 Weeks later: DNA Boost + CPG adjuvant (left & right ear-5 gene gun shots)
3. 3 Weeks later: 1st recombinant vaccinia boost (intra-dermal)
4. 2 Weeks later: 2nd recombinant vaccinia boost (intra-dermal)
Immunization Protocol # AR000158:
Although Vp30 and Vp72 are immunodominant antigens for ASFV, there are
confounding reports on whether or not groups of neutralizing antibodies generated against these
antigens are sufficient to protect against challenge with a virulent ASFV strain. Barderas et al.
have shown that immunization of pigs with a chimeric protein combining Vp30 and Vp54
proteins was sufficient to protect them against a virulent ASFV isolate E75 challenge [106].
Neilan et al. immunized pigs with baculovirus expressed ASFV-pr4 isolate Vp30, Vp72, Vp54
and Vp22 antigens and found that they did not survive post-challenge with the pr4 strain [108].
An experiment was conducted to isolate the effect of adding Vp30 along with the bin of antigens
in all Groups. The rationale for this experiment was to test if Vp30 alone or in combination with
Vp72 was responsible for the non-protective immune response as observed by Neilan et al. [108]
Group A: all antigens from previous Groups 1, 2 and 3 [= 37 antigens including Vp30] (6 pigs)
Group B: all antigens except Vp30 (6 pigs)
Group C: no ASFV antigens, irrelevant antigens for challenge control-HA, AAT, gp160 (3 pigs)
Post vaccination, pigs were intramuscularly challenged with 104 (50% hemadsorbing
doses) HAD50/ml ASFV strain Georgia 2007/1 (Genotype-II). None of these animals survived
the challenge and had to be humanely euthanized on day 6 and 7 post-challenge. Collaborators

298
from IAH sent information on viral load estimated via PCR from blood and tissues (spleen,
tonsil, mesenteric & gastro-hepatic lymph nodes) on the third day post-challenge. They also sent
other clinical parameters such as weight gain in kg, temperature per individual and clinical
scores based on the severity of disease symptoms manifested. Group A pigs showed moderately
higher viraemia in blood on day 3 as compared to pigs from group B. Group C pigs showed
higher viraemia as expected in comparison to groups A and B. All individual pigs in group A,
showed higher weight loss as compared to weight gain observed in 4 out of 6 pigs in group B
and 4 out 6 group C pigs. Normal body temperature in pigs is 38-39°C, and temperature of
febrile pigs in the immunized groups A and B raised to greater than 40.5 two days post-challenge
where as that of group C pigs became febrile three days post-challenge (except pig C5, febrile on
day 2). A clear bifurcation in the distribution of viraemia in blood was observed between
individual animals in all three groups. The sera for two pigs showing higher viraemia and two
showing lower viraemia in blood per group were processed on the PPP array and data presented
in Figure A3- 4.

299
Figure A3- 4 Humoral immune response as measured on PPP array from Group A, B, C pigs
sera post-challenge with ASFV
Average signal intensities in FIU (Y-axis) from animals in groups A, B and C (X-axis) as
measured using ASFV (red bars) and Vaccinia (blue bars) peptides on the pathogen proteome
peptide (PPP) microarray. The error bars represent standard error.
Figure A3- 4 represents the average signal intensities from ASFV as well as Vaccinia
(rVV boost) peptides as measured from capturing antibodies from individual pig sera. Pigs A5
and A6 had lower viraemia as compared to pigs A1 and A2 and this seems to correlate with
observing a marginally higher relative antibody response in pig A5 and a significantly higher
response in pig A6 as compared to A1 and A2. Pigs B4 and B6 had lower viremia as compared
to pigs B2 and B3 but the antibody response captured on the PPP array does not reflect a clear
correlation between viraemia and antibody response.

300
Figure A3- 5 Signal intensities from ASFV peptides averaged per ASFV protein as measured on
the PPP array from group A, B and C samples post-ASFV challenge.
Figure A3- 5 represents the signal averaged for peptides per ASFV protein from
individual animals in groups A, B and C. The control group C animals were not genetically
immunized with ASFV antigens and still mounted a strong antibody response to challenge
infection especially pig C1. Additional comparisons might be necessary to establish whether the
PPP array platform can be used to correlate protection post-challenge.
The Immunosignature non-natural sequence peptide microarray has been used to
distinguish the outcome from different vaccine regimens [75]. The pathogen proteome peptide
microarray could be potentially used for similar studies. Figure A3- 6 displays an individual
pigs’ antibody response as captured by the PPP array from group A before immunization, after

301
immunization and post-challenge. Panel B displays an individual pig’s antibody response from a
separate experiment, before and after immunization with an attenuated ASFV vaccine strain and
post-challenge with ASFV Georgia/2007 strain. In both cases the antibody immune response to
the challenge was lower as compared to that observed post-immunization. In Panel B, the
recombinant vaccinia vector containing ASFV antigens was not used for boosting the immune
response from the immunization and yet the peptide microarray captures cross-reactivity to
Vaccinia peptides. Ideally, for mapping the protective response post-immunization and challenge
the peptides for the complete ASFV viral proteome should be printed on a separate microarray
by themselves and not within the context of other pathogen peptides as done here on the PPP
array.
Figure A3- 6 Average signal intensities in FIU (Y-axis) from various stages (X-axis) in two
separate immunization and challenge regimes.
Panel A displays the antibody response as captured by PPP array peptides representing ASFV
(red bars) and Vaccinia (blue bars) peptides and Panel B displays the antibody response from

302
another pig immunized with the ASFV OURT88/3, attenuated vaccine strain. Both pigs were
challenged with ASFV Georgia/2007 virulent strain. The error bars represent standard error.
Despite the observable cross-reactivity when printing multiple pathogen peptides on a
single assay, an advantage of using the PPP microarray is its ability to resolve linear antibody
epitope within immunodominant antigens despite significant competition from several other
unrelated pathogen peptides. Figure A3- 7 displays the significant epitopes within the
hierarchical clustering map of Vp30. Figure A3- 8 displays Vp72 with a high resolution mapping
of exactly which linear peptide segments the individual pigs were responding to post-challenge.
Figure A3- 7 Peptides tiling Vp30 (ASFV127) an immunodominant antigen of ASFV displaying
individual (X-axis) responses from sera on PPP array.
303
Every column represents one individual pig and every row represents one peptide within the
ASFV127 protein. The coloring within this heatmap is based on median normalized signal
intensities obtained from the microarray. Blue squares represent no antibody binding whereas
yellow to orange represent moderate-high binding of antibody to those peptides on a relative
scale as colored in GeneSpring GX 7.3.1 (legend on right).
Figure A3- 8 Peptides tiling Vp72 (ASFV113) an immunodominant antigen of ASFV, displaying
individual (X-axis) responses from sera on PPP array.
Every column represents one individual pig and every row represents one peptide within the
ASFV113 protein. The coloring within this heatmap is based on median normalized signal

304
intensities obtained from the microarray. Blue squares represent no antibody binding whereas
yellow to red represent high binding of antibody to those peptides on a relative scale as colored
in GeneSpring GX 7.3.1 (legend on right).
Table A3- 2 summarizes the T-test p-value results reflecting statistical significance of
groups A and B over control non-ASFV genetic immunization (group C) sera. The p-value was
calculated using antibody signal intensities captured using ASFV and Vaccinia peptides on the
PPP array between groups A and B versus group C. Both groups A and B are statistically
significantly different as compared to the control group (p-value cut-off = 0.001155). The mean
antibody response post-challenge in group B is statistically significantly lower as compared to
the control group C. The addition of Vp30 in group A resulted in statistically significantly higher
mean antibody response as compared to animals in group C post-challenge.
Table A3- 2 Summary of statistical differences between groups A, B and control group C post-
ASFV challenge.
Groups Mean
Standard
Deviation Variance
p-value
(single
tailed,
paired)
A 15718 16037 257172615 5.00099E-63
B 7254 5173 26764966 1.0717E-106
C 10370 7875 62020663
p-value cut off = 1/no. of ASFV + Vaccinia peptides = 1/866 =
0.001155

305
The protective ability of Vp30 however could not be assessed using this immunization
regime as all pig’s perished post-challenge. It was estimated that the immune system of pigs in
group’s A and B was likely overwhelmed due to the amount of DNA injected from 37 and 36
ASFV genes respectively. An alternate protocol was therefore attempted with a balanced and
reduced DNA load in immunization protocol # AR000302.
Immunization Protocol # AR000302:
Group A: 21 antigens (contains Vp30)
Group B: 16 antigens approximately equivalent in DNA size to 21 antigens in group A. This was
done so as to roughly normalize for the amount of genetic material used for immunization
between Groups 1 and 2.
Group C: no ASFV antigens, irrelevant antigens for genetic-immunization control-HA, AAT,
gp160.
None of the pigs survived post-challenge. Our collaborators from IAH sent us in-vitro T-
cell response to virus as measured by an IFN-ɣ ELIspot assay pre-challenge and post-
immunization and boost from Day 70. Pigs from group A (A3, A4 and A5) showed a higher T-
cell response as compared to those from groups B and C. This observation correlates with our
antibody measurement using PPP array as summarized in Table A3- 3. Group A had a
significantly higher mean antibody response as compared to the immunization control group C.
The antibody response as measured in group B was not significant at the p-value cut-off of
0.001.

306
Table A3- 3 T-test p-value from samples on Day 70 post-immunization and boost, pre-challenge
as captured using ASFV and Vaccinia peptides on PPP array
Groups Mean
Standard
Deviation Variance
p-value
(single tailed,
two-sample,
unequal
variance)
A 22723 13140 172649302 1.74057E-42
B 18316 11988 143704928 0.017567
C 17575 15348 235549616
p-value cut-off: 1/n = 1/866 = 0.001155
Figure A3- 9 summarizes the results from measuring the antibody response on the PPP
array. Day 70 is after the second live vaccinia-ASFV construct boost and one day before
challenge. Day 76/77 is a time point post-challenge before these animals were humanely
euthanized. The immediately observable trend from this data is that of lower signals on Day
76/77 and this might be because these samples were severely hemolyzed and coagulated, making
them unusable for this comparison.

307
Figure A3- 9 Signal intensities averaged per ASFV protein (N=12) tested in the form of peptides
on the PPP microarray.
Day 70 (post-immunization and one day pre-ASFV challenge) and Day 76 (post-ASFV
challenge) sera per pig are depicted on the X-axis. The Y-axis displays the average raw (non-
normalized) signal intensities from background subtracted microarray data in FIU.
In summary, the antibody response obtained from group A, pigs A1 and A3 were higher
post-immunization and boost as compared to that obtained from group B pigs, not immunized
with Vp30, except pig B5, and group C control pigs (except pig C3). Given that neither of these
animals survived post-challenge, the protective effect of including Vp30 could not be isolated.
Conclusion: The PPP microarray can be used to distinguish the immune response generated
during various modulations of an immunization regime using genetic-immunization. Additional

308
sera need to be processed to compare if quantifiable differences in the immune response due to
vaccination using an attenuated virus versus genetic-immunization could be accurately
distinguished using the PPP array.
3.) IVTT bead protein array–Rapid screening of immunogenic/immunodominant proteins
The IVTT bead protein array is part of the MPID (Membrane proteins in Infectious
diseases) grant. Performing in-vitro translation of proteins in the presence of uncoupled (without
protein anti-tag antibody) tosyl-activated magnetic beads, results in binding of the membrane
proteins to the beads. This is an irreversible hydrophobic interaction which allows the membrane
protein to stabilize on the tosyl-activated bead surface. The beads containing proteins are printed
onto aminosilane glass surface using sonication printing technology developed by Matt Greving.
All proteins printed on the slide have the folding reporter green fluorescent protein (frGFP)
construct integrated within their expression cassette. The frGFP construct was included to allow
a quick quality control over the spotting and appropriate folding and presentation of these
proteins by measuring the fluorescence from frGFP [excitation 490nm, emission 510nm [212]]
under the blue wavelength (488 nm) on the Perkin Elmer ProScan Array HT microarray scanner
(Melville, NY).
Sonication printing protocols
Three different print protocols were used for printing in the first print run so as to be able
to optimize for the best printing conditions going forward. The array was initially printed with 13
reagents, some proteins being captured on Dynabeads MyOne-1 µm diameter bead versus some
on M280-2.8 µm beads from Life Technologies (Grand Island, NY) as listed:
1.) frGFP LEE (Linear Expression Element) [213] #1 - MyOne

309
2.) frGFP LEE#2 - MyOne
3.) ASFV113-F1 - MyOne
4.) ASFV113-F2 - MyOne
5.) FTT0583-frGFP - MyOne
6.) FTT1258-frGFP - MyOne
7.) GFP-HA in pET 32 - MyOne
8.) Mock IVT (no template) – Negative control
9.) My one beads – clean (no protein bound) – Negative control
10.) frGFP LEE#1 – M280
11.) frGFP LEE#2 - M280
12.) ASFV113F1 - M280
13.) GFP-HA in pET 32 - M280
Out of the 13 reagents mentioned above, only proteins 3, 5, 6, 7, 12 and 13 were
expressed and observed on a protein gel during pre-printing quality control. Reagents numbered
8 and 9 are negative controls to allow estimation of background fluorescence from spots due to
either the beads themselves or the IVT reagent mixture. All proteins represented on the array
have the folding reporter GFP tag on them. The same calibration file was used for all 13
solutions. However sample 9 did not print consistently with these conditions in initial tests. It
was removed from the map and printed afterwards with a slight increase in energy onto the same
slide.
Slide 1: 400787

310
5µL of each bead-PBS buffer solution were placed in a 1536 well plate. Each sample
was laid out in a square pattern of 4 replicates. A dot pitch of 0.5mm was used, which is the
distance between IVTT bead protein spots on array. The samples were printed in a randomized
manner with each well ejecting 10 times and hitting 10 different blocks of 4 in order to ensure
even drying on the surface. The rapid cycling through the sets of 13 samples was an attempt to
ensure that the beads remained in suspension in the solution over the entire time of the print (~20
minutes.) Slide 3 (400931) was printed using this same protocol.
Slide 2: 400940
The print plate from slide 1 was used for slide 2 and a pitch of 0.5mm was used for
printing the slide. However, in order to test the quality of the suspension over time, each sample
was printed completely (~350 prints) before moving on to the next sample. Additionally, each
well was primed onto a disposable surface between each print on the final slide. Visually this
produced worse alignment of reagents on the slide as compared to slide 1. This might perhaps be
due to the loading and unloading of the target plate. The plate map for the 0.5mm pitch is
included in Figure A3- 10.

311
Figure A3- 10 Plate map for 0.5 mm pitch sonication printing protocol.
The red and white squares in a ‘Z’ pattern show location of proteins expressed in IVTT on the
array, green show the location of negative control and un-expressed proteins.
Slide 4: 400941
The slide was printed with a pitch of 0.75mm. The printing was done with 5 prints from
each source well. Sample 9 printed slightly off target alignment but within register from the rest
of samples. This is most likely due to the unloading of the target for priming. The plate map for
the 0.75mm pitch is included in Figure A3- 11.

312
Figure A3- 11 Plate map for 0.75 mm pitch sonication printing protocol.
The red and white squares in a number ‘1’ pattern show location of proteins expressed in IVTT
on the array, green show the location of negative control and un-expressed proteins.
For quality control, the arrays were screened using a polyclonal Rabbit anti-frGFP
primary antibody and appropriate reactivity detected using a secondary Alexa Fluor 647
conjugated antibody as seen in Figure A3-12, Panels A, B and C. In all four panels, the green
spots are from bead-protein mixtures where the protein were not expressed and therefore the
folding reporter GFP could not be detected with the anti-frGFP antibody. The orange-red

313
fluorescence is from the polyclonal rabbit anti-GFP antibody binding the GFP protein tag,
detected using an Alexa Fluor 647 labeled anti-rabbit secondary antibody in panels A, B and C.
In panel D the faint orange fluorescence from certain spots highlighted with white dotted lines is
from the anti-mouse Alexa Fluor 647 labeled secondary antibody detecting mouse antibodies to
cognate antigens used in immunization. The spot margins are much more regular at 0.75 mm
pitch (Slide 4) instead of the 0.5 mm pitch (Slide 1, 2 and 3) The printing protocol used for Slide
2 produced some brighter spots due to the same protein being printed on the whole slide (~350
prints) first and then resuming other proteins sequentially. But the positioning of these spots was
extremely irregular making alignment using the GenePix Pro (Molecular Dynamics, Sunnyvale,
CA) program difficult. The signal intensities obtained from testing these 4 slides are represented
in Table A3- 4 (Section A-D).

314
Figure A3-12 Anti-GFP antibody reactivity captured from translated proteins on IVTT bead
protein array.
Panels A, B and C show orange dots representing anti-GFP antibody recognizing the GFP tag
on IVTT proteins on beads being detected by an Alexa Fluor 647 labeled secondary antibody.
Panel D shows the anti-FTT583 protein polyclonal mouse sera detected using an anti-mouse
secondary binding cognate bead-protein spots (highlighted using grey dotted squares).

315
Table A3- 4 Signal captured from slides included in the printing protocol comparison in
Fluorescence intensity units (FIU).
The count N represents the number of replicates printed & measured per reagent on a given
slide.
A.) Rabbit anti-GFP (polyclonal) - 5nM (Slide 1-400787, pitch=0.5 mm)
Reagent
No. Reagent
Protein
Expression Count(N)
Min
(FIU)
Max
(FIU)
Mean
(FIU)
Median
(FIU)
1
rGFP_LEE#1
(MyOne) -ve 167 98 220 137 132
2
rGFP_LEE#2
(MyOne) -ve 169 112 263 147 141
3
ASFV113-F1
(MyOne) +ve 170 236 9952 2656 1721
4
ASFV113-F2
(MyOne) -ve 176 104 268 138 136
5
FTT0583 in
GFP
(MyOne) +ve 171 859 18593 4142 3290
6
FTT1258 in
GFP
(MyOne) +ve 171 152 6416 1661 1032
7
GFP-HA-in
pET32
(MyOne) +ve 168 378 5045 1352 1111
8
Mock IVT
(IVT
reaction/no
template)
(MyOne) -ve 174 112 296 168 166
9
MyOne
beads clean -ve 170 99 165 121 119
10
rGFP_LEE#1
(M280) -ve 166 107 228 147 143
11
rGFP_LEE#2
(M280) -ve 167 104 237 131 127

316
12
ASFV113-F1
(M280) +ve 174 139 4277 2096 1978
13
GFP-HA-in
pET32
(M280) +ve 172 203 1553 431 379
B.) Rabbit anti-GFP (polyclonal) - 5nM (Slide 2-400940, pitch=0.5 mm)
Reagent
No. Reagent
Protein
Expression Count(N)
Min
(FIU)
Max
(FIU)
Mean
(FIU)
Median
(FIU)
1
rGFP_LEE#1
(MyOne) -ve 305 123 378 203 201
2
rGFP_LEE#2
(MyOne) -ve 312 132 405 201 200
3
ASFV113-F1
(MyOne) +ve 312 518 16820 2812 1403
4
ASFV113-F2
(MyOne) -ve 307 119 371 174 170
5
FTT0583 in
GFP
(MyOne) +ve 312 238 6064 2170 1637
6
FTT1258 in
GFP
(MyOne) +ve 312 331 8450 1702 1016
7
GFP-HA-in
pET32
(MyOne) +ve 312 342 8017 2123 1614
8
Mock IVT
(IVT
reaction/no
template)
(MyOne) -ve 305 127 338 171 166
9
MyOne
beads clean -ve 300 111 318 197 197
10
rGFP_LEE#1
(M280) -ve 308 135 290 204 203
11
rGFP_LEE#2
(M280) -ve 313 0 376 204 200
12
ASFV113-F1
(M280) +ve 312 741 41258 6338 4710
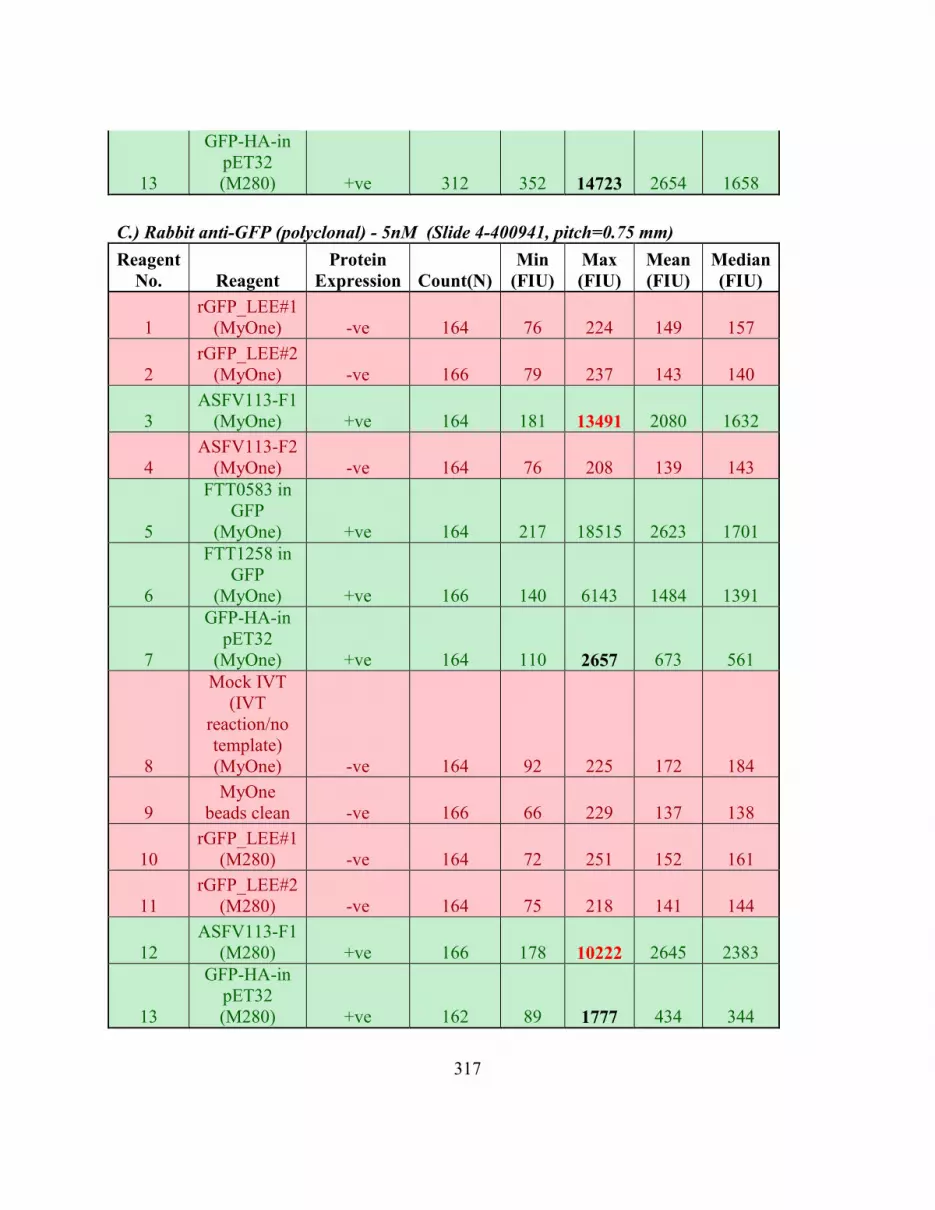
317
13
GFP-HA-in
pET32
(M280) +ve 312 352 14723 2654 1658
C.) Rabbit anti-GFP (polyclonal) - 5nM (Slide 4-400941, pitch=0.75 mm)
Reagent
No. Reagent
Protein
Expression Count(N)
Min
(FIU)
Max
(FIU)
Mean
(FIU)
Median
(FIU)
1
rGFP_LEE#1
(MyOne) -ve 164 76 224 149 157
2
rGFP_LEE#2
(MyOne) -ve 166 79 237 143 140
3
ASFV113-F1
(MyOne) +ve 164 181 13491 2080 1632
4
ASFV113-F2
(MyOne) -ve 164 76 208 139 143
5
FTT0583 in
GFP
(MyOne) +ve 164 217 18515 2623 1701
6
FTT1258 in
GFP
(MyOne) +ve 166 140 6143 1484 1391
7
GFP-HA-in
pET32
(MyOne) +ve 164 110 2657 673 561
8
Mock IVT
(IVT
reaction/no
template)
(MyOne) -ve 164 92 225 172 184
9
MyOne
beads clean -ve 166 66 229 137 138
10
rGFP_LEE#1
(M280) -ve 164 72 251 152 161
11
rGFP_LEE#2
(M280) -ve 164 75 218 141 144
12
ASFV113-F1
(M280) +ve 166 178 10222 2645 2383
13
GFP-HA-in
pET32
(M280) +ve 162 89 1777 434 344

318
D.) Polyclonal mouse anti-FTT0583 sera (1:500 diluted) - (Slide 3-400931,
pitch=0.5mm)
Reagent
No. Reagent
Protein
Expression Count
Min
(FIU)
Max
(FIU)
Mean
(FIU)
Median
(FIU)
5
FTT0583 in
GFP
(MyOne) +ve 168 108 505 190 156
On slide 1-400787 (Table A3- 4, Section A), from the maximum signal captured, MyOne
bead-proteins showed higher signal as compared to M280 for 2 antigens ASFV113-F1 and
Hemagglutinin (HA). This is an unexpected result given that M280 beads have a larger surface
area as compared to MyOne beads. One reason why this might have happened could be due to
lesser retention of M280 (larger) beads on the aminosilane surface as compared to MyOne beads
during slide processing. Bead run-off before and after microarray processing would be difficult
to estimate. Alternatively, the suspension time of beads in buffer during printing might be more
important for M280 (heavier) beads. The effect of suspension time on beads is tested in Section
B on slide 2-400940 whereby one reagent is printed on the complete slide before moving onto
the second reagent. Here as expected M280 bead-proteins show higher signal intensity as
compared to MyOne for both proteins ASFV113-F1 and HA. The quality of suspension
decreases over time as observed when comparing intensities obtained from these two proteins
between Section A and B. Higher sonication energy was used to deposit beads in slide 4 –
400941 (Table A3- 4, Section C) to estimate if doing so would equalize the amount of deposited
bead-proteins regardless of the bead diameter. Increase in sonication energy was sufficient to
overcome the difference in spotting between M280 and MyOne bead-proteins and resulted in
better spot morphology as compared to Slides 1 and 2.

319
We also probed the array with polyclonal sera from mice immunized with protein # 5
(FTT0583) and protein # 6 (FTT1258). The overall signal obtained from polyclonal sera was low
and very close to background as depicted in Figure A3-12, Panel D and Table A3- 4, Section D.
This observation might be because polyclonal sera takes longer to equilibrate as observed from
the pathogen proteome peptide (PPP) microarray in Chapter 4 and we only incubated the primary
polyclonal sera for 1 hour during our initial test. Going forward, we would be testing polyclonal
sera reactivity observed after 16 hours of incubation, which is recommended for protein
microarrays [214].
For the next set of experiments, I would recommend testing different slide surfaces and
using the print protocol that was approved in this first round of comparison. Again quality
control testing should be repeated using the polyclonal anti-tag antibody so as to decide which
slide surface provides maximum retention of beads. This technology could potentially be used
for screening proteins from a pathogen whose epitope peptides have not been empirically
mapped in literature or the Immune Epitope DataBase (IEDB) to rapidly identify both
immunoreactive and immunodominant antigens.
Acknowledgements
I would like to thank Dr. Kathryn Sykes for involving me on these projects that help
highlight some of the potential uses for the PPP array technology. I would also like to thank Dr.
Linda Dixon from The Pirbright Institute, UK for providing ASFV sera.
I am grateful everyone listed below for providing data towards this appendix. The ELISA
data for the TVDC project was obtained from Dr. Andrey Loskutov and Miss. Felicia

320
Craciunescu. The ELISA data for the ASFV project was obtained from Dr. Mark Robida and Dr.
Debbie Tumbula Hansen. The sonication based printing was done by Matt Greving and the
printing protocols were contributed by him in this manuscript. The polyclonal mouse sera data
was obtained from Dr. Debbie Tumbula Hansen using Dr. Mark Robida’s mouse immunization
experiment. Miss Felicia Craciunescu completed a quality control assessment before sending out
the 13 printing reagents using protein gel electrophoresis.

321
Bibliography
1. Chan KH, To KKW, Hung IFN, Zhang AJX, Chan JFW, et al. (2011) Differences in Antibody
Responses of Individuals with Natural Infection and Those Vaccinated against Pandemic H1N1
2009 Influenza. Clinical and Vaccine Immunology 18: 867-873.
2. Prim D, Rebeaud F, Cosandey V, Marti R, Passeraub P, et al. (2013) ADIBO-Based "Click"
Chemistry for Diagnostic Peptide Micro-Array Fabrication: Physicochemical and Assay
Characteristics. Molecules 18: 9833-9849.
3. Cretich M, Damin F, Longhi R, Gotti C, Galati C, et al. (2010) Peptide Microarrays on Coated
Silicon Slides for Highly Sensitive Antibody Detection. Small Molecule Microarrays: Methods
and Protocols 669: 147-160.
4. Hjelm B, Forsström B, Löfblom J, Rockberg J, Uhlén M (2012) Parallel Immunizations of
Rabbits Using the Same Antigen Yield Antibodies with Similar, but Not Identical, Epitopes.
PLoS ONE 7: e45817.
5. Loh J, Zhao GY, Presti RM, Holtz LR, Finkbeiner SR, et al. (2009) Detection of Novel
Sequences Related to African Swine Fever Virus in Human Serum and Sewage. Journal of
Virology 83: 13019-13025.
6. Registry NSA HHS and USDA Select Agents and Toxins List.
7. Whitlock GC, Robida MD, Judy BM, Qazi O, Brown KA, et al. (2011) Protective antigens
against glanders identified by expression library immunization. Frontiers in Microbiology 2.
8. Borca MV, Irusta P, Carrillo C, Afonso CL, Burrage T, et al. (1994) African swine fever virus
structural protein p72 contains a conformational neutralizing epitope. Virology 201: 413-418.
9. GomezPuertas P, Rodriguez F, Oviedo JM, RamiroIbanez F, RuizGonzalvo F, et al. (1996)
Neutralizing antibodies to different proteins of African swine fever virus inhibit both virus
attachment and internalization. Journal of Virology 70: 5689-5694.
10. Neilan JG, Zsak L, Lu Z, Burrage TG, Kutish GF, et al. (2004) Neutralizing antibodies to
African swine fever virus proteins p30, p54, and p72 are not sufficient for antibody-mediated
protection. Virology 319: 337-342.

322
11. Barderas MG, Rodriguez F, Gomez-Puertas P, Aviles M, Beitia F, et al. (2001) Antigenic
and immunogenic properties of a chimera of two immunodominant African swine fever virus
proteins. Archives of Virology 146: 1681-1691.
12. Legutki JB, Johnston SA (2013) Immunosignatures can predict vaccine efficacy. Proceedings
of the National Academy of Sciences of the United States of America 110: 18614-18619.
13. Pedelacq JD, Cabantous S, Tran T, Terwilliger TC, Waldo GS (2006) Engineering and
characterization of a superfolder green fluorescent protein. Nature Biotechnology 24: 79-88.
14. Sykes KF, Johnston SA (1999) Linear expression elements: a rapid, in vivo, method to
screen for gene functions. Nature Biotechnology 17: 355-359.
15. Montor WR, Huang J, Hu YH, Hainsworth E, Lynch S, et al. (2009) Genome-Wide Study of
Pseudomonas aeruginosa Outer Membrane Protein Immunogenicity Using Self-Assembling
Protein Microarrays. Infection and Immunity 77: 4877-4886.

323
APPENDIX IV
INSTITUTIONAL REVIEW BOARD (IRB) APPROVAL

324

325

326

327

328

329

330
APPENDIX V
INSTITUTIONAL ANIMAL CARE & USE COMMITTEE

331

332

333

334

335

336

337

338

339
BIOGRAPHICAL SKETCH
I earned my Bachelor of Science degree majoring in Microbiology from the University of
Mumbai in India. During my bachelors degree I simultaneously completed 2 diplomas in
computer programming with the intention of pursuing a career in the field of Bioinformatics. My
bachelors in Microbiology piqued my interest in medical diagnostics applied to diagnose
infections caused by the microorganisms I was studying at the time. This led me to obtaining a
Post Graduate Diploma in Medical Laboratory Technology (PGDMLT). As part of the
culminating experience of this diploma I had the fine opportunity of interning and later working
at a Harvard Medical International (HMI) affiliate hospital in India where I learnt first-hand how
differential diagnosis is applied in the field of infectious disease. Pursing my aspirations for
higher education, I came to Arizona State University to complete my Professional Science
Masters (PSM) in Computational Biosciences. My mentors at the time encouraged enrolling into
the Biological Design PhD program during which time at the Center for Innovation in Medicine
in Biodesign, I learnt how diagnostics are made for infectious diseases. From having seen both
perspectives (end-users and manufacturing) of medical diagnostics I hope to continue to apply
my expertise to create novel forms of diagnostic interventions enabling earlier resolution of
disease.


