Embed Size (px)
Citation preview

Article
Antidiabetic Effects of Yam (Dioscorea batatas) andIts Active Constituent, Allantoin, in a Rat Model ofStreptozotocin-Induced Diabetes
Hyeon-Kyu Go 1, Md. Mahbubur Rahman 1, Gi-Beum Kim 1, Chong-Sam Na 2, Choon-Ho Song 3,Jin-Shang Kim 1, Shang-Jin Kim 1,* and Hyung-Sub Kang 1,*
Received: 26 June 2015 ; Accepted: 8 October 2015 ; Published: 15 October 2015
1 Department of Veterinary Pharmacology and Toxicology, College of Veterinary Medicine,Chonbuk National University, Iksan Campus, 79 Gobong-ro, Iksan-si, Jeollabuk-do 570-752, Korea;[email protected] (H.-K.G.); [email protected] (M.M.R.); [email protected] (G.-B.K.);[email protected] (J.-S.K.)
2 Department of Animal Biotechnology, College of Agriculture and Life Science, Chonbuk NationalUniversity, 567 Baekje-daero, Deokjin-gu, Jeonju-si, Jeollabuk-do 561-756, Korea; [email protected]
3 Department of Food Resource Marketing Economics, College of Environmental and Bioresource Sciences,Chonbuk National University, 567 Baekje-daero, Deokjin-gu, Jeonju-si, Jeollabuk-do 561-756, Korea;[email protected]
* Correspondence: [email protected] (S.-J.K.); [email protected] (H.-S.K.); Tel.: +82-63-850-0963 (S.-J.K.);+82-63-850-0942 (H.-S.K.); Fax: +82-63-850-0910
Abstract: The objective of this study was to investigate the therapeutic efficacies of crude yam(Dioscorea batatas) powder (PY), water extract of yam (EY), and allantoin (the active constituent ofyam) in streptozotocin (STZ)-induced diabetic rats with respect to glucose, insulin, glucagon-likepeptide-1 (GLP-1), C-peptide, glycated hemoglobin (HbAlc), lipid metabolism, and oxidative stress.For this purpose, 50 rats were divided into five groups: normal control (NC), diabetic control(STZ), and STZ plus treatment groups (STZ + PY, STZ + EY, and STZ + allantoin). After treatmentfor one-month, there was a decrease in blood glucose: 385 ˘ 7 in STZ, 231 ˘ 3 in STZ + PY,214 ˘ 11 in STZ + EY, and 243 ˘ 6 mg/dL in STZ + allantoin, respectively. There were significantstatistical differences (p < 0.001) compared to STZ (100%): 60% in STZ + PY, 55% in STZ + EY,and 63% in STZ + allantoin. With groups in the same order, there were significant decreases(p < 0.001) in HbAlc (100% as 24.4 ˘ 0.6 ng/mL, 78%, 75%, and 77%), total cholesterol (100% as122 ˘ 3 mg/dL, 70%, 67%, and 69%), and low-density lipoprotein (100% as 29 ˘ 1 mg/dL,45%, 48%, and 38%). There were also significant increases (p < 0.001) in insulin (100% as0.22 ˘ 0.00 ng/mL, 173%, 209%, and 177%), GLP-1 (100% as 18.4 ˘ 0.7 pmol/mL, 160%, 166%, and162%), and C-peptide (100% as 2.56˘ 0.10 ng/mL, 129%, 132%, and 130%). The treatment effectivelyameliorated antioxidant stress as shown by a significant decrease (p < 0.001) in malondialdehyde(100% as 7.25 ˘ 0.11 nmol/mL, 87%, 86%, and 85%) together with increases (p < 0.01) insuperoxide dismutase (100% as 167 ˘ 6 IU/mL, 147%, 159%, and 145%) and reduced glutathione(100% as 167˘ 6 nmol/mL, 123%, 141%, and 140%). The results indicate that yam and allantoin haveantidiabetic effects by modulating antioxidant activities, lipid profiles and by promoting the releaseof GLP-1, thereby improving the function of β-cells maintaining normal insulin and glucose levels.
Keywords: Dioscorea batatas; diabetic; insulin; hyperglycemia; glucagon-like peptide-1;antioxidant; rat
Nutrients 2015, 7, 8532–8544; doi:10.3390/nu7105411 www.mdpi.com/journal/nutrients

Nutrients 2015, 7, 8532–8544
1. Introduction
Diabetes is a chronic endocrine disease characterized by persistent hyperglycemia and associatedwith abnormalities of carbohydrate, protein, and lipid metabolism. This disease is caused by adecrease or deficiency of insulin secretion and/or from increased cellular resistance [1]. Diabetesposes a serious threat to health worldwide due to its severe effects on the micro- and macrovascularsystems. Specifically, diabetes can cause damage and/or dysfunction of multiple organs and tissues,especially the eyes, kidneys, nerves, heart, and blood vessels [1]. The total number of people withdiabetes is projected to rise from 171 million in 2000 to 366 million in 2030 [2]. Controlling bloodglucose levels is essential for preventing diabetic complications and for improving the health ofpatients with diabetes. Currently available drugs for diabetes, however, have a number of limitations,such as unwanted side effects that include hypoglycemia, cell death, and high rates of secondaryfailure [3]. Recent efforts for the complementary treatment of diabetes have focused on functionalfoods and their bioactive compounds [4].
Yam, Dioscorea batatas (D. batatas), belongs to the Dioscoreaceae family and has been widelyused to promote health and in Asian traditional medicine for the treatment of several illnessessuch as hypertension, asthma, abscesses, chronic diarrhea, diabetes, inflammation, cancer, andulcers [5–8]. The major constituents of yam are allantoin, dioscorin, sapogenins, prosapogenin,gracillin, choline, L-arginine, polysaccharides, and proteins [4,8–11]. Due to their immunomodulatoryand antitumor effects, yam polysaccharides have attracted increasing attention in the biochemical andmedical fields [9]. Yam mucopolysaccharide has been demonstrated to possess immunostimulatingbioactivities, including enhancing INF-γ secretion by splenic lymphocytes, stimulating phagocytosis,and aiding macrophages [9]. Choline is known to regulate the functioning of the peripheral andcentral nervous systems. L-arginine has been shown to boost the immune system and to be usefulin treating cancer [10]. Allantoin is nature-identical, safe, and nontoxic; moreover, this substance iseffective for treating diabetes, hypertension, cancer, and common aches [6,7,10].
Previous studies have demonstrated that the ability of yam to lower blood glucose is related toimproved glucose metabolism via the up-regulation of the plasma membrane receptor GLUT4 [4,12].Yam also improves intestinal Na`/K` ATPase activity [8] by activating imidazoline I-2 receptors [13].However, the mechanisms by which yam improve the biochemical profiles of patients with diabeteshave not yet been completely characterized. Decreased levels of insulin, glucagon-like peptide-1(GLP-1), and C-peptide; increased levels of glycated hemoglobin (HbAlc) and oxidative stressmarkers; and imbalanced lipid profiles, electrolyte levels, and antioxidant activities are associatedwith diabetes. Based on these observations, the objective of this study was to investigate thetherapeutic efficacies of crude yam (Dioscorea batatas) powder (PY), water extract of yam (EY), andallantoin (the active constituent of yam) in streptozotocin-induced diabetic rats with respect to GLP-1,C-peptide, HbAlc, oxidative stress, insulin, glucose, and lipid metabolism
2. Experimental Section
2.1. Plant Materials and Preparation of Water Extract
Powdered crude yam (Dioscorea batatas) was obtained from the Seodongma Local IndustryProject Association, Inc. (Iksan, Republic of Korea). A total amount of 10 g of crude yam powder(PY) was suspended in 1000 mL of distilled water, heated at 80 ˝C, stirred continuously for 48 h,and filtered. The resulting filtrate was sequentially concentrated in a vacuum rotary evaporator andfurther freeze-dried to obtain the water extract of yam (EY, 4.73 g). This extract was freshly dissolvedin distilled water before administration.
2.2. Experimental Animals
Male Sprague-Dawley rats weighing 200–250 g were purchased from Koatech (Gyeonggi-do,Korea). Rats were in housed controlled humidity (60%–70%) and temperature (23 ˘ 2 ˝C) conditions
8533

Nutrients 2015, 7, 8532–8544
with a 12 h light/dark cycle. Rats had free access to a standard rat pellet diet and tap water. Allexperimental protocols (CBU2013-0010) were approved by the Committee on the Care of LaboratoryAnimal Resources, Chonbuk National University and were conducted in accordance with the Guidefor the Care and Use of Laboratory Animals [14].
2.3. Induction of Experimental Diabetes Mellitus and Experimental Design
In total, 50 rats were divided equally into five groups: normal control, streptozotocin(STZ)-induced diabetic control, suspended crude yam powder-treated diabetic (STZ + PY), waterextract of yam-treated diabetic (STZ + EY), and allantoin-treated diabetic group (STZ + Allantoin).Diabetes was induced by intraperitoneal injection of STZ (Sigma-Aldrich, St. Louis, MO, USA) ata dose of 50 mg/kg body weight (BW). For this purpose, STZ was dissolved in 0.1 mol/L sodiumcitrate buffer (pH 4.5). Three days after the induction of diabetes, rats with blood glucose levels over350 mg/dL were considered to have type 1-like diabetes mellitus. Once diabetes was established,distilled water (DW) and yam were administered by gavage needle (Per Os) for 31 days. The dailydoses of PY, EY, and allantoin were 1000 mg/kg BW, 500 mg/kg BW, and 2 mg/kg BW, respectively.PY and EY were orally administrated, whereas allantoin (Sigma-Aldrich, St. Louis, MO, USA) wasinjected intraperitoneally because it degrades in the GI tract [4]. The NC group treated only withequal volume of DW. Yam (Dioscorea spp.) has been reported to contain a higher allantoin contentthan any other plant; moreover, allantoin has been identified as an abundant and active constituentof yam. A previous study reported that the amount of allantoin in D. batatas ranged from 4.1 to7.1 mg/g dry weight [15]. In a previous study, 0.5 mg/kgBW allantoin was administeredintravenously to STZ-induced diabetic rats [4]. Due to the high amount of moisture (about 80%)in D. batatas [16], in this study 2 mg/kg BW of allantoin and 1000 mg/kg BW of PY were used. Sincethe yield of EY was about 50% that of PY, 500 mg/kg BW was selected as the daily dose of EY. Allanimals were carefully monitored on a daily basis for the duration of the study.
2.4. Measurement of Blood Glucose Levels
Fresh blood samples were collected from the tail vein of the rats after 12 h fast. The fasting bloodglucose (FBG) levels were determined with a blood glucose meter (ACCU-CHEKr Active, RocheDiagnostics, Mannheim, Germany). These measurements were performed on days 0, 11, 21, and 31.
2.5. Biochemical Analysis
Blood was collected from the caudal vena cava after anesthesia with a mixture of Zoletil andRompun (30 and 5 mg/kg BW, respectively). Blood collection, storage, and measurement wereperformed as previously described [16]. A Nova Stat Profiler pHOxr Ultra analyzer (NOVABiomedical Corp., Waltham, MA, USA) was used to measure the levels of lactate, pH, HCO3
´,hemoglobin, hematocrit, ionized magnesium (Mg2`), calcium (Ca2`), potassium (K`), and chloride(Cl´) in freshly collected whole blood. As previously described [17], the anion gap values werecalculated by the formula, (Na` ´ (Cl´ + HCO3
´)).After clotting, blood serum was separated by centrifugation at 3000 rpm for 20 min. The
levels of alanine aminotransferase (ALT), aspartate aminotransferase (AST), alkaline phosphatase(ALP), lactate dehydrogenase (LDH), creatinine kinase (CK), albumin, total cholesterol (TC), totalprotein (TP), triglyceride (TG), high-density lipoprotein (HDL), low density lipoprotein (LDL),creatinine (CRE), blood urea nitrogen (BUN), and uric acid (UA) were analyzed using a Model 7020auto analyzer (Hitachi, Tokyo, Japan). Osmolality (Osm) values were calculated by the formula,(1.86 ˆ Na` + (Glucose/18) + (BUN/2.8) + 9) as previously described [17].
2.6. Serum Insulin, Nitrite/Nitrate, GLP-1, C-Peptide, and HbAlc Measurements
Fasting serum insulin levels were measured with a rat insulin enzyme-linked immune absorbentassay kit (ALPCO Diagnostics, Windham, NH, USA) according to the manufacturer’s protocol. GLP-1
8534

Nutrients 2015, 7, 8532–8544
(GLP-1 EIA Kit, Sigma-Aldrich, St. Louis, MO, USA), C-peptide (C-Peptide EIA Kit, Sigma-Aldrich,St. Louis, MO, USA), and HbA1c ELISA kit (Cusabio Biotech Co., Ltd., Wuhan, China) werequantitated using commercially available kits according to the manufacturers’ protocols.
2.7. Measurement of Antioxidant Defense
The serum concentrations of malondialdehyde (MDA) were measured with an OXI-TEK TBARSkit (Enzo Life Sciences Incorporated; Plymouth Meeting, PA, USA). The reaction products weredetermined by measuring the absorbance at 532 nm using a SpectraMax M2 microplate reader(Molecular Devices, Sunnyvale, CA, USA) according to the manufacturer’s instructions. The serumlevels of superoxide dismutase (SOD) were quantitated using a SOD activity kit (Enzo Life SciencesIncorporated) measuring the absorbance of the reaction products at 450 nm. The levels of totalglutathione (tGSH) and oxidized glutathione (GSSG) were measured using a glutathione (total)detection kit from Enzo Life Sciences Incorporated. The absorbance of the reaction products wasread at 405 nm. As per the manufacturer’s protocol, the concentration of reduced glutathione (GSH)was calculated using the formula, GSH = (tGSH – GSSG). The redox ratio was calculated using theformula, GSH:GSSG = (tGSH ´ 2 GSSG)/GSSG), as previously described [18].
2.8. Histological Analysis
For histological analysis, the pancreases, livers, and kidneys were dissected from all of the studygroups at the end of experiment period. The tissues were washed in normal saline, cut into piecesof the desired size, and fixed in 10% neutral buffered formalin solution. After fixation, the sampleswere cleaned and embedded in paraffin. Tissue sections of 5 µm thickness were mounted on slides,stained with hematoxylin-eosin (H-E), and examined on a light microscope.
2.9. Statistical Analysis
Data are expressed as means ˘ standard errors of the mean (SEMs). Differences between groupswere evaluated by analysis of variance (ANOVA) with the Bonferroni post hoc test or by calculationof Spearman’s rank correlation coefficient, as appropriate, using Prism 5.03 (GraphPad Software Inc.,San Diego, CA, USA). Statistical significance was set at p < 0.05.
3. Results
3.1. Effects of the Different Treatments on BW, Blood Glucose Levels, and Serum Insulin Levels
The effects of PY, EY, and allantoin on BW and FBG in STZ-induced diabetic rats are shown inFigure 1. During the study period, the normal control rats gained weight, while STZ-induced diabeticrats exhibited a lower body weight. The mean BWs of the treatment groups were significantly higherthan those of the diabetic control group.
The mean FBG in diabetic rats was significantly increased compared with the normal controlrats, whereas all the treatment groups showed significantly decreased blood glucose levels comparedwith the diabetic control group from Day 11 until the end of the experiment. Among all the groups,the EY-treated diabetic rats showed the lowest blood glucose levels.
3.2. Effects of the Different Treatments on Serum Insulin, GLP-1, C-Peptide, HbAlc, and Nitric Oxide Levels
At the end of the experiment, the serum insulin, GLP-1, and C-peptide levels of diabeticcontrol rats were significantly decreased compared to those of normal control rats. In contrast, theadministration of PY, EY, or allantoin to diabetic rats significantly increased all of these parameterscompared with the diabetic control rats. However, HbAlc significantly increased in diabetic rats,which were found near to normal in the treatment group (Figure 2).
8535

Nutrients 2015, 7, 8532–8544Nutrients 2015, 7, page–page
5
Figure 1. Effects of powdered yam (PY), extract of yam (EY), and allantoin on body weight (a) and
fasting blood glucose (b) in streptozotocin (STZ)‐induced diabetic rats. Data are reported as means ±
SEMs (n = 10). *: p < 0.05 and ***: p < 0.001, Bonferroni post hoc test following one‐way ANOVA versus
the NC group (Cont); #: p < 0.05; ##: p < 0.01; and ###: p < 0.001, Bonferroni post hoc test following two‐
way ANOVA versus the diabetic control group (STZ).
Figure 2. Effects of PY, EY, and allantoin treatments on the serum levels of insulin (a), GLP‐1 (b), C‐
peptide (c), and HbAlc (d) in STZ‐induced diabetic rats: GLP‐1, glucagon‐like peptide‐1; HbA1c,
glycated hemoglobin. Data are reported as means ± SEMs (n = 10). *: p < 0.05; **: p < 0.01; and
***: p < 0.001, Bonferroni post hoc test following one‐way ANOVA versus the NC group (Cont); #: p < 0.05; ##: p < 0.01; and ###: p < 0.001, Bonferroni post hoc test following one‐way ANOVA versus the
diabetic control group (STZ).
3.3. Effects of the Different Treatments on the Serum Levels of Metabolic Enzymes, BUN, CRE, and UA
As shown in Figure 3, the serum levels of ALT, AST, ALP, LDH, CK, BUN, CRE, and UA were
significantly increased in the diabetic control rats compared with the normal control rats. However,
these elevations were significantly reduced in the yam‐treated (PY and EY) and allantoin‐treated
groups compared with the diabetic control group.
3.4. Effects of the Different Treatments on Serum Lipid and Protein Levels
The serum levels of TC, LDL, and TG were markedly elevated in the diabetic group compared
with the normal group, whereas the opposite effect was observed on the serum levels of LDL, TP,
and albumin. However, these effects were reduced in the treatment groups (Figure 4).
Figure 1. Effects of powdered yam (PY), extract of yam (EY), and allantoin on body weight(a) and fasting blood glucose (b) in streptozotocin (STZ)-induced diabetic rats. Data are reported asmeans ˘ SEMs (n = 10). *: p < 0.05 and ***: p < 0.001, Bonferroni post hoc test following one-wayANOVA versus the NC group (Cont); #: p < 0.05; ##: p < 0.01; and ###: p < 0.001, Bonferroni post hoc testfollowing two-way ANOVA versus the diabetic control group (STZ).
Nutrients 2015, 7, page–page
5
Figure 1. Effects of powdered yam (PY), extract of yam (EY), and allantoin on body weight (a) and
fasting blood glucose (b) in streptozotocin (STZ)‐induced diabetic rats. Data are reported as means ±
SEMs (n = 10). *: p < 0.05 and ***: p < 0.001, Bonferroni post hoc test following one‐way ANOVA versus
the NC group (Cont); #: p < 0.05; ##: p < 0.01; and ###: p < 0.001, Bonferroni post hoc test following two‐
way ANOVA versus the diabetic control group (STZ).
Figure 2. Effects of PY, EY, and allantoin treatments on the serum levels of insulin (a), GLP‐1 (b), C‐
peptide (c), and HbAlc (d) in STZ‐induced diabetic rats: GLP‐1, glucagon‐like peptide‐1; HbA1c,
glycated hemoglobin. Data are reported as means ± SEMs (n = 10). *: p < 0.05; **: p < 0.01; and
***: p < 0.001, Bonferroni post hoc test following one‐way ANOVA versus the NC group (Cont); #: p < 0.05; ##: p < 0.01; and ###: p < 0.001, Bonferroni post hoc test following one‐way ANOVA versus the
diabetic control group (STZ).
3.3. Effects of the Different Treatments on the Serum Levels of Metabolic Enzymes, BUN, CRE, and UA
As shown in Figure 3, the serum levels of ALT, AST, ALP, LDH, CK, BUN, CRE, and UA were
significantly increased in the diabetic control rats compared with the normal control rats. However,
these elevations were significantly reduced in the yam‐treated (PY and EY) and allantoin‐treated
groups compared with the diabetic control group.
3.4. Effects of the Different Treatments on Serum Lipid and Protein Levels
The serum levels of TC, LDL, and TG were markedly elevated in the diabetic group compared
with the normal group, whereas the opposite effect was observed on the serum levels of LDL, TP,
and albumin. However, these effects were reduced in the treatment groups (Figure 4).
Figure 2. Effects of PY, EY, and allantoin treatments on the serum levels of insulin (a), GLP-1 (b),C-peptide (c), and HbAlc (d) in STZ-induced diabetic rats: GLP-1, glucagon-like peptide-1; HbA1c,glycated hemoglobin. Data are reported as means ˘ SEMs (n = 10). *: p < 0.05; **: p < 0.01;and ***: p < 0.001, Bonferroni post hoc test following one-way ANOVA versus the NC group (Cont);#: p < 0.05; ##: p < 0.01; and ###: p < 0.001, Bonferroni post hoc test following one-way ANOVA versusthe diabetic control group (STZ).
3.3. Effects of the Different Treatments on the Serum Levels of Metabolic Enzymes, BUN, CRE, and UA
As shown in Figure 3, the serum levels of ALT, AST, ALP, LDH, CK, BUN, CRE, and UA weresignificantly increased in the diabetic control rats compared with the normal control rats. However,these elevations were significantly reduced in the yam-treated (PY and EY) and allantoin-treatedgroups compared with the diabetic control group.
8536

Nutrients 2015, 7, 8532–8544
3.4. Effects of the Different Treatments on Serum Lipid and Protein Levels
The serum levels of TC, LDL, and TG were markedly elevated in the diabetic group comparedwith the normal group, whereas the opposite effect was observed on the serum levels of LDL, TP, andalbumin. However, these effects were reduced in the treatment groups (Figure 4).Nutrients 2015, 7, page–page
6
Figure 3. Effects of PY, EY, and allantoin treatments on the serum levels of metabolic enzymes, BUN,
CRE, and UA in STZ‐induced diabetic rats. ALT, alanine aminotransaminase (a); AST, aspartate
aminotransferase (b); LDH, lactate dehydrogenase (c); ALP, alkaline phosphatase (d); CK, creatinine
kinase (e); CRE, creatinine (f); BUN, blood urea nitrogen (g); UA, uric acid (h). Data are reported as
means ± SEMs (n = 10). *: p < 0.05; **: p < 0.01; and ***: p < 0.001, Bonferroni post hoc test following one‐
way ANOVA versus the NC group (Cont); #: p < 0.05; ##: p < 0.01; and ###: p < 0.001, Bonferroni post hoc
test following one‐way ANOVA versus the diabetic control group (STZ).
Figure 4. Effects of PY, EY, and allantoin treatments on serum lipid and protein profiles in
STZ‐induced diabetic rats. TC, total cholesterol (a); HDL, high density lipoprotein (b); LDL, low
density lipoprotein (c); TG, triglyceride (d); TP, total protein (e); Albumin (f). Data are reported as
means ± SEMs (n = 10). *: p < 0.05; **: p < 0.01; and ***: p < 0.001, Bonferroni post hoc test following
one‐way ANOVA versus the NC group (Cont); #: p < 0.05; ##: p < 0.01; and ###: p < 0.001, Bonferroni post
hoc test following one‐way ANOVA versus the diabetic control group (STZ).
3.5. Effects of the on Different Treatments Antioxidant Activities
The serum concentrations of tGSH, GSH, and SOD were significantly decreased in the diabetic
group compared with the normal group. These changes were accompanied by a significant decrease
in the redox ratio (GSH:GSSG), an increase in the serum concentration of oxidized glutathione, and
an increase in lipid peroxidation (MDA). However, these effects were lessened after 31 days of PY,
EY, or allantoin administration (Figure 5).
3.6. Effects of the Different Treatments on Blood Ion and Metabolite Concentrations
As shown in Table 1, the blood pH, HCO3− concentration, Hb concentration, and hematocrit
values were markedly decreased, while the blood lactate concentration and osmolarity were
increased in the diabetic group. Similarly, alterations in the concentrations of various ions (Mg2+, Ca2+,
Figure 3. Effects of PY, EY, and allantoin treatments on the serum levels of metabolic enzymes, BUN,CRE, and UA in STZ-induced diabetic rats. ALT, alanine aminotransaminase (a); AST, aspartateaminotransferase (b); LDH, lactate dehydrogenase (c); ALP, alkaline phosphatase (d); CK, creatininekinase (e); CRE, creatinine (f); BUN, blood urea nitrogen (g); UA, uric acid (h). Data are reported asmeans ˘ SEMs (n = 10). *: p < 0.05; **: p < 0.01; and ***: p < 0.001, Bonferroni post hoc test followingone-way ANOVA versus the NC group (Cont); #: p < 0.05; ##: p < 0.01; and ###: p < 0.001, Bonferronipost hoc test following one-way ANOVA versus the diabetic control group (STZ).
Nutrients 2015, 7, page–page
6
Figure 3. Effects of PY, EY, and allantoin treatments on the serum levels of metabolic enzymes, BUN,
CRE, and UA in STZ‐induced diabetic rats. ALT, alanine aminotransaminase (a); AST, aspartate
aminotransferase (b); LDH, lactate dehydrogenase (c); ALP, alkaline phosphatase (d); CK, creatinine
kinase (e); CRE, creatinine (f); BUN, blood urea nitrogen (g); UA, uric acid (h). Data are reported as
means ± SEMs (n = 10). *: p < 0.05; **: p < 0.01; and ***: p < 0.001, Bonferroni post hoc test following one‐
way ANOVA versus the NC group (Cont); #: p < 0.05; ##: p < 0.01; and ###: p < 0.001, Bonferroni post hoc
test following one‐way ANOVA versus the diabetic control group (STZ).
Figure 4. Effects of PY, EY, and allantoin treatments on serum lipid and protein profiles in
STZ‐induced diabetic rats. TC, total cholesterol (a); HDL, high density lipoprotein (b); LDL, low
density lipoprotein (c); TG, triglyceride (d); TP, total protein (e); Albumin (f). Data are reported as
means ± SEMs (n = 10). *: p < 0.05; **: p < 0.01; and ***: p < 0.001, Bonferroni post hoc test following
one‐way ANOVA versus the NC group (Cont); #: p < 0.05; ##: p < 0.01; and ###: p < 0.001, Bonferroni post
hoc test following one‐way ANOVA versus the diabetic control group (STZ).
3.5. Effects of the on Different Treatments Antioxidant Activities
The serum concentrations of tGSH, GSH, and SOD were significantly decreased in the diabetic
group compared with the normal group. These changes were accompanied by a significant decrease
in the redox ratio (GSH:GSSG), an increase in the serum concentration of oxidized glutathione, and
an increase in lipid peroxidation (MDA). However, these effects were lessened after 31 days of PY,
EY, or allantoin administration (Figure 5).
3.6. Effects of the Different Treatments on Blood Ion and Metabolite Concentrations
As shown in Table 1, the blood pH, HCO3− concentration, Hb concentration, and hematocrit
values were markedly decreased, while the blood lactate concentration and osmolarity were
increased in the diabetic group. Similarly, alterations in the concentrations of various ions (Mg2+, Ca2+,
Figure 4. Effects of PY, EY, and allantoin treatments on serum lipid and protein profiles inSTZ-induced diabetic rats. TC, total cholesterol (a); HDL, high density lipoprotein (b); LDL, lowdensity lipoprotein (c); TG, triglyceride (d); TP, total protein (e); Albumin (f). Data are reported asmeans ˘ SEMs (n = 10). *: p < 0.05; **: p < 0.01; and ***: p < 0.001, Bonferroni post hoc test followingone-way ANOVA versus the NC group (Cont); #: p < 0.05; ##: p < 0.01; and ###: p < 0.001, Bonferronipost hoc test following one-way ANOVA versus the diabetic control group (STZ).
3.5. Effects of the on Different Treatments Antioxidant Activities
The serum concentrations of tGSH, GSH, and SOD were significantly decreased in the diabeticgroup compared with the normal group. These changes were accompanied by a significant decreasein the redox ratio (GSH:GSSG), an increase in the serum concentration of oxidized glutathione, andan increase in lipid peroxidation (MDA). However, these effects were lessened after 31 days of PY, EY,or allantoin administration (Figure 5).
8537

Nutrients 2015, 7, 8532–8544
3.6. Effects of the Different Treatments on Blood Ion and Metabolite Concentrations
As shown in Table 1, the blood pH, HCO3´ concentration, Hb concentration, and hematocrit
values were markedly decreased, while the blood lactate concentration and osmolarity were increasedin the diabetic group. Similarly, alterations in the concentrations of various ions (Mg2`, Ca2`, K`,and Cl´) were observed in this group. After treatment, most of these parameters had returnedto normal.
Nutrients 2015, 7, page–page
7
K+, and Cl−) were observed in this group. After treatment, most of these parameters had returned to
normal.
Figure 5. Effects of PY, EY, and allantoin treatments on serum lipid peroxidation and antioxidant
activities in STZ‐induced diabetic rats. MDA. Malondialdehyde (a); SOD, superoxide dismutase (b);
tGSH, total glutathione (c); GSH, reduced glutathione (d); GSSG, oxidized glutathione (e); GSH/GSSG,
ratio of GSH to GSSG (redox ratio) (f). Data are reported as means ± SEMs (n = 10). *: p < 0.05;
**: p < 0.01; and ***: p < 0.001, Bonferroni post hoc test following one‐way ANOVA versus the NC group
(Cont); #: p < 0.05; ##: p < 0.01; and ###: p < 0.001, Bonferroni post hoc test following one‐way ANOVA
versus the diabetic control group (STZ).
Table 1. Effects of PY, EY, and allantoin on the blood hemoglobin concentration, hematocrit value,
and electrolytic balance in STZ‐induced diabetic rats.
NC STZ STZ + PY STZ + EY STZ + Allatoin
Hb (g/dL) 13.4 ± 0.3 10.8 ± 0.3 13.2 ± 0.4 *** 13.5 ± 0.2 * 13.3 ± 0.1 ***
Hct (%) 42 ± 1 36 ± 1 *** 41 ± 1 ## 42 ± 1 ### 41 ± 1 **
pH 7.41 ± 0.01 7.33 ± 0.01 *** 7.43 ± 0.01 ### 7.43 ± 0.01 ### 7.44 ± 0.01 ##
Lactate (mmol/L) 3.9 ± 0.4 6.0 ± 0.3 ** 4.2 ± 0.2 ### 4.3 ± 0.3 ## 4.4 ± 0.4 #
HCO3− (mmol/L) 27.54 ± 0.58 23.63 ± 0.87 * 26.86 ± 0.36 29.24 ± 0.40 ## 28.97 ± 0.069 ##
Osm (mOsm/L) 298 ± 1 324 ± 1 *** 307 ± 3 *,## 298 ± 1 ### 302 ± 3 *,###
Angap (mmol/L) 13.5 ± 0.7 14.7 ± 1.0 13.6 ± 0.8 12.8 ± 0.3 12.9 ± 1.1
Na+ (mmol/L) 149 ± 0 151 ± 0 * 150 ± 1 148 ± 0 # 150 ± 1
Cl− (mmol/L) 108 ± 1 113 ± 1 * 112 ± 2 106 ± 0 ## 110 ± 1
Mg2+ (mmol/L) 0.44 ± 0.11 0.41 ± 0.01 0.44 ± 0.01 ### 0.43 ± 0.01 ### 0.44 ± 0.02 ###
K+ (mmol/L) 4.3 ± 0.1 5.0 ± 0.2 * 4.5 ± 0.2 4.3 ± 0.1 # 4.3 ± 0.1 #
Ca2+ (mmol/L) 1.11 ± 0.01 1.02 ± 0.02 * 1.14 ± 0.03 # 1.15 ± 0.02 ## 1.12 ± 0.01 #
NC, normal control; STZ, diabetic control; STZ + PY, crude yam powder‐treated diabetic; STZ + EY, water extract
of yam‐treated diabetic; STZ + Allantoin, allatoin‐treated diabetic rats; Hb, hemoglobin; Hct, hematocrete; HCO3−,
bicarbonate ion; Osm, osmolality; Angap, anionic gap. Data are reported as means ± SEMs (n = 10). *: p < 0.05;
**: p < 0.01; and ***: p < 0.001, Bonferroni post hoc test following one‐way ANOVA versus the NC group (Cont);
#: p < 0.05; ##: p < 0.01; and ###: p < 0.001, Bonferroni post hoc test following one‐way ANOVA versus the diabetic control
group (STZ).
3.7. Histological Analysis
In normal control rats, histological analysis revealed normal pancreatic beta‐cells in the islet of
Langerhans and the acini (Figure 6). Conversely, STZ‐induced diabetic rats exhibited extensive
granulation of beta cells and severe vacuolation of the pancreatic islets. Histological analysis of
diabetic rats treated with PY, EY, and allantoin revealed comparatively less beta‐cell granulation and
reduced pancreatic islet vacuolation compared with diabetic control rats. Liver investigation of the
Figure 5. Effects of PY, EY, and allantoin treatments on serum lipid peroxidation and antioxidantactivities in STZ-induced diabetic rats. MDA. Malondialdehyde (a); SOD, superoxide dismutase(b); tGSH, total glutathione (c); GSH, reduced glutathione (d); GSSG, oxidized glutathione (e);GSH/GSSG, ratio of GSH to GSSG (redox ratio) (f). Data are reported as means ˘ SEMs (n = 10).*: p < 0.05; **: p < 0.01; and ***: p < 0.001, Bonferroni post hoc test following one-way ANOVA versusthe NC group (Cont); #: p < 0.05; ##: p < 0.01; and ###: p < 0.001, Bonferroni post hoc test followingone-way ANOVA versus the diabetic control group (STZ).
Table 1. Effects of PY, EY, and allantoin on the blood hemoglobin concentration, hematocrit value,and electrolytic balance in STZ-induced diabetic rats.
NC STZ STZ + PY STZ + EY STZ + Allatoin
Hb (g/dL) 13.4 ˘ 0.3 10.8 ˘ 0.3 13.2 ˘ 0.4 ˚˚˚ 13.5 ˘ 0.2 ˚ 13.3 ˘ 0.1 ˚˚˚
Hct (%) 42 ˘ 1 36 ˘ 1 ˚˚˚ 41 ˘ 1 ## 42 ˘ 1 ### 41 ˘ 1 ˚˚
pH 7.41 ˘ 0.01 7.33 ˘ 0.01 ˚˚˚ 7.43 ˘ 0.01 ### 7.43 ˘ 0.01 ### 7.44 ˘ 0.01 ##
Lactate (mmol/L) 3.9 ˘ 0.4 6.0 ˘ 0.3 ˚˚ 4.2 ˘ 0.2 ### 4.3 ˘ 0.3 ## 4.4 ˘ 0.4 #
HCO3´
(mmol/L) 27.54 ˘ 0.58 23.63 ˘ 0.87 ˚ 26.86 ˘ 0.36 29.24 ˘ 0.40 ## 28.97 ˘ 0.069 ##
Osm (mOsm/L) 298 ˘ 1 324 ˘ 1 ˚˚˚ 307 ˘ 3 ˚,## 298 ˘ 1 ### 302 ˘ 3 ˚,###
Angap (mmol/L) 13.5 ˘ 0.7 14.7 ˘ 1.0 13.6 ˘ 0.8 12.8 ˘ 0.3 12.9 ˘ 1.1Na` (mmol/L) 149 ˘ 0 151 ˘ 0 ˚ 150 ˘ 1 148 ˘ 0 # 150 ˘ 1Cl´ (mmol/L) 108 ˘ 1 113 ˘ 1 ˚ 112 ˘ 2 106 ˘ 0 ## 110 ˘ 1Mg2` (mmol/L) 0.44 ˘ 0.11 0.41 ˘ 0.01 0.44 ˘ 0.01 ### 0.43 ˘ 0.01 ### 0.44 ˘ 0.02 ###
K` (mmol/L) 4.3 ˘ 0.1 5.0 ˘ 0.2 ˚ 4.5 ˘ 0.2 4.3 ˘ 0.1 # 4.3 ˘ 0.1 #
Ca2` (mmol/L) 1.11 ˘ 0.01 1.02 ˘ 0.02 ˚ 1.14 ˘ 0.03 # 1.15 ˘ 0.02 ## 1.12 ˘ 0.01 #
NC, normal control; STZ, diabetic control; STZ + PY, crude yam powder-treated diabetic; STZ + EY,water extract of yam-treated diabetic; STZ + Allantoin, allatoin-treated diabetic rats; Hb, hemoglobin;Hct, hematocrete; HCO3
´, bicarbonate ion; Osm, osmolality; Angap, anionic gap. Data are reported asmeans ˘ SEMs (n = 10). *: p < 0.05; **: p < 0.01; and ***: p < 0.001, Bonferroni post hoc test following one-wayANOVA versus the NC group (Cont); #: p < 0.05; ##: p < 0.01; and ###: p < 0.001, Bonferroni post hoc test followingone-way ANOVA versus the diabetic control group (STZ).
8538
Nutrients 2015, 7, 8532–8544
3.7. Histological Analysis
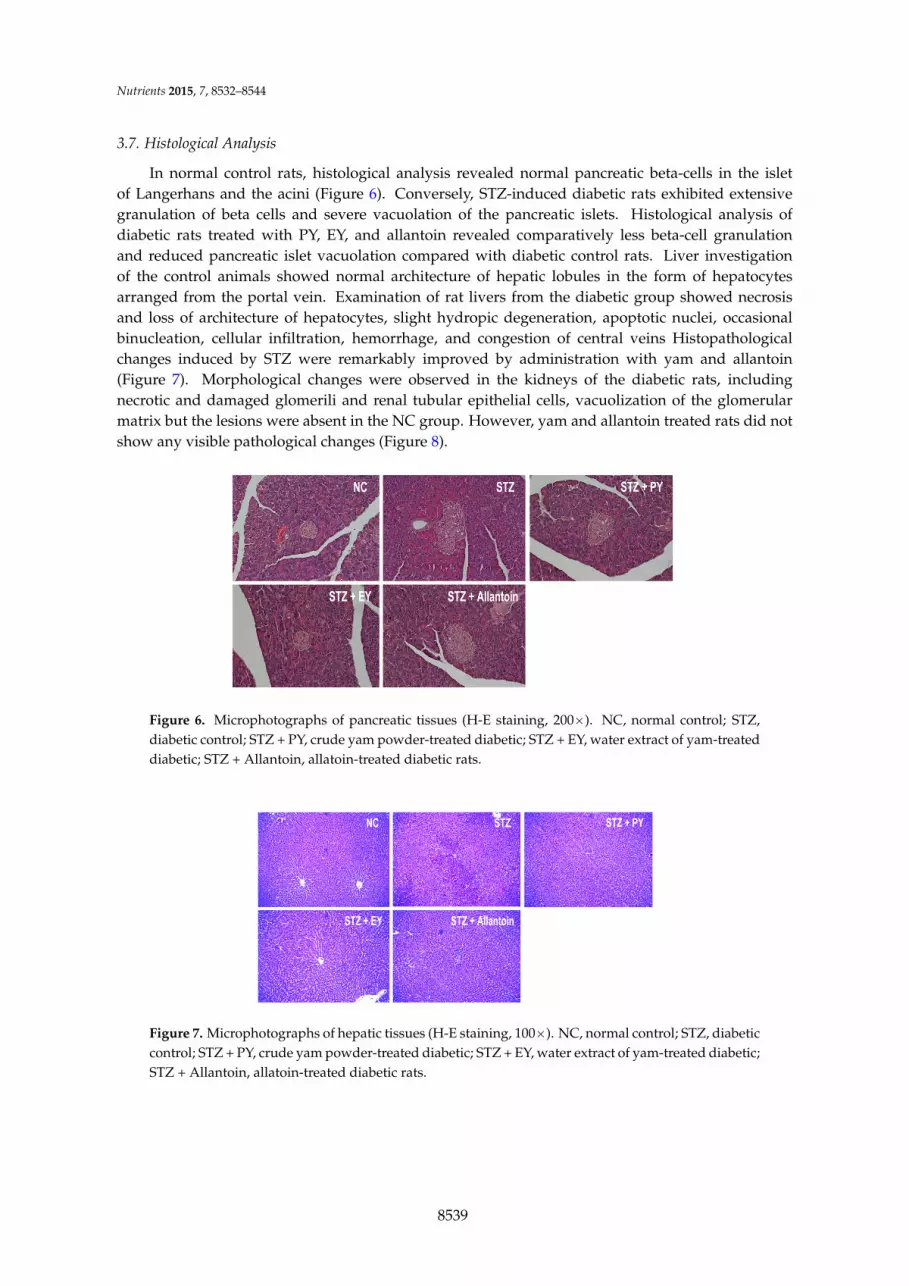
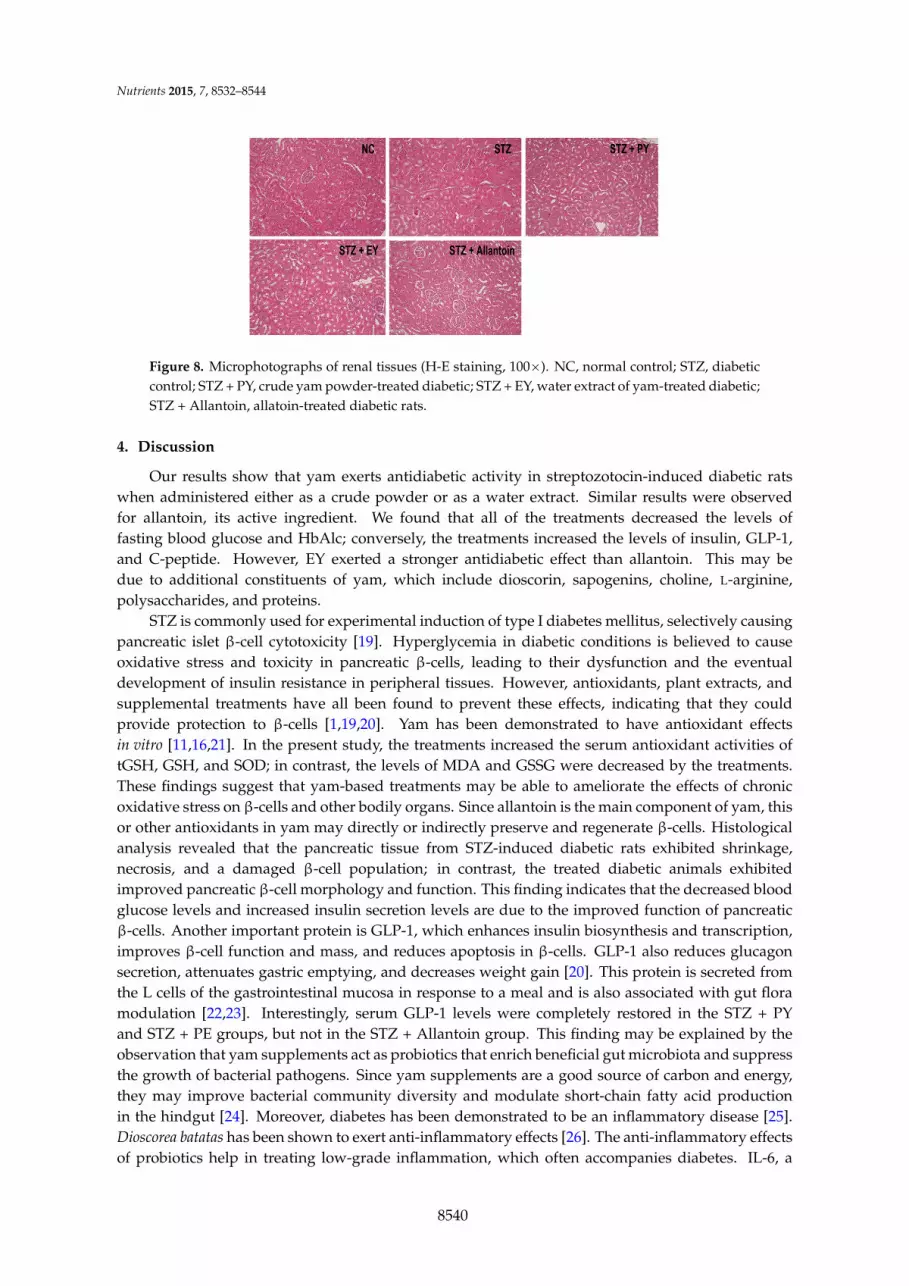
In normal control rats, histological analysis revealed normal pancreatic beta-cells in the isletof Langerhans and the acini (Figure 6). Conversely, STZ-induced diabetic rats exhibited extensivegranulation of beta cells and severe vacuolation of the pancreatic islets. Histological analysis ofdiabetic rats treated with PY, EY, and allantoin revealed comparatively less beta-cell granulationand reduced pancreatic islet vacuolation compared with diabetic control rats. Liver investigationof the control animals showed normal architecture of hepatic lobules in the form of hepatocytesarranged from the portal vein. Examination of rat livers from the diabetic group showed necrosisand loss of architecture of hepatocytes, slight hydropic degeneration, apoptotic nuclei, occasionalbinucleation, cellular infiltration, hemorrhage, and congestion of central veins Histopathologicalchanges induced by STZ were remarkably improved by administration with yam and allantoin(Figure 7). Morphological changes were observed in the kidneys of the diabetic rats, includingnecrotic and damaged glomerili and renal tubular epithelial cells, vacuolization of the glomerularmatrix but the lesions were absent in the NC group. However, yam and allantoin treated rats did notshow any visible pathological changes (Figure 8).
Nutrients 2015, 7, page–page
8
control animals showed normal architecture of hepatic lobules in the form of hepatocytes arranged
from the portal vein. Examination of rat livers from the diabetic group showed necrosis and loss of
architecture of hepatocytes, slight hydropic degeneration, apoptotic nuclei, occasional binucleation,
cellular infiltration, hemorrhage, and congestion of central veins Histopathological changes induced
by STZ were remarkably improved by administration with yam and allantoin (Figure 7).
Morphological changes were observed in the kidneys of the diabetic rats, including necrotic and
damaged glomerili and renal tubular epithelial cells, vacuolization of the glomerular matrix but the
lesions were absent in the NC group. However, yam and allantoin treated rats did not show any
visible pathological changes (Figure 8).
Figure 6. Microphotographs of pancreatic tissues (H‐E staining, 200×). NC, normal control; STZ,
diabetic control; STZ + PY, crude yam powder‐treated diabetic; STZ + EY, water extract of yam‐treated
diabetic; STZ + Allantoin, allatoin‐treated diabetic rats.
Figure 7. Microphotographs of hepatic tissues (H‐E staining, 100×). NC, normal control; STZ, diabetic
control; STZ + PY, crude yam powder‐treated diabetic; STZ + EY, water extract of yam‐treated diabetic;
STZ + Allantoin, allatoin‐treated diabetic rats.
Figure 8. Microphotographs of renal tissues (H‐E staining, 100×). NC, normal control; STZ, diabetic
control; STZ + PY, crude yam powder‐treated diabetic; STZ + EY, water extract of yam‐treated diabetic;
STZ + Allantoin, allatoin‐treated diabetic rats.
Figure 6. Microphotographs of pancreatic tissues (H-E staining, 200ˆ). NC, normal control; STZ,diabetic control; STZ + PY, crude yam powder-treated diabetic; STZ + EY, water extract of yam-treateddiabetic; STZ + Allantoin, allatoin-treated diabetic rats.
Nutrients 2015, 7, page–page
8
control animals showed normal architecture of hepatic lobules in the form of hepatocytes arranged
from the portal vein. Examination of rat livers from the diabetic group showed necrosis and loss of
architecture of hepatocytes, slight hydropic degeneration, apoptotic nuclei, occasional binucleation,
cellular infiltration, hemorrhage, and congestion of central veins Histopathological changes induced
by STZ were remarkably improved by administration with yam and allantoin (Figure 7).
Morphological changes were observed in the kidneys of the diabetic rats, including necrotic and
damaged glomerili and renal tubular epithelial cells, vacuolization of the glomerular matrix but the
lesions were absent in the NC group. However, yam and allantoin treated rats did not show any
visible pathological changes (Figure 8).
Figure 6. Microphotographs of pancreatic tissues (H‐E staining, 200×). NC, normal control; STZ,
diabetic control; STZ + PY, crude yam powder‐treated diabetic; STZ + EY, water extract of yam‐treated
diabetic; STZ + Allantoin, allatoin‐treated diabetic rats.
Figure 7. Microphotographs of hepatic tissues (H‐E staining, 100×). NC, normal control; STZ, diabetic
control; STZ + PY, crude yam powder‐treated diabetic; STZ + EY, water extract of yam‐treated diabetic;
STZ + Allantoin, allatoin‐treated diabetic rats.
Figure 8. Microphotographs of renal tissues (H‐E staining, 100×). NC, normal control; STZ, diabetic
control; STZ + PY, crude yam powder‐treated diabetic; STZ + EY, water extract of yam‐treated diabetic;
STZ + Allantoin, allatoin‐treated diabetic rats.
Figure 7. Microphotographs of hepatic tissues (H-E staining, 100ˆ). NC, normal control; STZ, diabeticcontrol; STZ + PY, crude yam powder-treated diabetic; STZ + EY, water extract of yam-treated diabetic;STZ + Allantoin, allatoin-treated diabetic rats.
8539
Nutrients 2015, 7, 8532–8544
Nutrients 2015, 7, page–page
8
control animals showed normal architecture of hepatic lobules in the form of hepatocytes arranged
from the portal vein. Examination of rat livers from the diabetic group showed necrosis and loss of
architecture of hepatocytes, slight hydropic degeneration, apoptotic nuclei, occasional binucleation,
cellular infiltration, hemorrhage, and congestion of central veins Histopathological changes induced
by STZ were remarkably improved by administration with yam and allantoin (Figure 7).
Morphological changes were observed in the kidneys of the diabetic rats, including necrotic and
damaged glomerili and renal tubular epithelial cells, vacuolization of the glomerular matrix but the
lesions were absent in the NC group. However, yam and allantoin treated rats did not show any
visible pathological changes (Figure 8).
Figure 6. Microphotographs of pancreatic tissues (H‐E staining, 200×). NC, normal control; STZ,
diabetic control; STZ + PY, crude yam powder‐treated diabetic; STZ + EY, water extract of yam‐treated
diabetic; STZ + Allantoin, allatoin‐treated diabetic rats.
Figure 7. Microphotographs of hepatic tissues (H‐E staining, 100×). NC, normal control; STZ, diabetic
control; STZ + PY, crude yam powder‐treated diabetic; STZ + EY, water extract of yam‐treated diabetic;
STZ + Allantoin, allatoin‐treated diabetic rats.
Figure 8. Microphotographs of renal tissues (H‐E staining, 100×). NC, normal control; STZ, diabetic
control; STZ + PY, crude yam powder‐treated diabetic; STZ + EY, water extract of yam‐treated diabetic;
STZ + Allantoin, allatoin‐treated diabetic rats.
Figure 8. Microphotographs of renal tissues (H-E staining, 100ˆ). NC, normal control; STZ, diabeticcontrol; STZ + PY, crude yam powder-treated diabetic; STZ + EY, water extract of yam-treated diabetic;STZ + Allantoin, allatoin-treated diabetic rats.
4. Discussion
Our results show that yam exerts antidiabetic activity in streptozotocin-induced diabetic ratswhen administered either as a crude powder or as a water extract. Similar results were observedfor allantoin, its active ingredient. We found that all of the treatments decreased the levels offasting blood glucose and HbAlc; conversely, the treatments increased the levels of insulin, GLP-1,and C-peptide. However, EY exerted a stronger antidiabetic effect than allantoin. This may bedue to additional constituents of yam, which include dioscorin, sapogenins, choline, L-arginine,polysaccharides, and proteins.
STZ is commonly used for experimental induction of type I diabetes mellitus, selectively causingpancreatic islet β-cell cytotoxicity [19]. Hyperglycemia in diabetic conditions is believed to causeoxidative stress and toxicity in pancreatic β-cells, leading to their dysfunction and the eventualdevelopment of insulin resistance in peripheral tissues. However, antioxidants, plant extracts, andsupplemental treatments have all been found to prevent these effects, indicating that they couldprovide protection to β-cells [1,19,20]. Yam has been demonstrated to have antioxidant effectsin vitro [11,16,21]. In the present study, the treatments increased the serum antioxidant activities oftGSH, GSH, and SOD; in contrast, the levels of MDA and GSSG were decreased by the treatments.These findings suggest that yam-based treatments may be able to ameliorate the effects of chronicoxidative stress on β-cells and other bodily organs. Since allantoin is the main component of yam, thisor other antioxidants in yam may directly or indirectly preserve and regenerate β-cells. Histologicalanalysis revealed that the pancreatic tissue from STZ-induced diabetic rats exhibited shrinkage,necrosis, and a damaged β-cell population; in contrast, the treated diabetic animals exhibitedimproved pancreatic β-cell morphology and function. This finding indicates that the decreased bloodglucose levels and increased insulin secretion levels are due to the improved function of pancreaticβ-cells. Another important protein is GLP-1, which enhances insulin biosynthesis and transcription,improves β-cell function and mass, and reduces apoptosis in β-cells. GLP-1 also reduces glucagonsecretion, attenuates gastric emptying, and decreases weight gain [20]. This protein is secreted fromthe L cells of the gastrointestinal mucosa in response to a meal and is also associated with gut floramodulation [22,23]. Interestingly, serum GLP-1 levels were completely restored in the STZ + PYand STZ + PE groups, but not in the STZ + Allantoin group. This finding may be explained by theobservation that yam supplements act as probiotics that enrich beneficial gut microbiota and suppressthe growth of bacterial pathogens. Since yam supplements are a good source of carbon and energy,they may improve bacterial community diversity and modulate short-chain fatty acid productionin the hindgut [24]. Moreover, diabetes has been demonstrated to be an inflammatory disease [25].Dioscorea batatas has been shown to exert anti-inflammatory effects [26]. The anti-inflammatory effectsof probiotics help in treating low-grade inflammation, which often accompanies diabetes. IL-6, a
8540

Nutrients 2015, 7, 8532–8544
multifunctional pro-inflammatory cytokine, affects the secretion of GLP-1 by intestinal L cells. Thelevels of circulating GLP-1 have been found to correlate with the concentration of systemic IL-6and also with the concentrations of other markers of inflammation, suggesting that the regulationof GLP-1 is inflammation-dependent [19]. Thus, it is noteworthy that treatment with yam extractpromoted the release of GLP-1 and improved the function of β-cells, thereby maintaining insulin andglucose levels.
Fasting blood glucose and HbAlc levels are important indicators for patients with diabeteswho have microvascular disease, coronary heart disease, ischemic stroke, and/or retinopathy. TheHbAlc level has been found to be directly proportional to the blood glucose concentration [1,27].As expected, the HbA1c levels were increased in the diabetic control groups in our study, whichwere lowered by the three treatment protocols. This outcome could be due to improved insulinsecretion [1]. C-peptide is a protein that joins the α- and β-chains of insulin in the pro-insulinmolecule. During insulin synthesis, this protein is cleaved from pro-insulin and secreted in equimolarconcentration as insulin from the β-cells. Persistent C-peptide elevation is associated with lowerhyperglycemia, which is in turn associated with reduced complications. These findings suggestthat the relationship of endogenous secretion with complications could be secondary to the effectsof secretion on glycemic control. Diabetic patients with C-peptide levels ě 0.2 pmol/mL have beenshown to have low fasting glucose and HbAlc values. Specifically, for every pmol/mL increase inthe baseline stimulated C-peptide level, a 1% reduction in the HbA1c level was observed amongintensively treated patients with diabetes [28].
STZ induced elevated levels of TG, TC, and LDL, but decreased the level of HDL.Hypertriglyceridemia and hypercholesterolemia are major risk factors in diabetes with respect tothe development of atherosclerosis and coronary heart disease, which are secondary complications ofdiabetes [1]. We found that after 31 days of treatment the levels of TG, TC, and LDL were reducedwhile the serum levels of HDL were improved. Thus, yam could potentially be used to reducelong-term cardiovascular complications in patients with diabetes. These results agree with previousreports on the antilipidemic and anticholesterolic properties of yam [12,26,29].
Also as expected, the serum CRE, BUN, and UA levels were significantly increased indiabetic rats as a consequence of renal failure, extracellular dehydration, and protein catabolism,respectively [1,17]. In contrast, the treated groups exhibited significantly reduced levels of theseindicators, suggesting that allation, yam powder, and its aqueous extract can all improve renalfunction, prevent extracellular dehydration, and avoid protein catabolism. The histological evidenceof kidney also proved the renoprotective effects of yam and allantoin in this study. The kidney isa main organ that regulates ion and electrolyte homeostasis. Altered concentrations of Mg2`, Ca2,K`, Na`, Cl´, anion gap, and electrolyte balance are common features in patients with diabetesdue to deteriorated kidney function or increased urinary loss. These symptoms were improved bythe treatments here describe, indicating that they may have renoprotective and/or antioxidativeproperties [16,29,30]. The elevated plasma levels of ALT, AST, ALP, LDH, and CK in our studyindicate hepatotoxicity and oxidative stress. These elevations were prevented by the yam andallantoin treatments, which indicate that they also have antioxidative and hepatoprotective abilitieslike as other Dioscorea. spp. [16,26,29]. In this study, the improved hepatic histological appearancein the treated groups also supported the hepatoprotective effects of yam. Moreover, the levels of TPand albumin in treated diabetic rats were close to normal, suggesting that the treatments might bebeneficial for kidney and liver function. Lowered blood pH, reduced HCO3
´, and increased lactatelevels were observed in the diabetic indicating acidic blood, which may be a sign of ketoacidosis [31].As with other symptoms, all the treatments reduced these effects, indicating that they promote theproper utilization of glucose thereby ameliorating ketosis. The increased blood Osm in the diabeticgroup may result from the elevated blood glucose and BUN levels [17,32]. Alternatively, it may resultfrom insulin deficiency [32]. Importantly, the blood Osm was reduced after treatment.
8541

Nutrients 2015, 7, 8532–8544
5. Conclusions
The results of this study indicate that yam and allantoin exert antidiabetic effects. These twosubstances may modulate oxidative stress, antioxidant activities, and lipid profiles; improve kidneyand liver function; promote the release of GLP-1; and improve the function of β-cells, therebymaintaining insulin and glucose levels (Figure 9).
Nutrients 2015, 7, page–page
10
glucose and HbAlc values. Specifically, for every pmol/mL increase in the baseline stimulated C‐
peptide level, a 1% reduction in the HbA1c level was observed among intensively treated patients
with diabetes [28].
STZ induced elevated levels of TG, TC, and LDL, but decreased the level of HDL.
Hypertriglyceridemia and hypercholesterolemia are major risk factors in diabetes with respect to the
development of atherosclerosis and coronary heart disease, which are secondary complications of
diabetes [1]. We found that after 31 days of treatment the levels of TG, TC, and LDL were reduced
while the serum levels of HDL were improved. Thus, yam could potentially be used to reduce long‐
term cardiovascular complications in patients with diabetes. These results agree with previous
reports on the antilipidemic and anticholesterolic properties of yam [12,26,29].
Also as expected, the serum CRE, BUN, and UA levels were significantly increased in diabetic
rats as a consequence of renal failure, extracellular dehydration, and protein catabolism, respectively
[1,17]. In contrast, the treated groups exhibited significantly reduced levels of these indicators,
suggesting that allation, yam powder, and its aqueous extract can all improve renal function, prevent
extracellular dehydration, and avoid protein catabolism. The histological evidence of kidney also
proved the renoprotective effects of yam and allantoin in this study. The kidney is a main organ that
regulates ion and electrolyte homeostasis. Altered concentrations of Mg2+, Ca2, K+, Na+, Cl−, anion gap,
and electrolyte balance are common features in patients with diabetes due to deteriorated kidney
function or increased urinary loss. These symptoms were improved by the treatments here describe,
indicating that they may have renoprotective and/or antioxidative properties [16,29,30]. The elevated
plasma levels of ALT, AST, ALP, LDH, and CK in our study indicate hepatotoxicity and oxidative
stress. These elevations were prevented by the yam and allantoin treatments, which indicate that they
also have antioxidative and hepatoprotective abilities like as other Dioscorea. spp. [16,26,29]. In this
study, the improved hepatic histological appearance in the treated groups also supported the
hepatoprotective effects of yam. Moreover, the levels of TP and albumin in treated diabetic rats were
close to normal, suggesting that the treatments might be beneficial for kidney and liver function.
Lowered blood pH, reduced HCO3−, and increased lactate levels were observed in the diabetic
indicating acidic blood, which may be a sign of ketoacidosis [31]. As with other symptoms, all the
treatments reduced these effects, indicating that they promote the proper utilization of glucose
thereby ameliorating ketosis. The increased blood Osm in the diabetic group may result from the
elevated blood glucose and BUN levels [17,32]. Alternatively, it may result from insulin deficiency
[32]. Importantly, the blood Osm was reduced after treatment.
5. Conclusions
The results of this study indicate that yam and allantoin exert antidiabetic effects. These two
substances may modulate oxidative stress, antioxidant activities, and lipid profiles; improve kidney
and liver function; promote the release of GLP‐1; and improve the function of β‐cells, thereby
maintaining insulin and glucose levels (Figure 9).
Figure 9. Schematic diagram of the proposed mechanisms by which powder or water extract of yam
(Dioscorea batatas), and allantoin regulate blood glucose. Administration of yam or allantoin increased
the GLP‐1 level, responsible for enhancing insulin biosynthesis and transcription, improved β‐cell
function and mass, and reduced apoptosis in β‐cells, controlling insulin and glucose levels. They also
increased the antioxidant level and decreased the MDA level, which ultimately decreased oxidative
stress protecting pancreatic β‐cells and other organs.
Figure 9. Schematic diagram of the proposed mechanisms by which powder or water extract of yam(Dioscorea batatas), and allantoin regulate blood glucose. Administration of yam or allantoin increasedthe GLP-1 level, responsible for enhancing insulin biosynthesis and transcription, improved β-cellfunction and mass, and reduced apoptosis in β-cells, controlling insulin and glucose levels. They alsoincreased the antioxidant level and decreased the MDA level, which ultimately decreased oxidativestress protecting pancreatic β-cells and other organs.
Acknowledgments: This research was supported by research funds of Chonbuk National University in 2013and the Seodongma Local Industry Project Association, Inc. We are very grateful to Manuel F. Flores-Arce ande-World Editing Ltd. for proofreading of the manuscript.
Author Contributions: Shang-Jin Kim and Hyung-Sub Kang conceived and designed the study;Hyeon-Kyu Go and Md. Mahbubur Rahman collected the data; Shang-Jin Kim and Choon-Ho Songanalyzed the data; Gi-Beum Kim, Chong-Sam Na, Jin-Shang Kim, and Hyung-Sub Kang contributedreagents/materials/analysis tools; and Hyeon-Kyu Go, Md. Mahbubur Rahman, and Shang-Jin Kim wrotethe paper.
Conflicts of Interest: The authors declare no conflict of interest.
References
1. Mahendran, G.; Thamotharan, G.; Sengottuvelu, S.; Bai, V.N. Anti-diabetic activity of Swertia corymbosa(griseb.) Wight ex C.B. Clarke aerial parts extract in streptozotocin induced diabetic rats. J. Ethnopharmacol.2014, 151, 1175–1183. [CrossRef] [PubMed]
2. Wild, S.; Roglic, G.; Green, A.; Sicree, R.; King, H. Global prevalence of diabetes: Estimates for the year 2000and projections for 2030. Diabetes Care 2004, 27, 1047–1053. [CrossRef] [PubMed]
3. Giorgino, F.; Laviola, L.; Leonardini, A. Pathophysiology of type 2 diabetes: Rationale for different oralantidiabetic treatment strategies. Diabetes Res. Clin. Pract. 2005, 68, S22–S29. [CrossRef] [PubMed]
4. Niu, C.S.; Chen, W.; Wu, H.T.; Cheng, K.C.; Wen, Y.J.; Lin, K.C.; Cheng, J.T. Decrease of plasma glucose byallantoin, an active principle of yam (Dioscorea spp.), in streptozotocin-induced diabetic rats. J. Agric. FoodChem. 2010, 58, 12031–12035. [CrossRef] [PubMed]
5. Park, H.S.; Kim, M.J.; Moon, H.B. Occupational asthma caused by two herb materials, dioscorea batatas andpinellia ternata. Clin. Exp. Allergy 1994, 24, 575–581. [CrossRef] [PubMed]
6. Miyoshi, N.; Nagasawa, T.; Mabuchi, R.; Yasui, Y.; Wakabayashi, K.; Tanaka, T.; Ohshima, H.Chemoprevention of azoxymethane/dextran sodium sulfate-induced mouse colon carcinogenesis byfreeze-dried yam sanyaku and its constituent diosgenin. Cancer Prev. Res. 2011, 4, 924–934. [CrossRef][PubMed]
8542

Nutrients 2015, 7, 8532–8544
7. Chen, M.F.; Tsai, J.T.; Chen, L.J.; Wu, T.P.; Yang, J.J.; Yin, L.T.; Yang, Y.L.; Chiang, T.A.; Lu, H.L.; Wu, M.C.Antihypertensive action of allantoin in animals. Biomed. Res. Int. 2014, doi:10.1155/2014/690135.[CrossRef] [PubMed]
8. McAnuff, M.A.; Harding, W.W.; Omoruyi, F.O.; Jacobs, H.; Morrison, E.Y.; Asemota, H.N. Hypoglycemiceffects of steroidal sapogenins isolated from jamaican bitter yam, dioscorea polygonoides. Food Chem.Toxicol. 2005, 43, 1667–1672. [CrossRef] [PubMed]
9. Liu, J.Y.; Yang, F.L.; Lu, C.P.; Yang, Y.L.; Wen, C.L.; Hua, K.F.; Wu, S.H. Polysaccharides from dioscoreabatatas induce tumor necrosis factor-alpha secretion via toll-like receptor 4-mediated protein kinasesignaling pathways. J. Agric. Food. Chem. 2008, 56, 9892–9898. [CrossRef] [PubMed]
10. Zhang, L.; Liu, Y.; Chen, G. Simultaneous determination of allantoin, choline and L-arginine in RhizomaDioscoreae by capillary electrophoresis. J. Chromatogr. A 2004, 1043, 317–321. [CrossRef] [PubMed]
11. Son, I.S.; Kim, J.H.; Sohn, H.Y.; Son, K.H.; Kim, J.S.; Kwon, C.S. Antioxidative and hypolipidemic effectsof diosgenin, a steroidal saponin of yam (Dioscorea spp.), on high-cholesterol fed rats. Biosci. Biotechnol.Biochem. 2007, 71, 3063–3071. [CrossRef] [PubMed]
12. Kim, S.; Jwa, H.; Yanagawa, Y.; Park, T. Extract from dioscorea batatas ameliorates insulin resistance in micefed a high-fat diet. J. Med. Food. 2012, 15, 527–534. [CrossRef] [PubMed]
13. Lin, K.C.; Yeh, L.R.; Chen, L.J.; Wen, Y.J.; Cheng, K.C.; Cheng, J.T. Plasma glucose-lowering action ofallantoin is induced by activation of imidazoline I-2 receptors in streptozotocin-induced diabetic rats. Horm.Metab. Res. 2012, 44, 41–46. [CrossRef] [PubMed]
14. Institute of Laboratory Animal Resources; Commission on Life Sciences; National Research Council;National Research Council. Guide for the Care and Use of Laboratory Animals; National Academy Press:Washington, DC, USA, 1996; pp. 1–124.
15. Yoon, K.D.; Yang, M.H.; Chin, Y.W.; Park, J.H.; Kim, J.W. Determination of allantoin in Dioscorea Rhizomaby high performance liquid chromatography using cyano columns. Nat. Prod. Sci. 2008, 14, 254–259.
16. Kwon, J.E.; Kwon, J.B.; Kwun, I.S.; Sohn, H.Y. Antimicrobial and antioxidant activity of the Dioscorea alataL. J. Microbiol. Biotechnol. 2010, 38, 283–288.
17. Rahman, M.M.; Lee, S.J.; Mun, A.R.; Adam, G.O.; Park, R.M.; Kim, G.B.; Kang, H.S.; Kim, J.S.; Kim, S.J.;Kim, S.Z. Relationships between blood Mg2` and energy metabolites/enzymes after acute exhaustiveswimming exercise in rats. Biol. Trace Element Res. 2014, 161, 85–90. [CrossRef] [PubMed]
18. Behr, J.; Maier, K.; Degenkolb, B.; Krombach, F.; Vogelmeier, C. Antioxidative and clinicaleffects of high-dose N-acetylcysteine in fibrosing alveolitis—Adjunctive therapy to maintenanceimmunosuppression. Am. J. Respir. Crit. Care Med. 1997, 156, 1897–1901. [CrossRef] [PubMed]
19. Manaer, T.; Yu, L.; Zhang, Y.; Xiao, X.J.; Nabi, X.H. Anti-diabetic effects of shubat in type 2 diabetic ratsinduced by combination of high-glucose-fat diet and low-dose streptozotocin. J. Ethnopharmacol. 2015, 169,269–274. [CrossRef] [PubMed]
20. Lin, E.; Wang, Y.; Mehendale, S.; Sun, S.; Wang, C.Z.; Xie, J.T.; Aung, H.H.; Yuan, C.S. Antioxidant protectionby American ginseng in pancreatic β-cells. Am. J. Chin. Med. 2008, 36, 981–988. [CrossRef] [PubMed]
21. Chang, S.J.; Lee, Y.C.; Liu, S.Y.; Chang, T.W. Chinese yam (Dioscorea alata cv. Tainung No. 2) feedingexhibited antioxidative effects in hyperhomocysteinemia rats. J. Agric. Food. Chem. 2004, 52, 1720–1725.[CrossRef] [PubMed]
22. Li, W.X.; Gou, J.F.; Tian, J.H.; Yan, X.A.; Yang, L. Glucagon-like peptide-1 receptor agonists versus insulinglargine for type 2 diabetes mellitus: A systematic review and meta-analysis of randomized controlledtrials. Curr. Ther. Res. Clin. Exp. 2010, 71, 211–238. [CrossRef] [PubMed]
23. Cani, P.D.; Lecourt, E.; Dewulf, E.M.; Sohet, F.M.; Pachikian, B.D.; Naslain, D.; de Backer, F.; Neyrinck, A.M.;Delzenne, N.M. Gut microbiota fermentation of prebiotics increases satietogenic and incretin gut peptideproduction with consequences for appetite sensation and glucose response after a meal. Am. J. Clin. Nutr.2009, 90, 1236–1243. [CrossRef] [PubMed]
24. Kong, X.F.; Zhang, Y.Z.; Yin, Y.L.; Wu, G.Y.; Zhou, H.J.; Tan, Z.L.; Yang, F.; Bo, M.J.; Huang, R.L.; Li, T.J.; et al.Chinese yam polysaccharide enhances growth performance and cellular immune response in weanling rats.J. Sci. Food Agric. 2009, 89, 2039–2044. [CrossRef]
25. Donath, M.Y.; Dalmas, E.; Sauter, N.S.; Boni-Schnetzler, M. Inflammation in obesity and diabetes: Isletdysfunction and therapeutic opportunity. Cell Metab. 2013, 17, 860–872. [CrossRef] [PubMed]
8543

Nutrients 2015, 7, 8532–8544
26. Gil, H.W.; Lee, E.Y.; Lee, J.H.; Kim, Y.S.; Lee, B.E.; Suk, J.W.; Song, H.Y. Dioscorea batatas extract attenuateshigh-fat diet-induced obesity in mice by decreasing expression of inflammatory cytokines. Med. Sci. Monitor2015, 21, 489–495.
27. Selvin, E.; Steffes, M.W.; Zhu, H.; Matsushita, K.; Wagenknecht, L.; Pankow, J.; Coresh, J.; Brancati, F.L.Glycated hemoglobin, diabetes, and cardiovascular risk in nondiabetic adults. N. Engl. J. Med. 2010, 362,800–811. [CrossRef] [PubMed]
28. VanBuecken, D.E.; Greenbaum, C.J. Residual C-peptide in type 1 diabetes: What do we really know? Pediatr.Diabetes 2014, 15, 84–90. [CrossRef] [PubMed]
29. McKoy, M.L.; Grant, K.; Asemota, H.; Simon, O.; Omoruyi, F. Renal and hepatic function inhypercholesterolemic rats fed jamaican bitter yam (Dioscorea polygonoides). J. Diet. Suppl. 2015, 12, 173–183.[CrossRef] [PubMed]
30. Yu, J.; Zhou, M.-N.; Lu, Q-J. Effects of yam polysaccharides on P-selectin expression and macrophageinfiltration in diabetic nephropathy model rats. Clin. Exp. Med. Sci. 2015, 3, 11–21.
31. Westerberg, D.P. Diabetic ketoacidosis: Evaluation and treatment. Am. Fam. Physician 2013, 87, 337–346.[PubMed]
32. Jakobsen, J.; Knudsen, G.M.; Juhler, M. Cation permeability of the blood-brain barrier instreptozotocin-diabetic rats. Diabetologia 1987, 30, 409–413. [CrossRef] [PubMed]
© 2015 by the authors; licensee MDPI, Basel, Switzerland. This article is an openaccess article distributed under the terms and conditions of the Creative Commons byAttribution (CC-BY) license (http://creativecommons.org/licenses/by/4.0/).
8544


![Distributions, ex situ conservation priorities, and genetic resource potential of crop wild relatives of sweetpotato [Ipomoea batatas (L.) Lam., I. series Batatas]](https://img.pdfslide.net/doc/110x75/6335e47c379741109e00d3a5/distributions-ex-situ-conservation-priorities-and-genetic-resource-potential-of-1682629684.jpg)

![Studies on propagation materials and growing conditions for sweetpotato [Ipomoea Batatas (L.) Lam] production](https://img.pdfslide.net/doc/110x75/6361942b244e676a2a0eb766/studies-on-propagation-materials-and-growing-conditions-for-sweetpotato-ipomoea.jpg)


