Embed Size (px)
Citation preview
University of Tennessee, Knoxville University of Tennessee, Knoxville
TRACE: Tennessee Research and Creative TRACE: Tennessee Research and Creative
Exchange Exchange
Masters Theses Graduate School
8-2003
“Effect of Labeling on Consumer Perception of Commercial and “Effect of Labeling on Consumer Perception of Commercial and
Laboratory-Produced Vanilla Ice Creams Laboratory-Produced Vanilla Ice Creams
April Rae Parker University of Tennessee - Knoxville
Follow this and additional works at: https://trace.tennessee.edu/utk_gradthes
Part of the Food Science Commons
Recommended Citation Recommended Citation Parker, April Rae, "“Effect of Labeling on Consumer Perception of Commercial and Laboratory-Produced Vanilla Ice Creams. " Master's Thesis, University of Tennessee, 2003. https://trace.tennessee.edu/utk_gradthes/2159
This Thesis is brought to you for free and open access by the Graduate School at TRACE: Tennessee Research and Creative Exchange. It has been accepted for inclusion in Masters Theses by an authorized administrator of TRACE: Tennessee Research and Creative Exchange. For more information, please contact [email protected].
To the Graduate Council:
I am submitting herewith a thesis written by April Rae Parker entitled "“Effect of Labeling on
Consumer Perception of Commercial and Laboratory-Produced Vanilla Ice Creams." I have
examined the final electronic copy of this thesis for form and content and recommend that it be
accepted in partial fulfillment of the requirements for the degree of Master of Science, with a
major in Food Science and Technology.
Marjorie P. Penfield, Major Professor
We have read this thesis and recommend its acceptance:
John R. Mount, P. Michael Davidson
Accepted for the Council:
Carolyn R. Hodges
Vice Provost and Dean of the Graduate School
(Original signatures are on file with official student records.)
To the Graduate Council: I am submitting herewith a thesis written by April Rae Parker entitled “Effect of Labeling on Consumer Perception of Commercial and Laboratory-Produced Vanilla Ice Creams”. I have examined the final electronic copy of this thesis for form and content and recommend that it be accepted in partial fulfillment of the requirements for the degree of Master of Science, with a major in Food Science and Technology. Marjorie P. Penfield
Major Professor We have read this thesis and recommend its acceptance: John R. Mount P. Michael Davidson
Accepted for the Council:
Anne Mayhew Vice Provost and Dean of Graduate Studies
(Original signatures are on file with official student records.)
Effect of Labeling on Consumer Perception of Commercial and Laboratory-Produced Vanilla Ice Creams
A Thesis Presented for the Master of Science
Degree The University of Tennessee, Knoxville
April Rae Parker August 2003
Acknowledgements
Much appreciation is extended to my instructors, family, and friends for
their guidance and support. I would like to extend special appreciation to Dr.
Marjorie Penfield for providing me with many wonderful opportunities throughout
the years and her belief in my abilities. Thank you to Dr. John Mount for helping
me with many projects over the past six years and for serving on my committee.
Thanks to Dr. Michael Davidson for serving on my committee and being willing to
provide answers when they were needed.
Thank you to Emayet Spencer for her laboratory assistance and her
encouragement throughout the process of obtaining my degree, Aaron Woody for
his computer expertise and wonderful attitude, and Alisa Doan, Donna Greene,
and Kari Russell for their help in the laboratory. Thank you to all my many
panelists, many of who are from the Food Science and Technology Department,
without whom this research would not have been possible. Mr. Bill Thompson, a
manufacturer’s representative for Vanlab Corporation in Rochester, NY, is
thanked for providing the vanilla for this research and his expertise on vanilla. Mr.
Ronnie Gaw, manager of the ice cream plant for Purity Dairies, Inc. in Nashville,
TN is thanked for providing the ice cream base mix. The Agricultural Experiment
Station at The University of Tennessee is thanked for the financial support. Also,
thanks to Tommy Burch for his skilled taste buds when it comes to tasting ice
cream.
ii

I thank my parents, Jerry and Elaine Parker, for their unending support,
guidance, and love. I thank my brother, Brian Parker, for his assistance and
unwavering belief in my abilities. Thanks to Kristina Phillips Franks for her
wonderful attitude and commiserating viewpoint. I would like to thank all my
family and friends for their encouragement and moral support that made this
work possible.
iii
Abstract
Ice cream, produced in millions of gallons, has been a favorite comfort
food to many people since its development centuries ago. Vanilla ice cream has
long been a staple in the ice cream industry with its production and consumption
being the highest when compared to other flavors. Since many consumers want
more “natural” foods, the objective of this study was to study the effect of labeling
the type of vanilla flavoring on consumer perception of commercial ice cream and
laboratory-produced vanilla ice cream.
Four commercial vanilla ice creams, one containing natural vanilla, one
with artificial, and two containing both, were evaluated by several sensory
panels. Nine-point hedonic scales were used to evaluate overall liking,
appearance, color, flavor, vanilla flavor, sweetness and 9-point intensity scales
were used to evaluate the strength of vanilla flavor and the strength of sweetness
of the commercial ice creams. When the samples were not labeled with the type
of vanilla flavoring, ANOVA data showed that the naturally flavored ice cream
was not liked as well as the ice cream with mixed flavorings overall and for
vanilla flavor. When the samples were labeled with the type of vanilla flavoring,
the artificially flavored ice cream was not liked as well as the mixed flavored ice
creams. The naturally flavored ice cream was liked as well as one of the mixed
flavored ice creams overall and for flavor and vanilla flavor. Another experiment
was conducted with an incomplete block design (n=150) with the same four ice
creams being labeled (correctly or incorrectly) for twelve combinations. No
iv
overall, flavor, vanilla flavor, or sweetness differences in hedonic scores existed
among the products, yet differences did exist between the ice creams with
particular labels no matter which product was used. Products labeled “natural”
were liked more (p<0.05) overall and for vanilla flavor than the products with
other labels.
Further experimentation involved using a standard ice cream base mix to
adjust for the effect of other ingredients on flavor. A ranking test was used to
determine which amount of artificial or natural vanilla flavoring (6,8,10,or 12 mL)
was liked best for strength of vanilla flavor. Further experiments using the base
mix used ice cream made with 10 mL of 2-fold pure vanilla extract, 10 mL of
artificial vanilla flavoring, or 5mL of natural and 5 mL of artificial flavoring. In
general, the 10 mL of vanilla flavoring matched the “ideal” strength of vanilla
flavoring.
Hedonic and intensity testing similar to that used for the commercial ice
cream was used for the laboratory-produced ice cream. For an experiment where
the ice cream was not labeled with the type of vanilla flavoring, ANOVA showed
the naturally flavored ice cream was not liked as well as the other two samples
overall, for color, flavor, vanilla flavor, or sweetness. When the samples were
labeled with the type of vanilla flavoring used, the artificially flavored ice cream
was not liked as well as the other two samples overall and for flavor and vanilla
flavor. Another experiment was conduced using an incomplete block design with
each ice cream being labeled (correctly or incorrectly) with the type of vanilla
flavoring for a total of 9 combinations. The naturally flavored ice cream was not
v
liked as well overall and for flavor and vanilla flavor as the other two samples. No
differences were found among the samples when they were evaluated based on
the label assigned to the ice cream.
For both the commercial and the laboratory-produced ice creams, labeling
was shown to have an effect on consumer perception. Psychological effects on
consumer perceptions need further consideration and research.
vi
Table of Contents
Chapter Page
I. Introduction ............................................................................................1 II. Review of Literature ...............................................................................4
Ice Cream Ingredients..................................................................... 4 Vanilla .............................................................................................8 Consumer Acceptance ..................................................................13
III. Materials and Methods ......................................................................19
Experiments with Commercial Ice Cream .....................................19 Experiment IA—No Labeling of Vanilla Type .....................20 Experiment IB—Labeling of Vanilla Type ...........................20 Experiment IC—Labeling (Correctly or Incorrectly) of Vanilla Type ...................................................................21 Data Collection and Analysis .............................................21
Experiments with Ice Cream made with the Same Base Ingredients ...........................................................................22
Experiment IIA—Ranking Analysis of Liking of Strength of Vanilla ..........................................................23 Experiment IIB—No Labeling of Vanilla Type ....................24 Experiment IIC—Labeling of Vanilla Type ..........................25 Experiment IID—Labeling (Correctly or Incorrectly) of Vanilla Type ...................................................................25 Data Collection and Analysis .............................................25
IV. Results and Discussion .....................................................................27 Experiments with Commercial Ice Cream .....................................27
Experiment IA—No Labeling of Vanilla Type .....................27 Experiment IB—Labeling of Vanilla Type ...........................32 Experiment IC—Labeling (Correctly or Incorrectly) of Vanilla Type ...................................................................35 Demographics ....................................................................39
Experiments with Ice Cream made with the Same Base Ingredients ...........................................................................39
Experiment IIA—Ranking Analysis of Liking of Strength of Vanilla ..........................................................39 Experiment IIB—No Labeling of Vanilla Type ....................40 Experiment IIC—Labeling of Vanilla Type ..........................42 Experiment IID—Labeling (Correctly or Incorrectly) of Vanilla Type ...................................................................44 Demographics ....................................................................46
vii
Chapter Page
V. Summary and Conclusions ................................................................48 List of References.................................................................................... 52 Appendices ..............................................................................................57
A. Ingredient Lists and Information from Nutrition Labels of Commercial Ice Creams and Prepackaged Base Mix ..................................................................................58
B. Sample Scorecards for Experiments IA, IB, and IC .................60 C. SAS Programs for Analysis of Data .........................................64 D. ANOVA Tables ........................................................................67 E. Demographic Frequencies ......................................................95
Vita ..........................................................................................................99
viii

List of Tables Table Page 1—Least-squares mean hedonic valuesab for several sensory
characteristics of four commercial vanilla ice creams evaluated by consumer panels in May and October 2001 (n=72) .......................28
2—Least-squares mean hedonic valuesab for several sensory characteristics of four commercial vanilla ice creams evaluated by consumer panels in May and October 2001 (n=144) .....................29
3—Least-squares mean intensity valuesa for two sensory attributes of an ideal and four commercial vanilla ice creams evaluated by consumer panels in May and October 2001 (n=144) .........................29
4—Least-squares mean hedonic valuesab for several sensory characteristics of four commercial vanilla ice creams evaluated by consumer panels (n=144).............................................................. 33
5—Least-squares mean intensity valuesa for two sensory attributes of an ideal and four commercial vanilla ice creams evaluated by consumer panels (n=144) ..................................................................34
6—Least-squares mean hedonic valuesabc for several sensory characteristics of four commercial vanilla ice creams evaluated by consumer panels (n=150) ..............................................................36
7—Least-squares mean intensity valuesab for two sensory attributes of four commercial vanilla ice creams evaluated by consumer panels (n=150) ...................................................................................37
8—Least-squares mean hedonic and intensity valuesa for several sensory characteristics of vanilla ice cream labeled with a type of flavoring as evaluated by consumer panels (n=200)b .........................38
9—Rank sums of 4 laboratory-produced ice creams judged for likeability of strength of vanilla flavor by 96 panelists over a 2-day period for each type of flavoring ....................................40
ix
Table Page 10—Least-squares mean hedonic valuesab for several sensory
characteristics of three laboratory-produced vanilla ice creams as evaluated by consumer panels (n=116) ......................................41
11—Least-squares mean intensity valuesa for two sensory attributes of an ideal and three laboratory-produced vanilla ice creams as evaluated by consumer panels (n=116) ..........................................42
12—Least-squares mean hedonic valuesab for several sensory characteristics of three laboratory-produced vanilla ice creams as evaluated by consumer panels (n=120) ......................................43
13—Least-squares mean intensity valuesa for two sensory attributes of an ideal and three laboratory-produced vanilla ice creams as evaluated by consumer panels (n=120) ..........................................44
14—Least-squares mean hedonic valuesab for several sensory characteristics of three laboratory-produced vanilla ice creams evaluated by consumer panels (n=150) ..........................................45
15—Least-squares mean intensity valuesa for two sensory attributes of three laboratory-produced vanilla ice creams evaluated by consumer panels (n=150) ................................................................46
16—Least-squares mean hedonic and intensity valuesa for several sensory characteristics of three laboratory-produced vanilla ice creams labeled with a type of flavoring as evaluated by consumer panels (n=150)b ..............................................................47
x
Chapter I
Introduction
Many stories mixing fact and fiction describe the beginnings of ice cream
and the first person to introduce the dessert to others. Everyone from the Roman
Emperor Nero to Charles I of England to Marco Polo have stories attached to
them as being the first to enjoy frozen desserts resembling modern day sherbets
(Goff 2000). In the United States, Dolley Madison, wife of President James
Madison, created a stir when she served ice cream at the White House at the
inaugural ball in 1812 (Anon 2000). In the mid-1800s Nancy Johnson created the
first hand-cranked freezer although reports vary about the patent information
(Anon 2000; Goff 2000). Commercial production was started in North America by
Jacob Fussell in Baltimore, MD in 1851 (Goff 2000). Development of the
homogenizer, mechanical refrigeration, and the continuous freezing process also
contributed to the evolution of today’s product known as ice cream.
Today ice cream, produced in millions of gallons, is a favorite “comfort“
food to many people. This flavorful and diverse dessert is so dearly loved in the
United States that Ronald Reagan declared July to be National Ice Cream Month
(Zaborsky 2001). Ice cream products, available in many unique flavors, were
produced by 1,124 manufacturers in 2000 (Agriculture Statistics Board and
others 2001). Products are made available in reduced-fat, low-fat, and no-sugar
varieties to provide for people with different nutritional needs along with many
inclusions to accommodate any individual’s desire. Ice cream is an approximately
1
$3.5 billion retail industry with each American consuming an average of “23.2
quarts of ice cream, ice milk, sherbet, ices, and other commercially produced
frozen dairy products” per year (Hollingsworth 1999; Anon 2001). In 1999, trends
showed an increase in consumption of high-butterfat ice creams as consumers
gave into their cravings and indulged in ice cream (Hollingsworth 1999). As some
of the reduced-fat or reduced-calorie products did not live up to consumer
expectations, some people decided to just go ahead and eat a portion of the
calories and fat found in some of their favorite desserts (Anon 1999).
Liking of a product’s taste may no longer be as desirable to many people
as the word “natural”. Trends in consumer demands are leaning towards organic
foods and food made from natural ingredients without preservatives and other
“chemicals” that people have decided they no longer want in their food. In the
past several years, one brand of ice cream has commercials making the point
that their ice cream is a wholesome natural product and that a young child can
read all the ingredients listed in their ice cream (Breyers 2002). In the United
States, the organic food industry “has grown 20% every year for the past ten
years” and now is a $6 billion piece of the grocery industry as many companies
are interested in organic foods (Ianzito 2001). Many consumers believe that
organic or natural foods are safer, more healthful, and more wholesome than
other products. Worries about chemical additives, genetically modified foods, and
Mad Cow Disease have all increased organic sales (Pollan 2001). While using
“organic” and “all natural” on products is a great marketing tool, it is interesting to
2
study whether consumers actually like the naturally flavored product better or
does the labeling of these products affect consumer perception.
Vanilla is a flavor that is incorporated into many products so it is of interest
to look at this ingredient and consumer perception. Natural vanilla has become
more expensive in the past several years but if consumers do not really like the
taste of natural vanilla, why should the companies go to the extra expense of
using it? Many companies follow current trends of having all natural products,
which leads to sales to consumers who believe they want these products; the
companies might benefit by consumer acceptance of products containing both
artificial and natural flavorings, especially if consumers really do not like the taste
of naturally flavored products. It is of interest to see which type of flavoring
(natural, artificial, or a mixture) is liked best by consumers and if labeling can
affect consumer perception. Therefore, the goals of this research were to 1)
determine which of four commercial ice creams containing different types of
vanilla flavoring is liked best by consumers, 2) ascertain if consumer perception
of commercial ice cream can be affected by labeling (correctly or incorrectly) the
type of vanilla used in the product, 3) investigate the type of vanilla flavoring liked
best by consumers in laboratory-produced ice cream that adjusts for the effect of
other ingredients on flavor, and 4) discover the effect of labeling (correctly or
incorrectly) on vanilla ice cream made with the same base mix but with different
vanilla flavorings.
3
Chapter II
Review of Literature
Ice Cream Ingredients
Ice cream is a “frozen mixture of a combination of components of milk,
sweeteners, stabilizers, emulsifiers, and flavoring” with the possible addition of
other ingredients like eggs, colorings, and starch hydrolysates (Marshall and
Arbuckle 1996). The mixture of these ingredients is pasteurized and
homogenized before freezing, which quickly removes heat and incorporates air
into the product to create a smooth and creamy texture. Today ice cream comes
in a variety of colors, flavors, qualities, and prices, yet all frozen desserts
classified as ice cream have to meet the same minimum standards as set by the
federal government in the Code of Federal Regulations (CFR) Title 21 Section
135.110. Ice cream must contain “not less than 1.6 pounds of total solids to the
gallon, and weighs not less than 4.5 pounds to the gallon” (FDA 2001a). Ice
cream must contain at least 10% milkfat and 10% nonfat milk solids and not
more than 3% stabilizers, except if the product contains 1% increments above
the 10% minimum for milkfat, the amount of nonfat milk solids may decrease in
proportion to the increase of milkfat (FDA 2001a).
Milkfat is an essential ice cream ingredient that is used to create a proper
balance of flavor and textural properties as well as satisfy legal standards. It is
extremely important that the fat in the ice cream is of good quality since any off-
flavors produced by rancidity or oxidation will be carried over into the final
4
product (Andreasen and Nielsen 1998). Milkfat can affect ice cream flavor by
“contributing its own natural richness and creaminess; by contributing flavors
acquired through hydrolysis, oxidation, or processing; and by modifying the
perception of flavorful substances in the product” (Ohmes and others 1998). The
fat globules concentrate at the surface of air cells during the freezing process,
which imparts the characteristic rich flavor (Marshall and Arbuckle 1996). Vanilla,
a fat-soluble flavor, is carried by fat into the mouth where the flavors are
volatilized prior to sensory reception in the olfactory system. If there is not
enough fat to carry the flavor, it rapidly volatilizes and quickly disappears from
the perceived flavor profile (Ohmes and others 1998).
Many studies have been conducted to determine the effect of fat and
possible fat replacers on the flavor of the ice cream. Guinard and others (1997)
found that increased fat caused “higher buttery, custard/eggy and sweet flavor”
as well as “fatty, creamy, doughy, and mouthcoating texture” as perceived by a
trained 13-judge panel. A 136-judge panel consumer liked ice creams containing
18% fat with either 13 or 18% sugar the most (Guinard and others 1997). Ohmes
and others (1998) showed that fat is important as a flavor modifier and milkfat
“significantly reduced the syrup, whey, and cooked milk flavors and increases the
fresh milk and cream flavors of ice cream” when compared to fat substitutes. Li
and others (1997) demonstrated that as fat content increases, the amount of free
vanillin decreases as determined with HPLC. In addition, a 63-judge panel from
the University of Missouri-Columbia indicated that as fat content increases, the
overall liking increases.
5
Nonfat milk solids consist of proteins, lactose, and minerals. The proteins
add nutritional value to the ice cream and affect the whipping characteristics
(Andreasen and Nielsen 1998). In addition, protein from the nonfat milk solids
helps to stabilize the foam during the incorporation of air when making ice cream
and stabilizes the fat emulsion after homogenization (Andreasen and Nielsen
1998; Walstra and others 1999). Casein acts as an emulsifier at the interfacial
area around the fat globule but whey proteins only interact with the fat to a limited
extent (Andreasen and Nielsen 1998). Nonfat milk solids enhance palatability of
ice cream but do not contribute much to the flavor (Marshall and Arbuckle 1996).
Lactose can add a slightly sweet taste while the minerals in nonfat milk solids
can add a slightly salty taste; yet, too much of either can result in undesirable
flavors.
Sweeteners like sucrose or corn syrup make the ice cream sweet and
increase consumer acceptance. Sugars, varying from 12-20% of the mixture, can
also “enhance the pleasing creamy flavor and the delicate fruit flavors” (Marshall
and Arbuckle 1996). Sugars depress the freezing point of the ice cream inversely
proportional to their molecular weight (Andreasen and Nielsen 1998; Walstra and
others 1999; Marshall and Arbuckle 1996). This allows the sweeteners to control
the amount of water that freezes and therefore the softness and mouthfeel of the
ice cream. Sweeteners also increase viscosity, which improves the body and
texture of the ice cream. Too much sugar will make the ice cream too sweet,
soggy, and sticky while too little sugar could cause too much ice to form and the
flavor defect of sandiness to occur (Walstra and others 1999). Guinard and
6
others (1996) found that out of ice creams containing various sugar and fat
levels, the favorite ice cream among 146 university students was the one
containing 13.54% sugar and 14.99% fat. Guinard and others (1997) showed that
increasing sugar content “caused higher vanilla, almond, buttery, custard/eggy,”
and sweetness flavors as well as “fatty, creamy, doughy, and mouthcoating
characteristics” as determined by 13 judges. A consumer panel with 146
panelists liked the ice creams containing 13% sugar with either 14 or 18% fat
more than the ice creams containing 8 or 18% sugar independent of fat
concentration.
Stabilizers improve the mouthfeel of ice cream by increasing the viscosity
and preventing the formation of ice crystals (Marshall and Arbuckle 1996). They
generally do not affect flavor. Stabilizers can be divided into three main types:
gelatin stabilizers from animal sources, vegetable stabilizers, and gums.
Combinations of stabilizers in commercial ice cream are normally used to obtain
desirable texture properties and prevent a soggy or heavy body in the ice cream
(Marshall and Arbuckle 1996). Miller-Livney and Hartel (1997) showed that in
most cases carrageenan and locust bean gum are most effective in retarding ice
crystal growth which can lead to a coarse texture while xanthan gum and gelatin
are only effective when combined with sucrose or high fructose corn sweeteners
and stored at -15ºC but not –5.2 or –9.5ºC.
Emulsifiers, commonly mono- and diglycerides, are used to produce a
smoother texture and reduce the whipping time of the ice cream (Marshall and
Arbuckle 1996). Abd El-Rahman and others (1997) evaluated the effect of the
7
8
presence of emulsifiers in vanilla ice cream made with cream, an anhydrous
milkfat, a high-melting milkfat fraction, or a low-melting milkfat fraction on sensory
scores for vanilla ice cream. They found no differences among samples for
overall acceptability, flavor, or texture with or without an emulsifier present. Baer
and others (1997) studied the effect of type of emulsifier (polysorbate 80 blend
with monoglycerides and diglycerides, 40% α-monoglyceride, 70% α-
monoglyceride, and lecithin) on 2% fat ice cream and found that all increased
viscosity, reduced whipping time, provided heat shock stability, reduced ice
crystal size, and improved the body and texture of the low-fat ice cream.
Egg yolk solids are one optional ingredient that adds a characteristic flavor
to the overall blend of flavors in the ice cream. They also improve the body and
texture of the ice cream and help with the whipping ability (Marshall and Arbuckle
1996). Other optional ingredients such as caseinate derivatives or mineral salts
can be added to enhance flavor or to improve the body and texture of the ice
cream. It is important that no matter which ingredients are used in ice cream that
they be of good quality because the quality of the final product will be a direct
reflection of the quality of the ingredients.
Vanilla
Vanilla is produced from beans from plants belonging to the orchid family.
Due to the growth requirements of these plants, only the climates in regions
around the equator allow for the growth and production of vanilla beans. Three
commercial varieties are available: Vanilla fragrans (otherwise known as V.
planifolia), V. tahitensis, and V. pompona (Marshall and Arbuckle 1996). V.
planifolia and V. tahitensis are used to produce vanilla extracts and flavorings
while the V. pompona, grown in Martinique and Guadeloupe, is used for
perfumes and fragrances. There are a variety of common names for the vanilla
beans including: Mexican from Mexico; Bourbon from the islands off the east
coast of Africa, such as Madagascar; South American from Guadeloupe,
Dominica and Martinique; Indonesian from Indonesia; and Tahitian from Tahiti
and Society Islands (Goff 2000). Between 25 and 30% of the world’s supply of
vanilla beans come from Indonesia while approximately 70% comes from
Madagascar. Each type of vanilla possesses its own unique flavor due to growth
region and the processing procedure. Bourbon vanilla from Madagascar is
“characterized by a full-bodied taste accompanied by a sharp vanillin lift and
underlying rummy notes” while Mexican beans are described as having a softer
vanillin flavor and a “vinous (wine-like) nose with a fruity, prune like edge”
(Webster 1995). Indonesian beans of high quality are similar to Bourbon beans
but lack the complete fullness and have a good fruity flavor with a slight spiciness
(Webster 1995). Lower quality Indonesian beans called Java beans have a
harsher flavor with a “deep, woody, smoky, phenolic flavor” that is often
accompanied by a “strong spicy note”, probably due to the different processing
method (Webster 1995). Tahitian vanilla is produced from a different species, V.
tahitensis, than other vanillas and has a distinguishable flavor characterized by “a
sweet cherry or almond-like character” (Webster 1995).
9
In order to obtain the flavoring, the vanilla pods must be cured, which
initiates the necessary enzymatic reactions that develop the unique flavors and
aromas associated with vanilla (Riley and Kleyn 1989). McCormick (1988)
defined curing as “the process in which the pods absorb heat from the sun, they
exude fats which blend with the natural resins present to provide the substrate for
the enzymes in the bean.” The process of curing varies among the different
growing regions with one being developed in Mexico called the sun process and
another developed in Madagascar (Reineccius 1994).
The Mexican process requires that the vanilla pods be stored in sheds
until they shrivel and then they are placed in large mahogany sweating boxes
with mats placed around the boxes so that proper temperatures are maintained
and enzymatic reactions take place (Reineccius 1994). The sweating process is
repeated 6-8 times over 2-3 weeks until the beans turn dark brown. After the
desired color is acquired, the beans receive fewer “sweatings” to help reduce
moisture levels and then the beans are placed in aging boxes for 2-3 months.
Following aging, the beans are bundled according to quality, packed in special
tins lined with wax paper, and shipped to market. The entire curing process takes
approximately 8 months. (Reineccius 1994).
The Madagascar process is shorter and starts with the green vanilla pods
being wilted in hot water for 7-15 min at 79-85ºC in order to destroy the
chlorophyll and increase enzymatic reactions (Riley and Kleyn 1989). After the
hot water treatment, the pods are spread out on blankets and exposed to the sun
until night when they are wrapped in the blankets (Reineccius 1994). This
10
process is repeated daily for 2-8 weeks during which time enzymatic reactions
take place and “key products such as tannins, fats and oils, vanillin, and
nitrogenous components are formed” (Riley and Kleyn 1989). Next the beans are
placed in trays and stored in warehouses for natural dehydration and curing. The
final steps are sorting for quality, bundling, and shipping to market (Reineccius
1994).
Originally to extract the flavor, vanilla beans were ground with sugar
(known today as vanilla sugar) but now liquid extraction is used (Webster 1995).
One method involves a percolation process similar to the one used for coffee;
however, it is limited to a fourfold concentration (Webster 1995). Typically an
ethyl alcohol-water mixture is used as a solvent but in order to modify the
characteristics of the extract, the ethanol-water ratio can be altered or
alternatives such as supercritical carbon dioxide can be used (Webster 1995). By
using CO2, the extracts have higher vanillin content and more floral notes than
conventionally extracted vanilla but it is expensive and only valid for some
specialized applications (Webster 1995).
Vanilla contains vanillin and over 200 other compounds, many of which
are volatile. These compounds include esters, oils, acids, aromatic aldehydes,
and resins (Reineccius 1994). Yet, of all these components, only vanillin (3-
methoxy-4-hydroxy-benzaldehyde) is synthesized (Reineccius 1994). Synthetic
vanillin is “usually produced from lignin that is present in sulfite waste liquors
from paper mills at a concentration of approximately 6%” (Riley and Kleyn 1989).
Vanillin can also be synthesized from guaiacol (from wood creosote), eugenol
11
(from clove oil), and lignin (Jagerdeo and others 1999). Imitation vanilla flavors
are typically composed of a small number of synthetic compounds including
“vanillin, ethyl vanillin, piperonal and low levels of a few esters” (Heath 1978).
According to McCormick (1988), synthetic vanillin “exhibits a characteristic
vanilla-like note, but lacks some of the aromatic factors present in the natural
bean.” Pure vanilla has a “delicate, yet rich and mellow aroma” while imitation
has a “heavy, grassy odor” and leaves an unpleasant aftertaste according to
Reineccius (1994).
Ethyl vanillin (3-ethoxy-4-hydroxy-benzaldehyde) is closely related to
vanillin but it is not found in nature; it is prepared synthetically from safrole and
used in the preparation of imitation vanilla flavorings (Heath 1978). It has an
intense flavor and is 3-4 times stronger than vanillin and can replace 10% of
vanillin without being noticeable (Heath 1978).
Vanilla is the only flavor that has a standard of identity. Vanilla can be
found in two different areas of Title 21 of the CFR- one under Food Dressings
and Flavorings in chapter I part 169.175 that describes vanilla extract and vanilla
flavoring and the other under Frozen Desserts chapter I part 135.110, which
describes vanilla in ice cream. In chapter I part 135.110, there are three different
labels possible for vanilla in ice cream. “Vanilla” is used if no artificial flavorings
are used, “vanilla flavored” if the food contains both a natural flavor and an
artificial flavor with the natural flavor being dominate, or “artificial vanilla” if the
food contains both a natural and artificial flavor with the artificial flavor
predominating or if the artificial flavor is used alone (FDA 2001a).
12
As described in chapter I part 169.175 of the CFR, vanilla extract is “the
solution in aqueous ethyl alcohol of the sapid and odorous principles extractable
from vanilla beans” with the ethyl alcohol being not less than 35% by volume and
the vanilla constituent being “not less than one unit per gallon” (FDA 2001b).
Vanilla flavoring must follow the same standards of identity as vanilla extract
except it contains less than 35% ethyl alcohol by volume (FDA 2001b). Vanilla
also can be found in several other forms such as vanilla powder, concentrated
vanilla extract, vanilla-vanillin extract, or vanilla-vanillin flavoring.
Natural vanilla, containing unique flavor compounds, has always been
unstable in price and when a hurricane destroyed the vanilla crop in the 1980’s
the price rose dramatically (Webster 1995). A cyclone in early 2000 destroyed
almost 1/3 of the total vanilla crop as it swept through Madagascar. Since it takes
3 years for new vanilla plants to be planted, flower, produce beans and almost
another year to get the ripened beans to market, it will take a long time to recoup
losses. Due to losses in 2000, the price has risen again with a gallon of vanilla
extract costing over $100 in 2002 (Thompson 2002). Vanilla is not just a common
flavor but allows a flavorist to create a myriad of tastes and profiles by custom
blending vanilla beans from various sources (Webster 1995).
Consumer Acceptance
Vanilla ice cream has long been a staple in the ice cream industry; its
production and consumption are the highest compared to other ice cream flavors.
Part of the high consumption is the use of vanilla ice cream in other products
13
such as banana splits, milkshakes, and sundaes. In 1999, vanilla ice cream
accounted for 29.3% of the US supermarket sales (Agricultural Statistics Boards
and others 2001). Reports over the last several years indicate that as low-fat ice
cream sales declined, consumers indulged in full-fat ice cream as they decided
that the taste of ice cream is worth the extra calories and fat. (Anon 1999).
Alternatively Hollingsworth (2003a) indicates as worries about obesity sweep the
country, more and more people are looking for foods that offer both good taste
and healthy attributes. Despite the past decline in sales of reduced-fat ice
creams, manufacturers are now expecting sales to increase because of
consumer education and health concerns as well as reformulated, better tasting
products (Hollingsworth 2003a). Not only are consumers looking for lower fat but
they are also searching for foods that provide other nutritional benefits. For
example, Breyers® ice cream is introducing ice creams that are lactose-free or
calcium-rich in order to give health conscience consumers alternative treats.
Many food manufacturers have become well versed in promoting “all
natural” or “vitamin added” products as a way to convince consumers to buy their
products because they are purportedly better and healthier. So-called healthy
foods include nutraceuticals, fortified foods, supplements, organic and natural
foods with the total U.S. natural product sales being $26 billion in 1999
(Hollingsworth 2000). While consumers have rejected past healthy products due
to their lack of appealing flavor, many manufacturers are coming up with better
tasting, more appealing foods that are lower in fat, sugar, or calories and hope to
persuade consumers to buy healthy foods. One of the reasons for the growth of
14
the healthy food industry is the introduction of niche restaurants that have
launched meals using exotic ingredients and healthy alternatives (Hollingsworth
2000).
Increased consumer knowledge, a variety of fad diets, the increased
availability of organic foods, and marketing of these products to specific groups
have all added fuel to the growing natural foods industry. The Organic Trade
Association reports organic foods currently represent about 2% of the retail
market with sales growing 20% a year despite the fact that some organic
products may cost twice as much as their regular counterparts (Hollingsworth
2003b). Many advocates of organic foods proclaim them to be more
environmentally friendly, healthier, and better tasting than other foods although
no scientific studies have determined that they are healthier or more nutritious
(Hollingsworth 2003b). IFT (1990) believes that “consumers desire more fresh or
fresh-like products that are visually appealing, full-flavored, nutritious, convenient
to prepare and serve, pesticide-free, and available year-round at a reasonable
price” but all of these attributes are not currently available in products. Therefore
as the battle continues to wage between those who desire organically grown
foods and those who do not believe they hold an added benefit, it is accurate to
state that neither group is willing to compromise when it comes to the taste of the
product.
Increased press coverage and general concern about unhealthy
Americans, genetically modified foods, the environment, and possible effects of
chemical residues in food products have all motivated some consumers to look
15
for natural/organic alternatives. Labeling of these products is a marketing tool
that can affect consumer decisions to buy products whether it is a new product
that the consumer wants to try or a natural product that the consumer believes to
have added benefits. Companies with brands such as Radical Cuisines®,
Certified Organic Soups®, YoSelf® , Nature Valley®, Morningstar®, and Nature’s
Own® have developed natural or organic products with labels that consumers
are beginning to recognize (Sloan 2002).
Although consumers repurchase products based on taste, price, or other
factors, labeling (package design or structure or claims) can also increase sales
of products. Rice (1995) looked at several food products that have labels
designed to increase sales. Molson Dry® (liquor company in Canada) and
Coors® used holograms on their labels to attract attention and entice consumers
to try their beer. Borden won the 1994 New Product of the Year by International
Dairy Foods Association for their Crazy Milk line- flavored milks with colorful
packages and fun names geared towards children. Specialty Brands released 10
entrees called Spice Islands Quick Meals that are made of rice/bean/vegetables
or pasta/vegetables in colorful, attractive packages. Lisa Henderson, director of
new products for Specialty Brands, suggested that the appearance of the
packages had a strong impact on the market effectiveness of their products (Rice
1995).
Light and others (1992) conducted a study to determine if label information
(nutritional labeling, ingredient information, and product claims) and perceived
risks associated with the selected foods would affect the hedonic responses to
16
high-fat and low-fat samples of processed American cheese and vanilla ice
cream. Consumer panelists rated their liking for the dairy products without any
information, then rated them with the labeling information, and finally completed a
questionnaire about the risk perception. For the vanilla ice cream, the low-fat
sample was not liked as much as the normal-fat sample no matter if labeling
information was provided or not. There was no difference for liking between the
low-fat ice cream with labeling information and the low-fat sample without
labeling information. Also, there was no difference for liking between the normal-
fat ice cream with or without the labeling information. Overall this study indicated
that providing information does not change the response of most consumers; the
differences in liking the product were based on the fat level found in the products.
Light and others (1990) believe that information “may influence an initial
purchase of a product, but in the final analysis, liking of a product is determined
by its sensory analysis.”
Bower and Turner (2001) conducted a study on the effects of liking, brand
names, and prices on the purchase intent for crisp snack foods. Overall it was
found that for university staff and students, liking the product had more effect on
purchase intent than either the brand, price, or both sets of information when
dealing with economy and brand name crisp snack foods. Alternatively, Jacoby
and others (1971) found that extrinsic factors not intrinsic factors (taste, texture,
aroma) affect consumer product choices.
Wansink and Park (2002) conducted a study to determine if ingredient
labels “contains soy protein” versus “contains protein” and health claims “may
17
reduce heart disease” versus “no claim” could influence consumer perception of
two segments of consumers (taste-conscious and health-conscious) for a
nutrition bar that did not contain soy. They concluded that labeling can influence
consumer perception but labels do not influence all consumers equally.
While several studies have shown that liking of a particular product has
more bearing on consumers and their intent to purchase items, these studies
were conducted in a laboratory and thus cannot accurately judge what
consumers are going to do when they enter a grocery store or other buying
situation. Marketers therefore try to influence consumers by using packages that
are colorful, eye appealing, memorable, or contain information such as health
claims that promote the product as something consumers should eat and use.
Since some consumers desire all natural/organic products in order to promote
better health or because they believe the products to be better tasting or other
reasons, manufacturers are producing “natural” products to give consumers what
they want. Yet do consumers really prefer “natural” products or do they just
believe they are better because the word is listed on the package and can
labeling effect consumer perception?
18
19
Chapter III
Materials and Methods
Experiments with Commercial Ice Cream
Three experiments were conducted using 4 regional, commercial vanilla
flavored ice creams to determine which one was liked best by consumers and to
evaluate if labeling of vanilla type does effect consumer perception. As shown in
Appendix A, one ice cream contained natural vanilla, one contained artificial
vanilla, and the other 2 contained a mixture of natural and artificial flavorings.
The ice cream was bought in a local grocery store and held in the freezer at -
19°C until the day prior to panel when it was scooped into individual 59-mL clear
plastic cups (Georgia-Pacific) using a #30 metal scoop. The small, lidded
containers of ice cream were placed back into the freezer at -19°C until the
morning of panel when they were placed into another freezer at -21°C in the
laboratory. Hedonic testing (degree of liking) of the ice creams was conducted
with 9-point hedonic scales, as shown in Appendix B, that ranged from dislike
extremely to like extremely for the following attributes: overall, appearance, color,
flavor, vanilla flavor, and sweetness. Two 9-point unstructured scales were used
as intensity scales to determine the strength of vanilla flavor (extremely weak to
extremely strong) and strength of sweetness (not at all sweet to extremely
sweet). A scorecard was given to the panelists in the first two experiments to
establish their “ideal” strength of vanilla flavor and strength of sweetness on an
20
unstructured scale (Szczesniak and others 1975). A demographics page was
also given to obtain information about the age and gender of the panelists as well
as how often the panelists ate ice cream and vanilla ice cream, previous dairy
products training, and brands of ice cream typically eaten by the panelists.
Students, staff, and faculty from The University of Tennessee in Knoxville,
TN, were used as panelists for all experiments. No criteria were used for
obtaining panelists other than their willingness to taste vanilla ice cream. In The
University of Tennessee Sensory Laboratory, samples were individually
presented under cool white fluorescent lighting. For Experiments A, B, and C
each panelist was presented with a tray containing, a glass of water, a spoon,
and the paper scorecards. For all the experiments, the samples were served
individually to each panelist.
Experiment IA—No Labeling of Vanilla Type
Seventy-two panelists each received all 4 samples of commercial ice
cream individually to create a complete balanced design. Panelists were given
the scorecard shown in Appendix B. This experiment was replicated several
months later. Data were combined from both panels for analysis.
Experiment IB—Labeling of Vanilla Type
Seventy-two panelists were used to create a balanced design. The same
4 commercial ice creams were used again with each sample being labeled with
the type of vanilla−−natural, artificial, or a mixture of natural and artificial. Each
panelist received all 4 samples of ice cream. The scorecards were the same as
shown in Appendix B except there was not a question asking the panelists to
identify the type of vanilla used in the product. This experiment was replicated
several weeks later and data were combined for analysis.
Experiment IC—Labeling (Correctly or Incorrectly) of Vanilla Type
For Experiment IC, an incomplete block design was used with 150
panelists over a 2-day period using the same 4 commercial ice creams. The ice
cream was labeled (either correctly or incorrectly) with the type of vanilla- natural,
artificial, or a mixture of artificial and natural- used for a total of 12 treatments.
Each panelist received 4 samples of ice cream individually to evaluate.
Assignment of samples to each panelist was determined by using PROC OPTEX
(SAS Institute, Inc 2001). No ideal scorecard was given for this experiment. The
scorecard for hedonic testing plus two intensity questions and the demographic
pages were the same as shown in Appendix B.
Data Collection and Analysis
For each experiment the data were collected with paper ballots and hand
coded and checked. The data were entered in SAS version 8.02 for statistical
analysis (SAS Institute Inc. 2001). PROC GLM and frequencies were run on the
data as shown in Appendix C. Analysis of variance (ANOVA) tables, as shown in
Appendix D, were examined at to determine if there were significant differences
(p<0.05) among the mean scores for each ice cream. Mean separation was
21
22
accomplished by least significant differences (LSD). Experiments IA and IB both
had panels conducted in separate months; therefore, the month was considered
a fixed effect with month and product interactions being evaluated for
significance using PROC GLM.
Experiments with Ice Cream made with the Same Base Ingredients
In order to investigate the type of vanilla flavoring liked best by consumers
and to discover the effect of labeling (correctly or incorrectly) on vanilla ice
cream, a base mix that adjusts for the effect of other ingredients on flavor was
used for further experimentation. A standard 14% fat ice cream mix that did not
contain any flavoring (Appendix A) was obtained from Purity Dairies (Dean
Foods, Nashville, TN) and used to make ice cream. Specified amounts of
artificial and pure vanilla extract (2-fold) obtained from Van Labs (New York)
were added to the ice cream mix. Ice cream was made from the mix one day
prior to the sensory panel using an ice cream maker (Cuisinart® model Ice 20,
East Windsor, NJ). Freezer bowls used in the mixers were placed in the freezer
at -19°C several days prior to making the ice cream. To make the ice cream, 750
mL of the base mix were put into the ice cream maker with a specified amount of
vanilla (as discussed below for each experiment). The mixer was run 20 min (as
indicated in the directions for the mixer). Following mixing, the ice cream was
scraped off of the plastic dasher. The ice cream temperature ranged from -4.6 to
-6.0ºC. A ruler was used to determine the height of the ice cream. The ice cream,
scooped using a #40 plastic cookie dropper scoop, was put in 59-mL clear plastic
23
cups (Georgia-Pacific) with lids that were labeled with random 3-digit numbers,
placed into plastic boxes, and then hardened in a freezer at -19°C. After cleaning
up the freezer bowls and allowing them to defrost, known volumes (mL) of
distilled water was placed in the bowl to the same height as the ice cream that
had been made in that bowl. Overrun, the amount of air incorporated in to the ice
cream, was calculated for each mix using the following equation (Chandan
1997): 100*(volume of ice cream)-(volume of mix at 750 mL) /volume of mix at
750 mL. The average overrun across all the ice creams was 23%. Temperature
of the room where the ice cream was made ranged from 19.9 to 23.1°C. There
was not enough ice cream in a single mixer for an entire panel so a total of 4
mixers and 12 bowls were randomly selected and used. Each panelist was
presented with a tray containing a glass of water and a spoon. Each sample was
served individually to the panelists except for Experiment IIA, where four samples
were presented together.
Experiment IIA—Ranking Analysis of Liking of Strength of Vanilla
Experiment IIA was a ranking test using 48 panelists to determine the
amount of vanilla liked best for strength of vanilla flavoring. For the artificial
vanilla, the manufacturer recommended between 0.3 to 0.6 % (volume basis) of
the mix or 2.25-4.5 mL vanilla for 750 mL of mix. Informal sensory testing in the
laboratory showed that approximately 10 mL was more appropriate. For natural
vanilla, 45 oz per 100 gal of mix or 2.64 mL per 750 mL of mix was used initially
(Thompson 2002). Preliminary testing showed that more vanilla might be
needed. For testing 6, 8, 10, and 12 mL per 750 mL of mix were used for both
artificial and natural flavorings. The ice cream was made as previously stated.
For 48 panelists, 2 mixer bowls of ice cream for each level of vanilla flavoring
were made with 24 samples of ice cream being taken from each bowl. All 4
mixers were used with 8 of the bowls for each panel. Each panelist received all 4
samples at the same time on a tray with a glass of water and spoon and was
asked to rank them based on likeability of the strength of the vanilla flavoring. A
panel was conducted with natural vanilla flavor and a repetition was performed a
week later. Two panels were conducted with artificial vanilla flavor with the
repetition being the following day. The data from the 2 panels for each type of
flavoring were combined to determine rank sums.
Experiment IIB—No Labeling of Vanilla Type
As determined in Experiment IIA (ranking analysis), this experiment used
the following amounts of vanilla to make the ice cream with 750 mL of mix: 10 mL
of natural vanilla flavoring, 10 mL of artificial vanilla flavoring, or 5 mL of artificial
plus 5 mL of natural for a mixed flavored ice cream. Each panelist received each
of the 3 samples individually. The panel had a balanced design with 60 panelists
getting each of the three samples individually. Scorecards, including the ideal,
given to the panelists were similar to the one found in Appendix B except there
was not a question asking the panelists to identify the type of flavoring used in
the samples. A repetition of this experiment was performed and the data were
combined for analysis. For 60 panelists, all 4 of the mixers were used with 9 of
24
the bowls for a single panel with a third of the samples being taken from each
bowl.
Experiment IIC—Labeling of Vanilla Type
Experiment IIC was a balanced design with 60 panelists where the
panelists received each of the 3 samples of ice cream, described in Experiment
IIB, but they were labeled with the type of vanilla used. This was used to see if
labeling affects consumer likeability. The scorecard was the same as described
above. The samples were served and evaluated individually. A repetition of this
experiment was performed and the data was combined for analysis.
Experiment IID—Labeling (Correctly or Incorrectly) of Vanilla Type
Experiment IID was an incomplete block design with 150 panelists, who
each received 3 samples, and the sensory panel was conducted over a two-day
period. The ice creams were labeled (correctly or incorrectly) with the type of
vanilla flavoring for a total of 9 treatments (3 flavors x 3 labels). The scorecard
was the same as described in Experiment IIA and the samples were individually
served.
Data Collection and Analysis
Data were collected using FIZZ, a computer sensory program developed
by Biosystems (2002) in France. For Experiment IIA, ranking was used with the
program allowing each of the 4 samples to be ordered from lowest to highest for
25
likeability of strength of vanilla flavor. In Experiments IIB, IIC, and IID the
program provided a nine-point scale for hedonic testing with the scale ranging
from like extremely to dislike extremely for overall likeability, appearance, color,
flavor, vanilla flavor, and sweetness. Also, Experiments IIB, IIC, and IID, used an
unstructured scale for strength of vanilla and strength of sweetness with
references points of extremely too sweet to not at all sweet for sweetness and
extremely strong to extremely weak for vanilla flavor. An ideal page was used to
determine the ideal strength of vanilla flavoring and strength of sweetness.
Data for the ranking test (Experiment IIA) were calculated in FIZZ using
the Friedman’s test to determine if differences existed among the rank sums. The
rank sums also were analyzed according to Basker (1988). Data for Experiments
IIB IIC and IID were exported from FIZZ to an EXCEL file and then transferred to
SAS version 8.02 for analysis. PROC GLM was used to determine means values
and frequencies of demographic questions were also determined. PROC GLM
with the PDIFF option was used for mean separation. Differences were deemed
significant at p<0.05. For Experiment IID, the type of label placed on the sample
was used as an effect instead of day like the other experiments to see if there
was an interaction between product and the label placed on the product.
26
Chapter IV
Results and Discussion
Experiments with Commercial Ice Cream
Experiment IA—No Labeling of Vanilla Type
This experiment was conducted to determine hedonic scores for 4
commercial ice creams that contained natural vanilla flavoring, artificial flavoring,
or a combination of natural and artificial flavorings. Two panels were conducted
in May and October 2001 with the same ice creams being used for each test. As
shown in Table 1, the combination of panel data resulted in product by time
interactions (p<0.05) for appearance, color, and flavor scores. For appearance,
the mean value for the mixed flavored ice cream 2 was between liked moderately
and liked very much in October but was less than liked moderately in May. For
color, the mixed flavored ice cream 2 was liked more in October than in May. All
other ice creams did not differ over time within the specific ice cream for
appearance and color. For flavor, the naturally flavored ice cream differed over
time with the ice cream being above liked slightly in May but being between
neither liked nor disliked and liked slightly for October. The ingredient list and
nutrition label information, as shown in Appendix A, did not differ between
months for the 4 commercial ice creams; therefore, the differences in hedonic
scores between the months could be explained by production differences,
alterations in consumer perception of ice cream, or differences in the panels
27
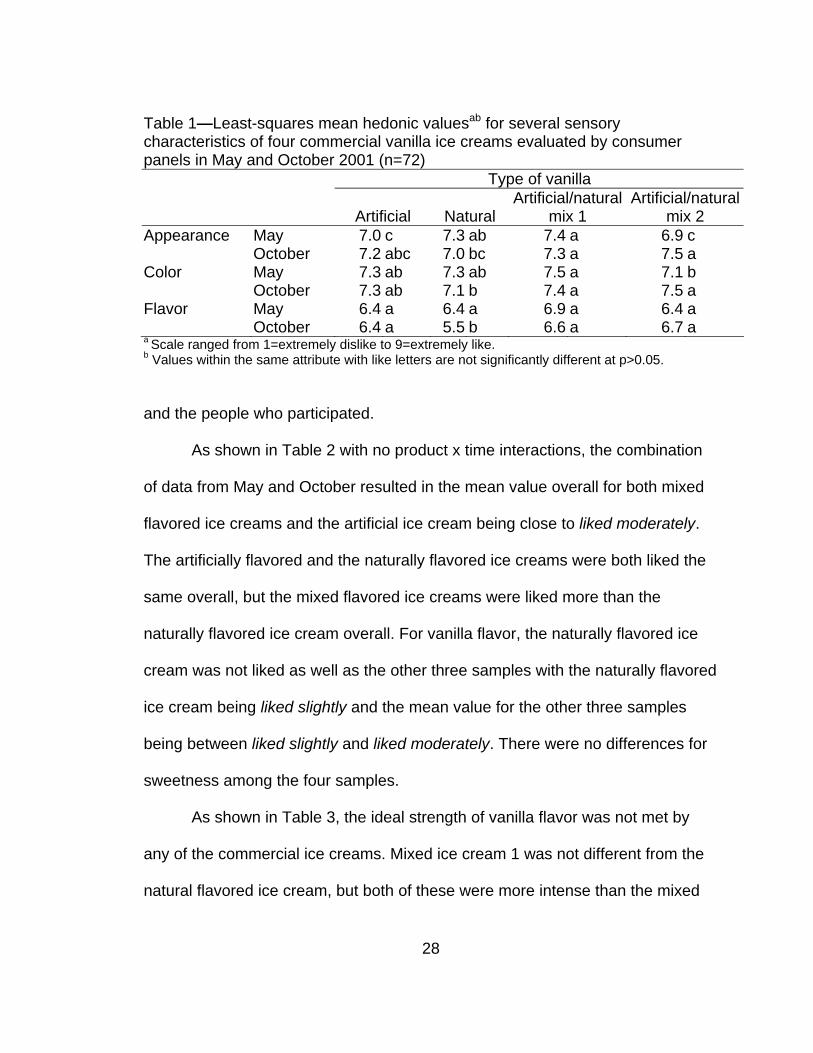
Table 1—Least-squares mean hedonic valuesab for several sensory characteristics of four commercial vanilla ice creams evaluated by consumer panels in May and October 2001 (n=72) Type of vanilla
Artificial
Natural
Artificial/natural mix 1
Artificial/natural mix 2
Appearance May 7.0 c 7.3 ab 7.4 a 6.9 c October 7.2 abc 7.0 bc 7.3 a 7.5 a Color May 7.3 ab 7.3 ab 7.5 a 7.1 b October 7.3 ab 7.1 b 7.4 a 7.5 a Flavor May 6.4 a 6.4 a 6.9 a 6.4 a October 6.4 a 5.5 b 6.6 a 6.7 a a Scale ranged from 1=extremely dislike to 9=extremely like. b Values within the same attribute with like letters are not significantly different at p>0.05.
and the people who participated.
As shown in Table 2 with no product x time interactions, the combination
of data from May and October resulted in the mean value overall for both mixed
flavored ice creams and the artificial ice cream being close to liked moderately.
The artificially flavored and the naturally flavored ice creams were both liked the
same overall, but the mixed flavored ice creams were liked more than the
naturally flavored ice cream overall. For vanilla flavor, the naturally flavored ice
cream was not liked as well as the other three samples with the naturally flavored
ice cream being liked slightly and the mean value for the other three samples
being between liked slightly and liked moderately. There were no differences for
sweetness among the four samples.
As shown in Table 3, the ideal strength of vanilla flavor was not met by
any of the commercial ice creams. Mixed ice cream 1 was not different from the
natural flavored ice cream, but both of these were more intense than the mixed
28
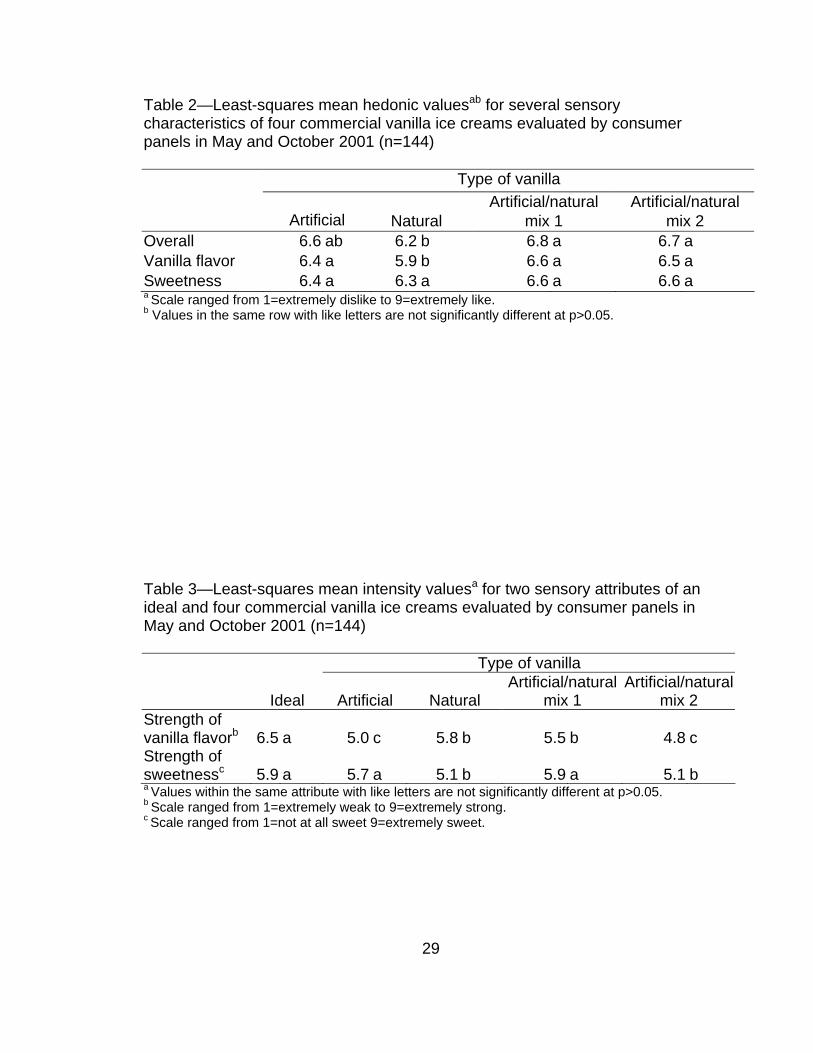
Table 2—Least-squares mean hedonic valuesab for several sensory characteristics of four commercial vanilla ice creams evaluated by consumer panels in May and October 2001 (n=144) Type of vanilla
Artificial Natural Artificial/natural
mix 1 Artificial/natural
mix 2 Overall 6.6 ab 6.2 b 6.8 a 6.7 a Vanilla flavor 6.4 a 5.9 b 6.6 a 6.5 a Sweetness 6.4 a 6.3 a 6.6 a 6.6 a a Scale ranged from 1=extremely dislike to 9=extremely like. b Values in the same row with like letters are not significantly different at p>0.05.
Table 3—Least-squares mean intensity valuesa for two sensory attributes of an ideal and four commercial vanilla ice creams evaluated by consumer panels in May and October 2001 (n=144) Type of vanilla
Ideal
Artificial
Natural Artificial/natural
mix 1 Artificial/natural
mix 2 Strength of vanilla flavorb
6.5
a 5.0
c 5.8
b 5.5
b 4.8
c
Strength of sweetnessc
5.9
a 5.7
a 5.1
b 5.9
a 5.1
b
a Values within the same attribute with like letters are not significantly different at p>0.05. b Scale ranged from 1=extremely weak to 9=extremely strong. c Scale ranged from 1=not at all sweet 9=extremely sweet.
29
ice cream 2 and the artificially flavored ice cream, which did not differ. For
strength of sweetness, both the artificial and mixed ice cream 1 did not differ from
the ideal with all three being sweeter than the other two products. The natural ice
cream did not differ from the mixed ice cream 2 for strength of sweetness but
neither of these were as sweet as the artificial, mixed ice cream 1, and the ideal.
There was a time difference (p<0.05) for strength of vanilla flavor with October
(5.7) having a higher overall mean across all products than May (5.3).
As shown in Figure 1, all of the ice creams were most frequently identified
by consumers as containing artificial flavoring. Only 17% of the panelists
correctly identified the naturally flavored ice cream while 56% of the panelists
correctly identified the artificially flavored ice cream. Forty-seven percent of the
panelists identified the naturally flavored ice cream as containing artificial
flavoring and approximately 50% of the panelists called the mixed flavored ice
creams artificial. Of all the panelists, only 2% labeled all 4 samples with the
correct type of vanilla flavoring. Three of the samples were correctly labeled by
11% of the panelists, while 34% of the panelists correctly identified 2 of the
samples. Thirty-eight percent of the panelists correctly identified 1 sample while
22% of the panelists could not correctly identify any of the samples. This
indicates that the majority of panelists cannot correctly identify the type of vanilla
flavoring used in these ice creams especially natural flavoring.
From these panels, the results indicate that the naturally flavored ice
cream was liked less overall than the ice creams containing a mixture of
30
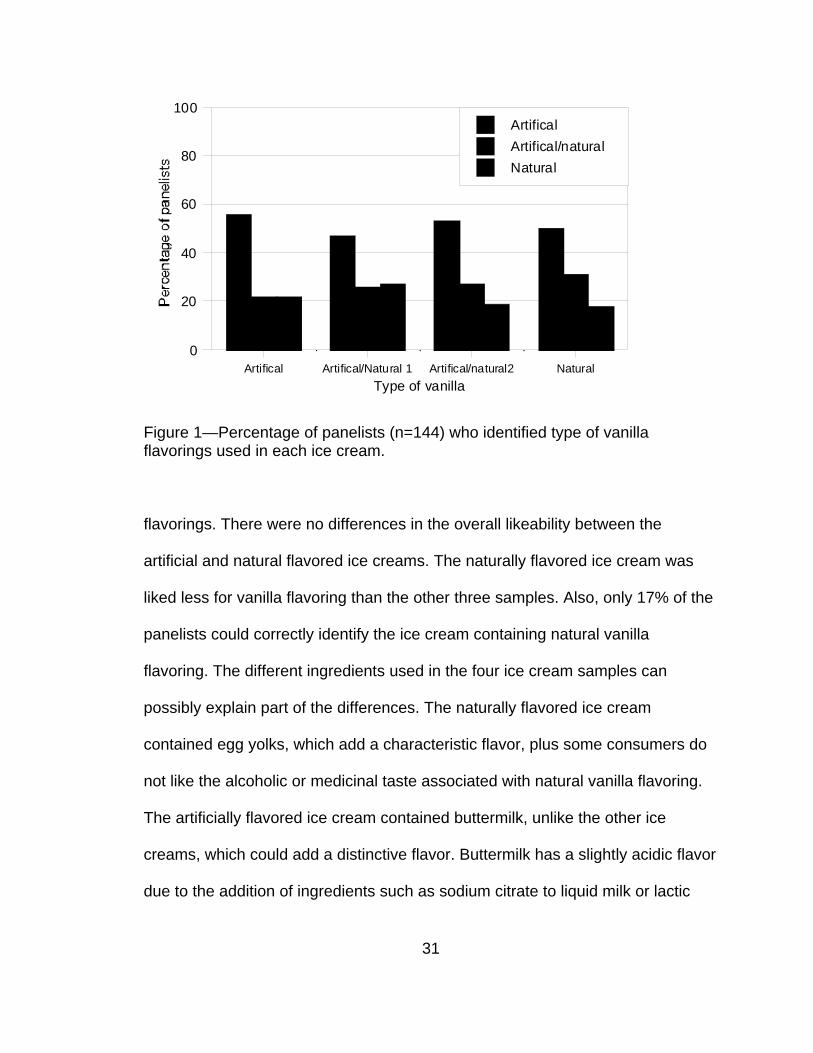
Type of vanillaArtifical Artifical/Natural 1 Artifical/natural2 Natural
0
20
40
60
80
100ArtificalArtifical/naturalNatural
Figure 1—Percentage of panelists (n=144) who identified type of vanilla flavorings used in each ice cream.
flavorings. There were no differences in the overall likeability between the
artificial and natural flavored ice creams. The naturally flavored ice cream was
liked less for vanilla flavoring than the other three samples. Also, only 17% of the
panelists could correctly identify the ice cream containing natural vanilla
flavoring. The different ingredients used in the four ice cream samples can
possibly explain part of the differences. The naturally flavored ice cream
contained egg yolks, which add a characteristic flavor, plus some consumers do
not like the alcoholic or medicinal taste associated with natural vanilla flavoring.
The artificially flavored ice cream contained buttermilk, unlike the other ice
creams, which could add a distinctive flavor. Buttermilk has a slightly acidic flavor
due to the addition of ingredients such as sodium citrate to liquid milk or lactic
31
acid to powdered buttermilk. Percentage of fat also varied among the ice creams.
The naturally flavored ice cream and mixed flavored 1 ice cream both had
approximately 11% fat while mixed flavored ice cream 2 had around 14% and the
artificial flavored one had a slightly over 9%. The differing amounts of fat could
alter perceptions because milkfat does contribute to flavor through its own
properties and by being a carrier for fat-soluble flavorings. Also, the different
amount of sweeteners contributes to flavor and can affect the body and texture of
the ice cream.
Even with different ingredients, results suggest that panelists cannot
identify natural vanilla flavoring in ice cream and do not really like naturally
flavored ice cream when compared to other ice creams containing other types of
flavoring. It is possible that people only like the idea of natural flavorings without
particularly liking the flavoring. To determine if labeling of the type of vanilla in the
ice cream did affect consumer perception of vanilla ice cream, another study was
conducted.
Experiment IB—Labeling of Vanilla Type
Sensory panels were conducted in March and April 2002 with the same
four commercial ice creams but the samples were identified as to the type of
flavoring used in each vanilla ice cream sample. As shown in Table 4, the
addition of the label altered the results when compared to the Experiment IA
results. Overall, both mixed flavored ice creams were liked moderately and both
were liked more than the artificially flavored ice cream, which had a mean value
32
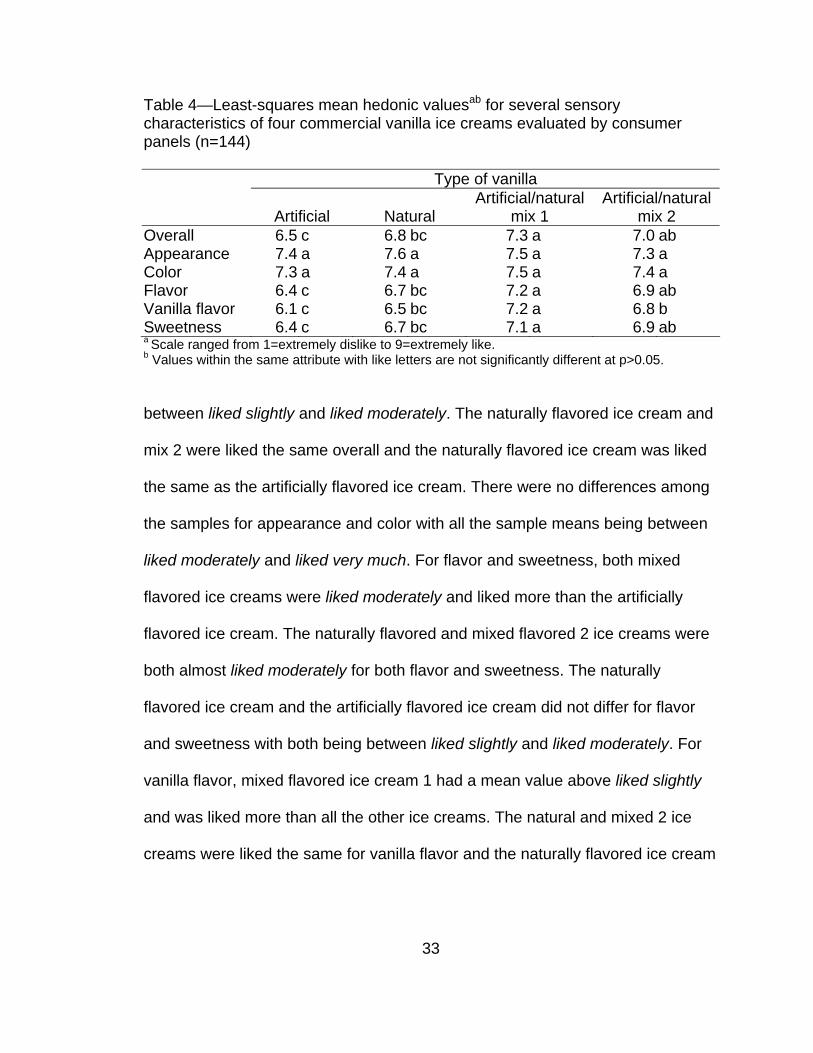
Table 4—Least-squares mean hedonic valuesab for several sensory characteristics of four commercial vanilla ice creams evaluated by consumer panels (n=144) Type of vanilla
Artificial
Natural Artificial/natural
mix 1 Artificial/natural
mix 2 Overall 6.5 c 6.8 bc 7.3 a 7.0 ab Appearance 7.4 a 7.6 a 7.5 a 7.3 a Color 7.3 a 7.4 a 7.5 a 7.4 a Flavor 6.4 c 6.7 bc 7.2 a 6.9 ab Vanilla flavor 6.1 c 6.5 bc 7.2 a 6.8 b Sweetness 6.4 c 6.7 bc 7.1 a 6.9 ab a Scale ranged from 1=extremely dislike to 9=extremely like. b Values within the same attribute with like letters are not significantly different at p>0.05.
between liked slightly and liked moderately. The naturally flavored ice cream and
mix 2 were liked the same overall and the naturally flavored ice cream was liked
the same as the artificially flavored ice cream. There were no differences among
the samples for appearance and color with all the sample means being between
liked moderately and liked very much. For flavor and sweetness, both mixed
flavored ice creams were liked moderately and liked more than the artificially
flavored ice cream. The naturally flavored and mixed flavored 2 ice creams were
both almost liked moderately for both flavor and sweetness. The naturally
flavored ice cream and the artificially flavored ice cream did not differ for flavor
and sweetness with both being between liked slightly and liked moderately. For
vanilla flavor, mixed flavored ice cream 1 had a mean value above liked slightly
and was liked more than all the other ice creams. The natural and mixed 2 ice
creams were liked the same for vanilla flavor and the naturally flavored ice cream
33
was liked the same as the artificially flavored one. No time x product interactions
or time differences occurred (p>0.05).
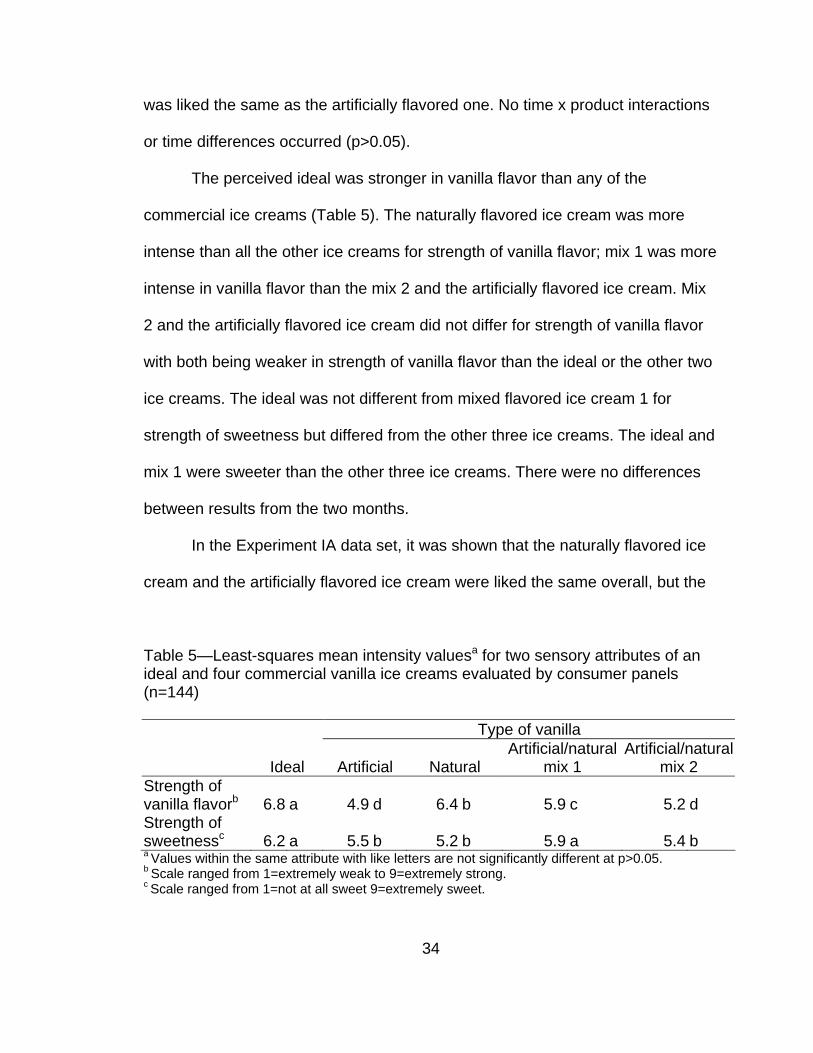
The perceived ideal was stronger in vanilla flavor than any of the
commercial ice creams (Table 5). The naturally flavored ice cream was more
intense than all the other ice creams for strength of vanilla flavor; mix 1 was more
intense in vanilla flavor than the mix 2 and the artificially flavored ice cream. Mix
2 and the artificially flavored ice cream did not differ for strength of vanilla flavor
with both being weaker in strength of vanilla flavor than the ideal or the other two
ice creams. The ideal was not different from mixed flavored ice cream 1 for
strength of sweetness but differed from the other three ice creams. The ideal and
mix 1 were sweeter than the other three ice creams. There were no differences
between results from the two months.
In the Experiment IA data set, it was shown that the naturally flavored ice
cream and the artificially flavored ice cream were liked the same overall, but the
Table 5—Least-squares mean intensity valuesa for two sensory attributes of an ideal and four commercial vanilla ice creams evaluated by consumer panels (n=144) Type of vanilla
Ideal
Artificial
Natural Artificial/natural
mix 1 Artificial/natural
mix 2 Strength of vanilla flavorb
6.8
a 4.9
d 6.4
b 5.9
c 5.2
d
Strength of sweetnessc
6.2
a 5.5
b 5.2
b 5.9
a 5.4
b
a Values within the same attribute with like letters are not significantly different at p>0.05. b Scale ranged from 1=extremely weak to 9=extremely strong. c Scale ranged from 1=not at all sweet 9=extremely sweet.
34
naturally flavored ice cream was liked less for flavor and vanilla flavor than all the
other ice creams. In the Experiment IB data set where the ice cream was
correctly labeled with the type of flavoring used, the naturally flavored ice cream
was liked the same as the artificially flavored ice cream and one of the ice
creams containing artificial and natural flavoring overall and for flavor and vanilla
flavor. The naturally flavored ice cream was liked the same as the mixed flavored
ice cream 2 in Experiment IB unlike in Experiment IA where the naturally flavored
ice cream was liked less than mix 2, which may be a result of the labeling. To
see if labeling truly had an effect on the likeability of the ice cream, a further
study was conducted.
Experiment IC—Labeling (Correctly or Incorrectly) of Vanilla Type
In late April 2002, an incomplete block design was used with each panelist
receiving four samples of ice cream. Each ice cream (product) was labeled with
all possible flavor types. No product x label interactions were found for any of the
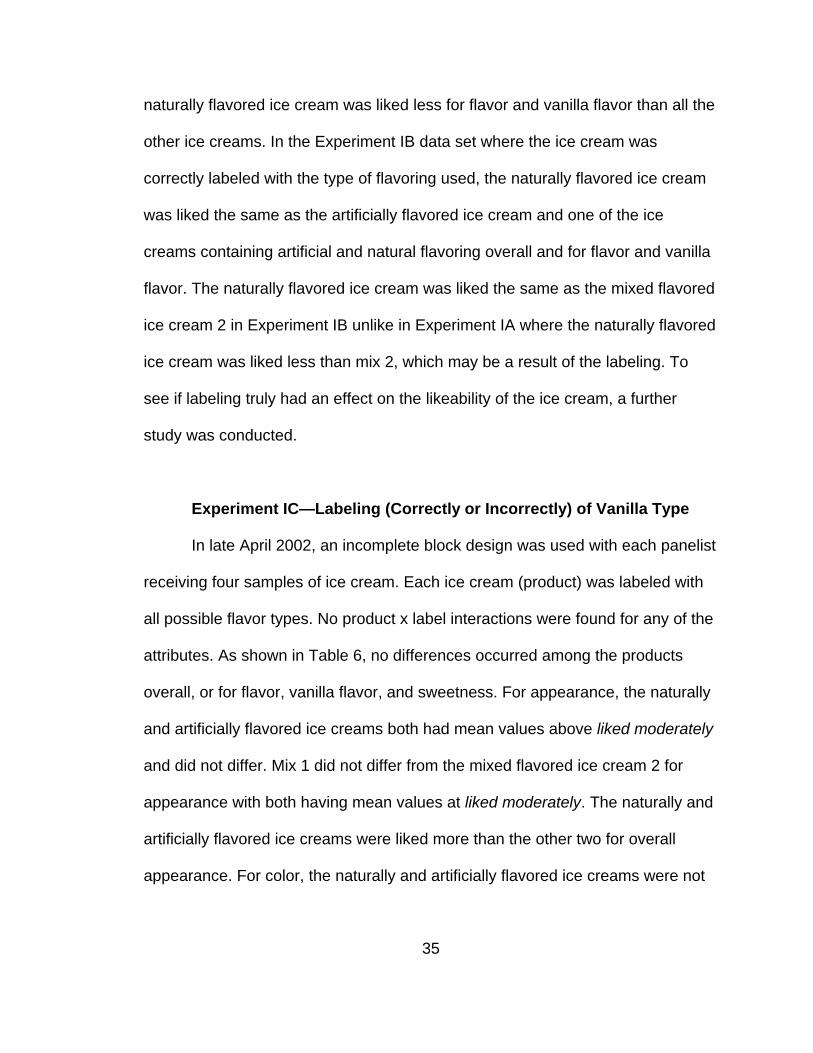
attributes. As shown in Table 6, no differences occurred among the products
overall, or for flavor, vanilla flavor, and sweetness. For appearance, the naturally
and artificially flavored ice creams both had mean values above liked moderately
and did not differ. Mix 1 did not differ from the mixed flavored ice cream 2 for
appearance with both having mean values at liked moderately. The naturally and
artificially flavored ice creams were liked more than the other two for overall
appearance. For color, the naturally and artificially flavored ice creams were not
35
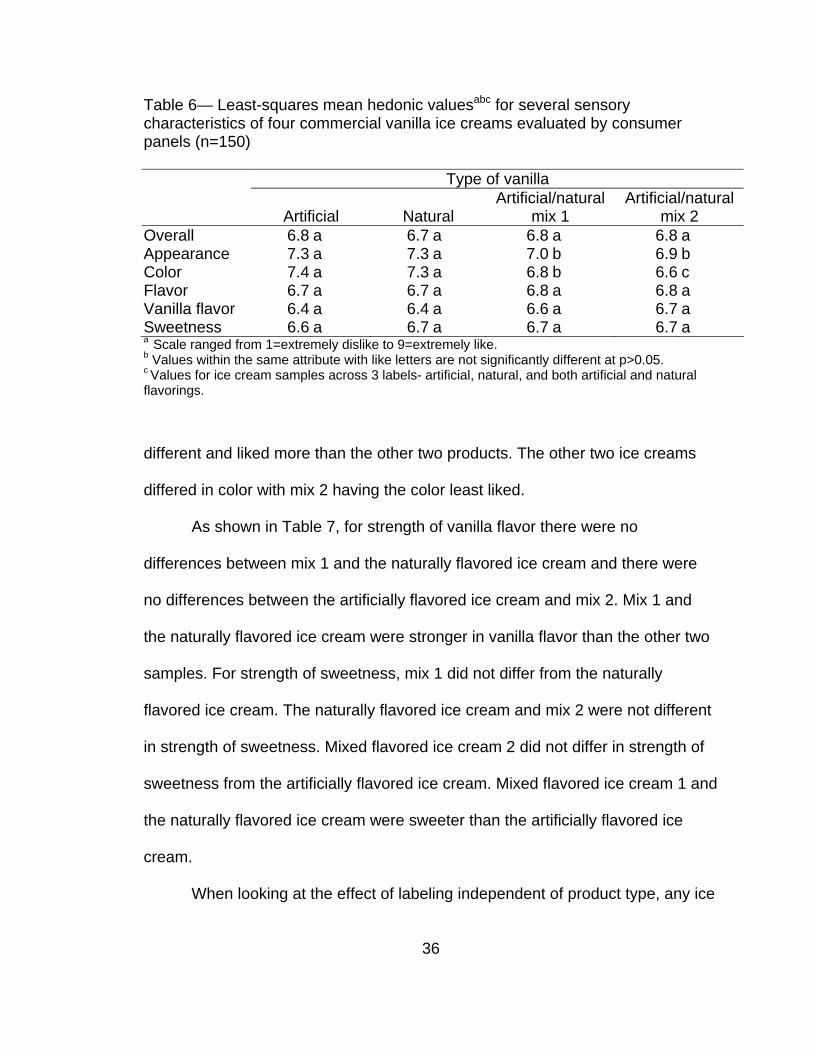
Table 6— Least-squares mean hedonic valuesabc for several sensory characteristics of four commercial vanilla ice creams evaluated by consumer panels (n=150) Type of vanilla
Artificial
Natural Artificial/natural
mix 1 Artificial/natural
mix 2 Overall 6.8 a 6.7 a 6.8 a 6.8 a Appearance 7.3 a 7.3 a 7.0 b 6.9 b Color 7.4 a 7.3 a 6.8 b 6.6 c Flavor 6.7 a 6.7 a 6.8 a 6.8 a Vanilla flavor 6.4 a 6.4 a 6.6 a 6.7 a Sweetness 6.6 a 6.7 a 6.7 a 6.7 a a Scale ranged from 1=extremely dislike to 9=extremely like. b Values within the same attribute with like letters are not significantly different at p>0.05. c Values for ice cream samples across 3 labels- artificial, natural, and both artificial and natural flavorings. different and liked more than the other two products. The other two ice creams
differed in color with mix 2 having the color least liked.
As shown in Table 7, for strength of vanilla flavor there were no
differences between mix 1 and the naturally flavored ice cream and there were
no differences between the artificially flavored ice cream and mix 2. Mix 1 and
the naturally flavored ice cream were stronger in vanilla flavor than the other two
samples. For strength of sweetness, mix 1 did not differ from the naturally
flavored ice cream. The naturally flavored ice cream and mix 2 were not different
in strength of sweetness. Mixed flavored ice cream 2 did not differ in strength of
sweetness from the artificially flavored ice cream. Mixed flavored ice cream 1 and
the naturally flavored ice cream were sweeter than the artificially flavored ice
cream.
When looking at the effect of labeling independent of product type, any ice
36
Table 7—Least-squares mean intensity valuesab for two sensory attributes of four commercial vanilla ice creams evaluated by consumer panels (n=150) Type of vanilla
Artificial
Natural Artificial/natural
mix 1 Artificial/natural
mix 2 Strength of vanilla flavorc
4.8
b 5.7
a 5.6
a 5.0
b
Strength of sweetnessd
5.2
c 5.6
ab 5.8
a 5.4
bc
a Values for ice cream samples across 3 labels- artificial, natural, and both artificial and natural flavorings. b Values within the same attribute with like letters are not significantly different at p>0.05. c Scale ranged from 1=extremely weak to 9=extremely strong. d Scale ranged from 1=not at all sweet 9=extremely sweet.
cream labeled “natural” was liked more overall and for vanilla flavor than the ice
creams labeled “artificial” or “both artificial and natural” as shown in Table 8. Any
ice creams labeled as containing ‘both artificial and natural’ flavorings did not
differ overall or for vanilla flavor from the ice creams labeled “artificial”. For
appearance, the ice creams labeled “natural” and “both artificial and natural”
were liked the same and more than the ice creams labeled “artificial”. For color
and flavor, the ice creams labeled “natural” were liked the same as the ice
creams labeled as having “both artificial and natural” flavorings. The ice creams
labeled “artificial” and “both artificial and natural” were liked the same for color
and flavor. The ice creams labeled “natural” were liked more than the ice creams
labeled “artificial” for both color and flavor. No matter which label was applied, all
of the ice creams were liked the same for sweetness and strength of sweetness.
For strength of vanilla flavor, there was no perceived difference for the ice
creams labeled “natural” or “both artificial and natural” but the ice creams labeled
37
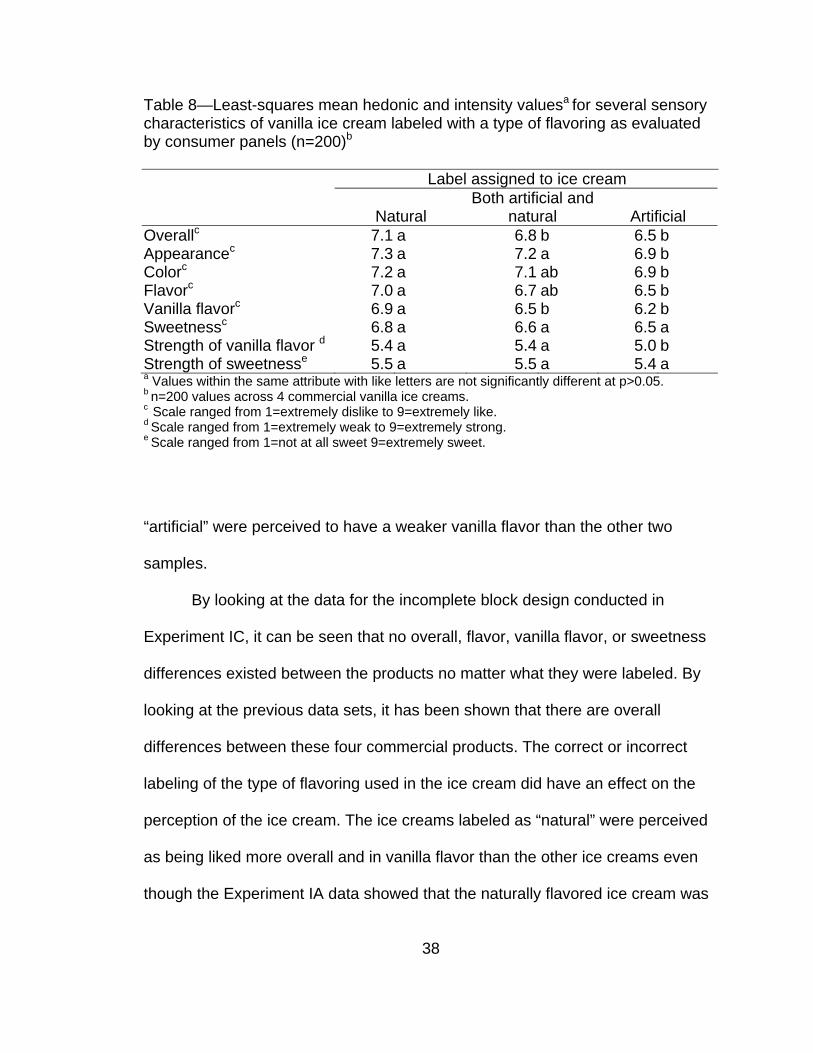
Table 8—Least-squares mean hedonic and intensity valuesa for several sensory characteristics of vanilla ice cream labeled with a type of flavoring as evaluated by consumer panels (n=200)b
Label assigned to ice cream
Natural Both artificial and
natural
Artificial Overallc 7.1 a 6.8 b 6.5 b Appearancec 7.3 a 7.2 a 6.9 b Colorc 7.2 a 7.1 ab 6.9 b Flavorc 7.0 a 6.7 ab 6.5 b Vanilla flavorc 6.9 a 6.5 b 6.2 b Sweetnessc 6.8 a 6.6 a 6.5 a Strength of vanilla flavor d 5.4 a 5.4 a 5.0 b Strength of sweetnesse 5.5 a 5.5 a 5.4 a a Values within the same attribute with like letters are not significantly different at p>0.05. b n=200 values across 4 commercial vanilla ice creams. c Scale ranged from 1=extremely dislike to 9=extremely like. d Scale ranged from 1=extremely weak to 9=extremely strong. e Scale ranged from 1=not at all sweet 9=extremely sweet.
“artificial” were perceived to have a weaker vanilla flavor than the other two
samples.
By looking at the data for the incomplete block design conducted in
Experiment IC, it can be seen that no overall, flavor, vanilla flavor, or sweetness
differences existed between the products no matter what they were labeled. By
looking at the previous data sets, it has been shown that there are overall
differences between these four commercial products. The correct or incorrect
labeling of the type of flavoring used in the ice cream did have an effect on the
perception of the ice cream. The ice creams labeled as “natural” were perceived
as being liked more overall and in vanilla flavor than the other ice creams even
though the Experiment IA data showed that the naturally flavored ice cream was
38
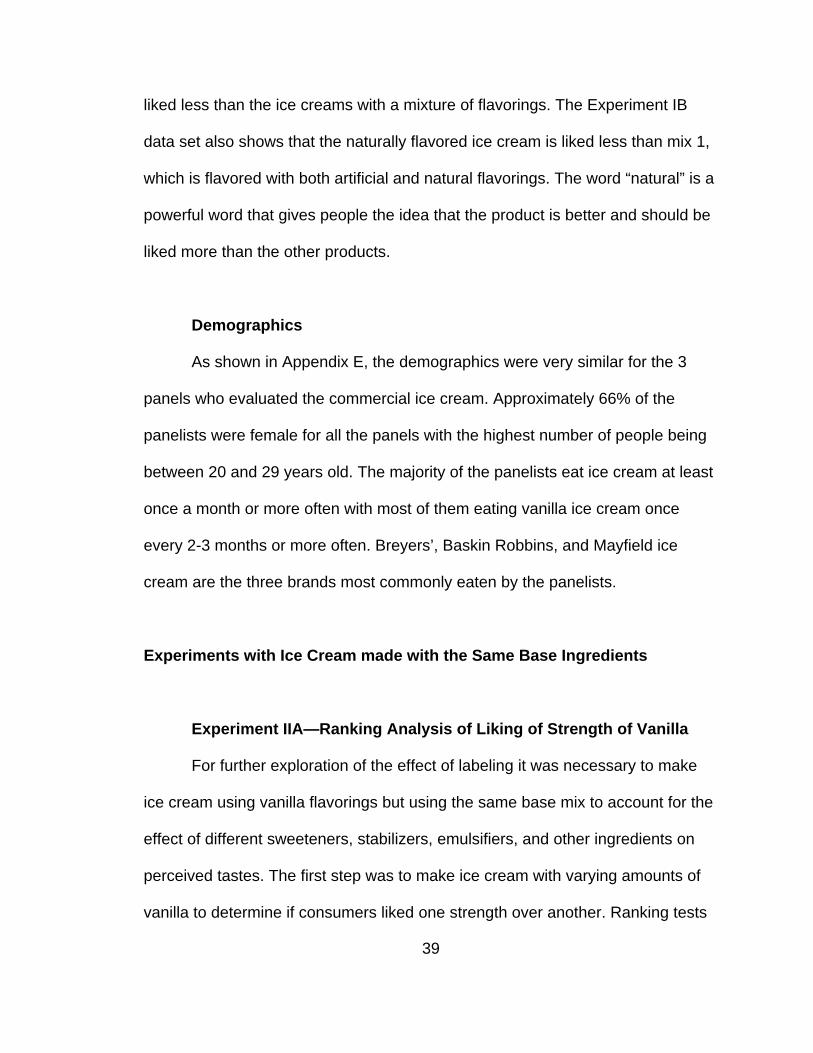
liked less than the ice creams with a mixture of flavorings. The Experiment IB
data set also shows that the naturally flavored ice cream is liked less than mix 1,
which is flavored with both artificial and natural flavorings. The word “natural” is a
powerful word that gives people the idea that the product is better and should be
liked more than the other products.
Demographics
As shown in Appendix E, the demographics were very similar for the 3
panels who evaluated the commercial ice cream. Approximately 66% of the
panelists were female for all the panels with the highest number of people being
between 20 and 29 years old. The majority of the panelists eat ice cream at least
once a month or more often with most of them eating vanilla ice cream once
every 2-3 months or more often. Breyers’, Baskin Robbins, and Mayfield ice
cream are the three brands most commonly eaten by the panelists.
Experiments with Ice Cream made with the Same Base Ingredients
Experiment IIA—Ranking Analysis of Liking of Strength of Vanilla
For further exploration of the effect of labeling it was necessary to make
ice cream using vanilla flavorings but using the same base mix to account for the
effect of different sweeteners, stabilizers, emulsifiers, and other ingredients on
perceived tastes. The first step was to make ice cream with varying amounts of
vanilla to determine if consumers liked one strength over another. Ranking tests
39
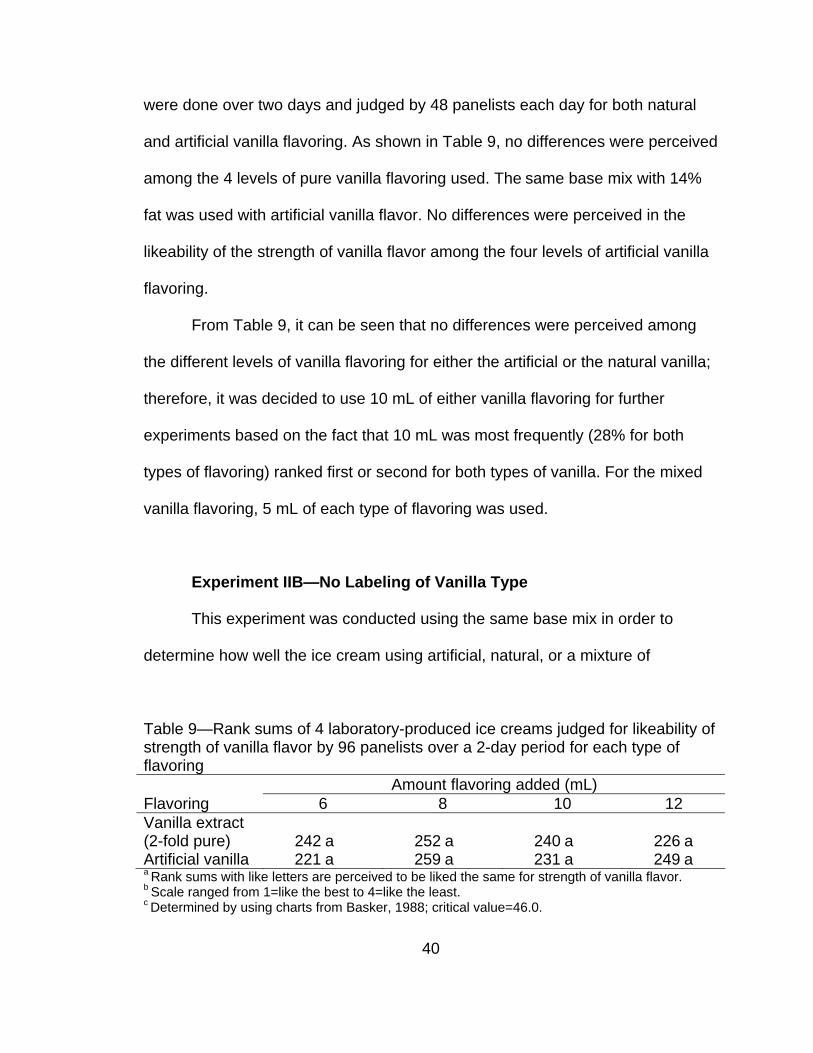
were done over two days and judged by 48 panelists each day for both natural
and artificial vanilla flavoring. As shown in Table 9, no differences were perceived
among the 4 levels of pure vanilla flavoring used. The same base mix with 14%
fat was used with artificial vanilla flavor. No differences were perceived in the
likeability of the strength of vanilla flavor among the four levels of artificial vanilla
flavoring.
From Table 9, it can be seen that no differences were perceived among
the different levels of vanilla flavoring for either the artificial or the natural vanilla;
therefore, it was decided to use 10 mL of either vanilla flavoring for further
experiments based on the fact that 10 mL was most frequently (28% for both
types of flavoring) ranked first or second for both types of vanilla. For the mixed
vanilla flavoring, 5 mL of each type of flavoring was used.
Experiment IIB—No Labeling of Vanilla Type
This experiment was conducted using the same base mix in order to
determine how well the ice cream using artificial, natural, or a mixture of
Table 9—Rank sums of 4 laboratory-produced ice creams judged for likeability of strength of vanilla flavor by 96 panelists over a 2-day period for each type of flavoring Amount flavoring added (mL) Flavoring 6 8 10 12 Vanilla extract (2-fold pure)
242
a
252
a
240
a
226
a
Artificial vanilla 221 a 259 a 231 a 249 a a Rank sums with like letters are perceived to be liked the same for strength of vanilla flavor. b Scale ranged from 1=like the best to 4=like the least. c Determined by using charts from Basker, 1988; critical value=46.0.
40
flavorings was liked. There was a product x day interaction for appearance
(p<0.05) with values (7.0-7.2) including the mean value for the naturally flavored
ice cream on day 1. As shown in Table 10, the natural flavored ice cream was
liked less than other 2 products for overall likeability, color, flavor, vanilla flavor,
and sweetness. The other two products did not differ significantly for these
attributes.
As shown in the naturally flavored ice cream on day 2 (6.4) differing from
the other mean the Table 11, there were no differences among the samples and
the ideal for strength of vanilla flavor or strength of sweetness. Unlike Experiment
IA where none of the commercial samples met the ideal for strength of vanilla
flavor and only one sample met the ideal for strength of sweetness, all three
made samples did meet the ideal for strength of vanilla flavoring and strength of
sweetness. Overall and for vanilla flavor, both Experiment IA using commercial
ice creams and Experiment IIB using the same base mix showed that the
naturally flavored ice creams was not liked as well as the mixed flavored ice
Table 10—Least-squares mean hedonic valuesab for several sensory characteristics of three laboratory-produced vanilla ice creams as evaluated by consumer panels (n=116) Type of vanilla Natural Artificial Artificial and natural mix Overall 6.1 b 6.7 a 6.8 a Color 6.7 b 7.3 a 7.2 a Flavor 5.9 b 6.6 a 6.7 a Vanilla flavor 5.8 b 6.5 a 6.5 a Sweetness 6.0 b 6.6 a 6.5 a a Scale ranged from 1=extremely dislike to 9=extremely like. b Values within the same attribute with like letters are not significantly different at p>0.05.
41
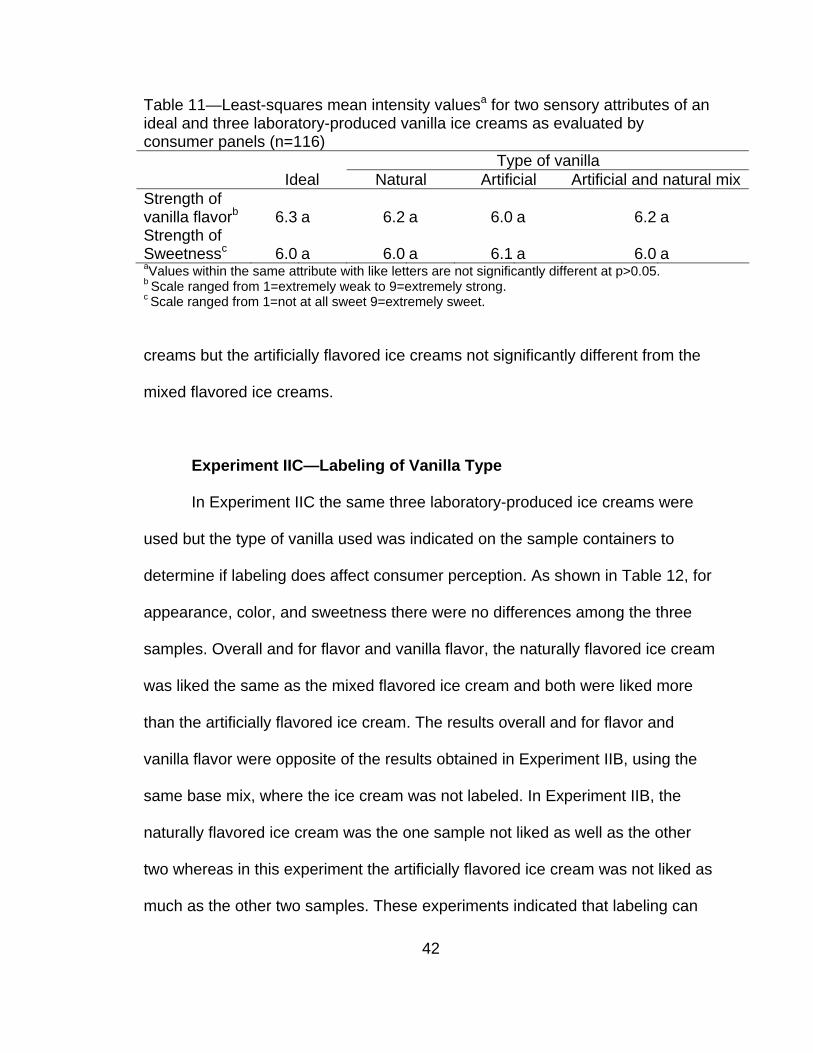
Table 11—Least-squares mean intensity valuesa for two sensory attributes of an ideal and three laboratory-produced vanilla ice creams as evaluated by consumer panels (n=116) Type of vanilla Ideal Natural Artificial Artificial and natural mixStrength of vanilla flavorb 6.3 a 6.2 a 6.0 a 6.2 a Strength of Sweetnessc 6.0 a 6.0 a 6.1 a 6.0 a aValues within the same attribute with like letters are not significantly different at p>0.05. b Scale ranged from 1=extremely weak to 9=extremely strong. c Scale ranged from 1=not at all sweet 9=extremely sweet.
creams but the artificially flavored ice creams not significantly different from the
mixed flavored ice creams.
Experiment IIC—Labeling of Vanilla Type
In Experiment IIC the same three laboratory-produced ice creams were
used but the type of vanilla used was indicated on the sample containers to
determine if labeling does affect consumer perception. As shown in Table 12, for
appearance, color, and sweetness there were no differences among the three
samples. Overall and for flavor and vanilla flavor, the naturally flavored ice cream
was liked the same as the mixed flavored ice cream and both were liked more
than the artificially flavored ice cream. The results overall and for flavor and
vanilla flavor were opposite of the results obtained in Experiment IIB, using the
same base mix, where the ice cream was not labeled. In Experiment IIB, the
naturally flavored ice cream was the one sample not liked as well as the other
two whereas in this experiment the artificially flavored ice cream was not liked as
much as the other two samples. These experiments indicated that labeling can
42
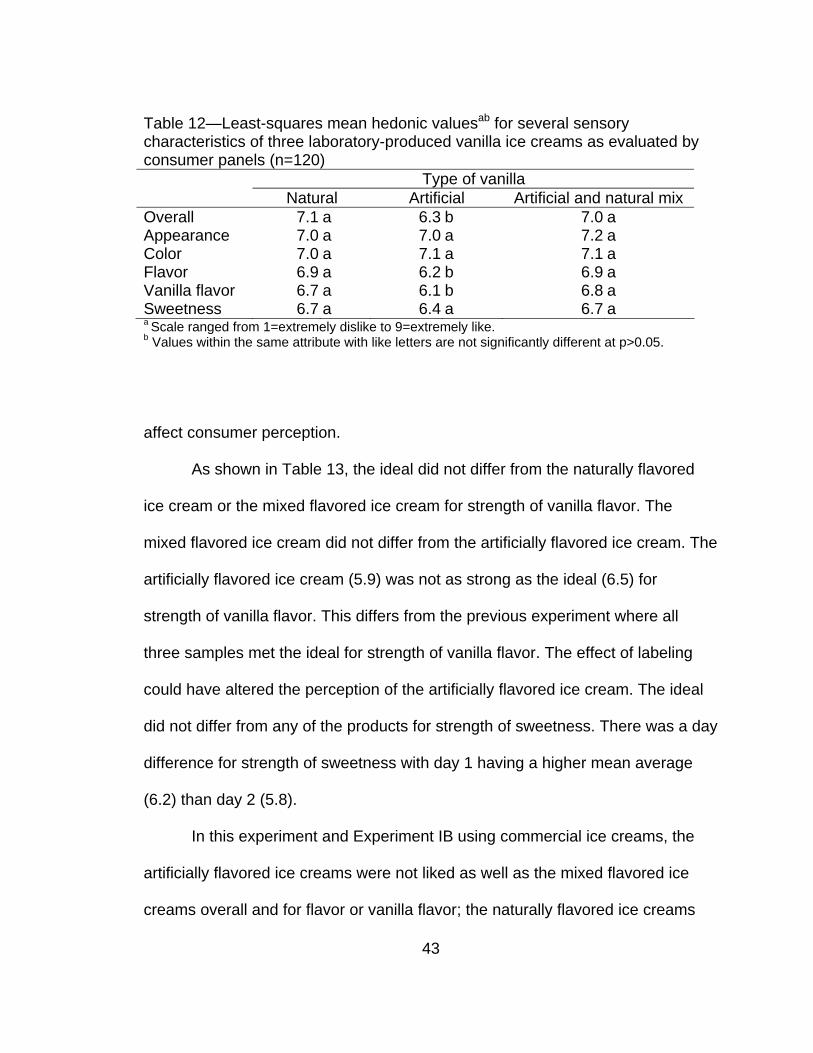
Table 12—Least-squares mean hedonic valuesab for several sensory characteristics of three laboratory-produced vanilla ice creams as evaluated by consumer panels (n=120) Type of vanilla Natural Artificial Artificial and natural mix Overall 7.1 a 6.3 b 7.0 a Appearance 7.0 a 7.0 a 7.2 a Color 7.0 a 7.1 a 7.1 a Flavor 6.9 a 6.2 b 6.9 a Vanilla flavor 6.7 a 6.1 b 6.8 a Sweetness 6.7 a 6.4 a 6.7 a a Scale ranged from 1=extremely dislike to 9=extremely like. b Values within the same attribute with like letters are not significantly different at p>0.05.
affect consumer perception.
As shown in Table 13, the ideal did not differ from the naturally flavored
ice cream or the mixed flavored ice cream for strength of vanilla flavor. The
mixed flavored ice cream did not differ from the artificially flavored ice cream. The
artificially flavored ice cream (5.9) was not as strong as the ideal (6.5) for
strength of vanilla flavor. This differs from the previous experiment where all
three samples met the ideal for strength of vanilla flavor. The effect of labeling
could have altered the perception of the artificially flavored ice cream. The ideal
did not differ from any of the products for strength of sweetness. There was a day
difference for strength of sweetness with day 1 having a higher mean average
(6.2) than day 2 (5.8).
In this experiment and Experiment IB using commercial ice creams, the
artificially flavored ice creams were not liked as well as the mixed flavored ice
creams overall and for flavor or vanilla flavor; the naturally flavored ice creams
43
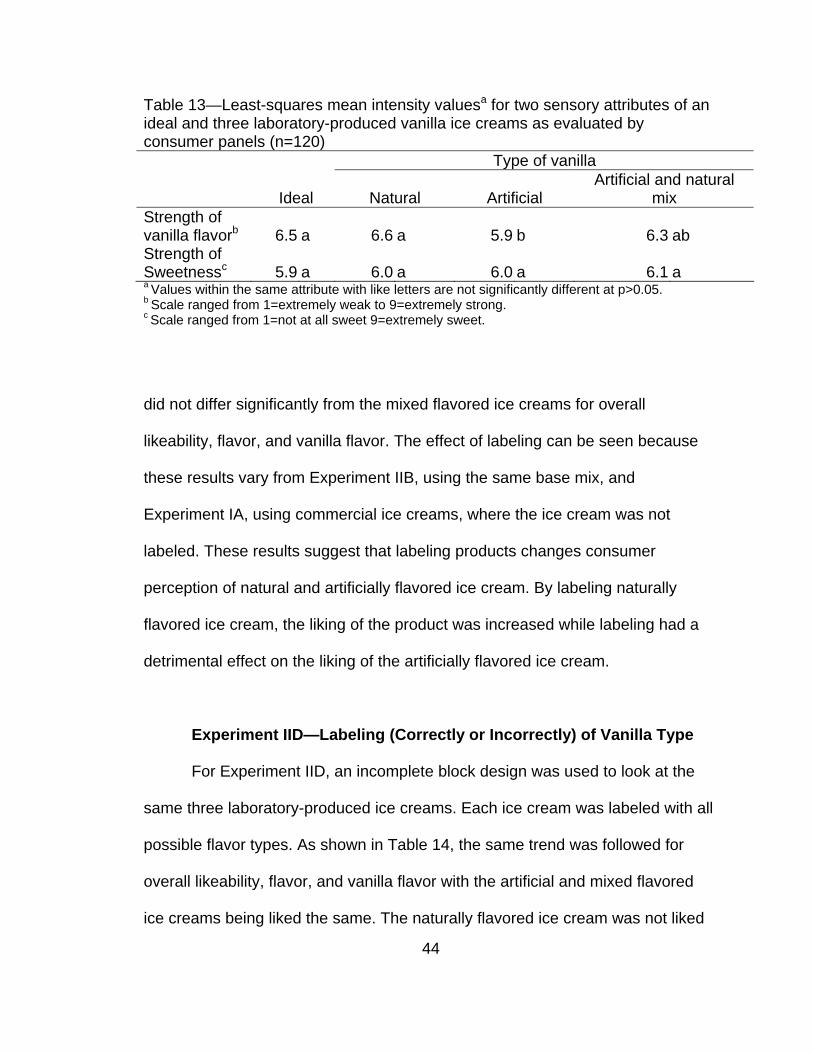
Table 13—Least-squares mean intensity valuesa for two sensory attributes of an ideal and three laboratory-produced vanilla ice creams as evaluated by consumer panels (n=120) Type of vanilla
Ideal
Natural
Artificial Artificial and natural
mix Strength of vanilla flavorb 6.5 a 6.6 a 5.9 b 6.3 ab Strength of Sweetnessc 5.9 a 6.0 a 6.0 a 6.1 a a Values within the same attribute with like letters are not significantly different at p>0.05. b Scale ranged from 1=extremely weak to 9=extremely strong. c Scale ranged from 1=not at all sweet 9=extremely sweet.
did not differ significantly from the mixed flavored ice creams for overall
likeability, flavor, and vanilla flavor. The effect of labeling can be seen because
these results vary from Experiment IIB, using the same base mix, and
Experiment IA, using commercial ice creams, where the ice cream was not
labeled. These results suggest that labeling products changes consumer
perception of natural and artificially flavored ice cream. By labeling naturally
flavored ice cream, the liking of the product was increased while labeling had a
detrimental effect on the liking of the artificially flavored ice cream.
Experiment IID—Labeling (Correctly or Incorrectly) of Vanilla Type
For Experiment IID, an incomplete block design was used to look at the
same three laboratory-produced ice creams. Each ice cream was labeled with all
possible flavor types. As shown in Table 14, the same trend was followed for
overall likeability, flavor, and vanilla flavor with the artificial and mixed flavored
ice creams being liked the same. The naturally flavored ice cream was not liked
44
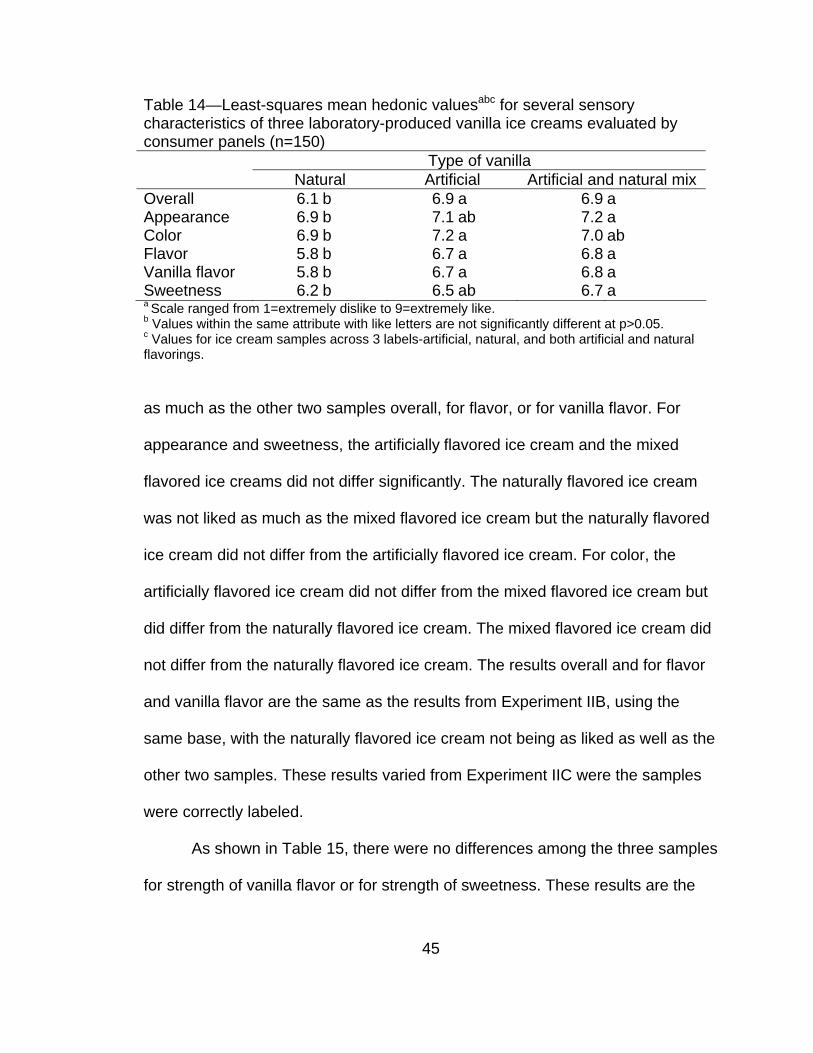
Table 14—Least-squares mean hedonic valuesabc for several sensory characteristics of three laboratory-produced vanilla ice creams evaluated by consumer panels (n=150) Type of vanilla Natural Artificial Artificial and natural mix Overall 6.1 b 6.9 a 6.9 a Appearance 6.9 b 7.1 ab 7.2 a Color 6.9 b 7.2 a 7.0 ab Flavor 5.8 b 6.7 a 6.8 a Vanilla flavor 5.8 b 6.7 a 6.8 a Sweetness 6.2 b 6.5 ab 6.7 a a Scale ranged from 1=extremely dislike to 9=extremely like. b Values within the same attribute with like letters are not significantly different at p>0.05. c Values for ice cream samples across 3 labels-artificial, natural, and both artificial and natural flavorings.
as much as the other two samples overall, for flavor, or for vanilla flavor. For
appearance and sweetness, the artificially flavored ice cream and the mixed
flavored ice creams did not differ significantly. The naturally flavored ice cream
was not liked as much as the mixed flavored ice cream but the naturally flavored
ice cream did not differ from the artificially flavored ice cream. For color, the
artificially flavored ice cream did not differ from the mixed flavored ice cream but
did differ from the naturally flavored ice cream. The mixed flavored ice cream did
not differ from the naturally flavored ice cream. The results overall and for flavor
and vanilla flavor are the same as the results from Experiment IIB, using the
same base, with the naturally flavored ice cream not being as liked as well as the
other two samples. These results varied from Experiment IIC were the samples
were correctly labeled.
As shown in Table 15, there were no differences among the three samples
for strength of vanilla flavor or for strength of sweetness. These results are the
45
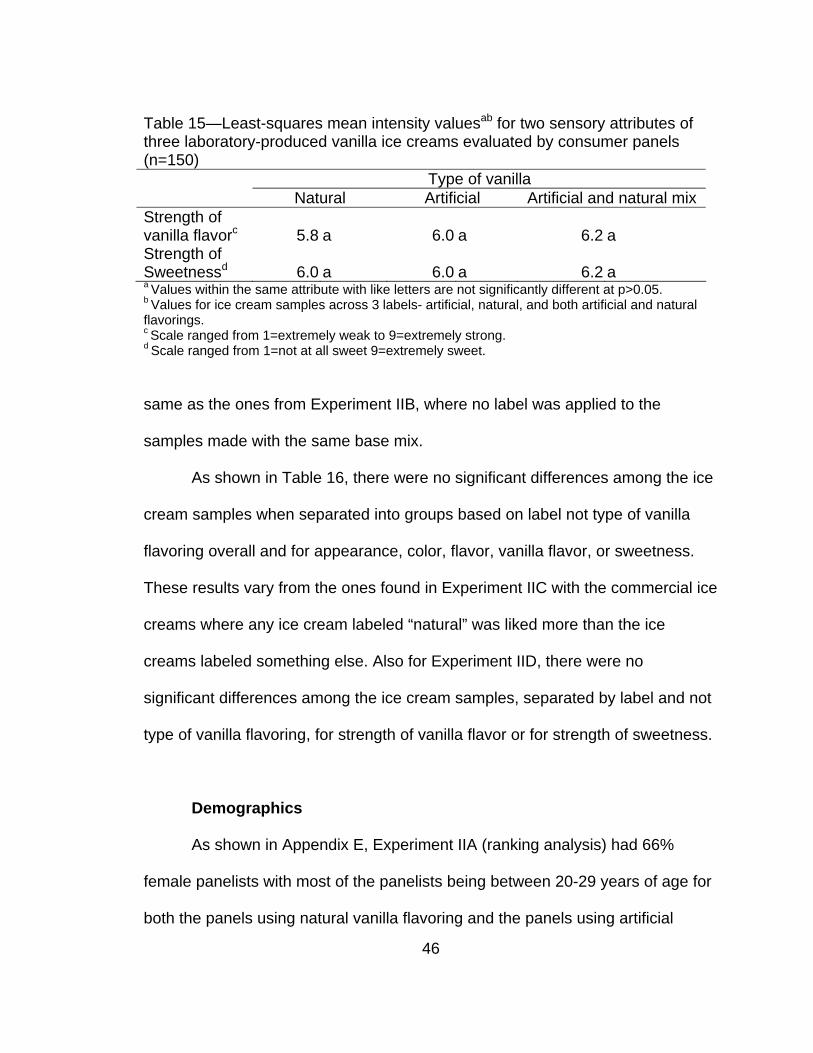
Table 15—Least-squares mean intensity valuesab for two sensory attributes of three laboratory-produced vanilla ice creams evaluated by consumer panels (n=150) Type of vanilla Natural Artificial Artificial and natural mix Strength of vanilla flavorc 5.8 a 6.0 a 6.2 a Strength of Sweetnessd 6.0 a 6.0 a 6.2 a a Values within the same attribute with like letters are not significantly different at p>0.05. b Values for ice cream samples across 3 labels- artificial, natural, and both artificial and natural flavorings. c Scale ranged from 1=extremely weak to 9=extremely strong. d Scale ranged from 1=not at all sweet 9=extremely sweet.
same as the ones from Experiment IIB, where no label was applied to the
samples made with the same base mix.
As shown in Table 16, there were no significant differences among the ice
cream samples when separated into groups based on label not type of vanilla
flavoring overall and for appearance, color, flavor, vanilla flavor, or sweetness.
These results vary from the ones found in Experiment IIC with the commercial ice
creams where any ice cream labeled “natural” was liked more than the ice
creams labeled something else. Also for Experiment IID, there were no
significant differences among the ice cream samples, separated by label and not
type of vanilla flavoring, for strength of vanilla flavor or for strength of sweetness.
Demographics
As shown in Appendix E, Experiment IIA (ranking analysis) had 66%
female panelists with most of the panelists being between 20-29 years of age for
both the panels using natural vanilla flavoring and the panels using artificial
46
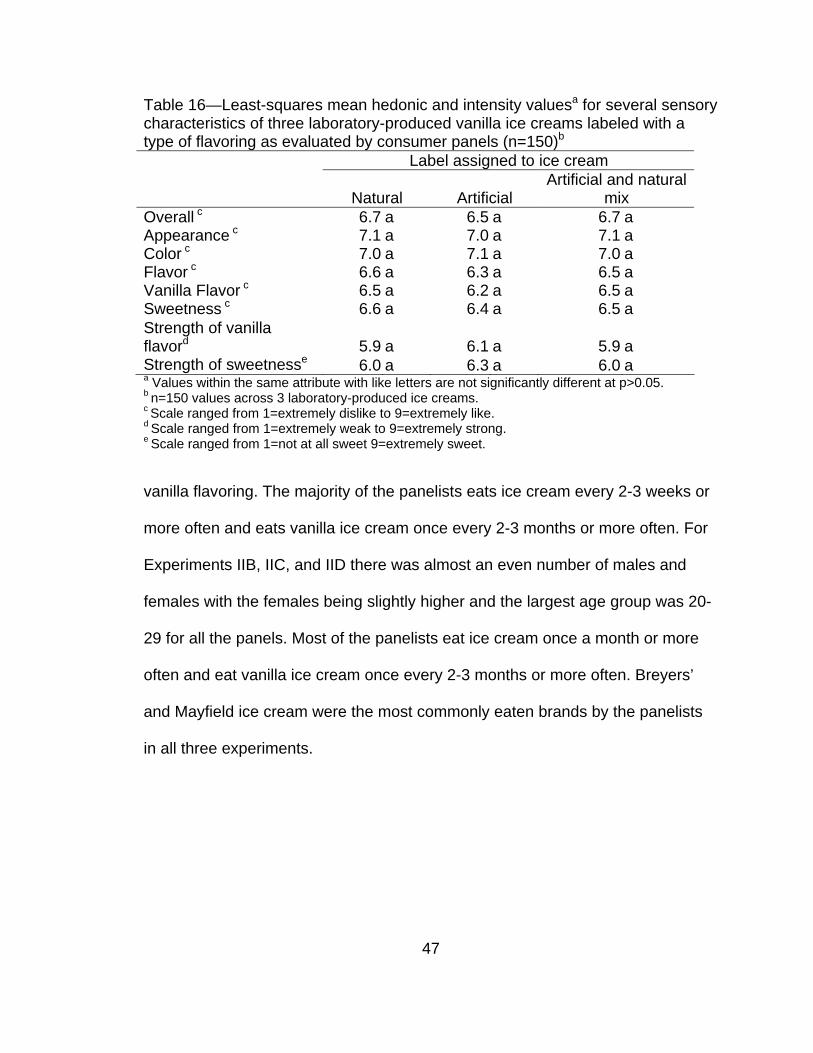
Table 16—Least-squares mean hedonic and intensity valuesa for several sensory characteristics of three laboratory-produced vanilla ice creams labeled with a type of flavoring as evaluated by consumer panels (n=150)b
Label assigned to ice cream
Natural
Artificial Artificial and natural
mix Overall c 6.7 a 6.5 a 6.7 a Appearance c 7.1 a 7.0 a 7.1 a Color c 7.0 a 7.1 a 7.0 a Flavor c 6.6 a 6.3 a 6.5 a Vanilla Flavor c 6.5 a 6.2 a 6.5 a Sweetness c 6.6 a 6.4 a 6.5 a Strength of vanilla flavord 5.9 a 6.1 a 5.9 a Strength of sweetnesse 6.0 a 6.3 a 6.0 a a Values within the same attribute with like letters are not significantly different at p>0.05. b n=150 values across 3 laboratory-produced ice creams. c Scale ranged from 1=extremely dislike to 9=extremely like. d Scale ranged from 1=extremely weak to 9=extremely strong. e Scale ranged from 1=not at all sweet 9=extremely sweet.
vanilla flavoring. The majority of the panelists eats ice cream every 2-3 weeks or
more often and eats vanilla ice cream once every 2-3 months or more often. For
Experiments IIB, IIC, and IID there was almost an even number of males and
females with the females being slightly higher and the largest age group was 20-
29 for all the panels. Most of the panelists eat ice cream once a month or more
often and eat vanilla ice cream once every 2-3 months or more often. Breyers’
and Mayfield ice cream were the most commonly eaten brands by the panelists
in all three experiments.
47
Chapter V
Summary and Conclusions
Based on this study, labeling of the type of vanilla flavoring used in ice
cream does have an effect on consumer perception of ice cream. Like trends
were seen for commercial ice creams and the laboratory-produced ice creams
where no label was applied to the samples and the experiments where an
accurate label was applied. Without any label present on the commercial or
laboratory-produced samples, the naturally flavored ice cream was not liked as
much as the other ice creams; yet, when the ice cream was labeled, the naturally
flavored ice cream was liked as well as or better overall than the other samples.
The only difference among the laboratory-produced ice cream samples was the
type of vanilla flavoring used in the samples so it is possible the vanilla flavoring
was not as masked by other possible ingredients like the commercial ice creams
that were made with a variety of ingredients. The laboratory-produced ice creams
used more vanilla flavoring than was recommended by the manufacturer. The
panelists could have been able to tell differences among the samples because
the vanilla was very strong. It is possible this occurred because the laboratory-
produced ice cream had a higher percentage of fat than the several of the
commercial ice creams. Also, the commercial ice creams varied in the
ingredients used while the laboratory-produced ice creams had the same base
mix with the only alteration being the type of vanilla used in the samples. As King
(1994) showed, the base is an important part of ice cream that affects the overall
48
flavor of the product. These results have indicated that the vanilla also can play a
role in the flavor of ice cream.
While accurate labeling can alter consumer perception of the ice cream,
labeling (correctly and incorrectly) just created confusion for panelists and no
differences were found among the commercial samples for hedonic scores of
overall, flavor, vanilla flavor, and sweetness. For the laboratory-produced ice
creams with correct and incorrect labels, it is possible that the consumers
ignored the label or the label did not affect their liking decisions. For overall
likeability, flavor, and vanilla flavor, the results of correct and incorrect labeling
were the same as the ones found with no labeling on the samples—the naturally
flavored ice cream was liked the least of the three samples.
While there were no differences in the commercial samples across
correctly and incorrectly labeled samples, there were differences among the ice
creams when separated by label instead of type of vanilla flavoring. Any sample
labeled “natural” was liked more than the other samples overall and for vanilla
flavor. The samples labeled “natural” also had a more intense perceived strength
of vanilla flavor than the other samples. For the commercial ice creams, the word
“natural” on the sample, despite the actual flavoring used, apparently biased
consumer’s perception of the product. For the laboratory-produced ice creams,
no differences were found among the ice cream samples for any attribute when
they were divided into groups based on label instead of type of vanilla flavoring;
however, differences were found among the laboratory-produced ice cream no
matter what label was applied. The naturally flavored ice cream was not liked as
49
well as the other two samples. One explanation could have been that the
consumers did not believe the labels placed on the ice cream based on their
previous knowledge and experience; therefore, the hedonic scores were based
totally on the liking of the vanilla flavor and the label placed on the samples did
not affect the decision. The varying ingredients found in the commercial ice
cream sample can affect the overall taste of the sample plus the strength of the
vanilla was not as strong as consumers wanted so the label on the commercial
samples could have been more believable since it was hard to distinguish among
the types of vanilla flavoring. This would have led to the differences found among
the commercial ice creams when separated by label instead of type of vanilla
flavoring.
In general, for both the commercial and laboratory-made ice creams when
no label or only accurate labels were presented, the artificial and natural mixed
flavored ice creams were liked the best or just as well as any other sample.
Accordingly, it would seem that manufacturers of ice cream would prefer to use a
mixture of vanilla flavors in order to achieve the highest likeability of flavor plus
avoid certain pitfalls such as the extremely high cost of natural vanilla or the
“fake” flavor of artificial vanillas. Yet, manufacturers using only natural vanilla in
their product may promote it as just including natural flavorings, which is a
popular marketing technique to convince consumers to buy the product since
many people are looking for all-natural products. Alternatively, manufacturers
using just artificially flavored products can produce and sell a cheaper product
since the artificial vanilla does not cost as much as natural vanilla. Natural vanilla
50
is dependent on the conditions where the plant is grown as well as the handling
and processing of the beans to determine quality. Artificial vanilla can have more
consistent quality control since it is chemically produced.
While the mixed flavored ice creams were liked the best in general, in this
study it was found that labeling does affect consumer perception of natural and
artificial flavorings both in commercial ice creams and laboratory-made ice
creams. It is up to the manufacture to decide if the advantages of one type of
flavoring outweigh the disadvantages. Should the price of natural vanilla continue
to rise and/or manufacturers no longer find it cost effective, further research may
be needed in the market place to determine if it is the label, the taste likeability,
the price, or other factor that affects consumer purchasing of vanilla ice cream.
51

List of References
52
List of References
Abd El-Rahman AM, Shalabi SI, Hollender R, Kilara A. 1997. Effect of milk fat fractions on the sensory evaluation of frozen desserts. J Dairy Sci 80: 1936-1940. Agricultural Statistics Board, NASS, and USDA. 2001. Dairy Products 2000 Summary. <http:www.usda.gov/nass/pubs/estindx.htm> (October 21, 2001). Andreasen TG, Nielsen H. 1998. Ice cream and aerated desserts. In: Early R, editor. Technology of dairy products. 2nd ed. London: Blackie Academic and Professional. p 301-324. Anonymous. 1999. Cream of the crop. Consumer Reports 64(7): 18-21. Anonymous 2000. History of ice cream. International Dairy Foods Association. <http://www.idfa.org/facts/icecrea/histroy/htm> (Dec. 17, 2001). Anonymous 2001. Ice cream consumption. Long Branch, NJ: MakeIceCream.com. <http://www.makeicecream.com.contriv.html> (Jan. 10, 2002). Baer RJ, Wolkow MD, Kasperson KM. 1997. Effect of emulsifiers on the body and texture of low fat ice cream. J Dairy Sci 80: 3123-3132. Basker D. 1988. Critical values of differences among rank sums for multiple comparisons. Food Technol 42(2): 79-84. Biosystemes. 2002. FIZZ software solutions for sensory analysis and consumer tests version 2. Couteron, France. Bower JA and Turner L. 2001. Effect of liking, brand name and price on purchase intention for branded own label and economy line crisp snack foods. J Sensory Studies 16: 95-115. Breyers. 2002. Naturally good. Green Bay, WI: Good Humor-Breyers. <http://www.breyers.com/breyers/default/asp> (May 23, 2003). Chandan R. 1997. Dairy-base ingredients. St. Paul, MN: Eagan Press. 137p. FDA. 2001a. Frozen desserts. In: Food and Drug Administration. Code of Federal Regulations. Title 21 Ch 1 Part 135.110. <http://www.access.gpo.gov/nara/cfr/waisidx_01/21cfr135_01.html> (Dec 11, 2002).
53
FDA. 2001b. Food dressings and flavorings. In: Food and Drug Administration. Code of Federal Regulations. Title 21 Ch 1 Part 169.175. <http://www.access.gpo.gov/nara/cfr/waisidx_01/21cfr169_01.html> (Dec 11, 2002). Goff D. 2000. Finding science in ice cream. U Guelph. <http://www.cpes.uoguelph.ca/STAO/icecream.html> (Jan. 8, 2002). Guinard JX, Zoumas-Morse C, Mori L, Panyam D, Kilara A. 1996. Effect of sugar and fat on the acceptability of vanilla ice cream. J Dairy Sci 79: 1922-1927. Guinard JX, Zoumas-Morse C, Mori L, Uatoni B, Panyam D, Kilara A. 1997. Sugar and fat effects on sensory properties of ice cream. J Food Sci 62: 1087-1094. Heath HB. 1978. Vanilla. In: Flavor technology: profiles, products, applications. Westport, CT:AVI Publishing. p198-207. Hollingworth P. 1999. Self-indulgence trends. Food Technol 53(7): 64-67. Hollingsworth P. 2000. Marketing trends fueling healthful foods success. Food Technol 54(10): 53-59. Hollingsworth P. 2003a. Frozen desserts: formulating, manufacturing, and marketing. Food Technol 57(5): 26-30. Hollingsworth P. 2003b. Organic foods back in the spotlight. Food Technol 57(5): 16. Ianzito C. 2001. It’s only natural. Kiplinger’s Personal Finance. Washington. May: 116-119. IFT. 1990. Organically grown foods. Food Technol 44(12): 123-130. Jacoby J, Chestnut RW, Silberman W. 1977. Consumer use and comprehension of nutrition information. J Consumer Research 4: 119-128. Jagerdeo and others. 2000. Liquid chromatographic determination of vanillin and related aromatic compounds. J Assoc Anal Chem Intl 83: 237-239. King B. 1994. Sensory profiling of vanilla ice cream: flavour and base interactions. Food Sci Technol 27(5): 450-456. Li Z, Marshall R, Heymann J, Fernando L. 1997. Effect of milk fat content on flavor perception of vanilla ice cream. J Dairy Sci 80: 3133-3141.
54
Light A, Heymann H, Holt DL. 1992. Hedonic responses to dairy products: effects of fat levels, label information, and risk perception. Food Technol 46(7): 54-57. Marshall RT and Arbuckle WS. 1996. Ice cream. 5th ed. New York: Chapman and Hall. 349p. McCormick.R. 1988. Vanilla and vanillin remain ever-versatile ingredients. Prepared Foods 157(2): 123-124. Miller-Livney T, Hartel RW. 1997. Ice recrystallization in ice cream: interactions between sweeteners and stabilizers. J Dairy Sci 80: 447-456. Ohmes RL, Marshall RT, Heymann H. 1998. Sensory and physical properties of ice creams containing milk fat or fat replacers. J Dairy Sci 81: 1222-1228. Pollan M. 2001. Naturally. The New York Times Magazine May 13. Reineccius G, editor. 1994. Source book of flavors. 2nd ed. Gaithersburg, MD: Chapman & Hall. 914p. Rice J. 1995. Suited for success: playing the label game. Food Processing 56(4): 47-53. Riley KA and Kleyn DH. 1989. Fundamental principles of vanilla/vanilla extract processing and methods of detecting adulteration in vanilla extracts. Food Tech 43(10): 64-77. SAS Institute, Inc. 2001. Sas/Stat Software. The SAS system for Window release 8.02. Cary, NC: SAS Institute, Inc. Sloan E. 2002. The natural & organic foods marketplace. Food Technol 56(1): 27-37. Szczesniak A, Loew BJ, Skinner EZ. 1975. Consumer texture profile technique. J Food Sci 40: 1253-1256. Thompson B. 2002. Personal communication. Rochester, NY: Vanlab Corporation. (Jan. 3, 2002). Walstra P, Geurts TJ, Noomen A, Jellema, van Boekel MAJS. 1999. Ice cream. In: Dairy technology. New York:Marcel Dekker, Inc. p 416-423. Wansink B and Park S.-B. 2002. Sensory suggestiveness and labeling: Do soy labels bias taste? J Sensory Studies 17: 483-491.
55
Webster TM. 1995. New perspectives on vanilla. Cereal Foods World 40: 198-200. Zaborsky V. 2001. Eating it up-ice cream sales and usage trends. International Dairy Foods Association. <http://www.ifda.org/facts/icmonth/page2.htm> (Dec 17, 2001).
56

Appendices
57
58
Appendix A
Ingredient Lists and Information from Nutrition Labels of Commercial Ice Creams and Prepackaged Base Mix
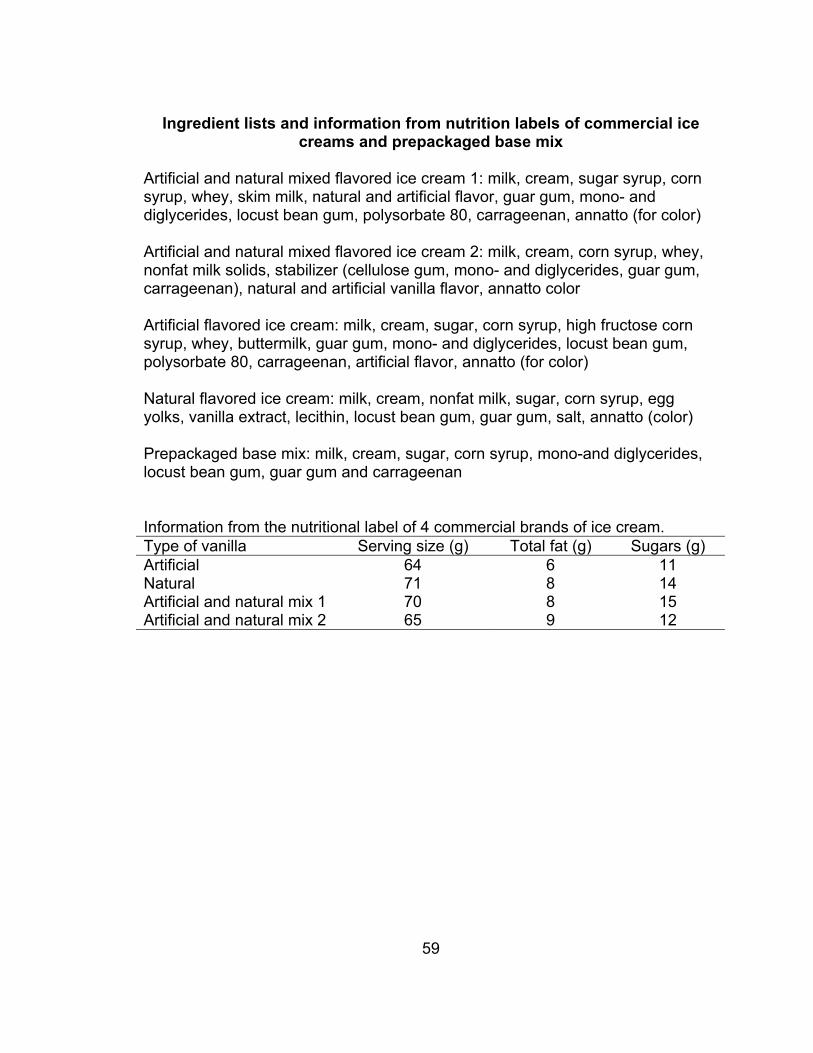
59
Ingredient lists and information from nutrition labels of commercial ice
creams and prepackaged base mix Artificial and natural mixed flavored ice cream 1: milk, cream, sugar syrup, corn syrup, whey, skim milk, natural and artificial flavor, guar gum, mono- and diglycerides, locust bean gum, polysorbate 80, carrageenan, annatto (for color) Artificial and natural mixed flavored ice cream 2: milk, cream, corn syrup, whey, nonfat milk solids, stabilizer (cellulose gum, mono- and diglycerides, guar gum, carrageenan), natural and artificial vanilla flavor, annatto color Artificial flavored ice cream: milk, cream, sugar, corn syrup, high fructose corn syrup, whey, buttermilk, guar gum, mono- and diglycerides, locust bean gum, polysorbate 80, carrageenan, artificial flavor, annatto (for color) Natural flavored ice cream: milk, cream, nonfat milk, sugar, corn syrup, egg yolks, vanilla extract, lecithin, locust bean gum, guar gum, salt, annatto (color) Prepackaged base mix: milk, cream, sugar, corn syrup, mono-and diglycerides, locust bean gum, guar gum and carrageenan Information from the nutritional label of 4 commercial brands of ice cream. Type of vanilla Serving size (g) Total fat (g) Sugars (g) Artificial 64 6 11 Natural 71 8 14 Artificial and natural mix 1 70 8 15 Artificial and natural mix 2 65 9 12
Appendix B
Sample Scorecards for Experiments IA, IB, and IC
60
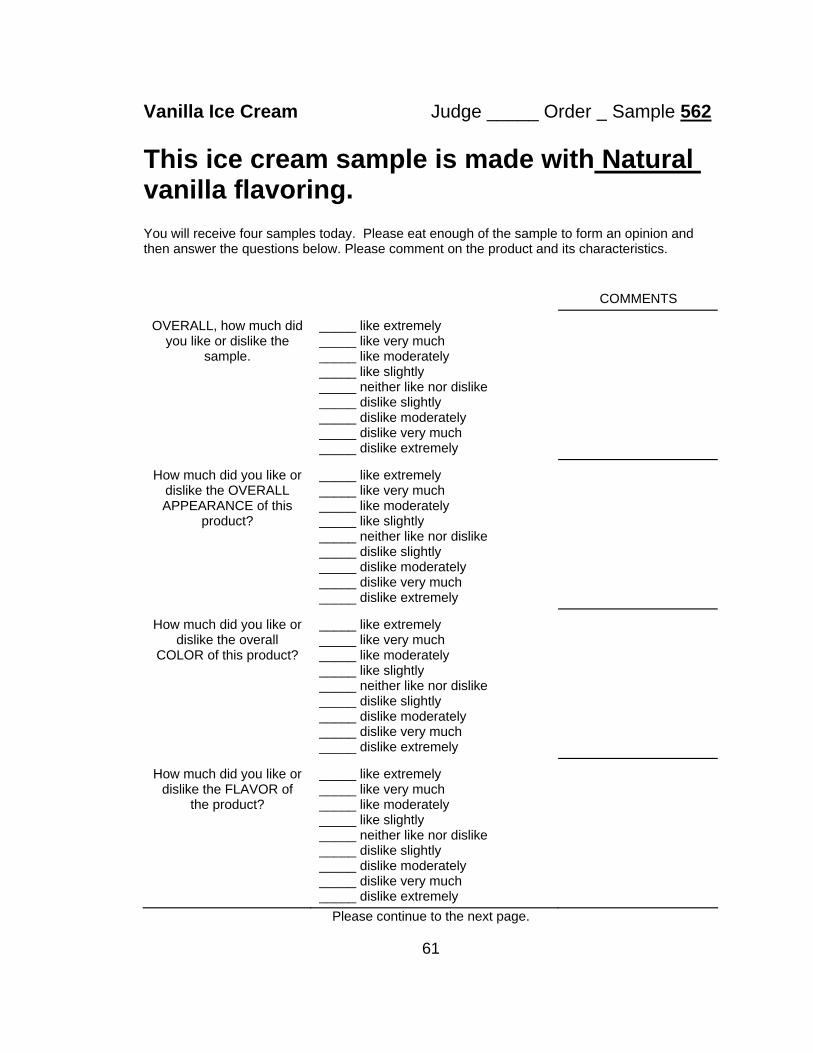
Vanilla Ice Cream Judge _____ Order Sample 562 This ice cream sample is made with Natural vanilla flavoring. You will receive four samples today. Please eat enough of the sample to form an opinion and then answer the questions below. Please comment on the product and its characteristics.
COMMENTS
OVERALL, how much did you like or dislike the
sample.
_____ like extremely _____ like very much _____ like moderately _____ like slightly _____ neither like nor dislike _____ dislike slightly _____ dislike moderately _____ dislike very much _____ dislike extremely
How much did you like or dislike the OVERALL APPEARANCE of this
product?
_____ like extremely _____ like very much _____ like moderately _____ like slightly _____ neither like nor dislike _____ dislike slightly _____ dislike moderately _____ dislike very much _____ dislike extremely
How much did you like or dislike the overall
COLOR of this product?
_____ like extremely _____ like very much _____ like moderately _____ like slightly _____ neither like nor dislike _____ dislike slightly _____ dislike moderately _____ dislike very much _____ dislike extremely
How much did you like or dislike the FLAVOR of
the product?
_____ like extremely _____ like very much _____ like moderately _____ like slightly _____ neither like nor dislike _____ dislike slightly _____ dislike moderately _____ dislike very much _____ dislike extremely
Please continue to the next page.
61
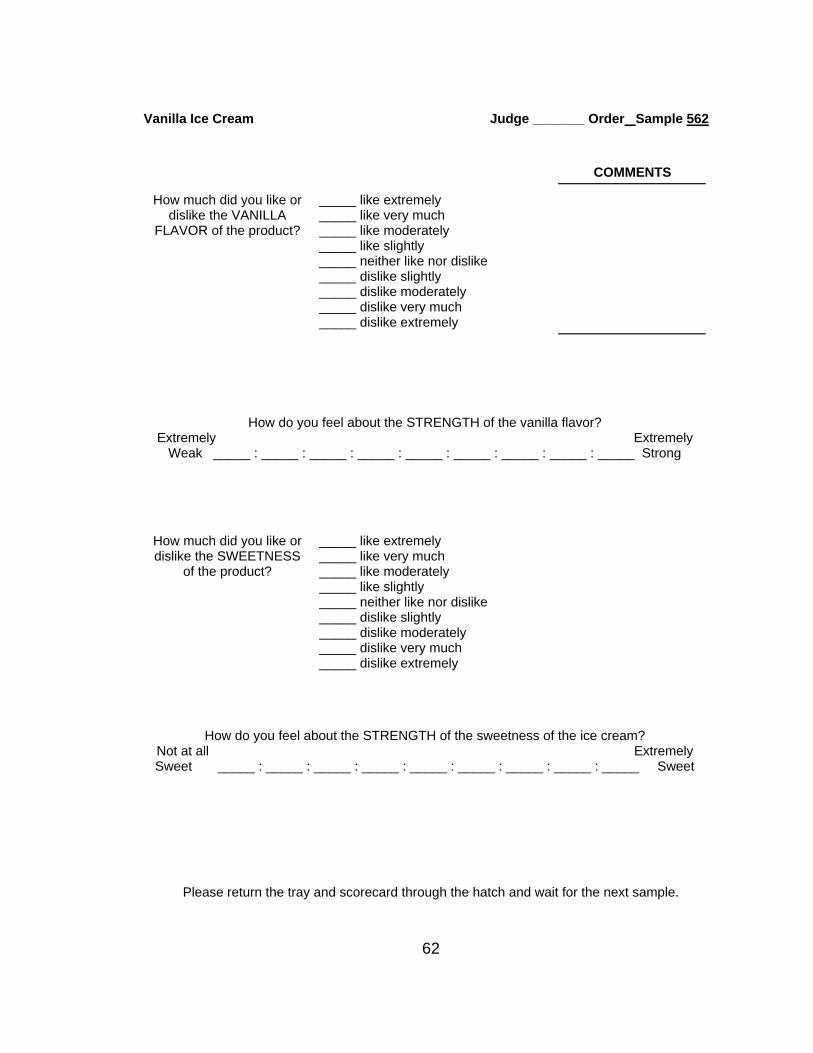
Vanilla Ice Cream Judge _______ Order Sample 562
COMMENTS
How much did you like or dislike the VANILLA
FLAVOR of the product?
_____ like extremely _____ like very much _____ like moderately _____ like slightly _____ neither like nor dislike _____ dislike slightly _____ dislike moderately _____ dislike very much _____ dislike extremely
How do you feel about the STRENGTH of the vanilla flavor? Extremely Extremely
Weak _____ : _____ : _____ : _____ : _____ : _____ : _____ : _____ : _____ Strong
How much did you like or dislike the SWEETNESS
of the product?
_____ like extremely _____ like very much _____ like moderately _____ like slightly _____ neither like nor dislike _____ dislike slightly _____ dislike moderately _____ dislike very much _____ dislike extremely
How do you feel about the STRENGTH of the sweetness of the ice cream? Not at all Extremely Sweet _____ : _____ : _____ : _____ : _____ : _____ : _____ : _____ : _____ Sweet
Please return the tray and scorecard through the hatch and wait for the next sample.
62
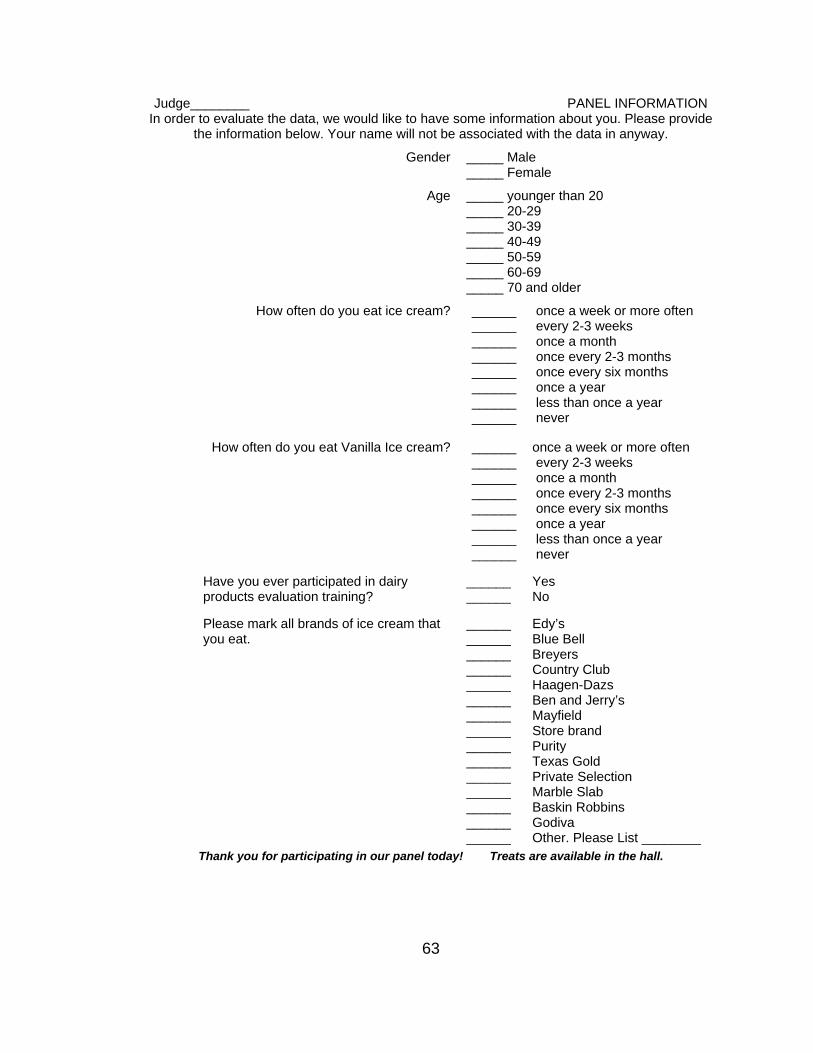
Judge________ PANEL INFORMATION In order to evaluate the data, we would like to have some information about you. Please provide
the information below. Your name will not be associated with the data in anyway. Gender _____ Male
_____ Female
Age _____ younger than 20 _____ 20-29 _____ 30-39 _____ 40-49 _____ 50-59 _____ 60-69 _____ 70 and older
How often do you eat ice cream? ______ ______ ______ ______ ______ ______ ______ ______
once a week or more often every 2-3 weeks once a month once every 2-3 months once every six months once a year less than once a year never
How often do you eat Vanilla Ice cream? ______ ______ ______ ______ ______ ______ ______ ______
once a week or more often every 2-3 weeks once a month once every 2-3 months once every six months once a year less than once a year never
Have you ever participated in dairy products evaluation training?
______ ______
Yes No
Please mark all brands of ice cream that you eat.
______ ______ ______ ______ ______ ______ ______ ______ ______ ______ ______ ______ ______ ______ ______
Edy’s Blue Bell Breyers Country Club Haagen-Dazs Ben and Jerry’s Mayfield Store brand Purity Texas Gold Private Selection Marble Slab Baskin Robbins Godiva Other. Please List ________
Thank you for participating in our panel today! Treats are available in the hall.
63
Appendix C SAS Programs for Analysis of Data
64
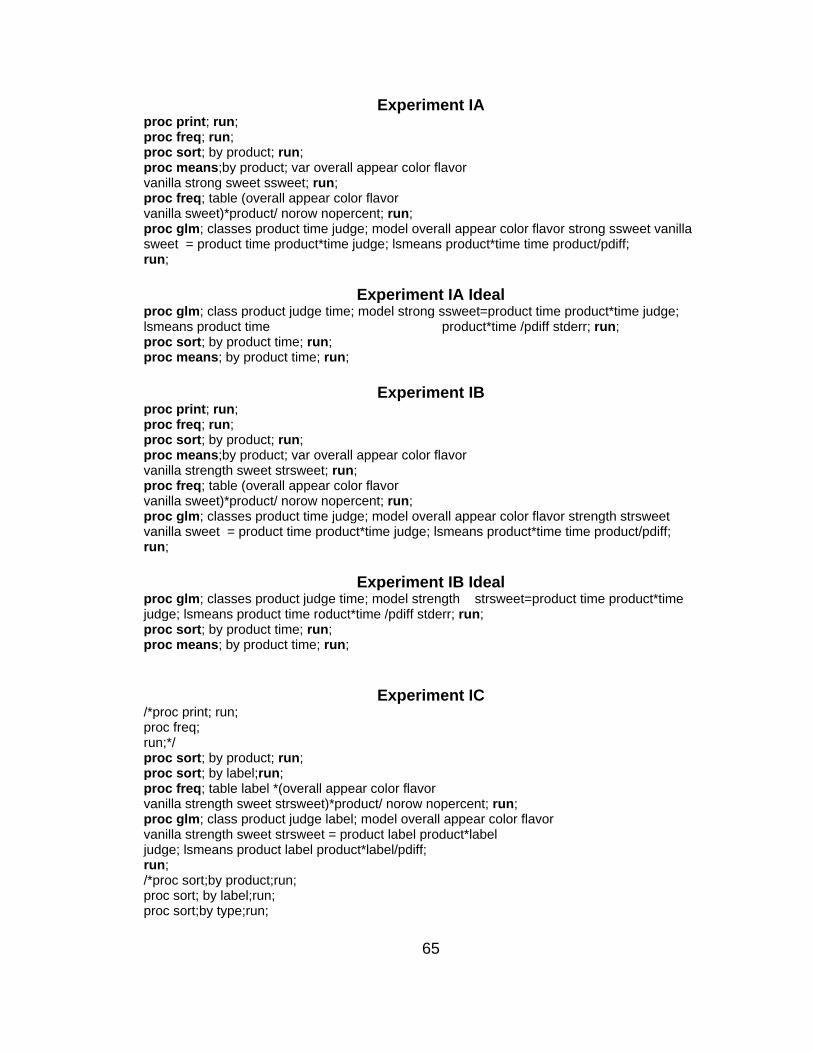
Experiment IA proc print; run; proc freq; run; proc sort; by product; run; proc means;by product; var overall appear color flavor vanilla strong sweet ssweet; run; proc freq; table (overall appear color flavor vanilla sweet)*product/ norow nopercent; run; proc glm; classes product time judge; model overall appear color flavor strong ssweet vanilla sweet = product time product*time judge; lsmeans product*time time product/pdiff; run;
Experiment IA Ideal proc glm; class product judge time; model strong ssweet=product time product*time judge; lsmeans product time product*time /pdiff stderr; run; proc sort; by product time; run; proc means; by product time; run;
Experiment IB proc print; run; proc freq; run; proc sort; by product; run; proc means;by product; var overall appear color flavor vanilla strength sweet strsweet; run; proc freq; table (overall appear color flavor vanilla sweet)*product/ norow nopercent; run; proc glm; classes product time judge; model overall appear color flavor strength strsweet vanilla sweet = product time product*time judge; lsmeans product*time time product/pdiff; run;
Experiment IB Ideal proc glm; classes product judge time; model strength strsweet=product time product*time judge; lsmeans product time roduct*time /pdiff stderr; run; proc sort; by product time; run; proc means; by product time; run;
Experiment IC /*proc print; run; proc freq; run;*/ proc sort; by product; run; proc sort; by label;run; proc freq; table label *(overall appear color flavor vanilla strength sweet strsweet)*product/ norow nopercent; run; proc glm; class product judge label; model overall appear color flavor vanilla strength sweet strsweet = product label product*label judge; lsmeans product label product*label/pdiff; run; /*proc sort;by product;run; proc sort; by label;run; proc sort;by type;run;
65
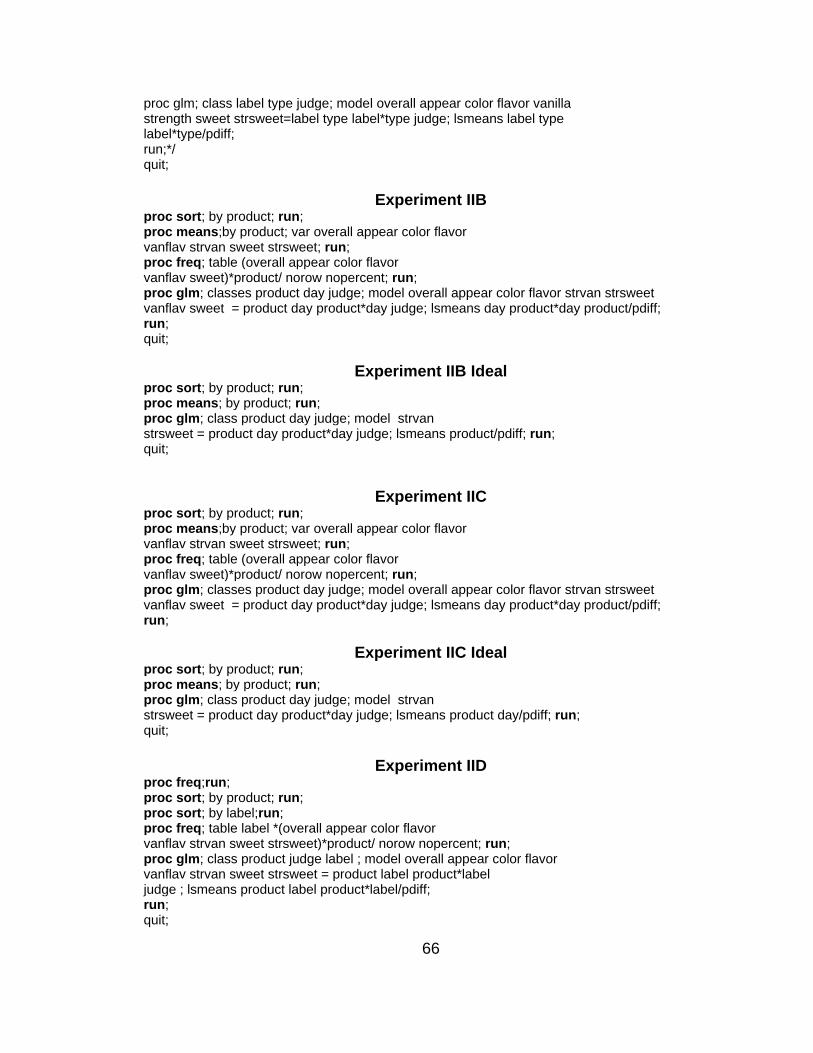
proc glm; class label type judge; model overall appear color flavor vanilla strength sweet strsweet=label type label*type judge; lsmeans label type label*type/pdiff; run;*/ quit;
Experiment IIB proc sort; by product; run; proc means;by product; var overall appear color flavor vanflav strvan sweet strsweet; run; proc freq; table (overall appear color flavor vanflav sweet)*product/ norow nopercent; run; proc glm; classes product day judge; model overall appear color flavor strvan strsweet vanflav sweet = product day product*day judge; lsmeans day product*day product/pdiff; run; quit;
Experiment IIB Ideal proc sort; by product; run; proc means; by product; run; proc glm; class product day judge; model strvan strsweet = product day product*day judge; lsmeans product/pdiff; run; quit;
Experiment IIC proc sort; by product; run; proc means;by product; var overall appear color flavor vanflav strvan sweet strsweet; run; proc freq; table (overall appear color flavor vanflav sweet)*product/ norow nopercent; run; proc glm; classes product day judge; model overall appear color flavor strvan strsweet vanflav sweet = product day product*day judge; lsmeans day product*day product/pdiff; run;
Experiment IIC Ideal proc sort; by product; run; proc means; by product; run; proc glm; class product day judge; model strvan strsweet = product day product*day judge; lsmeans product day/pdiff; run; quit;
Experiment IID proc freq;run; proc sort; by product; run; proc sort; by label;run; proc freq; table label *(overall appear color flavor vanflav strvan sweet strsweet)*product/ norow nopercent; run; proc glm; class product judge label ; model overall appear color flavor vanflav strvan sweet strsweet = product label product*label judge ; lsmeans product label product*label/pdiff; run; quit;
66

Appendix D ANOVA Tables
67
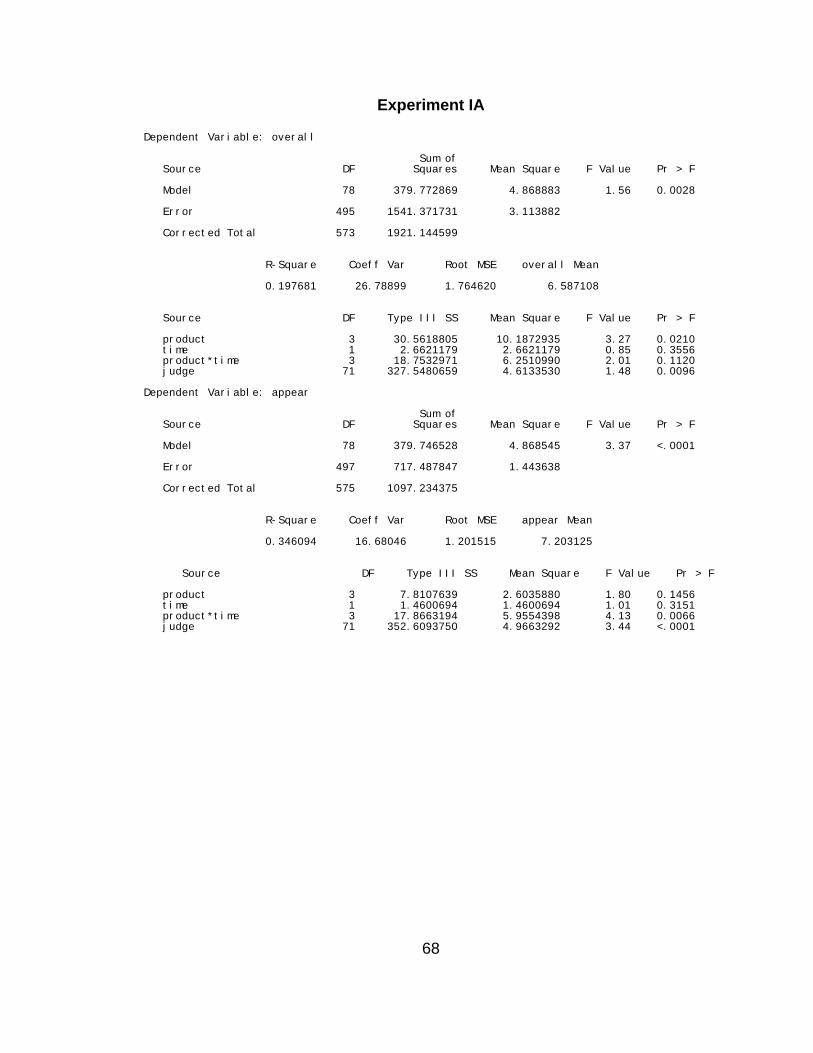
Experiment IA Dependent Variable: overall Sum of Source DF Squares Mean Square F Value Pr > F Model 78 379.772869 4.868883 1.56 0.0028 Error 495 1541.371731 3.113882 Corrected Total 573 1921.144599 R-Square Coeff Var Root MSE overall Mean 0.197681 26.78899 1.764620 6.587108 Source DF Type III SS Mean Square F Value Pr > F product 3 30.5618805 10.1872935 3.27 0.0210 time 1 2.6621179 2.6621179 0.85 0.3556 product*time 3 18.7532971 6.2510990 2.01 0.1120 judge 71 327.5480659 4.6133530 1.48 0.0096 Dependent Variable: appear Sum of Source DF Squares Mean Square F Value Pr > F Model 78 379.746528 4.868545 3.37 <.0001 Error 497 717.487847 1.443638 Corrected Total 575 1097.234375 R-Square Coeff Var Root MSE appear Mean 0.346094 16.68046 1.201515 7.203125 Source DF Type III SS Mean Square F Value Pr > F product 3 7.8107639 2.6035880 1.80 0.1456 time 1 1.4600694 1.4600694 1.01 0.3151 product*time 3 17.8663194 5.9554398 4.13 0.0066 judge 71 352.6093750 4.9663292 3.44 <.0001
68
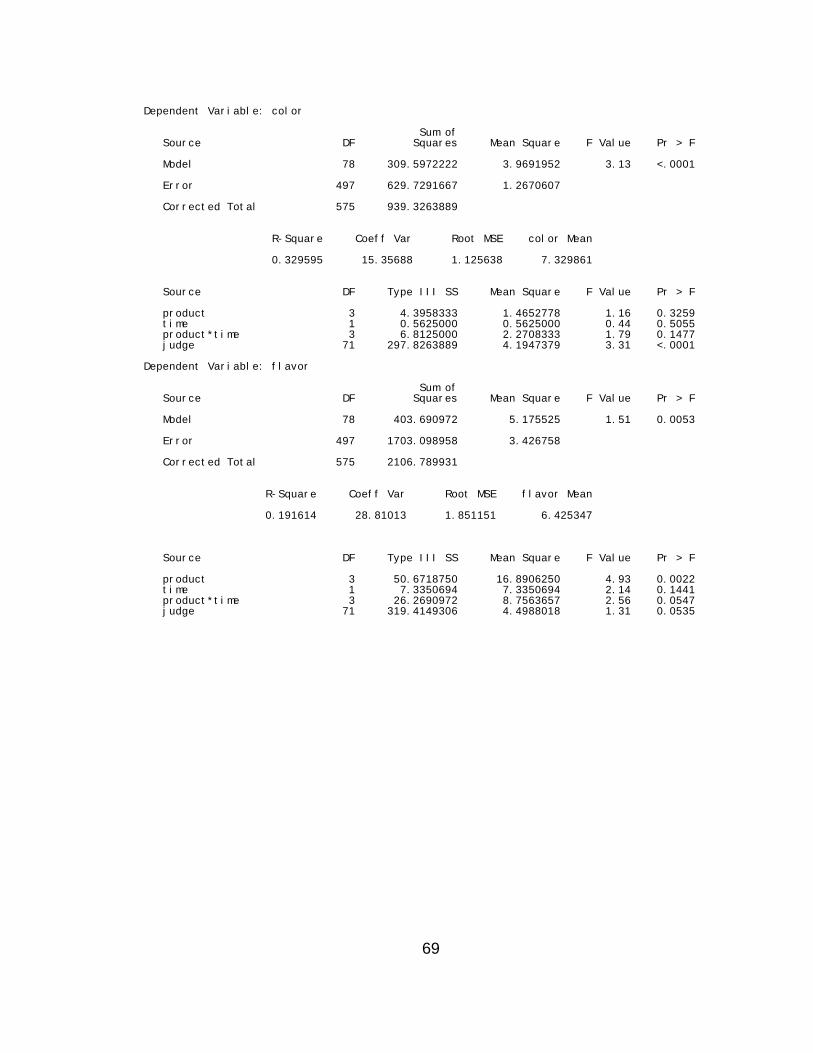
Dependent Variable: color Sum of Source DF Squares Mean Square F Value Pr > F Model 78 309.5972222 3.9691952 3.13 <.0001 Error 497 629.7291667 1.2670607 Corrected Total 575 939.3263889 R-Square Coeff Var Root MSE color Mean 0.329595 15.35688 1.125638 7.329861 Source DF Type III SS Mean Square F Value Pr > F product 3 4.3958333 1.4652778 1.16 0.3259 time 1 0.5625000 0.5625000 0.44 0.5055 product*time 3 6.8125000 2.2708333 1.79 0.1477 judge 71 297.8263889 4.1947379 3.31 <.0001 Dependent Variable: flavor Sum of Source DF Squares Mean Square F Value Pr > F Model 78 403.690972 5.175525 1.51 0.0053 Error 497 1703.098958 3.426758 Corrected Total 575 2106.789931 R-Square Coeff Var Root MSE flavor Mean 0.191614 28.81013 1.851151 6.425347 Source DF Type III SS Mean Square F Value Pr > F product 3 50.6718750 16.8906250 4.93 0.0022 time 1 7.3350694 7.3350694 2.14 0.1441 product*time 3 26.2690972 8.7563657 2.56 0.0547 judge 71 319.4149306 4.4988018 1.31 0.0535
69
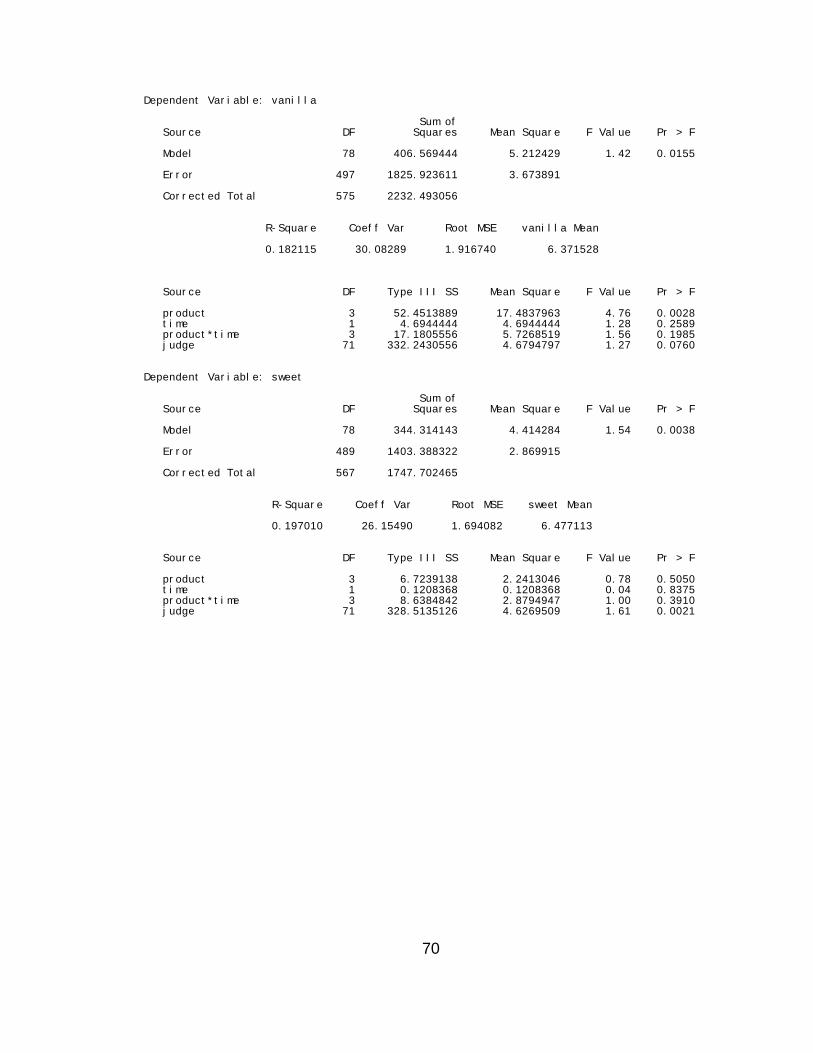
Dependent Variable: vanilla Sum of Source DF Squares Mean Square F Value Pr > F Model 78 406.569444 5.212429 1.42 0.0155 Error 497 1825.923611 3.673891 Corrected Total 575 2232.493056 R-Square Coeff Var Root MSE vanilla Mean 0.182115 30.08289 1.916740 6.371528 Source DF Type III SS Mean Square F Value Pr > F product 3 52.4513889 17.4837963 4.76 0.0028 time 1 4.6944444 4.6944444 1.28 0.2589 product*time 3 17.1805556 5.7268519 1.56 0.1985 judge 71 332.2430556 4.6794797 1.27 0.0760 Dependent Variable: sweet Sum of Source DF Squares Mean Square F Value Pr > F Model 78 344.314143 4.414284 1.54 0.0038 Error 489 1403.388322 2.869915 Corrected Total 567 1747.702465 R-Square Coeff Var Root MSE sweet Mean 0.197010 26.15490 1.694082 6.477113 Source DF Type III SS Mean Square F Value Pr > F product 3 6.7239138 2.2413046 0.78 0.5050 time 1 0.1208368 0.1208368 0.04 0.8375 product*time 3 8.6384842 2.8794947 1.00 0.3910 judge 71 328.5135126 4.6269509 1.61 0.0021
70
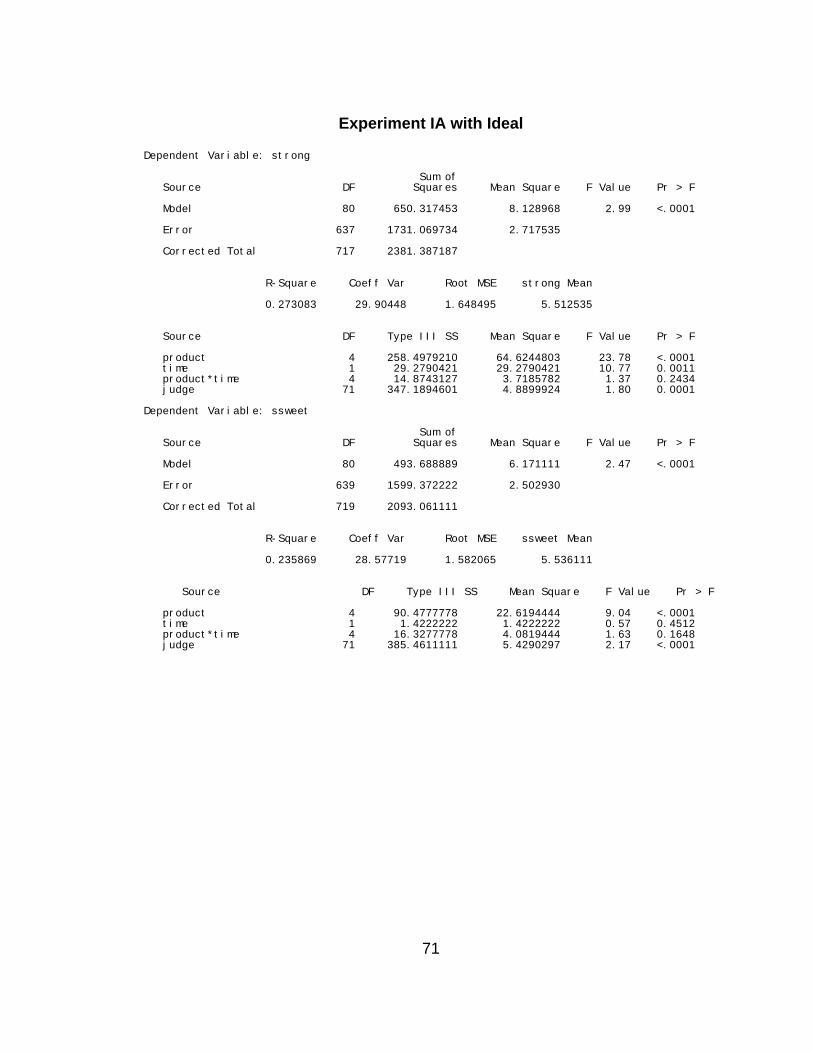
Experiment IA with Ideal
Dependent Variable: strong Sum of Source DF Squares Mean Square F Value Pr > F Model 80 650.317453 8.128968 2.99 <.0001 Error 637 1731.069734 2.717535 Corrected Total 717 2381.387187 R-Square Coeff Var Root MSE strong Mean 0.273083 29.90448 1.648495 5.512535 Source DF Type III SS Mean Square F Value Pr > F product 4 258.4979210 64.6244803 23.78 <.0001 time 1 29.2790421 29.2790421 10.77 0.0011 product*time 4 14.8743127 3.7185782 1.37 0.2434 judge 71 347.1894601 4.8899924 1.80 0.0001 Dependent Variable: ssweet Sum of Source DF Squares Mean Square F Value Pr > F Model 80 493.688889 6.171111 2.47 <.0001 Error 639 1599.372222 2.502930 Corrected Total 719 2093.061111 R-Square Coeff Var Root MSE ssweet Mean 0.235869 28.57719 1.582065 5.536111 Source DF Type III SS Mean Square F Value Pr > F product 4 90.4777778 22.6194444 9.04 <.0001 time 1 1.4222222 1.4222222 0.57 0.4512 product*time 4 16.3277778 4.0819444 1.63 0.1648 judge 71 385.4611111 5.4290297 2.17 <.0001
71
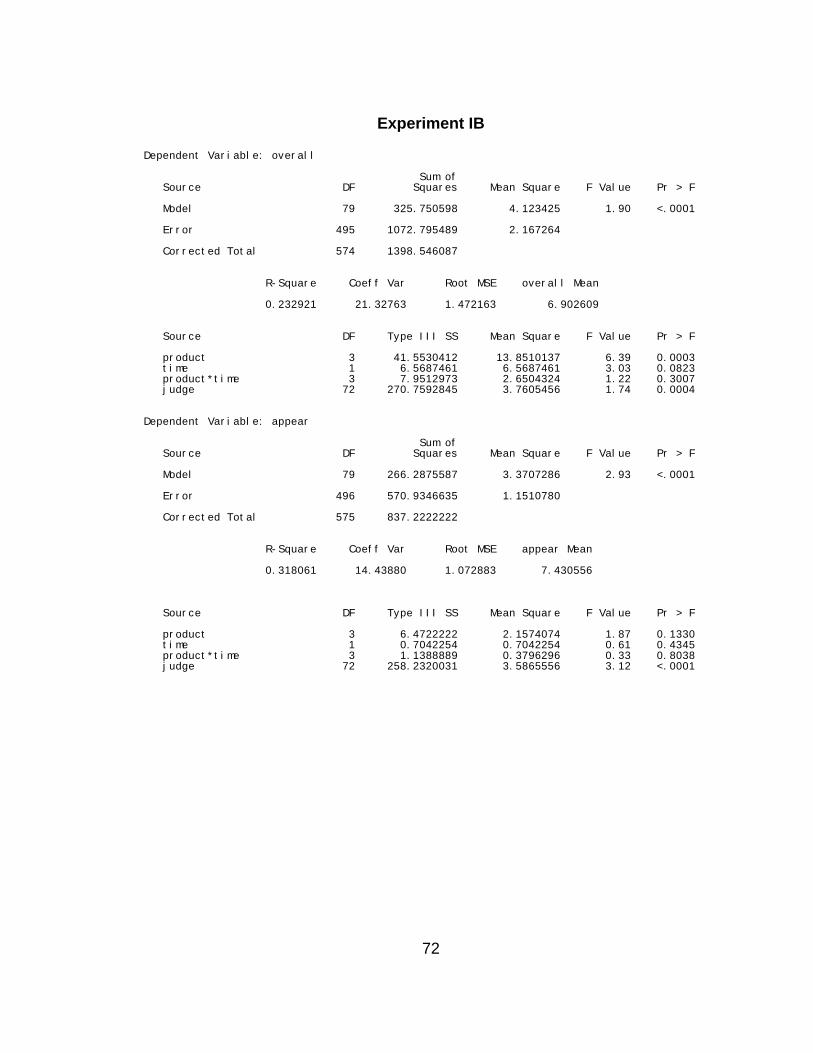
Experiment IB
Dependent Variable: overall Sum of Source DF Squares Mean Square F Value Pr > F Model 79 325.750598 4.123425 1.90 <.0001 Error 495 1072.795489 2.167264 Corrected Total 574 1398.546087 R-Square Coeff Var Root MSE overall Mean 0.232921 21.32763 1.472163 6.902609 Source DF Type III SS Mean Square F Value Pr > F product 3 41.5530412 13.8510137 6.39 0.0003 time 1 6.5687461 6.5687461 3.03 0.0823 product*time 3 7.9512973 2.6504324 1.22 0.3007 judge 72 270.7592845 3.7605456 1.74 0.0004 Dependent Variable: appear Sum of Source DF Squares Mean Square F Value Pr > F Model 79 266.2875587 3.3707286 2.93 <.0001 Error 496 570.9346635 1.1510780 Corrected Total 575 837.2222222 R-Square Coeff Var Root MSE appear Mean 0.318061 14.43880 1.072883 7.430556 Source DF Type III SS Mean Square F Value Pr > F product 3 6.4722222 2.1574074 1.87 0.1330 time 1 0.7042254 0.7042254 0.61 0.4345 product*time 3 1.1388889 0.3796296 0.33 0.8038 judge 72 258.2320031 3.5865556 3.12 <.0001
72
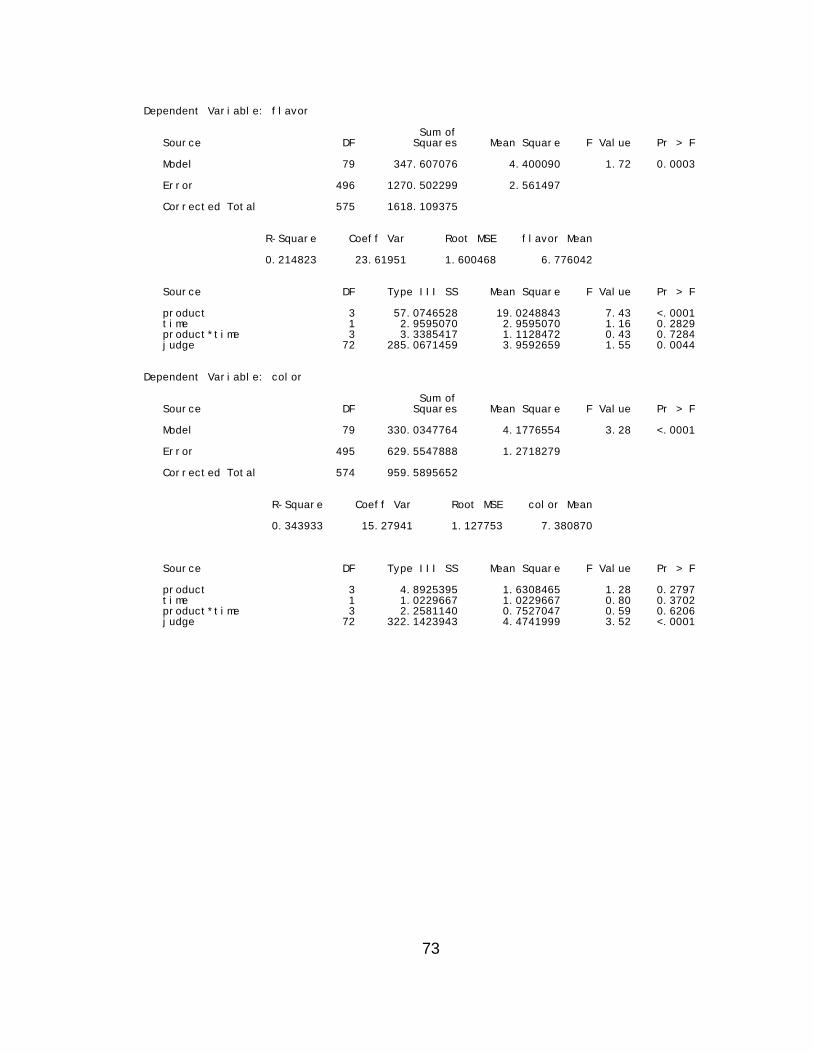
Dependent Variable: flavor Sum of Source DF Squares Mean Square F Value Pr > F Model 79 347.607076 4.400090 1.72 0.0003 Error 496 1270.502299 2.561497 Corrected Total 575 1618.109375 R-Square Coeff Var Root MSE flavor Mean 0.214823 23.61951 1.600468 6.776042 Source DF Type III SS Mean Square F Value Pr > F product 3 57.0746528 19.0248843 7.43 <.0001 time 1 2.9595070 2.9595070 1.16 0.2829 product*time 3 3.3385417 1.1128472 0.43 0.7284 judge 72 285.0671459 3.9592659 1.55 0.0044 Dependent Variable: color Sum of Source DF Squares Mean Square F Value Pr > F Model 79 330.0347764 4.1776554 3.28 <.0001 Error 495 629.5547888 1.2718279 Corrected Total 574 959.5895652 R-Square Coeff Var Root MSE color Mean 0.343933 15.27941 1.127753 7.380870 Source DF Type III SS Mean Square F Value Pr > F product 3 4.8925395 1.6308465 1.28 0.2797 time 1 1.0229667 1.0229667 0.80 0.3702 product*time 3 2.2581140 0.7527047 0.59 0.6206 judge 72 322.1423943 4.4741999 3.52 <.0001
73
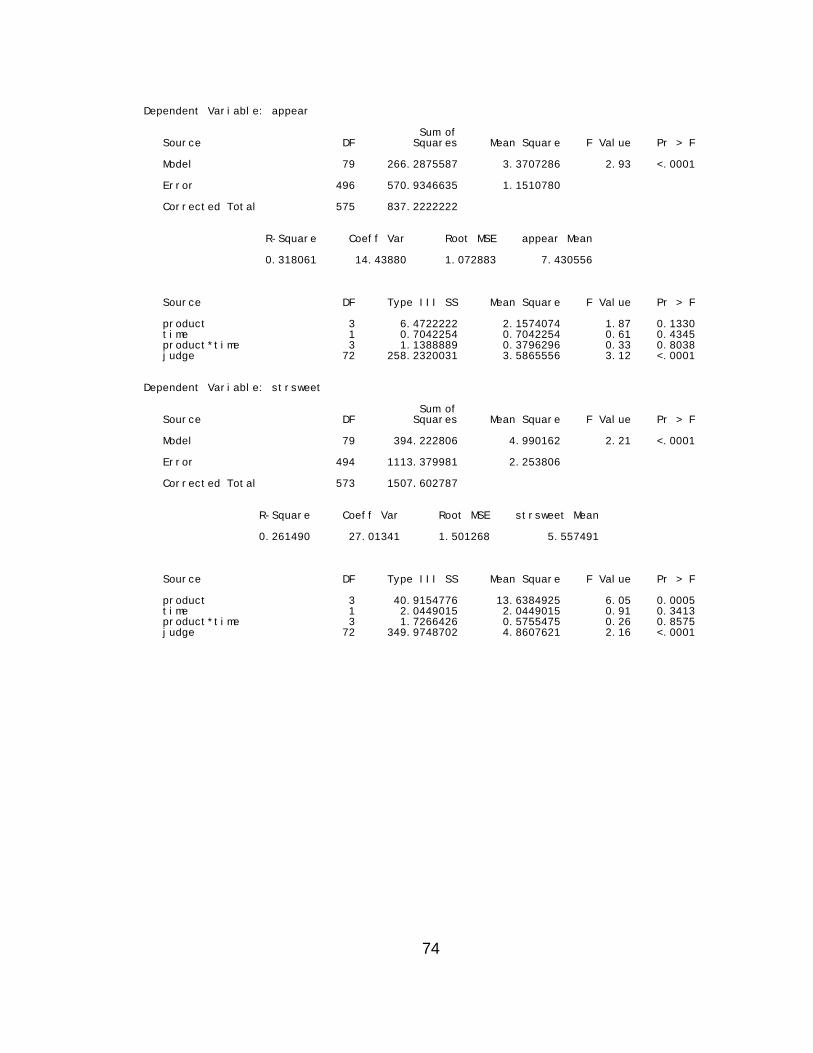
Dependent Variable: appear Sum of Source DF Squares Mean Square F Value Pr > F Model 79 266.2875587 3.3707286 2.93 <.0001 Error 496 570.9346635 1.1510780 Corrected Total 575 837.2222222 R-Square Coeff Var Root MSE appear Mean 0.318061 14.43880 1.072883 7.430556 Source DF Type III SS Mean Square F Value Pr > F product 3 6.4722222 2.1574074 1.87 0.1330 time 1 0.7042254 0.7042254 0.61 0.4345 product*time 3 1.1388889 0.3796296 0.33 0.8038 judge 72 258.2320031 3.5865556 3.12 <.0001 Dependent Variable: strsweet Sum of Source DF Squares Mean Square F Value Pr > F Model 79 394.222806 4.990162 2.21 <.0001 Error 494 1113.379981 2.253806 Corrected Total 573 1507.602787 R-Square Coeff Var Root MSE strsweet Mean 0.261490 27.01341 1.501268 5.557491 Source DF Type III SS Mean Square F Value Pr > F product 3 40.9154776 13.6384925 6.05 0.0005 time 1 2.0449015 2.0449015 0.91 0.3413 product*time 3 1.7266426 0.5755475 0.26 0.8575 judge 72 349.9748702 4.8607621 2.16 <.0001
74
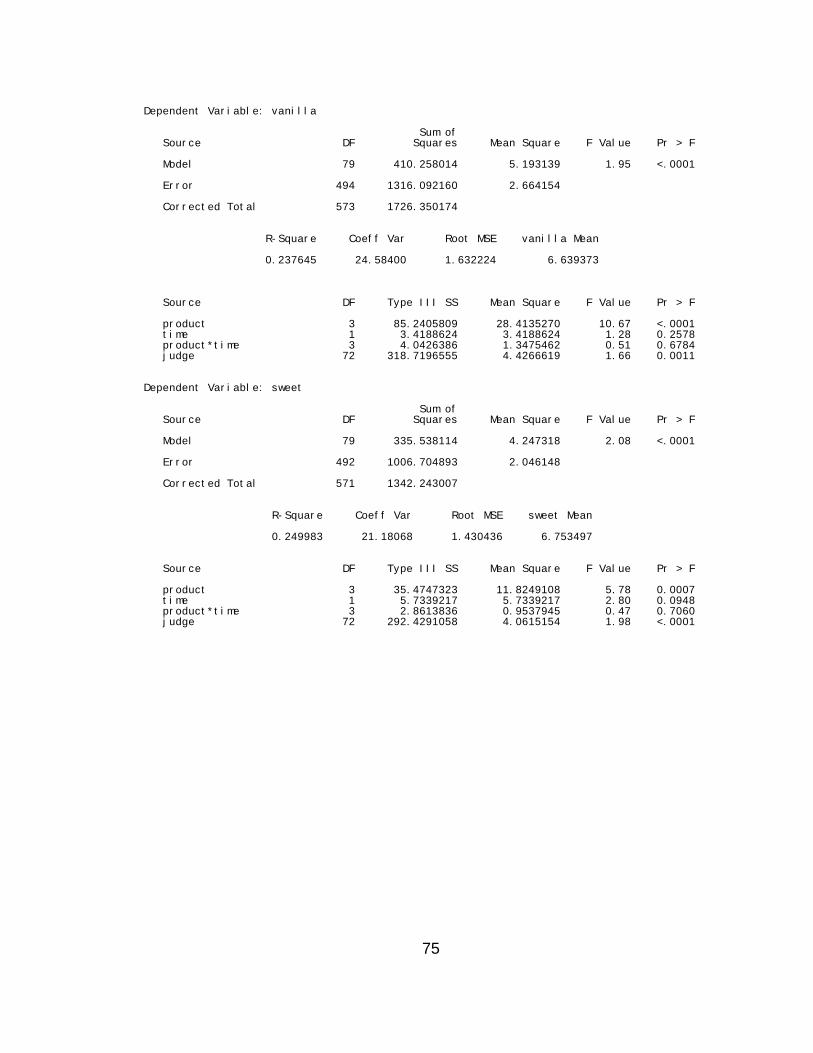
Dependent Variable: vanilla Sum of Source DF Squares Mean Square F Value Pr > F Model 79 410.258014 5.193139 1.95 <.0001 Error 494 1316.092160 2.664154 Corrected Total 573 1726.350174 R-Square Coeff Var Root MSE vanilla Mean 0.237645 24.58400 1.632224 6.639373 Source DF Type III SS Mean Square F Value Pr > F product 3 85.2405809 28.4135270 10.67 <.0001 time 1 3.4188624 3.4188624 1.28 0.2578 product*time 3 4.0426386 1.3475462 0.51 0.6784 judge 72 318.7196555 4.4266619 1.66 0.0011 Dependent Variable: sweet Sum of Source DF Squares Mean Square F Value Pr > F Model 79 335.538114 4.247318 2.08 <.0001 Error 492 1006.704893 2.046148 Corrected Total 571 1342.243007 R-Square Coeff Var Root MSE sweet Mean 0.249983 21.18068 1.430436 6.753497 Source DF Type III SS Mean Square F Value Pr > F product 3 35.4747323 11.8249108 5.78 0.0007 time 1 5.7339217 5.7339217 2.80 0.0948 product*time 3 2.8613836 0.9537945 0.47 0.7060 judge 72 292.4291058 4.0615154 1.98 <.0001
75
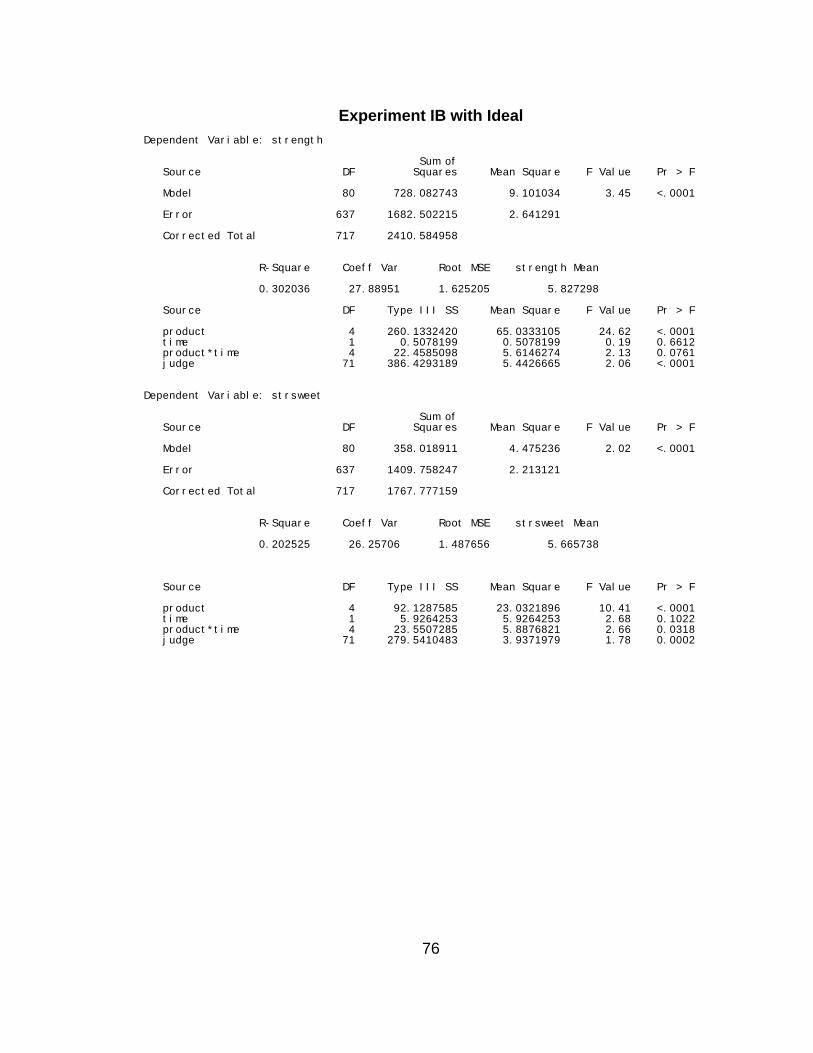
Experiment IB with Ideal
Dependent Variable: strength Sum of Source DF Squares Mean Square F Value Pr > F Model 80 728.082743 9.101034 3.45 <.0001 Error 637 1682.502215 2.641291 Corrected Total 717 2410.584958 R-Square Coeff Var Root MSE strength Mean 0.302036 27.88951 1.625205 5.827298 Source DF Type III SS Mean Square F Value Pr > F product 4 260.1332420 65.0333105 24.62 <.0001 time 1 0.5078199 0.5078199 0.19 0.6612 product*time 4 22.4585098 5.6146274 2.13 0.0761 judge 71 386.4293189 5.4426665 2.06 <.0001 Dependent Variable: strsweet Sum of Source DF Squares Mean Square F Value Pr > F Model 80 358.018911 4.475236 2.02 <.0001 Error 637 1409.758247 2.213121 Corrected Total 717 1767.777159 R-Square Coeff Var Root MSE strsweet Mean 0.202525 26.25706 1.487656 5.665738 Source DF Type III SS Mean Square F Value Pr > F product 4 92.1287585 23.0321896 10.41 <.0001 time 1 5.9264253 5.9264253 2.68 0.1022 product*time 4 23.5507285 5.8876821 2.66 0.0318 judge 71 279.5410483 3.9371979 1.78 0.0002
76
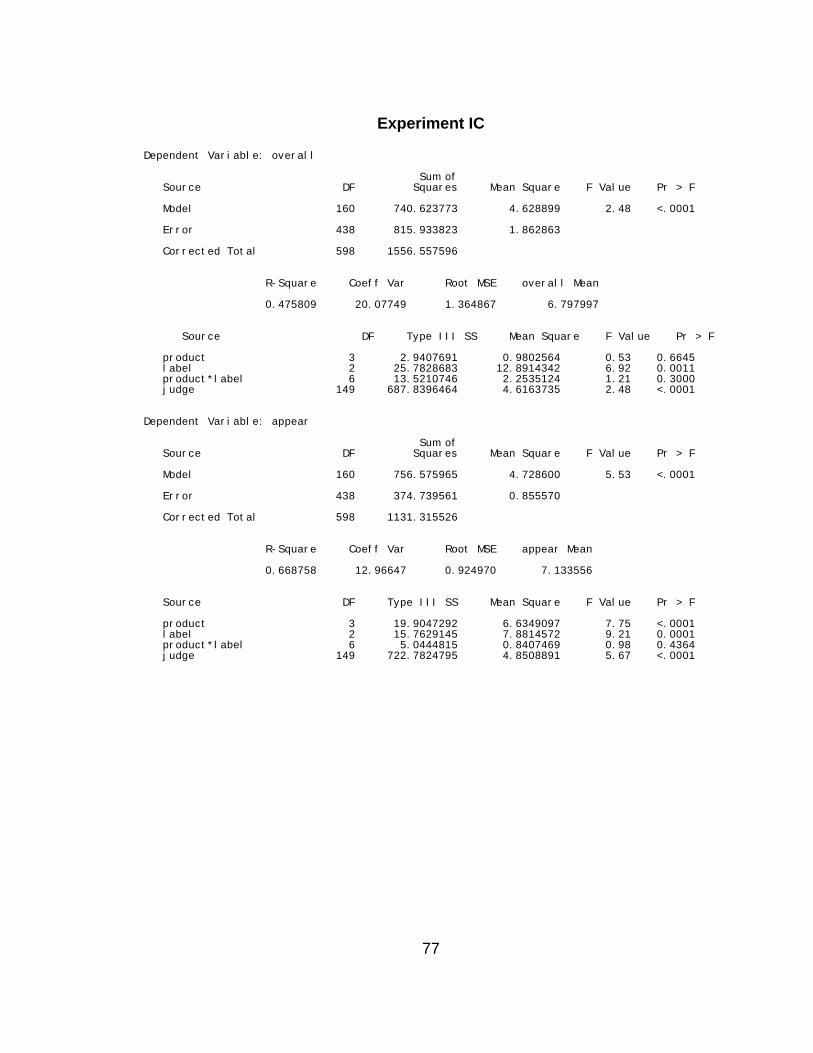
Experiment IC
Dependent Variable: overall Sum of Source DF Squares Mean Square F Value Pr > F Model 160 740.623773 4.628899 2.48 <.0001 Error 438 815.933823 1.862863 Corrected Total 598 1556.557596 R-Square Coeff Var Root MSE overall Mean 0.475809 20.07749 1.364867 6.797997 Source DF Type III SS Mean Square F Value Pr > F product 3 2.9407691 0.9802564 0.53 0.6645 label 2 25.7828683 12.8914342 6.92 0.0011 product*label 6 13.5210746 2.2535124 1.21 0.3000 judge 149 687.8396464 4.6163735 2.48 <.0001 Dependent Variable: appear Sum of Source DF Squares Mean Square F Value Pr > F Model 160 756.575965 4.728600 5.53 <.0001 Error 438 374.739561 0.855570 Corrected Total 598 1131.315526 R-Square Coeff Var Root MSE appear Mean 0.668758 12.96647 0.924970 7.133556 Source DF Type III SS Mean Square F Value Pr > F product 3 19.9047292 6.6349097 7.75 <.0001 label 2 15.7629145 7.8814572 9.21 0.0001 product*label 6 5.0444815 0.8407469 0.98 0.4364 judge 149 722.7824795 4.8508891 5.67 <.0001
77
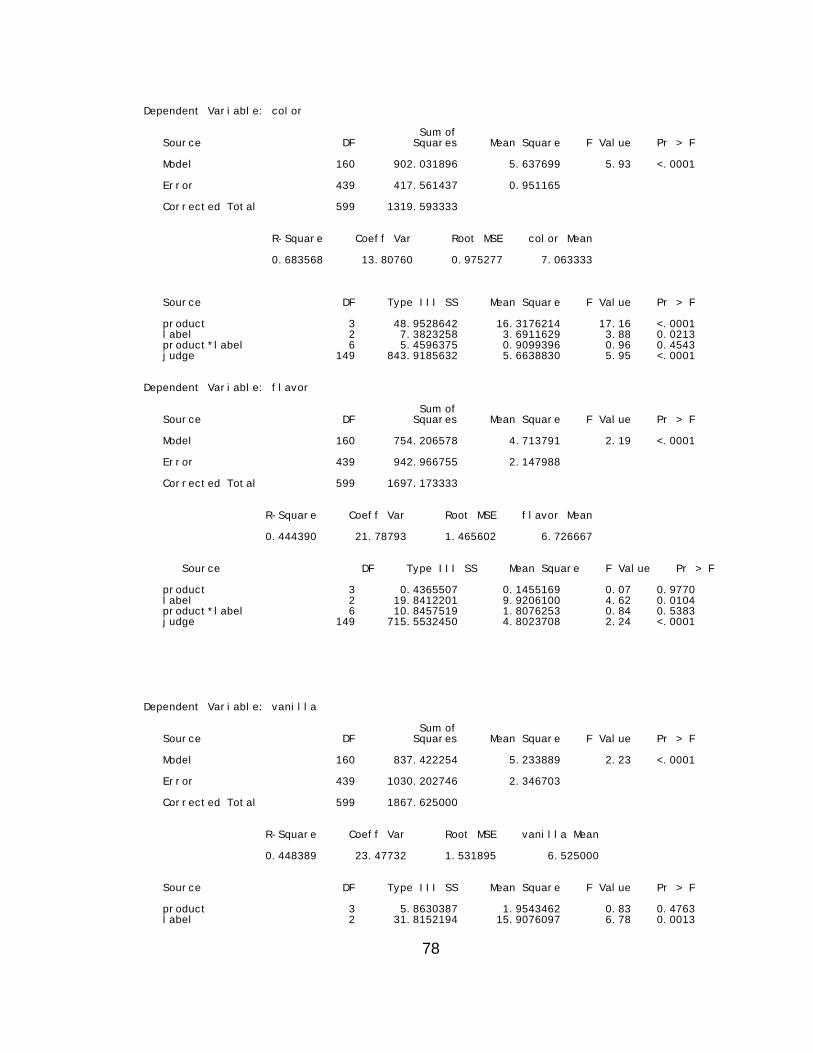
Dependent Variable: color Sum of Source DF Squares Mean Square F Value Pr > F Model 160 902.031896 5.637699 5.93 <.0001 Error 439 417.561437 0.951165 Corrected Total 599 1319.593333 R-Square Coeff Var Root MSE color Mean 0.683568 13.80760 0.975277 7.063333 Source DF Type III SS Mean Square F Value Pr > F product 3 48.9528642 16.3176214 17.16 <.0001 label 2 7.3823258 3.6911629 3.88 0.0213 product*label 6 5.4596375 0.9099396 0.96 0.4543 judge 149 843.9185632 5.6638830 5.95 <.0001 Dependent Variable: flavor Sum of Source DF Squares Mean Square F Value Pr > F Model 160 754.206578 4.713791 2.19 <.0001 Error 439 942.966755 2.147988 Corrected Total 599 1697.173333 R-Square Coeff Var Root MSE flavor Mean 0.444390 21.78793 1.465602 6.726667 Source DF Type III SS Mean Square F Value Pr > F product 3 0.4365507 0.1455169 0.07 0.9770 label 2 19.8412201 9.9206100 4.62 0.0104 product*label 6 10.8457519 1.8076253 0.84 0.5383 judge 149 715.5532450 4.8023708 2.24 <.0001 Dependent Variable: vanilla Sum of Source DF Squares Mean Square F Value Pr > F Model 160 837.422254 5.233889 2.23 <.0001 Error 439 1030.202746 2.346703 Corrected Total 599 1867.625000 R-Square Coeff Var Root MSE vanilla Mean 0.448389 23.47732 1.531895 6.525000 Source DF Type III SS Mean Square F Value Pr > F product 3 5.8630387 1.9543462 0.83 0.4763 label 2 31.8152194 15.9076097 6.78 0.0013
78
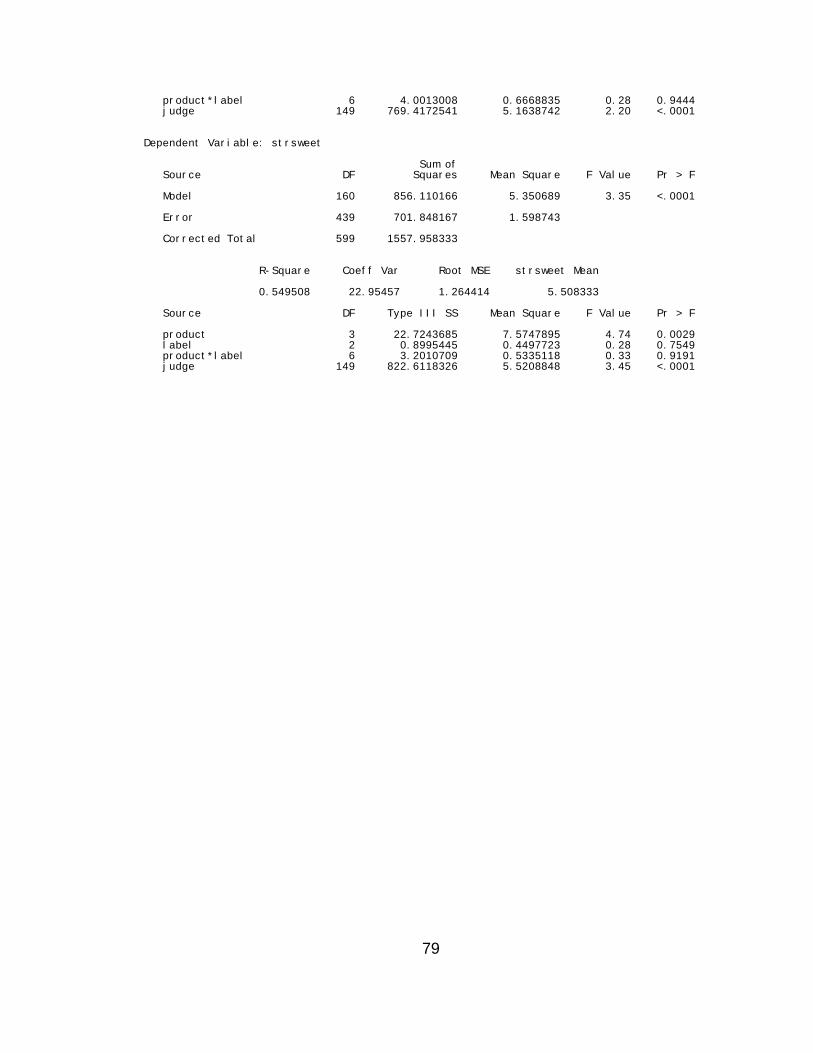
product*label 6 4.0013008 0.6668835 0.28 0.9444 judge 149 769.4172541 5.1638742 2.20 <.0001 Dependent Variable: strsweet Sum of Source DF Squares Mean Square F Value Pr > F Model 160 856.110166 5.350689 3.35 <.0001 Error 439 701.848167 1.598743 Corrected Total 599 1557.958333 R-Square Coeff Var Root MSE strsweet Mean 0.549508 22.95457 1.264414 5.508333 Source DF Type III SS Mean Square F Value Pr > F product 3 22.7243685 7.5747895 4.74 0.0029 label 2 0.8995445 0.4497723 0.28 0.7549 product*label 6 3.2010709 0.5335118 0.33 0.9191 judge 149 822.6118326 5.5208848 3.45 <.0001
79
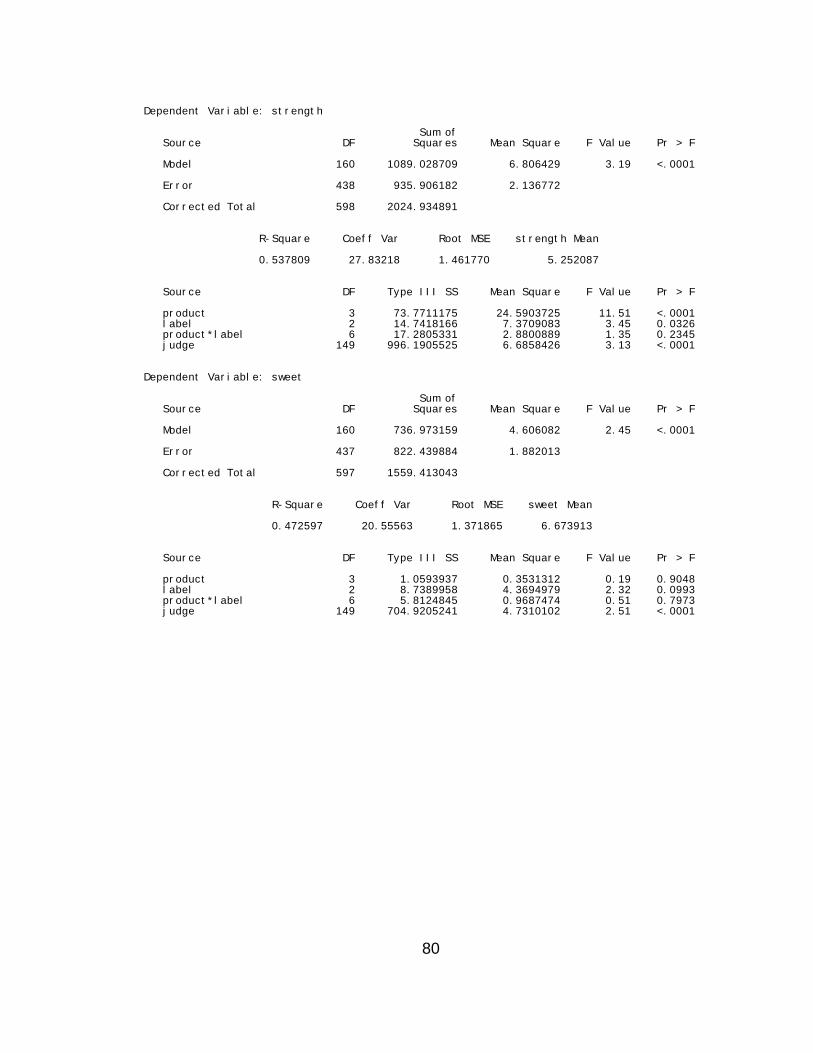
Dependent Variable: strength Sum of Source DF Squares Mean Square F Value Pr > F Model 160 1089.028709 6.806429 3.19 <.0001 Error 438 935.906182 2.136772 Corrected Total 598 2024.934891 R-Square Coeff Var Root MSE strength Mean 0.537809 27.83218 1.461770 5.252087 Source DF Type III SS Mean Square F Value Pr > F product 3 73.7711175 24.5903725 11.51 <.0001 label 2 14.7418166 7.3709083 3.45 0.0326 product*label 6 17.2805331 2.8800889 1.35 0.2345 judge 149 996.1905525 6.6858426 3.13 <.0001 Dependent Variable: sweet Sum of Source DF Squares Mean Square F Value Pr > F Model 160 736.973159 4.606082 2.45 <.0001 Error 437 822.439884 1.882013 Corrected Total 597 1559.413043 R-Square Coeff Var Root MSE sweet Mean 0.472597 20.55563 1.371865 6.673913 Source DF Type III SS Mean Square F Value Pr > F product 3 1.0593937 0.3531312 0.19 0.9048 label 2 8.7389958 4.3694979 2.32 0.0993 product*label 6 5.8124845 0.9687474 0.51 0.7973 judge 149 704.9205241 4.7310102 2.51 <.0001
80
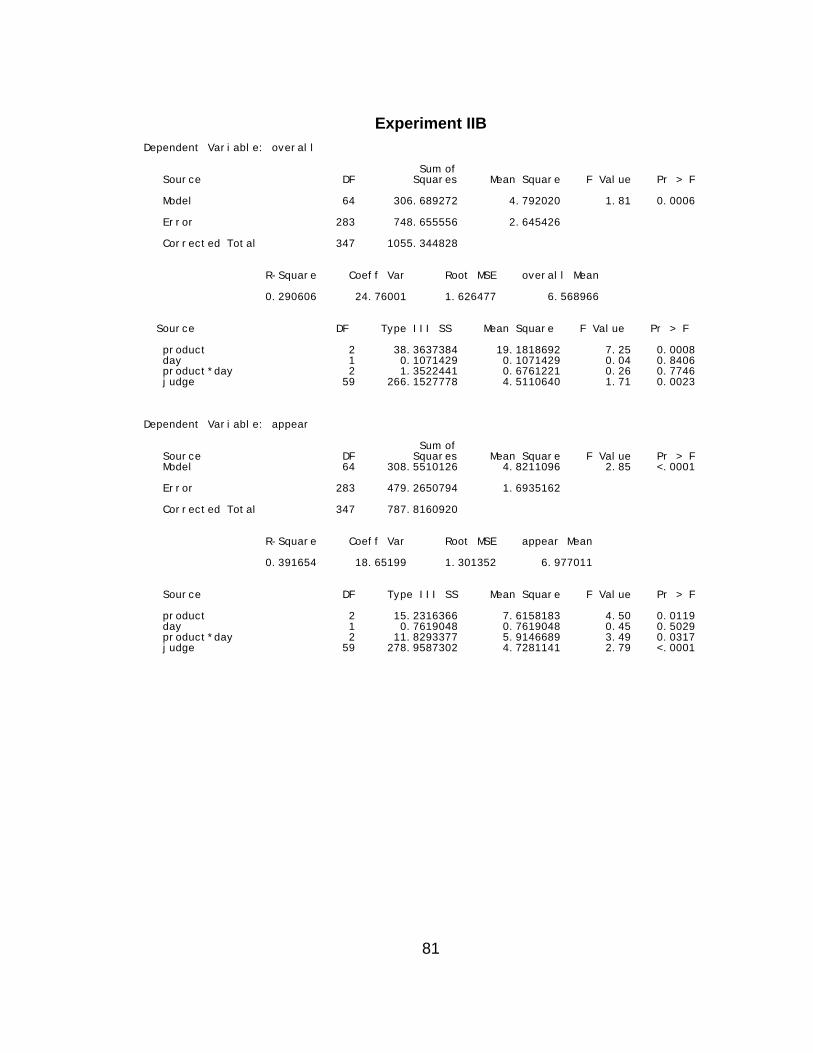
Experiment IIB
Dependent Variable: overall Sum of Source DF Squares Mean Square F Value Pr > F Model 64 306.689272 4.792020 1.81 0.0006 Error 283 748.655556 2.645426 Corrected Total 347 1055.344828 R-Square Coeff Var Root MSE overall Mean 0.290606 24.76001 1.626477 6.568966 Source DF Type III SS Mean Square F Value Pr > F product 2 38.3637384 19.1818692 7.25 0.0008 day 1 0.1071429 0.1071429 0.04 0.8406 product*day 2 1.3522441 0.6761221 0.26 0.7746 judge 59 266.1527778 4.5110640 1.71 0.0023 Dependent Variable: appear Sum of Source DF Squares Mean Square F Value Pr > F Model 64 308.5510126 4.8211096 2.85 <.0001 Error 283 479.2650794 1.6935162 Corrected Total 347 787.8160920 R-Square Coeff Var Root MSE appear Mean 0.391654 18.65199 1.301352 6.977011 Source DF Type III SS Mean Square F Value Pr > F product 2 15.2316366 7.6158183 4.50 0.0119 day 1 0.7619048 0.7619048 0.45 0.5029 product*day 2 11.8293377 5.9146689 3.49 0.0317 judge 59 278.9587302 4.7281141 2.79 <.0001
81
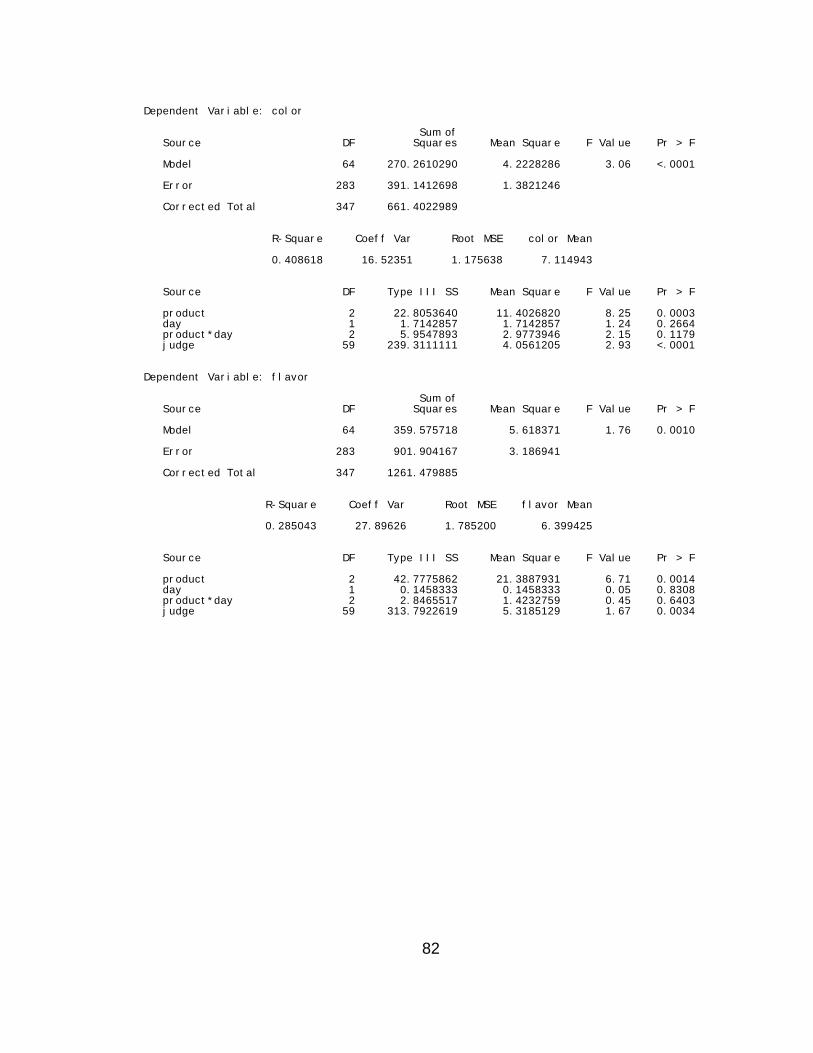
Dependent Variable: color Sum of Source DF Squares Mean Square F Value Pr > F Model 64 270.2610290 4.2228286 3.06 <.0001 Error 283 391.1412698 1.3821246 Corrected Total 347 661.4022989 R-Square Coeff Var Root MSE color Mean 0.408618 16.52351 1.175638 7.114943 Source DF Type III SS Mean Square F Value Pr > F product 2 22.8053640 11.4026820 8.25 0.0003 day 1 1.7142857 1.7142857 1.24 0.2664 product*day 2 5.9547893 2.9773946 2.15 0.1179 judge 59 239.3111111 4.0561205 2.93 <.0001 Dependent Variable: flavor Sum of Source DF Squares Mean Square F Value Pr > F Model 64 359.575718 5.618371 1.76 0.0010 Error 283 901.904167 3.186941 Corrected Total 347 1261.479885 R-Square Coeff Var Root MSE flavor Mean 0.285043 27.89626 1.785200 6.399425 Source DF Type III SS Mean Square F Value Pr > F product 2 42.7775862 21.3887931 6.71 0.0014 day 1 0.1458333 0.1458333 0.05 0.8308 product*day 2 2.8465517 1.4232759 0.45 0.6403 judge 59 313.7922619 5.3185129 1.67 0.0034
82
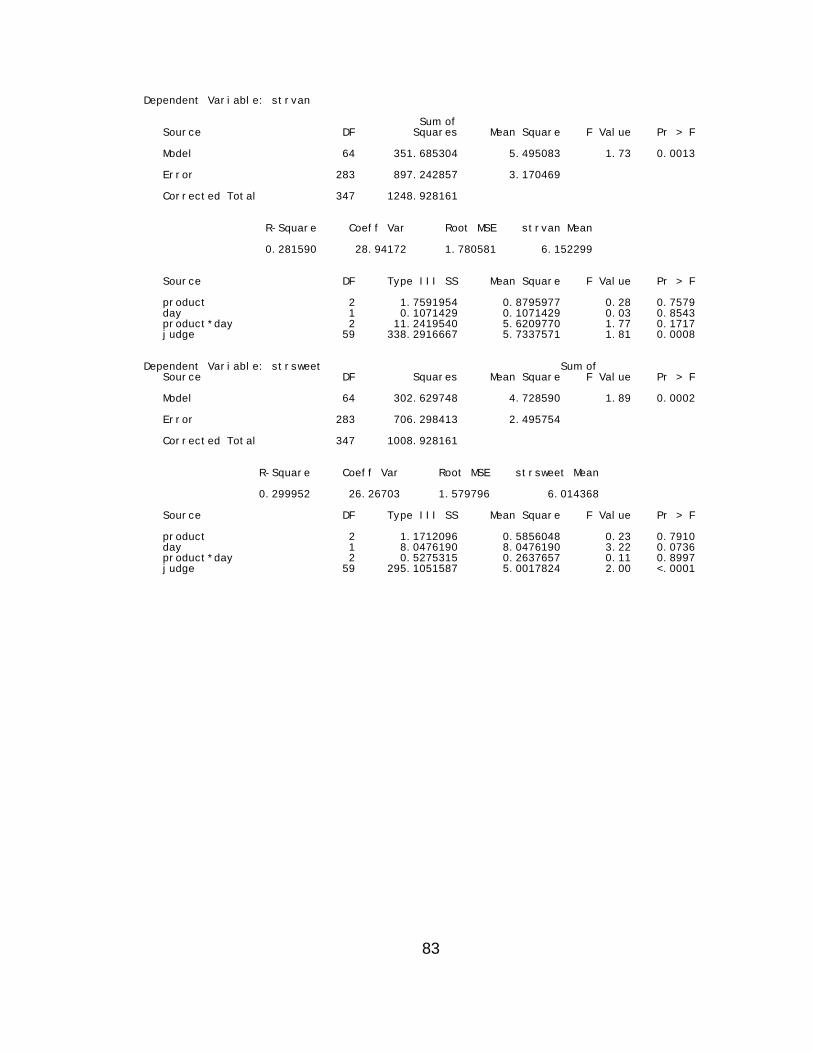
Dependent Variable: strvan Sum of Source DF Squares Mean Square F Value Pr > F Model 64 351.685304 5.495083 1.73 0.0013 Error 283 897.242857 3.170469 Corrected Total 347 1248.928161 R-Square Coeff Var Root MSE strvan Mean 0.281590 28.94172 1.780581 6.152299 Source DF Type III SS Mean Square F Value Pr > F product 2 1.7591954 0.8795977 0.28 0.7579 day 1 0.1071429 0.1071429 0.03 0.8543 product*day 2 11.2419540 5.6209770 1.77 0.1717 judge 59 338.2916667 5.7337571 1.81 0.0008 Dependent Variable: strsweet Sum of Source DF Squares Mean Square F Value Pr > F Model 64 302.629748 4.728590 1.89 0.0002 Error 283 706.298413 2.495754 Corrected Total 347 1008.928161 R-Square Coeff Var Root MSE strsweet Mean 0.299952 26.26703 1.579796 6.014368 Source DF Type III SS Mean Square F Value Pr > F product 2 1.1712096 0.5856048 0.23 0.7910 day 1 8.0476190 8.0476190 3.22 0.0736 product*day 2 0.5275315 0.2637657 0.11 0.8997 judge 59 295.1051587 5.0017824 2.00 <.0001
83
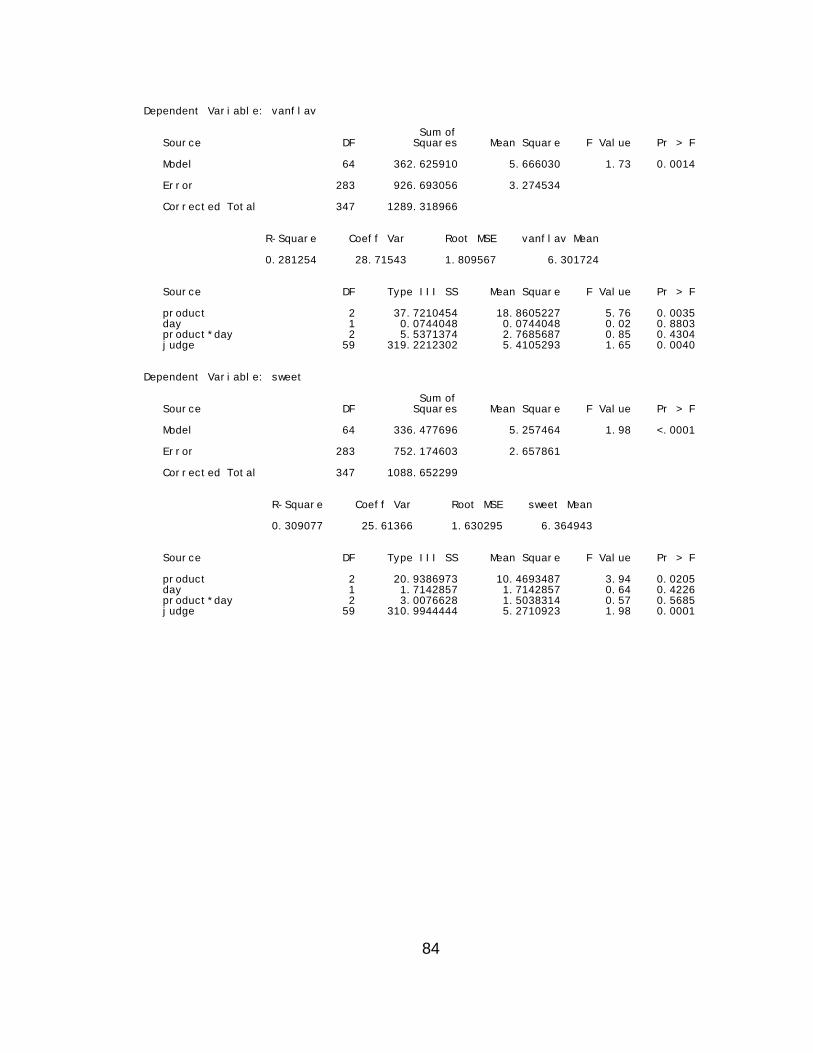
Dependent Variable: vanflav Sum of Source DF Squares Mean Square F Value Pr > F Model 64 362.625910 5.666030 1.73 0.0014 Error 283 926.693056 3.274534 Corrected Total 347 1289.318966 R-Square Coeff Var Root MSE vanflav Mean 0.281254 28.71543 1.809567 6.301724 Source DF Type III SS Mean Square F Value Pr > F product 2 37.7210454 18.8605227 5.76 0.0035 day 1 0.0744048 0.0744048 0.02 0.8803 product*day 2 5.5371374 2.7685687 0.85 0.4304 judge 59 319.2212302 5.4105293 1.65 0.0040 Dependent Variable: sweet Sum of Source DF Squares Mean Square F Value Pr > F Model 64 336.477696 5.257464 1.98 <.0001 Error 283 752.174603 2.657861 Corrected Total 347 1088.652299 R-Square Coeff Var Root MSE sweet Mean 0.309077 25.61366 1.630295 6.364943 Source DF Type III SS Mean Square F Value Pr > F product 2 20.9386973 10.4693487 3.94 0.0205 day 1 1.7142857 1.7142857 0.64 0.4226 product*day 2 3.0076628 1.5038314 0.57 0.5685 judge 59 310.9944444 5.2710923 1.98 0.0001
84

Experiment IIB with Ideal
Dependent Variable: strvan Sum of Source DF Squares Mean Square F Value Pr > F Model 66 353.096280 5.349944 1.86 0.0002 Error 397 1139.591220 2.870507 Corrected Total 463 1492.687500 R-Square Coeff Var Root MSE strvan Mean 0.236551 27.38193 1.694257 6.187500 Source DF Type III SS Mean Square F Value Pr > F product 3 3.6223727 1.2074576 0.42 0.7383 day 1 0.1808036 0.1808036 0.06 0.8020 product*day 3 13.5534072 4.5178024 1.57 0.1952 judge 59 335.4325893 5.6852981 1.98 <.0001 Dependent Variable: strsweet Sum of Source DF Squares Mean Square F Value Pr > F Model 66 284.872568 4.316251 1.80 0.0004 Error 397 954.108036 2.403295 Corrected Total 463 1238.980603 R-Square Coeff Var Root MSE strsweet Mean 0.229925 25.80979 1.550256 6.006466 Source DF Type III SS Mean Square F Value Pr > F product 3 1.2808190 0.4269397 0.18 0.9115 day 1 6.0357143 6.0357143 2.51 0.1138 product*day 3 1.6428879 0.5476293 0.23 0.8770 judge 59 277.2288690 4.6987944 1.96 <.0001
85

Experiment IIC
Dependent Variable: overall Sum of Source DF Squares Mean Square F Value Pr > F Model 64 276.7777778 4.3246528 2.16 <.0001 Error 295 590.2194444 2.0007439 Corrected Total 359 866.9972222 R-Square Coeff Var Root MSE overall Mean 0.319237 20.79263 1.414477 6.802778 Source DF Type III SS Mean Square F Value Pr > F product 2 42.5722222 21.2861111 10.64 <.0001 day 1 0.0027778 0.0027778 0.00 0.9703 product*day 2 2.7055556 1.3527778 0.68 0.5094 judge 59 231.4972222 3.9236817 1.96 0.0001 Dependent Variable: appear Sum of Source DF Squares Mean Square F Value Pr > F Model 64 267.3000000 4.1765625 2.91 <.0001 Error 295 423.1000000 1.4342373 Corrected Total 359 690.4000000 R-Square Coeff Var Root MSE appear Mean 0.387167 16.94712 1.197596 7.066667 Source DF Type III SS Mean Square F Value Pr > F product 2 1.8166667 0.9083333 0.63 0.5315 day 1 1.8777778 1.8777778 1.31 0.2535 product*day 2 0.2055556 0.1027778 0.07 0.9309 judge 59 263.4000000 4.4644068 3.11 <.0001
86
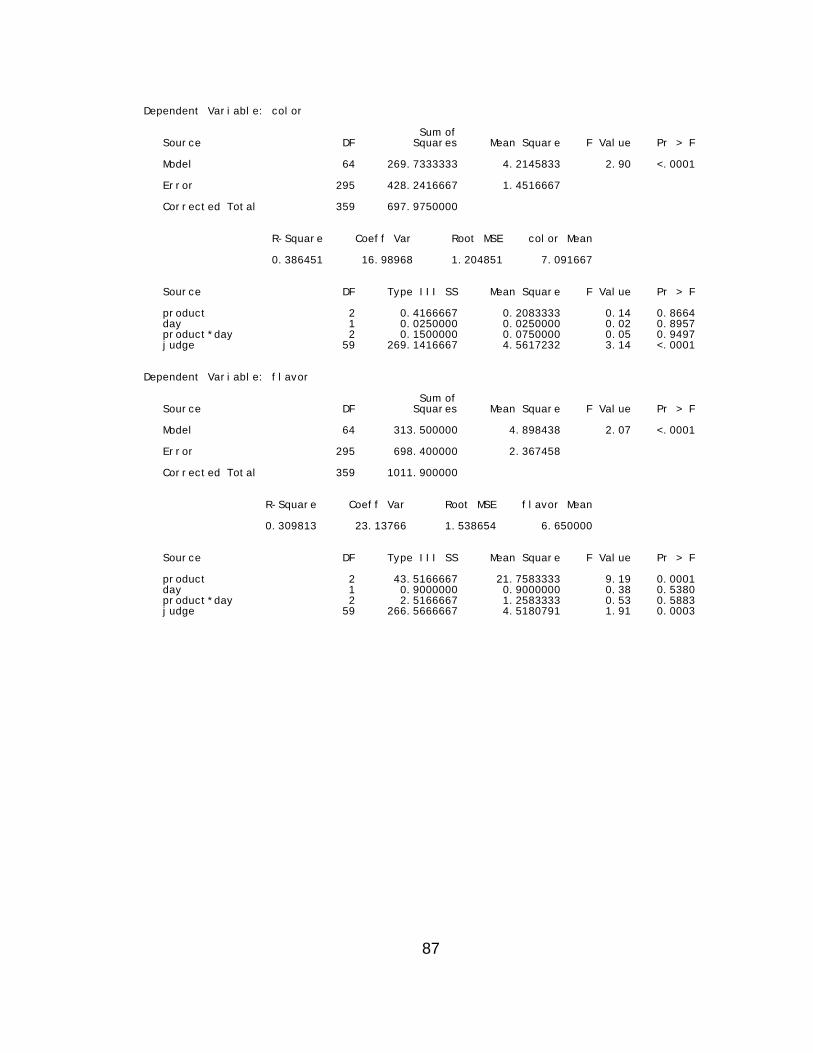
Dependent Variable: color Sum of Source DF Squares Mean Square F Value Pr > F Model 64 269.7333333 4.2145833 2.90 <.0001 Error 295 428.2416667 1.4516667 Corrected Total 359 697.9750000 R-Square Coeff Var Root MSE color Mean 0.386451 16.98968 1.204851 7.091667 Source DF Type III SS Mean Square F Value Pr > F product 2 0.4166667 0.2083333 0.14 0.8664 day 1 0.0250000 0.0250000 0.02 0.8957 product*day 2 0.1500000 0.0750000 0.05 0.9497 judge 59 269.1416667 4.5617232 3.14 <.0001 Dependent Variable: flavor Sum of Source DF Squares Mean Square F Value Pr > F Model 64 313.500000 4.898438 2.07 <.0001 Error 295 698.400000 2.367458 Corrected Total 359 1011.900000 R-Square Coeff Var Root MSE flavor Mean 0.309813 23.13766 1.538654 6.650000 Source DF Type III SS Mean Square F Value Pr > F product 2 43.5166667 21.7583333 9.19 0.0001 day 1 0.9000000 0.9000000 0.38 0.5380 product*day 2 2.5166667 1.2583333 0.53 0.5883 judge 59 266.5666667 4.5180791 1.91 0.0003
87
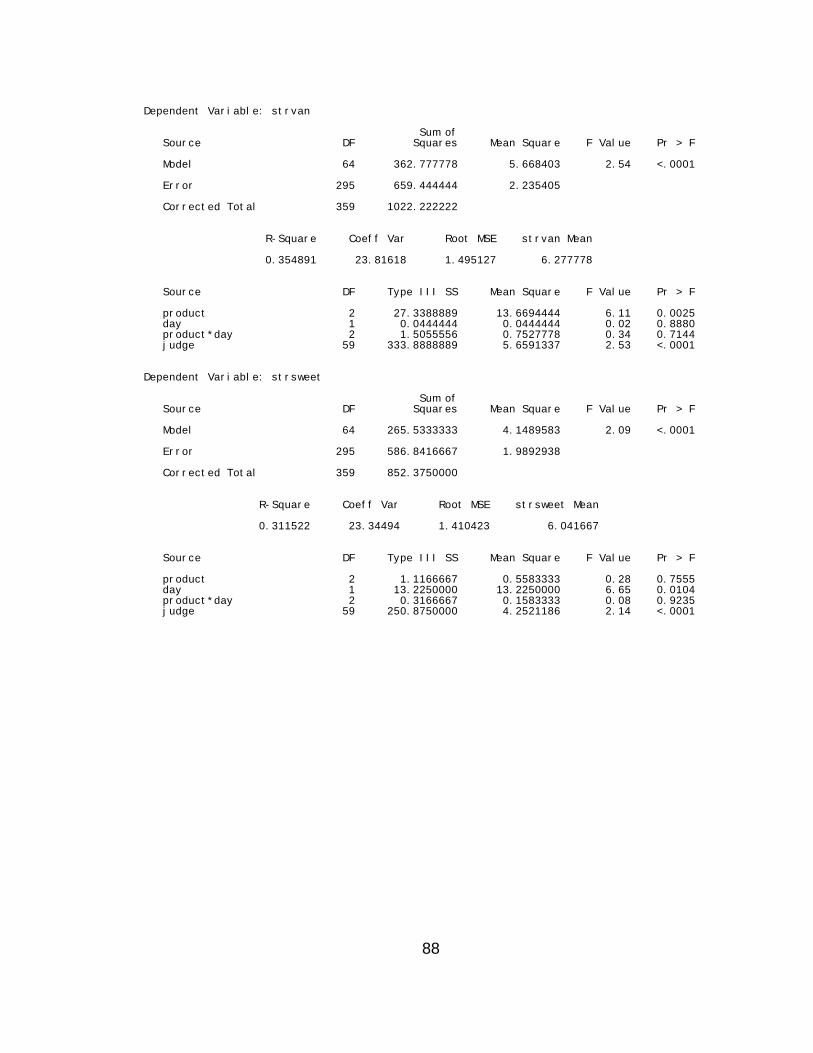
Dependent Variable: strvan Sum of Source DF Squares Mean Square F Value Pr > F Model 64 362.777778 5.668403 2.54 <.0001 Error 295 659.444444 2.235405 Corrected Total 359 1022.222222 R-Square Coeff Var Root MSE strvan Mean 0.354891 23.81618 1.495127 6.277778 Source DF Type III SS Mean Square F Value Pr > F product 2 27.3388889 13.6694444 6.11 0.0025 day 1 0.0444444 0.0444444 0.02 0.8880 product*day 2 1.5055556 0.7527778 0.34 0.7144 judge 59 333.8888889 5.6591337 2.53 <.0001 Dependent Variable: strsweet Sum of Source DF Squares Mean Square F Value Pr > F Model 64 265.5333333 4.1489583 2.09 <.0001 Error 295 586.8416667 1.9892938 Corrected Total 359 852.3750000 R-Square Coeff Var Root MSE strsweet Mean 0.311522 23.34494 1.410423 6.041667 Source DF Type III SS Mean Square F Value Pr > F product 2 1.1166667 0.5583333 0.28 0.7555 day 1 13.2250000 13.2250000 6.65 0.0104 product*day 2 0.3166667 0.1583333 0.08 0.9235 judge 59 250.8750000 4.2521186 2.14 <.0001
88
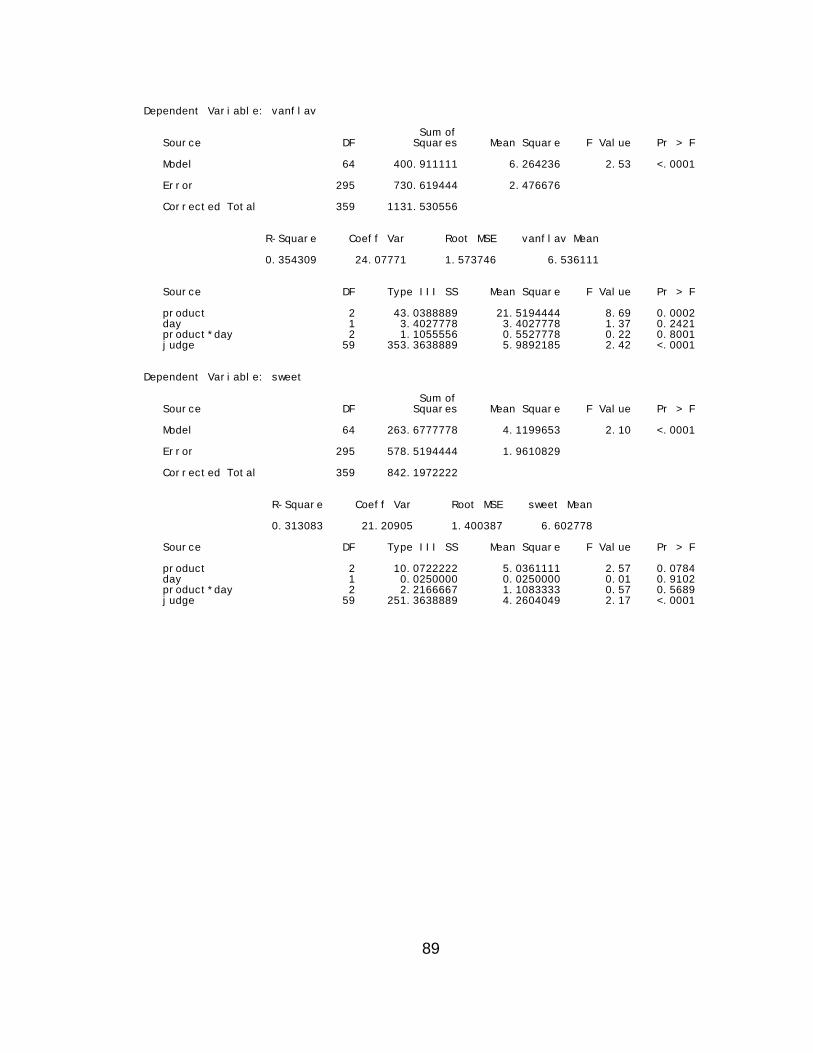
Dependent Variable: vanflav Sum of Source DF Squares Mean Square F Value Pr > F Model 64 400.911111 6.264236 2.53 <.0001 Error 295 730.619444 2.476676 Corrected Total 359 1131.530556 R-Square Coeff Var Root MSE vanflav Mean 0.354309 24.07771 1.573746 6.536111 Source DF Type III SS Mean Square F Value Pr > F product 2 43.0388889 21.5194444 8.69 0.0002 day 1 3.4027778 3.4027778 1.37 0.2421 product*day 2 1.1055556 0.5527778 0.22 0.8001 judge 59 353.3638889 5.9892185 2.42 <.0001 Dependent Variable: sweet Sum of Source DF Squares Mean Square F Value Pr > F Model 64 263.6777778 4.1199653 2.10 <.0001 Error 295 578.5194444 1.9610829 Corrected Total 359 842.1972222 R-Square Coeff Var Root MSE sweet Mean 0.313083 21.20905 1.400387 6.602778 Source DF Type III SS Mean Square F Value Pr > F product 2 10.0722222 5.0361111 2.57 0.0784 day 1 0.0250000 0.0250000 0.01 0.9102 product*day 2 2.2166667 1.1083333 0.57 0.5689 judge 59 251.3638889 4.2604049 2.17 <.0001
89
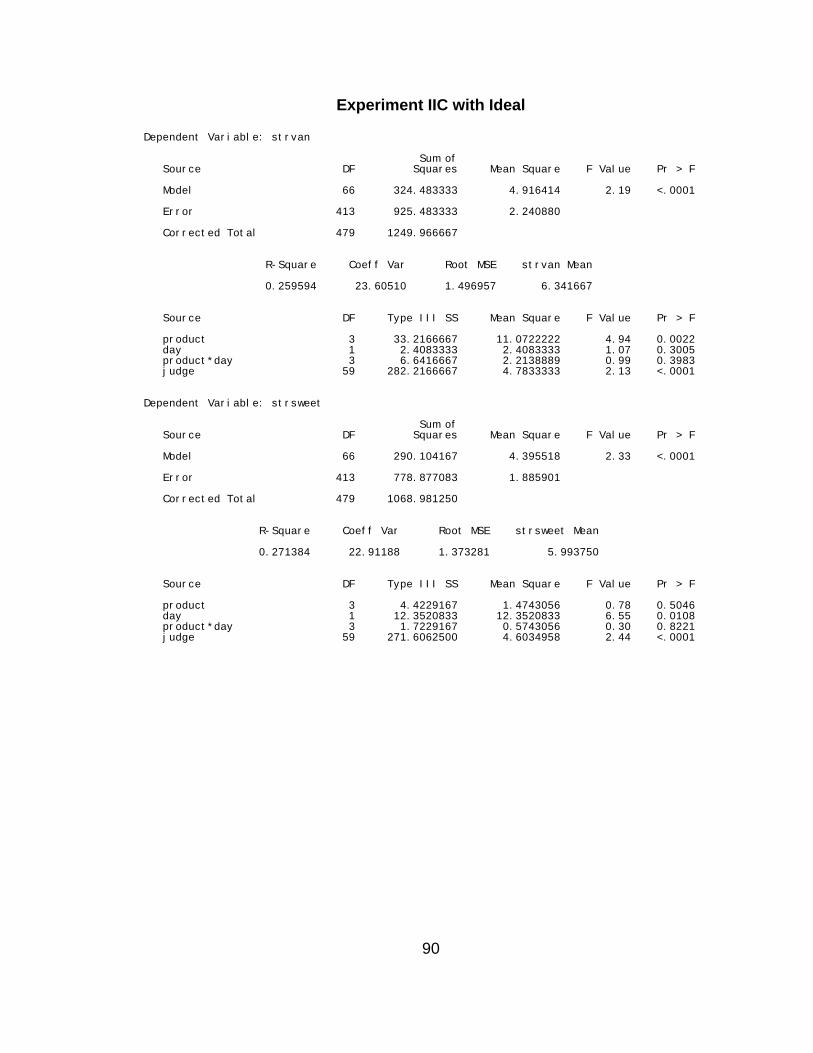
Experiment IIC with Ideal Dependent Variable: strvan Sum of Source DF Squares Mean Square F Value Pr > F Model 66 324.483333 4.916414 2.19 <.0001 Error 413 925.483333 2.240880 Corrected Total 479 1249.966667 R-Square Coeff Var Root MSE strvan Mean 0.259594 23.60510 1.496957 6.341667 Source DF Type III SS Mean Square F Value Pr > F product 3 33.2166667 11.0722222 4.94 0.0022 day 1 2.4083333 2.4083333 1.07 0.3005 product*day 3 6.6416667 2.2138889 0.99 0.3983 judge 59 282.2166667 4.7833333 2.13 <.0001 Dependent Variable: strsweet Sum of Source DF Squares Mean Square F Value Pr > F Model 66 290.104167 4.395518 2.33 <.0001 Error 413 778.877083 1.885901 Corrected Total 479 1068.981250 R-Square Coeff Var Root MSE strsweet Mean 0.271384 22.91188 1.373281 5.993750 Source DF Type III SS Mean Square F Value Pr > F product 3 4.4229167 1.4743056 0.78 0.5046 day 1 12.3520833 12.3520833 6.55 0.0108 product*day 3 1.7229167 0.5743056 0.30 0.8221 judge 59 271.6062500 4.6034958 2.44 <.0001
90
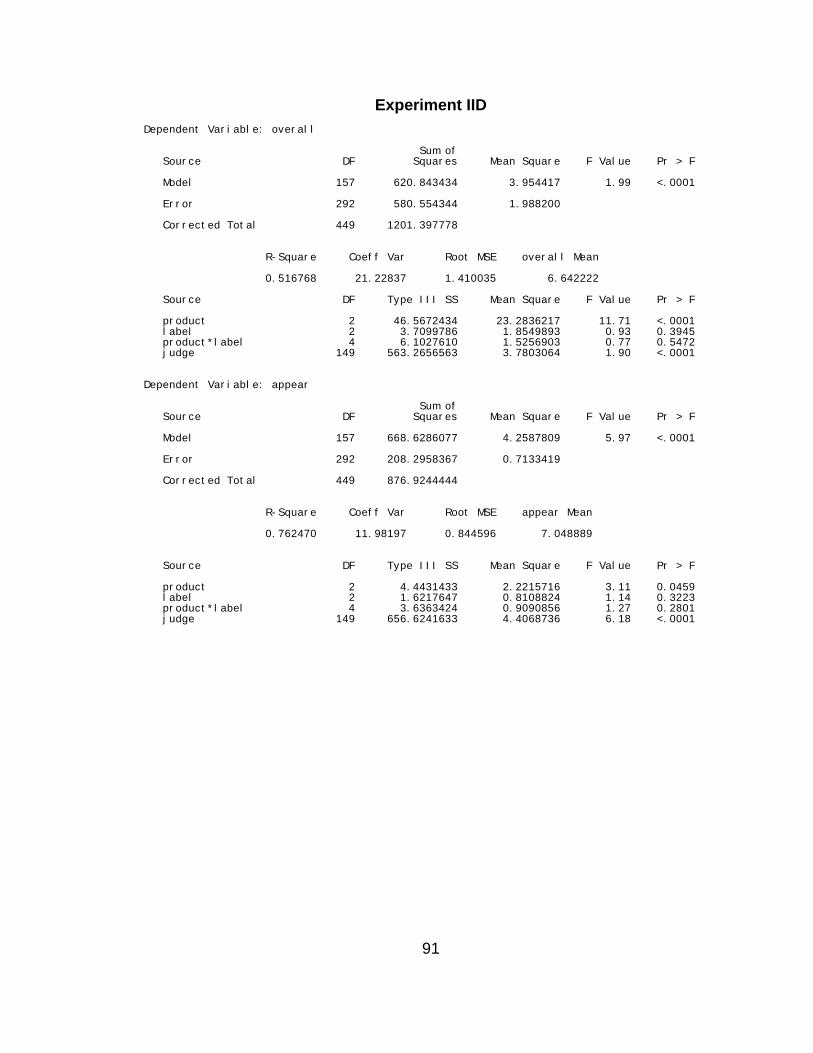
Experiment IID Dependent Variable: overall Sum of Source DF Squares Mean Square F Value Pr > F Model 157 620.843434 3.954417 1.99 <.0001 Error 292 580.554344 1.988200 Corrected Total 449 1201.397778 R-Square Coeff Var Root MSE overall Mean 0.516768 21.22837 1.410035 6.642222 Source DF Type III SS Mean Square F Value Pr > F product 2 46.5672434 23.2836217 11.71 <.0001 label 2 3.7099786 1.8549893 0.93 0.3945 product*label 4 6.1027610 1.5256903 0.77 0.5472 judge 149 563.2656563 3.7803064 1.90 <.0001 Dependent Variable: appear Sum of Source DF Squares Mean Square F Value Pr > F Model 157 668.6286077 4.2587809 5.97 <.0001 Error 292 208.2958367 0.7133419 Corrected Total 449 876.9244444 R-Square Coeff Var Root MSE appear Mean 0.762470 11.98197 0.844596 7.048889 Source DF Type III SS Mean Square F Value Pr > F product 2 4.4431433 2.2215716 3.11 0.0459 label 2 1.6217647 0.8108824 1.14 0.3223 product*label 4 3.6363424 0.9090856 1.27 0.2801 judge 149 656.6241633 4.4068736 6.18 <.0001
91
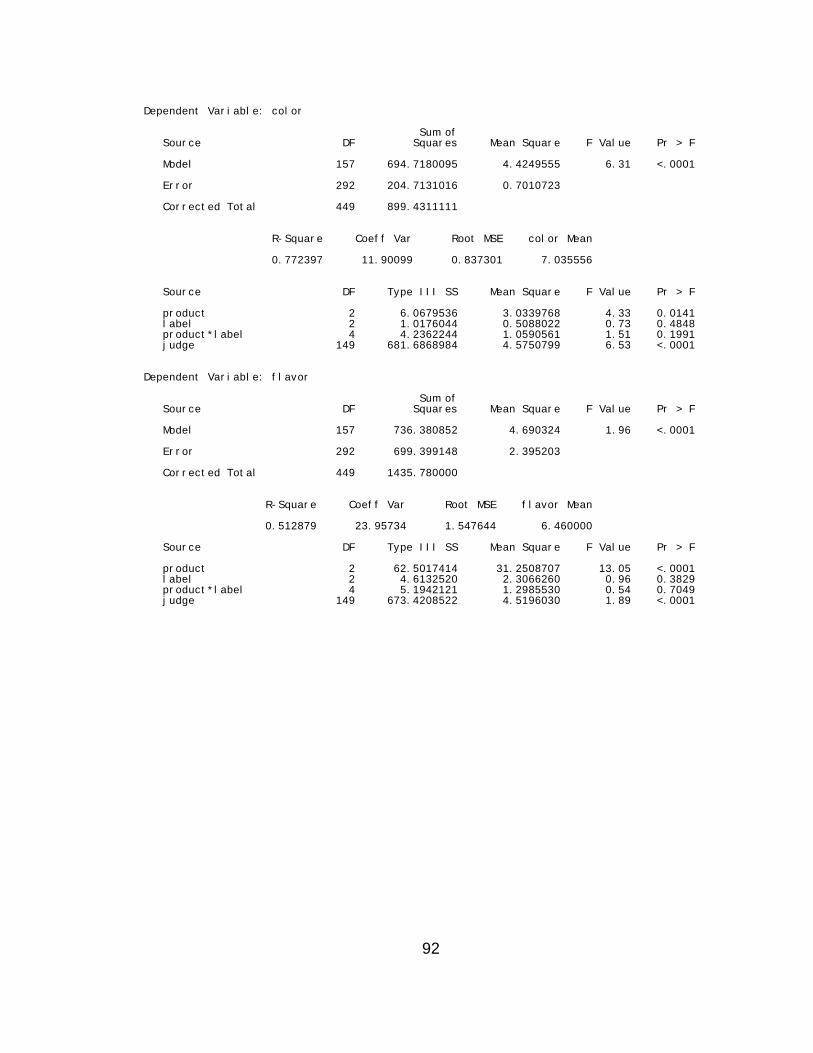
Dependent Variable: color Sum of Source DF Squares Mean Square F Value Pr > F Model 157 694.7180095 4.4249555 6.31 <.0001 Error 292 204.7131016 0.7010723 Corrected Total 449 899.4311111 R-Square Coeff Var Root MSE color Mean 0.772397 11.90099 0.837301 7.035556 Source DF Type III SS Mean Square F Value Pr > F product 2 6.0679536 3.0339768 4.33 0.0141 label 2 1.0176044 0.5088022 0.73 0.4848 product*label 4 4.2362244 1.0590561 1.51 0.1991 judge 149 681.6868984 4.5750799 6.53 <.0001 Dependent Variable: flavor Sum of Source DF Squares Mean Square F Value Pr > F Model 157 736.380852 4.690324 1.96 <.0001 Error 292 699.399148 2.395203 Corrected Total 449 1435.780000 R-Square Coeff Var Root MSE flavor Mean 0.512879 23.95734 1.547644 6.460000 Source DF Type III SS Mean Square F Value Pr > F product 2 62.5017414 31.2508707 13.05 <.0001 label 2 4.6132520 2.3066260 0.96 0.3829 product*label 4 5.1942121 1.2985530 0.54 0.7049 judge 149 673.4208522 4.5196030 1.89 <.0001
92
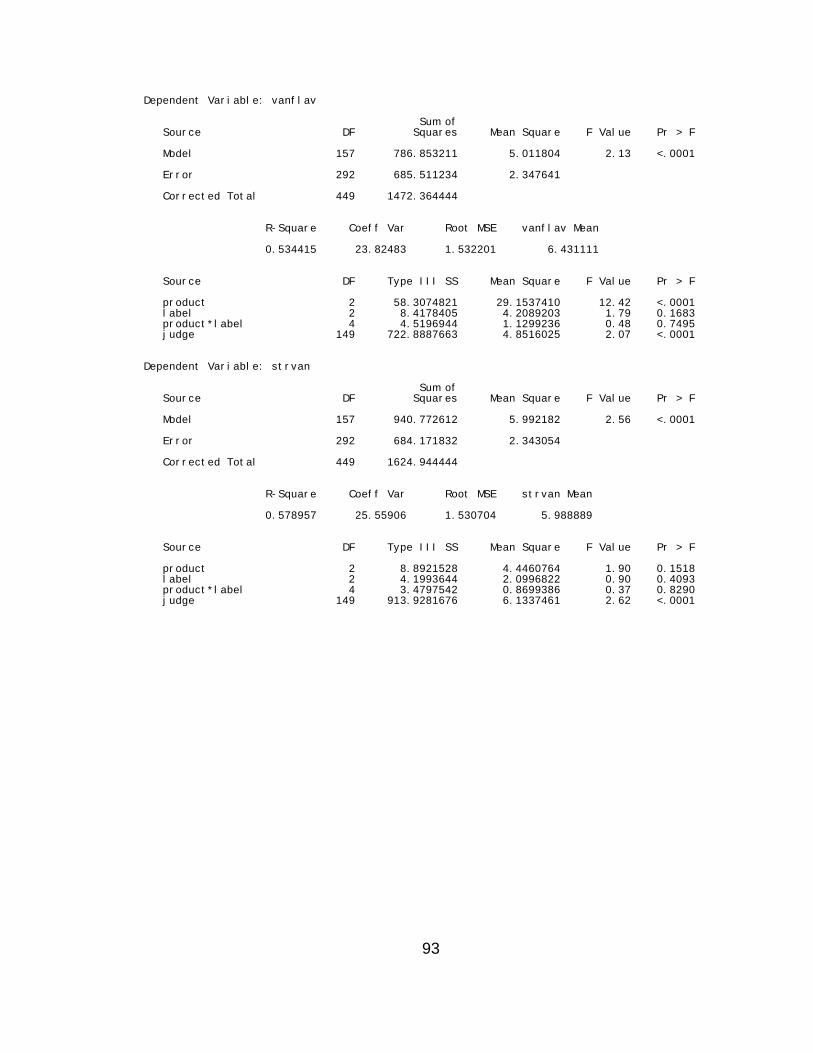
Dependent Variable: vanflav Sum of Source DF Squares Mean Square F Value Pr > F Model 157 786.853211 5.011804 2.13 <.0001 Error 292 685.511234 2.347641 Corrected Total 449 1472.364444 R-Square Coeff Var Root MSE vanflav Mean 0.534415 23.82483 1.532201 6.431111 Source DF Type III SS Mean Square F Value Pr > F product 2 58.3074821 29.1537410 12.42 <.0001 label 2 8.4178405 4.2089203 1.79 0.1683 product*label 4 4.5196944 1.1299236 0.48 0.7495 judge 149 722.8887663 4.8516025 2.07 <.0001 Dependent Variable: strvan Sum of Source DF Squares Mean Square F Value Pr > F Model 157 940.772612 5.992182 2.56 <.0001 Error 292 684.171832 2.343054 Corrected Total 449 1624.944444 R-Square Coeff Var Root MSE strvan Mean 0.578957 25.55906 1.530704 5.988889 Source DF Type III SS Mean Square F Value Pr > F product 2 8.8921528 4.4460764 1.90 0.1518 label 2 4.1993644 2.0996822 0.90 0.4093 product*label 4 3.4797542 0.8699386 0.37 0.8290 judge 149 913.9281676 6.1337461 2.62 <.0001
93
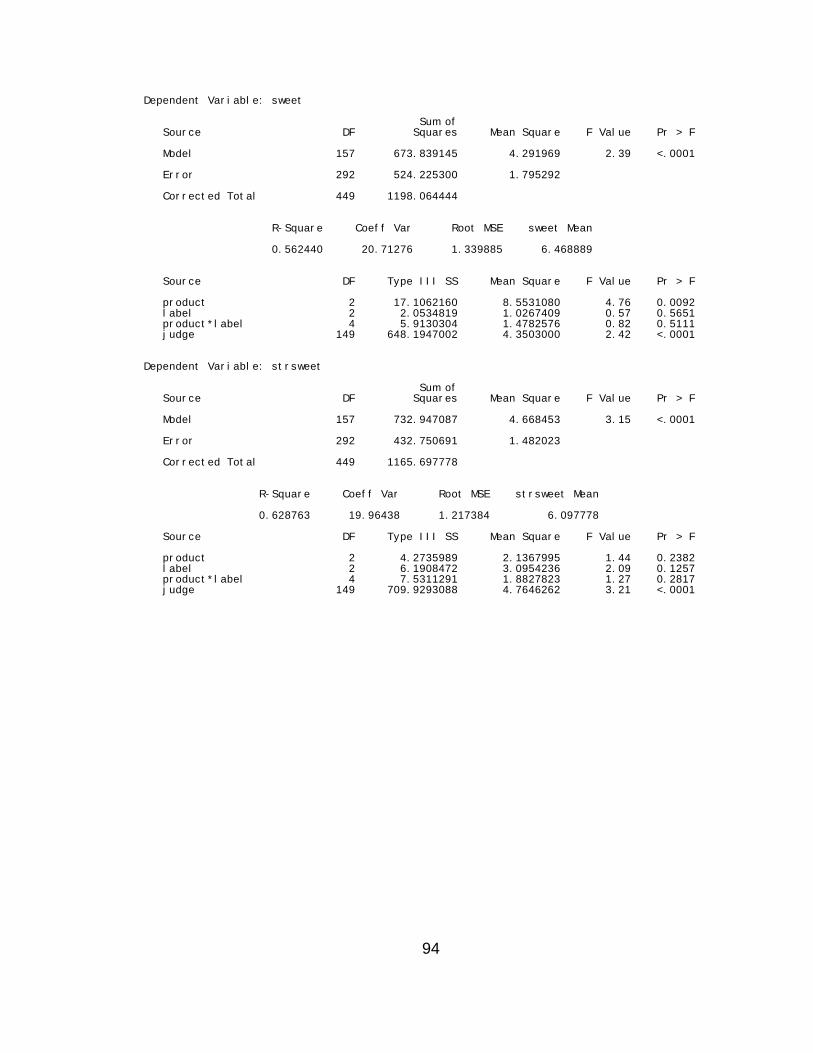
Dependent Variable: sweet Sum of Source DF Squares Mean Square F Value Pr > F Model 157 673.839145 4.291969 2.39 <.0001 Error 292 524.225300 1.795292 Corrected Total 449 1198.064444 R-Square Coeff Var Root MSE sweet Mean 0.562440 20.71276 1.339885 6.468889 Source DF Type III SS Mean Square F Value Pr > F product 2 17.1062160 8.5531080 4.76 0.0092 label 2 2.0534819 1.0267409 0.57 0.5651 product*label 4 5.9130304 1.4782576 0.82 0.5111 judge 149 648.1947002 4.3503000 2.42 <.0001 Dependent Variable: strsweet Sum of Source DF Squares Mean Square F Value Pr > F Model 157 732.947087 4.668453 3.15 <.0001 Error 292 432.750691 1.482023 Corrected Total 449 1165.697778 R-Square Coeff Var Root MSE strsweet Mean 0.628763 19.96438 1.217384 6.097778 Source DF Type III SS Mean Square F Value Pr > F product 2 4.2735989 2.1367995 1.44 0.2382 label 2 6.1908472 3.0954236 2.09 0.1257 product*label 4 7.5311291 1.8827823 1.27 0.2817 judge 149 709.9293088 4.7646262 3.21 <.0001
94

Appendix E Demographic Frequencies
95
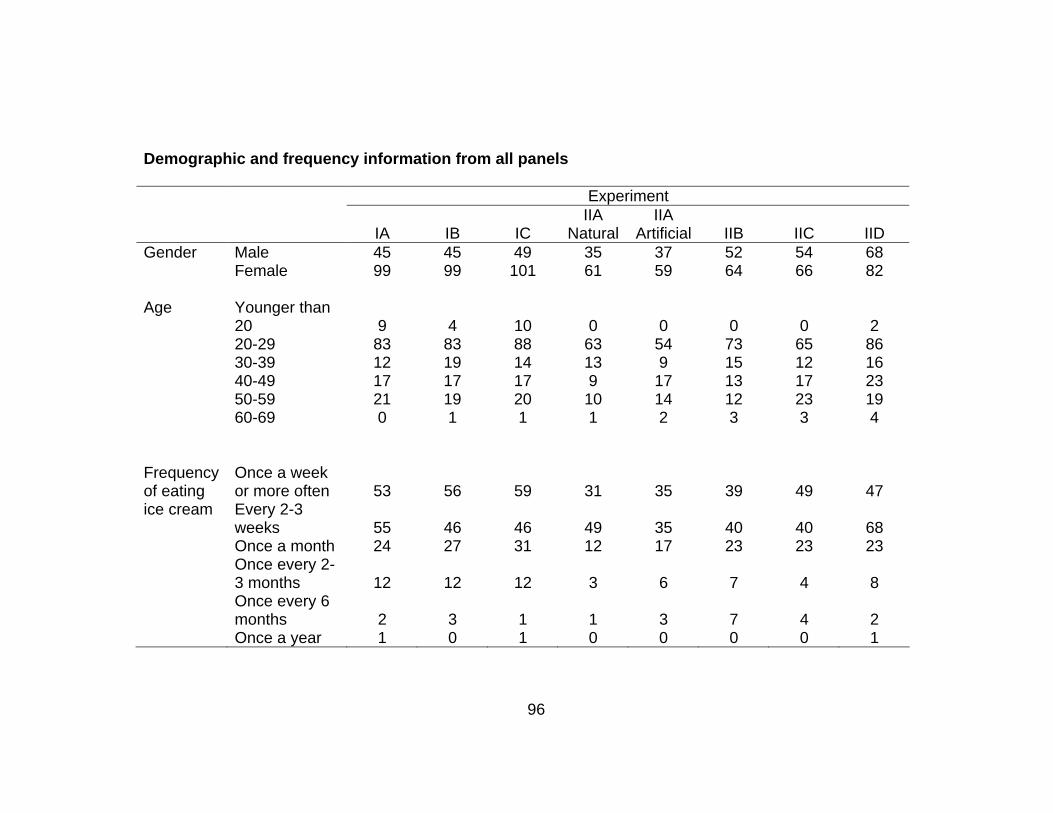
Demographic and frequency information from all panels Experiment
IA
IB
IC IIA
Natural IIA
Artificial
IIB
IIC
IID Gender Male 45 45 49 35 37 52 54 68 Female
99 99 101 61 59 64 66 82
Age Younger than20
9
4
10
0
0
0
0
2
20-29 83 83 88 63 54 73 65 8630-39 12 19 14 13 9 15 12 1640-49 17 17 17 9 17 13 17 2350-59 21 19 20 10 14 12 23 1960-69 0 1 1 1 2 3 3 4
Frequency of eating
Once a week or more often
53
56
59
31
35
39
49
47
ice cream Every 2-3 weeks
55
46
46
49
35
40
40
68
Once a month 24 27 31 12 17 23 23 23 Once every 2-
3 months
12
12
12
3 6
7
4
8
Once every 6 months
2
3
1
1
3
7
4
2
Once a year 1 0 1 0 0 0 0 1
96
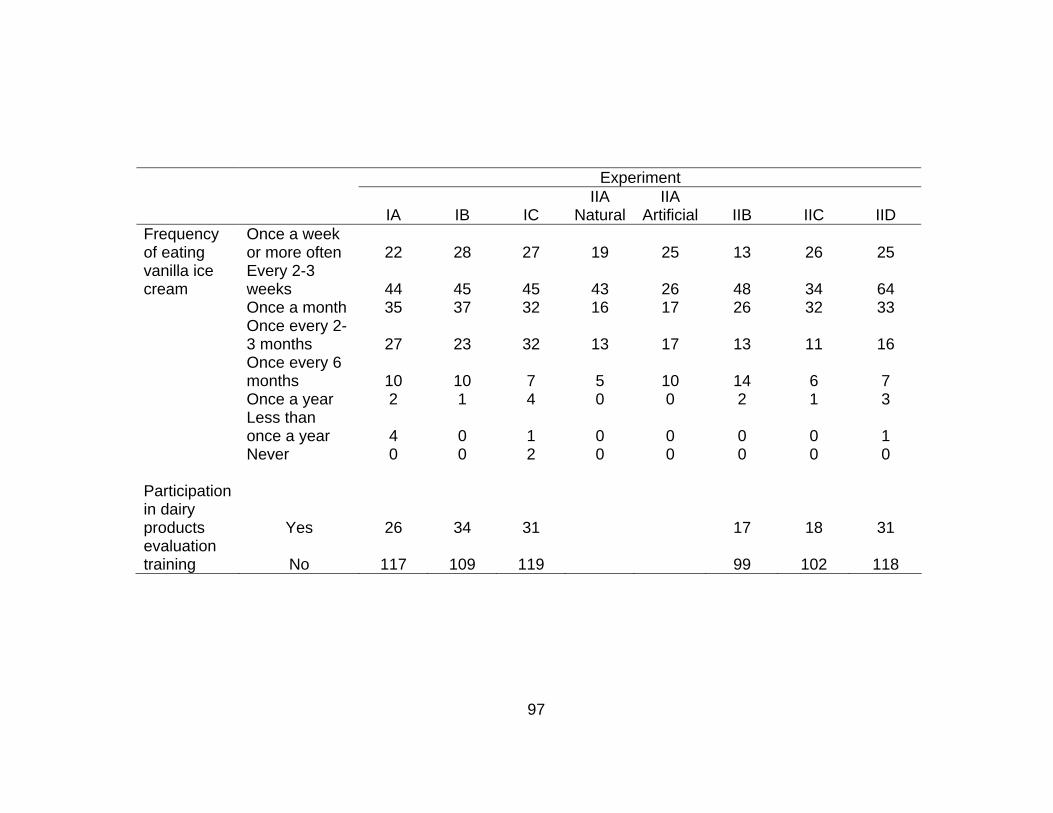
Experiment
IA
IB
IC IIA
Natural IIA
Artificial
IIB
IIC
IID Frequency of eating
Once a week or more often
22
28
27
19
25
13
26
25
vanilla ice cream
Every 2-3 weeks
44
45
45
43
26
48
34
64
Once a month
35 37 32 16 17 26 32 33 Once every 2-
3 months
27
23
32
13
17
13
11
16 Once every 6
months
10
10
7
5
10
14
6
7 Once a year
2 1 4 0 0 2 1 3
Less thanonce a year
4
0
1
0
0
0
0
1
Never
0 0 2 0 0 0 0 0
Participation in dairy products
Yes
26
34
31
17
18
31 evaluation training
No
117
109
119 99
102
118
97
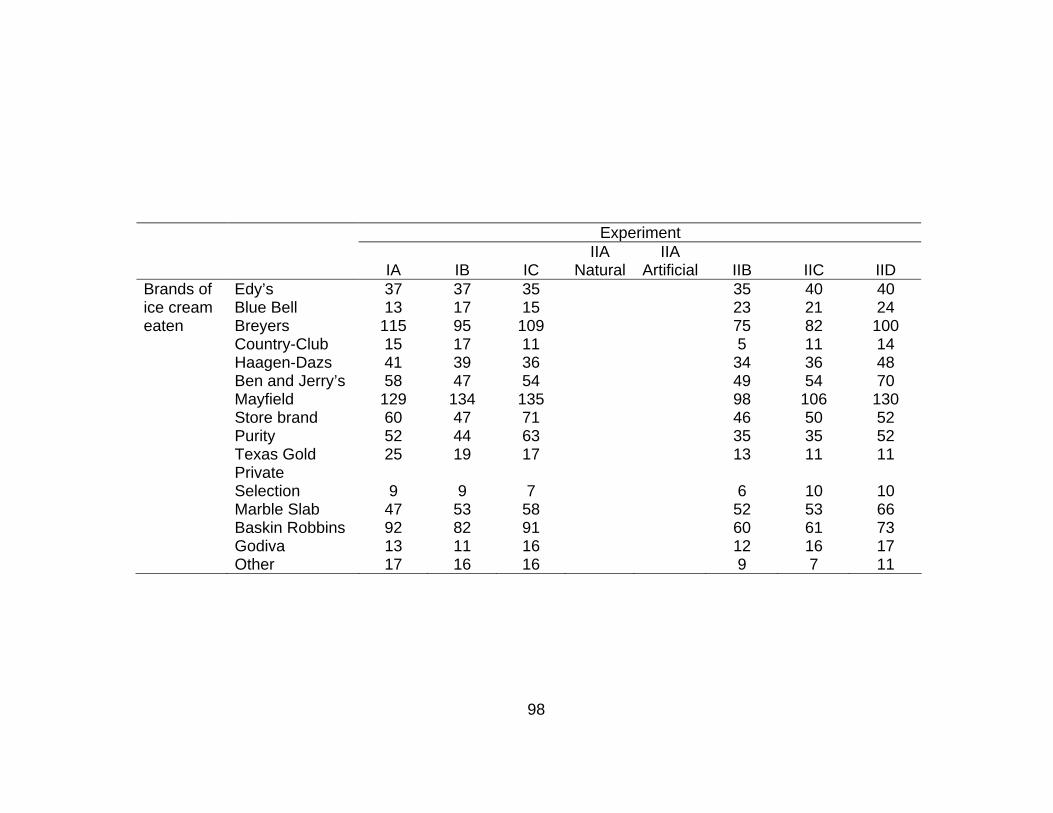
Experiment
IA
IB
IC IIA
Natural IIA
Artificial
IIB
IIC
IID Brands of Edy’s 37 37 35 35 40 40 ice cream
Blue Bell 13 17 15 23 21 24
eaten
Breyers
115 95 109
75 82 100Country-Club 15 17 11 5 11 14Haagen-Dazs 41 39 36 34 36 48
Ben and Jerry’s
58 47 54 49 54 70 Mayfield 129 134 135 98 106 130Store brand
60 47 71 46 50 52
Purity 52 44 63 35 35 52Texas Gold 25 19 17 13 11 11PrivateSelection
9
9
7 6
10
10
Marble Slab 47 53 58 52 53 66Baskin Robbins
92 82 91 60 61 73
Godiva 13 11 16 12 16 17Other 17 16 16 9 7 11
98
Vita
April Rae Parker was born in Jackson, Tennessee on April 24, 1979, the
daughter of William G. (Jerry) and Elaine Parker of Ripley, Tennessee. April has
one brother, Brain Parker. April lived and attended school in Ripley where she
graduated as Valedictorian in 1997 from Ripley High School. She graduated
magna cum laude with a Bachelor of Science degree in Agriculture from The
University of Tennessee in the spring of 2001. The following fall she accepted a
graduate research assistantship and began study toward a Master of Science
degree in Food Science and Technology at The University of Tennessee.
April is a member of the Delta Gamma sorority, Institute of Food
Technologists, and UT’s Food Science Club. She has been involved in Alpha
Zeta Agricultural Honor Society and the Collegiate Dairy Products Evaluation
Team, where she placed 12th as an individual in all-products in 1999 at the
national competition in Chicago, IL. April also had the opportunity to travel to
Thailand and Austria for international studies.
99


