Embed Size (px)
Citation preview

Matthew A. Cohen, Beyond Beauty: Reexamining Architectural Proportion through the Basilicas of San Lorenzo and Santo Spirito in Florence. Venice: Marsilio Editore, 2013. List of Appendices (provided in this PDF package) A1 San Lorenzo and Old Sacristy Surveys A2 Santo Spirito Survey A3 Statistical Analysis A4 Serlio Illustration Measurements * * * Matthew A. Cohen, “How Much Brunelleschi? A Late Medieval Proportional System in the Basilica of San Lorenzo in Florence.” Journal of the Society of Architectural Historians 67 (2008): 18-57. List of Appendices (provided in this PDF package) Please note that the appendices listed on pages 45-49 of this article have been superseded by Beyond Beauty… (see above), as follows: “How Much Brunelleschi?...,” Appendix 1, Survey Methodology, is now found in: Beyond
Beauty…, Appendices A1 and A2: Survey Methodology. “How Much Brunelleschi?...,” Appendix 2, The San Lorenzo Nave Arcade Survey, is now
found in Appendix A1: The San Lorenzo Survey. “How Much Brunelleschi?...,” Appendix 3, Previous Studies, is now found in: Beyond
Beauty…, Bibliography, pages 288-299, entries marked with an asterisk (*) but now without annotations.
“How Much Brunelleschi?...,” Appendix 4, The San Lorenzo, Old Sacristy and Santo Spirito Surveys (excerpted in the former Appendix 2), is now found in: Beyond Beauty…, Appendix A1: The San Lorenzo Survey, and Appendix A2: The Santo Spirito Survey.”
“How Much Brunelleschi?...,” Appendix 5, Statistical Analysis, is now found in: Beyond Beauty…, Appendix A3: Statistical Analysis.
“How Much Brunelleschi?...,” Appendix 6, Serlio Illustration Measurements, is now found in: Beyond Beauty…, Appendix A4, “Serlio Portal Measurements.”
“How Much Brunelleschi?...,” Appendix 7, Reconstruction of the San Lorenzo Overall Basilica Design Process, is now incorporated into Beyond Beauty…, Chapter 3.
“How Much Brunelleschi?...,” Appendix 8, Dimensions from Dolfini’s 1418 Petition Compared with Actual Conditions, is now incorporated into Beyond Beauty…, Chapter 4.
“How Much Brunelleschi?...,” Appendix 9, Ordine, and Fortezza and Bellezza, is now incorporated into Beyond Beauty, Chapter 6.
Matthew A. Cohen 1 September 20o14

i
Matthew A. Cohen, Beyond Beauty: Reexamining Architectural Proportion through the Basilicas of San Lorenzo and Santo Spirito in Florence. Venice: Marsilio Editore, 2013.
Appendices A1 and A2: Survey Methodology
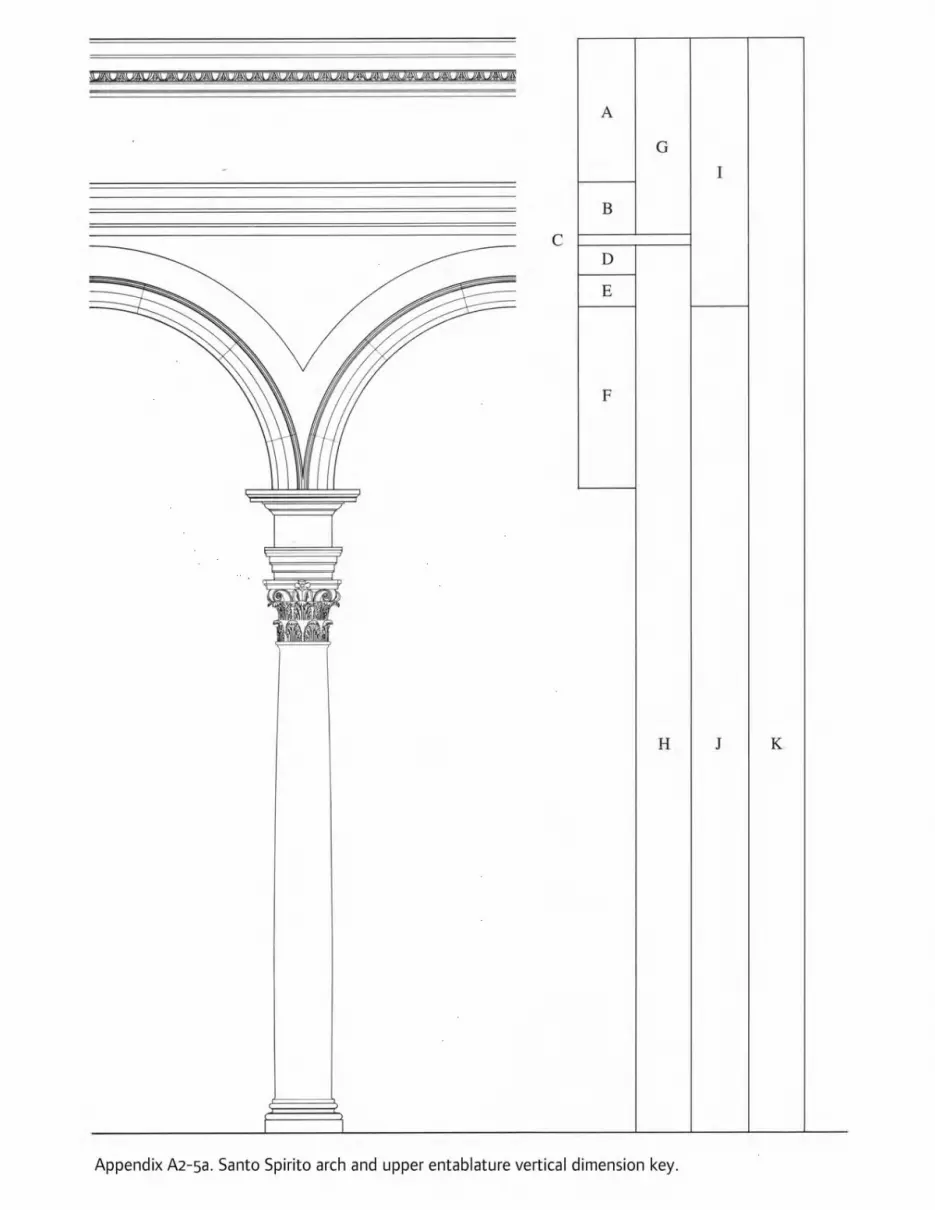
The surveys of the basilica of San Lorenzo, the Old Sacristy, and the basilica of Santo
Spirito, recorded by the author for this study, are the first comprehensive surveys of these
structures ever published, and perhaps ever recorded.1 The surveys are based on points of
measurement that correspond to the edges of clearly articulated components of the classical orders
and their subdivisions (points that usually correspond to the locations of masonry joints), those
points being likely to indicate the dimensions that the various capomaestri and masons responsible
for these buildings considered important. As a rule, these surveys always include the mortar joint
height with the element above it.
In order to minimize measurement error, the author worked alone whenever possible, using
the simplest possible measuring techniques (Figures 6-3 and 6-4). Basic equipment consisted of
steel tape measures manufactured by S.E.B., 80 cm levels, and a plumb line. For most vertical
measurements, the zero end of the tape measure was secured to the floor at the edge of the
column or pilaster plinth with a heavy weight. The measurement was then recorded from the
scaffolding by projecting the desired point horizontally from the masonry surface to the tape
measure, kept vertical with the plumb line. For upper entablature measurements, from the
scaffolding the zero end of the tape measure was raised to the desired points with a specially
adapted extendable pole, while an assistant recorded the measurements at the floor. The ceiling
heights were measured in July 2005 with a Leica Disto A5 laser measuring device.
The surveys are organized into a system of key diagrams and spread sheets rather than
traditional measured drawings, in order to make them easily retrievable and conducive to statistical
analysis. The organization of each survey follows the compositional structure of the building it
ii
documents. The compositional structure of San Lorenzo is rather complex and requires some
introduction. The basilica contains five types of vertical point supports (some of which are actually
structural, and others merely expressions of structure). The minor order contains the nave columns
and two types of pilasters, which I will term “floor pilasters” and “step pilasters.” The tops of all of
these minor order members align with the lower entablature circumscribing the basilica (see Figure
25). The positions of the bottoms of these members vary, however. While the bases and plinths of
the columns and floor pilasters stand on the nave floor, those of the step pilasters stand atop three
steps (see Figures 1 and 25). Thus, the shafts of the step pilasters are approximately 1 br. shorter
than those of the columns and floor pilasters. The major order contains the tall crossing pilasters,
half of which are “floor crossing pilasters,” and the rest “step crossing pilasters.” The nave arcades
contain only columns and floor pilasters. The nave arcade survey excerpted in Appendix 2 contains
three sets of measurements: 1) San Lorenzo Nave Arcade Bay Horizontal Measurements
(Intercolumniations), 2) San Lorenzo Column and Floor Pilaster Vertical Measurements, and 3) San
Lorenzo Column and Floor Pilaster Horizontal Measurements. Key diagrams corresponding to these
categories identify the various measurements recorded, and spread sheets contain the actual
measurements.
1 The most extensive previously published surveys of these structures are those of Stegmann and
Geymüller, 1: 10-19 and 27-35, which provide a scattering of measurements taken throughout each
structure. The term “comprehensive” here refers to the inclusion of every repeated instance of a
particular dimension, such as all nave column heights, rather than one representative dimension.


Matthew A. Cohen, Beyond Beauty: Reexamining Architectural Proportion through the Basilicas of San Lorenzo and Santo Spirito in Florence. Venice: Marsilio Editore, 2013.
Appendix A3: Statistical Analysis (Revised: 1 September 2014)
One of the underlying assumptions of Chapter 2 of this book is that all of the San Lorenzo nave
arcade bays were intended to be dimensionally identical. Since slight dimensional variations from one bay
to the next are inevitable, however, and greater variations are not uncommon, we face the problem of
identifying which bays to analyze as the most likely representations of the proportions that the masons
intended. Even after we eliminate the five easternmost bays of the nave from consideration (ten individual
nave arcade bays, five on each side) due to their notably lower quality of execution compared with the
westernmost three bays (see Figure 2-1; and pages 61-79), we are still left with six individual nave arcade
bays to choose from (three on each side). The most logical solution might seem to be to take the average
dimensions of all six bays. Proportional calculations based on averages, however, are mathematically
unreliable because they do not account for statistically significant conditions within the data, such as
systematic error, or wide dispersion of extremes. The next most logical solution might seem to be to select
one representative bay at random for analysis. By this approach, however, we would run the risk of
selecting the one bay that least accurately represents the intended proportions; or, conversely, the one
that best supports a particular hypothesis, thus potentially calling into question the objectivity of the
study.
Another problem presented by non-identical nave arcade bays is how to correlate two potential
irregularities: the degree of dimensional inconsistency from one bay to the next, and the degree of
imprecision with which particular proportions correspond to the nave arcade dimensions (see Criterion #1,
page 60). How closely, for example, must the proportion 1:√2 correspond to the true width-to-height
proportions of each nave arcade bay, individually, according to the points of measurement shown in Figure
2-2, for us to consider that proportion to be a likely reflection of the masons’ intentions? Since arbitrarily
established tolerances, such as, say, plus or minus 5%, undercut the mathematical advantages of recording
precise measurements in the first place, how can a correspondence between a particular proportion and the
actual dimensions be established in a mathematically reliable way?1
The best strategy for resolving these problems, albeit an imperfect one, is to turn to the science of
statistics. At the simplest level, statistics can be descriptive. Calculating the “standard deviation,” for
example, measures the dispersion of data relative to the mean. The lower the standard deviation, the more
closely clustered are the magnitudes of the measurements around the mean. We thus have a quantitative
basis for evaluating dimensional variations within a set of repeating dimensions. Our task at San Lorenzo,

ii
however, is not to describe the survey data per se, but to make inferences from them. Such inferences
involve uncertainties due to the unknown measurement and construction errors embedded in the data. Our
proportional analysis must therefore be expressed in the non-definitive terms of confidence, probability,
and ranges of values.
A computer spread sheet designed for this study provides a mechanism for quantitatively testing
proportional hypotheses.2 It does so by ruling out proportional values that do not fall within calculated
ranges, based on a confidence level that we choose. This spread sheet takes into account assumed
estimates for construction and measurement error, and thus provides the most accurate possible estimates
of the nave arcade bay proportions in light of the bay to bay dimensional variations revealed by my
survey.3 The use of this spread sheet has two notable limitations in a study of architectural proportion.
First, the numbers of nave arcade bays that we can examine at San Lorenzo—fourteen, if we consider the
full nave, or six, if we consider only the earlier, more dimensionally consistent construction phase—are not
truly statistical populations. Ideally, hundreds or thousands of repeating elements should be analyzed.
Second, statistical analysis is best applied to data that is not subject to the whims of human nature.
Variations in mass produced machine tool dimensions, for example, would be more conducive to statistical
analysis than six (or fourteen) column heights, which might exhibit variation simply because an otherwise
careful mason happened to be having a bad day. Nevertheless, the computer analysis presented here is
useful when treated as one component in a range of documentary and observation-based historical
evidence.
Let us consider an example of how the statistical spread sheet works. In Chapter 2, I note that a
dual diagon can be inscribed within each nave arcade bay, measured plinth-to-plinth in width, and from
the floor to the tops of the entablature blocks in height (Figure 2-3). How closely does this dual diagon
conform to the measurements? The spread sheet requires that we enter all the height and width
measurements of interest into the “numerator” and “denominator” cells, and that we choose a “confidence
level” (Appendix A3-1a).4 It then calculates the standard deviation for all the width and all the height
measurements of the bays, and uses these deviations, in turn, to calculate an upper and lower limit of a
“probable proportion range” for the intended width-by-height proportion of the bays. The proportions
that fall outside this range are the ones most likely not to have been intended by the masons. (For
mathematical reasons, it would not be technically correct to say that the proportions that fall inside the
probable proportion range are those most likely intended by the masons.)5 The greater the confidence
level, the farther apart the limits of the probable proportion range will be. In other words, the more
iii
certainty we demand of our findings, the broader will be the range of proportions that we will have to
consider. Statisticians typically choose a confidence level of 95%.
Let us first analyze the dual diagon hypothesis based on the measurements from all sixteen nave
arcade bays. We enter the plinth to plinth distances and total order heights into the appropriate cells and,
based on a confidence level of 95%, the spread sheet calculates a confidence interval of 1:1.812 to 1:1.827
(Appendix A3-1a). Since the dual diagon proportion, 1:1.828… (or, 2√2-1), falls outside this range (albeit
just barely), we may state with 95% certainty that the spread sheet has rejected this proportion, and
therefore, that the masons did not intend to use it here. Of course, there is a 5% chance that the results of
this calculation are incorrect—i.e., that the masons intended this proportion after all. We cannot eliminate
this uncertainty. If we enter a higher confidence level into the spread sheet, say, 99%, the probable
proportion range increases to 1.809 to 1.830 (Appendix A3-1b). The dual diagon proportion now falls inside
the interval, but so do many others; and due to this greater inclusiveness, the test becomes less effective
at screening out the proportions the masons did not intend. Clearly, the more proportions that fall outside
the probable proportion range, the better—provided, of course, that intentional proportions exist in the
nave arcade bays at all. In short, we need to maximize our certainty (confidence level), while minimizing
the range of possible proportions (probable proportion range). In this effort, our observations regarding
the construction history of the nave arcades provide a significant advantage.
A mediator between the confidence level and the probable proportion range is the standard
deviation. Generally, the lower the standard deviation, the narrower the probable proportion range for a
given confidence level will be. Thus, had the masons built the basilica of San Lorenzo with greater care, the
dimensional irregularities would presumably have been fewer and smaller, the standard deviation lower,
and the probable proportion range narrower relative to the confidence level. We would therefore be able to
reject more proportions as candidates for the ones the masons intended, within 95% confidence (if that is
the confidence level we choose). Although we cannot go back in time and implore the masons to be more
careful, we can reduce the standard deviation by limiting our data to the measurements of the more
carefully constructed western portion of the nave (see pages 61-79).
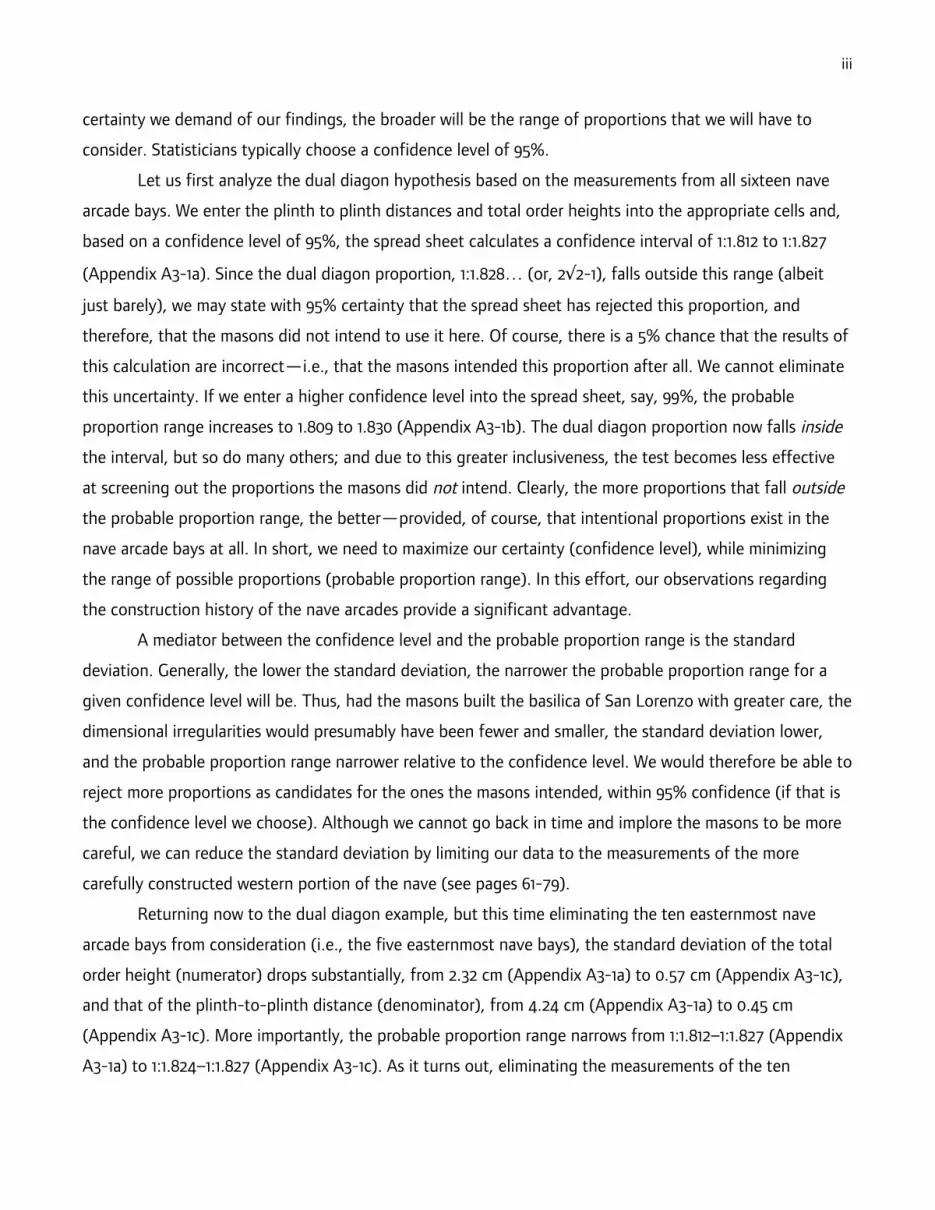
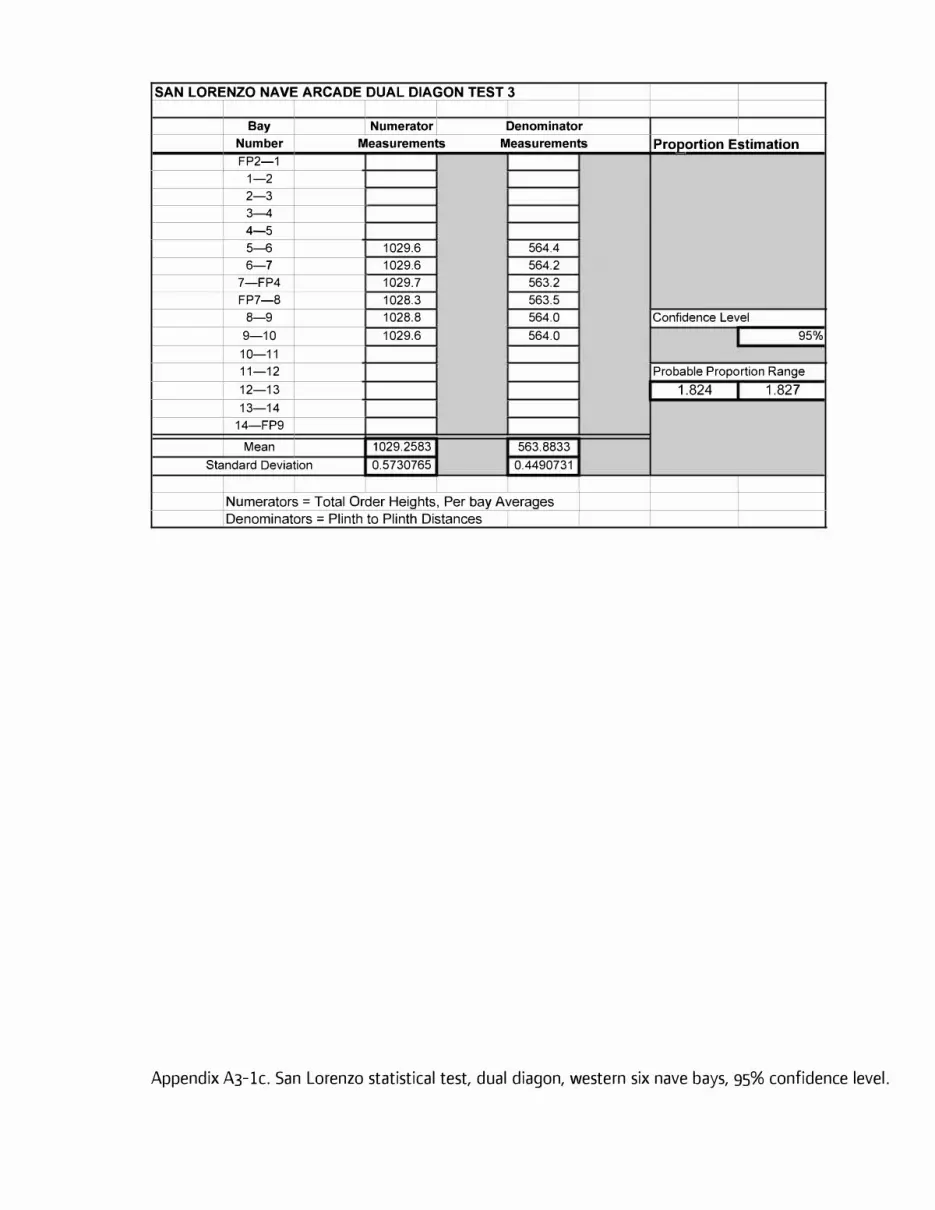
Returning now to the dual diagon example, but this time eliminating the ten easternmost nave
arcade bays from consideration (i.e., the five easternmost nave bays), the standard deviation of the total
order height (numerator) drops substantially, from 2.32 cm (Appendix A3-1a) to 0.57 cm (Appendix A3-1c),
and that of the plinth-to-plinth distance (denominator), from 4.24 cm (Appendix A3-1a) to 0.45 cm
(Appendix A3-1c). More importantly, the probable proportion range narrows from 1:1.812–1:1.827 (Appendix
A3-1a) to 1:1.824–1:1.827 (Appendix A3-1c). As it turns out, eliminating the measurements of the ten

iv
easternmost nave arcade bays does not affect the upper limit of the probable proportion range, which
remains at 1:1.827 (Appendix A3-1c). Thus, with the confidence level maintained at 95%, even these revised
spread sheet calculations reject the dual diagon proportion (albeit by a miniscule margin of 0.001). With
the confidence level increased to 99%, however, this proportion falls within the probable proportion range
(Appendix A3-1d), as it did when we considered the measurements of all sixteen nave arcade bays at this
confidence level (Appendix A3-1b). This time, however, the probable proportion range is more narrow, at
1:1.823—1: 1.828 (Appendix A3-1d). How are we to interpret these results?
First let us note that we are now dealing with exceedingly small tolerances. If each total order
height were to measure just 0.5 cm (0.05%) taller than it does at present, the dual diagon proportion
would fall within the confidence intervals in all four of the preceding tests. Such a small and consistent
insufficiency in the heights of the orders could be the result of mortar shrinkage. In each order there are
eight mortar joints (nine in the case of Col. 4; see Figure 2-6 and page 63), and each would have had to
shrink by slightly less than one millimeter to account for this shortfall—a reasonable estimate for mortar
joint shrinkage in medieval construction.6 Thus, for now let us simply consider the dual diagon hypothesis
to be a promising one, and defer final judgment of its merit until we have completed similar spread sheet
tests for the other proportions in the nave arcade bay that appear to be related to it both geometrically
and historically.
For our next spread sheet test, let us return to my first proportional observation (see pages 11 and
54), the comparison of the plinth to plinth distances in each nave arcade bay, measured first between the
nearer edges of adjacent column plinths, and then between the farther edges. Note that the measurements
of the two nave arcade bays nearest the crossing square cannot be included in this test because each
terminates with a pilaster on the west side (Fig. 2-50). Thus, the second plinth to plinth measurement in
question (taken between the farther edges of the column plinths) is not found in these bays. Based on the
measurements of the remaining four nave arcade bays that date to the earlier nave construction phase, we
find very low standard deviations of 0.17 cm. and 0.19 cm, and a probable proportion range of 1:1.413—
1:1.414 (Appendix A3-2a). This test result could not be more supportive of my root-2 rectangle hypothesis,
which calls for a proportion of 1:1.414… (1:√2).
When we next test how closely the height of a root-2 rectangle, inscribed between each pair of
adjacent column plinths, corresponds to the heights of the column shafts, however, the results are less
encouraging (Figure 2-2, center; and Appendix A3-2b). The standard deviations of approximately 0.5 cm.
indicate that the column shaft heights and intercolumniations were executed with great consistency from
one to the next, thus making ambiguous test results unlikely, and the very narrow probable proportion

v
range of 1:1.433—1:1.436 definitively excludes the root-2 rectangle proportion of 1:1.414… (1:√2) as an
accurate description of the proportions of the nave arcade bays, when measured plinth to plinth. Indeed,
the discrepancy in question represents approximately 11-12 cm of excess column shaft height, which is quite
substantial when we observe that the maximum height difference between any two column shafts within
the western six nave arcade bays is just 1.5 cm.7 When we next test how closely the height of a square,
constructed to touch the farther edges of adjacent column plinths, corresponds to the heights of the
column shafts (Figure 2-2), we obtain similar results. For a square, the upper and lower ends of the probable
proportion range should both be 1 (reflecting the ratio 1:1). Instead, both again indicate excess column shaft
heights of approximately 11-12 cm.
The tests described above help to reveal the intentions of the masons, but not necessarily of the
architect. Since the masons were capable of making all the column shafts consistent in height within 1.5 cm
from one to the next, we may assume that they were equally capable of making each column shaft
conform to the height they intended within the same tolerance. From the preceding tests and other
considerations, therefore, we may conclude that the masons intended to construct the present dual diagon
proportion in each nave arcade bay (Figure 2-3), which we have seen was built with an error of only 1 mm;
and that they intended to construct the present flawless 1:√2 relationship in the distances between the
nearer and farther edges of adjacent column plinths in each bay (though they may not have understood
this relationship in terms of this ratio). We may also assume that they intended neither the root-2 rectangle
nor the square shown in Figure 2-2.
We need not come to the same conclusion with regard to the architect’s intentions, however.
Statistical analysis is a tool, not a final, tyrannical arbiter. I have argued in Chapter 2 that the masons’
intentions were based on incorrect information or assumptions (see pages 104-111), and thus, that the
present column shaft and entablature block heights must be considered to be at variance with the
architect’s intentions. The preceding statistical analysis has shown that what the masons built, they built
with great precision. In the case of the column shaft heights, that precision appears to have been guided
by incorrect information about the dimensions (and thus the proportions) that the architect intended.
Statistical analysis cannot tell us what proportions the architect intended; it can only tell us with 95%
certainty what the masons built. Statistical analysis is but one of several tools that I have applied to the
study of the architectural proportional systems of the basilica of San Lorenzo. Spread sheets provide data,
but are incapable of providing historical analysis. Thus Criterion #1 of my methodology (see page 60) allows
me to propose that certain proportions rejected by the spread sheets might nevertheless reflect the

vi
architect’s intentions, as long as some convincing historical explanation for the dimensional discrepancies
can be provided. I have proposed such an explanation on pages 104-111.

vii
1 See, for example, the following arbitrary tolerances established by Saalman: “Any suggested proportional
relationship must be demonstrable in carefully surveyed measurements of the buildings involved, with a
tolerance of no more than 15 cm in large dimensions and no tolerance at all in small dimensions. A small
margin of error in laying out or surveying dimensions from 5 to 40 metres cannot be excluded. In
dimensions up to 2 metres no tolerance is permissible. Between 2 and 5 metres discrepancies of perhaps 2
cm may be allowed.” Saalman, Filippo Brunelleschi: The Buildings, 361. 2 The spread sheet program was designed by James E. Georges of Statistics Unlimited, Inc., formerly of
Wellesley Hills, Massachusetts. I thank Stephen Blyth for generously providing additional assistance. 3 The standard deviations give estimates of the combined measurement and construction error. If the
measurements are normally distributed, which is one of our assumptions, mathematicians typically assume
that 95% of all measurements will be within two standard deviations above and two standard deviations
below the mean. 4 Since each bay contains one width dimension—the “denominator”—but two height dimensions (because
there are two columns), I have entered the average total order height (column + entablature block) for
each bay as the numerator. Taking the average is a simple way to split the difference between these two
heights, and does not present the mathematical problems that an average of a larger number of
dimensions would, as noted above. 5 The spread sheet formulae are as follows: For the mean of both numerator and denominator:
=AVERAGE(R[-15]C:R[-2]C); for the standard deviation of both numerator and denominator: = STDEV(R[-
16]C:R[-3]C); for the lower limit of the probable proportion range: =(-B-SQRT(B^2-4*A*C_))/2/A; and for
the upper limit of the probable proportion range: (-B+SQRT(B^2-4*A*C_))/2/A. 6 Fitchen, Building Construction Before Mechanization, 80. 7 This approximately 11-12 cm discrepancy has been calculated as follows: the mean plinth to plinth
dimension, 563.883 cm, was multiplied by the hypothetical ratio of 1:√2 (i.e., 1.414...), to obtain a
hypothetical column shaft height of 797.331 cm. This figure is then subtracted from the heights of both the
shortest and tallest column shafts in the nave, respectively, those being the shaft of Column 8, which
measures 808.0 cm high, and the shaft of Column 10, which measures 809.5 cm high (note the 1.5 cm.
height difference between them).


SAN LORENZO NAVE ARCADE DUAL DIAGON TEST 3
Bay Numerator Denominator
Number Measurements Measurements Proportion Estimation FP2-1
1-2
2-3
3-4
4-5
5-6 1029.6 564.4
6-7 1029.6 564.2
7-FP4 1029.7 563.2
FP7-8 1028.3 563.5
8-9 1028.8 564.0 Confidence Level
9-10 1029.6 564.0 95%
10-11
11-12 Probable Proportion Range
12-13 1.824 1.827
13-14
14-FP9
Mean 1029.2583 563.8833
Standard Deviation 0.5730765 0.4490731
Numerators = Total Order Heights, Per bay Averages
Denominators = Plinth to Plinth Distances
Appendix A3-1c. San Lorenzo statistical test, dual diagon, western six nave bays, 95% confidence level.

SAN LORENZO NAVE ARCADE DUAL DIAGON TEST 4
Bay Numerator Denominator
Number Measurements Measurements Proportion Estimation FP2-1
1-2
2-3
3-4
4-5
5-6 1029.6 564.4
6-7 1029.6 564.2
7-FP4 1029.7 563.2
FP7-8 1028.3 563.5
8-9 1028.8 564.0 Confidence Level
9-10 1029.6 564.0 99%
10-11
11-12 Probable Proportion Range
12-13 1.823 1.828
13-14
14-FP9
Mean 1029.2583 563.8833
Standard Deviation 0.5730765 0.4490731
Numerators = Total Order Heights, Per Bay Averages
Denominators = Plinth to Plinth Distances
Appendix A3-1d. San Lorenzo statistical test, dual diagon, western six nave bays, 99% confidence level.

SAN LORENZO NAVE ARCADE PLINTH TO PLINTH DIMENSION TEST
Bay Numerator Denominator
Number Measurements Measurements Proportion Estimation
FP2-1 1-22-33--4 4-55-6 797.9 564.4 6-7 797.6 564.2
7-FP4 FP7-8
8-9 797.7 564.0 Proportion Probability 9-10 797.5 564.0 I 95%
10-11 11-12 Probable Proportion Range 12-13 1.413 1.414 13-14
14-FP9Mean I 797.675 564.150
Standard Deviation 0.171 0.191
Numerator = Plinth to Plinth Distance, Farther Edges Denominator = Plinth to Plinth Distance, Nearer Edges (Note: -v2 = 1.414 ... )
Appendix A3-2a. San Lorenzo statistical test, plinth to plinth distances between nearer and
farther edges of adjacent column plinths, western six nave bays, 95% confidence level.

SAN LORENZO NAVE ARCADE ROOT-2 RECTANGLE TEST
Bay Numerator Denominator
Number Measurements Measurements Proportion Estimation FP2-1
1-2
2-3
3-4
4-5
5-6 809.2 564.4
6-7 809.1 564.2
7-FP4 808.9 563.2
FP7-8 807.8 563.5
8-9 808.7 564.0 Confidence Level
9-10 809.5 564.0 95%
10-11
11-12 Probable Proportion Range
12-13 1.433 1.436
13-14
14-FP9
Mean 808.842 563.883
Standard Deviation 0.591 0.449
Numerator = Column Shaft Height, Average Per Bay Denominator= Plinth to Plinth Distance (Nearer Edges) (Note: '1/2 = 1.414 ... )
Appendix A3-2b. San Lorenzo statistical test, root-2 rectangle inscribed between adjacent column
plinths and to the tops of the column shafts, western six nave bays, 95% confidence level.