Embed Size (px)
Citation preview

Appendices F: Conference Handbook

1
APEC綠能融資能力建構研討會
Conference on APEC Green Energy Finance Capacity Building
會場:集思交通部國際會議中心 3F國際會議廳
Venue: 3F, International Conference Room, GIS MOTC Convention Center
時間:2017年 9月 28至 29日
Time:28-29 September, 2017
第一日(9/28)
Day One, 28 September
時間
Time
議程
Agenda
08:30~09:00 報到
Registration
09:00~09:10
開幕致詞
Opening Remarks
主講者:經濟部主任秘書陳怡鈴女士
Speaker: Ms. Yi-Ling Chen, Chief Secretary, Ministry of Economic
Affairs
09:10~09:25 團體合照
Group Photos
專題演講:全球氣候變遷行動與克服融資挑戰
Keynote Speech: Global Climate Change Actions and Overcoming Financing
Barriers
09:25~09:45
主講者:經濟合作暨發展組織環境局綠色金融及投資部門資深政策分
析師 Hideki Takada先生
Speaker: Mr. Hideki Takada, Senior Policy Analyst, Green Finance and
Investment, Environment Directorate, Organisation for Economic
Co-operation and Development
專題演講:2017世界能源投資報告
Keynote Speech: World Energy Investment 2017
09:45~10:05
主講者:國際能源總署經濟與投資辦公室能源投資分析師 Michael
Waldron
Speaker: Mr. Michael Waldron, Energy Investment Analyst, Economics
and Investment Office, International Energy Agency
場次一:全球綠能市場發展及融資趨勢
Session I : Global Trends in Green Energy Market Development and Financing
2
10:05~10:10
主持人:經濟合作暨發展組織環境局綠色金融及投資部門資深政策分
析師 Hideki Takada先生
Moderator: Mr. Hideki Takada, Senior Policy Analyst, Green Finance and
Investment, Environment Directorate, Organisation for Economic
Co-operation and Development
10:10~10:30
I-1.G20集團能源效率投資工具
1-1.G20 Energy Efficiency Investment Toolkit
主講者:國際能效合作夥伴關係組織計畫主任 Ailin Huang女士
Speaker: Ms. Ailin Huang, Programme Officer, International
Partnership for Energy Efficiency Cooperation
10:30~10:50 茶敘
Coffee Break
10:50~11:10
I-2.清潔能源轉型
I-2.The Clean Energy Transition
主講者:彭博新能源金融亞太區主管 Justin Wu先生
Speaker: Mr. Justin Wu, Head, Asia-Pacific, Bloomberg New Energy
Finance
11:10~11:30
I-3.亞太地區能源趨勢
I-3.Energy Trends in APEC
主講者:亞太能源研究中心研究員 Kirsten Smith女士
Speaker: Ms. Kirsten Smith, Researcher, Asia Pacific Energy Research
Centre
11:30~12:00 綜合討論
Panel Discussion
12:00~13:00 午餐
Lunch
場次二:促進綠能融資發展
Session II: Facilitating Green Energy Finance
13:00~13:05
主持人:國際能源總署資深能源投資分析師 Michael Waldron先生
Moderator: Mr. Michael Waldron, Energy Investment Analyst, Economics
and Investment Office, International Energy Agency
13:05~13:25
II-1.擴展能源效率投資
II-1.Scaling up Investments in Energy Efficiency
主講者:亞洲開發銀行東亞部門東亞能源處資深金融專家(能源)
Jennifer Romero- Torres女士
Speaker: Ms. Jennifer Romero- Torres, Senior Finance Specialist
(Energy), East Asia Energy Division, East Asia Regional Department,
Asian Development Bank
13:25~13:45 II-2.加速綠能融資—風險管理及財務模型
3
II-2.Facilitating Green Energy Finance – Risk Management and
Financial Modelling
主講者:麥格里銀行綠色投資群董事總經理Peter Knott先生
Speaker: Mr. Peter Knott, Managing Director, Green Investment Group,
Macquarie Capital
13:45~14:15 綜合討論
Panel Discussion
14: 15~14:35 茶敘
Coffee Break
場次三:能源效率融資專案最佳作業分享
Session III: Best Practices in Energy Efficiency Financing
14:35~14:40
主持人:國際能效合作夥伴關係組織計畫主任 Ailin Huang女士
Moderator: Ms. Ailin Huang, Programme Officer, International
Partnership for Energy Efficiency Cooperation
14:40~15:00
III-1.韓國優惠貸款(能源使用合理化基金)
III-1.Korea Soft Loan (Energy Use Rationalization Funds)
主講者:韓國能源局財政支持部門副理 Seulgi Cho女士
Speaker: Ms. Seulgi Cho, Assistant Manager, Finance Support Division,
Korea Energy Agency, Korea
15:00~15:20
III-2.韓國的能源服務業
III-2.ESCO Program in Korea
主講者:韓國能源局財政支持部門能源服務業組長 Dongwook Cho先
生
Speaker: Mr. Dongwook Cho, ESCO Team Manager, Finance Support
Division, Korea Energy Agency, Korea
15:20~15:40
III-3.美國聯邦與州政府的能源效率相關政策及技術
III-3.US Federal and State-Based Energy Policy and Technology in
Regards to Energy Efficiency
主講者:美國加州大學柏克萊分校加州能源及環境學院資深顧問
Terry Surles博士
Speaker: Dr. Terry Surles, Senior Advisor, California Institute of Energy
and Environment, University of California/Berkeley, The United States
15:40~16:10
綜合討論
Panel Discussion
與談人
Panelists:
主講會員體代表
Presenting APEC Economies Delegates
4
第二日(9/29)
Day Two, 29 September
時間
Time
議程
Agenda
09:00~09:30 報到
Registration
專題演講:東協綠能源發展目標與合作概況
Keynote Speech: Green Energy Target and Cooperation in ASEAN
09:30~09:50
主講者:東協與東亞經濟研究院能源單位資深經濟學家
Venkatachalam Anbumozhi博士
Speakers: Dr. Venkatachalam Anbumozhi, Senior Economist, Energy
Unit, Economic Research Institute for ASEAN and East Asia
場次四:再生能源融資專案最佳作業分享
Session IV: Best Practices in Renewable Energy Financing
09:50~09:55
主持人:東協與東亞經濟研究院能源單位資深經濟學家
Venkatachalam Anbumozhi博士
Moderator: Dr. Venkatachalam Anbumozhi, Senior Economist, Energy
Unit, Economic Research Institute for ASEAN and East Asia
09:55~10:15
IV-1.再生能源融資專案最佳作業分享:智利案例
IV-1.Best Practices in Renewable Energy Financing: The Chilean
Case
主講者:智利能源部能源基礎建設部門主任 Diego Valenzuela先生
Speaker: Mr. Diego Valenzuela, Head of Unit, Energy Infrastructure
Division, Ministry of Energy, Chile
10:15~10:35
IV-2.基礎建設基金市場
IV-2.Listed Infrastructure Fund Market
主講者:日本東京證券交易所新上市證券推廣部門副總裁 Takumi
Hayase先生
Speaker: Mr. Takumi Hayase, Vice President, New Listing Promotion
Dept., Tokyo Stock Exchange, Inc., Japan
10:35~10:55
IV-3.再生能源融資專案最佳作業分享
IV-3.Best Practices in Renewable Energy Financing
主講者:馬來西亞生物質公會聯合會主席拿督梁健文先生
Speaker: Dato’ Leong Kin Mun, President, Malaysia Biomass Industries
Confederation, Malaysia
10:55~11:15 茶敘
Coffee Break
11:15~11:35 IV-4.再生能源融資專案最佳作業-新加坡之觀點
5
IV-4.Best Practices in Renewable Energy Financing–A Singaporean
Perspective
主講者:新加坡國立大學新加坡太陽能研究所研究員 Monika Bieri女
士
Speaker: Ms. Monika Bieri, Research Associate, Solar Energy Research
Institute of Singapore, National University of Singapore, Singapore
11:35~11:55
IV-5.再生能源目標及推動方案
IV-5.Renewable Energy Target and Promotion Program
主講者:中華台北台灣金融研訓院彭勝本副研究員
Speaker: Mr. Peng, Sheng-Pen, Associate Research Fellow, Taiwan
Academy of Banking and Finance, Chinese Taipei
11:55~13:00 午餐
Lunch
13:00~13:20
IV-6.泰國再生能源融資專案最佳作業
IV-6.Best Practices in Renewable Energy Financing in Thailand
主講者:泰國能源部替代能源發展與效率部門資深科學家 Sutthasini
Glawgitigul女士
Speaker: Ms. Sutthasini Glawgitigul, Senior Professional Scientist,
Department of Alternative Energy and Efficiency, Ministry of Energy,
Thailand
13:20~13:40
IV-7.美國聯邦與州政府的再生能源相關政策及技術
IV-7.US Federal and State-Based Energy Policy and Technology in
Regards to Renewable Energy
主講者:美國加州大學柏克萊分校加州能源與環境學院資深顧問
Terry Surles博士
Speaker: Dr. Terry Surles, Senior Advisor, California Institute of Energy
and Environment, University of California/Berkeley, The United States
13:40~14:40
綜合討論
Panel Discussion
與談人
Panelists:
主講會員體代表
Presenting APEC Economies Delegates
14:40~15:00 茶敘
Coffee Break
場次五:透過 APEC區域合作促進綠能融資發展
Session V: Accelerating Green Energy Finance through Regional Cooperation in
APEC
15:00~15:05 主持人:APEC能源工作組主席陳炯曉博士
6
Moderator: Dr. Jyuung-Shiauu Chern, Lead Shepherd, APEC Energy
Working Group
15:05~16:05
圓桌論壇
Round Table
與談人:
Panelists:
東協與東亞經濟研究院能源單位資深經濟學家Venkatachalam
Anbumozhi博士
Dr. Venkatachalam Anbumozhi, Senior Economist, Energy Unit,
Economic Research Institute for ASEAN and East Asia
國際能源總署經濟與投資辦公室能源投資分析師Michael
Waldron先生
Mr. Michael Waldron, Energy Investment Analyst, Economics and
Investment Office, International Energy Agency
麥格里銀行綠色投資群董事總經理Peter Knott先生
Mr. Peter Knott, Managing Director, Green Investment Group,
Macquarie Capital
經濟合作暨發展組織環境局綠色金融及投資部門資深政策分析
師 Hideki Takada先生
Mr. Hideki Takada, Senior Policy Analyst, Green Finance and
Investment, Environment Directorate, Organisation for Economic
Co-operation and Development
智利能源部能源基礎建設部門主任 Diego Valenzuela先生
Mr. Diego Valenzuela, Unit Chief, Energy Infrastructure Division,
Ministry of Energy, Chile
美國加州大學柏克萊分校加州能源及環境學院資深顧問 Terry
Surles博士
Dr. Terry Surles, Senior Advisor, California Institute of Energy and
Environment, University of California/Berkeley, The United States
16:05~16:10
閉幕致詞
Closing Remarks
主講者:經濟部能源局主任秘書蘇金勝先生
Speaker: Mr. Jin-Sheng Su, Chief Secretary, Bureau of Energy, Ministry
of Economic Affairs
Keynote Speech:
Global Climate Change Actions and Overcoming Financing Barriers

Biography
Hideki TAKADA (Mr.)
Mr. Hideki Takada works as a Senior Policy Analyst on green finance in the
Environment Directorate at OECD since July 2015.
Mr. Takada is seconded from Japanese Ministry of Finance which he joined in 1995. He
has had a wide range of experience in policy-making at the heart of the government including
public finance, tax, trade policies and financial services. During over 20 years of his career he
spent 5 years in the UK: study at Cambridge and LSE (1997-99), and secondment to HM
Treasury (the UK finance ministry, 2003-06) where he worked on financial regulation,
investment market policies and public spending.
In 2009, he became the first staff of the newly created National Policy Unit and worked
in the Prime Minister’s Office and the Cabinet Secretariat as an architect of the new public
finance framework and as a private advisor to the Prime Minister. His latest position in
Tokyo which he held until 2015 was the Director of Public Relations, in charge of
management of external communications of the Ministry of Finance.
Mr. Takada received a Bachelor degree in Law (University of Tokyo), a Master degree
in Law (Cambridge University) and an MBA (Imperial College London).

Global Climate Change Actions and Overcoming Financing Barriers
This presentation represents the views of the author alone and does not necessarily represent views of the OECD or its member countries.
28 September 2017
Hideki TakadaSenior Policy AnalystGreen FinanceOrganisation for Economic Co-operation and [email protected]
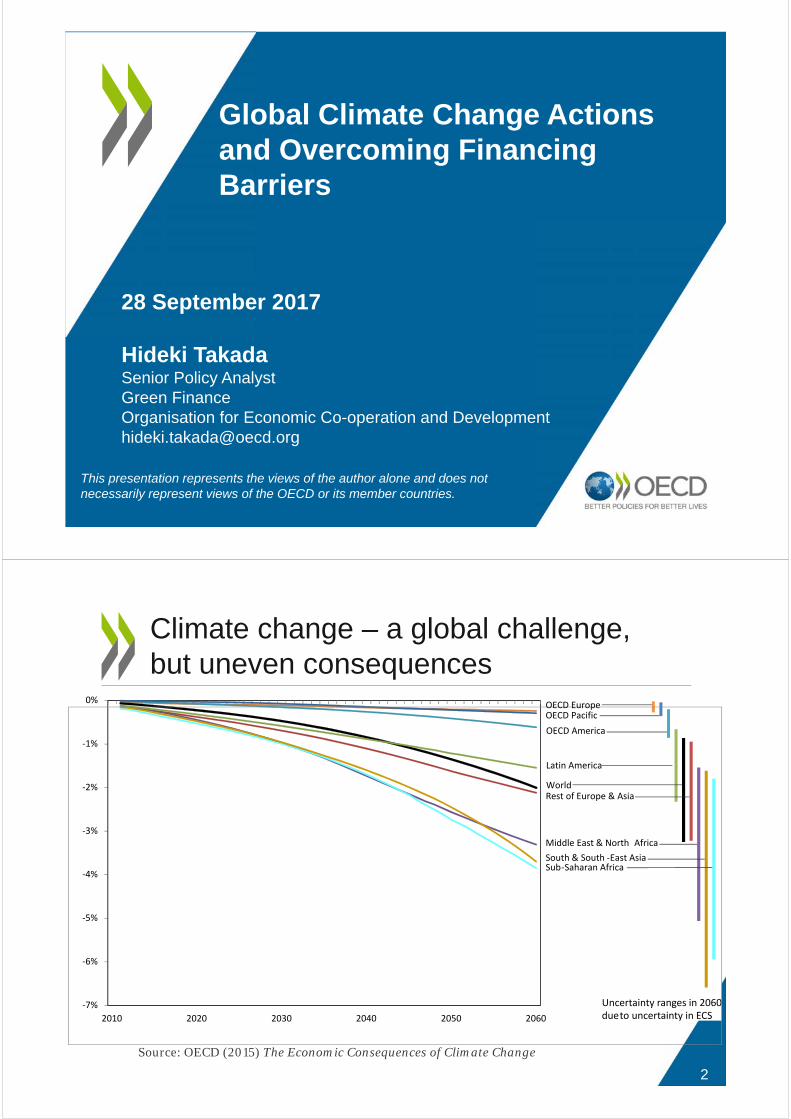
Climate change – a global challenge, but uneven consequences
2
Uncertainty ranges in 2060 dueto uncertainty in ECS
‐7%
‐6%
‐5%
‐4%
‐3%
‐2%
‐1%
0%
2010 2020 2030 2040 2050 2060
‐South & South East Asia
OECD Pacific
Rest of Europe & Asia
OECD Europe
Latin America
OECD America
World
‐Sub Saharan Africa
Middle East & North Africa
Source: OECD (2015) The Economic Consequences of Climate Change
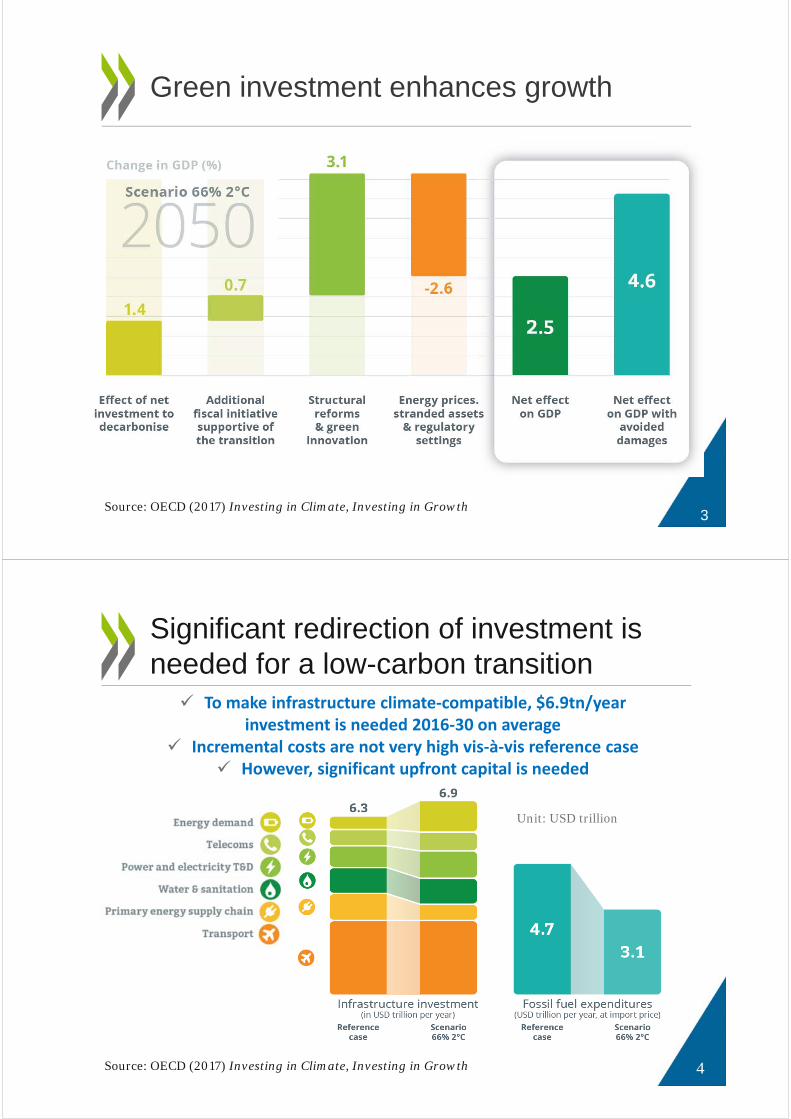
Green investment enhances growth
Source: OECD (2017) Investing in Climate, Investing in Growth3
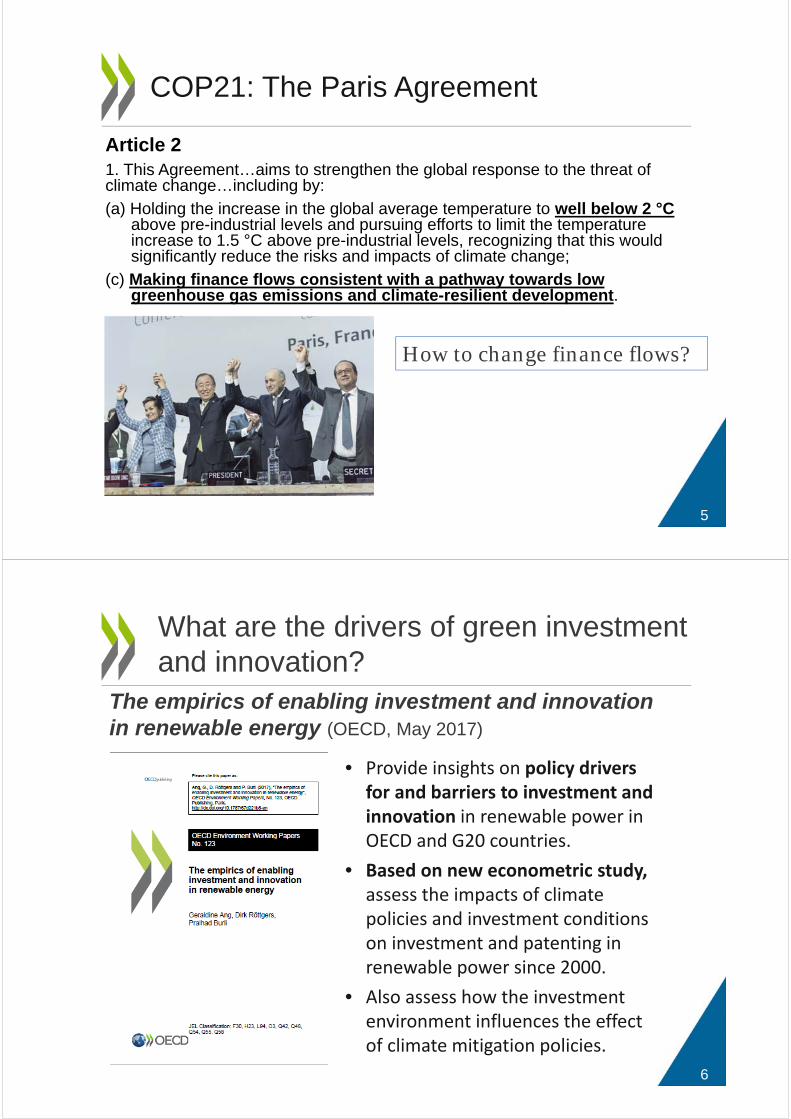
Significant redirection of investment is needed for a low-carbon transition
Source: OECD (2017) Investing in Climate, Investing in Growth 4
To make infrastructure climate‐compatible, $6.9tn/yearinvestment is needed 2016‐30 on average
Incremental costs are not very high vis‐à‐vis reference case However, significant upfront capital is needed
Unit: USD trillion
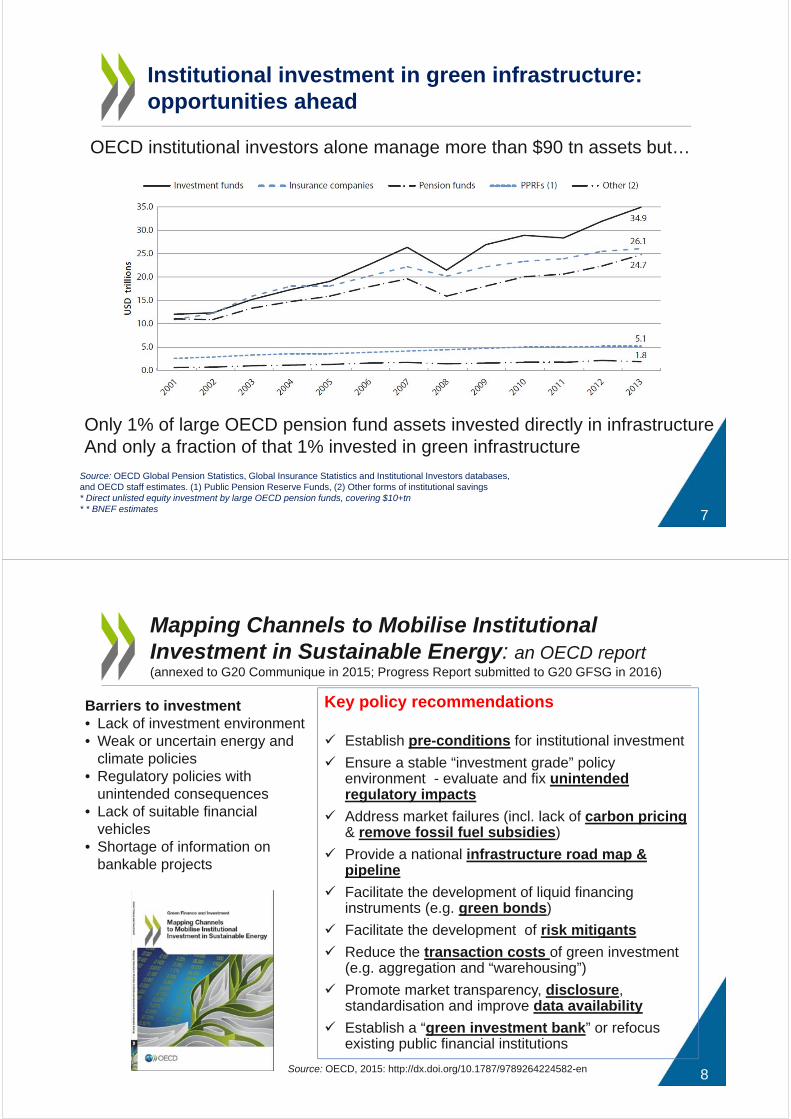
Article 2 1. This Agreement…aims to strengthen the global response to the threat of climate change…including by:
(a) Holding the increase in the global average temperature to well below 2 °C above pre-industrial levels and pursuing efforts to limit the temperature increase to 1.5 °C above pre-industrial levels, recognizing that this would significantly reduce the risks and impacts of climate change;
(c) Making finance flows consistent with a pathway towards low greenhouse gas emissions and climate-resilient development.
COP21: The Paris Agreement
How to change finance flows?
5
• Provide insights on policy drivers for and barriers to investment and innovation in renewable power in OECD and G20 countries.
• Based on new econometric study, assess the impacts of climate policies and investment conditions on investment and patenting in renewable power since 2000.
• Also assess how the investment environment influences the effect of climate mitigation policies.
What are the drivers of green investment and innovation?
The empirics of enabling investment and innovation in renewable energy (OECD, May 2017)
6
Institutional investment in green infrastructure:opportunities ahead
Source: OECD Global Pension Statistics, Global Insurance Statistics and Institutional Investors databases,and OECD staff estimates. (1) Public Pension Reserve Funds, (2) Other forms of institutional savings* Direct unlisted equity investment by large OECD pension funds, covering $10+tn* * BNEF estimates
Only 1% of large OECD pension fund assets invested directly in infrastructureAnd only a fraction of that 1% invested in green infrastructure
OECD institutional investors alone manage more than $90 tn assets but…
7
Mapping Channels to Mobilise Institutional Investment in Sustainable Energy: an OECD report (annexed to G20 Communique in 2015; Progress Report submitted to G20 GFSG in 2016)
Key policy recommendations
Establish pre-conditions for institutional investment
Ensure a stable “investment grade” policy environment - evaluate and fix unintended regulatory impacts
Address market failures (incl. lack of carbon pricing & remove fossil fuel subsidies)
Provide a national infrastructure road map & pipeline
Facilitate the development of liquid financing instruments (e.g. green bonds)
Facilitate the development of risk mitigants
Reduce the transaction costs of green investment (e.g. aggregation and “warehousing”)
Promote market transparency, disclosure, standardisation and improve data availability
Establish a “green investment bank” or refocus existing public financial institutions
Source: OECD, 2015: http://dx.doi.org/10.1787/9789264224582-en 8
Barriers to investment• Lack of investment environment• Weak or uncertain energy and
climate policies• Regulatory policies with
unintended consequences• Lack of suitable financial
vehicles• Shortage of information on
bankable projects
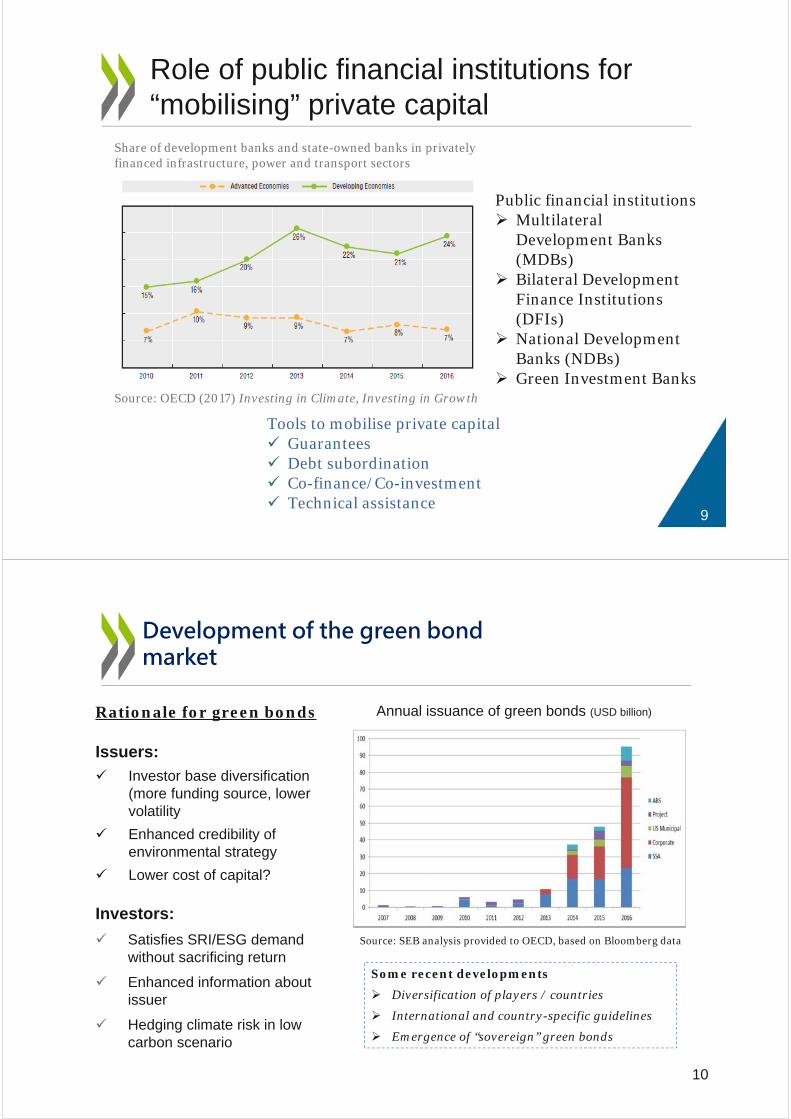
Role of public financial institutions for “mobilising” private capital
Share of development banks and state-owned banks in privately financed infrastructure, power and transport sectors
Source: OECD (2017) Investing in Climate, Investing in Growth
Public financial institutions Multilateral
Development Banks (MDBs)
Bilateral Development Finance Institutions (DFIs)
National Development Banks (NDBs)
Green Investment Banks
Tools to mobilise private capital Guarantees Debt subordination Co-finance/Co-investment Technical assistance
9
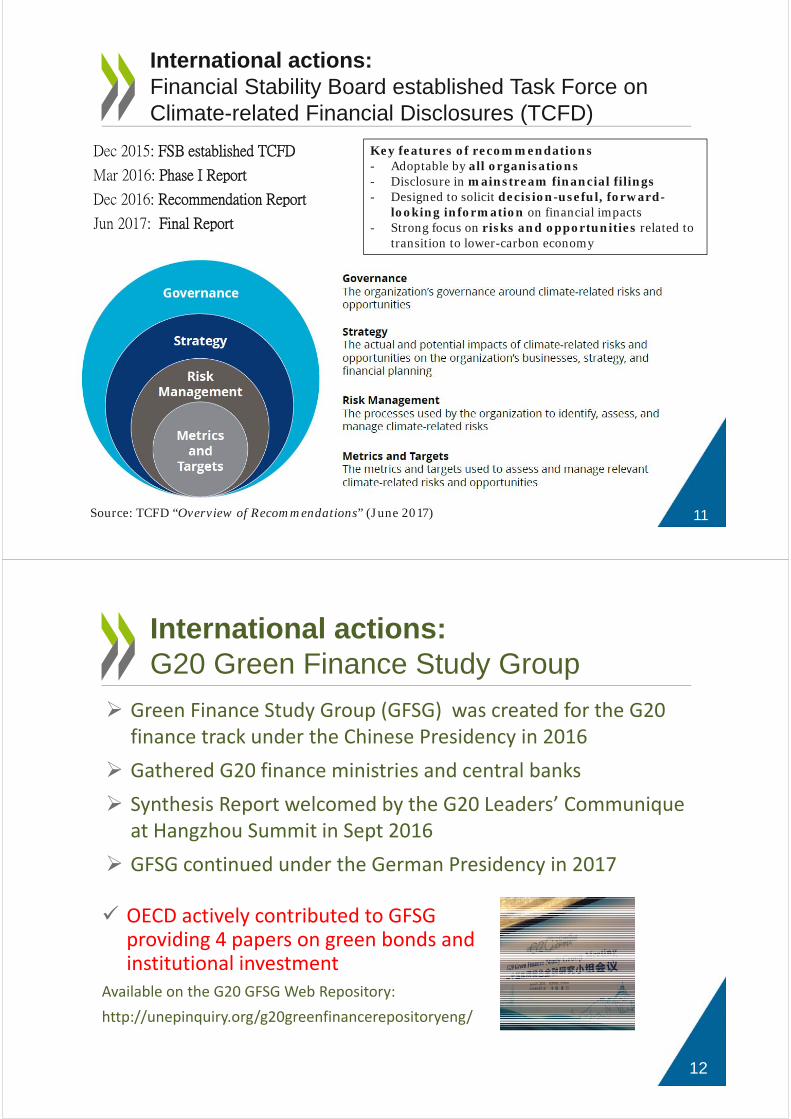
Development of the green bond market
Rationale for green bonds
Issuers:
Investor base diversification (more funding source, lower volatility
Enhanced credibility of environmental strategy
Lower cost of capital?
Investors:
Satisfies SRI/ESG demand without sacrificing return
Enhanced information about issuer
Hedging climate risk in low carbon scenario
Annual issuance of green bonds (USD billion)
Source: SEB analysis provided to OECD, based on Bloomberg data
Some recent developments
Diversification of players / countries
International and country-specific guidelines
Emergence of “sovereign” green bonds
10
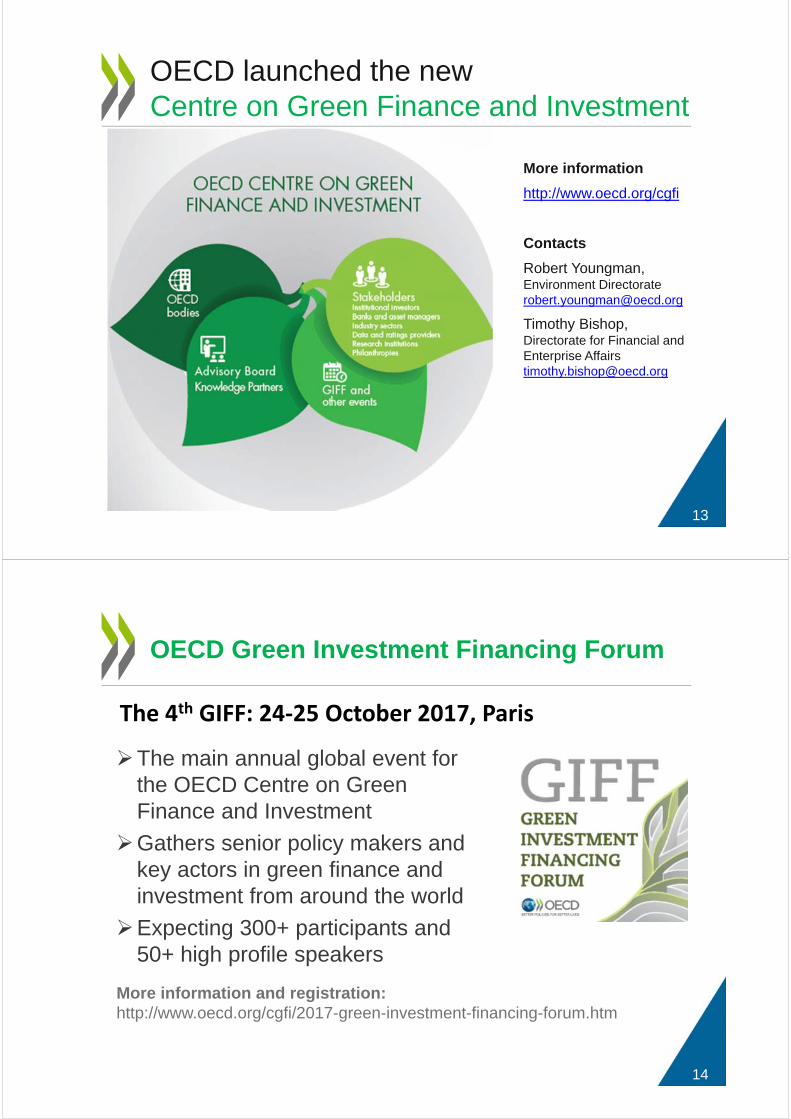
Dec 2015: FSB established TCFD
Mar 2016: Phase I Report
Dec 2016: Recommendation Report
Jun 2017: Final Report
International actions: Financial Stability Board established Task Force on Climate-related Financial Disclosures (TCFD)
Source: TCFD “Overview of Recommendations” (June 2017)
Key features of recommendations - Adoptable by all organisations- Disclosure in mainstream financial filings- Designed to solicit decision-useful, forward-
looking information on financial impacts- Strong focus on risks and opportunities related to
transition to lower-carbon economy
11
Green Finance Study Group (GFSG) was created for the G20 finance track under the Chinese Presidency in 2016
Gathered G20 finance ministries and central banks
Synthesis Report welcomed by the G20 Leaders’ Communique at Hangzhou Summit in Sept 2016
GFSG continued under the German Presidency in 2017
12
International actions:G20 Green Finance Study Group
OECD actively contributed to GFSG providing 4 papers on green bonds and institutional investment
Available on the G20 GFSG Web Repository:
http://unepinquiry.org/g20greenfinancerepositoryeng/
More information
http://www.oecd.org/cgfi
Contacts
Robert Youngman, Environment Directorate [email protected]
Timothy Bishop, Directorate for Financial and Enterprise Affairs [email protected]
OECD launched the new Centre on Green Finance and Investment
13
OECD Green Investment Financing Forum
The main annual global event for the OECD Centre on Green Finance and Investment
Gathers senior policy makers and key actors in green finance and investment from around the world
Expecting 300+ participants and 50+ high profile speakers
More information and registration:http://www.oecd.org/cgfi/2017-green-investment-financing-forum.htm
The 4th GIFF: 24‐25 October 2017, Paris
14

Keynote Speech:
World Energy Investment 2017

Mr Michael Waldron is an energy investment analyst in the Economics and Investment
Office of the International Energy Agency. He is currently the project co-manager and one of
the lead authors of the IEA World Energy Investment report, which assesses investment
trends across the energy sector. He was previously the project leader and lead author of the
IEA’s Medium-Term Renewable Energy Market Report, which analyzes market trends of
renewables in the electricity, transport and heat sectors. At the IEA he has also worked as an
oil demand and biofuels analyst. Prior to joining the IEA, Mr Waldron worked as a senior
energy markets analyst at Lehman Brothers in New York and London. Mr Waldron obtained
his Masters in International Energy Policy & International Economics at Johns Hopkins
University, School of Advanced International Studies (SAIS) and his Bachelors degree in
Economics & Government at Cornell University.

IEA© OECD/IEA 2017
World Energy Investment 2017
APEC Conference on Green Energy Finance Capacity Building, September 2017
Michael Waldron, Economics and Investment Office
0
250
500
750
1 000
USD
(2016) billion
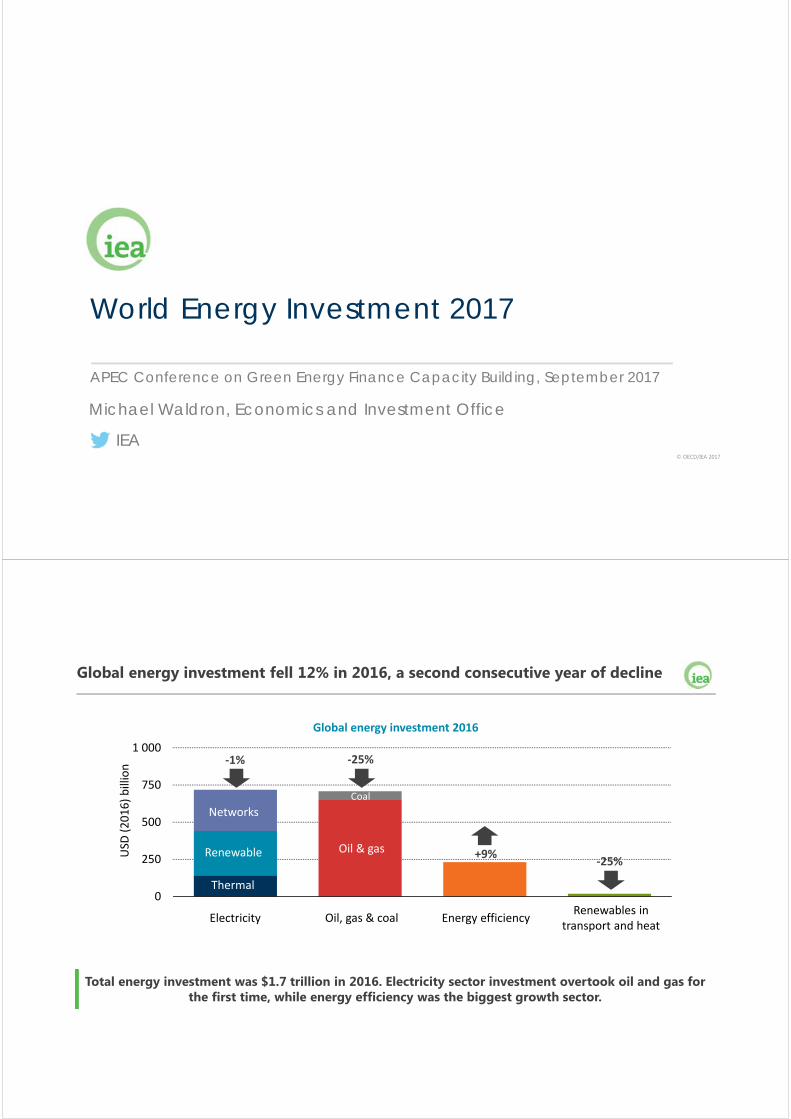
Global energy investment fell 12% in 2016, a second consecutive year of decline
Total energy investment was $1.7 trillion in 2016. Electricity sector investment overtook oil and gas for the first time, while energy efficiency was the biggest growth sector.
Global energy investment 2016
‐25%‐1%
+9%
Networks
Renewable
Thermal
Oil & gas
Coal
Electricity Oil, gas & coalRenewables in
transport and heatEnergy efficiency
‐25%
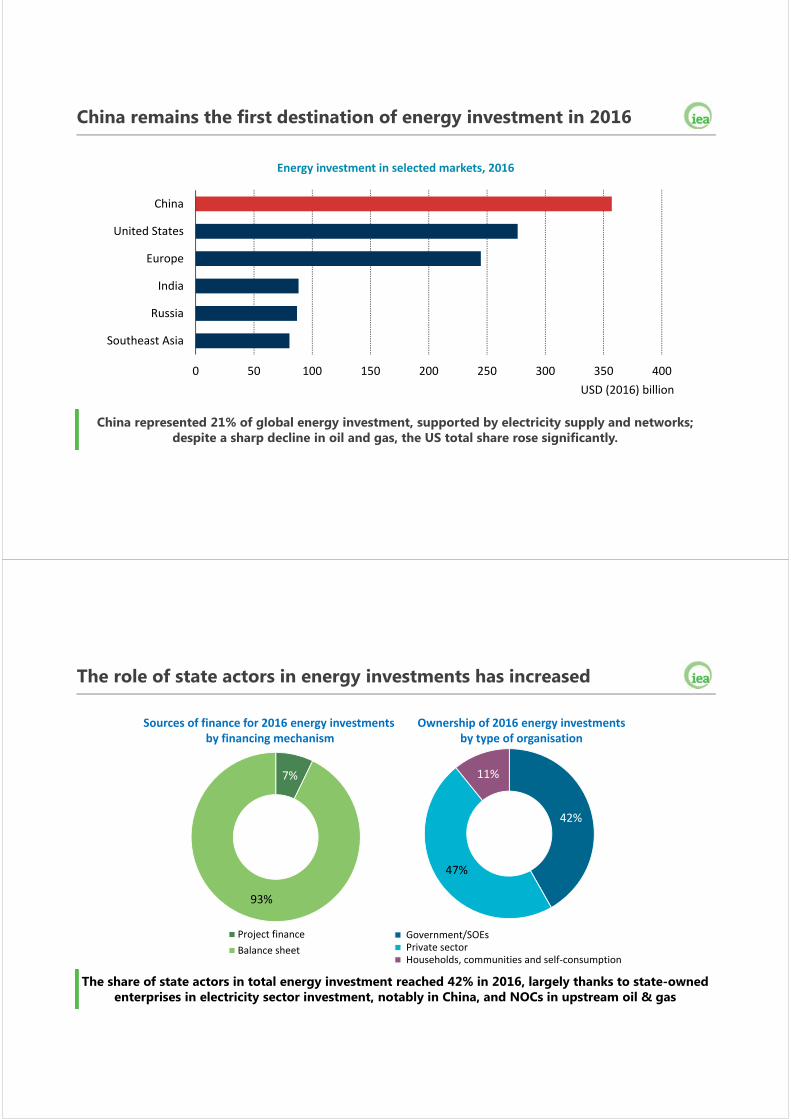
China remains the first destination of energy investment in 2016
China represented 21% of global energy investment, supported by electricity supply and networks; despite a sharp decline in oil and gas, the US total share rose significantly.
Energy investment in selected markets, 2016
0 50 100 150 200 250 300 350 400
Southeast Asia
Russia
India
Europe
United States
China
USD (2016) billion
The role of state actors in energy investments has increased
The share of state actors in total energy investment reached 42% in 2016, largely thanks to state-owned enterprises in electricity sector investment, notably in China, and NOCs in upstream oil & gas
Sources of finance for 2016 energy investmentsby financing mechanism
7%
93%
Project finance
Balance sheet
42%
47%
11%
Government/SOEs Private sector Households, communities and self‐consumption
Ownership of 2016 energy investments by type of organisation
0
20
40
60
80
Europe China United States Rest of Asia
USD
(2016) billion
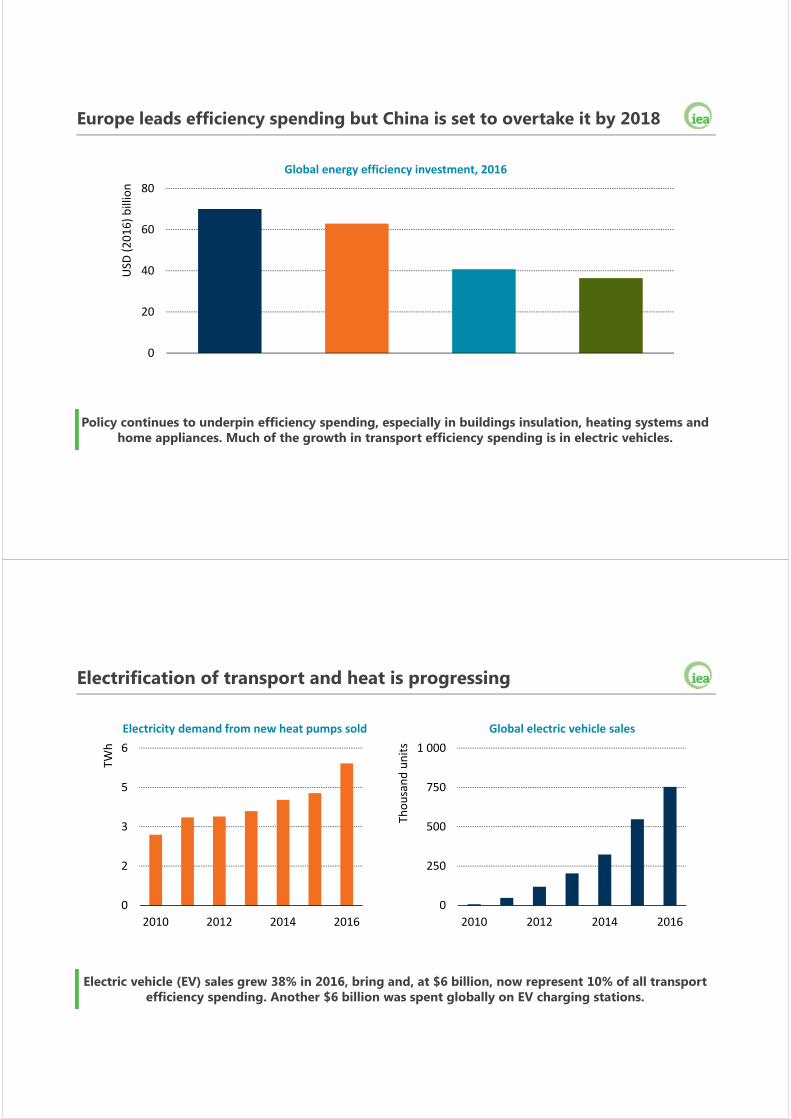
Europe leads efficiency spending but China is set to overtake it by 2018
Policy continues to underpin efficiency spending, especially in buildings insulation, heating systems and home appliances. Much of the growth in transport efficiency spending is in electric vehicles.
Global energy efficiency investment, 2016
Electrification of transport and heat is progressing
Electric vehicle (EV) sales grew 38% in 2016, bring and, at $6 billion, now represent 10% of all transport efficiency spending. Another $6 billion was spent globally on EV charging stations.
Global electric vehicle salesElectricity demand from new heat pumps sold
0
2
3
5
6
2010 2012 2014 2016
TWh
0
250
500
750
1 000
2010 2012 2014 2016
Thousand units
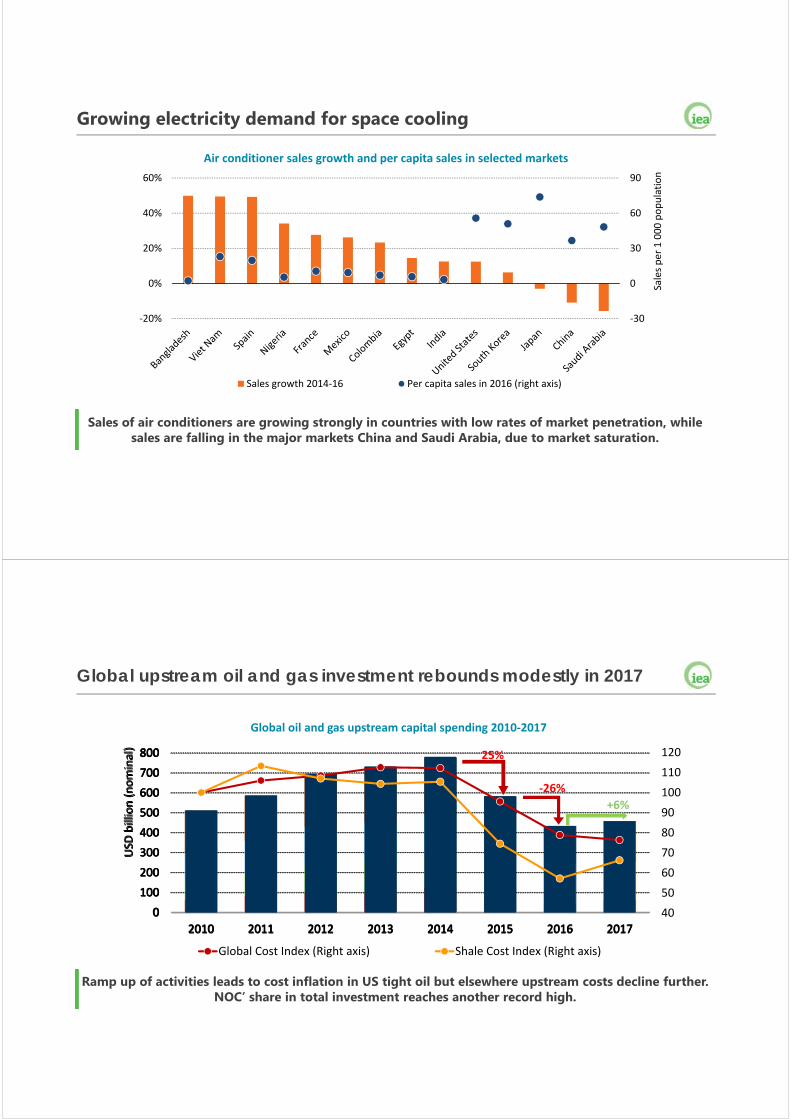
Growing electricity demand for space cooling
Sales of air conditioners are growing strongly in countries with low rates of market penetration, whilesales are falling in the major markets China and Saudi Arabia, due to market saturation.
Air conditioner sales growth and per capita sales in selected markets
‐30
0
30
60
90
‐20%
0%
20%
40%
60%
Sales per 1 000 population
Sales growth 2014‐16 Per capita sales in 2016 (right axis)
0
100
200
300
400
500
600
700
800
2010 2011 2012 2013 2014 2015 2016 2017
USD
billion (nominal)
0
100
200
300
400
500
600
700
800
2010 2011 2012 2013 2014 2015 2016 2017
USD
billion (nominal)
US independents Majors Other private NOCs
37%
12% 14% 14% 14% 16% 10% 13%18% 19% 20% 21% 20%
19% 17%
28%
42%
29%
39%
28%
38%
27%
38%
27%
42%
26%
44% 45%
25%
12%
21%
25%
40
50
60
70
80
90
100
110
120
0
100
200
300
400
500
600
700
800
2010 2011 2012 2013 2014 2015 2016 2017
USD
billion (nominal)
Global Cost Index (Right axis) Shale Cost Index (Right axis)
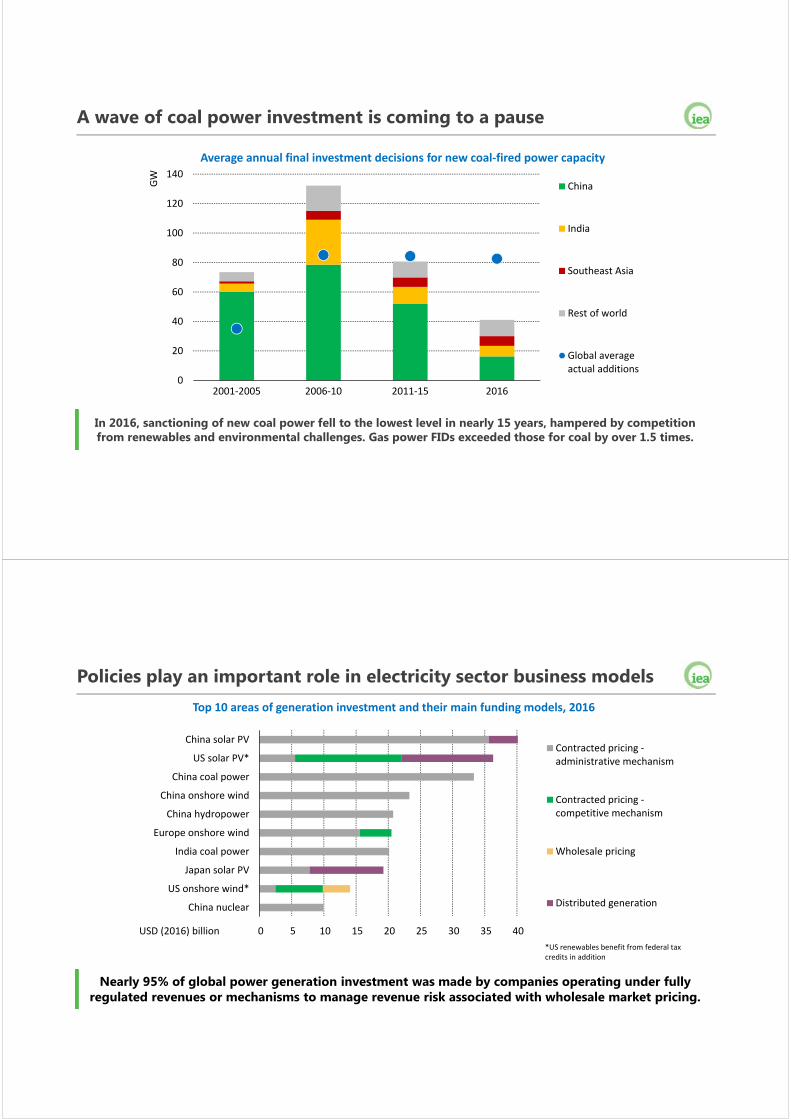
Global upstream oil and gas investment rebounds modestly in 2017
Ramp up of activities leads to cost inflation in US tight oil but elsewhere upstream costs decline further. NOC’ share in total investment reaches another record high.
Global oil and gas upstream capital spending 2010‐2017
+6%
‐26%
25%
37%
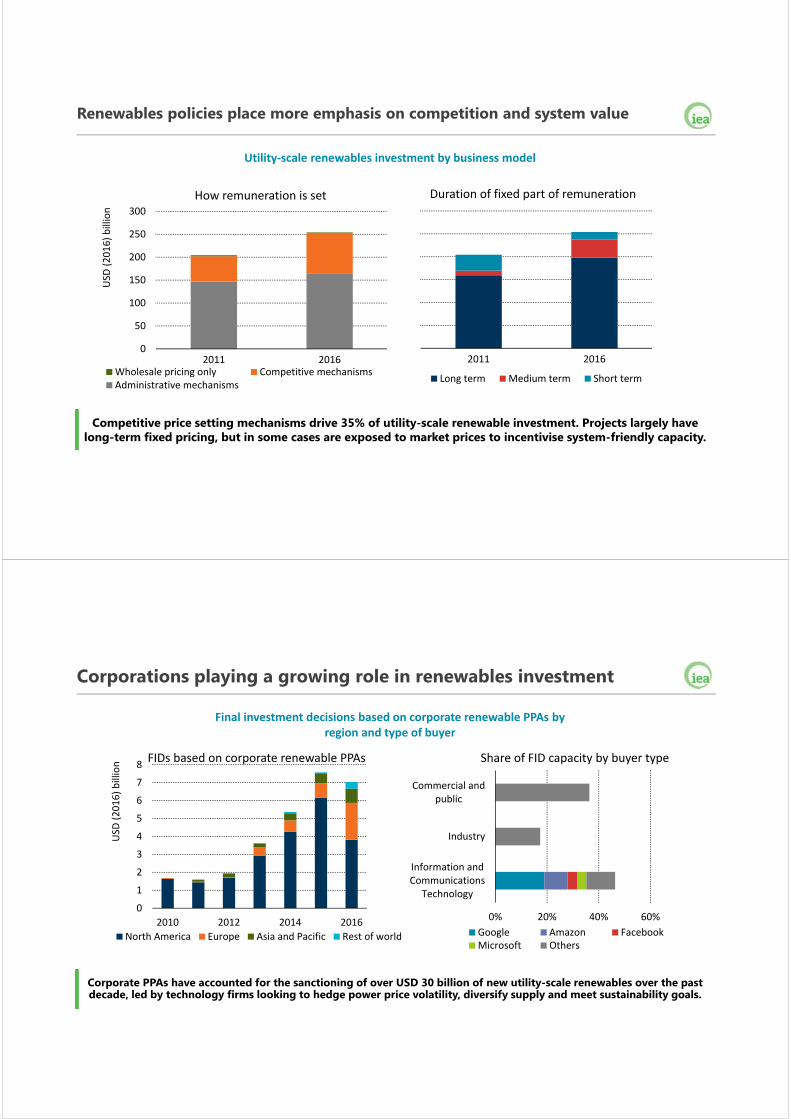
A wave of coal power investment is coming to a pause
In 2016, sanctioning of new coal power fell to the lowest level in nearly 15 years, hampered by competition from renewables and environmental challenges. Gas power FIDs exceeded those for coal by over 1.5 times.
Average annual final investment decisions for new coal‐fired power capacity
0
20
40
60
80
100
120
140
2001‐2005 2006‐10 2011‐15 2016
GW
China
India
Southeast Asia
Rest of world
Global averageactual additions
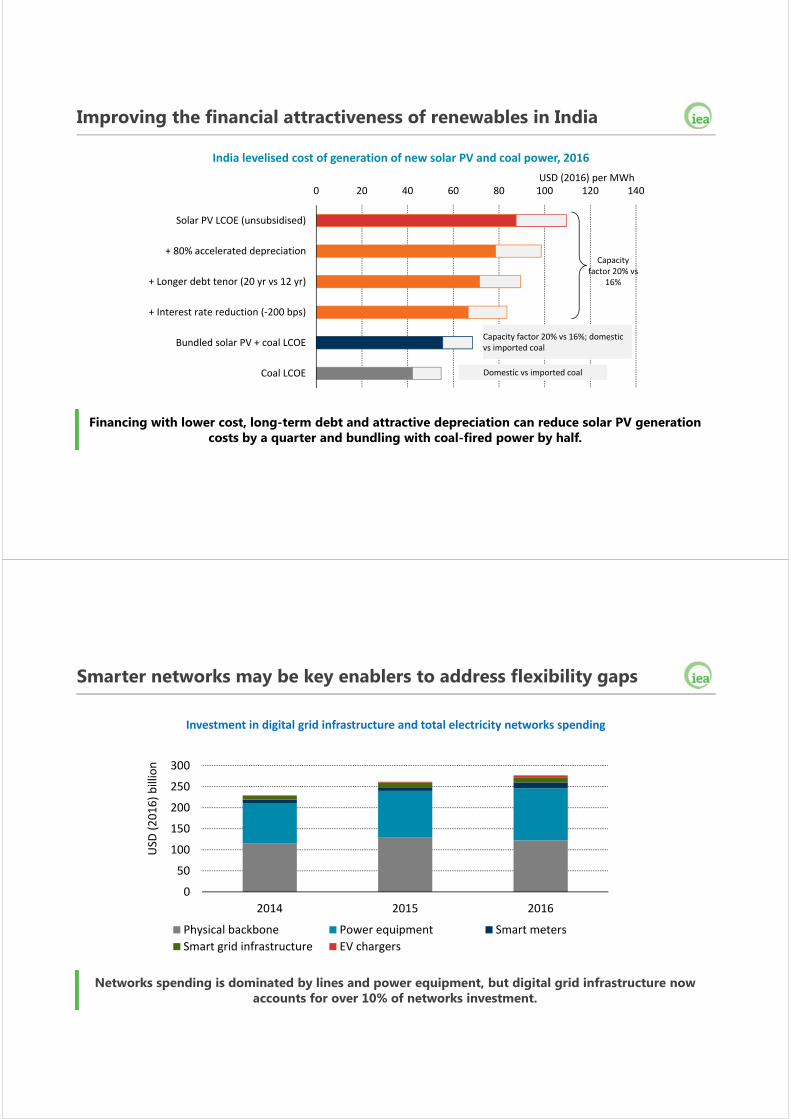
Policies play an important role in electricity sector business models
Nearly 95% of global power generation investment was made by companies operating under fully regulated revenues or mechanisms to manage revenue risk associated with wholesale market pricing.
Top 10 areas of generation investment and their main funding models, 2016
*US renewables benefit from federal tax credits in addition
0 5 10 15 20 25 30 35 40 45
China nuclear
US onshore wind*
Japan solar PV
India coal power
Europe onshore wind
China hydropower
China onshore wind
China coal power
US solar PV*
China solar PV
USD (2016) billion
Contracted pricing ‐administrative mechanism
Contracted pricing ‐competitive mechanism
Wholesale pricing
Distributed generation
Renewables policies place more emphasis on competition and system value
Competitive price setting mechanisms drive 35% of utility-scale renewable investment. Projects largely have long-term fixed pricing, but in some cases are exposed to market prices to incentivise system-friendly capacity.
Utility‐scale renewables investment by business model
0
50
100
150
200
250
300
2011 2016
USD
(2016) billion
How remuneration is set
Wholesale pricing only Competitive mechanismsAdministrative mechanisms
2011 2016
Duration of fixed part of remuneration
Long term Medium term Short term
Corporations playing a growing role in renewables investment
Corporate PPAs have accounted for the sanctioning of over USD 30 billion of new utility-scale renewables over the past decade, led by technology firms looking to hedge power price volatility, diversify supply and meet sustainability goals.
Final investment decisions based on corporate renewable PPAs byregion and type of buyer
0
1
2
3
4
5
6
7
8
2010 2012 2014 2016
USD
(2016) billion FIDs based on corporate renewable PPAs
North America Europe Asia and Pacific Rest of world
0% 20% 40% 60%
Information andCommunications
Technology
Industry
Commercial andpublic
Share of FID capacity by buyer type
Google Amazon FacebookMicrosoft Others
Improving the financial attractiveness of renewables in India
Financing with lower cost, long-term debt and attractive depreciation can reduce solar PV generationcosts by a quarter and bundling with coal-fired power by half.
India levelised cost of generation of new solar PV and coal power, 2016
0 20 40 60 80 100 120 140
Solar PV LCOE (unsubsidised)
+ 80% accelerated depreciation
+ Longer debt tenor (20 yr vs 12 yr)
+ Interest rate reduction (‐200 bps)
Bundled solar PV + coal LCOE
Coal LCOE
USD (2016) per MWh
Capacity factor 20% vs
16%
Domestic vs imported coal
Capacity factor 20% vs 16%; domestic vs imported coal
Networks spending is dominated by lines and power equipment, but digital grid infrastructure now accounts for over 10% of networks investment.
Smarter networks may be key enablers to address flexibility gaps
Investment in digital grid infrastructure and total electricity networks spending
0
50
100
150
200
250
300
2014 2015 2016
USD
(2016) billion
Physical backbone Power equipment Smart meters
Smart grid infrastructure EV chargers
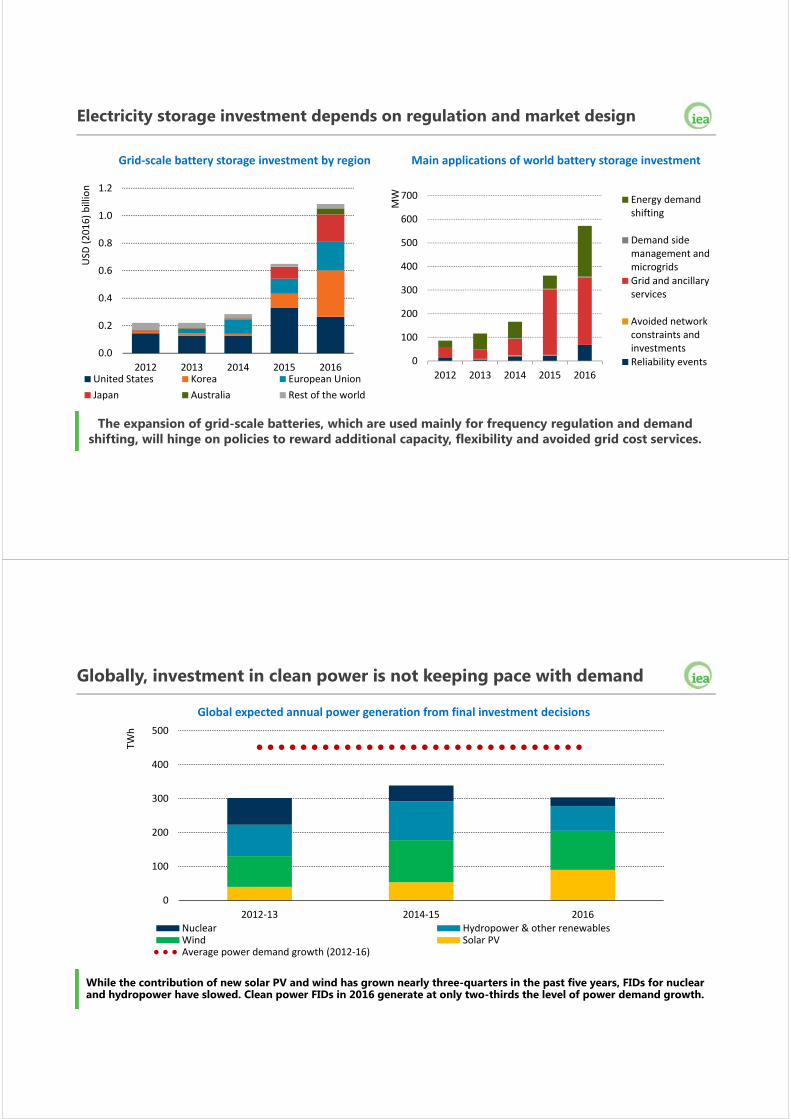
The expansion of grid-scale batteries, which are used mainly for frequency regulation and demandshifting, will hinge on policies to reward additional capacity, flexibility and avoided grid cost services.
Electricity storage investment depends on regulation and market design
Main applications of world battery storage investment
0
100
200
300
400
500
600
700
2012 2013 2014 2015 2016
MW Energy demand
shifting
Demand sidemanagement andmicrogridsGrid and ancillaryservices
Avoided networkconstraints andinvestmentsReliability events
0.0
0.2
0.4
0.6
0.8
1.0
1.2
2012 2013 2014 2015 2016
USD
(2016) billion
United States Korea European Union
Japan Australia Rest of the world
Grid‐scale battery storage investment by region
Globally, investment in clean power is not keeping pace with demand
While the contribution of new solar PV and wind has grown nearly three-quarters in the past five years, FIDs for nuclear and hydropower have slowed. Clean power FIDs in 2016 generate at only two-thirds the level of power demand growth.
Global expected annual power generation from final investment decisions
0
100
200
300
400
500
2012‐13 2014‐15 2016
TWh
Nuclear Hydropower & other renewablesWind Solar PVAverage power demand growth (2012‐16)
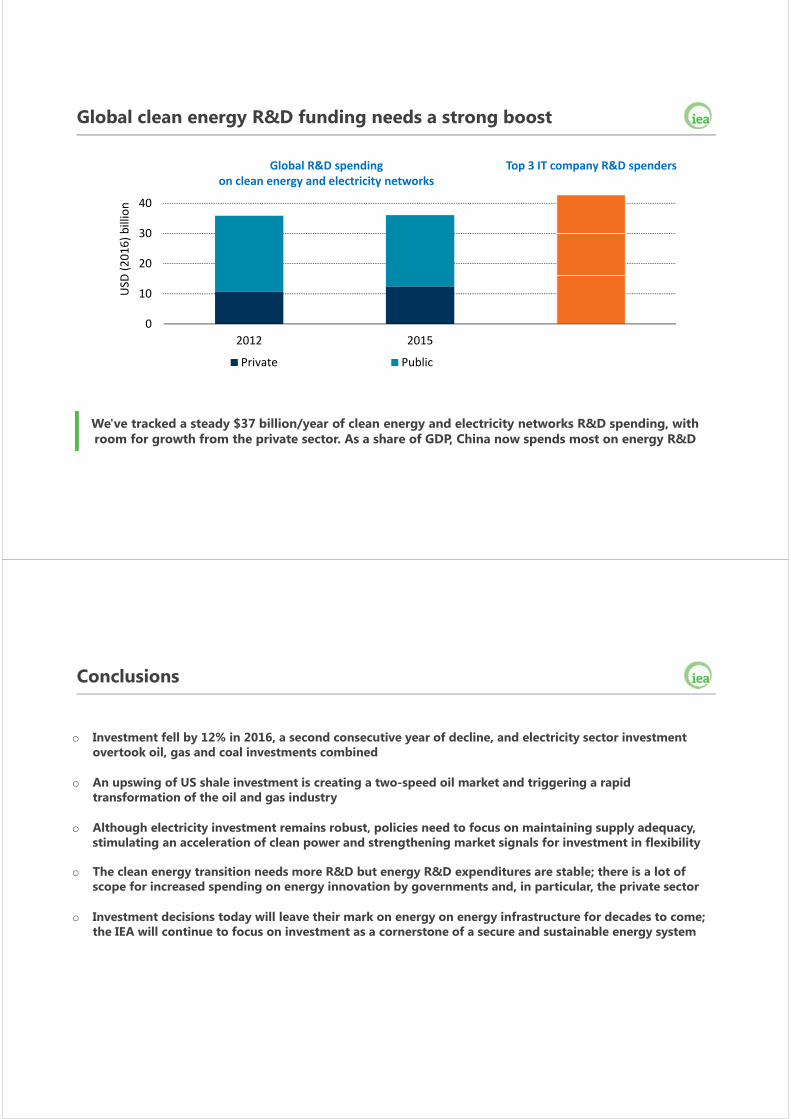
We've tracked a steady $37 billion/year of clean energy and electricity networks R&D spending, with room for growth from the private sector. As a share of GDP, China now spends most on energy R&D
Global clean energy R&D funding needs a strong boost
Global R&D spendingon clean energy and electricity networks
Top 3 IT company R&D spenders
0
10
20
30
40
2012 2015
USD
(2016) billion
Private Public
Conclusions
o Investment fell by 12% in 2016, a second consecutive year of decline, and electricity sector investment overtook oil, gas and coal investments combined
o An upswing of US shale investment is creating a two-speed oil market and triggering a rapid transformation of the oil and gas industry
o Although electricity investment remains robust, policies need to focus on maintaining supply adequacy, stimulating an acceleration of clean power and strengthening market signals for investment in flexibility
o The clean energy transition needs more R&D but energy R&D expenditures are stable; there is a lot of scope for increased spending on energy innovation by governments and, in particular, the private sector
o Investment decisions today will leave their mark on energy on energy infrastructure for decades to come; the IEA will continue to focus on investment as a cornerstone of a secure and sustainable energy system
Backup slides
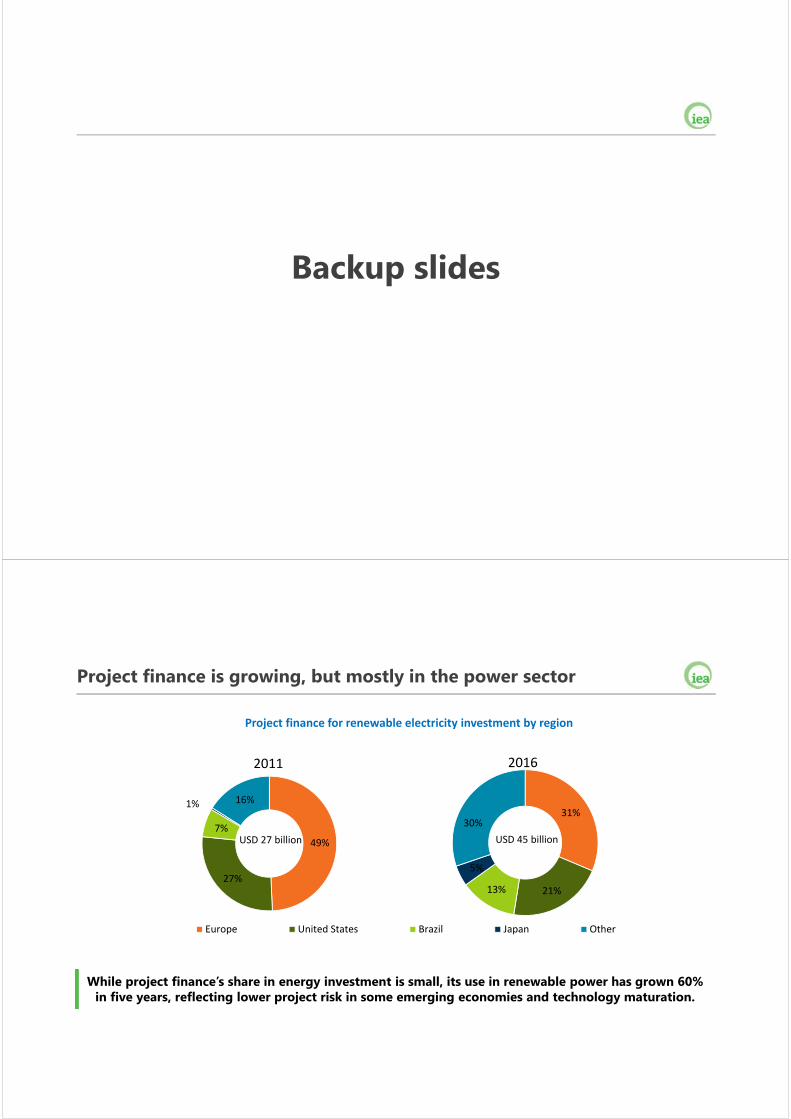
Project finance is growing, but mostly in the power sector
While project finance’s share in energy investment is small, its use in renewable power has grown 60% in five years, reflecting lower project risk in some emerging economies and technology maturation.
Project finance for renewable electricity investment by region
49%
27%
7%
1% 16%
2011
Europe United States Brazil Japan Other
USD 27 billion
31%
21%13%
5%
30%
2016
USD 45 billion
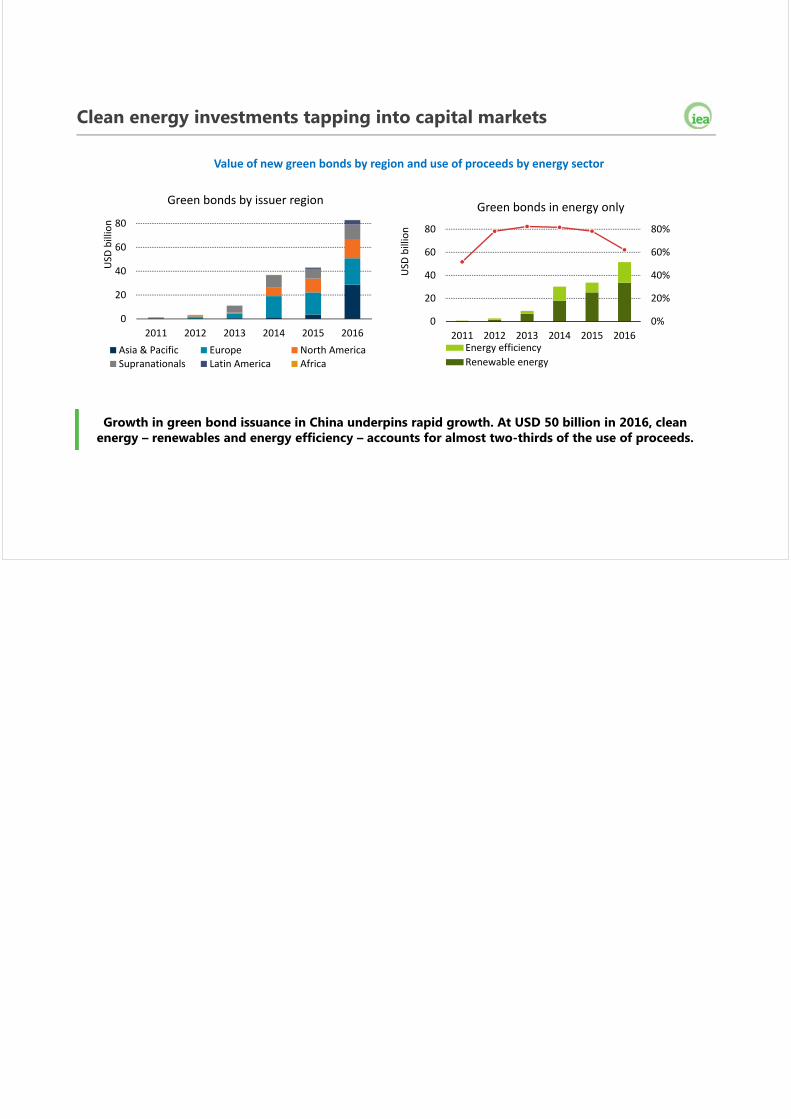
Clean energy investments tapping into capital markets
Growth in green bond issuance in China underpins rapid growth. At USD 50 billion in 2016, clean energy – renewables and energy efficiency – accounts for almost two-thirds of the use of proceeds.
Value of new green bonds by region and use of proceeds by energy sector
0
20
40
60
80
2011 2012 2013 2014 2015 2016
USD
billion
Green bonds by issuer region
Asia & Pacific Europe North AmericaSupranationals Latin America Africa
0%
20%
40%
60%
80%
0
20
40
60
80
2011 2012 2013 2014 2015 2016
USD
billion
Green bonds in energy only
Energy efficiency
Renewable energy

Session I :
Global Trends in Green Energy Market Development and Financing

I-1
G20 Energy Efficiency Investment Toolkit

Bio
As a Programme Officer at International Partnership for Energy Efficiency Cooperation
(IPEEC), Ailin manages the coordination of IPEEC Task Groups and facilitates collaboration
on energy efficiency between IPEEC’s members and with the G20. She is part of the
Secretariat of the Energy Efficiency Finance Task Group (EEFTG) and has been a co-author
of its landmark project, the G20 Energy Efficiency Investment Toolkit, which launched at the
G20 Energy Efficiency Forum in May 2017.
A Chinese German, Ailin has engaged closely with the Chinese and German G20
Presidencies. She previously worked on environmental policy at UNEP and also at
environmental consulting firm EPEA on circular economy projects. She holds BSc and MSc
degrees in Environmental Policy and Economics from the London School of Economics and
the University of Oxford.

1
APEC Conference on Green Energy Finance Capacity Building28-29th September, 2017, Taipei
Ailin Huang, IPEEC
2
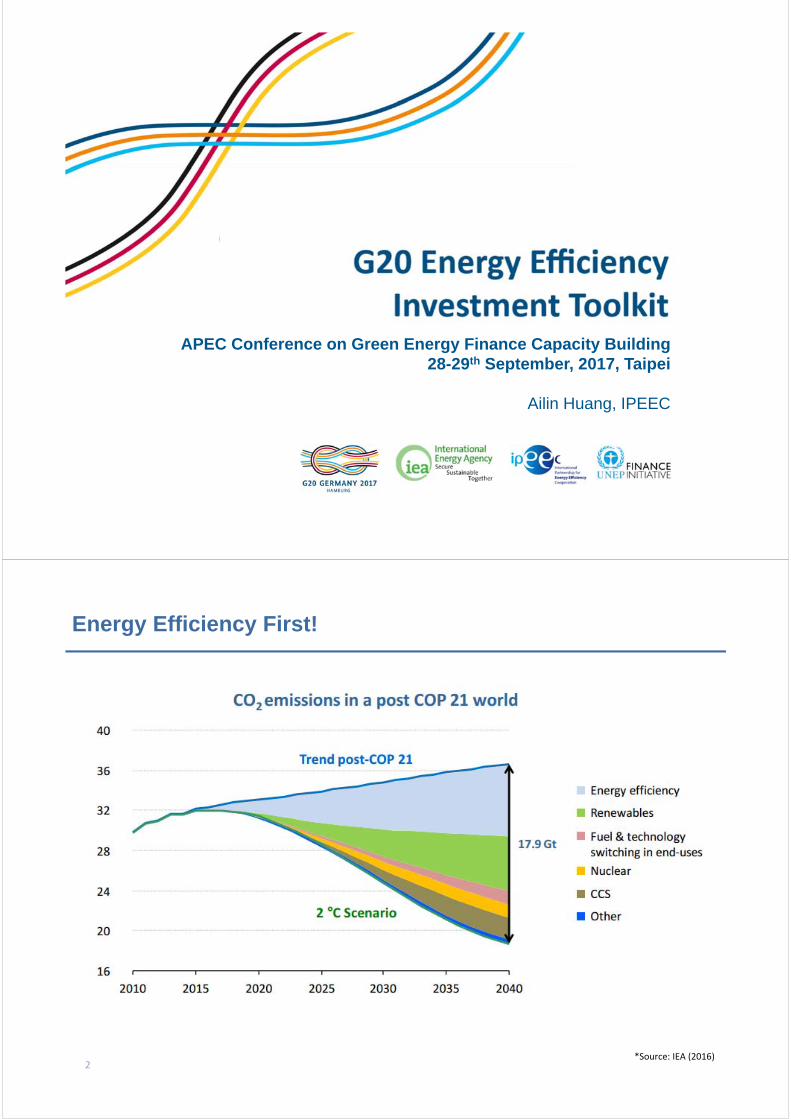
Energy Efficiency First!
*Source: IEA (2016)
3
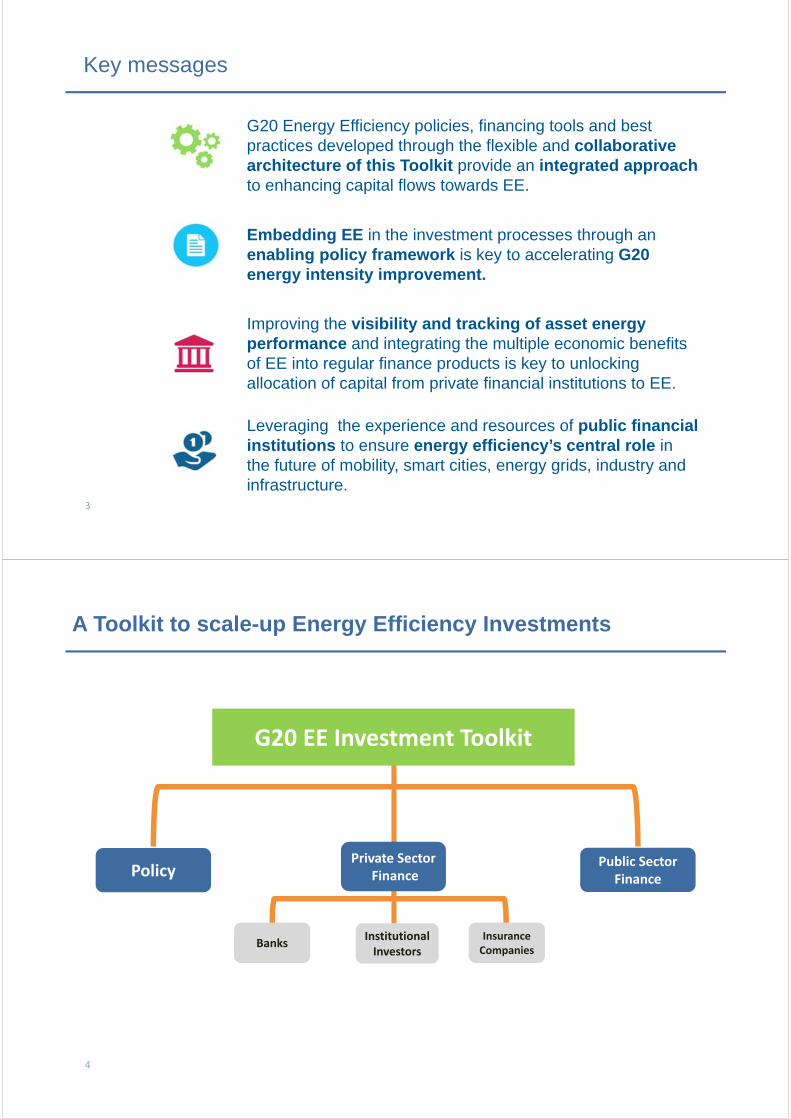
Key messages
G20 Energy Efficiency policies, financing tools and best practices developed through the flexible and collaborative architecture of this Toolkit provide an integrated approach to enhancing capital flows towards EE.
Embedding EE in the investment processes through an enabling policy framework is key to accelerating G20 energy intensity improvement.
Improving the visibility and tracking of asset energy performance and integrating the multiple economic benefits of EE into regular finance products is key to unlocking allocation of capital from private financial institutions to EE.
Leveraging the experience and resources of public financial institutions to ensure energy efficiency’s central role in the future of mobility, smart cities, energy grids, industry and infrastructure.
4
A Toolkit to scale-up Energy Efficiency Investments
G20 EE Investment Toolkit
Private SectorFinancePolicy
Public Sector Finance
Institutional Investors
BanksInsurance Companies
5
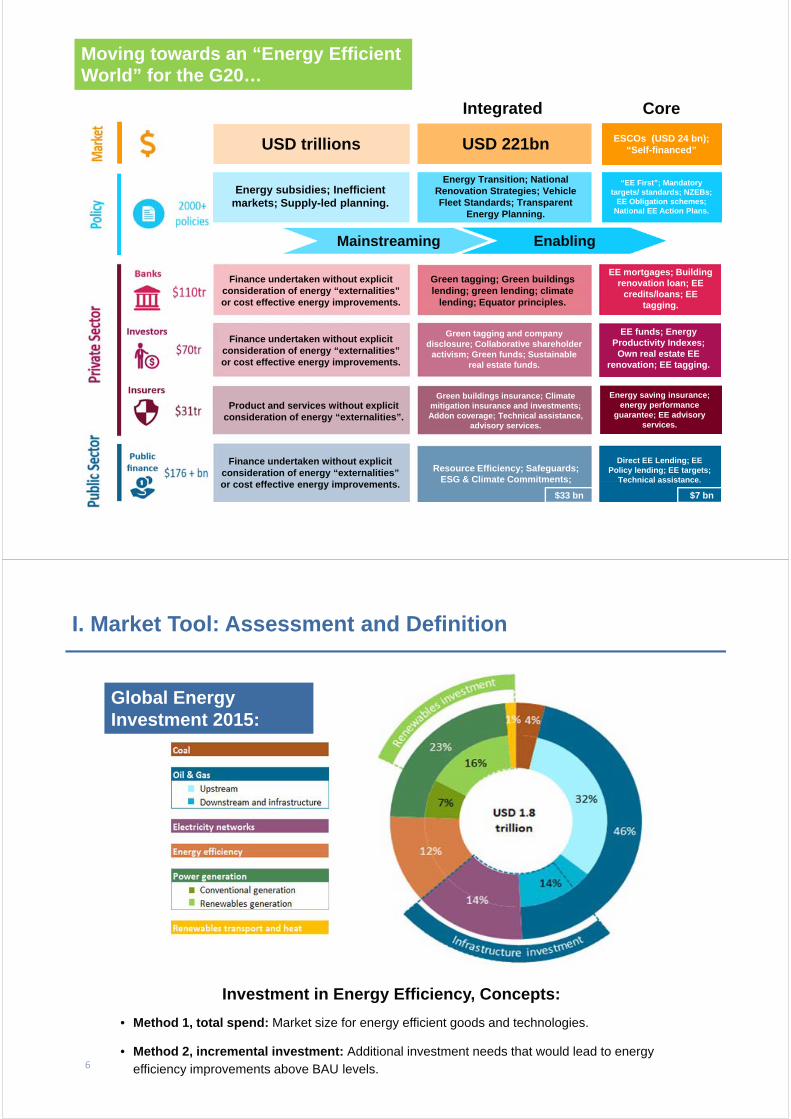
CoreIntegrated
USD trillions USD 221bn ESCOs (USD 24 bn); “Self-financed”
Energy subsidies; Inefficient markets; Supply-led planning.
Energy Transition; National Renovation Strategies; Vehicle Fleet Standards; Transparent
Energy Planning.
“EE First”; Mandatory targets/ standards; NZEBs;
EE Obligation schemes; National EE Action Plans.
Mainstreaming Enabling
Finance undertaken without explicit consideration of energy “externalities” or cost effective energy improvements.
Green tagging; Green buildings lending; green lending; climate
lending; Equator principles.
EE mortgages; Building renovation loan; EE
credits/loans; EE tagging.
Finance undertaken without explicit consideration of energy “externalities” or cost effective energy improvements.
Green tagging and company disclosure; Collaborative shareholder
activism; Green funds; Sustainable real estate funds.
EE funds; Energy Productivity Indexes;
Own real estate EE renovation; EE tagging.
Product and services without explicit consideration of energy “externalities”.
Green buildings insurance; Climate mitigation insurance and investments; Addon coverage; Technical assistance,
advisory services.
Energy saving insurance; energy performance
guarantee; EE advisory services.
Finance undertaken without explicit consideration of energy “externalities” or cost effective energy improvements.
Resource Efficiency; Safeguards; ESG & Climate Commitments;
Direct EE Lending; EE Policy lending; EE targets;
Technical assistance.
$33 bn $7 bn
Moving towards an “Energy Efficient World” for the G20…
6
I. Market Tool: Assessment and Definition
Investment in Energy Efficiency, Concepts:
• Method 1, total spend: Market size for energy efficient goods and technologies.
• Method 2, incremental investment: Additional investment needs that would lead to energy efficiency improvements above BAU levels.
Global Energy Investment 2015:
7
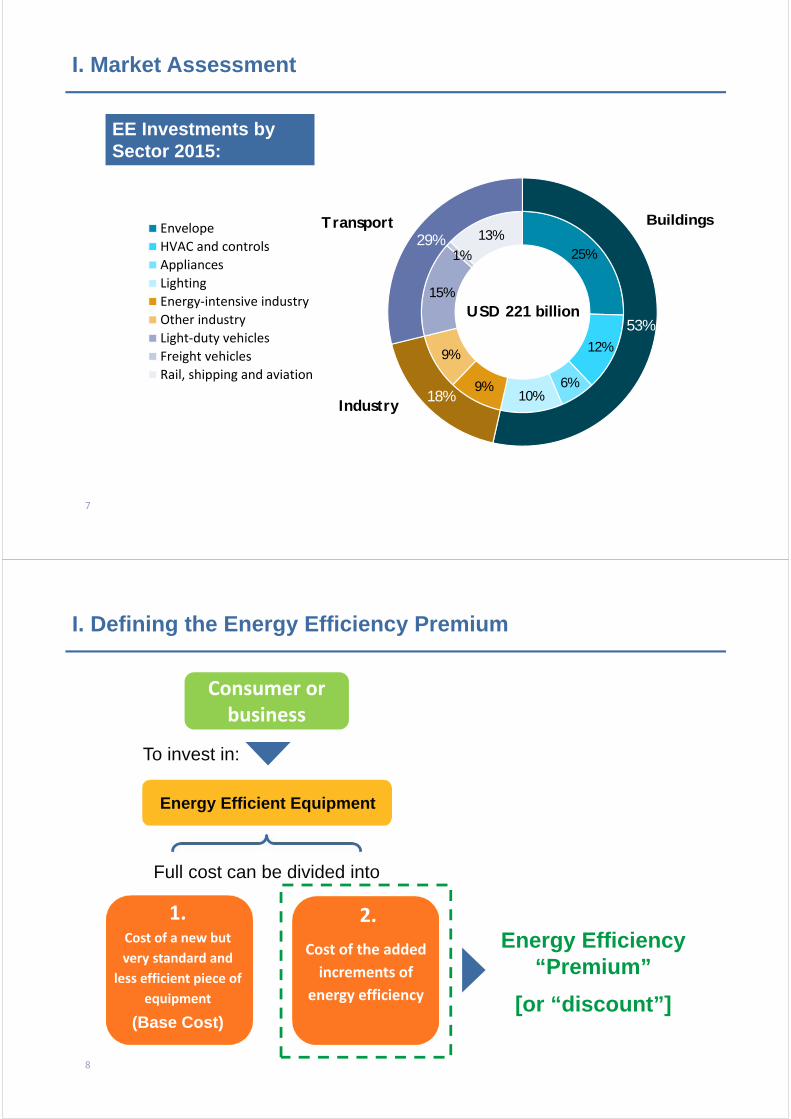
Buildings
EE Investments by Sector 2015:
25%
12%
6%10%
9%
9%
15%
1%
13%
53%
18%
29%
USD 221 billion
Transport
Industry
Envelope
HVAC and controls
Appliances
Lighting
Energy‐intensive industry
Other industry
Light‐duty vehicles
Freight vehicles
Rail, shipping and aviation
I. Market Assessment
8
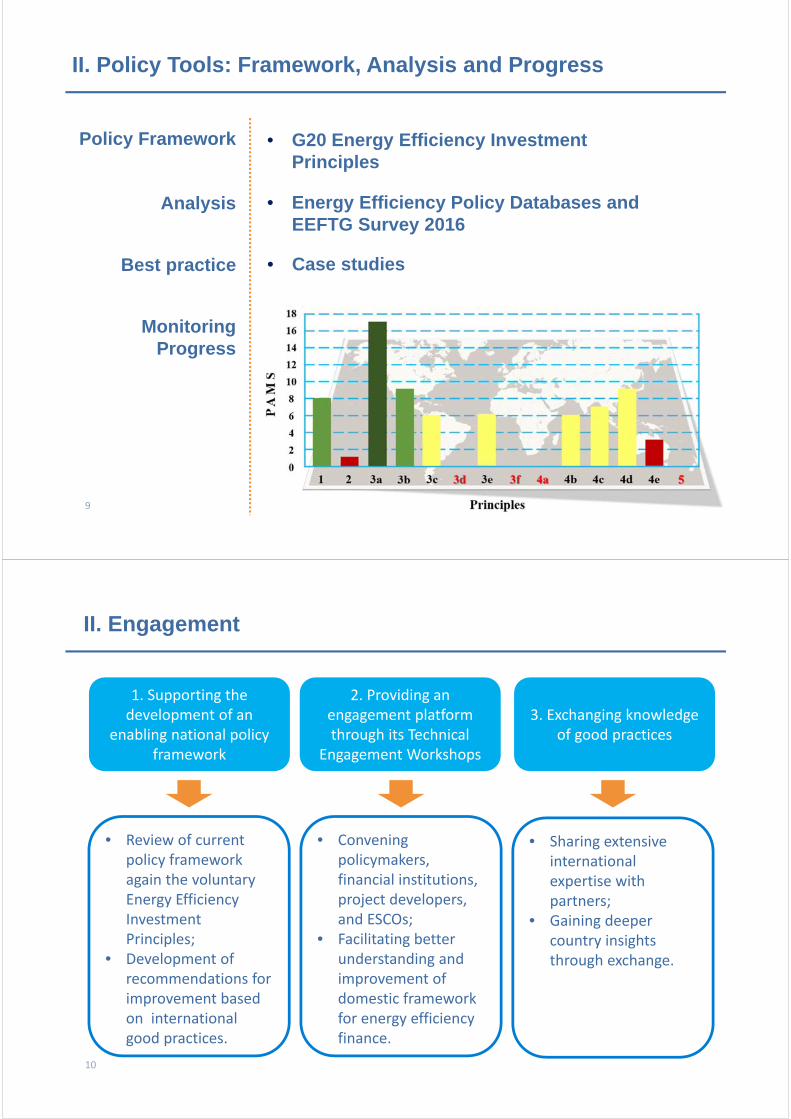
I. Defining the Energy Efficiency Premium
Energy Efficient Equipment
To invest in:
1.Cost of a new but
very standard and
less efficient piece of
equipment
(Base Cost)
Cost of the added
increments of
energy efficiency
Cost of the added
increments of
energy efficiency
Cost of the added
increments of
energy efficiency
Full cost can be divided into
Energy Efficiency “Premium”
[or “discount”]
2.
Consumer or business
9
II. Policy Tools: Framework, Analysis and Progress
Monitoring Progress
Policy Framework • G20 Energy Efficiency Investment Principles
Analysis • Energy Efficiency Policy Databases and EEFTG Survey 2016
Best practice • Case studies
10
II. Engagement
1. Supporting the development of an
enabling national policy framework
2. Providing an engagement platform through its Technical
Engagement Workshops
3. Exchanging knowledge of good practices
• Review of current policy framework again the voluntary Energy Efficiency Investment Principles;
• Development of recommendations for improvement based on international good practices.
• Convening policymakers, financial institutions, project developers, and ESCOs;
• Facilitating better understanding and improvement of domestic framework for energy efficiency finance.
• Sharing extensive international expertise with partners;
• Gaining deeper country insights through exchange.
11
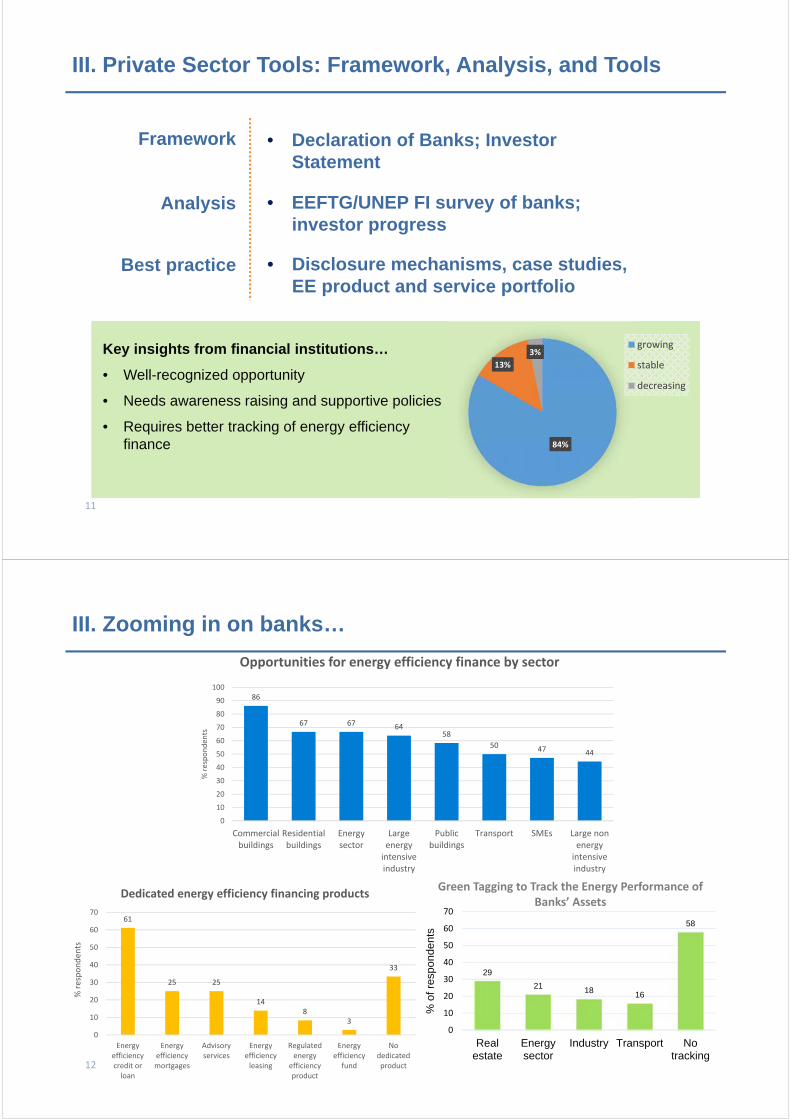
III. Private Sector Tools: Framework, Analysis, and Tools
Key insights from financial institutions…
• Well-recognized opportunity
• Needs awareness raising and supportive policies
• Requires better tracking of energy efficiency finance 84%
13%
3%growing
stable
decreasing
Framework • Declaration of Banks; Investor Statement
Analysis • EEFTG/UNEP FI survey of banks; investor progress
Best practice • Disclosure mechanisms, case studies, EE product and service portfolio
12
61
25 25
148
3
33
0
10
20
30
40
50
60
70
Energyefficiencycredit orloan
Energyefficiencymortgages
Advisoryservices
Energyefficiencyleasing
Regulatedenergy
efficiencyproduct
Energyefficiencyfund
Nodedicatedproduct
% responden
ts
Dedicated energy efficiency financing products
86
67 67 6458
50 47 44
0
10
20
30
40
50
60
70
80
90
100
Commercialbuildings
Residentialbuildings
Energysector
Largeenergyintensiveindustry
Publicbuildings
Transport SMEs Large nonenergyintensiveindustry
% responden
ts
Opportunities for energy efficiency finance by sector
III. Zooming in on banks…
29
21 18 16
58
0
10
20
30
40
50
60
70
Realestate
Energysector
Industry Transport Notracking
% o
f res
pond
ents
Green Tagging to Track the Energy Performance of Banks’ Assets
13
3
36
50
56
61
69
72
0 10 20 30 40 50 60 70 80
Other
Facilitate inflows of international lenders
Develop EE expertise
Increase availability of EE data
Increase priority of EE in public policy
Strengthening EE standards and enforcement
Raise public awareness on the benefits of EE
% respondents
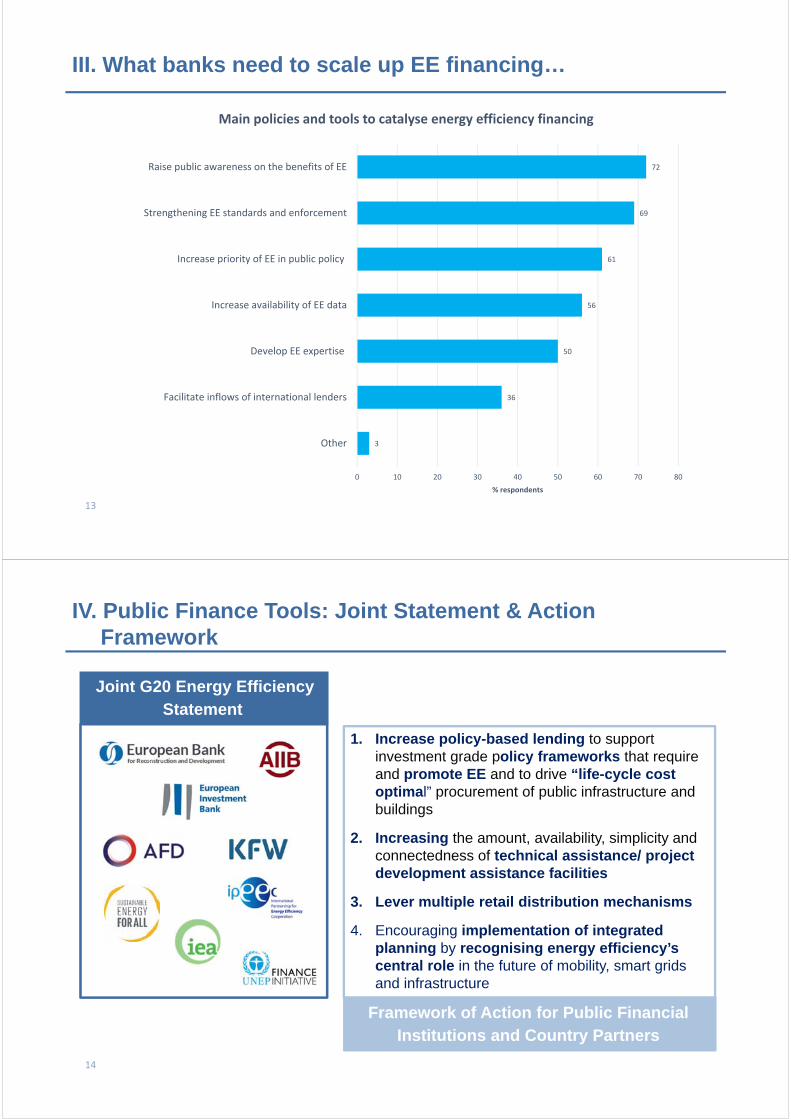
Main policies and tools to catalyse energy efficiency financing
III. What banks need to scale up EE financing…
14
IV. Public Finance Tools: Joint Statement & Action Framework
Joint G20 Energy Efficiency Statement
1. Increase policy-based lending to support investment grade policy frameworks that require and promote EE and to drive “life-cycle cost optimal” procurement of public infrastructure and buildings
2. Increasing the amount, availability, simplicity and connectedness of technical assistance/ project development assistance facilities
3. Lever multiple retail distribution mechanisms
4. Encouraging implementation of integrated planning by recognising energy efficiency’s central role in the future of mobility, smart grids and infrastructure
Framework of Action for Public Financial Institutions and Country Partners
15
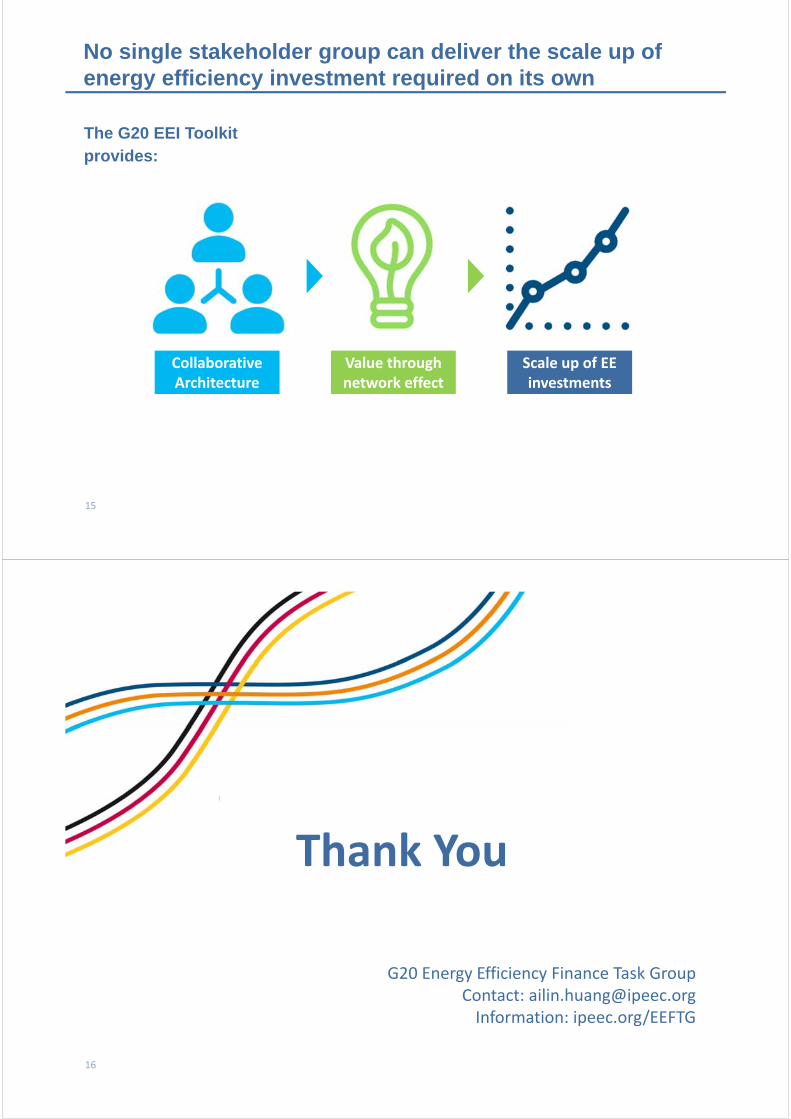
No single stakeholder group can deliver the scale up of energy efficiency investment required on its own
The G20 EEI Toolkit provides:
Collaborative Architecture
Value through network effect
Scale up of EE investments
16
G20 Energy Efficiency Finance Task Group Contact: [email protected]: ipeec.org/EEFTG
Thank You
I-2
The Clean Energy Transition

Justin Wu, Head of Asia-Pacific, Bloomberg New Energy
Finance
Justin has more than a decade of experience analyzing the development of renewable
energy in Asia. He is a specialist in Chinese energy and environmental policy, clean energy trade
and investment and electricity markets. From 2007 to 2011, he was based in Beijing as a senior
analyst covering China’s renewable energy industry. After moving to Hong Kong in 2011, he ran
BNEF’s Global Wind Insight service, where he helped developed a number of research products
and analysis tools to serve the global wind industry. Since 2015, he became the Head of Asia-
Pacific for BNEF, acting as the managing director for the company and responsible for all
business development and research activities across the region.
Justin has been quoted extensively in international media and testified before the US Senate
Committee on Energy and Natural Resources on competitiveness and collaboration between the
US and China on clean energy in 2013. He is also a frequent contributor on Asian energy issues
for Bloomberg radio and television.
A native of the Washington DC area, Justin holds a MS in Politics from the School of
Oriental and African Studies at the University of London and a BS in International Politics and
Economics from Georgetown University’s Edmund A. Walsh School of Foreign Service.

I-3
Energy Trends in APEC

Kirsten Smith
Kirsten Smith is a visiting researcher at the Asia Pacific Energy Research Centre (APERC)
based in Tokyo, Japan. The primary objective of APERC is to foster understanding amongst APEC
economies of global, regional and domestic energy demand and supply trends, energy infrastructure
development, energy regulatory reform, and related policy issues in view of the regional prosperity.
APERC advocates rational energy policy formulation and enhances capacity building in energy
research in the region.
She is responsible for Canadian energy policy and researches supply, investment and carbon
pricing policy for the APEC 7th Edition Energy Demand and Supply Outlook. She is also involved
in research and cooperative projects related to natural gas and LNG markets.
Prior to joining APERC, she worked on carbon pricing policy and the royalty regime review as
part of the Economics and Markets team at the Alberta Department of Energy. She holds two
bachelor’s degrees from the University of Alberta in economics, political science and finance, and
has previously worked on federal oil and gas carbon policy at Environment and Climate Change
Canada.

Kirsten SmithSeptember 2017APEC Green Energy Finance Capacity Building, Chinese Taipei
1. Key Trends
3
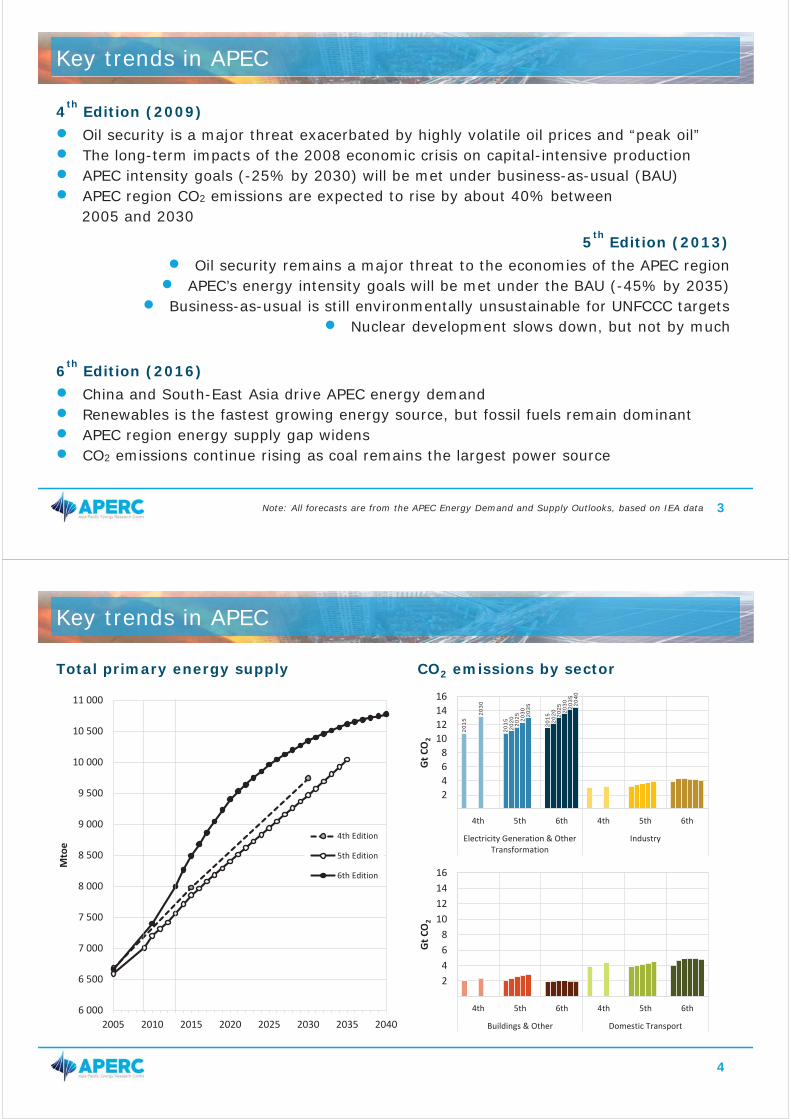
4th Edition (2009)Oil security is a major threat exacerbated by highly volatile oil prices and “peak oil”The long-term impacts of the 2008 economic crisis on capital-intensive production APEC intensity goals (-25% by 2030) will be met under business-as-usual (BAU)APEC region CO2 emissions are expected to rise by about 40% between 2005 and 2030
5th Edition (2013)Oil security remains a major threat to the economies of the APEC region
APEC’s energy intensity goals will be met under the BAU (-45% by 2035)Business-as-usual is still environmentally unsustainable for UNFCCC targets
Nuclear development slows down, but not by much
6th Edition (2016)China and South-East Asia drive APEC energy demandRenewables is the fastest growing energy source, but fossil fuels remain dominantAPEC region energy supply gap widensCO2 emissions continue rising as coal remains the largest power source
Key trends in APEC
Note: All forecasts are from the APEC Energy Demand and Supply Outlooks, based on IEA data
4
6 000
6 500
7 000
7 500
8 000
8 500
9 000
9 500
10 000
10 500
11 000
2005 2010 2015 2020 2025 2030 2035 2040
Mto
e
4th Edition
5th Edition
6th Edition
Total primary energy supply
Key trends in APEC
2 4 6 8
10 12 14 16
4th 5th 6th 4th 5th 6th
Electricity Generation & OtherTransformation
Industry
Gt C
O2
2 4 6 8
10 12 14 16
4th 5th 6th 4th 5th 6th
Buildings & Other Domestic Transport
Gt C
O2
CO2 emissions by sector
2015
2030
2015
2020 2025 20
30 2035
2015 2020 20
25 2030 20
3520
40
5
Total primary energy supply
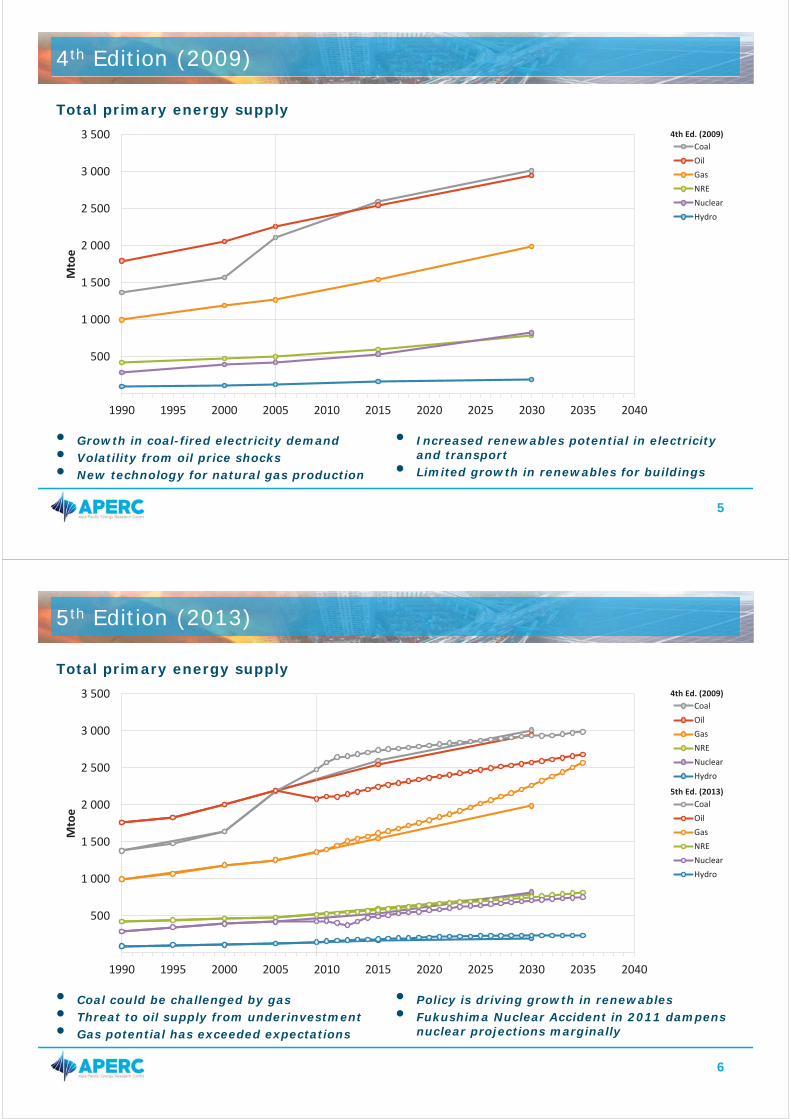
• Growth in coal-fired electricity demand• Volatility from oil price shocks• New technology for natural gas production
• Increased renewables potential in electricity and transport
• Limited growth in renewables for buildings
4th Edition (2009)
500
1 000
1 500
2 000
2 500
3 000
3 500
1990 1995 2000 2005 2010 2015 2020 2025 2030 2035 2040
Mto
e
Coal
Oil
Gas
NRE
Nuclear
Hydro
4th Ed. (2009)
6
Total primary energy supply
5th Edition (2013)
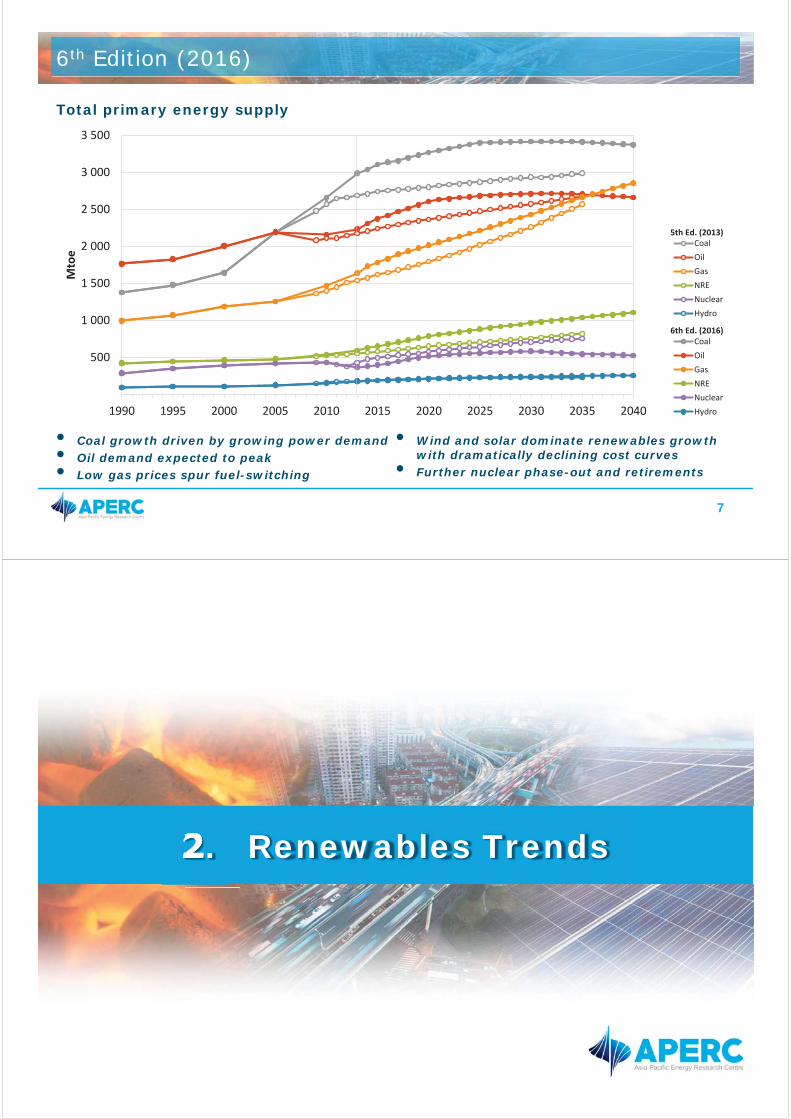
• Coal could be challenged by gas• Threat to oil supply from underinvestment• Gas potential has exceeded expectations
• Policy is driving growth in renewables• Fukushima Nuclear Accident in 2011 dampens
nuclear projections marginally
500
1 000
1 500
2 000
2 500
3 000
3 500
1990 1995 2000 2005 2010 2015 2020 2025 2030 2035 2040
Mto
e
Coal
Oil
Gas
NRE
Nuclear
Hydro
Coal
Oil
Gas
NRE
Nuclear
Hydro
5th Ed. (2013)
4th Ed. (2009)
7
500
1 000
1 500
2 000
2 500
3 000
3 500
1990 1995 2000 2005 2010 2015 2020 2025 2030 2035 2040
Mto
e
Coal
Oil
Gas
NRE
Nuclear
Hydro
Coal
Oil
Gas
NRE
Nuclear
Hydro
Total primary energy supply
6th Edition (2016)
• Coal growth driven by growing power demand• Oil demand expected to peak• Low gas prices spur fuel-switching
• Wind and solar dominate renewables growth with dramatically declining cost curves
• Further nuclear phase-out and retirements
6th Ed. (2016)
5th Ed. (2013)
2. Renewables Trends
9
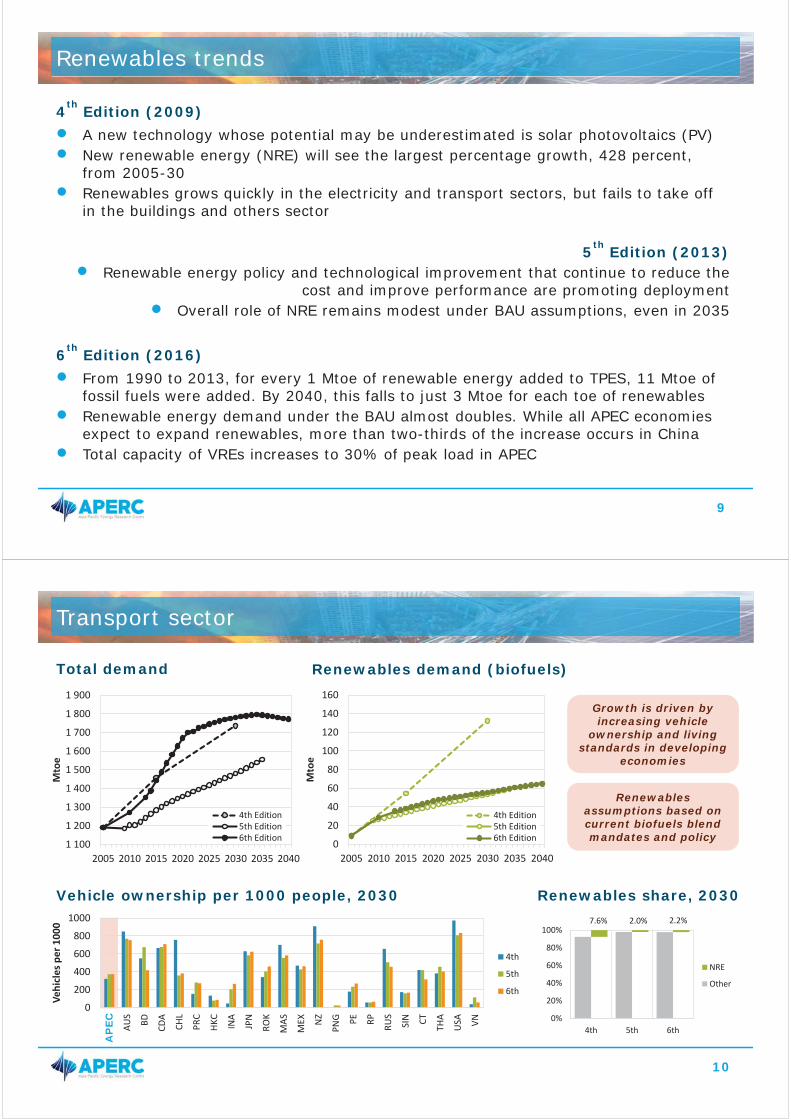
4th Edition (2009)A new technology whose potential may be underestimated is solar photovoltaics (PV)New renewable energy (NRE) will see the largest percentage growth, 428 percent, from 2005-30 Renewables grows quickly in the electricity and transport sectors, but fails to take off in the buildings and others sector
5th Edition (2013)Renewable energy policy and technological improvement that continue to reduce the
cost and improve performance are promoting deploymentOverall role of NRE remains modest under BAU assumptions, even in 2035
6th Edition (2016)From 1990 to 2013, for every 1 Mtoe of renewable energy added to TPES, 11 Mtoe of fossil fuels were added. By 2040, this falls to just 3 Mtoe for each toe of renewablesRenewable energy demand under the BAU almost doubles. While all APEC economies expect to expand renewables, more than two-thirds of the increase occurs in ChinaTotal capacity of VREs increases to 30% of peak load in APEC
Renewables trends
10
0
200
400
600
800
1000
APEC
AUS
BD CDA
CHL
PRC
HKC IN
A
JPN
ROK
MAS
MEX N
Z
PNG PE RP RUS
SIN CT
THA
USA VN
Vehi
cles
per
100
0
4th
5th
6th
Total demand
Transport sector
Growth is driven by increasing vehicle
ownership and living standards in developing
economies
1 100
1 200
1 300
1 400
1 500
1 600
1 700
1 800
1 900
2005 2010 2015 2020 2025 2030 2035 2040
Mto
e
4th Edition5th Edition6th Edition 0
20
40
60
80
100
120
140
160
2005 2010 2015 2020 2025 2030 2035 2040
Mto
e
4th Edition5th Edition6th Edition
Renewables demand (biofuels)
Vehicle ownership per 1000 people, 2030
Renewables assumptions based on current biofuels blend mandates and policy
AP
EC
7.6% 2.0% 2.2%
0%
20%
40%
60%
80%
100%
4th 5th 6th
NRE
Other
Renewables share, 2030
11
-1.0%0.0%1.0%2.0%3.0%4.0%5.0%6.0%
APEC
AUS
BD CDA
CHL
PRC
HKC IN
A
JPN
ROK
MAS
MEX N
Z
PNG PE RP RUS
SIN CT
THA
USA VN
AAG
R (%
)
4th
5th
6th
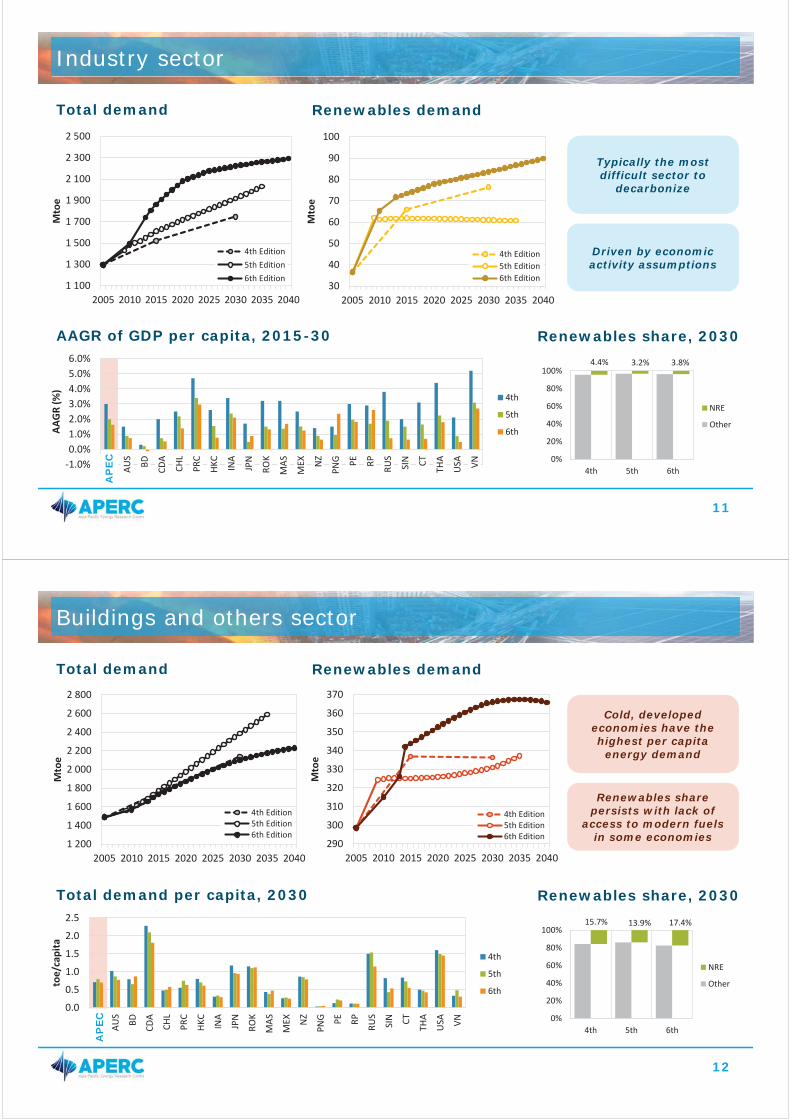
4.4% 3.2% 3.8%
0%
20%
40%
60%
80%
100%
4th 5th 6th
NRE
Other
1 100
1 300
1 500
1 700
1 900
2 100
2 300
2 500
2005 2010 2015 2020 2025 2030 2035 2040
Mto
e
4th Edition5th Edition6th Edition
Total demand
Industry sector
Typically the most difficult sector to
decarbonize
Renewables demand
AAGR of GDP per capita, 2015-30
Driven by economic activity assumptions
Renewables share, 2030
AP
EC
30
40
50
60
70
80
90
100
2005 2010 2015 2020 2025 2030 2035 2040M
toe
4th Edition5th Edition6th Edition
12
0.0
0.5
1.0
1.5
2.0
2.5
APEC
AUS
BD CDA
CHL
PRC
HKC IN
A
JPN
ROK
MAS
MEX N
Z
PNG PE RP RUS
SIN CT
THA
USA VN
toe/
capi
ta
4th
5th
6th
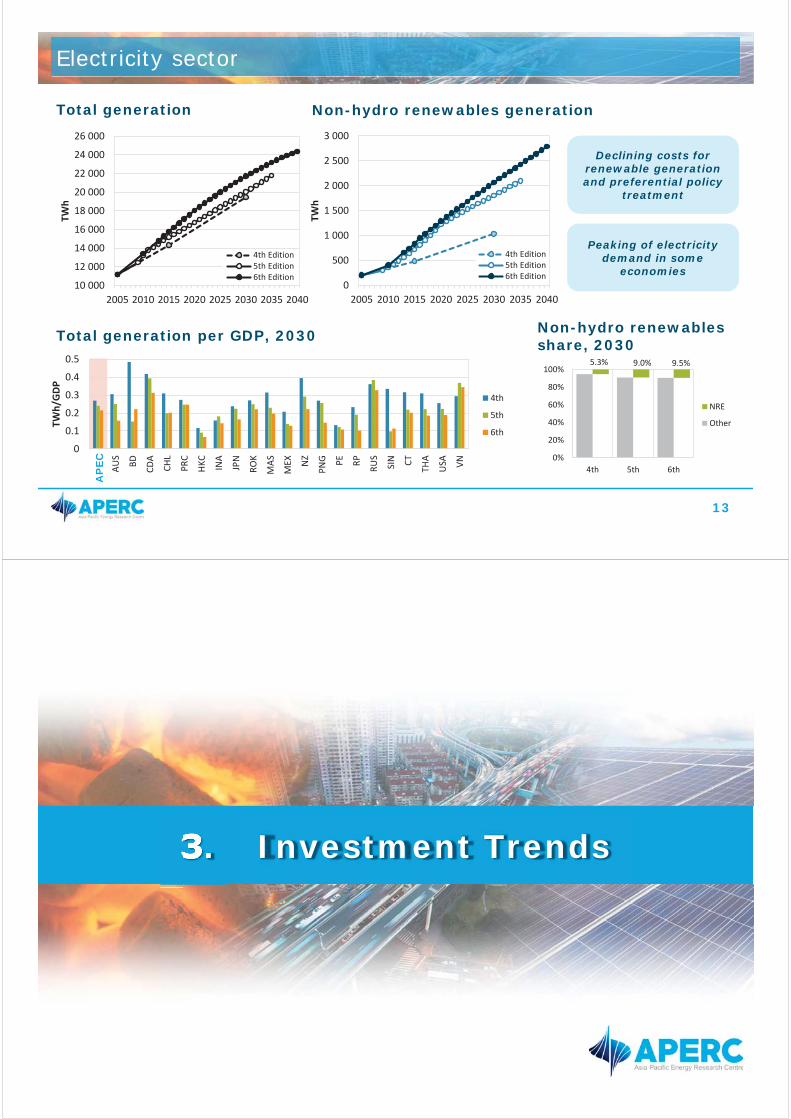
15.7% 13.9% 17.4%
0%
20%
40%
60%
80%
100%
4th 5th 6th
NRE
Other
1 200
1 400
1 600
1 800
2 000
2 200
2 400
2 600
2 800
2005 2010 2015 2020 2025 2030 2035 2040
Mto
e
4th Edition5th Edition6th Edition
Total demand
Buildings and others sector
Cold, developed economies have the highest per capita
energy demand
Renewables demand
Total demand per capita, 2030
Renewables share persists with lack of
access to modern fuels in some economies 290
300
310
320
330
340
350
360
370
2005 2010 2015 2020 2025 2030 2035 2040
Mto
e
4th Edition5th Edition6th Edition
Renewables share, 2030
AP
EC
13
0
0.1
0.2
0.3
0.4
0.5
APEC
AUS
BD CDA
CHL
PRC
HKC IN
A
JPN
ROK
MAS
MEX N
Z
PNG PE RP RUS
SIN CT
THA
USA VN
TWh/
GD
P
4th
5th
6th
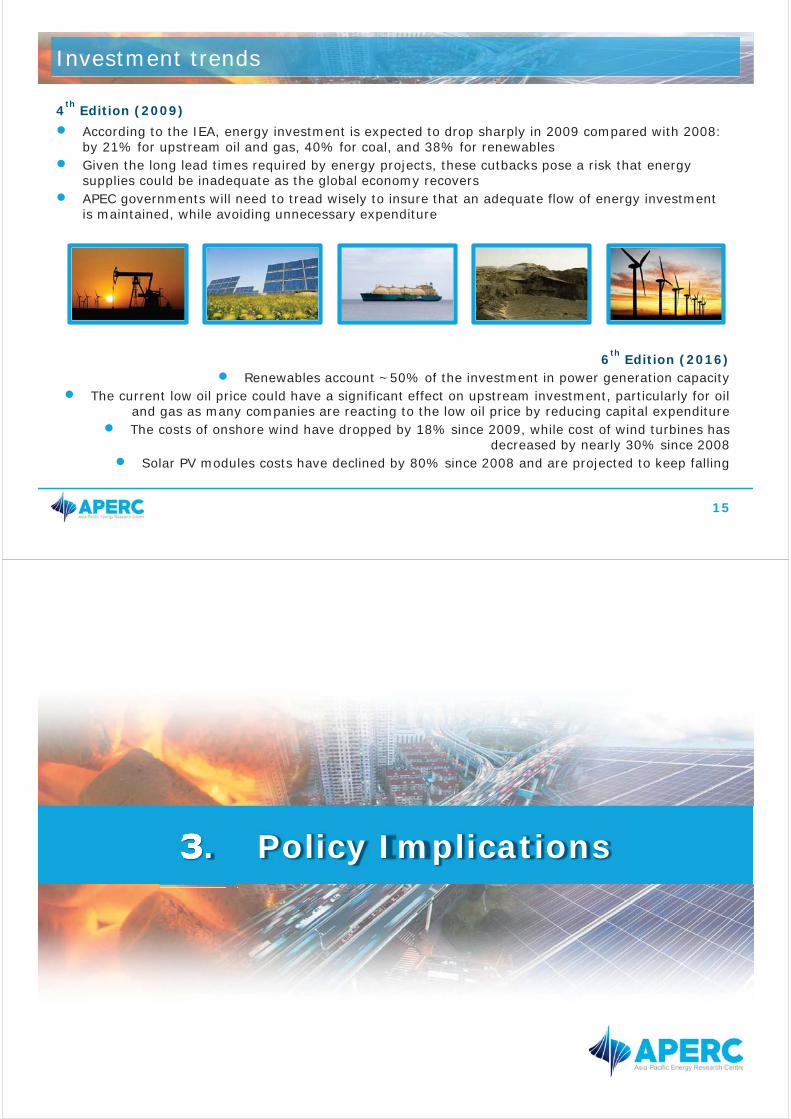
5.3% 9.0% 9.5%
0%
20%
40%
60%
80%
100%
4th 5th 6th
NRE
Other
10 000
12 000
14 000
16 000
18 000
20 000
22 000
24 000
26 000
2005 2010 2015 2020 2025 2030 2035 2040
TWh
4th Edition5th Edition6th Edition
Total generation
Electricity sector
Non-hydro renewables generation
Total generation per GDP, 2030
Declining costs for renewable generation and preferential policy
treatment
Peaking of electricity demand in some
economies 0
500
1 000
1 500
2 000
2 500
3 000
2005 2010 2015 2020 2025 2030 2035 2040TW
h
4th Edition5th Edition6th Edition
Non-hydro renewables share, 2030
AP
EC
3. Investment Trends
15
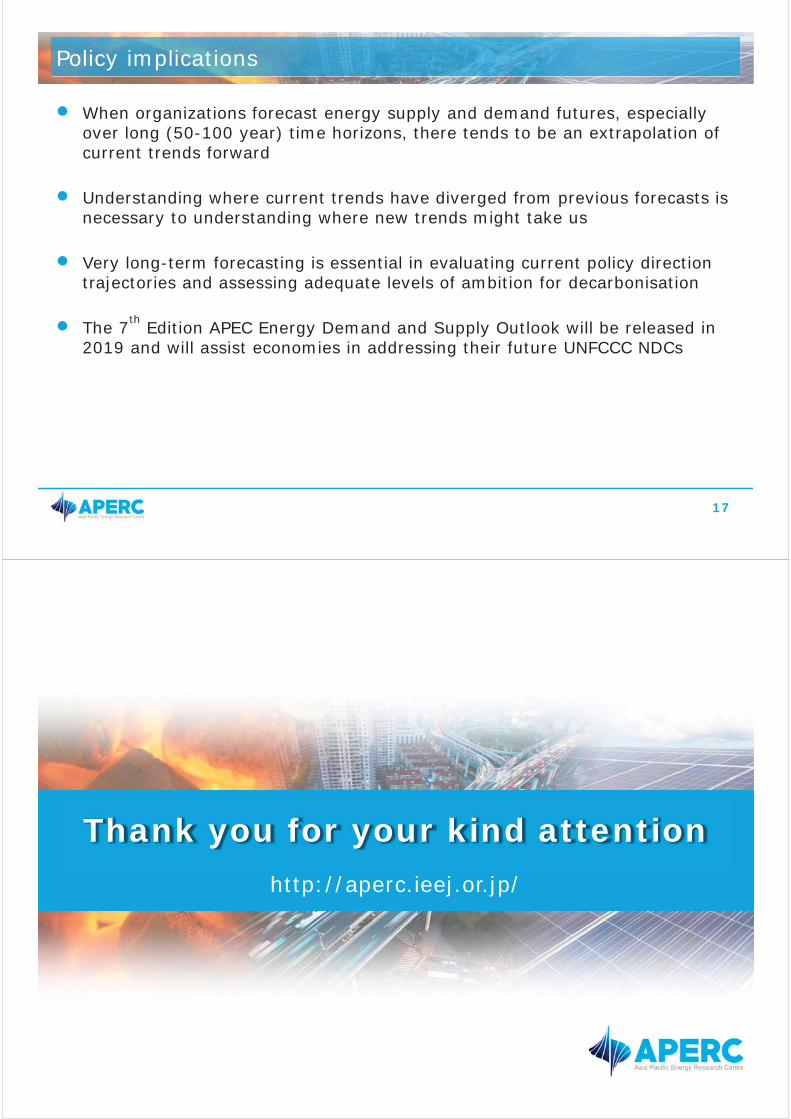
4th Edition (2009)According to the IEA, energy investment is expected to drop sharply in 2009 compared with 2008: by 21% for upstream oil and gas, 40% for coal, and 38% for renewablesGiven the long lead times required by energy projects, these cutbacks pose a risk that energy supplies could be inadequate as the global economy recoversAPEC governments will need to tread wisely to insure that an adequate flow of energy investment is maintained, while avoiding unnecessary expenditure
6th Edition (2016)Renewables account ~50% of the investment in power generation capacity
The current low oil price could have a significant effect on upstream investment, particularly for oil and gas as many companies are reacting to the low oil price by reducing capital expenditure The costs of onshore wind have dropped by 18% since 2009, while cost of wind turbines has
decreased by nearly 30% since 2008 Solar PV modules costs have declined by 80% since 2008 and are projected to keep falling
Investment trends
3. Policy Implications
17
When organizations forecast energy supply and demand futures, especially over long (50-100 year) time horizons, there tends to be an extrapolation of current trends forward
Understanding where current trends have diverged from previous forecasts is necessary to understanding where new trends might take us
Very long-term forecasting is essential in evaluating current policy direction trajectories and assessing adequate levels of ambition for decarbonisation
The 7th Edition APEC Energy Demand and Supply Outlook will be released in 2019 and will assist economies in addressing their future UNFCCC NDCs
Policy implications
http://aperc.ieej.or.jp/
Thank you for your kind attention

Session II:
Facilitating Green Energy Finance

II-1
Scaling up Investments in
Energy Efficiency

Brief Curriculum Vitae
Jennifer Romero-Torres is a Senior Finance Specialist (Energy) in the Asian Development
Bank’s East Asia Regional Department. She has worked on major investment projects, technical
assistance and knowledge management related to infrastructure financing, financial and capital
markets development in South Asia, and more recently in East Asia. Prior to ADB, she has also
worked on corporate and structured finance, institutional banking, credit, and management
consultancy for major international investment banks and global advisory firms. Ms. Romero-
Torres is a national of Australia. She holds postgraduate degrees, including a Master of Applied
Finance from the University of Melbourne, Australia.
PROFESSIONAL EXPERIENCE
ASIAN DEVELOPMENT BANK – Current
Senior Finance Specialist
East Asia Energy Division
Led several investment loans, grants, technical assistance, and knowledge management
involving infrastructure financing, public private partnership, financial sector and capital
markets development, local currency financing and SMEs in India, Bangladesh, Nepal, Bhutan,
Maldives and Sri Lanka.
Has recently moved to East Asia Regional Department and is involved in financing and
regional cooperation related to energy projects in China and Mongolia.
BOS INTERNATIONAL (AUSTRALIA) LIMITED (HBOS GROUP), SYDNEY
AUSTRALIA (2004 –2007)
Senior Manager, Corporate & Structured Finance
Responsible for origination, execution and syndication of acquisition finance / leveraged
transactions tailored for private equity clients in the LBO/MBO market in addition to other
complex corporate financing transactions. Worked on several major leveraged finance
transactions, refinancing and IPO transactions in Australia and New Zealand.
AUSTRALIA AND NEW ZEALAND BANKING GROUP (SYDNEY, AUSTRALIA)
(2003-2004)
Manager, Corporate and Institutional Banking
Responsible for credit and risk management, including the preparation of credit memorandum,
portfolio review and monitoring of various corporate and institutional investments.
ERNST & YOUNG TRANSACTION ADVISORY SERVICES (SYDNEY,
AUSTRALIA) (2001–2002)
Senior Consultant, Corporate Finance
Worked on major transaction advisory engagements relating to public float, vendor and
acquisition due diligence, and public private partnership.
EDUCATION
Master of Applied Finance, The University of Melbourne
Master of Business Administration (with Distinction) and
Bachelor of Science in Commerce (US Institute of International Education Starr Foundation
Scholar), De La Salle University
II-2
Facilitating Green Energy Finance –
Risk Management and Financial Modelling

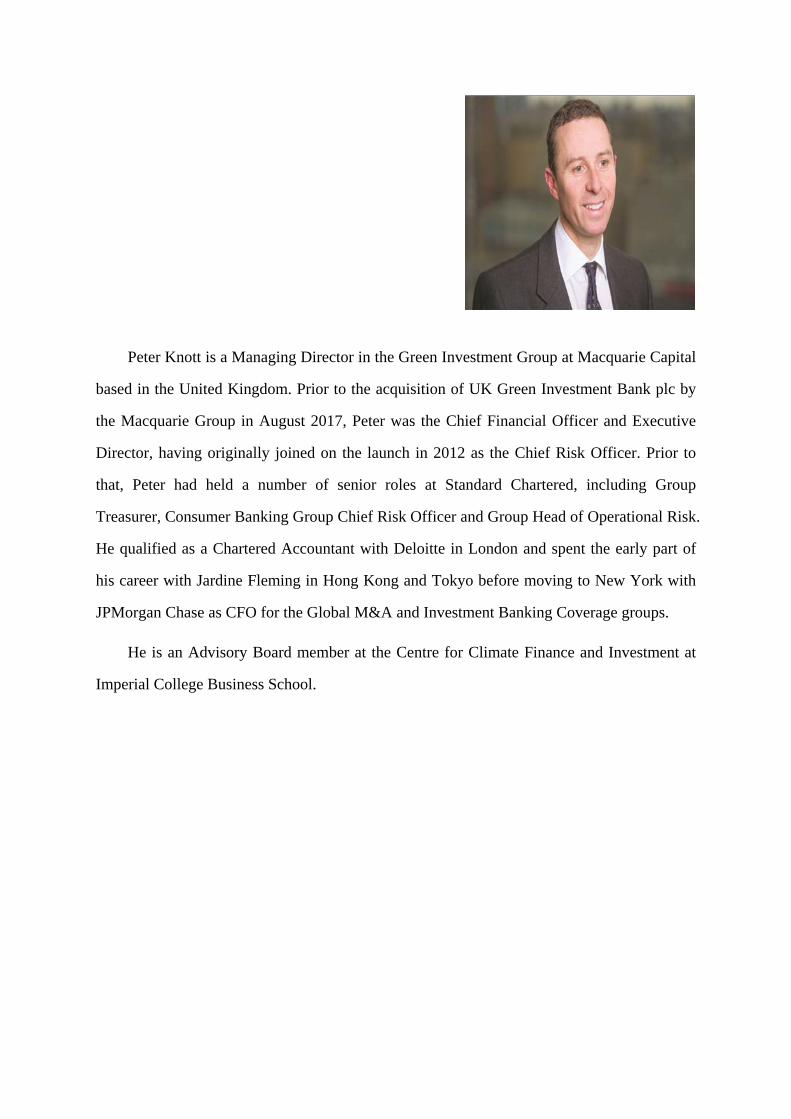
Peter Knott is a Managing Director in the Green Investment Group at Macquarie Capital
based in the United Kingdom. Prior to the acquisition of UK Green Investment Bank plc by
the Macquarie Group in August 2017, Peter was the Chief Financial Officer and Executive
Director, having originally joined on the launch in 2012 as the Chief Risk Officer. Prior to
that, Peter had held a number of senior roles at Standard Chartered, including Group
Treasurer, Consumer Banking Group Chief Risk Officer and Group Head of Operational Risk.
He qualified as a Chartered Accountant with Deloitte in London and spent the early part of
his career with Jardine Fleming in Hong Kong and Tokyo before moving to New York with
JPMorgan Chase as CFO for the Global M&A and Investment Banking Coverage groups.
He is an Advisory Board member at the Centre for Climate Finance and Investment at
Imperial College Business School.

STRICTLY CONFIDENTIAL
Facilitating Green Energy Finance – Risk Management
and Financial ModellingAPEC Conference on Green Energy
Finance Capacity Building28-29 September 2017
Peter KnottManaging Director
Green Investment Group
PAGE 2
The information contained in this presentation is confidential and must not be disclosed to any other party.
This presentation does not constitute an offer, invitation or recommendation and does not oblige Green Investment Group Limited (or any of its affiliates, or funds managed by its affiliates) ("GIG") to make an investment, underwrite or otherwise acquire an interest in any securities or to provide any financing in relation to the content of this document. Any proposal or offer would be conditional upon, amongst other things, GIG obtaining internal approvals and external approvals and detailed legal, taxation and accounting advice.
This presentation does not purport to contain all the information that may be required by the Recipient to assess its interests in any proposal. GIG has prepared this presentation on the basis of information which is publicly available, and sources believed to be reliable. The accuracy of such information (including all assumptions) has been relied upon by GIG, and has not been independently verified by GIG. Recipient should conduct its own independent investigation and assessment as to the validity of the information contained in this presentation, and the economic, financial, regulatory, legal, taxation, stamp duty and accounting implications of that information. Recipient represents that it is not relying on any recommendation or statement of GIG. Except as required by law, GIG and its respective directors, officers, employees, agents and consultants make no representation or warranty as to the accuracy or completeness of the information contained in this presentation, and take no responsibility under any circumstances for any loss or damage suffered as a result of any omission, inadequacy, or inaccuracy in this presentation.
This presentation may contain certain forward-looking statements, forecasts, estimates, projections and opinions ("Forward Statements"). No representation is made or will be made that any Forward Statements will be achieved or will prove to be correct. Actual future results and operations could vary materially from the Forward Statements. Similarly no representation is given that the assumptions disclosed in this presentation upon which Forward Statements may be based are reasonable. Recipient acknowledges that circumstances may change and the contents of this presentation may become outdated as a result.
The recipient acknowledges that neither it nor GIG intends that GIG act or be responsible as a fiduciary to the recipient, its management, stockholders, creditors or any other person. Each of the recipient and GIG, by accepting and providing this presentation respectively, expressly disclaims any fiduciary relationship and agrees that the recipient is responsible for making its own independent judgments with respect to any transaction and any other matters regarding this presentation.
Green Investment Group Limited is not authorised or regulated by the Financial Conduct Authority or the Prudential Regulatory Authority. Neither UK Green Investment Bank Limited nor Green Investment Group Limited (“GIB”) is an authorised deposit-taking institution for the purposes of the Banking Act 1959 (Commonwealth of Australia), nor do its obligations represent deposits or other liabilities of Macquarie Bank Limited ABN 46 008 583 542. Macquarie Bank Limited does not guarantee or otherwise provide assurance in respect of the obligations of UK Green Investment Bank Limited or Green Investment Group Limited.
Important Notice and Disclaimer
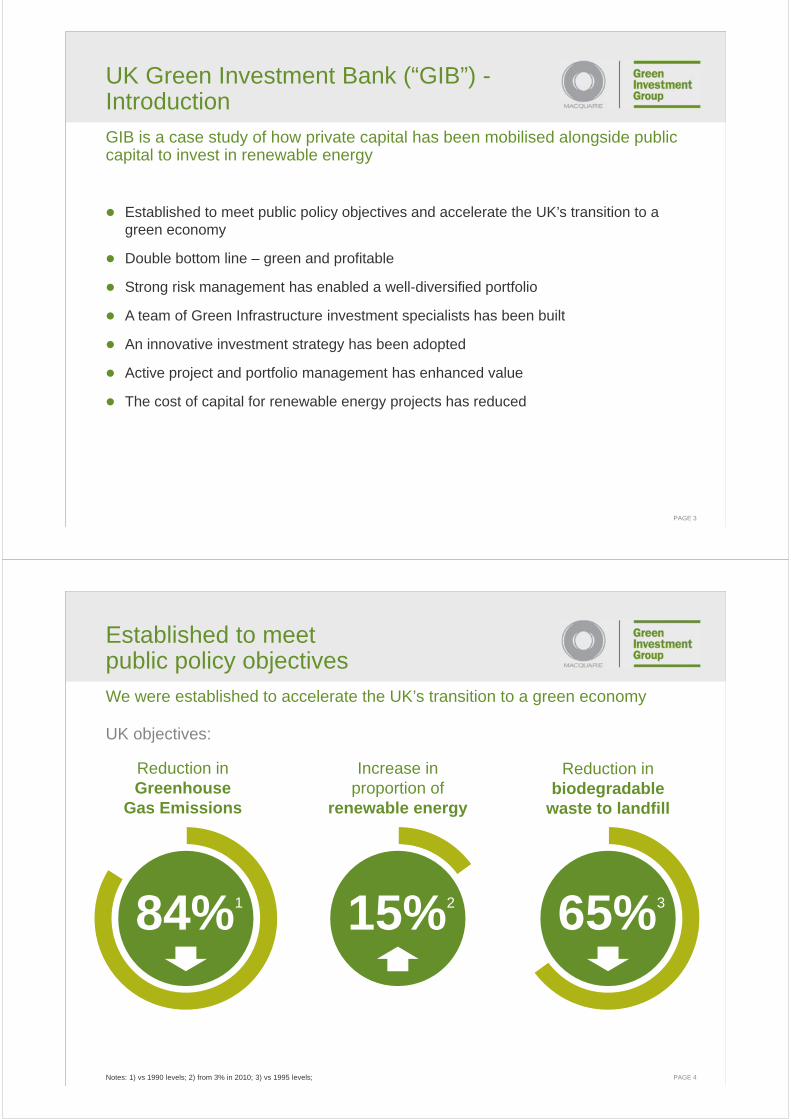
PAGE 3
Established to meet public policy objectives and accelerate the UK’s transition to a green economy
Double bottom line – green and profitable
Strong risk management has enabled a well-diversified portfolio
A team of Green Infrastructure investment specialists has been built
An innovative investment strategy has been adopted
Active project and portfolio management has enhanced value
The cost of capital for renewable energy projects has reduced
UK Green Investment Bank (“GIB”) -IntroductionGIB is a case study of how private capital has been mobilised alongside public capital to invest in renewable energy
PAGE 4
Established to meetpublic policy objectivesWe were established to accelerate the UK’s transition to a green economy
Notes: 1) vs 1990 levels; 2) from 3% in 2010; 3) vs 1995 levels;
UK objectives:
84%1
Reduction in Greenhouse
Gas Emissions
Increase inproportion of
renewable energy
Reduction in biodegradable
waste to landfill
15%2 65%3
PAGE 5
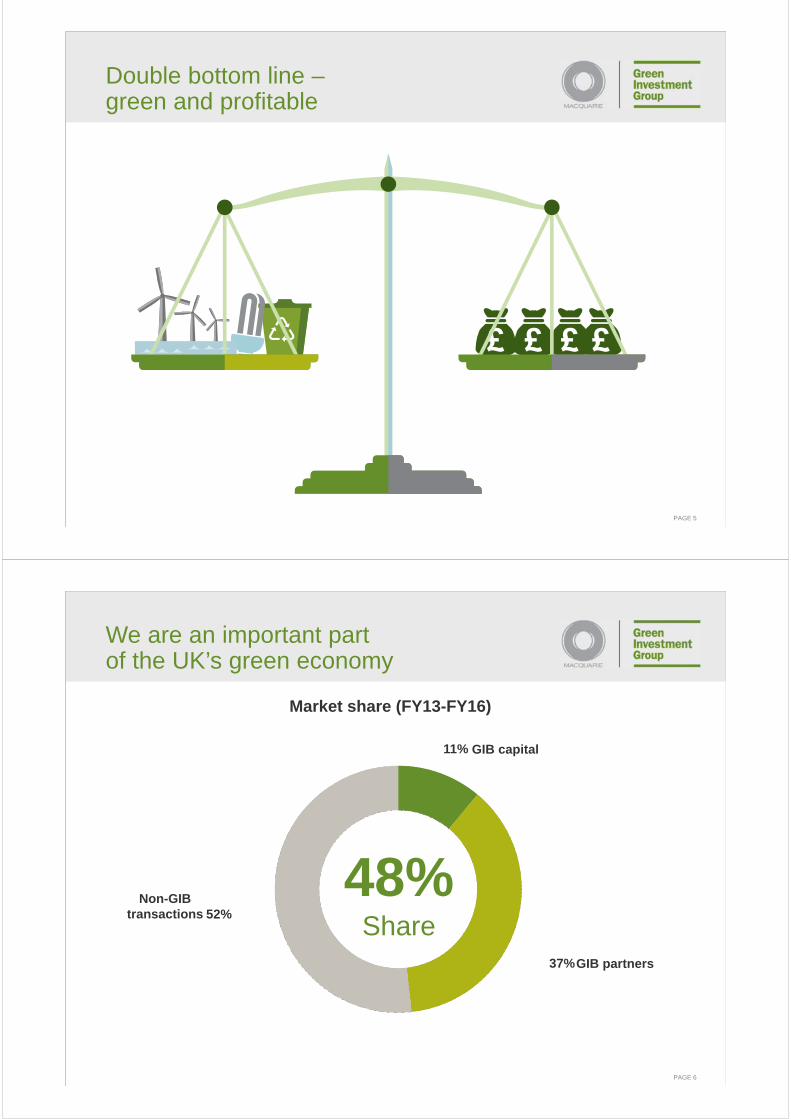
Double bottom line –green and profitable
PAGE 6
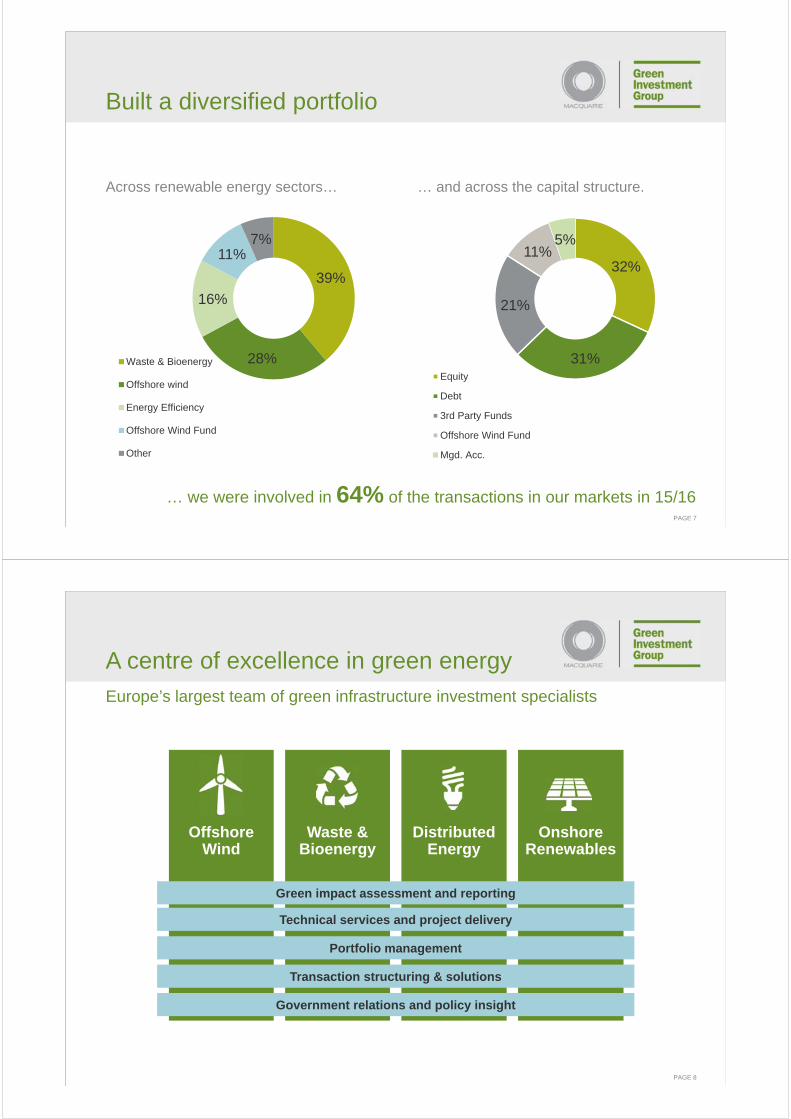
We are an important partof the UK’s green economy
11%
37%
52%
Market share (FY13-FY16)
Non-GIB transactions
GIB capital
GIB partners
48%Share
PAGE 7
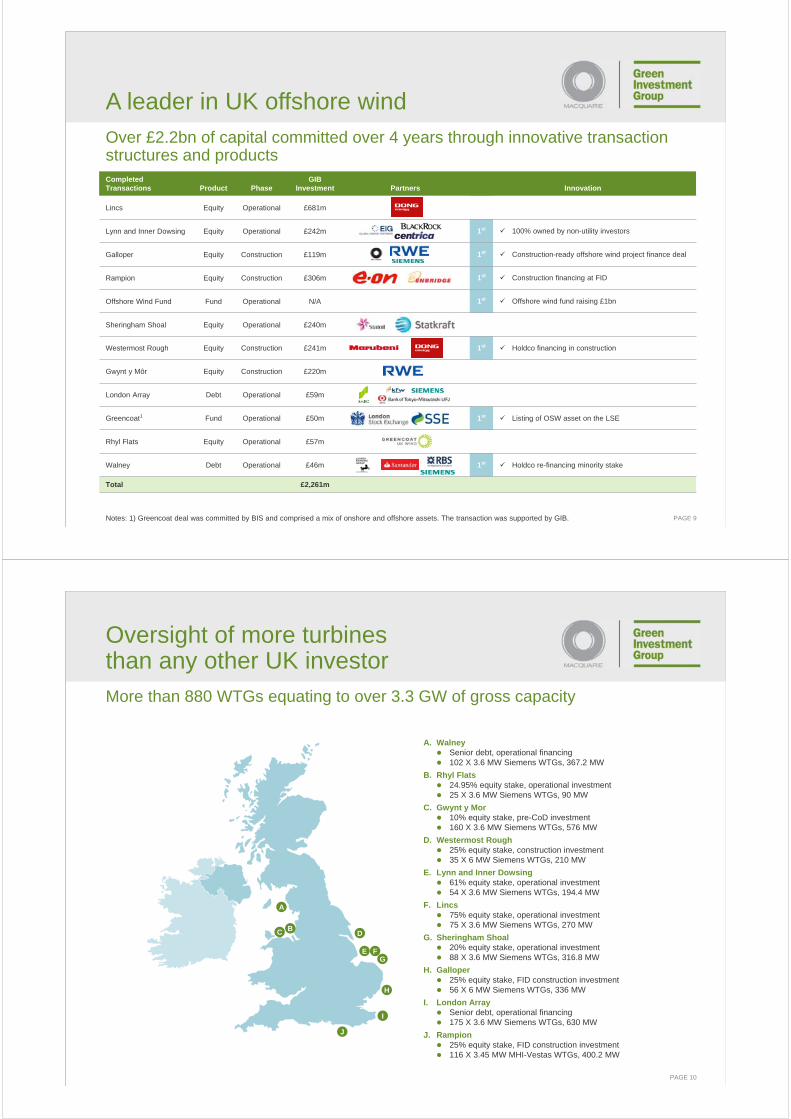
Built a diversified portfolio
… and across the capital structure.
… we were involved in 64% of the transactions in our markets in 15/16
Across renewable energy sectors…
39%
28%
16%
11%7%
Waste & Bioenergy
Offshore wind
Energy Efficiency
Offshore Wind Fund
Other
32%
31%
21%
11%5%
Equity
Debt
3rd Party Funds
Offshore Wind Fund
Mgd. Acc.
PAGE 8
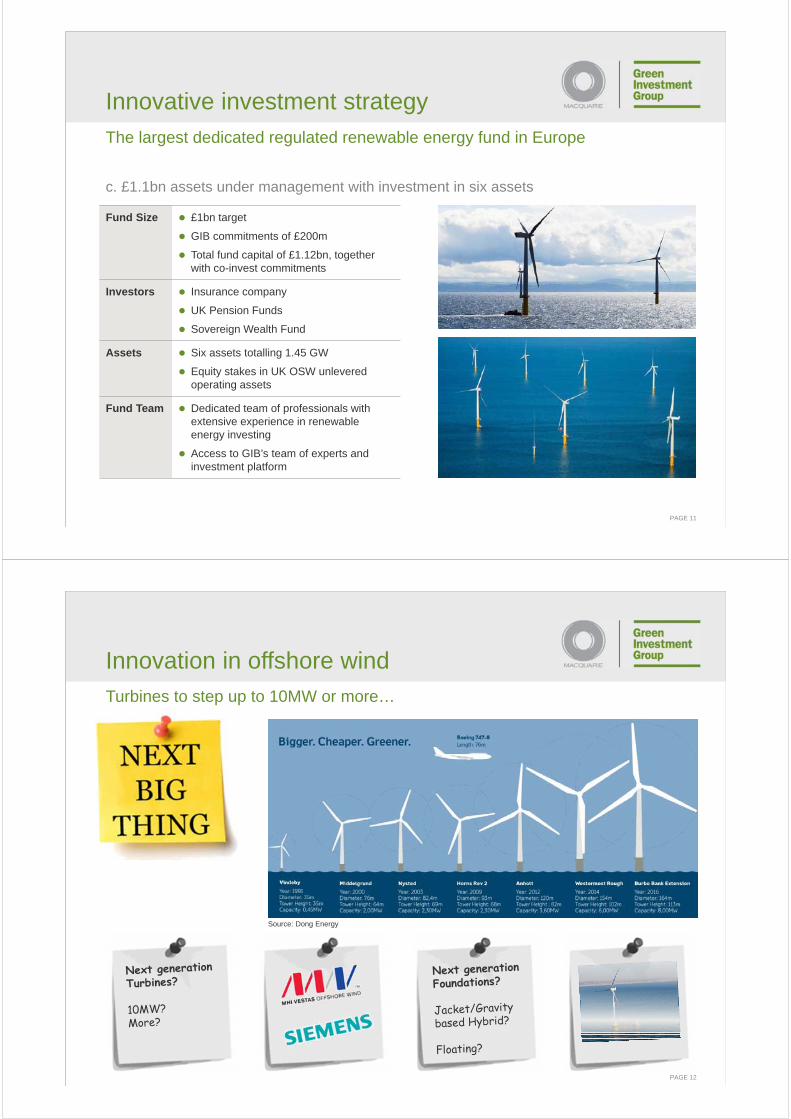
A centre of excellence in green energyEurope’s largest team of green infrastructure investment specialists
OffshoreWind
Waste & Bioenergy
Distributed Energy
Onshore Renewables
Green impact assessment and reporting
Technical services and project delivery
Portfolio management
Transaction structuring & solutions
Government relations and policy insight
PAGE 9
Over £2.2bn of capital committed over 4 years through innovative transaction structures and products
A leader in UK offshore wind
Completed Transactions Product Phase
GIB Investment Partners Innovation
Lincs Equity Operational £681m
Lynn and Inner Dowsing Equity Operational £242m 1st 100% owned by non-utility investors
Galloper Equity Construction £119m 1st Construction-ready offshore wind project finance deal
Rampion Equity Construction £306m 1st Construction financing at FID
Offshore Wind Fund Fund Operational N/A 1st Offshore wind fund raising £1bn
Sheringham Shoal Equity Operational £240m
Westermost Rough Equity Construction £241m 1st Holdco financing in construction
Gwynt y Môr Equity Construction £220m
London Array Debt Operational £59m
Greencoat1 Fund Operational £50m 1st Listing of OSW asset on the LSE
Rhyl Flats Equity Operational £57m
Walney Debt Operational £46m 1st Holdco re-financing minority stake
Total £2,261m
Notes: 1) Greencoat deal was committed by BIS and comprised a mix of onshore and offshore assets. The transaction was supported by GIB.
PAGE 10
Oversight of more turbinesthan any other UK investor
BC
EG
F
J
A
I
H
D
A. Walney Senior debt, operational financing 102 X 3.6 MW Siemens WTGs, 367.2 MW
B. Rhyl Flats 24.95% equity stake, operational investment 25 X 3.6 MW Siemens WTGs, 90 MW
C. Gwynt y Mor 10% equity stake, pre-CoD investment 160 X 3.6 MW Siemens WTGs, 576 MW
D. Westermost Rough 25% equity stake, construction investment 35 X 6 MW Siemens WTGs, 210 MW
E. Lynn and Inner Dowsing 61% equity stake, operational investment 54 X 3.6 MW Siemens WTGs, 194.4 MW
F. Lincs 75% equity stake, operational investment 75 X 3.6 MW Siemens WTGs, 270 MW
G. Sheringham Shoal 20% equity stake, operational investment 88 X 3.6 MW Siemens WTGs, 316.8 MW
H. Galloper 25% equity stake, FID construction investment 56 X 6 MW Siemens WTGs, 336 MW
I. London Array Senior debt, operational financing 175 X 3.6 MW Siemens WTGs, 630 MW
J. Rampion 25% equity stake, FID construction investment 116 X 3.45 MW MHI-Vestas WTGs, 400.2 MW
More than 880 WTGs equating to over 3.3 GW of gross capacity
PAGE 11
The largest dedicated regulated renewable energy fund in Europe
c. £1.1bn assets under management with investment in six assets
Innovative investment strategy
Fund Size £1bn target
GIB commitments of £200m
Total fund capital of £1.12bn, together with co-invest commitments
Investors Insurance company
UK Pension Funds
Sovereign Wealth Fund
Assets Six assets totalling 1.45 GW
Equity stakes in UK OSW unlevered operating assets
Fund Team Dedicated team of professionals with extensive experience in renewable energy investing
Access to GIB’s team of experts and investment platform
PAGE 12
Innovation in offshore windTurbines to step up to 10MW or more…
Source: Dong Energy
PAGE 13
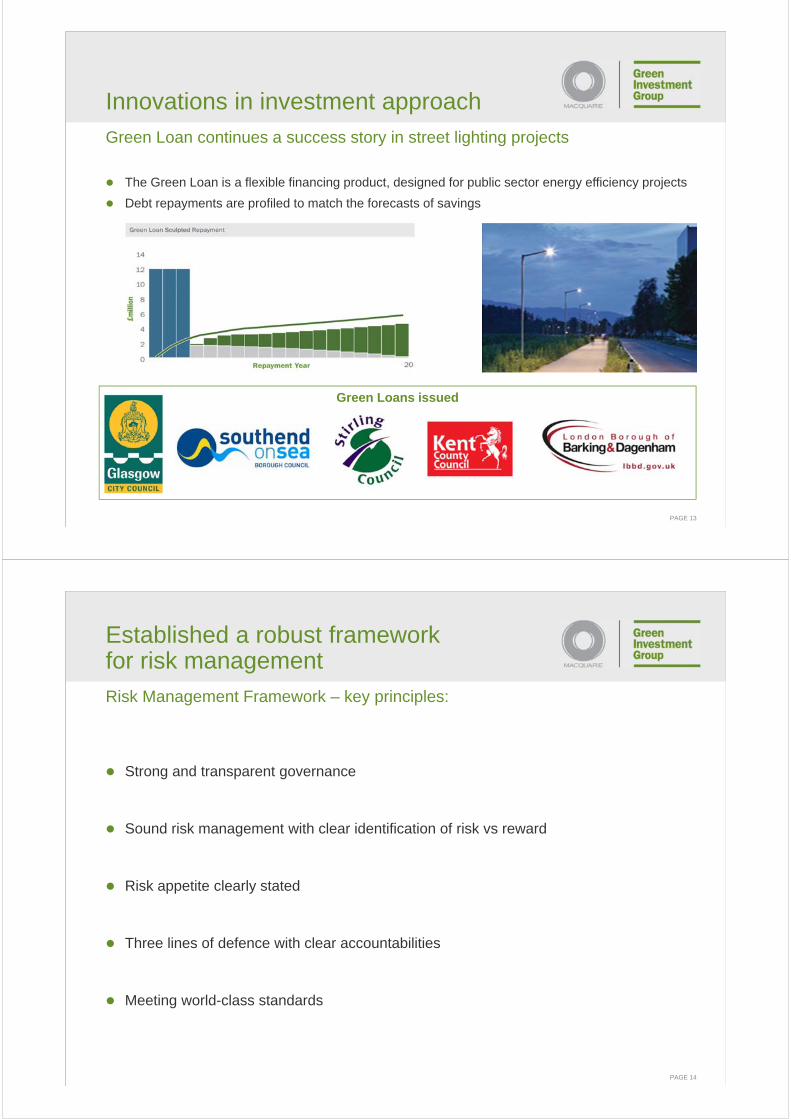
Green Loan continues a success story in street lighting projects
The Green Loan is a flexible financing product, designed for public sector energy efficiency projects
Debt repayments are profiled to match the forecasts of savings
Innovations in investment approach
Green Loans issued
PAGE 14
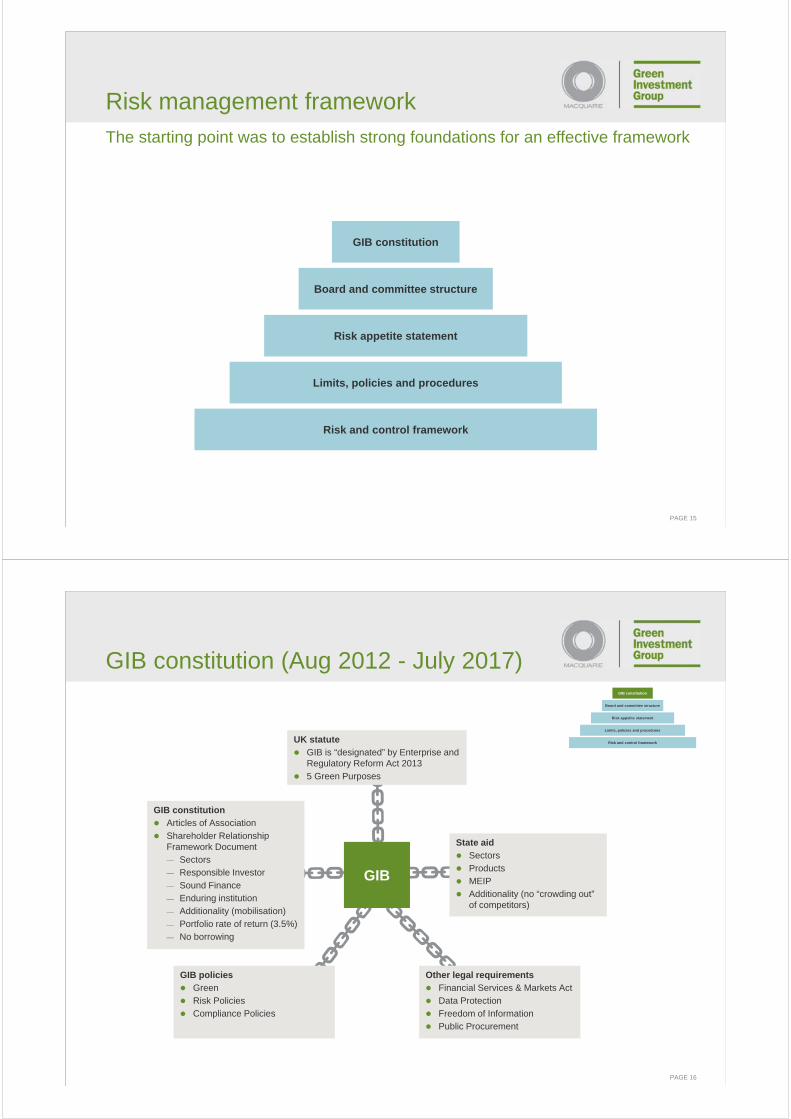
Risk Management Framework – key principles:
Strong and transparent governance
Sound risk management with clear identification of risk vs reward
Risk appetite clearly stated
Three lines of defence with clear accountabilities
Meeting world-class standards
Established a robust frameworkfor risk management
PAGE 15
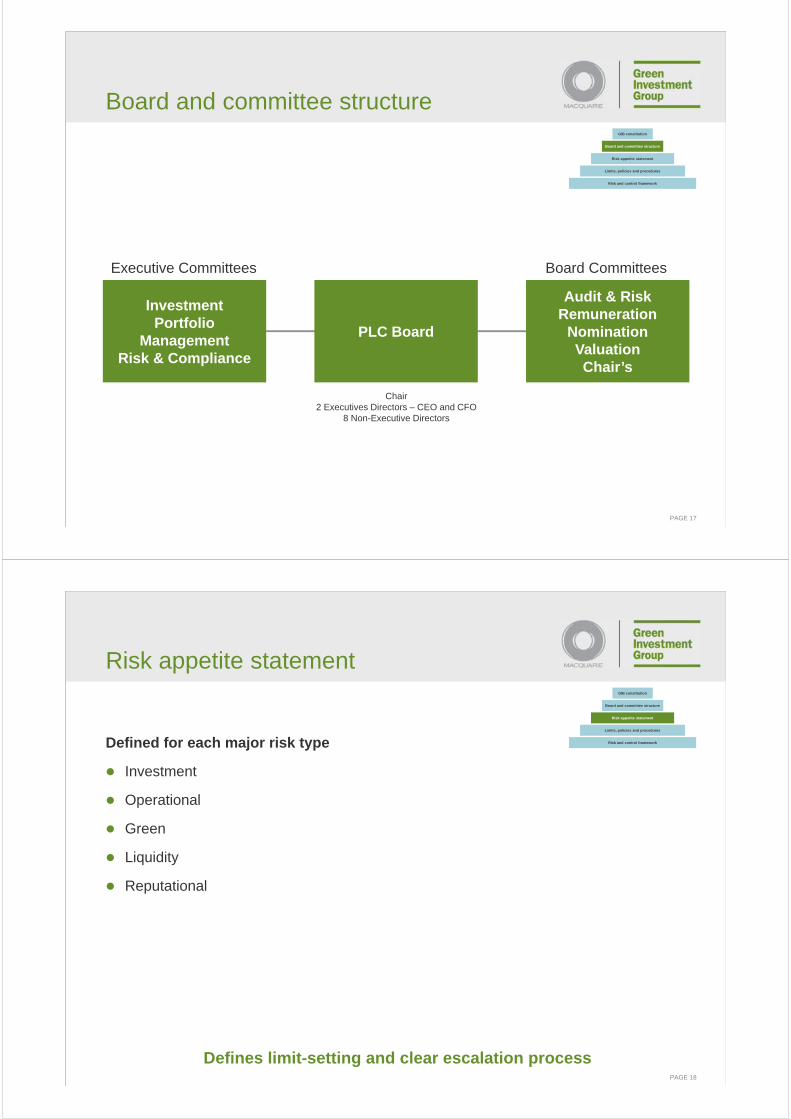
Risk management frameworkThe starting point was to establish strong foundations for an effective framework
GIB constitution
Board and committee structure
Risk appetite statement
Limits, policies and procedures
Risk and control framework
PAGE 16
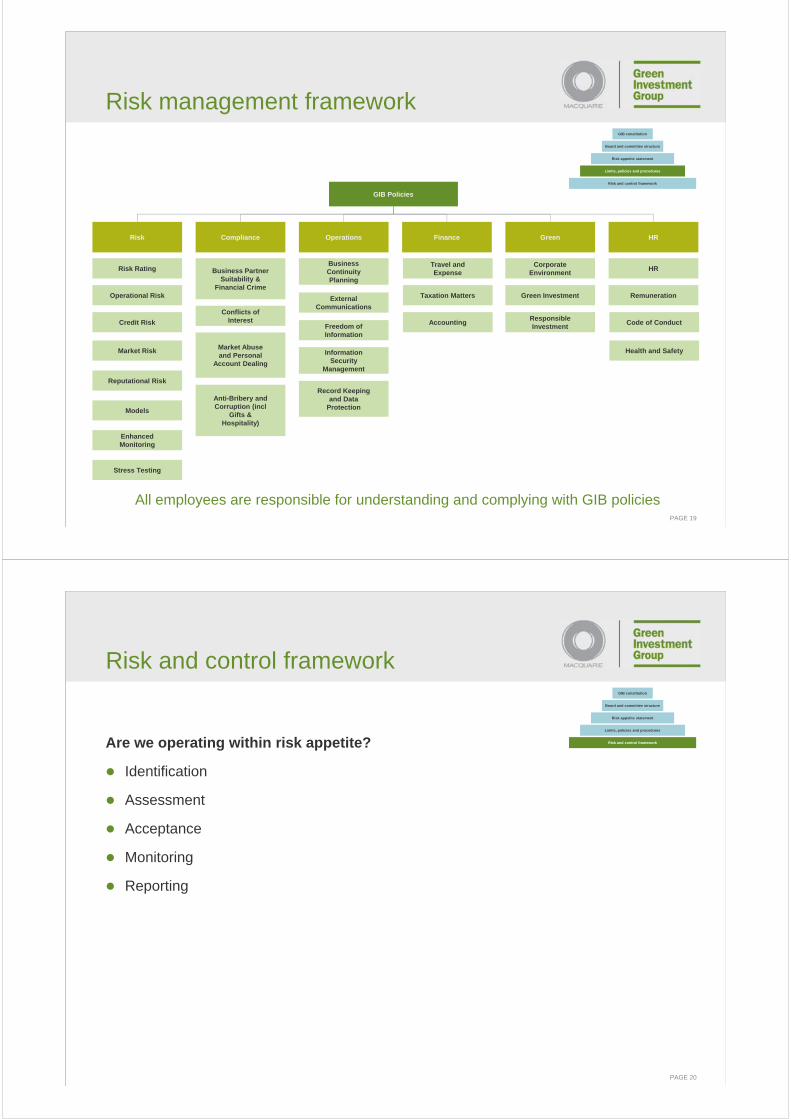
GIB constitution (Aug 2012 - July 2017) GIB constitution
Board and committee structure
Risk appetite statement
Limits, policies and procedures
Risk and control framework
Other legal requirements
Financial Services & Markets Act
Data Protection
Freedom of Information
Public Procurement
GIB policies
Green
Risk Policies
Compliance Policies
State aid
Sectors
Products
MEIP
Additionality (no “crowding out” of competitors)
GIB constitution
Articles of Association
Shareholder Relationship Framework Document
— Sectors
— Responsible Investor
— Sound Finance
— Enduring institution
— Additionality (mobilisation)
— Portfolio rate of return (3.5%)
— No borrowing
UK statute
GIB is “designated” by Enterprise and Regulatory Reform Act 2013
5 Green Purposes
GIB
PAGE 17
Board and committee structureGIB constitution
Board and committee structure
Risk appetite statement
Limits, policies and procedures
Risk and control framework
InvestmentPortfolio
ManagementRisk & Compliance
PLC Board
Audit & RiskRemuneration
NominationValuationChair’s
Executive Committees Board Committees
Chair2 Executives Directors – CEO and CFO
8 Non-Executive Directors
PAGE 18
Defined for each major risk type
Investment
Operational
Green
Liquidity
Reputational
Defines limit-setting and clear escalation process
Risk appetite statementGIB constitution
Board and committee structure
Risk appetite statement
Limits, policies and procedures
Risk and control framework
PAGE 19
Risk management framework
All employees are responsible for understanding and complying with GIB policies
GIB constitution
Board and committee structure
Risk appetite statement
Limits, policies and procedures
Risk and control framework
GIB Policies
Risk Compliance Operations Finance Green HR
Operational Risk
Credit Risk
Market Risk
Models
Risk Rating
Enhanced Monitoring
Reputational Risk
Conflicts of Interest
Market Abuse and Personal
Account Dealing
Business Partner Suitability &
Financial Crime
Anti-Bribery and Corruption (incl
Gifts & Hospitality)
External Communications
Freedom of Information
Information Security
Management
Business Continuity Planning
Record Keeping and Data
Protection
Stress Testing
Accounting
Taxation Matters
Travel and Expense
Corporate Environment
Green Investment
HR
Remuneration
Code of Conduct
Health and Safety
Responsible Investment
PAGE 20
Are we operating within risk appetite?
Identification
Assessment
Acceptance
Monitoring
Reporting
Risk and control frameworkGIB constitution
Board and committee structure
Risk appetite statement
Limits, policies and procedures
Risk and control framework
PAGE 21
Idiosyncratic assets
Small portfolio and no history
Financial models to understand value drivers and sensitivities
Complex technical, operating and contractual risks:
— Challenging offshore operating environment
— Evolving technology
— Dependency on many partners
— Complex legal contracts
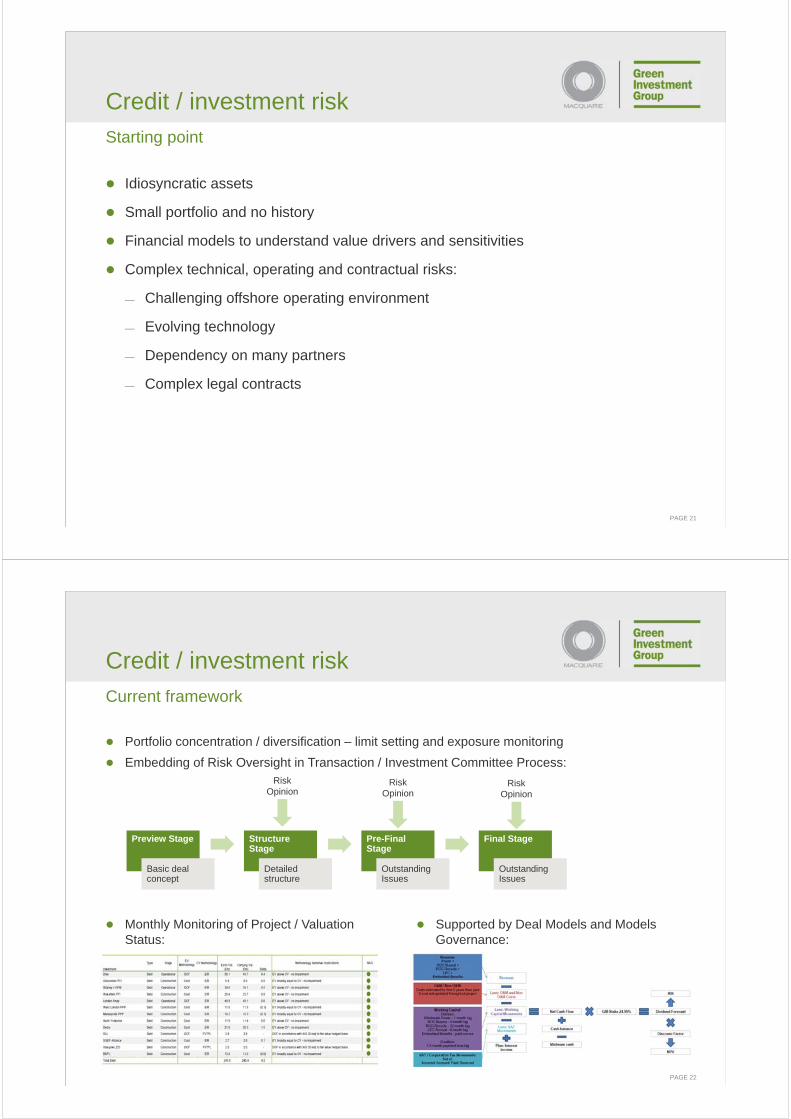
Credit / investment riskStarting point
PAGE 22
Portfolio concentration / diversification – limit setting and exposure monitoring
Embedding of Risk Oversight in Transaction / Investment Committee Process:
Credit / investment riskCurrent framework
Preview Stage
Basic deal concept
Structure Stage
Detailed structure
Pre-Final Stage
Outstanding Issues
Final Stage
Outstanding Issues
Risk Opinion
Risk Opinion
Risk Opinion
Monthly Monitoring of Project / Valuation Status:
Supported by Deal Models and Models Governance:
PAGE 23
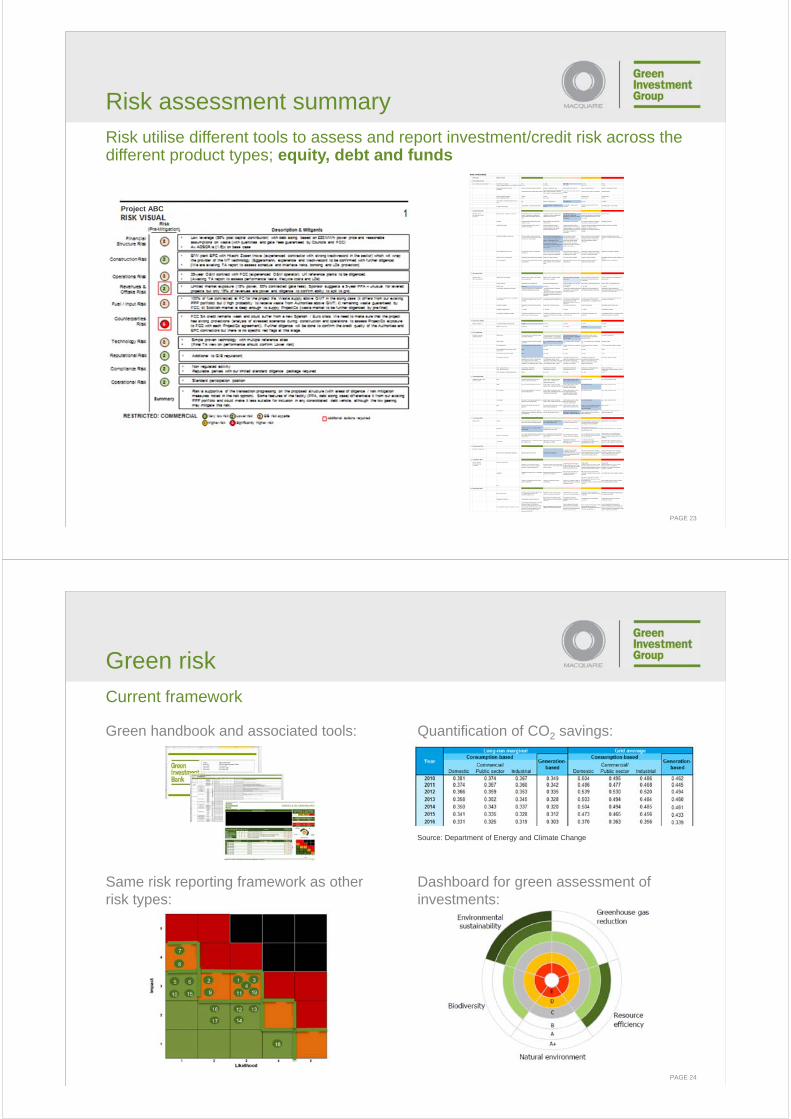
Risk assessment summaryRisk utilise different tools to assess and report investment/credit risk across the different product types; equity, debt and funds
RISK CATEGORIES
Risk Type What is tested
1 Financial Structure
(Is it suitable and properly sized ?) Overall Project Leverage 0% 0 - 45% 45% - 65% 65 - 80% > 80%Project Leverage Downside Ave. ADSCR (with P50) > 2.0x 1.75 - 2.0x 1.5 - 1.75x 1.25 - 1.5X < 1.25x
Relative Equity Investor Position minority / experienced major and others minority / experienced major equal experienced minorities major / experienced other majority / no experienced othersOur Rights
Board representation and all items reservedBoard representation, control, financial & major contracts reserved + other key items subject to super-majority approval
Control, financial & major contracts reserved
Control or major contracs not reserved Standard Articles
Mezz Intercreditor standstill 90 days 60 days 30 days Notification only No intercreditorLock up (total debt ADSC) 1.15x 1.15 - 1.25x 1.25x 1.25 - 1.35x >1.35x
Senior Debt % merchant income over loan tenor
0% Sized on contracted only Less than 40% 40 - 67% 67 -100%
Funding process timingGood timeline - cost and time recovoery
Achievable timeline - appropriate cost recovery
Tight timeline - only our cost recovered
Concerns on deal / our time / cost exposure
Risk through rush / loss of costs
2 Construction Risk
(Can they do it?)(Are they able to do it?)(Prove it?)
EPC Contractor - Developer / constructor Positive GIB experience of experienced engineer / infrastructure construction / project manager with multiple reference sites
Experienced engineer / infrastructure construction / project manager with satisfactory reference site
Sizeable (resourced) and experienced in engineering / infrastructure construction / project management
Sizeable (resourced) and experienced in engineering / infrastructure construction / project management but project is non core activity
New constructor
Schedule Extensive buffers capable of absorbing multiple key risks
Buffers capable of absorbing main schedule risks
Independantly verified schedule Risk of delay requiring non scheduled work around to avoid missing COD
Inadequate schedule
Planning and Permits Planning and permits in place with all conditions discharged.
Planning and permits in place. Conditions are inline with industry standard obligations and capable of being discharged prior to FID.
Planning and permits in place. Conditions are in line with industry standard obligations or a appropriate management strategy is in place for more onerous conditions or timescales.
Planning or permit requirements requiring re-application, subject to review challenge or conditions are as yet undefined / onerous with inexperienced manager
Planning or permits not satisfied.
Contracting strategy / interface risk Turnkey contractor with track record of successful delivery of projects with similar characteristics and risk profile.
Some contractors providing wraps to reduced interface risk compared to multi contracting strategy. Comprehensive interface management plan with interface / responsibility register agreed between primary contractors. Contractors have experience in delivery of their SoW for projects of similar characteristics.
Multi-contracting strategy, comprehensive interface management plan with interface / responsibility register agreed between primary contractors. Contractors have experience in delivery of their SoW for projects of similar characteristics.
Some contractors do not have relevant experience of their SoW or interface management plan is not fully defined when compared against industry standards.
Unproven combinations with no lead experience or defined interface management plan.
Project definition (site risk, etc.) No site issues, access or construction impediments
Site conditions assessed with only minor unusual features and adequate access / construction impediments
Site assessed with unusual site conditions capable of mitigation with no additional cost or delay
Unusual site conditions left as project responsibility. Challenge or impediment to access / construction possible
Multiple site and access challenges
Quality of test & commissioning Significantly higher than industry standards Higher than industry standard In line with industry standard Lower than industry standard Significantly lower than industry standard / no warrantee
Cost / Contingency In exceess of benchmarks based on project characteristics
Independently verified as adequate for project schedule / key sub contract values
Within benchmarks based on project characteristics
Below benchmarks and reliant on cheaper sub contract values
Inadequate values or contingency
3 Operations Risk
(Can they dio it?)(Our cost exposure ?)
Quality of the O&M providers Multiple reference plants, most of which have over-performed
Multiple reference plants with good performance on average
Reference plants with reasonable performance
Reference plants have slightly under-performed but they have shown they could improve
Reference plants have underperformed / no reference plant
Contract structure Wrapped O&M, no interface risk Wrapped, limited interface risk Wrapped, interface risk in line with market standard
Multi-contract, significant interface risk Multi-contract, very high interface risk
Contract tenor Project life > 15 years 10 - 15 years 5 - 10 years 1 - 5 years
Cost certainty (maintenance and repair) Long term fixed fee for both scheduled and unscheduled maintenance and repair
- Long term fixed fee for scheduled maintenance- Short term fixed fee for unscheduled maintenance and repair, variable fee for unscheduled maintenance and repair thereafter
Fixed fee for scheduled maintenance and variable fee for unscheduled maintenance and repair
Variable fee for both scheduled and unscheduled maintenance and repair
Variable fee for both scheduled and unscheduled maintenance and repair with no track record / basis of allocation
Cost certainty (lifecycle costs, ash disposal, consumables)
All operating costs fully backed off to O&M, EPC and Fuel Supply contracts (or PPP authority)
SPV takes cost variation exposure to limited/small portion of operating costs
SPV takes cost variation exposure to consumable unit pricing and/or ash disposal unit cost with independent validation of unit price robustness
SPV takes cost variation exposure to lifecycle/maintenance costs or ash disposal volume or consumables volume
SPV takes cost variation exposure on all operating cost parameters
Availability warrantee Significantly higher than the model base case
Higher than the model base case In line with the base case Lower than base case Significantly lower than base case
Availability warrantee tenor > 10 years 5 - 10 years 2-5 years 0 - 2 years No availability warrantee
LD package for availability warrantee Provides fair compensation for the loss of production with minimal carve-outs
Provides fair compensation for the loss of production with better than standard carve-outs
Provides fair compensation for the loss of production
Compensations fall below loss of production
No availability warrantee / compensations fall significantly below loss of production
4 Revenue & Offtake
(Risky or certain ?) % merchant revenue over project life 0 - 20% 20 - 40% 40 - 60% 60 - 80% 80 - 100%
Offtake contract tenor Project life > 15 years 10 - 15 years 5 - 10 years 1 - 5 years
5 Fuel / Input Risk
(Certainty on quality, quantity and cost ?)
W&B Quality Uncomplicated fuel, established handling and simple combustion
Existing tested source of pre-treated / uncomplicated fuel. Pre combustion process in place for sensitive technology
Existing tested source. Wide technology handling / acceptability and firing range
Untested new or broker sources / sensitive technology requirements requiring protection
Fuel outwith requirements
W&B Quantity Consistent over supply and no forseeable competition
1.5 - 2.0x downside cover in catchment area
1.5x downside cover in catchment area
1.0 - 1.5x downside cover in catchment area
Inadequate supply
Fuel contract tenor > 80% of project life covered by contract 65 to 80% of project life is covered by contract
45 -65% of project life is covered by contract
25 - 45 of project life is covered by contract
< 25% of project life covered by contract
Fuel contracted fuel at FC (as % of total required fuel)
100% 75 - 100% 50 - 75% 25 - 50% < 25%
% of fixed price guaranteed supply 100% 75 - 100% 50 - 75% 25 - 50% < 25%
Fuel quality management Sampling/testing regimes fully aligned on all parameters across the key subcontracts, with a single source of fuel supply responsibility and frequent measurement / averaging on key parameters (daily, 3 daily)
Sampling/testing regimes fully aligned on all parameters across the key subcontracts, with multiple fuel suppliers and frequent measurement / averaging on key parameters (daily, 3 daily)
Sampling/testing regimes fully aligned on all parameters across the key subcontracts with longer measurement / averaging periods than green (e.g monthly )
Sampling/testing regime has inconsistencies between subcontract regimes on key parameters (e.g. Chlorine) and potential for dispute between subcontractors
No testing or inspection regime
Wind - Equity base case Independently verified P90 Independently verified P75 Independently verified P50 Verified by non certified third party Vendor's assumptionsWind - Debt Sizing case Independently verified P99 Independently verified P90 Independently verified P75 Independently verified P50 Verified by non certified third party / vendor's
assumptionsWind uncertainty (10 year standard error) <6.5% 6.5 - 7.5% 7.5 - 9.5% 9.5 - 11% > 11%
6 Counterparty Risk
(Capable and able to take the risk transfer?)
EPC Investment grade and track record, no adverse rating or trading update
Stable trading, sizeable and strong balance sheet, established and significant business line
Stable trading, good for contract value, experienced track record
One of Peach not met Two or more of peach not met
O&M Investment grade and long track record Stable trading, sizeable and strong balance sheet, established business line
Stable trading, good for contract value (short medium term), resources to fulfill contract
One of Peach not met Two or more of peach not met
PPA / Offtaker Investment grade Utility with no adverse rating or trading update
Stable Trading, sizeable and strong balance sheet, established business line / need with end user market
Stable trading, good for contract value (short medium term), meaningful requirement within business or end user market
One of Peach not met Two or more of peach not met
Fuel Supplier Investment grade and main business line, no adverse rating or trading update
Stable trading, sizeable and strong balance sheet, established business line
Stable trading, good for contract value (short medium term), resources to fulfill contract
One of Peach not met Two or more of peach not met
SHA Existing equity provider with indicative approval
Committed funds available and existing active investor alongside GIB
Committed funds available and active investor with track record
Doubts on committed funding availability or ticket size or project non core to investment strategy
New to market
Debt providers Existing Lender with indicative approval; strategic sponsor relationship; underwriting & hold approval
Leading industry lender, deal in keeping with size and proven at this level
Active lender, experienced team, short lines of communication in organisation; syndication required
Limited record or looks stretched in sector, pulling out record or decision making disconnect
New to market or a re-entry or not an investment grade entity
7 Technology Risk
(Will it work?) Design Proven technology at industrial scale with proven track record and overperformance
Proven technology at industrial scale with multiple reference sites
Proven technology at industrial scale in at least one reference site
Proven technology at industrial scale but with either a key evolution or proven technologies but first combination
Application of a new technology
ManufactureEstablished process and facility with the market leader
Established process and facility with tangible positive track record
Established process and facilityNew manufacturing process in an existing facility / new facility with existing manufacturing process
New manufacturing process in new facility
Transport and installationUse of long established and proven methods with multiple references on similar site characteristics
Use of established and proven methods with several references on similar site characteristics
Use of established and proven methods with several references
Use of established and proven methods with one aspect of novelty introduced for site or fuel specificity
New methods or use of established and proven methods with several significant aspects of novelty introduced for site or fuel specificity
PerformanceDesign performance exceeded with evidence from reference site
Independent verification of enhanced performance over design
Independantly validated as applicable to site, interface or fuel / wind assessment
As a result of novel design, manufacturing or installation process, underperformance is likely
Not validated by an independent technical advisor or by an independent certifying body
8 Reputational Risk
(We have no tolerance)
Impact on GIB or Shareholders reputations Marketing opportunity for GIB Additional to GIB reputation
No negative impact on GIB or Shareholders reputationsNo detrimental impact on GIB green activity, social responsibility and NGO feedback
Potential of negative impact on GIB or Shareholders reputations and detrimental impact on GIB green activity, social responsibility and NGO feedback
Likelyhood of negative impact on GIB or Shareholders reputations and detrimental impact on GIB green activity, social responsibility and NGO feedback
9 Compliance Risk
(Do we comply?)(Will they hurt our standing?)
Initial Risk Assessment
Regulated, Listed or public Authority organisations incorporated in a low risk jurisdiction requiring simplified DD,
Reputable UK organisations with simple corporate structure and operating within a low risk sector
Large deal structure or range of Business Partners some of which are new to GIB, with more complex beneficial ownership stucture.
Enhanced DDComplex deal structure and sector with all parties unknown at this stage and complex beneficial ownership, along with operations located outside of the UK
Enhanced DDHigh risk jurisdictions or sector, Ultimate beneficial owners are individuals. Red flags or concerns around business activities or reputation
RegulationEstablished transaction type – unregulated activity
Established transaction type within our regulated activity approval
New transaction type within our regulated activity approval if documented correctly
GIB charging for work that would be construed as regulated unless we prove otherwise
New activity that requires regulatory approval
KYC
Positive KYC through well known and UK active counterparties
Positive KYC through well known counterparties
Positive KYC results for a range of Business Partners with all findings adequately resolved.
Jurisdictions, operations or complex Ultimate beneficial ownership structure deemed higher risk.Reservation on efficacy of past or present activities.
Major red flags on past or present activities. Non compliant Business Partners
10 Operational Risk
Back office activitiesParticipant in loan or minority equity stake in an operational investment with experienced agent / lead
Participant in loan or minority equity stake in a construction investment
Active Partner in loan or equity stake in a construction investment
Active partner with responsibility for generation of some management activity or reporting
Management and reporting of trading entity is the responsibility of GIB
Management intervention Fully agented internal reporting onlyBoard position with normal reserved items covering control, financial and key contracts
Fully agented but GIB has parameters and veto on specific activities
Controlling stake with management outsourced
Responsible for governance and active management of entity
New capabilities required to manage the asset
Asset management will require none of the following: changes to GIB business processes, a materially greater per-asset time commitment than other assets in the same sector, new PIM employees, new internal technology platforms or new regulatory permissions
Asset management will require minor changes to GIB business processes
Asset management will require minor changes to GIB business processes and / or a greater per-asset time commitment than other assets in the same sector
Asset management will require new GIB business processes, new PIM employees or a significant investment in internal technology platforms
Asset management would represent a fundamental change in, or extension to, the business operating model of the GIB group, possibly including new operating teams, legal entities or regulatory permissions
Project ABC
PAGE 24
Green risk
Current framework
Quantification of CO2 savings:Green handbook and associated tools:
Dashboard for green assessment of investments:
Same risk reporting framework as other risk types:
Source: Department of Energy and Climate Change
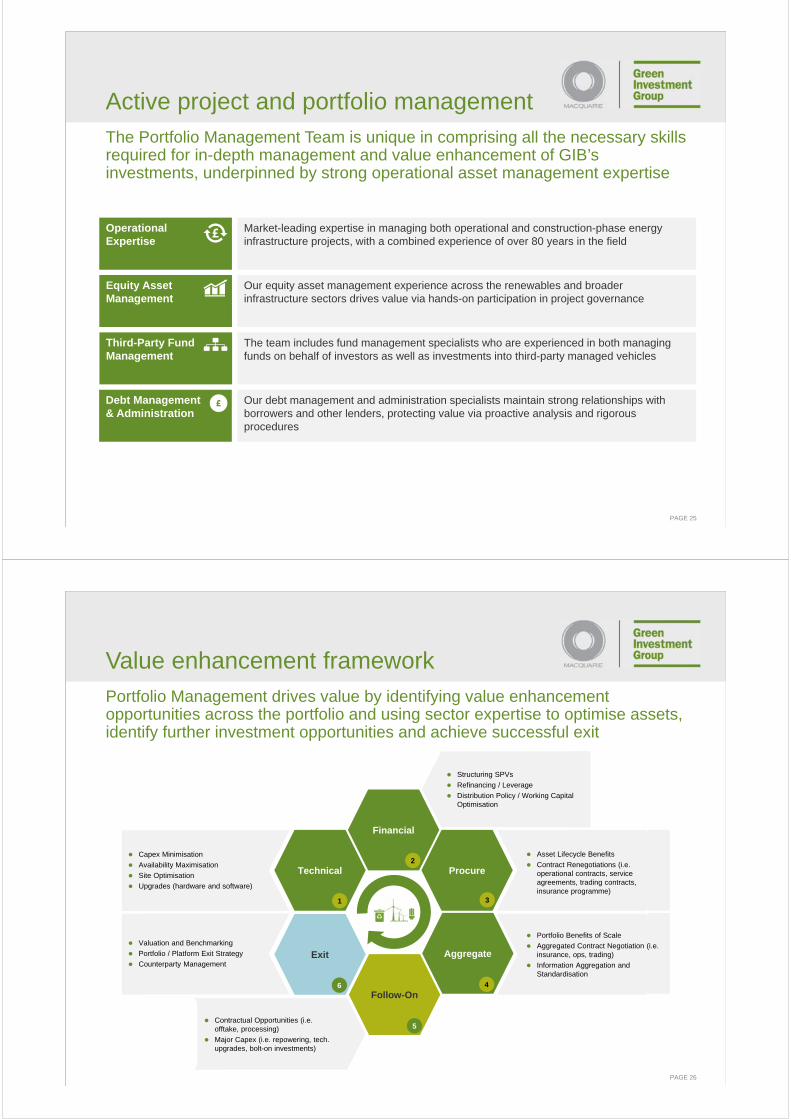
PAGE 25
Active project and portfolio managementThe Portfolio Management Team is unique in comprising all the necessary skills required for in-depth management and value enhancement of GIB’s investments, underpinned by strong operational asset management expertise
Equity Asset Management
Third-Party Fund Management
Debt Management & Administration
Operational Expertise
Market-leading expertise in managing both operational and construction-phase energy infrastructure projects, with a combined experience of over 80 years in the field
The team includes fund management specialists who are experienced in both managing funds on behalf of investors as well as investments into third-party managed vehicles
Our equity asset management experience across the renewables and broader infrastructure sectors drives value via hands-on participation in project governance
Our debt management and administration specialists maintain strong relationships with borrowers and other lenders, protecting value via proactive analysis and rigorous procedures
PAGE 26
Value enhancement frameworkPortfolio Management drives value by identifying value enhancement opportunities across the portfolio and using sector expertise to optimise assets, identify further investment opportunities and achieve successful exit
Financial
Technical Procure
Exit Aggregate
Follow-On
2
3
4
1
5
6
Capex Minimisation
Availability Maximisation
Site Optimisation
Upgrades (hardware and software)
Valuation and Benchmarking
Portfolio / Platform Exit Strategy
Counterparty Management
Contractual Opportunities (i.e. offtake, processing)
Major Capex (i.e. repowering, tech. upgrades, bolt-on investments)
Structuring SPVs
Refinancing / Leverage
Distribution Policy / Working Capital Optimisation
Asset Lifecycle Benefits
Contract Renegotiations (i.e. operational contracts, service agreements, trading contracts, insurance programme)
Portfolio Benefits of Scale
Aggregated Contract Negotiation (i.e. insurance, ops, trading)
Information Aggregation and Standardisation
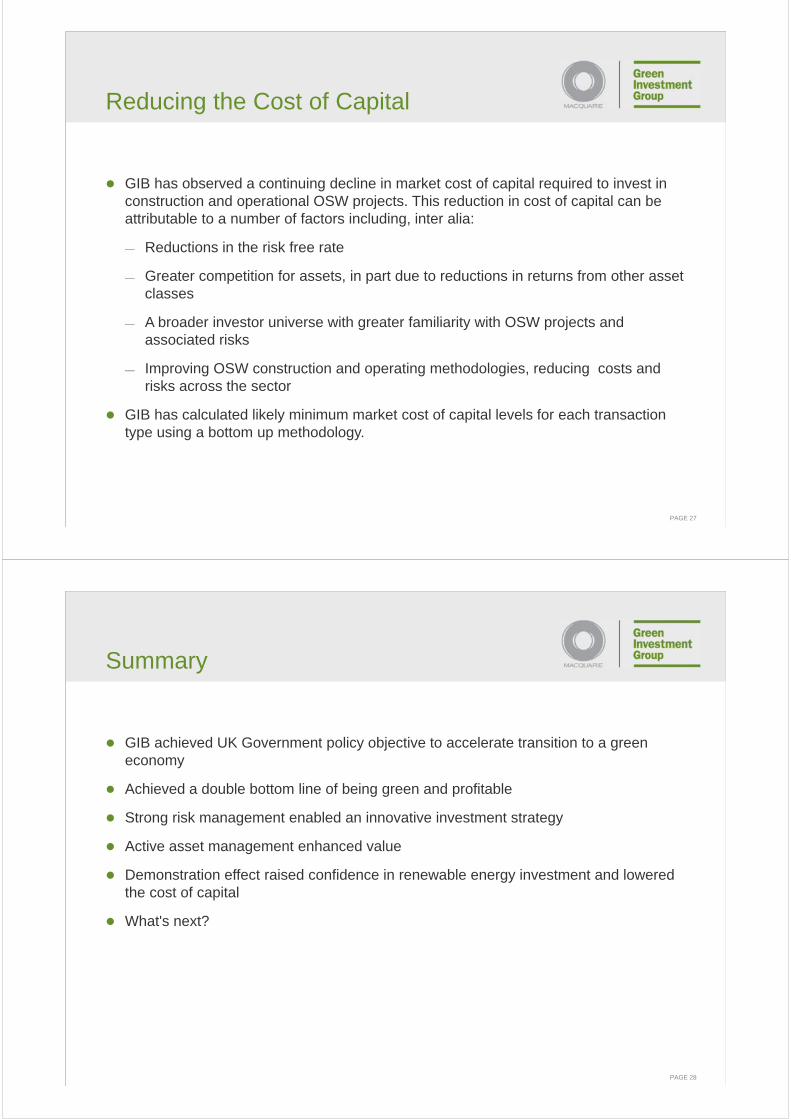
PAGE 27
GIB has observed a continuing decline in market cost of capital required to invest in construction and operational OSW projects. This reduction in cost of capital can be attributable to a number of factors including, inter alia:
— Reductions in the risk free rate
— Greater competition for assets, in part due to reductions in returns from other asset classes
— A broader investor universe with greater familiarity with OSW projects and associated risks
— Improving OSW construction and operating methodologies, reducing costs and risks across the sector
GIB has calculated likely minimum market cost of capital levels for each transaction type using a bottom up methodology.
Reducing the Cost of Capital
PAGE 28
GIB achieved UK Government policy objective to accelerate transition to a green economy
Achieved a double bottom line of being green and profitable
Strong risk management enabled an innovative investment strategy
Active asset management enhanced value
Demonstration effect raised confidence in renewable energy investment and lowered the cost of capital
What's next?
Summary

PAGE 29
PAGE 30
Q&A

Session III:
Best Practices in Energy Efficiency Financing

III-2
Korea Soft Loan
(Energy Use Rationalization Funds)

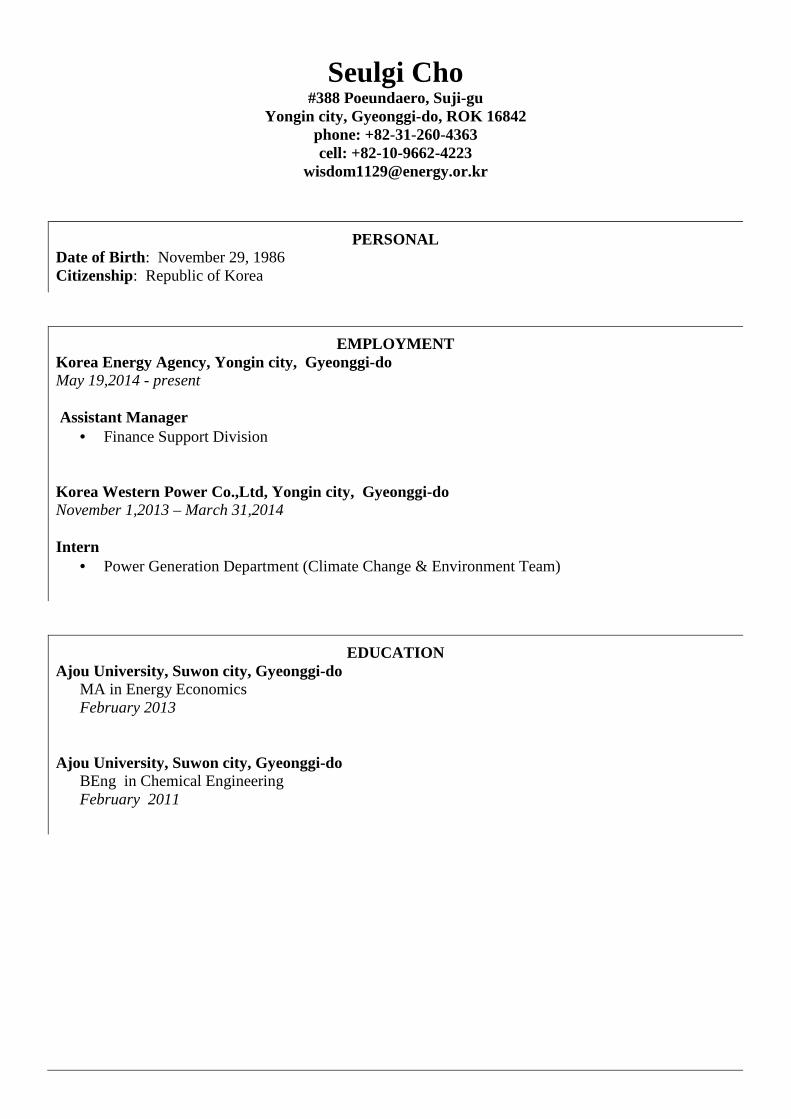
Seulgi Cho #388 Poeundaero, Suji-gu
Yongin city, Gyeonggi-do, ROK 16842 phone: +82-31-260-4363 cell: +82-10-9662-4223
PERSONAL Date of Birth: November 29, 1986 Citizenship: Republic of Korea
EMPLOYMENT Korea Energy Agency, Yongin city, Gyeonggi-do May 19,2014 - present Assistant Manager
• Finance Support Division
Korea Western Power Co.,Ltd, Yongin city, Gyeonggi-do November 1,2013 – March 31,2014 Intern
• Power Generation Department (Climate Change & Environment Team)
EDUCATION Ajou University, Suwon city, Gyeonggi-do
MA in Energy Economics February 2013
Ajou University, Suwon city, Gyeonggi-do
BEng in Chemical Engineering February 2011

Copyright © by KEA. All rights reserved.
http://www.energy.or.kr
Copyright © by KEA. All rights reserved.
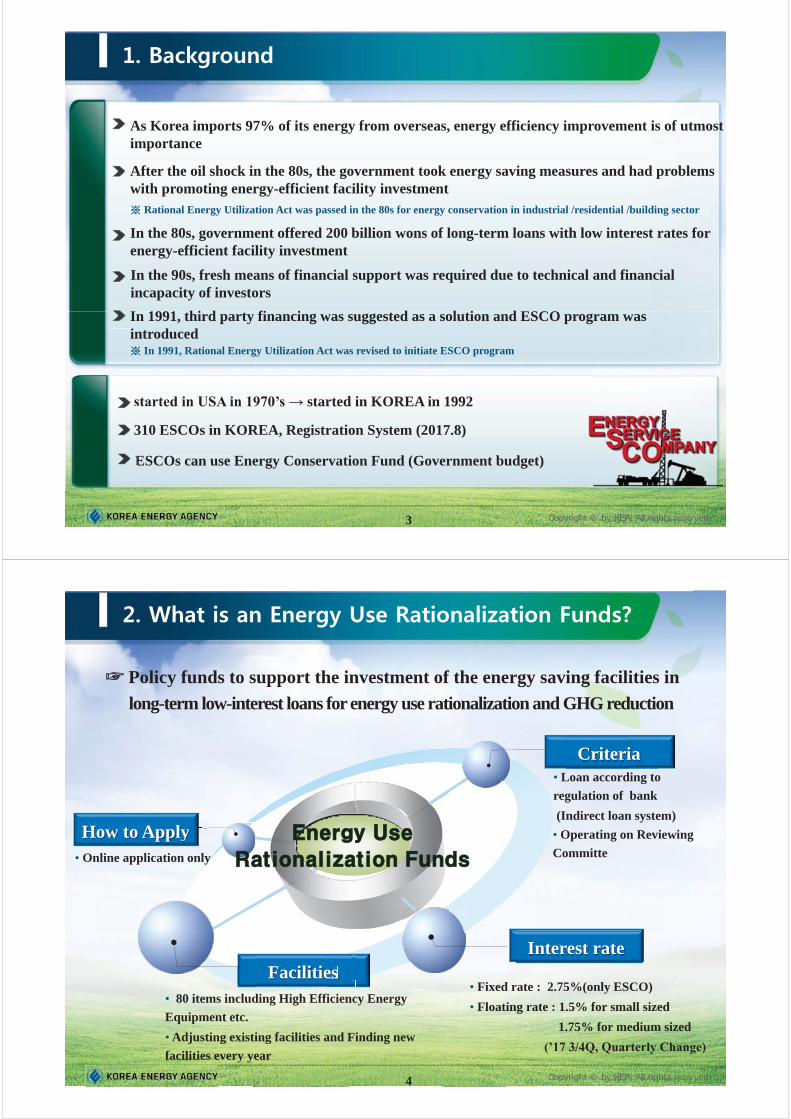
Copyright © by KEA. All rights reserved. 3
After the oil shock in the 80s, the government took energy saving measures and had problems with promoting energy-efficient facility investment
In 1991, Rational Energy Utilization Act was revised to initiate ESCO program
In the 90s, fresh means of financial support was required due to technical and financial incapacity of investors In 1991, third party financing was suggested as a solution and ESCO program was introduced
Rational Energy Utilization Act was passed in the 80s for energy conservation in industrial /residential /building sector
In the 80s, government offered 200 billion wons of long-term loans with low interest rates for energy-efficient facility investment
As Korea imports 97% of its energy from overseas, energy efficiency improvement is of utmost importance
started in USA in 1970’s → started in KOREA in 1992 s
310 ESCOs in KOREA, Registration System (2017.8) 3
ESCOs can use Energy Conservation Fund (Government budget) E
Copyright © by KEA. All rights reserved.
Policy funds to support the investment of the energy saving facilities in
long-term low-interest loans for energy use rationalization and GHG reduction
Interest ratete Facilitieses
How to Applyly
Criteriaia
• Fixed rate : 2.75%(only ESCO)
• Floating rate : 1.5% for small sized
1.75% for medium sized
(’17 3/4Q, Quarterly Change)
• Loan according to
regulation of bank
(Indirect loan system)
• 80 items including High Efficiency Energy
Equipment etc.
• Adjusting existing facilities and Finding new
facilities every year
• Online application only
• Operating on Reviewing
Committe
4
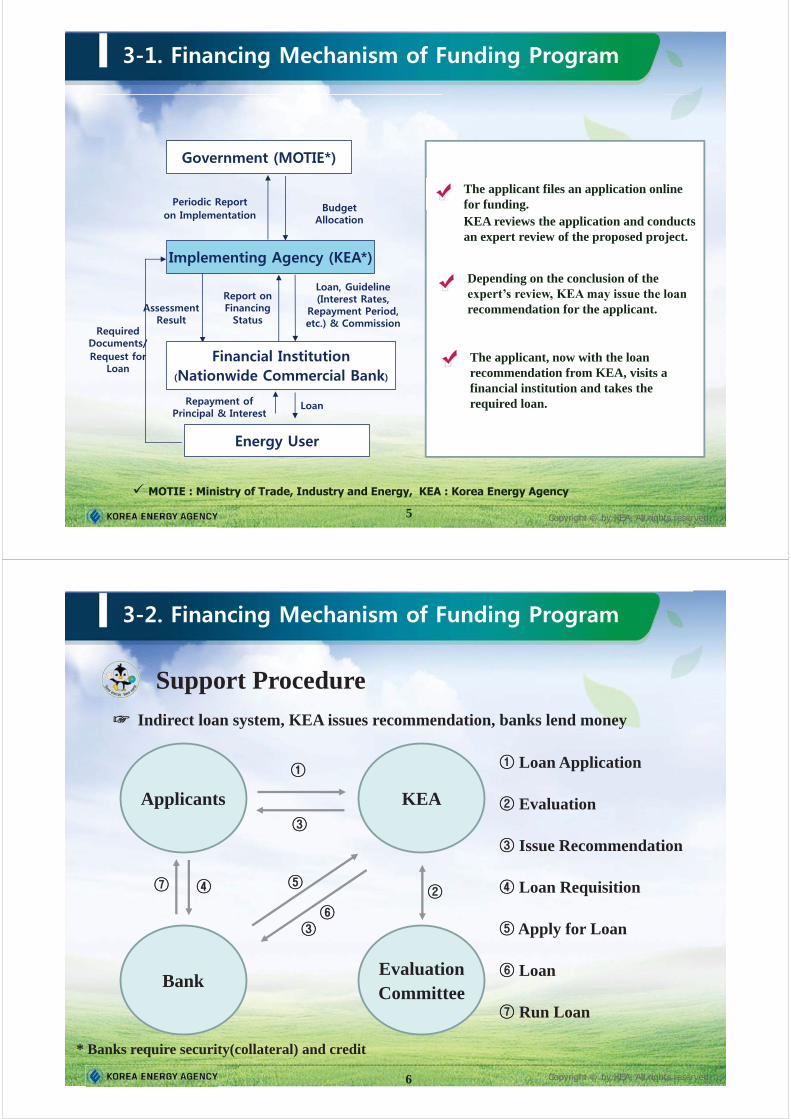
Copyright © by KEA. All rights reserved. 5
The applicant files an application online for funding. KEA reviews the application and conducts an expert review of the proposed project.
MOTIE : Ministry of Trade, Industry and Energy, KEA : Korea Energy Agency
Depending on the conclusion of the expert’s review, KEA may issue the loan recommendation for the applicant.
The applicant, now with the loan recommendation from KEA, visits a financial institution and takes the required loan.
Copyright © by KEA. All rights reserved. 6
Support Procedure
Loan Application
Evaluation
Issue Recommendation
Loan Requisition
Apply for Loan
Loan
Run Loan
Applicants
Evaluation Committee
Bank
KEA
* Banks require security(collateral) and credit
Indirect loan system, KEA issues recommendation, banks lend money
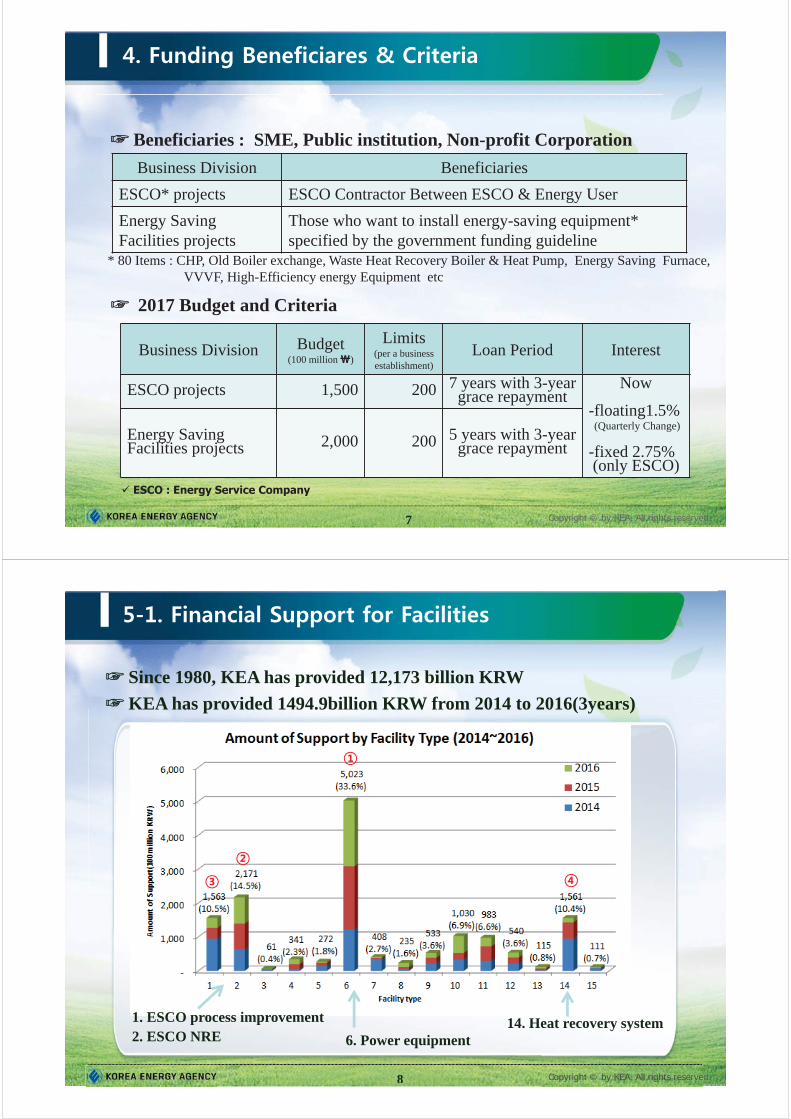
Copyright © by KEA. All rights reserved.
Business Division Beneficiaries
ESCO* projects ESCO Contractor Between ESCO & Energy User
Energy Saving Facilities projects
Those who want to install energy-saving equipment* specified by the government funding guideline
Beneficiaries : SME, Public institution, Non-profit Corporation
Business Division Budget (100 million )
Limits (per a business establishment)
Loan Period Interest
ESCO projects 1,500 200 7 years with 3-year grace repayment
Now
-floating1.5% (Quarterly Change)
-fixed 2.75% (only ESCO)
Energy Saving Facilities projects 2,000 200 5 years with 3-year
grace repayment
2017 Budget and Criteria
* 80 Items : CHP, Old Boiler exchange, Waste Heat Recovery Boiler & Heat Pump, Energy Saving Furnace, VVVF, High-Efficiency energy Equipment etc
ESCO : Energy Service Company
7
Copyright © by KEA. All rights reserved. 8 Copyright © by KEA. All rights reserve8
Since 1980, KEA has provided 12,173 billion KRW
KEA has provided 1494.9billion KRW from 2014 to 2016(3years)
6. Power equipment
1. ESCO process improvement 2. ESCO NRE
14. Heat recovery system
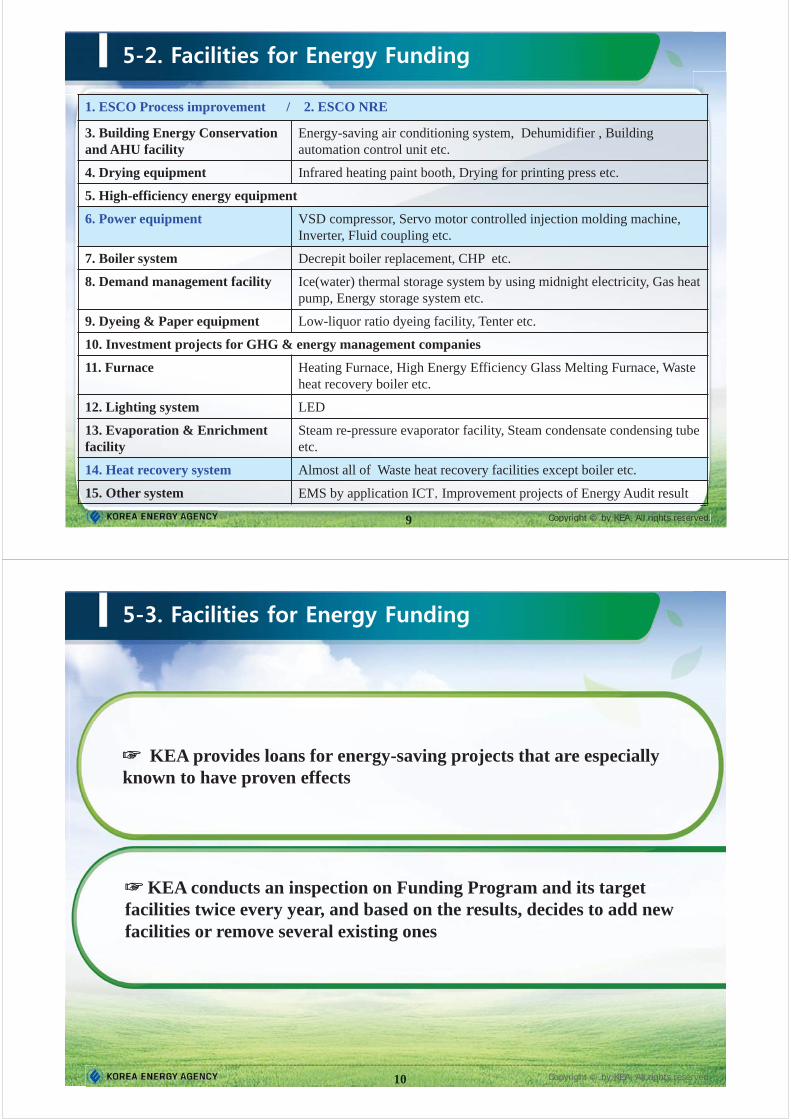
Copyright © by KEA. All rights reserved. CCoCoCoCopypypypy iriririri hghghghghttttt ©©©©© bbybybyby KKKKKEAEAEAEAEA.. AlAlAlAlAllllll iriririri hghghghghttstststs rrrresesesesererrerervvevevev d.9
1. ESCO Process improvement / 2. ESCO NRE
3. Building Energy Conservation and AHU facility
Energy-saving air conditioning system, Dehumidifier , Building automation control unit etc.
4. Drying equipment Infrared heating paint booth, Drying for printing press etc.
5. High-efficiency energy equipment
6. Power equipment VSD compressor, Servo motor controlled injection molding machine, Inverter, Fluid coupling etc.
7. Boiler system Decrepit boiler replacement, CHP etc.
8. Demand management facility Ice(water) thermal storage system by using midnight electricity, Gas heat pump, Energy storage system etc.
9. Dyeing & Paper equipment Low-liquor ratio dyeing facility, Tenter etc.
10. Investment projects for GHG & energy management companies
11. Furnace Heating Furnace, High Energy Efficiency Glass Melting Furnace, Waste heat recovery boiler etc.
12. Lighting system LED
13. Evaporation & Enrichment facility
Steam re-pressure evaporator facility, Steam condensate condensing tube etc.
14. Heat recovery system Almost all of Waste heat recovery facilities except boiler etc.
15. Other system EMS by application ICT Improvement projects of Energy Audit result
Copyright © by KEA. All rights reserved.
KEA provides loans for energy-saving projects that are especially known to have proven effects
KEA conducts an inspection on Funding Program and its target facilities twice every year, and based on the results, decides to add new facilities or remove several existing ones
10
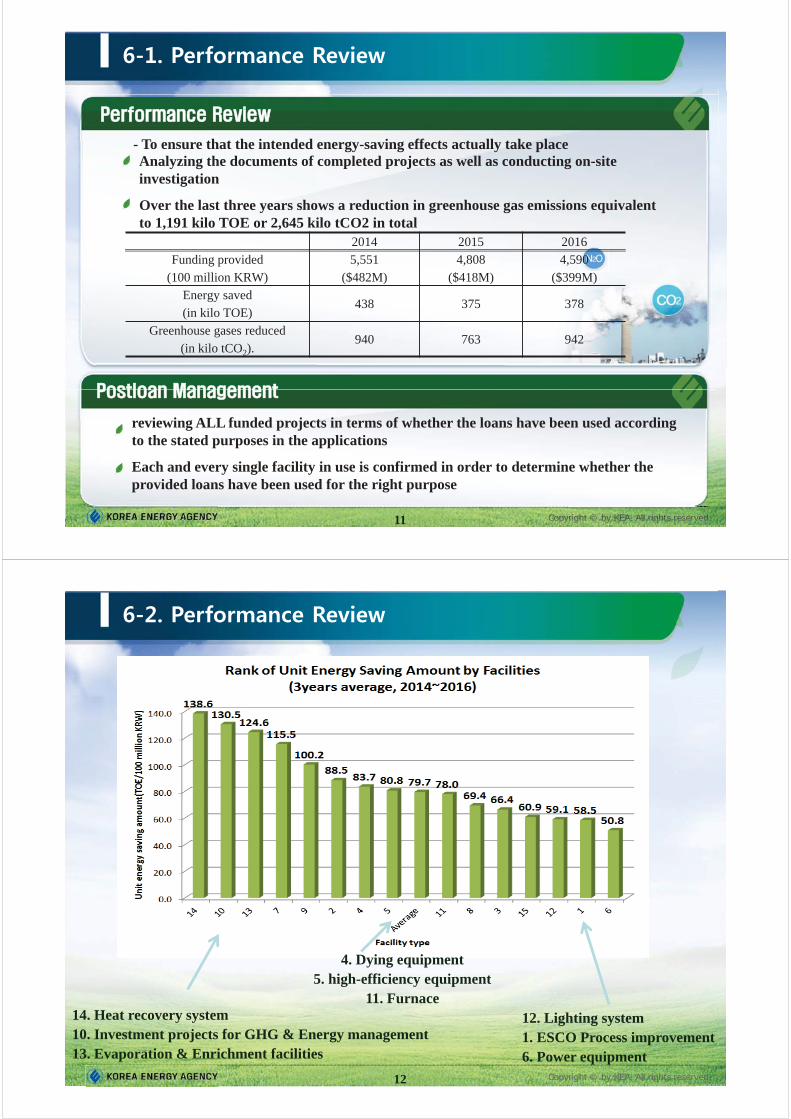
Copyright © by KEA. All rights reserved. 11
Analyzing the documents of completed projects as well as conducting on-site investigation
Over the last three years shows a reduction in greenhouse gas emissions equivalent to 1,191 kilo TOE or 2,645 kilo tCO2 in total
- To ensure that the intended energy-saving effects actually take place
2014 2015 2016 Funding provided
(100 million KRW) 5,551
($482M) 4,808
($418M) 4,590
($399M) Energy saved (in kilo TOE)
438 375 378
Greenhouse gases reduced (in kilo tCO2).
940 763 942
Copyright © by KEA All rights reserved11
reviewing ALL funded projects in terms of whether the loans have been used according to the stated purposes in the applications
Each and every single facility in use is confirmed in order to determine whether the provided loans have been used for the right purpose
Copyright © by KEA. All rights reserved. 12
4. Dying equipment 5. high-efficiency equipment
11. Furnace 14. Heat recovery system 10. Investment projects for GHG & Energy management 13. Evaporation & Enrichment facilities
12. Lighting system 1. ESCO Process improvement 6. Power equipment
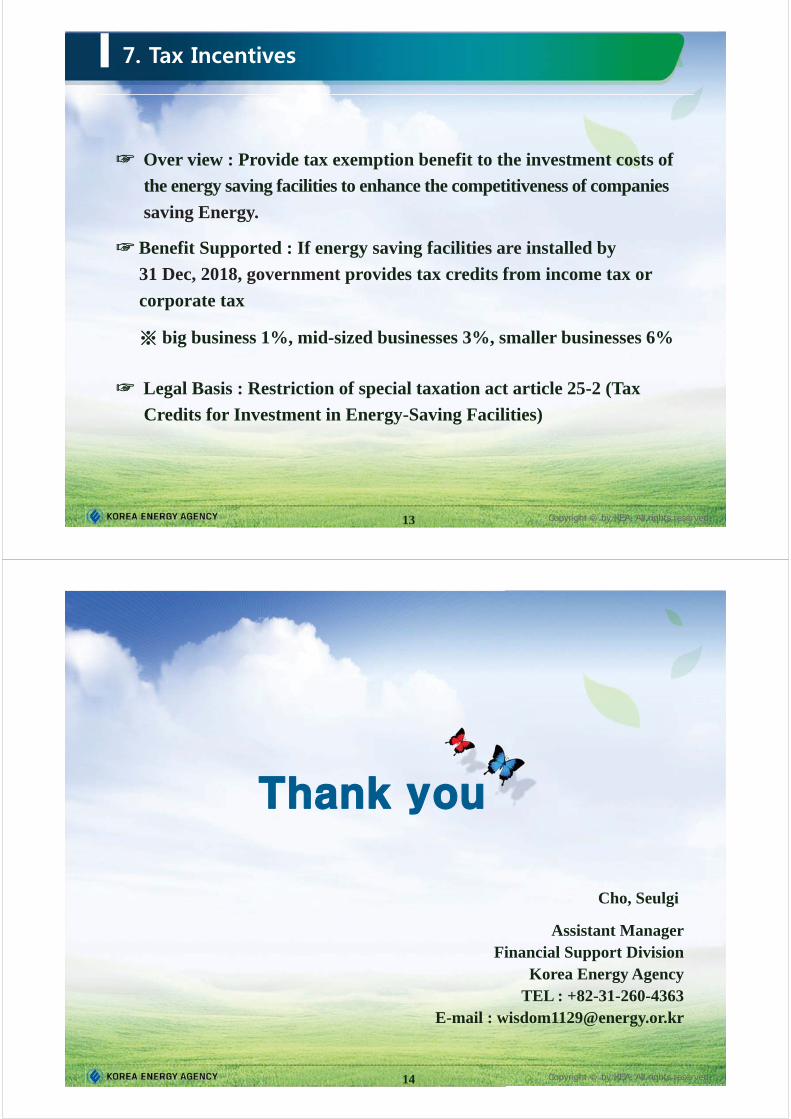
Copyright © by KEA. All rights reserved. 13
Over view : Provide tax exemption benefit to the investment costs of
the energy saving facilities to enhance the competitiveness of companies
saving Energy.
Legal Basis : Restriction of special taxation act article 25-2 (Tax
Credits for Investment in Energy-Saving Facilities)
Benefit Supported : If energy saving facilities are installed by
31 Dec, 2018, government provides tax credits from income tax or
corporate tax
big business 1%, mid-sized businesses 3%, smaller businesses 6%
Copyright © by KEA. All rights reserved. 14
Assistant Manager Financial Support Division
Korea Energy Agency TEL : +82-31-260-4363
E-mail : [email protected]
Cho, Seulgi

III-1
ESCO Program in Korea

Dongwook Cho #388 Poeundaero, Suji-gu
Yongin city, Gyeonggi-do, ROK 16842 phone: +82-31-260-4355 cell: +82-10-2811-4026 [email protected]
PERSONAL Date of Birth: April 20, 1974 Citizenship: Republic of Korea
EMPLOYMENT Korea Energy Agency, Yongin city, Gyeonggi-do January 1,2001 - present Team Manager
• Finance Support Division Manager / Deputy General Manager
• Energy Consulting Division • New & Renewable Energy Center • Inspection on Thermal Equipments
EDUCATION Dongguk University in korea
MS in New & Renewable Energy February 2011 ~ present
Sung kyun kwan University in korea
BEng in Electrical, Electronics & Computer Engineering August 2000

Copyright © by KEA. All rights reserved.
http://www.energy.or.kr
ESCO Program In Korea
Copyright © by KEA. All rights reserved.
ESCO Program
What is an ESCO(Energy Service Company) ?
ESCO means Company or Business Model
Company concept : Registered Company in MOTIE with the
requirements of Assets, Technical Manpower and Equipment
by the Energy Use Rationalization Act
Business Model concept : Business to perform Energy Saving
Projects, in place of the Energy User(Recovering the investment
costs by Savings)
ESCO generally perform such as
Energy Audit, Project Proposal, EPC, MRV, Maintenance etc * EPC : Engineering, Procurement, Construction, MRV : Measuring, Reporting, Verification
2
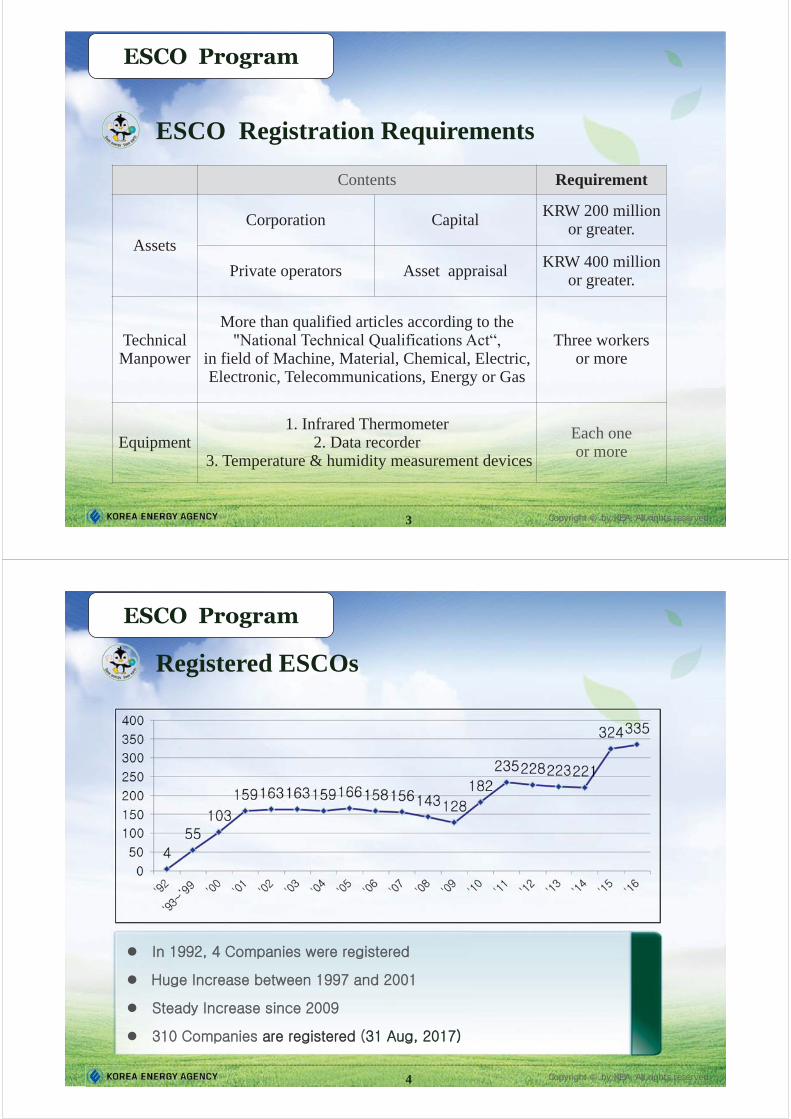
Copyright © by KEA. All rights reserved. 3
ESCO Program
ESCO Registration Requirements
Contents Requirement
Assets
Corporation Capital KRW 200 million
or greater.
Private operators Asset appraisal KRW 400 million
or greater.
Technical Manpower
More than qualified articles according to the "National Technical Qualifications Act“,
in field of Machine, Material, Chemical, Electric, Electronic, Telecommunications, Energy or Gas
Three workers or more
Equipment 1. Infrared Thermometer
2. Data recorder 3. Temperature & humidity measurement devices
Each one or more
Copyright © by KEA. All rights reserved. 4
Registered ESCOs
ESCO Program
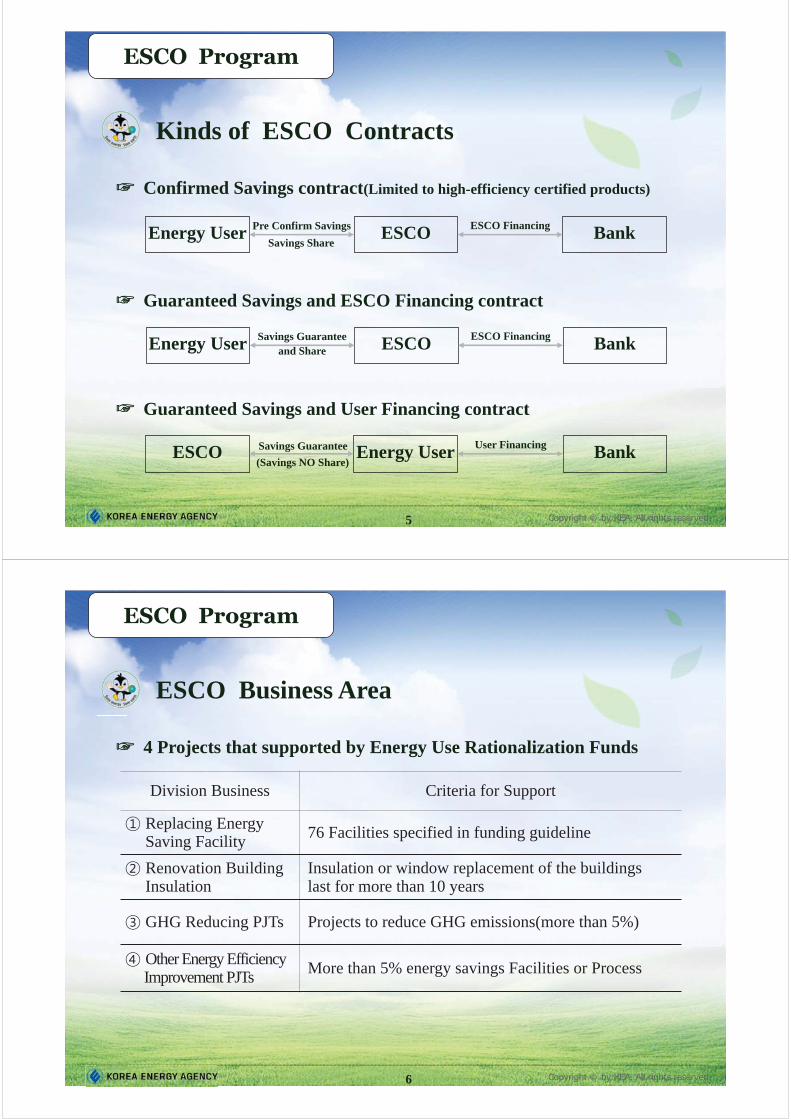
Copyright © by KEA. All rights reserved. 5
ESCO Program
Kinds of ESCO Contracts
Confirmed Savings contract(Limited to high-efficiency certified products)
Guaranteed Savings and ESCO Financing contract
Guaranteed Savings and User Financing contract
Energy User ESCO Bank Pre Confirm Savings ESCO Financing
Savings Share
Energy User ESCO Bank Savings Guarantee and Share
ESCO Financing
Energy User ESCO Bank User Financing Savings Guarantee
(Savings NO Share)
Copyright © by KEA. All rights reserved. 6
ESCO Program
ESCO Business Area
4 Projects that supported by Energy Use Rationalization Funds
Division Business Criteria for Support
Replacing Energy Saving Facility
76 Facilities specified in funding guideline
Renovation Building Insulation
Insulation or window replacement of the buildings last for more than 10 years
GHG Reducing PJTs Projects to reduce GHG emissions(more than 5%)
Other Energy Efficiency Improvement PJTs
More than 5% energy savings Facilities or Process
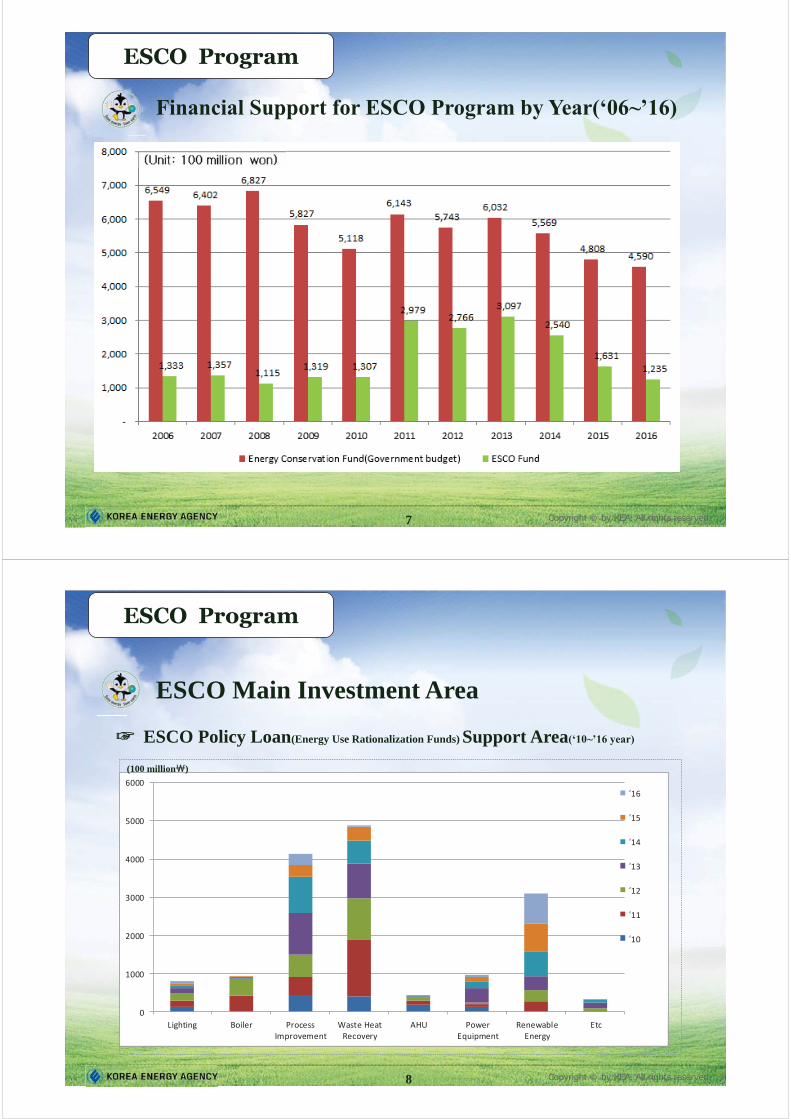
Copyright © by KEA. All rights reserved. 7
ESCO Program
Financial Support for ESCO Program by Year(‘06~’16)
Copyright © by KEA. All rights reserved. 8
ESCO Program
ESCO Main Investment Area
ESCO Policy Loan(Energy Use Rationalization Funds) Support Area(‘10~’16 year)
0
1000
2000
3000
4000
5000
6000
Lighting Boiler ProcessImprovement
Waste HeatRecovery
AHU PowerEquipment
RenewableEnergy
Etc
16
15
14
13
12
11
10
(100 million )
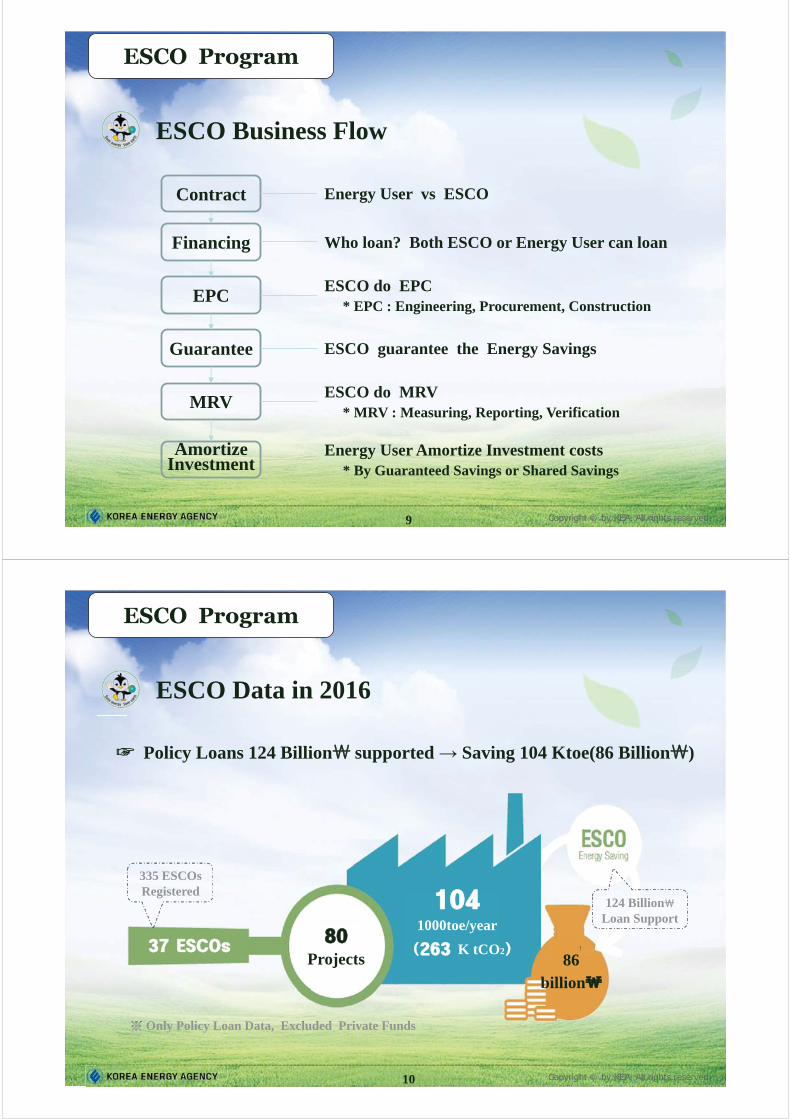
Copyright © by KEA. All rights reserved. 9
ESCO Program
ESCO Business Flow
Contract Energy User vs ESCO
Financing Who loan? Both ESCO or Energy User can loan
EPC ESCO do EPC * EPC : Engineering, Procurement, Construction
Guarantee ESCO guarantee the Energy Savings
MRV ESCO do MRV * MRV : Measuring, Reporting, Verification
Amortize Investment
Energy User Amortize Investment costs * By Guaranteed Savings or Shared Savings
Copyright © by KEA. All rights reserved. 10
ESCO Program
ESCO Data in 2016
Policy Loans 124 Billion supported → Saving 104 Ktoe(86 Billion )
Only Policy Loan Data, Excluded Private Funds O l P li L D t E l d d P i t F d
86 billion
1000toe/year
K tCO2
Projects
335 ESCOs Registered
124 Billion
Loan Support
Copyright © by KEA. All rights reserved.
KEA
Thank you for your kind attention
Dong-Wook Cho
Financial Support Division ESCO Team Manager. Tel : +82-31-260-4355 / [email protected]
III-3
US Federal and State-Based Energy Policy and Technology in Regards to
Energy Efficiency

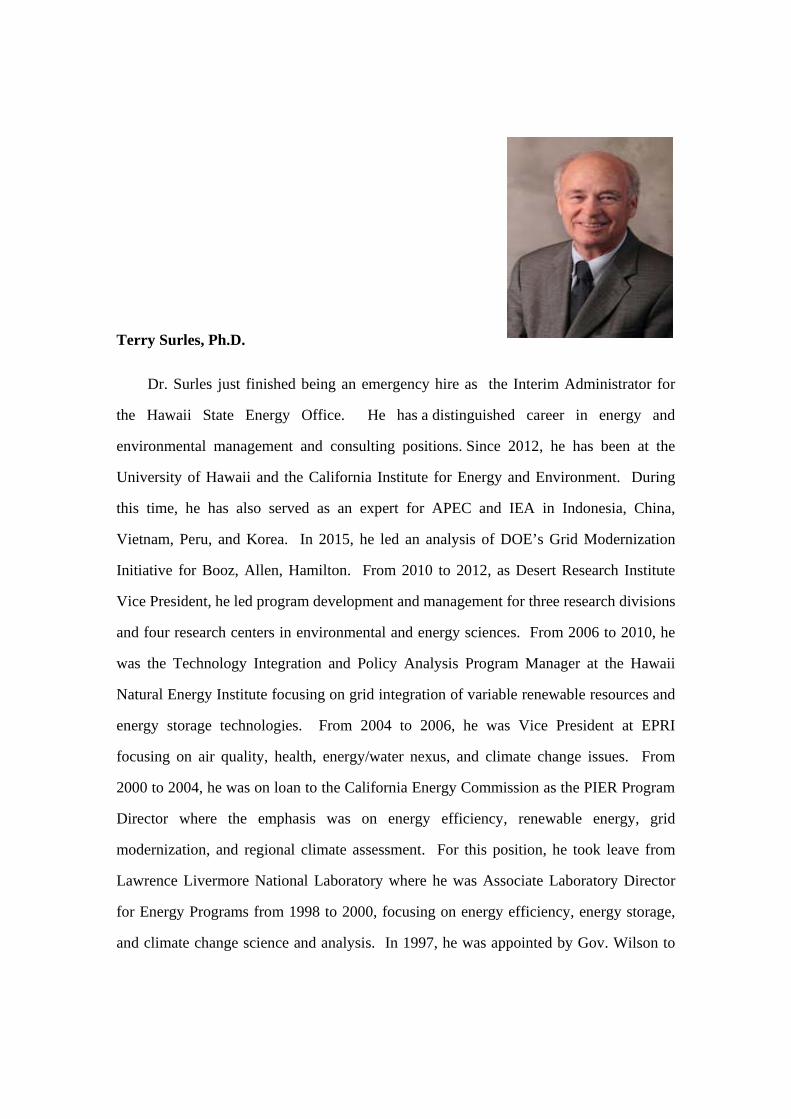
Terry Surles, Ph.D.
Dr. Surles just finished being an emergency hire as the Interim Administrator for
the Hawaii State Energy Office. He has a distinguished career in energy and
environmental management and consulting positions. Since 2012, he has been at the
University of Hawaii and the California Institute for Energy and Environment. During
this time, he has also served as an expert for APEC and IEA in Indonesia, China,
Vietnam, Peru, and Korea. In 2015, he led an analysis of DOE’s Grid Modernization
Initiative for Booz, Allen, Hamilton. From 2010 to 2012, as Desert Research Institute
Vice President, he led program development and management for three research divisions
and four research centers in environmental and energy sciences. From 2006 to 2010, he
was the Technology Integration and Policy Analysis Program Manager at the Hawaii
Natural Energy Institute focusing on grid integration of variable renewable resources and
energy storage technologies. From 2004 to 2006, he was Vice President at EPRI
focusing on air quality, health, energy/water nexus, and climate change issues. From
2000 to 2004, he was on loan to the California Energy Commission as the PIER Program
Director where the emphasis was on energy efficiency, renewable energy, grid
modernization, and regional climate assessment. For this position, he took leave from
Lawrence Livermore National Laboratory where he was Associate Laboratory Director
for Energy Programs from 1998 to 2000, focusing on energy efficiency, energy storage,
and climate change science and analysis. In 1997, he was appointed by Gov. Wilson to

be Deputy Secretary for Science and Technology at California EPA. From 1978 to 1997,
he was at Argonne National Laboratory (ANL) with his final position being General
Manager for Environmental Programs. Major program areas included energy systems
assessment, climate change science, risk analysis and assessment, emergency planning
and response, and energy and environmental modeling. From 1974 to 1978, he was at
Camp, Dresser, & McKee, with his final position as Vice President.
Dr. Surles received his Ph.D. in Chemistry from Michigan State and has more than
330 publications, technical reports, and presentations. He has served on a number of
committees, including seven appointments with the National Research Council as well as
advisory groups for DOE and its laboratories. In addition to those listed above, he
consulted or is currently consulting with NELHA, the Northeast Asia Economic Forum,
East-West Center, the United Kingdom Energy Research Centre, the California Public
Utility Commission, and the State of Victoria.
1
US Federal and State-Based Energy Policy and Technology in Regards to Energy Efficiency
Terry Surles, [email protected] Conference
TaipeiSeptember 28, 2017
US Consumption at 97.3 Quads – No Substantive Increase in Twenty Years
2
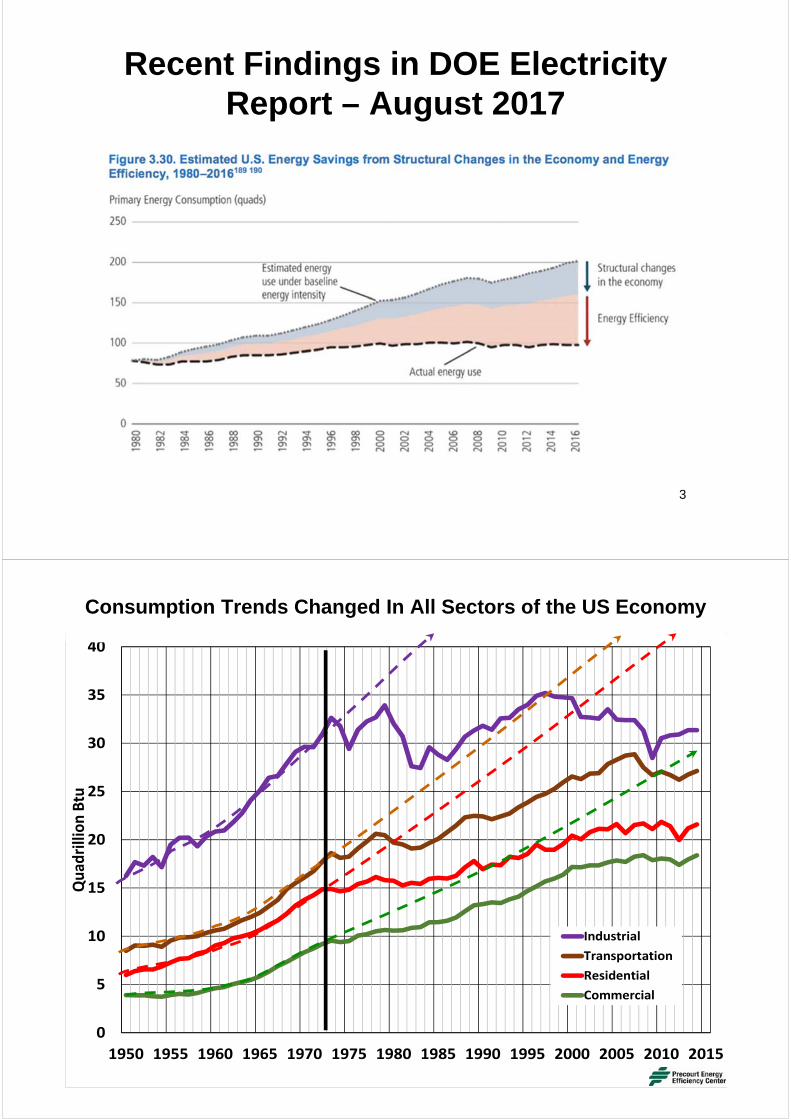
Recent Findings in DOE Electricity Report – August 2017
3
0
5
10
15
20
25
30
35
40
1950 1955 1960 1965 1970 1975 1980 1985 1990 1995 2000 2005 2010 2015
Quad
rillion Btu
Industrial
Transportation
Residential
Commercial
Consumption Trends Changed In All Sectors of the US Economy
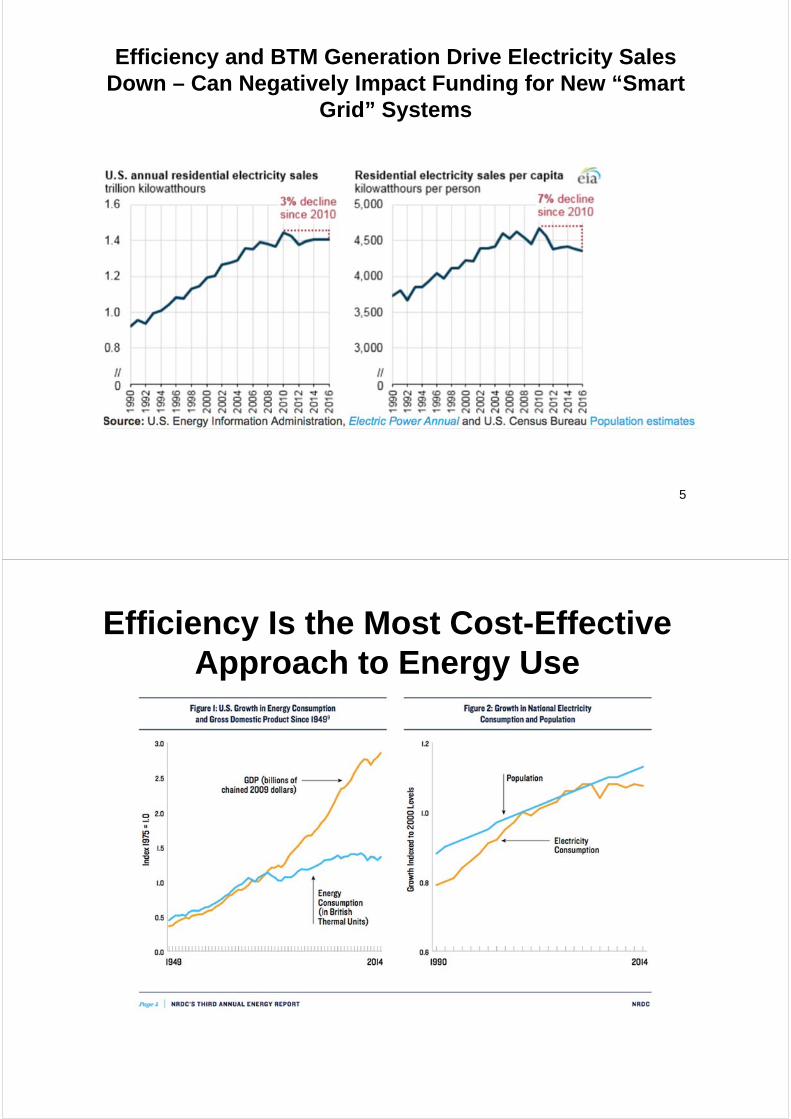
Efficiency and BTM Generation Drive Electricity Sales Down – Can Negatively Impact Funding for New “Smart
Grid” Systems
5
Efficiency Is the Most Cost-Effective Approach to Energy Use

7
Unfortunately, This Fact Is Now Not Recognized on a National Level
A President “so untethered to reality” – LA Times, 4/2/17 – or “Absent at the Creation” today in NYT
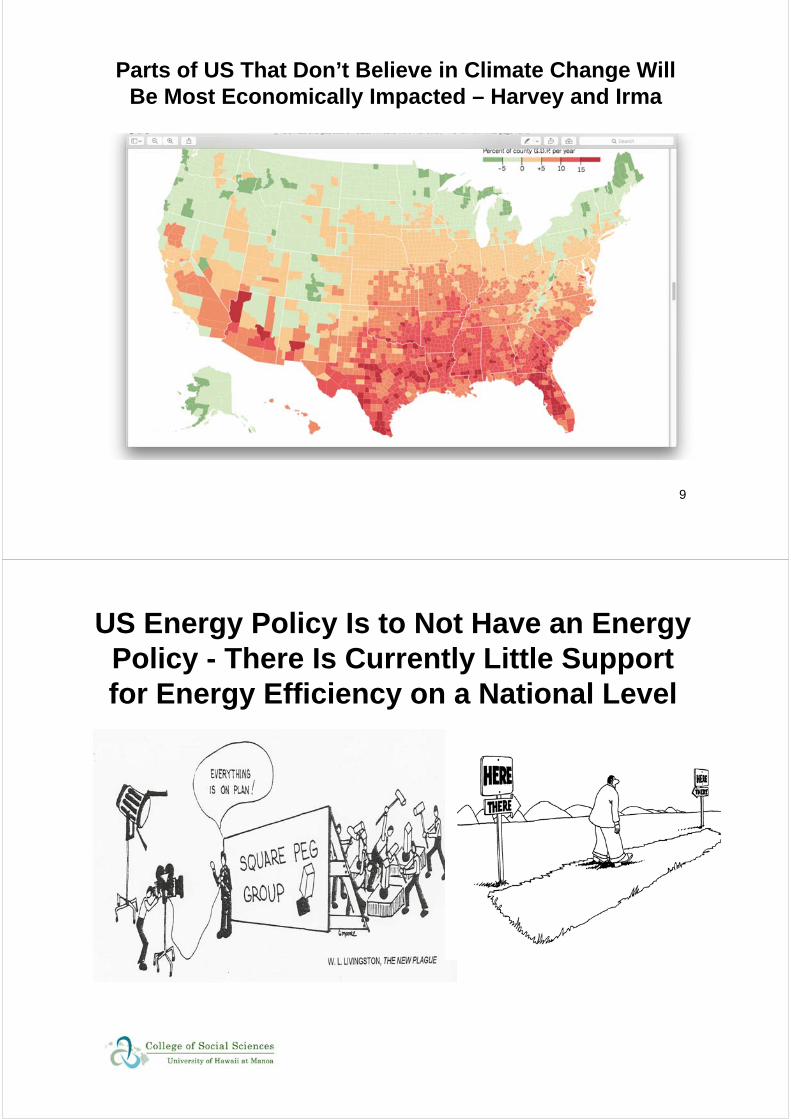
Parts of US That Don’t Believe in Climate Change Will Be Most Economically Impacted – Harvey and Irma
9
10
US Energy Policy Is to Not Have an Energy Policy - There Is Currently Little Support for Energy Efficiency on a National Level
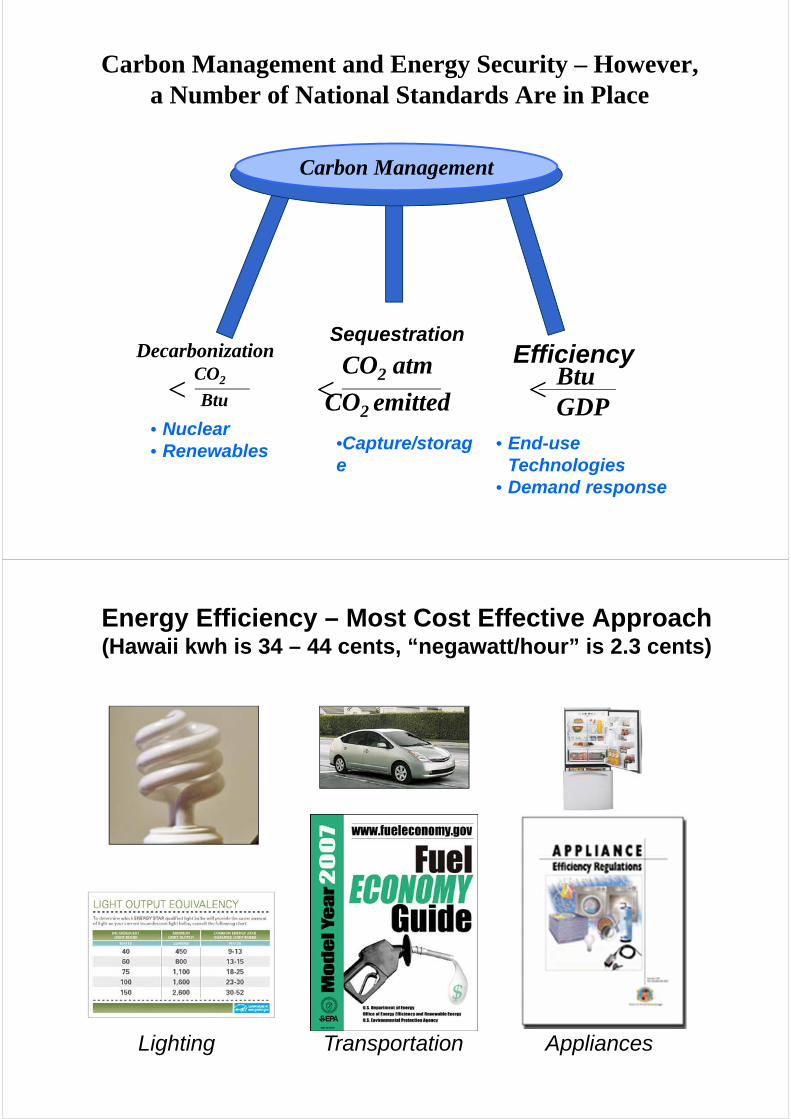
Carbon Management and Energy Security – However, a Number of National Standards Are in Place
Carbon Management
BtuGDP
<Decarbonization
CO2
Btu<CO2 atm
CO2 emitted<
SequestrationEfficiency
• Nuclear• Renewables •Capture/storag
e• End-use
Technologies• Demand response
Energy Efficiency – Most Cost Effective Approach (Hawaii kwh is 34 – 44 cents, “negawatt/hour” is 2.3 cents)
Lighting Transportation Appliances
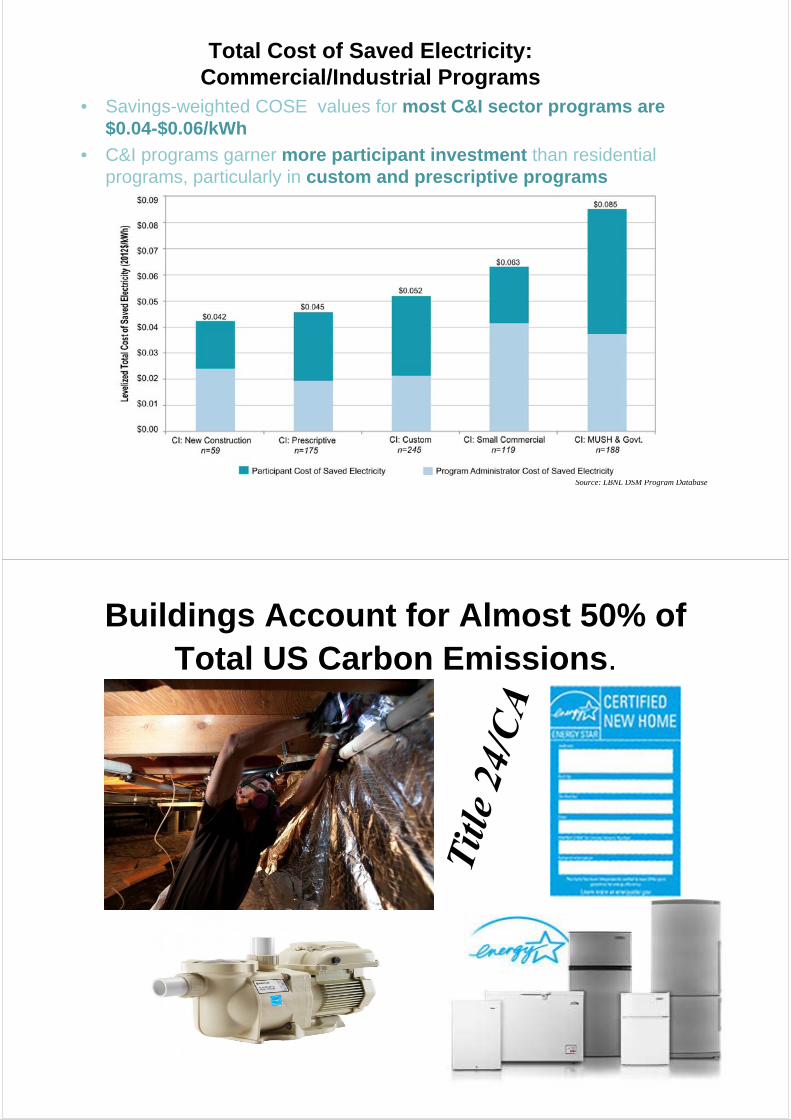
Total Cost of Saved Electricity: Commercial/Industrial Programs
• Savings-weighted COSE values for most C&I sector programs are $0.04-$0.06/kWh
• C&I programs garner more participant investment than residential programs, particularly in custom and prescriptive programs
Source: LBNL DSM Program Database
Buildings Account for Almost 50% of Total US Carbon Emissions.
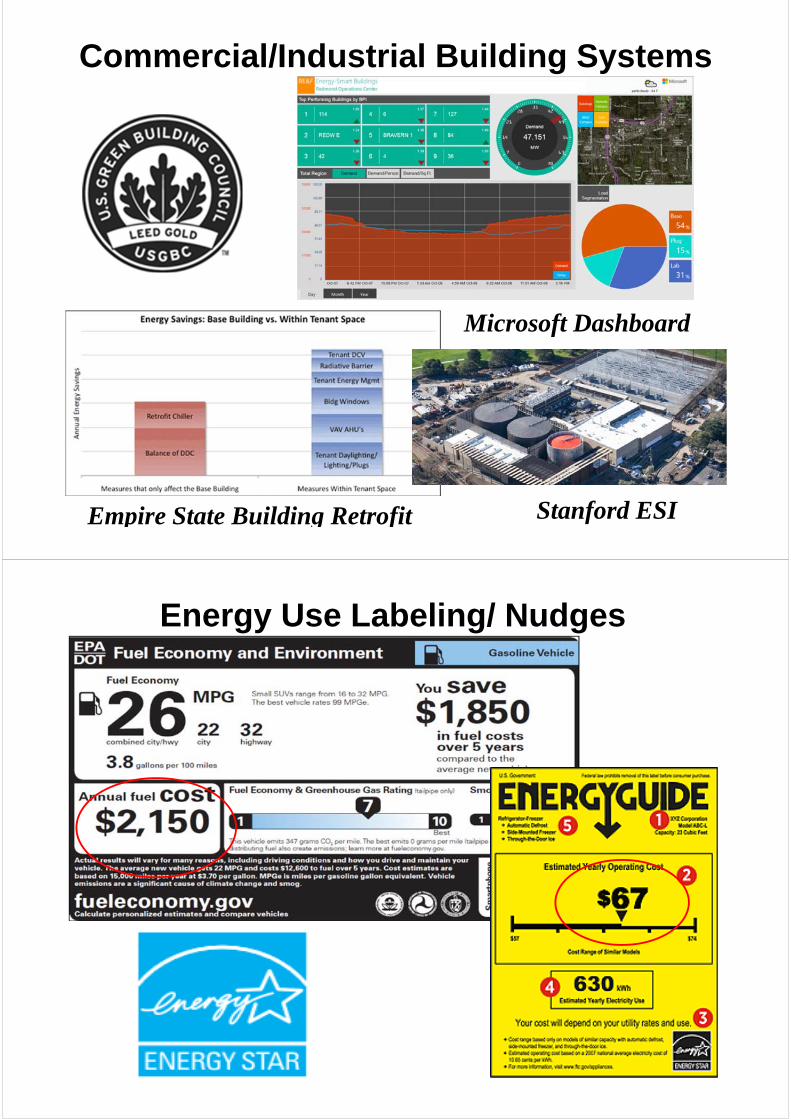
Commercial/Industrial Building Systems
Empire State Building Retrofit Stanford ESI
Microsoft Dashboard
Energy Use Labeling/ Nudges
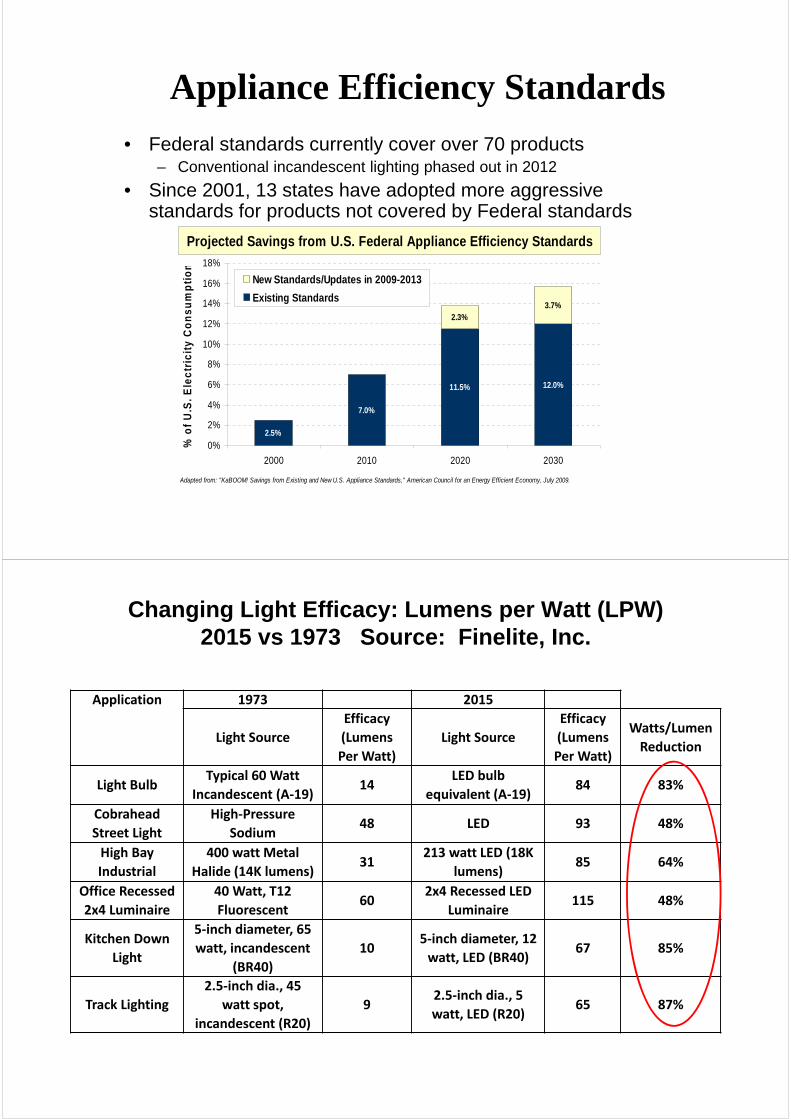
Appliance Efficiency Standards
• Federal standards currently cover over 70 products– Conventional incandescent lighting phased out in 2012
• Since 2001, 13 states have adopted more aggressive standards for products not covered by Federal standards
2.5%
7.0%
11.5% 12.0%
2.3%3.7%
0%
2%
4%
6%
8%
10%
12%
14%
16%
18%
2000 2010 2020 2030
% o
f U
.S.
Ele
ctr
icit
y C
on
su
mp
tio
n
New Standards/Updates in 2009-2013
Existing Standards
Projected Savings from U.S. Federal Appliance Efficiency Standards
Adapted from: "KaBOOM! Savings from Existing and New U.S. Appliance Standards," American Council for an Energy Efficient Economy, July 2009.
Changing Light Efficacy: Lumens per Watt (LPW) 2015 vs 1973 Source: Finelite, Inc.
Application 1973 2015
Light Source
Efficacy
(Lumens
Per Watt)
Light Source
Efficacy
(Lumens
Per Watt)
Watts/Lumen
Reduction
Light Bulb Typical 60 Watt
Incandescent (A‐19)14
LED bulb
equivalent (A‐19)84 83%
Cobrahead
Street Light
High‐Pressure
Sodium48 LED 93 48%
High Bay
Industrial
400 watt Metal
Halide (14K lumens)31
213 watt LED (18K
lumens)85 64%
Office Recessed
2x4 Luminaire
40 Watt, T12
Fluorescent60
2x4 Recessed LED
Luminaire115 48%
Kitchen Down
Light
5‐inch diameter, 65
watt, incandescent
(BR40)
105‐inch diameter, 12
watt, LED (BR40)67 85%
Track Lighting
2.5‐inch dia., 45
watt spot,
incandescent (R20)
92.5‐inch dia., 5
watt, LED (R20)65 87%
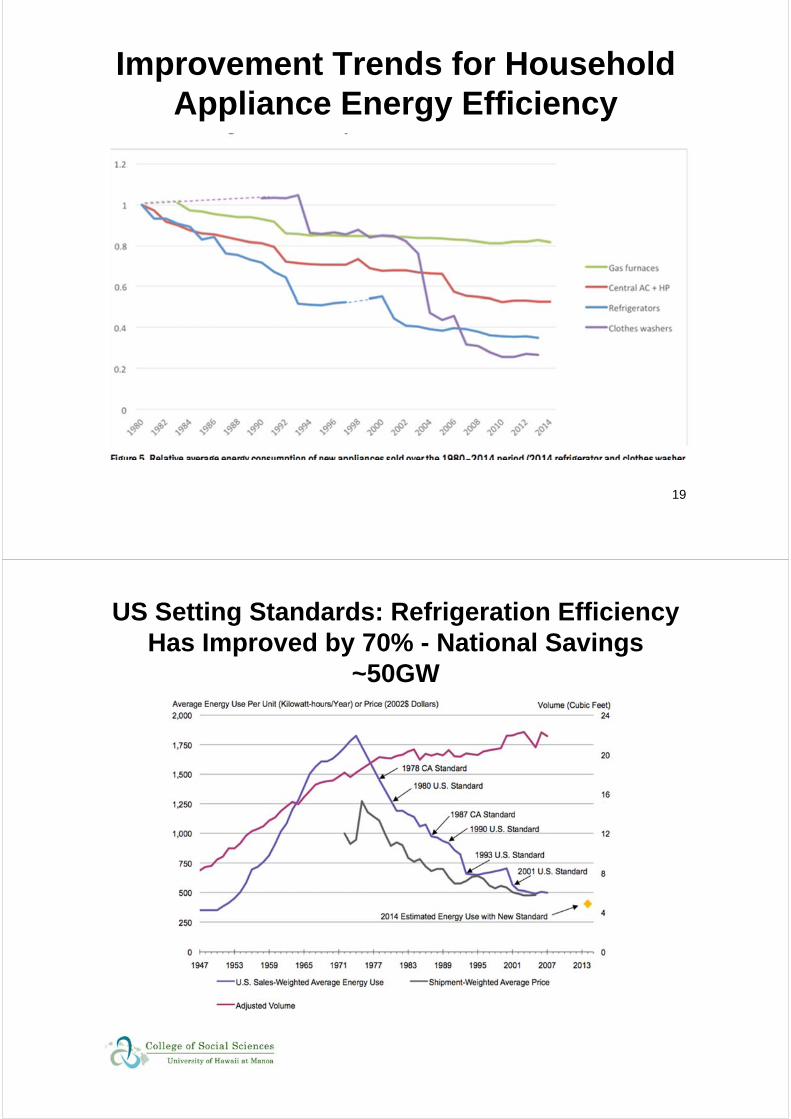
Improvement Trends for Household Appliance Energy Efficiency
19
US Setting Standards: Refrigeration Efficiency Has Improved by 70% - National Savings
~50GW
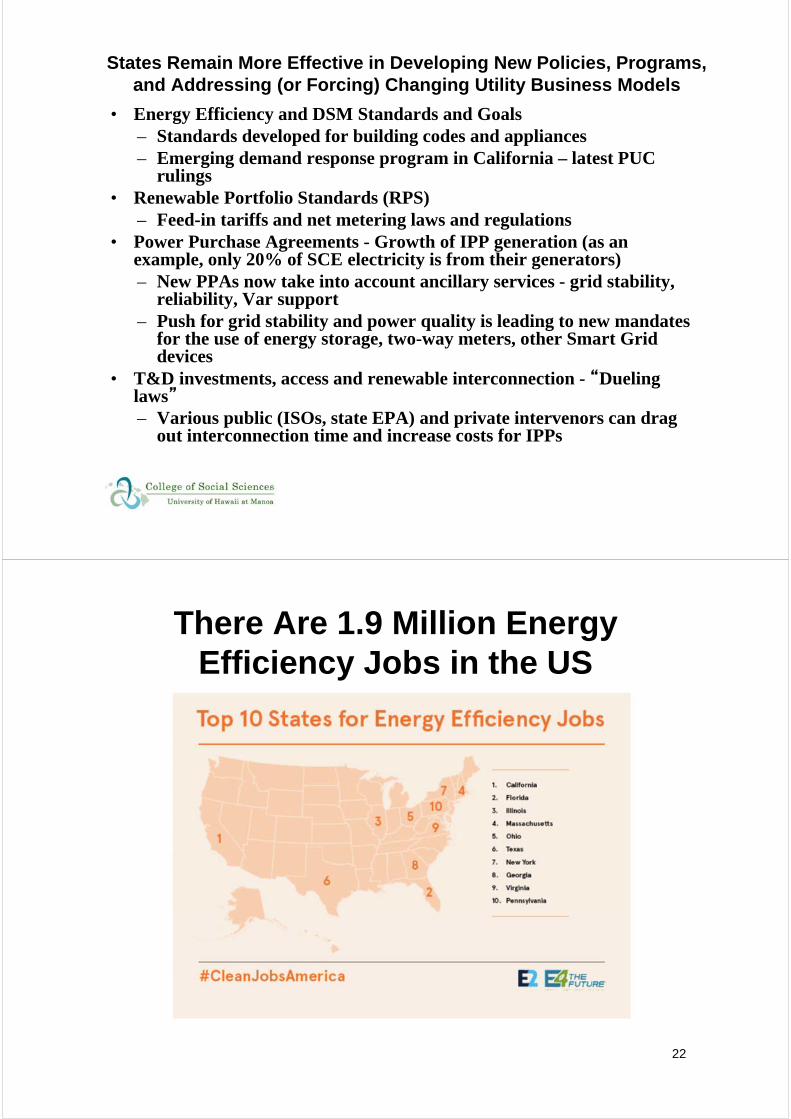
States Remain More Effective in Developing New Policies, Programs, and Addressing (or Forcing) Changing Utility Business Models
• Energy Efficiency and DSM Standards and Goals– Standards developed for building codes and appliances– Emerging demand response program in California – latest PUC
rulings• Renewable Portfolio Standards (RPS)
– Feed-in tariffs and net metering laws and regulations• Power Purchase Agreements - Growth of IPP generation (as an
example, only 20% of SCE electricity is from their generators)– New PPAs now take into account ancillary services - grid stability,
reliability, Var support– Push for grid stability and power quality is leading to new mandates
for the use of energy storage, two-way meters, other Smart Grid devices
• T&D investments, access and renewable interconnection - “Dueling laws”– Various public (ISOs, state EPA) and private intervenors can drag
out interconnection time and increase costs for IPPs
There Are 1.9 Million Energy Efficiency Jobs in the US
22
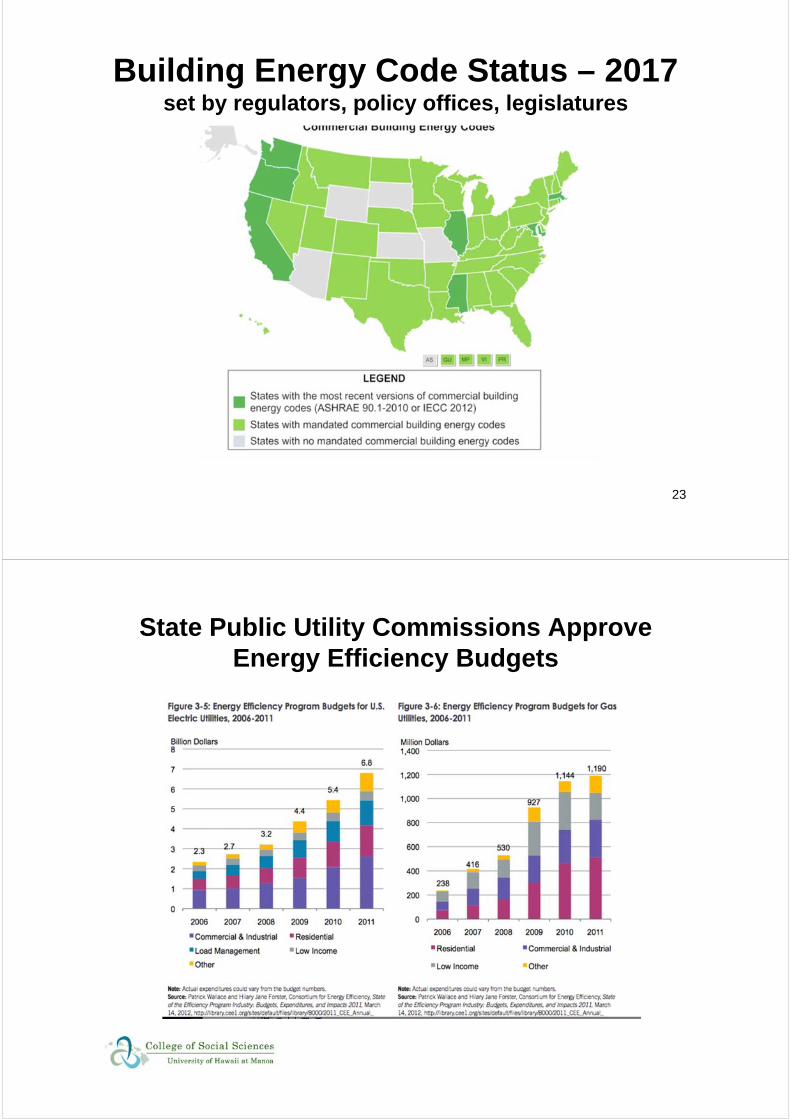
Building Energy Code Status – 2017set by regulators, policy offices, legislatures
23
State Public Utility Commissions Approve Energy Efficiency Budgets
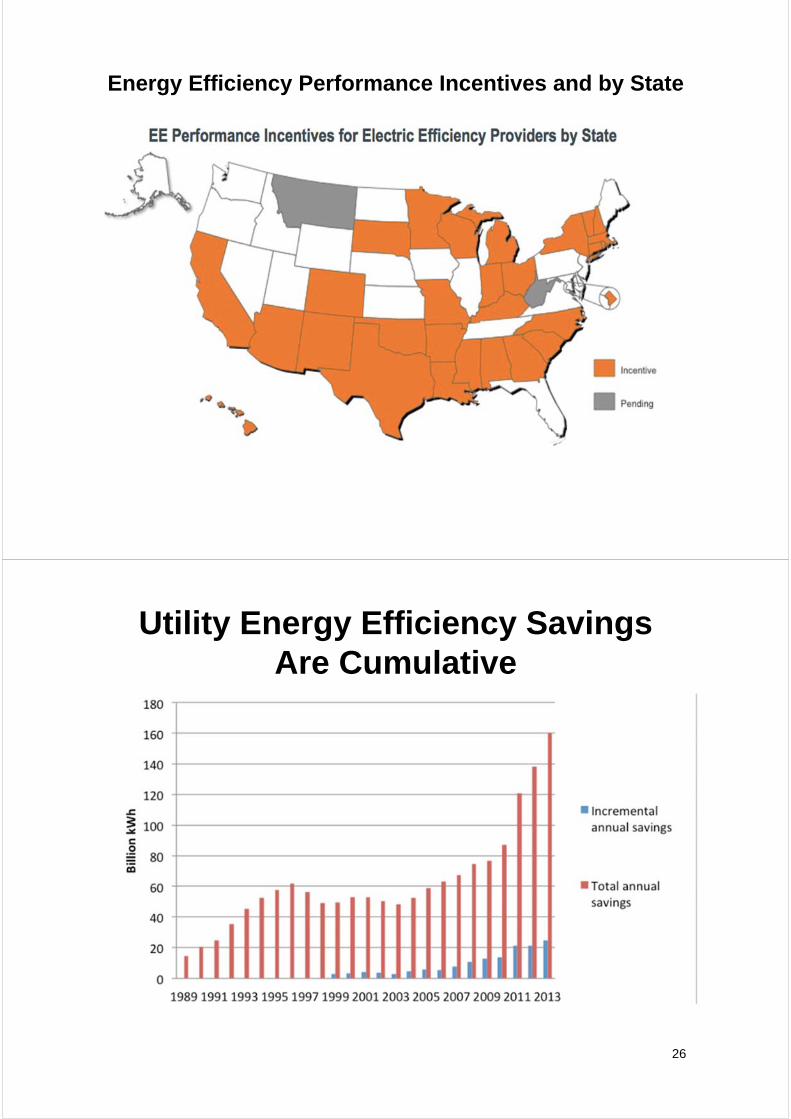
Energy Efficiency Performance Incentives and by State
Utility Energy Efficiency Savings Are Cumulative
26
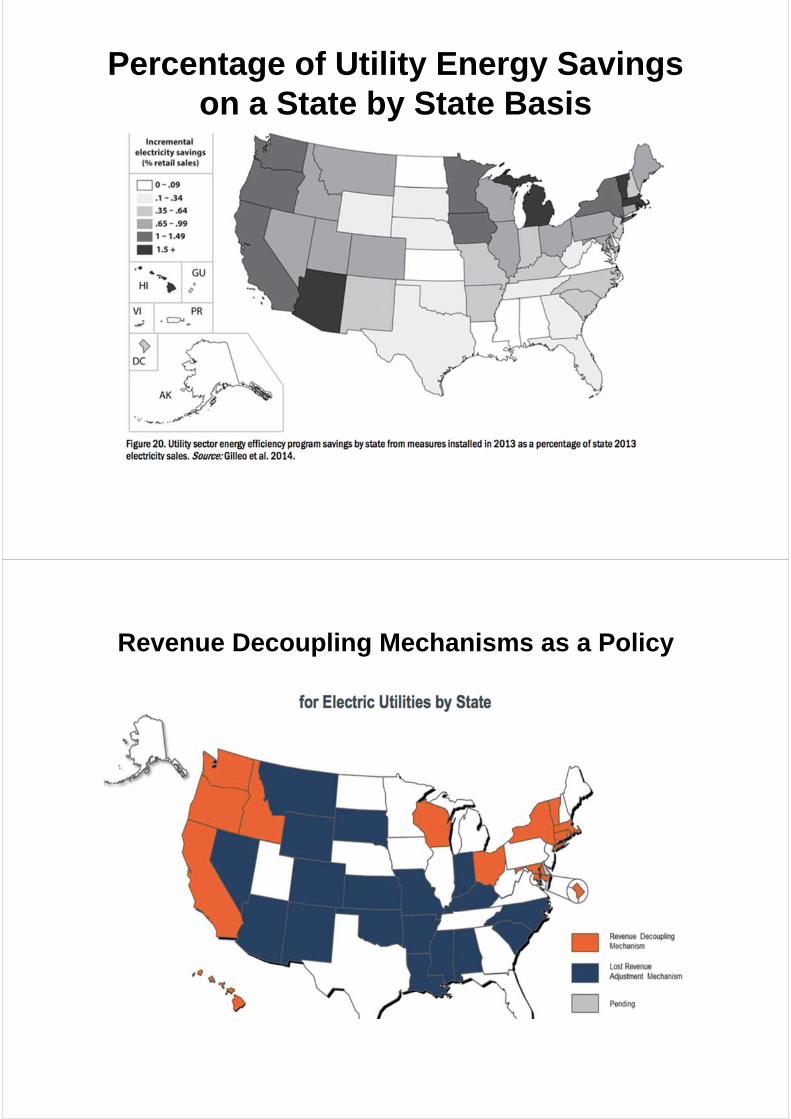
Percentage of Utility Energy Savings on a State by State Basis
Revenue Decoupling Mechanisms as a Policy
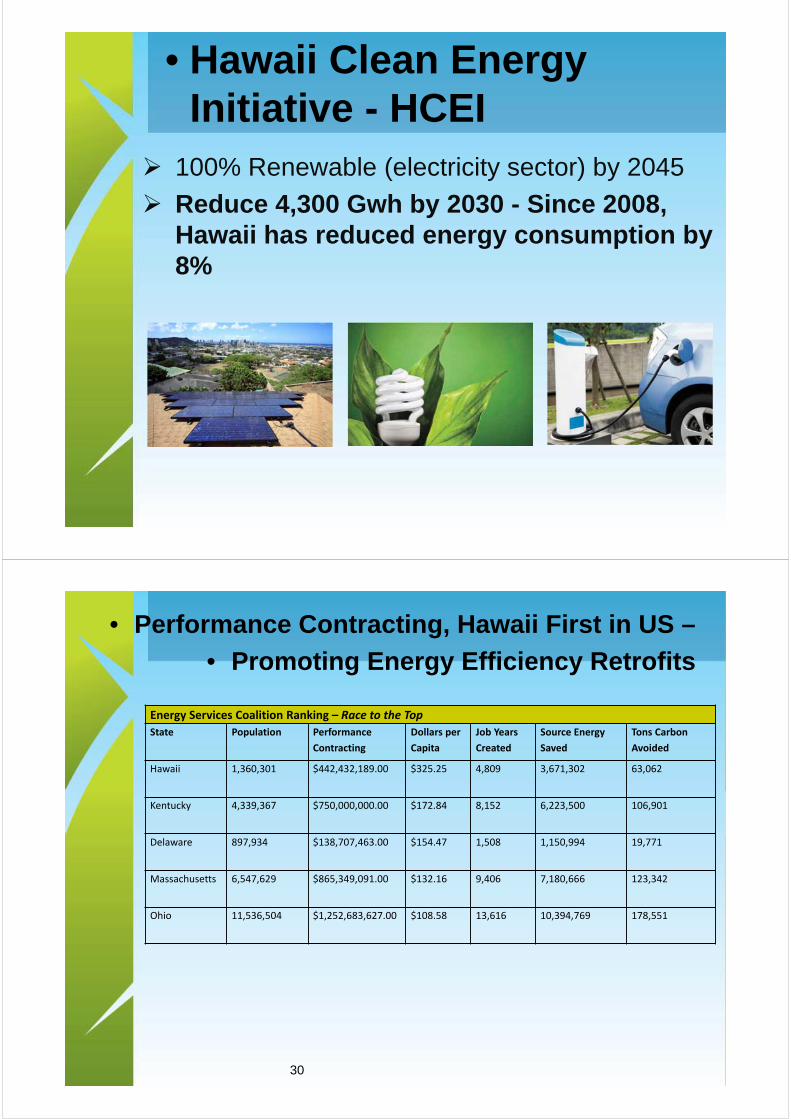
• Hawaii Clean Energy Initiative - HCEI
100% Renewable (electricity sector) by 2045
Reduce 4,300 Gwh by 2030 - Since 2008, Hawaii has reduced energy consumption by 8%
• Performance Contracting, Hawaii First in US –
• Promoting Energy Efficiency Retrofits
30
Energy Services Coalition Ranking – Race to the Top
State Population Performance
Contracting
Dollars per
Capita
Job Years
Created
Source Energy
Saved
Tons Carbon
Avoided
Hawaii 1,360,301 $442,432,189.00 $325.25 4,809 3,671,302 63,062
Kentucky 4,339,367 $750,000,000.00 $172.84 8,152 6,223,500 106,901
Delaware 897,934 $138,707,463.00 $154.47 1,508 1,150,994 19,771
Massachusetts 6,547,629 $865,349,091.00 $132.16 9,406 7,180,666 123,342
Ohio 11,536,504 $1,252,683,627.00 $108.58 13,616 10,394,769 178,551
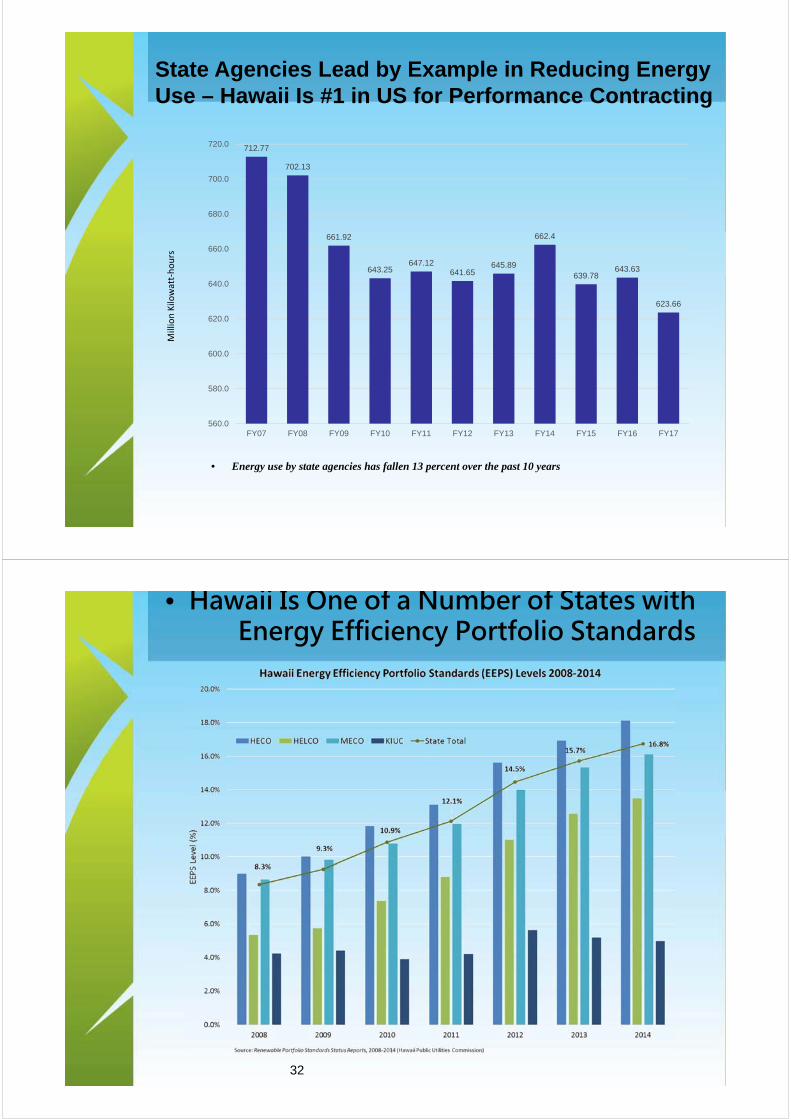
712.77
702.13
661.92
643.25647.12
641.65645.89
662.4
639.78643.63
623.66
560.0
580.0
600.0
620.0
640.0
660.0
680.0
700.0
720.0
FY07 FY08 FY09 FY10 FY11 FY12 FY13 FY14 FY15 FY16 FY17
Million Kilowatt‐hours
State Agencies Lead by Example in Reducing Energy Use – Hawaii Is #1 in US for Performance Contracting
• Energy use by state agencies has fallen 13 percent over the past 10 years
• Hawaii Is One of a Number of States with Energy Efficiency Portfolio Standards
32
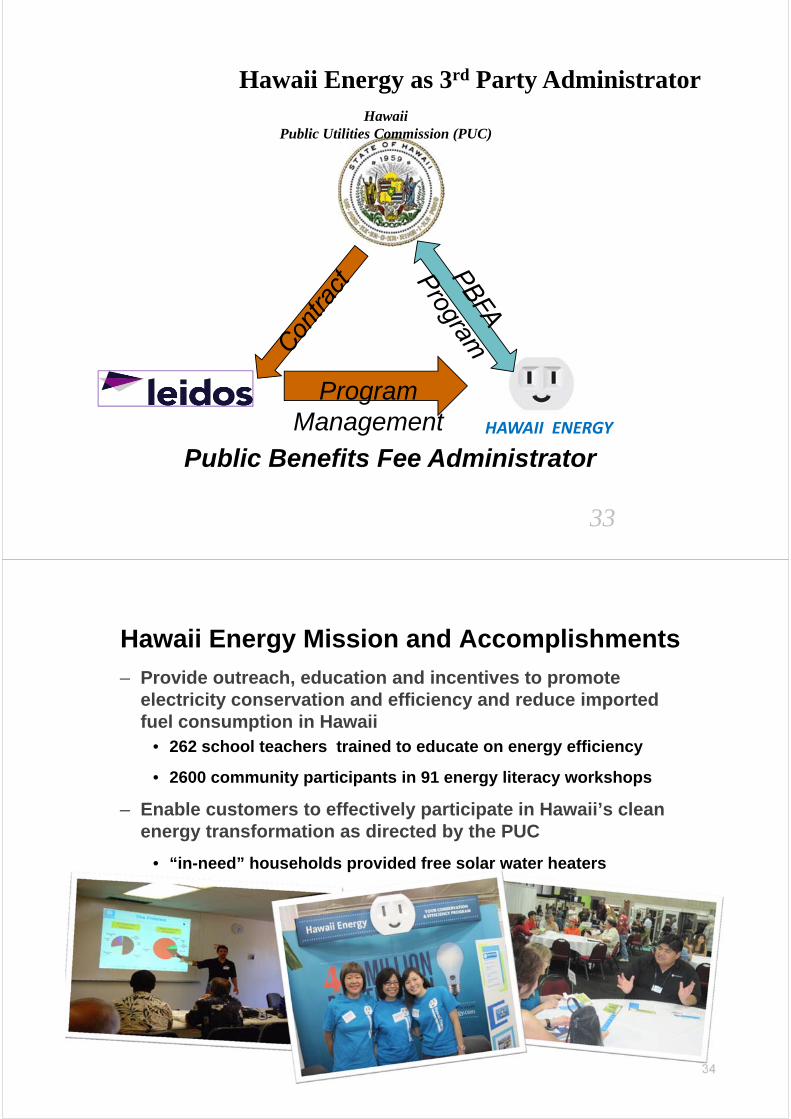
HAWAII ENERGY
Program Management
Public Benefits Fee Administrator
Hawaii Public Utilities Commission (PUC)
33
Hawaii Energy as 3rd Party Administrator
– Provide outreach, education and incentives to promote electricity conservation and efficiency and reduce imported fuel consumption in Hawaii
• 262 school teachers trained to educate on energy efficiency
• 2600 community participants in 91 energy literacy workshops
– Enable customers to effectively participate in Hawaii’s clean energy transformation as directed by the PUC
• “in-need” households provided free solar water heaters
–
34
Hawaii Energy Mission and Accomplishments
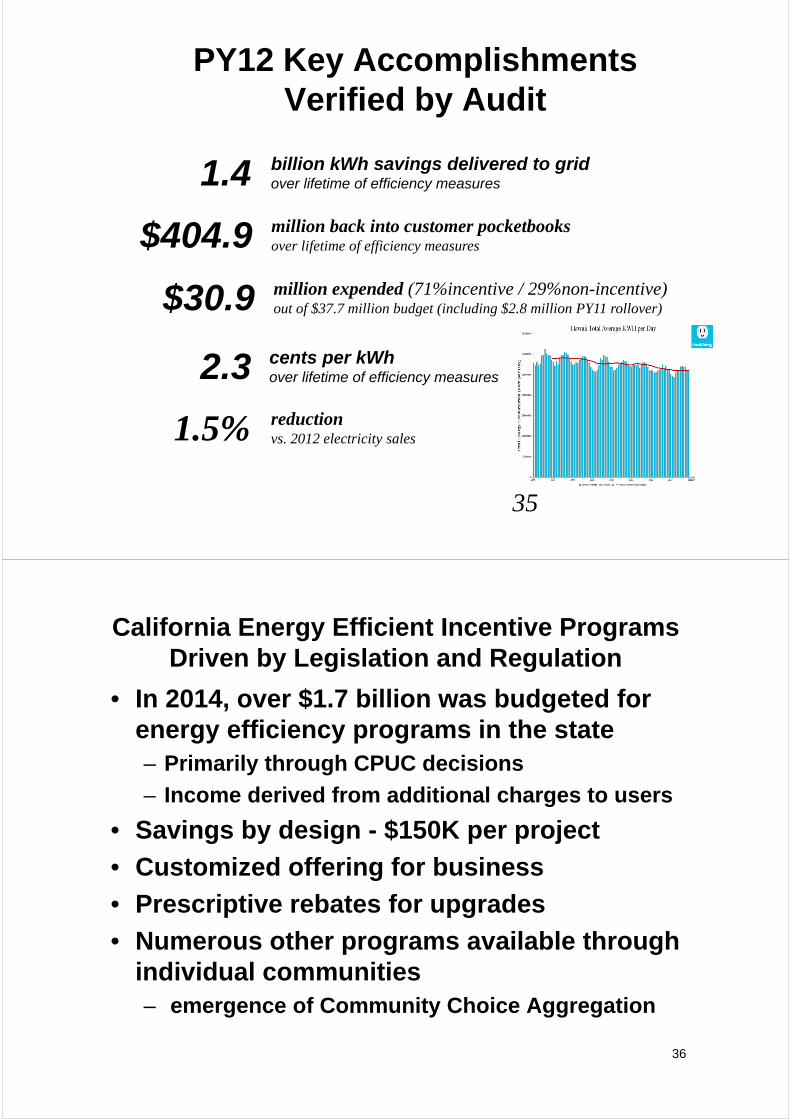
35
reduction vs. 2012 electricity sales1.5%
cents per kWh over lifetime of efficiency measures2.3
million back into customer pocketbooksover lifetime of efficiency measures$404.9million expended (71%incentive / 29%non-incentive)out of $37.7 million budget (including $2.8 million PY11 rollover) $30.9
PY12 Key AccomplishmentsVerified by Audit
billion kWh savings delivered to gridover lifetime of efficiency measures1.4
California Energy Efficient Incentive Programs Driven by Legislation and Regulation
• In 2014, over $1.7 billion was budgeted for energy efficiency programs in the state– Primarily through CPUC decisions
– Income derived from additional charges to users
• Savings by design - $150K per project
• Customized offering for business
• Prescriptive rebates for upgrades
• Numerous other programs available through individual communities– emergence of Community Choice Aggregation
36
California Public Utility Commission Develops Regulations for Investor-Owned Utilities
• Electricity savings from 2010 to 2012 equaled powering over 800,000 homes, $317M budget
– In 2013, over $300M leading to savings of almost 500Gwh
• Over $110M/yr in On-Bill financing for efficiency upgrades
• Lighting - $70M with 63MW saved, 414Gwh
• HVAC - $120M, 186 Gwh saved, 61MW
• Emerging tech - $38M funded by utilities
• Addressing water/energy nexus
37
California Energy Commission Develops Codes and Standards for all Utilities
• Statewide Codes and Standards Program saved ~1100Gwh in 2014: – 1) CPUC influences standards and code-setting at
CEC to strengthen energy efficiency regulations
– 2) Improving compliance with existing codes and standards(both agencies)
– 3) Assisting local governments to develop ordinances that exceed statewide minimum requirements
– 4) coordinating with other programs and entities to support the state’s ambitious policy goals
38
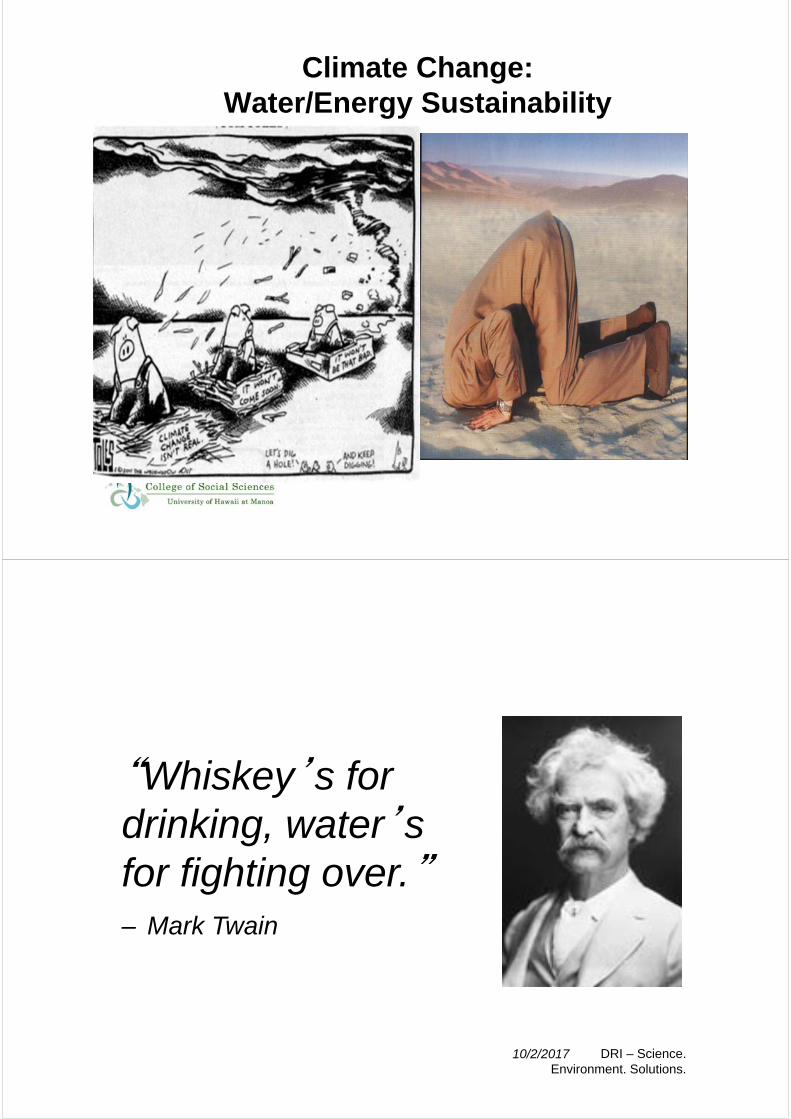
Climate Change: Water/Energy Sustainability
10/2/201740 DRI – Science. Environment. Solutions.
“Whiskey’s for drinking, water’s for fighting over.”– Mark Twain
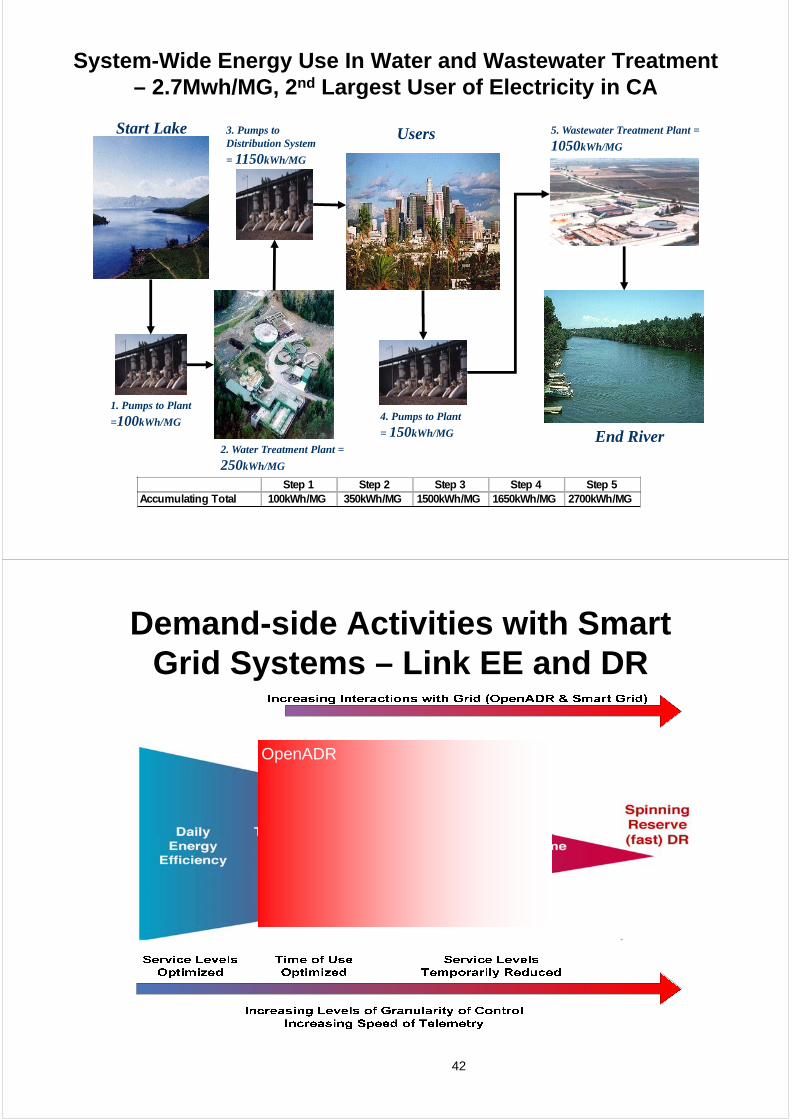
System-Wide Energy Use In Water and Wastewater Treatment – 2.7Mwh/MG, 2nd Largest User of Electricity in CA
1. Pumps to Plant
=100kWh/MG
Start Lake
2. Water Treatment Plant =
250kWh/MG
3. Pumps to Distribution System
= 1150kWh/MG
4. Pumps to Plant
= 150kWh/MG
Users 5. Wastewater Treatment Plant =
1050kWh/MG
End River
Step 1 Step 2 Step 3 Step 4 Step 5Accumulating Total 100kWh/MG 350kWh/MG 1500kWh/MG 1650kWh/MG 2700kWh/MG
Demand-side Activities with Smart Grid Systems – Link EE and DR
42
OpenADR
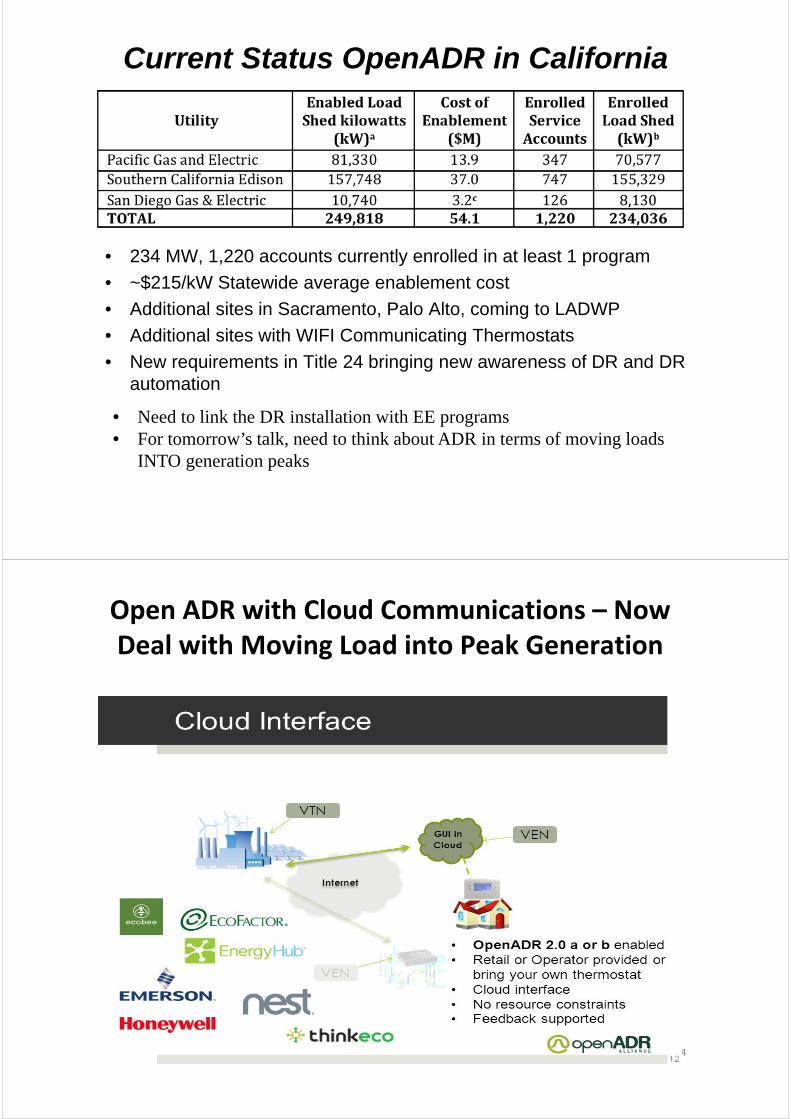
• 234 MW, 1,220 accounts currently enrolled in at least 1 program
• ~$215/kW Statewide average enablement cost
• Additional sites in Sacramento, Palo Alto, coming to LADWP
• Additional sites with WIFI Communicating Thermostats
• New requirements in Title 24 bringing new awareness of DR and DR automation
Current Status OpenADR in California
• Need to link the DR installation with EE programs• For tomorrow’s talk, need to think about ADR in terms of moving loads
INTO generation peaks
Open ADR with Cloud Communications – Now Deal with Moving Load into Peak Generation
44
Government Remains Critical Part of Equation
• Financial instruments (loan guarantees, etc.) must be available to overcome “Valley of Death”
• Regulatory and institutional approaches must remain flexible
• Public/private partnerships for technology development
• Laws should promote the insertion of new, environmentally-acceptable technology, but not “pick winners”
• Should lead public education and information dissemination
• Must link public policies with technology development and scientific findings
Better Direction Is Needed for Regulatory and Institutional Changes
• Major energy technology initiatives require that institutional and regulatory barriers be addressed in addition to technical and financial aspects of the technology
• Example: Clear direction articulated by AB1925/AB32 was needed versus dog’s breakfast in the California regulatory and policy environment

47
Keynote Speech:
Green Energy Target and Cooperation in ASEAN

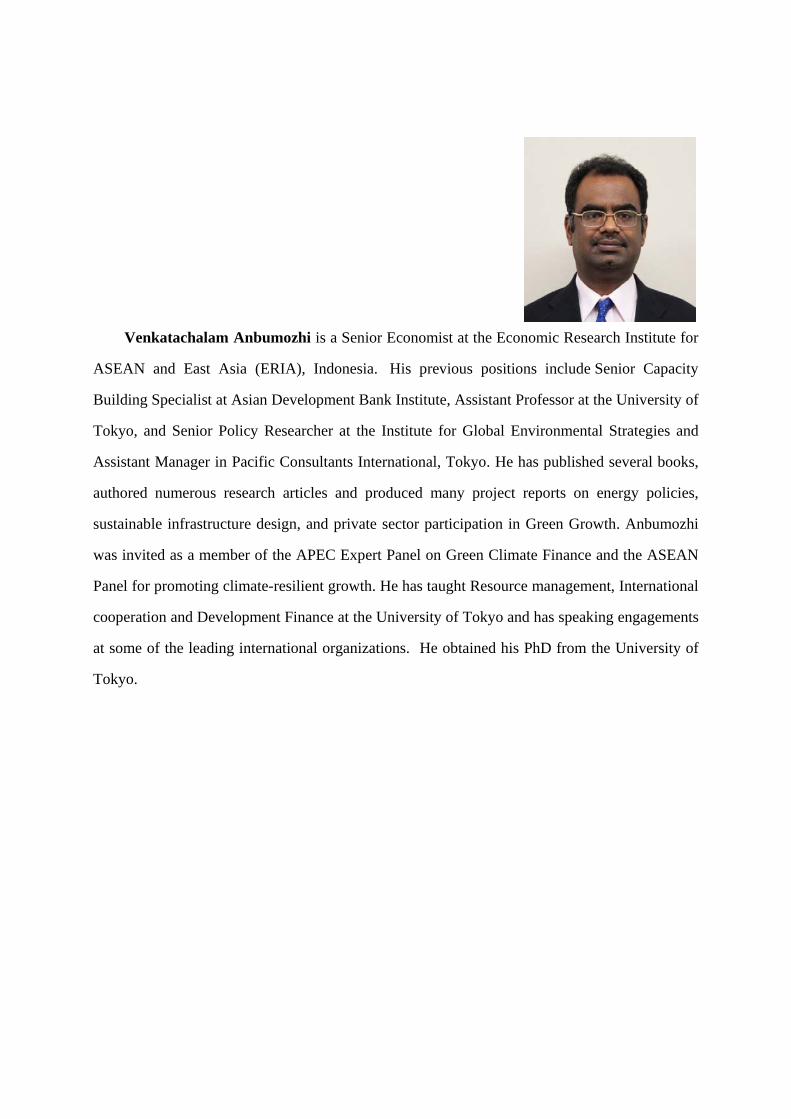
Venkatachalam Anbumozhi is a Senior Economist at the Economic Research Institute for
ASEAN and East Asia (ERIA), Indonesia. His previous positions include Senior Capacity
Building Specialist at Asian Development Bank Institute, Assistant Professor at the University of
Tokyo, and Senior Policy Researcher at the Institute for Global Environmental Strategies and
Assistant Manager in Pacific Consultants International, Tokyo. He has published several books,
authored numerous research articles and produced many project reports on energy policies,
sustainable infrastructure design, and private sector participation in Green Growth. Anbumozhi
was invited as a member of the APEC Expert Panel on Green Climate Finance and the ASEAN
Panel for promoting climate-resilient growth. He has taught Resource management, International
cooperation and Development Finance at the University of Tokyo and has speaking engagements
at some of the leading international organizations. He obtained his PhD from the University of
Tokyo.

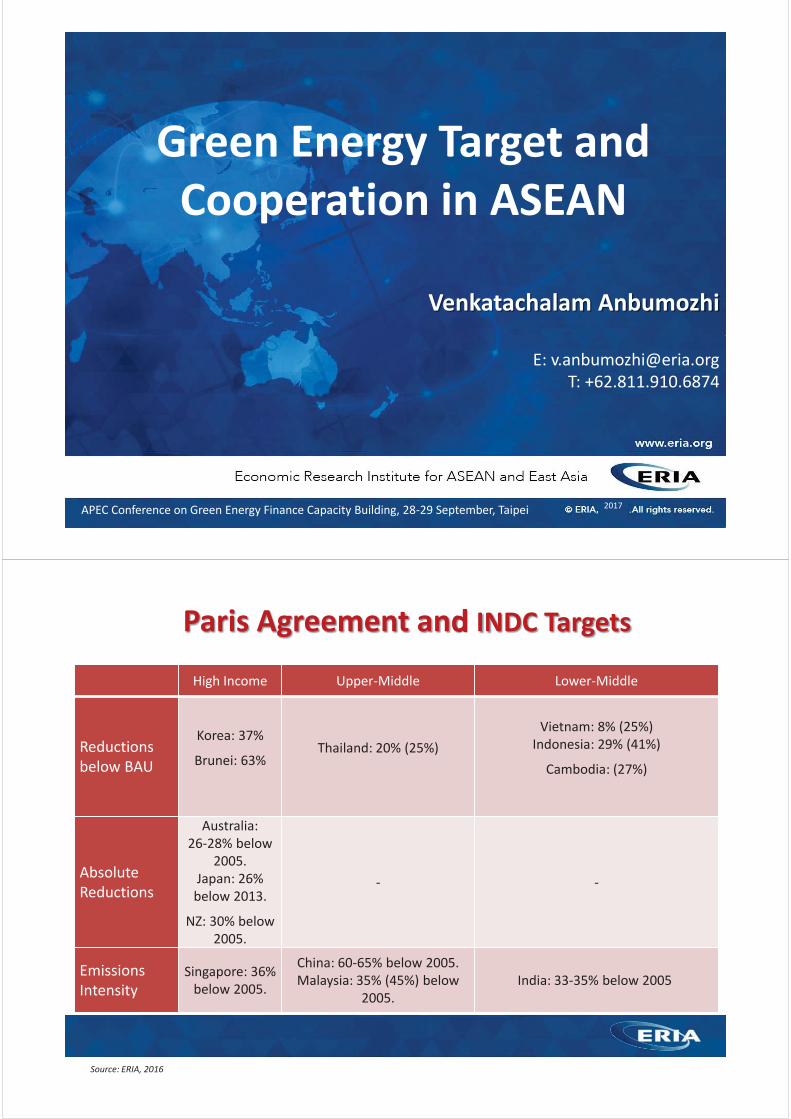
Green Energy Target and Cooperation in ASEAN
2017
Venkatachalam Anbumozhi
E: [email protected]: +62.811.910.6874
APEC Conference on Green Energy Finance Capacity Building, 28-29 September, Taipei
Paris Agreement and INDC Targets
High Income Upper-Middle Lower-Middle
Reductions below BAU
Korea: 37%
Brunei: 63%Thailand: 20% (25%)
Vietnam: 8% (25%)Indonesia: 29% (41%)
Cambodia: (27%)
Absolute Reductions
Australia: 26-28% below
2005.Japan: 26% below 2013.
NZ: 30% below 2005.
- -
Emissions Intensity
Singapore: 36% below 2005.
China: 60-65% below 2005.Malaysia: 35% (45%) below
2005.India: 33-35% below 2005
Source: ERIA, 2016
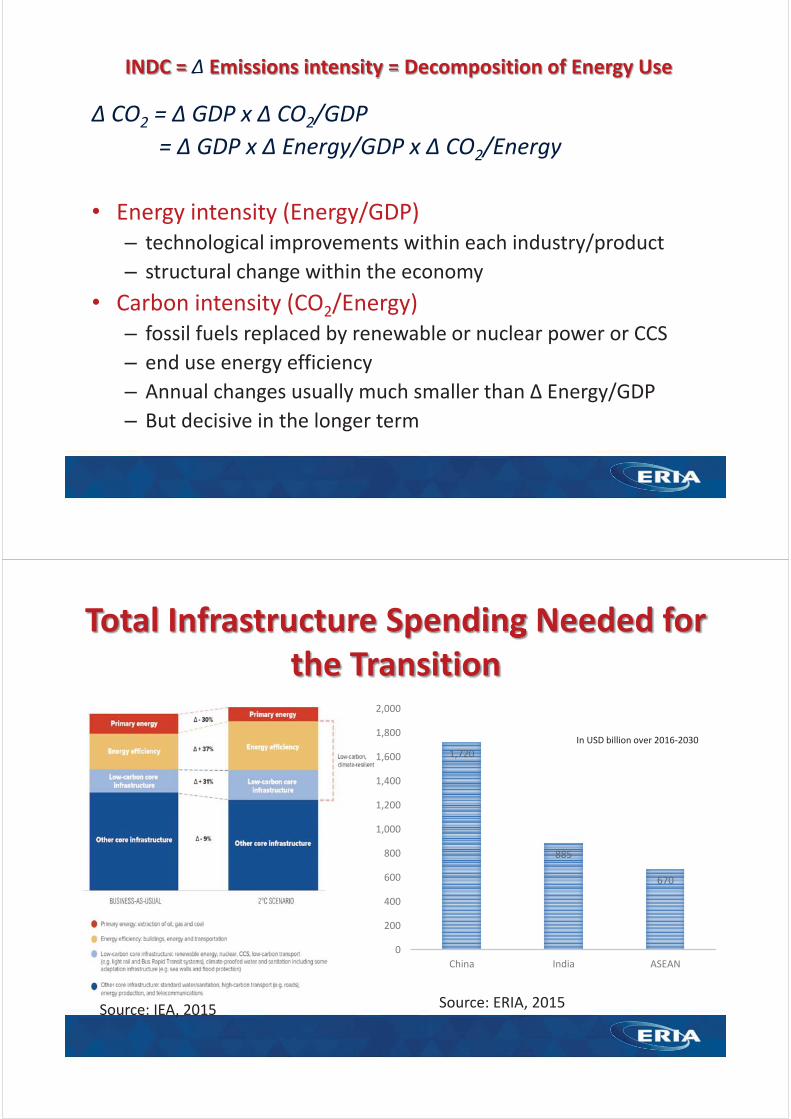
INDC = Δ Δ Emissions intensity y == Decomposition of Energy Use
Δ CO2 = Δ GDP x Δ CO2/GDP = Δ GDP x Δ Energy/GDP x Δ CO2/Energy
• Energy intensity (Energy/GDP) – technological improvements within each industry/product– structural change within the economy
• Carbon intensity (CO2/Energy)– fossil fuels replaced by renewable or nuclear power or CCS – end use energy efficiency – Annual changes usually much smaller than Δ Energy/GDP– But decisive in the longer term
Total Infrastructure Spending Needed for the Transition
1,720
885
670
0
200
400
600
800
1,000
1,200
1,400
1,600
1,800
2,000
China India ASEAN
In USD billion over 2016-2030
Source: IEA, 2015 Source: ERIA, 2015
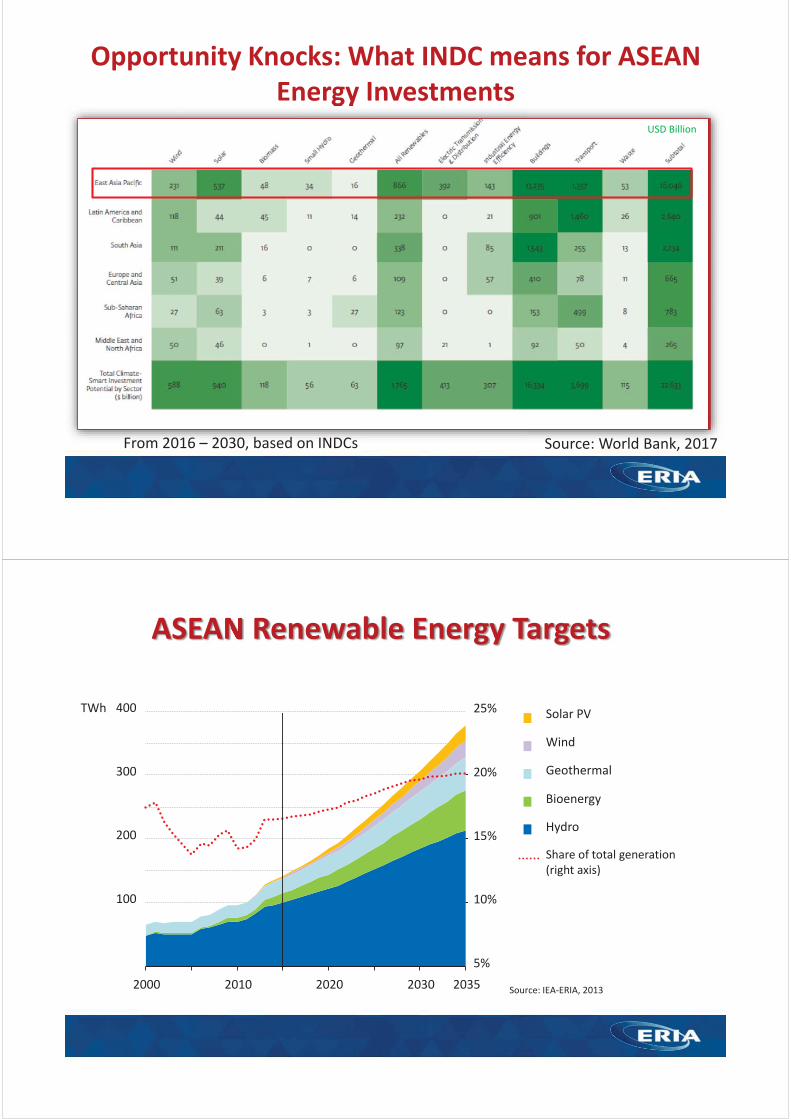
Opportunity Knocks: What INDC means for ASEAN Energy Investments
From 2016 – 2030, based on INDCs Source: World Bank, 2017
USD Billion
ASEAN Renewable Energy Targets
100
200
300
400
2000 2010 2020 2030 2035
TWh
5%
10%
15%
20%
25% Solar PV
Wind
Geothermal
Bioenergy
Hydro
Share of total generation(right axis)
Source: IEA-ERIA, 2013
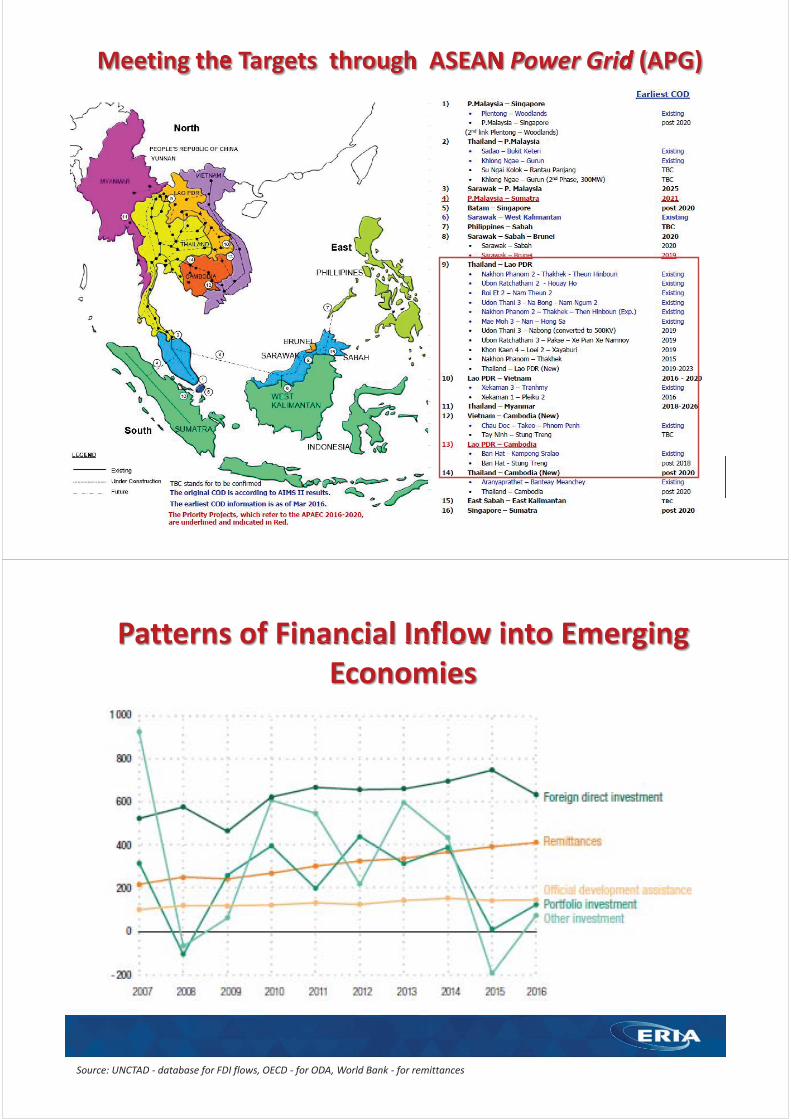
Meeting the Targets through ASEAN Power Grid (APG)
Patterns of Financial Inflow into Emerging Economies
Source: UNCTAD - database for FDI flows, OECD - for ODA, World Bank - for remittances
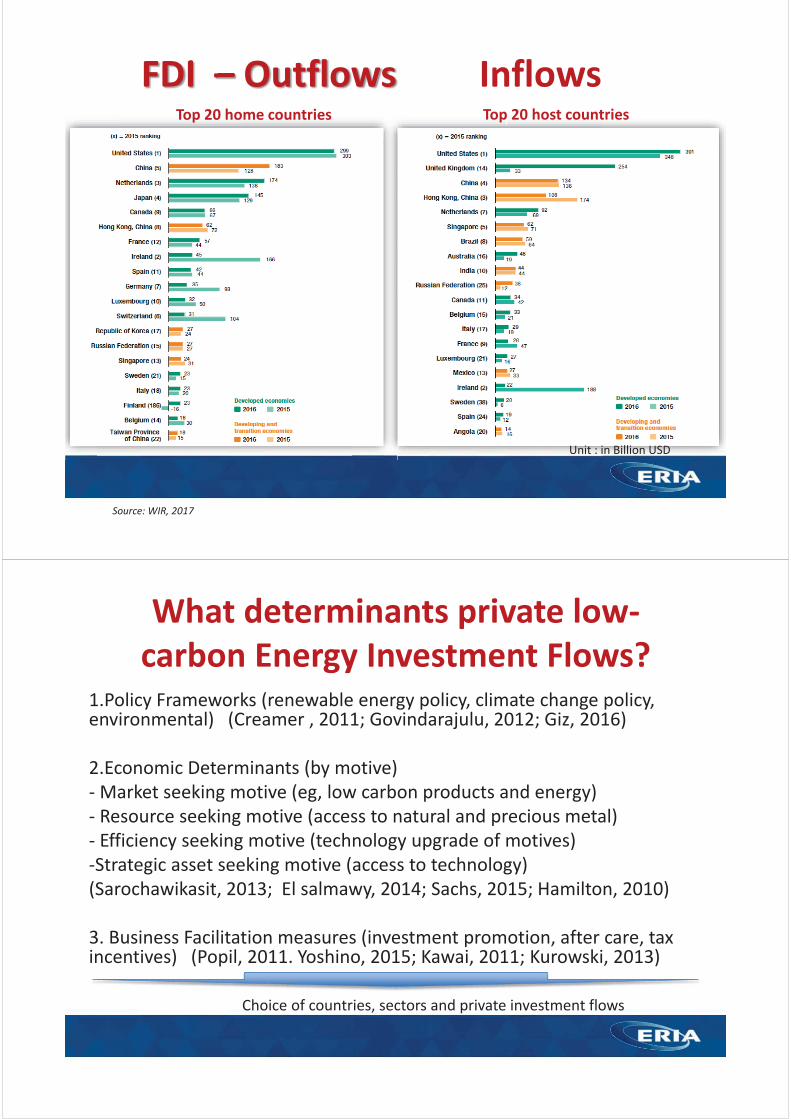
FDI – Outflows InflowsTop 20 home countries Top 20 host countries
Unit : in Billion USD
Source: WIR, 2017
What determinants private low-carbon Energy Investment Flows?
1.Policy Frameworks (renewable energy policy, climate change policy, environmental) (Creamer , 2011; Govindarajulu, 2012; Giz, 2016)
2.Economic Determinants (by motive) - Market seeking motive (eg, low carbon products and energy)- Resource seeking motive (access to natural and precious metal)- Efficiency seeking motive (technology upgrade of motives)-Strategic asset seeking motive (access to technology) (Sarochawikasit, 2013; El salmawy, 2014; Sachs, 2015; Hamilton, 2010)
3. Business Facilitation measures (investment promotion, after care, tax incentives) (Popil, 2011. Yoshino, 2015; Kawai, 2011; Kurowski, 2013)
Choice of countries, sectors and private investment flows
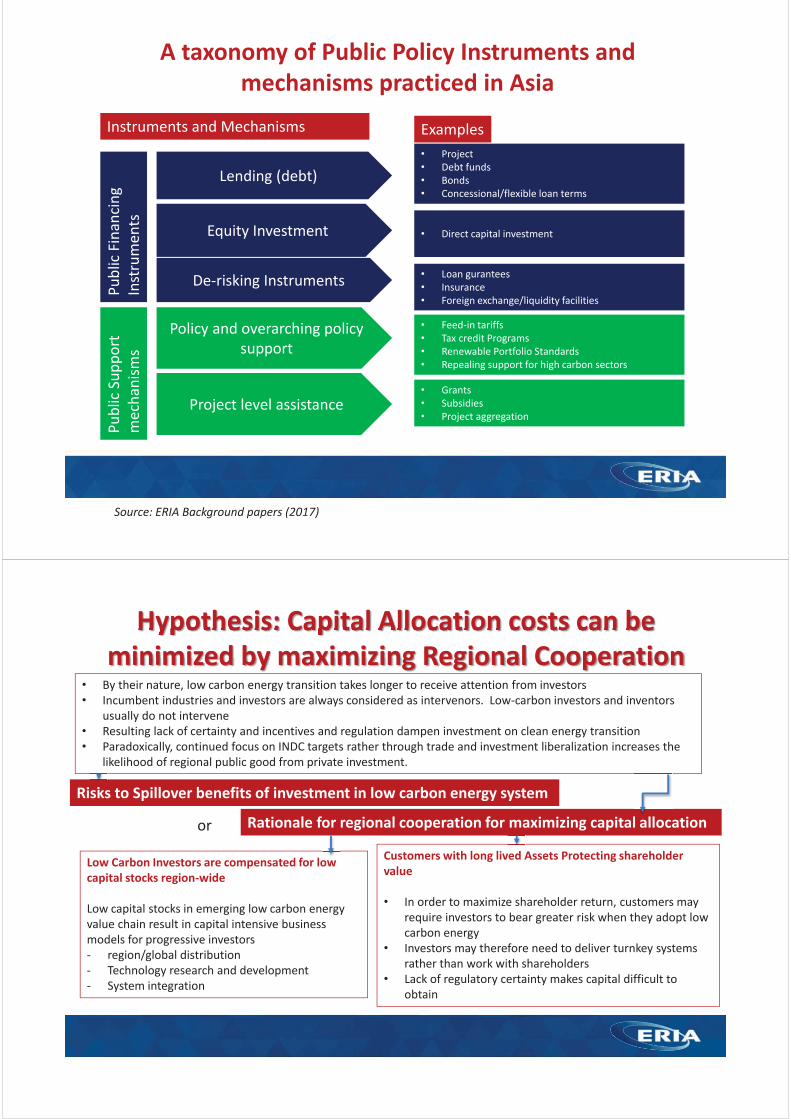
A taxonomy of Public Policy Instruments and mechanisms practiced in Asia
Instruments and Mechanisms ExamplesPu
blic
Sup
port
m
echa
nism
s
Policy and overarching policy support
Project level assistance
Lending (debt)
Publ
ic F
inan
cing
In
stru
men
ts Equity Investment
De-risking Instruments
• Project • Debt funds• Bonds• Concessional/flexible loan terms
• Direct capital investment
• Loan gurantees• Insurance• Foreign exchange/liquidity facilities
• Feed-in tariffs• Tax credit Programs• Renewable Portfolio Standards• Repealing support for high carbon sectors
• Grants• Subsidies• Project aggregation
Source: ERIA Background papers (2017)
Hypothesis: Capital Allocation costs can be minimized by maximizing Regional Cooperation
• By their nature, low carbon energy transition takes longer to receive attention from investors• Incumbent industries and investors are always considered as intervenors. Low-carbon investors and inventors
usually do not intervene• Resulting lack of certainty and incentives and regulation dampen investment on clean energy transition• Paradoxically, continued focus on INDC targets rather through trade and investment liberalization increases the
likelihood of regional public good from private investment.
Low Carbon Investors are compensated for low capital stocks region-wide
Low capital stocks in emerging low carbon energy value chain result in capital intensive business models for progressive investors- region/global distribution- Technology research and development- System integration
Customers with long lived Assets Protecting shareholder value
• In order to maximize shareholder return, customers may require investors to bear greater risk when they adopt low carbon energy
• Investors may therefore need to deliver turnkey systems rather than work with shareholders
• Lack of regulatory certainty makes capital difficult to obtain
Risks to Spillover benefits of investment in low carbon energy system
Rationale for regional cooperation for maximizing capital allocation or l alloca
ow ved A
k
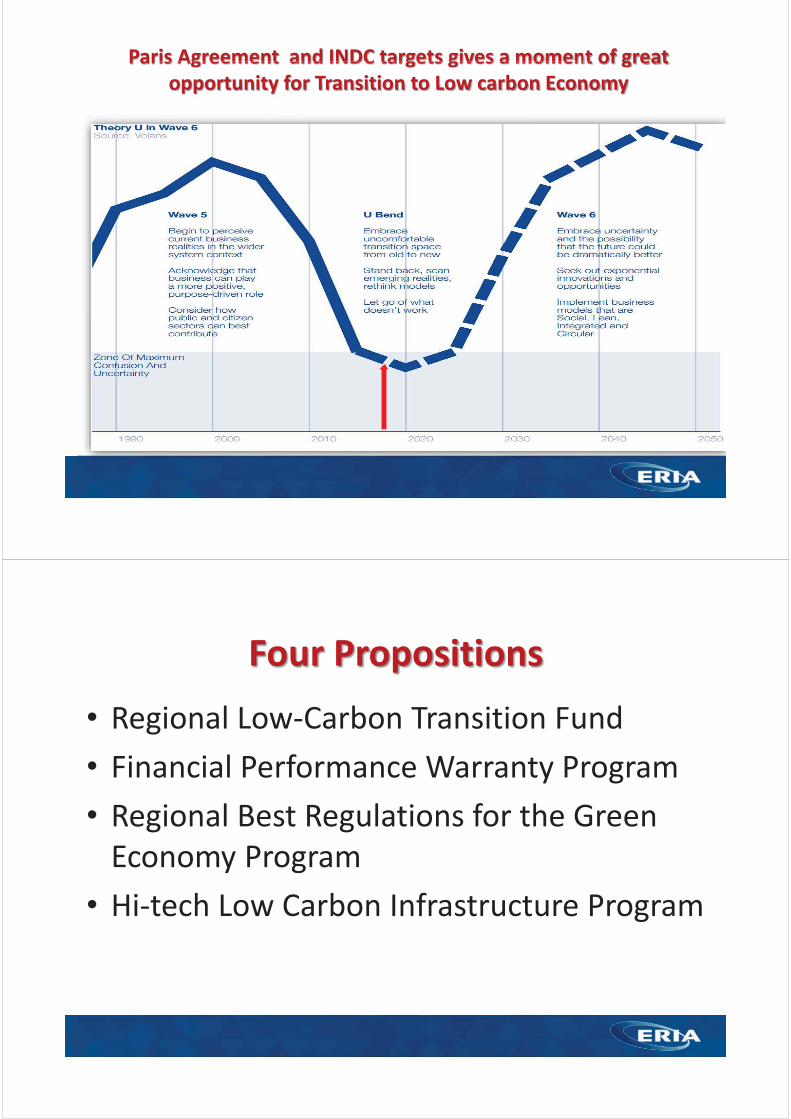
Paris Agreement and INDC targets gives a moment nt of great ris Agreement and INDC targets gives a momennt f greofopportunity for Transition to Low carbon Economy
Four Propositions
• Regional Low-Carbon Transition Fund• Financial Performance Warranty Program• Regional Best Regulations for the Green
Economy Program• Hi-tech Low Carbon Infrastructure Program
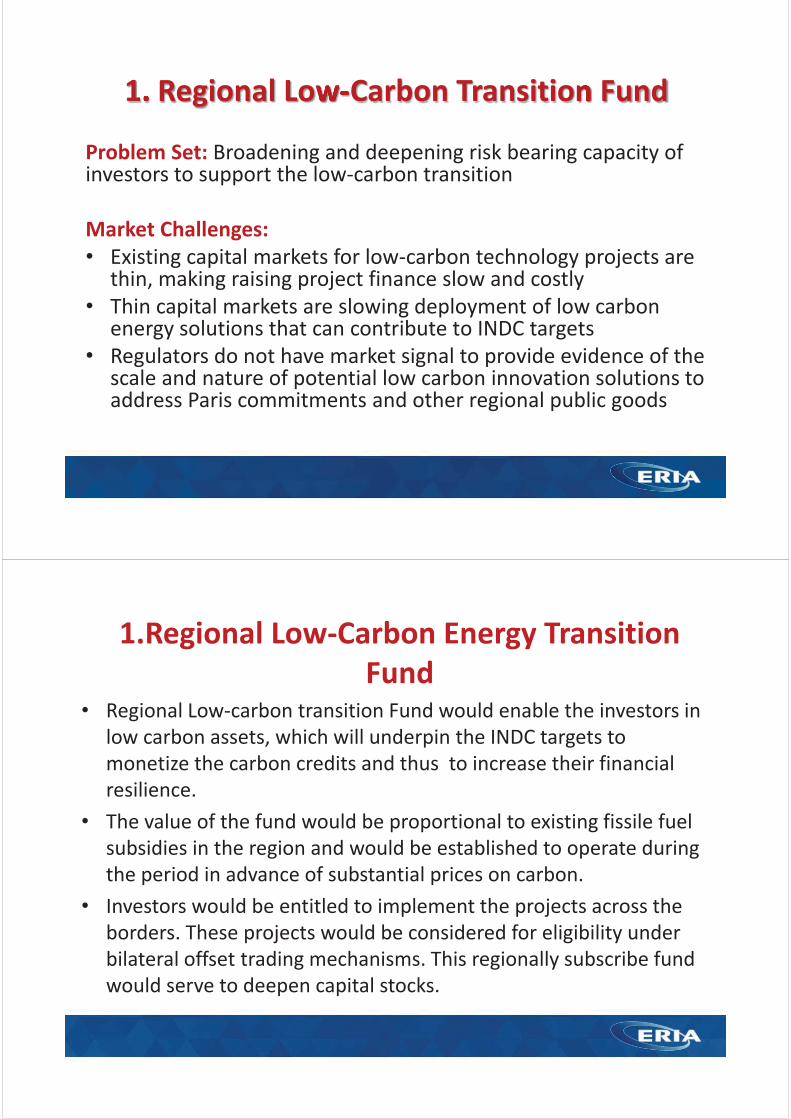
1. Regional Low-Carbon Transition Fund
Problem Set: Broadening and deepening risk bearing capacity of investors to support the low-carbon transition
Market Challenges:• Existing capital markets for low-carbon technology projects are
thin, making raising project finance slow and costly• Thin capital markets are slowing deployment of low carbon
energy solutions that can contribute to INDC targets• Regulators do not have market signal to provide evidence of the
scale and nature of potential low carbon innovation solutions to address Paris commitments and other regional public goods
1.Regional Low-Carbon Energy Transition Fund
• Regional Low-carbon transition Fund would enable the investors in low carbon assets, which will underpin the INDC targets to monetize the carbon credits and thus to increase their financial resilience.
• The value of the fund would be proportional to existing fissile fuel subsidies in the region and would be established to operate during the period in advance of substantial prices on carbon.
• Investors would be entitled to implement the projects across the borders. These projects would be considered for eligibility under bilateral offset trading mechanisms. This regionally subscribe fund would serve to deepen capital stocks.
2. Regional Finance Warranty ProgramProblem Set: Broadening and deepening financial markets to reduce the cost of financing low carbon energy investments/new innovative solutions
Market challenges: • Public sector actors seeking low carbon technology absorption or other projects
cannot bear the full risks for technical and business performance.• As a result, contractual agreement with low-carbon projects proponents may
result in risk down loading whose balance sheet are still forming, or the exclusion of such investments together
• Financial markets have not received sufficiently concentrated market signal to build or acquire lending and underwriting experience for low carbon investment
• Performance insurance underwriting capacity exists for risky sectors such as mining, oil and gas – but market signals have not triggered a spill over of this capacity to low carbon energy sectors.
2. Regional Finance Warranty Program
• Low-carbon finance performance warranty program would target sellers of low carbon technology whose customers, require insurance to warranty technology availability and performance.
• This regional wide program would target the formation of a critical mass of risk underwriting opportunities to attract private sector underwriters to warranty the performance and availability of innovations and investments being procured by the public and private sector.
• The program goal would be to enable the formation of a low carbon risk underwriting market. The market signals to kick-start such performance warranty or insurance market would come from the accreditation of low carbon projects under the regional low carbon energy transition fund.
3. Best Regional Regulations for Green Energy Investment
Problem Set: Broadening and deepening demand for low carbon investment to gain the eco- productivity benefitsMarket Challenge:• Many regulators at regional and national level are not now
structured to accommodate low carbon innovative solution.• Energy sector investors have low-regulatory engagement, but
they are knowledgeable of regulations and policies that enable the deployment of their investments in international/regional markets.
• Provision in articles in AEC and Paris Agreement will lead to increasing regional cooperation and a greater need for regulatory harmonization
3. Best Regional Regulations for Green Energy Investment
• The best regional regulation program would enable countries request a third party assessment o the potential within their country of international policies and regulations that have enabled commercial deployment of low carbon technology investment.
• The intent of the programs would be to recruit academia and non-profits to assesse the effectiveness of current policy barriers and regulations internationally to determine and prioritize the reforms.
• This program could be established for a period of five years to coincide with INDC implementation review. The review could also consider structural impediments such as costs, delays and current investment status.
4. High Tech Low-Carbon Energy Infrastructure Program
Problem Set: Broadening and deepening demand for low carbon energy investment to gain economic productivity benefits
Market Challenges:• Infrastructure procurement criteria generally assesse one time capital
expenditure only, with no requirement to consider the cost of future carbon targets and other operating costs or cost effective alternatives
• With very few exceptions, low carbon high technology firms and investments have been unsuccessful in integrating their innovations into public infrastructure projects.
• Taking up innovative solutions within public procurement and or demand stimulus program would be a vehicle to ensure that spill over benefits of the last three propositions are realized
4. High tech low -carbon Energy Infrastructure Program
• Under the regionally coordinated or agreed programs, a procurement approach with three stages would be taken to elauria new energy infrastructure investments proposal.
• Full economic life-cycle cost assessment, including taking into account operating costs, social benefits and the impact on INDC targets.
• Full emission cost assessment, accounting for embodied, operational and end of life costs
• Best available technology solutions – assessment that requires investors to undertake analysis of whether the need associate with the energy infrastructure project can be met through high tech or natural means.

Session IV:
Best Practices in Renewable Energy Financing

IV-1
Best Practices in Renewable Energy Financing: The Chilean Case

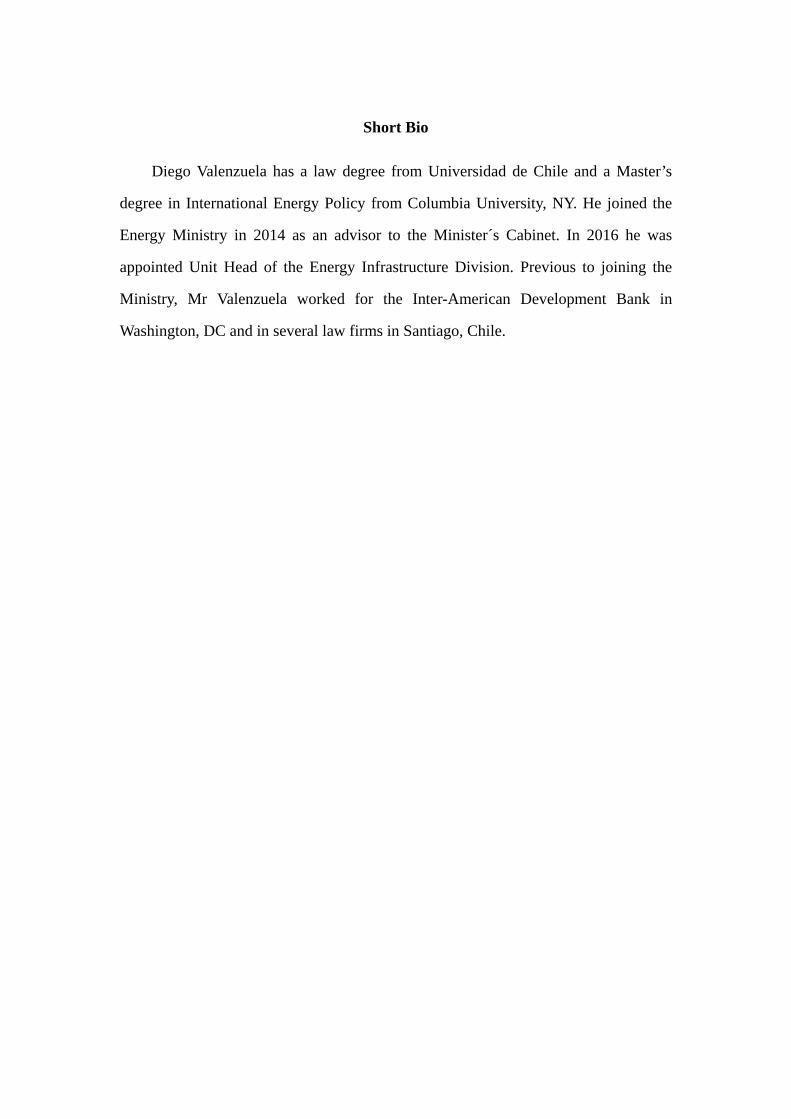
Short Bio
Diego Valenzuela has a law degree from Universidad de Chile and a Master’s
degree in International Energy Policy from Columbia University, NY. He joined the
Energy Ministry in 2014 as an advisor to the Minister´s Cabinet. In 2016 he was
appointed Unit Head of the Energy Infrastructure Division. Previous to joining the
Ministry, Mr Valenzuela worked for the Inter-American Development Bank in
Washington, DC and in several law firms in Santiago, Chile.

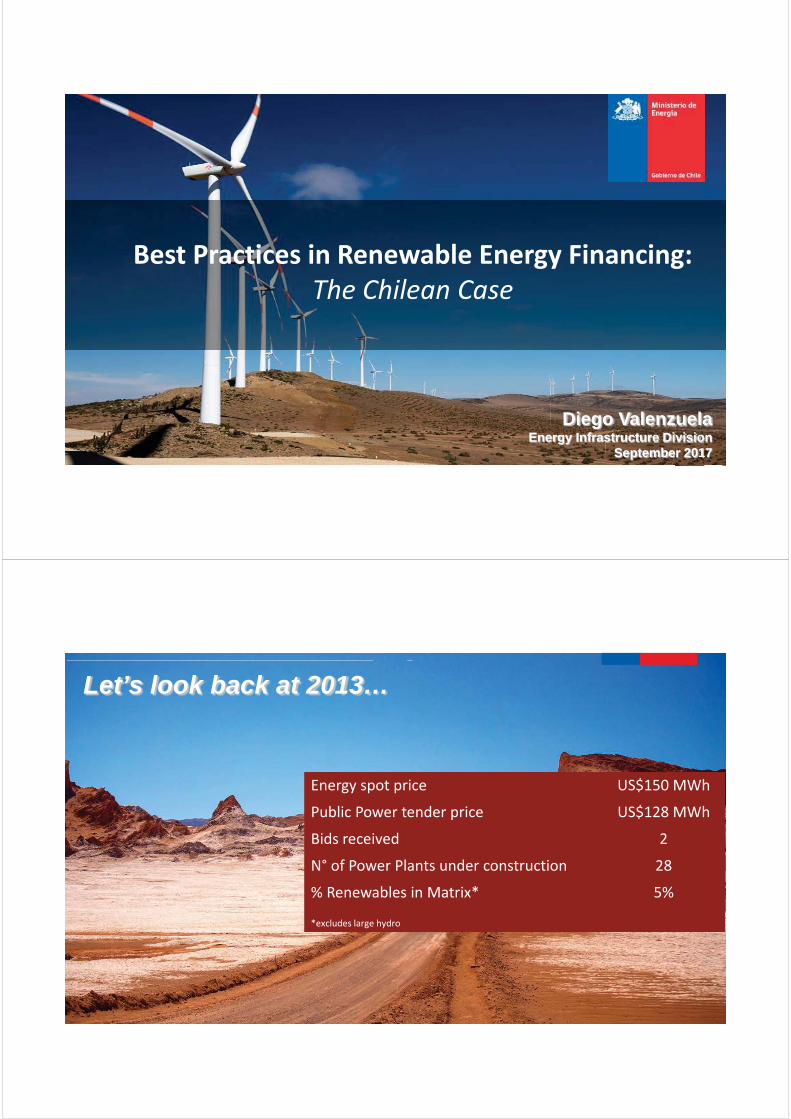
Diego ValenzuelaEnergy Infrastructure Division
September 2017
Best Practices in Renewable Energy Financing: The Chilean Case
Let’s look back at 2013…
Energy spot price US$150 MWh
Public Power tender price US$128 MWh
Bids received 2
N° of Power Plants under construction 28
% Renewables in Matrix* 5%
*excludes large hydro
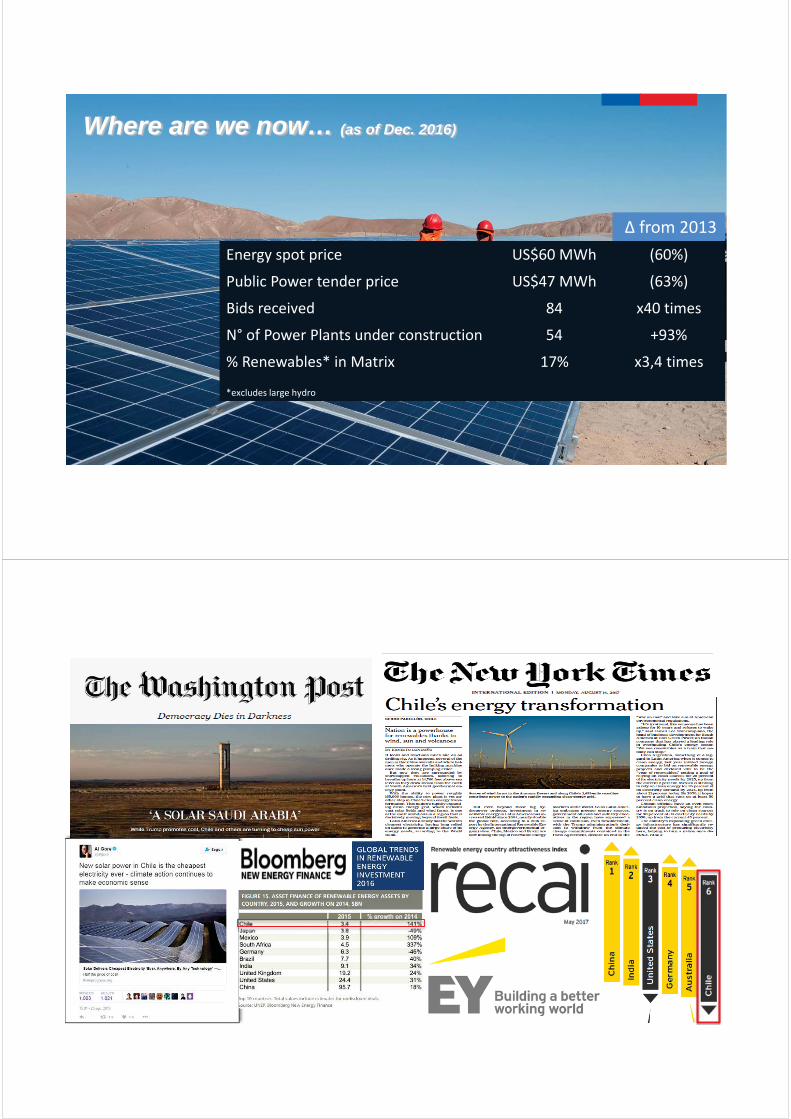
Where are we now… (as of Dec. 2016)
from 2013 Energy spot price US$60 MWh (60%)
Public Power tender price US$47 MWh (63%)
Bids received 84 x40 times
N° of Power Plants under construction 54 +93%
% Renewables* in Matrix 17% x3,4 times
*excludes large hydro
What happened?
Policies implemented:
• Short Term Energy Policy (Energy Agenda) • Long Term Energy Policy (Energy 2050) • 6 new laws enacted:
- Institutional strengthening - Power Tender Processes - National Oil Company - Residential Gas - Electric Transmission - Residential Electricity Tariff
IInnssttiittuuttiioonnaall ssttrreenngggggggggtthheenniinnggggggggg- Power Tender Processes
NNNNNNatttiiiiiiionallllllll OOOOOOiiiiiiillllllll CCCCCCompan
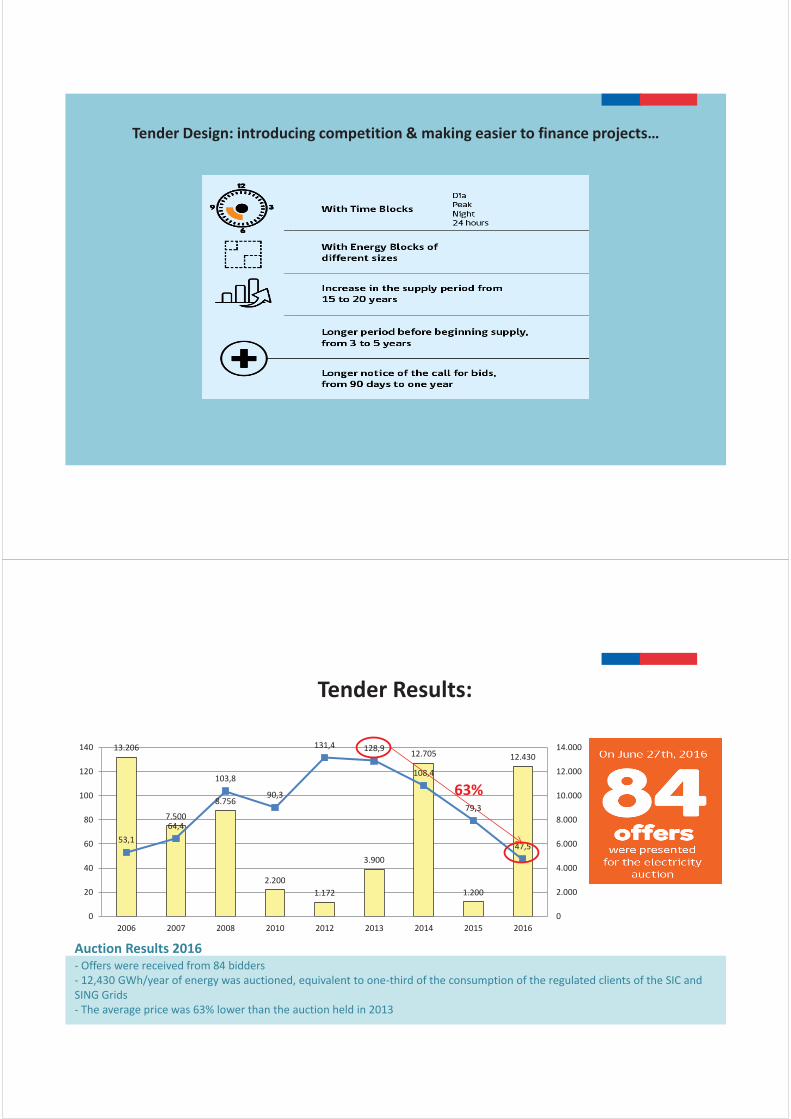
Tender Design: introducing competition & making easier to finance projects…
Auction Results 2016 - Offers were received from 84 bidders - 12,430 GWh/year of energy was auctioned, equivalent to one-third of the consumption of the regulated clients of the SIC and SING Grids - The average price was 63% lower than the auction held in 2013
Tender Results:
13.206
7.500
8.756
2.200 1.172
3.900
12.705
1.200
12.430
53,1 64,4
103,8
90,3
131,4 128,9
108,4
79,3
47,5
0
20
40
60
80
100
120
140
2006 2007 2008 2010 2012 2013 2014 2015 20160
2.000
4.000
6.000
8.000
10.000
12.000
14.000
63%
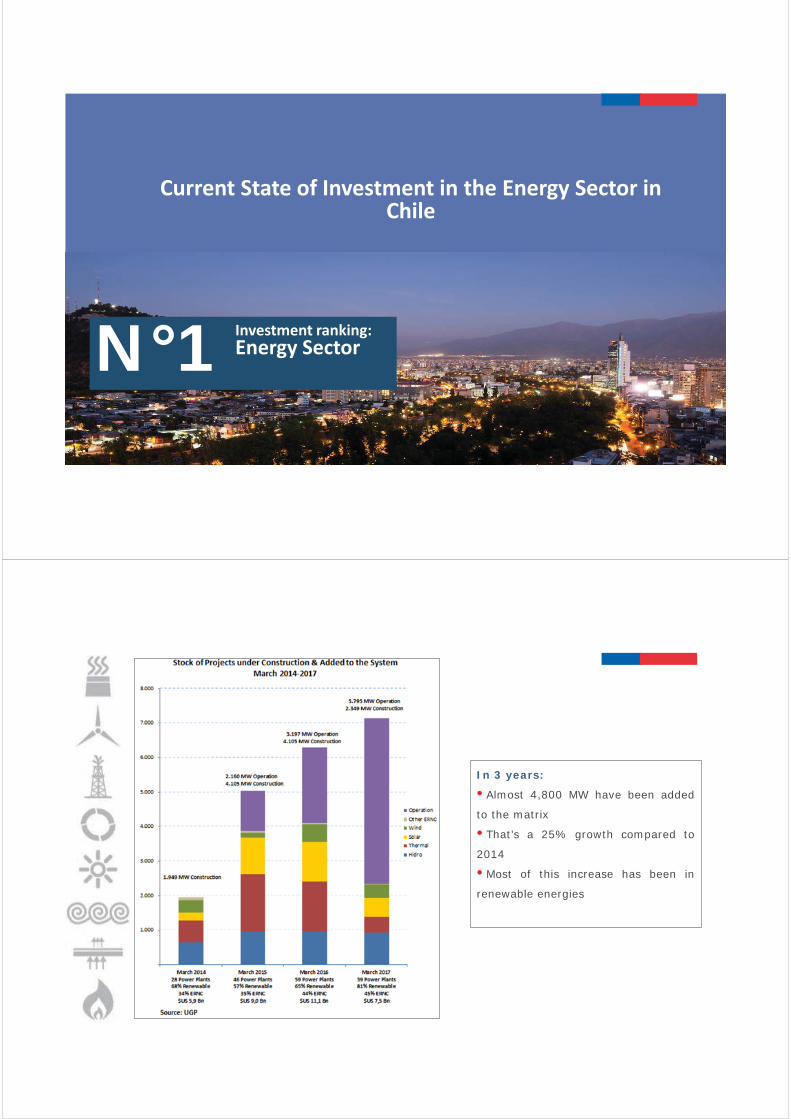
Investment ranking: Energy Sector N°1
Current State of Investment in the Energy Sector in Chile
In 3 years:
• Almost 4,800 MW have been added
to the matrix
• That’s a 25% growth compared to
2014
• Most of this increase has been in
renewable energies
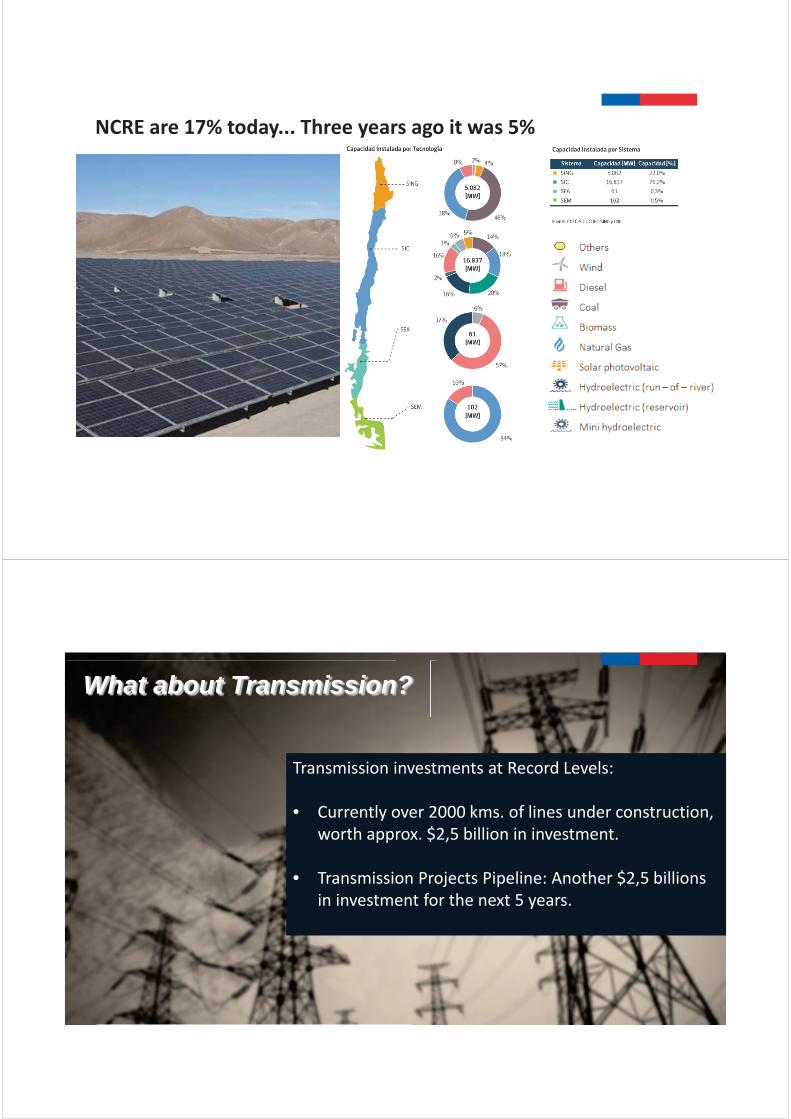
NCRE are 17% today... Three years ago it was 5%
What about Transmission?
Transmission investments at Record Levels: • Currently over 2000 kms. of lines under construction,
worth approx. $2,5 billion in investment. • Transmission Projects Pipeline: Another $2,5 billions
in investment for the next 5 years.
13
Thank you!

IV-2
Listed Infrastructure Fund Market

Takumi Hayase
Vice President, New Listings Promotion Department
Tokyo Stock Exchange, Inc.
Takumi Hayase is a Vice President at New Listings Promotion Department based
in Tokyo, Japan. The team is responsible developing listing rules for structured financial
products, such as Infrastructure Funds, REITs, and etc. as well as promoting these
structured financial products.
Mr. Hayase receives his Bachelor of Economics from The University of Tokyo
(Japan).

Listed Infrastructure Fund Market
Sep. 29, 2017 Tokyo Stock Exchange, Inc.
About JPX Group and Tokyo Stock Exchange
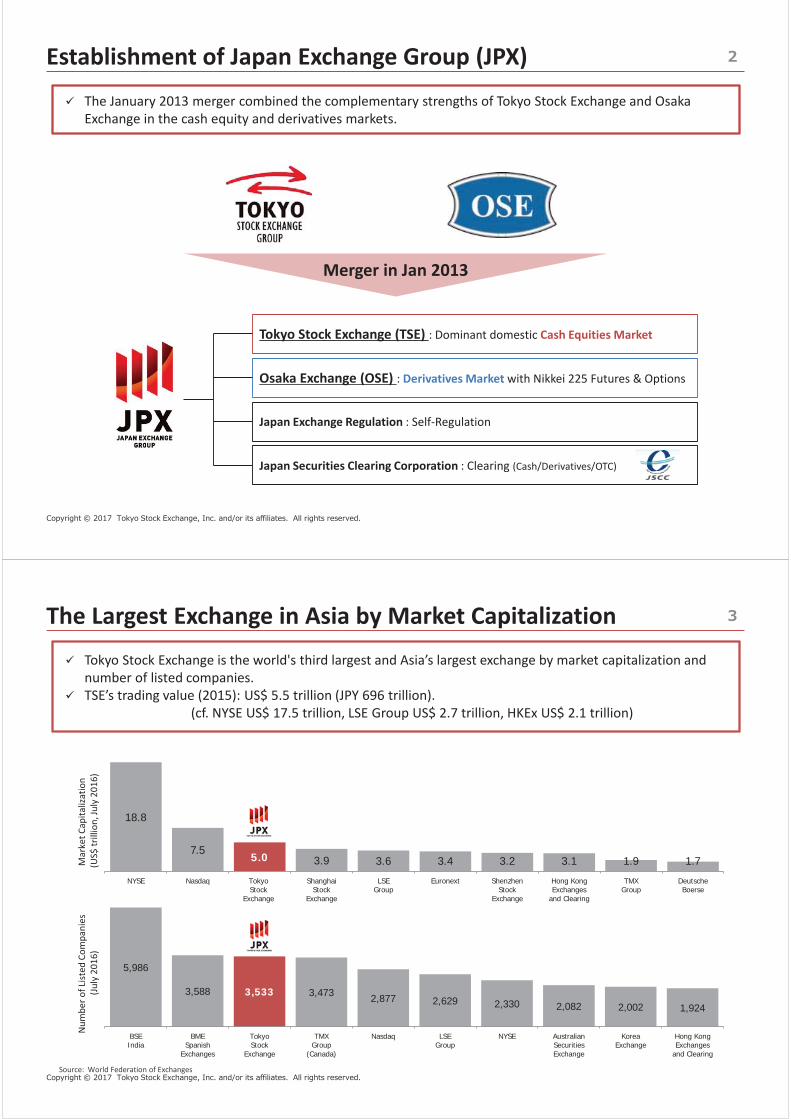
Establishment of Japan Exchange Group (JPX)
Merger in Jan 2013
Japan Exchange Regulation : Self-Regulation
Japan Securities Clearing Corporation : Clearing (Cash/Derivatives/OTC)
Tokyo Stock Exchange (TSE) : Dominant domestic Cash Equities Market
Osaka Exchange (OSE) : Derivatives Market with Nikkei 225 Futures & Options
The January 2013 merger combined the complementary strengths of Tokyo Stock Exchange and Osaka Exchange in the cash equity and derivatives markets.
Tokyo Stock Exchange is the world's third largest and Asia’s largest exchange by market capitalization and number of listed companies. TSE’s trading value (2015): US$ 5.5 trillion (JPY 696 trillion). (cf. NYSE US$ 17.5 trillion, LSE Group US$ 2.7 trillion, HKEx US$ 2.1 trillion)
17,787 18.8
7.55.0 3.9 3.6 3.4 3.2 3.1 1.9 1.7
NYSE Nasdaq TokyoStock
Exchange
ShanghaiStock
Exchange
LSEGroup
Euronext ShenzhenStock
Exchange
Hong KongExchanges
and Clearing
TMXGroup
DeutscheBoerse
5,986
3,588 3,533 3,473 2,877 2,629 2,330 2,082 2,002 1,924
BSEIndia
BMESpanish
Exchanges
TokyoStock
Exchange
TMXGroup
(Canada)
Nasdaq LSEGroup
NYSE AustralianSecuritiesExchange
KoreaExchange
Hong KongExchanges
and Clearing
Mar
ket C
apita
lizat
ion
(US$
trill
ion,
July
201
6)
Num
ber o
f Lis
ted
Com
pani
es
(Jul
y 20
16)
Source: World Federation of Exchanges
The Largest Exchange in Asia by Market Capitalization
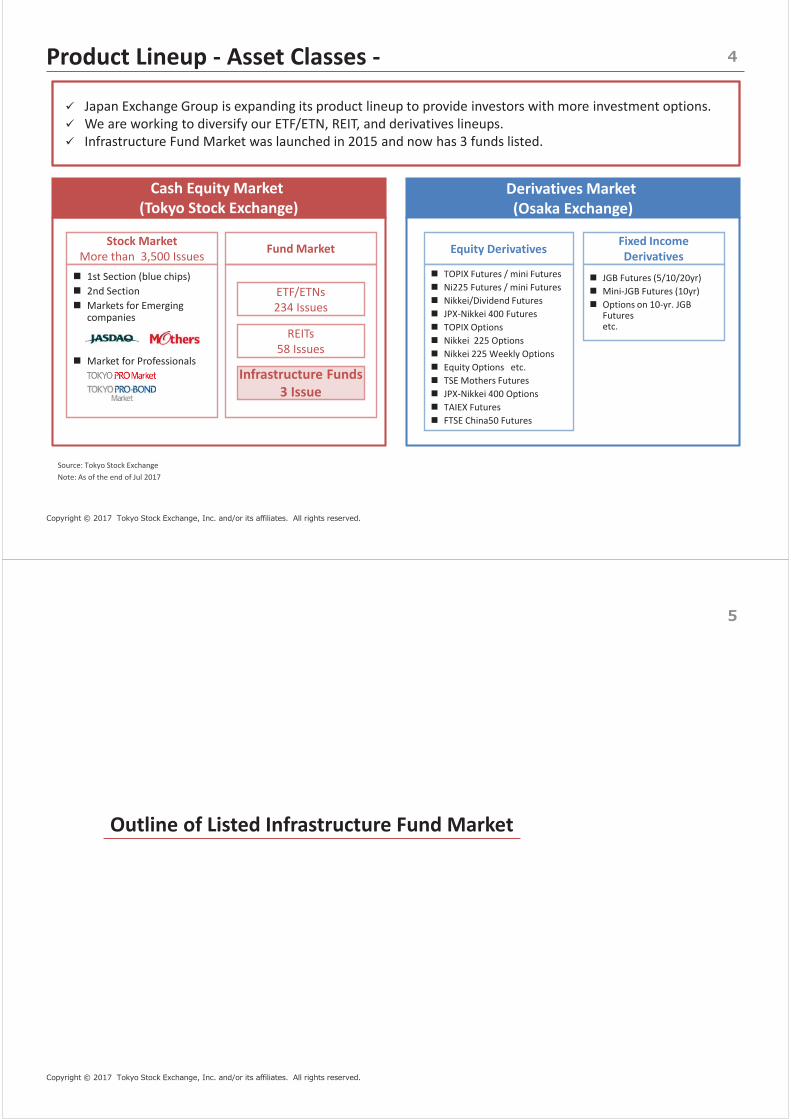
Product Lineup - Asset Classes -
Derivatives Market (Osaka Exchange)
Equity Derivatives Fixed Income Derivatives
TOPIX Futures / mini Futures Ni225 Futures / mini Futures Nikkei/Dividend Futures JPX-Nikkei 400 Futures TOPIX Options Nikkei 225 Options Nikkei 225 Weekly Options Equity Options etc. TSE Mothers Futures JPX-Nikkei 400 Options TAIEX Futures FTSE China50 Futures
JGB Futures (5/10/20yr) Mini-JGB Futures (10yr) Options on 10-yr. JGB Futures etc.
Cash Equity Market (Tokyo Stock Exchange)
Stock Market More than 3,500 Issues
1st Section (blue chips) 2nd Section Markets for Emerging companies Market for Professionals
Source: Tokyo Stock Exchange Note: As of the end of Jul 2017
Japan Exchange Group is expanding its product lineup to provide investors with more investment options. We are working to diversify our ETF/ETN, REIT, and derivatives lineups. Infrastructure Fund Market was launched in 2015 and now has 3 funds listed.
Fund Market
REITs 58 Issues
ETF/ETNs 234 Issues
Infrastructure Funds 3 Issue
Outline of Listed Infrastructure Fund Market
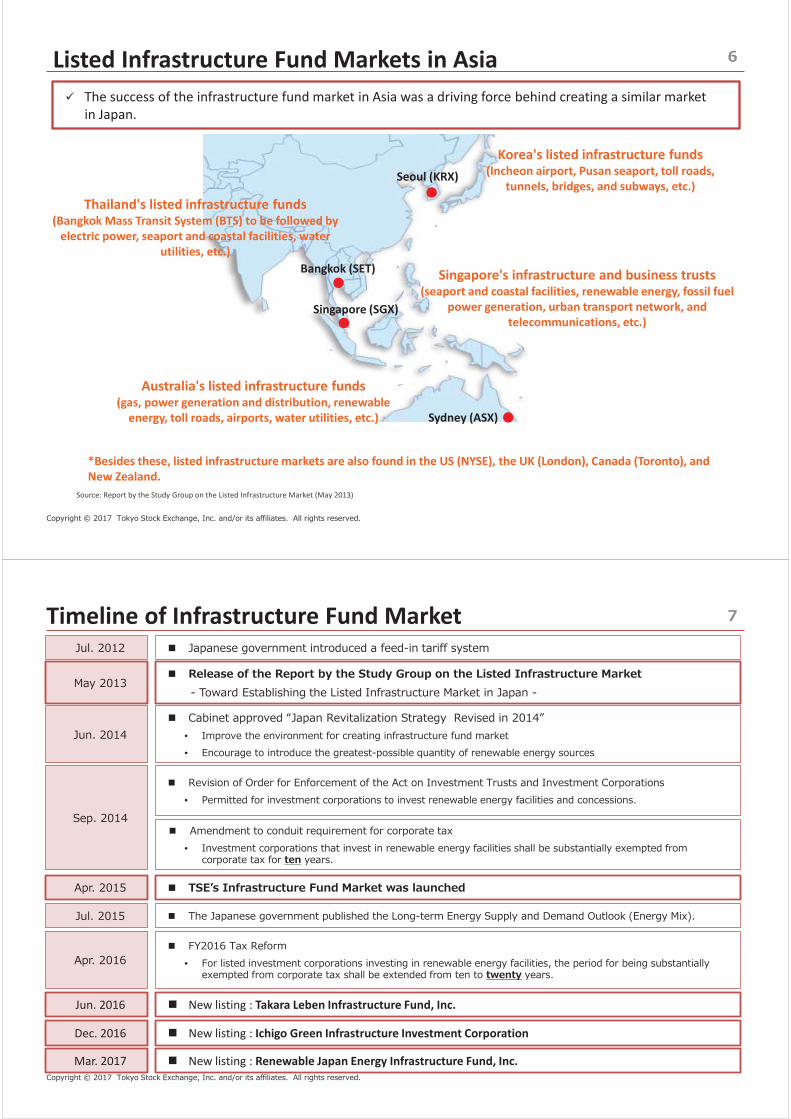
Listed Infrastructure Fund Markets in Asia
Singapore's infrastructure and business trusts (seaport and coastal facilities, renewable energy, fossil fuel
power generation, urban transport network, and telecommunications, etc.)
Singapore (SGX)
Sydney (ASX)
Australia's listed infrastructure funds (gas, power generation and distribution, renewable
energy, toll roads, airports, water utilities, etc.)
*Besides these, listed infrastructure markets are also found in the US (NYSE), the UK (London), Canada (Toronto), and New Zealand.
Korea's listed infrastructure funds (Incheon airport, Pusan seaport, toll roads,
tunnels, bridges, and subways, etc.) Seoul (KRX)
Thailand's listed infrastructure funds (Bangkok Mass Transit System (BTS) to be followed by
electric power, seaport and coastal facilities, water utilities, etc.)
Bangkok (SET)
Source: Report by the Study Group on the Listed Infrastructure Market (May 2013)
The success of the infrastructure fund market in Asia was a driving force behind creating a similar market in Japan.
Timeline of Infrastructure Fund Market
•
•
New listing : Takara Leben Infrastructure Fund, Inc. Jun. 2016
New listing : Ichigo Green Infrastructure Investment Corporation Dec. 2016
New listing : Renewable Japan Energy Infrastructure Fund, Inc. Mar. 2017
•
•
•
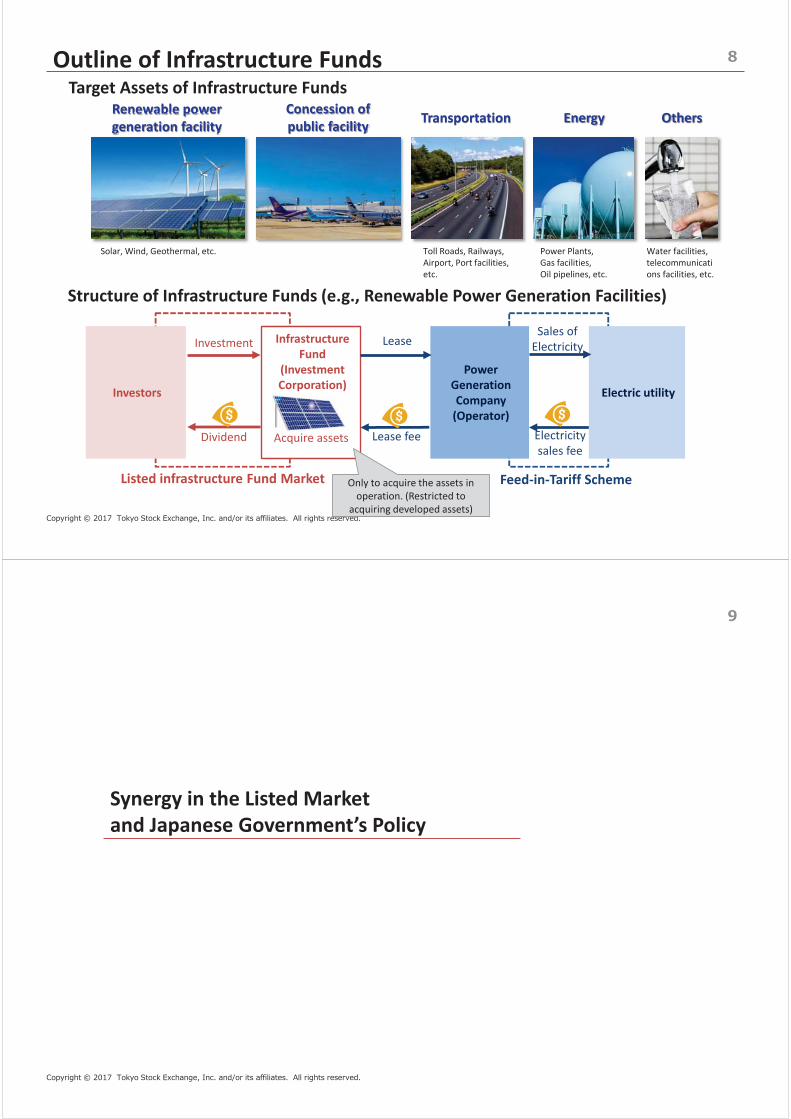
Outline of Infrastructure Funds Target Assets of Infrastructure Funds
Solar, Wind, Geothermal, etc.
Renewable power generation facility
Concession of public facility Transportation Energy Others
Toll Roads, Railways, Airport, Port facilities, etc.
Power Plants, Gas facilities, Oil pipelines, etc.
Water facilities, telecommunications facilities, etc.
Structure of Infrastructure Funds (e.g., Renewable Power Generation Facilities)
Power Generation Company
(Operator)
Infrastructure Fund
(Investment Corporation)
Acquire assets
Electric utility
Sales of Electricity
Electricity sales fee
Lease
Lease fee
Investment
Dividend
Feed-in-Tariff Scheme Listed infrastructure Fund Market
Investors
Only to acquire the assets in operation. (Restricted to
acquiring developed assets)
Synergy in the Listed Market and Japanese Government’s Policy
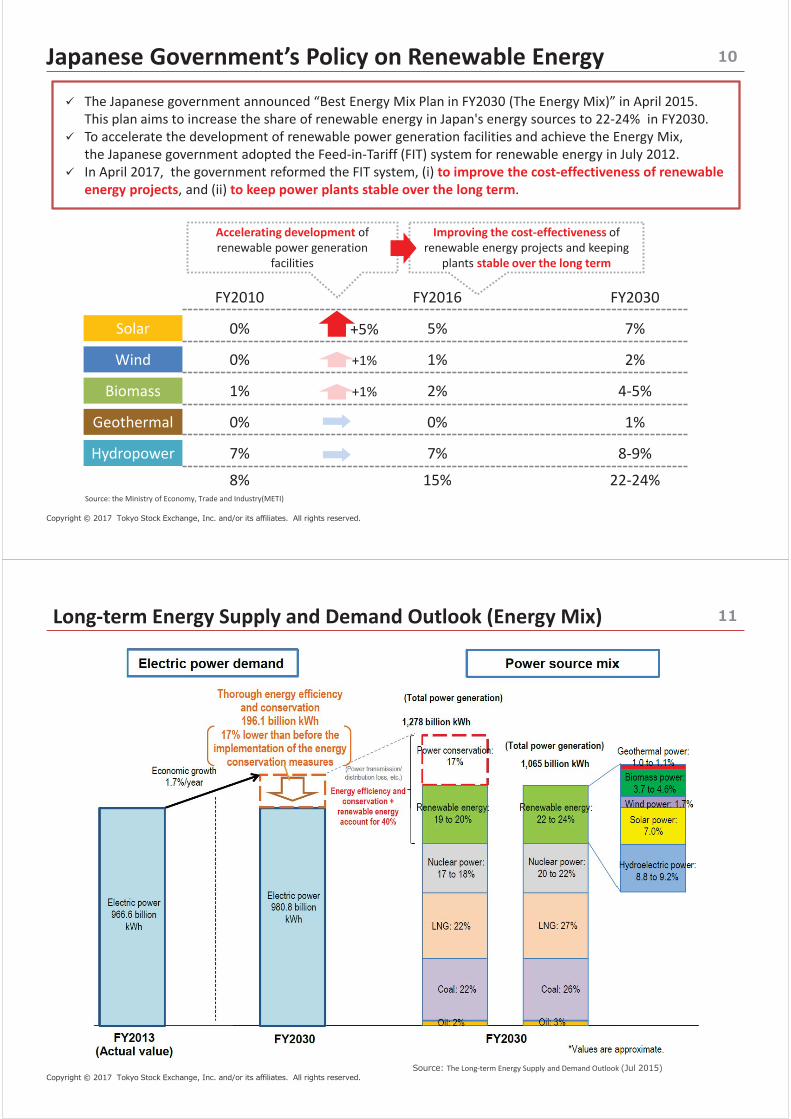
Japanese Government’s Policy on Renewable Energy
The Japanese government announced “Best Energy Mix Plan in FY2030 (The Energy Mix)” in April 2015. This plan aims to increase the share of renewable energy in Japan's energy sources to 22-24% in FY2030. To accelerate the development of renewable power generation facilities and achieve the Energy Mix, the Japanese government adopted the Feed-in-Tariff (FIT) system for renewable energy in July 2012. In April 2017, the government reformed the FIT system, (i) to improve the cost-effectiveness of renewable energy projects, and (ii) to keep power plants stable over the long term.
Solar
Wind
Biomass
Geothermal
Hydropower
FY2010
0%
0%
1%
0%
7%
FY2016
5%
1%
2%
0%
7%
FY2030
7%
2%
4-5%
1%
8-9%
8% 15% 22-24%
+5%
+1%
+1%
Source: the Ministry of Economy, Trade and Industry(METI)
Accelerating development of renewable power generation
facilities
Improving the cost-effectiveness of renewable energy projects and keeping
plants stable over the long term
Long-term Energy Supply and Demand Outlook (Energy Mix)
The Long-term Energy Supply and Demand Outlook
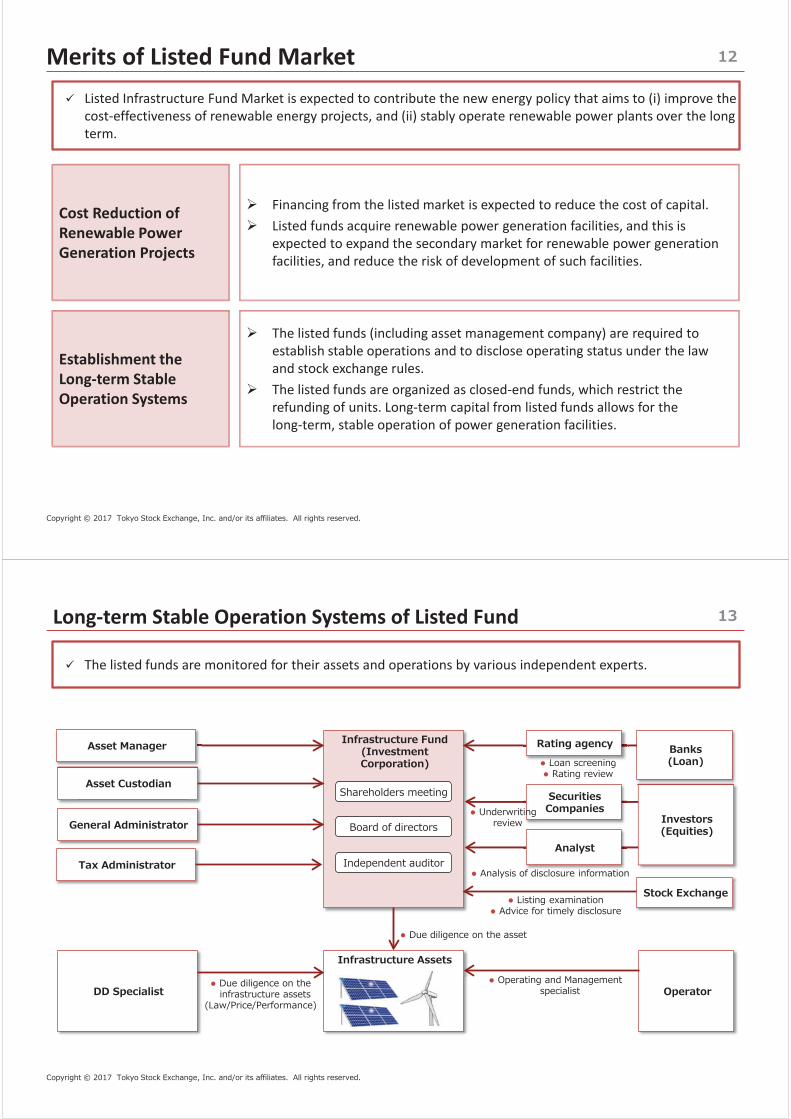
Merits of Listed Fund Market Listed Infrastructure Fund Market is expected to contribute the new energy policy that aims to (i) improve the cost-effectiveness of renewable energy projects, and (ii) stably operate renewable power plants over the long term.
Cost Reduction of Renewable Power Generation Projects
Financing from the listed market is expected to reduce the cost of capital. Listed funds acquire renewable power generation facilities, and this is expected to expand the secondary market for renewable power generation facilities, and reduce the risk of development of such facilities.
Establishment the Long-term Stable Operation Systems
The listed funds (including asset management company) are required to establish stable operations and to disclose operating status under the law and stock exchange rules. The listed funds are organized as closed-end funds, which restrict the refunding of units. Long-term capital from listed funds allows for the long-term, stable operation of power generation facilities.
Long-term Stable Operation Systems of Listed Fund
The listed funds are monitored for their assets and operations by various independent experts.
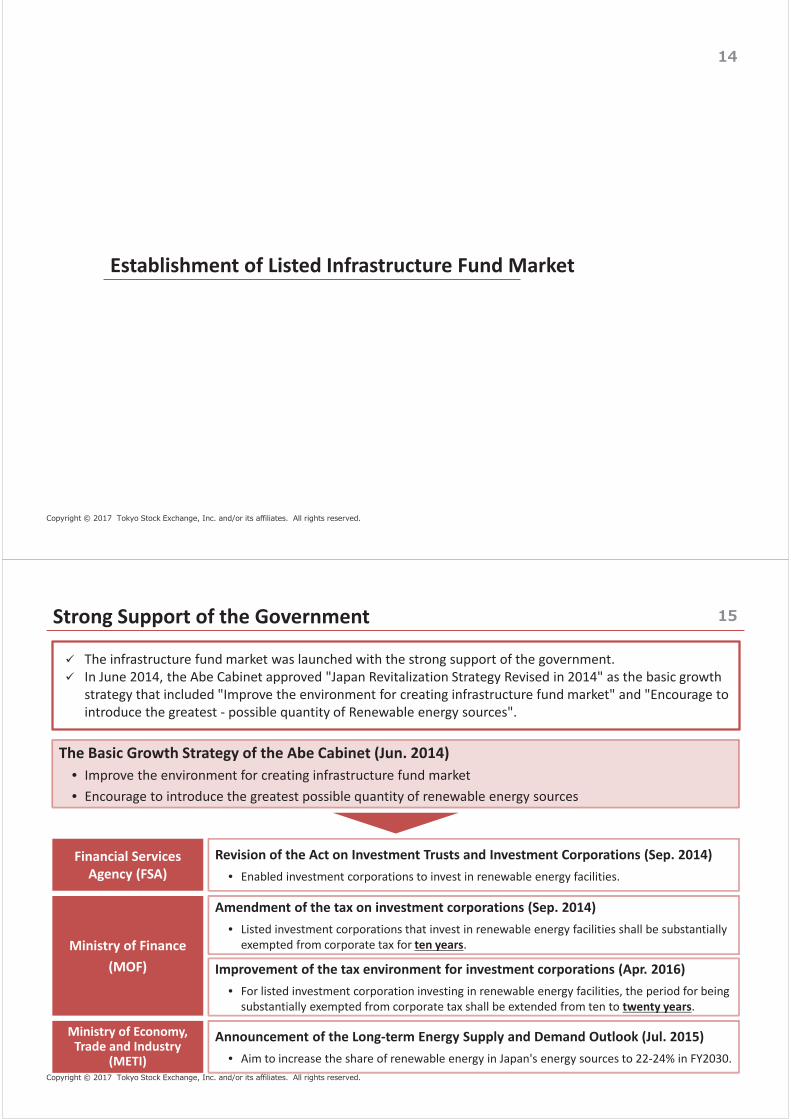
Establishment of Listed Infrastructure Fund Market
Strong Support of the Government
The infrastructure fund market was launched with the strong support of the government. In June 2014, the Abe Cabinet approved "Japan Revitalization Strategy Revised in 2014" as the basic growth strategy that included "Improve the environment for creating infrastructure fund market" and "Encourage to introduce the greatest - possible quantity of Renewable energy sources".
Financial Services Agency (FSA)
Revision of the Act on Investment Trusts and Investment Corporations (Sep. 2014) • Enabled investment corporations to invest in renewable energy facilities.
Ministry of Finance (MOF)
Amendment of the tax on investment corporations (Sep. 2014) • Listed investment corporations that invest in renewable energy facilities shall be substantially
exempted from corporate tax for ten years.
Ministry of Economy, Trade and Industry
(METI)
Announcement of the Long-term Energy Supply and Demand Outlook (Jul. 2015)• Aim to increase the share of renewable energy in Japan's energy sources to 22-24% in FY2030.
Improvement of the tax environment for investment corporations (Apr. 2016) • For listed investment corporation investing in renewable energy facilities, the period for being
substantially exempted from corporate tax shall be extended from ten to twenty years.
The Basic Growth Strategy of the Abe Cabinet (Jun. 2014) • Improve the environment for creating infrastructure fund market • Encourage to introduce the greatest possible quantity of renewable energy sources
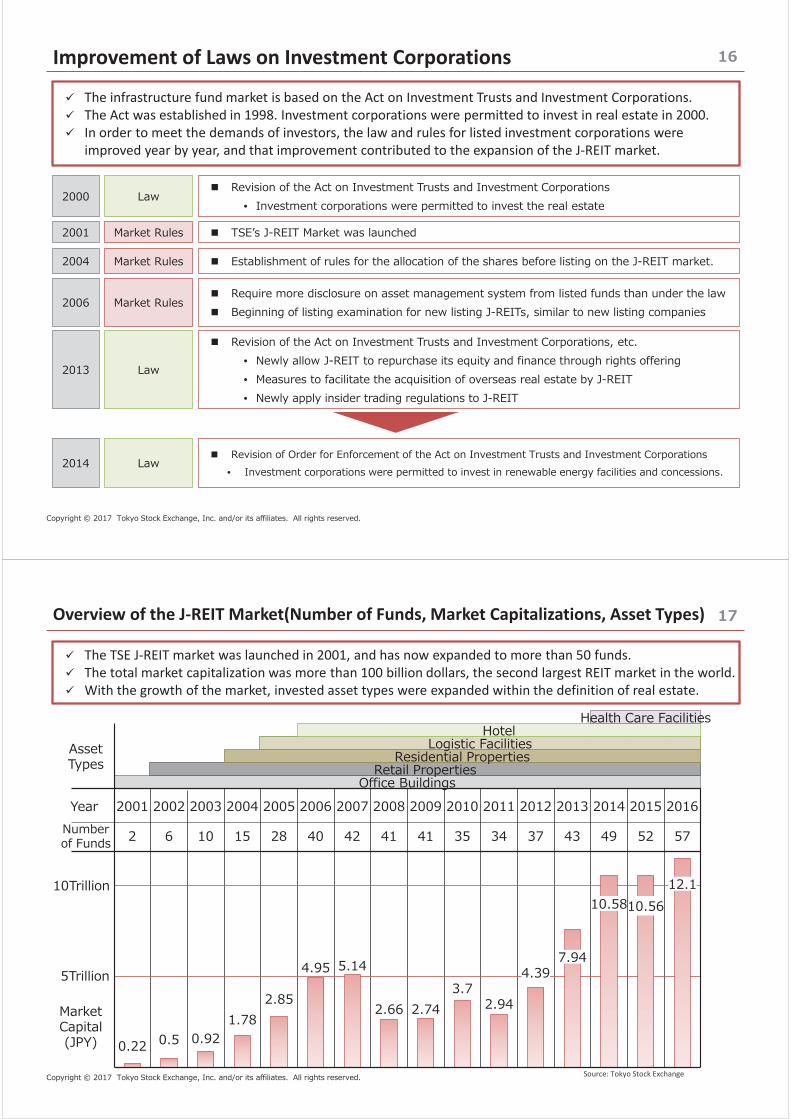
Improvement of Laws on Investment Corporations
The infrastructure fund market is based on the Act on Investment Trusts and Investment Corporations. The Act was established in 1998. Investment corporations were permitted to invest in real estate in 2000. In order to meet the demands of investors, the law and rules for listed investment corporations were improved year by year, and that improvement contributed to the expansion of the J-REIT market.
•
•
•
•
•
Overview of the J-REIT Market(Number of Funds, Market Capitalizations, Asset Types)
The TSE J-REIT market was launched in 2001, and has now expanded to more than 50 funds. The total market capitalization was more than 100 billion dollars, the second largest REIT market in the world. With the growth of the market, invested asset types were expanded within the definition of real estate.
Source: Tokyo Stock Exchange
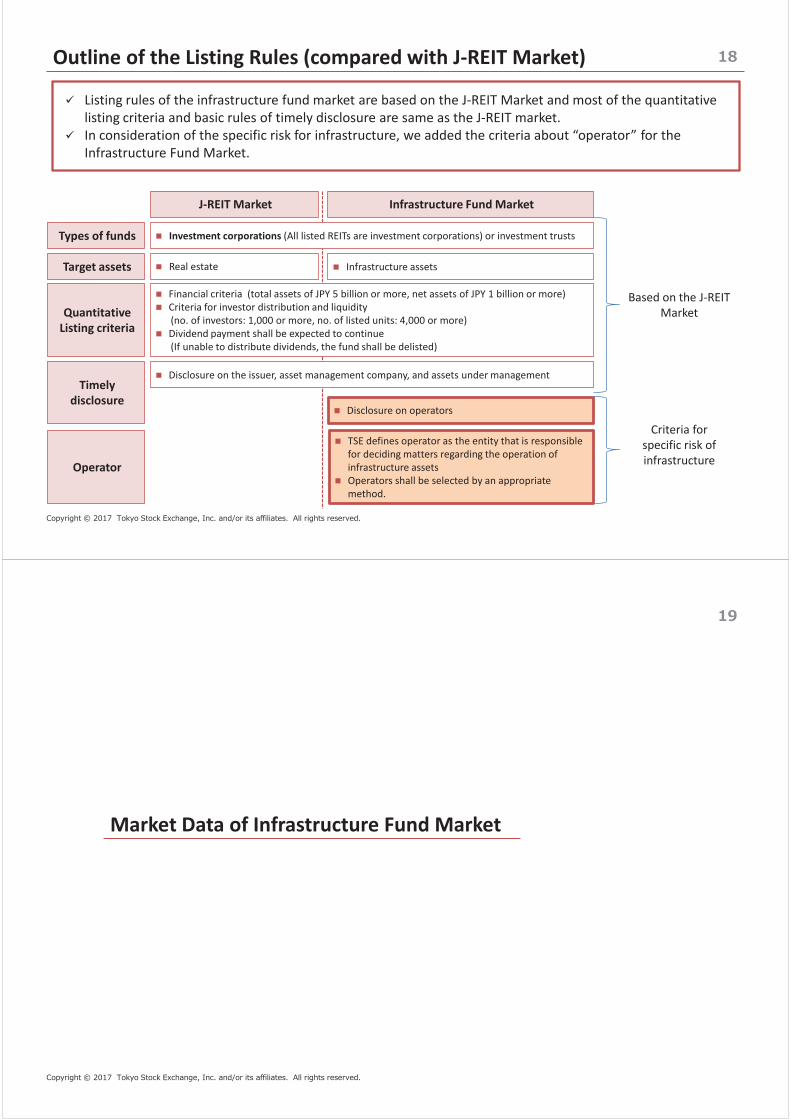
Outline of the Listing Rules (compared with J-REIT Market)
Infrastructure Fund Market J-REIT Market
Types of funds
Target assets Infrastructure assets Real estate
Quantitative Listing criteria
TSE defines operator as the entity that is responsible for deciding matters regarding the operation of infrastructure assets Operators shall be selected by an appropriate method.
Disclosure on operators
Timely disclosure
Financial criteria (total assets of JPY 5 billion or more, net assets of JPY 1 billion or more) Criteria for investor distribution and liquidity
(no. of investors: 1,000 or more, no. of listed units: 4,000 or more) Dividend payment shall be expected to continue
(If unable to distribute dividends, the fund shall be delisted)
Disclosure on the issuer, asset management company, and assets under management
Investment corporations (All listed REITs are investment corporations) or investment trusts
Operator
Listing rules of the infrastructure fund market are based on the J-REIT Market and most of the quantitative listing criteria and basic rules of timely disclosure are same as the J-REIT market. In consideration of the specific risk for infrastructure, we added the criteria about “operator” for the Infrastructure Fund Market.
Based on the J-REIT Market
Criteria for specific risk of infrastructure
Market Data of Infrastructure Fund Market
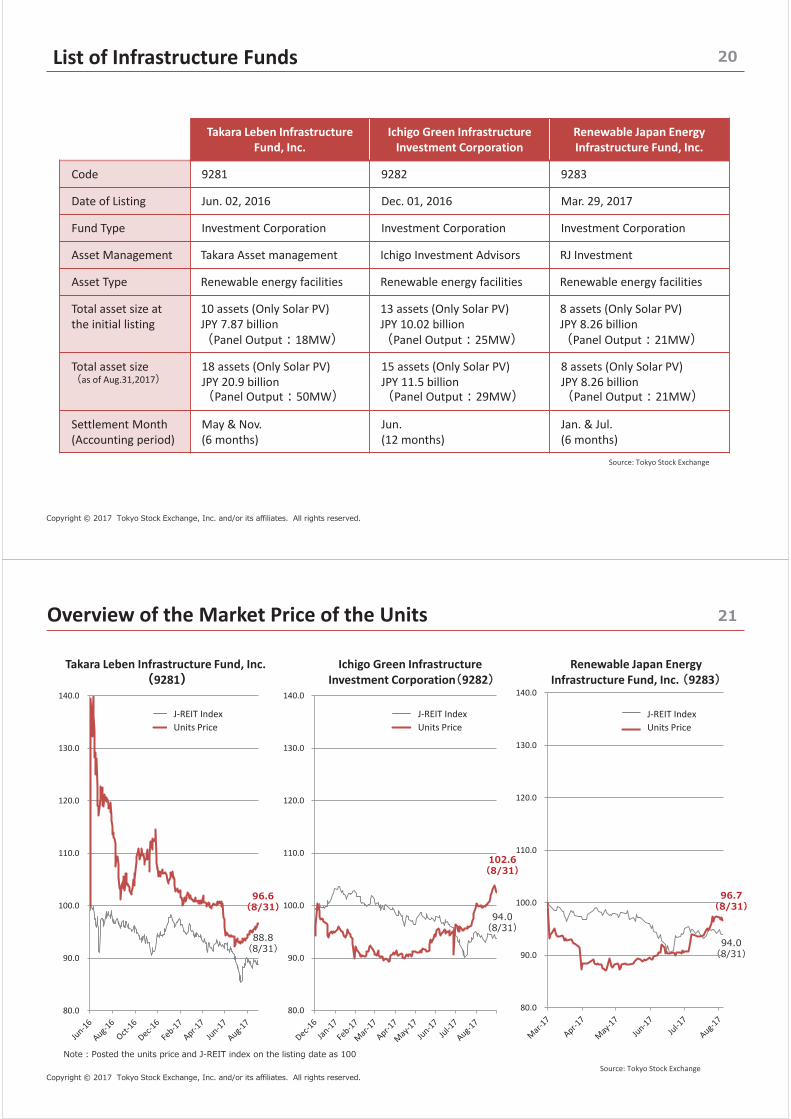
List of Infrastructure Funds
Takara Leben Infrastructure Fund, Inc.
Ichigo Green Infrastructure Investment Corporation
Renewable Japan Energy Infrastructure Fund, Inc.
Code 9281 9282 9283
Date of Listing Jun. 02, 2016 Dec. 01, 2016 Mar. 29, 2017
Fund Type Investment Corporation Investment Corporation Investment Corporation
Asset Management Takara Asset management Ichigo Investment Advisors RJ Investment
Asset Type Renewable energy facilities Renewable energy facilities Renewable energy facilities
Total asset size at the initial listing
10 assets (Only Solar PV) JPY 7.87 billion
Panel Output 18MW
13 assets (Only Solar PV) JPY 10.02 billion
Panel Output 25MW
8 assets (Only Solar PV) JPY 8.26 billion
Panel Output 21MW
Total asset size as of Aug.31,2017
18 assets (Only Solar PV) JPY 20.9 billion
Panel Output 50MW
15 assets (Only Solar PV) JPY 11.5 billion
Panel Output 29MW
8 assets (Only Solar PV) JPY 8.26 billion
Panel Output 21MW
Settlement Month (Accounting period)
May & Nov. (6 months)
Jun. (12 months)
Jan. & Jul. (6 months)
Source: Tokyo Stock Exchange
Overview of the Market Price of the Units
Takara Leben Infrastructure Fund, Inc. 9281
Renewable Japan Energy Infrastructure Fund, Inc. 9283
Source: Tokyo Stock Exchange
80.0
90.0
100.0
110.0
120.0
130.0
140.0
J-REIT
J-REIT Index Units Price
80.0
90.0
100.0
110.0
120.0
130.0
140.0
J-REIT
Ichigo Green Infrastructure Investment Corporation 9282
J-REIT Index Units Price
80.0
90.0
100.0
110.0
120.0
130.0
140.0
J-REIT
J-REIT Index Units Price
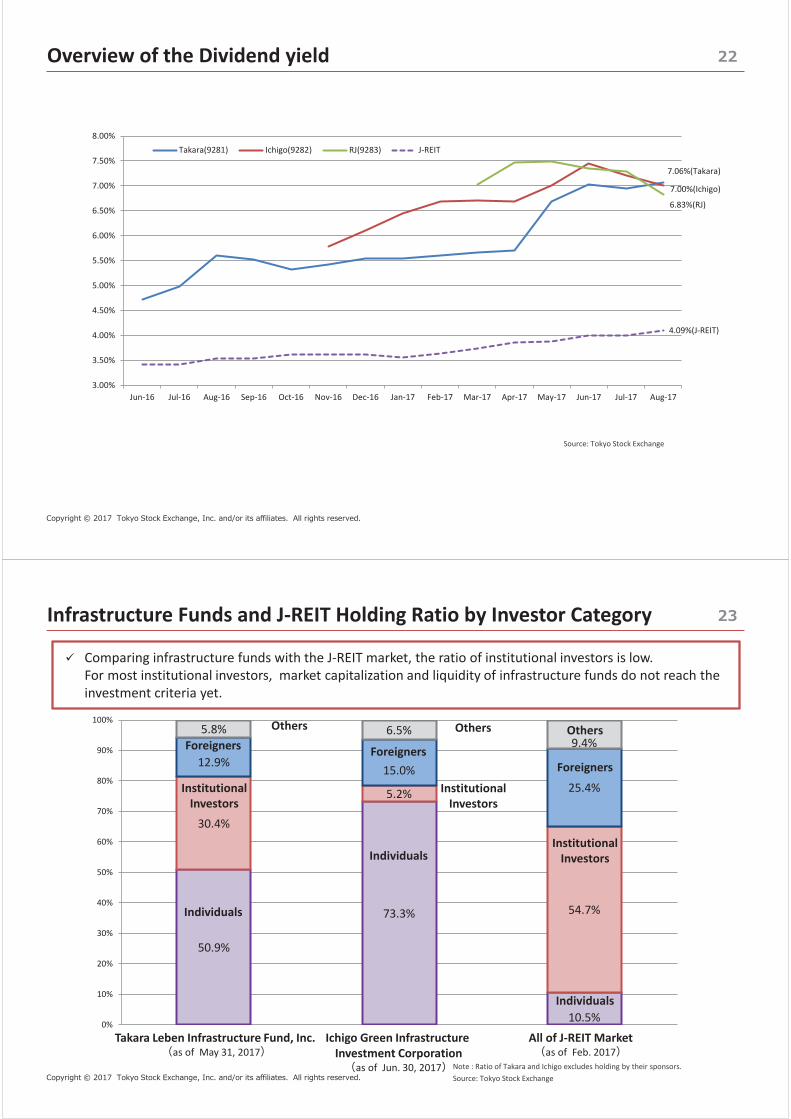
Overview of the Dividend yield
Source: Tokyo Stock Exchange
7.06%(Takara)
7.00%(Ichigo)
6.83%(RJ)
4.09%(J-REIT)
3.00%
3.50%
4.00%
4.50%
5.00%
5.50%
6.00%
6.50%
7.00%
7.50%
8.00%
Jun-16 Jul-16 Aug-16 Sep-16 Oct-16 Nov-16 Dec-16 Jan-17 Feb-17 Mar-17 Apr-17 May-17 Jun-17 Jul-17 Aug-17
Takara(9281) Ichigo(9282) RJ(9283) J-REIT
Infrastructure Funds and J-REIT Holding Ratio by Investor Category
50.9%
73.3%
10.5%
30.4%
5.2%
54.7%
12.9% 15.0%
25.4%
5.8% 6.5% 9.4%
0%
10%
20%
30%
40%
50%
60%
70%
80%
90%
100%
Takara Leben Infrastructure Fund, Inc. as of May 31, 2017
Ichigo Green Infrastructure Investment Corporation
as of Jun. 30, 2017
All of J-REIT Market as of Feb. 2017
Individuals
Individuals
Individuals
Institutional Investors
Institutional Investors
Institutional Investors
Foreigners Foreigners Foreigners
Others Others Others
Note : Ratio of Takara and Ichigo excludes holding by their sponsors. Source: Tokyo Stock Exchange
Comparing infrastructure funds with the J-REIT market, the ratio of institutional investors is low. For most institutional investors, market capitalization and liquidity of infrastructure funds do not reach the investment criteria yet.
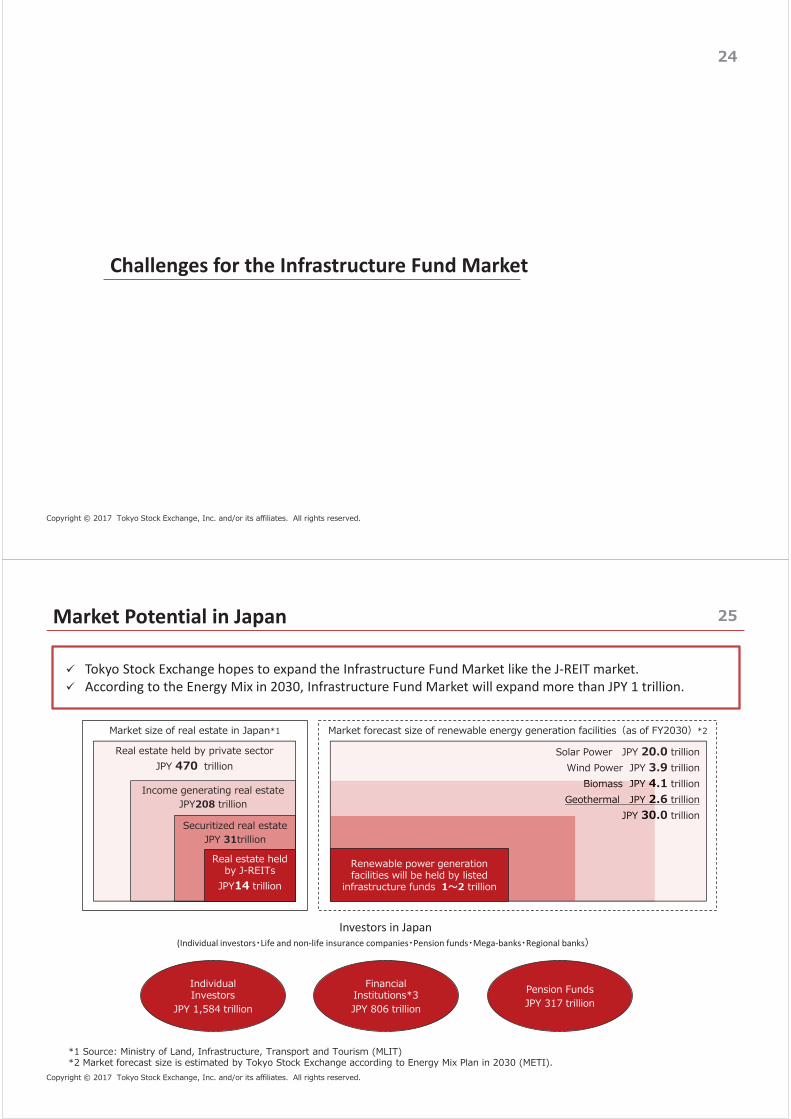
Challenges for the Infrastructure Fund Market
Market Potential in Japan
Tokyo Stock Exchange hopes to expand the Infrastructure Fund Market like the J-REIT market. According to the Energy Mix in 2030, Infrastructure Fund Market will expand more than JPY 1 trillion.
Investors in Japan (Individual investors Life and non-life insurance companies Pension funds Mega-banks Regional banks
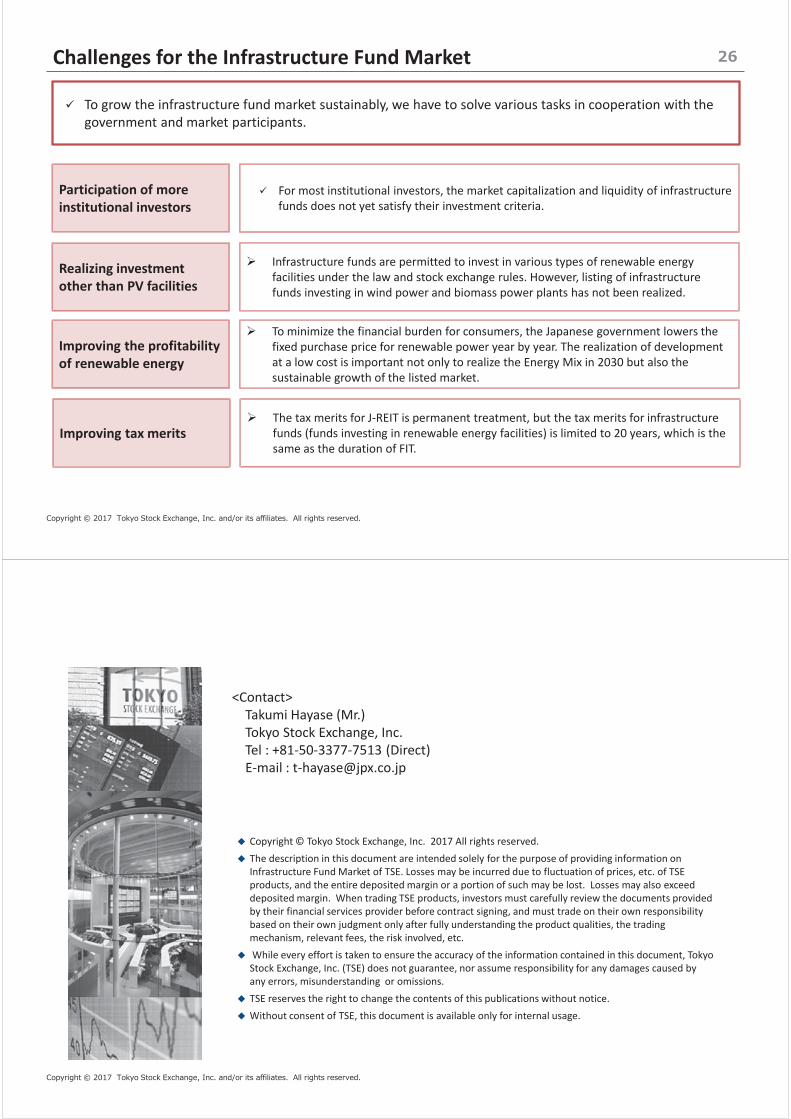
Challenges for the Infrastructure Fund Market
To grow the infrastructure fund market sustainably, we have to solve various tasks in cooperation with the government and market participants.
Participation of more institutional investors
For most institutional investors, the market capitalization and liquidity of infrastructure funds does not yet satisfy their investment criteria.
Realizing investment other than PV facilities
Infrastructure funds are permitted to invest in various types of renewable energy facilities under the law and stock exchange rules. However, listing of infrastructure funds investing in wind power and biomass power plants has not been realized.
Improving the profitability of renewable energy
To minimize the financial burden for consumers, the Japanese government lowers the fixed purchase price for renewable power year by year. The realization of development at a low cost is important not only to realize the Energy Mix in 2030 but also the sustainable growth of the listed market.
Improving tax merits The tax merits for J-REIT is permanent treatment, but the tax merits for infrastructure funds (funds investing in renewable energy facilities) is limited to 20 years, which is the same as the duration of FIT.
Copyright © Tokyo Stock Exchange, Inc. 2017 All rights reserved.
The description in this document are intended solely for the purpose of providing information on Infrastructure Fund Market of TSE. Losses may be incurred due to fluctuation of prices, etc. of TSE products, and the entire deposited margin or a portion of such may be lost. Losses may also exceed deposited margin. When trading TSE products, investors must carefully review the documents provided by their financial services provider before contract signing, and must trade on their own responsibility based on their own judgment only after fully understanding the product qualities, the trading mechanism, relevant fees, the risk involved, etc.
While every effort is taken to ensure the accuracy of the information contained in this document, Tokyo Stock Exchange, Inc. (TSE) does not guarantee, nor assume responsibility for any damages caused by any errors, misunderstanding or omissions.
TSE reserves the right to change the contents of this publications without notice.
Without consent of TSE, this document is available only for internal usage.
<Contact> Takumi Hayase (Mr.) Tokyo Stock Exchange, Inc. Tel : +81-50-3377-7513 (Direct) E-mail : [email protected]
IV-3
Best Practices in Renewable Energy Financing

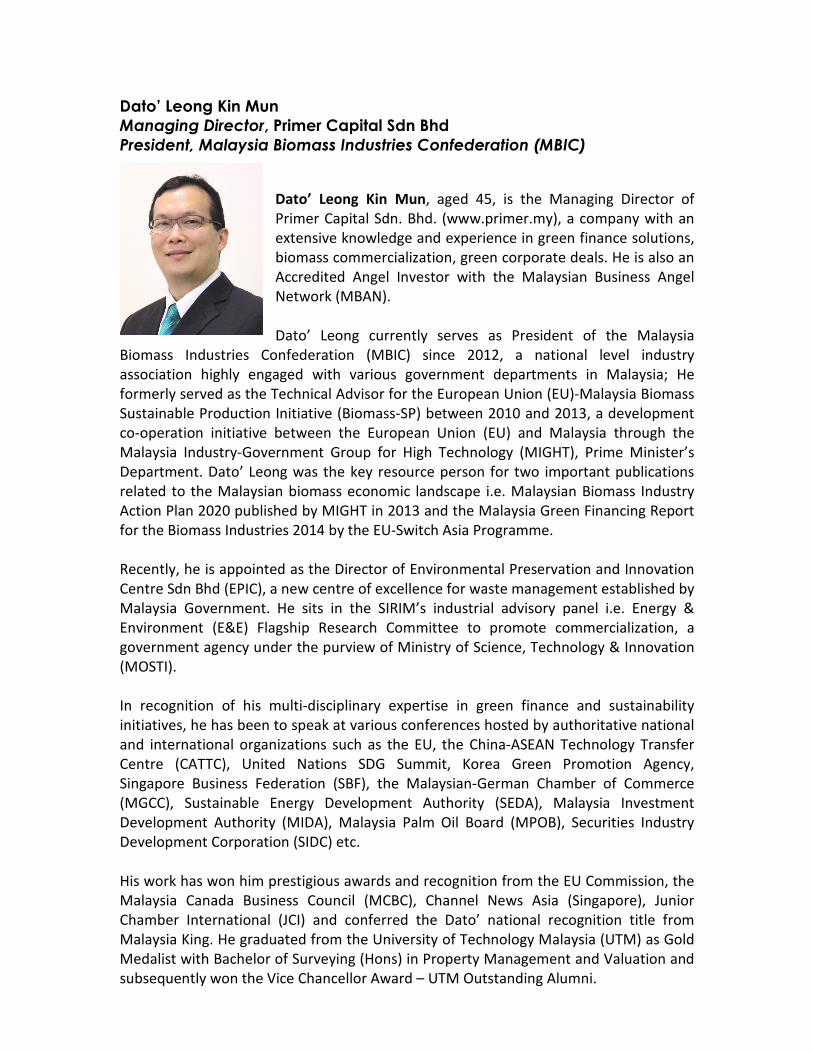
Dato’ Leong Kin Mun
Managing Director, Primer Capital Sdn Bhd
President, Malaysia Biomass Industries Confederation (MBIC)
Dato’ Leong Kin Mun, aged 45, is the Managing Director of
Primer Capital Sdn. Bhd. (www.primer.my), a company with an
extensive knowledge and experience in green finance solutions,
biomass commercialization, green corporate deals. He is also an
Accredited Angel Investor with the Malaysian Business Angel
Network (MBAN).
Dato’ Leong currently serves as President of the Malaysia
Biomass Industries Confederation (MBIC) since 2012, a national level industry
association highly engaged with various government departments in Malaysia; He
formerly served as the Technical Advisor for the European Union (EU)-Malaysia Biomass
Sustainable Production Initiative (Biomass-SP) between 2010 and 2013, a development
co-operation initiative between the European Union (EU) and Malaysia through the
Malaysia Industry-Government Group for High Technology (MIGHT), Prime Minister’s
Department. Dato’ Leong was the key resource person for two important publications
related to the Malaysian biomass economic landscape i.e. Malaysian Biomass Industry
Action Plan 2020 published by MIGHT in 2013 and the Malaysia Green Financing Report
for the Biomass Industries 2014 by the EU-Switch Asia Programme.
Recently, he is appointed as the Director of Environmental Preservation and Innovation
Centre Sdn Bhd (EPIC), a new centre of excellence for waste management established by
Malaysia Government. He sits in the SIRIM’s industrial advisory panel i.e. Energy &
Environment (E&E) Flagship Research Committee to promote commercialization, a
government agency under the purview of Ministry of Science, Technology & Innovation
(MOSTI).
In recognition of his multi-disciplinary expertise in green finance and sustainability
initiatives, he has been to speak at various conferences hosted by authoritative national
and international organizations such as the EU, the China-ASEAN Technology Transfer
Centre (CATTC), United Nations SDG Summit, Korea Green Promotion Agency,
Singapore Business Federation (SBF), the Malaysian-German Chamber of Commerce
(MGCC), Sustainable Energy Development Authority (SEDA), Malaysia Investment
Development Authority (MIDA), Malaysia Palm Oil Board (MPOB), Securities Industry
Development Corporation (SIDC) etc.
His work has won him prestigious awards and recognition from the EU Commission, the
Malaysia Canada Business Council (MCBC), Channel News Asia (Singapore), Junior
Chamber International (JCI) and conferred the Dato’ national recognition title from
Malaysia King. He graduated from the University of Technology Malaysia (UTM) as Gold
Medalist with Bachelor of Surveying (Hons) in Property Management and Valuation and
subsequently won the Vice Chancellor Award – UTM Outstanding Alumni.

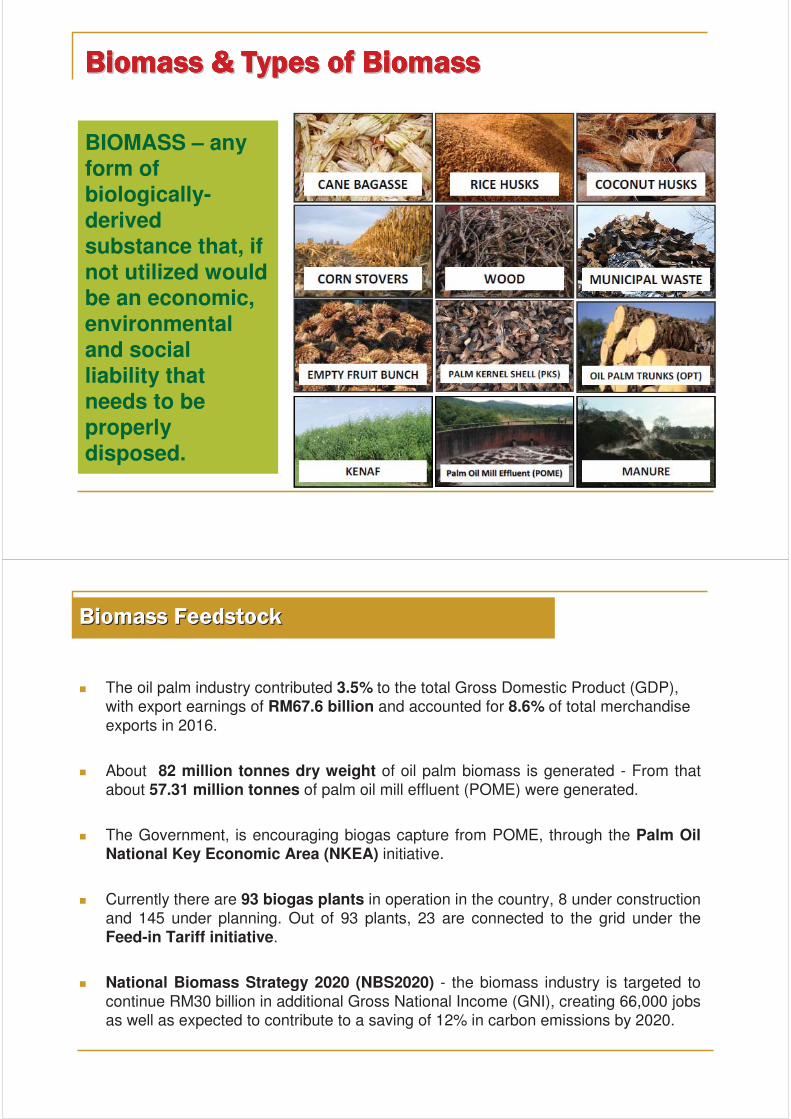
BIOMASS – any form of biologically-derived substance that, if not utilized would be an economic, environmental and social liability that needs to be properly disposed.
The oil palm industry contributed 3.5% to the total Gross Domestic Product (GDP), with export earnings of RM67.6 billion and accounted for 8.6% of total merchandise exports in 2016.
About 82 million tonnes dry weight of oil palm biomass is generated - From that about 57.31 million tonnes of palm oil mill effluent (POME) were generated.
The Government, is encouraging biogas capture from POME, through the Palm Oil National Key Economic Area (NKEA) initiative.
Currently there are 93 biogas plants in operation in the country, 8 under construction and 145 under planning. Out of 93 plants, 23 are connected to the grid under the Feed-in Tariff initiative.
National Biomass Strategy 2020 (NBS2020) - the biomass industry is targeted to continue RM30 billion in additional Gross National Income (GNI), creating 66,000 jobs as well as expected to contribute to a saving of 12% in carbon emissions by 2020.
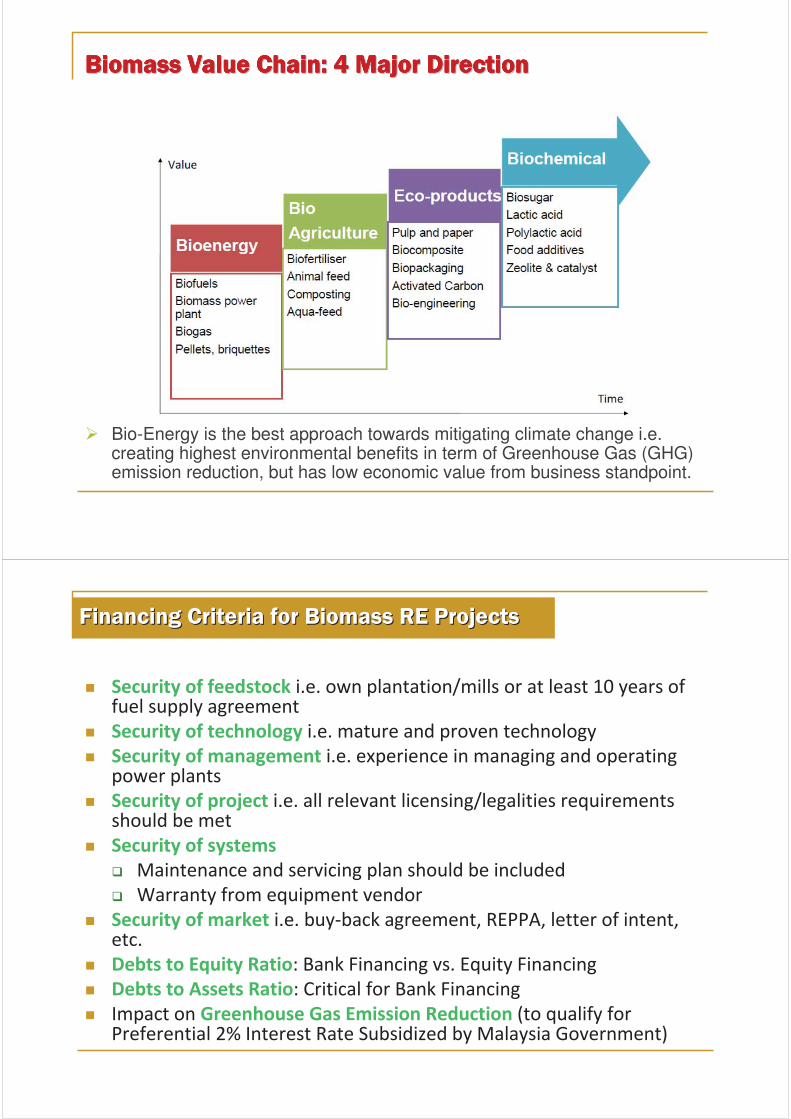
Bio-Energy is the best approach towards mitigating climate change i.e. creating highest environmental benefits in term of Greenhouse Gas (GHG) emission reduction, but has low economic value from business standpoint.
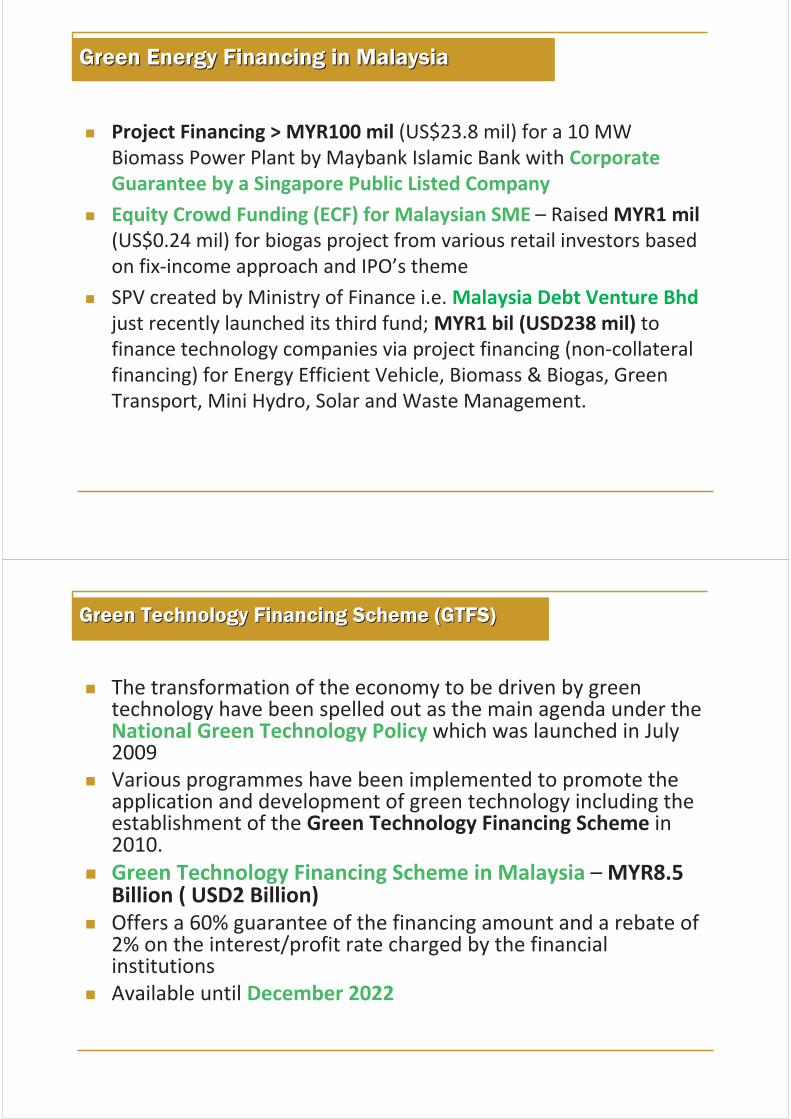
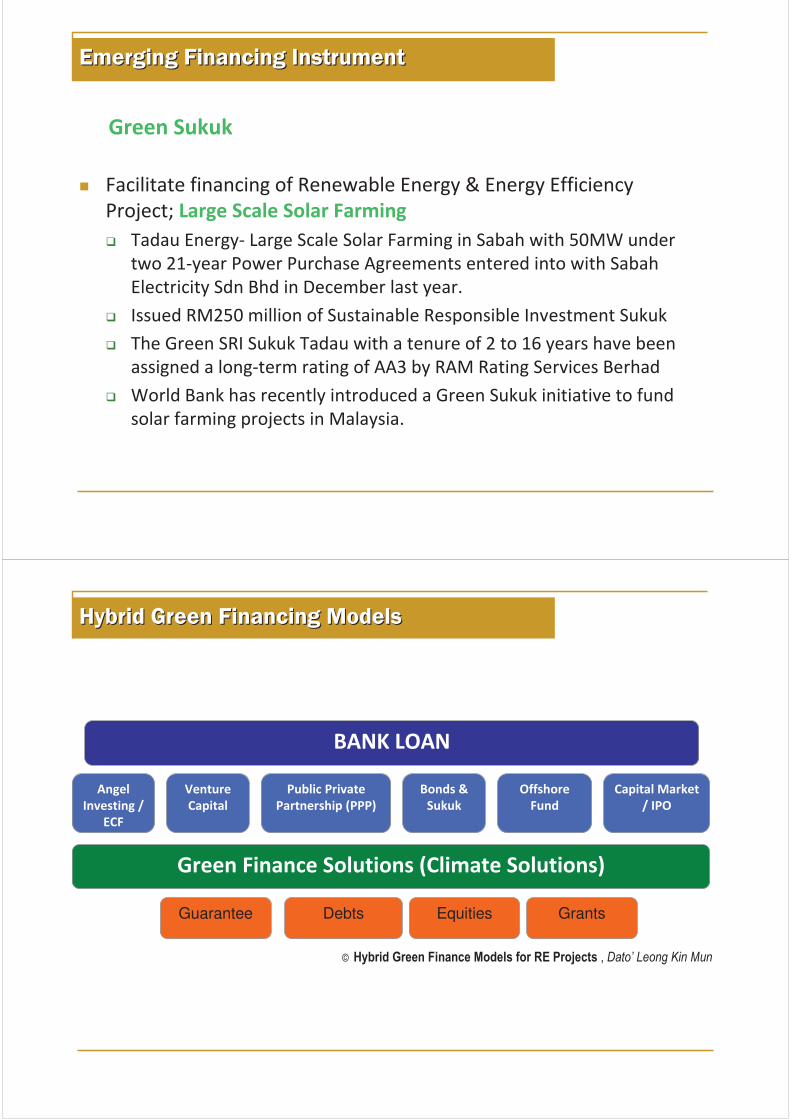
GrantsEquitiesGuarantee Debts
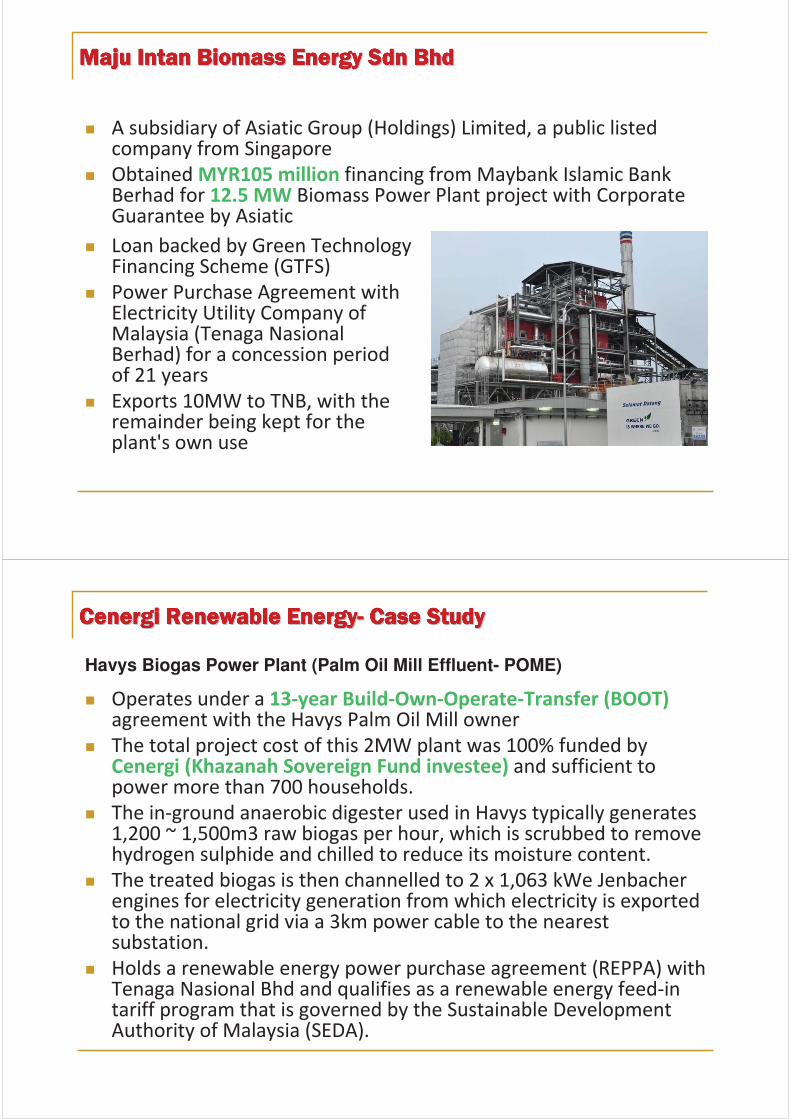
Havys Biogas Power Plant (Palm Oil Mill Effluent- POME)
The Sawira and Cheekah-Kemayan Biogas Power Plants
DATODATO’’ LEONG KIN MUNLEONG KIN MUNTel: +603-8884 8882 Fax: +603-8884 8838
E-mail: [email protected] / [email protected]: www.biomass.org.my / www.primer.my
IV-4
Best Practices in Renewable Energy Financing – A Singaporean Perspective

Monika BIERI
Solar Financial and Economic Specialist, Solar Energy Research
Institute of Singapore (SERIS)
Ms. Monika BIERI is a solar economic specialist with the combination of her unique
expertise in solar technologies, energy and economics. She is a research associate at the Solar
Energy Systems Cluster of SERIS, complementing the team with her expertise in economic
viability assessments of renewable energy applications and fundamental power market
analysis including future power price scenario modelling. She is the “Solar Energy
Economist” playing a critical role in providing comprehensive financial/economic
analysis/modelling in all solar energy system related projects. She is the author of Singapore
Solar Economics Handbook and provides content and continuous updates of the National
Solar Repository (NSR) of Singapore website. She was a financial analyst with UBS AG,
Zurich for fourteen years. She was responsible for covering the European power sector within
the fixed income team at UBS Global Asset Management. This accorded her a wide breadth
of experience in providing strategic investment recommendations to portfolio managers for
water, gas and electricity companies. In order to further enhance her finance knowledge with
renewable energies, Monika completed the executive programme ‘Diploma of Advanced
Studies in Renewable Energy Management (REM-HSG)’ at the University of St. Gallen in
2013. She obtained her Bachelor’s degree in Economics at the University of Applied Science
in Business Administration in Zurich, Switzerland and successfully completed the Chartered
Financial Analyst (CFA) exams in 2003.

SERIS is a research institute at the National University of Singapore (NUS). SERIS is sponsored by the National University ofSingapore (NUS) and Singapore’s National Research Foundation (NRF) through the Singapore Economic Development Board (EDB).
1
Best practices in renewable energy financing– A Singaporean perspective
Monika BIERIResearch Associate
Solar Energy Research Institute of Singapore (SERIS)National University of Singapore (NUS)
APEC Conference on Green Energy Finance Capacity BuildingGIS MOTC Convention Center, Taipei, Chinese Taipei28-29 September 2017
SERIS is a research institute at the National University of Singapore (NUS). SERIS is sponsored by the National University ofSingapore (NUS) and Singapore’s National Research Foundation (NRF) through the Singapore Economic Development Board (EDB).
2
Outline
Supporting policy framework in an unsubsidised market
Economic viability assessment of distributed solar investment
Proper quality assurance – technical risk assessment framework
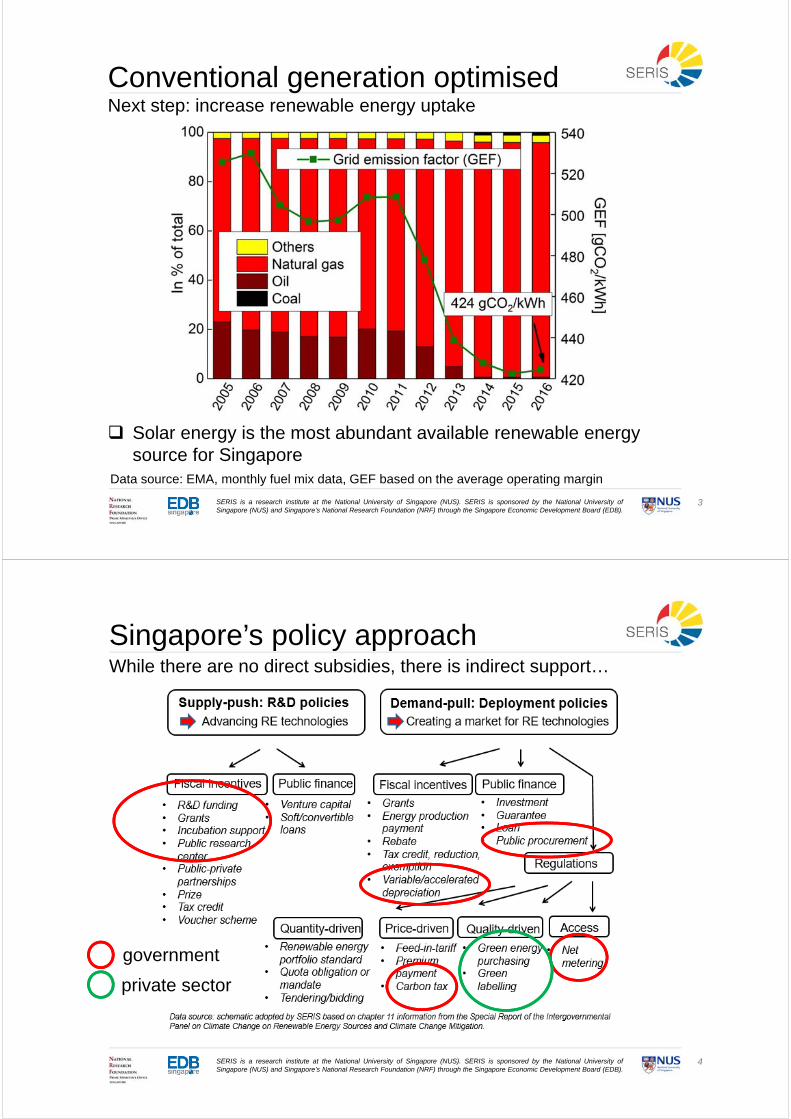
SERIS is a research institute at the National University of Singapore (NUS). SERIS is sponsored by the National University ofSingapore (NUS) and Singapore’s National Research Foundation (NRF) through the Singapore Economic Development Board (EDB).
3
Conventional generation optimisedNext step: increase renewable energy uptake
Data source: EMA, monthly fuel mix data, GEF based on the average operating margin
Solar energy is the most abundant available renewable energy source for Singapore
SERIS is a research institute at the National University of Singapore (NUS). SERIS is sponsored by the National University ofSingapore (NUS) and Singapore’s National Research Foundation (NRF) through the Singapore Economic Development Board (EDB).
4
Singapore’s policy approachWhile there are no direct subsidies, there is indirect support…
government
private sector
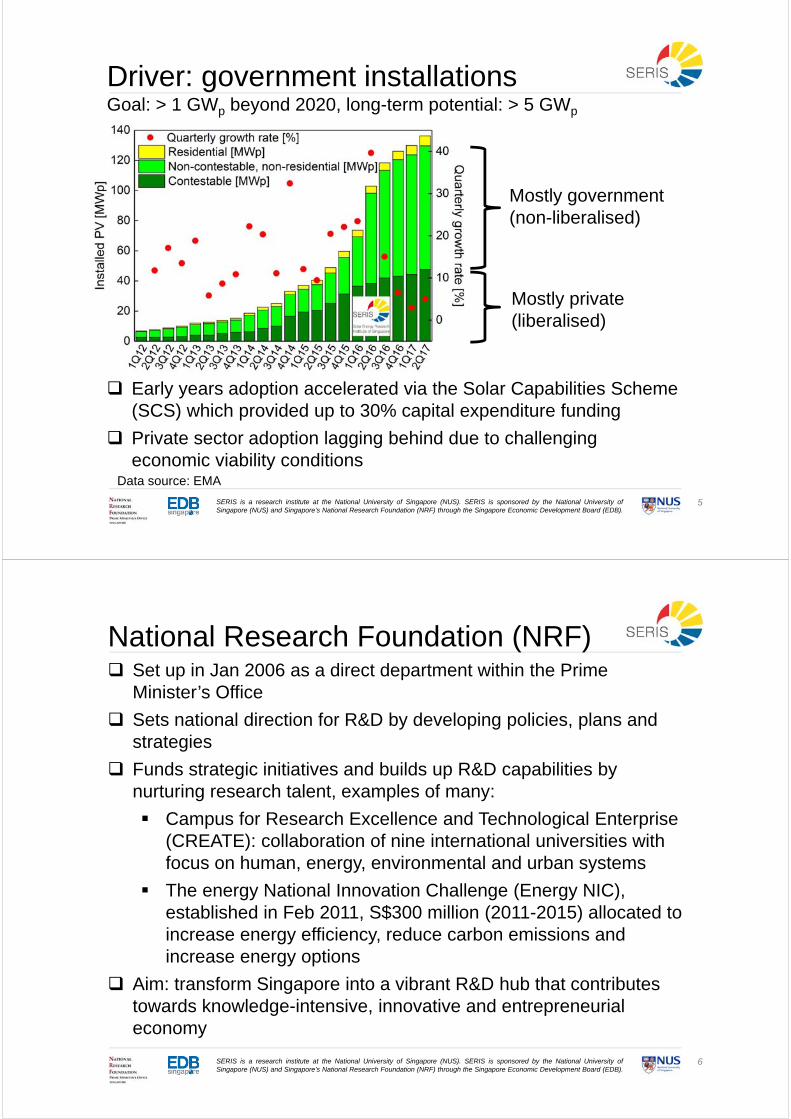
SERIS is a research institute at the National University of Singapore (NUS). SERIS is sponsored by the National University ofSingapore (NUS) and Singapore’s National Research Foundation (NRF) through the Singapore Economic Development Board (EDB).
5
Driver: government installationsGoal: > 1 GWp beyond 2020, long-term potential: > 5 GWp
Data source: EMA
Early years adoption accelerated via the Solar Capabilities Scheme (SCS) which provided up to 30% capital expenditure funding
Private sector adoption lagging behind due to challenging economic viability conditions
Mostly government (non-liberalised)
Mostly private (liberalised)
SERIS is a research institute at the National University of Singapore (NUS). SERIS is sponsored by the National University ofSingapore (NUS) and Singapore’s National Research Foundation (NRF) through the Singapore Economic Development Board (EDB).
6
National Research Foundation (NRF) Set up in Jan 2006 as a direct department within the Prime
Minister’s Office
Sets national direction for R&D by developing policies, plans and strategies
Funds strategic initiatives and builds up R&D capabilities by nurturing research talent, examples of many:
Campus for Research Excellence and Technological Enterprise (CREATE): collaboration of nine international universities with focus on human, energy, environmental and urban systems
The energy National Innovation Challenge (Energy NIC), established in Feb 2011, S$300 million (2011-2015) allocated to increase energy efficiency, reduce carbon emissions and increase energy options
Aim: transform Singapore into a vibrant R&D hub that contributes towards knowledge-intensive, innovative and entrepreneurial economy
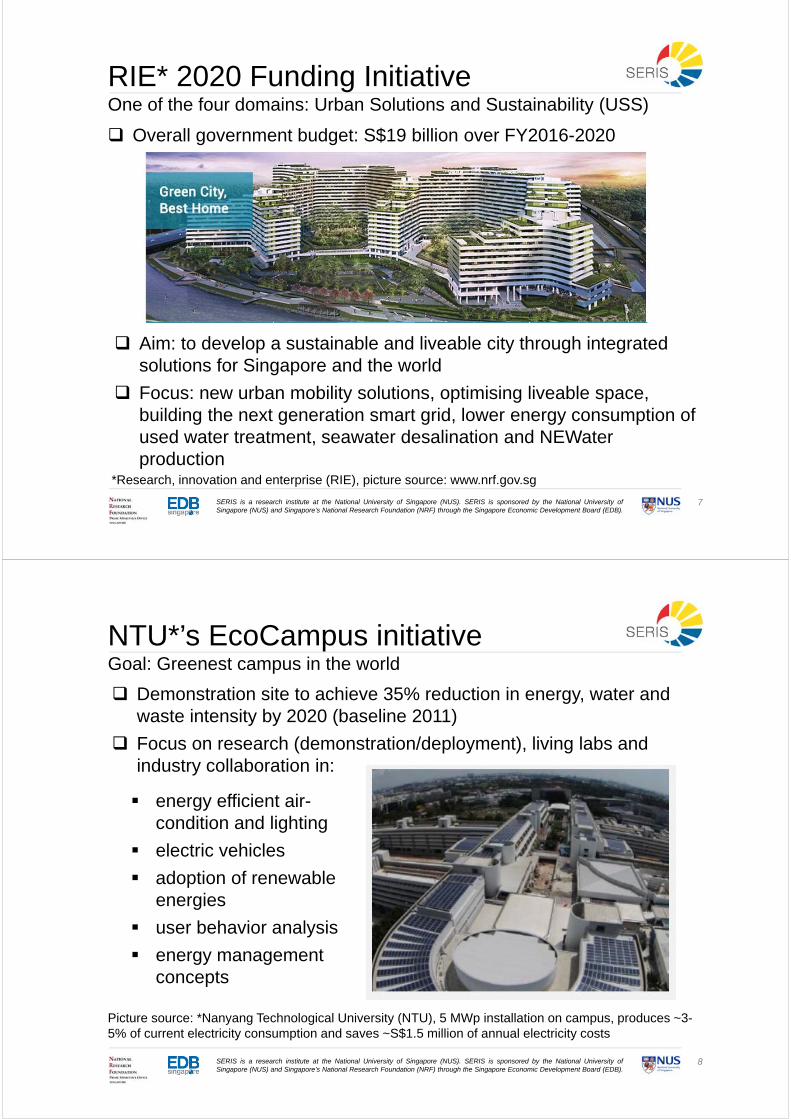
SERIS is a research institute at the National University of Singapore (NUS). SERIS is sponsored by the National University ofSingapore (NUS) and Singapore’s National Research Foundation (NRF) through the Singapore Economic Development Board (EDB).
7
RIE* 2020 Funding InitiativeOne of the four domains: Urban Solutions and Sustainability (USS)
Overall government budget: S$19 billion over FY2016-2020
*Research, innovation and enterprise (RIE), picture source: www.nrf.gov.sg
Aim: to develop a sustainable and liveable city through integrated solutions for Singapore and the world
Focus: new urban mobility solutions, optimising liveable space, building the next generation smart grid, lower energy consumption of used water treatment, seawater desalination and NEWater production
SERIS is a research institute at the National University of Singapore (NUS). SERIS is sponsored by the National University ofSingapore (NUS) and Singapore’s National Research Foundation (NRF) through the Singapore Economic Development Board (EDB).
8
NTU*’s EcoCampus initiativeGoal: Greenest campus in the world
Demonstration site to achieve 35% reduction in energy, water and waste intensity by 2020 (baseline 2011)
Focus on research (demonstration/deployment), living labs and industry collaboration in:
Picture source: *Nanyang Technological University (NTU), 5 MWp installation on campus, produces ~3-5% of current electricity consumption and saves ~S$1.5 million of annual electricity costs
energy efficient air-condition and lighting
electric vehicles
adoption of renewable energies
user behavior analysis
energy management concepts
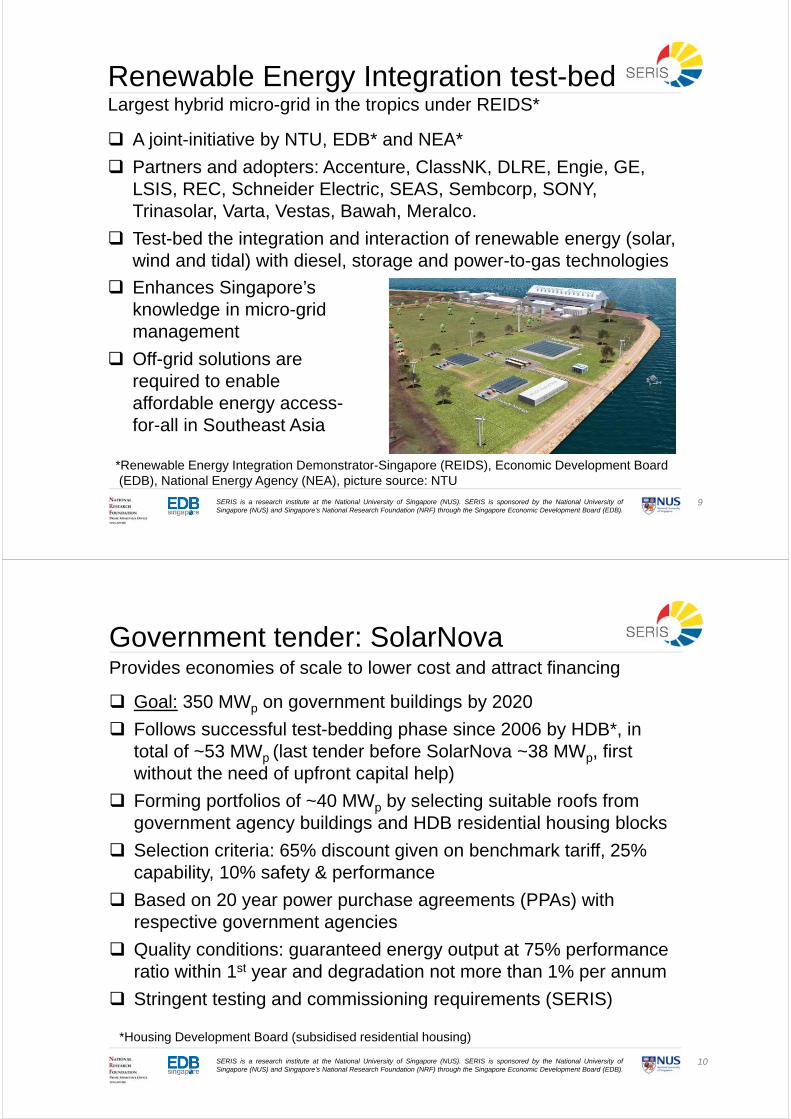
SERIS is a research institute at the National University of Singapore (NUS). SERIS is sponsored by the National University ofSingapore (NUS) and Singapore’s National Research Foundation (NRF) through the Singapore Economic Development Board (EDB).
9
Renewable Energy Integration test-bedLargest hybrid micro-grid in the tropics under REIDS*
A joint-initiative by NTU, EDB* and NEA*
Partners and adopters: Accenture, ClassNK, DLRE, Engie, GE, LSIS, REC, Schneider Electric, SEAS, Sembcorp, SONY, Trinasolar, Varta, Vestas, Bawah, Meralco.
Test-bed the integration and interaction of renewable energy (solar, wind and tidal) with diesel, storage and power-to-gas technologies
*Renewable Energy Integration Demonstrator-Singapore (REIDS), Economic Development Board (EDB), National Energy Agency (NEA), picture source: NTU
Enhances Singapore’s knowledge in micro-grid management
Off-grid solutions are required to enable affordable energy access-for-all in Southeast Asia
SERIS is a research institute at the National University of Singapore (NUS). SERIS is sponsored by the National University ofSingapore (NUS) and Singapore’s National Research Foundation (NRF) through the Singapore Economic Development Board (EDB).
10
Government tender: SolarNovaProvides economies of scale to lower cost and attract financing
Goal: 350 MWp on government buildings by 2020
Follows successful test-bedding phase since 2006 by HDB*, in total of ~53 MWp (last tender before SolarNova ~38 MWp, first without the need of upfront capital help)
Forming portfolios of ~40 MWp by selecting suitable roofs from government agency buildings and HDB residential housing blocks
Selection criteria: 65% discount given on benchmark tariff, 25% capability, 10% safety & performance
Based on 20 year power purchase agreements (PPAs) with respective government agencies
Quality conditions: guaranteed energy output at 75% performance ratio within 1st year and degradation not more than 1% per annum
Stringent testing and commissioning requirements (SERIS)
*Housing Development Board (subsidised residential housing)
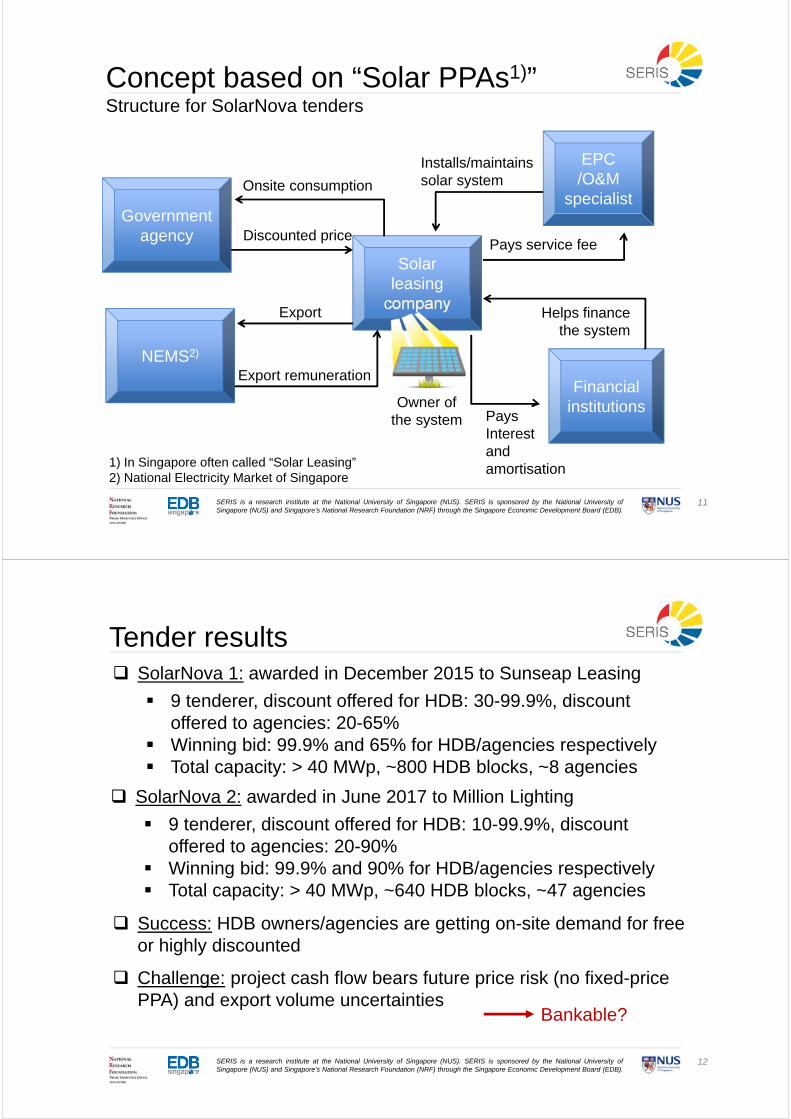
SERIS is a research institute at the National University of Singapore (NUS). SERIS is sponsored by the National University ofSingapore (NUS) and Singapore’s National Research Foundation (NRF) through the Singapore Economic Development Board (EDB).
11
Concept based on “Solar PPAs1)”Structure for SolarNova tenders
Government agency
Solar leasing
company
EPC /O&M
specialist
Financial institutions
Onsite consumption
Discounted price
Owner ofthe system
Installs/maintains solar system
Helps finance the system
Pays Interestandamortisation
Pays service fee
NEMS2)
1) In Singapore often called “Solar Leasing” 2) National Electricity Market of Singapore
Export
Export remuneration
SERIS is a research institute at the National University of Singapore (NUS). SERIS is sponsored by the National University ofSingapore (NUS) and Singapore’s National Research Foundation (NRF) through the Singapore Economic Development Board (EDB).
12
Tender results
Success: HDB owners/agencies are getting on-site demand for free or highly discounted
SolarNova 1: awarded in December 2015 to Sunseap Leasing
9 tenderer, discount offered for HDB: 30-99.9%, discount offered to agencies: 20-65%
Winning bid: 99.9% and 65% for HDB/agencies respectively Total capacity: > 40 MWp, ~800 HDB blocks, ~8 agencies
Challenge: project cash flow bears future price risk (no fixed-price PPA) and export volume uncertainties
Bankable?
SolarNova 2: awarded in June 2017 to Million Lighting
9 tenderer, discount offered for HDB: 10-99.9%, discount offered to agencies: 20-90%
Winning bid: 99.9% and 90% for HDB/agencies respectively Total capacity: > 40 MWp, ~640 HDB blocks, ~47 agencies
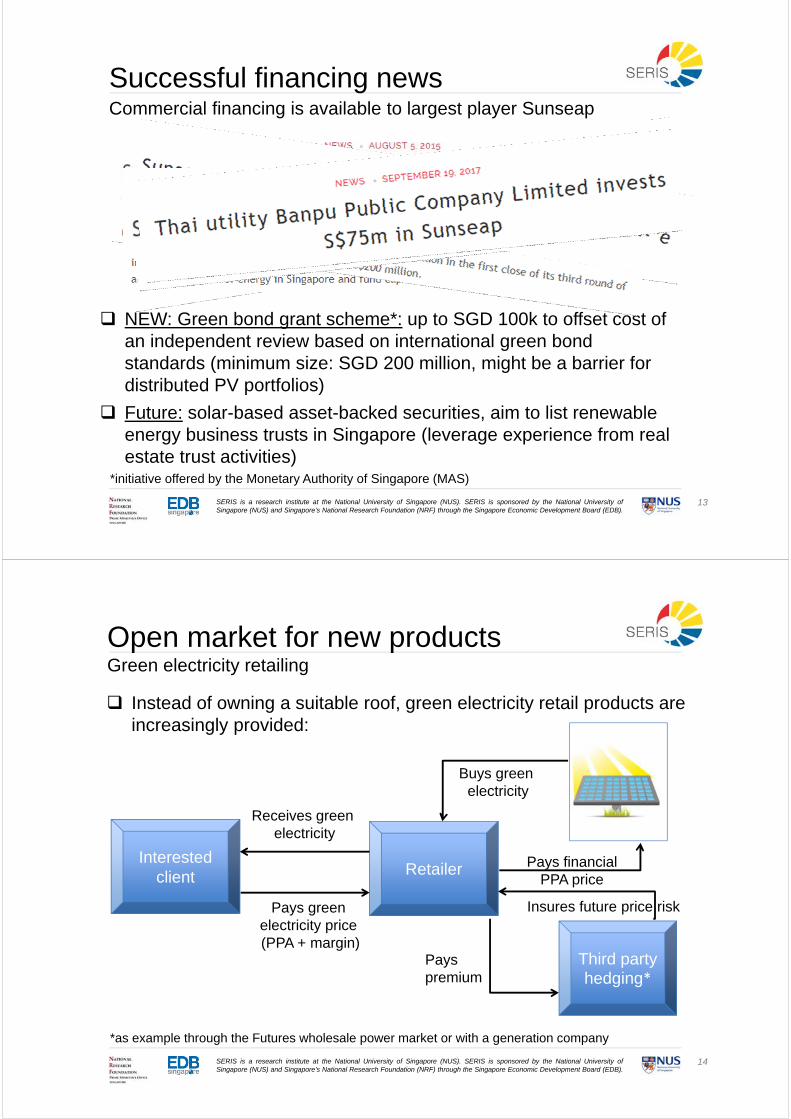
SERIS is a research institute at the National University of Singapore (NUS). SERIS is sponsored by the National University ofSingapore (NUS) and Singapore’s National Research Foundation (NRF) through the Singapore Economic Development Board (EDB).
13
Successful financing newsCommercial financing is available to largest player Sunseap
NEW: Green bond grant scheme*: up to SGD 100k to offset cost of an independent review based on international green bond standards (minimum size: SGD 200 million, might be a barrier for distributed PV portfolios)
Future: solar-based asset-backed securities, aim to list renewable energy business trusts in Singapore (leverage experience from real estate trust activities)
*initiative offered by the Monetary Authority of Singapore (MAS)
SERIS is a research institute at the National University of Singapore (NUS). SERIS is sponsored by the National University ofSingapore (NUS) and Singapore’s National Research Foundation (NRF) through the Singapore Economic Development Board (EDB).
14
Open market for new productsGreen electricity retailing
Instead of owning a suitable roof, green electricity retail products are increasingly provided:
Interested client Retailer
Third party hedging*
Receives green electricity
Pays green electricity price (PPA + margin)
Buys green electricity
Pays financialPPA price
*as example through the Futures wholesale power market or with a generation company
Insures future price risk
Pays premium
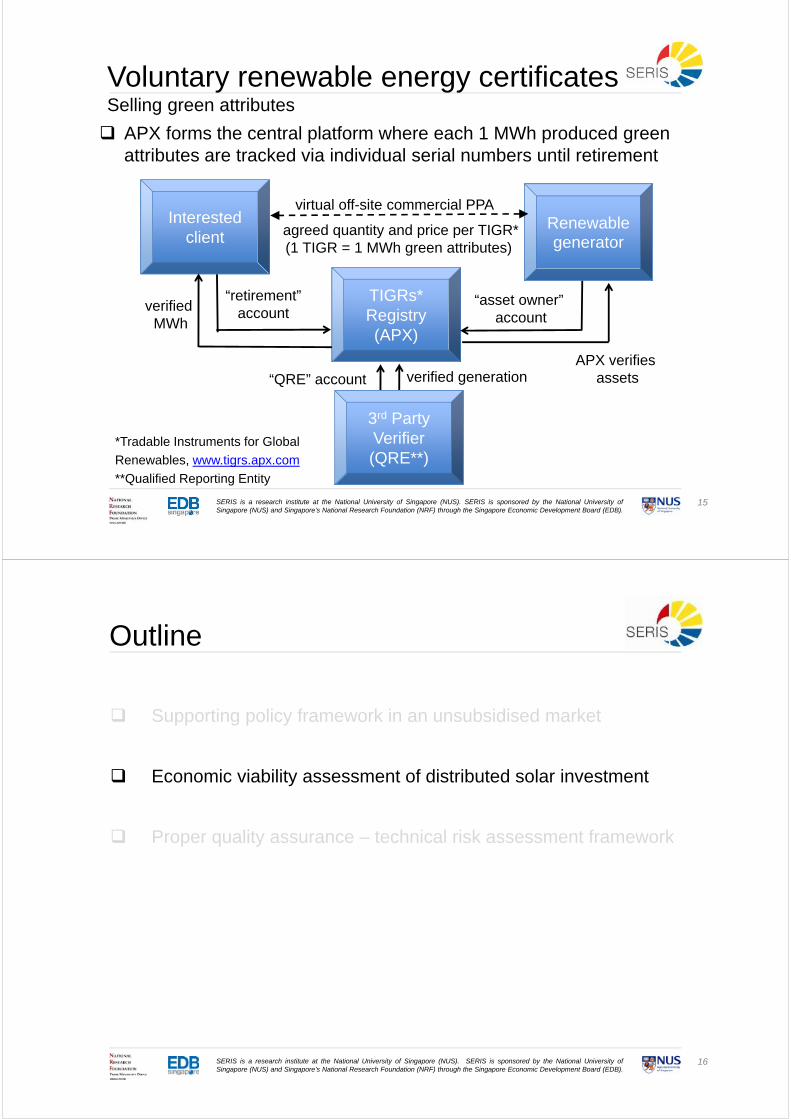
SERIS is a research institute at the National University of Singapore (NUS). SERIS is sponsored by the National University ofSingapore (NUS) and Singapore’s National Research Foundation (NRF) through the Singapore Economic Development Board (EDB).
15
Voluntary renewable energy certificatesSelling green attributes
APX forms the central platform where each 1 MWh produced green attributes are tracked via individual serial numbers until retirement
Interested client
TIGRs* Registry (APX)
Renewable generator
virtual off-site commercial PPA
“retirement”account
*Tradable Instruments for Global
Renewables, www.tigrs.apx.com
**Qualified Reporting Entity
agreed quantity and price per TIGR*(1 TIGR = 1 MWh green attributes)
APX verifies assets
3rd Party Verifier (QRE**)
“asset owner” account
verified MWh
verified generation“QRE” account
SERIS is a research institute at the National University of Singapore (NUS). SERIS is sponsored by the National University ofSingapore (NUS) and Singapore’s National Research Foundation (NRF) through the Singapore Economic Development Board (EDB).
16
Outline
Supporting policy framework in an unsubsidised market
Economic viability assessment of distributed solar investment
Proper quality assurance – technical risk assessment framework
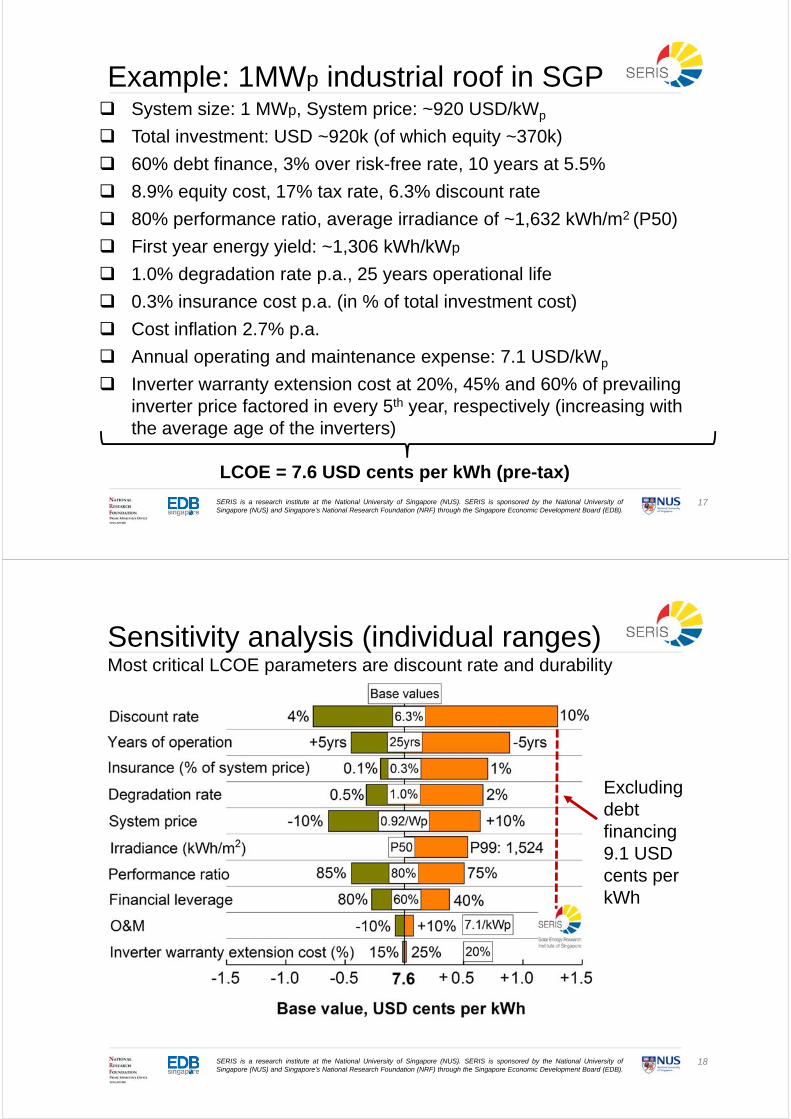
SERIS is a research institute at the National University of Singapore (NUS). SERIS is sponsored by the National University ofSingapore (NUS) and Singapore’s National Research Foundation (NRF) through the Singapore Economic Development Board (EDB).
17
System size: 1 MWp, System price: ~920 USD/kWp
Total investment: USD ~920k (of which equity ~370k)
60% debt finance, 3% over risk-free rate, 10 years at 5.5%
8.9% equity cost, 17% tax rate, 6.3% discount rate
80% performance ratio, average irradiance of ~1,632 kWh/m2 (P50)
First year energy yield: ~1,306 kWh/kWp
1.0% degradation rate p.a., 25 years operational life
0.3% insurance cost p.a. (in % of total investment cost)
Cost inflation 2.7% p.a.
Annual operating and maintenance expense: 7.1 USD/kWp
Inverter warranty extension cost at 20%, 45% and 60% of prevailing inverter price factored in every 5th year, respectively (increasing with the average age of the inverters)
LCOE = 7.6 USD cents per kWh (pre-tax)
Example: 1MWp industrial roof in SGP
SERIS is a research institute at the National University of Singapore (NUS). SERIS is sponsored by the National University ofSingapore (NUS) and Singapore’s National Research Foundation (NRF) through the Singapore Economic Development Board (EDB).
18
Sensitivity analysis (individual ranges)Most critical LCOE parameters are discount rate and durability
Excluding debt financing9.1 USD cents per kWh
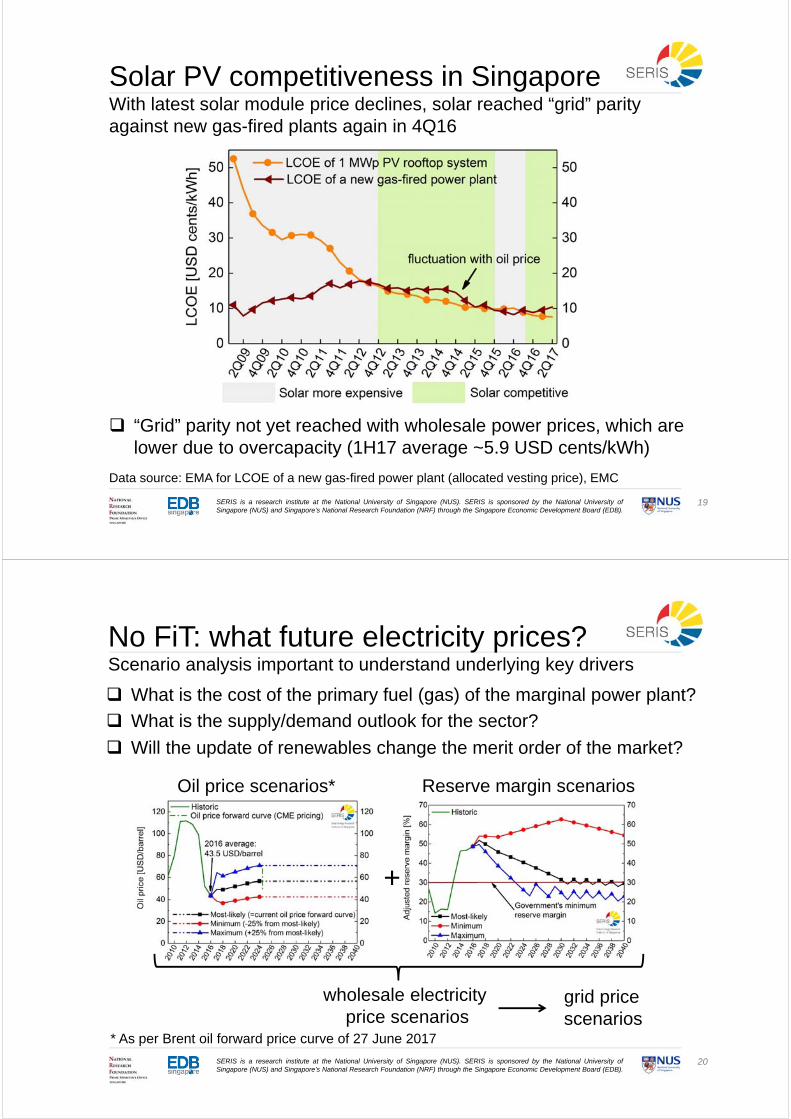
SERIS is a research institute at the National University of Singapore (NUS). SERIS is sponsored by the National University ofSingapore (NUS) and Singapore’s National Research Foundation (NRF) through the Singapore Economic Development Board (EDB).
19
Solar PV competitiveness in SingaporeWith latest solar module price declines, solar reached “grid” parity against new gas-fired plants again in 4Q16
Data source: EMA for LCOE of a new gas-fired power plant (allocated vesting price), EMC
“Grid” parity not yet reached with wholesale power prices, which are lower due to overcapacity (1H17 average ~5.9 USD cents/kWh)
SERIS is a research institute at the National University of Singapore (NUS). SERIS is sponsored by the National University ofSingapore (NUS) and Singapore’s National Research Foundation (NRF) through the Singapore Economic Development Board (EDB).
20
No FiT: what future electricity prices?Scenario analysis important to understand underlying key drivers
Oil price scenarios*
+
Reserve margin scenarios
wholesale electricity price scenarios
grid price scenarios
What is the cost of the primary fuel (gas) of the marginal power plant?
* As per Brent oil forward price curve of 27 June 2017
What is the supply/demand outlook for the sector?
Will the update of renewables change the merit order of the market?
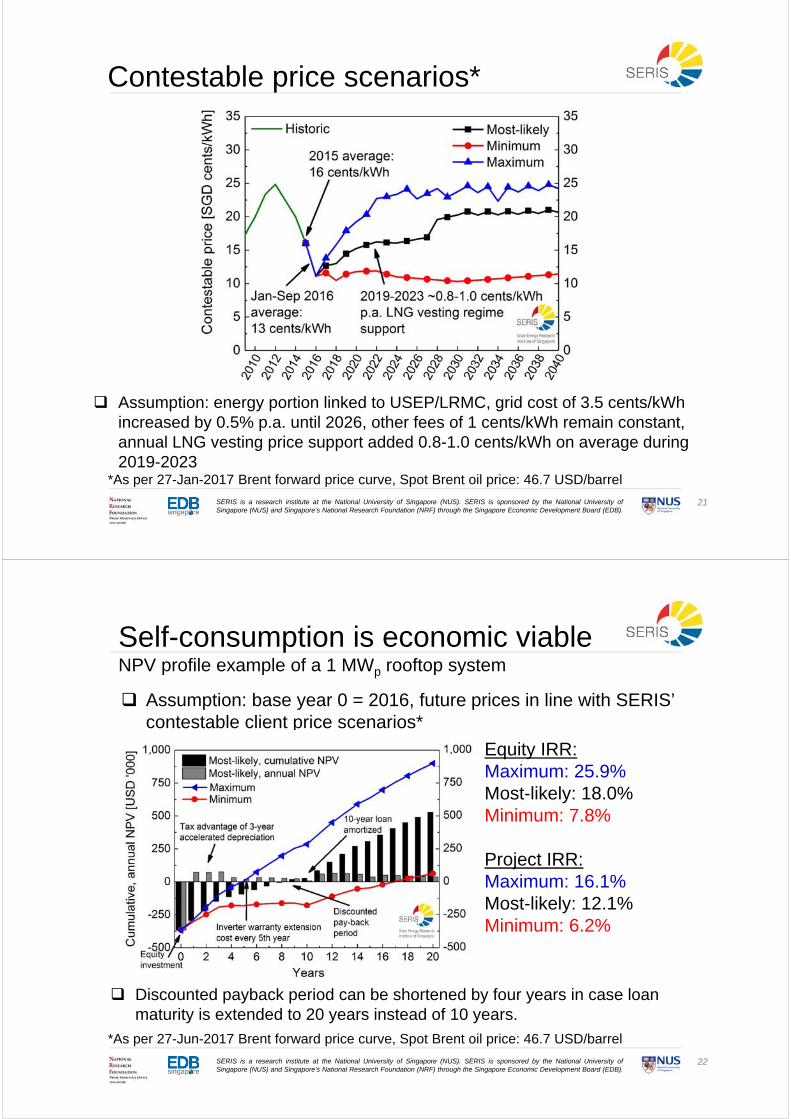
SERIS is a research institute at the National University of Singapore (NUS). SERIS is sponsored by the National University ofSingapore (NUS) and Singapore’s National Research Foundation (NRF) through the Singapore Economic Development Board (EDB).
21
Contestable price scenarios*
Assumption: energy portion linked to USEP/LRMC, grid cost of 3.5 cents/kWh increased by 0.5% p.a. until 2026, other fees of 1 cents/kWh remain constant, annual LNG vesting price support added 0.8-1.0 cents/kWh on average during 2019-2023
*As per 27-Jan-2017 Brent forward price curve, Spot Brent oil price: 46.7 USD/barrel
SERIS is a research institute at the National University of Singapore (NUS). SERIS is sponsored by the National University ofSingapore (NUS) and Singapore’s National Research Foundation (NRF) through the Singapore Economic Development Board (EDB).
22
Self-consumption is economic viableNPV profile example of a 1 MWp rooftop system
Assumption: base year 0 = 2016, future prices in line with SERIS’ contestable client price scenarios*
Equity IRR:Most-likely: 18.0%
Project IRR:Most-likely: 12.1%
Discounted payback period can be shortened by four years in case loan maturity is extended to 20 years instead of 10 years.
*As per 27-Jun-2017 Brent forward price curve, Spot Brent oil price: 46.7 USD/barrel
Equity IRR:Most-likely: 23.7%
Project IRR:Most-likely: 12.1%
Equity IRR:Most-likely: 18.0%
Project IRR:Most-likely: 12.1%
Equity IRR:Maximum: 25.9%Most-likely: 18.0%
Project IRR:Maximum: 16.1%Most-likely: 12.1%
Equity IRR:Maximum: 25.9%Most-likely: 18.0%Minimum: 7.8%
Project IRR:Maximum: 16.1%Most-likely: 12.1%Minimum: 6.2%
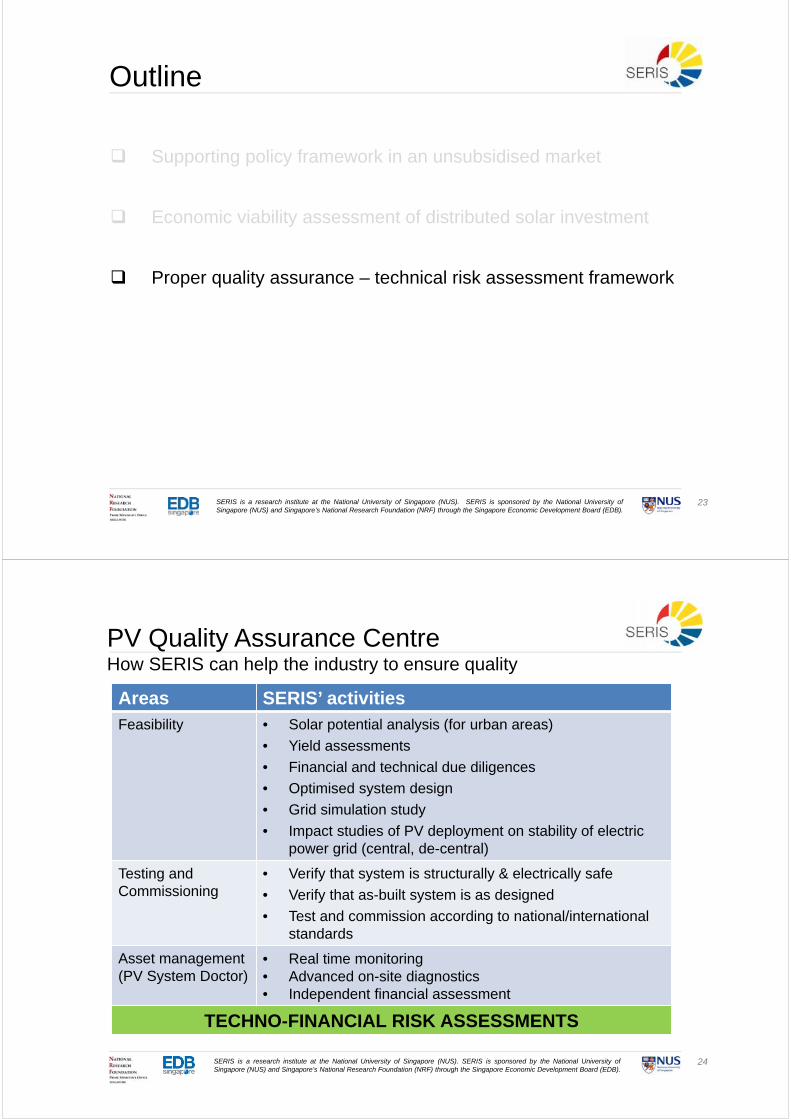
SERIS is a research institute at the National University of Singapore (NUS). SERIS is sponsored by the National University ofSingapore (NUS) and Singapore’s National Research Foundation (NRF) through the Singapore Economic Development Board (EDB).
23
Outline
Supporting policy framework in an unsubsidised market
Economic viability assessment of distributed solar investment
Proper quality assurance – technical risk assessment framework
24SERIS is a research institute at the National University of Singapore (NUS). SERIS is sponsored by the National University ofSingapore (NUS) and Singapore’s National Research Foundation (NRF) through the Singapore Economic Development Board (EDB).
PV Quality Assurance CentreHow SERIS can help the industry to ensure quality
Areas SERIS’ activitiesFeasibility • Solar potential analysis (for urban areas)
• Yield assessments
• Financial and technical due diligences
• Optimised system design
• Grid simulation study
• Impact studies of PV deployment on stability of electric power grid (central, de-central)
Testing and Commissioning
• Verify that system is structurally & electrically safe
• Verify that as-built system is as designed
• Test and commission according to national/international standards
Asset management (PV System Doctor)
• Real time monitoring• Advanced on-site diagnostics• Independent financial assessment
TECHNO-FINANCIAL RISK ASSESSMENTS
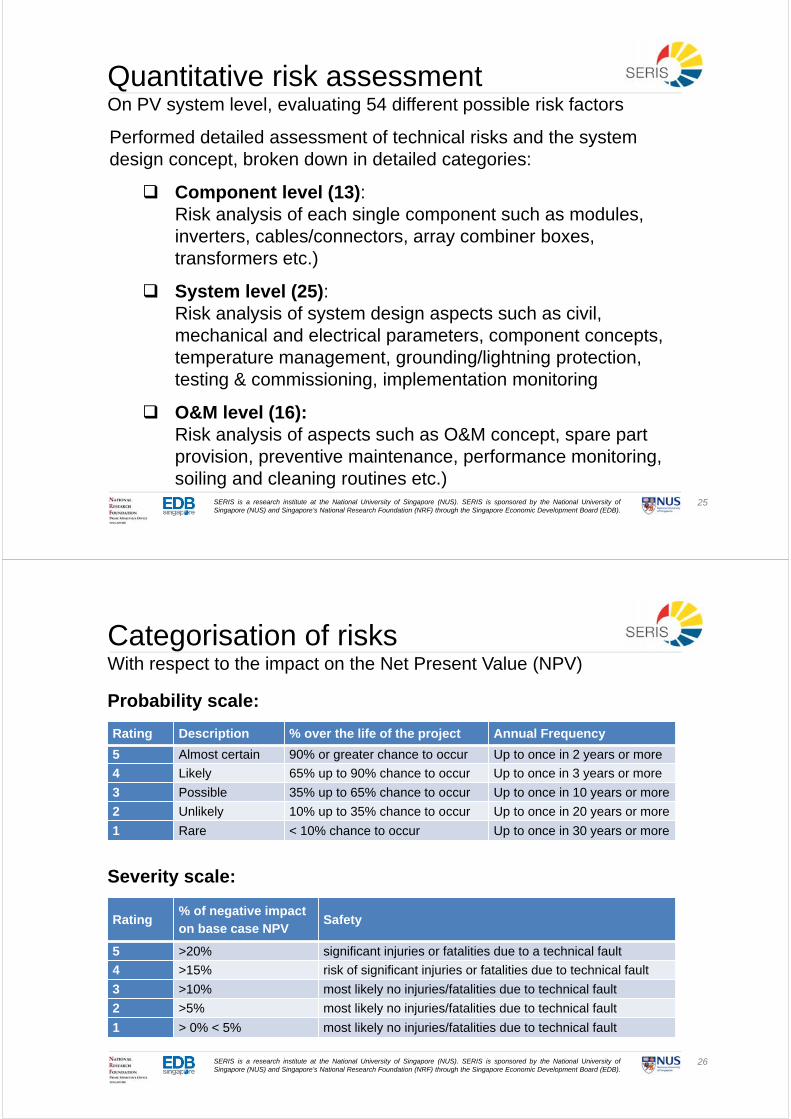
25SERIS is a research institute at the National University of Singapore (NUS). SERIS is sponsored by the National University ofSingapore (NUS) and Singapore’s National Research Foundation (NRF) through the Singapore Economic Development Board (EDB).
Performed detailed assessment of technical risks and the system design concept, broken down in detailed categories:
Component level (13):Risk analysis of each single component such as modules, inverters, cables/connectors, array combiner boxes, transformers etc.)
System level (25):Risk analysis of system design aspects such as civil, mechanical and electrical parameters, component concepts, temperature management, grounding/lightning protection, testing & commissioning, implementation monitoring
O&M level (16):Risk analysis of aspects such as O&M concept, spare part provision, preventive maintenance, performance monitoring, soiling and cleaning routines etc.)
Quantitative risk assessmentOn PV system level, evaluating 54 different possible risk factors
26SERIS is a research institute at the National University of Singapore (NUS). SERIS is sponsored by the National University ofSingapore (NUS) and Singapore’s National Research Foundation (NRF) through the Singapore Economic Development Board (EDB).
Categorisation of risksWith respect to the impact on the Net Present Value (NPV)
Rating Description % over the life of the project Annual Frequency
5 Almost certain 90% or greater chance to occur Up to once in 2 years or more
4 Likely 65% up to 90% chance to occur Up to once in 3 years or more
3 Possible 35% up to 65% chance to occur Up to once in 10 years or more
2 Unlikely 10% up to 35% chance to occur Up to once in 20 years or more
1 Rare < 10% chance to occur Up to once in 30 years or more
Rating% of negative impact on base case NPV
Safety
5 >20% significant injuries or fatalities due to a technical fault
4 >15% risk of significant injuries or fatalities due to technical fault
3 >10% most likely no injuries/fatalities due to technical fault
2 >5% most likely no injuries/fatalities due to technical fault
1 > 0% < 5% most likely no injuries/fatalities due to technical fault
Probability scale:
Severity scale:
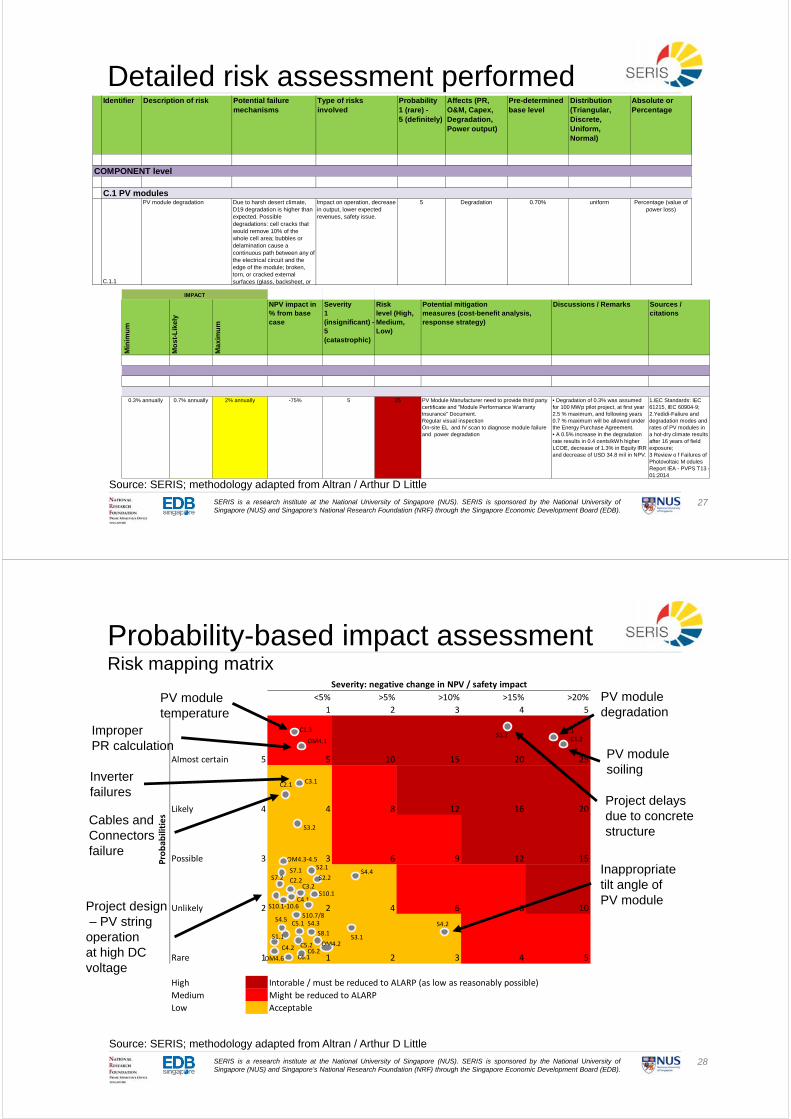
27SERIS is a research institute at the National University of Singapore (NUS). SERIS is sponsored by the National University ofSingapore (NUS) and Singapore’s National Research Foundation (NRF) through the Singapore Economic Development Board (EDB).
Detailed risk assessment performed
Min
imu
m
Mo
st-
Lik
ely
Ma
xim
um
NPV impact in % from base case
Severity1 (insignificant) -5 (catastrophic)
Risklevel (High, Medium, Low)
Potential mitigationmeasures (cost-benefit analysis, response strategy)
Discussions / Remarks Sources /citations
0.3% annually 0.7% annually 2% annually -75% 5 25 PV Module Manufacturer need to provide third party certificate and "Module Performance Warranty Insurance" Document.Regular visual inspectionOn-site EL and IV scan to diagnose module failure and power degradation
• Degradation of 0.3% was assumed for 100 MWp pilot project, at first year 2.5 % maximum, and following years 0.7 % maximum will be allowed under the Energy Purchase Agreement. • A 0.5% increase in the degradation rate results in 0.4 cents/kWh higher LCOE, decrease of 1.3% in Equity IRR and decrease of USD 34.8 mil in NPV.
1.IEC Standards: IEC 61215, IEC 60904-9; 2.Yedidi-Faliure and degradation modes and rates of PV modules in a hot-dry climate results after 16 years of field exposure; 3 Review o f Failures of Photovoltaic M odules Report IEA - PVPS T13 -01:2014
IMPACT
Identifier Description of risk Potential failuremechanisms
Type of risksinvolved
Probability1 (rare) -5 (definitely)
Affects (PR, O&M, Capex, Degradation, Power output)
Pre-determined base level
Distribution (Triangular, Discrete, Uniform, Normal)
Absolute or Percentage
COMPONENT level
C.1 PV modules
C.1.1
PV module degradation Due to harsh desert climate, D19 degradation is higher than expected. Possible degradations: cell cracks that would remove 10% of the whole cell area; bubbles or delamination cause a continuous path between any of the electrical circuit and the edge of the module; broken, torn, or cracked external surfaces (glass, backsheet, or
Impact on operation, decrease in output, lower expected revenues, safety issue.
5 Degradation 0.70% uniform Percentage (value of power loss)
Source: SERIS; methodology adapted from Altran / Arthur D Little
28SERIS is a research institute at the National University of Singapore (NUS). SERIS is sponsored by the National University ofSingapore (NUS) and Singapore’s National Research Foundation (NRF) through the Singapore Economic Development Board (EDB).
Probability-based impact assessmentRisk mapping matrix
Source: SERIS; methodology adapted from Altran / Arthur D Little
<5% >5% >10% >15% >20%
1 2 3 4 5
Almost certain 5 5 10 15 20 25
Likely 4 4 8 12 16 20
Possible 3 3 6 9 12 15
Unlikely 2 2 4 6 8 10
Rare 1 1 2 3 4 5
High Intorable / must be reduced to ALARP (as low as reasonably possible)
Medium Might be reduced to ALARP
Low Acceptable
Probab
ilities
Severity: negative change in NPV / safety impact
C1.1
C2.1
C1.2
C2.2
C3.1
C5.1
S4.4
C4.2 C6.2
C4.1
C3.2
C6.1
S3.2
S4.5
C5.2
S4.2S4.3
S7.1S7.2
C1.3
S1.1
S1.2
S2.1
S2.2
S3.1S8.1
S10.1
S10.1‐10.6
OM4.6
S10.7/8
OM4.3‐4.5
OM4.1
OM4.2
PV module soiling
PV module degradation
Project delays due to concrete structure
Inappropriatetilt angle of PV module
PV module temperature
ImproperPR calculation
Cables andConnectors failure
Inverter failures
Project design– PV string
operation at high DC voltage
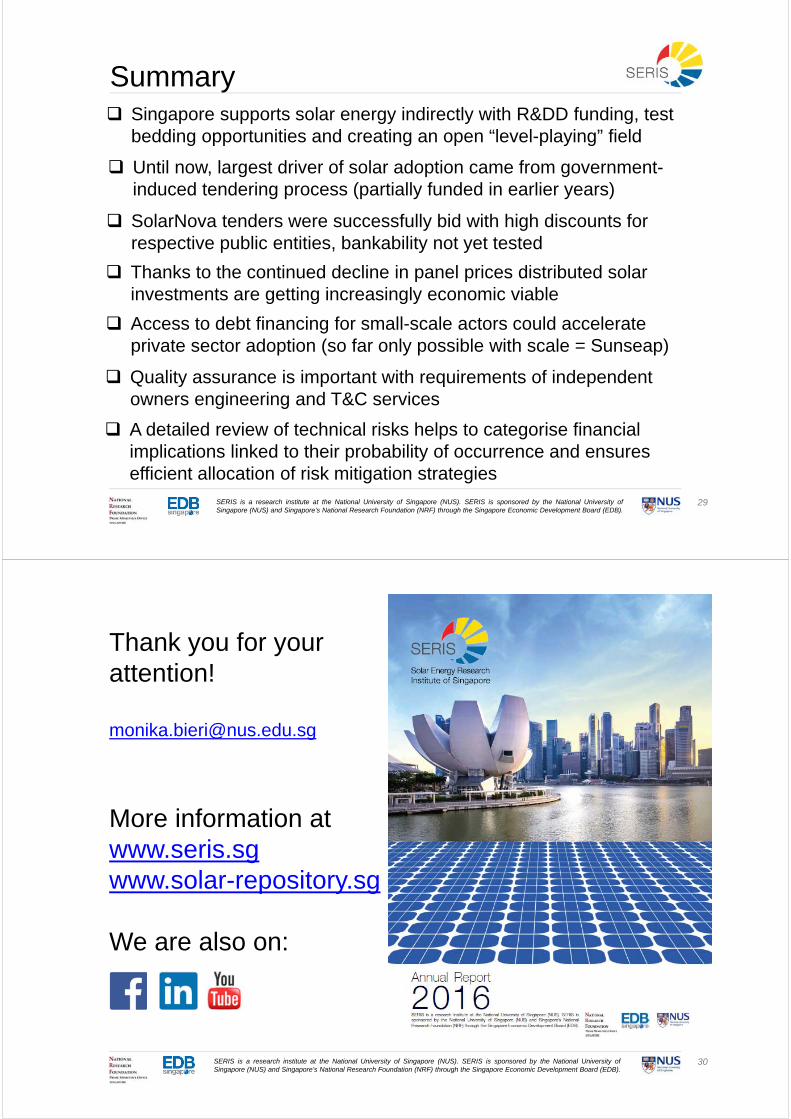
SERIS is a research institute at the National University of Singapore (NUS). SERIS is sponsored by the National University ofSingapore (NUS) and Singapore’s National Research Foundation (NRF) through the Singapore Economic Development Board (EDB).
29
Singapore supports solar energy indirectly with R&DD funding, test bedding opportunities and creating an open “level-playing” field
Summary
Until now, largest driver of solar adoption came from government-induced tendering process (partially funded in earlier years)
SolarNova tenders were successfully bid with high discounts for respective public entities, bankability not yet tested
Thanks to the continued decline in panel prices distributed solar investments are getting increasingly economic viable
Quality assurance is important with requirements of independent owners engineering and T&C services
A detailed review of technical risks helps to categorise financial implications linked to their probability of occurrence and ensures efficient allocation of risk mitigation strategies
Access to debt financing for small-scale actors could accelerate private sector adoption (so far only possible with scale = Sunseap)
30SERIS is a research institute at the National University of Singapore (NUS). SERIS is sponsored by the National University ofSingapore (NUS) and Singapore’s National Research Foundation (NRF) through the Singapore Economic Development Board (EDB).
Thank you for your attention!
More information at www.seris.sgwww.solar-repository.sg
We are also on:

IV-5
Renewable Energy Target and Promotion Program

Sheng-pen Peng
Associate Research Fellow, Taiwan Academy of Banking and Finance
Education:
Ph.D. in Economics, The City University of New York, USA
B.A. in Economics, Fu-Jen Catholic University, Taiwan
Past Positions:
Cathay Life Insurance
Standard Chartered Bank
Assistant Research Fellow, Taiwan Academy of Banking and Finance

Renewable Energy Target and Promotion Program
Sheng pen Peng
2017/9
Ⓒ 2017財團法人台灣金融研訓院
Table of content
Renewable Energy Policy Target Renewable Energy Policy Target
Forward-looking Infrastructure Development
Program:(Green energy)
Forward-looking Infrastructure Development
Program:(Green energy)
Financial Supervisory Commission Green Finance ActionFinancial Supervisory Commission Green Finance Action
The Finance Environment and CommodityThe Finance Environment and Commodity
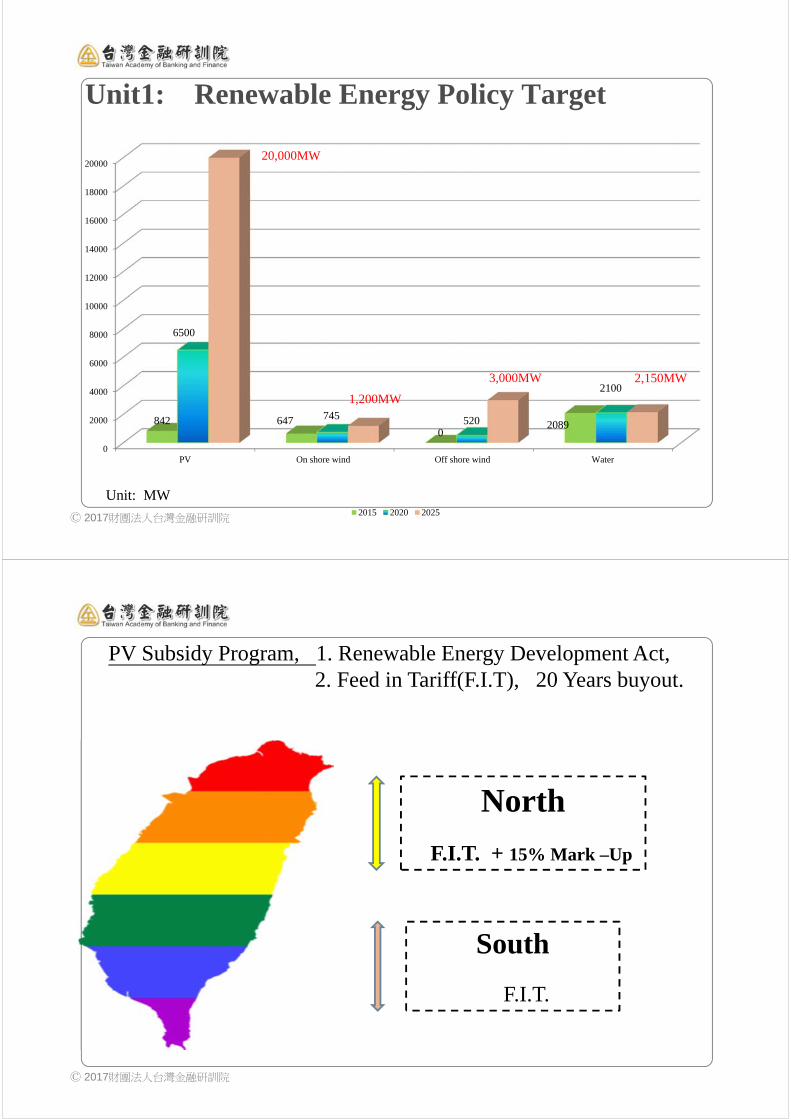
Ⓒ 2017財團法人台灣金融研訓院
Unit1: Renewable Energy Policy Target
0
2000
4000
6000
8000
10000
12000
14000
16000
18000
20000
PV On shore wind Off shore wind Water
842 6470
2089
6500
745 520
2100
20,000MW
1,200MW
3,000MW 2,150MW
2015 2020 2025
Unit: MW
Ⓒ 2017財團法人台灣金融研訓院
North
F.I.T. + 15% Mark –Up
South
F.I.T.
PV Subsidy Program, 1. Renewable Energy Development Act, 2. Feed in Tariff(F.I.T), 20 Years buyout.
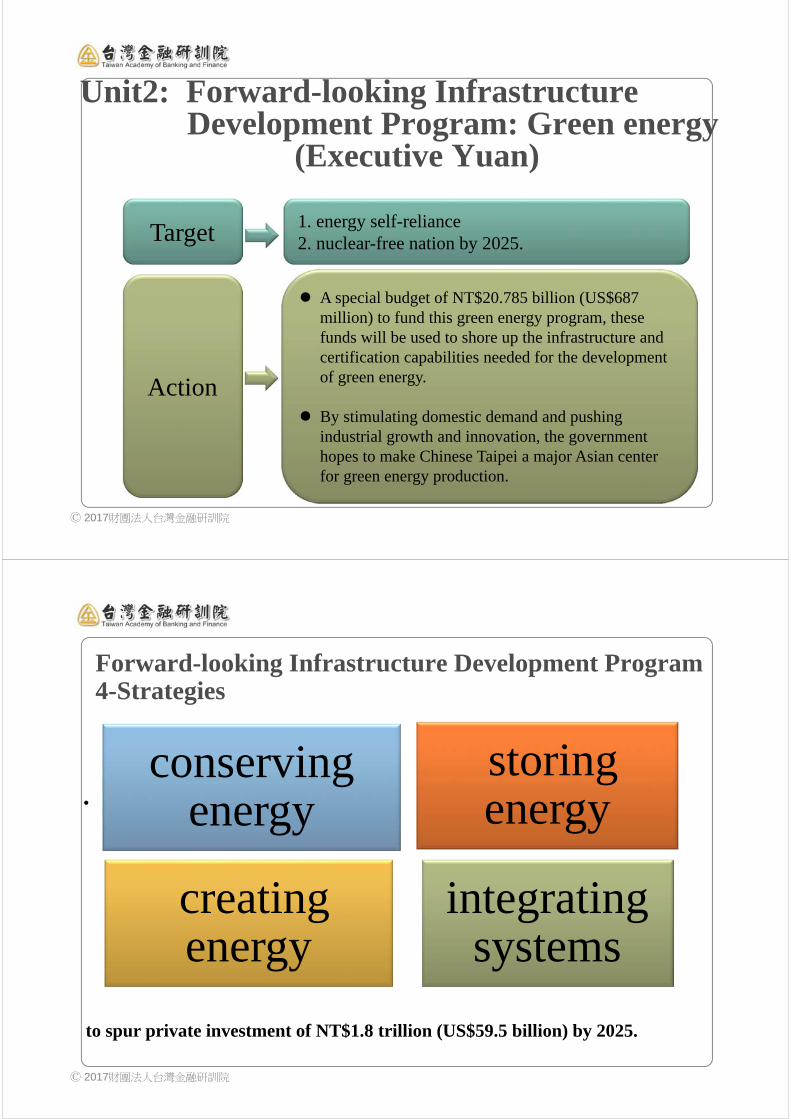
Ⓒ 2017財團法人台灣金融研訓院
Unit2: Forward-looking InfrastructureDevelopment Program: Green energy
(Executive Yuan)
Target 1. energy self-reliance2. nuclear-free nation by 2025.
Action
A special budget of NT$20.785 billion (US$687 million) to fund this green energy program, these funds will be used to shore up the infrastructure and certification capabilities needed for the development of green energy.
By stimulating domestic demand and pushing industrial growth and innovation, the government hopes to make Chinese Taipei a major Asian center for green energy production.
Ⓒ 2017財團法人台灣金融研訓院
Forward-looking Infrastructure Development Program4-Strategies
.conserving
energystoring energy
creating energy
integrating systems
to spur private investment of NT$1.8 trillion (US$59.5 billion) by 2025.
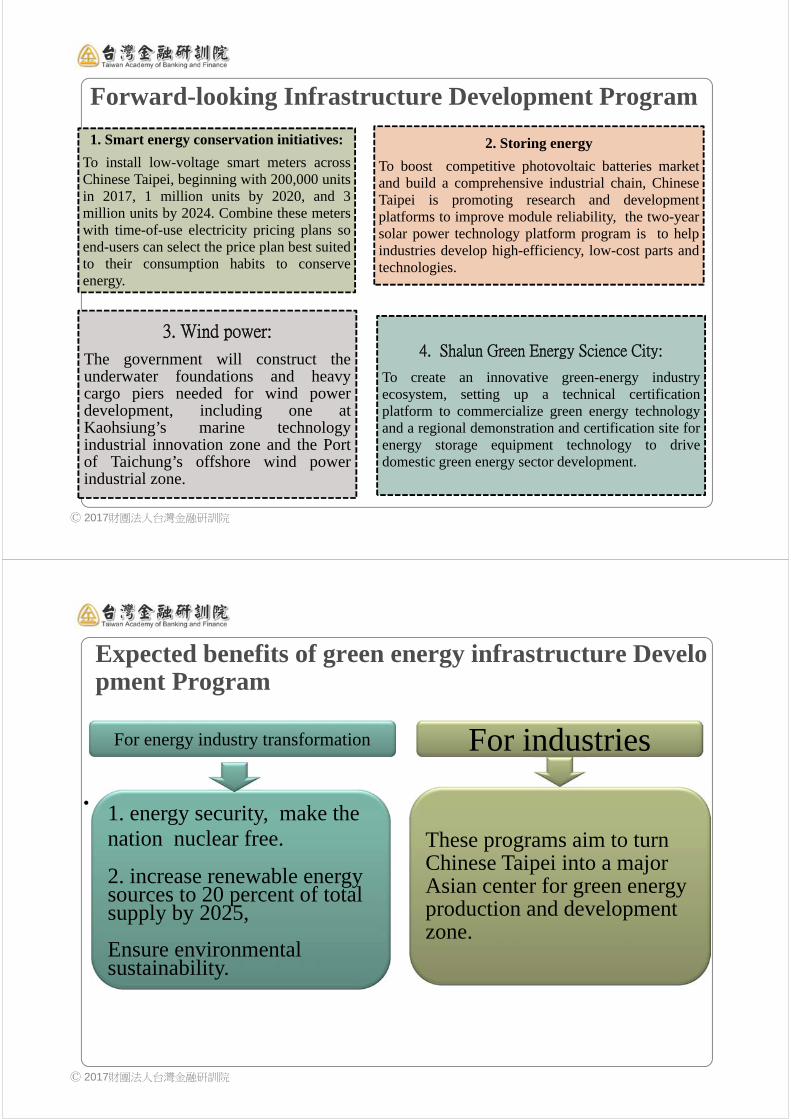
Ⓒ 2017財團法人台灣金融研訓院
Forward-looking Infrastructure Development Program
.
1. Smart energy conservation initiatives:
To install low-voltage smart meters acrossChinese Taipei, beginning with 200,000 unitsin 2017, 1 million units by 2020, and 3million units by 2024. Combine these meterswith time-of-use electricity pricing plans soend-users can select the price plan best suitedto their consumption habits to conserveenergy.
2. Storing energy
To boost competitive photovoltaic batteries marketand build a comprehensive industrial chain, ChineseTaipei is promoting research and developmentplatforms to improve module reliability, the two-yearsolar power technology platform program is to helpindustries develop high-efficiency, low-cost parts andtechnologies.
3. Wind power:
The government will construct theunderwater foundations and heavycargo piers needed for wind powerdevelopment, including one atKaohsiung’s marine technologyindustrial innovation zone and the Portof Taichung’s offshore wind powerindustrial zone.
4. Shalun Green Energy Science City:
To create an innovative green-energy industryecosystem, setting up a technical certificationplatform to commercialize green energy technologyand a regional demonstration and certification site forenergy storage equipment technology to drivedomestic green energy sector development.
Ⓒ 2017財團法人台灣金融研訓院
Expected benefits of green energy infrastructure Development Program
.1. energy security, make the nation nuclear free.
2. increase renewable energy sources to 20 percent of total supply by 2025,
Ensure environmental sustainability.
These programs aim to turn Chinese Taipei into a major Asian center for green energy production and development zone.
For energy industry transformation For industries

Ⓒ 2017財團法人台灣金融研訓院
.
1.Assisting the green energy industry obtain finance:
The Bankers Association has drafted the “Program to encourage domestic banks to provide loans to green energy technology and increase the SME credit guarantee loan to value from 80% to 90%.
2. Equator Principles
The Bankers Association has adopted it in “Guidelines for Members of the ROC Bankers Association to Extend Credits” which will spur financial institutions to consider social or environmental impact when carrying out loan evaluation.
3.Guiding investment of insurance industry capital into green energy industry.
4.Enhancing green finance talent nurturing program :
To hold various courses through the Taiwan Academy of Banking and Finance to nurture green finance talent, to help the financial industry obtain information and understand the characteristics of the green energy industry to serve as the basis for assessing risk control.
Unit3: Financial Supervisory Commission supports thedevelopment of the green energy industry
Green Finance Program by Million Rooftop PVs Office
(sponsored by Bureau of Energy of the Ministry of Economic Affairs )
and Taiwan Academy of Banking & Finance(TABF) since 2013
To bridge the gap between PV and Finance field
1.Annual Solar Photovoltaic Finance Training Programs
2.Held various conferences open to the public each year
3.Conduct various research projects related to PV finance and business law topics (Asset securitization, close company law, etc)
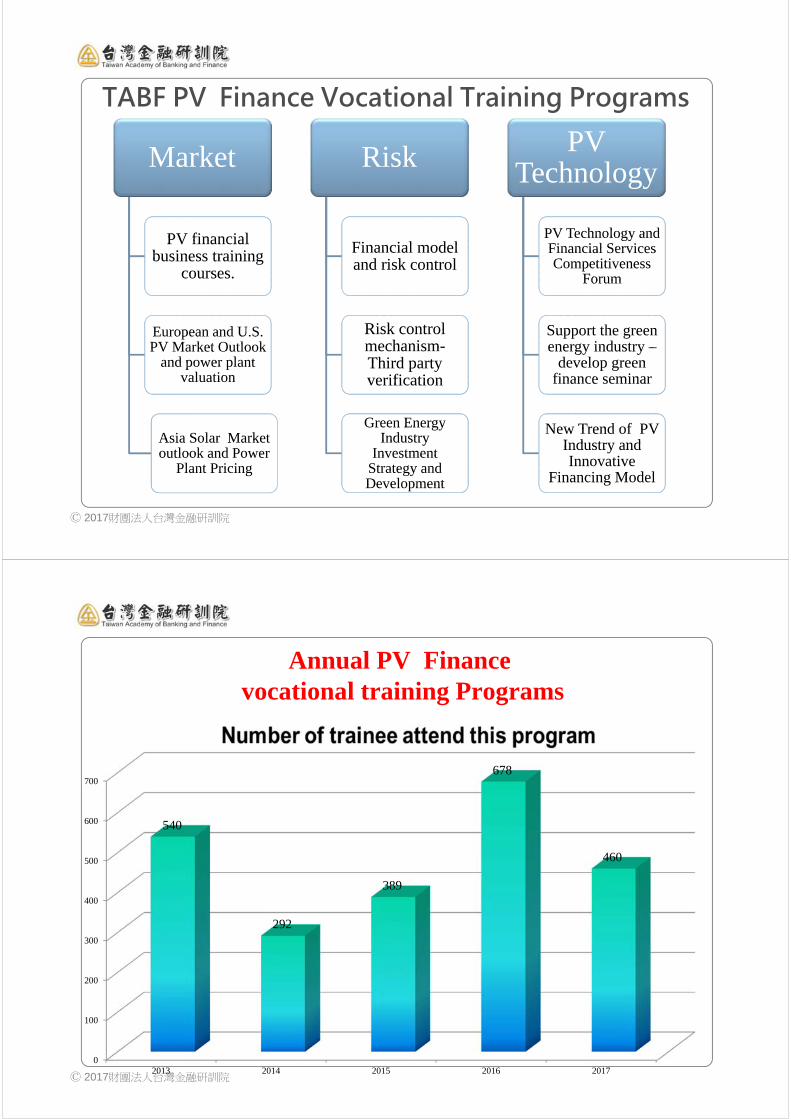
Ⓒ 2017財團法人台灣金融研訓院
TABF PV Finance Vocational Training Programs
Market
PV financial business training
courses.
PV financial business training
courses.
European and U.S. PV Market Outlook
and power plant valuation
European and U.S. PV Market Outlook
and power plant valuation
Asia Solar Market outlook and Power
Plant Pricing
Asia Solar Market outlook and Power
Plant Pricing
Risk
Financial model and risk controlFinancial model and risk control
Risk control mechanism-Third party verification
Risk control mechanism-Third party verification
Green Energy Industry
Investment Strategy and Development
Green Energy Industry
Investment Strategy and Development
PV Technology
PV Technology and Financial Services Competitiveness
Forum
PV Technology and Financial Services Competitiveness
Forum
Support the green energy industry –
develop green finance seminar
Support the green energy industry –
develop green finance seminar
New Trend of PV Industry and Innovative
Financing Model
New Trend of PV Industry and Innovative
Financing Model
Ⓒ 2017財團法人台灣金融研訓院
Annual PV Financevocational training Programs
0
100
200
300
400
500
600
700
2013 2014 2015 2016 2017
540
292
389
678
460
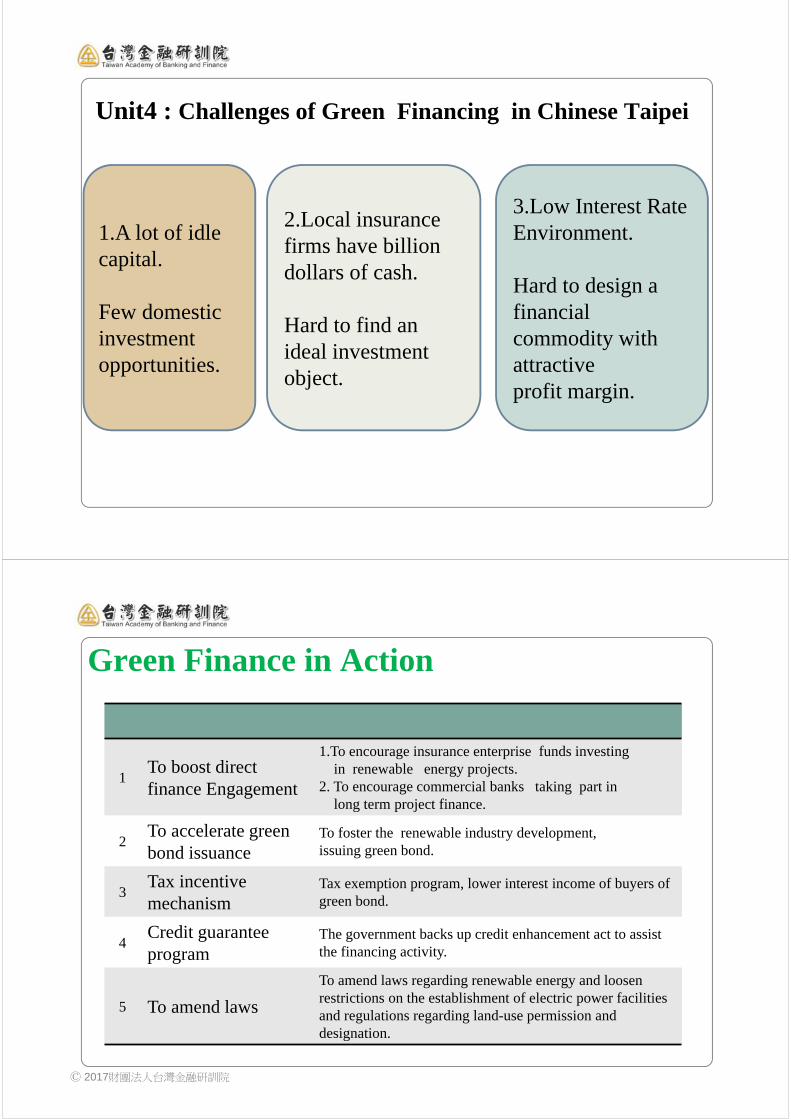
Unit4 : Challenges of Green Financing in Chinese Taipei
1.A lot of idle capital.
Few domestic investment opportunities.
2.Local insurance firms have billion dollars of cash.
Hard to find an ideal investment object.
3.Low Interest Rate Environment.
Hard to design a financial commodity with attractiveprofit margin.
Ⓒ 2017財團法人台灣金融研訓院
Green Finance in Action
1To boost direct finance Engagement
1.To encourage insurance enterprise funds investingin renewable energy projects.
2. To encourage commercial banks taking part in long term project finance.
2To accelerate green bond issuance
To foster the renewable industry development, issuing green bond.
3Tax incentive mechanism
Tax exemption program, lower interest income of buyers of green bond.
4Credit guaranteeprogram
The government backs up credit enhancement act to assist the financing activity.
5 To amend laws
To amend laws regarding renewable energy and loosen restrictions on the establishment of electric power facilities and regulations regarding land-use permission and designation.
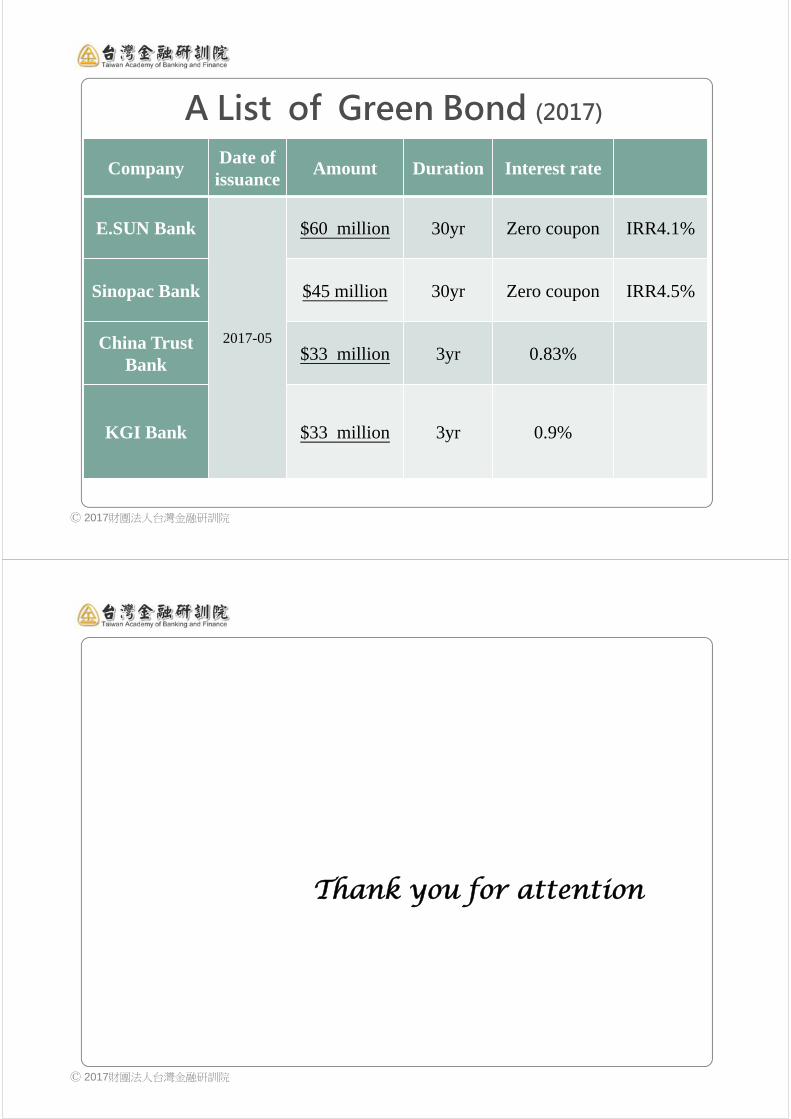
Ⓒ 2017財團法人台灣金融研訓院
A List of Green Bond (2017)
CompanyDate of issuance
Amount Duration Interest rate
E.SUN Bank
2017-05
$60 million 30yr Zero coupon IRR4.1%
Sinopac Bank $45 million 30yr Zero coupon IRR4.5%
China Trust Bank
$33 million 3yr 0.83%
KGI Bank $33 million 3yr 0.9%
Ⓒ 2017財團法人台灣金融研訓院
Thank you for attention
IV-6
Best Practices in Renewable Energy Financing in Thailand

Biography
Miss Sutthasini Glawgitigul
Sutthasini Glawgitigul has worked at the Department of Alternative Energy
Development and Efficiency (DEDE), Ministry of Energy for 7 years where
I am currently a senior professional scientist. Before that I worked at the Office
of Natural Resources and Environmental Policy and Planning as an
environmentalist for more than 10 years. I graduated with a Master of science
degree in Water, Energy and Waste at from University of Salford. I have been
active in many projects for promoting renewable energy in Thailand, especially
biomass, wind and waste to energy. I were in a team that developed alternative
energy development plan (AEDP 2015).

Best Practices in Renewable Energy Financing in Thailand
Miss Sutthasini GlawgitigulScientist, Senior Professional level
Department of Alternative Energy Development And EfficiencyMinistry of Energy, Thailand
Workshop: APEC Conference on Green Energy Finance Capacity Building
28‐29 September 2017 : GIS MOTC Convenction Center,Taipei, Chinese Taipei
1
Content
Thailand’s Energy Situation
Thailand’s Energy Policy
Green Financing Policy for RE
2
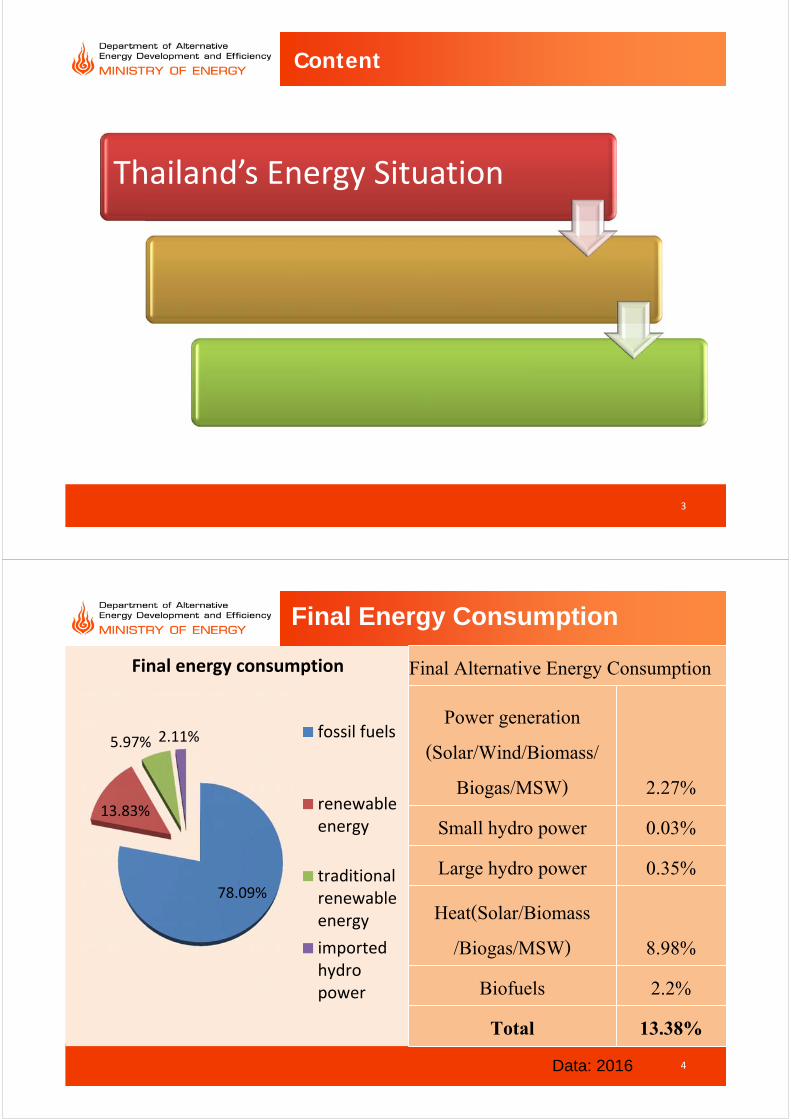
Content
Thailand’s Energy Situation
3
4
78.09%
13.83%
5.97% 2.11%
Final energy consumption
fossil fuels
renewableenergy
traditionalrenewableenergy
importedhydropower
Final Energy Consumption
Final Alternative Energy Consumption
Power generation (Solar/Wind/Biomass/
Biogas/MSW) 2.27%Small hydro power 0.03%Large hydro power 0.35%
Heat(Solar/Biomass /Biogas/MSW) 8.98%
Biofuels 2.2%Total 13.38%
Data: 2016
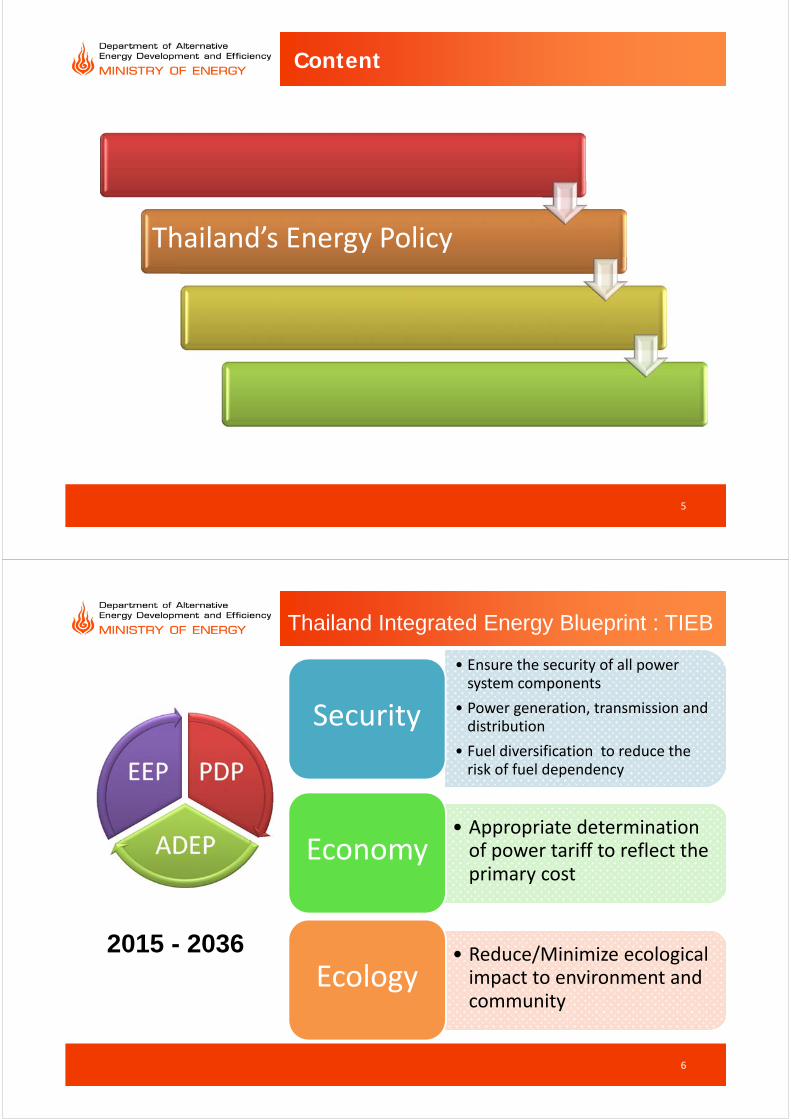
Content
Thailand’s Energy Policy
5
PDP
ADEP
EEP
Thailand Integrated Energy Blueprint : TIEB
2015 - 2036
• Ensure the security of all power system components
• Power generation, transmission and distribution
• Fuel diversification to reduce the risk of fuel dependency
Security
• Appropriate determination of power tariff to reflect the primary cost
Economy
• Reduce/Minimize ecological impact to environment and community
Ecology
6
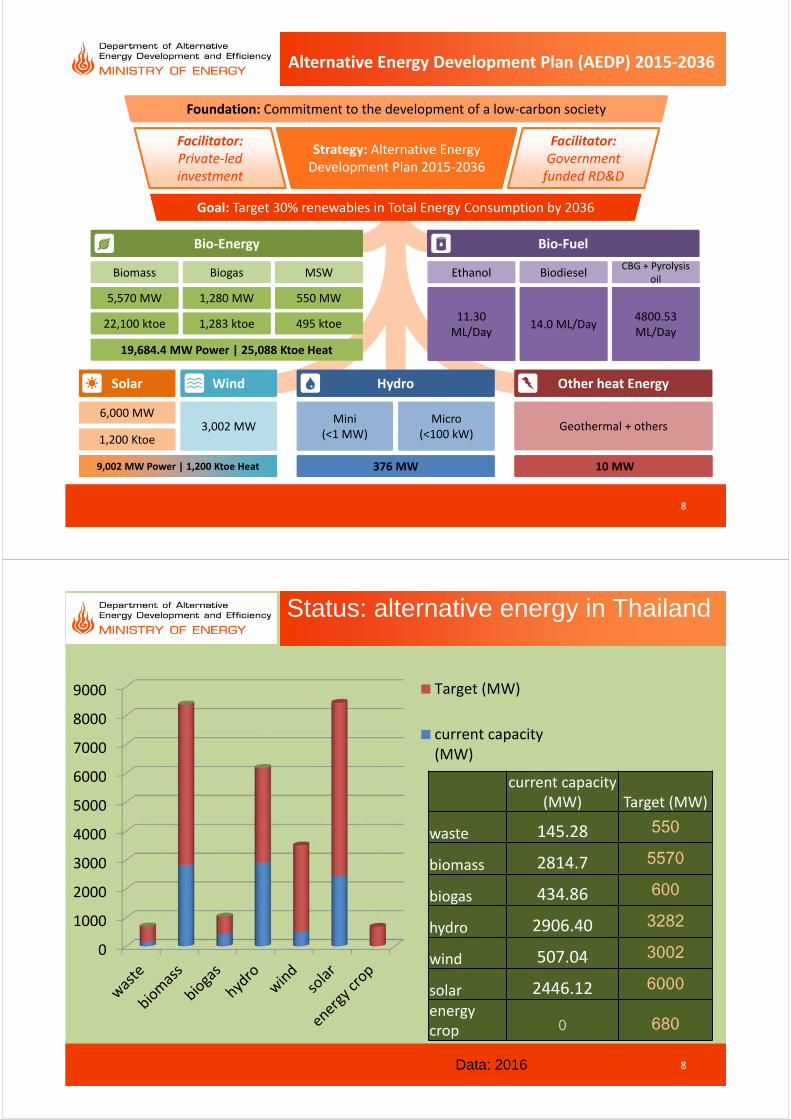
8
Alternative Energy Development Plan (AEDP) 2015‐2036
Solar Wind
3,002 MW6,000 MW
1,200 Ktoe
9,002 MW Power | 1,200 Ktoe Heat
Hydro
Mini (<1 MW)
Micro (<100 kW)
376 MW
Other heat Energy
Geothermal + others
10 MW
Bio‐Fuel
Ethanol BiodieselC G l i
oilCBG + Pyrolysis
oil
11.30 ML/Day
14.0 ML/Day4800.53 ML/Day
Bio‐Energy
Biomass Biogas MSW
5,570 MW 1,280 MW
22,100 ktoe 1,283 ktoe
550 MW
495 ktoe
19,684.4 MW Power | 25,088 Ktoe Heat
Goal: Target 30% renewables in Total Energy Consumption by 2036
Facilitator: Government funded RD&D
Facilitator: Private‐led investment
Strategy: Alternative Energy Development Plan 2015‐2036
Foundation: Commitment to the development of a low‐carbon society
8
0
1000
2000
3000
4000
5000
6000
7000
8000
9000 Target (MW)
current capacity(MW)
Status: alternative energy in Thailand
current capacity
(MW) Target (MW)
waste 145.28 550
biomass 2814.7 5570
biogas 434.86 600
hydro 2906.40 3282
wind 507.04 3002
solar 2446.12 6000energy crop 0 680
Data: 2016
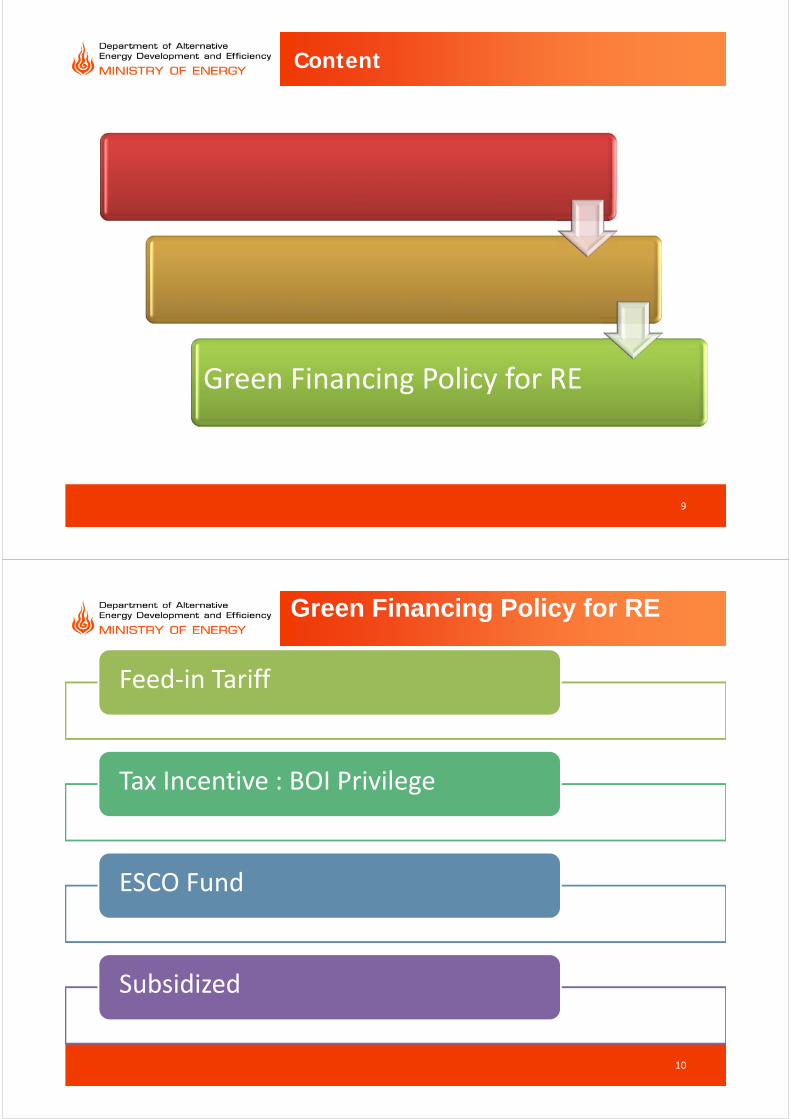
Content
Green Financing Policy for RE
9
10
Feed‐in Tariff
Tax Incentive : BOI Privilege
ESCO Fund
Subsidized
Green Financing Policy for RE
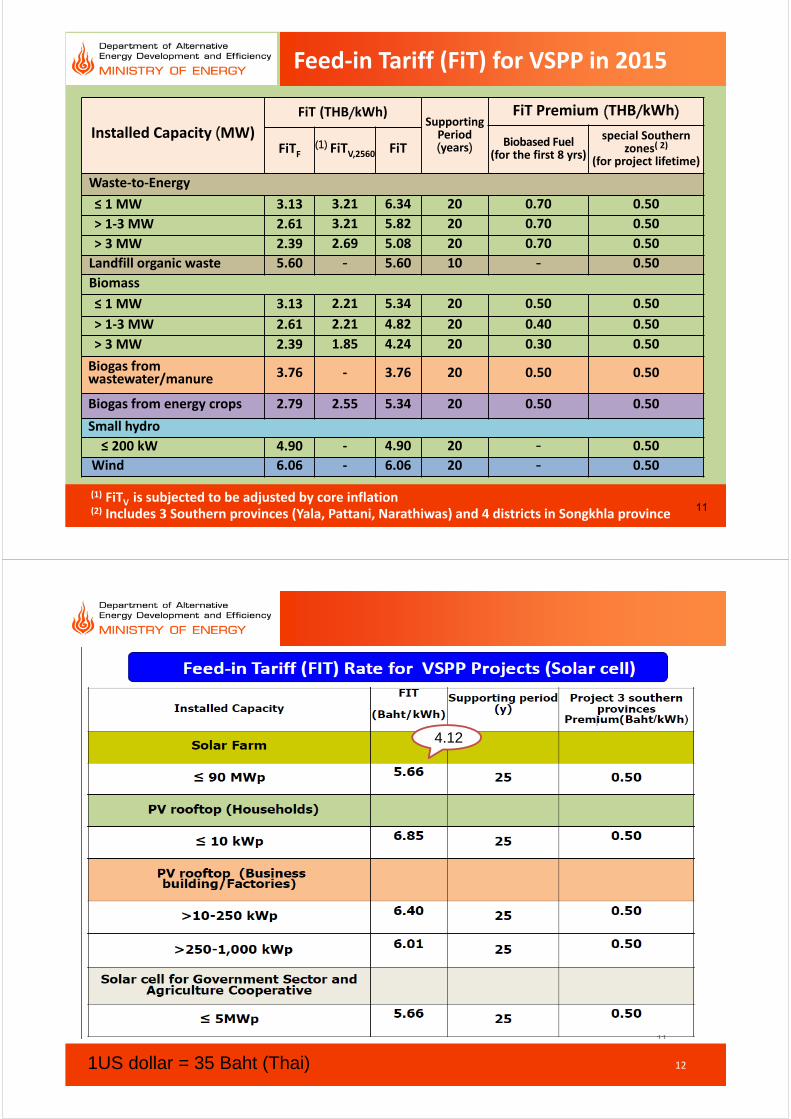
Installed Capacity (MW)
FiT (THB/kWh)SupportingPeriod(years)
FiT Premium (THB/kWh)
Biobased Fuel(for the first 8 yrs)
special Southern zones( 2)
(for project lifetime)FiTF
(1) FiTV,2560 FiT
Waste‐to‐Energy ≤ 1 MW 3.13 3.21 6.34 20 0.70 0.50
> 1‐3 MW 2.61 3.21 5.82 20 0.70 0.50
> 3 MW 2.39 2.69 5.08 20 0.70 0.50
Landfill organic waste 5.60 - 5.60 10 - 0.50
Biomass ≤ 1 MW 3.13 2.21 5.34 20 0.50 0.50
> 1‐3 MW 2.61 2.21 4.82 20 0.40 0.50
> 3 MW 2.39 1.85 4.24 20 0.30 0.50
Biogas from wastewater/manure 3.76 ‐ 3.76 20 0.50 0.50
Biogas from energy crops 2.79 2.55 5.34 20 0.50 0.50
Small hydro ≤ 200 kW 4.90 ‐ 4.90 20 - 0.50
Wind 6.06 ‐ 6.06 20 - 0.50
Feed‐in Tariff (FiT) for VSPP in 2015
(1) FiTV is subjected to be adjusted by core inflation (2) Includes 3 Southern provinces (Yala, Pattani, Narathiwas) and 4 districts in Songkhla province
11
4.12
121US dollar = 35 Baht (Thai)
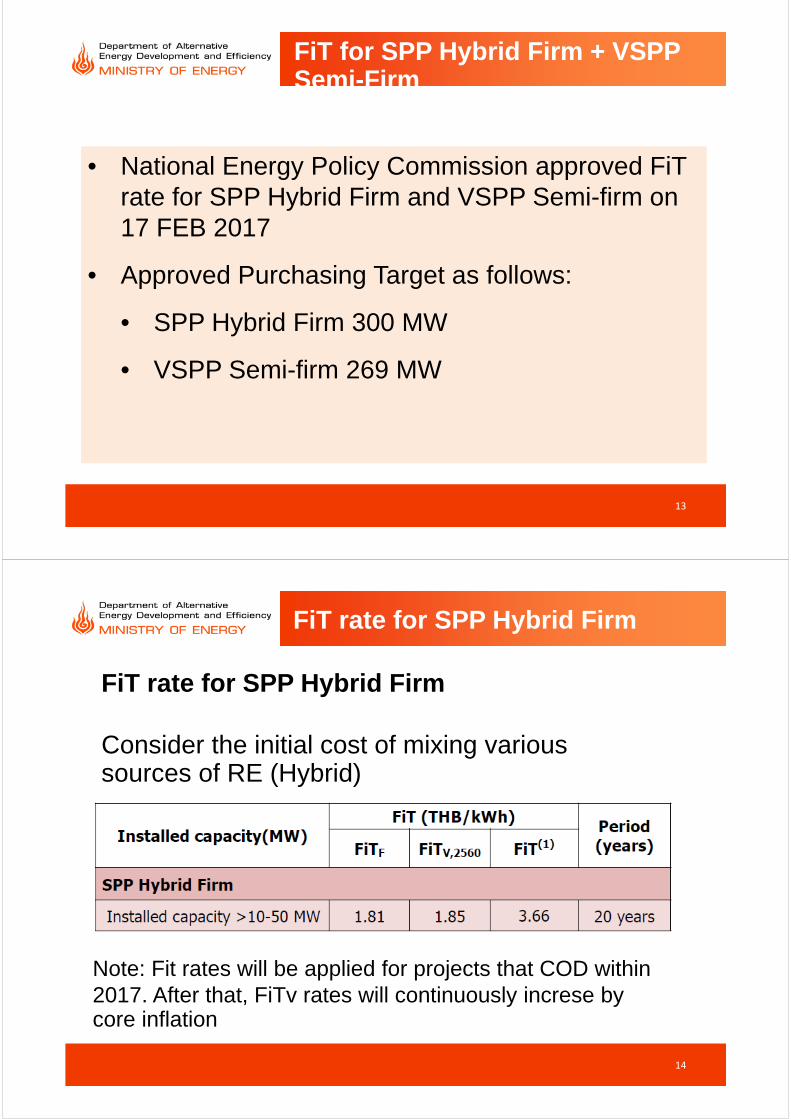
13
FiT for SPP Hybrid Firm + VSPP Semi-Firm
• National Energy Policy Commission approved FiTrate for SPP Hybrid Firm and VSPP Semi-firm on 17 FEB 2017
• Approved Purchasing Target as follows:
• SPP Hybrid Firm 300 MW
• VSPP Semi-firm 269 MW
14
FiT rate for SPP Hybrid Firm
FiT rate for SPP Hybrid Firm
Consider the initial cost of mixing various sources of RE (Hybrid)
Note: Fit rates will be applied for projects that COD within 2017. After that, FiTv rates will continuously increse by core inflation
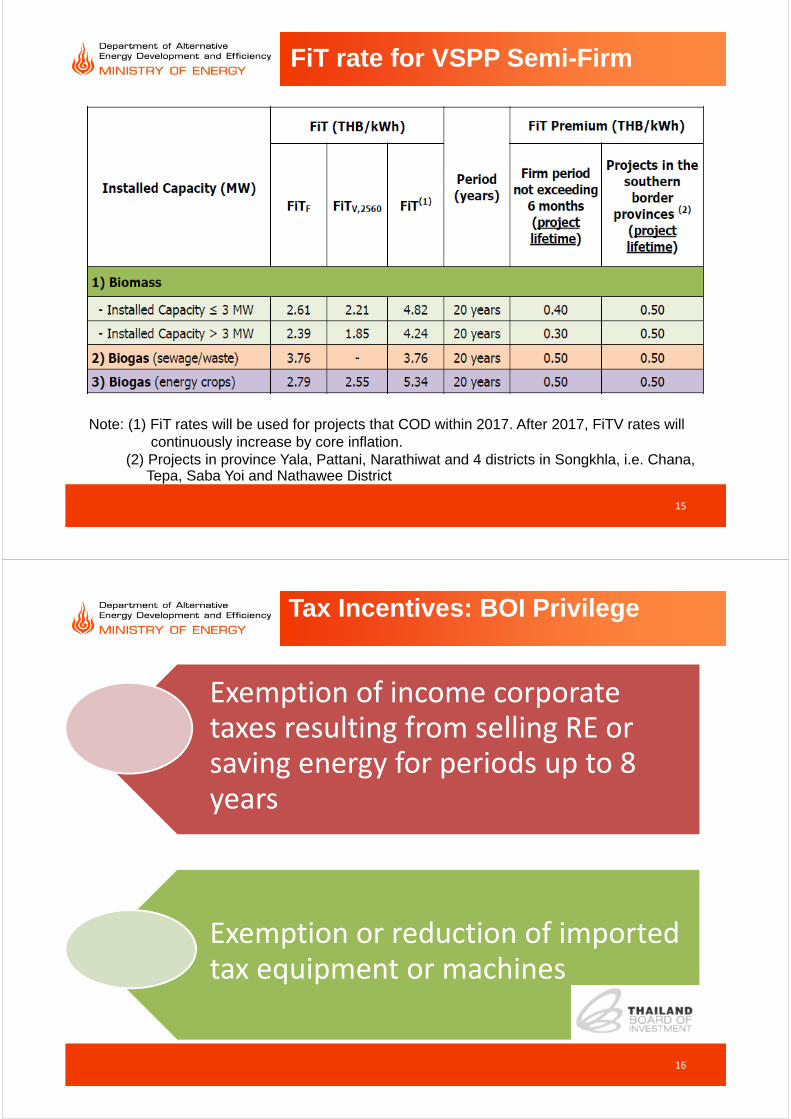
15
FiT rate for VSPP Semi-Firm
Note: (1) FiT rates will be used for projects that COD within 2017. After 2017, FiTV rates will continuously increase by core inflation.
(2) Projects in province Yala, Pattani, Narathiwat and 4 districts in Songkhla, i.e. Chana, Tepa, Saba Yoi and Nathawee District
16
Tax Incentives: BOI Privilege
Exemption of income corporate taxes resulting from selling RE or saving energy for periods up to 8 years
Exemption or reduction of imported tax equipment or machines
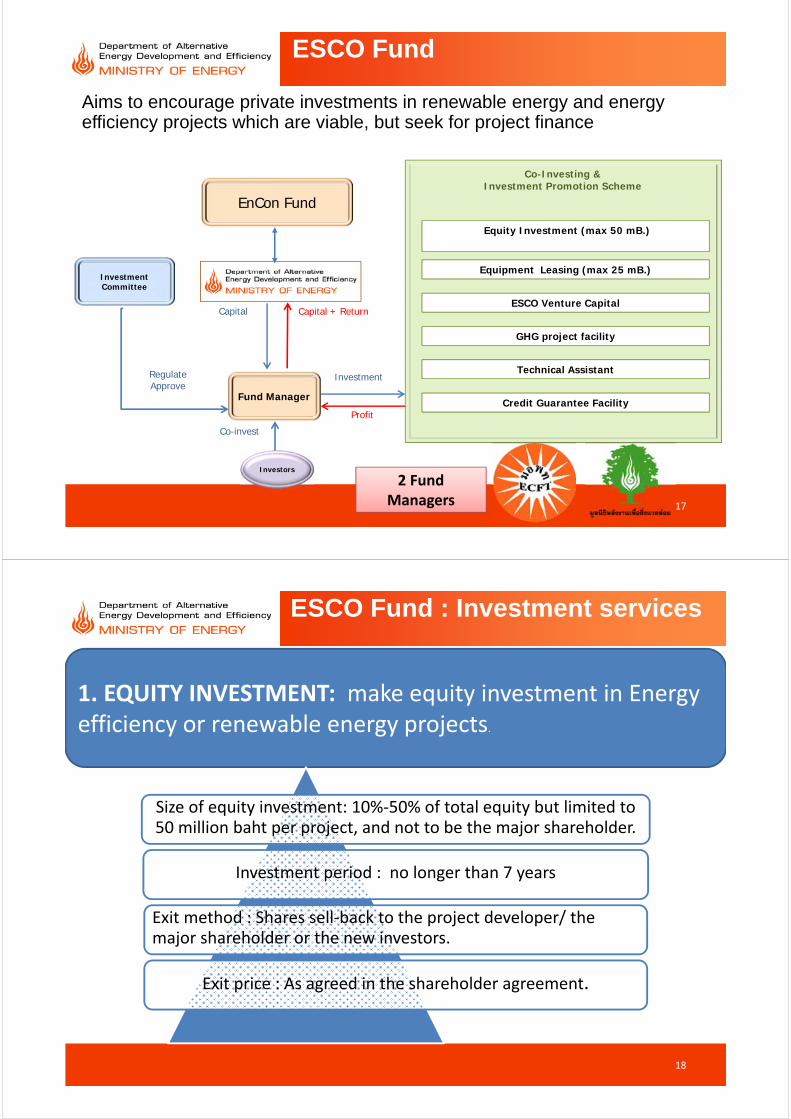
17
ESCO Fund
Co-Investing & Investment Promotion Scheme
Equity Investment (max 50 mB.)
Equipment Leasing (max 25 mB.)
ESCO Venture Capital
GHG project facility
Technical Assistant
Credit Guarantee Facility
Investment Committee
Fund Manager
EnCon Fund
Capital + ReturnCapital
Investment
Profit
RegulateApprove
Co-invest
Investors
Aims to encourage private investments in renewable energy and energy efficiency projects which are viable, but seek for project finance
2 Fund Managers
18
ESCO Fund : Investment services
1. EQUITY INVESTMENT: make equity investment in Energy efficiency or renewable energy projects.
Size of equity investment: 10%‐50% of total equity but limited to 50 million baht per project, and not to be the major shareholder.
Investment period : no longer than 7 years
Exit method : Shares sell‐back to the project developer/ the major shareholder or the new investors.
Exit price : As agreed in the shareholder agreement.
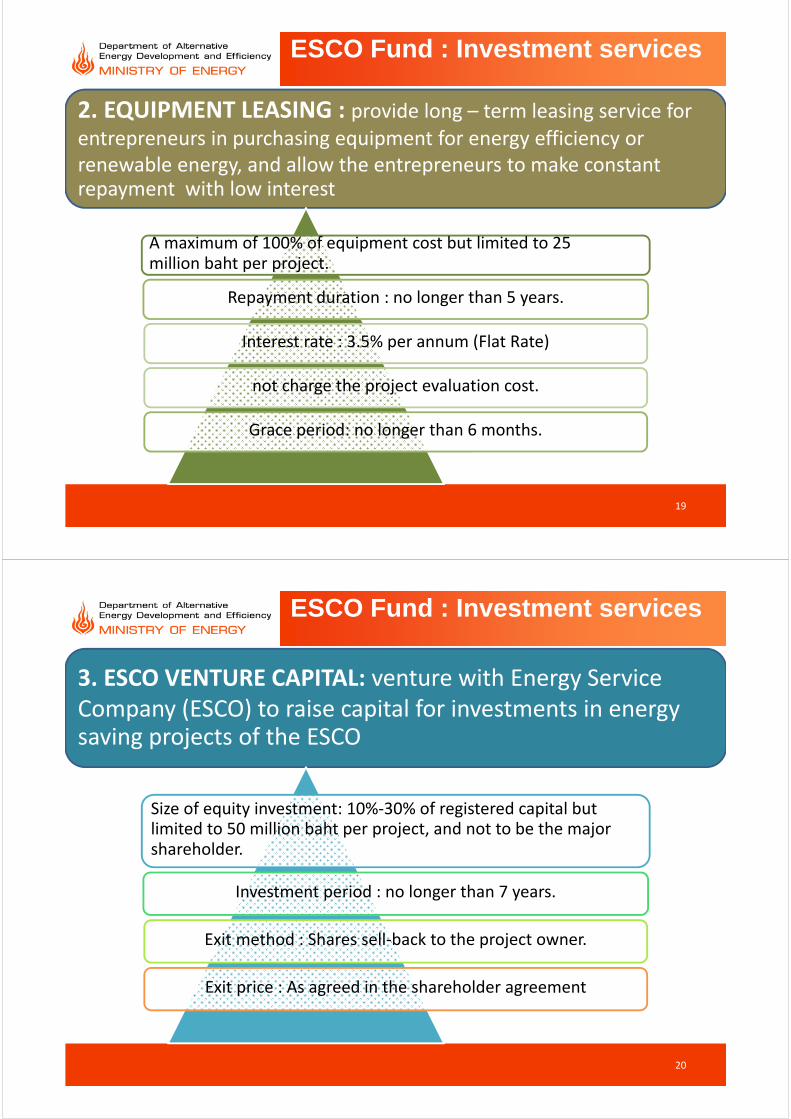
19
ESCO Fund : Investment services
2. EQUIPMENT LEASING : provide long – term leasing service for entrepreneurs in purchasing equipment for energy efficiency or renewable energy, and allow the entrepreneurs to make constant repayment with low interest
A maximum of 100% of equipment cost but limited to 25 million baht per project.
Repayment duration : no longer than 5 years.
Interest rate : 3.5% per annum (Flat Rate)
not charge the project evaluation cost.
Grace period: no longer than 6 months.
20
ESCO Fund : Investment services
3. ESCO VENTURE CAPITAL: venture with Energy Service Company (ESCO) to raise capital for investments in energy saving projects of the ESCO
Size of equity investment: 10%‐30% of registered capital but limited to 50 million baht per project, and not to be the major shareholder.
Investment period : no longer than 7 years.
Exit method : Shares sell‐back to the project owner.
Exit price : As agreed in the shareholder agreement
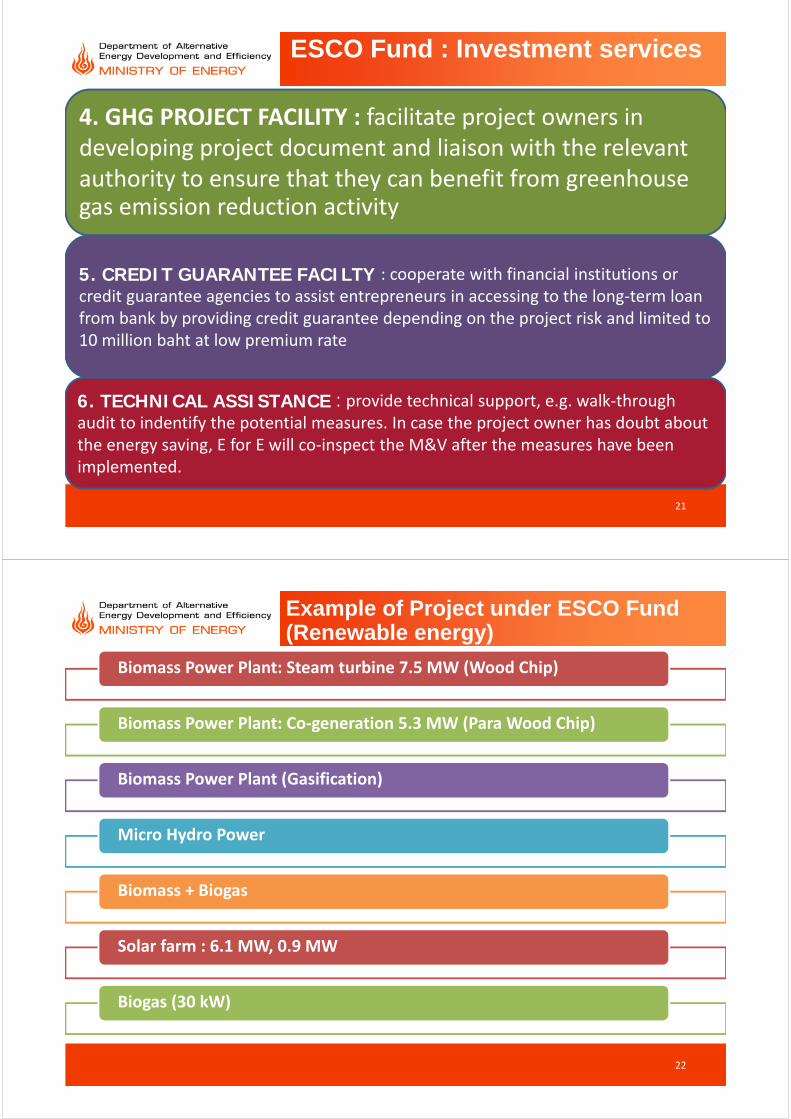
21
ESCO Fund : Investment services
4. GHG PROJECT FACILITY : facilitate project owners in developing project document and liaison with the relevant authority to ensure that they can benefit from greenhouse gas emission reduction activity
5. CREDIT GUARANTEE FACILTY : cooperate with financial institutions or credit guarantee agencies to assist entrepreneurs in accessing to the long‐term loan from bank by providing credit guarantee depending on the project risk and limited to 10 million baht at low premium rate
6. TECHNICAL ASSISTANCE : provide technical support, e.g. walk‐through audit to indentify the potential measures. In case the project owner has doubt about the energy saving, E for E will co‐inspect the M&V after the measures have been implemented.
22
Example of Project under ESCO Fund (Renewable energy)
Biomass Power Plant: Steam turbine 7.5 MW (Wood Chip)
Biomass Power Plant: Co‐generation 5.3 MW (Para Wood Chip)
Biomass Power Plant (Gasification)
Micro Hydro Power
Biomass + Biogas
Solar farm : 6.1 MW, 0.9 MW
Biogas (30 kW)
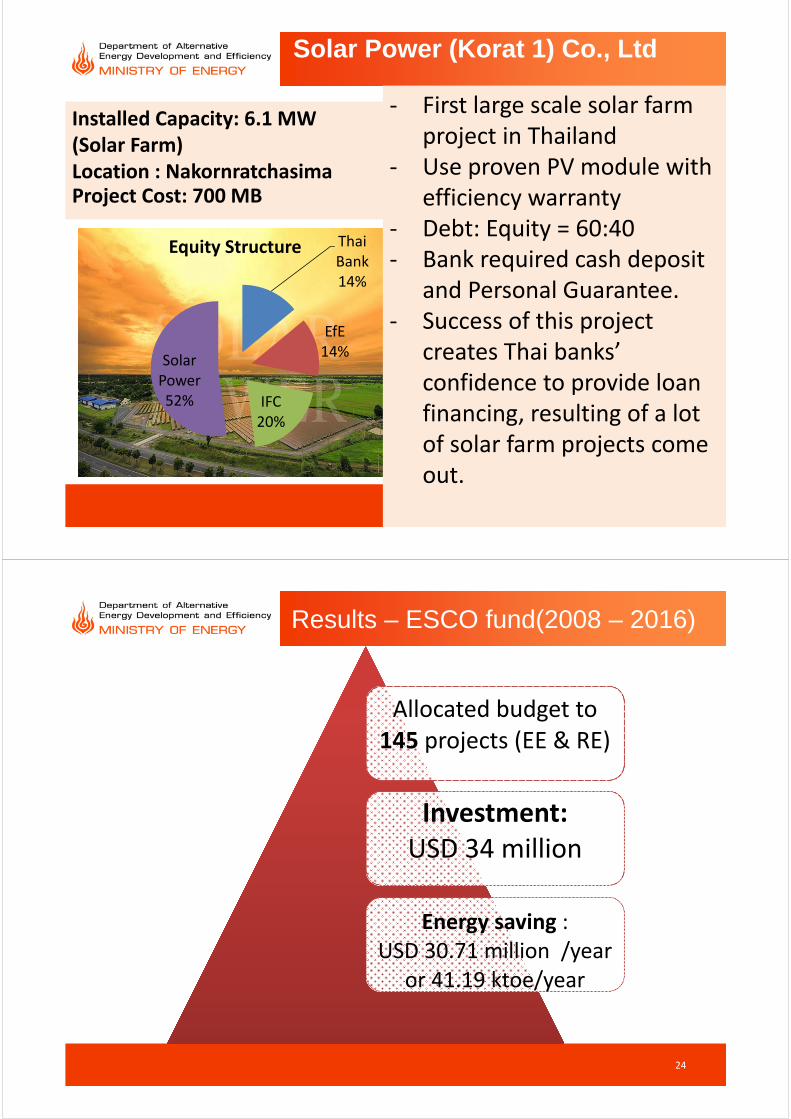
23
Solar Power (Korat 1) Co., Ltd
Installed Capacity: 6.1 MW (Solar Farm)Location : NakornratchasimaProject Cost: 700 MB
‐ First large scale solar farm project in Thailand
‐ Use proven PV module with efficiency warranty
‐ Debt: Equity = 60:40‐ Bank required cash deposit
and Personal Guarantee.‐ Success of this project
creates Thai banks’ confidence to provide loan financing, resulting of a lot of solar farm projects come out.
Thai Bank14%
EfE14%
IFC20%
Solar Power 52%
Equity Structure
24
Results – ESCO fund(2008 – 2016)
Allocated budget to 145 projects (EE & RE)
Investment: USD 34 million
Energy saving : USD 30.71 million /year
or 41.19 ktoe/year
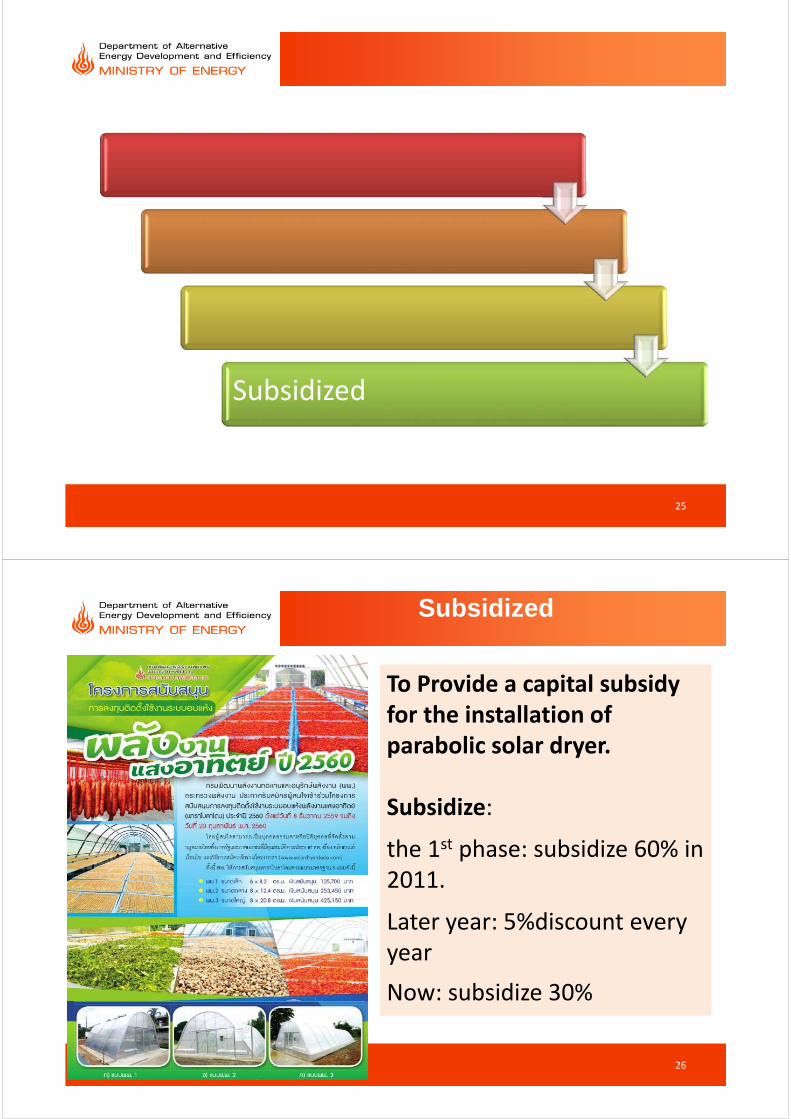
Subsidized
25
26
Subsidized
To Provide a capital subsidy for the installation of parabolic solar dryer.
Subsidize:
the 1st phase: subsidize 60% in 2011.
Later year: 5%discount every year
Now: subsidize 30%
27
Subsidized
2015: subsidy 100% for changing burner.
Changing the fuels heating from fossil oil to biomass pellet by changing the burner on boiler.
28
IV-7
US Federal and State-Based Energy Policy and Technology in Regards to
Renewable Energy

Terry Surles, Ph.D.
Dr. Surles just finished being an emergency hire as the Interim Administrator for
the Hawaii State Energy Office. He has a distinguished career in energy and
environmental management and consulting positions. Since 2012, he has been at the
University of Hawaii and the California Institute for Energy and Environment. During
this time, he has also served as an expert for APEC and IEA in Indonesia, China,
Vietnam, Peru, and Korea. In 2015, he led an analysis of DOE’s Grid Modernization
Initiative for Booz, Allen, Hamilton. From 2010 to 2012, as Desert Research Institute
Vice President, he led program development and management for three research divisions
and four research centers in environmental and energy sciences. From 2006 to 2010, he
was the Technology Integration and Policy Analysis Program Manager at the Hawaii
Natural Energy Institute focusing on grid integration of variable renewable resources and
energy storage technologies. From 2004 to 2006, he was Vice President at EPRI
focusing on air quality, health, energy/water nexus, and climate change issues. From
2000 to 2004, he was on loan to the California Energy Commission as the PIER Program
Director where the emphasis was on energy efficiency, renewable energy, grid
modernization, and regional climate assessment. For this position, he took leave from
Lawrence Livermore National Laboratory where he was Associate Laboratory Director
for Energy Programs from 1998 to 2000, focusing on energy efficiency, energy storage,
and climate change science and analysis. In 1997, he was appointed by Gov. Wilson to
be Deputy Secretary for Science and Technology at California EPA. From 1978 to 1997,
he was at Argonne National Laboratory (ANL) with his final position being General
Manager for Environmental Programs. Major program areas included energy systems
assessment, climate change science, risk analysis and assessment, emergency planning
and response, and energy and environmental modeling. From 1974 to 1978, he was at
Camp, Dresser, & McKee, with his final position as Vice President.
Dr. Surles received his Ph.D. in Chemistry from Michigan State and has more than
330 publications, technical reports, and presentations. He has served on a number of
committees, including seven appointments with the National Research Council as well as
advisory groups for DOE and its laboratories. In addition to those listed above, he
consulted or is currently consulting with NELHA, the Northeast Asia Economic Forum,
East-West Center, the United Kingdom Energy Research Centre, the California Public
Utility Commission, and the State of Victoria.
1
US Federal and State‐Based Energy Policy and Technology in Regards to Renewable Energy
Terry Surles, [email protected]
APEC Conference
Taipei
September 28, 2017
Renewable Generation Has Increased Significantly Over the Past Decade – from DOE August 2017 Report
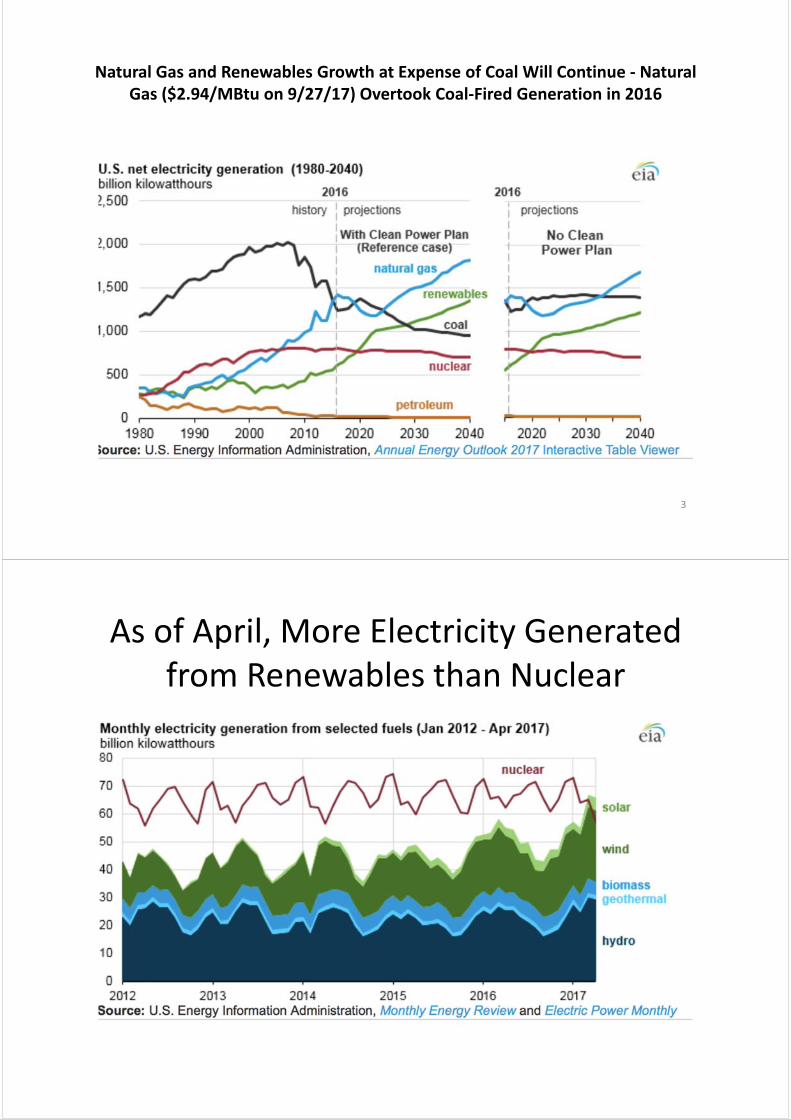
Natural Gas and Renewables Growth at Expense of Coal Will Continue ‐ Natural Gas ($2.94/MBtu on 9/27/17) Overtook Coal‐Fired Generation in 2016
3
As of April, More Electricity Generated from Renewables than Nuclear
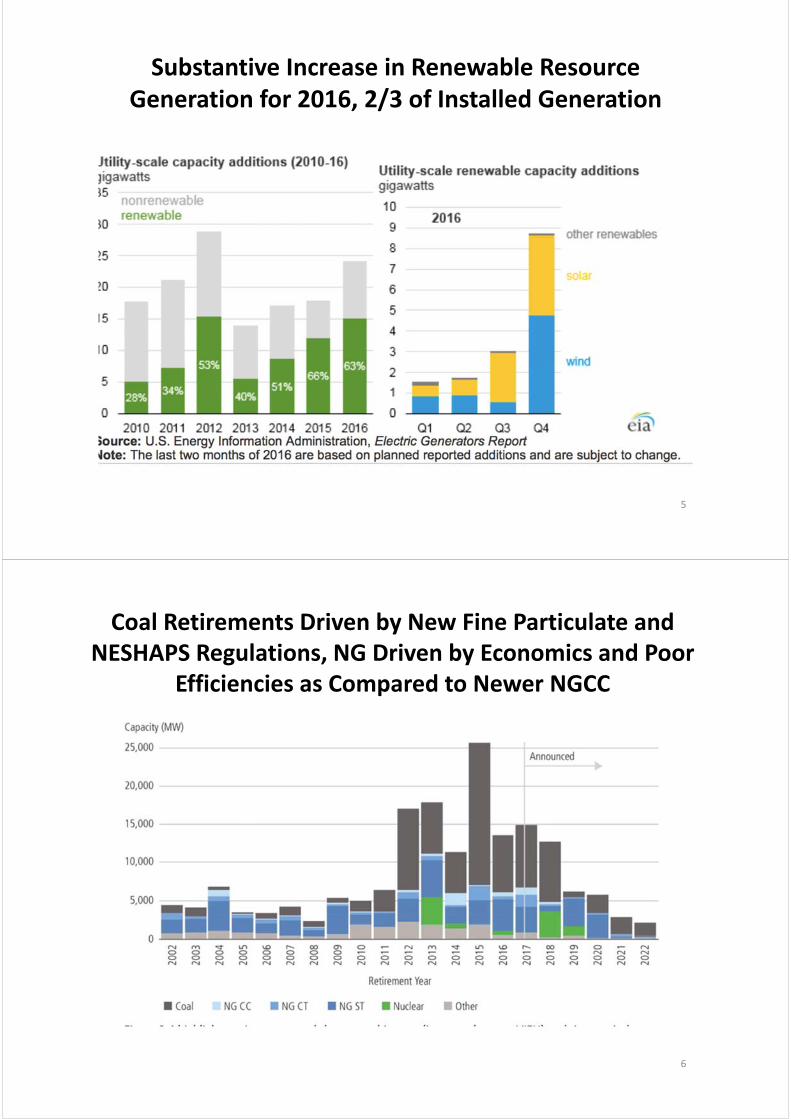
Substantive Increase in Renewable Resource Generation for 2016, 2/3 of Installed Generation
5
Coal Retirements Driven by New Fine Particulate and NESHAPS Regulations, NG Driven by Economics and Poor
Efficiencies as Compared to Newer NGCC
6
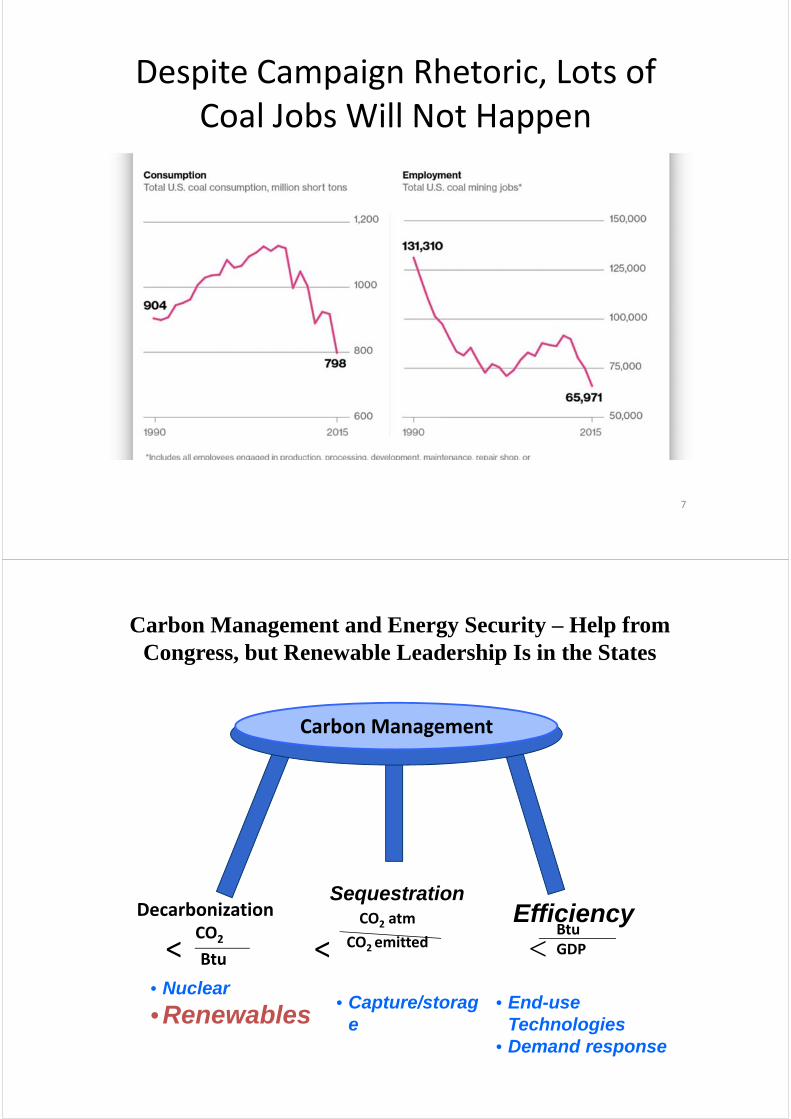
Despite Campaign Rhetoric, Lots of Coal Jobs Will Not Happen
7
Carbon Management and Energy Security – Help from Congress, but Renewable Leadership Is in the States
Carbon Management
BtuGDP<
DecarbonizationCO2
Btu<CO2 atm
CO2 emitted<
SequestrationEfficiency
• Nuclear
• Renewables• Capture/storag
e• End-use
Technologies• Demand response
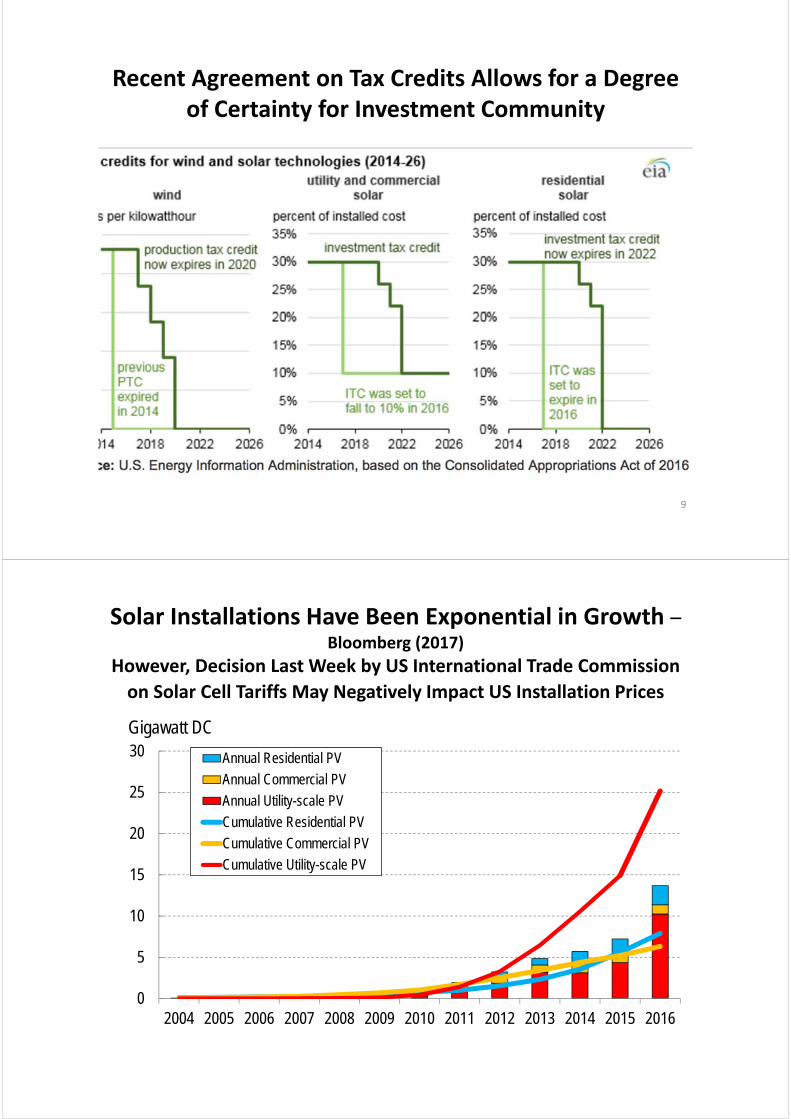
Recent Agreement on Tax Credits Allows for a Degree of Certainty for Investment Community
9
Solar Installations Have Been Exponential in Growth –Bloomberg (2017)
However, Decision Last Week by US International Trade Commission
on Solar Cell Tariffs May Negatively Impact US Installation Prices
0
5
10
15
20
25
30
2016201520142013201220112010200920082007200620052004
Annual Residential PV
Annual Commercial PV
Annual Utility-scale PV
Cumulative Residential PV
Cumulative Commercial PV
Cumulative Utility-scale PV
Gigawatt DC
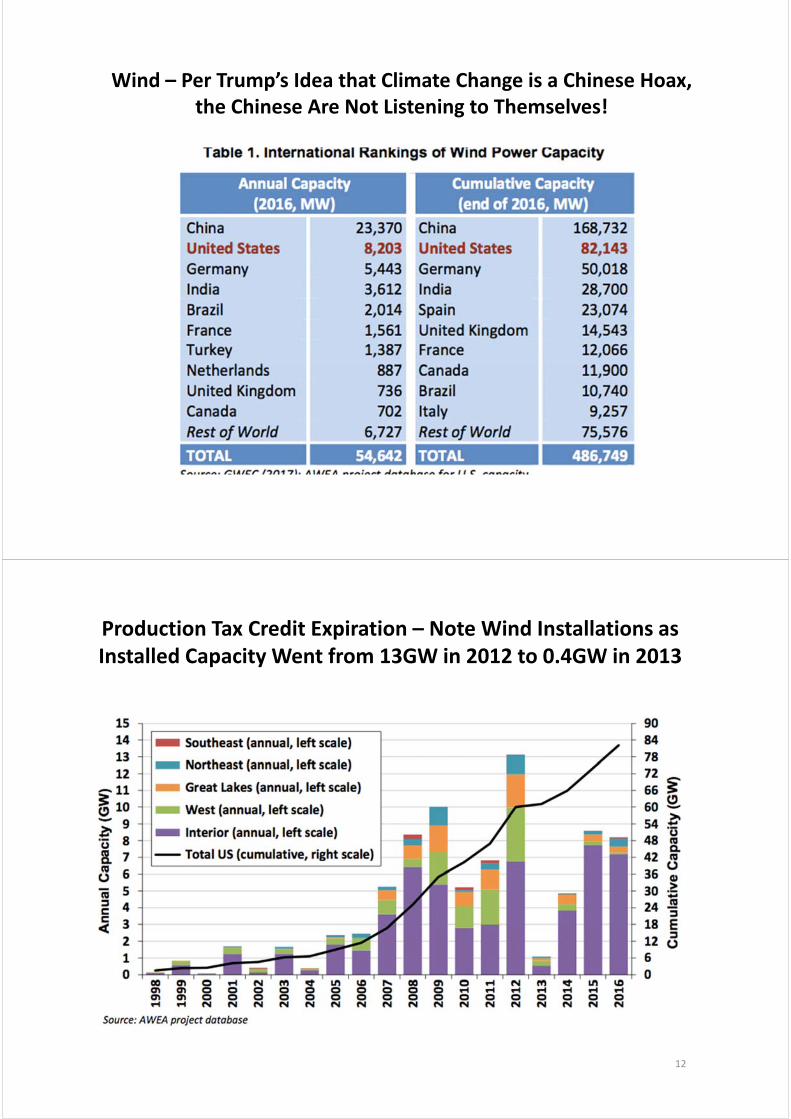
Wind – Per Trump’s Idea that Climate Change is a Chinese Hoax, the Chinese Are Not Listening to Themselves!
Production Tax Credit Expiration – Note Wind Installations as Installed Capacity Went from 13GW in 2012 to 0.4GW in 2013
12
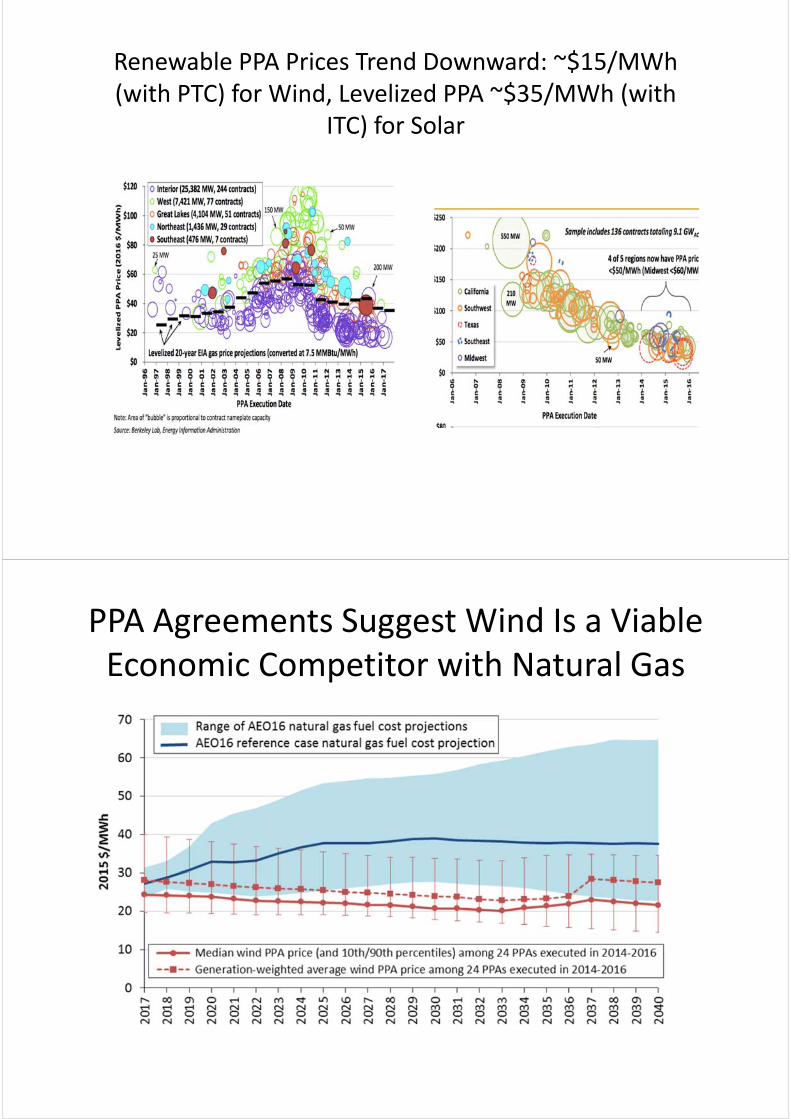
Renewable PPA Prices Trend Downward: ~$15/MWh(with PTC) for Wind, Levelized PPA ~$35/MWh (with
ITC) for Solar
PPA Agreements Suggest Wind Is a Viable Economic Competitor with Natural Gas
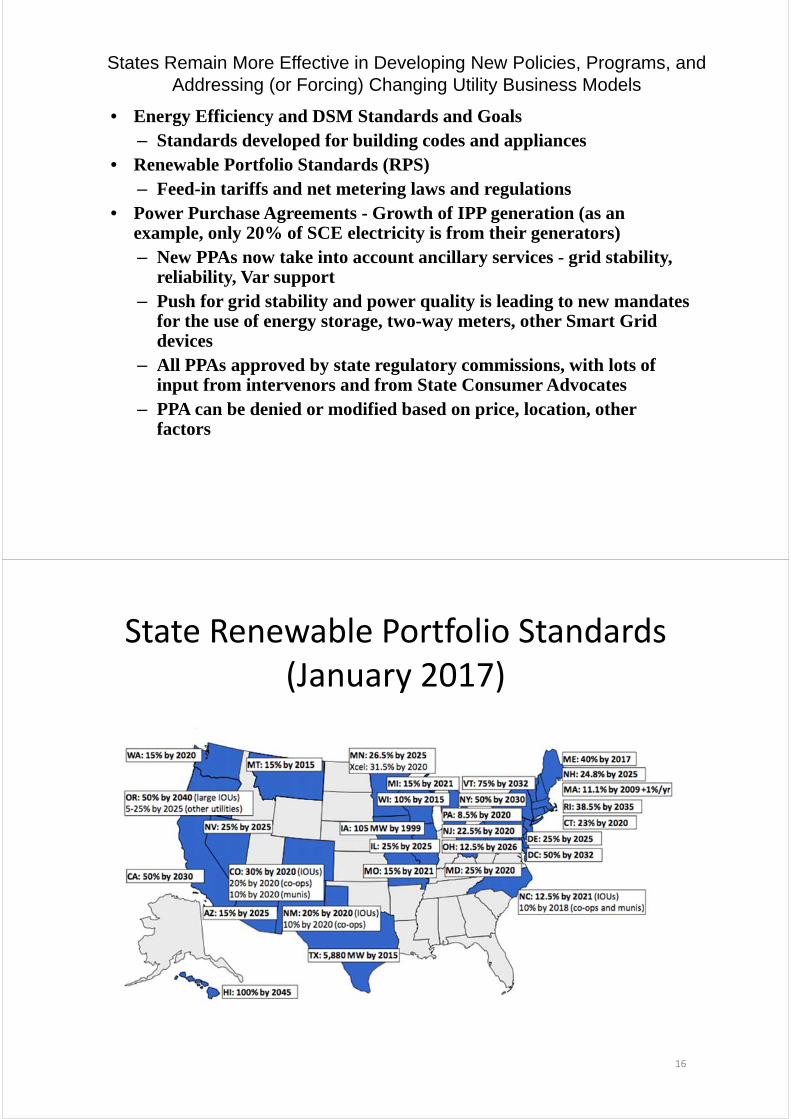
States Remain More Effective in Developing New Policies, Programs, and Addressing (or Forcing) Changing Utility Business Models
• Energy Efficiency and DSM Standards and Goals– Standards developed for building codes and appliances
• Renewable Portfolio Standards (RPS)– Feed-in tariffs and net metering laws and regulations
• Power Purchase Agreements - Growth of IPP generation (as an example, only 20% of SCE electricity is from their generators)– New PPAs now take into account ancillary services - grid stability,
reliability, Var support– Push for grid stability and power quality is leading to new mandates
for the use of energy storage, two-way meters, other Smart Grid devices
– All PPAs approved by state regulatory commissions, with lots of input from intervenors and from State Consumer Advocates
– PPA can be denied or modified based on price, location, other factors
State Renewable Portfolio Standards (January 2017)
16
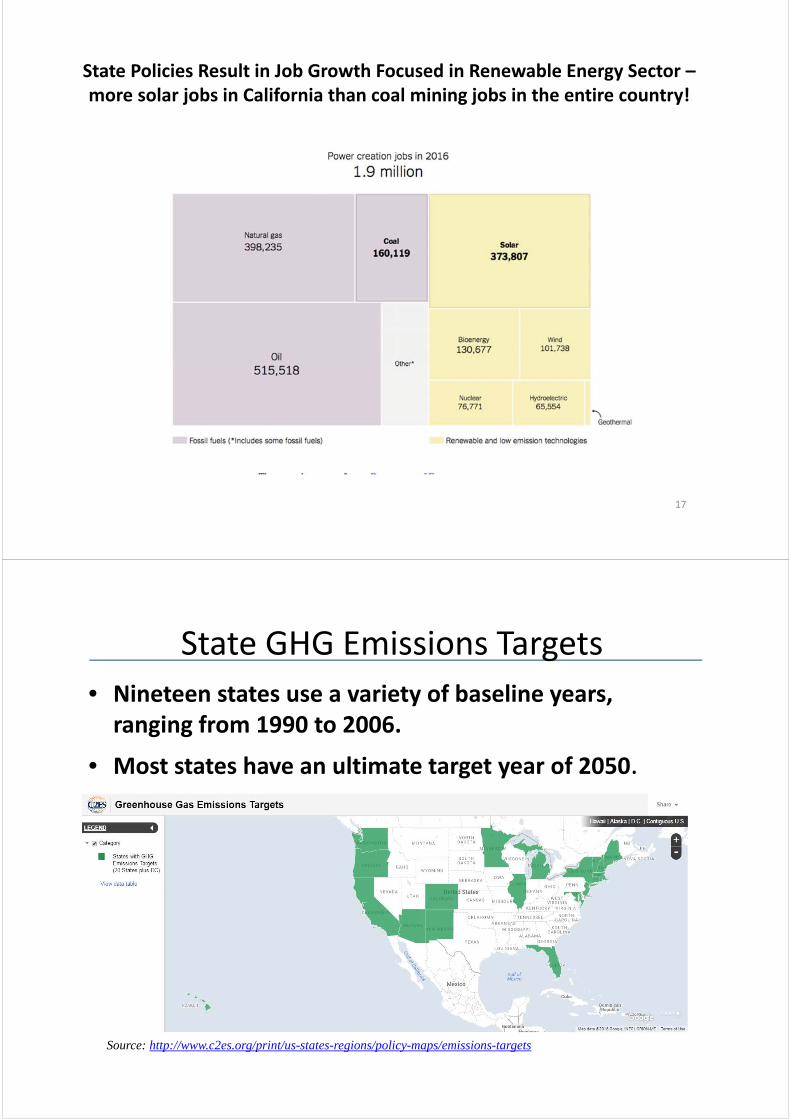
State Policies Result in Job Growth Focused in Renewable Energy Sector –more solar jobs in California than coal mining jobs in the entire country!
17
18
State GHG Emissions Targets
• Nineteen states use a variety of baseline years, ranging from 1990 to 2006.
• Most states have an ultimate target year of 2050.
Source: http://www.c2es.org/print/us-states-regions/policy-maps/emissions-targets
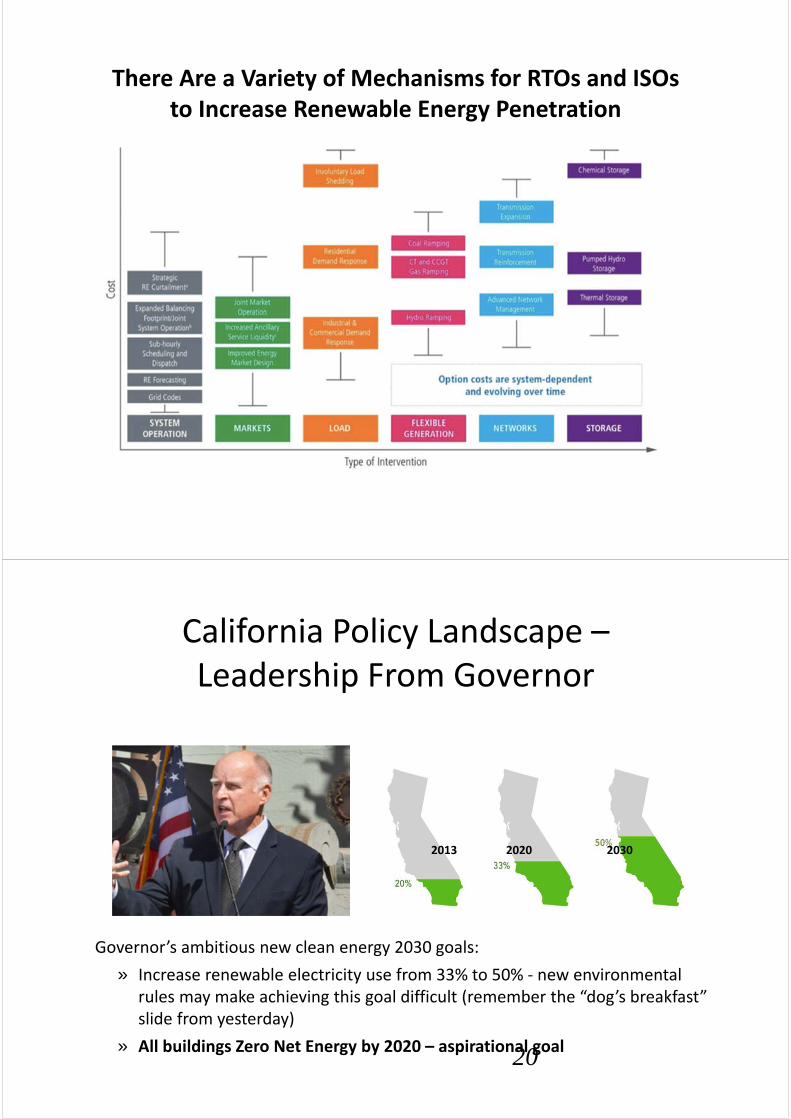
There Are a Variety of Mechanisms for RTOs and ISOs to Increase Renewable Energy Penetration
California Policy Landscape –Leadership From Governor
20
Governor’s ambitious new clean energy 2030 goals:
» Increase renewable electricity use from 33% to 50% ‐ new environmental rules may make achieving this goal difficult (remember the “dog’s breakfast” slide from yesterday)
» All buildings Zero Net Energy by 2020 – aspirational goal
2013 2020 2030
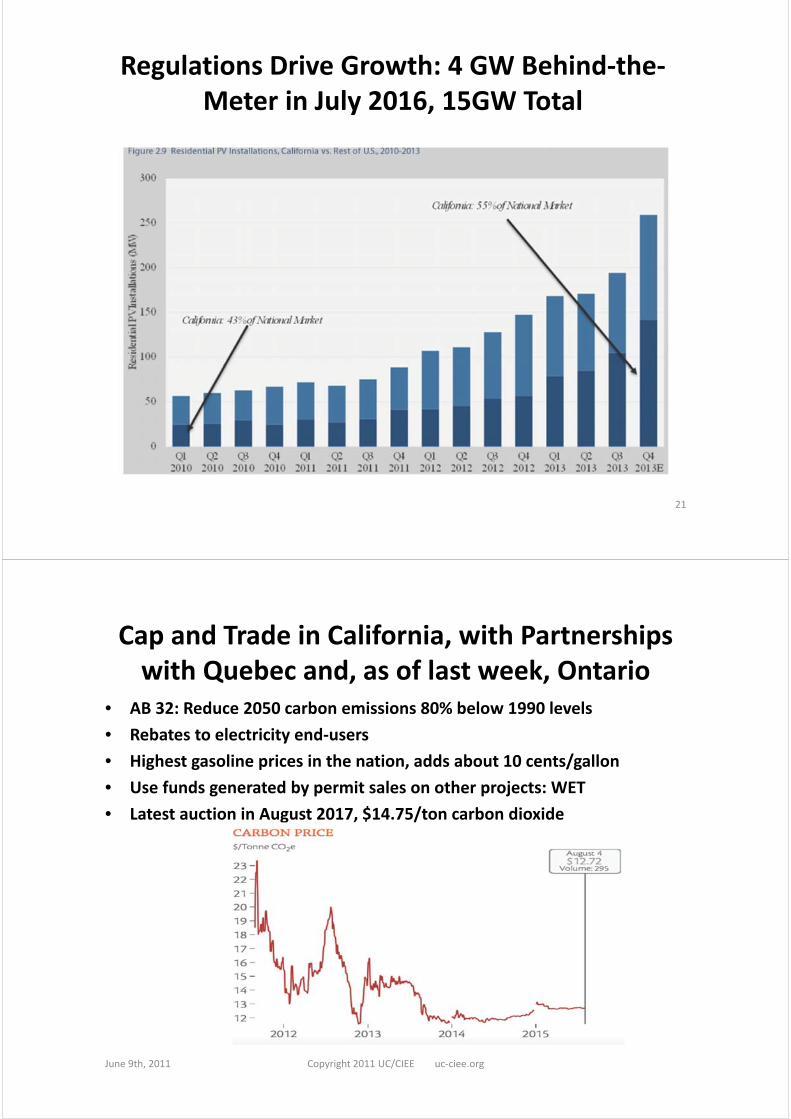
Regulations Drive Growth: 4 GW Behind‐the‐Meter in July 2016, 15GW Total
21
Cap and Trade in California, with Partnerships with Quebec and, as of last week, Ontario
June 9th, 2011 Copyright 2011 UC/CIEE uc‐ciee.org
• AB 32: Reduce 2050 carbon emissions 80% below 1990 levels
• Rebates to electricity end‐users
• Highest gasoline prices in the nation, adds about 10 cents/gallon
• Use funds generated by permit sales on other projects: WET
• Latest auction in August 2017, $14.75/ton carbon dioxide
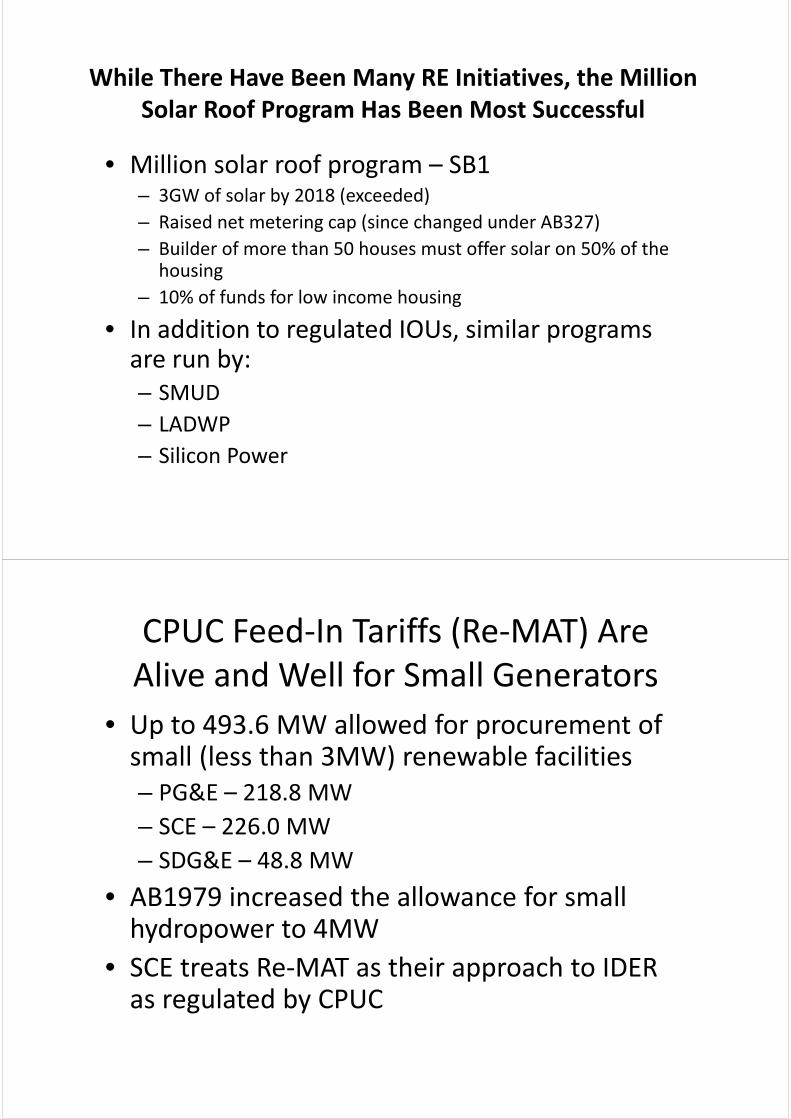
While There Have Been Many RE Initiatives, the Million Solar Roof Program Has Been Most Successful
• Million solar roof program – SB1– 3GW of solar by 2018 (exceeded)
– Raised net metering cap (since changed under AB327)
– Builder of more than 50 houses must offer solar on 50% of the housing
– 10% of funds for low income housing
• In addition to regulated IOUs, similar programs are run by:– SMUD
– LADWP
– Silicon Power
CPUC Feed‐In Tariffs (Re‐MAT) Are Alive and Well for Small Generators
• Up to 493.6 MW allowed for procurement of small (less than 3MW) renewable facilities– PG&E – 218.8 MW
– SCE – 226.0 MW
– SDG&E – 48.8 MW
• AB1979 increased the allowance for small hydropower to 4MW
• SCE treats Re‐MAT as their approach to IDER as regulated by CPUC
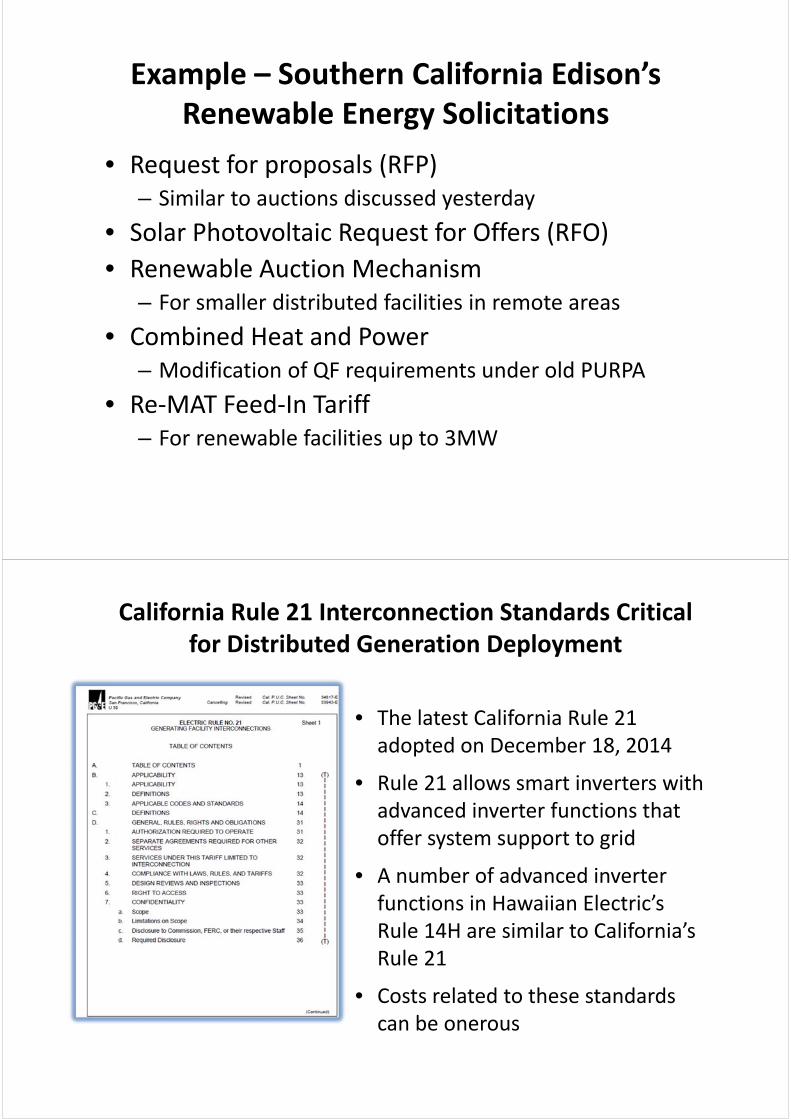
Example – Southern California Edison’s Renewable Energy Solicitations
• Request for proposals (RFP)– Similar to auctions discussed yesterday
• Solar Photovoltaic Request for Offers (RFO)
• Renewable Auction Mechanism– For smaller distributed facilities in remote areas
• Combined Heat and Power– Modification of QF requirements under old PURPA
• Re‐MAT Feed‐In Tariff– For renewable facilities up to 3MW
California Rule 21 Interconnection Standards Critical for Distributed Generation Deployment
• The latest California Rule 21 adopted on December 18, 2014
• Rule 21 allows smart inverters with advanced inverter functions that offer system support to grid
• A number of advanced inverter functions in Hawaiian Electric’s Rule 14H are similar to California’s Rule 21
• Costs related to these standards can be onerous
AB 2514 – Landmark Energy Storage Law in California
27
» Considered establishing Energy Storage Procurement Targets for 2020» IF cost-effective» IF commercially available
» Directed California Public Utility Commission to convene a proceeding to evaluate energy storage procurement targets:
Required CPUC to consider information from CAISO and integration of storage with other programs, including demand side management Utility-owned, customer-owned, and third party-owned are eligible
CPUC decision on October 17, 2013 requires utilities to purchase 1.3 GW of storage
400 MW permitted to date
CaliforniaEnergy Storage Businesses Source: California Energy Storage Alliance, 1/15
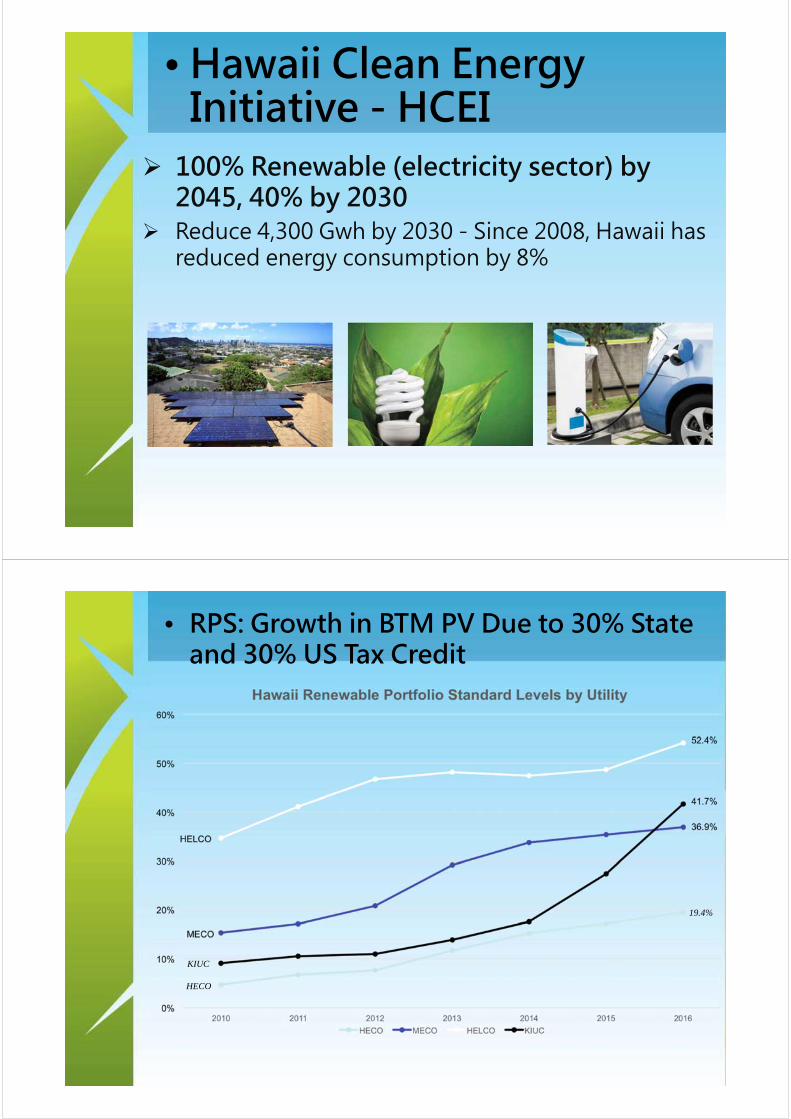
• Hawaii Clean Energy Initiative - HCEI
100% Renewable (electricity sector) by 2045, 40% by 2030
Reduce 4,300 Gwh by 2030 - Since 2008, Hawaii has reduced energy consumption by 8%
• RPS: Growth in BTM PV Due to 30% State and 30% US Tax Credit
HECO
KIUC
19.4%
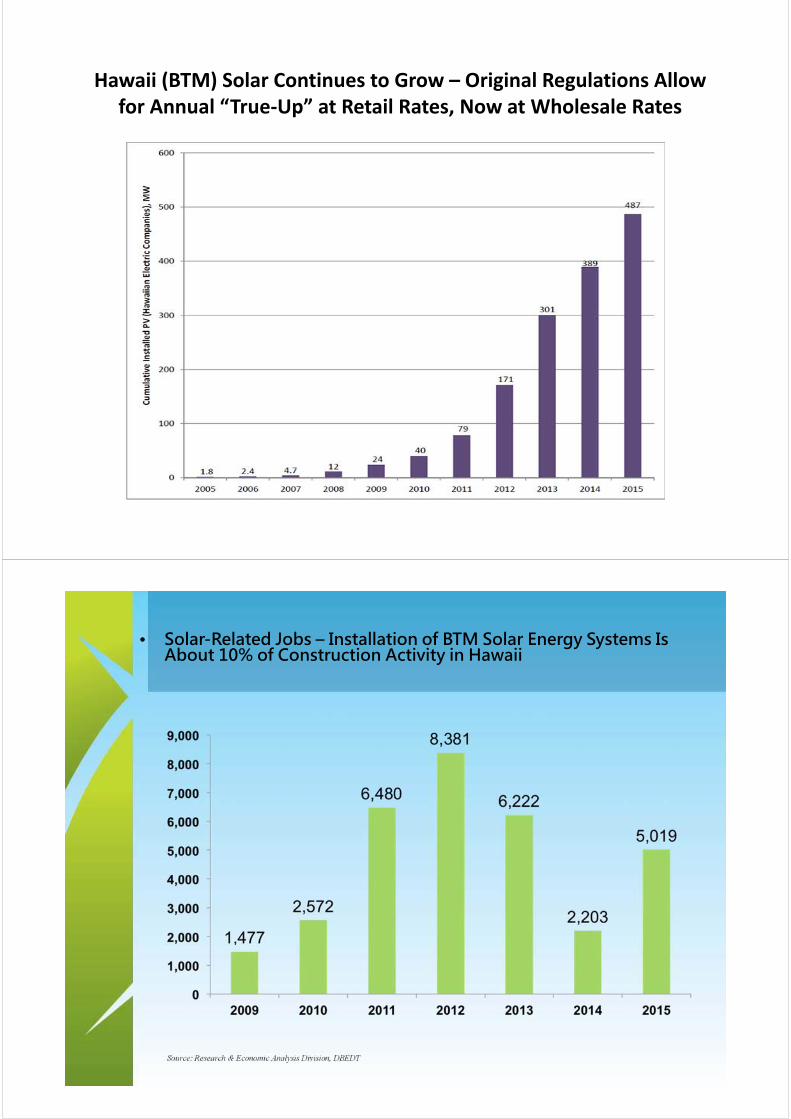
Hawaii (BTM) Solar Continues to Grow – Original Regulations Allow for Annual “True‐Up” at Retail Rates, Now at Wholesale Rates
• Solar-Related Jobs – Installation of BTM Solar Energy Systems Is About 10% of Construction Activity in Hawaii
Source: Research & Economic Analysis Division, DBEDT
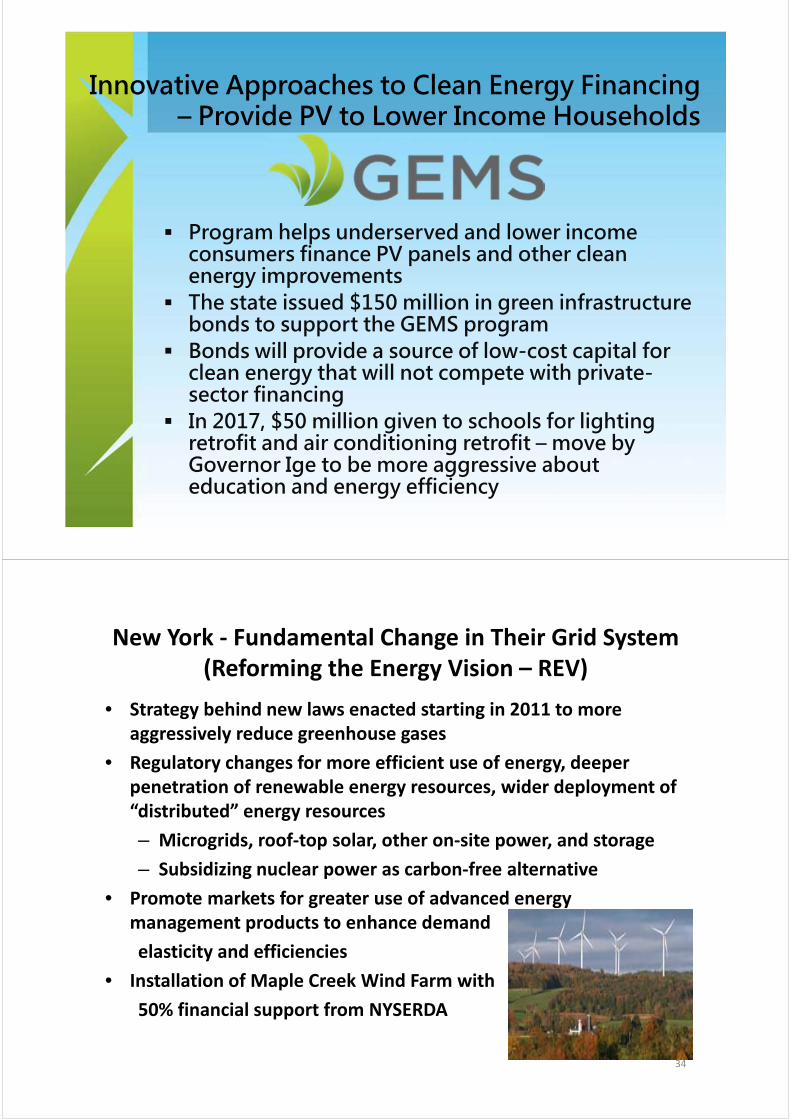
Program helps underserved and lower income consumers finance PV panels and other clean energy improvements
The state issued $150 million in green infrastructure bonds to support the GEMS program
Bonds will provide a source of low-cost capital for clean energy that will not compete with private-sector financing
In 2017, $50 million given to schools for lighting retrofit and air conditioning retrofit – move by Governor Ige to be more aggressive about education and energy efficiency
Innovative Approaches to Clean Energy Financing – Provide PV to Lower Income Households
New York ‐ Fundamental Change in Their Grid System (Reforming the Energy Vision – REV)
34
• Strategy behind new laws enacted starting in 2011 to more aggressively reduce greenhouse gases
• Regulatory changes for more efficient use of energy, deeper penetration of renewable energy resources, wider deployment of “distributed” energy resources
– Microgrids, roof‐top solar, other on‐site power, and storage
– Subsidizing nuclear power as carbon‐free alternative
• Promote markets for greater use of advanced energy management products to enhance demand
elasticity and efficiencies
• Installation of Maple Creek Wind Farm with
50% financial support from NYSERDA
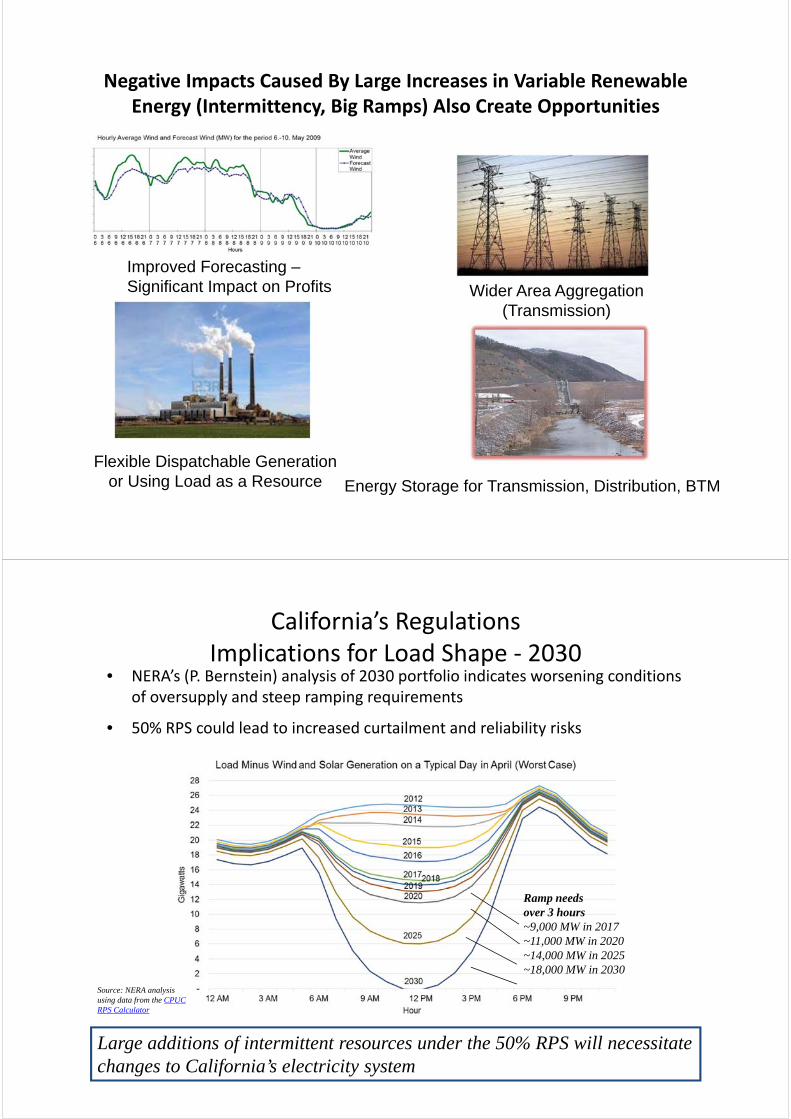
Negative Impacts Caused By Large Increases in Variable Renewable Energy (Intermittency, Big Ramps) Also Create Opportunities
Wider Area Aggregation(Transmission)
Improved Forecasting –Significant Impact on Profits
Energy Storage for Transmission, Distribution, BTM
Flexible Dispatchable Generation or Using Load as a Resource
California’s RegulationsImplications for Load Shape ‐ 2030
Ramp needs over 3 hours~9,000 MW in 2017~11,000 MW in 2020~14,000 MW in 2025~18,000 MW in 2030
Large additions of intermittent resources under the 50% RPS will necessitate changes to California’s electricity system
Source: NERA analysis using data from the CPUC RPS Calculator
• NERA’s (P. Bernstein) analysis of 2030 portfolio indicates worsening conditions of oversupply and steep ramping requirements
• 50% RPS could lead to increased curtailment and reliability risks
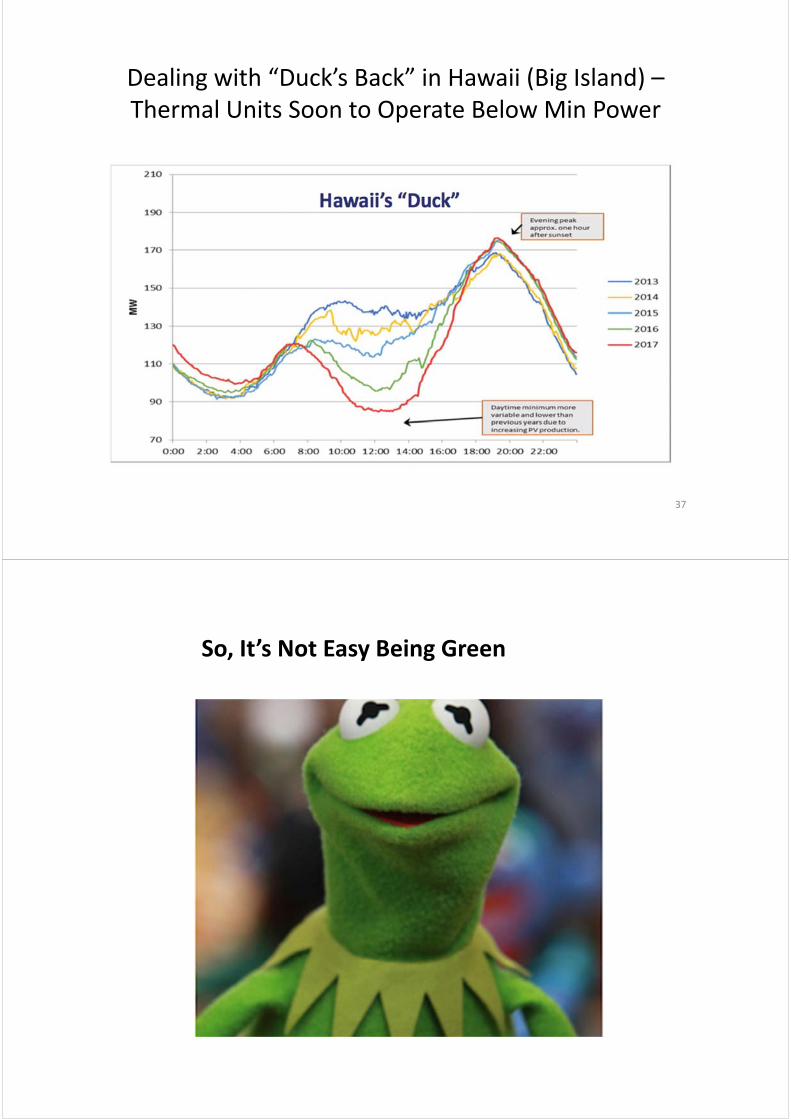
Dealing with “Duck’s Back” in Hawaii (Big Island) –Thermal Units Soon to Operate Below Min Power
37
So, It’s Not Easy Being Green
Renewable DG Has Most Impacts at Distribution Level: “Smart Grid” Solutions Offer Opportunities to SMEs• Many assets are aging, and based mostly on old (~1950s) technology:
• Little monitoring & control ability beyond substation
• Not designed for generation at the customer level• Two‐way power flow and potential for islanding create threats to human safety, asset protection and life, and power quality control
39
Need for Telecommunications – How Do Utilities Plan for and Manage Tsunami of Data Coming Their Way?
40
Distribution Level Line Monitoring
(microPMU)
SCADA
Weather Data
Customer Meters
Time Series Analysis Gen. Dispatch
Steady State AnalysisDynamic Response (Electromechanical)
Transient Response (Electromagnetic)
Switching/Lightning/GFOV Power Quality Protection (short-circuit, etc.) EconomicsFore-
casting
Micro-secs Milli-secs Seconds Minutes Hours Days
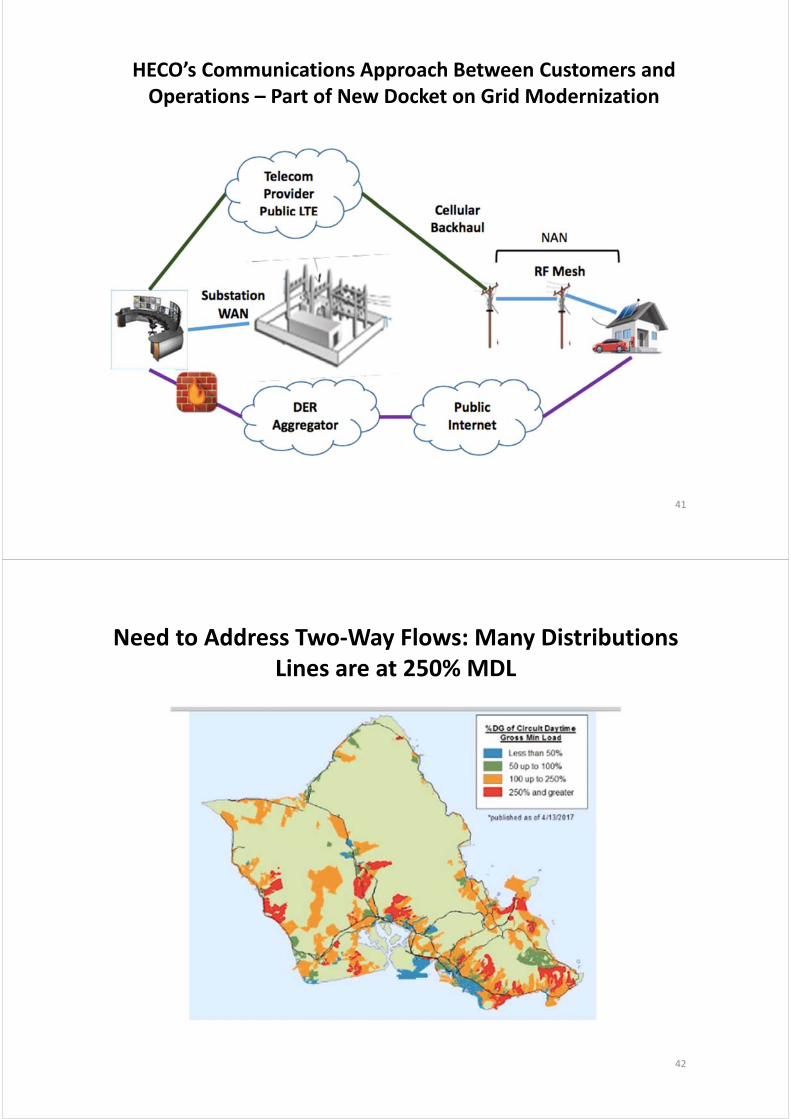
HECO’s Communications Approach Between Customers and Operations – Part of New Docket on Grid Modernization
41
Need to Address Two‐Way Flows: Many Distributions Lines are at 250% MDL
42
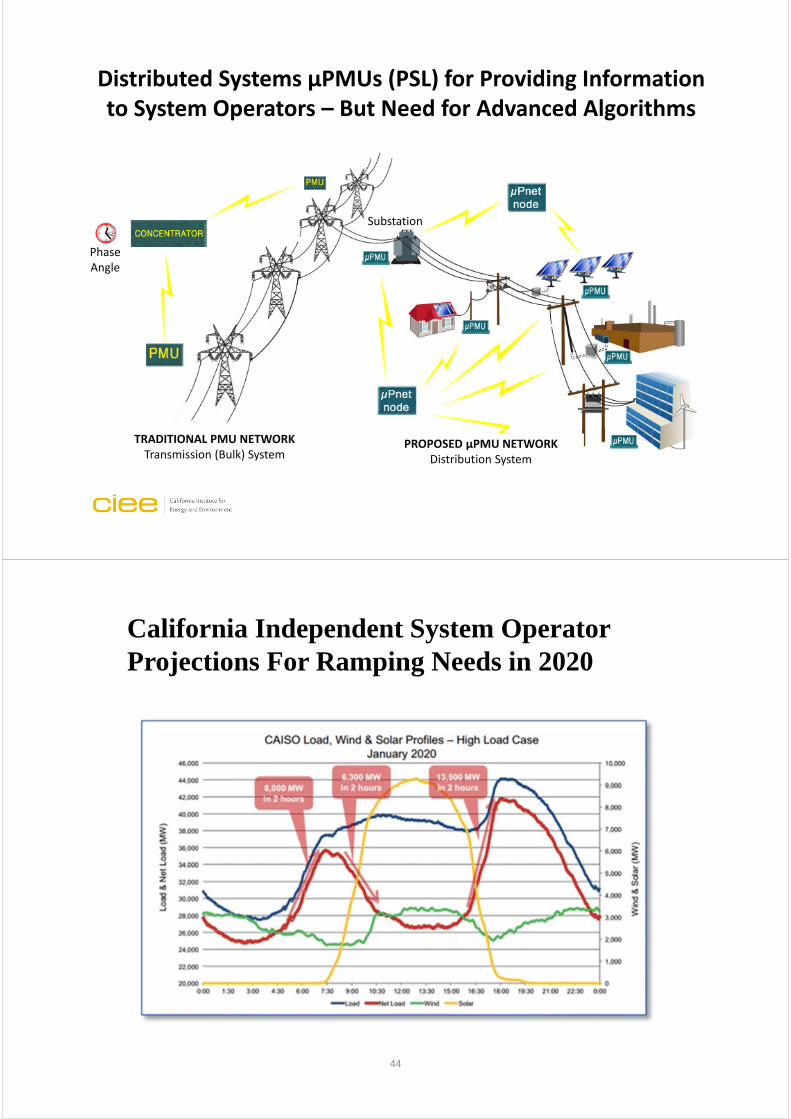
TRADITIONAL PMU NETWORKTransmission (Bulk) System
PROPOSED μPMU NETWORKDistribution System
Phase Angle
Substation
Distributed Systems µPMUs (PSL) for Providing Information to System Operators – But Need for Advanced Algorithms
:
44
California Independent System Operator Projections For Ramping Needs in 2020
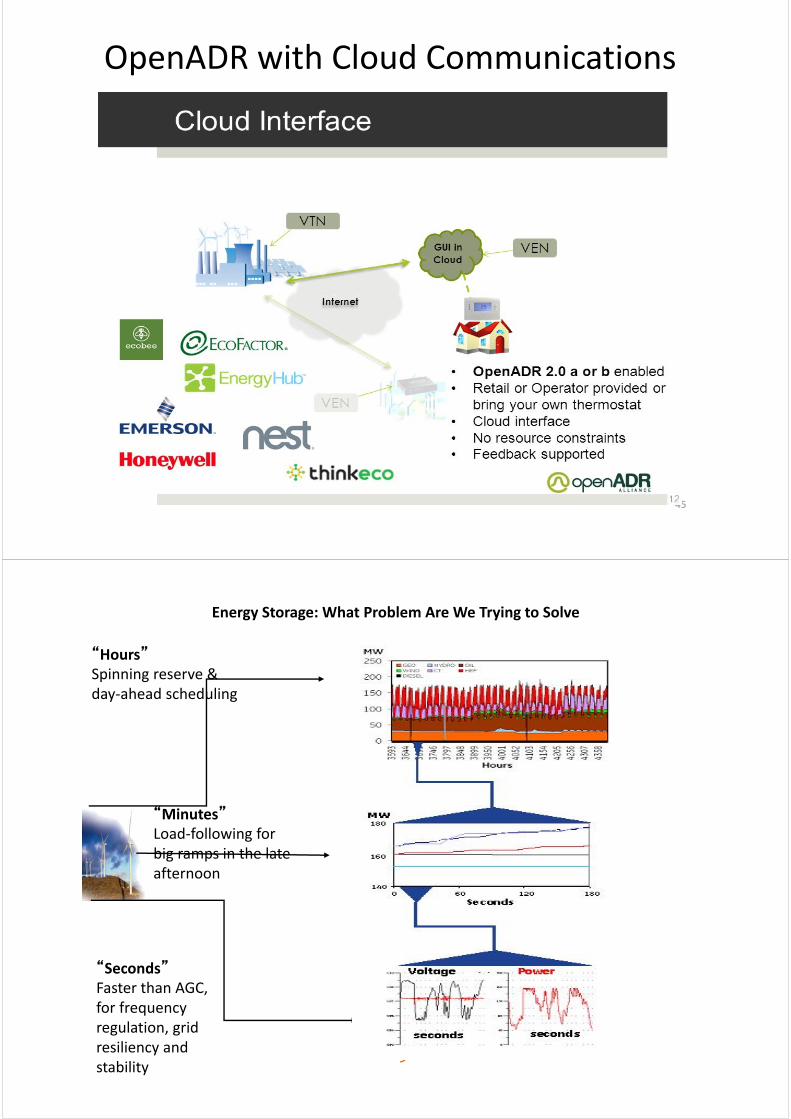
OpenADR with Cloud Communications
45
“Seconds”Faster than AGC, for frequency regulation, grid resiliency and stability
“Minutes”Load‐following for big ramps in the late afternoon
“Hours”Spinning reserve &day‐ahead scheduling
Energy Storage: What Problem Are We Trying to Solve
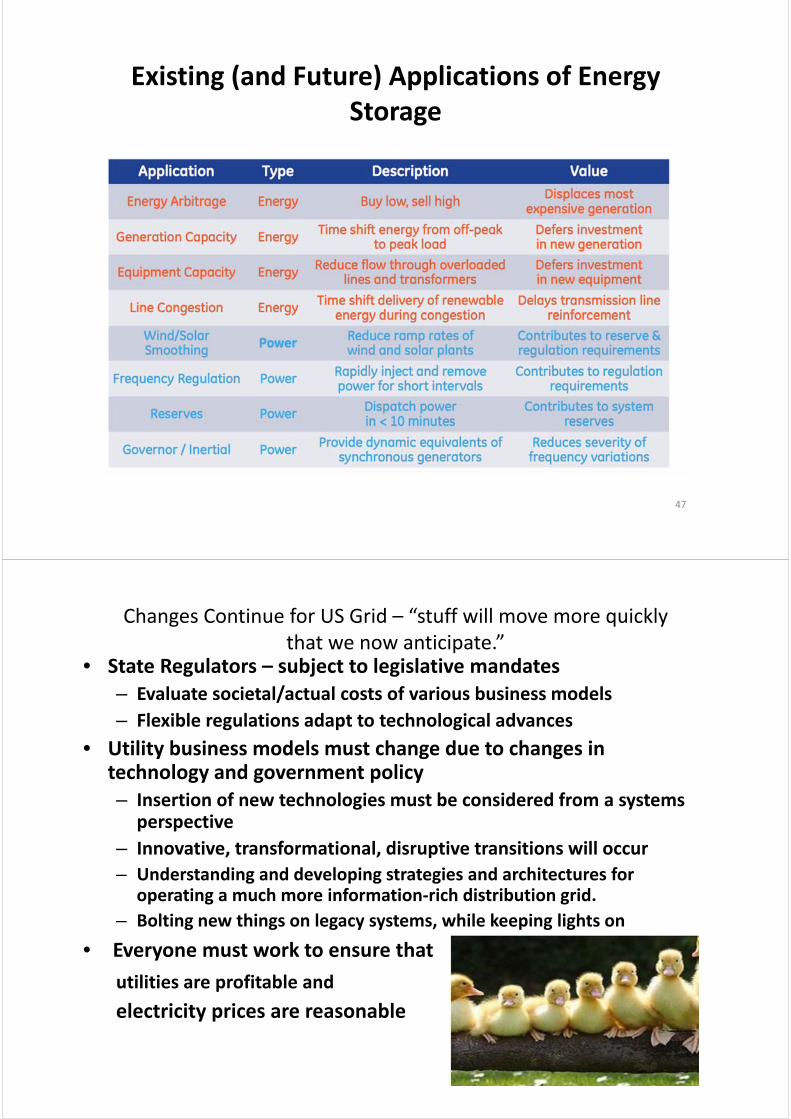
Existing (and Future) Applications of Energy Storage
47
Changes Continue for US Grid – “stuff will move more quickly that we now anticipate.”
• State Regulators – subject to legislative mandates– Evaluate societal/actual costs of various business models
– Flexible regulations adapt to technological advances
• Utility business models must change due to changes in technology and government policy– Insertion of new technologies must be considered from a systems
perspective
– Innovative, transformational, disruptive transitions will occur
– Understanding and developing strategies and architectures for operating a much more information‐rich distribution grid.
– Bolting new things on legacy systems, while keeping lights on
• Everyone must work to ensure that
utilities are profitable and
electricity prices are reasonable
48
In 2014, Vietnam MOIT Hosted an APEC Meeting on Facilitating Renewable Deployment
• International standardization is critical for raising capital and in supporting consistent government policies – Bankability – legal and financial services will want to have a
mechanism for properly evaluating the technology and company worth
– Product certification very useful for obtaining capital
• Consistent government policies– Critical for attracting investment– But be flexible in responding to new technologies and other
events
• Make effective use of national resources– Develop national training programs for enhancing intellectual
capacity
• Country collaboration on a regional level
49
Energy Systems’ Complexity, Risk, and the Attendant Policies and Politics - The Future
• “The road that I have turned on, the road that I have taken, it might be the beginning, it might be near the end.”
• Enya, circa 2000
Since This Is the Last Presentation
“Everybody have fun tonight
Everybody Wang Chung tonight!”
Wang Chung, circa 1986
51


