Embed Size (px)
Citation preview

Appendix 17.1
HAZID&RA Report

Indaver Site Sustainability Project Environmental Impact Assessment Report
Issue | 2020 | Arup
Page A1
Appendix 17.1 HAZID&RA Report
Byrne Ó Cléirigh, 30a Westland Square, Pearse Street, Dublin 2, D02 PN76, Ireland. Telephone: + 353 – 1 – 6770733. Facsimile: + 353 – 1 – 6770729. Email: [email protected]. Web: www.boc.ie
Directors: LM Ó Cléirigh BE MIE CEng FIEI FIMechE; LP Ó Cléirigh BE MEngSc MBA CEng FIEI FEI; ST Malone BE MIE CEng FIEI;
JB FitzPatrick FCA. Registered in Dublin, Ireland No. 237982.
Hazard Identification and Risk Assessment at Duleek
Prepared for:
Indaver Ireland Ltd
Ref: 462-20X0066. Rev.1
23rd April 2020
Byrne Ó Cléirigh Consulting i
HAZID Report for Duleek
462-20X0066 April 2020
DISCLAIMER
This report has been prepared by Byrne Ó Cléirigh Limited with all reasonable skill, care and diligence within the terms of the Contract with the Client, incorporating our Terms and Conditions and taking account of the resources devoted to it by agreement with the Client.
We disclaim any responsibility to the Client and others in respect of any matters outside the scope of the above.
This report is confidential to the Client and we accept no responsibility of whatsoever nature to third parties to whom this report, or any part thereof, is made known. Any such party relies upon the report at their own risk.
Byrne Ó Cléirigh Consulting ii
HAZID Report for Duleek
462-20X0066 April 2020
Contents
1 INTRODUCTION ................................................................................................................... 1
1.1 Background ................................................................................................................... 1
1.2 Description of Site ......................................................................................................... 1
1.3 Description of Surroundings ........................................................................................... 1
1.3.1 Neighbouring Land Use ........................................................................................................... 1
1.3.2 Geology and Hydrogeology ..................................................................................................... 1
1.3.3 Flora and Fauna ....................................................................................................................... 1
1.3.4 Weather Conditions................................................................................................................. 1
1.3.5 Listed Buildings and Monuments ............................................................................................ 1
2 HAZARD IDENTIFICATION AND RISK ASSESSMENT ................................................................. 1
2.1 Risk Assessment Methodology ....................................................................................... 1
2.1.1 HAZID&RA Team ...................................................................................................................... 1
2.1.2 Areas Assessed ........................................................................................................................ 1
2.1.3 Accident Scenarios................................................................................................................... 2
2.1.4 Assessment of Severity Ratings ............................................................................................... 2
2.1.5 Identification of Initiating Events ............................................................................................ 3
2.1.6 Assessment of Frequency Ratings ........................................................................................... 3
2.1.7 Calculation of Risk Rating ........................................................................................................ 4
2.2 Human Factors .............................................................................................................. 6
2.3 Criteria for eliminating scenarios from the risk assessment ............................................. 6
2.4 External Impacts / Off Site Risks ..................................................................................... 7
2.4.1 Earthquake .............................................................................................................................. 7
2.4.2 Flooding ................................................................................................................................... 9
2.4.3 Power Failure ......................................................................................................................... 10
2.4.4 Lightning ................................................................................................................................ 10
2.4.5 Extreme Weather Conditions ................................................................................................ 10
2.4.6 Aircraft impact ....................................................................................................................... 12
2.4.7 Off-site initiating events .......................................................................................................... 1
2.5 Suitability of information used ....................................................................................... 1
2.5.1 Consequence modelling – Thermal radiation endpoints ........................................................ 2
2.5.2 Consequence modelling – Explosion overpressures ............................................................... 2
2.5.3 Consequence modelling – Acute toxic exposure..................................................................... 3
2.5.4 Assessment of impacts – Releases to the aquatic environment ............................................. 3
2.5.5 Weather data for consequence modelling .............................................................................. 4
Byrne Ó Cléirigh Consulting iii
HAZID Report for Duleek
462-20X0066 April 2020
2.6 Credible Scenario Trail ................................................................................................... 4
2.7 Detailed subset of accident scenarios ............................................................................. 5
2.7.1 Bunker Fire .............................................................................................................................. 5
2.7.2 Loss of containment of aqueous ammonia ............................................................................. 6
2.7.3 Fire at Aqueous Waste Tank Farm .......................................................................................... 7
2.7.4 Explosion at Hydrogen Generation Unit .................................................................................. 7
2.8 Consequence Assessment .............................................................................................. 7
2.8.1 Bunker Fires ............................................................................................................................. 7
2.8.2 Loss of containment of aqueous ammonia ........................................................................... 10
2.8.3 Fire at aqueous waste tank farm ........................................................................................... 10
2.8.4 Explosion at hydrogen generation unit ................................................................................. 10
2.9 Demonstration of ALARP ............................................................................................. 11
APPENDIX 1: SITE DRAWINGS
APPENDIX 2: HAZID&RA FLOWCHARTS
APPENIDX 3: HAZARD IDENTIFICATION AND RISK ASSESSMENT WORKSHEETS
APPENDIX 4: RECOMMENDATIONS / ACTION ITEMS
APPENDIX 5: ASSESSMENT OF FLUE GAS RESIDUES
APPENDIX 6: CONSEQUENCE MODELLING FOR BUNKER FIRE SCENARIOS
Byrne Ó Cléirigh Consulting 1
HAZID Report for Duleek
462-20X0066 April 2020
1 INTRODUCTION
1.1 Background
At the request of Indaver Ireland Ltd, Byrne Ó Cléirigh (BÓC) has conducted a Hazard Identification and Risk Assessment (HAZID&RA) exercise for the waste-to-energy centre at Duleek. The Waste-to-Energy site was constructed in 2011 and is designed to recovery energy from the residual fraction of non-hazardous household, commercial and industrial waste.
The HAZID&RA described in this report examines the potential for major accident hazards associated with the existing plant and for the proposed development at the site, with the installation of a an aqueous waste solvent tank farm and a hydrogen generation unit.
1.2 Description of Site
The Duleek Waste-to-Energy site was constructed in 2011. It is situated on the R152 Drogheda to Duleek road and is located in the townland of Carranstown, approximately 3 km north east of Duleek, Co. Meath. The facility consists of a 70 MW WtE plant for the acceptance of up to 235,000 tonnes per annum of household, commercial and industrial waste.
The facility comprises the following main elements:
• the main process building (comprising of tipping hall, waste bunker, furnace boiler, steam turbine, flue gas treatment and ash storage)
• a solidification plant
• an air cooled condenser building
• a maintenance workshop
• a transformer compound and ESB substation with emergency generator
• a security building with weighbridge at facility entrance
• a water storage tank and pump house
• a surface water attenuation pond fire water retention tank
Waste is transported to the site daily by waste contractors. On entering the site, waste contractors follow a two-way route to the tipping hall where inspections on the waste are conducted by Indaver on a routine basis. In the tipping hall, waste is then deposited into the waste bunker where it is mixed by the grab before being placed in the hopper that feeds the furnace. In the furnace, the waste is incinerated at temperatures in excess of 850oC. The ash collected from the bottom of the furnace passes through a wet bath before being stored for collection and removal from the site. The combustion gases from the incineration process pass through a series of treatment stages. These include two stages of dosing (lime milk and lime) for acid removal and two stages of dosing (expanded clay and activated carbon) for dioxin removal, before passing through filter bags and being discharged to atmosphere via the stack.
A site layout drawing is included in Appendix 1.
Byrne Ó Cléirigh Consulting 2
HAZID Report for Duleek
462-20X0066 April 2020
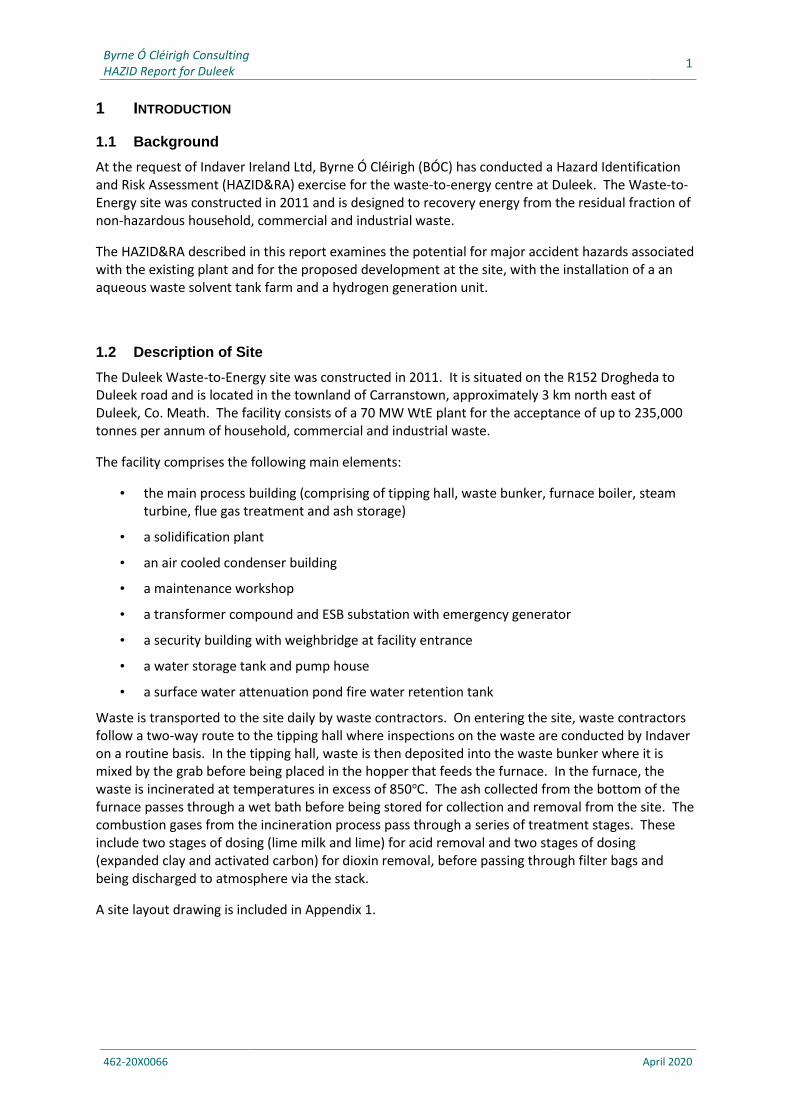
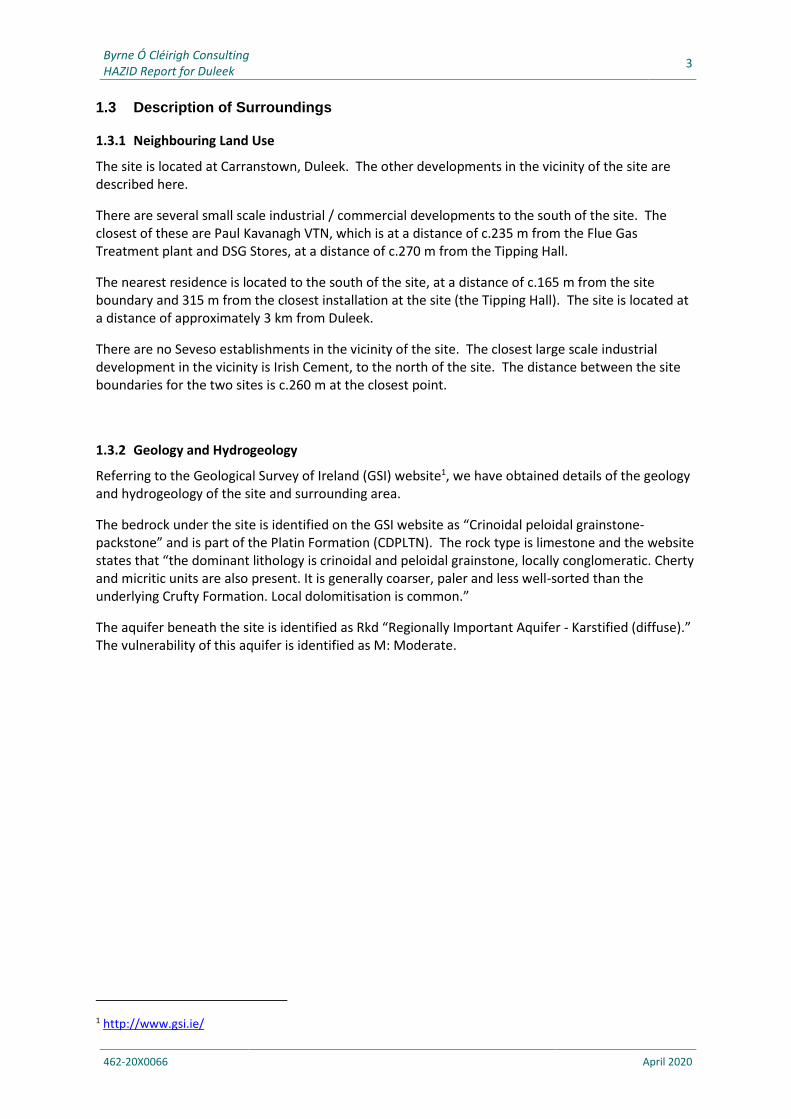
Figure 1-1: Site and Surroundings
Site location
Ordnance Survey Ireland Licence No. AR 0001420 © Ordnance Survey Ireland/Government of Ireland
Byrne Ó Cléirigh Consulting 3
HAZID Report for Duleek
462-20X0066 April 2020
1.3 Description of Surroundings
1.3.1 Neighbouring Land Use
The site is located at Carranstown, Duleek. The other developments in the vicinity of the site are described here.
There are several small scale industrial / commercial developments to the south of the site. The closest of these are Paul Kavanagh VTN, which is at a distance of c.235 m from the Flue Gas Treatment plant and DSG Stores, at a distance of c.270 m from the Tipping Hall.
The nearest residence is located to the south of the site, at a distance of c.165 m from the site boundary and 315 m from the closest installation at the site (the Tipping Hall). The site is located at a distance of approximately 3 km from Duleek.
There are no Seveso establishments in the vicinity of the site. The closest large scale industrial development in the vicinity is Irish Cement, to the north of the site. The distance between the site boundaries for the two sites is c.260 m at the closest point.
1.3.2 Geology and Hydrogeology
Referring to the Geological Survey of Ireland (GSI) website1, we have obtained details of the geology and hydrogeology of the site and surrounding area.
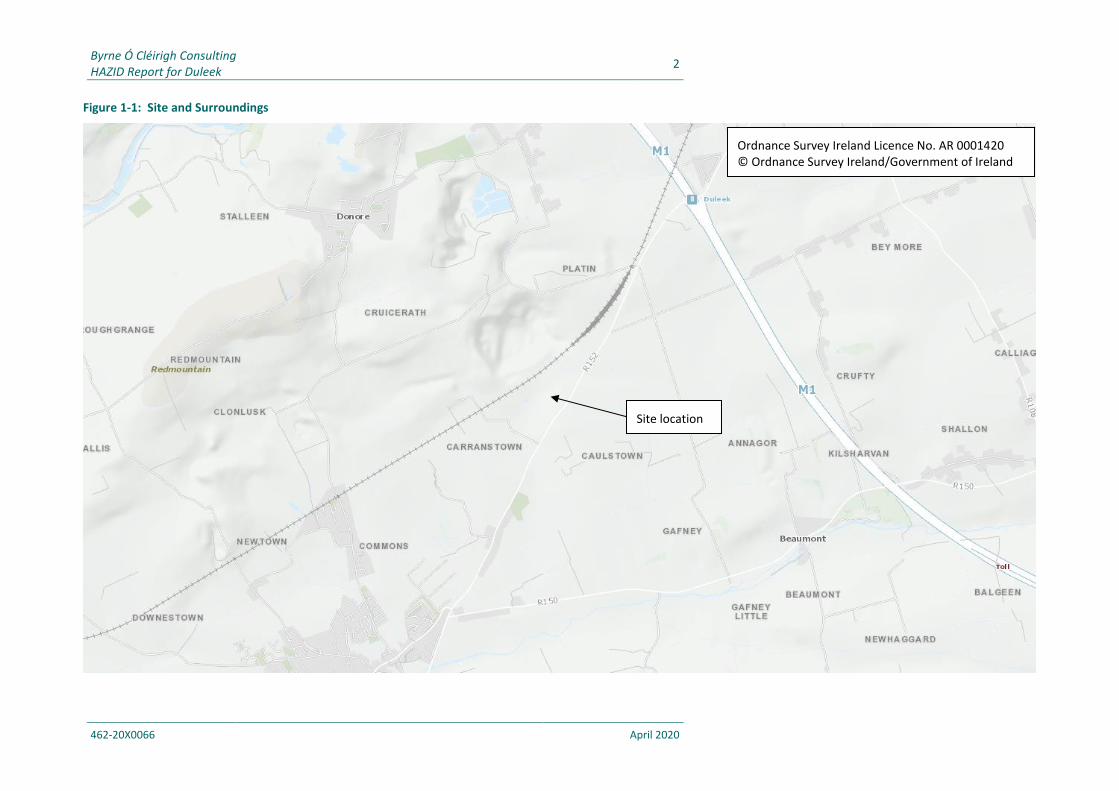
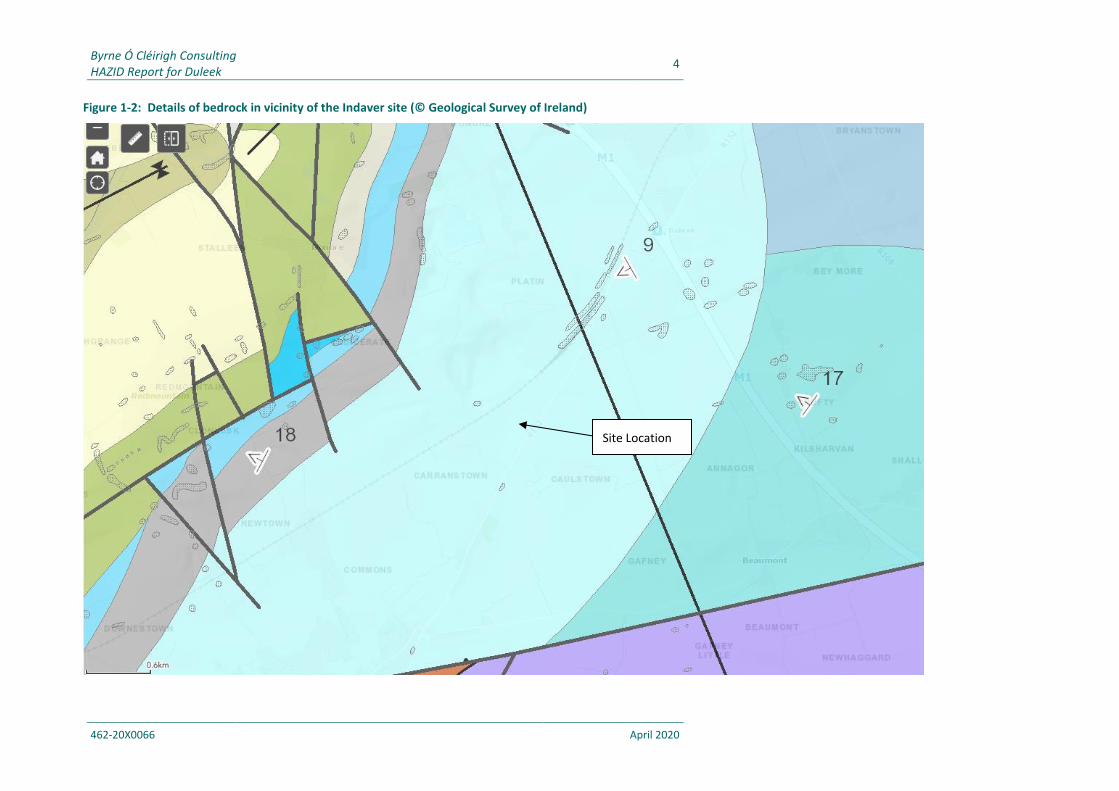
The bedrock under the site is identified on the GSI website as “Crinoidal peloidal grainstone-packstone” and is part of the Platin Formation (CDPLTN). The rock type is limestone and the website states that “the dominant lithology is crinoidal and peloidal grainstone, locally conglomeratic. Cherty and micritic units are also present. It is generally coarser, paler and less well-sorted than the underlying Crufty Formation. Local dolomitisation is common.”
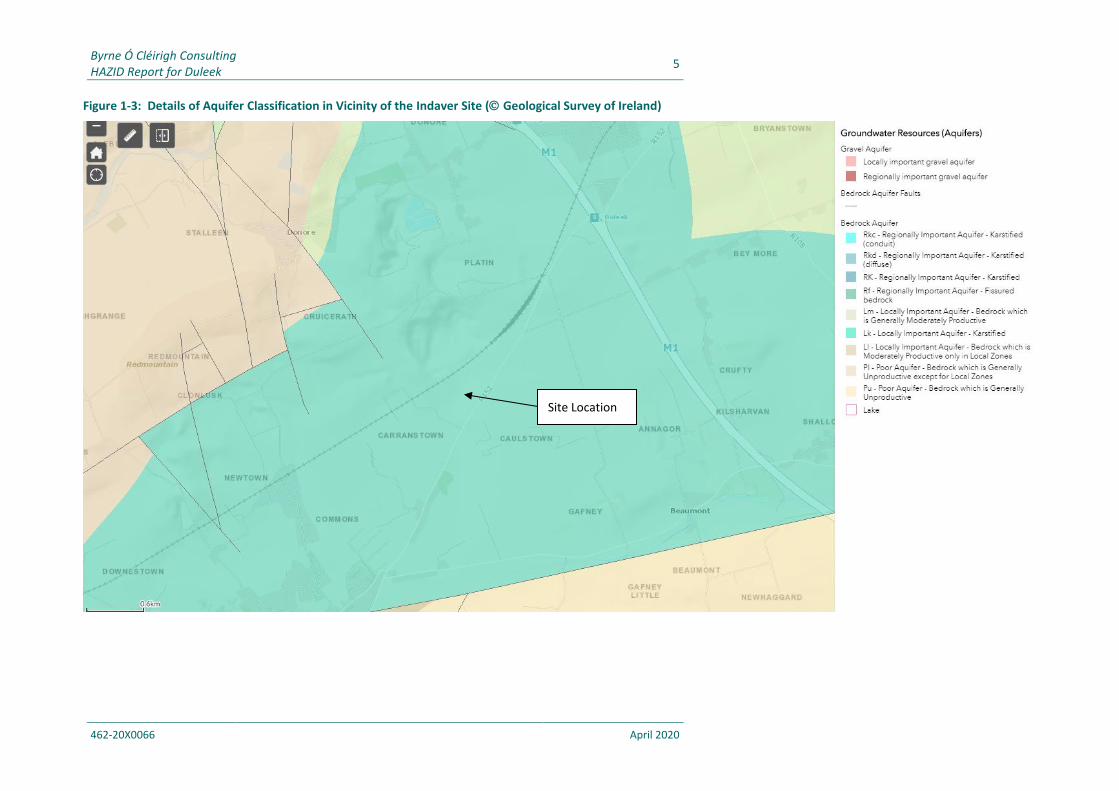
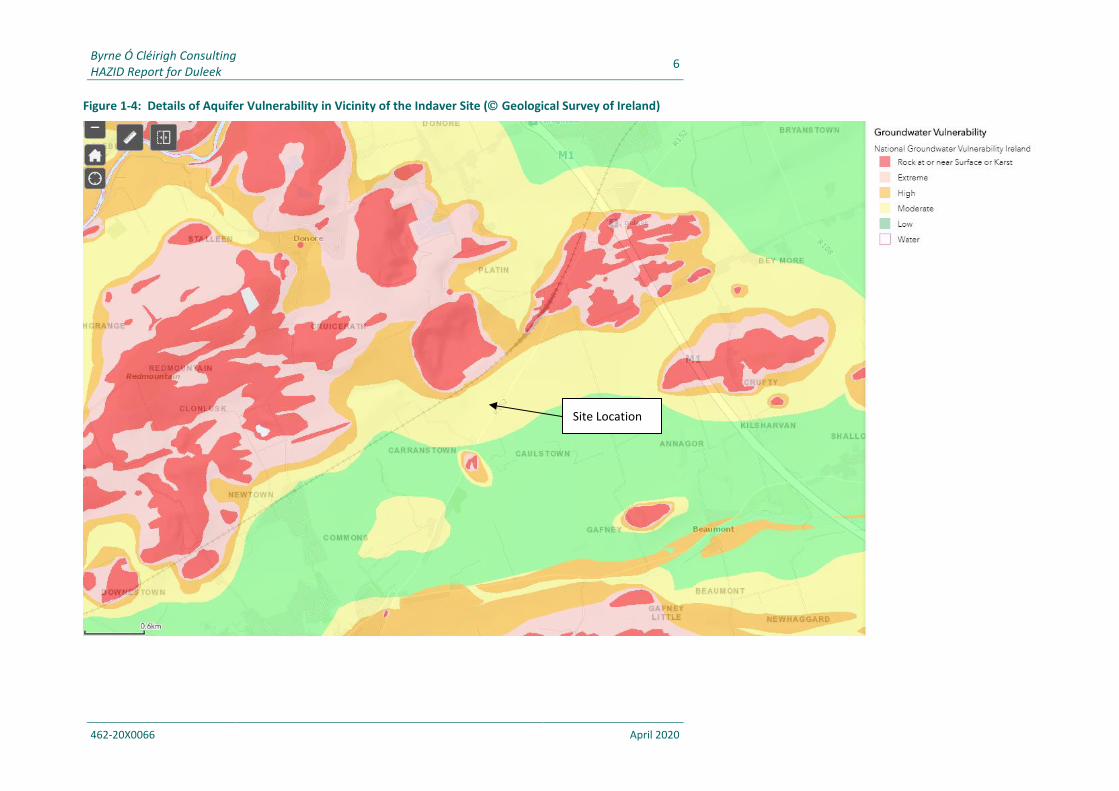
The aquifer beneath the site is identified as Rkd “Regionally Important Aquifer - Karstified (diffuse).” The vulnerability of this aquifer is identified as M: Moderate.
1 http://www.gsi.ie/
Byrne Ó Cléirigh Consulting 4
HAZID Report for Duleek
462-20X0066 April 2020
Figure 1-2: Details of bedrock in vicinity of the Indaver site (© Geological Survey of Ireland)
Site Location
Byrne Ó Cléirigh Consulting 5
HAZID Report for Duleek
462-20X0066 April 2020
Figure 1-3: Details of Aquifer Classification in Vicinity of the Indaver Site ( Geological Survey of Ireland)
Site Location
Byrne Ó Cléirigh Consulting 6
HAZID Report for Duleek
462-20X0066 April 2020
Figure 1-4: Details of Aquifer Vulnerability in Vicinity of the Indaver Site ( Geological Survey of Ireland)
Site Location
Byrne Ó Cléirigh Consulting 7
HAZID Report for Duleek
462-20X0066 April 2020
1.3.3 Flora and Fauna
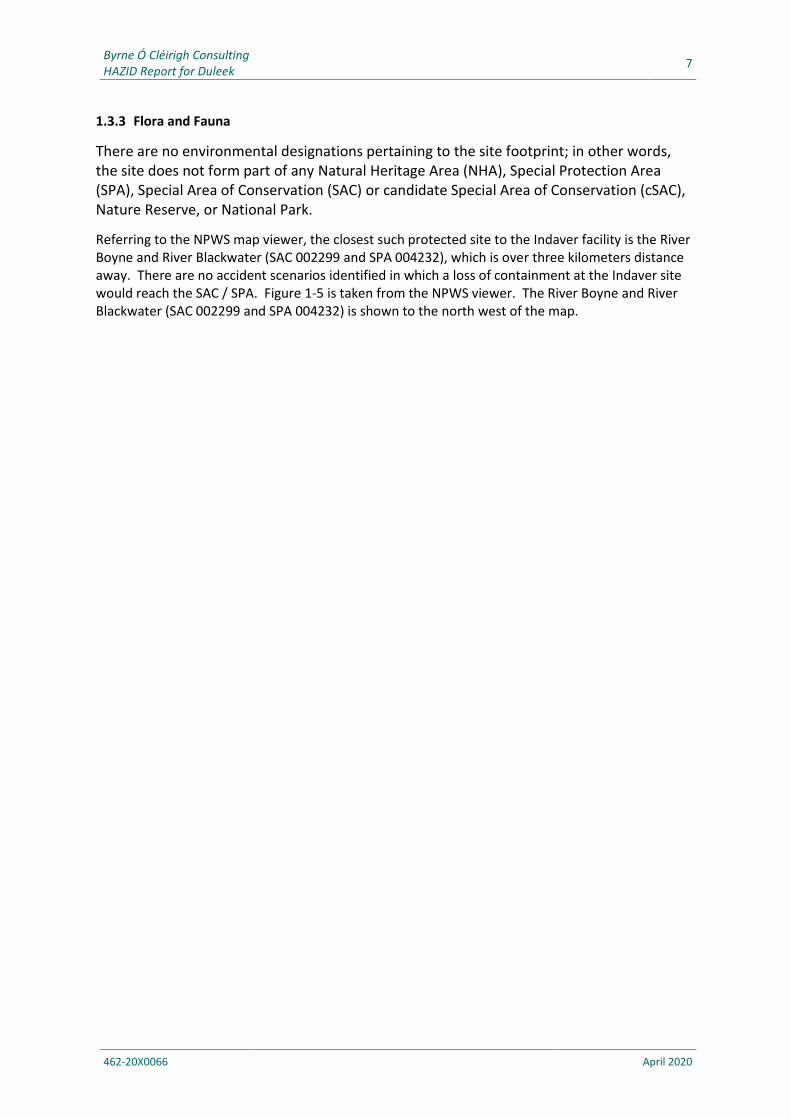
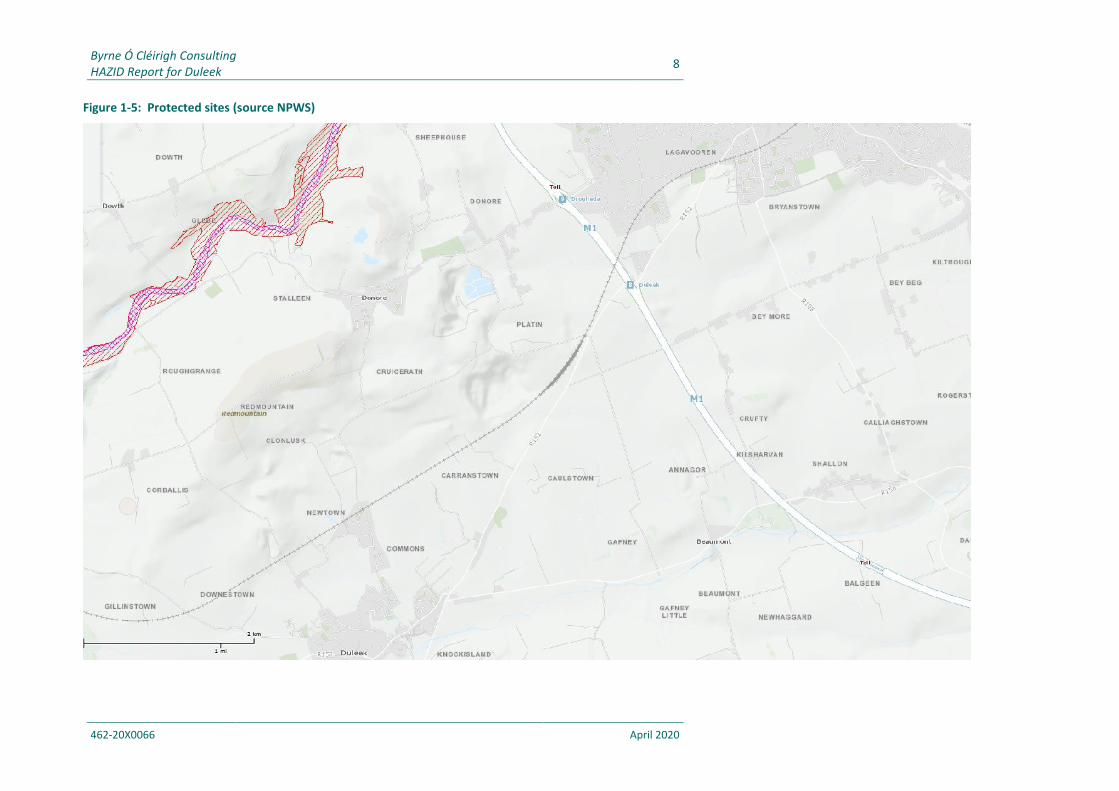
There are no environmental designations pertaining to the site footprint; in other words, the site does not form part of any Natural Heritage Area (NHA), Special Protection Area (SPA), Special Area of Conservation (SAC) or candidate Special Area of Conservation (cSAC), Nature Reserve, or National Park.
Referring to the NPWS map viewer, the closest such protected site to the Indaver facility is the River Boyne and River Blackwater (SAC 002299 and SPA 004232), which is over three kilometers distance away. There are no accident scenarios identified in which a loss of containment at the Indaver site would reach the SAC / SPA. Figure 1-5 is taken from the NPWS viewer. The River Boyne and River Blackwater (SAC 002299 and SPA 004232) is shown to the north west of the map.
Byrne Ó Cléirigh Consulting 8
HAZID Report for Duleek
462-20X0066 April 2020
Figure 1-5: Protected sites (source NPWS)
Byrne Ó Cléirigh Consulting 9
HAZID Report for Duleek
462-20X0066 April 2020
1.3.4 Weather Conditions
For the purposes of the risk assessment exercise detailed in this report, the meteorological parameters of most interest are ambient temperature, wind speed, atmospheric stability and rainfall. High ambient temperatures lead to increased evaporation rates from spilled materials. Low wind speeds and high atmospheric stability lead to reduced dispersion of a release, allowing higher concentrations to accumulate in the atmosphere. High wind speeds on the other hand can give rise to high angles of flame tilt in the event of a pool fire.
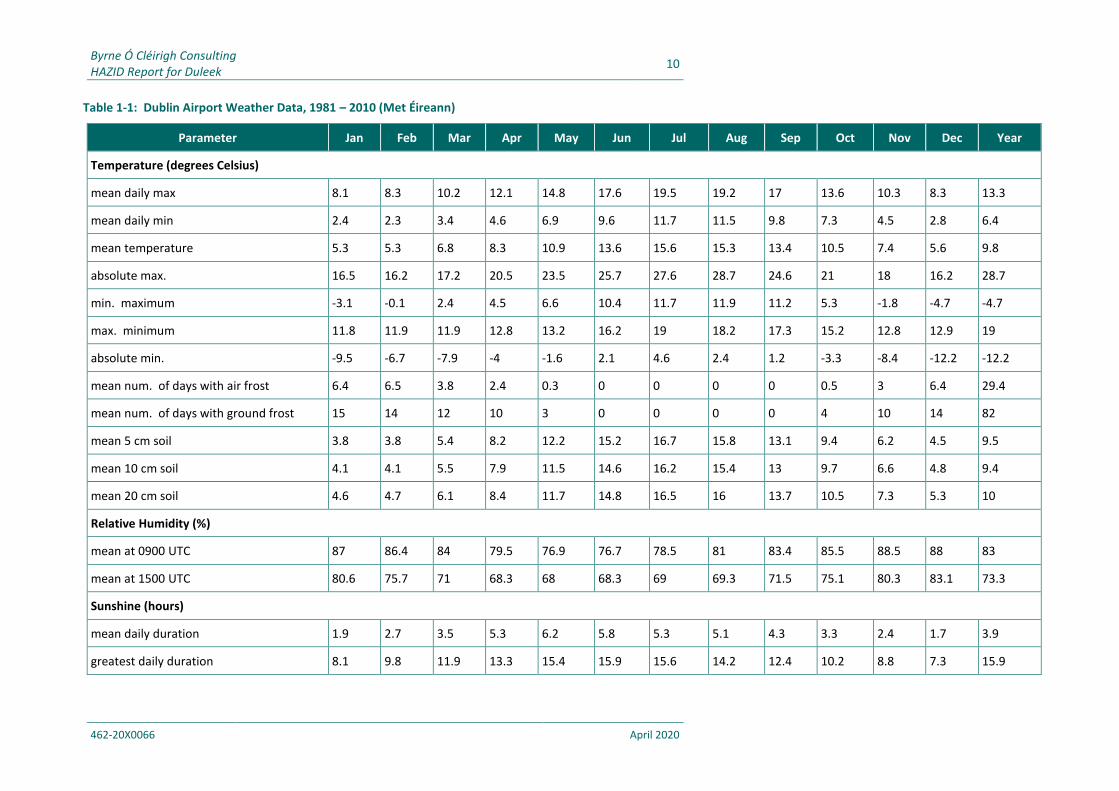
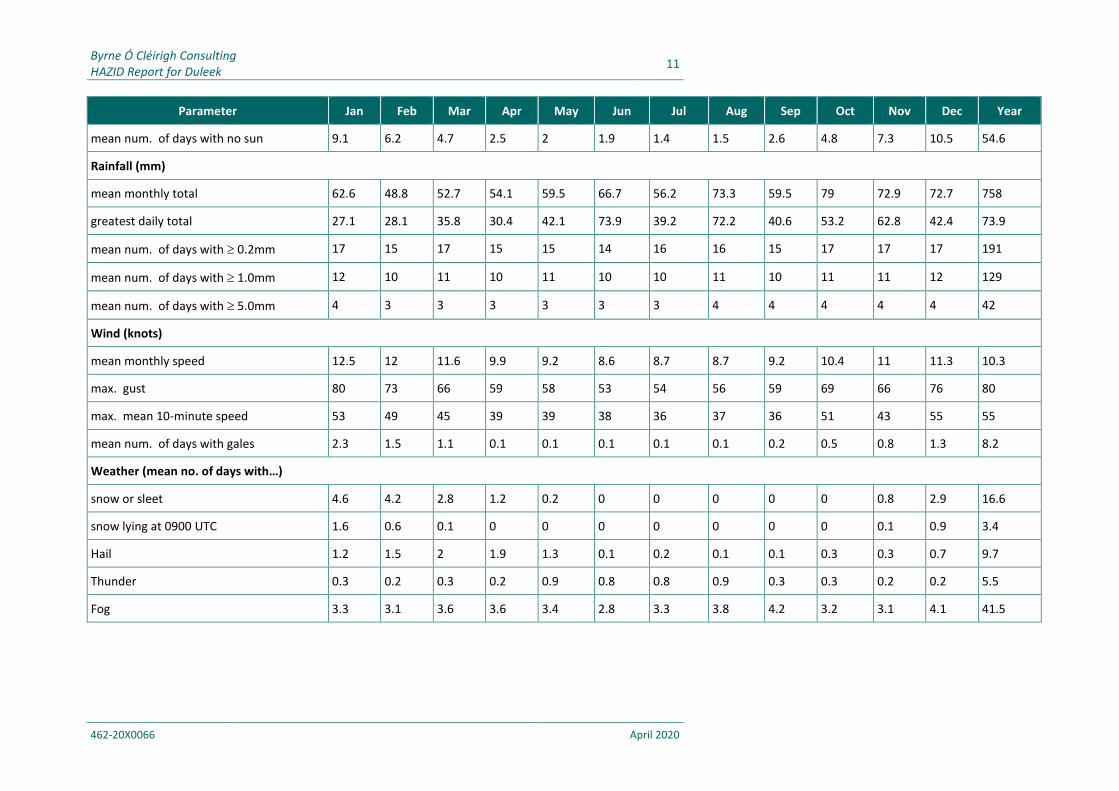
Dublin Airport is the closest weather monitoring station to the site and weather data for this station was obtained from Met Éireann for the period 1981 to 2010, which is the latest 30-year period reported on by Met Éireann. This is shown in Table 1-1 overleaf.
The temperature data shows that the average daily maximum temperature varies from 8.1°C in January to 19.5°C in July. The highest temperature recorded at the station over the 30-year reporting period was 28.7°C.
Wind speed and atmospheric stability are strongly interrelated. Greater atmospheric stability is found at low wind speeds and only certain combinations of wind speed and stability can occur. The data shows an average wind speed of 10.3 knots or 5.3 m/s.
Byrne Ó Cléirigh Consulting 10
HAZID Report for Duleek
462-20X0066 April 2020
Table 1-1: Dublin Airport Weather Data, 1981 – 2010 (Met Éireann)
Parameter Jan Feb Mar Apr May Jun Jul Aug Sep Oct Nov Dec Year
Temperature (degrees Celsius)
mean daily max 8.1 8.3 10.2 12.1 14.8 17.6 19.5 19.2 17 13.6 10.3 8.3 13.3
mean daily min 2.4 2.3 3.4 4.6 6.9 9.6 11.7 11.5 9.8 7.3 4.5 2.8 6.4
mean temperature 5.3 5.3 6.8 8.3 10.9 13.6 15.6 15.3 13.4 10.5 7.4 5.6 9.8
absolute max. 16.5 16.2 17.2 20.5 23.5 25.7 27.6 28.7 24.6 21 18 16.2 28.7
min. maximum -3.1 -0.1 2.4 4.5 6.6 10.4 11.7 11.9 11.2 5.3 -1.8 -4.7 -4.7
max. minimum 11.8 11.9 11.9 12.8 13.2 16.2 19 18.2 17.3 15.2 12.8 12.9 19
absolute min. -9.5 -6.7 -7.9 -4 -1.6 2.1 4.6 2.4 1.2 -3.3 -8.4 -12.2 -12.2
mean num. of days with air frost 6.4 6.5 3.8 2.4 0.3 0 0 0 0 0.5 3 6.4 29.4
mean num. of days with ground frost 15 14 12 10 3 0 0 0 0 4 10 14 82
mean 5 cm soil 3.8 3.8 5.4 8.2 12.2 15.2 16.7 15.8 13.1 9.4 6.2 4.5 9.5
mean 10 cm soil 4.1 4.1 5.5 7.9 11.5 14.6 16.2 15.4 13 9.7 6.6 4.8 9.4
mean 20 cm soil 4.6 4.7 6.1 8.4 11.7 14.8 16.5 16 13.7 10.5 7.3 5.3 10
Relative Humidity (%)
mean at 0900 UTC 87 86.4 84 79.5 76.9 76.7 78.5 81 83.4 85.5 88.5 88 83
mean at 1500 UTC 80.6 75.7 71 68.3 68 68.3 69 69.3 71.5 75.1 80.3 83.1 73.3
Sunshine (hours)
mean daily duration 1.9 2.7 3.5 5.3 6.2 5.8 5.3 5.1 4.3 3.3 2.4 1.7 3.9
greatest daily duration 8.1 9.8 11.9 13.3 15.4 15.9 15.6 14.2 12.4 10.2 8.8 7.3 15.9
Byrne Ó Cléirigh Consulting 11
HAZID Report for Duleek
462-20X0066 April 2020
Parameter Jan Feb Mar Apr May Jun Jul Aug Sep Oct Nov Dec Year
mean num. of days with no sun 9.1 6.2 4.7 2.5 2 1.9 1.4 1.5 2.6 4.8 7.3 10.5 54.6
Rainfall (mm)
mean monthly total 62.6 48.8 52.7 54.1 59.5 66.7 56.2 73.3 59.5 79 72.9 72.7 758
greatest daily total 27.1 28.1 35.8 30.4 42.1 73.9 39.2 72.2 40.6 53.2 62.8 42.4 73.9
mean num. of days with 0.2mm 17 15 17 15 15 14 16 16 15 17 17 17 191
mean num. of days with 1.0mm 12 10 11 10 11 10 10 11 10 11 11 12 129
mean num. of days with 5.0mm 4 3 3 3 3 3 3 4 4 4 4 4 42
Wind (knots)
mean monthly speed 12.5 12 11.6 9.9 9.2 8.6 8.7 8.7 9.2 10.4 11 11.3 10.3
max. gust 80 73 66 59 58 53 54 56 59 69 66 76 80
max. mean 10-minute speed 53 49 45 39 39 38 36 37 36 51 43 55 55
mean num. of days with gales 2.3 1.5 1.1 0.1 0.1 0.1 0.1 0.1 0.2 0.5 0.8 1.3 8.2
Weather (mean no. of days with…)
snow or sleet 4.6 4.2 2.8 1.2 0.2 0 0 0 0 0 0.8 2.9 16.6
snow lying at 0900 UTC 1.6 0.6 0.1 0 0 0 0 0 0 0 0.1 0.9 3.4
Hail 1.2 1.5 2 1.9 1.3 0.1 0.2 0.1 0.1 0.3 0.3 0.7 9.7
Thunder 0.3 0.2 0.3 0.2 0.9 0.8 0.8 0.9 0.3 0.3 0.2 0.2 5.5
Fog 3.3 3.1 3.6 3.6 3.4 2.8 3.3 3.8 4.2 3.2 3.1 4.1 41.5
Byrne Ó Cléirigh Consulting 12
HAZID Report for Duleek
462-20X0066 April 2020
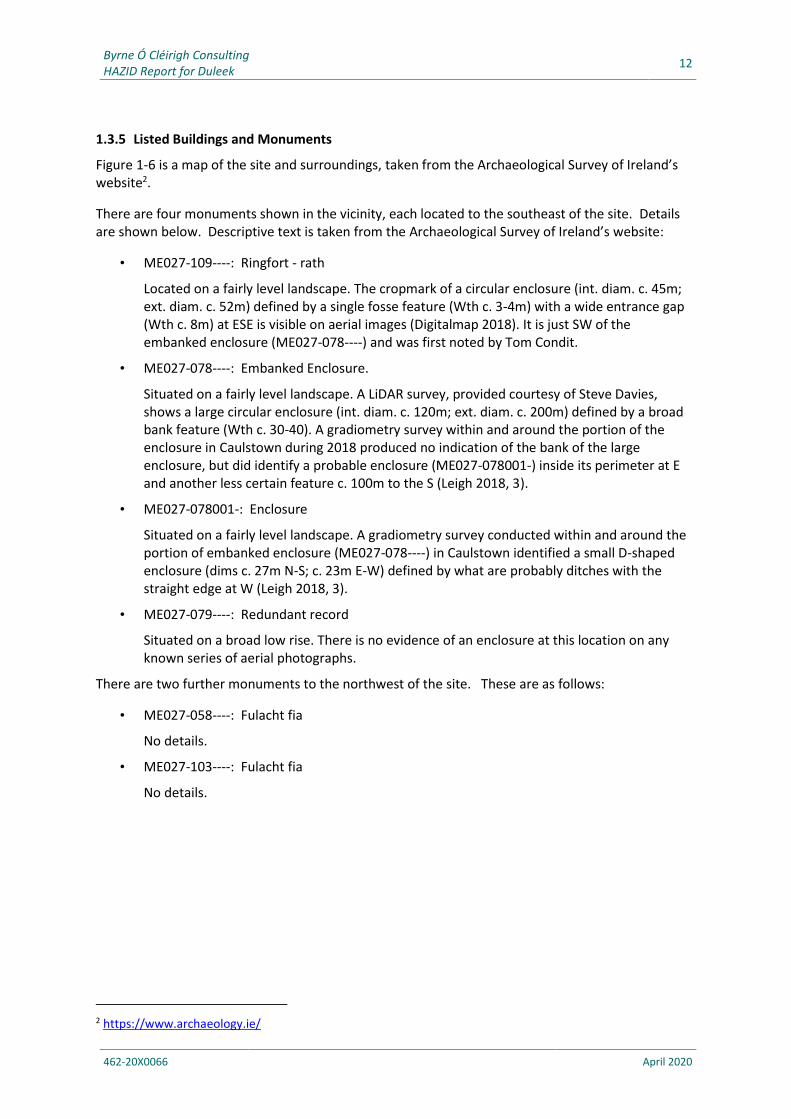
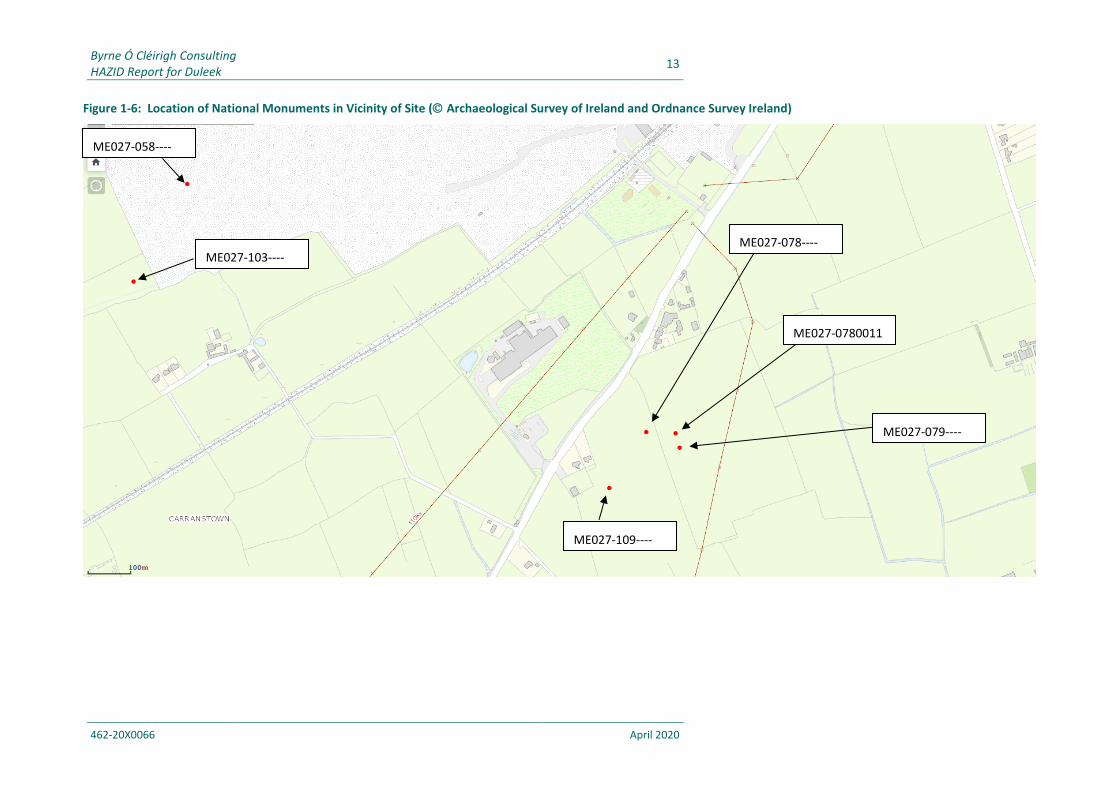
1.3.5 Listed Buildings and Monuments
Figure 1-6 is a map of the site and surroundings, taken from the Archaeological Survey of Ireland’s website2.
There are four monuments shown in the vicinity, each located to the southeast of the site. Details are shown below. Descriptive text is taken from the Archaeological Survey of Ireland’s website:
• ME027-109----: Ringfort - rath
Located on a fairly level landscape. The cropmark of a circular enclosure (int. diam. c. 45m; ext. diam. c. 52m) defined by a single fosse feature (Wth c. 3-4m) with a wide entrance gap (Wth c. 8m) at ESE is visible on aerial images (Digitalmap 2018). It is just SW of the embanked enclosure (ME027-078----) and was first noted by Tom Condit.
• ME027-078----: Embanked Enclosure.
Situated on a fairly level landscape. A LiDAR survey, provided courtesy of Steve Davies, shows a large circular enclosure (int. diam. c. 120m; ext. diam. c. 200m) defined by a broad bank feature (Wth c. 30-40). A gradiometry survey within and around the portion of the enclosure in Caulstown during 2018 produced no indication of the bank of the large enclosure, but did identify a probable enclosure (ME027-078001-) inside its perimeter at E and another less certain feature c. 100m to the S (Leigh 2018, 3).
• ME027-078001-: Enclosure
Situated on a fairly level landscape. A gradiometry survey conducted within and around the portion of embanked enclosure (ME027-078----) in Caulstown identified a small D-shaped enclosure (dims c. 27m N-S; c. 23m E-W) defined by what are probably ditches with the straight edge at W (Leigh 2018, 3).
• ME027-079----: Redundant record
Situated on a broad low rise. There is no evidence of an enclosure at this location on any known series of aerial photographs.
There are two further monuments to the northwest of the site. These are as follows:
• ME027-058----: Fulacht fia
No details.
• ME027-103----: Fulacht fia
No details.
2 https://www.archaeology.ie/
Byrne Ó Cléirigh Consulting 13
HAZID Report for Duleek
462-20X0066 April 2020
Figure 1-6: Location of National Monuments in Vicinity of Site ( Archaeological Survey of Ireland and Ordnance Survey Ireland)
ME027-109----
ME027-078----
ME027-0780011
ME027-079----
ME027-103----
ME027-058----
Byrne Ó Cléirigh Consulting 14
HAZID Report for Duleek
462-20X0066 April 2020
2 HAZARD IDENTIFICATION AND RISK ASSESSMENT
2.1 Risk Assessment Methodology
A formal Hazard Identification & Risk Assessment exercise (HAZID&RA) was carried out to identify all potential accident scenarios that could arise at each area of the site where dangerous substances are stored or handled. Each scenario was assessed using the HAZID&RA methodology to determine its likelihood of occurrence and the severity of impact to human health and to the environment if it did occur. This approach gives a semi-quantitative assessment of the overall level of risk associated with each accident scenario identified by the HAZID&RA Team. The Team took account of any relevant prevention or mitigation measures in place when assessing the risks associated with each scenario.
Each scenario was assigned a semi-quantitative Risk Rating, based on the findings of this analysis. The Risk Ratings were then compared with the various criteria established in the risk assessment methodology in order to determine the significance of the risks associated with each scenario. This approach allowed Indaver to prioritise attention on the scenarios presenting the highest risk and to ensure that all necessary measures would be in place to prevent accidents occurring and to limit the consequences of any such accidents for human health and the environment.
The methodology used is based on a technique outlined in Annex D of BS 8800: 1996, Guide to Occupational Health and Safety Management Systems. Similar risk assessment techniques have also been outlined by the IChemE3 and the US Naval Weapons Centre’s Practical Risk Analysis for Safety Management. It is described in more detail in the following sub-sections. A flowchart to illustrate this methodology is included in Appendix 2.
2.1.1 HAZID&RA Team
The HAZID&RA Team comprised the following personnel:
• Conor Jones, Regional Engineering Director, Indaver
• Paul Schutze, Project Engineer, Indaver
• Tom Leonard, Partner, Byrne Ó Cléirigh
The Team members between them have appropriate training in hazard identification, risk assessment and consequence analysis and had knowledge of the complete range of operations that will be conducted on the site. They also drew upon specialist input from other members at Indaver and at BÓC where required.
2.1.2 Areas Assessed
The Duleek site was divided into the following areas, each of which was assessed in turn by the HAZID&RA Team.
• Bunker and Tipping Hall
• Furnace
3 Institute of Chemical Engineers Course, Practical Quantitative Hazard Assessment, 1985
Byrne Ó Cléirigh Consulting 15
HAZID Report for Duleek
462-20X0066 April 2020
• Boiler
• Spray Dryer
• Raw Material Bulk Storage (expanded clay, activated carbon, quick lime and hydrated lime)
• Bag House
• Flue Gas Residue and Boiler Ash Storage and Treatment
• Chemstore Units
• ID Fan
• Stack
• Piperacks
• Bulk Liquid Storage Areas
• Nitric Acid Storage
• Warehouse / Workshop
• Air Cooled Condenser
• Roads (onsite)
• Bottom Ash Storage Building
• Hydrogen Generation Unit
• Turbine
These areas represent the various locations at the site where dangerous substances are stored or handled and which were considered as potentially presenting a risk of a significant accident scenario. Following the assessment of the HAZID&RA Team, not all of these areas were found to present a credible risk of an accident scenario. Further details of the assessment can be obtained from the HAZID&RA Worksheets in Appendix 3.
2.1.3 Accident Scenarios
Each area was assessed in detail by the HAZID&RA Team. For each area the Team identified the various accident scenarios, or end events, that could arise and noted them in the HAZID&RA Worksheets. This process involved cataloguing all the potential scenarios that could occur for each area; each scenario was described and an assessment made of the potential consequences that could result. A copy of the Worksheet is included in Appendix 3.
2.1.4 Assessment of Severity Ratings
Each scenario was assigned two Severity Ratings with values between 1 and 5, in accordance with the criteria set out in Table 2-1. The first Severity Rating was used to characterise the potential impacts to people, while the second Severity Rating was used to characterise the potential impacts to the environment.
Byrne Ó Cléirigh Consulting 16
HAZID Report for Duleek
462-20X0066 April 2020
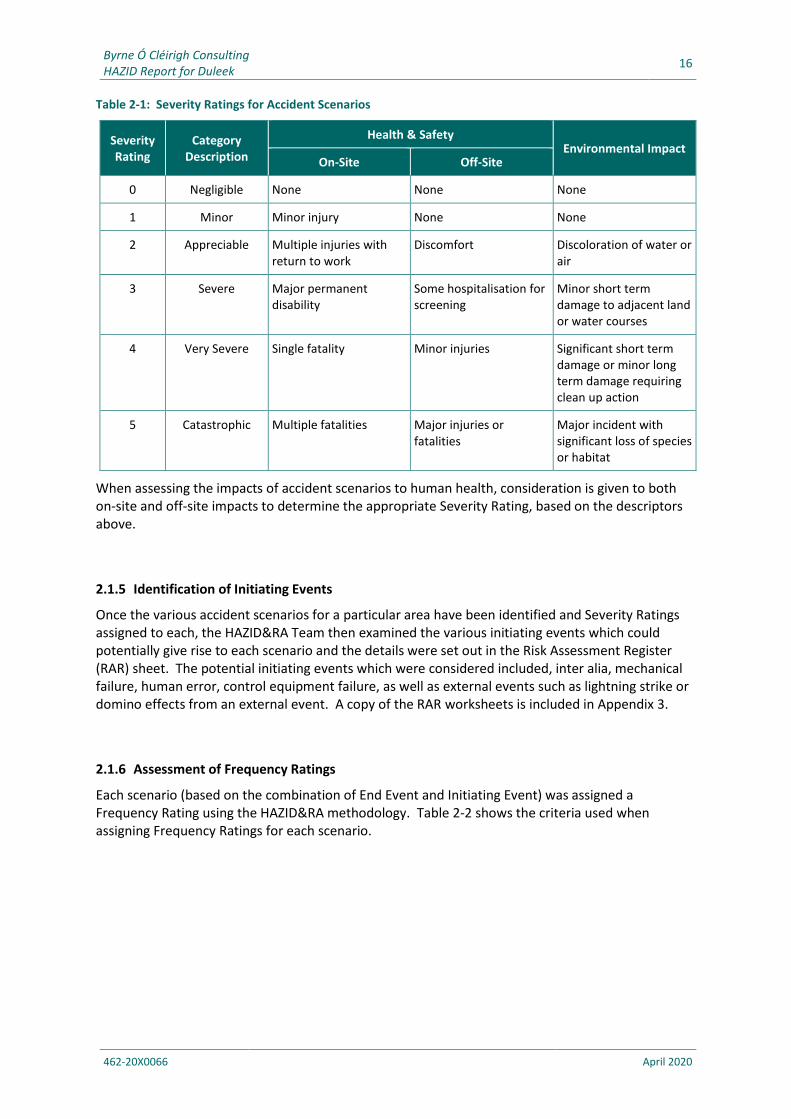
Table 2-1: Severity Ratings for Accident Scenarios
Severity Rating
Category Description
Health & Safety Environmental Impact
On-Site Off-Site
0 Negligible None None None
1 Minor Minor injury None None
2 Appreciable Multiple injuries with return to work
Discomfort Discoloration of water or air
3 Severe Major permanent disability
Some hospitalisation for screening
Minor short term damage to adjacent land or water courses
4 Very Severe Single fatality Minor injuries Significant short term damage or minor long term damage requiring clean up action
5 Catastrophic Multiple fatalities Major injuries or fatalities
Major incident with significant loss of species or habitat
When assessing the impacts of accident scenarios to human health, consideration is given to both on-site and off-site impacts to determine the appropriate Severity Rating, based on the descriptors above.
2.1.5 Identification of Initiating Events
Once the various accident scenarios for a particular area have been identified and Severity Ratings assigned to each, the HAZID&RA Team then examined the various initiating events which could potentially give rise to each scenario and the details were set out in the Risk Assessment Register (RAR) sheet. The potential initiating events which were considered included, inter alia, mechanical failure, human error, control equipment failure, as well as external events such as lightning strike or domino effects from an external event. A copy of the RAR worksheets is included in Appendix 3.
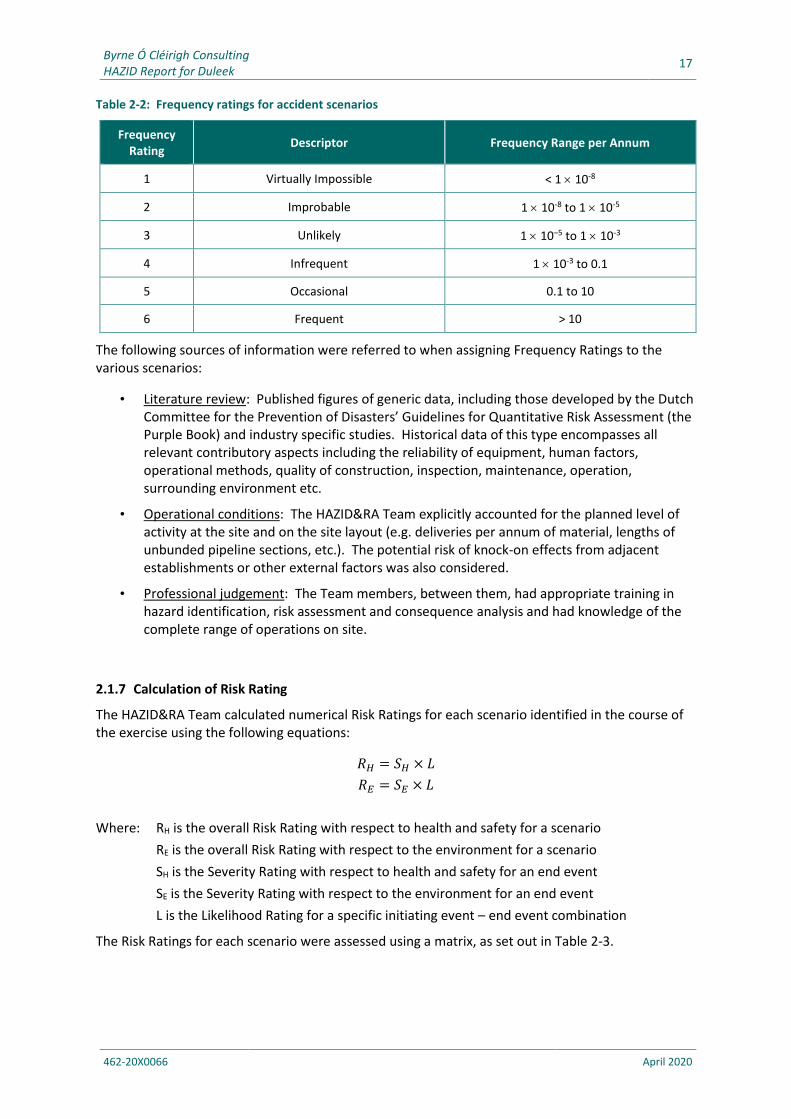
2.1.6 Assessment of Frequency Ratings
Each scenario (based on the combination of End Event and Initiating Event) was assigned a Frequency Rating using the HAZID&RA methodology. Table 2-2 shows the criteria used when assigning Frequency Ratings for each scenario.
Byrne Ó Cléirigh Consulting 17
HAZID Report for Duleek
462-20X0066 April 2020
Table 2-2: Frequency ratings for accident scenarios
Frequency Rating
Descriptor Frequency Range per Annum
1 Virtually Impossible < 1 10-8
2 Improbable 1 10-8 to 1 10-5
3 Unlikely 1 10–5 to 1 10-3
4 Infrequent 1 10-3 to 0.1
5 Occasional 0.1 to 10
6 Frequent > 10
The following sources of information were referred to when assigning Frequency Ratings to the various scenarios:
• Literature review: Published figures of generic data, including those developed by the Dutch Committee for the Prevention of Disasters’ Guidelines for Quantitative Risk Assessment (the Purple Book) and industry specific studies. Historical data of this type encompasses all relevant contributory aspects including the reliability of equipment, human factors, operational methods, quality of construction, inspection, maintenance, operation, surrounding environment etc.
• Operational conditions: The HAZID&RA Team explicitly accounted for the planned level of activity at the site and on the site layout (e.g. deliveries per annum of material, lengths of unbunded pipeline sections, etc.). The potential risk of knock-on effects from adjacent establishments or other external factors was also considered.
• Professional judgement: The Team members, between them, had appropriate training in hazard identification, risk assessment and consequence analysis and had knowledge of the complete range of operations on site.
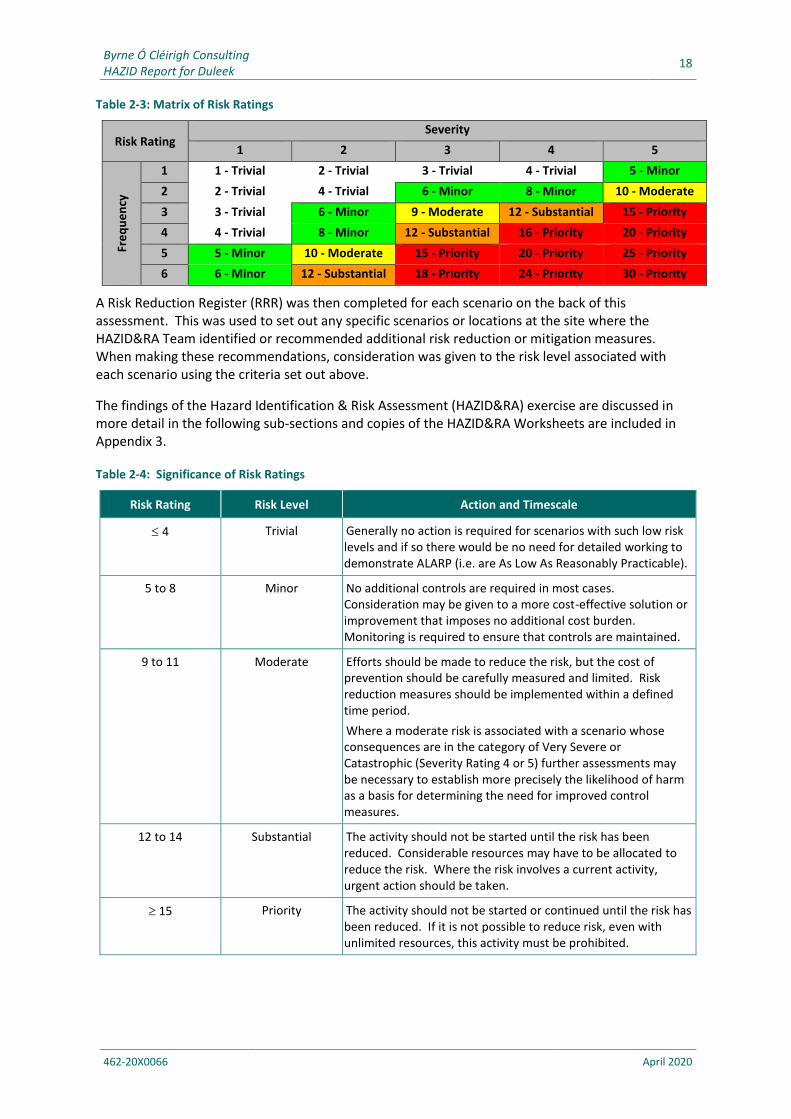
2.1.7 Calculation of Risk Rating
The HAZID&RA Team calculated numerical Risk Ratings for each scenario identified in the course of the exercise using the following equations:
𝑅𝐻 = 𝑆𝐻 × 𝐿
𝑅𝐸 = 𝑆𝐸 × 𝐿
Where: RH is the overall Risk Rating with respect to health and safety for a scenario
RE is the overall Risk Rating with respect to the environment for a scenario
SH is the Severity Rating with respect to health and safety for an end event
SE is the Severity Rating with respect to the environment for an end event
L is the Likelihood Rating for a specific initiating event – end event combination
The Risk Ratings for each scenario were assessed using a matrix, as set out in Table 2-3.
Byrne Ó Cléirigh Consulting 18
HAZID Report for Duleek
462-20X0066 April 2020
Table 2-3: Matrix of Risk Ratings
Risk Rating Severity
1 2 3 4 5
Fre
qu
en
cy
1 1 - Trivial 2 - Trivial 3 - Trivial 4 - Trivial 5 - Minor
2 2 - Trivial 4 - Trivial 6 - Minor 8 - Minor 10 - Moderate
3 3 - Trivial 6 - Minor 9 - Moderate 12 - Substantial 15 - Priority
4 4 - Trivial 8 - Minor 12 - Substantial 16 - Priority 20 - Priority
5 5 - Minor 10 - Moderate 15 - Priority 20 - Priority 25 - Priority
6 6 - Minor 12 - Substantial 18 - Priority 24 - Priority 30 - Priority
A Risk Reduction Register (RRR) was then completed for each scenario on the back of this assessment. This was used to set out any specific scenarios or locations at the site where the HAZID&RA Team identified or recommended additional risk reduction or mitigation measures. When making these recommendations, consideration was given to the risk level associated with each scenario using the criteria set out above.
The findings of the Hazard Identification & Risk Assessment (HAZID&RA) exercise are discussed in more detail in the following sub-sections and copies of the HAZID&RA Worksheets are included in Appendix 3.
Table 2-4: Significance of Risk Ratings
Risk Rating Risk Level Action and Timescale
4 Trivial Generally no action is required for scenarios with such low risk levels and if so there would be no need for detailed working to demonstrate ALARP (i.e. are As Low As Reasonably Practicable).
5 to 8 Minor No additional controls are required in most cases. Consideration may be given to a more cost-effective solution or improvement that imposes no additional cost burden. Monitoring is required to ensure that controls are maintained.
9 to 11 Moderate Efforts should be made to reduce the risk, but the cost of prevention should be carefully measured and limited. Risk reduction measures should be implemented within a defined time period.
Where a moderate risk is associated with a scenario whose consequences are in the category of Very Severe or Catastrophic (Severity Rating 4 or 5) further assessments may be necessary to establish more precisely the likelihood of harm as a basis for determining the need for improved control measures.
12 to 14 Substantial The activity should not be started until the risk has been reduced. Considerable resources may have to be allocated to reduce the risk. Where the risk involves a current activity, urgent action should be taken.
15 Priority The activity should not be started or continued until the risk has been reduced. If it is not possible to reduce risk, even with unlimited resources, this activity must be prohibited.
Byrne Ó Cléirigh Consulting 19
HAZID Report for Duleek
462-20X0066 April 2020
2.2 Human Factors
The possibility of human error was considered throughout the various areas covered by the risk assessment exercise. For all transfers of materials at the site, there are procedural controls in place to supplement the technical controls that are designed to prevent accidents, including loss of containment of hazardous materials, from occurring.
All deliveries or movements of waste are controlled by ensuring that they are carried out in accordance with documented Standard Operating Procedures and are carried out by trained personnel.
The layout of the site is also designed with the consideration of good separation distances between the locations of occupied buildings and the arrangements where operators must use or handle dangerous substances.
The layout is designed to minimise the risk of uncontrolled sources of ignition from reaching hazardous areas. This includes ATEX zoning of the site, where required, and the use of suitable (Ex-rated) equipment in zoned areas.
Where an operator’s activities involve the use or handling of dangerous substances, they are provided with training on the tasks to be carried out as well as with information on the hazards associated with the materials involved. Personnel are also provided with appropriate PPE for the tasks being carried out.
For any instances in which an operator is required to provide direct intervention in the event of abnormal operating conditions and/or a developing accident scenario, they are provided with the necessary training to do so (Emergency Response Team members).
In each case the roles to be taken by personnel are documented. Operators who are required to carry out these response plans receive training to ensure that they are fully aware of the steps to be carried out in response to an accident or incident and also that they are fully aware of the hazards and risks associated with the relevant plant or equipment. They are also provided with appropriate PPE to assist them in carrying out their required tasks.
Indaver also ensures that there are appropriate staffing levels at the site at all times to ensure safe operating and to implement emergency response measures, where necessary. Training is provided to operators, to ensure that they are aware of their duties and have sufficient knowledge of the tasks that they must carry out. They are also provided with awareness training of the hazards associated with the activities carried out on site. In addition to the training that is provided to ensure safe operations at the site, Indaver also provides emergency response training to personnel on the emergency response team (ERT). Indaver conducts monthly drills and exercises for the ERT, including drills and tests at the site covering specific events, together with offsite training on fire prevention and fire response. The training plan and drills are developed for each year and the ERT members are advised of the schedule.
2.3 Criteria for eliminating scenarios from the risk assessment
The HAZID&RA methodology used for this report involves the systematic assessment of all scenarios identified by the HAZID&RA Team, which includes events which are considered to have very low probability of occurrence. Table 2-2 shows that any scenario identified which was found to have a frequency of occurrence of less than 10-5 per annum would be assigned a Likelihood Rating of 2. In other words, the methodology allows for extremely remote events to be included in the risk assessment exercise.
Byrne Ó Cléirigh Consulting 20
HAZID Report for Duleek
462-20X0066 April 2020
It can be seen in Table 2-3 that highly remote events with potentially catastrophic consequences are considered to present a Medium Risk rather than a Low one. This means that these scenarios are examined further, particularly with respect to determining the potential impacts arising from such an event. This means that Indaver would need to consider implementing further risk reduction measures for these scenarios if the HAZIRD&RA Team found it necessary or desirable to do so.
2.4 External Impacts / Off Site Risks
2.4.1 Earthquake
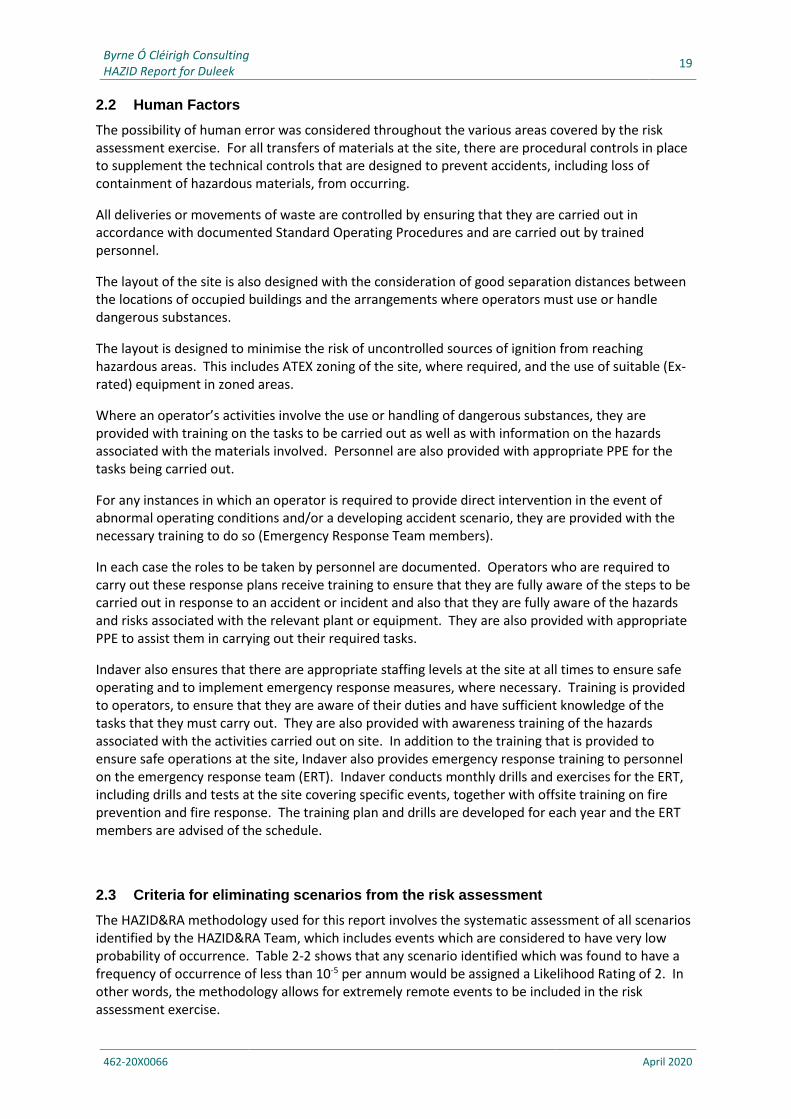
The level of seismic activity in Ireland is very low4. The School of Cosmic Physics, which has had a seismic network in operation in Ireland since 1978, has indicated that there is nothing to suggest that this will change in the coming millennia.
The Seismic Hazard Harmonization in Europe (SHARE) project, comprising eighteen European partner institutions, has compiled two European Earthquake Catalogues, one for the period 1000 to 1899, and one for the period 1900 to 2006, which show the locations of seismic events across Europe. The map for the period 1900 to 2006 is shown in Figure 2-1. This shows that there is relatively little seismic activity in Ireland.
Figure 2-1: SHARE European Earthquake Catalogue (1900 to 2006)
4 Seismic Hazard in Ireland, Jacob, W.B. (1993), Dublin Institute for Advanced Studies, School of Cosmic Physics, Geophysics Section
Byrne Ó Cléirigh Consulting 21
HAZID Report for Duleek
462-20X0066 April 2020
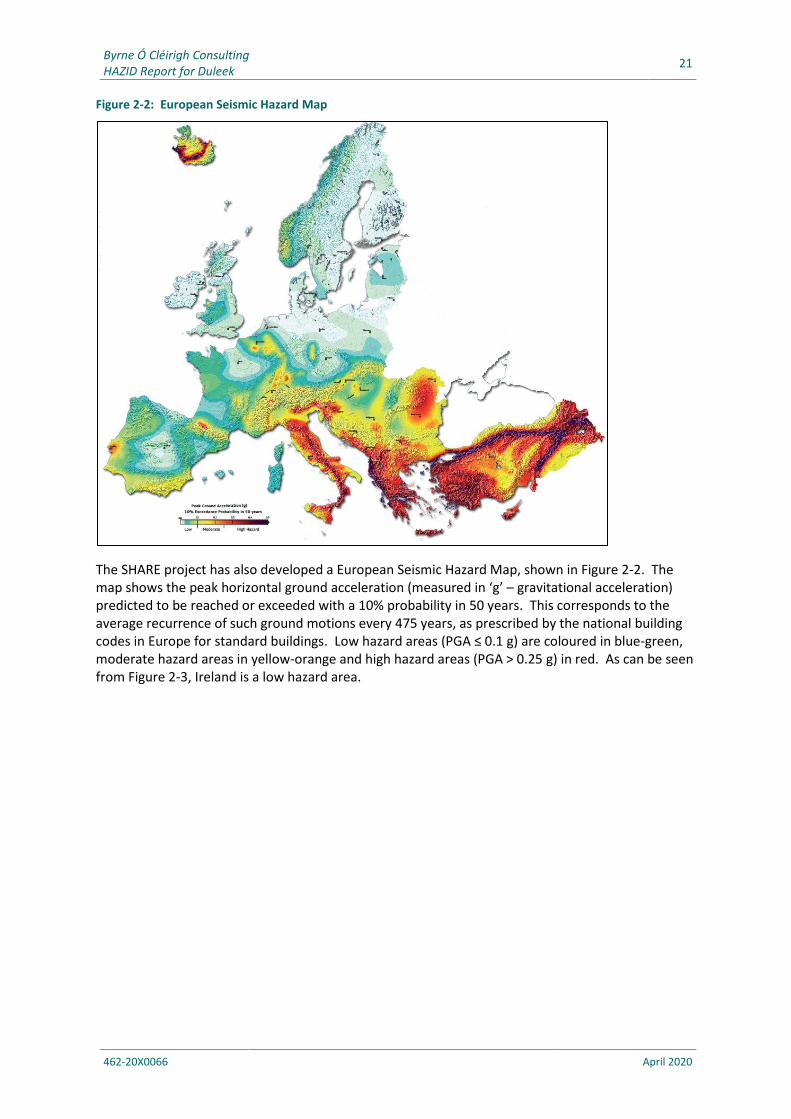
Figure 2-2: European Seismic Hazard Map
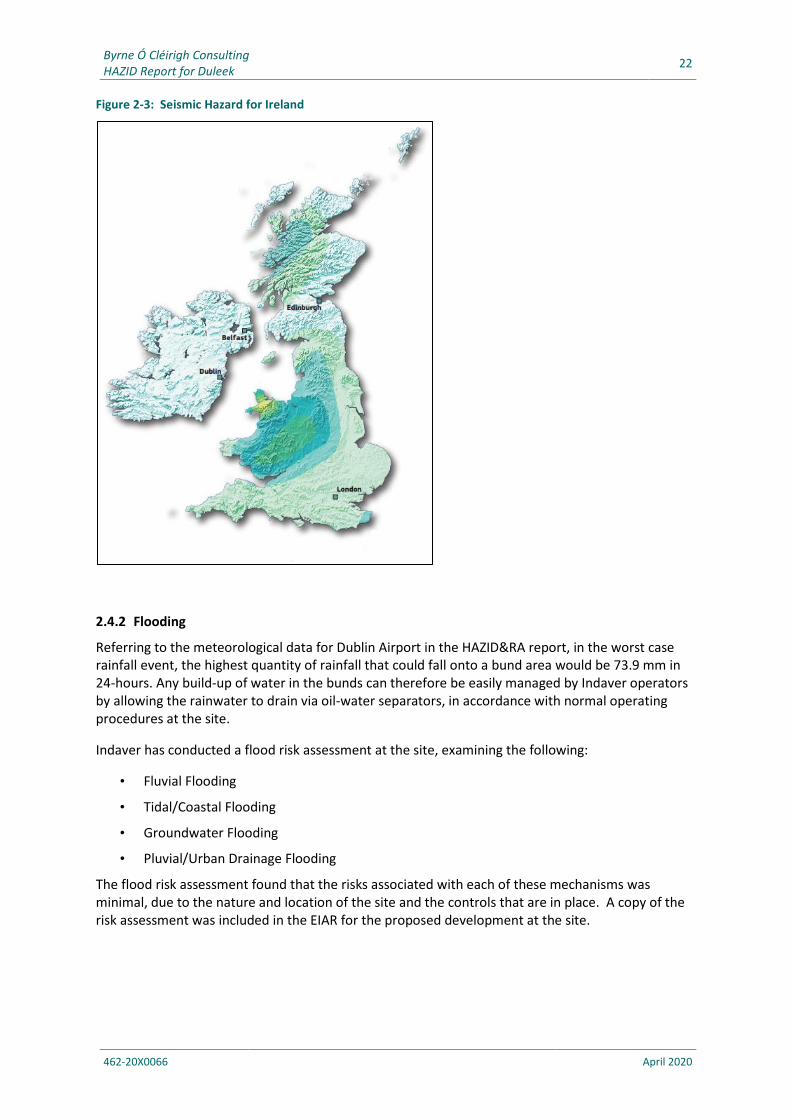
The SHARE project has also developed a European Seismic Hazard Map, shown in Figure 2-2. The map shows the peak horizontal ground acceleration (measured in ‘g’ – gravitational acceleration) predicted to be reached or exceeded with a 10% probability in 50 years. This corresponds to the average recurrence of such ground motions every 475 years, as prescribed by the national building codes in Europe for standard buildings. Low hazard areas (PGA ≤ 0.1 g) are coloured in blue-green, moderate hazard areas in yellow-orange and high hazard areas (PGA > 0.25 g) in red. As can be seen from Figure 2-3, Ireland is a low hazard area.
Byrne Ó Cléirigh Consulting 22
HAZID Report for Duleek
462-20X0066 April 2020
Figure 2-3: Seismic Hazard for Ireland
2.4.2 Flooding
Referring to the meteorological data for Dublin Airport in the HAZID&RA report, in the worst case rainfall event, the highest quantity of rainfall that could fall onto a bund area would be 73.9 mm in 24-hours. Any build-up of water in the bunds can therefore be easily managed by Indaver operators by allowing the rainwater to drain via oil-water separators, in accordance with normal operating procedures at the site.
Indaver has conducted a flood risk assessment at the site, examining the following:
• Fluvial Flooding
• Tidal/Coastal Flooding
• Groundwater Flooding
• Pluvial/Urban Drainage Flooding
The flood risk assessment found that the risks associated with each of these mechanisms was minimal, due to the nature and location of the site and the controls that are in place. A copy of the risk assessment was included in the EIAR for the proposed development at the site.
Byrne Ó Cléirigh Consulting 23
HAZID Report for Duleek
462-20X0066 April 2020
2.4.3 Power Failure
There are no accident scenarios identified at the site which would be associated with a power failure. There will be no materials at the site which are unstable or which require a power supply to ensure that they are stored or handled safely, e.g. materials requiring a temperature controlled environment.
The site has an uninterruptible power supply (UPS) system and emergency diesel generator to provide power in the event of a power cut. This means that Indaver retains the facility to activate the fire protection systems in the event of a disruption to the electrical supply to the site.
If a power failure occurred to a key item of plant or equipment at the same time as potentially hazardous materials were being delivered to the site (e.g. a delivery of aqueous ammonium hydroxide to the storage tank), the transfer would be halted for the duration of the loss of power event.
Based on the controls that will be in place it was considered that there was no credible risk of a major accident scenario associated with a power failure to the site.
2.4.4 Lightning
Referring to guidance from the UK HSE, it advises that the use of BS 62305 is the expected standard for lightning protection at hazardous industries5. The HSE states that the likelihood of a major accident being initiated by a lightning strike at a well-designed and maintained hazardous installation is, therefore, low so Inspectors must act proportionately to focus on those major hazard installations where reasonably foreseeable risk remains.
In other guidance, the UK HSE notes that the probability of an accident arising as a result of lightning strike at a typical facility involved in the storage of flammable liquids is extremely remote, with a
probability of 1 10-7 per annum6. This guidance is for activities involved in the storage and handling of materials which would present a greater fire hazard than the materials at the Indaver facility.
All areas of the site which are used for the storage and handling of dangerous substances have been assessed under BS EN/IEC 62305 and, where required, are fitted with lightning protection systems which are designed and installed in accordance with same. The proposed new development will also be fitted with appropriate earthing protection.
Based on the measures that will be in place and on the guidance from the UK HSE, it was considered that the risk that a lightning strike could initiate a major accident was found to be negligible.
2.4.5 Extreme Weather Conditions
The potential for extreme weather conditions was considered during the HAZID exercise. The HAZID Team considered whether such events could act to initiate and/or escalate a major accident hazard event at the site.
5 http://www.hse.gov.uk/foi/internalops/og/og-00044.htm 6 http://www.hse.gov.uk/comah/sraghfl/highly-flammable-liquids.pdf
Byrne Ó Cléirigh Consulting 24
HAZID Report for Duleek
462-20X0066 April 2020
Referring to data from Met Éireann, the two closest meteorological stations for which there is climate data available are Dublin Airport. We have referred to the data for this station when assessing the data referred to below.
Extreme Temperature
The mean daily maximum temperature recorded at the Dublin Airport weather station over the
period from 1981 – 2010 is 13.3C and the absolute maximum temperature is 28.7C. There are no scenarios envisioned in which high ambient temperatures could give rise to an accident at the site.
The absolute minimum temperature recorded at Dublin Airport during this period was -12.2C. Indaver mitigates the risk of accidents on site in freezing conditions by salting the roadways on the site and by imposing a speed limit on movements. The fire-fighting main is protected against water freezing in the line as the main is underground and any chambers for hydrants are insulated and heat traced.
Wind
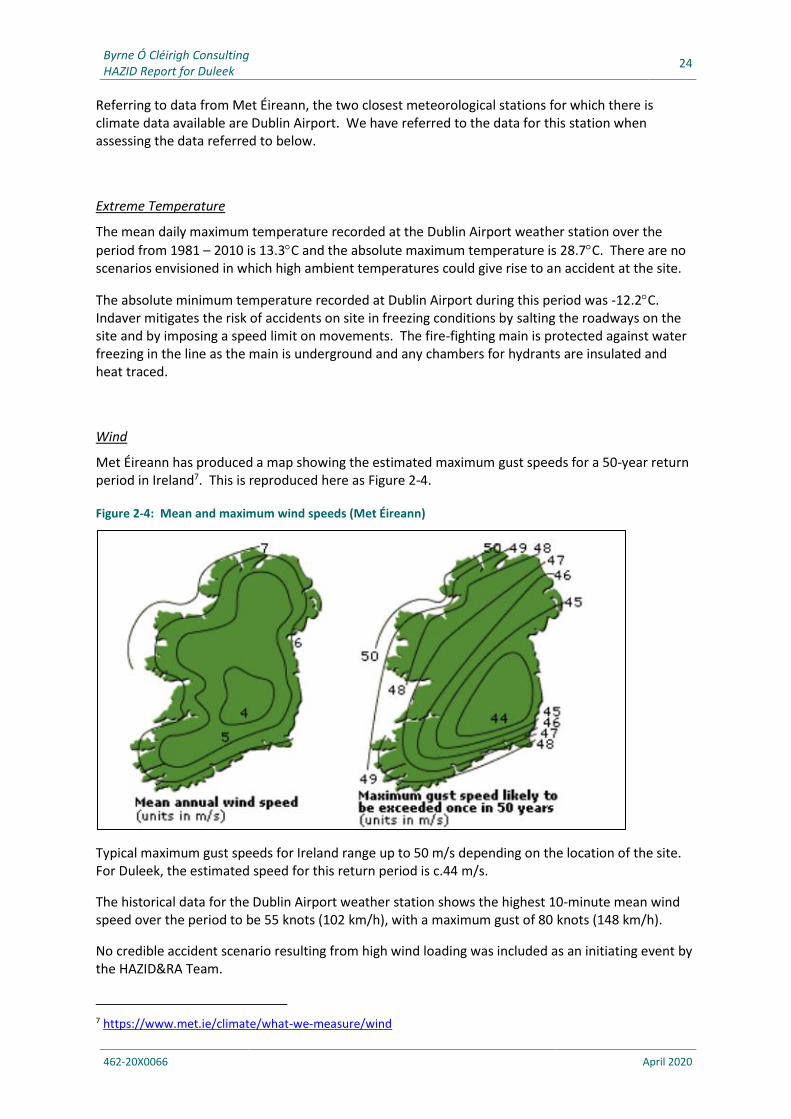
Met Éireann has produced a map showing the estimated maximum gust speeds for a 50-year return period in Ireland7. This is reproduced here as Figure 2-4.
Figure 2-4: Mean and maximum wind speeds (Met Éireann)
Typical maximum gust speeds for Ireland range up to 50 m/s depending on the location of the site. For Duleek, the estimated speed for this return period is c.44 m/s.
The historical data for the Dublin Airport weather station shows the highest 10-minute mean wind speed over the period to be 55 knots (102 km/h), with a maximum gust of 80 knots (148 km/h).
No credible accident scenario resulting from high wind loading was included as an initiating event by the HAZID&RA Team.
7 https://www.met.ie/climate/what-we-measure/wind
Byrne Ó Cléirigh Consulting 25
HAZID Report for Duleek
462-20X0066 April 2020
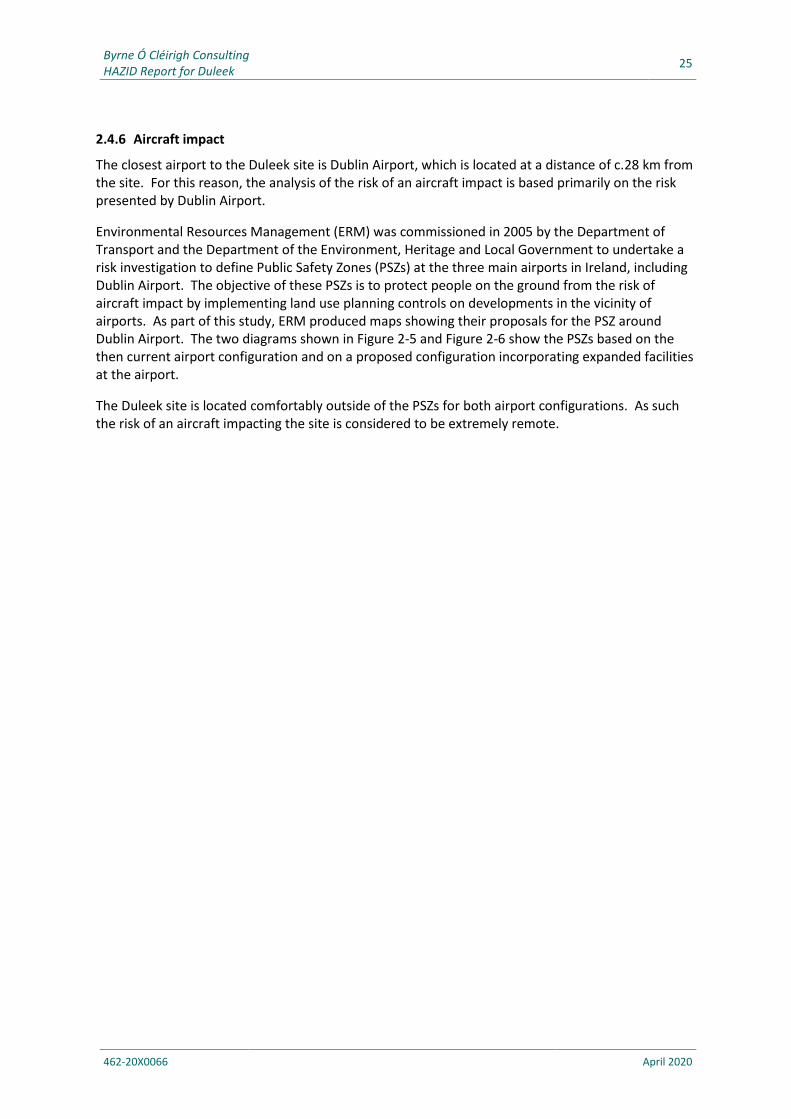
2.4.6 Aircraft impact
The closest airport to the Duleek site is Dublin Airport, which is located at a distance of c.28 km from the site. For this reason, the analysis of the risk of an aircraft impact is based primarily on the risk presented by Dublin Airport.
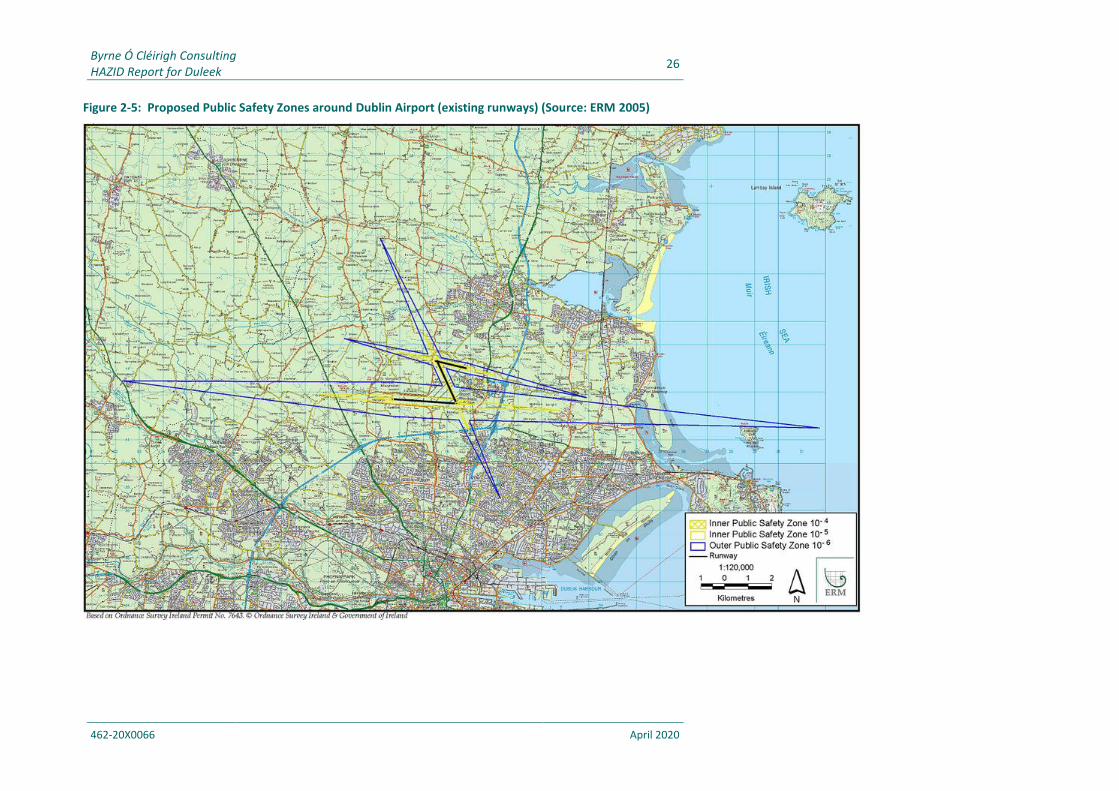
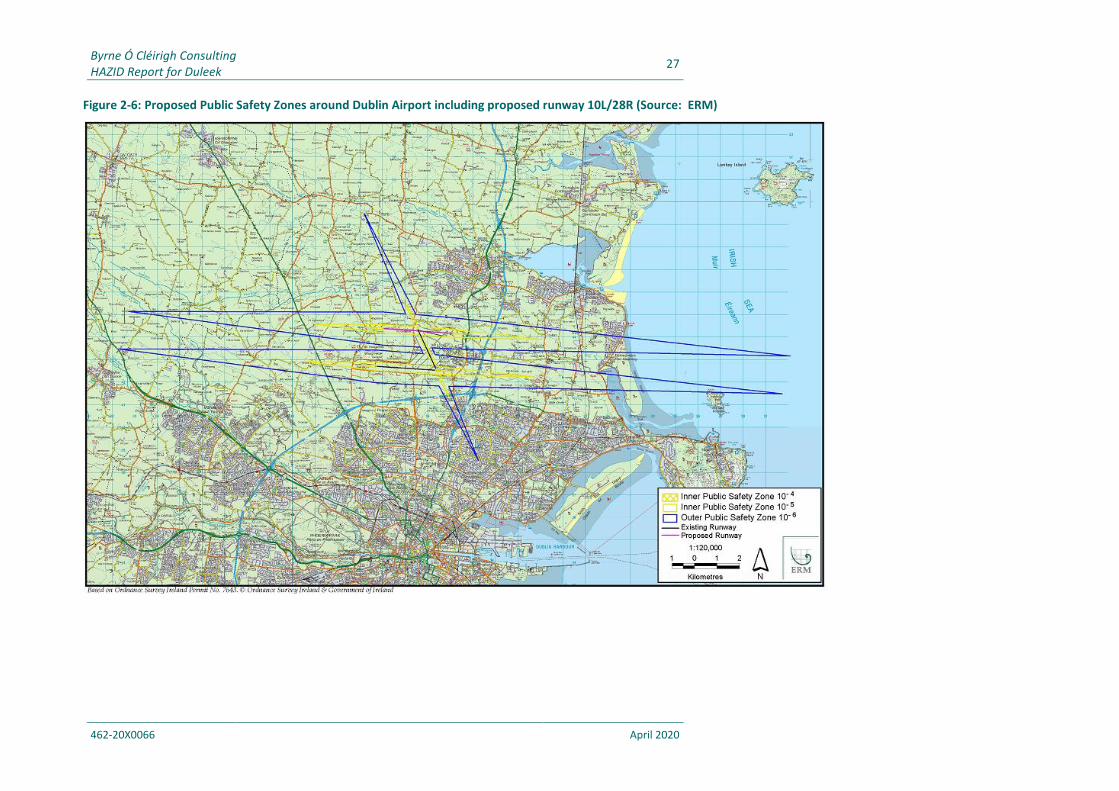
Environmental Resources Management (ERM) was commissioned in 2005 by the Department of Transport and the Department of the Environment, Heritage and Local Government to undertake a risk investigation to define Public Safety Zones (PSZs) at the three main airports in Ireland, including Dublin Airport. The objective of these PSZs is to protect people on the ground from the risk of aircraft impact by implementing land use planning controls on developments in the vicinity of airports. As part of this study, ERM produced maps showing their proposals for the PSZ around Dublin Airport. The two diagrams shown in Figure 2-5 and Figure 2-6 show the PSZs based on the then current airport configuration and on a proposed configuration incorporating expanded facilities at the airport.
The Duleek site is located comfortably outside of the PSZs for both airport configurations. As such the risk of an aircraft impacting the site is considered to be extremely remote.
Byrne Ó Cléirigh Consulting 26
HAZID Report for Duleek
462-20X0066 April 2020
Figure 2-5: Proposed Public Safety Zones around Dublin Airport (existing runways) (Source: ERM 2005)
Byrne Ó Cléirigh Consulting 27
HAZID Report for Duleek
462-20X0066 April 2020
Figure 2-6: Proposed Public Safety Zones around Dublin Airport including proposed runway 10L/28R (Source: ERM)
Byrne Ó Cléirigh Consulting 28
HAZID Report for Duleek
462-20X0066 April 2020
2.4.7 Off-site initiating events
The Indaver Duleek site is located to the northeast of Duleek village.
The maps of the site and surroundings illustrate that there are large separation distances between the installations at the Indaver Duleek site and any neighbouring facilities which could have any potential to act as an initiator for an accident at the site. The R152 runs along the south / east boundary of the site and there are several minor developments along this stretch of road (DSG Stores, Paul Kavanagh VTN, Platin Motor Factors). These closest of these is over 200 m from the production buildings and none of these developments present any risk of initiating an accident at the Duleek plant.
There are no COMAH establishments8 in the vicinity of the Indaver Duleek site. The closest major industrial development is the Irish Cement Factory Platin. There are large separation distances between the installations at Indaver and at Irish Cement; the closest buildings are over 400 m away from each other.
Prior to the construction of the Indaver site, discussions were held with Irish Cement to determine whether there is any risk to the Duleek site as a result of the blasting activities carried out at the quarry. This is carried out by Irish Cement in a controlled manner, in accordance with the conditions of their licence from the EPA. At the time of these discussions, it was noted that Irish Cement’s licence specified a peak particle velocity limit of 12 mm/s for ground-borne vibration at the nearest noise sensitive location. The Indaver site is located at a similar distance from the quarry as the sensitive location identified in the licence and so it was anticipated at the time of construction of the Indaver site that the worst-case vibration levels at the foundations of the buildings would be of the order of 12 mm/s. This assumed that geological ground conditions are consistent between the Irish Cement site and receptor locations around the quarry site. The latest version of the Irish Cement Industrial Emissions Licence retains the 12 mm/s limit, which applies now to three locations around the perimeter of the site.
In addition, to reflect the presence of the quarry in the vicinity, the building foundations at the Indaver site are designed to accommodate this potential seismic activity. On this basis it was anticipated prior to the commencement of construction of the site that there would not be any cosmetic or structural damage at Indaver as a result of the activities at Irish Cement. This has since been borne out and there has been no evidence of any such damage over the years of operation at Duleek.
Based on the above considerations, there is no credible risk that an accident at one of the neighbouring sites could act to initiate a major accident at the Indaver Duleek site.
2.5 Suitability of information used
Due to the range of materials stored at the site, the HAZID&RA Team examined scenarios presenting a variety of hazard types, including scenarios with flammable risks, scenarios with the potential for acute toxic exposure and scenarios involving releases of environmentally hazardous materials.
8 Establishments to which the Control of Major Accident Hazards Regulations (SI 209 of 2015) apply
Byrne Ó Cléirigh Consulting 29
HAZID Report for Duleek
462-20X0066 April 2020
When assessing the impacts of accident scenarios to people in the vicinity, a consequence modelling exercise was carried out, using a range of pre-determined endpoints. Some of the endpoints used are also of relevance for emergency response planning.
2.5.1 Consequence modelling – Thermal radiation endpoints
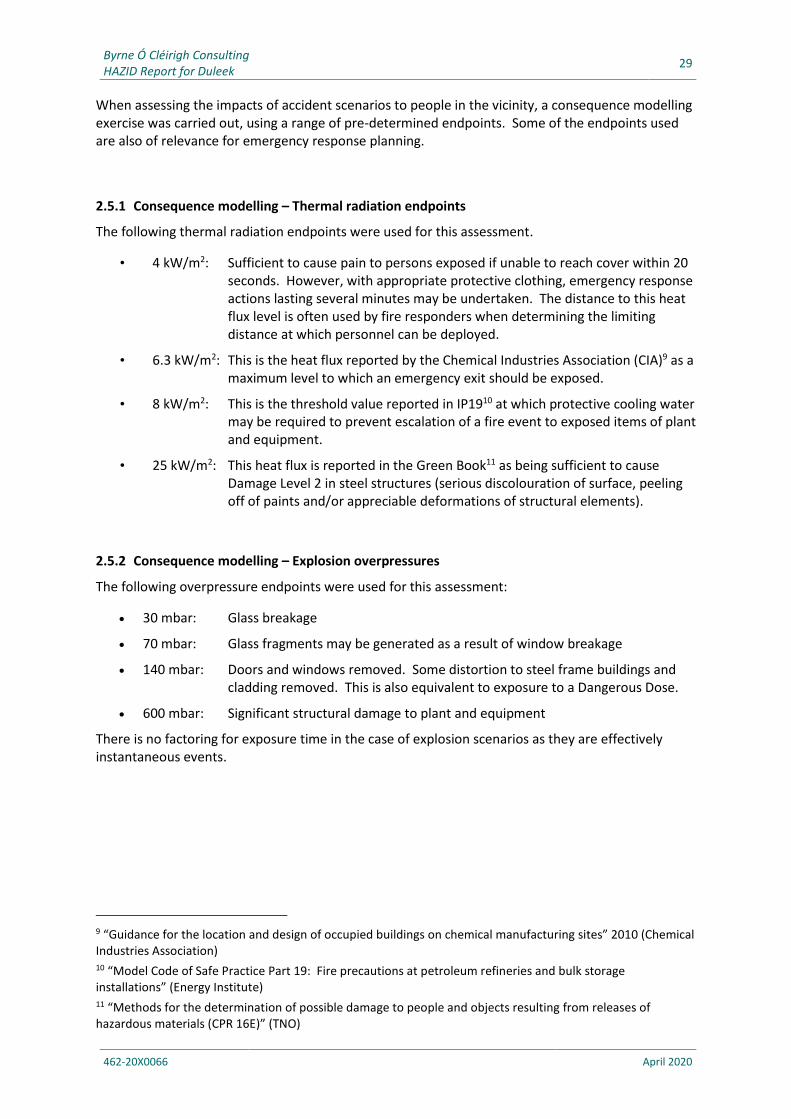
The following thermal radiation endpoints were used for this assessment.
• 4 kW/m2: Sufficient to cause pain to persons exposed if unable to reach cover within 20 seconds. However, with appropriate protective clothing, emergency response actions lasting several minutes may be undertaken. The distance to this heat flux level is often used by fire responders when determining the limiting distance at which personnel can be deployed.
• 6.3 kW/m2: This is the heat flux reported by the Chemical Industries Association (CIA)9 as a maximum level to which an emergency exit should be exposed.
• 8 kW/m2: This is the threshold value reported in IP1910 at which protective cooling water may be required to prevent escalation of a fire event to exposed items of plant and equipment.
• 25 kW/m2: This heat flux is reported in the Green Book11 as being sufficient to cause Damage Level 2 in steel structures (serious discolouration of surface, peeling off of paints and/or appreciable deformations of structural elements).
2.5.2 Consequence modelling – Explosion overpressures
The following overpressure endpoints were used for this assessment:
• 30 mbar: Glass breakage
• 70 mbar: Glass fragments may be generated as a result of window breakage
• 140 mbar: Doors and windows removed. Some distortion to steel frame buildings and cladding removed. This is also equivalent to exposure to a Dangerous Dose.
• 600 mbar: Significant structural damage to plant and equipment
There is no factoring for exposure time in the case of explosion scenarios as they are effectively instantaneous events.
9 “Guidance for the location and design of occupied buildings on chemical manufacturing sites” 2010 (Chemical Industries Association) 10 “Model Code of Safe Practice Part 19: Fire precautions at petroleum refineries and bulk storage installations” (Energy Institute) 11 “Methods for the determination of possible damage to people and objects resulting from releases of hazardous materials (CPR 16E)” (TNO)
Byrne Ó Cléirigh Consulting 30
HAZID Report for Duleek
462-20X0066 April 2020
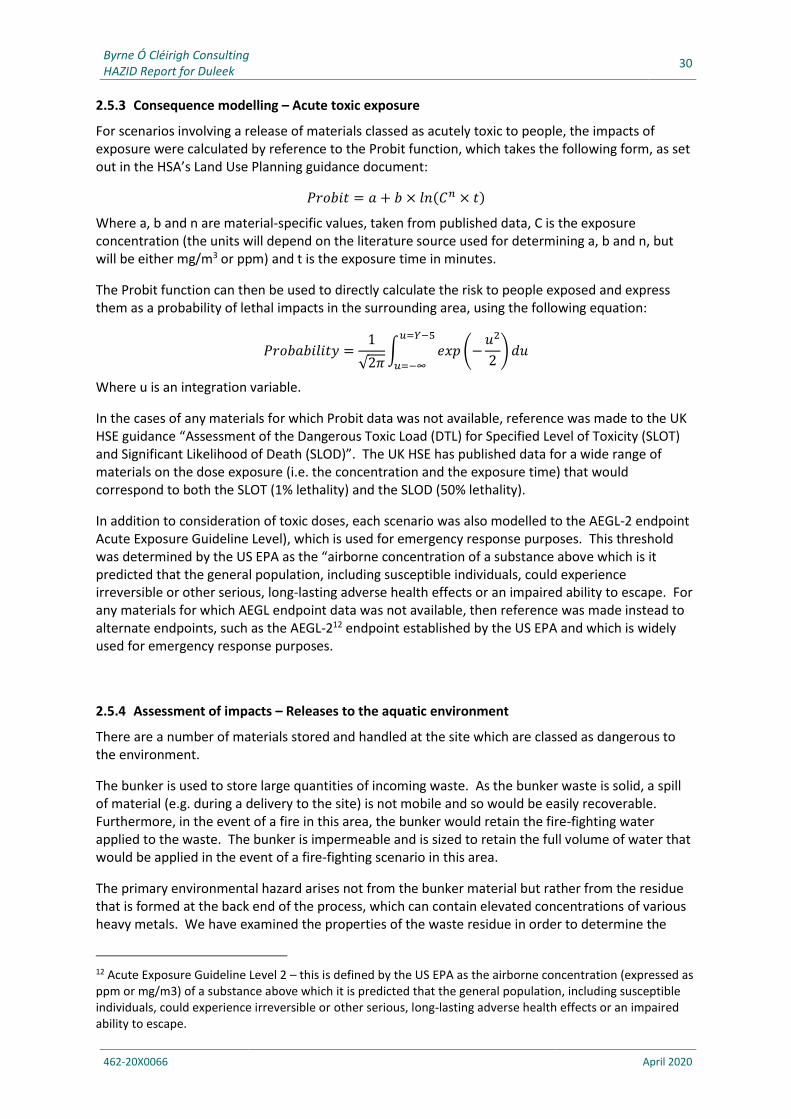
2.5.3 Consequence modelling – Acute toxic exposure
For scenarios involving a release of materials classed as acutely toxic to people, the impacts of exposure were calculated by reference to the Probit function, which takes the following form, as set out in the HSA’s Land Use Planning guidance document:
𝑃𝑟𝑜𝑏𝑖𝑡 = 𝑎 + 𝑏 × 𝑙𝑛(𝐶𝑛 × 𝑡)
Where a, b and n are material-specific values, taken from published data, C is the exposure concentration (the units will depend on the literature source used for determining a, b and n, but will be either mg/m3 or ppm) and t is the exposure time in minutes.
The Probit function can then be used to directly calculate the risk to people exposed and express them as a probability of lethal impacts in the surrounding area, using the following equation:
𝑃𝑟𝑜𝑏𝑎𝑏𝑖𝑙𝑖𝑡𝑦 =1
√2𝜋∫ 𝑒𝑥𝑝 (−
𝑢2
2)𝑑𝑢
𝑢=𝑌−5
𝑢=−∞
Where u is an integration variable.
In the cases of any materials for which Probit data was not available, reference was made to the UK HSE guidance “Assessment of the Dangerous Toxic Load (DTL) for Specified Level of Toxicity (SLOT) and Significant Likelihood of Death (SLOD)”. The UK HSE has published data for a wide range of materials on the dose exposure (i.e. the concentration and the exposure time) that would correspond to both the SLOT (1% lethality) and the SLOD (50% lethality).
In addition to consideration of toxic doses, each scenario was also modelled to the AEGL-2 endpoint Acute Exposure Guideline Level), which is used for emergency response purposes. This threshold was determined by the US EPA as the “airborne concentration of a substance above which is it predicted that the general population, including susceptible individuals, could experience irreversible or other serious, long-lasting adverse health effects or an impaired ability to escape. For any materials for which AEGL endpoint data was not available, then reference was made instead to alternate endpoints, such as the AEGL-212 endpoint established by the US EPA and which is widely used for emergency response purposes.
2.5.4 Assessment of impacts – Releases to the aquatic environment
There are a number of materials stored and handled at the site which are classed as dangerous to the environment.
The bunker is used to store large quantities of incoming waste. As the bunker waste is solid, a spill of material (e.g. during a delivery to the site) is not mobile and so would be easily recoverable. Furthermore, in the event of a fire in this area, the bunker would retain the fire-fighting water applied to the waste. The bunker is impermeable and is sized to retain the full volume of water that would be applied in the event of a fire-fighting scenario in this area.
The primary environmental hazard arises not from the bunker material but rather from the residue that is formed at the back end of the process, which can contain elevated concentrations of various heavy metals. We have examined the properties of the waste residue in order to determine the
12 Acute Exposure Guideline Level 2 – this is defined by the US EPA as the airborne concentration (expressed as ppm or mg/m3) of a substance above which it is predicted that the general population, including susceptible individuals, could experience irreversible or other serious, long-lasting adverse health effects or an impaired ability to escape.
Byrne Ó Cléirigh Consulting 31
HAZID Report for Duleek
462-20X0066 April 2020
appropriate hazard classification. The assessment in Appendix 5 shows that the Seveso Regulations do not apply to this waste but nonetheless it is environmentally hazardous.
The other potentially environmentally hazardous materials of note are fuel oil and ammonia:
• Fuel oil: 55 m3 capacity tank
• Aqueous Ammonia (259%): 62 m3 capacity tank
These tanks are both of double skinned construction in order to protect against the risk of catastrophic tank failure.
Any spills outside of bunded areas would be collected in the surface drainage systems at the site. The outfall from the site is fitted with an oil water separator to protect against elevated concentrations of oil in the surface water discharge. In the event of a spill of water soluble materials, Indaver can shut down the outfall and divert to a dedicated retention tank. This will be done automatically as there is a TOC, conductivity and pH meter on the line, which will shut down the outfall when necessary. There is also a switch which can be activated by Indaver personnel to manually shut down the outfall, if required.
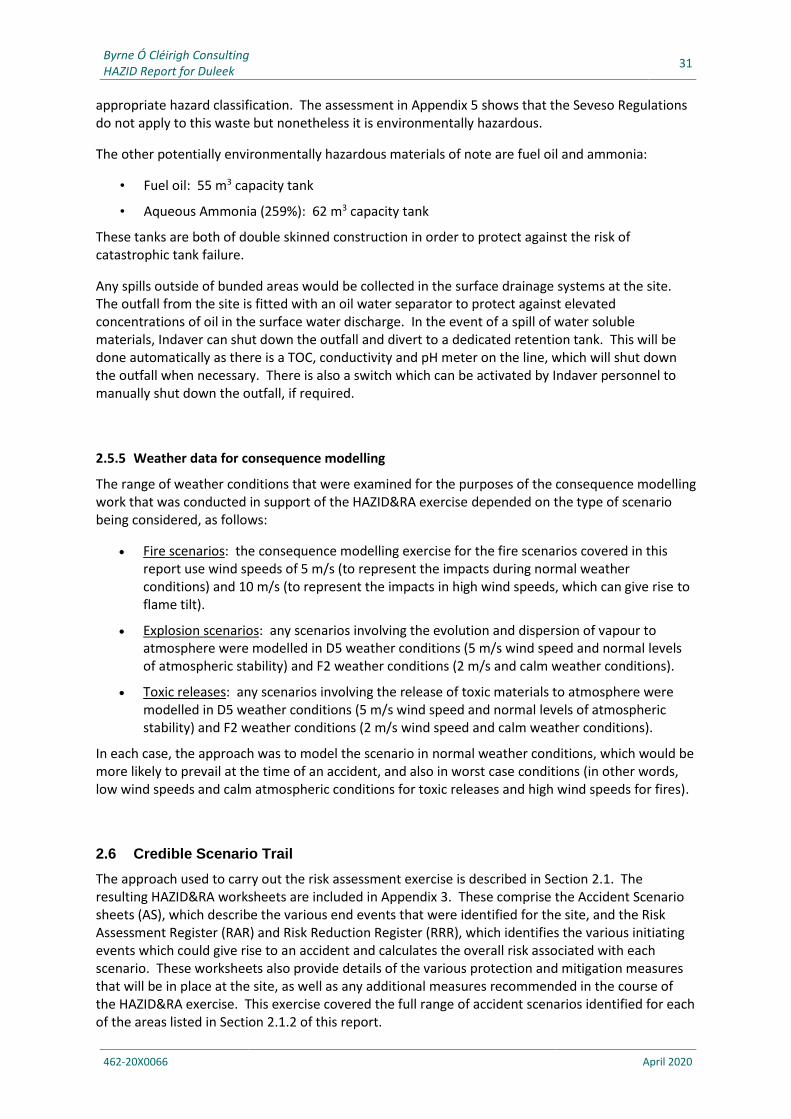
2.5.5 Weather data for consequence modelling
The range of weather conditions that were examined for the purposes of the consequence modelling work that was conducted in support of the HAZID&RA exercise depended on the type of scenario being considered, as follows:
• Fire scenarios: the consequence modelling exercise for the fire scenarios covered in this report use wind speeds of 5 m/s (to represent the impacts during normal weather conditions) and 10 m/s (to represent the impacts in high wind speeds, which can give rise to flame tilt).
• Explosion scenarios: any scenarios involving the evolution and dispersion of vapour to atmosphere were modelled in D5 weather conditions (5 m/s wind speed and normal levels of atmospheric stability) and F2 weather conditions (2 m/s and calm weather conditions).
• Toxic releases: any scenarios involving the release of toxic materials to atmosphere were modelled in D5 weather conditions (5 m/s wind speed and normal levels of atmospheric stability) and F2 weather conditions (2 m/s wind speed and calm weather conditions).
In each case, the approach was to model the scenario in normal weather conditions, which would be more likely to prevail at the time of an accident, and also in worst case conditions (in other words, low wind speeds and calm atmospheric conditions for toxic releases and high wind speeds for fires).
2.6 Credible Scenario Trail
The approach used to carry out the risk assessment exercise is described in Section 2.1. The resulting HAZID&RA worksheets are included in Appendix 3. These comprise the Accident Scenario sheets (AS), which describe the various end events that were identified for the site, and the Risk Assessment Register (RAR) and Risk Reduction Register (RRR), which identifies the various initiating events which could give rise to an accident and calculates the overall risk associated with each scenario. These worksheets also provide details of the various protection and mitigation measures that will be in place at the site, as well as any additional measures recommended in the course of the HAZID&RA exercise. This exercise covered the full range of accident scenarios identified for each of the areas listed in Section 2.1.2 of this report.
Byrne Ó Cléirigh Consulting 32
HAZID Report for Duleek
462-20X0066 April 2020
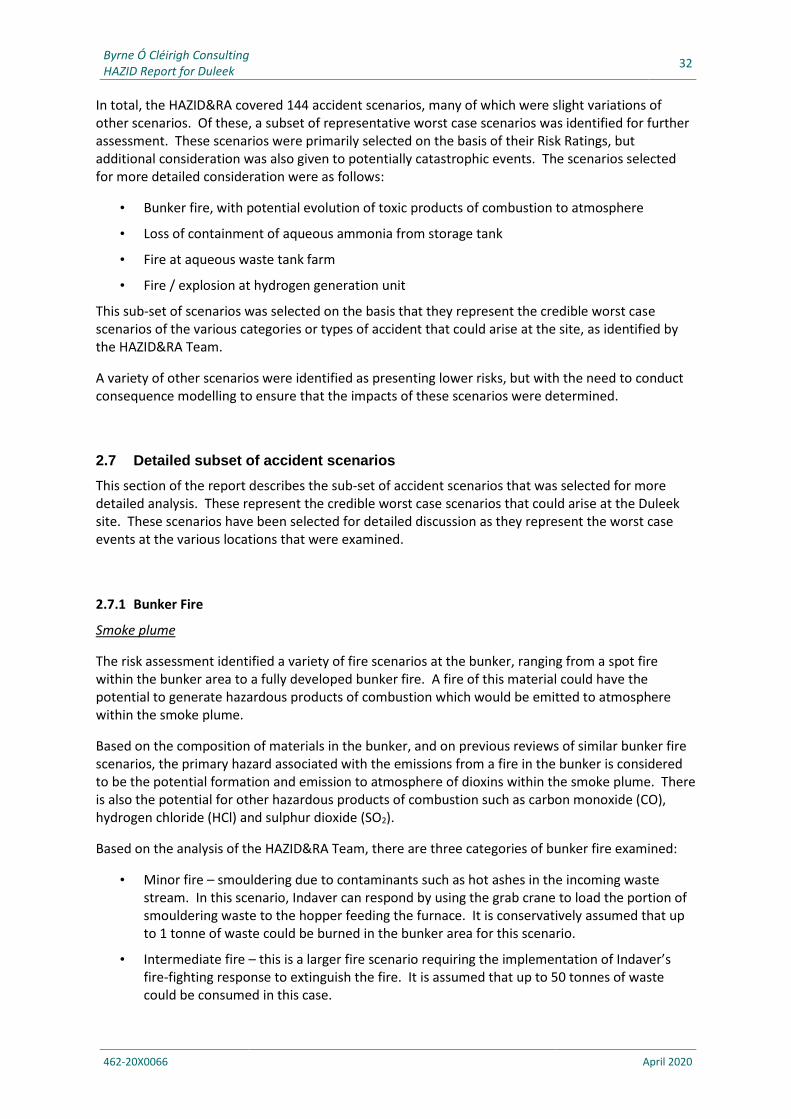
In total, the HAZID&RA covered 144 accident scenarios, many of which were slight variations of other scenarios. Of these, a subset of representative worst case scenarios was identified for further assessment. These scenarios were primarily selected on the basis of their Risk Ratings, but additional consideration was also given to potentially catastrophic events. The scenarios selected for more detailed consideration were as follows:
• Bunker fire, with potential evolution of toxic products of combustion to atmosphere
• Loss of containment of aqueous ammonia from storage tank
• Fire at aqueous waste tank farm
• Fire / explosion at hydrogen generation unit
This sub-set of scenarios was selected on the basis that they represent the credible worst case scenarios of the various categories or types of accident that could arise at the site, as identified by the HAZID&RA Team.
A variety of other scenarios were identified as presenting lower risks, but with the need to conduct consequence modelling to ensure that the impacts of these scenarios were determined.
2.7 Detailed subset of accident scenarios
This section of the report describes the sub-set of accident scenarios that was selected for more detailed analysis. These represent the credible worst case scenarios that could arise at the Duleek site. These scenarios have been selected for detailed discussion as they represent the worst case events at the various locations that were examined.
2.7.1 Bunker Fire
Smoke plume
The risk assessment identified a variety of fire scenarios at the bunker, ranging from a spot fire within the bunker area to a fully developed bunker fire. A fire of this material could have the potential to generate hazardous products of combustion which would be emitted to atmosphere within the smoke plume.
Based on the composition of materials in the bunker, and on previous reviews of similar bunker fire scenarios, the primary hazard associated with the emissions from a fire in the bunker is considered to be the potential formation and emission to atmosphere of dioxins within the smoke plume. There is also the potential for other hazardous products of combustion such as carbon monoxide (CO), hydrogen chloride (HCl) and sulphur dioxide (SO2).
Based on the analysis of the HAZID&RA Team, there are three categories of bunker fire examined:
• Minor fire – smouldering due to contaminants such as hot ashes in the incoming waste stream. In this scenario, Indaver can respond by using the grab crane to load the portion of smouldering waste to the hopper feeding the furnace. It is conservatively assumed that up to 1 tonne of waste could be burned in the bunker area for this scenario.
• Intermediate fire – this is a larger fire scenario requiring the implementation of Indaver’s fire-fighting response to extinguish the fire. It is assumed that up to 50 tonnes of waste could be consumed in this case.
Byrne Ó Cléirigh Consulting 33
HAZID Report for Duleek
462-20X0066 April 2020
• Fully developed fire – if the initial fire-fighting response fails to deal with the scenario the fire could escalate to become a fully developed scenario. In this case the full inventory of waste in the bunker area (between 4,000 and 6,000 tonnes) is consumed.
A more detailed description of the approach used for the consequence modelling exercise for these potential bunker fire scenarios is included in Appendix 6.
Thermal radiation
In addition to the potentially hazardous effects from the smoke plume arising from a bunker fire, there would also be significant thermal radiation to the surrounding area once the fire became fully developed. The software package that was used for this exercise does not include data on the burning rate and surface emissive power for the waste in the bunker and so a surrogate material was selected. The impacts of this scenario were modelled as a pool fire with a surface area equal to the cross sectional area of the bunker. Decane was selected as a surrogate material, as a longer chain hydrocarbon compound. This is considered to be conservative for the purposes of determining heat fluxes as decane will burn at a higher rate and with a higher intensity than would the material in the bunker.
2.7.2 Loss of containment of aqueous ammonia
There are several loss of containment events associated with the storage and handling of aqueous ammonia. The primary scenarios are as follows:
• Loss of containment of aqueous Ammonia from transfer pipeline. The maximum flow rate in the transfer line is 175 kg/hr. In the event of a major release (i.e. guillotine failure of the transfer line), Indaver personnel would be able to detect the loss of containment and to take the necessary measures to shut down the transfer. For the purposes of this assessment a response time of 15 minutes has been assumed. This is a conservative assumption when calculating the quantity of Ammonia that would be released in this scenario as, if the pipe line was to fail in this manner, the pumps would not be able to maintain the pressure in the line. In order to calculate the total quantity released in this period, we multiplied the flow rate by the response time and applied a factor of 2 to allow for additional material lost due to the reduced resistance against which the pump would be operating and for residual material in the line after the pumping ceased. The total volume spilled in this scenario is calculated to be 87.5 kg.
• Full loss of containment from aqueous Ammonia tank. This is an extremely remote event as the aqueous ammonia tank is a double-skinned vessel. The tank is also protected against impacts by the installation of barriers. However, the HAZID&RA team did not rule out the possibility of the tank being damaged due to mechanical impact. In this scenario the full inventory of the tank could be released (i.e. up to 62 m3 of aqueous ammonia). If the direction of release was towards the yard area, the smooth surface of the ground would enable the released material to spread out thinly, thereby giving a large surface area for evaporation from the spill surface. The dimensions of the pool in this case would be dictated by the presence of buildings in the vicinity. In the event of a release, the spill would be collected in an ACO drain to a forecourt separator. This is capable of collecting and removing any spilled material at a rate of 3 m3 per minute. As such it is calculated that the resulting pool would be removed from the area within 21 minutes following the release. Once collected in the surface water network, the spill would be routed to the retention facilities on site.
Byrne Ó Cléirigh Consulting 34
HAZID Report for Duleek
462-20X0066 April 2020
• Loss of containment during delivery of aqueous ammonia (rupture of transfer hose). This scenario involves a much higher flow rate than a release from a pipeline (40 m3/hr). However, as the operation is manned locally, there is a much more rapid response time (taken to be 1 to 2 minutes). In this case a factor of 1.5 was also applied to allow for the increase in flow rate following failure of the hose line. The total quantity released in this scenario is 2 m3.
2.7.3 Fire at Aqueous Waste Tank Farm
The waste tank farm is used for the storage of aqueous mixtures of flammable solvents. Although diluted with water, these mixtures are classed as flammable and so we have examined the impacts of major fire scenarios in this area.
In the event of a major release to the bund, the maximum resulting pool area would be determined by the bund dimensions; 28.86 m length by 10.93 m width. This gives a pool area of 313 m2.
Referring to the waste data for the site, these waste streams could comprise a variety of flammable solvents. For modelling purposes, we have examined the impacts based on a fire of acetonitrile, which is selected as a surrogate solvent for the mixture. The scenario is modelled as a fire of pure acetonitrile, as a conservative approach.
We also considered the potential for a scenario of catastrophic tank failure to occur. However, the tanks will be fitted with shields around their perimeters, to ensure that in the event of a loss of containment due to tank failure, the released liquid would impact the shielding. This would act to dissipate the energy of the release, thereby protecting against the potential for a release to subsequently overtop the bund wall.
2.7.4 Explosion at Hydrogen Generation Unit
The hydrogen generation unit will operate at a pressure of 350 bar, generating hydrogen at a rate of 162 kg/hr. This will be stored on site in a dedicate tank, which will have a capacity of 100 m3. We have modelled the impacts for the following scenarios:
• Guillotine failure of 2” hydrogen pipeline
• Rupture of storage vessel
2.8 Consequence Assessment
The consequence modelling results for the scenarios described in Section 2.7 are described in the following sub-sections.
2.8.1 Bunker Fires
Dioxin emissions from bunker fire – human health
The modelling exercise to determine the impacts of the dioxin emissions from a bunker fire is described in Appendix 6. The focus of this aspect of the assessment is to examine the combined dose that could be experienced over the course of the fire event, as follows:
Byrne Ó Cléirigh Consulting 35
HAZID Report for Duleek
462-20X0066 April 2020
• Initial phase with smouldering waste: this is characterised by lower emission rates but also has a less buoyant smoke plume
• Intermediate phase: this involves a fire in the bunker, but one which is extinguished before it can become fully developed.
• Fully developed fire: this involves a fire in the full inventory in the bunker. It is characterised by higher emission rates but it also has a higher buoyancy smoke plume which helps to reduce ground level impacts.
Each phase is progressively less likely to occur, due to the controls and response plans that Indaver has in place to protect against a fire developing in the bunker, but the combined impacts of all three phases have been examined.
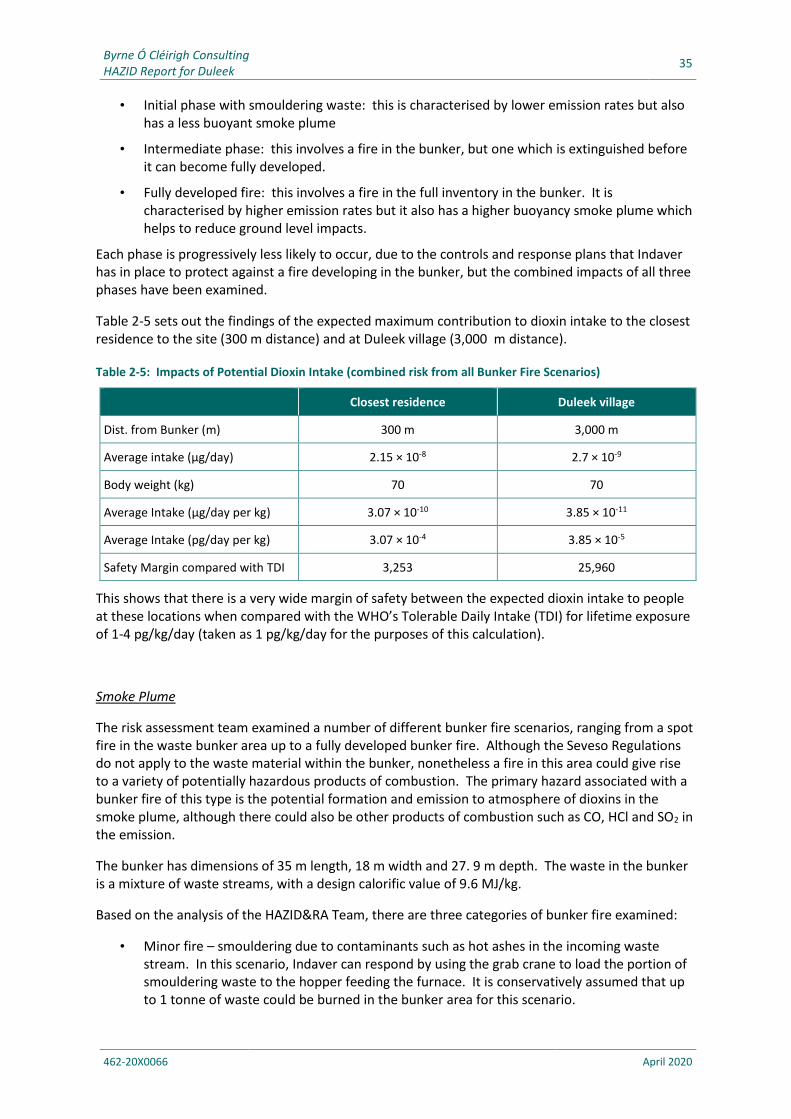
Table 2-5 sets out the findings of the expected maximum contribution to dioxin intake to the closest residence to the site (300 m distance) and at Duleek village (3,000 m distance).
Table 2-5: Impacts of Potential Dioxin Intake (combined risk from all Bunker Fire Scenarios)
Closest residence Duleek village
Dist. from Bunker (m) 300 m 3,000 m
Average intake (µg/day) 2.15 × 10⁻⁸ 2.7 × 10⁻⁹
Body weight (kg) 70 70
Average Intake (µg/day per kg) 3.07 × 10⁻¹⁰ 3.85 × 10⁻¹¹
Average Intake (pg/day per kg) 3.07 × 10⁻⁴ 3.85 × 10⁻⁵
Safety Margin compared with TDI 3,253 25,960
This shows that there is a very wide margin of safety between the expected dioxin intake to people at these locations when compared with the WHO’s Tolerable Daily Intake (TDI) for lifetime exposure of 1-4 pg/kg/day (taken as 1 pg/kg/day for the purposes of this calculation).
Smoke Plume
The risk assessment team examined a number of different bunker fire scenarios, ranging from a spot fire in the waste bunker area up to a fully developed bunker fire. Although the Seveso Regulations do not apply to the waste material within the bunker, nonetheless a fire in this area could give rise to a variety of potentially hazardous products of combustion. The primary hazard associated with a bunker fire of this type is the potential formation and emission to atmosphere of dioxins in the smoke plume, although there could also be other products of combustion such as CO, HCl and SO2 in the emission.
The bunker has dimensions of 35 m length, 18 m width and 27. 9 m depth. The waste in the bunker is a mixture of waste streams, with a design calorific value of 9.6 MJ/kg.
Based on the analysis of the HAZID&RA Team, there are three categories of bunker fire examined:
• Minor fire – smouldering due to contaminants such as hot ashes in the incoming waste stream. In this scenario, Indaver can respond by using the grab crane to load the portion of smouldering waste to the hopper feeding the furnace. It is conservatively assumed that up to 1 tonne of waste could be burned in the bunker area for this scenario.
Byrne Ó Cléirigh Consulting 36
HAZID Report for Duleek
462-20X0066 April 2020
• Intermediate fire – this is a larger fire scenario requiring the implementation of Indaver’s fire-fighting response to extinguish the fire. It is assumed that up to 50 tonnes of waste could be consumed in this case.
• Fully developed fire – if the initial fire-fighting response fails to deal with the scenario the fire could escalate to become a fully developed scenario. In this case the full inventory of waste in the bunker area is consumed.
A more detailed description of the approach used for the consequence modelling exercise for these potential bunker fire scenarios is included in Appendix 6.
Thermal Radiation
In addition to the potentially hazardous effects from the smoke plume arising from a bunker fire, there would also be significant thermal radiation to the surrounding area once the fire became fully developed. The software package that was used for this exercise does not include data on the burning rate and surface emissive power for the waste in the bunker and so a surrogate material was selected. The impacts of this scenario were modelled as a pool fire with a surface area equal to the cross sectional area of the bunker. Decane was selected as a surrogate material, as a longer chain hydrocarbon compound. This is considered to be conservative for the purposes of determining heat fluxes as Decane will burn at a higher rate and with a higher intensity than would the material in the bunker.
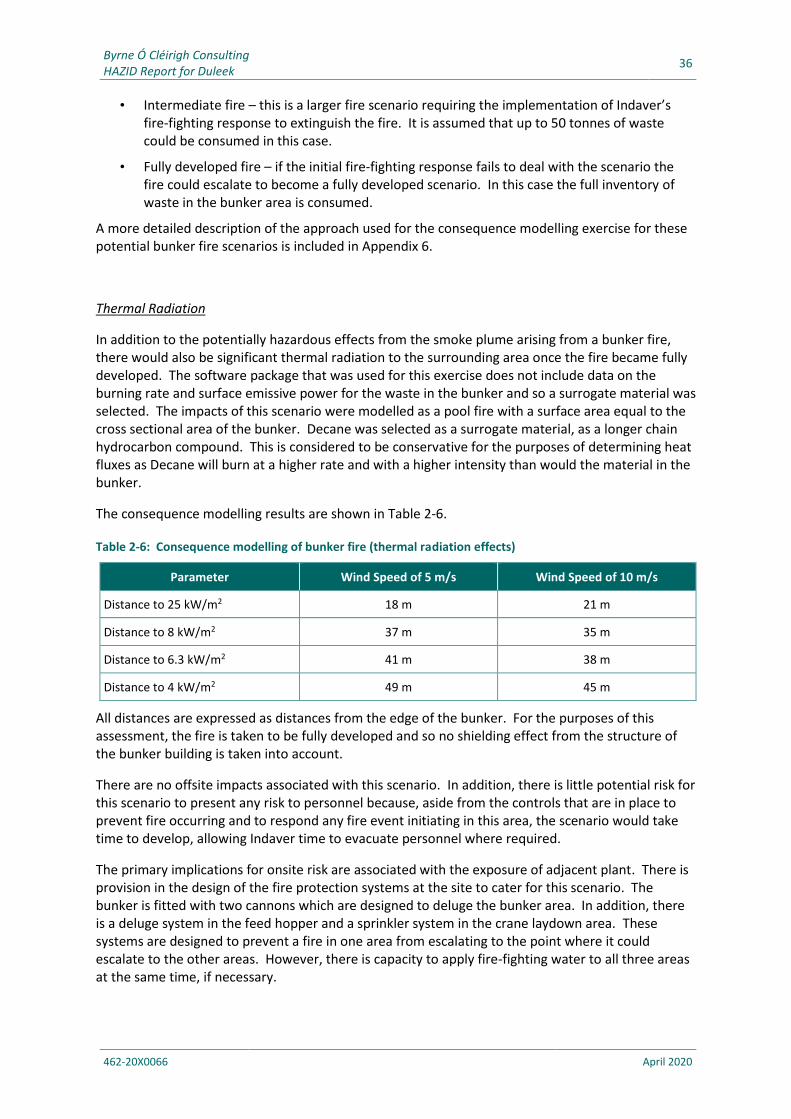
The consequence modelling results are shown in Table 2-6.
Table 2-6: Consequence modelling of bunker fire (thermal radiation effects)
Parameter Wind Speed of 5 m/s Wind Speed of 10 m/s
Distance to 25 kW/m2 18 m 21 m
Distance to 8 kW/m2 37 m 35 m
Distance to 6.3 kW/m2 41 m 38 m
Distance to 4 kW/m2 49 m 45 m
All distances are expressed as distances from the edge of the bunker. For the purposes of this assessment, the fire is taken to be fully developed and so no shielding effect from the structure of the bunker building is taken into account.
There are no offsite impacts associated with this scenario. In addition, there is little potential risk for this scenario to present any risk to personnel because, aside from the controls that are in place to prevent fire occurring and to respond any fire event initiating in this area, the scenario would take time to develop, allowing Indaver time to evacuate personnel where required.
The primary implications for onsite risk are associated with the exposure of adjacent plant. There is provision in the design of the fire protection systems at the site to cater for this scenario. The bunker is fitted with two cannons which are designed to deluge the bunker area. In addition, there is a deluge system in the feed hopper and a sprinkler system in the crane laydown area. These systems are designed to prevent a fire in one area from escalating to the point where it could escalate to the other areas. However, there is capacity to apply fire-fighting water to all three areas at the same time, if necessary.
Byrne Ó Cléirigh Consulting 37
HAZID Report for Duleek
462-20X0066 April 2020
2.8.2 Loss of containment of aqueous ammonia
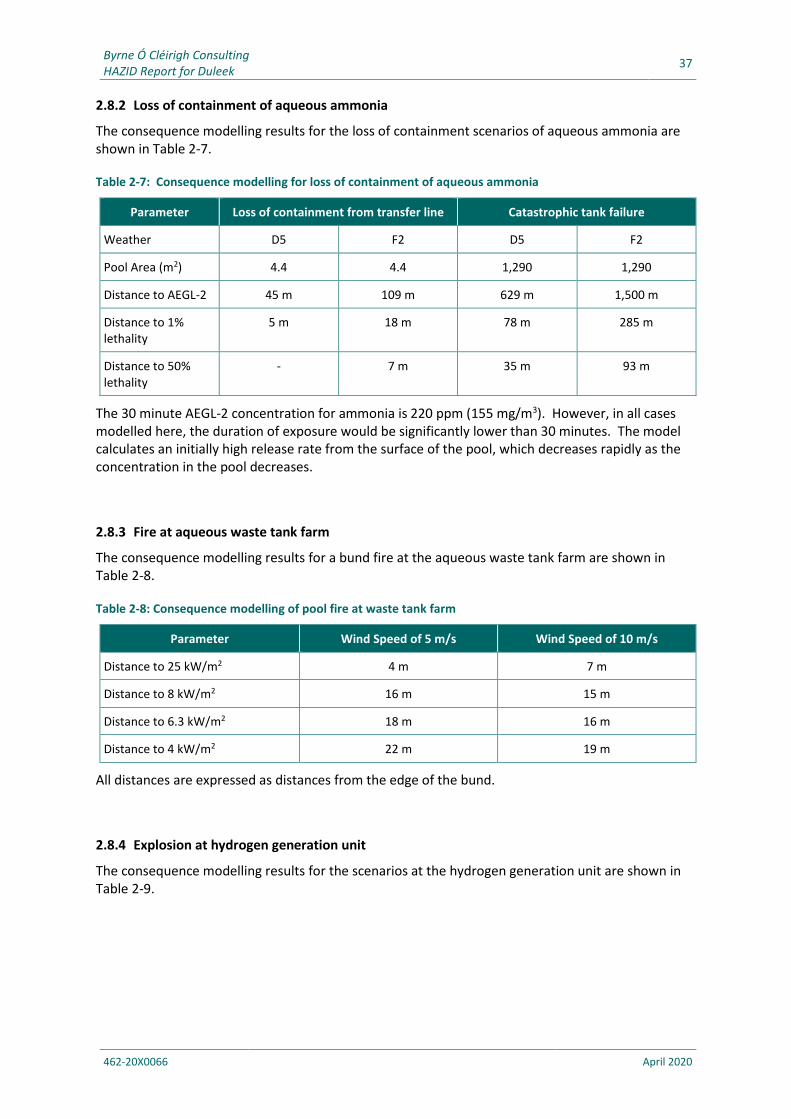
The consequence modelling results for the loss of containment scenarios of aqueous ammonia are shown in Table 2-7.
Table 2-7: Consequence modelling for loss of containment of aqueous ammonia
Parameter Loss of containment from transfer line Catastrophic tank failure
Weather D5 F2 D5 F2
Pool Area (m2) 4.4 4.4 1,290 1,290
Distance to AEGL-2 45 m 109 m 629 m 1,500 m
Distance to 1% lethality
5 m 18 m 78 m 285 m
Distance to 50% lethality
- 7 m 35 m 93 m
The 30 minute AEGL-2 concentration for ammonia is 220 ppm (155 mg/m3). However, in all cases modelled here, the duration of exposure would be significantly lower than 30 minutes. The model calculates an initially high release rate from the surface of the pool, which decreases rapidly as the concentration in the pool decreases.
2.8.3 Fire at aqueous waste tank farm
The consequence modelling results for a bund fire at the aqueous waste tank farm are shown in Table 2-8.
Table 2-8: Consequence modelling of pool fire at waste tank farm
Parameter Wind Speed of 5 m/s Wind Speed of 10 m/s
Distance to 25 kW/m2 4 m 7 m
Distance to 8 kW/m2 16 m 15 m
Distance to 6.3 kW/m2 18 m 16 m
Distance to 4 kW/m2 22 m 19 m
All distances are expressed as distances from the edge of the bund.
2.8.4 Explosion at hydrogen generation unit
The consequence modelling results for the scenarios at the hydrogen generation unit are shown in Table 2-9.
Byrne Ó Cléirigh Consulting 38
HAZID Report for Duleek
462-20X0066 April 2020
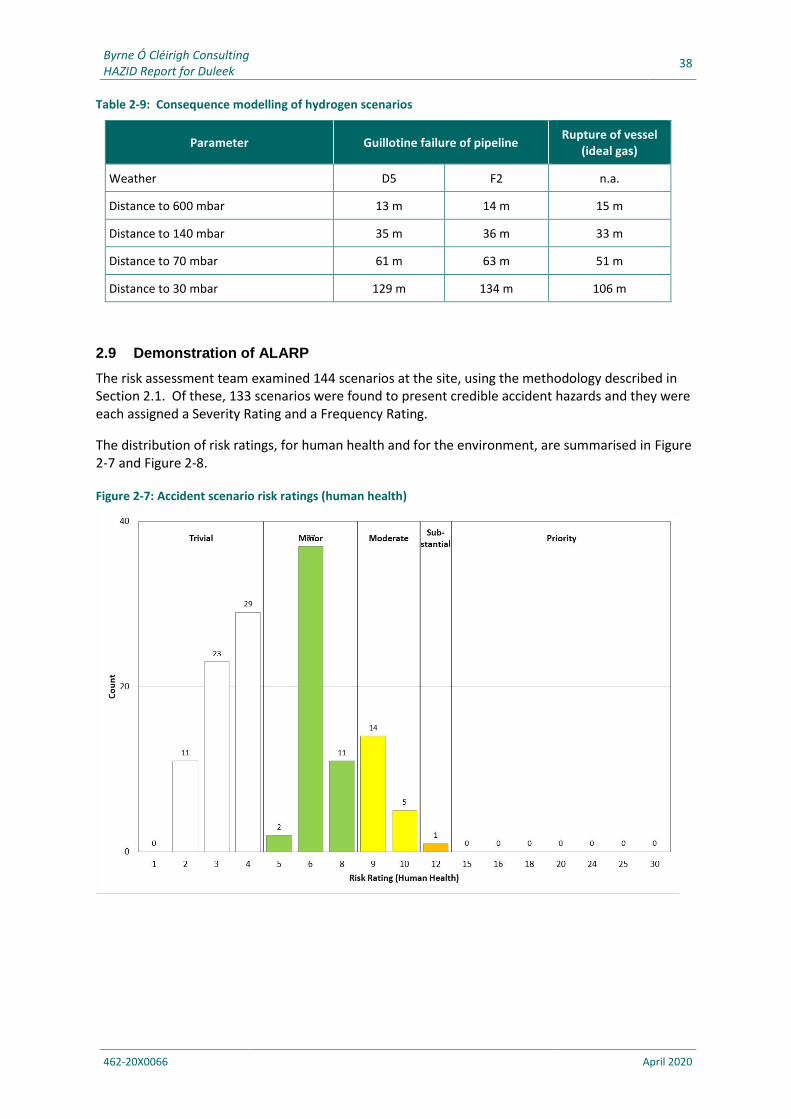
Table 2-9: Consequence modelling of hydrogen scenarios
Parameter Guillotine failure of pipeline Rupture of vessel
(ideal gas)
Weather D5 F2 n.a.
Distance to 600 mbar 13 m 14 m 15 m
Distance to 140 mbar 35 m 36 m 33 m
Distance to 70 mbar 61 m 63 m 51 m
Distance to 30 mbar 129 m 134 m 106 m
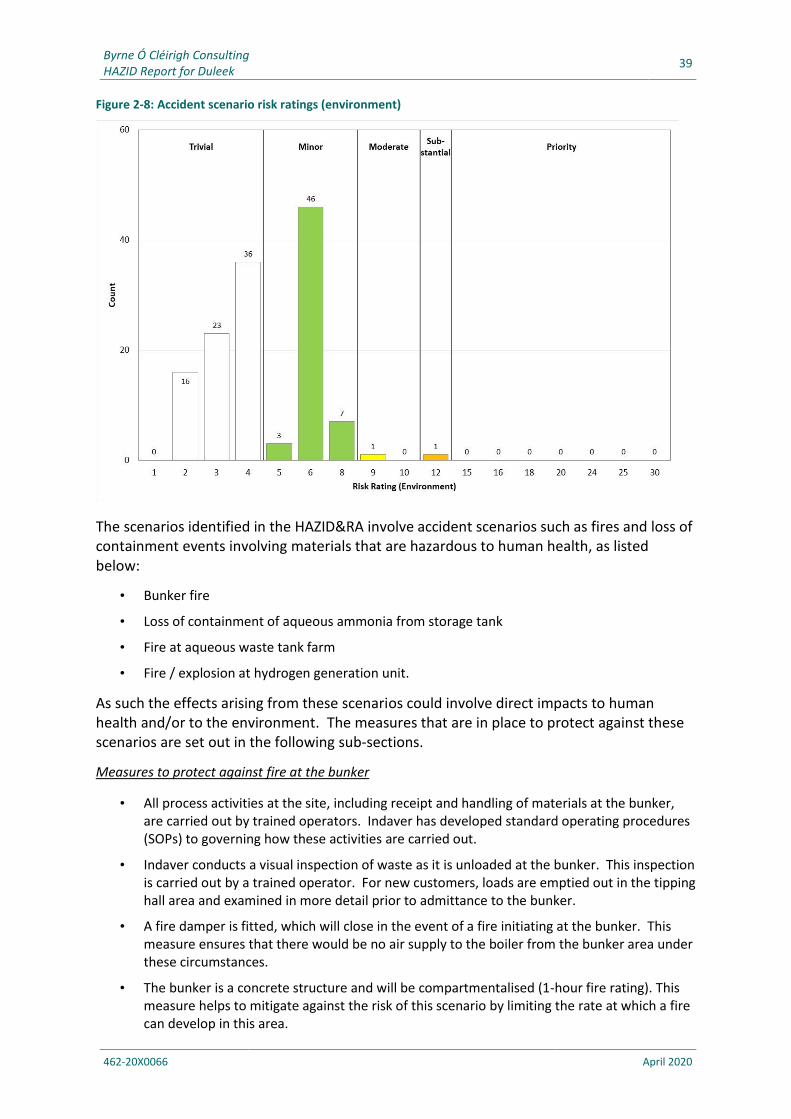
2.9 Demonstration of ALARP
The risk assessment team examined 144 scenarios at the site, using the methodology described in Section 2.1. Of these, 133 scenarios were found to present credible accident hazards and they were each assigned a Severity Rating and a Frequency Rating.
The distribution of risk ratings, for human health and for the environment, are summarised in Figure 2-7 and Figure 2-8.
Figure 2-7: Accident scenario risk ratings (human health)
Byrne Ó Cléirigh Consulting 39
HAZID Report for Duleek
462-20X0066 April 2020
Figure 2-8: Accident scenario risk ratings (environment)
The scenarios identified in the HAZID&RA involve accident scenarios such as fires and loss of containment events involving materials that are hazardous to human health, as listed below:
• Bunker fire
• Loss of containment of aqueous ammonia from storage tank
• Fire at aqueous waste tank farm
• Fire / explosion at hydrogen generation unit.
As such the effects arising from these scenarios could involve direct impacts to human health and/or to the environment. The measures that are in place to protect against these scenarios are set out in the following sub-sections.
Measures to protect against fire at the bunker
• All process activities at the site, including receipt and handling of materials at the bunker, are carried out by trained operators. Indaver has developed standard operating procedures (SOPs) to governing how these activities are carried out.
• Indaver conducts a visual inspection of waste as it is unloaded at the bunker. This inspection is carried out by a trained operator. For new customers, loads are emptied out in the tipping hall area and examined in more detail prior to admittance to the bunker.
• A fire damper is fitted, which will close in the event of a fire initiating at the bunker. This measure ensures that there would be no air supply to the boiler from the bunker area under these circumstances.
• The bunker is a concrete structure and will be compartmentalised (1-hour fire rating). This measure helps to mitigate against the risk of this scenario by limiting the rate at which a fire can develop in this area.
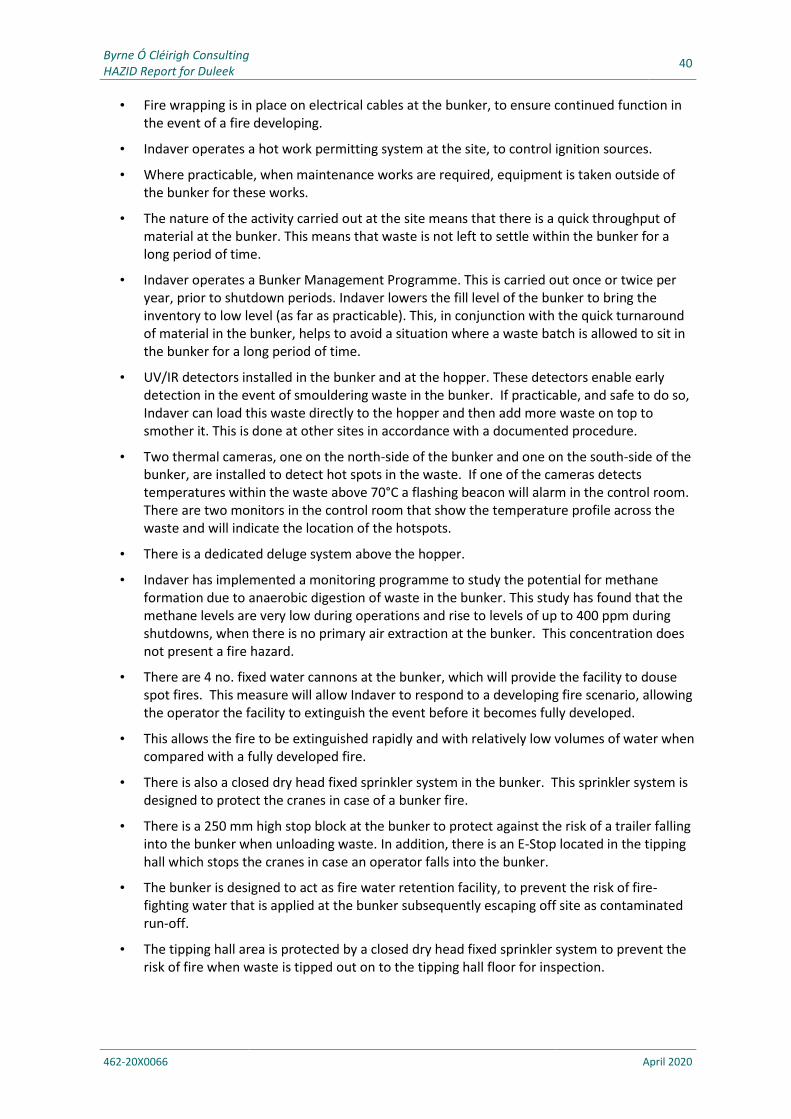
Byrne Ó Cléirigh Consulting 40
HAZID Report for Duleek
462-20X0066 April 2020
• Fire wrapping is in place on electrical cables at the bunker, to ensure continued function in the event of a fire developing.
• Indaver operates a hot work permitting system at the site, to control ignition sources.
• Where practicable, when maintenance works are required, equipment is taken outside of the bunker for these works.
• The nature of the activity carried out at the site means that there is a quick throughput of material at the bunker. This means that waste is not left to settle within the bunker for a long period of time.
• Indaver operates a Bunker Management Programme. This is carried out once or twice per year, prior to shutdown periods. Indaver lowers the fill level of the bunker to bring the inventory to low level (as far as practicable). This, in conjunction with the quick turnaround of material in the bunker, helps to avoid a situation where a waste batch is allowed to sit in the bunker for a long period of time.
• UV/IR detectors installed in the bunker and at the hopper. These detectors enable early detection in the event of smouldering waste in the bunker. If practicable, and safe to do so, Indaver can load this waste directly to the hopper and then add more waste on top to smother it. This is done at other sites in accordance with a documented procedure.
• Two thermal cameras, one on the north-side of the bunker and one on the south-side of the bunker, are installed to detect hot spots in the waste. If one of the cameras detects temperatures within the waste above 70°C a flashing beacon will alarm in the control room. There are two monitors in the control room that show the temperature profile across the waste and will indicate the location of the hotspots.
• There is a dedicated deluge system above the hopper.
• Indaver has implemented a monitoring programme to study the potential for methane formation due to anaerobic digestion of waste in the bunker. This study has found that the methane levels are very low during operations and rise to levels of up to 400 ppm during shutdowns, when there is no primary air extraction at the bunker. This concentration does not present a fire hazard.
• There are 4 no. fixed water cannons at the bunker, which will provide the facility to douse spot fires. This measure will allow Indaver to respond to a developing fire scenario, allowing the operator the facility to extinguish the event before it becomes fully developed.
• This allows the fire to be extinguished rapidly and with relatively low volumes of water when compared with a fully developed fire.
• There is also a closed dry head fixed sprinkler system in the bunker. This sprinkler system is designed to protect the cranes in case of a bunker fire.
• There is a 250 mm high stop block at the bunker to protect against the risk of a trailer falling into the bunker when unloading waste. In addition, there is an E-Stop located in the tipping hall which stops the cranes in case an operator falls into the bunker.
• The bunker is designed to act as fire water retention facility, to prevent the risk of fire-fighting water that is applied at the bunker subsequently escaping off site as contaminated run-off.
• The tipping hall area is protected by a closed dry head fixed sprinkler system to prevent the risk of fire when waste is tipped out on to the tipping hall floor for inspection.
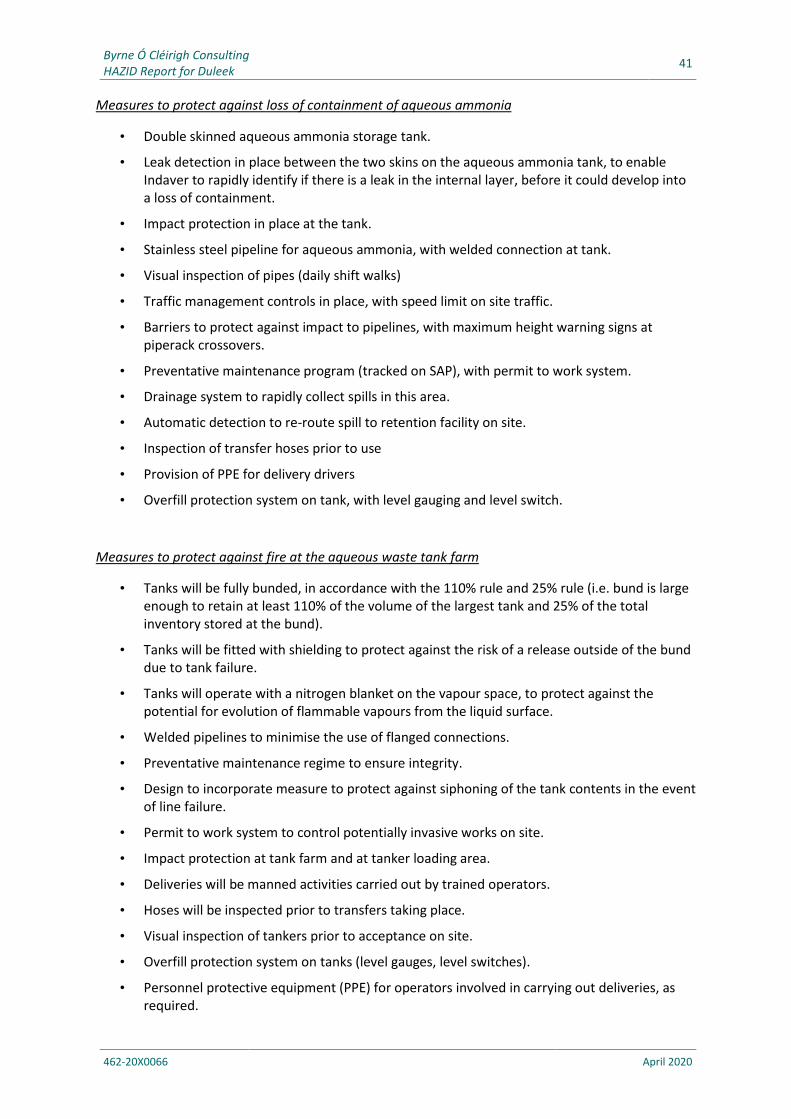
Byrne Ó Cléirigh Consulting 41
HAZID Report for Duleek
462-20X0066 April 2020
Measures to protect against loss of containment of aqueous ammonia
• Double skinned aqueous ammonia storage tank.
• Leak detection in place between the two skins on the aqueous ammonia tank, to enable Indaver to rapidly identify if there is a leak in the internal layer, before it could develop into a loss of containment.
• Impact protection in place at the tank.
• Stainless steel pipeline for aqueous ammonia, with welded connection at tank.
• Visual inspection of pipes (daily shift walks)
• Traffic management controls in place, with speed limit on site traffic.
• Barriers to protect against impact to pipelines, with maximum height warning signs at piperack crossovers.
• Preventative maintenance program (tracked on SAP), with permit to work system.
• Drainage system to rapidly collect spills in this area.
• Automatic detection to re-route spill to retention facility on site.
• Inspection of transfer hoses prior to use
• Provision of PPE for delivery drivers
• Overfill protection system on tank, with level gauging and level switch.
Measures to protect against fire at the aqueous waste tank farm
• Tanks will be fully bunded, in accordance with the 110% rule and 25% rule (i.e. bund is large enough to retain at least 110% of the volume of the largest tank and 25% of the total inventory stored at the bund).
• Tanks will be fitted with shielding to protect against the risk of a release outside of the bund due to tank failure.
• Tanks will operate with a nitrogen blanket on the vapour space, to protect against the potential for evolution of flammable vapours from the liquid surface.
• Welded pipelines to minimise the use of flanged connections.
• Preventative maintenance regime to ensure integrity.
• Design to incorporate measure to protect against siphoning of the tank contents in the event of line failure.
• Permit to work system to control potentially invasive works on site.
• Impact protection at tank farm and at tanker loading area.
• Deliveries will be manned activities carried out by trained operators.
• Hoses will be inspected prior to transfers taking place.
• Visual inspection of tankers prior to acceptance on site.
• Overfill protection system on tanks (level gauges, level switches).
• Personnel protective equipment (PPE) for operators involved in carrying out deliveries, as required.
Byrne Ó Cléirigh Consulting 42
HAZID Report for Duleek
462-20X0066 April 2020
• Contents of the aqueous waste tank are dilute (>90% water), thereby reducing the fire hazard.
Measures to protect against fire at the hydrogen generation unit
• Interlocks on system, to enable a leaking section of line to be isolated, reducing the potential quantity released to atmosphere.
• Pressure reduction at connection for vehicle fuelling.
• Siting of facility and separation distances to other plant, equipment, buildings, etc. in accordance with NFPA 55.
• Preventative maintenance system on plant and equipment, to ensure integrity and fitness for purpose.
• Forced ventilation at indoor area of plant, to prevent risk of hydrogen accumulation at ceiling level.
• Impact protection on hydrogen plant.
• Speed limit in place on site.
• Road tanker movements supervised by trained Indaver operator.
• Visual inspection of road tankers prior to acceptance on site.
• Transfer hoses inspected prior to use.
• ATEX zoning, with control of ignition sources.
These include measures to reduce the probability of an accident scenario developing (risk prevention) and measures to reduce the consequences if an accident did occur (risk mitigation). The measures protect against the conditions arising under which an accident could occur, they enable rapid detection and response and protect against the risk of environmental contamination.
With these measures in place, the HAZID&RA found that Indaver would have all necessary measures to in place at the bunker, throughout all phases of the operation. As such the risks associated with this scenario were considered to be ALARP (as low as reasonably practicable).
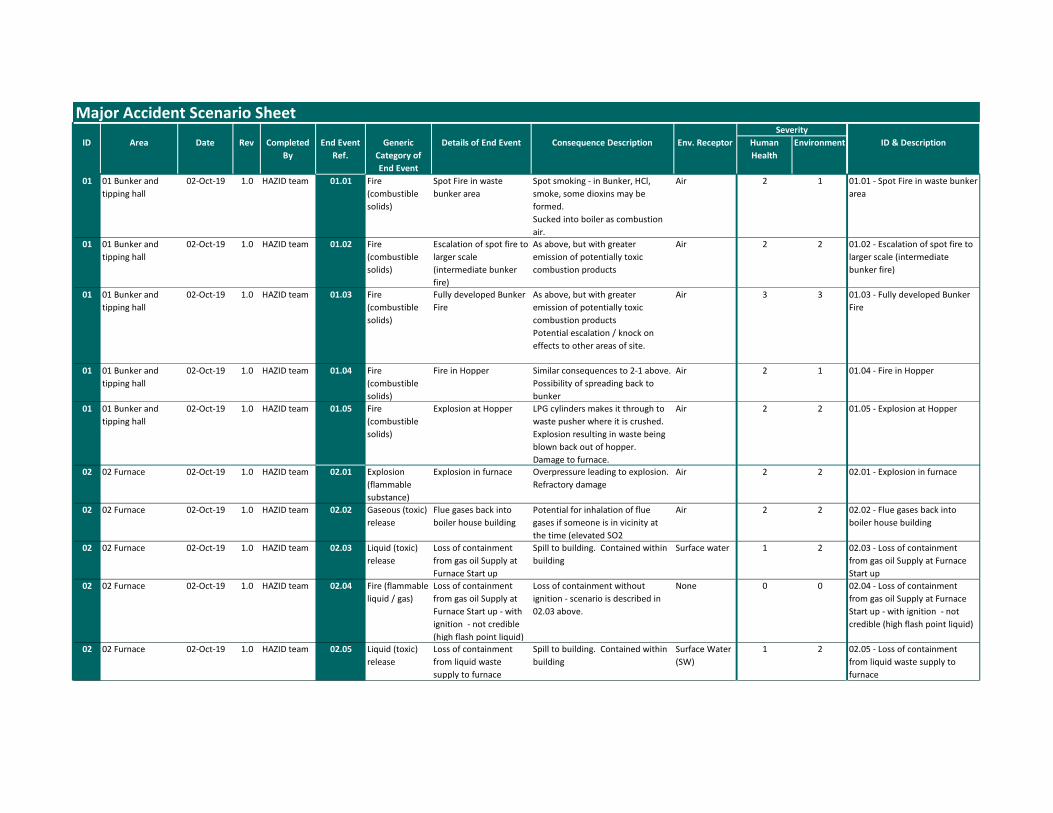
Major Accident Scenario Sheet
ID Area Date Rev Completed
By
End Event
Ref.
Generic
Category of
End Event
Details of End Event Consequence Description Env. Receptor Human
Health
Environment ID & Description
01 01 Bunker and
tipping hall
02-Oct-19 1.0 HAZID team 01.01 Fire
(combustible
solids)
Spot Fire in waste
bunker area
Spot smoking - in Bunker, HCl,
smoke, some dioxins may be
formed.
Sucked into boiler as combustion
air.
Air 2 1 01.01 - Spot Fire in waste bunker
area
01 01 Bunker and
tipping hall
02-Oct-19 1.0 HAZID team 01.02 Fire
(combustible
solids)
Escalation of spot fire to
larger scale
(intermediate bunker
fire)
As above, but with greater
emission of potentially toxic
combustion products
Air 2 2 01.02 - Escalation of spot fire to
larger scale (intermediate
bunker fire)
01 01 Bunker and
tipping hall
02-Oct-19 1.0 HAZID team 01.03 Fire
(combustible
solids)
Fully developed Bunker
Fire
As above, but with greater
emission of potentially toxic
combustion products
Potential escalation / knock on
effects to other areas of site.
Air 3 3 01.03 - Fully developed Bunker
Fire
01 01 Bunker and
tipping hall
02-Oct-19 1.0 HAZID team 01.04 Fire
(combustible
solids)
Fire in Hopper Similar consequences to 2-1 above.
Possibility of spreading back to
bunker
Air 2 1 01.04 - Fire in Hopper
01 01 Bunker and
tipping hall
02-Oct-19 1.0 HAZID team 01.05 Fire
(combustible
solids)
Explosion at Hopper LPG cylinders makes it through to
waste pusher where it is crushed.
Explosion resulting in waste being
blown back out of hopper.
Damage to furnace.
Air 2 2 01.05 - Explosion at Hopper
02 02 Furnace 02-Oct-19 1.0 HAZID team 02.01 Explosion
(flammable
substance)
Explosion in furnace Overpressure leading to explosion.
Refractory damage
Air 2 2 02.01 - Explosion in furnace
02 02 Furnace 02-Oct-19 1.0 HAZID team 02.02 Gaseous (toxic)
release
Flue gases back into
boiler house building
Potential for inhalation of flue
gases if someone is in vicinity at
the time (elevated SO2
Air 2 2 02.02 - Flue gases back into
boiler house building
02 02 Furnace 02-Oct-19 1.0 HAZID team 02.03 Liquid (toxic)
release
Loss of containment
from gas oil Supply at
Furnace Start up
Spill to building. Contained within
building
Surface water 1 2 02.03 - Loss of containment
from gas oil Supply at Furnace
Start up
02 02 Furnace 02-Oct-19 1.0 HAZID team 02.04 Fire (flammable
liquid / gas)
Loss of containment
from gas oil Supply at
Furnace Start up - with
ignition - not credible
(high flash point liquid)
Loss of containment without
ignition - scenario is described in
02.03 above.
None 0 0 02.04 - Loss of containment
from gas oil Supply at Furnace
Start up - with ignition - not
credible (high flash point liquid)
02 02 Furnace 02-Oct-19 1.0 HAZID team 02.05 Liquid (toxic)
release
Loss of containment
from liquid waste
supply to furnace
Spill to building. Contained within
building
Surface Water
(SW)
1 2 02.05 - Loss of containment
from liquid waste supply to
furnace
Severity
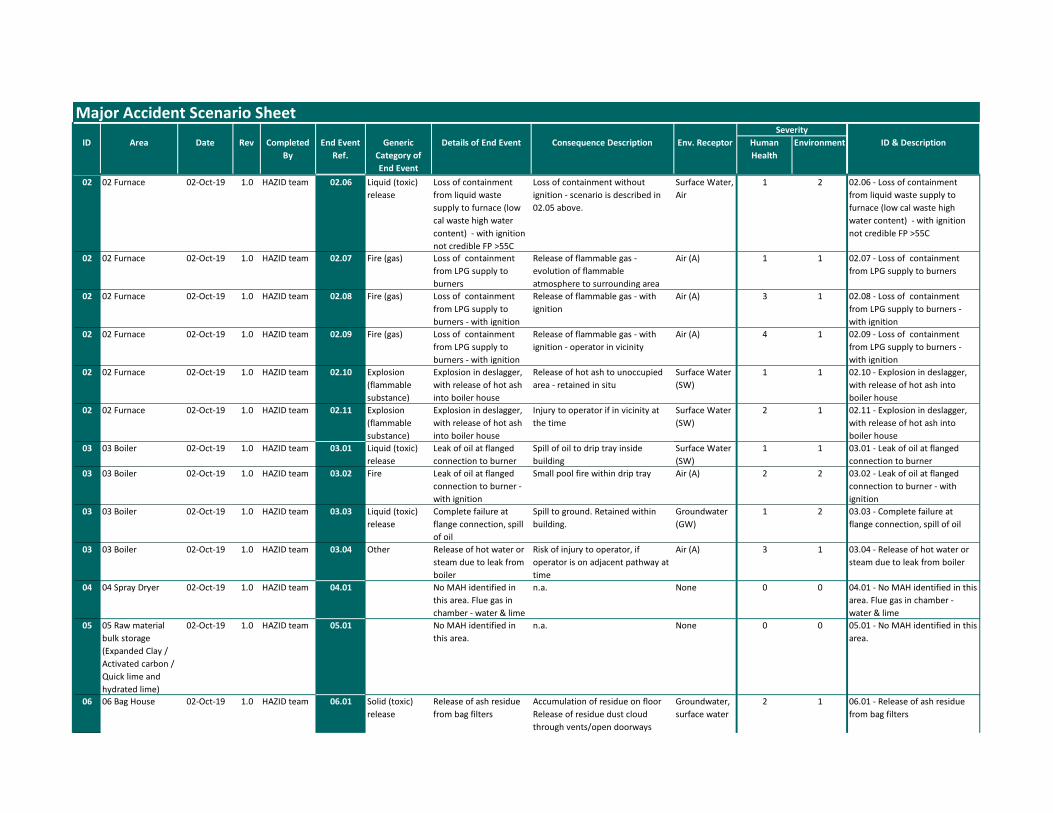
Major Accident Scenario Sheet
ID Area Date Rev Completed
By
End Event
Ref.
Generic
Category of
End Event
Details of End Event Consequence Description Env. Receptor Human
Health
Environment ID & Description
Severity
02 02 Furnace 02-Oct-19 1.0 HAZID team 02.06 Liquid (toxic)
release
Loss of containment
from liquid waste
supply to furnace (low
cal waste high water
content) - with ignition
not credible FP >55C
Loss of containment without
ignition - scenario is described in
02.05 above.
Surface Water,
Air
1 2 02.06 - Loss of containment
from liquid waste supply to
furnace (low cal waste high
water content) - with ignition
not credible FP >55C
02 02 Furnace 02-Oct-19 1.0 HAZID team 02.07 Fire (gas) Loss of containment
from LPG supply to
burners
Release of flammable gas -
evolution of flammable
atmosphere to surrounding area
Air (A) 1 1 02.07 - Loss of containment
from LPG supply to burners
02 02 Furnace 02-Oct-19 1.0 HAZID team 02.08 Fire (gas) Loss of containment
from LPG supply to
burners - with ignition
Release of flammable gas - with
ignition
Air (A) 3 1 02.08 - Loss of containment
from LPG supply to burners -
with ignition
02 02 Furnace 02-Oct-19 1.0 HAZID team 02.09 Fire (gas) Loss of containment
from LPG supply to
burners - with ignition
Release of flammable gas - with
ignition - operator in vicinity
Air (A) 4 1 02.09 - Loss of containment
from LPG supply to burners -
with ignition
02 02 Furnace 02-Oct-19 1.0 HAZID team 02.10 Explosion
(flammable
substance)
Explosion in deslagger,
with release of hot ash
into boiler house
Release of hot ash to unoccupied
area - retained in situ
Surface Water
(SW)
1 1 02.10 - Explosion in deslagger,
with release of hot ash into
boiler house
02 02 Furnace 02-Oct-19 1.0 HAZID team 02.11 Explosion
(flammable
substance)
Explosion in deslagger,
with release of hot ash
into boiler house
Injury to operator if in vicinity at
the time
Surface Water
(SW)
2 1 02.11 - Explosion in deslagger,
with release of hot ash into
boiler house
03 03 Boiler 02-Oct-19 1.0 HAZID team 03.01 Liquid (toxic)
release
Leak of oil at flanged
connection to burner
Spill of oil to drip tray inside
building
Surface Water
(SW)
1 1 03.01 - Leak of oil at flanged
connection to burner
03 03 Boiler 02-Oct-19 1.0 HAZID team 03.02 Fire Leak of oil at flanged
connection to burner -
with ignition
Small pool fire within drip tray Air (A) 2 2 03.02 - Leak of oil at flanged
connection to burner - with
ignition
03 03 Boiler 02-Oct-19 1.0 HAZID team 03.03 Liquid (toxic)
release
Complete failure at
flange connection, spill
of oil
Spill to ground. Retained within
building.
Groundwater
(GW)
1 2 03.03 - Complete failure at
flange connection, spill of oil
03 03 Boiler 02-Oct-19 1.0 HAZID team 03.04 Other Release of hot water or
steam due to leak from
boiler
Risk of injury to operator, if
operator is on adjacent pathway at
time
Air (A) 3 1 03.04 - Release of hot water or
steam due to leak from boiler
04 04 Spray Dryer 02-Oct-19 1.0 HAZID team 04.01 No MAH identified in
this area. Flue gas in
chamber - water & lime
n.a. None 0 0 04.01 - No MAH identified in this
area. Flue gas in chamber -
water & lime
05 05 Raw material
bulk storage
(Expanded Clay /
Activated carbon /
Quick lime and
hydrated lime)
02-Oct-19 1.0 HAZID team 05.01 No MAH identified in
this area.
n.a. None 0 0 05.01 - No MAH identified in this
area.
06 06 Bag House 02-Oct-19 1.0 HAZID team 06.01 Solid (toxic)
release
Release of ash residue
from bag filters
Accumulation of residue on floor
Release of residue dust cloud
through vents/open doorways
Groundwater,
surface water
2 1 06.01 - Release of ash residue
from bag filters
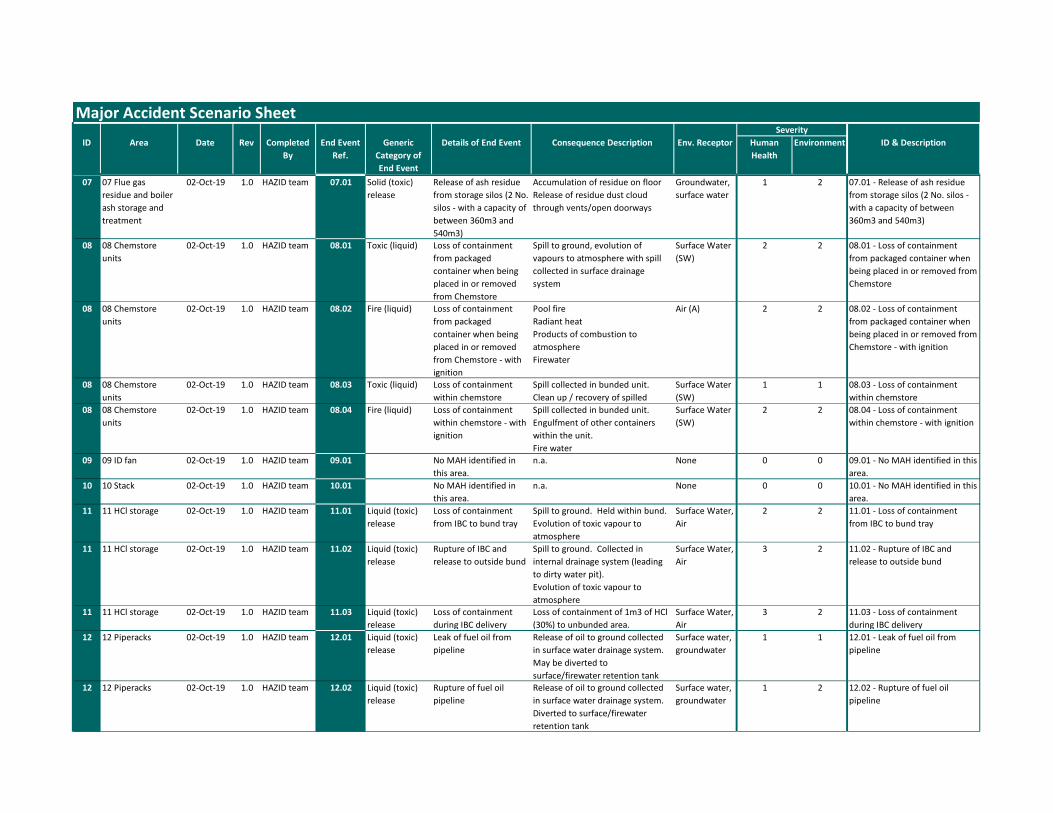
Major Accident Scenario Sheet
ID Area Date Rev Completed
By
End Event
Ref.
Generic
Category of
End Event
Details of End Event Consequence Description Env. Receptor Human
Health
Environment ID & Description
Severity
07 07 Flue gas
residue and boiler
ash storage and
treatment
02-Oct-19 1.0 HAZID team 07.01 Solid (toxic)
release
Release of ash residue
from storage silos (2 No.
silos - with a capacity of
between 360m3 and
540m3)
Accumulation of residue on floor
Release of residue dust cloud
through vents/open doorways
Groundwater,
surface water
1 2 07.01 - Release of ash residue
from storage silos (2 No. silos -
with a capacity of between
360m3 and 540m3)
08 08 Chemstore
units
02-Oct-19 1.0 HAZID team 08.01 Toxic (liquid) Loss of containment
from packaged
container when being
placed in or removed
from Chemstore
Spill to ground, evolution of
vapours to atmosphere with spill
collected in surface drainage
system
Surface Water
(SW)
2 2 08.01 - Loss of containment
from packaged container when
being placed in or removed from
Chemstore
08 08 Chemstore
units
02-Oct-19 1.0 HAZID team 08.02 Fire (liquid) Loss of containment
from packaged
container when being
placed in or removed
from Chemstore - with
ignition
Pool fire
Radiant heat
Products of combustion to
atmosphere
Firewater
Air (A) 2 2 08.02 - Loss of containment
from packaged container when
being placed in or removed from
Chemstore - with ignition
08 08 Chemstore
units
02-Oct-19 1.0 HAZID team 08.03 Toxic (liquid) Loss of containment
within chemstore
Spill collected in bunded unit.
Clean up / recovery of spilled
Surface Water
(SW)
1 1 08.03 - Loss of containment
within chemstore
08 08 Chemstore
units
02-Oct-19 1.0 HAZID team 08.04 Fire (liquid) Loss of containment
within chemstore - with
ignition
Spill collected in bunded unit.
Engulfment of other containers
within the unit.
Fire water
Surface Water
(SW)
2 2 08.04 - Loss of containment
within chemstore - with ignition
09 09 ID fan 02-Oct-19 1.0 HAZID team 09.01 No MAH identified in
this area.
n.a. None 0 0 09.01 - No MAH identified in this
area.
10 10 Stack 02-Oct-19 1.0 HAZID team 10.01 No MAH identified in
this area.
n.a. None 0 0 10.01 - No MAH identified in this
area.
11 11 HCl storage 02-Oct-19 1.0 HAZID team 11.01 Liquid (toxic)
release
Loss of containment
from IBC to bund tray
Spill to ground. Held within bund.
Evolution of toxic vapour to
atmosphere
Surface Water,
Air
2 2 11.01 - Loss of containment
from IBC to bund tray
11 11 HCl storage 02-Oct-19 1.0 HAZID team 11.02 Liquid (toxic)
release
Rupture of IBC and
release to outside bund
Spill to ground. Collected in
internal drainage system (leading
to dirty water pit).
Evolution of toxic vapour to
atmosphere
Surface Water,
Air
3 2 11.02 - Rupture of IBC and
release to outside bund
11 11 HCl storage 02-Oct-19 1.0 HAZID team 11.03 Liquid (toxic)
release
Loss of containment
during IBC delivery
Loss of containment of 1m3 of HCl
(30%) to unbunded area.
Surface Water,
Air
3 2 11.03 - Loss of containment
during IBC delivery
12 12 Piperacks 02-Oct-19 1.0 HAZID team 12.01 Liquid (toxic)
release
Leak of fuel oil from
pipeline
Release of oil to ground collected
in surface water drainage system.
May be diverted to
surface/firewater retention tank
Surface water,
groundwater
1 1 12.01 - Leak of fuel oil from
pipeline
12 12 Piperacks 02-Oct-19 1.0 HAZID team 12.02 Liquid (toxic)
release
Rupture of fuel oil
pipeline
Release of oil to ground collected
in surface water drainage system.
Diverted to surface/firewater
retention tank
Surface water,
groundwater
1 2 12.02 - Rupture of fuel oil
pipeline
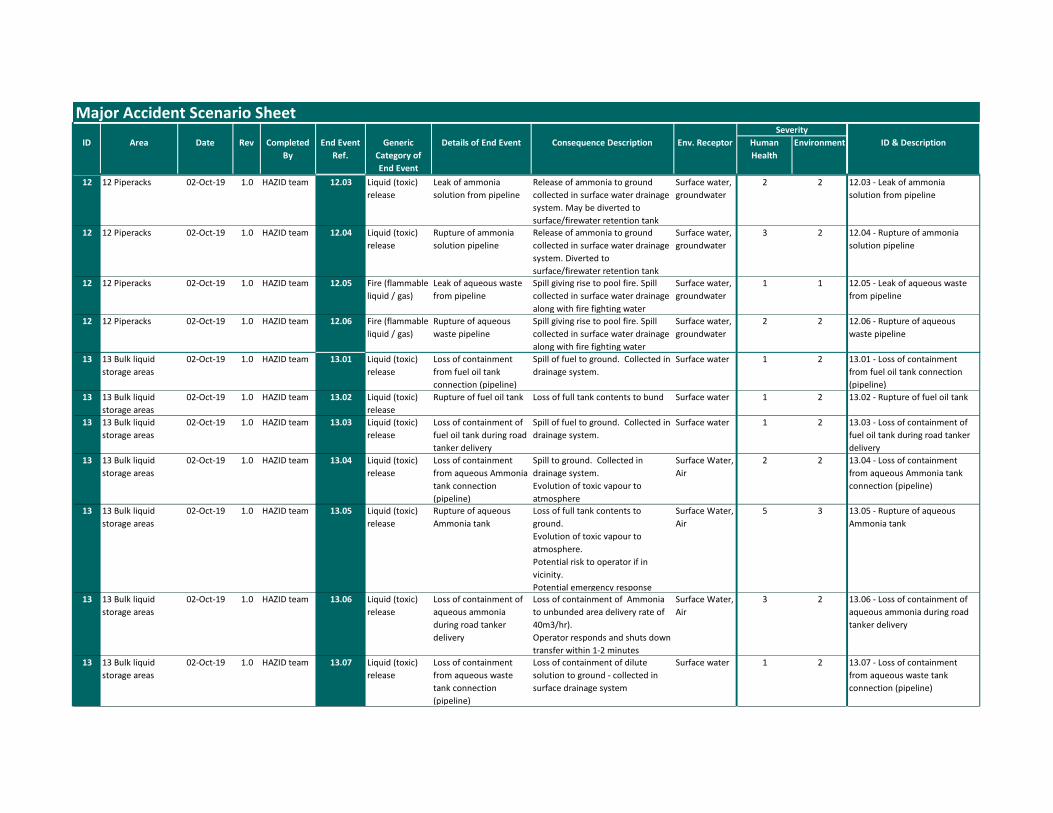
Major Accident Scenario Sheet
ID Area Date Rev Completed
By
End Event
Ref.
Generic
Category of
End Event
Details of End Event Consequence Description Env. Receptor Human
Health
Environment ID & Description
Severity
12 12 Piperacks 02-Oct-19 1.0 HAZID team 12.03 Liquid (toxic)
release
Leak of ammonia
solution from pipeline
Release of ammonia to ground
collected in surface water drainage
system. May be diverted to
surface/firewater retention tank
Surface water,
groundwater
2 2 12.03 - Leak of ammonia
solution from pipeline
12 12 Piperacks 02-Oct-19 1.0 HAZID team 12.04 Liquid (toxic)
release
Rupture of ammonia
solution pipeline
Release of ammonia to ground
collected in surface water drainage
system. Diverted to
surface/firewater retention tank
Surface water,
groundwater
3 2 12.04 - Rupture of ammonia
solution pipeline
12 12 Piperacks 02-Oct-19 1.0 HAZID team 12.05 Fire (flammable
liquid / gas)
Leak of aqueous waste
from pipeline
Spill giving rise to pool fire. Spill
collected in surface water drainage
along with fire fighting water
Surface water,
groundwater
1 1 12.05 - Leak of aqueous waste
from pipeline
12 12 Piperacks 02-Oct-19 1.0 HAZID team 12.06 Fire (flammable
liquid / gas)
Rupture of aqueous
waste pipeline
Spill giving rise to pool fire. Spill
collected in surface water drainage
along with fire fighting water
Surface water,
groundwater
2 2 12.06 - Rupture of aqueous
waste pipeline
13 13 Bulk liquid
storage areas
02-Oct-19 1.0 HAZID team 13.01 Liquid (toxic)
release
Loss of containment
from fuel oil tank
connection (pipeline)
Spill of fuel to ground. Collected in
drainage system.
Surface water 1 2 13.01 - Loss of containment
from fuel oil tank connection
(pipeline)
13 13 Bulk liquid
storage areas
02-Oct-19 1.0 HAZID team 13.02 Liquid (toxic)
release
Rupture of fuel oil tank Loss of full tank contents to bund Surface water 1 2 13.02 - Rupture of fuel oil tank
13 13 Bulk liquid
storage areas
02-Oct-19 1.0 HAZID team 13.03 Liquid (toxic)
release
Loss of containment of
fuel oil tank during road
tanker delivery
Spill of fuel to ground. Collected in
drainage system.
Surface water 1 2 13.03 - Loss of containment of
fuel oil tank during road tanker
delivery
13 13 Bulk liquid
storage areas
02-Oct-19 1.0 HAZID team 13.04 Liquid (toxic)
release
Loss of containment
from aqueous Ammonia
tank connection
(pipeline)
Spill to ground. Collected in
drainage system.
Evolution of toxic vapour to
atmosphere
Surface Water,
Air
2 2 13.04 - Loss of containment
from aqueous Ammonia tank
connection (pipeline)
13 13 Bulk liquid
storage areas
02-Oct-19 1.0 HAZID team 13.05 Liquid (toxic)
release
Rupture of aqueous
Ammonia tank
Loss of full tank contents to
ground.
Evolution of toxic vapour to
atmosphere.
Potential risk to operator if in
vicinity.
Potential emergency response
Surface Water,
Air
5 3 13.05 - Rupture of aqueous
Ammonia tank
13 13 Bulk liquid
storage areas
02-Oct-19 1.0 HAZID team 13.06 Liquid (toxic)
release
Loss of containment of
aqueous ammonia
during road tanker
delivery
Loss of containment of Ammonia
to unbunded area delivery rate of
40m3/hr).
Operator responds and shuts down
transfer within 1-2 minutes
Surface Water,
Air
3 2 13.06 - Loss of containment of
aqueous ammonia during road
tanker delivery
13 13 Bulk liquid
storage areas
02-Oct-19 1.0 HAZID team 13.07 Liquid (toxic)
release
Loss of containment
from aqueous waste
tank connection
(pipeline)
Loss of containment of dilute
solution to ground - collected in
surface drainage system
Surface water 1 2 13.07 - Loss of containment
from aqueous waste tank
connection (pipeline)
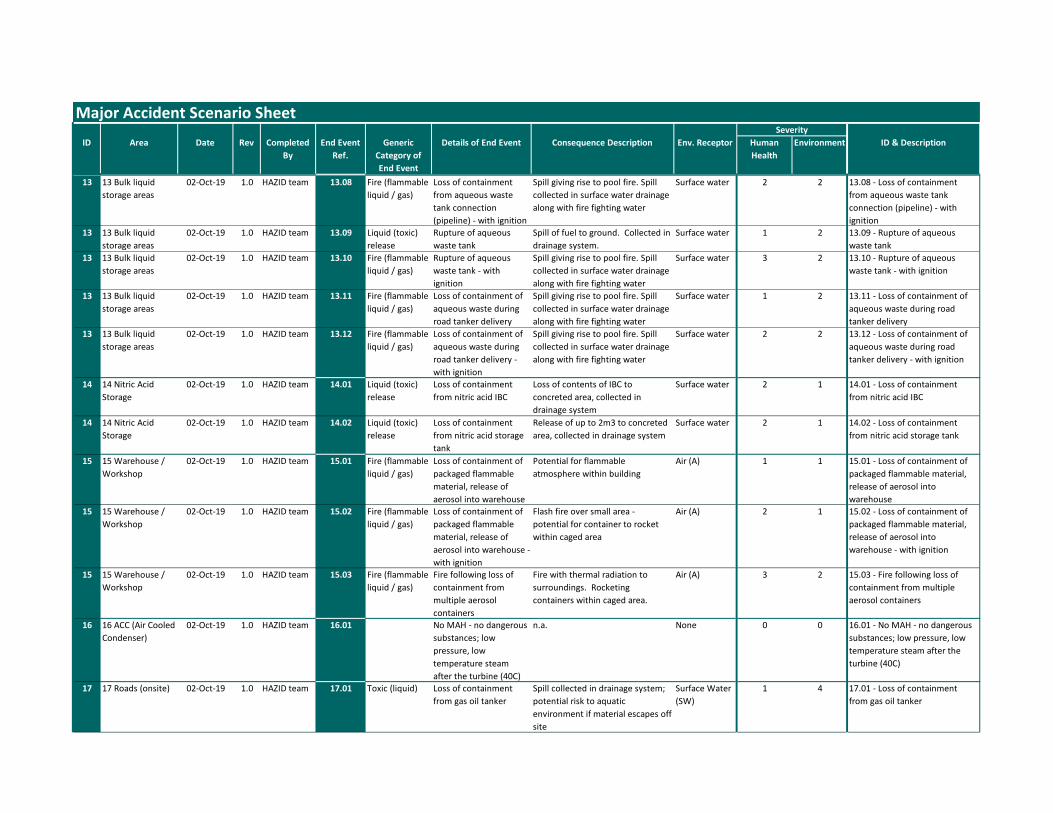
Major Accident Scenario Sheet
ID Area Date Rev Completed
By
End Event
Ref.
Generic
Category of
End Event
Details of End Event Consequence Description Env. Receptor Human
Health
Environment ID & Description
Severity
13 13 Bulk liquid
storage areas
02-Oct-19 1.0 HAZID team 13.08 Fire (flammable
liquid / gas)
Loss of containment
from aqueous waste
tank connection
(pipeline) - with ignition
Spill giving rise to pool fire. Spill
collected in surface water drainage
along with fire fighting water
Surface water 2 2 13.08 - Loss of containment
from aqueous waste tank
connection (pipeline) - with
ignition
13 13 Bulk liquid
storage areas
02-Oct-19 1.0 HAZID team 13.09 Liquid (toxic)
release
Rupture of aqueous
waste tank
Spill of fuel to ground. Collected in
drainage system.
Surface water 1 2 13.09 - Rupture of aqueous
waste tank
13 13 Bulk liquid
storage areas
02-Oct-19 1.0 HAZID team 13.10 Fire (flammable
liquid / gas)
Rupture of aqueous
waste tank - with
ignition
Spill giving rise to pool fire. Spill
collected in surface water drainage
along with fire fighting water
Surface water 3 2 13.10 - Rupture of aqueous
waste tank - with ignition
13 13 Bulk liquid
storage areas
02-Oct-19 1.0 HAZID team 13.11 Fire (flammable
liquid / gas)
Loss of containment of
aqueous waste during
road tanker delivery
Spill giving rise to pool fire. Spill
collected in surface water drainage
along with fire fighting water
Surface water 1 2 13.11 - Loss of containment of
aqueous waste during road
tanker delivery
13 13 Bulk liquid
storage areas
02-Oct-19 1.0 HAZID team 13.12 Fire (flammable
liquid / gas)
Loss of containment of
aqueous waste during
road tanker delivery -
with ignition
Spill giving rise to pool fire. Spill
collected in surface water drainage
along with fire fighting water
Surface water 2 2 13.12 - Loss of containment of
aqueous waste during road
tanker delivery - with ignition
14 14 Nitric Acid
Storage
02-Oct-19 1.0 HAZID team 14.01 Liquid (toxic)
release
Loss of containment
from nitric acid IBC
Loss of contents of IBC to
concreted area, collected in
drainage system
Surface water 2 1 14.01 - Loss of containment
from nitric acid IBC
14 14 Nitric Acid
Storage
02-Oct-19 1.0 HAZID team 14.02 Liquid (toxic)
release
Loss of containment
from nitric acid storage
tank
Release of up to 2m3 to concreted
area, collected in drainage system
Surface water 2 1 14.02 - Loss of containment
from nitric acid storage tank
15 15 Warehouse /
Workshop
02-Oct-19 1.0 HAZID team 15.01 Fire (flammable
liquid / gas)
Loss of containment of
packaged flammable
material, release of
aerosol into warehouse
Potential for flammable
atmosphere within building
Air (A) 1 1 15.01 - Loss of containment of
packaged flammable material,
release of aerosol into
warehouse
15 15 Warehouse /
Workshop
02-Oct-19 1.0 HAZID team 15.02 Fire (flammable
liquid / gas)
Loss of containment of
packaged flammable
material, release of
aerosol into warehouse -
with ignition
Flash fire over small area -
potential for container to rocket
within caged area
Air (A) 2 1 15.02 - Loss of containment of
packaged flammable material,
release of aerosol into
warehouse - with ignition
15 15 Warehouse /
Workshop
02-Oct-19 1.0 HAZID team 15.03 Fire (flammable
liquid / gas)
Fire following loss of
containment from
multiple aerosol
containers
Fire with thermal radiation to
surroundings. Rocketing
containers within caged area.
Air (A) 3 2 15.03 - Fire following loss of
containment from multiple
aerosol containers
16 16 ACC (Air Cooled
Condenser)
02-Oct-19 1.0 HAZID team 16.01 No MAH - no dangerous
substances; low
pressure, low
temperature steam
after the turbine (40C)
n.a. None 0 0 16.01 - No MAH - no dangerous
substances; low pressure, low
temperature steam after the
turbine (40C)
17 17 Roads (onsite) 02-Oct-19 1.0 HAZID team 17.01 Toxic (liquid) Loss of containment
from gas oil tanker
Spill collected in drainage system;
potential risk to aquatic
environment if material escapes off
site
Surface Water
(SW)
1 4 17.01 - Loss of containment
from gas oil tanker
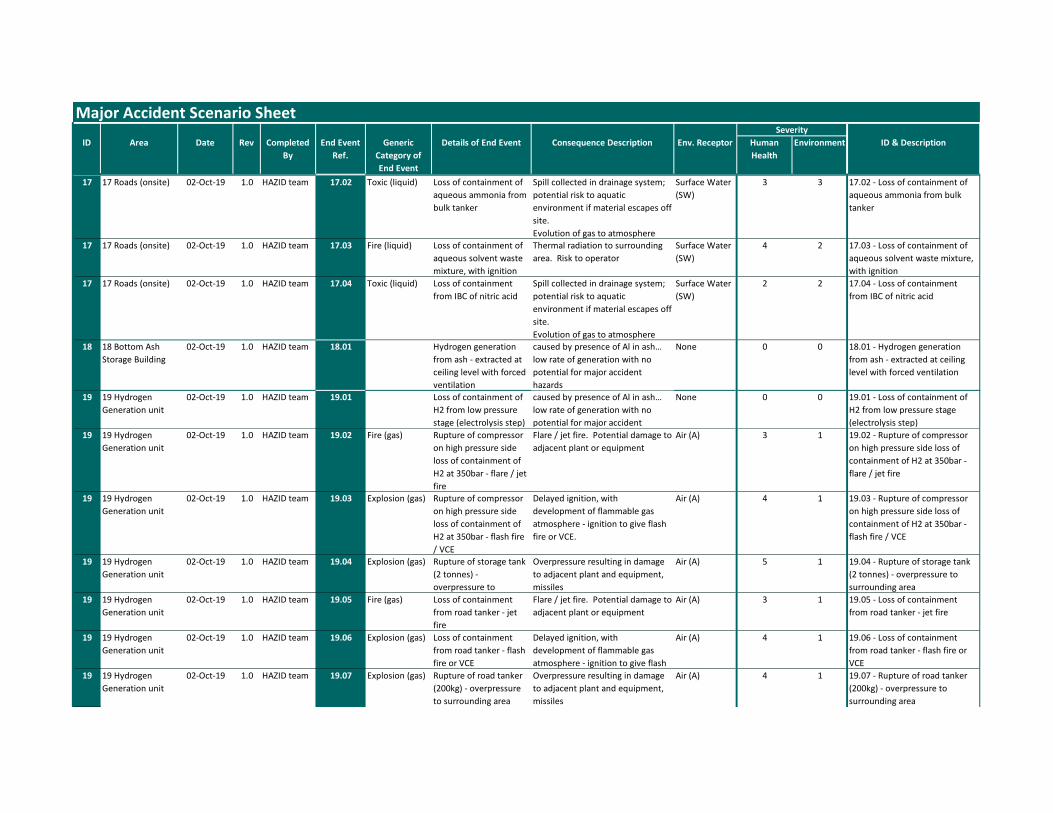
Major Accident Scenario Sheet
ID Area Date Rev Completed
By
End Event
Ref.
Generic
Category of
End Event
Details of End Event Consequence Description Env. Receptor Human
Health
Environment ID & Description
Severity
17 17 Roads (onsite) 02-Oct-19 1.0 HAZID team 17.02 Toxic (liquid) Loss of containment of
aqueous ammonia from
bulk tanker
Spill collected in drainage system;
potential risk to aquatic
environment if material escapes off
site.
Evolution of gas to atmosphere
Surface Water
(SW)
3 3 17.02 - Loss of containment of
aqueous ammonia from bulk
tanker
17 17 Roads (onsite) 02-Oct-19 1.0 HAZID team 17.03 Fire (liquid) Loss of containment of
aqueous solvent waste
mixture, with ignition
Thermal radiation to surrounding
area. Risk to operator
Surface Water
(SW)
4 2 17.03 - Loss of containment of
aqueous solvent waste mixture,
with ignition
17 17 Roads (onsite) 02-Oct-19 1.0 HAZID team 17.04 Toxic (liquid) Loss of containment
from IBC of nitric acid
Spill collected in drainage system;
potential risk to aquatic
environment if material escapes off
site.
Evolution of gas to atmosphere
Surface Water
(SW)
2 2 17.04 - Loss of containment
from IBC of nitric acid
18 18 Bottom Ash
Storage Building
02-Oct-19 1.0 HAZID team 18.01 Hydrogen generation
from ash - extracted at
ceiling level with forced
ventilation
caused by presence of Al in ash…
low rate of generation with no
potential for major accident
hazards
None 0 0 18.01 - Hydrogen generation
from ash - extracted at ceiling
level with forced ventilation
19 19 Hydrogen
Generation unit
02-Oct-19 1.0 HAZID team 19.01 Loss of containment of
H2 from low pressure
stage (electrolysis step)
caused by presence of Al in ash…
low rate of generation with no
potential for major accident
None 0 0 19.01 - Loss of containment of
H2 from low pressure stage
(electrolysis step)
19 19 Hydrogen
Generation unit
02-Oct-19 1.0 HAZID team 19.02 Fire (gas) Rupture of compressor
on high pressure side
loss of containment of
H2 at 350bar - flare / jet
fire
Flare / jet fire. Potential damage to
adjacent plant or equipment
Air (A) 3 1 19.02 - Rupture of compressor
on high pressure side loss of
containment of H2 at 350bar -
flare / jet fire
19 19 Hydrogen
Generation unit
02-Oct-19 1.0 HAZID team 19.03 Explosion (gas) Rupture of compressor
on high pressure side
loss of containment of
H2 at 350bar - flash fire
/ VCE
Delayed ignition, with
development of flammable gas
atmosphere - ignition to give flash
fire or VCE.
Air (A) 4 1 19.03 - Rupture of compressor
on high pressure side loss of
containment of H2 at 350bar -
flash fire / VCE
19 19 Hydrogen
Generation unit
02-Oct-19 1.0 HAZID team 19.04 Explosion (gas) Rupture of storage tank
(2 tonnes) -
overpressure to
Overpressure resulting in damage
to adjacent plant and equipment,
missiles
Air (A) 5 1 19.04 - Rupture of storage tank
(2 tonnes) - overpressure to
surrounding area
19 19 Hydrogen
Generation unit
02-Oct-19 1.0 HAZID team 19.05 Fire (gas) Loss of containment
from road tanker - jet
fire
Flare / jet fire. Potential damage to
adjacent plant or equipment
Air (A) 3 1 19.05 - Loss of containment
from road tanker - jet fire
19 19 Hydrogen
Generation unit
02-Oct-19 1.0 HAZID team 19.06 Explosion (gas) Loss of containment
from road tanker - flash
fire or VCE
Delayed ignition, with
development of flammable gas
atmosphere - ignition to give flash
Air (A) 4 1 19.06 - Loss of containment
from road tanker - flash fire or
VCE
19 19 Hydrogen
Generation unit
02-Oct-19 1.0 HAZID team 19.07 Explosion (gas) Rupture of road tanker
(200kg) - overpressure
to surrounding area
Overpressure resulting in damage
to adjacent plant and equipment,
missiles
Air (A) 4 1 19.07 - Rupture of road tanker
(200kg) - overpressure to
surrounding area
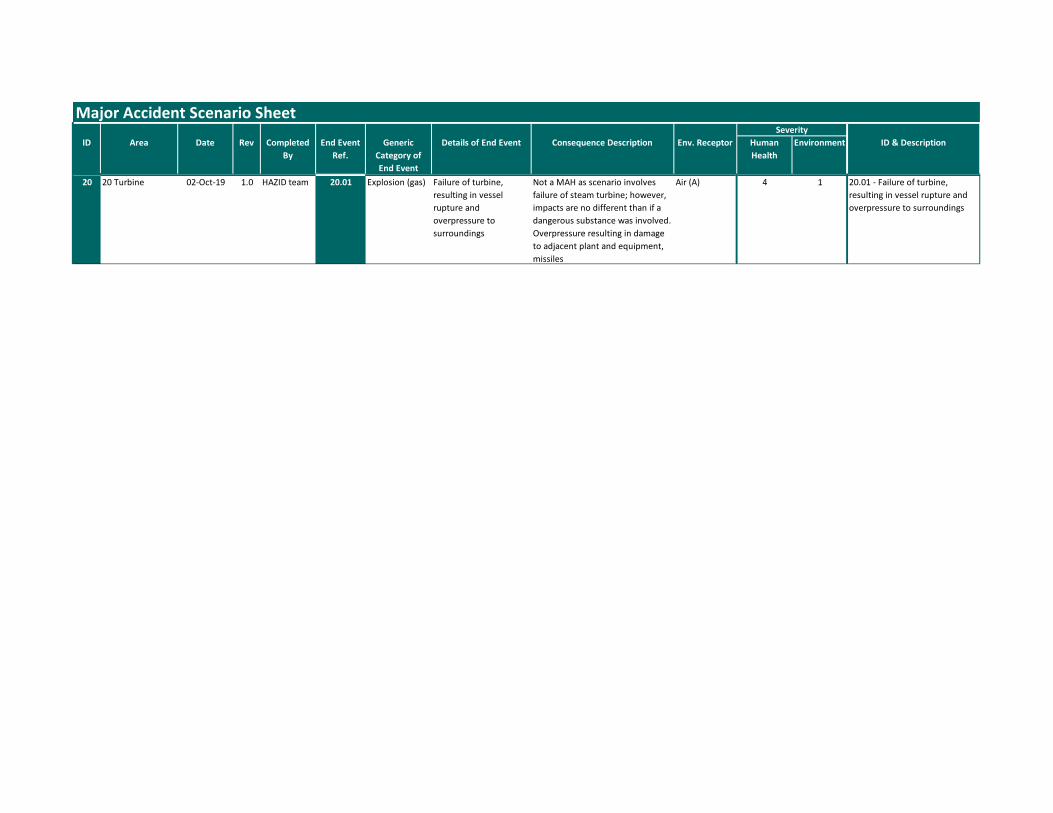
Major Accident Scenario Sheet
ID Area Date Rev Completed
By
End Event
Ref.
Generic
Category of
End Event
Details of End Event Consequence Description Env. Receptor Human
Health
Environment ID & Description
Severity
20 20 Turbine 02-Oct-19 1.0 HAZID team 20.01 Explosion (gas) Failure of turbine,
resulting in vessel
rupture and
overpressure to
surroundings
Not a MAH as scenario involves
failure of steam turbine; however,
impacts are no different than if a
dangerous substance was involved.
Overpressure resulting in damage
to adjacent plant and equipment,
missiles
Air (A) 4 1 20.01 - Failure of turbine,
resulting in vessel rupture and
overpressure to surroundings
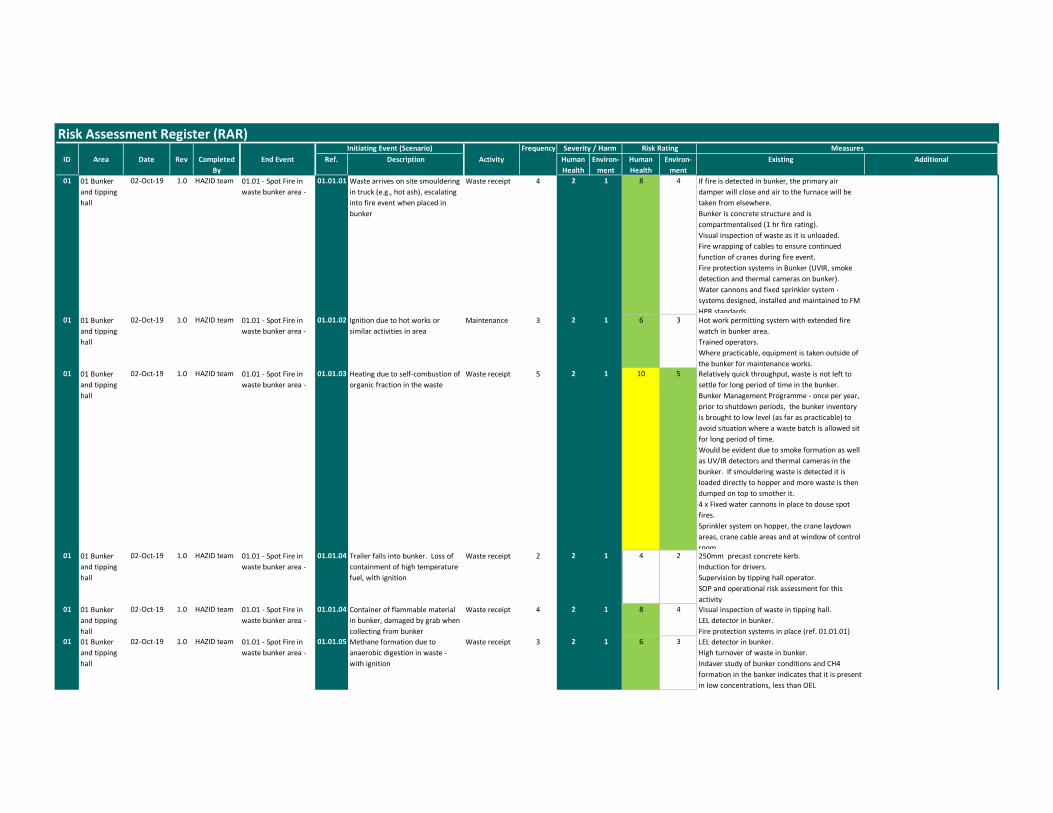
Risk Assessment Register (RAR)Frequency
ID Area Date Rev Completed
By
End Event Ref. Description Activity Human
Health
Environ-
ment
Human
Health
Environ-
ment
Existing Additional
01 01 Bunker
and tipping
hall
02-Oct-19 1.0 HAZID team 01.01 - Spot Fire in
waste bunker area -
01.01.01 Waste arrives on site smouldering
in truck (e.g., hot ash), escalating
into fire event when placed in
bunker
Waste receipt 4 2 1 8 4 If fire is detected in bunker, the primary air
damper will close and air to the furnace will be
taken from elsewhere.
Bunker is concrete structure and is
compartmentalised (1 hr fire rating).
Visual inspection of waste as it is unloaded.
Fire wrapping of cables to ensure continued
function of cranes during fire event.
Fire protection systems in Bunker (UVIR, smoke
detection and thermal cameras on bunker).
Water cannons and fixed sprinkler system -
systems designed, installed and maintained to FM
HPR standards01 01 Bunker
and tipping
hall
02-Oct-19 1.0 HAZID team 01.01 - Spot Fire in
waste bunker area -
01.01.02 Ignition due to hot works or
similar activities in area
Maintenance 3 2 1 6 3 Hot work permitting system with extended fire
watch in bunker area.
Trained operators.
Where practicable, equipment is taken outside of
the bunker for maintenance works.01 01 Bunker
and tipping
hall
02-Oct-19 1.0 HAZID team 01.01 - Spot Fire in
waste bunker area -
01.01.03 Heating due to self-combustion of
organic fraction in the waste
Waste receipt 5 2 1 10 5 Relatively quick throughput, waste is not left to
settle for long period of time in the bunker.
Bunker Management Programme - once per year,
prior to shutdown periods, the bunker inventory
is brought to low level (as far as practicable) to
avoid situation where a waste batch is allowed sit
for long period of time.
Would be evident due to smoke formation as well
as UV/IR detectors and thermal cameras in the
bunker. If smouldering waste is detected it is
loaded directly to hopper and more waste is then
dumped on top to smother it.
4 x Fixed water cannons in place to douse spot
fires.
Sprinkler system on hopper, the crane laydown
areas, crane cable areas and at window of control
room.01 01 Bunker
and tipping
hall
02-Oct-19 1.0 HAZID team 01.01 - Spot Fire in
waste bunker area -
01.01.04 Trailer falls into bunker. Loss of
containment of high temperature
fuel, with ignition
Waste receipt 2 2 1 4 2 250mm precast concrete kerb.
Induction for drivers.
Supervision by tipping hall operator.
SOP and operational risk assessment for this
activity01 01 Bunker
and tipping
hall
02-Oct-19 1.0 HAZID team 01.01 - Spot Fire in
waste bunker area -
01.01.04 Container of flammable material
in bunker, damaged by grab when
collecting from bunker
Waste receipt 4 2 1 8 4 Visual inspection of waste in tipping hall.
LEL detector in bunker.
Fire protection systems in place (ref. 01.01.01)
01 01 Bunker
and tipping
hall
02-Oct-19 1.0 HAZID team 01.01 - Spot Fire in
waste bunker area -
01.01.05 Methane formation due to
anaerobic digestion in waste -
with ignition
Waste receipt 3 2 1 6 3 LEL detector in bunker.
High turnover of waste in bunker.
Indaver study of bunker conditions and CH4
formation in the banker indicates that it is present
in low concentrations, less than OEL
Risk Rating MeasuresInitiating Event (Scenario) Severity / Harm
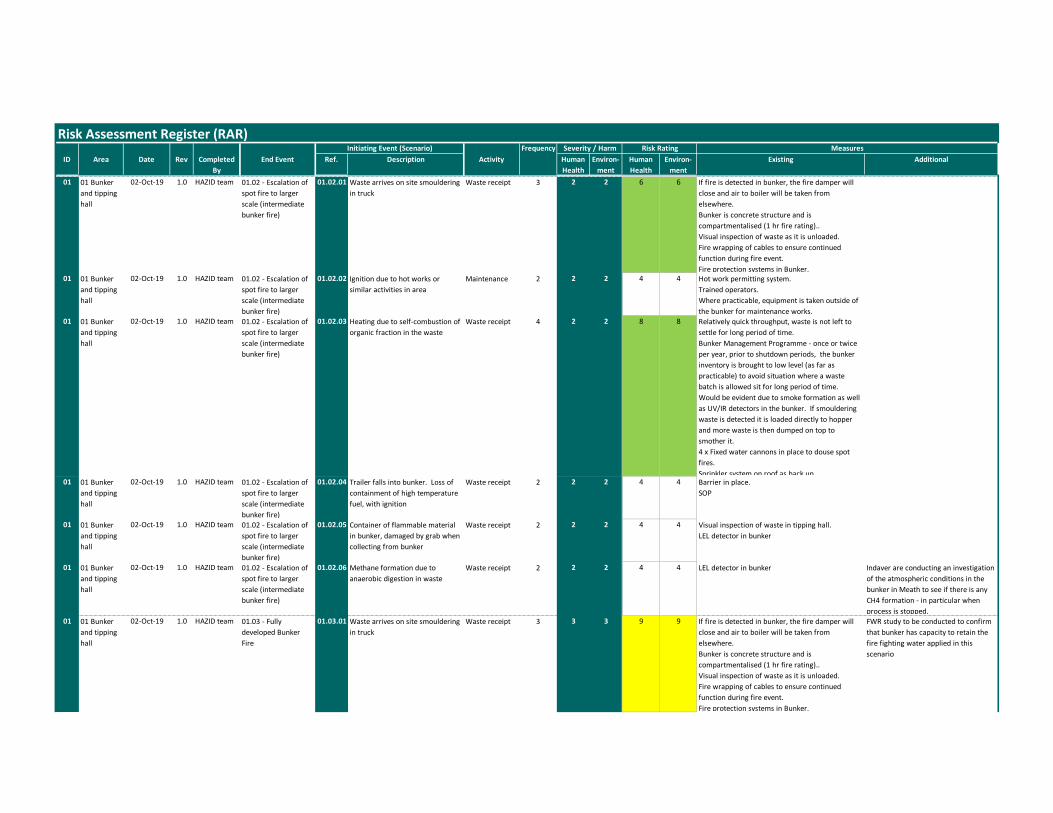
Risk Assessment Register (RAR)Frequency
ID Area Date Rev Completed
By
End Event Ref. Description Activity Human
Health
Environ-
ment
Human
Health
Environ-
ment
Existing Additional
Risk Rating MeasuresInitiating Event (Scenario) Severity / Harm
01 01 Bunker
and tipping
hall
02-Oct-19 1.0 HAZID team 01.02 - Escalation of
spot fire to larger
scale (intermediate
bunker fire)
01.02.01 Waste arrives on site smouldering
in truck
Waste receipt 3 2 2 6 6 If fire is detected in bunker, the fire damper will
close and air to boiler will be taken from
elsewhere.
Bunker is concrete structure and is
compartmentalised (1 hr fire rating)..
Visual inspection of waste as it is unloaded.
Fire wrapping of cables to ensure continued
function during fire event.
Fire protection systems in Bunker.01 01 Bunker
and tipping
hall
02-Oct-19 1.0 HAZID team 01.02 - Escalation of
spot fire to larger
scale (intermediate
bunker fire)
01.02.02 Ignition due to hot works or
similar activities in area
Maintenance 2 2 2 4 4 Hot work permitting system.
Trained operators.
Where practicable, equipment is taken outside of
the bunker for maintenance works.01 01 Bunker
and tipping
hall
02-Oct-19 1.0 HAZID team 01.02 - Escalation of
spot fire to larger
scale (intermediate
bunker fire)
01.02.03 Heating due to self-combustion of
organic fraction in the waste
Waste receipt 4 2 2 8 8 Relatively quick throughput, waste is not left to
settle for long period of time.
Bunker Management Programme - once or twice
per year, prior to shutdown periods, the bunker
inventory is brought to low level (as far as
practicable) to avoid situation where a waste
batch is allowed sit for long period of time.
Would be evident due to smoke formation as well
as UV/IR detectors in the bunker. If smouldering
waste is detected it is loaded directly to hopper
and more waste is then dumped on top to
smother it.
4 x Fixed water cannons in place to douse spot
fires.
Sprinkler system on roof as back up.01 01 Bunker
and tipping
hall
02-Oct-19 1.0 HAZID team 01.02 - Escalation of
spot fire to larger
scale (intermediate
bunker fire)
01.02.04 Trailer falls into bunker. Loss of
containment of high temperature
fuel, with ignition
Waste receipt 2 2 2 4 4 Barrier in place.
SOP
01 01 Bunker
and tipping
hall
02-Oct-19 1.0 HAZID team 01.02 - Escalation of
spot fire to larger
scale (intermediate
bunker fire)
01.02.05 Container of flammable material
in bunker, damaged by grab when
collecting from bunker
Waste receipt 2 2 2 4 4 Visual inspection of waste in tipping hall.
LEL detector in bunker
01 01 Bunker
and tipping
hall
02-Oct-19 1.0 HAZID team 01.02 - Escalation of
spot fire to larger
scale (intermediate
bunker fire)
01.02.06 Methane formation due to
anaerobic digestion in waste
Waste receipt 2 2 2 4 4 LEL detector in bunker Indaver are conducting an investigation
of the atmospheric conditions in the
bunker in Meath to see if there is any
CH4 formation - in particular when
process is stopped.01 01 Bunker
and tipping
hall
02-Oct-19 1.0 HAZID team 01.03 - Fully
developed Bunker
Fire
01.03.01 Waste arrives on site smouldering
in truck
Waste receipt 3 3 3 9 9 If fire is detected in bunker, the fire damper will
close and air to boiler will be taken from
elsewhere.
Bunker is concrete structure and is
compartmentalised (1 hr fire rating)..
Visual inspection of waste as it is unloaded.
Fire wrapping of cables to ensure continued
function during fire event.
Fire protection systems in Bunker.
FWR study to be conducted to confirm
that bunker has capacity to retain the
fire fighting water applied in this
scenario
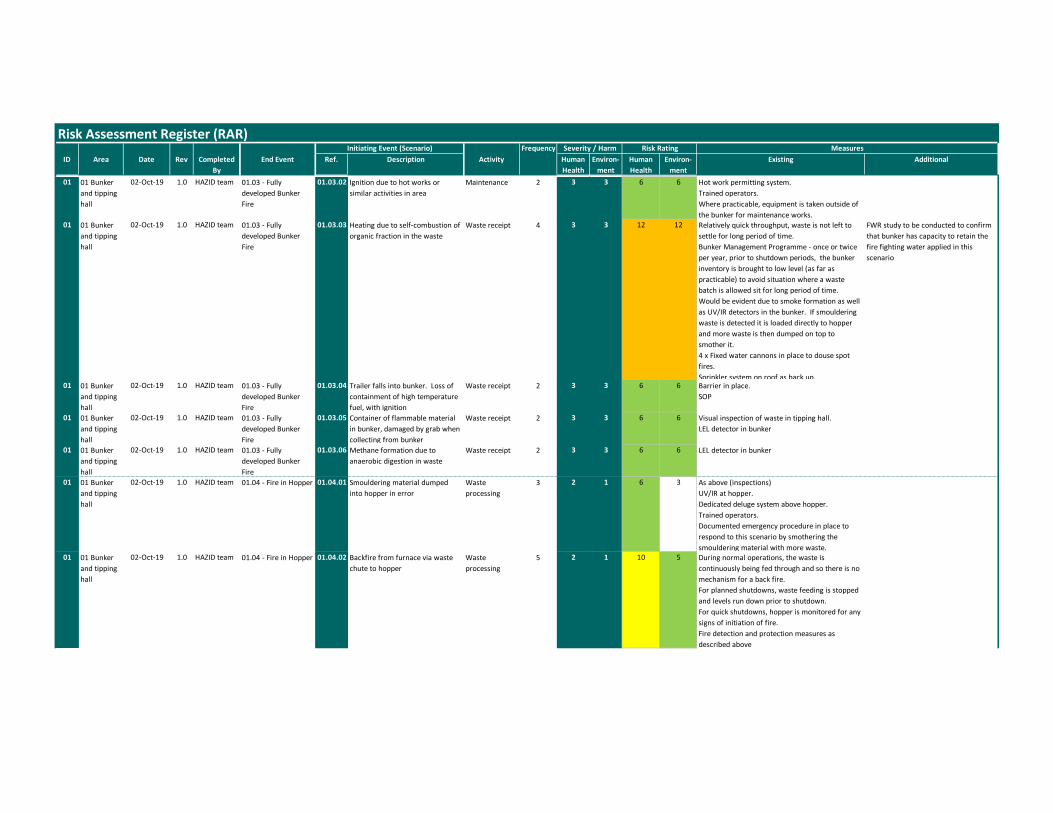
Risk Assessment Register (RAR)Frequency
ID Area Date Rev Completed
By
End Event Ref. Description Activity Human
Health
Environ-
ment
Human
Health
Environ-
ment
Existing Additional
Risk Rating MeasuresInitiating Event (Scenario) Severity / Harm
01 01 Bunker
and tipping
hall
02-Oct-19 1.0 HAZID team 01.03 - Fully
developed Bunker
Fire
01.03.02 Ignition due to hot works or
similar activities in area
Maintenance 2 3 3 6 6 Hot work permitting system.
Trained operators.
Where practicable, equipment is taken outside of
the bunker for maintenance works.01 01 Bunker
and tipping
hall
02-Oct-19 1.0 HAZID team 01.03 - Fully
developed Bunker
Fire
01.03.03 Heating due to self-combustion of
organic fraction in the waste
Waste receipt 4 3 3 12 12 Relatively quick throughput, waste is not left to
settle for long period of time.
Bunker Management Programme - once or twice
per year, prior to shutdown periods, the bunker
inventory is brought to low level (as far as
practicable) to avoid situation where a waste
batch is allowed sit for long period of time.
Would be evident due to smoke formation as well
as UV/IR detectors in the bunker. If smouldering
waste is detected it is loaded directly to hopper
and more waste is then dumped on top to
smother it.
4 x Fixed water cannons in place to douse spot
fires.
Sprinkler system on roof as back up.
FWR study to be conducted to confirm
that bunker has capacity to retain the
fire fighting water applied in this
scenario
01 01 Bunker
and tipping
hall
02-Oct-19 1.0 HAZID team 01.03 - Fully
developed Bunker
Fire
01.03.04 Trailer falls into bunker. Loss of
containment of high temperature
fuel, with ignition
Waste receipt 2 3 3 6 6 Barrier in place.
SOP
01 01 Bunker
and tipping
hall
02-Oct-19 1.0 HAZID team 01.03 - Fully
developed Bunker
Fire
01.03.05 Container of flammable material
in bunker, damaged by grab when
collecting from bunker
Waste receipt 2 3 3 6 6 Visual inspection of waste in tipping hall.
LEL detector in bunker
01 01 Bunker
and tipping
hall
02-Oct-19 1.0 HAZID team 01.03 - Fully
developed Bunker
Fire
01.03.06 Methane formation due to
anaerobic digestion in waste
Waste receipt 2 3 3 6 6 LEL detector in bunker
01 01 Bunker
and tipping
hall
02-Oct-19 1.0 HAZID team 01.04 - Fire in Hopper 01.04.01 Smouldering material dumped
into hopper in error
Waste
processing
3 2 1 6 3 As above (inspections)
UV/IR at hopper.
Dedicated deluge system above hopper.
Trained operators.
Documented emergency procedure in place to
respond to this scenario by smothering the
smouldering material with more waste.01 01 Bunker
and tipping
hall
02-Oct-19 1.0 HAZID team 01.04 - Fire in Hopper 01.04.02 Backfire from furnace via waste
chute to hopper
Waste
processing
5 2 1 10 5 During normal operations, the waste is
continuously being fed through and so there is no
mechanism for a back fire.
For planned shutdowns, waste feeding is stopped
and levels run down prior to shutdown.
For quick shutdowns, hopper is monitored for any
signs of initiation of fire.
Fire detection and protection measures as
described above
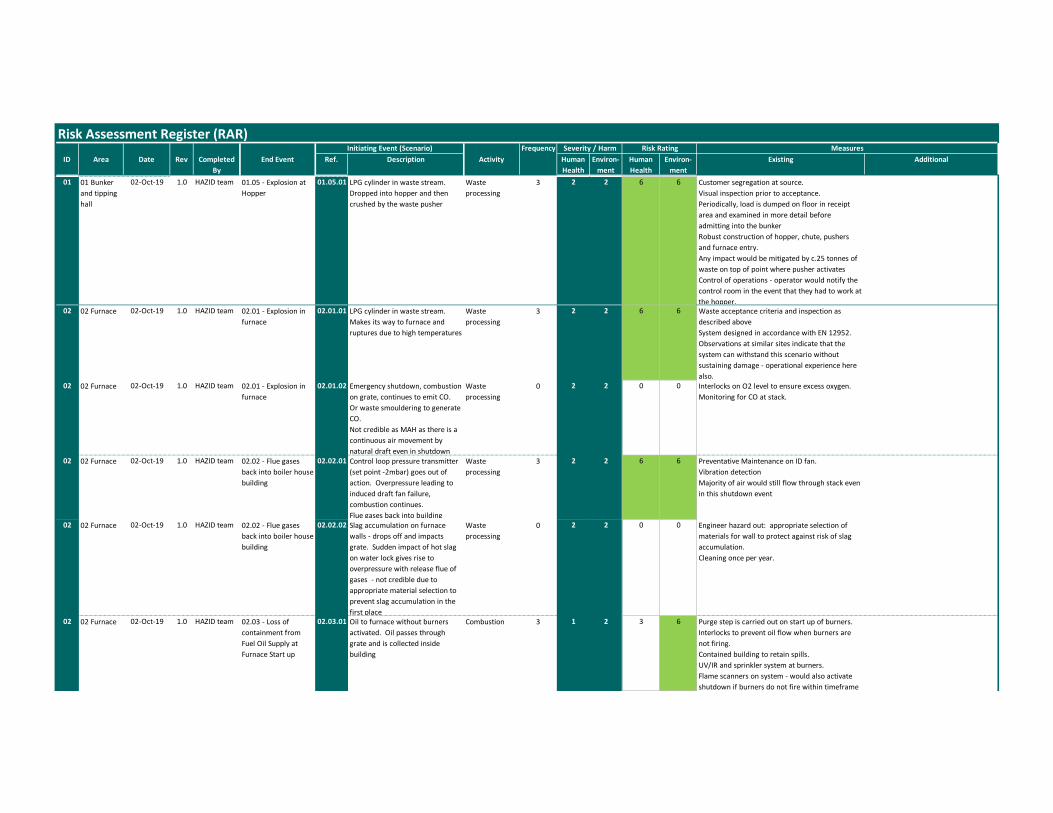
Risk Assessment Register (RAR)Frequency
ID Area Date Rev Completed
By
End Event Ref. Description Activity Human
Health
Environ-
ment
Human
Health
Environ-
ment
Existing Additional
Risk Rating MeasuresInitiating Event (Scenario) Severity / Harm
01 01 Bunker
and tipping
hall
02-Oct-19 1.0 HAZID team 01.05 - Explosion at
Hopper
01.05.01 LPG cylinder in waste stream.
Dropped into hopper and then
crushed by the waste pusher
Waste
processing
3 2 2 6 6 Customer segregation at source.
Visual inspection prior to acceptance.
Periodically, load is dumped on floor in receipt
area and examined in more detail before
admitting into the bunker
Robust construction of hopper, chute, pushers
and furnace entry.
Any impact would be mitigated by c.25 tonnes of
waste on top of point where pusher activates
Control of operations - operator would notify the
control room in the event that they had to work at
the hopper.02 02 Furnace 02-Oct-19 1.0 HAZID team 02.01 - Explosion in
furnace
02.01.01 LPG cylinder in waste stream.
Makes its way to furnace and
ruptures due to high temperatures
Waste
processing
3 2 2 6 6 Waste acceptance criteria and inspection as
described above
System designed in accordance with EN 12952.
Observations at similar sites indicate that the
system can withstand this scenario without
sustaining damage - operational experience here
also.02 02 Furnace 02-Oct-19 1.0 HAZID team 02.01 - Explosion in
furnace
02.01.02 Emergency shutdown, combustion
on grate, continues to emit CO.
Or waste smouldering to generate
CO.
Not credible as MAH as there is a
continuous air movement by
natural draft even in shutdown
Waste
processing
0 2 2 0 0 Interlocks on O2 level to ensure excess oxygen.
Monitoring for CO at stack.
02 02 Furnace 02-Oct-19 1.0 HAZID team 02.02 - Flue gases
back into boiler house
building
02.02.01 Control loop pressure transmitter
(set point -2mbar) goes out of
action. Overpressure leading to
induced draft fan failure,
combustion continues.
Flue gases back into building
Waste
processing
3 2 2 6 6 Preventative Maintenance on ID fan.
Vibration detection
Majority of air would still flow through stack even
in this shutdown event
02 02 Furnace 02-Oct-19 1.0 HAZID team 02.02 - Flue gases
back into boiler house
building
02.02.02 Slag accumulation on furnace
walls - drops off and impacts
grate. Sudden impact of hot slag
on water lock gives rise to
overpressure with release flue of
gases - not credible due to
appropriate material selection to
prevent slag accumulation in the
first place
Waste
processing
0 2 2 0 0 Engineer hazard out: appropriate selection of
materials for wall to protect against risk of slag
accumulation.
Cleaning once per year.
02 02 Furnace 02-Oct-19 1.0 HAZID team 02.03 - Loss of
containment from
Fuel Oil Supply at
Furnace Start up
02.03.01 Oil to furnace without burners
activated. Oil passes through
grate and is collected inside
building
Combustion 3 1 2 3 6 Purge step is carried out on start up of burners.
Interlocks to prevent oil flow when burners are
not firing.
Contained building to retain spills.
UV/IR and sprinkler system at burners.
Flame scanners on system - would also activate
shutdown if burners do not fire within timeframe
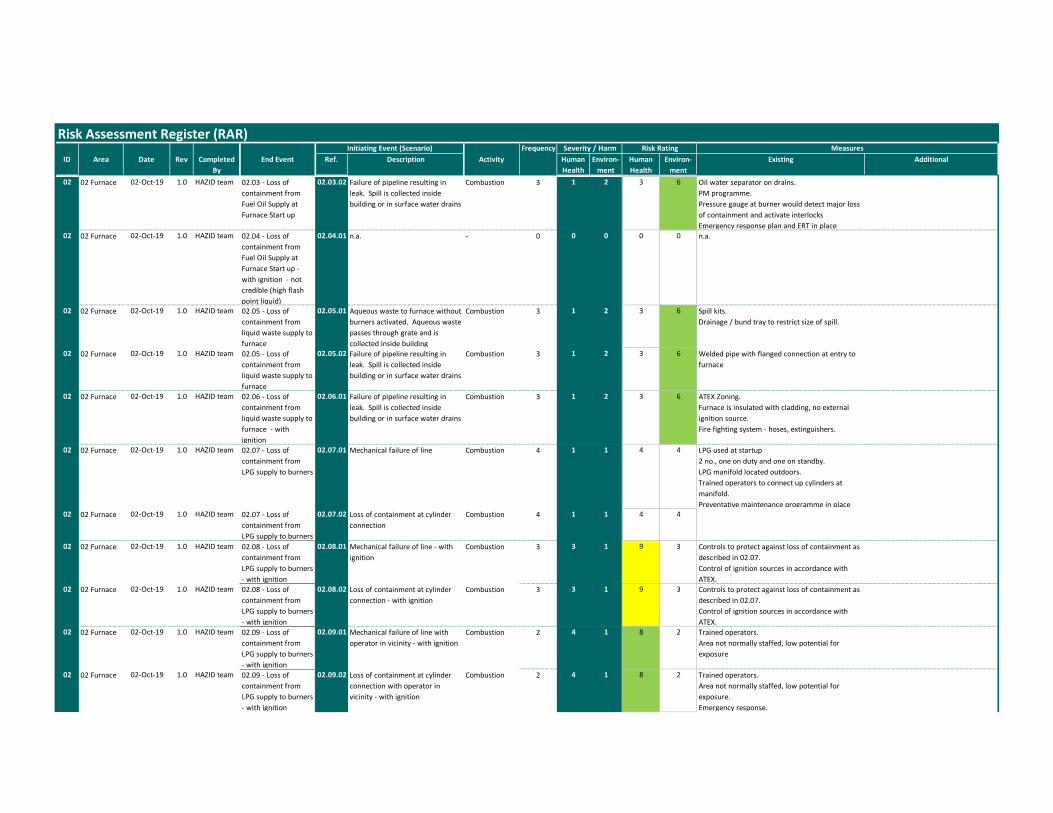
Risk Assessment Register (RAR)Frequency
ID Area Date Rev Completed
By
End Event Ref. Description Activity Human
Health
Environ-
ment
Human
Health
Environ-
ment
Existing Additional
Risk Rating MeasuresInitiating Event (Scenario) Severity / Harm
02 02 Furnace 02-Oct-19 1.0 HAZID team 02.03 - Loss of
containment from
Fuel Oil Supply at
Furnace Start up
02.03.02 Failure of pipeline resulting in
leak. Spill is collected inside
building or in surface water drains
Combustion 3 1 2 3 6 Oil water separator on drains.
PM programme.
Pressure gauge at burner would detect major loss
of containment and activate interlocks
Emergency response plan and ERT in place02 02 Furnace 02-Oct-19 1.0 HAZID team 02.04 - Loss of
containment from
Fuel Oil Supply at
Furnace Start up -
with ignition - not
credible (high flash
point liquid)
02.04.01 n.a. - 0 0 0 0 0 n.a.
02 02 Furnace 02-Oct-19 1.0 HAZID team 02.05 - Loss of
containment from
liquid waste supply to
furnace
02.05.01 Aqueous waste to furnace without
burners activated. Aqueous waste
passes through grate and is
collected inside building
Combustion 3 1 2 3 6 Spill kits.
Drainage / bund tray to restrict size of spill.
02 02 Furnace 02-Oct-19 1.0 HAZID team 02.05 - Loss of
containment from
liquid waste supply to
furnace
02.05.02 Failure of pipeline resulting in
leak. Spill is collected inside
building or in surface water drains
Combustion 3 1 2 3 6 Welded pipe with flanged connection at entry to
furnace
02 02 Furnace 02-Oct-19 1.0 HAZID team 02.06 - Loss of
containment from
liquid waste supply to
furnace - with
ignition
02.06.01 Failure of pipeline resulting in
leak. Spill is collected inside
building or in surface water drains
Combustion 3 1 2 3 6 ATEX Zoning.
Furnace is insulated with cladding, no external
ignition source.
Fire fighting system - hoses, extinguishers.
02 02 Furnace 02-Oct-19 1.0 HAZID team 02.07 - Loss of
containment from
LPG supply to burners
02.07.01 Mechanical failure of line Combustion 4 1 1 4 4 LPG used at startup
2 no., one on duty and one on standby.
LPG manifold located outdoors.
Trained operators to connect up cylinders at
manifold.
Preventative maintenance programme in place02 02 Furnace 02-Oct-19 1.0 HAZID team 02.07 - Loss of
containment from
LPG supply to burners
02.07.02 Loss of containment at cylinder
connection
Combustion 4 1 1 4 4
02 02 Furnace 02-Oct-19 1.0 HAZID team 02.08 - Loss of
containment from
LPG supply to burners
- with ignition
02.08.01 Mechanical failure of line - with
ignition
Combustion 3 3 1 9 3 Controls to protect against loss of containment as
described in 02.07.
Control of ignition sources in accordance with
ATEX.02 02 Furnace 02-Oct-19 1.0 HAZID team 02.08 - Loss of
containment from
LPG supply to burners
- with ignition
02.08.02 Loss of containment at cylinder
connection - with ignition
Combustion 3 3 1 9 3 Controls to protect against loss of containment as
described in 02.07.
Control of ignition sources in accordance with
ATEX.02 02 Furnace 02-Oct-19 1.0 HAZID team 02.09 - Loss of
containment from
LPG supply to burners
- with ignition
02.09.01 Mechanical failure of line with
operator in vicinity - with ignition
Combustion 2 4 1 8 2 Trained operators.
Area not normally staffed, low potential for
exposure
02 02 Furnace 02-Oct-19 1.0 HAZID team 02.09 - Loss of
containment from
LPG supply to burners
- with ignition
02.09.02 Loss of containment at cylinder
connection with operator in
vicinity - with ignition
Combustion 2 4 1 8 2 Trained operators.
Area not normally staffed, low potential for
exposure.
Emergency response.
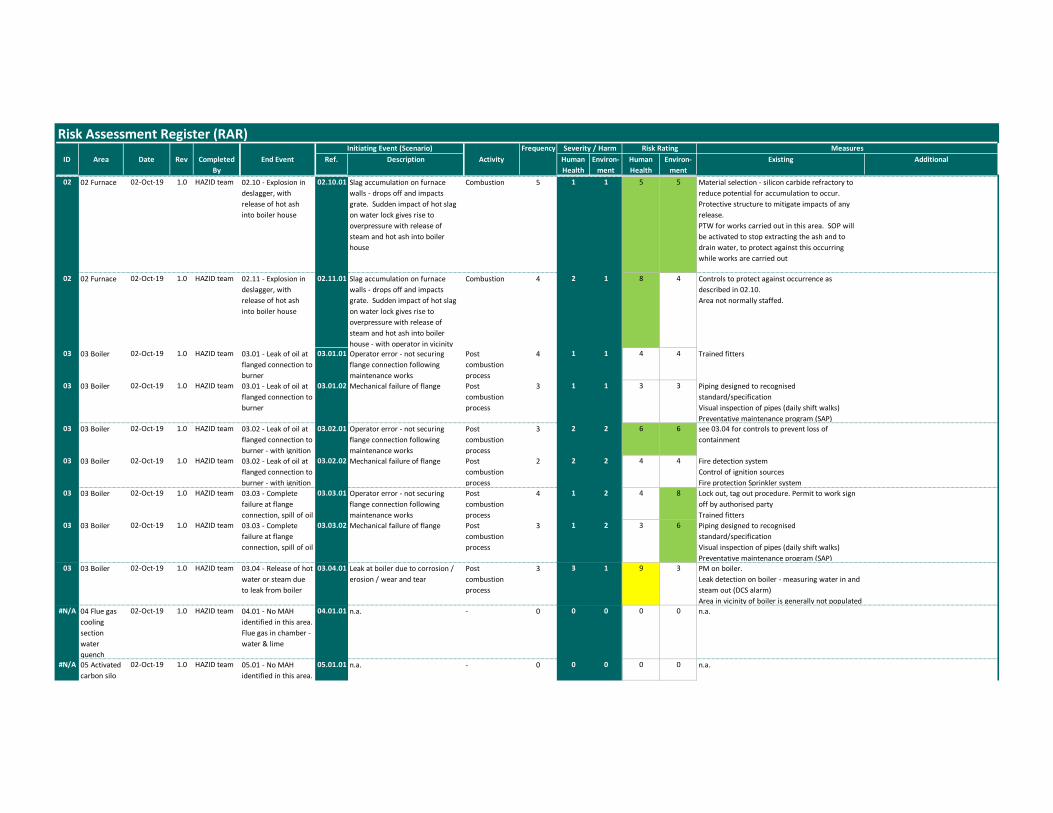
Risk Assessment Register (RAR)Frequency
ID Area Date Rev Completed
By
End Event Ref. Description Activity Human
Health
Environ-
ment
Human
Health
Environ-
ment
Existing Additional
Risk Rating MeasuresInitiating Event (Scenario) Severity / Harm
02 02 Furnace 02-Oct-19 1.0 HAZID team 02.10 - Explosion in
deslagger, with
release of hot ash
into boiler house
02.10.01 Slag accumulation on furnace
walls - drops off and impacts
grate. Sudden impact of hot slag
on water lock gives rise to
overpressure with release of
steam and hot ash into boiler
house
Combustion 5 1 1 5 5 Material selection - silicon carbide refractory to
reduce potential for accumulation to occur.
Protective structure to mitigate impacts of any
release.
PTW for works carried out in this area. SOP will
be activated to stop extracting the ash and to
drain water, to protect against this occurring
while works are carried out
02 02 Furnace 02-Oct-19 1.0 HAZID team 02.11 - Explosion in
deslagger, with
release of hot ash
into boiler house
02.11.01 Slag accumulation on furnace
walls - drops off and impacts
grate. Sudden impact of hot slag
on water lock gives rise to
overpressure with release of
steam and hot ash into boiler
house - with operator in vicinity
Combustion 4 2 1 8 4 Controls to protect against occurrence as
described in 02.10.
Area not normally staffed.
03 03 Boiler 02-Oct-19 1.0 HAZID team 03.01 - Leak of oil at
flanged connection to
burner
03.01.01 Operator error - not securing
flange connection following
maintenance works
Post
combustion
process
4 1 1 4 4 Trained fitters
03 03 Boiler 02-Oct-19 1.0 HAZID team 03.01 - Leak of oil at
flanged connection to
burner
03.01.02 Mechanical failure of flange Post
combustion
process
3 1 1 3 3 Piping designed to recognised
standard/specification
Visual inspection of pipes (daily shift walks)
Preventative maintenance program (SAP)03 03 Boiler 02-Oct-19 1.0 HAZID team 03.02 - Leak of oil at
flanged connection to
burner - with ignition
03.02.01 Operator error - not securing
flange connection following
maintenance works
Post
combustion
process
3 2 2 6 6 see 03.04 for controls to prevent loss of
containment
03 03 Boiler 02-Oct-19 1.0 HAZID team 03.02 - Leak of oil at
flanged connection to
burner - with ignition
03.02.02 Mechanical failure of flange Post
combustion
process
2 2 2 4 4 Fire detection system
Control of ignition sources
Fire protection Sprinkler system
03 03 Boiler 02-Oct-19 1.0 HAZID team 03.03 - Complete
failure at flange
connection, spill of oil
03.03.01 Operator error - not securing
flange connection following
maintenance works
Post
combustion
process
4 1 2 4 8 Lock out, tag out procedure. Permit to work sign
off by authorised party
Trained fitters
03 03 Boiler 02-Oct-19 1.0 HAZID team 03.03 - Complete
failure at flange
connection, spill of oil
03.03.02 Mechanical failure of flange Post
combustion
process
3 1 2 3 6 Piping designed to recognised
standard/specification
Visual inspection of pipes (daily shift walks)
Preventative maintenance program (SAP)03 03 Boiler 02-Oct-19 1.0 HAZID team 03.04 - Release of hot
water or steam due
to leak from boiler
03.04.01 Leak at boiler due to corrosion /
erosion / wear and tear
Post
combustion
process
3 3 1 9 3 PM on boiler.
Leak detection on boiler - measuring water in and
steam out (DCS alarm)
Area in vicinity of boiler is generally not populated#N/A 04 Flue gas
cooling
section
water
quench
02-Oct-19 1.0 HAZID team 04.01 - No MAH
identified in this area.
Flue gas in chamber -
water & lime
04.01.01 n.a. - 0 0 0 0 0 n.a.
#N/A 05 Activated
carbon silo
02-Oct-19 1.0 HAZID team 05.01 - No MAH
identified in this area.
05.01.01 n.a. - 0 0 0 0 0 n.a.
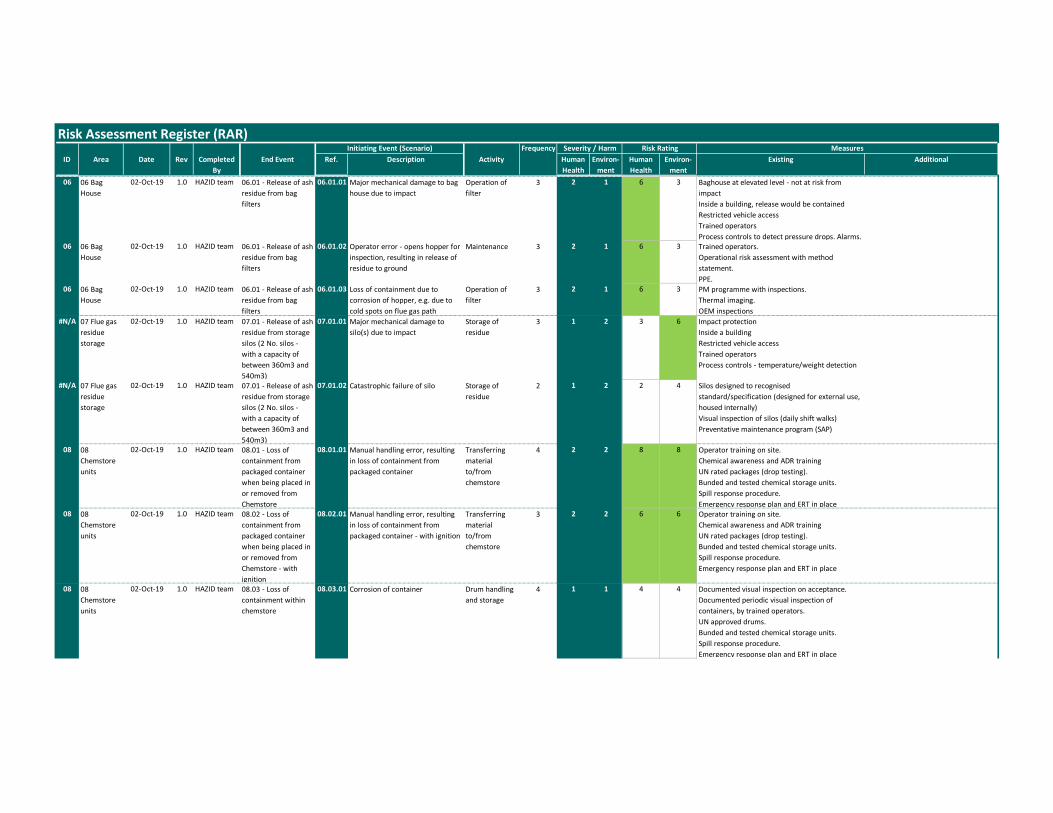
Risk Assessment Register (RAR)Frequency
ID Area Date Rev Completed
By
End Event Ref. Description Activity Human
Health
Environ-
ment
Human
Health
Environ-
ment
Existing Additional
Risk Rating MeasuresInitiating Event (Scenario) Severity / Harm
06 06 Bag
House
02-Oct-19 1.0 HAZID team 06.01 - Release of ash
residue from bag
filters
06.01.01 Major mechanical damage to bag
house due to impact
Operation of
filter
3 2 1 6 3 Baghouse at elevated level - not at risk from
impact
Inside a building, release would be contained
Restricted vehicle access
Trained operators
Process controls to detect pressure drops. Alarms.06 06 Bag
House
02-Oct-19 1.0 HAZID team 06.01 - Release of ash
residue from bag
filters
06.01.02 Operator error - opens hopper for
inspection, resulting in release of
residue to ground
Maintenance 3 2 1 6 3 Trained operators.
Operational risk assessment with method
statement.
PPE.06 06 Bag
House
02-Oct-19 1.0 HAZID team 06.01 - Release of ash
residue from bag
filters
06.01.03 Loss of containment due to
corrosion of hopper, e.g. due to
cold spots on flue gas path
Operation of
filter
3 2 1 6 3 PM programme with inspections.
Thermal imaging.
OEM inspections
#N/A 07 Flue gas
residue
storage
02-Oct-19 1.0 HAZID team 07.01 - Release of ash
residue from storage
silos (2 No. silos -
with a capacity of
between 360m3 and
540m3)
07.01.01 Major mechanical damage to
silo(s) due to impact
Storage of
residue
3 1 2 3 6 Impact protection
Inside a building
Restricted vehicle access
Trained operators
Process controls - temperature/weight detection
#N/A 07 Flue gas
residue
storage
02-Oct-19 1.0 HAZID team 07.01 - Release of ash
residue from storage
silos (2 No. silos -
with a capacity of
between 360m3 and
540m3)
07.01.02 Catastrophic failure of silo Storage of
residue
2 1 2 2 4 Silos designed to recognised
standard/specification (designed for external use,
housed internally)
Visual inspection of silos (daily shift walks)
Preventative maintenance program (SAP)
08 08
Chemstore
units
02-Oct-19 1.0 HAZID team 08.01 - Loss of
containment from
packaged container
when being placed in
or removed from
Chemstore
08.01.01 Manual handling error, resulting
in loss of containment from
packaged container
Transferring
material
to/from
chemstore
4 2 2 8 8 Operator training on site.
Chemical awareness and ADR training
UN rated packages (drop testing).
Bunded and tested chemical storage units.
Spill response procedure.
Emergency response plan and ERT in place08 08
Chemstore
units
02-Oct-19 1.0 HAZID team 08.02 - Loss of
containment from
packaged container
when being placed in
or removed from
Chemstore - with
ignition
08.02.01 Manual handling error, resulting
in loss of containment from
packaged container - with ignition
Transferring
material
to/from
chemstore
3 2 2 6 6 Operator training on site.
Chemical awareness and ADR training
UN rated packages (drop testing).
Bunded and tested chemical storage units.
Spill response procedure.
Emergency response plan and ERT in place
08 08
Chemstore
units
02-Oct-19 1.0 HAZID team 08.03 - Loss of
containment within
chemstore
08.03.01 Corrosion of container Drum handling
and storage
4 1 1 4 4 Documented visual inspection on acceptance.
Documented periodic visual inspection of
containers, by trained operators.
UN approved drums.
Bunded and tested chemical storage units.
Spill response procedure.
Emergency response plan and ERT in place
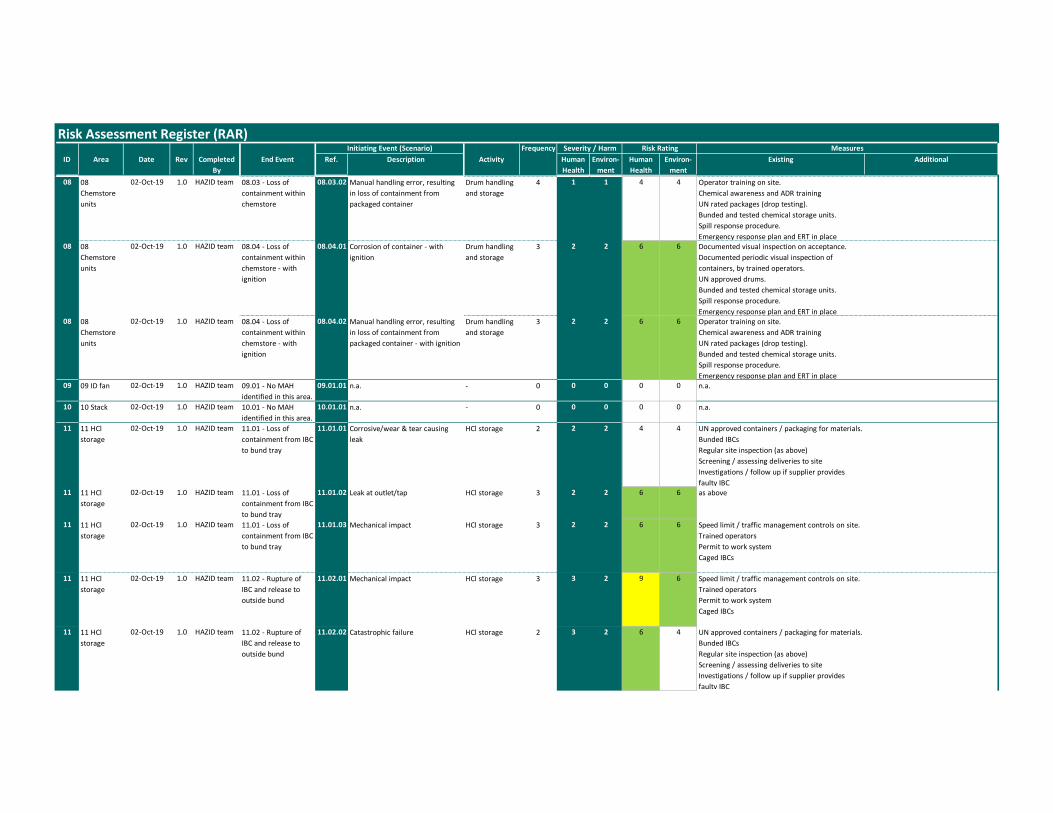
Risk Assessment Register (RAR)Frequency
ID Area Date Rev Completed
By
End Event Ref. Description Activity Human
Health
Environ-
ment
Human
Health
Environ-
ment
Existing Additional
Risk Rating MeasuresInitiating Event (Scenario) Severity / Harm
08 08
Chemstore
units
02-Oct-19 1.0 HAZID team 08.03 - Loss of
containment within
chemstore
08.03.02 Manual handling error, resulting
in loss of containment from
packaged container
Drum handling
and storage
4 1 1 4 4 Operator training on site.
Chemical awareness and ADR training
UN rated packages (drop testing).
Bunded and tested chemical storage units.
Spill response procedure.
Emergency response plan and ERT in place08 08
Chemstore
units
02-Oct-19 1.0 HAZID team 08.04 - Loss of
containment within
chemstore - with
ignition
08.04.01 Corrosion of container - with
ignition
Drum handling
and storage
3 2 2 6 6 Documented visual inspection on acceptance.
Documented periodic visual inspection of
containers, by trained operators.
UN approved drums.
Bunded and tested chemical storage units.
Spill response procedure.
Emergency response plan and ERT in place08 08
Chemstore
units
02-Oct-19 1.0 HAZID team 08.04 - Loss of
containment within
chemstore - with
ignition
08.04.02 Manual handling error, resulting
in loss of containment from
packaged container - with ignition
Drum handling
and storage
3 2 2 6 6 Operator training on site.
Chemical awareness and ADR training
UN rated packages (drop testing).
Bunded and tested chemical storage units.
Spill response procedure.
Emergency response plan and ERT in place09 09 ID fan 02-Oct-19 1.0 HAZID team 09.01 - No MAH
identified in this area.
09.01.01 n.a. - 0 0 0 0 0 n.a.
10 10 Stack 02-Oct-19 1.0 HAZID team 10.01 - No MAH
identified in this area.
10.01.01 n.a. - 0 0 0 0 0 n.a.
11 11 HCl
storage
02-Oct-19 1.0 HAZID team 11.01 - Loss of
containment from IBC
to bund tray
11.01.01 Corrosive/wear & tear causing
leak
HCl storage 2 2 2 4 4 UN approved containers / packaging for materials.
Bunded IBCs
Regular site inspection (as above)
Screening / assessing deliveries to site
Investigations / follow up if supplier provides
faulty IBC11 11 HCl
storage
02-Oct-19 1.0 HAZID team 11.01 - Loss of
containment from IBC
to bund tray
11.01.02 Leak at outlet/tap HCl storage 3 2 2 6 6 as above
11 11 HCl
storage
02-Oct-19 1.0 HAZID team 11.01 - Loss of
containment from IBC
to bund tray
11.01.03 Mechanical impact HCl storage 3 2 2 6 6 Speed limit / traffic management controls on site.
Trained operators
Permit to work system
Caged IBCs
11 11 HCl
storage
02-Oct-19 1.0 HAZID team 11.02 - Rupture of
IBC and release to
outside bund
11.02.01 Mechanical impact HCl storage 3 3 2 9 6 Speed limit / traffic management controls on site.
Trained operators
Permit to work system
Caged IBCs
11 11 HCl
storage
02-Oct-19 1.0 HAZID team 11.02 - Rupture of
IBC and release to
outside bund
11.02.02 Catastrophic failure HCl storage 2 3 2 6 4 UN approved containers / packaging for materials.
Bunded IBCs
Regular site inspection (as above)
Screening / assessing deliveries to site
Investigations / follow up if supplier provides
faulty IBC
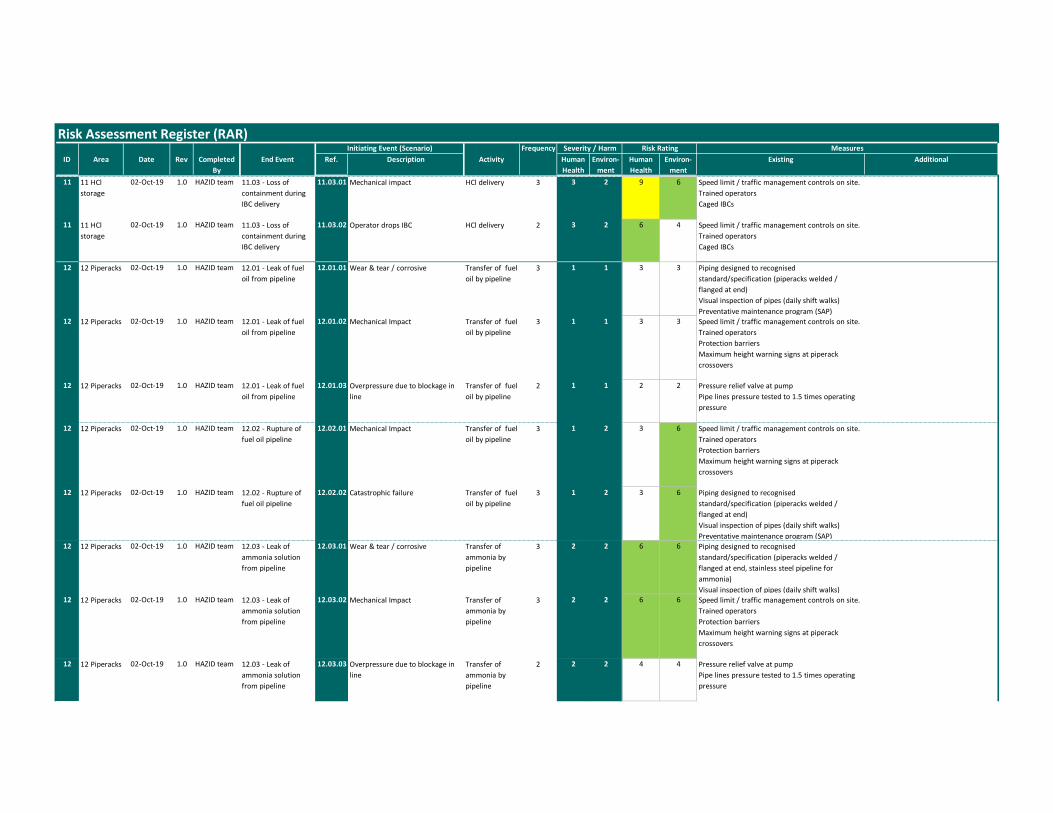
Risk Assessment Register (RAR)Frequency
ID Area Date Rev Completed
By
End Event Ref. Description Activity Human
Health
Environ-
ment
Human
Health
Environ-
ment
Existing Additional
Risk Rating MeasuresInitiating Event (Scenario) Severity / Harm
11 11 HCl
storage
02-Oct-19 1.0 HAZID team 11.03 - Loss of
containment during
IBC delivery
11.03.01 Mechanical impact HCl delivery 3 3 2 9 6 Speed limit / traffic management controls on site.
Trained operators
Caged IBCs
11 11 HCl
storage
02-Oct-19 1.0 HAZID team 11.03 - Loss of
containment during
IBC delivery
11.03.02 Operator drops IBC HCl delivery 2 3 2 6 4 Speed limit / traffic management controls on site.
Trained operators
Caged IBCs
12 12 Piperacks 02-Oct-19 1.0 HAZID team 12.01 - Leak of fuel
oil from pipeline
12.01.01 Wear & tear / corrosive Transfer of fuel
oil by pipeline
3 1 1 3 3 Piping designed to recognised
standard/specification (piperacks welded /
flanged at end)
Visual inspection of pipes (daily shift walks)
Preventative maintenance program (SAP)12 12 Piperacks 02-Oct-19 1.0 HAZID team 12.01 - Leak of fuel
oil from pipeline
12.01.02 Mechanical Impact Transfer of fuel
oil by pipeline
3 1 1 3 3 Speed limit / traffic management controls on site.
Trained operators
Protection barriers
Maximum height warning signs at piperack
crossovers
12 12 Piperacks 02-Oct-19 1.0 HAZID team 12.01 - Leak of fuel
oil from pipeline
12.01.03 Overpressure due to blockage in
line
Transfer of fuel
oil by pipeline
2 1 1 2 2 Pressure relief valve at pump
Pipe lines pressure tested to 1.5 times operating
pressure
12 12 Piperacks 02-Oct-19 1.0 HAZID team 12.02 - Rupture of
fuel oil pipeline
12.02.01 Mechanical Impact Transfer of fuel
oil by pipeline
3 1 2 3 6 Speed limit / traffic management controls on site.
Trained operators
Protection barriers
Maximum height warning signs at piperack
crossovers
12 12 Piperacks 02-Oct-19 1.0 HAZID team 12.02 - Rupture of
fuel oil pipeline
12.02.02 Catastrophic failure Transfer of fuel
oil by pipeline
3 1 2 3 6 Piping designed to recognised
standard/specification (piperacks welded /
flanged at end)
Visual inspection of pipes (daily shift walks)
Preventative maintenance program (SAP)12 12 Piperacks 02-Oct-19 1.0 HAZID team 12.03 - Leak of
ammonia solution
from pipeline
12.03.01 Wear & tear / corrosive Transfer of
ammonia by
pipeline
3 2 2 6 6 Piping designed to recognised
standard/specification (piperacks welded /
flanged at end, stainless steel pipeline for
ammonia)
Visual inspection of pipes (daily shift walks)12 12 Piperacks 02-Oct-19 1.0 HAZID team 12.03 - Leak of
ammonia solution
from pipeline
12.03.02 Mechanical Impact Transfer of
ammonia by
pipeline
3 2 2 6 6 Speed limit / traffic management controls on site.
Trained operators
Protection barriers
Maximum height warning signs at piperack
crossovers
12 12 Piperacks 02-Oct-19 1.0 HAZID team 12.03 - Leak of
ammonia solution
from pipeline
12.03.03 Overpressure due to blockage in
line
Transfer of
ammonia by
pipeline
2 2 2 4 4 Pressure relief valve at pump
Pipe lines pressure tested to 1.5 times operating
pressure
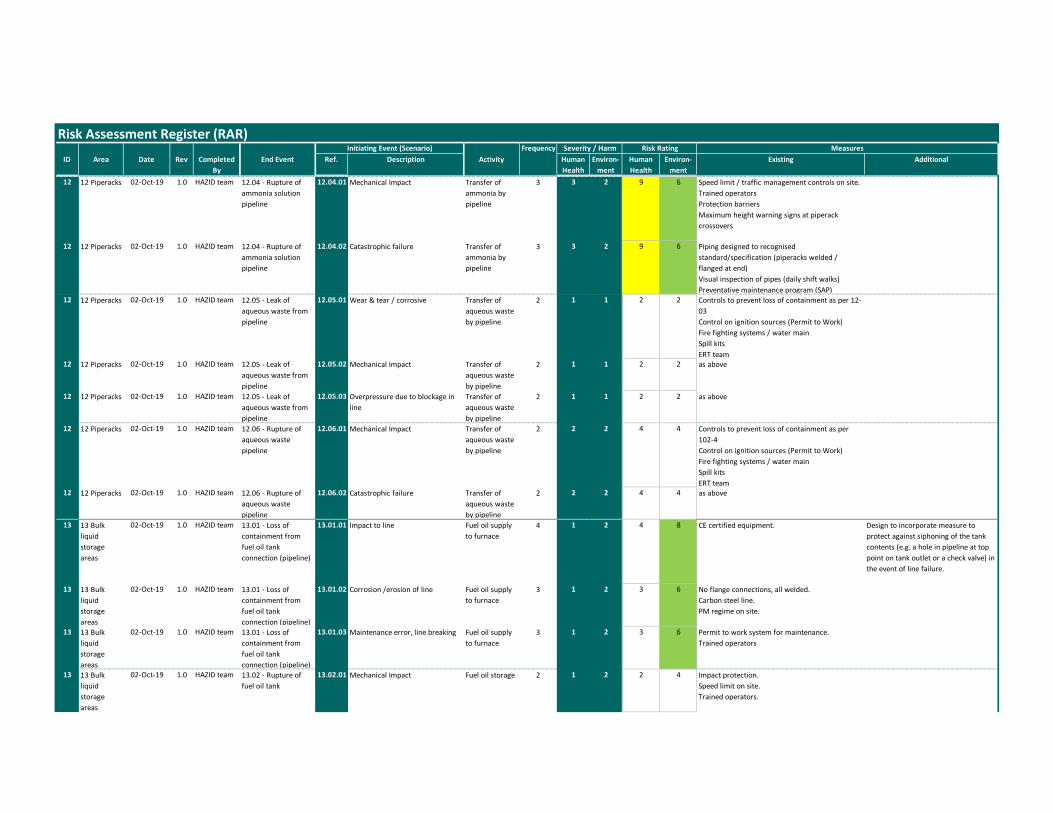
Risk Assessment Register (RAR)Frequency
ID Area Date Rev Completed
By
End Event Ref. Description Activity Human
Health
Environ-
ment
Human
Health
Environ-
ment
Existing Additional
Risk Rating MeasuresInitiating Event (Scenario) Severity / Harm
12 12 Piperacks 02-Oct-19 1.0 HAZID team 12.04 - Rupture of
ammonia solution
pipeline
12.04.01 Mechanical Impact Transfer of
ammonia by
pipeline
3 3 2 9 6 Speed limit / traffic management controls on site.
Trained operators
Protection barriers
Maximum height warning signs at piperack
crossovers
12 12 Piperacks 02-Oct-19 1.0 HAZID team 12.04 - Rupture of
ammonia solution
pipeline
12.04.02 Catastrophic failure Transfer of
ammonia by
pipeline
3 3 2 9 6 Piping designed to recognised
standard/specification (piperacks welded /
flanged at end)
Visual inspection of pipes (daily shift walks)
Preventative maintenance program (SAP)12 12 Piperacks 02-Oct-19 1.0 HAZID team 12.05 - Leak of
aqueous waste from
pipeline
12.05.01 Wear & tear / corrosive Transfer of
aqueous waste
by pipeline
2 1 1 2 2 Controls to prevent loss of containment as per 12-
03
Control on ignition sources (Permit to Work)
Fire fighting systems / water main
Spill kits
ERT team12 12 Piperacks 02-Oct-19 1.0 HAZID team 12.05 - Leak of
aqueous waste from
pipeline
12.05.02 Mechanical Impact Transfer of
aqueous waste
by pipeline
2 1 1 2 2 as above
12 12 Piperacks 02-Oct-19 1.0 HAZID team 12.05 - Leak of
aqueous waste from
pipeline
12.05.03 Overpressure due to blockage in
line
Transfer of
aqueous waste
by pipeline
2 1 1 2 2 as above
12 12 Piperacks 02-Oct-19 1.0 HAZID team 12.06 - Rupture of
aqueous waste
pipeline
12.06.01 Mechanical Impact Transfer of
aqueous waste
by pipeline
2 2 2 4 4 Controls to prevent loss of containment as per
102-4
Control on ignition sources (Permit to Work)
Fire fighting systems / water main
Spill kits
ERT team12 12 Piperacks 02-Oct-19 1.0 HAZID team 12.06 - Rupture of
aqueous waste
pipeline
12.06.02 Catastrophic failure Transfer of
aqueous waste
by pipeline
2 2 2 4 4 as above
13 13 Bulk
liquid
storage
areas
02-Oct-19 1.0 HAZID team 13.01 - Loss of
containment from
fuel oil tank
connection (pipeline)
13.01.01 Impact to line Fuel oil supply
to furnace
4 1 2 4 8 CE certified equipment. Design to incorporate measure to
protect against siphoning of the tank
contents (e.g. a hole in pipeline at top
point on tank outlet or a check valve) in
the event of line failure.
13 13 Bulk
liquid
storage
areas
02-Oct-19 1.0 HAZID team 13.01 - Loss of
containment from
fuel oil tank
connection (pipeline)
13.01.02 Corrosion /erosion of line Fuel oil supply
to furnace
3 1 2 3 6 No flange connections, all welded.
Carbon steel line.
PM regime on site.
13 13 Bulk
liquid
storage
areas
02-Oct-19 1.0 HAZID team 13.01 - Loss of
containment from
fuel oil tank
connection (pipeline)
13.01.03 Maintenance error, line breaking Fuel oil supply
to furnace
3 1 2 3 6 Permit to work system for maintenance.
Trained operators
13 13 Bulk
liquid
storage
areas
02-Oct-19 1.0 HAZID team 13.02 - Rupture of
fuel oil tank
13.02.01 Mechanical Impact Fuel oil storage 2 1 2 2 4 Impact protection.
Speed limit on site.
Trained operators.
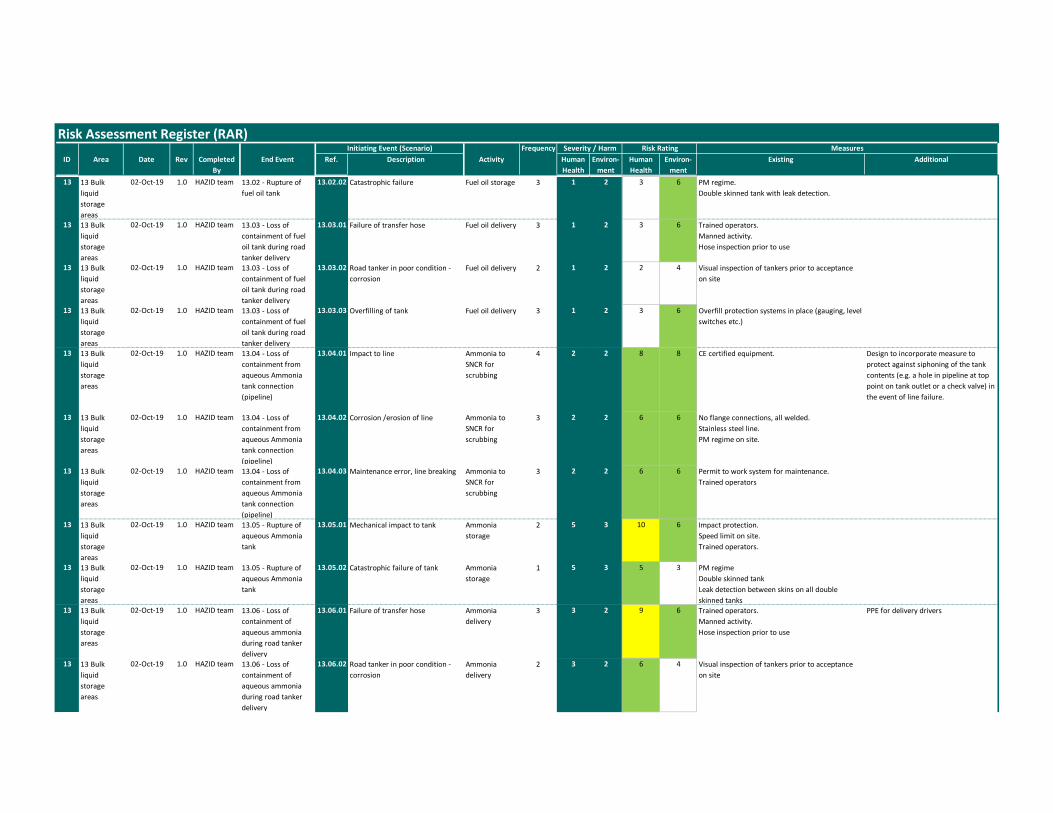
Risk Assessment Register (RAR)Frequency
ID Area Date Rev Completed
By
End Event Ref. Description Activity Human
Health
Environ-
ment
Human
Health
Environ-
ment
Existing Additional
Risk Rating MeasuresInitiating Event (Scenario) Severity / Harm
13 13 Bulk
liquid
storage
areas
02-Oct-19 1.0 HAZID team 13.02 - Rupture of
fuel oil tank
13.02.02 Catastrophic failure Fuel oil storage 3 1 2 3 6 PM regime.
Double skinned tank with leak detection.
13 13 Bulk
liquid
storage
areas
02-Oct-19 1.0 HAZID team 13.03 - Loss of
containment of fuel
oil tank during road
tanker delivery
13.03.01 Failure of transfer hose Fuel oil delivery 3 1 2 3 6 Trained operators.
Manned activity.
Hose inspection prior to use
13 13 Bulk
liquid
storage
areas
02-Oct-19 1.0 HAZID team 13.03 - Loss of
containment of fuel
oil tank during road
tanker delivery
13.03.02 Road tanker in poor condition -
corrosion
Fuel oil delivery 2 1 2 2 4 Visual inspection of tankers prior to acceptance
on site
13 13 Bulk
liquid
storage
areas
02-Oct-19 1.0 HAZID team 13.03 - Loss of
containment of fuel
oil tank during road
tanker delivery
13.03.03 Overfilling of tank Fuel oil delivery 3 1 2 3 6 Overfill protection systems in place (gauging, level
switches etc.)
13 13 Bulk
liquid
storage
areas
02-Oct-19 1.0 HAZID team 13.04 - Loss of
containment from
aqueous Ammonia
tank connection
(pipeline)
13.04.01 Impact to line Ammonia to
SNCR for
scrubbing
4 2 2 8 8 CE certified equipment. Design to incorporate measure to
protect against siphoning of the tank
contents (e.g. a hole in pipeline at top
point on tank outlet or a check valve) in
the event of line failure.
13 13 Bulk
liquid
storage
areas
02-Oct-19 1.0 HAZID team 13.04 - Loss of
containment from
aqueous Ammonia
tank connection
(pipeline)
13.04.02 Corrosion /erosion of line Ammonia to
SNCR for
scrubbing
3 2 2 6 6 No flange connections, all welded.
Stainless steel line.
PM regime on site.
13 13 Bulk
liquid
storage
areas
02-Oct-19 1.0 HAZID team 13.04 - Loss of
containment from
aqueous Ammonia
tank connection
(pipeline)
13.04.03 Maintenance error, line breaking Ammonia to
SNCR for
scrubbing
3 2 2 6 6 Permit to work system for maintenance.
Trained operators
13 13 Bulk
liquid
storage
areas
02-Oct-19 1.0 HAZID team 13.05 - Rupture of
aqueous Ammonia
tank
13.05.01 Mechanical impact to tank Ammonia
storage
2 5 3 10 6 Impact protection.
Speed limit on site.
Trained operators.
13 13 Bulk
liquid
storage
areas
02-Oct-19 1.0 HAZID team 13.05 - Rupture of
aqueous Ammonia
tank
13.05.02 Catastrophic failure of tank Ammonia
storage
1 5 3 5 3 PM regime
Double skinned tank
Leak detection between skins on all double
skinned tanks13 13 Bulk
liquid
storage
areas
02-Oct-19 1.0 HAZID team 13.06 - Loss of
containment of
aqueous ammonia
during road tanker
delivery
13.06.01 Failure of transfer hose Ammonia
delivery
3 3 2 9 6 Trained operators.
Manned activity.
Hose inspection prior to use
PPE for delivery drivers
13 13 Bulk
liquid
storage
areas
02-Oct-19 1.0 HAZID team 13.06 - Loss of
containment of
aqueous ammonia
during road tanker
delivery
13.06.02 Road tanker in poor condition -
corrosion
Ammonia
delivery
2 3 2 6 4 Visual inspection of tankers prior to acceptance
on site
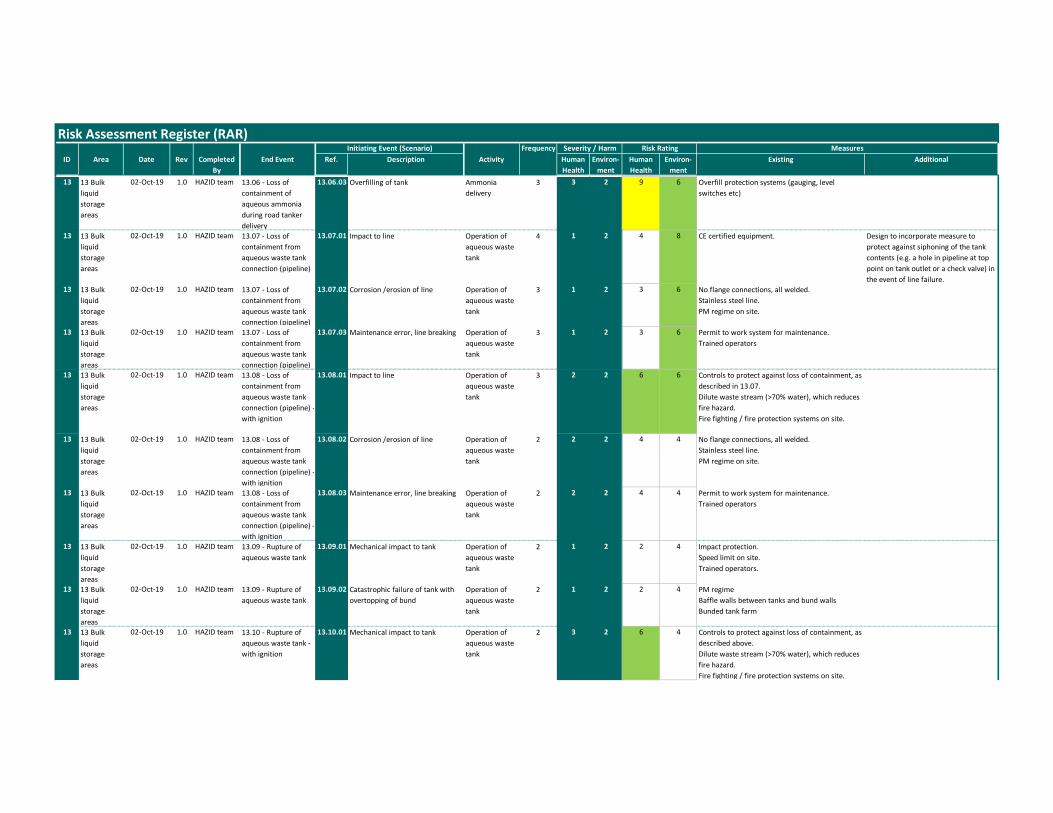
Risk Assessment Register (RAR)Frequency
ID Area Date Rev Completed
By
End Event Ref. Description Activity Human
Health
Environ-
ment
Human
Health
Environ-
ment
Existing Additional
Risk Rating MeasuresInitiating Event (Scenario) Severity / Harm
13 13 Bulk
liquid
storage
areas
02-Oct-19 1.0 HAZID team 13.06 - Loss of
containment of
aqueous ammonia
during road tanker
delivery
13.06.03 Overfilling of tank Ammonia
delivery
3 3 2 9 6 Overfill protection systems (gauging, level
switches etc)
13 13 Bulk
liquid
storage
areas
02-Oct-19 1.0 HAZID team 13.07 - Loss of
containment from
aqueous waste tank
connection (pipeline)
13.07.01 Impact to line Operation of
aqueous waste
tank
4 1 2 4 8 CE certified equipment. Design to incorporate measure to
protect against siphoning of the tank
contents (e.g. a hole in pipeline at top
point on tank outlet or a check valve) in
the event of line failure.13 13 Bulk
liquid
storage
areas
02-Oct-19 1.0 HAZID team 13.07 - Loss of
containment from
aqueous waste tank
connection (pipeline)
13.07.02 Corrosion /erosion of line Operation of
aqueous waste
tank
3 1 2 3 6 No flange connections, all welded.
Stainless steel line.
PM regime on site.
13 13 Bulk
liquid
storage
areas
02-Oct-19 1.0 HAZID team 13.07 - Loss of
containment from
aqueous waste tank
connection (pipeline)
13.07.03 Maintenance error, line breaking Operation of
aqueous waste
tank
3 1 2 3 6 Permit to work system for maintenance.
Trained operators
13 13 Bulk
liquid
storage
areas
02-Oct-19 1.0 HAZID team 13.08 - Loss of
containment from
aqueous waste tank
connection (pipeline) -
with ignition
13.08.01 Impact to line Operation of
aqueous waste
tank
3 2 2 6 6 Controls to protect against loss of containment, as
described in 13.07.
Dilute waste stream (>70% water), which reduces
fire hazard.
Fire fighting / fire protection systems on site.
13 13 Bulk
liquid
storage
areas
02-Oct-19 1.0 HAZID team 13.08 - Loss of
containment from
aqueous waste tank
connection (pipeline) -
with ignition
13.08.02 Corrosion /erosion of line Operation of
aqueous waste
tank
2 2 2 4 4 No flange connections, all welded.
Stainless steel line.
PM regime on site.
13 13 Bulk
liquid
storage
areas
02-Oct-19 1.0 HAZID team 13.08 - Loss of
containment from
aqueous waste tank
connection (pipeline) -
with ignition
13.08.03 Maintenance error, line breaking Operation of
aqueous waste
tank
2 2 2 4 4 Permit to work system for maintenance.
Trained operators
13 13 Bulk
liquid
storage
areas
02-Oct-19 1.0 HAZID team 13.09 - Rupture of
aqueous waste tank
13.09.01 Mechanical impact to tank Operation of
aqueous waste
tank
2 1 2 2 4 Impact protection.
Speed limit on site.
Trained operators.
13 13 Bulk
liquid
storage
areas
02-Oct-19 1.0 HAZID team 13.09 - Rupture of
aqueous waste tank
13.09.02 Catastrophic failure of tank with
overtopping of bund
Operation of
aqueous waste
tank
2 1 2 2 4 PM regime
Baffle walls between tanks and bund walls
Bunded tank farm
13 13 Bulk
liquid
storage
areas
02-Oct-19 1.0 HAZID team 13.10 - Rupture of
aqueous waste tank -
with ignition
13.10.01 Mechanical impact to tank Operation of
aqueous waste
tank
2 3 2 6 4 Controls to protect against loss of containment, as
described above.
Dilute waste stream (>70% water), which reduces
fire hazard.
Fire fighting / fire protection systems on site.
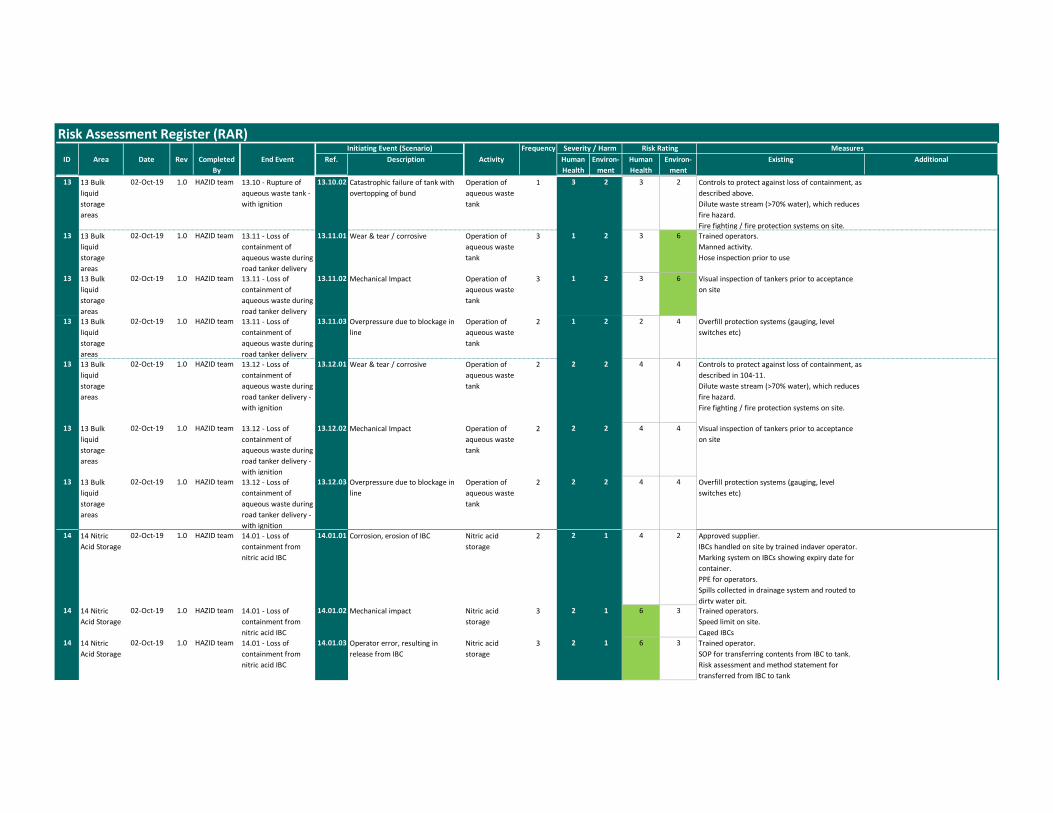
Risk Assessment Register (RAR)Frequency
ID Area Date Rev Completed
By
End Event Ref. Description Activity Human
Health
Environ-
ment
Human
Health
Environ-
ment
Existing Additional
Risk Rating MeasuresInitiating Event (Scenario) Severity / Harm
13 13 Bulk
liquid
storage
areas
02-Oct-19 1.0 HAZID team 13.10 - Rupture of
aqueous waste tank -
with ignition
13.10.02 Catastrophic failure of tank with
overtopping of bund
Operation of
aqueous waste
tank
1 3 2 3 2 Controls to protect against loss of containment, as
described above.
Dilute waste stream (>70% water), which reduces
fire hazard.
Fire fighting / fire protection systems on site.13 13 Bulk
liquid
storage
areas
02-Oct-19 1.0 HAZID team 13.11 - Loss of
containment of
aqueous waste during
road tanker delivery
13.11.01 Wear & tear / corrosive Operation of
aqueous waste
tank
3 1 2 3 6 Trained operators.
Manned activity.
Hose inspection prior to use
13 13 Bulk
liquid
storage
areas
02-Oct-19 1.0 HAZID team 13.11 - Loss of
containment of
aqueous waste during
road tanker delivery
13.11.02 Mechanical Impact Operation of
aqueous waste
tank
3 1 2 3 6 Visual inspection of tankers prior to acceptance
on site
13 13 Bulk
liquid
storage
areas
02-Oct-19 1.0 HAZID team 13.11 - Loss of
containment of
aqueous waste during
road tanker delivery
13.11.03 Overpressure due to blockage in
line
Operation of
aqueous waste
tank
2 1 2 2 4 Overfill protection systems (gauging, level
switches etc)
13 13 Bulk
liquid
storage
areas
02-Oct-19 1.0 HAZID team 13.12 - Loss of
containment of
aqueous waste during
road tanker delivery -
with ignition
13.12.01 Wear & tear / corrosive Operation of
aqueous waste
tank
2 2 2 4 4 Controls to protect against loss of containment, as
described in 104-11.
Dilute waste stream (>70% water), which reduces
fire hazard.
Fire fighting / fire protection systems on site.
13 13 Bulk
liquid
storage
areas
02-Oct-19 1.0 HAZID team 13.12 - Loss of
containment of
aqueous waste during
road tanker delivery -
with ignition
13.12.02 Mechanical Impact Operation of
aqueous waste
tank
2 2 2 4 4 Visual inspection of tankers prior to acceptance
on site
13 13 Bulk
liquid
storage
areas
02-Oct-19 1.0 HAZID team 13.12 - Loss of
containment of
aqueous waste during
road tanker delivery -
with ignition
13.12.03 Overpressure due to blockage in
line
Operation of
aqueous waste
tank
2 2 2 4 4 Overfill protection systems (gauging, level
switches etc)
14 14 Nitric
Acid Storage
02-Oct-19 1.0 HAZID team 14.01 - Loss of
containment from
nitric acid IBC
14.01.01 Corrosion, erosion of IBC Nitric acid
storage
2 2 1 4 2 Approved supplier.
IBCs handled on site by trained indaver operator.
Marking system on IBCs showing expiry date for
container.
PPE for operators.
Spills collected in drainage system and routed to
dirty water pit.14 14 Nitric
Acid Storage
02-Oct-19 1.0 HAZID team 14.01 - Loss of
containment from
nitric acid IBC
14.01.02 Mechanical impact Nitric acid
storage
3 2 1 6 3 Trained operators.
Speed limit on site.
Caged IBCs
14 14 Nitric
Acid Storage
02-Oct-19 1.0 HAZID team 14.01 - Loss of
containment from
nitric acid IBC
14.01.03 Operator error, resulting in
release from IBC
Nitric acid
storage
3 2 1 6 3 Trained operator.
SOP for transferring contents from IBC to tank.
Risk assessment and method statement for
transferred from IBC to tank
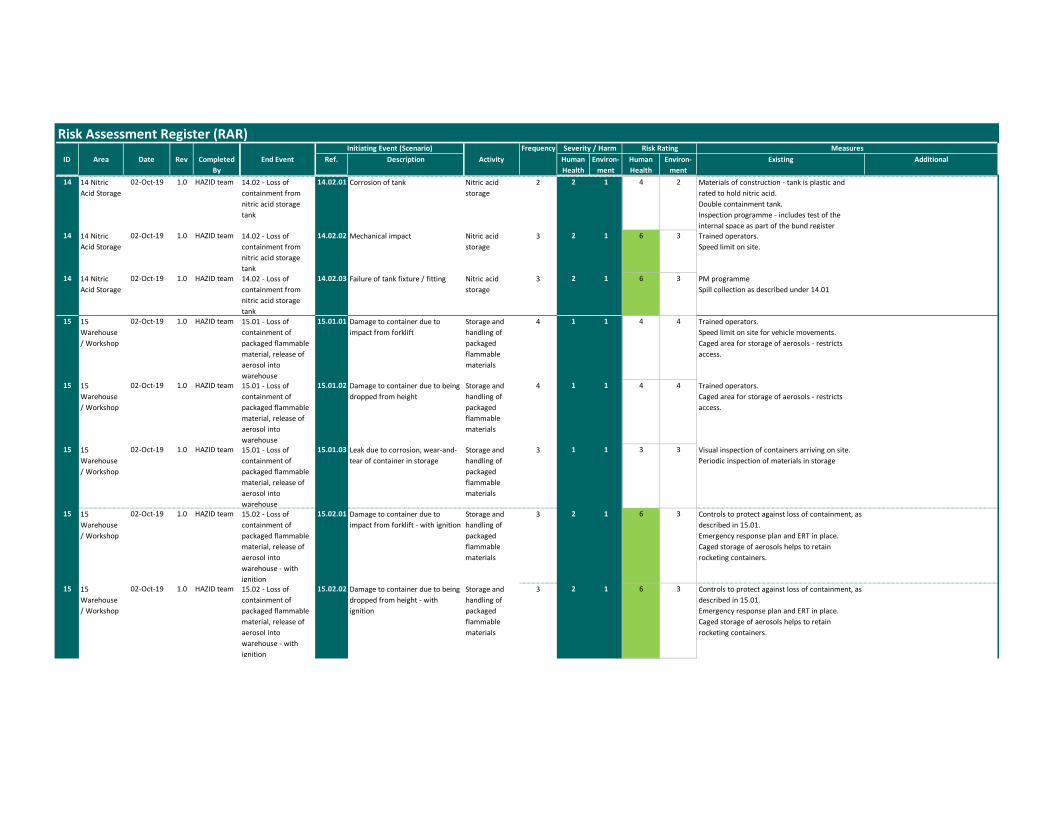
Risk Assessment Register (RAR)Frequency
ID Area Date Rev Completed
By
End Event Ref. Description Activity Human
Health
Environ-
ment
Human
Health
Environ-
ment
Existing Additional
Risk Rating MeasuresInitiating Event (Scenario) Severity / Harm
14 14 Nitric
Acid Storage
02-Oct-19 1.0 HAZID team 14.02 - Loss of
containment from
nitric acid storage
tank
14.02.01 Corrosion of tank Nitric acid
storage
2 2 1 4 2 Materials of construction - tank is plastic and
rated to hold nitric acid.
Double containment tank.
Inspection programme - includes test of the
internal space as part of the bund register14 14 Nitric
Acid Storage
02-Oct-19 1.0 HAZID team 14.02 - Loss of
containment from
nitric acid storage
tank
14.02.02 Mechanical impact Nitric acid
storage
3 2 1 6 3 Trained operators.
Speed limit on site.
14 14 Nitric
Acid Storage
02-Oct-19 1.0 HAZID team 14.02 - Loss of
containment from
nitric acid storage
tank
14.02.03 Failure of tank fixture / fitting Nitric acid
storage
3 2 1 6 3 PM programme
Spill collection as described under 14.01
15 15
Warehouse
/ Workshop
02-Oct-19 1.0 HAZID team 15.01 - Loss of
containment of
packaged flammable
material, release of
aerosol into
warehouse
15.01.01 Damage to container due to
impact from forklift
Storage and
handling of
packaged
flammable
materials
4 1 1 4 4 Trained operators.
Speed limit on site for vehicle movements.
Caged area for storage of aerosols - restricts
access.
15 15
Warehouse
/ Workshop
02-Oct-19 1.0 HAZID team 15.01 - Loss of
containment of
packaged flammable
material, release of
aerosol into
warehouse
15.01.02 Damage to container due to being
dropped from height
Storage and
handling of
packaged
flammable
materials
4 1 1 4 4 Trained operators.
Caged area for storage of aerosols - restricts
access.
15 15
Warehouse
/ Workshop
02-Oct-19 1.0 HAZID team 15.01 - Loss of
containment of
packaged flammable
material, release of
aerosol into
warehouse
15.01.03 Leak due to corrosion, wear-and-
tear of container in storage
Storage and
handling of
packaged
flammable
materials
3 1 1 3 3 Visual inspection of containers arriving on site.
Periodic inspection of materials in storage
15 15
Warehouse
/ Workshop
02-Oct-19 1.0 HAZID team 15.02 - Loss of
containment of
packaged flammable
material, release of
aerosol into
warehouse - with
ignition
15.02.01 Damage to container due to
impact from forklift - with ignition
Storage and
handling of
packaged
flammable
materials
3 2 1 6 3 Controls to protect against loss of containment, as
described in 15.01.
Emergency response plan and ERT in place.
Caged storage of aerosols helps to retain
rocketing containers.
15 15
Warehouse
/ Workshop
02-Oct-19 1.0 HAZID team 15.02 - Loss of
containment of
packaged flammable
material, release of
aerosol into
warehouse - with
ignition
15.02.02 Damage to container due to being
dropped from height - with
ignition
Storage and
handling of
packaged
flammable
materials
3 2 1 6 3 Controls to protect against loss of containment, as
described in 15.01.
Emergency response plan and ERT in place.
Caged storage of aerosols helps to retain
rocketing containers.
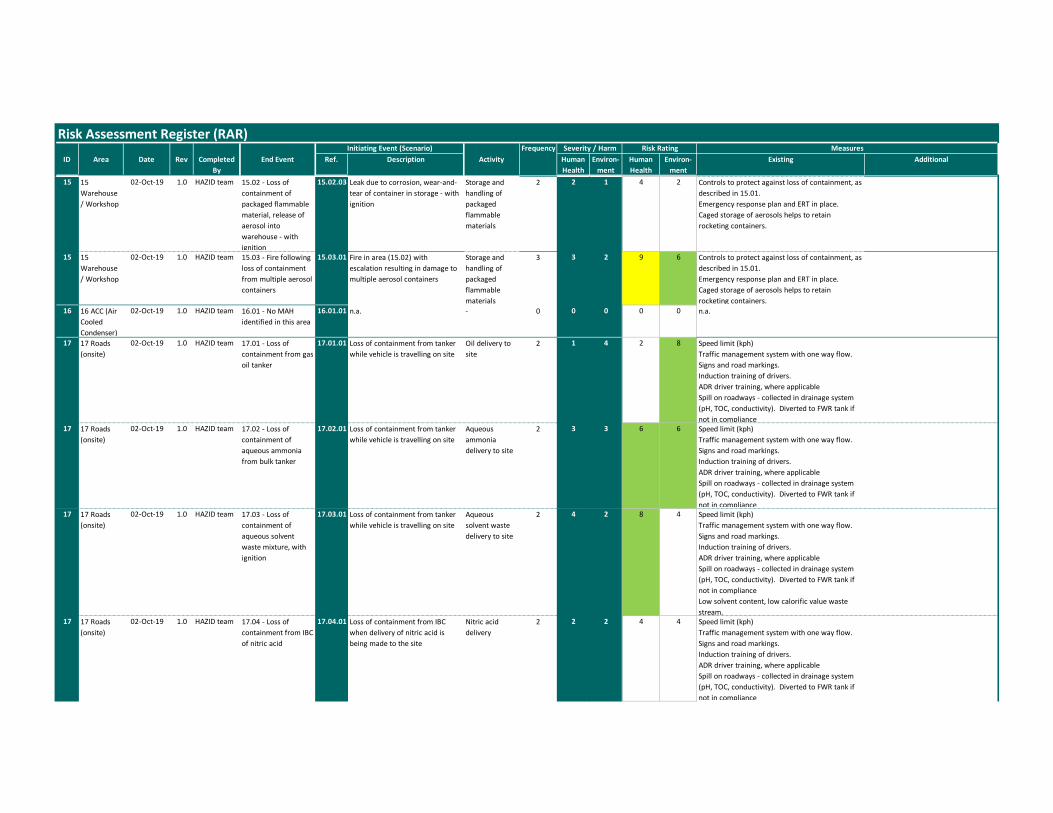
Risk Assessment Register (RAR)Frequency
ID Area Date Rev Completed
By
End Event Ref. Description Activity Human
Health
Environ-
ment
Human
Health
Environ-
ment
Existing Additional
Risk Rating MeasuresInitiating Event (Scenario) Severity / Harm
15 15
Warehouse
/ Workshop
02-Oct-19 1.0 HAZID team 15.02 - Loss of
containment of
packaged flammable
material, release of
aerosol into
warehouse - with
ignition
15.02.03 Leak due to corrosion, wear-and-
tear of container in storage - with
ignition
Storage and
handling of
packaged
flammable
materials
2 2 1 4 2 Controls to protect against loss of containment, as
described in 15.01.
Emergency response plan and ERT in place.
Caged storage of aerosols helps to retain
rocketing containers.
15 15
Warehouse
/ Workshop
02-Oct-19 1.0 HAZID team 15.03 - Fire following
loss of containment
from multiple aerosol
containers
15.03.01 Fire in area (15.02) with
escalation resulting in damage to
multiple aerosol containers
Storage and
handling of
packaged
flammable
materials
3 3 2 9 6 Controls to protect against loss of containment, as
described in 15.01.
Emergency response plan and ERT in place.
Caged storage of aerosols helps to retain
rocketing containers.16 16 ACC (Air
Cooled
Condenser)
02-Oct-19 1.0 HAZID team 16.01 - No MAH
identified in this area
16.01.01 n.a. - 0 0 0 0 0 n.a.
17 17 Roads
(onsite)
02-Oct-19 1.0 HAZID team 17.01 - Loss of
containment from gas
oil tanker
17.01.01 Loss of containment from tanker
while vehicle is travelling on site
Oil delivery to
site
2 1 4 2 8 Speed limit (kph)
Traffic management system with one way flow.
Signs and road markings.
Induction training of drivers.
ADR driver training, where applicable
Spill on roadways - collected in drainage system
(pH, TOC, conductivity). Diverted to FWR tank if
not in compliance17 17 Roads
(onsite)
02-Oct-19 1.0 HAZID team 17.02 - Loss of
containment of
aqueous ammonia
from bulk tanker
17.02.01 Loss of containment from tanker
while vehicle is travelling on site
Aqueous
ammonia
delivery to site
2 3 3 6 6 Speed limit (kph)
Traffic management system with one way flow.
Signs and road markings.
Induction training of drivers.
ADR driver training, where applicable
Spill on roadways - collected in drainage system
(pH, TOC, conductivity). Diverted to FWR tank if
not in compliance17 17 Roads
(onsite)
02-Oct-19 1.0 HAZID team 17.03 - Loss of
containment of
aqueous solvent
waste mixture, with
ignition
17.03.01 Loss of containment from tanker
while vehicle is travelling on site
Aqueous
solvent waste
delivery to site
2 4 2 8 4 Speed limit (kph)
Traffic management system with one way flow.
Signs and road markings.
Induction training of drivers.
ADR driver training, where applicable
Spill on roadways - collected in drainage system
(pH, TOC, conductivity). Diverted to FWR tank if
not in compliance
Low solvent content, low calorific value waste
stream.17 17 Roads
(onsite)
02-Oct-19 1.0 HAZID team 17.04 - Loss of
containment from IBC
of nitric acid
17.04.01 Loss of containment from IBC
when delivery of nitric acid is
being made to the site
Nitric acid
delivery
2 2 2 4 4 Speed limit (kph)
Traffic management system with one way flow.
Signs and road markings.
Induction training of drivers.
ADR driver training, where applicable
Spill on roadways - collected in drainage system
(pH, TOC, conductivity). Diverted to FWR tank if
not in compliance
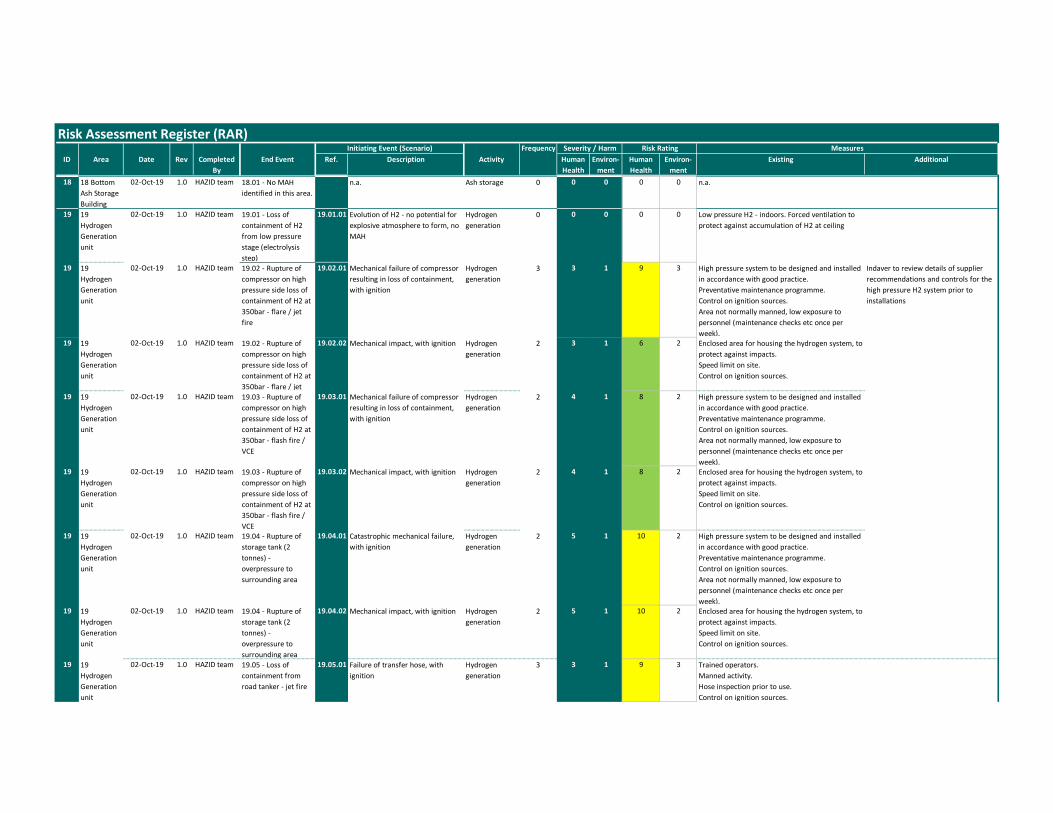
Risk Assessment Register (RAR)Frequency
ID Area Date Rev Completed
By
End Event Ref. Description Activity Human
Health
Environ-
ment
Human
Health
Environ-
ment
Existing Additional
Risk Rating MeasuresInitiating Event (Scenario) Severity / Harm
18 18 Bottom
Ash Storage
Building
02-Oct-19 1.0 HAZID team 18.01 - No MAH
identified in this area.
n.a. Ash storage 0 0 0 0 0 n.a.
19 19
Hydrogen
Generation
unit
02-Oct-19 1.0 HAZID team 19.01 - Loss of
containment of H2
from low pressure
stage (electrolysis
step)
19.01.01 Evolution of H2 - no potential for
explosive atmosphere to form, no
MAH
Hydrogen
generation
0 0 0 0 0 Low pressure H2 - indoors. Forced ventilation to
protect against accumulation of H2 at ceiling
19 19
Hydrogen
Generation
unit
02-Oct-19 1.0 HAZID team 19.02 - Rupture of
compressor on high
pressure side loss of
containment of H2 at
350bar - flare / jet
fire
19.02.01 Mechanical failure of compressor
resulting in loss of containment,
with ignition
Hydrogen
generation
3 3 1 9 3 High pressure system to be designed and installed
in accordance with good practice.
Preventative maintenance programme.
Control on ignition sources.
Area not normally manned, low exposure to
personnel (maintenance checks etc once per
week).
Indaver to review details of supplier
recommendations and controls for the
high pressure H2 system prior to
installations
19 19
Hydrogen
Generation
unit
02-Oct-19 1.0 HAZID team 19.02 - Rupture of
compressor on high
pressure side loss of
containment of H2 at
350bar - flare / jet
19.02.02 Mechanical impact, with ignition Hydrogen
generation
2 3 1 6 2 Enclosed area for housing the hydrogen system, to
protect against impacts.
Speed limit on site.
Control on ignition sources.
19 19
Hydrogen
Generation
unit
02-Oct-19 1.0 HAZID team 19.03 - Rupture of
compressor on high
pressure side loss of
containment of H2 at
350bar - flash fire /
VCE
19.03.01 Mechanical failure of compressor
resulting in loss of containment,
with ignition
Hydrogen
generation
2 4 1 8 2 High pressure system to be designed and installed
in accordance with good practice.
Preventative maintenance programme.
Control on ignition sources.
Area not normally manned, low exposure to
personnel (maintenance checks etc once per
week).19 19
Hydrogen
Generation
unit
02-Oct-19 1.0 HAZID team 19.03 - Rupture of
compressor on high
pressure side loss of
containment of H2 at
350bar - flash fire /
VCE
19.03.02 Mechanical impact, with ignition Hydrogen
generation
2 4 1 8 2 Enclosed area for housing the hydrogen system, to
protect against impacts.
Speed limit on site.
Control on ignition sources.
19 19
Hydrogen
Generation
unit
02-Oct-19 1.0 HAZID team 19.04 - Rupture of
storage tank (2
tonnes) -
overpressure to
surrounding area
19.04.01 Catastrophic mechanical failure,
with ignition
Hydrogen
generation
2 5 1 10 2 High pressure system to be designed and installed
in accordance with good practice.
Preventative maintenance programme.
Control on ignition sources.
Area not normally manned, low exposure to
personnel (maintenance checks etc once per
week).19 19
Hydrogen
Generation
unit
02-Oct-19 1.0 HAZID team 19.04 - Rupture of
storage tank (2
tonnes) -
overpressure to
surrounding area
19.04.02 Mechanical impact, with ignition Hydrogen
generation
2 5 1 10 2 Enclosed area for housing the hydrogen system, to
protect against impacts.
Speed limit on site.
Control on ignition sources.
19 19
Hydrogen
Generation
unit
02-Oct-19 1.0 HAZID team 19.05 - Loss of
containment from
road tanker - jet fire
19.05.01 Failure of transfer hose, with
ignition
Hydrogen
generation
3 3 1 9 3 Trained operators.
Manned activity.
Hose inspection prior to use.
Control on ignition sources.
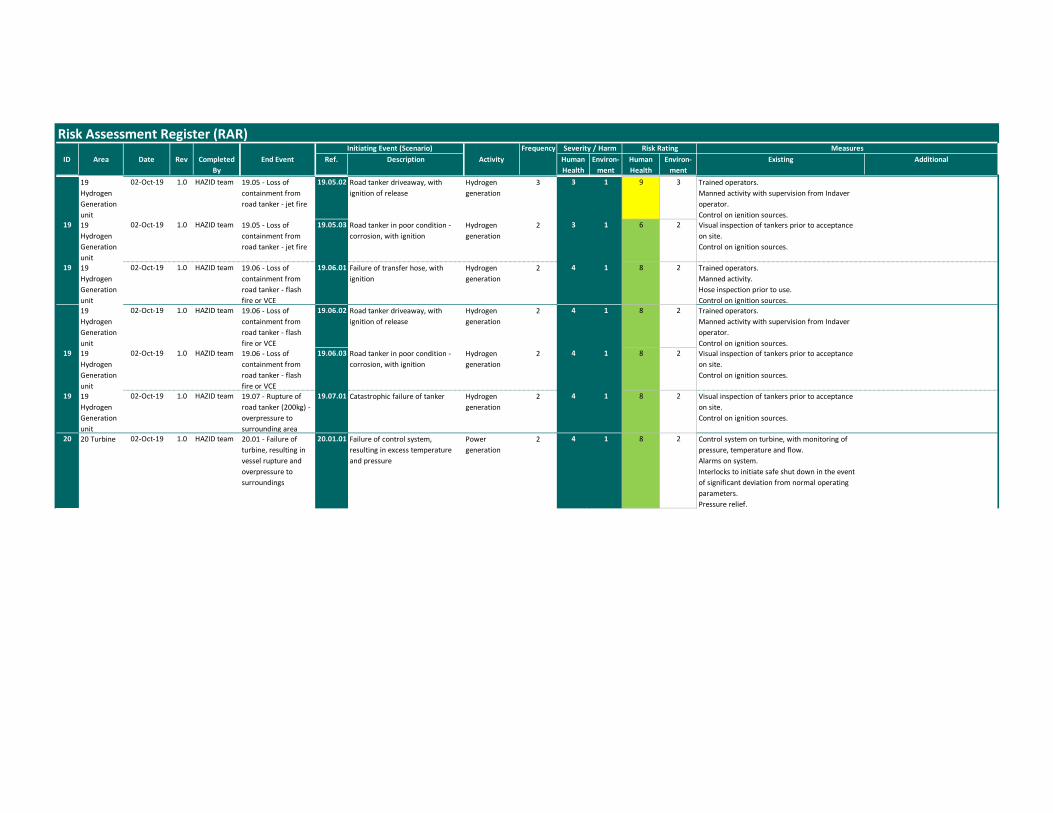
Risk Assessment Register (RAR)Frequency
ID Area Date Rev Completed
By
End Event Ref. Description Activity Human
Health
Environ-
ment
Human
Health
Environ-
ment
Existing Additional
Risk Rating MeasuresInitiating Event (Scenario) Severity / Harm
19
Hydrogen
Generation
unit
02-Oct-19 1.0 HAZID team 19.05 - Loss of
containment from
road tanker - jet fire
19.05.02 Road tanker driveaway, with
ignition of release
Hydrogen
generation
3 3 1 9 3 Trained operators.
Manned activity with supervision from Indaver
operator.
Control on ignition sources.19 19
Hydrogen
Generation
unit
02-Oct-19 1.0 HAZID team 19.05 - Loss of
containment from
road tanker - jet fire
19.05.03 Road tanker in poor condition -
corrosion, with ignition
Hydrogen
generation
2 3 1 6 2 Visual inspection of tankers prior to acceptance
on site.
Control on ignition sources.
19 19
Hydrogen
Generation
unit
02-Oct-19 1.0 HAZID team 19.06 - Loss of
containment from
road tanker - flash
fire or VCE
19.06.01 Failure of transfer hose, with
ignition
Hydrogen
generation
2 4 1 8 2 Trained operators.
Manned activity.
Hose inspection prior to use.
Control on ignition sources.
19
Hydrogen
Generation
unit
02-Oct-19 1.0 HAZID team 19.06 - Loss of
containment from
road tanker - flash
fire or VCE
19.06.02 Road tanker driveaway, with
ignition of release
Hydrogen
generation
2 4 1 8 2 Trained operators.
Manned activity with supervision from Indaver
operator.
Control on ignition sources.19 19
Hydrogen
Generation
unit
02-Oct-19 1.0 HAZID team 19.06 - Loss of
containment from
road tanker - flash
fire or VCE
19.06.03 Road tanker in poor condition -
corrosion, with ignition
Hydrogen
generation
2 4 1 8 2 Visual inspection of tankers prior to acceptance
on site.
Control on ignition sources.
19 19
Hydrogen
Generation
unit
02-Oct-19 1.0 HAZID team 19.07 - Rupture of
road tanker (200kg) -
overpressure to
surrounding area
19.07.01 Catastrophic failure of tanker Hydrogen
generation
2 4 1 8 2 Visual inspection of tankers prior to acceptance
on site.
Control on ignition sources.
20 20 Turbine 02-Oct-19 1.0 HAZID team 20.01 - Failure of
turbine, resulting in
vessel rupture and
overpressure to
surroundings
20.01.01 Failure of control system,
resulting in excess temperature
and pressure
Power
generation
2 4 1 8 2 Control system on turbine, with monitoring of
pressure, temperature and flow.
Alarms on system.
Interlocks to initiate safe shut down in the event
of significant deviation from normal operating
parameters.
Pressure relief.
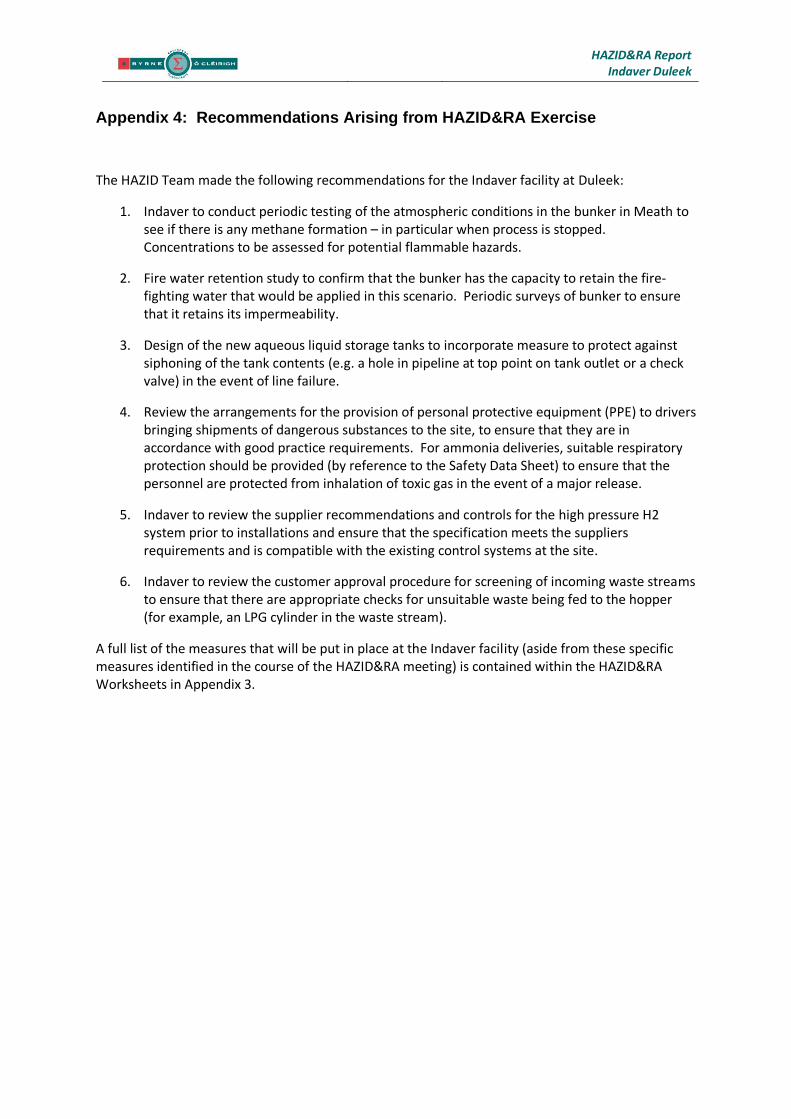
HAZID&RA Report Indaver Duleek
Appendix 4: Recommendations Arising from HAZID&RA Exercise
The HAZID Team made the following recommendations for the Indaver facility at Duleek:
1. Indaver to conduct periodic testing of the atmospheric conditions in the bunker in Meath to see if there is any methane formation – in particular when process is stopped. Concentrations to be assessed for potential flammable hazards.
2. Fire water retention study to confirm that the bunker has the capacity to retain the fire-fighting water that would be applied in this scenario. Periodic surveys of bunker to ensure that it retains its impermeability.
3. Design of the new aqueous liquid storage tanks to incorporate measure to protect against siphoning of the tank contents (e.g. a hole in pipeline at top point on tank outlet or a check valve) in the event of line failure.
4. Review the arrangements for the provision of personal protective equipment (PPE) to drivers bringing shipments of dangerous substances to the site, to ensure that they are in accordance with good practice requirements. For ammonia deliveries, suitable respiratory protection should be provided (by reference to the Safety Data Sheet) to ensure that the personnel are protected from inhalation of toxic gas in the event of a major release.
5. Indaver to review the supplier recommendations and controls for the high pressure H2 system prior to installations and ensure that the specification meets the suppliers requirements and is compatible with the existing control systems at the site.
6. Indaver to review the customer approval procedure for screening of incoming waste streams to ensure that there are appropriate checks for unsuitable waste being fed to the hopper (for example, an LPG cylinder in the waste stream).
A full list of the measures that will be put in place at the Indaver facility (aside from these specific measures identified in the course of the HAZID&RA meeting) is contained within the HAZID&RA Worksheets in Appendix 3.
Byrne Ó Cléirigh, 30a Westland Square, Pearse Street, Dublin 2, D02 PN76, Ireland. Telephone: + 353 – 1 – 6770733. Facsimile: + 353 – 1 – 6770729. Email: [email protected]. Web: www.boc.ie
Directors: LM Ó Cléirigh BE MIE CEng FIEI FIMechE; LP Ó Cléirigh BE MEngSc MBA CEng FIEI FEI; ST Malone BE MIE CEng FIEI;
JB FitzPatrick FCA. Registered in Dublin, Ireland No. 237982.
Seveso III Inventory Assessment at Duleek
Prepared for:
Indaver Ireland Limited
Ref: 462-20X0073
23rd April 2020
Byrne Ó Cléirigh Consulting i
Inventory assessment at Duleek
462-20X0073 April 2020
DISCLAIMER
This report has been prepared by Byrne Ó Cléirigh Limited with all reasonable skill, care and diligence within the terms of the Contract with the Client, incorporating our Terms and Conditions and taking account of the resources devoted to it by agreement with the Client.
We disclaim any responsibility to the Client and others in respect of any matters outside the scope of the above.
This report is confidential to the Client and we accept no responsibility of whatsoever nature to third parties to whom this report, or any part thereof, is made known. Any such party relies upon the report at their own risk.
Byrne Ó Cléirigh Consulting ii
Inventory assessment at Duleek
462-20X0073 April 2020
Contents
1 INTRODUCTION ................................................................................................................... 3
2 SEVESO REGULATIONS ......................................................................................................... 3
3 INVENTORY OF DANGEROUS SUBSTANCES ........................................................................... 4
3.1 Current operations ........................................................................................................ 4
3.1.1 Ash residues ............................................................................................................................. 4
3.1.2 Packaged waste ..................................................................................................................... 10
3.1.3 Other materials ...................................................................................................................... 11
3.2 Proposed new installations .......................................................................................... 11
3.2.1 Aqueous waste solvent tank farm ......................................................................................... 11
3.2.2 Hydrogen Generation Unit .................................................................................................... 14
3.3 Seveso Status of Site .................................................................................................... 14
4 CONCLUSIONS ................................................................................................................... 15
Byrne Ó Cléirigh Consulting 3
Inventory assessment at Duleek
462-20X0073 April 2020
1 INTRODUCTION
At the request of Indaver Ireland Limited, Byrne Ó Cléirigh (BÓC) has conducted an assessment of the inventory of dangerous substances at the Duleek site. This assessment takes account of the list of materials currently stored and handled at the site and also the plan to introduce more materials to the site by constructing a tank farm for the storage of aqueous wastes containing a small percentage of solvent contamination as well as the storage and handling of hydrogen at a new hydrogen generation unit.
We have examined this inventory of materials to determine whether the site would qualify under the Seveso III Regulations as a result of the proposed changes1.
2 SEVESO REGULATIONS
The Seveso III Regulations apply to operators of establishments engaged in the storage and handling of dangerous substances under the following headings.
• H - health hazards (materials that are acutely toxic to human health)
• P - physical hazards (materials presenting a fire / explosion hazard)
• E - environmental hazards (materials that are toxic to the aquatic environment)
• O - other hazards (water-reactive materials)
Schedule 1 of the regulations applies qualification thresholds to materials that fall under these headings. If the quantities of dangerous substances (q) stored by an operator exceeds these thresholds (Q), then the site qualifies as an establishment under the regulations.
The determination of whether a material falls into any of these categories is made by reference to the hazard statements that apply to it. The hazard statements are taken from the EU CLP Regulation2.
There are two qualification thresholds in each case, one of which is used to determine if the site qualifies as a lower tier establishment and one which is used to determine if the site qualifies as an upper tier establishment.
If no single material exceeds its threshold, there is an aggregation rule in which the individual ratios (i.e. the calculated value of q/Q) for all materials within the same hazard category are added together. This aggregation is carried out for materials within each of the first three categories shown above (health, physical and environmental hazards). The aggregation rule is not applied to materials within the ‘other hazards’ category.
There are three possible outcomes from this aggregation process:
1. The sum of the individual ratios against the lower tier thresholds for all three hazard types is less than one (1), in which case the regulations do not apply.
1 Chemicals act (Control of major accident hazards involving dangerous substances) regulations 2015 (SI 209 of 2015) 2 Regulation (EC) No 1272/2008 of the European Parliament and of the Council on classification, labelling and packaging of substances and mixtures
Byrne Ó Cléirigh Consulting 4
Inventory assessment at Duleek
462-20X0073 April 2020
2. The sum of the individual ratios against the lower combined inventory is greater than the lower tier threshold but less than the upper tier threshold, in which case the site qualifies as a lower tier establishment.
3. The combined inventory is greater than the upper tier threshold, in which case the site qualifies as an upper tier establishment.
3 INVENTORY OF DANGEROUS SUBSTANCES
3.1 Current operations
Indaver has provided details of the various materials that are currently stored and handled at the Duleek site. In each case we assess the materials to determine the appropriate hazard classifications to determine if they qualify under the Seveso Regulations. For those materials that do qualify, we have applied the qualifying quantities from Schedule 1 of the Regulations to determine their contribution to the overall calculation.
These are assessed in the following sub-sections.
3.1.1 Ash residues
Indaver has provided details of the composition of the boiler ash residue and flue gas residue arising from the process at Duleek. Summary details are provided in Table 1.
To determine the appropriate hazard classification of the ash residue stream, we have referred to the Classification Labelling and Packaging (CLP) Regulation3, which is the basis for determining whether a material qualifies under Seveso III and which also describes the approach to determine if a mixture or preparation containing multiple hazardous constituents should be classed as hazardous to the environment.
Referring to the CLP Regulation, many of the heavy metals identified in flue gas and boiler ash residues are capable of forming compounds that are classed as hazardous to the aquatic environment. The rule for determining the appropriate classification for a mixture containing constituents that present this hazard is set out in Table 4.1.2 of the CLP Regulation, which we reproduce here as Table 2.
3 Regulation (EC) No 1272/2008 of the European Parliament and of the Council on classification labelling and packaging of substances and mixtures
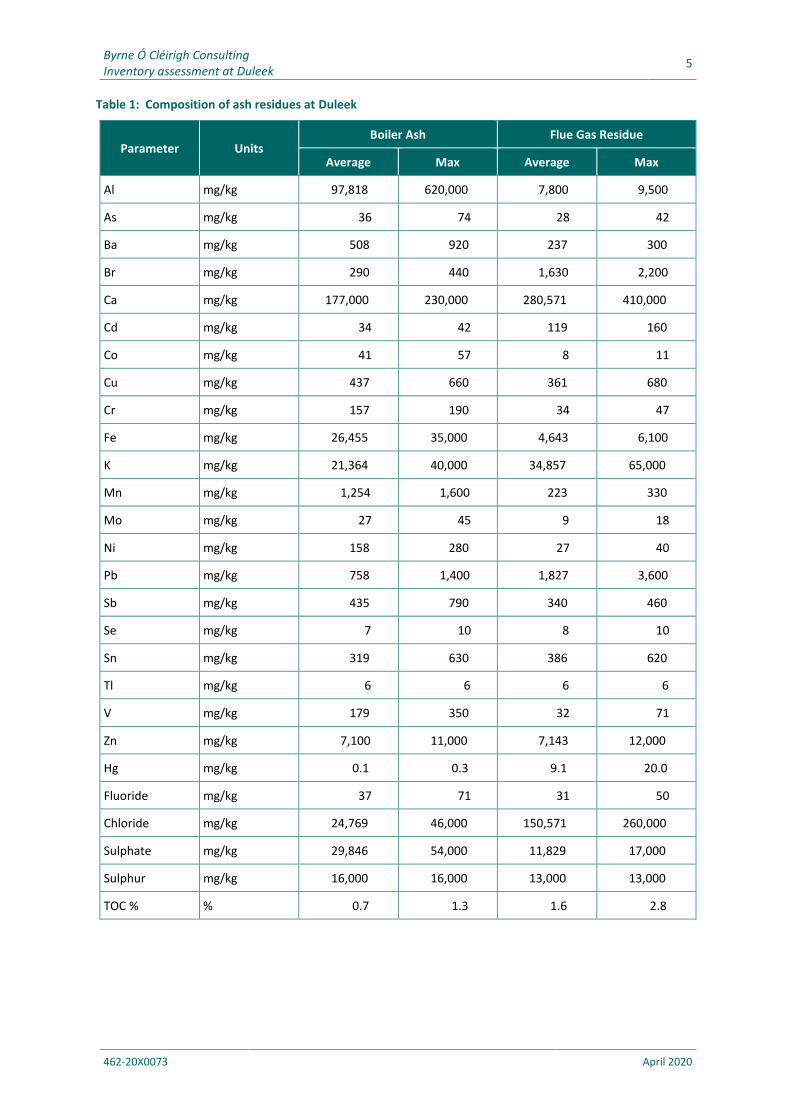
Byrne Ó Cléirigh Consulting 5
Inventory assessment at Duleek
462-20X0073 April 2020
Table 1: Composition of ash residues at Duleek
Parameter Units Boiler Ash Flue Gas Residue
Average Max Average Max
Al mg/kg 97,818 620,000 7,800 9,500
As mg/kg 36 74 28 42
Ba mg/kg 508 920 237 300
Br mg/kg 290 440 1,630 2,200
Ca mg/kg 177,000 230,000 280,571 410,000
Cd mg/kg 34 42 119 160
Co mg/kg 41 57 8 11
Cu mg/kg 437 660 361 680
Cr mg/kg 157 190 34 47
Fe mg/kg 26,455 35,000 4,643 6,100
K mg/kg 21,364 40,000 34,857 65,000
Mn mg/kg 1,254 1,600 223 330
Mo mg/kg 27 45 9 18
Ni mg/kg 158 280 27 40
Pb mg/kg 758 1,400 1,827 3,600
Sb mg/kg 435 790 340 460
Se mg/kg 7 10 8 10
Sn mg/kg 319 630 386 620
Tl mg/kg 6 6 6 6
V mg/kg 179 350 32 71
Zn mg/kg 7,100 11,000 7,143 12,000
Hg mg/kg 0.1 0.3 9.1 20.0
Fluoride mg/kg 37 71 31 50
Chloride mg/kg 24,769 46,000 150,571 260,000
Sulphate mg/kg 29,846 54,000 11,829 17,000
Sulphur mg/kg 16,000 16,000 13,000 13,000
TOC % % 0.7 1.3 1.6 2.8
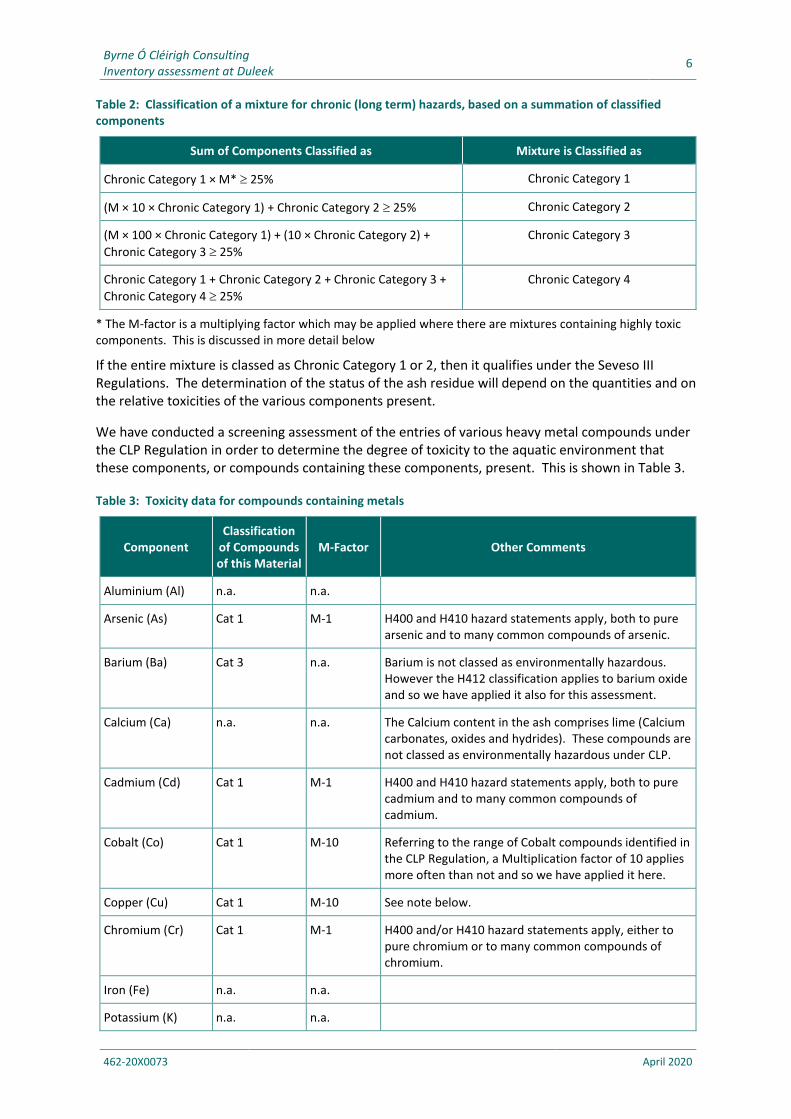
Byrne Ó Cléirigh Consulting 6
Inventory assessment at Duleek
462-20X0073 April 2020
Table 2: Classification of a mixture for chronic (long term) hazards, based on a summation of classified components
Sum of Components Classified as Mixture is Classified as
Chronic Category 1 × M* 25% Chronic Category 1
(M × 10 × Chronic Category 1) + Chronic Category 2 25% Chronic Category 2
(M × 100 × Chronic Category 1) + (10 × Chronic Category 2) +
Chronic Category 3 25%
Chronic Category 3
Chronic Category 1 + Chronic Category 2 + Chronic Category 3 +
Chronic Category 4 25%
Chronic Category 4
* The M-factor is a multiplying factor which may be applied where there are mixtures containing highly toxic components. This is discussed in more detail below
If the entire mixture is classed as Chronic Category 1 or 2, then it qualifies under the Seveso III Regulations. The determination of the status of the ash residue will depend on the quantities and on the relative toxicities of the various components present.
We have conducted a screening assessment of the entries of various heavy metal compounds under the CLP Regulation in order to determine the degree of toxicity to the aquatic environment that these components, or compounds containing these components, present. This is shown in Table 3.
Table 3: Toxicity data for compounds containing metals
Component Classification
of Compounds of this Material
M-Factor Other Comments
Aluminium (Al) n.a. n.a.
Arsenic (As) Cat 1 M-1 H400 and H410 hazard statements apply, both to pure arsenic and to many common compounds of arsenic.
Barium (Ba) Cat 3 n.a. Barium is not classed as environmentally hazardous. However the H412 classification applies to barium oxide and so we have applied it also for this assessment.
Calcium (Ca) n.a. n.a. The Calcium content in the ash comprises lime (Calcium carbonates, oxides and hydrides). These compounds are not classed as environmentally hazardous under CLP.
Cadmium (Cd) Cat 1 M-1 H400 and H410 hazard statements apply, both to pure cadmium and to many common compounds of cadmium.
Cobalt (Co) Cat 1 M-10 Referring to the range of Cobalt compounds identified in the CLP Regulation, a Multiplication factor of 10 applies more often than not and so we have applied it here.
Copper (Cu) Cat 1 M-10 See note below.
Chromium (Cr) Cat 1 M-1 H400 and/or H410 hazard statements apply, either to pure chromium or to many common compounds of chromium.
Iron (Fe) n.a. n.a.
Potassium (K) n.a. n.a.
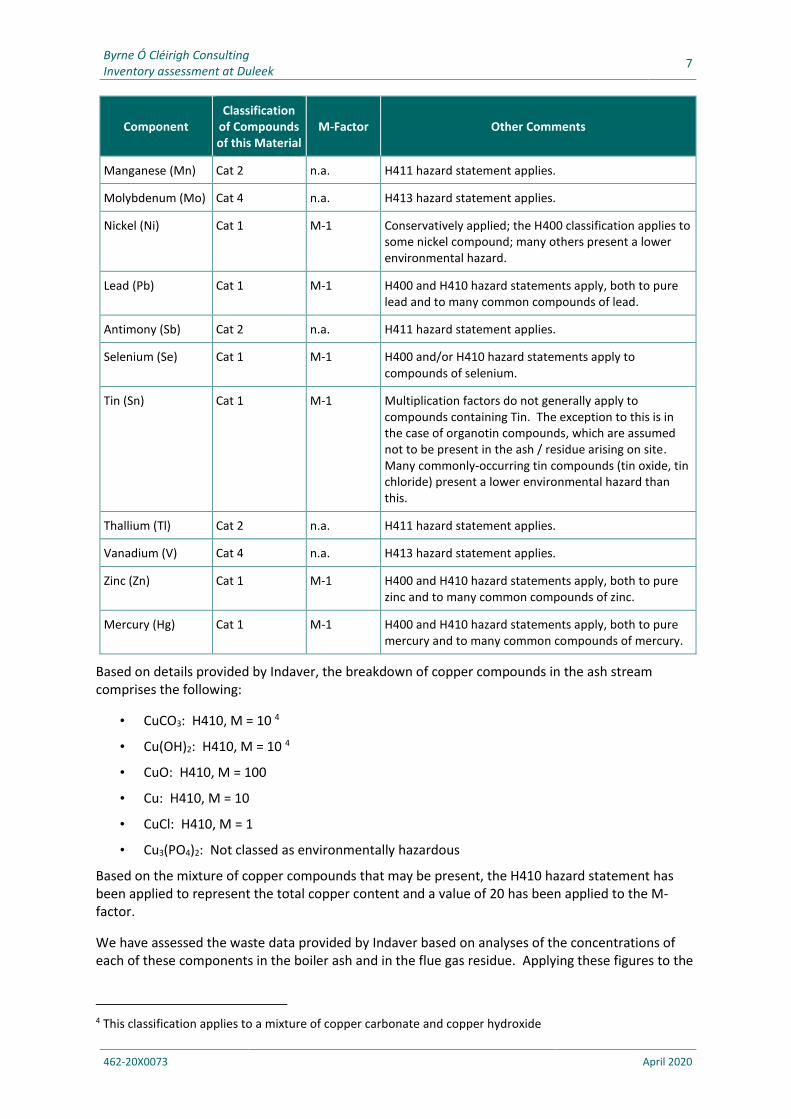
Byrne Ó Cléirigh Consulting 7
Inventory assessment at Duleek
462-20X0073 April 2020
Component Classification
of Compounds of this Material
M-Factor Other Comments
Manganese (Mn) Cat 2 n.a. H411 hazard statement applies.
Molybdenum (Mo) Cat 4 n.a. H413 hazard statement applies.
Nickel (Ni) Cat 1 M-1 Conservatively applied; the H400 classification applies to some nickel compound; many others present a lower environmental hazard.
Lead (Pb) Cat 1 M-1 H400 and H410 hazard statements apply, both to pure lead and to many common compounds of lead.
Antimony (Sb) Cat 2 n.a. H411 hazard statement applies.
Selenium (Se) Cat 1 M-1 H400 and/or H410 hazard statements apply to compounds of selenium.
Tin (Sn) Cat 1 M-1 Multiplication factors do not generally apply to compounds containing Tin. The exception to this is in the case of organotin compounds, which are assumed not to be present in the ash / residue arising on site. Many commonly-occurring tin compounds (tin oxide, tin chloride) present a lower environmental hazard than this.
Thallium (Tl) Cat 2 n.a. H411 hazard statement applies.
Vanadium (V) Cat 4 n.a. H413 hazard statement applies.
Zinc (Zn) Cat 1 M-1 H400 and H410 hazard statements apply, both to pure zinc and to many common compounds of zinc.
Mercury (Hg) Cat 1 M-1 H400 and H410 hazard statements apply, both to pure mercury and to many common compounds of mercury.
Based on details provided by Indaver, the breakdown of copper compounds in the ash stream comprises the following:
• CuCO3: H410, M = 10 4
• Cu(OH)2: H410, M = 10 4
• CuO: H410, M = 100
• Cu: H410, M = 10
• CuCl: H410, M = 1
• Cu3(PO4)2: Not classed as environmentally hazardous
Based on the mixture of copper compounds that may be present, the H410 hazard statement has been applied to represent the total copper content and a value of 20 has been applied to the M-factor.
We have assessed the waste data provided by Indaver based on analyses of the concentrations of each of these components in the boiler ash and in the flue gas residue. Applying these figures to the
4 This classification applies to a mixture of copper carbonate and copper hydroxide
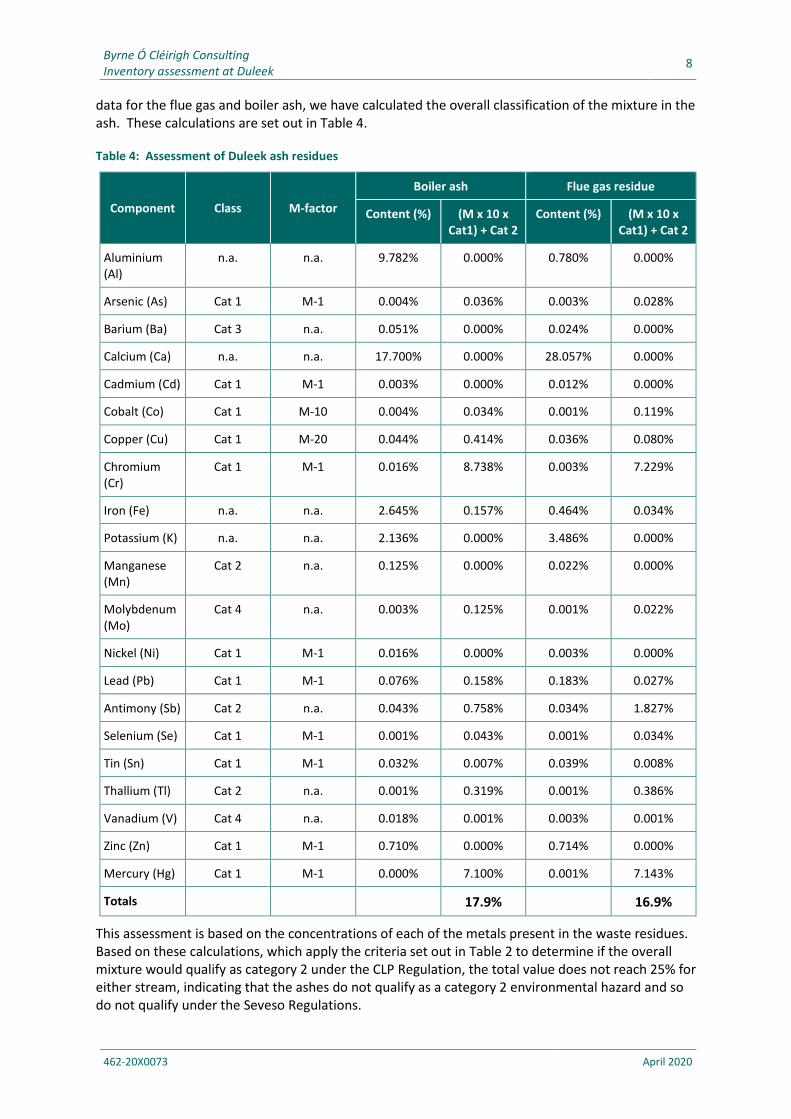
Byrne Ó Cléirigh Consulting 8
Inventory assessment at Duleek
462-20X0073 April 2020
data for the flue gas and boiler ash, we have calculated the overall classification of the mixture in the ash. These calculations are set out in Table 4.
Table 4: Assessment of Duleek ash residues
Component Class M-factor
Boiler ash Flue gas residue
Content (%) (M x 10 x Cat1) + Cat 2
Content (%) (M x 10 x Cat1) + Cat 2
Aluminium (Al)
n.a. n.a. 9.782% 0.000% 0.780% 0.000%
Arsenic (As) Cat 1 M-1 0.004% 0.036% 0.003% 0.028%
Barium (Ba) Cat 3 n.a. 0.051% 0.000% 0.024% 0.000%
Calcium (Ca) n.a. n.a. 17.700% 0.000% 28.057% 0.000%
Cadmium (Cd) Cat 1 M-1 0.003% 0.000% 0.012% 0.000%
Cobalt (Co) Cat 1 M-10 0.004% 0.034% 0.001% 0.119%
Copper (Cu) Cat 1 M-20 0.044% 0.414% 0.036% 0.080%
Chromium (Cr)
Cat 1 M-1 0.016% 8.738% 0.003% 7.229%
Iron (Fe) n.a. n.a. 2.645% 0.157% 0.464% 0.034%
Potassium (K) n.a. n.a. 2.136% 0.000% 3.486% 0.000%
Manganese (Mn)
Cat 2 n.a. 0.125% 0.000% 0.022% 0.000%
Molybdenum (Mo)
Cat 4 n.a. 0.003% 0.125% 0.001% 0.022%
Nickel (Ni) Cat 1 M-1 0.016% 0.000% 0.003% 0.000%
Lead (Pb) Cat 1 M-1 0.076% 0.158% 0.183% 0.027%
Antimony (Sb) Cat 2 n.a. 0.043% 0.758% 0.034% 1.827%
Selenium (Se) Cat 1 M-1 0.001% 0.043% 0.001% 0.034%
Tin (Sn) Cat 1 M-1 0.032% 0.007% 0.039% 0.008%
Thallium (Tl) Cat 2 n.a. 0.001% 0.319% 0.001% 0.386%
Vanadium (V) Cat 4 n.a. 0.018% 0.001% 0.003% 0.001%
Zinc (Zn) Cat 1 M-1 0.710% 0.000% 0.714% 0.000%
Mercury (Hg) Cat 1 M-1 0.000% 7.100% 0.001% 7.143%
Totals 17.9% 16.9%
This assessment is based on the concentrations of each of the metals present in the waste residues. Based on these calculations, which apply the criteria set out in Table 2 to determine if the overall mixture would qualify as category 2 under the CLP Regulation, the total value does not reach 25% for either stream, indicating that the ashes do not qualify as a category 2 environmental hazard and so do not qualify under the Seveso Regulations.
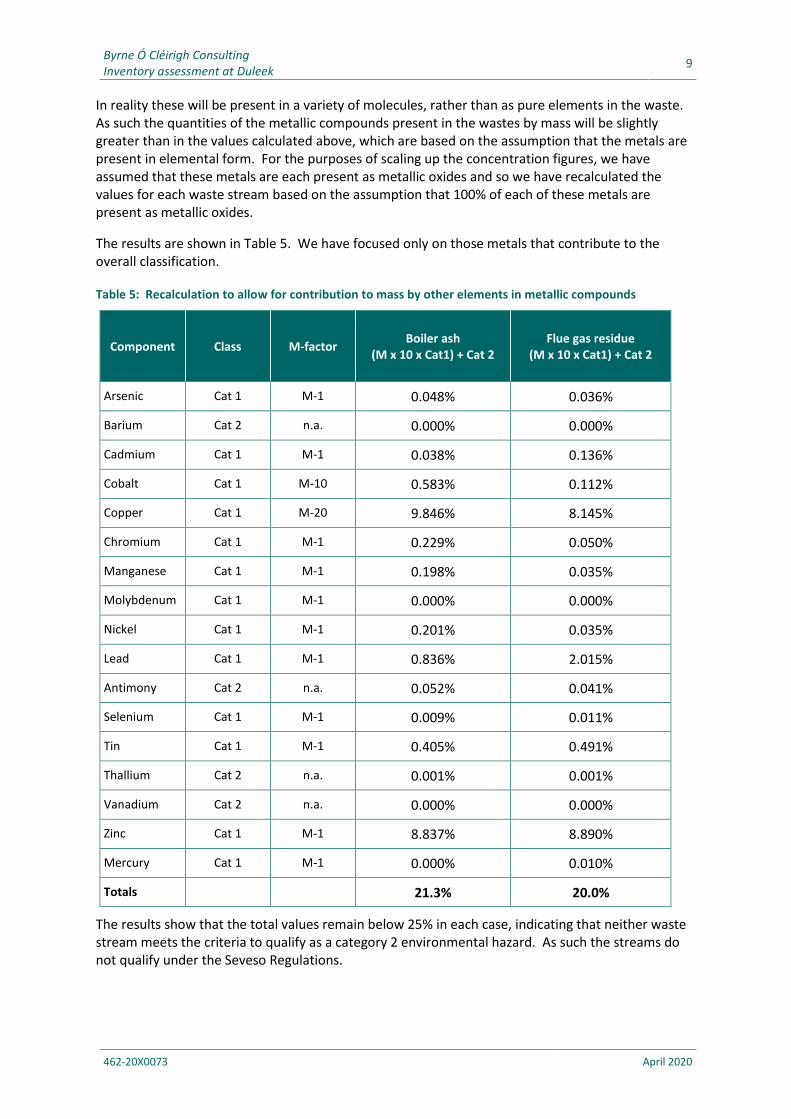
Byrne Ó Cléirigh Consulting 9
Inventory assessment at Duleek
462-20X0073 April 2020
In reality these will be present in a variety of molecules, rather than as pure elements in the waste. As such the quantities of the metallic compounds present in the wastes by mass will be slightly greater than in the values calculated above, which are based on the assumption that the metals are present in elemental form. For the purposes of scaling up the concentration figures, we have assumed that these metals are each present as metallic oxides and so we have recalculated the values for each waste stream based on the assumption that 100% of each of these metals are present as metallic oxides.
The results are shown in Table 5. We have focused only on those metals that contribute to the overall classification.
Table 5: Recalculation to allow for contribution to mass by other elements in metallic compounds
Component Class M-factor Boiler ash
(M x 10 x Cat1) + Cat 2 Flue gas residue
(M x 10 x Cat1) + Cat 2
Arsenic Cat 1 M-1 0.048% 0.036%
Barium Cat 2 n.a. 0.000% 0.000%
Cadmium Cat 1 M-1 0.038% 0.136%
Cobalt Cat 1 M-10 0.583% 0.112%
Copper Cat 1 M-20 9.846% 8.145%
Chromium Cat 1 M-1 0.229% 0.050%
Manganese Cat 1 M-1 0.198% 0.035%
Molybdenum Cat 1 M-1 0.000% 0.000%
Nickel Cat 1 M-1 0.201% 0.035%
Lead Cat 1 M-1 0.836% 2.015%
Antimony Cat 2 n.a. 0.052% 0.041%
Selenium Cat 1 M-1 0.009% 0.011%
Tin Cat 1 M-1 0.405% 0.491%
Thallium Cat 2 n.a. 0.001% 0.001%
Vanadium Cat 2 n.a. 0.000% 0.000%
Zinc Cat 1 M-1 8.837% 8.890%
Mercury Cat 1 M-1 0.000% 0.010%
Totals 21.3% 20.0%
The results show that the total values remain below 25% in each case, indicating that neither waste stream meets the criteria to qualify as a category 2 environmental hazard. As such the streams do not qualify under the Seveso Regulations.
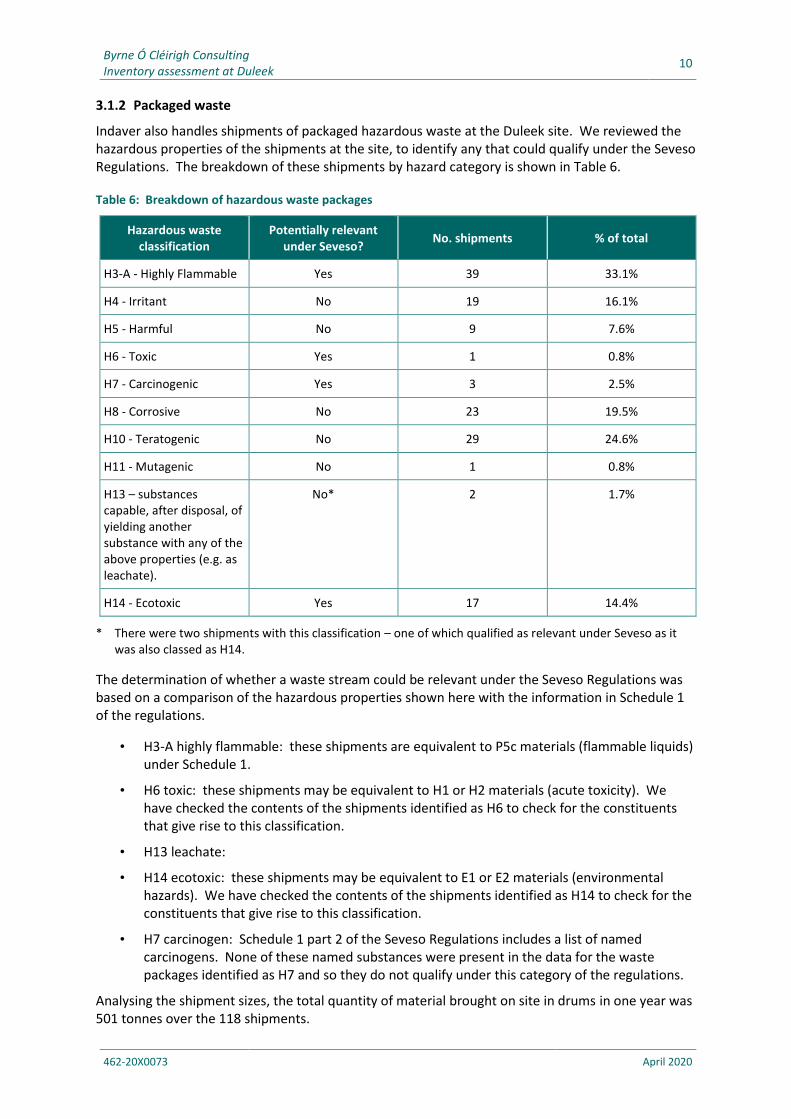
Byrne Ó Cléirigh Consulting 10
Inventory assessment at Duleek
462-20X0073 April 2020
3.1.2 Packaged waste
Indaver also handles shipments of packaged hazardous waste at the Duleek site. We reviewed the hazardous properties of the shipments at the site, to identify any that could qualify under the Seveso Regulations. The breakdown of these shipments by hazard category is shown in Table 6.
Table 6: Breakdown of hazardous waste packages
Hazardous waste classification
Potentially relevant under Seveso?
No. shipments % of total
H3-A - Highly Flammable Yes 39 33.1%
H4 - Irritant No 19 16.1%
H5 - Harmful No 9 7.6%
H6 - Toxic Yes 1 0.8%
H7 - Carcinogenic Yes 3 2.5%
H8 - Corrosive No 23 19.5%
H10 - Teratogenic No 29 24.6%
H11 - Mutagenic No 1 0.8%
H13 – substances capable, after disposal, of yielding another substance with any of the above properties (e.g. as leachate).
No* 2 1.7%
H14 - Ecotoxic Yes 17 14.4%
* There were two shipments with this classification – one of which qualified as relevant under Seveso as it was also classed as H14.
The determination of whether a waste stream could be relevant under the Seveso Regulations was based on a comparison of the hazardous properties shown here with the information in Schedule 1 of the regulations.
• H3-A highly flammable: these shipments are equivalent to P5c materials (flammable liquids) under Schedule 1.
• H6 toxic: these shipments may be equivalent to H1 or H2 materials (acute toxicity). We have checked the contents of the shipments identified as H6 to check for the constituents that give rise to this classification.
• H13 leachate:
• H14 ecotoxic: these shipments may be equivalent to E1 or E2 materials (environmental hazards). We have checked the contents of the shipments identified as H14 to check for the constituents that give rise to this classification.
• H7 carcinogen: Schedule 1 part 2 of the Seveso Regulations includes a list of named carcinogens. None of these named substances were present in the data for the waste packages identified as H7 and so they do not qualify under this category of the regulations.
Analysing the shipment sizes, the total quantity of material brought on site in drums in one year was 501 tonnes over the 118 shipments.
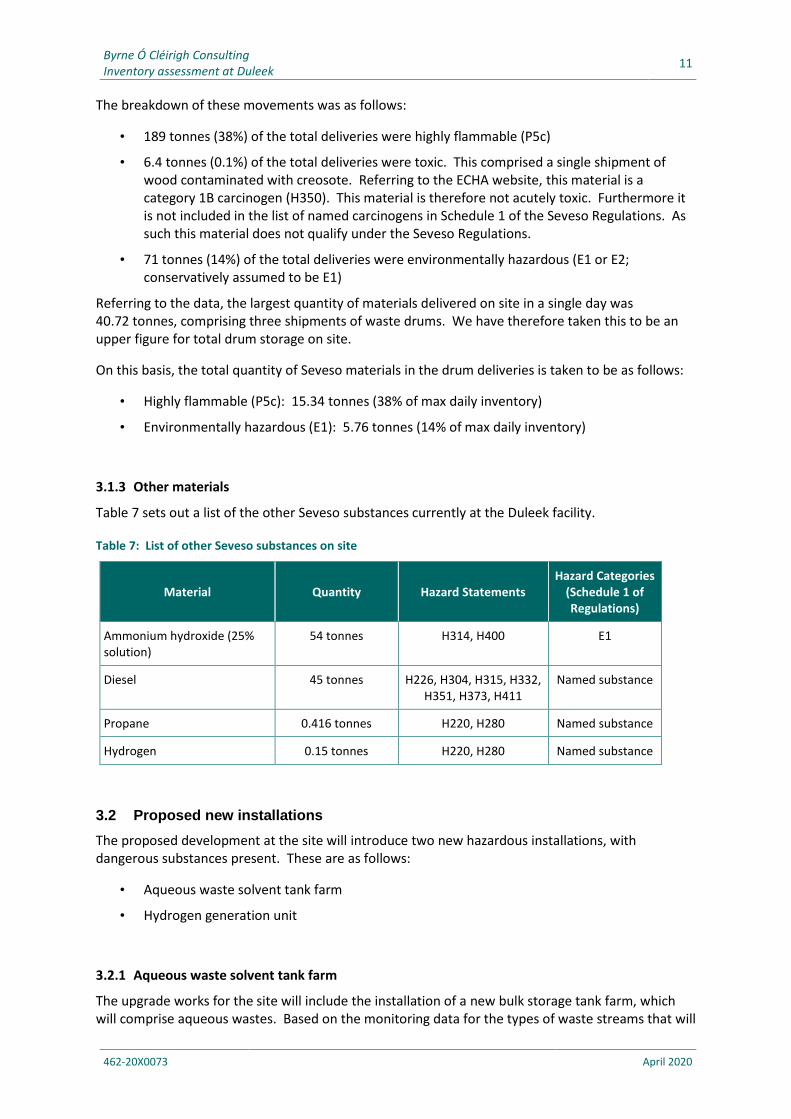
Byrne Ó Cléirigh Consulting 11
Inventory assessment at Duleek
462-20X0073 April 2020
The breakdown of these movements was as follows:
• 189 tonnes (38%) of the total deliveries were highly flammable (P5c)
• 6.4 tonnes (0.1%) of the total deliveries were toxic. This comprised a single shipment of wood contaminated with creosote. Referring to the ECHA website, this material is a category 1B carcinogen (H350). This material is therefore not acutely toxic. Furthermore it is not included in the list of named carcinogens in Schedule 1 of the Seveso Regulations. As such this material does not qualify under the Seveso Regulations.
• 71 tonnes (14%) of the total deliveries were environmentally hazardous (E1 or E2; conservatively assumed to be E1)
Referring to the data, the largest quantity of materials delivered on site in a single day was 40.72 tonnes, comprising three shipments of waste drums. We have therefore taken this to be an upper figure for total drum storage on site.
On this basis, the total quantity of Seveso materials in the drum deliveries is taken to be as follows:
• Highly flammable (P5c): 15.34 tonnes (38% of max daily inventory)
• Environmentally hazardous (E1): 5.76 tonnes (14% of max daily inventory)
3.1.3 Other materials
Table 7 sets out a list of the other Seveso substances currently at the Duleek facility.
Table 7: List of other Seveso substances on site
Material Quantity Hazard Statements Hazard Categories
(Schedule 1 of Regulations)
Ammonium hydroxide (25% solution)
54 tonnes H314, H400 E1
Diesel 45 tonnes H226, H304, H315, H332, H351, H373, H411
Named substance
Propane 0.416 tonnes H220, H280 Named substance
Hydrogen 0.15 tonnes H220, H280 Named substance
3.2 Proposed new installations
The proposed development at the site will introduce two new hazardous installations, with dangerous substances present. These are as follows:
• Aqueous waste solvent tank farm
• Hydrogen generation unit
3.2.1 Aqueous waste solvent tank farm
The upgrade works for the site will include the installation of a new bulk storage tank farm, which will comprise aqueous wastes. Based on the monitoring data for the types of waste streams that will
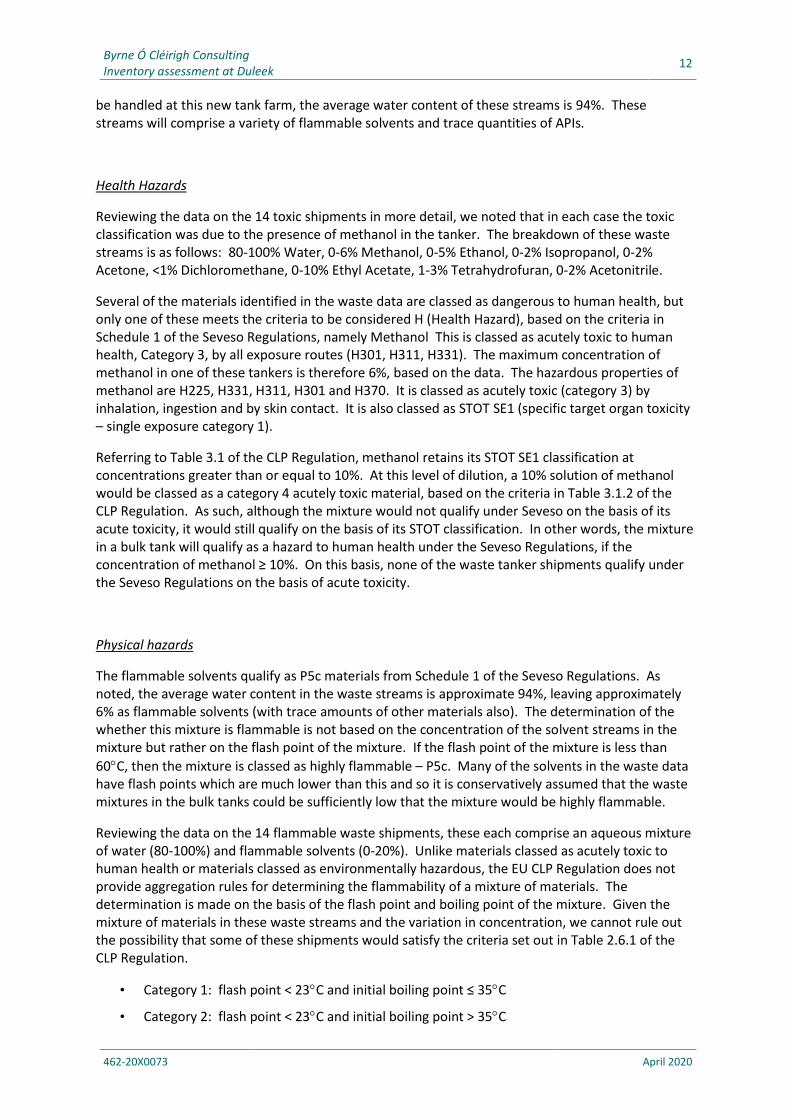
Byrne Ó Cléirigh Consulting 12
Inventory assessment at Duleek
462-20X0073 April 2020
be handled at this new tank farm, the average water content of these streams is 94%. These streams will comprise a variety of flammable solvents and trace quantities of APIs.
Health Hazards
Reviewing the data on the 14 toxic shipments in more detail, we noted that in each case the toxic classification was due to the presence of methanol in the tanker. The breakdown of these waste streams is as follows: 80-100% Water, 0-6% Methanol, 0-5% Ethanol, 0-2% Isopropanol, 0-2% Acetone, <1% Dichloromethane, 0-10% Ethyl Acetate, 1-3% Tetrahydrofuran, 0-2% Acetonitrile.
Several of the materials identified in the waste data are classed as dangerous to human health, but only one of these meets the criteria to be considered H (Health Hazard), based on the criteria in Schedule 1 of the Seveso Regulations, namely Methanol This is classed as acutely toxic to human health, Category 3, by all exposure routes (H301, H311, H331). The maximum concentration of methanol in one of these tankers is therefore 6%, based on the data. The hazardous properties of methanol are H225, H331, H311, H301 and H370. It is classed as acutely toxic (category 3) by inhalation, ingestion and by skin contact. It is also classed as STOT SE1 (specific target organ toxicity – single exposure category 1).
Referring to Table 3.1 of the CLP Regulation, methanol retains its STOT SE1 classification at concentrations greater than or equal to 10%. At this level of dilution, a 10% solution of methanol would be classed as a category 4 acutely toxic material, based on the criteria in Table 3.1.2 of the CLP Regulation. As such, although the mixture would not qualify under Seveso on the basis of its acute toxicity, it would still qualify on the basis of its STOT classification. In other words, the mixture in a bulk tank will qualify as a hazard to human health under the Seveso Regulations, if the concentration of methanol ≥ 10%. On this basis, none of the waste tanker shipments qualify under the Seveso Regulations on the basis of acute toxicity.
Physical hazards
The flammable solvents qualify as P5c materials from Schedule 1 of the Seveso Regulations. As noted, the average water content in the waste streams is approximate 94%, leaving approximately 6% as flammable solvents (with trace amounts of other materials also). The determination of the whether this mixture is flammable is not based on the concentration of the solvent streams in the mixture but rather on the flash point of the mixture. If the flash point of the mixture is less than
60C, then the mixture is classed as highly flammable – P5c. Many of the solvents in the waste data have flash points which are much lower than this and so it is conservatively assumed that the waste mixtures in the bulk tanks could be sufficiently low that the mixture would be highly flammable.
Reviewing the data on the 14 flammable waste shipments, these each comprise an aqueous mixture of water (80-100%) and flammable solvents (0-20%). Unlike materials classed as acutely toxic to human health or materials classed as environmentally hazardous, the EU CLP Regulation does not provide aggregation rules for determining the flammability of a mixture of materials. The determination is made on the basis of the flash point and boiling point of the mixture. Given the mixture of materials in these waste streams and the variation in concentration, we cannot rule out the possibility that some of these shipments would satisfy the criteria set out in Table 2.6.1 of the CLP Regulation.
• Category 1: flash point < 23C and initial boiling point ≤ 35C
• Category 2: flash point < 23C and initial boiling point > 35C
Byrne Ó Cléirigh Consulting 13
Inventory assessment at Duleek
462-20X0073 April 2020
• Category 3: flash point ≥ 23C and initial boiling point ≤ 60C
Based on the mix of solvents present in the aqueous streams, none of the bulk tanker deliveries will qualify as category 1 flammable liquids. For the purposes of this assessment, it is assumed that these shipments will fall into the category 2 or 3 classification. In either case, this corresponds to the P5c hazard category in Schedule 1 of the Seveso Regulations.
The aqueous waste tanks therefore contribute to the q/Q calculation for Physical Hazards at the site. Referring to Schedule 1, the Lower Tier threshold for P5c materials is 5,000 tonnes. The two new solvent tanks will comprise 300 m3 capacity each, giving 600 m3 in total. The q/Q value for these materials is therefore equal to 600/5,000 = 0.12.
In addition to the inventory in the tanks, there will be additional material on site in road tankers. These tankers will be used for interim storage but we have conservatively assumed there could be up to 14 tankers present on site at one time, all of which could be in flammable service.
Environmental Hazards
Very few of the materials in the waste data are classed as environmentally hazardous and only one meets the criteria to be classed as E (Environmental Hazard) under Schedule 1, namely API. Based on data provided by Indaver, the API materials qualify as H410. A shipment of API would therefore be classed as E1 Hazardous to the aquatic environment in category Chronic 1. However, when diluted in a mixture, the classification is reduced.
Referring to the CLP Regulation, the calculation of the chronic hazards presented by a mixture is determined using the following (this is a copy of Table 4.1.2 from the CLP Regulation).
This means that if the concentration of a Chronic 1 material is greater than or equal to 25%, the mixture is also Chronic 1. If it is greater than or equal to 2.5%, the mixture is Chronic 2. At lower concentrations, the mixture could also be Chronic 3 or Chronic 4, but these do not meet the criteria for inclusion in the Seveso inventory.
Byrne Ó Cléirigh Consulting 14
Inventory assessment at Duleek
462-20X0073 April 2020
Referring to the data from Indaver, in most cases where shipments contain API, these are in trace concentrations. They comprise wastes from aqueous washes carried out at a customer’s site, where very small quantities of API materials would be included in the wash. However, one of these waste streams is identified as containing 96% water, while the remainder comprises API and excipients. At a maximum concentration of 4%, the classification for a mixture with a Chronic 1 material included would be Chronic 2. As such, there is the potential that a single tanker on site would qualify as E – Environmental Hazard in accordance with the Seveso Regulations.
When diluted further in a 300 m3 storage tank, the concentration of API in the tank would be reduced to c.0.4%. As such, the mixture in the tank would be Chronic 3 once this mixture had been added to it. The tanks would therefore not qualify as environmentally hazardous under the Seveso Regulations.
The q/Q value for a single tanker with a mixture that is classed as E2 Hazardous to the aquatic environment in Category Chronic 2, is therefore equal to 27/200 = 0.135. Based on the data provided, there will be the occasional tanker on site to which this classification applies. To ensure that a conservative approach is adopted for the assessment, we have assumed that there could be two such tankers present at once.
3.2.2 Hydrogen Generation Unit
Indaver will also construct a hydrogen generation unit at the Duleek site. This will use water as a raw material to generate hydrogen by electrolysis. The plant will be capable of generating gas for injection into the natural gas network and for refuelling vehicles. The inventory of hydrogen will be up to 2 tonnes, based on a 100m3 tank operating at 350 bar.
Hydrogen is classed as H220 (extremely flammable gas) under the CLP Regulation. This means that it qualifies as P2 Flammable Gas under Schedule 1 of the Seveso Regulations. Hydrogen is also included in the list of Named Substances in Schedule 1 of these Regulations, with a lower tier threshold of 5 tonnes.
This means that the presence of the hydrogen generation unit on site will have a q/Q value of 2/5 = 0.4. This will contribute to the Physical Hazards at the site.
3.3 Seveso Status of Site
Based on the findings of this assessment, we calculated the overall inventory at the Duleek site, to determine if the site would qualify as an establishment under the Seveso Regulations. The breakdown of the maximum inventory of materials at the site at one time is as shown in Table 11.
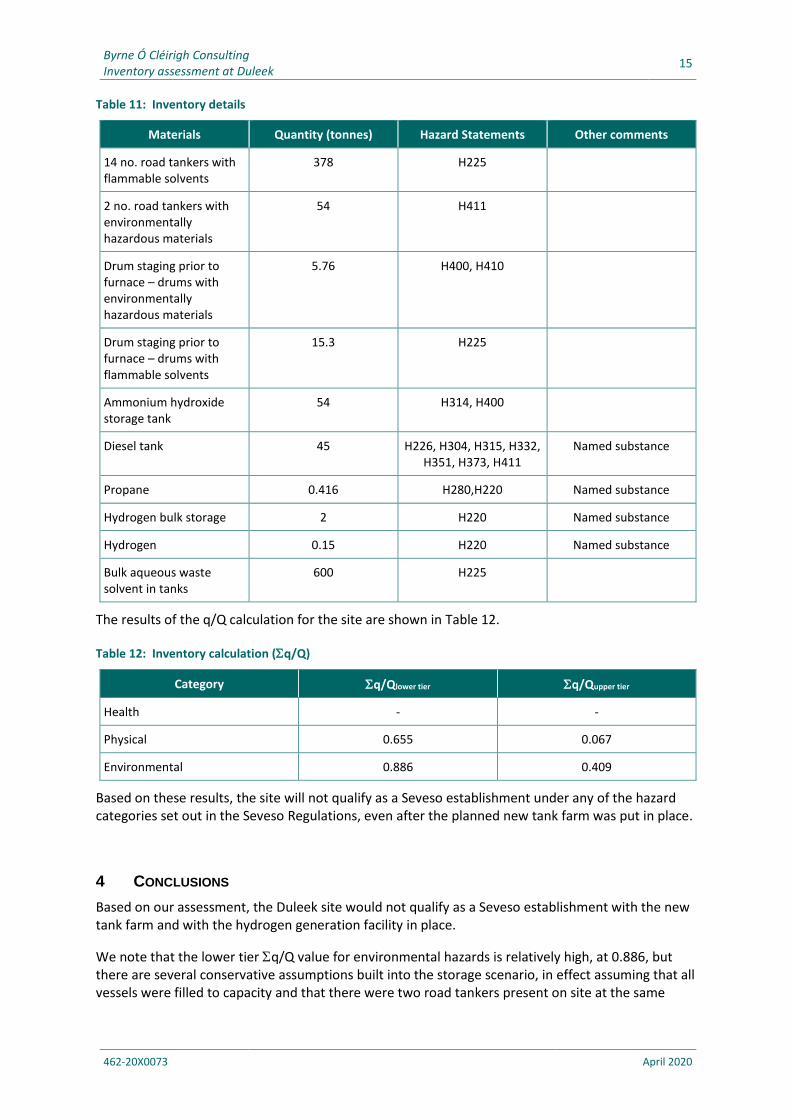
Byrne Ó Cléirigh Consulting 15
Inventory assessment at Duleek
462-20X0073 April 2020
Table 11: Inventory details
Materials Quantity (tonnes) Hazard Statements Other comments
14 no. road tankers with flammable solvents
378 H225
2 no. road tankers with environmentally hazardous materials
54 H411
Drum staging prior to furnace – drums with environmentally hazardous materials
5.76 H400, H410
Drum staging prior to furnace – drums with flammable solvents
15.3 H225
Ammonium hydroxide storage tank
54 H314, H400
Diesel tank 45 H226, H304, H315, H332, H351, H373, H411
Named substance
Propane 0.416 H280,H220 Named substance
Hydrogen bulk storage 2 H220 Named substance
Hydrogen 0.15 H220 Named substance
Bulk aqueous waste solvent in tanks
600 H225
The results of the q/Q calculation for the site are shown in Table 12.
Table 12: Inventory calculation (q/Q)
Category q/Qlower tier q/Qupper tier
Health - -
Physical 0.655 0.067
Environmental 0.886 0.409
Based on these results, the site will not qualify as a Seveso establishment under any of the hazard categories set out in the Seveso Regulations, even after the planned new tank farm was put in place.
4 CONCLUSIONS
Based on our assessment, the Duleek site would not qualify as a Seveso establishment with the new tank farm and with the hydrogen generation facility in place.
We note that the lower tier q/Q value for environmental hazards is relatively high, at 0.886, but there are several conservative assumptions built into the storage scenario, in effect assuming that all vessels were filled to capacity and that there were two road tankers present on site at the same

Byrne Ó Cléirigh Consulting 16
Inventory assessment at Duleek
462-20X0073 April 2020
time, where both tankers contained heptane at a concentration of 2.5% or greater. In practice, the site inventory will be lower than this.
The assessment of the ash residues has found that they do not meet the criteria to qualify as Seveso substances. The results of the calculations in this report show that the concentrations of metals in the ash / residue is too low for them to be classed as category 2 environmental hazards, which means that the ash residues do not meet the criteria in Schedule 1 of the Seveso Regulations and so the ash / residue streams do not qualify as Seveso substances.
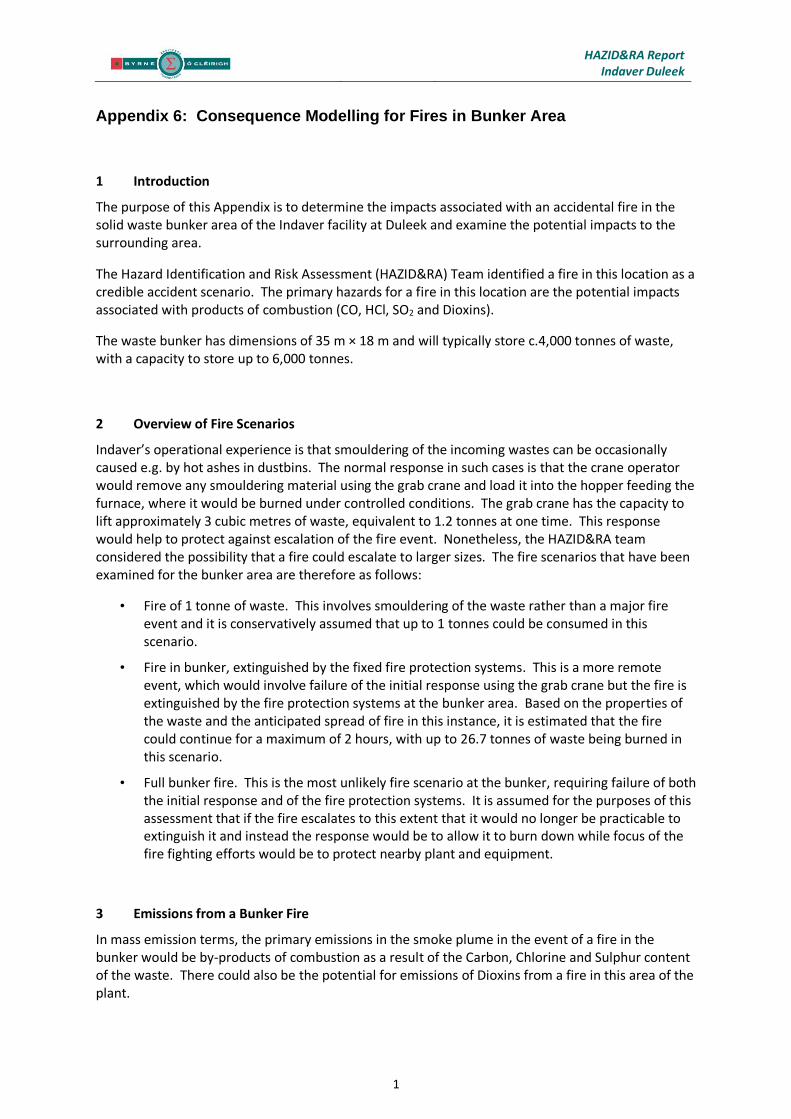
HAZID&RA Report Indaver Duleek
1
Appendix 6: Consequence Modelling for Fires in Bunker Area
1 Introduction
The purpose of this Appendix is to determine the impacts associated with an accidental fire in the solid waste bunker area of the Indaver facility at Duleek and examine the potential impacts to the surrounding area.
The Hazard Identification and Risk Assessment (HAZID&RA) Team identified a fire in this location as a credible accident scenario. The primary hazards for a fire in this location are the potential impacts associated with products of combustion (CO, HCl, SO2 and Dioxins).
The waste bunker has dimensions of 35 m × 18 m and will typically store c.4,000 tonnes of waste, with a capacity to store up to 6,000 tonnes.
2 Overview of Fire Scenarios
Indaver’s operational experience is that smouldering of the incoming wastes can be occasionally caused e.g. by hot ashes in dustbins. The normal response in such cases is that the crane operator would remove any smouldering material using the grab crane and load it into the hopper feeding the furnace, where it would be burned under controlled conditions. The grab crane has the capacity to lift approximately 3 cubic metres of waste, equivalent to 1.2 tonnes at one time. This response would help to protect against escalation of the fire event. Nonetheless, the HAZID&RA team considered the possibility that a fire could escalate to larger sizes. The fire scenarios that have been examined for the bunker area are therefore as follows:
• Fire of 1 tonne of waste. This involves smouldering of the waste rather than a major fire event and it is conservatively assumed that up to 1 tonnes could be consumed in this scenario.
• Fire in bunker, extinguished by the fixed fire protection systems. This is a more remote event, which would involve failure of the initial response using the grab crane but the fire is extinguished by the fire protection systems at the bunker area. Based on the properties of the waste and the anticipated spread of fire in this instance, it is estimated that the fire could continue for a maximum of 2 hours, with up to 26.7 tonnes of waste being burned in this scenario.
• Full bunker fire. This is the most unlikely fire scenario at the bunker, requiring failure of both the initial response and of the fire protection systems. It is assumed for the purposes of this assessment that if the fire escalates to this extent that it would no longer be practicable to extinguish it and instead the response would be to allow it to burn down while focus of the fire fighting efforts would be to protect nearby plant and equipment.
3 Emissions from a Bunker Fire
In mass emission terms, the primary emissions in the smoke plume in the event of a fire in the bunker would be by-products of combustion as a result of the Carbon, Chlorine and Sulphur content of the waste. There could also be the potential for emissions of Dioxins from a fire in this area of the plant.
2
The waste in the bunker will comprise 30-35% water and 65-70% solids. Of this solids content, it will comprise c.80% Carbon, 0.4% Chlorine and 0.1% Sulphur.
3.1 Rate of Burning
As mentioned above, the waste in the bunker will comprise 30-35% water and 65-70% solids. Based on Indaver’s operational experience at other facilities involved in the storage and handling of similar waste streams, the average calorific value of this waste is expected to be 9.6 MJ/kg.
In the initial stages of a fire in the bunker, this would involve a slow smouldering burn within the waste stream. A representative burning rate of 1 tonne of waste being consumed within 30 minutes was used. This slow burn would result in a correspondingly low emission rate to atmosphere. However, it is also expected that the resulting smoke plume would have lower buoyancy and there would be less plume rise than for a fully developed fire.
In the event that the scenario escalates into a fully developed fire, the rate of burning will be determined by the properties of the waste and (in the worst case scenario) by the dimensions of the bunker.
The Yellow Book1 provides data on typical burning rates for a variety of materials. We have extracted the data for a selection of these materials in Table 1. We have also included details of the energy content of these materials, for reference.
1 “Methods for the calculation of physical effects due to releases of hazardous materials (liquids and gases)”
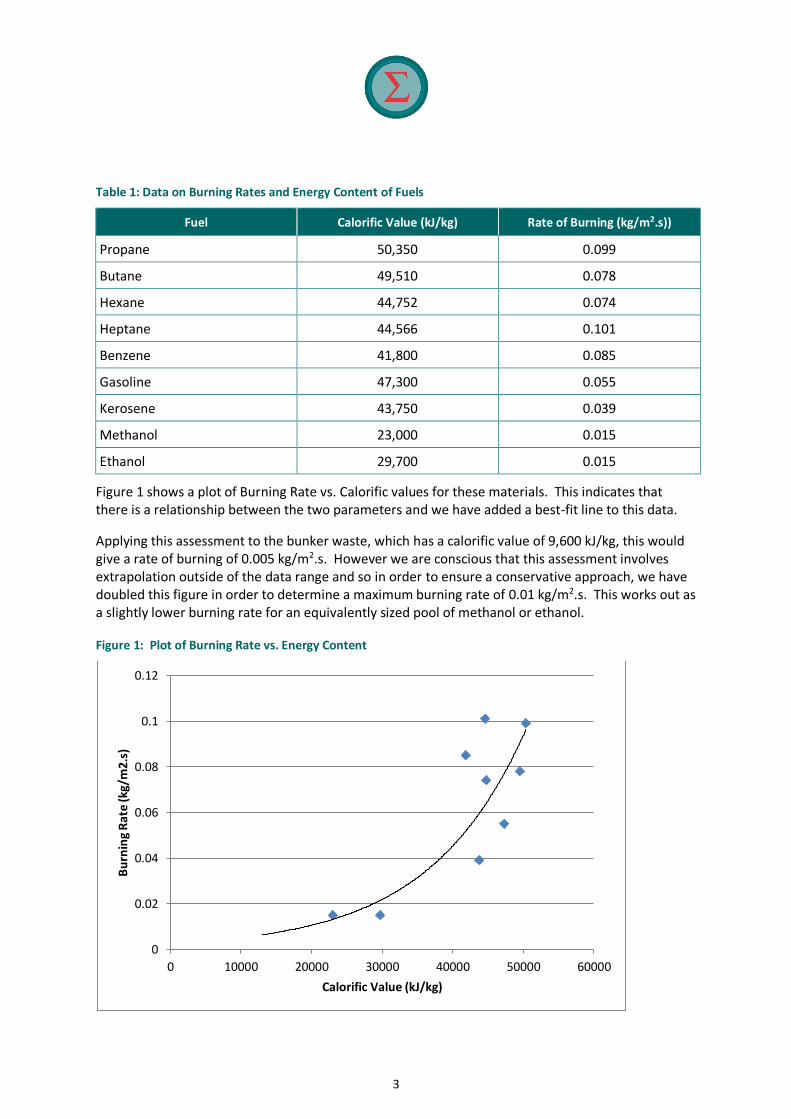
3
Table 1: Data on Burning Rates and Energy Content of Fuels
Fuel Calorific Value (kJ/kg) Rate of Burning (kg/m2.s))
Propane 50,350 0.099
Butane 49,510 0.078
Hexane 44,752 0.074
Heptane 44,566 0.101
Benzene 41,800 0.085
Gasoline 47,300 0.055
Kerosene 43,750 0.039
Methanol 23,000 0.015
Ethanol 29,700 0.015
Figure 1 shows a plot of Burning Rate vs. Calorific values for these materials. This indicates that there is a relationship between the two parameters and we have added a best-fit line to this data.
Applying this assessment to the bunker waste, which has a calorific value of 9,600 kJ/kg, this would give a rate of burning of 0.005 kg/m2.s. However we are conscious that this assessment involves extrapolation outside of the data range and so in order to ensure a conservative approach, we have doubled this figure in order to determine a maximum burning rate of 0.01 kg/m2.s. This works out as a slightly lower burning rate for an equivalently sized pool of methanol or ethanol.
Figure 1: Plot of Burning Rate vs. Energy Content
0
0.02
0.04
0.06
0.08
0.1
0.12
0 10000 20000 30000 40000 50000 60000
Bu
rnin
g R
ate
(kg/
m2.
s)
Calorific Value (kJ/kg)
4
The surface area of the bunker is 35 m × 18 m = 630 m2. Based on the calculations shown above, this means that the maximum burning rate in the bunker would be of the order of 0.385 tonnes per minute, or 23.1 tonnes per hour. This rate of burning would only arise where the fire is fully developed and covers the full areas of the bunker. For a typical inventory of 4,000 tonnes these results indicate that a fully developed bunker fire could continue for approximately one week.
For the intermediate fire scenario, i.e. where the fire escalates beyond the initial smouldering phase but has not spread to the full extent of the bunker area, we have applied a burning rate of 50% of the calculated maximum value.
The details of the three fire scenarios are summarised in Table 2.
Table 2: Burning Rates for different Fire Scenarios at the Bunker
Parameter Minor Fire, Smouldering
Waste in Bunker
Intermediate Fire, extinguished by
Emergency Response
Fully Developed Bunker Fire
Total quantity of waste burned (tonnes)
1 23.1 4,000
Rate of burning (t/hr) 2 11.55 23.1
Based on data provided by Indaver, the rate of evolution of flue gas to atmosphere arising from a fire in the bunker area would be c.6000 Nm3 per tonne of waste consumed.
For the purposes of this assessment we have also made the following assumptions about the smoke plume. For a scenario involving a smouldering 1 tonne fire, the resulting smoke plume would exhibit low thermal buoyancy as the fire would be in the early stages of development. A temperature of 50°C was used for modelling the impacts of this scenario. For the more developed bunker fire scenarios, the temperature of the gases would be much higher. A figure of 300°C has been used for the smoke plume from the intermediate fire and 500°C for the fully developed fire.
3.2 By Products of Combustion of Carbon, Chlorine and Sulphur
Based on data provided by Indaver, the bunker waste will comprise up to 65% solid matter. This solid fraction will typically comprise c.80% Carbon, 0.4% Chlorine and 0.1% Sulphur, by weight. In other words, for every tonne of waste burned, there would be 0.52 tonne Carbon, 0.0026 tonne Chlorine and 0.0007 tonne Sulphur consumed.
Referring to the HSA’s guidance document for Land Use Planning (LUP) provides conversion factors for the purposes of calculating combustion products from a fire. The relevant details are summarised below:
• Carbon Monoxide (CO): 9.7% C to CO
• Hydrogen Chloride (HCl): 100% Cl to HCl
• Sulphur Dioxide (SO2): 100% S to SO2
There would also be Carbon Dioxide formed in the fire, but the toxic impacts of this component of the smoke plume would be negligible when compared with the Carbon Monoxide emission.
5
On this basis, we have calculated the emission rates to atmosphere for these products of combustion for the three fire scenarios identified for the bunker. These are set out in Table 3.
Table 3: Emission Rates of Products of Combustion for Bunker Fire Scenarios
Parameter Minor Fire, Smouldering
Waste in Bunker
Intermediate Fire, extinguished by
Emergency Response
Fully Developed Bunker Fire
Rate of burning (t/hr) 2 13.4 26.7
Emission rates
Carbon Monoxide 0.103 kg/s 0.594 kg/s 1.187 kg/s
Hydrogen Chloride 0.0015 kg/s 0.0086 kg/s 0.0172 kg/s
Sulphur Dioxide 0.0007 kg/s 0.0042 kg/s 0.0083 kg/s
To assess the impacts of these emissions on the surrounding area, we have used the Probit function which is used to determine the relationship between dose exposure and potential lethal effects (see main report for more details on this function). The scenarios have been modelled to determine the maximum hazard distances to the AEGL-2 endpoint2 and to a 1% lethality dosage level.
These model runs were conducted using AERSCREEN, a software package developed by the USEPA. This software is used to model the impacts of the release in order to calculate the worst case impacts at distance, based on worst case weather conditions.
It should be noted that it is possible that there would be no emissions to atmosphere for the smaller fire scenarios as the Reception Hall is kept under negative pressure. Combustion air for the incinerators is drawn into the process via the reception hall in order to suppress odours. As such it is possible that the smoke plume arising from the fire would be drawn into the incinerator and treated in the abatement system, which includes filters. As such this assessment has been conducted on a conservative basis.
3.2.1 Carbon Monoxide
The model results for the Carbon Monoxide emissions are shown in Figure 2. This plot shows how the concentration profile varies with distance for each of the fire scenarios. Comparing the results, the impacts to the surrounding area are broadly comparable in the case of the minor fire and the intermediate fire. The impacts are less significant in the case of the fully developed fire due to the high plume buoyancy that arises in this scenario.
The maximum concentrations in the immediate vicinity of the fire tend to arise in conditions of high wind speed, as this can give rise to grounding of potentially buoyant plumes. However at longer
2 Acute Exposure Guideline Level 2 – this is defined by the US EPA as the airborne concentration (expressed as ppm or mg/m3) of a substance above which it is predicted that the general population, including susceptible individuals, could experience irreversible or other serious, long-lasting adverse health effects or an impaired ability to escape.
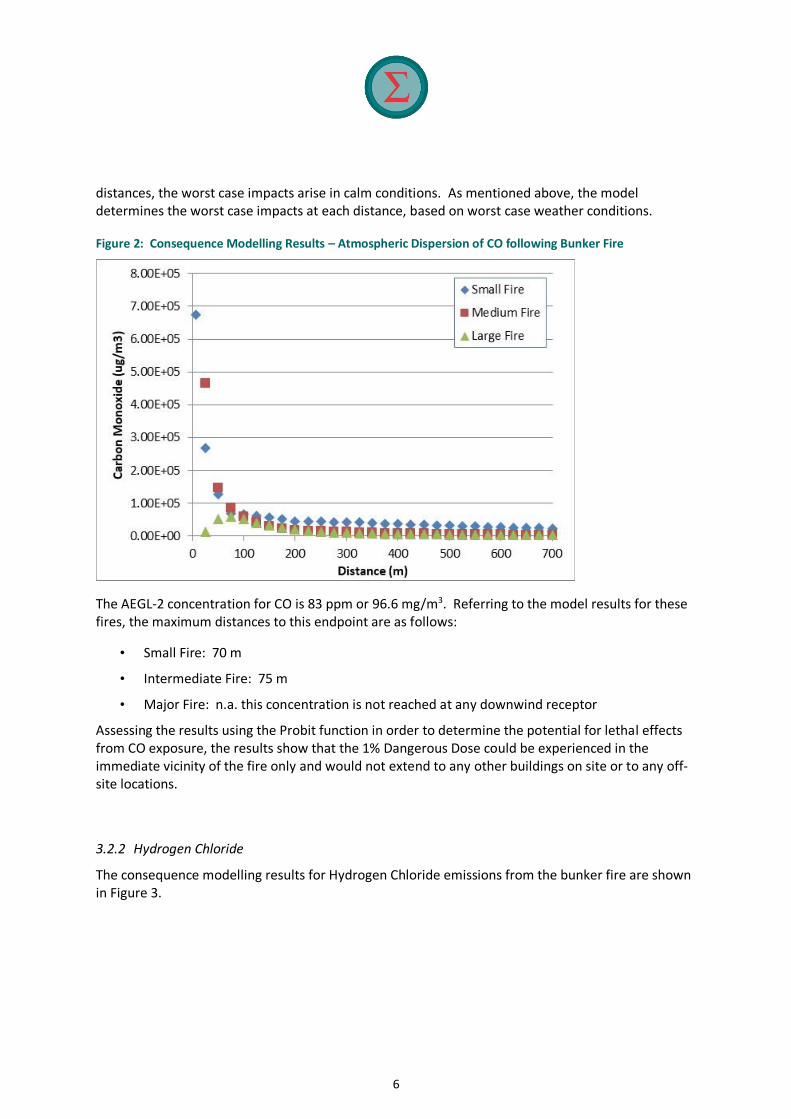
6
distances, the worst case impacts arise in calm conditions. As mentioned above, the model determines the worst case impacts at each distance, based on worst case weather conditions.
Figure 2: Consequence Modelling Results – Atmospheric Dispersion of CO following Bunker Fire
The AEGL-2 concentration for CO is 83 ppm or 96.6 mg/m3. Referring to the model results for these fires, the maximum distances to this endpoint are as follows:
• Small Fire: 70 m
• Intermediate Fire: 75 m
• Major Fire: n.a. this concentration is not reached at any downwind receptor
Assessing the results using the Probit function in order to determine the potential for lethal effects from CO exposure, the results show that the 1% Dangerous Dose could be experienced in the immediate vicinity of the fire only and would not extend to any other buildings on site or to any off-site locations.
3.2.2 Hydrogen Chloride
The consequence modelling results for Hydrogen Chloride emissions from the bunker fire are shown in Figure 3.
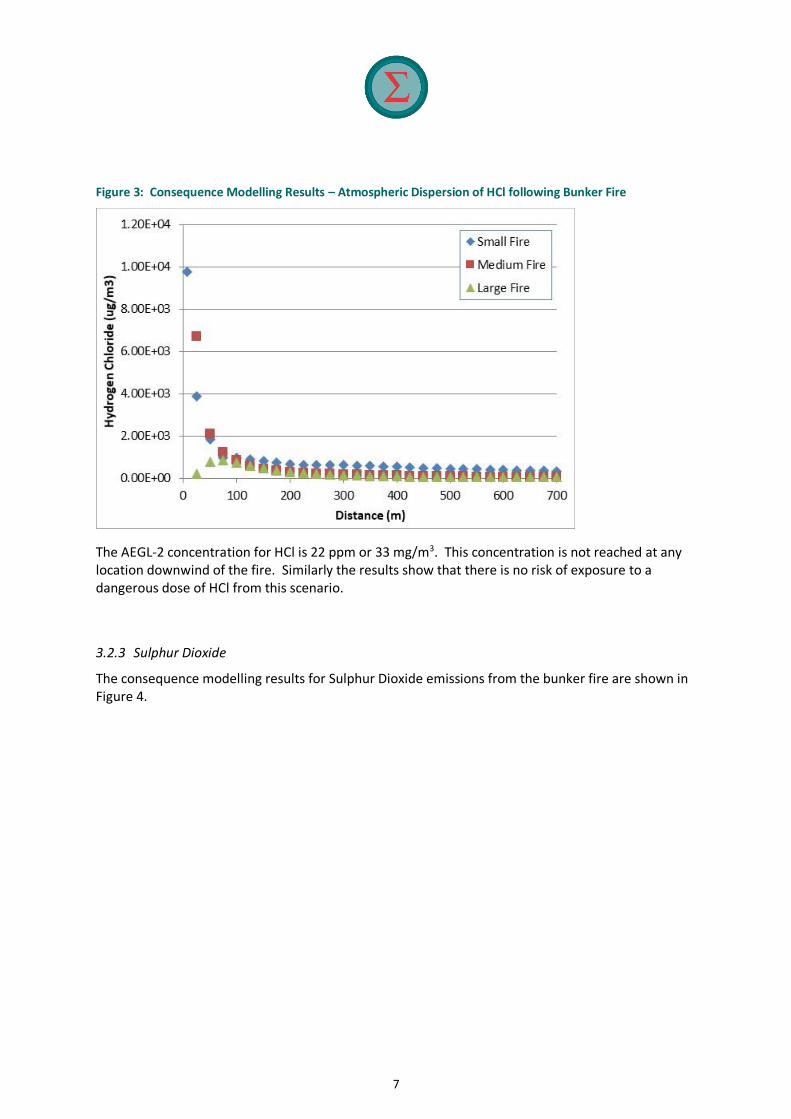
7
Figure 3: Consequence Modelling Results – Atmospheric Dispersion of HCl following Bunker Fire
The AEGL-2 concentration for HCl is 22 ppm or 33 mg/m3. This concentration is not reached at any location downwind of the fire. Similarly the results show that there is no risk of exposure to a dangerous dose of HCl from this scenario.
3.2.3 Sulphur Dioxide
The consequence modelling results for Sulphur Dioxide emissions from the bunker fire are shown in Figure 4.
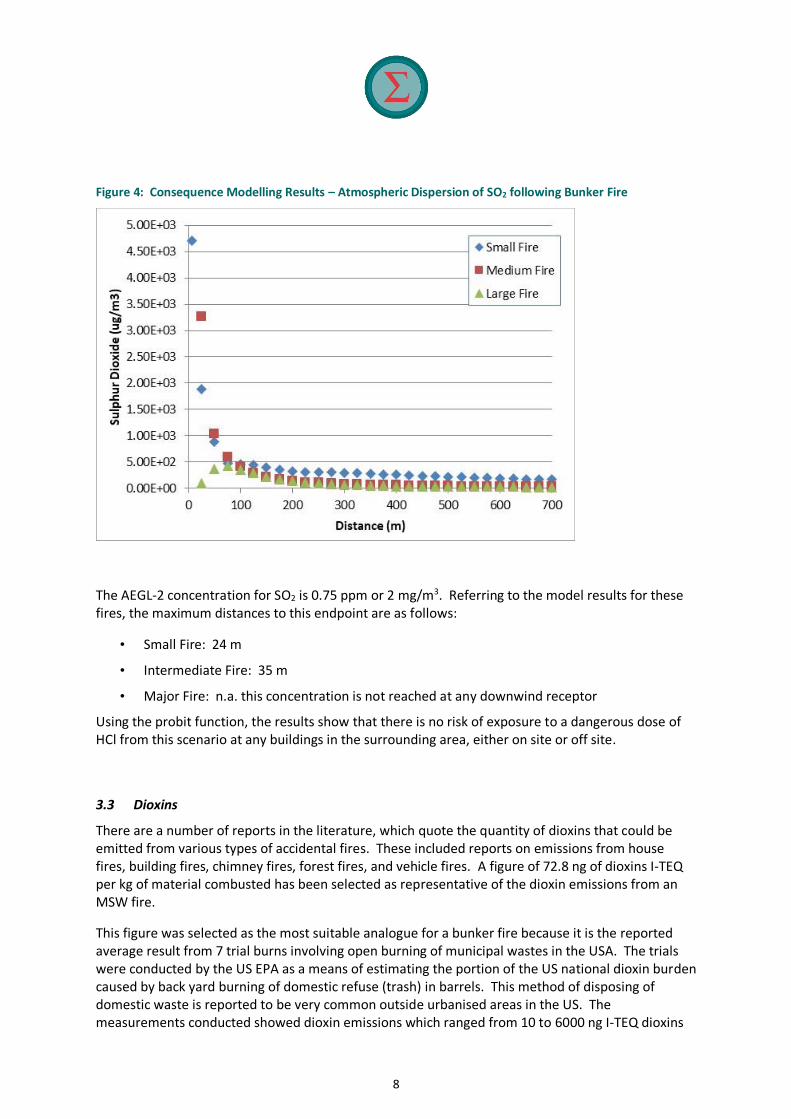
8
Figure 4: Consequence Modelling Results – Atmospheric Dispersion of SO2 following Bunker Fire
The AEGL-2 concentration for SO2 is 0.75 ppm or 2 mg/m3. Referring to the model results for these fires, the maximum distances to this endpoint are as follows:
• Small Fire: 24 m
• Intermediate Fire: 35 m
• Major Fire: n.a. this concentration is not reached at any downwind receptor
Using the probit function, the results show that there is no risk of exposure to a dangerous dose of HCl from this scenario at any buildings in the surrounding area, either on site or off site.
3.3 Dioxins
There are a number of reports in the literature, which quote the quantity of dioxins that could be emitted from various types of accidental fires. These included reports on emissions from house fires, building fires, chimney fires, forest fires, and vehicle fires. A figure of 72.8 ng of dioxins I-TEQ per kg of material combusted has been selected as representative of the dioxin emissions from an MSW fire.
This figure was selected as the most suitable analogue for a bunker fire because it is the reported average result from 7 trial burns involving open burning of municipal wastes in the USA. The trials were conducted by the US EPA as a means of estimating the portion of the US national dioxin burden caused by back yard burning of domestic refuse (trash) in barrels. This method of disposing of domestic waste is reported to be very common outside urbanised areas in the US. The measurements conducted showed dioxin emissions which ranged from 10 to 6000 ng I-TEQ dioxins
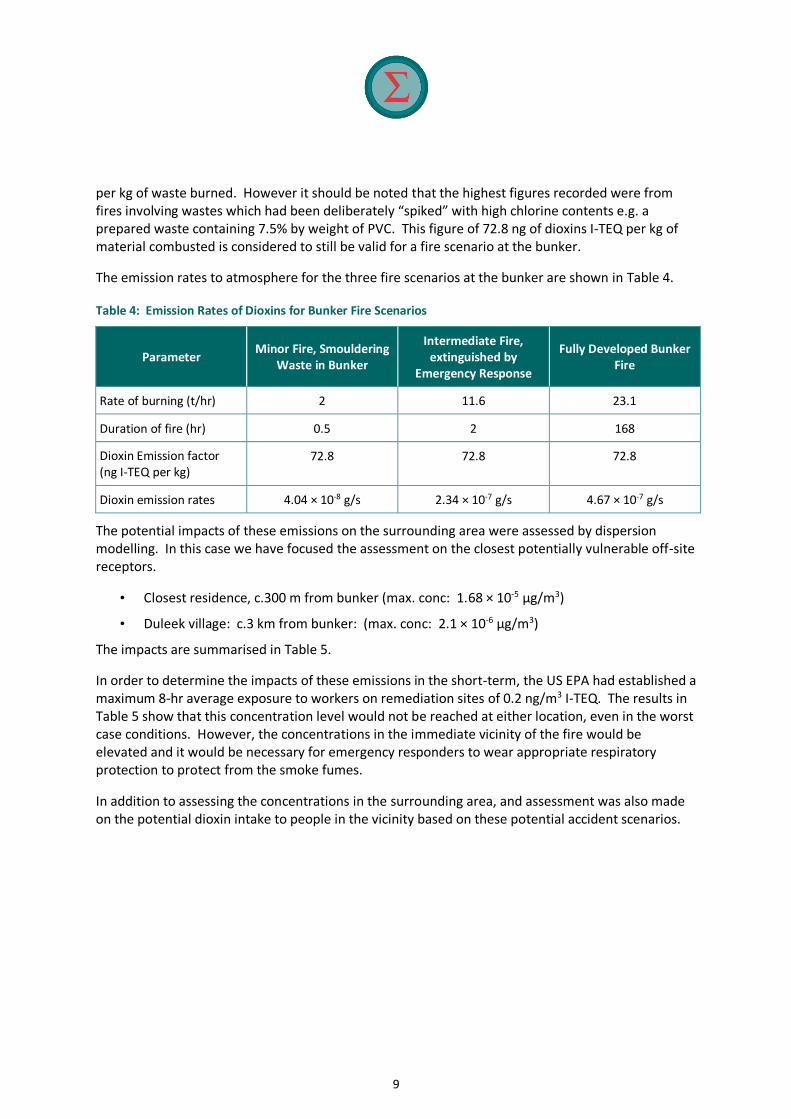
9
per kg of waste burned. However it should be noted that the highest figures recorded were from fires involving wastes which had been deliberately “spiked” with high chlorine contents e.g. a prepared waste containing 7.5% by weight of PVC. This figure of 72.8 ng of dioxins I-TEQ per kg of material combusted is considered to still be valid for a fire scenario at the bunker.
The emission rates to atmosphere for the three fire scenarios at the bunker are shown in Table 4.
Table 4: Emission Rates of Dioxins for Bunker Fire Scenarios
Parameter Minor Fire, Smouldering
Waste in Bunker
Intermediate Fire, extinguished by
Emergency Response
Fully Developed Bunker Fire
Rate of burning (t/hr) 2 11.6 23.1
Duration of fire (hr) 0.5 2 168
Dioxin Emission factor (ng I-TEQ per kg)
72.8 72.8 72.8
Dioxin emission rates 4.04 × 10⁻⁸ g/s 2.34 × 10⁻⁷ g/s 4.67 × 10⁻⁷ g/s
The potential impacts of these emissions on the surrounding area were assessed by dispersion modelling. In this case we have focused the assessment on the closest potentially vulnerable off-site receptors.
• Closest residence, c.300 m from bunker (max. conc: 1.68 × 10⁻⁵ µg/m3)
• Duleek village: c.3 km from bunker: (max. conc: 2.1 × 10⁻⁶ µg/m3)
The impacts are summarised in Table 5.
In order to determine the impacts of these emissions in the short-term, the US EPA had established a maximum 8-hr average exposure to workers on remediation sites of 0.2 ng/m3 I-TEQ. The results in Table 5 show that this concentration level would not be reached at either location, even in the worst case conditions. However, the concentrations in the immediate vicinity of the fire would be elevated and it would be necessary for emergency responders to wear appropriate respiratory protection to protect from the smoke fumes.
In addition to assessing the concentrations in the surrounding area, and assessment was also made on the potential dioxin intake to people in the vicinity based on these potential accident scenarios.
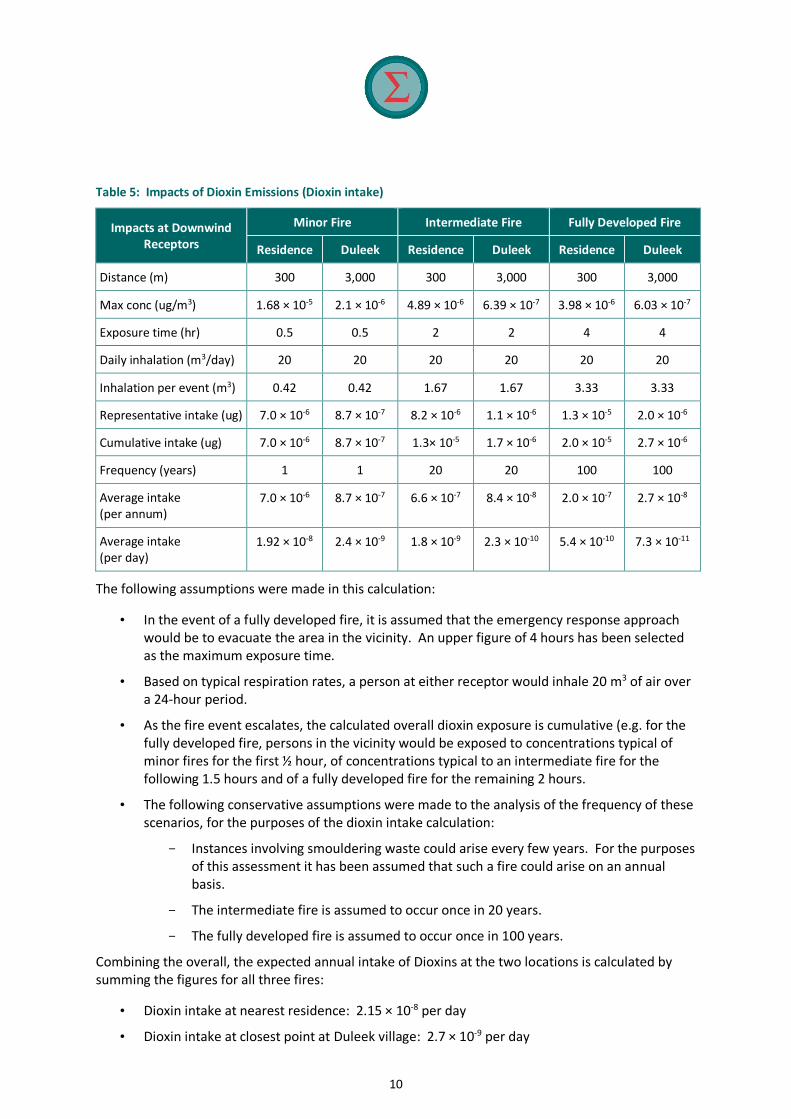
10
Table 5: Impacts of Dioxin Emissions (Dioxin intake)
Impacts at Downwind Receptors
Minor Fire Intermediate Fire Fully Developed Fire
Residence Duleek Residence Duleek Residence Duleek
Distance (m) 300 3,000 300 3,000 300 3,000
Max conc (ug/m3) 1.68 × 10⁻⁵ 2.1 × 10⁻⁶ 4.89 × 10⁻⁶ 6.39 × 10⁻⁷ 3.98 × 10⁻⁶ 6.03 × 10⁻⁷
Exposure time (hr) 0.5 0.5 2 2 4 4
Daily inhalation (m3/day) 20 20 20 20 20 20
Inhalation per event (m3) 0.42 0.42 1.67 1.67 3.33 3.33
Representative intake (ug) 7.0 × 10⁻⁶ 8.7 × 10⁻⁷ 8.2 × 10⁻⁶ 1.1 × 10⁻⁶ 1.3 × 10⁻⁵ 2.0 × 10⁻⁶
Cumulative intake (ug) 7.0 × 10⁻⁶ 8.7 × 10⁻⁷ 1.3× 10⁻⁵ 1.7 × 10⁻⁶ 2.0 × 10⁻⁵ 2.7 × 10⁻⁶
Frequency (years) 1 1 20 20 100 100
Average intake (per annum)
7.0 × 10⁻⁶ 8.7 × 10⁻⁷ 6.6 × 10⁻⁷ 8.4 × 10⁻⁸ 2.0 × 10⁻⁷ 2.7 × 10⁻⁸
Average intake (per day)
1.92 × 10⁻⁸ 2.4 × 10⁻⁹ 1.8 × 10⁻⁹ 2.3 × 10⁻¹⁰ 5.4 × 10⁻¹⁰ 7.3 × 10⁻¹¹
The following assumptions were made in this calculation:
• In the event of a fully developed fire, it is assumed that the emergency response approach would be to evacuate the area in the vicinity. An upper figure of 4 hours has been selected as the maximum exposure time.
• Based on typical respiration rates, a person at either receptor would inhale 20 m3 of air over a 24-hour period.
• As the fire event escalates, the calculated overall dioxin exposure is cumulative (e.g. for the fully developed fire, persons in the vicinity would be exposed to concentrations typical of minor fires for the first ½ hour, of concentrations typical to an intermediate fire for the following 1.5 hours and of a fully developed fire for the remaining 2 hours.
• The following conservative assumptions were made to the analysis of the frequency of these scenarios, for the purposes of the dioxin intake calculation:
- Instances involving smouldering waste could arise every few years. For the purposes of this assessment it has been assumed that such a fire could arise on an annual basis.
- The intermediate fire is assumed to occur once in 20 years.
- The fully developed fire is assumed to occur once in 100 years.
Combining the overall, the expected annual intake of Dioxins at the two locations is calculated by summing the figures for all three fires:
• Dioxin intake at nearest residence: 2.15 × 10⁻⁸ per day
• Dioxin intake at closest point at Duleek village: 2.7 × 10⁻⁹ per day
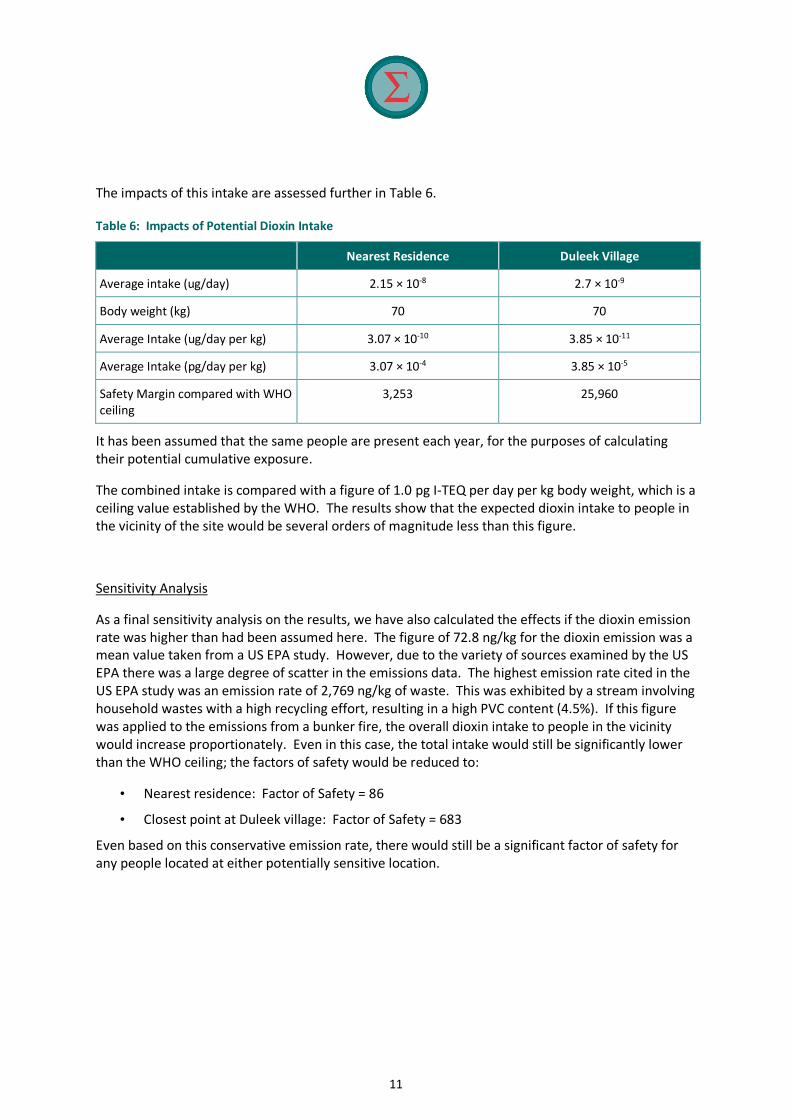
11
The impacts of this intake are assessed further in Table 6.
Table 6: Impacts of Potential Dioxin Intake
Nearest Residence Duleek Village
Average intake (ug/day) 2.15 × 10⁻⁸ 2.7 × 10⁻⁹
Body weight (kg) 70 70
Average Intake (ug/day per kg) 3.07 × 10⁻¹⁰ 3.85 × 10⁻¹¹
Average Intake (pg/day per kg) 3.07 × 10⁻⁴ 3.85 × 10⁻⁵
Safety Margin compared with WHO ceiling
3,253 25,960
It has been assumed that the same people are present each year, for the purposes of calculating their potential cumulative exposure.
The combined intake is compared with a figure of 1.0 pg I-TEQ per day per kg body weight, which is a ceiling value established by the WHO. The results show that the expected dioxin intake to people in the vicinity of the site would be several orders of magnitude less than this figure.
Sensitivity Analysis
As a final sensitivity analysis on the results, we have also calculated the effects if the dioxin emission rate was higher than had been assumed here. The figure of 72.8 ng/kg for the dioxin emission was a mean value taken from a US EPA study. However, due to the variety of sources examined by the US EPA there was a large degree of scatter in the emissions data. The highest emission rate cited in the US EPA study was an emission rate of 2,769 ng/kg of waste. This was exhibited by a stream involving household wastes with a high recycling effort, resulting in a high PVC content (4.5%). If this figure was applied to the emissions from a bunker fire, the overall dioxin intake to people in the vicinity would increase proportionately. Even in this case, the total intake would still be significantly lower than the WHO ceiling; the factors of safety would be reduced to:
• Nearest residence: Factor of Safety = 86
• Closest point at Duleek village: Factor of Safety = 683
Even based on this conservative emission rate, there would still be a significant factor of safety for any people located at either potentially sensitive location.