Embed Size (px)
Citation preview
i
SEVENTH FRAMEWORK
PROGRAMME
THEME [ENV.2010.2.1.5-1]
[Assessing vulnerability of urban systems, populations and goods in relation to natural and
man-made disasters in Africa]
Grant agreement no: 265137
Project acronym: CLUVA
Project title: "CLimate change and Urban Vulnerability in Africa"
D2.11: Review and evaluation of existing vulnerability indicators in order to
obtain an appropriate set of indicators for assessing climate related vulnerability
Due date of deliverable: 31/08/2011
Actual submission date: 31/08/2011
Start date of project: 01/12/2010 Duration: 36 months Organisation name of lead contractor for this deliverable: Helmholtz Centre for Environmental Research - UFZ
Project co-funded by the European Commission within the Sixth Framework Programme (2002-2006)
Dissemination Level PU Public X PP Restricted to other programme participants (including the Commission Services) RE Restricted to a group specified by the consortium (including the Commission Services) CO Confidential, only for members of the consortium (including the Commission Services)
ii
Note about contributors The following organisations contributed to the work described in this deliverable:
Lead partner responsible for the deliverable:
Helmholtz Centre for Environmental Research-UFZ Deliverable prepared by: Nathalie Jean-Baptiste Christian Kuhlicke Anna Kunath Sigrun Kabisch
Partner responsible for quality control:
Technical University of Munich Deliverable reviewed by: Stephan Pauleit
Other contributors:
CLUVA partners: Ardhi University Tanzania: Regina John Ecole nationale Supérieure Polytechnique Université Yaoundé 1: Joseph Nounyan Nguimbis Ethiopian Institute of Architecture, Building Construction and City Development: Rebka Fekade University of Copenhagen: Lise Herslund University of Manchester: Sarah Lindley University of Ouagadougou: Fatoumata Badini Kinda, Jean-Baptiste Ouedraogo Technical University of Munich: Andreas Printz Student assistants: University of Leipzig, Germany: Anne-Katrin Schultz University of Bologna, Italy: Pulcherie Tatiane Meyiem Tchounda
iii
SUMMARY
The report aims at providing a first theoretical setting on the concept of vulnerability, vulnerability assessment and indicators in order to identify and evaluate relevant assessment measures for CLUVA. It describes a set of identified indicators which serves as a starting point for selecting appropriate indicators for assessing climate related vulnerability in CLUVA cities. All partners are encouraged to discuss the list proposed in Chapter 5 in order to contribute to the process of evolution of vulnerability assessment measures and to ensure a more robust and sustainable results in CLUVA. This report should therefore be seen as an initial conceptual proposition which needs to be tested empirically, peer-reviewed and discussed among experts, PhD candidates and practitioners in CLUVA cities. Only then can it be refined and fed back for further conceptual development. At its core, the report aims at developing and discussing a vulnerability ladder that integrates four vulnerability dimensions fitting to CLUVA’s contextual vulnerability discourse. Such discourse reflects on social responses and outcomes with regards to climatic events within an urban frame. Vulnerability is considered not only by meteorological hazards, but by a series of dynamical processes involving socio-cultural, economic and political processes. Hence, the report adopts vulnerability as a concept that helps understanding ‘multi-scalar’ drivers and pressures that occur in anticipation to a natural hazard and identifies the strengths and weaknesses of different modes of vulnerability assessment. We took into account a mix of views and vulnerability assessment techniques at two different levels. One level reflects efforts from climate and risk management experts along with urban sociologists, planners and environmental scholars. Both European and African scientists are bound to produce multifaceted outcomes considering social, environmental and climatic systems. This reflects on one side CLUVA’s multidisciplinary nature. The other level is the interrelation of vulnerability themes within specific tasks. Task 2.3 (Assessing social vulnerability) for instance, seeks a dialogue between nature, society and the urban environment. This attempt requires inclusive interpretations between those concerned with the vulnerability and adaptation potential of CLUVA cities associated with urban attitudes, ecosystems, governance, land use and planning. This reflects on another side CLUVA’s interdisciplinary component.
iv
The report is organized around the development of a CLUVA vulnerability ladder that integrates core vulnerability dimensions fitting to CLUVA’s inter-linkage objectives and the realities and needs of CLUVA case study cities. We aimed at providing a platform for theoretical discussions on urban vulnerability and integrating the knowledge of other CLUVA tasks trough joined vulnerability questions. Another objective is to contribute to CLUVA by identifying the strengths and weaknesses of qualitative and quantitative methods and highlighting the utility of mixed methods for assessing vulnerability. The indicators proposed to facilitate the assessment of vulnerability follow up on discussions held during two working sessions focusing on social vulnerability assessment at the CLUVA Kick off Meeting in Ouagadougou, Burkina Faso (15-22 January 2011) and during two workshops organized by CLUVA partners in Addis Ababa, Ethiopia (8-10 June 2011) and Dar es Salaam, Tanzania (13-18 June 2011). The sessions in Ouagadougou aimed at exchanging our understanding on the terminology relative to Task 2.3 and at sharing previous experiences regarding research methodologies, data collection considerations and overall data requirements. It was established that the review of indicators shall be conducted based on the body of local knowledge and selected projects relevant to the African context. The sessions in Addis Ababa and Dar es Salaam focused on specific definitions of social vulnerability and discussions revolved around context-centred indicators. This was done based on a preliminary draft proposed in February 2011. Both workshops provided a forum for discussing specific approaches for capacity building and PhD topics as well as served as a platform for exchanges between CLUVA members and selected local actors and stakeholders. The results of discussions and joint efforts contributed to the evaluation of an identified list of indicators based on different desirable criteria. Chapter 1 reflects on the report’s aim and scope. It focuses on providing a general outline of what this study covers and focuses on defining the parameter of the literature review and the implementation processes behind the report. This chapter also provides a brief outline of CLUVA cities with regards to specific parameters. These profiles are a schematic overview of each city and merely accentuate aspects, which in our view require more in-depth explorations to contextualize vulnerability during the course of the CLUVA project. Chapter 2 in turn places attention towards understanding the vulnerability concept. It reflects on differentiated vulnerability ideas and provides several definitions, which encompasses a range of vulnerability concepts regrouped based on their synergetic virtue. It also highlights a historical
v
background of the vulnerability concept and emphasizes particularly on social vulnerability and its position in current vulnerability discourses. Chapter 3 highlights the use of conceptual frameworks for assessing vulnerability and proposes a model that integrate asset, institutional, attitudinal and physical vulnerability dimensions to form an interdisciplinary working framework for CLUVA. Chapter 4 addresses mixed methods of assessment and provides an overview of the attributes and procedures of quantitative and qualitative assessment modes. Chapter 5 reflects on indicators for assessing vulnerability and offers a set of indicators identified based on the literature and experiences in the vulnerability field. Chapter 6 emphasizes on the procedure and results of an evaluation of the above mentioned set of indicators based on four desirable criteria. Effort was made to foster contributions from experts in Europe and Africa by integrating the views and opinions of different CLUVA evaluators. The indicators were ranked by relevance and presented as a final set.
vi
CONTENTS
INTRODUCTION ............................................................................... 1
1 REPORT AIM AND SCOPE ..................................................... 4
1.1 REPORT AIM ....................................................................................... 4 1.2 REPORT SCOPE .................................................................................. 4 1.3 CLUVA CITIES IN BRIEF .................................................................. 9 1.3.1 Addis Ababa .............................................................................. 9 1.3.2 Dar es Salaam .......................................................................... 12 1.3.3 Douala ..................................................................................... 14 1.3.4 Ouagadougou .......................................................................... 16 1.3.5 St. Louis .................................................................................. 18
2 VULNERABILITY: BACKGROUND AND SELECTED
DEFINITIONS .......................................................................... 22
2.1 VULNERABILITY ROOTS AND HISTORICAL BACKGROUND................................................................................. 22 2.2 SOCIAL VULNERABILITY ............................................................. 25
3 VULNERABILITY ASSESSMENT: APPROACHES AND
FRAMEWORK ......................................................................... 28
3.1 SELECTED APPROACHES, FRAMEWORKS, MODELS AND PRACTICES OF VULNERABILITY ASSESSMENT ..................... 29 3.2 CLUVA VULNERABILITY LADDER IN URBAN AREAS .......... 33 3.2.1 Generic components of vulnerability: Coping/ Adaptive Capacity, Susceptibility/Sensitivity and Exposure .................... 34 3.2.2 Assessment at individual, household and community level ....... 35 3.2.3 Key vulnerability dimensions identified in urban areas .................
4 MIXED METHODS FOR ASSESSING
VULNERABILITY ................................................................... 45
4.1 QUANITATIVE VULNERABILITYASSESSMENT ....................... 46 4.2 QUALITATIVE VULNERABILITY ASSESSMENT ...................... 48 4.3 MIXED VULNERABILITY ASSESSMENT .................................... 49
vii
5 INDICATORS FOR ASSESSING VULNERABILITY ........ 53
5.1 OVERVIEW OF FUNCTIONS AND DEFINITIONS OF INDICATORS .............................................................................. 53 5.2 PRELIMINARY INDICATOR SET IDENTIFIED TO ASSESS VULNERAVILITY IN URBAN AREAS .......................................... 59
6 EVALUATION OF IDENTIFIED VULNERABILITY
INDICATORS ........................................................................... 74
6.1 CRITERIA FOR THE EVALUATION OF IDENTIFIED SET OF INDICATORS..................................................................................... 74 6.1.1 Basic criteria for the evaluation of indicators to assess vulnerability in urban areas ........................................................ 74 6.1.2 Desirable criteria for the evaluation of indicators to assess vulnerability in urban areas ........................................................ 75 6.2 PROCEDURE FOR THE EVALUATION OF IDENTIFIED INDICATORS..................................................................................... 76 6.3 OVERALL RESULTS OF THE EVALUATION OF IDENTIFIED
INDICATORS FOR CLUVA ............................................................ 79 6.4 FURTHER STEPS BASED ON COMMENTS AND OBSERVATIONS FROM CLUVA PARTNERS .............................. 86
CONCLUSION .................................................................................. 89
REFERENCES .................................................................................. 92
viii
APPENDIXES ................................................................................. 106
Appendix A: CLUVA Vulnerability Index Review ............................................ 106
Appendix B: CLUVA Vulnerability Indicator Review ....................................... 111
Appendix C: Evaluation of existing vulnerability indicators by
African partners ............................................................................. 120
Appendix C.1: Evaluation of existing vulnerability indicators by
RJO-ARU1 ........................................................................ 120
Appendix C.2: Evaluation of existing vulnerability indicators by
RFE-EiABC1 .................................................................... 130
Appendix C.3: Evaluation of existing vulnerability indicators by
FBD-UO1 .......................................................................... 139
Appendix C.4: Evaluation of existing vulnerability indicators by
JBO-UO2........................................................................... 148
Appendix C.5: Evaluation of existing vulnerability indicators by
JNN-UY1 .......................................................................... 157
Appendix D: Definitions of key terms provided by ARU ................................... 166
ix
LIST OF TABLES
Table 1: Profile of individuals, households and communities of Addis Ababa .... 11
Table 2: Profile of individuals, households and communities of Dar es Salaam .. 13
Table 3: Profile of individuals, households and communities of Douala .............. 15
Table 4: Profile of individuals, households and communities of Ouagadougou ... 17
Table 5: Profile of individuals, households and communities of St. Louis ........... 18
Table 6: Climatic stress identified in CLUVA cities ............................................. 19
Table 7: Identified weather related events in CLUVA cities ................................ 20
Table 8: Selected definitions of vulnerability ........................................................ 24
Table 9: Selected frameworks, model, approaches and practices of vulnerability
assessments relevant to CLUVA ............................................................. 31
Table 10: Identified vulnerability indicator themes .............................................. 42
Table 11: Difference between qualitative, quantitative and mixed assessments. .. 46
Table 12: Quantitative attributes and procedures .................................................. 47
Table 13: Qualitative attributes and procedures .................................................... 49
Table 14: The utility of mixed methods for CLUVA ............................................ 52
Table 15: Selected definitions of indicators .......................................................... 55
Table 16: Relevance of WDI themes for contextualizing vulnerability ................ 56
Table 17: Selected vulnerabilty indicators at household level .............................. 64
Table 18: Selected vulnerabilty indicators at community level ............................ 69
Table 19: Basic criteria for the evaluation of indicators to assess
vulnerability in CLUVA ....................................................................... 75
Table 20: Desirable criteria for the evaluation of indicators to assess
vulnerability in CLUVA ....................................................................... 75
Table 21: List of contributors to the evaluation of identified indicators ............... 78
Table 22: Indicators evaluated as meaningful to assess vulnerability in urban areas at
household and community levels .......................................................... 85
x
LIST OF FIGURES
Figure 1: Conceptual framework of vulnerability to natural hazards
in urban areas ......................................................................................... 35
Figure 2: Vulnerability to natural hazards at individual, household and
community level ..................................................................................... 36
Figure 3: Asset, institutional, attitudinal and physical dimensions of
vulnerability ........................................................................................... 38
Figure 4: Overall CLUVA model for a vulnerability ladder in urban areas .......... 44
Figure 5: Relation of indicators to the scale and dimension of
vulnerability in CLUVA ........................................................................ 57
Figure 6: Results from Task 2.3 session on indicators for vulnerability
assessment during the Addis Ababa workshop ...................................... 60
Figure 7: Results from Task 2.3 session on indicators for vulnerability
assessment during the Dar es Salaam workshop .................................... 62
Figure 8: Results of the evaluation of 39 selected indicators based on the criteria
‘Easy to interpret’ .................................................................................... 79
Figure 9: Results of the evaluation of 39 selected indicators based on the criteria
‘Trustworthiness’ .................................................................................... 80
Figure 10: Results of the evaluation of 39 selected indicators based on the criteria
‘Data availability’ .................................................................................. 82
Figure 11: Results of the evaluation of 39 selected indicators based on the criteria
‘Resource capacity’ ............................................................................... 83
Figure 12: Comparison of the ranked criteria ........................................................ 84
xi
LIST OF ABBREVIATIONS AND ACRONYMS AEA American Evaluation Association ARU Ardhi University Tanzania AWGDRR African Working Group for Disaster Risk Reduction BBC Model developed by Bogardi, Birkmann and Cardona CBO Community-Based Organization CBPR Community-Based Participatory Research CCA Climate Change Adaptation CDD Community Driven Development CHSI Community Health Status Indicators CIUP Community Infrastructure Upgrading Program CRED Centre for Research and Epidemiology Disasters CSA Central Statistical Agency of Ethiopia CSD Commission on Sustainable Development CVI Composite Vulnerability Index DFID Department For International Development DRM Disaster Risk Management DSM Dar es Salaam EAA European Environmental Agency EcVI Economic Vulnerability Index EEA European Environment Ageny EiABC Ethiopian Institute of Architecture, Building Construction
and City Development EM-DAT Emergency Events Database ETC/ACC European Topic Centre on Air and Climate Change EU European Union GDP Gross Domestic Product GIS Geographic Information System GURC Global Urban Research Centre ICLEI Local Governments for Sustainability IPCC Intergovernmental Panel Climate Change MAUT Multi-attribute utility theory MEDROPLAN Mediterranean Drought Preparedness and Mitigation Planning NGO Non-Governmental Organization OECD/DAC Organization for Economic Co-Operation and Development/
Development Assistance Committee
xii
PAR Participatory Action Research Pressure and Release PCA Principal Components Analysis PCCAA Participatory Climate Change Adaptation Appraisal PDNA Post Disaster Needs Assessment PRA Participatory Rural Appraisal SACCOS Savings and Credits Cooperatives SFVI Social Flood Vulnerability Index SIDS Small Island Developing States SITRASS Solidarité Internationale sur les Transports et la Recherche
en Afrique Sub-Saharienne SL Sustainable Livelihoods SOPAC South Pacific Applied Geoscience Commission SoVI or SVI Social Vulnerability Index SSATP Sub-Saharan Africa Transport Policy Program UFZ Helmholtz Centre for Environmental Research UN United Nations UNCTAD United Nations Conference on Trade and Development UN-DESA United Nations Department of Economic and Social Affairs UNDRO United Nations Disaster Relief Coordinator UN-ECLAC United Nations Economic Commission for Latin America and the
Caribbean
UN/ISSD United Nations International Institute for Sustainable Development UN/ISDR United Nations International Strategy for Disaster Reduction UNDP United Nations Development Programme UN-HABITAT United Nations Human Settlements Programme UNU-EHS United Nations University-Institute for Environmental and Human Security URT United Republic of Tanzania US-EPA United States Environmental Protection Agency VCI Vulnerability and Capacity Index VRIP Vulnerability-Resilience Indicator Prototype WDI World Development Indicators 2iE International Institute for Water and Environmental Engineering
1
INTRODUCTION
African cities are undergoing a remarkable transformation process and are experiencing growth rates of considerable magnitude. While managing and steering this process is a challenging task in itself; it gains further complexity when considering the consequences of climate change on these cities. This report therefore prepares the ground for a vulnerability analysis that explores how exposed and susceptible selected African cities, specific neighbourhoods and their residents are to the consequences of natural hazards and how to cope with and adapt to its impacts. We therefore aim at developing context-centred methods to assess vulnerability and increase knowledge regarding the management of climate related risks. According to one of central objectives of the CLUVA project, the practice of assessing vulnerability to natural hazards emerges from the need to detect the level of capacity, susceptibility and exposure of a system when it faces the risk of experiencing unwelcome and threatening events. Within CLUVA there are two predominant modes of exploring these issues. The first one considers a series of analyses based on projections of future climatic trends based on models and scenarios known in the literature as ‘endpoint’ (Kelly and Adger, 2000) or ‘outcome’ vulnerability (O’Brien et al., 2007). The second in contrast takes into account the inclusion of anthropogenic factors that may influence the vulnerability of residents to risk. This is referred in the literature as ‘starting point’ (Kelly and Adger, 2000) or ‘contextual’ vulnerability (O’Brien et al., 2007). We ally with this perspective and further specify throughout this document the theoretical cornerstones of our conception of vulnerability, central methodological procedures and give some recommendations on which indicators appear as particularly meaningful to assess social vulnerability in an urban, African context. The present report therefore aims at developing and discussing a model that integrates core vulnerability dimensions fitting to CLUVA’s contextual vulnerability discourse. Such discourse reflects on social responses and outcomes with regards to climatic events within an urban frame. Vulnerability is considered not only by meteorological hazards, but by a series of dynamical processes involving socio-cultural, economic and political processes. Hence, the report adopts vulnerability as a concept that helps understanding ‘multi-scalar’ drivers and pressures that occur in anticipation to a natural hazard and identifies the strengths and weaknesses of different modes of vulnerability assessment.
2
The report takes into account a mix of views and vulnerability assessment techniques at two different levels. One level reflects efforts from climate and risk management experts along with urban sociologists, planners and environmental scholars. Both European and African scientists are bound to produce multifaceted outcomes considering social, environmental and climatic systems. This reflects on one side CLUVA’s multidisciplinary nature. The other level is the interrelation of vulnerability themes within specific tasks. Task 2.3 (Assessing social vulnerability) for instance, seeks a dialogue between nature, society and the urban environment. This attempt requires inclusive interpretations between those concerned with the vulnerability and adaptation potential of CLUVA cities associated with urban attitudes, ecosystems, governance, land use and planning. This reflects on another side CLUVA’s interdisciplinary component. The discussion on assessment approaches and the set of indicators signalled in this report serves at a first step towards contextualizing the vulnerability of CLUVA cities along with our African counter parts. What is intended by placing vulnerability nuances into context is to: 1) Select pertinent study areas as well as identify, contact and map relevant authorities with partners in Addis Ababa, Dar es Salaam and Ouagadougou, which are the CLUVA cities for empirical studies in Task 2.3. 2) Specify and pre-test appropriate assessment methods according to respective context conditions and needs of local authorities and engaged stakeholders. 3) Explore and assess the vulnerability of specific groups at individual, household and community levels to ensure the formulation of appropriate recommendations for community-specific adaptation measures. Structure and logic of the report Chapter 1 reflects on the report’s aim and scope. It focuses on providing a general outline of what this study covers and focuses on defining the parameter of the literature review and the implementation processes behind the report. This chapter also provides a brief outline of the CLUVA cities with regards to specific parameters. Chapter 2 places attention towards understanding the vulnerability concept. It reflects on differentiated vulnerability ideas and provides several definitions, which encompasses a range of vulnerability concepts regrouped based on their synergetic virtue. It also highlights a historical background of the vulnerability concept and emphasizes particularly on social vulnerability and its position in current vulnerability discourses.
3
Chapter 3 highlights the use of conceptual frameworks for assessing vulnerability and proposes a model that integrate asset, institutional, attitudinal and physical vulnerability dimensions to form an interdisciplinary working framework for CLUVA. Chapter 4 addresses mixed methods of assessment and provides an overview of the attributes and procedures of quantitative and qualitative assessment modes. Chapter 5 reflects on indicators for assessing vulnerability and offers a set of indicators identified based on the literature and experiences in the vulnerability field. Chapter 6 emphasizes on the procedure and results of an evaluation of the above mentioned set of indicators based on four desirable criteria. Effort was made to foster contributions from experts in Europe and Africa by integrating the views and opinions of different CLUVA evaluators. The indicators were ranked by relevance and presented as a final set.
4
1 REPORT AIM AND SCOPE
1.1 REPORT AIM
The report aims at providing a first theoretical setting on the concept of vulnerability, vulnerability assessment and indicators in order to identify and evaluate relevant assessment measures for CLUVA. It describes a set of identified indicators which serves as a starting point for selecting appropriate indicators for assessing climate related vulnerability in CLUVA cities. All partners are encouraged to discuss the list proposed in Chapter 5 in order to contribute to the process of evolution and to ensure a more robust and sustainable results in CLUVA. The report should therefore be seen as initial conceptual proposition which needs to be tested empirically, peer-reviewed and discussed among experts, PhD candidates and practitioners in CLUVA cities. Only then can it be refined and fed back for further conceptual development. With this in mind the report was structured based on the following tasks:
To develop a CLUVA vulnerability ladder that integrates core vulnerability dimensions fitting to CLUVA’s inter-linkage objectives and the realities and need of CLUVA case study cities.
To provide a platform for theoretical discussions on urban vulnerability. To integrate the knowledge of other CLUVA tasks trough integrated vulnerability questions. To identify the strengths and weaknesses of qualitative and quantitative modes of
assessment. To recognize the utility of mixed methods for assessing vulnerability. To evaluate indicators based on different criteria and promoting the convergence of different
point of views.
1.2 REPORT SCOPE
The report seeks above all to frame the concept of vulnerability assessment in the CLUVA context. In consequence, it substantiates its claims not only from the literature but also from presentations from CLUVA partners, conversations with stakeholders, observations from field trips, idea exchanges and discussions from workshops among other data collection modes.
5
The report combines therefore theoretical propositions with local knowledge based on the assumption that a more accurate view of vulnerability in urban areas can be best obtained by balancing past discourses with current observations and hypotheses. With this in mind the report puts forward different vulnerability ideas, highlights a historical background of the vulnerability concept and collect thoughts from CLUVA cities partners. The literature review on vulnerability assessment initiated as an explorative exercise in which selected literature concerned with vulnerability in urban areas and methods for evaluating vulnerability to natural hazards were identified. The work conducted to date on vulnerability is extensive (Birkmann, 2006; Blaikie et al., 1994; Chambers, 1989; Cutter et al., 2003; Moser, 2009; O’Brien et al., 2007; Pelling, 2006, 2011; Sen, 1983; Wisner et al., 2004). The discourse varies depending on schools of thought, research backgrounds and different approaches to dominant vulnerability concepts (Hufschmidt, 2011). The topic of „vulnerability” gained considerable attention within policy discourses in both social and natural sciences over the last decades. Giving the breath of the concept, a set of models frameworks and approaches were selected, stemming from early vulnerability ideas from Sen, Blaikie and Wisner. The selection we provide is not extensive and does not regroup all dominant vulnerability concepts. It rather offers a range of assessment approaches from which - and to some extent - ‘tacit knowledge’ (Lincoln and Guba, 1985) of vulnerability is being exposed. The focus of the frameworks, concepts and models selected lies in making sense of context of vulnerability and how it progresses in a specific location by enabling actors to voice their ideas and take ownership of their circumstances. We insist in finding a balance between a ‘pre-established’ and ‘evolving’ research design in CLUVA. This means that specifications offered in advance needs to be combined with interactions with participants. In fact, we maintain a certain restraint in terms of qualifying or rationalising vulnerability in CLUVA cities, we only offer at this point a proposed ladder that conceptualize reflections put forward during our discussions and exchanges with CLUVA partners into four distinct dimensions. We also take into account more recent knowledge built at the Helmholtz Centre for Environmental Research (UFZ) from international projects such as FLOODsite1 (2004-2009),
1 See http://www.floodsite.net/default.htm
6
Risk Habitat Megacity2 (2007-2011) and CapHaz-Net3 (2009-2012) are incorporated in the report. The EU-financed project FLOODsite is relevant to CLUVA as it deals with the physical, environmental, ecological and socio-economic aspects of floods with knowledge based on flood risk management. Risk Habitat Megacity is a research project that contributes to sustainability and risk management for fast growing Latin American cities. West Africa alone is expected to reach 58 million inhabitants during the decade of 2010 / 2020 (UN-HABITAT, 2010). Africa’s collective population is becoming more urban and with this come challenges particular to urban agglomeration (cf. also Blanco et al., 2009). The strategies for sustainable development in megacities can serve as a good platform for implementing solutions that take the institutional, political, economic, and social aspects within dense settlements. Finally, CapHaz-Net develops an overview about the current state-of-art of research with regard to the social dimension of ‘natural’ hazards and disasters. This is particular relevant to CLUVA as it identifies and assesses existing practices for building actors’ capacity of actors in the field of natural hazards. The focus of CapHaz-Net is in Europe, however many aspects of the theoretical background, societal assets, skills and resources necessary to anticipate, cope with and recover from natural disasters and environmental stress can be transferred or at least considered in CLUVA. In consequence, the literature reviewed was indicative rather than extensive. Documents were selected from an existing pool of knowledge and special attention was given to those focused on Africa and in reference to climatic threats faced by CLUVA cities (e.g. flood and heavy precipitation, low water supply or decreased precipitation leading to water scarcity and drought and sea level rise). Additionally, the scope of the report was extended with the use of search engine using key words fitting to CLUVA. We also conducted a general search on Thomson Reuters Web of Knowledge for scientific journals addressing vulnerability assessment. Our findings reveal that vulnerability assessment studies have evolved over the last decade towards case study based approaches in which the knowledge built surrounding the vulnerabilities of populations expands from the biophysical vulnerability to the social vulnerability (Adger et al., 2004; Vincent, 2004). It appears the expansion of the theoretical discourse on the social condition of a population affected by a hazard has prompted the recognition of developing more robust assessment tools including relevant and systematic measurements that can contribute to more integrated studies (ibid).
2 See http://www.risk-habitat-megacity.ufz.de/ 3 See http://www.caphaz-net.org/
7
Another thread of approaches are participatory assessment efforts (Chambers, 1989; Moser et al., 2010; Swift, 1980; Wisner et al., 1991) addressing vulnerability issues with communities. These approaches, mostly applied in developing communities, stem from the work of Freire among others. In his work, Freire stressed the idea of “conscientization” (1968), putting emphasis on people’s level of enlightenment when recognizing their options. Later, this participatory idea was applied by Wisner et al. (1979) when designing a range of participatory techniques which included for instance food storage systems with villagers in Tanzania. There, the authors highlighted the challenges as well as the subtleness or participatory action research methods. In the report, attributes of qualitative vulnerability assessments which include participatory techniques are associated with more quantitative modes of inquiry, which include for the most part the development of indicators. By highlighting both techniques we maintain these methodological standpoints are more complementary then opposite. In vulnerability assessment, quantitative leaning authors acknowledge the relevance and importance of qualitative methods (Birkmann, 2006; Cardona, 2004) and qualitative contributors recognize the use of measurable outcomes (Wisner, 2006). This implies that there is a certain level of complementarity between qualitative and quantitative vulnerability assessment. The report provides a brief and partial review on both methods, however it suffice to introduce CLUVA partners to the advantages and shortcoming of each methodological perspectives and the utility of mixing them. While exploring more deterministic approaches of vulnerability assessment one realizes the spectrum of vulnerability indicators and indices is wide. It ranges from micro-scale assessment types (i.e. household/local level) to macro-scale determinant of vulnerabilities (i.e. national/regional level) addressing a collection of vulnerability typologies with different dimensions (i.e. social, institutional, material), different types of hazards (i.e. flood, drought, earthquake, heat, storm) and regions (Europe, US, Latin America, Africa). This may be due the fact that indicator development is an old practice which can be traced historically since the 1940s (Birkmann, 2006). Hence, it is not surprising to find many frameworks and approaches, indexes and variables which attempt to contribute to the current pool of knowledge with new ‘elements’. These being for instance statistical modelling techniques which take forms of aggregations or policy–orientated measurements. These procedures focus on systematic change and/or evaluation of a region’s political or economic structure which may feature certain application gaps when faced with irregular sources of data. The review of existing vulnerability indicators was conducted in distinctive phases. Each phase narrowed the scope of the search allowing a more focused exploration. The initial phase draws from
8
a global pool of knowledge on development issues in relations with climate change. The sources of documents reviewed emerge from intergovernmental agencies, research institutions and other agencies such as EM-DAT4 host by the Centre for Research and Epidemiology Disasters (CRED) and other documents which focus primarily on meta-analysis of vulnerability (Tyndall Centre for Climate Change Research). Further scoping led to the body of knowledge produced from the European experience with flood, which has prompted a regional-wide effort to effectively assess the risks and the degree to which Europeans are vulnerable to a natural hazard. Among the literature consulted is the contribution of the European Environmental Agency (EAA) through the work of the European Topic Centre on Air and Climate Change (ETC/ACC) which issued a study on vulnerability assessment in urban regions by indicators and adaptation options for climate change impacts. This document among others provided a broad overview on the attributes of indicators, how can they be tested in cities. Keeping in mind the geographical, cultural and historical differences between Europe and Africa, we considered European assessment techniques with prudence. Focusing similarly on practices of vulnerability assessments found in research reports, and other online sources (e.g. UN/ISSD Climate Change Knowledge Management on Africa) which provided periodic thematic feeds allowing the validation of indicators identified in the literature. The information on CLUVA cities came first from scientific journals, books and reports of UN-institutions. More precise knowledge of recent date was obtained during presentations and following discussions undertaken during the CLUVA Kick-off Meeting in Ouagadougou and subsequent workshops in Addis Ababa and Dar es Salaam. We took note of the overall state of three CLUVA cities which were visited between January and June 20011. During several trips to distinctive settlements, a photographic documentation was undertaken with particular focus on the livelihood of local population, land use, urban agriculture, and characteristics of buildings, neighbourhoods and people as well as its waste management organization. UFZ observed the conditions of the roads, canals and drainage systems that were impacted by the flood in September 2009 in Ouagadougou. These excursions provided an overall view of the urban transformation within Ouagadougou. In addition, UFZ took note of the overall state of Ouagadougou’s livelihood, different economical activities, and distinctive settlements as well as its waste management organization as well as the risk that population located in low lying areas in Dar 4 Indicators of historical EM-DAT Emergency events database cover all countries over the 20th century. This information is available online at: http://www.emdat.be/disaster-profiles.
9
es Salaam and those located in river banks in Addis Ababa face. In addition exchanges with local institutions (e.g. the Goethe Institute and the International Institute for Water and Environmental Engineering (2iE) in Ouagadougou, the Fire and Disaster Prevention Agency and the Mayor’s Office of the City Government of Addis as well as exchange with community leaders in Dar es Salaam help strengthen our understanding of the urban environment of CLUVA cities and allowed us to contextualize the information obtained from intergovernmental reports and scientific journals. 1.3 CLUVA CITIES IN BRIEF The CLUVA cities, located in West and East Africa, encompass coastal, estuary, inland, and highland characteristics and feature different weather conditions such as tropical dry, tropical humid and Sub-Saharan climate. The cities range from medium to large and are confronted not only with increasing weather related hazards but also with the pressure of a growing mix of people (modern and traditional) confronted with ideals of progress, traditional beliefs, security and equality. As urban development demands improved assets, more functional institutional structure and enhanced physical and social infrastructure, it subjects CLUVA cities to continual challenges to adapt in the face of a growing and changing continent. The profiles presented below are a schematic overview of each city and merely indicates aspects, which require more in-depth explorations to contextualize vulnerability during the course of the CLUVA project. 1.3.1 Addis Ababa
Addis Ababa is the capital and by far the largest city of Ethiopia. Based on the 2007 Census conducted by the Central Statistical Agency of Ethiopia (CSA), Addis Ababa hosts a population of 2,740,000 (ibid., 2008). The UN-HABITAT Addis Ababa Urban Profile (2008) in contrast estimates there are approximately 4 million inhabitants. Despite a relatively low population growth rate of 2.1% (CSA, 2008), Addis Ababa is expected to reach between 6-7 million by 2015 (CLUVA City Profile Addis Ababa, 2011). The capital covers an area of about 540 km²; from which 290 km² is covered (ibid). The climate of Addis Ababa is forecasted to have an increase in precipitation variability and temperature. This will likely induce a wide range of hazards in the city including flooding and landslides in addition to droughts and fires which have been the most common hazards in the rural
10
and urban areas. The urban green area is made of urban forest, vegetation along the river buffer, recreational public park and urban agriculture. These green areas can act as a purifier of the total environment. This area is under the control of governmental institution and some NGOs. However, the area is affected by infrastructure development, waste disposal, grazing, fuel wood collection, and informal settlement. The city is a self-governing chartered city with its own city council. It is divided into 10 Sub-Cities. Among them, Kolfe Keranio located west of the city features the highest number of habitants in contrast to Akaki Kaliti in the South with the lowest population (CLUVA City Profile Addis Ababa, 2011; Melesse, 2005). These Sub-Cities are further divided into a total of 116 Weredas/Kebeles, which are the lowest level of city administration.
11
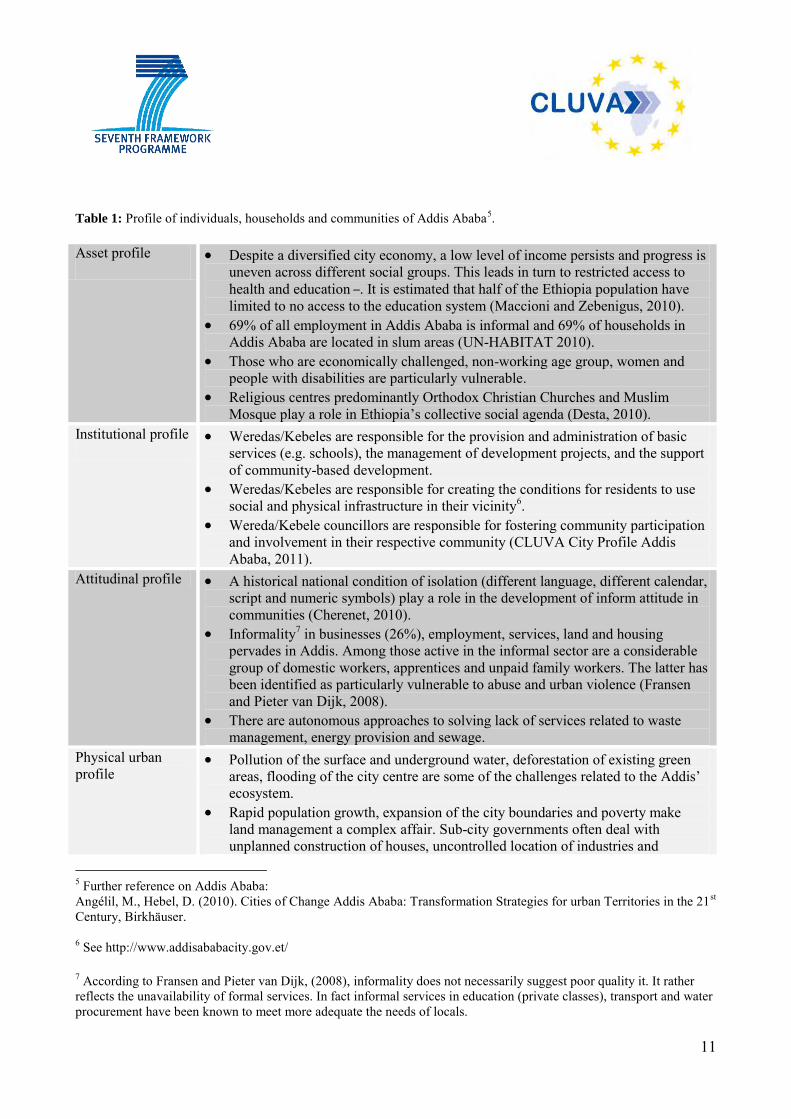
Table 1: Profile of individuals, households and communities of Addis Ababa5. Asset profile
Despite a diversified city economy, a low level of income persists and progress is uneven across different social groups. This leads in turn to restricted access to health and education –. It is estimated that half of the Ethiopia population have limited to no access to the education system (Maccioni and Zebenigus, 2010).
69% of all employment in Addis Ababa is informal and 69% of households in Addis Ababa are located in slum areas (UN-HABITAT 2010).
Those who are economically challenged, non-working age group, women and people with disabilities are particularly vulnerable.
Religious centres predominantly Orthodox Christian Churches and Muslim Mosque play a role in Ethiopia’s collective social agenda (Desta, 2010).
Institutional profile
Weredas/Kebeles are responsible for the provision and administration of basic services (e.g. schools), the management of development projects, and the support of community-based development.
Weredas/Kebeles are responsible for creating the conditions for residents to use social and physical infrastructure in their vicinity6.
Wereda/Kebele councillors are responsible for fostering community participation and involvement in their respective community (CLUVA City Profile Addis Ababa, 2011).
Attitudinal profile A historical national condition of isolation (different language, different calendar, script and numeric symbols) play a role in the development of inform attitude in communities (Cherenet, 2010).
Informality7 in businesses (26%), employment, services, land and housing pervades in Addis. Among those active in the informal sector are a considerable group of domestic workers, apprentices and unpaid family workers. The latter has been identified as particularly vulnerable to abuse and urban violence (Fransen and Pieter van Dijk, 2008).
There are autonomous approaches to solving lack of services related to waste management, energy provision and sewage.
Physical urban profile
Pollution of the surface and underground water, deforestation of existing green areas, flooding of the city centre are some of the challenges related to the Addis’ ecosystem.
Rapid population growth, expansion of the city boundaries and poverty make land management a complex affair. Sub-city governments often deal with unplanned construction of houses, uncontrolled location of industries and
5 Further reference on Addis Ababa: Angélil, M., Hebel, D. (2010). Cities of Change Addis Ababa: Transformation Strategies for urban Territories in the 21st Century, Birkhäuser. 6 See http://www.addisababacity.gov.et/ 7 According to Fransen and Pieter van Dijk, (2008), informality does not necessarily suggest poor quality it. It rather reflects the unavailability of formal services. In fact informal services in education (private classes), transport and water procurement have been known to meet more adequate the needs of locals.
12
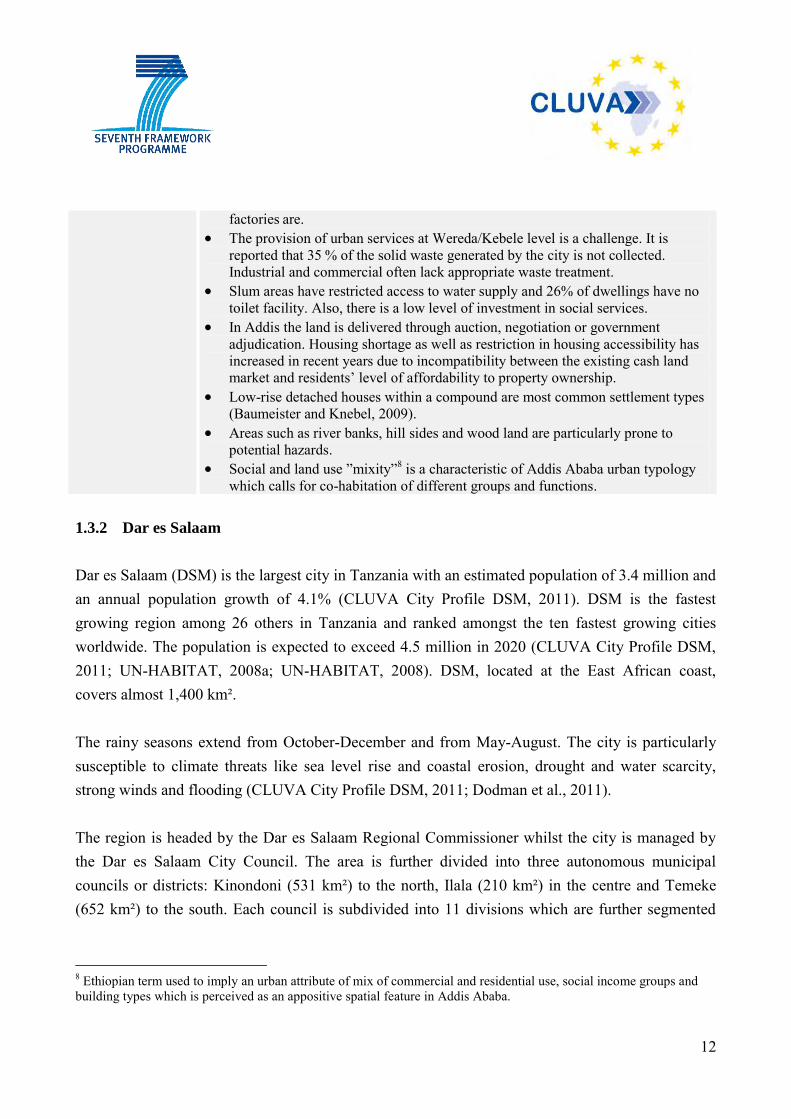
factories are. The provision of urban services at Wereda/Kebele level is a challenge. It is
reported that 35 % of the solid waste generated by the city is not collected. Industrial and commercial often lack appropriate waste treatment.
Slum areas have restricted access to water supply and 26% of dwellings have no toilet facility. Also, there is a low level of investment in social services.
In Addis the land is delivered through auction, negotiation or government adjudication. Housing shortage as well as restriction in housing accessibility has increased in recent years due to incompatibility between the existing cash land market and residents’ level of affordability to property ownership.
Low-rise detached houses within a compound are most common settlement types (Baumeister and Knebel, 2009).
Areas such as river banks, hill sides and wood land are particularly prone to potential hazards.
Social and land use ”mixity”8 is a characteristic of Addis Ababa urban typology which calls for co-habitation of different groups and functions.
1.3.2 Dar es Salaam
Dar es Salaam (DSM) is the largest city in Tanzania with an estimated population of 3.4 million and an annual population growth of 4.1% (CLUVA City Profile DSM, 2011). DSM is the fastest growing region among 26 others in Tanzania and ranked amongst the ten fastest growing cities worldwide. The population is expected to exceed 4.5 million in 2020 (CLUVA City Profile DSM, 2011; UN-HABITAT, 2008a; UN-HABITAT, 2008). DSM, located at the East African coast, covers almost 1,400 km². The rainy seasons extend from October-December and from May-August. The city is particularly susceptible to climate threats like sea level rise and coastal erosion, drought and water scarcity, strong winds and flooding (CLUVA City Profile DSM, 2011; Dodman et al., 2011). The region is headed by the Dar es Salaam Regional Commissioner whilst the city is managed by the Dar es Salaam City Council. The area is further divided into three autonomous municipal councils or districts: Kinondoni (531 km²) to the north, Ilala (210 km²) in the centre and Temeke (652 km²) to the south. Each council is subdivided into 11 divisions which are further segmented
8 Ethiopian term used to imply an urban attribute of mix of commercial and residential use, social income groups and building types which is perceived as an appositive spatial feature in Addis Ababa.
13
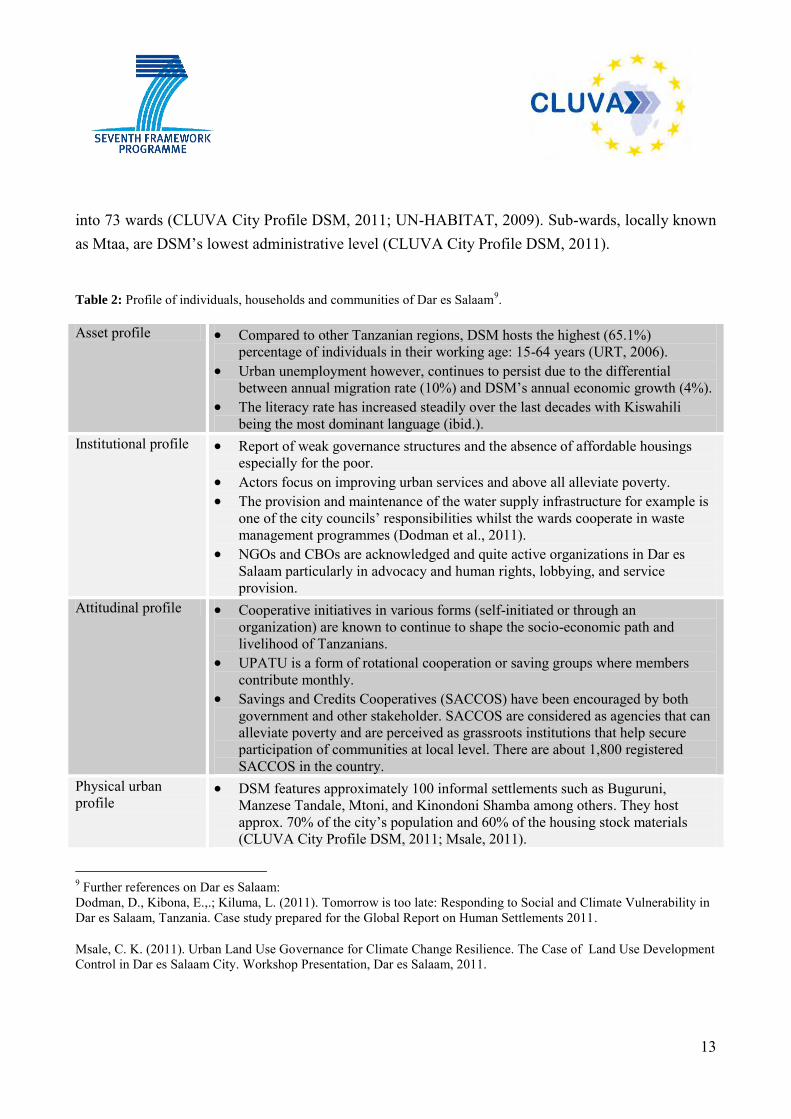
into 73 wards (CLUVA City Profile DSM, 2011; UN-HABITAT, 2009). Sub-wards, locally known as Mtaa, are DSM’s lowest administrative level (CLUVA City Profile DSM, 2011).
Table 2: Profile of individuals, households and communities of Dar es Salaam9. Asset profile Compared to other Tanzanian regions, DSM hosts the highest (65.1%)
percentage of individuals in their working age: 15-64 years (URT, 2006). Urban unemployment however, continues to persist due to the differential
between annual migration rate (10%) and DSM’s annual economic growth (4%). The literacy rate has increased steadily over the last decades with Kiswahili
being the most dominant language (ibid.). Institutional profile Report of weak governance structures and the absence of affordable housings
especially for the poor. Actors focus on improving urban services and above all alleviate poverty. The provision and maintenance of the water supply infrastructure for example is
one of the city councils’ responsibilities whilst the wards cooperate in waste management programmes (Dodman et al., 2011).
NGOs and CBOs are acknowledged and quite active organizations in Dar es Salaam particularly in advocacy and human rights, lobbying, and service provision.
Attitudinal profile Cooperative initiatives in various forms (self-initiated or through an organization) are known to continue to shape the socio-economic path and livelihood of Tanzanians.
UPATU is a form of rotational cooperation or saving groups where members contribute monthly.
Savings and Credits Cooperatives (SACCOS) have been encouraged by both government and other stakeholder. SACCOS are considered as agencies that can alleviate poverty and are perceived as grassroots institutions that help secure participation of communities at local level. There are about 1,800 registered SACCOS in the country.
Physical urban profile
DSM features approximately 100 informal settlements such as Buguruni, Manzese Tandale, Mtoni, and Kinondoni Shamba among others. They host approx. 70% of the city’s population and 60% of the housing stock materials (CLUVA City Profile DSM, 2011; Msale, 2011).
9 Further references on Dar es Salaam: Dodman, D., Kibona, E.,.; Kiluma, L. (2011). Tomorrow is too late: Responding to Social and Climate Vulnerability in Dar es Salaam, Tanzania. Case study prepared for the Global Report on Human Settlements 2011.
Msale, C. K. (2011). Urban Land Use Governance for Climate Change Resilience. The Case of Land Use Development Control in Dar es Salaam City. Workshop Presentation, Dar es Salaam, 2011.
14
Many are characterised by densely, unplanned, and unauthorised housings often constructed with low-end building materials (ibid.). The inhabitants of these informal settlements are often unemployed or working in the informal sector.
A Community Infrastructure Upgrading Program (CIUP) was set up to improve access to infrastructure and services in unplanned and under-served areas (URT, 2004).
Little or no social services and restricted access to other basic infrastructure such as roads, storm water drains, sewage systems, or provision of electricity. Also, the lack of clean and potable water and sanitation contributes to widespread illness incl. diarrhoea, malaria and cholera (CLUVA City Profile DSM, 2011; Msale, 2011).
1.3.3 Douala
Douala is the economic capital and the largest city of Cameroon; with a population of about 2.1 million people which is 20% of Cameroon's urban population and nearly 11% of the country's total population. The city's annual growth rate is 5%, compared to a national average of 2.3%. The city is divided into six communes and each of the six has one headquarter: Douala 1 (Bonandjo), Douala 2 (Newbell), Douala 3 (Logbaba), Douala 4 (Bonassama), Douala 5 (Kotto), Douala 6 (Monako). The first five communes are urban areas while the sixth one is a rural zone. The city is led by the community council of 37 members and two government representatives. Douala is a flat coastal city with extensive swampy areas (Ndjama et al., 2008). Douala features a tropical monsoon climate with constant temperatures throughout the course of the year. The city typically features warm and humid conditions. The raining period varies through the year; the annual average precipitation is roughly 4000 mm of rainfall.
15
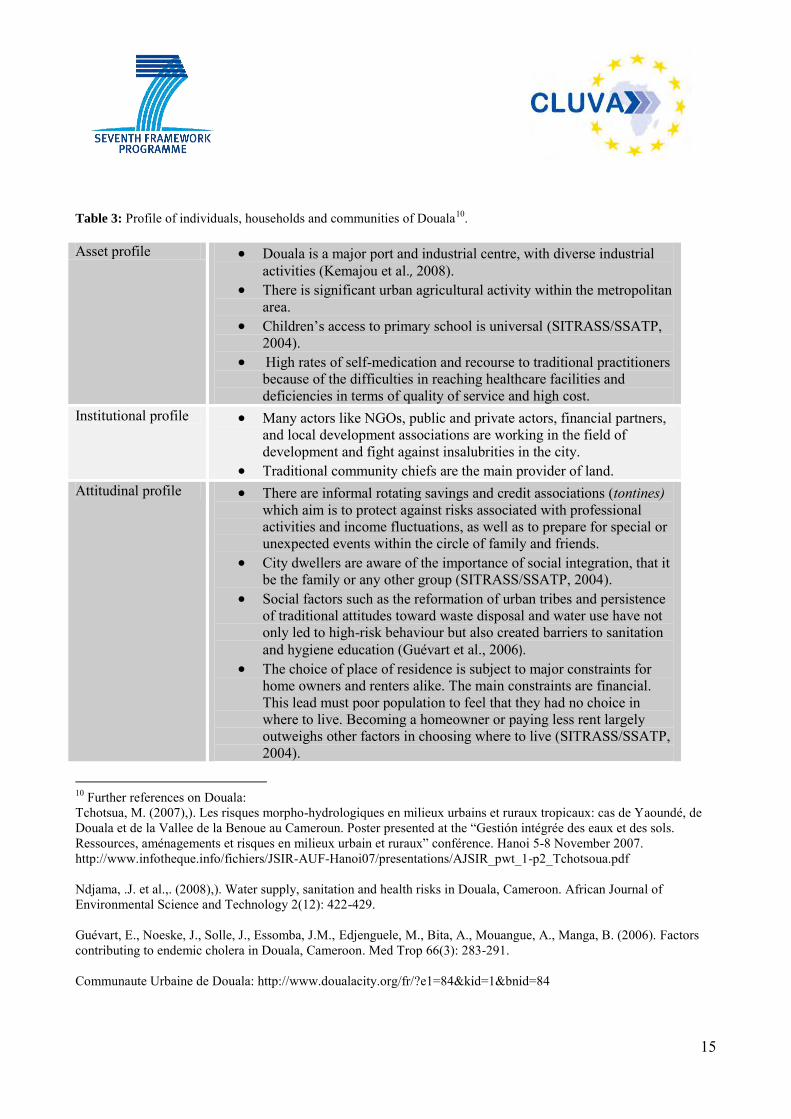
Table 3: Profile of individuals, households and communities of Douala10. Asset profile Douala is a major port and industrial centre, with diverse industrial
activities (Kemajou et al., 2008). There is significant urban agricultural activity within the metropolitan
area. Children’s access to primary school is universal (SITRASS/SSATP,
2004). High rates of self-medication and recourse to traditional practitioners
because of the difficulties in reaching healthcare facilities and deficiencies in terms of quality of service and high cost.
Institutional profile Many actors like NGOs, public and private actors, financial partners, and local development associations are working in the field of development and fight against insalubrities in the city.
Traditional community chiefs are the main provider of land. Attitudinal profile There are informal rotating savings and credit associations (tontines)
which aim is to protect against risks associated with professional activities and income fluctuations, as well as to prepare for special or unexpected events within the circle of family and friends.
City dwellers are aware of the importance of social integration, that it be the family or any other group (SITRASS/SSATP, 2004).
Social factors such as the reformation of urban tribes and persistence of traditional attitudes toward waste disposal and water use have not only led to high-risk behaviour but also created barriers to sanitation and hygiene education (Guévart et al., 2006).
The choice of place of residence is subject to major constraints for home owners and renters alike. The main constraints are financial. This lead must poor population to feel that they had no choice in where to live. Becoming a homeowner or paying less rent largely outweighs other factors in choosing where to live (SITRASS/SSATP, 2004).
10 Further references on Douala: Tchotsua, M. (2007),). Les risques morpho-hydrologiques en milieux urbains et ruraux tropicaux: cas de Yaoundé, de Douala et de la Vallee de la Benoue au Cameroun. Poster presented at the “Gestión intégrée des eaux et des sols. Ressources, aménagements et risques en milieux urbain et ruraux” conférence. Hanoi 5-8 November 2007. http://www.infotheque.info/fichiers/JSIR-AUF-Hanoi07/presentations/AJSIR_pwt_1-p2_Tchotsoua.pdf Ndjama, .J. et al.,. (2008),). Water supply, sanitation and health risks in Douala, Cameroon. African Journal of Environmental Science and Technology 2(12): 422-429. Guévart, E., Noeske, J., Solle, J., Essomba, J.M., Edjenguele, M., Bita, A., Mouangue, A., Manga, B. (2006). Factors contributing to endemic cholera in Douala, Cameroon. Med Trop 66(3): 283-291. Communaute Urbaine de Douala: http://www.doualacity.org/fr/?e1=84&kid=1&bnid=84
16
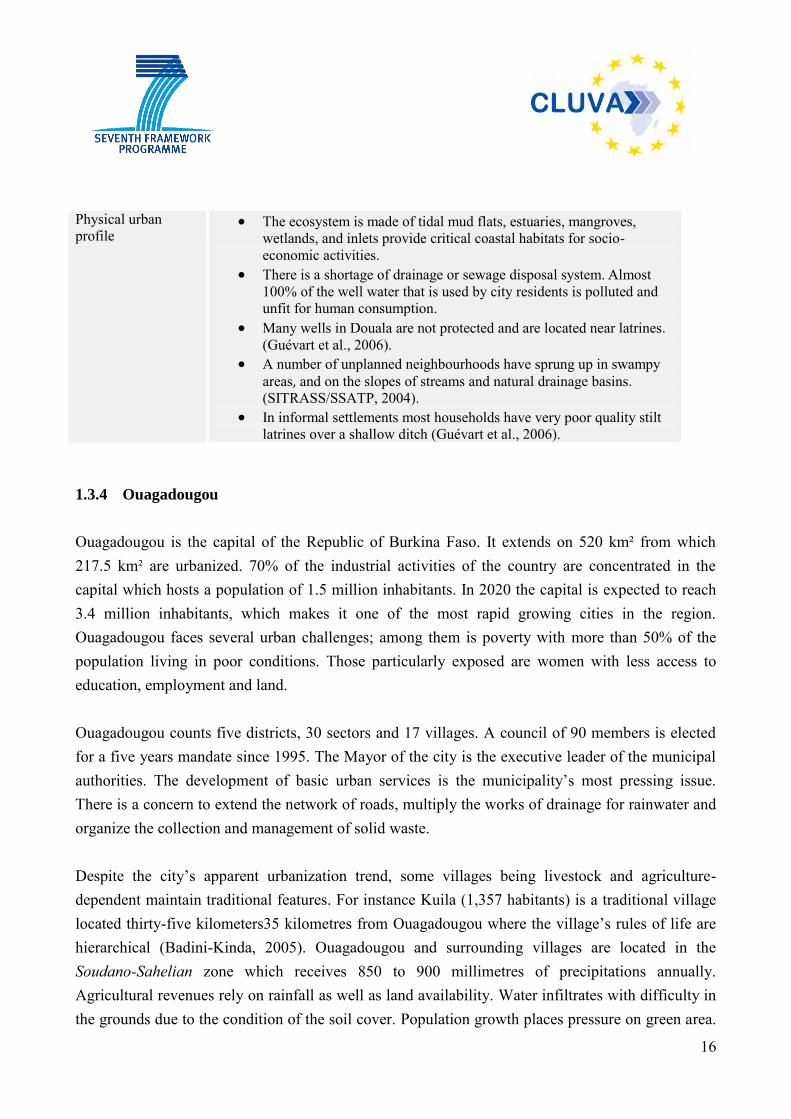
Physical urban profile
The ecosystem is made of tidal mud flats, estuaries, mangroves, wetlands, and inlets provide critical coastal habitats for socio-economic activities.
There is a shortage of drainage or sewage disposal system. Almost 100% of the well water that is used by city residents is polluted and unfit for human consumption.
Many wells in Douala are not protected and are located near latrines. (Guévart et al., 2006).
A number of unplanned neighbourhoods have sprung up in swampy areas, and on the slopes of streams and natural drainage basins. (SITRASS/SSATP, 2004).
In informal settlements most households have very poor quality stilt latrines over a shallow ditch (Guévart et al., 2006).
1.3.4 Ouagadougou
Ouagadougou is the capital of the Republic of Burkina Faso. It extends on 520 km² from which 217.5 km² are urbanized. 70% of the industrial activities of the country are concentrated in the capital which hosts a population of 1.5 million inhabitants. In 2020 the capital is expected to reach 3.4 million inhabitants, which makes it one of the most rapid growing cities in the region. Ouagadougou faces several urban challenges; among them is poverty with more than 50% of the population living in poor conditions. Those particularly exposed are women with less access to education, employment and land. Ouagadougou counts five districts, 30 sectors and 17 villages. A council of 90 members is elected for a five years mandate since 1995. The Mayor of the city is the executive leader of the municipal authorities. The development of basic urban services is the municipality’s most pressing issue. There is a concern to extend the network of roads, multiply the works of drainage for rainwater and organize the collection and management of solid waste. Despite the city’s apparent urbanization trend, some villages being livestock and agriculture-dependent maintain traditional features. For instance Kuila (1,357 habitants) is a traditional village located thirty-five kilometers35 kilometres from Ouagadougou where the village’s rules of life are hierarchical (Badini-Kinda, 2005). Ouagadougou and surrounding villages are located in the Soudano-Sahelian zone which receives 850 to 900 millimetres of precipitations annually. Agricultural revenues rely on rainfall as well as land availability. Water infiltrates with difficulty in the grounds due to the condition of the soil cover. Population growth places pressure on green area.
17
Deforestation is caused by foraging for firewood, food, and grazing. Ouagadougou’s surroundings are bare and dry, with little vegetation, while the natural, dense vegetation is preserved in specific protected areas. Three types of habitats co-exist in Ouagadougou: First, modern buildings, constituted of villas, located in residential zones. The houses built in these areas are by the private sector and proposed to the populations according to the formula of mortgage, but the hard conditions of acquisition make them inaccessible to the poor. Second, popular or traditional housing settlements found in the old districts or the newly structured quarters. Third, the informal dwellings occupied by the poor. There is no land title for the last two types of habitat, which is characterized by a low population density, poor services delivery, unsanitary conditions, and insecure tenure. Table 4: Profile of individuals, households and communities of Ouagadougou. Asset profile
Unemployment rate is estimated to reach 17 % (UN-HABITAT, 2007). Labour force is 49.8% for women and 62.8% for men.
Satellite schools and centres for ‘Non Formal Basic Education’ were created to tackle illiteracy and low level of schooling especially among women. (2 women against 5 men are taught to read and write; 1 girl against 2 boys is sent to school).
It has been reported that the morbidity rate in the capital is high compared to other African cities due to waterborne and infectious diseases (ibid.).
Institutional profile
At lowest administrative levels, problems that undermine current urban governance practices are: difficulties in the application of municipal regulations, lack of sanctions for regulations violation, ignorance of rules and regulations, lack of involvement of the local population in the decision making processes and their feeling of exclusion.
Attitudinal profile Social actors play an important role in reducing socio-cultural barriers. The focus on women is of particular importance as women living in villages live under traditional customs and practices like levirate, widowhood and sexual mutilation.
L’Association des Femmes Scientifiques, and l’Association des Femmes Elues du Burkina foster action towards giving women a place in society, improving their right and equity.
At municipal level, several associations and network groups contribute to the urban agenda (e.g. Brigade Verte focuses on urban sanitation).
Physical urban profile
The urban green structure is covered by sparse vegetation. The urban transport is dominated by motorbikes and bicycles, and is yet to
be regulated (ibid.). Spontaneous and informal settlements of lightweight low-rise types are
growing at the outskirts of the city. They generally lack access to electricity, water, sanitation and infrastructure (De Jong et al., 2000).
18
Ouagadougou features modern buildings located in new residential zones built by the private sector, traditional housing settlements found in old districts, and informal dwellings. The latter are characterized by poor services delivery and insecure land tenure.
1.3.5 Saint-Louis
The city of St. Louis is an archipelago and located on low-lying islands encompassing the Langue de Barbarie spit, Ndar Island and the Sor district along the east–west axis (Diagne, 2007). The city is surrounded by low-lying floodplains and marshes while sitting on the edge of the Sahel. As a result, St. Louis experiences periods of drought throughout much of the year and flooding during the rainy season when the river overflows. The city hosts a rapidly expanding population. It grew from 48,840 inhabitants in 1960 to 165,028 in 2005. With an annual rate growth of 2.4%, St. Louis has at present about 900,000 inhabitants and faces the challenge of providing services for a rapidly growing population from limited resources. Urban growth contributes to the cluster of individuals in areas at risk of flooding. Urban growth, poverty and natural hazards constitute main problems for the socioeconomic stability in the city. St. Louis is divided into 20 districts and 22 quarters or neighbourhoods. 28.8% of the population is living in informal settlements (CLUVA City Profile St. Louis, 2011). Some neighbourhoods are particularly at risk due to flooding and landslides caused by altered drainage patterns and destabilized slopes. In the Langue de Barbarie for instance 80,000 people suffered from the rise of sea level and inadequate access to resources (ibid.). As a means of flood prevention, the population of low-lying areas have learned to make barriers against floodwaters, but this generates additional sanitation issues causing further challenges in St. Louis. Table 5: Profile of individuals, households and communities of St. Louis. Asset profile
The main economic activity is fishing. 33% of households feature low income revenue and unemployment. The majority of those affected by floods are very poor. Guet ndar quarter
is one of the most populated zones of West Africa with 15 people per room (CLUVA City Profile St. Louis, 2011).
Institutional profile
Local organisations regrouped in Conseils de Quartier CQ coordinate municipal actions relative to urban services.
Stakeholders and actors who interact at organizational levels range from
19
public officers, financial partners, and private investment stakeholders to NGO organisations agents.
Attitudinal profile Social actors like NGOs, and local development associations serve as points of contact with local residents (ibid.)
Physical urban
profile Urban ecosystem is made by continental and aquatic vegetation which
constitute a great resource both touristic and environmental (e.g. the Guembeul Reserve on the outskirts of St. Louis and the Langue de Barbarie National Park).
30% of households are connected to the network of the Senegal national office of sanitation.
St. Louis features formal popular buildings (35.9%), informal popular buildings (28.75%), traditional and rural buildings (18.32%), colonial buildings (7.77%), and planning houses build by both private and public sectors which represents 1.45% (ibid.).
CLUVA cities are not exempt to natural disruptions. In fact severe weather events are expected to increase in the continent. Climatic threats ranging from drought, flood and windstorms events, change in rainfall patterns, sea level rise and decrease in river basin and water availability are predicted to have negative effects on the human, economic and environmental assets of populations. (Parry et al., 2007; UN-HABITAT, 2010; Vordzorgbe UN/ISRD, 2007). According to EM-DAT, Burkina Faso has experienced 11 floods between 1991 and 2009. The last flood reported in September 2009 affected 11 of a total of 13 regions and was reported as one of the worst floods in the history of the country. A Post Disaster Needs Assessment (PDNA) reported loss of human life as well as significant damages in the housing sector with 60% of the household sanitation facilities destroyed (Government of Burkina Faso et al., 2009). This highlights the severity of disruptions caused by some weather events, weakening therefore the urban environment and the overall livelihood of local populations. The tables below summarize different climatic hazards stressed in the reviewed literature on CLUVA cities and highlights some weather related events that have been reported. Table 6: Climatic stress identified in CLUVA cities. Addis Ababa Douala Dar es Salaam Ouagadougou St. Louis
Higher temperature and heat wave
Sea level rise Heavy precipitation
20
Fluvial floods Urban sanitary and drainage floods
Decreased precipitation Drought Water scarcity Table 7: Identified weather related events in CLUVA cities. Identified weather related events
Addis Ababa, Ethiopia History of droughts which affects water resources and reduce the availability of fresh water and affect food insecurity and human health.
Dar es Salaam, Tanzania
Flood and vector and water borne diseases such as malaria. Decrease in river basin run-off and water availability for agriculture and
hydropower generation. Douala, Cameroon Sea level rise and floods affecting the livelihood of the densest coastal
city of Cameroon. Ouagadougou, Burkina Faso
Incidence of high temperatures, heat waves and dust storms. Variable rainfall provoking floods and damaging the physical
infrastructure and existing drainage system and also affecting urban agriculture.
Cholera and malaria outbreak during rainy season pose a chronic health problem.
St. Louis, Senegal Sea level rise exerting pressure on the availability of land and the city development.
Adapted from CLUVA City Profiles, 2011; Government of Burkina Faso et al., 2009; UN-HABITAT, 2007, 2008, 2009 Reports on the state of cities concentrated along coastlines such as St. Louis, Dar es Salaam and Doula stress the vulnerability of the spatial environment and the uncertainty of future developments due to erosion, flooding and sea level rise. Burkina Faso, Ethiopia and Senegal are priority countries of the World Bank’s Disaster Risk Management for 2009 - 201111. A common threat they face is the incidence of increasing floods in their main cities (Ouagadougou, Addis Ababa and St. Louis), all showing growing urbanization trends (UN-HABITAT, 2010). Urban flood in Ethiopia is relatively new, the country which has a long history of recurring drought, is mostly known for its water scarcity, lack of farmland and famines. However some early signs of 11 See http://www.gfdrr.org/gfdrr/sites/gfdrr.org/files/publication/DRM_CountryPrograms_2011.pdf
21
flood events in recent years indicate that the city may have to prepare to adapt to increasing water flow events, which will further restrict access to fresh water in the city. Addis Ababa’s City Brigade Office reported 23 areas exposed to floods accidents which represents the second urban threat after fires incidents with 57 areas exposed to urban fires (Oral information, Workshop June 2011).
Some identified unplanned settlements in Dar es Salaam are often flooded due to poor soil infiltration, blockage of natural storm water channels and the malfunction of storm water drainage systems. In addition, rising sea level12, and erosion along the coast pose serious challenges to municipal councils. Dodman et al. (2011) stress there is however a growing risk awareness at community levels. Local-based resolutions such as the ones developed by Tandale residents against flood (e.g. moving household items and personal belongings to elevated areas before flooding occur or building protective walls) need to be included in broader strategic responses to prevent present and future threats. Lowlands characterize the littoral area of Douala, fed mainly by the River Wouri. The city, which is the most densely populated area of Cameroon’s coastal zone, is often inundated as it is also the case of Ouagadougou which paradoxically features high temperatures and unpredictable and variable rainfall persist. Droughts, floods, heat waves and dust storms are the major climatic hazards in the capital. They in consequence enhance desertification, land degradation and population migration. Although it is unclear how changes in precipitation will affect Ouagadougou, there is however a need to address the coping capacity of the population which face severe damages when flood and other severe weather events occur. St. Louis is located in a wetland area that extends for 10 kilometres along a seafront and has experienced frequent river flooding. Along with Ouagadougou and Dar es Salaam, St. Louis features a soil cover inadequate to water filtration in addition with the challenges of managing wastewater, household waste and also rain and river water. Following the introduction of African CLUVA cities, the subsequent chapter will deal with the concept of vulnerability. It includes its historical background and presents some selected definitions of “vulnerability”, “social vulnerability” and “urban vulnerability”. The final section provides a description of our understanding of “social vulnerability”.
12 Increasing headwater waves are modifying the level of the ocean’s surface by about 200 m in the past five decades affecting the viability of coastal life (Dodman et al., 2011).
22
2 VULNERABILITY: BACKGROUND AND SELECTED DEFINITIONS
The concept of vulnerability which has been recently applied to climate change impact assessments is a multifaceted and contested construct. It travels along with terms such at risk, natural hazards, coping and adaptive capacity, sensitivity, resilience, poverty and even food security in disaster and development studies literature as well as in climate change discourses. The existence of numerous definitions on vulnerability lies in the fact that there are different approaches and perspectives of what vulnerability represents. Birkmann (2006) identified over 25 different proposals of concepts, methods and systematizations of vulnerability which in his view reflects its broad and complex nature. There isn’t indeed a single concept of vulnerability. The review of the existing literature shows that the term stretches from being considered as an internal risk factor to being viewed as a multiple structure concept which integrates different spheres of knowledge (Vogel and O’Brien, 2004; O’Brien et al., 2007). Such spheres include the physical, environmental, institutional and social factors that investigate the sensitivity level of certain group or population to climate induced threats. The approach of the social sciences to issues related to a natural disaster stretches from the 1950s (Cardona, 2004). Studies evolved from the compilation of individual and collective reactions into multidimensional discourses stressing the fundamental social character of vulnerability. 2.1 VULNERABILITY ROOTS AND HISTORICAL BACKGROUND
Early studies on vulnerability dealt with droughts and famines13. Under the impression of the devastating famine crises in the African Sahel Region during the 1970s and 1980s, increasing attention was paid to the underlying causes of these famines. In trying to explain the occurrences of these processes two concepts, namely that of ‘adjustment’ and that of ‘poverty’ were rejected as too simplistic.
13 The following short historical reconstruction is based on Kuhlicke, C.; Steinführer, A. (forthcoming). Social vulnerability to flooding. In: Bernhofer, C.; Schanze, J.; Seegert, J. (Eds.). Textbook on Integrated Flood Risk Management". Springer, Berlin.
23
The term ‘adjustment’ goes back to the work of Harlow Barrows. In 1923 Barrows introduced the term “adjustment” to the field of geography, emphasizing the cultural efforts to adapt to changing natural conditions (Barrows, 1923). Barrow’s doctoral student Gilbert F. White took up this concept and incorporated it in his ground-breaking dissertation thesis on flood hazards and flood plain management (White, 1945). This piece of work was one of the first investigations on flood hazards, which, more rigorously than most of the research work before incorporated social aspects in order to explain the occurrences of floods. Based on this work White develop the so call “hazard research paradigm” (cf. also Kates and Burton, 1986; White, 1974). Both White’s emphasis on the individual’s decisions and perceptions as well as his underlying understanding of the human-environment relation was severely criticized. According to the critics the hazard research paradigm would imply that personality, perception and experience are of prime importance for understanding human adjustments; questions of power and political struggle are completely left out (Hewitt, 1983, 1997). In another strand of research, which is rooted in development research, the simple equation that poverty would result in starvation and malnutrition was rejected as too simplistic to explain collective crises such as famines (Bohle and Krüger, 1992). It was argued that this concept of poverty would not allow the consideration of the complex and diverse patterns of strategies with which even the poorest among the poor try to cope with and adapt to famine risks (cf. also Bohle and Glade, 2008). In this context, the entitlement theory of Amartya Sen (1983) became particularly influential (ibid., 1983). Sen convincingly showed that the devastating Bengal famine of 1943 had not been caused by a lack of food. Although millions of people starved to death, there was more food available than in previous years. Sen could prove that rice became an excellent investment during this time. As a consequence, it became more expensive and only wealthier people could afford it. Marginalized people, such as landless labourers or fishermen living in the rural areas of Bengal, however, could no longer afford to buy rice and were therefore starving to death. Both the rejection of the simplifying assumptions underlying White’s work as well as the work of Sen helped to develop the concept of vulnerability. As a result of both strands of reasoning, social vulnerability is a concept which: (1) Neither considers individual perceptions and decisions nor natural processes as solely relevant for explaining the occurrence of natural disasters and
24
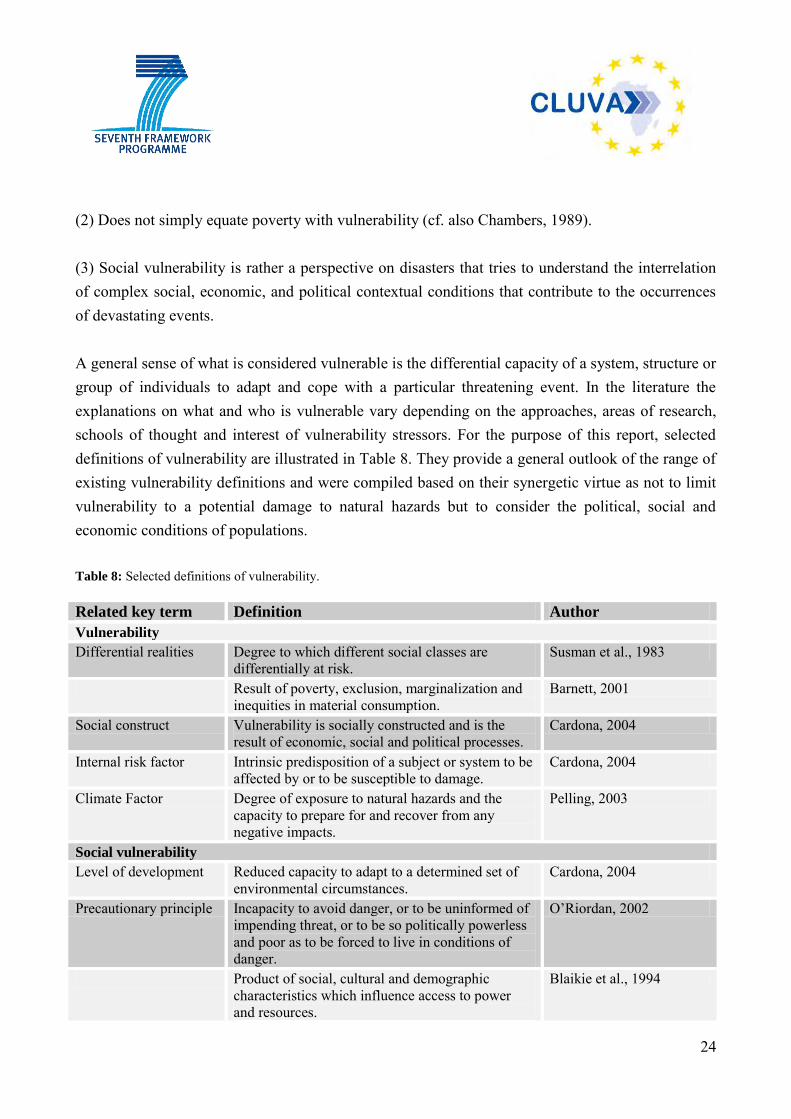
(2) Does not simply equate poverty with vulnerability (cf. also Chambers, 1989). (3) Social vulnerability is rather a perspective on disasters that tries to understand the interrelation of complex social, economic, and political contextual conditions that contribute to the occurrences of devastating events. A general sense of what is considered vulnerable is the differential capacity of a system, structure or group of individuals to adapt and cope with a particular threatening event. In the literature the explanations on what and who is vulnerable vary depending on the approaches, areas of research, schools of thought and interest of vulnerability stressors. For the purpose of this report, selected definitions of vulnerability are illustrated in Table 8. They provide a general outlook of the range of existing vulnerability definitions and were compiled based on their synergetic virtue as not to limit vulnerability to a potential damage to natural hazards but to consider the political, social and economic conditions of populations. Table 8: Selected definitions of vulnerability. Related key term Definition Author
Vulnerability
Differential realities Degree to which different social classes are differentially at risk.
Susman et al., 1983
Result of poverty, exclusion, marginalization and inequities in material consumption.
Barnett, 2001
Social construct Vulnerability is socially constructed and is the result of economic, social and political processes.
Cardona, 2004
Internal risk factor Intrinsic predisposition of a subject or system to be affected by or to be susceptible to damage.
Cardona, 2004
Climate Factor Degree of exposure to natural hazards and the capacity to prepare for and recover from any negative impacts.
Pelling, 2003
Social vulnerability
Level of development Reduced capacity to adapt to a determined set of environmental circumstances.
Cardona, 2004
Precautionary principle Incapacity to avoid danger, or to be uninformed of impending threat, or to be so politically powerless and poor as to be forced to live in conditions of danger.
O’Riordan, 2002
Product of social, cultural and demographic characteristics which influence access to power and resources.
Blaikie et al., 1994
25
Urban vulnerability
Function of human behaviour
Degree to which socioeconomic systems and physical assets in urban areas are either susceptible or resilient to the impact of natural hazards.
Mileti, 1999
Threat to wellbeing Lack of resilience to changes that threaten welfare; these can be environmental, economic, social and political, and they can take the form of sudden shocks, long-term trends, or seasonal cycles.
Moser, 2009
2.2 SOCIAL VULNERABILITY The term ‘social vulnerability’ describes in broad terms how susceptible people are to a hazard. For understanding and explaining this susceptibility the hazard itself (e.g. river flood, earthquake or fire) is of subordinate interest. On the contrary, the main focus of social vulnerability research is not the height of a flood or the intensity of an earthquake that defines its social, psychological, health and economic consequences; it is rather within the societal context that one can truly comprehend and explain how severe the consequences are. Social vulnerability research argues that it makes a difference whether a flood hits a wealthy or a poor community. From this perspective, an overall meaning of social vulnerability is: The specific social inequality of people in the context of a disaster.
This view is closely linked with the definition proposed by Wisner et al. (2004), who attribute social vulnerability to a “combination of factors that determine the degree to which someone’s life, livelihood, property and other assets are put at risk” (ibid: 11). This understanding focuses on the social dimensions of a hazard and a disaster respectively. It is very much inspired by sociological and geographical writings in social theory and development studies, but it has also been applied by natural hazards research. There are two basic assumptions at the core of social vulnerability. First, it is a relational construct as it relates “something or someone who is vulnerable to something else as a source of potential harm because of some property of the subject or the object” (Green, 2004: 323). It is hence a complex concept to place, for instance, a river and a household in relation to each other (cf. also Bohle and Glade, 2008). It is individuals, households, communities, organizations, regions or entire states that can be vulnerable to something. In that sense there is a reference point to social
26
vulnerability. Vulnerable individuals are exposed to a type of natural hazards or to urban structures and societal processes that affect them. Social vulnerability always needs a reference point (e.g. a certain type of risk – “vulnerability to what”) and a specific context (which transforms a risk into a hazard – “vulnerability of what and of whom”).
Second, it is not only the exposure of a household that is important but also people’s coping and adaptive capacities – this has an important implication, as it treats the people potentially or actually affected not as passive objects of a certain hazard, but as persons who are capable of acting. It implies a more dynamic side related to the level of awareness of a group of individuals and their knowledge about natural hazards, their motivation and attitude to act and take responsibility for their safety as well as their ability to access to different type of resources (i.e. financial aid, information) to prepare, cope with and recover from severe weather events. We therefore propose to understand vulnerability in accordance to Blaikie et al. (1994: 9) as “the characteristics of a person or group in terms of their capacity to anticipate, cope with, resist, and recover from the impact of a natural hazard". This definition highlights both the social and temporal dimensions of a disaster and focuses on the question of how individuals and social groups anticipate, resist and cope with, as well as recover from, a disaster or other stressing events. During workshops conducted in Burkina Faso, Ethiopia and Tanzania the concept of social vulnerability was discussed. In general, the subject of lack of assets (i.e. poverty, health and education), lack of institutional coping mechanisms and deficient infrastructure as well as other land tenure factors were raised in association with the construct of ‘social vulnerability’. Based on discussions with our research partners, observation made in specific study sites during field trips, and preliminary interviews with stakeholders, it became clear that the social vulnerability of studied subjects in CLUVA must be coupled with the physical and institutional dimension of vulnerability. Our Ouagadougou partner proposes to understand social vulnerability as followed: “La vulnérabilité sociale peut être caractérisée par une situation de précarité liée à l’exclusion ou l’absence de droits civiques (aspects sociaux et politiques). Elle se caractérise également par un état de déficit en matière d’éducation, de logement décent et de besoins fondamentaux comme l’alimentation, l’habillement, la santé, l’emploi et les ressources financières.”
27
During the workshop conducted at the EiABC14 a contextual definition of social vulnerability in the context of Addis Ababa was proposed by Dr. Katema as followed: “Insecurity and sensitivity in the wellbeing of the individuals, households and communities in the face of changing conditions – such as the case with the deterioration in the environmental quality that bring people to the status of defenceless, insecurity and exposure to risk, shock and stress” Following the history of debates on vulnerability and a presentation of current definitions with particular focus on social vulnerability; the next chapter will focus on assessment approaches. The first section provides an overview on a range of approaches used in different conceptional frameworks and for different hazards. In the second section we propose a vulnerability ladder as an appropriate assessment approach in the CLUVA context.
14 Social vulnerability definition proposed by Dr. Katema from EiABC was drafted during the Parallel session- Day 2 of the CLUVA workshop in Ethiopia in June 2011.
28
3 VULNERABILITY ASSESSMENT: APPROACHES AND
FRAMEWORK
Important facts for the assessment of vulnerability in CLUVA are the increasing severity of psychological, economic, social and physical damages due to natural hazards; the shortcomings of the social and technical infrastructure with regards to the rate of urban growth; the degradation of the ecosystem; the complexity of land management/ market, its lack of consistency and transparency; and the limited capacity of urban governance at low administrative levels. In addition, poverty manifested through a lack of asset (education, health, material goods) pervades throughout CLUVA cities. The numbers put forward by UN-HABITAT’s State of African Cities (2010) show uneven progress towards improving the conditions of slum dwellers with slower development in East and West Africa. However, considering poverty as a principal cause or condition of vulnerability is not enough nor adequate in CLUVA. Even though poor people are usually among the most vulnerable, not all vulnerable people are poor; this is one of the central insights from vulnerability research. It was highlighted by some of the first vulnerability researchers that the simple equation that poverty would result in starvation and malnutrition is too simplistic to explain collective crises such as famines (Bohle and Krüger, 1992). It was argued that the concept of poverty would not allow the consideration of the complex and diverse patterns of strategies with which even the poorest among the poor try to cope with and adapt to famine risks (cf. also Bohle and Glade, 2008). The rejection of any simplifying causalities helped to develop the concept of vulnerability and formed the basis of the concept of vulnerability as developed paradigmatically by Chambers (1989). Also in the context of the African cities of the CLUVA project particular features of poverty are rather dynamic, context depended and manifest in different ways. For instance, since 2006 to this date, electricity rationing occurs in Dar es Salaam. This disruption is the result of low water levels in the dams that generate power (Dodman et al., 2011). This disruption related to a period of drought affects in fact dwellers from all socio-economic groups to different degree. Apart from that, it would be too simplistic to only consider the exposure of people to various hazards: this idea has been contested, among other, by Chambers (1989), Bankoff (2001) and Cardona (2004) suggesting that vulnerability is not merely external to people. Individuals have the ability to minimize their risk when communication, education, participation and accountability are
29
put forward in the context of risk management. Moreover, field trips taken in three CLUVA cities and preliminary exchanges with locals have shown that the risk people face has different degree depending on their capacities and their access to resources. While poor constructions, location in disaster prone areas and limited accessibility among other conditions are signs linked to physical vulnerability, some social arrangements witnessed in Addis Ababa and Dar es Salaam in the form of family support groups, and micro-financing systems appear to be a determinant form of social wealth that may serves as an indicator of capacity and resilience. We therefore conclude that there is a necessity to develop an understanding of vulnerability and an assessment procedure that allows capturing the complex, embedded and nuanced manifestations of vulnerability in an urban context. We assume that vulnerability is often co-produced in everyday interactions among residents and local authorities their environment and infrastructures. This implies that vulnerability needs to be more contextualized, not only empirically but also conceptually (cf. also Kuhlicke et al., 2011). 3.1 SELECTED APPROACHES, FRAMEWORKS, MODELS AND PRACTICES OF
VULNERABILITY ASSESSMENT A common approach for assessing vulnerability is the development of conceptual models which enables those concerned with the effect of certain climatic threats for a particular region, to identify the vulnerable systems and population segments most affected. The importance of assessing vulnerability emerges from the idea of understanding and conceptualising the condition of people when affected by a hazard. This is closely related to the EU Commission’s risk assessment guideline in which vulnerability is defined as “the characteristics and circumstances of a community, system or asset that make it susceptible to the damaging effects of a hazard” (UNISDR, 2009). As much as there isn’t a concise definition of vulnerability, there is no universal model or approach towards assessing the characteristics of vulnerable groups. Among the variety of approaches to assessing vulnerability are those that combines hazard and vulnerability in a risk reduction perspective based on an IPCC approach which defines vulnerability “as a function of the character, magnitude and rate of climate change in variation to which a system is exposed, the sensitivity and adaptive capacity of that system” (Parry et al., 2007: 6). Approaches relative to the IPPC model
30
centre their analysis on broad external vulnerability causes. For instance, the BBC model (Birkmann, 2006) explicitly links vulnerability to the three pillars: environment, society and economy in a form of cyclical loop in order to define the causes of vulnerability. While the Move model (ibid.) understands society and the environment as a coupled system. Here, the exposure, vulnerability and lack of resilience of society can lead to economic, social and environmental risks. It was observed that aspects of the system can be influenced by risk governance. The international community defines the measuring of vulnerability as a key activity in the final document of the World Conference on Disaster reduction, the Hyogo framework for Action 2005-2015 (UN, 2005). The Risk Assessment and Mapping Guidelines for Disaster Management issued by the European Commission (2010) recognizes the different scales at which different social and economic dimensions of vulnerability operate and stresses the need to improve coherence and consistency among risks assessments. The guideline highlights the necessity to incorporate factors related to human, economic, environmental, political and social realm when examining the impacts15 of hazards. Thus contextualising vulnerability not only responds to the objectives of CLUVA but also echoes the need to improve coherence and consistency of risk assessment practices. The following subjects with regard to national vulnerability analysis were stressed: Identification of elements and people potentially at risk (exposure) Identification of vulnerability factors/ impacts (physical, economic, environmental, social/political) Assessment of likely impacts Analysis of self-protection capabilities reducing exposure or vulnerability Table 9 illustrates selected frameworks, models, approaches and practices of vulnerability assessments undertaken in developing contexts. The conceptual frameworks and models have in common an understanding of local assessment-based values with a problem-solving component. These approaches look first at understanding the social context of vulnerability and how it progress in specific areas. Participatory approaches focus on creating action plans at community levels enabling actors to share their results and take responsibility for their community. The focus is on a private domain 15 By impacts the guideline refers to a number of quantified and non-quantified indicators that could potentially be manipulated through a semi-quantitative scale. The guideline takes into account vulnerability interactions in multi-risks assessments (European Commission, 2010: 17).
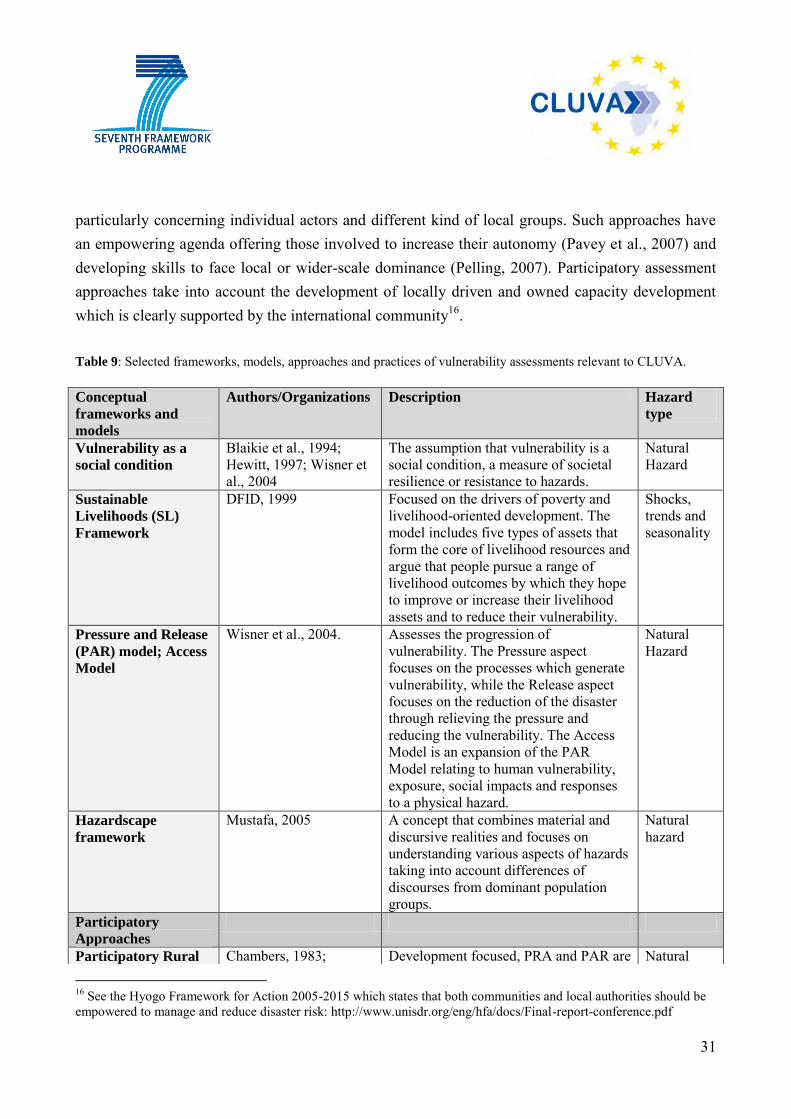
31
particularly concerning individual actors and different kind of local groups. Such approaches have an empowering agenda offering those involved to increase their autonomy (Pavey et al., 2007) and developing skills to face local or wider-scale dominance (Pelling, 2007). Participatory assessment approaches take into account the development of locally driven and owned capacity development which is clearly supported by the international community16. Table 9: Selected frameworks, models, approaches and practices of vulnerability assessments relevant to CLUVA.
16 See the Hyogo Framework for Action 2005-2015 which states that both communities and local authorities should be empowered to manage and reduce disaster risk: http://www.unisdr.org/eng/hfa/docs/Final-report-conference.pdf
Conceptual
frameworks and
models
Authors/Organizations Description Hazard
type
Vulnerability as a
social condition Blaikie et al., 1994; Hewitt, 1997; Wisner et al., 2004
The assumption that vulnerability is a social condition, a measure of societal resilience or resistance to hazards.
Natural Hazard
Sustainable
Livelihoods (SL)
Framework
DFID, 1999 Focused on the drivers of poverty and livelihood-oriented development. The model includes five types of assets that form the core of livelihood resources and argue that people pursue a range of livelihood outcomes by which they hope to improve or increase their livelihood assets and to reduce their vulnerability.
Shocks, trends and seasonality
Pressure and Release
(PAR) model; Access
Model
Wisner et al., 2004. Assesses the progression of vulnerability. The Pressure aspect focuses on the processes which generate vulnerability, while the Release aspect focuses on the reduction of the disaster through relieving the pressure and reducing the vulnerability. The Access Model is an expansion of the PAR Model relating to human vulnerability, exposure, social impacts and responses to a physical hazard.
Natural Hazard
Hazardscape
framework Mustafa, 2005 A concept that combines material and
discursive realities and focuses on understanding various aspects of hazards taking into account differences of discourses from dominant population groups.
Natural hazard
Participatory
Approaches
Participatory Rural Chambers, 1983; Development focused, PRA and PAR are Natural
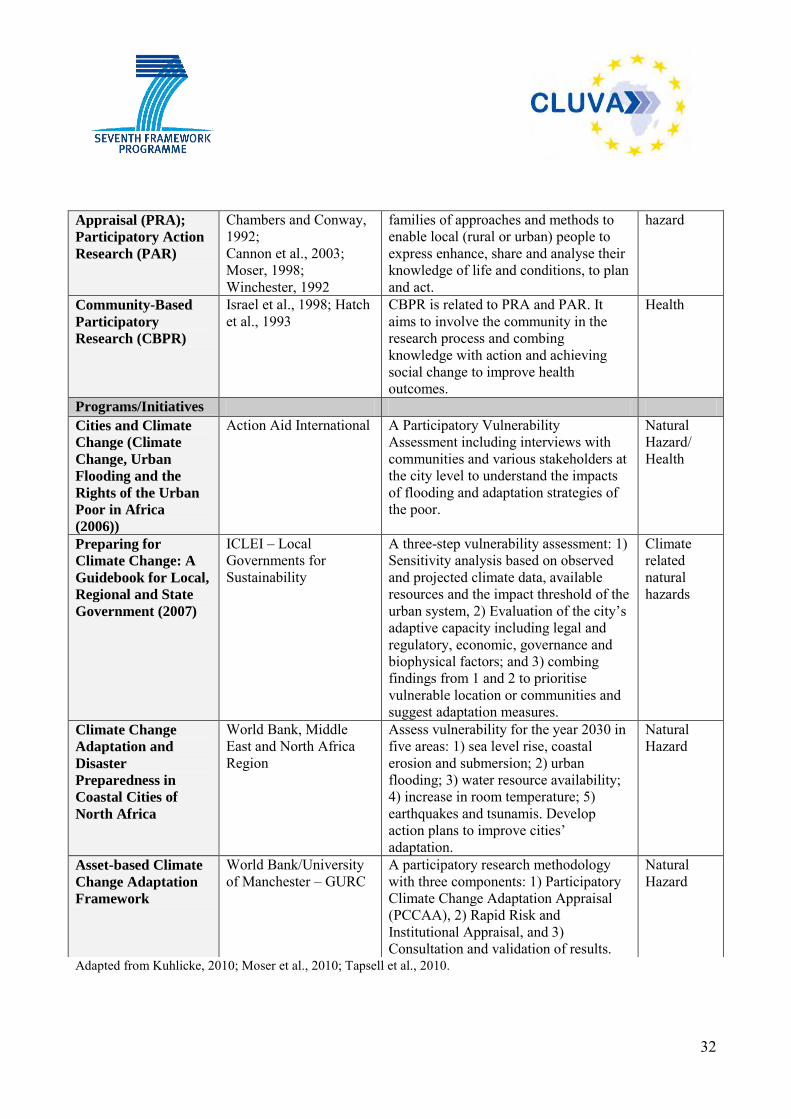
32
Adapted from Kuhlicke, 2010; Moser et al., 2010; Tapsell et al., 2010.
Appraisal (PRA);
Participatory Action
Research (PAR)
Chambers and Conway, 1992; Cannon et al., 2003; Moser, 1998; Winchester, 1992
families of approaches and methods to enable local (rural or urban) people to express enhance, share and analyse their knowledge of life and conditions, to plan and act.
hazard
Community-Based
Participatory
Research (CBPR)
Israel et al., 1998; Hatch et al., 1993
CBPR is related to PRA and PAR. It aims to involve the community in the research process and combing knowledge with action and achieving social change to improve health outcomes.
Health
Programs/Initiatives Cities and Climate
Change (Climate
Change, Urban
Flooding and the
Rights of the Urban
Poor in Africa
(2006))
Action Aid International A Participatory Vulnerability Assessment including interviews with communities and various stakeholders at the city level to understand the impacts of flooding and adaptation strategies of the poor.
Natural Hazard/ Health
Preparing for
Climate Change: A
Guidebook for Local,
Regional and State
Government (2007)
ICLEI – Local Governments for Sustainability
A three-step vulnerability assessment: 1) Sensitivity analysis based on observed and projected climate data, available resources and the impact threshold of the urban system, 2) Evaluation of the city’s adaptive capacity including legal and regulatory, economic, governance and biophysical factors; and 3) combing findings from 1 and 2 to prioritise vulnerable location or communities and suggest adaptation measures.
Climate related natural hazards
Climate Change
Adaptation and
Disaster
Preparedness in
Coastal Cities of
North Africa
World Bank, Middle East and North Africa Region
Assess vulnerability for the year 2030 in five areas: 1) sea level rise, coastal erosion and submersion; 2) urban flooding; 3) water resource availability; 4) increase in room temperature; 5) earthquakes and tsunamis. Develop action plans to improve cities’ adaptation.
Natural Hazard
Asset-based Climate
Change Adaptation
Framework
World Bank/University of Manchester – GURC
A participatory research methodology with three components: 1) Participatory Climate Change Adaptation Appraisal (PCCAA), 2) Rapid Risk and Institutional Appraisal, and 3) Consultation and validation of results.
Natural Hazard
33
3.2 CLUVA VULNERABILITY LADDER IN URBAN AREAS
At the centre of the model for a vulnerability ladder in urban areas we take into account the generic attributes of vulnerability to natural disaster and weather events. We understand it as a concept that aims to understand and explain the social reasons for the production of risky situations and hazardous developments. In this sense, we put the social, economic, political and cultural causes for the production of vulnerable conditions at the forefront of our analysis (Blaikie et al., 1994).
The vulnerability ladder exposed below integrates four specific dimensions of vulnerability - asset, institutional, attitudinal and physical - as a collective umbrella of vulnerability to the impacts of a disaster. This umbrella follows the work of Moser (1998), Moser et al. (2010), Mustafa (2005), and Mustafa et al. (2010) who have used these terms before.
In the following we introduce the vulnerability ladder more in-depth. The first component of the ladder considers at the heart of our assessment, the generic components of vulnerability which takes into account the exposure, susceptibility/sensitivity and coping and adaptive capacity of a system. Subsequently, the ladder stresses the resources and capacities that individuals and groups have when faced with a natural disaster (i.e. asset). It then recognizes urban governance at local levels as central in any inquiry on vulnerability (i.e. institutional). It also considers aspects of trust and social inclusion, network and risk awareness as key items to understand the urban dynamics when a disaster occur (i.e. attitudinal) and finally acknowledges the state of the urban environment within which all the above dimension interact (i.e. physical).
By integrating asset, institutional, attitudinal and physical vulnerability, an explicit linkage between CLUVA tasks and work packages occur. For instance, we propose to assess some physical components of vulnerability that deals with the conditions of the urban built environment. This includes for instance the local use and management of green structure (Task 2.2) which in turn plays an important role with livelihood and other social considerations of vulnerability. There lies a close link between Task 2.2 and Task 2.3. Moreover, we aimed at investigating adaptation mobilization processes at local levels, in other words how actors get together to solve a common problem and how their voices are heard at higher government levels. This requires a close collaboration with CLUVA partners focused on urban planning and governance systems in WP3.
34
3.2.1 Generic components of vulnerability: Coping/Adaptive Capacity, Susceptibility /
Sensitivity and Exposure
At the centre of the model for a vulnerability ladder in urban areas we take into account the generic attributes of vulnerability to natural disaster and weather events. We understand it as a concept that aims to understand and explain the social reasons for the production of risky situations and hazardous developments. In this sense, we put the social, economic, political and cultural causes for the production of vulnerable conditions at the forefront of our analysis (Blaikie et al., 1994).
A closer look at the various conceptions of vulnerability (for an overview see Hufschmidt, 2011) reveals that vulnerability is quite often, although mostly implicitly, distinguished in a phenomenological dimension and a causal dimension (Kuhlicke, 2010). The phenomenological dimension tries to capture how vulnerability appears in different societal contexts. The causal dimension is based on assumptions about the relationship between causes and effects. This dimension aims to explain the reasons why a group of people, for instance, is more exposed to environmental risks than others.
The causal dimension is interested in explaining the reasons for why a group of people does not have the capacity to influence their fortunes and/or why a group of persons is more exposed to hazards than others. Hence, it is interested in uncovering the causal forces at work defining vulnerability of actors. In vulnerability research traditionally, the most important causes are seen in the socio-political-economic structures. This view is, for instance, explicated by Watts and Bohle who aim to unravel the “causal forces of hunger and famine” (ibid., 1993: 43). They identify causal powers such as entitlements, empowerment and political economy that cause specific effects; that are vulnerable conditions. Another prominent example is presented in Blaikie and his colleagues in ‘At Risk’ (Blaikie et al., 1994); in their ‘Disaster Pressure and Release Model’ (PAR) they identify root causes translating into dynamic pressures and resulting into unsafe conditions. Figure 1 illustrates the conceptual framework for vulnerability to a natural hazard in which the coping and adaptive capacities relates to what Chambers (1989) defines as the internal side of vulnerability and refers to individuals or a group of individuals and considers their abilities to come to terms with stressing, threatening or damaging events by coping with or adapting to them. Susceptibility/sensitivity describes the preconditions to suffer harm because a person or a group experiences some level of fragility or disadvantageous conditions. Exposure simple describes the physical precondition to be harmed (cf. also Fuchs et al., 2011).
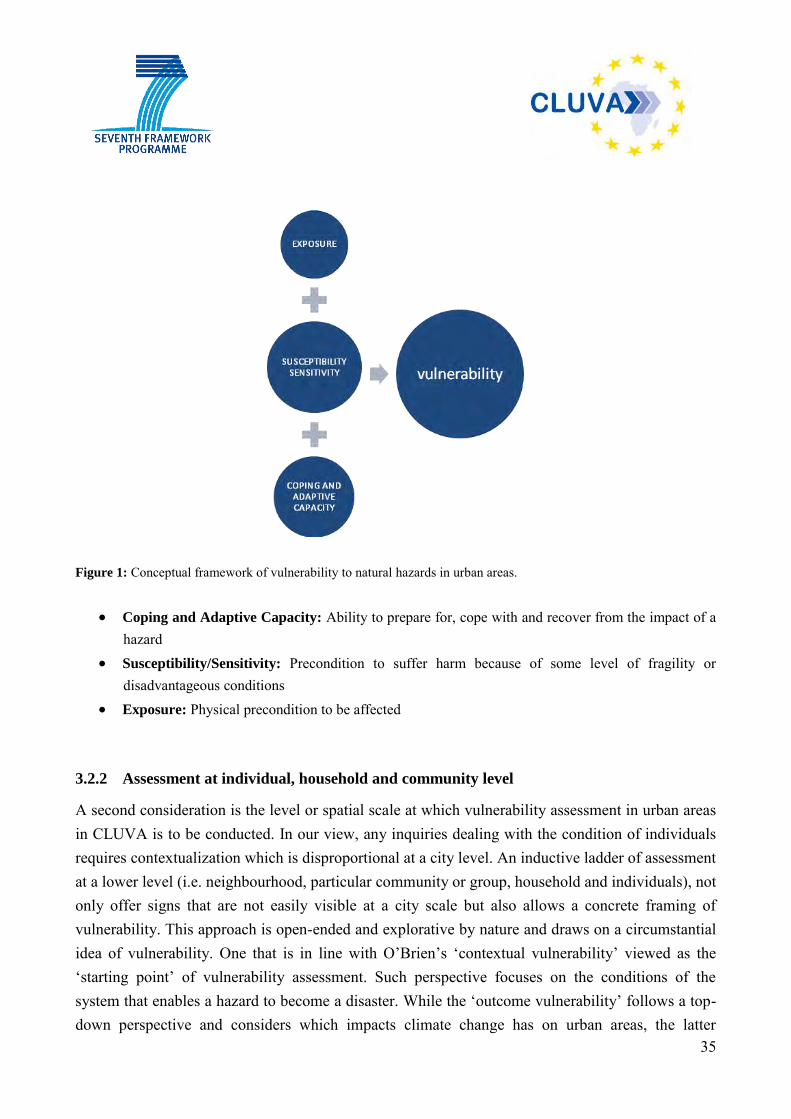
35
Figure 1: Conceptual framework of vulnerability to natural hazards in urban areas.
Coping and Adaptive Capacity: Ability to prepare for, cope with and recover from the impact of a hazard
Susceptibility/Sensitivity: Precondition to suffer harm because of some level of fragility or disadvantageous conditions
Exposure: Physical precondition to be affected 3.2.2 Assessment at individual, household and community level
A second consideration is the level or spatial scale at which vulnerability assessment in urban areas in CLUVA is to be conducted. In our view, any inquiries dealing with the condition of individuals requires contextualization which is disproportional at a city level. An inductive ladder of assessment at a lower level (i.e. neighbourhood, particular community or group, household and individuals), not only offer signs that are not easily visible at a city scale but also allows a concrete framing of vulnerability. This approach is open-ended and explorative by nature and draws on a circumstantial idea of vulnerability. One that is in line with O’Brien’s ‘contextual vulnerability’ viewed as the ‘starting point’ of vulnerability assessment. Such perspective focuses on the conditions of the system that enables a hazard to become a disaster. While the ‘outcome vulnerability’ follows a top-down perspective and considers which impacts climate change has on urban areas, the latter
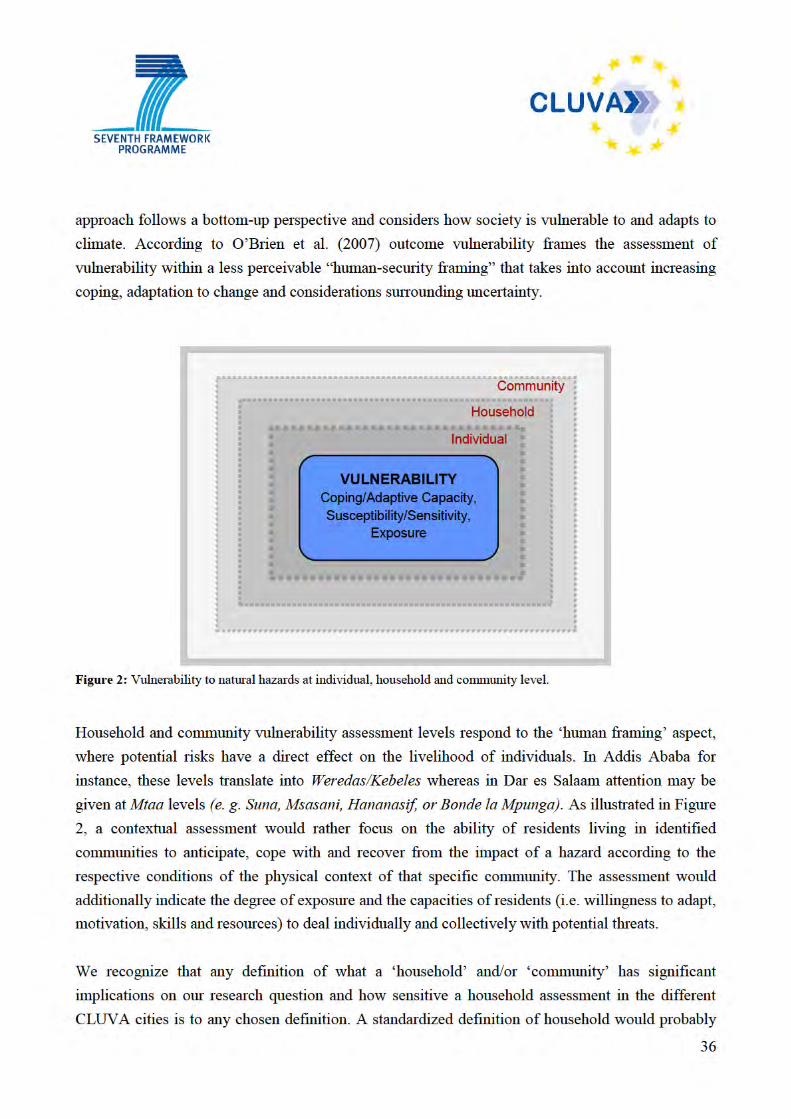
37
pose some conflicts to the intersection of key terms and misleading. In this light, we take reference from local interpretations provided by case study partners. The working definitions or rather examples below serve a starting point for framing the scale of our vulnerability assessment and are intended to be discussed further among partners, tested in the field and reflected upon in further reports. See a list of working definitions proposed by ARU in Appendix D. Household: A household is defined as a person or a group of persons, related or unrelated, who live together and share a common source of food17. Community: The concept “community”, although often referred to, is not simply given: In many cases it is understood as the lowest administrative level. Many disaster studies conceptualize a community as a geographical unit (neighbourhood, town, region, etc.) within which people interact on a daily basis. It is understood as a local unit which performs important social functions (e.g. Quarantelli and Dynes, 1976). However, as Kirschenbaum (2004) points out, traditional community-based approaches usually defined their object of research by taking physical and geographical borders as a matter of fact instead of referring to subjectively defined borders and cross-local networks (ibid.: 96). In this vein, communities are understood as being comprised by social networks of individuals belonging together because of specific interests and objectives as well as of ties based on kinship or positive emotions. Taking a more constructionist perspective one could even argue that “community” is also a category upon which people draw, rhetorically and strategically focusing on the attribution of meaning to a geographical locality or a social unit. Communities in this respect are created through symbolic attributions (Cohen, 1992). In this context, communities are understood as relational constructs that exist if people have a specific awareness of themselves in relation to other people. The most significant kind of awareness is based on the boundaries by which a group differentiates itself from others. Thus, a community is largely defined through the construction of boundaries (e.g., we/they, us/them). This implies also that the concept community may have multiple meanings to the different members of a community. The group may be homogeneous in a structural sense but quite heterogeneous in its usage of and identification with a community. CLUVA needs to take the view and interpretation of local actors into account. The term community
17 Definition provided by ARU from URT (2007), Tanzania Household Budget Survey 2006/07, National Bureau of Statistics. See Appendix D.
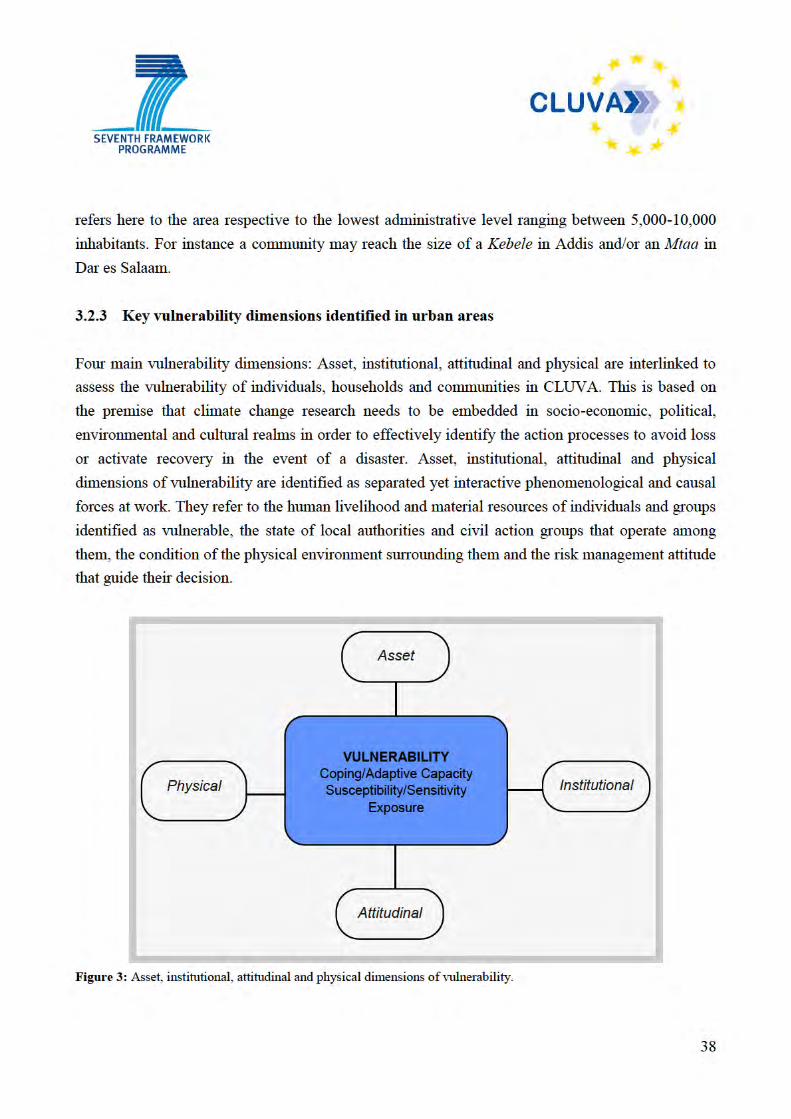
39
Asset vulnerability The perspective of linking asset to vulnerability stems from the idea of understanding the internal causes of vulnerability with regard to the shape of lives of those who face climatic threats. Asset is seen here not only in economic or material terms but also refers to other manifestations of wealth such as health and education. In other words, the term embodies the human, economic and social resources that individuals possess given them advantages, i.e. a certain margin in a changing urban environment. In the context of natural hazards induced by climate change in CLUVA, asset vulnerability not only requires an identification of the condition of the resources that individual have but also their ability to cope and their capacity to adapt to from negative climatic events. This implies for instance investigating on how residents of Hananasif tackle flood events in their area and how do they exploit relief opportunities with local government. Asset based assessment with regard to vulnerability has been conducted with the aim at identifying what are the different resources that individuals have (Barrett, 1999; Chambers, 1995; Moser, 1998). These assessments have been mostly targeted at identifying what the poor possess based on the premise that the more and diverse these assets are the less vulnerable they are. These ideas were developed in the 1990’s in association with poverty, food security and vulnerability, giving birth to a number of frameworks and approaches adding to an already extensive literature on asset and rights. One example is how food security was stressed as a determinant function of asset by Barrett (1999). In his view ‘asset forms the foundation of food security’, in other words someone with financial equity has access to food. A review at the scholarly literature on asset and vulnerability leads to different studies, which included among them the ‘Asset Vulnerability Framework’ from Moser (1998). This approach regroups an extensive household asset portfolio distinguishing asset types such as labour, human capital, productive assets, household relations and social capital, which aim at demonstrating how the collection of asset interplay with the concept of vulnerability. More recently, the author proposed a new asset focused framework with a differentiation in the assessment of the dynamics of individuals or groups, “asset vulnerability analytical framework” and the evaluation of their actions and initiatives “asset adaptation operation framework”.
40
The term asset has been used before to denote a set of resources (Barrett, 1999; Ford Foundation, 2004; Moser, 1998). While Moser’s asset definition extends to an array of tangible and intangible assets, the functions of asset identified in CLUVA include the economic condition, the education level, the demographic structure as well as the health of identified actors.
Institutional vulnerability Institutions refer to formal agreements (rule, laws and constitutions) as well as informal agreements (norms of behaviour, conventions) that mould interaction in a society. They include hence the “formal and informal procedures, routines, norms and conventions embedded in the organizational structure” of the local governance context (cf. Hall and Taylor, 1996: 938). Such institutions may be an important factor in increasing and/or decreasing the vulnerability of local households, organizations and entire urban areas. A key factor for the analysis will be local governance structures. This includes the “sum of the many ways individuals and institutions, public and private, manage their common affairs. It is a continuing process through which conflicting or diverse interests may be accommodated and co-operative action may be taken. It includes formal institutions and regimes empowered to enforce compliance, as well as informal arrangements that people and institutions either have agreed to or perceive to be in their interest” (Commission on Global Governance, 1995: 2). Attitudinal vulnerability Just like vulnerability, social capital is a term currently widely used and discussed (but only recently also in hazard research) (for an overview cf. Steinführer and Kuhlicke, 2007). The concept “has become one of the most popular exports from sociological theory into everyday language”, despite the fact that it “does not embody any idea really new to sociologists” (Portes, 1998: 2). Despite all the differences, in both conceptualisations social networks play a crucial part. Social networks form an important nexus between the individual and social structures. Therefore, network analysis is interested in the “in-between”, i.e. in the structure, quantity and quality of social relations as units of analysis. In the context of floods and other hazardous events, one might assume that social networks function as resources for information, material compensation, emotional support and physical help and are something exclusively “positive”. However, network theorists provide ambiguous hypotheses concerning the actual role of social networks in different situations. In this report, social
41
capital will be used in a non-romantic manner (which is one of the criticisms related to Putnam (1993) by taking into account social capital as an individual resource (i.e. related to the various social networks a person creates and belongs to and the economic, social and cultural resources they provide) as well as a collective asset (i.e. a community resource for which trust and shared norms are basic requirements). The question of how aware people are of a risk is not only a question of theoretical relevance; it also has relevant practical implications. How people decide and act, whether they consider themselves as being exposed to risks or whether they see themselves in the position to mitigate the risk of flooding is also influenced by the way how people perceive this risk. In this sense, some argue a heighted awareness of a hazard is a first step for preventing the occurrence, or at least reducing its impact, and hence a central component of adaptation strategy. Which information do residents need in order to take preventive steps and which information do people trust? Risk awareness can be defined as the everyday processes by which humans perceive risk without referring to statistical data and exact calculation models. Risk awareness is hence the more or less intuitive awareness of risks based on the evaluation of its likelihood as well as its adverse consequences. Physical vulnerability Managing the physical vulnerability of the built environment implies considering the urban ecosystem, existing green areas, the use of land as well as buildings and the infrastructure. In short the overcall characteristics of manmade land cover. Fell (1994) considers the physical vulnerability of a location the expected degree of loss to an element at risk and in particular the built structure (ibid.; Fell and Hartford, 1997). Based on this rationale what is located on the land cover is what is considered vulnerable and that includes the built structure in addition to the population. The role of the green structure for to protection of urban neighborhoods through flood and storm water retention, soil protection and mitigation of heat is particularly relevant to increase the coping and adaptive capacities of societies. We view the urbanization process and the management of ecosystem services as processes that cannot be disintegrated, rather combined in particular in locations which face potential hazards. As cities continue to grow, so do the resource demands imposed on the urban ecosystems and the impacts on the livelihood of populations.
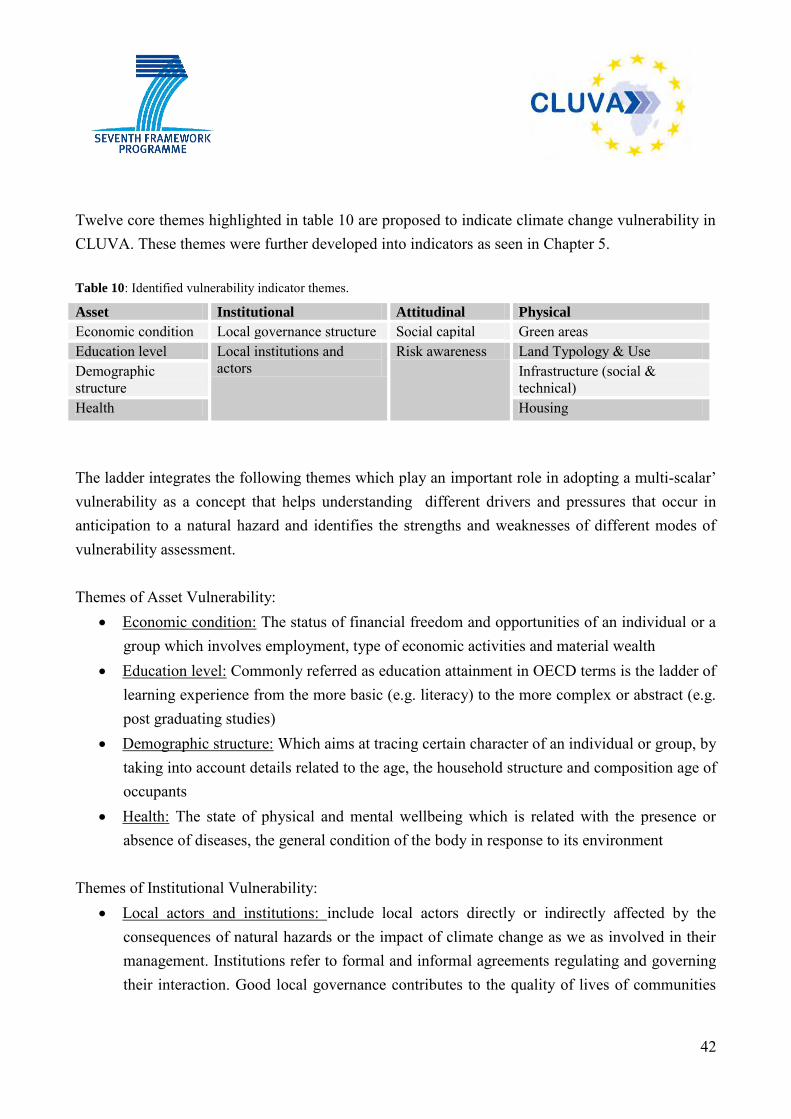
42
Twelve core themes highlighted in table 10 are proposed to indicate climate change vulnerability in CLUVA. These themes were further developed into indicators as seen in Chapter 5. Table 10: Identified vulnerability indicator themes.
Asset Institutional Attitudinal Physical
Economic condition Local governance structure Social capital Green areas Education level Local institutions and
actors Risk awareness Land Typology & Use
Demographic structure
Infrastructure (social & technical)
Health Housing The ladder integrates the following themes which play an important role in adopting a multi-scalar’ vulnerability as a concept that helps understanding different drivers and pressures that occur in anticipation to a natural hazard and identifies the strengths and weaknesses of different modes of vulnerability assessment. Themes of Asset Vulnerability:
Economic condition: The status of financial freedom and opportunities of an individual or a group which involves employment, type of economic activities and material wealth
Education level: Commonly referred as education attainment in OECD terms is the ladder of learning experience from the more basic (e.g. literacy) to the more complex or abstract (e.g. post graduating studies)
Demographic structure: Which aims at tracing certain character of an individual or group, by taking into account details related to the age, the household structure and composition age of occupants
Health: The state of physical and mental wellbeing which is related with the presence or absence of diseases, the general condition of the body in response to its environment
Themes of Institutional Vulnerability:
Local actors and institutions: include local actors directly or indirectly affected by the consequences of natural hazards or the impact of climate change as we as involved in their management. Institutions refer to formal and informal agreements regulating and governing their interaction. Good local governance contributes to the quality of lives of communities
43
which considers citizen’s voice and provide them with a platform for exercise their leadership
Local governance structures include the “sum of the many ways individuals and institutions, public and private, manage their common affairs. It is a continuing process through which conflicting or diverse interests may be accommodated and co-operative action may be taken. It includes formal institutions and regimes empowered to enforce compliance, as well as informal arrangements that people and institutions either have agreed to or perceive to be in their interest.” (Commission on Global Governance 1995: 2)
Attitudinal vulnerability:
Social capital: Includes individual resources (i.e. related to the various social networks a person creates and belongs to and the economic, social and cultural resources they provide) as well as a collective asset (i.e. a community resource for which trust and shared norms are basic requirements)
Risk awareness: Is defined as the everyday processes by which humans perceive risk without referring to statistical data and exact calculation models. Risk awareness is hence the more or less intuitive awareness of risks based on the evaluation of its likelihood as well as its adverse consequences
Physical vulnerability:
Green areas: Parks, green lands, open areas play an important role in the urban environment Green spaces along with their ecological benefits symbolize peace, help reduce stress and provide amenities for a community
Land typology and use: Is regarded as the nature of the land and its different types of exploitation namely agricultural, industrial, military, residential, recreational, or other purposes. The term refers here as the systematic use of land and patterns of management and planning
Infrastructure: Is distinguished into social and physical infrastructure. The social infrastructure refers to the facilities that ensure education, health care, community development, income distribution, employment and social welfare to a population. The technical infrastructure commonly refers to existing energy and water supply services, as well as sanitation and transportation and communication system which represents the basic facilities needed for a community or society in an urban area to function
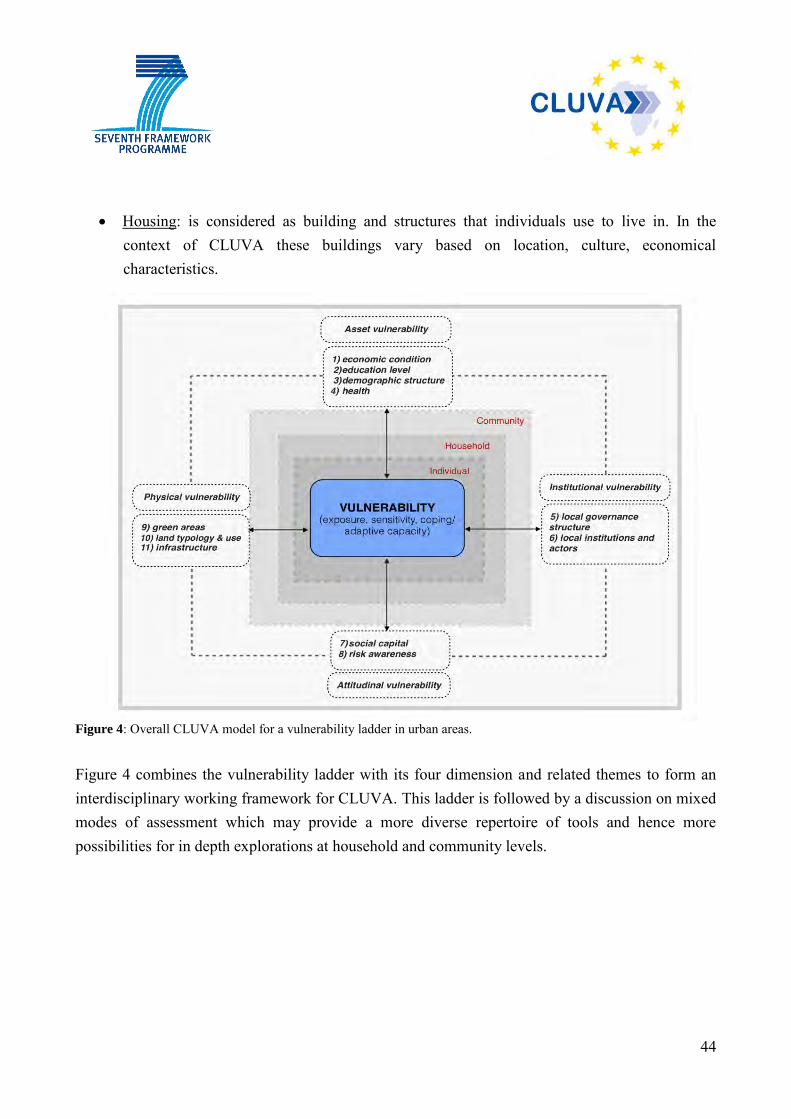
44
Housing: is considered as building and structures that individuals use to live in. In the context of CLUVA these buildings vary based on location, culture, economical characteristics.
Figure 4: Overall CLUVA model for a vulnerability ladder in urban areas.
Figure 4 combines the vulnerability ladder with its four dimension and related themes to form an interdisciplinary working framework for CLUVA. This ladder is followed by a discussion on mixed modes of assessment which may provide a more diverse repertoire of tools and hence more possibilities for in depth explorations at household and community levels.
45
4 MIXED METHODS FOR ASSESSING SOCIAL VULNERABILITY
Qualitative and quantitative methods have been both tested in the past to identify which group may be more sensitive to a hazard and what type of climatic threats they face (Adger et al., 2004; Chambers, 1983; Cutter et al. 2003; Mustafa et al., 2010; Tapsell et al., 2010; Vincent, 2004; Wisner, 2006). Contextual vulnerability assessments, which take into account the social dimension of populations, emerge largely from conventional research traditions which features important differences but aren’t necessarily opposite (Kuhlicke et al. 2011). The fundamental difference between a qualitative and a quantitative research design is that the combination of measures using either words/open instruments or numbers/close instruments lean towards one way or the other. A qualitative approach has an inductive assessment inclination. Those who engage in this form take into account the participation of individuals (Chambers, 1989; Moser, 2009; Wisner, 2006). A quantitative approach retains a deductive assessment disposition. Those interested in measuring data by relating variables are more inclined to proceed this way. Quantitative vulnerability assessments commonly involve the selection of indicators18 obtained by a combination of norms (Vincent, 2004; Adger, 2006; Birkmann, 2006). Mixed methods represent a combination of qualitative and quantitative approaches. Creswell (2009) suggests that a mixed approach “resides in the middle as it incorporates elements of both” (ibid.: 3). This research paradigm emerged from the need to expend the scope of studies particularly in the social sciences realm where complex human and urban incidents mandate a combination of assessment approaches. In fact, the blend of methodological approaches is not new. In 1959 the idea of mixing different methods emerged from a pragmatic knowledge philosophical stance that allows the use of multiple techniques to data collection (ibid.). Mixed method may also include themes and pattern interpretations based on participatory vulnerability assessment as well as in depth explorations that are bound by location, time and activity. In CLUVA, mixed method assessment enables us to combine the quantitative data policy makers generally request and utilized and the nuanced and more complex qualitative determinants that provide other type of explanations as to what are the coping capacity and resilience of at risk 18 Although much more prominent in quantitative studies, indicators can also be assessed qualitatively. They are considered as potentially useful tools for measuring the causes or processes triggering vulnerability (see Chapter 5).
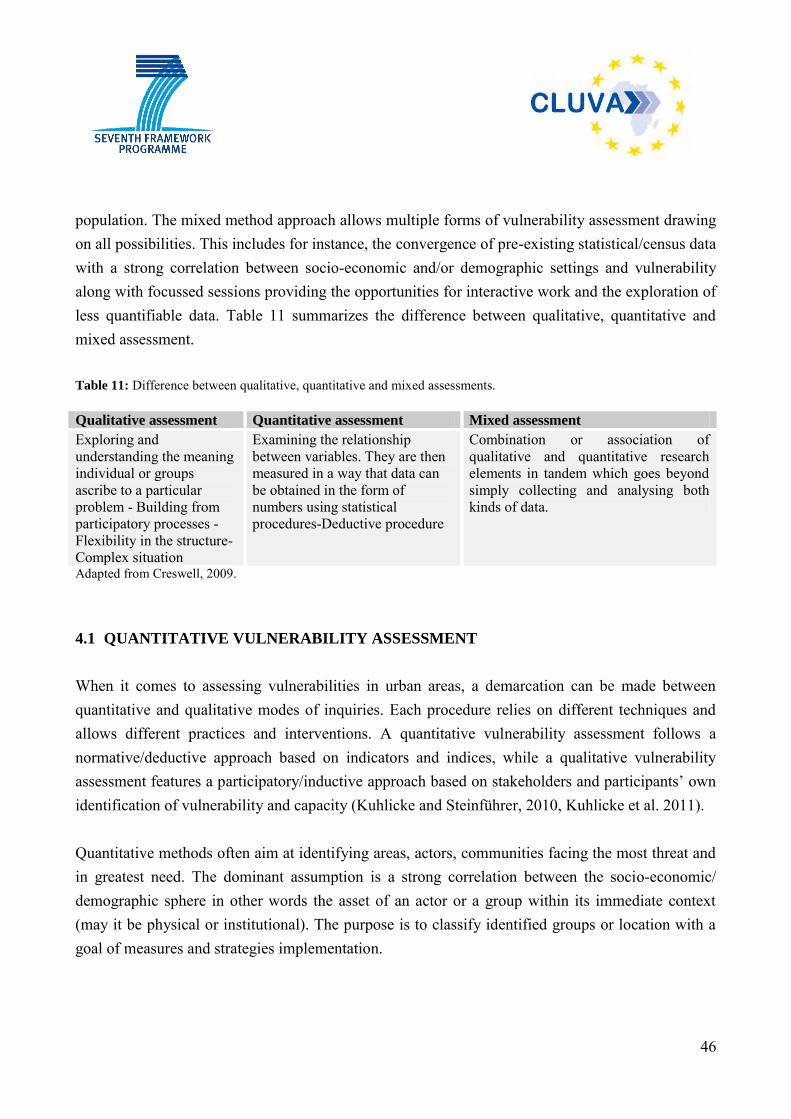
46
population. The mixed method approach allows multiple forms of vulnerability assessment drawing on all possibilities. This includes for instance, the convergence of pre-existing statistical/census data with a strong correlation between socio-economic and/or demographic settings and vulnerability along with focussed sessions providing the opportunities for interactive work and the exploration of less quantifiable data. Table 11 summarizes the difference between qualitative, quantitative and mixed assessment. Table 11: Difference between qualitative, quantitative and mixed assessments. Qualitative assessment Quantitative assessment Mixed assessment
Exploring and understanding the meaning individual or groups ascribe to a particular problem - Building from participatory processes -Flexibility in the structure-Complex situation
Examining the relationship between variables. They are then measured in a way that data can be obtained in the form of numbers using statistical procedures-Deductive procedure
Combination or association of qualitative and quantitative research elements in tandem which goes beyond simply collecting and analysing both kinds of data.
Adapted from Creswell, 2009.
4.1 QUANTITATIVE VULNERABILITY ASSESSMENT
When it comes to assessing vulnerabilities in urban areas, a demarcation can be made between quantitative and qualitative modes of inquiries. Each procedure relies on different techniques and allows different practices and interventions. A quantitative vulnerability assessment follows a normative/deductive approach based on indicators and indices, while a qualitative vulnerability assessment features a participatory/inductive approach based on stakeholders and participants’ own identification of vulnerability and capacity (Kuhlicke and Steinführer, 2010, Kuhlicke et al. 2011). Quantitative methods often aim at identifying areas, actors, communities facing the most threat and in greatest need. The dominant assumption is a strong correlation between the socio-economic/ demographic sphere in other words the asset of an actor or a group within its immediate context (may it be physical or institutional). The purpose is to classify identified groups or location with a goal of measures and strategies implementation.
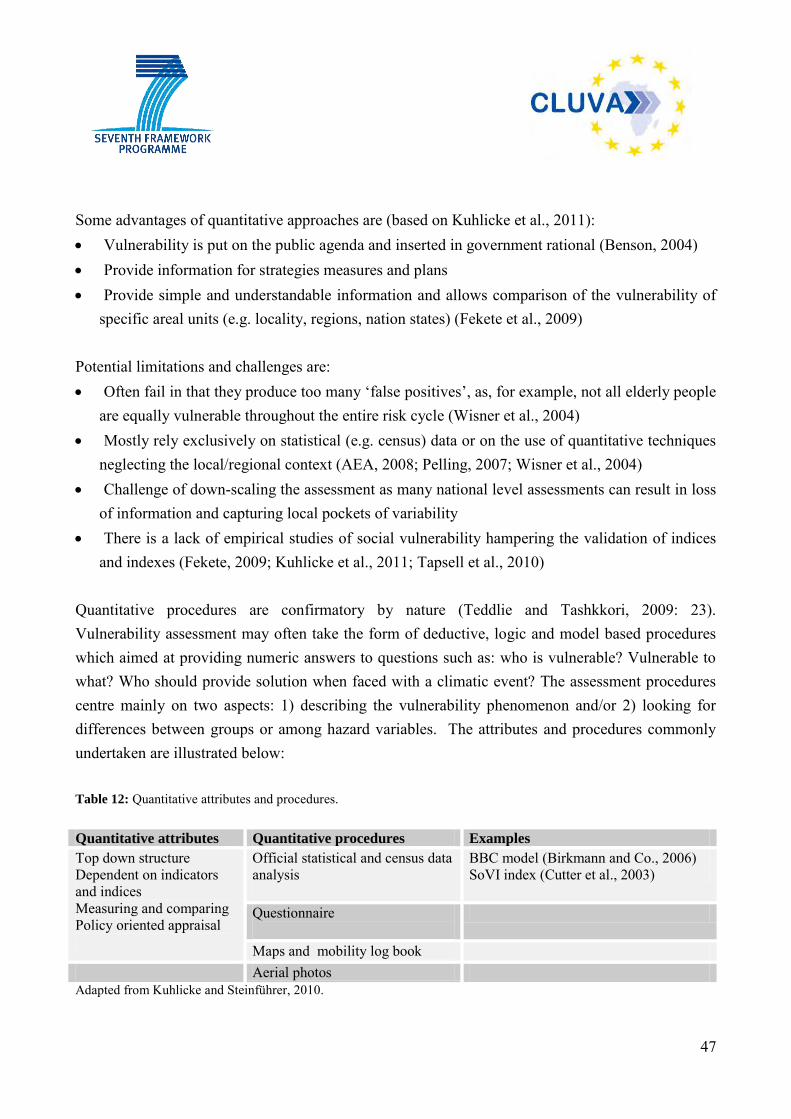
47
Some advantages of quantitative approaches are (based on Kuhlicke et al., 2011): Vulnerability is put on the public agenda and inserted in government rational (Benson, 2004) Provide information for strategies measures and plans Provide simple and understandable information and allows comparison of the vulnerability of
specific areal units (e.g. locality, regions, nation states) (Fekete et al., 2009) Potential limitations and challenges are: Often fail in that they produce too many ‘false positives’, as, for example, not all elderly people
are equally vulnerable throughout the entire risk cycle (Wisner et al., 2004) Mostly rely exclusively on statistical (e.g. census) data or on the use of quantitative techniques
neglecting the local/regional context (AEA, 2008; Pelling, 2007; Wisner et al., 2004) Challenge of down-scaling the assessment as many national level assessments can result in loss
of information and capturing local pockets of variability There is a lack of empirical studies of social vulnerability hampering the validation of indices
and indexes (Fekete, 2009; Kuhlicke et al., 2011; Tapsell et al., 2010) Quantitative procedures are confirmatory by nature (Teddlie and Tashkkori, 2009: 23). Vulnerability assessment may often take the form of deductive, logic and model based procedures which aimed at providing numeric answers to questions such as: who is vulnerable? Vulnerable to what? Who should provide solution when faced with a climatic event? The assessment procedures centre mainly on two aspects: 1) describing the vulnerability phenomenon and/or 2) looking for differences between groups or among hazard variables. The attributes and procedures commonly undertaken are illustrated below: Table 12: Quantitative attributes and procedures.
Quantitative attributes Quantitative procedures Examples
Top down structure Dependent on indicators and indices Measuring and comparing Policy oriented appraisal
Official statistical and census data analysis
BBC model (Birkmann and Co., 2006) SoVI index (Cutter et al., 2003)
Questionnaire
Maps and mobility log book Aerial photos Adapted from Kuhlicke and Steinführer, 2010.
48
Quantitative approaches are indicator-based modes of inquiry largely dependent on statistical data and based on measuring and comparing units of measurement. This method is particularly prone to the aggregation of variables and proxies, the standardization of components, mapping on categorical scale as well as regression exercises. These are approaches that are policy related as they offer a mean to measure an event or a progress. Decision/policy makers often require simple, clear, quantitative information and tend to favour quantitative modes of assessment. 4.2 QUALITATIVE VULNERABILITY ASSESSMENT
Qualitative methods in turn, seek to better understand actors’ own perception of vulnerability and capacities to cope and adapt to possible threatening climatic events, as opposed to quantitative modes of inquiry. There isn’t a dominant assumption; a qualitative approach explores multiple realities in contrast with a predicting, controlled and single truth. Actors are therefore encouraged to provide their own interpretations of their own vulnerability. This approach is inherently context-based as participants describe their needs as well as the difficulties they face in their own communities. The purpose here is to identify various forms of capacities, to reinforce their level of transferability and raise awareness at level. Some advantages of qualitative approaches are (based on Kuhlicke et al., 2011):
Actors can identify and assess their own vulnerabilities and capacities (Bankoff et al. 2004; Pelling, 2007)
Allows the integration of local stocks of knowledge, experiences, and perceptions into the assessment
Makes different and possibly conflicting views and opinions apparent and allows mutual learning processes
Potential limitations and challenges Up-scaling is a challenge as results are dependent on the definition Context and therefore, making comparison and aggregation across locations difficult
Qualitative procedures are often but not always explorative by nature (Teddlie and Tashkkori, 2009: 25). Vulnerability assessments may often take the form of inductive, narrative based procedures which aimed at arguing from the particular to the general. Qualitative interventions aim at
49
responding to questions such as how does vulnerability manifest? How actors cope with particular events? Why consider local-based resolution when faced with a climatic event? The assessment procedures conducted focus on the following aspects: 1) describing the different interpretations of the vulnerability phenomenon 2) identifying key multipliers and empowering them 3) providing platform for exchange, communication and change between interest groups. The attributes and procedures commonly undertaken are illustrated below: Table 13: Qualitative attributes and procedures. Qualitative attributes Qualitative procedures Examples
Bottom up structure Contextualizing and patterns interpretations Identifying capacities and empowering actors
Interviews with key actors
PAR model (Wisner et al.,2004)
Participant observation
Everyday life story capture
Workshop within case studies
PCCAA (Moser et al., 2010)
Audio visual use Adapted from Kuhlicke and Steinführer, 2010. Qualitative approaches are inherently multiple source methods as they rely on a diversity of tools such as interview and observation to make sense of the differentiate context of vulnerability. Qualitative procedures are natural setting prone, meaning the data is collected from the locations where the problems and/or phenomenon occur. The entire procedure focuses on understanding the meaning of particular vulnerability issues. For instance, with regards to social capital issues at household and community levels, qualitative procedures are more likely suitable to capture the extent to which locals trust the institutions and organizations that operate among them and how their voices are heard. 4.3 MIXED VULNERABILITY ASSESSMENT
In recent years, the utility of a combination of quantitative and qualitative modes of inquiry have been seen to simultaneously address situational and causal questions. This is due to a growing recognition of the quality of both techniques. Mixed methods when applied adequately provide better and stronger inferences (Teddlie and Tashkkori, 2009). That is to say that mixed methods are able to broaden the combination of assessment techniques particularly regarding sampling, data collection and data analysis.
50
There is a growing recognition of vulnerability assessment as being both vertical and horizontal (Tapsell et al., 2010). It suggests therefore that several layers of explanations are required to adequately pin point the causes of stress in a given society. The decision for combining qualitative or quantitative approaches rest in the type of research questions posed. Indeed the choice of vulnerability assessment methods lies in what needs to be assessed and what is the most efficient sustainable and sensible way to conduct this assessment. The literature illustrates some questions that may help clarify the selection of appropriate vulnerability assessment methods (Kuhlicke and Steinführer, 2010; Tapsell et al., 2010; UNU-EHS PhD Block Course, 2011):
Who and what is vulnerable? Vulnerable to what? (stressors/hazards) In what is context and circumstances? (location) Who want to know and why? (actors, interest) What type of information is required? What is the purpose of the assessment? (use of end product)
Questions such as ‘Who is vulnerable?’, ‘What is vulnerable?’ or ‘What is the context and circumstances of vulnerability’ have different focus and have been traditionally associated with situational data. While inquiries formulated along the lines of how does vulnerability manifest among those at risk and why are more concerned with causal attributes. These questions carry different meaning and have different strengths. They lead to different types of answers which require data sources based on data collection methods either more compatible with quantitative (i.e. confirmative) or quantitative (i.e. explorative) methods. Among quantitatively leaning vulnerability assessment tools are remote sensing, field surveys and the use of local statistics, known to highlight exposure of the critical infrastructure and settlement areas (Birkmann, 2006). Fekete (2009) used for instance a set of socio-economic and survey data and used factor analysis to identify and categorize variables correlated with floods. Another common practice is mapping vulnerability to determine at risk locations and population. O’Brien et al. (2004) note however that some maps may be misleading at a more detailed level and differences between vulnerability groups within certain communities are not necessarily captured in vulnerability maps. Hazard modelling techniques are also used to evaluate for instance the potential impact of heat waves (Kropp et al., 2009). The use of data census is known to help determine demographic vulnerability. However there is a risk of overlooking intangible factors as well as a
51
segment of the population who may not be considered in official numbers or are not easily identified by maps due to their nomadic nature. Other well-sought techniques are remote sensing unknown aspects of vulnerability or identified exposed groups. Components of vulnerability could be then standardized per building blocks based on the identification and aggregation of relevant variables (Ebert and Müller, 2010). These techniques require however a certain degree of manpower as well as computing knowledge and technology (e.g. latest available version of topographic dataset). Additionally it may not entirely serve the purpose of providing internal structure of households located in flood prone areas. More qualitative tools are structured interviews used to evaluate the conditions and perceptions of direct physical impacts; as well as institutional mapping, listing and ranking and the development of matrices which aim at identifying the significance of institutions supporting local adaptation to potential hazard (Moser et al., 2010). The entire qualitative assessment process keeps a focus on participants (Chamber, 1989; Mustafa, 2005) and attempts to understand the meaning that they hold about the risk they face. In that sense, this approach may offer more context-based answers to the question related to `who and what is vulnerable?´. This however does not come without challenges. Participatory assessments can be time-consuming, the process depends on the level of commitment of different actors and transferability as well as comparability remains an issue (Chambers, 1994). With CLUVA, multiple interactive techniques are recognized as not only useful but necessary. CLUVA’s objectives cannot be met by neither quantitative nor qualitative methods exclusively as one approach is not enough to accurately answer the multidimensional aspects of vulnerability in CLUVA cities. This lead us to consider how to best couple numerical and graphic techniques with participatory modes of inquiry in other words what are the mechanisms for working back and forth between concerns deep-seated in communities and larger database source such as census data and maps. Mixed methods provide the opportunities for presenting a ‘stronger inference’ ‘greater diversity of divergent views’ (Tashakkori and Teddlie, 2003: 15). The latter is particularly central to converge both outcome and contextual vulnerability assessment in CLUVA.
52
Table 14: The utility of mixed methods for CLUVA. Stronger inferences within tasks and between CLUVA WPs
Complementary attributes for instance the use of maps at community and city level offers a greater breath of vulnerability studies and the use of interviews with community leaders offer a greater depth in the conditions of a particular setting. The combination of both offers more accurate interpretations.
Greater diversity of results from outcome and contextual vulnerability perspectives
CLUVA involves the points of views of different disciplines with sometimes divergent perspectives. Mixed methods offer the possibility of including views instead of dismissing them. This lead to a re-examination of conceptual frameworks and assumptions underlying research results.
53
5 INDICATORS FOR ASSESSING VULNERABILITY
5.1 OVERVIEW OF FUNCTIONS AND DEFINITIONS OF INDICATORS
The practice of using indicators (i.e. indexes) to assess the vulnerability of populations at both national and local levels was reinforced in the final document of the World Conference on Disaster Reduction, the Hyogo Framework for Action 2005-2015 (Hyogo framework for Action 2005-2015; United Nations 2005) and is at the core of Task 2.3. The report stresses as priority actions the development of indicators to assess the impact of disasters on social, economic and environmental conditions as well as the need to horizontally communicate the results to decision makers, stakeholders and the population at risk. The call here is for the international community to develop realistic and measurable indicators with the following purposes:
1. Develop and track progress in disaster risk reduction 2. Enable decision-makers to assess the impact of disasters 3. Support early warning systems 4. Conformed with the respective development goals of the Millennium Declaration
Indicators are widely used. Their extensive application can be found not only in risk assessments but also in planning, in health, in environmental protection and many other fields where there is a certain requirement for policy, monitoring or evaluation. This means that indicators have different purposes and may take various forms. They can be considered as ‘measurement categories’ or may also serve as an evaluation instrument (Siedentop and Wiechmann, 2004). They can be used as tools, as communication and/or awareness instruments for political and practice purposes. They are also utilized for research activities and monitoring functions (Weiland et al., 2011). Urban indicators for instance, can be identified as ‘rate indicators’ having the purpose of describing a change over time, as ‘goal/steering indicators’ which focus rather on a given objective or as ‘performance indicators’ which are commonly utilized to evaluate behaviours within any given political setting (Weiland, 1999). A review of social indicators conducted by Fenton and McGregor (1999) lead to the proposal of the following functions: ‘informative indicators’ used to provide a description of the social context and associated changes. ‘Predictive indicator’ fitting to specific social sub-systems, ‘Problem-oriented indicators’ focused on policy and action, ‘Program evaluation indicators’ used to monitor a progress and finally ‘Target delineation indicators’ used to identify subgroups towards which policy is directed. Most recently, Perdicoúlis and Glasson (2011)
54
stress three types of function of indicators in relation with planning tasks, adapted from Hezri’s ‘taxonomy of indicators’ (2004). They are: ‘alert’ (relating to standards of operation), ‘calculation’ (referring to numerical attributes), and ‘understanding’/‘modelling’ (conveying a certain replication function of indicators) (ibid.: 361). The breath of indicators was stressed by Flowers et al. (2005), who recognize the range of functions attached to the term as well as the profusion of terms used as indicators. Indicators19 can sometimes travel under other aliases such as profiles, factors or variables. This may be attributed to the fact that although not perfect or unique, indicators generally tend to provide a representative estimation of what is considered important in a given system (Perdicoúlis and Glasson, 2011). Moreover this abundance of associated terminology and interpretations may well rest in the complex processes associated with urban, environmental, climatic changes as well as the interconnection between different fields of research. The use of indicators appears repeatedly in the vulnerability assessment literature, as they are perceived as tools that can -when applied adequately- predict the likely effect of a disaster (Briguglio, 2003) and are found useful for measuring development and change overtime. According to Schneiderbauer (2010), indicators make the complex, abstract and multidimensional concept of vulnerability operational. In order words, indicators rationalise the concept of vulnerability into measurable constructs that help evaluate the state of a system or organization. Using indicators to assess the degree to which people are susceptible to a hazard has a long history. Several approaches appear to dominate the literature on indicator development: Deductive approaches are theoretically centred using frameworks and models while inductive developments are data driven (AEA, 2008; Harvey et al., 2009; Schneiderbauer, 2010). Both approaches use past and present knowledge to develop indicator components and appear to be more leaning to a quantitative mind frame. In contrast the third approach known as a normative stance involves ‘subjective’ criteria from experts or stakeholder. This in turn relates more to a qualitative thinking which involves a more intuitive value judgement based on observation and experience in the field.
19 In this report we make a distinction between an indicator and a variable. The difference is that many indicators have a compound nature with a certain level of abstractness, whereas variables are descriptive and attached to a specific value. In that sense, the set of indicators presented below may include qualitative or quantitative variables considered as components of an indicator.
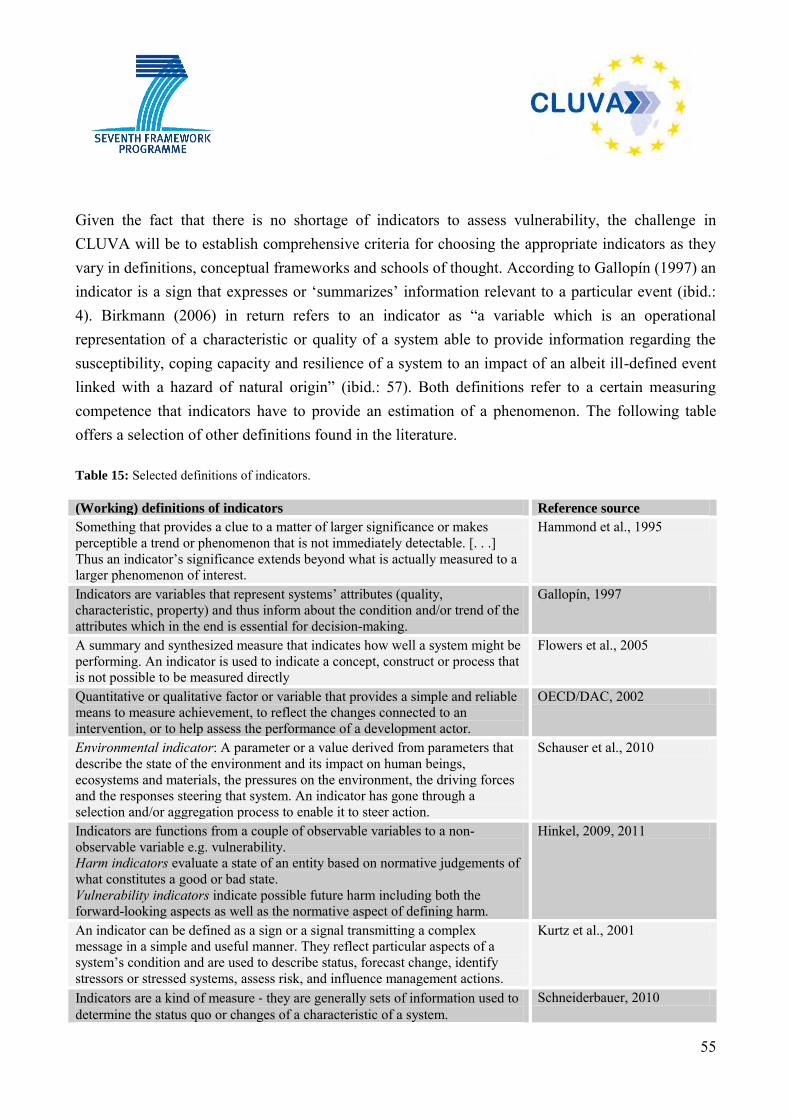
55
Given the fact that there is no shortage of indicators to assess vulnerability, the challenge in CLUVA will be to establish comprehensive criteria for choosing the appropriate indicators as they vary in definitions, conceptual frameworks and schools of thought. According to Gallopín (1997) an indicator is a sign that expresses or ‘summarizes’ information relevant to a particular event (ibid.: 4). Birkmann (2006) in return refers to an indicator as “a variable which is an operational representation of a characteristic or quality of a system able to provide information regarding the susceptibility, coping capacity and resilience of a system to an impact of an albeit ill-defined event linked with a hazard of natural origin” (ibid.: 57). Both definitions refer to a certain measuring competence that indicators have to provide an estimation of a phenomenon. The following table offers a selection of other definitions found in the literature. Table 15: Selected definitions of indicators. (Working) definitions of indicators Reference source
Something that provides a clue to a matter of larger significance or makes perceptible a trend or phenomenon that is not immediately detectable. [. . .] Thus an indicator’s significance extends beyond what is actually measured to a larger phenomenon of interest.
Hammond et al., 1995
Indicators are variables that represent systems’ attributes (quality, characteristic, property) and thus inform about the condition and/or trend of the attributes which in the end is essential for decision-making.
Gallopín, 1997
A summary and synthesized measure that indicates how well a system might be performing. An indicator is used to indicate a concept, construct or process that is not possible to be measured directly
Flowers et al., 2005
Quantitative or qualitative factor or variable that provides a simple and reliable means to measure achievement, to reflect the changes connected to an intervention, or to help assess the performance of a development actor.
OECD/DAC, 2002
Environmental indicator: A parameter or a value derived from parameters that describe the state of the environment and its impact on human beings, ecosystems and materials, the pressures on the environment, the driving forces and the responses steering that system. An indicator has gone through a selection and/or aggregation process to enable it to steer action.
Schauser et al., 2010
Indicators are functions from a couple of observable variables to a non-observable variable e.g. vulnerability. Harm indicators evaluate a state of an entity based on normative judgements of what constitutes a good or bad state. Vulnerability indicators indicate possible future harm including both the forward-looking aspects as well as the normative aspect of defining harm.
Hinkel, 2009, 2011
An indicator can be defined as a sign or a signal transmitting a complex message in a simple and useful manner. They reflect particular aspects of a system’s condition and are used to describe status, forecast change, identify stressors or stressed systems, assess risk, and influence management actions.
Kurtz et al., 2001
Indicators are a kind of measure ‐ they are generally sets of information used to determine the status quo or changes of a characteristic of a system.
Schneiderbauer, 2010
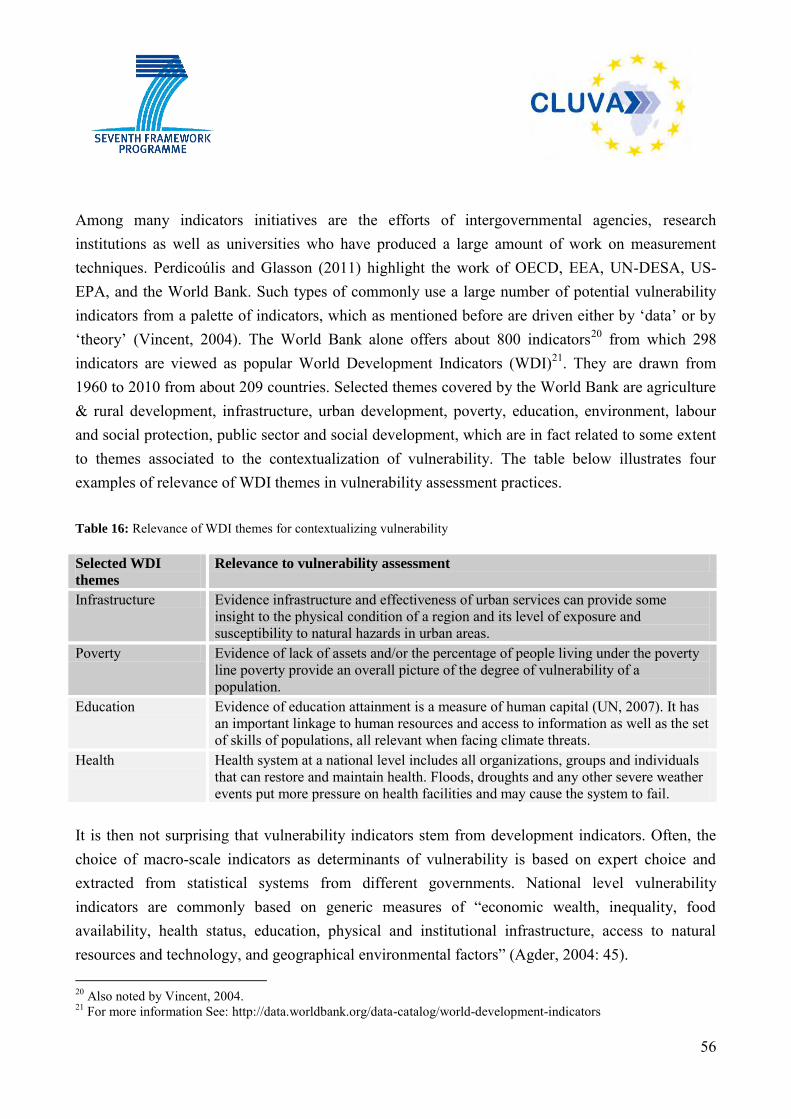
56
Among many indicators initiatives are the efforts of intergovernmental agencies, research institutions as well as universities who have produced a large amount of work on measurement techniques. Perdicoúlis and Glasson (2011) highlight the work of OECD, EEA, UN-DESA, US-EPA, and the World Bank. Such types of commonly use a large number of potential vulnerability indicators from a palette of indicators, which as mentioned before are driven either by ‘data’ or by ‘theory’ (Vincent, 2004). The World Bank alone offers about 800 indicators20 from which 298 indicators are viewed as popular World Development Indicators (WDI)21. They are drawn from 1960 to 2010 from about 209 countries. Selected themes covered by the World Bank are agriculture & rural development, infrastructure, urban development, poverty, education, environment, labour and social protection, public sector and social development, which are in fact related to some extent to themes associated to the contextualization of vulnerability. The table below illustrates four examples of relevance of WDI themes in vulnerability assessment practices. Table 16: Relevance of WDI themes for contextualizing vulnerability Selected WDI
themes Relevance to vulnerability assessment
Infrastructure Evidence infrastructure and effectiveness of urban services can provide some insight to the physical condition of a region and its level of exposure and susceptibility to natural hazards in urban areas.
Poverty Evidence of lack of assets and/or the percentage of people living under the poverty line poverty provide an overall picture of the degree of vulnerability of a population.
Education Evidence of education attainment is a measure of human capital (UN, 2007). It has an important linkage to human resources and access to information as well as the set of skills of populations, all relevant when facing climate threats.
Health Health system at a national level includes all organizations, groups and individuals that can restore and maintain health. Floods, droughts and any other severe weather events put more pressure on health facilities and may cause the system to fail.
It is then not surprising that vulnerability indicators stem from development indicators. Often, the choice of macro-scale indicators as determinants of vulnerability is based on expert choice and extracted from statistical systems from different governments. National level vulnerability indicators are commonly based on generic measures of “economic wealth, inequality, food availability, health status, education, physical and institutional infrastructure, access to natural resources and technology, and geographical environmental factors” (Agder, 2004: 45). 20 Also noted by Vincent, 2004. 21 For more information See: http://data.worldbank.org/data-catalog/world-development-indicators
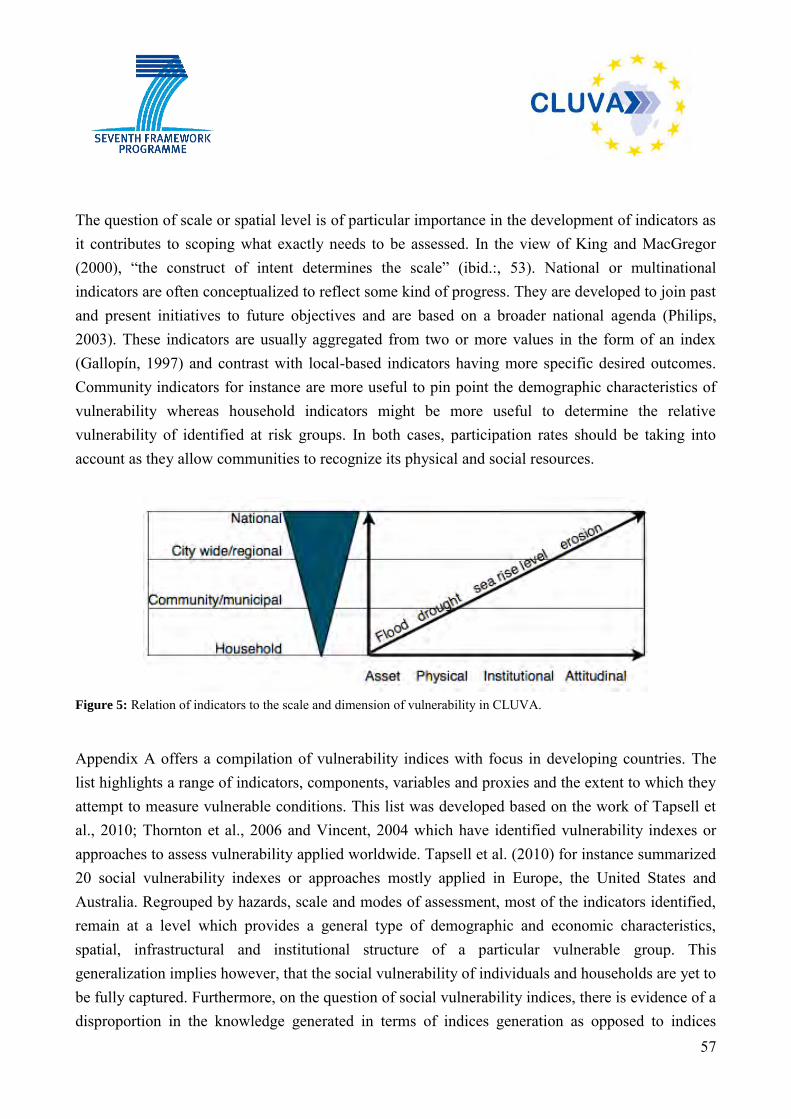
57
The question of scale or spatial level is of particular importance in the development of indicators as it contributes to scoping what exactly needs to be assessed. In the view of King and MacGregor (2000), “the construct of intent determines the scale” (ibid.:, 53). National or multinational indicators are often conceptualized to reflect some kind of progress. They are developed to join past and present initiatives to future objectives and are based on a broader national agenda (Philips, 2003). These indicators are usually aggregated from two or more values in the form of an index (Gallopín, 1997) and contrast with local-based indicators having more specific desired outcomes. Community indicators for instance are more useful to pin point the demographic characteristics of vulnerability whereas household indicators might be more useful to determine the relative vulnerability of identified at risk groups. In both cases, participation rates should be taking into account as they allow communities to recognize its physical and social resources.
Figure 5: Relation of indicators to the scale and dimension of vulnerability in CLUVA. Appendix A offers a compilation of vulnerability indices with focus in developing countries. The list highlights a range of indicators, components, variables and proxies and the extent to which they attempt to measure vulnerable conditions. This list was developed based on the work of Tapsell et al., 2010; Thornton et al., 2006 and Vincent, 2004 which have identified vulnerability indexes or approaches to assess vulnerability applied worldwide. Tapsell et al. (2010) for instance summarized 20 social vulnerability indexes or approaches mostly applied in Europe, the United States and Australia. Regrouped by hazards, scale and modes of assessment, most of the indicators identified, remain at a level which provides a general type of demographic and economic characteristics, spatial, infrastructural and institutional structure of a particular vulnerable group. This generalization implies however, that the social vulnerability of individuals and households are yet to be fully captured. Furthermore, on the question of social vulnerability indices, there is evidence of a disproportion in the knowledge generated in terms of indices generation as opposed to indices
58
validation (Fekete, 2009). In that regard, effort should be made in CLUVA not only to accurately identify indicators adequate to the African cases studies but also to evaluate and test their relevance/ acceptance. In CLUVA, we propose to consider indicators as: composite term that informs us and can provide a type of measure to evaluate the conditions of at risk populations and to estimate their exposure, susceptibility and/or coping and adaptive capacity with regard to the impact of natural hazards. They serve as an assessment tool that indicates a phenomenon and help us measure and communicate different realities of urban vulnerability. Indicators for vulnerability assessment are inherently linked to the mode of assessment. They can be in principle quantitative or qualitative. In any case they must be understandable, valid and context-sensitive. There are considerable constraints surrounding the use of indicators in measuring vulnerability. Despite that many indicators and indices have been introduced and are used by risk managers and local councils. This Chapter offers merely a snapshot on the use of indicators. For more extensive contributions on the subject see (Adger et al., 2004; Barnett et al., 2008; Birkmann, 2006; Briguglio, 2003; Brooks et al., 2005; Eriksen and Kelly, 2007; Gallopin, 2003; Thornton et al., 2006; UN, 2007; Vincent, 2004; Vincent and Cull, 2010; Weiland et al., 2011) among other publications and also see Appendix B. We aimed at highlighting to some extent the breath of indicators as an introduction to the following set of identified indicators. This preliminary set is based on the proposed CLUVA vulnerability ladder in urban areas and initials discussion with CLUVA partners in an attempt to integrate both theoretical/model-driven and context-based indicator development approaches.
59
5.2 PRELIMINARY INDICATOR SET IDENTIFIED TO ASSESS VULNERABILITY
IN URBAN AREAS
Considering that vulnerability indicators can be selected from a great and divergent mass of information from either primary or secondary data sources, the set illustrated in tables 17 and 18 does not embody nor present all possible indicators for vulnerability assessment. It highlights rather those that are more predominant in the recent vulnerability discourse; those that have been applied or tested in the past and that have been discussed in working sessions as potentially suitable in CLUVA cities. In essence their aim is to reflect the interaction between social, environmental and institutional factors, which play a role in the vulnerability of individuals, households and communities. The indicators proposed follow up on discussions held during two working sessions focusing on social vulnerability assessment at the CLUVA Kick off Meeting in Ouagadougou, Burkina Faso (15-22 January 2011) and during two workshops organized by CLUVA partners in Addis Ababa, Ethiopia (8-10 June 2011) and Dar es Salaam, Tanzania (13-18 June 2011). In Ouagadougou, it was established that the review of indicators should be conducted based on selected relevant literature and local knowledge. The sessions in Addis Ababa and Dar es Salaam revolved around identifying context-centred indicators. During the sessions conducted in Addis Ababa, two posters were presented. The first poster offered and overview of Task 2.3’s conceptual approach of vulnerability assessment while the second one illustrated a preliminary CLUVA vulnerability ladder22 with its four dimensions and 15 proposed themes. The sessions included nine participants composed by CLUVA European and African partners and stakeholders from Addis’ Fire & Emergency Prevention and Rescue Agency and Labor and Social Affairs Office. Participants were asked to take part in a brainstorm exercise on indicators that may best fit each theme or dimension proposed on the poster. Coloured cards were used to differentiate each set of indicators.
22 The CLUVA vulnerability ladder seen in Figure 6 and 7 was at its initial stage, it later evolved as seen in Chapter 3 Figure 4. The modifications emerged from comments and feedback received from CLUVA partners. For instance four themes were relocated and aggregated to others and the term ‘spatial vulnerability’ was renamed ‘physical vulnerability’ to convey more clearly a focus on the material and environmental context of vulnerability.
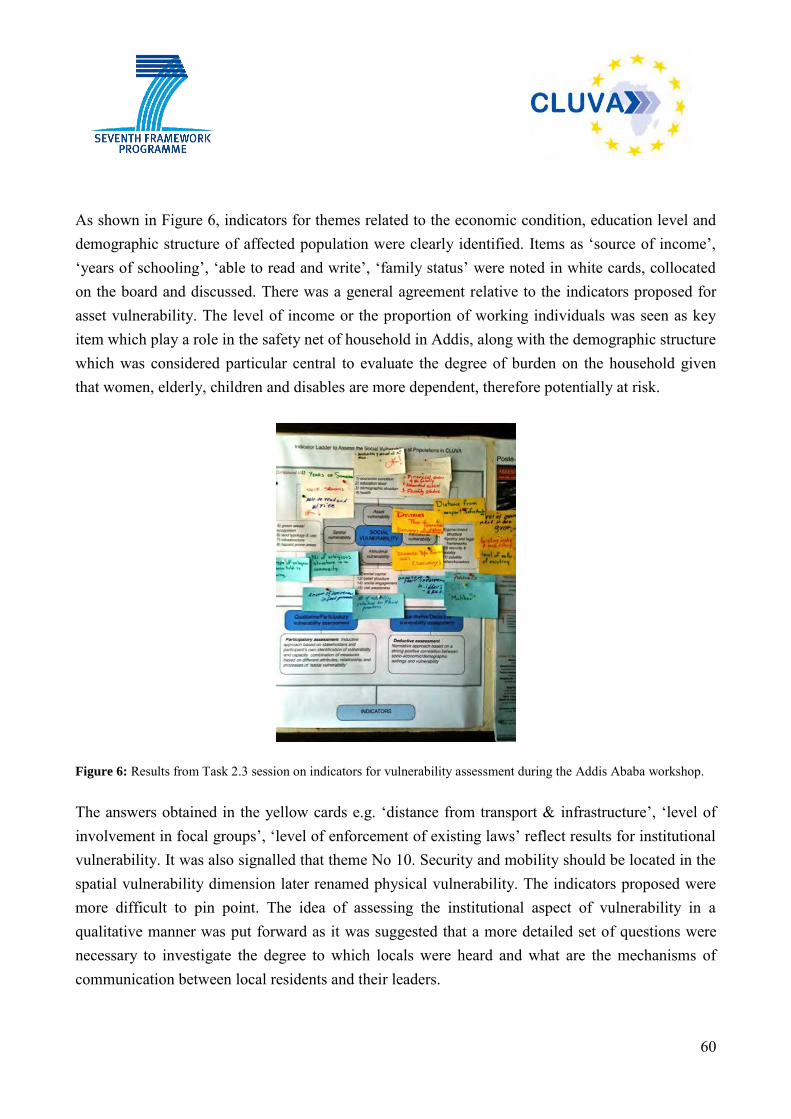
60
As shown in Figure 6, indicators for themes related to the economic condition, education level and demographic structure of affected population were clearly identified. Items as ‘source of income’, ‘years of schooling’, ‘able to read and write’, ‘family status’ were noted in white cards, collocated on the board and discussed. There was a general agreement relative to the indicators proposed for asset vulnerability. The level of income or the proportion of working individuals was seen as key item which play a role in the safety net of household in Addis, along with the demographic structure which was considered particular central to evaluate the degree of burden on the household given that women, elderly, children and disables are more dependent, therefore potentially at risk.
Figure 6: Results from Task 2.3 session on indicators for vulnerability assessment during the Addis Ababa workshop. The answers obtained in the yellow cards e.g. ‘distance from transport & infrastructure’, ‘level of involvement in focal groups’, ‘level of enforcement of existing laws’ reflect results for institutional vulnerability. It was also signalled that theme No 10. Security and mobility should be located in the spatial vulnerability dimension later renamed physical vulnerability. The indicators proposed were more difficult to pin point. The idea of assessing the institutional aspect of vulnerability in a qualitative manner was put forward as it was suggested that a more detailed set of questions were necessary to investigate the degree to which locals were heard and what are the mechanisms of communication between local residents and their leaders.
61
The blues cards represent ideas associated to social capital and risk awareness. They included for instance ‘number of activities related to flood prevention’, ‘number of religious structure in a community’, ‘number of CBOs’ and ‘amount of Mahber’. The latter represents the number of locally based affiliations typical for Addis. They are described by Addis partners as followed: “Local people collect money among them; it is a mutual assistance. You invest your own money and you take it later. This system of mutual assistance at the local level is common in Ethiopia. It is run by an informal organization, with community who organises and manages the money. The local community chose a leader among themselves especially the financial leader. It is a group of people who have a common understanding: they live together or they are friends. If you need money to buy something and you don’t have access to bank, you can get it from the community. Here you are force to save money every month.” In Dar es Salaam, two posters seen in Figure 7 were discussed among eight participants. As in the case of Addis Ababa, participants (European and African scholars) were asked to come up with ideas on indicators that may best fit each theme or dimension identified in the CLUVA vulnerability ladder. The poster on the left illustrates Task 2.3’s conceptual approach of vulnerability assessment presented at the Resilient Cities Conference which took place in Bonn, Germany in June 2011. It served as a tool to clarify Task 2.3’s framework and scope. The poster on the right offered an overview of the indicators discussed in Dar es Salaam.
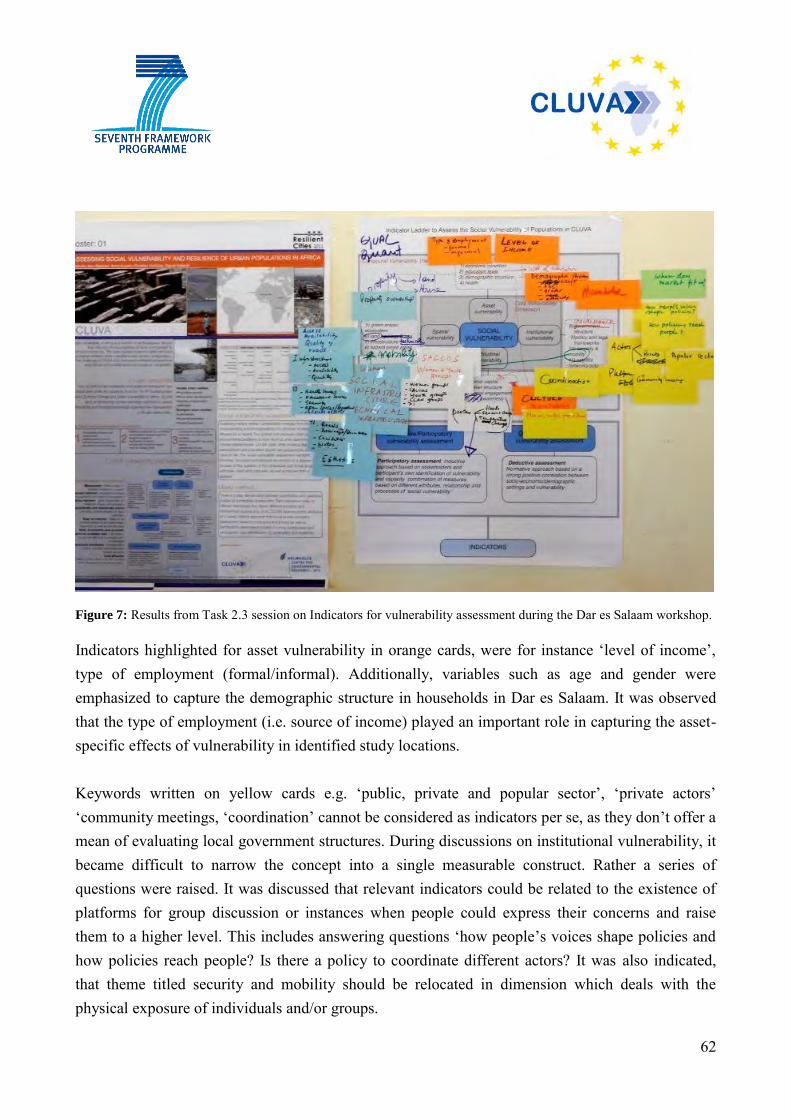
62
Figure 7: Results from Task 2.3 session on Indicators for vulnerability assessment during the Dar es Salaam workshop.
Indicators highlighted for asset vulnerability in orange cards, were for instance ‘level of income’, type of employment (formal/informal). Additionally, variables such as age and gender were emphasized to capture the demographic structure in households in Dar es Salaam. It was observed that the type of employment (i.e. source of income) played an important role in capturing the asset-specific effects of vulnerability in identified study locations. Keywords written on yellow cards e.g. ‘public, private and popular sector’, ‘private actors’ ‘community meetings, ‘coordination’ cannot be considered as indicators per se, as they don’t offer a mean of evaluating local government structures. During discussions on institutional vulnerability, it became difficult to narrow the concept into a single measurable construct. Rather a series of questions were raised. It was discussed that relevant indicators could be related to the existence of platforms for group discussion or instances when people could express their concerns and raise them to a higher level. This includes answering questions ‘how people’s voices shape policies and how policies reach people? Is there a policy to coordinate different actors? It was also indicated, that theme titled security and mobility should be relocated in dimension which deals with the physical exposure of individuals and/or groups.
63
White cards were used to signal indicator referent to two themes: social capital and risk awareness. The concept of Savings and Credit Cooperative Society (SACCOS) was presented as an example of grassroots affiliations which play a central role in the coping capacity of individuals. SACCOs are a network of credit unions in Tanzania. They are grassroots financial institutions which offer their members a savings opportunities and access point to loans and serves as a valuable support system against unexpected illness, accident, family death or any other emergency including floods. With regard to the physical conditions that may influence the vulnerability of individuals and groups, participants highlighted the following indicators: ‘property ownership’, ‘size and location of buildings’ ‘availability, access and quality of technical infrastructure (roads, drainage, water, sanitation, energy)’ as well as ‘social infrastructure (health, education, security, open spaces, religious objects)’. It was observed that indicators attached to asset and the physical vulnerability were more adapted for a quantitative assessment whereas attitudinal and institutional indicators responded more to a qualitative mode of inquiries.
Both workshops in Addis Ababa and Dar es Salaam were proven to be determinant in identifying quantifiable and explorative indicators that provide information on matter of significance fitting to the context of these CLUVA cities. The sessions essentially brought forward some key items that should be considered and also served as platforms for clarifying terms that may have different significance depending on their context. In the case of Dar es Salaam a list of definition was proposed and is annexed in Appendix D. Table 17 exposes indicators identified at a household level, while table 18 highlights those used at a community level. Household indicators offer an insight on the livelihood of individuals, whereas community indicators might help local leaders recognize the physical and social resources they have to address collective problems. The differentiation between indicators at household and community levels is relevant here because each scale adopts different values in time, space, population and therefore has difference significance. Household level indicators for instance, are based upon more personal and domestic factors.
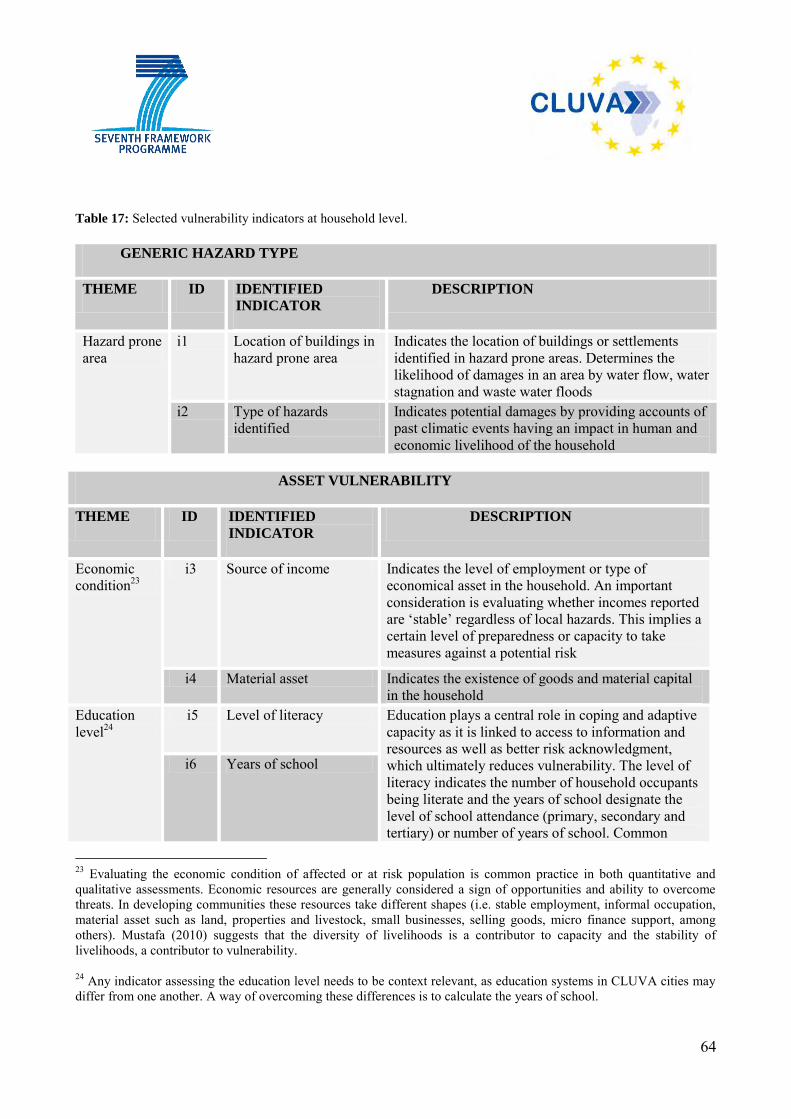
64
Table 17: Selected vulnerability indicators at household level.
GENERIC HAZARD TYPE
THEME ID IDENTIFIED
INDICATOR DESCRIPTION
Hazard prone area
i1 Location of buildings in hazard prone area
Indicates the location of buildings or settlements identified in hazard prone areas. Determines the likelihood of damages in an area by water flow, water stagnation and waste water floods
i2 Type of hazards identified
Indicates potential damages by providing accounts of past climatic events having an impact in human and economic livelihood of the household
ASSET VULNERABILITY
THEME ID IDENTIFIED
INDICATOR DESCRIPTION
Economic condition23
i3 Source of income Indicates the level of employment or type of economical asset in the household. An important consideration is evaluating whether incomes reported are ‘stable’ regardless of local hazards. This implies a certain level of preparedness or capacity to take measures against a potential risk
i4 Material asset Indicates the existence of goods and material capital in the household
Education level24
i5 Level of literacy Education plays a central role in coping and adaptive capacity as it is linked to access to information and resources as well as better risk acknowledgment, which ultimately reduces vulnerability. The level of literacy indicates the number of household occupants being literate and the years of school designate the level of school attendance (primary, secondary and tertiary) or number of years of school. Common
i6 Years of school
23 Evaluating the economic condition of affected or at risk population is common practice in both quantitative and qualitative assessments. Economic resources are generally considered a sign of opportunities and ability to overcome threats. In developing communities these resources take different shapes (i.e. stable employment, informal occupation, material asset such as land, properties and livestock, small businesses, selling goods, micro finance support, among others). Mustafa (2010) suggests that the diversity of livelihoods is a contributor to capacity and the stability of livelihoods, a contributor to vulnerability. 24 Any indicator assessing the education level needs to be context relevant, as education systems in CLUVA cities may differ from one another. A way of overcoming these differences is to calculate the years of school.
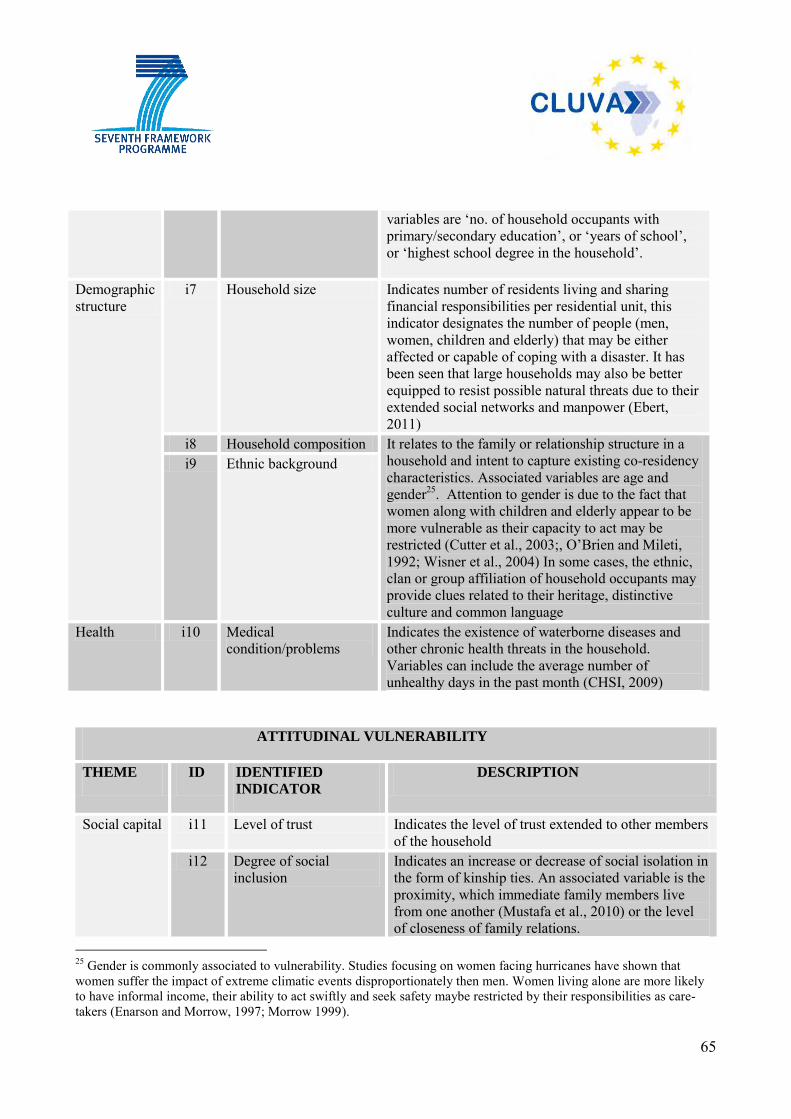
65
variables are ‘no. of household occupants with primary/secondary education’, or ‘years of school’, or ‘highest school degree in the household’.
Demographic structure
i7 Household size Indicates number of residents living and sharing financial responsibilities per residential unit, this indicator designates the number of people (men, women, children and elderly) that may be either affected or capable of coping with a disaster. It has been seen that large households may also be better equipped to resist possible natural threats due to their extended social networks and manpower (Ebert, 2011)
i8 Household composition It relates to the family or relationship structure in a household and intent to capture existing co-residency characteristics. Associated variables are age and gender25. Attention to gender is due to the fact that women along with children and elderly appear to be more vulnerable as their capacity to act may be restricted (Cutter et al., 2003;, O’Brien and Mileti, 1992; Wisner et al., 2004) In some cases, the ethnic, clan or group affiliation of household occupants may provide clues related to their heritage, distinctive culture and common language
i9 Ethnic background
Health i10 Medical condition/problems
Indicates the existence of waterborne diseases and other chronic health threats in the household. Variables can include the average number of unhealthy days in the past month (CHSI, 2009)
ATTITUDINAL VULNERABILITY
THEME ID IDENTIFIED
INDICATOR DESCRIPTION
Social capital i11 Level of trust Indicates the level of trust extended to other members of the household
i12 Degree of social inclusion
Indicates an increase or decrease of social isolation in the form of kinship ties. An associated variable is the proximity, which immediate family members live from one another (Mustafa et al., 2010) or the level of closeness of family relations.
25 Gender is commonly associated to vulnerability. Studies focusing on women facing hurricanes have shown that women suffer the impact of extreme climatic events disproportionately then men. Women living alone are more likely to have informal income, their ability to act swiftly and seek safety maybe restricted by their responsibilities as care-takers (Enarson and Morrow, 1997; Morrow 1999).
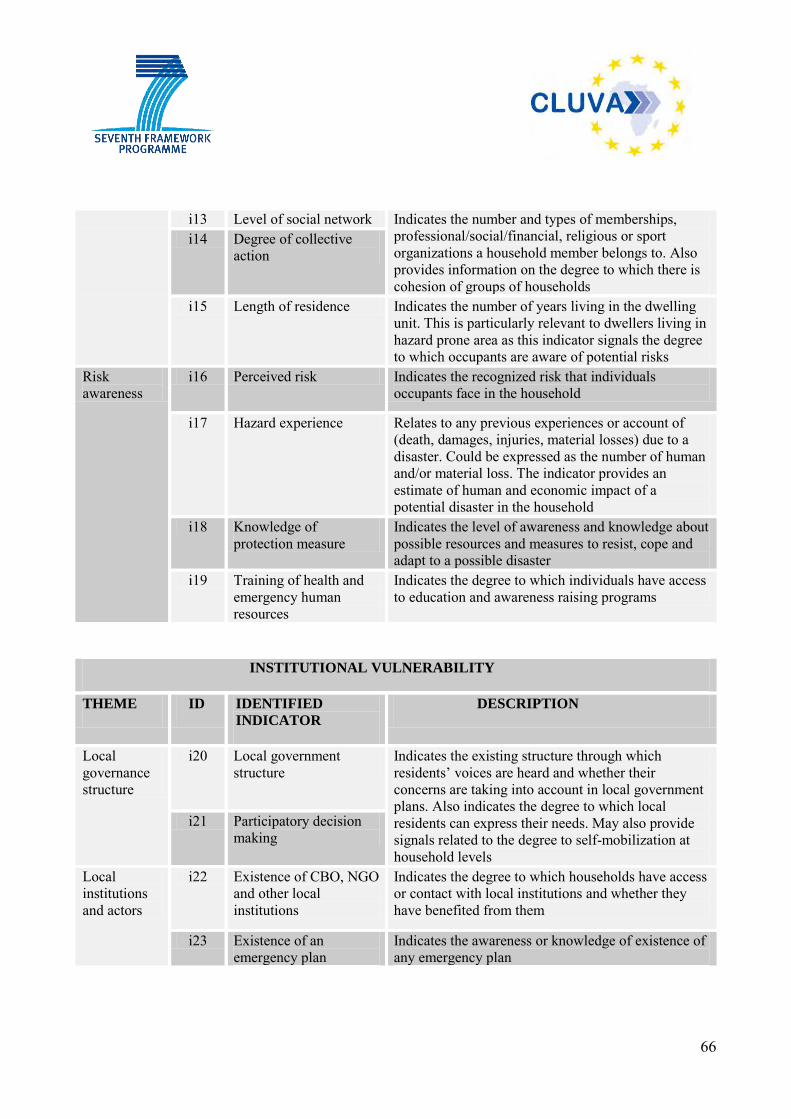
66
i13 Level of social network Indicates the number and types of memberships, professional/social/financial, religious or sport organizations a household member belongs to. Also provides information on the degree to which there is cohesion of groups of households
i14 Degree of collective action
i15 Length of residence Indicates the number of years living in the dwelling unit. This is particularly relevant to dwellers living in hazard prone area as this indicator signals the degree to which occupants are aware of potential risks
Risk awareness
i16 Perceived risk Indicates the recognized risk that individuals occupants face in the household
i17 Hazard experience Relates to any previous experiences or account of (death, damages, injuries, material losses) due to a disaster. Could be expressed as the number of human and/or material loss. The indicator provides an estimate of human and economic impact of a potential disaster in the household
i18 Knowledge of protection measure
Indicates the level of awareness and knowledge about possible resources and measures to resist, cope and adapt to a possible disaster
i19 Training of health and emergency human resources
Indicates the degree to which individuals have access to education and awareness raising programs
INSTITUTIONAL VULNERABILITY
THEME ID IDENTIFIED
INDICATOR DESCRIPTION
Local governance structure
i20 Local government structure
Indicates the existing structure through which residents’ voices are heard and whether their concerns are taking into account in local government plans. Also indicates the degree to which local residents can express their needs. May also provide signals related to the degree to self-mobilization at household levels
i21 Participatory decision making
Local institutions and actors
i22 Existence of CBO, NGO and other local institutions
Indicates the degree to which households have access or contact with local institutions and whether they have benefited from them
i23 Existence of an emergency plan
Indicates the awareness or knowledge of existence of any emergency plan
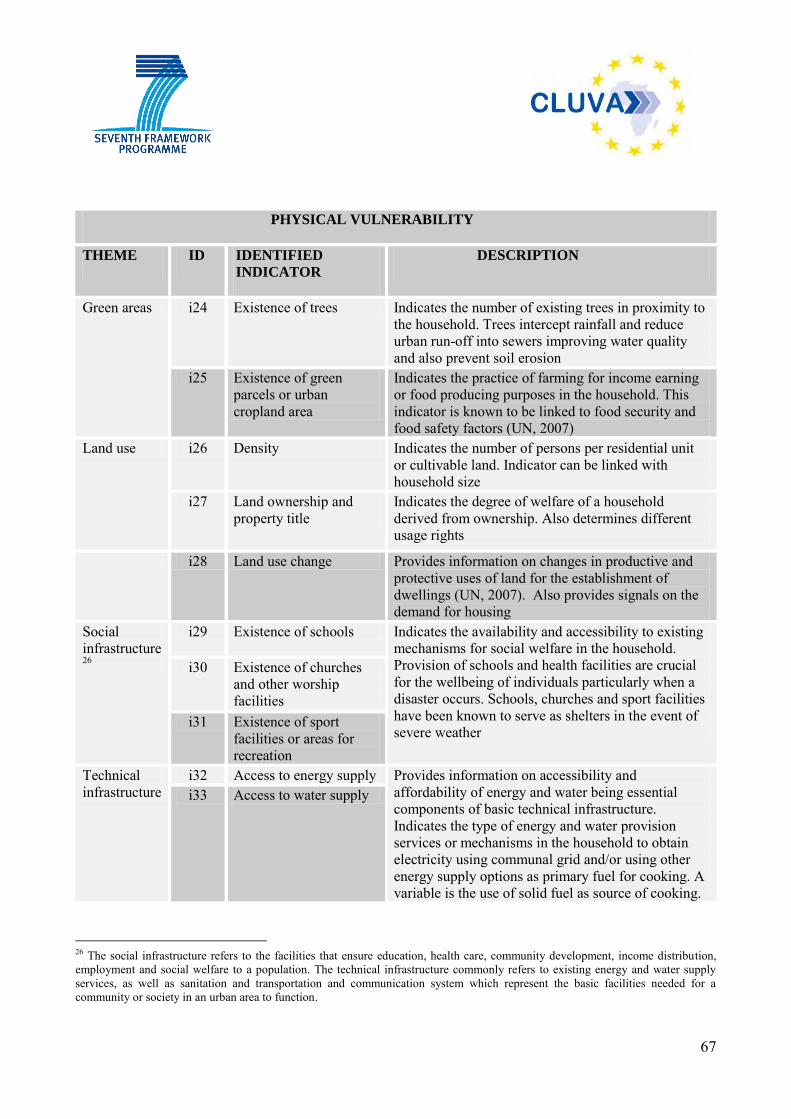
67
PHYSICAL VULNERABILITY
THEME ID IDENTIFIED
INDICATOR DESCRIPTION
Green areas i24 Existence of trees Indicates the number of existing trees in proximity to the household. Trees intercept rainfall and reduce urban run-off into sewers improving water quality and also prevent soil erosion
i25 Existence of green parcels or urban cropland area
Indicates the practice of farming for income earning or food producing purposes in the household. This indicator is known to be linked to food security and food safety factors (UN, 2007)
Land use i26 Density Indicates the number of persons per residential unit or cultivable land. Indicator can be linked with household size
i27 Land ownership and property title
Indicates the degree of welfare of a household derived from ownership. Also determines different usage rights
i28 Land use change Provides information on changes in productive and protective uses of land for the establishment of dwellings (UN, 2007). Also provides signals on the demand for housing
Social infrastructure26
i29 Existence of schools Indicates the availability and accessibility to existing mechanisms for social welfare in the household. Provision of schools and health facilities are crucial for the wellbeing of individuals particularly when a disaster occurs. Schools, churches and sport facilities have been known to serve as shelters in the event of severe weather
i30 Existence of churches and other worship facilities
i31 Existence of sport facilities or areas for recreation
Technical infrastructure
i32 Access to energy supply Provides information on accessibility and affordability of energy and water being essential components of basic technical infrastructure. Indicates the type of energy and water provision services or mechanisms in the household to obtain electricity using communal grid and/or using other energy supply options as primary fuel for cooking. A variable is the use of solid fuel as source of cooking.
i33 Access to water supply
26 The social infrastructure refers to the facilities that ensure education, health care, community development, income distribution, employment and social welfare to a population. The technical infrastructure commonly refers to existing energy and water supply services, as well as sanitation and transportation and communication system which represent the basic facilities needed for a community or society in an urban area to function.
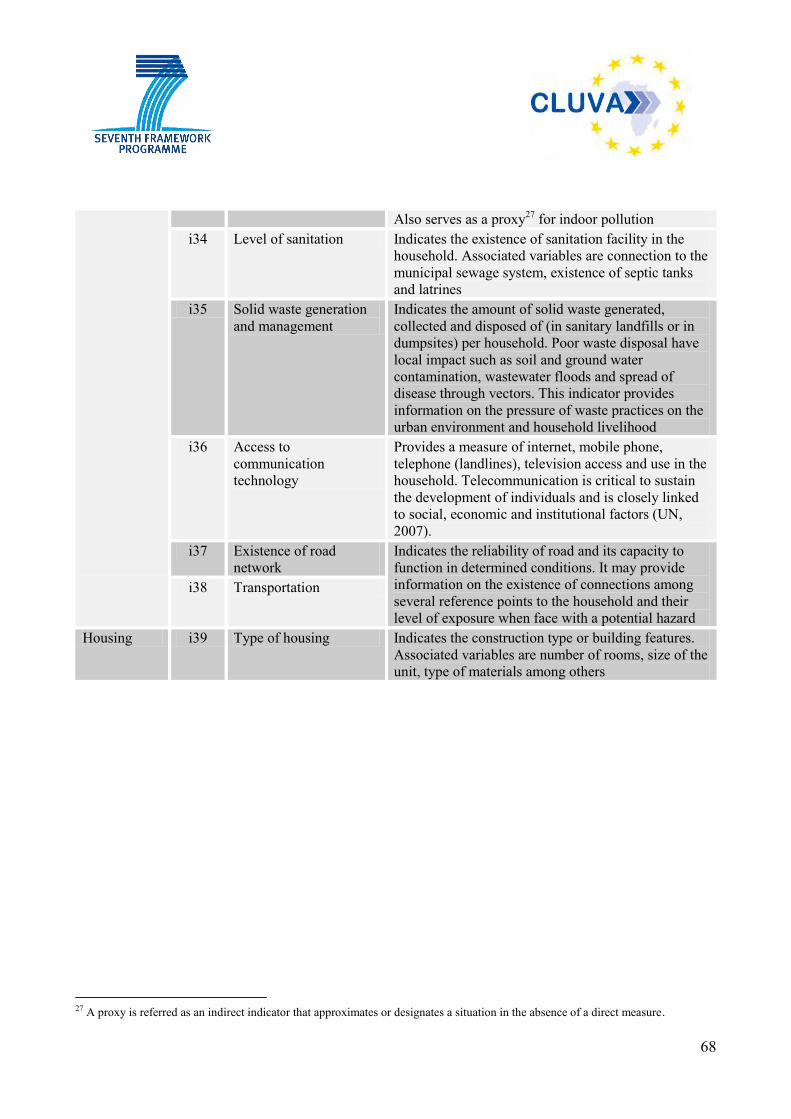
68
Also serves as a proxy27 for indoor pollution i34 Level of sanitation Indicates the existence of sanitation facility in the
household. Associated variables are connection to the municipal sewage system, existence of septic tanks and latrines
i35 Solid waste generation and management
Indicates the amount of solid waste generated, collected and disposed of (in sanitary landfills or in dumpsites) per household. Poor waste disposal have local impact such as soil and ground water contamination, wastewater floods and spread of disease through vectors. This indicator provides information on the pressure of waste practices on the urban environment and household livelihood
i36 Access to communication technology
Provides a measure of internet, mobile phone, telephone (landlines), television access and use in the household. Telecommunication is critical to sustain the development of individuals and is closely linked to social, economic and institutional factors (UN, 2007).
i37 Existence of road network
Indicates the reliability of road and its capacity to function in determined conditions. It may provide information on the existence of connections among several reference points to the household and their level of exposure when face with a potential hazard
i38 Transportation
Housing i39 Type of housing Indicates the construction type or building features. Associated variables are number of rooms, size of the unit, type of materials among others
27 A proxy is referred as an indirect indicator that approximates or designates a situation in the absence of a direct measure.
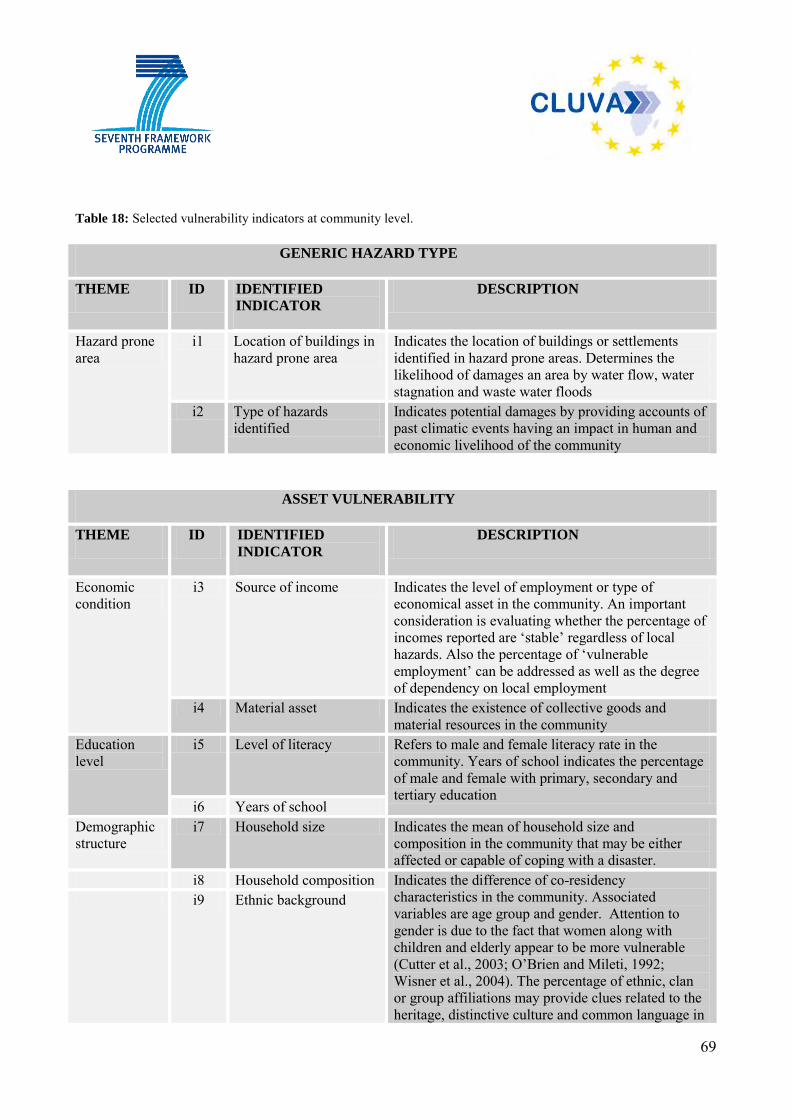
69
Table 18: Selected vulnerability indicators at community level.
GENERIC HAZARD TYPE
THEME ID IDENTIFIED
INDICATOR DESCRIPTION
Hazard prone area
i1 Location of buildings in hazard prone area
Indicates the location of buildings or settlements identified in hazard prone areas. Determines the likelihood of damages an area by water flow, water stagnation and waste water floods
i2 Type of hazards identified
Indicates potential damages by providing accounts of past climatic events having an impact in human and economic livelihood of the community
ASSET VULNERABILITY
THEME ID IDENTIFIED
INDICATOR DESCRIPTION
Economic condition
i3 Source of income Indicates the level of employment or type of economical asset in the community. An important consideration is evaluating whether the percentage of incomes reported are ‘stable’ regardless of local hazards. Also the percentage of ‘vulnerable employment’ can be addressed as well as the degree of dependency on local employment
i4 Material asset Indicates the existence of collective goods and material resources in the community
Education level
i5 Level of literacy Refers to male and female literacy rate in the community. Years of school indicates the percentage of male and female with primary, secondary and tertiary education
i6 Years of school Demographic structure
i7 Household size Indicates the mean of household size and composition in the community that may be either affected or capable of coping with a disaster.
i8 Household composition Indicates the difference of co-residency characteristics in the community. Associated variables are age group and gender. Attention to gender is due to the fact that women along with children and elderly appear to be more vulnerable (Cutter et al., 2003; O’Brien and Mileti, 1992; Wisner et al., 2004). The percentage of ethnic, clan or group affiliations may provide clues related to the heritage, distinctive culture and common language in
i9 Ethnic background
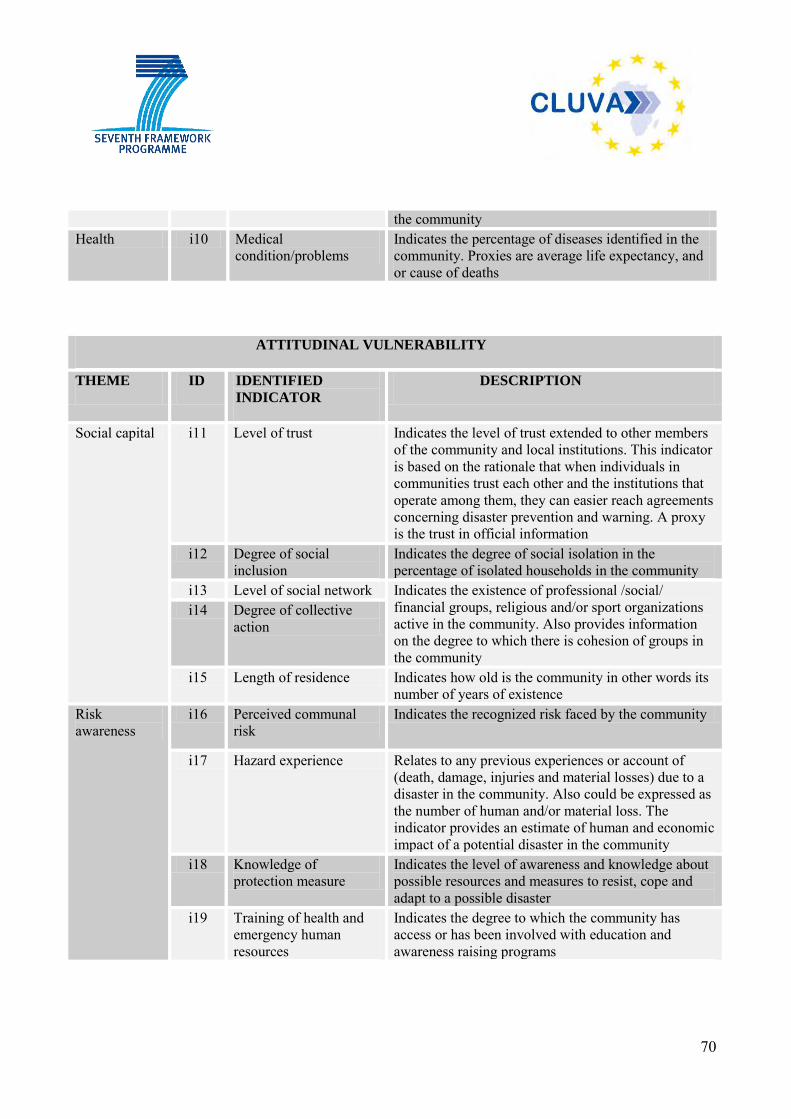
70
the community Health i10 Medical
condition/problems Indicates the percentage of diseases identified in the community. Proxies are average life expectancy, and or cause of deaths
ATTITUDINAL VULNERABILITY
THEME ID IDENTIFIED
INDICATOR DESCRIPTION
Social capital i11 Level of trust Indicates the level of trust extended to other members of the community and local institutions. This indicator is based on the rationale that when individuals in communities trust each other and the institutions that operate among them, they can easier reach agreements concerning disaster prevention and warning. A proxy is the trust in official information
i12 Degree of social inclusion
Indicates the degree of social isolation in the percentage of isolated households in the community
i13 Level of social network Indicates the existence of professional /social/ financial groups, religious and/or sport organizations active in the community. Also provides information on the degree to which there is cohesion of groups in the community
i14 Degree of collective action
i15 Length of residence Indicates how old is the community in other words its number of years of existence
Risk awareness
i16 Perceived communal risk
Indicates the recognized risk faced by the community
i17 Hazard experience Relates to any previous experiences or account of (death, damage, injuries and material losses) due to a disaster in the community. Also could be expressed as the number of human and/or material loss. The indicator provides an estimate of human and economic impact of a potential disaster in the community
i18 Knowledge of protection measure
Indicates the level of awareness and knowledge about possible resources and measures to resist, cope and adapt to a possible disaster
i19 Training of health and emergency human resources
Indicates the degree to which the community has access or has been involved with education and awareness raising programs
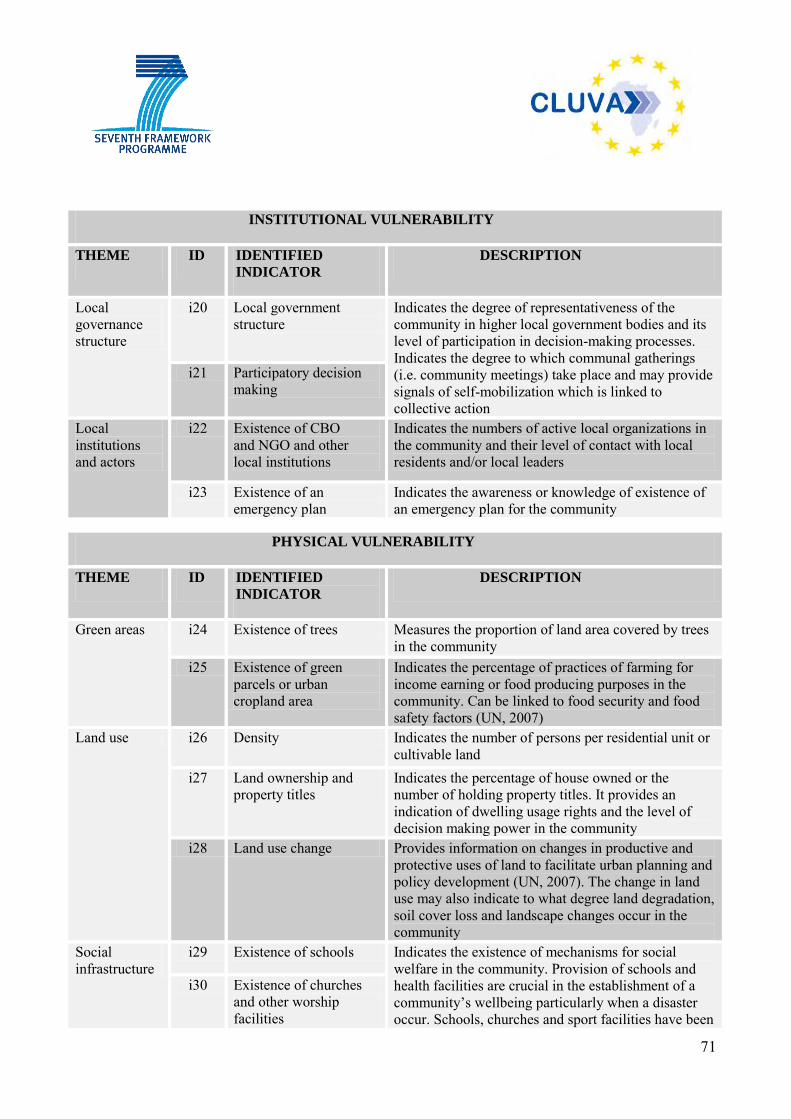
71
INSTITUTIONAL VULNERABILITY
THEME ID IDENTIFIED
INDICATOR DESCRIPTION
Local governance structure
i20 Local government structure
Indicates the degree of representativeness of the community in higher local government bodies and its level of participation in decision-making processes. Indicates the degree to which communal gatherings (i.e. community meetings) take place and may provide signals of self-mobilization which is linked to collective action
i21 Participatory decision making
Local institutions and actors
i22 Existence of CBO and NGO and other local institutions
Indicates the numbers of active local organizations in the community and their level of contact with local residents and/or local leaders
i23 Existence of an emergency plan
Indicates the awareness or knowledge of existence of an emergency plan for the community
PHYSICAL VULNERABILITY
THEME ID IDENTIFIED
INDICATOR DESCRIPTION
Green areas i24 Existence of trees Measures the proportion of land area covered by trees in the community
i25 Existence of green parcels or urban cropland area
Indicates the percentage of practices of farming for income earning or food producing purposes in the community. Can be linked to food security and food safety factors (UN, 2007)
Land use i26 Density Indicates the number of persons per residential unit or cultivable land
i27 Land ownership and property titles
Indicates the percentage of house owned or the number of holding property titles. It provides an indication of dwelling usage rights and the level of decision making power in the community
i28 Land use change Provides information on changes in productive and protective uses of land to facilitate urban planning and policy development (UN, 2007). The change in land use may also indicate to what degree land degradation, soil cover loss and landscape changes occur in the community
Social infrastructure
i29 Existence of schools Indicates the existence of mechanisms for social welfare in the community. Provision of schools and health facilities are crucial in the establishment of a community’s wellbeing particularly when a disaster occur. Schools, churches and sport facilities have been
i30 Existence of churches and other worship facilities
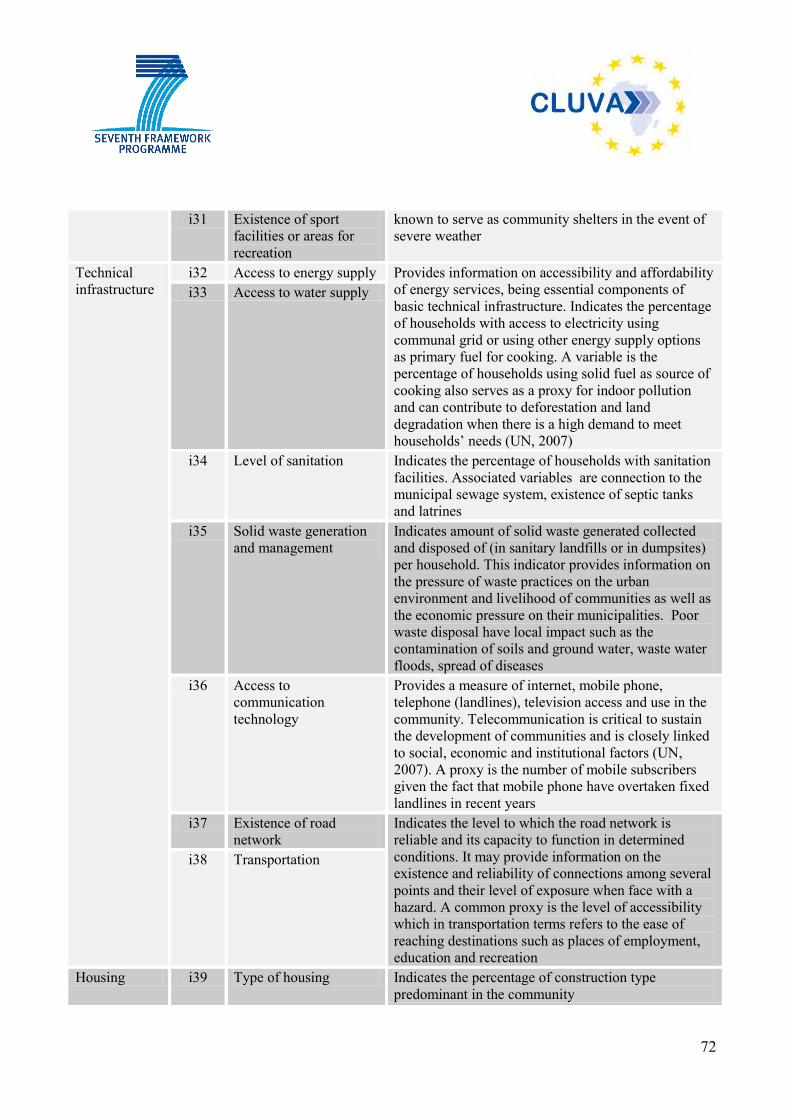
72
i31 Existence of sport facilities or areas for recreation
known to serve as community shelters in the event of severe weather
Technical infrastructure
i32 Access to energy supply Provides information on accessibility and affordability of energy services, being essential components of basic technical infrastructure. Indicates the percentage of households with access to electricity using communal grid or using other energy supply options as primary fuel for cooking. A variable is the percentage of households using solid fuel as source of cooking also serves as a proxy for indoor pollution and can contribute to deforestation and land degradation when there is a high demand to meet households’ needs (UN, 2007)
i33 Access to water supply
i34 Level of sanitation Indicates the percentage of households with sanitation facilities. Associated variables are connection to the municipal sewage system, existence of septic tanks and latrines
i35 Solid waste generation and management
Indicates amount of solid waste generated collected and disposed of (in sanitary landfills or in dumpsites) per household. This indicator provides information on the pressure of waste practices on the urban environment and livelihood of communities as well as the economic pressure on their municipalities. Poor waste disposal have local impact such as the contamination of soils and ground water, waste water floods, spread of diseases
i36 Access to communication technology
Provides a measure of internet, mobile phone, telephone (landlines), television access and use in the community. Telecommunication is critical to sustain the development of communities and is closely linked to social, economic and institutional factors (UN, 2007). A proxy is the number of mobile subscribers given the fact that mobile phone have overtaken fixed landlines in recent years
i37 Existence of road network
Indicates the level to which the road network is reliable and its capacity to function in determined conditions. It may provide information on the existence and reliability of connections among several points and their level of exposure when face with a hazard. A common proxy is the level of accessibility which in transportation terms refers to the ease of reaching destinations such as places of employment, education and recreation
i38 Transportation
Housing i39 Type of housing Indicates the percentage of construction type predominant in the community
73
The indicators illustrated in Table 17 and 18 were presented to CLUVA partners for an initial evaluation based on basic and desirable criteria. The basic criteria are related to how measurable and analytically sound indicators should be as well as their relevance to CLUVA identified hazards. The desirable criteria encompass are levels of comprehension (i.e. easy to interpret), trustworthiness, data availability and resource capacity. The description of the procedure and the results will be presented in the next chapter.
74
6 EVALUATION OF IDENTIFIED VULNERABILITY INDICATORS
6.1 CRITERIA FOR THE EVALUATION OF IDENTIFIED SET OF INDICATORS
While specific indicators will vary depending on the context, the needs and requirement of what is to be assessed, there are several criteria suggested in the literature. Birkmann (2006) proposes that indicators need to be ‘relevant’ as well as ‘analytically and statistically’ sound (ibid.: 65). This suggests that attention should be given to converting abstract factors of vulnerability into a systematic construct that can be measured. Weiland et al. (2011) stress the informative nature of indicators and therefore suggest them to be understandable by both practitioners and researchers. Technical criteria for selecting indicators put forward by Flowers et al. (2005) include a certain degree of well-behaviour, specification, repeatability, feasibility as well as the ability to construct and deconstruct. With regard to ranking indicators, Cutter et al. (2003) put forward the idea of using weighing schemes as not all vulnerability indicators are necessarily equal. Among weighing attempts proposed to reduce the level of subjectivity in balancing indicators is the development of a statistical multi-criteria analysis which attempt offsetting comprehensiveness and applicability (Meyer et al., 2007). Overall, it can be said that a common criteria to select relevant indicators should be defined by a set of standard norms as well as certain goals and priorities on what is relevant and applicable. Based on suggestions offered by Berry (1997), Flowers et al., (2005), Gallopín (1997), Parris (2000), Tapsell et al. (2010), and Weiland et al. (2011) as well as observations made by CLUVA partners, we propose that the construction of indicators must be then clear and transparent. It must not be ambiguous and should be understandable by different groups.
6.1.1 Basic criteria for the evaluation of indicators to assess vulnerability in urban areas
As basic criteria we consider that selected indicators should meet the following two critical requirements in CLUVA. The value of indicator must be measurable or at least observable (Galoppín, 1997) and it must be relevant to the different hazards identified in CLUVA cities.
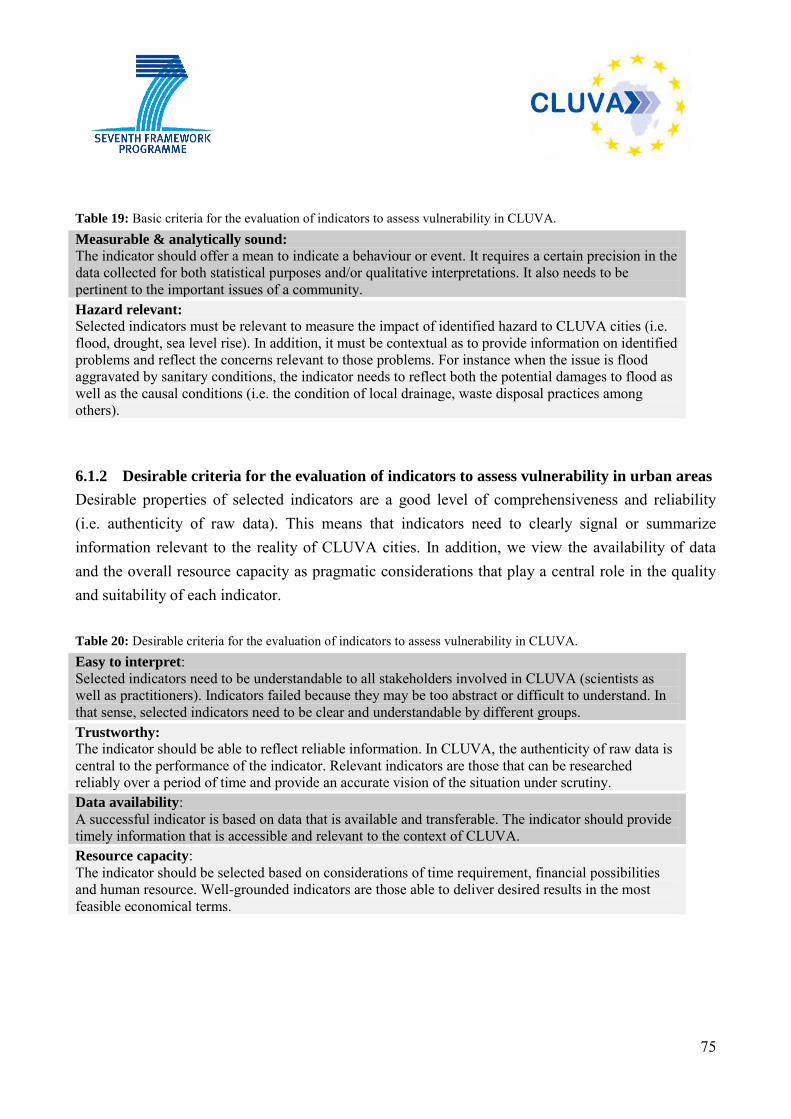
75
Table 19: Basic criteria for the evaluation of indicators to assess vulnerability in CLUVA. Measurable & analytically sound: The indicator should offer a mean to indicate a behaviour or event. It requires a certain precision in the data collected for both statistical purposes and/or qualitative interpretations. It also needs to be pertinent to the important issues of a community. Hazard relevant: Selected indicators must be relevant to measure the impact of identified hazard to CLUVA cities (i.e. flood, drought, sea level rise). In addition, it must be contextual as to provide information on identified problems and reflect the concerns relevant to those problems. For instance when the issue is flood aggravated by sanitary conditions, the indicator needs to reflect both the potential damages to flood as well as the causal conditions (i.e. the condition of local drainage, waste disposal practices among others).
6.1.2 Desirable criteria for the evaluation of indicators to assess vulnerability in urban areas
Desirable properties of selected indicators are a good level of comprehensiveness and reliability (i.e. authenticity of raw data). This means that indicators need to clearly signal or summarize information relevant to the reality of CLUVA cities. In addition, we view the availability of data and the overall resource capacity as pragmatic considerations that play a central role in the quality and suitability of each indicator.
Table 20: Desirable criteria for the evaluation of indicators to assess vulnerability in CLUVA. Easy to interpret: Selected indicators need to be understandable to all stakeholders involved in CLUVA (scientists as well as practitioners). Indicators failed because they may be too abstract or difficult to understand. In that sense, selected indicators need to be clear and understandable by different groups. Trustworthy: The indicator should be able to reflect reliable information. In CLUVA, the authenticity of raw data is central to the performance of the indicator. Relevant indicators are those that can be researched reliably over a period of time and provide an accurate vision of the situation under scrutiny. Data availability: A successful indicator is based on data that is available and transferable. The indicator should provide timely information that is accessible and relevant to the context of CLUVA. Resource capacity: The indicator should be selected based on considerations of time requirement, financial possibilities and human resource. Well-grounded indicators are those able to deliver desired results in the most feasible economical terms.
76
6.2 PROCEDURE FOR THE EVALUATION OF IDENTIFIED INDICATORS
CLUVA scholars in African case studies with links with Task 2.3 were requested to provide feedback and/or to evaluate the set of indicators illustrated in Table 17 and 18 between August 1st -19th 2001. A preliminary list of identified indicators at household and community levels and an evaluation sheet were sent via email to CLUVA partners. The evaluation consisted in a questionnaire, which included four main questions related to the desirable criteria mentioned above. See Appendix C (C.1-C.5) for an overview of the evaluation obtained from CLUVA contributors. Contributors were asked to fill in a Likert-style questionnaire to evaluate each identified indicator. The design of the questionnaire was based on a desire to measure the attitudes and opinion of CLUVA partners regarding identified indicators to assess vulnerability. Contributions were conducted individually or collectively. Collective evaluations involved preliminary discussions and a consensus was reached among participants. In addition to the evaluation, the set of identified indicators was also reviewed and commented among European partners with regard to their meanings categorization and overall level of comprehensiveness. The questionnaire was designed to allow evaluators to rate each indicator based on four main criteria:
Criteria 1. Easy to interpret: refers to the evaluator’s level of comprehensiveness of the indicator. As mentioned before, indicators that often failed are too abstract or difficult to understand. Questions therefore were geared towards finding out whether each indicator was understandable to CLUVA researcher and/or stakeholder. They were formulated as follow: ‘In your opinion, is the indicator Easy to interpret?’ and ‘Do you know what the indicator is telling you?’
Criteria 2. Trustworthiness: denotes the evaluator’s trust in the indicator. Validity and
authenticity of raw data are important qualities in an indicator hence we wanted to know whether contributors were confident in the ability of each indicator to provide reliable information. Questions were formulated as follow: ‘In your opinion, is the indicator Trustworthy to measure the condition of individuals, households and the community in your
77
case study location? Could this indicator provide an accurate vision of the situation in your context?’
Criteria 3. Data availability: conveys the evaluator’s opinion regarding the availability of
data for each indicator. Availability as well as accessibility of data was considered as key factors for assessing vulnerability at community levels. The question concerning availability of data was framed as a ‘yes and no’ question as follow: ‘To your knowledge, is there data (i.e. census, other studies, maps, audio-visual material) available and/or accessible for each indicator?’
Criteria 4. Resource capacity: refers to the evaluator’s judgement regarding the financial and
human means available to conduct in depth work in his/her institution. This criterion focus particularly in factors such as finances, manpower, time consideration and the overall institutional support to explore what the indicator attempts to measure. Questions therefore were formulated in the following manner: ‘In your opinion, is the indicator adequate to the resource available to conduct in depth work in your university or institution? Are there manpower, financial support, community approval and sufficient time to obtain the data to measure the indicator?’
By criteria 1.“Easy to Interpret”, 2.“Trustworthiness” and 4.“Resource Capacity”, contributors were asked to indicate their level of agreement or disagreement by means of a five point scales including ‘strongly agree’, ‘agree’, ‘neither agree nor disagree’, ‘disagree’ and ‘strongly disagree’. With regard to Criteria 3.“Data availability”, evaluators were asked to estimate the availability of data attached to each indicator using a polar ‘yes and no’ format. As shown in Table 21 below, all CLUVA African partner institutions attached to Task 2.3 contributed to the evaluation. In fact, the majority of African partners evaluated the indicators identified in this report. In total five evaluations were analysed quantitatively; all coming from African case study cities. They reflect both individual and collective judgements from scholars exploring the social vulnerability of CLUVA cities with exception of the evaluation of our UY1 partner which main tasks centre around probabilistic hazard, multi hazard and multi risk assessment. Hence we consider UY1’s contribution with particular interest as it allows a more inclusive and varied opinions to identify potential robust indicators for CLUVA.
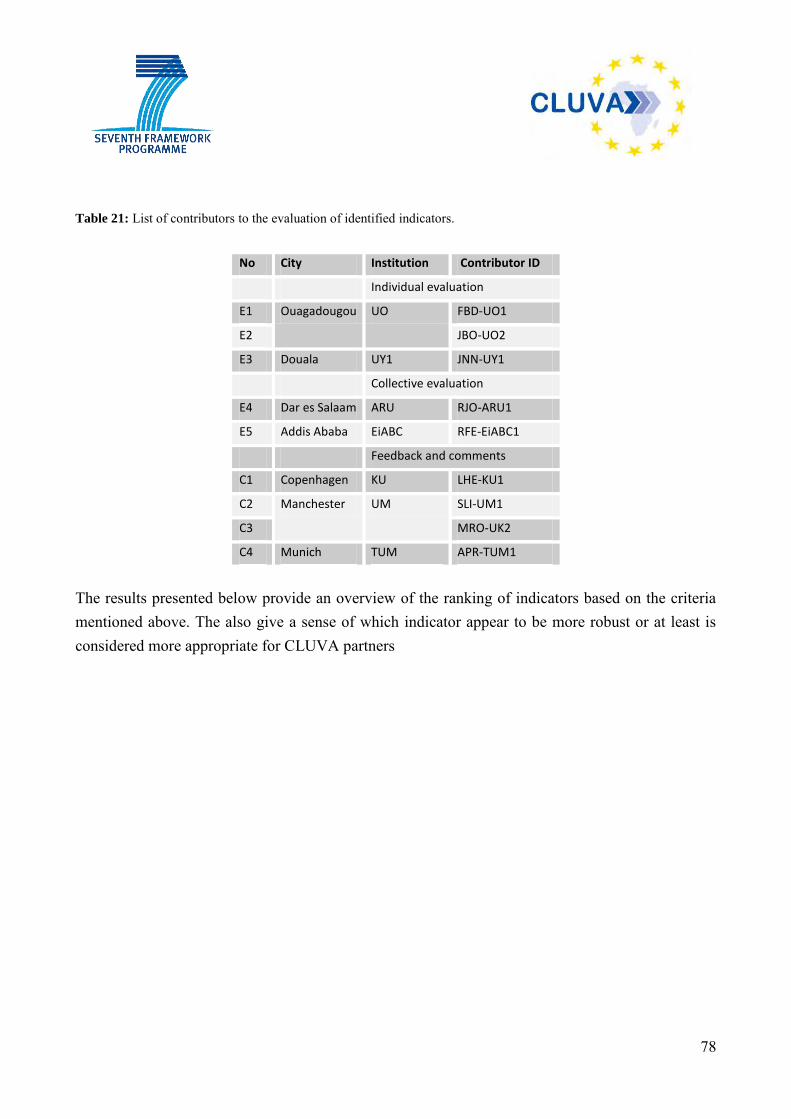
78
Table 21: List of contributors to the evaluation of identified indicators.
No City Institution Contributor ID
Individual evaluation
E1 Ouagadougou UO FBD-UO1
E2 JBO-UO2
E3 Douala UY1 JNN-UY1
Collective evaluation E4 Dar es Salaam ARU RJO-ARU1
E5 Addis Ababa EiABC RFE-EiABC1
Feedback and comments C1 Copenhagen KU LHE-KU1
C2 Manchester UM SLI-UM1
C3 MRO-UK2
C4 Munich TUM APR-TUM1
The results presented below provide an overview of the ranking of indicators based on the criteria mentioned above. The also give a sense of which indicator appear to be more robust or at least is considered more appropriate for CLUVA partners
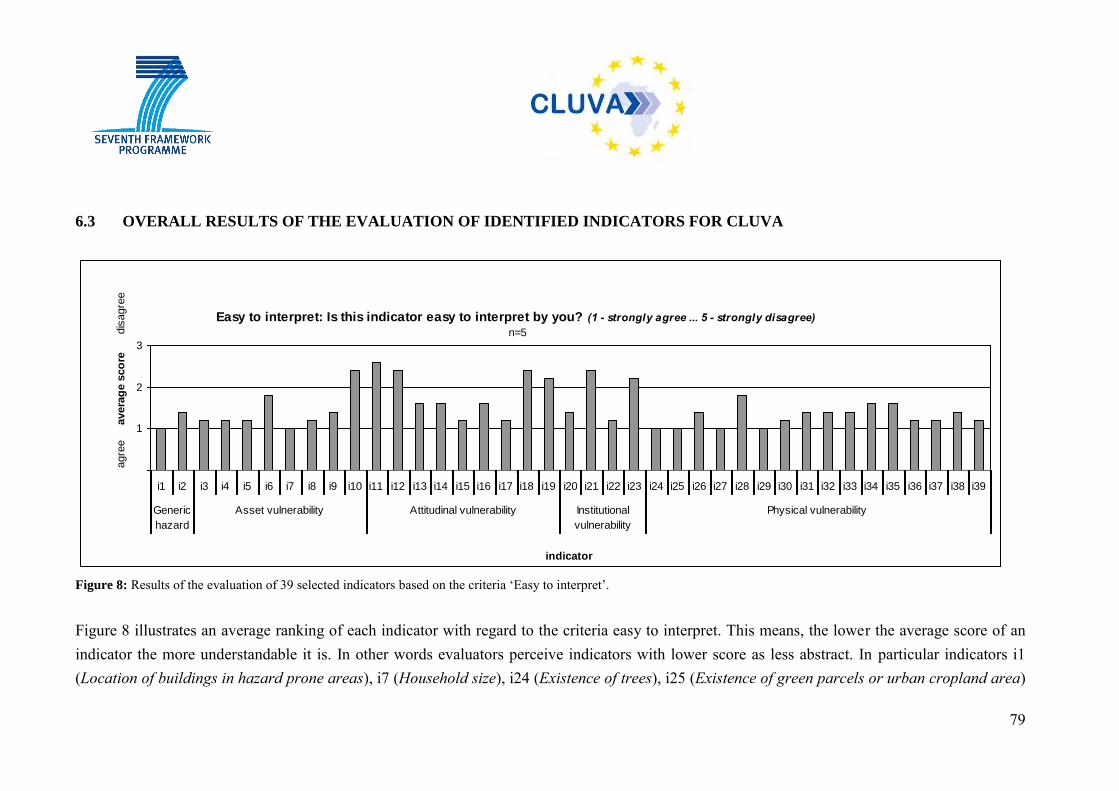
79
6.3 OVERALL RESULTS OF THE EVALUATION OF IDENTIFIED INDICATORS FOR CLUVA
Easy to interpret: Is this indicator easy to interpret by you? (1 - strongly agree ... 5 - strongly disagree)n=5
0
1
2
3
i1 i2 i3 i4 i5 i6 i7 i8 i9 i10 i11 i12 i13 i14 i15 i16 i17 i18 i19 i20 i21 i22 i23 i24 i25 i26 i27 i28 i29 i30 i31 i32 i33 i34 i35 i36 i37 i38 i39
Generic
hazard
Asset vulnerability Attitudinal vulnerability Institutional
vulnerability
Physical vulnerability
indicator
a
gre
e a
vera
ge s
co
re
dis
agre
e
Figure 8: Results of the evaluation of 39 selected indicators based on the criteria ‘Easy to interpret’.
Figure 8 illustrates an average ranking of each indicator with regard to the criteria easy to interpret. This means, the lower the average score of an indicator the more understandable it is. In other words evaluators perceive indicators with lower score as less abstract. In particular indicators i1 (Location of buildings in hazard prone areas), i7 (Household size), i24 (Existence of trees), i25 (Existence of green parcels or urban cropland area)
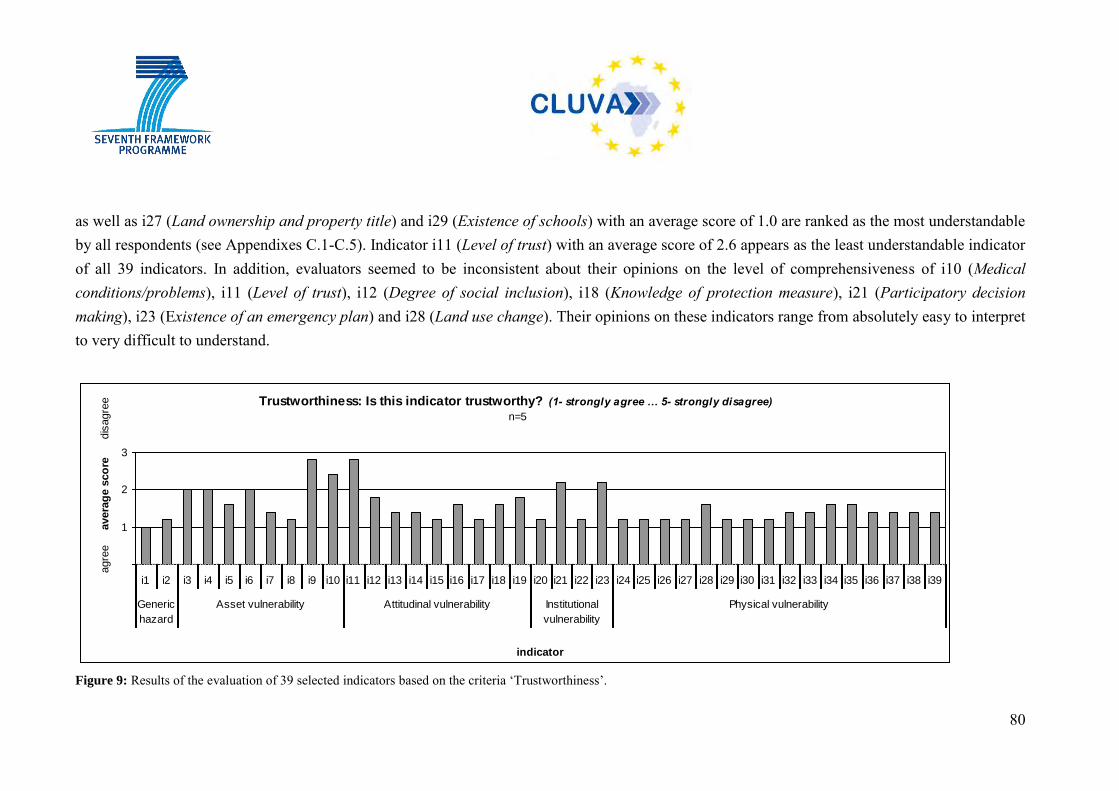
80
as well as i27 (Land ownership and property title) and i29 (Existence of schools) with an average score of 1.0 are ranked as the most understandable by all respondents (see Appendixes C.1-C.5). Indicator i11 (Level of trust) with an average score of 2.6 appears as the least understandable indicator of all 39 indicators. In addition, evaluators seemed to be inconsistent about their opinions on the level of comprehensiveness of i10 (Medical conditions/problems), i11 (Level of trust), i12 (Degree of social inclusion), i18 (Knowledge of protection measure), i21 (Participatory decision making), i23 (Existence of an emergency plan) and i28 (Land use change). Their opinions on these indicators range from absolutely easy to interpret to very difficult to understand.
Trustworthiness: Is this indicator trustworthy? (1- strongly agree … 5- strongly disagree)n=5
0
1
2
3
i1 i2 i3 i4 i5 i6 i7 i8 i9 i10 i11 i12 i13 i14 i15 i16 i17 i18 i19 i20 i21 i22 i23 i24 i25 i26 i27 i28 i29 i30 i31 i32 i33 i34 i35 i36 i37 i38 i39
Generic
hazard
Asset vulnerability Attitudinal vulnerability Institutional
vulnerability
Physical vulnerability
indicator
a
gre
e a
vera
ge s
co
re
dis
agre
e
Figure 9: Results of the evaluation of 39 selected indicators based on the criteria ‘Trustworthiness’.
81
Figure 9 offers an overview on the average ranking of identified indicators with regard their ability to reflect reliable information, according to CLUVA evaluators. They were asked whether the indicators provide an accurate vision of the situation in their respective context. Just as in the previous figure, a lower the average score points to the more likely indicators are to be perceived as trustworthy. For instance, respondents rated Indicator i1 (Location of buildings in hazard prone areas) as most trustworthy (see Appendixes C.1-C.5). In contrast, indicators i9 (Ethnic background) and i11 (Level of trust), both with an average score of 2.8, were rated as the least reliable indicators. In addition our analysis showed that several respondents rather differed in their opinion on the authenticity of i3 (Source of income), i4 (Material asset), i9 (Ethnic background), i10 (Medical conditions), i11 (Level of trust) and i21 (Participatory decision making). In these cases opinions fluctuated from absolutely trustworthy to absolutely not reliable.
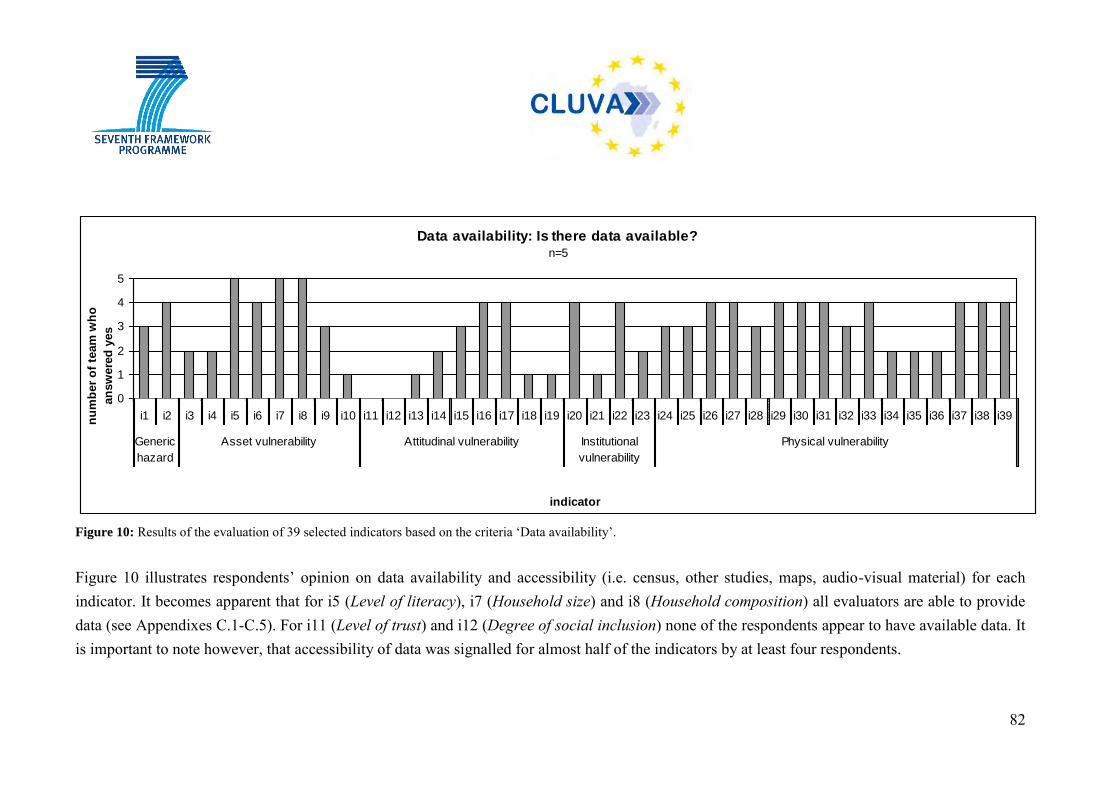
82
Data availability: Is there data available? n=5
0
1
2
3
4
5
i1 i2 i3 i4 i5 i6 i7 i8 i9 i10 i11 i12 i13 i14 i15 i16 i17 i18 i19 i20 i21 i22 i23 i24 i25 i26 i27 i28 i29 i30 i31 i32 i33 i34 i35 i36 i37 i38 i39
Generic
hazard
Asset vulnerability Attitudinal vulnerability Institutional
vulnerability
Physical vulnerability
indicator
nu
mb
er
of
team
wh
o
an
sw
ere
d y
es
Figure 10: Results of the evaluation of 39 selected indicators based on the criteria ‘Data availability’.
Figure 10 illustrates respondents’ opinion on data availability and accessibility (i.e. census, other studies, maps, audio-visual material) for each indicator. It becomes apparent that for i5 (Level of literacy), i7 (Household size) and i8 (Household composition) all evaluators are able to provide data (see Appendixes C.1-C.5). For i11 (Level of trust) and i12 (Degree of social inclusion) none of the respondents appear to have available data. It is important to note however, that accessibility of data was signalled for almost half of the indicators by at least four respondents.
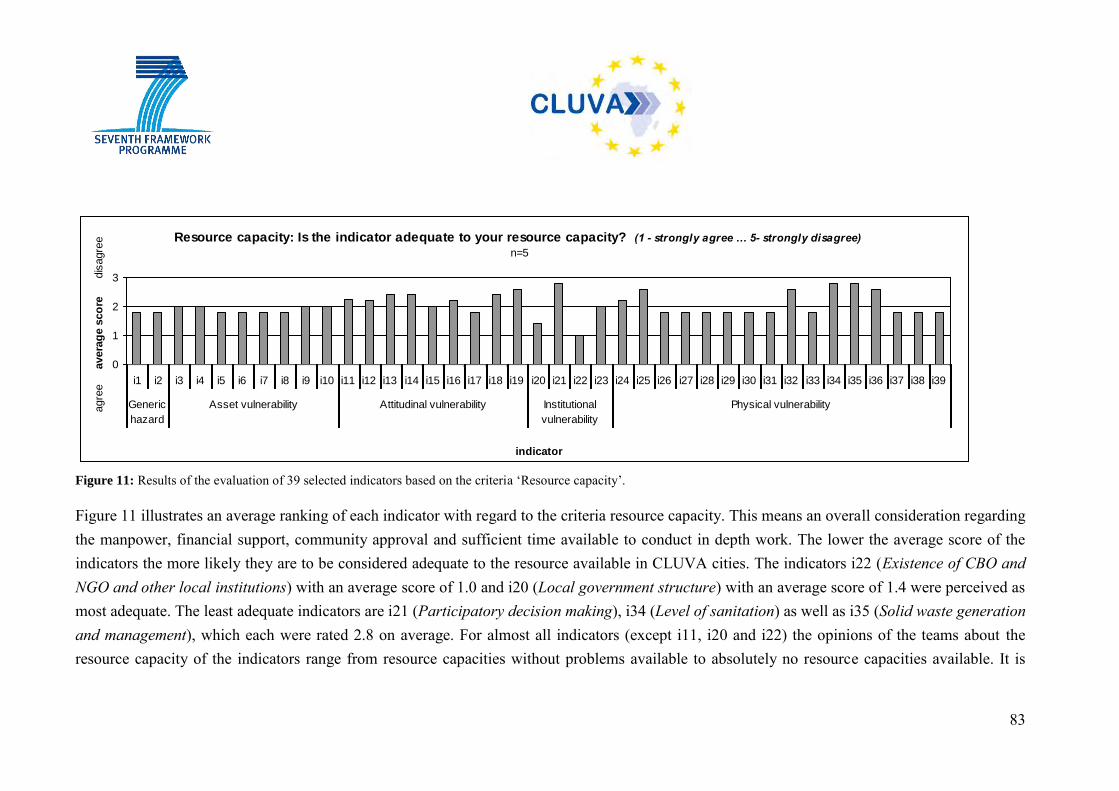
83
Resource capacity: Is the indicator adequate to your resource capacity? (1 - strongly agree … 5- strongly disagree)n=5
0
1
2
3
i1 i2 i3 i4 i5 i6 i7 i8 i9 i10 i11 i12 i13 i14 i15 i16 i17 i18 i19 i20 i21 i22 i23 i24 i25 i26 i27 i28 i29 i30 i31 i32 i33 i34 i35 i36 i37 i38 i39
Generic
hazard
Asset vulnerability Attitudinal vulnerability Institutional
vulnerability
Physical vulnerability
indicator
a
gre
e a
vera
ge s
co
re
dis
agre
e
Figure 11: Results of the evaluation of 39 selected indicators based on the criteria ‘Resource capacity’. Figure 11 illustrates an average ranking of each indicator with regard to the criteria resource capacity. This means an overall consideration regarding the manpower, financial support, community approval and sufficient time available to conduct in depth work. The lower the average score of the indicators the more likely they are to be considered adequate to the resource available in CLUVA cities. The indicators i22 (Existence of CBO and NGO and other local institutions) with an average score of 1.0 and i20 (Local government structure) with an average score of 1.4 were perceived as most adequate. The least adequate indicators are i21 (Participatory decision making), i34 (Level of sanitation) as well as i35 (Solid waste generation and management), which each were rated 2.8 on average. For almost all indicators (except i11, i20 and i22) the opinions of the teams about the resource capacity of the indicators range from resource capacities without problems available to absolutely no resource capacities available. It is
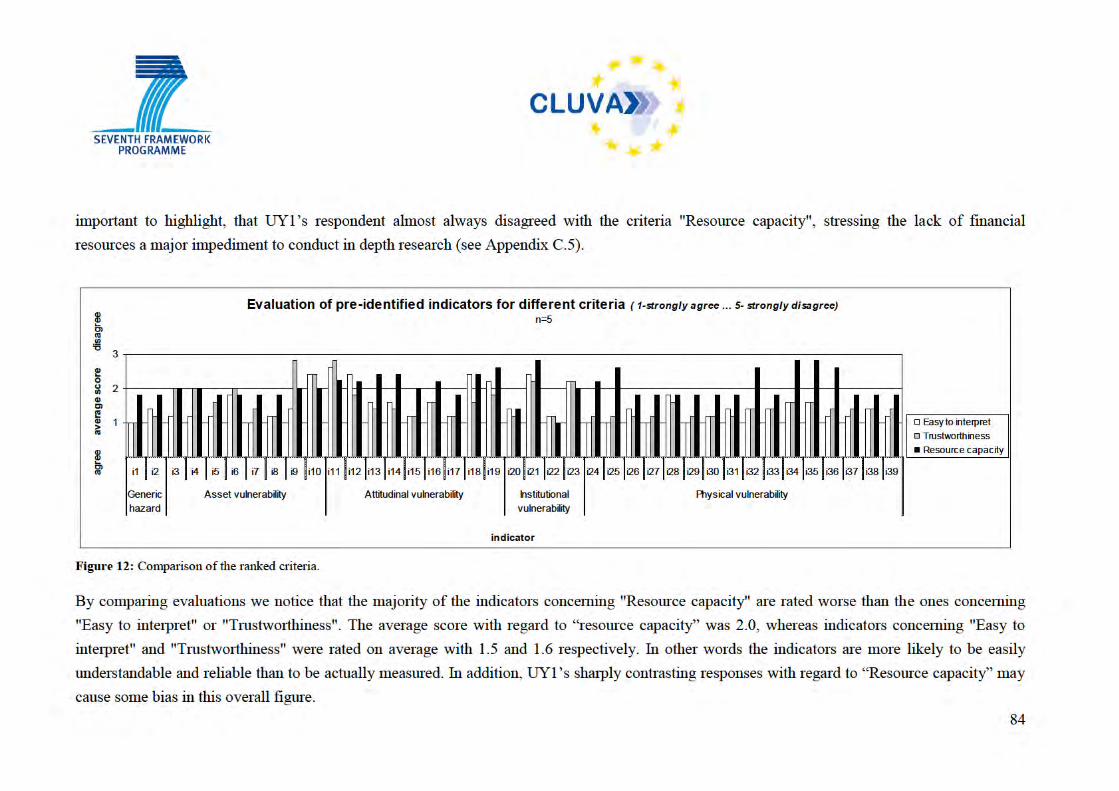
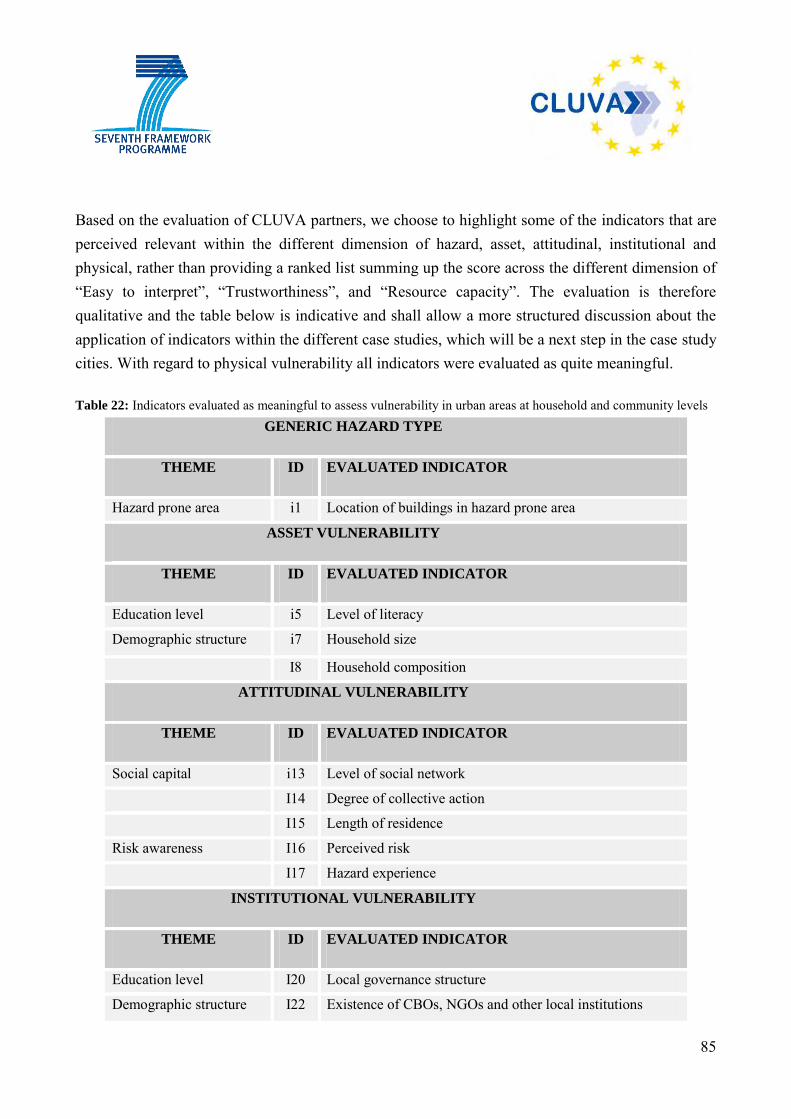
85
Based on the evaluation of CLUVA partners, we choose to highlight some of the indicators that are perceived relevant within the different dimension of hazard, asset, attitudinal, institutional and physical, rather than providing a ranked list summing up the score across the different dimension of “Easy to interpret”, “Trustworthiness”, and “Resource capacity”. The evaluation is therefore qualitative and the table below is indicative and shall allow a more structured discussion about the application of indicators within the different case studies, which will be a next step in the case study cities. With regard to physical vulnerability all indicators were evaluated as quite meaningful.
Table 22: Indicators evaluated as meaningful to assess vulnerability in urban areas at household and community levels GENERIC HAZARD TYPE
THEME ID EVALUATED INDICATOR
Hazard prone area i1 Location of buildings in hazard prone area
ASSET VULNERABILITY
THEME ID EVALUATED INDICATOR
Education level i5 Level of literacy
Demographic structure i7 Household size
I8 Household composition
ATTITUDINAL VULNERABILITY
THEME ID EVALUATED INDICATOR
Social capital i13 Level of social network
I14 Degree of collective action
I15 Length of residence
Risk awareness I16 Perceived risk
I17 Hazard experience
INSTITUTIONAL VULNERABILITY
THEME ID EVALUATED INDICATOR
Education level I20 Local governance structure
Demographic structure I22 Existence of CBOs, NGOs and other local institutions
86
6.4 FURTHER STEPS BASED ON COMMENTS AND OBSERVATIONS FROM
CLUVA PARTNERS
In addition to the evaluation, CLUVA partners commented extensively on the set of identified indicators proposed in this report. These comments are considered particularly valuable to expand the development and contextualization of identified indicators. The following aspects represent some items to be discussed in further steps: 1. Location of indicators within the proposed vulnerability dimension: The location or correct placement of some indicators within the different dimensions of the CLUVA vulnerability ladder was signalled. For instance, the location of i25 Existence of green parcel/or urban cropland area was questioned based on consideration of farming as a mean of subsistence. Remarks to relocate i1 location of the buildings to 'physical vulnerability' and i27 Land ownership to institutional vulnerability are also noted. We will take these comments into account when preparing the next steps in actually conducting the vulnerability assessment in the case study cities. 2. The question of scale: The majority of household indicators appeared to be upscale at community levels and to some extent also at city levels. However, a more accurate differentiation between household and community indicators was suggested at the physical vulnerability dimension. Again, we will take these comments into account when preparing the next steps in actually conducting the vulnerability assessment in the case study cities.
3. The attention to the meaning and working definitions of indicators: A clearer definition on "land use change" was suggested. Some indicators related to attitudinal vulnerability considered as subjective were noted for further discussions. Training of health and emergency human resources was pointed out as unclear to some partners. Further steps are required to provide more precision in selected indicators by CLUVA partners.
4. Other indicators proposed:
Emphasis should be given to ‘Resources supply’ - both water and energy. The use of different energy sources (kerosene, charcoal, firewood, etc.) and the different use
of firewood (e.g. by different types of ovens) could serve as an indicator for vulnerability.
87
Personal transport availability. 5. Identification of variables, identification of measurement/ unit/ coding and the formulation of
questions: Further steps include that case study partners identify more measurable variables, especially regarding compound indicators such as density, solid waste generation, collection and disposal, level of income, type of housing, existence of road network and transportation. In addition, several indicators will have to be measured differently, such as in binary, numeric, ordinal or nominal scales. It was suggested that a 'Data generating question' column could be useful for collecting relevant data. 6. Selected observations from Dar es Salaam:
In the Tanzanian context level of education is used as an indicator to reflect on literacy level and years of school.
Household demographic composition’ which includes household size, age distribution, gender, sex and marital status) is a common indicator.
There is a low percentage of people with access to sewage and energy services therefore, variables such as type of energy and type of sanitation should be considered.
Trustworthiness issue related to ‘access to energy supply’, ‘water supply’, level of sanitation, ‘solid waste generation and management’ will depend on their level of disaggregation.
7. Observations from Addis Ababa:
The level of income plays a major role in determining the social vulnerability and should be considered as an indicator.
The source of income is not always single rather it is more than one in most families and depends on factors such as season and market demand. Therefore it is rather difficult to report the stability of a household income.
8. Observations from Ouagadougou: Further vulnerability indicators proposed with regard to aspects of mobility of residents and
migrants as well as modes of transportation (bicycles/motors/cars). Another indicator proposed was ‘religion’.
88
For asset vulnerability it would be necessary to stress what is the main activity and other sources of financial support obtained in the household. Also a proxy could be considered as the level of consumption or the number of meals per day.
Gender ratio is to be considered such as No. of women as head of household. For physical vulnerability: ‘Zone lotie /Zone non lotie’ considering formal and informal
settlements.
89
CONCLUSION
Task 2.3 "Assessing Social Vulnerability" objectives’ includes Deliverable 2.11, which is presented here as a report on the review and evaluation of existing vulnerability indicators in order to obtain an appropriate set of indicators for assessing climate-related vulnerability. This research input is a first contribution to CLUVA and forms the basis for our next task which deals with the development of a framework for an asset vulnerability and adaptation appraisal which aims at analyzing and comparing the vulnerability and adaptation strategies for different population groups as well as different local contexts. The report refers to the CLUVA cities, located in West and East Africa. They encompass coastal, estuary, inland, and highland characteristics and feature different weather conditions such as tropical dry, tropical humid Sub-Saharan climate. The profiles of each city are schematic overviews and allow first insights in the specifics of the cities involved as well as comparisons in-between them. It provides a good base for more in-depth explorations to contextualize vulnerability during the course of the CLUVA project. The report also provides a clarification of the concept of vulnerability, in particular "social vulnerability". It puts forward several definitions and highlights a common understanding generated through exchanges with CLUVA case study partners during several workshops. Three aspects of social vulnerability are noted here: 1) The specific social inequality of people in the context of a disaster. 2) The needs of a reference point (e.g. a certain type of risk – “vulnerability to what”) and a specific context (which transforms a risk into a hazard – “vulnerability of what and of whom”). And 3) the characteristics of a person or group in terms of their capacity to anticipate, cope with, resist, and recover from the impact of a natural hazard. Within the CLUVA context we propose a vulnerability ladder as a conceptual framework for a specific assessment approach to develop appropriate and relevant indicators. The first component of the ladder considers at the heart of our assessment, the generic components of vulnerability which takes into account the exposure, susceptibility/sensitivity, and coping/adaptive capacity of a system. Subsequently, the ladder stresses the resources and capacities that individuals and groups have when faced with a natural disaster (i.e. asset). It then recognizes urban governance at local levels as central in any inquiry on vulnerability (i.e. institutional). It also considers aspects of trust and social inclusion, network and risk awareness as key items to understand the urban dynamics when a disaster occurs (i.e. attitudinal) and finally acknowledges the state of the urban environment within which all the above dimension interact (i.e. physical).
90
Therefore, we propose four main vulnerability dimensions (asset, institutional, attitudinal and physical), which put the social, economic, political and cultural causes for the production of vulnerable conditions at the forefront of our analysis. The dimensions are described broadly in the report and represent a common understanding of a framework for a CLUVA vulnerability assessment within the consortium. Exchanges with CLUVA partners which took place in the form of workshops in case study cities, served to contextualize our assessment at communities, households and individuals levels. Our suggestion of including four main dimensions in CLUVA allows the establishment of strong links to other tasks, and hence contributes to the overall integration of vulnerability assessment in the CLUVA context.
We propose a mixed method assessment approach including qualitative and quantitative social science-based methods. Mixed methods allow a combination of techniques to explore the social vulnerability of communities, households and individuals in the selected study areas. Furthermore, it enables us to combine the quantitative data policy makers generally request and utilized and the nuanced and more complex qualitative determinants that provide other type of explanations as to what are the coping capacity and resilience of at risk population. The mixed method approach allows multiple forms of vulnerability assessment drawing on all possibilities. This includes for instance, the convergence of pre-existing statistical/census data with a strong correlation between socio-economic and/or demographic settings and vulnerability along with focussed sessions providing the opportunities for interactive work and the exploration of less quantifiable data. Whereas quantitative approaches are indicator-based modes of inquiries largely dependent on statistical data and based on measuring and comparing units of measurement, qualitative methods in turn seek to better understand actors’ own perception of vulnerability and capacities to cope and adapt to possible threatening climatic events. The proposed mixed method approach uses the advantages of both methods and generates synergies which limit the weaknesses of each single method. The report also stresses the development of indicators as priority action to assess the impact of disasters on social, economic and environmental conditions by the international community as well as the need to horizontally communicate the results to decision makers, stakeholders and the population at risk. The call here is to develop realistic and measurable indicators with the following purposes: 1) to develop and track progress in disaster risk reduction 2) to enable decision-makers to assess the impact of disasters 3) to support early warning systems 4) to conform with the respective development goals of the Millennium Declaration.
91
We propose to consider indicators in CLUVA as a composite term that informs us and can provide a type of measure to evaluate the conditions of at risk populations and to estimate their exposure, susceptibility and/or coping and adaptive capacity with regard to the impact of natural hazards. They serve as an assessment tool that indicates a phenomenon and help us measure and communicate different realities of urban vulnerability. Indicators for vulnerability assessment are inherently linked to the mode of assessment. They can be in principle quantitative or qualitative. In any case they must be understandable, valid and context-sensitive. Our attention centres on household and community indicators. Household indicators offer an insight on the livelihood of individuals, whereas community indicators might help local leaders recognize the physical and social resources they have to address collective problems. The differentiation between indicators at household and community levels is relevant here because each scale adopts different values in time, space, population and therefore has difference significance. A total of 39 indicators were identified at household and community levels and are illustrated in the form of a table including vulnerability dimensions, related themes, indicator ID, indicator construct and description. The indicators were presented to the CLUVA partners for an initial evaluation concerning basic and desirable criteria. The basic criteria are: measurable and being analytically sound as well as hazard relevance. The desirable criteria are: ‘easy to interpret’, trustworthiness, ‘data availability’ and ‘resource capacity’. The evaluation procedure in which CLUVA partners concerned with WP 2 and WP 3 were involved, reveals a more meaningful indicator set based on CLUVA’s targets. Some of them are: ‘location of buildings in hazard prone area', ‘level of literacy’, ‘household size’, ‘household composition level of social network’, ‘degree of collective action’, ‘length of residence’, ‘perceived risk, hazard experience, local governance structure’, ‘existence of CBO, NGO and other local institutions’ as well as most of the physical vulnerability indicators identified for CLUVA. Finally we would like to stress, that this report combines theoretical propositions obtained by a literature review and topical local knowledge steaming from recent stakeholder discussions, field observations as well as intensive exchanges with partners. This represents an additional value for CLUVA. We consider the contents of the Deliverable 2.11 as a conceptual base and methodological frame for the further interdisciplinary and cross-cultural research within CLUVA. In particular, the results will be used to:
92
consolidate exchange and discussions within the CLUVA consortium to improve our common scientific understanding of the climate change induced urban vulnerability in Africa,
conduct surveys will be carried out in our case study areas to get empirical evidence according to the CLUVA hypotheses,
develop training offers and enhance PhD efforts included in CLUVA, engage peer review among practitioners and experts in order to accomplish practice/action
orientated research.
93
REFERENCES
Adger, W.N. (2006). Vulnerability. Global Environmental Change, 16: 268–281.
Adger, W.N., Brooks, N., Bentham, G., Agnew, M., Eriksen, S. (2004). New indicators of vulnerability and adaptive capacity. Technical Report No.7. Tyndall Centre for Climate Research, University of East Anglia: Norwich.
This report develops a conceptual framework enabling researchers to relate the concepts of vulnerability, risk and adaptive capacity. It focuses on robust and transparent indicator sets which enable to explain observed vulnerability to weather-related natural disasters. Those new indicators are related to governance, the state of the environment, and socio-economic and developmental conditions .
AEA (2008). Preliminary assessment and roadmap for the elaboration of Climate Change Vulnerability Indicators at regional level. Final Report to the European Commission. Restricted Commercial. ED45669. Issue Number 3. AEA: London.
Angélil, M., Hebel, D. (Eds.) (2010). Cities of Change: Addis Ababa. Transformation strategies for urban territories in the 21st century. Birkhäuser Verlag: Basel-Boston-Berlin.
Badini-Kinda, F. (2005). The Gap Between Ideas and Practices: Elderly Social Insecurity in Rural Burkina Faso. In: de Jong, W., Roth, C., Badini-Kinda, F., Bhagyanath, S. (Eds.). Ageing in Insecurity. Case studies on social Security and Gender in India and Burkina Faso. (Schweizerische Afrikastudien Band 5) Lit Verlag: Münster, pp. 139-166.
Bankoff, G. (2001). Rendering the world unsafe: "Vulnerability" as Western discourse. Disasters, 25(1): 19-35.
Bankoff, G., G. Frerks, Hilhorst, D. (2004). Mapping Vulnerability: Disasters, Development and People. Earthscan: London.
Barnett, J. (2001). The Meaning of Environmental Security. Ecological Politics and Policy in the New Security Era. Zed: London-New York.
Barnett, J., Lambert, S., Fry, I. (2008). The Hazards of Indicators: Insights from the Environmental Vulnerability Index. Annals of the Association of American Geographers, 98(1): 102-119.
Barrett, C. (1999). On Vulnerability, Asset Poverty and Subsidiarity. Working Paper.
Barrows, H. (1923). Geography as human ecology. Annals of the Association of American Geographers, 13: 1-14.
Baumeister, J., Knebel, N. (2009). The Indigenous Urban Tissue of Addis Ababa - A City Model for the Future Growth of African Metropolis. In: Bakker, K. (Ed.). Proceedings of African Perspectives 2009. The African Inner City: [Re]sourced. International conference held at the University of Pretoria, 25-28 September 2009, pp. 157-160.
Benson, C. (2004). Macro-economic concepts of vulnerability: Dynamics, complexity and public policy. In: Bankoff, G., Frerks, G., Hilhorst, D. (Eds.). Mapping vulnerability: Disasters, development and people. Earthscan: London, pp. 159-173.
94
Berry, D. (1997). Sustainable development in the United States: An Experimental Set of Indicators. Interim report. US Interagency Working group on Sustainable development Indicators: Washington D.C.
Birkmann, J. (Ed.). (2006). Measuring Vulnerability to Natural Hazards: Towards Disaster Resilient Societies. United Nations University Press: New York.
This book deals with vulnerabilities to hazards of natural origin. It is a compilation of state-of-the-art vulnerability assessment. The book provides a theoretical approach to measuring vulnerability based on previous incidents which can serve as an orientation for future research towards more disaster resilient communities. And suggests that the results of these studies be used to prevent serious harm in the future.
Blaikie, P., Cannon, T., Davis, I., Wisner, B. (1994). At Risk: Natural Hazards, People's Vulnerability and Disasters. Routledge: London.
Blanco, H., Alberti, M., Olshansky, R., Chang, S., et al. (2009). Shaken, shrinking, hot, impoverished and informal: Emerging research agendas in planning. Progress in Planning, 72: 195–250.
Bohle, H., Glade, T. (2008). Vulnerabilitätskonzepte in Sozial-und Naturwissenschaften. In: Felgentreff, C., Glade, T. (Eds.). Naturrisiken und Sozialkatastrophen. Spektrum Akademischer Verlag: Berlin, Heidelberg, pp. 99-120.
Bohle, H., Krüger, F. (1992). Perspektiven geographischer Nahrungskrisenforschung. Die Erde, 123 (4): 257-266.
Briguglio, L. (2003): The Vulnerability Index and Small Island Developing States. A Review of Conceptual and Methodological Issues. Presentation on the AIMS Regional Preparatory Meeting, 1-5 September 2003, Praia, Cap Verde. Available at: http://salises.mona.uwi.edu/sem1_08_09/SALI6010/Brugglio2003_vulner_slides__cape_verde.pdf
Brooks, N., Adger, WN., Kelly, P. (2005). The determinants of vulnerability and adaptive capacity at the national level and the implications for adaptation. Global Environmental Change, 15: 151–163.
Cannon, T., Twigg, J., Rowell, J. (2003): Social vulnerability, sustainability livelihoods and disasters. Department for International Development (DFID). (consulted 10.10.2007). Available at: www.livelihoods.org/info/doc/vulnerability.doc.
Cardona, O. (2004). The Need for Rethinking the Concepts of Vulnerability and Risk from a Holistic Perspective: A Necessary Review and Criticism for Effective Risk Management, in Bankoff, G., Frerks, G., Hilhorst, D. (Eds.): Mapping Vulnerability: Disasters, Development and People. Earthscan: London, pp. 37-51.
Chambers, R. (1983). Rural Development: Putting the Last First. Longman: London.
Chambers, R. (1989). Vulnerability, coping and policy. IDS-Bulletin, 20 (2): 1-7.
Chambers, R. (1994). Participatory Rural Appraisal (PRA): Challenges, Potentials and Paradigm. World Development, 22(10): 1437-1454.
95
Chambers, R. (1995). Poverty and livelihoods: Whose reality counts? Discussion Paper No. 347. Institute of Development Studies: Brighton.
Chambers, R., Conway, G. (1992). Sustainable rural livelihoods: practical concepts for the 21th century. Institute of Development studies, University of Sussex: Brighton.
Cherenet, Z. (2010).The portrait of an isolated nation. In: Angélil, M., Hebel, D. (Eds.). Cities of Change: Addis Ababa. Transformation strategies for urban territories in the 21st century. Birkhäuser Verlag: Basel-Boston-Berlin, pp. 30 -38.
CHSI (Community Health Status Indicators Project Working Group) (2009). Data Sources, Definitions and Notes for CHSI2009. Department of Health and Human Services: Washington, DC. Available at http://communityhealth.hhs.gov.
CLUVA City Profile Addis Ababa (2011). Provided by the CLUVA partners from Addis Ababa, Ethiopia.
CLUVA City Profile DSM (2011). Provided by the CLUVA partners from Dar es Salaam, Tanzania.
CLUVA City Profile St. Louis (2011). Provided by the CLUVA partners from St. Louis, Senegal.
Cohen, A. (1992). The Symbolic Construction of Community. Routledge: London.
Commission on Global Governance (1995). Our Global Neighbourhood. Oxford University Press: Oxford.
Creswell, J. (2009). Research Design: Qualitative, Quantitative, and Mixed Methods Approaches. 3rd Edition ed. Sage: Thousand Oaks.
This book advances a framework, a process, and compositional approaches for designing qualitative, quantitative, and mixed methods research in the human and social sciences. It compares the 3 approaches by addressing the key elements of the process of research: writing an introduction, stating a purpose for the study, identify research question and hypothesis, and advancing methods and procedures for data collection and analysis.
Crowards, T. (1999). An Economic Vulnerability Index for Developing Countries, with special reference to the Caribbean: Alternative Methodologies and Provisional Results. Caribbean Development Bank, March 1999.
CSA (2008). Summary and Statistical Report of the 2007 Population and Housing Census. Population Size by Age and Sex. Federal Democratic Republic of Ethiopia, Population Census Commission, Addis Ababa.
Cutter, S., Boruff, B., Shirley, W. (2003). Social Vulnerability to Environmental Hazards. Social Science Quarterly, 84(2): 242-261.
De Jong, S., A. Bagre, P. B. M. van Teeffelen, and W. P. A. van Deursen (2000). Monitoring trends in Urban Growth and Surveying City Quarters in Ouagadougou, Burkina Faso using SPOT-XS. Geocarto International
96
Desta, T. (2010). Ethnic-City: Ethnicity in the City. In: Angélil, M., Hebel, D. (Eds.). Cities of Change: Addis Ababa. Transformation strategies for urban territories in the 21st century. Birkhäuser Verlag: Basel-Boston-Berlin, pp. 207-210.
DFID (1999). Sustainable Livelihoods Guidance Sheets. DFID: London.
Diagne, K. (2007). Governance and natural disasters: addressing flooding in Saint Louis, Senegal. International Institute for Environment and Development (IIED). Vol 19(2).
Dodman, D., Kibona, E.; Kiluma, L. (2011). Tomorrow is too late: Responding to Social and Climate Vulnerability in Dar es Salaam, Tanzania. Case study prepared for the Global Report on Human Settlements 2011.
Easter, C. (1999). Small States Development: A Commonwealth Vulnerability Index. The Round Table, 88(35): 403-422.
Ebert, A. (2011). Development of a conceptual and methodological framework for the assessment of flood risk in a growing urban agglomeration. The case of Santiago de Chile. Dissertation. Universität Leipzig, Fakultät für Physik und Geowissenschaften: Leipzig.
Ebert, A., Müller, A. (2010). Bewertung von Vulnerabilität gegenüber Hochwasser in Santiago de Chile mithilfe einer dienstbasierten WebGIS-Anwendung. In: Strobl, J., Blaschke, T.; Griesebner, G. (Eds.). Angewandte Geoinformatik 2010. Beiträge zum 22. AGIT-Symposium Salzburg. Wichmann Verlag, pp. 840-849.
Eriksen, S., Kelly, P. (2007). Developing credible vulnerability. Indicators for climate adaption policy assessment. Mitigation and Adaptation Strategies for Global Change, 12: 495–524.
European Commission (2010). Risk Assessment and Mapping Guidelines for Disaster Management. Commission Staff Working Paper. European Commission: Brussels. Available at http://ec.europa.eu/echo/civil_protection/civil/pdfdocs/prevention/COMM_PDF_SEC_2010_1626_F_staff_working_document_en.pdf
These guidelines focus on the processes and methods of national risk assessments and mapping in the prevention, preparedness and planning stages, as carried out within the broader framework of disaster risk management. The guidelines are based on a multi-hazard and multi-risk approach. They cover in principle all natural and man-made disasters both within and outside the EU. Fell, R. (1994). Landslide risk assessment and acceptable risk. Canadian Geotechnical Journal, 31:
261–272.
Fell, R., Hartford, D. (1997). Landslide risk management. In: Cruden, D., Fell, R. (Eds.). Landslide risk assessment — Proceedings of the International Workshop on Landslide Risk Assessment, Honolulu, 19–21 February 1997, Balkema, Rotterdam, pp. 51–109.
Fekete, A. (2009). Validation of a social vulnerability index in context to river-floods in Germany. Natural Hazards and Earth System Sciences. 9(2): 393-403.
This article presents a social vulnerability index which goal is the development and the validation of a social vulnerability map of population characteristics towards river-floods covering Germany. The map is based on a composite index of three main indicators for social vulnerability in Germany – fragility, socio-economic conditions and region.
97
Fekete, A., Damm, M., Birkmann, J. (2009). Scales as a challenge for vulnerability assessment. Natural Hazards. Hazards and Earth System Sciences, 9: 393–403.
Fenton, D., MacGregor, C. (1999). Framework and Review of Capacity and Motivation for Chnage to Sustainable Management Practices. Theme 6: Project 6.2.1. Social Science Centre, Bureau of Rural Sciences: Canberra.
Flowers, J., Hall, P., Pencheon, D. (2005). Mini-Symposium-Public Health Observatories: Public Health Indicators. Public Health, 119: 239-245
This paper defines some of the terms used in relation to indicators. Its outlines some of the most important issues around selection and construction of indicators, and includes criteria for developing or assessing indicators. It uses the example of a funnel plot to show a method of summarising indicator data which avoids ranking, and allows rapid identification of areas functioning outside normal limits.
Ford Foundation (2004). Building Assets to Reduce Poverty and Injustice. Ford Foundation: New York.
Fransen, J., Dijk, van M. (2008). Informality in Addis Ababa, Ethiopia. Paper prepared for conference "Are cities more important than countries", Erasmus University Rotterdam - IHS, 30-31 October 2008.
Freire, P. (1968). Pedagogy of the oppressed. Seabury: New York.
Fuchs, S., Kuhlicke, C., Meyer, V. (2011). Editorial for the special issue: Vulnerability to natural hazards - the challenge of integration. Natural Hazards, 58: 609-619.
This paper focuses on the question to what extent the integration between natural and social scientific approaches to vulnerability is possible. It contains different perspectives on vulnerability and provides a forum to scrutinise to what extent these perspectives can be combined and processed in an integrative manner.
Gallopín, G. (1997). Indicators and their Use: Information for decision-ability Indicators: report of the project on Indicators of sustainability development. SCOPE- Scientific Committee on Problems of the Environment. John Wiley: New York. ONLINE: Access date January 2010. Available at http://www.icsu-scope.org/downloadpubs/scope58/ch01-introd.html
This chapter introduces the concept of indicators and their use in the context of policy and decision-making. It discusses the indicators framework in relation to environmental and development field, and highlights the requirements that indicators should meet. It also informs on the use of indicators in diverse sectors and levels. Government of Burkina Faso, UN, World Bank (2009). Inondations du 1er Septembre 2009 au
Burkina Faso. Evaluation des dommages, pertes et besoins de construction, de reconstruction et de relèvement. Rapport.
Green, C. (2004). The Evaluation of Vulnerability to Flooding. Disaster Prevention and Management, 13(4): 323-329
Greene, Jennifer (2007). Mixed methods in social inquiry. John Wiley and Sons: San Francisco.
98
Guévart, E., Noeske, J., Solle, J., Essomba, J., Edjenguele, M., Bita, A., Mouangue, A., Manga, B. (2006). Factors contributing to endemic cholera in Douala, Cameroon. Med Trop, 66(3): 283-291.
Guillaumont, P. (2009). Assessing the Economic Vulnerability of Small Island Developing States and the Least Developd Countries. CERDI, Etudes et Documents, E2009.13.
Haase, A., Haase, D., Kabisch, S., Steinführer, A., Buzar, S., Ogden, P.E., Hall, R. (2005). Monitoring of Reurbanisation: Conceptual Approach and a Set of Core Indicators from a Multidisciplinary Perspective. RE Urban Mobil WP8 (Information and Monitoring System). Electronic Version. Access date January 2010.
This paper outlines the results of work package 8 (information and monitoring system) of the inter-disciplinary analyses of the EU project Re Urban Mobil. It also presents the theoretical context for a monitoring of reurbanisation and embeds it into the general debate on urban monitoring as the necessary reference framework.
Haki, Z., Akyurek, Z., and Düzgün, S. (2004). Assessment of Social Vulnerability Using Geographic Information Systems: Pendik, Istanbul Case Study. 7th AGILE Conference on Geographic Information Science, pp. 413-423.
Hall, P., Taylor, R. (1996). Political Science and the Three New Institutionalisms. Political Studies, 5: 936-957.
Hammond, A., Adriaanse, A., Rodenburg, E., Bryant, D., Woodward, R. (1995). Environmental Indicators: A Systematic Approach to Measuring and Reporting on Environmental Policy Performance in the Context of Sustainable Development. World Resources Institute: Washington, DC.
Harvey, A. , Hinkel, J., Horrocks, L., Klein, R., Lasage, R., Hodgson, N., Sajwaj, T., Benzie, M. (2009). Preliminary assessment and roadmap for the elaboration of Climate Change Vulnerability Indicators at regional level. Not published yet, but available at DG ENV. Final Report to the European Commission (Restricted Commercial, ED45669, Issue Number: 3).
Hatch, J., Moss, N., Saran, A., Presley-Cantrell, L., Mallory, C. (1993) Community research: partnership in black communities. Am J Prev Med, 9(6 Suppl): 27–31.
Hewitt, K. (1983): Interpretations of Calamity from the Viewpoint of Human Ecology. Allen and Unwin: Boston.
Hewitt, K. (1997). Regions of Risks: a Geographical Introduction to disasters. Longman: Harlow.
Hezri, A. (2004). Sustainability indicator system and policiy processes in Malaysia: A framework for utilisation learning. Journal of environmental Management, 73: 357-371.
Hinkel, J. (2009). Vulnerability indicators. State of the art and policy implications. Potsdam Institute for Climate Impact Research (PIK), presentation Brussels, June 18, 2009.
Hinkel, J. (2011). Measuring vulnerability and adaptive capacity: towards a clarification of the science policy interface. Global Environmental Change, 21: 198-208.
Hufschmidt, G. (2011). A comparative analysis of several vulnerability concepts. Natural Hazards, 58: 621-643.
99
Iglesias, A., Moneo, M., Quiroga, S. (2009). Methods for Evaluating Social Vulnerability to Drought. In: Iglesias et al. (Eds.). Coping with Drought Risk in Agriculture and Water Supply Systems, Advances in Natural and Technological Hazards Research, 2009, Vol. 26, Part II, pp. 153-159.
Israel, B., Schulz, A., Parker, E., Becker, A. (1998). Review of community-based research: assesing partnership approaches to improve public health. Annu Rev Public Health, 19: 173-202.
Kaly, U., Briguglio, L., McLeod, H., Pratt, C., Schmall, S., Pal, R. (1999). Report on the Environmental Vulnerability Index (EVI) Think Tank, 7-10 September 1999, Pacific Harbour, Fiji. SOPAC Technical Report 299.
Kates, R., Burton, I. (Eds.). (1986). Geography, Resources and Environment: Vol 1.: Selected Writings of Gilbert F. White. Chicago University Press: Chigago.
Kelly, P. Adger, W.N. (2000). Theory and Practice in Assessing Vulnerability to Climate Change and Facilitating Adaptation. Climatic Change, 47: 325-352.
Kemajou, A et al. (2008). Is industrial development incompatible with constraints of industrial ecology in Cameroon? International Scientific Journal for Alternative Energy and Ecology, 6(62). Available at: http://isjaee.hydrogen.ru/pdf/pdf/06-08/Kemajou_194.pdf
King, D., Mac Gregor, C. (2000). Using social indicators to measure community vulnerability to natural hazards. Australian Journal of Emergency Management, 15(3): 52-57.
Kirschenbaum, A. (2004) Generic Sources of Disaster Communities: A Social Network Approach. International Journal of Sociology and Social Policy, 24 (10/11): 94–129.
Kropp, J., Holsten, A., Lissner, T., Roithmeier, O., Hattermann, F., Huang, S., Rock, J., Wechsung, F., Lüttger, A., Pompe, S., Kühn, I. , Costa, L., Steinhäuser, M., Walther, C., Klaus, M., Ritchie, S. Metzger, M. (2009). Klimawandel in Nordrhein-Westfalen -Regionale Abschätzung der Anfälligkeit ausgewählter Sektoren. Abschlussbericht des Potsdam Instituts für Klimafolgenforschung (PIK) für das Ministerium für Umwelt und Naturschutz, Landwirtschaft und Verbraucherschutz Nordrhein-Westfalen (MUNLV). Available at: http://www.umwelt.nrw.de/umwelt/pdf/abschluss_pik_0904.pdf
Kubal, C., Haase, D., Meyer, V., Scheuer, S. (2009). Integrated urban flood risk assessment - adapting a multicriteria approach to a city. Nat. Hazards Earth Syst. Sci., 9: 1881-1895.
Kuhlicke, C. (2010). The dynamics of vulnerability: some preliminary thoughts about the occurrence of ‘radical surprises’ and a case study on the 2002 flood (Germany). Natural Hazards, 55/3: 671-688.
Kuhlicke, C., Scolobig, A., Tapsell, S., Steinführer, A., De Marchi, B. (2011). Contextualizing social vulnerability: findings from case studies across Europe. Natural Hazards, 58: 789-810.
Kuhlicke, C., Steinführer, A. (2010). Knowledge Inventory: State of the Art of Natural Hazards Research in the Social Sciences and Further Research Needs for Social Capacity Building. CapHaz-Net.
100
Kurtz, J., Jackson, L., Fisher, W. (2001). Strategies for Evaluating Indicators Based on Guidelines from the Environmental Protection Agency’s Office of Research and Development Ecological Indicators, 1: 49-60.
Lincoln, Y., Guba, E. (1985). Naturalistic Inquiry. Sage Publications: Newbury Park, CA.
Maccioni, L., Zebenigus, D. (2010). Educity. In: Angélil, M., Hebel, D. (Eds.). Cities of Change: Addis Ababa. Transformation strategies for urban territories in the 21st century. Birkhäuser Verlag: Basel-Boston-Berlin, pp. 66-75.
Melesse, M. (2005). City Expansion, Squatter Settlements and policy Implications in Addis Ababa: The Case of Kolfe Keranio Sub-City. Working papers on population and land use change in central Ethiopia, No. 2. Acta Geographica: Trondheim.
Meyer, V., Haase, D., Scheuer, S. (2007). GIS-based Multicriteria Analysis as Decision Support in Flood Risk Management. (UFZ Diskussionspapiere) Helmholtz Zentrum für Umweltforschung: Leipzig.
Meyer, V., Scheuer, S., and Haase, D. (2009): A multicriteria approach for flood risk mapping exemplified at the Mulde River, Germany. Natural Hazards, 48(1): 17-39.
Mileti, D. (1999). Disasters by Design: A Reassessment of Natural Hazards in the United States. Joseph Henry Press: Washington, DC.
Moser, C. (1998). The asset vulnerability framework. Reassessing urban poverty reduction strategies. World Development, 26(1): 1-9.
Moser, C. (2009). A Conceptual and Operational Framework for Pro-poor Asset Adaptation to Urban Climate Change. Paper presented at the 5th World Bank Urban Research Symposium, Marseille, pp. 1-21.
This paper provides a useful theoretical framework for researchers seeking to better understand the link between climate change adaptation and the erosion of assets of the poor in cities of the South. The framework helps to understand and address the different phases of urban climate change as the impact on the lives of poor urban communities. The framework builds on earlier research on asset vulnerability, asset adaptation and poverty reduction as well as preliminary climate change related work.
Moser, C., Norton, A., Stein, A., Georgieva, S. (2010). Pro-Poor Adaption to Climate Change in Urban Centres: Case Studies of vulnerability and Resilience in Kenya and Nicaragua. Report No. 54947-GLB. World Bank: Washington.
Moss, R., Brenkert, A., Malone, E. (2001). Vulnerability to climate change: a quantitative approach. Report prepared by the Pacific Northwest National Laboratory, operated by the Battelle Memorial Institute, for the US Department of Energy.
Msale, C. (2011). Urban Land Use Governance for climate Change Resilience. The Case of Land Use Development Control in Dar es Salaam City. Workshop Presentation, Dar es Salaam.
Mustafa, D. (2005). The production of an urban hazardscape in Pakistan: modernity vulnerability and the range of choice. The Annals of the Association of American Geographers, 95(3): 566-586.
101
Mustafa, D., Ahmed, S., Saroch, E., Bell, H. (2010). Pinning Down Vulnerability from Narratives to Numbers. Overseas Development Institute. Blackwell Publishing: Oxford.
This paper addresses simple generalised, actionable information for input into policy process by presenting a theoretically informed, empirically tested, quantitative vulnerability and capacities index (VCI). VCI is draw upon 12 indicators to represent material, institutional and attitudinal aspects of differential vulnerability and capacities. Ndjama, J. et al. (2008). Water supply, sanitation and health risks in Doula, Cameroon. African
Journal of Environmental Science and Technology, 2(12): 422-429.
O’Brien, K., Eriksen, S., Schjolden, A., Nygaard, L., (2004) What’s in a Word? Conflicting Interpretations of Vulnerability in Climate Change Research. CICERO Working Paper: Oslo.
O'Brien, K., Eriksen, S., Nygaard, L.P., Schjolden, A. (2007). Why different interpretations of vulnerability matter in climate change discourses. Climate Policy, 7(1): 73-88.
This article addresses two different interpretation of vulnerability to climate change: outcome vulnerability and contextual vulnerability. It presents a diagnostic tool for distinguishing the two interpretation of vulnerability and uses this tool to illustrate the practical consequences that interpretations of vulnerability have for climate change policy and responses in Mozambique.
O’Brien, P., Mileti, D. (1992).Citizen participation in emergency response following the Loma Prieta earthquake. International Journal of Mass Emergencies and Disasters, 10: 71-89.
OECD/DAC (2002). Glossary of Key Terms in Evaluation and Results Based Management. Available at: http://www.oecd.org/dataoecd/29/21/2754804.pdf Access date July 2011.
O’Riordan, T. (2002). Precautionary Principle. In: Tolba, M. (Ed.). Encyclopedia of Global Environmental Change, vol. 4: responding to Global Environmental Change. John Wiley: Chichester, UK.
This part of the Encyclopaedia of Global Environmental Change, presents the precautionary principle as both a support for, and a criticism against, the science of global environmental change. It presents the quality of precaution and it application in North America and Europe institutions of sciences.
Parris, K. (2000). OECD AGRI-Environmental Indicators. In: Frameworks to Measure Sustainable Development. OECD Expert Workshop. OECD: Paris, pp. 125-136.
Parry, M., Canziani, O., Palutikof, J., van der Linden, P., Hanson, C. (Eds). (2007). Climate Change 2007: Impacts, Adaptation and Vulnerability. Contribution of Working Group II to the Fourth Assessment Report of the Intergovernmental Panel on Climate Change (IPPC). Cambridge University Press: Cambridge.
Pelling, M. (2003). The vulnerability of cities: Natural Disasters and Social Resilience. Earthscan: London.
Pelling, M., (2006). Measuring urban vulnerability to natural disaster risk: benchmarks for sustainability. Open House International, 31: 125-132.
Pelling, M. (2007). Learning from others. scope and challenges for participatory disaster risk assessment. Disasters, 31 (4): 373-385.
102
Pelling, M. (2011): The Vulnerability of Cities to Disasters and Climate Change: A Conceptual Framework. In Brauch, H. et al. (Eds.). Coping with Global Environmental Change, Disasters and Security. Threats, Challenges, Vulnerabilities and Risks. (Hexagon Series on Human and Environmental Security and Peace Vol. 5) Springer Verlag: Berlin -Heidelberg-New York, pp. 549-558.
Perdicoúlis, A., Glasson, J. (2011): The Use of Indicators in Planning: Effectiveness and Risks. Planning Practise & Research, 26(3): 349-367.
Philips, R. (2003). Community Indicators. Planning Advisory Service Report No. 517. American Planning Association: Chicago.
Portes A. (1998). Social Capital: Its Origins and Applications in Modern Sociology. Annual Review of Sociology, 24: 1–24.
Putnam, R. (1993). Making Democracy Work: Civic Traditions in Modern Italy. Princeton University Press: Princeton.
Quarantelli, E., Dynes, R. (1976). Community conflicts: Its Absence and its Presence in Natural Disasters. Mass Emergencies, 1(2): 139-152.
Schauser, I., Otto, S., Schneiderbauer, S., et al. (2010). Urban Regions: Vulnerabilities, Vulnerability Assessments by Indicators and Adaptation Options for Climate Change Impacts. European Topic Centre on Air ad Climate Change (ETC/ACC): Bilthoven.
Schneiderbauer, S. (2010). Introduction to vulnerability assessment by indicators. In: Schauser, I. et al. (Eds.). Urban Regions: Vulnerabilities, Vulnerability Assessments by Indicators and Adaptation Options for Climate Change Impacts (Scoping Study). ETC/ACC Technical Paper 2010/12, pp. 40-46.
Scheuer, S., Haase, D., Meyer, V. (2011). Exploring multicriteria flood vulnerability by integrating economic, social and ecological dimensions of flood risk and coping capacity: from a starting point view towards an end point view of vulnerability. Natural Hazards, 58: 731-751. http://www.ingentaconnect.com/content/klu/nhaz/2011/00000058/00000002/00009666
Sen, A. (1983). Poverty and famines. An essay on entitlement and deprivation. University Press: Oxford.
Siedentop, J., Wiechmann, T. (2004). Monitoring im Stadtumbau. Electronic Version. Access date October 2004.
SITRASS/SSATP (2004). Poverty and Urban Mobility in Douala. Final Report. SSATP Report No 09/04/Dla. Africa Region, World Bank.
Steinführer, A., Kuhlicke, C. (2007). Social Vulnerability and the 2002 Flood. Country. Report Germany (Mulde River), Submitted to the European Commission, S. 154. Deliverable of FLOODsite Integrated Project. Available at http://www.floodsite.net.
Susman, P., O’Keefe, P.; Wisner, B. (1983). Global disasters: A radical interpretation. In: Hewitt, K. (Ed.). Interpretations of Calamity from the Viewpoint of Human Ecology, Allen and Unwin: Boston, pp 264-83.
103
Swift, J. (1980). Rapid appraisal and cost-effective participatory research in dry pastoral areas of West Africa. Agricultural Administration, 8: 485-492.
Tannerfeldt, G., Ljung, P. (2006). More urban, less poor: an introduction to urban development and management. Earthscan: London.
Tapsell, S., McCarthy, S., Alexander, M. (2010): Social vulnerability to natural hazards. State of the art report from CapHaz-Net’s WP4. London.
Tapsell, S., Penning-Rowsell, E., Tunstall, S., Wilson, T. (2002). Vulnerability to flooding: health and social dimensions, Philos. T. Roy. Soc. A: 1511–1525.
This report is a revised version of the Work Package (WP) 4 report on Social Vulnerability originally completed in February 2010. It reviews the existing ‘state of the art’ literature on social vulnerability, and examines how the concepts of social vulnerability, and approaches to measuring it, have been or could be applied to natural hazards. Three empirical examples have been included from past natural hazard events to illustrate particular approaches to studying social vulnerability, and to raise some key issues in our understanding of the concept. The studies included in this draft report are the River Elbe flood of 2002 in Germany, flooding and mudflows in 2002 in Italy, The 2003 heat waves in Europe and particularly in Spain.
Tashakkori, A., Teddlie, C. (2003). Handbook of Mixed Methods in Social & behavioral Research. Sage Publication: Thousand Oaks, California.
Teddlie, C., Tashakkori, A. (2009). Foundations of Mixed Methods Research: Integrating Quantitative and Qualitative Approaches in the Social and Behavioural Sciences. Sage Publication: Thousand Oaks, California.
Thornton P., Jones, P., Owiyo, T., Kruska, R., Herrero, M., Kristjanson, P., Notenbaert, A., Bekele, N., Omolo, A. (2006). Mapping climate vulnerability and poverty in Africa. Report to the Department for International Development: Nairobi.
This work is a small piece of a larger activity that involved the commissioning of several studies on climate change and the identification of the critical researchable issues related to development. it is concentrated on approaches that work where government structures are weak. The information presented here relates projected climate change with vulnerability data. It helps to identify where to locate specific research activities and where to put in place uptake pathways for research outputs.
UN (2005). Hyogo Framework for Action 2005-2015. Building the Resilience of Nations and Communities to disasters. Available at: http://www.unisdr.org/
UN (2007). Indicators of Sustainable Development: Guidelines and Methodologies. Third edition. Economic & Social Affairs: New York.
UN-HABITAT. (2007). Profil Urbain de Ouagadougou. UNEP: Nairobi.
UN-HABITAT (2008). Ethiopia: Addis Ababa Urban Profile. United Nations Human Settlements Programme: Nairobi.
UN-HABITAT (2008a). The state of African Cities 2008. A framework for addressing urban challenges in Africa. United Nations Human Settlements Programme. Nairobi.
UN-HABITAT (2009). Tanzania: Dar es Salaam City Profile. United Nations Human Settlements Programme: Nairobi.
104
UN-HABITAT (2010). The State of African Cities 2010, Governance, Inequality and Urban Land Markets. UNEP: Nairobi.
UNISDR. (2009). UNISDR Terminology on Disaster Risk Reduction -2009. United Nations International Strategies for Disaster Reduction. ONLINE: Access date January 2010. Available at http://www.unisdr.org/eng/library/lib-terminology-eng.htm
UNU-EHS PhD Block Course (2011). From Vulnerability to Resilience in Disaster Risk Managment. Minutes taken by UFZ-participants (C. Begg, A. Kunath, A. Schwarz), 5-15 April 2011, Bonn.
URT (2004). Dar es Salaam City Profile. City Director, Dar es Salaam City Council, November 2004.
URT (2005). National Strategy for Growth and Reduction of Poverty (NSGRP). Vice President’s Office, Dar es Salaam, Tanzania.
URT (2006). Census 2002, Analytical report. National Bureau of Statistics, Ministry of Planning, Economy and Empowerment.
Vincent, K., (2004). Creating an index of Social Vulnerability to Climate Change in Africa. Working Paper No.56. Tyndall Centre for Climate Research, University of East Anglia, Norwich.
This paper presents an index to empirically assess relative levels of social vulnerability to climate change-induced variations in water availability and allow cross-country comparison in Africa. It proposes a methodology to overcome the persistent dichotomy in different epistemological approaches to vulnerability research.
Vincent, K., Cull, T. (2010). A Household Social Vulnerability Index (HSVI) for Evaluating Adaptation Projects in Developing Countries. In PEGNet Conference. Policies to foster and sustain equitable development in times of crises. Midrand, 2010.
Vogel, C., O´Brian, K. (2004). Vulnerability and Global Environmental change: Rhetoric and Reality. AVISO - Information Bulletin on Global Environmental Change and Human Security, 13.
Vordzorgbe, S., UN/ISRD (2007): Climate change and risk management in Africa: Major issues. Expert Background Paper for the Session on risk Management and Climate Change. World Economic Forum on Africa. Cape Town, 13-15 June 2007.
Watts, M., Bohle, H. (1993). The Space of Vulnerability: the Casual Structure of Hunger and Famine. Progress in Human Geography, 17(1): 43-67.
Weichselgartner, J. (2001). Disaster Mitigation: The Concept of Vulnerability Revisited. Disaster Prevention and Management, 10(2): 85-94.
Weiland, U. (1999). Indikatoren einer nachhaltigen Entwicklung – vom Monitoring zur politischen Steuerung?. In: Weiland, U (Ed.). Perspektiven der Raum – und Umweltplanung angesichts Globalisierung, Europäischer Integration und Nachhaltiger Entwicklung. VWF Verlag für Wissenschaft und Forschung: Berlin, pp. 245-262
105
Weiland, U., Annegret, K., Banzhaf, E., Ebert, A., Reyes-Paecke, S. (2011). Indicators For Sustainable Land Use Management in Santiago de Chile. Ecological Indicators, doi:10.1016/j.ecolind.2010.12.007
This article presents the indicator approach of the Land Use Management group within the Risk Habitat Megacity initiative. Based on the analysis of characteristics and demands on sustainability indicators, existing indicator sets for Santiago de Chile are analysed. Thereafter, it presents the indicators set for sustainable land use management in Santiago de Chile.
Werg, J., Grothmann T., Schmidt, P. (in preparation). Vulnerability and Adaptive Capacity on the Local Level.
White, G. (1945). Human adjustment to floods. a geographical approach to the flood problem in the United States, Department of Geography. Research Paper, 29. Department of Geography, University of Chicago: Chicago.
White, G. (1974): Natural Hazards. Local, National, Global. Oxford University Press: New York.
Winchester, P. (1992). Power, Choice and Vulnerability: A Case Study in Disaster Mismanagement in South India. James & James Science Publishers: London.
Wisner, B. (2006). Risk Reduction Indicators…Social Vulnerability. Annex B-6. In: TRIAMS Working Paper – Risk Reduction Indicators ONLINE: Access date January 2010. Available at http://www.proventionconsortium.org/themes/default/pdfs/TRIAMS_social_vulnerability.pdf
This paper suggest risk Reduction indicators. It proposes two groups of indicators. The first group is “readable” off existing while the second require new, specific sample surveys. Each group is made by 3 indicators. The 6 indicators are used to assess the impact of tsunami recovery activities on social vulnerability/ capacity or resilience.
Wisner, B., Blaikie, P., Cannon, T., Davis, I. (2004). At Risk: Natural Hazards, People's Vulnerability and Disasters. 2nd edition. Routledge: London.
This book is an overview of the different human responses to natural hazards.it focuses mainly on redressing the balance in assessing the’ causes’ of natural disasters away from the dominant view that natural processes are the most significant. But it is also concerned about what happens even when it is admitted that social and economic factors are the most crucial. The book also Examines key natural events and incorporates strategies to create a safer world.
Wisner, B., Neigus, D., Mduma, E., Kasi, T., Franco, L., Kruks, S. (1979): Designing storage systems with villagers. African Environment, 3(3/4): 85-95.
Wisner, B., Stea, D., Kruks, S. (1991). Participatory and Action Research Methods. In: Zube, E., Moore, G. (Eds.). Advances in Environment, Behavior and Design, Vol. 3. Plenum Press: New York, pp. 272-295.
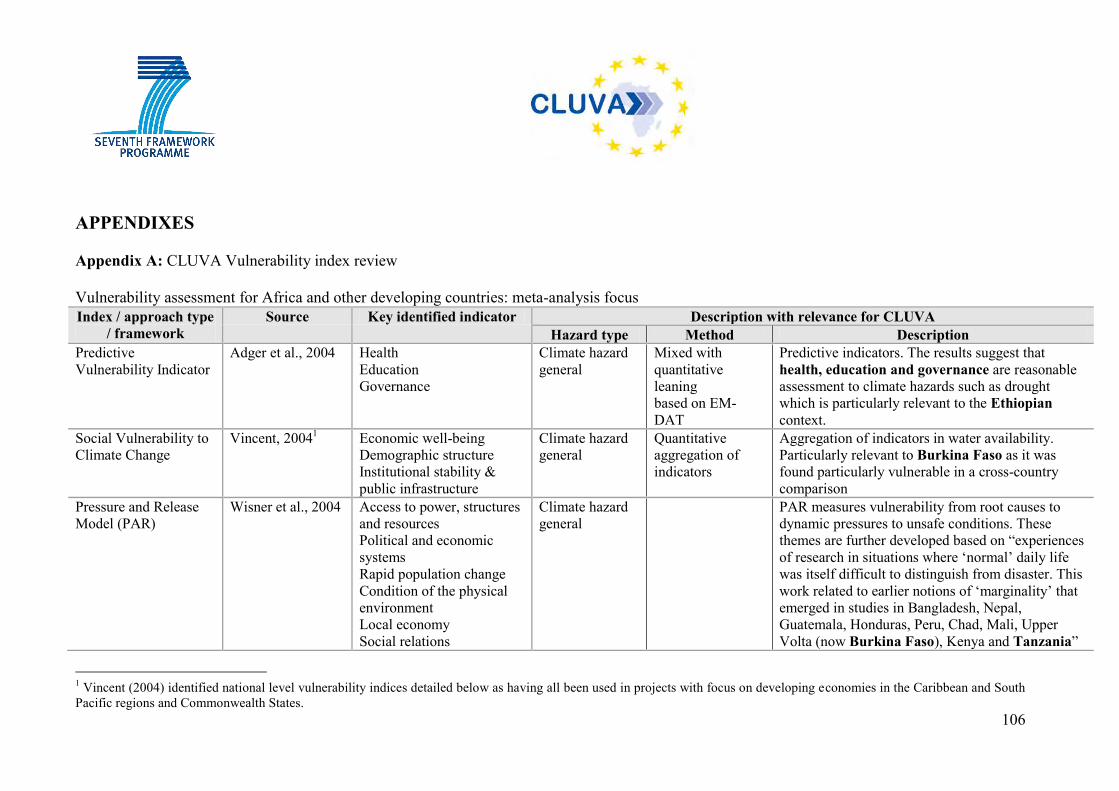
106
APPENDIXES Appendix A: CLUVA Vulnerability index review Vulnerability assessment for Africa and other developing countries: meta-analysis focus Index / approach type
/ framework Source Key identified indicator Description with relevance for CLUVA
Hazard type Method Description Predictive Vulnerability Indicator
Adger et al., 2004 Health Education Governance
Climate hazard general
Mixed with quantitative leaning based on EM-DAT
Predictive indicators. The results suggest that health, education and governance are reasonable assessment to climate hazards such as drought which is particularly relevant to the Ethiopian context.
Social Vulnerability to Climate Change
Vincent, 20041 Economic well-being Demographic structure Institutional stability & public infrastructure
Climate hazard general
Quantitative aggregation of indicators
Aggregation of indicators in water availability. Particularly relevant to Burkina Faso as it was found particularly vulnerable in a cross-country comparison
Pressure and Release Model (PAR)
Wisner et al., 2004 Access to power, structures and resources Political and economic systems Rapid population change Condition of the physical environment Local economy Social relations
Climate hazard general
PAR measures vulnerability from root causes to dynamic pressures to unsafe conditions. These themes are further developed based on “experiences of research in situations where ‘normal’ daily life was itself difficult to distinguish from disaster. This work related to earlier notions of ‘marginality’ that emerged in studies in Bangladesh, Nepal, Guatemala, Honduras, Peru, Chad, Mali, Upper Volta (now Burkina Faso), Kenya and Tanzania”
1 Vincent (2004) identified national level vulnerability indices detailed below as having all been used in projects with focus on developing economies in the Caribbean and South Pacific regions and Commonwealth States.
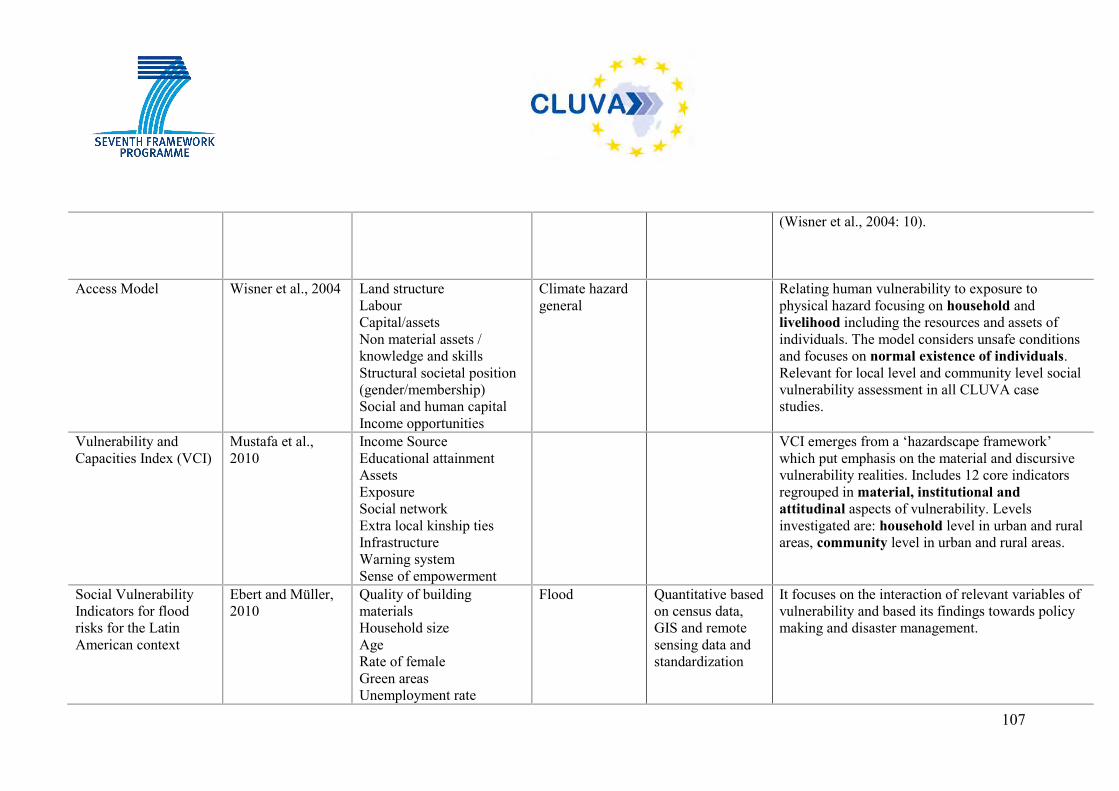
107
(Wisner et al., 2004: 10).
Access Model Wisner et al., 2004 Land structure Labour Capital/assets Non material assets / knowledge and skills Structural societal position (gender/membership) Social and human capital Income opportunities
Climate hazard general
Relating human vulnerability to exposure to physical hazard focusing on household and livelihood including the resources and assets of individuals. The model considers unsafe conditions and focuses on normal existence of individuals. Relevant for local level and community level social vulnerability assessment in all CLUVA case studies.
Vulnerability and Capacities Index (VCI)
Mustafa et al., 2010
Income Source Educational attainment Assets Exposure Social network Extra local kinship ties Infrastructure Warning system Sense of empowerment
VCI emerges from a ‘hazardscape framework’ which put emphasis on the material and discursive vulnerability realities. Includes 12 core indicators regrouped in material, institutional and attitudinal aspects of vulnerability. Levels investigated are: household level in urban and rural areas, community level in urban and rural areas.
Social Vulnerability Indicators for flood risks for the Latin American context
Ebert and Müller, 2010
Quality of building materials Household size Age Rate of female Green areas Unemployment rate
Flood Quantitative based on census data, GIS and remote sensing data and standardization
It focuses on the interaction of relevant variables of vulnerability and based its findings towards policy making and disaster management.
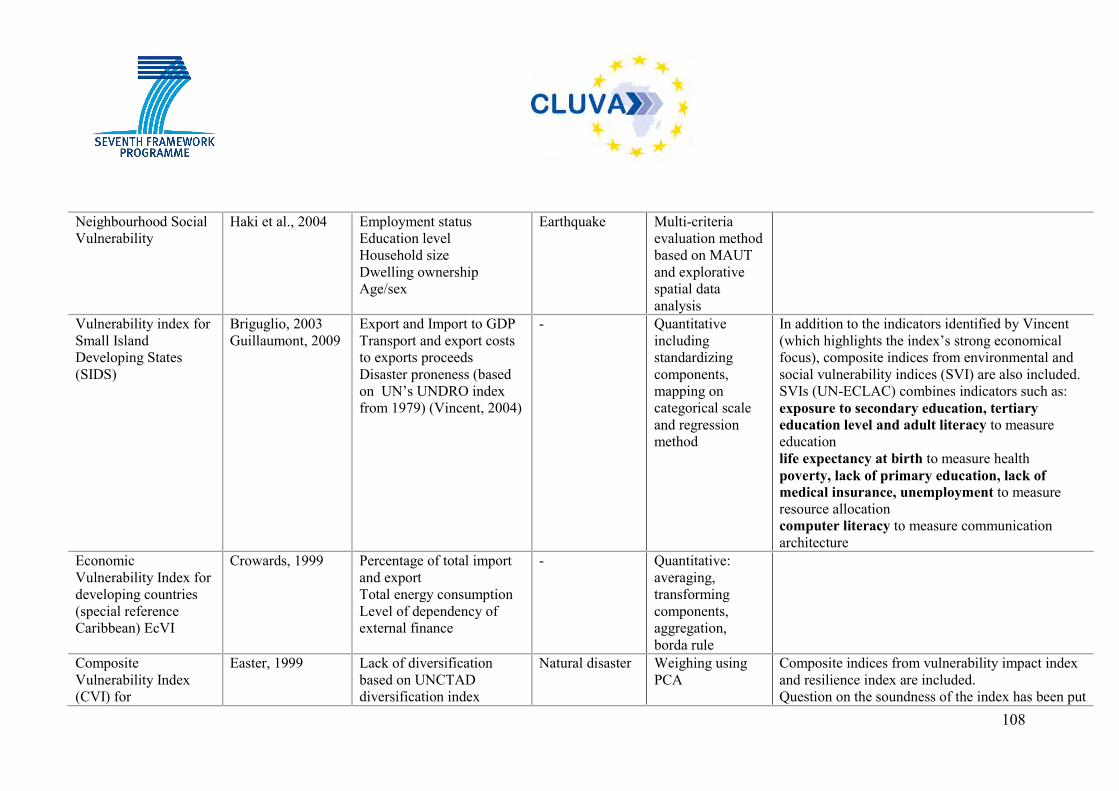
108
Neighbourhood Social Vulnerability
Haki et al., 2004 Employment status Education level Household size Dwelling ownership Age/sex
Earthquake Multi-criteria evaluation method based on MAUT and explorative spatial data analysis
Vulnerability index for Small Island Developing States (SIDS)
Briguglio, 2003 Guillaumont, 2009
Export and Import to GDP Transport and export costs to exports proceeds Disaster proneness (based on UN’s UNDRO index from 1979) (Vincent, 2004)
- Quantitative including standardizing components, mapping on categorical scale and regression method
In addition to the indicators identified by Vincent (which highlights the index’s strong economical focus), composite indices from environmental and social vulnerability indices (SVI) are also included. SVIs (UN-ECLAC) combines indicators such as: exposure to secondary education, tertiary education level and adult literacy to measure education life expectancy at birth to measure health poverty, lack of primary education, lack of medical insurance, unemployment to measure resource allocation computer literacy to measure communication architecture
Economic Vulnerability Index for developing countries (special reference Caribbean) EcVI
Crowards, 1999 Percentage of total import and export Total energy consumption Level of dependency of external finance
- Quantitative: averaging, transforming components, aggregation, borda rule
Composite Vulnerability Index (CVI) for
Easter, 1999 Lack of diversification based on UNCTAD diversification index
Natural disaster Weighing using PCA
Composite indices from vulnerability impact index and resilience index are included. Question on the soundness of the index has been put
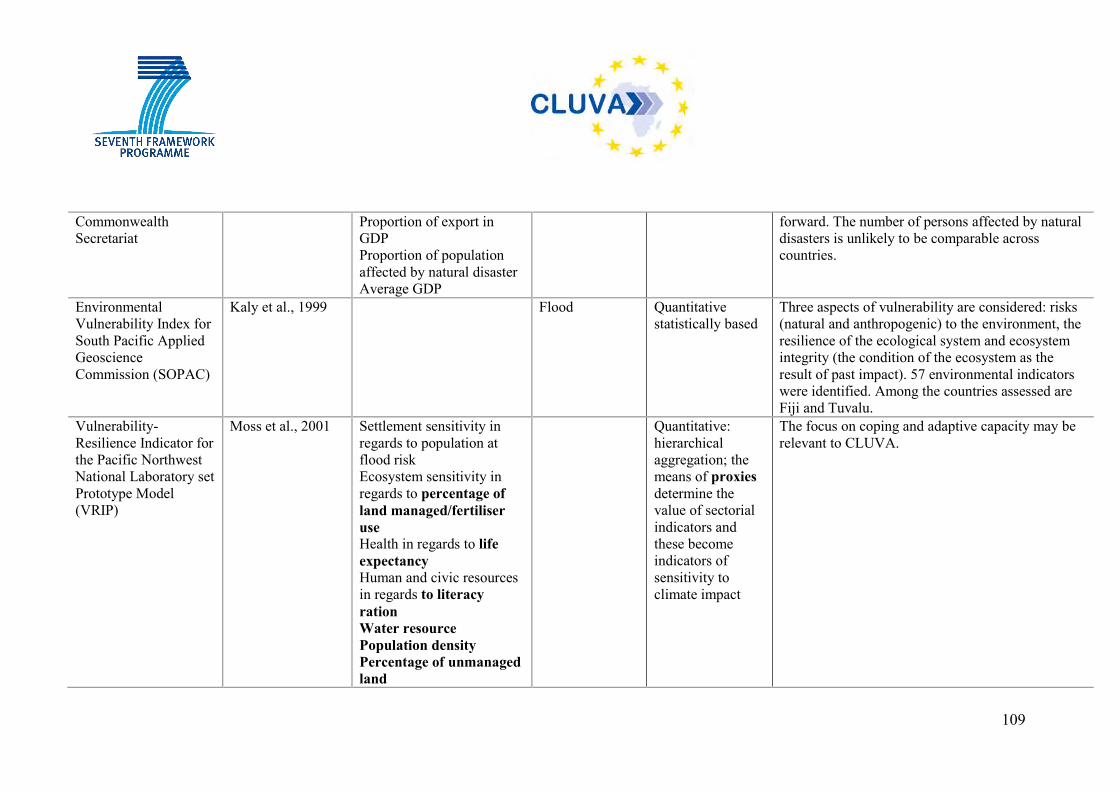
109
Commonwealth Secretariat
Proportion of export in GDP Proportion of population affected by natural disaster Average GDP
forward. The number of persons affected by natural disasters is unlikely to be comparable across countries.
Environmental Vulnerability Index for South Pacific Applied Geoscience Commission (SOPAC)
Kaly et al., 1999 Flood Quantitative statistically based
Three aspects of vulnerability are considered: risks (natural and anthropogenic) to the environment, the resilience of the ecological system and ecosystem integrity (the condition of the ecosystem as the result of past impact). 57 environmental indicators were identified. Among the countries assessed are Fiji and Tuvalu.
Vulnerability-Resilience Indicator for the Pacific Northwest National Laboratory set Prototype Model (VRIP)
Moss et al., 2001 Settlement sensitivity in regards to population at flood risk Ecosystem sensitivity in regards to percentage of land managed/fertiliser use Health in regards to life expectancy Human and civic resources in regards to literacy ration Water resource Population density Percentage of unmanaged land
Quantitative: hierarchical aggregation; the means of proxies determine the value of sectorial indicators and these become indicators of sensitivity to climate impact
The focus on coping and adaptive capacity may be relevant to CLUVA.
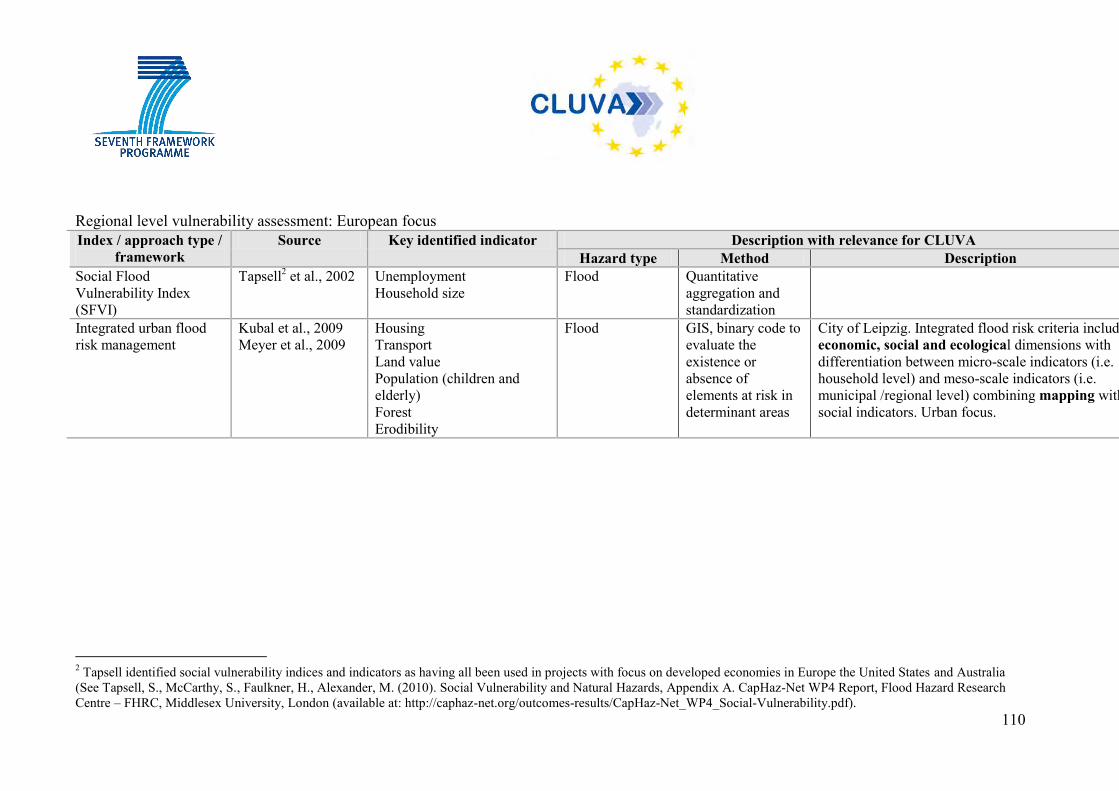
110
Regional level vulnerability assessment: European focus Index / approach type /
framework Source Key identified indicator Description with relevance for CLUVA
Hazard type Method Description Social Flood Vulnerability Index (SFVI)
Tapsell2 et al., 2002 Unemployment Household size
Flood Quantitative aggregation and standardization
Integrated urban flood risk management
Kubal et al., 2009 Meyer et al., 2009
Housing Transport Land value Population (children and elderly) Forest Erodibility
Flood GIS, binary code to evaluate the existence or absence of elements at risk in determinant areas
City of Leipzig. Integrated flood risk criteria including economic, social and ecological dimensions with differentiation between micro-scale indicators (i.e. household level) and meso-scale indicators (i.e. municipal /regional level) combining mapping with social indicators. Urban focus.
2 Tapsell identified social vulnerability indices and indicators as having all been used in projects with focus on developed economies in Europe the United States and Australia (See Tapsell, S., McCarthy, S., Faulkner, H., Alexander, M. (2010). Social Vulnerability and Natural Hazards, Appendix A. CapHaz-Net WP4 Report, Flood Hazard Research Centre – FHRC, Middlesex University, London (available at: http://caphaz-net.org/outcomes-results/CapHaz-Net_WP4_Social-Vulnerability.pdf).
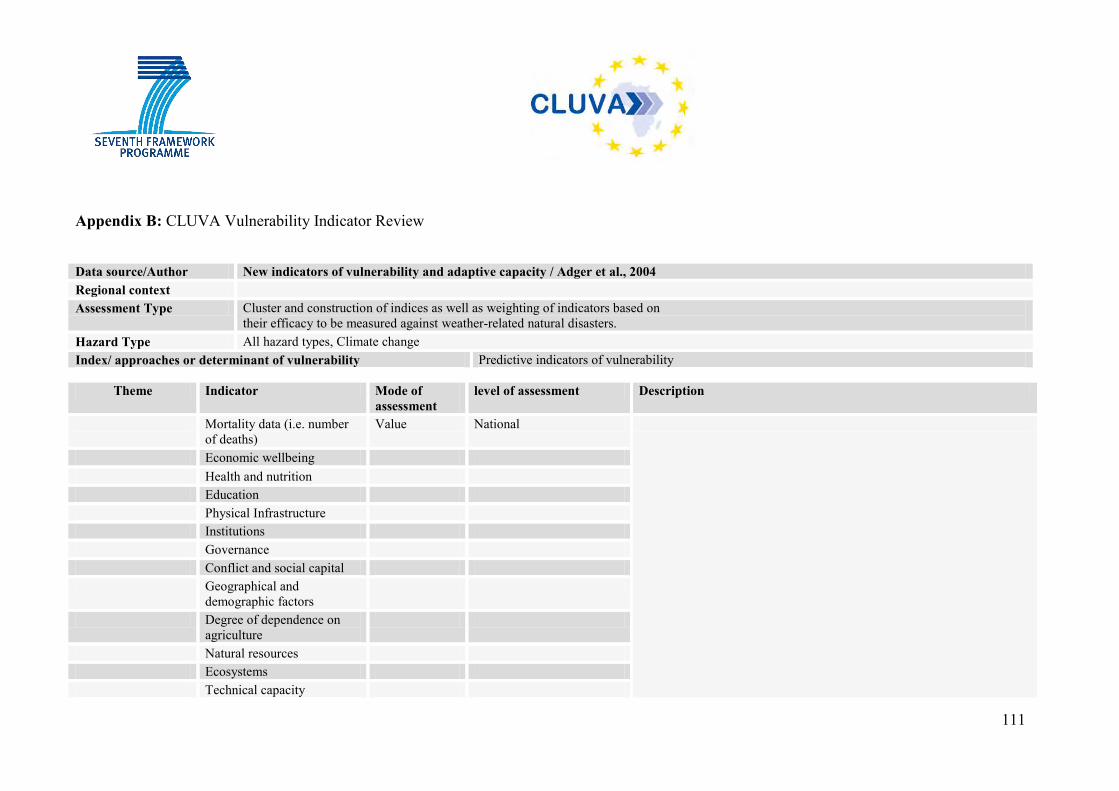
111
Appendix B: CLUVA Vulnerability Indicator Review Data source/Author New indicators of vulnerability and adaptive capacity / Adger et al., 2004 Regional context Assessment Type Cluster and construction of indices as well as weighting of indicators based on
their efficacy to be measured against weather-related natural disasters. Hazard Type All hazard types, Climate change Index/ approaches or determinant of vulnerability Predictive indicators of vulnerability
Theme Indicator Mode of assessment
level of assessment Description
Mortality data (i.e. number of deaths)
Value National
Economic wellbeing Health and nutrition Education Physical Infrastructure Institutions Governance Conflict and social capital Geographical and
demographic factors
Degree of dependence on agriculture
Natural resources Ecosystems Technical capacity
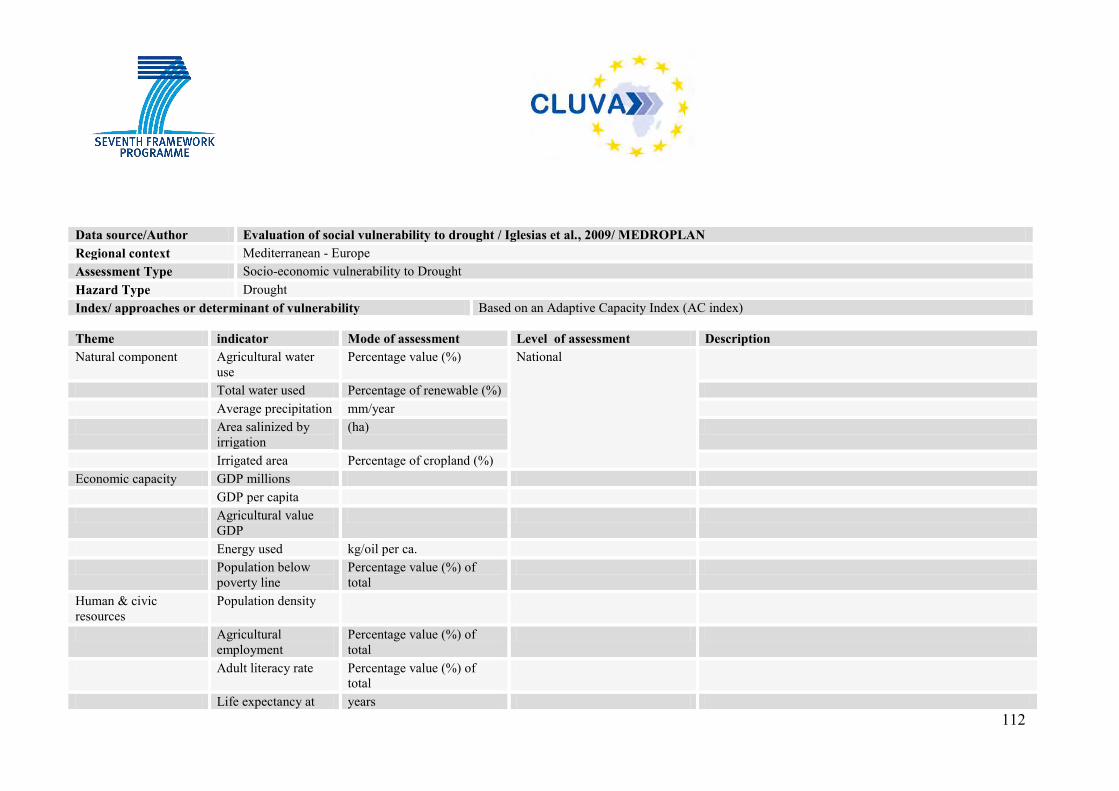
112
Data source/Author Evaluation of social vulnerability to drought / Iglesias et al., 2009/ MEDROPLAN Regional context Mediterranean - Europe Assessment Type Socio-economic vulnerability to Drought Hazard Type Drought Index/ approaches or determinant of vulnerability Based on an Adaptive Capacity Index (AC index) Theme indicator Mode of assessment Level of assessment Description Natural component Agricultural water
use Percentage value (%) National
Total water used Percentage of renewable (%) Average precipitation mm/year Area salinized by
irrigation (ha)
Irrigated area Percentage of cropland (%) Economic capacity GDP millions GDP per capita Agricultural value
GDP
Energy used kg/oil per ca. Population below
poverty line Percentage value (%) of total
Human & civic resources
Population density
Agricultural employment
Percentage value (%) of total
Adult literacy rate Percentage value (%) of total
Life expectancy at years
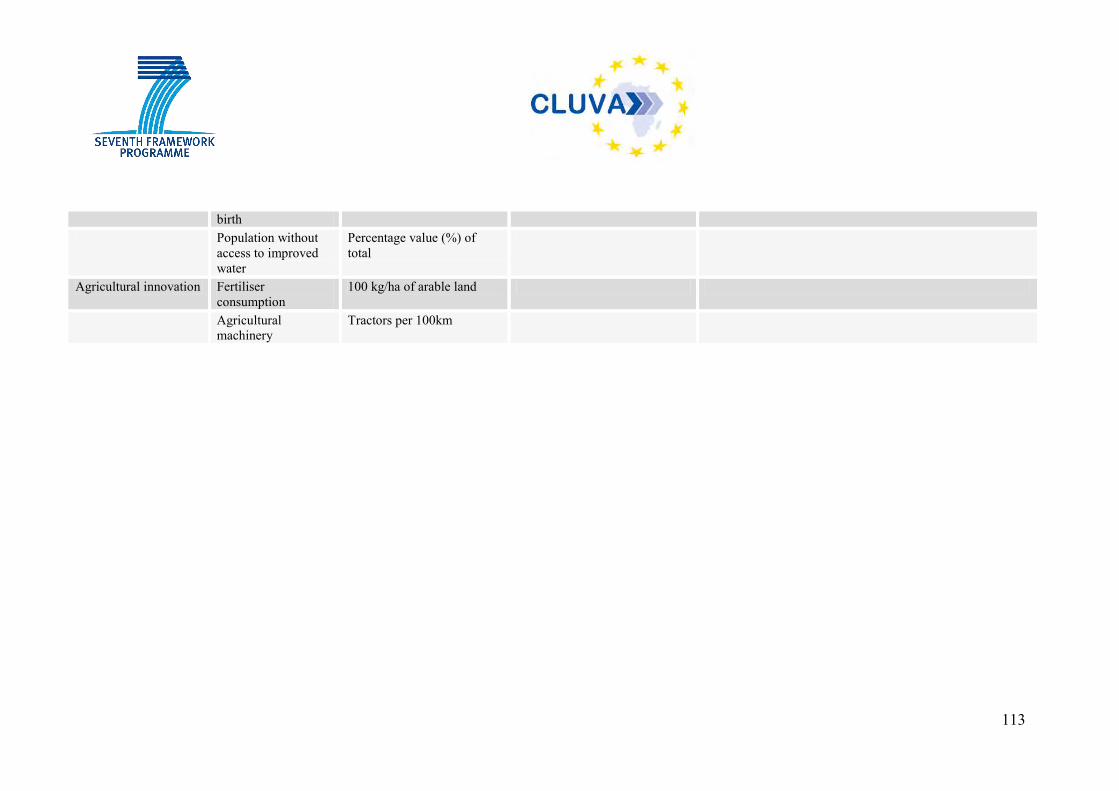
113
birth Population without
access to improved water
Percentage value (%) of total
Agricultural innovation Fertiliser consumption
100 kg/ha of arable land
Agricultural machinery
Tractors per 100km
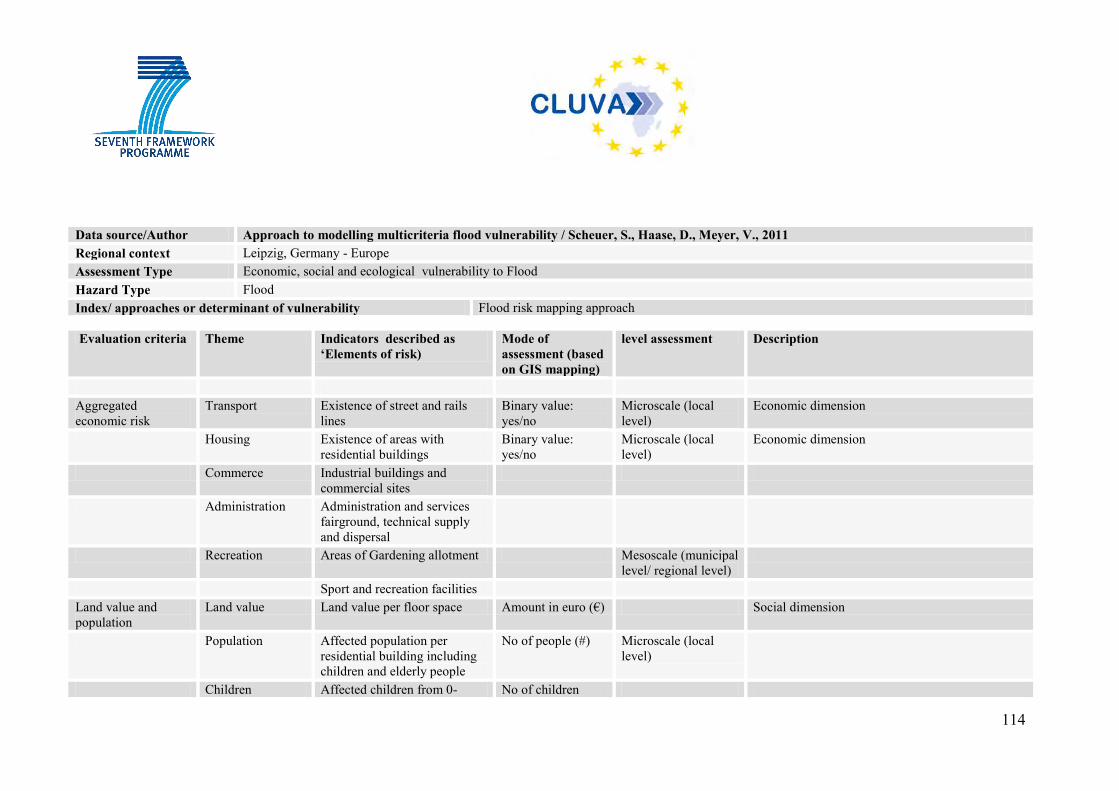
114
Data source/Author Approach to modelling multicriteria flood vulnerability / Scheuer, S., Haase, D., Meyer, V., 2011 Regional context Leipzig, Germany - Europe Assessment Type Economic, social and ecological vulnerability to Flood Hazard Type Flood Index/ approaches or determinant of vulnerability Flood risk mapping approach Evaluation criteria Theme Indicators described as
‘Elements of risk) Mode of assessment (based on GIS mapping)
level assessment Description
Aggregated economic risk
Transport Existence of street and rails lines
Binary value: yes/no
Microscale (local level)
Economic dimension
Housing Existence of areas with residential buildings
Binary value: yes/no
Microscale (local level)
Economic dimension
Commerce Industrial buildings and commercial sites
Administration Administration and services fairground, technical supply and dispersal
Recreation Areas of Gardening allotment Mesoscale (municipal level/ regional level)
Sport and recreation facilities Land value and population
Land value Land value per floor space Amount in euro (€) Social dimension
Population Affected population per residential building including children and elderly people
No of people (#) Microscale (local level)
Children Affected children from 0- No of children
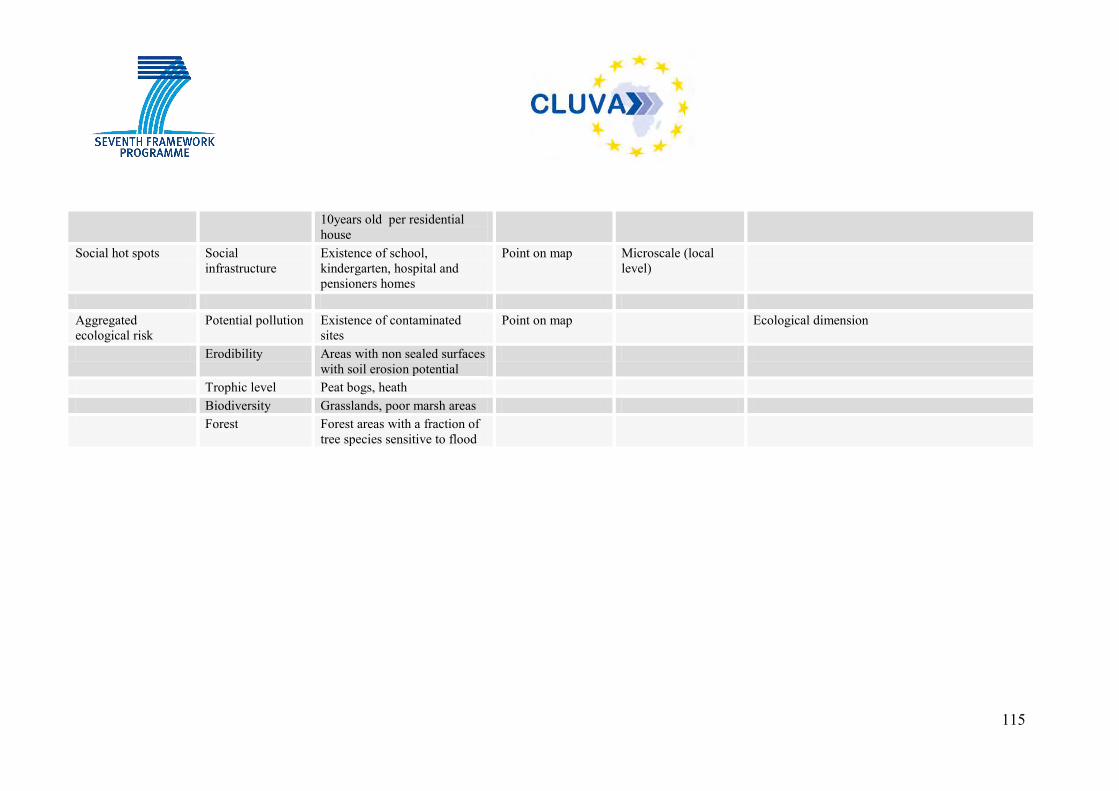
115
10years old per residential house
Social hot spots Social infrastructure
Existence of school, kindergarten, hospital and pensioners homes
Point on map Microscale (local level)
Aggregated ecological risk
Potential pollution Existence of contaminated sites
Point on map Ecological dimension
Erodibility Areas with non sealed surfaces with soil erosion potential
Trophic level Peat bogs, heath Biodiversity Grasslands, poor marsh areas Forest Forest areas with a fraction of
tree species sensitive to flood
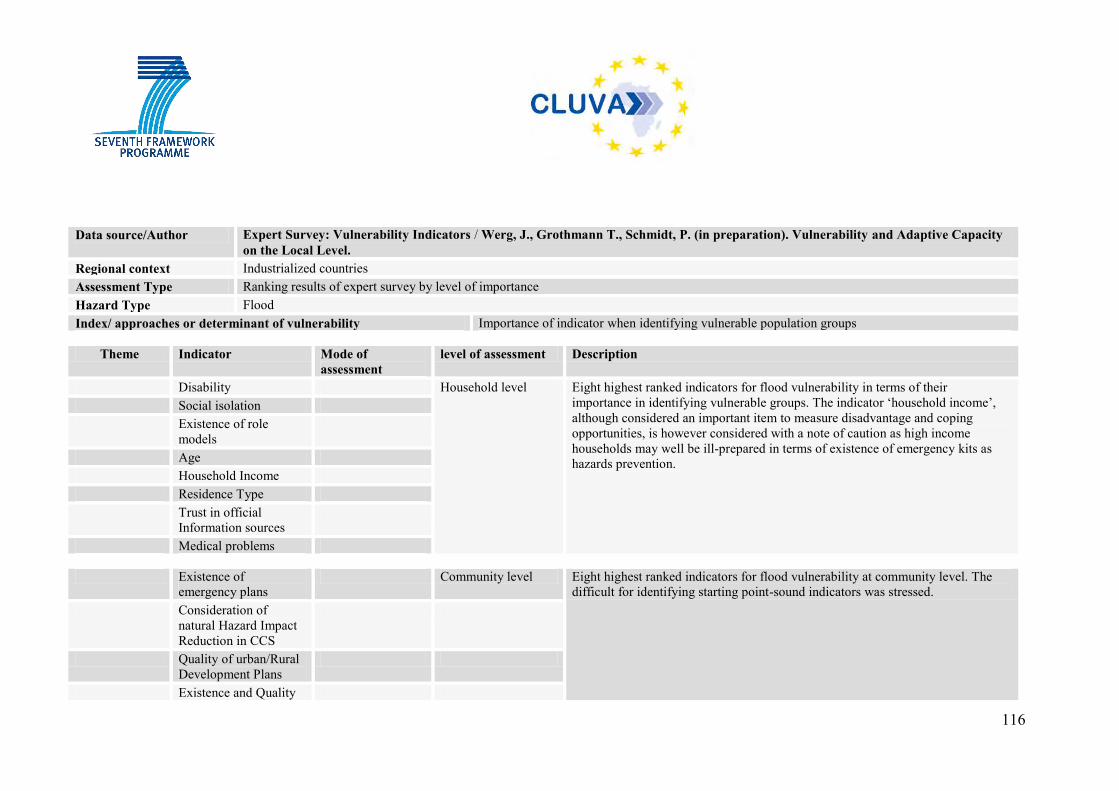
116
Data source/Author Expert Survey: Vulnerability Indicators / Werg, J., Grothmann T., Schmidt, P. (in preparation). Vulnerability and Adaptive Capacity
on the Local Level. Regional context Industrialized countries Assessment Type Ranking results of expert survey by level of importance Hazard Type Flood Index/ approaches or determinant of vulnerability Importance of indicator when identifying vulnerable population groups
Theme Indicator Mode of assessment
level of assessment Description
Disability Household level Eight highest ranked indicators for flood vulnerability in terms of their importance in identifying vulnerable groups. The indicator ‘household income’, although considered an important item to measure disadvantage and coping opportunities, is however considered with a note of caution as high income households may well be ill-prepared in terms of existence of emergency kits as hazards prevention.
Social isolation Existence of role
models
Age Household Income Residence Type Trust in official
Information sources
Medical problems Existence of
emergency plans Community level Eight highest ranked indicators for flood vulnerability at community level. The
difficult for identifying starting point-sound indicators was stressed. Consideration of
natural Hazard Impact Reduction in CCS
Quality of urban/Rural Development Plans
Existence and Quality
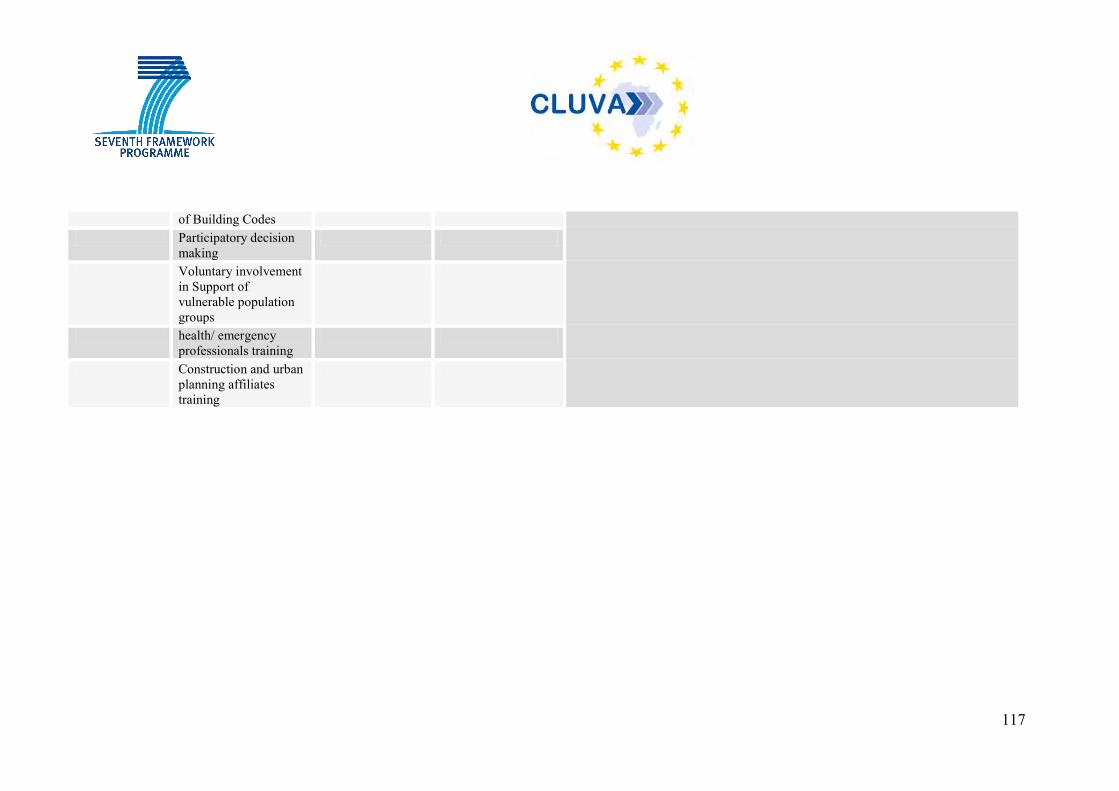
117
of Building Codes Participatory decision
making
Voluntary involvement in Support of vulnerable population groups
health/ emergency professionals training
Construction and urban planning affiliates training
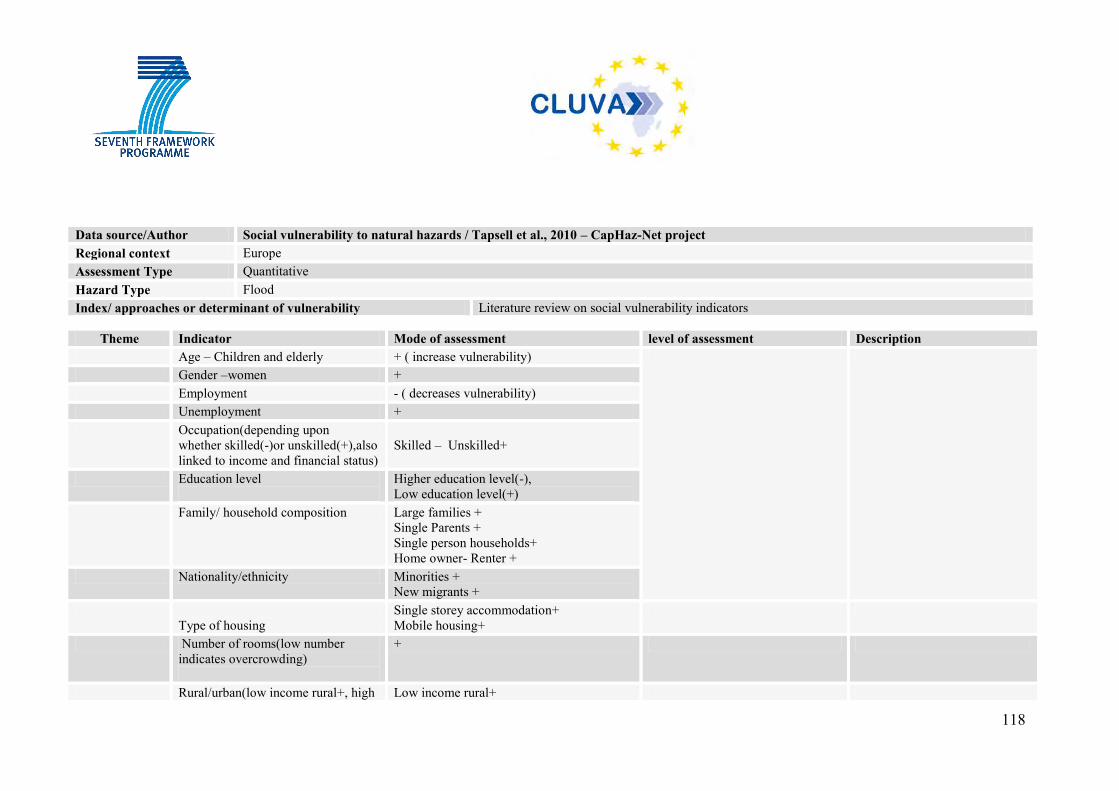
118
Data source/Author Social vulnerability to natural hazards / Tapsell et al., 2010 – CapHaz-Net project Regional context Europe Assessment Type Quantitative Hazard Type Flood Index/ approaches or determinant of vulnerability Literature review on social vulnerability indicators
Theme Indicator Mode of assessment level of assessment Description Age – Children and elderly + ( increase vulnerability) Gender –women + Employment - ( decreases vulnerability) Unemployment + Occupation(depending upon
whether skilled(-)or unskilled(+),also linked to income and financial status)
Skilled – Unskilled+
Education level
Higher education level(-), Low education level(+)
Family/ household composition Large families + Single Parents + Single person households+ Home owner- Renter +
Nationality/ethnicity Minorities + New migrants +
Type of housing
Single storey accommodation+ Mobile housing+
Number of rooms(low number indicates overcrowding)
+
Rural/urban(low income rural+, high Low income rural+
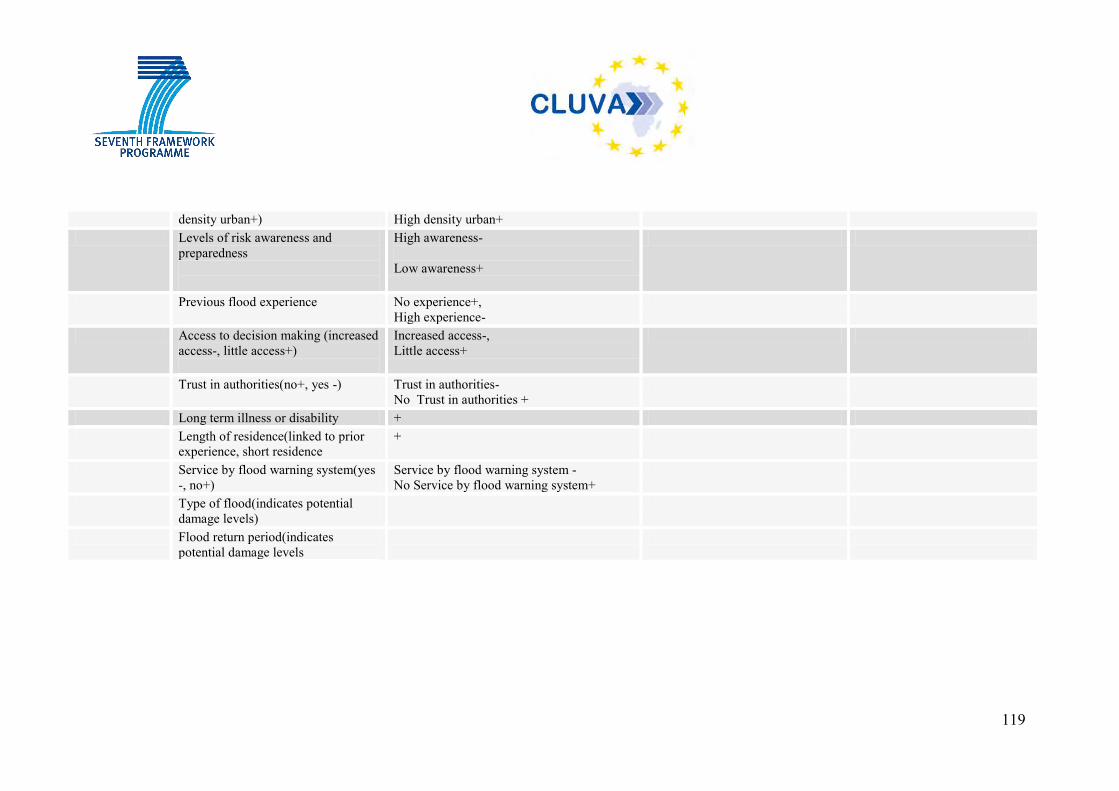
119
density urban+) High density urban+ Levels of risk awareness and
preparedness
High awareness- Low awareness+
Previous flood experience
No experience+, High experience-
Access to decision making (increased access-, little access+)
Increased access-, Little access+
Trust in authorities(no+, yes -) Trust in authorities- No Trust in authorities +
Long term illness or disability + Length of residence(linked to prior
experience, short residence +
Service by flood warning system(yes -, no+)
Service by flood warning system - No Service by flood warning system+
Type of flood(indicates potential damage levels)
Flood return period(indicates potential damage levels
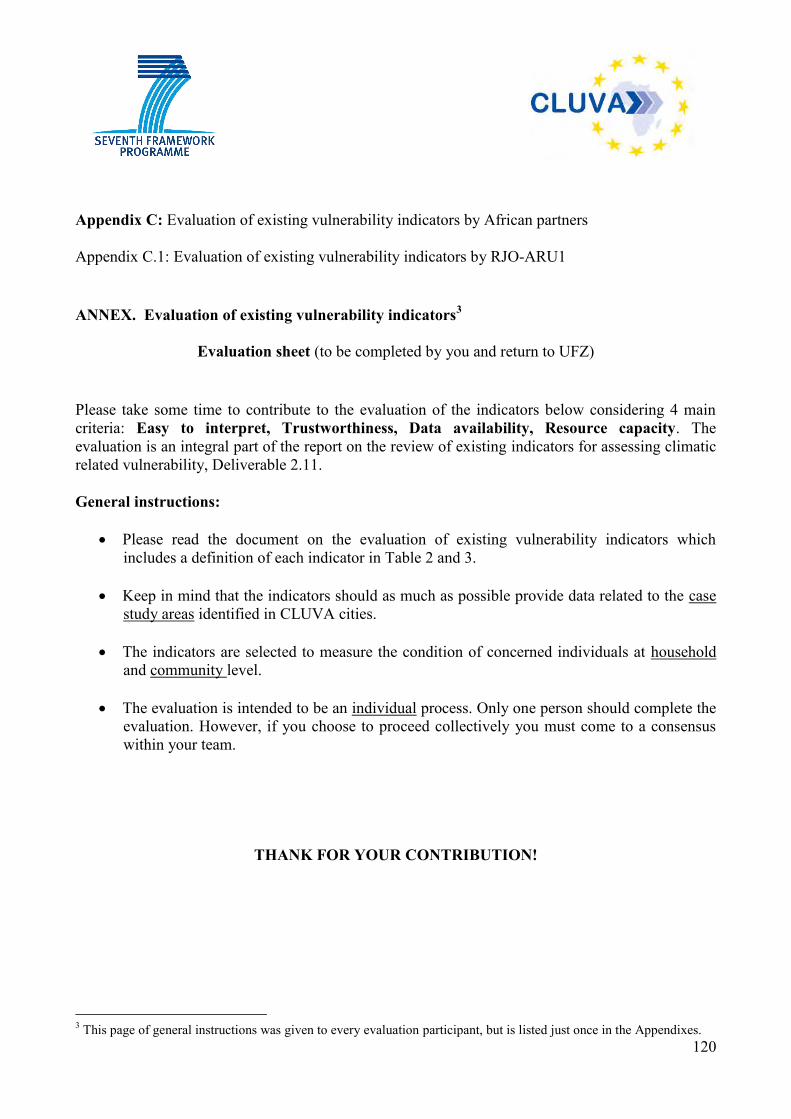
120
Appendix C: Evaluation of existing vulnerability indicators by African partners Appendix C.1: Evaluation of existing vulnerability indicators by RJO-ARU1 ANNEX. Evaluation of existing vulnerability indicators3
Evaluation sheet (to be completed by you and return to UFZ)
Please take some time to contribute to the evaluation of the indicators below considering 4 main criteria: Easy to interpret, Trustworthiness, Data availability, Resource capacity. The evaluation is an integral part of the report on the review of existing indicators for assessing climatic related vulnerability, Deliverable 2.11. General instructions:
Please read the document on the evaluation of existing vulnerability indicators which includes a definition of each indicator in Table 2 and 3.
Keep in mind that the indicators should as much as possible provide data related to the case
study areas identified in CLUVA cities. The indicators are selected to measure the condition of concerned individuals at household
and community level. The evaluation is intended to be an individual process. Only one person should complete the
evaluation. However, if you choose to proceed collectively you must come to a consensus within your team.
THANK FOR YOUR CONTRIBUTION!
3 This page of general instructions was given to every evaluation participant, but is listed just once in the Appendixes.
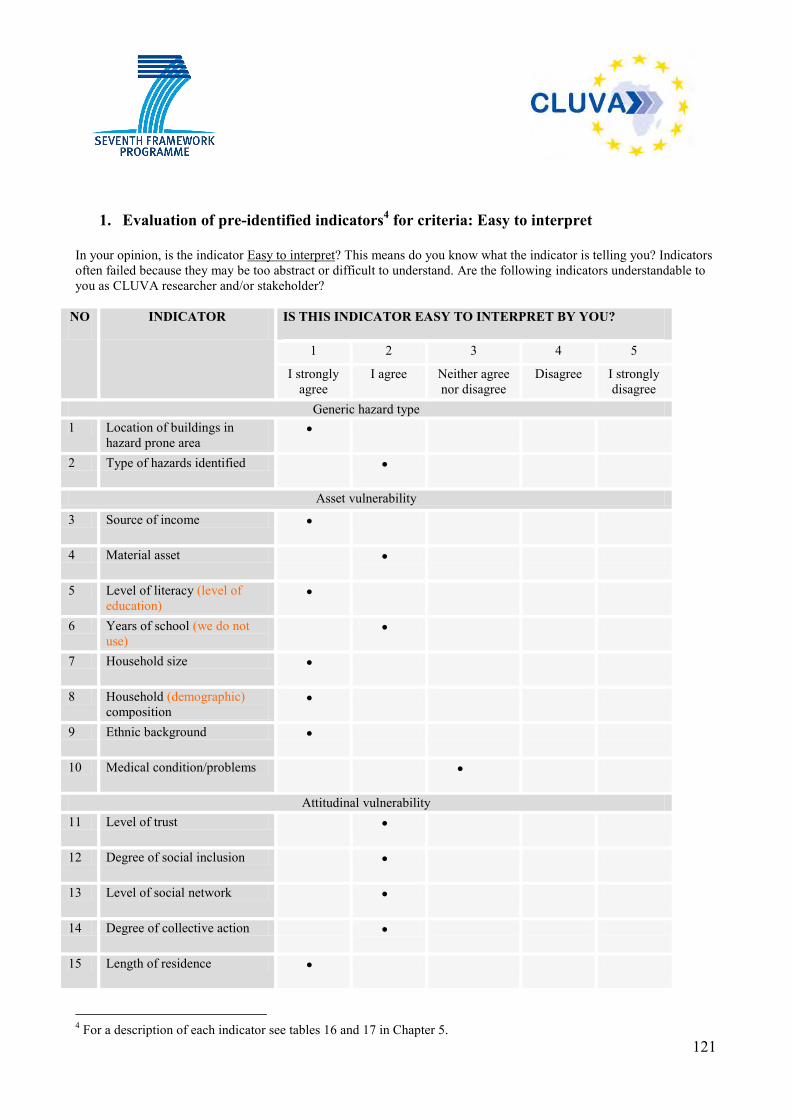
121
1. Evaluation of pre-identified indicators4 for criteria: Easy to interpret
In your opinion, is the indicator Easy to interpret? This means do you know what the indicator is telling you? Indicators often failed because they may be too abstract or difficult to understand. Are the following indicators understandable to you as CLUVA researcher and/or stakeholder?
NO INDICATOR IS THIS INDICATOR EASY TO INTERPRET BY YOU?
1 2 3 4 5
I strongly agree
I agree Neither agree nor disagree
Disagree I strongly disagree
Generic hazard type 1 Location of buildings in
hazard prone area
2 Type of hazards identified
Asset vulnerability 3 Source of income
4 Material asset
5 Level of literacy (level of education)
6 Years of school (we do not use)
7 Household size
8 Household (demographic) composition
9 Ethnic background
10 Medical condition/problems
Attitudinal vulnerability 11 Level of trust
12 Degree of social inclusion
13 Level of social network
14 Degree of collective action
15 Length of residence
4 For a description of each indicator see tables 16 and 17 in Chapter 5.
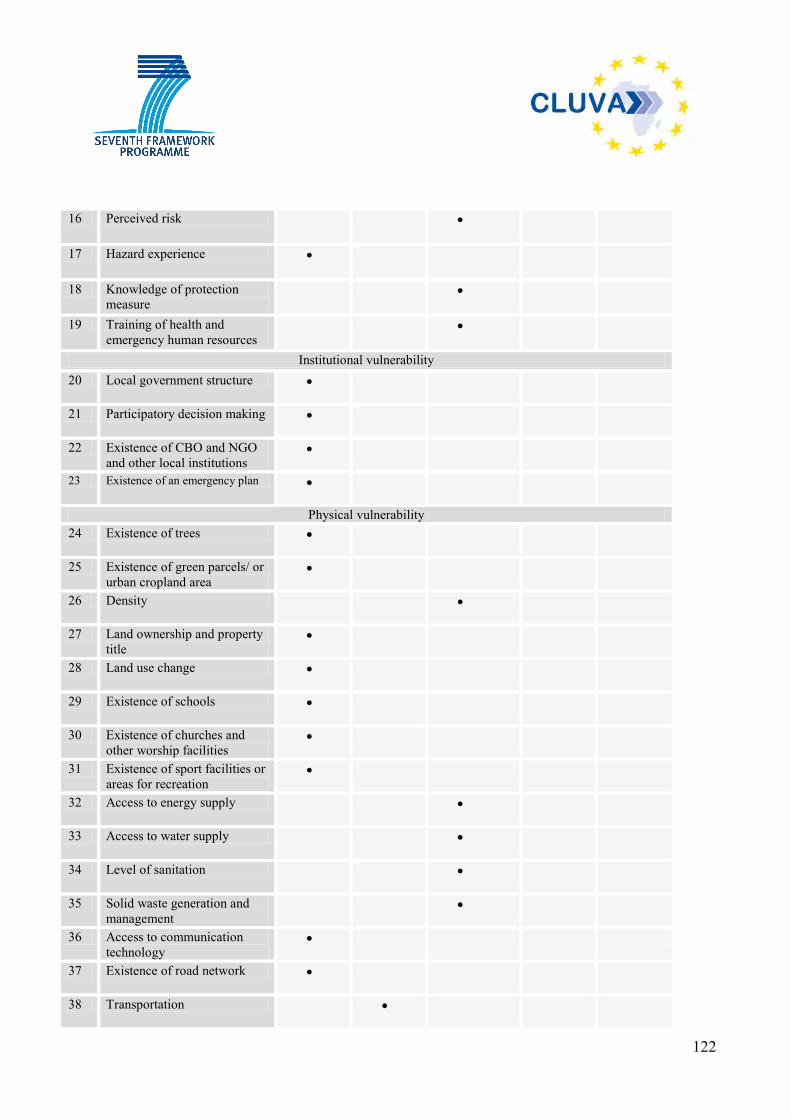
122
16 Perceived risk
17 Hazard experience
18 Knowledge of protection measure
19 Training of health and emergency human resources
Institutional vulnerability 20 Local government structure
21 Participatory decision making
22 Existence of CBO and NGO and other local institutions
23 Existence of an emergency plan
Physical vulnerability 24 Existence of trees
25 Existence of green parcels/ or urban cropland area
26 Density
27 Land ownership and property title
28 Land use change
29 Existence of schools
30 Existence of churches and other worship facilities
31 Existence of sport facilities or areas for recreation
32 Access to energy supply
33 Access to water supply
34 Level of sanitation
35 Solid waste generation and management
36 Access to communication technology
37 Existence of road network
38 Transportation
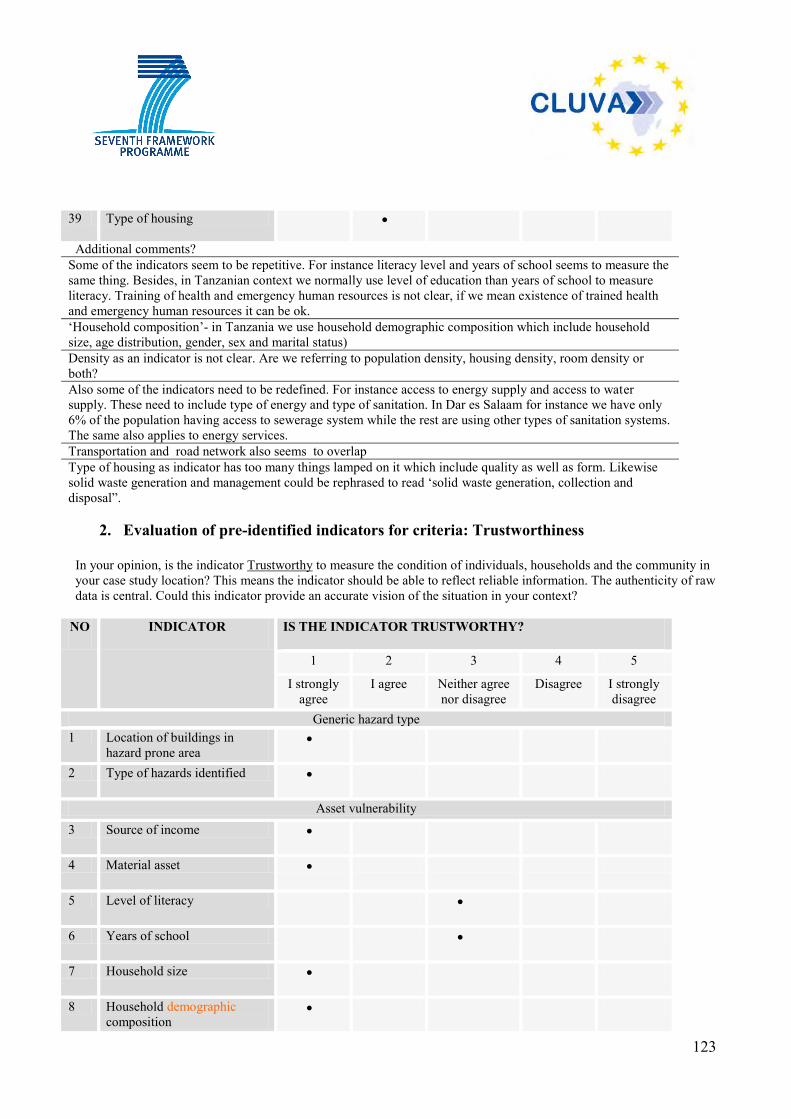
123
39 Type of housing
Additional comments? Some of the indicators seem to be repetitive. For instance literacy level and years of school seems to measure the same thing. Besides, in Tanzanian context we normally use level of education than years of school to measure literacy. Training of health and emergency human resources is not clear, if we mean existence of trained health and emergency human resources it can be ok. ‘Household composition’- in Tanzania we use household demographic composition which include household size, age distribution, gender, sex and marital status) Density as an indicator is not clear. Are we referring to population density, housing density, room density or both? Also some of the indicators need to be redefined. For instance access to energy supply and access to water supply. These need to include type of energy and type of sanitation. In Dar es Salaam for instance we have only 6% of the population having access to sewerage system while the rest are using other types of sanitation systems. The same also applies to energy services. Transportation and road network also seems to overlap Type of housing as indicator has too many things lamped on it which include quality as well as form. Likewise solid waste generation and management could be rephrased to read ‘solid waste generation, collection and disposal”.
2. Evaluation of pre-identified indicators for criteria: Trustworthiness
In your opinion, is the indicator Trustworthy to measure the condition of individuals, households and the community in your case study location? This means the indicator should be able to reflect reliable information. The authenticity of raw data is central. Could this indicator provide an accurate vision of the situation in your context?
NO INDICATOR IS THE INDICATOR TRUSTWORTHY?
1 2 3 4 5
I strongly agree
I agree Neither agree nor disagree
Disagree I strongly disagree
Generic hazard type 1 Location of buildings in
hazard prone area
2 Type of hazards identified
Asset vulnerability 3 Source of income
4 Material asset
5 Level of literacy
6 Years of school
7 Household size
8 Household demographic composition
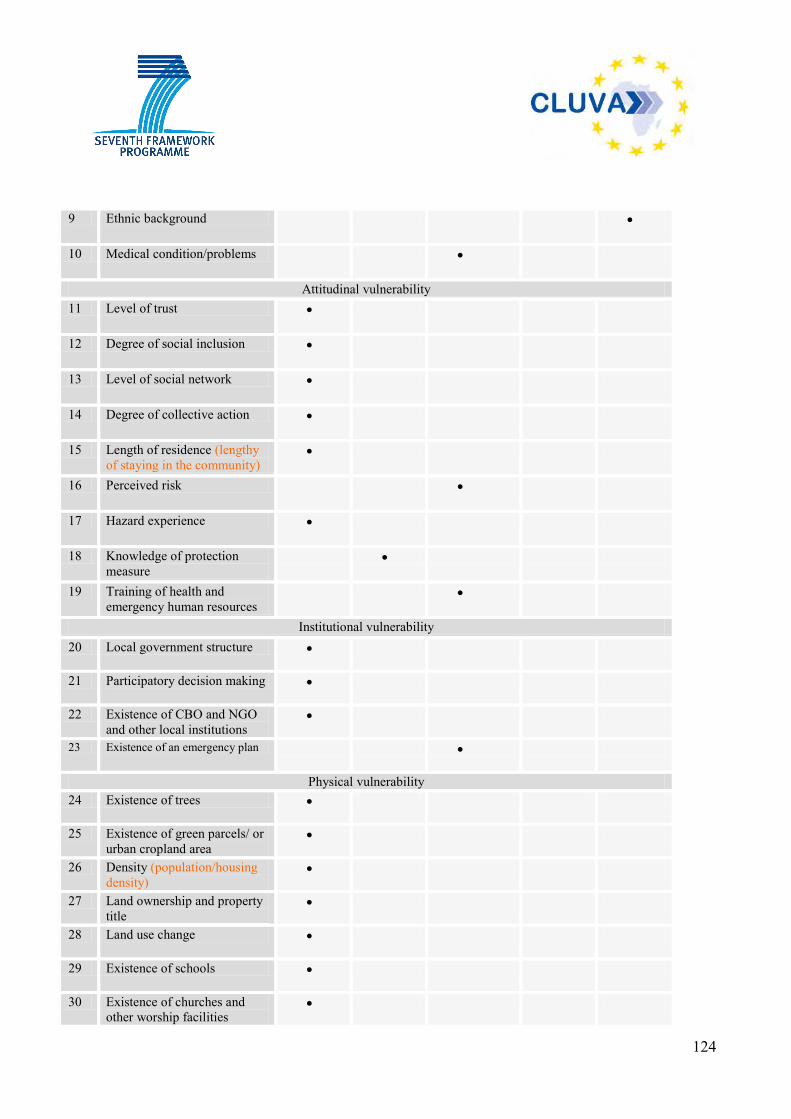
124
9 Ethnic background
10 Medical condition/problems
Attitudinal vulnerability 11 Level of trust
12 Degree of social inclusion
13 Level of social network
14 Degree of collective action
15 Length of residence (lengthy of staying in the community)
16 Perceived risk
17 Hazard experience
18 Knowledge of protection measure
19 Training of health and emergency human resources
Institutional vulnerability 20 Local government structure
21 Participatory decision making
22 Existence of CBO and NGO and other local institutions
23 Existence of an emergency plan
Physical vulnerability 24 Existence of trees
25 Existence of green parcels/ or urban cropland area
26 Density (population/housing density)
27 Land ownership and property title
1.
28 Land use change
29 Existence of schools
30 Existence of churches and other worship facilities
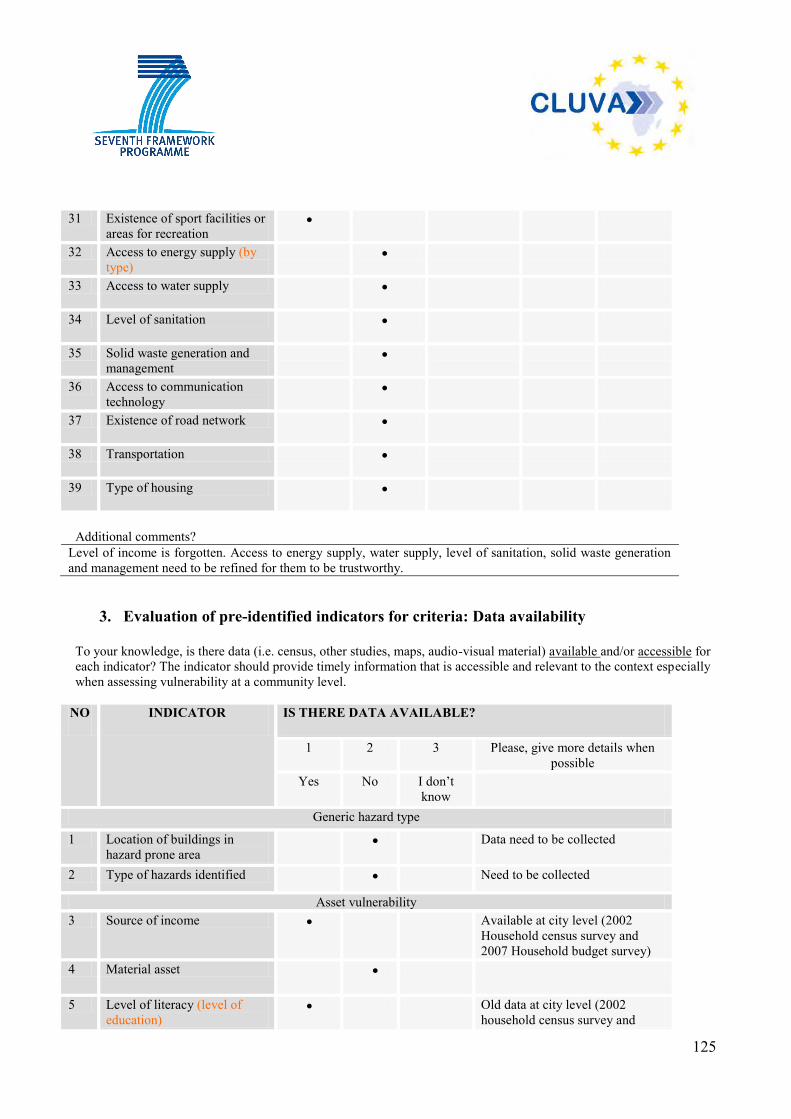
125
31 Existence of sport facilities or areas for recreation
32 Access to energy supply (by type)
33 Access to water supply
34 Level of sanitation
35 Solid waste generation and management
36 Access to communication technology
37 Existence of road network
38 Transportation
39 Type of housing
Additional comments?
Level of income is forgotten. Access to energy supply, water supply, level of sanitation, solid waste generation and management need to be refined for them to be trustworthy.
3. Evaluation of pre-identified indicators for criteria: Data availability
To your knowledge, is there data (i.e. census, other studies, maps, audio-visual material) available and/or accessible for each indicator? The indicator should provide timely information that is accessible and relevant to the context especially when assessing vulnerability at a community level.
NO INDICATOR IS THERE DATA AVAILABLE?
1 2 3 Please, give more details when possible
Yes No I don’t know
Generic hazard type
1 Location of buildings in hazard prone area
Data need to be collected
2 Type of hazards identified Need to be collected
Asset vulnerability 3 Source of income Available at city level (2002
Household census survey and 2007 Household budget survey)
4 Material asset
5 Level of literacy (level of education)
Old data at city level (2002 household census survey and
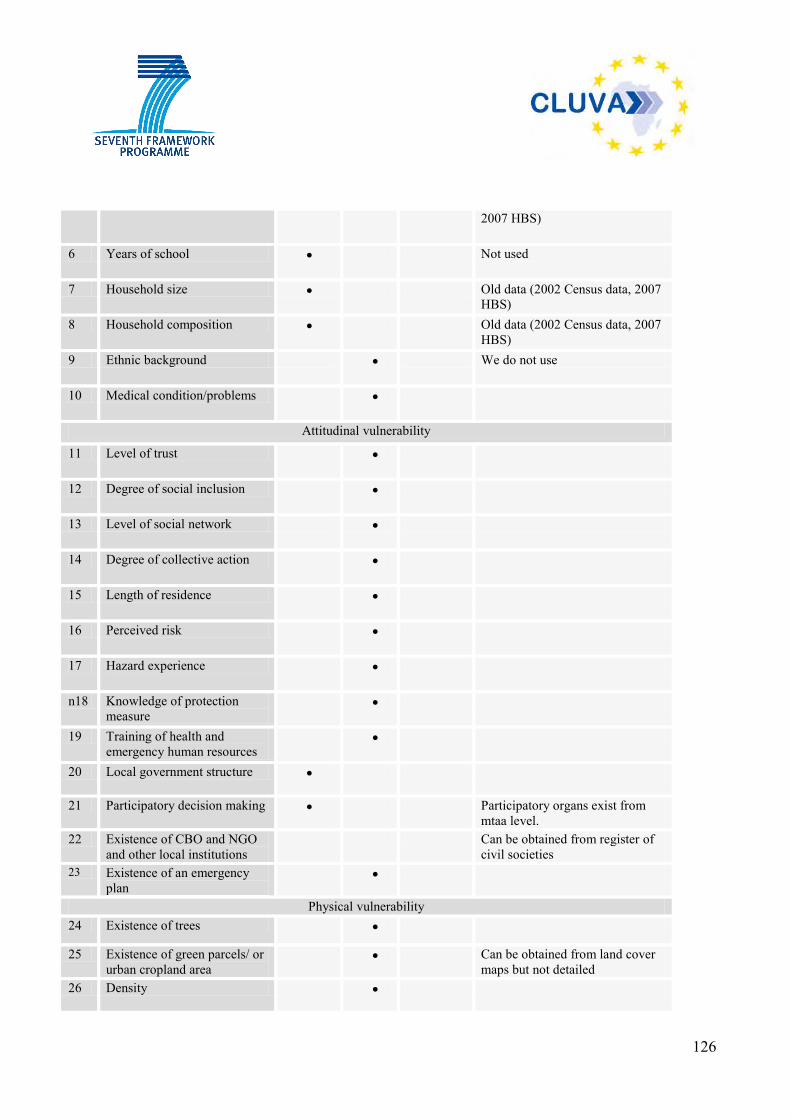
126
2007 HBS)
6 Years of school Not used
7 Household size Old data (2002 Census data, 2007 HBS)
8 Household composition Old data (2002 Census data, 2007 HBS)
9 Ethnic background We do not use
10 Medical condition/problems
Attitudinal vulnerability
11 Level of trust
12 Degree of social inclusion
13 Level of social network
14 Degree of collective action
15 Length of residence
16 Perceived risk
17 Hazard experience
n18 Knowledge of protection measure
19 Training of health and emergency human resources
20 Local government structure
21 Participatory decision making Participatory organs exist from mtaa level.
22 Existence of CBO and NGO and other local institutions
Can be obtained from register of civil societies
23 Existence of an emergency plan
Physical vulnerability 24 Existence of trees
25 Existence of green parcels/ or urban cropland area
Can be obtained from land cover maps but not detailed
26 Density
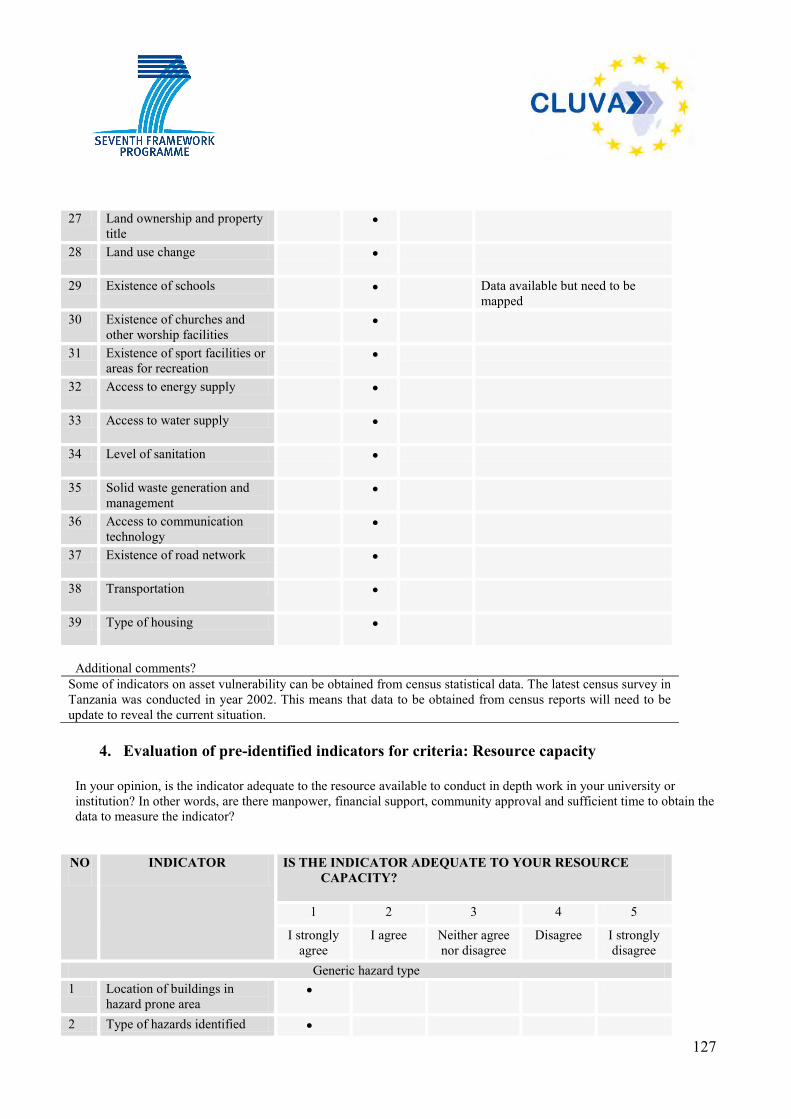
127
27 Land ownership and property title
28 Land use change
29 Existence of schools Data available but need to be mapped
30 Existence of churches and other worship facilities
31 Existence of sport facilities or areas for recreation
32 Access to energy supply
33 Access to water supply
34 Level of sanitation
35 Solid waste generation and management
36 Access to communication technology
37 Existence of road network
38 Transportation
39 Type of housing
Additional comments?
Some of indicators on asset vulnerability can be obtained from census statistical data. The latest census survey in Tanzania was conducted in year 2002. This means that data to be obtained from census reports will need to be update to reveal the current situation.
4. Evaluation of pre-identified indicators for criteria: Resource capacity
In your opinion, is the indicator adequate to the resource available to conduct in depth work in your university or institution? In other words, are there manpower, financial support, community approval and sufficient time to obtain the data to measure the indicator?
NO INDICATOR IS THE INDICATOR ADEQUATE TO YOUR RESOURCE CAPACITY?
1 2 3 4 5
I strongly agree
I agree Neither agree nor disagree
Disagree I strongly disagree
Generic hazard type 1 Location of buildings in
hazard prone area
2 Type of hazards identified
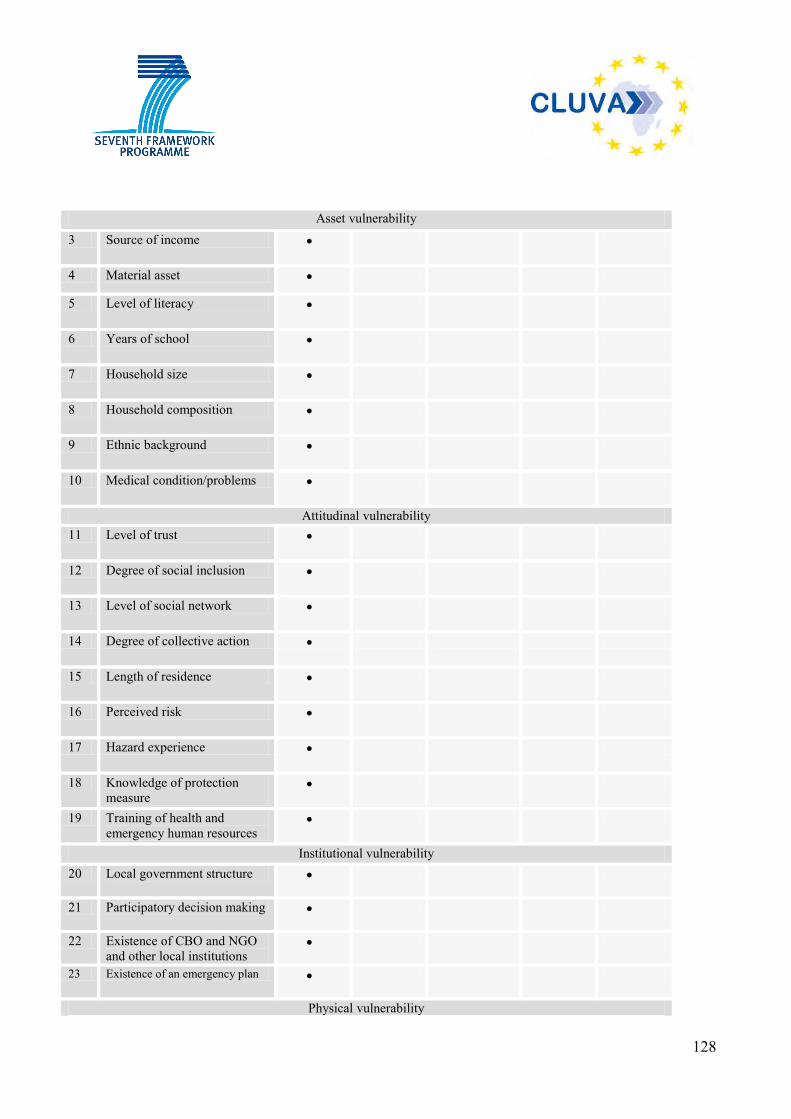
128
Asset vulnerability 3 Source of income
4 Material asset
5 Level of literacy
6 Years of school
7 Household size
8 Household composition
9 Ethnic background
10 Medical condition/problems
Attitudinal vulnerability 11 Level of trust
12 Degree of social inclusion
13 Level of social network
14 Degree of collective action
15 Length of residence
16 Perceived risk
17 Hazard experience
18 Knowledge of protection measure
19 Training of health and emergency human resources
Institutional vulnerability 20 Local government structure
21 Participatory decision making
22 Existence of CBO and NGO and other local institutions
23 Existence of an emergency plan
Physical vulnerability
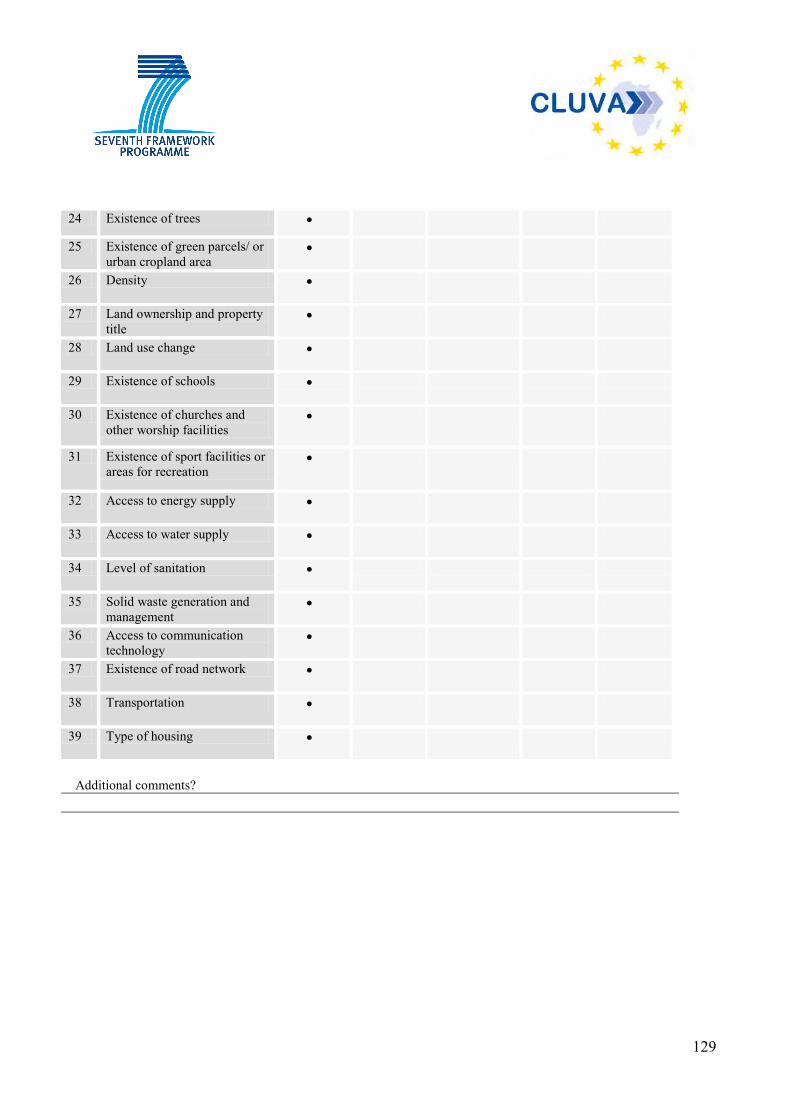
129
24 Existence of trees
25 Existence of green parcels/ or urban cropland area
26 Density
27 Land ownership and property title
28 Land use change
29 Existence of schools
30 Existence of churches and other worship facilities
31 Existence of sport facilities or areas for recreation
32 Access to energy supply
33 Access to water supply
34 Level of sanitation
35 Solid waste generation and management
36 Access to communication technology
37 Existence of road network
38 Transportation
39 Type of housing
Additional comments?

130
Appendix C.2: Evaluation of existing vulnerability indicators by RFE-EiABC1
1. Evaluation of pre-identified indicators for criteria: Easy to interpret
In your opinion, is the indicator Easy to interpret? This means do you know what the indicator is telling you? Indicators often failed because they may be too abstract or difficult to understand. Are the following indicators understandable to you as CLUVA researcher and/or stakeholder? NO INDICATOR IS THIS INDICATOR EASY TO INTERPRET BY YOU?
1 2 3 4 5
I strongly agree
I agree Neither agree nor disagree
Disagree I strongly disagree
Generic hazard type 1 Location of buildings in
hazard prone area X
2 Type of hazards identified X
Asset vulnerability 3 Source of income X
4 Material asset X
5 Level of literacy X
6 Years of school X
7 Household size X
8 Household composition X
9 Ethnic background X
10 Medical condition/problems X
Attitudinal vulnerability 11 Level of trust X
12 Degree of social inclusion X
13 Level of social network X
14 Degree of collective action X
15 Length of residence X
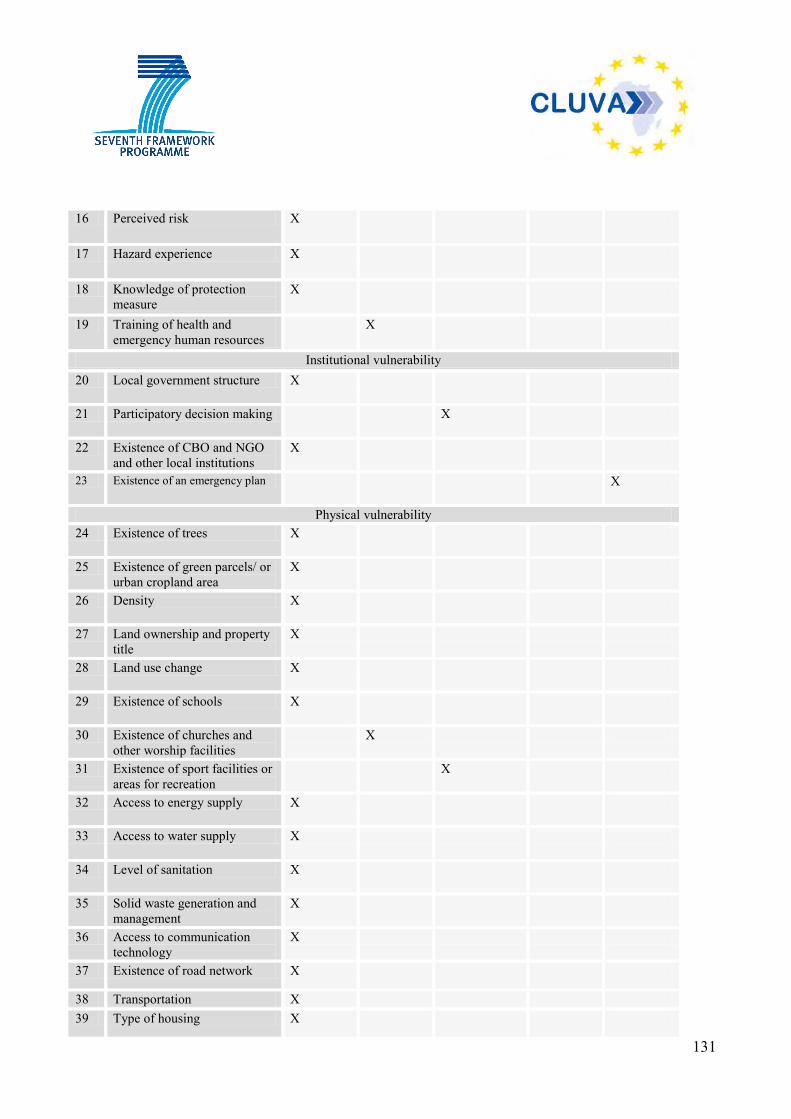
131
16 Perceived risk X
17 Hazard experience X
18 Knowledge of protection measure
X
19 Training of health and emergency human resources
X
Institutional vulnerability 20 Local government structure X
21 Participatory decision making X
22 Existence of CBO and NGO and other local institutions
X
23 Existence of an emergency plan X
Physical vulnerability 24 Existence of trees X
25 Existence of green parcels/ or urban cropland area
X
26 Density X
27 Land ownership and property title
X
28 Land use change X
29 Existence of schools X
30 Existence of churches and other worship facilities
X
31 Existence of sport facilities or areas for recreation
X
32 Access to energy supply X
33 Access to water supply X
34 Level of sanitation X
35 Solid waste generation and management
X
36 Access to communication technology
X
37 Existence of road network X
38 Transportation X 39 Type of housing X
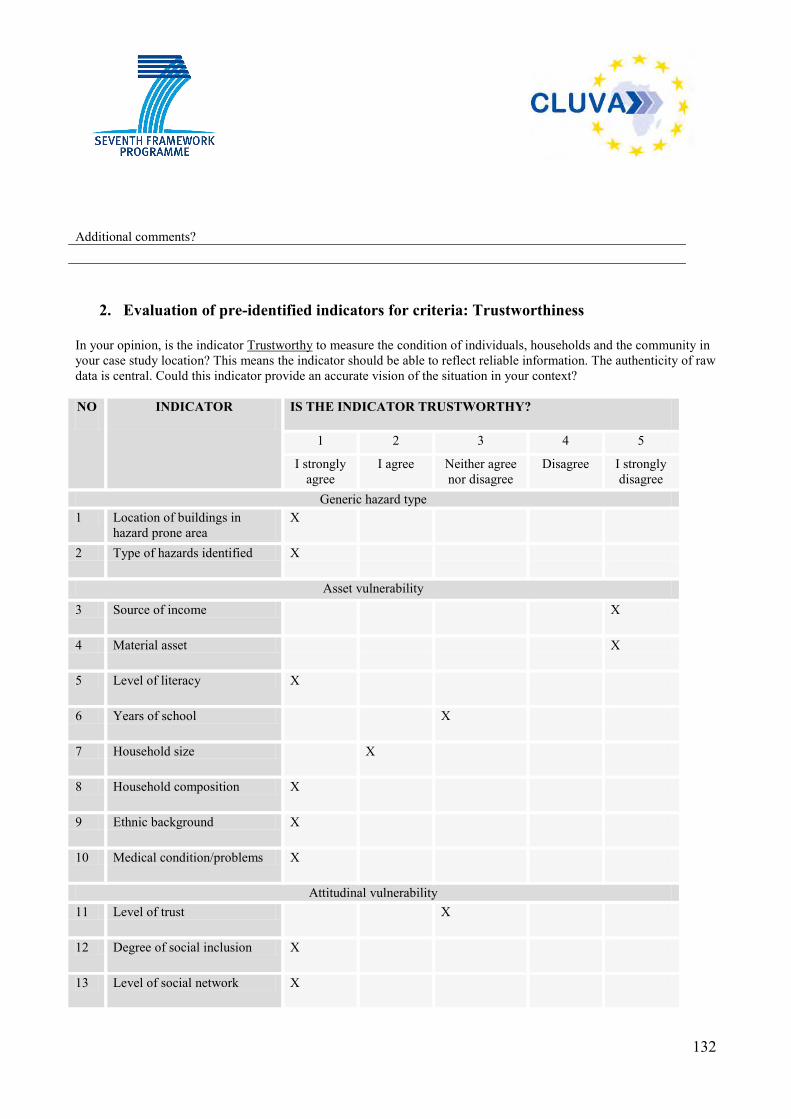
132
Additional comments?
2. Evaluation of pre-identified indicators for criteria: Trustworthiness
In your opinion, is the indicator Trustworthy to measure the condition of individuals, households and the community in your case study location? This means the indicator should be able to reflect reliable information. The authenticity of raw data is central. Could this indicator provide an accurate vision of the situation in your context? NO INDICATOR IS THE INDICATOR TRUSTWORTHY?
1 2 3 4 5
I strongly agree
I agree Neither agree nor disagree
Disagree I strongly disagree
Generic hazard type 1 Location of buildings in
hazard prone area X
2 Type of hazards identified X
Asset vulnerability 3 Source of income X
4 Material asset X
5 Level of literacy X
6 Years of school X
7 Household size X
8 Household composition X
9 Ethnic background X
10 Medical condition/problems X
Attitudinal vulnerability 11 Level of trust X
12 Degree of social inclusion X
13 Level of social network X
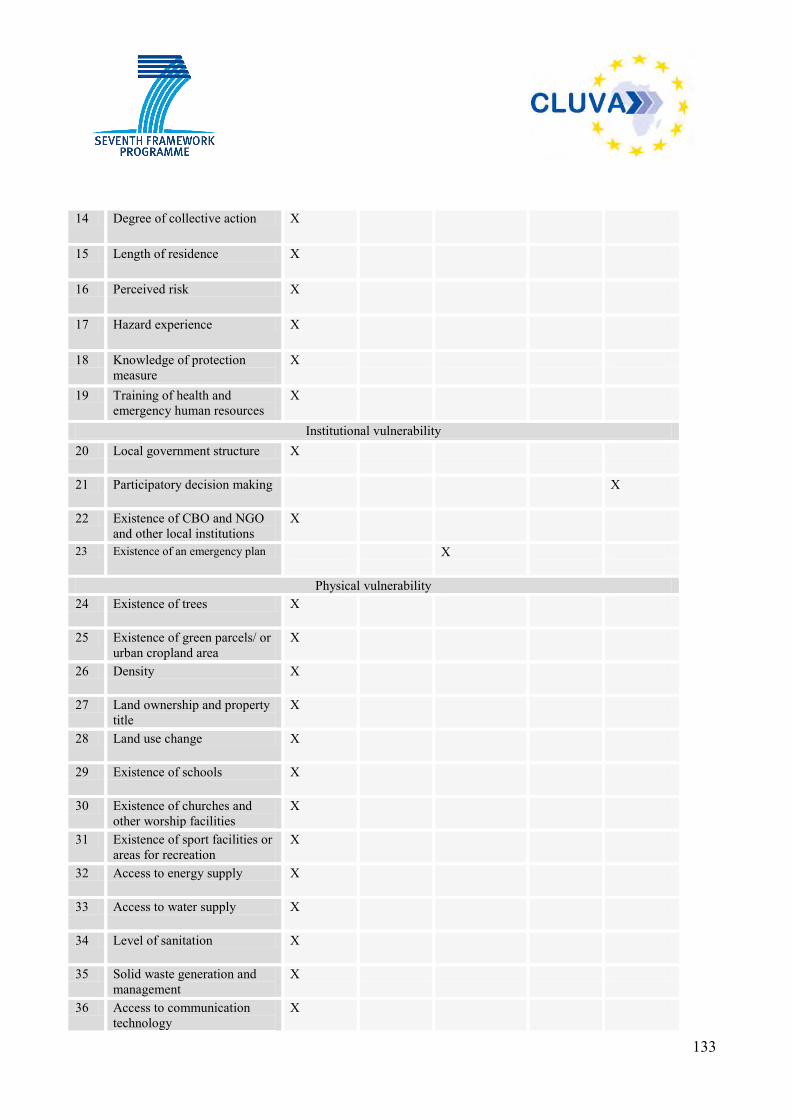
133
14 Degree of collective action X
15 Length of residence X
16 Perceived risk X
17 Hazard experience X
18 Knowledge of protection measure
X
19 Training of health and emergency human resources
X
Institutional vulnerability 20 Local government structure X
21 Participatory decision making X
22 Existence of CBO and NGO and other local institutions
X
23 Existence of an emergency plan X
Physical vulnerability 24 Existence of trees X
25 Existence of green parcels/ or urban cropland area
X
26 Density X
27 Land ownership and property title
X
28 Land use change X
29 Existence of schools X
30 Existence of churches and other worship facilities
X
31 Existence of sport facilities or areas for recreation
X
32 Access to energy supply X
33 Access to water supply X
34 Level of sanitation X
35 Solid waste generation and management
X
36 Access to communication technology
X
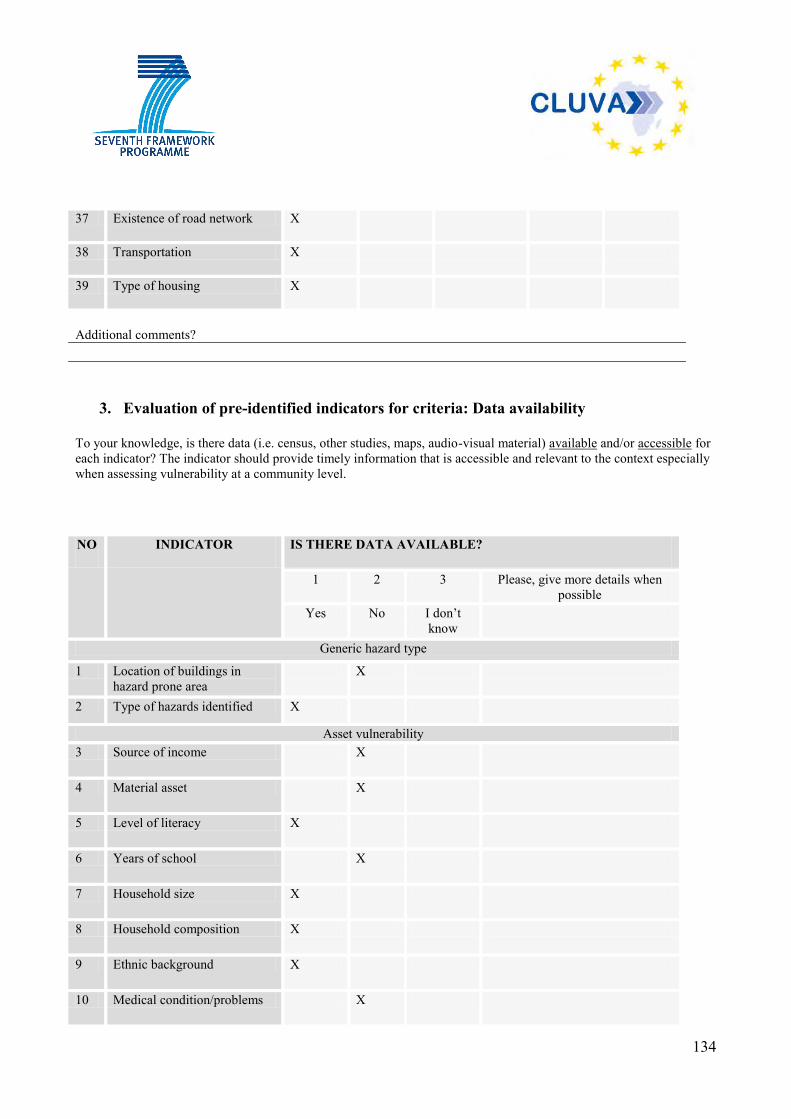
134
37 Existence of road network X
38 Transportation X
39 Type of housing X
Additional comments?
3. Evaluation of pre-identified indicators for criteria: Data availability
To your knowledge, is there data (i.e. census, other studies, maps, audio-visual material) available and/or accessible for each indicator? The indicator should provide timely information that is accessible and relevant to the context especially when assessing vulnerability at a community level. NO INDICATOR IS THERE DATA AVAILABLE?
1 2 3 Please, give more details when possible
Yes No I don’t know
Generic hazard type
1 Location of buildings in hazard prone area
X
2 Type of hazards identified X
Asset vulnerability 3 Source of income X
4 Material asset X
5 Level of literacy X
6 Years of school X
7 Household size X
8 Household composition X
9 Ethnic background X
10 Medical condition/problems X
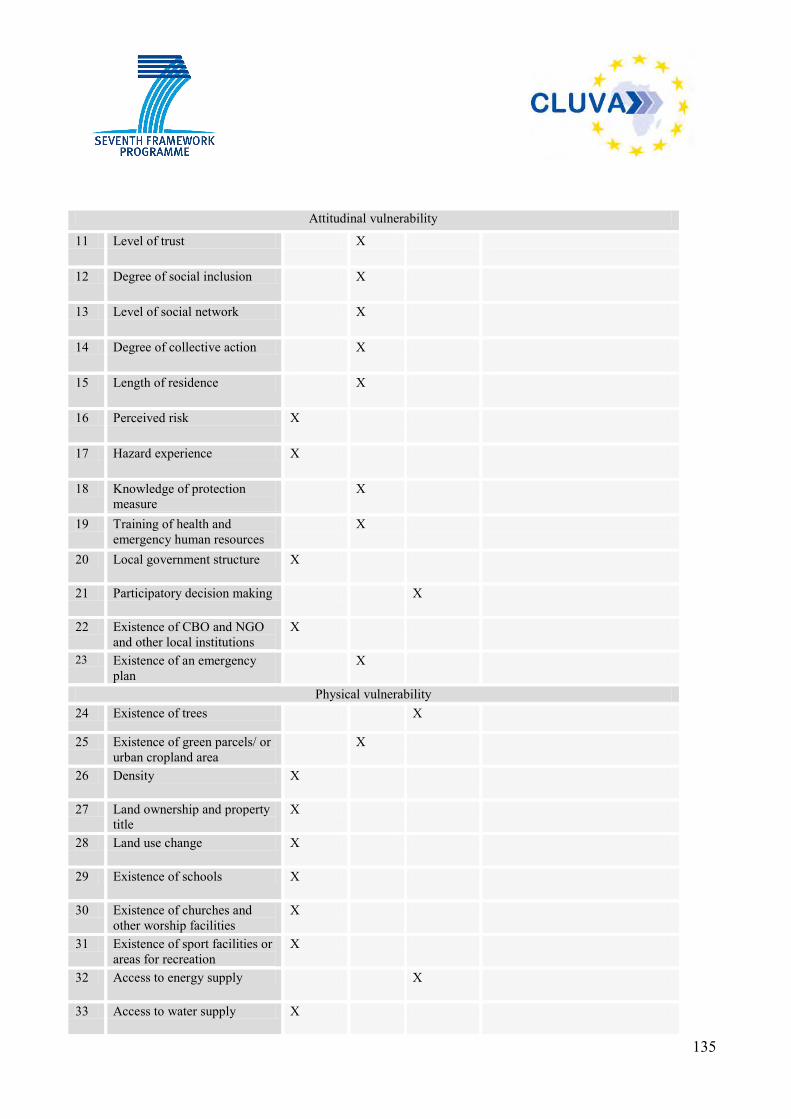
135
Attitudinal vulnerability
11 Level of trust X
12 Degree of social inclusion X
13 Level of social network X
14 Degree of collective action X
15 Length of residence X
16 Perceived risk X
17 Hazard experience X
18 Knowledge of protection measure
X
19 Training of health and emergency human resources
X
20 Local government structure X
21 Participatory decision making X
22 Existence of CBO and NGO and other local institutions
X
23 Existence of an emergency plan
X
Physical vulnerability 24 Existence of trees X
25 Existence of green parcels/ or urban cropland area
X
26 Density X
27 Land ownership and property title
X
28 Land use change X
29 Existence of schools X
30 Existence of churches and other worship facilities
X
31 Existence of sport facilities or areas for recreation
X
32 Access to energy supply X
33 Access to water supply X
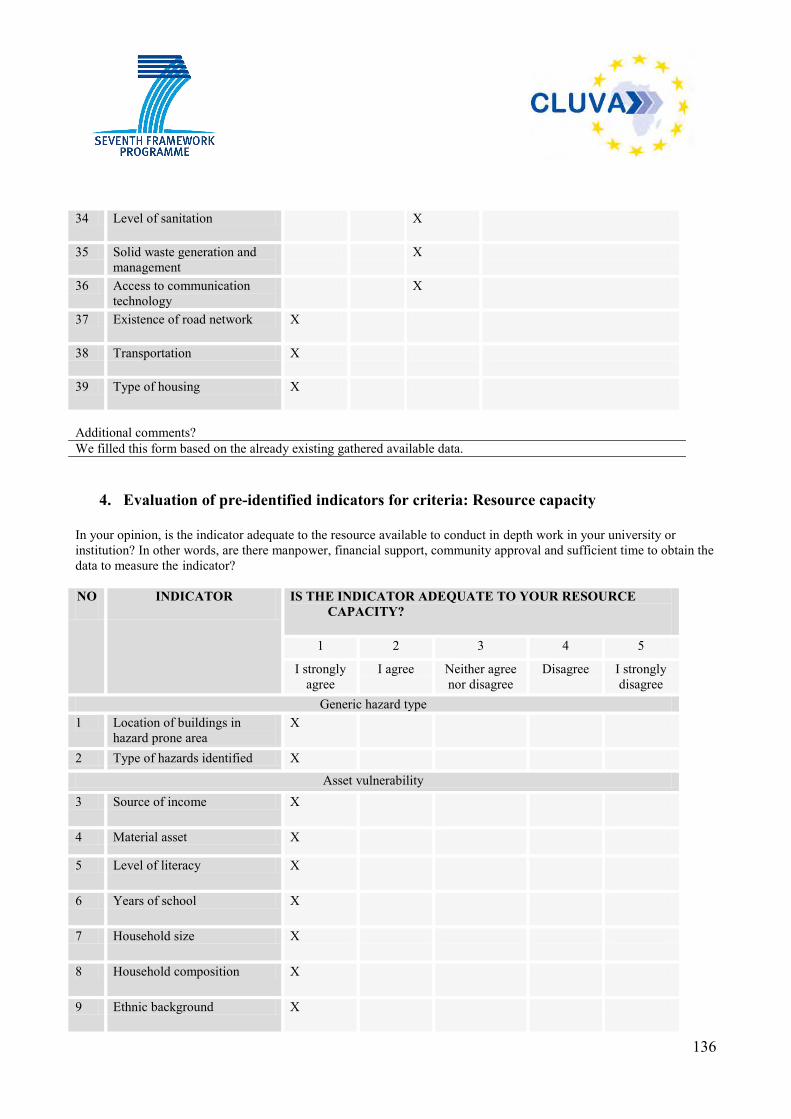
136
34 Level of sanitation X
35 Solid waste generation and management
X
36 Access to communication technology
X
37 Existence of road network X
38 Transportation X
39 Type of housing X
Additional comments? We filled this form based on the already existing gathered available data.
4. Evaluation of pre-identified indicators for criteria: Resource capacity
In your opinion, is the indicator adequate to the resource available to conduct in depth work in your university or institution? In other words, are there manpower, financial support, community approval and sufficient time to obtain the data to measure the indicator? NO INDICATOR IS THE INDICATOR ADEQUATE TO YOUR RESOURCE
CAPACITY?
1 2 3 4 5
I strongly agree
I agree Neither agree nor disagree
Disagree I strongly disagree
Generic hazard type 1 Location of buildings in
hazard prone area X
2 Type of hazards identified X
Asset vulnerability 3 Source of income X
4 Material asset X
5 Level of literacy X
6 Years of school X
7 Household size X
8 Household composition X
9 Ethnic background X
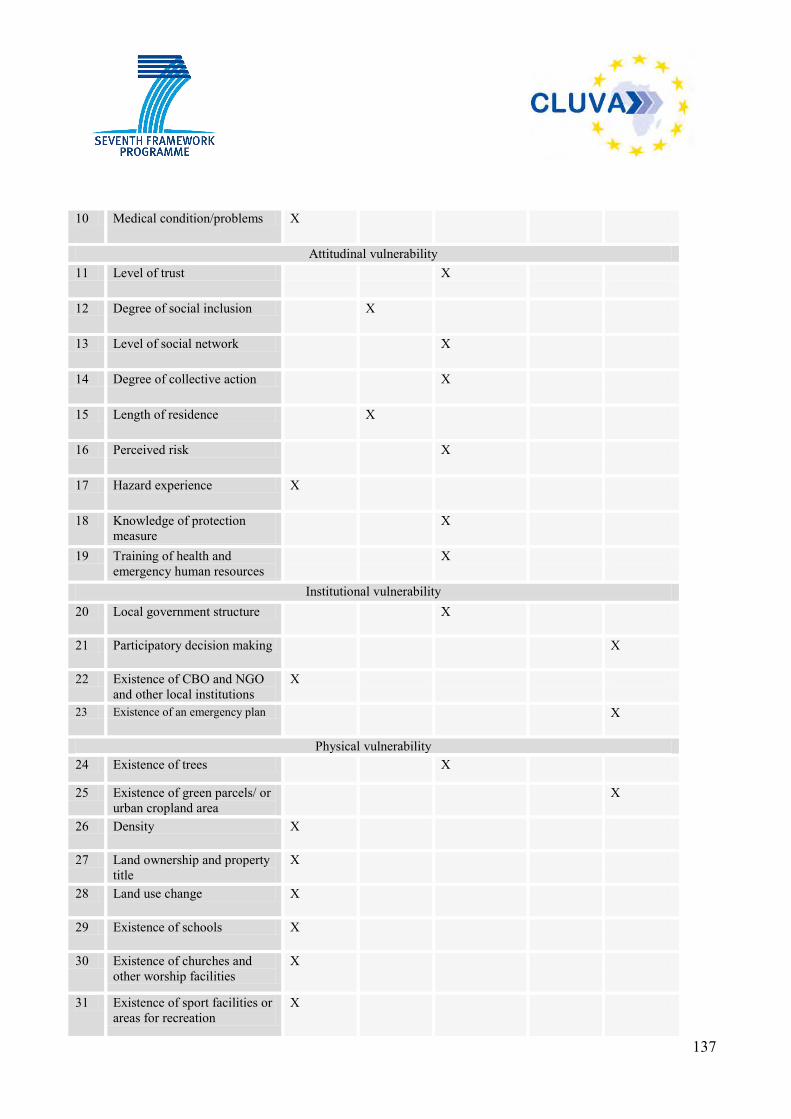
137
10 Medical condition/problems X
Attitudinal vulnerability 11 Level of trust X
12 Degree of social inclusion X
13 Level of social network X
14 Degree of collective action X
15 Length of residence X
16 Perceived risk X
17 Hazard experience X
18 Knowledge of protection measure
X
19 Training of health and emergency human resources
X
Institutional vulnerability 20 Local government structure X
21 Participatory decision making X
22 Existence of CBO and NGO and other local institutions
X
23 Existence of an emergency plan X
Physical vulnerability 24 Existence of trees X
25 Existence of green parcels/ or urban cropland area
X
26 Density X
27 Land ownership and property title
X
28 Land use change X
29 Existence of schools X
30 Existence of churches and other worship facilities
X
31 Existence of sport facilities or areas for recreation
X
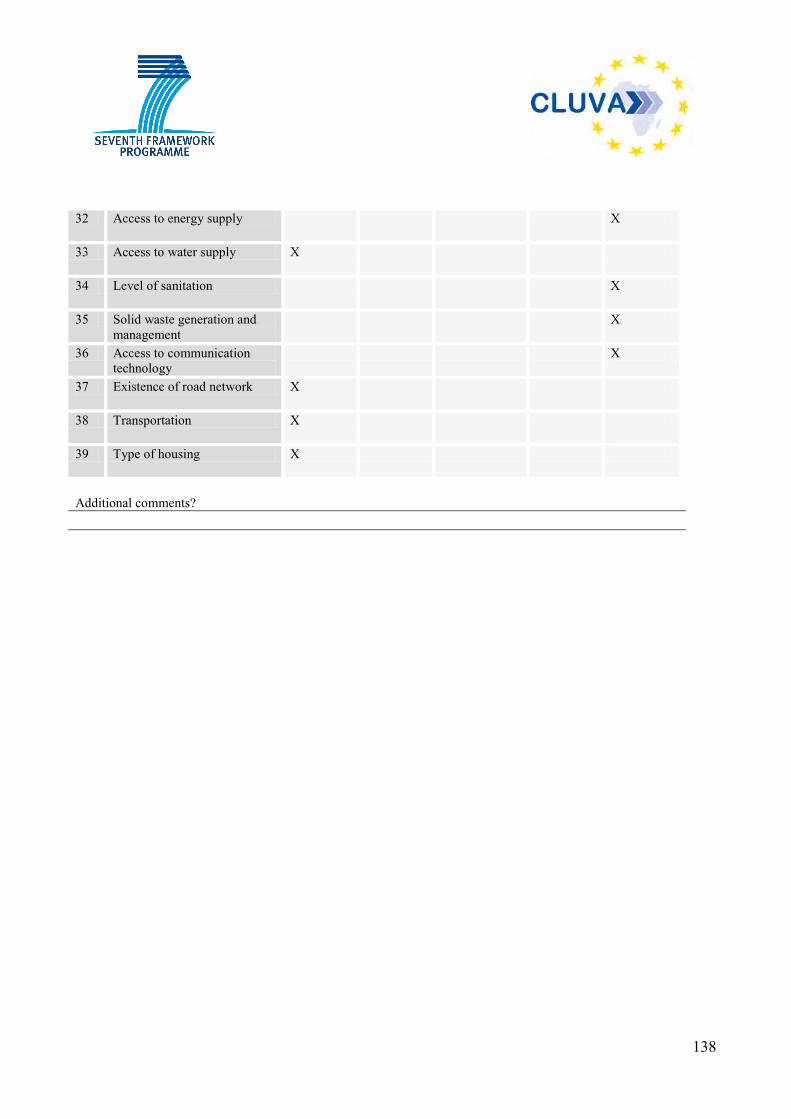
138
32 Access to energy supply X
33 Access to water supply X
34 Level of sanitation X
35 Solid waste generation and management
X
36 Access to communication technology
X
37 Existence of road network X
38 Transportation X
39 Type of housing X
Additional comments?
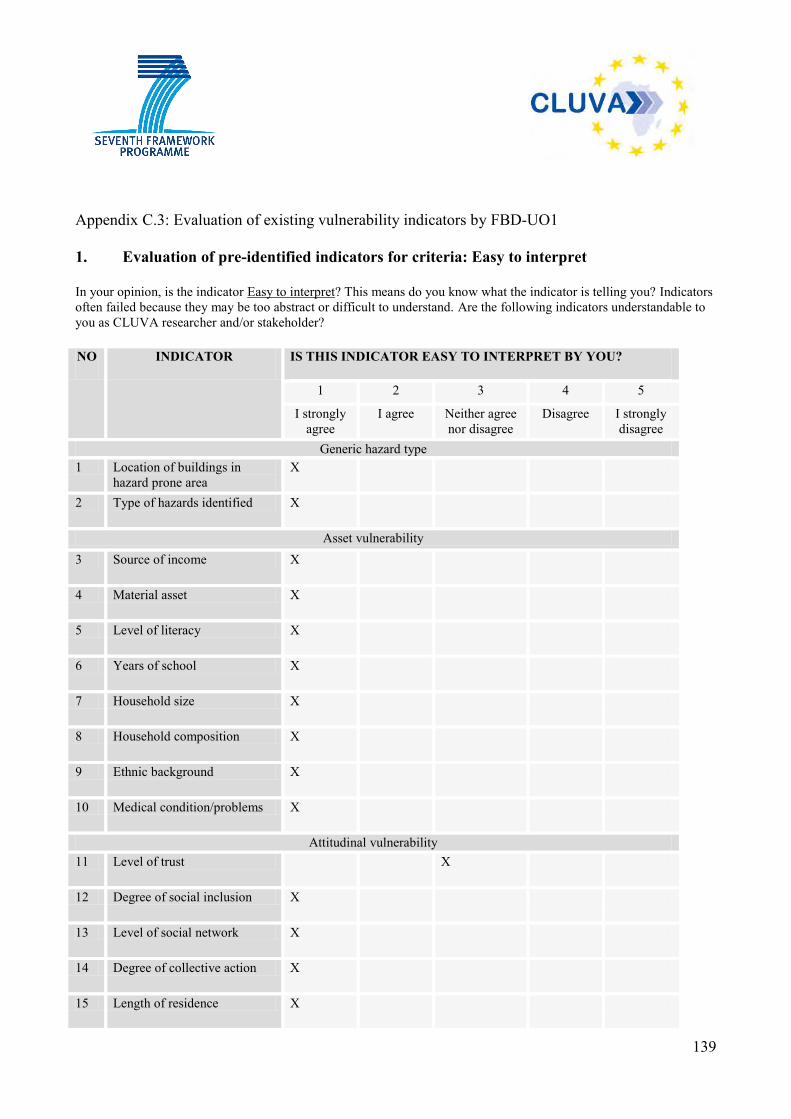
139
Appendix C.3: Evaluation of existing vulnerability indicators by FBD-UO1 1. Evaluation of pre-identified indicators for criteria: Easy to interpret
In your opinion, is the indicator Easy to interpret? This means do you know what the indicator is telling you? Indicators often failed because they may be too abstract or difficult to understand. Are the following indicators understandable to you as CLUVA researcher and/or stakeholder? NO INDICATOR IS THIS INDICATOR EASY TO INTERPRET BY YOU?
1 2 3 4 5
I strongly agree
I agree Neither agree nor disagree
Disagree I strongly disagree
Generic hazard type 1 Location of buildings in
hazard prone area X
2 Type of hazards identified X
Asset vulnerability 3 Source of income X
4 Material asset X
5 Level of literacy X
6 Years of school X
7 Household size X
8 Household composition X
9 Ethnic background X
10 Medical condition/problems X
Attitudinal vulnerability 11 Level of trust X
12 Degree of social inclusion X
13 Level of social network X
14 Degree of collective action X
15 Length of residence X
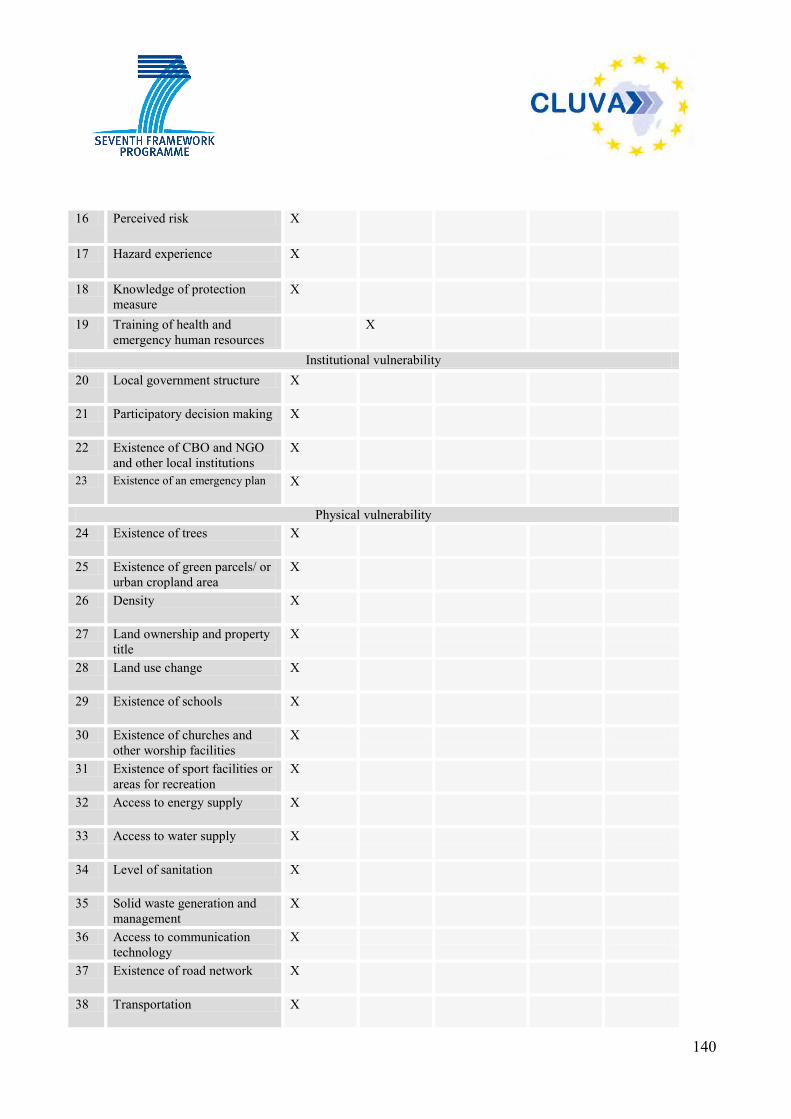
140
16 Perceived risk X
17 Hazard experience X
18 Knowledge of protection measure
X
19 Training of health and emergency human resources
X
Institutional vulnerability 20 Local government structure X
21 Participatory decision making X
22 Existence of CBO and NGO and other local institutions
X
23 Existence of an emergency plan X
Physical vulnerability 24 Existence of trees X
25 Existence of green parcels/ or urban cropland area
X
26 Density X
27 Land ownership and property title
X
28 Land use change X
29 Existence of schools X
30 Existence of churches and other worship facilities
X
31 Existence of sport facilities or areas for recreation
X
32 Access to energy supply X
33 Access to water supply X
34 Level of sanitation X
35 Solid waste generation and management
X
36 Access to communication technology
X
37 Existence of road network X
38 Transportation X
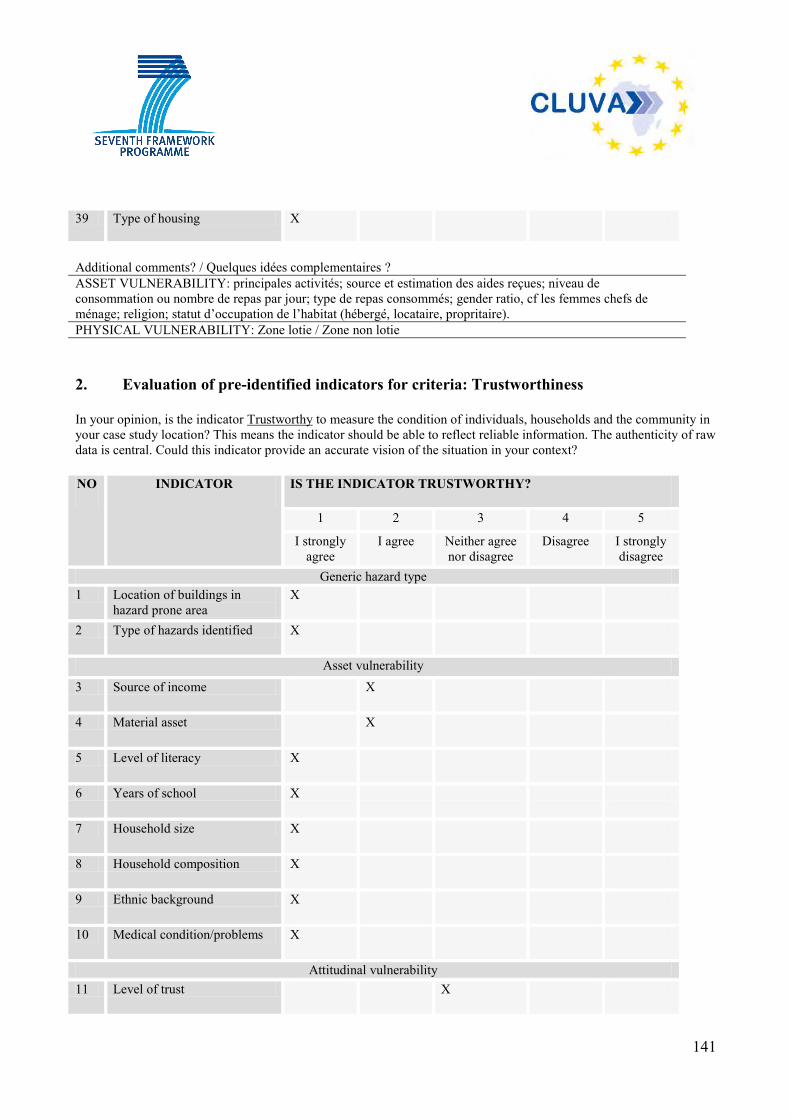
141
39 Type of housing X
Additional comments? / Quelques idées complementaires ? ASSET VULNERABILITY: principales activités; source et estimation des aides reçues; niveau de consommation ou nombre de repas par jour; type de repas consommés; gender ratio, cf les femmes chefs de ménage; religion; statut d’occupation de l’habitat (hébergé, locataire, propritaire). PHYSICAL VULNERABILITY: Zone lotie / Zone non lotie 2. Evaluation of pre-identified indicators for criteria: Trustworthiness
In your opinion, is the indicator Trustworthy to measure the condition of individuals, households and the community in your case study location? This means the indicator should be able to reflect reliable information. The authenticity of raw data is central. Could this indicator provide an accurate vision of the situation in your context? NO INDICATOR IS THE INDICATOR TRUSTWORTHY?
1 2 3 4 5
I strongly agree
I agree Neither agree nor disagree
Disagree I strongly disagree
Generic hazard type 1 Location of buildings in
hazard prone area X
2 Type of hazards identified X
Asset vulnerability 3 Source of income X
4 Material asset X
5 Level of literacy X
6 Years of school X
7 Household size X
8 Household composition X
9 Ethnic background X
10 Medical condition/problems X
Attitudinal vulnerability 11 Level of trust X

142
12 Degree of social inclusion X
13 Level of social network X
14 Degree of collective action X
15 Length of residence X
16 Perceived risk X
17 Hazard experience X
18 Knowledge of protection measure
X
19 Training of health and emergency human resources
X
Institutional vulnerability 20 Local government structure X
21 Participatory decision making X
22 Existence of CBO and NGO and other local institutions
X
23 Existence of an emergency plan X
Physical vulnerability 24 Existence of trees X
25 Existence of green parcels/ or urban cropland area
X
26 Density X
27 Land ownership and property title
X
28 Land use change X
29 Existence of schools X
30 Existence of churches and other worship facilities
X
31 Existence of sport facilities or areas for recreation
X
32 Access to energy supply X
33 Access to water supply X
34 Level of sanitation X
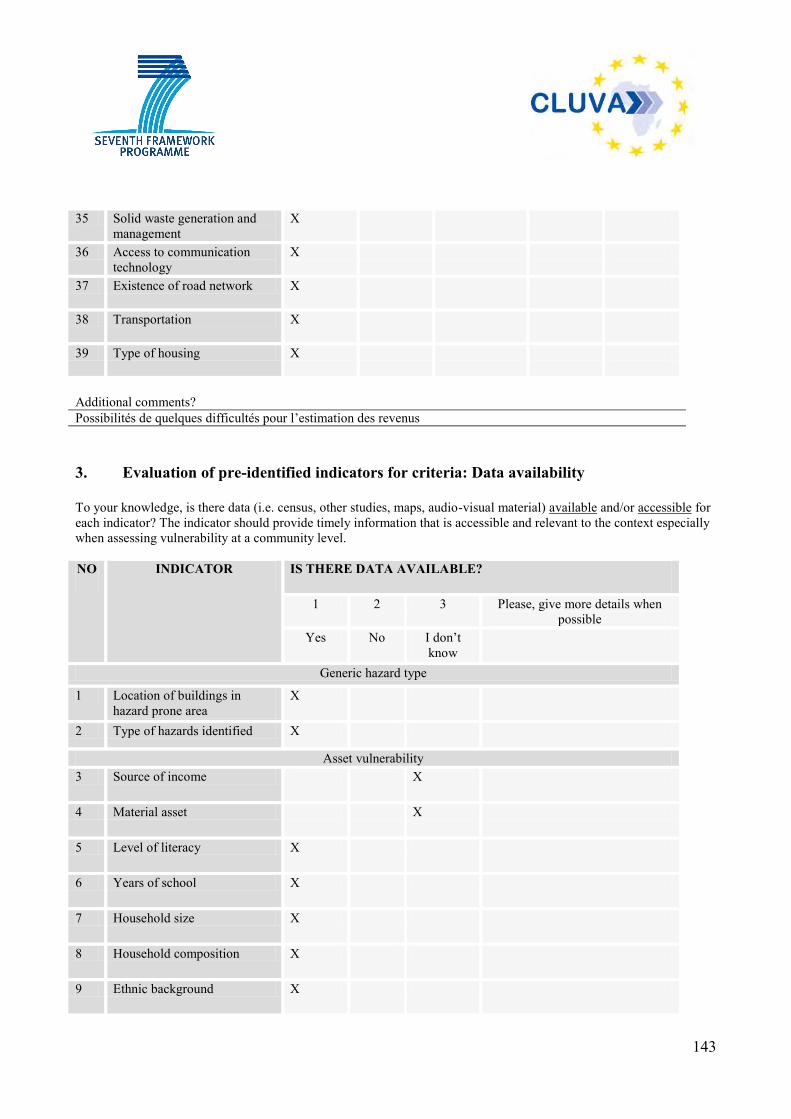
143
35 Solid waste generation and management
X
36 Access to communication technology
X
37 Existence of road network X
38 Transportation X
39 Type of housing X
Additional comments? Possibilités de quelques difficultés pour l’estimation des revenus 3. Evaluation of pre-identified indicators for criteria: Data availability
To your knowledge, is there data (i.e. census, other studies, maps, audio-visual material) available and/or accessible for each indicator? The indicator should provide timely information that is accessible and relevant to the context especially when assessing vulnerability at a community level. NO INDICATOR IS THERE DATA AVAILABLE?
1 2 3 Please, give more details when possible
Yes No I don’t know
Generic hazard type
1 Location of buildings in hazard prone area
X
2 Type of hazards identified X
Asset vulnerability 3 Source of income X
4 Material asset X
5 Level of literacy X
6 Years of school X
7 Household size X
8 Household composition X
9 Ethnic background X
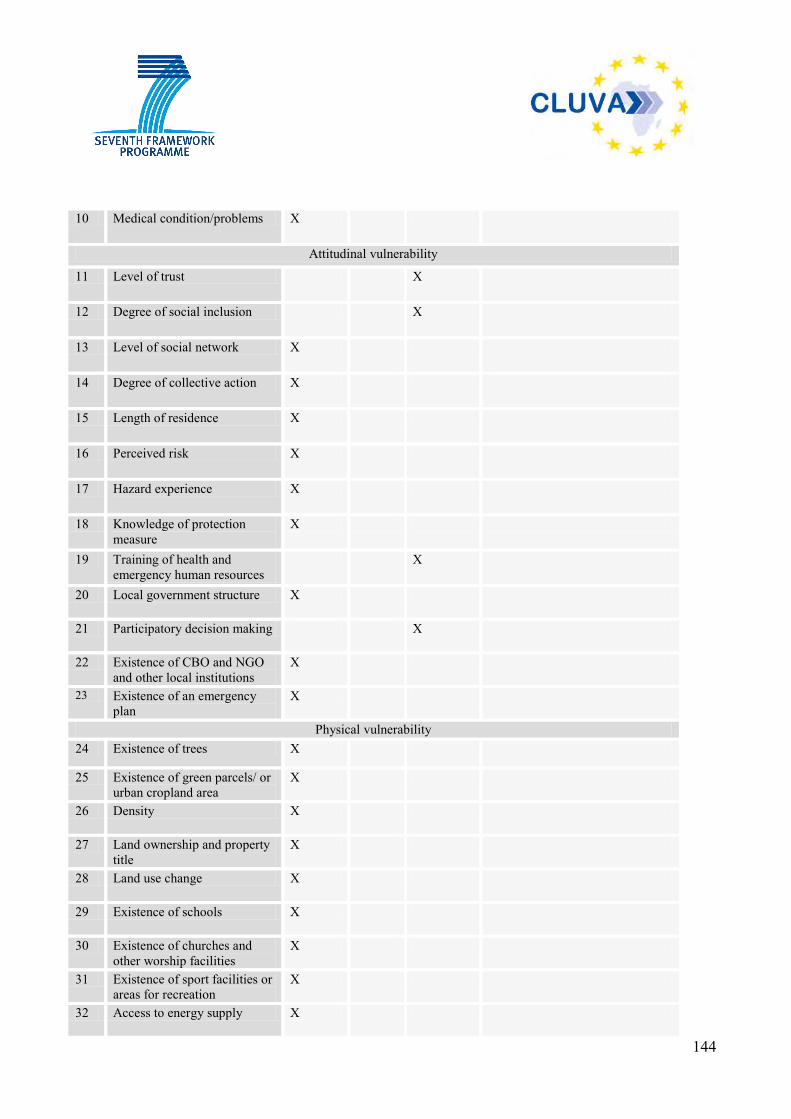
144
10 Medical condition/problems X
Attitudinal vulnerability
11 Level of trust X
12 Degree of social inclusion X
13 Level of social network X
14 Degree of collective action X
15 Length of residence X
16 Perceived risk X
17 Hazard experience X
18 Knowledge of protection measure
X
19 Training of health and emergency human resources
X
20 Local government structure X
21 Participatory decision making X
22 Existence of CBO and NGO and other local institutions
X
23 Existence of an emergency plan
X
Physical vulnerability 24 Existence of trees X
25 Existence of green parcels/ or urban cropland area
X
26 Density X
27 Land ownership and property title
X
28 Land use change X
29 Existence of schools X
30 Existence of churches and other worship facilities
X
31 Existence of sport facilities or areas for recreation
X
32 Access to energy supply X
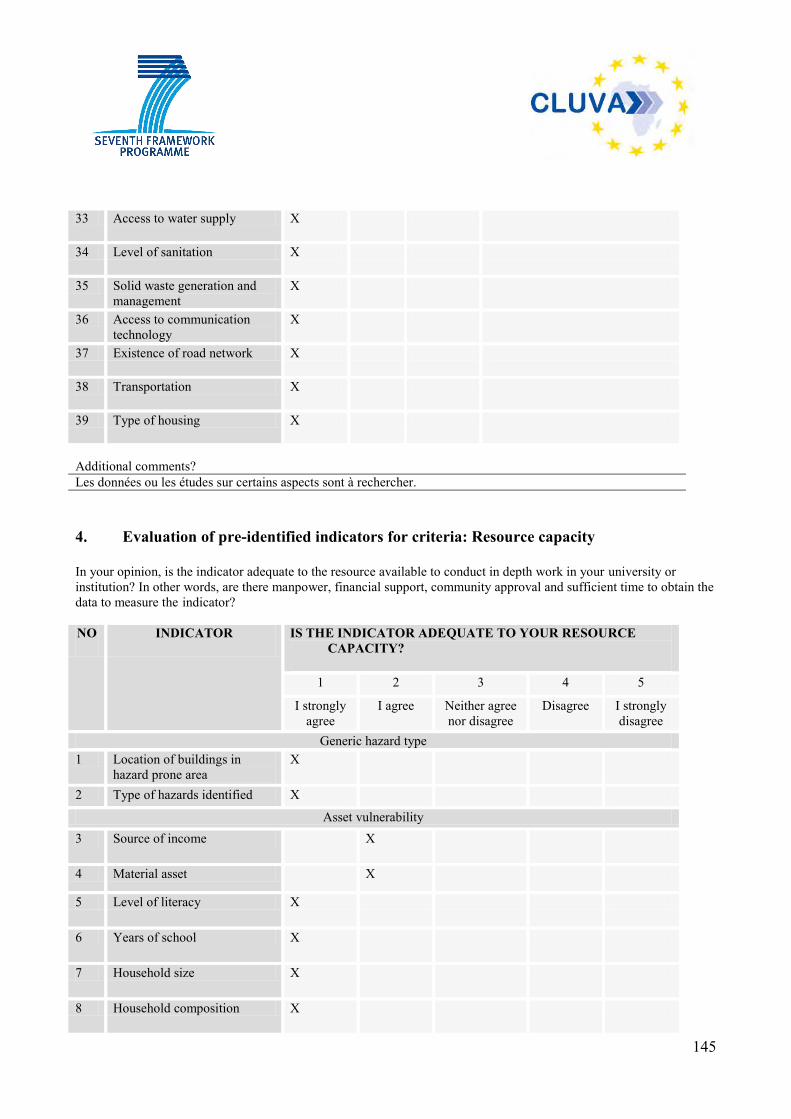
145
33 Access to water supply X
34 Level of sanitation X
35 Solid waste generation and management
X
36 Access to communication technology
X
37 Existence of road network X
38 Transportation X
39 Type of housing X
Additional comments? Les données ou les études sur certains aspects sont à rechercher. 4. Evaluation of pre-identified indicators for criteria: Resource capacity
In your opinion, is the indicator adequate to the resource available to conduct in depth work in your university or institution? In other words, are there manpower, financial support, community approval and sufficient time to obtain the data to measure the indicator? NO INDICATOR IS THE INDICATOR ADEQUATE TO YOUR RESOURCE
CAPACITY?
1 2 3 4 5
I strongly agree
I agree Neither agree nor disagree
Disagree I strongly disagree
Generic hazard type 1 Location of buildings in
hazard prone area X
2 Type of hazards identified X
Asset vulnerability 3 Source of income X
4 Material asset X
5 Level of literacy X
6 Years of school X
7 Household size X
8 Household composition X

146
9 Ethnic background X
10 Medical condition/problems X
Attitudinal vulnerability 11 Level of trust X
12 Degree of social inclusion X
13 Level of social network X
14 Degree of collective action X
15 Length of residence X
16 Perceived risk X
17 Hazard experience X
18 Knowledge of protection measure
X
19 Training of health and emergency human resources
X
Institutional vulnerability 20 Local government structure X
21 Participatory decision making X
22 Existence of CBO and NGO and other local institutions
X
23 Existence of an emergency plan X
Physical vulnerability 24 Existence of trees X
25 Existence of green parcels/ or urban cropland area
X
26 Density X
27 Land ownership and property title
X
28 Land use change X
29 Existence of schools X
30 Existence of churches and other worship facilities
X
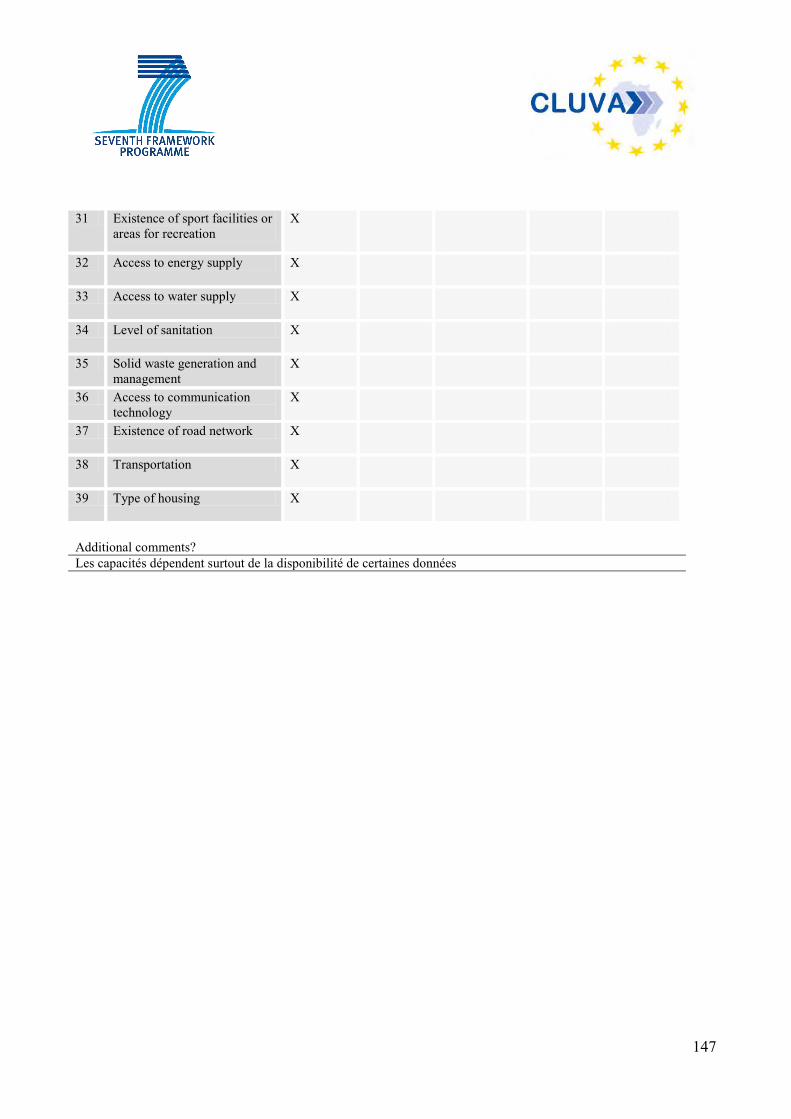
147
31 Existence of sport facilities or areas for recreation
X
32 Access to energy supply X
33 Access to water supply X
34 Level of sanitation X
35 Solid waste generation and management
X
36 Access to communication technology
X
37 Existence of road network X
38 Transportation X
39 Type of housing X
Additional comments? Les capacités dépendent surtout de la disponibilité de certaines données

148
Appendix C.4: Evaluation of existing vulnerability indicators by JBO-UO2
1. Evaluation of pre-identified indicators for criteria: Easy to interpret
In your opinion, is the indicator Easy to interpret? This means do you know what the indicator is telling you? Indicators often failed because they may be too abstract or difficult to understand. Are the following indicators understandable to you as CLUVA researcher and/or stakeholder? NO INDICATOR IS THIS INDICATOR EASY TO INTERPRET BY YOU?
1 2 3 4 5
I strongly agree
I agree Neither agree nor disagree
Disagree I strongly disagree
Generic hazard type 1 Location of buildings in
hazard prone area x
2 Type of hazards identified x
Asset vulnerability 3 Source of income x
4 Material asset x
5 Level of literacy x
6 Years of school x
7 Household size x
8 Household composition x
9 Ethnic background x
10 Medical condition/problems x
Attitudinal vulnerability 11 Level of trust x
12 Degree of social inclusion x
13 Level of social network x
14 Degree of collective action x
15 Length of residence x
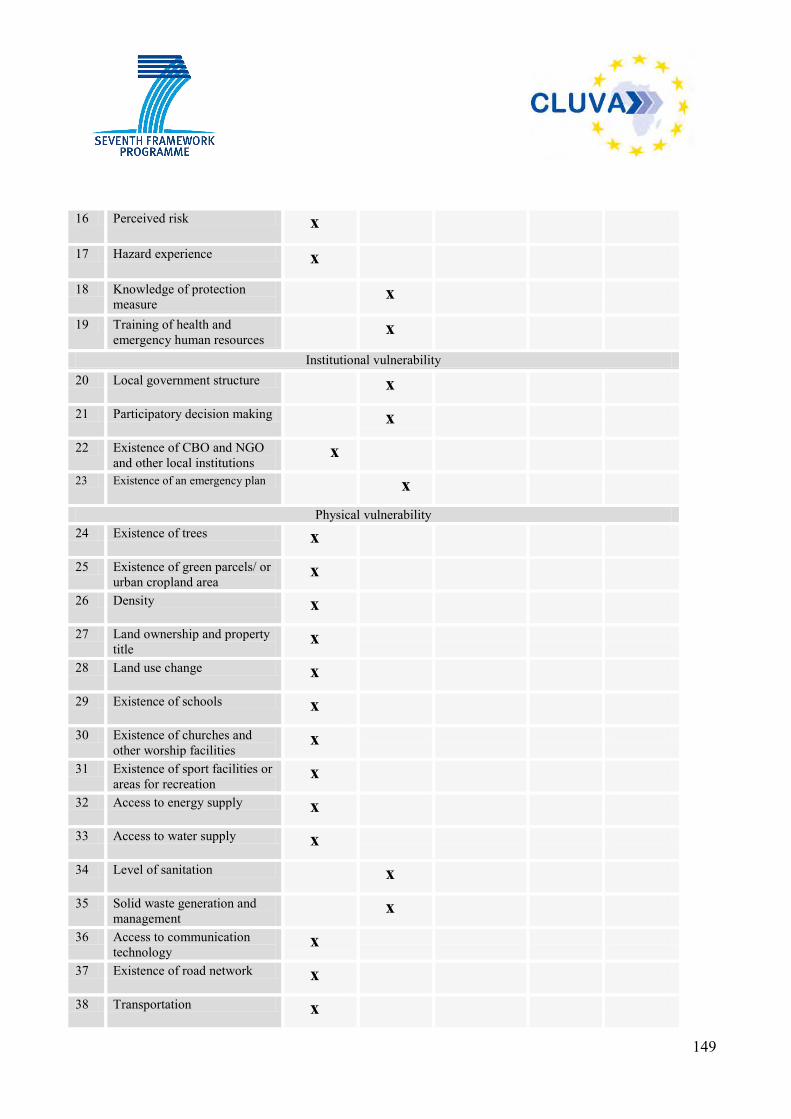
149
16 Perceived risk x
17 Hazard experience x
18 Knowledge of protection measure
x
19 Training of health and emergency human resources
x
Institutional vulnerability 20 Local government structure x
21 Participatory decision making x
22 Existence of CBO and NGO and other local institutions
x
23 Existence of an emergency plan x
Physical vulnerability 24 Existence of trees x
25 Existence of green parcels/ or urban cropland area
x
26 Density x
27 Land ownership and property title
x
28 Land use change x
29 Existence of schools x
30 Existence of churches and other worship facilities
x
31 Existence of sport facilities or areas for recreation
x
32 Access to energy supply x
33 Access to water supply x
34 Level of sanitation x
35 Solid waste generation and management
x
36 Access to communication technology
x
37 Existence of road network x
38 Transportation x
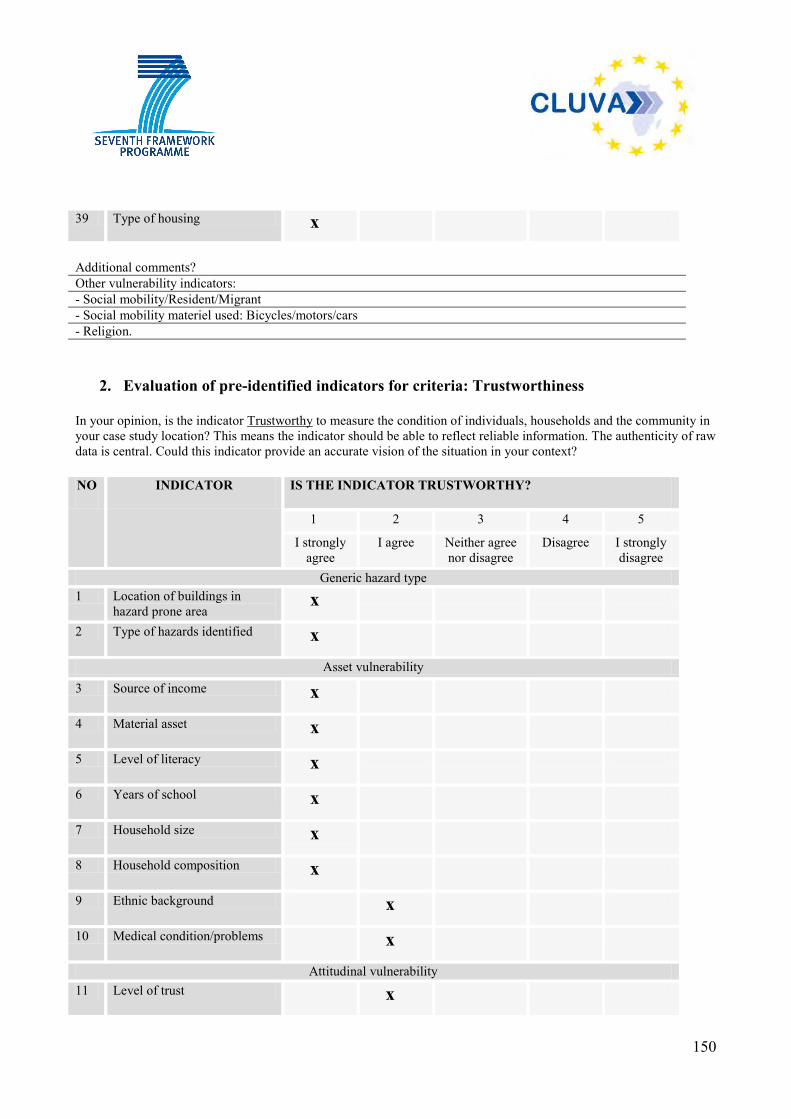
150
39 Type of housing x
Additional comments? Other vulnerability indicators: - Social mobility/Resident/Migrant - Social mobility materiel used: Bicycles/motors/cars - Religion.
2. Evaluation of pre-identified indicators for criteria: Trustworthiness
In your opinion, is the indicator Trustworthy to measure the condition of individuals, households and the community in your case study location? This means the indicator should be able to reflect reliable information. The authenticity of raw data is central. Could this indicator provide an accurate vision of the situation in your context? NO INDICATOR IS THE INDICATOR TRUSTWORTHY?
1 2 3 4 5
I strongly agree
I agree Neither agree nor disagree
Disagree I strongly disagree
Generic hazard type 1 Location of buildings in
hazard prone area x
2 Type of hazards identified x
Asset vulnerability 3 Source of income x
4 Material asset x
5 Level of literacy x
6 Years of school x
7 Household size x
8 Household composition x
9 Ethnic background x
10 Medical condition/problems x
Attitudinal vulnerability 11 Level of trust x
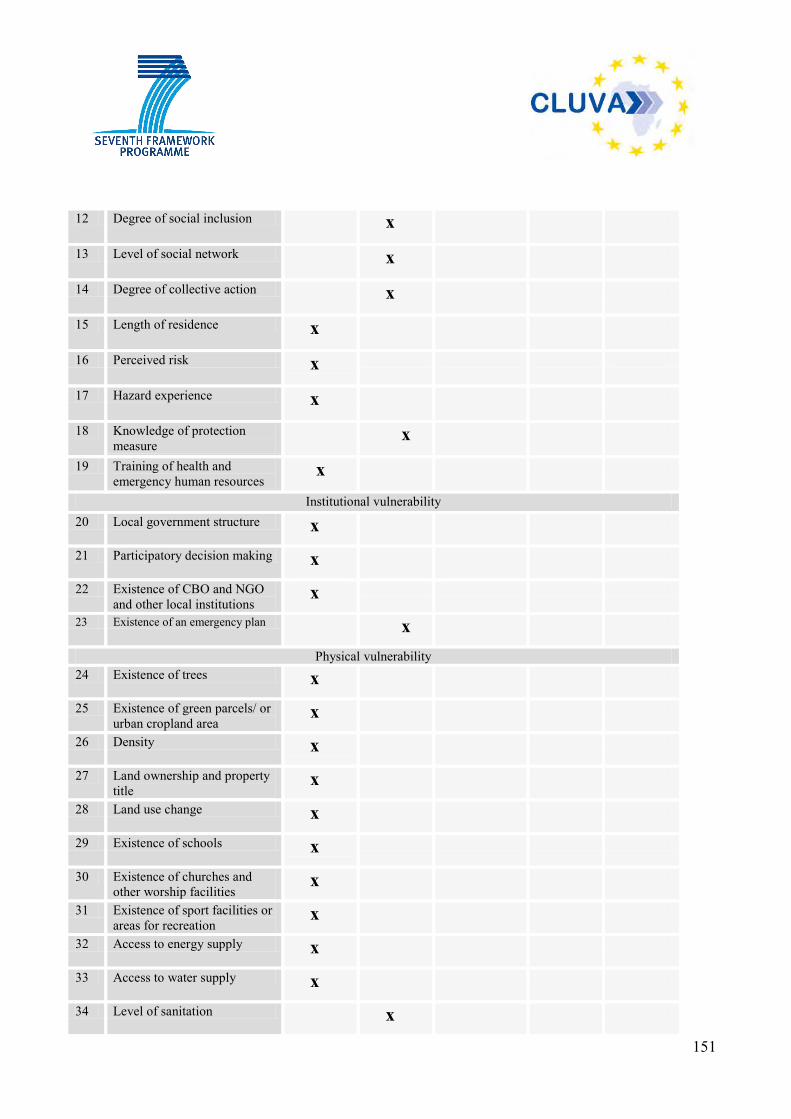
151
12 Degree of social inclusion x
13 Level of social network x
14 Degree of collective action x
15 Length of residence x
16 Perceived risk x
17 Hazard experience x
18 Knowledge of protection measure
x
19 Training of health and emergency human resources
x
Institutional vulnerability 20 Local government structure x
21 Participatory decision making x
22 Existence of CBO and NGO and other local institutions
x
23 Existence of an emergency plan x
Physical vulnerability 24 Existence of trees x
25 Existence of green parcels/ or urban cropland area
x
26 Density x
27 Land ownership and property title
x
28 Land use change x
29 Existence of schools x
30 Existence of churches and other worship facilities
x
31 Existence of sport facilities or areas for recreation
x
32 Access to energy supply x
33 Access to water supply x
34 Level of sanitation x
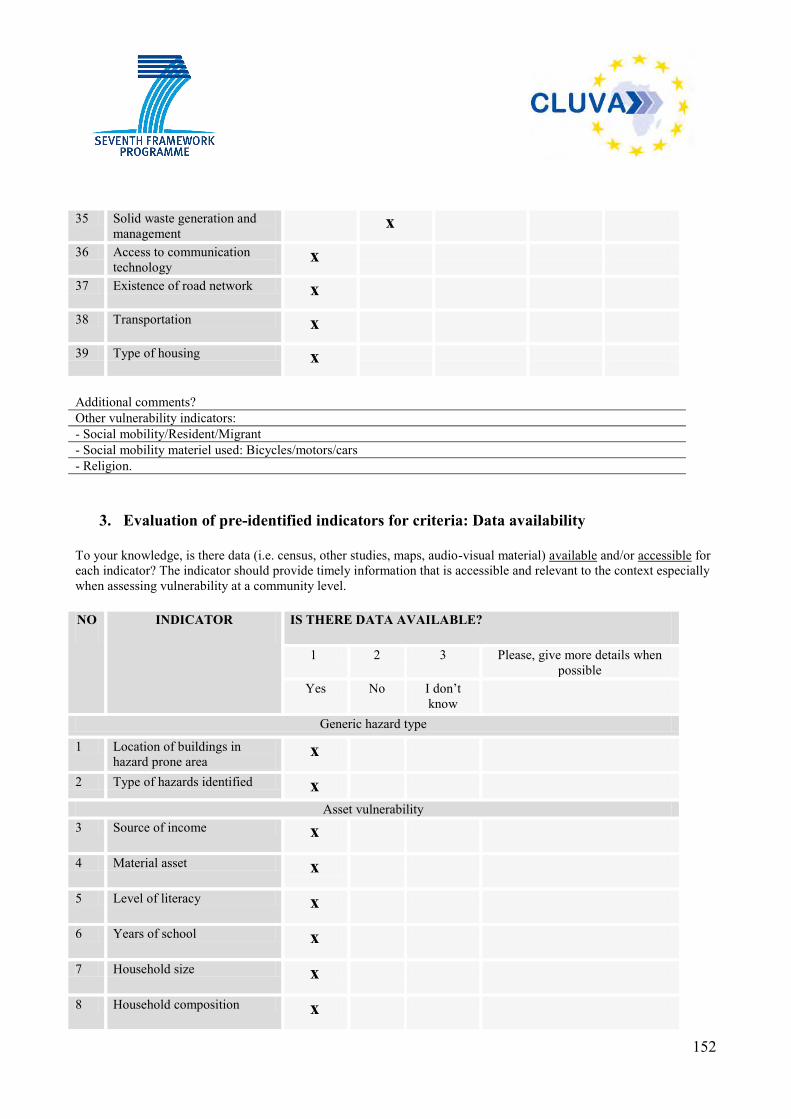
152
35 Solid waste generation and management
x
36 Access to communication technology
x
37 Existence of road network x
38 Transportation x
39 Type of housing x
Additional comments? Other vulnerability indicators: - Social mobility/Resident/Migrant - Social mobility materiel used: Bicycles/motors/cars - Religion.
3. Evaluation of pre-identified indicators for criteria: Data availability
To your knowledge, is there data (i.e. census, other studies, maps, audio-visual material) available and/or accessible for each indicator? The indicator should provide timely information that is accessible and relevant to the context especially when assessing vulnerability at a community level. NO INDICATOR IS THERE DATA AVAILABLE?
1 2 3 Please, give more details when possible
Yes No I don’t know
Generic hazard type
1 Location of buildings in hazard prone area
x
2 Type of hazards identified x
Asset vulnerability 3 Source of income x
4 Material asset x
5 Level of literacy x
6 Years of school x
7 Household size x
8 Household composition x
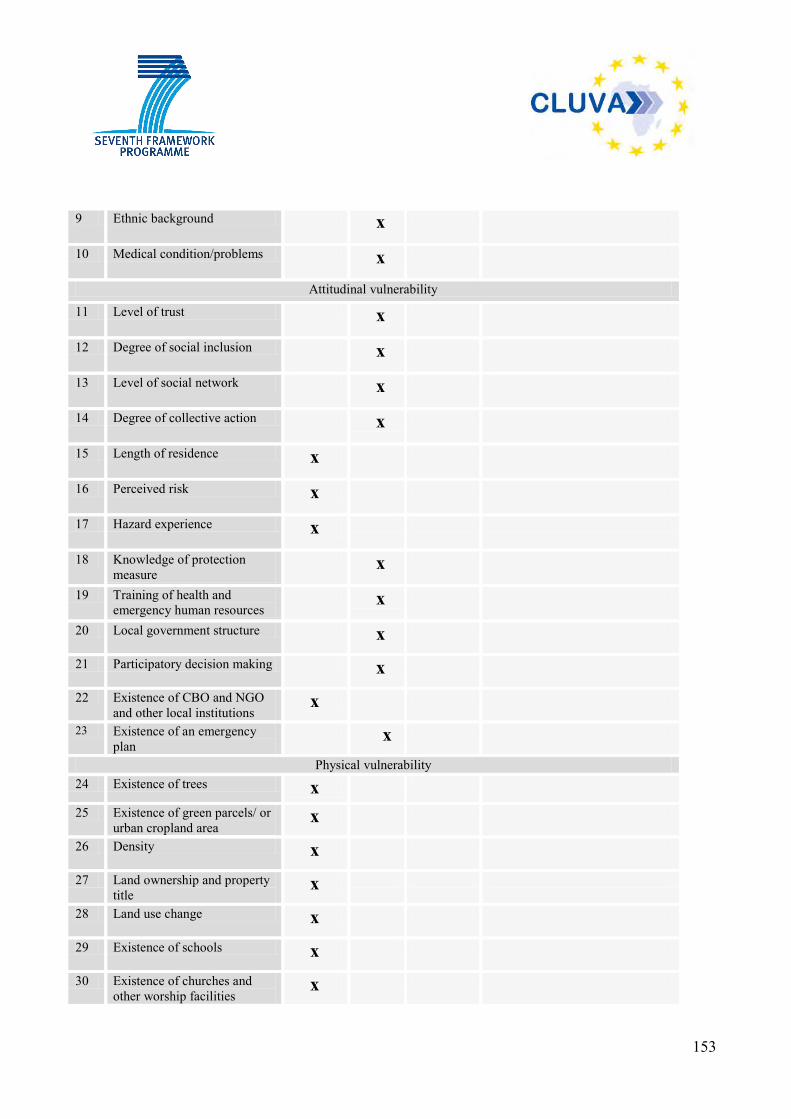
153
9 Ethnic background x
10 Medical condition/problems x
Attitudinal vulnerability
11 Level of trust x
12 Degree of social inclusion x
13 Level of social network x
14 Degree of collective action x
15 Length of residence x
16 Perceived risk x
17 Hazard experience x
18 Knowledge of protection measure
x
19 Training of health and emergency human resources
x
20 Local government structure x
21 Participatory decision making x
22 Existence of CBO and NGO and other local institutions
x
23 Existence of an emergency plan
x
Physical vulnerability 24 Existence of trees x
25 Existence of green parcels/ or urban cropland area
x
26 Density x
27 Land ownership and property title
x
28 Land use change x
29 Existence of schools x
30 Existence of churches and other worship facilities
x
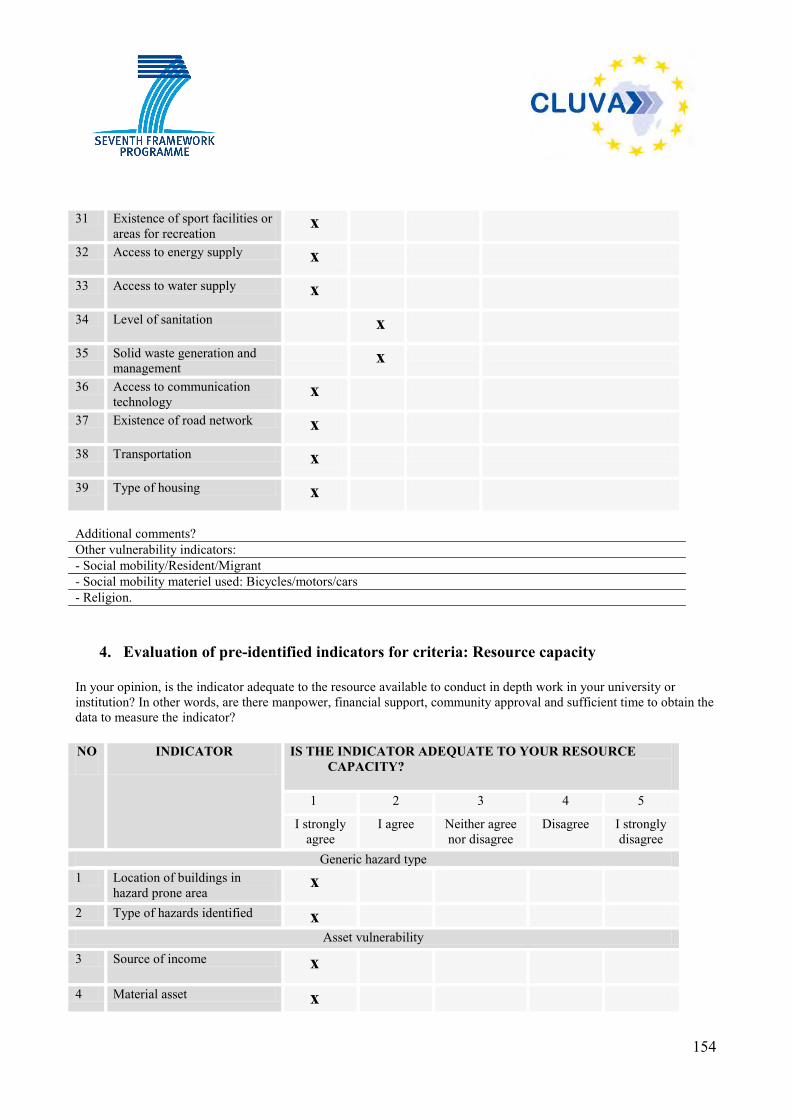
154
31 Existence of sport facilities or areas for recreation
x
32 Access to energy supply x
33 Access to water supply x
34 Level of sanitation x
35 Solid waste generation and management
x
36 Access to communication technology
x
37 Existence of road network x
38 Transportation x
39 Type of housing x
Additional comments? Other vulnerability indicators: - Social mobility/Resident/Migrant - Social mobility materiel used: Bicycles/motors/cars - Religion.
4. Evaluation of pre-identified indicators for criteria: Resource capacity
In your opinion, is the indicator adequate to the resource available to conduct in depth work in your university or institution? In other words, are there manpower, financial support, community approval and sufficient time to obtain the data to measure the indicator? NO INDICATOR IS THE INDICATOR ADEQUATE TO YOUR RESOURCE
CAPACITY?
1 2 3 4 5
I strongly agree
I agree Neither agree nor disagree
Disagree I strongly disagree
Generic hazard type 1 Location of buildings in
hazard prone area x
2 Type of hazards identified x
Asset vulnerability 3 Source of income x
4 Material asset x
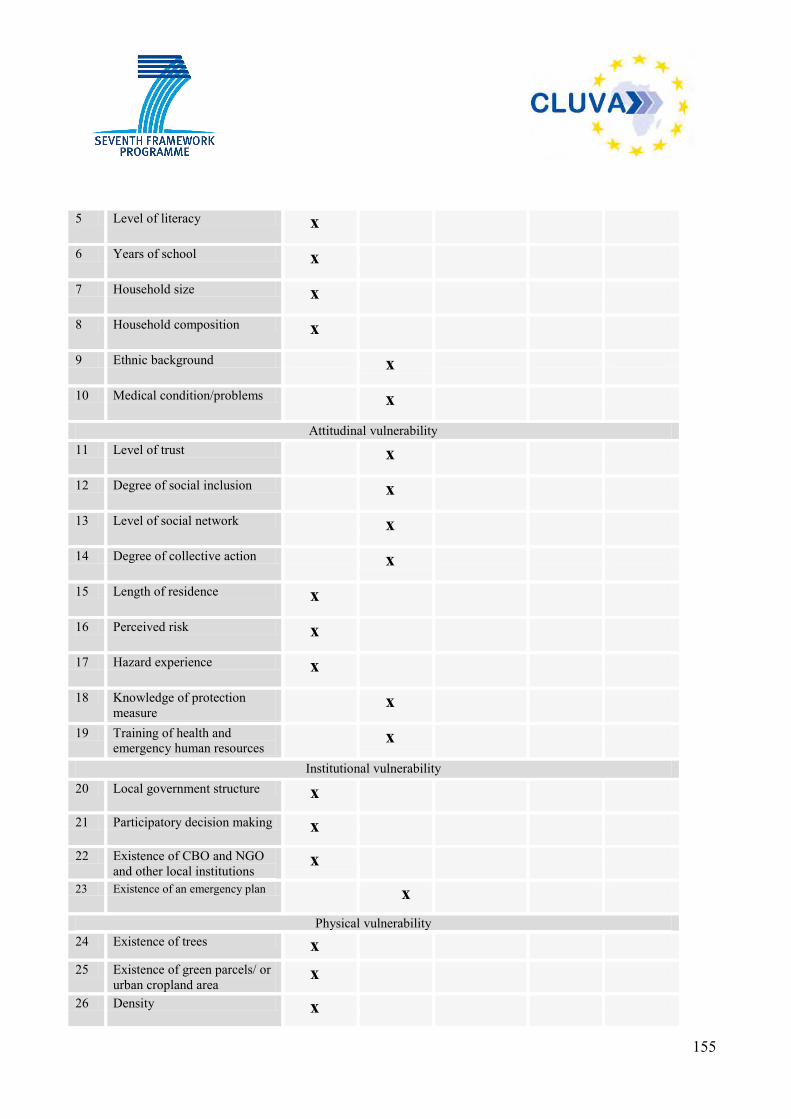
155
5 Level of literacy x
6 Years of school x
7 Household size x
8 Household composition x
9 Ethnic background x
10 Medical condition/problems x
Attitudinal vulnerability 11 Level of trust x
12 Degree of social inclusion x
13 Level of social network x
14 Degree of collective action x
15 Length of residence x
16 Perceived risk x
17 Hazard experience x
18 Knowledge of protection measure
x
19 Training of health and emergency human resources
x
Institutional vulnerability 20 Local government structure x
21 Participatory decision making x
22 Existence of CBO and NGO and other local institutions
x
23 Existence of an emergency plan x
Physical vulnerability 24 Existence of trees x
25 Existence of green parcels/ or urban cropland area
x
26 Density x
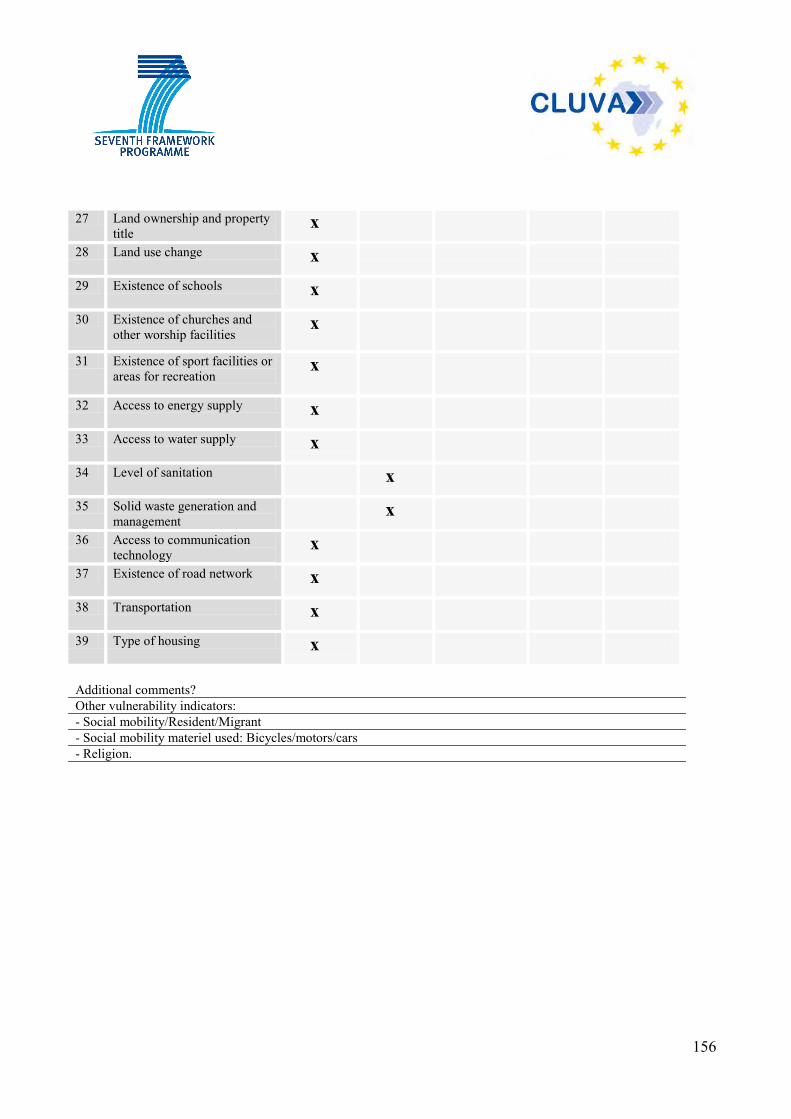
156
27 Land ownership and property title
x
28 Land use change x
29 Existence of schools x
30 Existence of churches and other worship facilities
x
31 Existence of sport facilities or areas for recreation
x
32 Access to energy supply x
33 Access to water supply x
34 Level of sanitation x
35 Solid waste generation and management
x
36 Access to communication technology
x
37 Existence of road network x
38 Transportation x
39 Type of housing x
Additional comments? Other vulnerability indicators: - Social mobility/Resident/Migrant - Social mobility materiel used: Bicycles/motors/cars - Religion.
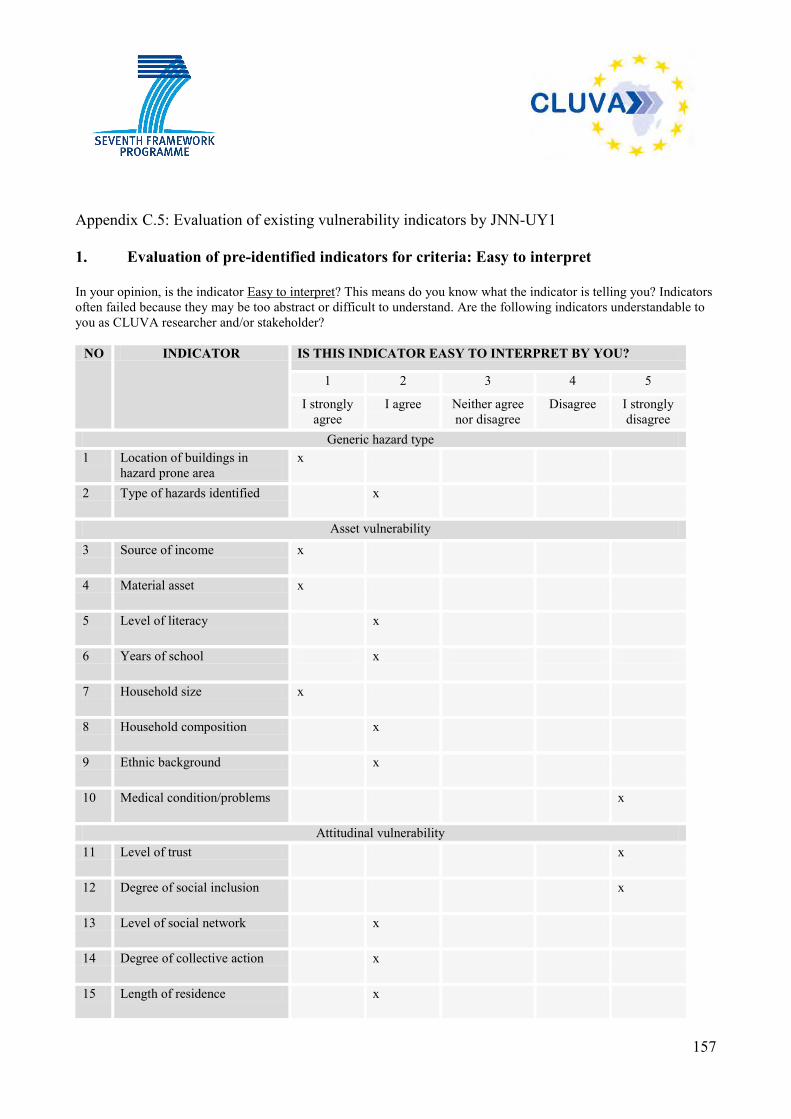
157
Appendix C.5: Evaluation of existing vulnerability indicators by JNN-UY1 1. Evaluation of pre-identified indicators for criteria: Easy to interpret
In your opinion, is the indicator Easy to interpret? This means do you know what the indicator is telling you? Indicators often failed because they may be too abstract or difficult to understand. Are the following indicators understandable to you as CLUVA researcher and/or stakeholder?
NO INDICATOR IS THIS INDICATOR EASY TO INTERPRET BY YOU?
1 2 3 4 5 I strongly
agree I agree Neither agree
nor disagree Disagree I strongly
disagree Generic hazard type
1 Location of buildings in hazard prone area
x
2 Type of hazards identified x
Asset vulnerability 3 Source of income x
4 Material asset x
5 Level of literacy x
6 Years of school x
7 Household size x
8 Household composition x
9 Ethnic background x
10 Medical condition/problems x
Attitudinal vulnerability 11 Level of trust x
12 Degree of social inclusion x
13 Level of social network x
14 Degree of collective action x
15 Length of residence x
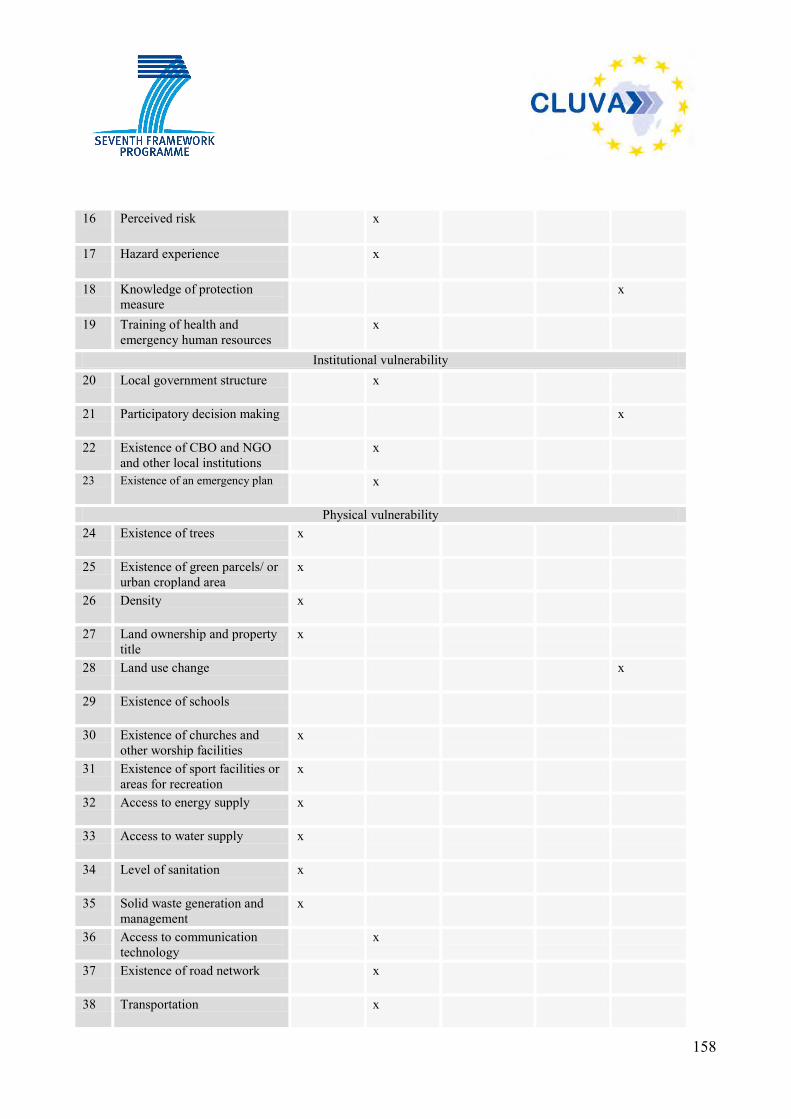
158
16 Perceived risk x
17 Hazard experience x
18 Knowledge of protection measure
x
19 Training of health and emergency human resources
x
Institutional vulnerability 20 Local government structure x
21 Participatory decision making x
22 Existence of CBO and NGO and other local institutions
x
23 Existence of an emergency plan x
Physical vulnerability 24 Existence of trees x
25 Existence of green parcels/ or urban cropland area
x
26 Density x
27 Land ownership and property title
x
28 Land use change x
29 Existence of schools
30 Existence of churches and other worship facilities
x
31 Existence of sport facilities or areas for recreation
x
32 Access to energy supply x
33 Access to water supply x
34 Level of sanitation x
35 Solid waste generation and management
x
36 Access to communication technology
x
37 Existence of road network x
38 Transportation x
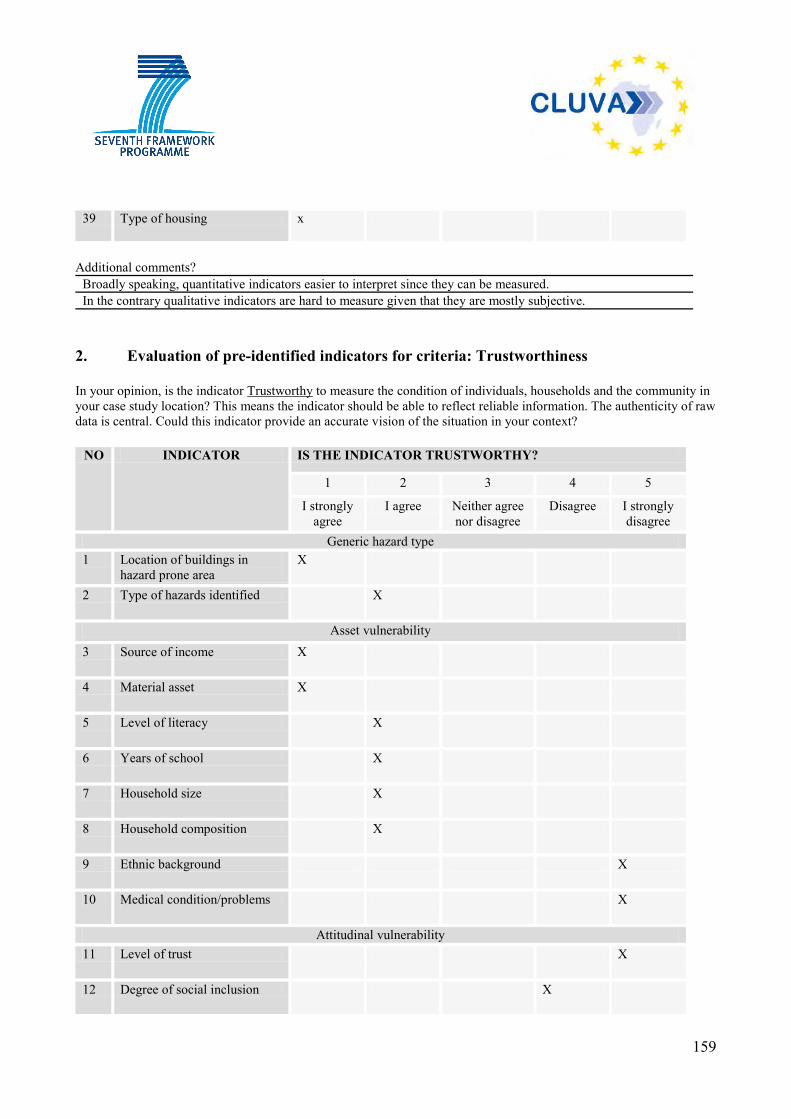
159
39 Type of housing x
Additional comments?
Broadly speaking, quantitative indicators easier to interpret since they can be measured. In the contrary qualitative indicators are hard to measure given that they are mostly subjective.
2. Evaluation of pre-identified indicators for criteria: Trustworthiness
In your opinion, is the indicator Trustworthy to measure the condition of individuals, households and the community in your case study location? This means the indicator should be able to reflect reliable information. The authenticity of raw data is central. Could this indicator provide an accurate vision of the situation in your context?
NO INDICATOR IS THE INDICATOR TRUSTWORTHY?
1 2 3 4 5 I strongly
agree I agree Neither agree
nor disagree Disagree I strongly
disagree Generic hazard type
1 Location of buildings in hazard prone area
X
2 Type of hazards identified X
Asset vulnerability 3 Source of income X
4 Material asset X
5 Level of literacy X
6 Years of school X
7 Household size X
8 Household composition X
9 Ethnic background X
10 Medical condition/problems X
Attitudinal vulnerability 11 Level of trust X
12 Degree of social inclusion X
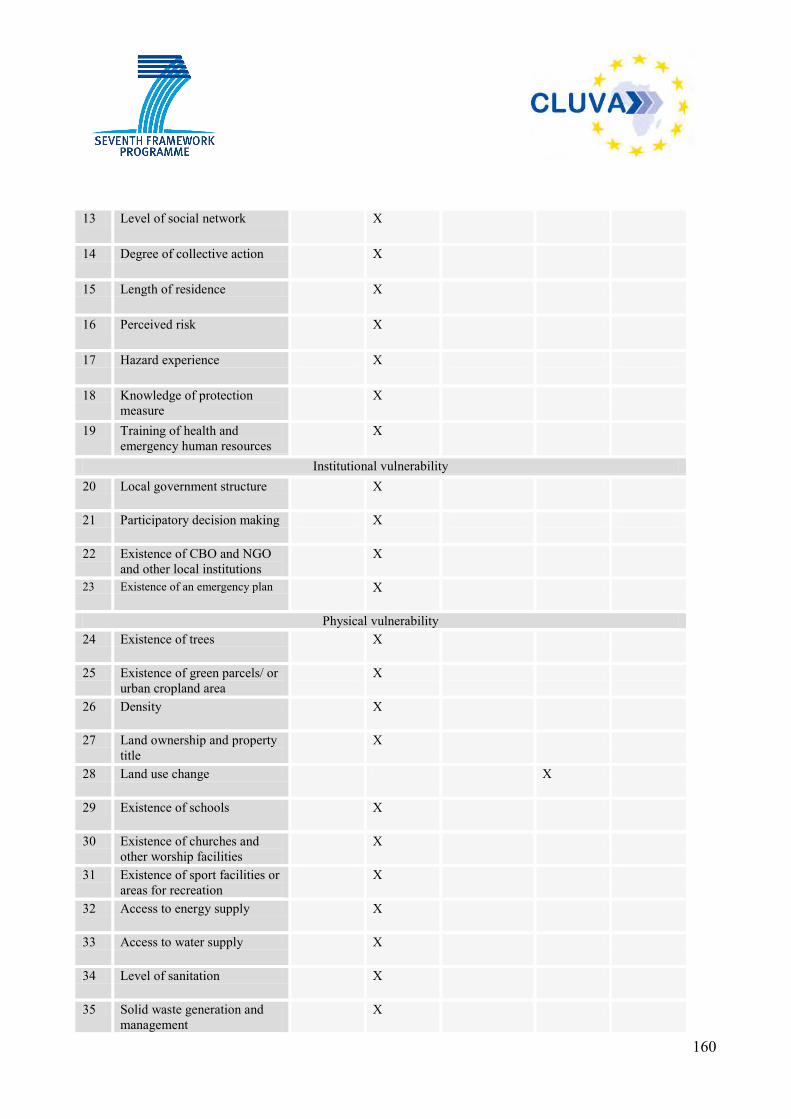
160
13 Level of social network X
14 Degree of collective action X
15 Length of residence X
16 Perceived risk X
17 Hazard experience X
18 Knowledge of protection measure
X
19 Training of health and emergency human resources
X
Institutional vulnerability 20 Local government structure X
21 Participatory decision making X
22 Existence of CBO and NGO and other local institutions
X
23 Existence of an emergency plan X
Physical vulnerability 24 Existence of trees X
25 Existence of green parcels/ or urban cropland area
X
26 Density X
27 Land ownership and property title
X
28 Land use change X
29 Existence of schools X
30 Existence of churches and other worship facilities
X
31 Existence of sport facilities or areas for recreation
X
32 Access to energy supply X
33 Access to water supply X
34 Level of sanitation X
35 Solid waste generation and management
X
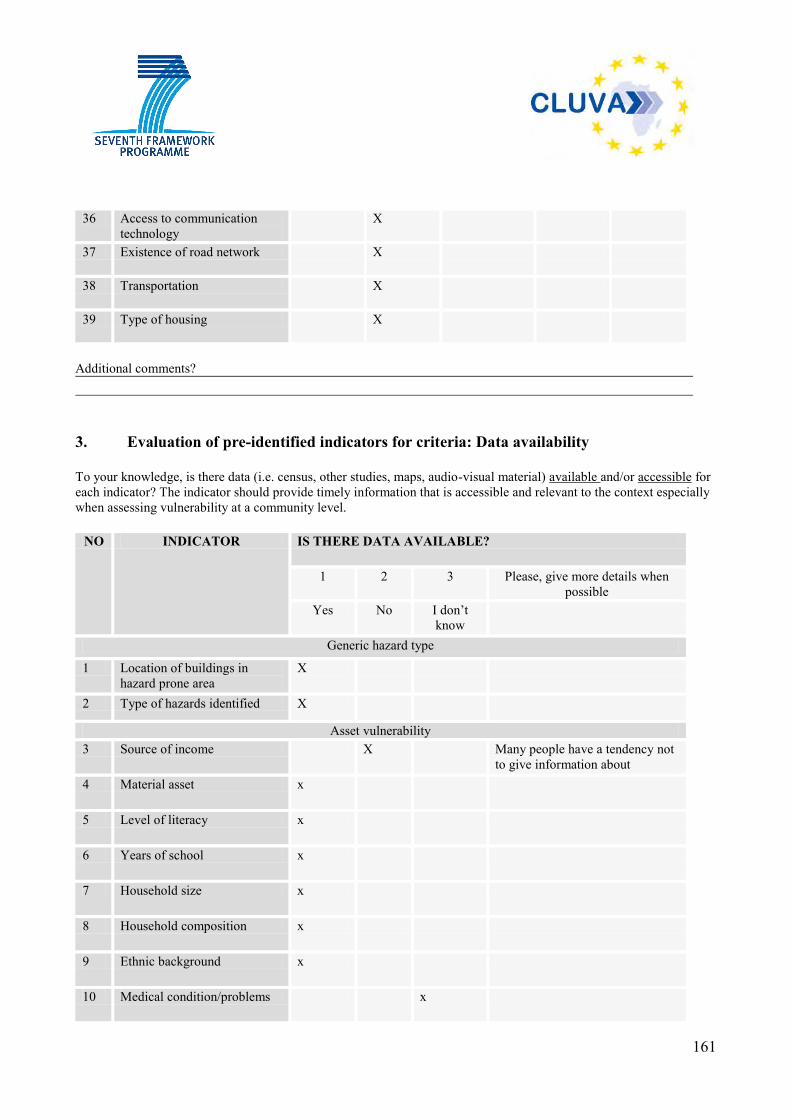
161
36 Access to communication technology
X
37 Existence of road network X
38 Transportation X
39 Type of housing X
Additional comments?
3. Evaluation of pre-identified indicators for criteria: Data availability
To your knowledge, is there data (i.e. census, other studies, maps, audio-visual material) available and/or accessible for each indicator? The indicator should provide timely information that is accessible and relevant to the context especially when assessing vulnerability at a community level.
NO INDICATOR IS THERE DATA AVAILABLE?
1 2 3 Please, give more details when possible
Yes No I don’t know
Generic hazard type 1 Location of buildings in
hazard prone area X
2 Type of hazards identified X
Asset vulnerability 3 Source of income X Many people have a tendency not
to give information about 4 Material asset x
5 Level of literacy x
6 Years of school x
7 Household size x
8 Household composition x
9 Ethnic background x
10 Medical condition/problems x

162
Attitudinal vulnerability 11 Level of trust x
12 Degree of social inclusion x
13 Level of social network x
14 Degree of collective action x
15 Length of residence x
16 Perceived risk x
17 Hazard experience x
18 Knowledge of protection measure
x
19 Training of health and emergency human resources
x
20 Local government structure x
21 Participatory decision making x
22 Existence of CBO and NGO and other local institutions
x
23 Existence of an emergency plan
x
Physical vulnerability 24 Existence of trees x
25 Existence of green parcels/ or urban cropland area
x
26 Density x
27 Land ownership and property title
x
28 Land use change x
29 Existence of schools x
30 Existence of churches and other worship facilities
x
31 Existence of sport facilities or areas for recreation
x
32 Access to energy supply x
33 Access to water supply x
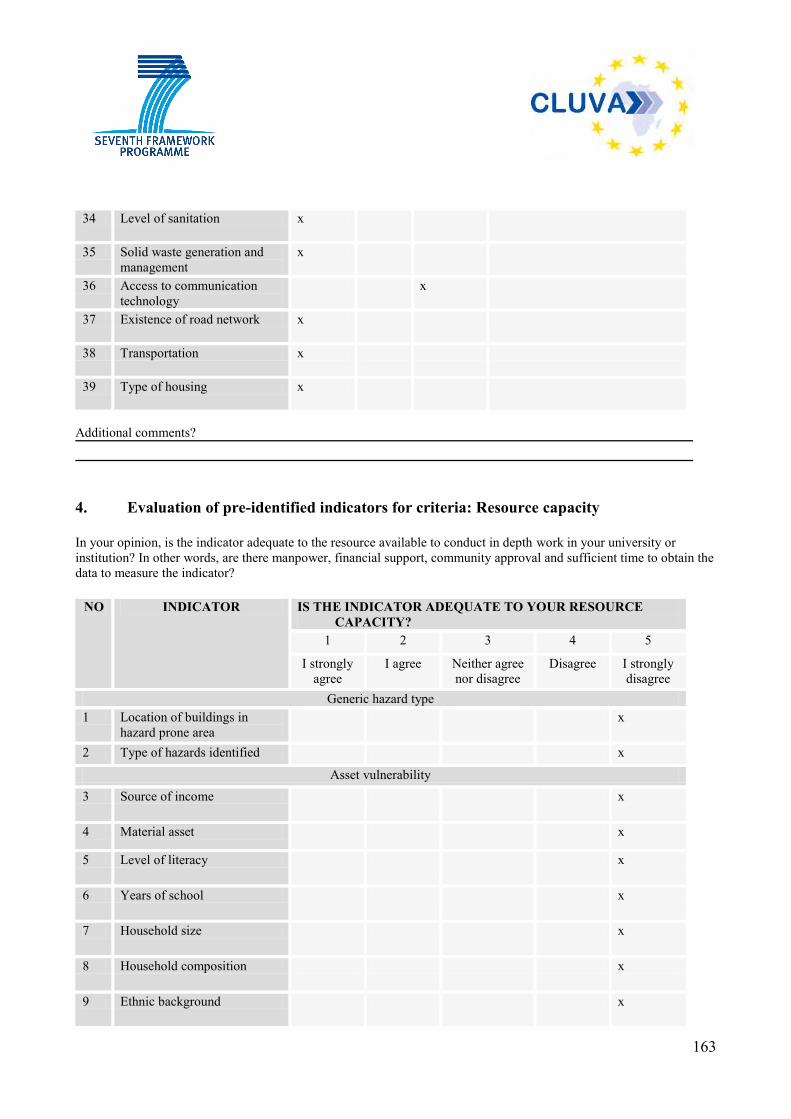
163
34 Level of sanitation x
35 Solid waste generation and management
x
36 Access to communication technology
x
37 Existence of road network x
38 Transportation x
39 Type of housing x
Additional comments?
4. Evaluation of pre-identified indicators for criteria: Resource capacity
In your opinion, is the indicator adequate to the resource available to conduct in depth work in your university or institution? In other words, are there manpower, financial support, community approval and sufficient time to obtain the data to measure the indicator?
NO INDICATOR IS THE INDICATOR ADEQUATE TO YOUR RESOURCE CAPACITY?
1 2 3 4 5 I strongly
agree I agree Neither agree
nor disagree Disagree I strongly
disagree Generic hazard type
1 Location of buildings in hazard prone area
x
2 Type of hazards identified x Asset vulnerability
3 Source of income x
4 Material asset x
5 Level of literacy x
6 Years of school x
7 Household size x
8 Household composition x
9 Ethnic background x
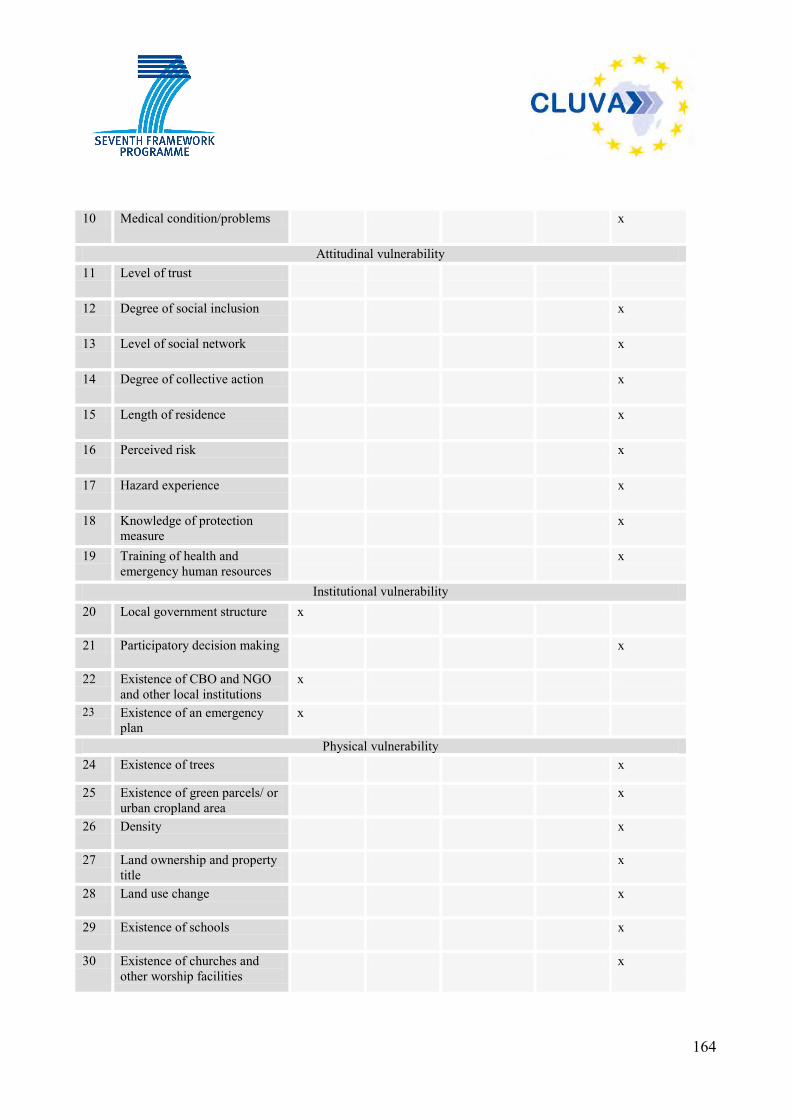
164
10 Medical condition/problems x
Attitudinal vulnerability 11 Level of trust
12 Degree of social inclusion x
13 Level of social network x
14 Degree of collective action x
15 Length of residence x
16 Perceived risk x
17 Hazard experience x
18 Knowledge of protection measure
x
19 Training of health and emergency human resources
x
Institutional vulnerability 20 Local government structure x
21 Participatory decision making x
22 Existence of CBO and NGO and other local institutions
x
23 Existence of an emergency plan
x
Physical vulnerability 24 Existence of trees x
25 Existence of green parcels/ or urban cropland area
x
26 Density x
27 Land ownership and property title
x
28 Land use change x
29 Existence of schools x
30 Existence of churches and other worship facilities
x
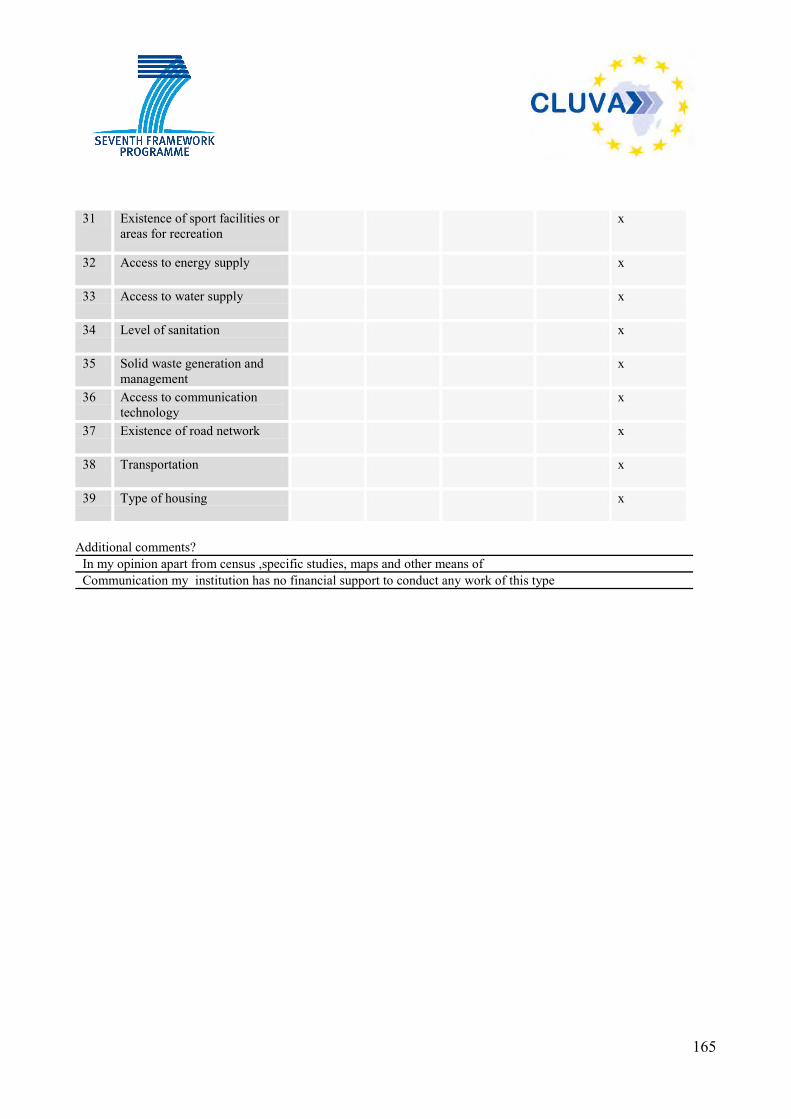
165
31 Existence of sport facilities or areas for recreation
x
32 Access to energy supply x
33 Access to water supply x
34 Level of sanitation x
35 Solid waste generation and management
x
36 Access to communication technology
x
37 Existence of road network x
38 Transportation x
39 Type of housing x
Additional comments?
In my opinion apart from census ,specific studies, maps and other means of Communication my institution has no financial support to conduct any work of this type
166
Appendix D: Proposed working definitions provided by Ardhi University Tanzania (ARU) a) Household A household is defined as a person or a group of persons, related or unrelated, who live together and share a common source of food5. b) Family structure In Tanzania we use household demographic composition which comprises of household size, age distribution, sex and marital status of household members, number of dependants and distribution of household head by sex and age. For instance, according to 2007 National household budget survey, average household size in Dar es Salaam is 3.7 and approximately one quarter of households is female headed. c) Community Tanzania community development policy6 defines community according to the following characteristics:
A community based on similar occupation such as farmers, pastoralists, fisheries, employees and self employed, small and big business people.
A community based on ethnic origin. A community based on geographical location such as rural and urban communities.
However, in Dar es Salaam community is defined by spatial terms as consisting of people living in the same subward or mtaa. d) Settlement types Human settlements in urban areas in Tanzania can be placed in two categories: formal and informal. In Dar es Salaam, informal settlements are the main refuges to the urban poor for whom formal procedures to access either land or housing units hardly exist. About 70% of the population of Dar es Salaam is accommodated in informal settlements7. Easy access to land as opposed to existing formal land delivery system is accounted for many to pay homage to informal settlements. Among the informal settlements, some are located on environmental hazard prone areas that host flooding. e) Landlord and tenant’s structure In Dar es Salaam, and other cities of Tanzania, private small scale rental tenure is the most common form of renting. The main types of rental tenure include the following: the renting of a whole house on a plot, the renting of rooms in a housing unit with an absentee owner or renting the rooms in a house with the owner living in the same housing unit8. The most common pattern of renting involves a house owner occupying part of his/her house and let the other rooms. In situation where the land lord share the same house with tenants, the physical structure of the house is important to the rental arrangement and everyday life of tenant such as whether the households have their own
5 URT (2007). Tanzania Household Budget Survey 2006/07, National Bureau of Statistics. 6 URT (1996). Community development policy. Ministry of community development, women affairs and development, Dar es Salaam. 7 URT (2000). National Human Settlement Development Policy, Dar es Salaam. 8 Cadstedt J (2006), Influence and invisibility, Tenants in housing provision in Mwanza City, Tanzania, Published PhD dissertation, Department of Human Geography, Stockholm University.
167
entrance or if there is one main door and a common corridor. In most cases, tenants are supposed to clean the common facilities and the courtyard. Tenants and landlords rental arrangements are established through oral or written agreements which however are not established through legal or formal procedures. The rental fee is thus detected by landlords. Middlemen who operate between land lords and tenants play a vital role in rental market and determination of rental prices in Dar es Salaam. Tenants have always to prepay the rental fees, according to an agreed rental contract which in most cases is either six months or a year and the whole sum has to be paid in advance. Periodic house maintenances and renovations are normally carried out by landlords in which part of the rental fee paid is used to cover the costs. Depending on the agreement between tenants and the landlord, house maintenances may also be carried out by the tenant if the need arises, and the cost may or may not be deducted from the rental fee. f) Disaster Definition of disaster in Dar es Salaam borrows the universal understanding of the term which is defined as a serious disruption of the functioning of society, causing widespread human, material or environmental losses which exceed the ability of the affected society to cope using its own resources9. g) SACCOS SACCOS is an acronym of Savings and Credit Cooperative Society. Thus the Savings and Credit Cooperative Societies (SACCOs) of Tanzania are a network of credit unions. They are grass-roots financial institutions which offer their members a convenient home for their savings and an access point for loans. For many people, membership of their SACCO is an invaluable safeguard against unexpected illness, accident, family death or any emergency including natural hazards such as floods. In Tanzania, the law (Cooperative Societies Act 1991) provides for the basis of development of SACCOS as equity based institutions. SACCOS operate under the Cooperative Society Act in offering savings and credit services to members. They are also covered under the Banking and Financial Institutions Act 1991 as financial intermediaries but they are not supervised by the Bank of Tanzania. Literature shows that there are about 1,400 registered SACCOS.
9 ISDR definition; available at http://www.unisdr.org/eng/library/lib-terminology-eng%20home.htm, accessed 1st August 2011.
168
h) Clan in Dar es Salaam context In Dar es Salaam, a clan is associated with ethnic origin of individuals and households. A clan consists of people who originate from the same area and share some family relations. Clanship systems are essential in helping each other in times of need such as in case of death of relatives, marriages, meeting health or medication costs in case of illness as well as assisting in raising education funds for families who cannot meet education needs of their children on their own. However, the structure and function of clans differs significantly from one ethnic group to another. In some cases, they form well-recognized groups while in others they are dispersed. In general, an elderly, or group of elders, is often responsible for coordinating activities and relations within the clan. i) Indicators for measuring health Health indicators include current state of health, access to health care facilities and prevalence of food and water borne diseases such as malaria, typhoid, diarrhoea and cholera. Prevalence or occurrences of these diseases indicates a poor environmental condition which has a close link with climate change related hazards such as floods. The above are indicators which are considered to have association with climate change induced flood hazards. However, in broad view, health indicators in Tanzania include life expectancy at birth, maternal mortality rate, child under five mortality rate, fertility rate, malnutrition rate and prevalence of diseases such as HIV/AIDS, tuberculosis and malaria. h) Household budget data and website for sharing We have in Tanzania household budget surveys which cover a range of individual and household characteristics such as household members’ education; economic activities; health status; household expenditure, consumption and income; ownership of consumer goods and assets; housing structure and materials as well as household access to services and facilities. Data for household budget surveys is collected from nationally representative sample of households selected from regional samples countrywide. The final statistics are presented comparing Dar es Salaam region with other urban and rural areas. We have household budget surveys conducted in 1991/92, 2000/01 and 2006/07. These can be downloaded from www.tanzania.go.tz/hbs/Key_Findings_HBS_Eng.pdf
Other important household data from census reports are available at http://www.nbs.go.tz/. We have the last census report at http://www.nbs.go.tz/pdf/2002popcensus.pdf.


