Embed Size (px)
Citation preview

Appendix A
Attachments A through I to Comment Letter Ross
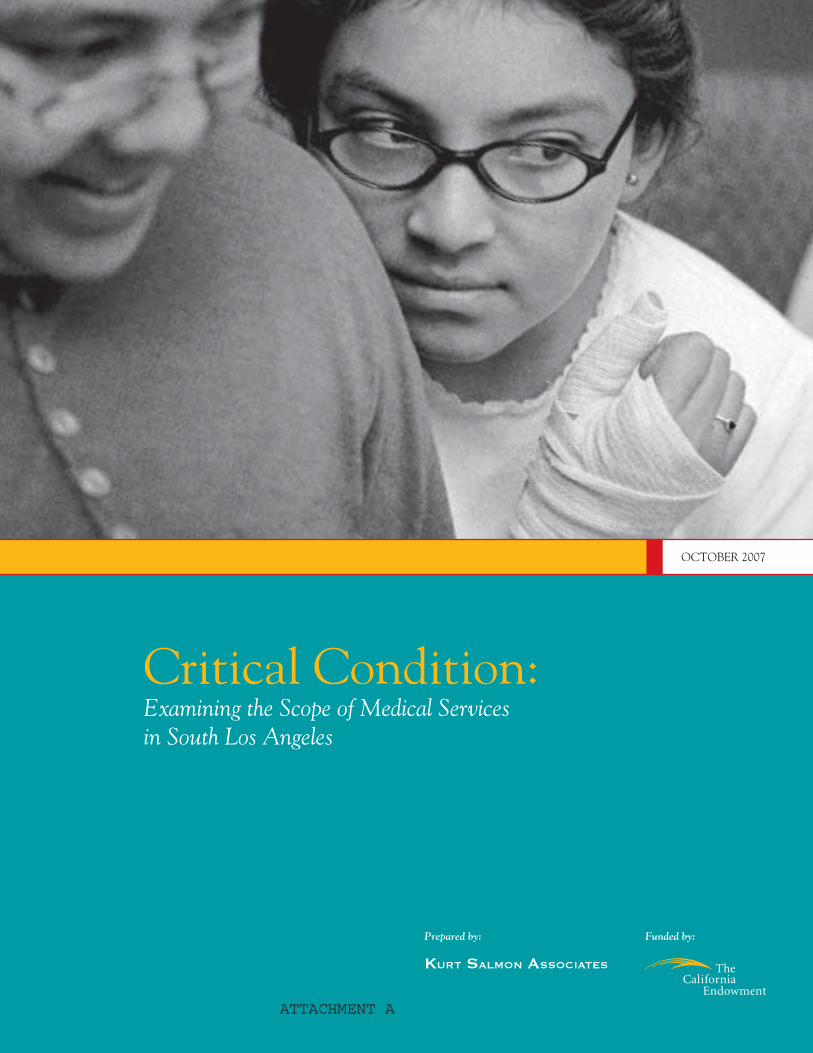
Funded by:
KURT SALMON ASSOCIATES
Prepared by:
Critical Condition:Examining the Scope of Medical Servicesin South Los Angeles
OCTOBER 2007
ATTACHMENT A

The purpose of this report
is to strengthen our
collective understanding
of the health needs
of the residents of
South Los Angeles.
Foreword
The county’s decision to close Martin Luther King Jr.-Harbor Hospital, following several inspections
citing serious quality of care issues and the subsequent loss of federal funding, is a sad one for the people
of South Los Angeles and, indeed, the entire county.
It is particularly distressing because the establishment of a comprehensive teaching hospital in the heart
of this community, in 1972, represented such a pivotal change and hopeful moment. The hospital was a
major step to correct the health injustices cited by the McCone Commission, which was formed in the
wake of the 1965 L.A. riots, and issued the following statement as part of its findings:
“Statistics indicate that health conditions of the residents of south central Los Angeles are relatively poor and
facilities to provide medical care are insufficient… Life expectancies are considerably shorter… the number of
doctors in the southeastern part of Los Angeles is grossly inadequate as compared to other parts of the city…
The hospitals readily accessible to the citizens in southeastern Los Angeles are also grossly inadequate in quality
and in numbers of beds “
Today, more than four decades later, it is both regrettable and shameful that the Commission’s findings
sound so current. Based on virtually every indicator, the residents of South Los Angeles experience
worse health outcomes. Diabetes rates are 44% higher than elsewhere in the county, while HIV/AIDS
rates are 38% higher. A generation of young people is being lost in South L.A., as the infant mortality
rate is 20% higher than the county as a whole. And, South L.A. has the highest percentage of children
without health insurance in the county.
“Shallow understanding from people of good will is
more frustrating than absolute misunderstanding
from people of ill will.”– MARTIN LUTHER KING, JR.
LETTER FROM BIRMINGHAM JAIL, APRIL 1963
Foreword 3
4
Martin Luther King/Charles R. Drew Medical Center (subsequently renamed MLK Harbor Hospital)
was opened to help provide critically needed medical services. Unfortunately, the medical center has
lurched from crisis to crisis almost since the beginning as a result of poor medical care and a failure of
effective governance and oversight. In response, critical services have been reduced over the last several
years. First, the trauma center was closed. Then the residency programs that supported many specialty
services were eliminated. Sadly, the hospital was further downsized, until, most recently, the
ER was closed and all inpatient services terminated.
In March 2005, The California Endowment established a Steering Committee on the Future of King
Drew Medical Center made up of noted health experts. Following extensive consultation and analysis,
it issued a report that constituted a roadmap to enable the medical center to fulfill its original purpose.
In that report, the Committee issued several recommendations to reform both the hospital and Drew
University. Some of them were heeded; many were not.
Precipitated by the most recent sequence of events, and the ensuing discussions about the needs of the
community, The Endowment then commissioned an independent analysis of the health needs and
provider capacity of South Los Angeles. Kurt Salmon Associations (KSA), a consulting firm specializing
in hospital planning, compiled data from a broad range of sources to provide an accurate and holistic
portrayal of the health care infrastructure – as well as the needs – in South Los Angeles. This analysis
was designed to provide a common base of information upon which policymakers, health care providers,
advocates and health consumers can develop priorities for action.
Not unexpectedly, the analysis found that Service Planning Area (SPA) 6 in South Los Angeles is one
of the most underserved communities in the entire nation, with desperate health care challenges. The
findings paint an alarming picture of a broken health system that has failed to meet the needs of South
Los Angeles, even prior to the recent closure of the MLK-Harbor inpatient facility. They include:
Emergency and Trauma ServicesIn 2004, SPA 6 had the lowest number of emergency department treatment stations compared
to LA County and other geographic areas. The current capacity of 59 treatment stations is well
below the estimated need for between 100 and 150 stations.
Inpatient ServicesThe SPA 6 population is at risk for limited access to inpatient services based on analysis of
existing available beds. The estimated bed need, based on current utilization patterns, is more
Critical Condition: Examining the Scope of Medical Services in South Los Angeles

Foreword 5
than 2,000 beds. Yet, there are now only approximately 700 existing beds. South Los Angeles
has among the lowest number of beds per 1,000 residents in the nation.
Specialty CareSouth Los Angeles residents experience long wait times to see a specialist, which delays effective
diagnosis and treatment. Public-Private Partnerships, which provide primary care but must refer
patients to county facilities for specialty care, report average wait times of six months to one
year for specialty care.
These data, and others contained in this report, should not numb us into inaction. On the contrary,
the analysis demonstrates that we must immediately re-think how to address these unmet needs.
Forty-two years have taught us, at a minimum, that this community requires a comprehensive hospital
that delivers high-quality care. Moreover, as this analysis documents, the community also needs greater
access to specialty services and better integration of primary care with mental health, public health, and
specialty care. These would be significant improvements and represent the core set of services needed for
a functioning health care infrastructure.
At the same time, to truly improve the health of South Los Angeles residents, we must also commit
to addressing the broader social determinants – such as economic opportunities, education, safety
and nutrition – that significantly contribute to a community’s overall health status. Responding to
the inpatient and specialty care needs, as outlined in this report, is a critical first step, but it cannot
be the only step. We will fail again if we convince ourselves that we can stop there.
From the standpoint of the McCone Commission and those who fought to open a medical center
in South Los Angeles, the plight of the King-Harbor hospital represents a dream deferred, to use
the famous words of poet Langston Hughes. This time we must do better and achieve the goal of a
healthy community.
Sincerely,
Robert K. Ross, M.D.President and CEO
The California Endowment

To assess if we are
meeting the medical needs
of the SPA 6 population
we have developed three
categories of assessment:
Service Area and Target
Population, Health Care
Services, Subsets of the
Targeted Population.
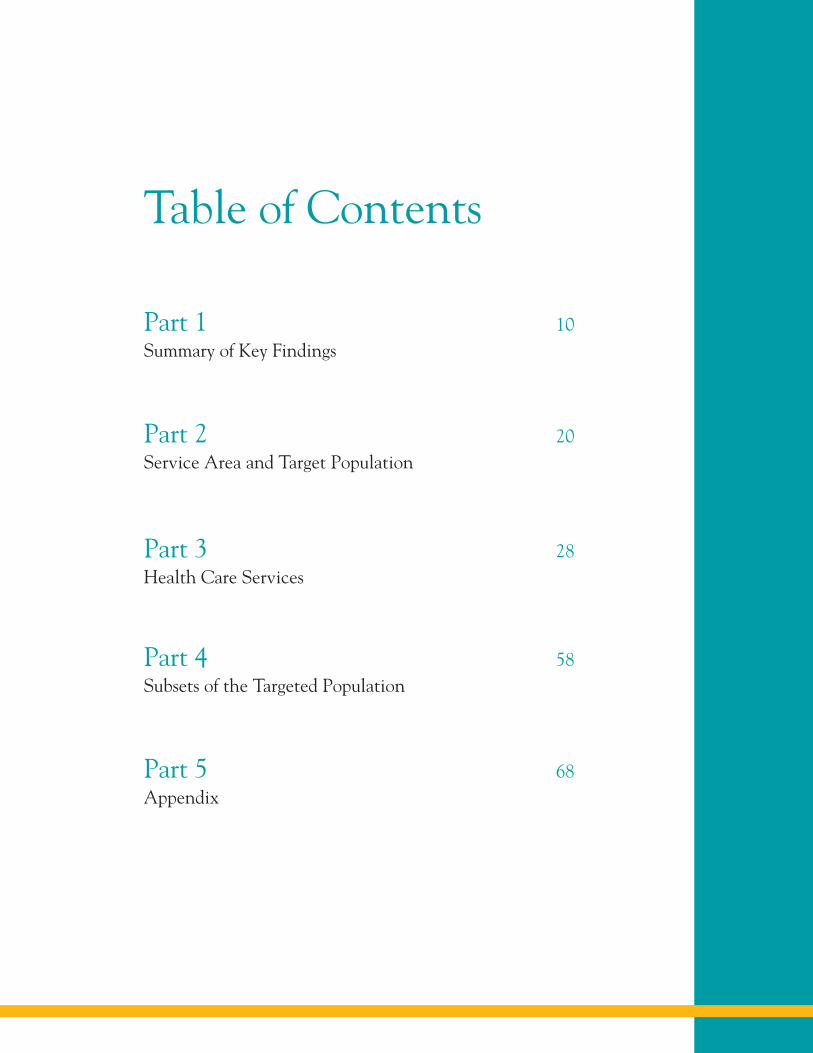
Table of Contents
Part 1 10Summary of Key Findings
Part 2 20Service Area and Target Population
Part 3 28Health Care Services
Part 4 58Subsets of the Targeted Population
Part 5 68Appendix

The diverse make up and
low-income characteristics
of the SPA 6 population,
coupled with a high
homicide rate... indicates
a relatively high demand
for trauma and ED.
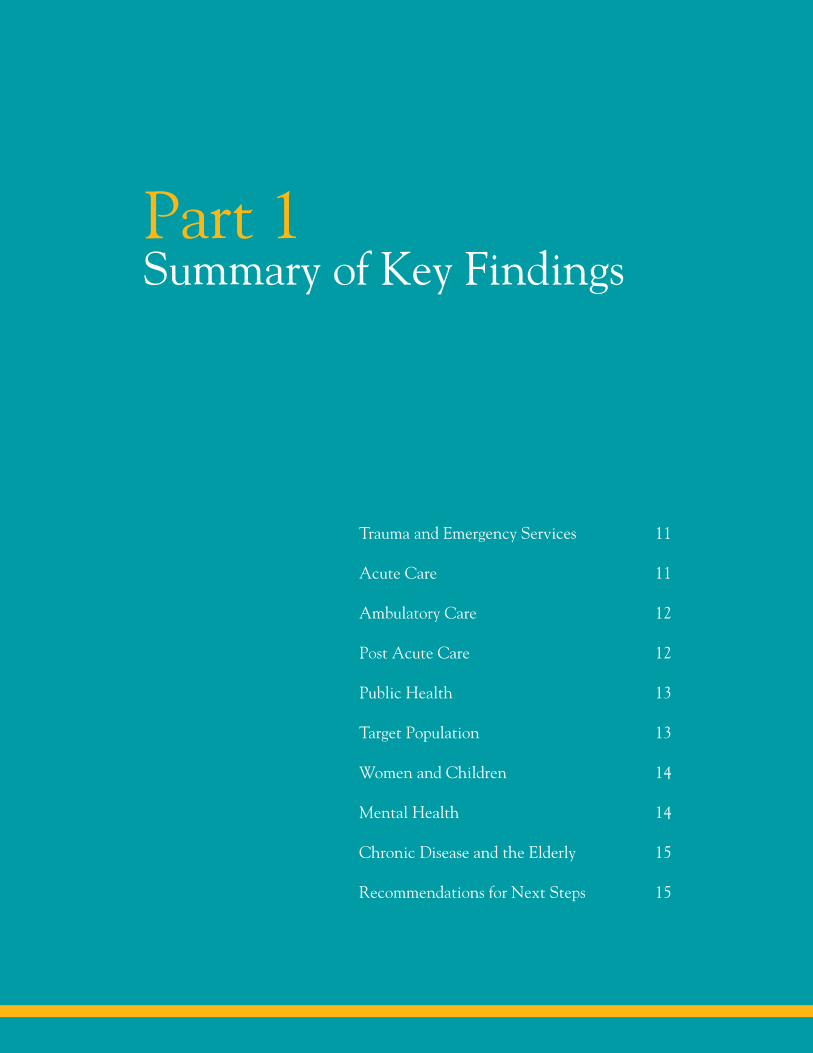
Trauma and Emergency Services 11
Acute Care 11
Ambulatory Care 12
Post Acute Care 12
Public Health 13
Target Population 13
Women and Children 14
Mental Health 14
Chronic Disease and the Elderly 15
Recommendations for Next Steps 15
Part 1Summary of Key Findings
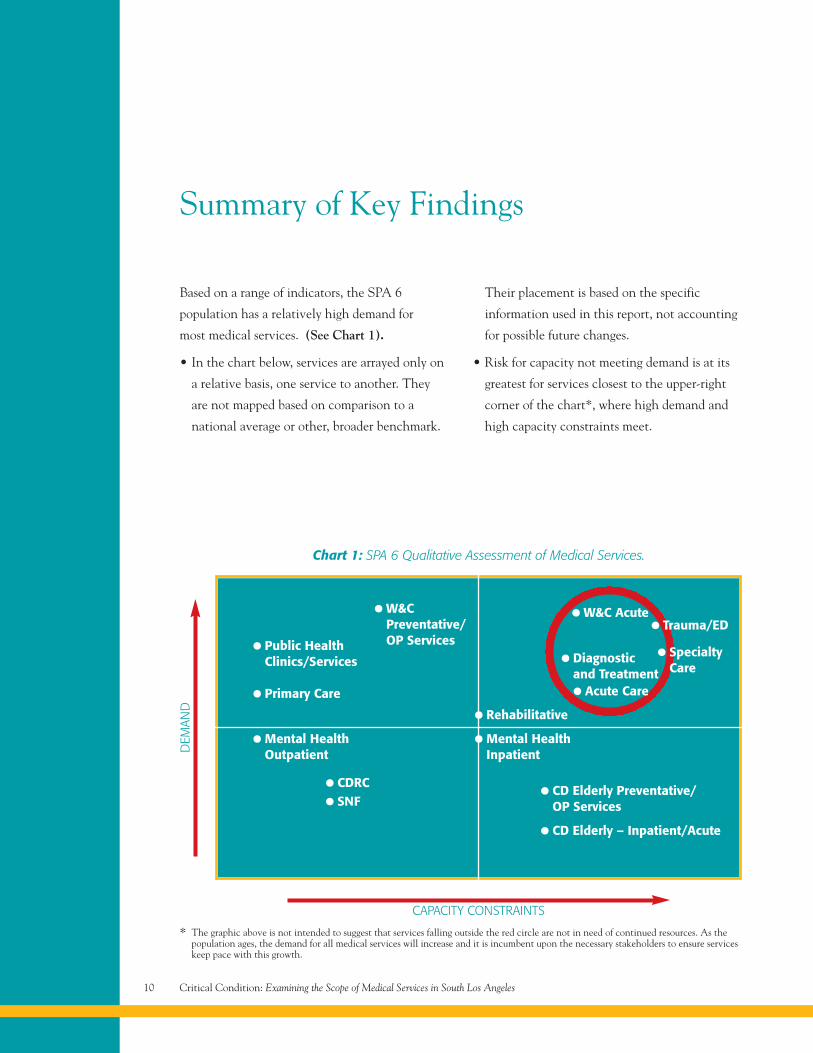
Chart 1: SPA 6 Qualitative Assessment of Medical Services.
• Public HealthClinics/Services
• Primary Care
• W&CPreventative/OP Services
• Mental HealthOutpatient
• CDRC
• SNF
• Rehabilitative
• Mental HealthInpatient
• CD Elderly Preventative/OP Services
• CD Elderly – Inpatient/Acute
• Acute Care
• Diagnosticand Treatment
• W&C Acute• Trauma/ED
• SpecialtyCare
CAPACITY CONSTRAINTS
DEM
AND
* The graphic above is not intended to suggest that services falling outside the red circle are not in need of continued resources. As thepopulation ages, the demand for all medical services will increase and it is incumbent upon the necessary stakeholders to ensure serviceskeep pace with this growth.
Critical Condition: Examining the Scope of Medical Services in South Los Angeles10
Summary of Key Findings
Based on a range of indicators, the SPA 6
population has a relatively high demand for
most medical services. (See Chart 1).
• In the chart below, services are arrayed only on
a relative basis, one service to another. They
are not mapped based on comparison to a
national average or other, broader benchmark.
Their placement is based on the specific
information used in this report, not accounting
for possible future changes.
• Risk for capacity not meeting demand is at its
greatest for services closest to the upper-right
corner of the chart*, where high demand and
high capacity constraints meet.
Part 1 – Summary of Key Findings 11
Trauma and Emergency ServicesThe diverse make up and low-income
characteristics of the SPA 6 population,
coupled with a high homicide rate [a proxy
for overall violence] indicates a relatively
high demand for trauma and ED.
• These findings are consistent with the Kurt
Salmon Associates/California HealthCare
Foundation study that identified populations
in south central and southeast LA to be most
at risk for limited access to ED and trauma.
• In 2004-2005 there was 1 trauma center
(St. Francis) and 2 hospital EDs (King/Harbor
and St. Francis) to serve the population of SPA 6.
• SPA 6 had the lowest number of ED treatment
stations per 100,000 compared to LAC and
other SPAs.
• There are 2 additional trauma centers (USC
and Harbor/UCLA) and 18 hospitals with
emergency services located within the 10-mile
radius surrounding SPA 6.
• Access to trauma units is crucial for victims of
violent crimes. The time allotted to reach a
trauma center is 30 minutes. The urban sprawl
and traffic patterns in LAC may impede quick
access to these services.
Implication
For truly emergent cases, quick access
to trauma and ED services is crucial
for the SPA 6 population.
Acute CareThe SPA 6 population is at risk for limited
access to inpatient services based on analysis
of existing available beds.
• In 2005, residents in SPA 6 were the highest
users of inpatient services compared to LA
County and CA (107 discharges/1,000 in
SPA6 vs. 101 discharges/1,000 in CA).
— SPA 6 use rates were comparable to
populations with similar characteristics
(e.g. LA Co. and San Bernardino Co.).
• Demand for services in SPA 6 is comparable to
the state of CA, with slight differences that
likely reflect the demographic profile of SPA 6.
— Highest demand is for Women and
Children services.
• Estimated bed need in SPA 6, based on current
utilization patterns, is over 2,000 beds (existing
beds ~ 1,000).
— The actual needs of the population
(defined as access to an available bed)
may differ from demand estimates
suggesting that we may be
underestimating the true bed need.
Implication
Inpatient demand may be met in the
short-term, however, population growth
will increase use of and demand for
these services in the future.
Critical Condition: Examining the Scope of Medical Services in South Los Angeles12
Ambulatory CareThe SPA 6 population has significant needs for
all ambulatory/outpatient services.
• Despite indications to the contrary, ~40% of
the population in SPA 6 does not have a usual
source of care.
— Compared to other SPAs, SPA 6 had
the 2nd highest number of clinics per
population (as reported by OSHPD), but
many of the PPP clinics are closed to new
patients because of capacity constraints.
• The SPA 6 population has a higher need for
specialty services compared to LA County.
— Individuals in SPA 6 reported a higher
percentage of asthma, diabetes and
hypertension compared to LA County.
— ~ 50% of people had to wait a month or
more to see a specialist.
— There is a clear shortage of outpatient
specialty clinics in SPA 6 including
outpatient rehab and surgery (possible
exception is dialysis centers).
— Only 2 hospitals offer diagnostics and
treatment modalities.
• Further research will be needed to assess the
dental needs of SPA 6 population.
Implication
As the demand for ambulatory care continues to
increase, the SPA 6 population is currently most
at risk for an inadequate supply of specialty care
and D&T services.
Post-Acute CareFor the SPA 6 population, all post-acute care
services (Rehab, Skilled Nursing Facilities, and
Chemical Dependency Recovery Centers) are
in high demand. As the population ages, the
demand for these services will only increase.
• There are no designated inpatient or outpatient
rehabilitative facilities in SPA 6.
— In 2005, LAC/Rancho had reported
occupancy of ~70% suggesting available
capacity in surrounding areas. Rehab
services are also available at four acute
care facilities in SPA 6.
• There are 2 Skilled Nursing Facilities in SPA 6
and 13 SNFs in the surrounding 10-mile radius.
— Trends show a decline in discharges from
2002 to 2005 with the highest users
being the 65 and over age cohort.
— In 2005, over 80% of SNF discharges
generated by SPA 6 residents took place
at facilities located outside of SPA 6.
• Data suggest the demand for outpatient/
preventative care CDRCs may be higher
for than CDRC inpatient services.
Part 1 – Summary of Key Findings 13
— SPA 6 appears to have more CDRC-
related outpatient clinics than expected
when compared to other SPAs.
Implication
Current capacity for Rehab and SNF appear to be
meeting the demands of the population in the
short-term; however, the true need for these services
remains to be determined. Existing CDRC clinics
may offer the opportunity for additional outreach
and preventative care.
Public HealthHealth status, preventative health and health
outcome indicators suggest SPA 6 is in greater
need of public health services than other areas
in LA County.
• Several, comprehensive studies have been
conducted on public health issues. This assessment
draws from all studies, isolating only a few key
indicators to show demand for public health
services. We offer citations for the detailed
studies for those wanting additional information.
• Though the SPA 6 population is worse off than
national and state averages for several public
health access indicators, evidence of significant
overall health improvements have appeared in
the last few years of available data.
• 37 Primary Care and Public Health clinics are
available in SPA 6 to provide preventative or
public health services.
• A large percentage of the clinics offer
community services, especially in areas
affecting public health (e.g., education,
nutrition, outreach, and social services).
Implication
Given the diverse population and resultant
differences in utilization of services, determining
whether or not public health clinics are meeting
the needs of the population remains a challenge.
One approach to address this question may be to
survey the population on public health issues
including access to and quality of care received.
Short-term opportunities may include additional
outreach and education around existing public
health resources.
Target PopulationThe SPA 6 population is young, growing, and
diverse with a higher proportion of low-income
and uninsured residents compared to other
LAC areas.
• The population in SPA 6 is estimated to
grow 1.3% per year over the next few years
(higher than U.S. average of ~1.0%).
— 75% of the population is under 45
suggesting a need for OB/GYN,
Trauma/ED, and Public/Preventative Care.
— While only 8% of the population is 65
and over, this population is forecasted to
grow 2.5% or more the next several years
Critical Condition: Examining the Scope of Medical Services in South Los Angeles14
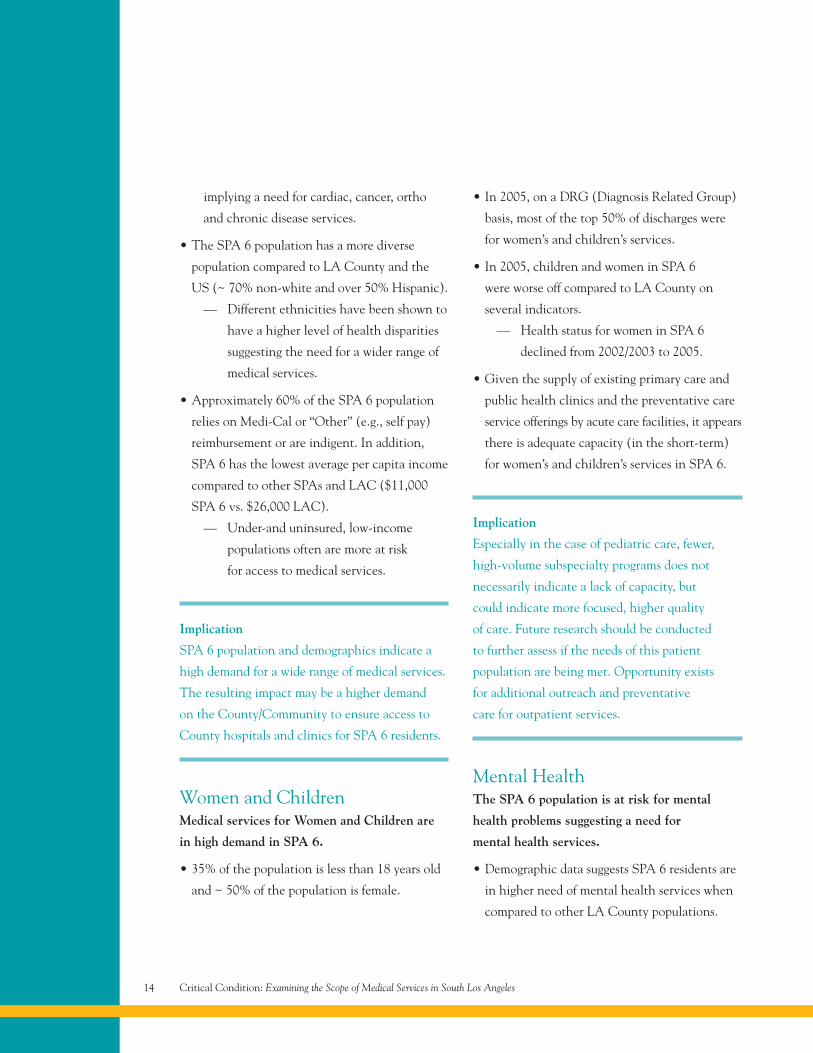
implying a need for cardiac, cancer, ortho
and chronic disease services.
• The SPA 6 population has a more diverse
population compared to LA County and the
US (~ 70% non-white and over 50% Hispanic).
— Different ethnicities have been shown to
have a higher level of health disparities
suggesting the need for a wider range of
medical services.
• Approximately 60% of the SPA 6 population
relies on Medi-Cal or “Other” (e.g., self pay)
reimbursement or are indigent. In addition,
SPA 6 has the lowest average per capita income
compared to other SPAs and LAC ($11,000
SPA 6 vs. $26,000 LAC).
— Under-and uninsured, low-income
populations often are more at risk
for access to medical services.
Implication
SPA 6 population and demographics indicate a
high demand for a wide range of medical services.
The resulting impact may be a higher demand
on the County/Community to ensure access to
County hospitals and clinics for SPA 6 residents.
Women and ChildrenMedical services for Women and Children are
in high demand in SPA 6.
• 35% of the population is less than 18 years old
and ~ 50% of the population is female.
• In 2005, on a DRG (Diagnosis Related Group)
basis, most of the top 50% of discharges were
for women’s and children’s services.
• In 2005, children and women in SPA 6
were worse off compared to LA County on
several indicators.
— Health status for women in SPA 6
declined from 2002/2003 to 2005.
• Given the supply of existing primary care and
public health clinics and the preventative care
service offerings by acute care facilities, it appears
there is adequate capacity (in the short-term)
for women’s and children’s services in SPA 6.
Implication
Especially in the case of pediatric care, fewer,
high-volume subspecialty programs does not
necessarily indicate a lack of capacity, but
could indicate more focused, higher quality
of care. Future research should be conducted
to further assess if the needs of this patient
population are being met. Opportunity exists
for additional outreach and preventative
care for outpatient services.
Mental HealthThe SPA 6 population is at risk for mental
health problems suggesting a need for
mental health services.
• Demographic data suggests SPA 6 residents are
in higher need of mental health services when
compared to other LA County populations.
Part 1 – Summary of Key Findings 15
• Conflicting data regarding inpatient use:
In 2005, only 26% of SPA 6 residents received
MH treatment at SPA 6 facilities.
— Patients are currently taken to other
facilities due to lack of available beds
in SPA 6.
— In contrast, using 2005 inpatient use
rates, the demand for psych beds was
~241 beds. In 2005, the total number
of psych beds available was 262
(includes King/Harbor) suggesting
a surplus of beds available.
• There are at least 32 outpatient facilities
available to treat MH patients. An additional
12 facilities are available within a 10-mile
radius from SPA 6.
Implication
Despite existing bed capacity, access to an
available bed appears to be the real issue.
Additional research is needed to further assess
the mental health needs (as opposed to demand)
of the SPA 6 population. Opportunities exist to
educate the population regarding mental health
conditions and available resources.
Chronic Disease and the ElderlyAlthough SPA 6 has a young demography,
the 65-and-over population drives much
of the demand for and use of medical services.
• The 65-and-over SPA 6 population represents
the smallest percentage of the population
(~8%), however, this cohort represents the
highest users of services and is estimated to
grow ~2.5% per year over the next few years.
• 11 out of 27 hospitals report having senior
wellness/geriatric programs within a 10-mile
radius of SPA 6.
• The subset of the population itself – Chronic
Disease and Elderly – has an expected demand
for ~700 inpatient beds, which represents 70%
of existing SPA 6 beds (~1,000 beds).
Implication
As the population ages the demand for these
services will continue to increase. Additional
research may be required in this area. Based on
information available, this population could be
at risk for access to inpatient and outpatient
services in the future.
Recommendations for Next StepsFactoring in the challenges with the findings
throughout this assessment, the following are
suggested recommendations for next steps:
Recommendation #1:
• Work towards compiling all data in a
central location.
Recommendation #2:
• In drawing conclusions and making
related decisions, quantitative data must
be combined with qualitative data.
Critical Condition: Examining the Scope of Medical Services in South Los Angeles16
• Continue to advance data collection methods
with a focus on capturing real-time information
(e.g., train staff, invest in technology, etc.)
and filling in gaps that would allow us to
better assess the community’s overall health.
Recommendation #3:
• Maintain the role of the Advisory Group
for continuity and communication.
• Seek out additional feedback to gain a
community perspective.
Recommendation #4:
• Learn from current successes and build upon
existing SPA 6 community assets.
In KSA’s review of a variety of materials, the
following statement captures a long-term vision
for addressing the unmet health care needs of the
South Los Angeles community that will require
long-term, sustained commitment:
To move forward on improving the health
status of low-income, uninsured South L.A.
residents, we should re-envision the fragmented
safety net system to address the changing
demographics and tremendous unmet health
needs in the community. Based on data
presented and input from community
experts, primary care, public health and
mental health should be integrated to create
a population-based, chronic disease-focused
model of health care delivery.
Sources: [1] LACDHS, The L.A. County Medicaid Demonstration Project (Section 1115): Stabilizing the Safety Net: 1995-2005 (June 2005).[2] Leong D, The Power of Partnerships: Solutions Created and Lessons Learned by the Public Private Partnership Program, CommunityClinic Association of Los Angeles County (May 2005).[3] LACDHS Office of Ambulatory Care, Public-Private Partnership (PPP) Program– Clinic Status (June 18, 2007). Accessed at www.ladhs.org/ambcare/patients/pdf/clinicstatuslist.pdf. [4] Southside Coalition of CommunityHealth Centers, Early Diagnostic and Invention Center (2007).
Current SPA 6 SuccessesThe Public-Private Partnership program (PPPs) has proven itself to offer efficient, coordinated,high-quality and cost-effective ambulatory care to the county’s vulnerable patient population.It allowed LACDHS to increase the number of primary care access points, improve geographicaccess to services in areas of high need, and provide better care and management of patientswith chronic conditions such as diabetes and high cholesterol. [1], [2] These disease managementinitiatives served as the basis for the county’s recently awarded $54 million Coverage Initiative,Healthy Way LA. [3]
The Southside Coalition of Community Health Centers has partnered with Orthopaedic Hospital todevelop the clinical footprint for specialty care that will complement the county’s existing deliverysystem. Starting in January 2007, podiatry has been piloted. To date, nearly 150 patients have beenprovided podiatry services with waiting times reduced to an average of two weeks as compared to3 to 6 months previously. [4]
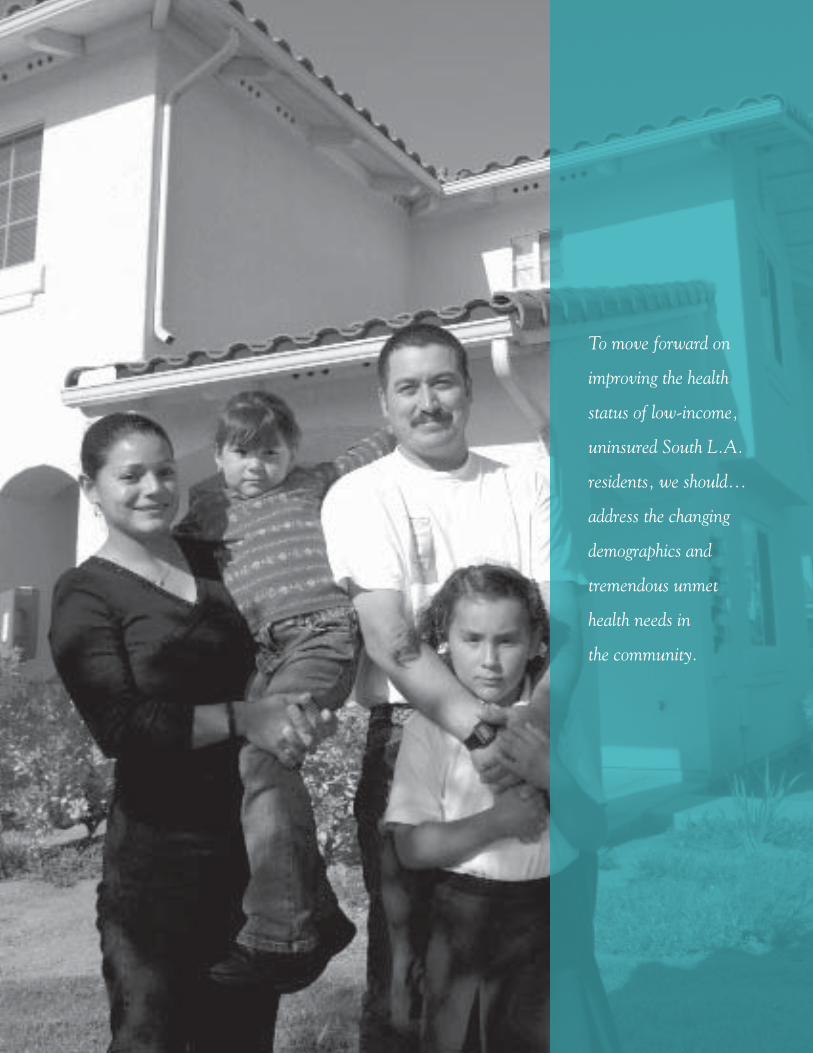
To move forward on
improving the health
status of low-income,
uninsured South L.A.
residents, we should...
address the changing
demographics and
tremendous unmet
health needs in
the community.

Medical services for
Women and Children
are in high demand in
SPA 6... 35% of the
population is less than
18 years old and ~ 50%
of the population is female.
Definition of South Los Angeles 20
Geographic Definition of Analyses 21
Rationale 21
Characteristics of the Population 22
Change in Population 23
Self Reported Health Status 23
Racial and Ethnic Groups 24
Insurance Status 24
Uninsured by SPA 24
Income 24
Part 2Service Area andTarget Population
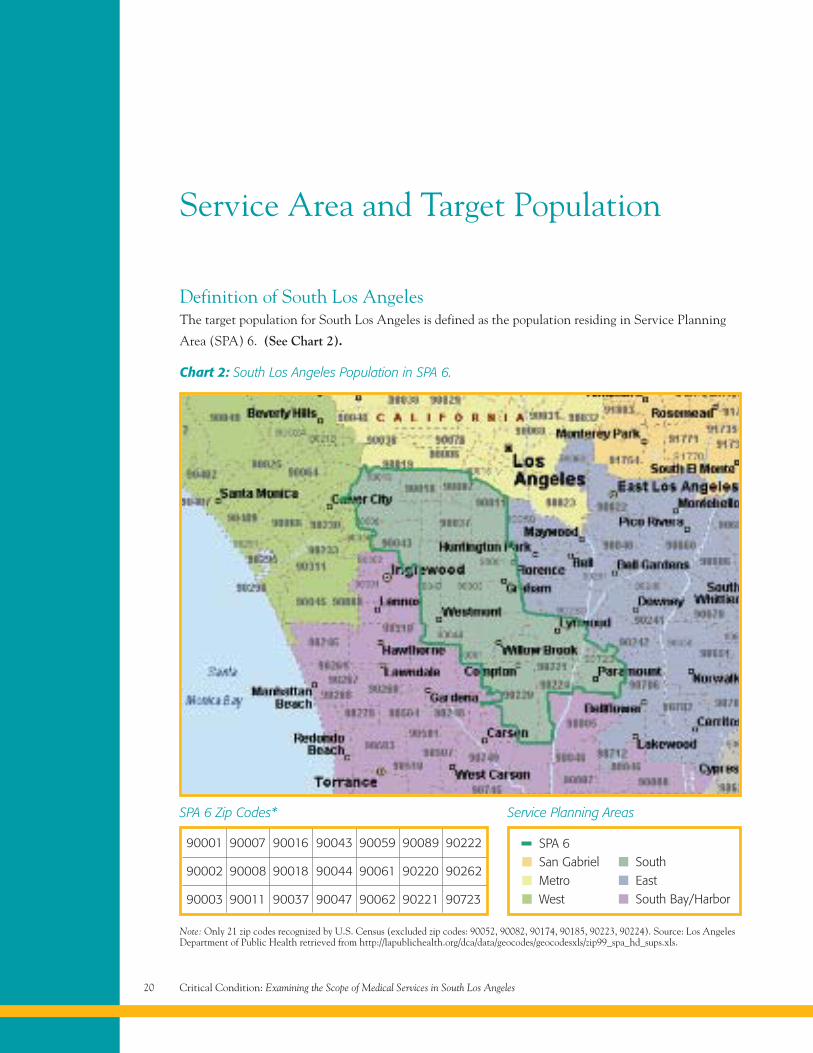
Definition of South Los AngelesThe target population for South Los Angeles is defined as the population residing in Service Planning
Area (SPA) 6. (See Chart 2).
Chart 2: South Los Angeles Population in SPA 6.
SPA 6San GabrielMetroWest
SouthEastSouth Bay/Harbor
Note: Only 21 zip codes recognized by U.S. Census (excluded zip codes: 90052, 90082, 90174, 90185, 90223, 90224). Source: Los AngelesDepartment of Public Health retrieved from http://lapublichealth.org/dca/data/geocodes/geocodesxls/zip99_spa_hd_sups.xls.
Service Area and Target Population
Service Planning AreasSPA 6 Zip Codes*
Critical Condition: Examining the Scope of Medical Services in South Los Angeles20
90001
90002
90003
90007
90008
90011
90016
90018
90037
90043
90044
90047
90059
90061
90062
90089
90220
90221
90222
90262
90723
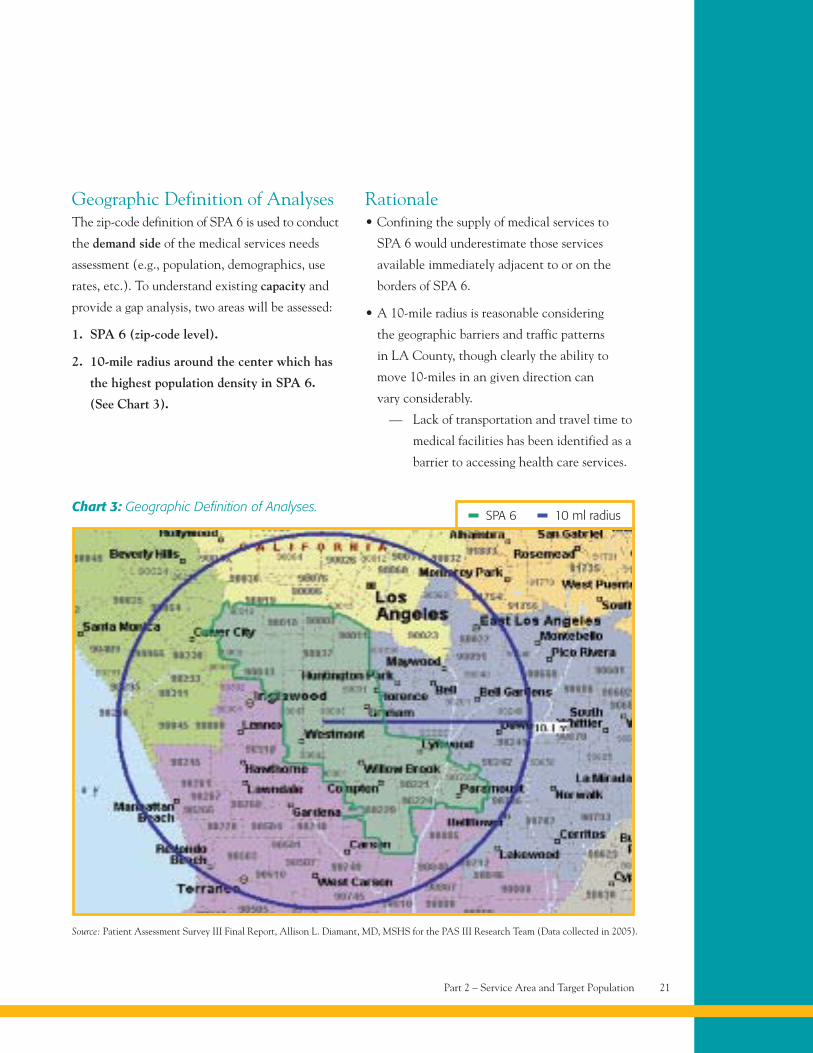
Geographic Definition of AnalysesThe zip-code definition of SPA 6 is used to conduct
the demand side of the medical services needs
assessment (e.g., population, demographics, use
rates, etc.). To understand existing capacity and
provide a gap analysis, two areas will be assessed:
1. SPA 6 (zip-code level).
2. 10-mile radius around the center which has
the highest population density in SPA 6.
(See Chart 3).
Rationale• Confining the supply of medical services to
SPA 6 would underestimate those services
available immediately adjacent to or on the
borders of SPA 6.
• A 10-mile radius is reasonable considering
the geographic barriers and traffic patterns
in LA County, though clearly the ability to
move 10-miles in an given direction can
vary considerably.
— Lack of transportation and travel time to
medical facilities has been identified as a
barrier to accessing health care services.
Chart 3: Geographic Definition of Analyses.SPA 6 10 ml radius
Source: Patient Assessment Survey III Final Report, Allison L. Diamant, MD, MSHS for the PAS III Research Team (Data collected in 2005).
Part 2 – Service Area and Target Population 21
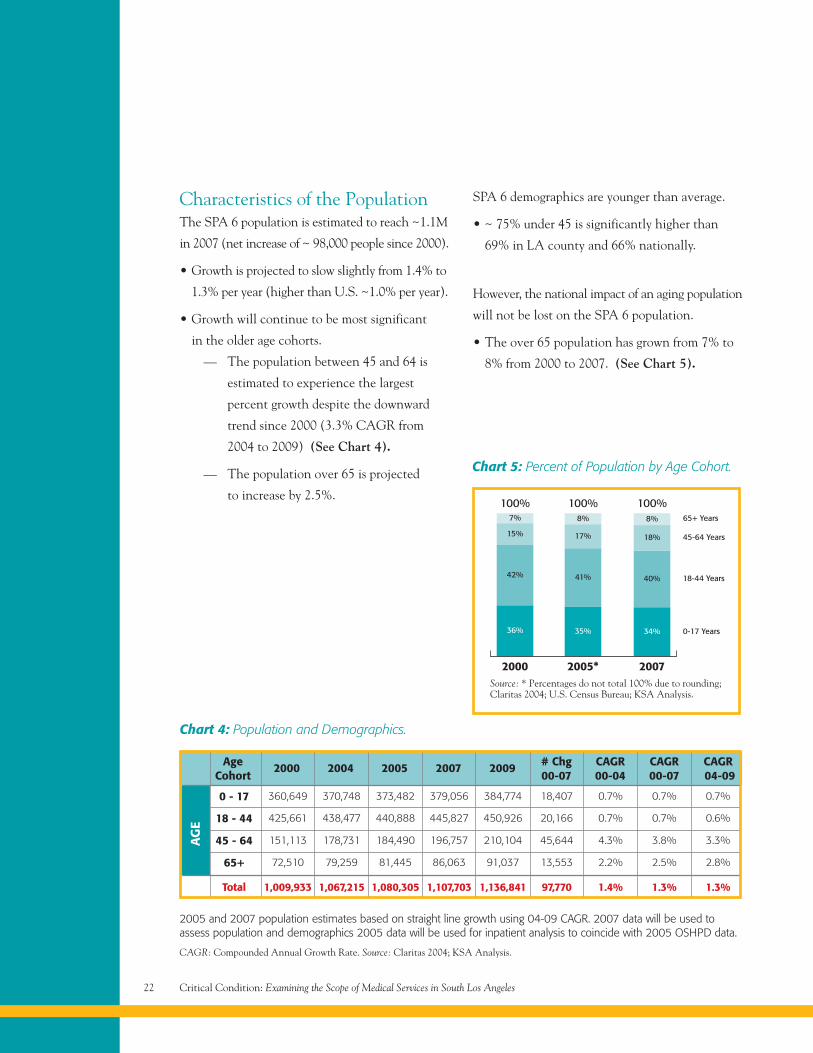
Chart 4: Population and Demographics.
CAGR: Compounded Annual Growth Rate. Source: Claritas 2004; KSA Analysis.
2005 and 2007 population estimates based on straight line growth using 04-09 CAGR. 2007 data will be used toassess population and demographics 2005 data will be used for inpatient analysis to coincide with 2005 OSHPD data.
0 - 17 360,649 370,748 373,482 379,056 384,774 18,407 0.7% 0.7% 0.7%
18 - 44 425,661 438,477 440,888 445,827 450,926 20,166 0.7% 0.7% 0.6%
45 - 64 151,113 178,731 184,490 196,757 210,104 45,644 4.3% 3.8% 3.3%
65+ 72,510 79,259 81,445 86,063 91,037 13,553 2.2% 2.5% 2.8%
Total 1,009,933 1,067,215 1,080,305 1,107,703 1,136,841 97,770 1.4% 1.3% 1.3%
AgeCohort
2000 2004 2005 2007 2009 # Chg00-07
CAGR00-04
CAGR00-07
CAGR04-09
AG
E
Critical Condition: Examining the Scope of Medical Services in South Los Angeles22
Characteristics of the PopulationThe SPA 6 population is estimated to reach ~1.1M
in 2007 (net increase of ~ 98,000 people since 2000).
• Growth is projected to slow slightly from 1.4% to
1.3% per year (higher than U.S. ~1.0% per year).
• Growth will continue to be most significant
in the older age cohorts.
— The population between 45 and 64 is
estimated to experience the largest
percent growth despite the downward
trend since 2000 (3.3% CAGR from
2004 to 2009) (See Chart 4).
— The population over 65 is projected
to increase by 2.5%.
SPA 6 demographics are younger than average.
• ~ 75% under 45 is significantly higher than
69% in LA county and 66% nationally.
However, the national impact of an aging population
will not be lost on the SPA 6 population.
• The over 65 population has grown from 7% to
8% from 2000 to 2007. (See Chart 5).
2000
100%7%
15%
42%
36%
2005*
100%8%
17%
41%
35%
2007
100%8%
40%
34%
65+ Years
45-64 Years
18-44 Years
0-17 Years
18%
Chart 5: Percent of Population by Age Cohort.
Source: * Percentages do not total 100% due to rounding;Claritas 2004; U.S. Census Bureau; KSA Analysis.
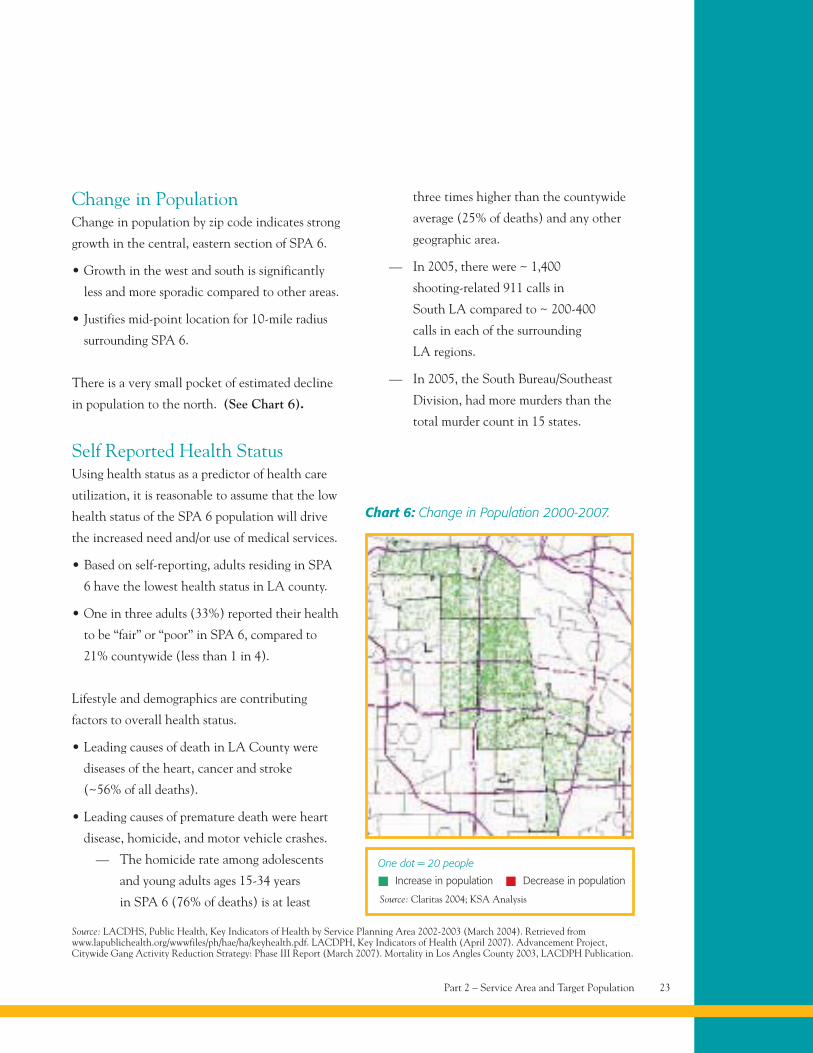
Change in PopulationChange in population by zip code indicates strong
growth in the central, eastern section of SPA 6.
• Growth in the west and south is significantly
less and more sporadic compared to other areas.
• Justifies mid-point location for 10-mile radius
surrounding SPA 6.
There is a very small pocket of estimated decline
in population to the north. (See Chart 6).
Self Reported Health StatusUsing health status as a predictor of health care
utilization, it is reasonable to assume that the low
health status of the SPA 6 population will drive
the increased need and/or use of medical services.
• Based on self-reporting, adults residing in SPA
6 have the lowest health status in LA county.
• One in three adults (33%) reported their health
to be “fair” or “poor” in SPA 6, compared to
21% countywide (less than 1 in 4).
Lifestyle and demographics are contributing
factors to overall health status.
• Leading causes of death in LA County were
diseases of the heart, cancer and stroke
(~56% of all deaths).
• Leading causes of premature death were heart
disease, homicide, and motor vehicle crashes.
— The homicide rate among adolescents
and young adults ages 15-34 years
in SPA 6 (76% of deaths) is at least
three times higher than the countywide
average (25% of deaths) and any other
geographic area.
— In 2005, there were ~ 1,400
shooting-related 911 calls in
South LA compared to ~ 200-400
calls in each of the surrounding
LA regions.
— In 2005, the South Bureau/Southeast
Division, had more murders than the
total murder count in 15 states.
Source: LACDHS, Public Health, Key Indicators of Health by Service Planning Area 2002-2003 (March 2004). Retrieved fromwww.lapublichealth.org/wwwfiles/ph/hae/ha/keyhealth.pdf. LACDPH, Key Indicators of Health (April 2007). Advancement Project,Citywide Gang Activity Reduction Strategy: Phase III Report (March 2007). Mortality in Los Angles County 2003, LACDPH Publication.
Part 2 – Service Area and Target Population 23
Increase in population Decrease in population
One dot = 20 people
Source: Claritas 2004; KSA Analysis
Chart 6: Change in Population 2000-2007.
Critical Condition: Examining the Scope of Medical Services in South Los Angeles24
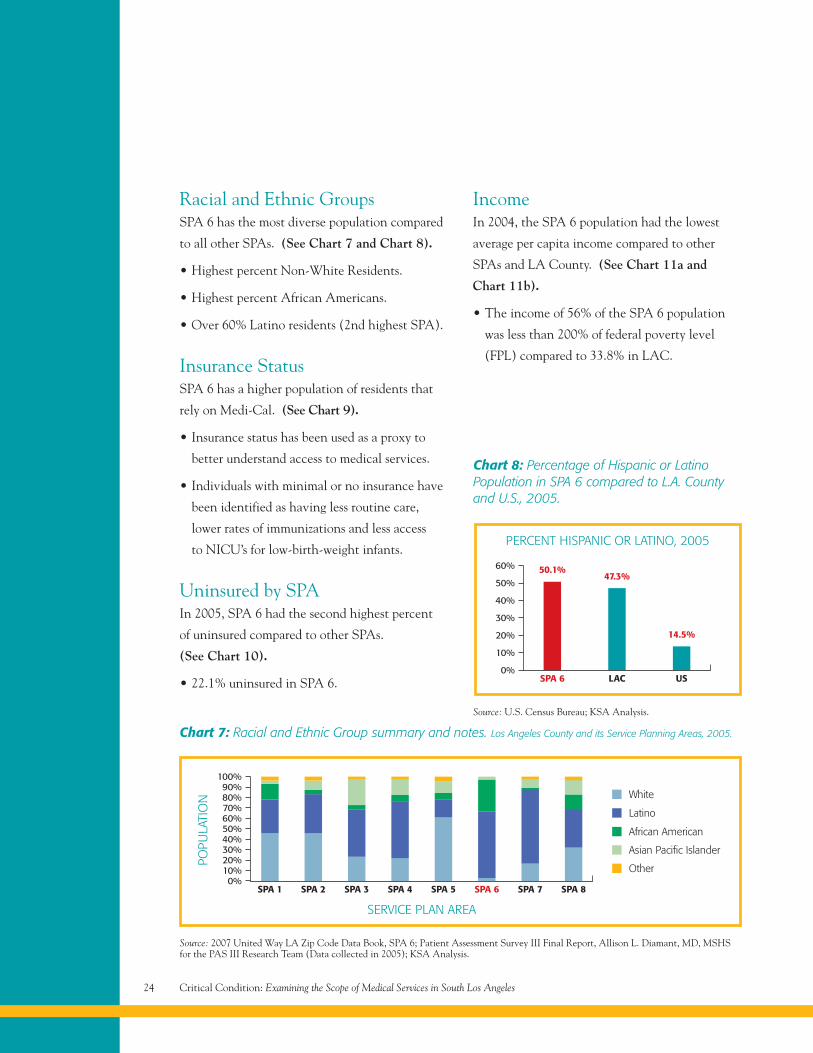
Racial and Ethnic GroupsSPA 6 has the most diverse population compared
to all other SPAs. (See Chart 7 and Chart 8).
• Highest percent Non-White Residents.
• Highest percent African Americans.
• Over 60% Latino residents (2nd highest SPA).
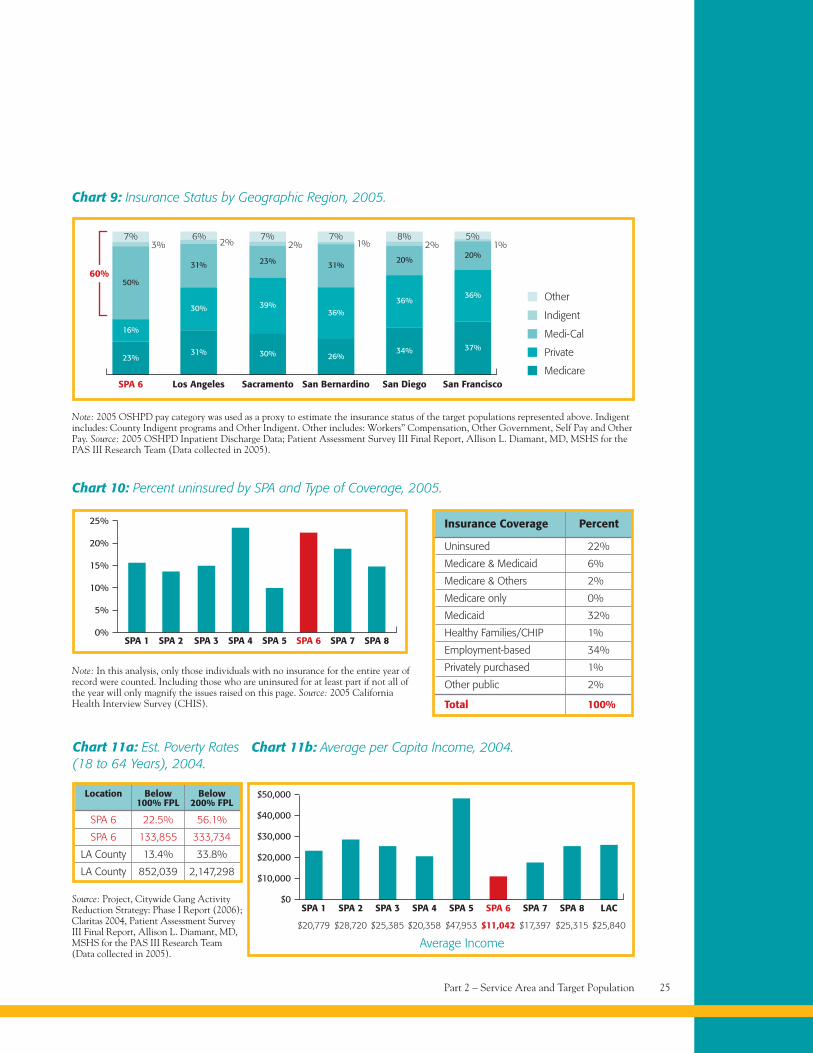
Insurance StatusSPA 6 has a higher population of residents that
rely on Medi-Cal. (See Chart 9).
• Insurance status has been used as a proxy to
better understand access to medical services.
• Individuals with minimal or no insurance have
been identified as having less routine care,
lower rates of immunizations and less access
to NICU’s for low-birth-weight infants.
Uninsured by SPAIn 2005, SPA 6 had the second highest percent
of uninsured compared to other SPAs.
(See Chart 10).
• 22.1% uninsured in SPA 6.
IncomeIn 2004, the SPA 6 population had the lowest
average per capita income compared to other
SPAs and LA County. (See Chart 11a and
Chart 11b).
• The income of 56% of the SPA 6 population
was less than 200% of federal poverty level
(FPL) compared to 33.8% in LAC.
SPA 1
100%90%80%70%60%50%40%30%20%10%0%
SPA 2 SPA 3 SPA 4 SPA 5 SPA 6 SPA 7
Chart 7: Racial and Ethnic Group summary and notes. Los Angeles County and its Service Planning Areas, 2005.
Source: 2007 United Way LA Zip Code Data Book, SPA 6; Patient Assessment Survey III Final Report, Allison L. Diamant, MD, MSHSfor the PAS III Research Team (Data collected in 2005); KSA Analysis.
White
Latino
African American
Asian Pacific Islander
Other
Chart 8: Percentage of Hispanic or LatinoPopulation in SPA 6 compared to L.A. Countyand U.S., 2005.
Source: U.S. Census Bureau; KSA Analysis.
SPA 8
POPU
LATI
ON
SERVICE PLAN AREA
SPA 60%
LAC US
PERCENT HISPANIC OR LATINO, 2005
10%
20%
30%
40%
50%
60% 50.1%47.3%
14.5%
60%
Part 2 – Service Area and Target Population 25
SPA 6
50%
16%
23%
Los Angeles
31%
30%
31%
Sacramento San Bernardino San Diego San Francisco
39%
30%
23%
36%
26%
31%
36%
34%
20%
36%
37%
20%
Chart 9: Insurance Status by Geographic Region, 2005.
Note: 2005 OSHPD pay category was used as a proxy to estimate the insurance status of the target populations represented above. Indigentincludes: County Indigent programs and Other Indigent. Other includes: Workers” Compensation, Other Government, Self Pay and OtherPay. Source: 2005 OSHPD Inpatient Discharge Data; Patient Assessment Survey III Final Report, Allison L. Diamant, MD, MSHS for thePAS III Research Team (Data collected in 2005).
7%3%
6%2%
7%2%
7%1%
8%2%
5%1%
Other
Indigent
Medi-Cal
Private
Medicare
SPA 10%
SPA 2 SPA 3 SPA 4 SPA 5 SPA 6 SPA 7
Chart 10: Percent uninsured by SPA and Type of Coverage, 2005.
Note: In this analysis, only those individuals with no insurance for the entire year ofrecord were counted. Including those who are uninsured for at least part if not all ofthe year will only magnify the issues raised on this page. Source: 2005 CaliforniaHealth Interview Survey (CHIS).
SPA 8
10%
15%
20%
25%
5%
Uninsured 22%
Medicare & Medicaid 6%
Medicare & Others 2%
Medicare only 0%
Medicaid 32%
Healthy Families/CHIP 1%
Employment-based 34%
Privately purchased 1%
Other public 2%
Total 100%
Insurance Coverage Percent
SPA 6 22.5% 56.1%
SPA 6 133,855 333,734
LA County 13.4% 33.8%
LA County 852,039 2,147,298
Location Below Below100% FPL 200% FPL
Chart 11a: Est. Poverty Rates(18 to 64 Years), 2004.
SPA 1$0
SPA 2 SPA 3 SPA 4 SPA 5 SPA 6 SPA 7
Chart 11b: Average per Capita Income, 2004.
Source: Project, Citywide Gang ActivityReduction Strategy: Phase I Report (2006);Claritas 2004, Patient Assessment SurveyIII Final Report, Allison L. Diamant, MD,MSHS for the PAS III Research Team(Data collected in 2005).
SPA 8 LAC
$20,779 $28,720 $25,385 $20,358 $47,953 $11,042 $17,397 $25,315 $25,840
Average Income
$10,000
$20,000
$30,000
$40,000
$50,000

SPA 6 has the most
diverse populations
compared to all
other SPAs, with a
high percentage of
African Americans.
Part 3Health Care Services
Trauma and Emergency Services 28
Acute Care 30
Ambulatory Care 35
Post Acute Care 48
Public Health 54
Critical Condition: Examining the Scope of Medical Services in South Los Angeles28
Health Care Services
Trauma and Emergency ServicesTo assess if residents of SPA 6 have access to
trauma and emergent services, we will identify
the current demand for these services in relation
to the existing capacity of trauma centers and
emergency departments.
Indicators of demand include the following:
• Population/demographic characteristics.
• Income/Health Insurance.
• Homicide rates.
• ED treatment station need.
The diverse make up and low income characteristics
of the SPA 6 population, coupled to the high
homicide rate indicates a relatively high demand
for trauma and emergency services.
• Additionally, access to trauma centers/emergency
departments is crucial for victims of violent
crimes. Using homicides as a proxy to assess the
rate of violent crimes, the SPA 6 population is
in further demand for trauma/emergent services.
– In 2003, homicide was the second
leading cause of pre-mature death
in the County.
– It was the 4th cause of death and
1st cause of premature death among
Hispanics, and;
– The 5th leading cause of death and
1st cause of premature death among
African Americans.
— In 2005, SPA 6 had the highest rate
of homicides among 15-34 year-olds
compared to other SPAs and LAC
(75.6% SPA 6 vs. 25.0% LAC).
• From 2002 to 2004, 70% of King/Harbor patients
were from SPA 6 and 80% of patients were
admitted through the ED.
• African Americans and Whites were found to be
more in need of ED services compared to Latinos
and Asian/Pacific Islanders (~ 40% vs. 18%).
• ~ 75% of LAC-DHS patients were in need of
emergency services (e.g., they felt their condition
was an emergency, they were told to go to the
ED by their doctor, or they were brought to the
ED by ambulance).
• Insured consumers (specifically chronically ill
adults and patients covered by Medi-Cal) are
most prone to ED use.
In 2004-2005 there was 1 trauma center (St.
Francis) and 2 hospitals with EDs (King/Harbor
and St. Francis) to serve the population of SPA 6.
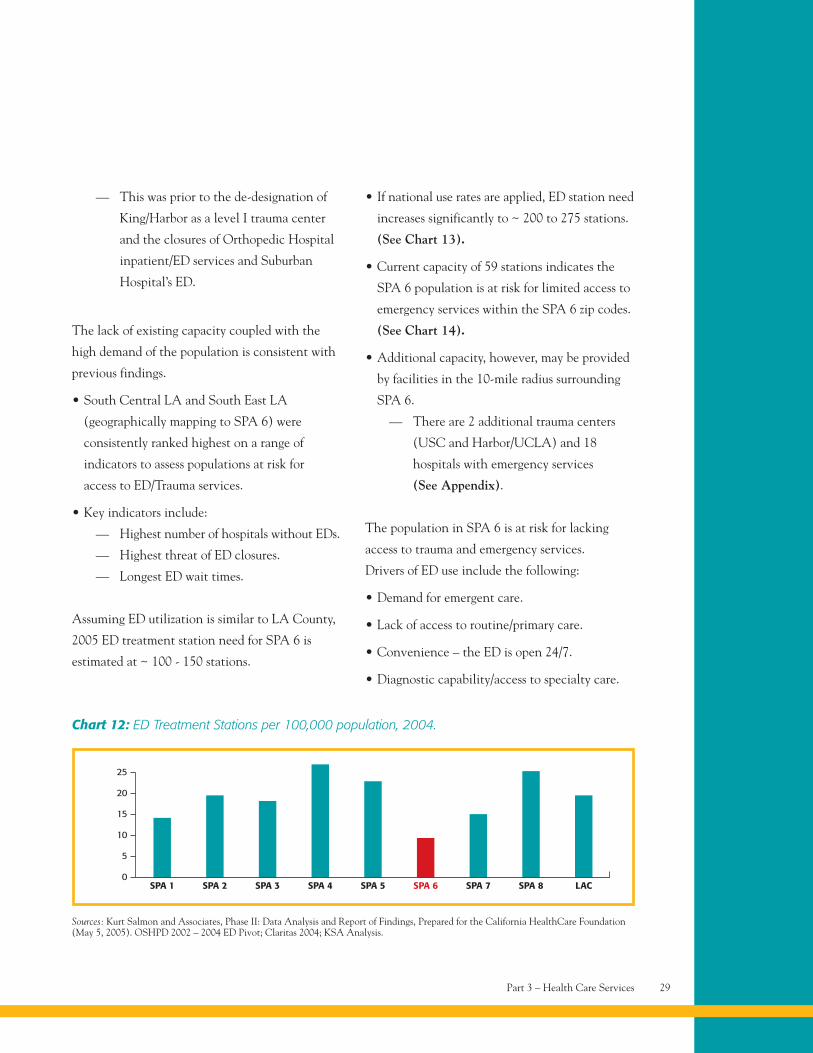
• In 2004, SPA 6 had the lowest number of ED
treatment stations per 100,000 compared to
LAC and other SPAs. (See Chart 12).
Sources: Overuse of Emergency Departments Among Insured Californians, CHCF Issue Brief Oct. 2006; Key Indicators of Health by ServicePlanning Area, 2007 (LACDPH Publication); Bitler, M and Shi, W., Health Insurance, Health Care Use and Health Status in Los AngelesCounty, Public Policy Institute of CA 2006; Patient Assessment Survey III, Final Report; King/Harbor Hospital Transition Report, NHF2005; KSA Analysis.).
Part 3 – Health Care Services 29
— This was prior to the de-designation of
King/Harbor as a level I trauma center
and the closures of Orthopedic Hospital
inpatient/ED services and Suburban
Hospital’s ED.
The lack of existing capacity coupled with the
high demand of the population is consistent with
previous findings.
• South Central LA and South East LA
(geographically mapping to SPA 6) were
consistently ranked highest on a range of
indicators to assess populations at risk for
access to ED/Trauma services.
• Key indicators include:
— Highest number of hospitals without EDs.
— Highest threat of ED closures.
— Longest ED wait times.
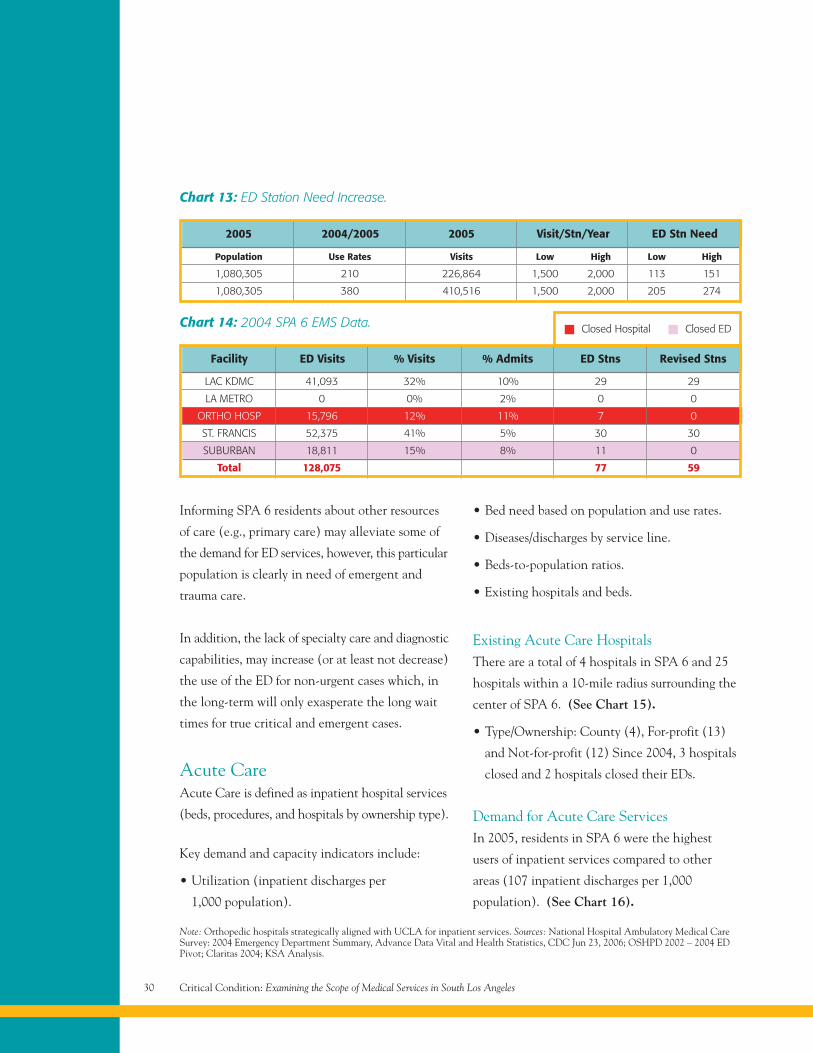
Assuming ED utilization is similar to LA County,
2005 ED treatment station need for SPA 6 is
estimated at ~ 100 - 150 stations.
• If national use rates are applied, ED station need
increases significantly to ~ 200 to 275 stations.
(See Chart 13).
• Current capacity of 59 stations indicates the
SPA 6 population is at risk for limited access to
emergency services within the SPA 6 zip codes.
(See Chart 14).
• Additional capacity, however, may be provided
by facilities in the 10-mile radius surrounding
SPA 6.
— There are 2 additional trauma centers
(USC and Harbor/UCLA) and 18
hospitals with emergency services
(See Appendix).
The population in SPA 6 is at risk for lacking
access to trauma and emergency services.
Drivers of ED use include the following:
• Demand for emergent care.
• Lack of access to routine/primary care.
• Convenience – the ED is open 24/7.
• Diagnostic capability/access to specialty care.
Sources: Kurt Salmon and Associates, Phase II: Data Analysis and Report of Findings, Prepared for the California HealthCare Foundation(May 5, 2005). OSHPD 2002 – 2004 ED Pivot; Claritas 2004; KSA Analysis.
SPA 10
SPA 2 SPA 3 SPA 4 SPA 5 SPA 6 SPA 7
Chart 12: ED Treatment Stations per 100,000 population, 2004.
SPA 8 LAC
5
10
15
20
25
Critical Condition: Examining the Scope of Medical Services in South Los Angeles30
Note: Orthopedic hospitals strategically aligned with UCLA for inpatient services. Sources: National Hospital Ambulatory Medical CareSurvey: 2004 Emergency Department Summary, Advance Data Vital and Health Statistics, CDC Jun 23, 2006; OSHPD 2002 – 2004 EDPivot; Claritas 2004; KSA Analysis.
Population Use Rates Visits Low High Low High
1,080,305 210 226,864 1,500 2,000 113 151
1,080,305 380 410,516 1,500 2,000 205 274
2005 2004/2005 2005 Visit/Stn/Year ED Stn Need
Chart 13: ED Station Need Increase.
LAC KDMC 41,093 32% 10% 29 29
LA METRO 0 0% 2% 0 0
ORTHO HOSP 15,796 12% 11% 7 0
ST. FRANCIS 52,375 41% 5% 30 30
SUBURBAN 18,811 15% 8% 11 0
Total 128,075 77 59
Facility ED Visits % Visits % Admits ED Stns Revised Stns
Chart 14: 2004 SPA 6 EMS Data. Closed Hospital Closed ED
Informing SPA 6 residents about other resources
of care (e.g., primary care) may alleviate some of
the demand for ED services, however, this particular
population is clearly in need of emergent and
trauma care.
In addition, the lack of specialty care and diagnostic
capabilities, may increase (or at least not decrease)
the use of the ED for non-urgent cases which, in
the long-term will only exasperate the long wait
times for true critical and emergent cases.
Acute CareAcute Care is defined as inpatient hospital services
(beds, procedures, and hospitals by ownership type).
Key demand and capacity indicators include:
• Utilization (inpatient discharges per
1,000 population).
• Bed need based on population and use rates.
• Diseases/discharges by service line.
• Beds-to-population ratios.
• Existing hospitals and beds.
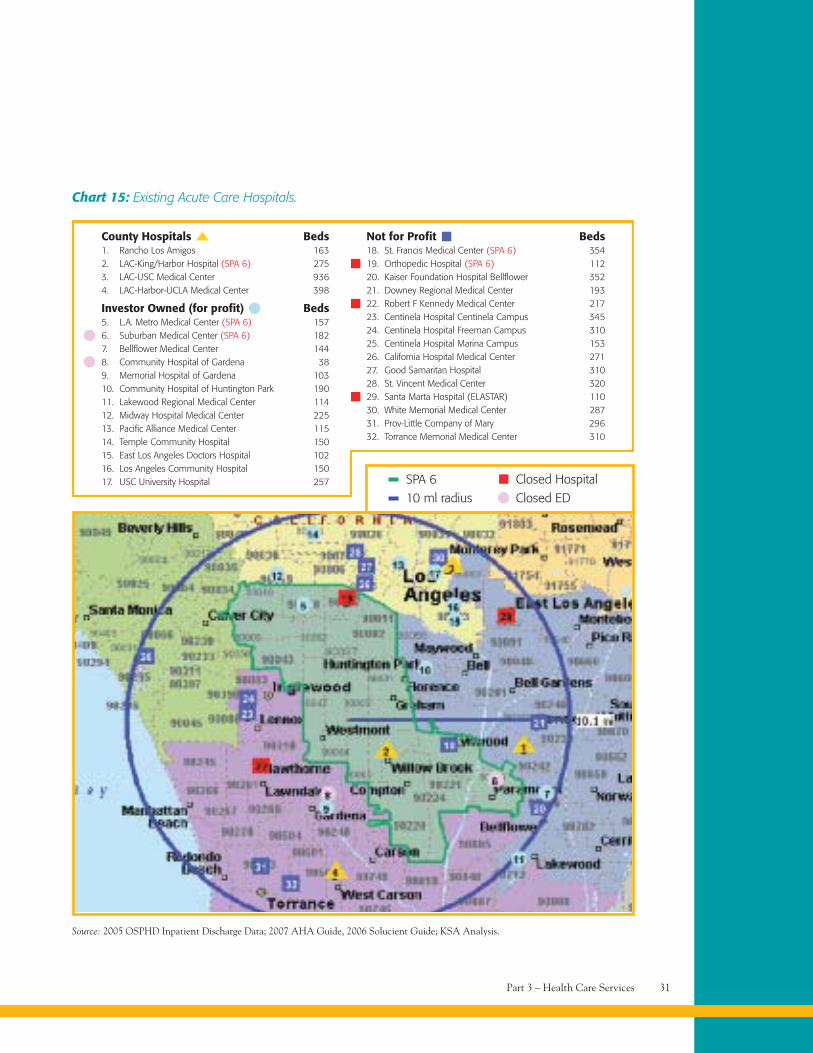
Existing Acute Care HospitalsThere are a total of 4 hospitals in SPA 6 and 25
hospitals within a 10-mile radius surrounding the
center of SPA 6. (See Chart 15).
• Type/Ownership: County (4), For-profit (13)
and Not-for-profit (12) Since 2004, 3 hospitals
closed and 2 hospitals closed their EDs.
Demand for Acute Care ServicesIn 2005, residents in SPA 6 were the highest
users of inpatient services compared to other
areas (107 inpatient discharges per 1,000
population). (See Chart 16).
Part 3 – Health Care Services 31
Chart 15: Existing Acute Care Hospitals.
Source: 2005 OSPHD Inpatient Discharge Data; 2007 AHA Guide, 2006 Solucient Guide; KSA Analysis.
County Hospitals Beds1. Rancho Los Amigos 1632. LAC-King/Harbor Hospital (SPA 6) 2753. LAC-USC Medical Center 9364. LAC-Harbor-UCLA Medical Center 398
Investor Owned (for profit) Beds5. L.A. Metro Medical Center (SPA 6) 1576. Suburban Medical Center (SPA 6) 1827. Bellflower Medical Center 1448. Community Hospital of Gardena 389. Memorial Hospital of Gardena 10310. Community Hospital of Huntington Park 19011. Lakewood Regional Medical Center 11412. Midway Hospital Medical Center 22513. Pacific Alliance Medical Center 11514. Temple Community Hospital 15015. East Los Angeles Doctors Hospital 10216. Los Angeles Community Hospital 15017. USC University Hospital 257 SPA 6
10 ml radiusClosed HospitalClosed ED
Not for Profit Beds18. St. Francis Medical Center (SPA 6) 35419. Orthopedic Hospital (SPA 6) 11220. Kaiser Foundation Hospital Bellflower 35221. Downey Regional Medical Center 19322. Robert F Kennedy Medical Center 21723. Centinela Hospital Centinela Campus 34524. Centinela Hospital Freeman Campus 31025. Centinela Hospital Marina Campus 15326. California Hospital Medical Center 27127. Good Samaritan Hospital 31028. St. Vincent Medical Center 32029. Santa Marta Hospital (ELASTAR) 11030. White Memorial Medical Center 28731. Prov-Little Company of Mary 29632. Torrance Memorial Medical Center 310
Critical Condition: Examining the Scope of Medical Services in South Los Angeles32
County 2005 Acute CarePopulation Discharges Use Rate
Chart 16: SPA 6 similar in use of healthservices compared to other counties.
SPA 6 1,080,305 115,428 107
Los Angeles 9,758,886 1,027,237 105
Sacramento 1,337,942 132,896 99
San Bernardino 1,916,665 203,926 106
San Diego 2,824,259 269,652 95
San Francisco 719,077 72,481 101
CA 36,457,549 3,673,824 1010 - 17 Years
59.8
18 - 44
91.5
45 - 64 65+
121.8
373.4
Note: Los Angeles County Population in table above is from 2005 Census to maintain consistency with other County benchmarks.Source: Claritas 2004 (2005 Est.); 2005 U.S. Census Bureau; OSPHD 2005 Inpatient Discharge Data; KSA Analysis.
107 Total SPA 6 Use Rate
101 Total California Use Rate
Chart 17: 2005 Bed Need.
÷ =
Notes: Bed need based on 2005 patient days originating from SPA 6 zip codes; assumes target occupancy of 75%.
18 - 44 440,939 40,429 91.7 3.51 142,001 389 519
45 - 64 184,606 22,512 121.9 5.44 122,532 336 448
65+ 81,486 30,133 369.8 6.21 187,220 513 684
Total 1,080,543 115,428 106.8 5.03 580,824 1,591 2,122
AG
E
Source: Claritas 2004 (2005 Est.); 2005 OSPHD Inpatient Discharge Data; KSA Analysis.
AgeCohort
2005Population
2005Discharges
2005Use Rates
ALOS PatientDays
ADC BedNeed
0 - 17 373,512 22,353 59.8 5.77 29,071 354 471
Methodology2005
Patient Days365 DaysPer Year
2005ADC ÷ =2005
ADCTarget
Occupancy2005 Bed
Need
Inpatient Discharges per1,000 Population, 2005
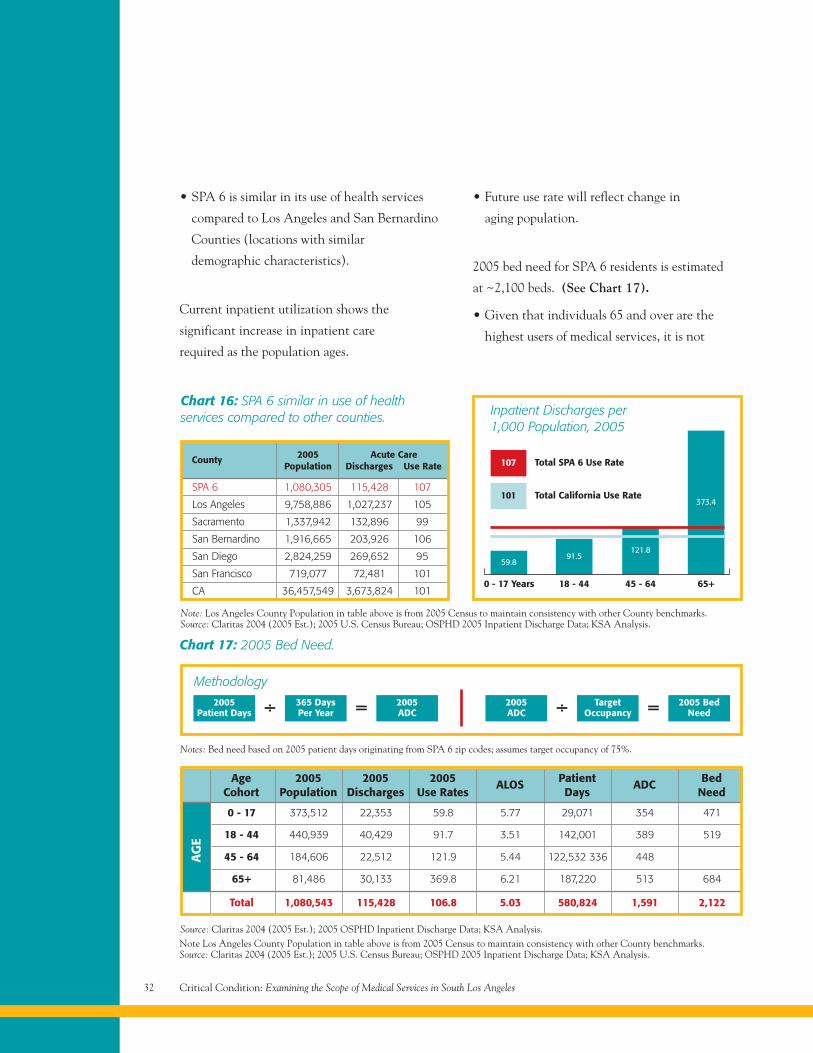
• SPA 6 is similar in its use of health services
compared to Los Angeles and San Bernardino
Counties (locations with similar
demographic characteristics).
Current inpatient utilization shows the
significant increase in inpatient care
required as the population ages.
• Future use rate will reflect change in
aging population.
2005 bed need for SPA 6 residents is estimated
at ~2,100 beds. (See Chart 17).
• Given that individuals 65 and over are the
highest users of medical services, it is not
Note Los Angeles County Population in table above is from 2005 Census to maintain consistency with other County benchmarks.Source: Claritas 2004 (2005 Est.); 2005 U.S. Census Bureau; OSPHD 2005 Inpatient Discharge Data; KSA Analysis.
Part 3 – Health Care Services 33
surprising that this age cohort drives the
largest need for acute care beds (~680 beds).
• ~470 beds are needed for the young
adult/pediatric populations (age 0-17).
• Note: Bed NEED defined as DEMAND for acute
care beds based on current utilization patterns.
Does not assess if beds are available upon need.
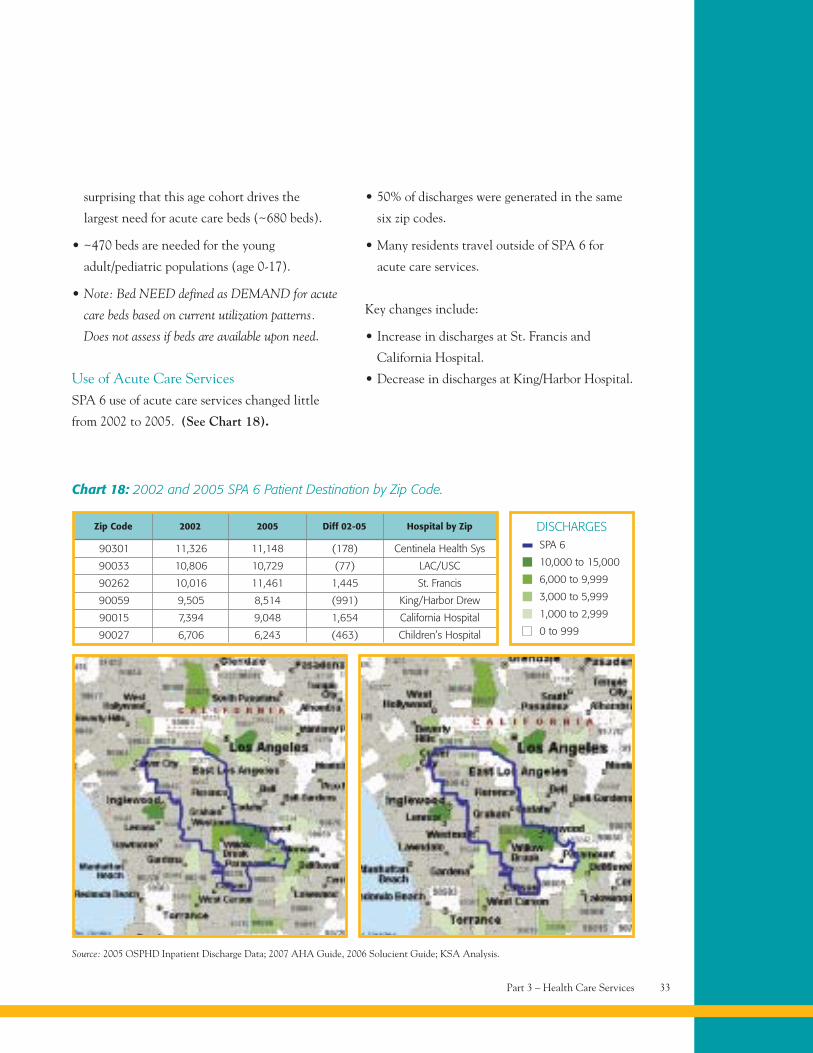
Use of Acute Care ServicesSPA 6 use of acute care services changed little
from 2002 to 2005. (See Chart 18).
• 50% of discharges were generated in the same
six zip codes.
• Many residents travel outside of SPA 6 for
acute care services.
Key changes include:
• Increase in discharges at St. Francis and
California Hospital.
• Decrease in discharges at King/Harbor Hospital.
Zip Code 2002 2005 Diff 02-05 Hospital by Zip
Chart 18: 2002 and 2005 SPA 6 Patient Destination by Zip Code.
Source: 2005 OSPHD Inpatient Discharge Data; 2007 AHA Guide, 2006 Solucient Guide; KSA Analysis.
10,000 to 15,000
6,000 to 9,999
3,000 to 5,999
1,000 to 2,999
0 to 999
DISCHARGES
90301 11,326 11,148 (178) Centinela Health Sys
90033 10,806 10,729 (77) LAC/USC
90262 10,016 11,461 1,445 St. Francis
90059 9,505 8,514 (991) King/Harbor Drew
90015 7,394 9,048 1,654 California Hospital
90027 6,706 6,243 (463) Children’s Hospital
SPA 6
Critical Condition: Examining the Scope of Medical Services in South Los Angeles34
Source: 2005 OSPHD Inpatient Discharge Data; 2007 AHA Guide, 2006 Solucient Guide; KSA Analysis.
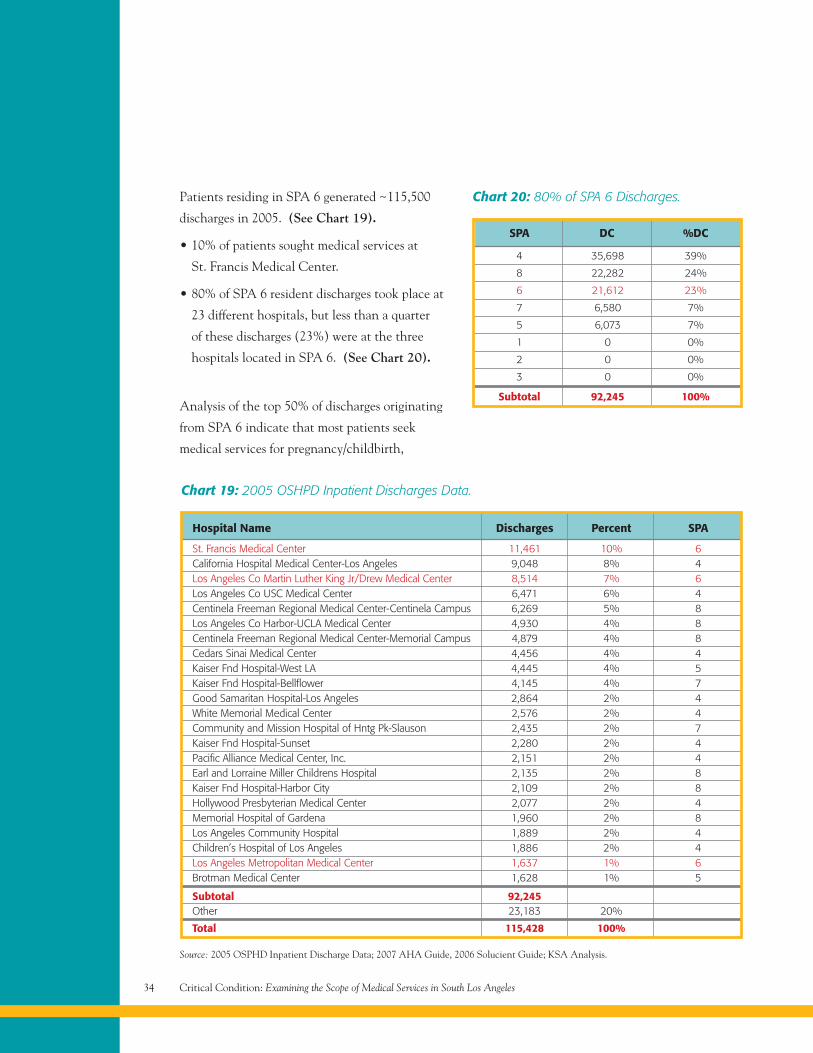
Chart 19: 2005 OSHPD Inpatient Discharges Data.
Hospital Name Discharges Percent SPA
St. Francis Medical Center 11,461 10% 6California Hospital Medical Center-Los Angeles 9,048 8% 4Los Angeles Co Martin Luther King Jr/Drew Medical Center 8,514 7% 6Los Angeles Co USC Medical Center 6,471 6% 4Centinela Freeman Regional Medical Center-Centinela Campus 6,269 5% 8Los Angeles Co Harbor-UCLA Medical Center 4,930 4% 8Centinela Freeman Regional Medical Center-Memorial Campus 4,879 4% 8Cedars Sinai Medical Center 4,456 4% 4Kaiser Fnd Hospital-West LA 4,445 4% 5Kaiser Fnd Hospital-Bellflower 4,145 4% 7Good Samaritan Hospital-Los Angeles 2,864 2% 4White Memorial Medical Center 2,576 2% 4Community and Mission Hospital of Hntg Pk-Slauson 2,435 2% 7Kaiser Fnd Hospital-Sunset 2,280 2% 4Pacific Alliance Medical Center, Inc. 2,151 2% 4Earl and Lorraine Miller Childrens Hospital 2,135 2% 8Kaiser Fnd Hospital-Harbor City 2,109 2% 8Hollywood Presbyterian Medical Center 2,077 2% 4Memorial Hospital of Gardena 1,960 2% 8Los Angeles Community Hospital 1,889 2% 4Children’s Hospital of Los Angeles 1,886 2% 4Los Angeles Metropolitan Medical Center 1,637 1% 6Brotman Medical Center 1,628 1% 5
Subtotal 92,245Other 23,183 20%
Total 115,428 100%
Patients residing in SPA 6 generated ~115,500
discharges in 2005. (See Chart 19).
• 10% of patients sought medical services at
St. Francis Medical Center.
• 80% of SPA 6 resident discharges took place at
23 different hospitals, but less than a quarter
of these discharges (23%) were at the three
hospitals located in SPA 6. (See Chart 20).
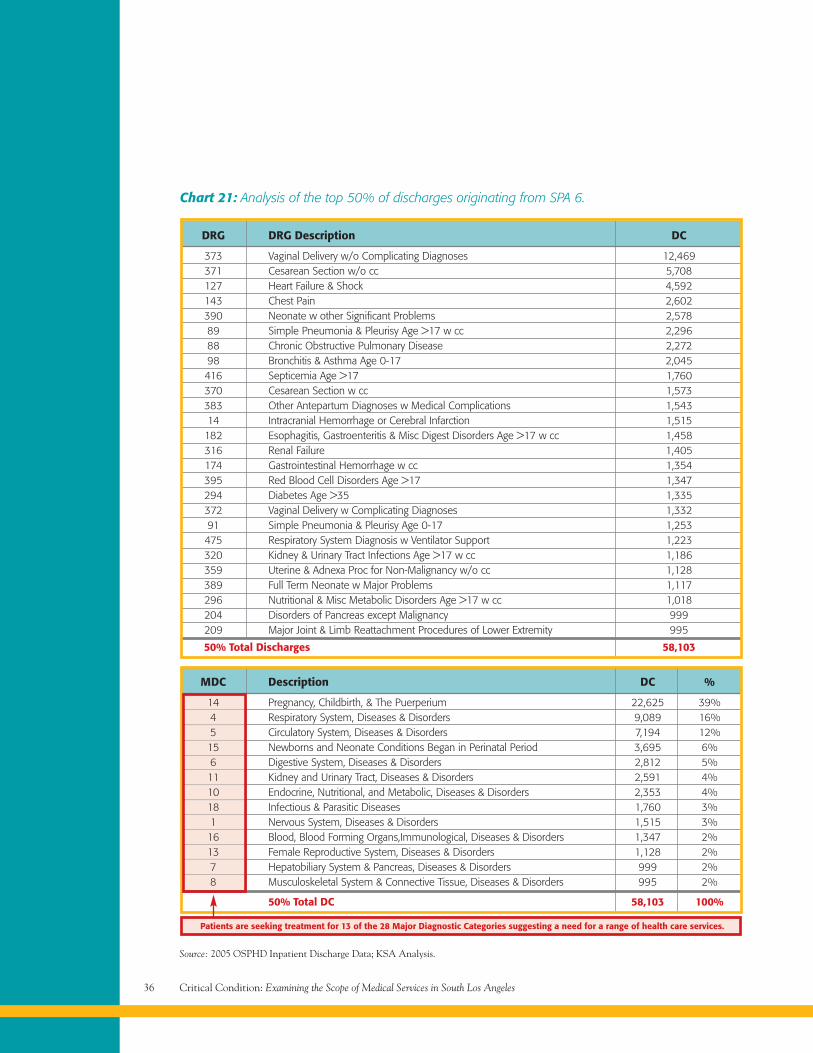
Analysis of the top 50% of discharges originating
from SPA 6 indicate that most patients seek
medical services for pregnancy/childbirth,
4 35,698 39%
8 22,282 24%
6 21,612 23%
7 6,580 7%
5 6,073 7%
1 0 0%
2 0 0%
3 0 0%
Subtotal 92,245 100%
SPA DC %DC
Chart 20: 80% of SPA 6 Discharges.
Part 3 – Health Care Services 35
respiratory care, and circulatory disorders;
however, a full spectrum of services are needed
to serve the population. (See Chart 21).
• 39% of the top 50% of discharges were for
women’s and children services.
• The top 50% of discharges by DRG (Diagnosis
Related Group) is similar to CA with the
exception of Simple Pneumonia and Major
Joint Procedures (most likely a reflection of
the younger demographic profile in SPA 6).
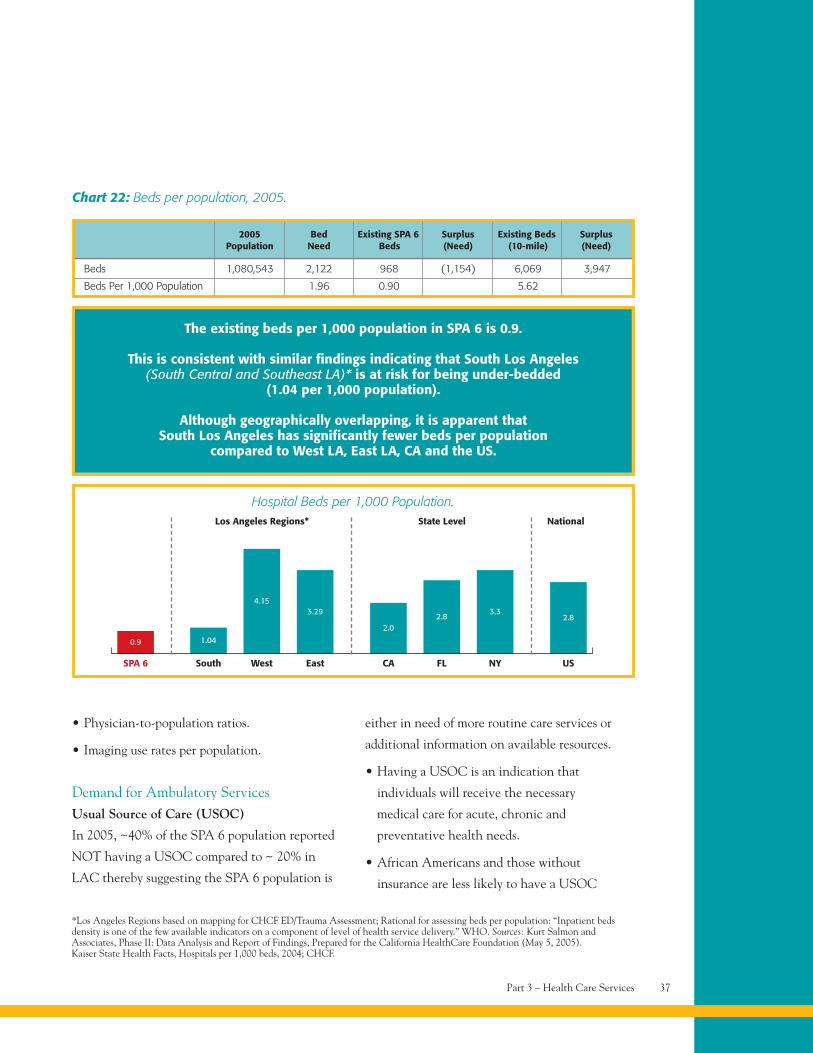
Acute Care Gaps in ServicesCoupling demand with existing supply there
is a need for ~1,200 additional beds in SPA 6
suggesting this population is at risk for access to
available inpatient beds. (See Chart 22).
• If additional capacity can be provided
by surrounding hospitals, the bed deficit
diminishes; however, this does not factor
in the communities currently being served
by those hospitals.
Acute Care Key FindingsIs there enough acute care capacity available
to satisfy the demand for services?
• Patients originating from SPA 6 zip codes
tend to use health services at a same rate
as populations with similar characteristics
(e.g., diverse population, low-income,
high dependency on Medi-Cal and indigent
care) such as Los Angeles County and
San Bernardino County.
• Total estimated bed need, based on current
utilization, for SPA 6 in 2005 is ~ 2,100 beds.
• The number of existing beds available in
SPA 6 today suggests this population is at
risk for limited access to inpatient services.
However….
• SPA 6 residents tend to seek care at hospitals
in the neighboring communities.
— This has been a consistent trend,
with slight variations, since 2002.
Implications
• As the population continues to grow the demand
for medical services will continue to increase.
• Existing hospitals will need to ensure
bed availability for the communities
they currently serve.
• Due to data limitations, it could be that the
need for acute care services is greater than the
demand, suggesting a higher bed than specified.
Ambulatory CareAmbulatory care is defined as outpatient visits
and clinics (primary care and specialty care)
as well as outpatient diagnostic and treatment
volumes and modalities (e.g., surgery, endoscopy,
cath and imaging).
While few methodologies exist to measure,
reliably, demand for ambulatory services, several
indicators have been identified, including:
• Usual source of care.
• Wait times for an appointment.
• Ambulatory care-sensitive conditions (ACS).
• Visits per population.
Critical Condition: Examining the Scope of Medical Services in South Los Angeles36
Source: 2005 OSPHD Inpatient Discharge Data; KSA Analysis.
Chart 21: Analysis of the top 50% of discharges originating from SPA 6.
DRG DRG Description DC
373 Vaginal Delivery w/o Complicating Diagnoses 12,469371 Cesarean Section w/o cc 5,708127 Heart Failure & Shock 4,592143 Chest Pain 2,602390 Neonate w other Significant Problems 2,57889 Simple Pneumonia & Pleurisy Age >17 w cc 2,29688 Chronic Obstructive Pulmonary Disease 2,27298 Bronchitis & Asthma Age 0-17 2,045416 Septicemia Age >17 1,760370 Cesarean Section w cc 1,573383 Other Antepartum Diagnoses w Medical Complications 1,54314 Intracranial Hemorrhage or Cerebral Infarction 1,515182 Esophagitis, Gastroenteritis & Misc Digest Disorders Age >17 w cc 1,458316 Renal Failure 1,405174 Gastrointestinal Hemorrhage w cc 1,354395 Red Blood Cell Disorders Age >17 1,347294 Diabetes Age >35 1,335372 Vaginal Delivery w Complicating Diagnoses 1,33291 Simple Pneumonia & Pleurisy Age 0-17 1,253475 Respiratory System Diagnosis w Ventilator Support 1,223320 Kidney & Urinary Tract Infections Age >17 w cc 1,186359 Uterine & Adnexa Proc for Non-Malignancy w/o cc 1,128389 Full Term Neonate w Major Problems 1,117296 Nutritional & Misc Metabolic Disorders Age >17 w cc 1,018204 Disorders of Pancreas except Malignancy 999209 Major Joint & Limb Reattachment Procedures of Lower Extremity 995
50% Total Discharges 58,103
Patients are seeking treatment for 13 of the 28 Major Diagnostic Categories suggesting a need for a range of health care services.
MDC Description DC %
14 Pregnancy, Childbirth, & The Puerperium 22,625 39%4 Respiratory System, Diseases & Disorders 9,089 16%5 Circulatory System, Diseases & Disorders 7,194 12%15 Newborns and Neonate Conditions Began in Perinatal Period 3,695 6%6 Digestive System, Diseases & Disorders 2,812 5%11 Kidney and Urinary Tract, Diseases & Disorders 2,591 4%10 Endocrine, Nutritional, and Metabolic, Diseases & Disorders 2,353 4%18 Infectious & Parasitic Diseases 1,760 3%1 Nervous System, Diseases & Disorders 1,515 3%16 Blood, Blood Forming Organs,Immunological, Diseases & Disorders 1,347 2%13 Female Reproductive System, Diseases & Disorders 1,128 2%7 Hepatobiliary System & Pancreas, Diseases & Disorders 999 2%8 Musculoskeletal System & Connective Tissue, Diseases & Disorders 995 2%
50% Total DC 58,103 100%
Part 3 – Health Care Services 37
• Physician-to-population ratios.
• Imaging use rates per population.
Demand for Ambulatory ServicesUsual Source of Care (USOC)
In 2005, ~40% of the SPA 6 population reported
NOT having a USOC compared to ~ 20% in
LAC thereby suggesting the SPA 6 population is
either in need of more routine care services or
additional information on available resources.
• Having a USOC is an indication that
individuals will receive the necessary
medical care for acute, chronic and
preventative health needs.
• African Americans and those without
insurance are less likely to have a USOC
2005 Bed Existing SPA 6 Surplus Existing Beds SurplusPopulation Need Beds (Need) (10-mile) (Need)
Chart 22: Beds per population, 2005.
Beds 1,080,543 2,122 968 (1,154) 6,069 3,947
Beds Per 1,000 Population 1.96 0.90 5.62
The existing beds per 1,000 population in SPA 6 is 0.9.
This is consistent with similar findings indicating that South Los Angeles(South Central and Southeast LA)* is at risk for being under-bedded
(1.04 per 1,000 population).
Although geographically overlapping, it is apparent thatSouth Los Angeles has significantly fewer beds per population
compared to West LA, East LA, CA and the US.
SPA 6
0.9
South
1.04
West
4.15
East
3.29
CA
2.0
FL
2.8
NY
3.3
US
2.8
Hospital Beds per 1,000 Population.
*Los Angeles Regions based on mapping for CHCF ED/Trauma Assessment; Rational for assessing beds per population: “Inpatient bedsdensity is one of the few available indicators on a component of level of health service delivery.” WHO. Sources: Kurt Salmon andAssociates, Phase II: Data Analysis and Report of Findings, Prepared for the California HealthCare Foundation (May 5, 2005).Kaiser State Health Facts, Hospitals per 1,000 beds, 2004; CHCF.
Los Angeles Regions* State Level National
compared to other races/ethnicities and
those with insurance.
— The high percentage of African
Americans and under/uninsured in
SPA 6 puts this population further
at risk for limited access to a USOC**.
Access/Wait Times
• Long wait times indicate the supply of
ambulatory services (whether physicians
or clinics) is not meeting the demands
of the population.
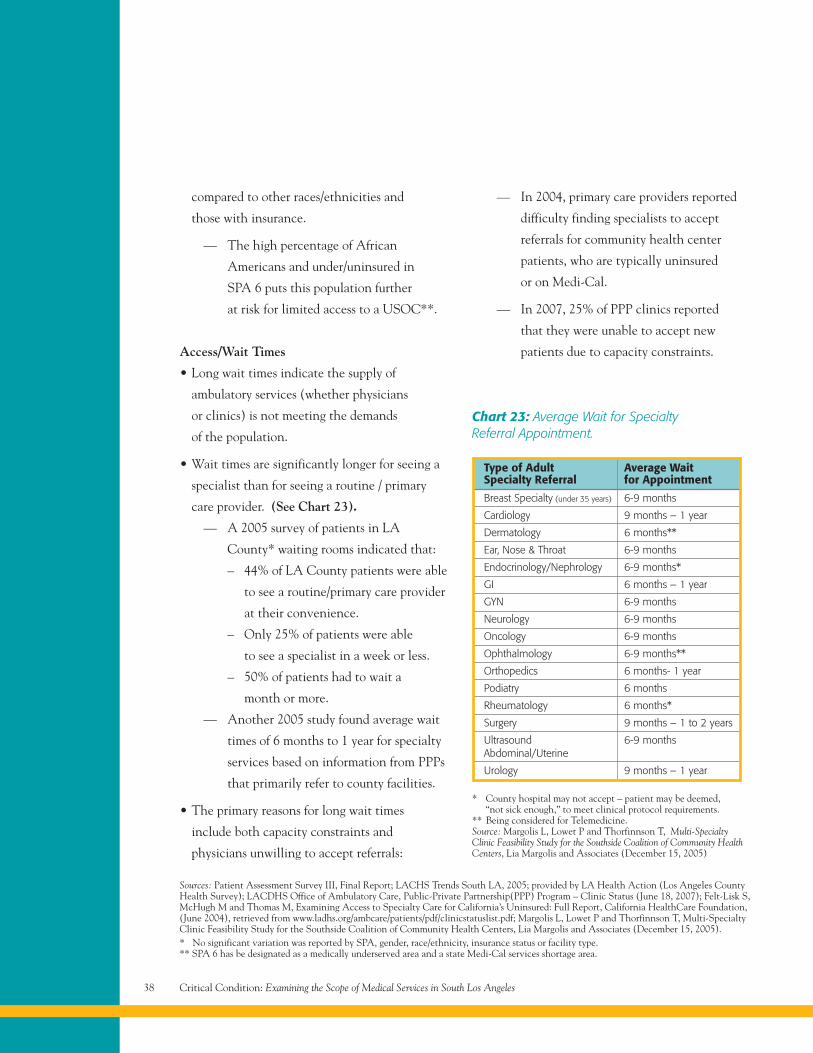
• Wait times are significantly longer for seeing a
specialist than for seeing a routine / primary
care provider. (See Chart 23).
— A 2005 survey of patients in LA
County* waiting rooms indicated that:
– 44% of LA County patients were able
to see a routine/primary care provider
at their convenience.
– Only 25% of patients were able
to see a specialist in a week or less.
– 50% of patients had to wait a
month or more.
— Another 2005 study found average wait
times of 6 months to 1 year for specialty
services based on information from PPPs
that primarily refer to county facilities.
• The primary reasons for long wait times
include both capacity constraints and
physicians unwilling to accept referrals:
— In 2004, primary care providers reported
difficulty finding specialists to accept
referrals for community health center
patients, who are typically uninsured
or on Medi-Cal.
— In 2007, 25% of PPP clinics reported
that they were unable to accept new
patients due to capacity constraints.
Critical Condition: Examining the Scope of Medical Services in South Los Angeles38
Sources: Patient Assessment Survey III, Final Report; LACHS Trends South LA, 2005; provided by LA Health Action (Los Angeles CountyHealth Survey); LACDHS Office of Ambulatory Care, Public-Private Partnership(PPP) Program – Clinic Status (June 18, 2007); Felt-Lisk S,McHugh M and Thomas M, Examining Access to Specialty Care for California’s Uninsured: Full Report, California HealthCare Foundation,(June 2004), retrieved from www.ladhs.org/ambcare/patients/pdf/clinicstatuslist.pdf; Margolis L, Lowet P and Thorfinnson T, Multi-SpecialtyClinic Feasibility Study for the Southside Coalition of Community Health Centers, Lia Margolis and Associates (December 15, 2005).* No significant variation was reported by SPA, gender, race/ethnicity, insurance status or facility type.** SPA 6 has be designated as a medically underserved area and a state Medi-Cal services shortage area.
Breast Specialty (under 35 years) 6-9 months
Cardiology 9 months – 1 year
Dermatology 6 months**
Ear, Nose & Throat 6-9 months
Endocrinology/Nephrology 6-9 months*
GI 6 months – 1 year
GYN 6-9 months
Neurology 6-9 months
Oncology 6-9 months
Ophthalmology 6-9 months**
Orthopedics 6 months- 1 year
Podiatry 6 months
Rheumatology 6 months*
Surgery 9 months – 1 to 2 years
Ultrasound 6-9 monthsAbdominal/Uterine
Urology 9 months – 1 year
Type of Adult Average WaitSpecialty Referral for Appointment
Chart 23: Average Wait for SpecialtyReferral Appointment.
* County hospital may not accept – patient may be deemed,“not sick enough,” to meet clinical protocol requirements.
** Being considered for Telemedicine.Source: Margolis L, Lowet P and Thorfinnson T, Multi-SpecialtyClinic Feasibility Study for the Southside Coalition of Community HealthCenters, Lia Margolis and Associates (December 15, 2005)
Part 3 – Health Care Services 39
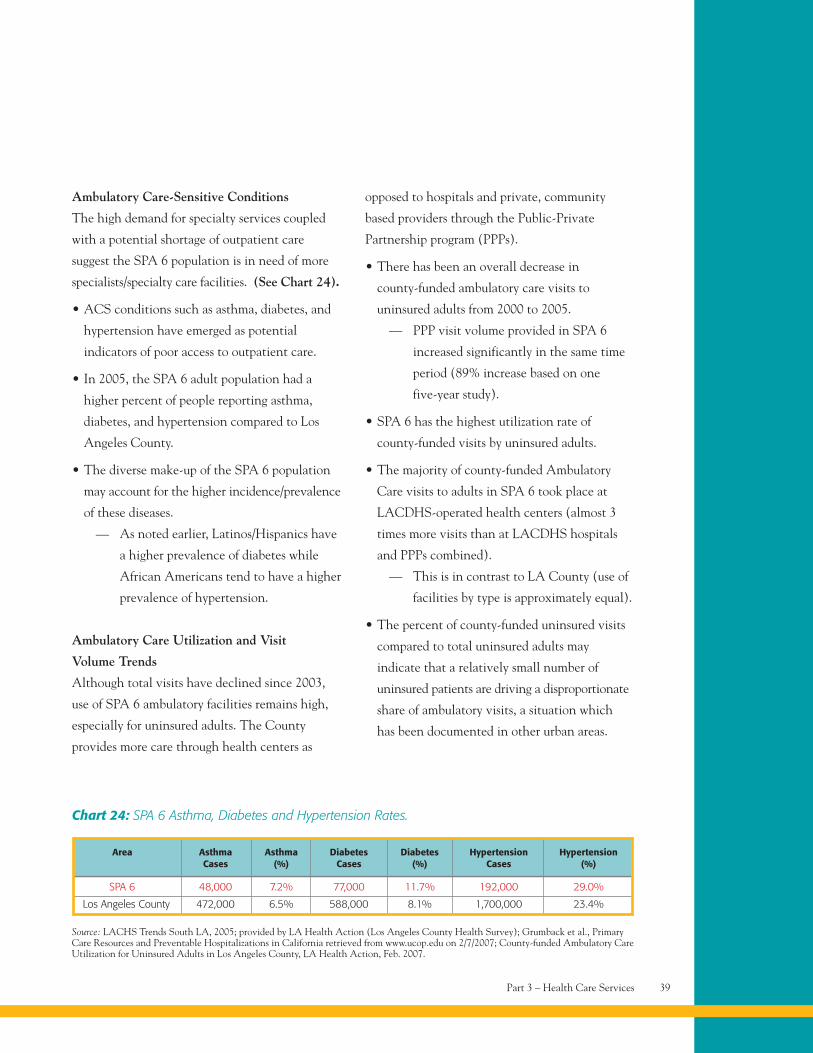
Ambulatory Care-Sensitive Conditions
The high demand for specialty services coupled
with a potential shortage of outpatient care
suggest the SPA 6 population is in need of more
specialists/specialty care facilities. (See Chart 24).
• ACS conditions such as asthma, diabetes, and
hypertension have emerged as potential
indicators of poor access to outpatient care.
• In 2005, the SPA 6 adult population had a
higher percent of people reporting asthma,
diabetes, and hypertension compared to Los
Angeles County.
• The diverse make-up of the SPA 6 population
may account for the higher incidence/prevalence
of these diseases.
— As noted earlier, Latinos/Hispanics have
a higher prevalence of diabetes while
African Americans tend to have a higher
prevalence of hypertension.
Ambulatory Care Utilization and Visit
Volume Trends
Although total visits have declined since 2003,
use of SPA 6 ambulatory facilities remains high,
especially for uninsured adults. The County
provides more care through health centers as
opposed to hospitals and private, community
based providers through the Public-Private
Partnership program (PPPs).
• There has been an overall decrease in
county-funded ambulatory care visits to
uninsured adults from 2000 to 2005.
— PPP visit volume provided in SPA 6
increased significantly in the same time
period (89% increase based on one
five-year study).
• SPA 6 has the highest utilization rate of
county-funded visits by uninsured adults.
• The majority of county-funded Ambulatory
Care visits to adults in SPA 6 took place at
LACDHS-operated health centers (almost 3
times more visits than at LACDHS hospitals
and PPPs combined).
— This is in contrast to LA County (use of
facilities by type is approximately equal).
• The percent of county-funded uninsured visits
compared to total uninsured adults may
indicate that a relatively small number of
uninsured patients are driving a disproportionate
share of ambulatory visits, a situation which
has been documented in other urban areas.
Source: LACHS Trends South LA, 2005; provided by LA Health Action (Los Angeles County Health Survey); Grumback et al., PrimaryCare Resources and Preventable Hospitalizations in California retrieved from www.ucop.edu on 2/7/2007; County-funded Ambulatory CareUtilization for Uninsured Adults in Los Angeles County, LA Health Action, Feb. 2007.
Area Asthma Asthma Diabetes Diabetes Hypertension HypertensionCases (%) Cases (%) Cases (%)
SPA 6 48,000 7.2% 77,000 11.7% 192,000 29.0%
Los Angeles County 472,000 6.5% 588,000 8.1% 1,700,000 23.4%
Chart 24: SPA 6 Asthma, Diabetes and Hypertension Rates.
Critical Condition: Examining the Scope of Medical Services in South Los Angeles40
— 21% of county-funded visits by uninsured
adults took place at SPA 6 facilities (2nd
highest compared to other SPAs); range
was 2% in SPA 5 to 25% in SPA 4)).
— But only 12% of LA County’s uninsured
adults live in SPA 6.
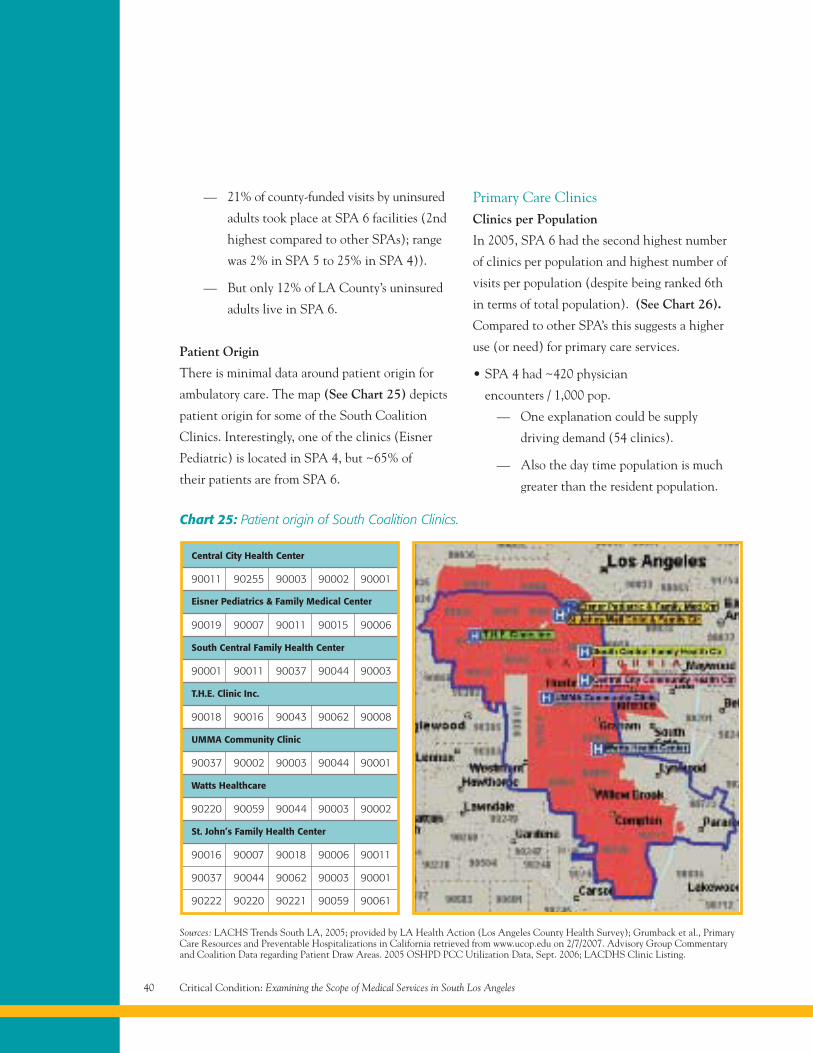
Patient Origin
There is minimal data around patient origin for
ambulatory care. The map (See Chart 25) depicts
patient origin for some of the South Coalition
Clinics. Interestingly, one of the clinics (Eisner
Pediatric) is located in SPA 4, but ~65% of
their patients are from SPA 6.
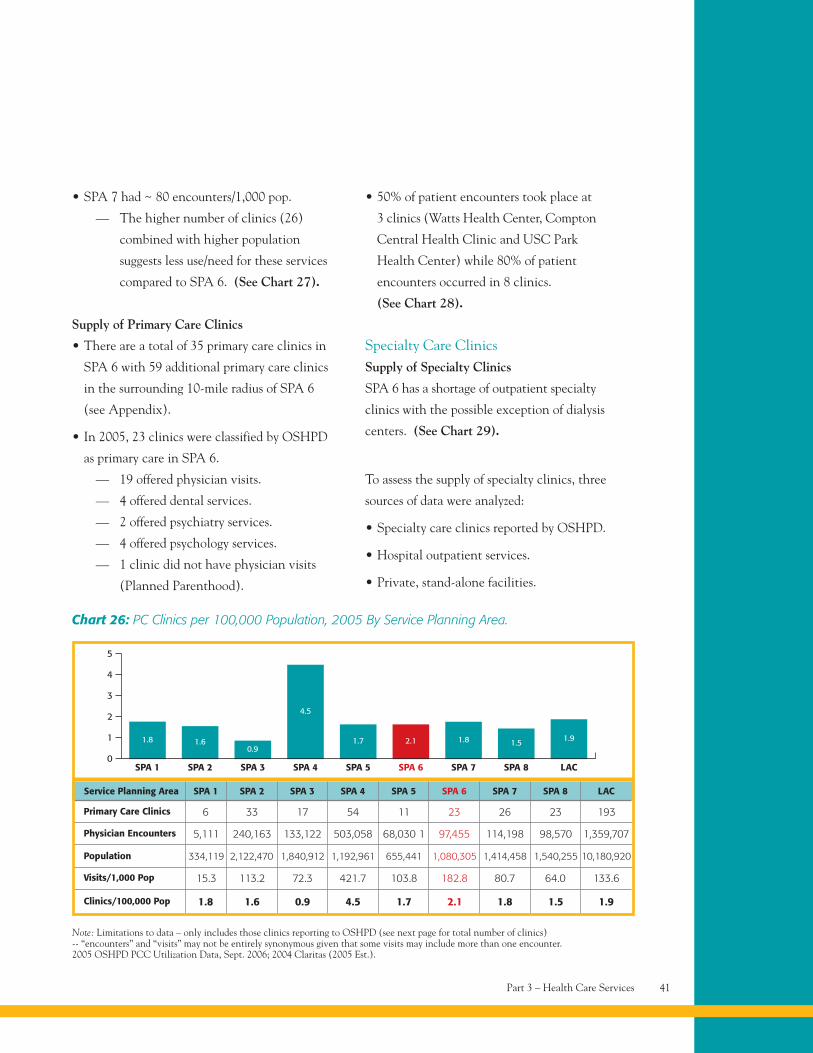
Primary Care ClinicsClinics per Population
In 2005, SPA 6 had the second highest number
of clinics per population and highest number of
visits per population (despite being ranked 6th
in terms of total population). (See Chart 26).
Compared to other SPA’s this suggests a higher
use (or need) for primary care services.
• SPA 4 had ~420 physician
encounters / 1,000 pop.
— One explanation could be supply
driving demand (54 clinics).
— Also the day time population is much
greater than the resident population.
Chart 25: Patient origin of South Coalition Clinics.
Central City Health Center
Eisner Pediatrics & Family Medical Center
South Central Family Health Center
T.H.E. Clinic Inc.
UMMA Community Clinic
Watts Healthcare
St. John’s Family Health Center
90011 90255 90003 90002 90001
90019 90007 90011 90015 90006
90001 90011 90037 90044 90003
90018 90016 90043 90062 90008
90037 90002 90003 90044 90001
90220 90059 90044 90003 90002
90016 90007 90018 90006 90011
90037 90044 90062 90003 90001
90222 90220 90221 90059 90061
Sources: LACHS Trends South LA, 2005; provided by LA Health Action (Los Angeles County Health Survey); Grumback et al., PrimaryCare Resources and Preventable Hospitalizations in California retrieved from www.ucop.edu on 2/7/2007. Advisory Group Commentaryand Coalition Data regarding Patient Draw Areas. 2005 OSHPD PCC Utilization Data, Sept. 2006; LACDHS Clinic Listing.
Part 3 – Health Care Services 41
Note: Limitations to data – only includes those clinics reporting to OSHPD (see next page for total number of clinics)-- “encounters” and “visits” may not be entirely synonymous given that some visits may include more than one encounter.2005 OSHPD PCC Utilization Data, Sept. 2006; 2004 Claritas (2005 Est.).
SPA 10
SPA 2 SPA 3 SPA 4 SPA 5 SPA 6 SPA 7
Chart 26: PC Clinics per 100,000 Population, 2005 By Service Planning Area.
SPA 8 LAC
1
2
3
4
5
1.8 1.60.9
4.5
1.7 2.1 1.8 1.5 1.9
Primary Care Clinics
Physician Encounters
Population
Visits/1,000 Pop
Clinics/100,000 Pop
6 33 17 54 11 23 26 23 193
5,111 240,163 133,122 503,058 68,030 1 97,455 114,198 98,570 1,359,707
15.3 113.2 72.3 421.7 103.8 182.8 80.7 64.0 133.6
1.8 1.6 0.9 4.5 1.7 2.1 1.8 1.5 1.9
Service Planning Area SPA 1 SPA 2 SPA 3 SPA 4 SPA 5 SPA 6 SPA 7 SPA 8 LAC
334,119 2,122,470 1,840,912 1,192,961 655,441 1,080,305 1,414,458 1,540,255 10,180,920
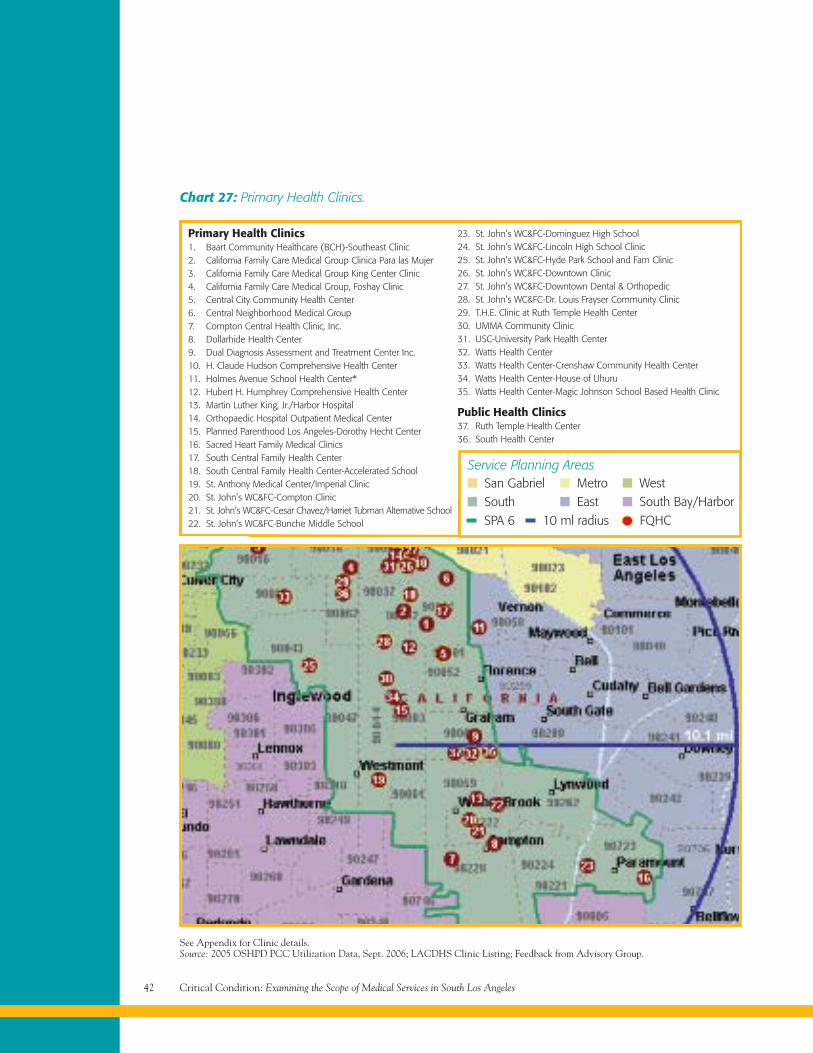
• SPA 7 had ~ 80 encounters/1,000 pop.
— The higher number of clinics (26)
combined with higher population
suggests less use/need for these services
compared to SPA 6. (See Chart 27).
Supply of Primary Care Clinics
• There are a total of 35 primary care clinics in
SPA 6 with 59 additional primary care clinics
in the surrounding 10-mile radius of SPA 6
(see Appendix).
• In 2005, 23 clinics were classified by OSHPD
as primary care in SPA 6.
— 19 offered physician visits.
— 4 offered dental services.
— 2 offered psychiatry services.
— 4 offered psychology services.
— 1 clinic did not have physician visits
(Planned Parenthood).
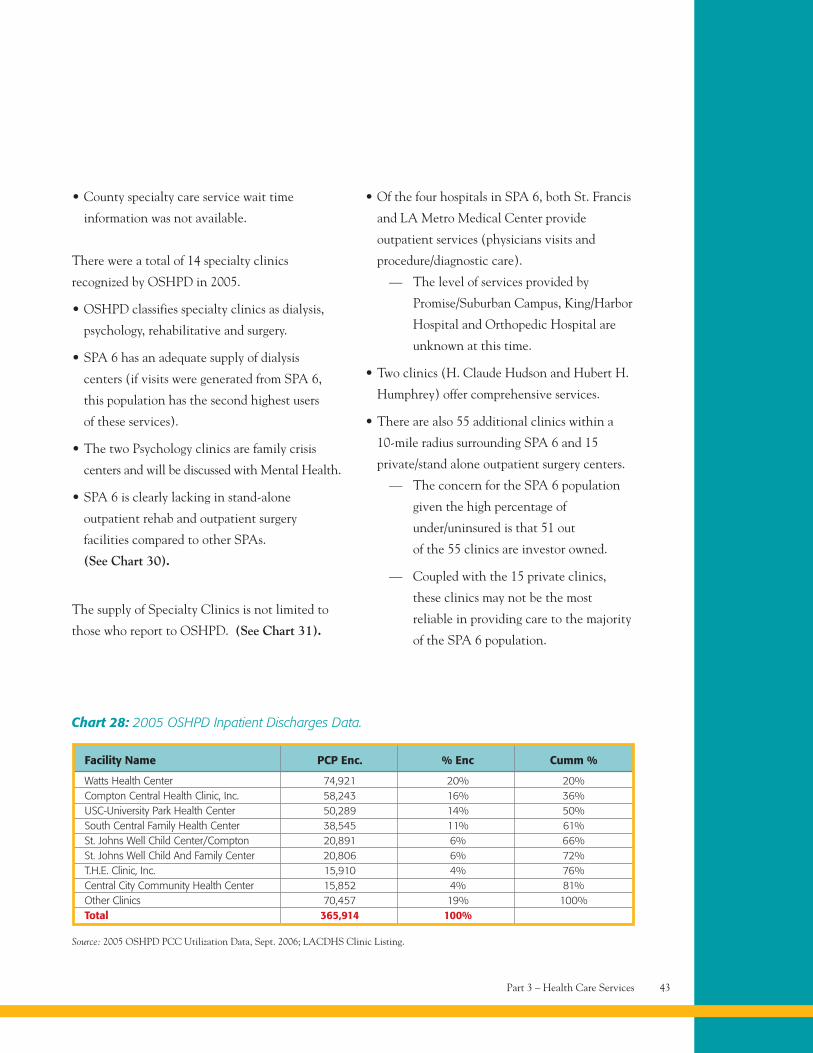
• 50% of patient encounters took place at
3 clinics (Watts Health Center, Compton
Central Health Clinic and USC Park
Health Center) while 80% of patient
encounters occurred in 8 clinics.
(See Chart 28).
Specialty Care ClinicsSupply of Specialty Clinics
SPA 6 has a shortage of outpatient specialty
clinics with the possible exception of dialysis
centers. (See Chart 29).
To assess the supply of specialty clinics, three
sources of data were analyzed:
• Specialty care clinics reported by OSHPD.
• Hospital outpatient services.
• Private, stand-alone facilities.
Critical Condition: Examining the Scope of Medical Services in South Los Angeles42
Chart 27: Primary Health Clinics.
See Appendix for Clinic details.Source: 2005 OSHPD PCC Utilization Data, Sept. 2006; LACDHS Clinic Listing; Feedback from Advisory Group.
Primary Health Clinics1. Baart Community Healthcare (BCH)-Southeast Clinic2. California Family Care Medical Group Clinica Para las Mujer3. California Family Care Medical Group King Center Clinic4. California Family Care Medical Group, Foshay Clinic5. Central City Community Health Center6. Central Neighborhood Medical Group7. Compton Central Health Clinic, Inc.8. Dollarhide Health Center9. Dual Diagnosis Assessment and Treatment Center Inc.10. H. Claude Hudson Comprehensive Health Center11. Holmes Avenue School Health Center*12. Hubert H. Humphrey Comprehensive Health Center13. Martin Luther King, Jr./Harbor Hospital14. Orthopaedic Hospital Outpatient Medical Center15. Planned Parenthood Los Angeles-Dorothy Hecht Center16. Sacred Heart Family Medical Clinics17. South Central Family Health Center18. South Central Family Health Center-Accelerated School19. St. Anthony Medical Center/Imperial Clinic20. St. John’s WC&FC-Compton Clinic21. St. John’s WC&FC-Cesar Chavez/Harriet Tubman Alternative School22. St. John’s WC&FC-Bunche Middle School
23. St. John’s WC&FC-Dominguez High School24. St. John’s WC&FC-Lincoln High School Clinic25. St. John’s WC&FC-Hyde Park School and Fam Clinic26. St. John’s WC&FC-Downtown Clinic27. St. John’s WC&FC-Downtown Dental & Orthopedic28. St. John’s WC&FC-Dr. Louis Frayser Community Clinic29. T.H.E. Clinic at Ruth Temple Health Center30. UMMA Community Clinic31. USC-University Park Health Center32. Watts Health Center33. Watts Health Center-Crenshaw Community Health Center34. Watts Health Center-House of Uhuru35. Watts Health Center-Magic Johnson School Based Health Clinic
Public Health Clinics37. Ruth Temple Health Center36. South Health Center
Service Planning Areas
SPA 6 10 ml radius FQHC
San GabrielSouth
MetroEast
WestSouth Bay/Harbor
Part 3 – Health Care Services 43
Chart 28: 2005 OSHPD Inpatient Discharges Data.
Facility Name PCP Enc. % Enc Cumm %
Watts Health Center 74,921 20% 20%Compton Central Health Clinic, Inc. 58,243 16% 36%USC-University Park Health Center 50,289 14% 50%South Central Family Health Center 38,545 11% 61%St. Johns Well Child Center/Compton 20,891 6% 66%St. Johns Well Child And Family Center 20,806 6% 72%T.H.E. Clinic, Inc. 15,910 4% 76%Central City Community Health Center 15,852 4% 81%Other Clinics 70,457 19% 100%Total 365,914 100%
Source: 2005 OSHPD PCC Utilization Data, Sept. 2006; LACDHS Clinic Listing.
• County specialty care service wait time
information was not available.
There were a total of 14 specialty clinics
recognized by OSHPD in 2005.
• OSHPD classifies specialty clinics as dialysis,
psychology, rehabilitative and surgery.
• SPA 6 has an adequate supply of dialysis
centers (if visits were generated from SPA 6,
this population has the second highest users
of these services).
• The two Psychology clinics are family crisis
centers and will be discussed with Mental Health.
• SPA 6 is clearly lacking in stand-alone
outpatient rehab and outpatient surgery
facilities compared to other SPAs.
(See Chart 30).
The supply of Specialty Clinics is not limited to
those who report to OSHPD. (See Chart 31).
• Of the four hospitals in SPA 6, both St. Francis
and LA Metro Medical Center provide
outpatient services (physicians visits and
procedure/diagnostic care).
— The level of services provided by
Promise/Suburban Campus, King/Harbor
Hospital and Orthopedic Hospital are
unknown at this time.
• Two clinics (H. Claude Hudson and Hubert H.
Humphrey) offer comprehensive services.
• There are also 55 additional clinics within a
10-mile radius surrounding SPA 6 and 15
private/stand alone outpatient surgery centers.
— The concern for the SPA 6 population
given the high percentage of
under/uninsured is that 51 out
of the 55 clinics are investor owned.
— Coupled with the 15 private clinics,
these clinics may not be the most
reliable in providing care to the majority
of the SPA 6 population.
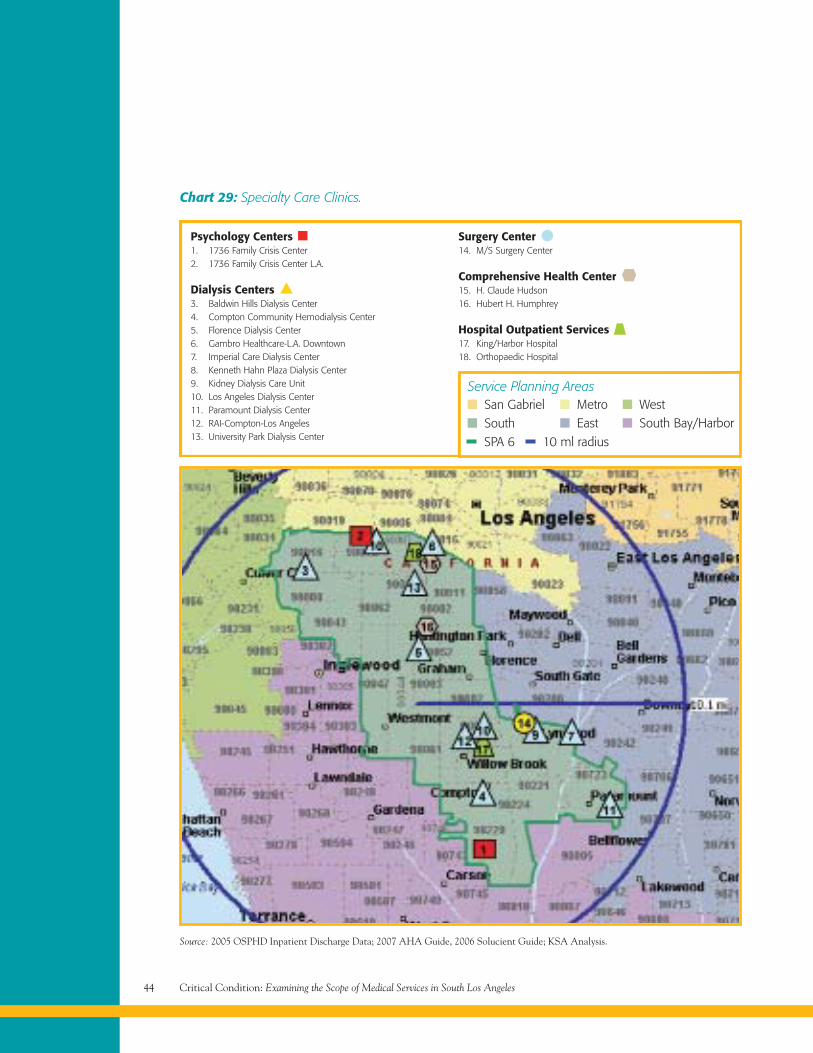
Surgery Center14. M/S Surgery Center
Comprehensive Health Center15. H. Claude Hudson16. Hubert H. Humphrey
Hospital Outpatient Services17. King/Harbor Hospital18. Orthopaedic Hospital
Critical Condition: Examining the Scope of Medical Services in South Los Angeles44
Chart 29: Specialty Care Clinics.
Source: 2005 OSPHD Inpatient Discharge Data; 2007 AHA Guide, 2006 Solucient Guide; KSA Analysis.
Psychology Centers1. 1736 Family Crisis Center2. 1736 Family Crisis Center L.A.
Dialysis Centers3. Baldwin Hills Dialysis Center4. Compton Community Hemodialysis Center5. Florence Dialysis Center6. Gambro Healthcare-L.A. Downtown7. Imperial Care Dialysis Center8. Kenneth Hahn Plaza Dialysis Center9. Kidney Dialysis Care Unit10. Los Angeles Dialysis Center11. Paramount Dialysis Center12. RAI-Compton-Los Angeles13. University Park Dialysis Center
Service Planning Areas
SPA 6 10 ml radius
San GabrielSouth
MetroEast
WestSouth Bay/Harbor
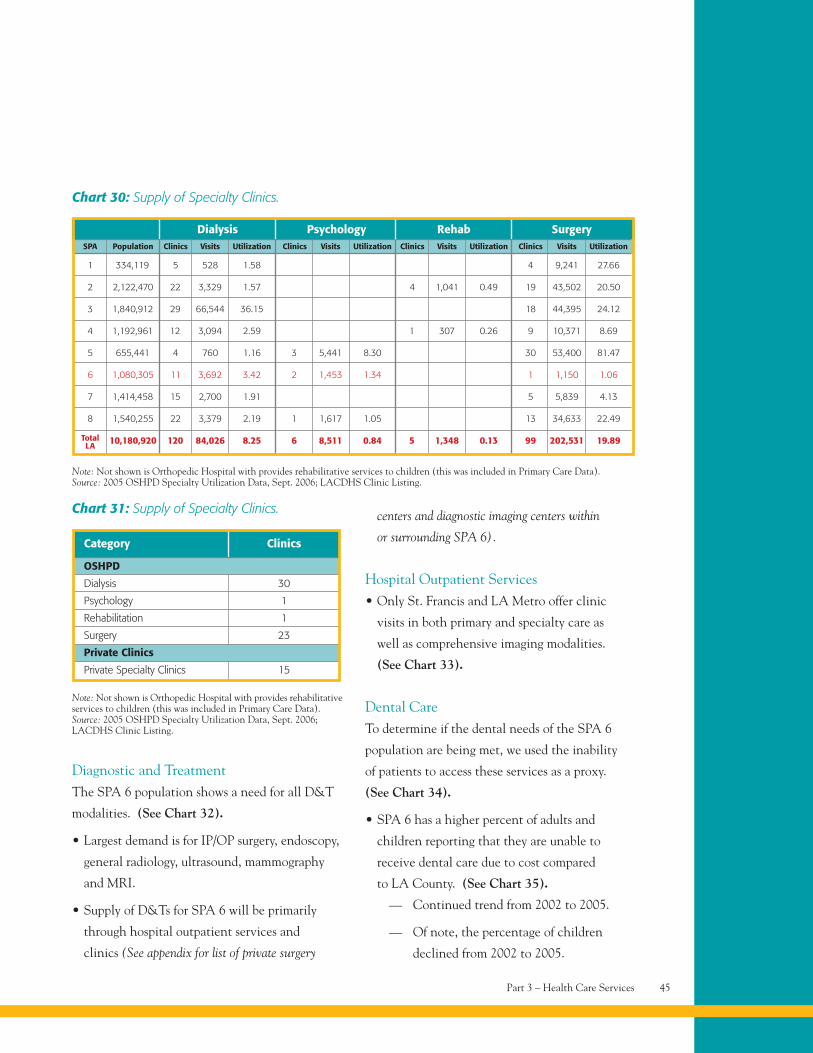
Diagnostic and TreatmentThe SPA 6 population shows a need for all D&T
modalities. (See Chart 32).
• Largest demand is for IP/OP surgery, endoscopy,
general radiology, ultrasound, mammography
and MRI.
• Supply of D&Ts for SPA 6 will be primarily
through hospital outpatient services and
clinics (See appendix for list of private surgery
centers and diagnostic imaging centers within
or surrounding SPA 6).
Hospital Outpatient Services• Only St. Francis and LA Metro offer clinic
visits in both primary and specialty care as
well as comprehensive imaging modalities.
(See Chart 33).
Dental CareTo determine if the dental needs of the SPA 6
population are being met, we used the inability
of patients to access these services as a proxy.
(See Chart 34).
• SPA 6 has a higher percent of adults and
children reporting that they are unable to
receive dental care due to cost compared
to LA County. (See Chart 35).
— Continued trend from 2002 to 2005.
— Of note, the percentage of children
declined from 2002 to 2005.
Part 3 – Health Care Services 45
Chart 30: Supply of Specialty Clinics.
Note: Not shown is Orthopedic Hospital with provides rehabilitative services to children (this was included in Primary Care Data).Source: 2005 OSHPD Specialty Utilization Data, Sept. 2006; LACDHS Clinic Listing.
Rehab SurgerySPA Population Clinics Visits Utilization Clinics Visits Utilization Clinics Visits Utilization
1 5 528 1.58 4 9,241 27.66334,119
2 22 3,329 1.57 4 1,041 0.49 19 43,502 20.502,122,470
3 29 66,544 36.15 18 44,395 24.121,840,912
4 12 3,094 2.59 1 307 0.26 9 10,371 8.691,192,961
5 4 760 1.16 30 53,400 81.47655,441
6 11 3,692 3.42 1 1,150 1.061,080,305
7 15 2,700 1.91 5 5,839 4.131,414,458
8 22 3,379 2.19 13 34,633 22.491,540,255
120 84,026 8.25 5 1,348 0.13 99 202,531 19.8910,180,920
Dialysis PsychologyClinics Visits Utilization
3 5,441 8.30
2 1,453 1.34
1 1,617 1.05
6 8,511 0.84TotalLA
Category Clinics
Chart 31: Supply of Specialty Clinics.
Note: Not shown is Orthopedic Hospital with provides rehabilitativeservices to children (this was included in Primary Care Data).Source: 2005 OSHPD Specialty Utilization Data, Sept. 2006;LACDHS Clinic Listing.
OSHPD
Dialysis 30
Psychology 1
Rehabilitation 1
Surgery 23
Private Clinics
Private Specialty Clinics 15
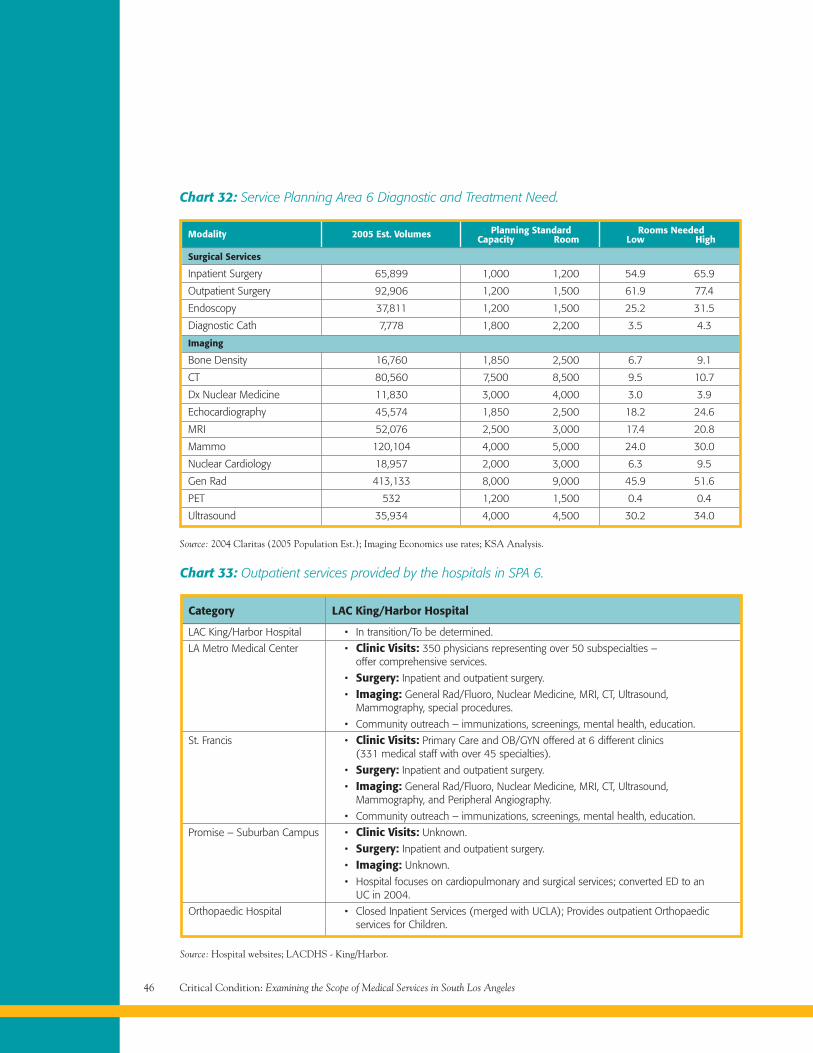
Critical Condition: Examining the Scope of Medical Services in South Los Angeles46
Modality 2005 Est. Volumes Planning Standard Rooms NeededCapacity Room Low High
Chart 32: Service Planning Area 6 Diagnostic and Treatment Need.
Surgical Services
Inpatient Surgery 65,899 1,000 1,200 54.9 65.9
Outpatient Surgery 92,906 1,200 1,500 61.9 77.4
Endoscopy 37,811 1,200 1,500 25.2 31.5
Diagnostic Cath 7,778 1,800 2,200 3.5 4.3
Imaging
Bone Density 16,760 1,850 2,500 6.7 9.1
CT 80,560 7,500 8,500 9.5 10.7
Dx Nuclear Medicine 11,830 3,000 4,000 3.0 3.9
Echocardiography 45,574 1,850 2,500 18.2 24.6
MRI 52,076 2,500 3,000 17.4 20.8
Mammo 120,104 4,000 5,000 24.0 30.0
Nuclear Cardiology 18,957 2,000 3,000 6.3 9.5
Gen Rad 413,133 8,000 9,000 45.9 51.6
PET 532 1,200 1,500 0.4 0.4
Ultrasound 35,934 4,000 4,500 30.2 34.0
Source: 2004 Claritas (2005 Population Est.); Imaging Economics use rates; KSA Analysis.
Category LAC King/Harbor Hospital
Chart 33: Outpatient services provided by the hospitals in SPA 6.
LAC King/Harbor Hospital • In transition/To be determined.
LA Metro Medical Center • Clinic Visits: 350 physicians representing over 50 subspecialties –offer comprehensive services.
• Surgery: Inpatient and outpatient surgery.
• Imaging: General Rad/Fluoro, Nuclear Medicine, MRI, CT, Ultrasound,Mammography, special procedures.
• Community outreach – immunizations, screenings, mental health, education.
St. Francis • Clinic Visits: Primary Care and OB/GYN offered at 6 different clinics(331 medical staff with over 45 specialties).
• Surgery: Inpatient and outpatient surgery.
• Imaging: General Rad/Fluoro, Nuclear Medicine, MRI, CT, Ultrasound,Mammography, and Peripheral Angiography.
• Community outreach – immunizations, screenings, mental health, education.
Promise – Suburban Campus • Clinic Visits: Unknown.
• Surgery: Inpatient and outpatient surgery.
• Imaging: Unknown.
• Hospital focuses on cardiopulmonary and surgical services; converted ED to anUC in 2004.
Orthopaedic Hospital • Closed Inpatient Services (merged with UCLA); Provides outpatient Orthopaedicservices for Children.
Source: Hospital websites; LACDHS - King/Harbor.
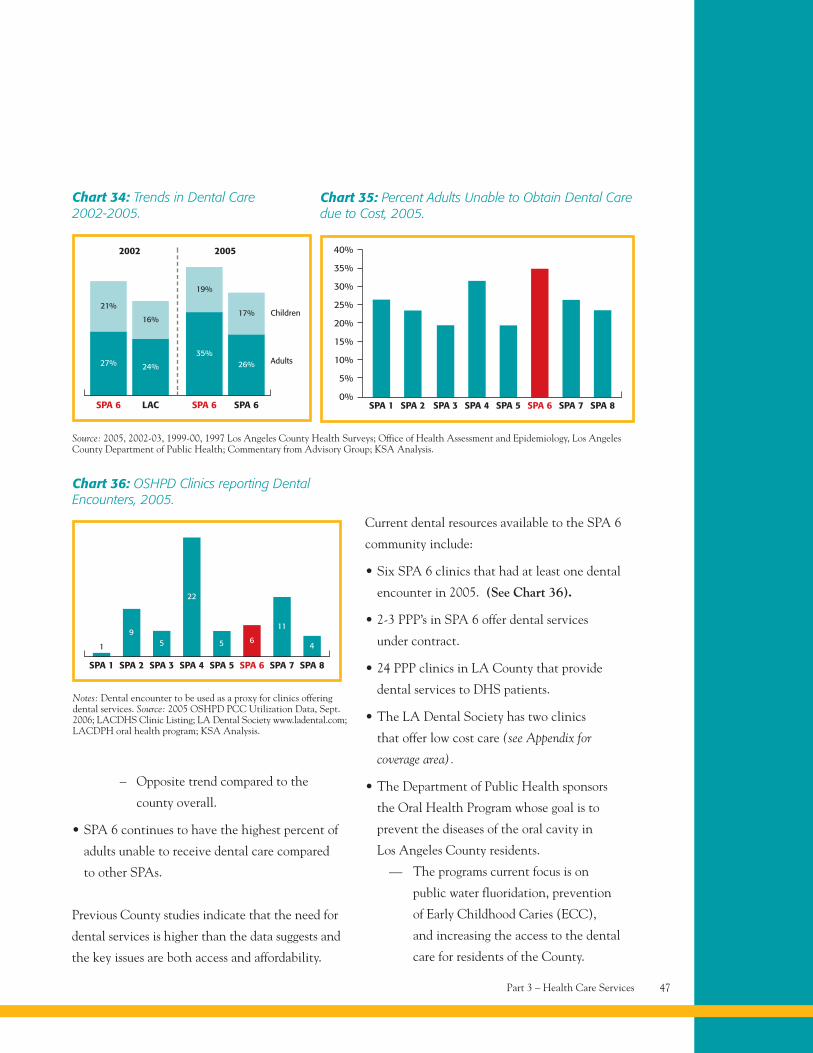
– Opposite trend compared to the
county overall.
• SPA 6 continues to have the highest percent of
adults unable to receive dental care compared
to other SPAs.
Previous County studies indicate that the need for
dental services is higher than the data suggests and
the key issues are both access and affordability.
Current dental resources available to the SPA 6
community include:
• Six SPA 6 clinics that had at least one dental
encounter in 2005. (See Chart 36).
• 2-3 PPP’s in SPA 6 offer dental services
under contract.
• 24 PPP clinics in LA County that provide
dental services to DHS patients.
• The LA Dental Society has two clinics
that offer low cost care (see Appendix for
coverage area).
• The Department of Public Health sponsors
the Oral Health Program whose goal is to
prevent the diseases of the oral cavity in
Los Angeles County residents.
— The programs current focus is on
public water fluoridation, prevention
of Early Childhood Caries (ECC),
and increasing the access to the dental
care for residents of the County.
Part 3 – Health Care Services 47
SPA 6
27%
LAC
24%
SPA 6 SPA 6
35%26%
21%
16%
19%
17%
Chart 34: Trends in Dental Care2002-2005.
Source: 2005, 2002-03, 1999-00, 1997 Los Angeles County Health Surveys; Office of Health Assessment and Epidemiology, Los AngelesCounty Department of Public Health; Commentary from Advisory Group; KSA Analysis.
2002 2005
Children
Adults
SPA 1 SPA 2 SPA 3 SPA 4 SPA 5 SPA 6 SPA 7
Chart 35: Percent Adults Unable to Obtain Dental Caredue to Cost, 2005.
SPA 8
40%
35%
30%
25%
20%
15%
10%
5%
0%
Notes: Dental encounter to be used as a proxy for clinics offeringdental services. Source: 2005 OSHPD PCC Utilization Data, Sept.2006; LACDHS Clinic Listing; LA Dental Society www.ladental.com;LACDPH oral health program; KSA Analysis.
SPA 1 SPA 2 SPA 3 SPA 4 SPA 5 SPA 6 SPA 7
Chart 36: OSHPD Clinics reporting DentalEncounters, 2005.
SPA 8
1
95
22
5 6
11
4
• Medi-Cal offers Denti-Cal to help provide dental
coverage for individuals insured by Medi-Cal.
Ambulatory Services Key FindingsPrimary Care
• ~ 40% of the population in SPA 6 does not
have a usual source of care.
• If capacity does not continue to grow with
demand, problems will increase.
Specialty Care
• The percent of patients with ACS’s such as
asthma, hypertension and diabetes indicate
high demand for specialists.
• Long wait times for specialists coupled to
the lack of county/public-funded clinics
indicate the SPA 6 population is at risk
for access to outpatient rehab, surgery,
and specialty care clinics.
Diagnostic and Treatment
• The SPA 6 population is in need of all
D&T modalities including, surgery, general
radiography, mammography and ultrasound.
• Given the demographics of the population,
the supply of these services will most likely be
through hospital-based outpatient facilities.
With only 2 hospitals offering these services,
it appears the needs of the population are not
being met or are at risk for not being met
in the near future.
Dental Care
• There are mixed views on whether or not the
dental needs of SPA 6 are being met. Surveys
indicate that cost, not lack of access, is the
primary reason for not seeing a dentist;
however, other studies show patients are
not able to access nor afford dental care.
Post Acute CarePost Acute services are defined as Inpatient/
Outpatient Rehab, Skilled Nursing Facilities
and Chemical Dependency Recovery Care.
(See Chart 37).
To determine if the existing supply meets the
current demand for post acute services the
following indicators will be assessed:
• Existing capacity for Rehab, SNF, and CDRC’s.
• Health care use for Rehab, SNF and CDRC’s.
— Trends from 2002 to 2005.
• Use rates by age cohort to assess demand for
Rehab and SNFs.
• Mortality rates as a proxy to assess demand for
rehab services.
• Alcohol and drug use as a proxy to assess
demand for CDRC’s.
Skilled Nursing FacilitiesThe demand for SNFs in SPA 6 appears to
be relatively low but may increase as the
population ages.
• From 2002 to 2005, the number of discharges
originating in SPA 6 decreased from ~2,600
to ~1,800. (See Chart 38).
• In 2005, highest users of SNF services were
individuals 65 and over.
• While this age cohort represents only 8% of the
population, it is forecasted to grow ~2.5% or
Critical Condition: Examining the Scope of Medical Services in South Los Angeles48
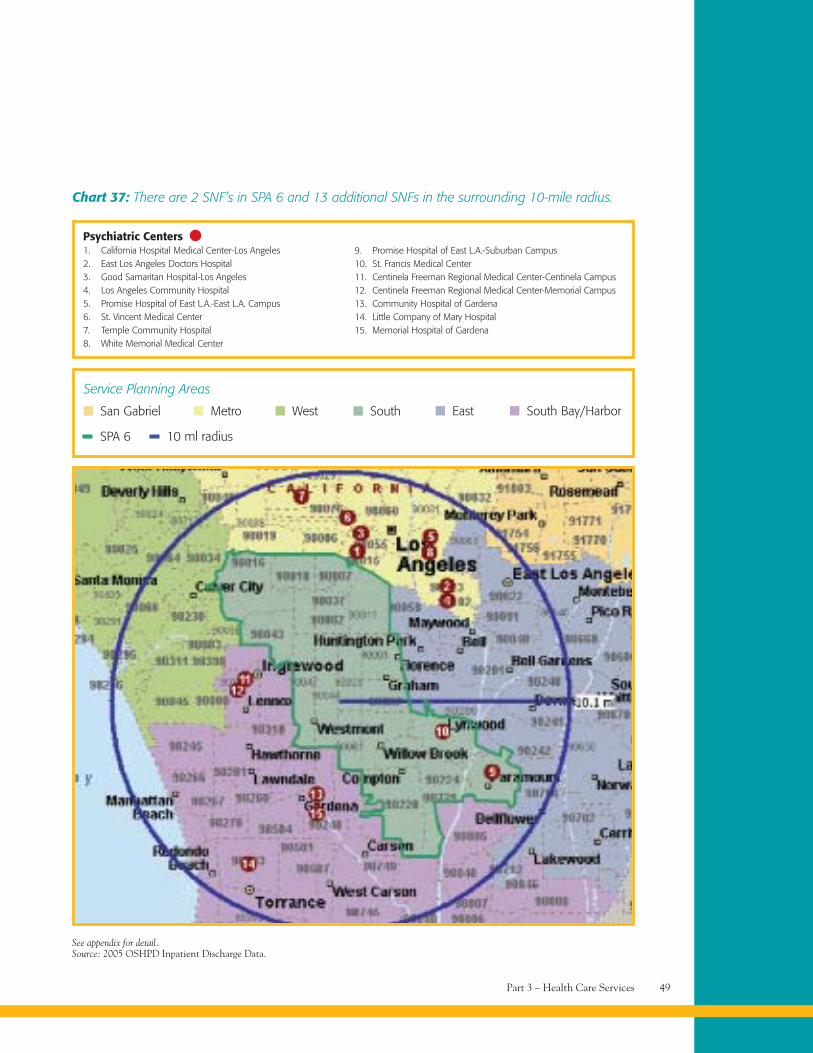
Part 3 – Health Care Services 49
Chart 37: There are 2 SNF’s in SPA 6 and 13 additional SNFs in the surrounding 10-mile radius.
Psychiatric Centers1. California Hospital Medical Center-Los Angeles2. East Los Angeles Doctors Hospital3. Good Samaritan Hospital-Los Angeles4. Los Angeles Community Hospital5. Promise Hospital of East L.A.-East L.A. Campus6. St. Vincent Medical Center7. Temple Community Hospital8. White Memorial Medical Center
9. Promise Hospital of East L.A.-Suburban Campus10. St. Francis Medical Center11. Centinela Freeman Regional Medical Center-Centinela Campus12. Centinela Freeman Regional Medical Center-Memorial Campus13. Community Hospital of Gardena14. Little Company of Mary Hospital15. Memorial Hospital of Gardena
Service Planning Areas
SPA 6 10 ml radius
San Gabriel Metro West South East South Bay/Harbor
See appendix for detail.Source: 2005 OSHPD Inpatient Discharge Data.
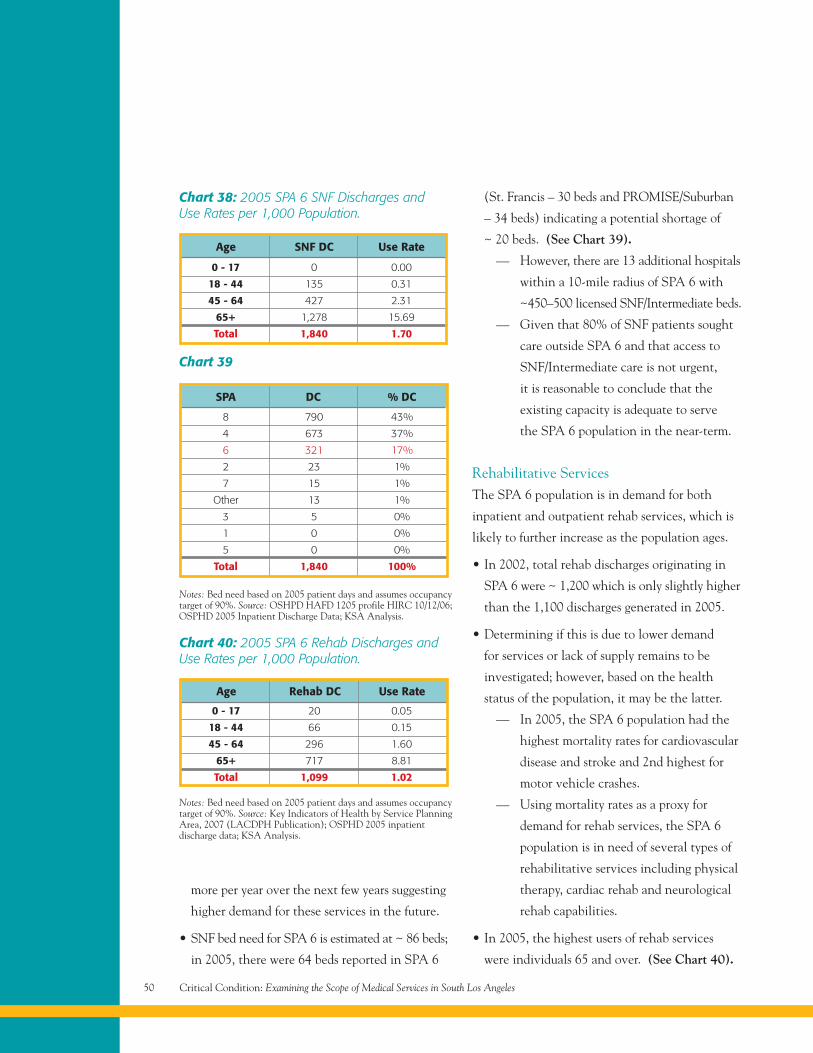
more per year over the next few years suggesting
higher demand for these services in the future.
• SNF bed need for SPA 6 is estimated at ~ 86 beds;
in 2005, there were 64 beds reported in SPA 6
(St. Francis – 30 beds and PROMISE/Suburban
– 34 beds) indicating a potential shortage of
~ 20 beds. (See Chart 39).
— However, there are 13 additional hospitals
within a 10-mile radius of SPA 6 with
~450–500 licensed SNF/Intermediate beds.
— Given that 80% of SNF patients sought
care outside SPA 6 and that access to
SNF/Intermediate care is not urgent,
it is reasonable to conclude that the
existing capacity is adequate to serve
the SPA 6 population in the near-term.
Rehabilitative ServicesThe SPA 6 population is in demand for both
inpatient and outpatient rehab services, which is
likely to further increase as the population ages.
• In 2002, total rehab discharges originating in
SPA 6 were ~ 1,200 which is only slightly higher
than the 1,100 discharges generated in 2005.
• Determining if this is due to lower demand
for services or lack of supply remains to be
investigated; however, based on the health
status of the population, it may be the latter.
— In 2005, the SPA 6 population had the
highest mortality rates for cardiovascular
disease and stroke and 2nd highest for
motor vehicle crashes.
— Using mortality rates as a proxy for
demand for rehab services, the SPA 6
population is in need of several types of
rehabilitative services including physical
therapy, cardiac rehab and neurological
rehab capabilities.
• In 2005, the highest users of rehab services
were individuals 65 and over. (See Chart 40).
Critical Condition: Examining the Scope of Medical Services in South Los Angeles50
Chart 38: 2005 SPA 6 SNF Discharges andUse Rates per 1,000 Population.
Notes: Bed need based on 2005 patient days and assumes occupancytarget of 90%. Source: OSHPD HAFD 1205 profile HIRC 10/12/06;OSPHD 2005 Inpatient Discharge Data; KSA Analysis.
Notes: Bed need based on 2005 patient days and assumes occupancytarget of 90%. Source: Key Indicators of Health by Service PlanningArea, 2007 (LACDPH Publication); OSPHD 2005 inpatientdischarge data; KSA Analysis.
Chart 39
Chart 40: 2005 SPA 6 Rehab Discharges andUse Rates per 1,000 Population.
8 790 43%
4 673 37%
6 321 17%
2 23 1%
7 15 1%
Other 13 1%
3 5 0%
1 0 0%
5 0 0%
Total 1,840 100%
0 - 17 0 0.00
18 - 44 135 0.31
45 - 64 427 2.31
65+ 1,278 15.69
Total 1,840 1.70
0 - 17 20 0.05
18 - 44 66 0.15
45 - 64 296 1.60
65+ 717 8.81
Total 1,099 1.02
Age Rehab DC Use Rate
SPA DC % DC
Age SNF DC Use Rate
— While this age cohort represents only
8% of the population, it is forecasted to
grow 2.5% or more per year over the
next few years suggesting higher demand
for these services in the future.
• Bed need for inpatient post-acute rehab services
for SPA 6 is estimated at ~ 60 beds; in 2005,
there were 0 inpatients beds reported in SPA 6.
Although there are no designated inpatient
rehabilitative facilities in SPA 6; there are
resources available to serve this population.
(See Chart 41).
Inpatient Services
• There are 7 facilities within the surrounding
10-mile radius of SPA 6 that offer inpatient
rehab services. (See Chart 42).
• In 2005, SPA 6 residents generated ~ 1,100
rehab discharges (~80% of discharges were
generated at 7 facilities). (See Chart 43).
— 5 of these facilities are within the
10-mile radius.
• Top 3 facilities include LAC/Rancho Los
Amigos, Centinela Freeman – Memorial
Campus, and Brotman Medical Center.
— In 2005, LAC/Rancho reported an
occupancy percent of ~ 70% suggesting
additional available capacity.
Outpatient Services
Four facilities are available to provide outpatient
rehab services in SPA 6.
Chemical DependencyUsing the rate of alcohol and drug use as a proxy
to assess demand, the demand for substance abuse
treatment facilities in SPA 6 has declined over
the past few years. (See Chart 44).
• In 2002/2003, the alcohol and drug use rate per
100,000 population for SPA 6 was 11.2.
— This was higher than all other SPAs and
LAC (9.6) suggesting a high demand for
access to substance abuse services.
• In 2005, the rate of unintentional drug related
deaths in SPA 6 significantly decreased to 5.1.
— This is below the median compared to
other SPA’s and less than LAC (5.5).
In 2005, there were no inpatient beds for
chemical dependency recovery centers in SPA 6.
• Most SPA 6 patients received care in nearby
locations (SPA’s 3, 5, and 8).
• Inpatient utilization has changed little from
2002 to 2005 (~ 300 discharges in both years).
— Whether this is due to low demand
or a lack of capacity remains to
be determined.
On an outpatient basis, there were 5 clinics
in SPA 6 offering community outreach for
substance abuse and 2 clinics with substance
abuse contact FTEs.
— This is slightly above the median
compared to other SPAs indicating that
resources are available, but these clinics
may offer opportunity for additional
outreach and preventative care.
Part 3 – Health Care Services 51
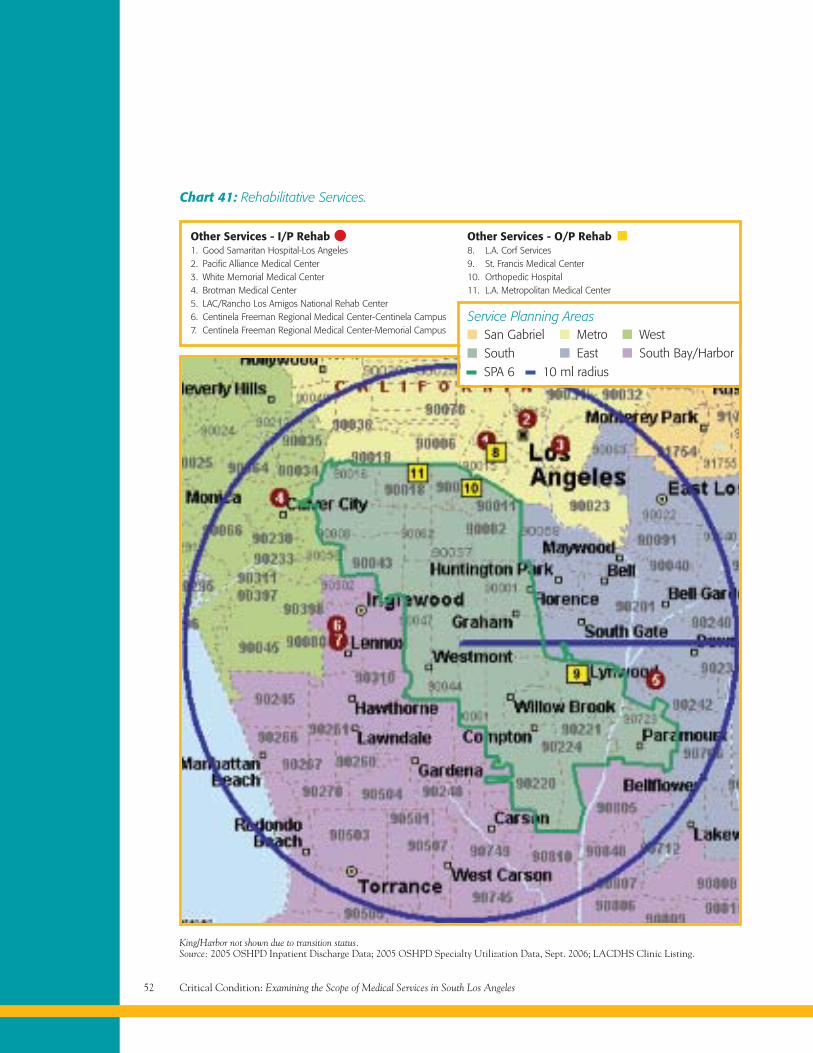
Critical Condition: Examining the Scope of Medical Services in South Los Angeles52
Chart 41: Rehabilitative Services.
Other Services - I/P Rehab1. Good Samaritan Hospital-Los Angeles2. Pacific Alliance Medical Center3. White Memorial Medical Center4. Brotman Medical Center5. LAC/Rancho Los Amigos National Rehab Center6. Centinela Freeman Regional Medical Center-Centinela Campus7. Centinela Freeman Regional Medical Center-Memorial Campus
Other Services - O/P Rehab8. L.A. Corf Services9. St. Francis Medical Center10. Orthopedic Hospital11. L.A. Metropolitan Medical Center
King/Harbor not shown due to transition status.Source: 2005 OSHPD Inpatient Discharge Data; 2005 OSHPD Specialty Utilization Data, Sept. 2006; LACDHS Clinic Listing.
Service Planning Areas
SPA 6 10 ml radius
San GabrielSouth
MetroEast
WestSouth Bay/Harbor
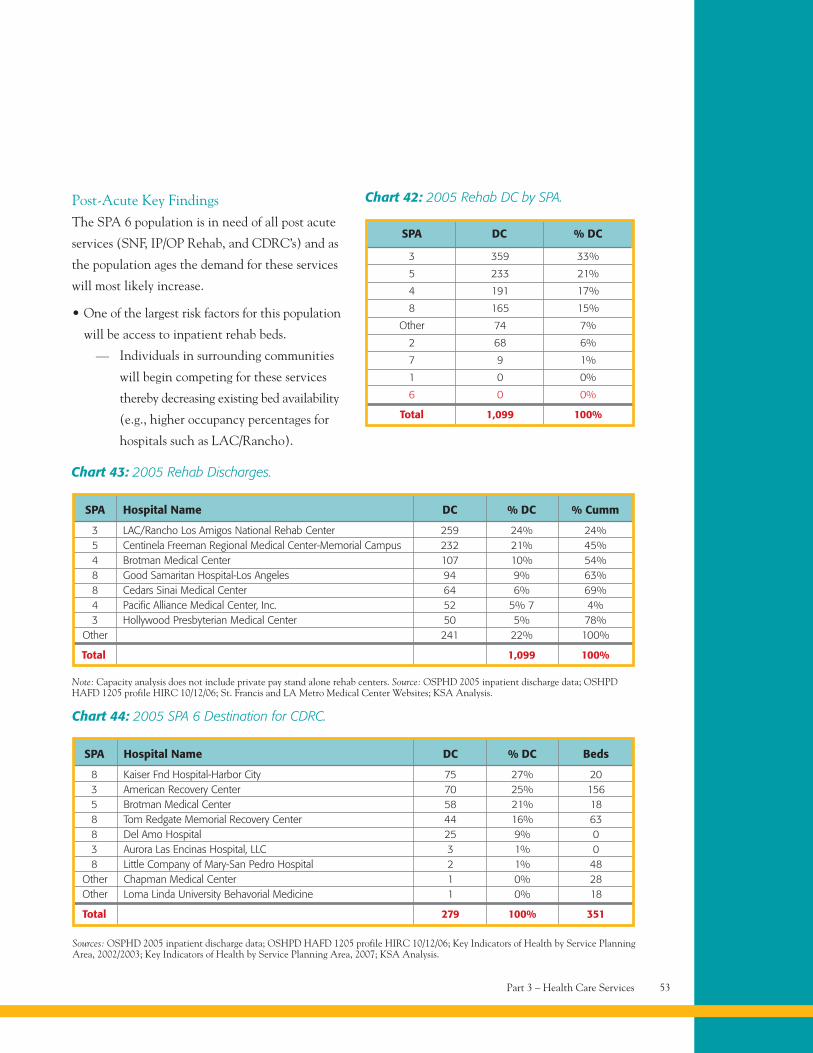
Part 3 – Health Care Services 53
Chart 43: 2005 Rehab Discharges.
SPA Hospital Name DC % DC % Cumm
3 LAC/Rancho Los Amigos National Rehab Center 259 24% 24%5 Centinela Freeman Regional Medical Center-Memorial Campus 232 21% 45%4 Brotman Medical Center 107 10% 54%8 Good Samaritan Hospital-Los Angeles 94 9% 63%8 Cedars Sinai Medical Center 64 6% 69%4 Pacific Alliance Medical Center, Inc. 52 5% 7 4%3 Hollywood Presbyterian Medical Center 50 5% 78%
Other 241 22% 100%
Total 1,099 100%
3 359 33%
5 233 21%
4 191 17%
8 165 15%
Other 74 7%
2 68 6%
7 9 1%
1 0 0%
6 0 0%
Total 1,099 100%
SPA DC % DC
Chart 42: 2005 Rehab DC by SPA.
Note: Capacity analysis does not include private pay stand alone rehab centers. Source: OSPHD 2005 inpatient discharge data; OSHPDHAFD 1205 profile HIRC 10/12/06; St. Francis and LA Metro Medical Center Websites; KSA Analysis.
Chart 44: 2005 SPA 6 Destination for CDRC.
SPA Hospital Name DC % DC Beds
8 Kaiser Fnd Hospital-Harbor City 75 27% 203 American Recovery Center 70 25% 1565 Brotman Medical Center 58 21% 188 Tom Redgate Memorial Recovery Center 44 16% 638 Del Amo Hospital 25 9% 03 Aurora Las Encinas Hospital, LLC 3 1% 08 Little Company of Mary-San Pedro Hospital 2 1% 48
Other Chapman Medical Center 1 0% 28Other Loma Linda University Behavorial Medicine 1 0% 18
Total 279 100% 351
Sources: OSPHD 2005 inpatient discharge data; OSHPD HAFD 1205 profile HIRC 10/12/06; Key Indicators of Health by Service PlanningArea, 2002/2003; Key Indicators of Health by Service Planning Area, 2007; KSA Analysis.
Post-Acute Key FindingsThe SPA 6 population is in need of all post acute
services (SNF, IP/OP Rehab, and CDRC’s) and as
the population ages the demand for these services
will most likely increase.
• One of the largest risk factors for this population
will be access to inpatient rehab beds.
— Individuals in surrounding communities
will begin competing for these services
thereby decreasing existing bed availability
(e.g., higher occupancy percentages for
hospitals such as LAC/Rancho).
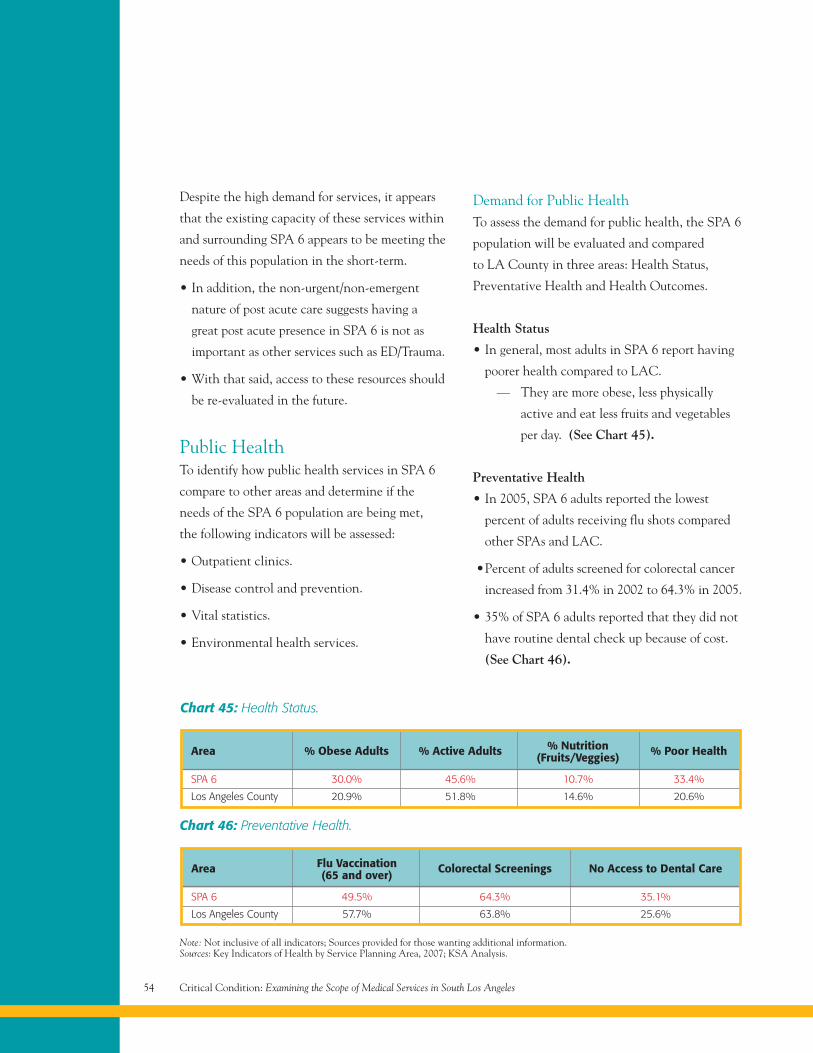
Critical Condition: Examining the Scope of Medical Services in South Los Angeles54
Despite the high demand for services, it appears
that the existing capacity of these services within
and surrounding SPA 6 appears to be meeting the
needs of this population in the short-term.
• In addition, the non-urgent/non-emergent
nature of post acute care suggests having a
great post acute presence in SPA 6 is not as
important as other services such as ED/Trauma.
• With that said, access to these resources should
be re-evaluated in the future.
Public HealthTo identify how public health services in SPA 6
compare to other areas and determine if the
needs of the SPA 6 population are being met,
the following indicators will be assessed:
• Outpatient clinics.
• Disease control and prevention.
• Vital statistics.
• Environmental health services.
Demand for Public HealthTo assess the demand for public health, the SPA 6
population will be evaluated and compared
to LA County in three areas: Health Status,
Preventative Health and Health Outcomes.
Health Status
• In general, most adults in SPA 6 report having
poorer health compared to LAC.
— They are more obese, less physically
active and eat less fruits and vegetables
per day. (See Chart 45).
Preventative Health
• In 2005, SPA 6 adults reported the lowest
percent of adults receiving flu shots compared
other SPAs and LAC.
•Percent of adults screened for colorectal cancer
increased from 31.4% in 2002 to 64.3% in 2005.
• 35% of SPA 6 adults reported that they did not
have routine dental check up because of cost.
(See Chart 46).
Note: Not inclusive of all indicators; Sources provided for those wanting additional information.Sources: Key Indicators of Health by Service Planning Area, 2007; KSA Analysis.
Area Flu Vaccination Colorectal Screenings No Access to Dental Care(65 and over)
SPA 6 49.5% 64.3% 35.1%
Los Angeles County 57.7% 63.8% 25.6%
Chart 46: Preventative Health.
Area % Obese Adults % Active Adults % Nutrition % Poor Health(Fruits/Veggies)
SPA 6 30.0% 45.6% 10.7% 33.4%
Los Angeles County 20.9% 51.8% 14.6% 20.6%
Chart 45: Health Status.
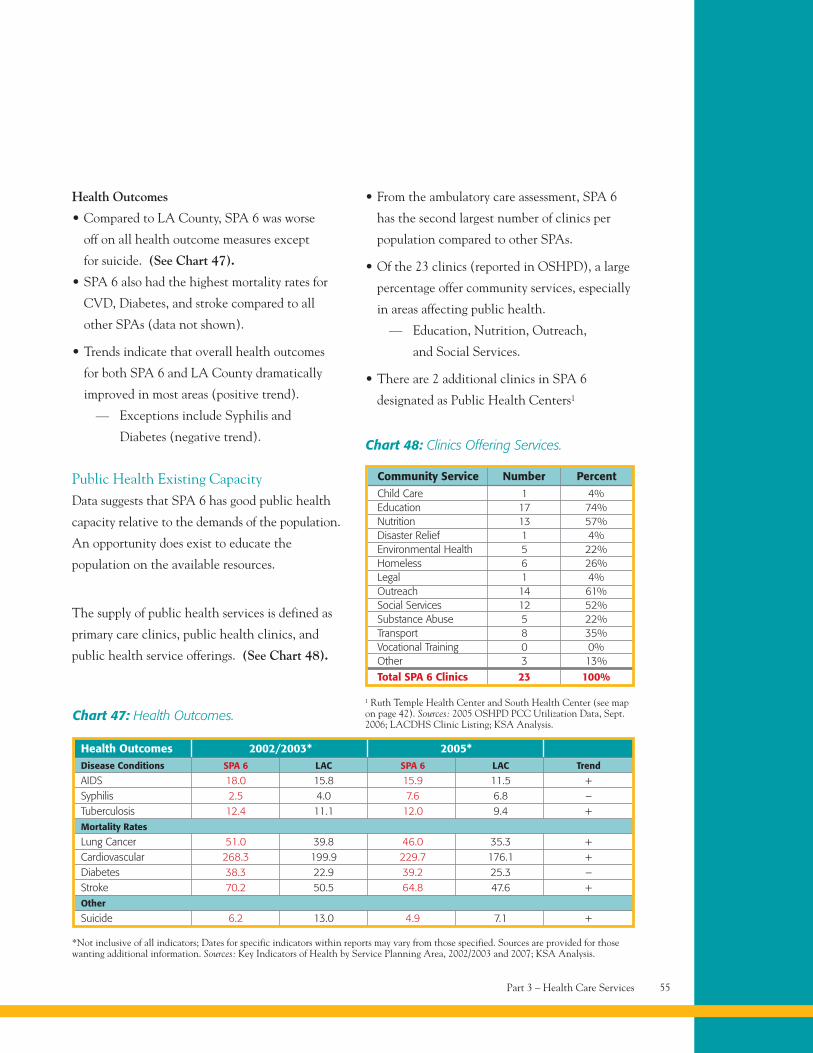
Health Outcomes
• Compared to LA County, SPA 6 was worse
off on all health outcome measures except
for suicide. (See Chart 47).
• SPA 6 also had the highest mortality rates for
CVD, Diabetes, and stroke compared to all
other SPAs (data not shown).
• Trends indicate that overall health outcomes
for both SPA 6 and LA County dramatically
improved in most areas (positive trend).
— Exceptions include Syphilis and
Diabetes (negative trend).
Public Health Existing CapacityData suggests that SPA 6 has good public health
capacity relative to the demands of the population.
An opportunity does exist to educate the
population on the available resources.
The supply of public health services is defined as
primary care clinics, public health clinics, and
public health service offerings. (See Chart 48).
• From the ambulatory care assessment, SPA 6
has the second largest number of clinics per
population compared to other SPAs.
• Of the 23 clinics (reported in OSHPD), a large
percentage offer community services, especially
in areas affecting public health.
— Education, Nutrition, Outreach,
and Social Services.
• There are 2 additional clinics in SPA 6
designated as Public Health Centers1
Community Service Number Percent
Chart 48: Clinics Offering Services.
1 Ruth Temple Health Center and South Health Center (see mapon page 42). Sources: 2005 OSHPD PCC Utilization Data, Sept.2006; LACDHS Clinic Listing; KSA Analysis.
Child Care 1 4%Education 17 74%Nutrition 13 57%Disaster Relief 1 4%Environmental Health 5 22%Homeless 6 26%Legal 1 4%Outreach 14 61%Social Services 12 52%Substance Abuse 5 22%Transport 8 35%Vocational Training 0 0%Other 3 13%
Total SPA 6 Clinics 23 100%
Part 3 – Health Care Services 55
Health Outcomes 2002/2003* 2005*
Chart 47: Health Outcomes.
Disease Conditions SPA 6 LAC SPA 6 LAC Trend
AIDS 18.0 15.8 15.9 11.5 +Syphilis 2.5 4.0 7.6 6.8 –Tuberculosis 12.4 11.1 12.0 9.4 +Mortality Rates
Lung Cancer 51.0 39.8 46.0 35.3 +Cardiovascular 268.3 199.9 229.7 176.1 +Diabetes 38.3 22.9 39.2 25.3 –Stroke 70.2 50.5 64.8 47.6 +Other
Suicide 6.2 13.0 4.9 7.1 +
*Not inclusive of all indicators; Dates for specific indicators within reports may vary from those specified. Sources are provided for thosewanting additional information. Sources: Key Indicators of Health by Service Planning Area, 2002/2003 and 2007; KSA Analysis.
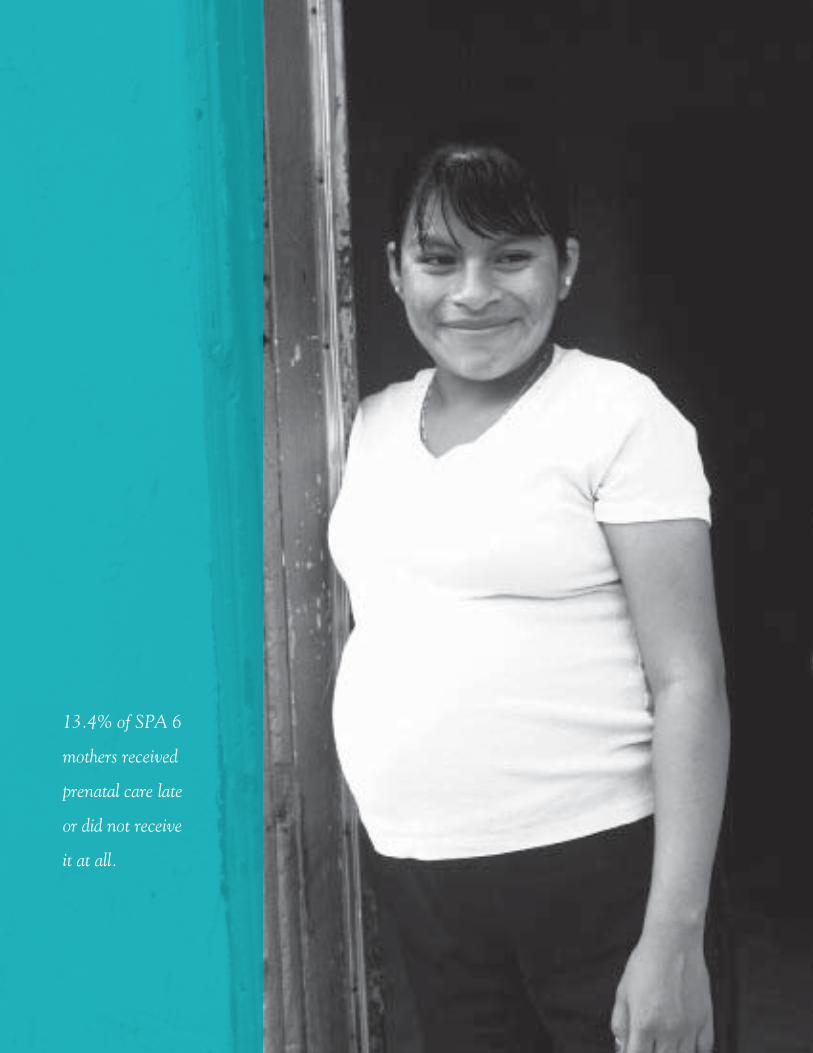
13.4% of SPA 6
mothers received
prenatal care late
or did not receive
it at all.
Mental Health Services 58
Mental Health Facilities 59
Inpatient Psychiatric Care 61
Mental Health Key Findings 62
Women and Children 62
Part 4Subsets of theTargeted Population
Critical Condition: Examining the Scope of Medical Services in South Los Angeles58
Subsets of the Targeted Population
Mental Health ServicesMental Health (MH) is defined as inpatient
psychiatric services and outpatient psychiatric,
psychology, and therapy services.
The following indicators will be used to determine
if the mental health needs of the SPA 6 population
are being met:
• Demand based on population/demographics.
• Use of inpatient services (comparison of
demand vs. supply).
• Supply of mental health services compared to
other locations.
The SPA 6 population is at risk for mental health
problems suggesting a high demand for mental
health services.
• The diverse and low-income population
suggests SPA 6 residents are in higher
need of mental health services.
— Ethnic and racial minority groups with
high levels of poverty and low levels of
education are thought to be more at risk
for mental-health problems.
— The under/uninsured are less likely to
receive treatment; racially and ethnically
diverse populations may also be less likely
to seek mental health care services.
• In 2001, 3.7% of the SPA 6 population sought
treatment for MH services; of these,
— 88% were for non 24-hour services
including major depression, personality
disorders, bipolar/psychosis, and
schizophrenia.
— 10% received 24-hour acute hospital
treatment and 2% sought treatment
in 24-hour non hospital facilities.
– The top diagnosis for these patients
was schizophrenia.
• More recently, it was found that the high rates
of depressive disorders in LA County call for an
expansion of MH services.
— It should be noted, however, that
the percent of adults diagnosed with
depression in SPA 6 is lower compared
to other SPAs and LA County (6.6%
SPA 6 vs. 9.8% LAC).
Substance abuse and failure to undergo treatment
(e.g., medication) for mental health disorders are
considered major predictors of homelessness.
The Treatment Advocacy Center states that at
any given time there are more people who go
untreated for severe psychiatric illness compared
to the number of people receiving care in hospitals.
Sources: Ethnic Minorities Still Lack Adequate MH Care, Experts State (American Psychiatric Association) retrieved from the Networkof Care-Los Angeles-Mental Health on 2/22/07; Mental Health and Racial Ethnic Minorities (American Association of World Health)retrieved from the Network of Care-Los Angeles-Mental Health on 2/22/07; Patient Assessment Survey III, Final Report; Key Indicatorsof Health by Service Planning Area 2002/2003 LACDPH.
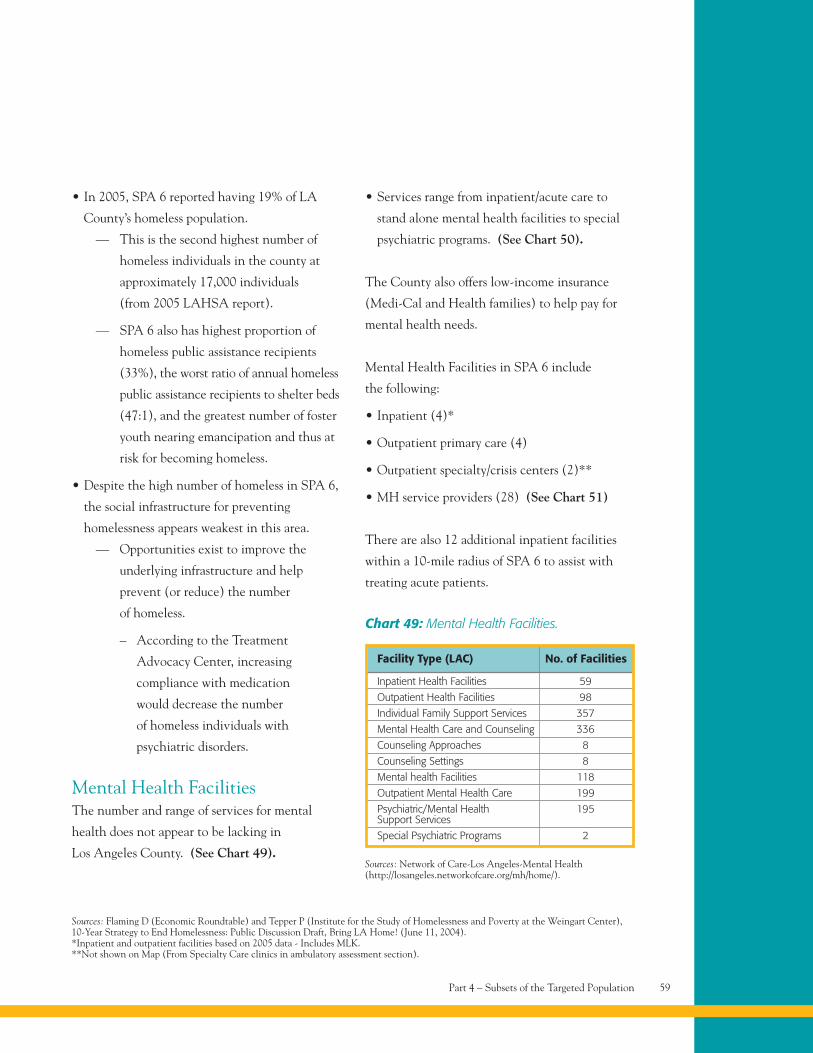
• In 2005, SPA 6 reported having 19% of LA
County’s homeless population.
— This is the second highest number of
homeless individuals in the county at
approximately 17,000 individuals
(from 2005 LAHSA report).
— SPA 6 also has highest proportion of
homeless public assistance recipients
(33%), the worst ratio of annual homeless
public assistance recipients to shelter beds
(47:1), and the greatest number of foster
youth nearing emancipation and thus at
risk for becoming homeless.
• Despite the high number of homeless in SPA 6,
the social infrastructure for preventing
homelessness appears weakest in this area.
— Opportunities exist to improve the
underlying infrastructure and help
prevent (or reduce) the number
of homeless.
– According to the Treatment
Advocacy Center, increasing
compliance with medication
would decrease the number
of homeless individuals with
psychiatric disorders.
Mental Health FacilitiesThe number and range of services for mental
health does not appear to be lacking in
Los Angeles County. (See Chart 49).
• Services range from inpatient/acute care to
stand alone mental health facilities to special
psychiatric programs. (See Chart 50).
The County also offers low-income insurance
(Medi-Cal and Health families) to help pay for
mental health needs.
Mental Health Facilities in SPA 6 include
the following:
• Inpatient (4)*
• Outpatient primary care (4)
• Outpatient specialty/crisis centers (2)**
• MH service providers (28) (See Chart 51)
There are also 12 additional inpatient facilities
within a 10-mile radius of SPA 6 to assist with
treating acute patients.
Part 4 – Subsets of the Targeted Population 59
Sources: Flaming D (Economic Roundtable) and Tepper P (Institute for the Study of Homelessness and Poverty at the Weingart Center),10-Year Strategy to End Homelessness: Public Discussion Draft, Bring LA Home! (June 11, 2004).*Inpatient and outpatient facilities based on 2005 data - Includes MLK.**Not shown on Map (From Specialty Care clinics in ambulatory assessment section).
Facility Type (LAC) No. of Facilities
Chart 49: Mental Health Facilities.
Sources: Network of Care-Los Angeles-Mental Health(http://losangeles.networkofcare.org/mh/home/).
Inpatient Health Facilities 59
Outpatient Health Facilities 98
Individual Family Support Services 357
Mental Health Care and Counseling 336
Counseling Approaches 8
Counseling Settings 8
Mental health Facilities 118
Outpatient Mental Health Care 199
Psychiatric/Mental Health 195Support Services
Special Psychiatric Programs 2
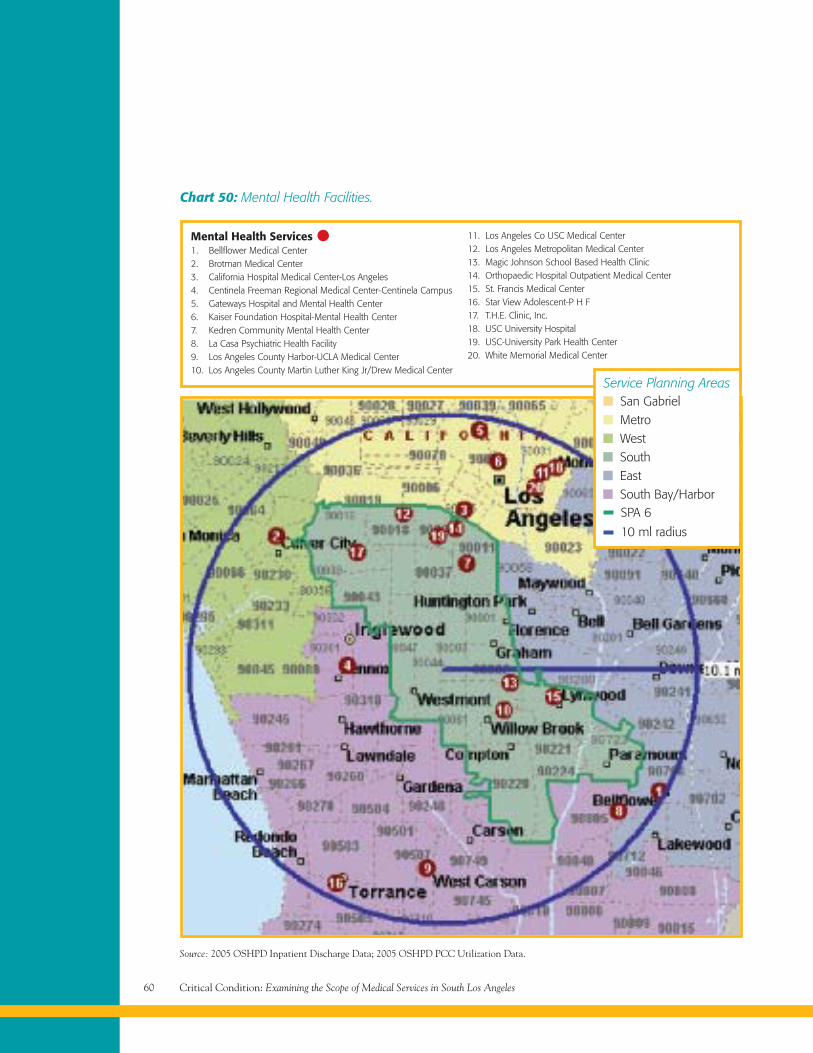
Critical Condition: Examining the Scope of Medical Services in South Los Angeles60
Chart 50: Mental Health Facilities.
Mental Health Services1. Bellflower Medical Center2. Brotman Medical Center3. California Hospital Medical Center-Los Angeles4. Centinela Freeman Regional Medical Center-Centinela Campus5. Gateways Hospital and Mental Health Center6. Kaiser Foundation Hospital-Mental Health Center7. Kedren Community Mental Health Center8. La Casa Psychiatric Health Facility9. Los Angeles County Harbor-UCLA Medical Center10. Los Angeles County Martin Luther King Jr/Drew Medical Center
11. Los Angeles Co USC Medical Center12. Los Angeles Metropolitan Medical Center13. Magic Johnson School Based Health Clinic14. Orthopaedic Hospital Outpatient Medical Center15. St. Francis Medical Center16. Star View Adolescent-P H F17. T.H.E. Clinic, Inc.18. USC University Hospital19. USC-University Park Health Center20. White Memorial Medical Center
Source: 2005 OSHPD Inpatient Discharge Data; 2005 OSHPD PCC Utilization Data.
Service Planning Areas
SPA 6
10 ml radius
SouthEastSouth Bay/Harbor
San GabrielMetroWest
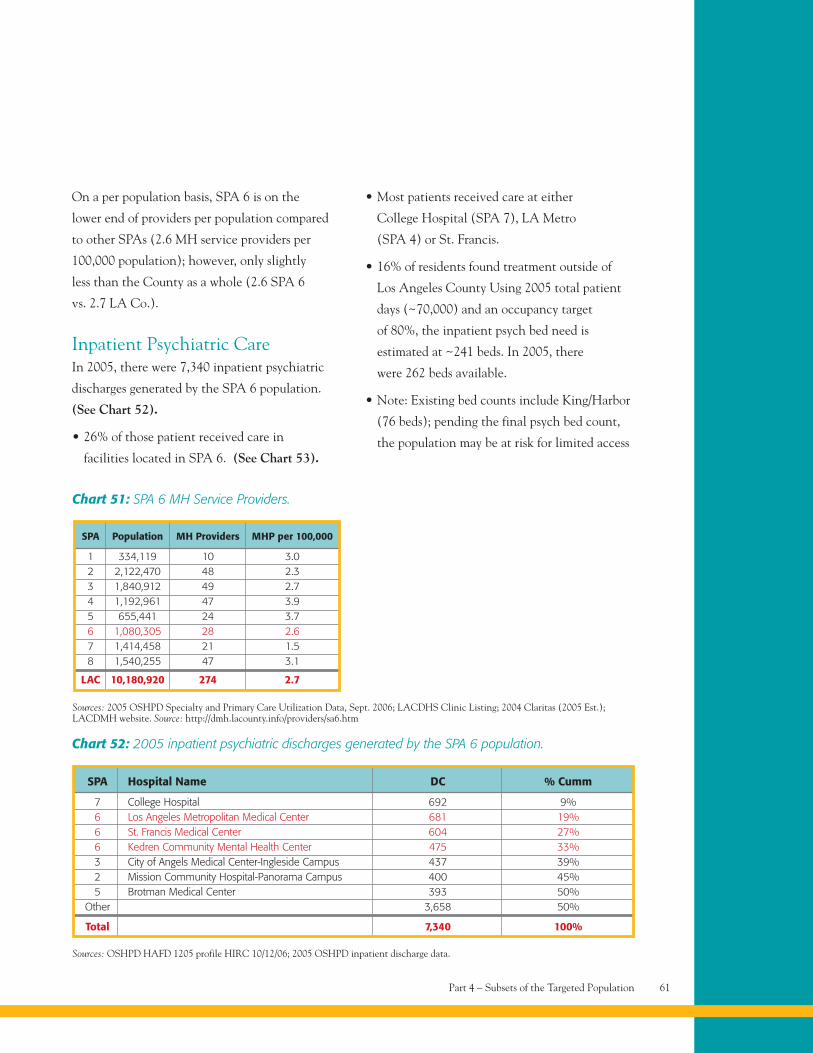
On a per population basis, SPA 6 is on the
lower end of providers per population compared
to other SPAs (2.6 MH service providers per
100,000 population); however, only slightly
less than the County as a whole (2.6 SPA 6
vs. 2.7 LA Co.).
Inpatient Psychiatric CareIn 2005, there were 7,340 inpatient psychiatric
discharges generated by the SPA 6 population.
(See Chart 52).
• 26% of those patient received care in
facilities located in SPA 6. (See Chart 53).
• Most patients received care at either
College Hospital (SPA 7), LA Metro
(SPA 4) or St. Francis.
• 16% of residents found treatment outside of
Los Angeles County Using 2005 total patient
days (~70,000) and an occupancy target
of 80%, the inpatient psych bed need is
estimated at ~241 beds. In 2005, there
were 262 beds available.
• Note: Existing bed counts include King/Harbor
(76 beds); pending the final psych bed count,
the population may be at risk for limited access
Part 4 – Subsets of the Targeted Population 61
Sources: 2005 OSHPD Specialty and Primary Care Utilization Data, Sept. 2006; LACDHS Clinic Listing; 2004 Claritas (2005 Est.);LACDMH website. Source: http://dmh.lacounty.info/providers/sa6.htm
SPA Population MH Providers MHP per 100,000
1 334,119 10 3.02 2,122,470 48 2.33 1,840,912 49 2.74 1,192,961 47 3.95 655,441 24 3.76 1,080,305 28 2.67 1,414,458 21 1.58 1,540,255 47 3.1
LAC 10,180,920 274 2.7
Chart 51: SPA 6 MH Service Providers.
Chart 52: 2005 inpatient psychiatric discharges generated by the SPA 6 population.
SPA Hospital Name DC % Cumm
7 College Hospital 692 9%6 Los Angeles Metropolitan Medical Center 681 19%6 St. Francis Medical Center 604 27%6 Kedren Community Mental Health Center 475 33%3 City of Angels Medical Center-Ingleside Campus 437 39%2 Mission Community Hospital-Panorama Campus 400 45%5 Brotman Medical Center 393 50%
Other 3,658 50%
Total 7,340 100%
Sources: OSHPD HAFD 1205 profile HIRC 10/12/06; 2005 OSHPD inpatient discharge data.
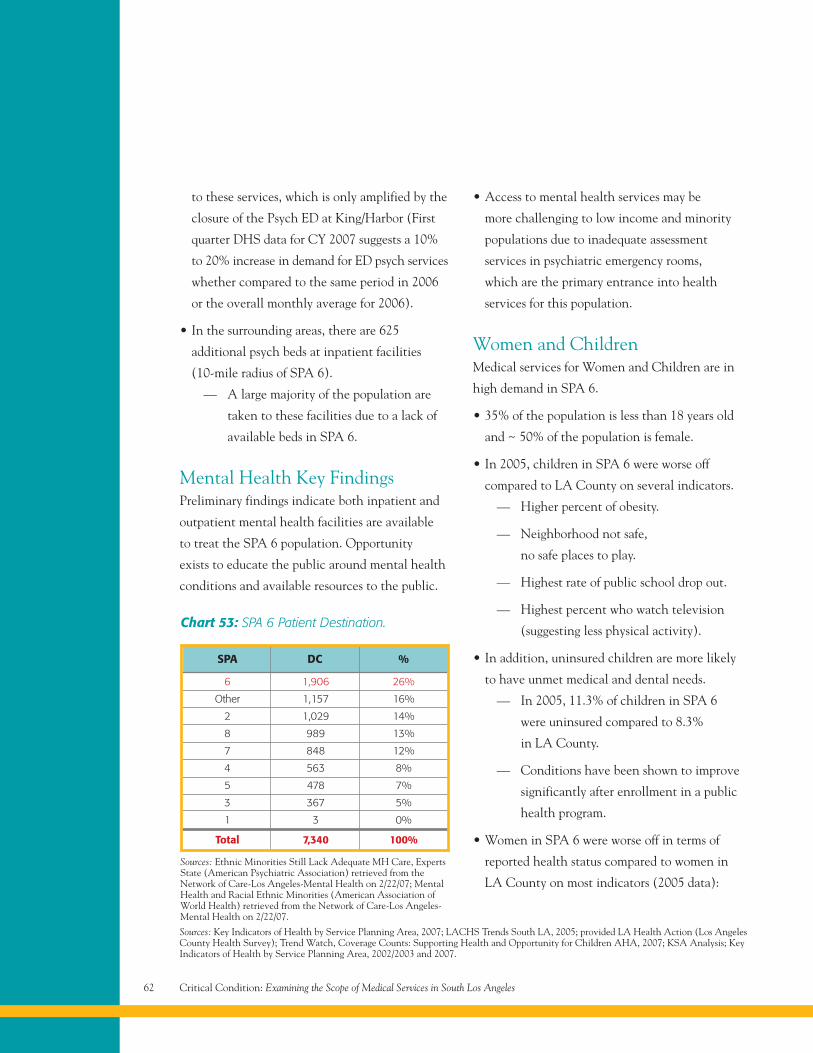
to these services, which is only amplified by the
closure of the Psych ED at King/Harbor (First
quarter DHS data for CY 2007 suggests a 10%
to 20% increase in demand for ED psych services
whether compared to the same period in 2006
or the overall monthly average for 2006).
• In the surrounding areas, there are 625
additional psych beds at inpatient facilities
(10-mile radius of SPA 6).
— A large majority of the population are
taken to these facilities due to a lack of
available beds in SPA 6.
Mental Health Key FindingsPreliminary findings indicate both inpatient and
outpatient mental health facilities are available
to treat the SPA 6 population. Opportunity
exists to educate the public around mental health
conditions and available resources to the public.
• Access to mental health services may be
more challenging to low income and minority
populations due to inadequate assessment
services in psychiatric emergency rooms,
which are the primary entrance into health
services for this population.
Women and ChildrenMedical services for Women and Children are in
high demand in SPA 6.
• 35% of the population is less than 18 years old
and ~ 50% of the population is female.
• In 2005, children in SPA 6 were worse off
compared to LA County on several indicators.
— Higher percent of obesity.
— Neighborhood not safe,
no safe places to play.
— Highest rate of public school drop out.
— Highest percent who watch television
(suggesting less physical activity).
• In addition, uninsured children are more likely
to have unmet medical and dental needs.
— In 2005, 11.3% of children in SPA 6
were uninsured compared to 8.3%
in LA County.
— Conditions have been shown to improve
significantly after enrollment in a public
health program.
• Women in SPA 6 were worse off in terms of
reported health status compared to women in
LA County on most indicators (2005 data):
Critical Condition: Examining the Scope of Medical Services in South Los Angeles62
6 1,906 26%
Other 1,157 16%
2 1,029 14%
8 989 13%
7 848 12%
4 563 8%
5 478 7%
3 367 5%
1 3 0%
Total 7,340 100%
SPA DC %
Chart 53: SPA 6 Patient Destination.
Sources: Ethnic Minorities Still Lack Adequate MH Care, ExpertsState (American Psychiatric Association) retrieved from theNetwork of Care-Los Angeles-Mental Health on 2/22/07; MentalHealth and Racial Ethnic Minorities (American Association ofWorld Health) retrieved from the Network of Care-Los Angeles-Mental Health on 2/22/07.
Sources: Key Indicators of Health by Service Planning Area, 2007; LACHS Trends South LA, 2005; provided LA Health Action (Los AngelesCounty Health Survey); Trend Watch, Coverage Counts: Supporting Health and Opportunity for Children AHA, 2007; KSA Analysis; KeyIndicators of Health by Service Planning Area, 2002/2003 and 2007.
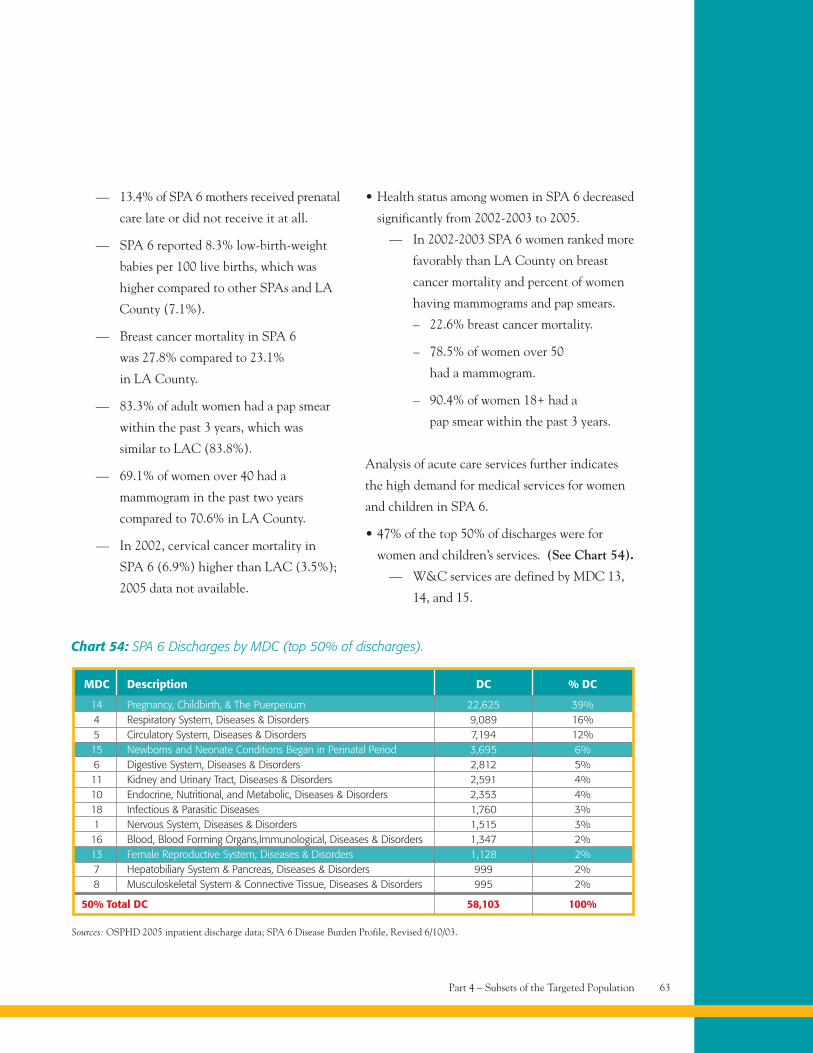
Part 4 – Subsets of the Targeted Population 63
— 13.4% of SPA 6 mothers received prenatal
care late or did not receive it at all.
— SPA 6 reported 8.3% low-birth-weight
babies per 100 live births, which was
higher compared to other SPAs and LA
County (7.1%).
— Breast cancer mortality in SPA 6
was 27.8% compared to 23.1%
in LA County.
— 83.3% of adult women had a pap smear
within the past 3 years, which was
similar to LAC (83.8%).
— 69.1% of women over 40 had a
mammogram in the past two years
compared to 70.6% in LA County.
— In 2002, cervical cancer mortality in
SPA 6 (6.9%) higher than LAC (3.5%);
2005 data not available.
• Health status among women in SPA 6 decreased
significantly from 2002-2003 to 2005.
— In 2002-2003 SPA 6 women ranked more
favorably than LA County on breast
cancer mortality and percent of women
having mammograms and pap smears.
– 22.6% breast cancer mortality.
– 78.5% of women over 50
had a mammogram.
– 90.4% of women 18+ had a
pap smear within the past 3 years.
Analysis of acute care services further indicates
the high demand for medical services for women
and children in SPA 6.
• 47% of the top 50% of discharges were for
women and children’s services. (See Chart 54).
— W&C services are defined by MDC 13,
14, and 15.
Chart 54: SPA 6 Discharges by MDC (top 50% of discharges).
MDC Description DC % DC
14 Pregnancy, Childbirth, & The Puerperium 22,625 39%4 Respiratory System, Diseases & Disorders 9,089 16%5 Circulatory System, Diseases & Disorders 7,194 12%15 Newborns and Neonate Conditions Began in Perinatal Period 3,695 6%6 Digestive System, Diseases & Disorders 2,812 5%11 Kidney and Urinary Tract, Diseases & Disorders 2,591 4%10 Endocrine, Nutritional, and Metabolic, Diseases & Disorders 2,353 4%18 Infectious & Parasitic Diseases 1,760 3%1 Nervous System, Diseases & Disorders 1,515 3%16 Blood, Blood Forming Organs,Immunological, Diseases & Disorders 1,347 2%13 Female Reproductive System, Diseases & Disorders 1,128 2%7 Hepatobiliary System & Pancreas, Diseases & Disorders 999 2%8 Musculoskeletal System & Connective Tissue, Diseases & Disorders 995 2%
50% Total DC 58,103 100%
Sources: OSPHD 2005 inpatient discharge data; SPA 6 Disease Burden Profile, Revised 6/10/03.
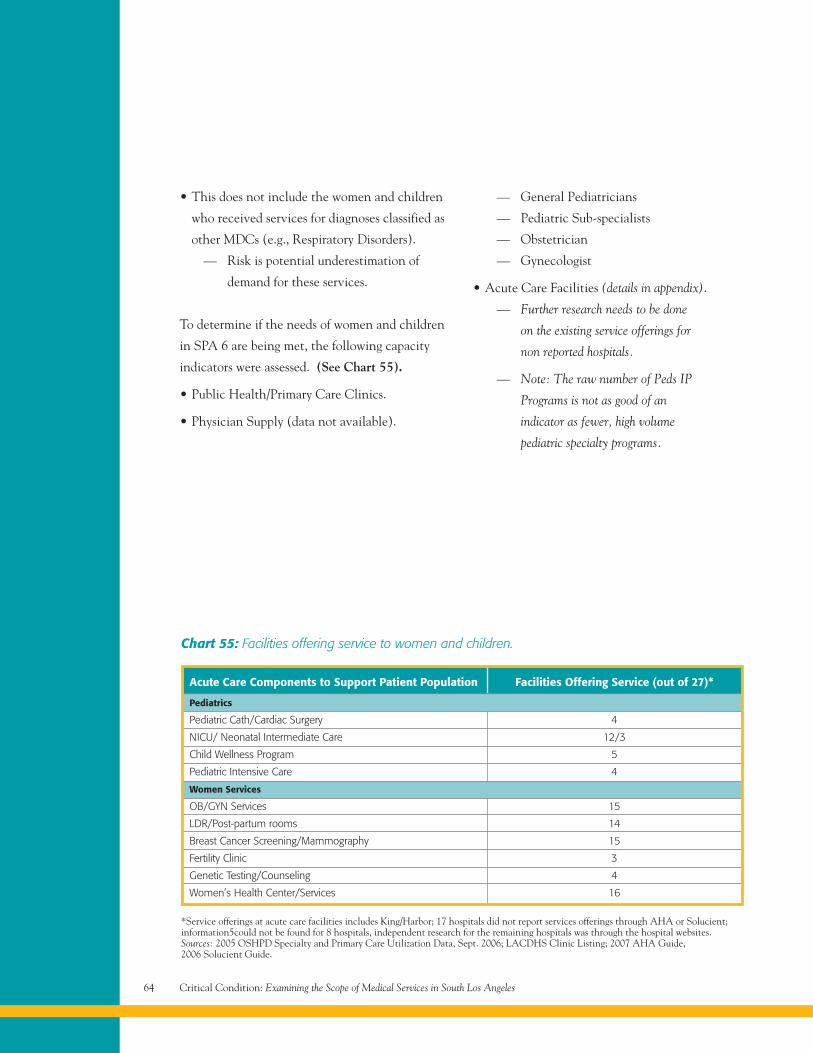
Critical Condition: Examining the Scope of Medical Services in South Los Angeles64
• This does not include the women and children
who received services for diagnoses classified as
other MDCs (e.g., Respiratory Disorders).
— Risk is potential underestimation of
demand for these services.
To determine if the needs of women and children
in SPA 6 are being met, the following capacity
indicators were assessed. (See Chart 55).
• Public Health/Primary Care Clinics.
• Physician Supply (data not available).
— General Pediatricians
— Pediatric Sub-specialists
— Obstetrician
— Gynecologist
• Acute Care Facilities (details in appendix).
— Further research needs to be done
on the existing service offerings for
non reported hospitals.
— Note: The raw number of Peds IP
Programs is not as good of an
indicator as fewer, high volume
pediatric specialty programs.
Acute Care Components to Support Patient Population Facilities Offering Service (out of 27)*
Chart 55: Facilities offering service to women and children.
Pediatrics
Pediatric Cath/Cardiac Surgery 4
NICU/ Neonatal Intermediate Care 12/3
Child Wellness Program 5
Pediatric Intensive Care 4
Women Services
OB/GYN Services 15
LDR/Post-partum rooms 14
Breast Cancer Screening/Mammography 15
Fertility Clinic 3
Genetic Testing/Counseling 4
Women’s Health Center/Services 16
*Service offerings at acute care facilities includes King/Harbor; 17 hospitals did not report services offerings through AHA or Solucient;information5could not be found for 8 hospitals, independent research for the remaining hospitals was through the hospital websites.Sources: 2005 OSHPD Specialty and Primary Care Utilization Data, Sept. 2006; LACDHS Clinic Listing; 2007 AHA Guide,2006 Solucient Guide.
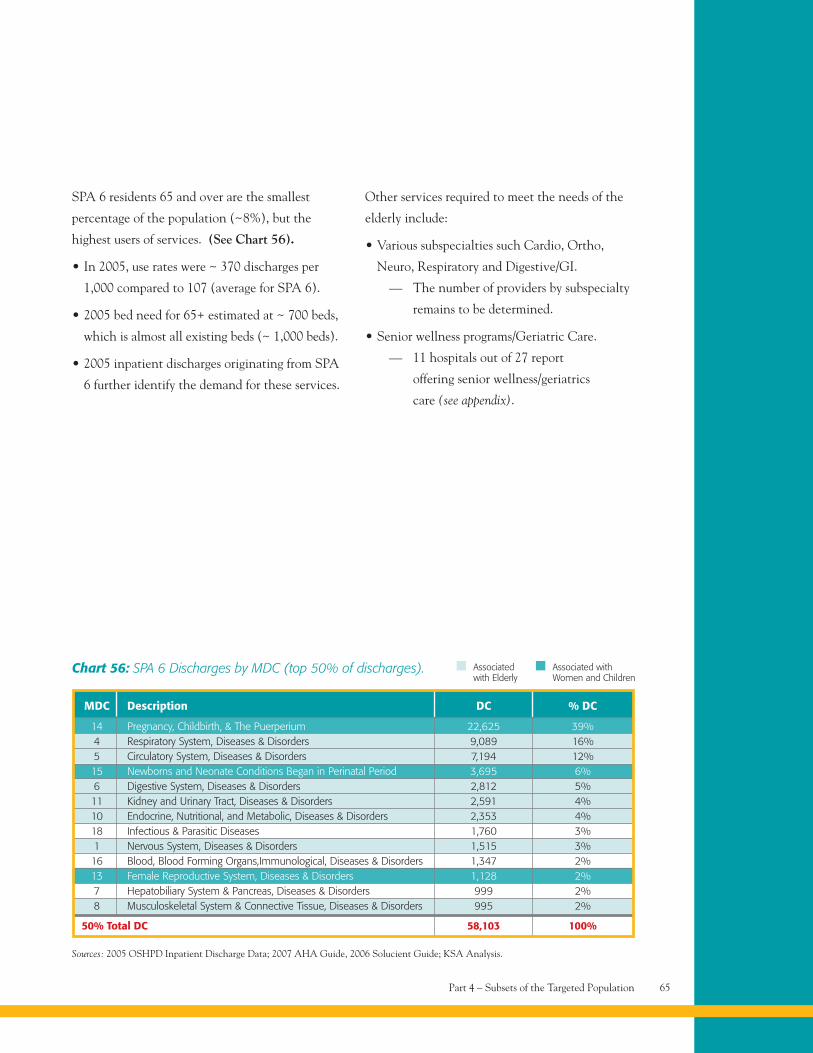
Part 4 – Subsets of the Targeted Population 65
Chart 56: SPA 6 Discharges by MDC (top 50% of discharges).
MDC Description DC % DC
14 Pregnancy, Childbirth, & The Puerperium 22,625 39%4 Respiratory System, Diseases & Disorders 9,089 16%5 Circulatory System, Diseases & Disorders 7,194 12%15 Newborns and Neonate Conditions Began in Perinatal Period 3,695 6%6 Digestive System, Diseases & Disorders 2,812 5%11 Kidney and Urinary Tract, Diseases & Disorders 2,591 4%10 Endocrine, Nutritional, and Metabolic, Diseases & Disorders 2,353 4%18 Infectious & Parasitic Diseases 1,760 3%1 Nervous System, Diseases & Disorders 1,515 3%16 Blood, Blood Forming Organs,Immunological, Diseases & Disorders 1,347 2%13 Female Reproductive System, Diseases & Disorders 1,128 2%7 Hepatobiliary System & Pancreas, Diseases & Disorders 999 2%8 Musculoskeletal System & Connective Tissue, Diseases & Disorders 995 2%
50% Total DC 58,103 100%
Sources: 2005 OSHPD Inpatient Discharge Data; 2007 AHA Guide, 2006 Solucient Guide; KSA Analysis.
Associatedwith Elderly
Associated withWomen and Children
SPA 6 residents 65 and over are the smallest
percentage of the population (~8%), but the
highest users of services. (See Chart 56).
• In 2005, use rates were ~ 370 discharges per
1,000 compared to 107 (average for SPA 6).
• 2005 bed need for 65+ estimated at ~ 700 beds,
which is almost all existing beds (~ 1,000 beds).
• 2005 inpatient discharges originating from SPA
6 further identify the demand for these services.
Other services required to meet the needs of the
elderly include:
• Various subspecialties such Cardio, Ortho,
Neuro, Respiratory and Digestive/GI.
— The number of providers by subspecialty
remains to be determined.
• Senior wellness programs/Geriatric Care.
— 11 hospitals out of 27 report
offering senior wellness/geriatrics
care (see appendix).

Substance abuse
and failure to
undergo treatment
for mental health
disorders are considered
major predictors
of homelessness.
Project Overview 68
Key Challenges 68
Population and 71Demographics
Ethnicity and Race 72
Payor Category and 73Insurance Status
Benchmark Criteria 74
2005 Census Data – 74Benchmarks
Inpatient Acute Care Facilities 76
SPA 6 Patient Origin – 79Discharges by Hospital
Primary Care Clinics 83
Primary Care Utilization 84Benchmarks
Primary Care Clinics 85Detailed – Revised
Primary Care Clinics 86(SPA 6 and 10-Mile)
Specialty Clinics 90Detailed – Revised
Specialty Clinics 91(SPA 6 and 10-Mile)
Specialty Clinics 93(Private/Stand Alone)
Diagnostic Imaging Centers 94
Diagnostic and Treatment 95Projections
LA Dental Society Map 98
Trauma and Emergency 99Services
Demand for Trauma and 100Emergency Services
Emergency Services 100
KSA/CHCF Study 101
KSA/CHCF Study – 102Summary of Findings
Trauma and Emergency 103Services
Skilled Nursing 104Facilities – Discharges
Rehabilitative Services 105
Public Health Clinics 106
Mental Health Facilities 106
Psychiatric – Discharges 107
Women, Children 108and the Elderly
Advisory Group 110
Bibliography 110
Part 5Appendix
Critical Condition: Examining the Scope of Medical Services in South Los Angeles68
Appendix
Project OverviewKey Points of Clarification
• The assessment is based on a wide
range of indicators.
— A measure of demand and capacity was
analyzed for each indicator.
— Outcomes should be evaluated
as a whole rather than by
individual indicators.
— Broader social determinants that
contribute to community health
status were not assessed in detail.
• DEMAND indicators were used as a
proxy to assess NEED in relative terms
given data limitations.
• The LA Health Surveys and other County
Departmental studies indicate that the
medical services NEEDS of the SPA 6
population are not being met.
• Services provided by King/Harbor Hospital
are included in the analyses depending
on year of data.
• Summary of key findings are just that. This
report should be read in total to gain a more
comprehensive understanding of the true
medical needs of the SPA 6 population.
Limitations of the Data
The analyses conducted in this effort are to
identify the medical services needs of South
Los Angeles residents based on where demand
appears to be mismatched with capacity. We have
aggregated publicly available information as of
early 2007 and have articulated salient themes
that are reflected in the data. We have NOT
conducted primary research nor have we
independently assessed the validity of the
individual reports and data sources that we cite
throughout this material. In fact, we hope that
this material will spur additional research as
appropriate (and not to the detriment of action)
to clarify the status in health access categories
about which less is available publicly.
This analysis is NOT…
• A conclusive analysis.
• An analysis of cause and effect.
Key ChallengesThroughout this assessment three key challenges
surfaced that deserve additional commentary:
Challenge #1
Significant data exists on the demand and supply
of medical services for the SPA 6 population,
however, there is no single repository to house all
of the available information for the community.
Implication: Limits the ability to develop a
comprehensive assessment.
Implication: Impedes access to the most current
available data.
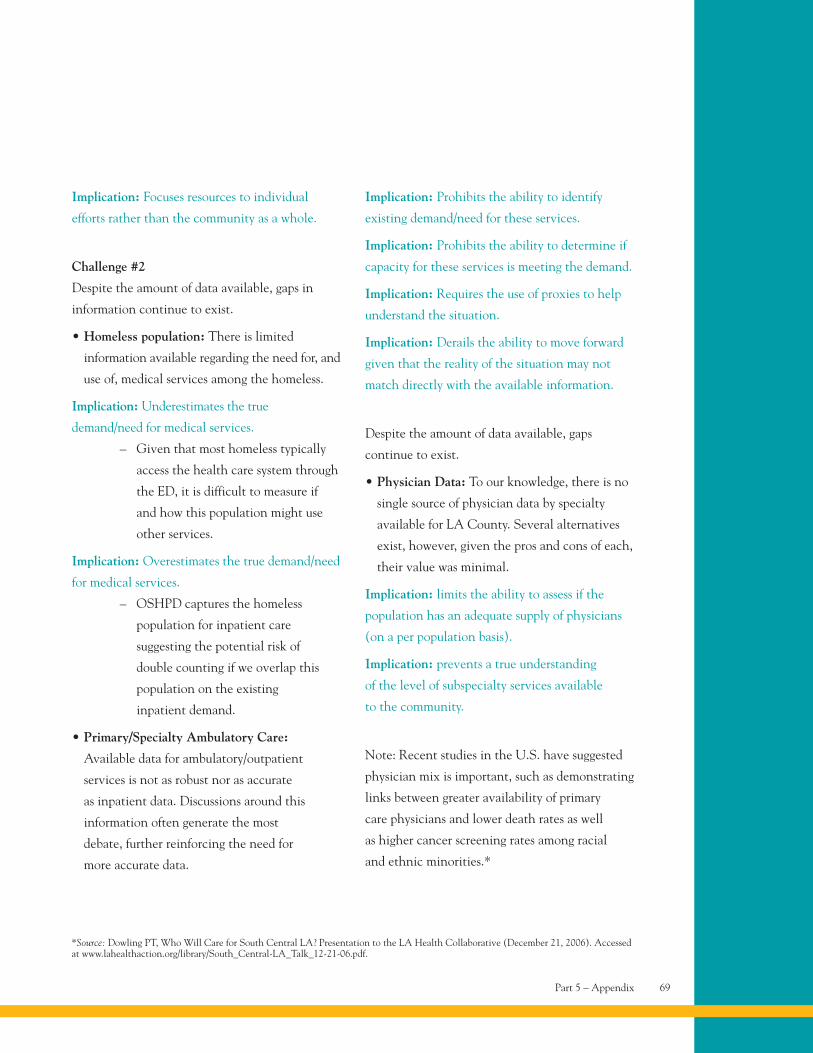
Part 5 – Appendix 69
Implication: Focuses resources to individual
efforts rather than the community as a whole.
Challenge #2
Despite the amount of data available, gaps in
information continue to exist.
• Homeless population: There is limited
information available regarding the need for, and
use of, medical services among the homeless.
Implication: Underestimates the true
demand/need for medical services.
– Given that most homeless typically
access the health care system through
the ED, it is difficult to measure if
and how this population might use
other services.
Implication: Overestimates the true demand/need
for medical services.
– OSHPD captures the homeless
population for inpatient care
suggesting the potential risk of
double counting if we overlap this
population on the existing
inpatient demand.
• Primary/Specialty Ambulatory Care:
Available data for ambulatory/outpatient
services is not as robust nor as accurate
as inpatient data. Discussions around this
information often generate the most
debate, further reinforcing the need for
more accurate data.
Implication: Prohibits the ability to identify
existing demand/need for these services.
Implication: Prohibits the ability to determine if
capacity for these services is meeting the demand.
Implication: Requires the use of proxies to help
understand the situation.
Implication: Derails the ability to move forward
given that the reality of the situation may not
match directly with the available information.
Despite the amount of data available, gaps
continue to exist.
• Physician Data: To our knowledge, there is no
single source of physician data by specialty
available for LA County. Several alternatives
exist, however, given the pros and cons of each,
their value was minimal.
Implication: limits the ability to assess if the
population has an adequate supply of physicians
(on a per population basis).
Implication: prevents a true understanding
of the level of subspecialty services available
to the community.
Note: Recent studies in the U.S. have suggested
physician mix is important, such as demonstrating
links between greater availability of primary
care physicians and lower death rates as well
as higher cancer screening rates among racial
and ethnic minorities.*
*Source: Dowling PT, Who Will Care for South Central LA? Presentation to the LA Health Collaborative (December 21, 2006). Accessedat www.lahealthaction.org/library/South_Central-LA_Talk_12-21-06.pdf.
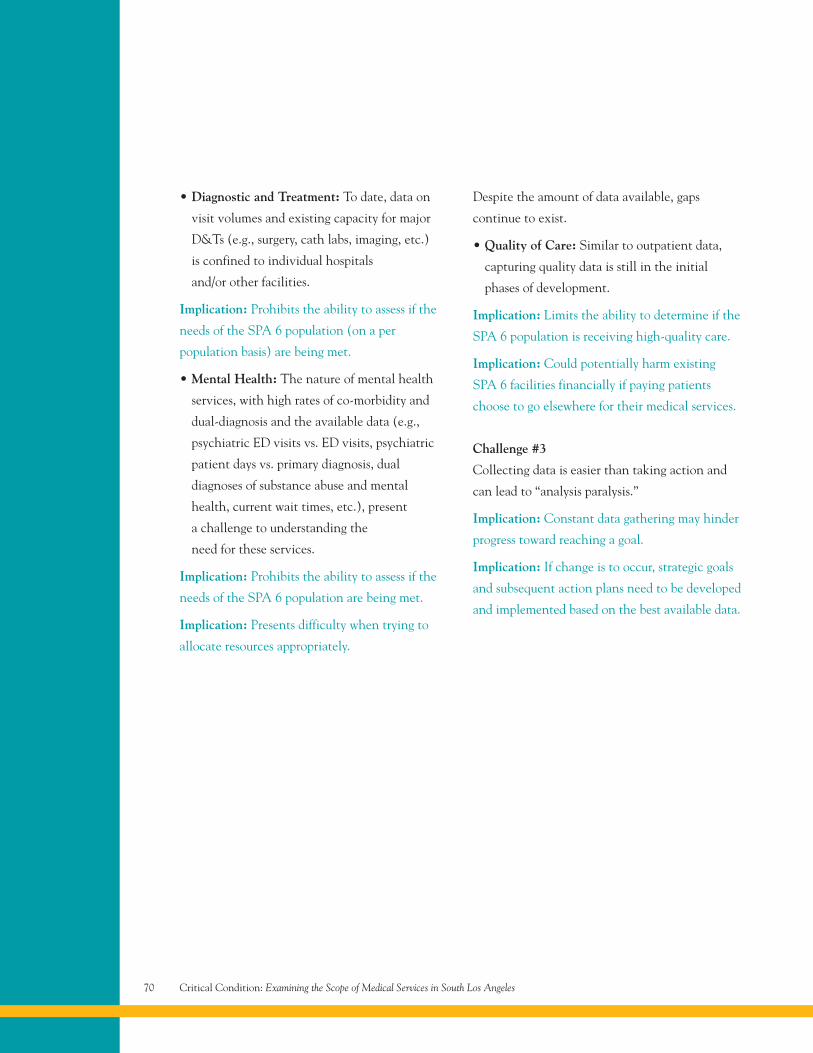
Critical Condition: Examining the Scope of Medical Services in South Los Angeles70
• Diagnostic and Treatment: To date, data on
visit volumes and existing capacity for major
D&Ts (e.g., surgery, cath labs, imaging, etc.)
is confined to individual hospitals
and/or other facilities.
Implication: Prohibits the ability to assess if the
needs of the SPA 6 population (on a per
population basis) are being met.
• Mental Health: The nature of mental health
services, with high rates of co-morbidity and
dual-diagnosis and the available data (e.g.,
psychiatric ED visits vs. ED visits, psychiatric
patient days vs. primary diagnosis, dual
diagnoses of substance abuse and mental
health, current wait times, etc.), present
a challenge to understanding the
need for these services.
Implication: Prohibits the ability to assess if the
needs of the SPA 6 population are being met.
Implication: Presents difficulty when trying to
allocate resources appropriately.
Despite the amount of data available, gaps
continue to exist.
• Quality of Care: Similar to outpatient data,
capturing quality data is still in the initial
phases of development.
Implication: Limits the ability to determine if the
SPA 6 population is receiving high-quality care.
Implication: Could potentially harm existing
SPA 6 facilities financially if paying patients
choose to go elsewhere for their medical services.
Challenge #3
Collecting data is easier than taking action and
can lead to “analysis paralysis.”
Implication: Constant data gathering may hinder
progress toward reaching a goal.
Implication: If change is to occur, strategic goals
and subsequent action plans need to be developed
and implemented based on the best available data.
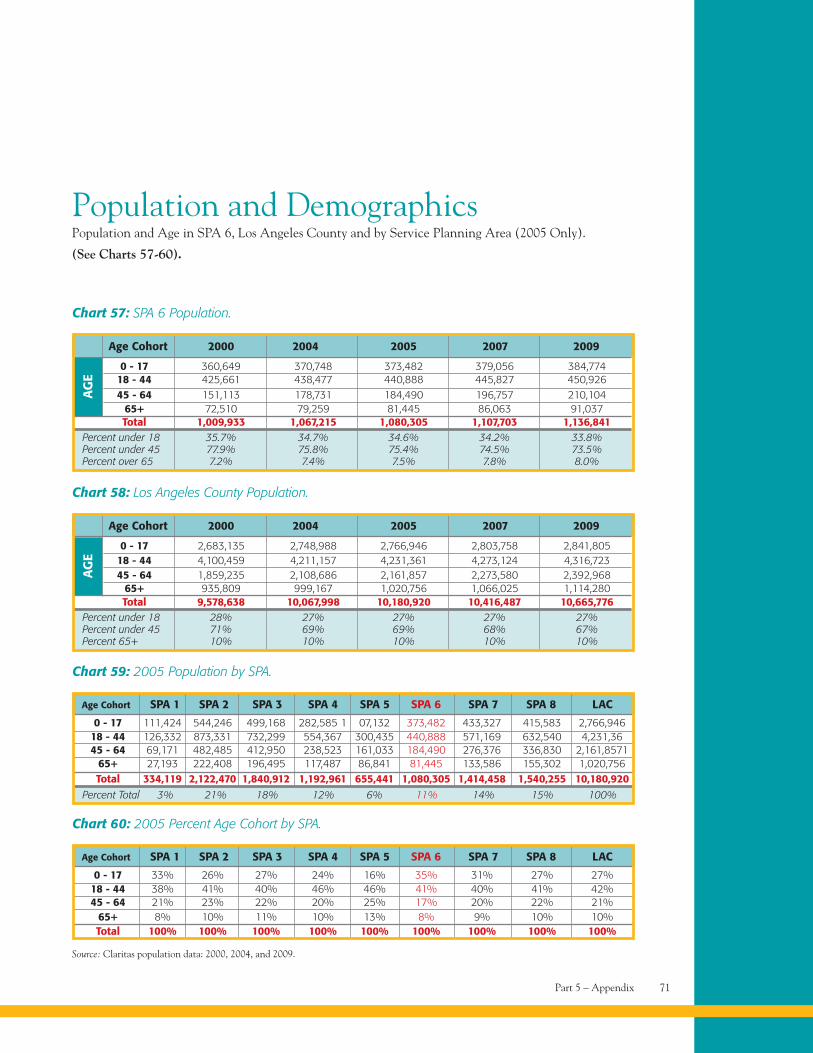
AG
E
Part 5 – Appendix 71
Population and DemographicsPopulation and Age in SPA 6, Los Angeles County and by Service Planning Area (2005 Only).
(See Charts 57-60).
Chart 57: SPA 6 Population.
0 - 17 360,649 370,748 373,482 379,056 384,77418 - 44 425,661 438,477 440,888 445,827 450,92645 - 64 151,113 178,731 184,490 196,757 210,104
65+ 72,510 79,259 81,445 86,063 91,037Total 1,009,933 1,067,215 1,080,305 1,107,703 1,136,841
Percent under 18 35.7% 34.7% 34.6% 34.2% 33.8%Percent under 45 77.9% 75.8% 75.4% 74.5% 73.5%Percent over 65 7.2% 7.4% 7.5% 7.8% 8.0%
Age Cohort 2000 2004 2005 2007 2009
Chart 59: 2005 Population by SPA.
0 - 17 111,424 544,246 499,168 282,585 1 07,132 373,482 433,327 415,583 2,766,94618 - 44 126,332 873,331 732,299 554,367 300,435 440,888 571,169 632,540 4,231,3645 - 64 69,171 482,485 412,950 238,523 161,033 184,490 276,376 336,830 2,161,8571
65+ 27,193 222,408 196,495 117,487 86,841 81,445 133,586 155,302 1,020,756Total 334,119 2,122,470 1,840,912 1,192,961 655,441 1,080,305 1,414,458 1,540,255 10,180,920
Age Cohort SPA 1 SPA 2 SPA 3 SPA 4 SPA 5 SPA 6 SPA 7 SPA 8 LAC
Source: Claritas population data: 2000, 2004, and 2009.
AG
E
Chart 58: Los Angeles County Population.
0 - 17 2,683,135 2,748,988 2,766,946 2,803,758 2,841,80518 - 44 4,100,459 4,211,157 4,231,361 4,273,124 4,316,72345 - 64 1,859,235 2,108,686 2,161,857 2,273,580 2,392,968
65+ 935,809 999,167 1,020,756 1,066,025 1,114,280Total 9,578,638 10,067,998 10,180,920 10,416,487 10,665,776
Percent under 18 28% 27% 27% 27% 27%Percent under 45 71% 69% 69% 68% 67%Percent 65+ 10% 10% 10% 10% 10%
Percent Total 3% 21% 18% 12% 6% 11% 14% 15% 100%
Age Cohort 2000 2004 2005 2007 2009
Chart 60: 2005 Percent Age Cohort by SPA.
0 - 17 33% 26% 27% 24% 16% 35% 31% 27% 27%18 - 44 38% 41% 40% 46% 46% 41% 40% 41% 42%45 - 64 21% 23% 22% 20% 25% 17% 20% 22% 21%
65+ 8% 10% 11% 10% 13% 8% 9% 10% 10%Total 100% 100% 100% 100% 100% 100% 100% 100% 100%
Age Cohort SPA 1 SPA 2 SPA 3 SPA 4 SPA 5 SPA 6 SPA 7 SPA 8 LAC
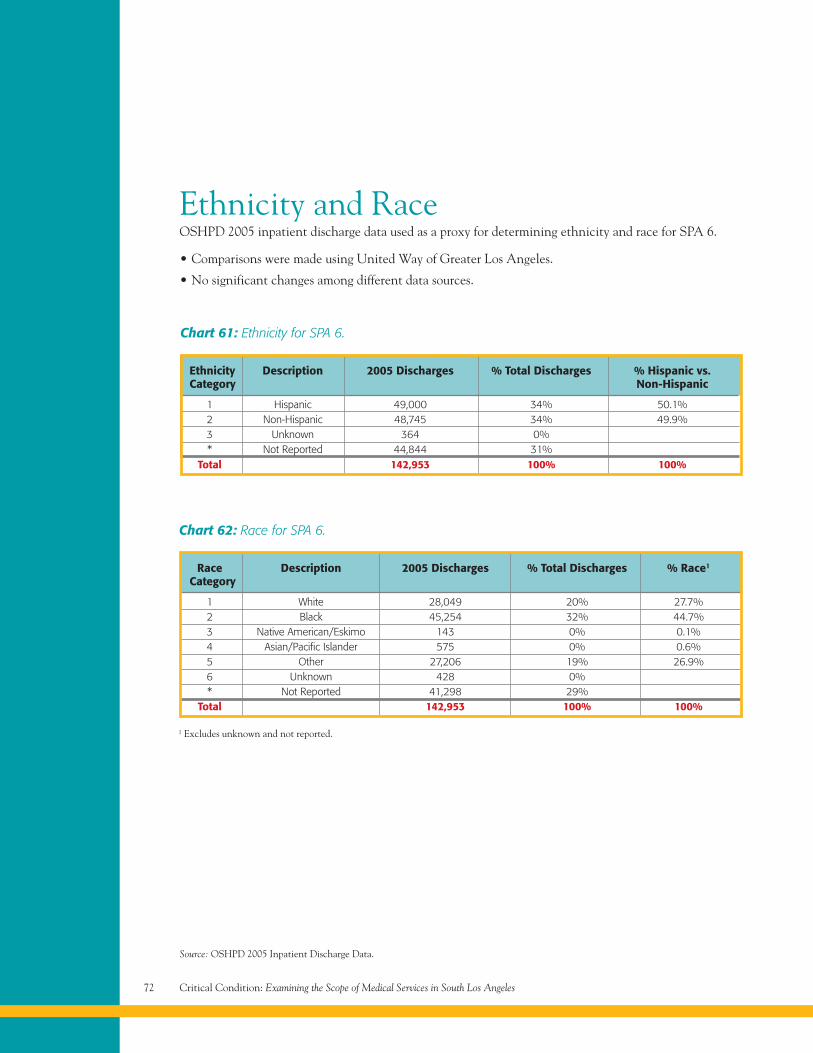
Critical Condition: Examining the Scope of Medical Services in South Los Angeles72
Ethnicity and RaceOSHPD 2005 inpatient discharge data used as a proxy for determining ethnicity and race for SPA 6.
• Comparisons were made using United Way of Greater Los Angeles.
• No significant changes among different data sources.
Chart 61: Ethnicity for SPA 6.
Ethnicity Description 2005 Discharges % Total Discharges % Hispanic vs.Category Non-Hispanic
1 Hispanic 49,000 34% 50.1%2 Non-Hispanic 48,745 34% 49.9%3 Unknown 364 0%* Not Reported 44,844 31%
Total 142,953 100% 100%
Chart 62: Race for SPA 6.
Race Description 2005 Discharges % Total Discharges % Race1
Category
1 White 28,049 20% 27.7%2 Black 45,254 32% 44.7%3 Native American/Eskimo 143 0% 0.1%4 Asian/Pacific Islander 575 0% 0.6%5 Other 27,206 19% 26.9%6 Unknown 428 0%* Not Reported 41,298 29%
Total 142,953 100% 100%
Source: OSHPD 2005 Inpatient Discharge Data.
1 Excludes unknown and not reported.
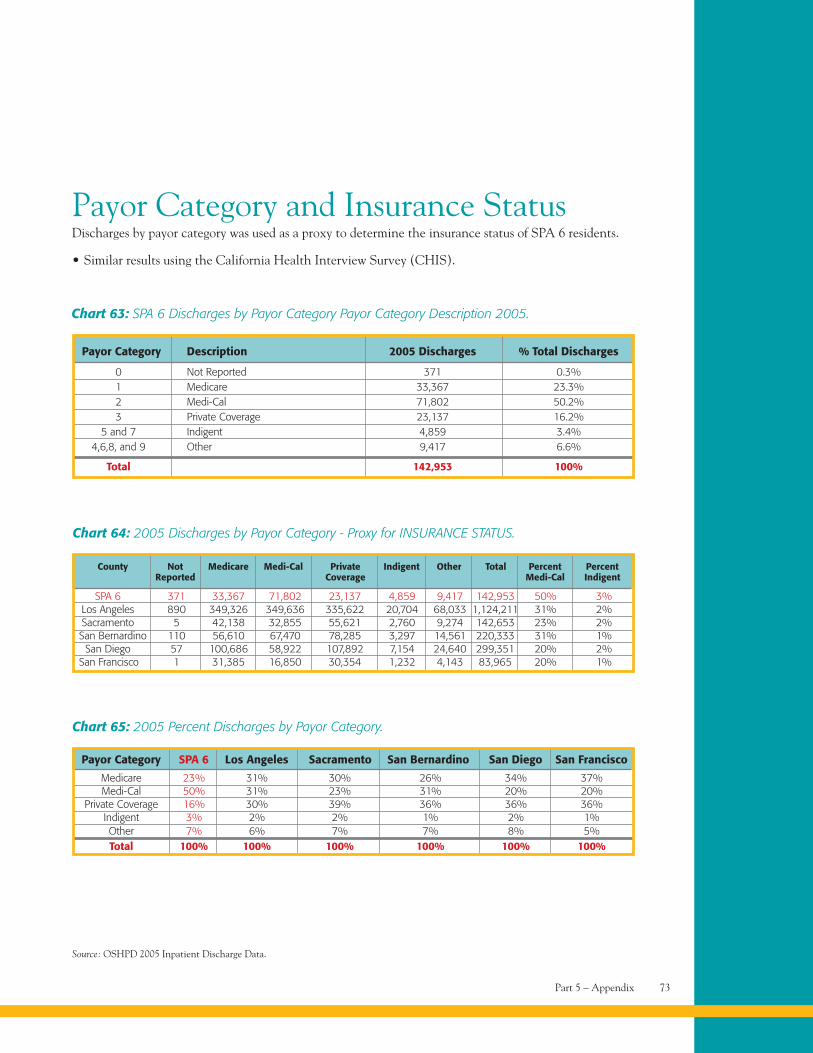
Part 5 – Appendix 73
Payor Category and Insurance StatusDischarges by payor category was used as a proxy to determine the insurance status of SPA 6 residents.
• Similar results using the California Health Interview Survey (CHIS).
Chart 63: SPA 6 Discharges by Payor Category Payor Category Description 2005.
Payor Category Description 2005 Discharges % Total Discharges
0 Not Reported 371 0.3%1 Medicare 33,367 23.3%2 Medi-Cal 71,802 50.2%3 Private Coverage 23,137 16.2%
5 and 7 Indigent 4,859 3.4%4,6,8, and 9 Other 9,417 6.6%
Total 142,953 100%
Chart 64: 2005 Discharges by Payor Category - Proxy for INSURANCE STATUS.
SPA 6 371 33,367 71,802 23,137 4,859 9,417 142,953 50% 3%Los Angeles 890 349,326 349,636 335,622 20,704 68,033 1,124,211 31% 2%Sacramento 5 42,138 32,855 55,621 2,760 9,274 142,653 23% 2%San Bernardino 110 56,610 67,470 78,285 3,297 14,561 220,333 31% 1%
San Diego 57 100,686 58,922 107,892 7,154 24,640 299,351 20% 2%San Francisco 1 31,385 16,850 30,354 1,232 4,143 83,965 20% 1%
County Not Medicare Medi-Cal Private Indigent Other Total Percent PercentReported Coverage Medi-Cal Indigent
Source: OSHPD 2005 Inpatient Discharge Data.
Chart 65: 2005 Percent Discharges by Payor Category.
Medicare 23% 31% 30% 26% 34% 37%Medi-Cal 50% 31% 23% 31% 20% 20%
Private Coverage 16% 30% 39% 36% 36% 36%Indigent 3% 2% 2% 1% 2% 1%Other 7% 6% 7% 7% 8% 5%Total 100% 100% 100% 100% 100% 100%
Payor Category SPA 6 Los Angeles Sacramento San Bernardino San Diego San Francisco
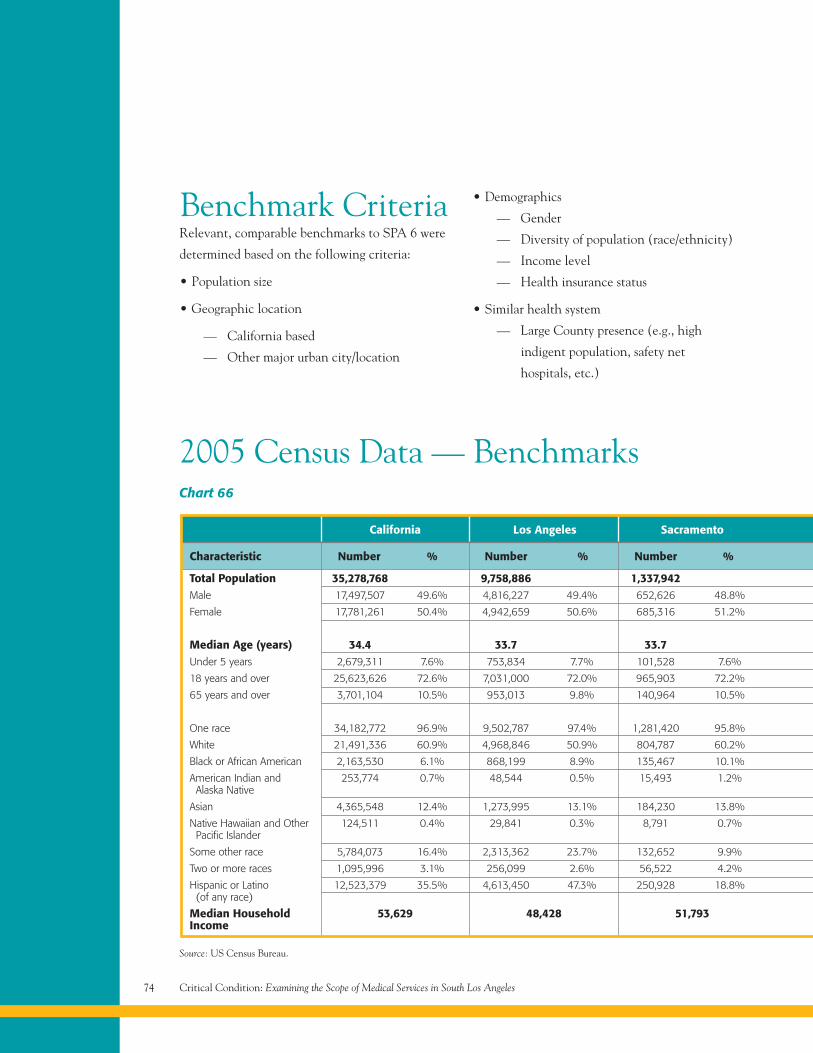
Critical Condition: Examining the Scope of Medical Services in South Los Angeles74
Benchmark CriteriaRelevant, comparable benchmarks to SPA 6 were
determined based on the following criteria:
• Population size
• Geographic location
— California based
— Other major urban city/location
• Demographics
— Gender
— Diversity of population (race/ethnicity)
— Income level
— Health insurance status
• Similar health system
— Large County presence (e.g., high
indigent population, safety net
hospitals, etc.)
Chart 66
California Los Angeles Sacramento
Characteristic Number % Number % Number %
Total Population 35,278,768 9,758,886 1,337,942Male 17,497,507 49.6% 4,816,227 49.4% 652,626 48.8%
Female 17,781,261 50.4% 4,942,659 50.6% 685,316 51.2%
Median Age (years) 34.4 33.7 33.7Under 5 years 2,679,311 7.6% 753,834 7.7% 101,528 7.6%
18 years and over 25,623,626 72.6% 7,031,000 72.0% 965,903 72.2%
65 years and over 3,701,104 10.5% 953,013 9.8% 140,964 10.5%
One race 34,182,772 96.9% 9,502,787 97.4% 1,281,420 95.8%
White 21,491,336 60.9% 4,968,846 50.9% 804,787 60.2%
Black or African American 2,163,530 6.1% 868,199 8.9% 135,467 10.1%
American Indian and 253,774 0.7% 48,544 0.5% 15,493 1.2%Alaska Native
Asian 4,365,548 12.4% 1,273,995 13.1% 184,230 13.8%
Native Hawaiian and Other 124,511 0.4% 29,841 0.3% 8,791 0.7%Pacific Islander
Some other race 5,784,073 16.4% 2,313,362 23.7% 132,652 9.9%
Two or more races 1,095,996 3.1% 256,099 2.6% 56,522 4.2%
Hispanic or Latino 12,523,379 35.5% 4,613,450 47.3% 250,928 18.8%(of any race)
Median Household 53,629 48,428 51,793Income
Source: US Census Bureau.
2005 Census Data — Benchmarks
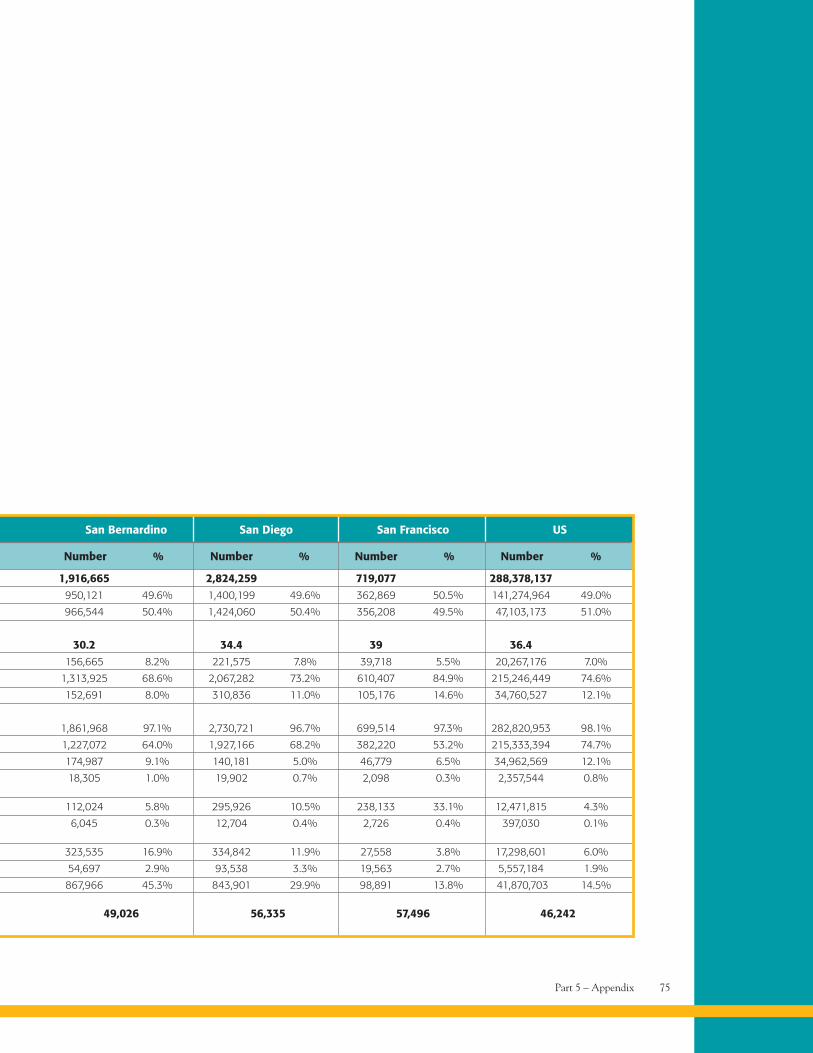
Part 5 – Appendix 75
San Bernardino San Diego San Francisco US
Number % Number % Number % Number %
1,916,665 2,824,259 719,077 288,378,137950,121 49.6% 1,400,199 49.6% 362,869 50.5% 141,274,964 49.0%
966,544 50.4% 1,424,060 50.4% 356,208 49.5% 47,103,173 51.0%
30.2 34.4 39 36.4156,665 8.2% 221,575 7.8% 39,718 5.5% 20,267,176 7.0%
1,313,925 68.6% 2,067,282 73.2% 610,407 84.9% 215,246,449 74.6%
152,691 8.0% 310,836 11.0% 105,176 14.6% 34,760,527 12.1%
1,861,968 97.1% 2,730,721 96.7% 699,514 97.3% 282,820,953 98.1%
1,227,072 64.0% 1,927,166 68.2% 382,220 53.2% 215,333,394 74.7%
174,987 9.1% 140,181 5.0% 46,779 6.5% 34,962,569 12.1%
18,305 1.0% 19,902 0.7% 2,098 0.3% 2,357,544 0.8%
112,024 5.8% 295,926 10.5% 238,133 33.1% 12,471,815 4.3%
6,045 0.3% 12,704 0.4% 2,726 0.4% 397,030 0.1%
323,535 16.9% 334,842 11.9% 27,558 3.8% 17,298,601 6.0%
54,697 2.9% 93,538 3.3% 19,563 2.7% 5,557,184 1.9%
867,966 45.3% 843,901 29.9% 98,891 13.8% 41,870,703 14.5%
49,026 56,335 57,496 46,242
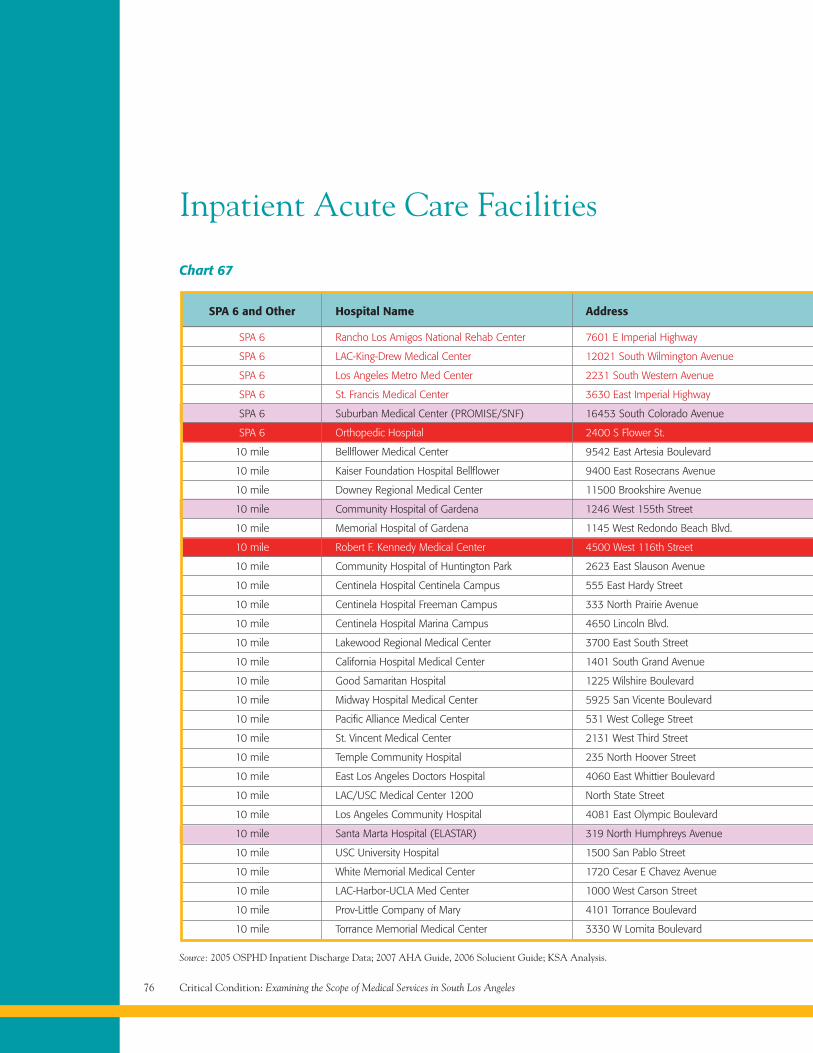
Critical Condition: Examining the Scope of Medical Services in South Los Angeles76
Inpatient Acute Care Facilities
Chart 67
Source: 2005 OSPHD Inpatient Discharge Data; 2007 AHA Guide, 2006 Solucient Guide; KSA Analysis.
SPA 6 and Other Hospital Name Address
SPA 6 Rancho Los Amigos National Rehab Center 7601 E Imperial Highway
SPA 6 LAC-King-Drew Medical Center 12021 South Wilmington Avenue
SPA 6 Los Angeles Metro Med Center 2231 South Western Avenue
SPA 6 St. Francis Medical Center 3630 East Imperial Highway
SPA 6 Suburban Medical Center (PROMISE/SNF) 16453 South Colorado Avenue
SPA 6 Orthopedic Hospital 2400 S Flower St.
10 mile Bellflower Medical Center 9542 East Artesia Boulevard
10 mile Kaiser Foundation Hospital Bellflower 9400 East Rosecrans Avenue
10 mile Downey Regional Medical Center 11500 Brookshire Avenue
10 mile Community Hospital of Gardena 1246 West 155th Street
10 mile Memorial Hospital of Gardena 1145 West Redondo Beach Blvd.
10 mile Robert F. Kennedy Medical Center 4500 West 116th Street
10 mile Community Hospital of Huntington Park 2623 East Slauson Avenue
10 mile Centinela Hospital Centinela Campus 555 East Hardy Street
10 mile Centinela Hospital Freeman Campus 333 North Prairie Avenue
10 mile Centinela Hospital Marina Campus 4650 Lincoln Blvd.
10 mile Lakewood Regional Medical Center 3700 East South Street
10 mile California Hospital Medical Center 1401 South Grand Avenue
10 mile Good Samaritan Hospital 1225 Wilshire Boulevard
10 mile Midway Hospital Medical Center 5925 San Vicente Boulevard
10 mile Pacific Alliance Medical Center 531 West College Street
10 mile St. Vincent Medical Center 2131 West Third Street
10 mile Temple Community Hospital 235 North Hoover Street
10 mile East Los Angeles Doctors Hospital 4060 East Whittier Boulevard
10 mile LAC/USC Medical Center 1200 North State Street
10 mile Los Angeles Community Hospital 4081 East Olympic Boulevard
10 mile Santa Marta Hospital (ELASTAR) 319 North Humphreys Avenue
10 mile USC University Hospital 1500 San Pablo Street
10 mile White Memorial Medical Center 1720 Cesar E Chavez Avenue
10 mile LAC-Harbor-UCLA Med Center 1000 West Carson Street
10 mile Prov-Little Company of Mary 4101 Torrance Boulevard
10 mile Torrance Memorial Medical Center 3330 W Lomita Boulevard
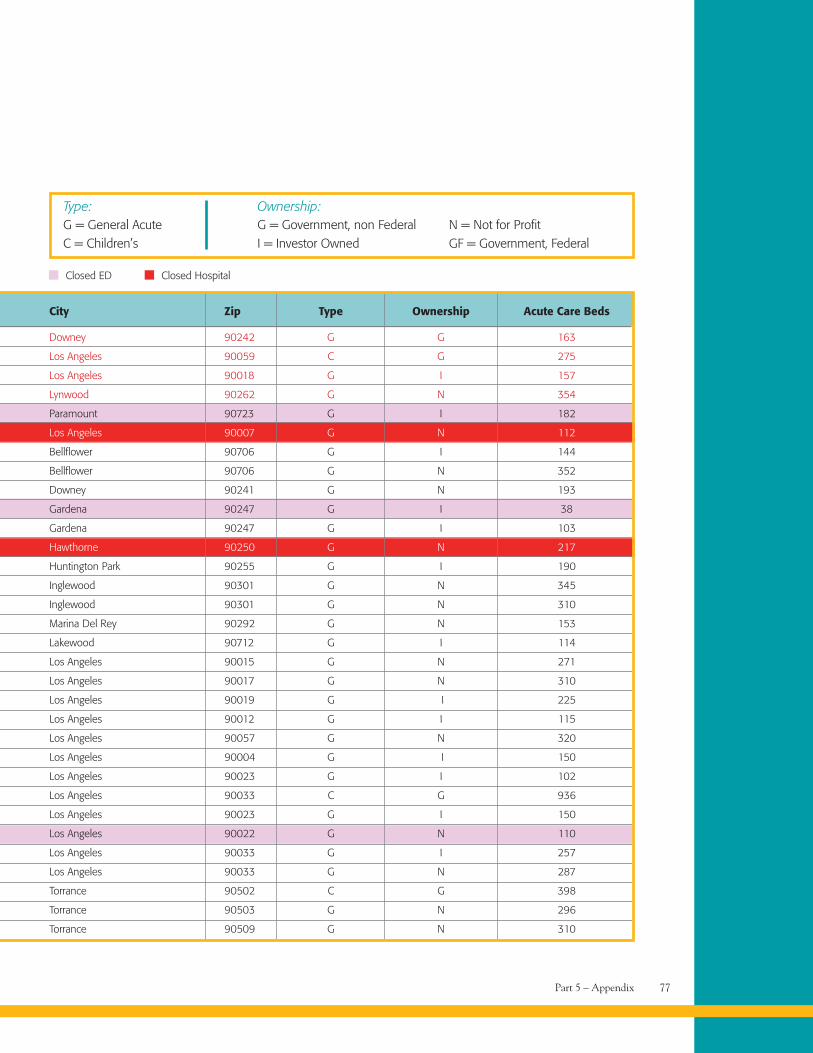
Part 5 – Appendix 77
G = General AcuteC = Children’s
Type:G = Government, non FederalI = Investor Owned
N = Not for ProfitGF = Government, Federal
Ownership:
Closed ED Closed Hospital
City Zip Type Ownership Acute Care Beds
Downey 90242 G G 163
Los Angeles 90059 C G 275
Los Angeles 90018 G I 157
Lynwood 90262 G N 354
Paramount 90723 G I 182
Los Angeles 90007 G N 112
Bellflower 90706 G I 144
Bellflower 90706 G N 352
Downey 90241 G N 193
Gardena 90247 G I 38
Gardena 90247 G I 103
Hawthorne 90250 G N 217
Huntington Park 90255 G I 190
Inglewood 90301 G N 345
Inglewood 90301 G N 310
Marina Del Rey 90292 G N 153
Lakewood 90712 G I 114
Los Angeles 90015 G N 271
Los Angeles 90017 G N 310
Los Angeles 90019 G I 225
Los Angeles 90012 G I 115
Los Angeles 90057 G N 320
Los Angeles 90004 G I 150
Los Angeles 90023 G I 102
Los Angeles 90033 C G 936
Los Angeles 90023 G I 150
Los Angeles 90022 G N 110
Los Angeles 90033 G I 257
Los Angeles 90033 G N 287
Torrance 90502 C G 398
Torrance 90503 G N 296
Torrance 90509 G N 310
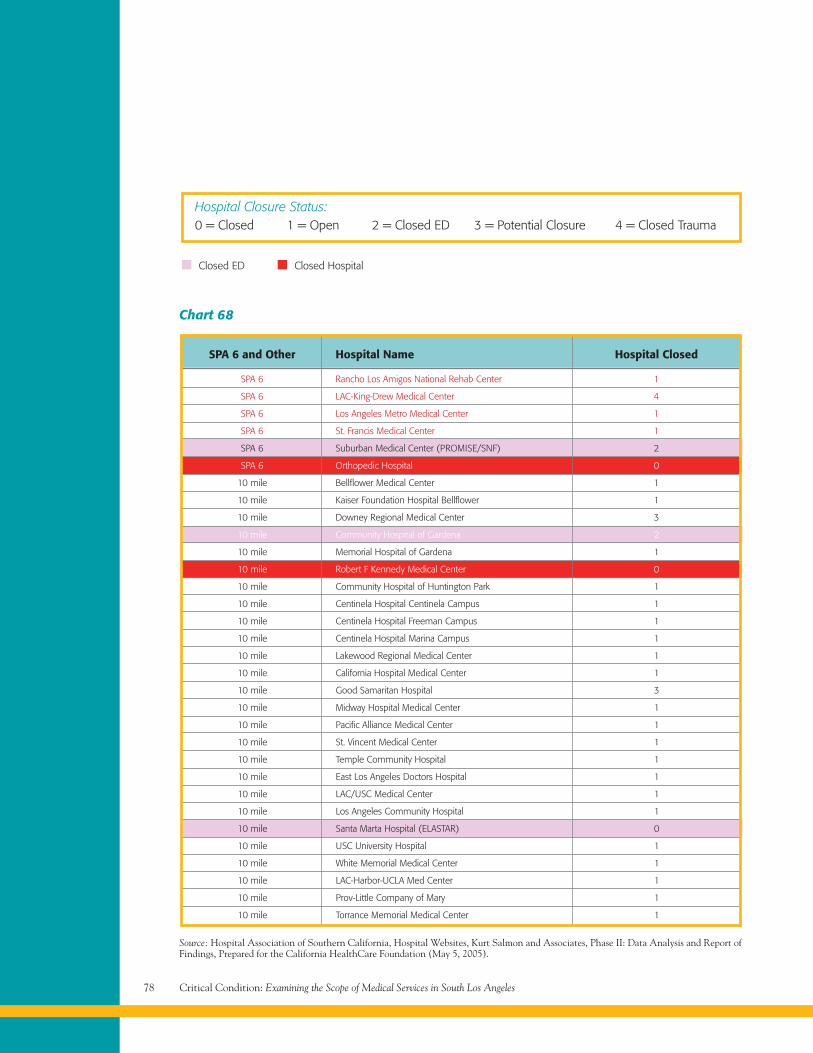
Critical Condition: Examining the Scope of Medical Services in South Los Angeles78
Chart 68
SPA 6 and Other Hospital Name Hospital Closed
SPA 6 Rancho Los Amigos National Rehab Center 1
SPA 6 LAC-King-Drew Medical Center 4
SPA 6 Los Angeles Metro Medical Center 1
SPA 6 St. Francis Medical Center 1
SPA 6 Suburban Medical Center (PROMISE/SNF) 2
SPA 6 Orthopedic Hospital 0
10 mile Bellflower Medical Center 1
10 mile Kaiser Foundation Hospital Bellflower 1
10 mile Downey Regional Medical Center 3
10 mile Community Hospital of Gardena 2
10 mile Memorial Hospital of Gardena 1
10 mile Robert F Kennedy Medical Center 0
10 mile Community Hospital of Huntington Park 1
10 mile Centinela Hospital Centinela Campus 1
10 mile Centinela Hospital Freeman Campus 1
10 mile Centinela Hospital Marina Campus 1
10 mile Lakewood Regional Medical Center 1
10 mile California Hospital Medical Center 1
10 mile Good Samaritan Hospital 3
10 mile Midway Hospital Medical Center 1
10 mile Pacific Alliance Medical Center 1
10 mile St. Vincent Medical Center 1
10 mile Temple Community Hospital 1
10 mile East Los Angeles Doctors Hospital 1
10 mile LAC/USC Medical Center 1
10 mile Los Angeles Community Hospital 1
10 mile Santa Marta Hospital (ELASTAR) 0
10 mile USC University Hospital 1
10 mile White Memorial Medical Center 1
10 mile LAC-Harbor-UCLA Med Center 1
10 mile Prov-Little Company of Mary 1
10 mile Torrance Memorial Medical Center 1
Source: Hospital Association of Southern California, Hospital Websites, Kurt Salmon and Associates, Phase II: Data Analysis and Report ofFindings, Prepared for the California HealthCare Foundation (May 5, 2005).
0 = Closed 1 = Open 2 = Closed ED 3 = Potential Closure 4 = Closed TraumaHospital Closure Status:
Closed ED Closed Hospital
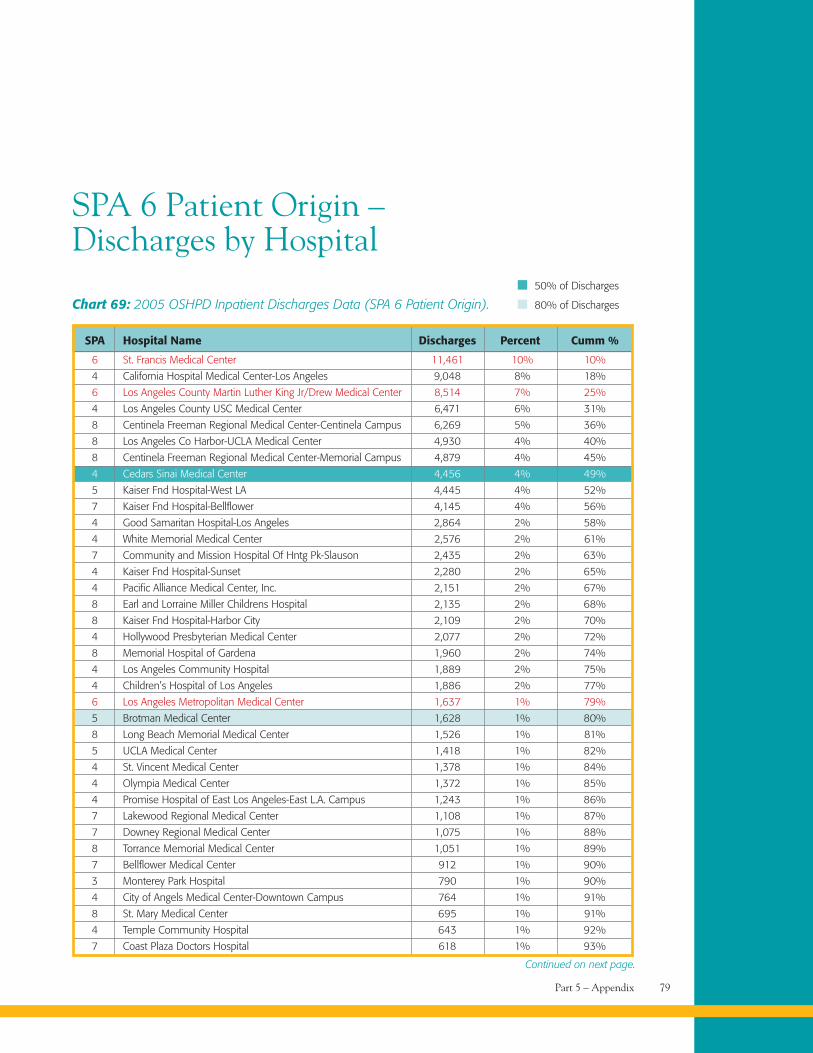
Part 5 – Appendix 79
SPA 6 Patient Origin –Discharges by Hospital
Chart 69: 2005 OSHPD Inpatient Discharges Data (SPA 6 Patient Origin).
SPA Hospital Name Discharges Percent Cumm %
6 St. Francis Medical Center 11,461 10% 10%
4 California Hospital Medical Center-Los Angeles 9,048 8% 18%
6 Los Angeles County Martin Luther King Jr/Drew Medical Center 8,514 7% 25%
4 Los Angeles County USC Medical Center 6,471 6% 31%
8 Centinela Freeman Regional Medical Center-Centinela Campus 6,269 5% 36%
8 Los Angeles Co Harbor-UCLA Medical Center 4,930 4% 40%
8 Centinela Freeman Regional Medical Center-Memorial Campus 4,879 4% 45%
4 Cedars Sinai Medical Center 4,456 4% 49%
5 Kaiser Fnd Hospital-West LA 4,445 4% 52%
7 Kaiser Fnd Hospital-Bellflower 4,145 4% 56%
4 Good Samaritan Hospital-Los Angeles 2,864 2% 58%
4 White Memorial Medical Center 2,576 2% 61%
7 Community and Mission Hospital Of Hntg Pk-Slauson 2,435 2% 63%
4 Kaiser Fnd Hospital-Sunset 2,280 2% 65%
4 Pacific Alliance Medical Center, Inc. 2,151 2% 67%
8 Earl and Lorraine Miller Childrens Hospital 2,135 2% 68%
8 Kaiser Fnd Hospital-Harbor City 2,109 2% 70%
4 Hollywood Presbyterian Medical Center 2,077 2% 72%
8 Memorial Hospital of Gardena 1,960 2% 74%
4 Los Angeles Community Hospital 1,889 2% 75%
4 Children’s Hospital of Los Angeles 1,886 2% 77%
6 Los Angeles Metropolitan Medical Center 1,637 1% 79%
5 Brotman Medical Center 1,628 1% 80%
8 Long Beach Memorial Medical Center 1,526 1% 81%
5 UCLA Medical Center 1,418 1% 82%
4 St. Vincent Medical Center 1,378 1% 84%
4 Olympia Medical Center 1,372 1% 85%
4 Promise Hospital of East Los Angeles-East L.A. Campus 1,243 1% 86%
7 Lakewood Regional Medical Center 1,108 1% 87%
7 Downey Regional Medical Center 1,075 1% 88%
8 Torrance Memorial Medical Center 1,051 1% 89%
7 Bellflower Medical Center 912 1% 90%
3 Monterey Park Hospital 790 1% 90%
4 City of Angels Medical Center-Downtown Campus 764 1% 91%
8 St. Mary Medical Center 695 1% 91%
4 Temple Community Hospital 643 1% 92%
7 Coast Plaza Doctors Hospital 618 1% 93%
50% of Discharges
80% of Discharges
Continued on next page.
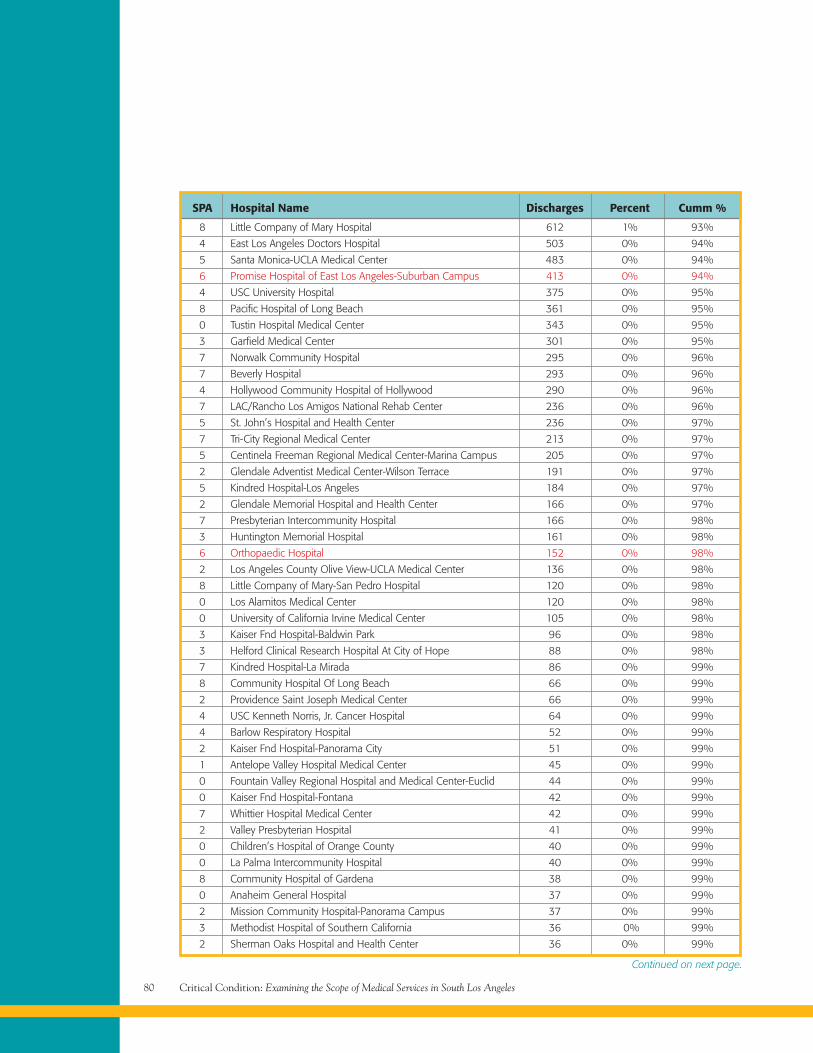
Critical Condition: Examining the Scope of Medical Services in South Los Angeles80
SPA Hospital Name Discharges Percent Cumm %
8 Little Company of Mary Hospital 612 1% 93%
4 East Los Angeles Doctors Hospital 503 0% 94%
5 Santa Monica-UCLA Medical Center 483 0% 94%
6 Promise Hospital of East Los Angeles-Suburban Campus 413 0% 94%
4 USC University Hospital 375 0% 95%
8 Pacific Hospital of Long Beach 361 0% 95%
0 Tustin Hospital Medical Center 343 0% 95%
3 Garfield Medical Center 301 0% 95%
7 Norwalk Community Hospital 295 0% 96%
7 Beverly Hospital 293 0% 96%
4 Hollywood Community Hospital of Hollywood 290 0% 96%
7 LAC/Rancho Los Amigos National Rehab Center 236 0% 96%
5 St. John’s Hospital and Health Center 236 0% 97%
7 Tri-City Regional Medical Center 213 0% 97%
5 Centinela Freeman Regional Medical Center-Marina Campus 205 0% 97%
2 Glendale Adventist Medical Center-Wilson Terrace 191 0% 97%
5 Kindred Hospital-Los Angeles 184 0% 97%
2 Glendale Memorial Hospital and Health Center 166 0% 97%
7 Presbyterian Intercommunity Hospital 166 0% 98%
3 Huntington Memorial Hospital 161 0% 98%
6 Orthopaedic Hospital 152 0% 98%
2 Los Angeles County Olive View-UCLA Medical Center 136 0% 98%
8 Little Company of Mary-San Pedro Hospital 120 0% 98%
0 Los Alamitos Medical Center 120 0% 98%
0 University of California Irvine Medical Center 105 0% 98%
3 Kaiser Fnd Hospital-Baldwin Park 96 0% 98%
3 Helford Clinical Research Hospital At City of Hope 88 0% 98%
7 Kindred Hospital-La Mirada 86 0% 99%
8 Community Hospital Of Long Beach 66 0% 99%
2 Providence Saint Joseph Medical Center 66 0% 99%
4 USC Kenneth Norris, Jr. Cancer Hospital 64 0% 99%
4 Barlow Respiratory Hospital 52 0% 99%
2 Kaiser Fnd Hospital-Panorama City 51 0% 99%
1 Antelope Valley Hospital Medical Center 45 0% 99%
0 Fountain Valley Regional Hospital and Medical Center-Euclid 44 0% 99%
0 Kaiser Fnd Hospital-Fontana 42 0% 99%
7 Whittier Hospital Medical Center 42 0% 99%
2 Valley Presbyterian Hospital 41 0% 99%
0 Children’s Hospital of Orange County 40 0% 99%
0 La Palma Intercommunity Hospital 40 0% 99%
8 Community Hospital of Gardena 38 0% 99%
0 Anaheim General Hospital 37 0% 99%
2 Mission Community Hospital-Panorama Campus 37 0% 99%
3 Methodist Hospital of Southern California 36 0% 99%
2 Sherman Oaks Hospital and Health Center 36 0% 99%
Continued on next page.
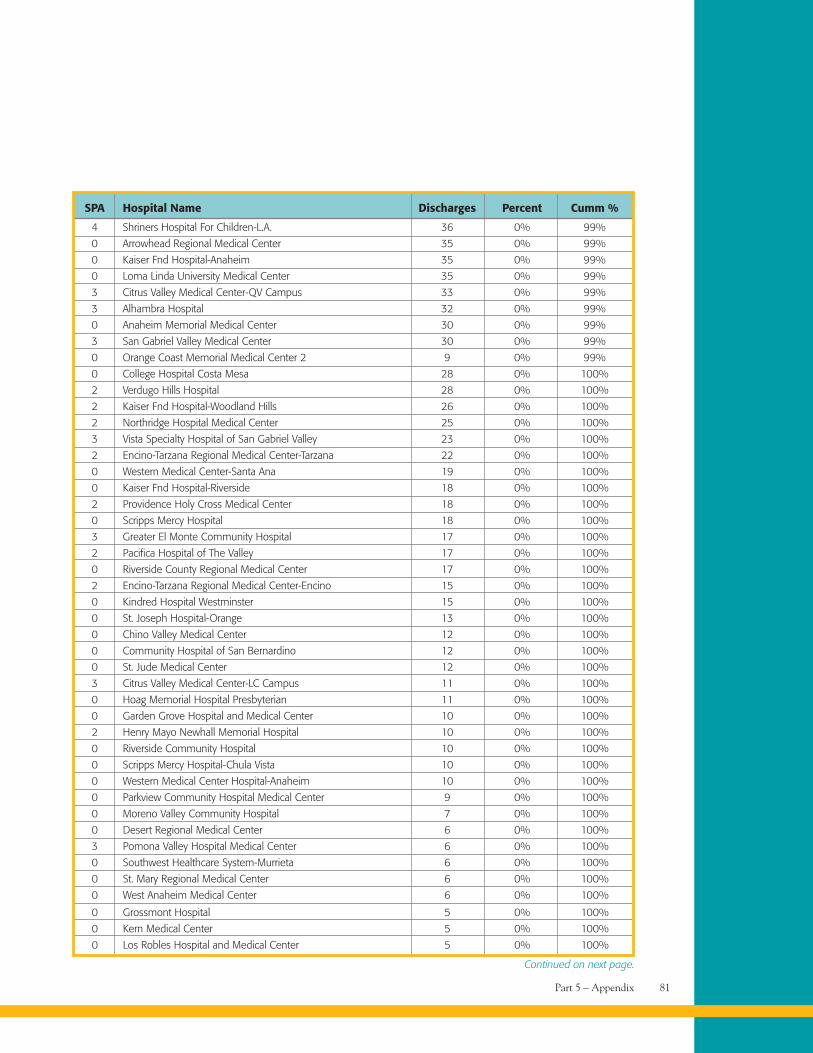
Part 5 – Appendix 81
SPA Hospital Name Discharges Percent Cumm %
4 Shriners Hospital For Children-L.A. 36 0% 99%
0 Arrowhead Regional Medical Center 35 0% 99%
0 Kaiser Fnd Hospital-Anaheim 35 0% 99%
0 Loma Linda University Medical Center 35 0% 99%
3 Citrus Valley Medical Center-QV Campus 33 0% 99%
3 Alhambra Hospital 32 0% 99%
0 Anaheim Memorial Medical Center 30 0% 99%
3 San Gabriel Valley Medical Center 30 0% 99%
0 Orange Coast Memorial Medical Center 2 9 0% 99%
0 College Hospital Costa Mesa 28 0% 100%
2 Verdugo Hills Hospital 28 0% 100%
2 Kaiser Fnd Hospital-Woodland Hills 26 0% 100%
2 Northridge Hospital Medical Center 25 0% 100%
3 Vista Specialty Hospital of San Gabriel Valley 23 0% 100%
2 Encino-Tarzana Regional Medical Center-Tarzana 22 0% 100%
0 Western Medical Center-Santa Ana 19 0% 100%
0 Kaiser Fnd Hospital-Riverside 18 0% 100%
2 Providence Holy Cross Medical Center 18 0% 100%
0 Scripps Mercy Hospital 18 0% 100%
3 Greater El Monte Community Hospital 17 0% 100%
2 Pacifica Hospital of The Valley 17 0% 100%
0 Riverside County Regional Medical Center 17 0% 100%
2 Encino-Tarzana Regional Medical Center-Encino 15 0% 100%
0 Kindred Hospital Westminster 15 0% 100%
0 St. Joseph Hospital-Orange 13 0% 100%
0 Chino Valley Medical Center 12 0% 100%
0 Community Hospital of San Bernardino 12 0% 100%
0 St. Jude Medical Center 12 0% 100%
3 Citrus Valley Medical Center-LC Campus 11 0% 100%
0 Hoag Memorial Hospital Presbyterian 11 0% 100%
0 Garden Grove Hospital and Medical Center 10 0% 100%
2 Henry Mayo Newhall Memorial Hospital 10 0% 100%
0 Riverside Community Hospital 10 0% 100%
0 Scripps Mercy Hospital-Chula Vista 10 0% 100%
0 Western Medical Center Hospital-Anaheim 10 0% 100%
0 Parkview Community Hospital Medical Center 9 0% 100%
0 Moreno Valley Community Hospital 7 0% 100%
0 Desert Regional Medical Center 6 0% 100%
3 Pomona Valley Hospital Medical Center 6 0% 100%
0 Southwest Healthcare System-Murrieta 6 0% 100%
0 St. Mary Regional Medical Center 6 0% 100%
0 West Anaheim Medical Center 6 0% 100%
0 Grossmont Hospital 5 0% 100%
0 Kern Medical Center 5 0% 100%
0 Los Robles Hospital and Medical Center 5 0% 100%
Continued on next page.
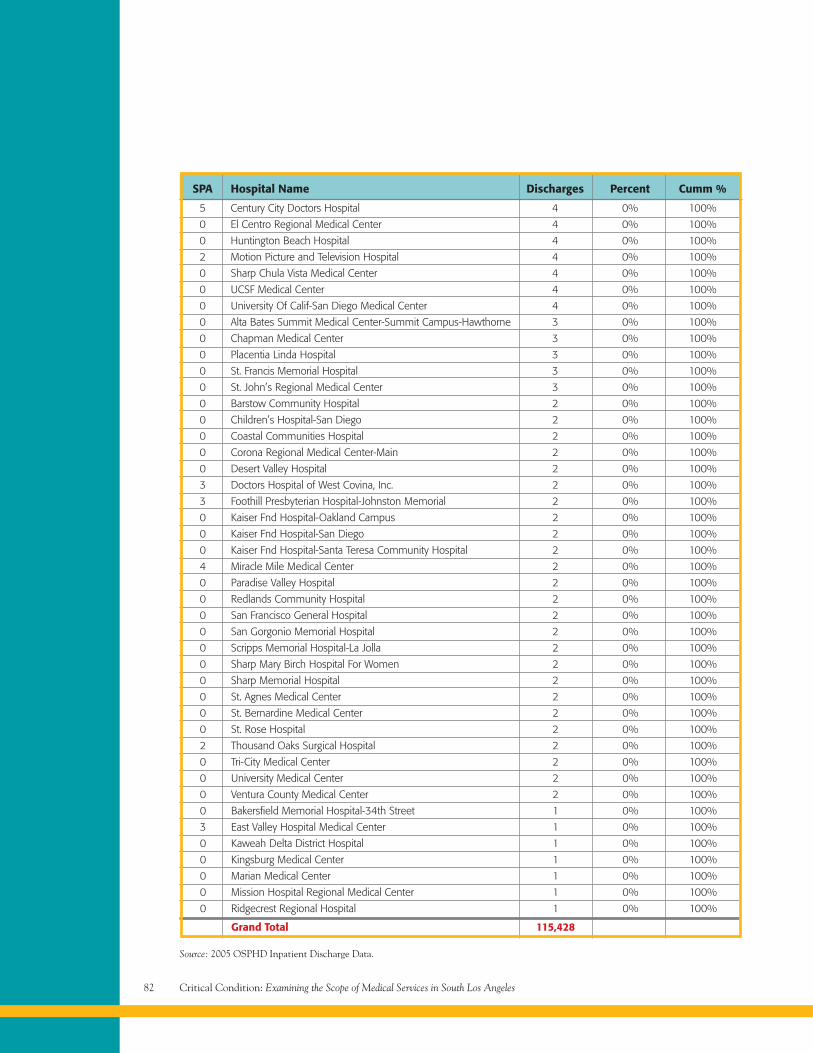
Critical Condition: Examining the Scope of Medical Services in South Los Angeles82
SPA Hospital Name Discharges Percent Cumm %
5 Century City Doctors Hospital 4 0% 100%
0 El Centro Regional Medical Center 4 0% 100%
0 Huntington Beach Hospital 4 0% 100%
2 Motion Picture and Television Hospital 4 0% 100%
0 Sharp Chula Vista Medical Center 4 0% 100%
0 UCSF Medical Center 4 0% 100%
0 University Of Calif-San Diego Medical Center 4 0% 100%
0 Alta Bates Summit Medical Center-Summit Campus-Hawthorne 3 0% 100%
0 Chapman Medical Center 3 0% 100%
0 Placentia Linda Hospital 3 0% 100%
0 St. Francis Memorial Hospital 3 0% 100%
0 St. John’s Regional Medical Center 3 0% 100%
0 Barstow Community Hospital 2 0% 100%
0 Children’s Hospital-San Diego 2 0% 100%
0 Coastal Communities Hospital 2 0% 100%
0 Corona Regional Medical Center-Main 2 0% 100%
0 Desert Valley Hospital 2 0% 100%
3 Doctors Hospital of West Covina, Inc. 2 0% 100%
3 Foothill Presbyterian Hospital-Johnston Memorial 2 0% 100%
0 Kaiser Fnd Hospital-Oakland Campus 2 0% 100%
0 Kaiser Fnd Hospital-San Diego 2 0% 100%
0 Kaiser Fnd Hospital-Santa Teresa Community Hospital 2 0% 100%
4 Miracle Mile Medical Center 2 0% 100%
0 Paradise Valley Hospital 2 0% 100%
0 Redlands Community Hospital 2 0% 100%
0 San Francisco General Hospital 2 0% 100%
0 San Gorgonio Memorial Hospital 2 0% 100%
0 Scripps Memorial Hospital-La Jolla 2 0% 100%
0 Sharp Mary Birch Hospital For Women 2 0% 100%
0 Sharp Memorial Hospital 2 0% 100%
0 St. Agnes Medical Center 2 0% 100%
0 St. Bernardine Medical Center 2 0% 100%
0 St. Rose Hospital 2 0% 100%
2 Thousand Oaks Surgical Hospital 2 0% 100%
0 Tri-City Medical Center 2 0% 100%
0 University Medical Center 2 0% 100%
0 Ventura County Medical Center 2 0% 100%
0 Bakersfield Memorial Hospital-34th Street 1 0% 100%
3 East Valley Hospital Medical Center 1 0% 100%
0 Kaweah Delta District Hospital 1 0% 100%
0 Kingsburg Medical Center 1 0% 100%
0 Marian Medical Center 1 0% 100%
0 Mission Hospital Regional Medical Center 1 0% 100%
0 Ridgecrest Regional Hospital 1 0% 100%
Grand Total 115,428
Source: 2005 OSPHD Inpatient Discharge Data.
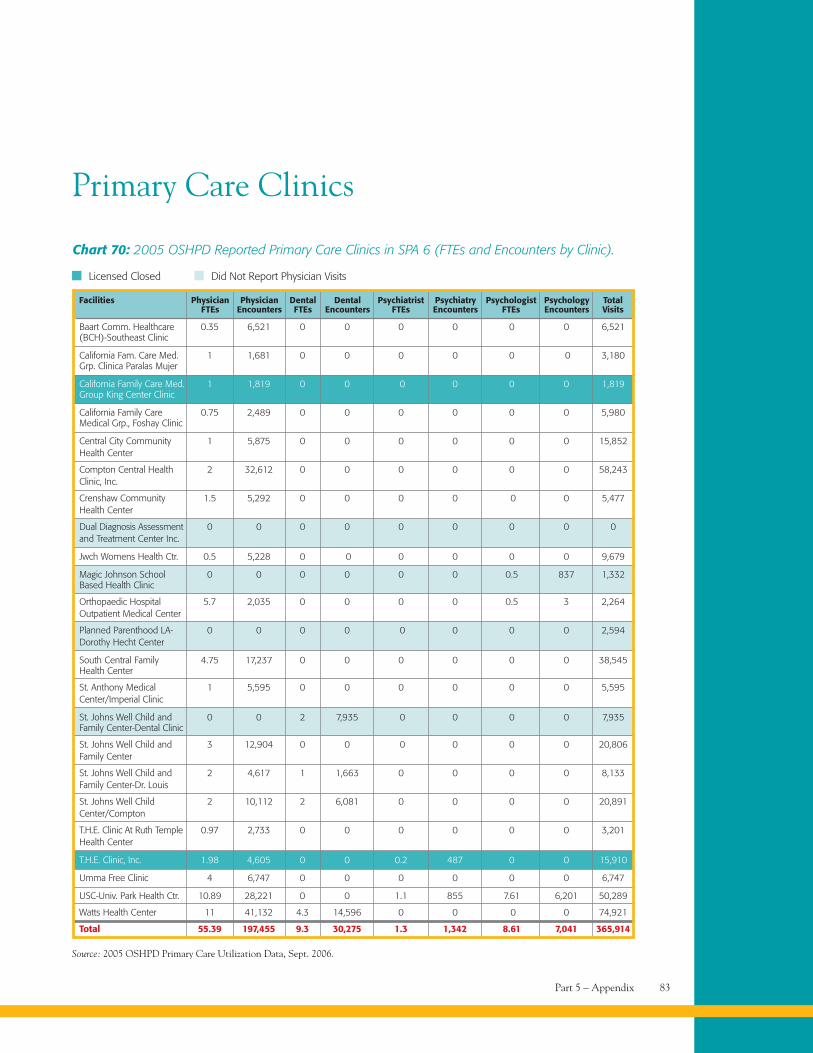
Part 5 – Appendix 83
Source: 2005 OSHPD Primary Care Utilization Data, Sept. 2006.
Primary Care Clinics
Chart 70: 2005 OSHPD Reported Primary Care Clinics in SPA 6 (FTEs and Encounters by Clinic).
Baart Comm. Healthcare 0.35 6,521 0 0 0 0 0 0 6,521(BCH)-Southeast Clinic
California Fam. Care Med. 1 1,681 0 0 0 0 0 0 3,180Grp. Clinica Paralas Mujer
California Family Care Med. 1 1,819 0 0 0 0 0 0 1,819Group King Center Clinic
California Family Care 0.75 2,489 0 0 0 0 0 0 5,980Medical Grp., Foshay Clinic
Central City Community 1 5,875 0 0 0 0 0 0 15,852Health Center
Compton Central Health 2 32,612 0 0 0 0 0 0 58,243Clinic, Inc.
Crenshaw Community 1.5 5,292 0 0 0 0 0 0 5,477Health Center
Dual Diagnosis Assessment 0 0 0 0 0 0 0 0 0and Treatment Center Inc.
Jwch Womens Health Ctr. 0.5 5,228 0 0 0 0 0 0 9,679
Magic Johnson School 0 0 0 0 0 0 0.5 837 1,332Based Health Clinic
Orthopaedic Hospital 5.7 2,035 0 0 0 0 0.5 3 2,264Outpatient Medical Center
Planned Parenthood LA- 0 0 0 0 0 0 0 0 2,594Dorothy Hecht Center
South Central Family 4.75 17,237 0 0 0 0 0 0 38,545Health Center
St. Anthony Medical 1 5,595 0 0 0 0 0 0 5,595Center/Imperial Clinic
St. Johns Well Child and 0 0 2 7,935 0 0 0 0 7,935Family Center-Dental Clinic
St. Johns Well Child and 3 12,904 0 0 0 0 0 0 20,806Family Center
St. Johns Well Child and 2 4,617 1 1,663 0 0 0 0 8,133Family Center-Dr. Louis
St. Johns Well Child 2 10,112 2 6,081 0 0 0 0 20,891Center/Compton
T.H.E. Clinic At Ruth Temple 0.97 2,733 0 0 0 0 0 0 3,201Health Center
T.H.E. Clinic, Inc. 1.98 4,605 0 0 0.2 487 0 0 15,910
Umma Free Clinic 4 6,747 0 0 0 0 0 0 6,747
USC-Univ. Park Health Ctr. 10.89 28,221 0 0 1.1 855 7.61 6,201 50,289
Watts Health Center 11 41,132 4.3 14,596 0 0 0 0 74,921
Total 55.39 197,455 9.3 30,275 1.3 1,342 8.61 7,041 365,914
Facilities Physician Physician Dental Dental Psychiatrist Psychiatry Psychologist Psychology TotalFTEs Encounters FTEs Encounters FTEs Encounters FTEs Encounters Visits
Licensed Closed Did Not Report Physician Visits
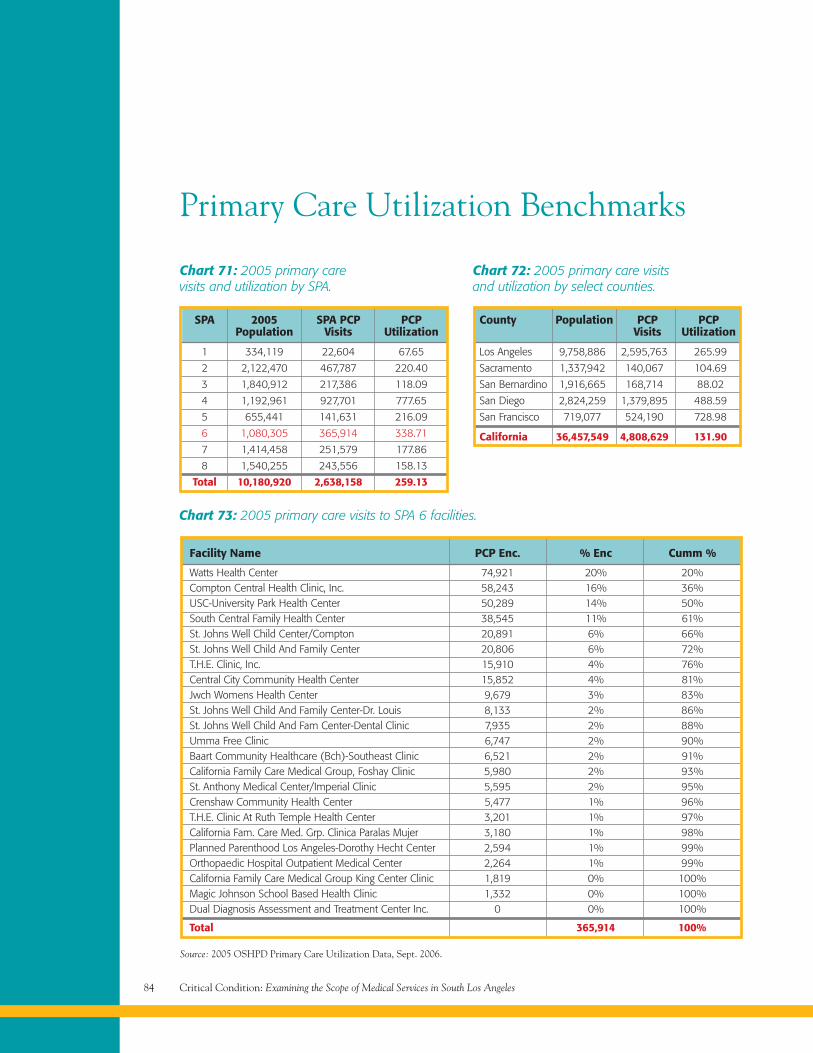
Critical Condition: Examining the Scope of Medical Services in South Los Angeles84
Primary Care Utilization Benchmarks
1 334,119 22,604 67.65
2 2,122,470 467,787 220.40
3 1,840,912 217,386 118.09
4 1,192,961 927,701 777.65
5 655,441 141,631 216.09
6 1,080,305 365,914 338.71
7 1,414,458 251,579 177.86
8 1,540,255 243,556 158.13
Total 10,180,920 2,638,158 259.13
SPA 2005 SPA PCP PCPPopulation Visits Utilization
Chart 71: 2005 primary carevisits and utilization by SPA.
Los Angeles 9,758,886 2,595,763 265.99
Sacramento 1,337,942 140,067 104.69
San Bernardino 1,916,665 168,714 88.02
San Diego 2,824,259 1,379,895 488.59
San Francisco 719,077 524,190 728.98
California 36,457,549 4,808,629 131.90
County Population PCP PCPVisits Utilization
Chart 72: 2005 primary care visitsand utilization by select counties.
Source: 2005 OSHPD Primary Care Utilization Data, Sept. 2006.
Chart 73: 2005 primary care visits to SPA 6 facilities.
Facility Name PCP Enc. % Enc Cumm %
Watts Health Center 74,921 20% 20%Compton Central Health Clinic, Inc. 58,243 16% 36%USC-University Park Health Center 50,289 14% 50%South Central Family Health Center 38,545 11% 61%St. Johns Well Child Center/Compton 20,891 6% 66%St. Johns Well Child And Family Center 20,806 6% 72%T.H.E. Clinic, Inc. 15,910 4% 76%Central City Community Health Center 15,852 4% 81%Jwch Womens Health Center 9,679 3% 83%St. Johns Well Child And Family Center-Dr. Louis 8,133 2% 86%St. Johns Well Child And Fam Center-Dental Clinic 7,935 2% 88%Umma Free Clinic 6,747 2% 90%Baart Community Healthcare (Bch)-Southeast Clinic 6,521 2% 91%California Family Care Medical Group, Foshay Clinic 5,980 2% 93%St. Anthony Medical Center/Imperial Clinic 5,595 2% 95%Crenshaw Community Health Center 5,477 1% 96%T.H.E. Clinic At Ruth Temple Health Center 3,201 1% 97%California Fam. Care Med. Grp. Clinica Paralas Mujer 3,180 1% 98%Planned Parenthood Los Angeles-Dorothy Hecht Center 2,594 1% 99%Orthopaedic Hospital Outpatient Medical Center 2,264 1% 99%California Family Care Medical Group King Center Clinic 1,819 0% 100%Magic Johnson School Based Health Clinic 1,332 0% 100%Dual Diagnosis Assessment and Treatment Center Inc. 0 0% 100%
Total 365,914 100%
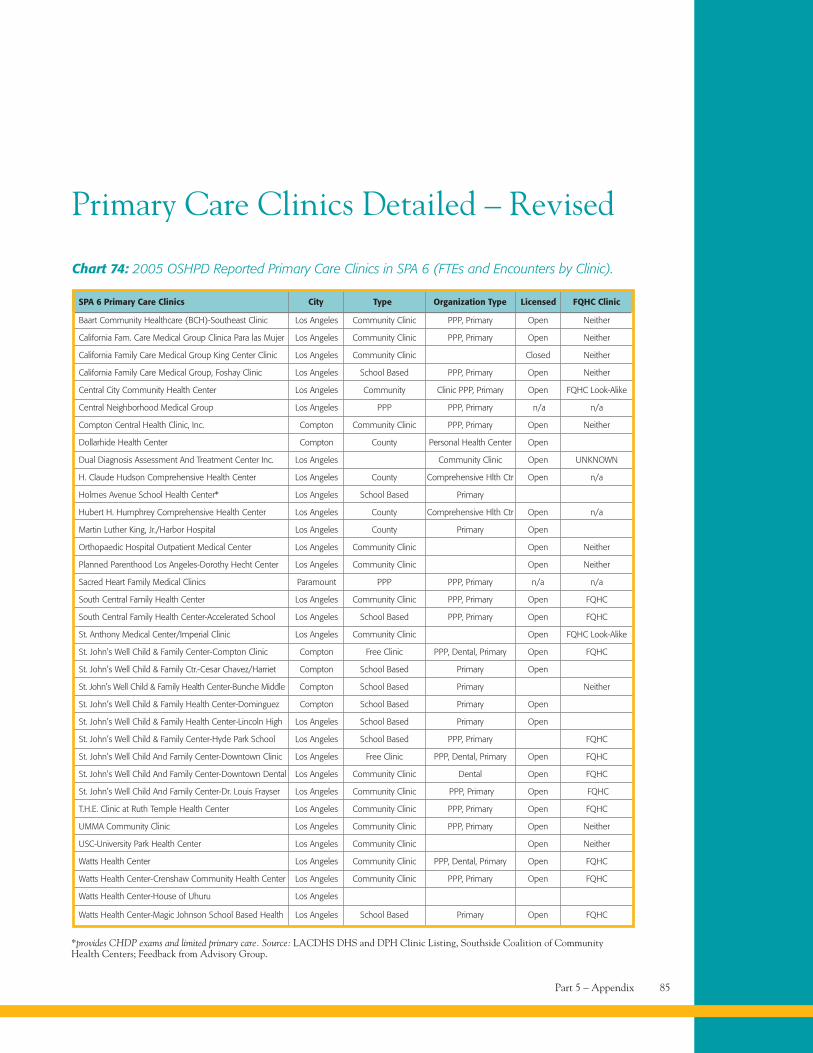
Part 5 – Appendix 85
*provides CHDP exams and limited primary care. Source: LACDHS DHS and DPH Clinic Listing, Southside Coalition of CommunityHealth Centers; Feedback from Advisory Group.
Primary Care Clinics Detailed – Revised
Chart 74: 2005 OSHPD Reported Primary Care Clinics in SPA 6 (FTEs and Encounters by Clinic).
Baart Community Healthcare (BCH)-Southeast Clinic Los Angeles Community Clinic PPP, Primary Open Neither
California Fam. Care Medical Group Clinica Para las Mujer Los Angeles Community Clinic PPP, Primary Open Neither
California Family Care Medical Group King Center Clinic Los Angeles Community Clinic Closed Neither
California Family Care Medical Group, Foshay Clinic Los Angeles School Based PPP, Primary Open Neither
Central City Community Health Center Los Angeles Community Clinic PPP, Primary Open FQHC Look-Alike
Central Neighborhood Medical Group Los Angeles PPP PPP, Primary n/a n/a
Compton Central Health Clinic, Inc. Compton Community Clinic PPP, Primary Open Neither
Dollarhide Health Center Compton County Personal Health Center Open
Dual Diagnosis Assessment And Treatment Center Inc. Los Angeles Community Clinic Open UNKNOWN
H. Claude Hudson Comprehensive Health Center Los Angeles County Comprehensive Hlth Ctr Open n/a
Holmes Avenue School Health Center* Los Angeles School Based Primary
Hubert H. Humphrey Comprehensive Health Center Los Angeles County Comprehensive Hlth Ctr Open n/a
Martin Luther King, Jr./Harbor Hospital Los Angeles County Primary Open
Orthopaedic Hospital Outpatient Medical Center Los Angeles Community Clinic Open Neither
Planned Parenthood Los Angeles-Dorothy Hecht Center Los Angeles Community Clinic Open Neither
Sacred Heart Family Medical Clinics Paramount PPP PPP, Primary n/a n/a
South Central Family Health Center Los Angeles Community Clinic PPP, Primary Open FQHC
South Central Family Health Center-Accelerated School Los Angeles School Based PPP, Primary Open FQHC
St. Anthony Medical Center/Imperial Clinic Los Angeles Community Clinic Open FQHC Look-Alike
St. John’s Well Child & Family Center-Compton Clinic Compton Free Clinic PPP, Dental, Primary Open FQHC
St. John’s Well Child & Family Ctr.-Cesar Chavez/Harriet Compton School Based Primary Open
St. John’s Well Child & Family Health Center-Bunche Middle Compton School Based Primary Neither
St. John’s Well Child & Family Health Center-Dominguez Compton School Based Primary Open
St. John’s Well Child & Family Health Center-Lincoln High Los Angeles School Based Primary Open
St. John’s Well Child & Family Center-Hyde Park School Los Angeles School Based PPP, Primary FQHC
St. John’s Well Child And Family Center-Downtown Clinic Los Angeles Free Clinic PPP, Dental, Primary Open FQHC
St. John’s Well Child And Family Center-Downtown Dental Los Angeles Community Clinic Dental Open FQHC
St. John’s Well Child And Family Center-Dr. Louis Frayser Los Angeles Community Clinic PPP, Primary Open FQHC
T.H.E. Clinic at Ruth Temple Health Center Los Angeles Community Clinic PPP, Primary Open FQHC
UMMA Community Clinic Los Angeles Community Clinic PPP, Primary Open Neither
USC-University Park Health Center Los Angeles Community Clinic Open Neither
Watts Health Center Los Angeles Community Clinic PPP, Dental, Primary Open FQHC
Watts Health Center-Crenshaw Community Health Center Los Angeles Community Clinic PPP, Primary Open FQHC
Watts Health Center-House of Uhuru Los Angeles
Watts Health Center-Magic Johnson School Based Health Los Angeles School Based Primary Open FQHC
SPA 6 Primary Care Clinics City Type Organization Type Licensed FQHC Clinic
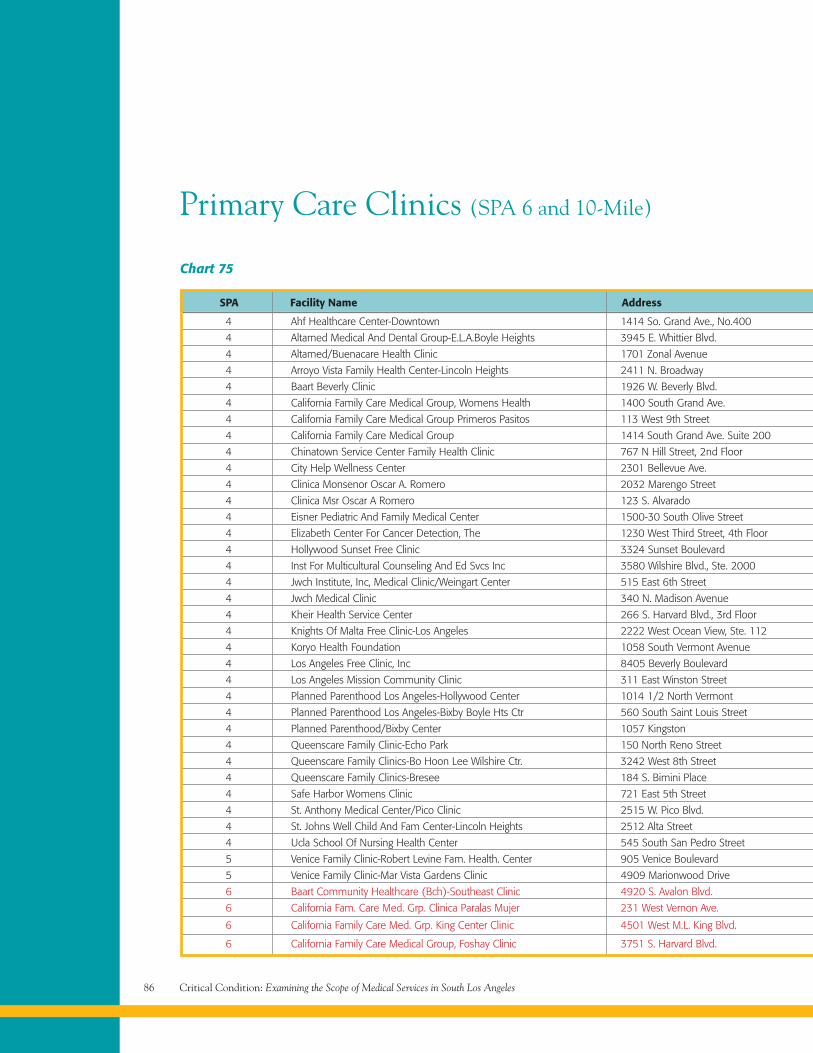
Critical Condition: Examining the Scope of Medical Services in South Los Angeles86
Primary Care Clinics (SPA 6 and 10-Mile)
Chart 75
4 Ahf Healthcare Center-Downtown 1414 So. Grand Ave., No.400
4 Altamed Medical And Dental Group-E.L.A.Boyle Heights 3945 E. Whittier Blvd.
4 Altamed/Buenacare Health Clinic 1701 Zonal Avenue
4 Arroyo Vista Family Health Center-Lincoln Heights 2411 N. Broadway
4 Baart Beverly Clinic 1926 W. Beverly Blvd.
4 California Family Care Medical Group, Womens Health 1400 South Grand Ave.
4 California Family Care Medical Group Primeros Pasitos 113 West 9th Street
4 California Family Care Medical Group 1414 South Grand Ave. Suite 200
4 Chinatown Service Center Family Health Clinic 767 N Hill Street, 2nd Floor
4 City Help Wellness Center 2301 Bellevue Ave.
4 Clinica Monsenor Oscar A. Romero 2032 Marengo Street
4 Clinica Msr Oscar A Romero 123 S. Alvarado
4 Eisner Pediatric And Family Medical Center 1500-30 South Olive Street
4 Elizabeth Center For Cancer Detection, The 1230 West Third Street, 4th Floor
4 Hollywood Sunset Free Clinic 3324 Sunset Boulevard
4 Inst For Multicultural Counseling And Ed Svcs Inc 3580 Wilshire Blvd., Ste. 2000
4 Jwch Institute, Inc, Medical Clinic/Weingart Center 515 East 6th Street
4 Jwch Medical Clinic 340 N. Madison Avenue
4 Kheir Health Service Center 266 S. Harvard Blvd., 3rd Floor
4 Knights Of Malta Free Clinic-Los Angeles 2222 West Ocean View, Ste. 112
4 Koryo Health Foundation 1058 South Vermont Avenue
4 Los Angeles Free Clinic, Inc 8405 Beverly Boulevard
4 Los Angeles Mission Community Clinic 311 East Winston Street
4 Planned Parenthood Los Angeles-Hollywood Center 1014 1/2 North Vermont
4 Planned Parenthood Los Angeles-Bixby Boyle Hts Ctr 560 South Saint Louis Street
4 Planned Parenthood/Bixby Center 1057 Kingston
4 Queenscare Family Clinic-Echo Park 150 North Reno Street
4 Queenscare Family Clinics-Bo Hoon Lee Wilshire Ctr. 3242 West 8th Street
4 Queenscare Family Clinics-Bresee 184 S. Bimini Place
4 Safe Harbor Womens Clinic 721 East 5th Street
4 St. Anthony Medical Center/Pico Clinic 2515 W. Pico Blvd.
4 St. Johns Well Child And Fam Center-Lincoln Heights 2512 Alta Street
4 Ucla School Of Nursing Health Center 545 South San Pedro Street
5 Venice Family Clinic-Robert Levine Fam. Health. Center 905 Venice Boulevard
5 Venice Family Clinic-Mar Vista Gardens Clinic 4909 Marionwood Drive
6 Baart Community Healthcare (Bch)-Southeast Clinic 4920 S. Avalon Blvd.
6 California Fam. Care Med. Grp. Clinica Paralas Mujer 231 West Vernon Ave.
6 California Family Care Med. Grp. King Center Clinic 4501 West M.L. King Blvd.
6 California Family Care Medical Group, Foshay Clinic 3751 S. Harvard Blvd.
SPA Facility Name Address
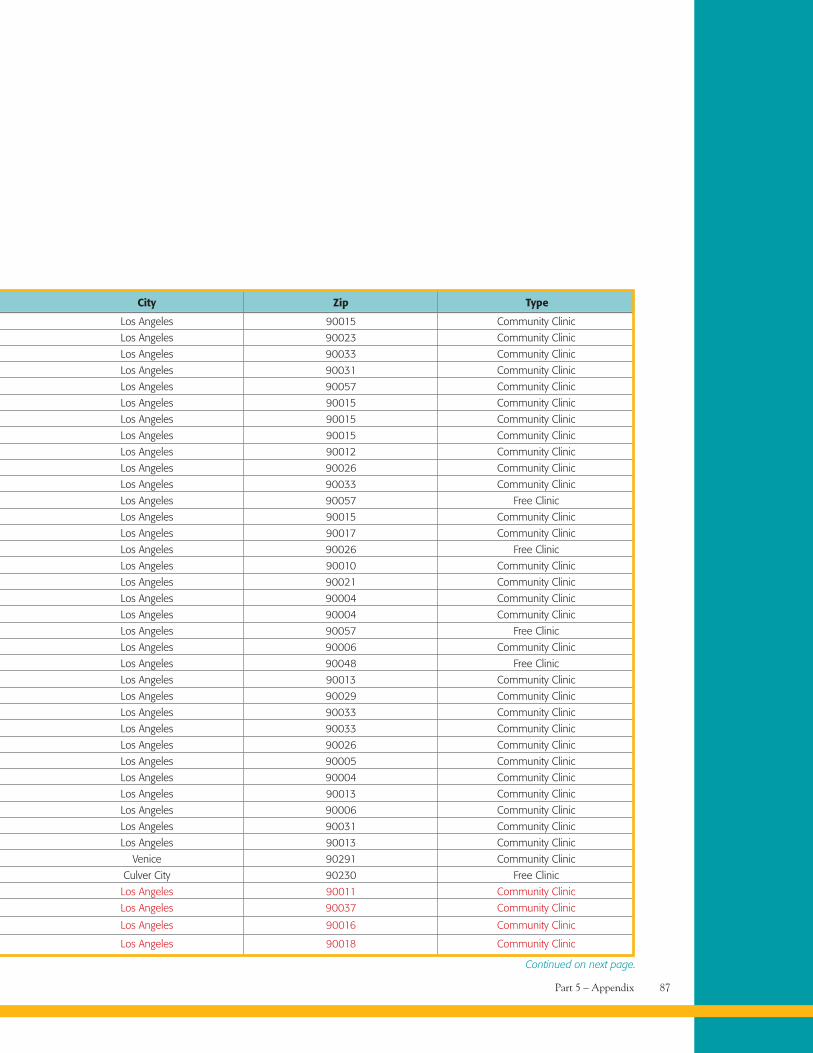
Part 5 – Appendix 87
Los Angeles 90015 Community Clinic
Los Angeles 90023 Community Clinic
Los Angeles 90033 Community Clinic
Los Angeles 90031 Community Clinic
Los Angeles 90057 Community Clinic
Los Angeles 90015 Community Clinic
Los Angeles 90015 Community Clinic
Los Angeles 90015 Community Clinic
Los Angeles 90012 Community Clinic
Los Angeles 90026 Community Clinic
Los Angeles 90033 Community Clinic
Los Angeles 90057 Free Clinic
Los Angeles 90015 Community Clinic
Los Angeles 90017 Community Clinic
Los Angeles 90026 Free Clinic
Los Angeles 90010 Community Clinic
Los Angeles 90021 Community Clinic
Los Angeles 90004 Community Clinic
Los Angeles 90004 Community Clinic
Los Angeles 90057 Free Clinic
Los Angeles 90006 Community Clinic
Los Angeles 90048 Free Clinic
Los Angeles 90013 Community Clinic
Los Angeles 90029 Community Clinic
Los Angeles 90033 Community Clinic
Los Angeles 90033 Community Clinic
Los Angeles 90026 Community Clinic
Los Angeles 90005 Community Clinic
Los Angeles 90004 Community Clinic
Los Angeles 90013 Community Clinic
Los Angeles 90006 Community Clinic
Los Angeles 90031 Community Clinic
Los Angeles 90013 Community Clinic
Venice 90291 Community Clinic
Culver City 90230 Free Clinic
Los Angeles 90011 Community Clinic
Los Angeles 90037 Community Clinic
Los Angeles 90016 Community Clinic
Los Angeles 90018 Community Clinic
City Zip Type
Continued on next page.
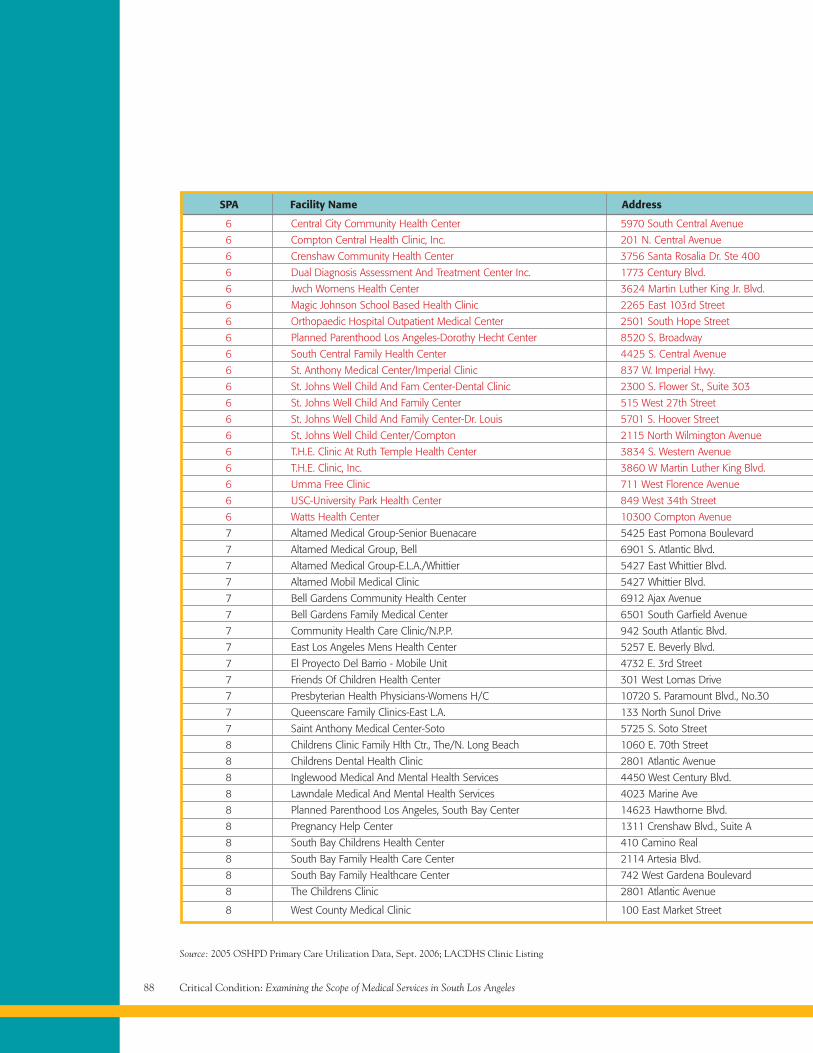
Critical Condition: Examining the Scope of Medical Services in South Los Angeles88
Source: 2005 OSHPD Primary Care Utilization Data, Sept. 2006; LACDHS Clinic Listing
6 Central City Community Health Center 5970 South Central Avenue
6 Compton Central Health Clinic, Inc. 201 N. Central Avenue
6 Crenshaw Community Health Center 3756 Santa Rosalia Dr. Ste 400
6 Dual Diagnosis Assessment And Treatment Center Inc. 1773 Century Blvd.
6 Jwch Womens Health Center 3624 Martin Luther King Jr. Blvd.
6 Magic Johnson School Based Health Clinic 2265 East 103rd Street
6 Orthopaedic Hospital Outpatient Medical Center 2501 South Hope Street
6 Planned Parenthood Los Angeles-Dorothy Hecht Center 8520 S. Broadway
6 South Central Family Health Center 4425 S. Central Avenue
6 St. Anthony Medical Center/Imperial Clinic 837 W. Imperial Hwy.
6 St. Johns Well Child And Fam Center-Dental Clinic 2300 S. Flower St., Suite 303
6 St. Johns Well Child And Family Center 515 West 27th Street
6 St. Johns Well Child And Family Center-Dr. Louis 5701 S. Hoover Street
6 St. Johns Well Child Center/Compton 2115 North Wilmington Avenue
6 T.H.E. Clinic At Ruth Temple Health Center 3834 S. Western Avenue
6 T.H.E. Clinic, Inc. 3860 W Martin Luther King Blvd.
6 Umma Free Clinic 711 West Florence Avenue
6 USC-University Park Health Center 849 West 34th Street
6 Watts Health Center 10300 Compton Avenue
7 Altamed Medical Group-Senior Buenacare 5425 East Pomona Boulevard
7 Altamed Medical Group, Bell 6901 S. Atlantic Blvd.
7 Altamed Medical Group-E.L.A./Whittier 5427 East Whittier Blvd.
7 Altamed Mobil Medical Clinic 5427 Whittier Blvd.
7 Bell Gardens Community Health Center 6912 Ajax Avenue
7 Bell Gardens Family Medical Center 6501 South Garfield Avenue
7 Community Health Care Clinic/N.P.P. 942 South Atlantic Blvd.
7 East Los Angeles Mens Health Center 5257 E. Beverly Blvd.
7 El Proyecto Del Barrio - Mobile Unit 4732 E. 3rd Street
7 Friends Of Children Health Center 301 West Lomas Drive
7 Presbyterian Health Physicians-Womens H/C 10720 S. Paramount Blvd., No.30
7 Queenscare Family Clinics-East L.A. 133 North Sunol Drive
7 Saint Anthony Medical Center-Soto 5725 S. Soto Street
8 Childrens Clinic Family Hlth Ctr., The/N. Long Beach 1060 E. 70th Street
8 Childrens Dental Health Clinic 2801 Atlantic Avenue
8 Inglewood Medical And Mental Health Services 4450 West Century Blvd.
8 Lawndale Medical And Mental Health Services 4023 Marine Ave
8 Planned Parenthood Los Angeles, South Bay Center 14623 Hawthorne Blvd.
8 Pregnancy Help Center 1311 Crenshaw Blvd., Suite A
8 South Bay Childrens Health Center 410 Camino Real
8 South Bay Family Health Care Center 2114 Artesia Blvd.
8 South Bay Family Healthcare Center 742 West Gardena Boulevard
8 The Childrens Clinic 2801 Atlantic Avenue
8 West County Medical Clinic 100 East Market Street
SPA Facility Name Address
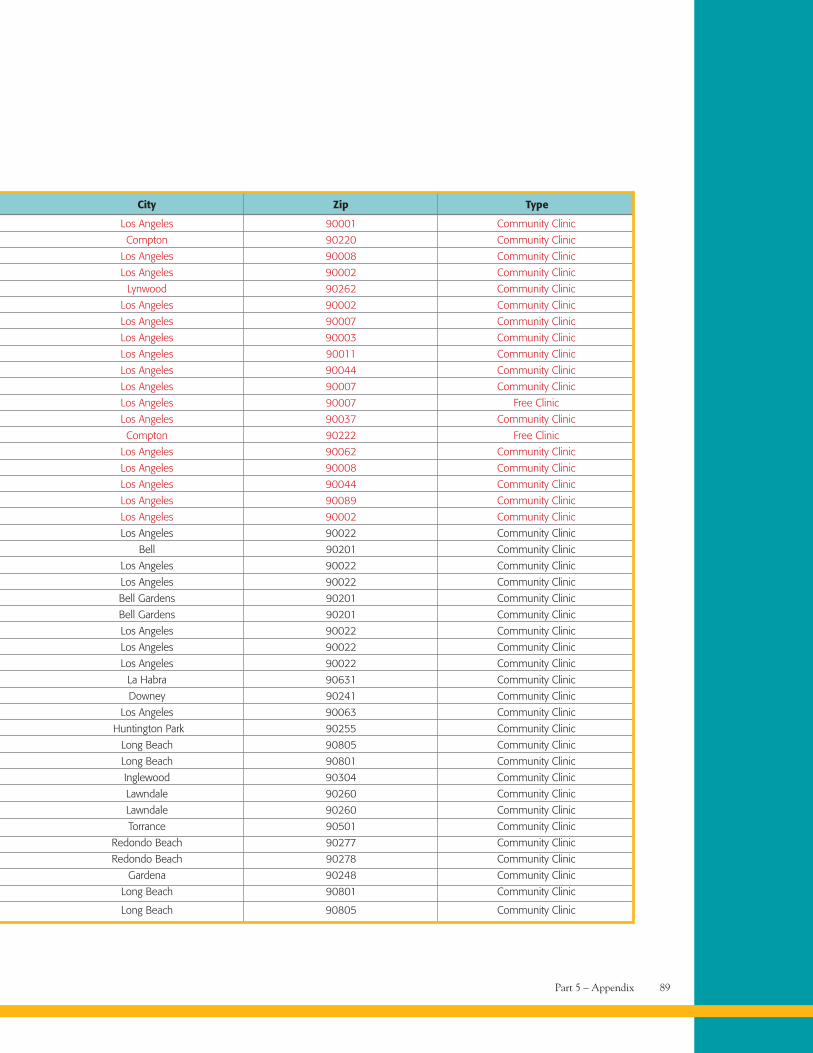
Part 5 – Appendix 89
Los Angeles 90001 Community Clinic
Compton 90220 Community Clinic
Los Angeles 90008 Community Clinic
Los Angeles 90002 Community Clinic
Lynwood 90262 Community Clinic
Los Angeles 90002 Community Clinic
Los Angeles 90007 Community Clinic
Los Angeles 90003 Community Clinic
Los Angeles 90011 Community Clinic
Los Angeles 90044 Community Clinic
Los Angeles 90007 Community Clinic
Los Angeles 90007 Free Clinic
Los Angeles 90037 Community Clinic
Compton 90222 Free Clinic
Los Angeles 90062 Community Clinic
Los Angeles 90008 Community Clinic
Los Angeles 90044 Community Clinic
Los Angeles 90089 Community Clinic
Los Angeles 90002 Community Clinic
Los Angeles 90022 Community Clinic
Bell 90201 Community Clinic
Los Angeles 90022 Community Clinic
Los Angeles 90022 Community Clinic
Bell Gardens 90201 Community Clinic
Bell Gardens 90201 Community Clinic
Los Angeles 90022 Community Clinic
Los Angeles 90022 Community Clinic
Los Angeles 90022 Community Clinic
La Habra 90631 Community Clinic
Downey 90241 Community Clinic
Los Angeles 90063 Community Clinic
Huntington Park 90255 Community Clinic
Long Beach 90805 Community Clinic
Long Beach 90801 Community Clinic
Inglewood 90304 Community Clinic
Lawndale 90260 Community Clinic
Lawndale 90260 Community Clinic
Torrance 90501 Community Clinic
Redondo Beach 90277 Community Clinic
Redondo Beach 90278 Community Clinic
Gardena 90248 Community Clinic
Long Beach 90801 Community Clinic
Long Beach 90805 Community Clinic
City Zip Type
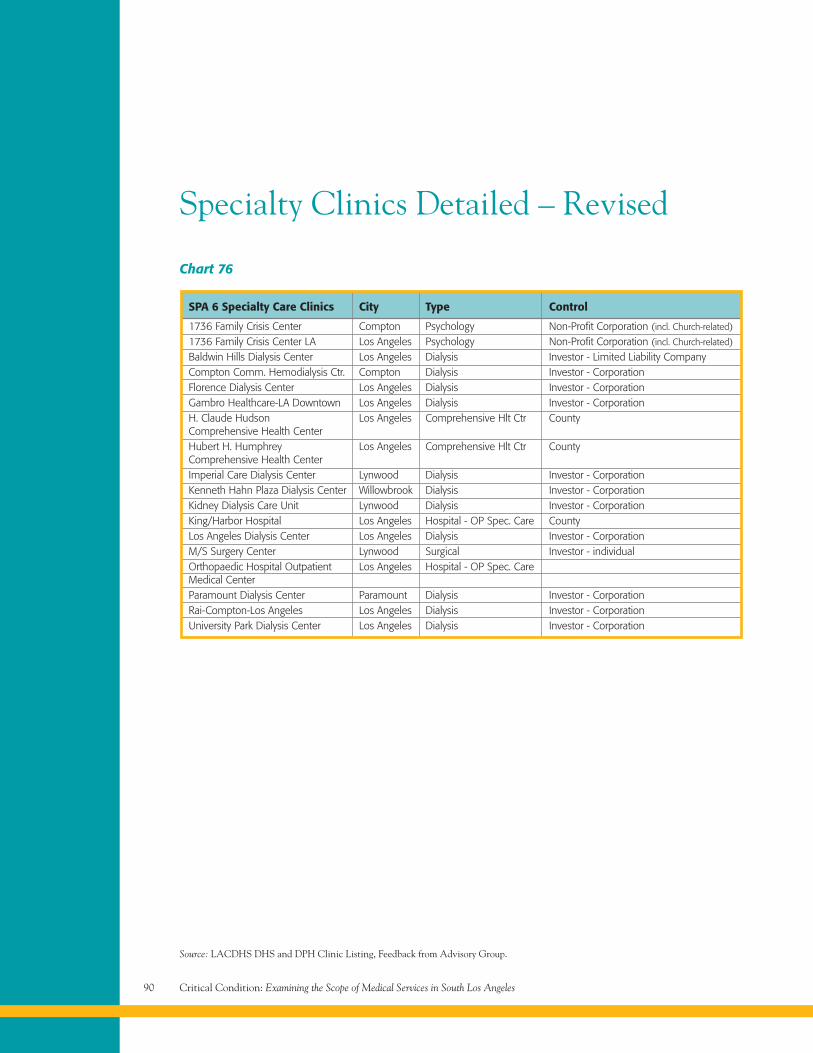
Critical Condition: Examining the Scope of Medical Services in South Los Angeles90
Source: LACDHS DHS and DPH Clinic Listing, Feedback from Advisory Group.
Chart 76
SPA 6 Specialty Care Clinics City Type Control
1736 Family Crisis Center Compton Psychology Non-Profit Corporation (incl. Church-related)
1736 Family Crisis Center LA Los Angeles Psychology Non-Profit Corporation (incl. Church-related)
Baldwin Hills Dialysis Center Los Angeles Dialysis Investor - Limited Liability CompanyCompton Comm. Hemodialysis Ctr. Compton Dialysis Investor - CorporationFlorence Dialysis Center Los Angeles Dialysis Investor - CorporationGambro Healthcare-LA Downtown Los Angeles Dialysis Investor - CorporationH. Claude Hudson Los Angeles Comprehensive Hlt Ctr CountyComprehensive Health CenterHubert H. Humphrey Los Angeles Comprehensive Hlt Ctr CountyComprehensive Health CenterImperial Care Dialysis Center Lynwood Dialysis Investor - CorporationKenneth Hahn Plaza Dialysis Center Willowbrook Dialysis Investor - CorporationKidney Dialysis Care Unit Lynwood Dialysis Investor - CorporationKing/Harbor Hospital Los Angeles Hospital - OP Spec. Care CountyLos Angeles Dialysis Center Los Angeles Dialysis Investor - CorporationM/S Surgery Center Lynwood Surgical Investor - individualOrthopaedic Hospital Outpatient Los Angeles Hospital - OP Spec. CareMedical CenterParamount Dialysis Center Paramount Dialysis Investor - CorporationRai-Compton-Los Angeles Los Angeles Dialysis Investor - CorporationUniversity Park Dialysis Center Los Angeles Dialysis Investor - Corporation
Specialty Clinics Detailed – Revised
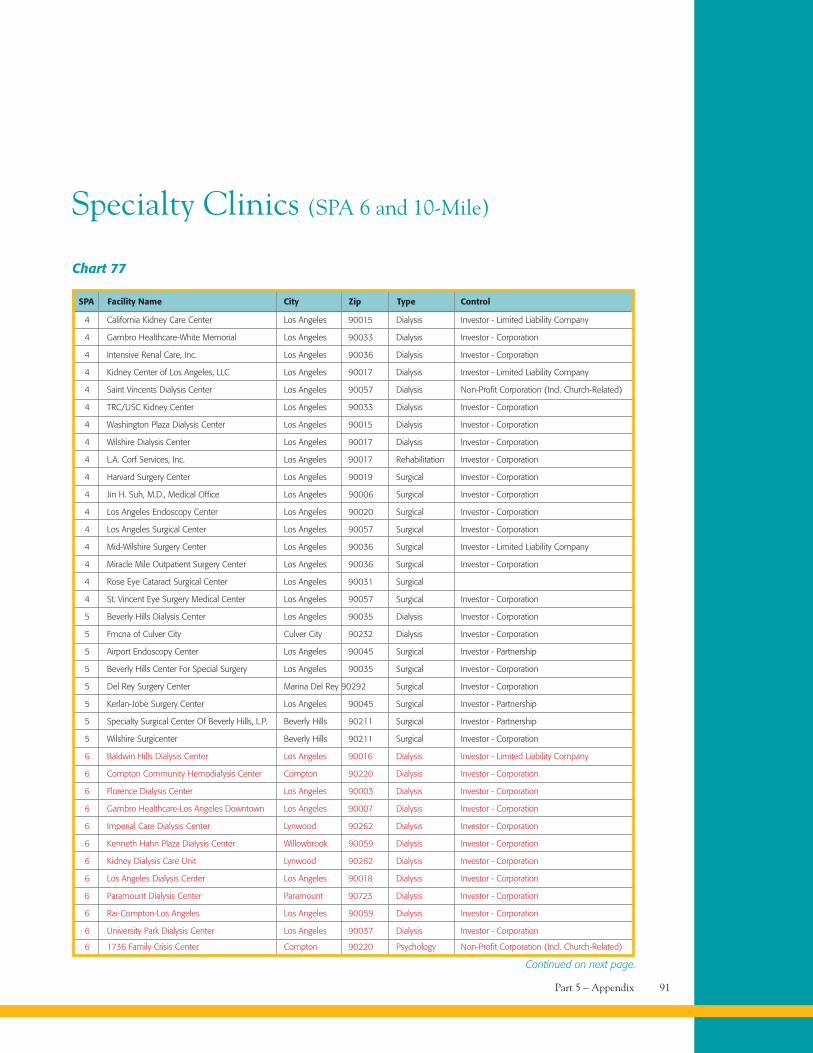
Part 5 – Appendix 91
Specialty Clinics (SPA 6 and 10-Mile)
Chart 77
4 California Kidney Care Center Los Angeles 90015 Dialysis Investor - Limited Liability Company
4 Gambro Healthcare-White Memorial Los Angeles 90033 Dialysis Investor - Corporation
4 Intensive Renal Care, Inc. Los Angeles 90036 Dialysis Investor - Corporation
4 Kidney Center of Los Angeles, LLC Los Angeles 90017 Dialysis Investor - Limited Liability Company
4 Saint Vincents Dialysis Center Los Angeles 90057 Dialysis Non-Profit Corporation (Incl. Church-Related)
4 TRC/USC Kidney Center Los Angeles 90033 Dialysis Investor - Corporation
4 Washington Plaza Dialysis Center Los Angeles 90015 Dialysis Investor - Corporation
4 Wilshire Dialysis Center Los Angeles 90017 Dialysis Investor - Corporation
4 L.A. Corf Services, Inc. Los Angeles 90017 Rehabilitation Investor - Corporation
4 Harvard Surgery Center Los Angeles 90019 Surgical Investor - Corporation
4 Jin H. Suh, M.D., Medical Office Los Angeles 90006 Surgical Investor - Corporation
4 Los Angeles Endoscopy Center Los Angeles 90020 Surgical Investor - Corporation
4 Los Angeles Surgical Center Los Angeles 90057 Surgical Investor - Corporation
4 Mid-Wilshire Surgery Center Los Angeles 90036 Surgical Investor - Limited Liability Company
4 Miracle Mile Outpatient Surgery Center Los Angeles 90036 Surgical Investor - Corporation
4 Rose Eye Cataract Surgical Center Los Angeles 90031 Surgical
4 St. Vincent Eye Surgery Medical Center Los Angeles 90057 Surgical Investor - Corporation
5 Beverly Hills Dialysis Center Los Angeles 90035 Dialysis Investor - Corporation
5 Fmcna of Culver City Culver City 90232 Dialysis Investor - Corporation
5 Airport Endoscopy Center Los Angeles 90045 Surgical Investor - Partnership
5 Beverly Hills Center For Special Surgery Los Angeles 90035 Surgical Investor - Corporation
5 Del Rey Surgery Center Marina Del Rey 90292 Surgical Investor - Corporation
5 Kerlan-Jobe Surgery Center Los Angeles 90045 Surgical Investor - Partnership
5 Specialty Surgical Center Of Beverly Hills, L.P. Beverly Hills 90211 Surgical Investor - Partnership
5 Wilshire Surgicenter Beverly Hills 90211 Surgical Investor - Corporation
6 Baldwin Hills Dialysis Center Los Angeles 90016 Dialysis Investor - Limited Liability Company
6 Compton Community Hemodialysis Center Compton 90220 Dialysis Investor - Corporation
6 Florence Dialysis Center Los Angeles 90003 Dialysis Investor - Corporation
6 Gambro Healthcare-Los Angeles Downtown Los Angeles 90007 Dialysis Investor - Corporation
6 Imperial Care Dialysis Center Lynwood 90262 Dialysis Investor - Corporation
6 Kenneth Hahn Plaza Dialysis Center Willowbrook 90059 Dialysis Investor - Corporation
6 Kidney Dialysis Care Unit Lynwood 90262 Dialysis Investor - Corporation
6 Los Angeles Dialysis Center Los Angeles 90018 Dialysis Investor - Corporation
6 Paramount Dialysis Center Paramount 90723 Dialysis Investor - Corporation
6 Rai-Compton-Los Angeles Los Angeles 90059 Dialysis Investor - Corporation
6 University Park Dialysis Center Los Angeles 90037 Dialysis Investor - Corporation
6 1736 Family Crisis Center Compton 90220 Psychology Non-Profit Corporation (Incl. Church-Related)
SPA Facility Name City Zip Type Control
Continued on next page.
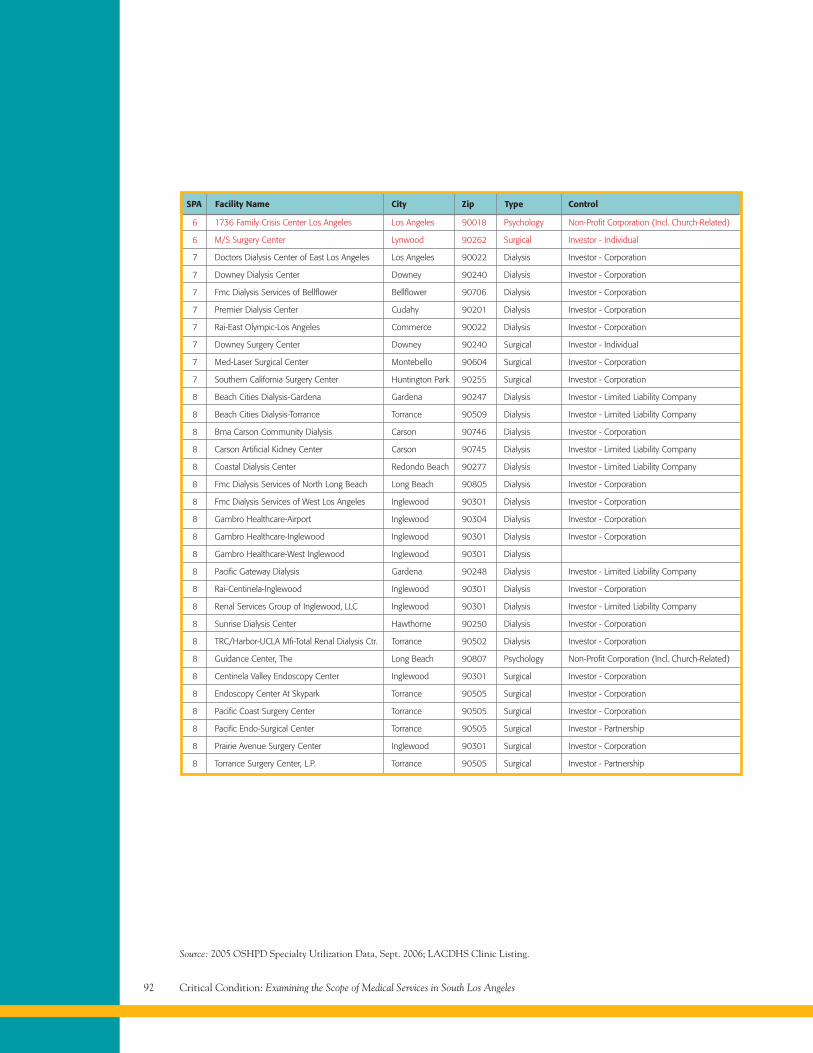
Critical Condition: Examining the Scope of Medical Services in South Los Angeles92
Source: 2005 OSHPD Specialty Utilization Data, Sept. 2006; LACDHS Clinic Listing.
6 1736 Family Crisis Center Los Angeles Los Angeles 90018 Psychology Non-Profit Corporation (Incl. Church-Related)
6 M/S Surgery Center Lynwood 90262 Surgical Investor - Individual
7 Doctors Dialysis Center of East Los Angeles Los Angeles 90022 Dialysis Investor - Corporation
7 Downey Dialysis Center Downey 90240 Dialysis Investor - Corporation
7 Fmc Dialysis Services of Bellflower Bellflower 90706 Dialysis Investor - Corporation
7 Premier Dialysis Center Cudahy 90201 Dialysis Investor - Corporation
7 Rai-East Olympic-Los Angeles Commerce 90022 Dialysis Investor - Corporation
7 Downey Surgery Center Downey 90240 Surgical Investor - Individual
7 Med-Laser Surgical Center Montebello 90604 Surgical Investor - Corporation
7 Southern California Surgery Center Huntington Park 90255 Surgical Investor - Corporation
8 Beach Cities Dialysis-Gardena Gardena 90247 Dialysis Investor - Limited Liability Company
8 Beach Cities Dialysis-Torrance Torrance 90509 Dialysis Investor - Limited Liability Company
8 Bma Carson Community Dialysis Carson 90746 Dialysis Investor - Corporation
8 Carson Artificial Kidney Center Carson 90745 Dialysis Investor - Limited Liability Company
8 Coastal Dialysis Center Redondo Beach 90277 Dialysis Investor - Limited Liability Company
8 Fmc Dialysis Services of North Long Beach Long Beach 90805 Dialysis Investor - Corporation
8 Fmc Dialysis Services of West Los Angeles Inglewood 90301 Dialysis Investor - Corporation
8 Gambro Healthcare-Airport Inglewood 90304 Dialysis Investor - Corporation
8 Gambro Healthcare-Inglewood Inglewood 90301 Dialysis Investor - Corporation
8 Gambro Healthcare-West Inglewood Inglewood 90301 Dialysis
8 Pacific Gateway Dialysis Gardena 90248 Dialysis Investor - Limited Liability Company
8 Rai-Centinela-Inglewood Inglewood 90301 Dialysis Investor - Corporation
8 Renal Services Group of Inglewood, LLC Inglewood 90301 Dialysis Investor - Limited Liability Company
8 Sunrise Dialysis Center Hawthorne 90250 Dialysis Investor - Corporation
8 TRC/Harbor-UCLA Mfi-Total Renal Dialysis Ctr. Torrance 90502 Dialysis Investor - Corporation
8 Guidance Center, The Long Beach 90807 Psychology Non-Profit Corporation (Incl. Church-Related)
8 Centinela Valley Endoscopy Center Inglewood 90301 Surgical Investor - Corporation
8 Endoscopy Center At Skypark Torrance 90505 Surgical Investor - Corporation
8 Pacific Coast Surgery Center Torrance 90505 Surgical Investor - Corporation
8 Pacific Endo-Surgical Center Torrance 90505 Surgical Investor - Partnership
8 Prairie Avenue Surgery Center Inglewood 90301 Surgical Investor - Corporation
8 Torrance Surgery Center, L.P. Torrance 90505 Surgical Investor - Partnership
SPA Facility Name City Zip Type Control
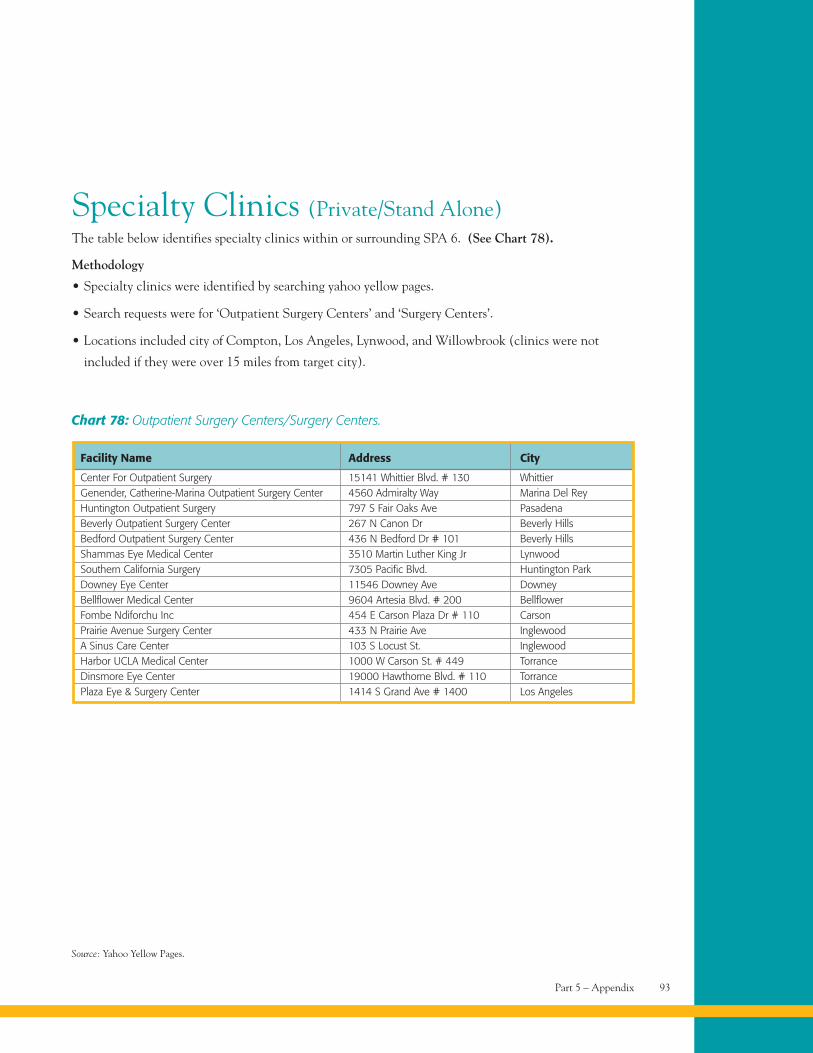
Part 5 – Appendix 93
Specialty Clinics (Private/Stand Alone)The table below identifies specialty clinics within or surrounding SPA 6. (See Chart 78).
Methodology
• Specialty clinics were identified by searching yahoo yellow pages.
• Search requests were for ‘Outpatient Surgery Centers’ and ‘Surgery Centers’.
• Locations included city of Compton, Los Angeles, Lynwood, and Willowbrook (clinics were not
included if they were over 15 miles from target city).
Source: Yahoo Yellow Pages.
Chart 78: Outpatient Surgery Centers/Surgery Centers.
Facility Name Address City
Center For Outpatient Surgery 15141 Whittier Blvd. # 130 WhittierGenender, Catherine-Marina Outpatient Surgery Center 4560 Admiralty Way Marina Del ReyHuntington Outpatient Surgery 797 S Fair Oaks Ave PasadenaBeverly Outpatient Surgery Center 267 N Canon Dr Beverly HillsBedford Outpatient Surgery Center 436 N Bedford Dr # 101 Beverly HillsShammas Eye Medical Center 3510 Martin Luther King Jr LynwoodSouthern California Surgery 7305 Pacific Blvd. Huntington ParkDowney Eye Center 11546 Downey Ave DowneyBellflower Medical Center 9604 Artesia Blvd. # 200 BellflowerFombe Ndiforchu Inc 454 E Carson Plaza Dr # 110 CarsonPrairie Avenue Surgery Center 433 N Prairie Ave InglewoodA Sinus Care Center 103 S Locust St. InglewoodHarbor UCLA Medical Center 1000 W Carson St. # 449 TorranceDinsmore Eye Center 19000 Hawthorne Blvd. # 110 TorrancePlaza Eye & Surgery Center 1414 S Grand Ave # 1400 Los Angeles
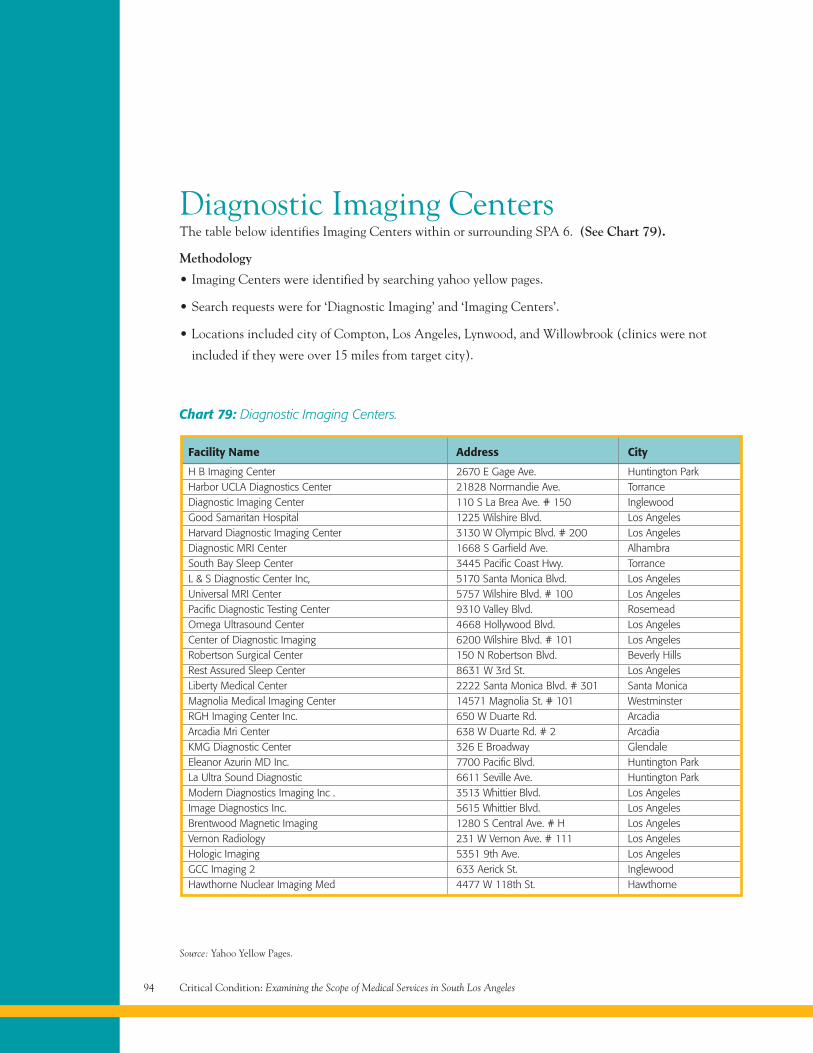
Critical Condition: Examining the Scope of Medical Services in South Los Angeles94
Diagnostic Imaging CentersThe table below identifies Imaging Centers within or surrounding SPA 6. (See Chart 79).
Methodology
• Imaging Centers were identified by searching yahoo yellow pages.
• Search requests were for ‘Diagnostic Imaging’ and ‘Imaging Centers’.
• Locations included city of Compton, Los Angeles, Lynwood, and Willowbrook (clinics were not
included if they were over 15 miles from target city).
Source: Yahoo Yellow Pages.
Chart 79: Diagnostic Imaging Centers.
Facility Name Address City
H B Imaging Center 2670 E Gage Ave. Huntington ParkHarbor UCLA Diagnostics Center 21828 Normandie Ave. TorranceDiagnostic Imaging Center 110 S La Brea Ave. # 150 InglewoodGood Samaritan Hospital 1225 Wilshire Blvd. Los AngelesHarvard Diagnostic Imaging Center 3130 W Olympic Blvd. # 200 Los AngelesDiagnostic MRI Center 1668 S Garfield Ave. AlhambraSouth Bay Sleep Center 3445 Pacific Coast Hwy. TorranceL & S Diagnostic Center Inc, 5170 Santa Monica Blvd. Los AngelesUniversal MRI Center 5757 Wilshire Blvd. # 100 Los AngelesPacific Diagnostic Testing Center 9310 Valley Blvd. RosemeadOmega Ultrasound Center 4668 Hollywood Blvd. Los AngelesCenter of Diagnostic Imaging 6200 Wilshire Blvd. # 101 Los AngelesRobertson Surgical Center 150 N Robertson Blvd. Beverly HillsRest Assured Sleep Center 8631 W 3rd St. Los AngelesLiberty Medical Center 2222 Santa Monica Blvd. # 301 Santa MonicaMagnolia Medical Imaging Center 14571 Magnolia St. # 101 WestminsterRGH Imaging Center Inc. 650 W Duarte Rd. ArcadiaArcadia Mri Center 638 W Duarte Rd. # 2 ArcadiaKMG Diagnostic Center 326 E Broadway GlendaleEleanor Azurin MD Inc. 7700 Pacific Blvd. Huntington ParkLa Ultra Sound Diagnostic 6611 Seville Ave. Huntington ParkModern Diagnostics Imaging Inc . 3513 Whittier Blvd. Los AngelesImage Diagnostics Inc. 5615 Whittier Blvd. Los AngelesBrentwood Magnetic Imaging 1280 S Central Ave. # H Los AngelesVernon Radiology 231 W Vernon Ave. # 111 Los AngelesHologic Imaging 5351 9th Ave. Los AngelesGCC Imaging 2 633 Aerick St. InglewoodHawthorne Nuclear Imaging Med 4477 W 118th St. Hawthorne
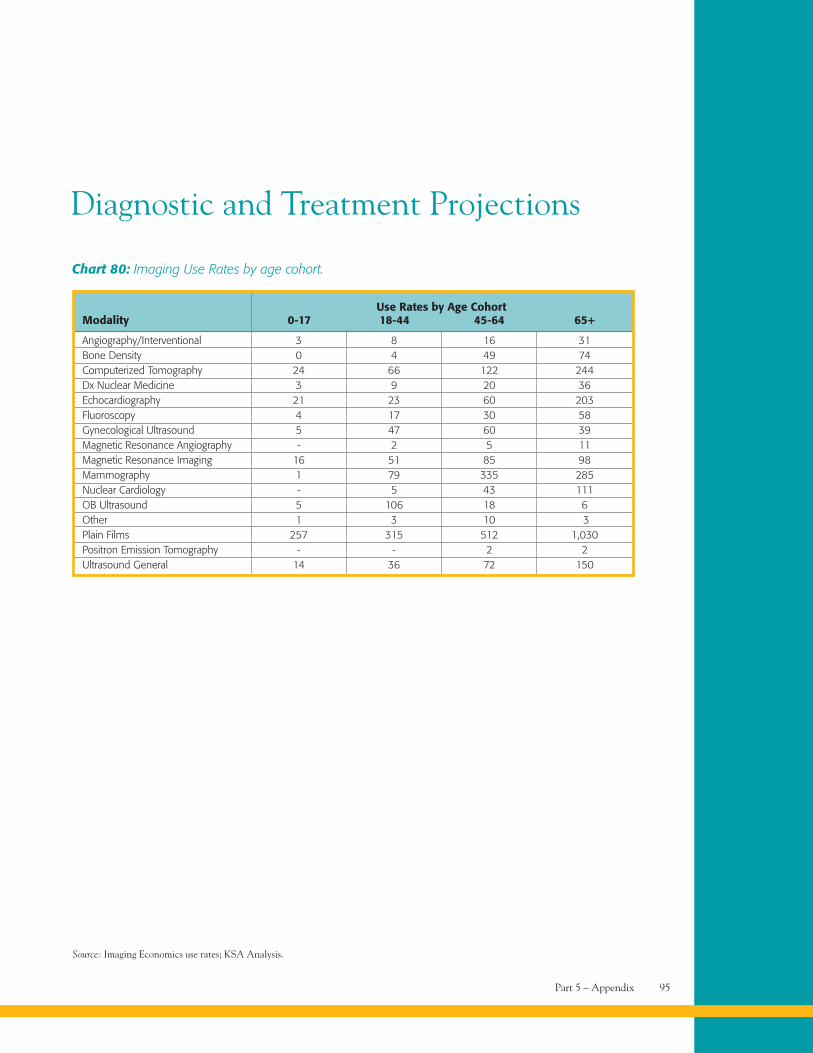
Part 5 – Appendix 95
Chart 80: Imaging Use Rates by age cohort.
Use Rates by Age CohortModality 0-17 18-44 45-64 65+
Angiography/Interventional 3 8 16 31Bone Density 0 4 49 74Computerized Tomography 24 66 122 244Dx Nuclear Medicine 3 9 20 36Echocardiography 21 23 60 203Fluoroscopy 4 17 30 58Gynecological Ultrasound 5 47 60 39Magnetic Resonance Angiography - 2 5 11Magnetic Resonance Imaging 16 51 85 98Mammography 1 79 335 285Nuclear Cardiology - 5 43 111OB Ultrasound 5 106 18 6Other 1 3 10 3Plain Films 257 315 512 1,030Positron Emission Tomography - - 2 2Ultrasound General 14 36 72 150
Source: Imaging Economics use rates; KSA Analysis.
Diagnostic and Treatment Projections
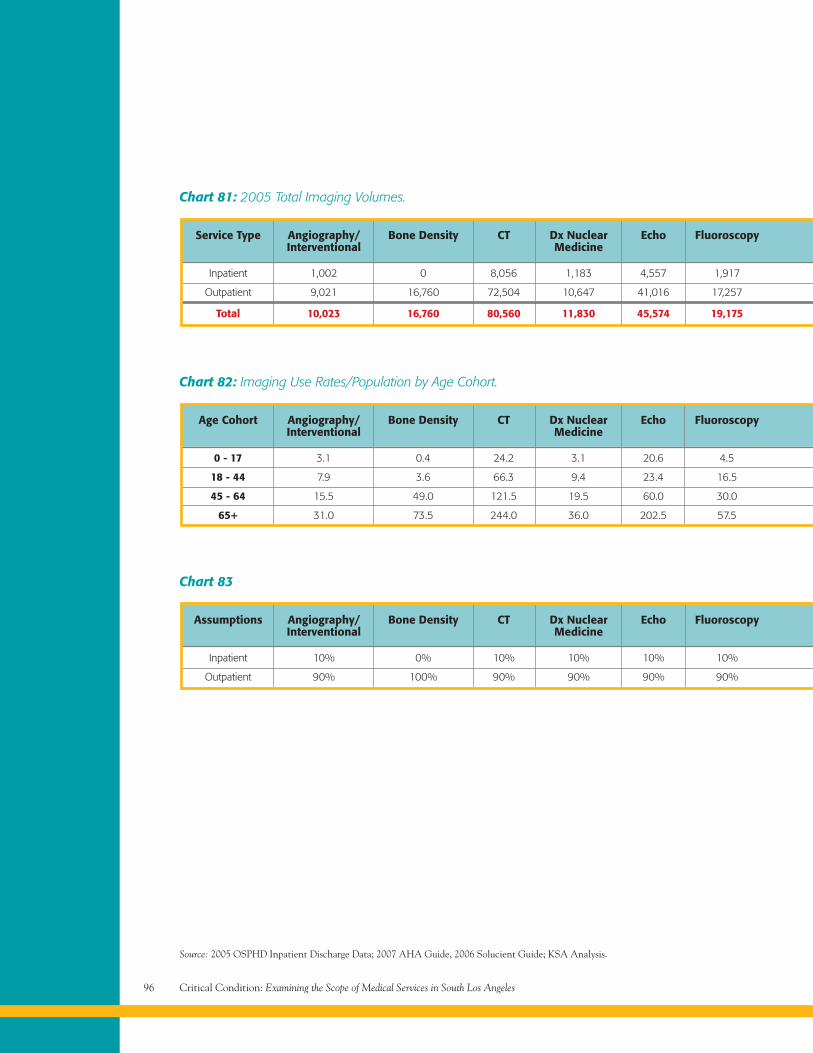
Critical Condition: Examining the Scope of Medical Services in South Los Angeles96
Chart 81: 2005 Total Imaging Volumes.
Service Type Angiography/ Bone Density CT Dx Nuclear Echo FluoroscopyInterventional Medicine
Inpatient 1,002 0 8,056 1,183 4,557 1,917
Outpatient 9,021 16,760 72,504 10,647 41,016 17,257
Total 10,023 16,760 80,560 11,830 45,574 19,175
Chart 83
Assumptions Angiography/ Bone Density CT Dx Nuclear Echo FluoroscopyInterventional Medicine
Inpatient 10% 0% 10% 10% 10% 10%
Outpatient 90% 100% 90% 90% 90% 90%
Chart 82: Imaging Use Rates/Population by Age Cohort.
Source: 2005 OSPHD Inpatient Discharge Data; 2007 AHA Guide, 2006 Solucient Guide; KSA Analysis.
Age Cohort Angiography/ Bone Density CT Dx Nuclear Echo FluoroscopyInterventional Medicine
0 - 17 3.1 0.4 24.2 3.1 20.6 4.5
18 - 44 7.9 3.6 66.3 9.4 23.4 16.5
45 - 64 15.5 49.0 121.5 19.5 60.0 30.0
65+ 31.0 73.5 244.0 36.0 202.5 57.5
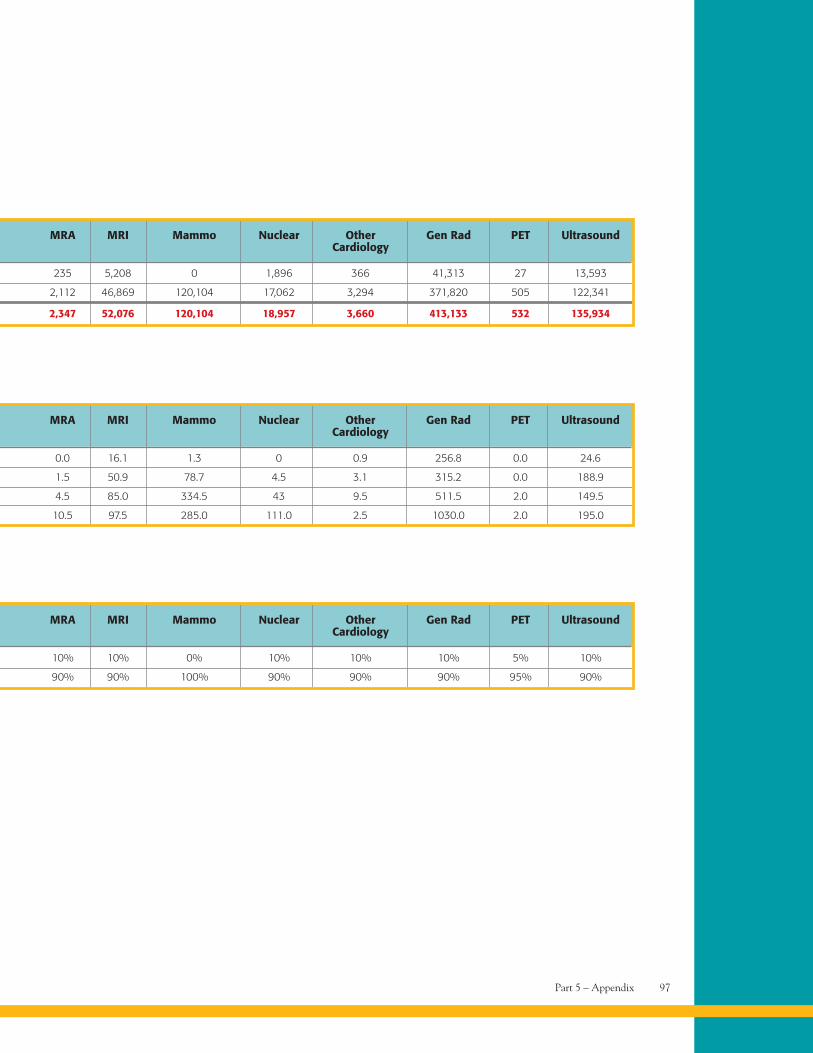
Part 5 – Appendix 97
MRA MRI Mammo Nuclear Other Gen Rad PET UltrasoundCardiology
235 5,208 0 1,896 366 41,313 27 13,593
2,112 46,869 120,104 17,062 3,294 371,820 505 122,341
2,347 52,076 120,104 18,957 3,660 413,133 532 135,934
MRA MRI Mammo Nuclear Other Gen Rad PET UltrasoundCardiology
10% 10% 0% 10% 10% 10% 5% 10%
90% 90% 100% 90% 90% 90% 95% 90%
MRA MRI Mammo Nuclear Other Gen Rad PET UltrasoundCardiology
0.0 16.1 1.3 0 0.9 256.8 0.0 24.6
1.5 50.9 78.7 4.5 3.1 315.2 0.0 188.9
4.5 85.0 334.5 43 9.5 511.5 2.0 149.5
10.5 97.5 285.0 111.0 2.5 1030.0 2.0 195.0
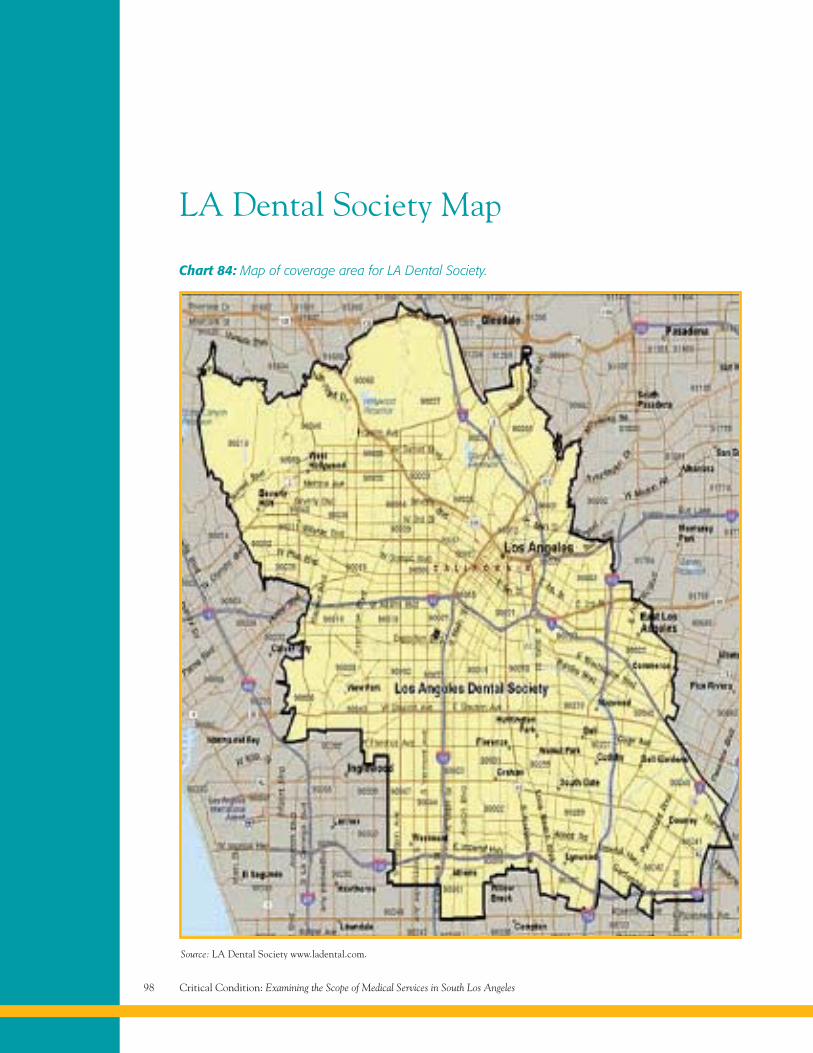
Critical Condition: Examining the Scope of Medical Services in South Los Angeles98
LA Dental Society Map
Chart 84: Map of coverage area for LA Dental Society.
Source: LA Dental Society www.ladental.com.
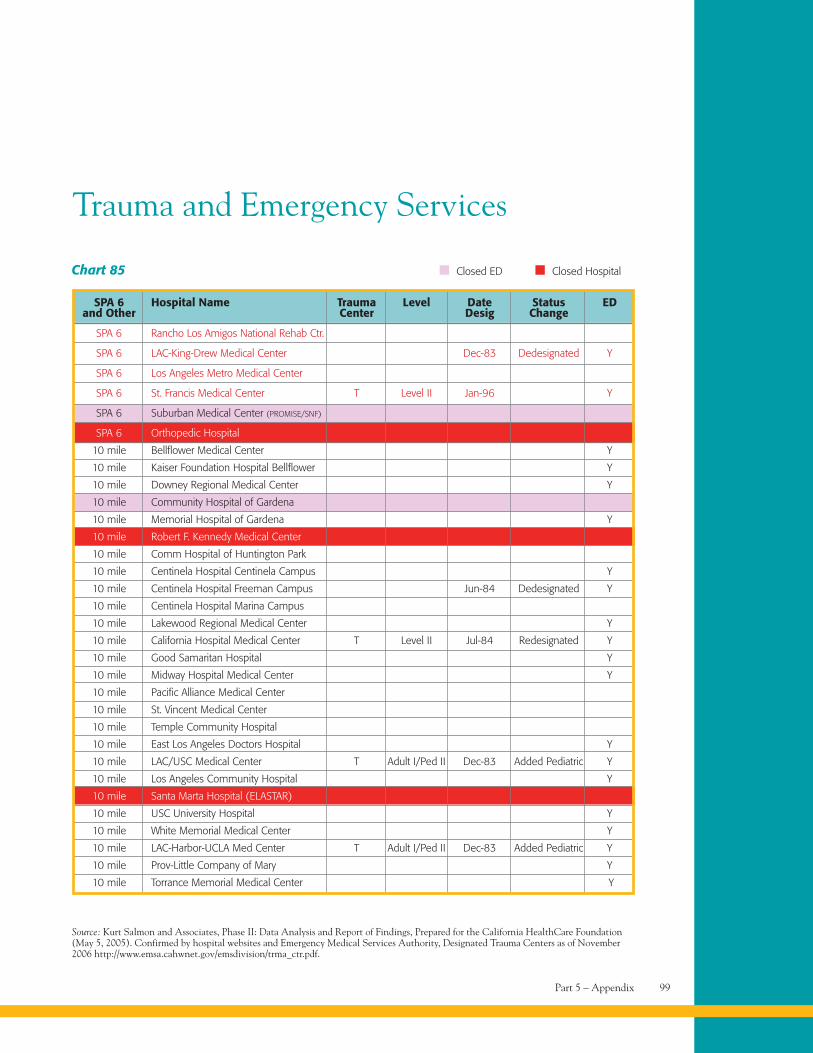
Part 5 – Appendix 99
Trauma and Emergency Services
Chart 85
SPA 6 Hospital Name Trauma Level Date Status EDand Other Center Desig Change
SPA 6 Rancho Los Amigos National Rehab Ctr.
SPA 6 LAC-King-Drew Medical Center Dec-83 Dedesignated Y
SPA 6 Los Angeles Metro Medical Center
SPA 6 St. Francis Medical Center T Level II Jan-96 Y
SPA 6 Suburban Medical Center (PROMISE/SNF)
SPA 6 Orthopedic Hospital
10 mile Bellflower Medical Center Y
10 mile Kaiser Foundation Hospital Bellflower Y
10 mile Downey Regional Medical Center Y
10 mile Community Hospital of Gardena
10 mile Memorial Hospital of Gardena Y
10 mile Robert F. Kennedy Medical Center
10 mile Comm Hospital of Huntington Park
10 mile Centinela Hospital Centinela Campus Y
10 mile Centinela Hospital Freeman Campus Jun-84 Dedesignated Y
10 mile Centinela Hospital Marina Campus
10 mile Lakewood Regional Medical Center Y
10 mile California Hospital Medical Center T Level II Jul-84 Redesignated Y
10 mile Good Samaritan Hospital Y
10 mile Midway Hospital Medical Center Y
10 mile Pacific Alliance Medical Center
10 mile St. Vincent Medical Center
10 mile Temple Community Hospital
10 mile East Los Angeles Doctors Hospital Y
10 mile LAC/USC Medical Center T Adult I/Ped II Dec-83 Added Pediatric Y
10 mile Los Angeles Community Hospital Y
10 mile Santa Marta Hospital (ELASTAR)
10 mile USC University Hospital Y
10 mile White Memorial Medical Center Y
10 mile LAC-Harbor-UCLA Med Center T Adult I/Ped II Dec-83 Added Pediatric Y
10 mile Prov-Little Company of Mary Y
10 mile Torrance Memorial Medical Center Y
Source: Kurt Salmon and Associates, Phase II: Data Analysis and Report of Findings, Prepared for the California HealthCare Foundation(May 5, 2005). Confirmed by hospital websites and Emergency Medical Services Authority, Designated Trauma Centers as of November2006 http://www.emsa.cahwnet.gov/emsdivision/trma_ctr.pdf.
Closed ED Closed Hospital
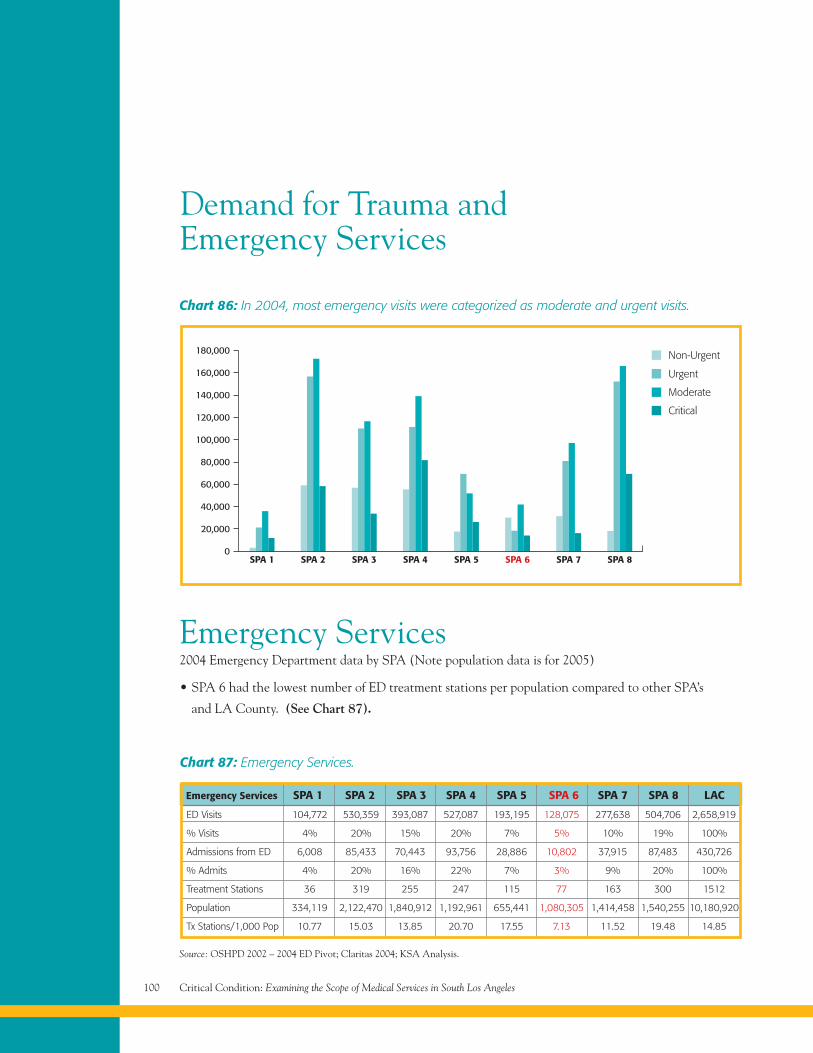
Critical Condition: Examining the Scope of Medical Services in South Los Angeles100
Emergency Services2004 Emergency Department data by SPA (Note population data is for 2005)
• SPA 6 had the lowest number of ED treatment stations per population compared to other SPA’s
and LA County. (See Chart 87).
Demand for Trauma andEmergency Services
Chart 86: In 2004, most emergency visits were categorized as moderate and urgent visits.
SPA 10
SPA 2 SPA 3 SPA 4 SPA 5 SPA 6 SPA 7 SPA 8
40,000
60,000
80,000
100,000
120,000
140,000
160,000
180,000
20,000
Non-Urgent
Urgent
Moderate
Critical
Source: OSHPD 2002 – 2004 ED Pivot; Claritas 2004; KSA Analysis.
Chart 87: Emergency Services.
ED Visits 104,772 530,359 393,087 527,087 193,195 128,075 277,638 504,706 2,658,919
% Visits 4% 20% 15% 20% 7% 5% 10% 19% 100%
Admissions from ED 6,008 85,433 70,443 93,756 28,886 10,802 37,915 87,483 430,726
% Admits 4% 20% 16% 22% 7% 3% 9% 20% 100%
Treatment Stations 36 319 255 247 115 77 163 300 1512
Population 334,119 2,122,470 1,840,912 1,192,961 655,441 1,080,305 1,414,458 1,540,255 10,180,920
Tx Stations/1,000 Pop 10.77 15.03 13.85 20.70 17.55 7.13 11.52 19.48 14.85
Emergency Services SPA 1 SPA 2 SPA 3 SPA 4 SPA 5 SPA 6 SPA 7 SPA 8 LAC
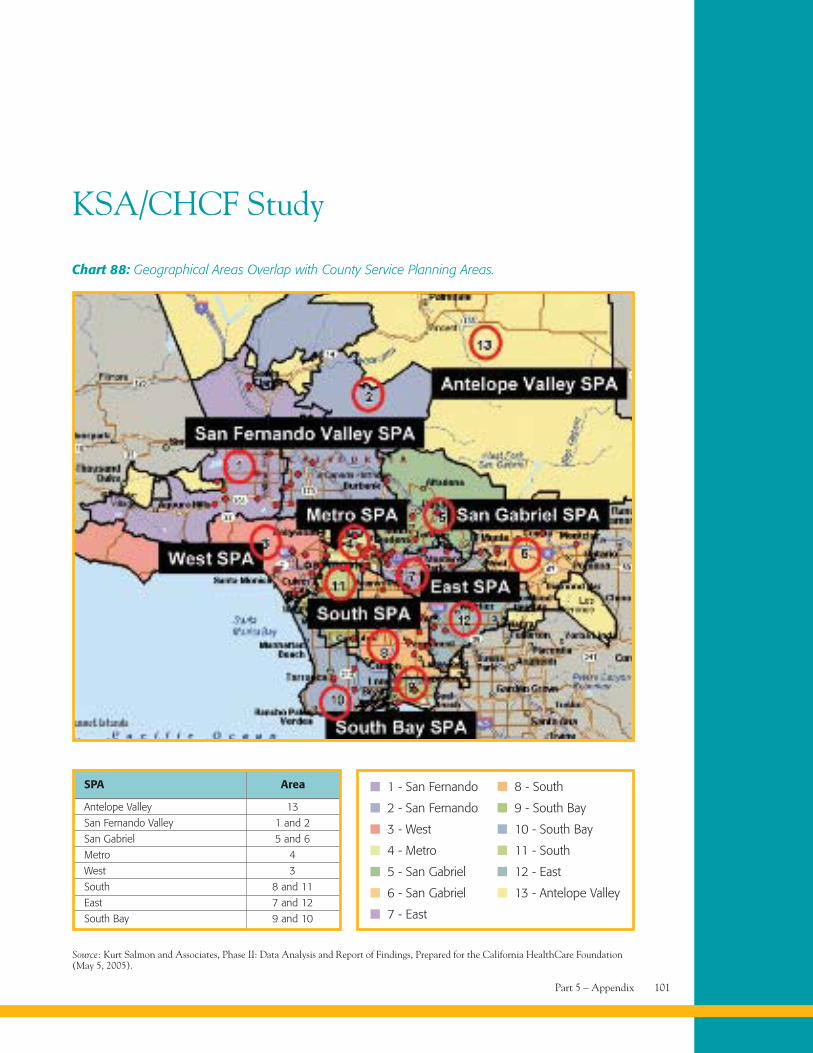
Part 5 – Appendix 101
KSA/CHCF Study
Chart 88: Geographical Areas Overlap with County Service Planning Areas.
Source: Kurt Salmon and Associates, Phase II: Data Analysis and Report of Findings, Prepared for the California HealthCare Foundation(May 5, 2005).
SPA Area
Antelope Valley 13
San Fernando Valley 1 and 2
San Gabriel 5 and 6
Metro 4
West 3
South 8 and 11
East 7 and 12
South Bay 9 and 10
1 - San Fernando
2 - San Fernando
3 - West
8 - South
9 - South Bay
10 - South Bay
4 - Metro 11 - South
5 - San Gabriel 12 - East
6 - San Gabriel 13 - Antelope Valley
7 - East
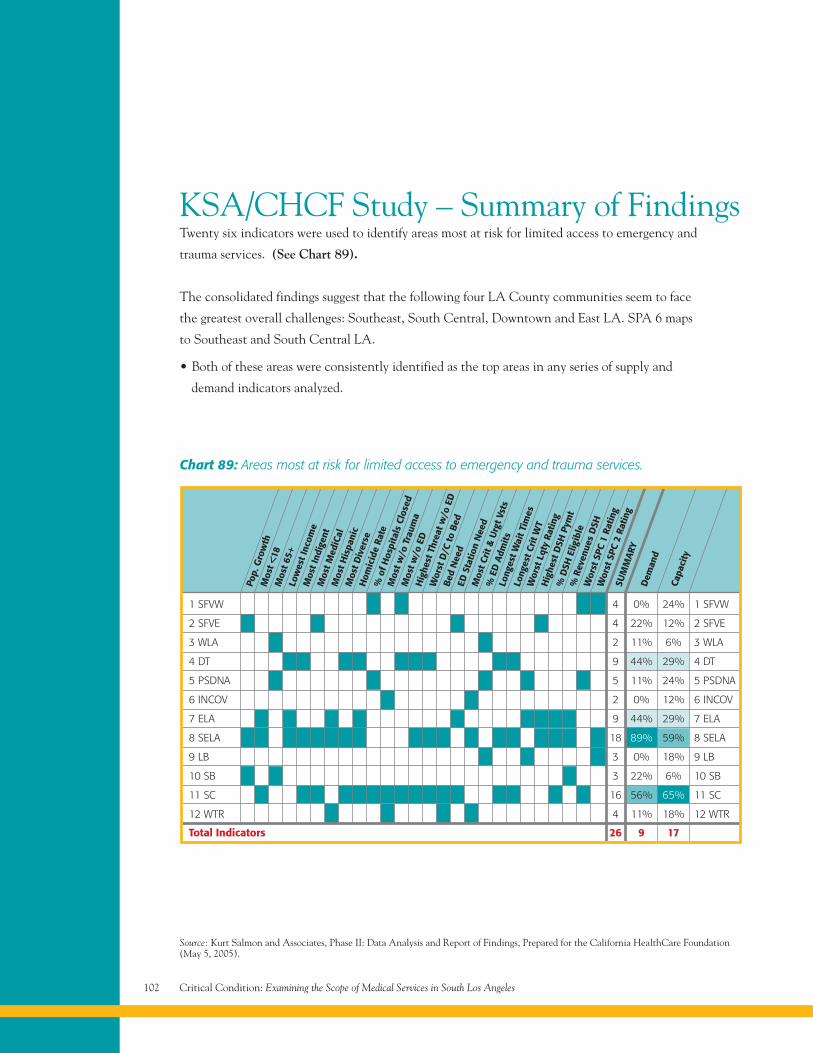
Critical Condition: Examining the Scope of Medical Services in South Los Angeles102
KSA/CHCF Study – Summary of FindingsTwenty six indicators were used to identify areas most at risk for limited access to emergency and
trauma services. (See Chart 89).
The consolidated findings suggest that the following four LA County communities seem to face
the greatest overall challenges: Southeast, South Central, Downtown and East LA. SPA 6 maps
to Southeast and South Central LA.
• Both of these areas were consistently identified as the top areas in any series of supply and
demand indicators analyzed.
Chart 89: Areas most at risk for limited access to emergency and trauma services.
Pop.
Gro
wth
Mos
t <18
Mos
t 65+
Low
est I
ncom
eM
ost I
ndig
ent
Mos
t Med
iCal
Mos
t His
pani
cM
ost D
iver
seH
omic
ide
Rate
%of
Hos
pita
lsCl
osed
Mos
t w/o
Trau
ma
Mos
t w/o
EDH
ighe
stTh
reat
w/o
ED
Wor
stD
/Cto
Bed
Bed
Nee
dED
Stat
ion
Nee
dM
ost C
rit &
Urg
t Vst
s
%ED
Adm
itsLo
nges
t Wai
t Tim
esLo
nges
t Cri
t WT
Wor
stLq
tyRa
ting
Hig
hest
DSH
Pym
t%
DSH
Elig
ible
%Re
venu
esD
SHW
orst
SPC
1Ra
ting
Wor
stSP
C2
Ratin
gSU
MM
ARY
Dem
and
Capa
city
1 SFVW 4 0% 24% 1 SFVW
2 SFVE 4 22% 12% 2 SFVE
3 WLA 2 11% 6% 3 WLA
4 DT 9 44% 29% 4 DT
5 PSDNA 5 11% 24% 5 PSDNA
6 INCOV 2 0% 12% 6 INCOV
7 ELA 9 44% 29% 7 ELA
8 SELA 18 89% 59% 8 SELA
9 LB 3 0% 18% 9 LB
10 SB 3 22% 6% 10 SB
11 SC 16 56% 65% 11 SC
12 WTR 4 11% 18% 12 WTR
Total Indicators 26 9 17
Source: Kurt Salmon and Associates, Phase II: Data Analysis and Report of Findings, Prepared for the California HealthCare Foundation(May 5, 2005).
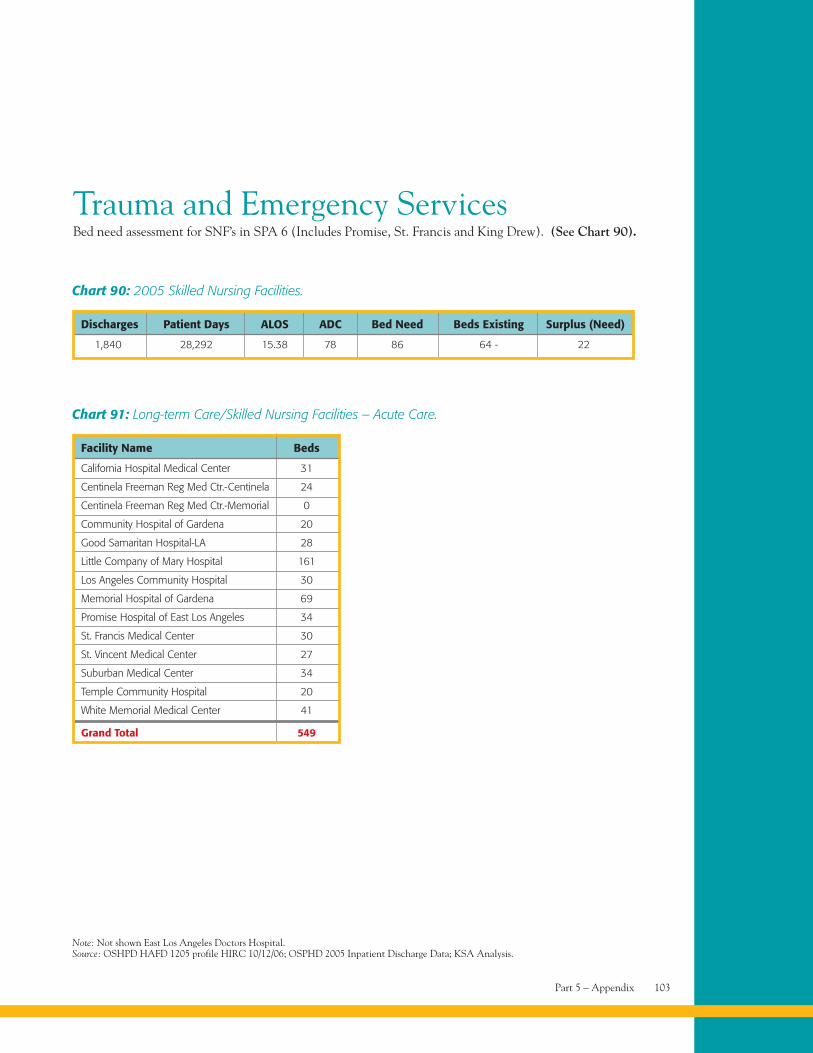
Part 5 – Appendix 103
Trauma and Emergency ServicesBed need assessment for SNF’s in SPA 6 (Includes Promise, St. Francis and King Drew). (See Chart 90).
Chart 90: 2005 Skilled Nursing Facilities.
Discharges Patient Days ALOS ADC Bed Need Beds Existing Surplus (Need)
1,840 28,292 15.38 78 86 64 - 22
Note: Not shown East Los Angeles Doctors Hospital.Source: OSHPD HAFD 1205 profile HIRC 10/12/06; OSPHD 2005 Inpatient Discharge Data; KSA Analysis.
Chart 91: Long-term Care/Skilled Nursing Facilities – Acute Care.
Facility Name Beds
California Hospital Medical Center 31
Centinela Freeman Reg Med Ctr.-Centinela 24
Centinela Freeman Reg Med Ctr.-Memorial 0
Community Hospital of Gardena 20
Good Samaritan Hospital-LA 28
Little Company of Mary Hospital 161
Los Angeles Community Hospital 30
Memorial Hospital of Gardena 69
Promise Hospital of East Los Angeles 34
St. Francis Medical Center 30
St. Vincent Medical Center 27
Suburban Medical Center 34
Temple Community Hospital 20
White Memorial Medical Center 41
Grand Total 549
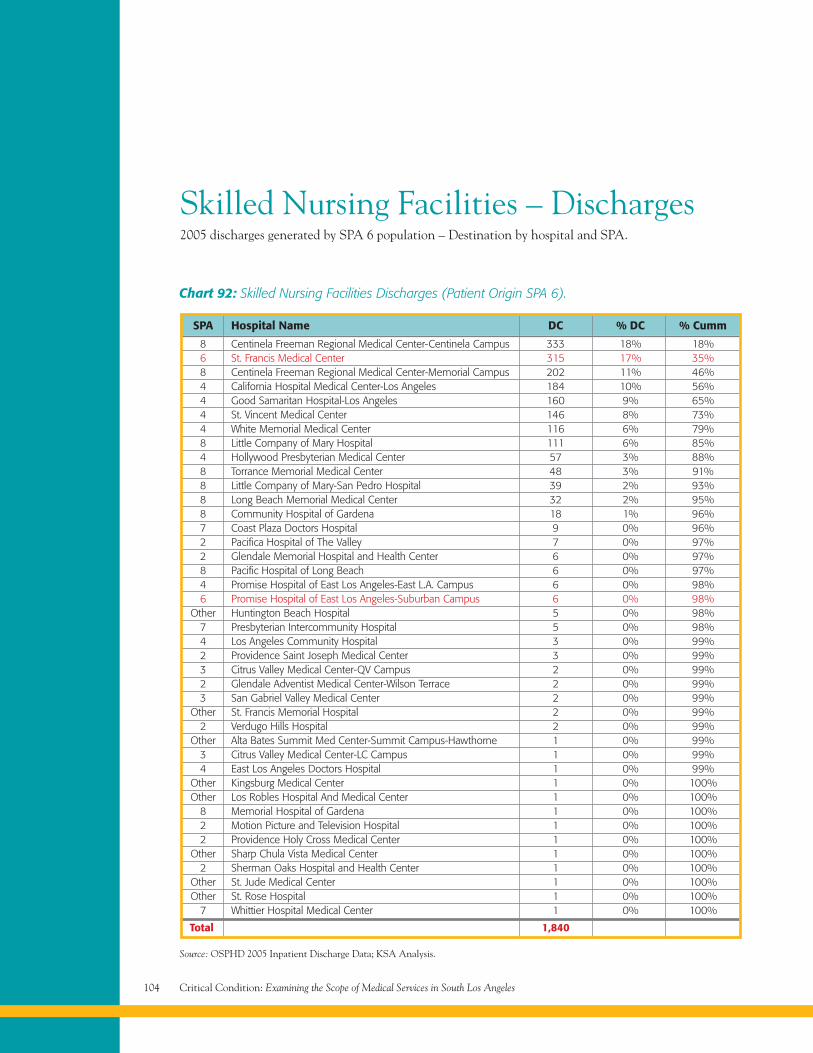
Critical Condition: Examining the Scope of Medical Services in South Los Angeles104
Skilled Nursing Facilities – Discharges2005 discharges generated by SPA 6 population – Destination by hospital and SPA.
Chart 92: Skilled Nursing Facilities Discharges (Patient Origin SPA 6).
SPA Hospital Name DC % DC % Cumm
8 Centinela Freeman Regional Medical Center-Centinela Campus 333 18% 18%6 St. Francis Medical Center 315 17% 35%8 Centinela Freeman Regional Medical Center-Memorial Campus 202 11% 46%4 California Hospital Medical Center-Los Angeles 184 10% 56%4 Good Samaritan Hospital-Los Angeles 160 9% 65%4 St. Vincent Medical Center 146 8% 73%4 White Memorial Medical Center 116 6% 79%8 Little Company of Mary Hospital 111 6% 85%4 Hollywood Presbyterian Medical Center 57 3% 88%8 Torrance Memorial Medical Center 48 3% 91%8 Little Company of Mary-San Pedro Hospital 39 2% 93%8 Long Beach Memorial Medical Center 32 2% 95%8 Community Hospital of Gardena 18 1% 96%7 Coast Plaza Doctors Hospital 9 0% 96%2 Pacifica Hospital of The Valley 7 0% 97%2 Glendale Memorial Hospital and Health Center 6 0% 97%8 Pacific Hospital of Long Beach 6 0% 97%4 Promise Hospital of East Los Angeles-East L.A. Campus 6 0% 98%6 Promise Hospital of East Los Angeles-Suburban Campus 6 0% 98%
Other Huntington Beach Hospital 5 0% 98%7 Presbyterian Intercommunity Hospital 5 0% 98%4 Los Angeles Community Hospital 3 0% 99%2 Providence Saint Joseph Medical Center 3 0% 99%3 Citrus Valley Medical Center-QV Campus 2 0% 99%2 Glendale Adventist Medical Center-Wilson Terrace 2 0% 99%3 San Gabriel Valley Medical Center 2 0% 99%
Other St. Francis Memorial Hospital 2 0% 99%2 Verdugo Hills Hospital 2 0% 99%
Other Alta Bates Summit Med Center-Summit Campus-Hawthorne 1 0% 99%3 Citrus Valley Medical Center-LC Campus 1 0% 99%4 East Los Angeles Doctors Hospital 1 0% 99%
Other Kingsburg Medical Center 1 0% 100%Other Los Robles Hospital And Medical Center 1 0% 100%
8 Memorial Hospital of Gardena 1 0% 100%2 Motion Picture and Television Hospital 1 0% 100%2 Providence Holy Cross Medical Center 1 0% 100%
Other Sharp Chula Vista Medical Center 1 0% 100%2 Sherman Oaks Hospital and Health Center 1 0% 100%
Other St. Jude Medical Center 1 0% 100%Other St. Rose Hospital 1 0% 100%
7 Whittier Hospital Medical Center 1 0% 100%
Total 1,840
Source: OSPHD 2005 Inpatient Discharge Data; KSA Analysis.
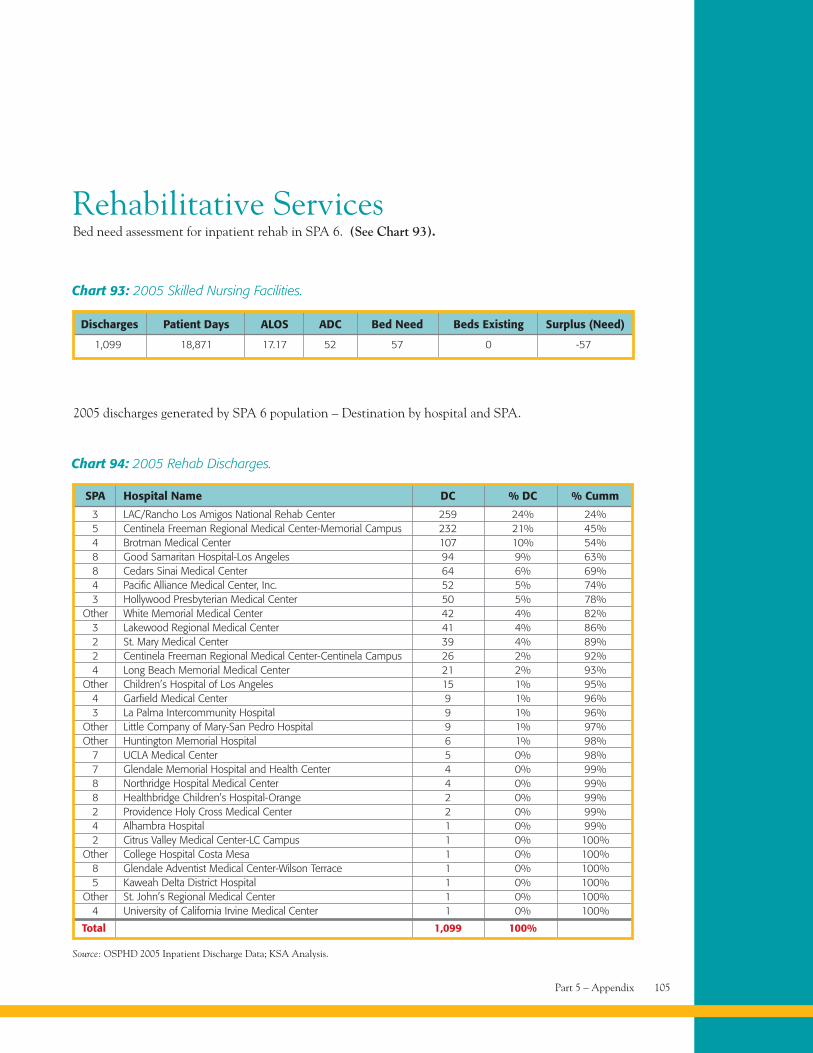
Part 5 – Appendix 105
Chart 94: 2005 Rehab Discharges.
SPA Hospital Name DC % DC % Cumm
3 LAC/Rancho Los Amigos National Rehab Center 259 24% 24%5 Centinela Freeman Regional Medical Center-Memorial Campus 232 21% 45%4 Brotman Medical Center 107 10% 54%8 Good Samaritan Hospital-Los Angeles 94 9% 63%8 Cedars Sinai Medical Center 64 6% 69%4 Pacific Alliance Medical Center, Inc. 52 5% 74%3 Hollywood Presbyterian Medical Center 50 5% 78%
Other White Memorial Medical Center 42 4% 82%3 Lakewood Regional Medical Center 41 4% 86%2 St. Mary Medical Center 39 4% 89%2 Centinela Freeman Regional Medical Center-Centinela Campus 26 2% 92%4 Long Beach Memorial Medical Center 21 2% 93%
Other Children’s Hospital of Los Angeles 15 1% 95%4 Garfield Medical Center 9 1% 96%3 La Palma Intercommunity Hospital 9 1% 96%
Other Little Company of Mary-San Pedro Hospital 9 1% 97%Other Huntington Memorial Hospital 6 1% 98%
7 UCLA Medical Center 5 0% 98%7 Glendale Memorial Hospital and Health Center 4 0% 99%8 Northridge Hospital Medical Center 4 0% 99%8 Healthbridge Children’s Hospital-Orange 2 0% 99%2 Providence Holy Cross Medical Center 2 0% 99%4 Alhambra Hospital 1 0% 99%2 Citrus Valley Medical Center-LC Campus 1 0% 100%
Other College Hospital Costa Mesa 1 0% 100%8 Glendale Adventist Medical Center-Wilson Terrace 1 0% 100%5 Kaweah Delta District Hospital 1 0% 100%
Other St. John’s Regional Medical Center 1 0% 100%4 University of California Irvine Medical Center 1 0% 100%
Total 1,099 100%
Source: OSPHD 2005 Inpatient Discharge Data; KSA Analysis.
Rehabilitative ServicesBed need assessment for inpatient rehab in SPA 6. (See Chart 93).
Chart 93: 2005 Skilled Nursing Facilities.
Discharges Patient Days ALOS ADC Bed Need Beds Existing Surplus (Need)
1,099 18,871 17.17 52 57 0 -57
2005 discharges generated by SPA 6 population – Destination by hospital and SPA.
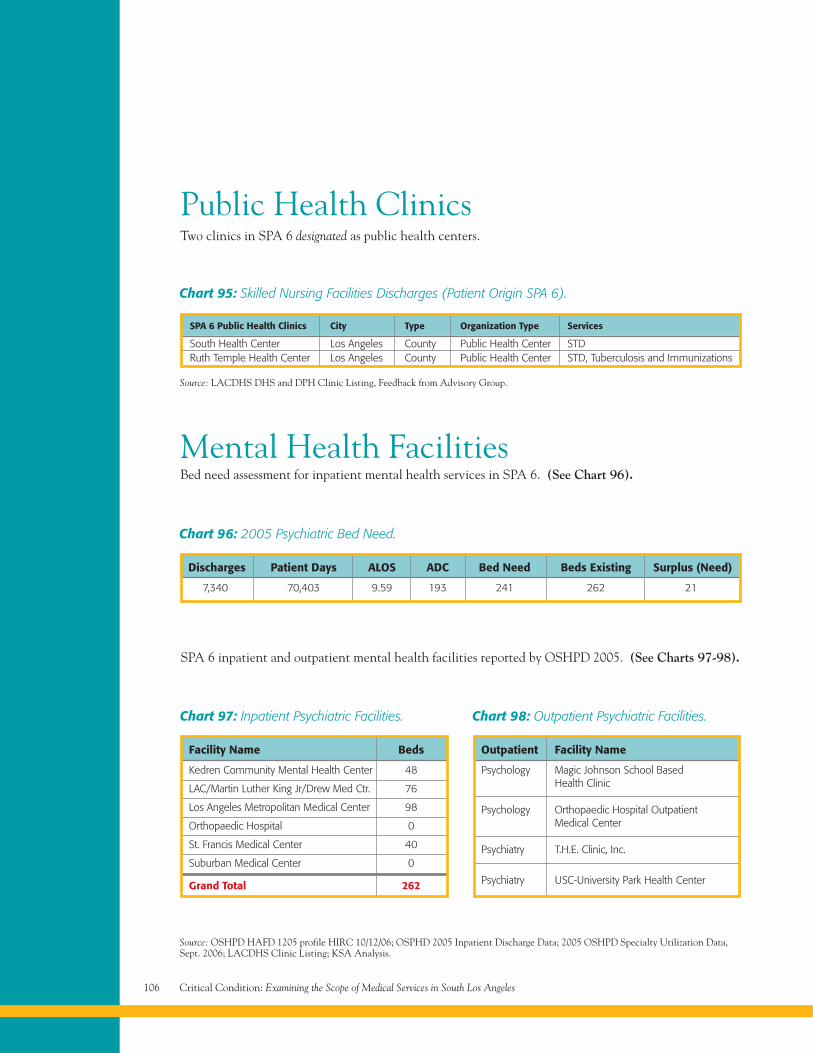
Critical Condition: Examining the Scope of Medical Services in South Los Angeles106
Public Health ClinicsTwo clinics in SPA 6 designated as public health centers.
Chart 95: Skilled Nursing Facilities Discharges (Patient Origin SPA 6).
SPA 6 Public Health Clinics City Type Organization Type Services
South Health Center Los Angeles County Public Health Center STDRuth Temple Health Center Los Angeles County Public Health Center STD, Tuberculosis and Immunizations
Source: LACDHS DHS and DPH Clinic Listing, Feedback from Advisory Group.
Mental Health FacilitiesBed need assessment for inpatient mental health services in SPA 6. (See Chart 96).
Chart 96: 2005 Psychiatric Bed Need.
Discharges Patient Days ALOS ADC Bed Need Beds Existing Surplus (Need)
7,340 70,403 9.59 193 241 262 21
SPA 6 inpatient and outpatient mental health facilities reported by OSHPD 2005. (See Charts 97-98).
Chart 97: Inpatient Psychiatric Facilities.
Facility Name Beds
Kedren Community Mental Health Center 48
LAC/Martin Luther King Jr/Drew Med Ctr. 76
Los Angeles Metropolitan Medical Center 98
Orthopaedic Hospital 0
St. Francis Medical Center 40
Suburban Medical Center 0
Grand Total 262
Chart 98: Outpatient Psychiatric Facilities.
Outpatient Facility Name
Psychology Magic Johnson School BasedHealth Clinic
Psychology Orthopaedic Hospital OutpatientMedical Center
Psychiatry T.H.E. Clinic, Inc.
Psychiatry USC-University Park Health Center
Source: OSHPD HAFD 1205 profile HIRC 10/12/06; OSPHD 2005 Inpatient Discharge Data; 2005 OSHPD Specialty Utilization Data,Sept. 2006; LACDHS Clinic Listing; KSA Analysis.
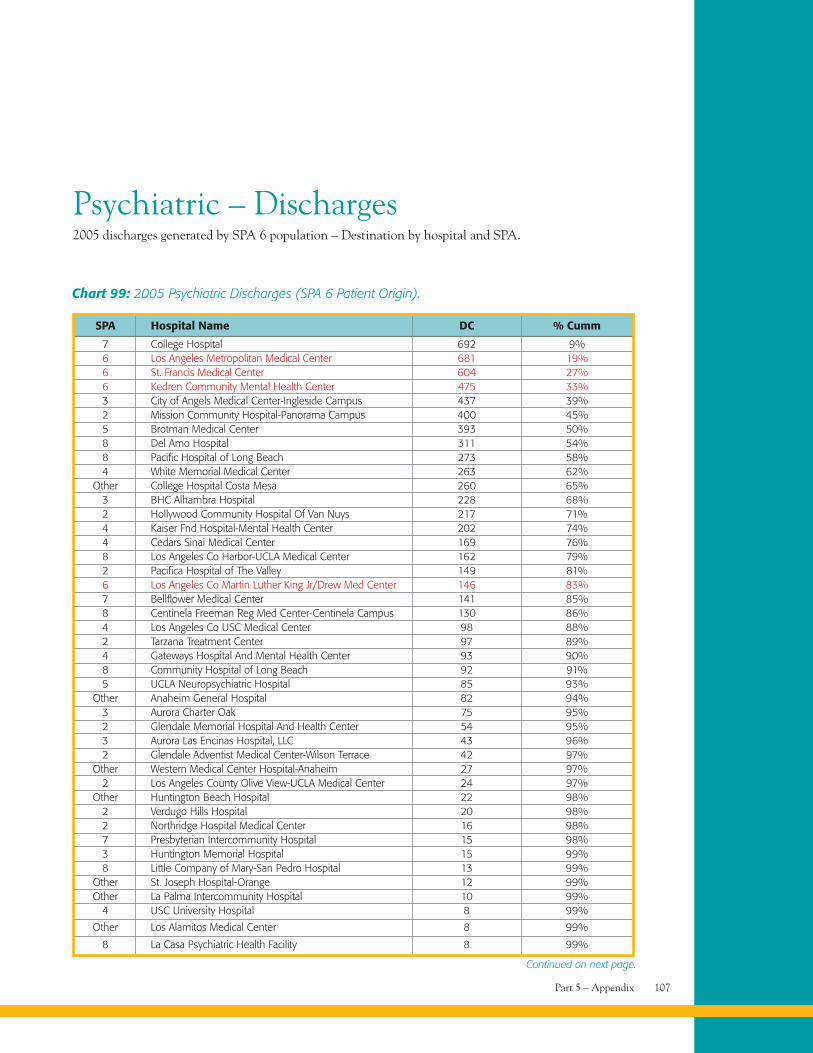
Part 5 – Appendix 107
Psychiatric – Discharges2005 discharges generated by SPA 6 population – Destination by hospital and SPA.
Chart 99: 2005 Psychiatric Discharges (SPA 6 Patient Origin).
SPA Hospital Name DC % Cumm
7 College Hospital 692 9%6 Los Angeles Metropolitan Medical Center 681 19%6 St. Francis Medical Center 604 27%6 Kedren Community Mental Health Center 475 33%3 City of Angels Medical Center-Ingleside Campus 437 39%2 Mission Community Hospital-Panorama Campus 400 45%5 Brotman Medical Center 393 50%8 Del Amo Hospital 311 54%8 Pacific Hospital of Long Beach 273 58%4 White Memorial Medical Center 263 62%
Other College Hospital Costa Mesa 260 65%3 BHC Alhambra Hospital 228 68%2 Hollywood Community Hospital Of Van Nuys 217 71%4 Kaiser Fnd Hospital-Mental Health Center 202 74%4 Cedars Sinai Medical Center 169 76%8 Los Angeles Co Harbor-UCLA Medical Center 162 79%2 Pacifica Hospital of The Valley 149 81%6 Los Angeles Co Martin Luther King Jr/Drew Med Center 146 83%7 Bellflower Medical Center 141 85%8 Centinela Freeman Reg Med Center-Centinela Campus 130 86%4 Los Angeles Co USC Medical Center 98 88%2 Tarzana Treatment Center 97 89%4 Gateways Hospital And Mental Health Center 93 90%8 Community Hospital of Long Beach 92 91%5 UCLA Neuropsychiatric Hospital 85 93%
Other Anaheim General Hospital 82 94%3 Aurora Charter Oak 75 95%2 Glendale Memorial Hospital And Health Center 54 95%3 Aurora Las Encinas Hospital, LLC 43 96%2 Glendale Adventist Medical Center-Wilson Terrace 42 97%
Other Western Medical Center Hospital-Anaheim 27 97%2 Los Angeles County Olive View-UCLA Medical Center 24 97%
Other Huntington Beach Hospital 22 98%2 Verdugo Hills Hospital 20 98%2 Northridge Hospital Medical Center 16 98%7 Presbyterian Intercommunity Hospital 15 98%3 Huntington Memorial Hospital 15 99%8 Little Company of Mary-San Pedro Hospital 13 99%
Other St. Joseph Hospital-Orange 12 99%Other La Palma Intercommunity Hospital 10 99%
4 USC University Hospital 8 99%
Other Los Alamitos Medical Center 8 99%
8 La Casa Psychiatric Health Facility 8 99%
Continued on next page.
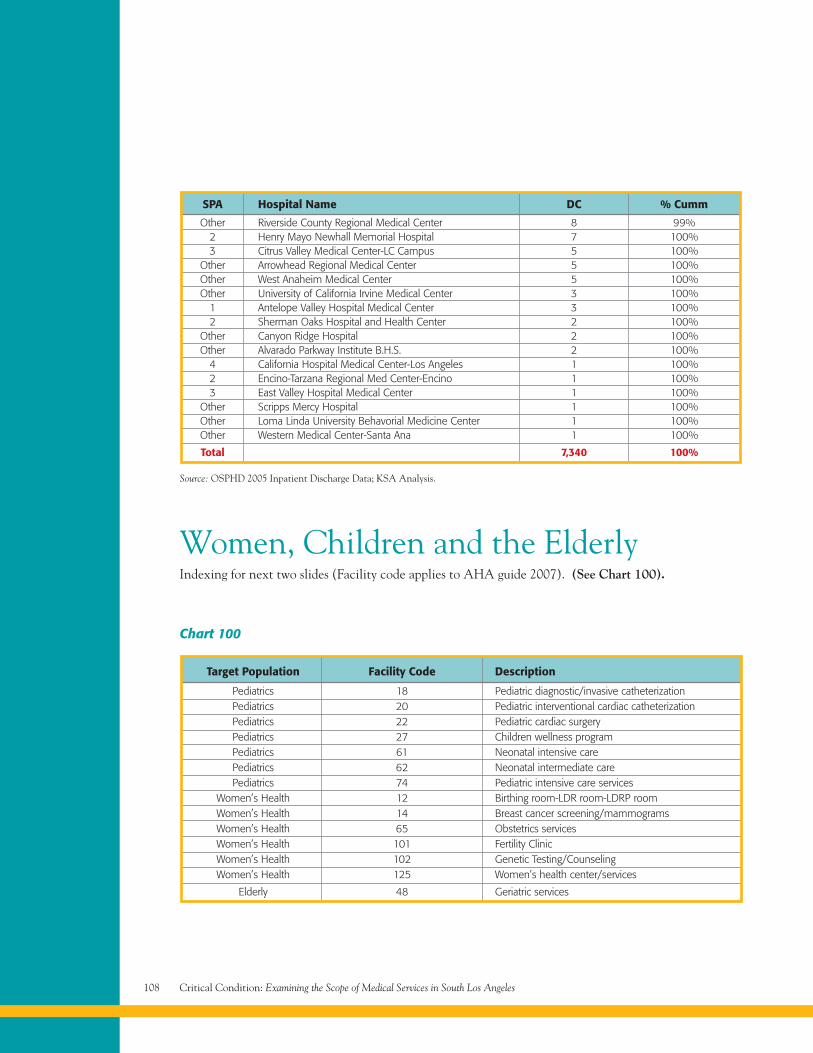
Critical Condition: Examining the Scope of Medical Services in South Los Angeles108
Source: OSPHD 2005 Inpatient Discharge Data; KSA Analysis.
SPA Hospital Name DC % Cumm
Other Riverside County Regional Medical Center 8 99%2 Henry Mayo Newhall Memorial Hospital 7 100%3 Citrus Valley Medical Center-LC Campus 5 100%
Other Arrowhead Regional Medical Center 5 100%Other West Anaheim Medical Center 5 100%Other University of California Irvine Medical Center 3 100%
1 Antelope Valley Hospital Medical Center 3 100%2 Sherman Oaks Hospital and Health Center 2 100%
Other Canyon Ridge Hospital 2 100%Other Alvarado Parkway Institute B.H.S. 2 100%
4 California Hospital Medical Center-Los Angeles 1 100%2 Encino-Tarzana Regional Med Center-Encino 1 100%3 East Valley Hospital Medical Center 1 100%
Other Scripps Mercy Hospital 1 100%Other Loma Linda University Behavorial Medicine Center 1 100%Other Western Medical Center-Santa Ana 1 100%
Total 7,340 100%
Women, Children and the ElderlyIndexing for next two slides (Facility code applies to AHA guide 2007). (See Chart 100).
Chart 100
Target Population Facility Code Description
Pediatrics 18 Pediatric diagnostic/invasive catheterizationPediatrics 20 Pediatric interventional cardiac catheterizationPediatrics 22 Pediatric cardiac surgeryPediatrics 27 Children wellness programPediatrics 61 Neonatal intensive carePediatrics 62 Neonatal intermediate carePediatrics 74 Pediatric intensive care services
Women’s Health 12 Birthing room-LDR room-LDRP roomWomen’s Health 14 Breast cancer screening/mammogramsWomen’s Health 65 Obstetrics servicesWomen’s Health 101 Fertility ClinicWomen’s Health 102 Genetic Testing/CounselingWomen’s Health 125 Women’s health center/services
Elderly 48 Geriatric services
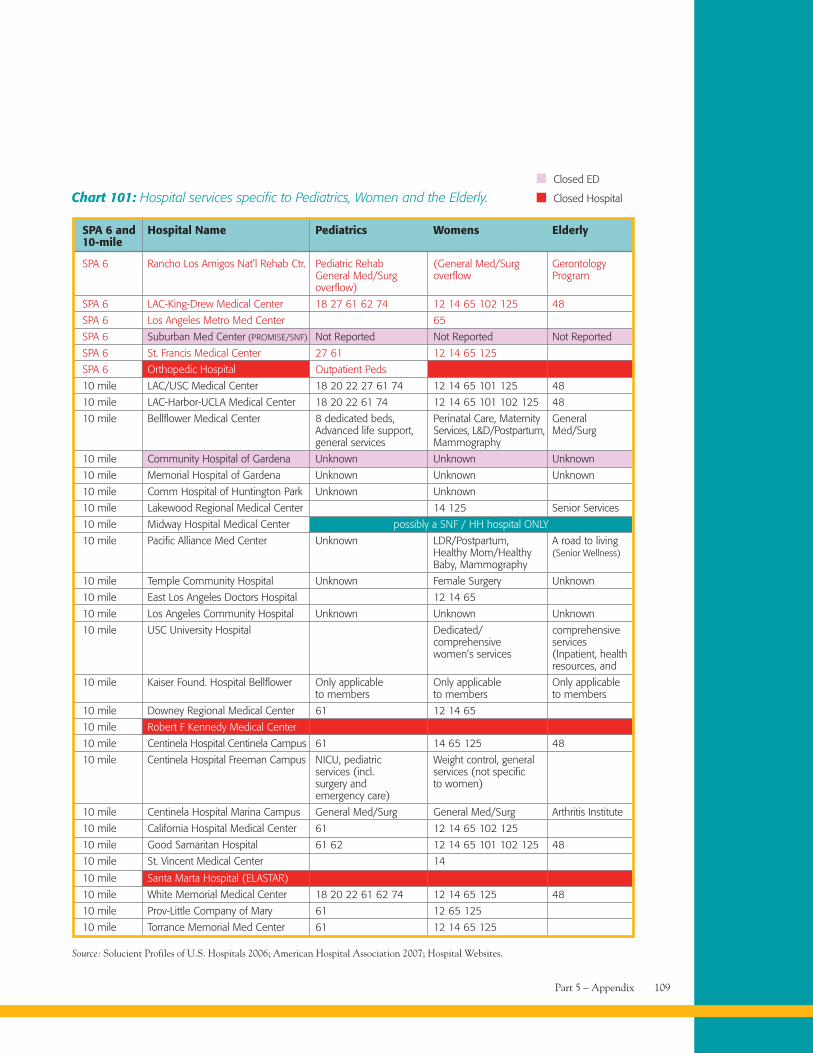
Part 5 – Appendix 109
Chart 101: Hospital services specific to Pediatrics, Women and the Elderly.
SPA 6 and Hospital Name Pediatrics Womens Elderly10-mile
SPA 6 Rancho Los Amigos Nat’l Rehab Ctr. Pediatric Rehab (General Med/Surg GerontologyGeneral Med/Surg overflow Programoverflow)
SPA 6 LAC-King-Drew Medical Center 18 27 61 62 74 12 14 65 102 125 48
SPA 6 Los Angeles Metro Med Center 65
SPA 6 Suburban Med Center (PROMISE/SNF) Not Reported Not Reported Not Reported
SPA 6 St. Francis Medical Center 27 61 12 14 65 125
SPA 6 Orthopedic Hospital Outpatient Peds
10 mile LAC/USC Medical Center 18 20 22 27 61 74 12 14 65 101 125 48
10 mile LAC-Harbor-UCLA Medical Center 18 20 22 61 74 12 14 65 101 102 125 48
10 mile Bellflower Medical Center 8 dedicated beds, Perinatal Care, Maternity GeneralAdvanced life support, Services, L&D/Postpartum, Med/Surggeneral services Mammography
10 mile Community Hospital of Gardena Unknown Unknown Unknown
10 mile Memorial Hospital of Gardena Unknown Unknown Unknown
10 mile Comm Hospital of Huntington Park Unknown Unknown
10 mile Lakewood Regional Medical Center 14 125 Senior Services
10 mile Midway Hospital Medical Center possibly a SNF / HH hospital ONLY
10 mile Pacific Alliance Med Center Unknown LDR/Postpartum, A road to livingHealthy Mom/Healthy (Senior Wellness)Baby, Mammography
10 mile Temple Community Hospital Unknown Female Surgery Unknown
10 mile East Los Angeles Doctors Hospital 12 14 65
10 mile Los Angeles Community Hospital Unknown Unknown Unknown
10 mile USC University Hospital Dedicated/ comprehensivecomprehensive serviceswomen’s services (Inpatient, health
resources, and
10 mile Kaiser Found. Hospital Bellflower Only applicable Only applicable Only applicableto members to members to members
10 mile Downey Regional Medical Center 61 12 14 65
10 mile Robert F Kennedy Medical Center
10 mile Centinela Hospital Centinela Campus 61 14 65 125 48
10 mile Centinela Hospital Freeman Campus NICU, pediatric Weight control, generalservices (incl. services (not specificsurgery and to women)emergency care)
10 mile Centinela Hospital Marina Campus General Med/Surg General Med/Surg Arthritis Institute
10 mile California Hospital Medical Center 61 12 14 65 102 125
10 mile Good Samaritan Hospital 61 62 12 14 65 101 102 125 48
10 mile St. Vincent Medical Center 14
10 mile Santa Marta Hospital (ELASTAR)
10 mile White Memorial Medical Center 18 20 22 61 62 74 12 14 65 125 48
10 mile Prov-Little Company of Mary 61 12 65 125
10 mile Torrance Memorial Med Center 61 12 14 65 125
Source: Solucient Profiles of U.S. Hospitals 2006; American Hospital Association 2007; Hospital Websites.
Closed ED
Closed Hospital
Critical Condition: Examining the Scope of Medical Services in South Los Angeles110
Advisory GroupObjectives• To advise and inform such that the research and
analyses remain grounded and attainable.
• To ensure the right questions are being askedregarding the medical needs assessment of SPA 6.
• To provide additional data where applicable to helpsupplement the analyses.
• To provide specific expertise and knowledge.
• To participate in discussion of key issues.
Time Commitment and ScheduleParticipation and attendance in phone calls andin-person meetings over the course of Phase I.
Advisory Group ParticipantsLark Galloway-Gilliam (Executive Director,Community Health Councils)
Nancy Watson (Policy Director, CommunityHealth Councils)
Irene Dyer (Director, Office of Planning and Analysis,Los Angeles County Department of Health Services)
Gloria Rodriguez (CEO, Community ClinicAssociation of Los Angeles County)
Brian Nolan (Vice President of Member Services,Community Clinic Association of Los Angeles County)
Nina Vaccaro (Director, Southside Coalition ofCommunity Health Centers)
Barbara Siegel (Managing Attorney, Health ConsumerCenter of Neighborhood Legal Services)
Wendy Schiffer (Director of Planning, Evaluation andDevelopment, Los Angeles County Department ofPublic Health Services)
Dr. Kathleen Daly (Medical Director, Adult Systems ofCare/Jail Mental Health Services, Los Angeles CountyDepartment of Mental Health)
Jim Allen (Deputy Director, Adult Systems of Care,Los Angeles County Department of Mental Health)
BibliographyKey Websites2000 and 2005 U.S. Census Bureau,http://www.census.gov/
All Hospital Websites – See listing of hospitalsin appendix
Los Angeles County Department of Health Services,http://www.ladhs.org/
Los Angeles County Department of Mental Health,
Los Angeles County Department of Public Health,http://lapublichealth.org/services.htm
SPA 6 Patient Resources,http://lapublichealth.org/spa6/index.htm
Data/Benchmark Comparisons2007 AHA Guide - America’s Directory of Hospitalsand Healthcare Systems
California Health Interview Survey, Insurance Data
Imaging Economics, Outpatient Use Rates, 2005
The Comparative Performance of U.S. Hospitals: TheSourcebook, 2006
US Centers for Disease Control and Prevention
Zip Code Data Book, Service Planning Area Six,South, United Way of Greater Los Angeles, 2007
General Information/Geography/Population/DemographicsAdvancement Project, Citywide Gang ActivityReduction Strategy: Phase III Report (March 2007)
Claritas Population Data, 2004 (KSA Internal Resource)
Dowling PT, Who Will Care for South Central LA?Presentation to the LA Health Collaborative(December 21, 2006). Retrieved fromwww.lahealthaction.org/library/South_Central-LA_Talk_12-21-06.pdf
Grumback et al., Primary Care Resources andPreventable Hospitalizations in California retrievedfrom www.ucop.edu/cprc/bindman.html on 2/7/2007
Part 5 – Appendix 111
LACHS Trends South LA, 2005; provided by LAHealth Action (Los Angeles County Health Survey)
Patient Assessment Survey III Final Report, Allison L.Diamant, MD, MSHS for the PAS III Research Team(Data collected in 2005)
Project, Citywide Gang Activity Reduction Strategy:Phase I Report (2006)
Public Policy Institute of California, Just the Facts,California Children, March 2005 www.ppic.org
Public Policy Institute of California, Just the Facts,Los Angeles County, March 2005 www.ppic.org
Service Planning Area 6 – Disease Burden Profile, Revised6.10.03, retrieved from http://chipts.cch.ucla.edu/ interven-tions/coordinated_networks/SPA6_profile_061003.pdf
The Drew Service Area: Profile of an UrbanUnderserved Community, Research Centersin Minority Institutions, retrieved fromhttp://www.cdrewu.edu/rcmi/community/default.asp
Zip Code Definition by SPA, Los Angeles Departmentof Public Health retrieved from http://lapublichealth.org/
Hospitals, Clinics, and HealthStatus InformationBitler, M and Shi, W., Health Insurance, Health CareUse and Health Status in Los Angeles County, PublicPolicy Institute of CA 2006
Community Acquired Pneumonia: Hospital Outcomesin California, 2002 – 2004; California HospitalOutcomes Program Report, 2006, OSHPD
County-funded Ambulatory Care Utilization forUninsured Adults in Los Angeles County, LA HealthAction, Feb. 2007
Emergency Medical Services Authority, DesignatedTrauma Centers as of November 2006http://www.emsa.cahwnet.gov/emsdivision/trma_ctr.pdf
Ethnic Minorities Still Lack Adequate MH Care,Experts State (American Psychiatric Association)retrieved from the Network of Care-Los Angeles-Mental Health on 2/22/07
Felt-Lisk S, McHugh M and Thomas M, ExaminingAccess to Specialty Care for California’s Uninsured: FullReport, California HealthCare Foundation, (June 2004)
Grumback et al., Primary Care Resources andPreventable Hospitalizations in California retrievedfrom www.ucop.edu/cprc/bindman.html on 2/7/2007
Kaiser State Health Facts, Hospitals per 1,000 beds, 2004retrieved from http://www.statehealthfacts.org/cgibin/healthfacts.cgi?previewid=290&action=compare&category=Providers+%26+Service+Use&subcategory=Hospitals&topic=Beds
Key Indicators of Health by Service Planning Area,2002/2003 (LACDPH Publication)
Key Indicators of Health by Service Planning Area,April 2007 (LACDPH Publication)
King/Drew Medical Center Transition Report,National Health Foundation Research Team, 2005
Kurt Salmon and Associates, Phase II: Data Analysisand Report of Findings, Prepared for the CaliforniaHealthCare Foundation (May 5, 2005).
LA Dental Society retrieved from http://www.ladental.com/
LACDHS Office of Ambulatory Care, Public-PrivatePartnership (PPP) Program – Clinic Status (June 18,2007). Accessed at www.ladhs.org/ambcare/patients/pdf/clinicstatuslist.pdf
LACDHS, The L.A. County Medicaid DemonstrationProject (Section 1115): Stabilizing the Safety Net:1995-2005 (June 2005).
LACDPH oral health program retrieved fromhttp://lapublichealth.org/ohp/
Leong D, The Power of Partnerships: Solutions Createdand Lessons Learned by the Public Private PartnershipProgram, Community Clinic Association of Los AngelesCounty (May 2005).
Los Angeles County Department of Health Services –Clinic Listings (Health Services Directory)
Margolis L, Lowet P and Thorfinnson T, Multi-SpecialtyClinic Feasibility Study for the Southside Coalition ofCommunity Health Centers, Lia Margolis and Associates(December 15, 2005)
Mental Health and Racial Ethnic Minorities(American Association of World Health) retrievedfrom the Network of Care-Los Angeles-Mental Healthon 2/22/07 http://losangeles.networkofcare.org/mh/library/detail.cfm?id=1424&cat=42
Critical Condition: Examining the Scope of Medical Services in South Los Angeles112
Mortality in 2003, Leading Causes of Death andPremature Death, A publication of the Los AngelesCounty Department of Public Health
National Hospital Ambulatory Medical Care Survey:2004 Emergency Department Summary, Advance DataVital and Health Statistics, CDC Jun 23, 2006
Office of Statewide Health Planning and Development
— 2002 – 2004 ED Pivot and Trends
— 2005 Inpatient Discharge Data
— 2005 OSHPD PCC Utilization Data, Sept. 2006
— 2005 OSHPD Specialty Utilization Data, Sept. 2006
— Hospital Profile data (Pivot and Trends), HAFD1205 profile HIRC 10/12/06
Overuse of Emergency Departments Among InsuredCalifornians, CHCF Issue Brief Oct. 2006
Public Policy Institute of California, health Insurance,Health Care Use, and Health Status in Los AngelesCounty, 2006
Trend Watch, Coverage Counts: Supporting Healthand Opportunity for Children American HospitalAssociation, 2007
Statistics indicate that
health conditions of the
residents of south central
Los Angeles are relatively
poor and facilities to
provide medical care
are insufficient.

CPA/Critical ConditionTCE 1022-07
South Los Angeles Health Equity Scorecard
Annie Park, MSW
Nancy Watson, MSW
Lark Galloway-Gilliam, MPA
December 2008
ATTACHMENT B
Community Health Councils, 2008
Community Health Councils (CHC) is a non-profit, community-based health advocacy, policy and educational organization. Established in 1992, our mission is to improve health and increase access to quality healthcare for uninsured, under-resourced and underserved populations.
Coalition for Health & Justice (CHJ), founded in 2004 to address the growing healthcare crisis in South Los Angeles, is a coalition of diverse leadership throughout South Los Angeles working to ensure access to quality healthcare for underserved residents of South Los Angeles.
This project was made possible with generous funding from
The California Endowment • Robert Wood Johnson Foundation • UCLA Center for Community Partnerships
South Los Angeles H
ealth Equity Scorecard
1
Table of Contents
Executive Summary 3
Introduction 8
Study Design 10
Community Profile 14
Health Status 17
Scorecard Domain 1: Healthcare Environment Resources 21
Healthcare Facilitiesß Healthcare Workforceß Healthcare Financingß Healthcare Coverageß Primary & Preventive Care Access ß Primary & Preventive Care Utilizationß
Scorecard Domain 2: Physical Environment Resources 51
Nutritionß Physical Activityß Public Safetyß Housingß Schoolsß Air & Land Qualityß
Next Steps/Conclusion 75
Acknowledgments 77
Appendices 78Appendix 1: Data Sources, Notes and LimitationsAppendix 2: Scoring MethodologyAppendix 3: Maps and Zip Codes of Study AreasAppendix 4: Table of Community Profile MeasuresAppendix 5: Table of Health Status OutcomesAppendix 6: Bibliography
South Los Angeles H
ealth Equity Scorecard
2
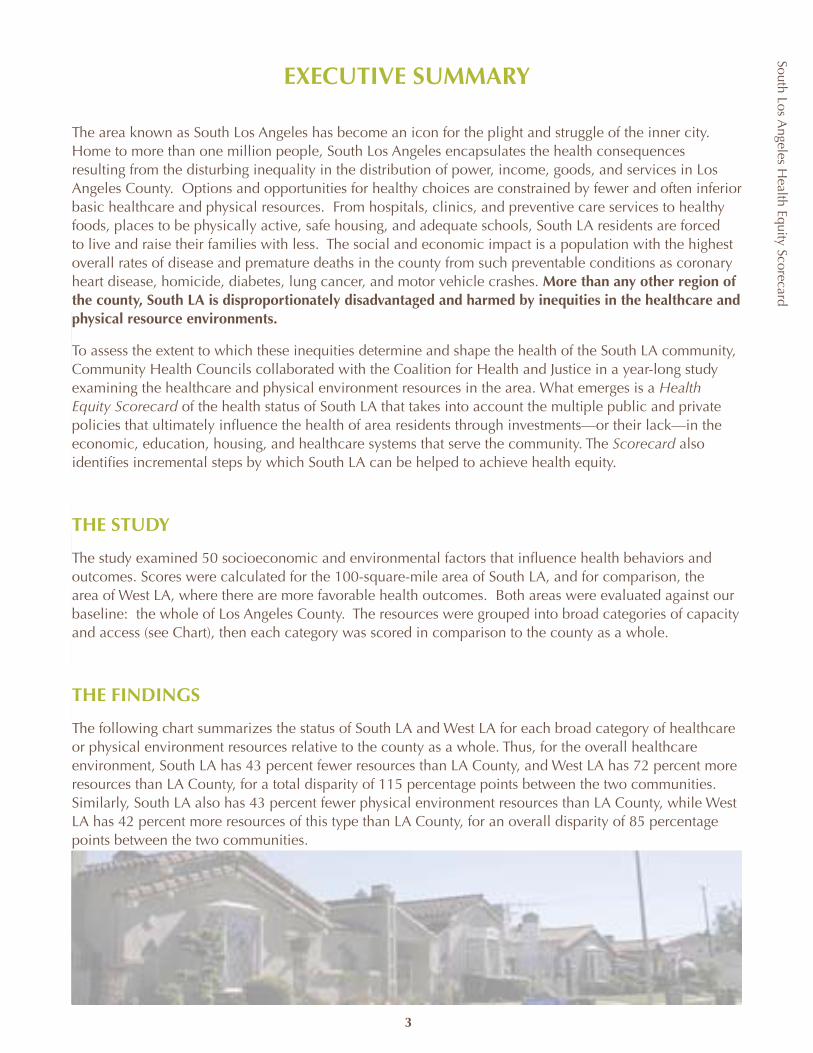
South Los Angeles H
ealth Equity Scorecard
3
EXECUTIVE SUMMARY
The South Los Angeles Health Equity Scorecard is the culmination of a year-long study conducted by Community Health Councils in collaboration with the Coalition for Health and Justice. The Scorecard was developed to:
Assess the extent to which the inequities in the resource environment determine and shape the 1. health of the communityDetermine the degree to which these inequities mirror disparities in health 2. Identify incremental steps to achieve health equity. 3.
The study compiled, calculated, and synthesized 50 socioeconomic and environmental factors that influence health behaviors and outcomes. These factors are categorized and discussed as follows:
SOUTH LA WEST LA
Healthcare Environment Resources
Healthcare Facilities -28% 59%
Healthcare Workforce -76% 182%
Healthcare Financing -65% 22%
Healthcare Coverage -30% 38%
Primary & Preventative Care Access -34% 27%
Primary & Preventative Care Utilization -24% 103%
Physical Environment Resources
Nutrition -76% 104%
Physical Activity Options -55% 24%
Public Safety -17% 7%
Housing -24% 103%
Schools -43% 42%
Air & Land 5% 39%
South LA, an area encompassing nearly 100 square miles and more than one million people, represents some of the greatest assets and most troubling health and socio-economic challenges within Los Angeles and across the country. The data were used to compare and contrast the access, capacity and quality of community, health and economic resources in South Los Angeles against both the overall resource environment of LA County and the contrast area of West Los Angeles with more favorable health outcomes. The data document a disproportionate disparity in access to care, resources, and infrastructure in South LA in comparison to other regions of Los Angeles County. The study shows unequivocally that South LA does not share equally in the overall regional resources, from inadequate access to healthcare to a lack of healthy food options. As a result, the overall population of South LA residents is less healthy and ranks at the top in LA County for rate of preventable disease and premature deaths.
EXECUTIVE SUMMARY
The area known as South Los Angeles has become an icon for the plight and struggle of the inner city. Home to more than one million people, South Los Angeles encapsulates the health consequences resulting from the disturbing inequality in the distribution of power, income, goods, and services in Los Angeles County. Options and opportunities for healthy choices are constrained by fewer and often inferior basic healthcare and physical resources. From hospitals, clinics, and preventive care services to healthy foods, places to be physically active, safe housing, and adequate schools, South LA residents are forced to live and raise their families with less. The social and economic impact is a population with the highest overall rates of disease and premature deaths in the county from such preventable conditions as coronary heart disease, homicide, diabetes, lung cancer, and motor vehicle crashes. More than any other region of the county, South LA is disproportionately disadvantaged and harmed by inequities in the healthcare and physical resource environments.
To assess the extent to which these inequities determine and shape the health of the South LA community, Community Health Councils collaborated with the Coalition for Health and Justice in a year-long study examining the healthcare and physical environment resources in the area. What emerges is a Health Equity Scorecard of the health status of South LA that takes into account the multiple public and private policies that ultimately influence the health of area residents through investments—or their lack—in the economic, education, housing, and healthcare systems that serve the community. The Scorecard also identifies incremental steps by which South LA can be helped to achieve health equity.
THE STUDY
The study examined 50 socioeconomic and environmental factors that influence health behaviors and outcomes. Scores were calculated for the 100-square-mile area of South LA, and for comparison, the area of West LA, where there are more favorable health outcomes. Both areas were evaluated against our baseline: the whole of Los Angeles County. The resources were grouped into broad categories of capacity and access (see Chart), then each category was scored in comparison to the county as a whole.
THE FINDINGS
The following chart summarizes the status of South LA and West LA for each broad category of healthcare or physical environment resources relative to the county as a whole. Thus, for the overall healthcare environment, South LA has 43 percent fewer resources than LA County, and West LA has 72 percent more resources than LA County, for a total disparity of 115 percentage points between the two communities. Similarly, South LA also has 43 percent fewer physical environment resources than LA County, while West LA has 42 percent more resources of this type than LA County, for an overall disparity of 85 percentage points between the two communities.
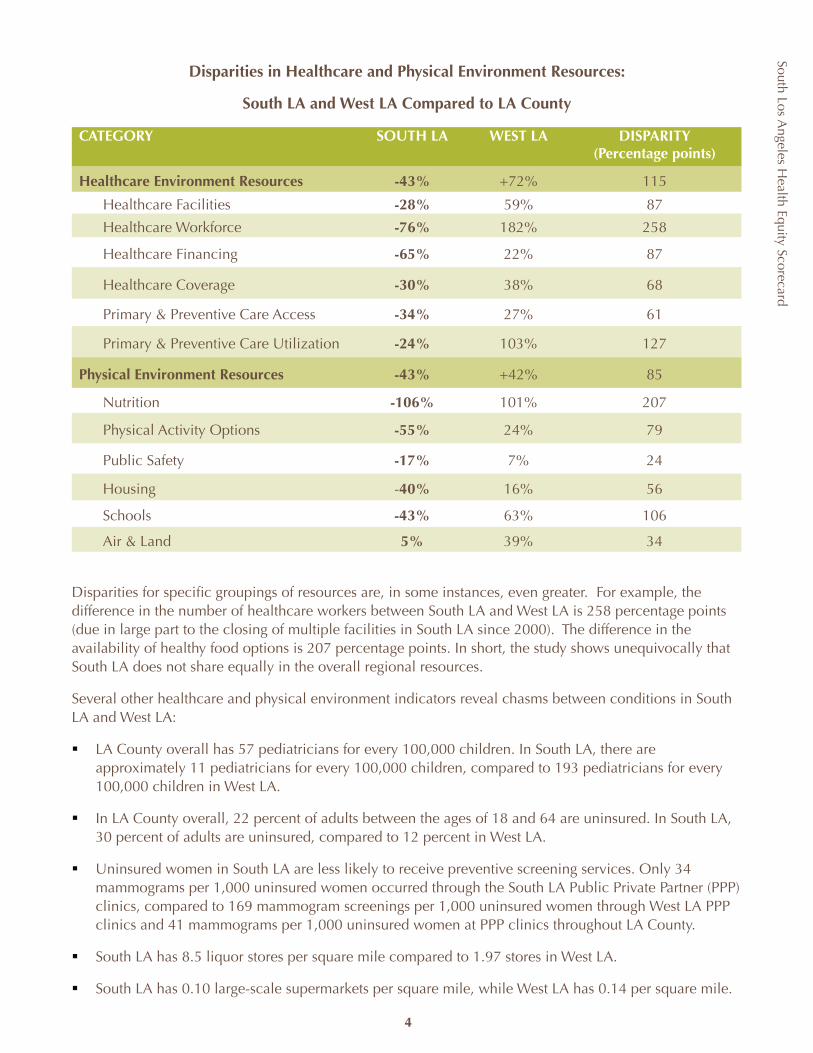
South Los Angeles H
ealth Equity Scorecard
4
The data in and of themselves do not add up to a groundbreaking discovery. They represent a first attempt to link a comprehensive overview of the community’s health with immediate policy opportunities and tools to eliminate inequities in the resource environment and ultimately banish disparities in health. What emerges from the Scorecard results is the degree to which disparities exist. Through the Scorecard, we seek to provide a framework and galvanize support across public and private sectors in Los Angeles County for policy change and community reinvestment for health equity..
KEY FINDINGS
1. The Scorecard shows significant inequities in the distribution, capacity and quality of resources for South LA in comparison to Los Angeles County in all areas. West LA, on the other hand, scored far better than LA County, demonstrating the potential opportunities and benefits but also widening the equity gap for South LA.
2. The overall Healthcare Environment Resources has a disparity of 115 percentage points between South LA (43% fewer resources than LA County overall) and West LA (72% more resources than LA County overall).
3. The combined Physical Environment Resources has a disparity of 85 percentage points between South LA and West LA. South LA has 43% fewer resources than LA County overall, while West LA has 42% more resources than LA County overall.
4. Within each domain, several indicators revealed chasms between South LA and West LA scores:
ß In South LA, there are approximately 11 pediatricians for every 100,000 children. In West LA, there are 193 pediatricians for every 100,000 children. LA County overall has 57 pediatricians for every 100,000 children.
ß Uninsured women in South LA are less likely to receive preventive screening services. Only 34 mammograms per 1,000 uninsured women occurred through the South LA PPP clinics, compared to169 mammogram screenings per 1,000 uninsured women through West LA PPP clinics and 41 mammograms throughout LA County.
ß South LA has over four times as many uninsured people as West LA. 30% of adults between the ages of 18 and 64 are uninsured in South LA, compared to 12% in West LA and 22% in LA County overall.
ß South LA has approximately twice the number of liquor stores and only half as many large-scale grocery stores as West LA.
ß 37% of South LA households are overcrowded compared to fewer than 8% in West LA.
ß 176 of South LA’s schools are classified as insufficiently staffed, resourced, and without a clean, safe, and functional learning environment. Only eight schools in West LA did not meet these standards.
Disparities in Healthcare and Physical Environment Resources:
South LA and West LA Compared to LA County
CATEGORY SOUTH LA WEST LA DISPARITY(Percentage points)
Healthcare Environment Resources -43% +72% 115
Healthcare Facilities -28% 59% 87
Healthcare Workforce -76% 182% 258
Healthcare Financing -65% 22% 87
Healthcare Coverage -30% 38% 68
Primary & Preventive Care Access -34% 27% 61
Primary & Preventive Care Utilization -24% 103% 127
Physical Environment Resources -43% +42% 85
Nutrition -106% 101% 207
Physical Activity Options -55% 24% 79
Public Safety -17% 7% 24
Housing -40% 16% 56
Schools -43% 63% 106
Air & Land 5% 39% 34
Disparities for specific groupings of resources are, in some instances, even greater. For example, the difference in the number of healthcare workers between South LA and West LA is 258 percentage points (due in large part to the closing of multiple facilities in South LA since 2000). The difference in the availability of healthy food options is 207 percentage points. In short, the study shows unequivocally that South LA does not share equally in the overall regional resources.
Several other healthcare and physical environment indicators reveal chasms between conditions in South LA and West LA:
LA County overall has 57 pediatricians for every 100,000 children. In South LA, there are ß approximately 11 pediatricians for every 100,000 children, compared to 193 pediatricians for every 100,000 children in West LA.
In LA County overall, 22 percent of adults between the ages of 18 and 64 are uninsured. In South LA, ß 30 percent of adults are uninsured, compared to 12 percent in West LA.
Uninsured women in South LA are less likely to receive preventive screening services. Only 34 ß mammograms per 1,000 uninsured women occurred through the South LA Public Private Partner (PPP) clinics, compared to 169 mammogram screenings per 1,000 uninsured women through West LA PPP clinics and 41 mammograms per 1,000 uninsured women at PPP clinics throughout LA County.
South LA has 8.5 liquor stores per square mile compared to 1.97 stores in West LA.ß
South LA has 0.10 large-scale supermarkets per square mile, while West LA has 0.14 per square mile.ß
South Los Angeles H
ealth Equity Scorecard
5
RECOMMENDATIONS AND CONCLUSIONS
The results of the Scorecard are conclusive: The opportunities and resources for South LA residents to make healthy choices or obtain health services are far more limited than for residents in other parts of the county or in communities such as West LA that benefit from the best health outcomes. The Scorecard demonstrates the clear need for coordinated leadership and a comprehensive agenda for policy change. A number of coalitions and organizations are already hard at work addressing these indicators. The Scorecard is intended to guide the agenda for South LA. Immediate recommendations include:
Healthcare Environment Resources1. Reopen LA County Martin Luther King Jr Medical Center and reestablish the facility as a teaching
hospital along with restoration of county outpatient services levels.
2. Preserve the level of funding previously allocated for MLK Medical Center for South LA healthcare providers through the extension of SB 474 South LA Preservation fund.
3. Increase primary and urgent care services in the South LA community clinic network through equitable Public Private Partnership funding from the county and an infusion of capital funding.
4. Streamline enrollment systems and financial eligibility categories to reduce enrollment barriers for public programs.
5. Strengthen systems for prevention, treatment, and management of chronic disease through higher provider reimbursement for delivery of continuous, coordinated quality disease management care.
Physical Environment Resources1. Incorporate health into local government planning including the general plan, redevelopment, and
transportation planning.
2. Provide block grants, targeted tax credits, redevelopment funding, and other financing vehicles to business owners to transform liquor and convenience stores and develop new retail supermarkets tied to healthy food products.
3. Reduce the number of Williams schools in the next 3 years by 33% through staff training and targeted policy changes.
4. Establish a citywide plan for the equitable geographic distribution of affordable housing through mixed-use neighborhoods particularly when rebuilding public housing.
5. Enhance the role and authority of local health departments to regulate and enforce the quality and condition of food in local markets.
In South LA, 37 percent of households are overcrowded compared to fewer than 8 percent of ß households in West LA.
In South LA, 64 percent of schools are classified as insufficiently staffed, resourced, and without a ß clean, safe, and functional learning environment according to Williams settlement standards. Only 8 percent of West LA schools did not meet these standards.
CONCLUSIONS
The data in and of themselves do not add up to a groundbreaking discovery: It has long been clear that residents in the poorer part of the county have worse health than those in the wealthier sections. However, the findings of this study point to the interrelationship among many factors that contribute to health, high among them the depressed socioeconomic status of residents of South LA. Similar to health outcomes, the challenges and disparities in the socioeconomic conditions found in South LA are not simply a result of individual behavior but rather an outgrowth of racial segregation and public and private policies and systems that concentrate poverty.
To bring health equity to all residents of Los Angeles County will take coordinated leadership and a comprehensive agenda for policy change that reinvests economic, political and social capital in underserved communities to achieve parity. Such an agenda can go a long way toward reversing the intentional or unintentional absence of positive public, economic, and institutional policies that isolate whole segments of the population from access and opportunity.
The compilation of data presented in the Health Equity Scorecard is the first to link a comprehensive overview of the community’s health with immediate policy opportunities to eliminate inequities in the resource environment and ultimately banish health disparities. What emerges from the Scorecard findings is the degree to which disparities exist. These findings provide a framework from which to galvanize support across public and private sectors in Los Angeles County for policy change and community reinvestment for health equity.
Inequality in the health of South LA is a “condition” that goes beyond the limits of any single city and necessitates collaboration and cooperation at every level of government and across jurisdictions. The Scorecard is designed to help break through artificial policy silos and the political gridlock that has prevented the revitalization of South LA.
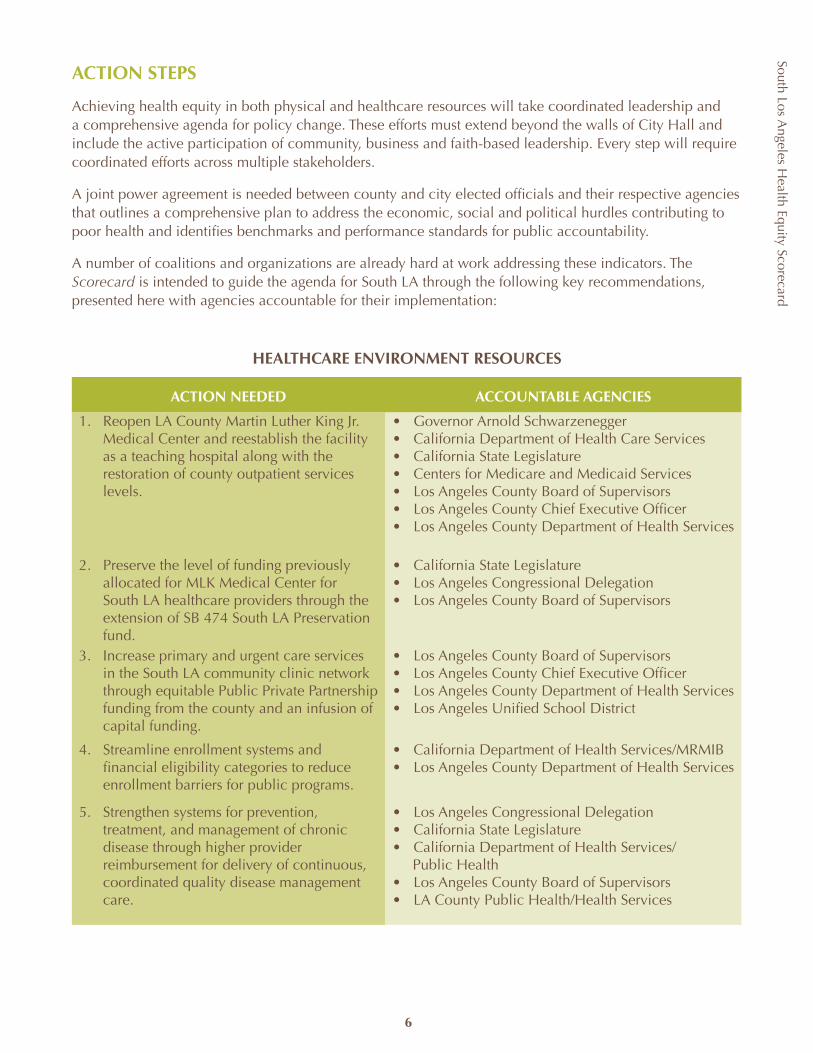
South Los Angeles H
ealth Equity Scorecard
6
ACTION STEPS
Achieving health equity in both physical and healthcare resources will take coordinated leadership and a comprehensive agenda for policy change. These efforts must extend beyond the walls of City Hall and include the active participation of community, business and faith-based leadership. Every step will require coordinated efforts across multiple stakeholders.
A joint power agreement is needed between county and city elected officials and their respective agencies that outlines a comprehensive plan to address the economic, social and political hurdles contributing to poor health and identifies benchmarks and performance standards for public accountability.
A number of coalitions and organizations are already hard at work addressing these indicators. The Scorecard is intended to guide the agenda for South LA through the following key recommendations, presented here with agencies accountable for their implementation:
HEALTHCARE ENVIRONMENT RESOURCES
ACTION NEEDED ACCOUNTABLE AGENCIES
1. Reopen LA County Martin Luther King Jr. Medical Center and reestablish the facility as a teaching hospital along with the restoration of county outpatient services levels.
• Governor Arnold Schwarzenegger• California Department of Health Care Services• California State Legislature• Centers for Medicare and Medicaid Services • Los Angeles County Board of Supervisors• Los Angeles County Chief Executive Officer• Los Angeles County Department of Health Services
2. Preserve the level of funding previously allocated for MLK Medical Center for South LA healthcare providers through the extension of SB 474 South LA Preservation fund.
• California State Legislature • Los Angeles Congressional Delegation• Los Angeles County Board of Supervisors
3. Increase primary and urgent care services in the South LA community clinic network through equitable Public Private Partnership funding from the county and an infusion of capital funding.
• Los Angeles County Board of Supervisors• Los Angeles County Chief Executive Officer• Los Angeles County Department of Health Services• Los Angeles Unified School District
4. Streamline enrollment systems and financial eligibility categories to reduce enrollment barriers for public programs.
• California Department of Health Services/MRMIB• Los Angeles County Department of Health Services
5. Strengthen systems for prevention, treatment, and management of chronic disease through higher provider reimbursement for delivery of continuous, coordinated quality disease management care.
• Los Angeles Congressional Delegation• California State Legislature• California Department of Health Services/ Public Health• Los Angeles County Board of Supervisors• LA County Public Health/Health Services
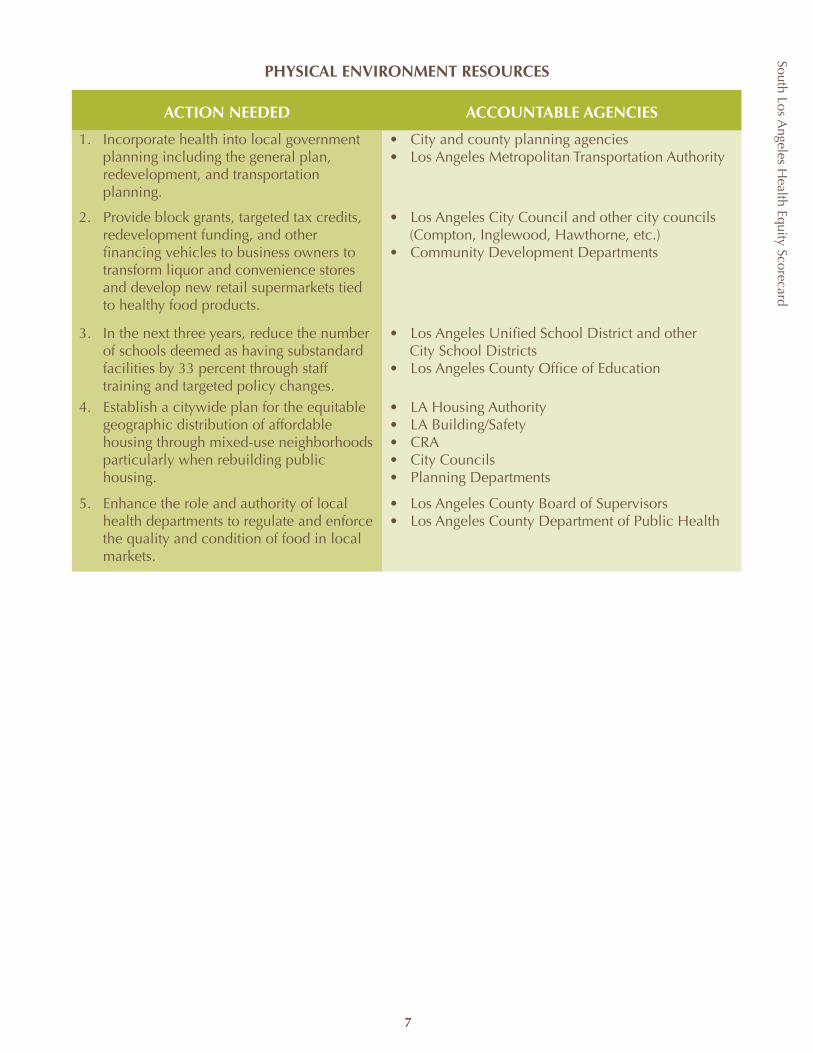
South Los Angeles H
ealth Equity Scorecard
7
PHYSICAL ENVIRONMENT RESOURCES
ACTION NEEDED ACCOUNTABLE AGENCIES
1. Incorporate health into local government planning including the general plan, redevelopment, and transportation planning.
• City and county planning agencies• Los Angeles Metropolitan Transportation Authority
2. Provide block grants, targeted tax credits, redevelopment funding, and other financing vehicles to business owners to transform liquor and convenience stores and develop new retail supermarkets tied to healthy food products.
• Los Angeles City Council and other city councils (Compton, Inglewood, Hawthorne, etc.)• Community Development Departments
3. In the next three years, reduce the number of schools deemed as having substandard facilities by 33 percent through staff training and targeted policy changes.
• Los Angeles Unified School District and other City School Districts• Los Angeles County Office of Education
4. Establish a citywide plan for the equitable geographic distribution of affordable housing through mixed-use neighborhoods particularly when rebuilding public housing.
• LA Housing Authority• LA Building/Safety• CRA• City Councils• Planning Departments
5. Enhance the role and authority of local health departments to regulate and enforce the quality and condition of food in local markets.
• Los Angeles County Board of Supervisors• Los Angeles County Department of Public Health
South Los Angeles H
ealth Equity ScorecardSouth Los A
ngeles Health Equity Scorecard
INTRODUCTION
South Los Angeles is a series of contiguous communities with a shared history and the highest morbidity and mortality rates in Los Angeles County. Community Health Councils in collaboration with the Coalition for Health and Justice examined the intersection between the health of the community and the distribution, capacity and quality of basic resources in Los Angeles County. The result is the South Los Angeles Health Equity Scorecard. The Scorecard uses the “Multi-Determinants of Health” model and goes beyond the articulation of the “healthcare crisis” and traditional categorical boundaries of public health to study the health status of the community in the context of the built environment and social and economic policies. A recent report by the World Health Organization Commission on the Social Determinants of Health concluded that inequities in health are caused by the unequal distribution of power, income, goods, and services. The Scorecard tests this conclusion by compiling data from a wide range of sectors and resources to (1) assess to what extent inequities exist in the resource environment and (2) determine to what degree they mirror disparities in health. The Scorecard shifts the focus and analysis from individual behavior to the larger socio-economic and political responsibilities we share as a society. Each section concludes with a summary of the incremental steps that can be taken towards a more comprehensive solution.
The Scorecard synthesizes 50 socioeconomic and environmental factors that influence health behaviors and outcomes and underlie the most disparate health outcomes in South LA. Comparisons and contrasts are made between the levels of access, capacity and quality of community, health, and economic resources in South Los Angeles and the overall resource environments of LA County and West Los Angeles, where we find more favorable health outcomes. The Scorecard is designed to help break through artificial policy silos and the intellectual, ethical, and political gridlock that has prevented the revitalization of South LA, even following the 1992 civil unrest. Through the Scorecard, we seek to galvanize both public and private resources to drive community reinvestment. The Scorecard identifies many immediate policy opportunities and tools that can be used to eliminate inequities in the resource environment and ultimately disparities in health.
We begin by providing a profile of the community using demographics and socioeconomic indicators and follow this with an overview of the health outcomes in South LA. The Scorecard itself is divided into two domains: Healthcare Environment Resources and the Physical Environment Resources. Each domain is scored according to six sub-areas of study. The Healthcare Environment Resources domain examines the following indicators:
Healthcare Facilities – healthcare facilities including hospital and ER beds, community clinics, HIV/mental health providers, and pharmaciesHealthcare Workforce – doctors, specialists, dentistsHealthcare Financing – public funding and costs of care Healthcare Coverage – the uninsured populationPrimary & Preventive Care Access – regular source of care, difficulties in accessing carePrimary & Preventive Care Utilization – utilization of recommended services, such as cancer screenings, regular doctor and dentist visits.
The Physical Environment Resources domain examines:Nutrition – grocery stores, farmers’ marketsPhysical Activity – parks and green space, bicycle lanesPublic Safety – crime rates and traffic accidentsHousing – age and structural safety of housing unitsSchools – proximity to freeways and structural safetyAir & Land Quality – toxic waste sites.
8
South Los Angeles H
ealth Equity Scorecard
9
As this is the first attempt at a community Scorecard of this size and scale, many indicators were left out due to constraints of time, resources, and data. We take these not as faults, but as lessons learned and opportunities to improve the next report. Each of the scored domain sub-sections concludes with policy recommendations and action steps to pursue until the next publication of the Scorecard. It is our hope that the Scorecard will be used as a tool and catalyst for education and organizing within the community and across interest areas.
BACKGROUND
Faced with the downward spiral and impending closure of services at Los Angeles County Martin Luther King-Charles Drew Medical Center, a broad cross section of stakeholders in South Los Angeles formed the Coalition of Health and Justice (CHJ). The South Los Angeles Health Equity Scorecard grew out of the partnership between Community Health Councils and CHJ to improve the overall public health of South LA by strengthening public policy, accountability, community participation and partnerships with government and the private sector. Modeled after the idea of using community-based participatory research as a strong and effective tool for improving population health, the project relied heavily on an Advisory Committee of advocates, researchers, public health workers, and healthcare experts to guide its efforts. Formed in February 2007, the Advisory Committee prioritized and selected indicators, recommended data sources, advised on community needs not identified through traditional means, provided input and reviewed content.
Community Health Councils led the research effort through the collection and analysis of data and the preparation of this report. After the work of the Advisory Committee, the data collected, the domain scores, and the accompanying research were presented to a broader community of health advocates, experts, researchers, policymakers, and public health officials at the Scorecard Policy Summit held in June 2008. Over 100 attendees at the Summit were divided into workgroups and asked to provide policy recommendations around the data and indicators most relevant to their knowledge and respective organizations’ missions. The policy recommendations included in the Scorecard reflect the contributions of the Summit participants, the CHJ, and other experts for an advocacy agenda for policymakers and community advocates to improve the health of South Los Angeles.
South Los Angeles is a series of contiguous communities with a shared history and the highest morbidity and mortality rates in Los Angeles County ...The Scorecard shifts the focus and analysis from individual behavior to the larger socio-economic and political responsibilities we share as a society.
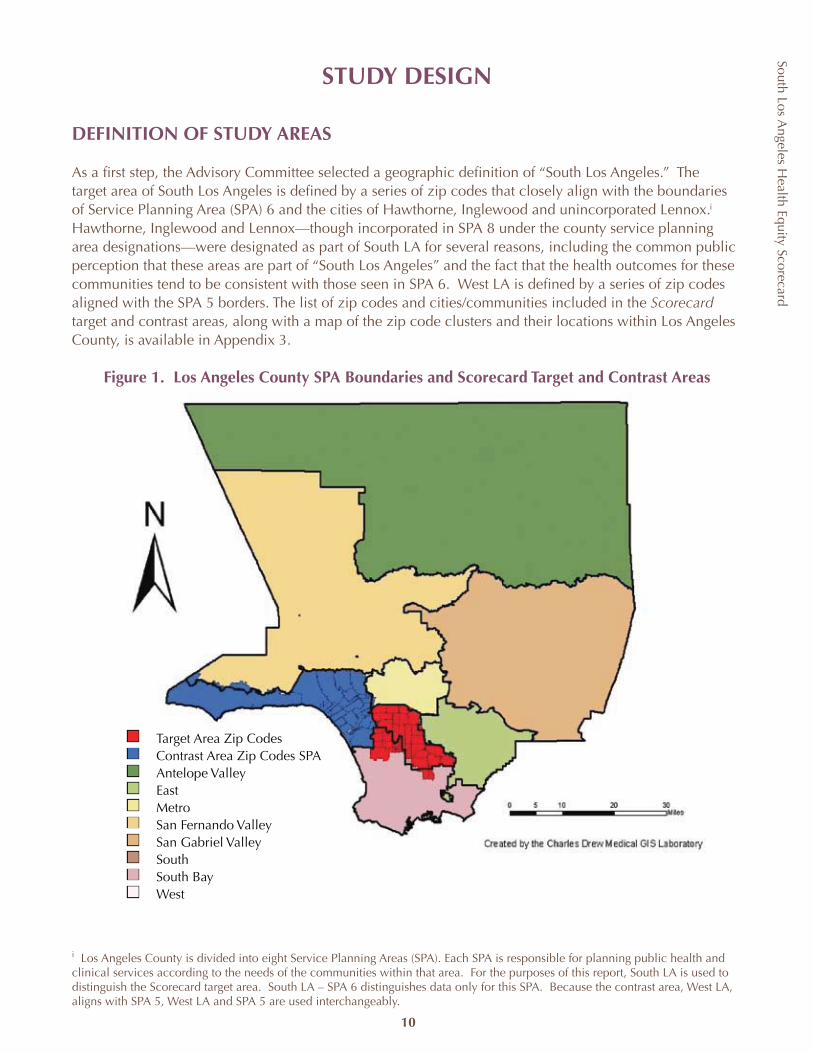
South Los Angeles H
ealth Equity Scorecard
STUDY DESIGN
DEFINITION OF STUDY AREAS
As a first step, the Advisory Committee selected a geographic definition of “South Los Angeles.” The target area of South Los Angeles is defined by a series of zip codes that closely align with the boundaries of Service Planning Area (SPA) 6 and the cities of Hawthorne, Inglewood and unincorporated Lennox. Hawthorne, Inglewood and Lennox—though incorporated in SPA 8 under the county service planning area designations—were designated as part of South LA for several reasons, including the common public perception that these areas are part of “South Los Angeles” and the fact that the health outcomes for these communities tend to be consistent with those seen in SPA 6. West LA is defined by a series of zip codes aligned with the SPA 5 borders. The list of zip codes and cities/communities included in the Scorecard target and contrast areas, along with a map of the zip code clusters and their locations within Los Angeles County, is available in Appendix 3.
Figure 1. Los Angeles County SPA Boundaries and Scorecard Target and Contrast Areas
i Los Angeles County is divided into eight Service Planning Areas (SPA). Each SPA is responsible for planning public health and clinical services according to the needs of the communities within that area. For the purposes of this report, South LA is used to distinguish the Scorecard target area. South LA – SPA 6 distinguishes data only for this SPA. Because the contrast area, West LA, aligns with SPA 5, West LA and SPA 5 are used interchangeably.
i
10
n Target Area Zip Codesn Contrast Area Zip Codes SPAn Antelope Valleyn Eastn Metron San Fernando Valleyn San Gabriel Valleyn Southn South Bayn West
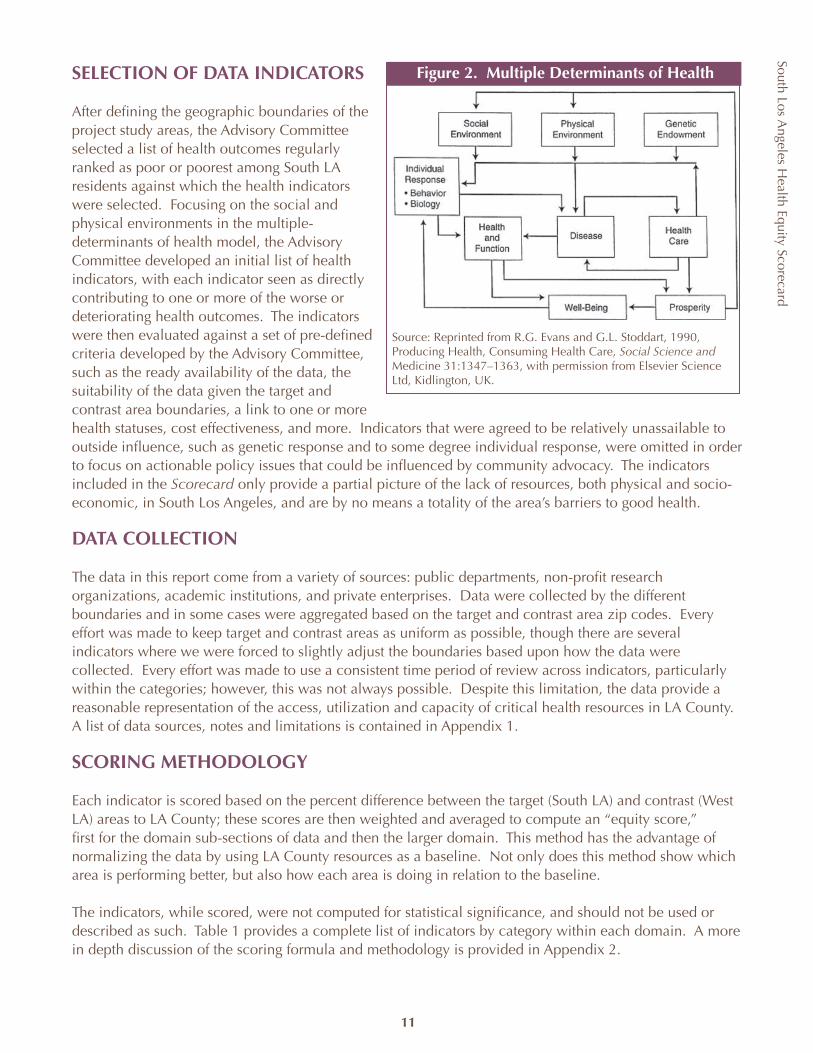
South Los Angeles H
ealth Equity Scorecard
11
SELECTION OF DATA INDICATORS
After defining the geographic boundaries of the project study areas, the Advisory Committee selected a list of health outcomes regularly ranked as poor or poorest among South LA residents against which the health indicators were selected. Focusing on the social and physical environments in the multiple-determinants of health model, the Advisory Committee developed an initial list of health indicators, with each indicator seen as directly contributing to one or more of the worse or deteriorating health outcomes. The indicators were then evaluated against a set of pre-defined criteria developed by the Advisory Committee, such as the ready availability of the data, the suitability of the data given the target and contrast area boundaries, a link to one or more health statuses, cost effectiveness, and more. Indicators that were agreed to be relatively unassailable to outside influence, such as genetic response and to some degree individual response, were omitted in order to focus on actionable policy issues that could be influenced by community advocacy. The indicators included in the Scorecard only provide a partial picture of the lack of resources, both physical and socio-economic, in South Los Angeles, and are by no means a totality of the area’s barriers to good health.
DATA COLLECTION
The data in this report come from a variety of sources: public departments, non-profit research organizations, academic institutions, and private enterprises. Data were collected by the different boundaries and in some cases were aggregated based on the target and contrast area zip codes. Every effort was made to keep target and contrast areas as uniform as possible, though there are several indicators where we were forced to slightly adjust the boundaries based upon how the data were collected. Every effort was made to use a consistent time period of review across indicators, particularly within the categories; however, this was not always possible. Despite this limitation, the data provide a reasonable representation of the access, utilization and capacity of critical health resources in LA County. A list of data sources, notes and limitations is contained in Appendix 1.
SCORING METHODOLOGY
Each indicator is scored based on the percent difference between the target (South LA) and contrast (West LA) areas to LA County; these scores are then weighted and averaged to compute an “equity score,” first for the domain sub-sections of data and then the larger domain. This method has the advantage of normalizing the data by using LA County resources as a baseline. Not only does this method show which area is performing better, but also how each area is doing in relation to the baseline.
The indicators, while scored, were not computed for statistical significance, and should not be used or described as such. Table 1 provides a complete list of indicators by category within each domain. A more in depth discussion of the scoring formula and methodology is provided in Appendix 2.
Source: Reprinted from R.G. Evans and G.L. Stoddart, 1990, Producing Health, Consuming Health Care, Social Science and Medicine 31:1347–1363, with permission from Elsevier Science Ltd, Kidlington, UK.
Figure 2. Multiple Determinants of Health
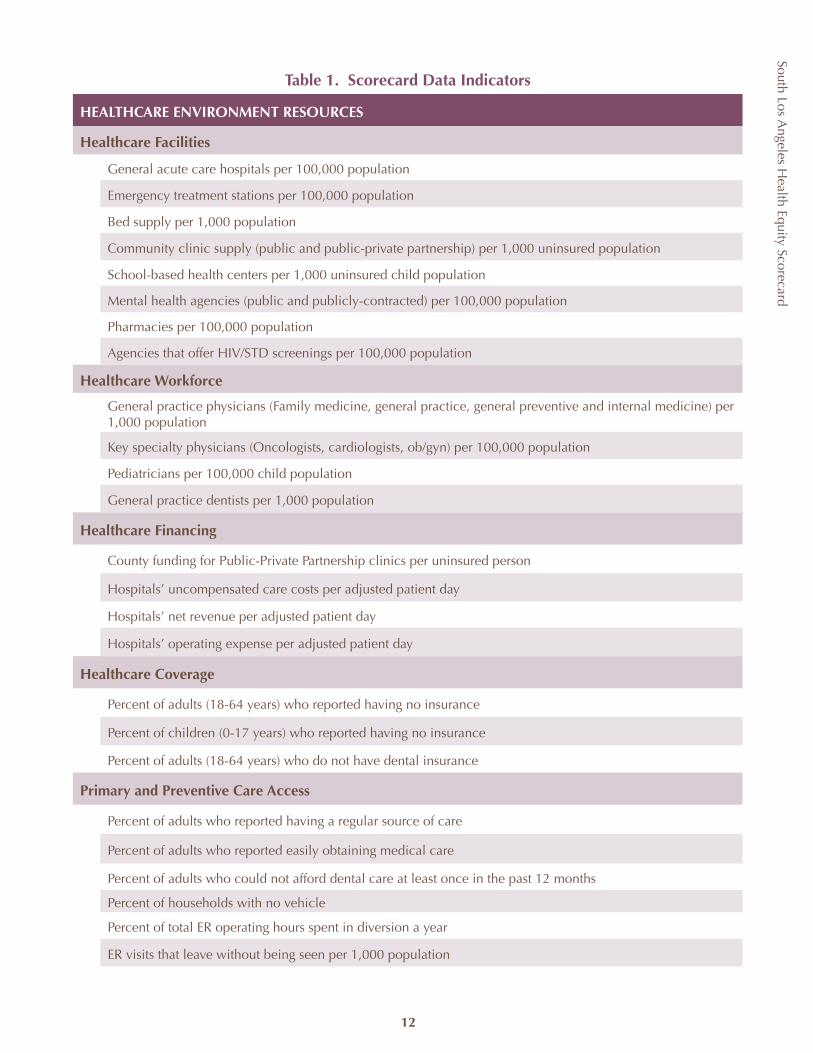
South Los Angeles H
ealth Equity Scorecard
12
Table 1. Scorecard Data Indicators
HEALTHCARE ENVIRONMENT RESOURCES
Healthcare Facilities
General acute care hospitals per 100,000 population
Emergency treatment stations per 100,000 population
Bed supply per 1,000 population
Community clinic supply (public and public-private partnership) per 1,000 uninsured population
School-based health centers per 1,000 uninsured child population
Mental health agencies (public and publicly-contracted) per 100,000 population
Pharmacies per 100,000 population
Agencies that offer HIV/STD screenings per 100,000 population
Healthcare Workforce
General practice physicians (Family medicine, general practice, general preventive and internal medicine) per 1,000 population
Key specialty physicians (Oncologists, cardiologists, ob/gyn) per 100,000 population
Pediatricians per 100,000 child population
General practice dentists per 1,000 population
Healthcare Financing
County funding for Public-Private Partnership clinics per uninsured person
Hospitals’ uncompensated care costs per adjusted patient day
Hospitals’ net revenue per adjusted patient day
Hospitals’ operating expense per adjusted patient day
Healthcare Coverage
Percent of adults (18-64 years) who reported having no insurance
Percent of children (0-17 years) who reported having no insurance
Percent of adults (18-64 years) who do not have dental insurance
Primary and Preventive Care Access
Percent of adults who reported having a regular source of care
Percent of adults who reported easily obtaining medical care
Percent of adults who could not afford dental care at least once in the past 12 months
Percent of households with no vehicle
Percent of total ER operating hours spent in diversion a year
ER visits that leave without being seen per 1,000 population
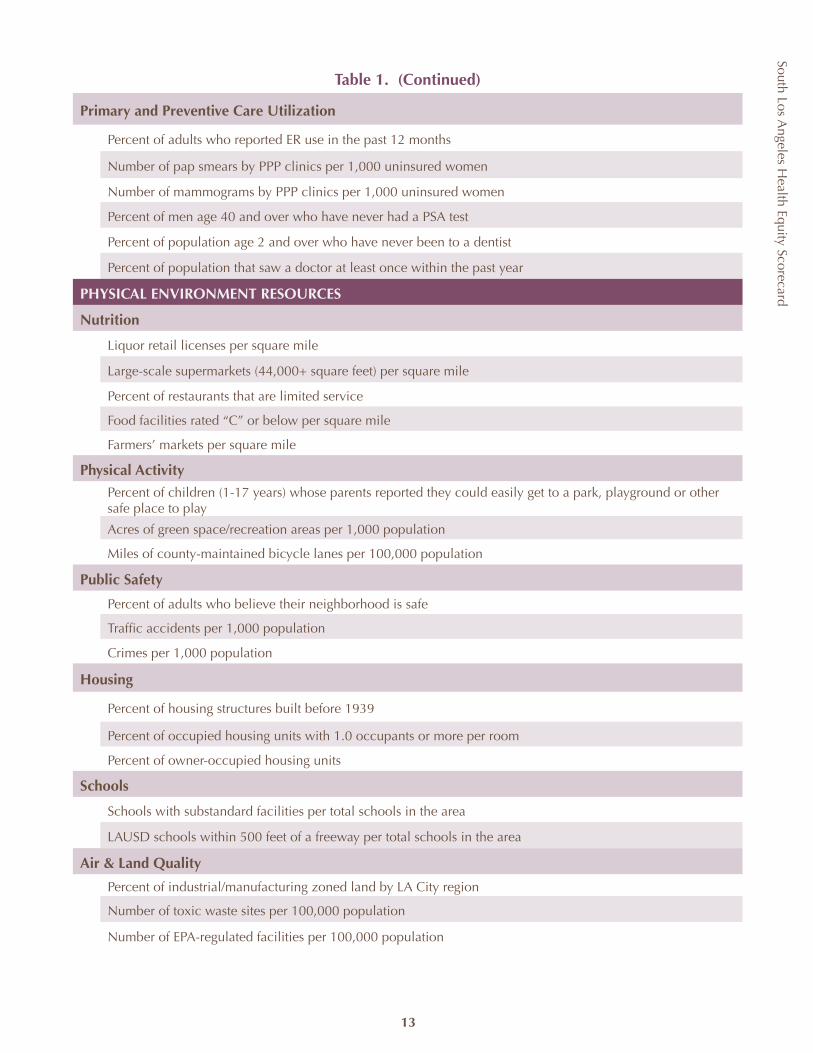
South Los Angeles H
ealth Equity Scorecard
13
Table 1. (Continued)
Primary and Preventive Care Utilization
Percent of adults who reported ER use in the past 12 months
Number of pap smears by PPP clinics per 1,000 uninsured women
Number of mammograms by PPP clinics per 1,000 uninsured women
Percent of men age 40 and over who have never had a PSA test
Percent of population age 2 and over who have never been to a dentist
Percent of population that saw a doctor at least once within the past year
PHYSICAL ENVIRONMENT RESOURCES
Nutrition
Liquor retail licenses per square mile
Large-scale supermarkets (44,000+ square feet) per square mile
Percent of restaurants that are limited service
Food facilities rated “C” or below per square mile
Farmers’ markets per square mile
Physical Activity
Percent of children (1-17 years) whose parents reported they could easily get to a park, playground or other safe place to play
Acres of green space/recreation areas per 1,000 population
Miles of county-maintained bicycle lanes per 100,000 population
Public Safety
Percent of adults who believe their neighborhood is safe
Traffic accidents per 1,000 population
Crimes per 1,000 population
Housing
Percent of housing structures built before 1939
Percent of occupied housing units with 1.0 occupants or more per room
Percent of owner-occupied housing units
Schools
Schools with substandard facilities per total schools in the area
LAUSD schools within 500 feet of a freeway per total schools in the area
Air & Land Quality
Percent of industrial/manufacturing zoned land by LA City region
Number of toxic waste sites per 100,000 population
Number of EPA-regulated facilities per 100,000 population
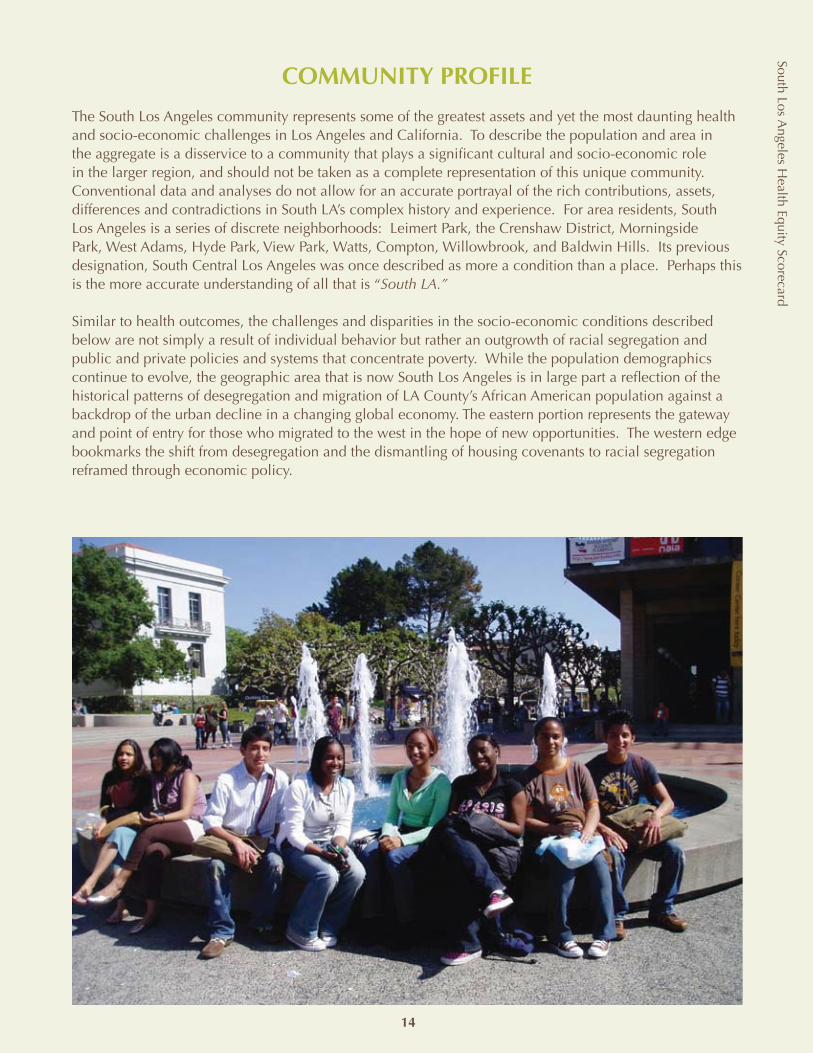
COMMUNITY PROFILE
The South Los Angeles community represents some of the greatest assets and yet the most daunting health and socio-economic challenges in Los Angeles and California. To describe the population and area in the aggregate is a disservice to a community that plays a significant cultural and socio-economic role in the larger region, and should not be taken as a complete representation of this unique community. Conventional data and analyses do not allow for an accurate portrayal of the rich contributions, assets, differences and contradictions in South LA’s complex history and experience. For area residents, South Los Angeles is a series of discrete neighborhoods: Leimert Park, the Crenshaw District, Morningside Park, West Adams, Hyde Park, View Park, Watts, Compton, Willowbrook, and Baldwin Hills. Its previous designation, South Central Los Angeles was once described as more a condition than a place. Perhaps this is the more accurate understanding of all that is “South LA.”
Similar to health outcomes, the challenges and disparities in the socio-economic conditions described below are not simply a result of individual behavior but rather an outgrowth of racial segregation and public and private policies and systems that concentrate poverty. While the population demographics continue to evolve, the geographic area that is now South Los Angeles is in large part a reflection of the historical patterns of desegregation and migration of LA County’s African American population against a backdrop of the urban decline in a changing global economy. The eastern portion represents the gateway and point of entry for those who migrated to the west in the hope of new opportunities. The western edge bookmarks the shift from desegregation and the dismantling of housing covenants to racial segregation reframed through economic policy.
South Los Angeles H
ealth Equity Scorecard
14
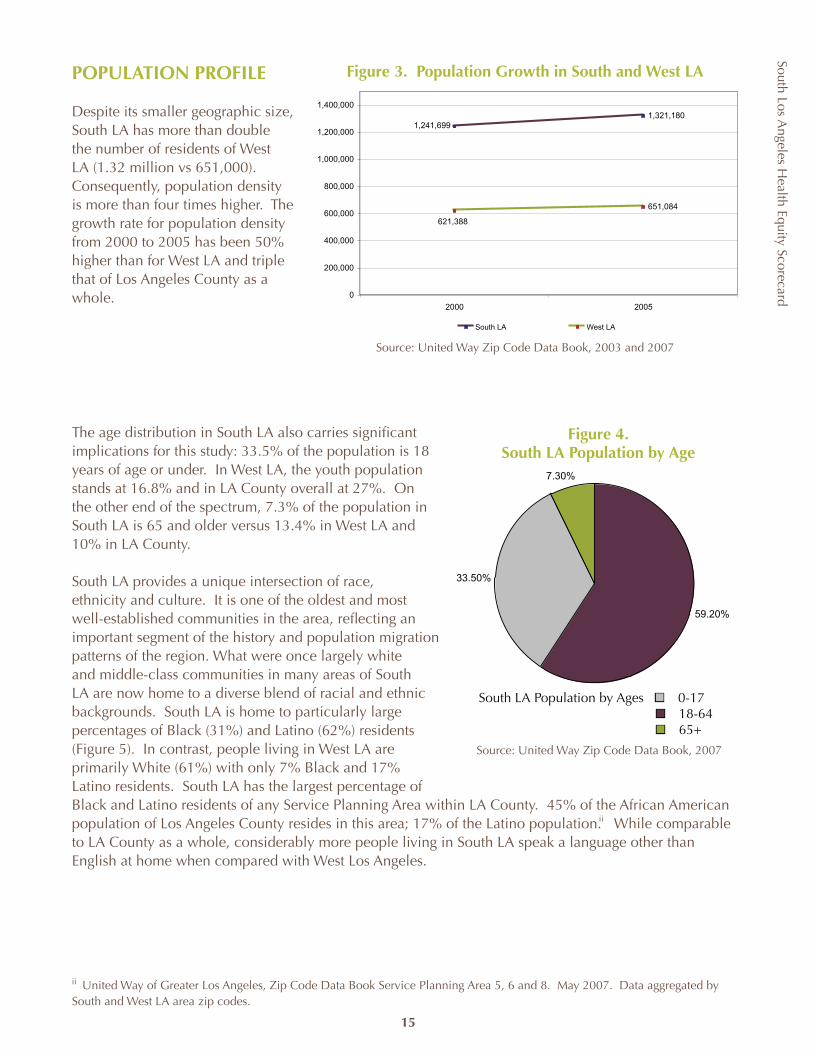
South Los Angeles H
ealth Equity Scorecard
15
POPULATION PROFILE
Despite its smaller geographic size, South LA has more than double the number of residents of West LA (1.32 million vs 651,000). Consequently, population density is more than four times higher. The growth rate for population density from 2000 to 2005 has been 50% higher than for West LA and triple that of Los Angeles County as a whole.
The age distribution in South LA also carries significant implications for this study: 33.5% of the population is 18 years of age or under. In West LA, the youth population stands at 16.8% and in LA County overall at 27%. On the other end of the spectrum, 7.3% of the population in South LA is 65 and older versus 13.4% in West LA and 10% in LA County.
South LA provides a unique intersection of race, ethnicity and culture. It is one of the oldest and most well-established communities in the area, reflecting an important segment of the history and population migration patterns of the region. What were once largely white and middle-class communities in many areas of South LA are now home to a diverse blend of racial and ethnic backgrounds. South LA is home to particularly large percentages of Black (31%) and Latino (62%) residents (Figure 5). In contrast, people living in West LA are primarily White (61%) with only 7% Black and 17% Latino residents. South LA has the largest percentage of Black and Latino residents of any Service Planning Area within LA County. 45% of the African American population of Los Angeles County resides in this area; 17% of the Latino population. While comparable to LA County as a whole, considerably more people living in South LA speak a language other than English at home when compared with West Los Angeles.
ii United Way of Greater Los Angeles, Zip Code Data Book Service Planning Area 5, 6 and 8. May 2007. Data aggregated by South and West LA area zip codes.
ii
59.20%
33.50%
7.30%
South LA Population by Age 0-17 18-64 65+
Figure 4. South LA Population by Age
South LA Population by Ages n 0-17 n 18-64 n 65+
Source: United Way Zip Code Data Book, 2007
1,321,180
651,084
1,241,699
621,388
0
200,000
400,000
600,000
800,000
1,000,000
1,200,000
1,400,000
2000 2005
South LA West LA
Figure 3. Population Growth in South and West LA
Source: United Way Zip Code Data Book, 2003 and 2007
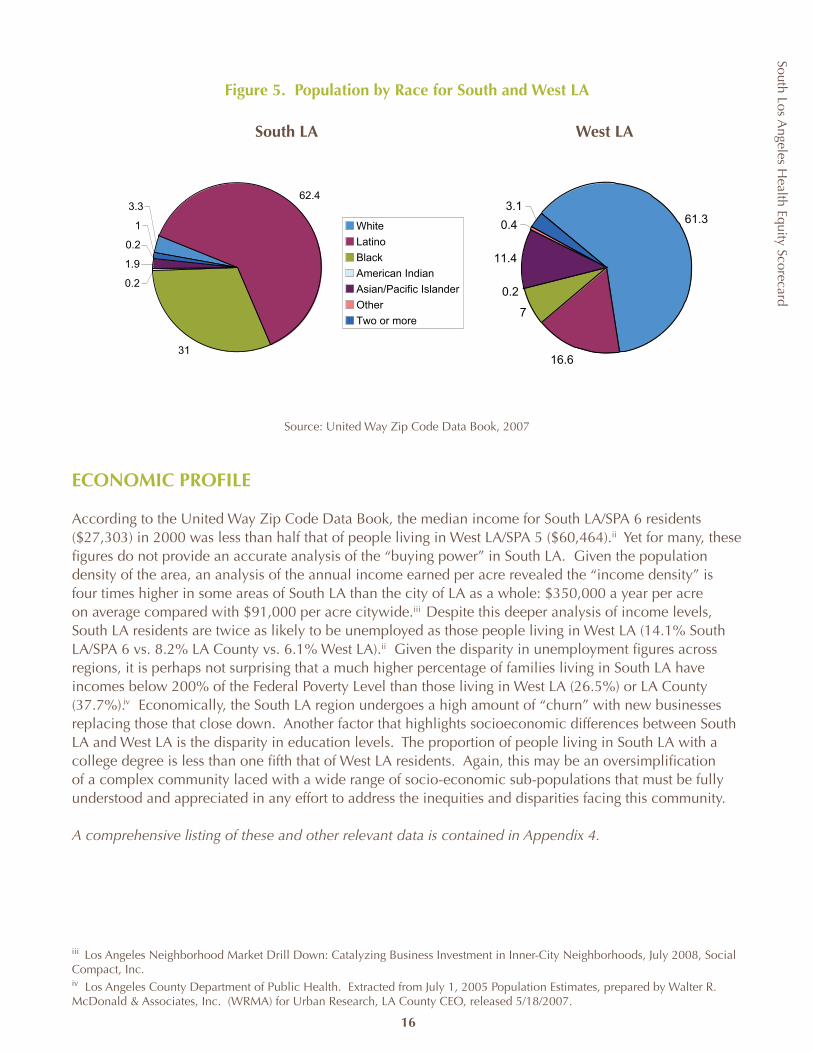
South Los Angeles H
ealth Equity Scorecard
16
Figure 5. Population by Race for South and West LA
Source: United Way Zip Code Data Book, 2007
ECONOMIC PROFILE
According to the United Way Zip Code Data Book, the median income for South LA/SPA 6 residents ($27,303) in 2000 was less than half that of people living in West LA/SPA 5 ($60,464).ii Yet for many, these figures do not provide an accurate analysis of the “buying power” in South LA. Given the population density of the area, an analysis of the annual income earned per acre revealed the “income density” is four times higher in some areas of South LA than the city of LA as a whole: $350,000 a year per acre on average compared with $91,000 per acre citywide. Despite this deeper analysis of income levels, South LA residents are twice as likely to be unemployed as those people living in West LA (14.1% South LA/SPA 6 vs. 8.2% LA County vs. 6.1% West LA).ii Given the disparity in unemployment figures across regions, it is perhaps not surprising that a much higher percentage of families living in South LA have incomes below 200% of the Federal Poverty Level than those living in West LA (26.5%) or LA County (37.7%). Economically, the South LA region undergoes a high amount of “churn” with new businesses replacing those that close down. Another factor that highlights socioeconomic differences between South LA and West LA is the disparity in education levels. The proportion of people living in South LA with a college degree is less than one fifth that of West LA residents. Again, this may be an oversimplification of a complex community laced with a wide range of socio-economic sub-populations that must be fully understood and appreciated in any effort to address the inequities and disparities facing this community.
A comprehensive listing of these and other relevant data is contained in Appendix 4.
iii Los Angeles Neighborhood Market Drill Down: Catalyzing Business Investment in Inner-City Neighborhoods, July 2008, Social Compact, Inc. iv Los Angeles County Department of Public Health. Extracted from July 1, 2005 Population Estimates, prepared by Walter R. McDonald & Associates, Inc. (WRMA) for Urban Research, LA County CEO, released 5/18/2007.
South LA West LA
iii
iv
3.362.4
31
0.2
1.9
0.2
1 White
Latino
Black
American Indian
Asian/Pacific Islander
Other
Two or more
61.3
16.6
7
0.2
11.4
0.4
3.1
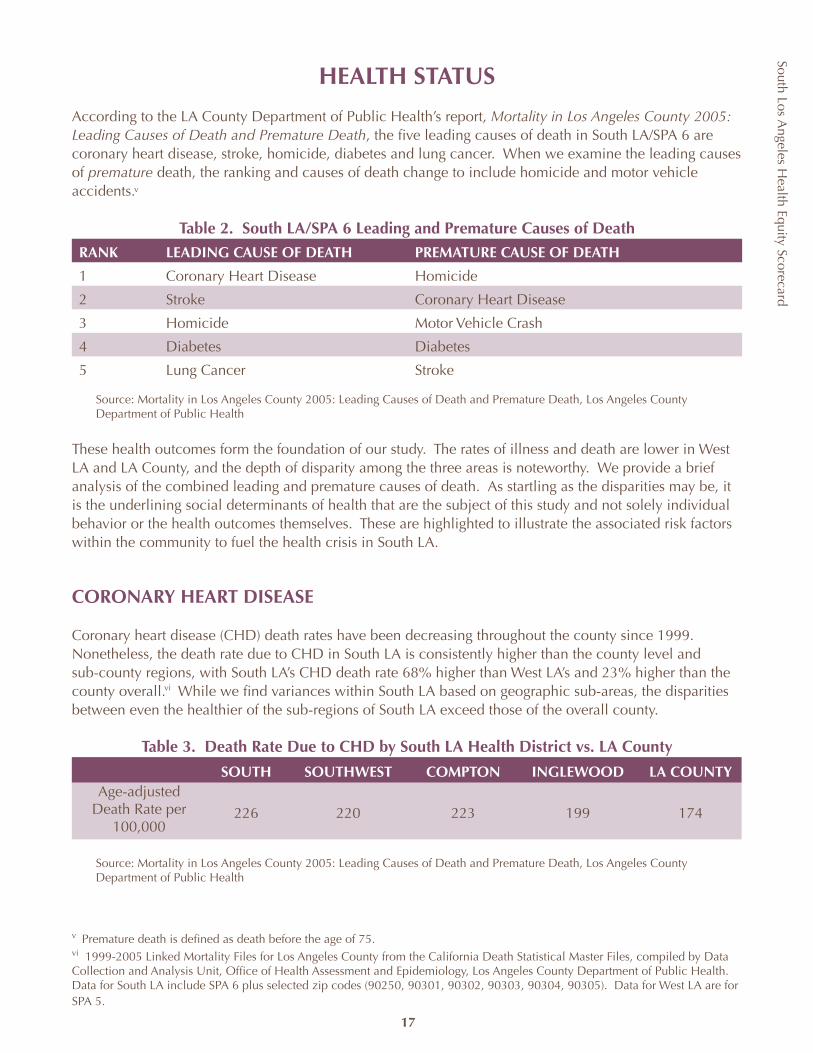
South Los Angeles H
ealth Equity Scorecard
HEALTH STATUS
According to the LA County Department of Public Health’s report, Mortality in Los Angeles County 2005: Leading Causes of Death and Premature Death, the five leading causes of death in South LA/SPA 6 are coronary heart disease, stroke, homicide, diabetes and lung cancer. When we examine the leading causes of premature death, the ranking and causes of death change to include homicide and motor vehicle accidents.
Table 2. South LA/SPA 6 Leading and Premature Causes of Death
RANK LEADING CAUSE OF DEATH PREMATURE CAUSE OF DEATH
1 Coronary Heart Disease Homicide
2 Stroke Coronary Heart Disease
3 Homicide Motor Vehicle Crash
4 Diabetes Diabetes
5 Lung Cancer Stroke
Source: Mortality in Los Angeles County 2005: Leading Causes of Death and Premature Death, Los Angeles County Department of Public Health
These health outcomes form the foundation of our study. The rates of illness and death are lower in West LA and LA County, and the depth of disparity among the three areas is noteworthy. We provide a brief analysis of the combined leading and premature causes of death. As startling as the disparities may be, it is the underlining social determinants of health that are the subject of this study and not solely individual behavior or the health outcomes themselves. These are highlighted to illustrate the associated risk factors within the community to fuel the health crisis in South LA.
CORONARY HEART DISEASE
Coronary heart disease (CHD) death rates have been decreasing throughout the county since 1999. Nonetheless, the death rate due to CHD in South LA is consistently higher than the county level and sub-county regions, with South LA’s CHD death rate 68% higher than West LA’s and 23% higher than the county overall.6 While we find variances within South LA based on geographic sub-areas, the disparities between even the healthier of the sub-regions of South LA exceed those of the overall county.
Table 3. Death Rate Due to CHD by South LA Health District vs. LA County
SOUTH SOUTHWEST COMPTON INGLEWOOD LA COUNTYAge-adjusted
Death Rate per 100,000
226 220 223 199 174
Source: Mortality in Los Angeles County 2005: Leading Causes of Death and Premature Death, Los Angeles County Department of Public Health
v Premature death is defined as death before the age of 75.vi 1999-2005 Linked Mortality Files for Los Angeles County from the California Death Statistical Master Files, compiled by Data Collection and Analysis Unit, Office of Health Assessment and Epidemiology, Los Angeles County Department of Public Health. Data for South LA include SPA 6 plus selected zip codes (90250, 90301, 90302, 90303, 90304, 90305). Data for West LA are for SPA 5.
v
vi
17
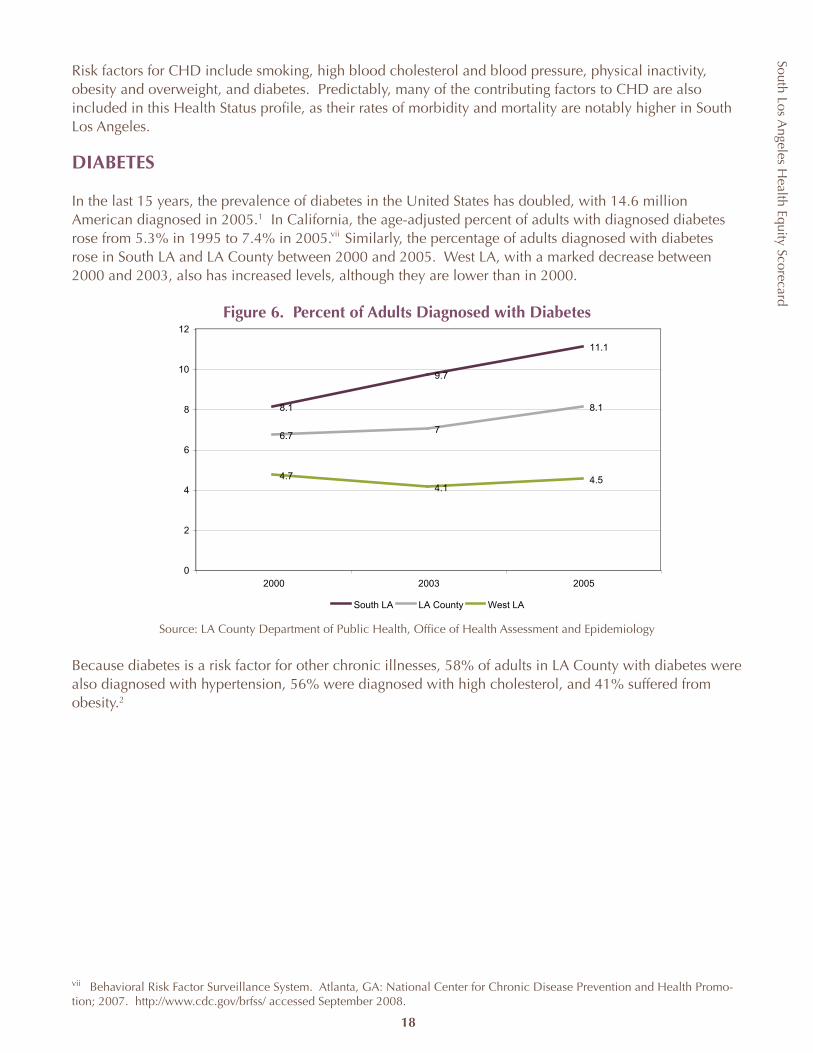
South Los Angeles H
ealth Equity Scorecard
18
8.1
9.7
11.1
6.77
8.1
4.74.1
4.5
0
2
4
6
8
10
12
2000 2003 2005
South LA LA County West LA
Risk factors for CHD include smoking, high blood cholesterol and blood pressure, physical inactivity, obesity and overweight, and diabetes. Predictably, many of the contributing factors to CHD are also included in this Health Status profile, as their rates of morbidity and mortality are notably higher in South Los Angeles.
DIABETES
In the last 15 years, the prevalence of diabetes in the United States has doubled, with 14.6 million American diagnosed in 2005.1 In California, the age-adjusted percent of adults with diagnosed diabetes rose from 5.3% in 1995 to 7.4% in 2005. Similarly, the percentage of adults diagnosed with diabetes rose in South LA and LA County between 2000 and 2005. West LA, with a marked decrease between 2000 and 2003, also has increased levels, although they are lower than in 2000.
Figure 6. Percent of Adults Diagnosed with Diabetes
Source: LA County Department of Public Health, Office of Health Assessment and Epidemiology
Because diabetes is a risk factor for other chronic illnesses, 58% of adults in LA County with diabetes were also diagnosed with hypertension, 56% were diagnosed with high cholesterol, and 41% suffered from obesity.2
vii Behavioral Risk Factor Surveillance System. Atlanta, GA: National Center for Chronic Disease Prevention and Health Promo-tion; 2007. http://www.cdc.gov/brfss/ accessed September 2008.
vii
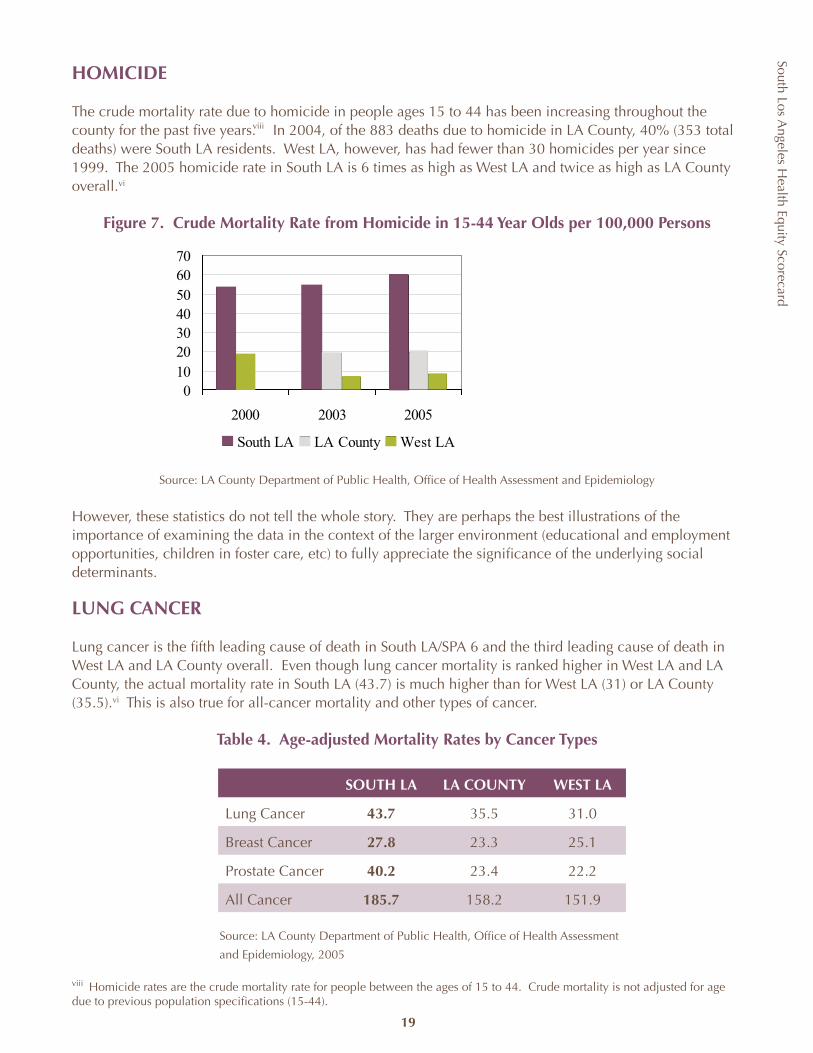
South Los Angeles H
ealth Equity Scorecard
19
HOMICIDE
The crude mortality rate due to homicide in people ages 15 to 44 has been increasing throughout the county for the past five years. In 2004, of the 883 deaths due to homicide in LA County, 40% (353 total deaths) were South LA residents. West LA, however, has had fewer than 30 homicides per year since 1999. The 2005 homicide rate in South LA is 6 times as high as West LA and twice as high as LA County overall.vi
Figure 7. Crude Mortality Rate from Homicide in 15-44 Year Olds per 100,000 Persons
Source: LA County Department of Public Health, Office of Health Assessment and Epidemiology
However, these statistics do not tell the whole story. They are perhaps the best illustrations of the importance of examining the data in the context of the larger environment (educational and employment opportunities, children in foster care, etc) to fully appreciate the significance of the underlying social determinants.
LUNG CANCER
Lung cancer is the fifth leading cause of death in South LA/SPA 6 and the third leading cause of death in West LA and LA County overall. Even though lung cancer mortality is ranked higher in West LA and LA County, the actual mortality rate in South LA (43.7) is much higher than for West LA (31) or LA County (35.5).vi This is also true for all-cancer mortality and other types of cancer.
Table 4. Age-adjusted Mortality Rates by Cancer Types
SOUTH LA LA COUNTY WEST LA
Lung Cancer 43.7 35.5 31.0
Breast Cancer 27.8 23.3 25.1
Prostate Cancer 40.2 23.4 22.2
All Cancer 185.7 158.2 151.9
Source: LA County Department of Public Health, Office of Health Assessment
and Epidemiology, 2005
viii Homicide rates are the crude mortality rate for people between the ages of 15 to 44. Crude mortality is not adjusted for age due to previous population specifications (15-44).
010203040506070
2000 2003 2005
South LA LA County West LA
viii
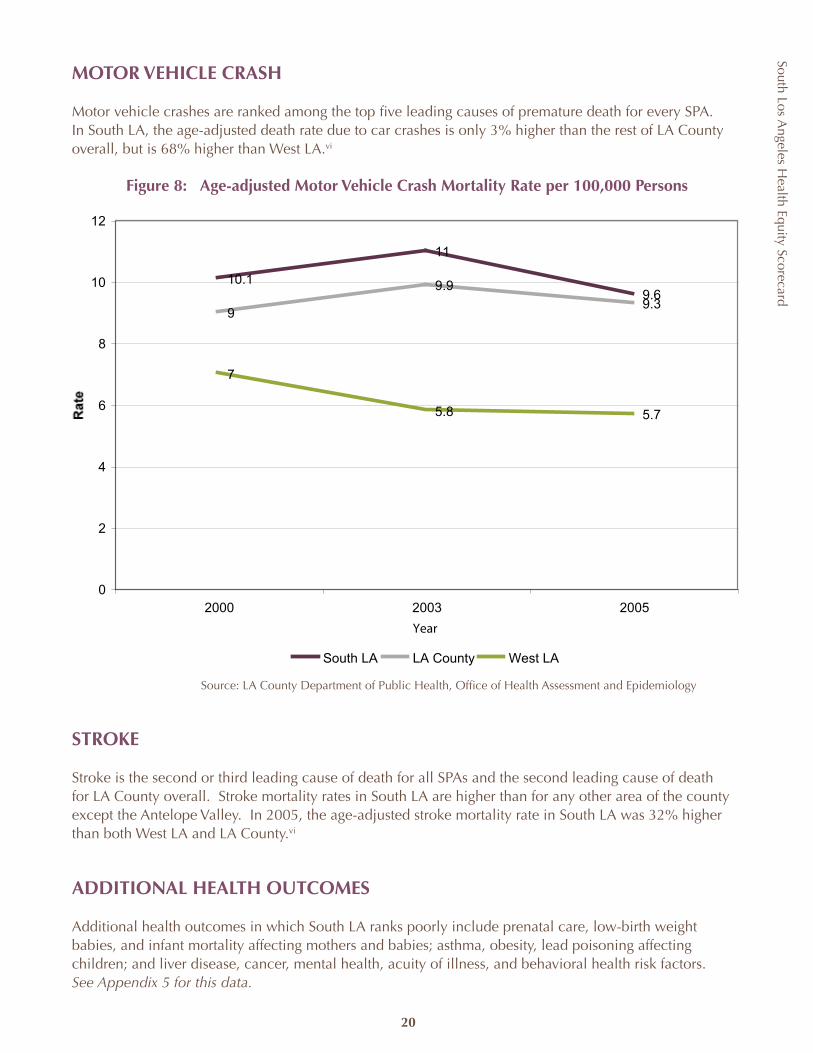
South Los Angeles H
ealth Equity Scorecard
20
10.1
11
9.69
9.99.3
7
5.8 5.7
0
2
4
6
8
10
12
2000 2003 2005
Year
South LA LA County West LA
MOTOR VEHICLE CRASH
Motor vehicle crashes are ranked among the top five leading causes of premature death for every SPA. In South LA, the age-adjusted death rate due to car crashes is only 3% higher than the rest of LA County overall, but is 68% higher than West LA.vi
Figure 8: Age-adjusted Motor Vehicle Crash Mortality Rate per 100,000 Persons
Source: LA County Department of Public Health, Office of Health Assessment and Epidemiology
STROKE
Stroke is the second or third leading cause of death for all SPAs and the second leading cause of death for LA County overall. Stroke mortality rates in South LA are higher than for any other area of the county except the Antelope Valley. In 2005, the age-adjusted stroke mortality rate in South LA was 32% higher than both West LA and LA County.vi
ADDITIONAL HEALTH OUTCOMES
Additional health outcomes in which South LA ranks poorly include prenatal care, low-birth weight babies, and infant mortality affecting mothers and babies; asthma, obesity, lead poisoning affecting children; and liver disease, cancer, mental health, acuity of illness, and behavioral health risk factors. See Appendix 5 for this data.
South Los Angeles H
ealth Equity Scorecard
Healthcare Environment Resources
Scorecard Domain 1
21
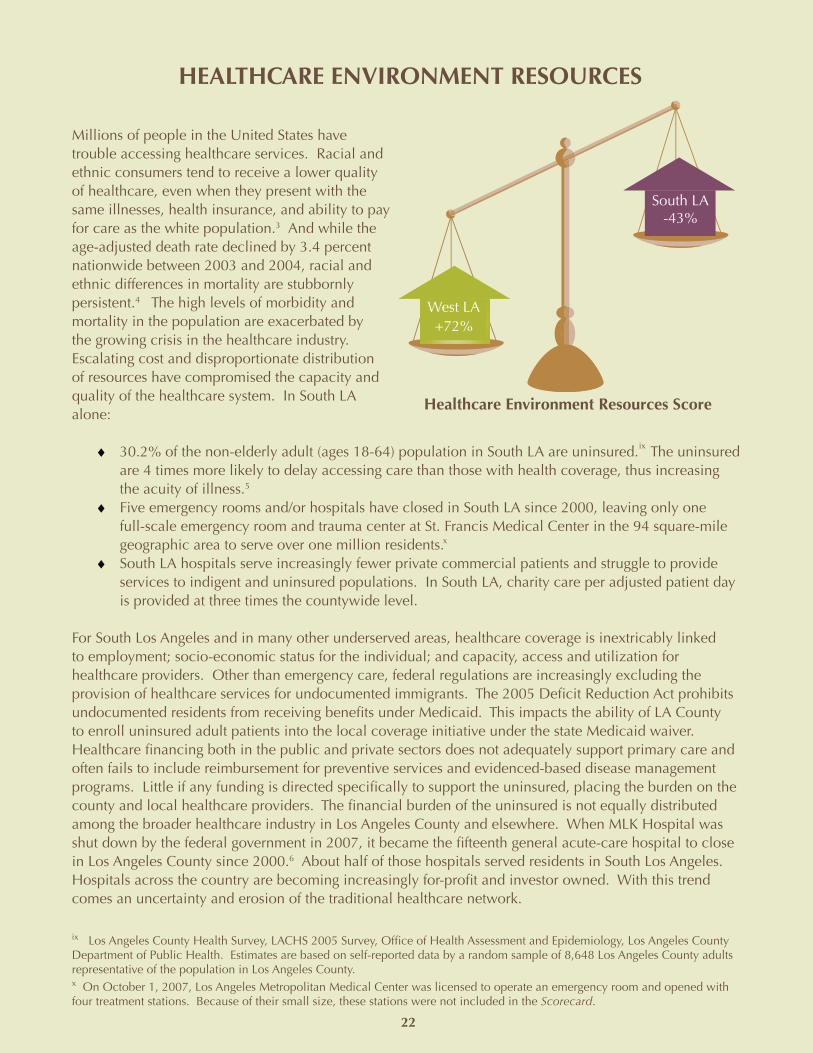
South Los Angeles H
ealth Equity Scorecard
HEALTHCARE ENVIRONMENT RESOURCES
Millions of people in the United States have trouble accessing healthcare services. Racial and ethnic consumers tend to receive a lower quality of healthcare, even when they present with the same illnesses, health insurance, and ability to pay for care as the white population.3 And while the age-adjusted death rate declined by 3.4 percent nationwide between 2003 and 2004, racial and ethnic differences in mortality are stubbornly persistent.4 The high levels of morbidity and mortality in the population are exacerbated by the growing crisis in the healthcare industry. Escalating cost and disproportionate distribution of resources have compromised the capacity and quality of the healthcare system. In South LA alone:
30.2% of the non-elderly adult (ages 18-64) population in South LA are uninsured. The uninsured are 4 times more likely to delay accessing care than those with health coverage, thus increasing the acuity of illness.5 Five emergency rooms and/or hospitals have closed in South LA since 2000, leaving only one full-scale emergency room and trauma center at St. Francis Medical Center in the 94 square-mile geographic area to serve over one million residents.South LA hospitals serve increasingly fewer private commercial patients and struggle to provide services to indigent and uninsured populations. In South LA, charity care per adjusted patient day is provided at three times the countywide level.
For South Los Angeles and in many other underserved areas, healthcare coverage is inextricably linked to employment; socio-economic status for the individual; and capacity, access and utilization for healthcare providers. Other than emergency care, federal regulations are increasingly excluding the provision of healthcare services for undocumented immigrants. The 2005 Deficit Reduction Act prohibits undocumented residents from receiving benefits under Medicaid. This impacts the ability of LA County to enroll uninsured adult patients into the local coverage initiative under the state Medicaid waiver. Healthcare financing both in the public and private sectors does not adequately support primary care and often fails to include reimbursement for preventive services and evidenced-based disease management programs. Little if any funding is directed specifically to support the uninsured, placing the burden on the county and local healthcare providers. The financial burden of the uninsured is not equally distributed among the broader healthcare industry in Los Angeles County and elsewhere. When MLK Hospital was shut down by the federal government in 2007, it became the fifteenth general acute-care hospital to close in Los Angeles County since 2000.6 About half of those hospitals served residents in South Los Angeles. Hospitals across the country are becoming increasingly for-profit and investor owned. With this trend comes an uncertainty and erosion of the traditional healthcare network.
ix Los Angeles County Health Survey, LACHS 2005 Survey, Office of Health Assessment and Epidemiology, Los Angeles County Department of Public Health. Estimates are based on self-reported data by a random sample of 8,648 Los Angeles County adults representative of the population in Los Angeles County.x On October 1, 2007, Los Angeles Metropolitan Medical Center was licensed to operate an emergency room and opened with four treatment stations. Because of their small size, these stations were not included in the Scorecard.
Healthcare Environment Resources Score
West LA +72%
South LA -43%
ix
x
22
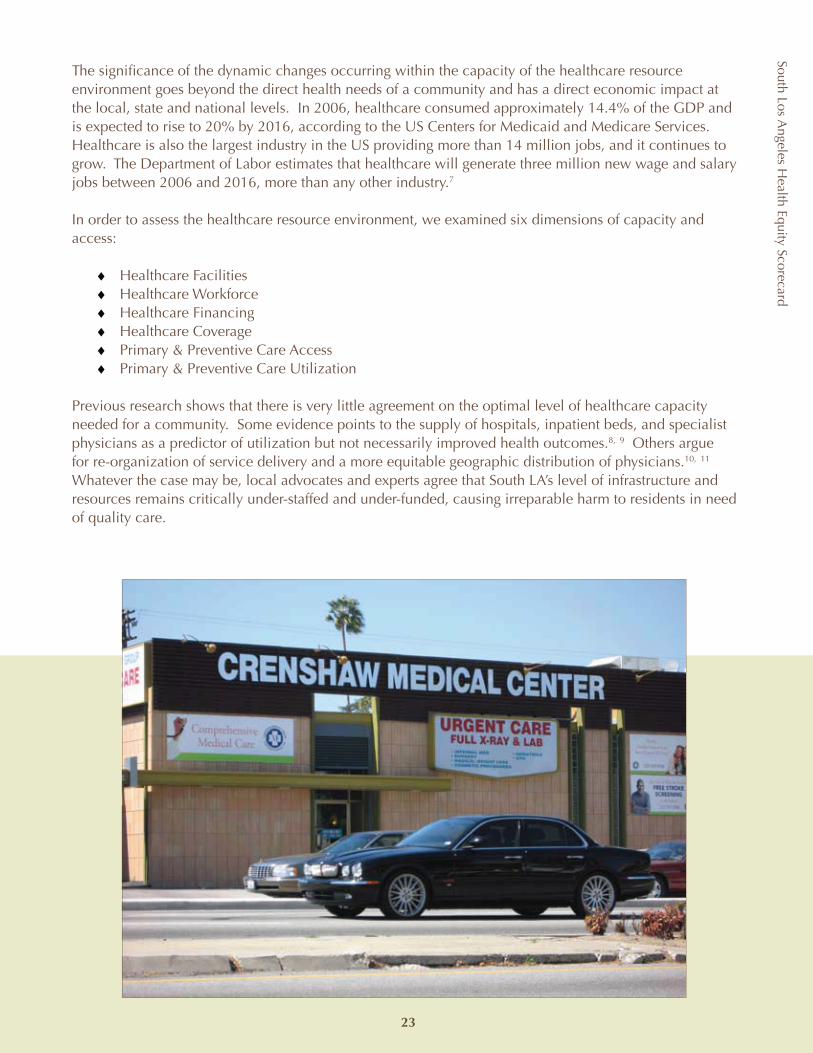
South Los Angeles H
ealth Equity Scorecard
The significance of the dynamic changes occurring within the capacity of the healthcare resource environment goes beyond the direct health needs of a community and has a direct economic impact at the local, state and national levels. In 2006, healthcare consumed approximately 14.4% of the GDP and is expected to rise to 20% by 2016, according to the US Centers for Medicaid and Medicare Services. Healthcare is also the largest industry in the US providing more than 14 million jobs, and it continues to grow. The Department of Labor estimates that healthcare will generate three million new wage and salary jobs between 2006 and 2016, more than any other industry.7
In order to assess the healthcare resource environment, we examined six dimensions of capacity and access:
Healthcare FacilitiesHealthcare WorkforceHealthcare FinancingHealthcare CoveragePrimary & Preventive Care AccessPrimary & Preventive Care Utilization
Previous research shows that there is very little agreement on the optimal level of healthcare capacity needed for a community. Some evidence points to the supply of hospitals, inpatient beds, and specialist physicians as a predictor of utilization but not necessarily improved health outcomes.8, 9 Others argue for re-organization of service delivery and a more equitable geographic distribution of physicians.10, 11 Whatever the case may be, local advocates and experts agree that South LA’s level of infrastructure and resources remains critically under-staffed and under-funded, causing irreparable harm to residents in need of quality care.
23
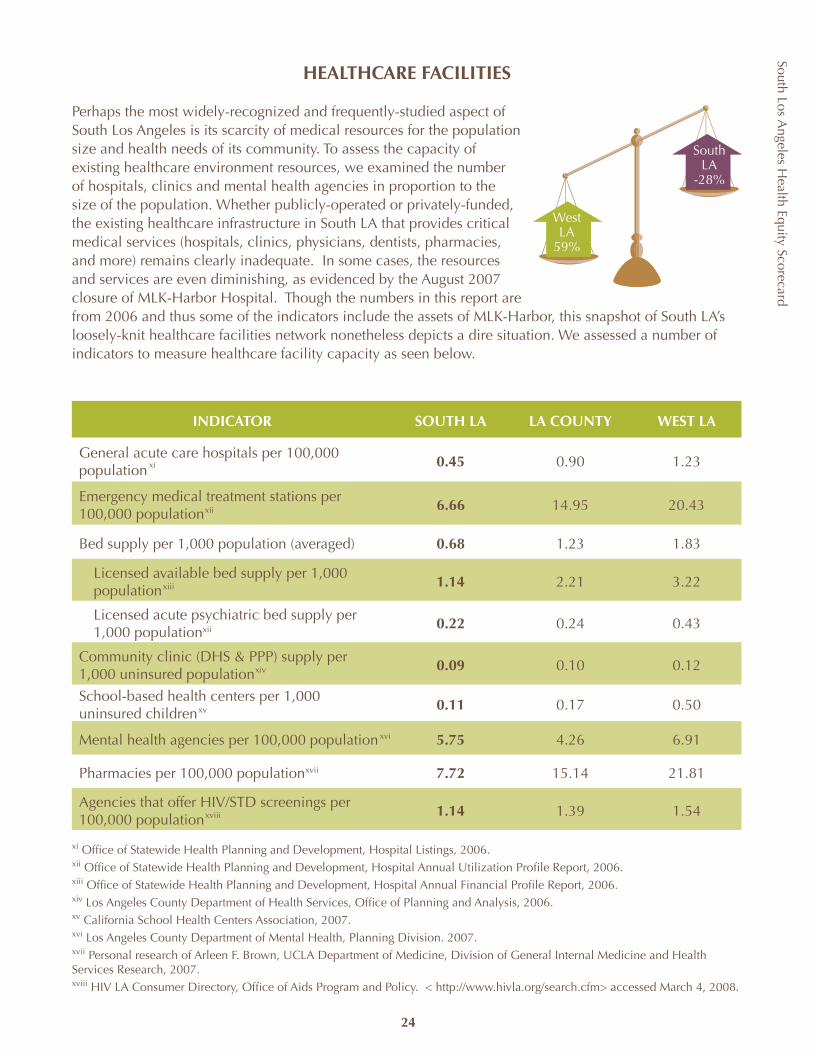
South Los Angeles H
ealth Equity Scorecard
24
HEALTHCARE FACILITIES
Perhaps the most widely-recognized and frequently-studied aspect of South Los Angeles is its scarcity of medical resources for the population size and health needs of its community. To assess the capacity of existing healthcare environment resources, we examined the number of hospitals, clinics and mental health agencies in proportion to the size of the population. Whether publicly-operated or privately-funded, the existing healthcare infrastructure in South LA that provides critical medical services (hospitals, clinics, physicians, dentists, pharmacies, and more) remains clearly inadequate. In some cases, the resources and services are even diminishing, as evidenced by the August 2007 closure of MLK-Harbor Hospital. Though the numbers in this report are from 2006 and thus some of the indicators include the assets of MLK-Harbor, this snapshot of South LA’s loosely-knit healthcare facilities network nonetheless depicts a dire situation. We assessed a number of indicators to measure healthcare facility capacity as seen below.
INDICATOR SOUTH LA LA COUNTY WEST LA
General acute care hospitals per 100,000 population
0.45 0.90 1.23
Emergency medical treatment stations per 100,000 population
6.66 14.95 20.43
Bed supply per 1,000 population (averaged) 0.68 1.23 1.83
Licensed available bed supply per 1,000 population
1.14 2.21 3.22
Licensed acute psychiatric bed supply per 1,000 populationxii 0.22 0.24 0.43
Community clinic (DHS & PPP) supply per 1,000 uninsured population
0.09 0.10 0.12
School-based health centers per 1,000 uninsured children
0.11 0.17 0.50
Mental health agencies per 100,000 population 5.75 4.26 6.91
Pharmacies per 100,000 population 7.72 15.14 21.81
Agencies that offer HIV/STD screenings per 100,000 population
1.14 1.39 1.54
West LA
59%
South LA
-28%
xi Office of Statewide Health Planning and Development, Hospital Listings, 2006. xii Office of Statewide Health Planning and Development, Hospital Annual Utilization Profile Report, 2006.xiii Office of Statewide Health Planning and Development, Hospital Annual Financial Profile Report, 2006.xiv Los Angeles County Department of Health Services, Office of Planning and Analysis, 2006.xv California School Health Centers Association, 2007.xvi Los Angeles County Department of Mental Health, Planning Division. 2007.xvii Personal research of Arleen F. Brown, UCLA Department of Medicine, Division of General Internal Medicine and Health Services Research, 2007.xviii HIV LA Consumer Directory, Office of Aids Program and Policy. < http://www.hivla.org/search.cfm> accessed March 4, 2008.
xi
xii
xiii
xv
xiv
xvi
xvii
xviii

South Los Angeles H
ealth Equity Scorecard
25
The largest disparity within health facilities occurs in the supply of school-based health centers. School-based health centers are widely recognized as providing access to a variety of needed services for children and adolescents, including mental health counseling, supervision of children’s weight and obesity, and early diagnoses and treatment of asthma, diabetes, and other chronic conditions. South LA has 0.11 school-based health centers (SBHC) per 1,000 uninsured children, or 35% less than the LA County baseline supply of 0.17 per 1,000 uninsured children. West LA, in comparison, has 0.50 SBHC per 1,000 uninsured children or 201% more than the LA County baseline.
Figure 9. School-based Health Clinics per 1,000 Uninsured Children
Source: California School Health Centers Association, 2007
School-based clinics are often the first point of medical contact for some student populations. One study found that the risk of hospitalization decreased 2.4-fold and emergency department visits decreased by 34% for students with asthma who attended schools with SBHC’s in Ohio.12 Similarly, another study conducted in inner-city New York found that students with asthma, in addition to having fewer hospitalizations, also gained three school days from lower absenteeism when treated at an SBHC.13 Expanding the system of school-based healthcare is particularly crucial in South LA, which has a disproportionate percentage of children who suffer from asthma (8.6%), obesity and overweight (28.8%).
The supply of available general acute care beds and licensed acute psychiatric beds per 1,000 population is 0.68 in South LA. By comparison, LA County has 1.23 beds per 1,000 population and West LA has 1.83. Following the closure of both MLK-Harbor and Daniel Freeman Memorial Hospital in December 2007, the inpatient bed capacity in South LA decreased dramatically to 0.43 beds per 1,000 population. Inpatient bed supply demonstrates the second-largest disparity between South and West LA’s medical facilities’ capacity. The number of EMS treatment stations is another critical area with significantly lower capacity. South LA only has 6.66 EMS stations per 1,000 population, while LA County has 14.95 and West LA has 20.43.
0
0.1
0.2
0.3
0.4
0.5
0.6
South LA LA County West LA
School Health Centers in South LA
Jordan High School Health CenterFoshay Learning Center, CA Medical Center Clinic
Manual Arts High School Health CenterHyde Park Clinic
Accelerated School – School Based Health Center
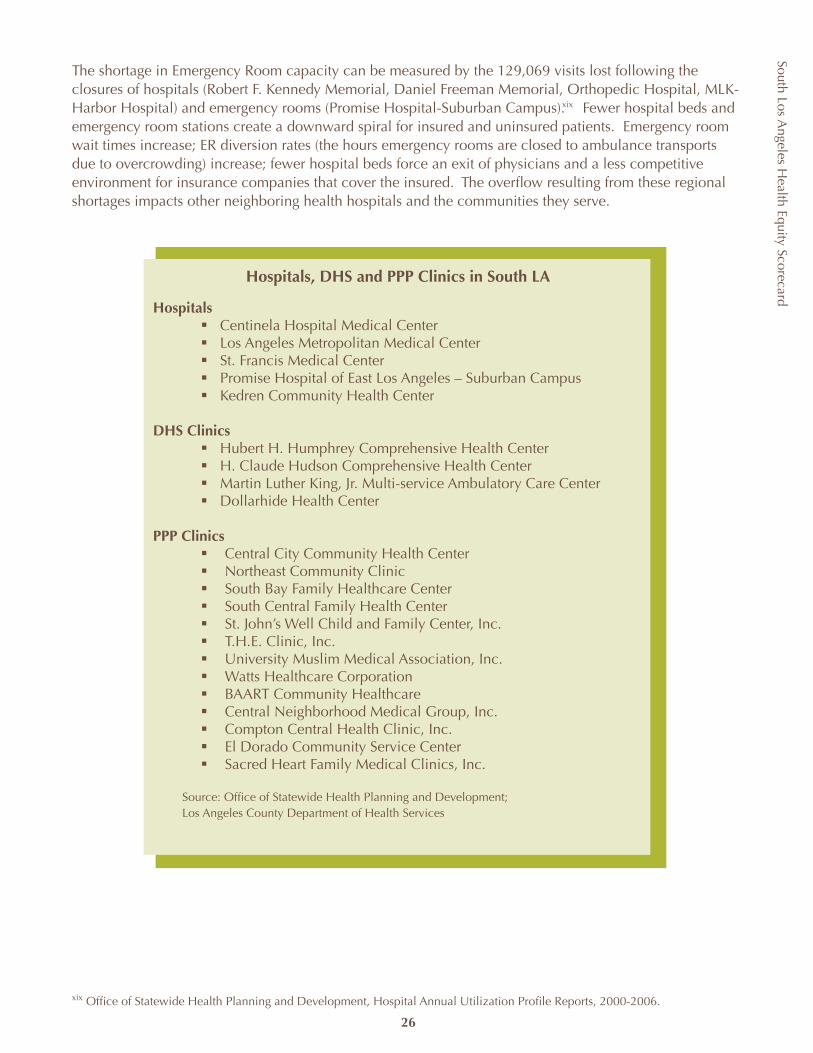
South Los Angeles H
ealth Equity Scorecard
26
The shortage in Emergency Room capacity can be measured by the 129,069 visits lost following the closures of hospitals (Robert F. Kennedy Memorial, Daniel Freeman Memorial, Orthopedic Hospital, MLK-Harbor Hospital) and emergency rooms (Promise Hospital-Suburban Campus). Fewer hospital beds and emergency room stations create a downward spiral for insured and uninsured patients. Emergency room wait times increase; ER diversion rates (the hours emergency rooms are closed to ambulance transports due to overcrowding) increase; fewer hospital beds force an exit of physicians and a less competitive environment for insurance companies that cover the insured. The overflow resulting from these regional shortages impacts other neighboring health hospitals and the communities they serve.
xix Office of Statewide Health Planning and Development, Hospital Annual Utilization Profile Reports, 2000-2006.
Hospitals, DHS and PPP Clinics in South LA
HospitalsCentinela Hospital Medical Centerß Los Angeles Metropolitan Medical Centerß St. Francis Medical Centerß Promise Hospital of East Los Angeles – Suburban Campusß Kedren Community Health Centerß
DHS ClinicsHubert H. Humphrey Comprehensive Health Centerß H. Claude Hudson Comprehensive Health Centerß Martin Luther King, Jr. Multi-service Ambulatory Care Centerß Dollarhide Health Centerß
PPP ClinicsCentral City Community Health Centerß Northeast Community Clinicß South Bay Family Healthcare Centerß South Central Family Health Centerß St. John’s Well Child and Family Center, Inc.ß T.H.E. Clinic, Inc.ß University Muslim Medical Association, Inc.ß Watts Healthcare Corporationß BAART Community Healthcareß Central Neighborhood Medical Group, Inc.ß Compton Central Health Clinic, Inc.ß El Dorado Community Service Centerß Sacred Heart Family Medical Clinics, Inc.ß
Source: Office of Statewide Health Planning and Development; Los Angeles County Department of Health Services
xix

South Los Angeles H
ealth Equity Scorecard
Additional disparities in the supply of health system facilities include:
Fewer pharmaciesß : South LA has 7.7 pharmacies per 100,000 population, while LA County had 15.1 and West LA has 21.8 pharmacies per 100,000 population. The supplies of pharmacists and pharmacies have come under recent study as possible avenues of chronic disease care and management and improved health outcomes,14, 15 and others have promoted increased integration and coordination of pharmacies and pharmacists into the safety net.16
Fewer community clinics and safety-net hospitalsß : Community clinics and safety-net hospitals represent a significant portion of the Healthcare Network for the uninsured. In South LA, there are only 0.09 community clinics (DHS-operated and PPP) per 1,000 uninsured population and 0.45 hospitals per 100,000 population. LA County’s clinic supply is 0.1 per 1,000 uninsured population and 0.9 hospitals per 100,000 population. Studies have shown that close proximity to safety-net providers increases access to care for the uninsured,17 which is approximately 30% of the adult and 11% of the child population in South LA.
Fewer mental health agenciesß : South LA/SPA 6 has 5.8 mental health agency providers per 100,000 population, which is more than the 4.3 available in LA County overall, but less than the 6.9 available in West LA. In 2002, 528 South LA children required out-of-home treatment compared to 109 in West LA. While fewer adults in South LA report being diagnosed (11.8%) with depression than LA County (12.9%) or West LA (16.6%), US trends also find lower rates among Latino, African American and other racial and ethnic groups, all of whom make up South LA’s population. Race and ethnicity, however, determine under-diagnosis of mood disorders and the likelihood that illness will be persistent, more severe or untreated.18
Fewer resources for HIV/STD screeningß : South LA has the highest rates of chlamydia and gonorrhea, and the highest HIV mortality rate in the county, yet there are only 1.1 HIV/STD screening agencies available per 100,000 population. There are 1.4 agencies available countywide and 1.5 available in West LA, per 100,000 populations.
xx Department of Mental Health data for services received through DMH in SPA 5 and SPA 6 accessed from http://publichealth.lacounty.gov/childpc/social.htm#mental accessed September 2008.
Partial List of Community Agencies Addressing HIV in South LA
AIDS Healthcare Foundation:ß comprehensive HIV/AIDS medical care
Charles R. Drew University of Medicine and Science:ß Early Intervention Program offers comprehensive outpatient HIV medical treatment, lab testing and physical exams
Hubert Humphrey Comprehensive Health Center: ß provides comprehensive medical services including AIDS drug assistance program, case management, prevention health education and support services
Minority AIDS Projectß : onsite and mobile, standard and rapid HIV testing and counseling
Watts Healthcare Corporation Community AIDS Program: ß early intervention, comprehensive HIV medical care, dental and vision, OB/GYN urgent care and nutritionist for people with HIV/AIDS
The OASIS Clinic offers comprehensive HIV/AIDS medical care, spanning the full spectrum of ß HIV disease from HIV testing to late-stage AIDS. In addition, the HIV clinic provides primary care to all patients including disease management of hypertension, diabetes, and women’s health issues.
xx
27
South Los Angeles H
ealth Equity Scorecard
28
RECOMMENDATIONS
The lack access and equity in healthcare facilities and thus services in South LA is a complex issue. In the absence of regional planning, the healthcare network has evolved based on market forces that fail to adequately provide for the uninsured and underinsured population. Until recently, there has been little if any coordination and joint planning across hospitals, clinics, their funders or regulators. A comprehensive regional plan for healthcare services is critical to the future of this community.
South Los Angeles Healthcare Leadership Roundtable
The South Los Angeles Healthcare Leadership Roundtable is composed of area healthcare stakeholders: hospital and clinic CEOs, health foundations, research and educational institutions, advocacy organizations and members of the business community. The coalition works in concert with each level of government and the private sector to amend policy and design a system to increase healthcare capacity in South Los Angeles.
Increasing the number of primary care and School-Based Health Clinics is one immediate and relatively cost effective strategy to avert hospitalization and help alleviate the pressure on South LA hospitals. In 2008, Governor Schwarzenegger signed SB 546 authored by Senator Mark Ridley-Thomas to aid the development of new and existing school health centers. Another consideration is the use of urgent care centers strategically placed throughout the area and in proximity to or associated with hospitals to divert inappropriate use of emergency rooms. All of these recommendations require a reinvestment of public and private funding in South LA and planning and coordination not only among the healthcare community, funders and regulators, but also with city planning, transportation and redevelopment to ensure the healthcare capacity of the region.
After the closure of Daniel Freeman Memorial Hospital in 2007, the City of Inglewood adopted a moratorium prohibiting the issuance of building permits, zoning approval, business tax certificates or licenses for non-medical uses in the Residential and Medical Zone. The moratorium was designed to give the city time to assess the impact of the hospital’s closure on residents’ health and study the feasibility of reestablishing services. California Government Code Section 65858 allows cities or counties to forgo the procedures otherwise required prior to the adoption of a zoning ordinance to protect the public safety, health, and welfare of residents. As an urgency measure, a city or county may adopt an interim ordinance for 2 years prohibiting any uses in conflict with a contemplated general plan, specific plan, or zoning proposal that the legislative body, planning commission or department is studying or intends to study within a reasonable time.
An effort must also be made to retain existing public funding and services historically provided by the county. With the closure of MLK Hospital, county and state officials acted swiftly to retain a portion of the funding for the hospital that would have otherwise been lost because of current hospital financing regulations. SB 474 allowed the county to retain $100 million of the state safety-net care pool under the Medicaid waiver formerly allocated to MLK. The funding was reallocated to impacted hospitals for the increase in uninsured patients and to support primary and urgent care services in the region. This funding is limited to three years and will sunset in August 2010 or, should the hospital reopen before then, be diverted to the reopened facility.
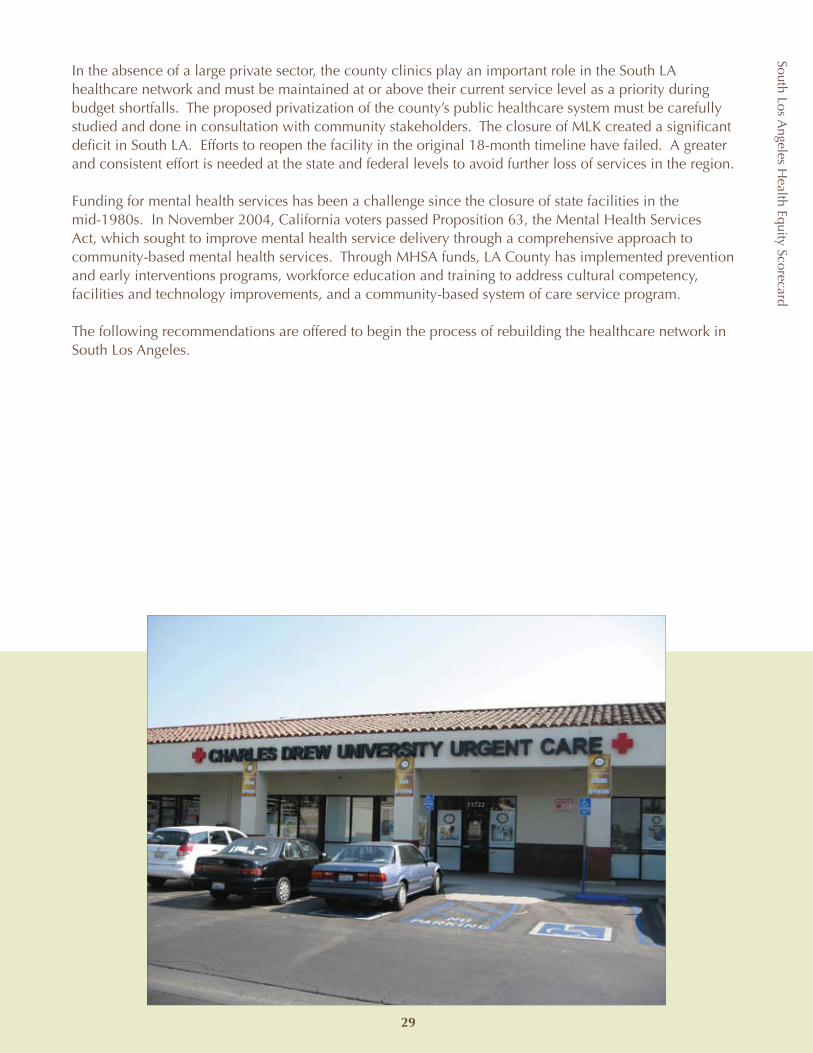
South Los Angeles H
ealth Equity Scorecard
In the absence of a large private sector, the county clinics play an important role in the South LA healthcare network and must be maintained at or above their current service level as a priority during budget shortfalls. The proposed privatization of the county’s public healthcare system must be carefully studied and done in consultation with community stakeholders. The closure of MLK created a significant deficit in South LA. Efforts to reopen the facility in the original 18-month timeline have failed. A greater and consistent effort is needed at the state and federal levels to avoid further loss of services in the region.
Funding for mental health services has been a challenge since the closure of state facilities in the mid-1980s. In November 2004, California voters passed Proposition 63, the Mental Health Services Act, which sought to improve mental health service delivery through a comprehensive approach to community-based mental health services. Through MHSA funds, LA County has implemented prevention and early interventions programs, workforce education and training to address cultural competency, facilities and technology improvements, and a community-based system of care service program.
The following recommendations are offered to begin the process of rebuilding the healthcare network in South Los Angeles.
29
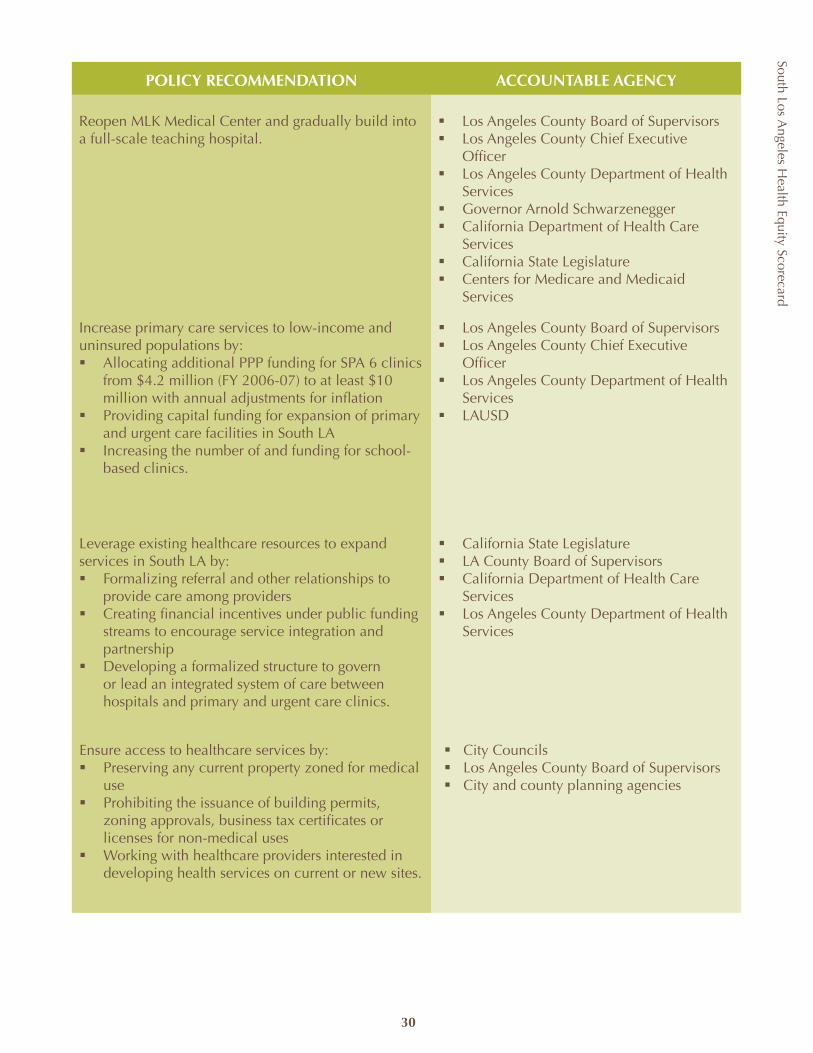
South Los Angeles H
ealth Equity Scorecard
30
POLICY RECOMMENDATION ACCOUNTABLE AGENCY
Reopen MLK Medical Center and gradually build into a full-scale teaching hospital.
ß Los Angeles County Board of Supervisorsß Los Angeles County Chief Executive
Officerß Los Angeles County Department of Health
Servicesß Governor Arnold Schwarzeneggerß California Department of Health Care
Servicesß California State Legislatureß Centers for Medicare and Medicaid
Services
Increase primary care services to low-income and uninsured populations by:ß Allocating additional PPP funding for SPA 6 clinics
from $4.2 million (FY 2006-07) to at least $10 million with annual adjustments for inflation
ß Providing capital funding for expansion of primary and urgent care facilities in South LA
ß Increasing the number of and funding for school-based clinics.
ß Los Angeles County Board of Supervisorsß Los Angeles County Chief Executive
Officerß Los Angeles County Department of Health
Servicesß LAUSD
Leverage existing healthcare resources to expand services in South LA by: ß Formalizing referral and other relationships to
provide care among providers ß Creating financial incentives under public funding
streams to encourage service integration and partnership
ß Developing a formalized structure to govern or lead an integrated system of care between hospitals and primary and urgent care clinics.
ß California State Legislatureß LA County Board of Supervisorsß California Department of Health Care
Servicesß Los Angeles County Department of Health
Services
Ensure access to healthcare services by:ß Preserving any current property zoned for medical
useß Prohibiting the issuance of building permits,
zoning approvals, business tax certificates or licenses for non-medical uses
ß Working with healthcare providers interested in developing health services on current or new sites.
ß City Councilsß Los Angeles County Board of Supervisorsß City and county planning agencies
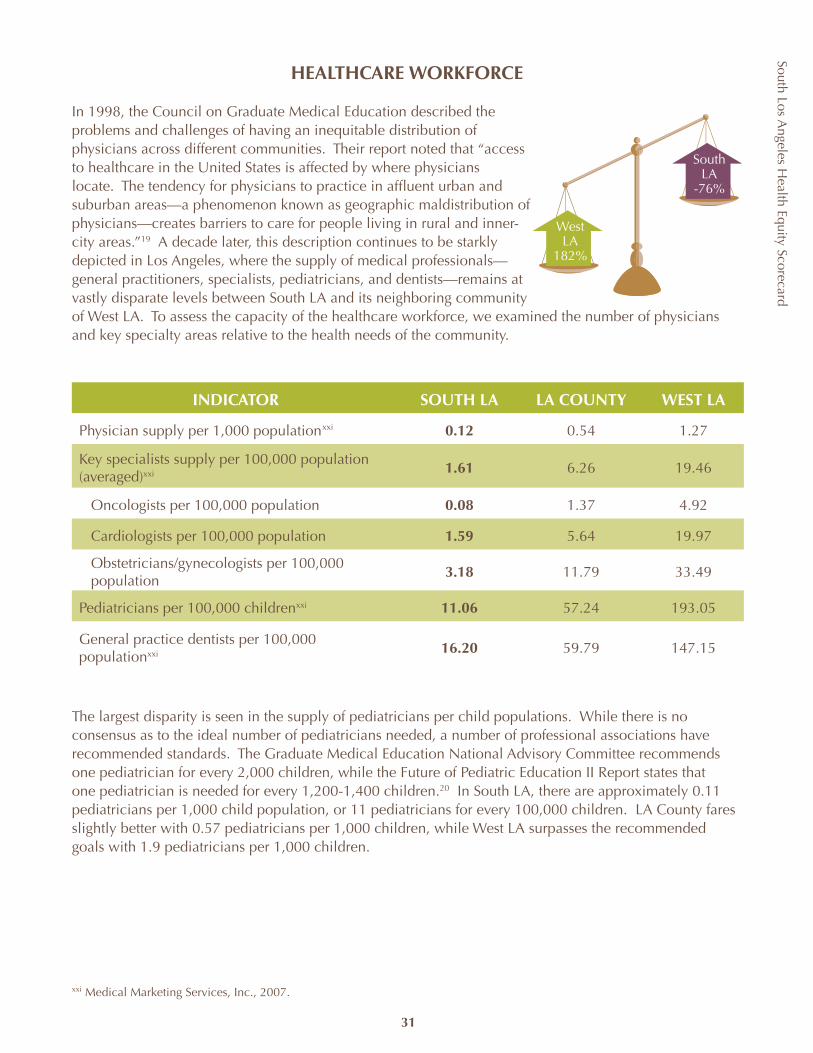
South Los Angeles H
ealth Equity Scorecard
31
HEALTHCARE WORKFORCE
In 1998, the Council on Graduate Medical Education described the problems and challenges of having an inequitable distribution of physicians across different communities. Their report noted that “access to healthcare in the United States is affected by where physicians locate. The tendency for physicians to practice in affluent urban and suburban areas—a phenomenon known as geographic maldistribution of physicians—creates barriers to care for people living in rural and inner-city areas.”19 A decade later, this description continues to be starkly depicted in Los Angeles, where the supply of medical professionals—general practitioners, specialists, pediatricians, and dentists—remains at vastly disparate levels between South LA and its neighboring community of West LA. To assess the capacity of the healthcare workforce, we examined the number of physicians and key specialty areas relative to the health needs of the community.
INDICATOR SOUTH LA LA COUNTY WEST LA
Physician supply per 1,000 population 0.12 0.54 1.27
Key specialists supply per 100,000 population (averaged)xxi
1.61 6.26 19.46
Oncologists per 100,000 population 0.08 1.37 4.92
Cardiologists per 100,000 population 1.59 5.64 19.97
Obstetricians/gynecologists per 100,000 population
3.18 11.79 33.49
Pediatricians per 100,000 childrenxxi 11.06 57.24 193.05
General practice dentists per 100,000 populationxxi 16.20 59.79 147.15
The largest disparity is seen in the supply of pediatricians per child populations. While there is no consensus as to the ideal number of pediatricians needed, a number of professional associations have recommended standards. The Graduate Medical Education National Advisory Committee recommends one pediatrician for every 2,000 children, while the Future of Pediatric Education II Report states that one pediatrician is needed for every 1,200-1,400 children.20 In South LA, there are approximately 0.11 pediatricians per 1,000 child population, or 11 pediatricians for every 100,000 children. LA County fares slightly better with 0.57 pediatricians per 1,000 children, while West LA surpasses the recommended goals with 1.9 pediatricians per 1,000 children.
WestLA
182%
South LA
-76%
xxi
xxi Medical Marketing Services, Inc., 2007.
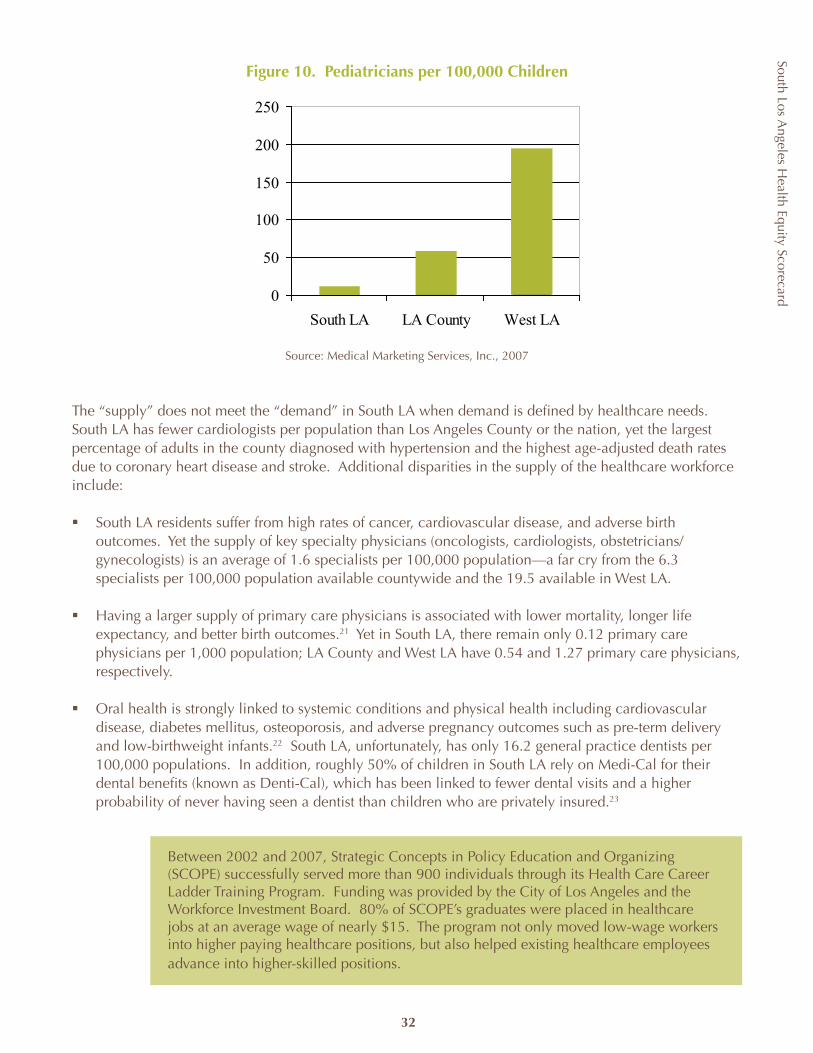
South Los Angeles H
ealth Equity Scorecard
32
Figure 10. Pediatricians per 100,000 Children
Source: Medical Marketing Services, Inc., 2007
The “supply” does not meet the “demand” in South LA when demand is defined by healthcare needs. South LA has fewer cardiologists per population than Los Angeles County or the nation, yet the largest percentage of adults in the county diagnosed with hypertension and the highest age-adjusted death rates due to coronary heart disease and stroke. Additional disparities in the supply of the healthcare workforce include:
South LA residents suffer from high rates of cancer, cardiovascular disease, and adverse birth ß outcomes. Yet the supply of key specialty physicians (oncologists, cardiologists, obstetricians/gynecologists) is an average of 1.6 specialists per 100,000 population—a far cry from the 6.3 specialists per 100,000 population available countywide and the 19.5 available in West LA.
Having a larger supply of primary care physicians is associated with lower mortality, longer life ß expectancy, and better birth outcomes.21 Yet in South LA, there remain only 0.12 primary care physicians per 1,000 population; LA County and West LA have 0.54 and 1.27 primary care physicians, respectively.
Oral health is strongly linked to systemic conditions and physical health including cardiovascular ß disease, diabetes mellitus, osteoporosis, and adverse pregnancy outcomes such as pre-term delivery and low-birthweight infants.22 South LA, unfortunately, has only 16.2 general practice dentists per 100,000 populations. In addition, roughly 50% of children in South LA rely on Medi-Cal for their dental benefits (known as Denti-Cal), which has been linked to fewer dental visits and a higher probability of never having seen a dentist than children who are privately insured.23
Between 2002 and 2007, Strategic Concepts in Policy Education and Organizing (SCOPE) successfully served more than 900 individuals through its Health Care Career Ladder Training Program. Funding was provided by the City of Los Angeles and the Workforce Investment Board. 80% of SCOPE’s graduates were placed in healthcare jobs at an average wage of nearly $15. The program not only moved low-wage workers into higher paying healthcare positions, but also helped existing healthcare employees advance into higher-skilled positions.
0
50
100
150
200
250
South LA LA County West LA
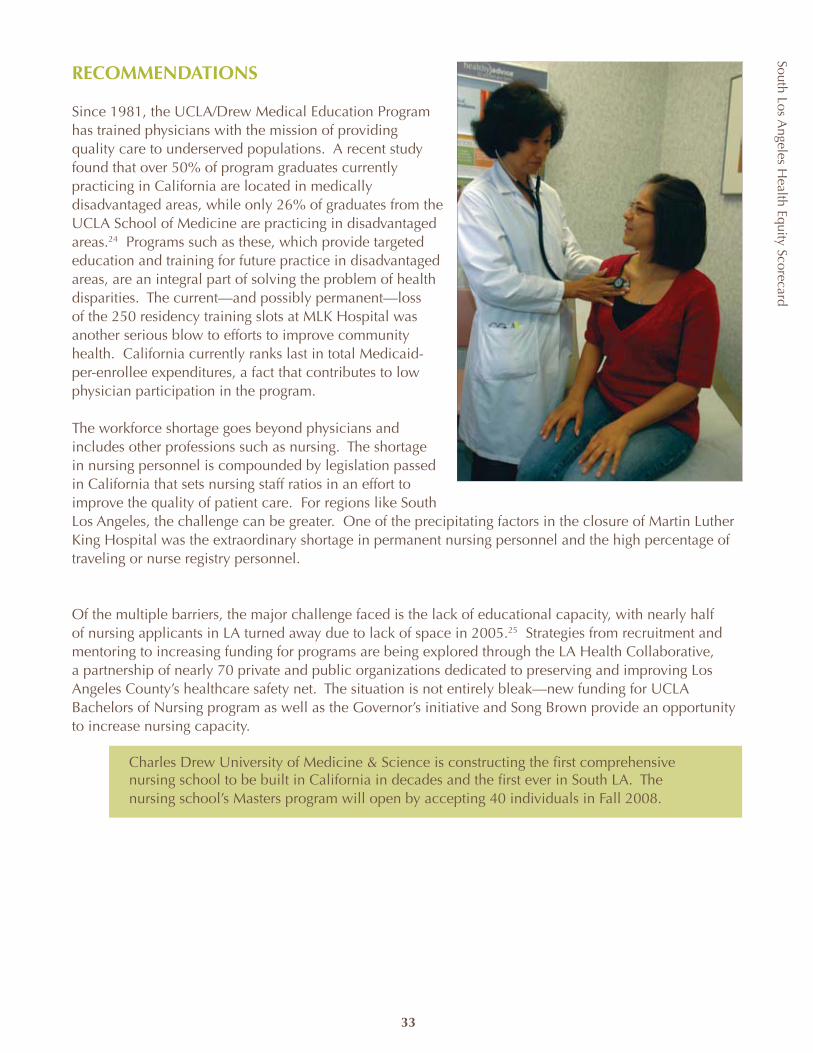
South Los Angeles H
ealth Equity Scorecard
33
RECOMMENDATIONS
Since 1981, the UCLA/Drew Medical Education Program has trained physicians with the mission of providing quality care to underserved populations. A recent study found that over 50% of program graduates currently practicing in California are located in medically disadvantaged areas, while only 26% of graduates from the UCLA School of Medicine are practicing in disadvantaged areas.24 Programs such as these, which provide targeted education and training for future practice in disadvantaged areas, are an integral part of solving the problem of health disparities. The current—and possibly permanent—loss of the 250 residency training slots at MLK Hospital was another serious blow to efforts to improve community health. California currently ranks last in total Medicaid-per-enrollee expenditures, a fact that contributes to low physician participation in the program.
The workforce shortage goes beyond physicians and includes other professions such as nursing. The shortage in nursing personnel is compounded by legislation passed in California that sets nursing staff ratios in an effort to improve the quality of patient care. For regions like South Los Angeles, the challenge can be greater. One of the precipitating factors in the closure of Martin Luther King Hospital was the extraordinary shortage in permanent nursing personnel and the high percentage of traveling or nurse registry personnel.
Of the multiple barriers, the major challenge faced is the lack of educational capacity, with nearly half of nursing applicants in LA turned away due to lack of space in 2005.25 Strategies from recruitment and mentoring to increasing funding for programs are being explored through the LA Health Collaborative, a partnership of nearly 70 private and public organizations dedicated to preserving and improving Los Angeles County’s healthcare safety net. The situation is not entirely bleak—new funding for UCLA Bachelors of Nursing program as well as the Governor’s initiative and Song Brown provide an opportunity to increase nursing capacity.
Charles Drew University of Medicine & Science is constructing the first comprehensive nursing school to be built in California in decades and the first ever in South LA. The nursing school’s Masters program will open by accepting 40 individuals in Fall 2008.
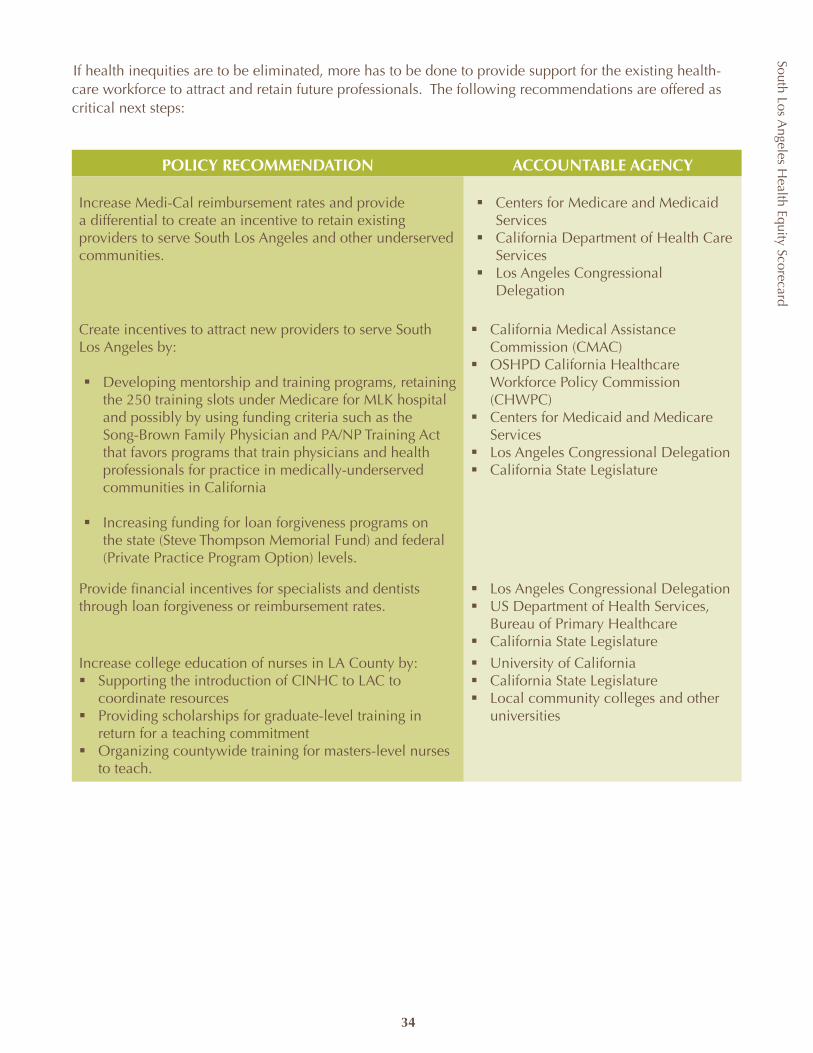
South Los Angeles H
ealth Equity Scorecard
34
If health inequities are to be eliminated, more has to be done to provide support for the existing health-care workforce to attract and retain future professionals. The following recommendations are offered as critical next steps:
POLICY RECOMMENDATION ACCOUNTABLE AGENCY
Increase Medi-Cal reimbursement rates and provide a differential to create an incentive to retain existing providers to serve South Los Angeles and other underserved communities.
Centers for Medicare and Medicaid ß ServicesCalifornia Department of Health Care ß ServicesLos Angeles Congressional ß Delegation
Create incentives to attract new providers to serve South Los Angeles by:
Developing mentorship and training programs, retaining ß the 250 training slots under Medicare for MLK hospital and possibly by using funding criteria such as the Song-Brown Family Physician and PA/NP Training Act that favors programs that train physicians and health professionals for practice in medically-underserved communities in California
Increasing funding for loan forgiveness programs on ß the state (Steve Thompson Memorial Fund) and federal (Private Practice Program Option) levels.
California Medical Assistance ß Commission (CMAC)OSHPD California Healthcare ß Workforce Policy Commission (CHWPC)Centers for Medicaid and Medicare ß ServicesLos Angeles Congressional Delegationß California State Legislatureß
Provide financial incentives for specialists and dentists through loan forgiveness or reimbursement rates.
Los Angeles Congressional Delegationß US Department of Health Services, ß Bureau of Primary HealthcareCalifornia State Legislatureß
Increase college education of nurses in LA County by: Supporting the introduction of CINHC to LAC to ß coordinate resources Providing scholarships for graduate-level training in ß return for a teaching commitmentOrganizing countywide training for masters-level nurses ß to teach.
University of Californiaß California State Legislatureß Local community colleges and other ß universities
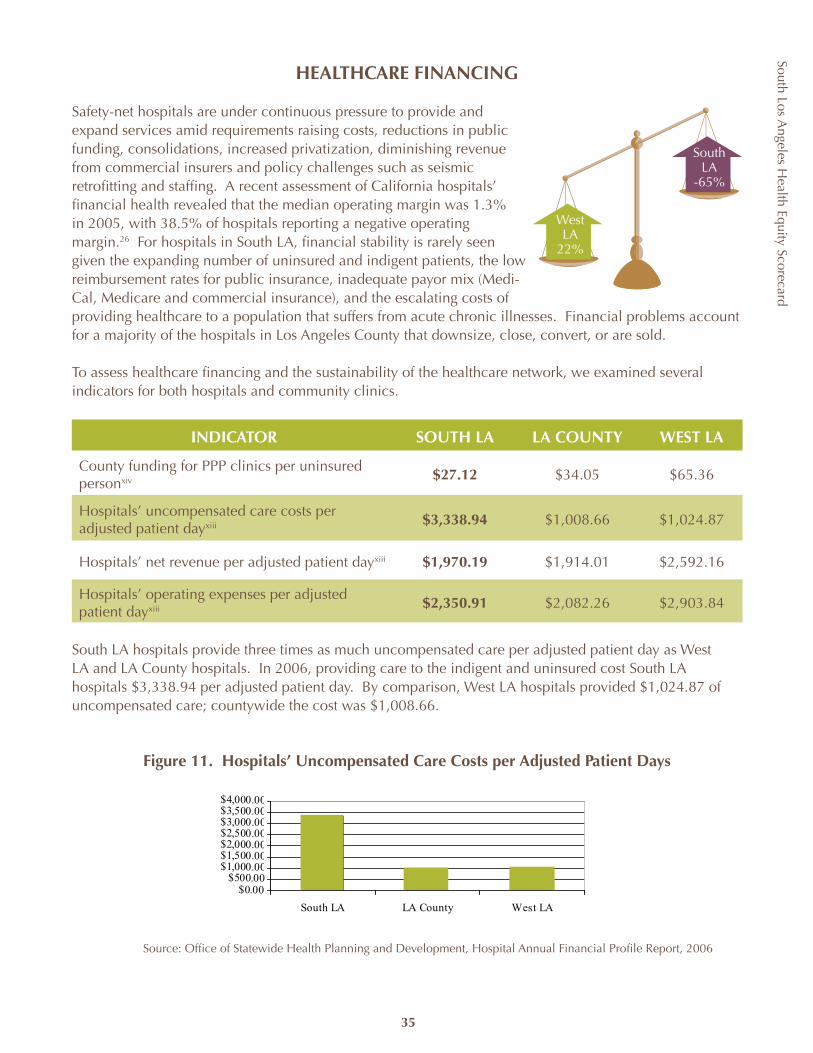
South Los Angeles H
ealth Equity Scorecard
35
HEALTHCARE FINANCING
Safety-net hospitals are under continuous pressure to provide and expand services amid requirements raising costs, reductions in public funding, consolidations, increased privatization, diminishing revenue from commercial insurers and policy challenges such as seismic retrofitting and staffing. A recent assessment of California hospitals’ financial health revealed that the median operating margin was 1.3% in 2005, with 38.5% of hospitals reporting a negative operating margin.26 For hospitals in South LA, financial stability is rarely seen given the expanding number of uninsured and indigent patients, the low reimbursement rates for public insurance, inadequate payor mix (Medi-Cal, Medicare and commercial insurance), and the escalating costs of providing healthcare to a population that suffers from acute chronic illnesses. Financial problems account for a majority of the hospitals in Los Angeles County that downsize, close, convert, or are sold.
To assess healthcare financing and the sustainability of the healthcare network, we examined several indicators for both hospitals and community clinics.
INDICATOR SOUTH LA LA COUNTY WEST LA
County funding for PPP clinics per uninsured personxiv $27.12 $34.05 $65.36
Hospitals’ uncompensated care costs per adjusted patient dayxiii $3,338.94 $1,008.66 $1,024.87
Hospitals’ net revenue per adjusted patient dayxiii $1,970.19 $1,914.01 $2,592.16
Hospitals’ operating expenses per adjusted patient dayxiii $2,350.91 $2,082.26 $2,903.84
South LA hospitals provide three times as much uncompensated care per adjusted patient day as West LA and LA County hospitals. In 2006, providing care to the indigent and uninsured cost South LA hospitals $3,338.94 per adjusted patient day. By comparison, West LA hospitals provided $1,024.87 of uncompensated care; countywide the cost was $1,008.66.
Figure 11. Hospitals’ Uncompensated Care Costs per Adjusted Patient Days
Source: Office of Statewide Health Planning and Development, Hospital Annual Financial Profile Report, 2006
WestLA
22%
South LA
-65%
$0.00 $500.00
$1,000.00$1,500.00$2,000.00$2,500.00$3,000.00$3,500.00$4,000.00
South LA LA County West LA
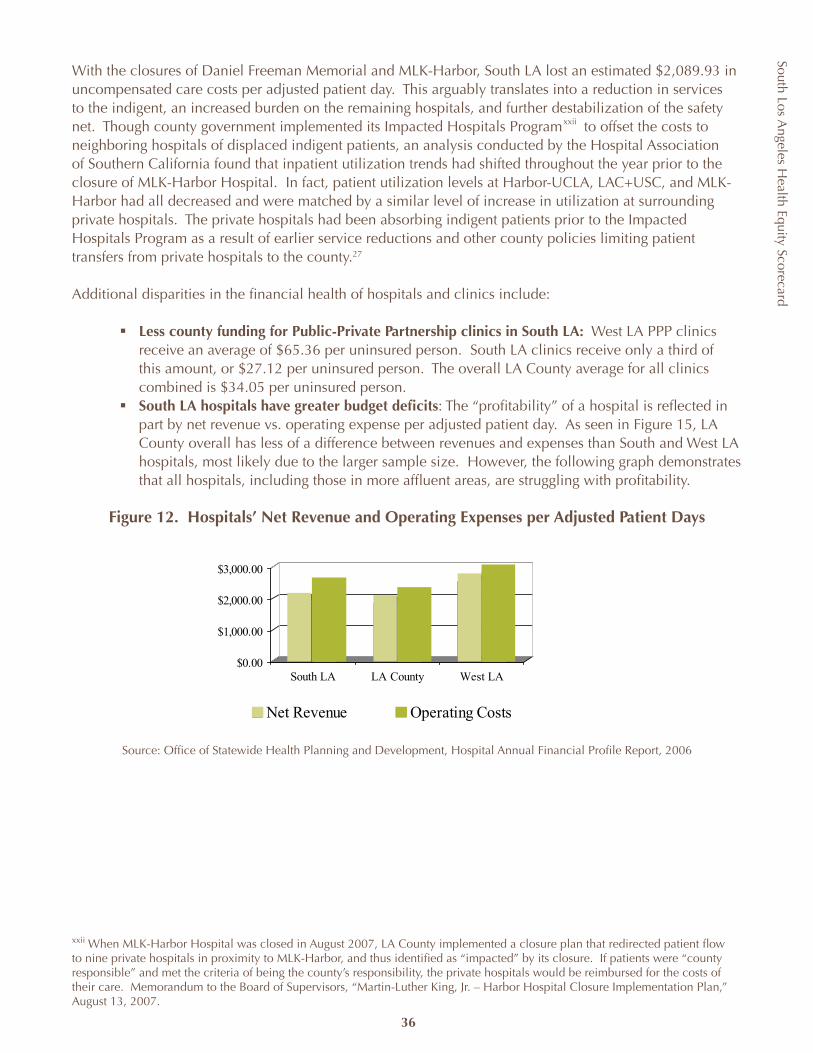
South Los Angeles H
ealth Equity Scorecard
36
With the closures of Daniel Freeman Memorial and MLK-Harbor, South LA lost an estimated $2,089.93 in uncompensated care costs per adjusted patient day. This arguably translates into a reduction in services to the indigent, an increased burden on the remaining hospitals, and further destabilization of the safety net. Though county government implemented its Impacted Hospitals Program to offset the costs to neighboring hospitals of displaced indigent patients, an analysis conducted by the Hospital Association of Southern California found that inpatient utilization trends had shifted throughout the year prior to the closure of MLK-Harbor Hospital. In fact, patient utilization levels at Harbor-UCLA, LAC+USC, and MLK-Harbor had all decreased and were matched by a similar level of increase in utilization at surrounding private hospitals. The private hospitals had been absorbing indigent patients prior to the Impacted Hospitals Program as a result of earlier service reductions and other county policies limiting patient transfers from private hospitals to the county.27
Additional disparities in the financial health of hospitals and clinics include:
Less county funding for Public-Private Partnership clinics in South LA:ß West LA PPP clinics receive an average of $65.36 per uninsured person. South LA clinics receive only a third of this amount, or $27.12 per uninsured person. The overall LA County average for all clinics combined is $34.05 per uninsured person.South LA hospitals have greater budget deficitsß : The “profitability” of a hospital is reflected in part by net revenue vs. operating expense per adjusted patient day. As seen in Figure 15, LA County overall has less of a difference between revenues and expenses than South and West LA hospitals, most likely due to the larger sample size. However, the following graph demonstrates that all hospitals, including those in more affluent areas, are struggling with profitability.
Figure 12. Hospitals’ Net Revenue and Operating Expenses per Adjusted Patient Days
Source: Office of Statewide Health Planning and Development, Hospital Annual Financial Profile Report, 2006
xxii When MLK-Harbor Hospital was closed in August 2007, LA County implemented a closure plan that redirected patient flow to nine private hospitals in proximity to MLK-Harbor, and thus identified as “impacted” by its closure. If patients were “county responsible” and met the criteria of being the county’s responsibility, the private hospitals would be reimbursed for the costs of their care. Memorandum to the Board of Supervisors, “Martin-Luther King, Jr. – Harbor Hospital Closure Implementation Plan,” August 13, 2007.
$0.00
$1,000.00
$2,000.00
$3,000.00
South LA LA County West LA
Net Revenue Operating Costs
xxii
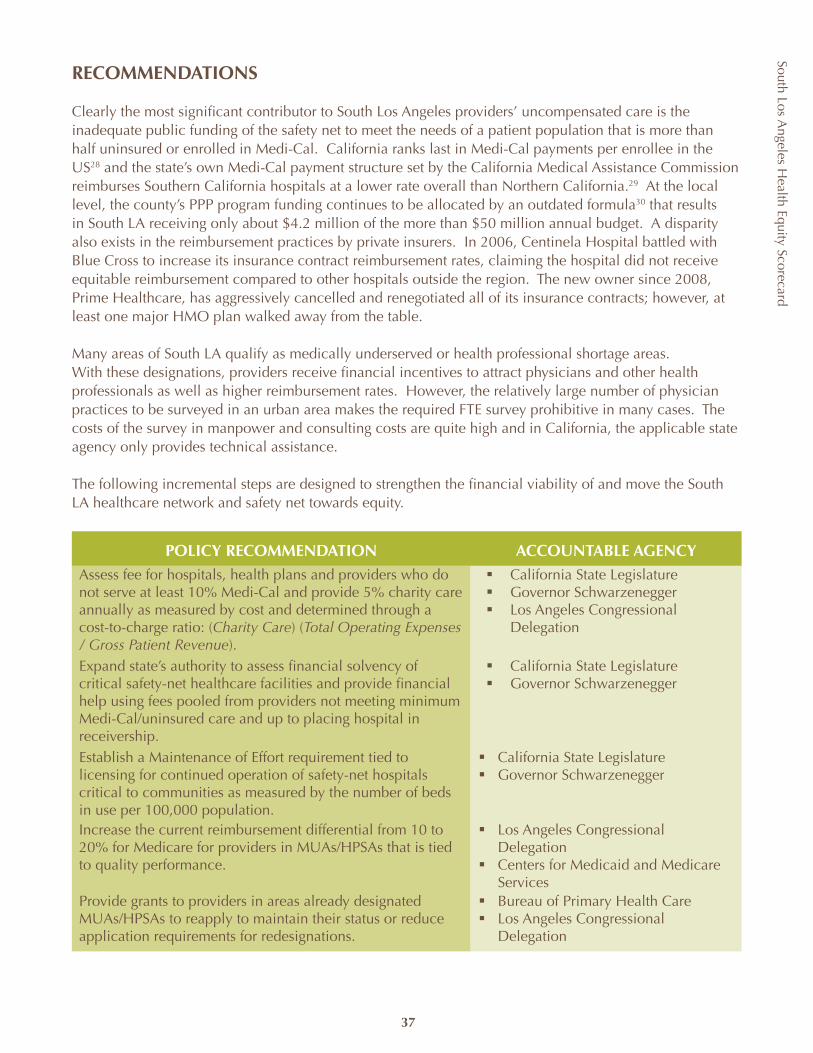
South Los Angeles H
ealth Equity Scorecard
37
RECOMMENDATIONS
Clearly the most significant contributor to South Los Angeles providers’ uncompensated care is the inadequate public funding of the safety net to meet the needs of a patient population that is more than half uninsured or enrolled in Medi-Cal. California ranks last in Medi-Cal payments per enrollee in the US28 and the state’s own Medi-Cal payment structure set by the California Medical Assistance Commission reimburses Southern California hospitals at a lower rate overall than Northern California.29 At the local level, the county’s PPP program funding continues to be allocated by an outdated formula30 that results in South LA receiving only about $4.2 million of the more than $50 million annual budget. A disparity also exists in the reimbursement practices by private insurers. In 2006, Centinela Hospital battled with Blue Cross to increase its insurance contract reimbursement rates, claiming the hospital did not receive equitable reimbursement compared to other hospitals outside the region. The new owner since 2008, Prime Healthcare, has aggressively cancelled and renegotiated all of its insurance contracts; however, at least one major HMO plan walked away from the table.
Many areas of South LA qualify as medically underserved or health professional shortage areas. With these designations, providers receive financial incentives to attract physicians and other health professionals as well as higher reimbursement rates. However, the relatively large number of physician practices to be surveyed in an urban area makes the required FTE survey prohibitive in many cases. The costs of the survey in manpower and consulting costs are quite high and in California, the applicable state agency only provides technical assistance.
The following incremental steps are designed to strengthen the financial viability of and move the South LA healthcare network and safety net towards equity.
POLICY RECOMMENDATION ACCOUNTABLE AGENCYAssess fee for hospitals, health plans and providers who do not serve at least 10% Medi-Cal and provide 5% charity care annually as measured by cost and determined through a cost-to-charge ratio: (Charity Care) (Total Operating Expenses / Gross Patient Revenue).
California State Legislatureß Governor Schwarzeneggerß Los Angeles Congressional ß Delegation
Expand state’s authority to assess financial solvency of critical safety-net healthcare facilities and provide financial help using fees pooled from providers not meeting minimum Medi-Cal/uninsured care and up to placing hospital in receivership.
California State Legislatureß Governor Schwarzeneggerß
Establish a Maintenance of Effort requirement tied to licensing for continued operation of safety-net hospitals critical to communities as measured by the number of beds in use per 100,000 population.
California State Legislatureß Governor Schwarzeneggerß
Increase the current reimbursement differential from 10 to 20% for Medicare for providers in MUAs/HPSAs that is tied to quality performance.
Los Angeles Congressional ß DelegationCenters for Medicaid and Medicare ß Services
Provide grants to providers in areas already designated MUAs/HPSAs to reapply to maintain their status or reduce application requirements for redesignations.
Bureau of Primary Health Careß Los Angeles Congressional ß Delegation
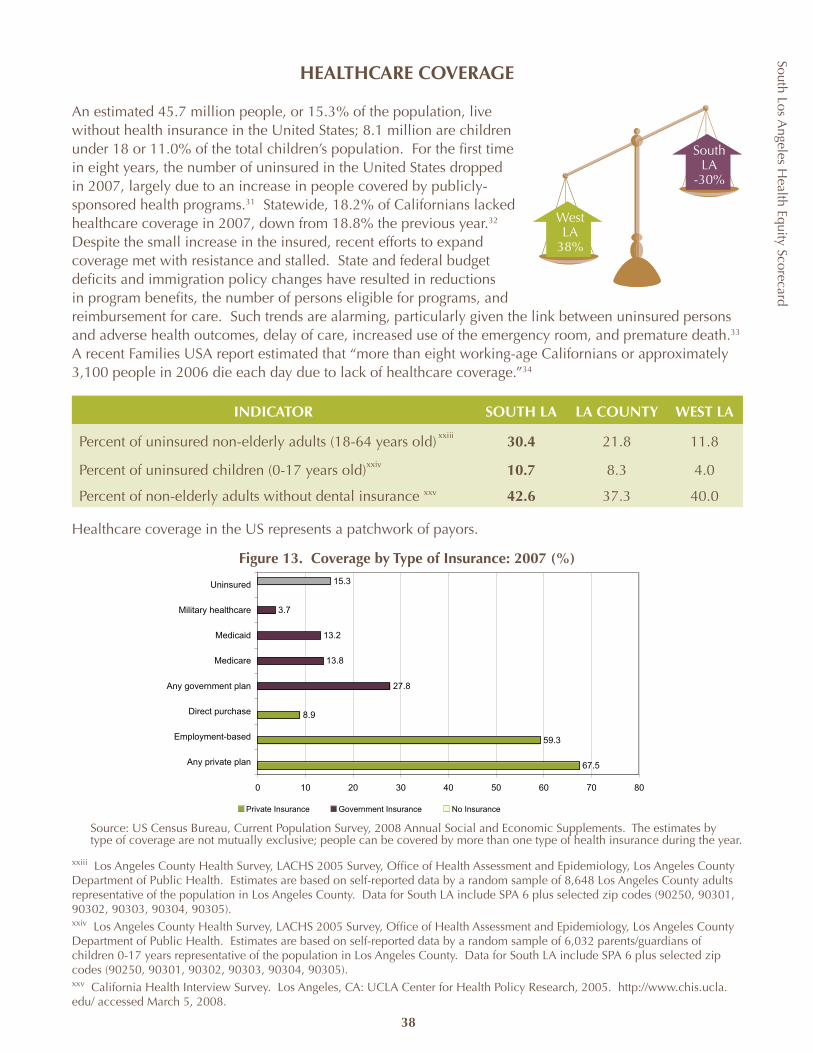
South Los Angeles H
ealth Equity Scorecard
38
HEALTHCARE COVERAGE
An estimated 45.7 million people, or 15.3% of the population, live without health insurance in the United States; 8.1 million are children under 18 or 11.0% of the total children’s population. For the first time in eight years, the number of uninsured in the United States dropped in 2007, largely due to an increase in people covered by publicly-sponsored health programs.31 Statewide, 18.2% of Californians lacked healthcare coverage in 2007, down from 18.8% the previous year.32 Despite the small increase in the insured, recent efforts to expand coverage met with resistance and stalled. State and federal budget deficits and immigration policy changes have resulted in reductions in program benefits, the number of persons eligible for programs, and reimbursement for care. Such trends are alarming, particularly given the link between uninsured persons and adverse health outcomes, delay of care, increased use of the emergency room, and premature death.33 A recent Families USA report estimated that “more than eight working-age Californians or approximately 3,100 people in 2006 die each day due to lack of healthcare coverage.”34
INDICATOR SOUTH LA LA COUNTY WEST LA
Percent of uninsured non-elderly adults (18-64 years old) 30.4 21.8 11.8
Percent of uninsured children (0-17 years old) 10.7 8.3 4.0
Percent of non-elderly adults without dental insurance 42.6 37.3 40.0
Healthcare coverage in the US represents a patchwork of payors.
Figure 13. Coverage by Type of Insurance: 2007 (%)
Source: US Census Bureau, Current Population Survey, 2008 Annual Social and Economic Supplements. The estimates by type of coverage are not mutually exclusive; people can be covered by more than one type of health insurance during the year.
67.5
59.3
8.9
27.8
13.8
13.2
3.7
15.3
0 10 20 30 40 50 60 70 80
Any private plan
Employment-based
Direct purchase
Any government plan
Medicare
Medicaid
Military healthcare
Uninsured
Private Insurance Government Insurance No Insurance
WestLA
38%
South LA
-30%
xxiii Los Angeles County Health Survey, LACHS 2005 Survey, Office of Health Assessment and Epidemiology, Los Angeles County Department of Public Health. Estimates are based on self-reported data by a random sample of 8,648 Los Angeles County adults representative of the population in Los Angeles County. Data for South LA include SPA 6 plus selected zip codes (90250, 90301, 90302, 90303, 90304, 90305).xxiv Los Angeles County Health Survey, LACHS 2005 Survey, Office of Health Assessment and Epidemiology, Los Angeles County Department of Public Health. Estimates are based on self-reported data by a random sample of 6,032 parents/guardians of children 0-17 years representative of the population in Los Angeles County. Data for South LA include SPA 6 plus selected zip codes (90250, 90301, 90302, 90303, 90304, 90305).xxv California Health Interview Survey. Los Angeles, CA: UCLA Center for Health Policy Research, 2005. http://www.chis.ucla.edu/ accessed March 5, 2008.
xxiii
xxiv
xxv
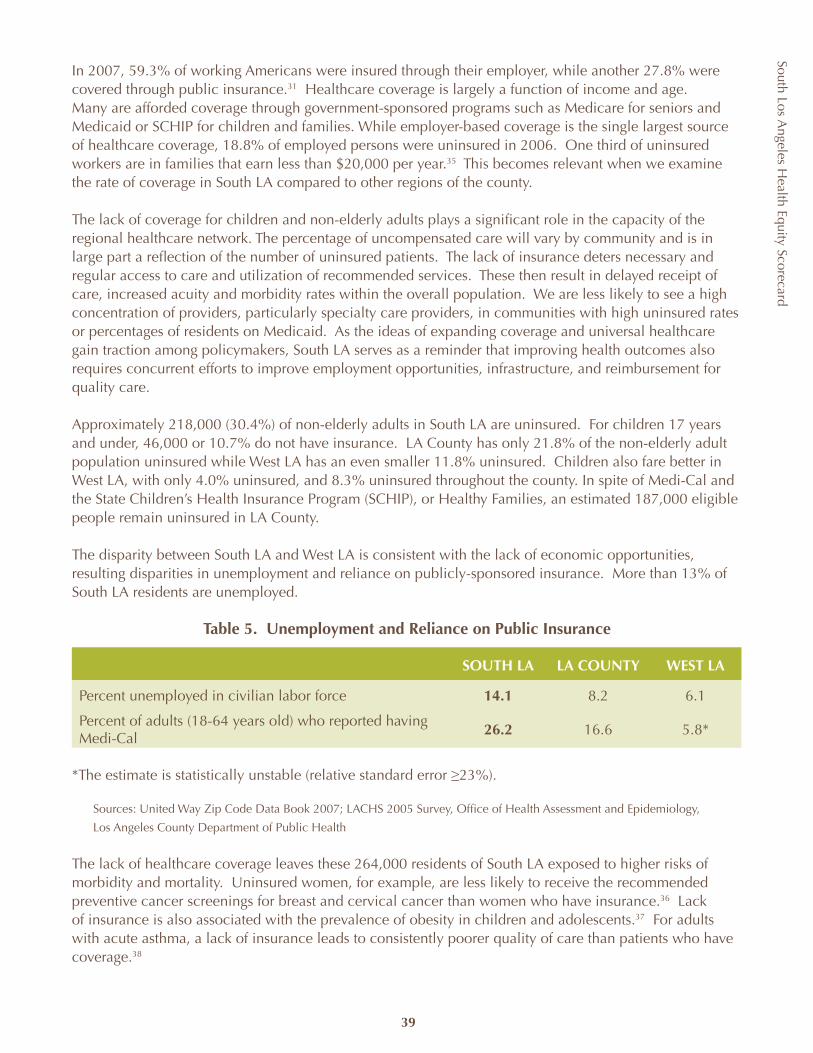
South Los Angeles H
ealth Equity Scorecard
39
In 2007, 59.3% of working Americans were insured through their employer, while another 27.8% were covered through public insurance.31 Healthcare coverage is largely a function of income and age. Many are afforded coverage through government-sponsored programs such as Medicare for seniors and Medicaid or SCHIP for children and families. While employer-based coverage is the single largest source of healthcare coverage, 18.8% of employed persons were uninsured in 2006. One third of uninsured workers are in families that earn less than $20,000 per year.35 This becomes relevant when we examine the rate of coverage in South LA compared to other regions of the county.
The lack of coverage for children and non-elderly adults plays a significant role in the capacity of the regional healthcare network. The percentage of uncompensated care will vary by community and is in large part a reflection of the number of uninsured patients. The lack of insurance deters necessary and regular access to care and utilization of recommended services. These then result in delayed receipt of care, increased acuity and morbidity rates within the overall population. We are less likely to see a high concentration of providers, particularly specialty care providers, in communities with high uninsured rates or percentages of residents on Medicaid. As the ideas of expanding coverage and universal healthcare gain traction among policymakers, South LA serves as a reminder that improving health outcomes also requires concurrent efforts to improve employment opportunities, infrastructure, and reimbursement for quality care.
Approximately 218,000 (30.4%) of non-elderly adults in South LA are uninsured. For children 17 years and under, 46,000 or 10.7% do not have insurance. LA County has only 21.8% of the non-elderly adult population uninsured while West LA has an even smaller 11.8% uninsured. Children also fare better in West LA, with only 4.0% uninsured, and 8.3% uninsured throughout the county. In spite of Medi-Cal and the State Children’s Health Insurance Program (SCHIP), or Healthy Families, an estimated 187,000 eligible people remain uninsured in LA County.
The disparity between South LA and West LA is consistent with the lack of economic opportunities, resulting disparities in unemployment and reliance on publicly-sponsored insurance. More than 13% of South LA residents are unemployed.
Table 5. Unemployment and Reliance on Public Insurance
SOUTH LA LA COUNTY WEST LA
Percent unemployed in civilian labor force 14.1 8.2 6.1
Percent of adults (18-64 years old) who reported having Medi-Cal
26.2 16.6 5.8*
*The estimate is statistically unstable (relative standard error ≥23%).
Sources: United Way Zip Code Data Book 2007; LACHS 2005 Survey, Office of Health Assessment and Epidemiology,
Los Angeles County Department of Public Health
The lack of healthcare coverage leaves these 264,000 residents of South LA exposed to higher risks of morbidity and mortality. Uninsured women, for example, are less likely to receive the recommended preventive cancer screenings for breast and cervical cancer than women who have insurance.36 Lack of insurance is also associated with the prevalence of obesity in children and adolescents.37 For adults with acute asthma, a lack of insurance leads to consistently poorer quality of care than patients who have coverage.38
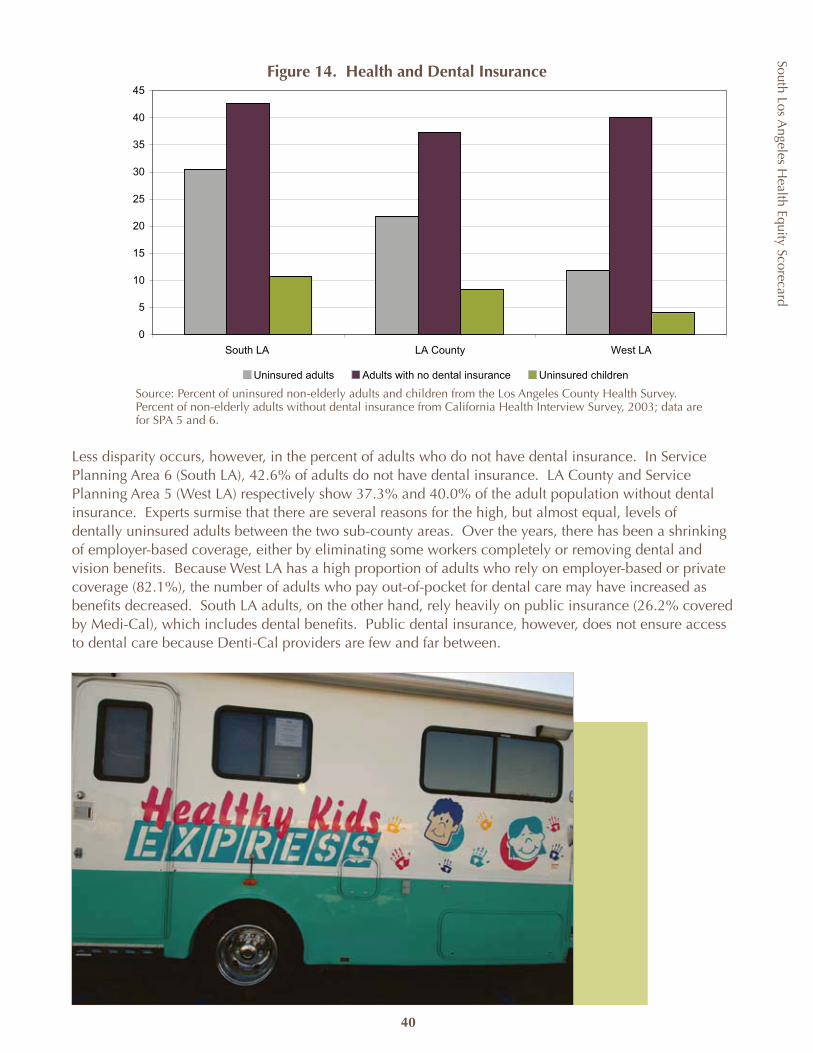
South Los Angeles H
ealth Equity Scorecard
40
0
5
10
15
20
25
30
35
40
45
South LA LA County West LA
Uninsured adults Adults with no dental insurance Uninsured children
Figure 14. Health and Dental Insurance
Source: Percent of uninsured non-elderly adults and children from the Los Angeles County Health Survey. Percent of non-elderly adults without dental insurance from California Health Interview Survey, 2003; data are for SPA 5 and 6.
Less disparity occurs, however, in the percent of adults who do not have dental insurance. In Service Planning Area 6 (South LA), 42.6% of adults do not have dental insurance. LA County and Service Planning Area 5 (West LA) respectively show 37.3% and 40.0% of the adult population without dental insurance. Experts surmise that there are several reasons for the high, but almost equal, levels of dentally uninsured adults between the two sub-county areas. Over the years, there has been a shrinking of employer-based coverage, either by eliminating some workers completely or removing dental and vision benefits. Because West LA has a high proportion of adults who rely on employer-based or private coverage (82.1%), the number of adults who pay out-of-pocket for dental care may have increased as benefits decreased. South LA adults, on the other hand, rely heavily on public insurance (26.2% covered by Medi-Cal), which includes dental benefits. Public dental insurance, however, does not ensure access to dental care because Denti-Cal providers are few and far between.
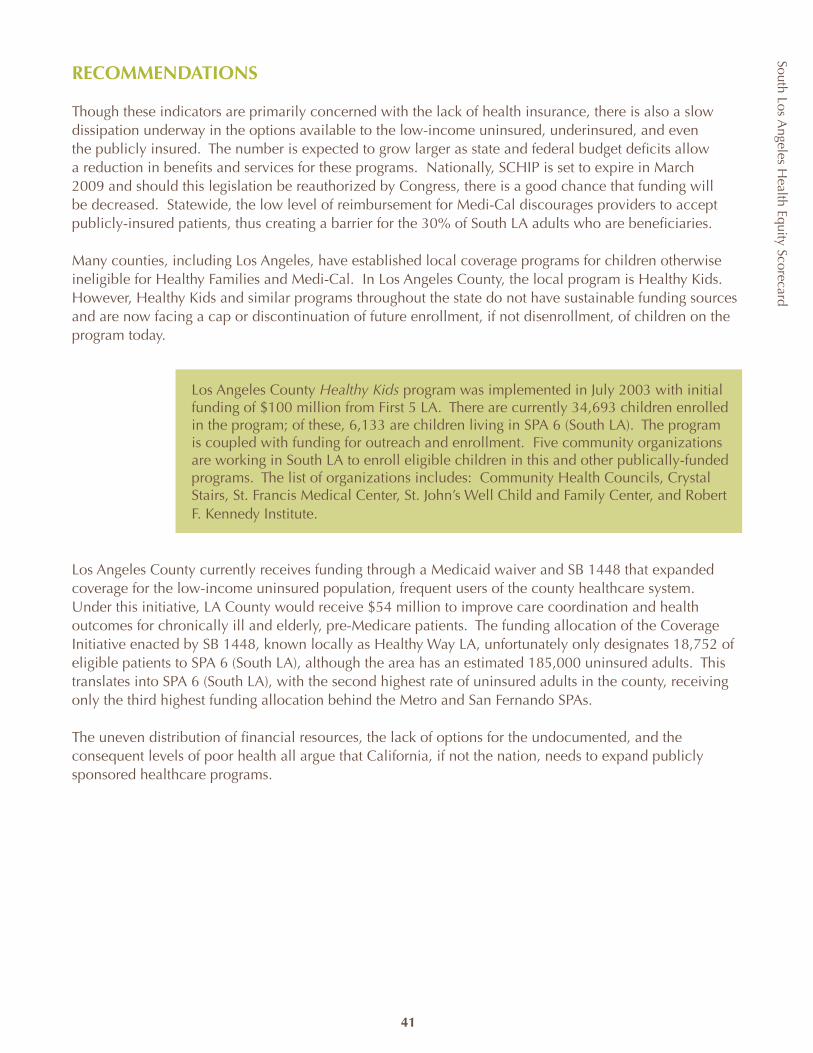
South Los Angeles H
ealth Equity Scorecard
41
RECOMMENDATIONS
Though these indicators are primarily concerned with the lack of health insurance, there is also a slow dissipation underway in the options available to the low-income uninsured, underinsured, and even the publicly insured. The number is expected to grow larger as state and federal budget deficits allow a reduction in benefits and services for these programs. Nationally, SCHIP is set to expire in March 2009 and should this legislation be reauthorized by Congress, there is a good chance that funding will be decreased. Statewide, the low level of reimbursement for Medi-Cal discourages providers to accept publicly-insured patients, thus creating a barrier for the 30% of South LA adults who are beneficiaries.
Many counties, including Los Angeles, have established local coverage programs for children otherwise ineligible for Healthy Families and Medi-Cal. In Los Angeles County, the local program is Healthy Kids. However, Healthy Kids and similar programs throughout the state do not have sustainable funding sources and are now facing a cap or discontinuation of future enrollment, if not disenrollment, of children on the program today.
Los Angeles County Healthy Kids program was implemented in July 2003 with initial funding of $100 million from First 5 LA. There are currently 34,693 children enrolled in the program; of these, 6,133 are children living in SPA 6 (South LA). The program is coupled with funding for outreach and enrollment. Five community organizations are working in South LA to enroll eligible children in this and other publically-funded programs. The list of organizations includes: Community Health Councils, Crystal Stairs, St. Francis Medical Center, St. John’s Well Child and Family Center, and Robert F. Kennedy Institute.
Los Angeles County currently receives funding through a Medicaid waiver and SB 1448 that expanded coverage for the low-income uninsured population, frequent users of the county healthcare system. Under this initiative, LA County would receive $54 million to improve care coordination and health outcomes for chronically ill and elderly, pre-Medicare patients. The funding allocation of the Coverage Initiative enacted by SB 1448, known locally as Healthy Way LA, unfortunately only designates 18,752 of eligible patients to SPA 6 (South LA), although the area has an estimated 185,000 uninsured adults. This translates into SPA 6 (South LA), with the second highest rate of uninsured adults in the county, receiving only the third highest funding allocation behind the Metro and San Fernando SPAs.
The uneven distribution of financial resources, the lack of options for the undocumented, and the consequent levels of poor health all argue that California, if not the nation, needs to expand publicly sponsored healthcare programs.
South Los Angeles H
ealth Equity Scorecard
42
Below are recommendations that were developed during the Scorecard Summit in June 2008 that seek to reduce the number of uninsured for South LA in the absence of state or national health reform.
POLICY RECOMMENDATION ACCOUNTABLE AGENCY
Expand the enrollment criteria under the Coverage Initiative (Healthy Way LA) to maximize participation in the program and increase the number of visits allotted to SPA 6 appropriate to the need.
ß Los Angeles County Board of Supervisorsß Los Angeles County Department of Health
Servicesß California Department of Health and Human
Services
Streamline enrollment systems and financial eligibility categories to reduce enrollment barriers and the number of eligible but not enrolled children and families.
ß California Department of Health Services/MRMIB
ß Los Angeles County Department of Health Services
Increase PPP dollars for dental, vision and mental health services for low-income uninsured populations.
ß Los Angeles County Board of Supervisorsß Los Angeles County Department of Health
Services
Expand eligibility for adults up to 133% FPL under Medi-Cal and Healthy Families.
ß Los Angeles Congressional Delegationß Governor Schwarzeneggerß Los Angeles County Board of Supervisorsß State of California Legislature
Maximize CHDP, emergency Medi-Cal and other funding streams to support children’s coverage.
ß California Department of Health Services
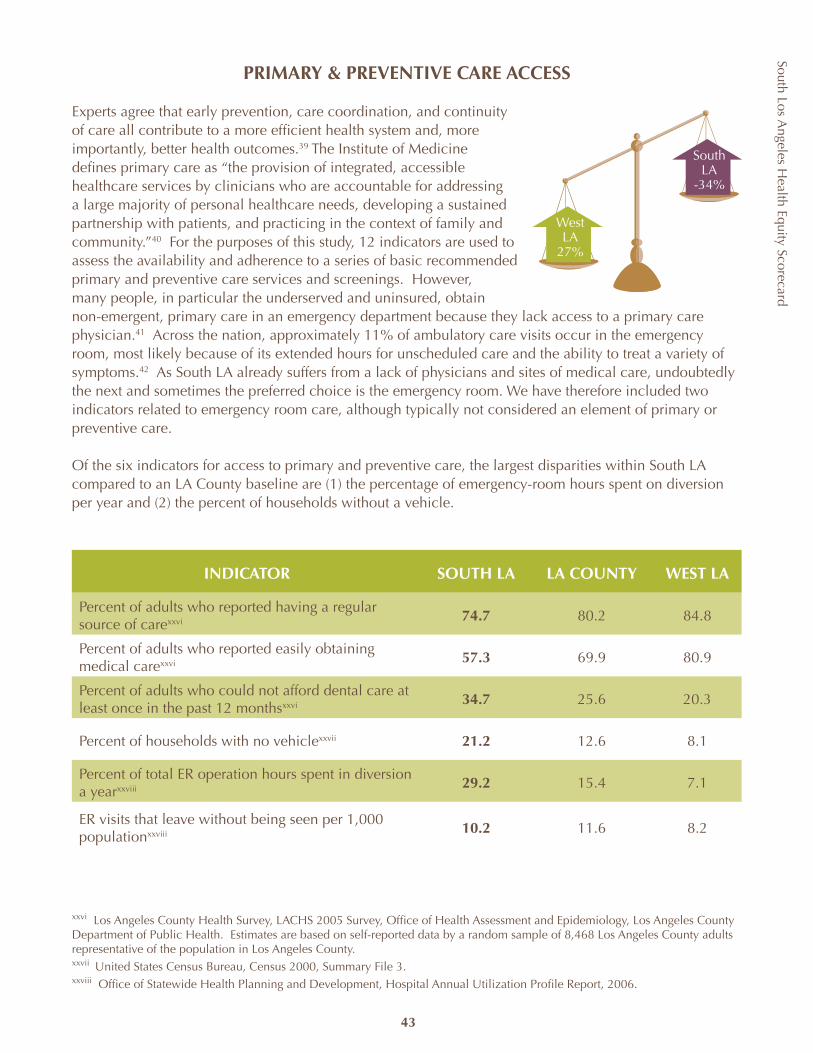
South Los Angeles H
ealth Equity Scorecard
43
PRIMARY & PREVENTIVE CARE ACCESS
Experts agree that early prevention, care coordination, and continuity of care all contribute to a more efficient health system and, more importantly, better health outcomes.39 The Institute of Medicine defines primary care as “the provision of integrated, accessible healthcare services by clinicians who are accountable for addressing a large majority of personal healthcare needs, developing a sustained partnership with patients, and practicing in the context of family and community.”40 For the purposes of this study, 12 indicators are used to assess the availability and adherence to a series of basic recommended primary and preventive care services and screenings. However, many people, in particular the underserved and uninsured, obtain non-emergent, primary care in an emergency department because they lack access to a primary care physician.41 Across the nation, approximately 11% of ambulatory care visits occur in the emergency room, most likely because of its extended hours for unscheduled care and the ability to treat a variety of symptoms.42 As South LA already suffers from a lack of physicians and sites of medical care, undoubtedly the next and sometimes the preferred choice is the emergency room. We have therefore included two indicators related to emergency room care, although typically not considered an element of primary or preventive care.
Of the six indicators for access to primary and preventive care, the largest disparities within South LA compared to an LA County baseline are (1) the percentage of emergency-room hours spent on diversion per year and (2) the percent of households without a vehicle.
INDICATOR SOUTH LA LA COUNTY WEST LA
Percent of adults who reported having a regular source of carexxvi 74.7 80.2 84.8
Percent of adults who reported easily obtaining medical carexxvi 57.3 69.9 80.9
Percent of adults who could not afford dental care at least once in the past 12 monthsxxvi 34.7 25.6 20.3
Percent of households with no vehiclexxvii 21.2 12.6 8.1
Percent of total ER operation hours spent in diversion a yearxxviii 29.2 15.4 7.1
ER visits that leave without being seen per 1,000 populationxxviii 10.2 11.6 8.2
WestLA
27%
South LA
-34%
xxvi Los Angeles County Health Survey, LACHS 2005 Survey, Office of Health Assessment and Epidemiology, Los Angeles County Department of Public Health. Estimates are based on self-reported data by a random sample of 8,468 Los Angeles County adults representative of the population in Los Angeles County.xxvii United States Census Bureau, Census 2000, Summary File 3.xxviii Office of Statewide Health Planning and Development, Hospital Annual Utilization Profile Report, 2006.
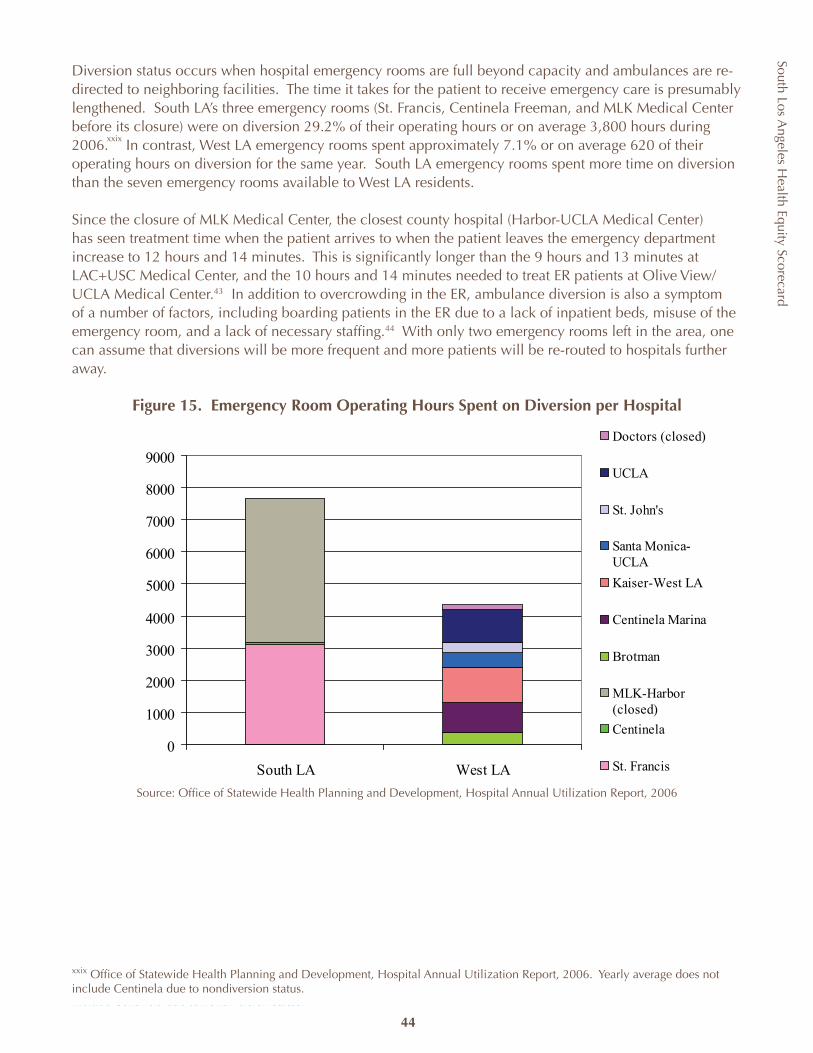
South Los Angeles H
ealth Equity Scorecard
44
Diversion status occurs when hospital emergency rooms are full beyond capacity and ambulances are re-directed to neighboring facilities. The time it takes for the patient to receive emergency care is presumably lengthened. South LA’s three emergency rooms (St. Francis, Centinela Freeman, and MLK Medical Center before its closure) were on diversion 29.2% of their operating hours or on average 3,800 hours during 2006. In contrast, West LA emergency rooms spent approximately 7.1% or on average 620 of their operating hours on diversion for the same year. South LA emergency rooms spent more time on diversion than the seven emergency rooms available to West LA residents.
Since the closure of MLK Medical Center, the closest county hospital (Harbor-UCLA Medical Center) has seen treatment time when the patient arrives to when the patient leaves the emergency department increase to 12 hours and 14 minutes. This is significantly longer than the 9 hours and 13 minutes at LAC+USC Medical Center, and the 10 hours and 14 minutes needed to treat ER patients at Olive View/UCLA Medical Center.43 In addition to overcrowding in the ER, ambulance diversion is also a symptom of a number of factors, including boarding patients in the ER due to a lack of inpatient beds, misuse of the emergency room, and a lack of necessary staffing.44 With only two emergency rooms left in the area, one can assume that diversions will be more frequent and more patients will be re-routed to hospitals further away.
Figure 15. Emergency Room Operating Hours Spent on Diversion per Hospital
Source: Office of Statewide Health Planning and Development, Hospital Annual Utilization Report, 2006
14 Office of Statewide Health Planning and Development, Hospital Annual Utilization Report, 2006. Yearly average does not include Centinela due to nondiversion status.
xxix
xxix Office of Statewide Health Planning and Development, Hospital Annual Utilization Report, 2006. Yearly average does not include Centinela due to nondiversion status.
0
1000
2000
3000
4000
5000
6000
7000
8000
9000
South LA West LA
Doctors (closed)
UCLA
St. John's
Santa Monica-UCLA
Kaiser-West LA
Centinela Marina
Brotman
MLK-Harbor(closed)
Centinela
St. Francis
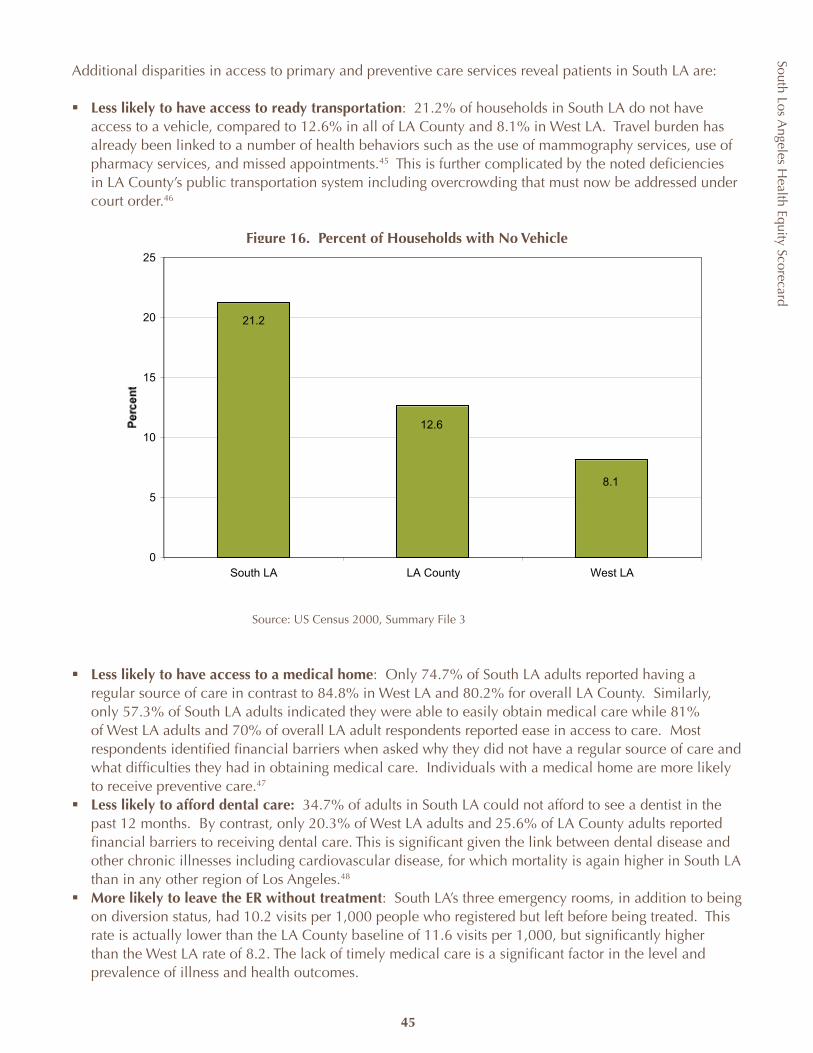
South Los Angeles H
ealth Equity Scorecard
45
Additional disparities in access to primary and preventive care services reveal patients in South LA are:
Less likely to have access to ready transportationß : 21.2% of households in South LA do not have access to a vehicle, compared to 12.6% in all of LA County and 8.1% in West LA. Travel burden has already been linked to a number of health behaviors such as the use of mammography services, use of pharmacy services, and missed appointments.45 This is further complicated by the noted deficiencies in LA County’s public transportation system including overcrowding that must now be addressed under court order.46
Figure 16. Percent of Households with No Vehicle
Source: US Census 2000, Summary File 3
Less likely to have access to a medical homeß : Only 74.7% of South LA adults reported having a regular source of care in contrast to 84.8% in West LA and 80.2% for overall LA County. Similarly, only 57.3% of South LA adults indicated they were able to easily obtain medical care while 81% of West LA adults and 70% of overall LA adult respondents reported ease in access to care. Most respondents identified financial barriers when asked why they did not have a regular source of care and what difficulties they had in obtaining medical care. Individuals with a medical home are more likely to receive preventive care.47
Less likely to afford dental care:ß 34.7% of adults in South LA could not afford to see a dentist in the past 12 months. By contrast, only 20.3% of West LA adults and 25.6% of LA County adults reported financial barriers to receiving dental care. This is significant given the link between dental disease and other chronic illnesses including cardiovascular disease, for which mortality is again higher in South LA than in any other region of Los Angeles.48
More likely to leave the ER without treatmentß : South LA’s three emergency rooms, in addition to being on diversion status, had 10.2 visits per 1,000 people who registered but left before being treated. This rate is actually lower than the LA County baseline of 11.6 visits per 1,000, but significantly higher than the West LA rate of 8.2. The lack of timely medical care is a significant factor in the level and prevalence of illness and health outcomes.
21.2
12.6
8.1
0
5
10
15
20
25
South LA LA County West LA
South Los Angeles H
ealth Equity Scorecard
46
RECOMMENDATIONS
In 1995, Los Angeles County applied for and received a Section 1115 Medicaid Waiver that called for a restructuring of the county’s health services delivery system by shifting patient care out of financially-burdened hospitals and into community-based, outpatient care settings focused on primary and preventive services.49 The crisis and bailout gave rise to the closure of a number of county clinics and in turn, the establishment of the Public Private Partnerships between the county and primary care safety-net providers.
There are currently 57 PPP providers with over 100 different sites throughout LA County. Thirteen providers are located in South LA. Seven of these have formed the Southside Coalition of Community Health Centers. The Coalition clinics offer primary and specialty care services, including dental care, and conducted more than 300,000 patient visits in 2006.
Since then, the county has continued to reduce services in public settings and shift care for the uninsured into the private sector. In the summer of 2002, the Board of Supervisors approved a redesign of the health services system that included the closure of 11 county health centers and converted the High Desert Hospital in Antelope Valley into a Multi-service Ambulatory Care Center (MACC). This redesign was necessary in light of budget deficits that called for cost savings and better management of limited resources. More recently, the county has again proposed the idea of shifting all primary care services to the PPP clinics in order to provide a stable health services budget. This privatization plan is still under study with a public hearing scheduled for December 2008, with an updated plan scheduled for board action in January 2009.
Clearly, these service reductions, added to the barriers of poverty, culture, linguistics and transportation, present significant hurdles to the uninsured population in accessing recommended, regular preventive and primary care. In order to reduce the high rates of chronic illnesses, targeted expansion of primary and preventive care access for the uninsured is necessary.
POLICY RECOMMENDATION ACCOUNTABLE AGENCY Expand access to and funding for urgent care centers including:ß Retain and allocate SB 474 funds and seek
federal match ß Expand services at the MLK MACC and/or
PPP clinics to provide 24hour/7day week serviceß Increase PPP clinic funding.
ß Los Angeles Congressional Delegationß Los Angeles County Board of Supervisorsß California State Legislature
Expand funding for oral health education and prevention programs to:ß Increase number of patient advisors and
interpretersß Increase outreach and education at WIC,
preschools and childcare settingsß Develop media campaigns by public health
and community-based agenciesß Train pediatricians and general medicine to
educate patients.
California State Legislatureß California Department of Public Healthß Los Angeles Congressional Delegationß LA County Public Health ß
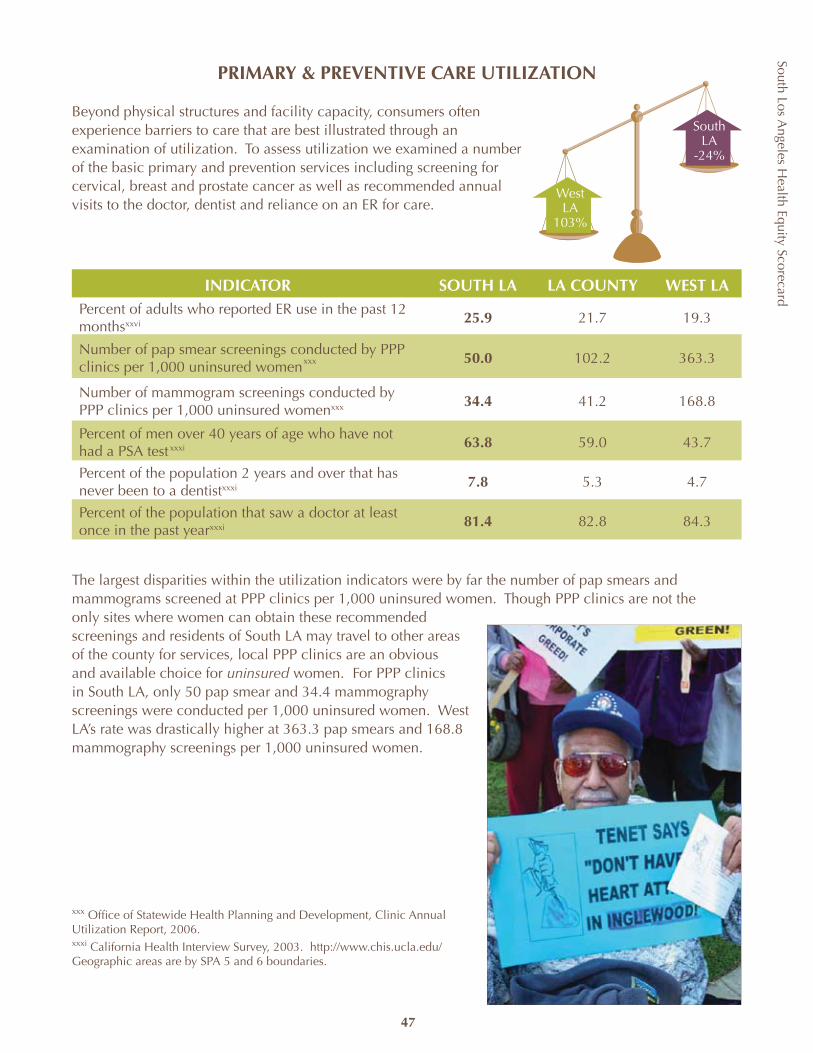
South Los Angeles H
ealth Equity Scorecard
47
PRIMARY & PREVENTIVE CARE UTILIZATION
Beyond physical structures and facility capacity, consumers often experience barriers to care that are best illustrated through an examination of utilization. To assess utilization we examined a number of the basic primary and prevention services including screening for cervical, breast and prostate cancer as well as recommended annual visits to the doctor, dentist and reliance on an ER for care.
INDICATOR SOUTH LA LA COUNTY WEST LA Percent of adults who reported ER use in the past 12 monthsxxvi 25.9 21.7 19.3
Number of pap smear screenings conducted by PPP clinics per 1,000 uninsured women
50.0 102.2 363.3
Number of mammogram screenings conducted by PPP clinics per 1,000 uninsured womenxxx 34.4 41.2 168.8
Percent of men over 40 years of age who have not had a PSA test
63.8 59.0 43.7
Percent of the population 2 years and over that has never been to a dentistxxxi 7.8 5.3 4.7
Percent of the population that saw a doctor at least once in the past yearxxxi 81.4 82.8 84.3
The largest disparities within the utilization indicators were by far the number of pap smears and mammograms screened at PPP clinics per 1,000 uninsured women. Though PPP clinics are not the only sites where women can obtain these recommended screenings and residents of South LA may travel to other areas of the county for services, local PPP clinics are an obvious and available choice for uninsured women. For PPP clinics in South LA, only 50 pap smear and 34.4 mammography screenings were conducted per 1,000 uninsured women. West LA’s rate was drastically higher at 363.3 pap smears and 168.8 mammography screenings per 1,000 uninsured women.
WestLA
103%
South LA
-24%
xxxi
xxx
xxx Office of Statewide Health Planning and Development, Clinic Annual Utilization Report, 2006.xxxi California Health Interview Survey, 2003. http://www.chis.ucla.edu/ Geographic areas are by SPA 5 and 6 boundaries.
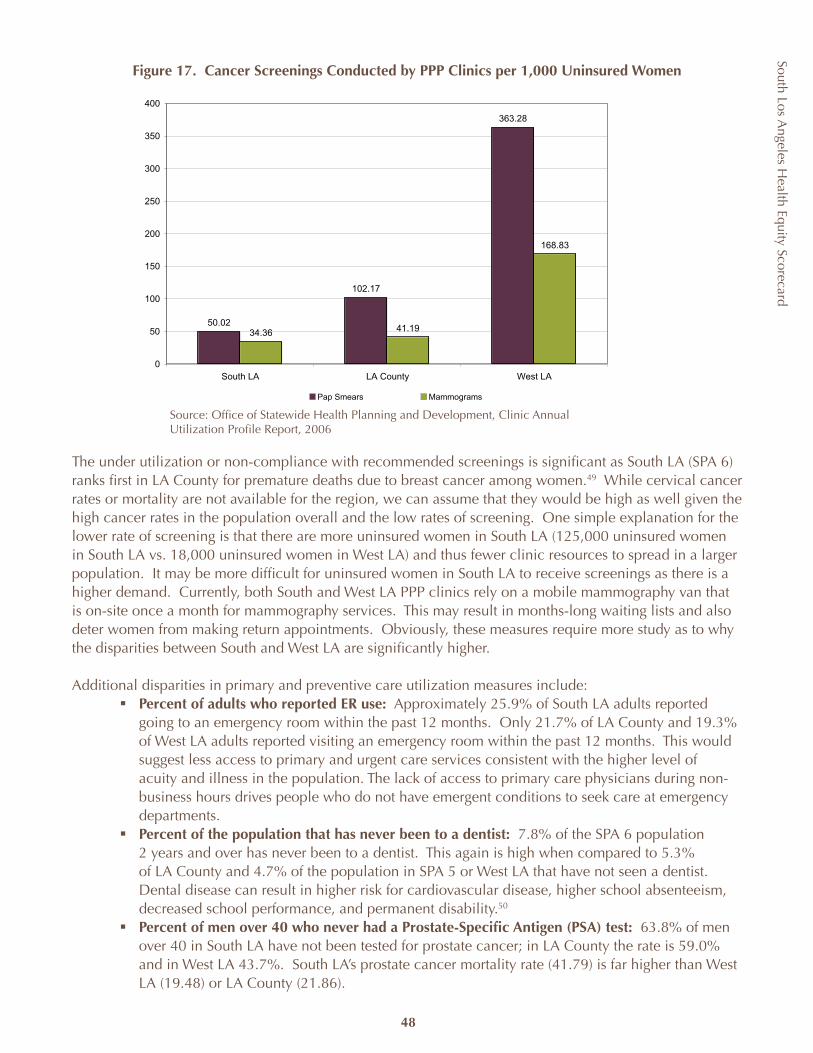
South Los Angeles H
ealth Equity Scorecard
48
50.02
102.17
363.28
34.36 41.19
168.83
0
50
100
150
200
250
300
350
400
South LA LA County West LA
Pap Smears Mammograms
Figure 17. Cancer Screenings Conducted by PPP Clinics per 1,000 Uninsured Women
The under utilization or non-compliance with recommended screenings is significant as South LA (SPA 6) ranks first in LA County for premature deaths due to breast cancer among women.49 While cervical cancer rates or mortality are not available for the region, we can assume that they would be high as well given the high cancer rates in the population overall and the low rates of screening. One simple explanation for the lower rate of screening is that there are more uninsured women in South LA (125,000 uninsured women in South LA vs. 18,000 uninsured women in West LA) and thus fewer clinic resources to spread in a larger population. It may be more difficult for uninsured women in South LA to receive screenings as there is a higher demand. Currently, both South and West LA PPP clinics rely on a mobile mammography van that is on-site once a month for mammography services. This may result in months-long waiting lists and also deter women from making return appointments. Obviously, these measures require more study as to why the disparities between South and West LA are significantly higher.
Additional disparities in primary and preventive care utilization measures include:Percent of adults who reported ER use:ß Approximately 25.9% of South LA adults reported going to an emergency room within the past 12 months. Only 21.7% of LA County and 19.3% of West LA adults reported visiting an emergency room within the past 12 months. This would suggest less access to primary and urgent care services consistent with the higher level of acuity and illness in the population. The lack of access to primary care physicians during non-business hours drives people who do not have emergent conditions to seek care at emergency departments.Percent of the population that has never been to a dentist:ß 7.8% of the SPA 6 population 2 years and over has never been to a dentist. This again is high when compared to 5.3% of LA County and 4.7% of the population in SPA 5 or West LA that have not seen a dentist. Dental disease can result in higher risk for cardiovascular disease, higher school absenteeism, decreased school performance, and permanent disability.50 Percent of men over 40 who never had a Prostate-Specific Antigen (PSA) test: ß 63.8% of men over 40 in South LA have not been tested for prostate cancer; in LA County the rate is 59.0% and in West LA 43.7%. South LA’s prostate cancer mortality rate (41.79) is far higher than West LA (19.48) or LA County (21.86).
Source: Office of Statewide Health Planning and Development, Clinic Annual Utilization Profile Report, 2006
South Los Angeles H
ealth Equity Scorecard
49
RECOMMENDATIONS A lack of healthcare coverage and capacity notwithstanding, South LA residents face a number of additional obstacles to obtaining primary and preventive care services, thus complicating the effort of refocusing attention and utilization from costly specialty, inpatient and emergent care to primary and preventive care. Financial resources, language proficiency, personal and cultural beliefs and practices, and social networks have all been found to contribute to an individual’s ready access and utilization of recommended medical services.51 Similar to what occurred in 1995 following the announcement to close many county clinics, outpatient services at county run clinics in South LA have declined by 130,000 visits or 21% from 2002-03 to 2005-06 as a result of the MLK crisis. The 13,000 visit increase across all PPP clinics during the same time period was not nearly enough to make up the difference. 52 The healthcare system remains oriented toward more costly, tertiary care rather than primary, preventative care. Public and private payors cap or do not reimburse certain services or programs to prevent and manage chronic diseases. While public insurance and HMO coverage have helped to eliminate financial barriers to mammography, women 40–64 years with public coverage still lag behind their privately insured counterparts in using mammography and out-of-pocket costs remain a barrier to use for uninsured women.53 In LA County, uninsured patients typically wait much longer than the insured to get referred for specialty care in the overwhelmed public healthcare system.
To combat the lack of primary and specialty care services at traditional healthcare providers, local community-based organizations have developed a wide-range of health education programs. Two examples are:
Mothernet’s ß Take Charge! chronic disease program in Compton incorporates family-focused in-home education and case management; healthcare coverage enrollment; and access services. No children participating in the program sought emergency treatment, compared to 80% in the year before being in the program. 87% of diabetic program participants adhered to treatment regimens including glucose monitoring, diet, stress reduction and standards of care.Theß Best Babies Collaboratives implement service plans in their community that are designed to reduce disparities and improve pregnancy and birth outcomes.
Many of South LA’s hospital-based programs focusing on heart disease, diabetes and cancer have dwindled. South LA community clinics struggle to subsidize education programs through a patchwork of grants and patient reimbursement from other services. Federal commitment to community clinics, hampered by competing budget priorities and the economy, has not lived up to prior years’ promise to make significant expansions. The current budget only contains a $27 million increase for community health centers (Section 330 program, etc).54 The use of promatoras or community health workers serves as an alternative or complement to the traditional medical system of clinic and hospitals, yet credentialing and recognition by the mainstream health systems limit sustainability and expansion.
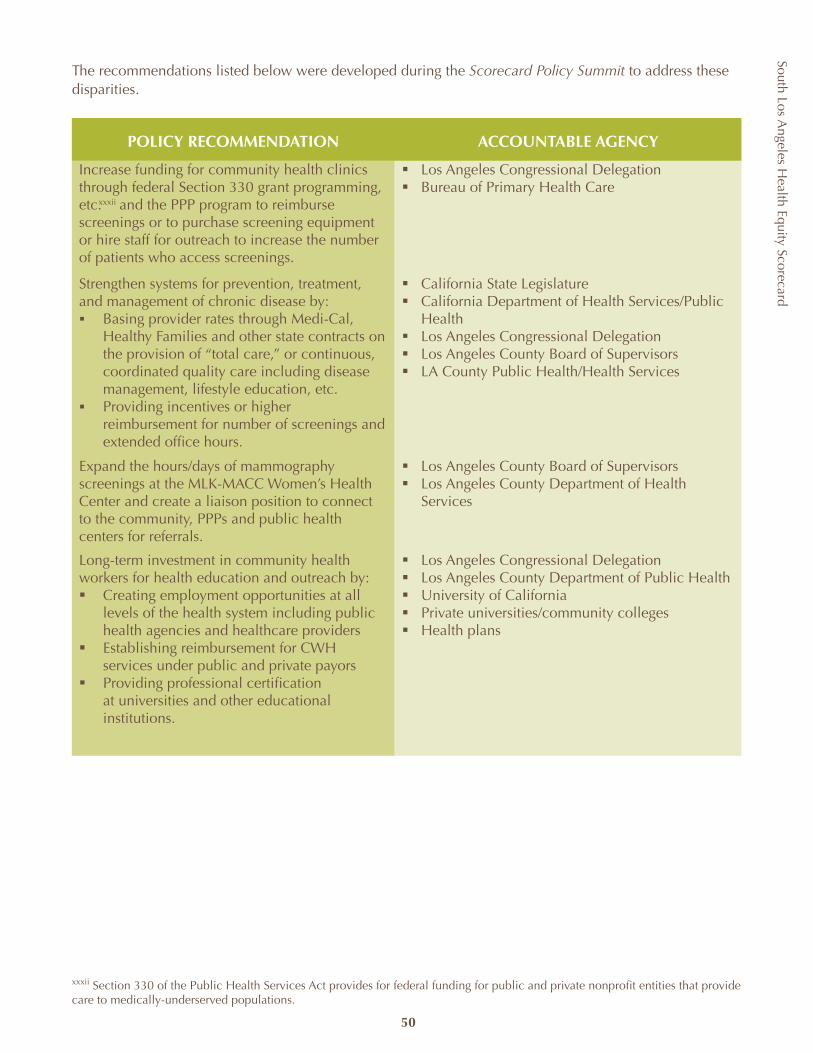
South Los Angeles H
ealth Equity Scorecard
50
The recommendations listed below were developed during the Scorecard Policy Summit to address these disparities.
POLICY RECOMMENDATION ACCOUNTABLE AGENCY
Increase funding for community health clinics through federal Section 330 grant programming, etc. and the PPP program to reimburse screenings or to purchase screening equipment or hire staff for outreach to increase the number of patients who access screenings.
Los Angeles Congressional Delegationß Bureau of Primary Health Careß
Strengthen systems for prevention, treatment, and management of chronic disease by:
Basing provider rates through Medi-Cal, ß Healthy Families and other state contracts on the provision of “total care,” or continuous, coordinated quality care including disease management, lifestyle education, etc.Providing incentives or higher ß reimbursement for number of screenings and extended office hours.
California State Legislatureß California Department of Health Services/Public ß HealthLos Angeles Congressional Delegationß Los Angeles County Board of Supervisorsß LA County Public Health/Health Servicesß
Expand the hours/days of mammography screenings at the MLK-MACC Women’s Health Center and create a liaison position to connect to the community, PPPs and public health centers for referrals.
Los Angeles County Board of Supervisorsß Los Angeles County Department of Health ß Services
Long-term investment in community health workers for health education and outreach by:ß Creating employment opportunities at all
levels of the health system including public health agencies and healthcare providers
ß Establishing reimbursement for CWH services under public and private payors
ß Providing professional certification at universities and other educational institutions.
ß Los Angeles Congressional Delegation ß Los Angeles County Department of Public Healthß University of Californiaß Private universities/community collegesß Health plans
xxxii
xxxii Section 330 of the Public Health Services Act provides for federal funding for public and private nonprofit entities that provide care to medically-underserved populations.
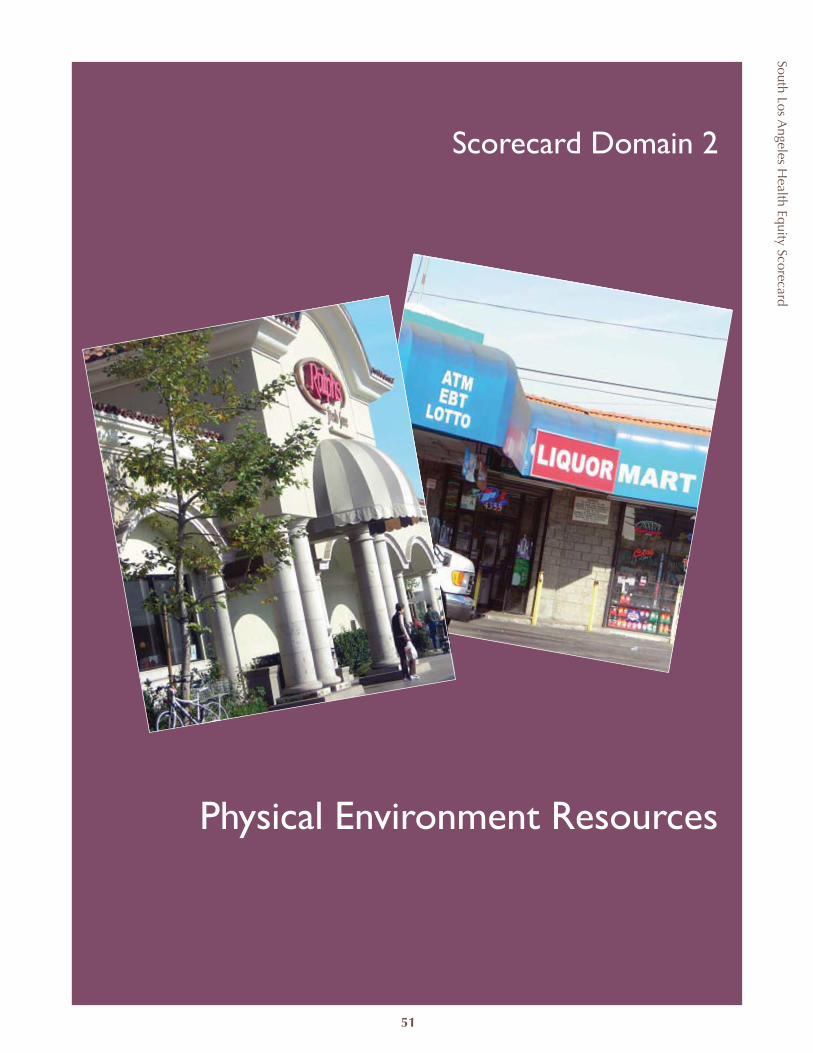
51
South Los Angeles H
ealth Equity Scorecard
Physical Environment Resources
Scorecard Domain 2
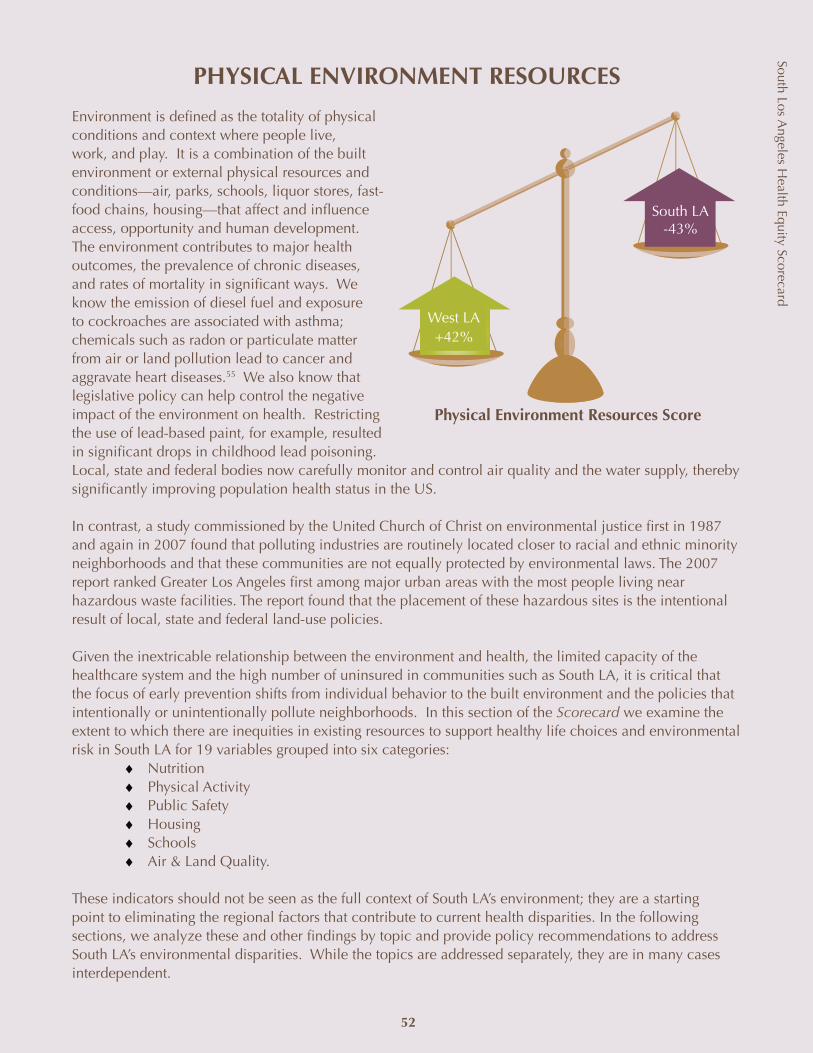
PHYSICAL ENVIRONMENT RESOURCES
Environment is defined as the totality of physical conditions and context where people live, work, and play. It is a combination of the built environment or external physical resources and conditions—air, parks, schools, liquor stores, fast- food chains, housing—that affect and influence access, opportunity and human development. The environment contributes to major health outcomes, the prevalence of chronic diseases, and rates of mortality in significant ways. We know the emission of diesel fuel and exposure to cockroaches are associated with asthma; chemicals such as radon or particulate matter from air or land pollution lead to cancer and aggravate heart diseases.55 We also know that legislative policy can help control the negative impact of the environment on health. Restricting the use of lead-based paint, for example, resulted in significant drops in childhood lead poisoning. Local, state and federal bodies now carefully monitor and control air quality and the water supply, thereby significantly improving population health status in the US.
In contrast, a study commissioned by the United Church of Christ on environmental justice first in 1987 and again in 2007 found that polluting industries are routinely located closer to racial and ethnic minority neighborhoods and that these communities are not equally protected by environmental laws. The 2007 report ranked Greater Los Angeles first among major urban areas with the most people living near hazardous waste facilities. The report found that the placement of these hazardous sites is the intentional result of local, state and federal land-use policies.
Given the inextricable relationship between the environment and health, the limited capacity of the healthcare system and the high number of uninsured in communities such as South LA, it is critical that the focus of early prevention shifts from individual behavior to the built environment and the policies that intentionally or unintentionally pollute neighborhoods. In this section of the Scorecard we examine the extent to which there are inequities in existing resources to support healthy life choices and environmental risk in South LA for 19 variables grouped into six categories:
NutritionPhysical ActivityPublic SafetyHousingSchools Air & Land Quality.
These indicators should not be seen as the full context of South LA’s environment; they are a starting point to eliminating the regional factors that contribute to current health disparities. In the following sections, we analyze these and other findings by topic and provide policy recommendations to address South LA’s environmental disparities. While the topics are addressed separately, they are in many cases interdependent.
Physical Environment Resources Score
West LA +42%
South LA -43%
52
South Los Angeles H
ealth Equity Scorecard
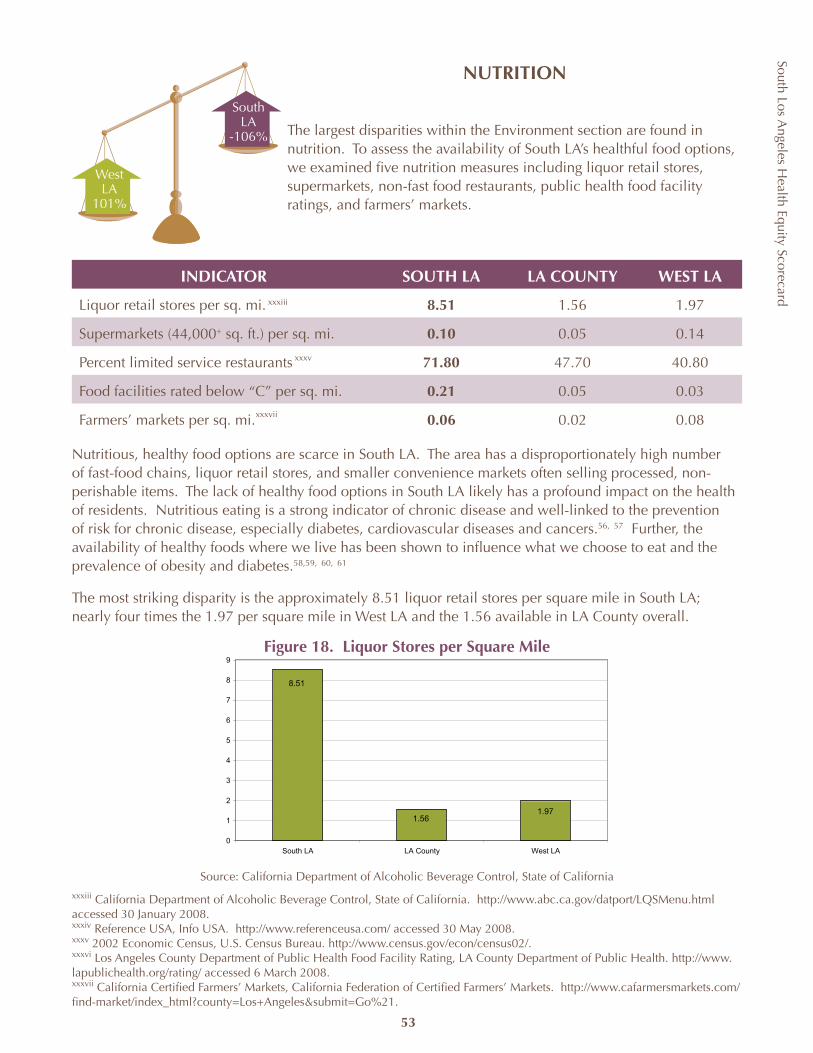
South Los Angeles H
ealth Equity Scorecard
53
WestLA
101%
South LA
-106%
xxxiii
xxxiv
xxxv
xxxvii
xxxvi
xxxiii California Department of Alcoholic Beverage Control, State of California. http://www.abc.ca.gov/datport/LQSMenu.html accessed 30 January 2008.xxxiv Reference USA, Info USA. http://www.referenceusa.com/ accessed 30 May 2008. xxxv 2002 Economic Census, U.S. Census Bureau. http://www.census.gov/econ/census02/.xxxvi Los Angeles County Department of Public Health Food Facility Rating, LA County Department of Public Health. http://www.lapublichealth.org/rating/ accessed 6 March 2008.xxxvii California Certified Farmers’ Markets, California Federation of Certified Farmers’ Markets. http://www.cafarmersmarkets.com/find-market/index_html?county=Los+Angeles&submit=Go%21.
Source: California Department of Alcoholic Beverage Control, State of California
1.971.56
8.51
0
1
2
3
4
5
6
7
8
9
South LA LA County West LA
NUTRITION
The largest disparities within the Environment section are found in nutrition. To assess the availability of South LA’s healthful food options, we examined five nutrition measures including liquor retail stores, supermarkets, non-fast food restaurants, public health food facility ratings, and farmers’ markets.
INDICATOR SOUTH LA LA COUNTY WEST LA
Liquor retail stores per sq. mi. 8.51 1.56 1.97
Supermarkets (44,000+ sq. ft.) per sq. mi. 0.10 0.05 0.14
Percent limited service restaurants 71.80 47.70 40.80
Food facilities rated below “C” per sq. mi. 0.21 0.05 0.03
Farmers’ markets per sq. mi. 0.06 0.02 0.08
Nutritious, healthy food options are scarce in South LA. The area has a disproportionately high number of fast-food chains, liquor retail stores, and smaller convenience markets often selling processed, non-perishable items. The lack of healthy food options in South LA likely has a profound impact on the health of residents. Nutritious eating is a strong indicator of chronic disease and well-linked to the prevention of risk for chronic disease, especially diabetes, cardiovascular diseases and cancers.56, 57 Further, the availability of healthy foods where we live has been shown to influence what we choose to eat and the prevalence of obesity and diabetes.58,59, 60, 61
The most striking disparity is the approximately 8.51 liquor retail stores per square mile in South LA; nearly four times the 1.97 per square mile in West LA and the 1.56 available in LA County overall.
Figure 18. Liquor Stores per Square Mile
South Los Angeles H
ealth Equity Scorecard
54
Community Coalition, a local South LA CBO, has long-championed a reduction in the 200 liquor stores within South LA to reduce crime near stores. Working with the city to target the closing of individual stores is a long process and requires continuous community pressure to accomplish.62
The negative health effects of alcohol are numerous. Consuming alcohol, particularly large amounts, harms all facets of the body’s nutritional process, which may lead to hypoglycemia and increased risk of liver disease and impaired brain function from the organs being malnourished.63, 64 Risky sexual behavior, infant mortality, unintentional injuries and violence are also associated with too much alcohol consumption.65 Studies have shown a significant relationship between the physical availability of alcohol and alcohol problems. Even small increases in the availability of alcohol lead to increased use; alcohol use has been associated with violence.66 Because research has linked increased availability of alcohol to higher sales, the World Health Organization supports limiting alcohol outlets to reduce negative outcomes.67
Many studies have shown that regularly eating fast food can lead to higher body-mass index scores. Limited service or fast-food restaurants comprise 71.8 percent of the restaurants in South LA, compared to 40.8% of West LA restaurants and 47.7% of LA County restaurants. The rate of obesity among children in South LA is 28.8% compared to 17.6% obesity among children in West LA and 23.3% for all children in the county. To curb the proliferation of fast food, the LA City Council adopted an interim ordinance placing a moratorium on new fast-food restaurants in South LA to provide an opportunity to attract more sit-down restaurants.68 Fast-food restaurants frequently offer high calorie menus and bargain priced large portions. Research has shown that consumers presented with menu labeling at the point of service make healthier food choices. California passed a law in 2008 requiring menu labeling in chain restaurants.
Retail food outlets and grocery stores tell an equally alarming story. Research has found that the presence of a supermarket in a neighborhood is linked to higher fruit and vegetable consumption.69 For each additional supermarket, the likelihood of residents meeting nutritional guidelines increases by one-third.70 The number of quality food retailers falls short of the community health need. We examined large stores—44,000 square feet or larger—as a proxy for access to a larger variety of fresh food products. However, of the 0.10 supermarkets per square mile that are over 44,000 square feet in size, many in South LA are value warehouses. West LA, with 0.14 supermarkets per square mile, has a larger selection of stores offering organic foods and healthier products. A study conducted by CHC of food retailers found fewer markets serve more people in South Los Angeles: 5,957 persons per store in South LA vs 3,763 persons per store in West LA.71 The study examined 261 local food retailers in South LA and 69stores in West LA, documenting notable differences in the availability of health-supporting foods. Freshproduce, whole grain bread, and nonfat milk were less likely to be found in South LA than in the West LAcommunity.72
xxxviii Los Angeles County Health Survey, LACHS 1999 & 2005 Surveys, Office of Health Assessment and Epidemiology, Los Angeles County Department of Public Health. 1999 estimates are based on self-reported data by a random sample of 8,354 Los Angeles County adults representative of the population in Los Angeles County.
xxxviii
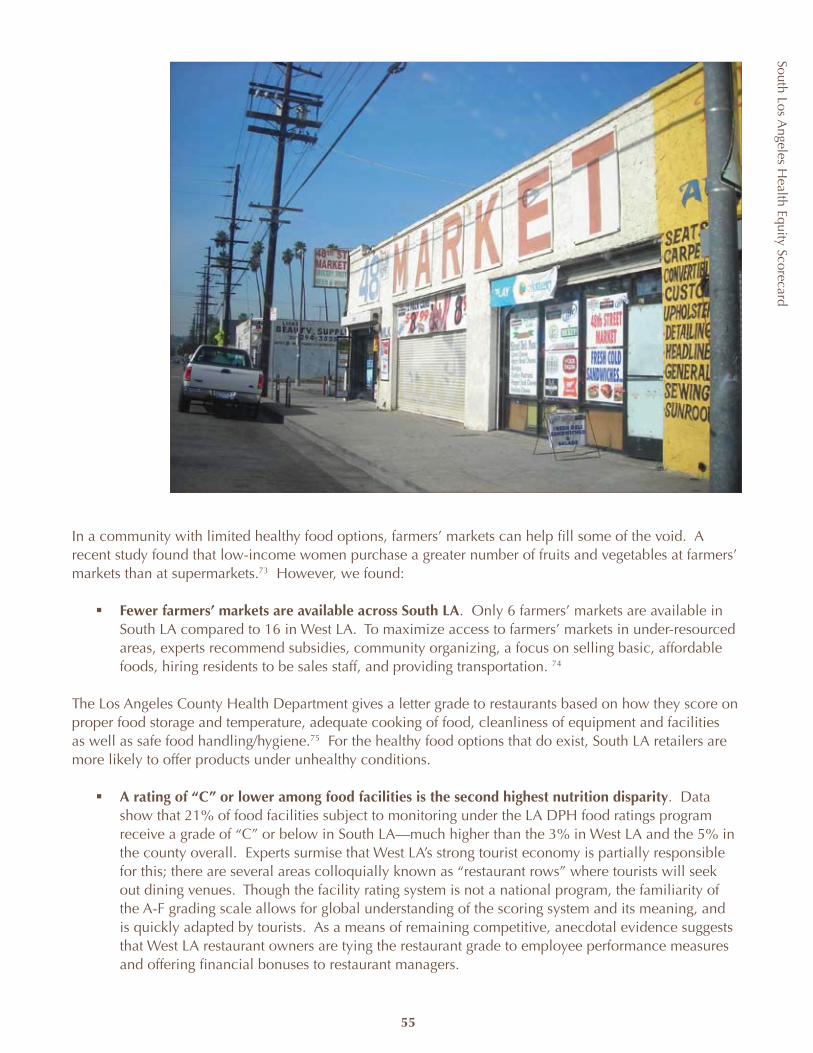
South Los Angeles H
ealth Equity Scorecard
55
In a community with limited healthy food options, farmers’ markets can help fill some of the void. A recent study found that low-income women purchase a greater number of fruits and vegetables at farmers’ markets than at supermarkets.73 However, we found:
Fewer farmers’ markets are available across South LAß . Only 6 farmers’ markets are available in South LA compared to 16 in West LA. To maximize access to farmers’ markets in under-resourced areas, experts recommend subsidies, community organizing, a focus on selling basic, affordable foods, hiring residents to be sales staff, and providing transportation. 74
The Los Angeles County Health Department gives a letter grade to restaurants based on how they score on proper food storage and temperature, adequate cooking of food, cleanliness of equipment and facilities as well as safe food handling/hygiene.75 For the healthy food options that do exist, South LA retailers are more likely to offer products under unhealthy conditions.
A rating of “C” or lower among food facilities is the second highest nutrition disparityß . Data show that 21% of food facilities subject to monitoring under the LA DPH food ratings program receive a grade of “C” or below in South LA—much higher than the 3% in West LA and the 5% in the county overall. Experts surmise that West LA’s strong tourist economy is partially responsible for this; there are several areas colloquially known as “restaurant rows” where tourists will seek out dining venues. Though the facility rating system is not a national program, the familiarity of the A-F grading scale allows for global understanding of the scoring system and its meaning, and is quickly adapted by tourists. As a means of remaining competitive, anecdotal evidence suggests that West LA restaurant owners are tying the restaurant grade to employee performance measures and offering financial bonuses to restaurant managers.
South Los Angeles H
ealth Equity Scorecard
56
Monitoring food retail/grocery stores is another matter and crosses several jurisdictions. Federal regulation and oversight are generally limited to the processing of food before it reaches stores. Both the US Department of Agriculture (USDA) and the Food and Drug Administration (FDA) regulate the products that are sold in stores. The USDA provides grading standards for produce, meat, poultry and other meat products. It also regulates the labels and contents of most products that contain meats. There are no standards for produce or meat that a store offers. Similarly, the FDA regulates the labels and contents of non-meat containing food products. Unfortunately, expiration dates on food products are not a federal mandate. In fact, it is up to the manufacturer of the food to provide the expiration of a product and the responsibility of the store to ensure that their shelves do not still contain these “expired” foods.
At the state and local levels, the Health Department is responsible for enforcing state laws associated with food safety standards. These standards are commonly associated with cleanliness, food preparation, temperatures for perishable foods and sanitary practices. Although any retail establishment that maintains a certain amount of food products (e.g., 10 square feet in Los Angeles County) falls under its purview, the Health Department does not evaluate the quality of the food sold in grocery stores. It is up to individual stores to ensure the safety and quality of food.
RECOMMENDATIONS
To bring South LA’s nutritional assets into greater balance with the county and better resourced, healthy areas, we turn to public policy in three key areas: (1) planning and land use; (2) economic development; and (3) public health. The objective must be not simply to improve access, but also to enrich the quality of the existing food resource environment. Given the limited number and size of parcels for new development, local government must play a more active and creative role in providing incentives and planning for access to healthy resources in underserved communities. A number of cities in California have addressed the issue of nutritional resources in their redevelopment activities and general plans, which provide a blueprint for zoning, development and land use decisions in cities. The City of Los Angeles is currently updating 12 of its 35 community plans. Three of these plans are part of the South Los Angeles region, including West Adams-Baldwin Hills-Leimert, Southeast, and South Los Angeles. West Adams-Baldwin Hills-Leimert is expected to be completed in Fall 2009, followed by Southeast and South LA in March 2010. Placing a limit on the number of fast-food outlets and other nuisance businesses either through the plan update or area-specific zoning ordinances can provide the physical space and economic opportunity for the development of healthy food outlets in communities that are “food deserts” such as South LA. Redevelopment funds can be used to ensure that healthy food resources are incorporated in new projects.
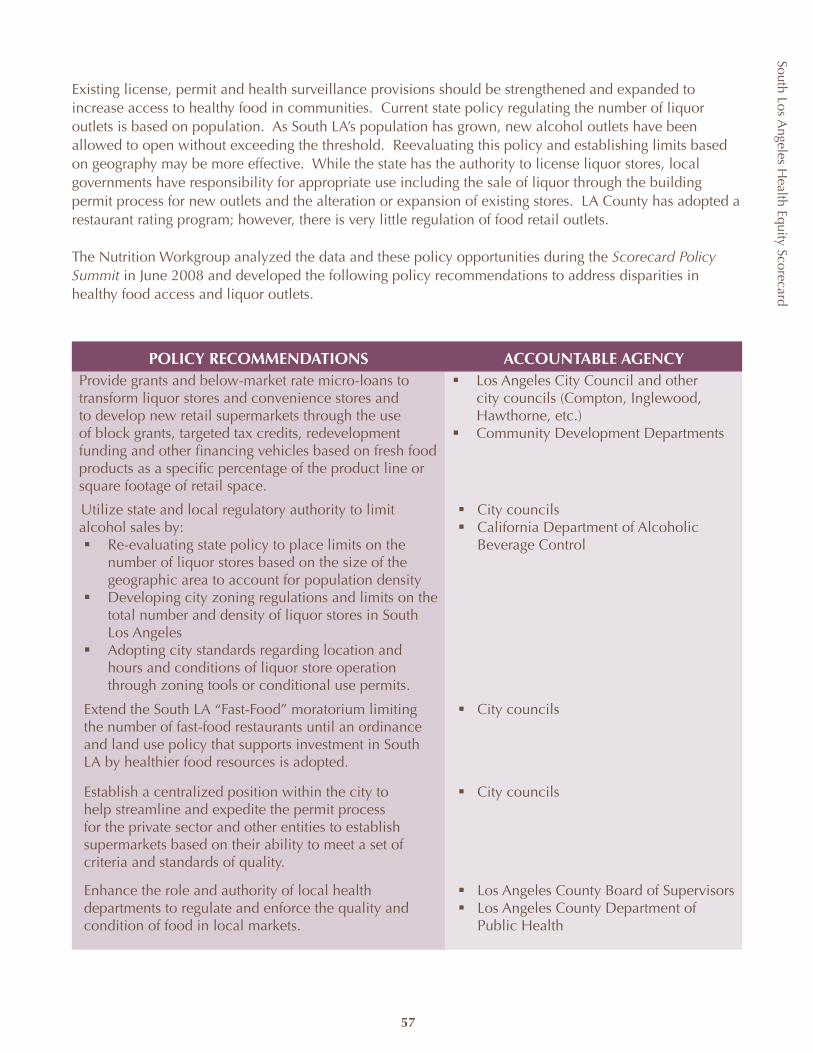
57
South Los Angeles H
ealth Equity Scorecard
Existing license, permit and health surveillance provisions should be strengthened and expanded to increase access to healthy food in communities. Current state policy regulating the number of liquor outlets is based on population. As South LA’s population has grown, new alcohol outlets have been allowed to open without exceeding the threshold. Reevaluating this policy and establishing limits based on geography may be more effective. While the state has the authority to license liquor stores, local governments have responsibility for appropriate use including the sale of liquor through the building permit process for new outlets and the alteration or expansion of existing stores. LA County has adopted a restaurant rating program; however, there is very little regulation of food retail outlets.
The Nutrition Workgroup analyzed the data and these policy opportunities during the Scorecard Policy Summit in June 2008 and developed the following policy recommendations to address disparities in healthy food access and liquor outlets.
POLICY RECOMMENDATIONS ACCOUNTABLE AGENCYProvide grants and below-market rate micro-loans to transform liquor stores and convenience stores and to develop new retail supermarkets through the use of block grants, targeted tax credits, redevelopment funding and other financing vehicles based on fresh food products as a specific percentage of the product line or square footage of retail space.
Los Angeles City Council and other ß city councils (Compton, Inglewood, Hawthorne, etc.)Community Development Departmentsß
Utilize state and local regulatory authority to limit alcohol sales by:
Re-evaluating state policy to place limits on the ß number of liquor stores based on the size of the geographic area to account for population density Developing city zoning regulations and limits on the ß total number and density of liquor stores in South Los AngelesAdopting city standards regarding location and ß hours and conditions of liquor store operation through zoning tools or conditional use permits.
City councilsß California Department of Alcoholic ß Beverage Control
Extend the South LA “Fast-Food” moratorium limiting the number of fast-food restaurants until an ordinance and land use policy that supports investment in South LA by healthier food resources is adopted.
City councilsß
Establish a centralized position within the city to help streamline and expedite the permit process for the private sector and other entities to establish supermarkets based on their ability to meet a set of criteria and standards of quality.
City councilsß
Enhance the role and authority of local health departments to regulate and enforce the quality and condition of food in local markets.
Los Angeles County Board of Supervisorsß Los Angeles County Department of ß Public Health
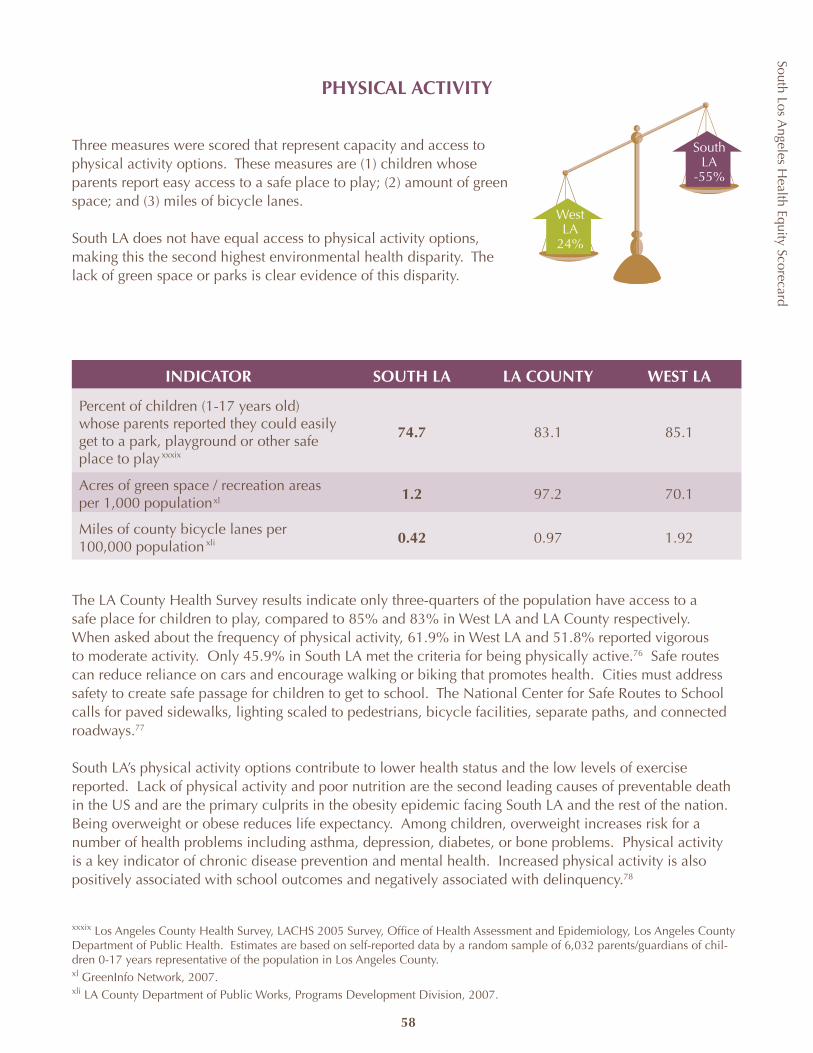
South Los Angeles H
ealth Equity Scorecard
58
PHYSICAL ACTIVITY
Three measures were scored that represent capacity and access to physical activity options. These measures are (1) children whose parents report easy access to a safe place to play; (2) amount of green space; and (3) miles of bicycle lanes.
South LA does not have equal access to physical activity options, making this the second highest environmental health disparity. The lack of green space or parks is clear evidence of this disparity.
INDICATOR SOUTH LA LA COUNTY WEST LA
Percent of children (1-17 years old) whose parents reported they could easily get to a park, playground or other safe place to play
74.7 83.1 85.1
Acres of green space / recreation areas per 1,000 population
1.2 97.2 70.1
Miles of county bicycle lanes per 100,000 population
0.42 0.97 1.92
The LA County Health Survey results indicate only three-quarters of the population have access to a safe place for children to play, compared to 85% and 83% in West LA and LA County respectively. When asked about the frequency of physical activity, 61.9% in West LA and 51.8% reported vigorous to moderate activity. Only 45.9% in South LA met the criteria for being physically active.76 Safe routes can reduce reliance on cars and encourage walking or biking that promotes health. Cities must address safety to create safe passage for children to get to school. The National Center for Safe Routes to School calls for paved sidewalks, lighting scaled to pedestrians, bicycle facilities, separate paths, and connected roadways.77
South LA’s physical activity options contribute to lower health status and the low levels of exercise reported. Lack of physical activity and poor nutrition are the second leading causes of preventable death in the US and are the primary culprits in the obesity epidemic facing South LA and the rest of the nation. Being overweight or obese reduces life expectancy. Among children, overweight increases risk for a number of health problems including asthma, depression, diabetes, or bone problems. Physical activity is a key indicator of chronic disease prevention and mental health. Increased physical activity is also positively associated with school outcomes and negatively associated with delinquency.78
WestLA
24%
South LA
-55%
xxxix
xl
xli
xxxix Los Angeles County Health Survey, LACHS 2005 Survey, Office of Health Assessment and Epidemiology, Los Angeles County Department of Public Health. Estimates are based on self-reported data by a random sample of 6,032 parents/guardians of chil-dren 0-17 years representative of the population in Los Angeles County. xl GreenInfo Network, 2007.xli LA County Department of Public Works, Programs Development Division, 2007.
South Los Angeles H
ealth Equity Scorecard
59
The environment within the community can significantly influence a child’s risk of obesity and how frequently individuals exercise. A recent LA County Public Health report ranked 128 cities and communities in LA County according to child obesity rates. The study also ranked the same areas on economic hardship indicators and park area per capita to determine their relationship to child obesity and found that park area was associated with child obesity. 79
FUNDING OPPORTUNITIES
Proposition Kß : a park-bond measure passed in 1996 by voters in the City of LA to address the inadequacies and deterioration of the city’s “youth infrastructure”—parks and recreation centers—and the currently unmet need for park, recreation, childcare, and community facilities in the city. Proposition K generates $25 million per year for 30 years for acquisition, improvement, construction, and maintenance of city parks and recreational facilities. Quimby Actß : a state law designed to generate funding for park development that requires developers to either pay in-lieu funds or set aside land for park and recreational uses within, or in the immediate vicinity of, new subdivisions.Proposition 40:ß a park and environmental bond measure passed in 2002 by California voters that includes $832.5 million for the acquisition and development of state and local parks including grants for local assistance programs to develop parks and recreation areas and facilities.
Other features of the physical environment, including access to facilities, aesthetics of the facilities/neighborhoods and land use mix, affect the amount of physical activity as well.80 CHC conducted a community assessment in 2001 that both inventoried and examined the capacity of a wide variety of physical activity resources in South LA in comparison to West Los Angeles. The assessment concluded that far more of the facilities in South LA were publicly owned (72%) than in West LA (52%). While both areas have relatively similar basic services for older adolescents, adults in South LA have fewer resources and choices. The imbalance towards public facilities in South LA suggests the vulnerability of the community to budgetary problems and also points to the important role that cities play in ensuring access to recreational resources in underserved communities. The recreational facilities in West LA were much more likely to offer a wide range of programs for adults and, in keeping with the public-private nature of the resource environment, open more days and longer each day. In return, West LA residents were more likely to pay a fee (62% versus 20%) for their physical activity services than residents in South LA. Other studies have shown that while use of parks is most intense in areas of low accessibility, access to adequate recreational opportunities is dependent upon proximity to parkland, available modes of transportation and hours of operation.81
City Controller Laura Chick conducted an audit of the City Department of Recreation and Parks in 2006 citing “inequity regarding access to recreational opportunities and the diversity of services provided.” The study found inequities in the manner in which the department allocated staffing resources and that “less affluent communities are more dependent on Department subsidized programs and are less likely to offer as many programs.” The audit called for the development of a five-year strategic plan, appropriate performance standards and measurements along with the completion of a community assessment every five years.
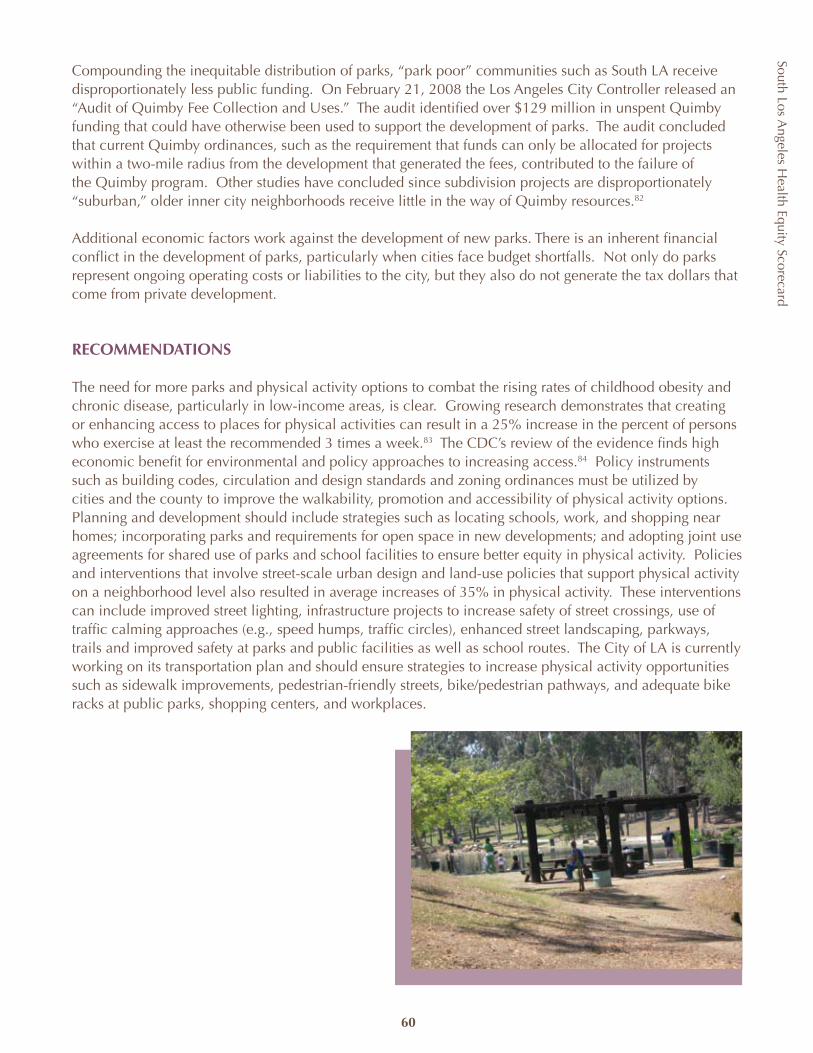
South Los Angeles H
ealth Equity Scorecard
60
Compounding the inequitable distribution of parks, “park poor” communities such as South LA receive disproportionately less public funding. On February 21, 2008 the Los Angeles City Controller released an “Audit of Quimby Fee Collection and Uses.” The audit identified over $129 million in unspent Quimby funding that could have otherwise been used to support the development of parks. The audit concluded that current Quimby ordinances, such as the requirement that funds can only be allocated for projects within a two-mile radius from the development that generated the fees, contributed to the failure of the Quimby program. Other studies have concluded since subdivision projects are disproportionately “suburban,” older inner city neighborhoods receive little in the way of Quimby resources.82
Additional economic factors work against the development of new parks. There is an inherent financial conflict in the development of parks, particularly when cities face budget shortfalls. Not only do parks represent ongoing operating costs or liabilities to the city, but they also do not generate the tax dollars that come from private development.
RECOMMENDATIONS
The need for more parks and physical activity options to combat the rising rates of childhood obesity and chronic disease, particularly in low-income areas, is clear. Growing research demonstrates that creating or enhancing access to places for physical activities can result in a 25% increase in the percent of persons who exercise at least the recommended 3 times a week.83 The CDC’s review of the evidence finds high economic benefit for environmental and policy approaches to increasing access.84 Policy instruments such as building codes, circulation and design standards and zoning ordinances must be utilized by cities and the county to improve the walkability, promotion and accessibility of physical activity options. Planning and development should include strategies such as locating schools, work, and shopping near homes; incorporating parks and requirements for open space in new developments; and adopting joint use agreements for shared use of parks and school facilities to ensure better equity in physical activity. Policies and interventions that involve street-scale urban design and land-use policies that support physical activity on a neighborhood level also resulted in average increases of 35% in physical activity. These interventions can include improved street lighting, infrastructure projects to increase safety of street crossings, use of traffic calming approaches (e.g., speed humps, traffic circles), enhanced street landscaping, parkways, trails and improved safety at parks and public facilities as well as school routes. The City of LA is currently working on its transportation plan and should ensure strategies to increase physical activity opportunities such as sidewalk improvements, pedestrian-friendly streets, bike/pedestrian pathways, and adequate bike racks at public parks, shopping centers, and workplaces.
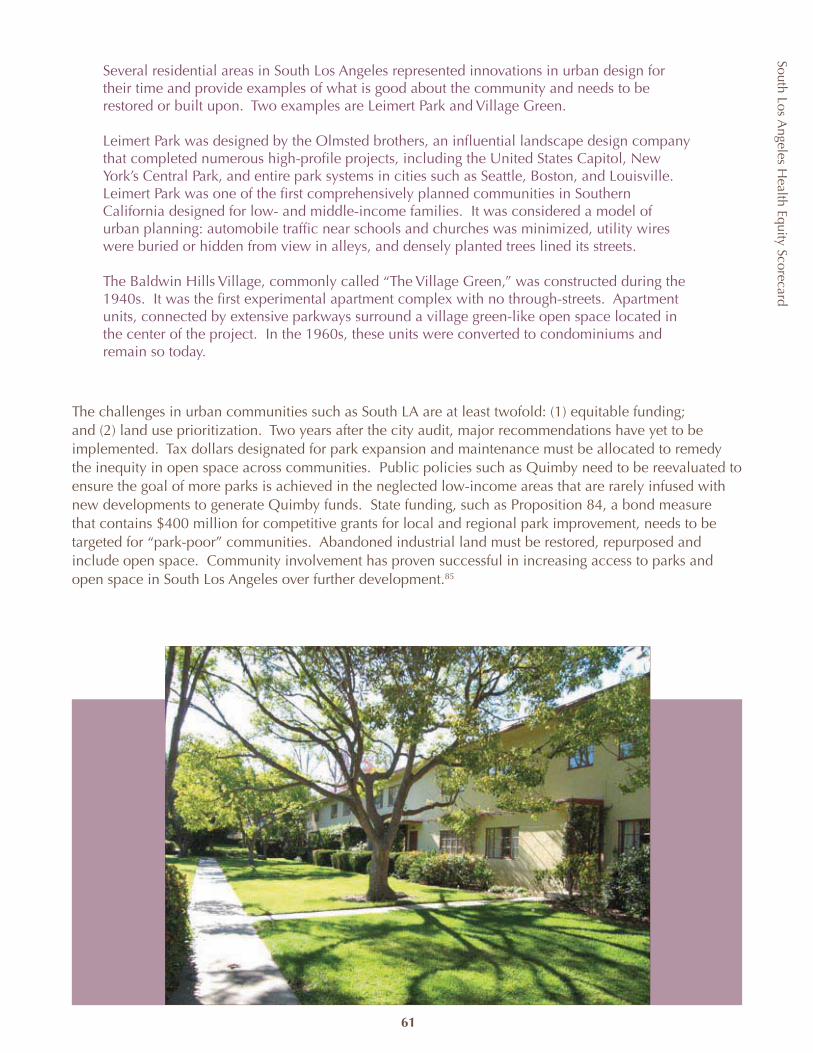
South Los Angeles H
ealth Equity Scorecard
61
Several residential areas in South Los Angeles represented innovations in urban design for their time and provide examples of what is good about the community and needs to be restored or built upon. Two examples are Leimert Park and Village Green.
Leimert Park was designed by the Olmsted brothers, an influential landscape design company that completed numerous high-profile projects, including the United States Capitol, New York’s Central Park, and entire park systems in cities such as Seattle, Boston, and Louisville. Leimert Park was one of the first comprehensively planned communities in Southern California designed for low- and middle-income families. It was considered a model of urban planning: automobile traffic near schools and churches was minimized, utility wires were buried or hidden from view in alleys, and densely planted trees lined its streets.
The Baldwin Hills Village, commonly called “The Village Green,” was constructed during the 1940s. It was the first experimental apartment complex with no through-streets. Apartment units, connected by extensive parkways surround a village green-like open space located in the center of the project. In the 1960s, these units were converted to condominiums and remain so today.
The challenges in urban communities such as South LA are at least twofold: (1) equitable funding; and (2) land use prioritization. Two years after the city audit, major recommendations have yet to be implemented. Tax dollars designated for park expansion and maintenance must be allocated to remedy the inequity in open space across communities. Public policies such as Quimby need to be reevaluated to ensure the goal of more parks is achieved in the neglected low-income areas that are rarely infused with new developments to generate Quimby funds. State funding, such as Proposition 84, a bond measure that contains $400 million for competitive grants for local and regional park improvement, needs to be targeted for “park-poor” communities. Abandoned industrial land must be restored, repurposed and include open space. Community involvement has proven successful in increasing access to parks and open space in South Los Angeles over further development.85
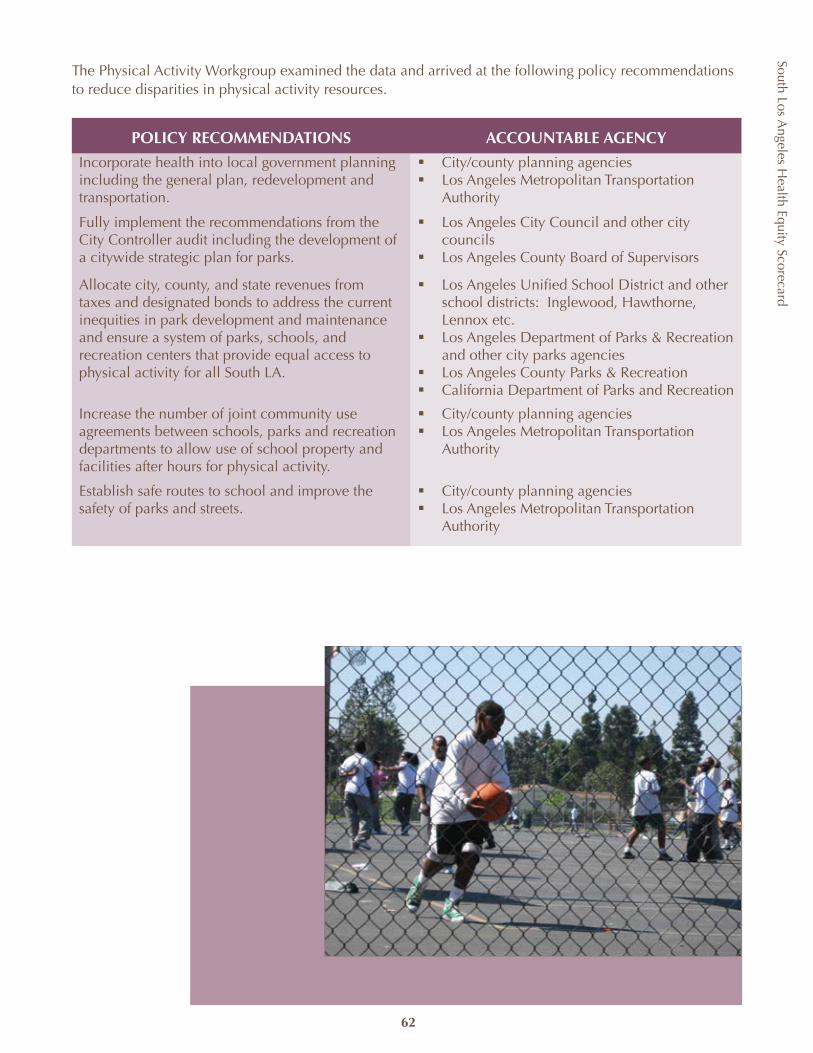
South Los Angeles H
ealth Equity Scorecard
62
The Physical Activity Workgroup examined the data and arrived at the following policy recommendations to reduce disparities in physical activity resources.
POLICY RECOMMENDATIONS ACCOUNTABLE AGENCY
Incorporate health into local government planning including the general plan, redevelopment and transportation.
City/county planning agenciesß Los Angeles Metropolitan Transportation ß Authority
Fully implement the recommendations from the City Controller audit including the development of a citywide strategic plan for parks.
Los Angeles City Council and other city ß councils Los Angeles County Board of Supervisorsß
Allocate city, county, and state revenues from taxes and designated bonds to address the current inequities in park development and maintenance and ensure a system of parks, schools, and recreation centers that provide equal access to physical activity for all South LA.
Los Angeles Unified School District and other ß school districts: Inglewood, Hawthorne, Lennox etc.Los Angeles Department of Parks & Recreation ß and other city parks agenciesLos Angeles County Parks & Recreationß California Department of Parks and Recreationß
Increase the number of joint community use agreements between schools, parks and recreation departments to allow use of school property and facilities after hours for physical activity.
City/county planning agenciesß Los Angeles Metropolitan Transportation ß Authority
Establish safe routes to school and improve the safety of parks and streets.
City/county planning agenciesß Los Angeles Metropolitan Transportation ß Authority
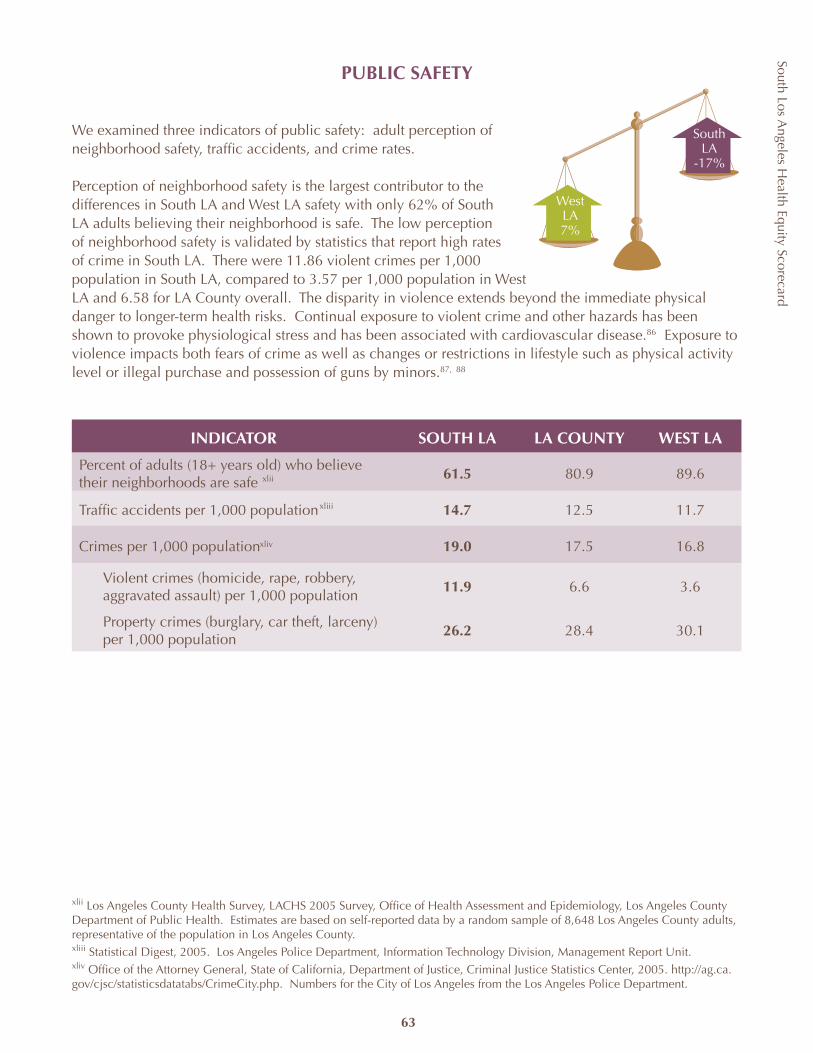
South Los Angeles H
ealth Equity Scorecard
63
PUBLIC SAFETY
We examined three indicators of public safety: adult perception of neighborhood safety, traffic accidents, and crime rates.
Perception of neighborhood safety is the largest contributor to the differences in South LA and West LA safety with only 62% of South LA adults believing their neighborhood is safe. The low perception of neighborhood safety is validated by statistics that report high rates of crime in South LA. There were 11.86 violent crimes per 1,000 population in South LA, compared to 3.57 per 1,000 population in West LA and 6.58 for LA County overall. The disparity in violence extends beyond the immediate physical danger to longer-term health risks. Continual exposure to violent crime and other hazards has been shown to provoke physiological stress and has been associated with cardiovascular disease.86 Exposure to violence impacts both fears of crime as well as changes or restrictions in lifestyle such as physical activity level or illegal purchase and possession of guns by minors.87, 88
INDICATOR SOUTH LA LA COUNTY WEST LA
Percent of adults (18+ years old) who believe their neighborhoods are safe
61.5 80.9 89.6
Traffic accidents per 1,000 population 14.7 12.5 11.7
Crimes per 1,000 population 19.0 17.5 16.8
Violent crimes (homicide, rape, robbery, aggravated assault) per 1,000 population
11.9 6.6 3.6
Property crimes (burglary, car theft, larceny) per 1,000 population
26.2 28.4 30.1
WestLA7%
South LA
-17%
xlii
xliii
xliv
xlii Los Angeles County Health Survey, LACHS 2005 Survey, Office of Health Assessment and Epidemiology, Los Angeles County Department of Public Health. Estimates are based on self-reported data by a random sample of 8,648 Los Angeles County adults, representative of the population in Los Angeles County.xliii Statistical Digest, 2005. Los Angeles Police Department, Information Technology Division, Management Report Unit.xliv Office of the Attorney General, State of California, Department of Justice, Criminal Justice Statistics Center, 2005. http://ag.ca.gov/cjsc/statisticsdatatabs/CrimeCity.php. Numbers for the City of Los Angeles from the Los Angeles Police Department.
South Los Angeles H
ealth Equity Scorecard
64
No one factor contributes to crime but rather multiple, often interrelated issues ranging from unemployment to difficulty in school to family support and substance abuse play a role. The findings for South LA reinforce this claim. The unemployment rate in South LA stands at 14.1% or 131% higher than West LA and 72% higher than the overall county. The “achievement gap” for students attending public schools in South LA has been documented extensively. In SPA 6 (South LA), a mere 13.7% of public school third graders were reading at or above the national average and only 33.7% were doing math at or above the national average. Public high school graduation rates in SPA 6 (South LA) are the lowest in the county, with only 62.4% of students graduating. The increasing number of single parent households strains the family support system. Zoning and planning codes and enforcement may also inadvertently result in unsafe facilities being built, and property owners and architects are not likely familiar with designing to prevent crime.89
The Summer Night Lights is a public/private collaboration to keep parks and recreation centers in eight high crime districts in Los Angeles City open until midnight four nights each week from July through September beginning in 2008. The program was designed to provide a safe and constructive environment for children, youth and families and deter crime. In the reporting districts that the SNL programs served, there was an 86% decrease in homicides, 23% reduction in aggravated assaults, 32% reduction in shots fired, and a 17% reduction in gang related crime. The most significant reduction was in the reporting districts served by Jim Gilliam SNL, where there was a 32% reduction in gang related crime and zero homicides as compared to 6 for the same time period in 2007. The project provided $250,000 in youth jobs, $40,000 in coaches and officials, $81,000 in artist fees, $63,000 spent with local vendors and $70,000 in intervention jobs. All these jobs went to residents of the SNL neighborhoods.
Other results are as follows:
The disparity in total combined Part 1 offenses did not vary widelyß . Part 1 offensives include violent and property crimes. South LA had 19.0 crimes per 1,000 population, with West LA’s rate slightly lower at 16.8 and LA County between the two at a rate of 17.5 during the study period. Violent crimes in South LA are 2-3 times higher than in West LA and LA Countyß . While South LA had a higher rate of violent crime than West LA, West LA showed a higher rate of property crime at 30.1 per 1,000 population. In South LA, there were 26.2 property crimes per 1,000 population in 2006.
Traffic accidents are also a significant disparity in South LA. Traffic accidents contribute to motor vehicle deaths and are the third leading cause of premature death in SPA 6.90 In the City of Los Angeles, 16% of all traffic accidents occurred in south LA City, at a rate of 14.7 accidents per 1,000 population. In west LA City, only 11% of LA City traffic accidents occurred locally at a rate of 11.7 accidents per 1,000 populations. The City of Los Angeles had an overall rate of 12.5 accidents per 1,000 population. This disparity also affects other environmental indicators. For example, traffic conditions have also been associated with levels of physical activity.91
xlv Los Angeles County Children’s Planning Council, Los Angeles County 2006 Children’s Scorecard.xlvi Data only available for City of LA communities. See Appendix for more details.
xlv
xlvi
South Los Angeles H
ealth Equity Scorecard
65
RECOMMENDATIONS
Public safety is a public health issue, and the level of violence is a public health crisis. The issue of public safety goes beyond suppression and must be addressed through a multi-disciplinary approach that includes prevention strategies aimed at changing the socioeconomic, behavioral and environment factors that lead to violence and traffic accidents. Mentoring programs, Job Corps and early intervention programs such as Healthy Start have been shown successful in preventing crime among participants. After school programming including recreation and tutoring is needed outside the classroom to support student achievement. A “safer communities” approach, or community policing, which focuses on direct problem solving as well as the underlying social and economic factors that contribute to crime is a best practice among law enforcement. Improvements in the physical design and condition of neighborhoods, the use of streetscapes and architectural design features are also useful tools in improving the safety of communities.
There are a number of opportunities to build upon successful program models. The City of Los Angeles has recently released $168 million in funding for gang prevention, intervention and reduction services in an attempt to address gang violence with a comprehensive, coordinated strategy. This citywide strategy is based upon the promising results of a federally-funded local initiative, the Gang Reduction Program, which saw a 44% reduction in gang-related crime in the Boyle Heights neighborhood.92 Statewide, California voters passed Proposition 36 in 2000, which required that those convicted of a non-violent, drug-related offense be offered probation and community-based drug treatment in lieu of a prison sentence. First and second year implementation studies and evaluations have shown that, while there is room for improvement in the program, there was a significant benefit in cost-savings to state and local governments.93
To prevent injuries from motor vehicle occupant injury, the CDC recommends ensuring adherence to existing policies for DUI, child safety seats and safety belts. The creation of safety zones in areas with high incidence of accidents or heavy traffic should utilize lane restriping, traffic signs, signal optimization, and increased education and enforcement of safety laws. Creating more bike lanes, traffic islands and single-lane roundabouts can create safer passage for motor vehicles, bikes and pedestrians and lower reliance on motor vehicles.
The Public Safety Workgroup analyzed these public safety indicators and recommends the following policy focuses:
POLICY RECOMMENDATION ACCOUNTABLE AGENCYIncrease funding and access to prevention programs for youth with a focus on academic remediation, school retention and job training.
City Councilß Community Development Agencyß School Districtß
Increase funding for multi-disciplinary gang prevention and expand community safety partnerships between schools, law enforcement, neighborhood associations and other key stakeholders.
City Councilß Law Enforcementß School Districtß
Create safety corridors on South LA roadways. Department of Transportationß Law Enforcementß City Planningß
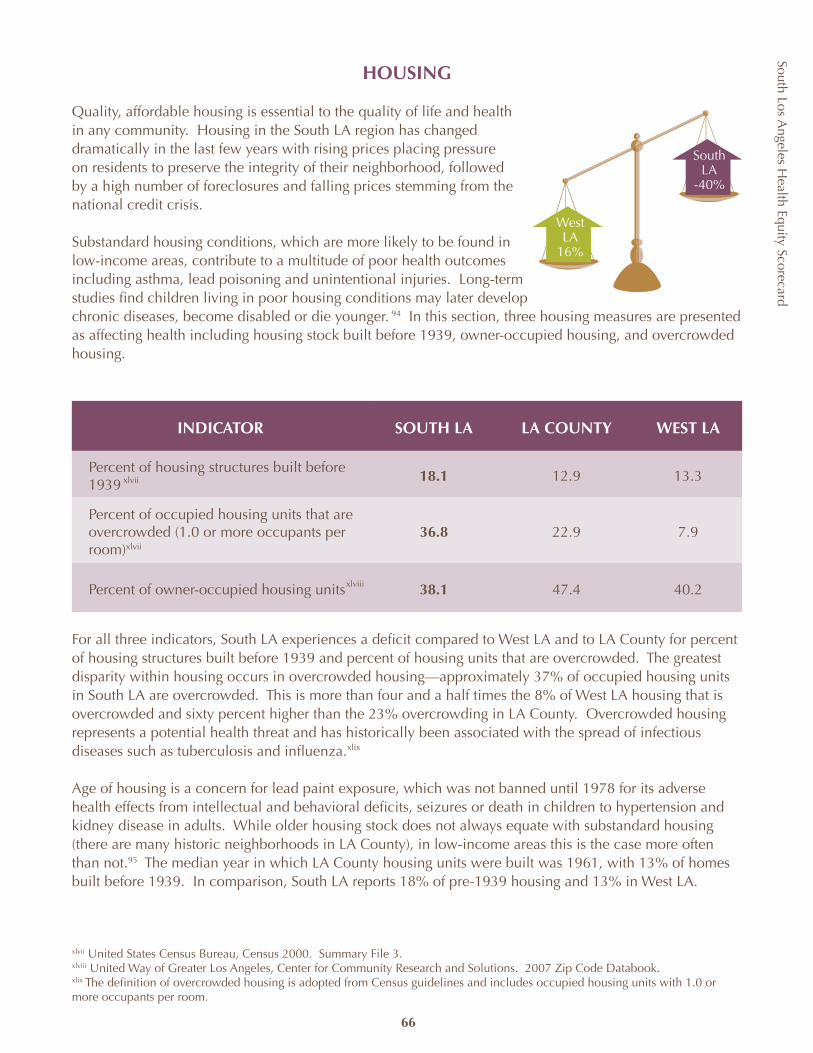
South Los Angeles H
ealth Equity Scorecard
66
HOUSING
Quality, affordable housing is essential to the quality of life and health in any community. Housing in the South LA region has changed dramatically in the last few years with rising prices placing pressure on residents to preserve the integrity of their neighborhood, followed by a high number of foreclosures and falling prices stemming from the national credit crisis.
Substandard housing conditions, which are more likely to be found in low-income areas, contribute to a multitude of poor health outcomes including asthma, lead poisoning and unintentional injuries. Long-term studies find children living in poor housing conditions may later develop chronic diseases, become disabled or die younger. 94 In this section, three housing measures are presented as affecting health including housing stock built before 1939, owner-occupied housing, and overcrowded housing.
INDICATOR SOUTH LA LA COUNTY WEST LA
Percent of housing structures built before 1939
18.1 12.9 13.3
Percent of occupied housing units that are overcrowded (1.0 or more occupants per room)xlvii
36.8 22.9 7.9
Percent of owner-occupied housing units 38.1 47.4 40.2
For all three indicators, South LA experiences a deficit compared to West LA and to LA County for percent of housing structures built before 1939 and percent of housing units that are overcrowded. The greatest disparity within housing occurs in overcrowded housing—approximately 37% of occupied housing units in South LA are overcrowded. This is more than four and a half times the 8% of West LA housing that is overcrowded and sixty percent higher than the 23% overcrowding in LA County. Overcrowded housing represents a potential health threat and has historically been associated with the spread of infectious diseases such as tuberculosis and influenza.
Age of housing is a concern for lead paint exposure, which was not banned until 1978 for its adverse health effects from intellectual and behavioral deficits, seizures or death in children to hypertension and kidney disease in adults. While older housing stock does not always equate with substandard housing (there are many historic neighborhoods in LA County), in low-income areas this is the case more often than not.95 The median year in which LA County housing units were built was 1961, with 13% of homes built before 1939. In comparison, South LA reports 18% of pre-1939 housing and 13% in West LA.
18 The definition of overcrowded housing is adopted from Census guidelines and includes occupied housing units with 1.0 or more occupants per room.
WestLA
16%
South LA
-40%
xlvii
xlviii
xlix
xlvii United States Census Bureau, Census 2000. Summary File 3.xlviii United Way of Greater Los Angeles, Center for Community Research and Solutions. 2007 Zip Code Databook.xlix The definition of overcrowded housing is adopted from Census guidelines and includes occupied housing units with 1.0 or more occupants per room.
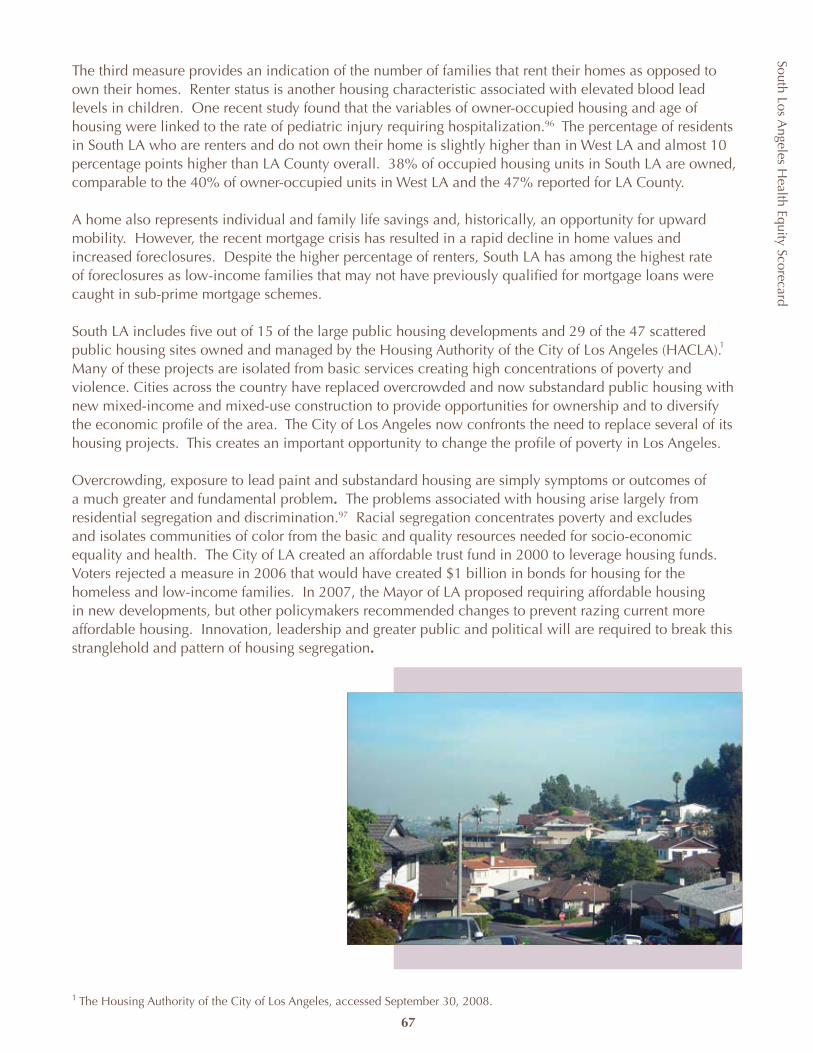
South Los Angeles H
ealth Equity Scorecard
67
The third measure provides an indication of the number of families that rent their homes as opposed to own their homes. Renter status is another housing characteristic associated with elevated blood lead levels in children. One recent study found that the variables of owner-occupied housing and age of housing were linked to the rate of pediatric injury requiring hospitalization.96 The percentage of residents in South LA who are renters and do not own their home is slightly higher than in West LA and almost 10 percentage points higher than LA County overall. 38% of occupied housing units in South LA are owned, comparable to the 40% of owner-occupied units in West LA and the 47% reported for LA County.
A home also represents individual and family life savings and, historically, an opportunity for upward mobility. However, the recent mortgage crisis has resulted in a rapid decline in home values and increased foreclosures. Despite the higher percentage of renters, South LA has among the highest rate of foreclosures as low-income families that may not have previously qualified for mortgage loans were caught in sub-prime mortgage schemes.
South LA includes five out of 15 of the large public housing developments and 29 of the 47 scattered public housing sites owned and managed by the Housing Authority of the City of Los Angeles (HACLA). Many of these projects are isolated from basic services creating high concentrations of poverty and violence. Cities across the country have replaced overcrowded and now substandard public housing with new mixed-income and mixed-use construction to provide opportunities for ownership and to diversify the economic profile of the area. The City of Los Angeles now confronts the need to replace several of its housing projects. This creates an important opportunity to change the profile of poverty in Los Angeles.
Overcrowding, exposure to lead paint and substandard housing are simply symptoms or outcomes of a much greater and fundamental problem. The problems associated with housing arise largely from residential segregation and discrimination.97 Racial segregation concentrates poverty and excludes and isolates communities of color from the basic and quality resources needed for socio-economic equality and health. The City of LA created an affordable trust fund in 2000 to leverage housing funds. Voters rejected a measure in 2006 that would have created $1 billion in bonds for housing for the homeless and low-income families. In 2007, the Mayor of LA proposed requiring affordable housing in new developments, but other policymakers recommended changes to prevent razing current more affordable housing. Innovation, leadership and greater public and political will are required to break this stranglehold and pattern of housing segregation.
1 The Housing Authority of the City of Los Angeles, accessed September 30, 2008.
1
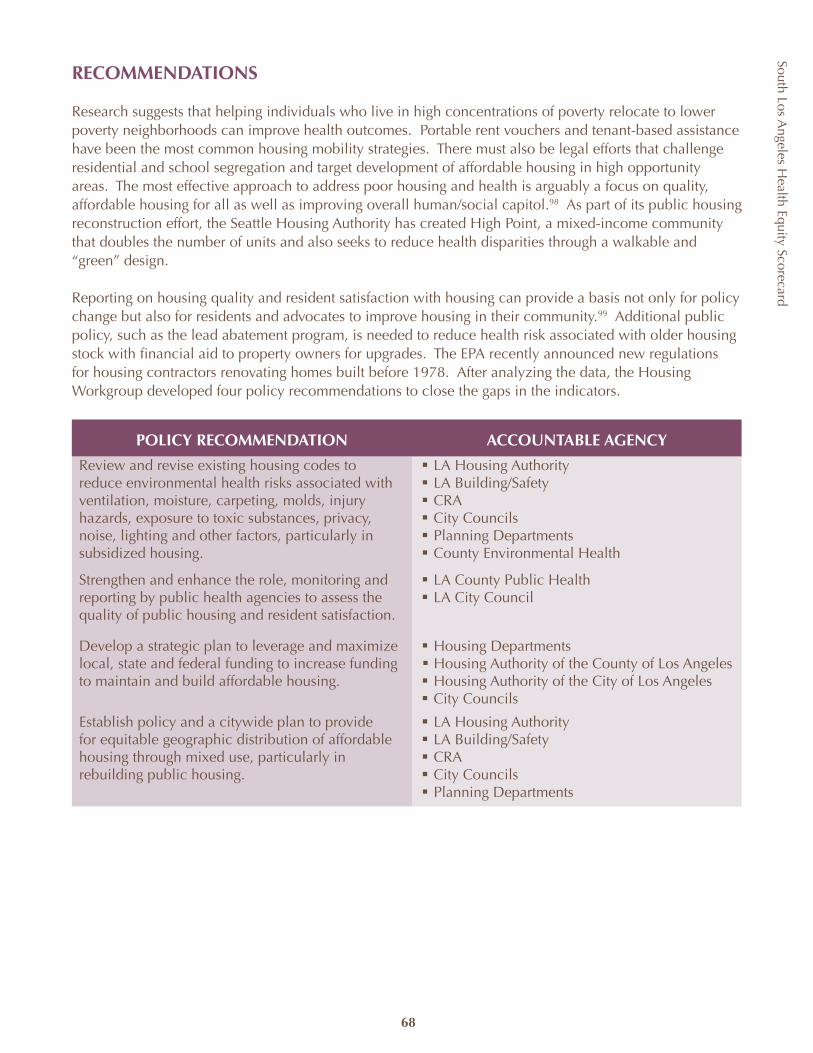
South Los Angeles H
ealth Equity Scorecard
68
RECOMMENDATIONS
Research suggests that helping individuals who live in high concentrations of poverty relocate to lower poverty neighborhoods can improve health outcomes. Portable rent vouchers and tenant-based assistance have been the most common housing mobility strategies. There must also be legal efforts that challenge residential and school segregation and target development of affordable housing in high opportunity areas. The most effective approach to address poor housing and health is arguably a focus on quality, affordable housing for all as well as improving overall human/social capitol.98 As part of its public housing reconstruction effort, the Seattle Housing Authority has created High Point, a mixed-income community that doubles the number of units and also seeks to reduce health disparities through a walkable and “green” design.
Reporting on housing quality and resident satisfaction with housing can provide a basis not only for policy change but also for residents and advocates to improve housing in their community.99 Additional public policy, such as the lead abatement program, is needed to reduce health risk associated with older housing stock with financial aid to property owners for upgrades. The EPA recently announced new regulations for housing contractors renovating homes built before 1978. After analyzing the data, the Housing Workgroup developed four policy recommendations to close the gaps in the indicators.
POLICY RECOMMENDATION ACCOUNTABLE AGENCY
Review and revise existing housing codes to reduce environmental health risks associated with ventilation, moisture, carpeting, molds, injury hazards, exposure to toxic substances, privacy, noise, lighting and other factors, particularly in subsidized housing.
LA Housing Authorityß LA Building/Safetyß CRAß City Councilsß Planning Departmentsß County Environmental Healthß
Strengthen and enhance the role, monitoring and reporting by public health agencies to assess the quality of public housing and resident satisfaction.
LA County Public Healthß LA City Councilß
Develop a strategic plan to leverage and maximize local, state and federal funding to increase funding to maintain and build affordable housing.
Housing Departmentsß Housing Authority of the County of Los Angelesß Housing Authority of the City of Los Angelesß City Councilsß
Establish policy and a citywide plan to provide for equitable geographic distribution of affordable housing through mixed use, particularly in rebuilding public housing.
LA Housing Authorityß LA Building/Safetyß CRAß City Councilsß Planning Departmentsß

South Los Angeles H
ealth Equity Scorecard
69
SCHOOLS
Education figures strongly in the immediate and long-term health of children. In South LA, 33.5% of the population is under 18 years of age. Only 62.4% of the population enrolled in SPA 6 (South LA) public high schools graduate, compared to 78.6% in West LA and 79.4% countywide.xlv In contrast, the percentage of the population in South LA that possesses a high school diploma (18.9%) is relatively similar to the overall county rate (19.9%). But while the data on educational achievement is compelling, it only tells part of the story. The school environment represents an equally potential risk to the development and educational achievement of children. For this reason, we go beyond the academic performance measures and examine the health and safety of school facilities.
INDICATOR SOUTH LA LA COUNTY WEST LA
Schools with substandard facilities (Williams schools) per total schools in the area
0.64 0.30 0.08
LAUSD schools within 500 feet of a freeway per total schools in area
0.06 0.08 0.04
To assess the quality of a school, we applied the Williams schools designation. This designation is the result of a May 2000 class-action lawsuit filed against the State of California and the California Department of Education that contended these agencies failed to provide the basic educational resources of instructional materials, qualified teachers, and safe and decent school facilities. Under the settlement agreement reached in August 2004, some 2,200 public schools in California were deemed in violation of the basic standards codified in the Williams legislation and are subject to yearly monitoring.100
In LA County, 594 schools were identified in violation of Williams standards, with 176 or 30% of the schools located in the South LA area. West LA, by comparison, had only eight schools that were designated. As a percentage of total schools in each area, non-compliant schools comprise 64% of schools in South LA, 8% in West LA, and 30% in LA County overall, leading to a 111% difference between South LA and LA County and a 73% difference between West LA and LA County.
The state of South LA’s schools contributes to less academic success and in turn bad health among residents. Low literacy, for example, which is concentrated among those with less education, may lead to ineffective communication with healthcare providers and lower quality of care. It has also been associated with negative health outcomes.101 The link between health education attainment and poorer health status and outcomes is also well established. And, as noted previously in the report, education plays a role in preventing crime.
WestLA
63%
South LA
-43%
li
lii
li Los Angeles County Office of Education, 2007 Reports of Williams Legislation Monitoring.lii Schools in Proximity to Freeways, Presentation to the Facilities Committee. Los Angeles Unified School District Office of Envi-ronmental Health and Safety. 8 November 2007.
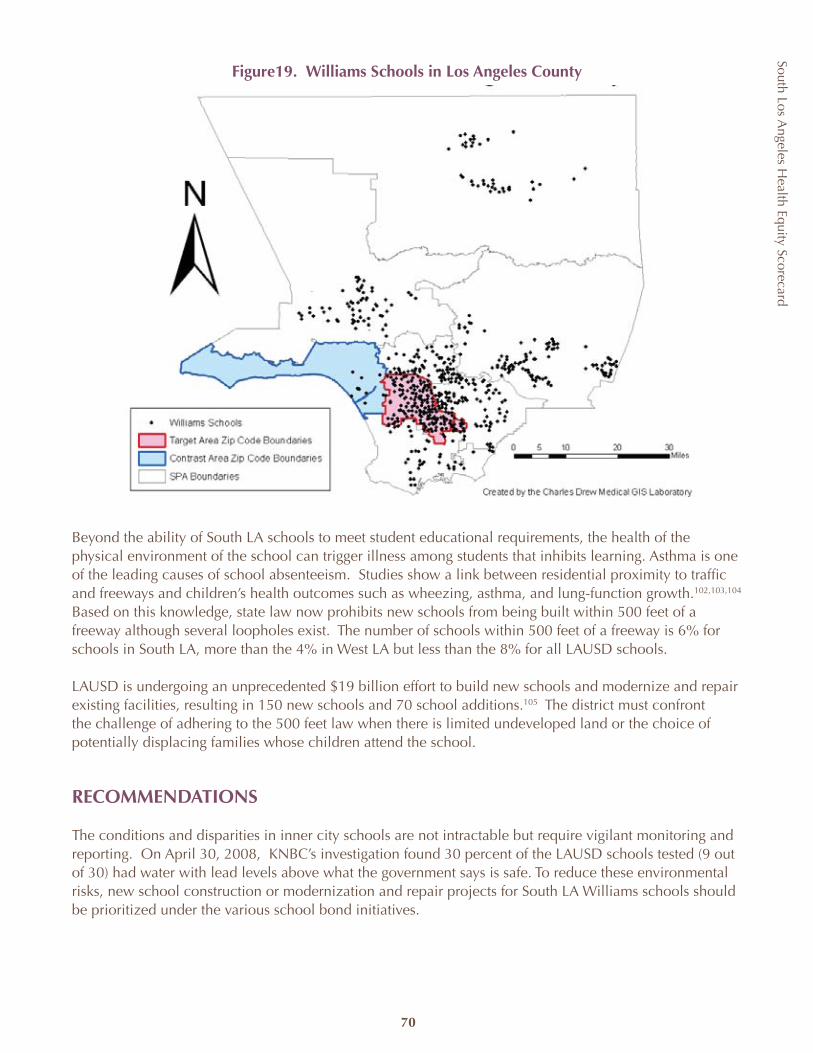
South Los Angeles H
ealth Equity Scorecard
70
Figure19. Williams Schools in Los Angeles County
Beyond the ability of South LA schools to meet student educational requirements, the health of the physical environment of the school can trigger illness among students that inhibits learning. Asthma is one of the leading causes of school absenteeism. Studies show a link between residential proximity to traffic and freeways and children’s health outcomes such as wheezing, asthma, and lung-function growth.102,103,104 Based on this knowledge, state law now prohibits new schools from being built within 500 feet of a freeway although several loopholes exist. The number of schools within 500 feet of a freeway is 6% for schools in South LA, more than the 4% in West LA but less than the 8% for all LAUSD schools.
LAUSD is undergoing an unprecedented $19 billion effort to build new schools and modernize and repair existing facilities, resulting in 150 new schools and 70 school additions.105 The district must confront the challenge of adhering to the 500 feet law when there is limited undeveloped land or the choice of potentially displacing families whose children attend the school.
RECOMMENDATIONS
The conditions and disparities in inner city schools are not intractable but require vigilant monitoring and reporting. On April 30, 2008, KNBC’s investigation found 30 percent of the LAUSD schools tested (9 out of 30) had water with lead levels above what the government says is safe. To reduce these environmental risks, new school construction or modernization and repair projects for South LA Williams schools should be prioritized under the various school bond initiatives.

South Los Angeles H
ealth Equity Scorecard
71
Primary prevention policies to address child asthma should focus on retrofitting school buses and diesel trucks, reducing vehicle emissions, increasing public transportation use, building bicycle and walking paths, and preventing idling of school buses. Secondary prevention approaches should include conditioning or filtering air in schools, limiting vehicles near schools, separating schools from roadways.106 In line with its core design principles, local school districts should make every attempt to find alternatives to building near freeways and other pollutants such as industrial facilities or in places where air quality risk standards are exceeded.
POLICY RECOMMENDATION ACCOUNTABLE AGENCY
Mandate completion of structural (retrofitting) improvements to comply with regulations related to indoor/outdoor air quality of all schools by a designated time.
California Department of Educationß California State Legislatureß
Increase enforcement of the school-freeway distance with an extended public review period and mitigation measures if a school district requests an exception under the law.
State Department of Educationß
Reduce the number of Williams Decile 1-3 South LA schools in the next 3 years by at least 33%.
Los Angeles Unified School District and other ß City School DistrictsLos Angeles County Office of Educationß
Conduct state legislative hearings to examine status of corrective action, examine critical Williams schools issues and provide greater public accountability.
California Department of Education ß California State Legislatureß
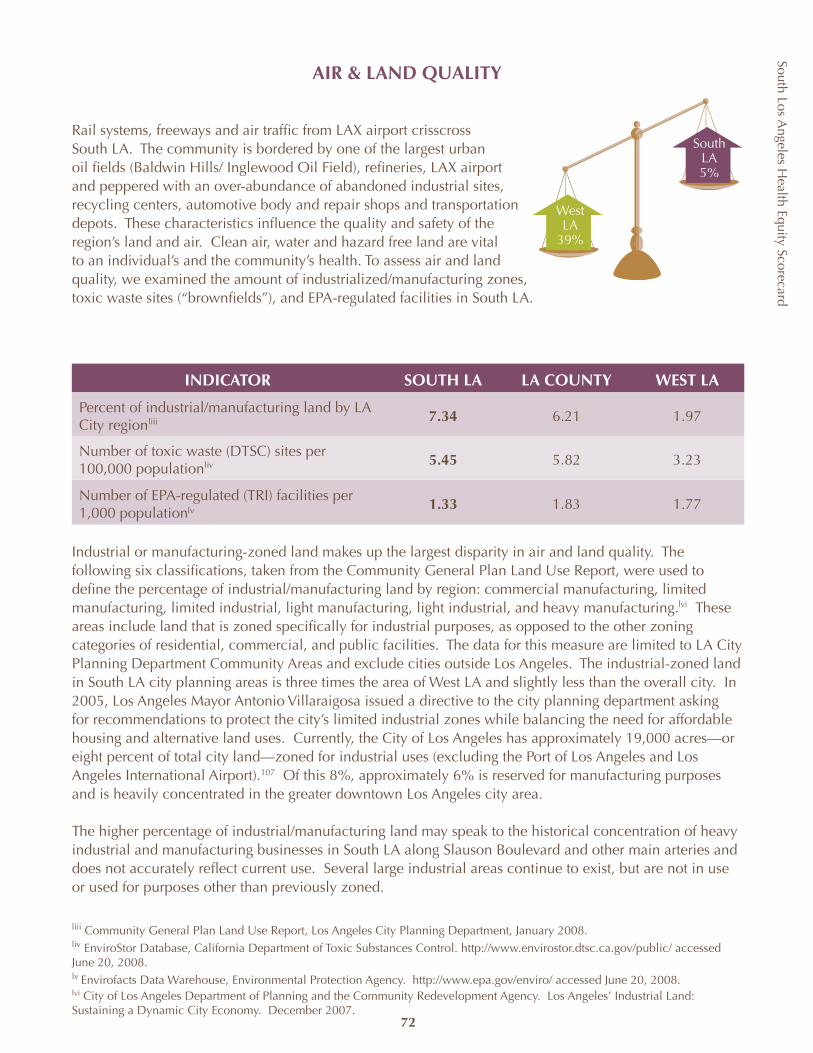
South Los Angeles H
ealth Equity Scorecard
72
WestLA
39%
South LA 5%
AIR & LAND QUALITY
Rail systems, freeways and air traffic from LAX airport crisscross South LA. The community is bordered by one of the largest urban oil fields (Baldwin Hills/ Inglewood Oil Field), refineries, LAX airport and peppered with an over-abundance of abandoned industrial sites, recycling centers, automotive body and repair shops and transportation depots. These characteristics influence the quality and safety of the region’s land and air. Clean air, water and hazard free land are vital to an individual’s and the community’s health. To assess air and land quality, we examined the amount of industrialized/manufacturing zones, toxic waste sites (“brownfields”), and EPA-regulated facilities in South LA.
INDICATOR SOUTH LA LA COUNTY WEST LA
Percent of industrial/manufacturing land by LA City region
7.34 6.21 1.97
Number of toxic waste (DTSC) sites per 100,000 population
5.45 5.82 3.23
Number of EPA-regulated (TRI) facilities per 1,000 population
1.33 1.83 1.77
Industrial or manufacturing-zoned land makes up the largest disparity in air and land quality. The following six classifications, taken from the Community General Plan Land Use Report, were used to define the percentage of industrial/manufacturing land by region: commercial manufacturing, limited manufacturing, limited industrial, light manufacturing, light industrial, and heavy manufacturing.20 These areas include land that is zoned specifically for industrial purposes, as opposed to the other zoning categories of residential, commercial, and public facilities. The data for this measure are limited to LA City Planning Department Community Areas and exclude cities outside Los Angeles. The industrial-zoned land in South LA city planning areas is three times the area of West LA and slightly less than the overall city. In 2005, Los Angeles Mayor Antonio Villaraigosa issued a directive to the city planning department asking for recommendations to protect the city’s limited industrial zones while balancing the need for affordable housing and alternative land uses. Currently, the City of Los Angeles has approximately 19,000 acres—or eight percent of total city land—zoned for industrial uses (excluding the Port of Los Angeles and Los Angeles International Airport).107 Of this 8%, approximately 6% is reserved for manufacturing purposes and is heavily concentrated in the greater downtown Los Angeles city area.
The higher percentage of industrial/manufacturing land may speak to the historical concentration of heavy industrial and manufacturing businesses in South LA along Slauson Boulevard and other main arteries and does not accurately reflect current use. Several large industrial areas continue to exist, but are not in use or used for purposes other than previously zoned.
20 City of Los Angeles Department of Planning and the Community Redevelopment Agency. Los Angeles’ Industrial Land: Sustaining a Dynamic City Economy. December 2007.
liii
liv
lv
lvi
liii Community General Plan Land Use Report, Los Angeles City Planning Department, January 2008.liv EnviroStor Database, California Department of Toxic Substances Control. http://www.envirostor.dtsc.ca.gov/public/ accessed June 20, 2008. lv Envirofacts Data Warehouse, Environmental Protection Agency. http://www.epa.gov/enviro/ accessed June 20, 2008. lvi City of Los Angeles Department of Planning and the Community Redevelopment Agency. Los Angeles’ Industrial Land: Sustaining a Dynamic City Economy. December 2007.
South Los Angeles H
ealth Equity Scorecard
73
Heavy manufacturing plants are one of the sources known to contribute to outdoor air pollution and potentially release toxic chemicals during production. Air pollution is known or suspected to cause cancer and is associated with other serious health conditions such as birth defects and asthma.108 The effects of exposure to toxic chemicals released into air or land can be acute or accumulate over time, and many are known to cause cancer.109 High temperature operations at industrial sources also contribute to nitrogen oxide, and short- and long-term air exposure is linked to respiratory illness.110 Heavier industry, such as oil field production, uses equipment that releases a variety of pollutants from particulate matter to sulfur dioxide.111
Many other sources including vehicles and planes, dry cleaners and gas stations add to the list of pollutants in South LA.112 To assess these sources and to identify more specifically the presence of toxic release among industry, we gathered data from state and federal regulatory databases for the county and the two study areas. The California Department of Toxic Substances’ (DTSC) EnviroStor database tracks and identifies sites known to have contamination or sites that may need further investigation. It also identifies facilities that are permitted to handle hazardous waste.21 In addition, because state and federal guidelines have differing threshold levels for reporting businesses, we also analyzed the EPA’s Envirofacts database for facility information from a variety of environmental databases, including those tracking toxic chemical release sites, water discharge permit compliance, hazardous waste handling processes, and air emission estimates. Though there may be some overlap between the two databases (DTSC EnviroStor and EPA Envirofacts), because California environmental policies establish higher thresholds than the federal EPA, many of the businesses that report to DTSC are not required to report to EPA.
Liberty Hill Foundation is working with researchers, environmental groups and local community residents in South LA, Pacoima, Van Nuys, the Figueroa corridor downtown, Boyle Heights, Maywood, Commerce and Wilmington to inventory potentially toxic and hazardous sites in neighborhoods. The effort, known as “ground truthing,” is designed to provide an accurate picture of toxic and hazardous sites and how they affect the health of nearby communities.
The rate of DTSC sites per 100,000 population in South LA (5.45) is consistent, but slightly lower than LA County (5.82) overall. It is, however, almost twice the rate of West LA (3.23 per 100,000). There is a precipitous and somewhat contradictory drop for South LA in the number of less stringently federally-reported sites. This may be attributed either to under-reporting and or the decline in related businesses in the area. Further research is needed to validate this data.
lvii Department of Toxic Substances Control, EnviroStor Frequently Asked Questions and Answers.lviii Environmental Protection Agency, Envirofacts Multi-system Query.
lvii
lviii
South Los Angeles H
ealth Equity Scorecard
74
RECOMMENDATIONS
A number of state and federal agencies are responsible for monitoring environmental standards including the South Coast Air Quality Management District, State Water Resources Control Board and the EPA. More stringent regulation and policy changes at the federal and state levels have allowed better control and reduction of air and land pollutants.113 This includes improved technology for garbage sites, industry and others to prevent release of contaminants. The EPA now stringently regulates and addresses land quality through the Superfund or CERCLA, which provides for the evaluation and cleanup of hazardous waste sites. While it is not yet clearly demonstrated that living near an industrial area is linked to adverse health outcomes because of the variances in each place, the potential risk is present and the City of LA has attempted to buffer residents with lighter industrial zones. However, this is not always possible where industry precedes a housing development. The Baldwin Hills community is organizing for a Community Standards District to regulate the planned expansion of oil drilling and production by the oil company PXP on land adjacent to the community as part of the environmental impact study required under the California Environmental Quality Act. The law was put in place to protect the environment in communities by allowing alternatives or mitigation through the EIR, but projects can still move forward even if specific hardships are demonstrated.114 The public often is not aware of these processes and public hearings may go unnoticed or unattended.
Of equal concern is the lack of coordination by city agencies for the significant number of current projects and developments. This includes planning for transit corridors by MTA and DOT (Crenshaw-Prairie); mixed use and retail development within the nine South LA Redevelopment Project areas; the City of Los Angeles Department of Parks and Recreation strategic planning; and Baldwin Hills Park Master Plan, to name a few. Greater coordination or consolidation of the planning and redevelopment function may facilitate a more cohesive plan balancing economic and community health priorities. The community plan update through the planning departments should be used to strengthen existing standards and set limits on the occurrence of potentially hazardous sites on a geographic basis, including light manufacturing and repair shops subject to DTSC reporting.
Greater coordination is needed among the city planning departments of neighboring cities to provide uniform standards, measures and reporting of land use. Reporting of current land use should be improved at all levels of government with limits placed on local variances. As the need for more affordable housing and responsible mixed-use development encroaches upon industrially-zoned areas, design standards must be more strictly enforced.
POLICY RECOMMENDATIONS ACCOUNTABLE AGENCYStrengthen adherence to planning and design requirements for buffering and clean-up of heavy and light industrial use.
LA City Planning and Zoning Administratorß LA City Councilß LA City Redevelopment Agencyß
Establish a fund similar to the federal CERCLA or Superfund that imposes fees on businesses to be used for removal or other corrective responses.
Los Angeles County Board of Supervisorsß California State Legislatureß
Strengthen coordination between responsible city departments to ensure more cohesive regional planning for parks, transportation, zoning, redevelopment and housing.
LA City Planning and Zoning Administratorß LA City Redevelopment Agencyß
Develop and implement a system to gather data and provide a set of indicators that accurately reflects air and land quality.
AQMDß California Department of Toxic Substancesß Environmental Protection Agencyß
NEXT STEPS
Although the disparities highlighted in the South LA Health Equity Scorecard are not new, national attention on the need for healthcare reform and the existence of several current local initiatives provide an opportunity “to get it right.” More than any single finding documented in this report, the Scorecard is designed to demonstrate that the health of a community is not the sole responsibility or authority of the county or the healthcare sector. Rather, just as the health of the population is influenced by multiple factors in both the healthcare environment and the physical environment, so must the response to poor health outcomes address the universe of these influences.
Even agencies that don’t typically see health as their responsibility have a powerful decision-making role that contributes to or diminishes health at a neighborhood, community and regional level. Local public health agencies across the country are starting to partner with urban planners, schools, businesses, and municipalities to focus on neighborhoods or “places” where many of the exposures to social determinants of health occur. Initiatives include, for example, rebuilding and expanding public housing to include recreational space such as bike paths and parks and increasing the number of affordable housing units throughout a community.
In the face of the current national economic crisis, greater attention must be given to the needs of the inner city as part of any economic stimulus or recovery plan if we are to avoid exacerbating inequities and prevent further erosion of the health of whole populations. These factors—highlighted by the Scorecard results—leave no doubt that the time for coordinated leadership and a comprehensive agenda for policy change is now. The recommendations outlined in this report are more than just the output of a project; they are a call for leadership and provide blueprints for an actionable agenda.
Success will require vision and forward thinking by policymakers and responsible agencies, along with a recognition that what works in one place may not work in another. The Mayor of Los Angeles recently released a South LA Strategic Initiative that opens a process of coordination among the various city departments to expedite a number of outstanding redevelopment projects and to support job creation. In cities such as Inglewood and Compton, as well as elsewhere in the region, there is increased development. However, the old political argument that “something, albeit inferior, is better than nothing” can no longer be tolerated. It is no longer in the best interests of the health of communities such as South LA to allow development or redevelopment in the absence or outside of a strategic plan for building a healthy community and sustainable economy. Job creation alone does not result in better access to quality services or community economic development. A job is not a job—part-time minimum wage jobs at fast-food restaurants or big box retailers do little to stimulate the re-entry of quality food retailers, better schools or to lift families out of poverty. An economic strategy is needed that not only stops the “leakage” of consumer spending but also results in the recirculation and reinvestment of dollars back into the community. Plans calling for higher housing density must be tempered by well-designed communities that support physical activity and disperse low-income housing in a rational and equitable manner.
This requires collaborative and strategic planning beyond any immediate project or sector initiative. The transportation agenda must support housing development; housing development must be supported and complemented by economic development and job creation. With redevelopment and increased density must come new opportunities for open space, improved infrastructure and additional support for education. The funding and resources are in place, but they need to be better aligned and leveraged with the benefit of the community foremost.
75
South Los Angeles H
ealth Equity Scorecard
The process begins with a commitment to health equity. Health equity does not take away from one community to improve the condition of another. Health equity is the targeted reinvestment of economic, political and social capital in underserved communities to achieve parity. It is the dismantling of intentional, unintentional or absence of public, economic and institutional policies that isolate whole segments of the population from access and opportunity as we see in South LA. It is the proactive creation of access and opportunity by decision makers and the community.
The inequality in the health of South LA is a “condition” that goes beyond the limits of any single city and necessitates collaboration and cooperation at every level of government and across jurisdictions. County and city elected officials and their respective agencies must develop a joint power agreement that outlines a comprehensive plan to address the economic, social and political hurdles and that identifies benchmarks and performance standards for public accountability. There must be a targeted and strategic commitment of resources insulated from fluctuations in the budget process.
The efforts to achieve health equity must extend beyond the walls of City Hall and include the active participation of community, business and faith-based leadership. A great deal can be done at the community level. Despite a history of economic, social and political obstacles, the residents of South LA have demonstrated creativity, resilience and a great capacity for creating a community rich in assets in a desert of equitable public and private investment. The many coalitions, outstanding community- and faith-based organizations, and the network of neighborhood councils and associations should be tapped and engaged in this effort.
The Coalition for Health & Justice and the Disparities in Healthcare Advisory Committee have already agreed to push forward on the recommendations in the Scorecard pertaining to Primary and Preventive Care Access and Utilization. Having discussed and expanded the recommendations in great detail, these coalitions are mobilizing on a number of action items, such as a postcard campaign for an increase of county funding for safety-net clinics, a future partnership with health-educator training programs, and the publication of a South LA Health Resources Guide. These action items were carefully chosen and developed to improve one or more of the 12 indicators of South LA’s deficient access to and utilization of primary and preventive care services. Both coalitions will be moving on these actions—and more—during the next year.
Much like the members of the Coalition for Health & Justice and the Disparities in Healthcare Advisory Committee, others attending the Policy Summit expressed interest in partnering with leaders working to eliminate disparities, either by conducting research or establishing connections for recommendations that lack an advocate. CHC is working with a number of the coalitions and groups through the publication of the Scorecard and establishment of a website to help provide greater public accountability and engagement. Our hope is that this report is only the beginning of a collaborative process, with every intention that in forthcoming editions the data will demonstrate progress achieved and thus a discernible improvement in the health of the South LA community.
South Los Angeles H
ealth Equity Scorecard
76
South Los Angeles H
ealth Equity Scorecard
77
ACKNOWLEDGMENTS
Community Health Councils would like to thank everyone who participated in the Community Health Councils’ Coalition for Health & Justice South Los Angeles Health Equity Scorecard Policy Summit. We thank you for your insights into the data indicators and the policy recommendations in the development of this Scorecard. Your contributions were invaluable.
Additional thanks go to the following individuals and organizations who contributed their ideas and resources to the South Los Angeles Health Equity Scorecard project. Without their participation, the Scorecard would not have been possible.
Scorecard Advisors:Cynthia Oredugba, American Cancer SocietyMarqueece Dawson, Community Coalition
Gloria Davis, Girl’s ClubAngela Young-Brinn, Healthy African American Families
Janice French, LA Best Babies Tonya Gorham, LA Best Babies
Jacquelyn Wilcoxen, Los Angeles County Department of Mental HealthMartina Travis, Los Angeles County Department of Public Health—SPA 6Nicole Vick, Los Angeles County Department of Public Health—SPA 6
Dr. Ricky Bluthenthal, RAND Corporation: Urban Community Research Center/Cal-State Dominquez Hills
Genevieve Filmardirossian, South Central Family Health Center Nina Vacarro, Southside Coalition of Community Health Centers
Jennifer Ito, Strategic Concepts in Organizing and Policy EducationT.H.E. Clinic
Alison Herrmann, UCLA Center to Eliminate Health DisparitiesDavid Sloane, USC School of Policy Planning and Development
Dr. Roderick Seamster, Watts Healthcare Corporation
Data Collection:California Department of Alcoholic Beverage Control
California Department of Toxic Substance Control California Health Interview Survey
California Office of the Attorney General California School Health Centers Association
Environmental Protection Agency GreenInfo Network
Healthy City LA City Planning Department
Los Angeles Police Department LA County Department of Health Services LA County Department of Mental Health LA County Department of Public Health LA County Department of Public Works Los Angeles County Office of Education
Los Angeles Unified School District Medical Marketing Service, Inc.
Office of Statewide Health Planning and Development Southern California Air Quality Management District
The City ProjectUnited Way of Greater Los Angeles
Bailitt Health, LLP Charles Drew University
Editor: Janice Taylor, Communications Director, Community Health CouncilsInterns: Anne Ferree, Lauren Frank, Jessica Jew, Ming Li, Katherine Mack, Nkechi Obioha
South Los Angeles H
ealth Equity Scorecard
78
APPENDIX 1: Data Sources, Notes and Known Limitations
As with all data collection and uses, limitations occur within this study. The South Los Angeles Health Equity Scorecard incorporates multiple data sources ranging from the widely-known US Census, LA County Health Survey, California Health Interview Survey, and Office of Statewide Health Planning and Development to specific data sets gathered from schools, planning departments, health service delivery agencies, state licensing bodies, etc. General data limitations that should be acknowledged include:
Scorecard data reflect multiple years and different methods of collection.ß Every attempt was made to collect data across like years. However, the report incorporates data from multiple repositories with different data collection periods and methods. We could not utilize the same year on every indicator, nor can we assure consistency in the ways in which data were gathered.
Scorecard data in some cases are not available for the equivalent geographic area.ß The boundaries of the study area were determined through zip codes, but much of the data was only available under other geographic boundaries such as cities or Service Planning Areas. In several cases, indicators and their data are for different geographic boundaries than the specified Scorecard target and contrast areas. One example of this is school proximity to freeways. Data were collected only from LAUSD; therefore data from other LA County school districts were excluded. Geographic boundaries are noted by indicator in Appendix 1.
Scorecard data are not computed for statistical significance and should not be represented as ß such. Some data are statistically unreliable and noted accordingly.
Some data are duplicated among indicators. ß For example, the supply of licensed acute psychiatric beds is the maximum number of psychiatric beds a hospital is licensed to operate at any time. Hospitals may be licensed to operate a certain number of beds, but this does not necessarily mean they have the physical and staff resources to occupy those beds with patients. The supply of licensed available beds represents the number of beds that can be staffed, equipped, and ready for use by a patient within 24 hours. Licensed available bed supply includes beds for all specialty services. Because of this, the supply of licensed acute psychiatric beds is included among the data. In these instances, data were averaged or weighted in an effort to offset duplication.
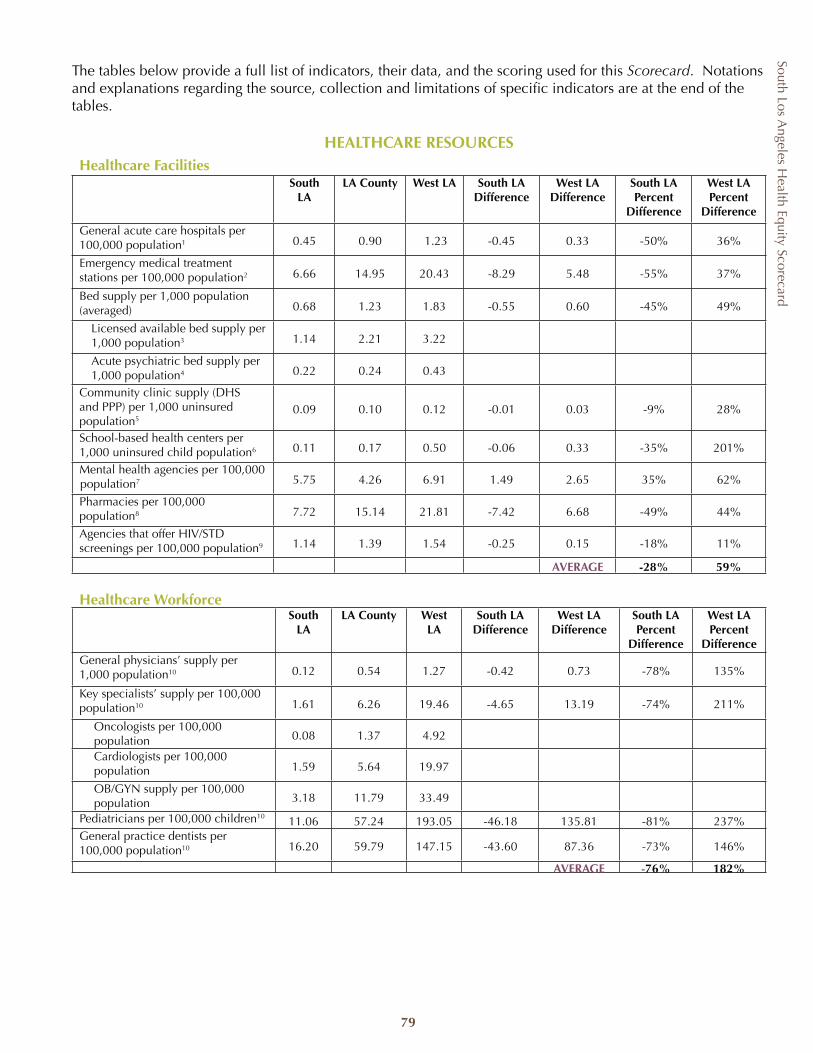
South Los Angeles H
ealth Equity Scorecard
79
The tables below provide a full list of indicators, their data, and the scoring used for this Scorecard. Notations and explanations regarding the source, collection and limitations of specific indicators are at the end of the tables.
HEALTHCARE RESOURCESHealthcare Facilities
South LA
LA County West LA South LA Difference
West LA Difference
South LA Percent
Difference
West LA Percent
Difference
General acute care hospitals per 100,000 population1 0.45 0.90 1.23 -0.45 0.33 -50% 36%
Emergency medical treatment stations per 100,000 population2 6.66 14.95 20.43 -8.29 5.48 -55% 37%
Bed supply per 1,000 population (averaged) 0.68 1.23 1.83 -0.55 0.60 -45% 49%
Licensed available bed supply per 1,000 population3 1.14 2.21 3.22
Acute psychiatric bed supply per 1,000 population4 0.22 0.24 0.43
Community clinic supply (DHS and PPP) per 1,000 uninsured population5
0.09 0.10 0.12 -0.01 0.03 -9% 28%
School-based health centers per 1,000 uninsured child population6 0.11 0.17 0.50 -0.06 0.33 -35% 201%
Mental health agencies per 100,000 population7 5.75 4.26 6.91 1.49 2.65 35% 62%
Pharmacies per 100,000 population8 7.72 15.14 21.81 -7.42 6.68 -49% 44%
Agencies that offer HIV/STD screenings per 100,000 population9 1.14 1.39 1.54 -0.25 0.15 -18% 11%
AVERAGE -28% 59%
Healthcare WorkforceSouth
LALA County West
LASouth LA
DifferenceWest LA
DifferenceSouth LA Percent
Difference
West LA Percent
DifferenceGeneral physicians’ supply per 1,000 population10 0.12 0.54 1.27 -0.42 0.73 -78% 135%
Key specialists’ supply per 100,000 population10 1.61 6.26 19.46 -4.65 13.19 -74% 211%
Oncologists per 100,000 population 0.08 1.37 4.92
Cardiologists per 100,000 population 1.59 5.64 19.97
OB/GYN supply per 100,000 population 3.18 11.79 33.49
Pediatricians per 100,000 children10 11.06 57.24 193.05 -46.18 135.81 -81% 237%General practice dentists per 100,000 population10 16.20 59.79 147.15 -43.60 87.36 -73% 146%
AVERAGE -76% 182%
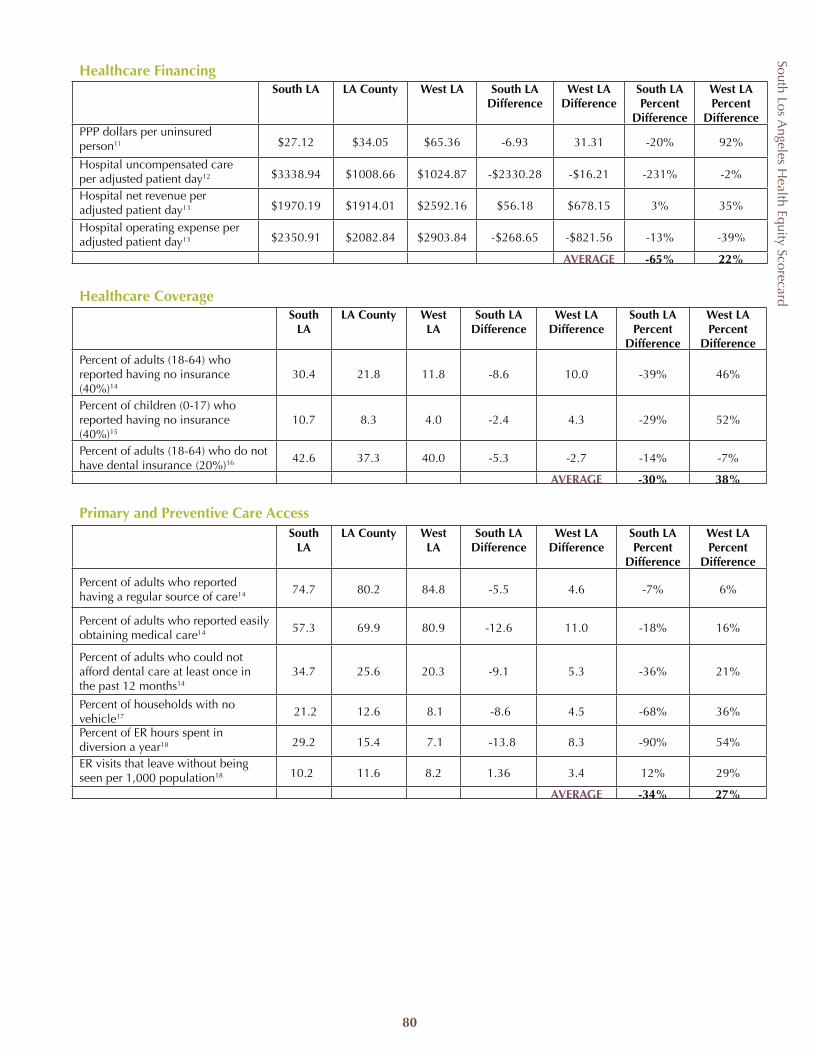
South Los Angeles H
ealth Equity Scorecard
80
Healthcare FinancingSouth LA LA County West LA South LA
DifferenceWest LA
DifferenceSouth LA Percent
Difference
West LA Percent
DifferencePPP dollars per uninsured person11 $27.12 $34.05 $65.36 -6.93 31.31 -20% 92%
Hospital uncompensated care per adjusted patient day12 $3338.94 $1008.66 $1024.87 -$2330.28 -$16.21 -231% -2%
Hospital net revenue per adjusted patient day13 $1970.19 $1914.01 $2592.16 $56.18 $678.15 3% 35%
Hospital operating expense per adjusted patient day13 $2350.91 $2082.84 $2903.84 -$268.65 -$821.56 -13% -39%
AVERAGE -65% 22%
Healthcare CoverageSouth
LALA County West
LASouth LA
DifferenceWest LA
DifferenceSouth LA Percent
Difference
West LA Percent
DifferencePercent of adults (18-64) who reported having no insurance
(40%)14
30.4 21.8 11.8 -8.6 10.0 -39% 46%
Percent of children (0-17) who reported having no insurance (40%)15
10.7 8.3 4.0 -2.4 4.3 -29% 52%
Percent of adults (18-64) who do not have dental insurance (20%)16 42.6 37.3 40.0 -5.3 -2.7 -14% -7%
AVERAGE -30% 38%
Primary and Preventive Care AccessSouth
LALA County West
LASouth LA
DifferenceWest LA
DifferenceSouth LA Percent
Difference
West LA Percent
Difference
Percent of adults who reported having a regular source of care14 74.7 80.2 84.8 -5.5 4.6 -7% 6%
Percent of adults who reported easily obtaining medical care14 57.3 69.9 80.9 -12.6 11.0 -18% 16%
Percent of adults who could not afford dental care at least once in the past 12 months14
34.7 25.6 20.3 -9.1 5.3 -36% 21%
Percent of households with no vehicle17 21.2 12.6 8.1 -8.6 4.5 -68% 36%
Percent of ER hours spent in diversion a year18 29.2 15.4 7.1 -13.8 8.3 -90% 54%
ER visits that leave without being seen per 1,000 population18 10.2 11.6 8.2 1.36 3.4 12% 29%
AVERAGE -34% 27%
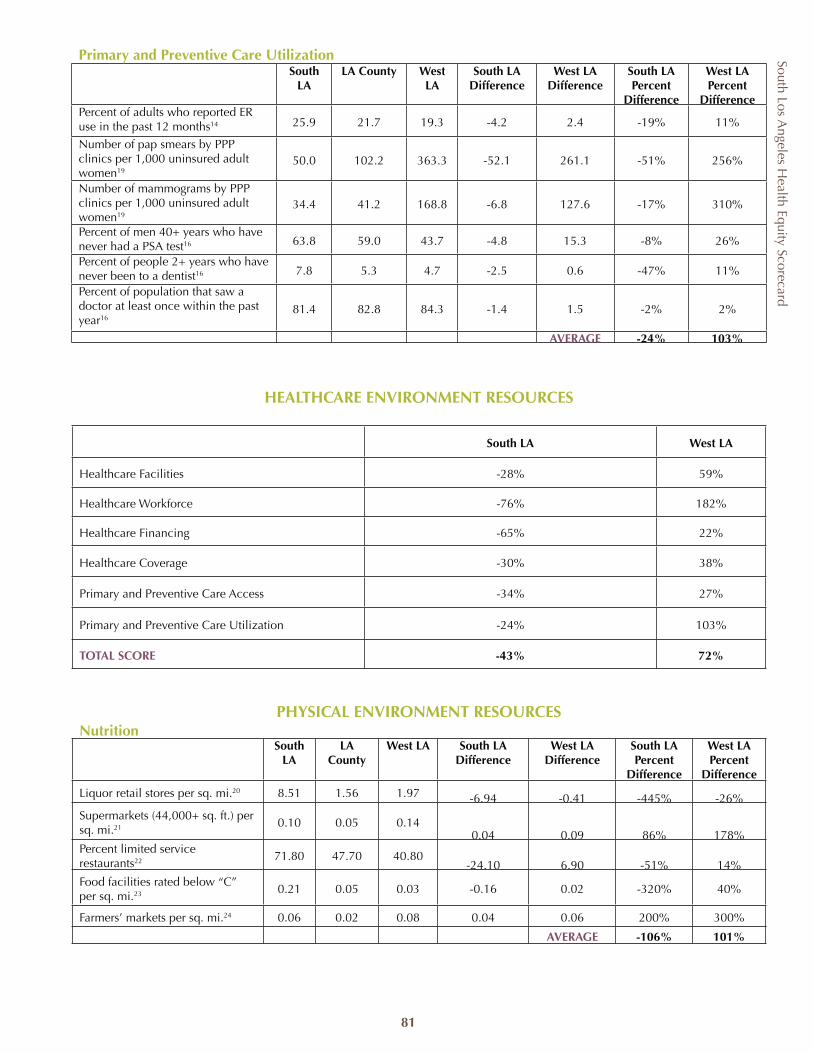
South Los Angeles H
ealth Equity Scorecard
81
Primary and Preventive Care UtilizationSouth
LALA County West
LASouth LA
DifferenceWest LA
DifferenceSouth LA Percent
Difference
West LA Percent
DifferencePercent of adults who reported ER use in the past 12 months14 25.9 21.7 19.3 -4.2 2.4 -19% 11%
Number of pap smears by PPP clinics per 1,000 uninsured adult women19
50.0 102.2 363.3 -52.1 261.1 -51% 256%
Number of mammograms by PPP clinics per 1,000 uninsured adult women19
34.4 41.2 168.8 -6.8 127.6 -17% 310%
Percent of men 40+ years who have never had a PSA test16 63.8 59.0 43.7 -4.8 15.3 -8% 26%
Percent of people 2+ years who have never been to a dentist16 7.8 5.3 4.7 -2.5 0.6 -47% 11%
Percent of population that saw a doctor at least once within the past year16
81.4 82.8 84.3 -1.4 1.5 -2% 2%
AVERAGE -24% 103%
HEALTHCARE ENVIRONMENT RESOURCES
South LA West LA
Healthcare Facilities -28% 59%
Healthcare Workforce -76% 182%
Healthcare Financing -65% 22%
Healthcare Coverage -30% 38%
Primary and Preventive Care Access -34% 27%
Primary and Preventive Care Utilization -24% 103%
TOTAL SCORE -43% 72%
PHYSICAL ENVIRONMENT RESOURCESNutrition
South LA
LA County
West LA South LA Difference
West LA Difference
South LA Percent
Difference
West LA Percent
Difference
Liquor retail stores per sq. mi.20 8.51 1.56 1.97 -6.94 -0.41 -445% -26%Supermarkets (44,000+ sq. ft.) per sq. mi.21 0.10 0.05 0.14
0.04 0.09 86% 178%Percent limited service restaurants22 71.80 47.70 40.80
-24.10 6.90 -51% 14%Food facilities rated below “C” per sq. mi.23 0.21 0.05 0.03 -0.16 0.02 -320% 40%
Farmers’ markets per sq. mi.24 0.06 0.02 0.08 0.04 0.06 200% 300%
AVERAGE -106% 101%
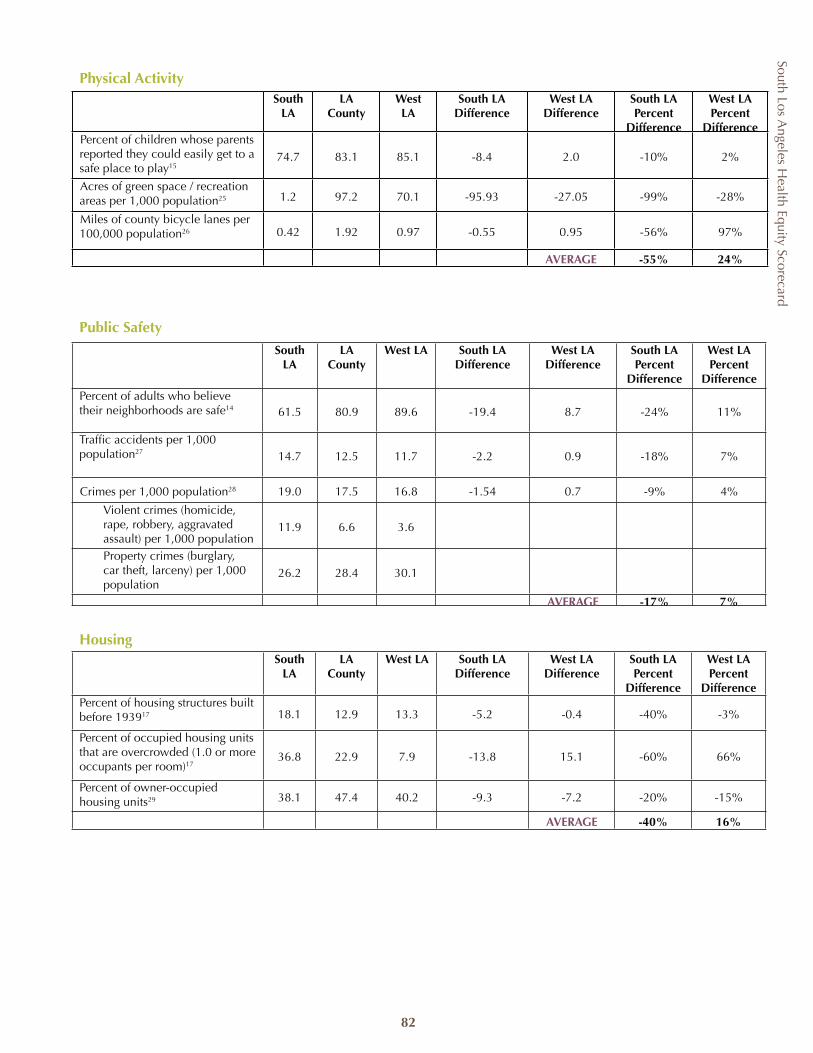
South Los Angeles H
ealth Equity Scorecard
82
Public Safety
South LA
LA County
West LA South LA Difference
West LA Difference
South LA Percent
Difference
West LA Percent
DifferencePercent of adults who believe their neighborhoods are safe14 61.5 80.9 89.6 -19.4 8.7 -24% 11%
Traffic accidents per 1,000 population27 14.7 12.5 11.7 -2.2 0.9 -18% 7%
Crimes per 1,000 population28 19.0 17.5 16.8 -1.54 0.7 -9% 4%
Violent crimes (homicide, rape, robbery, aggravated assault) per 1,000 population
11.9 6.6 3.6
Property crimes (burglary, car theft, larceny) per 1,000 population
26.2 28.4 30.1
AVERAGE -17% 7%
HousingSouth
LALA
CountyWest LA South LA
DifferenceWest LA
DifferenceSouth LA Percent
Difference
West LA Percent
DifferencePercent of housing structures built before 193917 18.1 12.9 13.3 -5.2 -0.4 -40% -3%
Percent of occupied housing units that are overcrowded (1.0 or more occupants per room)17
36.8 22.9 7.9 -13.8 15.1 -60% 66%
Percent of owner-occupied housing units29 38.1 47.4 40.2 -9.3 -7.2 -20% -15%
AVERAGE -40% 16%
Physical ActivitySouth
LALA
CountyWest LA
South LA Difference
West LA Difference
South LA Percent
Difference
West LA Percent
DifferencePercent of children whose parents reported they could easily get to a safe place to play15
74.7 83.1 85.1 -8.4 2.0 -10% 2%
Acres of green space / recreation areas per 1,000 population25 1.2 97.2 70.1 -95.93 -27.05 -99% -28%
Miles of county bicycle lanes per 100,000 population26 0.42 1.92 0.97 -0.55 0.95 -56% 97%
AVERAGE -55% 24%
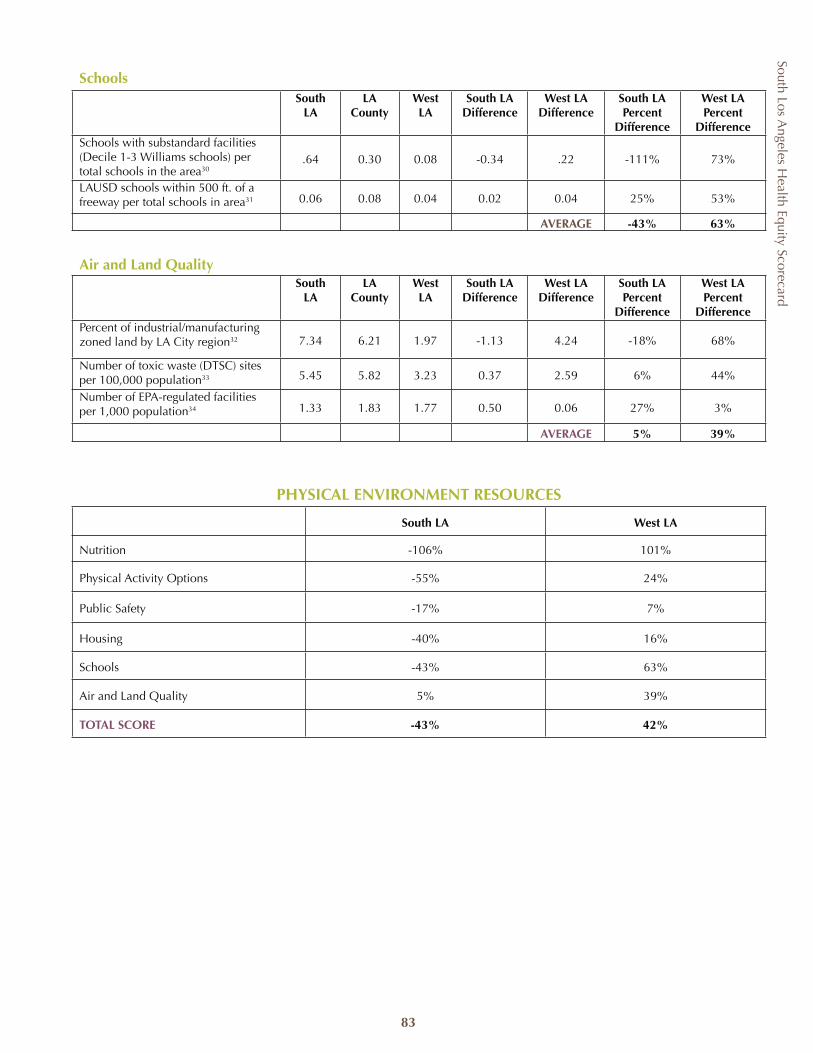
South Los Angeles H
ealth Equity Scorecard
83
PHYSICAL ENVIRONMENT RESOURCES
South LA West LA
Nutrition -106% 101%
Physical Activity Options -55% 24%
Public Safety -17% 7%
Housing -40% 16%
Schools -43% 63%
Air and Land Quality 5% 39%
TOTAL SCORE -43% 42%
Air and Land QualitySouth
LALA
CountyWest LA
South LA Difference
West LA Difference
South LA Percent
Difference
West LA Percent
DifferencePercent of industrial/manufacturing zoned land by LA City region32 7.34 6.21 1.97 -1.13 4.24 -18% 68%
Number of toxic waste (DTSC) sites per 100,000 population33 5.45 5.82 3.23 0.37 2.59 6% 44%
Number of EPA-regulated facilities per 1,000 population34 1.33 1.83 1.77 0.50 0.06 27% 3%
AVERAGE 5% 39%
SchoolsSouth
LALA
CountyWest LA
South LA Difference
West LA Difference
South LA Percent
Difference
West LA Percent
DifferenceSchools with substandard facilities (Decile 1-3 Williams schools) per total schools in the area30
.64 0.30 0.08 -0.34 .22 -111% 73%
LAUSD schools within 500 ft. of a freeway per total schools in area31 0.06 0.08 0.04 0.02 0.04 25% 53%
AVERAGE -43% 63%
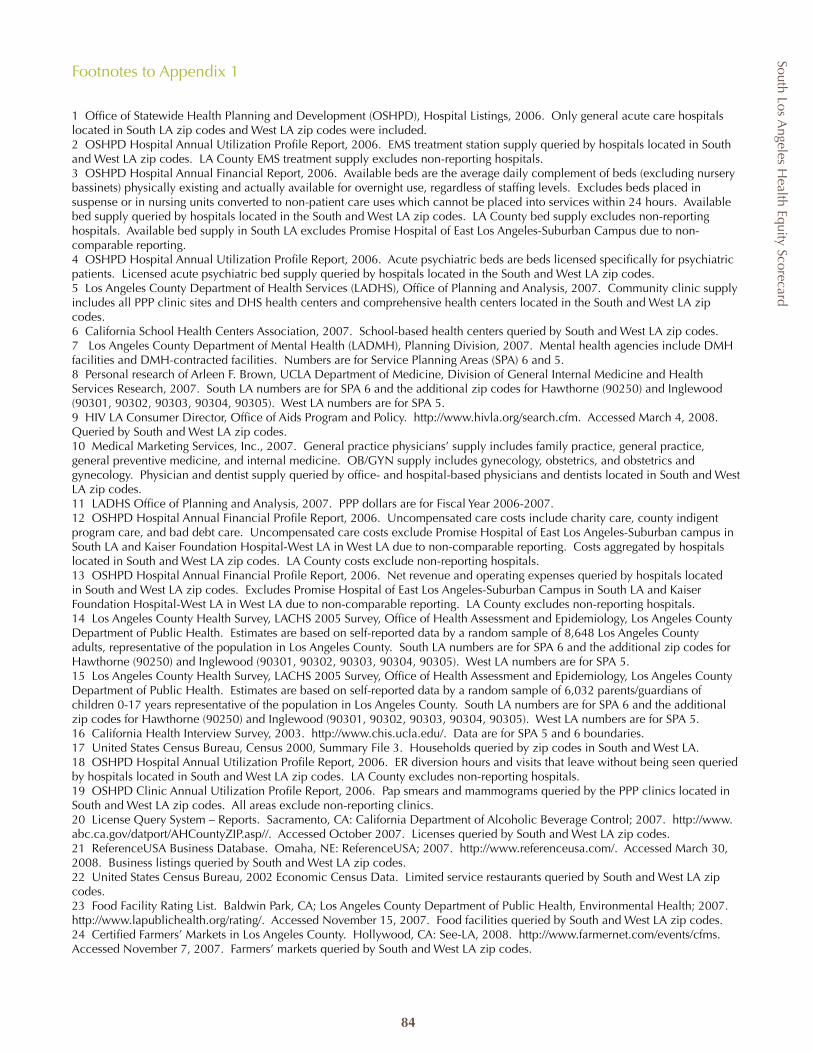
South Los Angeles H
ealth Equity Scorecard
84
Footnotes to Appendix 1
1 Office of Statewide Health Planning and Development (OSHPD), Hospital Listings, 2006. Only general acute care hospitals located in South LA zip codes and West LA zip codes were included. 2 OSHPD Hospital Annual Utilization Profile Report, 2006. EMS treatment station supply queried by hospitals located in South and West LA zip codes. LA County EMS treatment supply excludes non-reporting hospitals.3 OSHPD Hospital Annual Financial Report, 2006. Available beds are the average daily complement of beds (excluding nursery bassinets) physically existing and actually available for overnight use, regardless of staffing levels. Excludes beds placed in suspense or in nursing units converted to non-patient care uses which cannot be placed into services within 24 hours. Available bed supply queried by hospitals located in the South and West LA zip codes. LA County bed supply excludes non-reporting hospitals. Available bed supply in South LA excludes Promise Hospital of East Los Angeles-Suburban Campus due to non-comparable reporting.4 OSHPD Hospital Annual Utilization Profile Report, 2006. Acute psychiatric beds are beds licensed specifically for psychiatric patients. Licensed acute psychiatric bed supply queried by hospitals located in the South and West LA zip codes.5 Los Angeles County Department of Health Services (LADHS), Office of Planning and Analysis, 2007. Community clinic supply includes all PPP clinic sites and DHS health centers and comprehensive health centers located in the South and West LA zip codes. 6 California School Health Centers Association, 2007. School-based health centers queried by South and West LA zip codes.7 Los Angeles County Department of Mental Health (LADMH), Planning Division, 2007. Mental health agencies include DMH facilities and DMH-contracted facilities. Numbers are for Service Planning Areas (SPA) 6 and 5. 8 Personal research of Arleen F. Brown, UCLA Department of Medicine, Division of General Internal Medicine and Health Services Research, 2007. South LA numbers are for SPA 6 and the additional zip codes for Hawthorne (90250) and Inglewood (90301, 90302, 90303, 90304, 90305). West LA numbers are for SPA 5.9 HIV LA Consumer Director, Office of Aids Program and Policy. http://www.hivla.org/search.cfm. Accessed March 4, 2008. Queried by South and West LA zip codes.10 Medical Marketing Services, Inc., 2007. General practice physicians’ supply includes family practice, general practice, general preventive medicine, and internal medicine. OB/GYN supply includes gynecology, obstetrics, and obstetrics and gynecology. Physician and dentist supply queried by office- and hospital-based physicians and dentists located in South and West LA zip codes.11 LADHS Office of Planning and Analysis, 2007. PPP dollars are for Fiscal Year 2006-2007.12 OSHPD Hospital Annual Financial Profile Report, 2006. Uncompensated care costs include charity care, county indigent program care, and bad debt care. Uncompensated care costs exclude Promise Hospital of East Los Angeles-Suburban campus in South LA and Kaiser Foundation Hospital-West LA in West LA due to non-comparable reporting. Costs aggregated by hospitals located in South and West LA zip codes. LA County costs exclude non-reporting hospitals.13 OSHPD Hospital Annual Financial Profile Report, 2006. Net revenue and operating expenses queried by hospitals located in South and West LA zip codes. Excludes Promise Hospital of East Los Angeles-Suburban Campus in South LA and Kaiser Foundation Hospital-West LA in West LA due to non-comparable reporting. LA County excludes non-reporting hospitals.14 Los Angeles County Health Survey, LACHS 2005 Survey, Office of Health Assessment and Epidemiology, Los Angeles County Department of Public Health. Estimates are based on self-reported data by a random sample of 8,648 Los Angeles County adults, representative of the population in Los Angeles County. South LA numbers are for SPA 6 and the additional zip codes for Hawthorne (90250) and Inglewood (90301, 90302, 90303, 90304, 90305). West LA numbers are for SPA 5.15 Los Angeles County Health Survey, LACHS 2005 Survey, Office of Health Assessment and Epidemiology, Los Angeles County Department of Public Health. Estimates are based on self-reported data by a random sample of 6,032 parents/guardians of children 0-17 years representative of the population in Los Angeles County. South LA numbers are for SPA 6 and the additional zip codes for Hawthorne (90250) and Inglewood (90301, 90302, 90303, 90304, 90305). West LA numbers are for SPA 5.16 California Health Interview Survey, 2003. http://www.chis.ucla.edu/. Data are for SPA 5 and 6 boundaries.17 United States Census Bureau, Census 2000, Summary File 3. Households queried by zip codes in South and West LA.18 OSHPD Hospital Annual Utilization Profile Report, 2006. ER diversion hours and visits that leave without being seen queried by hospitals located in South and West LA zip codes. LA County excludes non-reporting hospitals.19 OSHPD Clinic Annual Utilization Profile Report, 2006. Pap smears and mammograms queried by the PPP clinics located in South and West LA zip codes. All areas exclude non-reporting clinics.20 License Query System – Reports. Sacramento, CA: California Department of Alcoholic Beverage Control; 2007. http://www.abc.ca.gov/datport/AHCountyZIP.asp//. Accessed October 2007. Licenses queried by South and West LA zip codes.21 ReferenceUSA Business Database. Omaha, NE: ReferenceUSA; 2007. http://www.referenceusa.com/. Accessed March 30, 2008. Business listings queried by South and West LA zip codes. 22 United States Census Bureau, 2002 Economic Census Data. Limited service restaurants queried by South and West LA zip codes.23 Food Facility Rating List. Baldwin Park, CA; Los Angeles County Department of Public Health, Environmental Health; 2007. http://www.lapublichealth.org/rating/. Accessed November 15, 2007. Food facilities queried by South and West LA zip codes.24 Certified Farmers’ Markets in Los Angeles County. Hollywood, CA: See-LA, 2008. http://www.farmernet.com/events/cfms. Accessed November 7, 2007. Farmers’ markets queried by South and West LA zip codes.
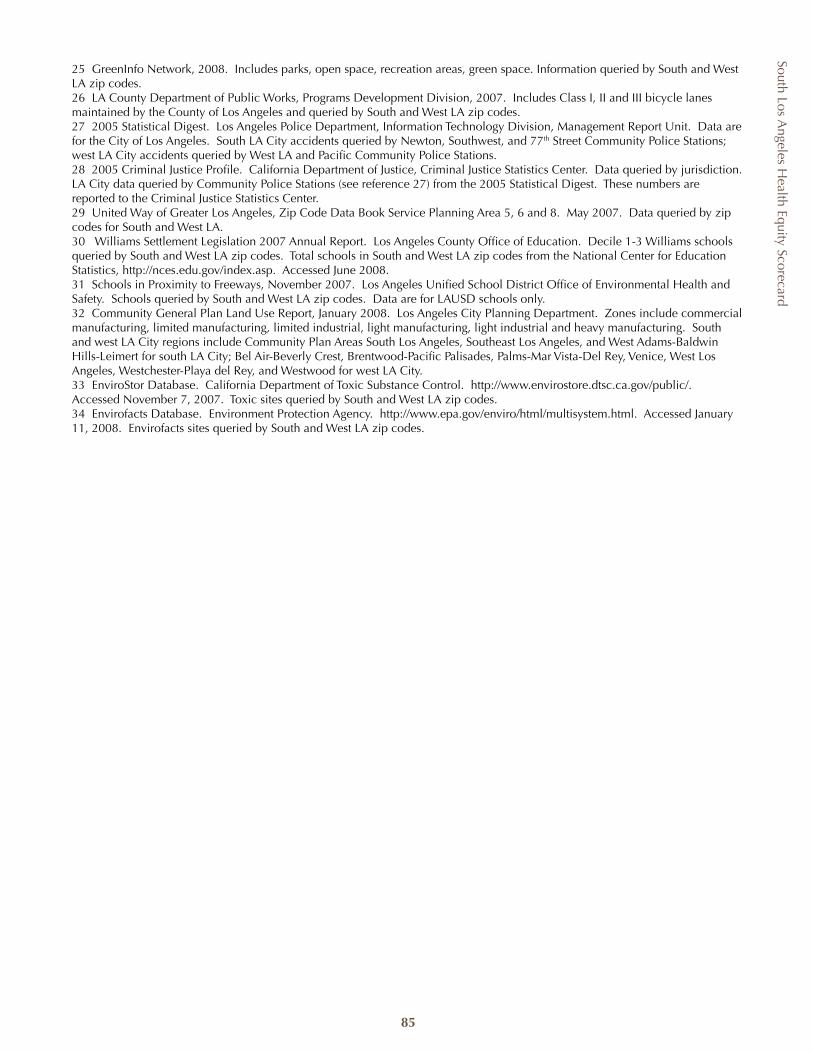
South Los Angeles H
ealth Equity Scorecard
85
25 GreenInfo Network, 2008. Includes parks, open space, recreation areas, green space. Information queried by South and West LA zip codes. 26 LA County Department of Public Works, Programs Development Division, 2007. Includes Class I, II and III bicycle lanes maintained by the County of Los Angeles and queried by South and West LA zip codes. 27 2005 Statistical Digest. Los Angeles Police Department, Information Technology Division, Management Report Unit. Data are for the City of Los Angeles. South LA City accidents queried by Newton, Southwest, and 77th Street Community Police Stations; west LA City accidents queried by West LA and Pacific Community Police Stations. 28 2005 Criminal Justice Profile. California Department of Justice, Criminal Justice Statistics Center. Data queried by jurisdiction. LA City data queried by Community Police Stations (see reference 27) from the 2005 Statistical Digest. These numbers are reported to the Criminal Justice Statistics Center.29 United Way of Greater Los Angeles, Zip Code Data Book Service Planning Area 5, 6 and 8. May 2007. Data queried by zip codes for South and West LA.30 Williams Settlement Legislation 2007 Annual Report. Los Angeles County Office of Education. Decile 1-3 Williams schools queried by South and West LA zip codes. Total schools in South and West LA zip codes from the National Center for Education Statistics, http://nces.edu.gov/index.asp. Accessed June 2008.31 Schools in Proximity to Freeways, November 2007. Los Angeles Unified School District Office of Environmental Health and Safety. Schools queried by South and West LA zip codes. Data are for LAUSD schools only. 32 Community General Plan Land Use Report, January 2008. Los Angeles City Planning Department. Zones include commercial manufacturing, limited manufacturing, limited industrial, light manufacturing, light industrial and heavy manufacturing. South and west LA City regions include Community Plan Areas South Los Angeles, Southeast Los Angeles, and West Adams-Baldwin Hills-Leimert for south LA City; Bel Air-Beverly Crest, Brentwood-Pacific Palisades, Palms-Mar Vista-Del Rey, Venice, West Los Angeles, Westchester-Playa del Rey, and Westwood for west LA City. 33 EnviroStor Database. California Department of Toxic Substance Control. http://www.envirostore.dtsc.ca.gov/public/. Accessed November 7, 2007. Toxic sites queried by South and West LA zip codes.34 Envirofacts Database. Environment Protection Agency. http://www.epa.gov/enviro/html/multisystem.html. Accessed January 11, 2008. Envirofacts sites queried by South and West LA zip codes.
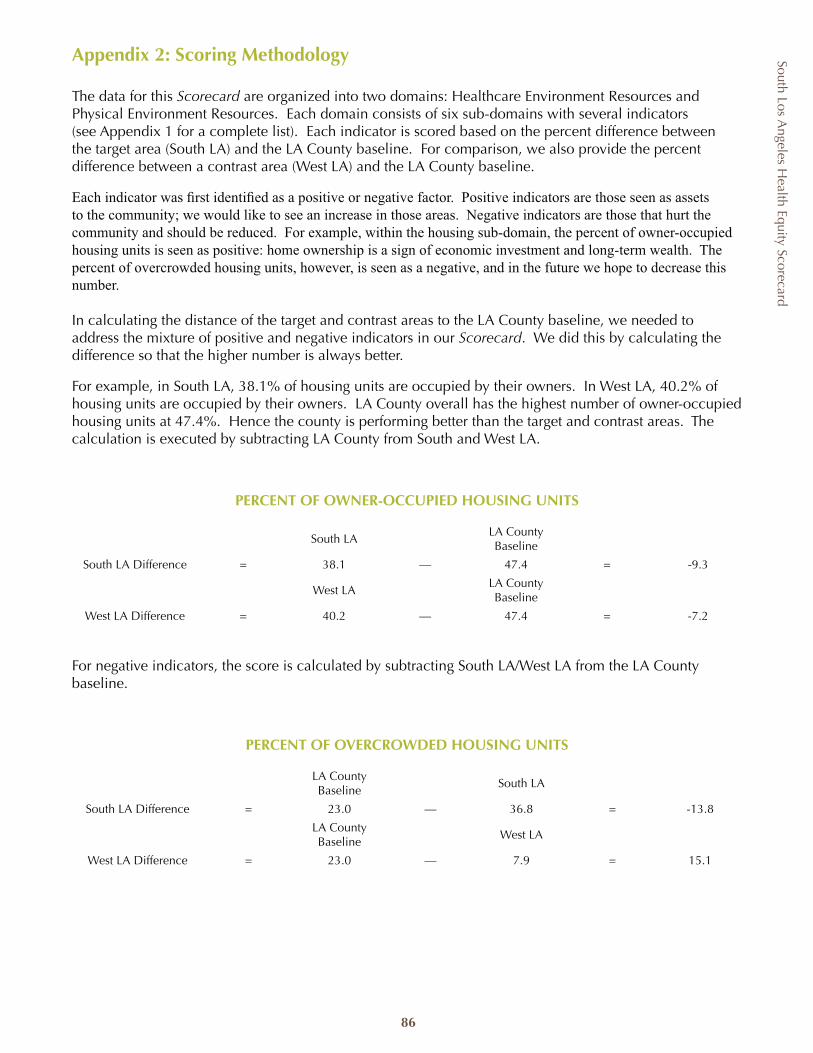
South Los Angeles H
ealth Equity Scorecard
86
Appendix 2: Scoring Methodology
The data for this Scorecard are organized into two domains: Healthcare Environment Resources and Physical Environment Resources. Each domain consists of six sub-domains with several indicators (see Appendix 1 for a complete list). Each indicator is scored based on the percent difference between the target area (South LA) and the LA County baseline. For comparison, we also provide the percent difference between a contrast area (West LA) and the LA County baseline.
Each indicator was first identified as a positive or negative factor. Positive indicators are those seen as assets to the community; we would like to see an increase in those areas. Negative indicators are those that hurt the community and should be reduced. For example, within the housing sub-domain, the percent of owner-occupied housing units is seen as positive: home ownership is a sign of economic investment and long-term wealth. The percent of overcrowded housing units, however, is seen as a negative, and in the future we hope to decrease this number.
In calculating the distance of the target and contrast areas to the LA County baseline, we needed to address the mixture of positive and negative indicators in our Scorecard. We did this by calculating the difference so that the higher number is always better.
For example, in South LA, 38.1% of housing units are occupied by their owners. In West LA, 40.2% of housing units are occupied by their owners. LA County overall has the highest number of owner-occupied housing units at 47.4%. Hence the county is performing better than the target and contrast areas. The calculation is executed by subtracting LA County from South and West LA.
PERCENT OF OWNER-OCCUPIED HOUSING UNITS
South LALA County Baseline
South LA Difference = 38.1 — 47.4 = -9.3
West LALA County Baseline
West LA Difference = 40.2 — 47.4 = -7.2
For negative indicators, the score is calculated by subtracting South LA/West LA from the LA County baseline.
PERCENT OF OVERCROWDED HOUSING UNITS
LA County Baseline
South LA
South LA Difference = 23.0 — 36.8 = -13.8
LA County Baseline
West LA
West LA Difference = 23.0 — 7.9 = 15.1
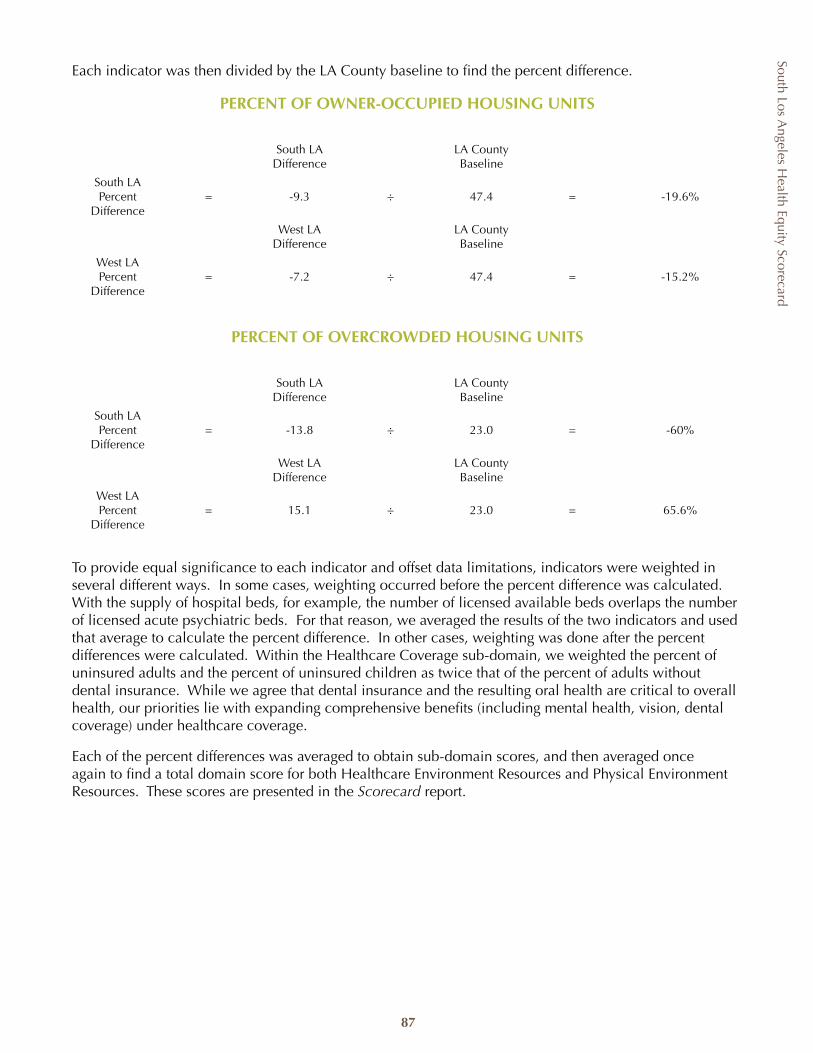
South Los Angeles H
ealth Equity Scorecard
87
Each indicator was then divided by the LA County baseline to find the percent difference.
PERCENT OF OWNER-OCCUPIED HOUSING UNITS
South LA Difference
LA County Baseline
South LA Percent
Difference= -9.3 ÷ 47.4 = -19.6%
West LA Difference
LA County Baseline
West LA Percent
Difference= -7.2 ÷ 47.4 = -15.2%
PERCENT OF OVERCROWDED HOUSING UNITS
South LA Difference
LA County Baseline
South LA Percent
Difference= -13.8 ÷ 23.0 = -60%
West LA Difference
LA County Baseline
West LA Percent
Difference= 15.1 ÷ 23.0 = 65.6%
To provide equal significance to each indicator and offset data limitations, indicators were weighted in several different ways. In some cases, weighting occurred before the percent difference was calculated. With the supply of hospital beds, for example, the number of licensed available beds overlaps the number of licensed acute psychiatric beds. For that reason, we averaged the results of the two indicators and used that average to calculate the percent difference. In other cases, weighting was done after the percent differences were calculated. Within the Healthcare Coverage sub-domain, we weighted the percent of uninsured adults and the percent of uninsured children as twice that of the percent of adults without dental insurance. While we agree that dental insurance and the resulting oral health are critical to overall health, our priorities lie with expanding comprehensive benefits (including mental health, vision, dental coverage) under healthcare coverage.
Each of the percent differences was averaged to obtain sub-domain scores, and then averaged once again to find a total domain score for both Healthcare Environment Resources and Physical Environment Resources. These scores are presented in the Scorecard report.
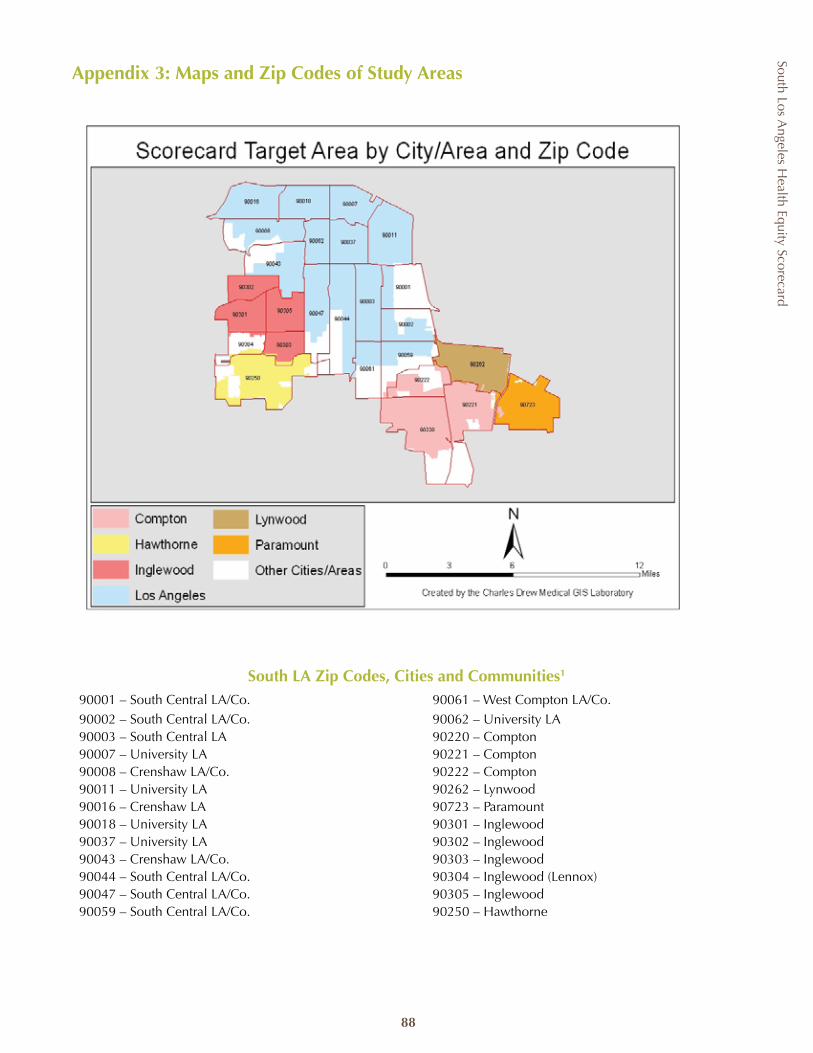
South Los Angeles H
ealth Equity Scorecard
88
South LA Zip Codes, Cities and Communities1
90001 – South Central LA/Co. 90061 – West Compton LA/Co.90002 – South Central LA/Co. 90062 – University LA90003 – South Central LA 90220 – Compton90007 – University LA 90221 – Compton90008 – Crenshaw LA/Co. 90222 – Compton90011 – University LA 90262 – Lynwood90016 – Crenshaw LA 90723 – Paramount 90018 – University LA 90301 – Inglewood90037 – University LA 90302 – Inglewood90043 – Crenshaw LA/Co. 90303 – Inglewood90044 – South Central LA/Co. 90304 – Inglewood (Lennox)90047 – South Central LA/Co. 90305 – Inglewood90059 – South Central LA/Co. 90250 – Hawthorne
Appendix 3: Maps and Zip Codes of Study Areas
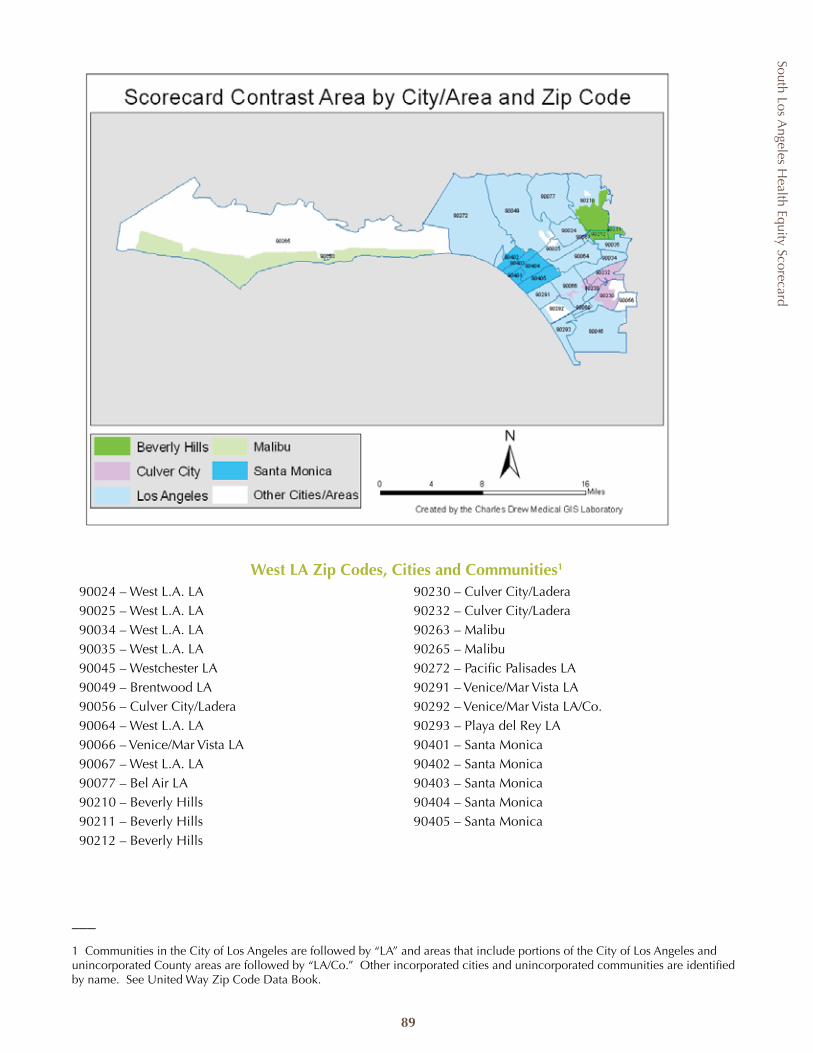
South Los Angeles H
ealth Equity Scorecard
89
West LA Zip Codes, Cities and Communities1
90024 – West L.A. LA 90230 – Culver City/Ladera90025 – West L.A. LA 90232 – Culver City/Ladera90034 – West L.A. LA 90263 – Malibu90035 – West L.A. LA 90265 – Malibu90045 – Westchester LA 90272 – Pacific Palisades LA90049 – Brentwood LA 90291 – Venice/Mar Vista LA90056 – Culver City/Ladera 90292 – Venice/Mar Vista LA/Co.90064 – West L.A. LA 90293 – Playa del Rey LA90066 – Venice/Mar Vista LA 90401 – Santa Monica90067 – West L.A. LA 90402 – Santa Monica90077 – Bel Air LA 90403 – Santa Monica90210 – Beverly Hills 90404 – Santa Monica90211 – Beverly Hills 90405 – Santa Monica90212 – Beverly Hills
___
1 Communities in the City of Los Angeles are followed by “LA” and areas that include portions of the City of Los Angeles and unincorporated County areas are followed by “LA/Co.” Other incorporated cities and unincorporated communities are identified by name. See United Way Zip Code Data Book.
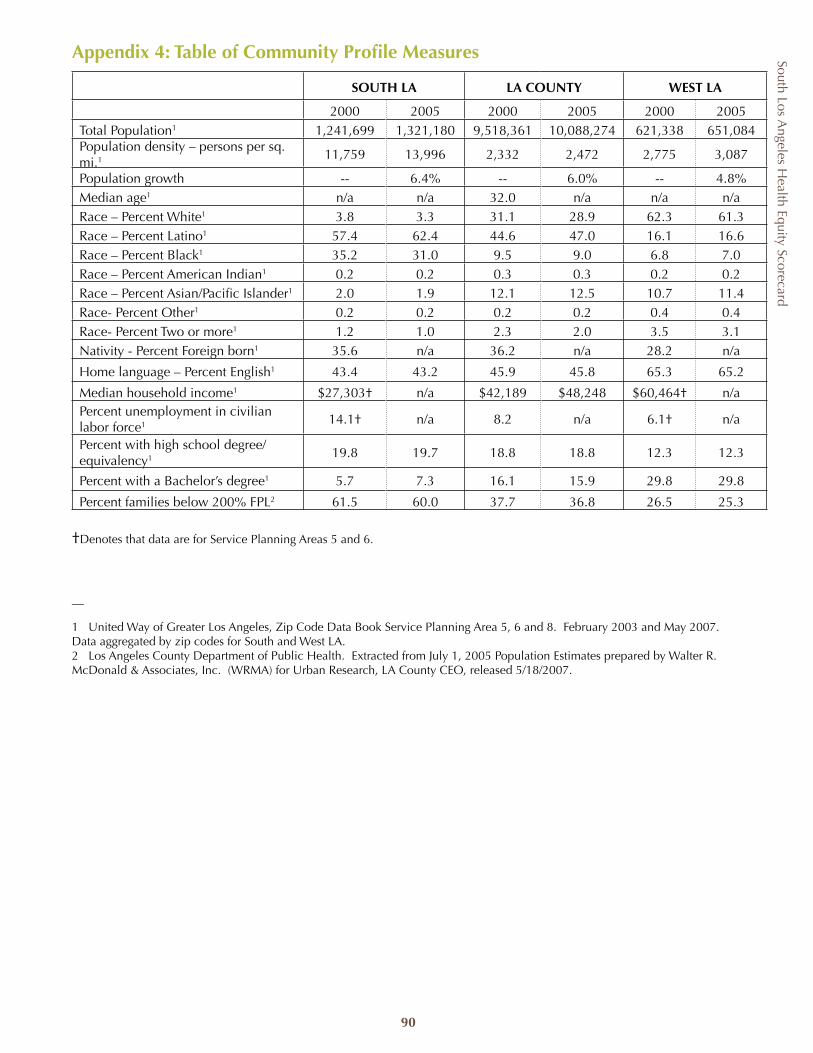
South Los Angeles H
ealth Equity Scorecard
90
SOUTH LA LA COUNTY WEST LA
2000 2005 2000 2005 2000 2005Total Population1 1,241,699 1,321,180 9,518,361 10,088,274 621,338 651,084Population density – persons per sq. mi.1 11,759 13,996 2,332 2,472 2,775 3,087
Population growth -- 6.4% -- 6.0% -- 4.8%Median age1 n/a n/a 32.0 n/a n/a n/aRace – Percent White1 3.8 3.3 31.1 28.9 62.3 61.3Race – Percent Latino1 57.4 62.4 44.6 47.0 16.1 16.6Race – Percent Black1 35.2 31.0 9.5 9.0 6.8 7.0Race – Percent American Indian1 0.2 0.2 0.3 0.3 0.2 0.2Race – Percent Asian/Pacific Islander1 2.0 1.9 12.1 12.5 10.7 11.4Race- Percent Other1 0.2 0.2 0.2 0.2 0.4 0.4Race- Percent Two or more1 1.2 1.0 2.3 2.0 3.5 3.1Nativity - Percent Foreign born1 35.6 n/a 36.2 n/a 28.2 n/a
Home language – Percent English1 43.4 43.2 45.9 45.8 65.3 65.2
Median household income1 $27,303† n/a $42,189 $48,248 $60,464† n/aPercent unemployment in civilian labor force1 14.1† n/a 8.2 n/a 6.1† n/a
Percent with high school degree/equivalency1 19.8 19.7 18.8 18.8 12.3 12.3
Percent with a Bachelor’s degree1 5.7 7.3 16.1 15.9 29.8 29.8
Percent families below 200% FPL2 61.5 60.0 37.7 36.8 26.5 25.3
†Denotes that data are for Service Planning Areas 5 and 6.
__
1 United Way of Greater Los Angeles, Zip Code Data Book Service Planning Area 5, 6 and 8. February 2003 and May 2007. Data aggregated by zip codes for South and West LA.2 Los Angeles County Department of Public Health. Extracted from July 1, 2005 Population Estimates prepared by Walter R. McDonald & Associates, Inc. (WRMA) for Urban Research, LA County CEO, released 5/18/2007.
Appendix 4: Table of Community Profile Measures
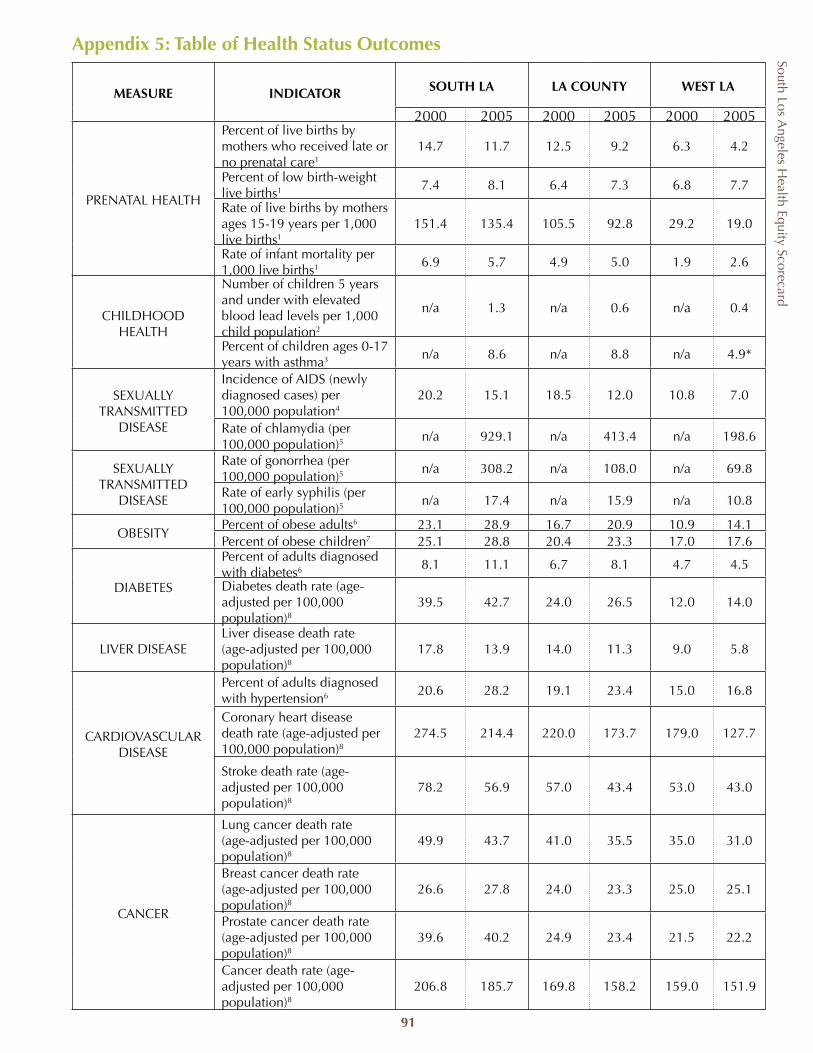
South Los Angeles H
ealth Equity Scorecard
91
MEASURE INDICATOR SOUTH LA LA COUNTY WEST LA
2000 2005 2000 2005 2000 2005
PRENATAL HEALTH
Percent of live births by mothers who received late or no prenatal care1
14.7 11.7 12.5 9.2 6.3 4.2
Percent of low birth-weight live births1 7.4 8.1 6.4 7.3 6.8 7.7
Rate of live births by mothers ages 15-19 years per 1,000 live births1
151.4 135.4 105.5 92.8 29.2 19.0
Rate of infant mortality per 1,000 live births1 6.9 5.7 4.9 5.0 1.9 2.6
CHILDHOOD HEALTH
Number of children 5 years and under with elevated blood lead levels per 1,000 child population2
n/a 1.3 n/a 0.6 n/a 0.4
Percent of children ages 0-17 years with asthma3 n/a 8.6 n/a 8.8 n/a 4.9*
SEXUALLY TRANSMITTED
DISEASE
Incidence of AIDS (newly diagnosed cases) per 100,000 population4
20.2 15.1 18.5 12.0 10.8 7.0
Rate of chlamydia (per 100,000 population)5 n/a 929.1 n/a 413.4 n/a 198.6
SEXUALLY TRANSMITTED
DISEASE
Rate of gonorrhea (per 100,000 population)5
n/a 308.2 n/a 108.0 n/a 69.8
Rate of early syphilis (per 100,000 population)5
n/a 17.4 n/a 15.9 n/a 10.8
OBESITYPercent of obese adults6 23.1 28.9 16.7 20.9 10.9 14.1Percent of obese children7 25.1 28.8 20.4 23.3 17.0 17.6
DIABETES
Percent of adults diagnosed with diabetes6 8.1 11.1 6.7 8.1 4.7 4.5
Diabetes death rate (age-adjusted per 100,000 population)8
39.5 42.7 24.0 26.5 12.0 14.0
LIVER DISEASELiver disease death rate (age-adjusted per 100,000 population)8
17.8 13.9 14.0 11.3 9.0 5.8
CARDIOVASCULAR DISEASE
Percent of adults diagnosed with hypertension6 20.6 28.2 19.1 23.4 15.0 16.8
Coronary heart disease death rate (age-adjusted per 100,000 population)8
274.5 214.4 220.0 173.7 179.0 127.7
Stroke death rate (age-adjusted per 100,000 population)8
78.2 56.9 57.0 43.4 53.0 43.0
CANCER
Lung cancer death rate (age-adjusted per 100,000 population)8
49.9 43.7 41.0 35.5 35.0 31.0
Breast cancer death rate (age-adjusted per 100,000 population)8
26.6 27.8 24.0 23.3 25.0 25.1
Prostate cancer death rate (age-adjusted per 100,000 population)8
39.6 40.2 24.9 23.4 21.5 22.2
Cancer death rate (age-adjusted per 100,000 population)8
206.8 185.7 169.8 158.2 159.0 151.9
Appendix 5: Table of Health Status Outcomes
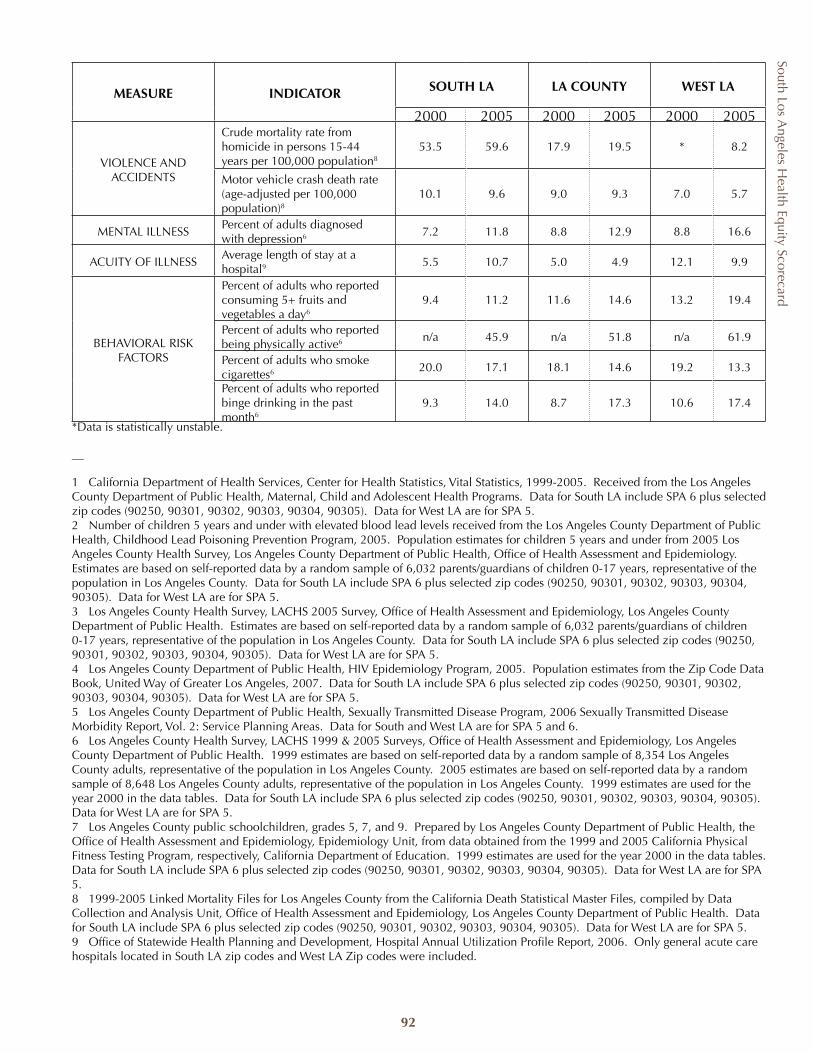
South Los Angeles H
ealth Equity Scorecard
92
MEASURE INDICATOR SOUTH LA LA COUNTY WEST LA
2000 2005 2000 2005 2000 2005
VIOLENCE AND ACCIDENTS
Crude mortality rate from homicide in persons 15-44 years per 100,000 population8
53.5 59.6 17.9 19.5 * 8.2
Motor vehicle crash death rate (age-adjusted per 100,000 population)8
10.1 9.6 9.0 9.3 7.0 5.7
MENTAL ILLNESSPercent of adults diagnosed with depression6 7.2 11.8 8.8 12.9 8.8 16.6
ACUITY OF ILLNESSAverage length of stay at a hospital9 5.5 10.7 5.0 4.9 12.1 9.9
BEHAVIORAL RISK FACTORS
Percent of adults who reported consuming 5+ fruits and vegetables a day6
9.4 11.2 11.6 14.6 13.2 19.4
Percent of adults who reported being physically active6 n/a 45.9 n/a 51.8 n/a 61.9
Percent of adults who smoke cigarettes6 20.0 17.1 18.1 14.6 19.2 13.3
Percent of adults who reported binge drinking in the past month6
9.3 14.0 8.7 17.3 10.6 17.4
*Data is statistically unstable.
__
1 California Department of Health Services, Center for Health Statistics, Vital Statistics, 1999-2005. Received from the Los Angeles County Department of Public Health, Maternal, Child and Adolescent Health Programs. Data for South LA include SPA 6 plus selected zip codes (90250, 90301, 90302, 90303, 90304, 90305). Data for West LA are for SPA 5. 2 Number of children 5 years and under with elevated blood lead levels received from the Los Angeles County Department of Public Health, Childhood Lead Poisoning Prevention Program, 2005. Population estimates for children 5 years and under from 2005 Los Angeles County Health Survey, Los Angeles County Department of Public Health, Office of Health Assessment and Epidemiology. Estimates are based on self-reported data by a random sample of 6,032 parents/guardians of children 0-17 years, representative of the population in Los Angeles County. Data for South LA include SPA 6 plus selected zip codes (90250, 90301, 90302, 90303, 90304, 90305). Data for West LA are for SPA 5.3 Los Angeles County Health Survey, LACHS 2005 Survey, Office of Health Assessment and Epidemiology, Los Angeles County Department of Public Health. Estimates are based on self-reported data by a random sample of 6,032 parents/guardians of children 0-17 years, representative of the population in Los Angeles County. Data for South LA include SPA 6 plus selected zip codes (90250, 90301, 90302, 90303, 90304, 90305). Data for West LA are for SPA 5.4 Los Angeles County Department of Public Health, HIV Epidemiology Program, 2005. Population estimates from the Zip Code Data Book, United Way of Greater Los Angeles, 2007. Data for South LA include SPA 6 plus selected zip codes (90250, 90301, 90302, 90303, 90304, 90305). Data for West LA are for SPA 5. 5 Los Angeles County Department of Public Health, Sexually Transmitted Disease Program, 2006 Sexually Transmitted Disease Morbidity Report, Vol. 2: Service Planning Areas. Data for South and West LA are for SPA 5 and 6.6 Los Angeles County Health Survey, LACHS 1999 & 2005 Surveys, Office of Health Assessment and Epidemiology, Los Angeles County Department of Public Health. 1999 estimates are based on self-reported data by a random sample of 8,354 Los Angeles County adults, representative of the population in Los Angeles County. 2005 estimates are based on self-reported data by a random sample of 8,648 Los Angeles County adults, representative of the population in Los Angeles County. 1999 estimates are used for the year 2000 in the data tables. Data for South LA include SPA 6 plus selected zip codes (90250, 90301, 90302, 90303, 90304, 90305). Data for West LA are for SPA 5.7 Los Angeles County public schoolchildren, grades 5, 7, and 9. Prepared by Los Angeles County Department of Public Health, the Office of Health Assessment and Epidemiology, Epidemiology Unit, from data obtained from the 1999 and 2005 California Physical Fitness Testing Program, respectively, California Department of Education. 1999 estimates are used for the year 2000 in the data tables. Data for South LA include SPA 6 plus selected zip codes (90250, 90301, 90302, 90303, 90304, 90305). Data for West LA are for SPA 5. 8 1999-2005 Linked Mortality Files for Los Angeles County from the California Death Statistical Master Files, compiled by Data Collection and Analysis Unit, Office of Health Assessment and Epidemiology, Los Angeles County Department of Public Health. Data for South LA include SPA 6 plus selected zip codes (90250, 90301, 90302, 90303, 90304, 90305). Data for West LA are for SPA 5. 9 Office of Statewide Health Planning and Development, Hospital Annual Utilization Profile Report, 2006. Only general acute care hospitals located in South LA zip codes and West LA Zip codes were included.
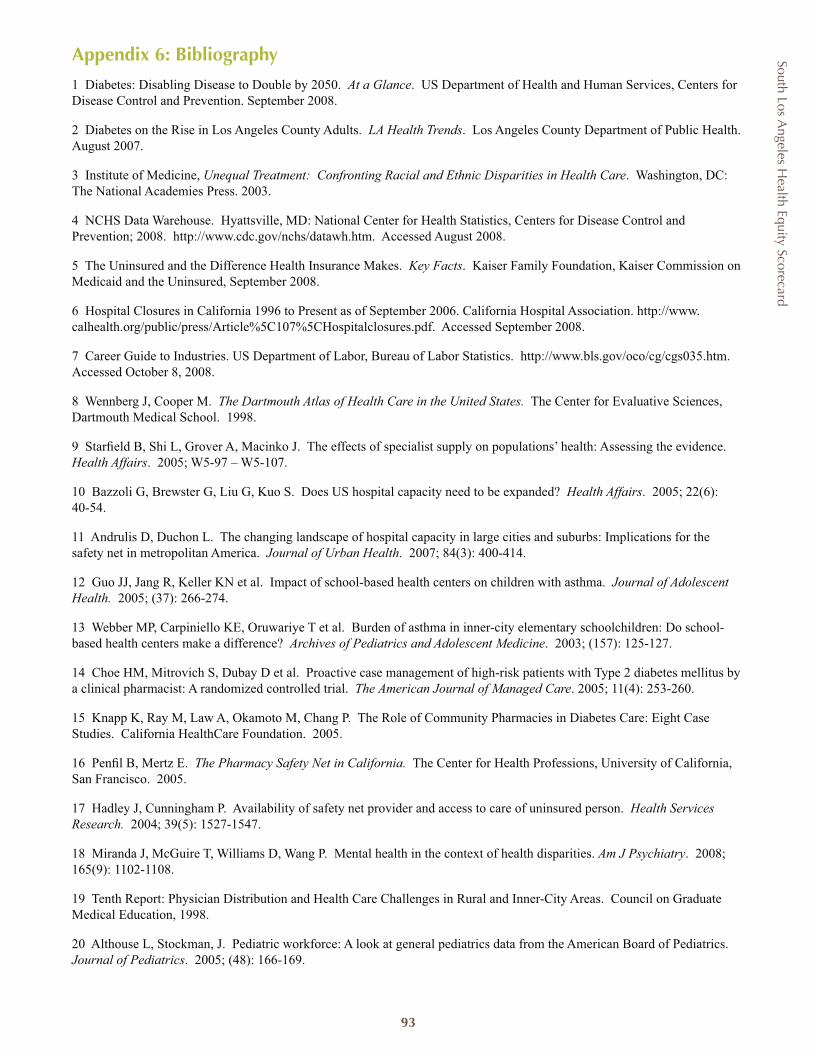
South Los Angeles H
ealth Equity Scorecard
93
Appendix 6: Bibliography
1 Diabetes: Disabling Disease to Double by 2050. At a Glance. US Department of Health and Human Services, Centers for Disease Control and Prevention. September 2008.
2 Diabetes on the Rise in Los Angeles County Adults. LA Health Trends. Los Angeles County Department of Public Health. August 2007.
3 Institute of Medicine, Unequal Treatment: Confronting Racial and Ethnic Disparities in Health Care. Washington, DC: The National Academies Press. 2003.
4 NCHS Data Warehouse. Hyattsville, MD: National Center for Health Statistics, Centers for Disease Control and Prevention; 2008. http://www.cdc.gov/nchs/datawh.htm. Accessed August 2008.
5 The Uninsured and the Difference Health Insurance Makes. Key Facts. Kaiser Family Foundation, Kaiser Commission on Medicaid and the Uninsured, September 2008.
6 Hospital Closures in California 1996 to Present as of September 2006. California Hospital Association. http://www.calhealth.org/public/press/Article%5C107%5CHospitalclosures.pdf. Accessed September 2008.
7 Career Guide to Industries. US Department of Labor, Bureau of Labor Statistics. http://www.bls.gov/oco/cg/cgs035.htm. Accessed October 8, 2008.
8 Wennberg J, Cooper M. The Dartmouth Atlas of Health Care in the United States. The Center for Evaluative Sciences, Dartmouth Medical School. 1998.
9 Starfield B, Shi L, Grover A, Macinko J. The effects of specialist supply on populations’ health: Assessing the evidence. Health Affairs. 2005; W5-97 – W5-107.
10 Bazzoli G, Brewster G, Liu G, Kuo S. Does US hospital capacity need to be expanded? Health Affairs. 2005; 22(6): 40-54.
11 Andrulis D, Duchon L. The changing landscape of hospital capacity in large cities and suburbs: Implications for the safety net in metropolitan America. Journal of Urban Health. 2007; 84(3): 400-414.
12 Guo JJ, Jang R, Keller KN et al. Impact of school-based health centers on children with asthma. Journal of Adolescent Health. 2005; (37): 266-274.
13 Webber MP, Carpiniello KE, Oruwariye T et al. Burden of asthma in inner-city elementary schoolchildren: Do school-based health centers make a difference? Archives of Pediatrics and Adolescent Medicine. 2003; (157): 125-127.
14 Choe HM, Mitrovich S, Dubay D et al. Proactive case management of high-risk patients with Type 2 diabetes mellitus by a clinical pharmacist: A randomized controlled trial. The American Journal of Managed Care. 2005; 11(4): 253-260.
15 Knapp K, Ray M, Law A, Okamoto M, Chang P. The Role of Community Pharmacies in Diabetes Care: Eight Case Studies. California HealthCare Foundation. 2005.
16 Penfil B, Mertz E. The Pharmacy Safety Net in California. The Center for Health Professions, University of California, San Francisco. 2005.
17 Hadley J, Cunningham P. Availability of safety net provider and access to care of uninsured person. Health Services Research. 2004; 39(5): 1527-1547.
18 Miranda J, McGuire T, Williams D, Wang P. Mental health in the context of health disparities. Am J Psychiatry. 2008; 165(9): 1102-1108.
19 Tenth Report: Physician Distribution and Health Care Challenges in Rural and Inner-City Areas. Council on Graduate Medical Education, 1998.
20 Althouse L, Stockman, J. Pediatric workforce: A look at general pediatrics data from the American Board of Pediatrics. Journal of Pediatrics. 2005; (48): 166-169.
South Los Angeles H
ealth Equity Scorecard
94
21 Shi L, Macinko J, Starfield B et al. The relationship between primary care, income inequality and mortality in United States, 1980-1995. Journal of the American Board of Family Practice. 2003; 16(5): 412-422.
22 Kim J, Amar S. Periodontal disease and systemic conditions: A bidirectional relationship. Odontology. 2006; 94(1): 10-21.
23 Pourat N. Haves and Have-Nots; A Look at Children’s Use of Dental Care in California. California HealthCare Foundation. 2008.
24 Ko M, Heslin K, Edelstein R, Grumbach K. The role of medical education in reducing health care disparities: The first ten years of the UCLA/Drew Education Program. Journal of General Internal Medicine. 2007; 22:625-631.
25 LA Health Action, http://lahealthaction.org/index.php/collaborative/committees/C82/. Accessed October 2008.
26 The Financial Health of California Hospitals, California HealthCare Foundation, 2007.
27 King-Harbor Closure Hospital Inpatient Impact Analysis. National Health Foundation, Hospital Association of Southern California. 2008.
28 Medicaid Payments per Enrollee, FY2005 http://www.statehealthfacts.org/comparetable.jsp?ind=183&cat=4&sub=47&yr=28&typ=4&o=d&rgnhl=6
29 California Medical Assistance Commission, Annual Report to the Legislature 2003. 30 Public-Private Partnership Allocation Formula Working Group Report and Recommendations, LA County Chief
Executive Office Memorandum to the Board of Supervisors, April 17, 2008.
31 DeNavas-Walt C, Proctor B, Smith J. US Census Bureau, Current Population Reports, P60-235, Income, Poverty, and Health Insurance Coverage in the United States: 2007. US Government Printing Office, Washington, DC. 2008.
32 Current Population Survey, 2007 and 2008 Annual Social Economic Supplements. US Census Bureau.
33 Insuring America’s Health: Principles and Recommendations. Institute of Medicine, Committee on the Consequences of Uninsurance. 2004.
34 Dying for Coverage in California. Families USA. 2008.
35 Fronstin P. Sources of Health Insurance and Characteristics of the Uninsured : Analysis of the March 2006 Current Population Survey. Employee Benefit Research Institute Issue Brief #298. 2006.
36 Makuc D, Freid V, Parsons PE. Health insurance and cancer screening among women. National Center for Health Statistics, Center for Disease Control and Prevention. 1994.
37 Haas J, Lee L, Kaplan C et al. The association of race, socioeconomic status, and health insurance status with the prevalence of overweight among children and adolescents. American Journal of Public Health. 2003; 93(12): 2105-2110.
38 Ferris T, Blumenthal D, Woodruff P, Clark S, Camargo C. Insurance and quality of care for adults with acute asthma. Journal of General Internal Medicine. 2002; 17: 905-913.
39 Primary Care Professionals: Recent Supply Trends, Projections and Valuations of Services. Testimony of A. Bruce Steinwald before the Committee on Health, Education, Labor and Pensions, United States Senate. US Government Accountability Office, GAO-08-472T. 2008.
40 Donaldson M, Yordy K, Lohr K, Vanselow N. Primary Care: America’s Health in a New Era, Committee on Future of Primary Care, Institute of Medicine. National Academies Press. 1996.
41 Overuse of Emergency Departments Among Insured Californians. California HealthCare Foundation. 2006.
42 Pitts S, Niska R, Xu J, Burt C. National Hospital Ambulatory Medical Care Survey: 2006 Emergency Department Summary, National Health Statistics Reports, No. 7. Hyattsville, MD: National Center for Health Statistics. 2008.
South Los Angeles H
ealth Equity Scorecard
95
43 Update on the emergency department at Harbor-UCLA Medical Center, Memorandum to the Board of Supervisors. February 19, 2008.
44 Burt C, McCaig L. Staffing, capacity and ambulance diversion in emergency departments: United States, 2003-04. Advance Data From Vital and Health Statistics. 2006.
45 Probst J, Laditka S, Wang J, Johnson A. Effects of resident and race on burden of travel for care: cross sectional analysis of the 2001 US National household Travel Survey. Health Services Research. 2007; 7(40).
46 Consent Decree Compliance Campaign: Overview and Demands. Bus Riders Union. Accessed at http://www.busridersunion.org/engli/Campaigs/consentdecreeoverview.htm. on September 2008.
47 Devoe J, Fryer G, Phillips R, Green L. Receipt of preventive care among adults: Insurance status and usual source of care. American Journal of Public Health. 2003; 95(5):786-791.
48 Key Indicators of Health. Los Angeles County Department of Public Health, Office of Health Assessment and Epidemiology. April 2007.
49 Zuckerman S, Lutzky A. The Medicaid Demonstration Project in Los Angeles County, 1995-2000: Progress, but Room for Improvement. The Urban Institute. 2001.
50 Geerts S, Nys M, Patrick D et al. Systemic release of endotoxins induced by gentle mastication: Association with periodontitis severity. Journal of Periodontology. 2002; 73(1): 73-78.
51 Diamante A, Hays R, Morales L et al. Delays and unmet need for health care among adult primary care patients in a restructured urban public health setting. American Journal of Public Health. 2004; 95(5): 783-789.
52 LA Health Action, Examining County-funded Outpatient Service Declines in South Los Angeles. March 2008. March 2008.53 Makuc D et al. Financial barriers to mammography: who pays out-of-pocket? Journal of Women’s Health 2007, 16(3): 349-360.
54 National Association of Community Health Centers. Federal Policy Issues http://www.nachc.org/appropriations.cfm Accessed October 2008.
55 Report on the Environment (Final Report). U.S. Environmental Protection Agency, Washington, DC, EPA/600/R-07/045F. 2008.
56 Diabetes Prevention Program Research Group. The diabetes prevention program design and methods for a clinical trial in the prevention of type 2 diabetes. Diabetes Care. 1999; 22: 623-34.
57 The Diabetes Prevention Program. Baseline characteristics of the randomized cohort. Diabetes Care. 2000; 23: 1619–29.
58 Designed for Disease: The Link Between Local Food Environments and Obesity and Diabetes. California Center for Public Health Advocacy, PolicyLink, and the UCLA Center for Health Policy Research. April 2008.
59 L. Lewis et al. African Americans’ Access to Healthy Food Options in South Los Angeles Restaurants. American Journal of Public Health. 2005; 95(4): 668-673.
60 B. Fisher and D. Strogatz. Community measures of low-fat milk consumption: comparing store shelves with households. American Journal of Public Health. 1999; 89 (2): 235-237.
61 K. Cullen et al. Effect of a la carte and snack bar foods at school on children’s intake of fruits and vegetables. Journal of American Diet Association. 2000; 100(12): 1482-6.
62 M. Aboelata. The Built Environment and Health: 11 Profiles of Neighborhood Transformation. 2004; Prevention Institute.
63 Alcohol Alert. National Institute on Alcohol Abuse and Alcoholism No. 22 PH 346 October 1993.
South Los Angeles H
ealth Equity Scorecard
96
64 Accessed on August 26, 2008 CDC http://www.cdc.gov/alcohol/index.htm.
65 As cited in Quick Stats General Information on Alcohol Use accessed on August 28, 2008 at http://www.cdc.gov/alcohol/quickstats/general_info.htm.
66 Ashe et al. Land use planning and the control of alcohol, tobacco, firearms and fast food restaurants. American Journal of Public Health. 2003; 93(9): 1404-1408.
67 WHO expert committee on problems related to alcohol use. Second Report. WHO Technical Series 944. World Health Organization, Geneva, 2007.
68 M. Hennessey and D. Zahniser, Council bans new fast food outlets in South L.A., LA Times, July 20, 2008.
69 S. Inagami, You are where you shop: grocery store locations, weight and neighborhoods. American Journal of Preventative Medicine.. 2006; 31(1): 10-17.
70 K. Morland et al., The contextual effect of the local food environment on resident’s diet. American Journal of Public Health. 2002; 92 (11): 1761-1768.
71 Sloane, D. Improving the nutritional resource environment for healthy living through community-based participatory research. Journal of General Internal Medicine. 2003; 18: 568-575.
72 Ibid
73 D. Herman , G. Harrison, A. Afifi, E.Jenks. Effect of a targeted subsidy on intake of fruits and vegetables among low-income women in the Special Supplemental Nutrition Program for Women, Infants, and Children. American Journal of Public Health. 2008; 98(1): 98-105.
74 A. Fisher. Hot peppers and parking lot peaches: evaluating farmer’s markets in low-income communities. Community Food Security Coalition. January 1999.
75 County of Los Angeles Environmental Health. Retail food inspection guide. Revised 7/07.
76 Los Angeles County Health Survey, LACHS 1999 & 2005 Surveys Office of Health Assessment and Epidemiology, Los Angeles County Department of Public Health. 1999 estimates are based on self-reported data by a random sample of 8,354 Los Angeles County adults, representative of the population in Los Angeles County.
77 http://www.saferoutesinfo.org/askaquestion/answer.cfm?id=178 accessed on NCSRTS site 8/27/08.
78 R. Garcia, E. Flores, & S. Chang. Healthy Children, Healthy Communities: Schools, Parks, Recreation and Regional Planning. 31 Fordham Urban Law Journal 101. Center for Law in the Public Interest Policy report. 2004.
79 Preventing Childhood Obesity: The Need to Create Healthy Places. A Cities and Communities Report. Los Angeles County Department of Public Health, Office of Assessment Epidemiology. October 2007.
80 A. Deshpande, E. Baker, and R. Brownson. Environmental correlates of physical activity among individuals with diabetes in the rural Midwest. Diabetes Care. 2005; 28: 1012-1018.
81 A. Loukaitou-Sideris; Children in Los Angeles Parks: A Study of Equity, Quality and Children’s Satisfaction with Neighborhood Parks. University of California at Los Angeles. 2002.
82 J. Wolch, J. Wilson. Park and Park Funding in Los Angeles: An Equity-Mapping Analysis, Urban Geography. 2005; 26(1): 4–35.
83 Creating or Improving Access to Places for Physical Activity Is Recommended to Increase Physical Activity. Guide to Community Preventive Services. Centers for Disease Control and Prevention. 2002.
84 Physical Activity: Economic Evidence, Guide to Community Preventative Services. Centers for Disease Control and Prevention. 2002.
85 R. Garcia, A. White. Healthy Parks, Schools and Communities: Mapping Green Access and Equity in the Los Angeles Region, The City Project. 2002.
South Los Angeles H
ealth Equity Scorecard
97
86 T. Augustin, T. Glass, B. James, and B. Schwartz. Neighborhood psychosocial hazards and cardiovascular disease: The Baltimore memory study, American Journal of Public Health. 2008; 98(9): 1664-1670.
87 J. Freedy & S. Hobfoll. Traumatic Stress, Freedy & Hobfoll, Springer. 1995.
88 Reducing Gun Violence: Community Problem Solving in Atlanta. U.S. Department of Justice, National Institute for Justice. 2006.
89 M. Smith. Crime Prevention Through Environmental Design in Parking Facilities. NIJ Research in Brief, US Department of Justice. 1996.
90 Mortality in Los Angeles County 2005: Leading causes of death and premature death. Los Angeles County Department of Public Health, Office of Health Assessment and Epidemiology. July 2008.
91 McGinn et al. Exploring associations between physical activity and perceived and objective measures of the built environment. Journal of Urban Health: Bulletin of the New York Academy of Medicine. 2007; 84(2): 162-184.
92 Gang Reduction Strategy. City of Los Angeles, Office of Mayor Antonio Villaraigosa. April 2007.
93 D. Longshore, A.Hawken, D. Urada, M. Anglin. Evaluation of the Substance Abuse and Crime Prevention Act. UCLA Integrated Substance Abuse Programs. March 2003.
94 J. Krieger & D. Higgins. Housing and health: Time Again for Public health Action. American Journal of Public Health. 2002; 92(5): 758-768.
95 Jacobs et al. Prevalence of lead-based paint in US Housing. Environmental Health Perspectives. 2002 110(10).
96 E. Shenassa, S. Stubbendick, and M. Brown. Social disparities in housing and related pediatric injury: A multi-level study. American Journal of Public Health. 2004; 94(4): 633-639.
97 D.R. Williams & C. Collins, Racial Residential Segregation: A Fundamental Cause of Racial Disparities in Health, 116 Pub. Health Rep. 2001; 405-16.
98 Saegert et al. Healthy housing: A structured review of published evaluations of US interventions to improve health by modifying housing in the United States, 1990–2001. American Journal of Public Health. 2003; 93(9): 1471-1477.
99 J. Krieger & D. Higgins. Housing and health: time again for public health action. American Journal of Public Health. 2002; 92(5): 758-768.
100 CA Department of Education, http://www.cde.ca.gov/eo/ce/wc/.
101 Literacy and Health Outcomes: A Summary Evidence Report/Technology Assessment: Number 87, Agency for Healthy Quality & Research.
102 R. McConnell et al. Traffic, susceptibility, and childhood asthma. Environmental Health Perspectives. 2006; 114(5): 766-772.
103 W. J. Gauderman et al. Childhood asthma and exposure to traffic and nitrogen dioxide. Epidemiology. 2005; 16(6): 1-7.
104 W. J. Gauderman et al. Effect of exposure to traffic on lung development from 10 to 18 years of age: a cohort study. Lancet. 2007; 369: 571-77.
105 Growth spurt at LAUSD. Buildings Magazine. July 2006.
106 Künzli et al. Breathless in Los Angeles: The exhausting search for clean air, American Journal of Public Health. 2003; 93(9): 1494-1499.
107 Los Angeles’ Industrial Land: Sustaining a Dynamic City Economy. Department of City Planning and the Community Redevelopment Agency of the City of Los Angeles. 2007.
South Los Angeles H
ealth Equity Scorecard
98
108 U..S. EPA’s 2008 Report on the Environment (Final Report). U.S. Environmental Protection Agency, Washington, DC, EPA/600/R-07/045F.
109 U.S. Department of Health and Human Services. 2005. Report on carcino gens. Eleventh edition. Washington, DC: Public Health Service, National Toxicology Program.
110 U.S. EPA. 2003. National air quality and emissions trends report—2003 special studies edition. EPA/454/R-03/005. Research Triangle Park, NC.
111 Oil and Gas Pollution Fact Sheet, Earthworks at http://www.earthworksaction.org/pubs/Oilandgaspollution.pdf accessed August 28, 2008.
112 U.S. EPA’s 2008 Report on the Environment (Final Report). U.S. Environmental Protection Agency, Washington, DC, EPA/600/R-07/045F.
113 Ibid
114 California Public Resources Code Division 13 Environmental Protection Chapter 1 Policy. http://ceres.ca.gov/ceqa/stat/Ch_1.html accessed on August 28, 2008.

Community Health Councils3731 Stocker Street, Suite 201
Los Angeles, CA 90008
323.295.9372 fax 323.295.9467email: [email protected]
www.chc-inc.org

Achieving the Vision:Healthcare Options for Los Angeles CountyA R E P O R T O F T H E L O S A N G E L E S H E A L T H C A R E O P T I O N S T A S K F O R C E
APRIL 2009
ATTACHMENT C
This report presents our analytical findingsand recommendations for
improving the quality and financial
sustainability of healthcare for medicallyindigent individuals in the County.

i
PrefaceThe Los Angeles Healthcare Options Task Force was charged by The California Endowment todevelop a vision and recommendations for achieving a high-quality, integrated healthcare deliverysystem in Los Angeles County. This report presents our analytical findings and recommendationsfor improving the quality and financial sustainability of healthcare for medically indigent individualsin the County.
We share with readers the inspiring and visionary experiences of other healthcare systems thathave faced challenges comparable to Los Angeles County and yet have made remarkable advances.These healthcare systems have undergone significant, long-term transformations to successfullyimprove the quality of care they provide to their communities. Our recommendations are informedby the lessons learned from both their achievements and their challenges. In addition, our reportbuilds on a substantial body of work by many others who have also considered ways to improvesafety net healthcare in the County.
We include a focus on South Los Angeles and the proposed reopening of Martin Luther King Jr. Hospital,a critical component of the public healthcare system. Findings regarding changes in healthcare needafter the closure of Martin Luther King Jr. Hospital helped to shape our vision and recommendations.For the hospital to succeed in the future, it is imperative that it be embedded in an integratedcountywide system.
This work was prepared by the Los Angeles Healthcare Options Task Force, with assistance fromthe Health Industries Advisory Practice at PricewaterhouseCoopers and a team of health servicesresearchers led by a Robert Wood Johnson Foundation Clinical Scholar.
An electronic version of this report, along with full appendices and referenced publications, is availableat The California Endowment website: http://www.calendow.org.

ContentsTables and Figures iii
Acknowledgments and Definitions iv
Abbreviations v
Foreword vi
Executive Summary 1
SECTION I Introduction 9
SECTION II Key Findings 15Task Force Vision for Safety Net Healthcare Delivery in LA County 15Healthcare Needs and Utilization in LA County 17Leading Practices from Public Healthcare Delivery Systems in the U.S. 25Case Studies 35
SECTION III Recommendations: Transitioning to the Future 49
Appendix A Reports, Memorandums and Other Documents on Governance andOperational Issues Relating to the LA County Departmentof Health Services (LACDHS) and/or Martin Luther King Jr. Hospital 59
Appendix B Reports on Public Safety Net Healthcare Systems 62
Appendix C Additional Details from the Needs Assessment of South LA 63
Appendix D Health System Profiles 68
Appendix E Report on Leading Practices of Public Safety Net Healthcare Delivery(electronic only) Systems in the United States (prepared by PricewaterhouseCoopers)
ii
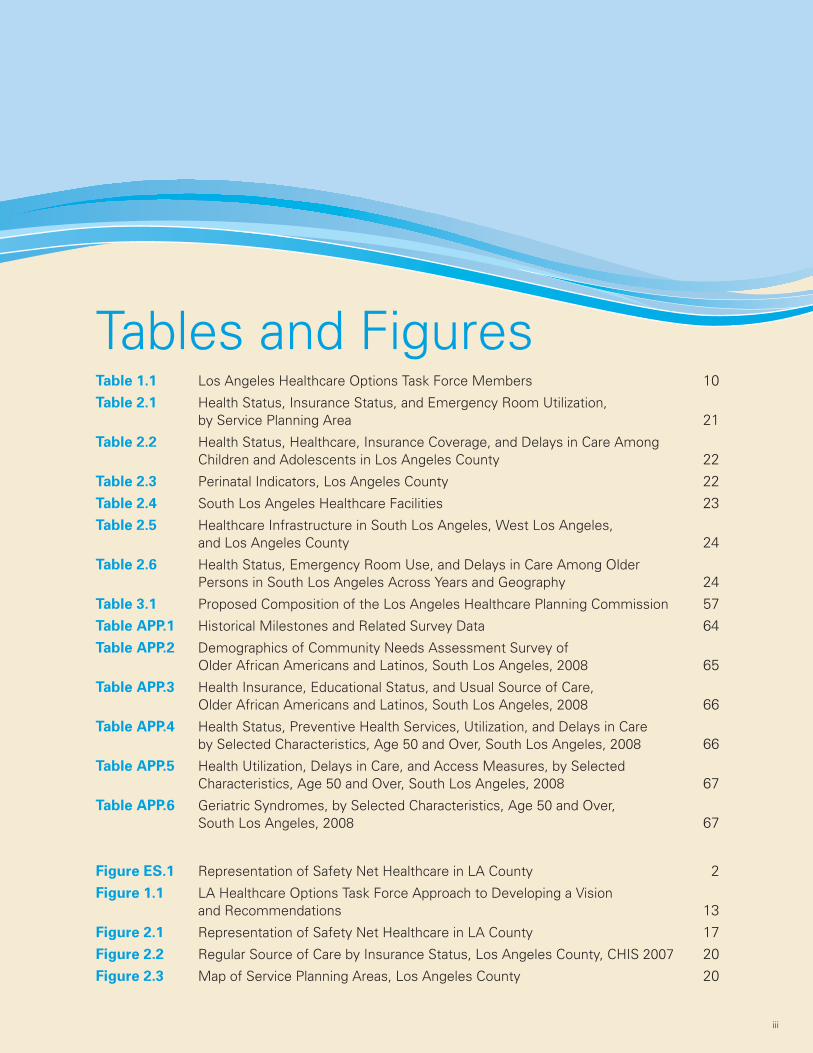
iii
Tables and FiguresTable 1.1 Los Angeles Healthcare Options Task Force Members 10Table 2.1 Health Status, Insurance Status, and Emergency Room Utilization,
by Service Planning Area 21Table 2.2 Health Status, Healthcare, Insurance Coverage, and Delays in Care Among
Children and Adolescents in Los Angeles County 22Table 2.3 Perinatal Indicators, Los Angeles County 22Table 2.4 South Los Angeles Healthcare Facilities 23Table 2.5 Healthcare Infrastructure in South Los Angeles, West Los Angeles,
and Los Angeles County 24Table 2.6 Health Status, Emergency Room Use, and Delays in Care Among Older
Persons in South Los Angeles Across Years and Geography 24Table 3.1 Proposed Composition of the Los Angeles Healthcare Planning Commission 57Table APP.1 Historical Milestones and Related Survey Data 64Table APP.2 Demographics of Community Needs Assessment Survey of
Older African Americans and Latinos, South Los Angeles, 2008 65Table APP.3 Health Insurance, Educational Status, and Usual Source of Care,
Older African Americans and Latinos, South Los Angeles, 2008 66Table APP.4 Health Status, Preventive Health Services, Utilization, and Delays in Care
by Selected Characteristics, Age 50 and Over, South Los Angeles, 2008 66Table APP.5 Health Utilization, Delays in Care, and Access Measures, by Selected
Characteristics, Age 50 and Over, South Los Angeles, 2008 67Table APP.6 Geriatric Syndromes, by Selected Characteristics, Age 50 and Over,
South Los Angeles, 2008 67
Figure ES.1 Representation of Safety Net Healthcare in LA County 2Figure 1.1 LA Healthcare Options Task Force Approach to Developing a Vision
and Recommendations 13Figure 2.1 Representation of Safety Net Healthcare in LA County 17Figure 2.2 Regular Source of Care by Insurance Status, Los Angeles County, CHIS 2007 20Figure 2.3 Map of Service Planning Areas, Los Angeles County 20
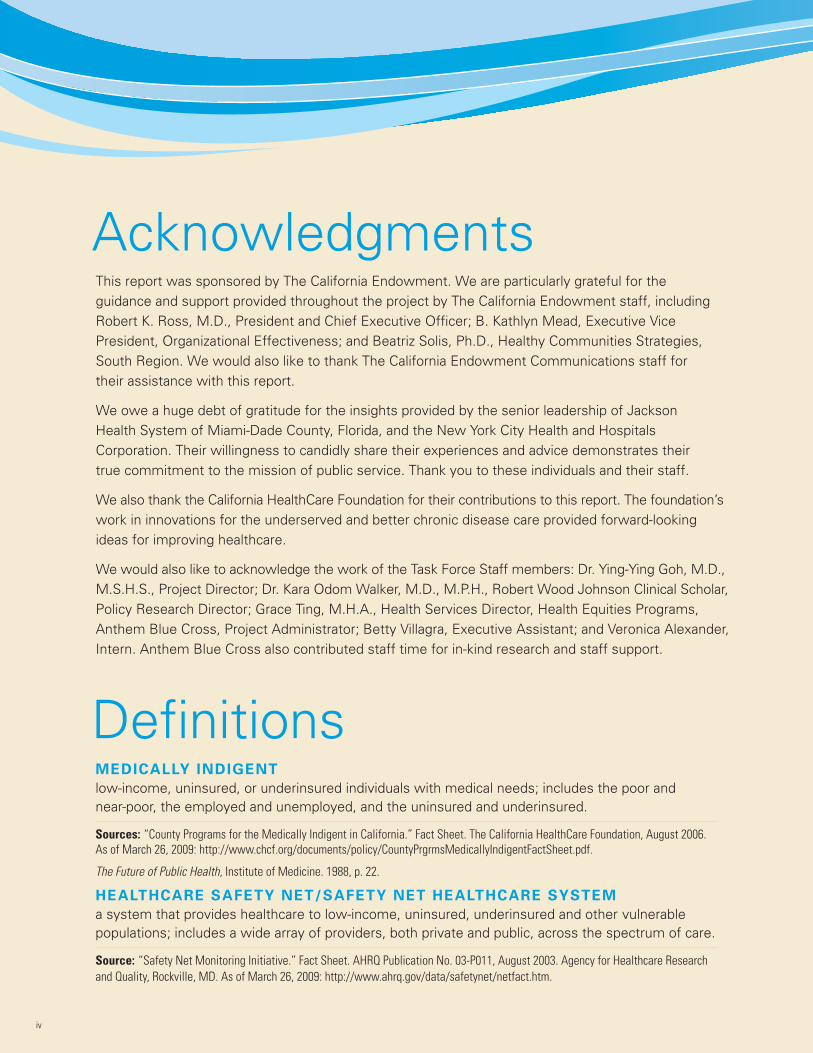
iv
AcknowledgmentsThis report was sponsored by The California Endowment. We are particularly grateful for theguidance and support provided throughout the project by The California Endowment staff, includingRobert K. Ross, M.D., President and Chief Executive Officer; B. Kathlyn Mead, Executive VicePresident, Organizational Effectiveness; and Beatriz Solis, Ph.D., Healthy Communities Strategies,South Region. We would also like to thank The California Endowment Communications staff fortheir assistance with this report.
We owe a huge debt of gratitude for the insights provided by the senior leadership of JacksonHealth System of Miami-Dade County, Florida, and the New York City Health and HospitalsCorporation. Their willingness to candidly share their experiences and advice demonstrates theirtrue commitment to the mission of public service. Thank you to these individuals and their staff.
We also thank the California HealthCare Foundation for their contributions to this report. The foundation’swork in innovations for the underserved and better chronic disease care provided forward-lookingideas for improving healthcare.
We would also like to acknowledge the work of the Task Force Staff members: Dr. Ying-Ying Goh, M.D.,M.S.H.S., Project Director; Dr. Kara Odom Walker, M.D., M.P.H., Robert Wood Johnson Clinical Scholar,Policy Research Director; Grace Ting, M.H.A., Health Services Director, Health Equities Programs,Anthem Blue Cross, Project Administrator; Betty Villagra, Executive Assistant; and Veronica Alexander,Intern. Anthem Blue Cross also contributed staff time for in-kind research and staff support.
DefinitionsMEDICALLY INDIGENT
low-income, uninsured, or underinsured individuals with medical needs; includes the poor andnear-poor, the employed and unemployed, and the uninsured and underinsured.
Sources: “County Programs for the Medically Indigent in California.” Fact Sheet. The California HealthCare Foundation, August 2006.As of March 26, 2009: http://www.chcf.org/documents/policy/CountyPrgrmsMedicallyIndigentFactSheet.pdf.
The Future of Public Health, Institute of Medicine. 1988, p. 22.
HEALTHCARE SAFETY NET/SAFETY NET HEALTHCARE SYSTEM
a system that provides healthcare to low-income, uninsured, underinsured and other vulnerablepopulations; includes a wide array of providers, both private and public, across the spectrum of care.
Source: “Safety Net Monitoring Initiative.” Fact Sheet. AHRQ Publication No. 03-P011, August 2003. Agency for Healthcare Researchand Quality, Rockville, MD. As of March 26, 2009: http://www.ahrq.gov/data/safetynet/netfact.htm.
v
AbbreviationsCAO Los Angeles Chief Administrative OfficerCCSF City College of San FranciscoCDU Charles Drew University of Medicine and ScienceCEO Chief Executive OfficerCHIS California Health Interview SurveyCOE center of excellenceHASC Hospital Association of Southern CaliforniaHCHD Harris County Hospital DistrictHCICP Kaiser Permanente’s Health Care Interpreter Certificate ProgramHCMC Hennepin County Medical CenterHHC New York City Health and Hospitals CorporationHHS Hennepin Healthcare System, Inc.HMO health maintenance organizationIHI Institute for Healthcare ImprovementIT information technologyJHS Jackson Health SystemKDMC King/Drew Medical CenterLA Los AngelesLA COUNTY Los Angeles CountyLACDHS Los Angeles County Department of Health ServicesMLK HOSPITAL Martin Luther King Jr. Hospital
(also known as King-Harbor Hospital from 2006 to 2007)MPI Master Patient IndexNCQA National Committee for Quality AssurancePMO Project Management OfficerRIE rapid improvement initiativeSPA Service Planning Area, LACDHS DesignationsSPA 1 Antelope ValleySPA 2 San Fernando ValleySPA 3 San Gabriel ValleySPA 4 MetroSPA 5 WestSPA 6 SouthSPA 7 EastSPA 8 South Bay
vi
ForewordThe pages that follow lay out a vision of a reengineered safety net of health services for residents ofLos Angeles County. This vision was not developed by some lofty academic think tank, or consultantsfrom a faraway land. Rather, it was crafted primarily by regional civic leaders who are in the businessof healthcare in our community, and who are as compassionate about high-quality healthcare as theyare tough-minded about controlling costs and managing budgets.
This group of individuals is the Los Angeles Healthcare Options Task Force, and we asked them to focuson some key questions regarding our healthcare delivery system for medically indigent and publiclyinsured patients: Given the advances in healthcare delivery, what should LA County’s currently fragmentedand inefficient safety net healthcare system look like? What large, regional models nationally are doingbetter on this front, and what can we learn from them? Finally, in recognition of the significant challengesfaced by community residents in South Los Angeles, what opportunities exist to build a model ofintegrated healthcare delivery around the future of a reopened Martin Luther King Jr. Hospital?
I readily confess that our foundation’s Board, staff, and many regional health and civic leaders voicedone overriding concern about commissioning this report: Will it lead to anything? The pessimistsamongst us predicted that this report would most likely end up in the graveyard of similar reportsabout LA County’s safety net healthcare system authored by commissions and well-intended groupsover the past two decades. Commissioning reports such as these costs time and money at a momentwhen both are in short supply.
We thoughtfully weighed these well-founded concerns, and decided to plow ahead. While the trackrecord of LA County government in boldly addressing health challenges is mixed, there are severalreasons to embrace a renewed sense of optimism that meaningful change can occur over the nextfew years:
• The idea of national health reform has traction, and President Barack Obama has made the issuea central focus of his administration. There has never been a better opportunity to engage federalleaders in addressing the plight of uninsured Americans and Angelenos.
• The unfortunate realities of the economic downturn will exacerbate the level of urgency about ournational health crisis, and how this crisis affects the lives of millions of residents of LA County.Public funds for healthcare safety net services will become even more constrained, while at thesame time the sheer numbers of uninsured and desperate patients will continue to grow. Businessas usual in healthcare simply cannot be sustained in this environment. An integrated healthcaredelivery model for our county is not just a nice thing to have – it is a fiscal imperative.
• Finally, recent news of the plans for County officials to reopen the shuttered Martin Luther King Jr.Hospital provides clear evidence that the Board of Supervisors is willing to rethink the notion ofpublic-private partnership to deliver health services. The three-way partnership among the LA County
vii
Board of Supervisors, the University of California, and the Governor’s office is creative. The idea of anew, public-private board to oversee the reopened hospital is refreshing. The Board of Supervisors’invitation to the private, nonprofit sector to operate a reopened MLK Hospital under a completelydifferent governance structure – and with the County’s financial support – demonstrates courageand pragmatism in equal parts on the part of the Board of Supervisors.
The plan to reopen MLK Hospital is a great step. In releasing this report, at this moment, we are ineffect saying to County officials: “Keep moving forward; we must achieve this vision of a countywideintegrated delivery system.” Moreover, the Task Force represents an important range of stakeholders:hospital executives, physicians, community clinics, health advocates, organized labor, and the businesscommunity. Thus this report’s broader message to our County’s elected officials is “If you choose tomove even more boldly in this direction, you will have the support of our region’s health, civic,community, and philanthropic leaders.”
The Task Force’s recommendation of a countywide, 18-month Planning Commission is an importantinterim step. County officials have historically viewed private and nonprofit health sector providerinstitutions merely as contractors for County-funded services. This is a limited and counterproductiveview. Private and nonprofit health systems, hospitals, and health clinics are learning to deliver high-quality services with constrained and limited resources. A Planning Commission that allows Countygovernment to tap the expertise and experience of these providers provides a meaningful opportunityto solve problems in a thoughtful, partnership approach – and move towards a shared vision. As thereport states, national health reform, the development of the next federal-state Medicaid waiverproposal, and the well-planned use of health information technology dollars in the federal stimuluspackage represent concrete opportunities to usher in a new era of public-private partnership toaddress our regional health challenges.
In closing, I would like to express our appreciation to the members of the LA Healthcare Options TaskForce, as well as to the Health Industries Advisory Practice at PricewaterhouseCoopers, for their timeand energy. The chair of the Task Force, Dr. Woodrow (Woody) Myers, deserves a special mention.He demonstrated an uncanny capacity to bring consensus to a group of stakeholders that often helddivergent views on certain issues. Dr. Hector Flores, the vice chair, contributed his vast expertise onhealthcare delivery for the medically indigent in LA and beyond. And of course, Dr. Myers’s ProjectStaff provided tireless support and assistance (evidenced by updated report drafts that were oftene-mailed at 2 a.m.). Mary Odell, my colleague and friend at the UniHealth Foundation, provided herguidance and support with the project, and we thank her as well.
Yes, we understand that this is “only” yet-another-report. But we are pleased to offer a vision – andrecommendations on how to achieve that vision – of a new era of public, private, and civic partnershipto meet the health needs of County residents who struggle to be healthy. The imperative and senseof urgency has never been more evident.
Robert K. Ross, M.D.President and CEO, The California Endowment
1
Executive SummaryNationwide, discussion of U.S. healthcare reformhas intensified as the recent economic downturnhas further exposed the need for affordable,high-quality healthcare for all. In Los Angeles(LA) County, the fragmented healthcare systemfaces the challenge of serving a high volume ofracially and ethnically diverse, medically indigentpatients, and doing so within the bounds ofsignificant financial and political constraints.Although certain considerations are unique toLA County, it is clear that other public healthcaresystems across the country have successfullyovercome similar challenges and offer importantlessons for the LA County region.
The Los Angeles Healthcare Options Task Force(Task Force) was created in October 2008 by TheCalifornia Endowment to develop a vision andrecommendations for achieving a high-quality,integrated safety net healthcare delivery systemin LA County. The Task Force was charged withproviding recommendations, based in part onleading practices from other systems, forimproving the quality and financial sustainabilityof healthcare for medically indigent individuals.This report includes a focus on South Los Angelesand the proposed reopening of Martin LutherKing Jr. (MLK) Hospital, a critical component ofthe safety net healthcare system. In order forMLK Hospital to achieve its service missionin the future, it will need to be embedded in ahigh-performing, integrated healthcare deliverysystem. The Task Force’s recommendations areintended to facilitate the success of MLK Hospitaland other safety net providers in LA County.
We used several analytical components to informour vision for safety net healthcare in LA Countyand to generate recommendations for realizingthat vision. These components included:
• a review of the literature on the LA Countyhealthcare system (including MLK Hospital)and on public healthcare systems in general.
• a community-based study to determine thenature and extent of delays in care and unmethealthcare needs of South LA elderly residents.
• a critical assessment of leading practicesfrom other public healthcare systems inthe United States.
• site visits to two leading systems withcharacteristics comparable to LA County.
• collaborative expert analysis sessions toevaluate the information and to considerit in the context of LA County.
It is important to recognize how this report differsfrom many others that preceded it, and whatactivities were outside the scope of the TaskForce’s mission. In contrast to prior efforts thathave focused on specific alternative governancemodels for the LA County Department of HealthServices (LACDHS), this report assesses healthcaresystems comprehensively in order to makesystemwide recommendations with a clearemphasis on improving quality of care. Thisreport is not intended to catalogue the manyexamples of excellence in the current system, orto outline all the gaps and weaknesses. The TaskForce did not repeat previous analyses andstudies of LA County or of other public
Introduction
ACHIE
VIN
GTHE
VIS
ION:
HEALTHCARE
OPTIO
NS
FOR
LOS
AN
GELES
COUN
TY
2
AREPORT
OF
THE
LOS
AN
GELES
HEALTHCARE
OPTIO
NS
TASK
FORCE
healthcare systems in general; instead, wereferenced and built upon this substantial bodyof work.
The County of Los Angeles is now at a criticaljuncture for improving the public healthcaresystem: Options for reopening MLK Hospital arebeing considered by LACDHS and the Universityof California, application for renewal of theCalifornia Medicaid waiver is approaching,federal funding streams have opened forhealthcare effectiveness and informationtechnology, and national healthcare reform isbeing considered. This report uniquely providesa rigorous and ambitious, yet achievable andrealistic, set of recommendations to improvethe service quality and financial viability of safetynet healthcare in LA County. Equipped with thisclear vision and recommendations, we feel thatLA County is well positioned to take swift, bold,
and measured steps toward a high-quality,integrated healthcare delivery systemaccessible to all.
Key FindingsTask Force Vision for Safety
Net Healthcare Delivery in
Los Angeles County
To frame our analyses and recommendations,we first defined the make-up of the regionalhealthcare safety net and then developed avision for improving the healthcare it delivers.
The “healthcare safety net” in LA County is thesystem that provides healthcare to the medicallyindigent (See Figure ES.1).
It is composed of the Public Sector HealthcareDelivery System, which provides Public SafetyNet services, and contracted private providers
EXECUTIVESUMMARY
FIGURE ES.1 Representation of Safety Net Healthcare in LA County.
PUBLIC-PRIVATE SAFETY NET HEALTHCARE DELIVERY NETWORK
PUBLIC SAFETY NET(services delivered by the Public
Sector Healthcare Delivery System)
PRIVATE SAFETY NET(services delivered byContracted Providers)
PPP1
FederallyQualifiedHealthCenters
OtherCommunity
Clinics
PrivateProviders
LACountyDept.
ofHealth
Services
LACountyDept.
ofMentalHealth
LACountyDept.
ofPublicHealth
LA CountyContractedHospitalsand other
HealthcareFacilities
Non-contracted& Non-LA CountyReimbursed Care
(EMTALA2 andother charity
provided by manyprivate providers)
NON-CONTRACTEDPRIVATE SAFETYNET PROVIDERS
1 Providers who participate in the Public Private Partnership Program are private practice, free clinics, and Community Health Centers that receive funds from theLA County Board of Supervisors to provide care to uninsured residents in underserved areas of the county.
2 In 1986, Congress enacted the Emergency Medical Treatment & Labor Act (EMTALA) to ensure public access to emergency services regardless of ability to pay.Section 1867 of the Social Security Act imposes specific obligations on Medicare-participating hospitals that offer emergency services to provide a medicalscreening examination when a request is made for examination or treatment for an emergency medical condition (EMC), including active labor, regardless of anindividual’s ability to pay. Hospitals are then required to provide stabilizing treatment for patients with EMCs. If a hospital is unable to stabilize a patient within itscapability, or if the patient requests, an appropriate transfer should be implemented.
3
ACHIE
VIN
GTHE
VIS
ION:
HEALTHCARE
OPTIO
NS
FOR
LOS
AN
GELES
COUN
TY
that supply Private Safety Net services. Werecognize that the functions of the Public SectorHealthcare Delivery System are not restricted tosafety net services, and that the private sectorprovides critical services for the medicallyindigent. Because the healthcare safety netinvolves many providers in addition to LACDHSfacilities, a coordinated and continuous effort isnecessary on the part of both public and privateentities. Below, we define a vision for the PublicSector Healthcare Delivery System, composedof the LA County Departments of HealthServices, Mental Health, and Public Health,and directly controlled by the LA CountyBoard of Supervisors.
A Vision for the Public SectorHealthcare Delivery SystemWe propose that the Public Sector HealthcareDelivery System be driven, first and foremost,by a mission to provide the highest qualityhealthcare to its patients. All operations shouldbe quality-focused and patient-centered.
In addition, the Public Sector Healthcare DeliverySystem should:
• Function with transparency and accountabilityto the public and its leadership, throughincreased public availability of specificquality indicators and information.
• Engage its entire workforce in a mission-driven,collaborative process of continuous innovationand learning.
• Ensure its financial sustainability by improvingits fiscal infrastructure, including diversificationof its payer mix.
• Function as an integrated delivery system:a system that coordinates health fromwellness and prevention to emergency andacute care services, and that emphasizesstrategic planning and resource allocation,capitalizing upon economies of scale.
• Drive decisions and practices with accurateinformation (real-time process measures,clinical indicators, population outcomes,and cost measures).
• Work to eliminate inequality (a two-tieredhealthcare system) by providing high-qualitycare – including prevention, primary care,specialty care, and tertiary and quaternarycare – that is desirable to all residents ofLA County.
• Recruit, develop, and retain transformationalleaders who are expert in modern healthcaremanagement.
• Expand long-term public-private partnershipsand community engagement.
• Strengthen relationships with academicmedical centers for education and research.
• Reintegrate MLK Hospital as part of acoordinated system that takes ownership ofits mission and these underlying principles.
Although the recommendations that follow inthis report (See Section III, Recommendations)pertain to the Public Sector Healthcare DeliverySystem, the quality of care for medically indigentpatients in LA would be improved by synergieswith both Private Safety Net Providers andNon-Contracted Private Providers who alsoserve these patients. Therefore, we describea vision for strengthened public-privatecollaboration in the future.
We propose that the PublicSector Healthcare Delivery
System be driven, first andforemost, by a mission to
provide the highest qualityhealthcare to its patients.
4
AREPORT
OF
THE
LOS
AN
GELES
HEALTHCARE
OPTIO
NS
TASK
FORCE
A Vision for Public-PrivateCollaborationThe Los Angeles Public-Private Safety NetHealthcare Delivery Network (the Network)includes the Public Safety Net (servicesdelivered by the Public Sector HealthcareDelivery System) and the Private Safety Net(services delivered by private entities withvoluntary contractual and/or public-privatepartnership relationships with LACDHS,including Federally Qualified Health Centers(FQHCs), community clinics, and other privateproviders and hospitals) (See Figure ES.1).
The Task Force proposes that, in the future,the Network should include private healthcareentities that voluntarily participate and are willingand able to take part in system improvementactivities and provide services complementaryto the Public Safety Net. The entire Networkshould be driven by a mission to provide thehighest quality healthcare to its patients andshould uphold the principles described above forthe Public Sector Healthcare Delivery System,including transparency and accountability,continuous innovation, and coordinated, patient-centered care. The quality of care for patientsserved by the Network would be improvedby future synergies with both Private SafetyNet Providers (i.e., those with contractualrelationships with LACDHS) and Non-ContractedSafety Net Providers.
In the next section, we outline the findings fromthe Task Force needs assessment and leadingpractices analysis. These findings reinforcedthe members’ fundamental supposition thatthe achievement of these visions is necessaryand possible, through defined contractualagreements that preserve the autonomy ofprivate providers while facilitating the integrationof services within the Public Sector HealthcareDelivery System.
Needs Assessment of LA County
and South LA
Our review of healthcare needs across LACounty highlighted variations in healthcareaccess and self-reported health status byService Planning Areas (SPAs). We foundvariation among subgroups of the populationin healthcare need and access. We alsoconducted a community-based study todetermine the nature and extent of delays andunmet healthcare needs of South LA (SPA 6)elderly residents (we refer to this as “the MLKStudy”). This telephone survey of AfricanAmerican and Latino middle-age and olderresidents found that certain segments of thepopulation may have greater reported diseaseburden as well as mental and physical disability.The data also indicate significant delays in careand unmet preventive care needs that could beaddressed through primary care and chronicdisease management among older adults inSouth LA.
Leading Practices Analysis
From the leading practices analysis andhealthcare system site visits, one overarchingtheme stands out from among all others:
Leading public healthcare systems
have clarity of mission throughout the
organizational culture: to achieve the
highest-quality care through transparency,
continuous innovation, and accountability
at all levels.
The successes of leading public healthcaresystems have been driven by dynamic leaderswho (1) recognize that their greatest assetis their people and (2) have the authoritynecessary to drive organizational and culturalchange. Leaders of these systems achieve thiscultural transformation at all levels and withinall component organizations; they cannot
EXECUTIVESUMMARY
5
ACHIE
VIN
GTHE
VIS
ION:
HEALTHCARE
OPTIO
NS
FOR
LOS
AN
GELES
COUN
TY
successfully improve one part of the systemwithout improving the whole system.
The Task Force utilized literature and expertdiscussions to identify four categories forimproving the healthcare system in LosAngeles: quality care delivery, finance,information technology (IT), and governanceand management. These categories areintended to be tools for organizing theleading practices analysis and are neitherexclusive of each other nor exhaustive.
• Quality Care Delivery – Leading publicsafety net healthcare systems sustain theircommitment to high-quality clinical carethrough evidence-based medicine andcontinuous measurement and improvement.They focus on improving quality in order tobe the “provider of choice” rather than the“provider of last resort,” and they demonstratea patient-centered, safety-and-quality-firstmindset in aspects of strategic planning,day-to-day care delivery, and other operationalprocesses. They view every patient encounteras an opportunity to improve patient health,service, and satisfaction. Leading systemscreate a culture of innovation, utilizequality-improvement tools, and valuecost-effectiveness. Measures and outcomesare made available to the public and toleaders, in order to achieve transparencyand accountability. Other leading practicesin quality care delivery include maintaininga strong focus on wellness, prevention, andprimary care; reducing access barriers throughinnovative, community-based programs;and redesigning clinical and administrativeprocesses to minimize wasted resourcesand patient inconvenience.
• Finance – Leading financial practices includedeveloping a community reputation for thehighest-quality patient care to attract insured aswell as medically indigent patients, minimizing
non-value-added costs, and achievingefficiencies of scale. These practices freeresources that are then used to enhance theservice mission. Leading systems engineerfinancial discipline into all activities, bycarefully monitoring resource utilization andcost through rigorous metrics and integrateddecision-support systems. These systemshave the autonomy and authority to quicklyimplement allocations of resources across thesystem. They also work collaboratively withtheir affiliated governments to garner financialsubsidies and contributions, even developingtheir own insurance products, critical tosustaining these services.
• Information Technology – Leading IT practicesinclude adoption of standard and interoperableclinical, financial, and administrative informationsystems, and alignment of IT strategy withorganizational business strategy and goals.IT systems are used to create patientinformation continuity and to link hospitalswith community-based providers. A single,centralized data warehouse across the entirehealthcare system is crucial. These IT systemsimprove quality of care by supporting evidence-based medicine, reducing medical errors, andimproving care coordination.
• Governance and Management – Leadinghealthcare systems have autonomousgovernance bodies that have healthcareexpertise and relative freedom from politicalpressures. These bodies remain accountableto, and subject to oversight by, an affiliatedgovernment that retains legally specifiedpowers. These bodies create three-to-five-yearstrategic master plans and annual budgetswith affiliated government input and approval.Leading systems are distinguished by havinga dynamic, hands-on CEO and a talented,cohesive leadership team that is trusted bythe dedicated and engaged governance body.Collectively, the leadership and governance
6
AREPORT
OF
THE
LOS
AN
GELES
HEALTHCARE
OPTIO
NS
TASK
FORCE
body promote a consistent vision and strategyfor a mission-driven, value-based culture withaccountability by all personnel. They establishpolicies that reinforce high performancebehavior, innovation, and continuousimprovement. Another practice of leadingsystems is transparency and opencommunication with all stakeholders.
Summary ofRecommendationsThe Task Force recommendations, organizedin the same four categories, are based on ourfindings of leading practices in public healthcaresystems and the analysis of these findings in thecontext of LA County. They also reflect the TaskForce’s vision for the Public Sector HealthcareDelivery System and Public-Private Collaborationin the future. All these recommendations supportthe mission of providing high-quality, financiallysustainable healthcare in LA County for all.
Quality Care Delivery
The Public Sector Healthcare DeliverySystem should:
1.Embrace a culture of clinical excellence,innovation, continuous improvement,cost-effectiveness, and accountability.This includes engagement of its entireworkforce – including physicians, managers,and front-line workers – in a mission-driven,collaborative process that operationalizesthis cultural transformation.
2.Operate as an integrated delivery system,to provide seamless, coordinated care withaccountability at all levels of the organization.This care coordination should be extendedfrom the public system to other careproviders in the safety net system,through public-private partnerships.
3.Continuously measure, evaluate, andimprove performance, in order to deliver
the highest-quality healthcare. This requirestransparency of performance measures and opencommunication with the public and its leaders.
4.Eliminate barriers to access in order toprovide appropriate, patient-centeredcare in a timely fashion.
5.Focus on systemwide, long-term investmentsin population wellness, prevention, and themanagement of chronic diseases.
Finance
The Public Sector Healthcare DeliverySystem should:
1.Accelerate efforts to achievefinancial sustainability.
2.Appropriately improve revenue streams,including a diversified payer mix, in orderto successfully achieve its service mission.
3.Minimize unnecessary, non-value-added costs.4.Make capital and resource allocation decisionsthat best contribute to improved health outcomesthrough strategic, systemwide planning.
Information Technology
The Public Sector Healthcare DeliverySystem should:
1.Develop and advance an IT strategic plan forstandardization and interoperability, enablingquality standards measurement, coordinatedcare, and financial rigor.
EXECUTIVESUMMARY
The Public Sector HealthcareDelivery System should
embrace a culture of clinicalexcellence, innovation,
continuous improvement,cost-effectiveness,
and accountability.
7
ACHIE
VIN
GTHE
VIS
ION:
HEALTHCARE
OPTIO
NS
FOR
LOS
AN
GELES
COUN
TY
2.Establish an integrated countywide healthinformation system for clinical, quality, andfinancial measures.
3.Create a best-in-class health IT leadership teamto manage and coordinate the IT portfolio.
4.Develop a robust telemedicine and telehealthinfrastructure to facilitate access and carecoordination, by leveraging public-privatepartnerships.
5.Ensure that IT systems include decision-support-enabled population-care managementtools that allow for tracking and optimizationof key prevention and disease managementoutcomes for the population.
Governance and Management
The Public Sector Healthcare DeliverySystem would benefit from a body ofexpertise, accountable to the LA CountyBoard of Supervisors, that is self-governedand has management autonomy and authority.
Mechanism for Transition:
The LA Healthcare Planning Commission
These recommendations provide a proposedstructure for achieving the vision of anintegrated healthcare delivery system in LosAngeles, but we recognize that the Countyneeds a mechanism for planning in order tomove toward implementation. Thus, werecommend the formation of a Los AngelesHealthcare Planning Commission (hereafterreferred to as the “Commission”).
This time-limited Commission, composed ofmembers appointed by the Board of Supervisors,should be formed to conduct the planningnecessary to advance the implementation of ahigh-performing, high-quality safety net healthcaresystem that serves all residents in LA County.The Commission’s work should be informedby the recommendations of the Los AngelesHealthcare Options Task Force. We propose
that funding be provided by the philanthropiccommunity in the Los Angeles region and theLA County Board of Supervisors. We believethat an 18-month lifespan is sufficient forthis Commission to complete its duties(July 1, 2009, to December 31, 2010).
This Commission would not be a governingbody, and this report does not provide specificrecommendations for a particular healthcaregovernance model. Other studies have analyzedalternative models and made recommendations(See Appendix A). However, the Commissioncould assist the Board of Supervisors withevaluation of potential future governance models.
In addition, this Commission could be directedby the Board of Supervisors to:
• Oversee the reintegration of inpatient andemergency services at MLK Hospital into thelarger Network, as its initial task. This wouldinclude a more formal articulation of theambulatory care system that will beneeded to support MLK Hospital.
• Optimize the application for the CaliforniaMedicaid waiver in 2010.
• Identify innovative strategies for the useof the federal economic stimulus funds.
• Create a coordinated and comprehensivecountywide health IT plan.
• Identify a process to define and advancecollaboration between public and privatesafety net providers.

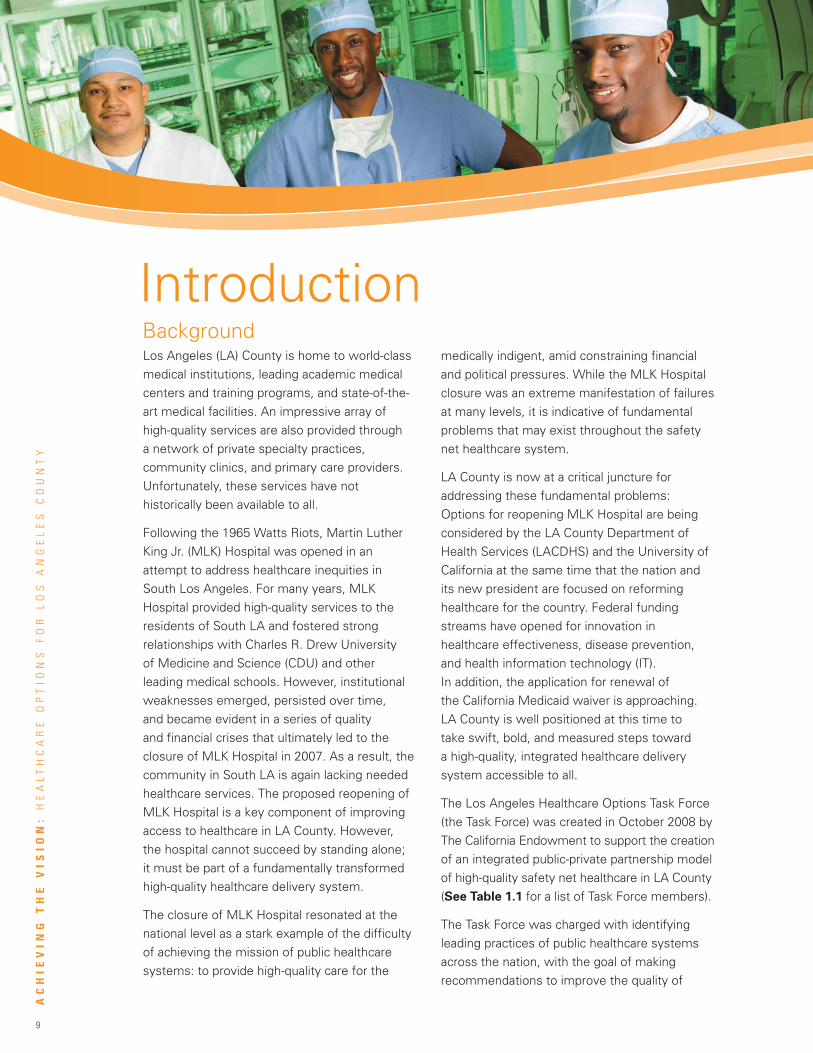
9
IntroductionLos Angeles (LA) County is home to world-classmedical institutions, leading academic medicalcenters and training programs, and state-of-the-art medical facilities. An impressive array ofhigh-quality services are also provided througha network of private specialty practices,community clinics, and primary care providers.Unfortunately, these services have nothistorically been available to all.
Following the 1965 Watts Riots, Martin LutherKing Jr. (MLK) Hospital was opened in anattempt to address healthcare inequities inSouth Los Angeles. For many years, MLKHospital provided high-quality services to theresidents of South LA and fostered strongrelationships with Charles R. Drew Universityof Medicine and Science (CDU) and otherleading medical schools. However, institutionalweaknesses emerged, persisted over time,and became evident in a series of qualityand financial crises that ultimately led to theclosure of MLK Hospital in 2007. As a result, thecommunity in South LA is again lacking neededhealthcare services. The proposed reopening ofMLK Hospital is a key component of improvingaccess to healthcare in LA County. However,the hospital cannot succeed by standing alone;it must be part of a fundamentally transformedhigh-quality healthcare delivery system.
The closure of MLK Hospital resonated at thenational level as a stark example of the difficultyof achieving the mission of public healthcaresystems: to provide high-quality care for the
medically indigent, amid constraining financialand political pressures. While the MLK Hospitalclosure was an extreme manifestation of failuresat many levels, it is indicative of fundamentalproblems that may exist throughout the safetynet healthcare system.
LA County is now at a critical juncture foraddressing these fundamental problems:Options for reopening MLK Hospital are beingconsidered by the LA County Department ofHealth Services (LACDHS) and the University ofCalifornia at the same time that the nation andits new president are focused on reforminghealthcare for the country. Federal fundingstreams have opened for innovation inhealthcare effectiveness, disease prevention,and health information technology (IT).In addition, the application for renewal ofthe California Medicaid waiver is approaching.LA County is well positioned at this time totake swift, bold, and measured steps towarda high-quality, integrated healthcare deliverysystem accessible to all.
The Los Angeles Healthcare Options Task Force(the Task Force) was created in October 2008 byThe California Endowment to support the creationof an integrated public-private partnership modelof high-quality safety net healthcare in LA County(See Table 1.1 for a list of Task Force members).
The Task Force was charged with identifyingleading practices of public healthcare systemsacross the nation, with the goal of makingrecommendations to improve the quality of
Background
ACHIE
VIN
GTHE
VIS
ION:
HEALTHCARE
OPTIO
NS
FOR
LOS
AN
GELES
COUN
TY
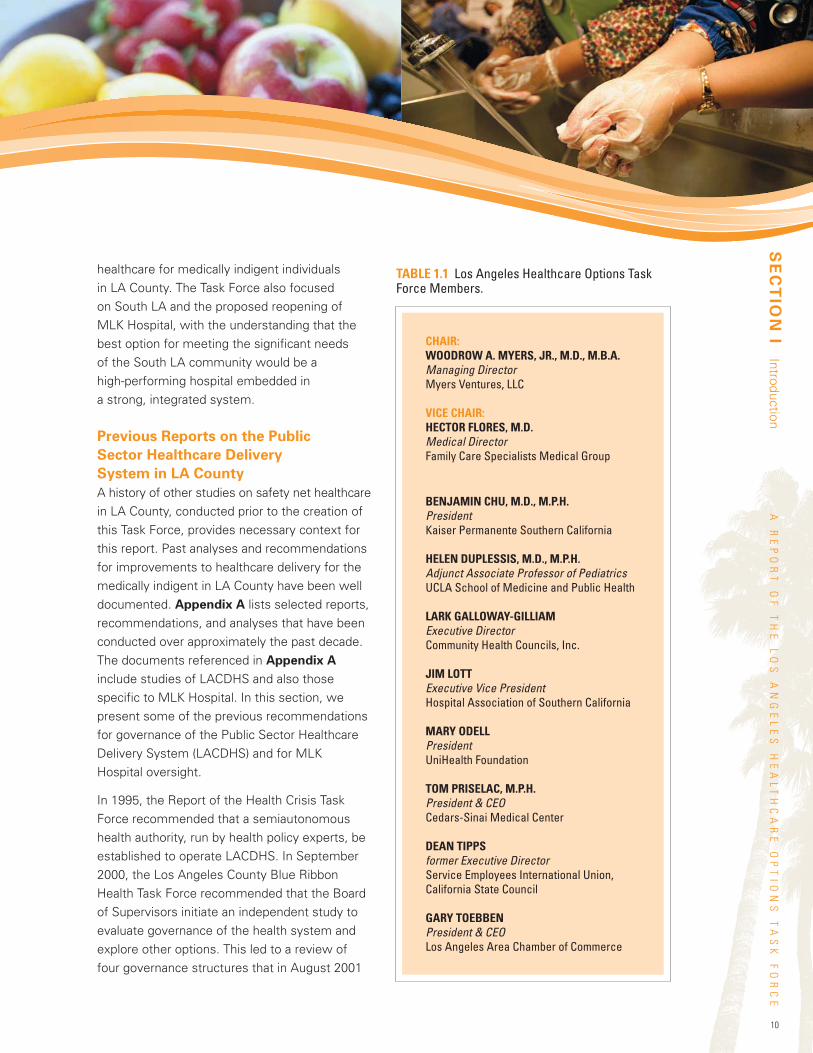
healthcare for medically indigent individualsin LA County. The Task Force also focusedon South LA and the proposed reopening ofMLK Hospital, with the understanding that thebest option for meeting the significant needsof the South LA community would be ahigh-performing hospital embedded ina strong, integrated system.
Previous Reports on the Public
Sector Healthcare Delivery
System in LA County
A history of other studies on safety net healthcarein LA County, conducted prior to the creation ofthis Task Force, provides necessary context forthis report. Past analyses and recommendationsfor improvements to healthcare delivery for themedically indigent in LA County have been welldocumented. Appendix A lists selected reports,recommendations, and analyses that have beenconducted over approximately the past decade.The documents referenced in Appendix Ainclude studies of LACDHS and also thosespecific to MLK Hospital. In this section, wepresent some of the previous recommendationsfor governance of the Public Sector HealthcareDelivery System (LACDHS) and for MLKHospital oversight.
In 1995, the Report of the Health Crisis TaskForce recommended that a semiautonomoushealth authority, run by health policy experts, beestablished to operate LACDHS. In September2000, the Los Angeles County Blue RibbonHealth Task Force recommended that the Boardof Supervisors initiate an independent study toevaluate governance of the health system andexplore other options. This led to a review offour governance structures that in August 2001
10
AREPORT
OF
THE
LOS
AN
GELES
HEALTHCARE
OPTIO
NS
TASK
FORCE
SECTIONI
Introduction
TABLE 1.1 Los Angeles Healthcare Options TaskForce Members.
CHAIR:WOODROW A. MYERS, JR., M.D., M.B.A.Managing DirectorMyers Ventures, LLC
VICE CHAIR:HECTOR FLORES, M.D.Medical DirectorFamily Care Specialists Medical Group
BENJAMIN CHU, M.D., M.P.H.PresidentKaiser Permanente Southern California
HELEN DUPLESSIS, M.D., M.P.H.Adjunct Associate Professor of PediatricsUCLA School of Medicine and Public Health
LARK GALLOWAY-GILLIAMExecutive DirectorCommunity Health Councils, Inc.
JIM LOTTExecutive Vice PresidentHospital Association of Southern California
MARY ODELLPresidentUniHealth Foundation
TOM PRISELAC, M.P.H.President & CEOCedars-Sinai Medical Center
DEAN TIPPSformer Executive DirectorService Employees International Union,California State Council
GARY TOEBBENPresident & CEOLos Angeles Area Chamber of Commerce
11
ACHIE
VIN
GTHE
VIS
ION:
HEALTHCARE
OPTIO
NS
FOR
LOS
AN
GELES
COUN
TY
resulted in a recommendation to provideLACDHS with more autonomy over contracting,financing, and personnel management.
In February 2002, the LA County ChiefAdministrative Officer (CAO) determined thata health commission model could be createdby Board ordinance and become operative 30days after the second reading of the ordinance.In May 2003, a report titled An Analysis ofAlternative Governance for the Los AngelesCounty Department of Health Servicesrecommended the creation of an independenthealth authority to operate LA County healthservices in cooperation with LACDHS. The reportrecommended that the authority should assumecontrol of administrative, contracting, personnelmanagement, and clinical service deliveryresponsibilities for LACDHS.
In April 2005, the CAO presented a HealthAuthority Blueprint to the Board of Supervisorsthat provided various options for delegatingcertain management functions of the publicsafety net. However, these were deemedunfeasible due to the prohibitive structuralfinancial deficits facing the LACDHS. In 2006,CA Assembly Bill 2470 was enacted, callingfor a master plan for healthcare in LA Countyincluding long-range planning and developmentof stronger public-private partnership, withLACDHS as a focal point.
On March 27, 2007, the Board of Supervisorsapproved Ordinance No. 2007-0048, dramaticallychanging the LA County governance structure,including delegation of significant day-to-dayadministrative authority from the Board ofSupervisors to a new Chief Executive Officer(CEO). As a result, the CEO has formal lineauthority over and responsibility for theoperations of the Departments of HealthServices, Mental Health, and Public Health.
Previous Reports on MLK Hospital
Regarding MLK Hospital, the SteeringCommittee on the Future of King/Drew in2004 found that the relationship betweenthe hospital and Charles Drew University ofMedicine and Science (CDU) led to policiesand procedures that hindered the system’saccountability for physician performance andcompensation. The hospital and CDU alsofaced challenges with financial reporting,funding, and monitoring. In 2005, the SteeringCommittee recommended formation of a newMLK Hospital leadership structure to alignmanagement incentives and accountability.The Committee recommended that oversightbe delegated to an external board of experts,independent and shielded from undue politicalinfluence. In addition, the report recommendedthat the hospital become “a healthcareinstitution recognized for consistent excellencein medical care delivery and services throughpublicly reported performance measures.”
In January 2005, a separate King/Drew MedicalCenter Assessment Report recommendedthat the Board of Supervisors continue toexplore implementation of a health authorityto govern the entire LACDHS health system.This recommendation would have transferredoversight responsibility of MLK Hospital toan advisory board that would oversee clinicaland educational programs, develop a strategicplan, assess financial performance, appointexecutives, and make recommendationsfor improvements.
That same year, at the state legislative level,Assembly Bill 1230 would have authorizedthe Board of Supervisors to establish anInspector General Office to exercise oversightof management and quality concerns, but wasvetoed by the governor upon determinationthat the Board of Supervisors already hadthat reserved power.
12
AREPORT
OF
THE
LOS
AN
GELES
HEALTHCARE
OPTIO
NS
TASK
FORCE
After 40 years of operation, MLK Hospital’sinpatient services and emergency departmentwere closed in August 2007. Now, the reopeningof MLK Hospital has been proposed, andimportant questions must be addressed onhow to reintegrate this hospital into a strongercountywide healthcare delivery system in orderto ensure its success.
Objectives and ScopeThe objectives of this report are (1) to present avision for a high-quality, financially sound publicsafety net healthcare delivery system supportedby public-private partnerships and (2) to providerecommendations for turning this vision intoreality. The vision for an integrated healthcaresystem in LA County is based on an understandingof not only the strengths and weaknesses of thecurrent system, but also the history of healthcaredelivery in the County.
What is an integrated healthcare deliverysystem? How can the stakeholders in LA Countyovercome significant political, financial, andoperational challenges to better achieve theCounty’s healthcare mission? From October2008 to April 2009, the multidisciplinary TaskForce of healthcare, business, and labor leadersresearched and examined integrated publichealthcare systems, including some inspiringexamples of systems that overcame greatobstacles to transform their quality of careand ensure financial stability. Althoughevery region of the country faces uniquecircumstances and constraints, we areconvinced that there are important lessonsto learn and apply to LA County.
It is important to recognize how this reportdiffers from many others that preceded it,and what activities were outside the scopeof the Task Force’s mission. In contrast to priorefforts that have focused on specific alternativegovernance models for LACDHS, this report
assesses healthcare systems comprehensivelyin order to make systemwide recommendationswith a clear emphasis on improving quality ofcare. This report is not intended to cataloguethe many examples of excellence in thecurrent system, or to outline all the gaps andweaknesses. The Task Force did not repeatprevious analyses and studies of LA County orof other public healthcare systems in general;instead, we referenced and built upon thissubstantial body of work.
We understand the complexity and challengeof serving LA County, the most populous countyin the nation, and also understand the longhistory of how the current fragmented systemevolved. As knowledgeable and experiencedindividuals who have served the Los Angelescommunity for many years in varied capacities,we brought our understanding of both thestrengths and weaknesses of current healthcarein LA County to develop recommendations toimprove it.
ApproachWe used several analytical components toinform our vision for healthcare in LA Countyand to generate the recommendations in thisreport. Figure 1.1 illustrates our approachfor accomplishing the Task Force objectives.We reviewed the literature on the LA County
SECTIONI
Introduction
...this report assesseshealthcare systems
comprehensively in orderto make systemwiderecommendations with
a clear emphasis onimproving quality of care.
13
ACHIE
VIN
GTHE
VIS
ION:
HEALTHCARE
OPTIO
NS
FOR
LOS
AN
GELES
COUN
TY
healthcare system (including MLK Hospital) andon public health systems in general; we criticallyassessed leading practices from public healthcaresystems; we made site visits to two leadingpublic healthcare systems with characteristicscomparable to LA County; and, finally, weconducted collaborative expert analysissessions to evaluate the information andto consider it in the context of LA County.
Literature Review
We reviewed the pertinent literature relating toprevious efforts to improve healthcare deliveryfor the medically indigent in LA County and tostrengthen LACDHS and/or MLK Hospital. Wealso used information from various studies onpublic healthcare delivery systems in general.
Needs Assessment
Because dramatic changes in the healthcarelandscape in LA County may have differentiallyimpacted certain communities more thanothers, we sought to describe and understandhow healthcare need has changed in recentyears. A team of health services researchers
worked with the Task Force to conduct asecondary data analysis of healthcare needin LA County and a primary data collection todescribe health status and healthcare needfor a targeted population in South LA.
Leading Practices Analysis
Our leading practices analysis consisted ofa literature review and an analysis of publichealthcare systems. The review of the literatureincluded an assessment of the thoughtful andwell-researched work that has been conductedon improving public healthcare systems, includingthat which focused specifically on LA County.We carefully assessed this literature, cullingfrom it important concepts and recommendationson delivering high-quality healthcare, creatingstrong financial structures, implementingsuccessful governance models, and usingcost-effective IT.
In addition, we conducted, with assistancefrom specialists at PricewaterhouseCoopers, anin-depth analysis of six urban public healthcaresystems in the United States to identify leading
LEADINGPRACTICESANALYSIS
SITEVISITS
LITERATUREREVIEW
NEEDSASSESSMENT
LAHEALTHCARETASK FORCE
VISION ANDRECOMMENDATIONS
COLLABORATIVE EXPERT
ANALYSIS SESSIONS
COLLABORATIVE EXPERT
ANALYSIS SESSIONS
FIGURE 1.1 LA Healthcare Options Task Force Approach to Defining a Vision and Recommendations.
14
AREPORT
OF
THE
LOS
AN
GELES
HEALTHCARE
OPTIO
NS
TASK
FORCE
practices in four categories: quality care delivery,finance, IT, and governance and management.These systems varied in their degree ofintegration and offered rich and relevantinformation from their diversity. In addition,we reviewed selected leading practices fromprivate integrated systems in this analysis.
Site Visits
Task Force members met with senior leadershipteams at two health systems, Jackson HealthSystem (in Miami-Dade County, Florida) and theNew York City Health and Hospitals Corporation.Site visit hosts included the Chief ExecutiveOfficers, health system board members,and other senior leaders from the systems.This allowed us to hear firsthand how theleadership of these health systems set and metsystemwide quality and financial goals. Mostimportant, we learned about the key drivers ofthe transformational process conducted at thesehealth systems over a decade or more, andheard candid discussion of their successes,mistakes, and ongoing challenges.
Collaborative Expert Analysis Sessions
The Task Force members conductedcollaborative group sessions to analyze thedata and to contextualize the informationfrom the needs assessment, leading practicesanalysis, and site visits. Task Force membersalso conducted individual stakeholder interviewsacross the County to further translate the findingsinto recommendations specific to LA.
Organization ofthis DocumentThe remainder of the document is organizedas follows. In Section II, we describe ourvision for safety net healthcare delivery inLA County and present the findings from ourneeds assessment, leading practices analysis,
and site visits. At the end of Section II, weprovide profiles of the two health systems wevisited and also several case studies thatillustrate, in a vivid and meaningful way, theleading practices, initiatives, and programs thatinformed the Task Force recommendations. InSection III, we present our recommendationsfor achieving the vision we detail in Section II.
At the end of the report, we include a series ofappendices. Appendix A provides a selected listof previous reports, memorandums, and otherdocuments on governance and operationalissues relating to LACDHS and MLK Hospital.Appendix B lists several studies on publicsafety net healthcare systems in general.Appendix C provides more details from theneeds assessment of South LA. Appendix Dprofiles four of the six public safety nethealthcare delivery systems included in ourleading practices analysis (the remainingtwo public healthcare delivery systems areprofiled in Section II). Appendix E, which isonly available electronically, is the full Reporton Leading Practices of Public Safety NetHealthcare Delivery Systems in the UnitedStates, prepared by PricewaterhouseCoopers.
SECTIONI
Introduction
We learned about the keydrivers of the transformationalprocess conducted at these
health systems over adecade or more, and heard
candid discussion of theirsuccesses, mistakes, and
ongoing challenges.
15
Key FindingsIn this section, we present our key findings in three parts.First, we describe the Task Force vision for safety nethealthcare delivery in LA County. Then, we discuss thefindings from our healthcare needs assessment in LA Countyand South LA. Finally, we describe the results of our leadingpractices analysis of public healthcare systems in the U.S. andour site visits to Jackson Health System (in Miami-Dade County,Florida) and the New York City Health and Hospitals Corporation.
To frame our analyses and recommendations,we first defined the make-up of the regionalhealthcare safety net and then developed avision for improved healthcare in LA County.
Components of the LA County
Healthcare Safety Net
The healthcare safety net in LA County – thesystem that provides healthcare to the medicallyindigent – includes a wide array of providers,both public and private, across the spectrumof care. Figure 2.1 represents the safety nethealthcare providers in LA County. Nearly everyprovider of healthcare services in LA Countyfits into one or more of the categories.
Because the healthcare safety net involvesmany providers in addition to LACDHS facilities,a coordinated and continuous effort is necessaryon the part of both public and private entitiesin order to achieve the Task Force vision ofhealthcare in LA County.
A Vision for the Public SectorHealthcare Delivery SystemThe Public Sector Healthcare Delivery Systemis the portion of the public-private networkcomposed of the LA County Departmentsof Health Services, Mental Health, and PublicHealth and directly controlled by the LA CountyBoard of Supervisors. Our vision for the futurePublic Sector Healthcare Delivery System isone that incorporates and operationalizes thefollowing principles.
ACHIE
VIN
GTHE
VIS
ION:
HEALTHCARE
OPTIO
NS
FOR
LOS
AN
GELES
COUN
TY
Task Force Vision for SafetyNet Healthcare Deliveryin LA County
16
AREPORT
OF
THE
LOS
AN
GELES
HEALTHCARE
OPTIO
NS
TASK
FORCE
The Task Force proposes that the Public
Sector Healthcare Delivery System should
be driven, first and foremost, by a mission
to provide the highest-quality healthcare
to its patients. All operations should be
quality-focused and patient-centered.
In addition, the Public Sector Healthcare DeliverySystem should:
• Function with transparency and accountabilityto the public and its leadership, throughincreased public availability of specificquality indicators and information.
• Engage its entire workforce in a mission-driven collaborative process of continuousinnovation and learning.
• Ensure its financial sustainability by improvingits fiscal infrastructure, including diversificationof its payer mix.
• Function as an integrated delivery system: asystem that coordinates health from wellnessand prevention to emergency and acutecare services, and that emphasizes strategicplanning and resource allocation, capitalizingupon economies of scale.
• Drive decisions and practices with accurateinformation (real-time process measures,clinical indicators, population outcomes,and cost measures).
• Work to eliminate inequality (a two-tieredhealthcare system) by providing high-qualitycare – including prevention, primary care,specialty care, and tertiary and quaternarycare – that is desirable to all residentsof LA County.
• Recruit, develop, and retain transformationalleaders who are expert in modern healthcaremanagement.
• Expand long-term public-private partnershipsand community engagement.
• Strengthen relationships with academicmedical centers for education and research.
• Reintegrate MLK Hospital as a part of acoordinated system that takes ownership ofits mission and these underlying principles.
Although the recommendations that follow inthis report (Section III, Recommendations)pertain to the Public Sector Healthcare DeliverySystem, the quality of care for medically indigentpatients in LA County would be improved bysynergies with Private Safety Net Providersand Non-Contracted Private Providers whoalso serve these patients (See Figure 2.1).Therefore, we also present a vision forstrengthened public-private collaborationin the future.
SECTIONII
Key
Findings
The Task Force proposesthat the Public SectorHealthcare Delivery Systemshould be driven, firstand foremost, by a mission
to provide the highest-qualityhealthcare to its patients.
All operations should bequality-focused and
patient-centered.
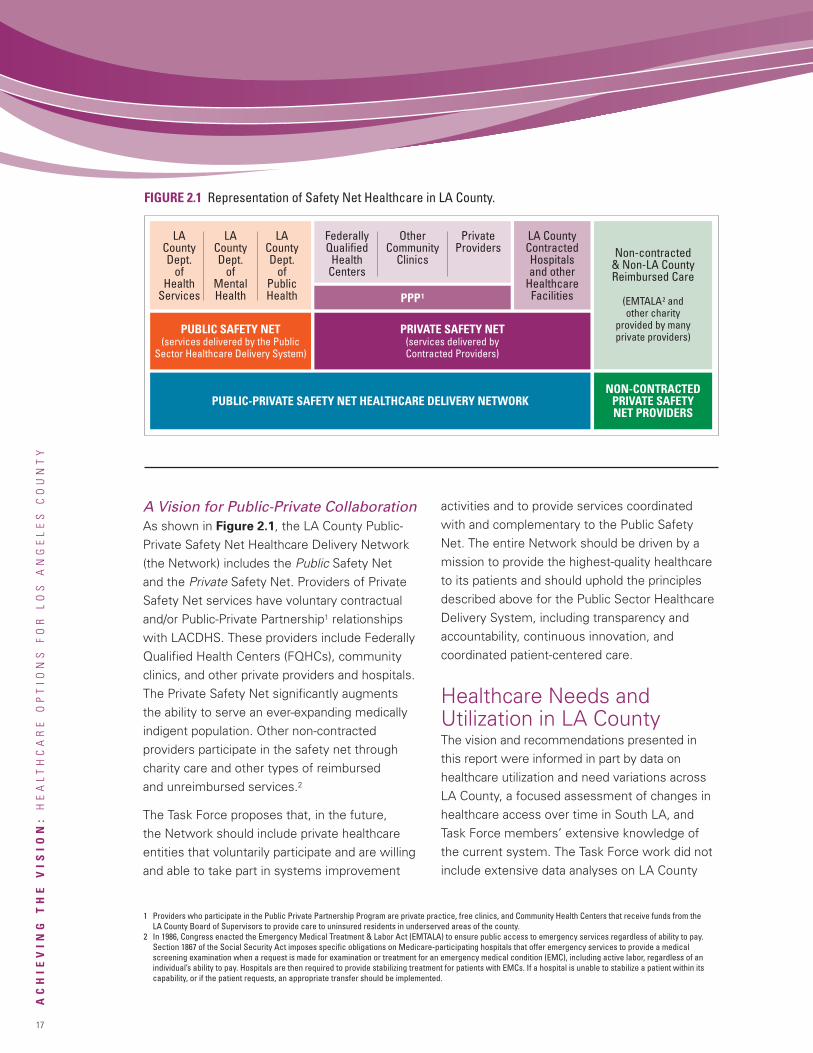
17
ACHIE
VIN
GTHE
VIS
ION:
HEALTHCARE
OPTIO
NS
FOR
LOS
AN
GELES
COUN
TY
A Vision for Public-Private CollaborationAs shown in Figure 2.1, the LA County Public-Private Safety Net Healthcare Delivery Network(the Network) includes the Public Safety Netand the Private Safety Net. Providers of PrivateSafety Net services have voluntary contractualand/or Public-Private Partnership1 relationshipswith LACDHS. These providers include FederallyQualified Health Centers (FQHCs), communityclinics, and other private providers and hospitals.The Private Safety Net significantly augmentsthe ability to serve an ever-expanding medicallyindigent population. Other non-contractedproviders participate in the safety net throughcharity care and other types of reimbursedand unreimbursed services.2
The Task Force proposes that, in the future,the Network should include private healthcareentities that voluntarily participate and are willingand able to take part in systems improvement
activities and to provide services coordinatedwith and complementary to the Public SafetyNet. The entire Network should be driven by amission to provide the highest-quality healthcareto its patients and should uphold the principlesdescribed above for the Public Sector HealthcareDelivery System, including transparency andaccountability, continuous innovation, andcoordinated patient-centered care.
Healthcare Needs andUtilization in LA CountyThe vision and recommendations presented inthis report were informed in part by data onhealthcare utilization and need variations acrossLA County, a focused assessment of changes inhealthcare access over time in South LA, andTask Force members’ extensive knowledge ofthe current system. The Task Force work did notinclude extensive data analyses on LA County
FIGURE 2.1 Representation of Safety Net Healthcare in LA County.
PUBLIC-PRIVATE SAFETY NET HEALTHCARE DELIVERY NETWORK
PUBLIC SAFETY NET(services delivered by the Public
Sector Healthcare Delivery System)
PRIVATE SAFETY NET(services delivered byContracted Providers)
PPP1
FederallyQualifiedHealthCenters
OtherCommunity
Clinics
PrivateProviders
LACountyDept.
ofHealth
Services
LACountyDept.
ofMentalHealth
LACountyDept.
ofPublicHealth
LA CountyContractedHospitalsand other
HealthcareFacilities
Non-contracted& Non-LA CountyReimbursed Care
(EMTALA2 andother charity
provided by manyprivate providers)
NON-CONTRACTEDPRIVATE SAFETYNET PROVIDERS
1 Providers who participate in the Public Private Partnership Program are private practice, free clinics, and Community Health Centers that receive funds from theLA County Board of Supervisors to provide care to uninsured residents in underserved areas of the county.
2 In 1986, Congress enacted the Emergency Medical Treatment & Labor Act (EMTALA) to ensure public access to emergency services regardless of ability to pay.Section 1867 of the Social Security Act imposes specific obligations on Medicare-participating hospitals that offer emergency services to provide a medicalscreening examination when a request is made for examination or treatment for an emergency medical condition (EMC), including active labor, regardless of anindividual’s ability to pay. Hospitals are then required to provide stabilizing treatment for patients with EMCs. If a hospital is unable to stabilize a patient within itscapability, or if the patient requests, an appropriate transfer should be implemented.
18
AREPORT
OF
THE
LOS
AN
GELES
HEALTHCARE
OPTIO
NS
TASK
FORCE
SECTIONII
Key
Findings
A VISION FOR THE PUBLIC SECTOR HEALTHCARE DELIVERY SYSTEMBuena Vista Clinic – Monday, April 14, 2014, 9:21 a.m.
Consuelo Osili is running late once again. Today, her three-year-old son, Manny, is not the cause. As she pulls intothe clinic driveway, she can blame another “new” electric SUV that has stalled on the southbound Harbor Freeway.
This is an important visit for Consuelo. She is expecting her second baby in another four months, and she has beenfeeling dizzy. Fortunately, for the past several years, the LA County Department of Health Services has contractedwith several major chain supermarkets and pharmacies in her neighborhood to provide blood pressure, diabetes,and asthma monitoring at their stores. When Consuelo complained of a headache while grocery shopping with herbest friend Alberta last Saturday, Alberta encouraged Consuelo to get her blood pressure checked right in thegrocery store. The blood pressure reading was very high. When she returned home that afternoon, Consuelo senta mobile phone text message to the prenatal nurse on-call at the LA County Department of Health Services clinics,who responded less than 30 minutes later.
When the nurse received Consuelo’s text message, Consuelo’s electronic medical record was automatically loadedto the nurse’s computer terminal for review. Consuelo had given permission for the LACDHS’s new computer systemto recognize her telephone number and email address, which formed a part of the Master Patient Index needed toaccess the electronic medical records now available in every LA hospital and clinic that joined the new Los AngelesIntegrated Delivery System, known as the Network.
The medical records indicated that Consuelo preferred to receive her medical care in Spanish. Before callingConsuelo back, the nurse accessed the LACDHS telephonic medical interpretation service and requested thata Spanish interpreter assist with the telephone consultation.
The medical records told the nurse that Consuelo was pregnant with her second child, had a family history ofheart disease, and had mild blood pressure elevations when pregnant with Manny. The nurse also reviewed thereport of the ultrasound image from Consuelo’s last prenatal visit and saw that Consuelo was gaining weight justa little faster than she should for this stage of her pregnancy. After a few more questions exchanged though theinterpreter, the nurse suggested more rest over the weekend and set an appointment for early Monday morning.All of the clinics now use “Open Access” scheduling, which ensures that there will be slots available for patientslike Consuelo who have an urgent need to see their physician.
Consuelo checks in at the front desk. The scheduling software had automatically adjusted the appointment timesthat morning after Consuelo did not check in by 9:10 a.m. for her 9 a.m. appointment. The front office staff quicklyplaces a paper wristband on Consuelo showing her name, date of birth, and allergies, along with a bar code, andsends her to an examination room.
After a minimal wait, Consuelo is weighed on the electronic scale, and her blood pressure and temperature are taken.The aide scans the barcode and the results are automatically uploaded into the electronic clinic record. The aidealso sends in a certified Spanish medical interpreter who is on staff at the clinic. Soon, the physician enters.
Dr. VanDyke is happy to see Consuelo and Manny. She took care of Consuelo during the last pregnancy with Manny.The medical student with Dr. VanDyke reads Consuelo’s medical record on the handheld electronic tablet andinforms Dr. VanDyke about the text message and the telephone call a few days before. Dr. VanDyke asks Consueloa few questions through the interpreter and orders both a urine test to look for protein and a blood test to checkfor possible anemia. Dr. VanDyke explains that the results will be ready shortly and that she will return to seeConsuelo in a few minutes. The clinic now uses laboratory technology that generates real-time results for themost common tests used in the clinic: Patients do not need to make a return visit just to hear about lab results,and the medical decision can be made during the initial visit.
Twenty minutes later, Consuelo and Manny are invited into Dr. VanDyke’s office. She and the medical interpreterhelp Consuelo understand that this pregnancy is a little different from her previous one, and some changes areneeded to minimize risk to her and to the baby. Dr. VanDyke prescribes a recently approved drug for hypertension
Continued on next page.
19
ACHIE
VIN
GTHE
VIS
ION:
HEALTHCARE
OPTIO
NS
FOR
LOS
AN
GELES
COUN
TY
healthcare statistics (much is already publiclyavailable); however, background informationis provided here to build the context forthe recommendations.
In addition to examining previous data onpatient visits, healthcare resources, andchanges in demand for inpatient and emergencyservices at private hospitals surrounding MLKHospital, it was useful to review updatedsnapshots of healthcare utilization aroundthe County and changes in access to care inSouth LA after the closure of MLK hospital.First, we conducted a literature search andanalyzed previously collected survey data fromthe California Health Interview Survey (CHIS)to answer additional questions about thecurrent picture in LA County. Second, acommunity-based study provided additionalcommunity-level information about potentialdelays in care after hospital closure in SouthLA (hereafter, we refer to this study as“the MLK study”). We describe bothsets of findings in this section.
Los Angeles County
LACDHS serves a diverse population of morethan 10 million residents; provides healthcareto over 700,000 patients and more than300,000 emergency and trauma victimsyearly; and currently operates four hospitals,two multi-service ambulatory care centers, sixcomprehensive health centers, and multiplehealth clinics throughout the County.
LA County has over 2.5 million peoplewithout health insurance – the highest rateamong the nation’s largest metropolitan areas.A large number of the uninsured receive theircare from both the Public Sector HealthcareDelivery System and Private Safety Netproviders. Almost one-third of the uninsuredidentify physicians from outside the publicsystem as their usual source of care(Figure 2.2).
Data used in these analyses are shown byservice planning area (SPA). These areaswere first defined in 1993 and have sincebeen used for planning by the Board ofSupervisors and LA County health planningentities. Figure 2.3 shows the geographic
in pre-eclampsia and places Consuelo in the Buena Vista Clinic Special Care Pregnancy program. Patients in theSpecial Care program are automatically scheduled for more frequent and longer visits, and between visits theyreceive Internet-based consultations on stress reduction, nutrition, and symptoms to watch for before the babyis born. In some cases, the mothers are prepared in advance for the possibility of a Caesarian delivery, which isdone both through Internet-based seminars and through the Special Care support groups managed by the clinic.Years earlier, LA County learned that an intensive risk-reduction effort for Special Care patients reduces morbidityand mortality. As a result, the County now enjoys far lower infant mortality rates than in 2009.
After the consultation, Consuelo is relieved that there is something she can do to treat her dizziness and keep herunborn baby healthy. She stops at her corner chain pharmacy on the way home to pick up her prescription, asthe clinic has sent the prescription electronically to the pharmacy of her choice. If the traffic isn’t too bad, she’llbe home before noon, but then you can never predict what happens on the Harbor freeway…
Continued from previous page.
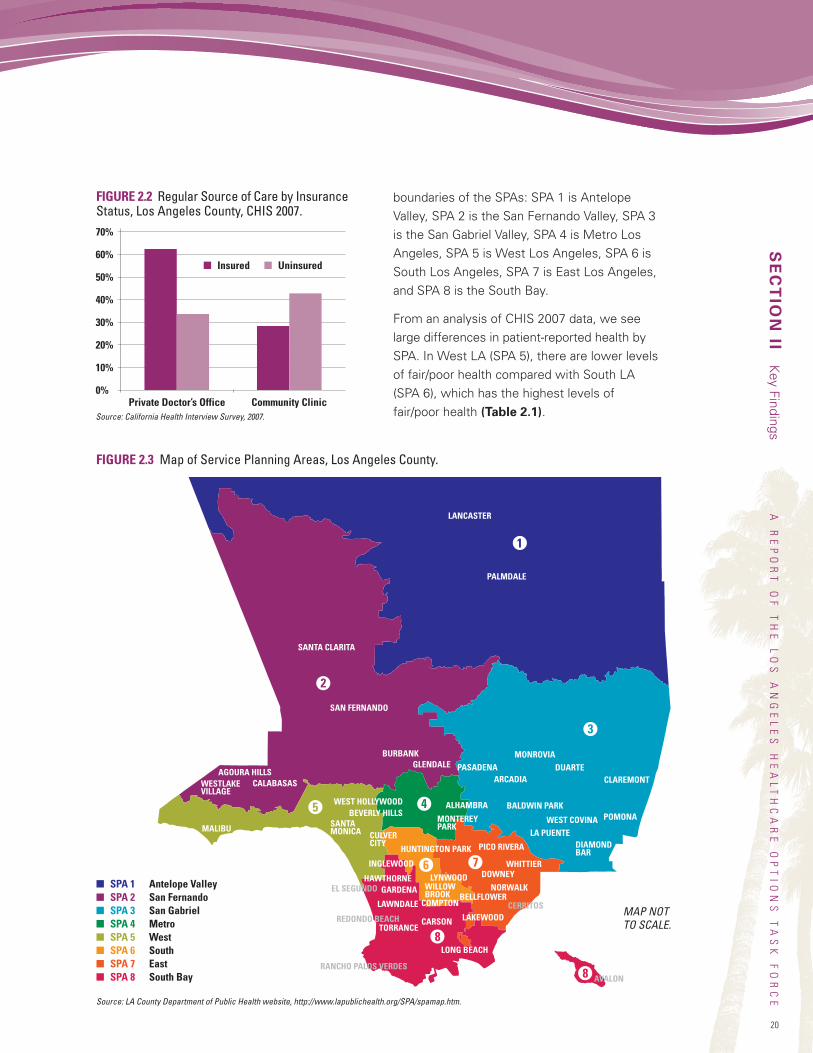
LANCASTER
PALMDALE
SANTA CLARITA
SAN FERNANDO
BURBANKGLENDALE
CALABASASAGOURA HILLS
WESTLAKEVILLAGE
MALIBU SANTAMONICA
WEST HOLLYWOODBEVERLY HILLS
CULVERCITY
INGLEWOOD
HAWTHORNEGARDENA
MONTEREYPARK
LAWNDALE COMPTON
WILLOWBROOK
CARSON
LONG BEACH
EL SEGUNDO
REDONDO BEACHTORRANCE
RANCHO PALOS VERDESAVALON
HUNTINGTON PARK
LAKEWOOD
BELLFLOWERNORWALK
LYNWOOD DOWNEY
PICO RIVERA
WHITTIER
MONROVIA
CLAREMONT
POMONA
PASADENA DUARTEARCADIA
WEST COVINA
DIAMONDBAR
LA PUENTE
BALDWIN PARKALHAMBRA
1
2
3
45
6 7
8
8
CERRITOS
boundaries of the SPAs: SPA 1 is AntelopeValley, SPA 2 is the San Fernando Valley, SPA 3is the San Gabriel Valley, SPA 4 is Metro LosAngeles, SPA 5 is West Los Angeles, SPA 6 isSouth Los Angeles, SPA 7 is East Los Angeles,and SPA 8 is the South Bay.
From an analysis of CHIS 2007 data, we seelarge differences in patient-reported health bySPA. In West LA (SPA 5), there are lower levelsof fair/poor health compared with South LA(SPA 6), which has the highest levels offair/poor health (Table 2.1).
20
AREPORT
OF
THE
LOS
AN
GELES
HEALTHCARE
OPTIO
NS
TASK
FORCE
SECTIONII
Key
Findings
Source: California Health Interview Survey, 2007.
Private Doctor’s Office Community Clinic
70%
60%
50%
40%
30%
20%
10%
0%
FIGURE 2.2 Regular Source of Care by InsuranceStatus, Los Angeles County, CHIS 2007.
� Insured � Uninsured
� SPA 1 Antelope Valley� SPA 2 San Fernando� SPA 3 San Gabriel� SPA 4 Metro� SPA 5 West� SPA 6 South� SPA 7 East� SPA 8 South Bay
FIGURE 2.3 Map of Service Planning Areas, Los Angeles County.
MAP NOTTO SCALE.
Source: LA County Department of Public Health website, http://www.lapublichealth.org/SPA/spamap.htm.
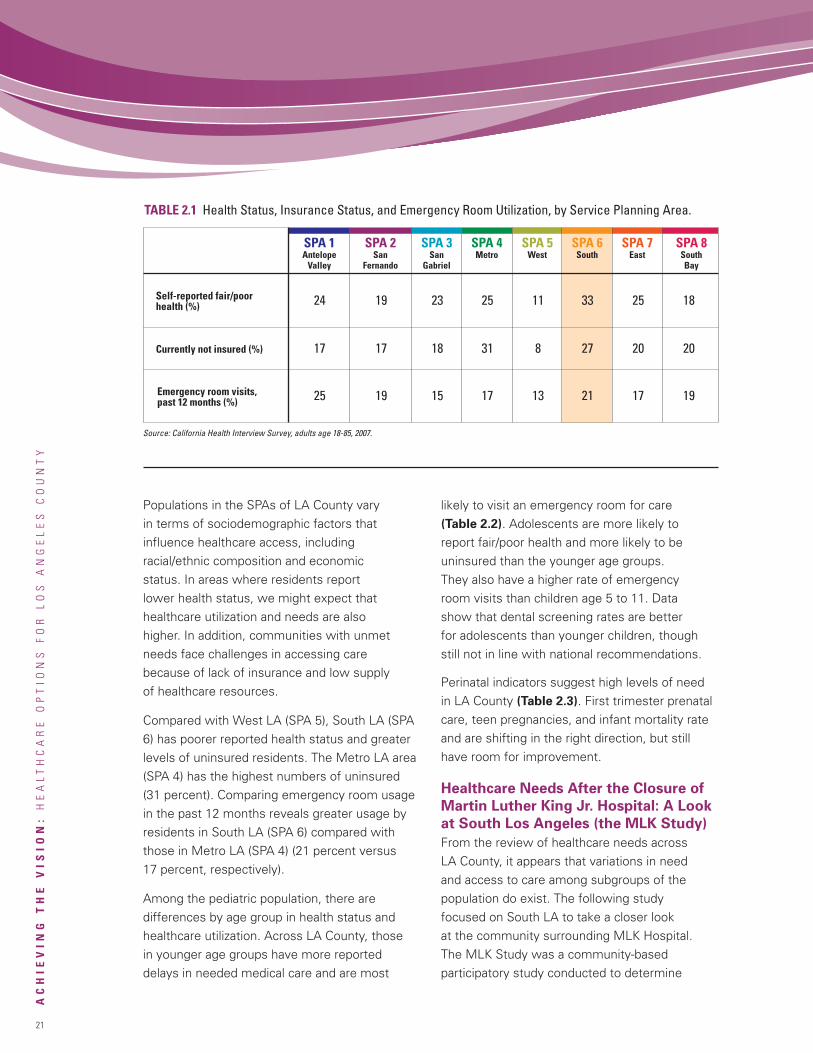
21
ACHIE
VIN
GTHE
VIS
ION:
HEALTHCARE
OPTIO
NS
FOR
LOS
AN
GELES
COUN
TY
Populations in the SPAs of LA County varyin terms of sociodemographic factors thatinfluence healthcare access, includingracial/ethnic composition and economicstatus. In areas where residents reportlower health status, we might expect thathealthcare utilization and needs are alsohigher. In addition, communities with unmetneeds face challenges in accessing carebecause of lack of insurance and low supplyof healthcare resources.
Compared with West LA (SPA 5), South LA (SPA6) has poorer reported health status and greaterlevels of uninsured residents. The Metro LA area(SPA 4) has the highest numbers of uninsured(31 percent). Comparing emergency room usagein the past 12 months reveals greater usage byresidents in South LA (SPA 6) compared withthose in Metro LA (SPA 4) (21 percent versus17 percent, respectively).
Among the pediatric population, there aredifferences by age group in health status andhealthcare utilization. Across LA County, thosein younger age groups have more reporteddelays in needed medical care and are most
likely to visit an emergency room for care(Table 2.2). Adolescents are more likely toreport fair/poor health and more likely to beuninsured than the younger age groups.They also have a higher rate of emergencyroom visits than children age 5 to 11. Datashow that dental screening rates are betterfor adolescents than younger children, thoughstill not in line with national recommendations.
Perinatal indicators suggest high levels of needin LA County (Table 2.3). First trimester prenatalcare, teen pregnancies, and infant mortality rateand are shifting in the right direction, but stillhave room for improvement.
Healthcare Needs After the Closure of
Martin Luther King Jr. Hospital: A Look
at South Los Angeles (the MLK Study)
From the review of healthcare needs acrossLA County, it appears that variations in needand access to care among subgroups of thepopulation do exist. The following studyfocused on South LA to take a closer lookat the community surrounding MLK Hospital.The MLK Study was a community-basedparticipatory study conducted to determine
TABLE 2.1 Health Status, Insurance Status, and Emergency Room Utilization, by Service Planning Area.
Self-reported fair/poorhealth (%)
SPA 1AntelopeValley
SPA 2San
Fernando
SPA 3San
Gabriel
SPA 4Metro
SPA 5West
SPA 6South
Currently not insured (%)
Emergency room visits,past 12 months (%) 25 19 15 17 13 21 17 19
17 17 18 31 8 27 20 20
24 19 23 25 11 33 25 18
Source: California Health Interview Survey, adults age 18-85, 2007.
SPA 7East
SPA 8SouthBay
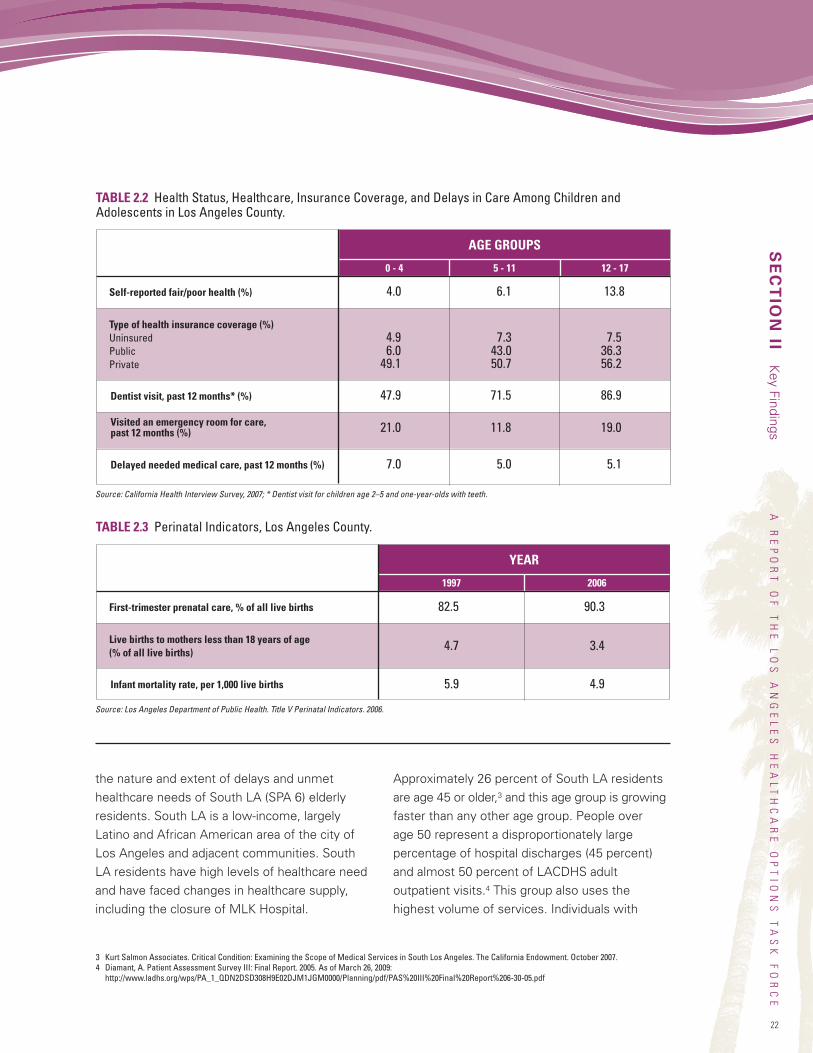
22
AREPORT
OF
THE
LOS
AN
GELES
HEALTHCARE
OPTIO
NS
TASK
FORCE
the nature and extent of delays and unmethealthcare needs of South LA (SPA 6) elderlyresidents. South LA is a low-income, largelyLatino and African American area of the city ofLos Angeles and adjacent communities. SouthLA residents have high levels of healthcare needand have faced changes in healthcare supply,including the closure of MLK Hospital.
Approximately 26 percent of South LA residentsare age 45 or older,3 and this age group is growingfaster than any other age group. People overage 50 represent a disproportionately largepercentage of hospital discharges (45 percent)and almost 50 percent of LACDHS adultoutpatient visits.4 This group also uses thehighest volume of services. Individuals with
SECTIONII
Key
Findings
Self-reported fair/poor health (%)
AGE GROUPS
Type of health insurance coverage (%)UninsuredPublicPrivate
Dentist visit, past 12 months* (%) 47.9 71.5 86.9
4.9 7.3 7.56.0 43.0 36.3
49.1 50.7 56.2
4.0 6.1 13.8
21.0 11.8 19.0
7.0 5.0 5.1
Source: California Health Interview Survey, 2007; * Dentist visit for children age 2–5 and one-year-olds with teeth.
TABLE 2.2 Health Status, Healthcare, Insurance Coverage, and Delays in Care Among Children andAdolescents in Los Angeles County.
Visited an emergency room for care,past 12 months (%)
Delayed needed medical care, past 12 months (%)
5 - 110 - 4 12 - 17
TABLE 2.3 Perinatal Indicators, Los Angeles County.
First-trimester prenatal care, % of all live births
YEAR
Live births to mothers less than 18 years of age(% of all live births)
Infant mortality rate, per 1,000 live births
Source: Los Angeles Department of Public Health. Title V Perinatal Indicators. 2006.
1997 2006
82.5 90.3
5.9 4.9
4.7 3.4
3 Kurt Salmon Associates. Critical Condition: Examining the Scope of Medical Services in South Los Angeles. The California Endowment. October 2007.4 Diamant, A. Patient Assessment Survey III: Final Report. 2005. As of March 26, 2009:
http://www.ladhs.org/wps/PA_1_QDN2DSD308H9E02DJM1JGM0000/Planning/pdf/PAS%20III%20Final%20Report%206-30-05.pdf
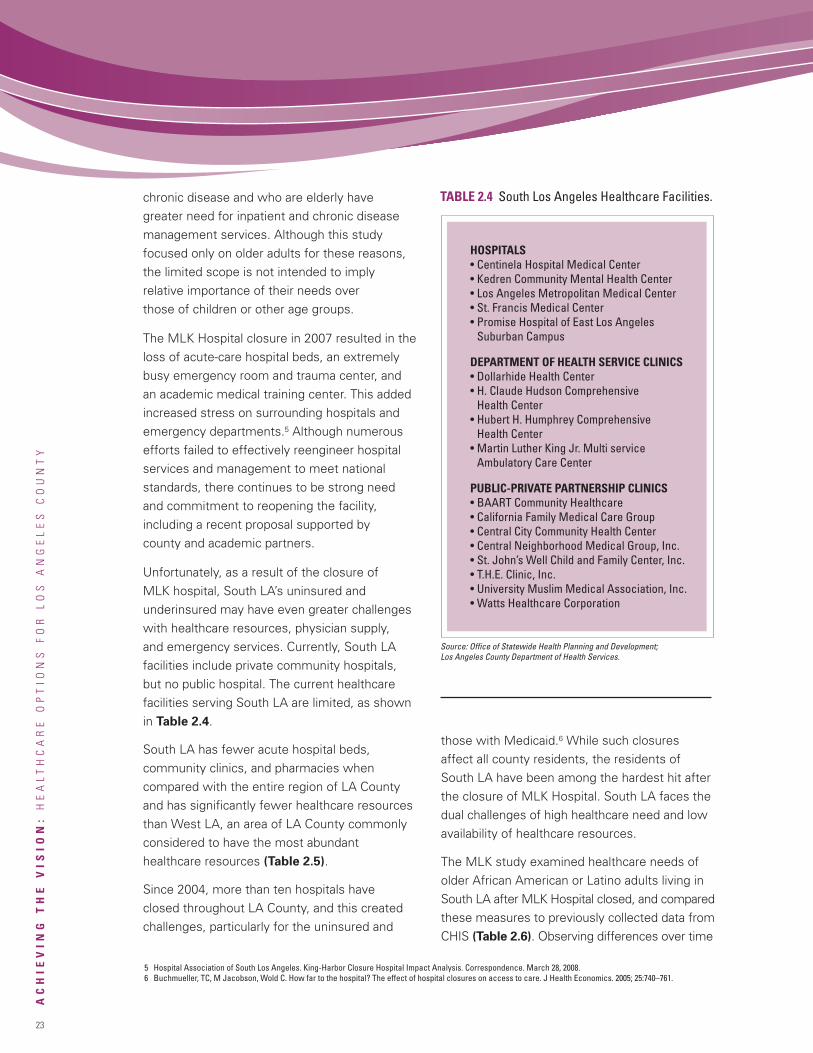
chronic disease and who are elderly havegreater need for inpatient and chronic diseasemanagement services. Although this studyfocused only on older adults for these reasons,the limited scope is not intended to implyrelative importance of their needs overthose of children or other age groups.
The MLK Hospital closure in 2007 resulted in theloss of acute-care hospital beds, an extremelybusy emergency room and trauma center, andan academic medical training center. This addedincreased stress on surrounding hospitals andemergency departments.5 Although numerousefforts failed to effectively reengineer hospitalservices and management to meet nationalstandards, there continues to be strong needand commitment to reopening the facility,including a recent proposal supported bycounty and academic partners.
Unfortunately, as a result of the closure ofMLK hospital, South LA’s uninsured andunderinsured may have even greater challengeswith healthcare resources, physician supply,and emergency services. Currently, South LAfacilities include private community hospitals,but no public hospital. The current healthcarefacilities serving South LA are limited, as shownin Table 2.4.
South LA has fewer acute hospital beds,community clinics, and pharmacies whencompared with the entire region of LA Countyand has significantly fewer healthcare resourcesthan West LA, an area of LA County commonlyconsidered to have the most abundanthealthcare resources (Table 2.5).
Since 2004, more than ten hospitals haveclosed throughout LA County, and this createdchallenges, particularly for the uninsured and
those with Medicaid.6 While such closuresaffect all county residents, the residents ofSouth LA have been among the hardest hit afterthe closure of MLK Hospital. South LA faces thedual challenges of high healthcare need and lowavailability of healthcare resources.
The MLK study examined healthcare needs ofolder African American or Latino adults living inSouth LA after MLK Hospital closed, and comparedthese measures to previously collected data fromCHIS (Table 2.6). Observing differences over time
23
ACHIE
VIN
GTHE
VIS
ION:
HEALTHCARE
OPTIO
NS
FOR
LOS
AN
GELES
COUN
TY
TABLE 2.4 South Los Angeles Healthcare Facilities.
HOSPITALS• Centinela Hospital Medical Center• Kedren Community Mental Health Center• Los Angeles Metropolitan Medical Center• St. Francis Medical Center• Promise Hospital of East Los Angeles
Suburban Campus
DEPARTMENT OF HEALTH SERVICE CLINICS• Dollarhide Health Center• H. Claude Hudson Comprehensive
Health Center• Hubert H. Humphrey Comprehensive
Health Center• Martin Luther King Jr. Multi service
Ambulatory Care Center
PUBLIC-PRIVATE PARTNERSHIP CLINICS• BAART Community Healthcare• California Family Medical Care Group• Central City Community Health Center• Central Neighborhood Medical Group, Inc.• St. John’s Well Child and Family Center, Inc.• T.H.E. Clinic, Inc.• University Muslim Medical Association, Inc.• Watts Healthcare Corporation
Source: Office of Statewide Health Planning and Development;Los Angeles County Department of Health Services.
5 Hospital Association of South Los Angeles. King-Harbor Closure Hospital Impact Analysis. Correspondence. March 28, 2008.6 Buchmueller, TC, M Jacobson, Wold C. How far to the hospital? The effect of hospital closures on access to care. J Health Economics. 2005; 25:740–761.
24
AREPORT
OF
THE
LOS
AN
GELES
HEALTHCARE
OPTIO
NS
TASK
FORCE
suggests greater demand for preventive care andprimary care services after the closure of MLKhospital. Appendix C shows more details of thestudy results. Overall, among African Americansand Latinos who are over age 50 in South LA,there were differences in preventive care, delaysin care, and unmet healthcare needs. There aresignificant differences among age and ethnic
groups. Routine screening guidelines for thoseover the age of 50 recommend a yearly flu shot,colon cancer screening every ten years, anda pneumonia shot once after the age of 65.In addition, most physicians continue torecommend prostate-specific antigen (PSA)screening, but may also discuss other optionswith their patients.
SECTIONII
Key
FindingsTABLE 2.6 Health Status, Emergency Room Use, and Delays in Care Among Older Persons in SouthLos Angeles Across Years and Geography.
Self-reported fair/poor health (%)
Source: CHIS data for geographic comparisons from most recent year available for SPA 6, African Americans and Latinos who are over age 50 similar to 2008 South LosAngeles study. Data shown is most recent CHIS survey (2007), unless otherwise noted: † CHIS 2005 ‡CHIS 2003 ^CHIS 2001. Italics indicate value is statistically unstable.
SPA 6South LA2008
SPA 6South LA2005
SPA 5West LA
LACounty
California
Visited an emergency room for care, past 12 months (%)
Preventive health services and utilization (%)No flu shot in past 12 monthsNever had a colonoscopy, within 10 yearsNever had a pneumonia shotMammogram, never/more than 2 years ago (women)PSA, never/more than 1 year ago (men)
Delays in care (%)Problem to receive needed medical careProblem to see a specialist
55.0 58.7 56.0 57.9 56.141.0 55.0 14.4 36.6 36.467.2 70.8 66.5‡ 72.4‡ 70.9‡
11.7 14.2 13.4 16.1 17.057.0 33.0 43.6† 61.8† 65.2†
16.6 16.4 10.9 14.7 17.312.1 18.4 13.4 14.1 13.8
32.3 32.7 25.5 † 26.8† 24.6†
39.6 49.6 36.3 42.4 40.2
CHIS COMPARISON
TABLE 2.5 Healthcare Infrastructure in South Los Angeles, West Los Angeles, and Los Angeles County.
General acute care hospitals per 100,000 population
Source: South Los Angeles Health Equity Scorecard, Community Health Councils, Inc.
SOUTH LA LA COUNTY WEST LAINDICATOR
0.45 0.90 1.23
0.09 0.10 0.12
7.72 15.14 21.81
0.68 1.23 1.83
1.14 2.21 3.22
Community clinic supply per 1,000 uninsured population
Pharmacies per 100,000 population
Bed supply per 1,000 population (averaged)
Licensed available bed supply per 1,000 population
25
ACHIE
VIN
GTHE
VIS
ION:
HEALTHCARE
OPTIO
NS
FOR
LOS
AN
GELES
COUN
TY
In the MLK study, significantly more adults age50–64, relative to older adults, did not receive aflu shot, have a colonoscopy within 10 years, orhave a pneumonia shot. Those who were Latinoalso had greater self-reported unmet preventiveneeds and delays in care compared with AfricanAmericans, including in rates of colonoscopy,pneumonia shot and prostate cancer screening.
Summary
Variation in the medical needs of vulnerablepopulations throughout LA County are reflectedby variation in healthcare demands and utilization.Some of the most vulnerable populations withinthe County are in South LA, where there isconsiderable disease burden. With greater risk formorbidity and mortality, South LA may have seenan increase in primary care needs for preventiveservices and chronic disease management afterthe closure of MLK Hospital. In a community asdiverse as South LA, the future system of carewill need to address these challenges throughintegrated, high-quality, patient-centered care.These findings underscore the importance ofthe Task Force’s vision for an improved safetynet healthcare system in LA County.
Leading Practices fromPublic Healthcare DeliverySystems in the U.S.The Task Force engaged a senior team at thePricewaterhouseCoopers (PwC) Health IndustriesAdvisory Practice to assist in identifying leadingpractices that have been found to be successfulin other public safety net healthcare deliverysystems. These leading practices, organized intofour categories, informed the development ofrecommendations for achieving a sustainable,high-performing system in LA. Based on ourreview of the literature and collaborative analysissessions, we determined these categories tobe key areas of focus that could contribute tosignificant improvement in the Network.
The four categories are as follows:
• Quality Care Delivery: Leading practices thatfacilitate high-quality service delivery to patientsand patient safety. This category includespractices that enable continuous qualityimprovement, a skilled workforce, anddevelopment of relationships with privatesector physicians, hospitals, and academicmedical centers.
• Finance: Leading practices that focus onsecuring the financial viability of public healthsystems in order to sustain and enhance theservice mission.
• Information Technology: Leading practicesthat promote continuity of care and information,as well as cost-efficient IT systems that facilitateintegrated healthcare delivery systems.
• Governance and Management:Leading practices that focus on the keycomponents of successful management andoversight of healthcare systems. This categoryincludes practices that support transformationalchange throughout the organization, includingimprovements in the other categories of servicedelivery, information technology, and finance.
The project methodology included amultidisciplinary approach to gather informationon leading practices within the U.S. healthcaredelivery system. Six urban public safety nethealthcare delivery systems were identified bythe Task Force and PwC. These systems havebeen recognized as high-performing and ashaving some characteristics comparable toLACDHS. The systems included in the analysiswere Denver Health Medical Center (Denver,CO), Harris County Hospital District (Houston,TX), Hennepin Healthcare System (Minneapolis,MN), Jackson Health System (Miami-DadeCounty, FL), New York City Health and HospitalsCorporation (New York, NY), and Parkland Healthand Hospital System (Dallas County, TX).We made site visits to Jackson Health System
26
AREPORT
OF
THE
LOS
AN
GELES
HEALTHCARE
OPTIO
NS
TASK
FORCE
and the New York City Health and HospitalsCorporation, and we provide a profile of thesetwo systems later in this section. We describethe other four systems in Appendix D. Thedescriptions are based on publicly availableinformation found on each system’s respectivewebsite, annual reports to the community,and audited financial reports. Our methodologywas specifically designed to bring togetherboth internal points of view related to leadingpractices as well as external views of thehealthcare industry, where these practicesappear to be successfully implemented.
The full report by PwC on leading practices ofpublic safety net healthcare delivery systemscan be found electronically in Appendix E, atwww.calendow.org.
Our methodology also included the following:
• Review of the literature on public healthcaresystems in general, leading practices ofcertain systems, and previous reportsand recommendations on the publichealthcare system in LA County.
• Analysis of public healthcare systemsthrough a PwC internal collaborative designsession in December 2008 with subject-matterspecialists to brainstorm ideas related to leadingpractices. With a focus on the four categories,the PwC team brought industry-level experienceto the process and contributed to building aleading practices framework throughknowledge of successful results.
• Site visits to two health systems, JacksonHealth System and New York City Health andHospitals Corporation. These two urban safetynet hospital systems were chosen by the TaskForce based on their relevance to LA Countyand their overall quality, financial, andoperational performance. Task Force membersconducted interactive focused discussionswith senior leadership and board members
at both systems on a range of topics. Keytopics included leading practice attributes oftheir systems, tools and methodologies foractualizing leading practices, and experience-and evidence-based guidance for transformingthe healthcare delivery system in LA County.
• Analysis of all the findings in collaborativeanalysis sessions throughout February andMarch 2009.
Overarching Findings
From the leading practices analysis andhealthcare system site visits, one overarchingtheme stands out from among all others:
Leading public healthcare systems have clarity
of mission throughout the organizational
culture: to achieve the highest-quality care
through transparency, continuous innovation,
and accountability at all levels.
The successes of leading public healthcaresystems have been driven by dynamic leaderswho (1) recognize that their greatest assetis their people and (2) have the authoritynecessary to drive organizational and culturalchange. Leaders of these systems achieve thiscultural transformation at all levels and withinall component organizations; they cannotsuccessfully improve one part of the systemwithout improving the whole system.
SECTIONII
Key
Findings
Leading public healthcaresystems have clarity of
mission throughout theorganizational culture:
to achieve the highest-qualitycare through transparency,
continuous innovation,and accountability at all levels.
27
ACHIE
VIN
GTHE
VIS
ION:
HEALTHCARE
OPTIO
NS
FOR
LOS
AN
GELES
COUN
TY
In our site visits, one physician stated, “We areon a quest to be the best. If we see others withmetrics higher than ours, we ask ‘why not us?’”Such statements illustrate the pervasive cultureof change that seems to be fundamental toquality improvement in these healthcare systems.
Quality Care Delivery Findings
Leading public safety net healthcare systemssustain their commitment to high-quality clinicalcare through evidence-based medicine andcontinuous measurement and improvement.They take an integrated approach to deliveringquality care and focus on improving quality inorder to be the “provider of choice” rather thanthe “provider of last resort.” For example, theirpatient-centered, safety-and-quality-first mindsetleads all aspects of strategic planning andday-to-day execution of care delivery and otheroperational processes. They view every patientencounter as an opportunity to improve patienthealth, service, and satisfaction.
Leading systems create a culture of innovation,utilize quality-improvement tools, and value cost-effectiveness. Measures and outcomes are madeavailable to the public and to leaders in orderto achieve transparency and accountability(See Case Study 1, page 35).
Other leading practices in quality caredelivery include:
• Maintaining a strong focus on wellness,prevention, and primary care, including theestablishment of a medical home for all patients.
• Reducing barriers to access through innovative,community-based programs such asimplementation of open access schedulingmodels, comprehensive interpreter programs,and partnering with community providers
or nontraditional delivery sites (See CaseStudies 2-5, pages 37-43).
• Developing centers of clinical excellencethat provide state-of-the-art care aligned withcommunity needs. These centers are oftenrooted in strong affiliations with top academicmedical centers and research institutions.
• Streamlining services for efficiency, effectiveness,and service satisfaction from the point of thepatient’s first contact with the system throughto follow-up and health maintenance services(See Case Study 6, page 43).
• Encouraging patient enrollment in preventiveand chronic disease management programs,including those for diabetes, asthma, anddepression (See Case Study 7, page 44).
• Redesigning clinical and administrativeprocesses utilizing performance-improvementinitiatives led by front-line workforce. Theseinitiatives minimize waste, unnecessary worksteps, and patient inconveniences, which thenfrees resources to be redirected toward servingpatients (See Case Study 8, page 45).
• Innovative labor-management partnerships torecruit, develop, and retain an experiencedworkforce that adapts easily to change andhealth system demands.
Finance Findings
Nearly all public safety net healthcare deliverysystems, including the leaders, lose money everyyear from their patient care delivery operations.Public hospitals report that 17 percent of theircosts are uncompensated, compared with 5.8percent for all hospitals.7 In California, theMedi-Cal physician reimbursement rate ranks42nd in the nation.8 Additional pressures includerising uninsurance due to unemployment anddeclining Medicaid reimbursement in responseto lower tax revenues.
7 America’s Public Hospitals and Health Systems, 2007. Results of the Annual NAPH Hospital Characteristics Survey Interim Report – December 2008.National Association of Public Hospitals and Health Systems.
8 Kaiser Commission on Medicaid & the Uninsured Facts, The California Medicaid Program at a Glance. Kaiser Family Foundation, June 2005.
28
AREPORT
OF
THE
LOS
AN
GELES
HEALTHCARE
OPTIO
NS
TASK
FORCE
Leading public safety net healthcare deliverysystems overcome the challenge of growingdemand coupled with insufficient resources,by continuously working to improve therevenue they earn, to reduce unnecessary,non-value-added costs, and to leveragetheir capital as much as possible to increasecommunity access and sustain high-qualityhealthcare service delivery.
Other leading practices include:
• Developing a community reputation and “brandrecognition” for the highest-quality experienceamong all patients. Leading public systemssuccessfully compete with private healthsystems, attracting not only indigent patientsbut increasing their market share of insuredpatients (See Case Study 9, page 47).
• Developing unique insurance products andcontracts that improve competitiveness andfinancial stability. Revenue earned from servicesto insured patients is used to cross-subsidizeuncompensated costs of care to uninsuredand underinsured patients, enhancing theservice mission.
• Aligning quality and financial incentives toimprove patient health status and delivercare more efficiently, for example, withpay-for-performance arrangements.
• Engineering financial discipline into allactivities, including monitoring resourceutilization and cost through integrateddecision support systems aligned withquality objectives. Leading systems applyrigorous patient-centered performanceimprovement techniques, using ingenuityto reap available financial gains that canbe reapplied to patient care.
• Using scale to exert volume purchasing powerwith vendors, to eliminate duplication and
inefficiencies, and to centralize and shareresources across the delivery system.
• Having senior leaders deeply engaged inworkforce-led initiatives that reduce riskand improve performance, with unions andmanagement joining as stakeholder-partnersto achieve a more efficient and effective caredelivery system while ensuring recruitmentand retention of workforce.
• Setting strategies that allocate resources foroptimum systemwide return on investment –not only in a financial sense, but in terms ofachieving mission goals of serving communitysafety net healthcare needs through the mostefficient and effective operations and thehighest-quality outcomes.
• Working collaboratively in a strong,constructive, interdependent partnershipwith their affiliated governments and thecommunity at large, and meriting sufficientlocal government and taxpayer-supportedsubsidy levels that are critical for closingfiscal gaps and sustaining the public safetynet healthcare delivery system.
SECTIONII
Key
Findings
Leading public safety nethealthcare delivery systemsovercome the challenge
of growing demand coupledwith insufficient resources,by continuously working toimprove the revenue theyearn, to reduce unnecessary,
non-value-added costs...
29
ACHIE
VIN
GTHE
VIS
ION:
HEALTHCARE
OPTIO
NS
FOR
LOS
AN
GELES
COUN
TY
Information Technology Findings
Leading public safety net healthcare deliverysystems make use of technology and theinformation it provides to fundamentallytransform the way they deliver care and runtheir operations. They develop systemwideIT strategies that are aligned with clinical,operational, and financial strategic plans.
Leading practices include:
• Utilizing standard, interoperable, broadlyadopted IT systems to link patients andclinicians and improve care coordinationbetween providers, including communityproviders, across the continuum of patient care.Health system investments in IT provide vital,readily accessible health information aboutpatients, stored in a single, central datawarehouse (See Case Study 10, page 47).
• Providing clinicians with IT to reference medicalknowledge and evidence-based protocols toinform clinical practice, and to support clinicaldecisions and processes, improving quality ofcare and reducing medical errors.
• Using IT to enable active promotion andmanagement of patient wellness andprevention, thereby reducing unnecessaryillnesses and costs.
• Developing and using robust, readily accessibledecision support and data analysis IT capabilitiesfor performance monitoring, risk management,and performance improvement initiatives.Unified systemwide metrics relate to clinicalquality, resource use, and financial impact andcan be aggregated or disaggregated at manylevels, including the business or clinical unit.
• Using technology at all levels – from the Boardof Directors and senior leaders, through front-line clinicians, managers, and staff – to sharerisk and performance information in a timely,transparent, and constructive manner. Thisdrives accountability at all levels of responsibility,
as well as agile course corrections. Individualsand teams across the enterprise take ownershipof solving performance problems at their rootcause, continuously driving performancemetrics to higher levels.
Governance and Management Findings
Leading public safety net healthcare deliverysystems apply visionary leadership. Theydemonstrate how their ability to function asautonomous, self-governed, and self-managedorganizations – separate from direct governmentoperation – is critical in their progress towardgreater efficiency, effectiveness, and highperformance. This characteristic of autonomydoes not usually mean complete independence:Under a variety of alternative structures, publicsystems remain accountable to, and subject tooversight by, an affiliated government that holdsreserve powers.
Leading health systems leverage the mutualcommitment, capabilities, resources, andbenefits of an interdependent partnershipbetween the care delivery system and affiliatedgovernment, with both entities focused onmeeting community health needs.
Relating to governance and management,leading practices include:
• Benefiting from ongoing high levels of supportfor their autonomy – evidenced by financialsupport beyond mandated levels – fromaffiliated government officials and electedleaders who enable the system to do what isbest for care delivery that meets communityhealth needs.
• Having a formative charter and annualoperating contract between a governanceboard and their affiliated governments toclarify mutual rights, authorities, fundingobligations, service level obligations, andaccountabilities. The charter and contracts
30
AREPORT
OF
THE
LOS
AN
GELES
HEALTHCARE
OPTIO
NS
TASK
FORCE
provide an effective framework to diffusepotential political pressures that may beinconsistent with a balanced healthcaredelivery strategy.
• Preparing a three-to-five-year strategic masterplan and annual budgets with affiliatedgovernment input and approval, enabling theautonomous care delivery system Board ofDirectors and management to effectivelyimplement strategies and make operationaldecisions without unconstructive interventions.
• Having a dynamic, hands-on CEO and atalented, cohesive leadership team that istrusted by the dedicated, engaged healthsystem board. Collectively, they promote aconsistent vision and strategy of a sustainablesafety net mission, a value-based culture,accountabilities for all personnel, and policesthat reinforce high performance behavior,
innovation, and continuous improvement,embraced throughout the organization.
The following profiles of the two healthcaresystems visited by the LA Healthcare OptionsTask Force include some background information,a financial profile, a summary of major recognitions,and selected leading practices. The selectedleading practices cited for each system areexamples and illustrations rather than an exhaustivelist of every leading practice at each system. Theinformation was obtained from our interviewswith senior leadership, the healthcare systemwebsites, annual community reports, financialreports, news releases, and other public sourcesas referenced. Appendix D contains profiles forfour additional public safety net healthcare systemsincluded in the leading practices analysis.
SECTIONII
Key
Findings
JACKSON HEALTH SYSTEM (Miami-Dade County, FL)
Established in 1918, Jackson Health System (JHS) is an integrated healthcare delivery system with more than11,000 employees that provides a single, high standard of medical care services to residents of Miami-Dade Countyregardless of their ability to pay. JHS is governed by the Public Health Trust of Miami-Dade County, Florida (theTrust). The Trust was created on October 1, 1973, by county ordinance to provide for an independent governingbody of volunteer citizens responsible for the operation, governance, and maintenance of designated facilitiescomprising the health system to assure that JHS is responsive to community needs. The Trust’s Board of Trusteesis appointed by the Miami-Dade County Commission. According to the September 30, 2007, audited financialstatements of Miami-Dade County, the Trust is considered part of the primary government of Miami-Dade County,and is presented as an enterprise fund, rather than a component unit, in the County’s financial statements. TheTrust is not considered to hold sufficient corporate powers of its own to be considered legally separate from theCounty for financial reporting purposes.
JHS includes 12 primary care centers and two primary care mobile vans; multiple school-based clinics servingmany elementary, middle, and high schools; two long-term care nursing facilities; six Corrections Health Servicesclinics; a network of mental health facilities; and Holtz Children’s Hospital, Jackson Rehabilitation Hospital, JacksonNorth Medical Center, Jackson South Community Hospital, and its flagship hospital, Jackson Memorial Hospital.With more than 1,550 licensed beds, Jackson Memorial Hospital is a referral center, a magnet for medical research,and home to Ryder Trauma Center – the only adult and pediatric Level 1 trauma center in Miami-Dade County.In conjunction with the University of Miami Miller School of Medicine faculty, Jackson Memorial Hospital providesa wide range of patient services, educational programs, a clinical setting for research activities, and a number of
Continued on next page.
31
ACHIE
VIN
GTHE
VIS
ION:
HEALTHCARE
OPTIO
NS
FOR
LOS
AN
GELES
COUN
TY
health-related community services. JHS also owns JMH Health Plan, an HMO serving over 105,000 commercialand Medicaid patients.
Financial ProfileIn its audited September 30, 2008, financial statements, the Public Health Trust reported total operating revenue of$1.4 billion, of which $1.2 billion was net patient service revenue. The Trust reported an operating loss of $426 millionand negative cash flows from operating activities of $344 million. Operating losses and negative cash flows wereoffset by $452 million and $440 million, respectively, of non-operating revenues and noncapital financing fundscontributed by federal, state, and miscellaneous sources. The non-operating revenues and noncapital financingare principally composed of funding from Miami-Dade County generated by ad valorem taxes to defray costs ofgeneral operations, additional assistance from the County, and a half-cent sales tax approved by county votersin 1992 to support the operations of the Trust.
For fiscal year 2008, the Trust reported an overall increase in net assets of $26 million and a net increase in cash andcash equivalents of $53 million. The estimated cost incurred to provide charitable services for 2008 was reportedat $531 million.
Major RecognitionsJackson Memorial Hospital has the distinction of being consistently listed among the top 50 of “America’s BestHospitals” by U.S. News & World Report, with more specialties ranked among the best in America than any otherhospital in South Florida for 2008.
Selected Leading Practices• Mission-Driven Culture and Transformational Leadership: A clearly expressed sentiment among the senior
leadership of JHS is the key role of a dynamic leader, in the position of CEO, with the autonomy and authorityto assemble a strong leadership team and transform the culture of the organization to focus on quality of careand cost-effectiveness. This mission-driven culture is described as pervasive at all levels, with emphasis oncontinuous process improvement to eliminate costs that do not benefit patients.
• Centers of Excellence (COEs): JHS’s strategy is characterized by the provision of advanced treatments andexcellent care, enabling it to attract patients regionally and internationally for its services. JHS is noted for itsCOEs in such areas as:— digestive disorders (more than half of the world’s reported multi-organ transplants have been performed there)— ear, nose, and throat (the Cochlear Implant Program is one of the most comprehensive and busiest programs
in the nation)— hormonal disorders (a recognized world leader in cure-focused diabetes research and a pioneer in islet cell
transplantation to treat diabetes)— kidney disease (home to a successful transplant program since 1977, where surgeons perform 150–200
transplants a year)— neurology and neurosurgery (a center of excellence in the neurosciences and a leader in the early treatment
of stroke, spine surgery, non-invasive Gamma Knife radiosurgery for brain tumors, minimally invasive
32
AREPORT
OF
THE
LOS
AN
GELES
HEALTHCARE
OPTIO
NS
TASK
FORCE
SECTIONII
Key
Findings
interventional neuroradiology treatments for intracranial aneurysms, and cerebrovascular disorders suchas aneurysm and stroke)
— ophthalmology (the University of Miami’s Bascom Palmer Eye Institute has consistently been named the topinstitution in the nation where a person could receive care and treatment for diseases of the eye)
— urology (The Batchelor Urology Diagnostic and Treatment Center treats a wide range of urologic disordersin men, women and children. Areas of expertise include prostate, bladder and kidney cancer as well asmale infertility and incontinence in females).
• Affiliation with Academic Medical Schools: Jackson Memorial Hospital provides the setting for the majorityof clinical research projects conducted. Among the most notable activities of the medical school at JacksonMemorial Hospital are those of the Sylvester Comprehensive Cancer Center and studies on cystic fibrosis,neonatology, diabetes, children’s kidney failure, transplantation, spinal cord regeneration, infant perceptionof temporal speech parameters, AIDS, hyperbaric therapy, microsurgery, clinical pharmacology, geriatrics,and Alzheimer’s disease. In addition, the medical school runs the largest tissue bank in the world.
• Adapting to Patient Needs: Jackson’s community outreach initiatives include two Jackson Care-A-Vans,staffed with bilingual and multicultural healthcare professionals and support staff. They bring high-quality,reliable, and comprehensive primary care services to adults and children in high-risk communities, includingscreenings, X-rays, pharmacy services, physicals, prescriptions, lab work, women’s health services, andprenatal care. They also provide eligibility screenings and enrollment on-site for such programs as Medicaidand KidCare. The vans are equipped with wireless laptops, email, and Internet access, and they travel toseven different locations in Miami-Dade County.
Additionally, to address an overcrowded emergency room, the ER was remodeled, expanded, and underwent aprocess-improvement redesign. This enables non-urgent patients to be moved out of the ER and into Jackson’sambulatory clinics and primary care centers for same-day appointments. The use of dedicated “bed coordinators”and the addition of a discharge lounge have enhanced patient flow out of the ER and decreased overcrowding.• Innovative Primary Care: To build a healthier community, JHS embarked on an innovative Primary Care Initiative
to solve health problems by providing quality healthcare, education, and disease prevention. By linking primarycare with disease management, school-based healthcare, and outreach, program staff members are improvingthe health of the community, with an added focus on recent immigrants and underserved areas.
• Patient Safety Focus: Patient safety rounds are scheduled weekly, allowing Jackson executive leaders andsupport staff to meet with those working on the hospital floors to better understand patient safety concerns.Once these safety issues are identified, a plan of action is quickly put into place to resolve them. A patient safetyprogram also has been developed for all of Jackson’s nursing units to study the causes of unsafe practices andput practical improvements in place to prevent medical errors. Through the use of Failure-Mode-Event-Analysis,a method of analysis adopted from the aviation industry, hospital staff now are better equipped to uncoverpotential quality and patient safety failure points, so they can prevent safety problems before they occur.
Sources:Miami Dade County Financial Statements. 2007. Available at: http://www.miamidade.gov/finance/finan07.aspMiami-Dade County, Florida Comprehensive Annual Financial Report for the Fiscal Year Ended September 30, 2007.Jackson Health System. A Report to the Community 2005-2006. Available at: http://www.jhsmiami.org/workfiles/pdfs/JHS_Report_to_Community.pdfJackson Health System website: http://www.jhsmiami.org/
33
ACHIE
VIN
GTHE
VIS
ION:
HEALTHCARE
OPTIO
NS
FOR
LOS
AN
GELES
COUN
TY
NEW YORK CITY HEALTH AND HOSPITALS CORPORATION (New York City, NY)
New York City Health and Hospitals Corporation (HHC) is the largest municipal public safety net healthcaredelivery system in the country, serving more than 1.3 million patients annually with a workforce of 39,000physicians, nurses, and other healthcare professionals. HHC was established in 1970 as a public benefitorganization by the New York State Legislature and is governed by a Board of Directors appointed by the Mayorof New York City (the City). According to the June 30, 2008, Comprehensive Annual Financial Report of the City,HHC is considered legally separate from the primary government of the City. The reason HHC is a discretelypresented component unit in the City financial statements is because the City either appoints HHC’s Board,is able to impose its will on HHC, or a financial benefit/burden situation exists.
HHC serves a diverse patient mix, including the uninsured and immigrant population, and provides care regardlessof ability to pay. HHC is composed of 11 acute care hospitals, four skilled nursing facilities, six large diagnostic andtreatment centers, and more than 80 community-based clinics. HHC also owns MetroPlus HMO and operates acertified home healthcare agency. MetroPlus insures more than 340,000 people and is consistently ranked amongthe highest-scoring New York City Medicaid managed care plans for quality and customer service.
Financial ProfileWithin its audited June 30, 2008, financial statements, HHC reported total operating revenue of $5.9 billion, of which$4.9 billion was net patient service revenue and $0.8 billion was premium revenue generated from its health plan.HHC reported an operating loss of $336 million and positive cash flows from operating activities of $66 million.HHC’s estimated expense incurred to provide charity care were reported at $487 million.
During 2008, HHC’s reported cash flow from operations included $248 million in cash appropriations from the Cityof New York and $338 million in HHC remittances to the City. The remittances to the City were principally forreimbursement of general liability settlements paid by the City on HHC’s behalf and for debt service on debt theCity incurred to fund HHC capital acquisitions. Also in 2008, HHC reported $152 million in capital contributions bythe City to fund major modernization and reconstruction projects.
Major RecognitionsHHC is consistently recognized by leading organizations for its quality and safety initiatives. In 2008, theCommonwealth Fund Commission on a High Performance Health System published a case study that recognizedand described the innovations and high performance of the system. In 2006, HHC achieved five of the top tenCenters for Medicare and Medicaid Services (CMS) rankings in all of New York City in each of three keycategories – treatment of pneumonia, heart attack, and heart failure. HHC has received numerous awards,including the 2008 John M. Eisenberg Award from the National Quality Forum and The Joint Commission forPatient Safety and Quality. HHC was also recognized for the North Bronx Health Network in 2008, receiving theHANYS (Hospital Association of New York State) Pinnacle Award for Quality Improvement and Patient Safety.HHC’s Sea View Hospital Rehabilitation Center and Home earned the 2007 Ernest Amory Codman Award fromThe Joint Commission for excellence in its use of outcomes measures to achieve improvements in the quality andsafety of healthcare. HHC’s Generations Plus Northern Manhattan Health and Network Queens Health Network
34
AREPORT
OF
THE
LOS
AN
GELES
HEALTHCARE
OPTIO
NS
TASK
FORCE
SECTIONII
Key
Findings
both earned the Nicholas E. Davies Award from the Healthcare Information and Management Systems Society forexcellence in their use of electronic health records to improve healthcare delivery. HHC’s North Bronx HealthcareNetwork garnered the Most Wired Award in 2005 for the fourth consecutive year for the effective use of IT in theareas of safety, quality, customer service, business processes, and workforce training.
Political support and passion for its mission have been critical to the HHC’s success. As noted in HHC’s 2007 annualreport to the community, Mayor Michael Bloomberg has provided unwavering support of the health system’s coremission. HHC’s President, Alan D. Aviles, noted: “HHC is transforming, changing to meet the complexity andbreadth of our patients’ needs and incorporating new technologies and treatment modalities that are dynamicallyaltering the way healthcare is delivered. In many ways, HHC’s hospitals and clinics are advancing at such a rapidpace that they are literally redefining public healthcare in New York City. Now, that is interesting.”
Selected Leading Practices• Mission-Driven Culture: Even under economic uncertainty, HHC holds steadfast in its core mission of affording
broad access without regard to patients’ ability to pay or immigrant status. Increasing access, making capitalinvestments, improving IT, enhancing quality and patient safety, and reducing health disparities are all criticalinitiatives undertaken by HHC.
• Centers of Excellence: COEs at HHC offer city residents some of the best specialty care in New York City.For example, patients have access to 6 regional trauma centers, 11 designated AIDS centers, 2 burn centers,2 regional perinatal centers, 11 Sexual Assault SAFE Centers, 9 stroke centers, 4 sickle cell anemia care centers,2 Parkinson’s disease care centers, and a World Trade Center Environmental Health Center with three locations.
• Information Technology: To drive clinical performance improvements while facing financial challenges, HHCidentified several outdated information systems for replacement. HHC announced a rollout of a systemwideimplementation over the next several years of new information systems. For example, the organization isimplementing a new financial system that will ensure optimizing the collection of revenue due from third-partypayers for all services provided to patients. Enhancements to the electronic medical record system will allowproviders to more readily access a patient’s clinical data from anywhere within the hospital system whileoffering much more robust functionality that will permit efficient documentation. Additionally, it will guideand support more comprehensive and consistent evidence-based care.
• Centered on Patient Needs: HHC focuses efforts on customer service to increase competitiveness throughpatient satisfaction. HHC’s Options Program aims to make healthcare affordable for very low-income NewYorkers. HHC eliminated all outpatient fees for pregnant women and children of families with incomes below250 percent of the federal poverty level. For patients at the lowest income levels, HHC reduced prescriptiondrug fees to $2 per prescription to further lower barriers to medication compliance. Additionally, marketingmaterials have been translated into 12 languages to increase access and to remain culturally competent.
• Population Health Management/Disease Management: HHC developed and implemented leading practices tohelp its patients manage their chronic disease more effectively, with an emphasis on asthma, diabetes,congestive heart failure, and depression. HHC has funded dedicated chronic disease coordinator positionsin every network and has deployed clinical IT solutions, including electronic chronic disease registries, tohelp support this work.
• Minimizing Costs: HHC is leveraging the size and breadth of the health system to reduce cost. For example, itinstalled an e-commerce system that helps track procurement of goods and supplies. It has also centralizedcontracts to ensure that its vast purchasing volume is optimized to obtain the lowest possible price.
Sources:Finance and Budget Reports. New York City. Available at: http://www.nyc.gov/html/records/html/govpub/finan1.shtmlComprehensive Annual Financial Report of the Comptroller of the City of New York for the Fiscal Year Ended June 30, 2008.New York City Health and Hospitals Corporation website: http://www.nyc.gov/html/hhc/html/home/home.shtmlNew York City Health and Hospitals Corporation. 2007 Year in Review.
Available at: http://www.nyc.gov/html/hhc/downloads/pdf/hhc-local-auth-ann-rpt-2008.pdfRedefining HHC, 2007 Annual Report. New York City Health and Hospitals Corporation.
Available at: http://www.nyc.gov/html/hhc/downloads/pdf/hhc-community-report.pdfNew York City Health and Hospitals Corporation – SWOT Analysis. Global Markets Direct Company Profiles. January 2009.
35
ACHIE
VIN
GTHE
VIS
ION:
HE
AL
TH
CA
RE
OP
TIO
NS
FO
RL
OS
AN
GE
LE
SC
OU
NT
Y
In a healthcare system with transparency as acore value, processes are designed to improveclinical quality and patient safety at all levels ofthe organization. Hospitals and health systems(both public and private) incorporate multipledepartments, committees, and specific positionsdedicated to addressing these concerns. Chiefmedical officers, clinical quality officers, chiefcompliance officers, and utilization review boardsare among those with oversight responsibilitiesregarding quality of care and patient safety.
Increased performance transparency enabledby the Internet (e.g., WebMD, The LeapfrogGroup for Patient Safety, and HealthGrades),more educated consumers, and the influx ofconsumer-directed health plans has broughtpublic attention to quality-control metrics thatwere previously unavailable. There is a largemovement for healthcare systems to embracetransparency and to be held accountable forthe quality of care provided. Well-publicizedconcerns on quality and safety include:
• Medical errors cost about $38 billion annuallyand result in 100,000 deaths each year.
• If medical errors were combined into a singlestatistical cause of death, it would be the sixth
leading cause of death in the United States(based on 2006 data).
• Medicare will no longer reimburse hospitals forinfections, complications, and incidents that theCenters for Medicare and Medicaid Services(CMS) has deemed preventable “never events.”
• The reputational damage due to poor quality andhighly visible “never events” are potentiallydisastrous for healthcare providers.
According to the National Quality Forum, “neverevents” are errors in medical care that are clearlyidentifiable, preventable, and serious in theirconsequences for patients and that indicate areal problem in the safety and credibility of ahealth care facility.
Many leading hospitals are able to demonstratehigh-quality process and outcomes measures topromote their clinical excellence to consumersand payers. Health system commitment to highclinical quality and patient safety requires regularsystematic and independent evaluations of theirclinical, operational, and management processesand outcomes.
What does it mean to “embrace transparency?”
Case Studies1
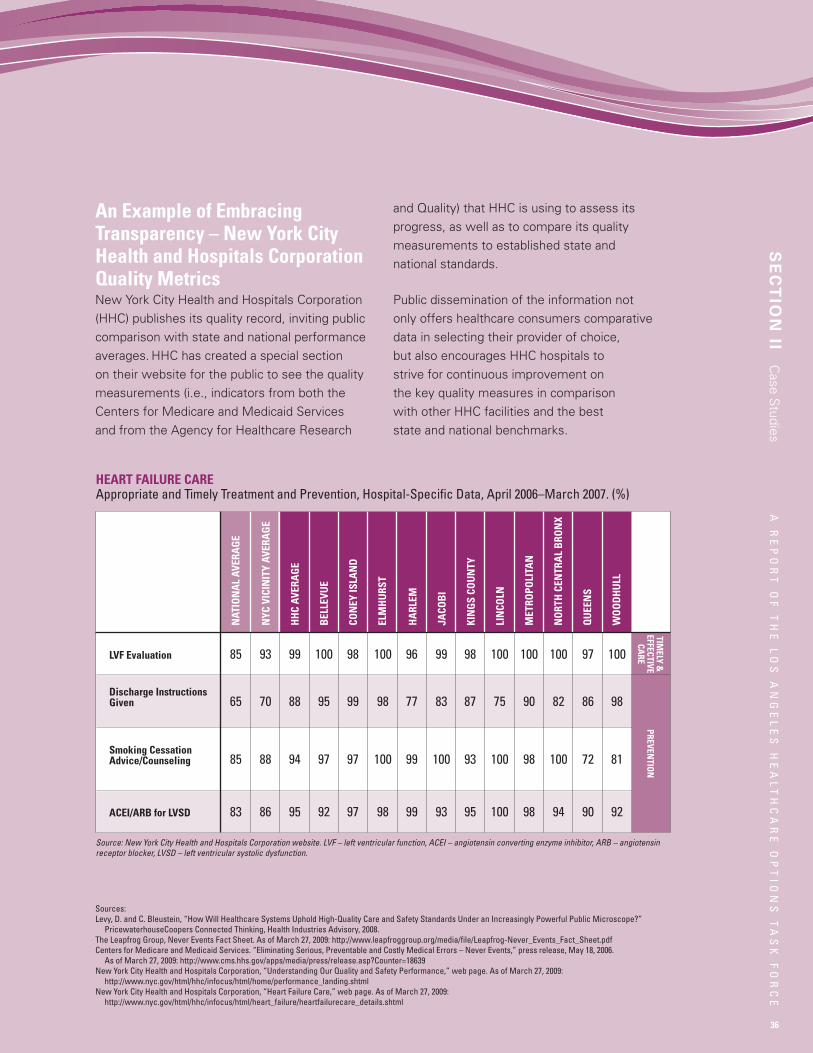
LVF Evaluation
Discharge InstructionsGiven
Smoking CessationAdvice/Counseling
ACEI/ARB for LVSD
Source: New York City Health and Hospitals Corporation website. LVF – left ventricular function, ACEI – angiotensin converting enzyme inhibitor, ARB – angiotensinreceptor blocker, LVSD – left ventricular systolic dysfunction.
HHCAV
ERAGE
BELLEVU
E
CONEY
ISLAND
ELMHURST
HARLEM
JACO
BI
KINGSCO
UNTY
LINCO
LN
METRO
POLITAN
NORTHCENTRALBRO
NX
WOODHULL
HEART FAILURE CAREAppropriate and Timely Treatment and Prevention, Hospital-Specific Data, April 2006–March 2007. (%)
36
AR
EP
OR
TO
FT
HE
LO
SA
NG
EL
ES
HE
AL
TH
CA
RE
OP
TIO
NS
TA
SK
FO
RC
E
An Example of EmbracingTransparency – New York CityHealth and Hospitals CorporationQuality MetricsNew York City Health and Hospitals Corporation(HHC) publishes its quality record, inviting publiccomparison with state and national performanceaverages.HHC has created a special sectionon their website for the public to see the qualitymeasurements (i.e., indicators from both theCenters for Medicare and Medicaid Servicesand from the Agency for Healthcare Research
and Quality) that HHC is using to assess itsprogress, as well as to compare its qualitymeasurements to established state andnational standards.
Public dissemination of the information notonly offers healthcare consumers comparativedata in selecting their provider of choice,but also encourages HHC hospitals tostrive for continuous improvement onthe key quality measures in comparisonwith other HHC facilities and the beststate and national benchmarks.
SECTIONII
Case
Studies
Sources:Levy, D. and C. Bleustein, “How Will Healthcare Systems Uphold High-Quality Care and Safety Standards Under an Increasingly Powerful Public Microscope?”
PricewaterhouseCoopers Connected Thinking, Health Industries Advisory, 2008.The Leapfrog Group, Never Events Fact Sheet. As of March 27, 2009: http://www.leapfroggroup.org/media/file/Leapfrog-Never_Events_Fact_Sheet.pdfCenters for Medicare and Medicaid Services. “Eliminating Serious, Preventable and Costly Medical Errors – Never Events,” press release, May 18, 2006.
As of March 27, 2009: http://www.cms.hhs.gov/apps/media/press/release.asp?Counter=18639New York City Health and Hospitals Corporation, “Understanding Our Quality and Safety Performance,” web page. As of March 27, 2009:
http://www.nyc.gov/html/hhc/infocus/html/home/performance_landing.shtmlNew York City Health and Hospitals Corporation, “Heart Failure Care,” web page. As of March 27, 2009:
http://www.nyc.gov/html/hhc/infocus/html/heart_failure/heartfailurecare_details.shtml
85 93 99 100 98 100 96 99 98 100 100 100 97 100
65 70 88 95 99 98 77 83 87 75 90 82 86 98
85 88 94 97 97 100 99 100 93 100 98 100 72 81
83 86 95 92 97 98 99 93 95 100 98 94 90 92
NATIONALAV
ERAGE
NYC
VICINITYAV
ERAGE
TIMELY
&EFFECTIVECA
REPREVEN
TION
QUEENS
37
ACHIE
VIN
GTHE
VIS
ION:
HE
AL
TH
CA
RE
OP
TIO
NS
FO
RL
OS
AN
GE
LE
SC
OU
NT
Y
Open access scheduling is a system that allowspatients to schedule an appointment with theirphysician when they want or need to be seen.It redesigns patient access and the schedulingprocess to allow patients to schedule same-dayappointments (or as close to same-day aspossible), regardless of the nature of thepatient’s reason for seeking care.
The concept of same-day appointments has beena reality among medical group practices for almosta decade. For example, Healthcare PartnersMedical Group, a Los Angeles–area practicewith more than 500 primary care and specialtyphysicians in more than 40 medical offices,initiated open access as part of a completeoverhaul of its practice protocols in early 2000.Healthcare Partners Medical Group providescare to over 550,000 members.
The medical group has pioneered such innovationsas Premier Appointments, which ensures thatpatients can schedule same-day appointmentswith their doctors as needed during the clinic’sregular business hours; automatic referralauthorizations for most common specialtyservices; new patient orientations; and CareTeams for primary care patients.
“We started by re-designing our clinical flow withthe care team process and then we proceededto open access,” said Francis L. Yemofio, FACP.
Step one was assigning caregivers – two orthree physicians, each with two medicalassistants – to a “care team” and reconfiguringspace so that team members worked closelytogether. That allows patients to becomeacquainted with other members of theirphysician’s care team, and for the caregiversto share work as the need arises.
Healthcare Partners Medical Group is not uniquein offering same-day access to primary carephysicians. Many other California medical groups,including Kaiser Permanente Medical Group,Buenaventura Medical Group, Sharp MissionPark, Bristol Park Medical Group, and Palo AltoMedical Foundation, have also implementedthis approach or other similar models.
In addition to patient satisfaction, the benefitsthey have achieved include the following:
• Improved clinical outcomes becausecontinuity of care is increased as morepatients see their regular physician of choice.
• Decline in urgent care or ER visits.• Decline in office phone volume.• Reduced patient no-show rates.• Greater adherence to preventivecare guidelines.
• Reduction in visits per patient, but increase inrevenue per patient for fee-for-service patients.
• More manageable office practice, with greaterphysician and staff satisfaction.
• Increased capacity for new patients.
Open Access to Healthcare Appointments
Sources:Butcher, Lola, “More Doctors Tell Patients, ‘We’ll See You Today,’” ACP Observer (American College of Physicians), November 2006.Lang, Lance, and Laura Jacobs. “Improving Patient Access: Health Plans and Physician Groups Unite!” CAPG Update. Vol. 5, No. 4, April 2003, p. 3.Witt, Mary J. “Advanced Access Works! Improved Patient Satisfaction, Access, P4P Scores.” The Camden Group, 2006.
Open access scheduling isa system that allows
patients to schedule anappointment with their
physician when they wantor need to be seen.
2
38
AR
EP
OR
TO
FT
HE
LO
SA
NG
EL
ES
HE
AL
TH
CA
RE
OP
TIO
NS
TA
SK
FO
RC
E
In order to meet the growing needs of themedically indigent, including those in SouthLos Angeles, more collaboration between thepublic and private sectors will be essential.One opportunity for public-private partnershipexists in the area of health care interpreterservices. Because of the diversity of languagesspoken by LA County residents, a greaternumber of qualified professional health careinterpreters is needed to provide linguisticallyand culturally appropriate health care assistance.
A program that could be adopted in South LA, andelsewhere in LA County, is Kaiser Permanente’sHealth Care Interpreter Certificate Program(HCICP). This program was a recipient ofthe 2006 Award for Innovative Practices inMulticultural Health Care from the NationalCommittee for Quality Assurance (NCQA).As a training program, it could provide bothemployment opportunities and improvedaccess and quality of care.
In 1995, Kaiser Permanente performed anational environmental scan of existinginterpreter programs and found the following:
• No private or public accreditation programexisted for professional healthcare interpretation.
• Interpreters provided by external agenciesoften lacked sufficient training anddemonstrated an inconsistent qualityin their interpretation.
Recognizing the lack of formally trained HealthCare Interpreters and related training programsand certification standards, Kaiser Permanentedesigned a model Health Care Interpretationcurriculum in 1996. Kaiser then collaborated with
the City College of San Francisco (CCSF) to offerthe curriculum as a formal HCICP, making CCSFthe first educational institution in the WesternUnited States to offer Health Care Interpretertraining at the college level.
The model Health Care Interpreter curriculumhas now been disseminated across the countrythrough collaboration with Hablamos Juntos, aproject of the Robert Wood Johnson Foundation.This innovative and cost-effective model hasshown that partnerships between cross-sectorhealth care organizations and accreditedacademic institutions are not only sustainable,but mutually beneficial. The collaborative effortshelp promote a renewable balance of supplyand demand. Kaiser Permanente continues todevelop the core content materials and supportsnew and existing HCICP partnerships acrossthe country. So far, over 100 faculties havereceived the training nationwide. Over 1,000graduates can provide interpreter services inmore than 10 different languages, including
SECTIONII
Case
Studies
Public-Private Partnership Opportunity:A Health Care Interpreter Training Program
Recognizing the lack offormally trained Health
Care Interpreters andrelated training programs
and certification standards,Kaiser Permanentedesigned a model Health
Care Interpretationcurriculum in 1996.
3
39
ACHIE
VIN
GTHE
VIS
ION:
HE
AL
TH
CA
RE
OP
TIO
NS
FO
RL
OS
AN
GE
LE
SC
OU
NT
Y
Arabic, Cantonese, Farsi, Japanese, Khmer,Korean, Laotian, Mandarin, Portuguese,Russian, Spanish, Tagalog, and Vietnamese.
Key program resources necessary forsuccess include:
• Personnel: Coordinators/instructors fromeach partnering academic and health careinstitution, language lab coaches, andvolunteer lecturers, such as physiciansand nurses.
• Financial: Kaiser Permanente pays forthe initial instructor training and providesclass materials and space. Grants or othersources of funding help support trainingand education programs.
• Training: The Health Care InterpreterInstructor Training Institute trains facultyat partnering academic institutions andimproves skills of existing faculty.
• Support: Continuous technical supportis provided to academic institutions andpartner healthcare institutions.
“Kaiser Permanente has created a modelfor plans nationwide to follow on how tobridge language and cultural gaps that soeasily get in the way of quality health care,”said NCQA President Margaret E. O’Kane,and provides “innovative solutions that tacklethe very real issue of health care disparitiesamong racial and ethnic minorities.”
Sources:NCQA, Innovative Practices in Multicultural Health Care 2006. As of March 27, 2009: http://www.ncqa.org/Portals/0/HEDISQM/CLAS/CLAS_InnovativePrac06.pdfThe Robert Wood Johnson Foundation, The National Health Plan Collaborative Toolkit. As of March 27, 2009: http://www.rwjf.org/qualityequality/product.jsp?id=34036
When the California HealthCare Foundation (CHCF)issued its first report on the topic “Health Carein the Express Lane: The Emergence of RetailClinics,” in the summer of 2006, there were justover 100 clinics across the country. In February of2009, most estimates show about 1,200 activesites. This three-year period has seen not only asignificant growth in sites, but the entrance ofmajor players in the retail sector – CVS, WalMart,Walgreens – and significant experimentationwith geographic locations, clinic design, andservice models.
There is significant debate regarding the meritsand detriments of the retail clinic model,and quantitative measures of the impactof the clinics are just beginning to emerge.Nevertheless, some interesting lessonshave become evident in the past few years.
Background
Who Uses Retail Clinics?The “typical” consumer (70 percent of visits) isa generation X woman (age 29–43) with children.Those without health coverage also comprise alarge proportion (up to 20 percent) of patients.
What are Retail Clinics Used For?The vast majority (75–90 percent) of visits arefor seven common conditions – sinusitis, upperrespiratory infection, pharyngitis, otitis media,bronchitis, urinary tract infection, and immunization.In the overall health care system, these conditionsaccount for 17 percent of primary care providervisits and 15–30 percent of ER visits. Clinicoperators consistently state that patients come tothe clinic with appropriate conditions about 96–97percent of the time (i.e. they’re not visitingclinics when they should be visiting ERs).
Innovative Care Delivery Models: Retail Clinics4
AR
EP
OR
TO
FT
HE
LO
SA
NG
EL
ES
HE
AL
TH
CA
RE
OP
TIO
NS
TA
SK
FO
RC
ESECTIONII
Case
Studies
What is the typical layoutand staffing model?Layout and staffing vary significantly, but MinuteClinic, which has almost half of the sites in theUnited States, operates clinics with 100–200square foot offices staffed with nurse practitionersoverseen by offsite physicians. WalMart clinicsare staffed by health care system partners.QuickHealth (Northern CA) uses a physicianmodel and targets uninsured consumers.
Lessons Learned from Retail Clinics
That May Be Applied in the Healthcare
Safety Net
1.Retail clinics won’t solve big health caresystems’ problems of quality and cost,
but they demonstrate some value in
“letting the simple things be simple.”
Common conditions may be able to bediagnosed and treated in this setting, ata lower cost to patients and the system.
2.Health care consumers do exhibit someconsistent preferences and behaviors.
Consumers/patients want to see a health careprovider at a time and place that works for them,and they want to know what the cost (in timeand money) of the visit will be. Polls on retailclinics have consistently shown satisfactionwith the model, willingness to return to clinics,and willingness to refer friends and family.Patients’ reasons for utilizing the clinics arethat they either don’t have a regular provideror can’t get an appointment with him/herwhen they need one; that the locations areconvenient (including parking); and that thecost of the retail clinic services is transparent.
3.Consumers have responded positivelyin surveys to nurse practitioners as
providers in the retail clinic setting.
4.Efficiencies can be created by limiting thescope of service and applying evidence-based
algorithms to minor, acute conditions.
The central tenet behind retail clinics is theirlimited scope of service. By limiting scope ofservice to simple routine acute care, theseclinics are able to streamline operations,improve the customer experience, reducecosts, and maintain quality (through theuse of technology and strict adherence toevidence-based care for minor conditions).Retail clinics are not trying to serve all patientsin the same way with the same level of care.
5.While many were initially quite resistantto the concept, many health care systems
are now testing the retail or “express”
clinic model as a way to extend their
customer offerings and to avoid
unnecessary ER visits.
How Can Community Health Centers
and Other Safety Net Providers Evaluate
and/or Incorporate Elements of the
Retail Clinic Model?
• Operate a retail clinic – in a retail location orwithin their facilities.
• Create a more involved partnership thatincludes an equity involvement.
• Create a simple partnership with a clinic toprovide physician oversight and/or branding
• Watch, learn and adapt existing operations.
CHCF and Scott & Company have producedthe Retail Clinic Toolkit for Safety Net Providers,which includes several tools for evaluatingor adapting retail clinic concepts to the safetynet setting. CHCF would like to work with oneor more safety net systems to pilot the use ofthe toolkit.
Sources:Margaret Laws, M.P.P., and Mary Kate Scott, “The Emergence of Retail-Based Clinics in the United States: Early Observations,” Health Affairs, Vol. 27, No. 5, 2008, 1293–1298.James C. Robinson, Ph.D., M.P.H., and Mark D. Smith, M.D., M.B.A., “Cost-Reducing Innovation in Health Care,” Health Affairs. Vol. 27, No. 5, 2008, 1353–1356.Contribution from Margaret Laws, Director of the Innovations for the Underserved Program of the California HealthCare Foundation.
40
41
ACHIE
VIN
GTHE
VIS
ION:
HE
AL
TH
CA
RE
OP
TIO
NS
FO
RL
OS
AN
GE
LE
SC
OU
NT
Y
Telemedicine and telehealth programs havebeen active in California for more than adecade. According to Dr. Thomas Nesbitt of theUniversity of California–Davis Medical Center,a nationally renowned expert on telehealthand steadfast California telehealth pioneer,
One might imagine such successes wouldhave led to broad adoption of telehealth.Yet, in more than 15 years of working toeliminate disparities in care, I have oftenbeen frustrated that so few patientshave been able to access care in thisway. Telehealth works best, not as a“demonstration” project grafted ontoa broken health care system, but whenit is accepted as a way to leverage newtechnologies to create new models of carethat were formerly impossible. At long last,the prospects in California are improving.Recent investments in telecommunicationsinfrastructure by the Federal CommunicationsCommission, the California EmergingTechnology Fund, California Public UtilitiesCommission, and the State of California,through Proposition 1D bonds, are allpotential “game changers.” I believe the timehas finally come for telehealth to thrive.
Background – A Few Basic Facts
What Is Telehealth?Telehealth is the use of technology andprocesses to electronically connect patients inremote or underserved areas with health careproviders and educators, overcoming barriersof time and distance and delivering healthservices and education in places that lackthose resources. It can be as simple as aremote provider discussing a case over thephone with a specialist, or as sophisticated
as a patient having a virtual appointmentwith a distant provider via videoconferencing.Telehealth is an expansion of telemedicine.Whereas telemedicine is narrowly focusedon diagnosis and direct treatment of illnesses,telehealth encompasses a broad definitionof remote health care services enabled bytelecommunication technology, includingeducation, diagnosis, treatment, assessment,and monitoring.
What Are Some Prominent Uses?Telehealth excels at services for which aremote provider can review an image and offerfeedback – for example, radiology, dermatology,and diabetic retinopathy. A provider sendsan image to a consultant or specialist in astructured format and the consultant can viewthe image at any time and provide feedbackto the sending provider. This method, knownas “store and forward,” removes someof the challenges associated with havingboth providers available at the same time.Specialties such as behavioral health andpsychiatry – in which the intervention involvesverbal communication and a visual examinationof the patient – are also successful. A patientin a remote location can meet via video witha provider, and the provider can observe thepatient visually and provide therapy.
These real-life examples illustrate the promiseof telehealth:
• Live from the ER, a rural provider consultswith a neurologist at an urban medical centeras he treats a patient with acute head trauma.The neurologist can see what is happeningvia videoconferencing and advises theprovider in real time.
Telemedicine and Telehealth5
42
AR
EP
OR
TO
FT
HE
LO
SA
NG
EL
ES
HE
AL
TH
CA
RE
OP
TIO
NS
TA
SK
FO
RC
E
• A remote provider keeps up on best practicesand the latest advances in care through virtualattendance at grand rounds at a world-classmedical center.
• A patient in an urban clinic has a persistentrash. Her primary care provider takes a pictureand sends the image to a dermatologist via a“store and forward” system. The dermatologistreads the patient notes, views the image, andprovides interpretation and treatment adviceto the primary care provider. The patient istreated in a week instead of waiting monthsfor an appointment with a dermatologist.
• A rural practitioner in Humboldt downloadsdiabetes educational materials in Spanishfrom the University of California MedicalCenter in Los Angeles to give to herSpanish-speaking patient.
What are the Benefits?Patients: Telehealth technologies can helppatients in underserved areas get accessto medical resources around the state.People who need access to specialtycare currently unavailable in their owncommunities can receive it without thecost and inconvenience of traveling.
Remote providers: Remote providers gainaccess to the consultative services of providersat other locations around the state, as wellas educational opportunities and “knowledgenetworks” to improve their ability to managepatient care.
All Californians: All Californians benefit fromthe reduction in travel (fuel consumption andpollution) associated with the use of telehealthtechnologies. Telehealth technologies offerthe opportunity to help make health caremore environmentally friendly.
Lessons Learned About
Telehealth Programs
It has been demonstrated that telehealthtechnology works and that patients andproviders have high levels of satisfactionwith telehealth. However, there has not beensufficient evaluation and business modeldevelopment for programs to be sustained.
One of the major areas of promise fortelehealth is connecting primary care providerswith (scarce) specialist resources. The dearthof specialists willing to accept safety netpatients, and our poor ability to match thelimited supply with the demand, is one ofthe persistent challenges of launching andsustaining telehealth programs.
The use of traditional “paper” businessprocesses and workflow with telehealthtechnologies does not leverage thetechnology, and changes in process andworkflow are difficult for (and often not corecompetencies of) many primary care providers.
Reimbursement, billing, and coding fortelehealth are not well understood by theprovider community or payer organizations(public or private).
For examples of Telehealth Programs in California and linksto resources, statistics and more in-depth information, seenext page.
SECTIONII
Case
Studies
A patient in a remote locationcan meet via video with a
provider, and the providercan observe the patient
visually and provide therapy.
43
ACHIE
VIN
GTHE
VIS
ION:
HE
AL
TH
CA
RE
OP
TIO
NS
FO
RL
OS
AN
GE
LE
SC
OU
NT
Y
Sources:California HealthCare Foundation, Delivering Care Anytime, Anywhere: Telehealth Alters the Medical Ecosystem. November 2008. As of March 27, 2009:
http://www.chcf.org/documents/policy/TelehealthAltersMedicalEcosystem.pdfContribution from Margaret Laws, Director of the Innovations for the Underserved Program of the California HealthCare Foundation.
A FEW EXAMPLES OF ACTIVE TELEHEALTH PROGRAMS IN CALIFORNIA:• The Southside Coalition of Clinics in LA has recently launched a tele-dermatology program:
http://lahealthaction.org/index.php/directory/detail/1022• The Open Door Health Network runs a “Telehealth and Visiting Specialists Center”:
http://www.opendoorhealth.com/tvsc-opening.php• Kings View Behavioral Health Telepsychiatry: http://www.kingsview.org/Default.aspx?tabid=38• The Northern Sierra Health Network:
http://www.nsrhn.org/index.php?option=com_content&task=view&id=33&Itemid=41• Children’s Hospital LA Tele-Dentistry Program:
http://www.childrenshospitalla.org/site/c.ipINKTOAJsG/b.3838323/
LINKS TO RESOURCES, STATISTICS, AND MORE IN-DEPTH INFORMATION:American Telemedicine Association: http://www.americantelemed.org/i4a/pages/index.cfm?pageid=1California Center for Connected Health: http://www.chcf.org/topics/view.cfm?itemID=133805California Telemedicine and eHealth Center: http://www.cteconline.org/California Telehealth Network: http://www.caltelehealth.org/Partners Center for Connected Health: http://www.connected-health.org/
The Institute for Healthcare Improvement (IHI) isan independent, not-for-profit organization with amission to globally accelerate improvement ofhealthcare by fostering promising concepts forimproving patient care and turning ideas intoaction. IHI’s focus is on the Institute of Medicine’ssix improvement aims for the healthcare system:Safety, Effectiveness, Patient-Centered,Timeliness, Efficiency, and Equity.
IHI organizes various programs for healthsystems, hospitals, and professionals,which include but are not limited to:
• the Improvement Map to help hospitalsunderstand numerous regulatory requirementsand focus on high-leverage changes totransform care.
• campaigns such as the 5 Million LivesCampaign, a national initiative to protect
patients from 5 million incidents of medicalharm (e.g., hospital-acquired infections) inU.S. hospitals for a two-year period.
• conferences and seminars for professionalsto learn and engage in conversations onimprovement ideas.
• IMPACT, a membership network for healthcareorganizations to come together in collaborativelearning sessions to improve results in clinicaloutcomes, patient and provider satisfaction,and financial performance.
• professional development through trainingprograms designed to help professionalsdevelop and improve skills to leadimprovement initiatives and to build theirorganization’s overall capacity to change.
Leading healthcare systems committed tocontinuously improving patient care quality, likethe New York Health and Hospitals Corporation,
Institute for Healthcare Improvement6
44
AR
EP
OR
TO
FT
HE
LO
SA
NG
EL
ES
HE
AL
TH
CA
RE
OP
TIO
NS
TA
SK
FO
RC
ESECTIONII
Case
Studies
take part in IHI activities. Senior HHC leadersregularly participate in IHI professionaldevelopment programs.
IHI continuously seeks to identify organizationsthat are measuring their improvements andobtaining results. The Institute’s aim is to close
the gap between the vision of ideal care andinadequate/unsatisfactory care. IHI disseminatesthis information through various programs andits website, so that healthcare organizations canlearn and build upon successful practices.
Successful long-term care of patients withchronic health conditions requires the skills ofa multidisciplinary team of health professionals.In addition to primary healthcare providers,support from other professionals, such asspecialist physicians, nurse practitioners,nurses, dietitians, social workers, pharmacists,psychologists, and other providers, is criticalto ensuring that patients receive appropriate,high-quality services, including education forself-care. Such common conditions as diabetes,asthma, and cardiovascular disease could bebetter managed by integrated specialty clinics.
Patients in underserved communities suchas South Los Angeles often lack necessaryresources to seek, obtain, and coordinatecomplex care, such as time off from work,transportation, or insurance. The followingcase study describes a specialty diabetesmanagement program within LACDHS thatis achieving better health outcomes formedically indigent individuals.
LACDHS Specialty Diabetes Clinics
An existing program within LACDHS is alreadyrealizing the vision of patient-centered, effective,gold- standard diabetes management in low-income areas. Specialty diabetes clinics at the
Edward Roybal Comprehensive Health Centerin East Los Angeles and the Hubert HumphreyComprehensive Health Center in South LosAngeles, two communities with the highestrates of diabetes in the county, are run byinterdisciplinary teams of nurse practitioners,doctors, pharmacists, social workers, andcommunity educators to educate and supportdiabetic patients. Most of the patients areuninsured or on Medi-Cal.
The treatment team members make phone calls,hold classes, and help patients change their diets,prescriptions, or medication doses. They evenvisit patients’ homes to keep treatment on track.Community members who speak the samelanguage and share the same culture, and whohave successfully controlled their diabetes, arerecruited to teach classes and help coordinatecare for newcomers to diabetes management.The model allows specialist physicians, suchas endocrinologists, to become consultants tocommunity-savvy teams led by nurse practitionerswho have more opportunities to provide moreconsistent and frequent medical services andlifestyle education.
To participate, patients in the county program signan agreement that they will keep appointmentsand follow medical instructions. If they fail to
Integrated Medical Specialty Clinics
Source: Institute for Healthcare Improvement website. As of March 27, 2009: http://www.ihi.org.
7
45
ACHIE
VIN
GTHE
VIS
ION:
HE
AL
TH
CA
RE
OP
TIO
NS
FO
RL
OS
AN
GE
LE
SC
OU
NT
Y
comply, they are disenrolled from the program.Since funding is limited, patients can stay with theprogram only 6 to 9 months, but the expectationis that they can learn to control their disease in thattime, then go back to a primary care physician.
Early studies suggest that the program worksfor controlling blood sugar, hypertension, anddyslipidemia. A report in the April 2006 AmericanJournal of Managed Care looked at how a keyblood sugar test, hemoglobin A1c, was controlledin 367 patients in the LA County program theyear before and the year after they entered theprogram. The A1c guideline was met by only 28percent of participants when they were under
traditional medical care. After a year in theprogram, 60 percent of patients met theblood sugar level goal.
A second study published in February 2007 inthe journal Diabetes Care found that diabeticpatients in the program reduced their ER useby half and cut down on hospitalizations.Total hospital charges dropped that yearfor the 331 patients studied to $24,630,from $129,176 the year before.
This type of program could potentially bereplicated to achieve both better patienthealth outcomes and cost savings.
Sources:Mayer B. Davidson, M.D.; Maria Castellanos, RN; Petra Duran, BS; and Vicki Karlan, MPH, “Effective Diabetes Care by a Registered Nurse Following Treatment
Algorithms in a Minority Population,” American Journal of Managed Care, Vol 12, 2006, 226–232.Mayer B. Davidson, M.D., Adeela Ansari, M.D., and Vicki J. Karlan, MPH, “Effect of a Nurse-Directed Diabetes Disease Management Program on Urgent Care/Emergency
Room Visits and Hospitalizations in a Minority Population,” Diabetes Care, Vol. 30, 2007, 224–227.Brink, Susan, “Their Best Shot,” Los Angeles Times, May 07, 2007, p. F-1.
Leading healthcare systems have tailoredcontinuous process-improvement tools, proveneffective for companies in other industries, foruse in their quality improvement initiatives.These tools may become more effective whenused in combination with complementary tools.Six Sigma and Lean are two of the oldestand most widely respected tools used forprocess improvement.
Six Sigma
Six Sigma,™ a registered trademark of Motorola,is a data-driven approach for reducing variationand developing consistently repeatable processesto meet customer requirements. Six Sigmaevolved as a quality initiative aimed at improvingmanufacturing processes in the semiconductorindustry and to eliminate defects. The components
of the Six Sigma methodology were created byBill Smith at Motorola in the 1980s, inspired bydecades of quality-improvement methodologiesbased on the work of Shewhart, Deming, Juran,Ishikawa, and others.
Lean
Lean has its roots as a method for optimizingautomotive manufacturing mostly derived fromthe Toyota Production System. Lean manufacturingfocuses on the elimination of waste and delaysin an effort to create efficiencies and overallimprovement of customer value.
Lean Six Sigma
Lean and Six Sigma have stronglycomplementary strengths that are particularlyuseful for systematically developing healthcare
Tools for Continuous Process Improvement8
46
AR
EP
OR
TO
FT
HE
LO
SA
NG
EL
ES
HE
AL
TH
CA
RE
OP
TIO
NS
TA
SK
FO
RC
E
service innovations. Synthesizing theseapproaches leads to an integrated programincorporating the organizational infrastructureand the thorough diagnosis and analysis toolsof Six Sigma with Lean analysis tools andbest-practice solutions for problems dealingwith waste and unnecessary time consumption.A combined Lean/Six Sigma methodology forperformance improvement assists organizationsin managing the large-scale integration offundamental changes in processes, culture,and stakeholder management to achieveand sustain breakaway results. Phases mayinclude defining opportunities, measuringperformance, analyzing opportunities, andimproving performance. Benefits include thecreation of operating efficiencies (e.g., throughthe elimination of re-work cycles or non-value-added activities), implementation of processcontrols, cost reductions, data-driven decisionmaking, and standardized methodology.
Process Improvement Methods atWork: The New York City Healthand Hospitals CorporationQueens Hospital Center held the Corporation’sfirst Breakthrough event to improve the flow ofpatients through operating rooms. “The Queensteam conducted a Rapid Improvement Event(RIE), a key Breakthrough tool used to identifywaste, design new processes and effectimmediate change. The team reviewed howpatients were being processed for ambulatoryand other surgeries performed in the operatingroom, identified waste and redundancy thatcould be removed to make the process morepatient-centric, put the new processes in place,wrote up the new procedures and trained unitstaff. As a result, the team was able to achievea reduction in patient processing time of1 hour and 20 minutes per patient.”
HHC’s corporate-wide Breakthrough initiativeis “a system of principles and tools based inan improvement philosophy known widelyas ‘Lean,’ that was first developed in themanufacturing industry and was more recentlyadapted for healthcare.” Through Breakthrough,HHC will be creating “a culture that improvesclinical outcomes, brings service closer to thepatient, improves patient and staff satisfaction,and reduces waste and long-term costs.”
SECTIONII
Case
Studies
Sources:H deKoning, JP Verver, et al., “Lean Six Sigma in Healthcare,” Journal of Healthcare Quality, March/April 2006.New York City Health and Hospitals Corporation, “Report to the Board of Directors: Queens Hospital Leads Corporate-Wide Breakthrough Initiative with Completion of
First Rapid Improvement Event,” March 27, 2008. As of March 27, 2009: http://www.nyc.gov/html/hhc/html/board-report/hhc-presidents-report-2008-03.shtml.
A combined Lean/Six Sigmamethodology for
performance improvementassists organizations in
managing the large-scaleintegration of fundamental
changes in processes,culture, and stakeholder
management to achieveand sustain breakaway results.
47
ACHIE
VIN
GTHE
VIS
ION:
HE
AL
TH
CA
RE
OP
TIO
NS
FO
RL
OS
AN
GE
LE
SC
OU
NT
Y
By improving quality of care, many public safetynet hospital systems are able to attract a morediversified payer mix that includes private payers.The health systems have found that this enhancedpayer mix does not detract from their mission,but rather increases the resources available toprovide high-quality care to the medically indigent.
The New York City Health and HospitalsCorporation (HHC), the largest municipalhealthcare system in the United States, isone example. Over the past decade, HHChas transformed from an organization at riskof dissolution due to financial and qualityproblems, to a mission-driven, patient-centeredsystem with higher performance and wheremany patients are choosing to obtain their care.In 2006, the total number of patients served byHHC’s outpatient clinics increased again for thefifth time in the past six years. Inpatient dischargesfrom all HHC acute care hospitals is up as well;overall, HHC’s total inpatient occupancy rate isabove 90 percent.
Multiple efforts have led to a stronger revenuestreams, including financial counseling toenroll more uninsured patients eligible forpublic programs, and also consolidation ofits Medicaid managed care to improveadministrative efficiency and margins, andto align incentives to support prevention andcare coordination. HHC contracts exclusivelywith its two affiliated plans (reduced fromeighteen managed care plans): HealthFirst,in which HHC has an ownership stake, andMetroPlus Health Plan, a subsidiary that wasstarted in 1985 and currently enrolls more than320,000 members in Medicaid managed care,Medicare Advantage, the State Children’s HealthInsurance Program (SCHIP), and state coverageexpansion programs. These tactics allow HHCto align its strategy and capture more revenueto fund improvements that sustain and expandthe organization’s ability to serve all patients.
Diversifying Payer Mix to Achieve the PublicService Mission
Source:McCarthy, D and Mueller K. A., The New York City Health and Hospitals Corporation: Transforming a Public Safety Net Delivery System to Achieve Higher Performance.The Commonwealth Fund Commission on a High Performance Health System, October 2008. Available at http://www.commonwealthfund.org.
Information Technology and Electronic MedicalRecords as the Backbone of an IntegratedMedicalSystem - Kaiser Permanente’s HealthConnect™In 2003, Kaiser Permanente took the bold stepof launching a wide-scale, comprehensiveelectronic health record in more than 430medical office buildings and 36 hospitals thatwould allow it to put patient safety first.
Today, Kaiser Permanente is nearing thecompletion of this transformative experience,and the system, HealthConnect,™ is the largestcivilian electronic health record in the world.It securely connects 8.6 million people to
9
10
their health care teams, their personal healthinformation, and the latest medical knowledge.All Kaiser Permanente members have an activeHealthConnect record, providing them with newand evolving ways to partner with their doctorsand other care providers.
HealthConnect is designed to help KaiserPermanente standardize the practice ofmedicine across its eight regions, create betteraccess to patient medical records, improvesafety and efficacy of care, enhance patientexperience and access to care, and becomethe largest single research source in the nation.HealthConnect’s built-in treatment guidelinesalso help Kaiser Permanente improve themanagement of common/chronic conditions,such as diabetes and hypertension. Doctorsand caregivers have data at their fingertips toidentify what treatments and protocols workbest. The system also offers scheduling,registration, and referral management.
Prior to HealthConnect, Kaiser Permanentefaced a fractured IT infrastructure: There werenine separate communication silos formed byKaiser Permanente’s eight regions and itsnational infrastructure, no common platform,numerous disparate IT systems, limited standarddata elements, expensive IT maintenance costs,and regional or physician office-owned papermedical records.
Industry studies show that paper medicalrecords are unavailable up to 30 percent of thetime for patient office visits and are almostnever available for patient care in an emergencyroom. Kaiser Permanente’s electronic healthrecord is available when and where it is neededby any clinician serving the member.
For an integrated health care system like KaiserPermanente, this capability helps the organizationcreate a seamless experience for its members
as their health information moves quickly andsecurely between doctors’ offices, hospitals,outpatient centers, and pharmacies, allowingscenarios in which ER staff can immediatelyaccess information about a patient’s blood type,allergies, and medications.
In addition, because HealthConnect includesmore comprehensive patient information, it ishelping caregivers address multiple problemsor the provision of multiple services in a singlevisit, reducing the need for additionalfollow-up appointments.
Besides patients’ clinical medical records, thesystem also notes and uses up-to-date socialand patient preference information to enhancepersonalized care with language interpretation orsocial services needs. There are patient accessinterfaces that provide patients information forshared decision making, which patients may accessvia telephone, Web, and email. The advancesoffered by HealthConnect reduce the cost of careand improve visit experiences. Costly in-personservices are eliminated unless medicallynecessary or desired by the patient.
Kaiser is already seeing clear patient safetyand improved clinical outcomes as a resultof implementing HealthConnect. There has beendramatically lowered cardiac disease mortality,improved use of preferred drugs, bettersyndromic surveillance, improved vaccine rates,enhanced data about clinician performance fordevelopment of quality improvement initiativesand performance coaching, and improvedClinical Research Capabilities.
To learn more about the impact KP HealthConnect™
is having on care, videos profiling real membersand caregivers are available for viewing athttp://www.kphctestimonials.org/
48
AR
EP
OR
TO
FT
HE
LO
SA
NG
EL
ES
HE
AL
TH
CA
RE
OP
TIO
NS
TA
SK
FO
RC
ESECTIONII
Case
Studies
Source: Kaiser Permanente Newscenter, February 15, 2007.
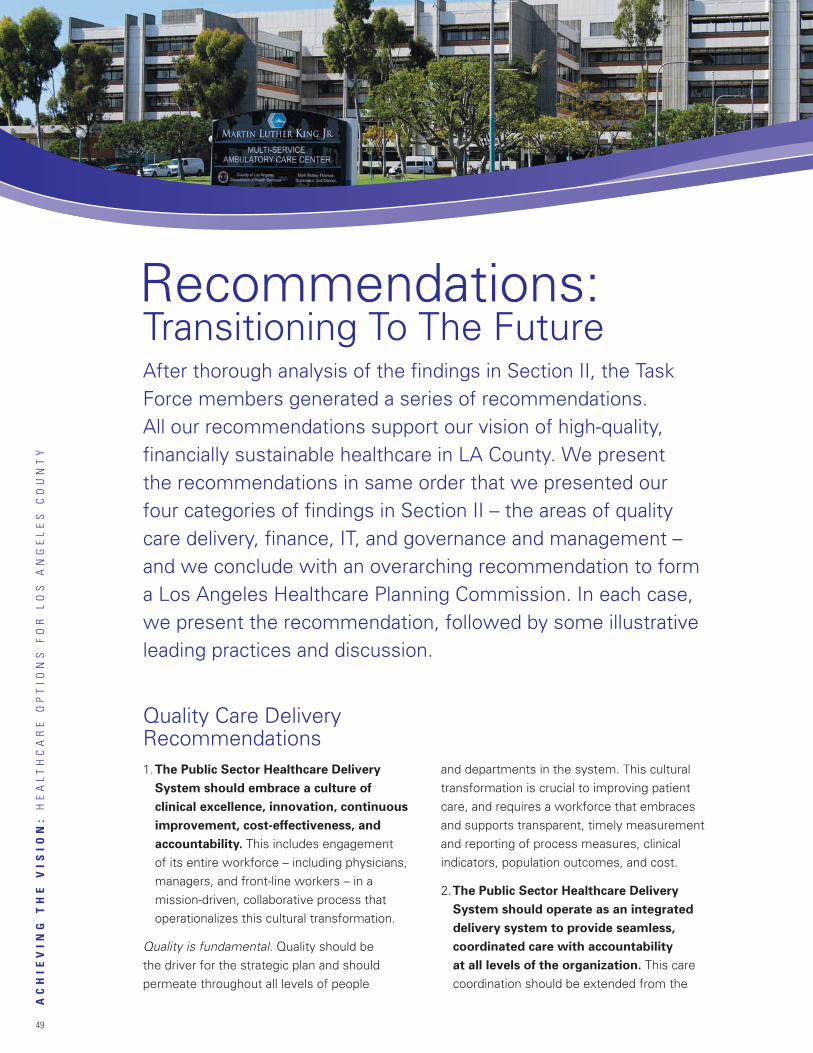
49
Recommendations:Transitioning To The FutureAfter thorough analysis of the findings in Section II, the TaskForce members generated a series of recommendations.All our recommendations support our vision of high-quality,financially sustainable healthcare in LA County. We presentthe recommendations in same order that we presented ourfour categories of findings in Section II – the areas of qualitycare delivery, finance, IT, and governance and management –and we conclude with an overarching recommendation to forma Los Angeles Healthcare Planning Commission. In each case,we present the recommendation, followed by some illustrativeleading practices and discussion.
Quality Care DeliveryRecommendations1.The Public Sector Healthcare DeliverySystem should embrace a culture of
clinical excellence, innovation, continuous
improvement, cost-effectiveness, and
accountability. This includes engagementof its entire workforce – including physicians,managers, and front-line workers – in amission-driven, collaborative process thatoperationalizes this cultural transformation.
Quality is fundamental. Quality should bethe driver for the strategic plan and shouldpermeate throughout all levels of people
and departments in the system. This culturaltransformation is crucial to improving patientcare, and requires a workforce that embracesand supports transparent, timely measurementand reporting of process measures, clinicalindicators, population outcomes, and cost.
2.The Public Sector Healthcare DeliverySystem should operate as an integrated
delivery system to provide seamless,
coordinated care with accountability
at all levels of the organization. This carecoordination should be extended from the
ACHIE
VIN
GTHE
VIS
ION:
HEALTHCARE
OPTIO
NS
FOR
LOS
AN
GELES
COUN
TY
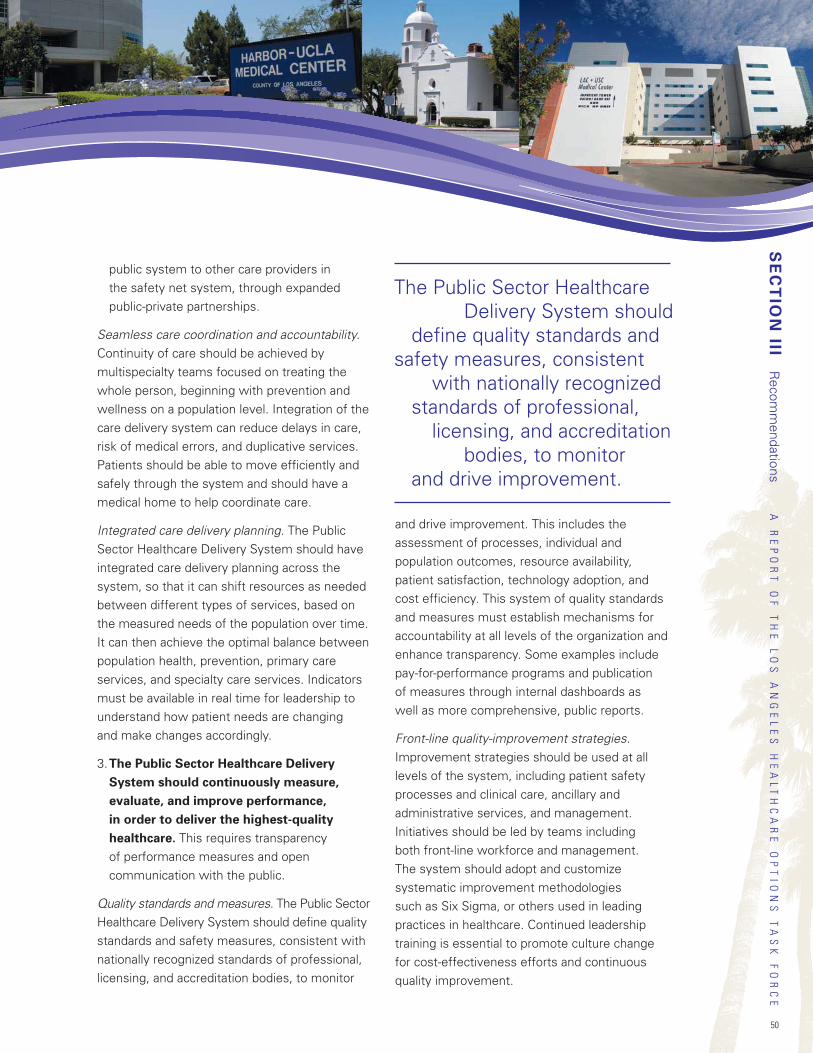
50
AREPORT
OF
THE
LOS
AN
GELES
HEALTHCARE
OPTIO
NS
TASK
FORCE
public system to other care providers inthe safety net system, through expandedpublic-private partnerships.
Seamless care coordination and accountability.Continuity of care should be achieved bymultispecialty teams focused on treating thewhole person, beginning with prevention andwellness on a population level. Integration of thecare delivery system can reduce delays in care,risk of medical errors, and duplicative services.Patients should be able to move efficiently andsafely through the system and should have amedical home to help coordinate care.
Integrated care delivery planning. The PublicSector Healthcare Delivery System should haveintegrated care delivery planning across thesystem, so that it can shift resources as neededbetween different types of services, based onthe measured needs of the population over time.It can then achieve the optimal balance betweenpopulation health, prevention, primary careservices, and specialty care services. Indicatorsmust be available in real time for leadership tounderstand how patient needs are changingand make changes accordingly.
3.The Public Sector Healthcare DeliverySystem should continuously measure,
evaluate, and improve performance,
in order to deliver the highest-quality
healthcare. This requires transparencyof performance measures and opencommunication with the public.
Quality standards and measures. The Public SectorHealthcare Delivery System should define qualitystandards and safety measures, consistent withnationally recognized standards of professional,licensing, and accreditation bodies, to monitor
and drive improvement. This includes theassessment of processes, individual andpopulation outcomes, resource availability,patient satisfaction, technology adoption, andcost efficiency. This system of quality standardsand measures must establish mechanisms foraccountability at all levels of the organization andenhance transparency. Some examples includepay-for-performance programs and publicationof measures through internal dashboards aswell as more comprehensive, public reports.
Front-line quality-improvement strategies.Improvement strategies should be used at alllevels of the system, including patient safetyprocesses and clinical care, ancillary andadministrative services, and management.Initiatives should be led by teams includingboth front-line workforce and management.The system should adopt and customizesystematic improvement methodologiessuch as Six Sigma, or others used in leadingpractices in healthcare. Continued leadershiptraining is essential to promote culture changefor cost-effectiveness efforts and continuousquality improvement.
SECTIONIII
Recom
mendations
The Public Sector HealthcareDelivery System should
define quality standards andsafety measures, consistent
with nationally recognizedstandards of professional,licensing, and accreditation
bodies, to monitorand drive improvement.
51
ACHIE
VIN
GTHE
VIS
ION:
HEALTHCARE
OPTIO
NS
FOR
LOS
AN
GELES
COUN
TY
4.The Public Sector Healthcare DeliverySystem should eliminate barriers to access
in order to provide appropriate, patient-
centered care in a timely fashion.
Open access scheduling model. The PublicSector Healthcare Delivery System should adoptan open access scheduling model that allowspatients to contact their provider and obtainan appointment on the same day or within oneday, regardless of the type of appointment. Anefficient referral system should be in place toallow appropriate referral and tracking to occur.
Appropriate level of care. The Public SectorHealthcare Delivery System should provideaccess to all levels of care, including a primarycare medical home, specialty services, andhospital services. Geographic distribution ofservices should be equitable.
Community-oriented care. The Public SectorHealthcare Delivery System must adeptly servean extremely diverse patient population throughculturally competent care, including languageservices and community advisory boards thathelp the system identify and address the needsof the community.
New ways for patients to interface with thehealthcare system. Innovative modes of care canimprove access, quality, and cost-effectiveness.Technology can facilitate improved access tocare providers, increased convenience, andreduced costs to patients seeking healthcare.New sites, such as retail or school-based clinics,may be beneficial to patients.
5.The Public Sector Healthcare DeliverySystem should focus on systemwide,
long-term investments in population
wellness, prevention, and the
management of chronic diseases.
Population health and wellness. An integratedhealthcare delivery system can leverage its sizeto focus on prevention and wellness. Preventionat both the individual and population level isbeneficial to the health of communities andcan create cost efficiencies as well. Diseaseprevention requires long-term planning acrossmany disciplines beyond hospital-basedmedicine and will require partnershipwith other agencies.
Chronic disease prevention and management.The burden of chronic diseases, such as diabetes,obesity, asthma, and depression, is growing,and this burden is greater among the safety netpatient population than the general population.The escalating human and financial costs mustbe stemmed by population-level interventions,as well as by coordinated case management.Models of specialty clinics that offercoordinated, cost-effective, evidence-baseddisease management to achieve betterhealth outcomes exist both in LA Countyand elsewhere and should be supportedand replicated.
Patient empowerment. Individual and grouppatient education should be conducted tohelp promote patient self-management andempowerment. High-quality, patient-centereddischarge planning and post-hospitalizationcare and education are important to empowerpatients and reduce hospital readmission.
Finance Recommendations1.The Public Sector Healthcare DeliverySystem should accelerate efforts to
achieve financial sustainability.
LA County should provide sufficient start-up capital,such as liquid assets, facilities, equipment, andother infrastructure assets. The Public SectorHealthcare Delivery System should partner
52
AREPORT
OF
THE
LOS
AN
GELES
HEALTHCARE
OPTIO
NS
TASK
FORCE
with the County to carefully evaluate and definelong-term operating and capital funding needs inthe context of an agreed-upon strategic masterplan, which should be reviewed annually.
2.The Public Sector Healthcare DeliverySystem should appropriately improve
revenue streams, including a diversified
payer mix, in order to successfully
achieve its service mission.
Provider of choice. A major cultural shift needsto occur: The Public Sector Healthcare DeliverySystem should earn a community reputationfor the highest-quality experience among allpatients, as the “provider of choice” and notthe “provider of last resort.” The Public SectorHealthcare Delivery System should increasetheir market share of insured patients and usethe revenue to cross-subsidize uncompensatedcosts of care to uninsured and underinsuredpatients, enhancing the service mission.
Optimizing reimbursement. The Public SectorHealthcare Delivery System should work withthe County government, other safety nethealthcare providers, and industry groups toadvocate for more rational reimbursement fromthe Medi-Cal program. It should also ensurecompleteness and accuracy of cost report datathat drive supplemental, disproportionate share,and medical education funding from Medicaidand Medicare.
Financial counseling. The Public Sector HealthcareDelivery System should continue to work withpatients for financial counseling to enroll patientsin appropriate governmental programs, includingdevelopment of a systemwide tool to monitorchanges in enrollment status.
Collaborative, interdependent partnershipwith affiliated government and community.The Public Sector Healthcare Delivery System
should partner with the affiliated governmentsto merit sufficient local government andtaxpayer-supported subsidy levels that arecritical for financial sustainability. Privatesources may be able to fund investmentsin care innovations and infrastructure.
County HMO. The healthcare system should“grow” its own health maintenanceorganization plan.
3.The Public Sector Healthcare DeliverySystem should minimize unnecessary,
non-value-added costs.
Tools for minimizing unnecessary costs.The Public Sector Healthcare Delivery Systemshould develop robust, readily accessiblecapabilities for decision support, costaccounting, and data analysis. Accuratedata are important for both retrospectiveand forward-looking cost monitoring and forroot-cause performance improvements thatenhance the bottom line. The integratedsystem should use a comprehensive, unifieddecision support system with metrics forquality outcomes, resource use, and cost.
Quality-improvement strategies. The PublicSector Healthcare Delivery System shouldadopt patient-centered quality-improvementtools to develop cost efficiencies throughoutthe system. Performance improvementtechniques such as Lean and Six Sigma candrive rapid, sustained improvements in qualityof care and cost reduction.
Leveraging size to achieve economies of scale.The Public Sector Healthcare Delivery Systemshould eliminate redundancies or inefficienciesto reduce unnecessary, non-value-added costs.It should utilize volume purchasing andbargaining power and use centralized,shared services where prudent.
SECTIONIII
Recom
mendations
53
ACHIE
VIN
GTHE
VIS
ION:
HEALTHCARE
OPTIO
NS
FOR
LOS
AN
GELES
COUN
TY
Maximizing staff productivity. The Public SectorHealthcare Delivery System should invest inrecruitment, retention, and skills developmentof employees at all levels. Senior leaders shouldengage in workforce-led initiatives to improveperformance, and join with union partners toachieve a more efficient and effective caredelivery system.
Efficient approaches to centralized managementfunctions. The Public Sector Healthcare DeliverySystem should have the autonomy to developits own efficient approaches to overheadand human resources management andprocurement or purchasing functions.
Cost-effective care means higher-quality carefor the same amount of (or fewer) resources.The Public Sector Healthcare Delivery Systemshould utilize multidisciplinary teams, includingphysician extenders, strong partnerships withcommunity health centers and physicians, andsuch resources as 24-hour call lines for remotescreening and monitoring of patients.
4.The Public Sector Healthcare DeliverySystem should make capital and resource
allocation decisions that best contribute
to improved health outcomes through
strategic, systemwide planning.
Autonomy in capital allocation. The PublicSector Healthcare Delivery System shouldhave the autonomy and authority, with dueoversight by the County, to make strategicallocations of capital across the care deliverysystem to optimize returns on investment – notonly in a financial sense, but also in terms ofachieving service mission goals.
Workforce as the greatest asset. The PublicSector Healthcare Delivery System, whenintegrated, will be able to promote leadershipand professional development within itsworkforce, at all levels of the organization.
When necessary, staff retraining can bedone across the system in a cost-effectiveway that supports the healthcare mission.
Information TechnologyRecommendations1.The Public Sector Healthcare DeliverySystem should develop and advance an
IT strategic plan for standardization and
interoperability, enabling quality standards
measurement, coordinated care, and
financial rigor.
Strategic, centralized information technologyplanning. The Public Sector Healthcare DeliverySystem’s central IT office, led by the chiefinformation officer, should manage a state-of-the-art central data warehouse of clinical andfinancial information. The central office shouldensure that IT projects are coordinated systemwideand are aligned with the healthcare system’sstrategic plan. The IT infrastructure must beable to link with all public facilities and affiliatedprivate sector partners.
2.The Public Sector Healthcare DeliverySystem should develop an integrated
countywide health information system for
clinical, quality and financial measures.
Centralized database. The Public SectorHealthcare Delivery System should maintaina single, centralized database in order toconduct standardized monitoring of keyquality and performance indicators.
Master Patient Index (MPI). A single, centralMPI will allow the Public Sector HealthcareDelivery System to eliminate duplicate recordsand improve patient search capabilities toimprove patient registration processesthrough the integrated healthcare system.
54
AREPORT
OF
THE
LOS
AN
GELES
HEALTHCARE
OPTIO
NS
TASK
FORCE
Health information system implementation.The clinical health information system shouldinclude and integrate electronic medicalrecords, inpatient computerized provider orderentry, clinical decision support software,medication management and reconciliation,a picture archiving and communicationsystem, and laboratory information systems.This interoperable infrastructure can informclinical practice, interconnect providers,improve population health and healthdisparities monitoring, and promoteadoption of future technologies acrossthe healthcare delivery system.
3.The Public Sector Healthcare DeliverySystem should create a best-in-class health
information technology leadership team to
manage and coordinate the IT portfolio.
Project Management Office (PMO). Using aproject management office to develop andmanage the internal infrastructure for theorganization’s IT portfolio would promotea holistic view of IT initiatives. The PMOcan evaluate the current available systems,design system and vendor interfaces, andtest, implement, maintain, and upgradethe system. In order to promote technologyadoption, technical support and hiring ITstaff is critical for successful culture change.The PMO can also identify key organizationhealth information technology “champions”for each initiative and change. The PMO iskey to promoting adoption of technologyby employees and patients.
4.The Public Sector Healthcare DeliverySystem should develop a robust
telemedicine and telehealth infrastructure
to facilitate access and care coordination,
by leveraging public-private partnerships.
Telemedicine and telehealth technologies.Telemedicine is an infrastructure that allows formultiple modalities of delivering care, includingtelephone, email, video, digital imaging, andhealthcare monitoring devices. Telemedicine canincrease access to specialties as well as assistmonitoring homebound patients with chronicdisease and disability. Automated health riskscreenings can be used to assist clinicians inevaluating and managing health risks in personsin high-risk groups. Telehealth is an expansionof telemedicine, encompassing more types ofhealth services enabled by telecommunicationtechnology, including education, diagnosis,treatment, assessment, and monitoring.
5.The Public Sector Healthcare DeliverySystem should ensure that IT systems
include robust, decision support tools for
both the individual patient encounter as
well as population care management.
Improving quality of patient care. The IT systemshould allow clinicians to reference medicalliterature and evidence-based protocols, inreal time, and to support decisions andimprove clinical care.
Population care management. The IT systemshould enable tracking and optimization of keyprevention and disease management outcomesfor the population.
Governance andManagementRecommendations1.The Public Sector Healthcare DeliverySystem would benefit from a body of
expertise, accountable to the Los Angeles
County Board of Supervisors, that is
self-governed and has management
autonomy and authority.
SECTIONIII
Recom
mendations
55
ACHIE
VIN
GTHE
VIS
ION:
HEALTHCARE
OPTIO
NS
FOR
LOS
AN
GELES
COUN
TY
Formative charter. A formative charterestablishes a framework for constructiveworking relations between the body ofexpertise and the affiliated government.It clarifies mutual rights, authorities, fundingobligations, service level obligations, andaccountabilities. It helps to diffuse politicalpressures that create barriers to amission-focused healthcare strategy.
Self-governing and self-managing. The PublicSector Healthcare Delivery System wouldbenefit from an autonomous, self-governed,and self-managed body of expertise that hasboth the time and the knowledge base tooversee the operations and management ofthe integration effort. This type of change ingovernance structure is essential to thesuccessful recruitment of a transformationalleader and key staff for the healthcare systemenvisioned by the Task Force.
Membership. The LA County Board ofSupervisors should select members for thisbody of expertise who will be accountableto the Supervisors and, ultimately, the public.Mechanisms such as public meetings andannual accountability reports should be used,and members should also be able to actindependently of individualized political interests.Other necessary attributes of the membersinclude expertise in healthcare, a track recordof good judgment and integrity, and a fiduciarymindset. The healthcare system body ofexpertise should provide continuous anddedicated service on a voluntary basis.
Transformational leadership. The Public SectorHealthcare Delivery System must recruit a CEOwith a proven track record and the trust of thehealth system body of expertise. A seniorleadership team should be assembled to carry outthe improvements that will enable the healthcaresystem to better achieve its service mission.
2.The Public Sector Healthcare DeliverySystem should create a single strategic
master plan with integrated clinical,
quality, financial, and IT strategies,
and should keep the organization
focused on meeting quality and
performance standards.
Strategic planning. The body of expertiseshould prepare a three-to-five-year strategicmaster plan with input and approval fromaffiliated government and stakeholders, andhave authority for implementation of strategieswithout unconstructive interventions.
Relationships with academic partners.Relationships with hospital operating partners,particularly academic medical centers, shouldbe reviewed with a rational set of criteria andmeasured performance outcomes. Agreementsshould be coordinated through the body ofexpertise to clearly define relationships withother service providers, including medicalschools, and to evaluate the ability of partnersto meet quality standards in exchange for thepublic’s investment.
3.The Public Sector Healthcare DeliverySystem should be led by a dynamic,
hands-on CEO and a talented, cohesive
leadership team.
Leadership sets the tone. The CEO and leadershipteam should promote a mission-driven culture ofinnovation and continuous improvement. Theyshould adopt and implement policies thatreinforce high performance behavior,accountability, and transparency.
56
AREPORT
OF
THE
LOS
AN
GELES
HEALTHCARE
OPTIO
NS
TASK
FORCE
OverarchingRecommendation:Form a Los AngelesHealthcare PlanningCommissionThese recommendations provide a proposedstructure for achieving the vision of an integratedhealthcare delivery system in LA County, but werecognize that the County needs a mechanism forplanning, in order to move toward implementation.Thus, we recommend the formation of a LosAngeles Healthcare Planning Commission(hereafter referred to as “the Commission”).
This time-limited Commission, composed ofmembers appointed by the Board of Supervisors,should be formed to conduct the planningnecessary to advance the implementationof a high-performing, high-quality safety nethealthcare system accessible to all residentsin LA County. This Commission’s work shouldbe informed by the recommendations of theLos Angeles Healthcare Options Task Force.We propose that funding be provided by thephilanthropic community in Los Angeles and theLA County Board of Supervisors. We believethat an 18-month lifespan is sufficient for thisCommission to complete its duties (July 1, 2009,to December 31, 2010).
The Commission’s primary tasks should be todevelop a strategic plan for the Public SectorHealthcare Delivery System and to assistthe LA County Board of Supervisors withconsideration of potential future governancemodels. As evidenced by the proposedreopening of MLK Hospital with a novelform of governance, the LA County Board ofSupervisors is taking creative, pragmatic stepsto work with partners in order to improveCounty healthcare. The Planning Commissionwould not be a governing body, and this report
does not provide specific recommendations fora particular healthcare governance model. Otherstudies have analyzed alternative models andmade recommendations (See Appendix A).
In addition, this Commission could be directedby the Board of Supervisors to accomplishother tasks:
• Oversee the reintegration of inpatient andemergency services at MLK Hospital intothe larger Network, as its initial task. Thiswould include a more formal articulation ofthe ambulatory care system that will beneeded to support MLK Hospital.
• Optimize the application for the CaliforniaMedicaid waiver in 2010.
• Create a coordinated and comprehensivecountywide health information technology plan.
These suggested additional tasks for theCommission are complex, timely, and importantfor supporting the public safety net mission.Other planning commissions, including theChildren’s Council, have served the Board ofSupervisors as respected bodies on planningissues. We believe this planning model willalso be successful for these specific tasks.
SECTIONIII
Recom
mendations
As evidenced by theproposed reopening of
MLK Hospital with a novelform of governance, the
LA County Board ofSupervisors is taking creative,
pragmatic steps to workwith partners in order to
improve County healthcare.
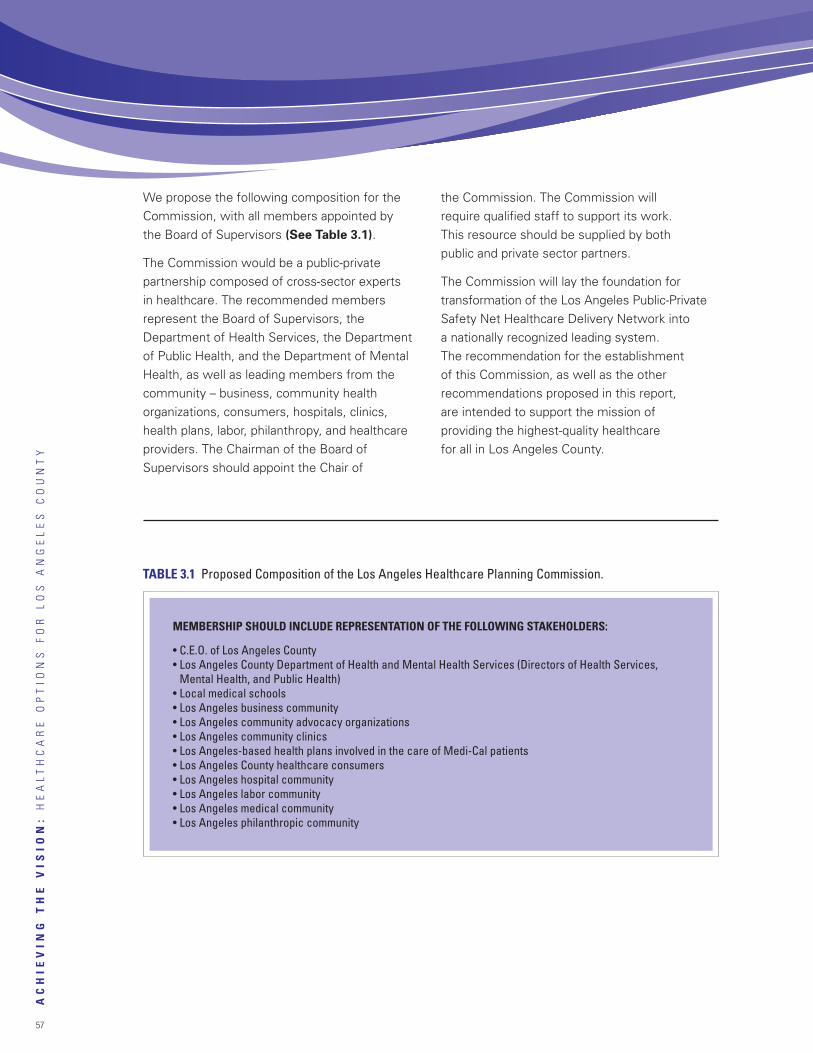
57
ACHIE
VIN
GTHE
VIS
ION:
HEALTHCARE
OPTIO
NS
FOR
LOS
AN
GELES
COUN
TY
We propose the following composition for theCommission, with all members appointed bythe Board of Supervisors (See Table 3.1).
The Commission would be a public-privatepartnership composed of cross-sector expertsin healthcare. The recommended membersrepresent the Board of Supervisors, theDepartment of Health Services, the Departmentof Public Health, and the Department of MentalHealth, as well as leading members from thecommunity – business, community healthorganizations, consumers, hospitals, clinics,health plans, labor, philanthropy, and healthcareproviders. The Chairman of the Board ofSupervisors should appoint the Chair of
the Commission. The Commission willrequire qualified staff to support its work.This resource should be supplied by bothpublic and private sector partners.
The Commission will lay the foundation fortransformation of the Los Angeles Public-PrivateSafety Net Healthcare Delivery Network intoa nationally recognized leading system.The recommendation for the establishmentof this Commission, as well as the otherrecommendations proposed in this report,are intended to support the mission ofproviding the highest-quality healthcarefor all in Los Angeles County.
TABLE 3.1 Proposed Composition of the Los Angeles Healthcare Planning Commission.
MEMBERSHIP SHOULD INCLUDE REPRESENTATION OF THE FOLLOWING STAKEHOLDERS:
• C.E.O. of Los Angeles County• Los Angeles County Department of Health and Mental Health Services (Directors of Health Services,
Mental Health, and Public Health)• Local medical schools• Los Angeles business community• Los Angeles community advocacy organizations• Los Angeles community clinics• Los Angeles-based health plans involved in the care of Medi-Cal patients• Los Angeles County healthcare consumers• Los Angeles hospital community• Los Angeles labor community• Los Angeles medical community• Los Angeles philanthropic community

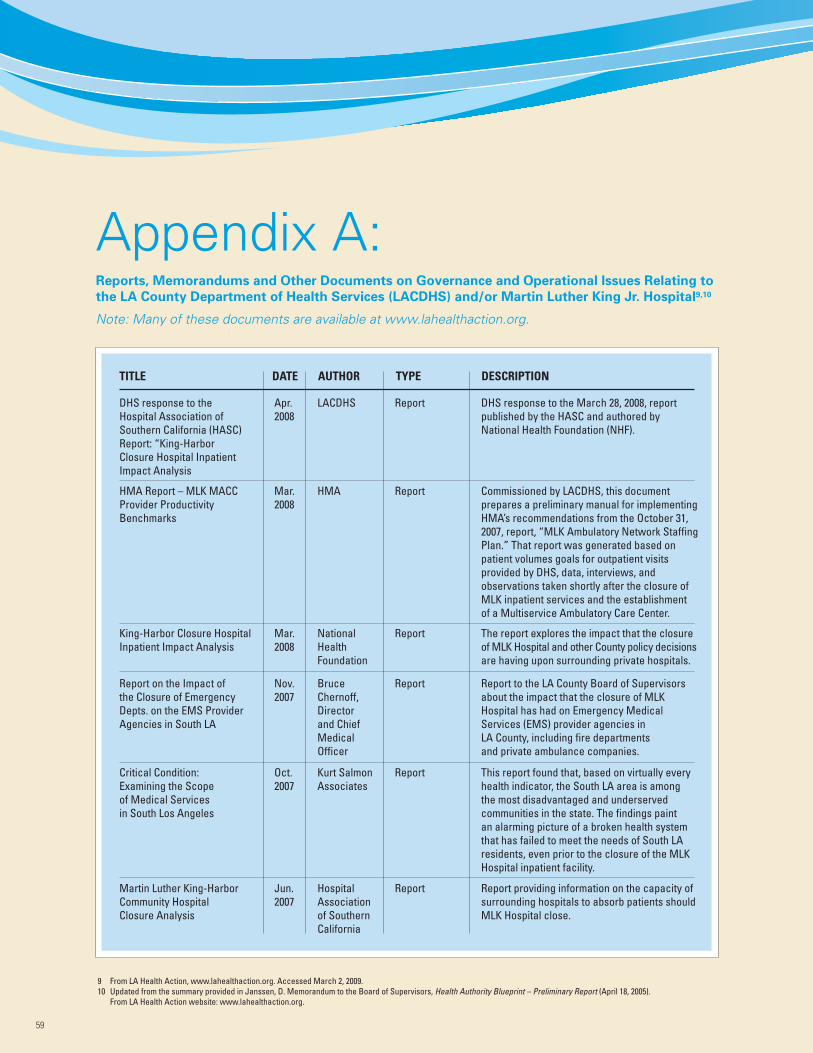
Appendix A:Reports, Memorandums and Other Documents on Governance and Operational Issues Relating to
the LA County Department of Health Services (LACDHS) and/or Martin Luther King Jr. Hospital9,10
Note: Many of these documents are available at www.lahealthaction.org.
59
TITLE DATE AUTHOR TYPE DESCRIPTION
LACDHSApr.2008
Report DHS response to the March 28, 2008, reportpublished by the HASC and authored byNational Health Foundation (NHF).
HMA Report – MLK MACCProvider ProductivityBenchmarks
HMAMar.2008
Report Commissioned by LACDHS, this documentprepares a preliminary manual for implementingHMA’s recommendations from the October 31,2007, report, “MLK Ambulatory Network StaffingPlan.” That report was generated based onpatient volumes goals for outpatient visitsprovided by DHS, data, interviews, andobservations taken shortly after the closure ofMLK inpatient services and the establishmentof a Multiservice Ambulatory Care Center.
King-Harbor Closure HospitalInpatient Impact Analysis
NationalHealthFoundation
Mar.2008
Report The report explores the impact that the closureof MLK Hospital and other County policy decisionsare having upon surrounding private hospitals.
Report on the Impact ofthe Closure of EmergencyDepts. on the EMS ProviderAgencies in South LA
BruceChernoff,Directorand ChiefMedicalOfficer
Nov.2007
Report Report to the LA County Board of Supervisorsabout the impact that the closure of MLKHospital has had on Emergency MedicalServices (EMS) provider agencies inLA County, including fire departmentsand private ambulance companies.
Critical Condition:Examining the Scopeof Medical Servicesin South Los Angeles
Kurt SalmonAssociates
Oct.2007
Report This report found that, based on virtually everyhealth indicator, the South LA area is amongthe most disadvantaged and underservedcommunities in the state. The findings paintan alarming picture of a broken health systemthat has failed to meet the needs of South LAresidents, even prior to the closure of the MLKHospital inpatient facility.
9 From LA Health Action, www.lahealthaction.org. Accessed March 2, 2009.10 Updated from the summary provided in Janssen, D. Memorandum to the Board of Supervisors, Health Authority Blueprint – Preliminary Report (April 18, 2005).
From LA Health Action website: www.lahealthaction.org.
Martin Luther King-HarborCommunity HospitalClosure Analysis
HospitalAssociationof SouthernCalifornia
Jun.2007
Report Report providing information on the capacity ofsurrounding hospitals to absorb patients shouldMLK Hospital close.
DHS response to theHospital Association ofSouthern California (HASC)Report: “King-HarborClosure Hospital InpatientImpact Analysis
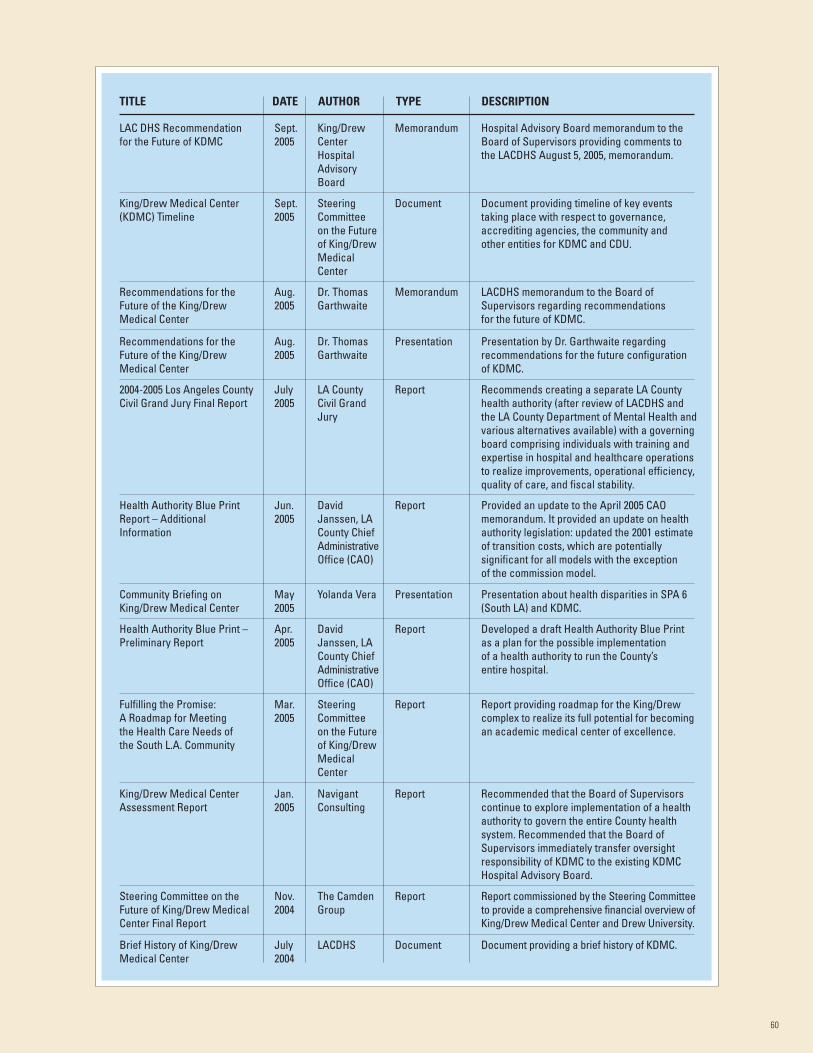
60
TITLE DATE AUTHOR TYPE DESCRIPTION
LAC DHS Recommendationfor the Future of KDMC
King/DrewCenterHospitalAdvisoryBoard
Sept.2005
Memorandum Hospital Advisory Board memorandum to theBoard of Supervisors providing comments tothe LACDHS August 5, 2005, memorandum.
King/Drew Medical Center(KDMC) Timeline
SteeringCommitteeon the Futureof King/DrewMedicalCenter
Sept.2005
Document Document providing timeline of key eventstaking place with respect to governance,accrediting agencies, the community andother entities for KDMC and CDU.
Recommendations for theFuture of the King/DrewMedical Center
Dr. ThomasGarthwaite
Aug.2005
Memorandum LACDHS memorandum to the Board ofSupervisors regarding recommendationsfor the future of KDMC.
Recommendations for theFuture of the King/DrewMedical Center
Dr. ThomasGarthwaite
Aug.2005
Presentation Presentation by Dr. Garthwaite regardingrecommendations for the future configurationof KDMC.
2004-2005 Los Angeles CountyCivil Grand Jury Final Report
LA CountyCivil GrandJury
July2005
Report Recommends creating a separate LA Countyhealth authority (after review of LACDHS andthe LA County Department of Mental Health andvarious alternatives available) with a governingboard comprising individuals with training andexpertise in hospital and healthcare operationsto realize improvements, operational efficiency,quality of care, and fiscal stability.
Health Authority Blue PrintReport – AdditionalInformation
DavidJanssen, LACounty ChiefAdministrativeOffice (CAO)
Jun.2005
Report Provided an update to the April 2005 CAOmemorandum. It provided an update on healthauthority legislation: updated the 2001 estimateof transition costs, which are potentiallysignificant for all models with the exceptionof the commission model.
Community Briefing onKing/Drew Medical Center
Yolanda VeraMay2005
Presentation Presentation about health disparities in SPA 6(South LA) and KDMC.
Health Authority Blue Print –Preliminary Report
DavidJanssen, LACounty ChiefAdministrativeOffice (CAO)
Apr.2005
Report Developed a draft Health Authority Blue Printas a plan for the possible implementationof a health authority to run the County’sentire hospital.
Fulfilling the Promise:A Roadmap for Meetingthe Health Care Needs ofthe South L.A. Community
SteeringCommitteeon the Futureof King/DrewMedicalCenter
Mar.2005
Report Report providing roadmap for the King/Drewcomplex to realize its full potential for becomingan academic medical center of excellence.
King/Drew Medical CenterAssessment Report
NavigantConsulting
Jan.2005
Report Recommended that the Board of Supervisorscontinue to explore implementation of a healthauthority to govern the entire County healthsystem. Recommended that the Board ofSupervisors immediately transfer oversightresponsibility of KDMC to the existing KDMCHospital Advisory Board.
Steering Committee on theFuture of King/Drew MedicalCenter Final Report
The CamdenGroup
Nov.2004
Report Report commissioned by the Steering Committeeto provide a comprehensive financial overview ofKing/Drew Medical Center and Drew University.
Brief History of King/DrewMedical Center
LACDHSJuly2004
Document Document providing a brief history of KDMC.
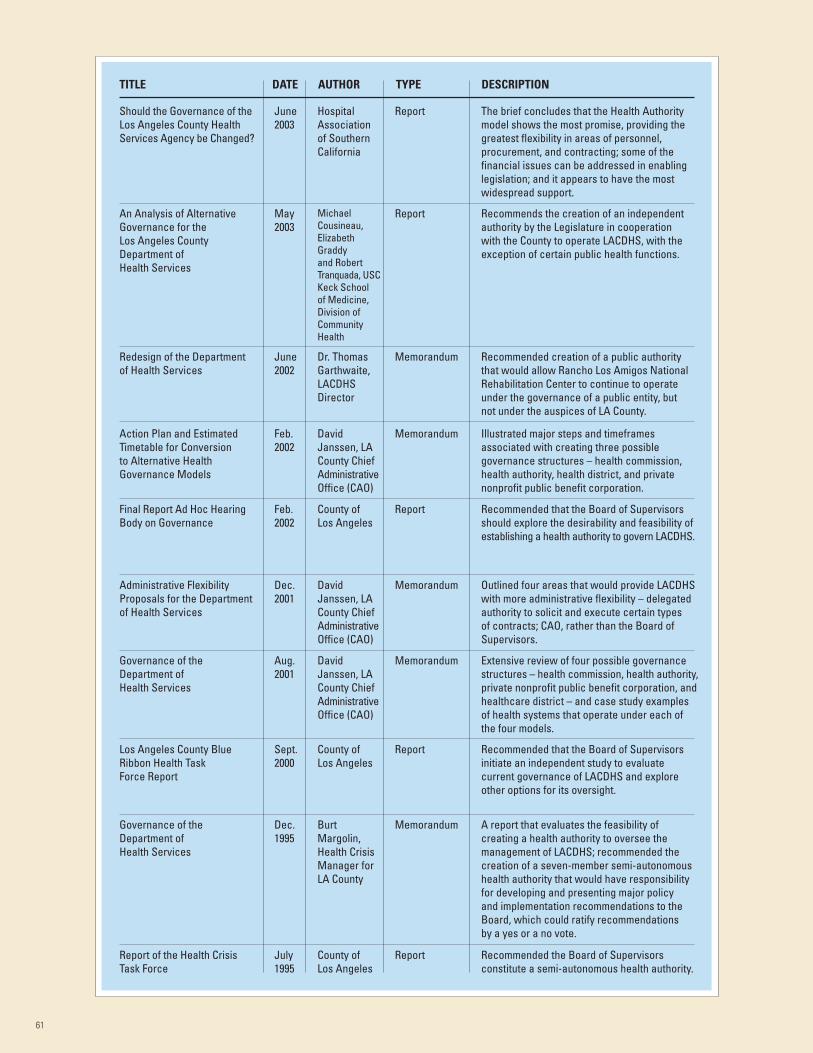
61
TITLE DATE AUTHOR TYPE DESCRIPTION
Redesign of the Departmentof Health Services
HospitalAssociationof SouthernCalifornia
June2003
Report The brief concludes that the Health Authoritymodel shows the most promise, providing thegreatest flexibility in areas of personnel,procurement, and contracting; some of thefinancial issues can be addressed in enablinglegislation; and it appears to have the mostwidespread support.
An Analysis of AlternativeGovernance for theLos Angeles CountyDepartment ofHealth Services
MichaelCousineau,ElizabethGraddyand RobertTranquada, USCKeck Schoolof Medicine,Division ofCommunityHealth
May2003
Report Recommends the creation of an independentauthority by the Legislature in cooperationwith the County to operate LACDHS, with theexception of certain public health functions.
Should the Governance of theLos Angeles County HealthServices Agency be Changed?
Dr. ThomasGarthwaite,LACDHSDirector
June2002
Memorandum Recommended creation of a public authoritythat would allow Rancho Los Amigos NationalRehabilitation Center to continue to operateunder the governance of a public entity, butnot under the auspices of LA County.
Action Plan and EstimatedTimetable for Conversionto Alternative HealthGovernance Models
DavidJanssen, LACounty ChiefAdministrativeOffice (CAO)
Feb.2002
Memorandum Illustrated major steps and timeframesassociated with creating three possiblegovernance structures – health commission,health authority, health district, and privatenonprofit public benefit corporation.
Final Report Ad Hoc HearingBody on Governance
County ofLos Angeles
Feb.2002
Report Recommended that the Board of Supervisorsshould explore the desirability and feasibility ofestablishing a health authority to govern LACDHS.
Administrative FlexibilityProposals for the Departmentof Health Services
DavidJanssen, LACounty ChiefAdministrativeOffice (CAO)
Dec.2001
Memorandum Outlined four areas that would provide LACDHSwith more administrative flexibility – delegatedauthority to solicit and execute certain typesof contracts; CAO, rather than the Board ofSupervisors.
Governance of theDepartment ofHealth Services
DavidJanssen, LACounty ChiefAdministrativeOffice (CAO)
Aug.2001
Memorandum Extensive review of four possible governancestructures – health commission, health authority,private nonprofit public benefit corporation, andhealthcare district – and case study examplesof health systems that operate under each ofthe four models.
Los Angeles County BlueRibbon Health TaskForce Report
County ofLos Angeles
Sept.2000
Report Recommended that the Board of Supervisorsinitiate an independent study to evaluatecurrent governance of LACDHS and exploreother options for its oversight.
Governance of theDepartment ofHealth Services
BurtMargolin,Health CrisisManager forLA County
Dec.1995
Memorandum A report that evaluates the feasibility ofcreating a health authority to oversee themanagement of LACDHS; recommended thecreation of a seven-member semi-autonomoushealth authority that would have responsibilityfor developing and presenting major policyand implementation recommendations to theBoard, which could ratify recommendationsby a yes or a no vote.
Report of the Health CrisisTask Force
County ofLos Angeles
July1995
Report Recommended the Board of Supervisorsconstitute a semi-autonomous health authority.
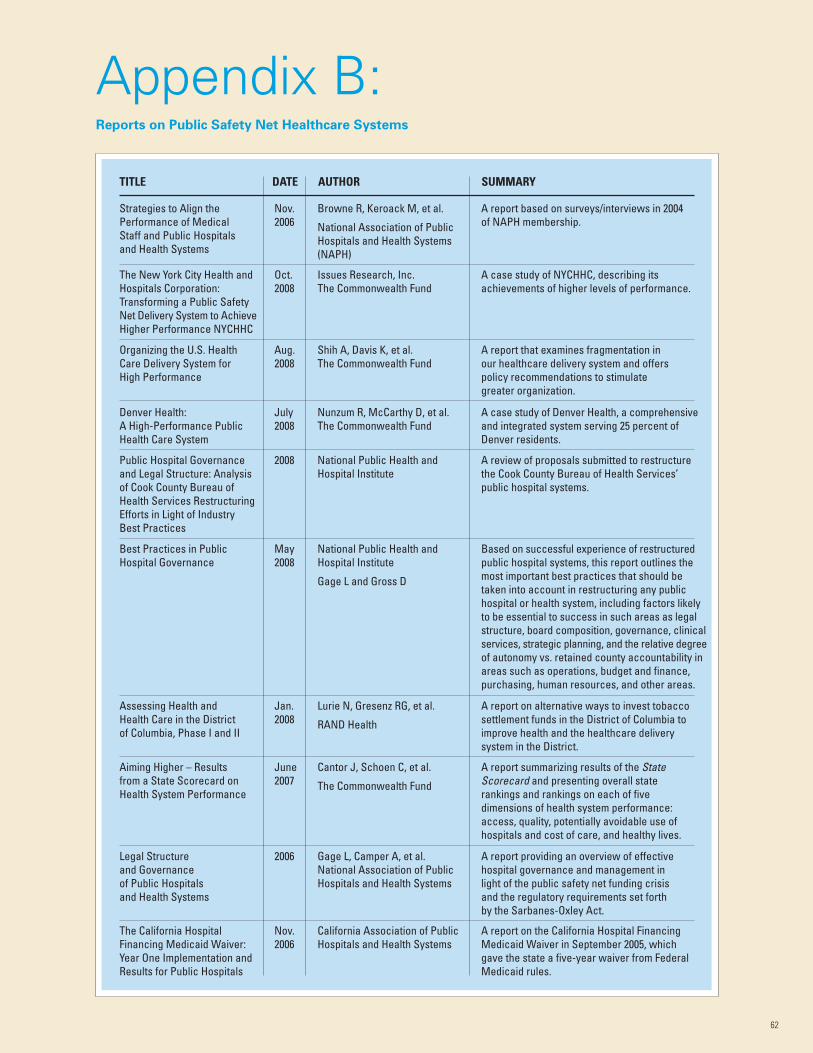
62
Appendix B:Reports on Public Safety Net Healthcare Systems
TITLE DATE AUTHOR SUMMARY
Browne R, Keroack M, et al.
National Association of PublicHospitals and Health Systems(NAPH)
Nov.2006
A report based on surveys/interviews in 2004of NAPH membership.
The New York City Health andHospitals Corporation:Transforming a Public SafetyNet Delivery System to AchieveHigher Performance NYCHHC
Issues Research, Inc.The Commonwealth Fund
Oct.2008
A case study of NYCHHC, describing itsachievements of higher levels of performance.
Organizing the U.S. HealthCare Delivery System forHigh Performance
Shih A, Davis K, et al.The Commonwealth Fund
Aug.2008
A report that examines fragmentation inour healthcare delivery system and offerspolicy recommendations to stimulategreater organization.
Denver Health:A High-Performance PublicHealth Care System
Nunzum R, McCarthy D, et al.The Commonwealth Fund
July2008
A case study of Denver Health, a comprehensiveand integrated system serving 25 percent ofDenver residents.
Public Hospital Governanceand Legal Structure: Analysisof Cook County Bureau ofHealth Services RestructuringEfforts in Light of IndustryBest Practices
National Public Health andHospital Institute
2008 A review of proposals submitted to restructurethe Cook County Bureau of Health Services’public hospital systems.
Best Practices in PublicHospital Governance
National Public Health andHospital Institute
Gage L and Gross D
May2008
Based on successful experience of restructuredpublic hospital systems, this report outlines themost important best practices that should betaken into account in restructuring any publichospital or health system, including factors likelyto be essential to success in such areas as legalstructure, board composition, governance, clinicalservices, strategic planning, and the relative degreeof autonomy vs. retained county accountability inareas such as operations, budget and finance,purchasing, human resources, and other areas.
Assessing Health andHealth Care in the Districtof Columbia, Phase I and II
Lurie N, Gresenz RG, et al.
RAND Health
Jan.2008
A report on alternative ways to invest tobaccosettlement funds in the District of Columbia toimprove health and the healthcare deliverysystem in the District.
Aiming Higher – Resultsfrom a State Scorecard onHealth System Performance
Cantor J, Schoen C, et al.
The Commonwealth Fund
June2007
A report summarizing results of the StateScorecard and presenting overall staterankings and rankings on each of fivedimensions of health system performance:access, quality, potentially avoidable use ofhospitals and cost of care, and healthy lives.
Legal Structureand Governanceof Public Hospitalsand Health Systems
Gage L, Camper A, et al.National Association of PublicHospitals and Health Systems
2006 A report providing an overview of effectivehospital governance and management inlight of the public safety net funding crisisand the regulatory requirements set forthby the Sarbanes-Oxley Act.
The California HospitalFinancing Medicaid Waiver:Year One Implementation andResults for Public Hospitals
California Association of PublicHospitals and Health Systems
Nov.2006
A report on the California Hospital FinancingMedicaid Waiver in September 2005, whichgave the state a five-year waiver from FederalMedicaid rules.
Strategies to Align thePerformance of MedicalStaff and Public Hospitalsand Health Systems
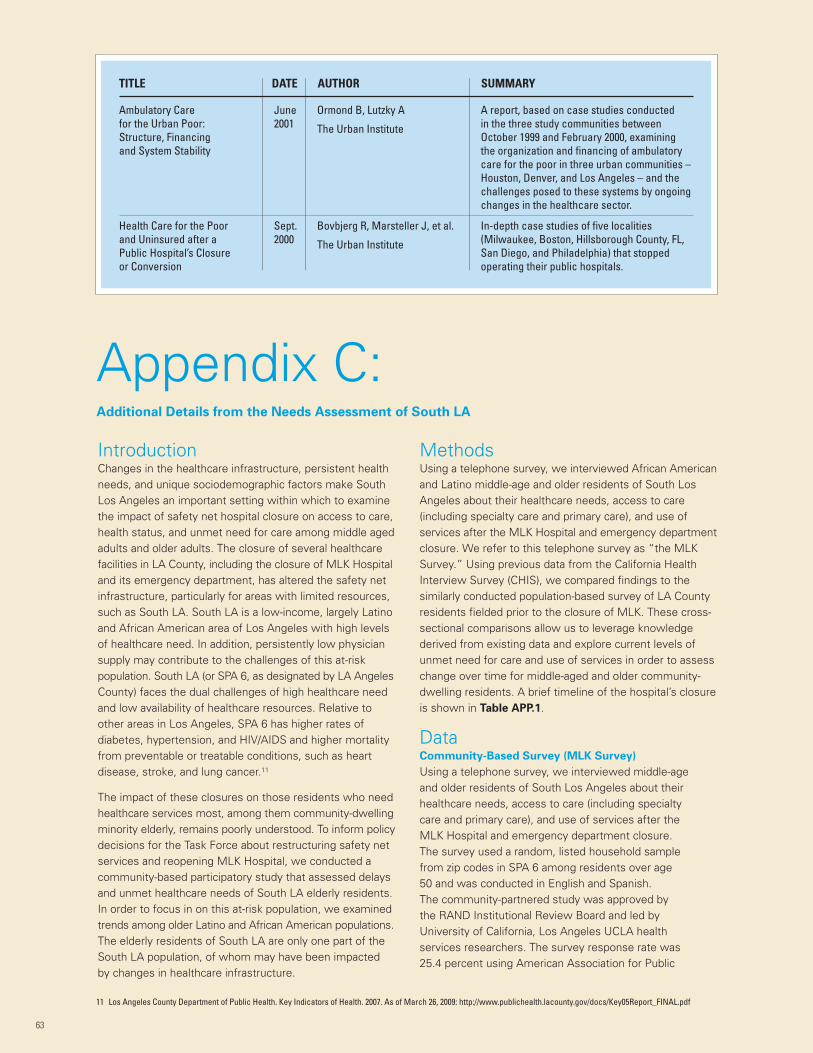
IntroductionChanges in the healthcare infrastructure, persistent healthneeds, and unique sociodemographic factors make SouthLos Angeles an important setting within which to examinethe impact of safety net hospital closure on access to care,health status, and unmet need for care among middle agedadults and older adults. The closure of several healthcarefacilities in LA County, including the closure of MLK Hospitaland its emergency department, has altered the safety netinfrastructure, particularly for areas with limited resources,such as South LA. South LA is a low-income, largely Latinoand African American area of Los Angeles with high levelsof healthcare need. In addition, persistently low physiciansupply may contribute to the challenges of this at-riskpopulation. South LA (or SPA 6, as designated by LA AngelesCounty) faces the dual challenges of high healthcare needand low availability of healthcare resources. Relative toother areas in Los Angeles, SPA 6 has higher rates ofdiabetes, hypertension, and HIV/AIDS and higher mortalityfrom preventable or treatable conditions, such as heartdisease, stroke, and lung cancer.11
The impact of these closures on those residents who needhealthcare services most, among them community-dwellingminority elderly, remains poorly understood. To inform policydecisions for the Task Force about restructuring safety netservices and reopening MLK Hospital, we conducted acommunity-based participatory study that assessed delaysand unmet healthcare needs of South LA elderly residents.In order to focus in on this at-risk population, we examinedtrends among older Latino and African American populations.The elderly residents of South LA are only one part of theSouth LA population, of whom may have been impactedby changes in healthcare infrastructure.
MethodsUsing a telephone survey, we interviewed African Americanand Latino middle-age and older residents of South LosAngeles about their healthcare needs, access to care(including specialty care and primary care), and use ofservices after the MLK Hospital and emergency departmentclosure. We refer to this telephone survey as “the MLKSurvey.” Using previous data from the California HealthInterview Survey (CHIS), we compared findings to thesimilarly conducted population-based survey of LA Countyresidents fielded prior to the closure of MLK. These cross-sectional comparisons allow us to leverage knowledgederived from existing data and explore current levels ofunmet need for care and use of services in order to assesschange over time for middle-aged and older community-dwelling residents. A brief timeline of the hospital’s closureis shown in Table APP.1.
DataCommunity-Based Survey (MLK Survey)
Using a telephone survey, we interviewed middle-ageand older residents of South Los Angeles about theirhealthcare needs, access to care (including specialtycare and primary care), and use of services after theMLK Hospital and emergency department closure.The survey used a random, listed household samplefrom zip codes in SPA 6 among residents over age50 and was conducted in English and Spanish.The community-partnered study was approved bythe RAND Institutional Review Board and led byUniversity of California, Los Angeles UCLA healthservices researchers. The survey response rate was25.4 percent using American Association for Public
63
TITLE DATE AUTHOR SUMMARY
Ormond B, Lutzky A
The Urban Institute
June2001
A report, based on case studies conductedin the three study communities betweenOctober 1999 and February 2000, examiningthe organization and financing of ambulatorycare for the poor in three urban communities –Houston, Denver, and Los Angeles – and thechallenges posed to these systems by ongoingchanges in the healthcare sector.
Health Care for the Poorand Uninsured after aPublic Hospital’s Closureor Conversion
Bovbjerg R, Marsteller J, et al.
The Urban Institute
Sept.2000
In-depth case studies of five localities(Milwaukee, Boston, Hillsborough County, FL,San Diego, and Philadelphia) that stoppedoperating their public hospitals.
Ambulatory Carefor the Urban Poor:Structure, Financingand System Stability
Appendix C:Additional Details from the Needs Assessment of South LA
11 Los Angeles County Department of Public Health. Key Indicators of Health. 2007. As of March 26, 2009: http://www.publichealth.lacounty.gov/docs/Key05Report_FINAL.pdf
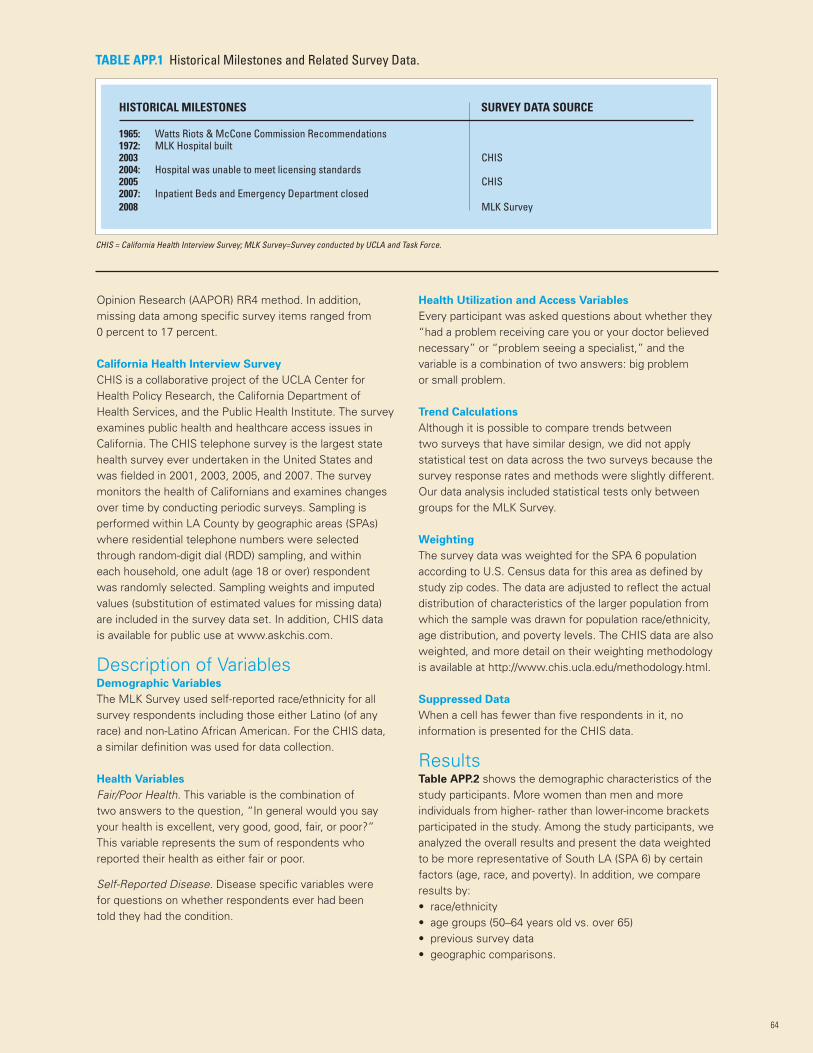
64
Opinion Research (AAPOR) RR4 method. In addition,missing data among specific survey items ranged from0 percent to 17 percent.
California Health Interview Survey
CHIS is a collaborative project of the UCLA Center forHealth Policy Research, the California Department ofHealth Services, and the Public Health Institute. The surveyexamines public health and healthcare access issues inCalifornia. The CHIS telephone survey is the largest statehealth survey ever undertaken in the United States andwas fielded in 2001, 2003, 2005, and 2007. The surveymonitors the health of Californians and examines changesover time by conducting periodic surveys. Sampling isperformed within LA County by geographic areas (SPAs)where residential telephone numbers were selectedthrough random-digit dial (RDD) sampling, and withineach household, one adult (age 18 or over) respondentwas randomly selected. Sampling weights and imputedvalues (substitution of estimated values for missing data)are included in the survey data set. In addition, CHIS datais available for public use at www.askchis.com.
Description of VariablesDemographic Variables
The MLK Survey used self-reported race/ethnicity for allsurvey respondents including those either Latino (of anyrace) and non-Latino African American. For the CHIS data,a similar definition was used for data collection.
Health Variables
Fair/Poor Health. This variable is the combination oftwo answers to the question, “In general would you sayyour health is excellent, very good, good, fair, or poor?”This variable represents the sum of respondents whoreported their health as either fair or poor.
Self-Reported Disease. Disease specific variables werefor questions on whether respondents ever had beentold they had the condition.
Health Utilization and Access Variables
Every participant was asked questions about whether they“had a problem receiving care you or your doctor believednecessary” or “problem seeing a specialist,” and thevariable is a combination of two answers: big problemor small problem.
Trend Calculations
Although it is possible to compare trends betweentwo surveys that have similar design, we did not applystatistical test on data across the two surveys because thesurvey response rates and methods were slightly different.Our data analysis included statistical tests only betweengroups for the MLK Survey.
Weighting
The survey data was weighted for the SPA 6 populationaccording to U.S. Census data for this area as defined bystudy zip codes. The data are adjusted to reflect the actualdistribution of characteristics of the larger population fromwhich the sample was drawn for population race/ethnicity,age distribution, and poverty levels. The CHIS data are alsoweighted, and more detail on their weighting methodologyis available at http://www.chis.ucla.edu/methodology.html.
Suppressed Data
When a cell has fewer than five respondents in it, noinformation is presented for the CHIS data.
ResultsTable APP.2 shows the demographic characteristics of thestudy participants. More women than men and moreindividuals from higher- rather than lower-income bracketsparticipated in the study. Among the study participants, weanalyzed the overall results and present the data weightedto be more representative of South LA (SPA 6) by certainfactors (age, race, and poverty). In addition, we compareresults by:• race/ethnicity• age groups (50–64 years old vs. over 65)• previous survey data• geographic comparisons.
HISTORICAL MILESTONES SURVEY DATA SOURCE
1965: Watts Riots & McCone Commission Recommendations1972: MLK Hospital built2003 CHIS2004: Hospital was unable to meet licensing standards2005 CHIS2007: Inpatient Beds and Emergency Department closed2008 MLK Survey
TABLE APP.1 Historical Milestones and Related Survey Data.
CHIS = California Health Interview Survey; MLK Survey=Survey conducted by UCLA and Task Force.
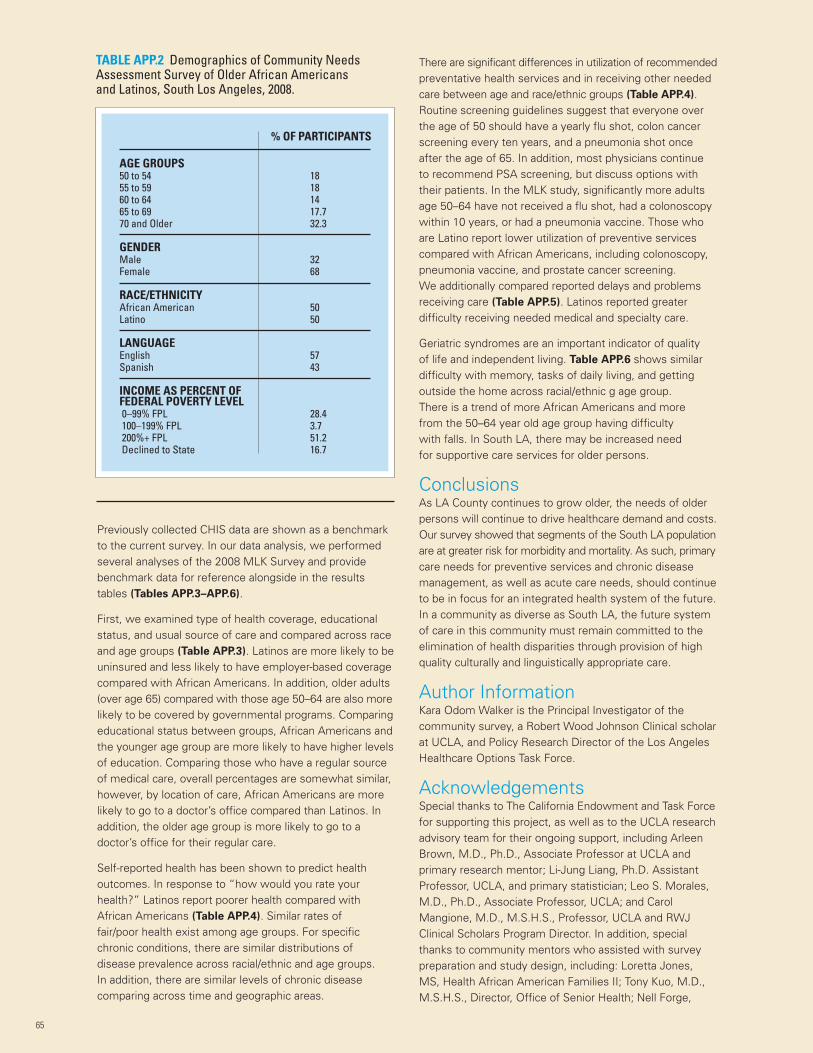
Previously collected CHIS data are shown as a benchmarkto the current survey. In our data analysis, we performedseveral analyses of the 2008 MLK Survey and providebenchmark data for reference alongside in the resultstables (Tables APP.3–APP.6).
First, we examined type of health coverage, educationalstatus, and usual source of care and compared across raceand age groups (Table APP.3). Latinos are more likely to beuninsured and less likely to have employer-based coveragecompared with African Americans. In addition, older adults(over age 65) compared with those age 50–64 are also morelikely to be covered by governmental programs. Comparingeducational status between groups, African Americans andthe younger age group are more likely to have higher levelsof education. Comparing those who have a regular sourceof medical care, overall percentages are somewhat similar,however, by location of care, African Americans are morelikely to go to a doctor’s office compared than Latinos. Inaddition, the older age group is more likely to go to adoctor’s office for their regular care.
Self-reported health has been shown to predict healthoutcomes. In response to “how would you rate yourhealth?” Latinos report poorer health compared withAfrican Americans (Table APP.4). Similar rates offair/poor health exist among age groups. For specificchronic conditions, there are similar distributions ofdisease prevalence across racial/ethnic and age groups.In addition, there are similar levels of chronic diseasecomparing across time and geographic areas.
There are significant differences in utilization of recommendedpreventative health services and in receiving other neededcare between age and race/ethnic groups (Table APP.4).Routine screening guidelines suggest that everyone overthe age of 50 should have a yearly flu shot, colon cancerscreening every ten years, and a pneumonia shot onceafter the age of 65. In addition, most physicians continueto recommend PSA screening, but discuss options withtheir patients. In the MLK study, significantly more adultsage 50–64 have not received a flu shot, had a colonoscopywithin 10 years, or had a pneumonia vaccine. Those whoare Latino report lower utilization of preventive servicescompared with African Americans, including colonoscopy,pneumonia vaccine, and prostate cancer screening.We additionally compared reported delays and problemsreceiving care (Table APP.5). Latinos reported greaterdifficulty receiving needed medical and specialty care.
Geriatric syndromes are an important indicator of qualityof life and independent living. Table APP.6 shows similardifficulty with memory, tasks of daily living, and gettingoutside the home across racial/ethnic g age group.There is a trend of more African Americans and morefrom the 50–64 year old age group having difficultywith falls. In South LA, there may be increased needfor supportive care services for older persons.
ConclusionsAs LA County continues to grow older, the needs of olderpersons will continue to drive healthcare demand and costs.Our survey showed that segments of the South LA populationare at greater risk for morbidity and mortality. As such, primarycare needs for preventive services and chronic diseasemanagement, as well as acute care needs, should continueto be in focus for an integrated health system of the future.In a community as diverse as South LA, the future systemof care in this community must remain committed to theelimination of health disparities through provision of highquality culturally and linguistically appropriate care.
Author InformationKara Odom Walker is the Principal Investigator of thecommunity survey, a Robert Wood Johnson Clinical scholarat UCLA, and Policy Research Director of the Los AngelesHealthcare Options Task Force.
AcknowledgementsSpecial thanks to The California Endowment and Task Forcefor supporting this project, as well as to the UCLA researchadvisory team for their ongoing support, including ArleenBrown, M.D., Ph.D., Associate Professor at UCLA andprimary research mentor; Li-Jung Liang, Ph.D. AssistantProfessor, UCLA, and primary statistician; Leo S. Morales,M.D., Ph.D., Associate Professor, UCLA; and CarolMangione, M.D., M.S.H.S., Professor, UCLA and RWJClinical Scholars Program Director. In addition, specialthanks to community mentors who assisted with surveypreparation and study design, including: Loretta Jones,MS, Health African American Families II; Tony Kuo, M.D.,M.S.H.S., Director, Office of Senior Health; Nell Forge,
65
% OF PARTICIPANTS
AGE GROUPS50 to 54 1855 to 59 1860 to 64 1465 to 69 17.770 and Older 32.3
GENDERMale 32Female 68
RACE/ETHNICITYAfrican American 50Latino 50
LANGUAGEEnglish 57Spanish 43
INCOME AS PERCENT OFFEDERAL POVERTY LEVEL0–99% FPL 28.4100–199% FPL 3.7200%+ FPL 51.2Declined to State 16.7
TABLE APP.2 Demographics of Community NeedsAssessment Survey of Older African Americansand Latinos, South Los Angeles, 2008.
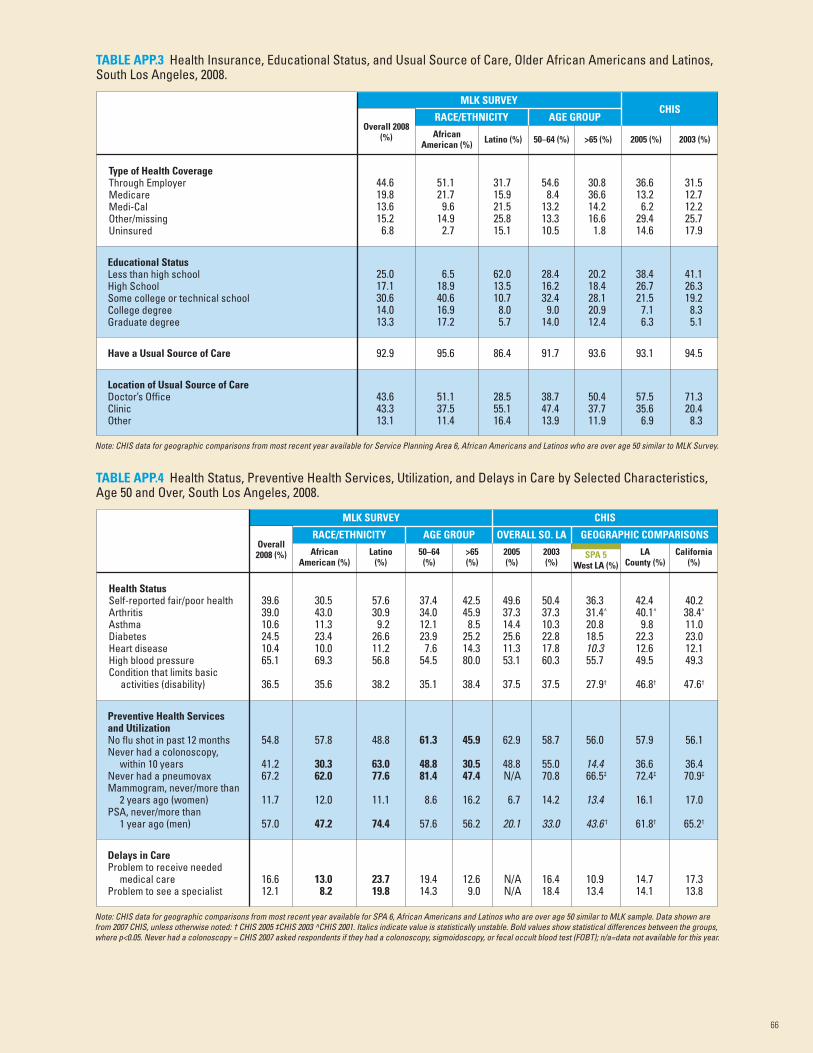
66
TABLE APP.3 Health Insurance, Educational Status, and Usual Source of Care, Older African Americans and Latinos,South Los Angeles, 2008.
Type of Health CoverageThrough EmployerMedicareMedi-CalOther/missingUninsured
Overall 2008(%) African
American (%)
Location of Usual Source of CareDoctor’s OfficeClinicOther
43.6 51.1 28.5 38.7 50.4 57.5 71.343.3 37.5 55.1 47.4 37.7 35.6 20.413.1 11.4 16.4 13.9 11.9 6.9 8.3
Have a Usual Source of Care 92.9 95.6 86.4 91.7 93.6 93.1 94.5
25.0 6.5 62.0 28.4 20.2 38.4 41.117.1 18.9 13.5 16.2 18.4 26.7 26.330.6 40.6 10.7 32.4 28.1 21.5 19.214.0 16.9 8.0 9.0 20.9 7.1 8.313.3 17.2 5.7 14.0 12.4 6.3 5.1
Educational StatusLess than high schoolHigh SchoolSome college or technical schoolCollege degreeGraduate degree
44.6 51.1 31.7 54.6 30.8 36.6 31.519.8 21.7 15.9 8.4 36.6 13.2 12.713.6 9.6 21.5 13.2 14.2 6.2 12.215.2 14.9 25.8 13.3 16.6 29.4 25.76.8 2.7 15.1 10.5 1.8 14.6 17.9
Latino (%) 50–64 (%) >65 (%) 2005 (%) 2003 (%)
TABLE APP.4 Health Status, Preventive Health Services, Utilization, and Delays in Care by Selected Characteristics,Age 50 and Over, South Los Angeles, 2008.
Health StatusSelf-reported fair/poor healthArthritisAsthmaDiabetesHeart diseaseHigh blood pressureCondition that limits basic
activities (disability)
Overall2008 (%)
RACE/ETHNICITY
Delays in CareProblem to receive needed
medical careProblem to see a specialist
16.6 13.0 23.7 19.4 12.6 N/A 16.4 10.9 14.7 17.312.1 8.2 19.8 14.3 9.0 N/A 18.4 13.4 14.1 13.8
54.8 57.8 48.8 61.3 45.9 62.9 58.7 56.0 57.9 56.1
41.2 30.3 63.0 48.8 30.5 48.8 55.0 14.4 36.6 36.467.2 62.0 77.6 81.4 47.4 N/A 70.8 66.5‡ 72.4‡ 70.9‡
11.7 12.0 11.1 8.6 16.2 6.7 14.2 13.4 16.1 17.0
57.0 47.2 74.4 57.6 56.2 20.1 33.0 43.6 † 61.8† 65.2†
Preventive Health Servicesand UtilizationNo flu shot in past 12 monthsNever had a colonoscopy,
within 10 yearsNever had a pneumovaxMammogram, never/more than
2 years ago (women)PSA, never/more than
1 year ago (men)
39.6 30.5 57.6 37.4 42.5 49.6 50.4 36.3 42.4 40.239.0 43.0 30.9 34.0 45.9 37.3 37.3 31.4^ 40.1^ 38.4^
10.6 11.3 9.2 12.1 8.5 14.4 10.3 20.8 9.8 11.024.5 23.4 26.6 23.9 25.2 25.6 22.8 18.5 22.3 23.010.4 10.0 11.2 7.6 14.3 11.3 17.8 10.3 12.6 12.165.1 69.3 56.8 54.5 80.0 53.1 60.3 55.7 49.5 49.3
36.5 35.6 38.2 35.1 38.4 37.5 37.5 27.9† 46.8† 47.6†
Latino(%)
50–64(%)
>65(%)
2005(%)
2003(%)
Note: CHIS data for geographic comparisons from most recent year available for Service Planning Area 6, African Americans and Latinos who are over age 50 similar to MLK Survey.
Note: CHIS data for geographic comparisons from most recent year available for SPA 6, African Americans and Latinos who are over age 50 similar to MLK sample. Data shown arefrom 2007 CHIS, unless otherwise noted: † CHIS 2005 ‡CHIS 2003 ^CHIS 2001. Italics indicate value is statistically unstable. Bold values show statistical differences between the groups,where p<0.05. Never had a colonoscopy = CHIS 2007 asked respondents if they had a colonoscopy, sigmoidoscopy, or fecal occult blood test (FOBT); n/a=data not available for this year.
SPA 5West LA (%)
LACounty (%)
California(%)
AfricanAmerican (%)
AGE GROUP OVERALL SO. LA
CHISMLK SURVEY
GEOGRAPHIC COMPARISONS
AGE GROUPRACE/ETHNICITY
MLK SURVEYCHIS
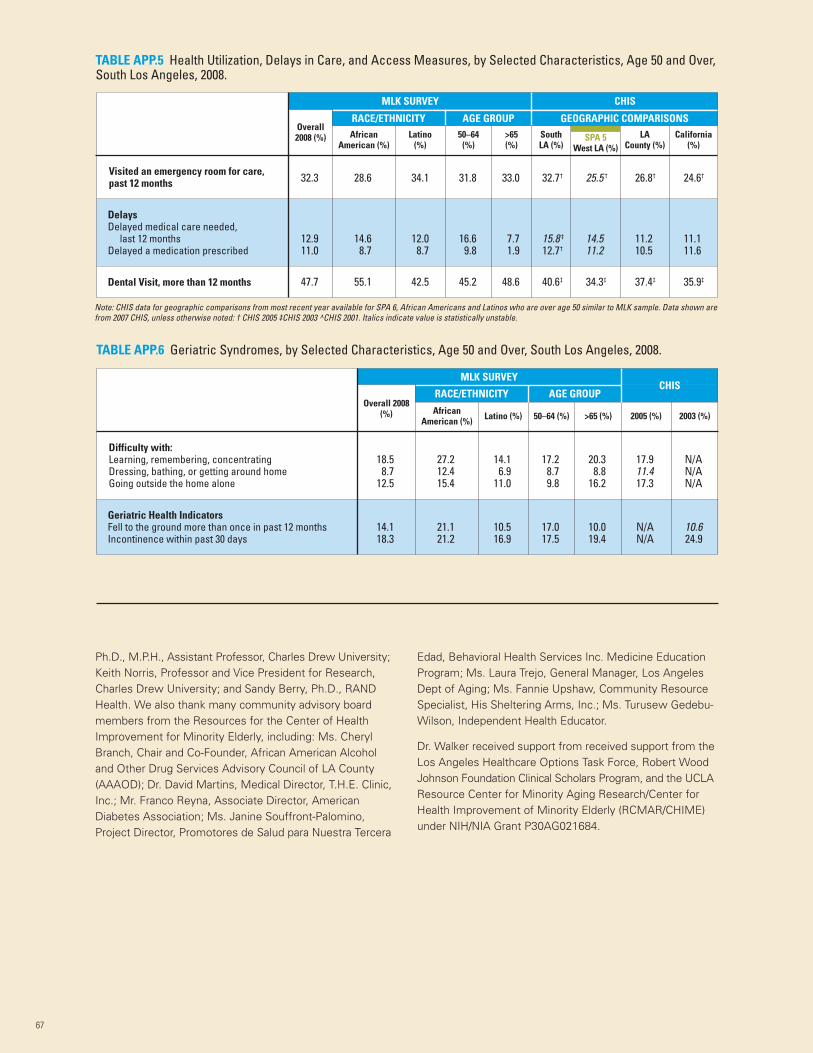
Ph.D., M.P.H., Assistant Professor, Charles Drew University;Keith Norris, Professor and Vice President for Research,Charles Drew University; and Sandy Berry, Ph.D., RANDHealth. We also thank many community advisory boardmembers from the Resources for the Center of HealthImprovement for Minority Elderly, including: Ms. CherylBranch, Chair and Co-Founder, African American Alcoholand Other Drug Services Advisory Council of LA County(AAAOD); Dr. David Martins, Medical Director, T.H.E. Clinic,Inc.; Mr. Franco Reyna, Associate Director, AmericanDiabetes Association; Ms. Janine Souffront-Palomino,Project Director, Promotores de Salud para Nuestra Tercera
Edad, Behavioral Health Services Inc. Medicine EducationProgram; Ms. Laura Trejo, General Manager, Los AngelesDept of Aging; Ms. Fannie Upshaw, Community ResourceSpecialist, His Sheltering Arms, Inc.; Ms. Turusew Gedebu-Wilson, Independent Health Educator.
Dr. Walker received support from received support from theLos Angeles Healthcare Options Task Force, Robert WoodJohnson Foundation Clinical Scholars Program, and the UCLAResource Center for Minority Aging Research/Center forHealth Improvement of Minority Elderly (RCMAR/CHIME)under NIH/NIA Grant P30AG021684.
67
TABLE APP.5 Health Utilization, Delays in Care, and Access Measures, by Selected Characteristics, Age 50 and Over,South Los Angeles, 2008.
47.7 55.1 42.5 45.2 48.6 40.6‡ 34.3‡ 37.4‡ 35.9‡
12.9 14.6 12.0 16.6 7.7 15.8 ‡ 14.5 11.2 11.111.0 8.7 8.7 9.8 1.9 12.7† 11.2 10.5 11.6
32.3 28.6 34.1 31.8 33.0 32.7† 25.5 † 26.8† 24.6†
Note: CHIS data for geographic comparisons from most recent year available for SPA 6, African Americans and Latinos who are over age 50 similar to MLK sample. Data shown arefrom 2007 CHIS, unless otherwise noted: † CHIS 2005 ‡CHIS 2003 ^CHIS 2001. Italics indicate value is statistically unstable.
LACounty (%)
California(%)
SPA 5West LA (%)
SouthLA (%)
>65(%)
50–64(%)
Latino(%)
AfricanAmerican (%)
Overall2008 (%)
Visited an emergency room for care,past 12 months
DelaysDelayed medical care needed,
last 12 monthsDelayed a medication prescribed
Dental Visit, more than 12 months
CHISMLK SURVEY
RACE/ETHNICITY AGE GROUP GEOGRAPHIC COMPARISONS
TABLE APP.6 Geriatric Syndromes, by Selected Characteristics, Age 50 and Over, South Los Angeles, 2008.
Difficulty with:Learning, remembering, concentratingDressing, bathing, or getting around homeGoing outside the home alone
Overall 2008(%) African
American (%)
14.1 21.1 10.5 17.0 10.0 N/A 10.618.3 21.2 16.9 17.5 19.4 N/A 24.9
Geriatric Health IndicatorsFell to the ground more than once in past 12 monthsIncontinence within past 30 days
18.5 27.2 14.1 17.2 20.3 17.9 N/A8.7 12.4 6.9 8.7 8.8 11.4 N/A
12.5 15.4 11.0 9.8 16.2 17.3 N/A
Latino (%) 50–64 (%) >65 (%) 2005 (%) 2003 (%)
AGE GROUPCHIS
RACE/ETHNICITY
MLK SURVEY
68
Denver Health and HospitalAuthority (Denver, CO)Denver Health, formerly Denver General, was firstestablished in 1860 as part of the city government. In1997, it became the Denver Health and Hospital Authority(the Authority, or Denver Health), separating its governancefrom the city government. However, Denver Health hasremained as the city’s healthcare system. Denver Healthprovides access to care for individuals regardless of theirability to pay; its “mantra” is to provide high-quality carewithout disparity. It provides life-saving emergent andtrauma services, fulfills public health functions, participatesin medical education, and engages in research.
Denver Health is an integrated organization that includes ahospital housing a trauma center, a 911 response systemfor Denver County, the Denver Public Health Department,8 family health centers, 12 school-based health centers,the Rocky Mountain Poison and Drug Center, a telephoneadvice line for patients, a community detoxification facility,correctional facility care, and a health plan. Denver Healthalso has research and education operations that include theDenver Health Paramedic School; the Rocky MountainCenter for Medical Response to Terrorism, MassCasualties and Epidemics; the Rita Bass Trauma & EMSEducation Institute; and the Colorado Biological, Nuclear,Incendiary, Chemical and Explosive (BNICE) TrainingCenter. Denver Health estimates that 25 percent of allDenver residents, or 160,000 individuals, receive theirhealthcare through Denver Health.
The Denver Public Health Department’s physiciansnot only treat patients, but also manage issues relatedto epidemics, tuberculosis, HIV/AIDS, and sexuallytransmitted diseases. Denver’s Public Health Departmentalso offers immunizations and provides inoculations topeople planning travel abroad. In the area of infectiousdisease, the Public Health Department has three board-certified specialists and seven physicians and incurs50,000 patient visits each year.
Denver Health is governed by a nine-member Board ofDirectors that is appointed by the Mayor of Denver.The State of Colorado statute that created the Authorityindicates that “except for the power of the City and theMayor to appoint and remove members of the Authority’sBoard of Directors, the City shall have no further controlover the operation of the health system.” Since the City of
Denver’s accountability for the Authority does not extendbeyond making Board appointments and there is no fiscaldependency by the Authority on the City, the City considersthe Authority a related organization and does not presentthe financial position and results for the Authority in theCity’s financial statements.
Financial Profile
Since 1996, the City and the Authority have adopted anOperating Agreement to describe the relationship in theprovision of services to the City. According to the City ofDenver’s audited December 31, 2007, ComprehensiveAnnual Financial Report, the City reimbursed the Authority$51.2 million for providing various health related servicesto the City and its residents during 2007, and the Authoritymade payments in the amount of $1.9 million to the Cityfor police, fire, legal, and human resources services.
According to its 2007 Annual Report to the Community,Denver Health reported total operating revenue of $551million, principally composed of $219 million in net patientservice revenue, $124 million in premiums earned from itsmanaged care plan, Denver Health Medical Plan, Inc., $70million in Medicaid disproportionate share and other safetynet reimbursement, $44 million in hospital and otherpurchased services by the City of Denver, $31 million inFederal and State grants, $22 million in poison and drugcenter contracts, and $17 million in other grants. DenverHealth reported operating income of $5 million and anincrease in net assets of $6 million. The Annual Reportindicates that $276 million of care was provided to theuninsured in 2007, but does not identify whether thatamount represents the cost of care provided or theamount of charges foregone for such care.
Major Recognitions
Denver Health was named a top performing public safetynet hospital by the University Healthcare Consortium(UHC) for areas related to patient safety and quality.Denver Health has also received the following recognitions:The Denver Health Immunization Program (DHIP) receivedthe Award of Excellence from the Colorado Departmentof Public Health and Environment for its ImmunizationOutreach Project; Denver Health was named to Hospitals& Health Network’s 2007 “Most Wired” list; and DenverHealth ranked on the Hospitals & Health Network’s Top 25Most Improved list in 2005 and 2003.
Appendix D:Health System Profiles
This appendix profiles four public safety net healthcare delivery systems in the United States, and includesbackground information, a financial profile, a summary of some major recognitions, and selected leadingpractices. The selected leading practices cited for each system are examples and illustrations only, ratherthan an exhaustive list of every leading practice at each system. The information is cited from the websites,annual community reports, financial reports, news releases, and other public sources as referenced.
69
Selected Leading Practices
• Quality Measures: Denver Health focuses on reducingmortality rates within service lines and has been praisedby the Commonwealth Fund for being a “learninglaboratory” for the nation in patient safety and quality.Mortality information is displayed as expected-to-observed,with the standard being one to one – one expecteddeath, one observed death. At Denver Health, the ratiodropped to as low as 0.47, meaning that less than halfthe expected deaths occurred. The ratio was consistentlybelow 1.0 during the entire previous three-year period.
• Trauma Care: The Rocky Mountain Regional Level OneTrauma Center at Denver Health cares for severely injuredpatients from around the region. The trauma teamconsists of emergency medicine physicians, surgeons,neurosurgeons, orthopedic surgeons, plastic surgeons,anesthesiologists, radiologists, and numerous physicianspecialists, along with trauma nurses and other criticalcare professionals. The survival rate for patients enteringthe facility is 95 percent. A highly trained cadre ofparamedics serves as the pre-hospital team.
• Continuous Improvement/Improved Cost Effectiveness:Denver Health was once faced with serious challengesto its financial viability. Rather than cutting the numberof uninsured patients it served, Denver Health embracedthe need for transformation and launched a comprehensiveredesign initiative.
In 2003, Denver Health streamlined its operations usingToyota’s “Lean Manufacturing” approach, focusing onaccess, inpatient flow, outpatient flow, operating roomflow, and billing. The Lean model was used to identifyand eliminate waste to reduce overhead. Lean processimprovements have generated the most widespreadactivity and the broadest organization-wide change.The Lean tools for seeing and eliminating waste areemployed in a structured way in the Rapid ImprovementEvent (RIE), which pulls together a team of employeeswith the goal of fixing a process problem in one week.Ultimately, Denver Health trained 100 employees,including doctors and nurses, as “Black Belts” in Lean.In this manner, Denver Health eliminates wastefulsteps and processes, improving efficiency and qualityby engaging hundreds of employees. As a result,Denver Health employees have become very savvyabout eliminating waste.
As noted by Denver Health’s CEO and Medical Director,Patricia A. Grabow, M.D., in the 2007 Annual Report,Denver Health views the elimination of waste throughthe Lean as a matter of respect for people – fundamental
to the organization’s commitment. “It may seem strangeto say that elimination of waste is about respect, but thepresident of Toyota has said just that: ‘waste is disrespectfulof humanity because it squanders scarce resources, andwaste is disrespectful of the individual because it asksthem to work with no value.’ At Denver Health, we haveadded that waste is disrespectful of our patients becauseit makes them endure processes with no value.’”
In 2007, Denver Health reported saving $11 million with100 Black Belt employees, including 130 RIEs held and704 employees involved. Over 19 different departmentssuccessfully used RIEs. Employees consistently came upwith ideas for RIEs that have the potential to enhance thepatient experience, solve problems, reduce waste, andsave money in just one week.
Other reported noticeable benefits included:
— Hospital length of stay decreased by one day.— Clinic visits per provider increased, adding revenue
without adding cost and increasing patient access.— The time from initial bed request to room
assignment was reduced by more than 33 percent.— Patients receiving antibiotics within one hour of
surgical cut reached nearly 100 percent, therebyreducing the number of hospital acquired infections.
— Patient appointment reminder calls initiated with a75 percent patient contact rate.
— Collection of unused pagers resulted in a savings ofmore than $4,000 per year.
— Infusion Center redesigned to add patient carespace thereby increasing revenue by nearly$200,000 in just one year.
• Telemedicine: Denver Health offers telemedicine to treatand teach. Telemedicine is used to treat minor injuriesand illnesses as an alternate option to an in-personconsult with prisoners. Denver Health’s educationalprograms in trauma/EMS, medicine, pediatrics, andnursing are available via videoconferencing.
• Population Health/Disease Management: Denver Healthoffers a “Health Coach” program that assists its membersin managing chronic disease and promotes healthylifestyle changes. The program places an emphasis onthe members that have more than one chronic disease,such as asthma and diabetes. Members who havecomplicated healthcare issues have been hospitalized orhad an ER visit can also obtain coaching from a HealthCoach. Most coaching is conducted over the telephoneand through e-mail.
Sources:Denver Health Facts. Available at: www.denverhealth.org/portal/LinkClick.aspx?fileticket=qo6FWlICpHo%3d&tabid=1966&mid=3083Denver Health 2007 Annual Report. Available at: http://www.denverhealth.org/portal/LinkClick.aspx?fileticket=rxqVfEwSXkY%3d&tabid=1976&mid=3084Denver Health website. Available at: http://www.denverhealth.org/portal/AboutDH/DenverHealthOverview/tabid/267/Default.aspxDenver Health Brochure. Available at: http://www.denverhealth.org/portal/LinkClick.aspx?fileticket=d1Wry7whCSU%3d&tabid=1966&mid=3083R. Nuzum, D. McCarthy, A. Gauthier, and C. Beck, Denver Health: A High-Performance Public Health Care System, The Commonwealth Fund, July 2007.Denver Audits, 2008. Available at: http://www.denvergov.org/Audits2008/tabid/428946/Default.aspx
70
Harris County Hospital District(Houston, TX)The Harris County Hospital District (HCHD, or “the District”)was established in 1966 as a political subdivision with taxingauthority by the State of Texas legislature and approved bythe voters of Harris County. According to the February 29,2008, HCHD-audited financial statements and the HarrisCounty, Texas, audited Comprehensive Annual FinancialReport, the District is legally separate from the County andis presented as a discrete component unit in the HarrisCounty financial statements, since the members of theDistrict’s governing Board of Managers are appointed bythe Harris County Commissioners’ Court, composed offour Commissioners and the County Judge. The HarrisCounty Commissioners’ Court also approves the District’stax rate, as well as the annual operating and capital budget.Harris County does not provide any funding to the District,hold title to any of the District’s assets, or have any rightsto any surpluses of the District. The Hospital Districtcannot issue bonded debt without Commissioners’ Courtapproval, and the County has no obligation to assume anyliability for the bonds issued by the District.
HCHD provides medical care to all residents of Harris County,regardless of their ability to pay. The Hospital District includesthree hospitals (Ben Taub General Hospital, Lyndon B. JohnsonGeneral Hospital, and Quentin Mease Community Hospital),12 community health centers, a dialysis center, a dentalcenter, 8 school-based clinics, 13 homeless shelter clinics,and 5 mobile health units throughout Harris County. In2004, HCHD accommodated more than 1.26 millionemergency and outpatient visits.
Best known for its hospitals and trauma care, HCHD offersa broad range of services for Houston’s uninsured andunderinsured. As the public healthcare system for thenation’s third most populous county, HCHD delivers fullyintegrated healthcare services to a broad cross-section ofarea residents. Patients are insured by Medicare, Medicaid,or private insurance, but many are among the 1.2 millionHarris County residents who are uninsured or underinsured.Harris County has unique employment characteristics, withsmall businesses employing a majority of the residents.Such small businesses are not able to afford adequateemployee health insurance, and, as a result, there is amajor need for healthcare services greater than what iscurrently provided at HCHD facilities.
Financial Profile
In its audited February 29, 2008, financial statements, theDistrict reported total operating revenue of $793 million,principally composed of $258 million in net patient servicerevenue, $165 million of Disproportionate Share Hospitaland Upper Payment Limit Funding through the State ofTexas Medicaid program, and $345 million in premiumrevenue from the District’s health maintenance organization,Community Health Choice, Inc. The District reported anoperating loss of $389 million and negative cash flowsfrom operating activities of $250 million. Operating losses
and negative cash flows were offset by $521 million and$505 million, respectively, of non-operating revenues andnoncapital financing funds principally composed of advalorem taxes levied by the Harris County Commissioner’sCourt for the District, as provided under state law.
Overall, for fiscal year 2008, the District reported anincrease in net assets of $133 million and a net increase incash and cash equivalents of $45 million. The estimatedcost incurred to provide charitable services for 2008 wasreported at $846 million.
Major Recognitions
HCHD received the 2007 Gold Award for community-basedprograms from the American Psychiatric Association forthe Community Behavioral Health Program.
Selected Leading Practices
• Taxing Authority: Harris receives tax-based support – over$478 million received in 2008. HCHD is tax-supported andalmost 60 percent of funding comes from other sources.During fiscal year 2008, HCHD leveraged that $478 millionin tax-base support into $846 million of charity care.
• Capital Investment: During fiscal year 2008, HCHDlaunched a major, multiphase capital program. Over thenext four years, an investment of over $350 million isplanned to expand and balance their healthcare deliveryplatform. Investments are intended to improve accessto healthcare services, reduce wait times, and increasethe number of patients. As a basis for their capitalinvestments, HCHD developed a strategic plan designedto ensure that patients are seen by the appropriateclinicians at the appropriate locations. HDHD’s planemphasizes community-based preventive and primarycare, augments the traditional doctor/nurse modelwith a wide variety of medical practitioners, andprovides for outpatient and diagnostic servicesoutside of the hospital setting.
• Centers of Excellence: Patients benefit from a Level 1Trauma Center, a regional center for neonatal intensivecare, a mental health program, and an HIV/AIDStreatment facility.
• Community Health and Disease Management:HCHD provides several community programs thatpromote preventive care and disease management.Such programs include TroubleShooting for Health – amobile health program providing preventive care andhealth screenings to patients in their neighborhoods.
• Patient Access and Counseling: HCHD helps patientschoose a facility to meet their needs through a freetelephone service. This service is staffed by a registerednurse and is available 24 hours a day, seven days aweek. The nurse advises patients regarding whetheran ER visit is required, as well as information ontreatment of routine medical conditions.
Sources:Harris County Financial Statements. Available at: http://www.co.harris.tx.us/Auditor/statements_reports.aspxA Healthier Harris County. 2008 Annual Report. Available at: http://www.hchdonline.com/about/financials/2008AnnualReport.pdf
71
Hennepin Healthcare System, Inc.(Minneapolis, MN)Hennepin County Medical Center (HCMC) was foundedin 1964 after Hennepin County (the County) assumedownership. Predecessor organizations provided care forthe health of County residents for almost 120 years.HCMC includes one hospital and four primary care clinicsin the Twin Cities. HCMC is the Level 1 Trauma centerfor the state and is the leading safety net system in theregion for low income, uninsured, and vulnerable patients.HCMC serves patients, regardless of their ability to pay.
In 2005, the Minnesota Legislature passed legislationenabling the Hennepin County Board of Commissionersto create Hennepin Healthcare System, Inc. (HHS), a publiccorporation to be operated as a subsidiary of the County.The purpose of HHS is to deliver healthcare and relatedservices to the general public, including the indigent, toengage in related programs of education and research,continuing to operate HCMC, and to possibly developother healthcare services in the future. This change ingovernance was designed to give HCMC the autonomyand flexibility it needs to compete in a rapidly andever-changing healthcare industry.
HHS’s volunteer Board of Directors consists of between11 and 15 members (13 during the first three years) andincludes two County Commissioners and the CEO of theCorporation in an ex officio capacity. Remaining Boardmembers are selected based in part on the objective ofensuring diverse and beneficial perspectives including,but not limited to medical and other health professionals,urban, cultural, and ethnic professionals served, businessmanagement, law, finance, health sector employees,public health, serving the uninsured, health professionaltraining, and the patient or consumer perspective. The initialBoard of Directors was appointed by the County Board;thereafter, except for the ex officio directors, the HHSBoard selects its own directors through a nominationprocess facilitated by an HHS Governance Committee.
The County Board retains significant control over HHS’smission and operations, capital planning, issuance of debt,and authority over the operating budget via annual approval.State legislation provides that if the County Board is notsatisfied with the performance of HHS, it may dissolve thecorporation with a two-thirds vote of the County Board.
Financial Profile
According to the December 31, 2007, auditedComprehensive Annual Financial Report of HennepinCounty, HCMC is a legally separate entity and is presentedas a discrete component unit with the County’s financialstatements, rather than as a County enterprise fund, aswas the case prior to the January 1, 2007, governancechange. For the year ended December 31, 2006 – the yearprior to the governance change – HCMC reported totaloperating revenue of $464 million, principally composedof $430 million in net patient service revenue. HCMC
reported an operating loss of $12 million and negativecash flows from operating activities of $5 million.Operating losses and negative cash flows were offsetby $20 million and $44 million, respectively, of non-operating revenues and noncapital financing fundsprincipally composed of property taxes.
According to the December 31, 2007, auditedComprehensive Annual Financial Report of HennepinCounty, the County is committed to provide significantsupport to HCMC operations based upon the communitybenefits it provides. This includes use of certain County-owned lands and buildings at essentially no cost (theCounty owns the hospital assets), guaranteeing a specificlevel of cash liquidity for the Medical Center, providingfunding for the provision of uncompensated care based ona specific formula, and providing funds ($90 million) forcertain large Medical Center capital improvement projects.
The County provided 100 percent of employer paidhealthcare benefits for HCMC employees retiredas of December 31, 2006, and agreed that in wouldpay 50 percent of such costs in excess of $1 millionfor employees retiring after December 31, 2006.
The net assets contributed from the County to HCMCwhen it initially became a separately governed entity werein excess of $173.5 million. During 2007, the Countyprovided $28 million to HCMC in support ofuncompensated care provided to County citizens.
Major Recognitions
In 2008, HCMC was named one of America’s BestHospitals by U.S. News & World Report for the 12th yearin a row. HCMC has a kidney transplant program that wasranked third in the nation in 2003 by the University HealthSystem Consortium (UHC) study of “best performers” inthe area of kidney transplants. HCMC was awarded the2003 Medica Choice Quality Improvement award in theareas of diabetes, prenatal, and child and teen checkups.HCMC was the recipient of the Partners for ChangeAward from the Hospitals for a Healthy Environment(H2E) program, by the U.S. Environmental ProtectionAgency, the American Hospital Association, the AmericanNurses Association, and Health Care without Harm designedto improve the environmental performance of the field.
Selected Leading Practices
• Operational Agility Through County-Initiated GovernanceChange: In her 2007 annual budget message, HennepinCounty Administrator, Sandra L. Vargas, providedthese comments on Hennepin County MedicalCenter governance:
“The cost of healthcare services and technology hasskyrocketed, and the number of residents withoutinsurance and without access to health insurance hascontinued to climb. Uncompensated care costs at thehospital increased 27 percent, from about $26 millionin 2004 to more than $33 million in 2005. Given this
72
and other industry pressures, [the County] Boardrecognized the need to provide the hospital withgreater operational agility.”
• Centers of Excellence: HCMC offers COEs for patients inthe following areas – Cardiology/CV Surgery, Critical CareMedicine/Pulmonary, Diabetes, Emergency Services,Gastroenterology/Digestive Disorders, InfectiousDiseases, Maternal/Child Health, Neurosciences,Oncology, Orthopedics, Primary Care/Adult and Children,Psychiatry, Renal Diseases/Transplantation, PhysicalRehabilitation, Sleep Disorders, and Trauma.
• Disaster Preparedness: HCMC is the backbone of thestate’s disaster-preparedness system. HCMC providestrauma training to police, sheriff, and fire “first responders,”ambulance and air-link crews, and local emergencydepartment health personnel across the state. HCMCprovides Critical Care Teleconferences to hospitalsoutside the metro area and on-site trauma consultationand/or customized on-site training at the request of ruralhospitals. Other efforts include:
— Leading the coordination of hospital responseto emergency events within the metro areaand the state.
— Treating the first cases of any unknown infectiousdisease that arrive in the Twin Cities.
— Coordinating a cooperation response agreementwith 28 area hospitals to coordinate adisaster response.
— Monitoring and reporting hospital bed availabilityand coordinating transportation of patients betweenthe hospital and the disaster site.
— Providing funding to hospitals and lawenforcement agencies to purchase equipment, builddecontamination facilities, increase supplies of keypharmaceuticals, and otherwise prepare to respondto any incident where a large number of casualtiesmust be treated.
— Providing training in hazardous materials to firstresponders for illnesses and injuries related toweapons of mass destruction.
• Traumatic Brain Injury Focus: Hennepin’s “Save ThisBrain” campaign was an effort to educate consumersabout the impact, recognition, prevention, and treatmentof traumatic brain injuries. As a result of much success,Hennepin was presented with the internationalConsumer Health World Award for its successful publicawareness and prevention program.
• Community Health: HCMC is focusing on enhancingmental health, reducing health disparities, and improvingthe health of immigrant populations, expanding accessto primary care, and training the healthcare workforce.
• Cancer Care: The Cancer Center at Hennepin CountyMedical Center was awarded a certificate of approvalwith commendation from the Commission on Cancer,approving the cancer program through the year 2010.The cancer program exceeded standards of excellencein the diagnosis and treatment of cancer patients.
Sources:Hennepin County website. Available at: http://www.co.hennepin.mn.us/portal and http://www.hcmc.org/pr/publicrelations.aspHennepin County Medical Center Governance. Available at: http://www.hcmc.org/governance.htmHennepin County Medical Center. National Reputation for Quality and Centers of Emphasis and Excellence.
Available at: http://www.hcmc.org/pr/documents/NationalReputationforQuality.docHennepin County Medical Center. Minnesota’s Safety Net. Available at: http://www.hcmc.org/pr/documents/SafetyNet.docNews Releases:
a. Hennepin Receives International Award for Health Promotion. December 2008.b. Public invited to review 2008/2009 Health Services Plan draft. September 2008.c. One of America’s Best Hospitals – for the 12th year in a row. July 2008.d. Comprehensive Cancer Center approved with commendation from Commission on Cancer. April 2008.
Hennepin County Medical Center. Proposed Bylaws of Hennepin Healthcare System, Inc. April, 2006. Available at: http://www.hcmc.org/governance_bylaws.htm.
Appendix D continued on next page.
73
Parkland Health and HospitalSystem, Dallas County HospitalDistrict (Dallas, TX)Parkland Health and Hospital System has served thecommunity since the late 1800s. It was forever thrustinto national memory on November 22, 1963, as ParklandHospital’s trauma doctors and nurses struggled to savethe life of President John F. Kennedy.
From the poor and homeless to the wealthy, Parkland’scare delivery system, with over 8,100 physicians, nurses,and employees, treats one of the largest and most diversegroups of patients in the area. Parkland reports a diversepayer mix, comprised of self-pay (22 percent), charity(26 percent), Medicare (13 percent), Medicaid (30 percent),and commercial patients (9 percent).
According to the audited September 30, 2008, financialstatements of Dallas County Hospital District, doingbusiness as Parkland Health and Hospital System (theDistrict or Parkland) and the audited September 30, 2007,Dallas County, Texas (the County) Comprehensive AnnualFinancial Report, the District is a political subdivision ofthe State of Texas, legally separate from the primarygovernment of the County. The District operates as aspecial taxing district created in 1954 by a vote of thetaxpayers of the County.
The District is governed by a seven-member, volunteerBoard of Managers appointed by, but not composed of,County Commissioners. Five members of the Board areselected by individual Court officials; the remaining twoserve in an at-large capacity. The Commissioners Court ofthe County (composed of the four County Commissionersand the County Judge) approves the District’s tax rateand annual budget; however, the District operates underdifferent statutory and constitutional authority. The Districthas a separate constitutional tax limitation; independentpower of eminent domain; and individual right of ownershipof property. Dallas County does not provide any fundingto the District, hold title to any of the District’s assets, orhave any rights to any surpluses of the District. The Districtis presented as a discrete component unit in the DallasCounty financial statements to emphasize that it is legallyseparate from the primary Dallas County government.
Financial Profile
In its audited September 30, 2008 financial statements,Parkland reported total operating revenue of $983 million,principally composed of $385 million in net patient servicerevenue, $181 million of Disproportionate Share Hospitaland Upper Payment Limit Funding through the State ofTexas Medicaid program, and $386 million in premiumrevenue from Parkland’s HMO. Parkland reported anoperating loss of $321 million and negative cash flowsfrom operating activities of $345 million. Operating lossesand negative cash flows were offset by $444 million and$403 million, respectively, of non-operating revenues andnoncapital financing funds principally composed of ad
valorem taxes levied by Parkland and collected on itsbehalf by the County.
For fiscal year 2008, the District reported an increasein net assets of $128 million and a net increase in cashand cash equivalents of $80 million. The estimated costincurred to provide charitable services for 2008 wasreported at $259 million.
Major Recognitions
In 2008, Parkland was listed as one America’s BestHospitals for the 15th consecutive year by U.S. News& World Report. Additional recognitions include listing inthe 2009 ‘Top 100 Hospitals to Work For’ for nurses, the2007 Thomson 100 Top Hospitals National Benchmarksfor Success award, and the 2007 Quality ImprovementAchievement Award from the TMF Health Quality Institute.Additionally, in 2008, four Parkland nurses were named inthe “Great 100 Nurses” by the Texas Nurses Associationand the Dallas-Fort Worth Hospital Council. Parkland wasalso included in Verispan’s “Best of the Rest” listing ofIntegrated Healthcare Networks in 2007.
Selected Leading Practices
• Engaged Board: Parkland’s dedicated governingBoard of Managers meets monthly to overseemanagement’s activities, approve major contractsand policies, and perform reviews of performanceresults and major improvement initiatives. The Board’sagenda includes detailed briefings and analysisof historic and forward-looking metrics, includingcomparisons against targets, benchmarks, andpeer groups, in such areas as clinical quality, finance,technology, and internal audits. The Board is supportedby the work of its committees, including StrategicPlanning, Quality and Risk Management, Budget andFinance, Audit and Compliance, Information Systems,and Human Resources. The Board transparentlypublishes its agendas, minutes and meeting materialson the Parkland website. The Board meets in executivesession when warranted within the parametersestablished by State of Texas statute.
• Philanthropic Activity and Taxpayer-Approved FundingIncrease to Support Strategic Facility Upgrade: During2008, Parkland Foundation, the system’s philanthropicarm, announced its $150 million “I Stand for Parkland”campaign to replace Parkland’s aging main facilityand announced total gifts and commitments ofapproximately $80 million. The effort supports thesystem’s strategic plan, which includes a $1.3 billioncapital project for a 968-bed replacement hospital,outpatient center, and office space across from thepresent facility. Built in 1954, the hospital, whichoperates at full capacity, is more than 50 percent toosmall for the current volume of more than 1 millionpatient visits per year and to accommodate a doublingof Dallas County’s population by 2025.
74
In November 2008, Dallas County voters overwhelminglyapproved supporting ad valorem tax increase to supportthe issuance of up to $747 million in a combination oftax and revenue bonds – the primary source for thecapital project. Current and future hospital cash andinvestments are anticipated as another primary sourceof funding for the modernization project. Otherwise,Parkland’s tax rate did not increase from 2000 to 2008.
• Affiliation with Academic Medical Schools: Parkland isa primary teaching hospital for the University of TexasSouthwestern Medical Center. The hospital’s affiliationwith the University of Texas Southwestern MedicalCenter at Dallas helps educate physicians throughresidency and fellowship programs. More than60 percent of the doctors in the Dallas area haveundergone formal training at Parkland.
• Centers of Excellence: Parkland is comprised of onehospital organized around 10 COEs with the most skilledhealth professionals and state-of-the-art tools andequipment: Trauma, Burns, Spinal Cord Injuries,Cancer, Endocrinology, Women and Infants, Epilepsy,Gastroenterology, Cardiology, and Orthopedics.
• Primary Care and Outreach: In addition to Parkland’sCOEs at its hospital, the system focuses on communityhealth through its eleven community-oriented primarycare health centers, eleven youth and family centers,eight women’s clinics, four mobile vans, and variousoutreach programs aimed at education and prevention.For example, Parkland offers a Homeless OutreachMedical Services program that provides medical careto homeless individuals through medical vans. Anotherprogram is the mobile mammography van that assistsin early detection of breast cancer in the community.
• Process Improvement: Parkland adopted the Lean SixSigma methodology to reduce variations and wastedcosts from processes, operational inefficiencies, andorganizational performance. “As a public hospitalsystem it behooves us to find better ways to manageour dollars and to become more efficient in the ways
we use those funds. Part of our responsibility is tobe good stewards of our taxpayers’ dollars as wellas contributions from philanthropists, communityorganizations and government entities that help fundmany of our programs,” said Ron Anderson, M.D.,president and CEO of Parkland. “Six Sigma helps bringthose principles to the forefront of our operations.”
• Managed Care Plan and Programs to Promote Accessand Integrated Care: To focus on its mission, theParkland Community Health Plan, Inc. (PCHP) servesas a bridge, connecting Medicaid and Children’s HealthInsurance Program (CHIP) members to programs andservices designed specifically for them. PCHP membershave a “medical home” to address their medical andrelated social needs in a comprehensive, coordinatedfashion. The PCHP Medicaid Managed Care Programis called Parkland HEALTHfirst and the PCHP Children’sHealth Insurance Program is Parkland KIDSfirst.Unique to PCHP, members of Parkland HEALTHfirstand Parkland KIDSfirst who choose Parkland providerscan access their “medical home” with their providerafter Medicaid or CHIP eligibility ends through theParkland HEALTHplus program. Members’ primarycare provider serves as a partner who helps themmanage their medical care and well-being.
Parkland HEALTHplus is not a part of ParklandCommunity Health Plan, and is not health insurance.Parkland HEALTHplus is for Dallas County residentswho qualify based on information such as income,family size, and residency. Parkland HEALTHplus isa payment program for services received at ParklandMemorial Hospital or at one of the Parkland CommunityOriented Primary Care health centers only. There isno enrollment cost. Eligible enrollees are asked fora co-payment due at the time of service for clinicvisits, pharmacy prescriptions, supply items, orspecific procedures. Parkland HEALTHplus patientsreceive services that are medically necessary andare normally provided at any Parkland facility.
Sources:Parkland Hospital website. Available at: http://www.parklandhospital.com/index.htmlParkland Hospital Careers. Available at: http://www.parklandcareers.com/content.asp?c=aboparParkland Hospital 2006-2007 Annual Report. Available at http://www.parklandhospital.com/whoweare/pdf/AnnualReport.pdfParkland Hospital Fact Sheet. Available at: http://www.parklandhospital.com/whoweare/pdf/Parkland_FactSheet_FY07.pdfCorporate Approaches in Public Hospital Management. The Magazine of the National Association of Public Hospitals and Health Systems. The Safety Net, 21 (1). Winter 2007.National Association of Public Hospitals and Health Systems website. Available at: www.naph.org
Appendix E:Report on Leading Practices of Public Safety Net Healthcare Delivery Systems in the United States,
prepared by PricewaterhouseCoopers Available at www.calendow.org.
PHOTO CEDITS:Inside Cover, 33, 35 : New York City Health and Hospitals Corporation; Pages 2, 10, 15 : Anthem Blue Cross; Page 9 : UniHealth Foundation; Pages 31-32 : Jackson Health System;Pages 35, 49, 50 : Los Angeles County Department of Health Services.

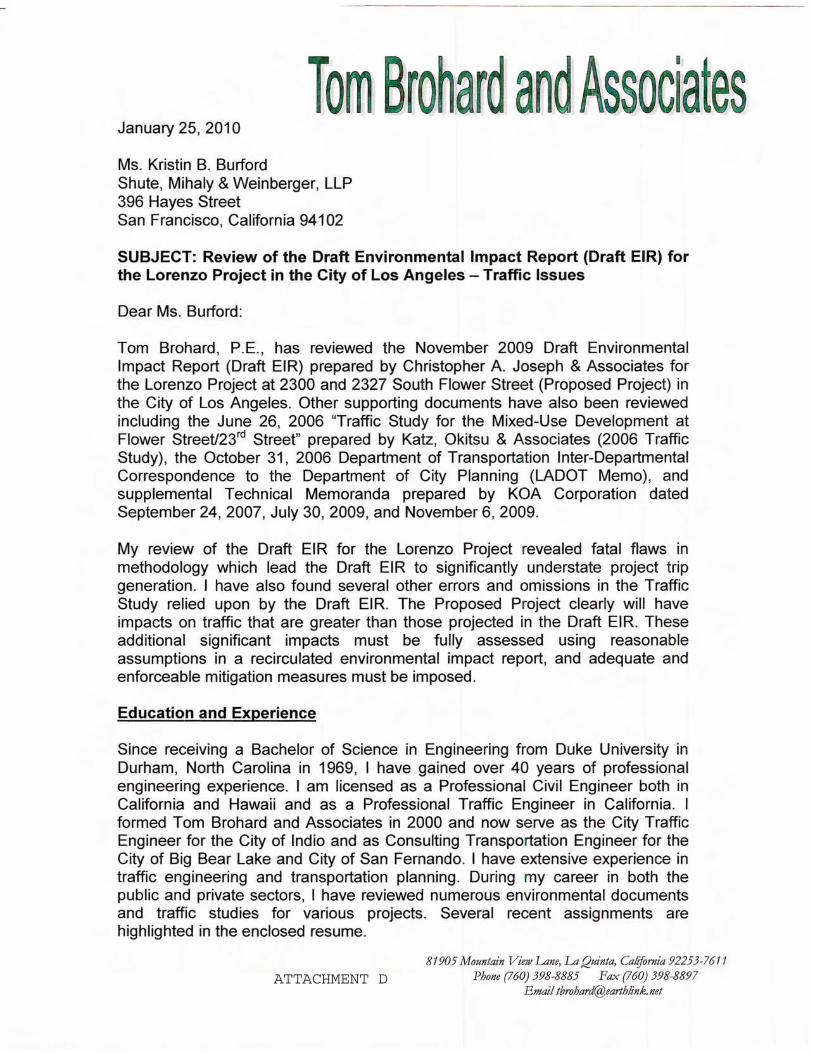
ATTACHMENT D
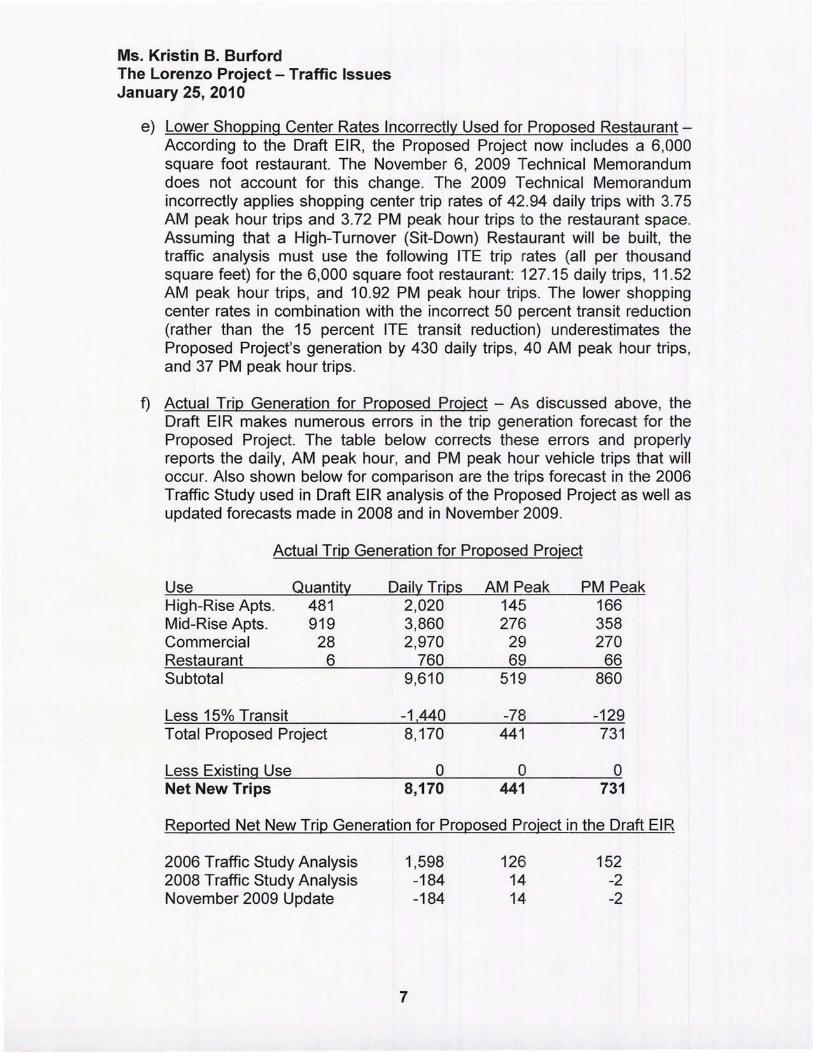
Tom Brohard and Associates
Tom Brohard, PE
Licenses: 1975 / Professional Engineer / California – Civil, No. 24577 1977 / Professional Engineer / California – Traffic, No. 724 2006 / Professional Engineer / Hawaii – Civil, No. 12321
Education: 1969 / BSE / Civil Engineering / Duke University
Experience: 39 Years
Memberships: 1977 / Institute of Transportation Engineers – Fellow, Life 1978 / Orange County Traffic Engineers Council - Chair 1982-1983 1981 / American Public Works Association - Member
Tom is a recognized expert in the field of traffic engineering and transportation planning. His background also includes responsibility for leading and managing the delivery of various contract services to numerous cities in Southern California.
Tom has extensive experience in providing transportation planning and traffic engineering services to public agencies. Since May 2005, he has served as Consulting City Traffic Engineer three days a week to the City of Indio. He also currently provides “on call” Traffic and Transportation Engineer services to the Cities of Big Bear Lake and San Fernando. In addition to conducting traffic engineering investigations for Los Angeles County from 1972 to 1978, he has previously served as City Traffic Engineer in the following communities:
o Bellflower ..................................................... 1997 - 1998 o Bell Gardens ................................................ 1982 - 1995 o Huntington Beach ........................................ 1998 - 2004 o Lawndale ..................................................... 1973 - 1978 o Los Alamitos ................................................ 1981 - 1982 o Oceanside ................................................... 1981 - 1982 o Paramount................................................... 1982 - 1988 o Rancho Palos Verdes .................................. 1973 - 1978 o Rolling Hills .................................................. 1973 - 1978, 1985 - 1993 o Rolling Hills Estates ..................................... 1973 - 1978, 1984 - 1991 o San Marcos ................................................. 1981 o Santa Ana .................................................... 1978 - 1981 o Westlake Village .......................................... 1983 - 1994
During these assignments, Tom has supervised City staff and directed other consultants including traffic engineers and transportation planners, traffic signal and street lighting personnel, and signing, striping, and marking crews. He has secured over $5 million in grant funding for various improvements. He has managed and directed many traffic and transportation studies and projects. While serving these communities, he has personally conducted investigations of hundreds of citizen requests for various traffic control devices. Tom has also successfully presented numerous engineering reports at City Council, Planning Commission, and Traffic Commission meetings in these and other municipalities.
Tom Brohard, PE, Page 2
Tom Brohard and Associates
In his service to the City of Indio since May 2005, Tom has accomplished the following:
� Oversaw preparation and adoption of the Circulation Element Update of the General Plan including development of Year 2035 buildout traffic volumes, revised and simplified arterial roadway cross sections, and reduction in acceptable Level of Service criteria under certain constraints
� Oversaw preparation of plans and provided assistance during construction of a $1.5 million project to install traffic signals and widen three of four ramps at the I-10/Jackson Street Interchange under a Caltrans encroachment permit issued under the Streamlined Permit Process
� Oversaw preparation of traffic impact analyses for Project Study Reports evaluating different alternatives for buildout improvement of the I-10/Monroe Street and the I-10/Golf Center Parkway Interchanges
� Oversaw preparation of plans and provided assistance during construction of 10 new traffic signal installations
� Reviewed and approved temporary traffic control plans as well as for signing and striping for all City and developer funded roadway improvement projects
� Oversaw preparation of a City wide traffic safety study of conditions at all schools
� Prepared over 300 work orders directing City forces to install, modify, and/or remove traffic signs, pavement and curb markings, and roadway striping
� Reviewed and approved traffic impact studies prepared for more than 15 major development projects
Since forming Tom Brohard and Associates in 2000, Tom has reviewed many traffic impact reports and environmental documents for various development projects. He has provided expert witness services and also prepared traffic studies for public agencies and private sector clients. Significant accomplishments during the last eight years include the following:
� Prepared critique of traffic and parking impacts identified in the Initial Study and Traffic Study for the 1960-1998 Market Street Project in the City of San Francisco for Adams Broadwell Joseph & Cardozo (12/2008)
� Prepared critique of traffic and circulation impacts identified in the Supplemental Draft EIR for the US Gypsum Wallboard Plant Project in the Port of Stockton for Lozeau/Drury LLP (11/2008 to 12/2008)
� Prepared critique of traffic and parking impacts identified in the Draft EIR for the Bentley School Major Conditional Use Permit in the City of Oakland for Veneruso & Moncharsh (11/2008 to 12/2008)
Tom Brohard, PE, Page 3
Tom Brohard and Associates
� Prepared critique of the traffic impacts identified in the Addendum to the Master EIR and Initial Study for the Lane Field Development Project in the City of San Diego for Adams Broadwell Joseph & Cardozo (12/2007); prepared critique of parking and transit impacts for the Project’s Coastal Development Permit Amendment (11/2008)
� Prepared critique of the traffic impacts identified in the Draft EIR and Traffic Impact Study for the Delta Shores Project in the City of Sacramento for Adams Broadwell Joseph & Cardozo (10/2008)
� Served as an expert witness regarding work area traffic control during roadway construction at a traffic signal on State Route 111 in the City of Palm Desert for Workman Law Office (9/2008)
� Prepared Data Requests for traffic issues associated with the Application for Certification from the California Energy Commission for the Avenal Energy Power Plant in the City of Avenal for Adams Broadwell Joseph & Cardozo (9/2008)
� Prepared critique of traffic and parking impacts identified in the Initial Study and Traffic Study for the 5050 Mission Street Mixed Use Project in the City of San Francisco for Lozeau/Drury LLP (8/2008)
� Prepared critique of traffic and circulation impacts identified in the Draft EIR for the Altamont Motorsports Park Rezoning Project in the County of Alameda for Mark R. Wolfe & Associates (8/2008)
� Prepared critique of the traffic impacts identified in the Draft EIR and Traffic Impact Study for the Fulcrum Property Development Project in the City of West Sacramento for Adams Broadwell Joseph & Cardozo (7/2008 to 8/2008)
� Conducted studies for STOP signs on Plumley Road at two intersections for the City of Cathedral City (5/2008 to 8/2008)
� Prepared critique of traffic and circulation impacts identified in the Draft EIR for the Concord Community Reuse Plan Project in the City of Concord for Lozeau/Drury LLP (6/2008 to 7/2008)
� Prepared critique of the Traffic Impact Study for the Sky Harbor Ranch Project for the Town of Yucca Valley (6/2008 to 7/2008)
� Prepared critique of the traffic impacts identified in the Revised Draft EIR and Traffic Impact Analysis for the Chula Vista Bayfront Master Plan in the City of Chula Vista for Adams Broadwell Joseph & Cardozo (7/2008)
� Prepared critique of traffic and circulation impacts identified in the Draft and Final EIRs for the River Oaks Crossing Specific Plan Project in the City of Oakley for Mark R. Wolfe & Associates (10/2007 to 5/2008)
Tom Brohard, PE, Page 4
Tom Brohard and Associates
� Prepared critique of the Traffic Impact Study for the Downtown Revitalization Project (Bisno Development) for the City of Baldwin Park (4/2008 to 5/2008)
� Prepared critiques of traffic and circulation impacts identified in the Draft EIR, Final EIR and various supporting technical studies for the Bakersfield Winco in the City of Bakersfield for Mark R. Wolfe & Associates (4/2007 to 3/2008)
� Prepared critique of traffic and circulation impacts identified in the Draft and Final EIRs and Traffic Study for the Soledad Shopping Center Project in the City of Soledad for Weinberg, Roger & Rosenfeld (3/2008)
� Prepared critique of the traffic impacts identified in the Initial Study for the Columbus Salami Manufacturing Plant Project in the City of Fairfield for Adams Broadwell Joseph & Cardozo (3/2008)
� Prepared critique of traffic and parking impacts identified in the Draft EIR and Traffic Impact Study for the Sherwin Project in the Town of Mammoth Lakes for Shute, Mihaly, & Weinberger (1/2008 to 2/2008)
� Prepared critiques of traffic and parking impacts identified in the Draft EIR and various supporting technical studies for the Solana Beach Train Station Mixed Use Project in the City of Solana Beach for area residents; presented findings to area property owners and to City Council; prepared rebuttal to responses to comments in the Final EIR for the project (6/2006 to 1/2008)
� Provided technical assistance for the Santa Monica Growth Limitation Ballot Initiative to Shute, Mihaly, & Weinberger (1/2008)
� Prepared critique of the traffic impacts identified in the Initial Study for the United Spiral Pipe Manufacturing Plant Project in the City of Pittsburg for Adams Broadwell Joseph & Cardozo (10/2007 to 11/2007)
� Prepared critique of traffic and parking impacts identified in the Traffic Impact Study for the Initial Study for the Wilshire Parkview Hotel and Residences Project in the City of Los Angeles for Shute, Mihaly, & Weinberger (8/2007 to 9/2007)
� Prepared critique of the traffic impacts identified in the Initial Study with Proposed Mitigated Negative Declaration prepared by Caltrans for the widening of State Route 74, Lower Ortega Highway, in the City of San Juan Capistrano for Shute, Mihaly, & Weinberger (8/2007)
� Prepared critique of traffic and parking impacts identified in the Traffic Impact Analysis for the Providence Medical Center Expansion Project in the City of Los Angeles for Weinberg, Roger & Rosenfeld (11/2006 to 8/2007)
� Prepared critique of the traffic impacts identified in the Draft and Final EIRs for the Rockville Trails Estates Project in Solano County for Shute, Mihaly, & Weinberger (7/2007)
Tom Brohard, PE, Page 5
Tom Brohard and Associates
� Prepared critique of traffic and parking impacts identified in the Draft EIR for the La Bahia Hotel Expansion in the City of Santa Cruz for Mark R. Wolfe & Associates (6/2007 to 7/2007)
� Prepared preliminary critique of the traffic impacts identified in the Draft EIR for the Delano Marketplace Project in the City of Delano for Mark R. Wolfe & Associates; prepared rebuttal to responses in Final EIR (5/2006 to 7/2007)
� Prepared critique of the traffic impacts identified in the Draft EIR for the Live Oak Master Plan Project in the City of Hanford for Adams Broadwell Joseph & Cardozo (5/2007)
� Prepared critique of the traffic impacts identified in the Draft EIR and the supporting traffic study for the La Floresta Development Project in the City of Brea for the City of Yorba Linda (1/2007 to 4/2007)
� Prepared critique of the traffic impacts identified in the Addendum to the Program EIR and Transportation Analysis for the Davidon Homes Project in the City of Antioch for Adams Broadwell Joseph & Cardozo (1/2007)
� Prepared critique of the traffic and circulation impacts identified in the Monterey County 2006 General Plan Final EIR for Mark R. Wolfe & Associates (12/2006)
� Provided expert witness evaluation of traffic and circulation impacts identified in the EIS, Traffic Impact Report, and Updates for the Turtle Bay Resort Expansion Project on the North Shore of Oahu for Alston Hunt Floyd & Ing (9/2006 to 11/2006)
� Prepared trip generation study for a bank and separate drive through bank facility in Century City in the City of Los Angeles for Tract No. 7260 Association (11/2006)
� Prepared preliminary critique of the traffic impacts identified in the Draft EIR and Traffic Impact Study for the Rio Vista Riverwalk Project in the City of Rio Vista for Adams Broadwell Joseph & Cardozo (11/2006)
� Prepared critique of the traffic impacts identified in the Draft EIR and Traffic Impact Analysis for the Chula Vista Bayfront Master Plan (Gaylord Resort Project) in the City of Chula Vista for Adams Broadwell Joseph & Cardozo (10/2006 to 11/2006)
� Prepared critique of the traffic impacts identified in the Draft EIR and Traffic Impact Study for the Antioch Wal-Mart Expansion Project in the City of Antioch for Mark R. Wolfe & Associates (6/2006 to 8/2006); prepared rebuttal to responses to comments in the Final EIR (9/2006 to 10/2006)
� Prepared critique of the traffic and circulation impacts identified in the Revised Partial Draft EIR and the Traffic Study for the Gregory Canyon Landfill Project in San Diego County (7/2006 to 8/2006)
Tom Brohard, PE, Page 6
Tom Brohard and Associates
� Prepared critique of the traffic and circulation impacts identified in the Conditional Use Permit Application for Altamont Motorsports Park in Alameda County for Mark R. Wolfe & Associates (6/2006)
� Prepared response to Initial Study/Notice of Preparation of a Draft EIR for 483 condominiums proposed in three high rise towers in Century City in the City of Los Angeles for Tract No. 7260 Association (6/2005); prepared critique of the Draft EIR for the 10131 Constellation Boulevard Project proposed by JMB (12/2005 to 1/2006); reviewed responses to comments in the Final EIR (5/2006)
� Conducted study which developed traffic engineering measures as well as potential enforcement and legislative actions to deter excessive speeding on Stunt Road adjacent to Calabasas in Los Angeles County for area residents (9/2005 to 4/2006)
� Prepared critique of the Draft EIR and Traffic Impact Analysis for the Rancho Santa Fe Elementary School Project in San Diego County for Coast Law Group (9/2005); prepared rebuttal to responses to comments in the Final EIR (2/2006 to 3/2006)
� Prepared critique of the traffic, circulation, and parking impacts identified in the Traffic Impact Analysis for Los Angeles Unified School District Valley Elementary School #8 in the City of San Fernando (1/2006)
� Prepared critique of the traffic impacts identified in the Focused EIR and Traffic Impact Analysis for the Temecula Regional Hospital Project in the City of Temecula for Adams Broadwell Joseph & Cardozo (10/2005); prepared rebuttal to responses to comments in the Final EIR (1/2006)
� Prepared critiques of the traffic impacts identified in the Draft EIR and in the Revised Draft EIR for the Central Larkspur Specific Plan in the City of Larkspur and prepared responses to comments in the Final EIR for Shute, Mihaly, & Weinberger (7/2002 to 8/2002, 12/2003 to 2/2004, 1/2005 to 3/2005, and 12/2005 to 1/2006)
� Conducted Traffic Impact Analyses for the Sacred Heart Church and School Master Plan in the City of Palm Desert including presentations to community residents and testimony at Public Hearings before the City Council (3/2005 to 12/2005)
� Prepared critique of traffic impacts identified in the Final EIR and Traffic Study for the Preserve at San Marcos Project in Santa Barbara County for the San Marcos Foothill Coalition (10/2005 to 11/2005)
� Prepared critique of the traffic impacts identified in the Draft EIR and the Traffic Impact Analysis for the Borden Ranch Surface Mining Project in Sacramento County for Weinberg, Roger & Rosenfeld (11/2005)
� Prepared critiques of the Mitigated Negative Declaration and Traffic Impact Analysis and of these documents as revised for the Providence Center Specific Plan in the City of Fullerton for Shute, Mihaly, & Weinberger (6/2005 to 7/2005; 11/2005)
Tom Brohard, PE, Page 7
Tom Brohard and Associates
� Prepared critique of the traffic impacts identified in the Draft EIR for the Blue Rock Quarry Expansion near the Town of Forestville in Sonoma County for Weinberg, Roger & Rosenfeld (10/2005)
� Prepared critique of the traffic impacts identified in the Draft EIR and Traffic Study for the Oak to Ninth Project in the City of Oakland for Mark R. Wolfe & Associates (9/2005 to 10/2005)
� Prepared critique of the traffic impacts identified in the Draft EIR for the East Cypress Corridor Specific Plan Project adjacent to the City of Oakley in Contra Costa County for Adams Broadwell Joseph & Cardozo (9/2005 to 10/2005)
� Prepared critique of the Mitigated Negative Declaration for the Providence Medical Center Expansion Project in the City of Los Angeles for Shute, Mihaly, & Weinberger (9/2005)
� Prepared critique of the traffic impacts identified in the Draft EIR for the University District Specific Plan Project adjacent to the City of Rohnert Park in Sonoma County for Mark R. Wolfe & Associates (9/2005)
� Prepared preliminary critique of the traffic impacts identified in the Draft Subsequent EIR for the Mare Island Specific Plan Project in the City of Vallejo for Adams Broadwell Joseph & Cardozo (9/2005)
� Prepared critique of the traffic portions of the Revised EIR and the traffic study of the Deer Creek Park 2 Project in the County of Nevada for Shute, Mihaly, & Weinberger and the City of Nevada City (8/2005 to 9/2005)
� Prepared preliminary critique of the traffic impacts identified in the Draft EIR and traffic study for the Prewett Ranch Project in the City of Brentwood for Adams Broadwell Joseph & Cardozo (7/2005)
� Prepared critique of the traffic and circulation sections of the Draft Subsequent EIR of the County of Ventura Focused General Plan Update and prepared rebuttal to responses for Shute, Mihaly, & Weinberger and the Community of Somis (12/2004 to 1/2005; 6/2005)
� Prepared critique of the traffic and parking impacts identified in the Draft EIR and Traffic Impact Analysis for the Long Beach Memorial Medical Center Expansion in the City of Long Beach for Weinberg, Roger & Rosenfeld (2/2005 to 5/2005)
� Prepared critique of the Draft EIR and traffic study for the Villages at Fairfield Project in the City of Fairfield for Adams Broadwell Joseph & Cardozo (4/2005 to 5/2005)
� Prepared critique of the traffic, circulation, and parking impacts identified in the Traffic Impact Analysis for Los Angeles Unified School District Valley High School #5 in the City of San Fernando (4/2005)
Tom Brohard, PE, Page 8
Tom Brohard and Associates
� Prepared critique of the transportation, circulation, and parking impacts identified in the Draft EIR and the Final EIR for the Wood Street Project in the City of Oakland for the East Bay Community Law Center (3/2005)
� Conducted City wide engineering and traffic surveys confirming enforceable speed limits on 31 street segments for the City of San Fernando (1/2005 to 3/2005)
� Checked plans for traffic signal installations and modifications as well as signing and striping revisions for various projects for Engineering Resources of Southern California and the Cities of Hemet and Palm Springs (12/2003 to 3/2005)
� Prepared critique of the Initial Study and traffic study prepared for the Hidden Canyon (Greenfield) Quarry Use Permit and Reclamation Plan in Monterey County for Weinberg, Roger & Rosenfeld (2/2005)
� Prepared critiques of the traffic impacts identified in the Los Angeles International Airport Master Plan Draft EIS/EIR for Alternatives A, B, and C and in the Supplement Draft EIS/EIR for Alternative D, prepared responses to comments in the Final EIS/EIR, and reviewed Addendum #3 for Shute, Mihaly, & Weinberger and the City of El Segundo (2/2001 to 7/2001, 7/2003 to 10/2003, 11/2004, and 12/2004)
� Prepared critique of the Traffic Study for the 450-460 North Palm Drive Senior Housing Residential Project in the City of Beverly Hills for Luna & Glushon (11/2004)
� Prepared critique of the Draft EIR and traffic study and provided testimony at a public hearing regarding the West Los Angeles College Facilities Master Plan in Los Angeles County for Culver Crest Neighborhood Association (10/2004 to 12/2004)
� Prepared critique of the Draft EIR and the associated traffic impact analysis as well as subsequent rebuttal to responses to these comments in the Final EIR for The Ranch Plan in the County of Orange for the Endangered Habitats League (6/2004 to 7/2004 and 10/2004)
� Prepared preliminary critique of the Draft EIR and traffic study for the Chandler Ranch Specific Plan Project in the City of Paso Robles for Adams Broadwell Joseph & Cardozo (9/2004)
� Prepared critique of the Draft EIR and traffic report associated with the Magnolia Park Project in the City of Oakley for Adams Broadwell Joseph & Cardozo (9/2004)
� Prepared critique of the traffic impacts identified in the Recirculated Draft EIR and traffic study for the McKean Road Sports Complex in Santa Clara County for Shute, Mihaly, & Weinberger (9/2004)
� Prepared critique of the Environmental Assessment for Robie Ranch Reclamation Project in Calaveras County for Weinberg, Roger & Rosenfeld (9/2004)
Tom Brohard, PE, Page 9
Tom Brohard and Associates
� Provided expert assistance to residents in the City of La Mirada during settlement negotiations regarding litigation involving the Big T Residential Development Project in the City of Buena Park (6/2004 to 9/2004)
� Prepared critique of the traffic impacts identified in the Recirculated Draft EIR and the associated traffic study for the Lake Jennings Ralph’s Shopping Center in San Diego County for SOFAR and Shute, Mihaly, & Weinberger (8/2004)
� Reviewed Traffic Impact Study prepared for the San Fernando Corridors Specific Plan for the City of San Fernando (7/2004 to 8/2004)
� Prepared critique of the Negative Declaration for the Brisbane Recycling Project in the City of Brisbane for Weinberg, Roger & Rosenfeld (6/2004)
� Reviewed various alternative alignments for the extension of Lexington Drive from Cerritos Avenue to Katella Avenue, a proposed secondary highway, for the City of Los Alamitos; provided expert assistance to the City of Los Alamitos during settlement negotiations regarding litigation of the proposed Cottonwood Christian Center Project in the City of Cypress (4/2004 to 6/2004)
� Prepared critique of the Draft EIR and the associated traffic impact study for the Jaxon Enterprises Mine and Reclamation Expansion Project in the County of Merced for Weinberg, Roger & Rosenfeld (5/2004)
� Prepared critique of the Environmental Secondary Study for the Santa Fe Parcel 6 Mixed Use Project in the City of San Diego for Adams Broadwell Joseph & Cardozo (4/2004 to 5/2004)
� Prepared critique of the Draft EIR and the associated traffic impact analysis for the for the San Mateo Rail Corridor Plan & Bay Meadows Specific Plan Amendment in the City of San Mateo for Adams Broadwell Joseph & Cardozo (3/2004 to 5/2004)
� Reviewed the Edinger Corridor Specific Plan Traffic Analysis for the proposed redevelopment and intensification of adjacent land uses for the City of Huntington Beach (12/2003, 4/2004, and 5/2004)
� Conducted the Traffic Impact Study of the San Fernando Regional Pool Facility Project and the associated street improvements for the City of San Fernando (3/2004 to 4/2004)
� Prepared critique of the Initial Study/Mitigated Negative Declaration and the associated traffic study for the Pixar Headquarters Expansion in the City of Emeryville for Shute, Mihaly, & Weinberger (3/2004 to 4/2004)
� Prepared critique of the Draft EIR and the associated traffic impact analysis for the Lower Lagoon Valley Specific Plan in the City of Vacaville for Adams Broadwell Joseph & Cardozo (3/2004 to 4/2004)
Tom Brohard, PE, Page 10
Tom Brohard and Associates
� Conducted the Traffic Study of Two Parking Alternatives for the City of San Dimas to provide on street parking to complement potential retail/residential development on the east side of San Dimas Avenue north of Arrow Highway (12/2003 to 4/2004)
� Prepared trip generation calculations for various retail and “Big Box” stores in conjunction with a March 2004 ballot measure in Contra Costa County for Mark R. Wolfe & Associates (1/2004 to 2/2004)
� Prepared critique of the Initial Study/Mitigated Negative Declaration and the associated transportation impact analysis for the S&S Farms and Hancock Property Residential Development Plan in the City of Brentwood for Adams Broadwell Joseph & Cardozo (2/2004)
� Prepared critiques of the traffic impacts identified in the Mitigated Negative Declarations as well as subsequent rebuttal to responses to these comments for the Bayfront Live Work Project in the City of Hercules for Adams Broadwell Joseph & Cardozo (4/2003, 10/2003, and 2/2004)
� Conducted the City Wide Traffic Calming Study of Residential Streets in the City of San Fernando including development of traffic calming guidelines and specific recommendations addressing over 70 “Hot Spots” throughout the City including monthly presentations at Transportation & Safety Commission meetings and a presentation of the Final Report to the City Council (5/2003 to 1/2004)
� Prepared critique of the Initial Study/Mitigated Negative Declaration and the associated transportation analysis for the Cottonwood Christian Center in the City of Cypress for the City of Los Alamitos (1/2004)
� Prepared critique of the Recirculated Draft EIR and the associated transportation analysis for the Sand Creek Specific Plan in the City of Antioch for Adams Broadwell Joseph & Cardozo (1/2004)
� Prepared critique of the Initial Study and the associated traffic impact studies for the West Dublin Transit Village in the City of Dublin for Adams Broadwell Joseph & Cardozo (11/2003 to 1/2004)
� Prepared critiques of the Initial Study and the Recirculated Initial Study/General Plan Amendment and Rezoning for the Jack Parker Trucking Site in the City of San Pablo for Adams Broadwell Joseph & Cardozo (9/2003 and 11/2003)
� Prepared critique of the traffic impacts identified in the Draft EIR and rebuttal to responses to comments in the Final EIR for the proposed Wal-Mart in the City of Fremont for Mark R. Wolfe & Associates (7/2002 to 10/2003)
� Prepared critique of the traffic impacts identified in the Draft EIR, rebuttal to responses in the Final EIR, and testimony at a public hearing regarding the Alpine Village Shopping Center in San Diego County for Shute, Mihaly, & Weinberger (6/2002 to 10/2003)
Tom Brohard, PE, Page 11
Tom Brohard and Associates
� Prepared critique of the traffic impacts identified in the Draft EIR, rebuttal to responses in the Final EIR, testimony at public hearings, and assistance during settlement negotiations regarding the 2000 Avenue of the Stars Project in Century City in the City of Los Angeles for Tract No. 7260 Association (9/2002 to 10/2003)
� Prepared critique of the traffic impacts identified in the Draft EIR for the Glen Loma Ranch Project in the City of Gilroy for Adams Broadwell Joseph & Cardozo (9/2003)
� Prepared critique of the traffic impacts identified in the Initial Study and the Traffic Impact Analysis for the Ryder Homes Project in the City of Oakley for Adams Broadwell Joseph & Cardozo (9/2003)
� Prepared critique of the traffic impacts identified in the Initial Study and the Traffic Impact Analysis for the Ravenswood Residential Project in Contra Costa County for Adams Broadwell Joseph & Cardozo (8/2003 to 9/2003)
� Prepared critique of the traffic impacts identified in the Draft Subsequent EIR for the proposed Boronda Crossing Commercial Project in the City of Salinas for Mark R. Wolfe & Associates (8/2002 to 9/2003)
� Prepared four grant applications to Caltrans for $1,115,000 of Hazard Elimination Safety funding to modify traffic signals and to upgrade regulatory, warning, and street name signs in the City of Santa Ana (3/2003 to 8/2003)
� Prepared critique of the traffic impacts identified in the Draft EIR and the Traffic Impact Analysis for the Bluerock Business Center Project in the City of Antioch for Adams Broadwell Joseph & Cardozo (8/2003)
� Prepared critique of the traffic impacts identified in the Draft EIR for the Clark Road Residential Project in the City of Richmond for Adams Broadwell Joseph & Cardozo (8/2003)
� Prepared critique of the traffic impacts identified in the Initial Study and the Traffic Impact Analysis for the Sky Ranch Residential Project in the City of Antioch for Adams Broadwell Joseph & Cardozo (7/2003 to 8/2003)
� Prepared critique of the traffic impacts identified in the Draft EIR for the Cal Poly Student Housing North Project in the City of San Luis Obispo for Adams Broadwell Joseph & Cardozo (7/2003)
� Prepared critique of the traffic impacts identified in the Final EIR for the Lake Jennings Ralph’s Shopping Center in San Diego County for SOFAR and Shute, Mihaly, & Weinberger (3/2003 to 7/2003)
� Prepared critique of the traffic impacts identified in the Draft EIR for the Cypress Grove Residential Project in the City of Oakley for Adams Broadwell Joseph & Cardozo (6/2003)
Tom Brohard, PE, Page 12
Tom Brohard and Associates
� Prepared critique of the traffic impacts identified in the Draft EIR for the McKean Road Sports Complex in Santa Clara County for Shute, Mihaly, & Weinberger (5/2003)
� Prepared grant application to Caltrans for $448,000 of Safe Route to School funding to upgrade all school signs at 68 public and private schools in the City of Santa Ana (3/2003 to 5/2003)
� Prepared critique of the traffic impacts identified in the Traffic Impact Analysis for the Blossom Valley Middle School for the Dunbar Lane Task Force in San Diego County (4/2003 to 5/2003)
� Prepared critique of the traffic impacts identified in the Draft EIR and the Traffic Impact Analysis for the Bettencourt Ranch Aggregate Mining Project in Merced County for Weinberg, Roger & Rosenfeld (4/2003)
� Conducted a complete review of the General Plan Circulation Element for the City of Huntington Beach including comparisons to the Orange County Transportation Authority’s Master Plan of Arterial Streets and drafted a Request for Proposal to update the City’s Circulation Element (8/2002 to 4/2003)
� Prepared critique of the traffic impacts identified in the Traffic Impact Analysis for the proposed Wal-Mart in the City of Gilroy for Mark R. Wolfe & Associates (2/2003 to 3/2003)
� Prepared critique of the traffic impacts identified in the Draft EIR for the Waterfront/Downtown Mixed Use Project in the City of Vallejo for Adams Broadwell Joseph & Cardozo (2/2003)
� Provided expert witness evaluation of the traffic impacts caused by simultaneous construction of various Alameda Corridor Transportation Authority projects for Sullivan, Workman, & Dee (12/2002 to 2/2003)
� Conducted 12 training sessions in Urban Street Design Fundamentals for the Engineering Department staff in the City of Torrance (4/2001 to 4/2002 and 10/2002 to 12/2002)
� Prepared critique of the traffic impacts identified in the Transportation Impact Study for the Western Research Campus in the City of Richmond in Contra Costa County for Adams Broadwell Joseph & Cardozo (11/2002)
� Evaluated Conditions of Approval for the proposed intersection of Mulholland Highway and Hazel Nut Court in Los Angeles County and provided testimony to the Board of Supervisors for Seminole Springs Mobile Home Park (11/2002)
� Reviewed the Traffic Impact Analysis prepared for the Pacific City Project for the City of Huntington Beach (9/2002)
Tom Brohard, PE, Page 13
Tom Brohard and Associates
� Prepared critique of the traffic impacts identified in the Draft EIR for North Yorba Linda Estates in the City of Yorba Linda for Shute, Mihaly, and Weinberger (9/2002)
� Conducted the Hacienda Road Traffic Calming Study and presented the final report at locally televised meetings of the Traffic Committee and the City Council in the City of La Habra Heights (10/2001 to 9/2002)
� Prepared critique of the traffic impacts identified in Initial Studies with Traffic Impact Analyses for three residential subdivisions in the City of Pittsburg for Adams Broadwell Joseph & Cardozo (8/2002)
� Conducted the City Wide Traffic Safety Study and presented the final report at meetings of the Traffic Committee and the City Council in the City of Rolling Hills Estates (4/2001 to 5/2002)
� Prepared critique of the traffic impacts identified in the Draft EIR, rebuttal to responses, and testimony at a public hearing regarding extensions of Corona and Valley View Avenues in the City of Norco for C. Robert Ferguson (1/2002 to 4/2002)
� Prepared critique of the traffic impacts identified in the Draft Initial Study and Environmental Assessment, rebuttal to responses, and testimony at public hearings before the Ventura County Board of Supervisors regarding intersection improvements proposed by Caltrans at State Route 118/State Route 34 in Ventura County for the Community of Somis (12/2000 to 10/2001)
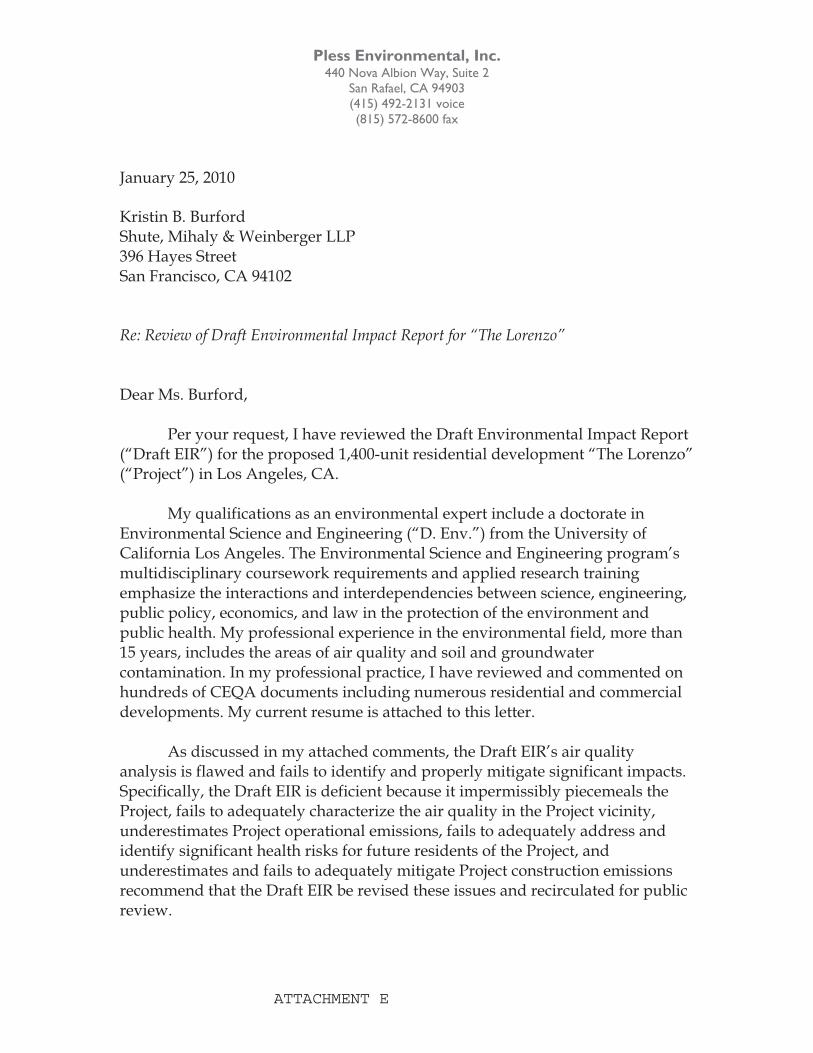
Pless Environmental, Inc. 440 Nova Albion Way, Suite 2
San Rafael, CA 94903 (415) 492-2131 voice (815) 572-8600 fax
January 25, 2010 Kristin B. Burford Shute, Mihaly & Weinberger LLP 396 Hayes Street San Francisco, CA 94102 Re: Review of Draft Environmental Impact Report for “The Lorenzo” Dear Ms. Burford,
Per your request, I have reviewed the Draft Environmental Impact Report (“Draft EIR”) for the proposed 1,400-unit residential development “The Lorenzo” (“Project”) in Los Angeles, CA.
My qualifications as an environmental expert include a doctorate in
Environmental Science and Engineering (“D. Env.”) from the University of California Los Angeles. The Environmental Science and Engineering program’s multidisciplinary coursework requirements and applied research training emphasize the interactions and interdependencies between science, engineering, public policy, economics, and law in the protection of the environment and public health. My professional experience in the environmental field, more than 15 years, includes the areas of air quality and soil and groundwater contamination. In my professional practice, I have reviewed and commented on hundreds of CEQA documents including numerous residential and commercial developments. My current resume is attached to this letter.
As discussed in my attached comments, the Draft EIR’s air quality
analysis is flawed and fails to identify and properly mitigate significant impacts. Specifically, the Draft EIR is deficient because it impermissibly piecemeals the Project, fails to adequately characterize the air quality in the Project vicinity, underestimates Project operational emissions, fails to adequately address and identify significant health risks for future residents of the Project, and underestimates and fails to adequately mitigate Project construction emissions recommend that the Draft EIR be revised these issues and recirculated for public review.
ATTACHMENT E
Burford, January 25, 2010 Page 2
The most serious deficiency in the Draft EIR’s air quality section relates to the health risk assessment which erroneously finds that the Project’s future residents would not experience significant cancer risks due to emissions from Interstate 110, which is parallels the western boundary of the Project site. Contrary to the Draft EIR’s conclusion, emissions from I-110 indeed result significant cancer risks. Further, the emissions from I-110 must be considered in conjunction with the extremely unhealthy background air pollutant concentrations in Los Angeles County, which together would expose future residents to unacceptable levels of pollution with the resultant health effects including cancer, asthma, and increased incidences of heart attacks. In my opinion, the Project site is an extremely poor location for a residential development.
Very truly yours,
Dr. Petra Pless
Enclosures:
- Resume - Comment Letter
Comments
on
The Lorenzo Draft Environmental Impact Report
Prepared for
Kristin B. Burford Shute, Mihaly & Weinberger LLP
396 Hayes Street San Francisco, CA 94102
Prepared by
Petra Pless, D.Env. Pless Environmental, Inc.
440 Nova Albion Way, Suite 2 San Rafael, CA 94903
January 25, 2010
i
Table of Contents
I.� Review of the Project Is Impermissibly Piecemealed ...................................... 2�
II.� The Draft EIR Fails to Adequately Characterize the Existing Air Quality in the Project Vicinity ............................................................................ 3�
III.� The Draft EIR Underestimates Project Operational Emissions and Fails to Identify and Adequately Mitigate Significant Impacts on Air Quality ................................................................................................................... 4�III.A� URBEMIS Modeling Runs Are Based on Incorrect Vehicle Trip Generation Rates ............ 5�III.B� Mitigation Measures for Reduction of Vehicle Trip Generation Rates Are
Double-Counted .................................................................................................................................. 6�III.C� URBEMIS Modeling Runs Fail to Account for Emissions of Re-entrained Fugitive
Road Dust ............................................................................................................................................. 7�III.D� Revised URBEMIS Modeling for Project Daily Operational Mitigated Emissions ................. 8�III.E� Air Pollutant Concentrations Associated with Localized Operational Emissions
Presented in Draft EIR Are Based on Erroneous Assumptions and Should Be Remodeled ............................................................................................................................................ 9�
III.F� Mitigation Measures for the Project’s Operational Phase Exist and Should Be Required to Mitigate the Project’s Significant Impacts on Air Quality ................................... 9�
IV.� The Draft EIR Fails to Adequately Address and Identify Significant Health Risks Associated with Locating Residential Uses Next to Freeway ............................................................................................................... 10�IV.A� The Health Risk Assessment Underestimates Potential Health Risks for Future
Residents Associated with Vehicle Emissions from I-110 ........................................................ 14�IV.A.1� The Health Risk Assessment Relies on an Incorrect Average Vehicle
Fleet Speed ........................................................................................................................... 14�IV.A.2� The Health Risk Assessment Erroneusly Relies on Ambient Air Pollutant
Concentrations Modeled at Building Top Floor ......................................................... 17�IV.A.3� The Health Risk Assessment Fails to Account for A Number of Emission
Sources .................................................................................................................................. 17�IV.A.4� The Health Risk Assessment Assumes an Incorrect Cancer Potency
Factor for Diesel Particulate Matter .............................................................................. 18�IV.A.5� The Health Risk Assessment Relies on Non-conservative Exposure
Duration ................................................................................................................................ 18�IV.B� The Draft EIR Fails to Adequately Discuss the Health Risks for Future Residents
of the Project ...................................................................................................................................... 19�IV.C� The Draft EIR’s Proposed MERV-13 Filtration System Is Inadequate to Protect
Future Residents from Adverse Health Effects .......................................................................... 20�
ii
V.� The Draft EIR Underestimates and Fails to Adequately Mitigate Construction Emissions .................................................................................... 23�V.A� The Draft EIR Underestimates Emissions Associated with Earthmoving ............................ 23�V.B� The Draft EIR Underestimates Building Construction Emissions .......................................... 23�V.C� The Draft EIR Overestimates the Control Efficiency of the Proposed Mitigation
Measures for Fugitive Dust ............................................................................................................. 24�V.D� The Proposed Mitigation Measures for Reducing Exhaust Emissions from
Construction Equipment Are Inadequate and Additional Mitigation Is Feasible ................ 24�V.D.1� Mitigation Measures to Reduce Construction Equipment Engine Exhaust
Is Ineffective and Should Be Revised .............................................................................. 26�V.D.2� The Construction Mitigation Measures Required by the Draft EIR Fail to
Include Monitoring, Feedback, or Enforcement .......................................................... 27�
Figures
Figure 1: Traffic spreads pollutants up to 1,500 feet from the roadway ............................................... 11�
Figure 2: Health risks in proximity to traffic ................................................................................................ 13�
Figure 3: Vehicle speed vs. emission rates .................................................................................................... 15�
Figure 4: 2001 total cancer risk per million in South Central Los Angeles .......................................... 20�
Tables
Table 1: Number of days per year in SRA 1 (Central Los Angeles Area) exceeding ambient air quality standards for PM10 and PM2.5 ..................................................................................... 4�
Table 2: Revised estimated future (2013) Project daily operational mitigated emissions .................. 8�
Table 3: Average running exhaust emission factors for ROG and diesel particulate matter for vehicle fleet in Los Angeles County in 2013 ............................................................................... 16�
iii
Exhibits
Exhibit 1: URBEMIS output files “Detail Report for Summer Operational Mitigated Emissions (Pounds/Day)” and “Detail Report for Summer Operational Mitigated Emissions (Pounds/Day)”
Exhibit 2: URBEMIS modeling for Project operational phase emissions using the Draft EIR’s assumptions but with fugitive dust option checked
Exhibit 3: Revised URBEMIS modeling for future (2013) Project daily operational mitigated emissions
Exhibit 4: Excel spreadsheets provided by Christopher Joseph & Associates
Exhibit 5: Federal Highway Administration, Recurring Traffic Bottlenecks: A Primer – Focus on Low-Cost Operational Improvements, 2009
Exhibit 6: Spreadsheets for revised estimates of cancer risks associated with I-110 (accounting for 70-year exposure duration and DPM cancer potency factor of 1.10)
Exhibit 7: Excerpt from Union of Concerned Scientists, Digging Up Trouble, November 2006
Exhibit 8: Los Angeles Times, December 6, 2006
COMMENTS
The City of Los Angeles (“City”) as the lead agency under the California Environmental Quality Act (“CEQA”) has published a Draft Environmental Impact Report (“Draft EIR”) for the mixed-use development “The Lorenzo” to be located at 2300 South Flower Street and 2327 South Flower Street in southwestern Los Angeles1 (“Project”).2
The Project, proposed by Palmer/Flower Street Properties, LP, (“Applicant”),
would include construction of 1,400 multi-family residential units (230 one-bedroom units, 888 two-bedroom units, and 282 three-bedroom units) and ancillary common area and recreation amenities including two subterranean parking garages providing a total of 3,204 parking spaces; 34,000 square feet of commercial retail uses; including 6,000 square feet of restaurant use.3
The 9.5-acre Project site, located approximately half a mile southeast from the
intersection of the I-110 and I-10 freeways, consists of two currently vacant parcels generally bounded by West 23rd Street to the north, Orthopaedic Hospital Medical Magnet High School and South Grand Avenue to the east, West Adams Boulevard to the south, and South Flower Street and the interstate 110 Freeway (“I-110”) to the west. The Project site is bisected by South Flower Street, forming Project Sites A and B.4
As discussed in the following comments, the Draft EIR is deficient because it
impermissibly piecemeals the Project (see Comment I); fails to adequately characterize the air quality in the Project vicinity (see Comment II); underestimates Project operational emissions, (see Comment III); fails to adequately address and identify significant health risks for future residents of the Project (see Comment III.F); and underestimates and fails to adequately mitigate Project construction emissions (see Comment V). The Draft EIR should be revised these issues and recirculated for public review.
1 The Draft EIR states that the Project site is located in the Southeast Community of Los Angeles; see p. II-5. 2 City of Los Angeles, Southeast Los Angeles Community Plan Area, The Lorenzo Project, Draft Environmental Impact Report, Case No. ENV-2006-9471-EIR, November 2009. 3 Draft EIR, pp. II-5 through II-7. 4 Draft EIR, p. II-1.
Pless Comments on The Lorenzo Project Draft EIR January 25, 2010
2
I. Review of the Project Is Impermissibly Piecemealed
The Project site currently consists of two vacant, graded lots which are used as surface parking lots and does not contain any structures. The Project site was formerly occupied by the Orthopaedic Hospital, clinical space, medical office buildings, and associated surface parking areas. According to the project description contained in the City’s Notice of Preparation of a Draft EIR, dated June 11, 2008, the Project included the demolition of existing structures and the removal of the associated landscaping and surface parking areas.5 Yet the Draft EIR makes no mention and contains no analysis of the demolition phase. It appears that the Applicant demolished these buildings in preparation for the Project and that the demolition permits were issued without CEQA review.6
CEQA forbids “piecemeal” review of the significant environmental impacts of a
project. This rule derives, in part, from section 21002.1(d), which requires the lead agency to consider the effects, both individual and collective, of all activities involved in a project. The CEQA Guidelines, Section 15378(a), define the term “project” as “the whole of an action, which has a potential for resulting in either a direct physical change in the environment, or a reasonably indirect physical change in the environment…” Thus, the environmental impacts of demolishing the existing buildings should have been analyzed as part of the Draft EIR’s analysis of Project’s construction phase.
The potential adverse impacts on air quality associated with the demolition of
the buildings that existed at the Project site include combustion exhaust emissions from diesel-powered construction equipment and haul trucks, substantial amounts of fugitive dust, as well as the potential releases of asbestos containing materials. Particularly troublesome is the fact that the Project site is located in proximity to a number of schools: Orthopaedic Hospital Medical Magnet High School is located immediately east of Site A. The Project site is also approximately 0.2 miles north-northwest of Adams Middle School and approximately 0.2 miles west-southwest of Lanterman High School.7 In addition, St. Vincent School and the New Designs Charter School are located about 0.1 miles from Project Site B, immediately to the west of Figueroa Street.8 Other sensitive in receptors in the vicinity of the Project include the hotel to the northwest of the project site, the various medical buildings to the south of Site A, and an adult health care center (Felices Dias Adult Day Health Care Center) to
5 City of Los Angeles, Notice of Preparation, EIR No.: ENC-2006-9471-EIR, Project Name: Palmer Lorenzo, June 11, 2008, p. 1. 6 Personal communication with Kristin Burford, Shute, Mihaly & Weinberger, January 12, 2010. 7 Draft EIR, pp. III-5 and IV.F-2.
8 See Google Maps at http://snipurl.com/u6yxk [maps_google_com].
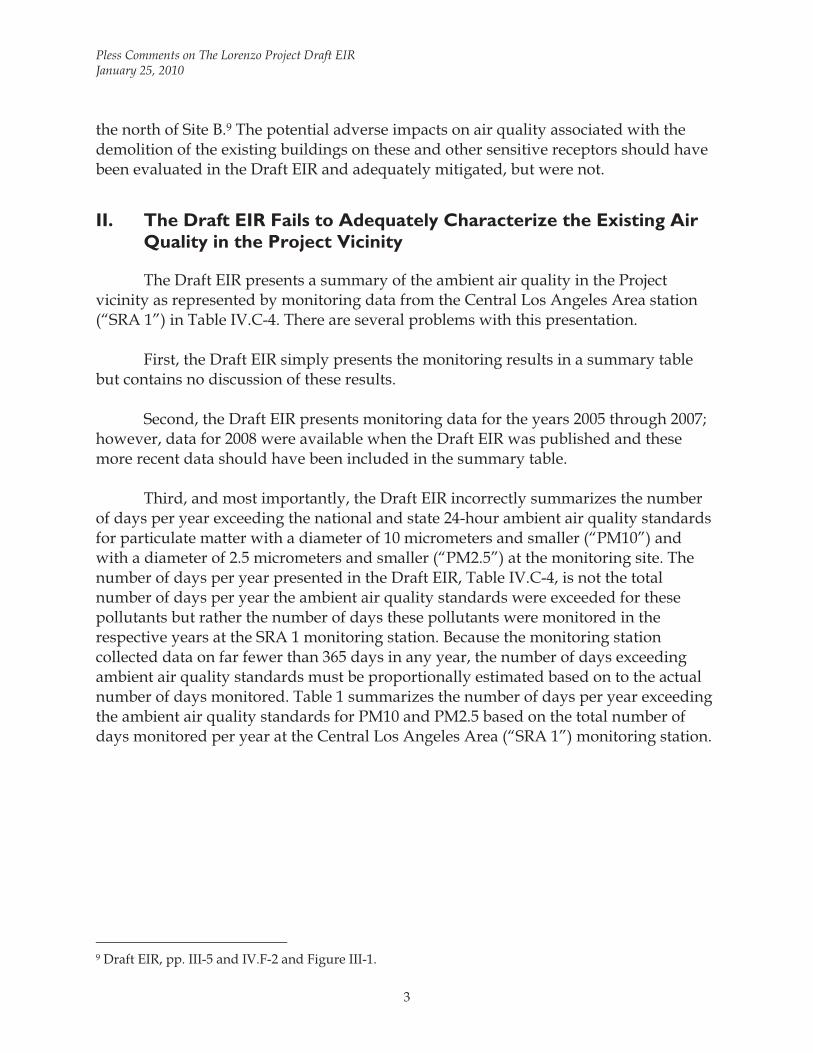
Pless Comments on The Lorenzo Project Draft EIR January 25, 2010
3
the north of Site B.9 The potential adverse impacts on air quality associated with the demolition of the existing buildings on these and other sensitive receptors should have been evaluated in the Draft EIR and adequately mitigated, but were not.
II. The Draft EIR Fails to Adequately Characterize the Existing Air Quality in the Project Vicinity
The Draft EIR presents a summary of the ambient air quality in the Project vicinity as represented by monitoring data from the Central Los Angeles Area station (“SRA 1”) in Table IV.C-4. There are several problems with this presentation.
First, the Draft EIR simply presents the monitoring results in a summary table
but contains no discussion of these results. Second, the Draft EIR presents monitoring data for the years 2005 through 2007;
however, data for 2008 were available when the Draft EIR was published and these more recent data should have been included in the summary table.
Third, and most importantly, the Draft EIR incorrectly summarizes the number
of days per year exceeding the national and state 24-hour ambient air quality standards for particulate matter with a diameter of 10 micrometers and smaller (“PM10”) and with a diameter of 2.5 micrometers and smaller (“PM2.5”) at the monitoring site. The number of days per year presented in the Draft EIR, Table IV.C-4, is not the total number of days per year the ambient air quality standards were exceeded for these pollutants but rather the number of days these pollutants were monitored in the respective years at the SRA 1 monitoring station. Because the monitoring station collected data on far fewer than 365 days in any year, the number of days exceeding ambient air quality standards must be proportionally estimated based on to the actual number of days monitored. Table 1 summarizes the number of days per year exceeding the ambient air quality standards for PM10 and PM2.5 based on the total number of days monitored per year at the Central Los Angeles Area (“SRA 1”) monitoring station.
9 Draft EIR, pp. III-5 and IV.F-2 and Figure III-1.
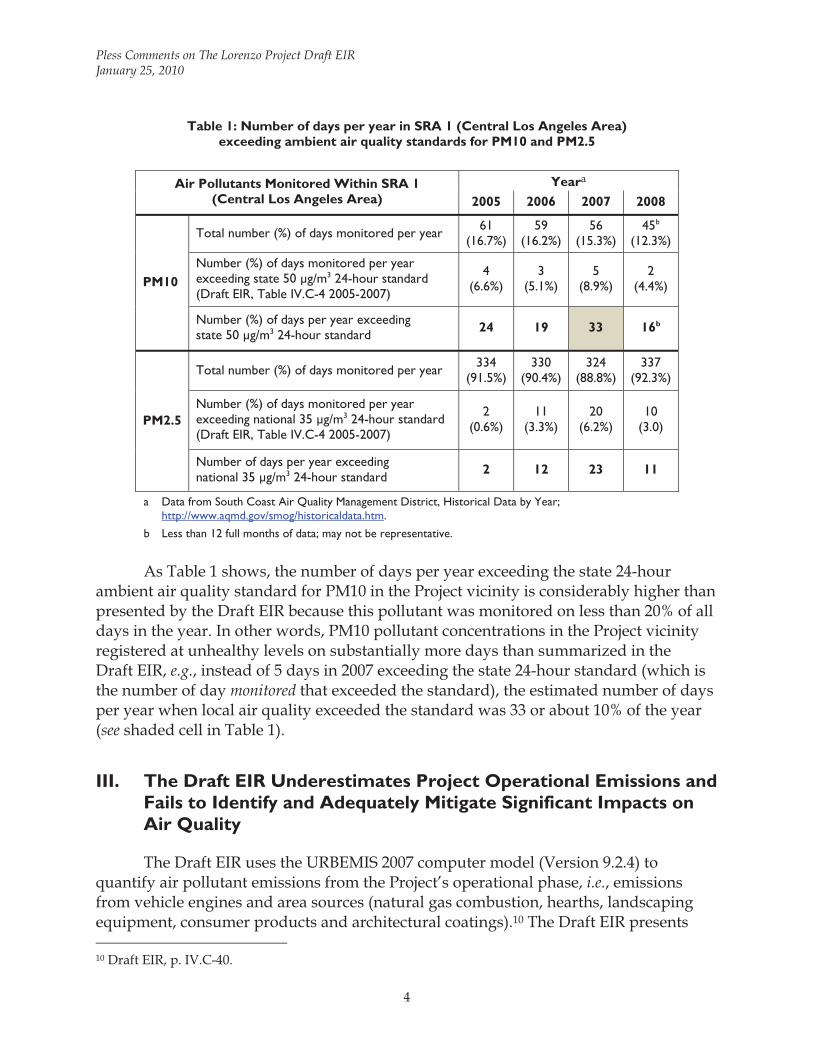
Pless Comments on The Lorenzo Project Draft EIR January 25, 2010
4
Table 1: Number of days per year in SRA 1 (Central Los Angeles Area) exceeding ambient air quality standards for PM10 and PM2.5
Air Pollutants Monitored Within SRA 1
(Central Los Angeles Area) Yeara
2005 2006 2007 2008
PM10
Total number (%) of days monitored per year 61 (16.7%)
59 (16.2%)
56 (15.3%)
45b
(12.3%)
Number (%) of days monitored per year exceeding state 50 μg/m3 24-hour standard (Draft EIR, Table IV.C-4 2005-2007)
4 (6.6%)
3 (5.1%)
5 (8.9%)
2 (4.4%)
Number (%) of days per year exceeding state 50 μg/m3 24-hour standard 24 19 33 16b
PM2.5
Total number (%) of days monitored per year 334 (91.5%)
330 (90.4%)
324 (88.8%)
337 (92.3%)
Number (%) of days monitored per year exceeding national 35 μg/m3 24-hour standard (Draft EIR, Table IV.C-4 2005-2007)
2 (0.6%)
11 (3.3%)
20 (6.2%)
10 (3.0)
Number of days per year exceeding national 35 μg/m3 24-hour standard 2 12 23 11
a Data from South Coast Air Quality Management District, Historical Data by Year; http://www.aqmd.gov/smog/historicaldata.htm.
b Less than 12 full months of data; may not be representative.
As Table 1 shows, the number of days per year exceeding the state 24-hour
ambient air quality standard for PM10 in the Project vicinity is considerably higher than presented by the Draft EIR because this pollutant was monitored on less than 20% of all days in the year. In other words, PM10 pollutant concentrations in the Project vicinity registered at unhealthy levels on substantially more days than summarized in the Draft EIR, e.g., instead of 5 days in 2007 exceeding the state 24-hour standard (which is the number of day monitored that exceeded the standard), the estimated number of days per year when local air quality exceeded the standard was 33 or about 10% of the year (see shaded cell in Table 1).
III. The Draft EIR Underestimates Project Operational Emissions and Fails to Identify and Adequately Mitigate Significant Impacts on Air Quality
The Draft EIR uses the URBEMIS 2007 computer model (Version 9.2.4) to quantify air pollutant emissions from the Project’s operational phase, i.e., emissions from vehicle engines and area sources (natural gas combustion, hearths, landscaping equipment, consumer products and architectural coatings).10 The Draft EIR presents 10 Draft EIR, p. IV.C-40.
Pless Comments on The Lorenzo Project Draft EIR January 25, 2010
5
future (2013) daily unmitigated area and mitigated vehicle engine emissions of criteria pollutants for the Project’s operational phase (for summertime and wintertime) compared to the CEQA thresholds of significance set by the South Coast Air Quality Management District (“SCAQMD”) in Table IV.C-10. The Draft EIR concludes that total emissions associated with the Project’s operational phase would exceed the SCAQMD’s thresholds of significance for volatile organic compounds (“VOCs”) but not for nitrogen oxides (“NOx”), carbon monoxide (“CO”), sulfur oxides (“SOx”), PM10, and PM2.5.11 As discussed in the following comments, the Draft EIR’s URBEMIS modeling runs rely on a number of erroneous assumptions and, as a result, significantly underestimate air pollutant emissions associated with the Project’s operational phase.
III.A URBEMIS Modeling Runs Are Based on Incorrect Vehicle Trip Generation Rates
The URBEMIS emissions model calculates vehicle traffic emissions for various land uses (residential, commercial, etc.) based on the number of dwelling units or square footage and default trip generation rates associated with these land uses which are based on the Institute of Transportation Engineers (“ITE”) Trip Generation Rate Manual. Review of the Draft EIR’s URBEMIS modeling runs, contained in Appendix B, shows that the Draft EIR considerably underestimated Project operational emissions associated with vehicle traffic from residential and commercial uses because it relied on incorrect vehicle trip generation rates.
The Draft EIR states that default vehicle trip generation rates for residential uses
in URBEMIS were considerably reduced to be consistent with the traffic impact analysis.12 The URBEMIS modeling is based on a total of only 4,410 vehicle trips per day from the proposed 1,400 residential units13, taking a 25% trip generation credit for the nearby planned Expo light rail “as allowed by updates to the LADOT traffic impact study guidelines” and a total of only 730 vehicle trips per day attributable to the commercial uses of the site.14 However, review of this traffic analysis by Tom Brohard & Associates found that the trip generation rates assumed by the Draft EIR are considerably underestimated. Tom Brohard & Associates found that the Project would result in 4,998 vehicle trips per day from residential units and 3,137 vehicle trips per day associated with the proposed commercial uses. These revised vehicle trip
11 See Draft EIR, Table IV.C-10. 12 Draft EIR, Appendix B, Air Quality Calculation Sheets, “Explanation of Changes Made to Default Settings in Urbemis 2007,” at pdf page 30. 13 Draft EIR, Appendix B, Air Quality Calculation Sheets, URBEMIS modeling run, at pdf pages 16, 20, 24, and 28. 14 Draft EIR, Appendix F, Supplemental Traffic Analysis Memorandum Traffic Study, Technical Memorandum from KOA Corporation to Christopher A. Joseph & Associates, November 6, 2009, pp. 1-2.
Pless Comments on The Lorenzo Project Draft EIR January 25, 2010
6
generation estimates also take into account the trip generation credit for the nearby planned Expo light rail.15 Thus, the inputs to the URBEMIS modeling underestimates residential trips by 13% and commercial trips by a factor of more than four. The remarkable discrepancy in the Draft EIR’s vehicle trip generation rates for commercial uses and those developed by Tom Brohard & Associates are partially explained by the fact that the Draft EIR failed to account for the high vehicle trip generation rates associated with the proposed 6,000 square feet of restaurant uses. Instead, the Draft EIR’s URBEMIS modeling included these 6,000 square feet in the “regional shopping center” category.16
III.B Mitigation Measures for Reduction of Vehicle Trip Generation Rates Are Double-Counted
The Draft EIR’s estimates for vehicle emissions associated with the Project’s operational phase assumes a considerable reduction, between about 6% to about 15% depending on pollutant, due to selection of a number of mitigation options in the URBEMIS modeling runs.17 The mitigation options selected in URBEMIS include “Transit Service Mitigation,” “Pedestrian/Bicycle Friendliness Mitigation,” “Local-Serving Retail Mitigation.”18
For the “Transit Service Mitigation” option, the Draft EIR specifies 12 daily weekday bus stops within ¼ mile of the site and 1 daily rail or bus rapid transit stops within ½ mile of the site. As discussed in the previous comment, the Draft EIR’s vehicle trip generation rates, which were the basis for the URBEMIS modeling, already account for a 25% credit for the nearby planned Expo light rail as well as for the specific land uses of the Project. Thus, the trip reductions associated with the URBEMIS mitigation measures are double-counted and inappropriately reduce the emissions estimates for the Project’s operational phase.
15 Personal communication with Tom Brohard, Tom Brohard & Associates, January 14, 2010. 16 See Draft EIR, Appendix B, Air Quality Calculation Sheets, URBEMIS modeling runs, at pdf pages 16, 20, 24, and 28. 17 See Draft EIR, Appendix B, Air Quality Calculation Sheets, URBEMIS modeling runs, at pdf pages 14, 18, 22, and 26. 18 URBEMIS modeling runs “Detail Report for Summer Operational Mitigated Emissions (Pounds/Day)”, and “Detail Report for Summer Operational Mitigated Emissions (Pounds/Day)”, file name “Palmer operational.urb924” provided “via email by Bryan Chen, Christopher Joseph & Associates, on January 20, 2010 (attached as Exhibit 1).
Pless Comments on The Lorenzo Project Draft EIR January 25, 2010
7
III.C URBEMIS Modeling Runs Fail to Account for Emissions of Re-entrained Fugitive Road Dust
When vehicles travel paved or unpaved roads, particles are pulverized by the force of the wheels, lifted and dropped from the rolling wheels, and lifted from the road surface due to strong air currents behind the vehicles. This ‘re-entrained’ fugitive road dust contributes a substantial portion of an air basin’s total particulate matter inventory. Since the mid 1970s, direct emissions of particulate matter have been increasing in the South Coast Air Basin, primarily due to fugitive road dust emissions, dust from construction, and demolition operations. This emission increase reflects the increased growth and vehicle miles traveled in the South Coast air basin.19 These re-entrained road dust emissions significantly affect the South Coast Air Basin’s attainment of the particulate matter ambient air quality standards. For example, the current Transportation Conformity Emissions Budget attributes more than 50% of the entire emissions inventory of directly emitted PM2.5 to re-entrained road dust.20
The URBEMIS model provides the option to include re-entrained road dust in
vehicle traffic emission estimates. However, the Draft EIR’s URBEMIS modeling for the Project’s operational phase does not include re-entrained road dust emissions. Thus, by excluding road dust emissions, the modeling significantly underestimates the Project’s operational phase PM10 and PM2.5 emission estimates. The Draft EIR contains no explanation why re-entrained road dust was not included in these emission estimates.
A preliminary URBEMIS modeling run based on the Draft EIR’s assumptions but
with the “Paved Road Dust” option checked indicates that re-entrained road dust due to the Project’s vehicle traffic would account for approximately 60 pounds per day (“lb/day”) of PM and approximately 10 lb/day of PM2.5.21 (See Exhibit 2.)
19 California Air Resource Board, The California Almanac of Emissions and Air Quality - 2009 Edition, Chapter 4: Air Basin Trends and Forecasts – Criteria Pollutants, pp. 4-10 and 4-11; http://www.arb.ca.gov/aqd/almanac/almanac09/pdf/chap409.pdf, accessed January 21, 2010. 20 Total directly emitted PM2.5 inventory: 37.4 tons/day, thereof 17.8 tons/day re-entrained road dust (49.7%) from paved roads and 1.0 tons/day re-entrained road dust from unpaved roads (2.7%); see South Coast Air Quality Management District, Request to Revise 8-Hour Ozone and PM2.5 Transportation Conformity Emission Budgets for South Coast Air Basin and Coachella Valley; http://www.aqmd.gov/hb/2010/January/100129a.htm at http://www.aqmd.gov/hb/attachments/2010/January/100129.exe, accessed January 21, 2010. 21 (total mitigated PM10 emissions including fugitive dust: 64.31 lb/day) – (total mitigated PM10 emissions without fugitive dust: 3.13 lb/day) = 61.18 lb/day;
(total mitigated PM2.5 emissions including fugitive dust: 12.24 lb/day) – (total mitigated PM2.5 without fugitive dust: 1.92 lb/day) = 10.32 lb/day.
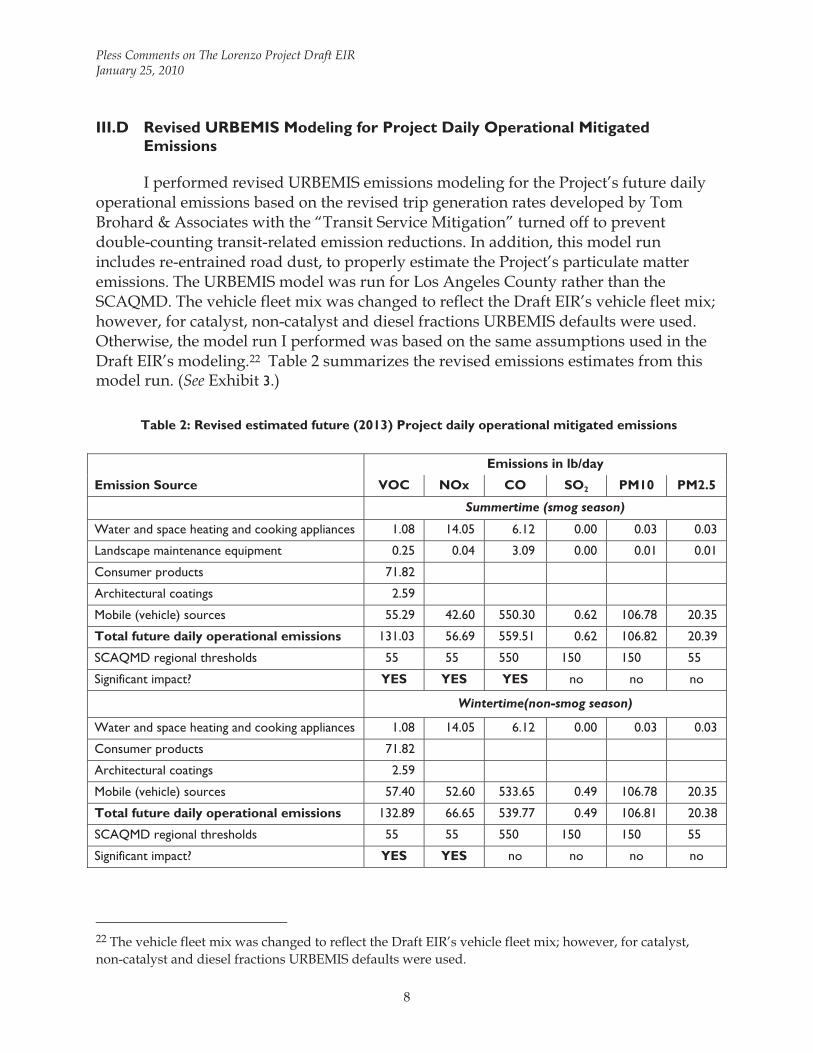
Pless Comments on The Lorenzo Project Draft EIR January 25, 2010
8
III.D Revised URBEMIS Modeling for Project Daily Operational Mitigated Emissions
I performed revised URBEMIS emissions modeling for the Project’s future daily operational emissions based on the revised trip generation rates developed by Tom Brohard & Associates with the “Transit Service Mitigation” turned off to prevent double-counting transit-related emission reductions. In addition, this model run includes re-entrained road dust, to properly estimate the Project’s particulate matter emissions. The URBEMIS model was run for Los Angeles County rather than the SCAQMD. The vehicle fleet mix was changed to reflect the Draft EIR’s vehicle fleet mix; however, for catalyst, non-catalyst and diesel fractions URBEMIS defaults were used. Otherwise, the model run I performed was based on the same assumptions used in the Draft EIR’s modeling.22 Table 2 summarizes the revised emissions estimates from this model run. (See Exhibit 3.)
Table 2: Revised estimated future (2013) Project daily operational mitigated emissions
Emission Source
Emissions in lb/day
VOC NOx CO SO2 PM10 PM2.5
Summertime (smog season)
Water and space heating and cooking appliances 1.08 14.05 6.12 0.00 0.03 0.03
Landscape maintenance equipment 0.25 0.04 3.09 0.00 0.01 0.01
Consumer products 71.82
Architectural coatings 2.59
Mobile (vehicle) sources 55.29 42.60 550.30 0.62 106.78 20.35
Total future daily operational emissions 131.03 56.69 559.51 0.62 106.82 20.39
SCAQMD regional thresholds 55 55 550 150 150 55
Significant impact? YES YES YES no no no
Wintertime(non-smog season)
Water and space heating and cooking appliances 1.08 14.05 6.12 0.00 0.03 0.03
Consumer products 71.82
Architectural coatings 2.59
Mobile (vehicle) sources 57.40 52.60 533.65 0.49 106.78 20.35
Total future daily operational emissions 132.89 66.65 539.77 0.49 106.81 20.38
SCAQMD regional thresholds 55 55 550 150 150 55
Significant impact? YES YES no no no no
22 The vehicle fleet mix was changed to reflect the Draft EIR’s vehicle fleet mix; however, for catalyst, non-catalyst and diesel fractions URBEMIS defaults were used.
Pless Comments on The Lorenzo Project Draft EIR January 25, 2010
9
As shown in Table 2, the revised mitigated operational emissions associated with the Project’s operational phase exceed the SCAQMD’s regional thressholds of significance for VOC, NOx, and CO in summer and for VOC and NOx in winter. The significant emissions of VOC and NOx, which are both ozone precursors, will contribute to the already extreme ozone problem in Los Angeles County.
III.E Air Pollutant Concentrations Associated with Localized Operational Emissions Presented in Draft EIR Are Based on Erroneous Assumptions and Should Be Remodeled
The Draft EIR presents ambient air pollutant concentrations resulting from localized emissions for the Project’s operational phase in Table IV.C-11. The localized emission rates used for calculating these ambient pollutant concentrations from the ISCST3 dispersion modeling were based on the daily operational emission rates obtained with URBEMIS modeling for area sources and vehicles assuming that each vehicle would travel for an average of 0.1 miles within the Project site.23
As discussed in Comments III.A through III.C above, several of the Draft EIR’s
modeling assumptions for the URBEMIS runs with respect to vehicle emissions are erroneous. Thus, the localized operational air pollutant concentrations should be remodeled using correct assumptions to verify the Draft EIR’s conclusions regarding their significance. In addition, rather than being compared to the 2007 ambient pollutant concentrations, emissions should be compared to the highest ambient pollutant concentrations in the past three years.
III.F Mitigation Measures for the Project’s Operational Phase Exist and Should Be Required to Mitigate the Project’s Significant Impacts on Air Quality
The Draft EIR requires no mitigation whatsoever for the significant emissions associated with the Project’s operational phase beyond requiring that the Project design shall meet “the intent of the criteria for Leadership in Energy and Environment (LEED) certification level which shall meet the 2008 Title 24 standards. A number of mitigation measures beyond meeting “the intent” of LEED certification exist. These include, for example, increasing energy efficiency of the residential and commercial buildings beyond Title 24 requirements and the requirement that a percentage of housing units that are deed-restricted below market rate housing (4% reduction in vehicle trips for each deed-restricted unit).24 The SCAQMD has also developed a list of mitigation
23 Draft EIR, p. IV.C-41. 24 South Coast Air Quality Management District, Software User’s Guide: URBEMIS2007 for Windows Version 9.2, Emissions Estimation for Land Use Development Projects, November 2007, p. 41; http://www.urbemis.com/software/URBEMIS9%20Users%20Manual%20Main%20Body.pdf, accessed January 22, 2010.
Pless Comments on The Lorenzo Project Draft EIR January 25, 2010
10
measures for residential buildings that would be applicable to the Project including purchasing renewable energy; installation of smart meters; providing shade for a minimum of 50% of the non-roof surfaces; installation of solar-powered street-lights; use of solid wall systems in floors, walls, and roofs; installation of energy-reducing ceiling fans; installation of electrical outlets for plug-in hybrids; providing transportation information in a prominent area accessible to residents; and providing for one bicycle space for every 20 car parking spaces.25 Other mitigation measures could include the requirement for neighborhood shuttles, paying into a transportation mitigation fund, or providing a donation to non-profit organizations that work on improving the air quality in Los Angeles. Numerous other mitigation measures could be developed that would contribute to improving the local and regional air quality. The City should require the Applicant to implement some of these measures.
IV. The Draft EIR Fails to Adequately Address and Identify Significant Health Risks Associated with Locating Residential Uses Next to Freeway
As mentioned before, the Project site is located adjacent to both I-110 and West Adams Boulevard, a busy arterial street. Over the last ten years, numerous public health studies have shown that that air pollutants are more concentrated near heavily traveled roadways. As a result, air pollution exposure levels are greater close to roadways than are typically reported through regional air pollution measurements and individuals living in proximity to freeways or busy roadways have poorer health outcomes.26 The distance from the road within which pollution levels are noticeably higher varies by pollutant. (See Figure 1.)
25 South Coast Air Quality Management District, PR 2301 Examples of Non-Quantifiable Operational Mitigation Measures, Residential, March 5, 2008; http://www.aqmd.gov/rules/proposed/2301/pr2301_residentia_nonquant_20080305.pdf, accessed January 25, 2010. 26 California Air Resources Board, Air Quality and Land Use Handbook: A Community Health Perspective, April 2005; http://www.arb.ca.gov/ch/handbook.pdf, accessed January 22, 2010.
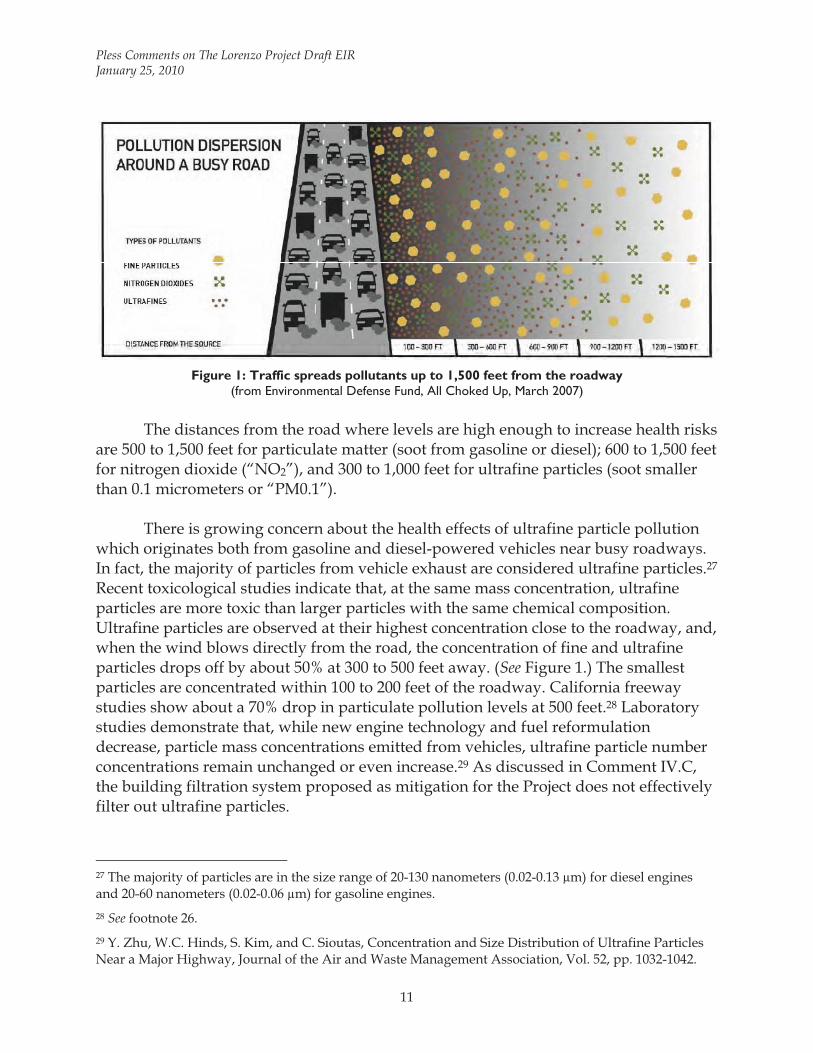
Pless Comments on The Lorenzo Project Draft EIR January 25, 2010
11
Figure 1: Traffic spreads pollutants up to 1,500 feet from the roadway
(from Environmental Defense Fund, All Choked Up, March 2007) The distances from the road where levels are high enough to increase health risks
are 500 to 1,500 feet for particulate matter (soot from gasoline or diesel); 600 to 1,500 feet for nitrogen dioxide (“NO2”), and 300 to 1,000 feet for ultrafine particles (soot smaller than 0.1 micrometers or “PM0.1”).
There is growing concern about the health effects of ultrafine particle pollution
which originates both from gasoline and diesel-powered vehicles near busy roadways. In fact, the majority of particles from vehicle exhaust are considered ultrafine particles.27 Recent toxicological studies indicate that, at the same mass concentration, ultrafine particles are more toxic than larger particles with the same chemical composition. Ultrafine particles are observed at their highest concentration close to the roadway, and, when the wind blows directly from the road, the concentration of fine and ultrafine particles drops off by about 50% at 300 to 500 feet away. (See Figure 1.) The smallest particles are concentrated within 100 to 200 feet of the roadway. California freeway studies show about a 70% drop in particulate pollution levels at 500 feet.28 Laboratory studies demonstrate that, while new engine technology and fuel reformulation decrease, particle mass concentrations emitted from vehicles, ultrafine particle number concentrations remain unchanged or even increase.29 As discussed in Comment IV.C, the building filtration system proposed as mitigation for the Project does not effectively filter out ultrafine particles.
27 The majority of particles are in the size range of 20-130 nanometers (0.02-0.13 μm) for diesel engines and 20-60 nanometers (0.02-0.06 μm) for gasoline engines. 28 See footnote 26. 29 Y. Zhu, W.C. Hinds, S. Kim, and C. Sioutas, Concentration and Size Distribution of Ultrafine Particles Near a Major Highway, Journal of the Air and Waste Management Association, Vol. 52, pp. 1032-1042.
Pless Comments on The Lorenzo Project Draft EIR January 25, 2010
12
Studies implicate exposure to traffic-related pollutant emissions with a variety of cancer as well as non-cancer health risks including acute and chronic respiratory disease and heart attacks as well as premature death in elderly individuals with heart disease. Studies show that children living near a freeway have substantial deficits in lung formation compared with children living farther away. Another study shows that postmenopausal women living in communities with high levels of fine particulate matter have a 150% greater risk of dying from heart disease and stroke than women living in less polluted areas. In another study, adults with asthma who spent just two hours walking on a street with heavy diesel traffic suffered acute effects on their lung function, including lung and airway inflammation. Yet another study shows that exposure to ultrafine particles from incomplete combustion of fuel as well as lubricating oils can bypass the body’s defense mechanisms, enter cells and tissues, and disrupt normal cellular function. Other studies link traffic-related pollutant exposure to increased risk for low birth weight and premature birth. 30,31,32 A recent study found that particulate matter pollution also raises the risk of deep vein thrombosis, a particular concern for elderly people.33 Most recently, a study implicated air pollution and traffic exposure with increased incidences of spontaneous abortion.34
Figure 2 shows an illustration of the most common health effects depending on
receptor proximity to traffic.
30 Environmental Defense Fund, All Choked Up, Heavy Traffic, Dirty Air, and the Risk to New Yorkers, March 2007. 31 See footnote 26. 32 For a summary, see, e.g., D.G. Shendell and V.L. Boothe, Potential Health Effects Associated with Residential Proximity to Freeways and Primary Roads: Scientific Literature 1999-2006, Journal of Environmental Health, April 2008; http://snipurl.com/u6fnw [www_britannica_com], accessed January 24, 2010. 33 A. Baccarelli, I. Martinelli, A. Zanobetti, P. Grillo, L.F. Hou, P.A. Bertazzi, P.M. Mannucci, J. Schwartz, Exposure to Particulate Air Pollution and Risk of Deep Vein Thrombosis; abstract available at: http://snipurl.com/28nor [www_ctv_ca], accessed January 21, 2010. 34 R.S. Green, B. Malig, G.C. Windham, L. Fenster, B. Ostro, and S. Swan, Residential Exposure to Traffic and Spontaneous Abortion, Environmental Health Perspectives, 117(12): 1939-1944, 2009; abstract available at http://snipurl.com/u6fui [ehp03_niehs_nih_gov], accessed January 22, 2010.
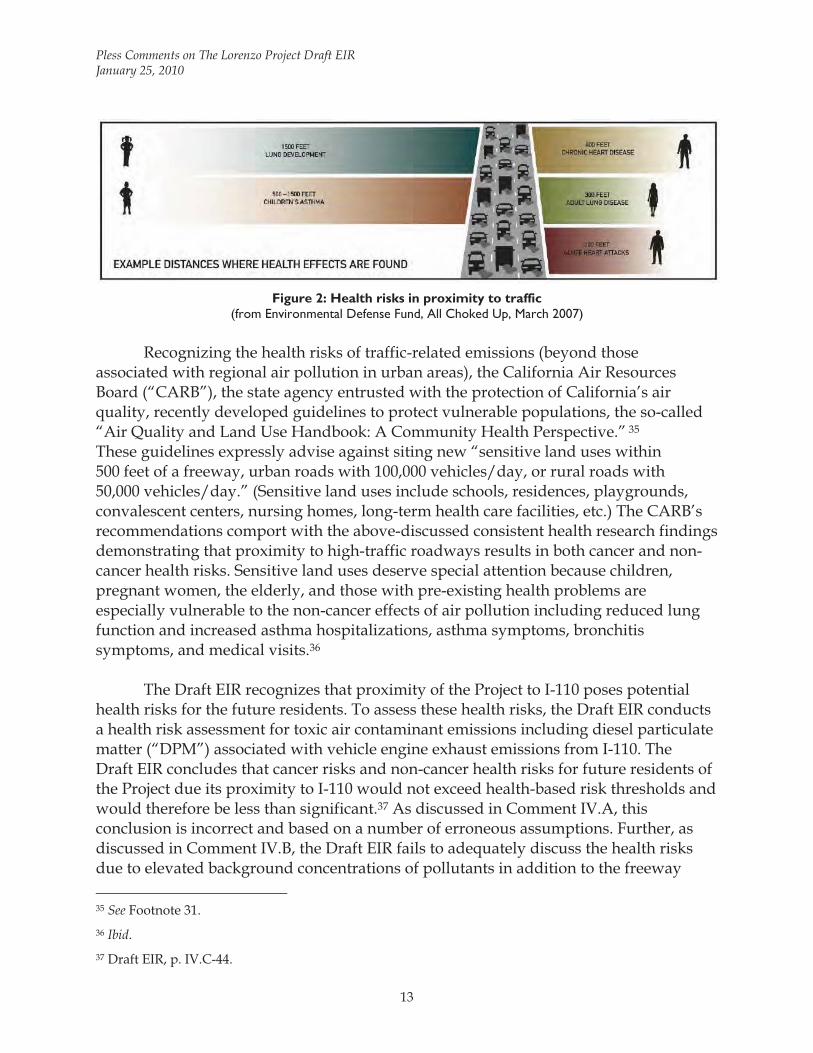
Pless Comments on The Lorenzo Project Draft EIR January 25, 2010
13
Figure 2: Health risks in proximity to traffic
(from Environmental Defense Fund, All Choked Up, March 2007) Recognizing the health risks of traffic-related emissions (beyond those
associated with regional air pollution in urban areas), the California Air Resources Board (“CARB”), the state agency entrusted with the protection of California’s air quality, recently developed guidelines to protect vulnerable populations, the so-called “Air Quality and Land Use Handbook: A Community Health Perspective.” 35 These guidelines expressly advise against siting new “sensitive land uses within 500 feet of a freeway, urban roads with 100,000 vehicles/day, or rural roads with 50,000 vehicles/day.” (Sensitive land uses include schools, residences, playgrounds, convalescent centers, nursing homes, long-term health care facilities, etc.) The CARB’s recommendations comport with the above-discussed consistent health research findings demonstrating that proximity to high-traffic roadways results in both cancer and non-cancer health risks. Sensitive land uses deserve special attention because children, pregnant women, the elderly, and those with pre-existing health problems are especially vulnerable to the non-cancer effects of air pollution including reduced lung function and increased asthma hospitalizations, asthma symptoms, bronchitis symptoms, and medical visits.36
The Draft EIR recognizes that proximity of the Project to I-110 poses potential
health risks for the future residents. To assess these health risks, the Draft EIR conducts a health risk assessment for toxic air contaminant emissions including diesel particulate matter (“DPM”) associated with vehicle engine exhaust emissions from I-110. The Draft EIR concludes that cancer risks and non-cancer health risks for future residents of the Project due its proximity to I-110 would not exceed health-based risk thresholds and would therefore be less than significant.37 As discussed in Comment IV.A, this conclusion is incorrect and based on a number of erroneous assumptions. Further, as discussed in Comment IV.B, the Draft EIR fails to adequately discuss the health risks due to elevated background concentrations of pollutants in addition to the freeway 35 See Footnote 31. 36 Ibid. 37 Draft EIR, p. IV.C-44.
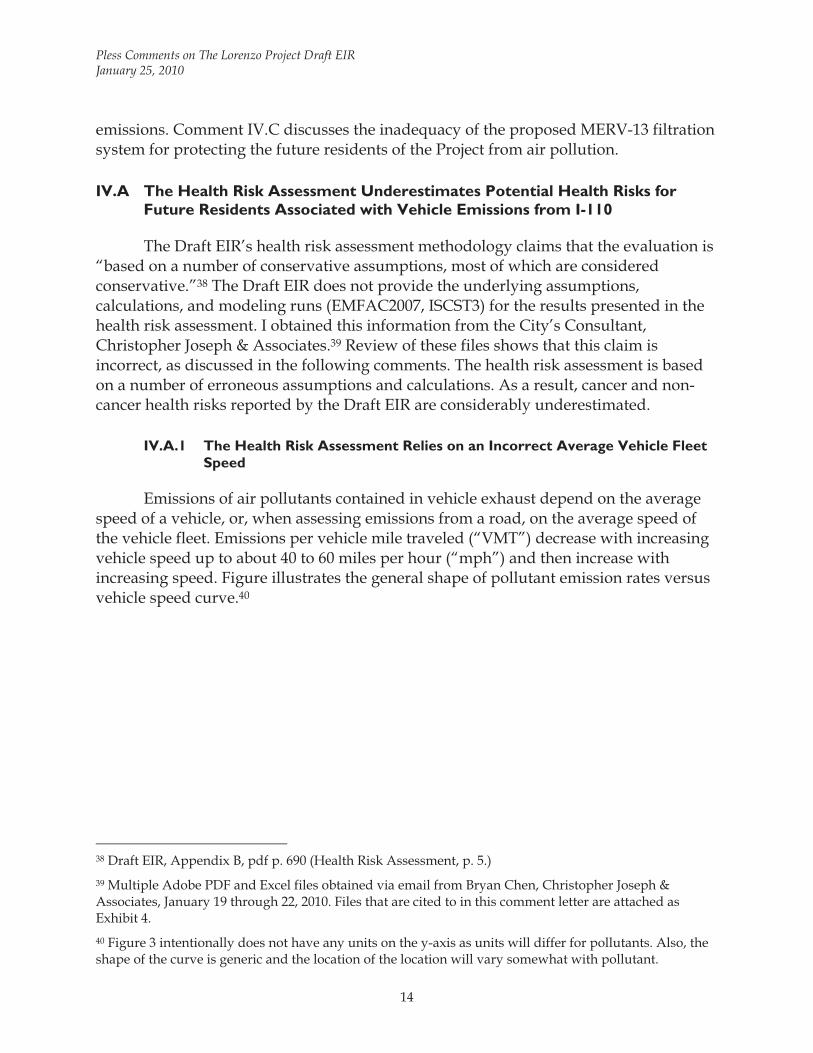
Pless Comments on The Lorenzo Project Draft EIR January 25, 2010
14
emissions. Comment IV.C discusses the inadequacy of the proposed MERV-13 filtration system for protecting the future residents of the Project from air pollution.
IV.A The Health Risk Assessment Underestimates Potential Health Risks for Future Residents Associated with Vehicle Emissions from I-110
The Draft EIR’s health risk assessment methodology claims that the evaluation is “based on a number of conservative assumptions, most of which are considered conservative.”38 The Draft EIR does not provide the underlying assumptions, calculations, and modeling runs (EMFAC2007, ISCST3) for the results presented in the health risk assessment. I obtained this information from the City’s Consultant, Christopher Joseph & Associates.39 Review of these files shows that this claim is incorrect, as discussed in the following comments. The health risk assessment is based on a number of erroneous assumptions and calculations. As a result, cancer and non-cancer health risks reported by the Draft EIR are considerably underestimated.
IV.A.1 The Health Risk Assessment Relies on an Incorrect Average Vehicle Fleet Speed
Emissions of air pollutants contained in vehicle exhaust depend on the average speed of a vehicle, or, when assessing emissions from a road, on the average speed of the vehicle fleet. Emissions per vehicle mile traveled (“VMT”) decrease with increasing vehicle speed up to about 40 to 60 miles per hour (“mph”) and then increase with increasing speed. Figure illustrates the general shape of pollutant emission rates versus vehicle speed curve.40
38 Draft EIR, Appendix B, pdf p. 690 (Health Risk Assessment, p. 5.) 39 Multiple Adobe PDF and Excel files obtained via email from Bryan Chen, Christopher Joseph & Associates, January 19 through 22, 2010. Files that are cited to in this comment letter are attached as Exhibit 4. 40 Figure 3 intentionally does not have any units on the y-axis as units will differ for pollutants. Also, the shape of the curve is generic and the location of the location will vary somewhat with pollutant.
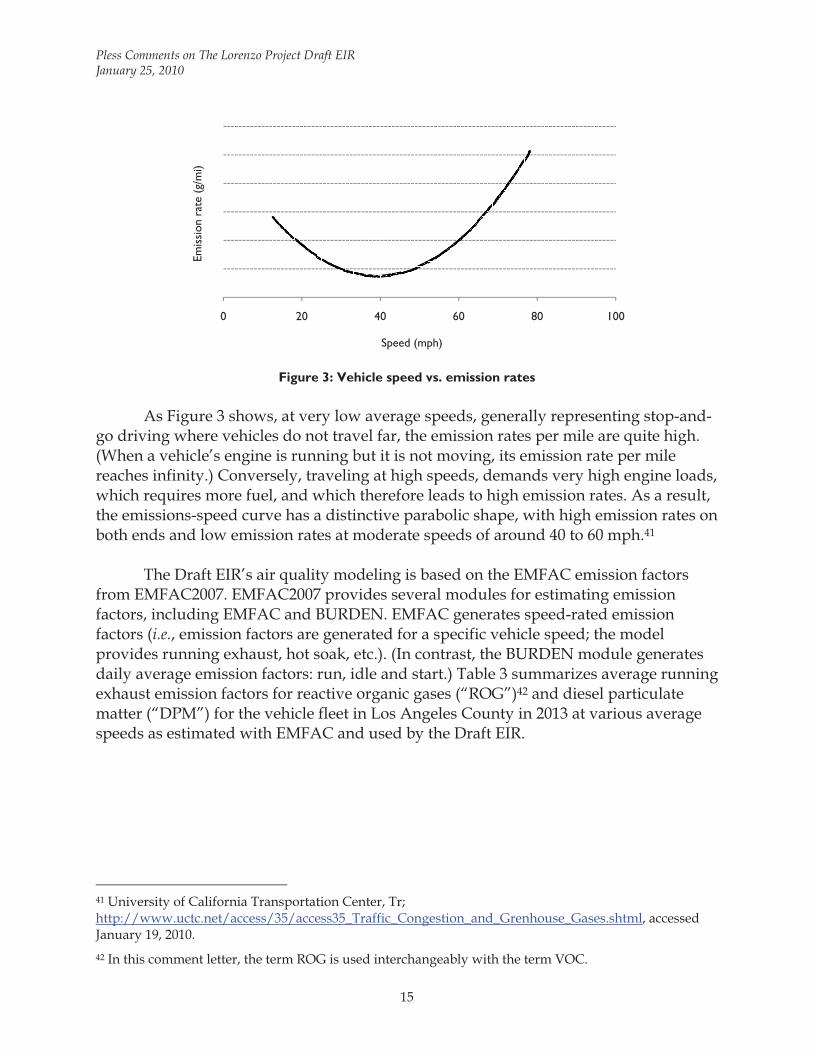
Pless Comments on The Lorenzo Project Draft EIR January 25, 2010
15
Figure 3: Vehicle speed vs. emission rates
As Figure 3 shows, at very low average speeds, generally representing stop-and-
go driving where vehicles do not travel far, the emission rates per mile are quite high. (When a vehicle’s engine is running but it is not moving, its emission rate per mile reaches infinity.) Conversely, traveling at high speeds, demands very high engine loads, which requires more fuel, and which therefore leads to high emission rates. As a result, the emissions-speed curve has a distinctive parabolic shape, with high emission rates on both ends and low emission rates at moderate speeds of around 40 to 60 mph.41
The Draft EIR’s air quality modeling is based on the EMFAC emission factors
from EMFAC2007. EMFAC2007 provides several modules for estimating emission factors, including EMFAC and BURDEN. EMFAC generates speed-rated emission factors (i.e., emission factors are generated for a specific vehicle speed; the model provides running exhaust, hot soak, etc.). (In contrast, the BURDEN module generates daily average emission factors: run, idle and start.) Table 3 summarizes average running exhaust emission factors for reactive organic gases (“ROG”)42 and diesel particulate matter (“DPM”) for the vehicle fleet in Los Angeles County in 2013 at various average speeds as estimated with EMFAC and used by the Draft EIR.
41 University of California Transportation Center, Tr; http://www.uctc.net/access/35/access35_Traffic_Congestion_and_Grenhouse_Gases.shtml, accessed January 19, 2010. 42 In this comment letter, the term ROG is used interchangeably with the term VOC.
0 20 40 60 80 100
Speed (mph)
Emis
sion
rate
(g/
mi)
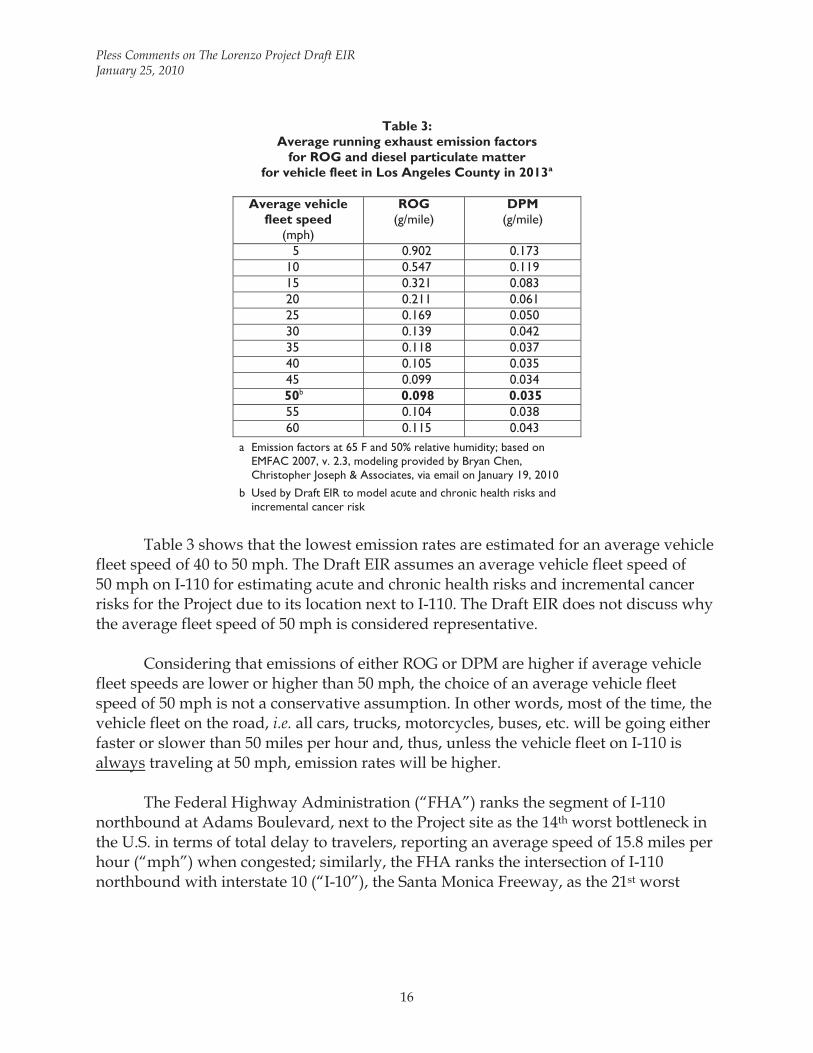
Pless Comments on The Lorenzo Project Draft EIR January 25, 2010
16
Table 3: Average running exhaust emission factors
for ROG and diesel particulate matter for vehicle fleet in Los Angeles County in 2013a
Average vehicle
fleet speed (mph)
ROG (g/mile)
DPM (g/mile)
5 0.902 0.173 10 0.547 0.119 15 0.321 0.083 20 0.211 0.061 25 0.169 0.050 30 0.139 0.042 35 0.118 0.037 40 0.105 0.035 45 0.099 0.034 50b 0.098 0.035 55 0.104 0.038 60 0.115 0.043
a Emission factors at 65 F and 50% relative humidity; based on EMFAC 2007, v. 2.3, modeling provided by Bryan Chen, Christopher Joseph & Associates, via email on January 19, 2010
b Used by Draft EIR to model acute and chronic health risks and incremental cancer risk
Table 3 shows that the lowest emission rates are estimated for an average vehicle
fleet speed of 40 to 50 mph. The Draft EIR assumes an average vehicle fleet speed of 50 mph on I-110 for estimating acute and chronic health risks and incremental cancer risks for the Project due to its location next to I-110. The Draft EIR does not discuss why the average fleet speed of 50 mph is considered representative.
Considering that emissions of either ROG or DPM are higher if average vehicle
fleet speeds are lower or higher than 50 mph, the choice of an average vehicle fleet speed of 50 mph is not a conservative assumption. In other words, most of the time, the vehicle fleet on the road, i.e. all cars, trucks, motorcycles, buses, etc. will be going either faster or slower than 50 miles per hour and, thus, unless the vehicle fleet on I-110 is always traveling at 50 mph, emission rates will be higher.
The Federal Highway Administration (“FHA”) ranks the segment of I-110
northbound at Adams Boulevard, next to the Project site as the 14th worst bottleneck in the U.S. in terms of total delay to travelers, reporting an average speed of 15.8 miles per hour (“mph”) when congested; similarly, the FHA ranks the intersection of I-110 northbound with interstate 10 (“I-10”), the Santa Monica Freeway, as the 21st worst
Pless Comments on The Lorenzo Project Draft EIR January 25, 2010
17
bottleneck in the U.S. with an average speed of 16.8 mph when congested.43 (See Exhibit 5.) Clearly, an average vehicle fleet speed of 50 mph is bordering on wishful thinking for this segment of I-110. Thus, the emission rates for (and consequently emissions from) vehicle emissions from I-110 used by the Draft EIR are considerably underestimated.
The Draft EIR’s emission estimates from I-110 vehicle traffic and the air
dispersion modeling should be revised to reflect a realistic annual average vehicle fleet speed (based on emission factors estimated by the BURDEN module).
IV.A.2 The Health Risk Assessment Erroneusly Relies on Ambient Air Pollutant Concentrations Modeled at Building Top Floor
The dispersion modeling for the Project estimates air pollutant concentrations at the top floor of the proposed on-site residential buildings, where air intakes are anticipated to be located.44 This assumes that all air entering the residential units comes through the central air intake and assumes that all windows are non-operable. However, the drawings indicate that each residential unit would have a balcony, and, thus, operable windows/doors.45 Thus, the Draft EIR’s assumption of the future residents’ exposure to central intake of air only is not conservative and, thus, underestimated. The health risk assessment should be revised to account for the potential exposure of residents to pollutant emissions from the freeway entering through open windows.
IV.A.3 The Health Risk Assessment Fails to Account for A Number of Emission Sources
The Draft EIR’s health risk assessment does not take into account the considerable emissions associated with delivery trucks accessing the Project’s commercial portion, including retail and restaurant uses, or waste management trucks. Emissions from delivery and waste management trucks include on-site running exhaust emissions and idling emissions. Other sources that are not included in the Draft EIR’s health risk assessment are emissions from the testing of on-site diesel backup generators and potential dry cleaning operations.
These emissions will result in higher pollutant concentrations and higher
exposure of the residents than estimated by the Draft EIR’s health risk assessment. 43 Federal Highway Administration, Recurring Traffic Bottlenecks: A Primer – Focus on Low-Cost Operational Improvements, 2009; http://ops.fhwa.dot.gov/publications/fhwahop09037/understanding.htm, accessed January 21, 2010. 44 Appendix B, pdf p. 687 (Health Risk Assessment, p. 2). 45 Draft EIR, Figures II-3 through II-15.
Pless Comments on The Lorenzo Project Draft EIR January 25, 2010
18
IV.A.4 The Health Risk Assessment Assumes an Incorrect Cancer Potency Factor for Diesel Particulate Matter
The health risk assessment assumes a cancer potency factor for diesel particulate matter corrected of 1.0546; the cancer potency factor established by the U.S. EPA and the OEHHA is 1.10.47 The revised health risk assessment should be based on the correct cancer potency factor of 1.10 for diesel particulate matter.
IV.A.5 The Health Risk Assessment Relies on Non-conservative Exposure Duration
The Draft EIR’s health risk assessment assumes a 30-year exposure duration for adult residents, arguing that this assumption is conservative as about 50% of the population lives in the same residence for only nine years, while only 10% remain in the same residence for 30 years.48 While guidance exists for calculating risks based on 9-year and 30 year exposure timeframes, the 30-year exposure duration is not a conservative assumption and is not supported by Office of Environmental Health Hazard Assessment (“OEHHA”) or the SCAQMD.
According to the Air Toxics Hot Spots Program Risk Assessment Guidelines: The
Air Toxics Hot Spots Program Guidance Manual for the Preparation of Health Risk Assessments (“Guidelines”) published by OEHHA “... recommends the 70-year exposure duration be used for determining residential cancer risks. This will ensure that the person residing in the vicinity of the facility for a lifetime will be included in the evaluation of risk posed by that facility. Exposure durations of 9-years and 30-years may also be evaluated as supplemental information to show the range of cancer risk based on residency periods.” The Guidelines further clarify:
In addition to using an estimate of average and high-end consumption rates, cancer risk evaluations for 9, 30, and 70-year exposure durations can be presented instead of just a single 70-year exposure duration. While 9 and 30-year exposure durations are available to present potential impacts over a range of residency periods, all HRAs must present the results based on 70-year exposure.49
46 The spreadsheet “tox values” in file “HRA risk PL.xls” displays a cancer potency factor of 1.1; however, review shows that cell “C4” contains the value 1.05 and displays a rounded value of 1.1. 47 Office of Environmental Health Hazard Assessment, OEHHA Toxicity Criteria Database; http://www.oehha.ca.gov/risk/chemicalDB/index.asp, accessed January 20, 2010. 48 Draft EIR, Appendix B, Health Risk Assessment, p. 6. 49 California Environmental Protection Agency, Office of Environmental Health Hazard Assessment, Air Toxics Hot Spots Program Risk Assessment Guidelines: The Air Toxics Hot Spots Program Guidance Manual for the Preparation of Health Risk Assessments, August 2003, p. 2-4; http://oehha.ca.gov/air/hot_spots/pdf/HRAguidefinal.pdf, accessed January 22, 2010.
Pless Comments on The Lorenzo Project Draft EIR January 25, 2010
19
The SCAQMD recommends using the standard OEHHA 70-year timeframe as the basis for the site-specific health risk assessment. Also worth noting is that while most time is spent indoors, some studies show that the diesel PM penetration rate is around 65%:
In order to protect public health, and in accordance with the recommendations of the State of California Office of Environmental Health Hazard Assessment (OEHHA), a 70-year lifetime exposure is assumed for all receptor locations except for off-site workers (i.e., receptor locations in commercial or industrial areas).50 Based on an exposure duration of 70 years, a cancer potency factor for diesel
particulate matter of 1.10 and otherwise assuming all of the Draft EIR’s assumptions, the cancer risk associated with emissions from the freeway would be 18.5 in one million, by far exceeding the significance threshold of 10 in one million. (See Exhibit 6.) Thus, the Draft EIR fails to identify the significant impacts associated with locating the Project next to I-110. This cancer risk estimate is only a lower bound estimate and will considerably increase if direct exposure to freeway emissions at the lowest residential level is modeled rather than ambient air intake on the top floor of the residential buildings and when accounting for emissions from dry cleaners, backup generators, and delivery and waste management trucks. Thus, the health risk assessment should be revised to account for an exposure duration of 70 years and the Draft EIR be recirculated to discuss the revised results and any necessary mitigation.
IV.B The Draft EIR Fails to Adequately Discuss the Health Risks for Future Residents of the Project
The Draft EIR discusses potential health risks for future residents of the Project as if the I-110 freeway were the only concern. Yet, the extremely unhealthy ambient background concentrations of air pollutants in Los Angeles must be considered in addition to the freeway emissions when discussing the considerable health risks for the Project’s future residents.
The ambient air quality in the South Coast Air Basin is dire. In Los Angeles
County, 7% of the population or 650,000 residents experience asthma symptoms and an additional 9% or 931,000 residents experience asthma-like symptoms. In the City of Los Angeles’ urban schools about 14% of all students have asthma and 28% of young patients at St. John’s Downtown Los Angeles Clinic (located near Adams and Figueroa) are reported to have asthma.51 Further, because of the extremely unhealthy levels of air
50 South Coast Air Quality Management District, Health Risk Assessment Guidance for Analyzing Cancer Risks from Mobile Source Diesel Idling Emissions for CEQA Air Quality Analysis, August 2003, p. 9. 51 St. John’s Well Child and Family Center, Esperanza Community Housing Corporation, Los Angeles Community Action Network, and Strategic Actions for a Just Economy, Shame of the City: Slum Housing
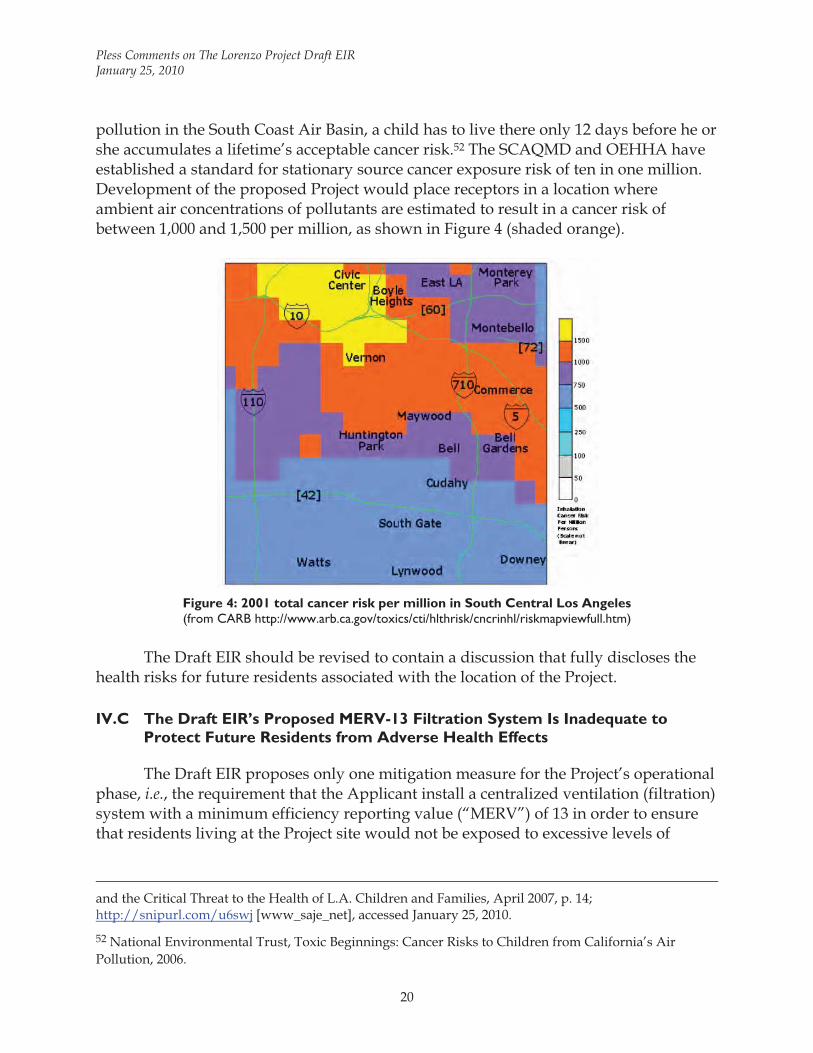
Pless Comments on The Lorenzo Project Draft EIR January 25, 2010
20
pollution in the South Coast Air Basin, a child has to live there only 12 days before he or she accumulates a lifetime’s acceptable cancer risk.52 The SCAQMD and OEHHA have established a standard for stationary source cancer exposure risk of ten in one million. Development of the proposed Project would place receptors in a location where ambient air concentrations of pollutants are estimated to result in a cancer risk of between 1,000 and 1,500 per million, as shown in Figure 4 (shaded orange).
Figure 4: 2001 total cancer risk per million in South Central Los Angeles (from CARB http://www.arb.ca.gov/toxics/cti/hlthrisk/cncrinhl/riskmapviewfull.htm)
The Draft EIR should be revised to contain a discussion that fully discloses the
health risks for future residents associated with the location of the Project.
IV.C The Draft EIR’s Proposed MERV-13 Filtration System Is Inadequate to Protect Future Residents from Adverse Health Effects
The Draft EIR proposes only one mitigation measure for the Project’s operational phase, i.e., the requirement that the Applicant install a centralized ventilation (filtration) system with a minimum efficiency reporting value (“MERV”) of 13 in order to ensure that residents living at the Project site would not be exposed to excessive levels of
and the Critical Threat to the Health of L.A. Children and Families, April 2007, p. 14; http://snipurl.com/u6swj [www_saje_net], accessed January 25, 2010.
52 National Environmental Trust, Toxic Beginnings: Cancer Risks to Children from California’s Air Pollution, 2006.
Pless Comments on The Lorenzo Project Draft EIR January 25, 2010
21
particulate matter pollution in their homes.53 Unfortunately, the MERV-13 filter specification is insufficient to achieve the goal of protecting future residents from traffic-related emissions.
First, as discussed before, the Draft EIR improperly assumes that the residents
would only be exposed to air that has been filtered through the building’s centralized filtration system. However, the building is not hermetically sealed and it appears that the residential buildings feature balconies and operable windows. Thus, unfiltered air can enter the building through open doors and windows, bypassing the centralized filtration system.
Second, the filtration system only addresses health risks associated with particle
pollution. As shown by the Draft EIR’s health risk assessment, more than 30% of the risk associated with freeway emissions can be attributed to TACs other than particulate matter.
Third, a MERV-13 filtration system54 has the capacity to remove up to 75% of
particles with a diameter between 0.3 to 1.0 μm and 90% of particles with a diameter between 1.0 and 10.0 μm.55 Thus, 25% or more of the fine particle pollution (0.3 to 1.0 μm) and 10% of larger particles up to 10.0 μm would pass through the filter and enter the Project’s apartments via the building’s air conditioning and filtration system. For ultrafine particles (smaller than 0.1 μm), there is no guaranteed filtration efficiency. And, as previously discussed, exposure to ultrafine particles is associated with considerable health risks.
Fourth, the MERV-13 designation for the filters alone is insufficient. Even though
the designation represents a comprehensive specification for the filter itself, it does not address the efficiency of the total air filtration system in the building because it does not address the total performance of the air filter when considered in tandem with the filter holding device. The use of a MERV-13 filter in a holding frame or housing that has gaps or leaks defeats any filter evaluation system. Air flow will follow the path of least resistance. Since a filter offers airflow resistance, gaps or leaks within the holding mechanism will allow air bypass. Therefore, system performance must be evaluated to
53 Draft EIR, Mitigation Measure C-17, p. IVC-58. 54 The MERV scale ranges from 1 (least efficient) to 16 (most efficient), and measures a filter’s ability remove particles from 3 to 10 microns in size. Filters with higher ratings not only remove more particles from the air, they also remove smaller particles. 55 Rosenthal J., CAFS, Understanding MERV or the Minimum Efficiency Reporting Value, How the ASHRAE 52.2 Helps You Select an Air Filter; http://www.allergyclean.com/article-understandingmerv.htm, accessed May 7, 2008.
Pless Comments on The Lorenzo Project Draft EIR January 25, 2010
22
assure that all the air moving through the system is treated by the filter.56 To ensure that the building’s entire air filtration system would function at the specified efficiency, other aspects of the ventilation system design such as ventilation rates, infiltration rates, and maintenance of positive pressure m be explicitly specified.
Fifth, the City should require a construction indoor air quality (“IAQ”)
management plan to ensure that the building ventilation system will perform at the MERV-13 rating and is not contaminated during the construction process. The following control measures have been suggested to meet the U.S. Green Building Council Leadership in Energy and Environmental Design (“LEED”) Green Building Rating System during construction of buildings:
- A common practice used to protect the HVAC system during construction is to shut down the
return side of the HVAC system during heavy construction activities, and to replace the ventilation system filters at frequent intervals throughout the construction process. Returns should be shrink-wrapped with plastic or even dampered off during especially disruptive construction activities.
- Temporary barriers should be constructed in an effort to isolate areas under construction from clean or occupied areas. If weather permits, construction areas should also be ventilated directly to the outdoors if particularly dusty operations or installation of VOC-emitting materials are being performed.
- Ensure that materials stored onsite do not get contaminated by dirt or other particulate matter that is always present on construction sites. An overall jobsite maintenance program should be developed that includes the storage and protection of building materials in a dry, clean location. Ductwork should be delivered to the jobsite shrink-wrapped on both ends until immediately prior to installation, and the returns should be kept wrapped until final installation of the finish grates. Implementing a no smoking policy for the workers during construction, using HEPA vacuums for cleanup, and making everyone on the jobsite aware of the housekeeping plan through onsite training programs.
- Conduct a minimum two-week building flush-out with new MERV 13 filtration media at 100% outside air. After the two-week flush-out is complete, new MERV 13 filters must be replaced in all locations except those that have been processing only outside air during the flush-out.57
56 Thornburg D., ASHRAE Filter Test Standard Provides New Tool for IAQ Control, Invironment 2000; http://www.invironment.com/research/v6n7f1.pdf, accessed May 7, 2008. 57 Abbreviated from: Southwest Contractor, Indoor Air Quality Management Plan to Meet LEED Requirements; http://southwest.construction.com/features/archive/0510_feature7.asp, accessed May 12, 2008.
Pless Comments on The Lorenzo Project Draft EIR January 25, 2010
23
V. The Draft EIR Underestimates and Fails to Adequately Mitigate Construction Emissions
The Draft EIR’s estimates of construction emissions substantially underestimate the emissions associated with construction of the Project as discussed in the following comments.
V.A The Draft EIR Underestimates Emissions Associated with Earthmoving
The URBEMIS modeling for emissions for earthmoving is based on the assumption that only 2 acres per day would be actively disturbed and no on-site cut-and-fill would be required.58 These assumptions fail to account for the considerable emissions associated with construction of the subterranean parking lots and leveling the project site. The Draft EIR indicates that approximately 385,000 cubic yards of soil would be excavated and exported to allow for the subterranean parking lots and building foundations.59 The excavation and hauling of soil result in considerable emissions that are not accounted for in the Draft EIR’s estimates. Further, the URBEMIS modeling only includes emissions from mass grading but fails to include emissions from fine grading. Thus, the URBEMIS modeling should be revised and included in a recirculated Draft EIR.
V.B The Draft EIR Underestimates Building Construction Emissions
The Draft EIR’s URBEMIS estimates of construction emissions during building construction are based on the assumption of a maximum of seven pieces of equipment operating on site (1 cement and mortar mixer, 1 crane, 2 forklifts, 2 rough-terrain forklifts, 1 tractor/loader/backhoe, 1 trencher).60 This appears to be a considerable underestimate for the scale of the Project. Presumably there would be more than one crane, more than one cement and mortar mixer, and several welders, flatbed trucks, etc. on site to construct the Project’s five-story and 44-story buildings within the proposed construction timeframe of three years. To properly estimate construction emissions, the equipment counts must be provided by a construction company experienced in determining the maximum quantity of each type of construction equipment that would realistically be operating on site.
58 Draft EIR, Appendix B, URBEMIS modeling run for construction emissions, p. 6 (pdf page 11) 59 Draft EIR, p. II-24. 60 Ibid.
Pless Comments on The Lorenzo Project Draft EIR January 25, 2010
24
V.C The Draft EIR Overestimates the Control Efficiency of the Proposed Mitigation Measures for Fugitive Dust
The Draft EIR’s URBEMIS modeling runs for the construction phase include the following control efficiencies for PM10 and PM2.5 emissions: 84% for using soil stabilizers on inactive areas; 5% for replacing ground cover in disturbed areas quickly; 55% for watering exposed surfaces twice daily; and 69% for equipment loading/unloading measures.61 The estimated reduction in construction emissions associated with these mitigation measures is overestimated because the URBEMIS model version 9.2.4 used by the Draft EIR incorrectly estimates the emission reductions, as noted by the SCAQMD: “An error has been identified associated with the fugitive dust construction mitigation measures for PM. Therefore, the only mitigation measures acceptable for use are either watering OR chemical suppressants.62The Draft EIR’s URBEMIS modeling for construction should therefore be revised and recirculated for public review.
V.D The Proposed Mitigation Measures for Reducing Exhaust Emissions from Construction Equipment Are Inadequate and Additional Mitigation Is Feasible
Most heavy-duty construction equipment is diesel-powered. Diesel exhaust is a complex mixture of gaseous and solid materials. The visible emissions in diesel exhaust are known as diesel particulate matter (“DPM”), which includes carbon particles or “soot.” Diesel exhaust also contains a variety of harmful gases and over 40 other known cancer-causing substances and is estimated to contribute to more than 75% of the added cancer risk from air toxics in the United States. Diesel exhaust also has the potential to cause serious adverse health effects including pulmonary and cardiovascular diseases.63,64
Lagging emission standards and very old equipment in the fleet have made construction equipment one of the largest sources of toxic diesel particulate matter (soot) pollution in California. An estimated 70% of California’s construction equipment
61 Ibid, p. 11 (pdf page 12). 62 South Coast Air Quality Management District, Air Quality Modeling, Transportation and Land Use Programs Computer Model (URBEMIS 2007 v.9.2.4); http://www.aqmd.gov/CEQA/models.html, accessed January 21, 2010. 63 California Air Resources Board, Health Effects of Diesel Exhaust; http://www.arb.ca.gov/research/diesel/diesel-health.htm, accessed January 22, 2010. 64 Environmental Defense Fund, Cleaner Diesel Handbook, Bring Cleaner Fuel and Diesel Retrofits into Your Neighborhood, April 2005, p. iv; http://www.environmentaldefense.org/documents/4941_cleanerdieselhandbook.pdf, accessed January 22, 2010.
Pless Comments on The Lorenzo Project Draft EIR January 25, 2010
25
is currently not covered by federal and state regulations because it is too old.65 Clouds of soot emitted with the exhaust from construction equipment can travel downwind for miles, then drift into heavily populated areas.
A recent analysis found that air pollution from construction equipment is already
taking a staggering toll on the health and economic well-being of Californians. For the South Coast Air Basin, 2005 estimates for health and economic damage from construction equipment emissions included more than 700 premature deaths, about 650 hospitalizations for respiratory and cardio-vascular disease, almost 27,000 incidences of asthma attacks, acute bronchitis, and other lower respiratory symptoms, about 125,000 days of lost work, about 175,000 school absences, and almost one million restricted activity days. This loss of life and productivity cost South Coast Air Basin residents an estimated $5.9 billion.66 These estimates are conservative because they do not include emissions from a large number of smaller construction projects (residential and commercial and projects smaller than one acre in size and because multi-story buildings were treated as one-story buildings). Further, John Hakel, Vice President of the Associated General Contractors, an organization representing construction equipment fleet owners and general contractors, indicated that the analysis appeared to underestimate the sheer volume of construction equipment in use.67
The entire City of Los Angeles including the Project site is located in a high risk
area for construction equipment emissions.68 The Project would be built out over a period of three years69, concurrently with many other construction projects in the region. During this time, heavy-duty diesel-powered construction equipment would emit considerable amounts of diesel particulate matter, which would travel into nearby residential areas, increase ambient concentrations of this pollutant, and result in potentially adverse health impacts. Sensitive receptors that may be adversely affected include the schools, residences, the hotel, and medical buildings in the vicinity of the Project site. The Project’s construction emission would exacerbate the already existing severe health impacts on the City’s residents caused by construction equipment.
The Draft EIR proposes four mitigation measures to reduce exhaust emissions
from construction equipment: keeping construction equipment in proper tune (C-11);
65 Union of Concerned Scientists, Digging up Trouble, The Health Risk of Construction Pollution in California, November 2006; http://www.ucsusa.org/assets/documents/clean_vehicles/digging-up-trouble.pdf, accessed January 22, 2010; pp. 12 and 13 attached as Exhibit 7. 66 Ibid, p. 12. 67 Los Angeles Times, Dire Health Effects of Pollution Reported, Diesel Soot from Construction Equipment Is Blamed for Illnesses and Premature Deaths, December 6, 2006; attached as Exhibit 8. 68 See Exhibit 7, p. 13. 69 See Draft EIR, Appendix B, URBEMIS modeling for construction emissions.
Pless Comments on The Lorenzo Project Draft EIR January 25, 2010
26
restricting idling to five minutes (C-12); use of electricity infrastructure (C-13), and a requirement that a number of construction equipment be equipped with a diesel oxidation catalyst (C-14). These mitigation measures are inadequate as discussed in the following comments. In light of the undisputed dire health consequences including excess deaths resulting from increased elevations of diesel particulate matter and other pollutants in construction equipment exhaust, the City should require the Applicant to implement effective mitigation measures to reduce these emissions.
V.D.1 Mitigation Measures to Reduce Construction Equipment Engine Exhaust Is Ineffective and Should Be Revised
The Draft EIR’s Mitigation Measure C-14 requires that “all scrapers, excavators, crawlers, forklifts, water trucks, pavers, and tractors used in the construction phase ... be equipped with diesel oxidation catalyst systems that would achieve a 20 percent reduction of NOx emissions from approved systems.” This mitigation measure is poorly worded and, consequently, ineffective as it contains no reference level to which the 20% reduction of NOx is compared and does not include all diesel-powered equipment that would potentially be operating on site (e.g., cranes, backhoes, loaders, trenchers). Further, the mitigation measure should specify a percent reduction for particulate matter. Effective language for this mitigation measure has, for example, been developed by the Sacramento Metropolitan Air Quality Management District (“SMAQMD”):
Category 1: Reducing NOx emissions from off-road diesel powered equipment The project shall provide a plan, for approval by the lead agency and SMAQMD, demonstrating that the heavy-duty (> 50 horsepower) self-propelled off-road vehicles to be used in the construction project, including owned, leased and subcontractor vehicles, will achieve a project wide fleet-average 20 percent NOx reduction and 45 percent particulate reduction1 compared to the most recent CARB fleet average at time of construction; and The project representative shall submit to the lead agency and SMAQMD a comprehensive inventory of all off-road construction equipment, equal to or greater than 50 horsepower, that will be used an aggregate of 40 or more hours during any portion of the construction project. The inventory shall include the horsepower rating, engine production year, and projected hours of use for each piece of equipment. The inventory shall be updated and submitted monthly throughout the duration of the project, except that an inventory shall not be required for any 30-day period in which no construction activity occurs. At least 48 hours prior to the use of subject heavy-duty off-road equipment, the project representative shall provide SMAQMD with the anticipated construction timeline including start date, and name and phone number of the project manager and on-site foreman. and:
Pless Comments on The Lorenzo Project Draft EIR January 25, 2010
27
Category 2: Controlling visible emissions from off-road diesel powered equipment The project shall ensure that emissions from all off-road diesel powered equipment used on the project site do not exceed 40 percent opacity for more than three minutes in any one hour. Any equipment found to exceed 40 percent opacity (or Ringelmann 2.0) shall be repaired immediately, and the lead agency and SMAQMD shall be notified within 48 hours of identification of non-compliant equipment. A visual survey of all in-operation equipment shall be made at least weekly, and a monthly summary of the visual survey results shall be submitted throughout the duration of the project, except that the monthly summary shall not be required for any 30-day period in which no construction activity occurs. The monthly summary shall include the quantity and type of vehicles surveyed as well as the dates of each survey. The SMAQMD and/or other officials may conduct periodic site inspections to determine compliance. Nothing in this section shall supercede other SMAQMD or state rules or regulations. and/or: If at the time of construction, the SMAQMD has adopted a regulation applicable to construction emissions, compliance with the regulation may completely or partially replace this mitigation. Consultation with SMAQMD prior to construction will be necessary to make this determination. 1 Acceptable options for reducing emissions may include use of newer model year engines, low-emission diesel products, alternative fuels, engine retrofit technology, after-treatment products, and/or other options as they become available.70 To effectively control emissions from heavy-duty diesel-powered construction
equipment, the Draft EIR’s mitigation measures should be revised to include similar language.
V.D.2 The Construction Mitigation Measures Required by the Draft EIR Fail to Include Monitoring, Feedback, or Enforcement
The mitigation measures proposed in the Draft EIR only instruct the Applicant to require the construction contractor to implement the listed measures. None of the mitigation measures stipulates any monitoring, feedback, or enforcement in case the construction contractor should fail to implement or adequately execute the control measures, thereby rendering the proposed mitigation measures essentially meaningless. The Draft EIR should require the development of a construction mitigation plan and the presence of an on-site construction mitigation manager during construction of the Project.
70 Sacramento Metropolitan Air Quality Management District, SMAQMD Recommended Mitigation for Reducing Emissions from Heavy-Duty Construction Vehicles, Revised December 1, 2008; http://www.airquality.org/ceqa/mitigation.shtml#construction, accessed January 20, 2010.

Exhibit 1:
URBEMIS output files “Detail Report for Summer Operational Mitigated Emissions (Pounds/Day)” and “Detail Report for Summer Operational Mitigated Emissions (Pounds/Day)”

Exhibit 2: URBEMIS modeling for Project operational phase emissions
using the Draft EIR’s assumptions but with fugitive dust option checked

Exhibit 3: Revised URBEMIS modeling for future (2013) Project daily operational mitigated emissions

Exhibit 4: Excel spreadsheets provided by Christopher Joseph & Associates

Exhibit 5: Federal Highway Administration, Recurring Traffic Bottlenecks:
A Primer – Focus on Low-Cost Operational Improvements, 2009

Exhibit 6: Spreadsheets for revised estimates of cancer risks associated with I-110
(accounting for 70-year exposure duration and DPM cancer potency factor of 1.10)

Exhibit 7: Excerpt from Union of Concerned Scientists, Digging Up Trouble, November 2006

Exhibit 8: Los Angeles Times, December 6, 2006

Exhibit 1:
URBEMIS output files “Detail Report for Summer Operational Mitigated Emissions (Pounds/Day)” and “Detail Report for Summer Operational Mitigated Emissions (Pounds/Day)”
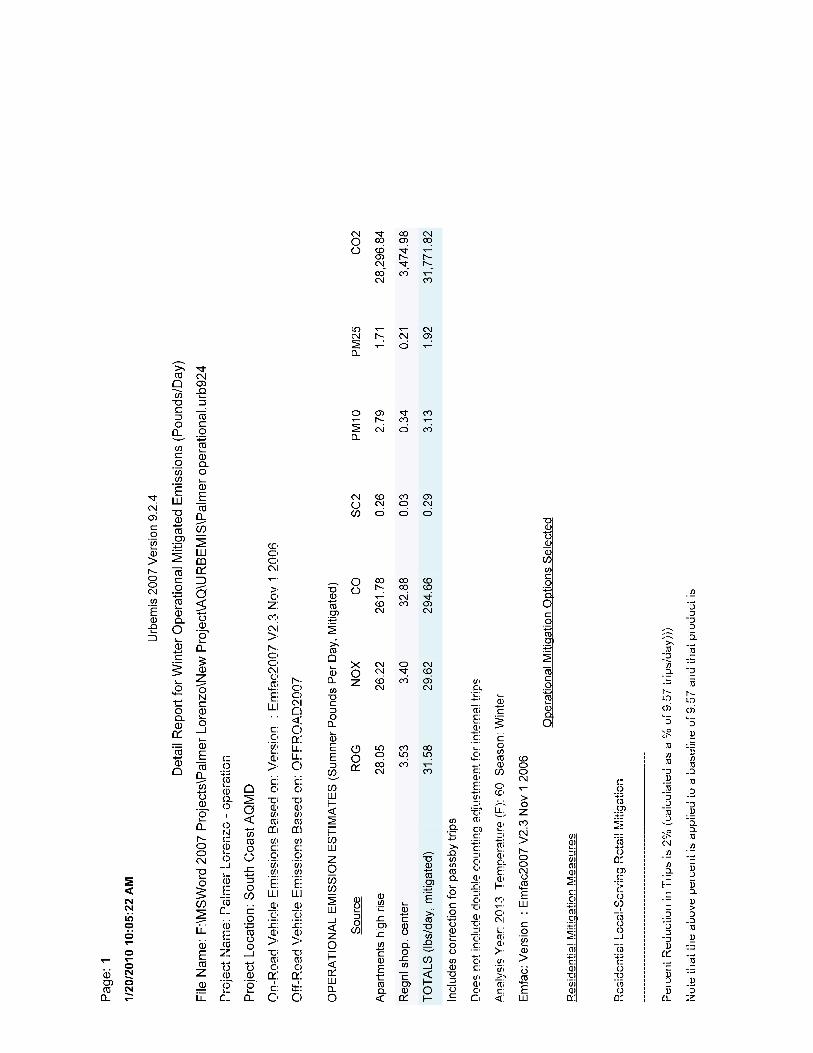


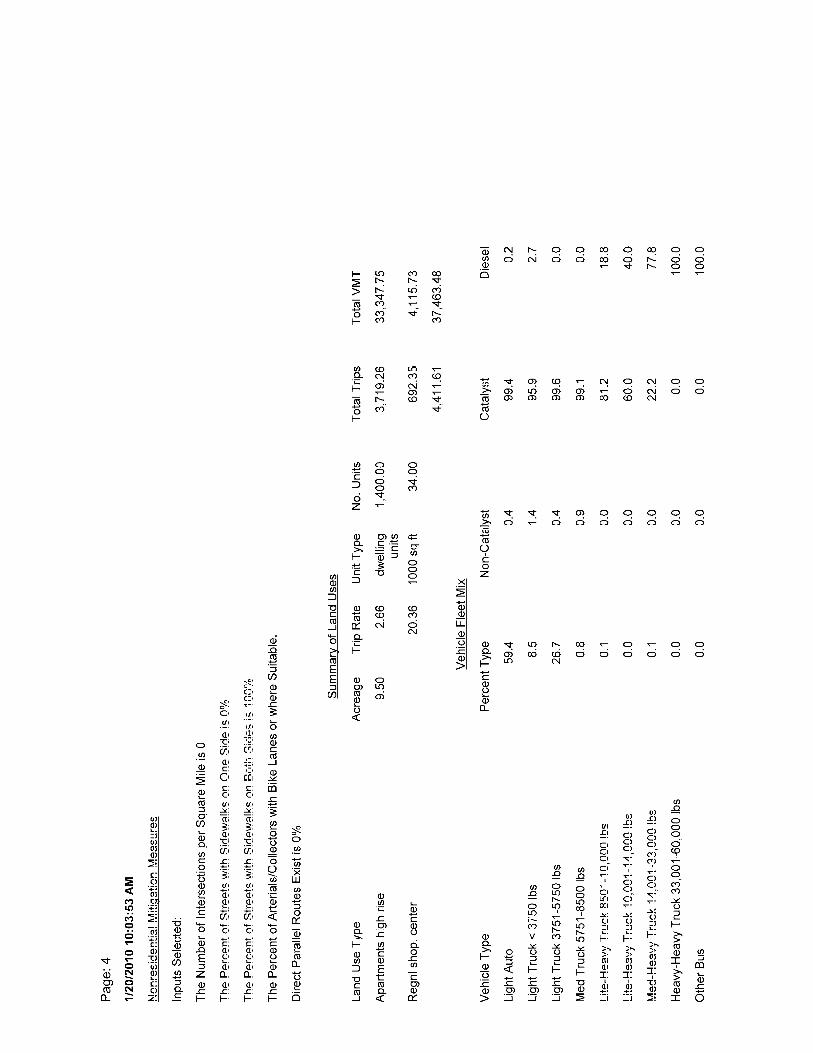
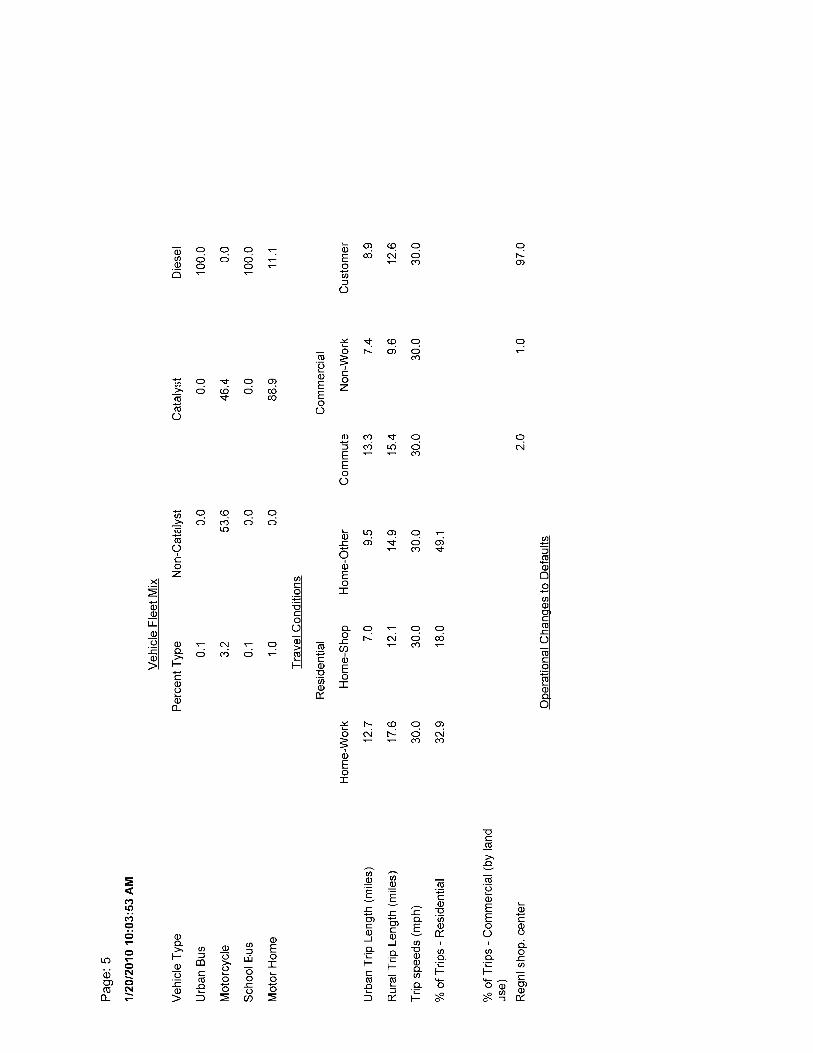

Exhibit 2: URBEMIS modeling for Project operational phase emissions
using the Draft EIR’s assumptions but with fugitive dust option checked
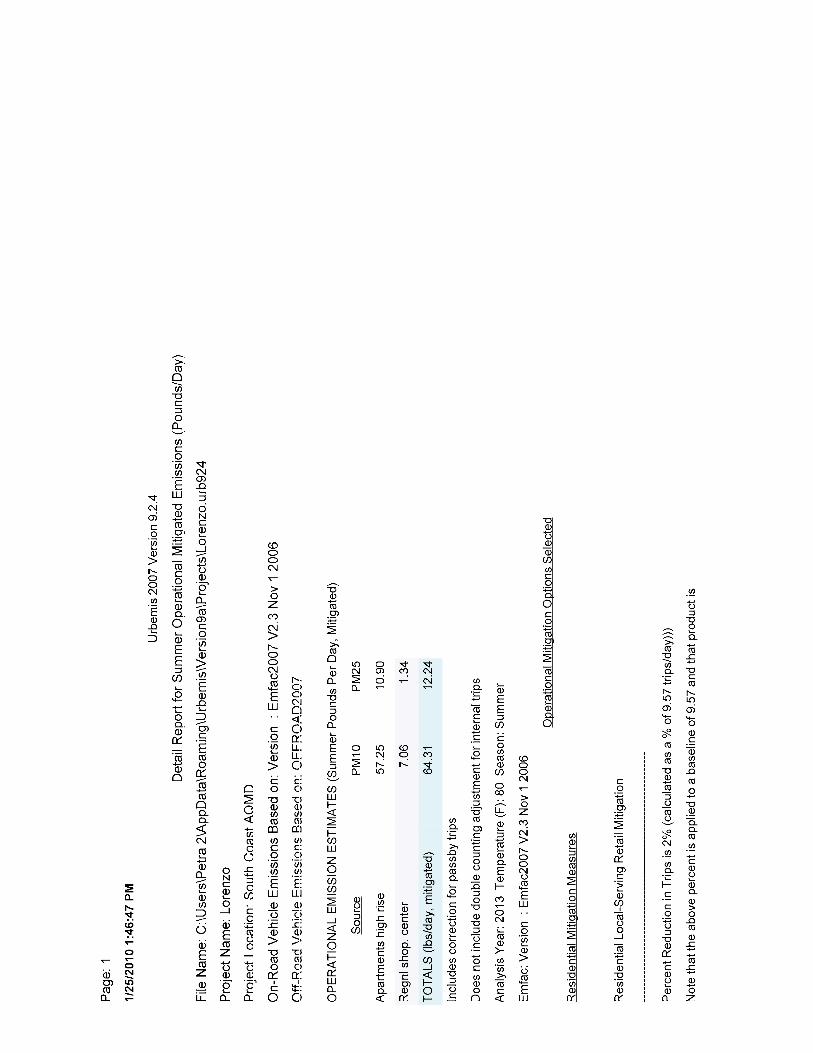
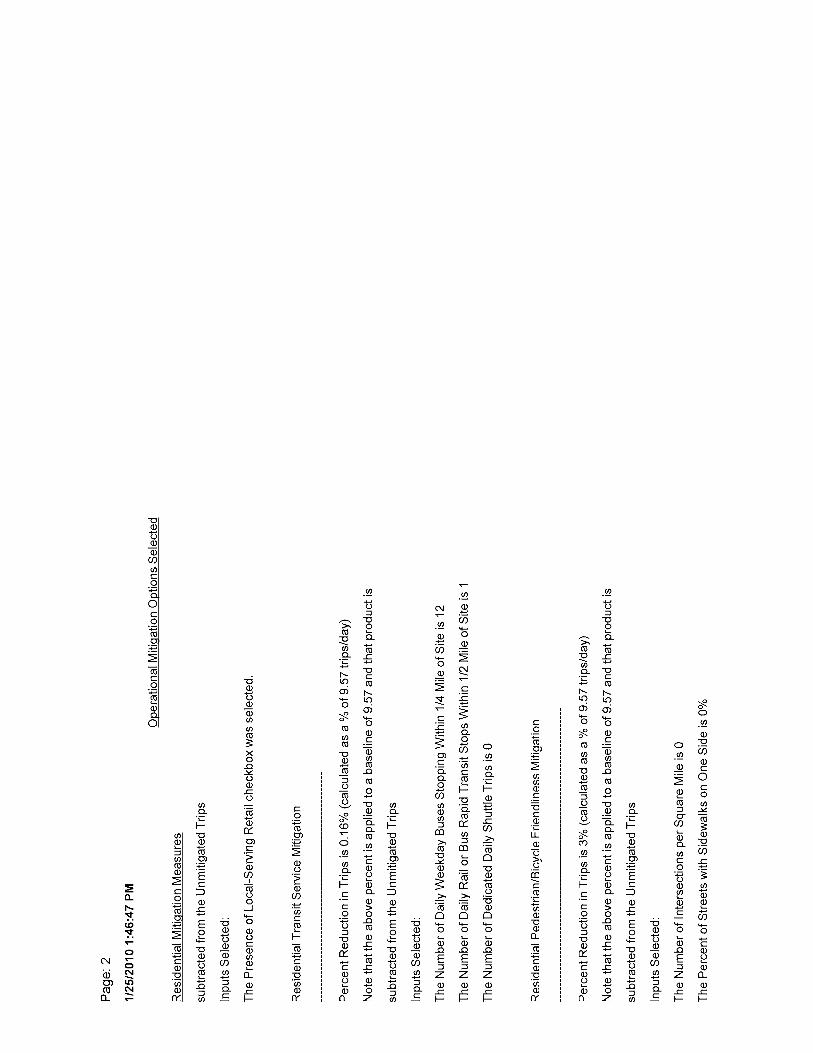
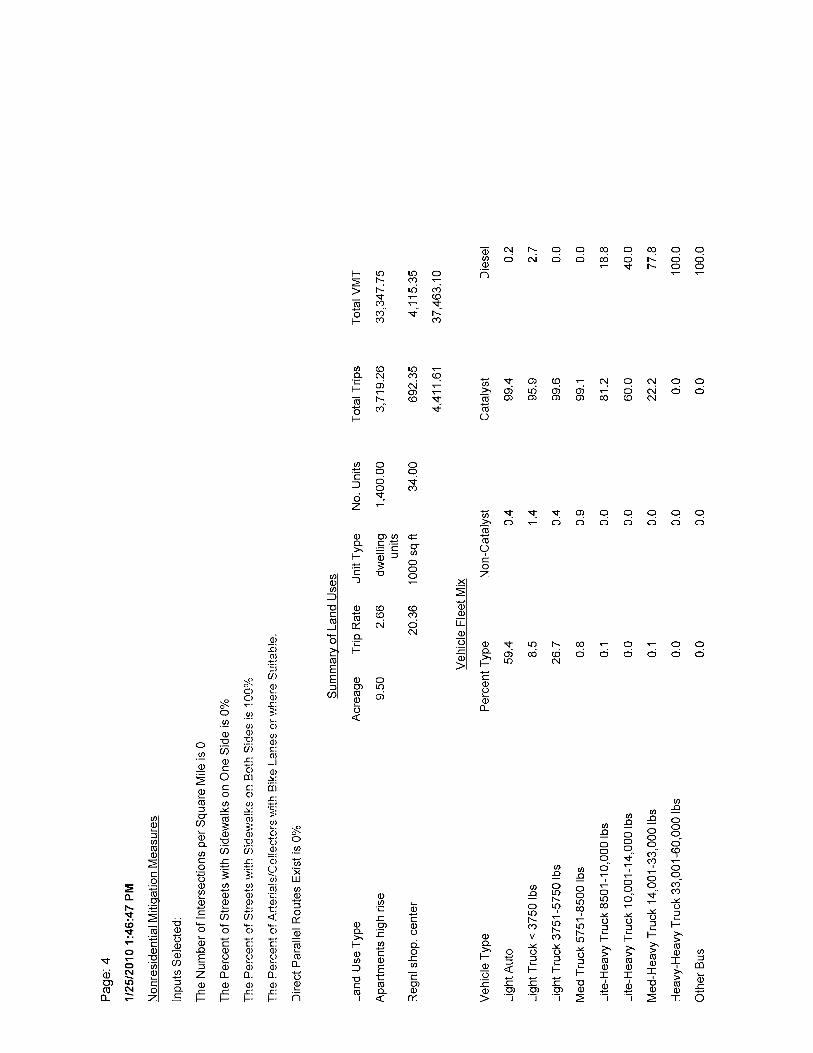
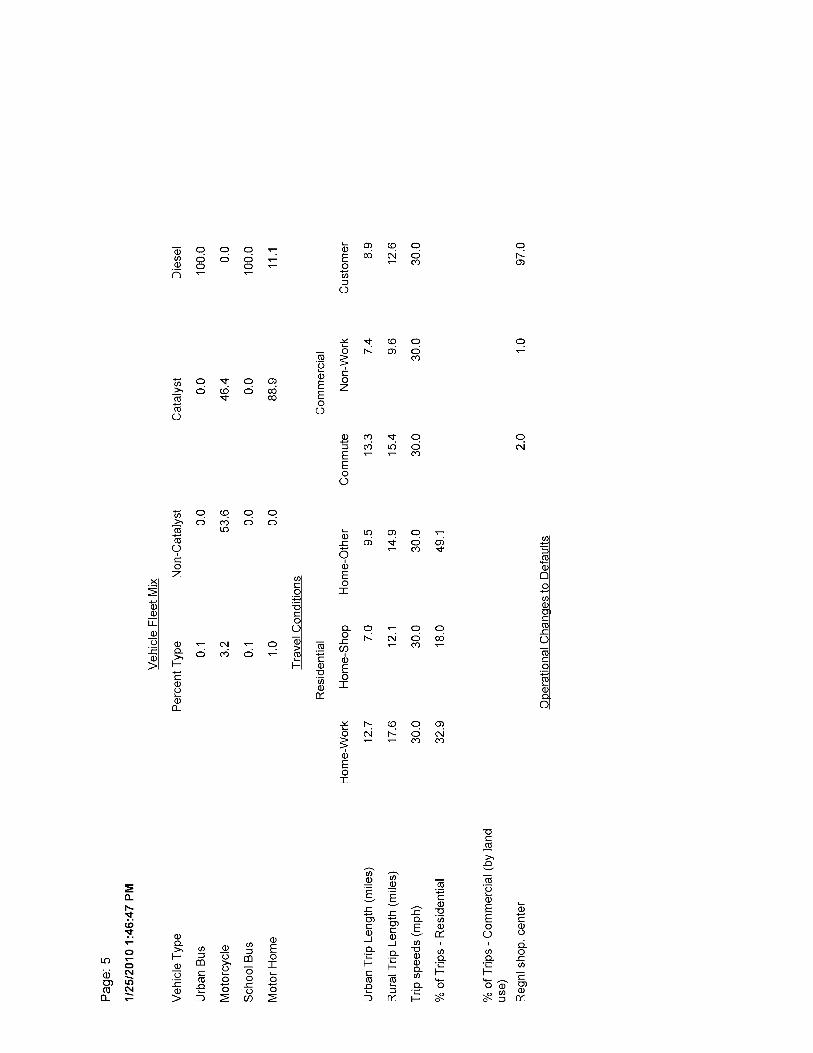

Exhibit 3: Revised URBEMIS modeling for future (2013) Project daily operational mitigated emissions
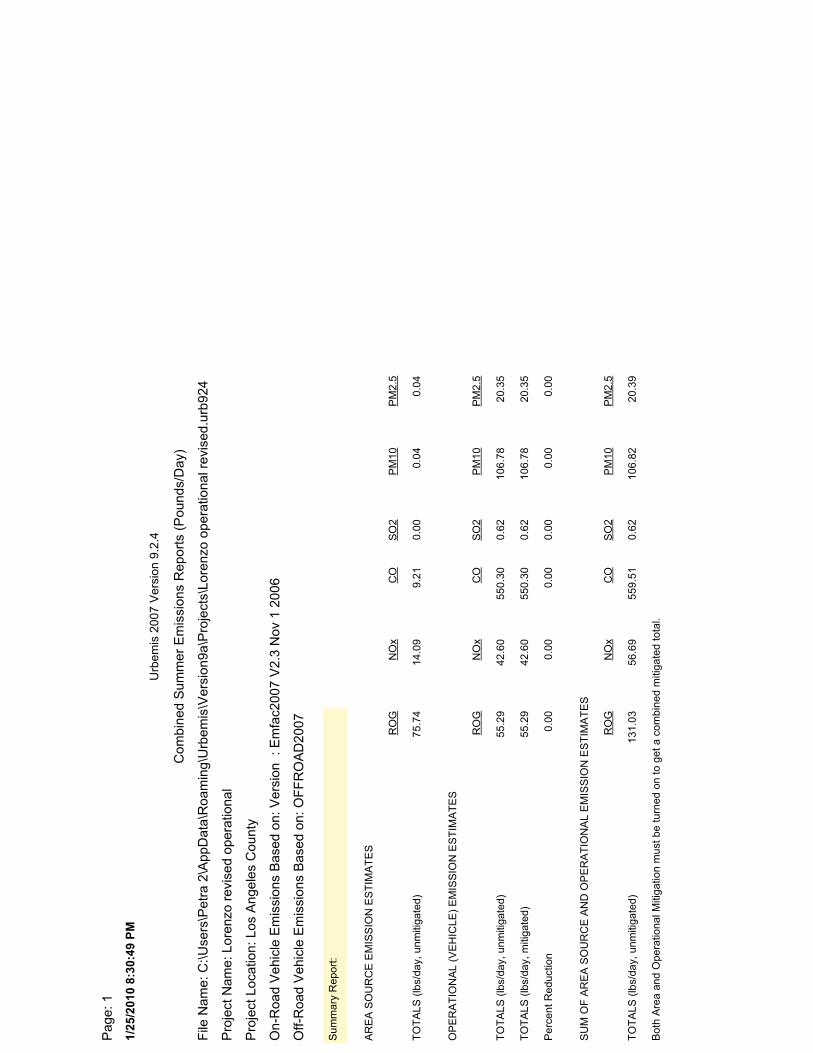
1/25
/201
0 8:
30:4
9 PM
Pag
e: 1
File
Nam
e: C
:\Use
rs\P
etra
2\A
ppD
ata\
Roa
min
g\U
rbem
is\V
ersi
on9a
\Pro
ject
s\Lo
renz
o op
erat
iona
l rev
ised
.urb
924
Pro
ject
Nam
e: L
oren
zo r
evis
ed o
pera
tiona
l
Pro
ject
Loc
atio
n: L
os A
ngel
es C
ount
y
On-
Roa
d V
ehic
le E
mis
sion
s B
ased
on:
Ver
sion
: E
mfa
c200
7 V
2.3
Nov
1 2
006
Off-
Roa
d V
ehic
le E
mis
sion
s B
ased
on:
OF
FR
OA
D20
07
Com
bine
d S
umm
er E
mis
sion
s R
epor
ts (
Pou
nds/
Day
)
Urb
emis
200
7 V
ersi
on 9
.2.4
Bot
h A
rea
and
Ope
ratio
nal M
itiga
tion
mus
t be
turn
ed o
n to
get
a c
ombi
ned
miti
gate
d to
tal.
TO
TA
LS (
lbs/
day,
unm
itiga
ted)
131.
0356
.69
559.
510.
6210
6.82
20.3
9
SU
M O
F A
RE
A S
OU
RC
E A
ND
OP
ER
AT
ION
AL
EM
ISS
ION
ES
TIM
AT
ES
RO
GN
Ox
CO
SO
2P
M10
PM
2.5
Per
cent
Red
uctio
n0.
000.
000.
000.
000.
000.
00
TO
TA
LS (
lbs/
day,
miti
gate
d)55
.29
42.6
055
0.30
0.62
106.
7820
.35
TO
TA
LS (
lbs/
day,
unm
itiga
ted)
55.2
942
.60
550.
300.
6210
6.78
20.3
5
OP
ER
AT
ION
AL
(VE
HIC
LE)
EM
ISS
ION
ES
TIM
AT
ES
RO
GN
Ox
CO
SO
2P
M10
PM
2.5
TO
TA
LS (
lbs/
day,
unm
itiga
ted)
75.7
414
.09
9.21
0.00
0.04
0.04
AR
EA
SO
UR
CE
EM
ISS
ION
ES
TIM
AT
ES
RO
GN
Ox
CO
SO
2P
M10
PM
2.5
Sum
mar
y R
epor
t:
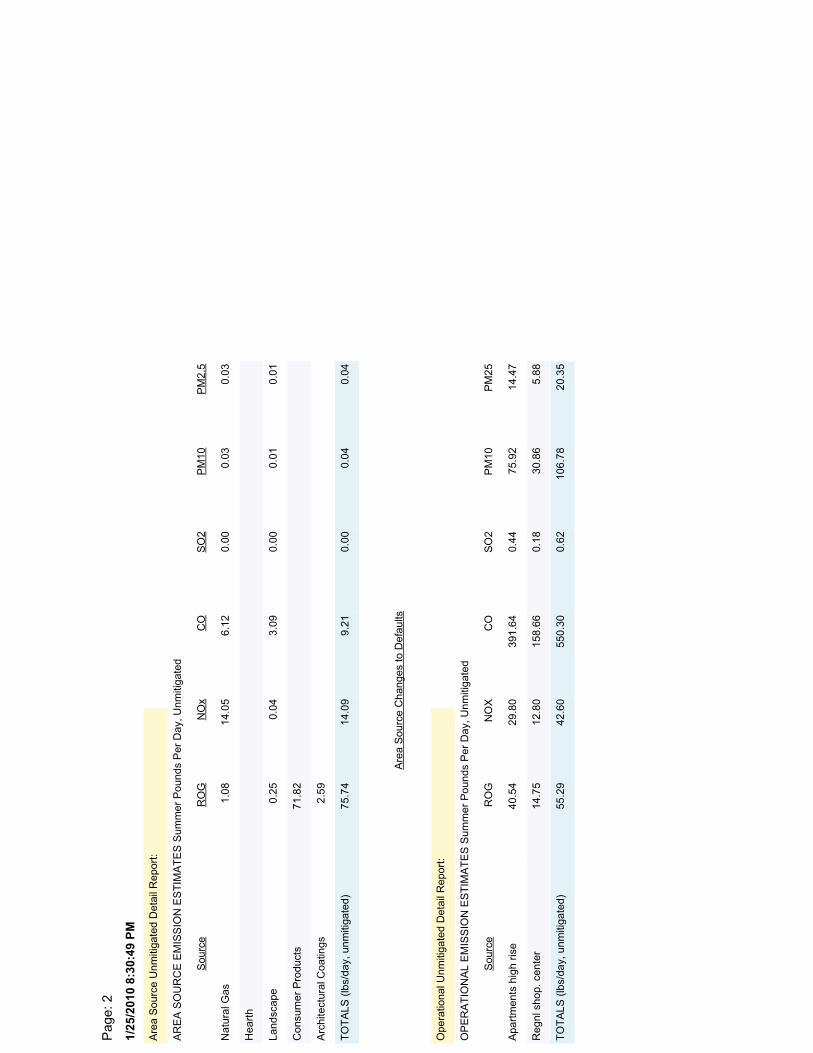
1/25
/201
0 8:
30:4
9 PM
Pag
e: 2
OP
ER
AT
ION
AL
EM
ISS
ION
ES
TIM
AT
ES
Sum
mer
Pou
nds
Per
Day
, Unm
itiga
ted
Reg
nl s
hop.
cen
ter
14.7
512
.80
158.
660.
1830
.86
5.88
Apa
rtm
ents
hig
h ris
e40
.54
29.8
039
1.64
0.44
75.9
214
.47
TO
TA
LS (
lbs/
day,
unm
itiga
ted)
55.2
942
.60
550.
300.
6210
6.78
20.3
5
Sou
rce
RO
GN
OX
CO
SO
2P
M10
PM
25
Ope
ratio
nal U
nmiti
gate
d D
etai
l Rep
ort:
Arc
hite
ctur
al C
oatin
gs2.
59
Con
sum
er P
rodu
cts
71.8
2
Hea
rth
Land
scap
e0.
250.
043.
090.
000.
010.
01
Nat
ural
Gas
1.08
14.0
56.
120.
000.
030.
03
TO
TA
LS (
lbs/
day,
unm
itiga
ted)
75.7
414
.09
9.21
0.00
0.04
0.04
Sou
rce
RO
GN
Ox
CO
SO
2P
M10
PM
2.5
AR
EA
SO
UR
CE
EM
ISS
ION
ES
TIM
AT
ES
Sum
mer
Pou
nds
Per
Day
, Unm
itiga
ted
Are
a S
ourc
e U
nmiti
gate
d D
etai
l Rep
ort:
Are
a S
ourc
e C
hang
es to
Def
aults
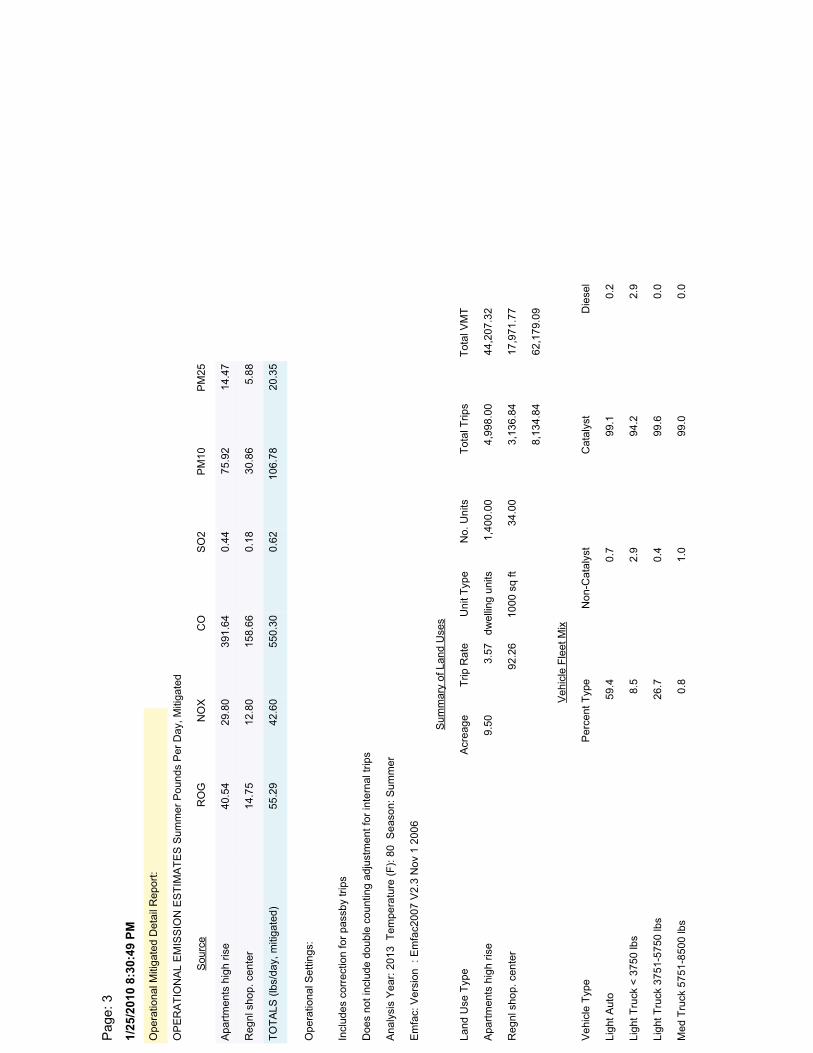
1/25
/201
0 8:
30:4
9 PM
Pag
e: 3
OP
ER
AT
ION
AL
EM
ISS
ION
ES
TIM
AT
ES
Sum
mer
Pou
nds
Per
Day
, Miti
gate
d
Reg
nl s
hop.
cen
ter
14.7
512
.80
158.
660.
1830
.86
5.88
Apa
rtm
ents
hig
h ris
e40
.54
29.8
039
1.64
0.44
75.9
214
.47
TO
TA
LS (
lbs/
day,
miti
gate
d)55
.29
42.6
055
0.30
0.62
106.
7820
.35
Sou
rce
RO
GN
OX
CO
SO
2P
M10
PM
25
Ope
ratio
nal M
itiga
ted
Det
ail R
epor
t:
Ligh
t Tru
ck <
375
0 lb
s8.
52.
994
.22.
9
Ligh
t Aut
o59
.40.
799
.10.
2
Med
Tru
ck 5
751-
8500
lbs
0.8
1.0
99.0
0.0
Ligh
t Tru
ck 3
751-
5750
lbs
26.7
0.4
99.6
0.0
Veh
icle
Fle
et M
ix
Veh
icle
Typ
eP
erce
nt T
ype
Non
-Cat
alys
tC
atal
yst
Die
sel
Reg
nl s
hop.
cen
ter
92.2
610
00 s
q ft
34.0
03,
136.
8417
,971
.77
Apa
rtm
ents
hig
h ris
e9.
503.
57dw
ellin
g un
its1,
400.
004,
998.
0044
,207
.32
8,13
4.84
62,1
79.0
9
Sum
mar
y of
Lan
d U
ses
Land
Use
Typ
eA
crea
geT
rip R
ate
Uni
t Typ
eN
o. U
nits
Tot
al T
rips
Tot
al V
MT
Ana
lysi
s Y
ear:
201
3 T
empe
ratu
re (
F):
80
Sea
son:
Sum
mer
Em
fac:
Ver
sion
: E
mfa
c200
7 V
2.3
Nov
1 2
006
Incl
udes
cor
rect
ion
for
pass
by tr
ips
Doe
s no
t inc
lude
dou
ble
coun
ting
adju
stm
ent f
or in
tern
al tr
ips
Ope
ratio
nal S
ettin
gs:

1/25
/201
0 8:
30:4
9 PM
Pag
e: 4
% o
f Trip
s -
Res
iden
tial
32.9
18.0
49.1
Trip
spe
eds
(mph
)30
.030
.030
.030
.030
.030
.0
% o
f Trip
s -
Com
mer
cial
(by
land
use
)
Reg
nl s
hop.
cen
ter
2.0
1.0
97.0
Rur
al T
rip L
engt
h (m
iles)
17.6
12.1
14.9
15.4
9.6
12.6
Urb
an T
rip L
engt
h (m
iles)
12.7
7.0
9.5
13.3
7.4
8.9
Tra
vel C
ondi
tions
Hom
e-W
ork
Hom
e-S
hop
Hom
e-O
ther
Com
mut
eN
on-W
ork
Cus
tom
er
Res
iden
tial
Com
mer
cial
Oth
er B
us0.
00.
00.
010
0.0
Mot
or H
ome
1.0
0.0
87.5
12.5
Urb
an B
us0.
10.
00.
010
0.0
Sch
ool B
us0.
10.
00.
010
0.0
Mot
orcy
cle
3.2
65.2
34.8
0.0
Lite
-Hea
vy T
ruck
850
1-10
,000
lbs
0.1
0.0
86.7
13.3
Hea
vy-H
eavy
Tru
ck 3
3,00
1-60
,000
lbs
0.0
0.0
0.0
100.
0
Med
-Hea
vy T
ruck
14,
001-
33,0
00 lb
s0.
10.
022
.277
.8
Lite
-Hea
vy T
ruck
10,
001-
14,0
00 lb
s0.
00.
060
.040
.0
Veh
icle
Fle
et M
ix
Veh
icle
Typ
eP
erce
nt T
ype
Non
-Cat
alys
tC
atal
yst
Die
sel
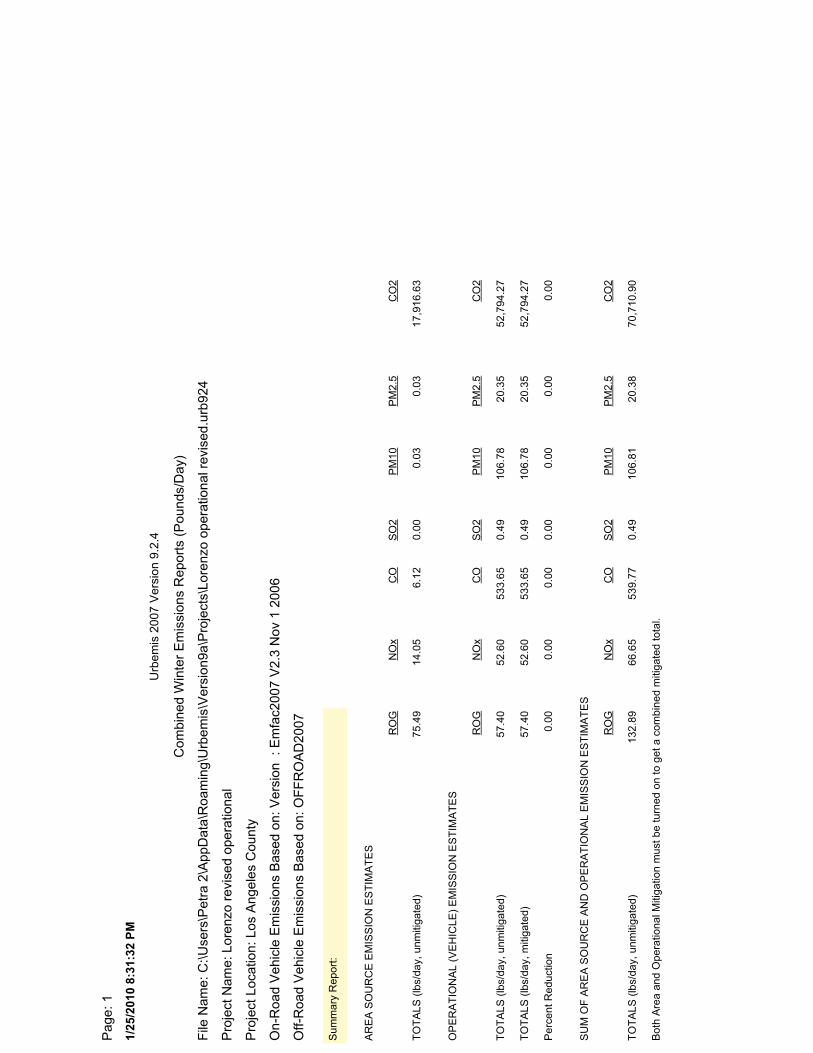
1/25
/201
0 8:
31:3
2 PM
Pag
e: 1
File
Nam
e: C
:\Use
rs\P
etra
2\A
ppD
ata\
Roa
min
g\U
rbem
is\V
ersi
on9a
\Pro
ject
s\Lo
renz
o op
erat
iona
l rev
ised
.urb
924
Pro
ject
Nam
e: L
oren
zo r
evis
ed o
pera
tiona
l
Pro
ject
Loc
atio
n: L
os A
ngel
es C
ount
y
On-
Roa
d V
ehic
le E
mis
sion
s B
ased
on:
Ver
sion
: E
mfa
c200
7 V
2.3
Nov
1 2
006
Off-
Roa
d V
ehic
le E
mis
sion
s B
ased
on:
OF
FR
OA
D20
07
Com
bine
d W
inte
r E
mis
sion
s R
epor
ts (
Pou
nds/
Day
)
Urb
emis
200
7 V
ersi
on 9
.2.4
Bot
h A
rea
and
Ope
ratio
nal M
itiga
tion
mus
t be
turn
ed o
n to
get
a c
ombi
ned
miti
gate
d to
tal.
TO
TA
LS (
lbs/
day,
unm
itiga
ted)
132.
8966
.65
539.
770.
4910
6.81
20.3
870
,710
.90
SU
M O
F A
RE
A S
OU
RC
E A
ND
OP
ER
AT
ION
AL
EM
ISS
ION
ES
TIM
AT
ES
RO
GN
Ox
CO
SO
2P
M10
PM
2.5
CO
2
Per
cent
Red
uctio
n0.
000.
000.
000.
000.
000.
000.
00
TO
TA
LS (
lbs/
day,
miti
gate
d)57
.40
52.6
053
3.65
0.49
106.
7820
.35
52,7
94.2
7
TO
TA
LS (
lbs/
day,
unm
itiga
ted)
57.4
052
.60
533.
650.
4910
6.78
20.3
552
,794
.27
OP
ER
AT
ION
AL
(VE
HIC
LE)
EM
ISS
ION
ES
TIM
AT
ES
RO
GN
Ox
CO
SO
2P
M10
PM
2.5
CO
2
TO
TA
LS (
lbs/
day,
unm
itiga
ted)
75.4
914
.05
6.12
0.00
0.03
0.03
17,9
16.6
3
AR
EA
SO
UR
CE
EM
ISS
ION
ES
TIM
AT
ES
RO
GN
Ox
CO
SO
2P
M10
PM
2.5
CO
2
Sum
mar
y R
epor
t:
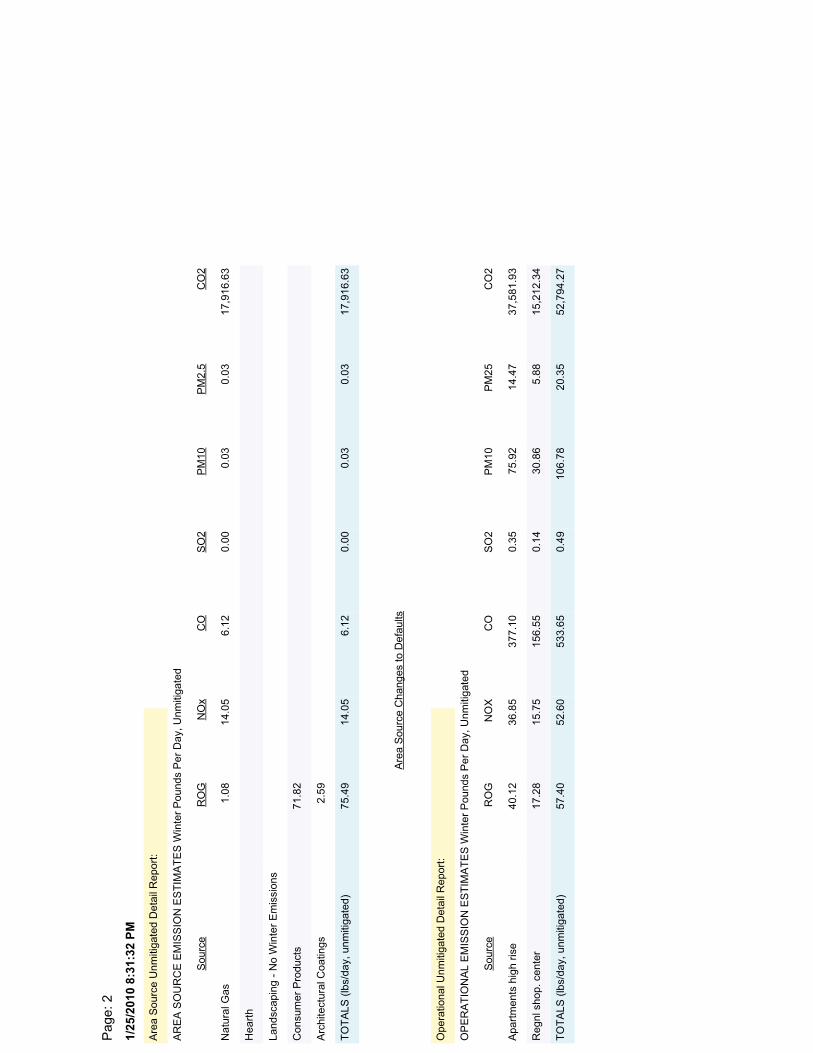
1/25
/201
0 8:
31:3
2 PM
Pag
e: 2
OP
ER
AT
ION
AL
EM
ISS
ION
ES
TIM
AT
ES
Win
ter
Pou
nds
Per
Day
, Unm
itiga
ted
Reg
nl s
hop.
cen
ter
17.2
815
.75
156.
550.
1430
.86
5.88
15,2
12.3
4
Apa
rtm
ents
hig
h ris
e40
.12
36.8
537
7.10
0.35
75.9
214
.47
37,5
81.9
3
TO
TA
LS (
lbs/
day,
unm
itiga
ted)
57.4
052
.60
533.
650.
4910
6.78
20.3
552
,794
.27
Sou
rce
RO
GN
OX
CO
SO
2P
M10
PM
25C
O2
Ope
ratio
nal U
nmiti
gate
d D
etai
l Rep
ort:
Arc
hite
ctur
al C
oatin
gs2.
59
Con
sum
er P
rodu
cts
71.8
2
Hea
rth
Land
scap
ing
- N
o W
inte
r E
mis
sion
s
Nat
ural
Gas
1.08
14.0
56.
120.
000.
030.
0317
,916
.63
TO
TA
LS (
lbs/
day,
unm
itiga
ted)
75.4
914
.05
6.12
0.00
0.03
0.03
17,9
16.6
3
Sou
rce
RO
GN
Ox
CO
SO
2P
M10
PM
2.5
CO
2
AR
EA
SO
UR
CE
EM
ISS
ION
ES
TIM
AT
ES
Win
ter
Pou
nds
Per
Day
, Unm
itiga
ted
Are
a S
ourc
e U
nmiti
gate
d D
etai
l Rep
ort:
Are
a S
ourc
e C
hang
es to
Def
aults

1/25
/201
0 8:
31:3
2 PM
Pag
e: 3
OP
ER
AT
ION
AL
EM
ISS
ION
ES
TIM
AT
ES
Win
ter
Pou
nds
Per
Day
, Miti
gate
d
Reg
nl s
hop.
cen
ter
17.2
815
.75
156.
550.
1430
.86
5.88
15,2
12.3
4
Apa
rtm
ents
hig
h ris
e40
.12
36.8
537
7.10
0.35
75.9
214
.47
37,5
81.9
3
TO
TA
LS (
lbs/
day,
miti
gate
d)57
.40
52.6
053
3.65
0.49
106.
7820
.35
52,7
94.2
7
Sou
rce
RO
GN
OX
CO
SO
2P
M10
PM
25C
O2
Ope
ratio
nal M
itiga
ted
Det
ail R
epor
t:
Ligh
t Tru
ck <
375
0 lb
s8.
52.
994
.22.
9
Ligh
t Aut
o59
.40.
799
.10.
2
Med
Tru
ck 5
751-
8500
lbs
0.8
1.0
99.0
0.0
Ligh
t Tru
ck 3
751-
5750
lbs
26.7
0.4
99.6
0.0
Veh
icle
Fle
et M
ix
Veh
icle
Typ
eP
erce
nt T
ype
Non
-Cat
alys
tC
atal
yst
Die
sel
Reg
nl s
hop.
cen
ter
92.2
610
00 s
q ft
34.0
03,
136.
8417
,971
.77
Apa
rtm
ents
hig
h ris
e9.
503.
57dw
ellin
g un
its1,
400.
004,
998.
0044
,207
.32
8,13
4.84
62,1
79.0
9
Sum
mar
y of
Lan
d U
ses
Land
Use
Typ
eA
crea
geT
rip R
ate
Uni
t Typ
eN
o. U
nits
Tot
al T
rips
Tot
al V
MT
Ana
lysi
s Y
ear:
201
3 T
empe
ratu
re (
F):
60
Sea
son:
Win
ter
Em
fac:
Ver
sion
: E
mfa
c200
7 V
2.3
Nov
1 2
006
Incl
udes
cor
rect
ion
for
pass
by tr
ips
Doe
s no
t inc
lude
dou
ble
coun
ting
adju
stm
ent f
or in
tern
al tr
ips
Ope
ratio
nal S
ettin
gs:
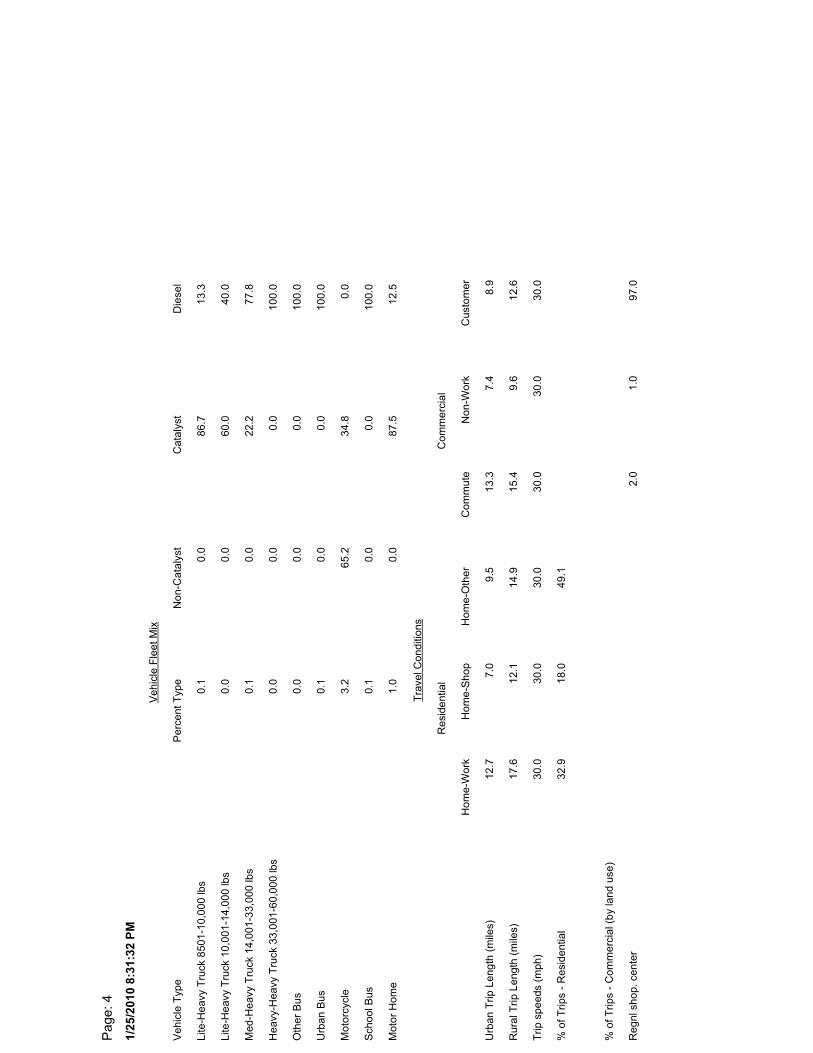
1/25
/201
0 8:
31:3
2 PM
Pag
e: 4
% o
f Trip
s -
Res
iden
tial
32.9
18.0
49.1
Trip
spe
eds
(mph
)30
.030
.030
.030
.030
.030
.0
% o
f Trip
s -
Com
mer
cial
(by
land
use
)
Reg
nl s
hop.
cen
ter
2.0
1.0
97.0
Rur
al T
rip L
engt
h (m
iles)
17.6
12.1
14.9
15.4
9.6
12.6
Urb
an T
rip L
engt
h (m
iles)
12.7
7.0
9.5
13.3
7.4
8.9
Tra
vel C
ondi
tions
Hom
e-W
ork
Hom
e-S
hop
Hom
e-O
ther
Com
mut
eN
on-W
ork
Cus
tom
er
Res
iden
tial
Com
mer
cial
Oth
er B
us0.
00.
00.
010
0.0
Mot
or H
ome
1.0
0.0
87.5
12.5
Urb
an B
us0.
10.
00.
010
0.0
Sch
ool B
us0.
10.
00.
010
0.0
Mot
orcy
cle
3.2
65.2
34.8
0.0
Lite
-Hea
vy T
ruck
850
1-10
,000
lbs
0.1
0.0
86.7
13.3
Hea
vy-H
eavy
Tru
ck 3
3,00
1-60
,000
lbs
0.0
0.0
0.0
100.
0
Med
-Hea
vy T
ruck
14,
001-
33,0
00 lb
s0.
10.
022
.277
.8
Lite
-Hea
vy T
ruck
10,
001-
14,0
00 lb
s0.
00.
060
.040
.0
Veh
icle
Fle
et M
ix
Veh
icle
Typ
eP
erce
nt T
ype
Non
-Cat
alys
tC
atal
yst
Die
sel

Exhibit 4: Excel spreadsheets provided by Christopher Joseph & Associates
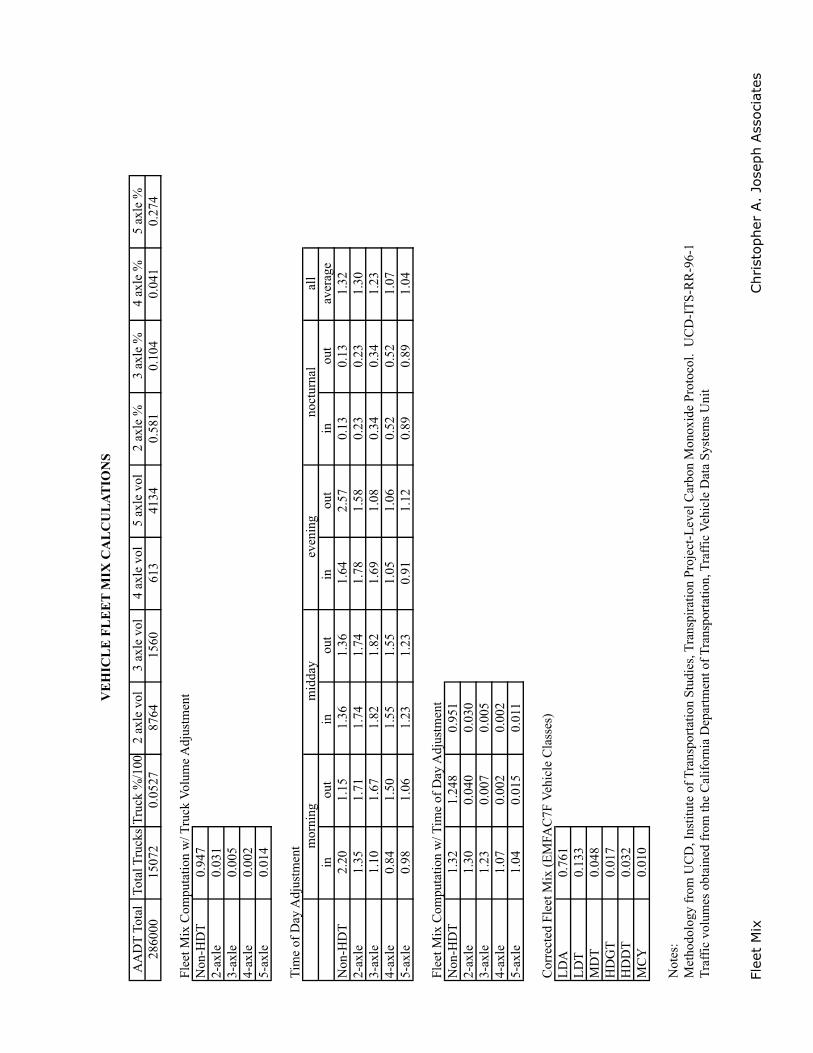
Flee
t M
ixChr
isto
pher
A.
Jose
ph A
ssoc
iate
s
AA
DT
Tot
alTo
tal T
ruck
sT
ruck
%/1
002
axle
vol
3 ax
le v
ol4
axle
vol
5 ax
le v
ol2
axle
%3
axle
%4
axle
%5
axle
%28
6000
1507
20.
0527
8764
1560
613
4134
0.58
10.
104
0.04
10.
274
Flee
t Mix
Com
puta
tion
w/ T
ruck
Vol
ume
Adj
ustm
ent
Non
-HD
T0.
947
2-ax
le0.
031
3-ax
le0.
005
4-ax
le0.
002
5-ax
le0.
014
Tim
e of
Day
Adj
ustm
ent
all
inou
tin
ou
tin
ou
tin
out
aver
age
Non
-HD
T2.
201.
151.
361.
361.
642.
570.
130.
131.
322-
axle
1.35
1.71
1.74
1.74
1.78
1.58
0.23
0.23
1.30
3-ax
le1.
101.
671.
821.
821.
691.
080.
340.
341.
234-
axle
0.84
1.50
1.55
1.55
1.05
1.06
0.52
0.52
1.07
5-ax
le0.
981.
061.
231.
230.
911.
120.
890.
891.
04
Flee
t Mix
Com
puta
tion
w/ T
ime
of D
ay A
djus
tmen
t N
on-H
DT
1.32
1.24
80.
951
2-ax
le1.
300.
040
0.03
03-
axle
1.23
0.00
70.
005
4-ax
le1.
070.
002
0.00
25-
axle
1.04
0.01
50.
011
Cor
rect
ed F
leet
Mix
(E
MFA
C7F
Veh
icle
Cla
sses
)L
DA
0.76
1L
DT
0.13
3M
DT
0.04
8H
DG
T0.
017
HD
DT
0.03
2M
CY
0.01
0
Not
es:
Met
hodo
logy
fro
m U
CD
, Ins
titut
e of
Tra
nspo
rtat
ion
Stud
ies,
Tra
nspi
ratio
n Pr
ojec
t-L
evel
Car
bon
Mon
oxid
e Pr
otoc
ol.
UC
D-I
TS-
RR
-96-
1 T
raff
ic v
olum
es o
btai
ned
from
the
Cal
ifor
nia
Dep
artm
ent o
f T
rans
port
atio
n, T
raff
ic V
ehic
le D
ata
Syst
ems
Uni
t
VE
HIC
LE
FL
EE
T M
IX C
AL
CU
LAT
ION
S
mor
nin g
mid
day
even
ing
noct
urna
l
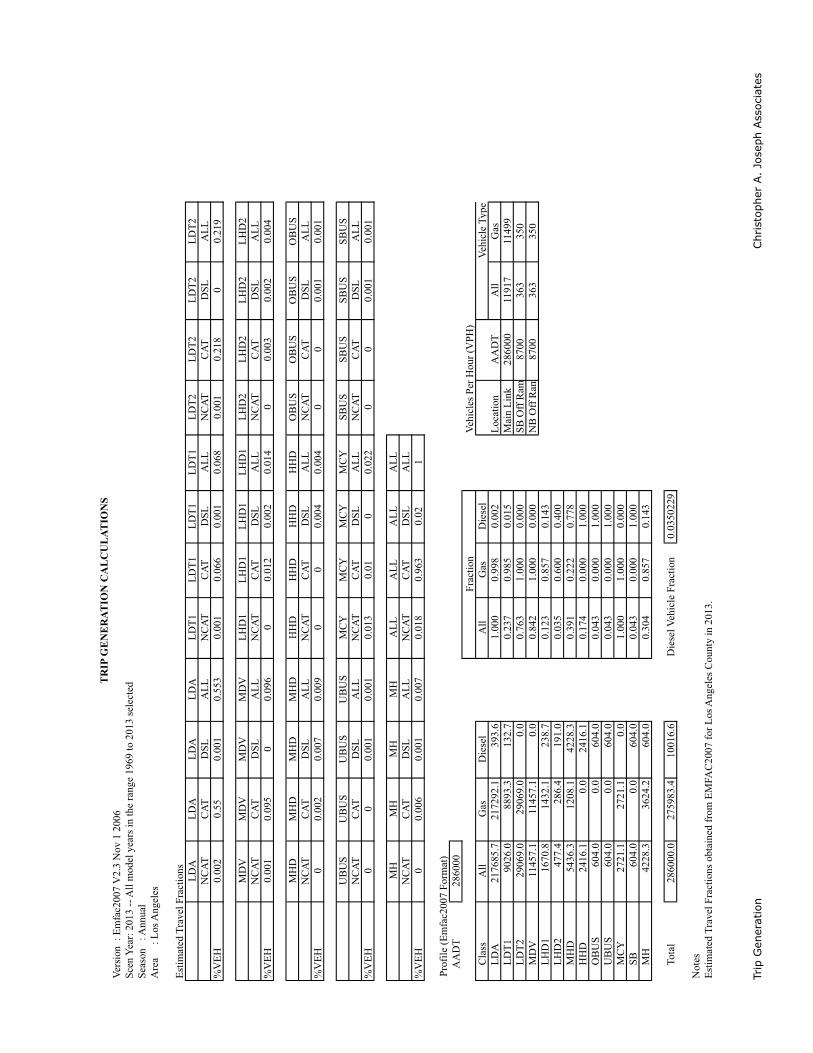
Trip
Gen
erat
ion
Chr
isto
pher
A.
Jose
ph A
ssoc
iate
s
Ver
sion
: E
mfa
c200
7 V
2.3
Nov
1 2
006
Scen
Yea
r: 2
013
-- A
ll m
odel
yea
rs in
the
rang
e 19
69 to
201
3 se
lect
edSe
ason
: A
nnua
lA
rea
:
Los
Ang
eles
Est
imat
ed T
rave
l Fra
ctio
nsL
DA
LD
AL
DA
LD
AL
DT
1L
DT
1L
DT
1L
DT
1L
DT
2L
DT
2L
DT
2L
DT
2N
CA
TC
AT
DSL
AL
LN
CA
TC
AT
DSL
AL
LN
CA
TC
AT
DSL
AL
L%
VE
H0.
002
0.55
0.00
10.
553
0.00
10.
066
0.00
10.
068
0.00
10.
218
00.
219
MD
VM
DV
MD
VM
DV
LH
D1
LH
D1
LH
D1
LH
D1
LH
D2
LH
D2
LH
D2
LH
D2
NC
AT
CA
TD
SLA
LL
NC
AT
CA
TD
SLA
LL
NC
AT
CA
TD
SLA
LL
%V
EH
0.00
10.
095
00.
096
00.
012
0.00
20.
014
00.
003
0.00
20.
004
MH
DM
HD
MH
DM
HD
HH
DH
HD
HH
DH
HD
OB
US
OB
US
OB
US
OB
US
NC
AT
CA
TD
SLA
LL
NC
AT
CA
TD
SLA
LL
NC
AT
CA
TD
SLA
LL
%V
EH
00.
002
0.00
70.
009
00
0.00
40.
004
00
0.00
10.
001
UB
US
UB
US
UB
US
UB
US
MC
YM
CY
MC
YM
CY
SBU
SSB
US
SBU
SSB
US
NC
AT
CA
TD
SLA
LL
NC
AT
CA
TD
SLA
LL
NC
AT
CA
TD
SLA
LL
%V
EH
00
0.00
10.
001
0.01
30.
010
0.02
20
00.
001
0.00
1
MH
MH
MH
MH
AL
LA
LL
AL
LA
LL
NC
AT
CA
TD
SLA
LL
NC
AT
CA
TD
SLA
LL
%V
EH
00.
006
0.00
10.
007
0.01
80.
963
0.02
1
n Pr
ofile
(E
mfa
c200
7 Fo
rmat
)
AA
DT
2860
00V
ehic
les
Per
Hou
r (V
PH)
C
lass
All
Gas
Die
sel
All
Gas
Die
sel
L
DA
2176
85.7
2172
92.1
393.
61.
000
0.99
80.
002
Loc
atio
nA
AD
TA
llG
as
LD
T1
9026
.088
93.3
132.
70.
237
0.98
50.
015
Mai
n L
ink
2860
0011
917
1149
9
LD
T2
2906
9.0
2906
9.0
0.0
0.76
31.
000
0.00
0SB
Off
Ram
8700
363
350
M
DV
1145
7.1
1145
7.1
0.0
0.84
21.
000
0.00
0N
B O
ff R
am87
0036
335
0
LH
D1
1670
.814
32.1
238.
70.
123
0.85
70.
143
L
HD
247
7.4
286.
419
1.0
0.03
50.
600
0.40
0
MH
D54
36.3
1208
.142
28.3
0.39
10.
222
0.77
8
HH
D24
16.1
0.0
2416
.10.
174
0.00
01.
000
O
BU
S60
4.0
0.0
604.
00.
043
0.00
01.
000
U
BU
S60
4.0
0.0
604.
00.
043
0.00
01.
000
M
CY
2721
.127
21.1
0.0
1.00
01.
000
0.00
0
SB
604.
00.
060
4.0
0.04
30.
000
1.00
0
MH
4228
.336
24.2
604.
00.
304
0.85
70.
143
T
otal
2860
00.0
2759
83.4
1001
6.6
Die
sel V
ehic
le F
ract
ion
0.03
5022
9
Not
esE
stim
ated
Tra
vel F
ract
ions
obt
aine
d fr
om E
MFA
C20
07 f
or L
os A
ngel
es C
ount
y in
201
3.
TR
IP G
EN
ER
ATIO
N C
AL
CU
LAT
ION
S
Frac
tion
Veh
icle
Typ
e
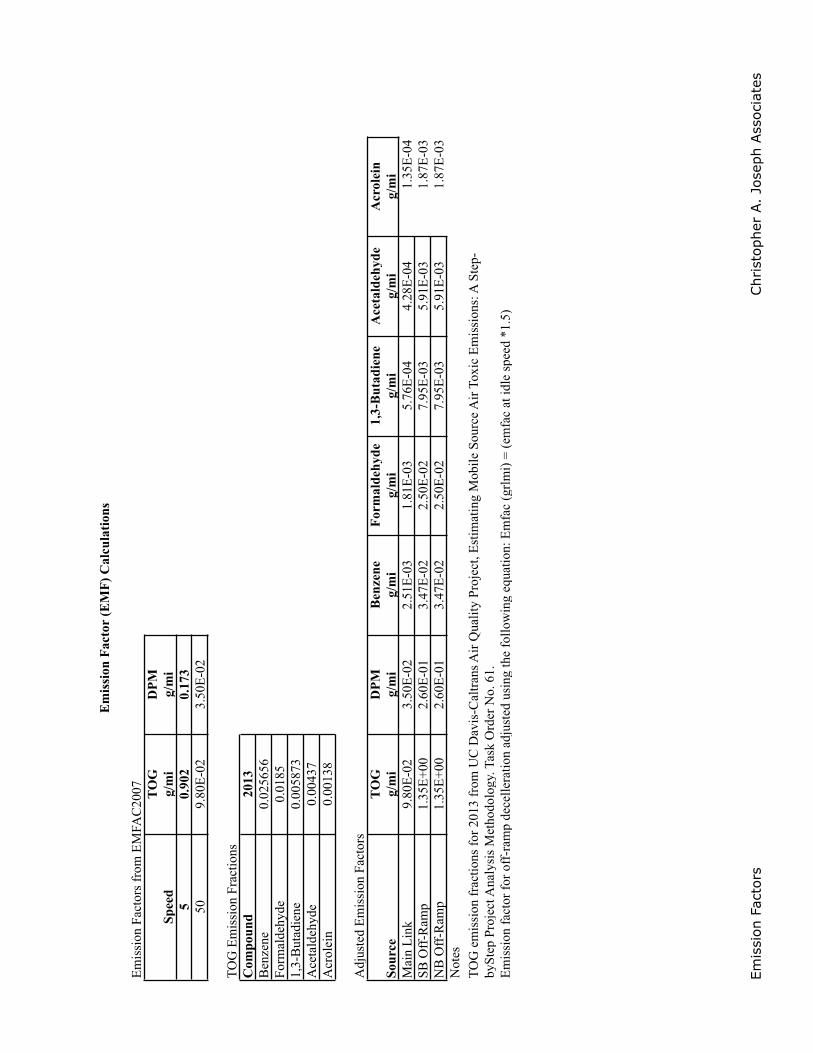
Emis
sion
Fac
tors
Chr
isto
pher
A.
Jose
ph A
ssoc
iate
s
Em
issi
onFa
ctor
sfr
omE
MFA
C20
07 TOG
DPM
g/m
ig/
mi
50.
902
0.17
350
9.80
E-0
23.
50E
-02
TO
GE
mis
sion
Frac
tions
Com
poun
d20
13B
enze
ne0.
0256
56Fo
rmal
deh y
de0.
0185
1,3-
But
adie
ne0.
0058
73A
ceta
ldeh
yde
0.00
437
Acr
olei
n0.
0013
8
Ad j
uste
dE
mis
sion
Fact
ors
TOG
DPM
Ben
zene
Form
alde
h yde
1,3-
But
adie
neA
ceta
ldeh
yde
Acr
olei
nSo
urce
g/m
ig/
mi
g/m
ig/
mi
g/m
ig/
mi
g/m
iM
ain
Lin
k9.
80E
-02
3.50
E-0
22.
51E
-03
1.81
E-0
35.
76E
-04
4.28
E-0
41.
35E
-04
SBO
ff-R
amp
1.35
E+0
02.
60E
-01
3.47
E-0
22.
50E
-02
7.95
E-0
35.
91E
-03
1.87
E-0
3N
BO
ff-R
amp
1.35
E+0
02.
60E
-01
3.47
E-0
22.
50E
-02
7.95
E-0
35.
91E
-03
1.87
E-0
3N
otes
S pee
d
Em
issi
on F
acto
r (E
MF)
Cal
cula
tions
TO
G e
mis
sion
fra
ctio
ns f
or 2
013
from
UC
Dav
is-C
altr
ans
Air
Qua
lity
Proj
ect,
Est
imat
ing
Mob
ile S
ourc
e A
ir T
oxic
Em
issi
ons:
A S
tep-
b ySt
epPr
ojec
tAna
lysi
sM
etho
dolo
gy.T
ask
Ord
erN
o.61
.E
mis
sion
fact
orfo
rof
f-ra
mp
dece
llera
tion
adju
sted
usin
gth
efo
llow
ing
equa
tion:
Em
fac
(grl
mi)
= (e
mfa
cat
idle
spee
d*1
.5)
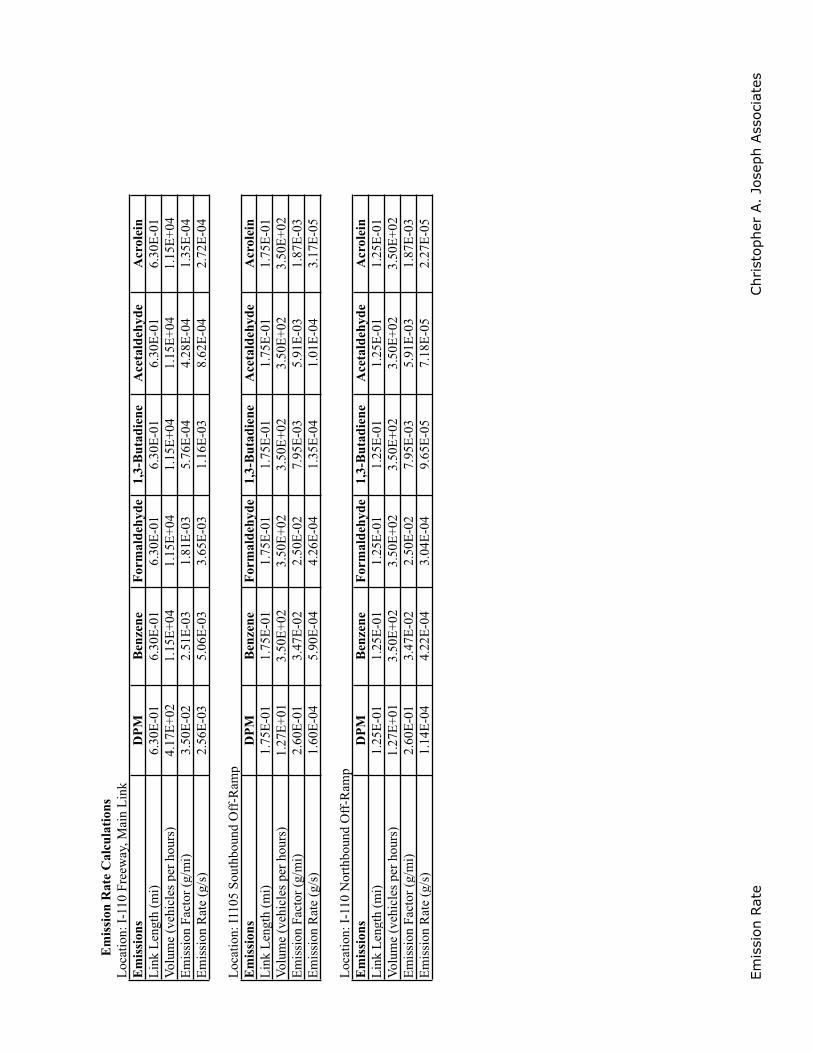
Emis
sion
Rat
eChr
isto
pher
A.
Jose
ph A
ssoc
iate
s
Em
issi
on R
ate
Cal
cula
tions
Loc
atio
n:I-
110
Free
way
,Mai
nL
ink
Em
issi
ons
DPM
Ben
zene
Form
alde
h yde
1,3-
But
adie
neA
ceta
ldeh
yde
Acr
olei
nL
ink
Len
gth
(mi)
6.30
E-0
16.
30E
-01
6.30
E-0
16.
30E
-01
6.30
E-0
16.
30E
-01
Vol
ume
(veh
icle
s pe
rho
urs)
4.17
E+0
21.
15E
+04
1.15
E+0
41.
15E
+04
1.15
E+0
41.
15E
+04
Em
issi
onFa
ctor
(g/
mi)
3.50
E-0
22.
51E
-03
1.81
E-0
35.
76E
-04
4.28
E-0
41.
35E
-04
Em
issi
onR
ate
(g/s
)2.
56E
-03
5.06
E-0
33.
65E
-03
1.16
E-0
38.
62E
-04
2.72
E-0
4
Loc
atio
n:I1
105
Sout
hbou
ndO
ff-R
amp
Em
issi
ons
DPM
Ben
zene
Form
alde
hyde
1,3-
But
adie
neA
ceta
ldeh
yde
Acr
olei
nL
ink
Len
gth
(mi)
1.75
E-0
11.
75E
-01
1.75
E-0
11.
75E
-01
1.75
E-0
11.
75E
-01
Vol
ume
(veh
icle
s pe
rho
urs)
1.27
E+0
13.
50E
+02
3.50
E+0
23.
50E
+02
3.50
E+0
23.
50E
+02
Em
issi
onFa
ctor
(g/
mi)
2.60
E-0
13.
47E
-02
2.50
E-0
27.
95E
-03
5.91
E-0
31.
87E
-03
Em
issi
onR
ate
(g/s
)1.
60E
-04
5.90
E-0
44.
26E
-04
1.35
E-0
41.
01E
-04
3.17
E-0
5
Loc
atio
n:I-
110
Nor
thbo
und
Off
-Ram
pE
mis
sion
sD
PMB
enze
neFo
rmal
dehy
de1,
3-B
utad
iene
Ace
tald
ehyd
eA
crol
ein
Lin
kL
engt
h (m
i)1.
25E
-01
1.25
E-0
11.
25E
-01
1.25
E-0
11.
25E
-01
1.25
E-0
1V
olum
e (v
ehic
les
per
hour
s)1.
27E
+01
3.50
E+0
23.
50E
+02
3.50
E+0
23.
50E
+02
3.50
E+0
2E
mis
sion
Fact
or (
g/m
i)2.
60E
-01
3.47
E-0
22.
50E
-02
7.95
E-0
35.
91E
-03
1.87
E-0
3E
mis
sion
Rat
e (g
/s)
1.14
E-0
44.
22E
-04
3.04
E-0
49.
65E
-05
7.18
E-0
52.
27E
-05
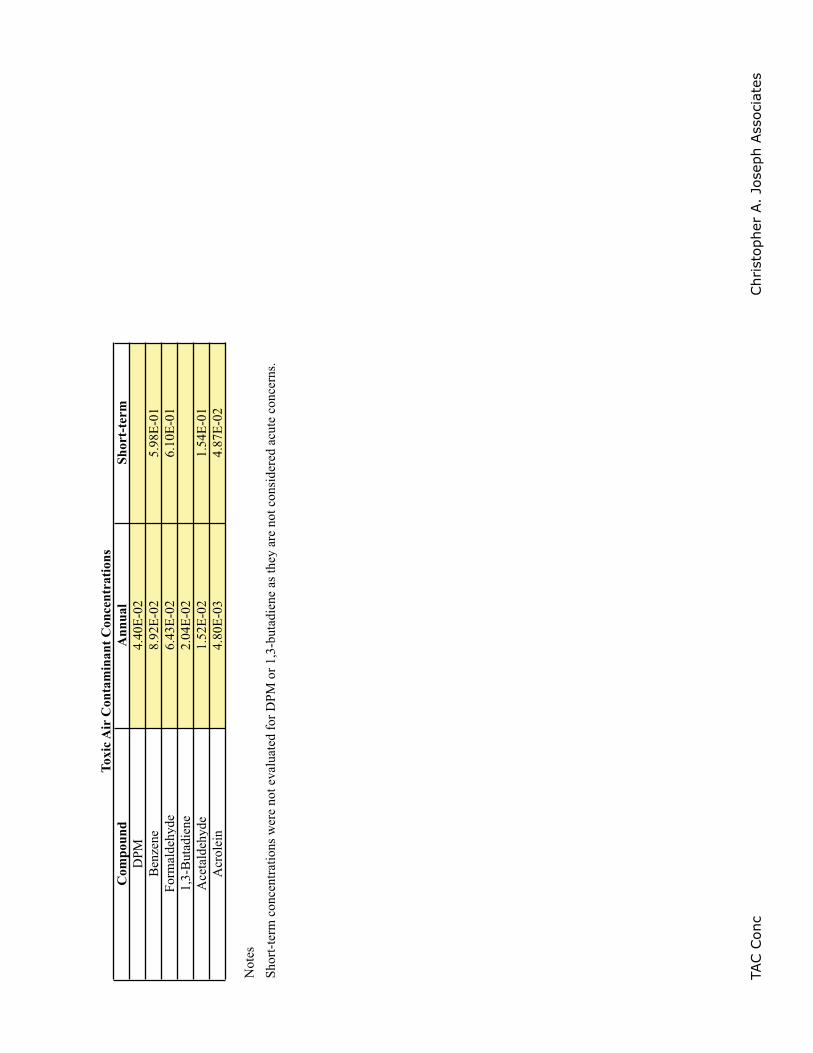
TAC C
onc
Chr
isto
pher
A.
Jose
ph A
ssoc
iate
s
Com
poun
dA
nnua
lSh
ort-
term
DPM
4.40
E-0
2B
enze
ne8.
92E
-02
5.98
E-0
1Fo
rmal
deh y
de6.
43E
-02
6.10
E-0
11,
3-B
utad
iene
2.04
E-0
2A
ceta
ldeh
yde
1.52
E-0
21.
54E
-01
Acr
olei
n4.
80E
-03
4.87
E-0
2
Not
es
Toxi
c Air
Con
tam
inan
t Con
cent
ratio
ns
Shor
t-te
rm c
once
ntra
tions
wer
e no
t eva
luat
ed f
or D
PM o
r 1,
3-bu
tadi
ene
as th
e y a
re n
ot c
onsi
dere
d ac
ute
conc
erns
.
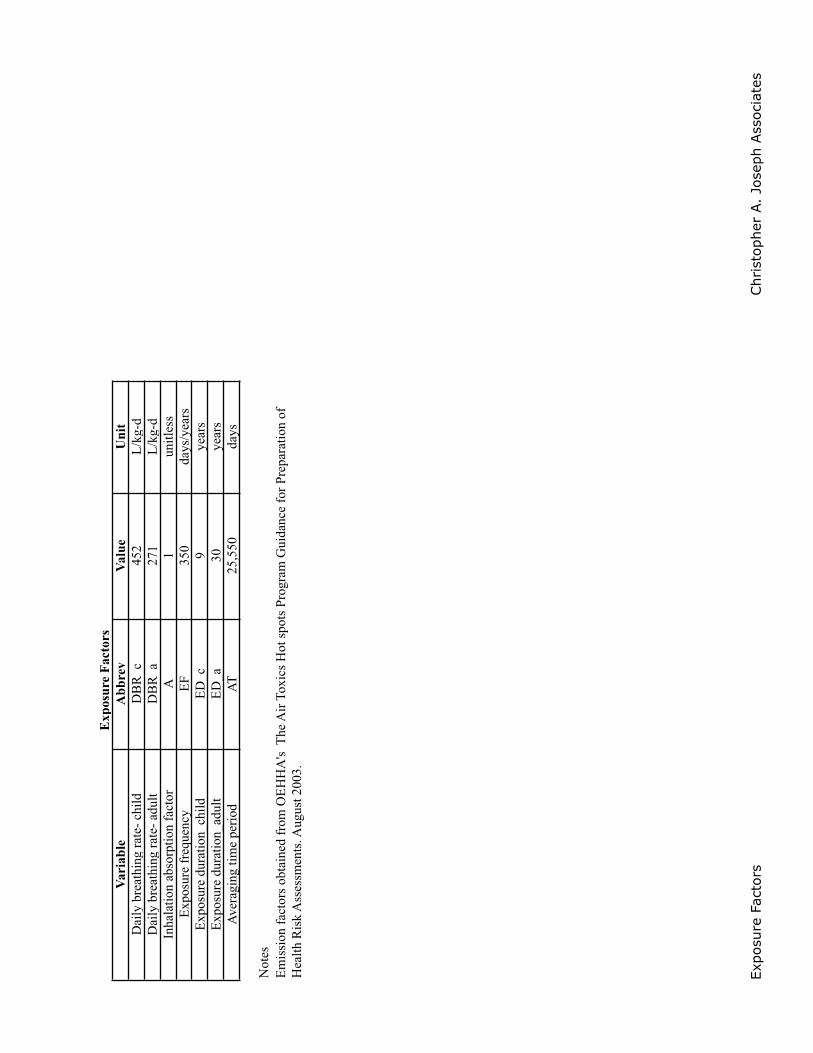
Expo
sure
Fac
tors
Chr
isto
pher
A.
Jose
ph A
ssoc
iate
s
Vari
able
Abb
rev
Valu
eU
nit
Dai
l y b
reat
hing
rat
e- c
hild
DB
R_c
452
L/k
g-d
Dai
l y b
reat
hing
rat
e- a
dult
DB
R_a
271
L/k
g-d
Inha
latio
n ab
sor p
tion
fact
orA
1un
itles
sE
x pos
ure
freq
uenc
yE
F35
0da
ys/y
ears
Ex p
osur
e du
ratio
n_ch
ildE
D_c
9ye
ars
Ex p
osur
e du
ratio
n_ad
ult
ED
_a30
year
sA
vera
ging
tim
e pe
riod
AT
25,5
50da
ys
Not
es
Exp
osur
e Fa
ctor
s
Em
issi
on f
acto
rs o
btai
ned
from
OE
HH
A's
The
Air
Tox
ics
Hot
spo
ts P
rogr
am G
uida
nce
for
Prep
arat
ion
of
Hea
lth R
isk
Ass
essm
ents
. Au g
ust 2
003.
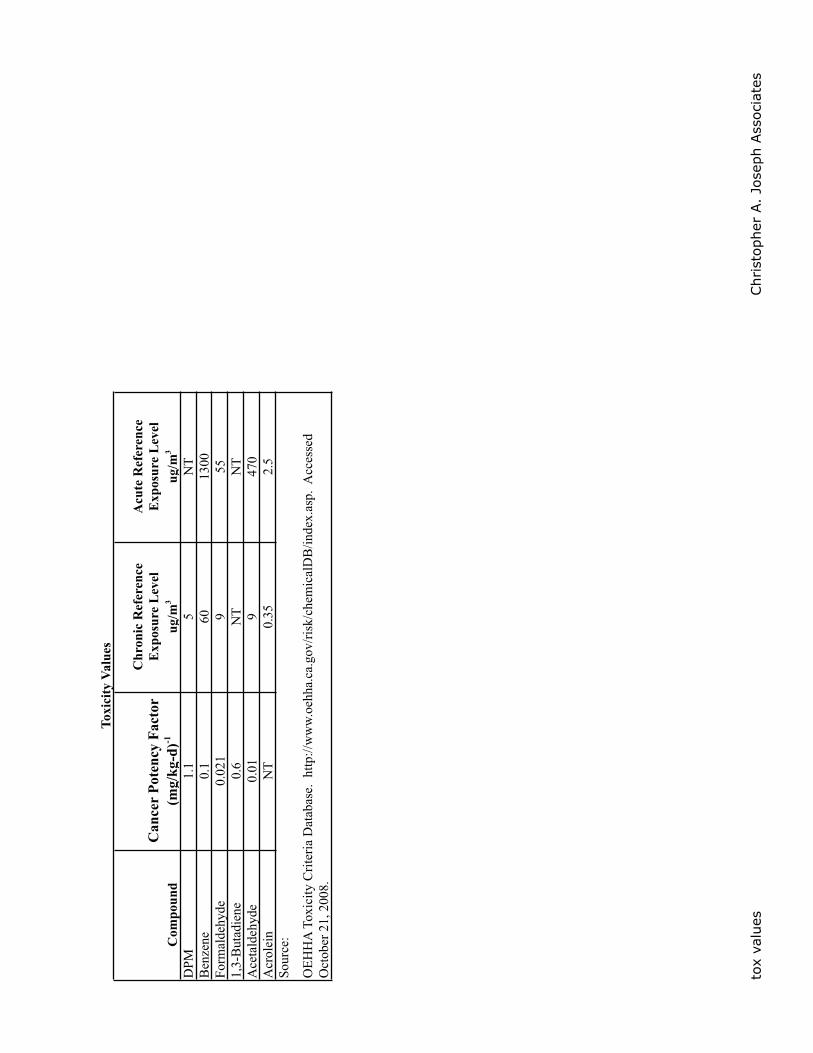
tox
valu
esChr
isto
pher
A.
Jose
ph A
ssoc
iate
s
Can
cer
Pote
ncy
Fact
orC
hron
ic R
efer
ence
E
x pos
ure
Lev
elA
cute
Ref
eren
ce
Exp
osur
e L
evel
Com
poun
d(m
g/kg
-d)-1
ug/m
3ug
/m3
DPM
1.1
5N
TB
enze
ne0.
160
1300
Form
alde
h yde
0.02
19
551,
3-B
utad
iene
0.6
NT
NT
Ace
tald
ehyd
e0.
019
470
Acr
olei
nN
T0.
352.
5So
urce
:
OE
HH
A T
oxic
ity C
rite
ria
Dat
abas
e. h
ttp://
ww
w.o
ehha
.ca.
gov/
risk
/che
mic
alD
B/in
dex.
asp.
Acc
esse
d O
ctob
er 2
1, 2
008.
Toxi
cit y
Val
ues
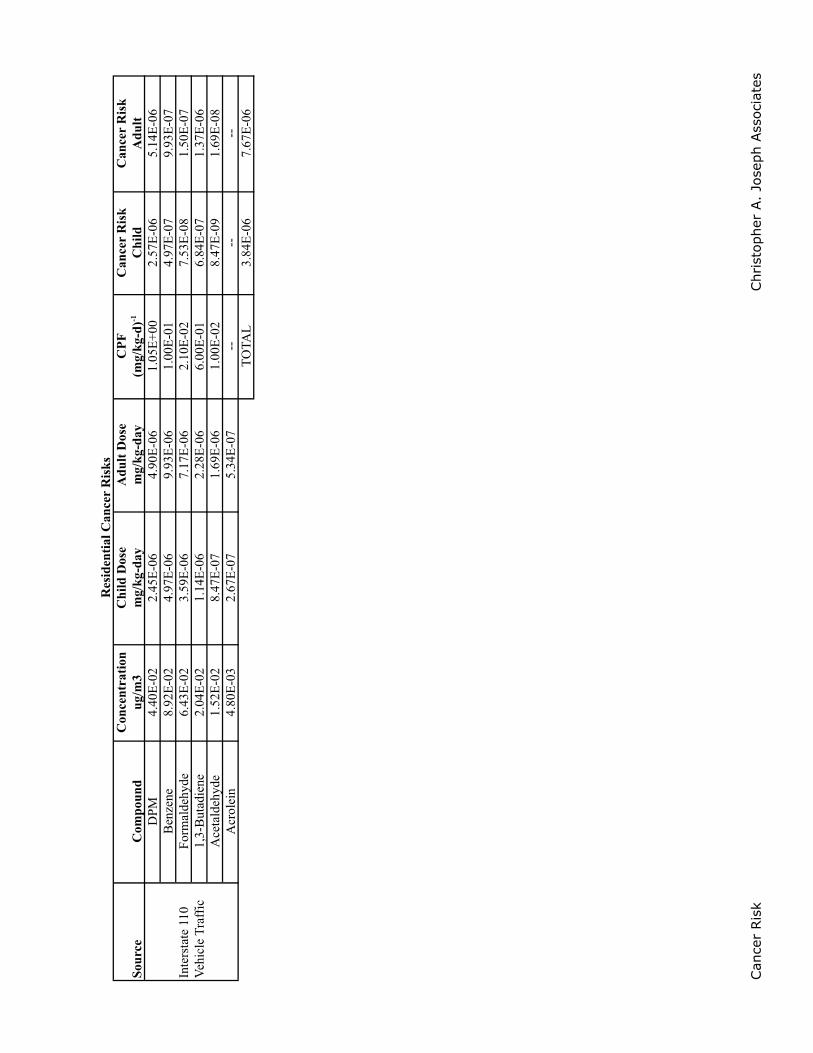
Can
cer
Ris
kChr
isto
pher
A.
Jose
ph A
ssoc
iate
s
Con
cent
ratio
nC
hild
Dos
eA
dult
Dos
eC
PFC
ance
rR
isk
Can
cer
Ris
kSo
urce
Com
poun
dug
/m3
mg/
kg-d
aym
g/kg
-day
(mg/
kg-d
)-1C
hild
Adu
ltD
PM4.
40E
-02
2.45
E-0
64.
90E
-06
1.05
E+0
02.
57E
-06
5.14
E-0
6B
enze
ne8.
92E
-02
4.97
E-0
69.
93E
-06
1.00
E-0
14.
97E
-07
9.93
E-0
7Fo
rmal
dehy
de6.
43E
-02
3.59
E-0
67.
17E
-06
2.10
E-0
27.
53E
-08
1.50
E-0
71,
3-B
utad
iene
2.04
E-0
21.
14E
-06
2.28
E-0
66.
00E
-01
6.84
E-0
71.
37E
-06
Ace
tald
ehyd
e1.
52E
-02
8.47
E-0
71.
69E
-06
1.00
E-0
28.
47E
-09
1.69
E-0
8A
crol
ein
4.80
E-0
32.
67E
-07
5.34
E-0
7--
----
TO
TAL
3.84
E-0
67.
67E
-06
Inte
rsta
te 1
10
Veh
icle
Tra
ffic
Res
iden
tial C
ance
rR
isks
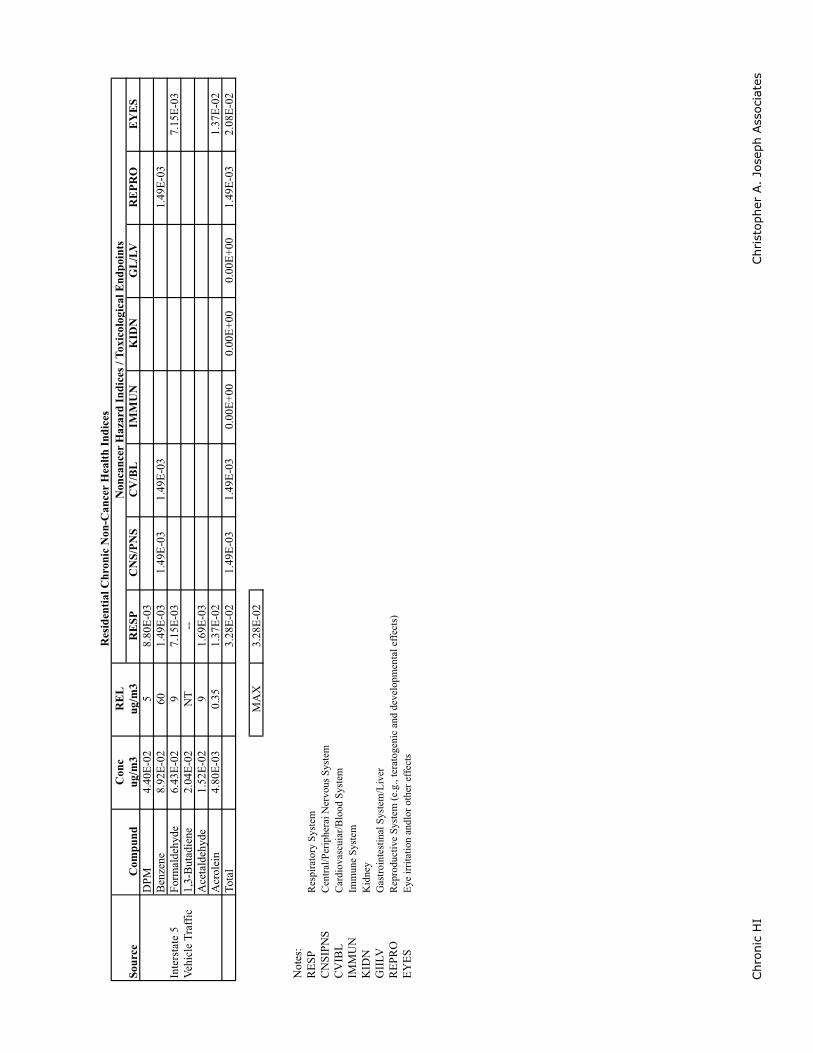
Chr
onic
HI
Chr
isto
pher
A.
Jose
ph A
ssoc
iate
s
Con
cR
EL
Com
pund
ug/m
3ug
/m3
RE
SPC
NS/
PNS
CV
/BL
IMM
UN
KID
NG
L/L
VR
EPR
OE
YE
SD
PM4.
40E
-02
58.
80E
-03
Ben
zene
8.92
E-0
260
1.49
E-0
31.
49E
-03
1.49
E-0
31.
49E
-03
Form
alde
hyde
6.43
E-0
29
7.15
E-0
37.
15E
-03
1,3-
But
adie
ne2.
04E
-02
NT
--A
ceta
ldeh
yde
1.52
E-0
29
1.69
E-0
3A
crol
ein
4.80
E-0
30.
351.
37E
-02
1.37
E-0
2To
tal
3.28
E-0
21.
49E
-03
1.49
E-0
30.
00E
+00
0.00
E+0
00.
00E
+00
1.49
E-0
32.
08E
-02
MA
X3.
28E
-02
Not
es:
RE
SPR
espi
rato
ry S
yste
mC
NSI
PNS
Cen
tral
/Per
iphe
rai N
ervo
us S
yste
mC
VIB
LC
ardi
ovas
cuia
r/B
lood
Sys
tem
IMM
UN
Imm
une
Syst
emK
IDN
Kid
ney
GII
LVG
astr
oint
estin
al S
yste
m/L
iver
RE
PRO
Rep
rodu
ctiv
e Sy
stem
(e.
g., t
erat
ogen
ic a
nd d
evel
opm
enta
l eff
ects
)E
YE
SE
ye ir
rita
tion
andl
or o
ther
eff
ects
Inte
rsta
te 5
V
ehic
le T
raff
ic
Sour
ceN
onca
ncer
Haz
ard
Indi
ces /
Tox
icol
o gic
al E
ndpo
ints
Res
iden
tial C
hron
ic N
on-C
ance
r H
ealth
Indi
ces
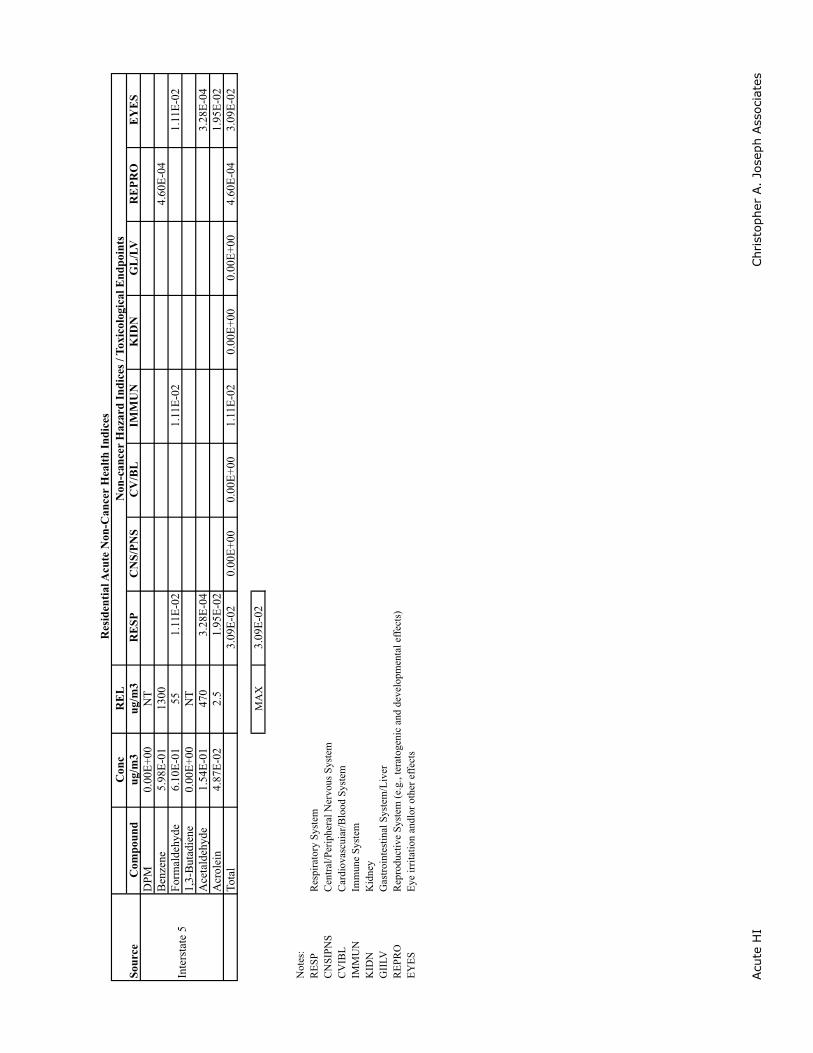
Acu
te H
IChr
isto
pher
A.
Jose
ph A
ssoc
iate
s
Con
cR
EL
Com
poun
dug
/m3
ug/m
3R
ESP
CN
S/PN
SC
V/B
LIM
MU
NK
IDN
GL
/LV
RE
PRO
EY
ES
DPM
0.00
E+0
0N
TB
enze
ne5.
98E
-01
1300
4.60
E-0
4Fo
rmal
dehy
de6.
10E
-01
551.
11E
-02
1.11
E-0
21.
11E
-02
1,3-
But
adie
ne0.
00E
+00
NT
Ace
tald
ehyd
e1.
54E
-01
470
3.28
E-0
43.
28E
-04
Acr
olei
n4.
87E
-02
2.5
1.95
E-0
21.
95E
-02
Tota
l3.
09E
-02
0.00
E+0
00.
00E
+00
1.11
E-0
20.
00E
+00
0.00
E+0
04.
60E
-04
3.09
E-0
2
MA
X3.
09E
-02
Not
es:
RE
SPR
espi
rato
ry S
yste
mC
NSI
PNS
Cen
tral
/Per
iphe
ral N
ervo
us S
yste
mC
VIB
LC
ardi
ovas
cuia
r/B
lood
Sys
tem
IMM
UN
Imm
une
Syst
emK
IDN
Kid
ney
GII
LVG
astr
oint
estin
al S
yste
m/L
iver
RE
PRO
Rep
rodu
ctiv
e Sy
stem
(e.
g., t
erat
ogen
ic a
nd d
evel
opm
enta
l eff
ects
)E
YE
SE
ye ir
rita
tion
andl
or o
ther
eff
ects
Sour
ceN
on-c
ance
r H
azar
d In
dice
s / T
oxic
olo g
ical
End
poin
ts
Inte
rsta
te 5
Res
iden
tial A
cute
Non
-Can
cer
Hea
lth In
dice
s

x/QAvg Time ug/m3/(g/s)1-HR 442.188-HR 131.1224-HR 109.31
Hours of Operation 8
Palmer xQ-localized operational-winter.xls, ISC xQ

NOx CO PM10 PM2.5Phase lbs/day lbs/day lbs/day lbs/day
Operation - local 18.76 72.42 0.17 0.15
Localized Emissions Rates
Palmer xQ-localized operational-winter.xls, Local Emissions

Nox PM10 PM2.5SRA 1 Hr (ppm) 1 Hr (ppm) 8 Hr (ppm)24 Hr (ug/m3)24 Hr (ug/m3)
1 0.1 3 2.2
Nox PM10 PM2.51 Hr (ppm) 1 Hr (ppm) 8 Hr (ppm)24 Hr (ug/m3)24 Hr (ug/m3)
0.18 20 9 2.5 2.5
Thresholds
CO
CO
2007 Air Quality SCAQMD
Palmer xQ-localized operational-winter.xls, Max Ambient
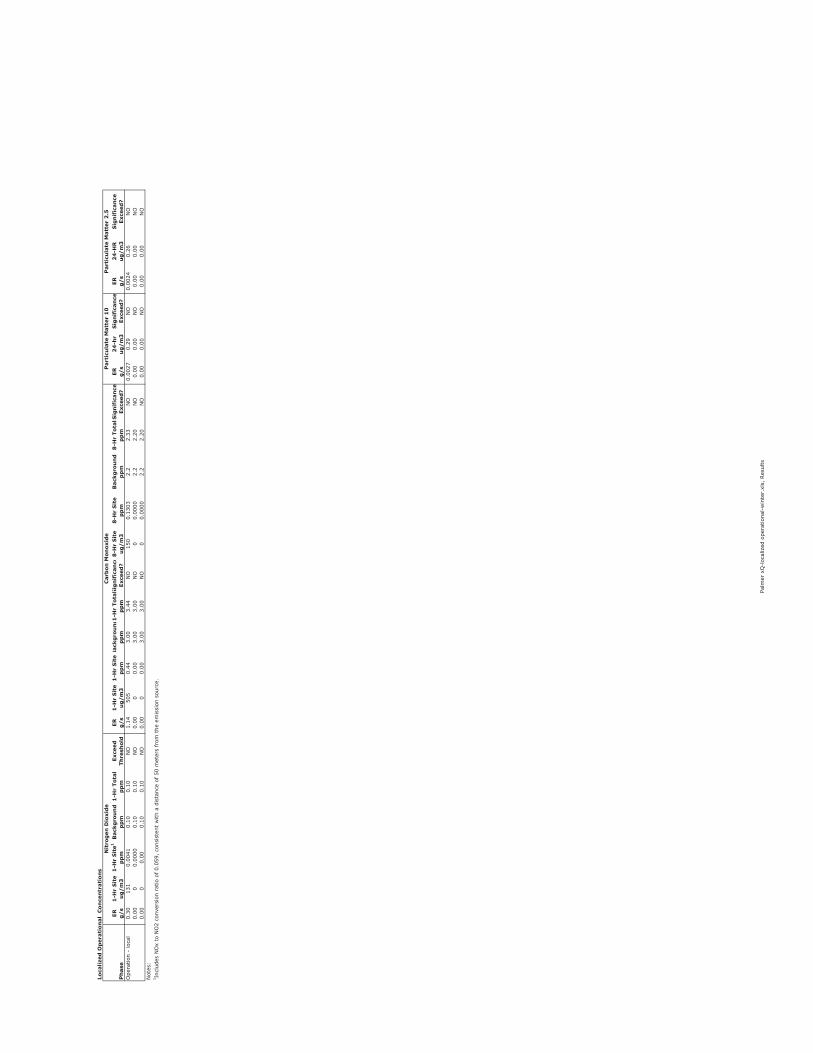
Loca
lized
Op
erat
ion
al C
once
ntr
atio
ns
ER1
-Hr
Sit
e1
-Hr
Sit
e1B
ackg
rou
nd
1-H
r To
tal
Exce
edER
1-H
r S
ite
1-H
r S
ite
Bac
kgro
un
d1-H
r To
talS
ign
ific
ance
8-H
r S
ite
8-H
r S
ite
Bac
kgro
un
d8
-Hr
Tota
lSig
nif
ican
ceER
24
-hr
Sig
nif
ican
ceER
24
-HR
Sig
nif
ican
ceP
has
eg
/s
ug
/m
3p
pm
pp
mp
pm
Thre
shol
dg
/s
ug
/m
3p
pm
pp
mp
pm
Exce
ed?
ug
/m
3p
pm
pp
mp
pm
Exce
ed?
g/
su
g/
m3
Exce
ed?
g/
su
g/
m3
Exce
ed?
Ope
ratio
n -
loca
l0.
3013
10.
0041
0.10
0.10
NO
1.14
505
0.44
3.00
3.44
NO
150
0.13
032.
22.
33N
O0.
0027
0.29
NO
0.00
240.
26N
O0.
000
0.00
000.
100.
10N
O0.
000
0.00
3.00
3.00
NO
00.
0000
2.2
2.20
NO
0.00
0.00
NO
0.00
0.00
NO
0.00
00.
000.
100.
10N
O0.
000
0.00
3.00
3.00
NO
00.
0000
2.2
2.20
NO
0.00
0.00
NO
0.00
0.00
NO
Not
es:
1 Inc
lude
s N
Ox
to N
O2
conv
ersi
on r
atio
of 0.
059,
con
sist
ent
with
a d
ista
nce
of 5
0 m
eter
s fr
om t
he e
mis
sion
sou
rce.
Car
bon
Mon
oxid
eN
itro
gen
Dio
xid
eP
arti
cula
te M
atte
r 1
0P
arti
cula
te M
atte
r 2
.5
Palm
er x
Q-l
ocal
ized
ope
ratio
nal-
win
ter.
xls,
Res
ults

x/QAvg Time ug/m3/(g/s)1-HR 442.188-HR 131.1224-HR 109.31
Hours of Operation 8
Palmer xQ-localized operational-summer.xls, ISC xQ

NOx CO PM10 PM2.5Phase lbs/day lbs/day lbs/day lbs/day
Operation - local 18.12 63.76 0.18 0.16
Localized Emissions Rates
Palmer xQ-localized operational-summer.xls, Local Emissions
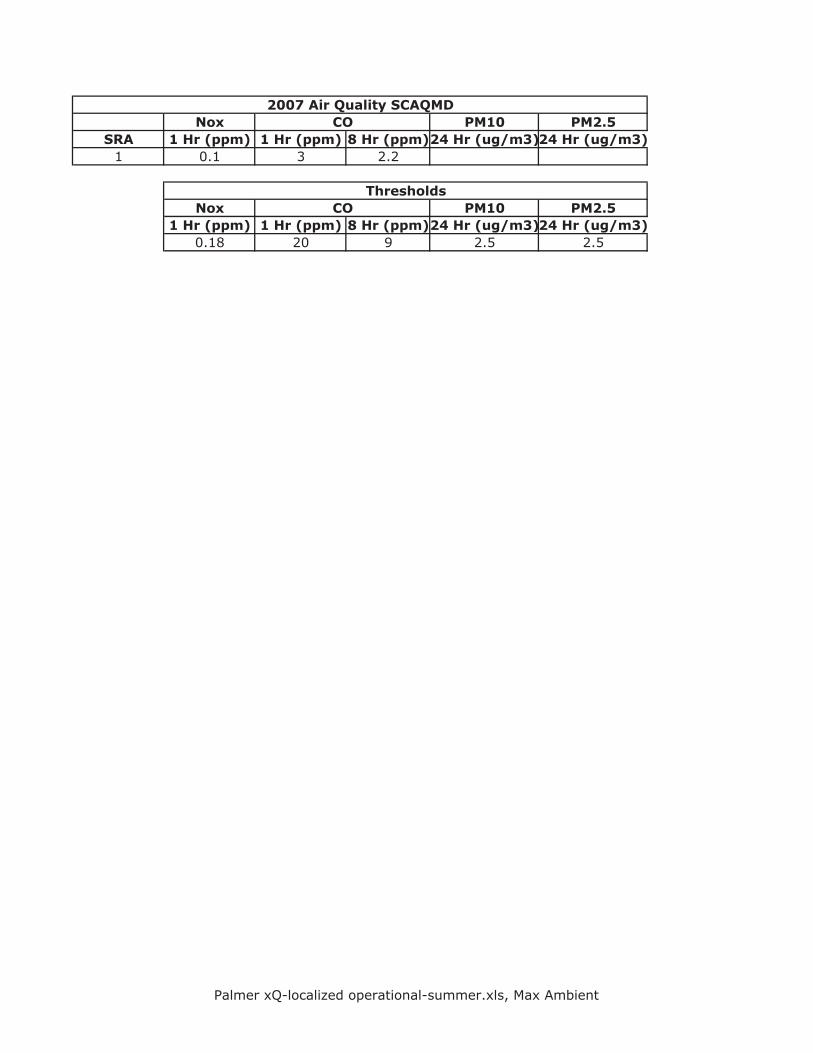
Nox PM10 PM2.5SRA 1 Hr (ppm) 1 Hr (ppm) 8 Hr (ppm)24 Hr (ug/m3)24 Hr (ug/m3)
1 0.1 3 2.2
Nox PM10 PM2.51 Hr (ppm) 1 Hr (ppm) 8 Hr (ppm)24 Hr (ug/m3)24 Hr (ug/m3)
0.18 20 9 2.5 2.5
Thresholds
CO
CO
2007 Air Quality SCAQMD
Palmer xQ-localized operational-summer.xls, Max Ambient
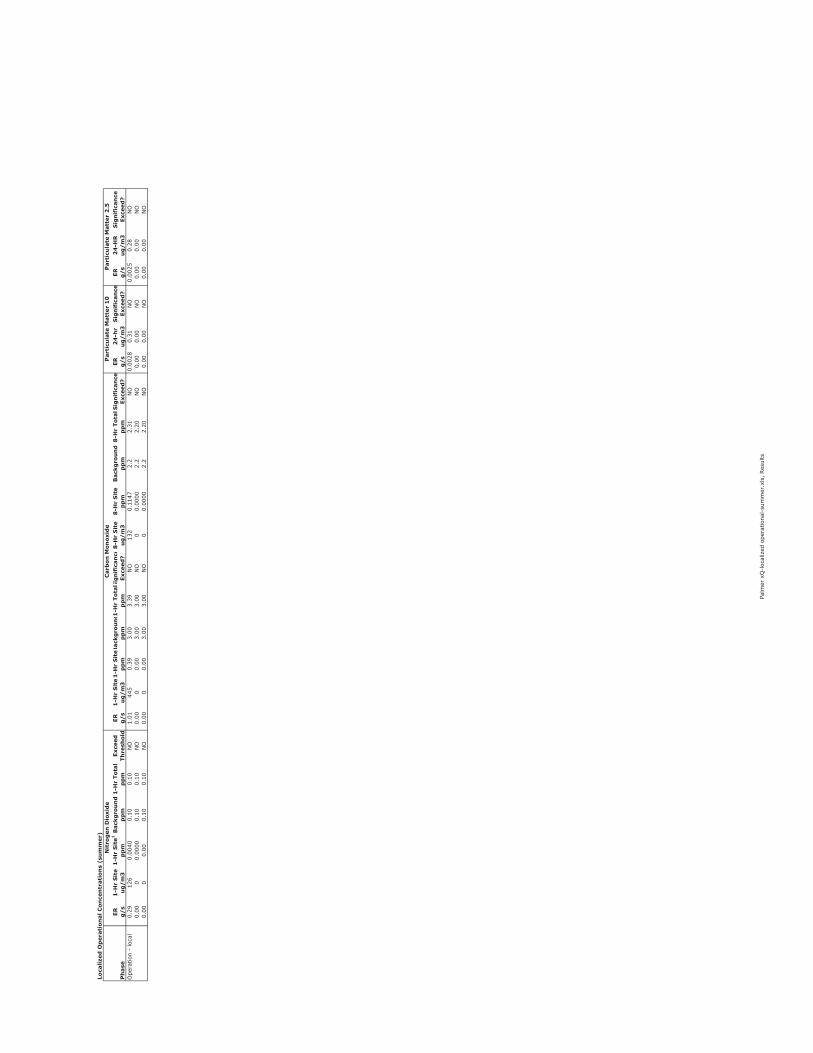
Loca
lized
Op
erat
ion
al C
once
ntr
atio
ns
(su
mm
er)
ER1
-Hr
Sit
e1
-Hr
Sit
e1B
ackg
rou
nd
1-H
r To
tal
Exce
edER
1-H
r S
ite
1-H
r S
iteB
ackg
rou
nd1
-Hr
Tota
lSig
nif
ican
ce8
-Hr
Sit
e8
-Hr
Sit
eB
ackg
rou
nd
8-H
r To
talS
ign
ific
ance
ER2
4-h
rS
ign
ific
ance
ER2
4-H
RS
ign
ific
ance
Ph
ase
g/
su
g/
m3
pp
mp
pm
pp
mTh
resh
old
g/
su
g/
m3
pp
mp
pm
pp
mEx
ceed
?u
g/
m3
pp
mp
pm
pp
mEx
ceed
?g
/s
ug
/m
3Ex
ceed
?g
/s
ug
/m
3Ex
ceed
?O
pera
tion
- lo
cal
0.29
126
0.00
400.
100.
10N
O1.
0144
50.
393.
003.
39N
O13
20.
1147
2.2
2.31
NO
0.00
280.
31N
O0.
0025
0.28
NO
0.00
00.
0000
0.10
0.10
NO
0.00
00.
003.
003.
00N
O0
0.00
002.
22.
20N
O0.
000.
00N
O0.
000.
00N
O0.
000
0.00
0.10
0.10
NO
0.00
00.
003.
003.
00N
O0
0.00
002.
22.
20N
O0.
000.
00N
O0.
000.
00N
O
Car
bon
Mon
oxid
eN
itro
gen
Dio
xid
eP
arti
cula
te M
atte
r 1
0P
arti
cula
te M
atte
r 2
.5
Palm
er x
Q-l
ocal
ized
ope
ratio
nal-
sum
mer
.xls
, Res
ults

Exhibit 5: Federal Highway Administration, Recurring Traffic Bottlenecks:
A Primer – Focus on Low-Cost Operational Improvements, 2009
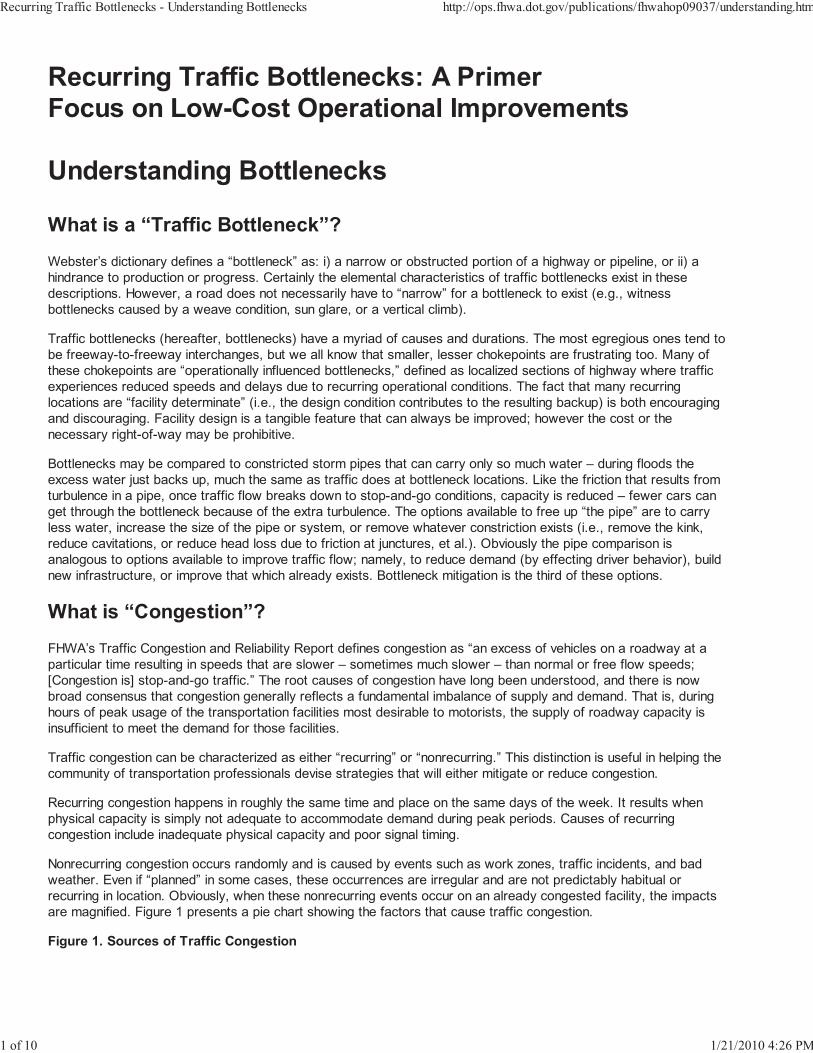
What is a “Traffic Bottleneck”?Webster’s dictionary defines a “bottleneck” as: i) a narrow or obstructed portion of a highway or pipeline, or ii) ahindrance to production or progress. Certainly the elemental characteristics of traffic bottlenecks exist in thesedescriptions. However, a road does not necessarily have to “narrow” for a bottleneck to exist (e.g., witnessbottlenecks caused by a weave condition, sun glare, or a vertical climb).
Traffic bottlenecks (hereafter, bottlenecks) have a myriad of causes and durations. The most egregious ones tend tobe freeway-to-freeway interchanges, but we all know that smaller, lesser chokepoints are frustrating too. Many ofthese chokepoints are “operationally influenced bottlenecks,” defined as localized sections of highway where trafficexperiences reduced speeds and delays due to recurring operational conditions. The fact that many recurringlocations are “facility determinate” (i.e., the design condition contributes to the resulting backup) is both encouragingand discouraging. Facility design is a tangible feature that can always be improved; however the cost or thenecessary right-of-way may be prohibitive.
Bottlenecks may be compared to constricted storm pipes that can carry only so much water – during floods theexcess water just backs up, much the same as traffic does at bottleneck locations. Like the friction that results fromturbulence in a pipe, once traffic flow breaks down to stop-and-go conditions, capacity is reduced – fewer cars canget through the bottleneck because of the extra turbulence. The options available to free up “the pipe” are to carryless water, increase the size of the pipe or system, or remove whatever constriction exists (i.e., remove the kink,reduce cavitations, or reduce head loss due to friction at junctures, et al.). Obviously the pipe comparison isanalogous to options available to improve traffic flow; namely, to reduce demand (by effecting driver behavior), buildnew infrastructure, or improve that which already exists. Bottleneck mitigation is the third of these options.
What is “Congestion”?FHWA’s Traffic Congestion and Reliability Report defines congestion as “an excess of vehicles on a roadway at aparticular time resulting in speeds that are slower – sometimes much slower – than normal or free flow speeds;[Congestion is] stop-and-go traffic.” The root causes of congestion have long been understood, and there is nowbroad consensus that congestion generally reflects a fundamental imbalance of supply and demand. That is, duringhours of peak usage of the transportation facilities most desirable to motorists, the supply of roadway capacity isinsufficient to meet the demand for those facilities.
Traffic congestion can be characterized as either “recurring” or “nonrecurring.” This distinction is useful in helping thecommunity of transportation professionals devise strategies that will either mitigate or reduce congestion.
Recurring congestion happens in roughly the same time and place on the same days of the week. It results whenphysical capacity is simply not adequate to accommodate demand during peak periods. Causes of recurringcongestion include inadequate physical capacity and poor signal timing.
Nonrecurring congestion occurs randomly and is caused by events such as work zones, traffic incidents, and badweather. Even if “planned” in some cases, these occurrences are irregular and are not predictably habitual orrecurring in location. Obviously, when these nonrecurring events occur on an already congested facility, the impactsare magnified. Figure 1 presents a pie chart showing the factors that cause traffic congestion.
Figure 1. Sources of Traffic Congestion
Recurring Traffic Bottlenecks - Understanding Bottlenecks http://ops.fhwa.dot.gov/publications/fhwahop09037/understanding.htm
1 of 10 1/21/2010 4:26 PM
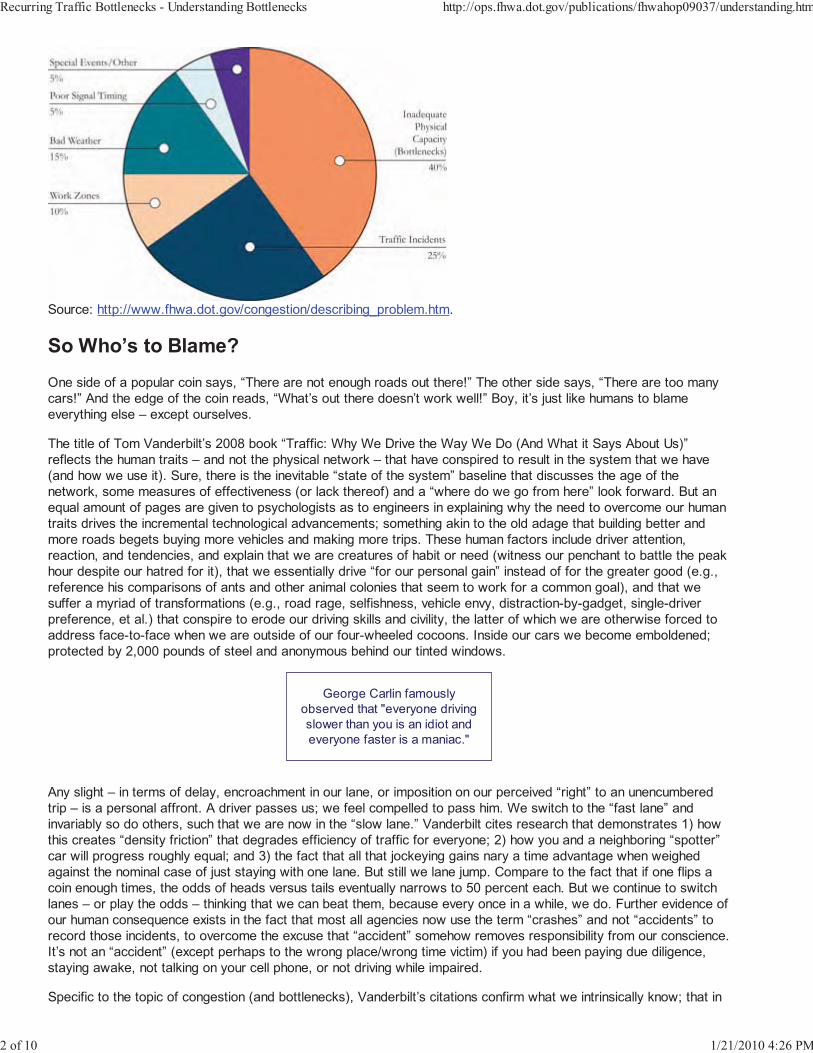
Source: http://www.fhwa.dot.gov/congestion/describing_problem.htm.
So Who’s to Blame?One side of a popular coin says, “There are not enough roads out there!” The other side says, “There are too manycars!” And the edge of the coin reads, “What’s out there doesn’t work well!” Boy, it’s just like humans to blameeverything else – except ourselves.
The title of Tom Vanderbilt’s 2008 book “Traffic: Why We Drive the Way We Do (And What it Says About Us)”reflects the human traits – and not the physical network – that have conspired to result in the system that we have(and how we use it). Sure, there is the inevitable “state of the system” baseline that discusses the age of thenetwork, some measures of effectiveness (or lack thereof) and a “where do we go from here” look forward. But anequal amount of pages are given to psychologists as to engineers in explaining why the need to overcome our humantraits drives the incremental technological advancements; something akin to the old adage that building better andmore roads begets buying more vehicles and making more trips. These human factors include driver attention,reaction, and tendencies, and explain that we are creatures of habit or need (witness our penchant to battle the peakhour despite our hatred for it), that we essentially drive “for our personal gain” instead of for the greater good (e.g.,reference his comparisons of ants and other animal colonies that seem to work for a common goal), and that wesuffer a myriad of transformations (e.g., road rage, selfishness, vehicle envy, distraction-by-gadget, single-driverpreference, et al.) that conspire to erode our driving skills and civility, the latter of which we are otherwise forced toaddress face-to-face when we are outside of our four-wheeled cocoons. Inside our cars we become emboldened;protected by 2,000 pounds of steel and anonymous behind our tinted windows.
George Carlin famouslyobserved that "everyone drivingslower than you is an idiot andeveryone faster is a maniac."
Any slight – in terms of delay, encroachment in our lane, or imposition on our perceived “right” to an unencumberedtrip – is a personal affront. A driver passes us; we feel compelled to pass him. We switch to the “fast lane” andinvariably so do others, such that we are now in the “slow lane.” Vanderbilt cites research that demonstrates 1) howthis creates “density friction” that degrades efficiency of traffic for everyone; 2) how you and a neighboring “spotter”car will progress roughly equal; and 3) the fact that all that jockeying gains nary a time advantage when weighedagainst the nominal case of just staying with one lane. But still we lane jump. Compare to the fact that if one flips acoin enough times, the odds of heads versus tails eventually narrows to 50 percent each. But we continue to switchlanes – or play the odds – thinking that we can beat them, because every once in a while, we do. Further evidence ofour human consequence exists in the fact that most all agencies now use the term “crashes” and not “accidents” torecord those incidents, to overcome the excuse that “accident” somehow removes responsibility from our conscience.It’s not an “accident” (except perhaps to the wrong place/wrong time victim) if you had been paying due diligence,staying awake, not talking on your cell phone, or not driving while impaired.
Specific to the topic of congestion (and bottlenecks), Vanderbilt’s citations confirm what we intrinsically know; that in
Recurring Traffic Bottlenecks - Understanding Bottlenecks http://ops.fhwa.dot.gov/publications/fhwahop09037/understanding.htm
2 of 10 1/21/2010 4:26 PM
survey after survey the majority of us consider ourselves superior drivers to practically anyone else despite that inother surveys we are very poor at estimating time spent in delay, distances traveled, and the cost of that delay. Aquarter is worth twenty-five cents to everyone, but a minute is overestimated by the guy sitting in a queue, andunderestimated by the guy racing to an appointment.
The aforementioned “superiority” manifests itself in our belief that somehow we are more worthy of being on the roadand it is everyone else who is clogging it up. We are ridiculously inept at estimating our own speed (“I was going 30MPH” when in fact he was clocked at 46); estimating time spent circling for a parking space (“I must have spent 5minutes looking” when in fact she only spent 1 minute 45 seconds from street to space); and estimating others’speed (“everyone travels 50 down my street” when in fact, a radar study found an average of 34 MPH and only twocars doing above 46 MPH in a three-day study). Or maybe in the latter case, it was the same car observed twice;hard to tell, but a moot point in terms of accusing “everyone.” We often travel at a speed that the road “allows” andnot what the sign mandates. We’re not intentionally flouting the law, but hey, we know better than the police and theengineers what it takes to get from here to there! After all, the engineers dutifully allow for a “safety factor” in theirdesign; that’s for me, right? Sometimes the prior examples of estimation can be written off as exaggeration butresearch consistently reproduces like results when people are observed first hand, or when focus groups are askedsituational questions.
In the context of “a road never jumped up and bit me” it seems hardly right to “blame” the roads, absent poormaintenance or a malfunctioning signal. So we blame the planners, the engineers, the politicians, and the “idiots” onthe road. Never mind that those same “idiots” are the neighbors, customers, and peers we somehow otherwiseabide. Clearly our desire to drive more often, and further, and own more vehicles, has strained our major highwayarteries. The effort becomes to reduce the rate of congestion, if not to eliminate it altogether in as many locations asfunding and right-of-way can bear. All the while we will swim upstream against perpetual waves of drivers, mileage,and demand. So the battle against congestion wages on while our human instincts contribute to the malaise.
The Frustration of CongestionIt seems hardly necessary to state that we are frustrated by congestion. We are frustrated because we feel we can’tcontrol it. We can control most everything else in our lives. We control what, when, and how much TV we watchbecause we have the remote and the DVR! We control what, when, and how much we eat. To the best of our ability,we control what we do (our jobs) and where we do it; although we’d like a little more control on how much they payus! We control our pastimes, our hobbies, and our vacations. We somewhat control our spouses and children; or atleast we have influence upon them. But unlike the scene in Bruce Almighty, we can’t part the “sea” of traffic in front ofus like Jim Carrey did.
But do we have to accept congestion? Our grandparents – and theirs – didn’t have to endure the levels of congestionthat we see today. But they also didn’t enjoy the extent of today’s roadway network, the availability of gas stationsand services, and the efficiencies and perks of modern cars. Time marches on, not back, so we are left to suffer theravages of our success.
Why Can’t it be Like This All the Time? (Uncongested, That Is!)Shopping mall planners design parking lots for the twelfth highest demand day of the year so as not to “waste”valuable land that would otherwise be squandered 96 percent of the time. (Similar to insurance actuary tables, the“12th highest” axiom is an accord based on the intrinsic worth of land cost, parking demand, and of course, retailprofit.) No doubt, during the Christmas shopping season, we all would love to get those “unnecessary” spaces back!Recurring congestion is sort of like that, except that highway builders don’t intentionally under-build; it just seems thatway. Highways are built to “design hour” and “design year” tenets, but population and traffic demand are evergrowing – and rarely receding – over time. Outside of peak hours, the great majority of highway facilities are morethan sufficient for the dynamic demand. Unfortunately, we tend to see highways at their busiest hours. But weoccasionally experience the off-hour conditions too, i.e., when traffic flows freely. And like those too-few vacationswhen we are pampered and coddled, we ask “why can’t it be like this all the time?” Recurring congestion is a functionof physical constraints, as well as how and when drivers interact with a given facility and other vehicles on the facility.
A “Bottleneck” May Be “Congestion,” but Congestion is Not Always“Just a Bottleneck”
Recurring Traffic Bottlenecks - Understanding Bottlenecks http://ops.fhwa.dot.gov/publications/fhwahop09037/understanding.htm
3 of 10 1/21/2010 4:26 PM
The word “paper” can mean either a single sheet or a ream; likewise, “congestion” can be a single bottleneck – ormuch more. A bottleneck is distinguished from congestion in that it occurs at a specific location, and not pervasivelyalong the entire corridor. Recognizing this difference is the first important distinction in developing strategies for oneor the other. When too many vehicles compete along all segments of a facility, corridor- or systemwide “congestion”will inevitably result. It is overarching in nature. But when only subordinate segments of that facility are burdened,then operationally recurring bottlenecks are said to exist. In this context then, a bottleneck certainly constitutes“congestion,” but congestion cannot be said to be universally analogous to a “bottleneck.”
The FHWA estimates that 40 percent of all congestion nationwide can be attributed to recurring bottlenecks (i.e.,inadequate physical capacity) and another 5 percent is attributable to inefficient traffic signalization. The good news isthat all these things are potentially correctible by remediation. The bad news is that there are many, many candidatelocations, and agencies are fiscally constrained on how much they can do. All things being equal, a recurringbottleneck will disappear once traffic demand has decreased to a point where the operational or geometric deficiencyis no longer a factor, while a nonrecurring bottleneck will disappear only after the random event has been removed. Anonrecurring bottleneck may be further impacted by traffic volumes, but it is not caused by traffic demand.Conversely, only a physical improvement will relieve a recurring bottleneck.
What Elements Typically Exist to Define a “Bottleneck”?The Localized Bottleneck Reduction Program focuses on operationally influenced locations; that is to say, those thathave a fundamentally design-based cause, resulting in recurring delays of generally predictable times and durations.The root cause of traffic flow degradation at the subject point of a recurrent constriction is almost always acorrectable problem. The following conditions either exist or help to identify a recurring bottleneck condition.
A traffic queue upstream of the bottleneck, wherein speeds are below free-flow conditions elsewhere on thefacility. (Note: if speeds at all or most-all of the facility are consistently and regularly lower than free-flowspeeds, then overarching congestion exists. This is congestion beyond a mere point-specific bottlenecklocation.)
A beginning point for a queue. There should be a definable point that separates upstream and downstreamconditions. The geometry of that point is often coincidently the root cause of the operational deficiency.
Free flow traffic conditions downstream of the bottleneck that have returned to nominal or design conditions.
As it pertains to an operational deficiency, a predictable recurring cause. (Note: this implies that all thingsbeing equal, a solution exists that is nevertheless theoretically “correctable” by design, as opposed to, say, anamorphous, random event.)
Traffic volumes that exceed the capacity of the confluence to process traffic. (Note: this applies to recurringevents even more-so than nonrecurring.)
What Options Exist to Combat Congestion (and by Extension,Bottlenecks)?Fixing operationally influenced deficiencies applies to the fourth of the following four strategies available to combatcongestion.
Bring supply and demand in alignment through congestion pricing. Congestion pricing or peak-period pricingentails fees or tolls for road use that varies by level of vehicle demand on the facility. As with market pricing inother sectors, road pricing helps allocate limited supply – in this case, that of available road space. With usercharges assesses at the point of use, greater efficiency results through improved response to market forces.Charges are typically assessed electronically to eliminate delays associated with manual toll collectionfacilities. Road-use charges that vary with the level of vehicle demand provide incentives to shift some trips tooff-peak times, less congested routes, or alternative modes; or to cause some lower-value trips to becombined with other trips or simply to be eliminated. Congestion pricing has several important objectives.First, it seeks to balance demand with available capacity, i.e., the supply of road space. Second, it seeks tofairly allocate the costs associated with operating, maintaining, and expanding the transportation system tomeet growing demand. Third, it seeks to improve operation of the highway system. A fourth objective mayinclude revenue generation.
Provide alternatives as to how, when, where, and if to travel. The goal of this strategy is to reduce the numberof vehicles on a given road. This may take the form of promoting alternative commute options such as
Recurring Traffic Bottlenecks - Understanding Bottlenecks http://ops.fhwa.dot.gov/publications/fhwahop09037/understanding.htm
4 of 10 1/21/2010 4:26 PM
employee telecommuting options or making transit easier and more attractive to use. Also of interest inmanaging demand are driver incentive programs that, for example, promote ridesharing and off-peak use.
Invest in new highway capacity. Add new construction on new alignments to preserve or improve systemperformance.
Improve the management and operation of the system. Improve the day-to-day operation of the system byretiming traffic signals, applying access management techniques, removing operational deficiencies, andimproving response time and management of traffic disrupting events like work zones, accidents, and specialevents. Provide real time information about the system so that travelers can make immediate decisions aboutwhen, where, and how to travel, and transportation agencies can make real-time adjustments to improvesystem operations.
Why Do Recurring Bottlenecks Occur?Every highway facility has decision points such as on and off ramps, merge areas, weave areas, lane drops,tollbooth areas, and traffic signals; or design constraints such as curves, climbs, underpasses, and narrow ornonexistent shoulders. In many thousands of cases, these operational junctions and characteristics operatesufficiently and anonymously; however, when the design itself becomes the constricting factor in processing trafficdemand, then an operationally influenced bottleneck can result.
The degree of congestion at a bottleneck location is related to its physical design. Some operational junctions wereconstructed years ago using design standards now considered to be antiquated, while others were built to sufficientlyhigh design standards but are simply overwhelmed by traffic demand. Whatever the root cause, operationallyinfluenced bottlenecks can occur at:
A lane drop particularly mid-segment where one or more traffic lanes are lost. These typically appear atbridge crossings and in work zones. The latter, however, is a nonrecurring event and is usually remedied whenthe work zone is removed. Ideally, lane drops should be located at exit ramps where there is a large volume ofexiting traffic.
A weaving area, where traffic must merge across one or more lanes to access entry or exit ramps. Bottleneckconditions are worsened when there are confusing or insufficient weaving lengths.
Freeway on-ramps, which are merging areas where traffic from local streets can join a freeway. Bottleneckconditions are worsened on freeway on-ramps without auxiliary lanes, short acceleration ramps, or wherethere are multiple on-ramps in close proximity.
Freeway-to-freeway interchanges, which are special cases of on-ramps where flow from one freeway isdirected to another. These are typically the most severe form of physical bottlenecks because of the hightraffic volumes involved.
Freeway exit ramps, which are diverging areas where traffic leaves a freeway. Bottleneck conditions areworsened on freeway exit ramps that have a short ramp length, traffic signal deficiencies at the ramp terminalintersection, or other conditions that may cause ramp queues to back up onto freeway mainlanes.
Abrupt changes in highway alignment, which occur at sharp curves and hills and cause drivers to slow downeither because of safety concerns or because their vehicles cannot maintain speed on upgrades. Anotherexample of this type of bottleneck is in work zones where lanes may be redirected or “shifted” duringconstruction.
Low clearance structures such as tunnels and underpasses. Drivers slow to use extra caution, or overloadbypass routes. Even sufficiently tall clearances may impart problems. In one renowned case, the mere opticalillusion of a bridge appearing lower than it really is causes drivers to slow down, resulting in recurringbottleneck conditions.
Lane narrowing, caused by either narrow travel lanes or narrow or nonexistent shoulders.
Intended interruptions to traffic flow are literally “traffic disruptions on purpose” that are sometimes necessaryin order to manage system flow. Traffic signals, freeway ramp meters, and tollbooths can all contribute tocapacity loss.
Figure 2 lists various types of freeway bottleneck causes.
Figure 2. Types of Freeway Bottlenecks
Recurring Traffic Bottlenecks - Understanding Bottlenecks http://ops.fhwa.dot.gov/publications/fhwahop09037/understanding.htm
5 of 10 1/21/2010 4:26 PM
What is Stopping Us from Fixing Bottlenecks?The knee jerk reaction might be “lack of money.” But that’s everyone’s first complaint about, well, most everyproblem! In visiting with many states to ascertain if they have a bottleneck-specific program or similar that targetschokepoint congestion, we have found a sampling of reasons.
A predisposition to execute major projects. Certainly, no one is faulting an agency which is attentive toexecuting major transportation initiatives. There is no shortage of “fronts” on which to fight the congestionbattle. A short list would include HOVs, tolling and pricing, transit alternatives, ridesharing programs, andbridge rehabilitation. But the onerous processes involved in many of these initiatives can squeeze out smallerprograms.
Lack of a champion. Many successful state or metropolitan planning organization (MPO) programs are theresult of one or more persons taking charge to either mandate or adopt a program. High-level administratorsform the direction for their agencies. Mid-level managers’ production reflects their priorities and skills inexecuting those initiatives.
Lack of a “named” program. Unless there is an identity, bottleneck remediation is usually relegated to a fewprojects done “by rote,” e.g., as part of an annualized safety program, or as a subordinate part of larger,other-purposed projects.
A culture of historical practices. Example: an agency that dutifully executed an annualized “safety” programlooked only at crash rates in determining their annual top ten list of projects. After instituting a congestionmapping process, they identified several significant stand-alone chokepoints that did not correlate with theirhigh crash mapping. Thereafter, high congestion hot spots competed with high accident hot spots on theirunified top ten list of projects.
Solving Recurring Bottlenecks is a Win-Win Situation for NonrecurringIncidents Too!
Strategies to alleviate bottlenecks will lessen delay caused by nonrecurringevents such as accidents, weather, work zones, etc. For example, consider anaccident that blocks a single lane of traffic. If only two lanes existed prior to theaccident occurring, the impact would be greater than if three lanes existed. Thecapacity loss resulting from the nonrecurring event will be lessened due to theimprovements made to the system to benefit the recurring situation.
Recurring Traffic Bottlenecks - Understanding Bottlenecks http://ops.fhwa.dot.gov/publications/fhwahop09037/understanding.htm
6 of 10 1/21/2010 4:26 PM
Common Myths about Bottlenecks“Bottlenecks are caused only by not enough lanes on an extended highway section.”
In the past, recurring congestion was thought to be an overarching or systemic problem (i.e., not enough lanes) thatcould only be resolved by widening an entire corridor. However, the fact that other subordinate sections within thesystem operate sufficiently demonstrates that the uniform highway segments may not necessarily be under-designed.
Traditional capital solutions often grew from the misconception that a multilane facility should be designed to alleviaterecurring congestion during the peak hours each day. The problem is that funding for such large scale projects islimited, and right-of-way is often restricted, such that these projects take many years to complete. As a result,recurring congestion historically goes untreated, or is forced to compete against other worthy projects, until fundingbecomes available to “catch up” to the problem that has grown from the day the facility opens.
With a shift in focus away from the perception that recurring congestion is systemic (and thus treatable with onlylarge scale projects), it is possible to explore a wider range of improvement strategies that are possible in theshort-term. While these will never replace the need for corridor-wide fixes – especially at “mega-bottlenecks” such asmajor freeway-to-freeway interchanges – low-cost, quick turnaround bottleneck fixes can provide congestion relief atthe point of occurrence.
“Bottlenecks can’t be fixed without massive reconstruction.”
With the focus of traditional transportation planning and programming efforts on major capital projects, it has beenassumed for many years that bottlenecks cannot be fixed without massive reconstruction of an interchange orcorridor. However, there are numerous examples where agencies opted to make lower-cost improvements thatresulted in significant improvements in traffic flow.
“Improving a bottleneck won’t help traffic flow outside of peak periods.”
Because traffic-influencing events like incidents, bad weather, work zones, and special events can happen at anytime, congestion is not restricted to peak times of the day. Benefits realized from improvements made to addresspeak-period bottleneck problems will invariably carry over to the times outside of the peak when congestion occurs.
A Rogue’s Gallery of Infamous BottlenecksOn much of the urban highway system, there are specific points that are notorious for causing congestion on a dailybasis. These locations – which can be a single interchange (usually freeway-to-freeway), a series of closely spacedinterchanges, or lane drops – are focal points for congestion in corridors. Major bottlenecks tend to dominate thecongestion problem in corridors where they exist, some even acquiring nicknames from local motorists such as the“Spaghetti Bowl,” “Hillside Strangler,” “Spaghetti Junction,” “Malfunction Junction,” and “Mixmaster”.
Over the past several years, transportation professionals have come to realize that highway bottlenecks demandspecial attention. Several national studies have highlighted bottlenecks as a major congestion problem in urban areas.These studies have raised the level of awareness about bottlenecks as a problem, warranting that they be treated asa significant part of the congestion problem.The American Highway Users Alliance (AHUA) conducted two studies of the nation’s urban bottlenecks in 1999 and2004. The studies produced rankings of the worst bottlenecks in terms of total delay to travelers and discussed whatwas being done to fix the problems at locations where specific improvements had been scheduled. The studies foundthat nearly all of the worst bottlenecks are major freeway-to-freeway interchanges in large urban areas. The 2004study updated the rankings and discussed three bottleneck improvement success stories – bottlenecks identified in1999 that were subsequently improved or well under construction.
Improvements Are Possible"Seven of 18 bottlenecks identified in 1999 – including hotspots in Houston,
Albuquerque, Denver, Boston, Los Angeles, and Washington, D.C. – no longerappeared on (subsequent) rankings of the country's worst chokepoints (due to)
major reconstruction projects completed or underway.”
Recurring Traffic Bottlenecks - Understanding Bottlenecks http://ops.fhwa.dot.gov/publications/fhwahop09037/understanding.htm
7 of 10 1/21/2010 4:26 PM
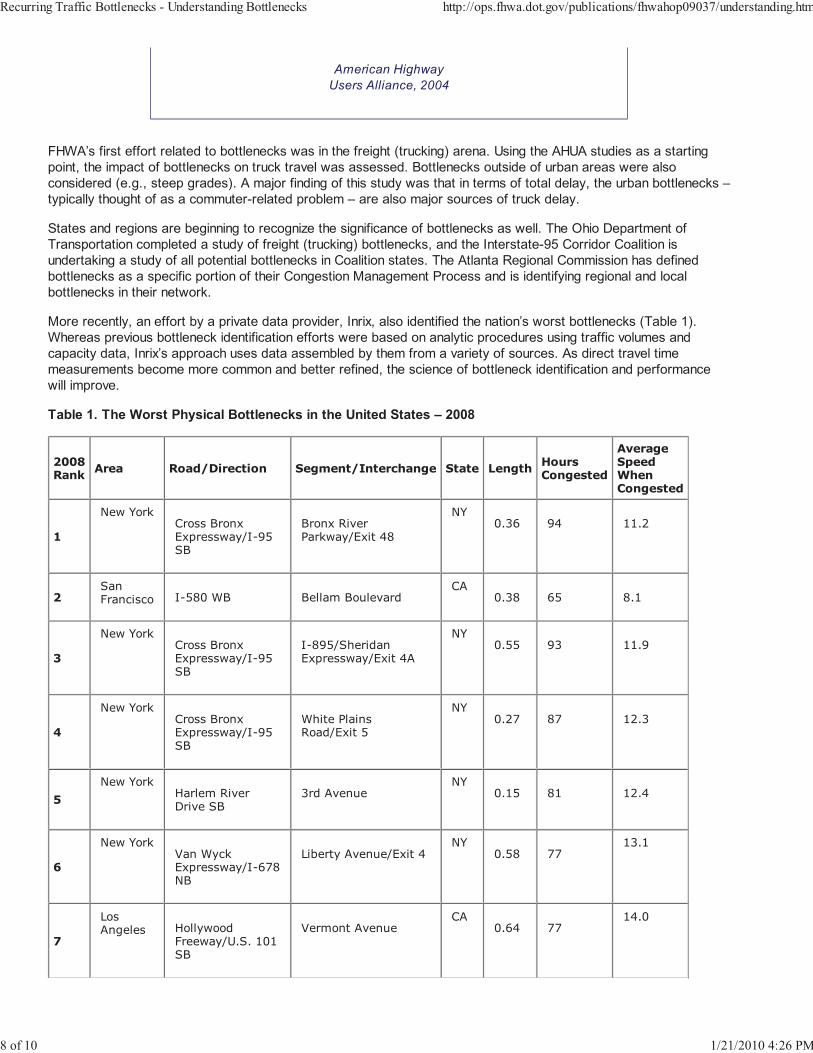
American HighwayUsers Alliance, 2004
FHWA’s first effort related to bottlenecks was in the freight (trucking) arena. Using the AHUA studies as a startingpoint, the impact of bottlenecks on truck travel was assessed. Bottlenecks outside of urban areas were alsoconsidered (e.g., steep grades). A major finding of this study was that in terms of total delay, the urban bottlenecks –typically thought of as a commuter-related problem – are also major sources of truck delay.
States and regions are beginning to recognize the significance of bottlenecks as well. The Ohio Department ofTransportation completed a study of freight (trucking) bottlenecks, and the Interstate-95 Corridor Coalition isundertaking a study of all potential bottlenecks in Coalition states. The Atlanta Regional Commission has definedbottlenecks as a specific portion of their Congestion Management Process and is identifying regional and localbottlenecks in their network.
More recently, an effort by a private data provider, Inrix, also identified the nation’s worst bottlenecks (Table 1).Whereas previous bottleneck identification efforts were based on analytic procedures using traffic volumes andcapacity data, Inrix’s approach uses data assembled by them from a variety of sources. As direct travel timemeasurements become more common and better refined, the science of bottleneck identification and performancewill improve.
Table 1. The Worst Physical Bottlenecks in the United States – 2008
2008Rank Area Road/Direction Segment/Interchange State Length Hours
Congested
AverageSpeedWhenCongested
1
New YorkCross BronxExpressway/I-95SB
Bronx RiverParkway/Exit 48
NY0.36 94 11.2
2SanFrancisco I-580 WB Bellam Boulevard
CA0.38 65 8.1
3
New YorkCross BronxExpressway/I-95SB
I-895/SheridanExpressway/Exit 4A
NY0.55 93 11.9
4
New YorkCross BronxExpressway/I-95SB
White PlainsRoad/Exit 5
NY0.27 87 12.3
5New York
Harlem RiverDrive SB
3rd AvenueNY
0.15 81 12.4
6
New YorkVan WyckExpressway/I-678NB
Liberty Avenue/Exit 4NY
0.58 7713.1
7
LosAngeles Hollywood
Freeway/U.S. 101SB
Vermont AvenueCA
0.64 7714.0
Recurring Traffic Bottlenecks - Understanding Bottlenecks http://ops.fhwa.dot.gov/publications/fhwahop09037/understanding.htm
8 of 10 1/21/2010 4:26 PM
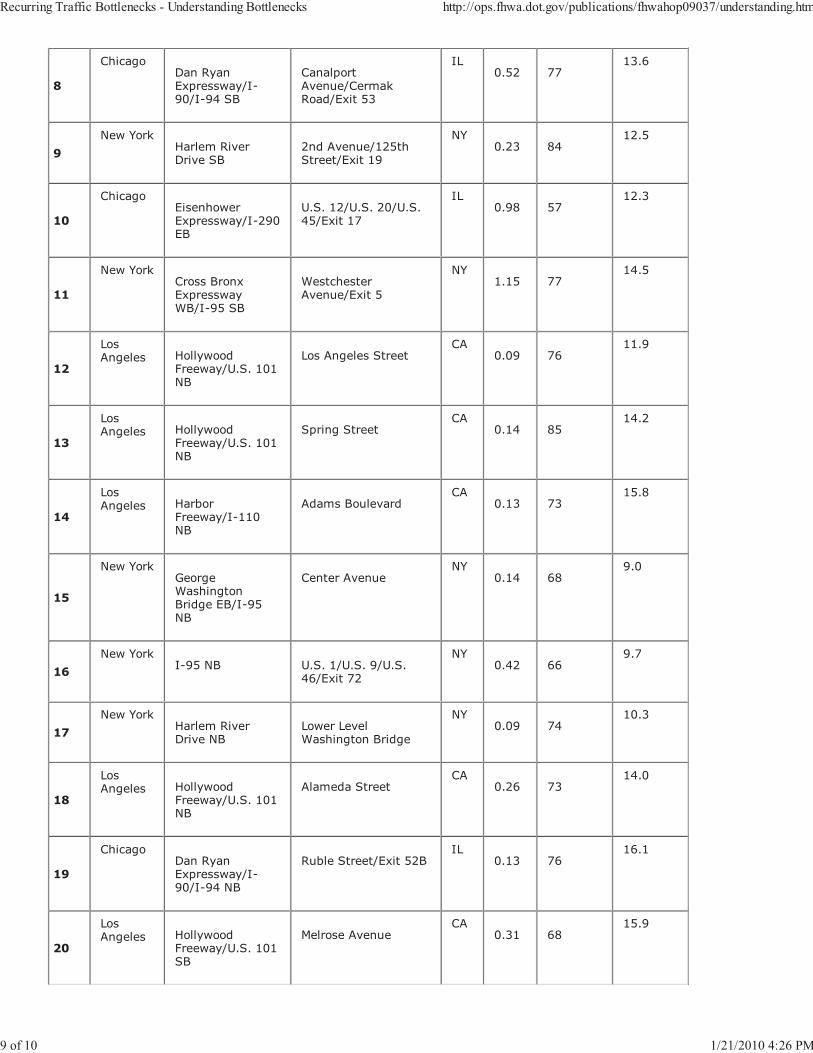
8
ChicagoDan RyanExpressway/I-90/I-94 SB
CanalportAvenue/CermakRoad/Exit 53
IL0.52 77
13.6
9New York
Harlem RiverDrive SB
2nd Avenue/125thStreet/Exit 19
NY0.23 84
12.5
10
ChicagoEisenhowerExpressway/I-290EB
U.S. 12/U.S. 20/U.S.45/Exit 17
IL0.98 57
12.3
11
New YorkCross BronxExpresswayWB/I-95 SB
WestchesterAvenue/Exit 5
NY1.15 77
14.5
12
LosAngeles Hollywood
Freeway/U.S. 101NB
Los Angeles StreetCA
0.09 7611.9
13
LosAngeles Hollywood
Freeway/U.S. 101NB
Spring StreetCA
0.14 8514.2
14
LosAngeles Harbor
Freeway/I-110NB
Adams BoulevardCA
0.13 7315.8
15
New YorkGeorgeWashingtonBridge EB/I-95NB
Center AvenueNY
0.14 689.0
16New York
I-95 NB U.S. 1/U.S. 9/U.S.46/Exit 72
NY0.42 66
9.7
17New York
Harlem RiverDrive NB
Lower LevelWashington Bridge
NY0.09 74
10.3
18
LosAngeles Hollywood
Freeway/U.S. 101NB
Alameda StreetCA
0.26 7314.0
19
ChicagoDan RyanExpressway/I-90/I-94 NB
Ruble Street/Exit 52BIL
0.13 7616.1
20
LosAngeles Hollywood
Freeway/U.S. 101SB
Melrose AvenueCA
0.31 6815.9
Recurring Traffic Bottlenecks - Understanding Bottlenecks http://ops.fhwa.dot.gov/publications/fhwahop09037/understanding.htm
9 of 10 1/21/2010 4:26 PM
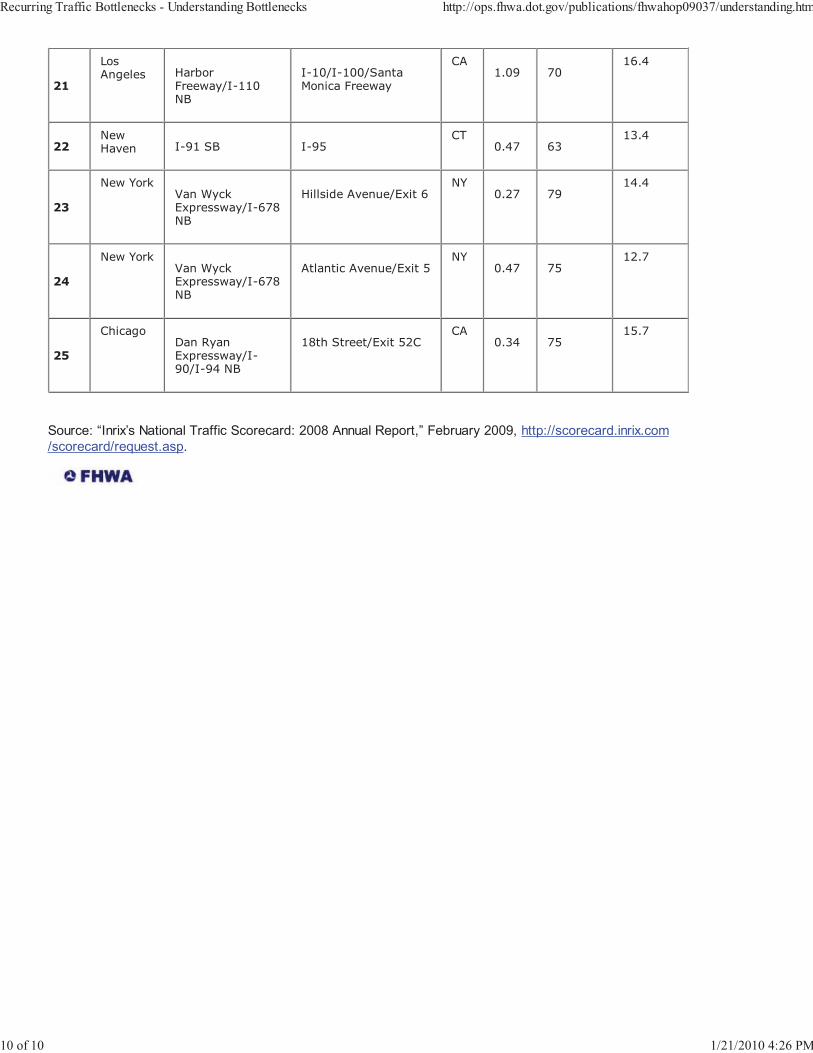
21
LosAngeles Harbor
Freeway/I-110NB
I-10/I-100/SantaMonica Freeway
CA1.09 70
16.4
22NewHaven I-91 SB I-95
CT0.47 63
13.4
23
New YorkVan WyckExpressway/I-678NB
Hillside Avenue/Exit 6NY
0.27 7914.4
24
New YorkVan WyckExpressway/I-678NB
Atlantic Avenue/Exit 5NY
0.47 7512.7
25
ChicagoDan RyanExpressway/I-90/I-94 NB
18th Street/Exit 52CCA
0.34 7515.7
Source: “Inrix’s National Traffic Scorecard: 2008 Annual Report,” February 2009, http://scorecard.inrix.com/scorecard/request.asp.
Recurring Traffic Bottlenecks - Understanding Bottlenecks http://ops.fhwa.dot.gov/publications/fhwahop09037/understanding.htm
10 of 10 1/21/2010 4:26 PM

Exhibit 6: Spreadsheets for revised estimates of cancer risks associated with I-110
(accounting for 70-year exposure duration and DPM cancer potency factor of 1.10)
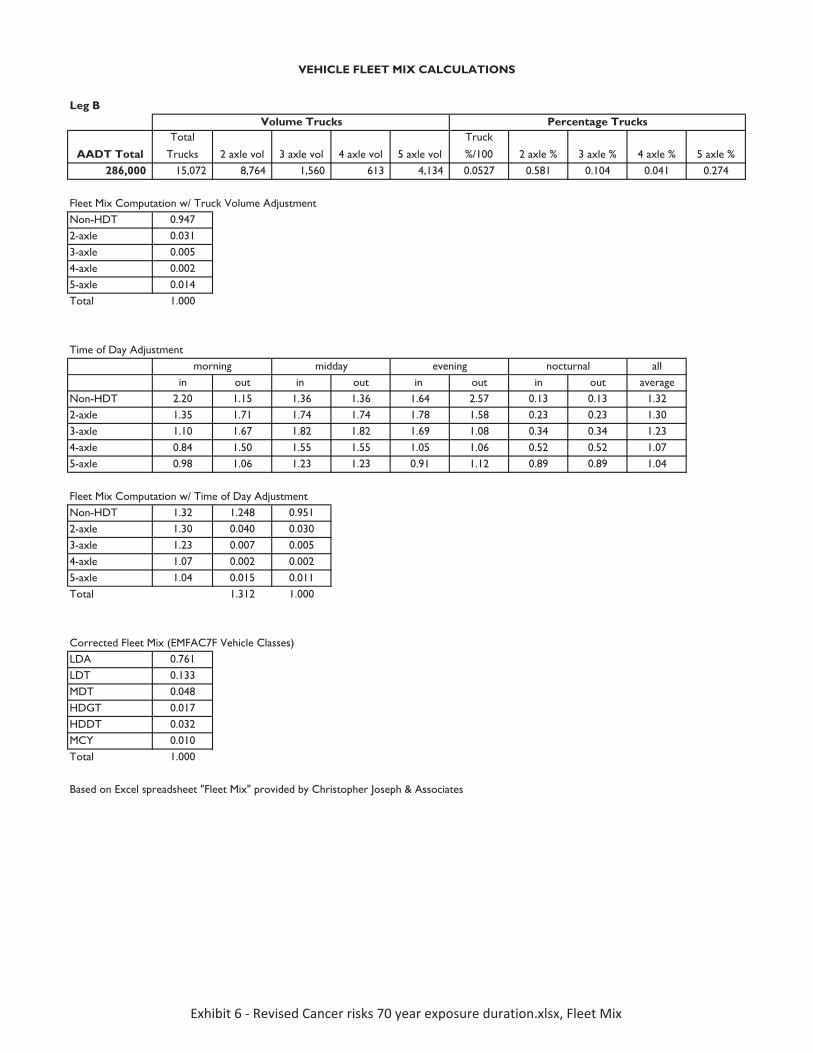
Leg B
AADT TotalTotal
Trucks 2 axle vol 3 axle vol 4 axle vol 5 axle vol
Truck
%/100 2 axle % 3 axle % 4 axle % 5 axle %286,000 15,072 8,764 1,560 613 4,134 0.0527 0.581 0.104 0.041 0.274
Fleet Mix Computation w/ Truck Volume AdjustmentNon-HDT 0.9472-axle 0.0313-axle 0.0054-axle 0.0025-axle 0.014Total 1.000
Time of Day Adjustmentall
in out in out in out in out averageNon-HDT 2.20 1.15 1.36 1.36 1.64 2.57 0.13 0.13 1.322-axle 1.35 1.71 1.74 1.74 1.78 1.58 0.23 0.23 1.303-axle 1.10 1.67 1.82 1.82 1.69 1.08 0.34 0.34 1.234-axle 0.84 1.50 1.55 1.55 1.05 1.06 0.52 0.52 1.075-axle 0.98 1.06 1.23 1.23 0.91 1.12 0.89 0.89 1.04
Fleet Mix Computation w/ Time of Day Adjustment Non-HDT 1.32 1.248 0.9512-axle 1.30 0.040 0.0303-axle 1.23 0.007 0.0054-axle 1.07 0.002 0.0025-axle 1.04 0.015 0.011Total 1.312 1.000
Corrected Fleet Mix (EMFAC7F Vehicle Classes)LDA 0.761LDT 0.133MDT 0.048HDGT 0.017HDDT 0.032MCY 0.010Total 1.000
Based on Excel spreadsheet "Fleet Mix" provided by Christopher Joseph & Associates
VEHICLE FLEET MIX CALCULATIONS
morning midday evening nocturnal
Volume Trucks Percentage Trucks
Exhibit�6���Revised�Cancer�risks�70�year�exposure�duration.xlsx,�Fleet�Mix
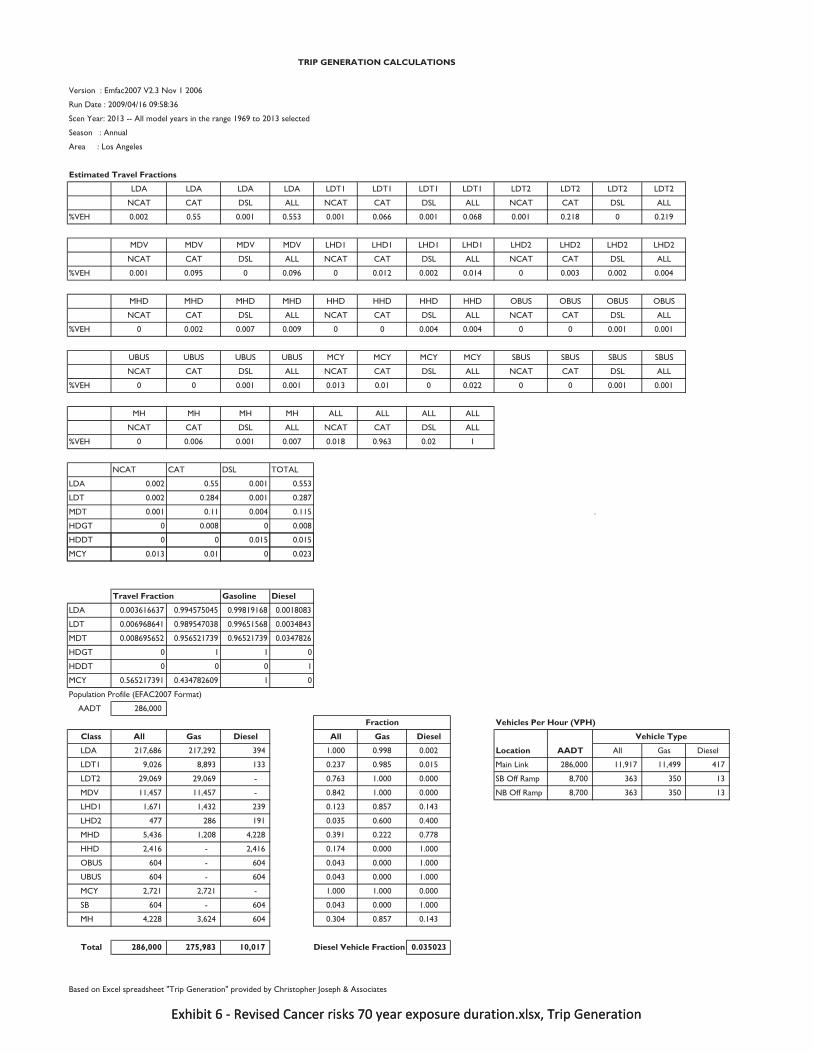
Version : Emfac2007 V2.3 Nov 1 2006
Run Date : 2009/04/16 09:58:36
Scen Year: 2013 -- All model years in the range 1969 to 2013 selected
Season : Annual
Area : Los Angeles
Estimated Travel Fractions
LDA LDA LDA LDA LDT1 LDT1 LDT1 LDT1 LDT2 LDT2 LDT2 LDT2
NCAT CAT DSL ALL NCAT CAT DSL ALL NCAT CAT DSL ALL
%VEH 0.002 0.55 0.001 0.553 0.001 0.066 0.001 0.068 0.001 0.218 0 0.219
MDV MDV MDV MDV LHD1 LHD1 LHD1 LHD1 LHD2 LHD2 LHD2 LHD2
NCAT CAT DSL ALL NCAT CAT DSL ALL NCAT CAT DSL ALL
%VEH 0.001 0.095 0 0.096 0 0.012 0.002 0.014 0 0.003 0.002 0.004
MHD MHD MHD MHD HHD HHD HHD HHD OBUS OBUS OBUS OBUS
NCAT CAT DSL ALL NCAT CAT DSL ALL NCAT CAT DSL ALL
%VEH 0 0.002 0.007 0.009 0 0 0.004 0.004 0 0 0.001 0.001
UBUS UBUS UBUS UBUS MCY MCY MCY MCY SBUS SBUS SBUS SBUS
NCAT CAT DSL ALL NCAT CAT DSL ALL NCAT CAT DSL ALL
%VEH 0 0 0.001 0.001 0.013 0.01 0 0.022 0 0 0.001 0.001
MH MH MH MH ALL ALL ALL ALL
NCAT CAT DSL ALL NCAT CAT DSL ALL
%VEH 0 0.006 0.001 0.007 0.018 0.963 0.02 1
NCAT CAT DSL TOTAL
LDA 0.002 0.55 0.001 0.553
LDT 0.002 0.284 0.001 0.287
MDT 0.001 0.11 0.004 0.115 .
HDGT 0 0.008 0 0.008
HDDT 0 0 0.015 0.015
TRIP GENERATION CALCULATIONS
Exhibit�6���Revised�Cancer�risks�70�year�exposure�duration.xlsx,�Trip�Generation
MCY 0.013 0.01 0 0.023
Travel Fraction Gasoline Diesel
LDA 0.003616637 0.994575045 0.99819168 0.0018083
LDT 0.006968641 0.989547038 0.99651568 0.0034843
MDT 0.008695652 0.956521739 0.96521739 0.0347826
HDGT 0 1 1 0
HDDT 0 0 0 1
MCY 0.565217391 0.434782609 1 0
Population Profile (EFAC2007 Format)
AADT 286,000
Vehicles Per Hour (VPH)
Class All Gas Diesel All Gas Diesel
LDA 217,686 217,292 394 1.000 0.998 0.002 Location AADT All Gas Diesel
LDT1 9,026 8,893 133 0.237 0.985 0.015 Main Link 286,000 11,917 11,499 417
LDT2 29,069 29,069 - 0.763 1.000 0.000 SB Off Ramp 8,700 363 350 13
MDV 11,457 11,457 - 0.842 1.000 0.000 NB Off Ramp 8,700 363 350 13
LHD1 1,671 1,432 239 0.123 0.857 0.143
LHD2 477 286 191 0.035 0.600 0.400
MHD 5,436 1,208 4,228 0.391 0.222 0.778
HHD 2,416 - 2,416 0.174 0.000 1.000
OBUS 604 - 604 0.043 0.000 1.000
UBUS 604 - 604 0.043 0.000 1.000
MCY 2,721 2,721 - 1.000 1.000 0.000
SB 604 - 604 0.043 0.000 1.000
MH 4,228 3,624 604 0.304 0.857 0.143
Total 286,000 275,983 10,017 Diesel Vehicle Fraction 0.035023
Based on Excel spreadsheet "Trip Generation" provided by Christopher Joseph & Associates
Fraction
Vehicle Type
Exhibit�6���Revised�Cancer�risks�70�year�exposure�duration.xlsx,�Trip�Generation
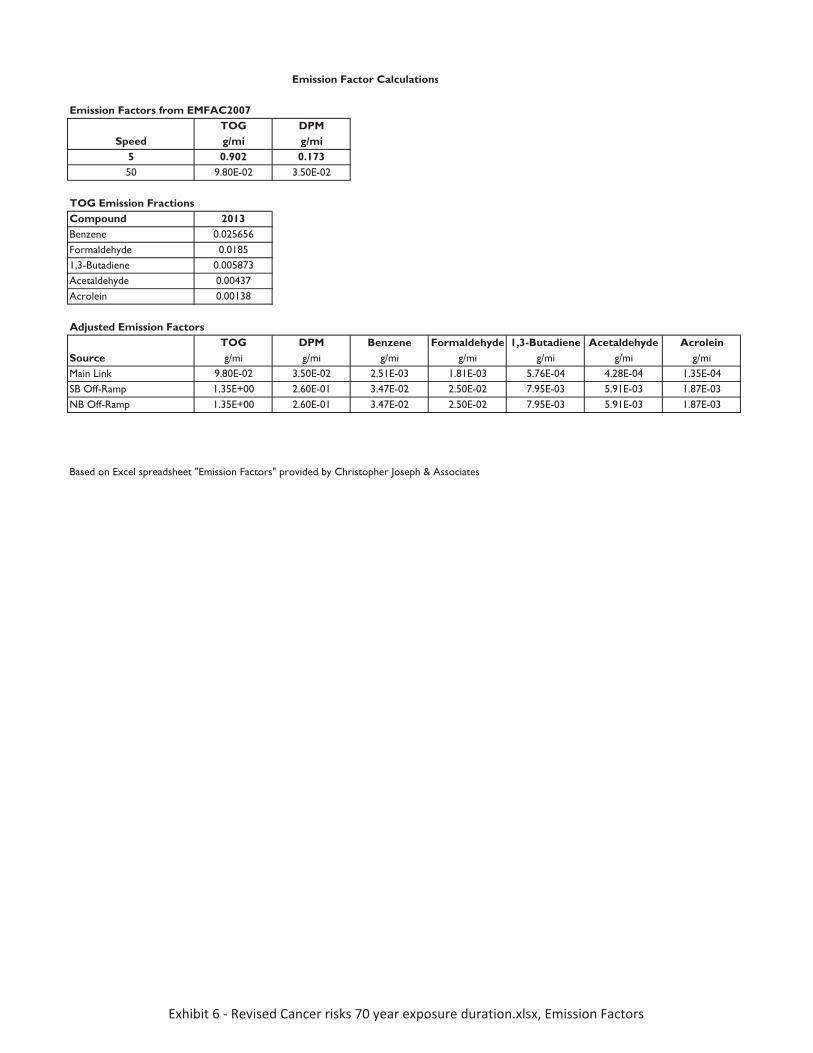
Emission Factors from EMFAC2007TOG DPMg/mi g/mi
5 0.902 0.17350 9.80E-02 3.50E-02
TOG Emission FractionsCompound 2013Benzene 0.025656Formaldehyde 0.01851,3-Butadiene 0.005873Acetaldehyde 0.00437Acrolein 0.00138
Adjusted Emission FactorsTOG DPM Benzene Formaldehyde 1,3-Butadiene Acetaldehyde Acrolein
Source g/mi g/mi g/mi g/mi g/mi g/mi g/miMain Link 9.80E-02 3.50E-02 2.51E-03 1.81E-03 5.76E-04 4.28E-04 1.35E-04SB Off-Ramp 1.35E+00 2.60E-01 3.47E-02 2.50E-02 7.95E-03 5.91E-03 1.87E-03NB Off-Ramp 1.35E+00 2.60E-01 3.47E-02 2.50E-02 7.95E-03 5.91E-03 1.87E-03
Emission Factor Calculations
Speed
Based on Excel spreadsheet "Emission Factors" provided by Christopher Joseph & Associates
Exhibit�6���Revised�Cancer�risks�70�year�exposure�duration.xlsx,�Emission�Factors
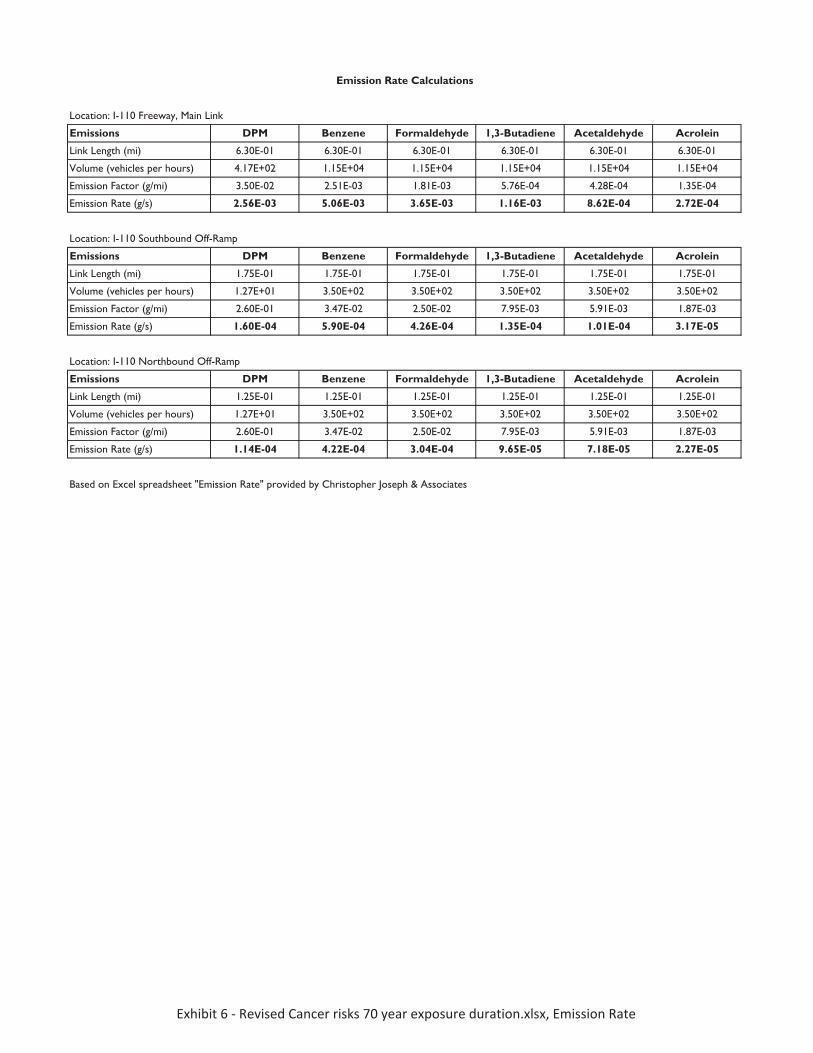
Location: I-110 Freeway, Main Link
Emissions DPM Benzene Formaldehyde 1,3-Butadiene Acetaldehyde Acrolein
Link Length (mi) 6.30E-01 6.30E-01 6.30E-01 6.30E-01 6.30E-01 6.30E-01
Volume (vehicles per hours) 4.17E+02 1.15E+04 1.15E+04 1.15E+04 1.15E+04 1.15E+04
Emission Factor (g/mi) 3.50E-02 2.51E-03 1.81E-03 5.76E-04 4.28E-04 1.35E-04
Emission Rate (g/s) 2.56E-03 5.06E-03 3.65E-03 1.16E-03 8.62E-04 2.72E-04
Location: I-110 Southbound Off-Ramp
Emissions DPM Benzene Formaldehyde 1,3-Butadiene Acetaldehyde Acrolein
Link Length (mi) 1.75E-01 1.75E-01 1.75E-01 1.75E-01 1.75E-01 1.75E-01
Volume (vehicles per hours) 1.27E+01 3.50E+02 3.50E+02 3.50E+02 3.50E+02 3.50E+02
Emission Factor (g/mi) 2.60E-01 3.47E-02 2.50E-02 7.95E-03 5.91E-03 1.87E-03
Emission Rate (g/s) 1.60E-04 5.90E-04 4.26E-04 1.35E-04 1.01E-04 3.17E-05
Location: I-110 Northbound Off-Ramp
Emissions DPM Benzene Formaldehyde 1,3-Butadiene Acetaldehyde Acrolein
Link Length (mi) 1.25E-01 1.25E-01 1.25E-01 1.25E-01 1.25E-01 1.25E-01
Volume (vehicles per hours) 1.27E+01 3.50E+02 3.50E+02 3.50E+02 3.50E+02 3.50E+02
Emission Factor (g/mi) 2.60E-01 3.47E-02 2.50E-02 7.95E-03 5.91E-03 1.87E-03
Emission Rate (g/s) 1.14E-04 4.22E-04 3.04E-04 9.65E-05 7.18E-05 2.27E-05
Emission Rate Calculations
Based on Excel spreadsheet "Emission Rate" provided by Christopher Joseph & Associates
Exhibit�6���Revised�Cancer�risks�70�year�exposure�duration.xlsx,�Emission�Rate
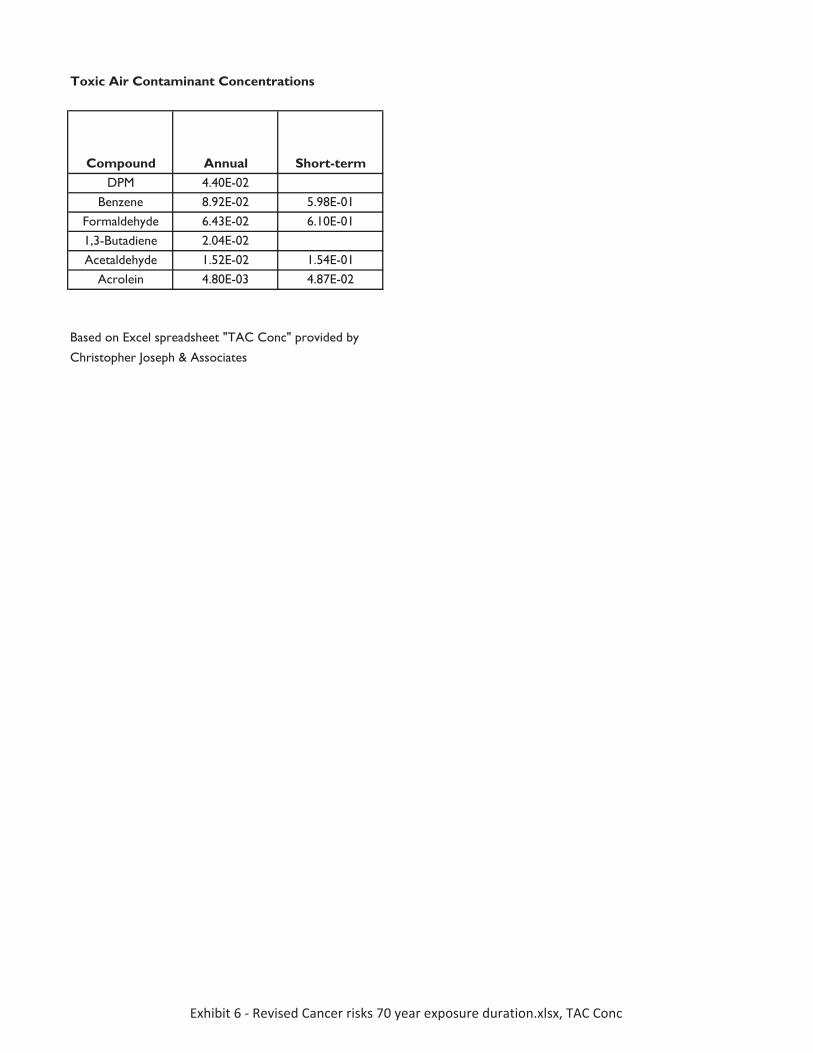
Compound Annual Short-termDPM 4.40E-02
Benzene 8.92E-02 5.98E-01Formaldehyde 6.43E-02 6.10E-011,3-Butadiene 2.04E-02Acetaldehyde 1.52E-02 1.54E-01
Acrolein 4.80E-03 4.87E-02
Toxic Air Contaminant Concentrations
Based on Excel spreadsheet "TAC Conc" provided by
Christopher Joseph & Associates
Exhibit�6���Revised�Cancer�risks�70�year�exposure�duration.xlsx,�TAC�Conc
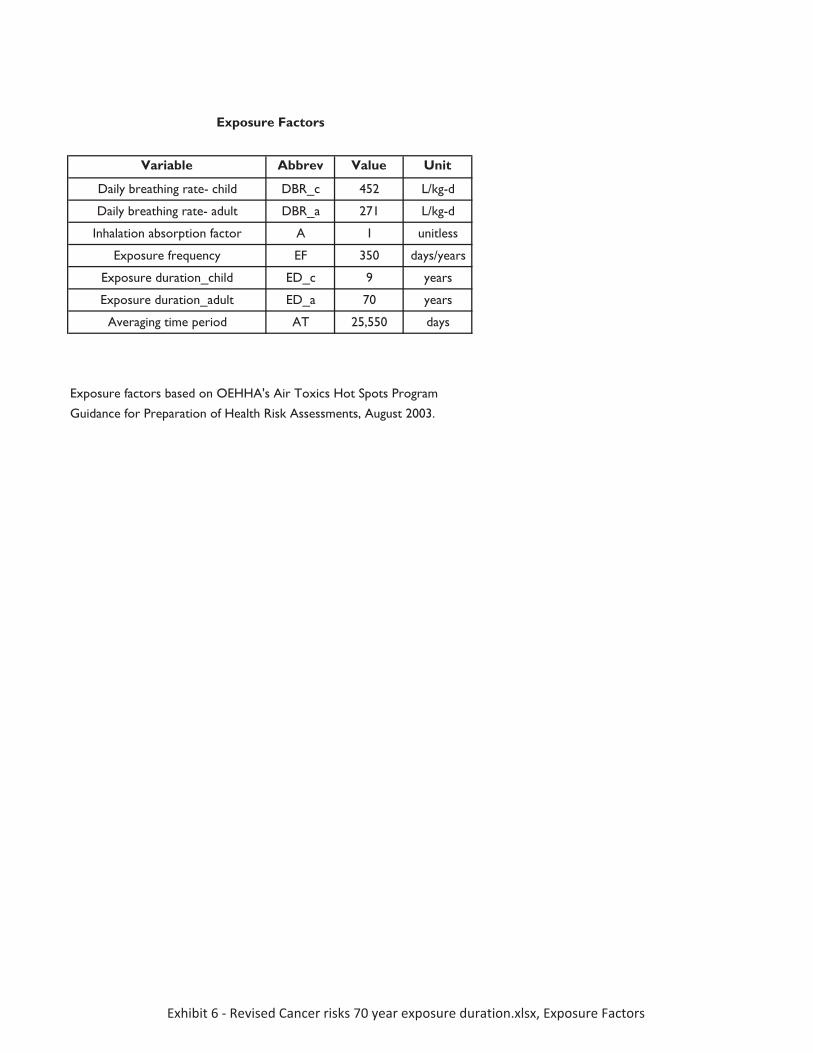
Variable Abbrev Value Unit
Daily breathing rate- child DBR_c 452 L/kg-d
Daily breathing rate- adult DBR_a 271 L/kg-d
Inhalation absorption factor A 1 unitless
Exposure frequency EF 350 days/years
Exposure duration_child ED_c 9 years
Exposure duration_adult ED_a 70 years
Averaging time period AT 25,550 days
Exposure Factors
Exposure factors based on OEHHA's Air Toxics Hot Spots Program
Guidance for Preparation of Health Risk Assessments, August 2003.
Exhibit�6���Revised�Cancer�risks�70�year�exposure�duration.xlsx,�Exposure�Factors
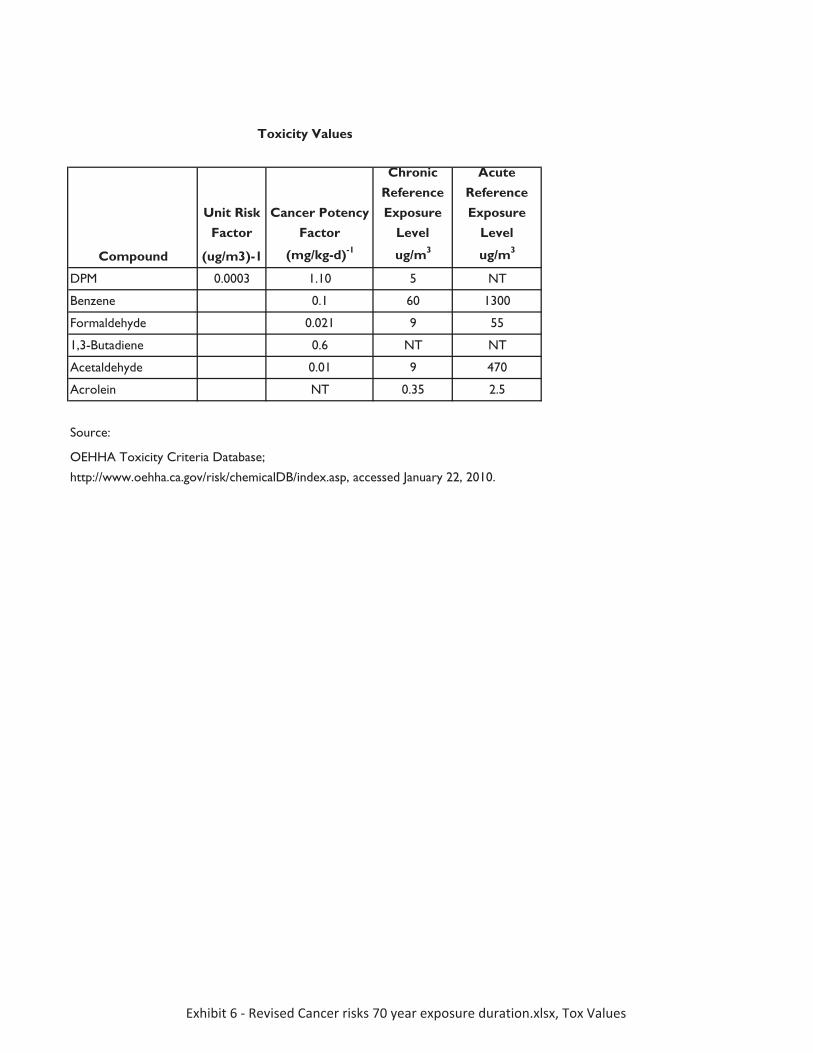
Unit Risk Factor
Cancer Potency Factor
Chronic Reference Exposure
Level
Acute Reference Exposure
Level
Compound (ug/m3)-1 (mg/kg-d)-1 ug/m3 ug/m3
DPM 0.0003 1.10 5 NT
Benzene 0.1 60 1300
Formaldehyde 0.021 9 55
1,3-Butadiene 0.6 NT NT
Acetaldehyde 0.01 9 470
Acrolein NT 0.35 2.5
Source:
Toxicity Values
OEHHA Toxicity Criteria Database;
http://www.oehha.ca.gov/risk/chemicalDB/index.asp, accessed January 22, 2010.
Exhibit�6���Revised�Cancer�risks�70�year�exposure�duration.xlsx,�Tox�Values
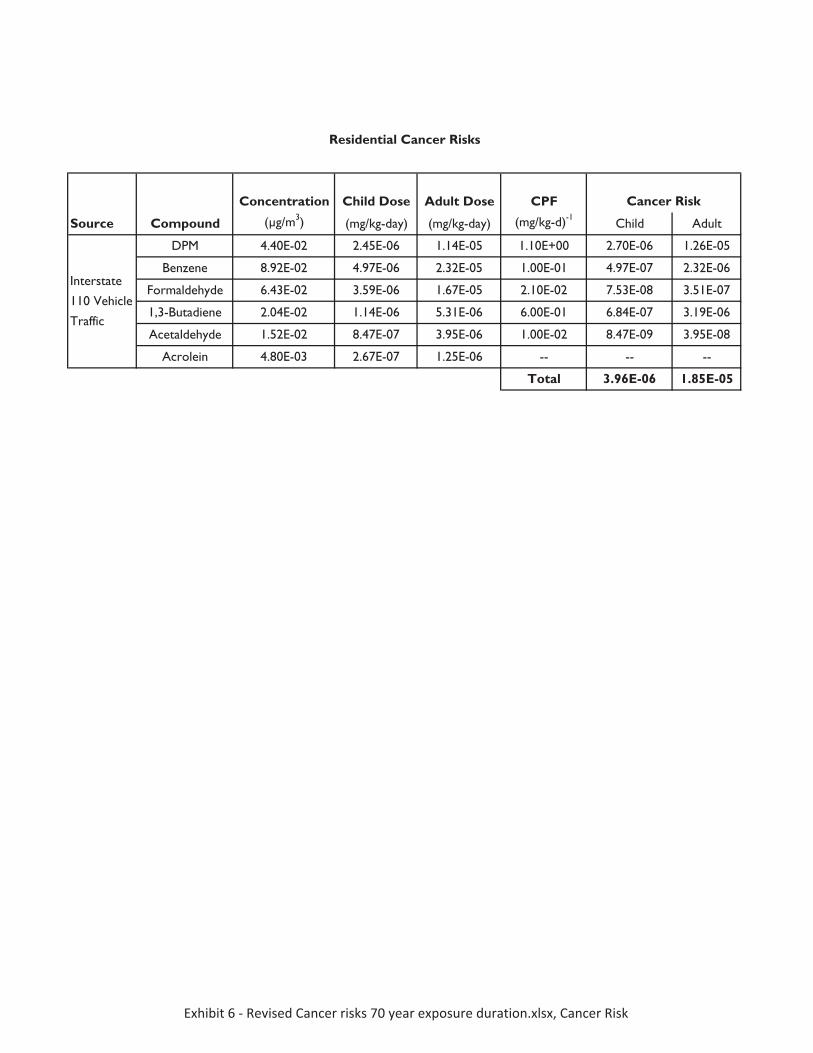
Concentration Child Dose Adult Dose CPF
Source Compound (μg/m3) (mg/kg-day) (mg/kg-day) (mg/kg-d)-1Child Adult
DPM 4.40E-02 2.45E-06 1.14E-05 1.10E+00 2.70E-06 1.26E-05
Benzene 8.92E-02 4.97E-06 2.32E-05 1.00E-01 4.97E-07 2.32E-06
Formaldehyde 6.43E-02 3.59E-06 1.67E-05 2.10E-02 7.53E-08 3.51E-07
1,3-Butadiene 2.04E-02 1.14E-06 5.31E-06 6.00E-01 6.84E-07 3.19E-06
Acetaldehyde 1.52E-02 8.47E-07 3.95E-06 1.00E-02 8.47E-09 3.95E-08
Acrolein 4.80E-03 2.67E-07 1.25E-06 -- -- --
Total 3.96E-06 1.85E-05
Residential Cancer Risks
Interstate
110 Vehicle
Traffic
Cancer Risk
Exhibit�6���Revised�Cancer�risks�70�year�exposure�duration.xlsx,�Cancer�Risk

Exhibit 7: Excerpt from Union of Concerned Scientists, Digging Up Trouble, November 2006
Union of Concerned ScientistsNovember 2006
D O N A N A I R
The Health Risks of Construction Pollution in California
Digging Up Trouble
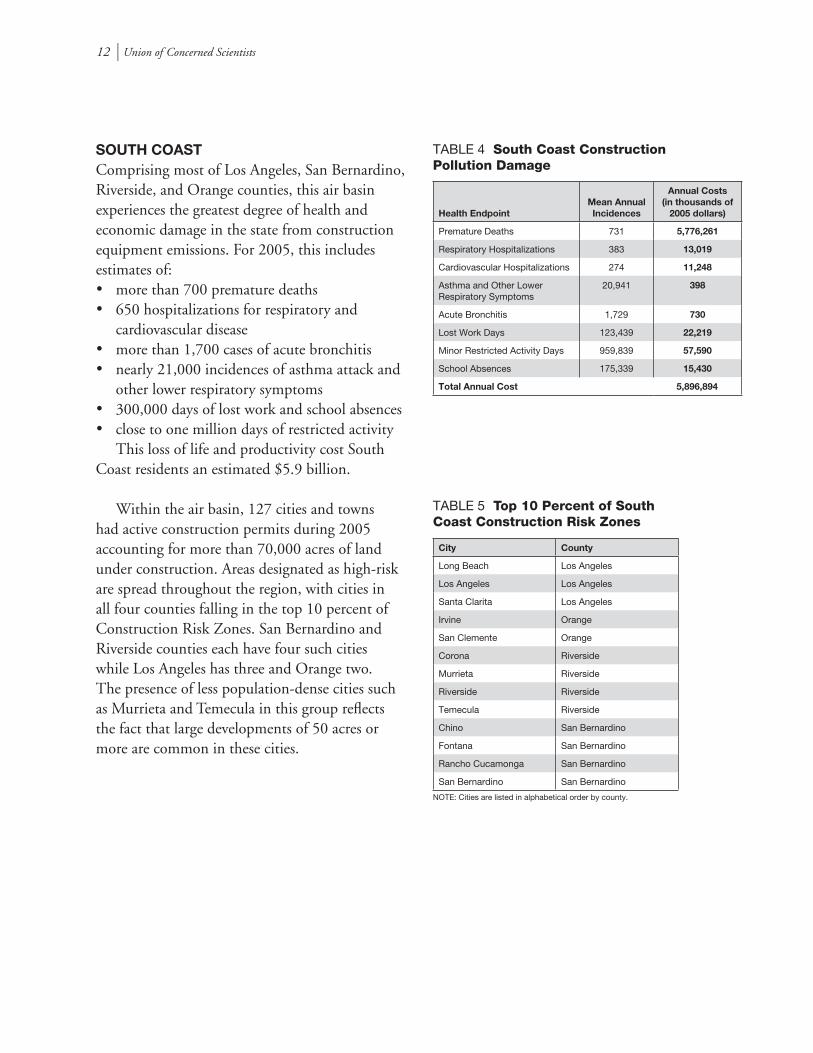
12 l Union of Concerned Scientists
SOUTH COAST Comprising most of Los Angeles, San Bernardino, Riverside, and Orange counties, this air basin experiences the greatest degree of health and economic damage in the state from construction equipment emissions. For 2005, this includes estimates of:• more than 700 premature deaths• 650 hospitalizations for respiratory and
cardiovascular disease • more than 1,700 cases of acute bronchitis • nearly 21,000 incidences of asthma attack and
other lower respiratory symptoms • 300,000 days of lost work and school absences • close to one million days of restricted activity This loss of life and productivity cost South Coast residents an estimated $5.9 billion.
Within the air basin, 127 cities and towns had active construction permits during 2005 accounting for more than 70,000 acres of land under construction. Areas designated as high-risk are spread throughout the region, with cities in all four counties falling in the top 10 percent of Construction Risk Zones. San Bernardino and Riverside counties each have four such cities while Los Angeles has three and Orange two. The presence of less population-dense cities such as Murrieta and Temecula in this group reflects the fact that large developments of 50 acres or more are common in these cities.
Health EndpointMean Annual Incidences
Annual Costs (in thousands of
2005 dollars)
Premature Deaths 731 5,776,261
Respiratory Hospitalizations 383 13,019
Cardiovascular Hospitalizations 274 11,248
Asthma and Other Lower Respiratory Symptoms
20,941 398
Acute Bronchitis 1,729 730
Lost Work Days 123,439 22,219
Minor Restricted Activity Days 959,839 57,590
School Absences 175,339 15,430
Total Annual Cost 5,896,894
TABLE 4 South Coast Construction Pollution Damage
City County
Long Beach Los Angeles
Los Angeles Los Angeles
Santa Clarita Los Angeles
Irvine Orange
San Clemente Orange
Corona Riverside
Murrieta Riverside
Riverside Riverside
Temecula Riverside
Chino San Bernardino
Fontana San Bernardino
Rancho Cucamonga San Bernardino
San Bernardino San Bernardino
TABLE 5 Top 10 Percent of South Coast Construction Risk Zones
NOTE: Cities are listed in alphabetical order by county.
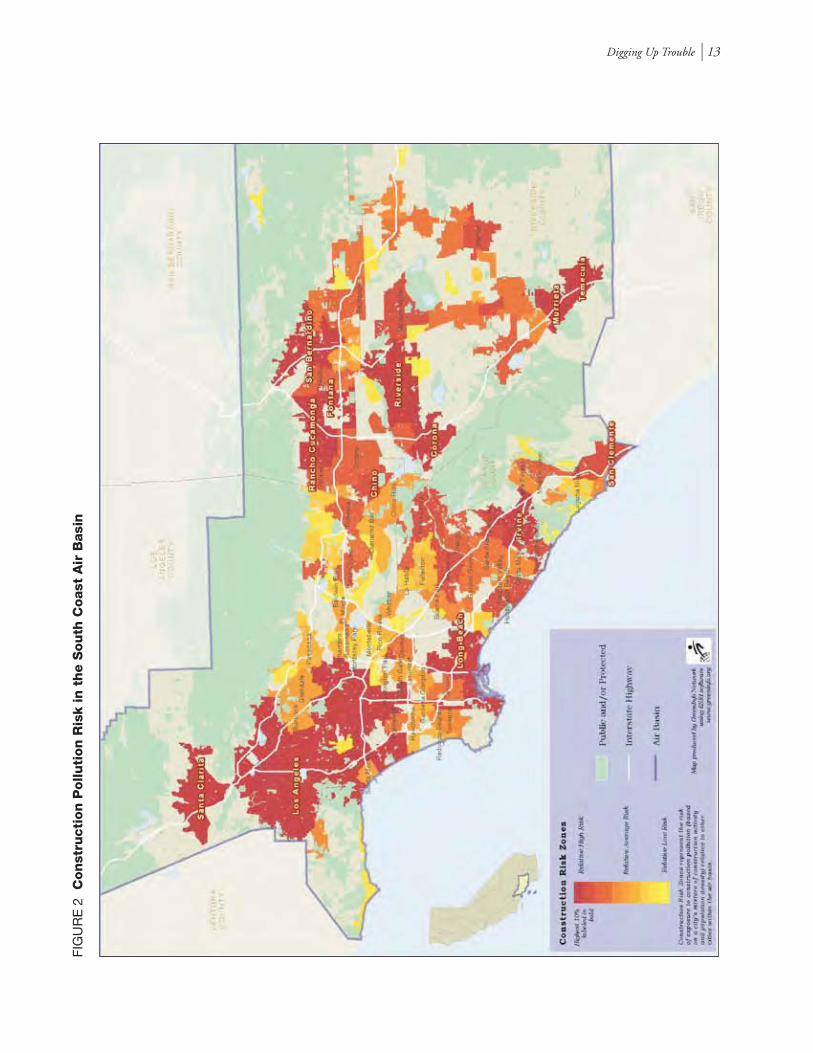
Digging Up Trouble l 13
FIG
UR
E 2
C
on
stru
cti
on
Pollu
tion
Ris
k in t
he S
outh
Coast
Air
Basi
n

Exhibit 8: Los Angeles Times, December 6, 2006
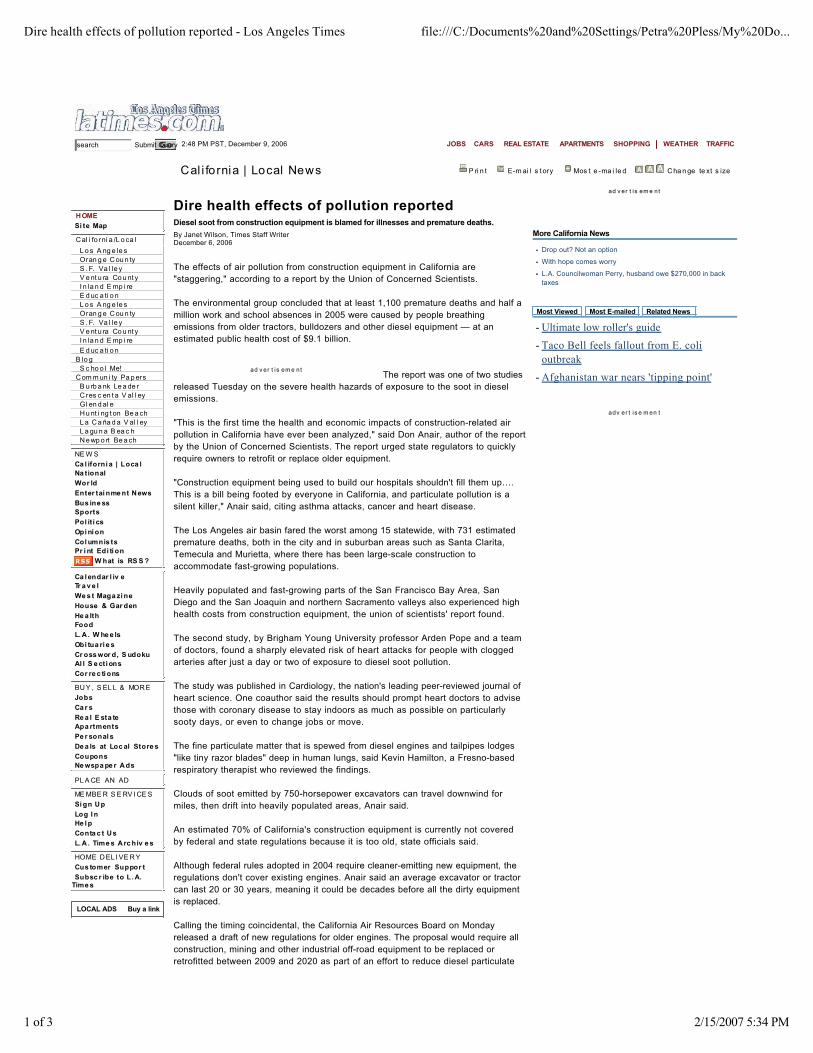
Dire health effects of pollution reported - Los Angeles Times file:///C:/Documents%20and%20Settings/Petra%20Pless/My%20Do...
1 of 3 2/15/2007 5:34 PM
WEATHER TRAFFICJOBS CARS REAL ESTATE APARTMENTS SHOPPING
Buy a link
ad v er t is em e nt
Submit Query 2:48 PM PST, December 9, 2006
L o s A ng e le sOran g e Cou n tyS . F. Va l le yV e nt u ra Co u nt yI n la n d E mp i reE d uc a ti o nL o s A ng e le sOran g e Cou n tyS . F. Va l le yV e nt u ra Co u nt yI n la n d E mp i re
E d uc a ti o nB lo g
S c ho o l Me!Com m un i ty Pa p ers
B u rb a nk Le a de rCres c en t a V al l eyGl en d al eHu nt i ng t on Be a chL a Ca ña d a V al l eyL a gu n a B ea c hNe wp o rt Be a ch
LOCAL ADS
Cal i fornia | Local News P ri n t E-m ai l s t ory Mos t e -ma i le d Cha n ge te xt s ize
Dire health effects of pollution reportedDiesel soot from construction equipment is blamed for illnesses and premature deaths.By Janet Wilson, Times Staff WriterDecember 6, 2006
The effects of air pollution from construction equipment in California are"staggering," according to a report by the Union of Concerned Scientists.
The environmental group concluded that at least 1,100 premature deaths and half amillion work and school absences in 2005 were caused by people breathingemissions from older tractors, bulldozers and other diesel equipment — at anestimated public health cost of $9.1 billion.
The report was one of two studiesreleased Tuesday on the severe health hazards of exposure to the soot in diesel emissions.
"This is the first time the health and economic impacts of construction-related airpollution in California have ever been analyzed," said Don Anair, author of the reportby the Union of Concerned Scientists. The report urged state regulators to quicklyrequire owners to retrofit or replace older equipment.
"Construction equipment being used to build our hospitals shouldn't fill them up….This is a bill being footed by everyone in California, and particulate pollution is asilent killer," Anair said, citing asthma attacks, cancer and heart disease.
The Los Angeles air basin fared the worst among 15 statewide, with 731 estimatedpremature deaths, both in the city and in suburban areas such as Santa Clarita,Temecula and Murietta, where there has been large-scale construction toaccommodate fast-growing populations.
Heavily populated and fast-growing parts of the San Francisco Bay Area, SanDiego and the San Joaquin and northern Sacramento valleys also experienced highhealth costs from construction equipment, the union of scientists' report found.
The second study, by Brigham Young University professor Arden Pope and a teamof doctors, found a sharply elevated risk of heart attacks for people with cloggedarteries after just a day or two of exposure to diesel soot pollution.
The study was published in Cardiology, the nation's leading peer-reviewed journal ofheart science. One coauthor said the results should prompt heart doctors to advisethose with coronary disease to stay indoors as much as possible on particularlysooty days, or even to change jobs or move.
The fine particulate matter that is spewed from diesel engines and tailpipes lodges"like tiny razor blades" deep in human lungs, said Kevin Hamilton, a Fresno-basedrespiratory therapist who reviewed the findings.
Clouds of soot emitted by 750-horsepower excavators can travel downwind formiles, then drift into heavily populated areas, Anair said.
An estimated 70% of California's construction equipment is currently not coveredby federal and state regulations because it is too old, state officials said.
Although federal rules adopted in 2004 require cleaner-emitting new equipment, theregulations don't cover existing engines. Anair said an average excavator or tractorcan last 20 or 30 years, meaning it could be decades before all the dirty equipmentis replaced.
Calling the timing coincidental, the California Air Resources Board on Mondayreleased a draft of new regulations for older engines. The proposal would require allconstruction, mining and other industrial off-road equipment to be replaced orretrofitted between 2009 and 2020 as part of an effort to reduce diesel particulate
ad v er t is em e nt
More California News
- Drop out? Not an option
- With hope comes worry
- L.A. Councilwoman Perry, husband owe $270,000 in back taxes
Most Viewed Most E-mailed Related News
adv er t is e m en t
search
HOMESi te Map
Cal i fo rni a /L o ca l
NE W S
Ca l iforni a | Loca lNa tionalWor ldEnter tai nme nt NewsBus ine ssSportsPol it i csOpi ni onCol umnis tsPr i nt Edi ti on
W hat is RS S ?
Ca l endar l iv eTr a v e lWe s t Maga zi neHouse & Gar denHe a lthFoodL. A . W he e lsObi tua ri e sCr oss wor d, S udokuAl l S e cti onsCor re c ti ons
BUY , S EL L & MORE
JobsCa r sRe a l E sta teApa rtmentsPe r sonal sDe a ls at Loc al Store sCouponsNe wspa pe r Ads
PL A CE AN AD
ME MBE R S E RV I CE S
Si gn UpLog I nHe l pConta c t UsL. A . Time s Arc hiv e s
HOME DEL I VE RY
Cus tomer Suppor tSubsc r ibe to L. A.
Time s
- Ultimate low roller's guide
- Taco Bell feels fallout from E. coli outbreak
- Afghanistan war nears 'tipping point'
Dire health effects of pollution reported - Los Angeles Times file:///C:/Documents%20and%20Settings/Petra%20Pless/My%20Do...
2 of 3 2/15/2007 5:34 PM
emissions by 85% and nitrogen oxide, a key ingredient in smog, by 70%, said ErikWhite, chief of the board's heavy-duty diesel branch. Public workshops on the planwill be held this month, and the board is expected to vote next spring.
White said estimated compliance costs could top $3 billion over 11 years butmaintained that the $60 billion-a-year construction industry "is certainly capable ofabsorbing the impacts."
He added, however, that both cost and a lack of readily available retrofittingdevices — combined with the need to include smog-reduction as well as soot-controldevices — meant cleanup would occur gradually.
John Hakel, vice president of the Associated General Contractors, which representsconstruction equipment fleet owners and general contractors, said late Tuesday thathe had just received the report and could not comment on specifics. But he said theindustry is dedicated to cleaning up equipment. He agreed it would be a costly andlengthy process and said state officials and the Union of Concerned Scientistsreport appeared to underestimate the sheer volume of construction equipment,which he estimated at 250,000 to 300,000 machines . The second study found thatfor every additional 10 micrograms of soot in a cubic meter of air, there was a 4.5%increase in heart attacks.
In areas like Salt Lake City or Greater Los Angeles, which can experience wideswings in air quality based on weather patterns, the risk of heart attack can be 10times higher than normal on a bad air day, said Pope, who has done extensiveresearch on the health effects of fine particles produced by diesel engines.Coauthor Dr. Jeffrey Anderson, a cardiologist whose patients were among morethan 12,000 people with heart disease who participated in the short-term exposurestudy, said he was already changing his advice to patients based on the results,urging them to stay inside on bad air days or, in severe cases, to move to a morefavorable climate.
"By a more favorable climate," Anderson said, "I don't mean Southern California. Imean in terms of air pollution, a less-polluted environment."
*
The construction pollution report can be found online athttp://www.ucsusa.org/clean_vehicles
The draft regulations can be found at
http://arb.ca.gov/msprog/ordiesel/workshops.htm *
(INFOBOX BELOW)
Under construction
A report released Tuesday found serious health damage tied to construction related air pollution from diesel powered equipment.
Health damage from construction pollution in the South Coast Air Basin: (estimated number of cases in 2005)
Premature deaths: 731
Respiratory hospitalizations: 383
Cardiovascular hospitalizations: 274
Asthma and other lower respiratory symptoms: 20,941
Acute bronchitis: 1,729
Lost work days: 123,439
Minor restricted activity days: 959,839
School absences: 175,339
Cities* in South Coast counties in the top 10% for risk

Dire health effects of pollution reported - Los Angeles Times file:///C:/Documents%20and%20Settings/Petra%20Pless/My%20Do...
3 of 3 2/15/2007 5:34 PM
of health damage from pollution caused by construction equipment:
Los Angeles
- Long Beach
- Los Angeles
- Santa Clarita
---
Orange
- Irvine
- San Clemente
---
Riverside
- Corona
- Murrieta
- Riverside
- Temecula
---
San Bernardino
- Chino
- Fontana
- Rancho Cucamonga
- San Bernardino
---
* Listed in alphabetical order by county
Source: Union of Concerned Scientists
MORE NEWS
- Mystery in spy's death veers to Germany- Shuttle readied, may launch tonight | VIDEO- Afghan war nears 'tipping point'
What's the real beauty of "Southern California"? View reader photos at Your Scene.
Submit your photo now >>
Copyright 2006 Los Angeles Times Privacy Policy | Terms of Service | Advertise | Home Delivery | Permissions | Contact
PARTNERS: Hoy | KTLA | Careerbuilder.com for jobs | Cars.com for autos | Apartments.com for rentals | ShopLocal for shopping | FSBO (For Sale By Owner)

Petra Pless, D.Env. 440 Nova Albion Way, #2
San Rafael, CA 94903 (415) 492-2131 phone
(815) 572-8600 fax [email protected]
Dr. Pless is a court-recognized expert with over 10 years of experience in environmental consulting conducting and managing interdisciplinary environmental research projects and preparing and reviewing environmental permits and other documents for U.S. and European stakeholder groups. Her broad-based experience includes air quality and air pollution control; water quality, water supply, and water pollution control; biology; public health and safety; and noise studies; California Environmental Quality Act (“CEQA”), Clean Air Act (“CAA”), and National Environmental Policy Act (“NEPA”) review; industrial ecology and risk assessment; and use of a wide range of environmental software.
EDUCATION
Doctorate in Environmental Science and Engineering (D.Env.), University of California Los Angeles, 2001
Master of Science (equivalent) in Biology, Technical University of Munich, Germany, 1991
PROFESSIONAL HISTORY
Pless Environmental, Inc., Principal, 2008–present
Environmental Consultant, Sole Proprietor, 2006–2008
Leson & Associates (previously Leson Environmental Consulting), Kensington, CA, Environmental Scientist/Project Manager, 1997–2005
University of California Los Angeles, Graduate Research Assistant/Teaching Assistant, 1994–1996
ECON Research and Development, Environmental Scientist, Ingelheim, Germany, 1992–1993
Biocontrol, Environmental Projects Manager, Ingelheim, Germany, 1991–1992
REPRESENTATIVE EXPERIENCE
Air Quality and Pollution Control
Projects include CEQA/NEPA review; attainment and non-attainment new source review (“NSR”), prevention of significant deterioration (“PSD”) and Title V permitting; control technology analyses (BACT, LAER, RACT, BARCT, BART, MACT); technology evaluations and cost-effectiveness analyses; criteria and toxic pollutant emission inventories; emission offsets; ambient and source monitoring; analysis of emissions estimates and ambient air pollutant concentration modeling. Some typical projects include:
— Critically reviewed and prepared technical comments on the air quality, biology, noise, water quality, and public health and safety sections of CEQA/NEPA documents for numerous
Petra Pless, D.Env.
2
commercial, residential, and industrial projects (e.g., power plants, airports, residential developments, retail developments, hospitals, refineries, slaughterhouses, asphalt plants, food processing facilities, printing facilities, quarries, and mines) and provided litigation support in a number of cases filed under CEQA.
— Critically reviewed and prepared technical comments on the air quality and public health sections of the Los Angeles Airport Master Plan (Draft, Supplement, and Final Environmental Impact Statement/Environmental Impact Report) for the City of El Segundo. Provided technical comments on the Draft and Final General Conformity Determination for the preferred alternative submitted to the Federal Aviation Administration.
— For several California refineries, evaluated compliance of fired sources with Bay Area Air Quality Management District Rule 9-10. This required evaluation and review of hundreds of source tests to determine if refinery-wide emission caps and compliance monitoring provisions were being met.
— Critically reviewed and prepared technical comments on Draft Title V permits for several refineries and other industrial facilities in California.
— Evaluated the public health impacts of locating big-box retail developments in densely populated areas in California and Hawaii. Monitored and evaluated impacts of diesel exhaust emissions and noise on surrounding residential communities.
— In conjunction with the permitting of several residential and commercial developments, conducted studies to determine baseline concentrations of diesel exhaust particulate matter using an aethalometer.
— For an Indiana steel mill, evaluated technology to control NOx and CO emissions from fired sources, including electric arc furnaces and reheat furnaces, to establish BACT. This required a comprehensive review of U.S. and European operating experience. The lowest emission levels were being achieved by steel mills using selective catalytic reduction (“SCR”) and selective non-catalytic reduction (“SNCR”) in Sweden and The Netherlands.
— For a California petroleum coke calciner, evaluated technology to control NOx, CO, VOCs, and PM10 emissions from the kiln and pyroscrubbers to establish BACT and LAER. This required a review of state and federal clearinghouses, working with regulatory agencies and pollution control vendors, and obtaining and reviewing permits and emissions data from other similar facilities. The best-controlled facilities were located in the South Coast Air Quality Manage-ment District.
— For a Kentucky coal-fired power plant, identified the lowest NOx levels that had been permitted and demonstrated in practice to establish BACT. Reviewed operating experience of European, Japanese, and U.S. facilities and evaluated continuous emission monitoring data. The lowest NOx levels had been permitted and achieved in Denmark and in the U.S. in Texas and New York.
— In support of efforts to lower the CO BACT level for power plant emissions, evaluated the contribution of CO emissions to tropospheric ozone formation and co-authored report on same.
— Critically reviewed and prepared technical comments on applications for certification (“AFCs”) for numerous natural-gas fired, solar, biomass, and geothermal power plants in California permitted by the California Energy Commission. The comments addressed construction and operational emissions inventories and dispersion modeling, BACT
Petra Pless, D.Env.
3
determinations for combustion turbine generators, fluidized bed combustors, diesel emergency generators, etc.
— Critically reviewed and prepared technical comments on draft PSD permits for several natural gas-fired power plants in California, Indiana, and Oregon. The comments addressed emission inventories, greenhouse gas emissions, BACT, case-by-case MACT, compliance monitoring, cost-effectiveness analyses, and enforceability of permit limits.
— For a California refinery, evaluated technology to control NOx and CO emissions from CO Boilers to establish RACT/BARCT to comply with BAAQMD Rule 9-10. This required a review of BACT/RACT/LAER clearinghouses, working with regulatory agencies across the U.S., and reviewing federal and state regulations and State Implementation Plans (“SIPs”). The lowest levels were required in a South Coast Air Quality Management District rule and in the Texas SIP.
— In support of several federal lawsuits filed under the federal Clean Air Act, prepared cost-effectiveness analyses for SCR and oxidation catalysts for simple cycle gas turbines and evaluated opacity data.
— Provided litigation support for a CEQA lawsuit addressing the pollution control equipment at a proposed biomass cogeneration plant.
— Prepared comments and provided litigation support on several proposed regulations including the Mojave Desert Air Quality Management District Rule 1406 (fugitive dust emission reduction credits for road paving); South Coast Air Quality Management District Rule 1316, San Joaquin Valley Air Pollution Control District Rule 2201, Antelope Valley Air Quality Management District Regulation XIII, and Mojave Desert Air Quality Management District Regulation XIII (implementation of December 2002 amendments to the federal Clean Air Act).
— Critically reviewed draft permits for several ethanol plants in California, Indiana, Ohio, and Illinois and prepared technical comments.
— Reviewed state-wide average emissions, state-of-the-art control devices, and emissions standards for construction equipment and developed recommendations for mitigation measures for numerous large construction projects.
— Researched sustainable building concepts and alternative energy and determined their feasibility for residential and commercial developments, e.g., regional shopping malls and hospitals.
— Provided comprehensive environmental and regulatory services for an industrial laundry chain. Facilitated permit process with the South Coast Air Quality Management District. Developed test protocol for VOC emissions, conducted field tests, and used mass balance methods to estimate emissions. Reduced disposal costs for solvent-containing waste streams by identifying alternative disposal options. Performed health risk screening for air toxics emissions. Provided permitting support. Renegotiated sewer surcharges with wastewater treatment plant. Identified new customers for shop-towel recycling services.
— Designed computer model to predict performance of biological air pollution control (biofilters) as part of a collaborative technology assessment project, co-funded by several major chemical manufacturers. Experience using a wide range of environmental software, including air dispersion models, air emission modeling software, database programs, and geographic information systems (“GIS”).

Petra Pless, D.Env.
4
Water Quality and Pollution Control
Experience in water quality and pollution control, including surface water and ground water quality and supply studies, evaluating water and wastewater treatment technologies, and identifying, evaluating and implementing pollution controls. Some typical projects include:
— Evaluated impacts of on-shore oil drilling activities on large-scale coastal erosion in Nigeria.
— For a 500-MW combined-cycle power plant, prepared a study to evaluate the impact of proposed groundwater pumping on local water quality and supply, including a nearby stream, springs, and a spring-fed waterfall. The study was docketed with the California Energy Commission.
— For a 500-MW combined-cycle power plant, identified and evaluated methods to reduce water use and water quality impacts. These included the use of zero-liquid-discharge systems and alternative cooling technologies, including dry and parallel wet-dry cooling. Prepared cost analyses and evaluated impact of options on water resources. This work led to a settlement in which parallel wet dry cooling and a crystallizer were selected, replacing 100 percent groundwater pumping and wastewater disposal to evaporation ponds.
— For a homeowner’s association, reviewed a California Coastal Commission staff report on the replacement of 12,000 linear feet of wooden bulkhead with PVC sheet pile armor. Researched and evaluated impact of proposed project on lagoon water quality, including sediment resuspension, potential leaching of additives and sealants, and long-term stability. Summarized results in technical report.
Applied Ecology, Industrial Ecology and Risk Assessment
Experience in applied ecology, industrial ecology and risk assessment, including human and ecological risk assessments, life cycle assessment, evaluation and licensing of new chemicals, and fate and transport studies of contaminants. Experienced in botanical, phytoplankton, and intertidal species identification and water chemistry analyses. Some typical projects include:
— Conducted technical, ecological, and economic assessments of product lines from agricultural fiber crops for European equipment manufacturer; co-authored proprietary client reports.
— Developed life cycle assessment methodology for industrial products, including agricultural fiber crops and mineral fibers; analyzed technical feasibility and markets for thermal insulation materials from natural plant fibers and conducted comparative life cycle assessments.
— For the California Coastal Conservancy, San Francisco Estuary Institute, Invasive Spartina Project, evaluated the potential use of a new aquatic pesticide for eradication of non-native, invasive cordgrass (Spartina spp.) species in the San Francisco Estuary with respect to water quality, biological resources, and human health and safety. Assisted staff in preparing an amendment to the Final EIR.
— Evaluated likelihood that organochlorine pesticide concentrations detected at a U.S. naval air station are residuals from past applications of these pesticides consistent with manufacturers’ recommendations. Retained as expert witness in federal court case.
— Prepared human health risk assessments of air pollutant emissions from several industrial and commercial establishments, including power plants, refineries, and commercial laundries.
Petra Pless, D.Env.
5
— Managed and conducted laboratory studies to license pesticides. This work included the evaluation of the adequacy and identification of deficiencies in existing physical/chemical and health effects data sets, initiating and supervising studies to fill data gaps, conducting environmental fate and transport studies, and QA/QC compliance at subcontractor laboratories. Prepared licensing applications and coordinated the registration process with German environmental protection agencies. This work led to regulatory approval of several pesticide applications in less than six months.
— Designed and implemented database on physical/chemical properties, environmental fate, and health impacts of pesticides for a major multi-national pesticide manufacturer.
— Designed and managed experimental toxicological study on potential interference of delta-9-tetrahydrocannabinol in food products with U.S. employee drug testing; co-authored peer-reviewed publication.
— Critically reviewed and prepared technical comments on applications for certification for several natural-gas fired, solar, and geothermal power plants and transmission lines in California permitted by the California Energy Commission. The comments addressed avian collisions and electrocution, construction and operational noise impacts on wildlife, risks from brine ponds, and impacts on endangered species.
— For a 180-MW geothermal power plant, evaluated the impacts of plant construction and operation on the fragile desert ecosystem in the Salton Sea area. This work included baseline noise monitoring and assessing the impact of noise, brine handling and disposal, and air emissions on local biota, public health, and welfare.
— Designed research protocols for a coastal ecological inventory; developed sampling methodologies, coordinated field sampling, determined species abundance and distribution in intertidal zone, and conducted statistical data analyses.
— Designed and conducted limnological study on effects of physical/chemical parameters on phytoplankton succession; performed water chemistry analyses and identified phytoplankton species; co-authored two journal articles on results.
— Organized and conducted surveying and mapping of aquatic plant species in several lakes and rivers in Sweden and Germany as ecological indicators for the health of limnological ecosystems.
PRO BONO ACTIVITIES
Founding member of “SecondAid,” a non-profit organization providing tsunami relief for the recovery of small family businesses in Sri Lanka. (www.secondaid.org.)
PROFESSIONAL AFFILIATIONS
Association of Environmental Professionals
PUBLICATIONS
Available upon request
Slum Housing and the Critical Threat to the Health of L.A. Children and Families
Shame of the City:
April 2007
St. John’s Well Child and Family CenterEsperanza Community Housing CorporationLos Angeles Community Action NetworkStrategic Actions for a Just Economy
ATTACHMENT F


For reference purposes, this report should be cited as: Albert Lowe and Gilda Haas, eds., The Shame of the City: Slum Housing and the Critical Threat to the Health of
L.A. Children and Families, (Los Angeles: Strategic Actions for a Just Economy, April 2007).
1S h a m e o f t h e C i t y : S l u m H o u s i n g a n d t h e C r i t i c a l T h r e a t t o t h e H e a l t h o f L . A . C h i l d r e n a n d F a m i l i e s
Table of ContentsExecutive Summary 3
1. Introduction 7
1.1. Better Neighborhoods, Same Neighbors: A Public Health Approach to
Slum Housing and Neighborhood Stability 7
2. Health Effects of Slum Housing: Understanding the Connection 8
2.1. The View of Two Medical Experts 9
2.2. An In Depth View of the Health / Housing Connection 11
2.2.1. Lead Poisoning 11
2.2.1.1. Lead Poisoning Costs 13
2.2.2. Asthma and Respiratory Disease 14
2.2.2.1. Asthma Treatment Costs 16
2.2.3. Esperanza Case Study: Health & Housing Survey and Environmental Sampling 16
2.2.4. LA CAN Regent Hotel Case Study 16
2.2.5. Downtown Building Case Study: Stress and Depression 19
2.2.6. Staph and Other Skin Infections 19
3. The Scale and Scope of the Slum Housing Problem: Los Angeles Housing
Department Data 20
4. The Cost of Slum Housing 21
4.1 Calculating The Costs of Slum Housing 22
4.2 Three Models for Determining the Cost of Slum Housing 23
4.2.1 Public Process – Smith Hotel Case Study 23
4.2.2 Property Damage and Material Costs 24
4.2.3 Slum Health Costs – Near Downtown LA Case Study 24
Total Costs 25
5. Understanding Slumlords 26
5.1. Defining “Slumlord” 26
5.2. Slum Housing And The Current Historical Moment In Los Angeles 26
5.3. Understanding Slumlord Business Models 29
5.3.1. Flippers 29
5.3.2. Hoarders 30
5.3.3 Incompetents 30
6. Strategies for Change: New Alignment, Policy, and Practice 30
6.1. Solutions Are Available And Achievable In The Near Term 30
Acknowledgements: 34
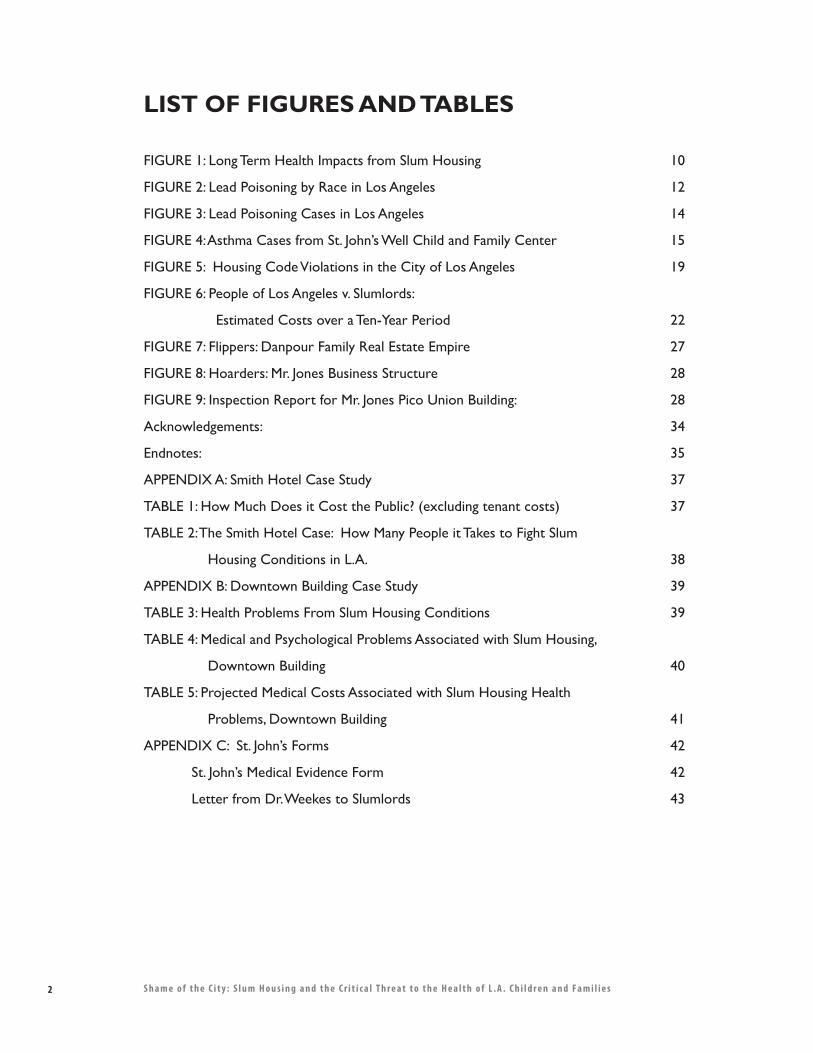
2 S h a m e o f t h e C i t y : S l u m H o u s i n g a n d t h e C r i t i c a l T h r e a t t o t h e H e a l t h o f L . A . C h i l d r e n a n d F a m i l i e s
LIST OF FIGURES AND TABLES
FIGURE 1: Long Term Health Impacts from Slum Housing 10
FIGURE 2: Lead Poisoning by Race in Los Angeles 12
FIGURE 3: Lead Poisoning Cases in Los Angeles 14
FIGURE 4: Asthma Cases from St. John’s Well Child and Family Center 15
FIGURE 5: Housing Code Violations in the City of Los Angeles 19
FIGURE 6: People of Los Angeles v. Slumlords:
Estimated Costs over a Ten-Year Period 22
FIGURE 7: Flippers: Danpour Family Real Estate Empire 27
FIGURE 8: Hoarders: Mr. Jones Business Structure 28
FIGURE 9: Inspection Report for Mr. Jones Pico Union Building: 28
Acknowledgements: 34
Endnotes: 35
APPENDIX A: Smith Hotel Case Study 37
TABLE 1: How Much Does it Cost the Public? (excluding tenant costs) 37
TABLE 2: The Smith Hotel Case: How Many People it Takes to Fight Slum
Housing Conditions in L.A. 38
APPENDIX B: Downtown Building Case Study 39
TABLE 3: Health Problems From Slum Housing Conditions 39
TABLE 4: Medical and Psychological Problems Associated with Slum Housing,
Downtown Building 40
TABLE 5: Projected Medical Costs Associated with Slum Housing Health
Problems, Downtown Building 41
APPENDIX C: St. John’s Forms 42
St. John’s Medical Evidence Form 42
Letter from Dr. Weekes to Slumlords 43
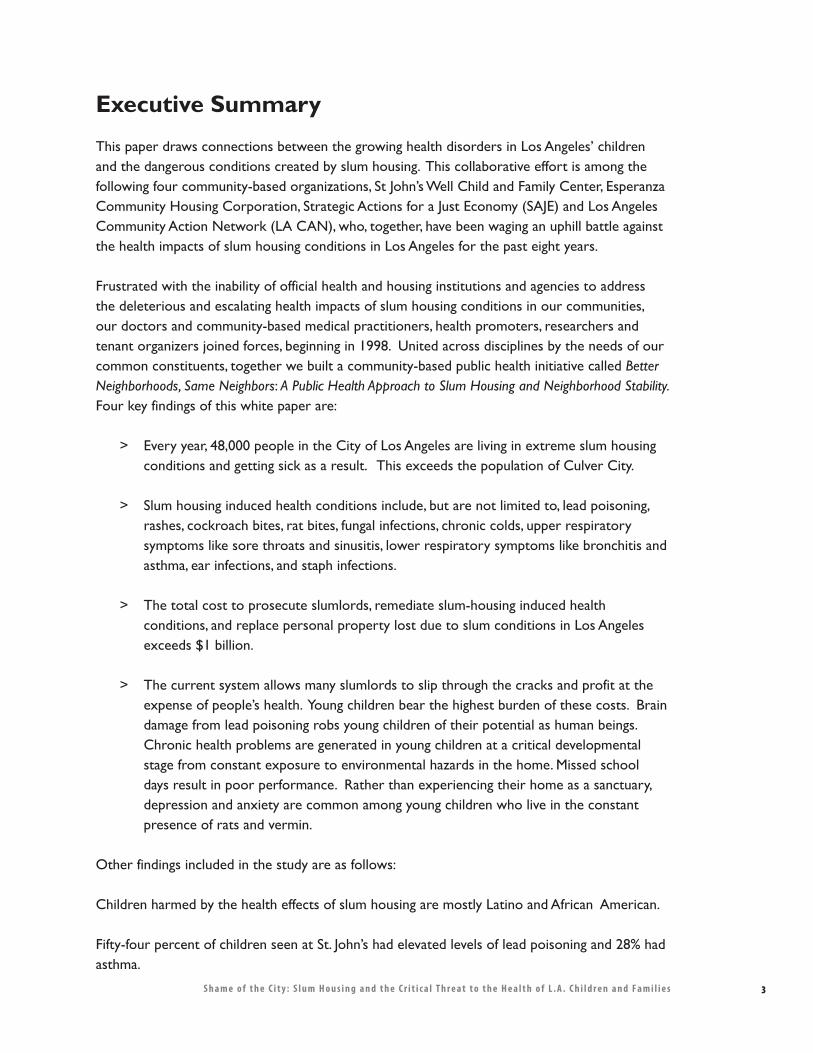
3S h a m e o f t h e C i t y : S l u m H o u s i n g a n d t h e C r i t i c a l T h r e a t t o t h e H e a l t h o f L . A . C h i l d r e n a n d F a m i l i e s
Executive Summary
This paper draws connections between the growing health disorders in Los Angeles’ children and the dangerous conditions created by slum housing. This collaborative effort is among the following four community-based organizations, St John’s Well Child and Family Center, Esperanza Community Housing Corporation, Strategic Actions for a Just Economy (SAJE) and Los Angeles Community Action Network (LA CAN), who, together, have been waging an uphill battle against the health impacts of slum housing conditions in Los Angeles for the past eight years.
Frustrated with the inability of official health and housing institutions and agencies to address the deleterious and escalating health impacts of slum housing conditions in our communities, our doctors and community-based medical practitioners, health promoters, researchers and tenant organizers joined forces, beginning in 1998. United across disciplines by the needs of our common constituents, together we built a community-based public health initiative called Better Neighborhoods, Same Neighbors: A Public Health Approach to Slum Housing and Neighborhood Stability.Four key findings of this white paper are:
> Every year, 48,000 people in the City of Los Angeles are living in extreme slum housing conditions and getting sick as a result. This exceeds the population of Culver City.
> Slum housing induced health conditions include, but are not limited to, lead poisoning, rashes, cockroach bites, rat bites, fungal infections, chronic colds, upper respiratory symptoms like sore throats and sinusitis, lower respiratory symptoms like bronchitis and asthma, ear infections, and staph infections.
> The total cost to prosecute slumlords, remediate slum-housing induced health conditions, and replace personal property lost due to slum conditions in Los Angeles exceeds $1 billion.
> The current system allows many slumlords to slip through the cracks and profit at the expense of people’s health. Young children bear the highest burden of these costs. Brain damage from lead poisoning robs young children of their potential as human beings. Chronic health problems are generated in young children at a critical developmental stage from constant exposure to environmental hazards in the home. Missed school days result in poor performance. Rather than experiencing their home as a sanctuary, depression and anxiety are common among young children who live in the constant presence of rats and vermin.
Other findings included in the study are as follows:
Children harmed by the health effects of slum housing are mostly Latino and African American.
Fifty-four percent of children seen at St. John’s had elevated levels of lead poisoning and 28% had asthma.
4 S h a m e o f t h e C i t y : S l u m H o u s i n g a n d t h e C r i t i c a l T h r e a t t o t h e H e a l t h o f L . A . C h i l d r e n a n d F a m i l i e s
The public costs to prosecute one typical slumlord building took 149 Los Angeles City, Los Angeles County and non-profit staff at a cost of $232,000. Most “professional slumlords” are not prosecuted and continue to profit from human misery. The estimated cost for effective prosecution of all known criminal slumlords in Los Angeles would be between $344 and $462 million.
Los Angeles slum tenants lose as much as $10 million a year in damaged private property, mostly in cost of food which is contaminated by cockroaches and vermin but also from collapsing ceilings, poor plumbing. Cockroaches harboring in warm appliances ruin televisions, DVD players, computers and other electronics.
One case study surveyed building conditions and tenant health conditions and made connections between the two. The average unit cost to remediate the resulting slum induced health problems comes to approximately $41,000 per apartment unit. Using this average cost, the total cost to remediate equivalent slum housing induced health conditions in the entire City of Los Angeles would come to over $400 million.
Slumlords are the criminal landlords who profit by collecting rent and by not maintaining their properties, even when they are repeatedly cited by building inspectors. Although they only constitute 1-2% of the entire landlord population, they nevertheless can have a major impact. For example, one slumlord owns over 200 buildings in Los Angeles which house over 1,700 families and 8,000 people.
Today’s slum housing problems are the result of a collision course between a hot real estate market and a thriving criminal class of property owner. The result, however, is a public health crisis that cannot be ignored because it will ultimately impact everyone in the City. Unlike other environmental health issues such as polluted air and water, the AIDS crisis, or global warming, the solutions to slum housing are attainable locally and in the near term. Although seeds of these solutions are already underway within several public agencies and community organizations, these are still disparate, lack coordination, and have divergent priorities.
With these facts in mind, our call for new alignment, policy and practice includes:
> Improve health and housing: L.A.’s children must be brought back to health through effective and coordinated health interventions by medical professionals, community-based organizations, and slum enforcement agencies. Slum housing conditions and treatment of health symptoms both must be corrected with great urgency.
> Prevent Displacement: It is absolutely imperative that Los Angeles improves housing and health conditions without displacing the people who have been suffering for all these years. There is no benefit to be gained if buildings are repaired, only to result in people’s lives and communities being further destabilized.
5S h a m e o f t h e C i t y : S l u m H o u s i n g a n d t h e C r i t i c a l T h r e a t t o t h e H e a l t h o f L . A . C h i l d r e n a n d F a m i l i e s
> Protect and increase the affordable housing stock in Los Angeles. At the risk of stating the obvious, if there were an adequate supply of affordable housing for all in Los Angeles, low income people would no longer provide a sheltered market for criminal slumlords.
> Reimburse medical providers for environmental health services and treatment.
> Unprecedented enforcement: It is essential that the criminal slumlords – the unrepentant, worst of the worst – finally pay the costs of the damage they inflict on our City. These penalties, in turn, can help pay for the stepped up enforcement program.
> Increase health testing by enforcing and ensuring compliance with California State regulations requiring that all children ages one and two are assessed for risk of lead poisoning, and given a blood lead test when risk is identified. Ensure that medical professionals inform families about environmental risks to their children’s health.
> Align sectors and resources: In light of the current crisis, we must build a stronger alignment of government health and housing agencies and community-based organizations across health and housing sectors at every level of society.
> A vigilant criminal justice strategy: With so many people’s health at stake, we must abandon specious arguments that “tenants cause slum housing,” and that organizers and health promoters who are invited to people’s homes are “trespassers.” We need to look at the health evidence, the business practices, and the resulting slum conditions and dismiss the tired argument that slumlords who own scores of buildings which have been strip-mined of their equity cannot afford to make repairs. Los Angeles can no longer afford its current booming slumlord industry.
It is time to reverse the trend. Slumlords rather than low-income children need to start to pay for the cost of the problem. With shared alignment and renewed commitment, it is currently within our collective means and capacity to eliminate the slum housing threat to public health in Los Angeles and improve the lives and futures of thousands of families and children.

6 S h a m e o f t h e C i t y : S l u m H o u s i n g a n d t h e C r i t i c a l T h r e a t t o t h e H e a l t h o f L . A . C h i l d r e n a n d F a m i l i e s
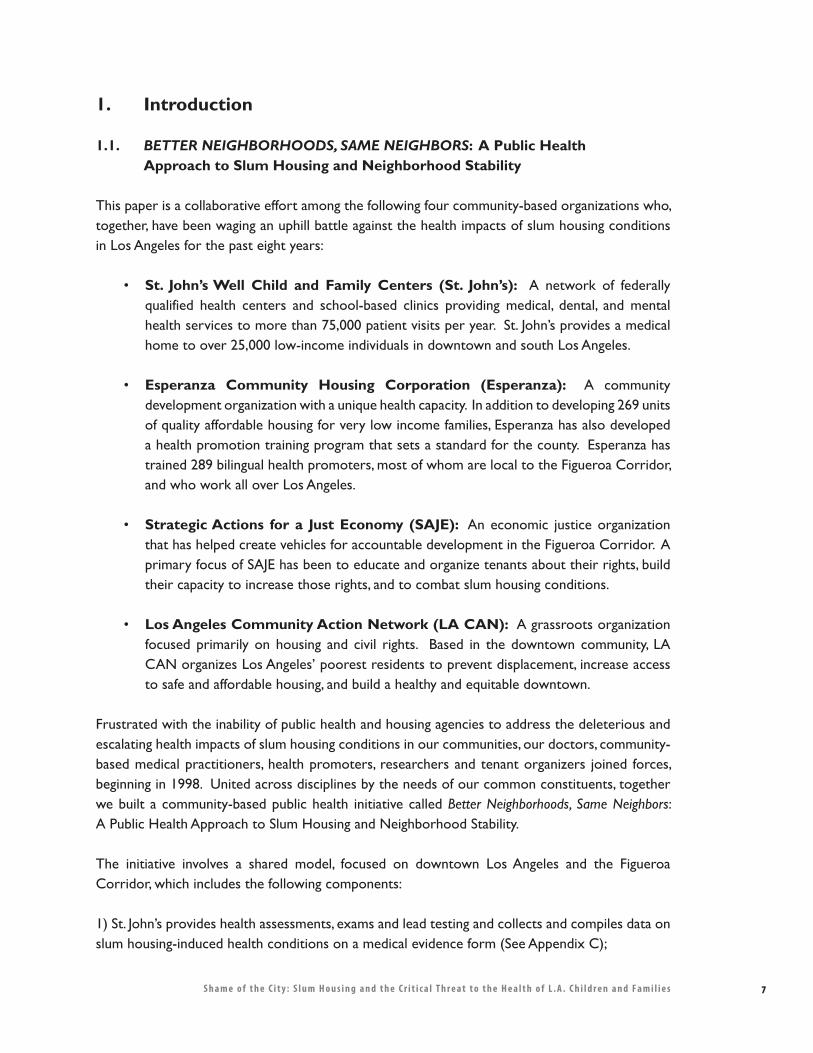
7S h a m e o f t h e C i t y : S l u m H o u s i n g a n d t h e C r i t i c a l T h r e a t t o t h e H e a l t h o f L . A . C h i l d r e n a n d F a m i l i e s
1. Introduction
1.1. BETTER NEIGHBORHOODS, SAME NEIGHBORS: A Public Health Approach to Slum Housing and Neighborhood Stability
This paper is a collaborative effort among the following four community-based organizations who, together, have been waging an uphill battle against the health impacts of slum housing conditions in Los Angeles for the past eight years:
• St. John’s Well Child and Family Centers (St. John’s): A network of federally qualified health centers and school-based clinics providing medical, dental, and mental health services to more than 75,000 patient visits per year. St. John’s provides a medical home to over 25,000 low-income individuals in downtown and south Los Angeles.
• Esperanza Community Housing Corporation (Esperanza): A community development organization with a unique health capacity. In addition to developing 269 units of quality affordable housing for very low income families, Esperanza has also developed a health promotion training program that sets a standard for the county. Esperanza has trained 289 bilingual health promoters, most of whom are local to the Figueroa Corridor, and who work all over Los Angeles.
• Strategic Actions for a Just Economy (SAJE): An economic justice organization that has helped create vehicles for accountable development in the Figueroa Corridor. A primary focus of SAJE has been to educate and organize tenants about their rights, build their capacity to increase those rights, and to combat slum housing conditions.
• Los Angeles Community Action Network (LA CAN): A grassroots organization focused primarily on housing and civil rights. Based in the downtown community, LA CAN organizes Los Angeles’ poorest residents to prevent displacement, increase access to safe and affordable housing, and build a healthy and equitable downtown.
Frustrated with the inability of public health and housing agencies to address the deleterious and escalating health impacts of slum housing conditions in our communities, our doctors, community-based medical practitioners, health promoters, researchers and tenant organizers joined forces, beginning in 1998. United across disciplines by the needs of our common constituents, together we built a community-based public health initiative called Better Neighborhoods, Same Neighbors: A Public Health Approach to Slum Housing and Neighborhood Stability.
The initiative involves a shared model, focused on downtown Los Angeles and the Figueroa Corridor, which includes the following components:
1) St. John’s provides health assessments, exams and lead testing and collects and compiles data on slum housing-induced health conditions on a medical evidence form (See Appendix C);
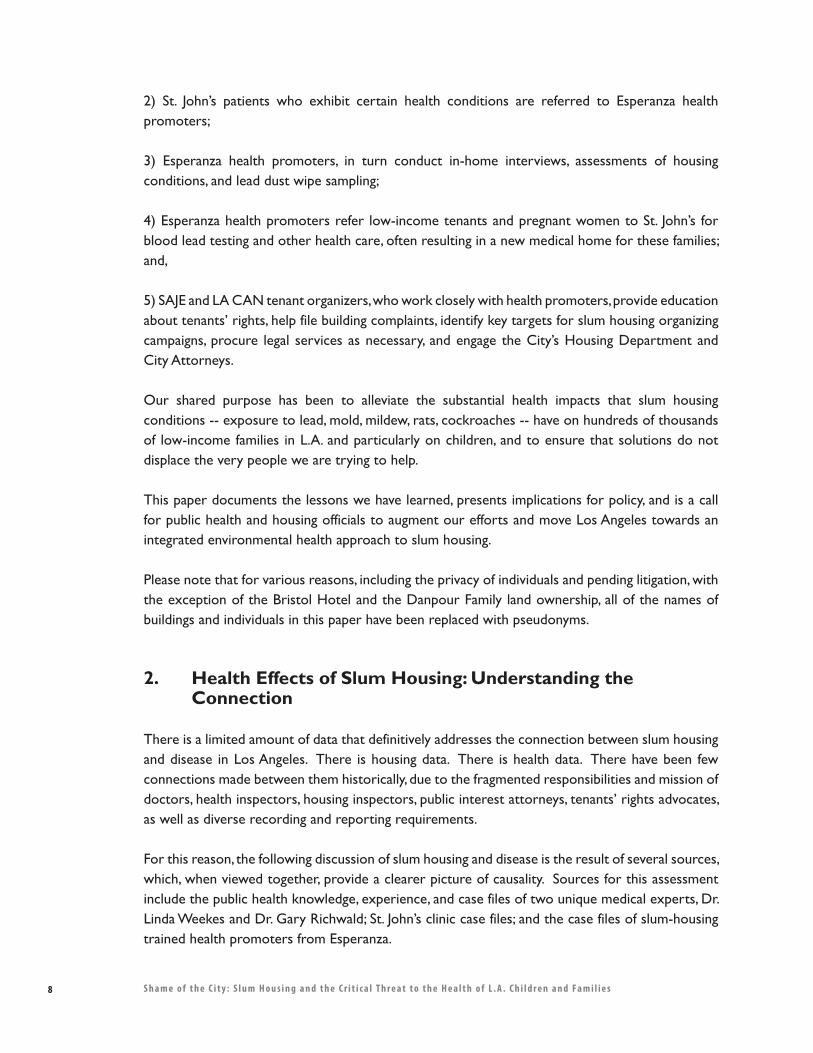
2) St. John’s patients who exhibit certain health conditions are referred to Esperanza health promoters;
3) Esperanza health promoters, in turn conduct in-home interviews, assessments of housing conditions, and lead dust wipe sampling;
4) Esperanza health promoters refer low-income tenants and pregnant women to St. John’s for blood lead testing and other health care, often resulting in a new medical home for these families; and,
5) SAJE and LA CAN tenant organizers, who work closely with health promoters, provide education about tenants’ rights, help file building complaints, identify key targets for slum housing organizing campaigns, procure legal services as necessary, and engage the City’s Housing Department and City Attorneys.
Our shared purpose has been to alleviate the substantial health impacts that slum housing conditions -- exposure to lead, mold, mildew, rats, cockroaches -- have on hundreds of thousands of low-income families in L.A. and particularly on children, and to ensure that solutions do not displace the very people we are trying to help. This paper documents the lessons we have learned, presents implications for policy, and is a call for public health and housing officials to augment our efforts and move Los Angeles towards an integrated environmental health approach to slum housing.
Please note that for various reasons, including the privacy of individuals and pending litigation, with the exception of the Bristol Hotel and the Danpour Family land ownership, all of the names of buildings and individuals in this paper have been replaced with pseudonyms.
2. Health Effects of Slum Housing: Understanding the Connection
There is a limited amount of data that definitively addresses the connection between slum housing and disease in Los Angeles. There is housing data. There is health data. There have been few connections made between them historically, due to the fragmented responsibilities and mission of doctors, health inspectors, housing inspectors, public interest attorneys, tenants’ rights advocates, as well as diverse recording and reporting requirements.
For this reason, the following discussion of slum housing and disease is the result of several sources, which, when viewed together, provide a clearer picture of causality. Sources for this assessment include the public health knowledge, experience, and case files of two unique medical experts, Dr. Linda Weekes and Dr. Gary Richwald; St. John’s clinic case files; and the case files of slum-housing trained health promoters from Esperanza.
8 S h a m e o f t h e C i t y : S l u m H o u s i n g a n d t h e C r i t i c a l T h r e a t t o t h e H e a l t h o f L . A . C h i l d r e n a n d F a m i l i e s
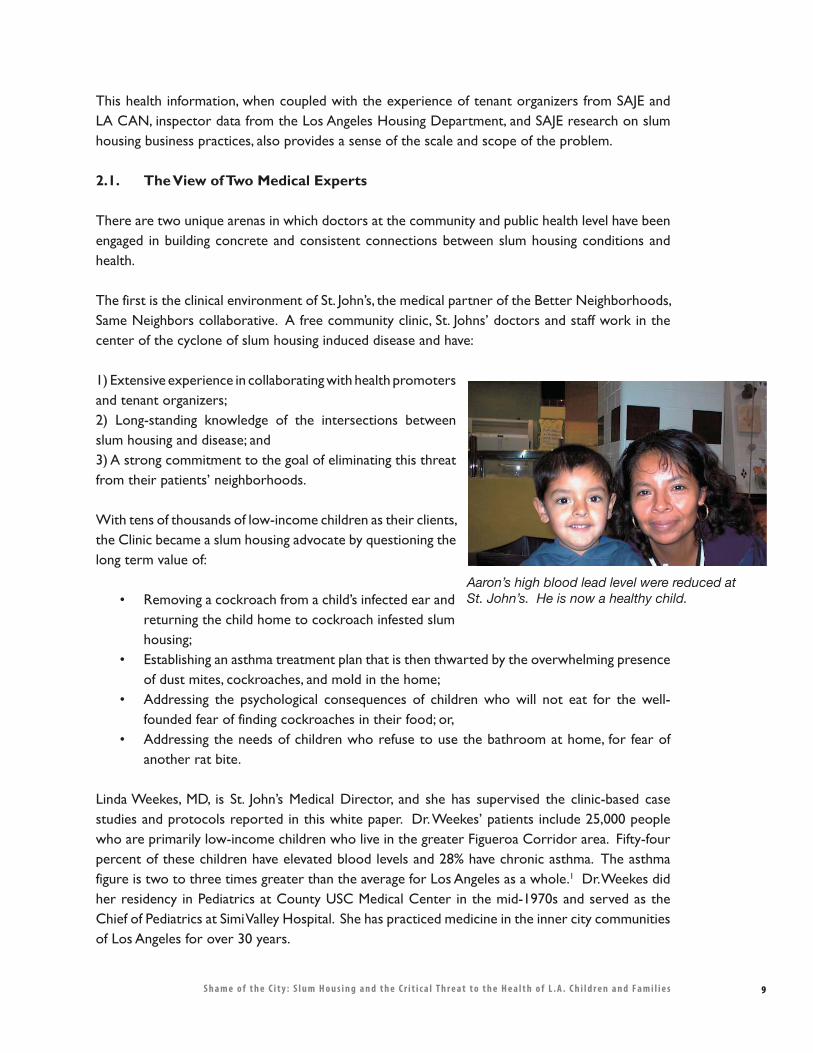
This health information, when coupled with the experience of tenant organizers from SAJE and LA CAN, inspector data from the Los Angeles Housing Department, and SAJE research on slum housing business practices, also provides a sense of the scale and scope of the problem.
2.1. The View of Two Medical Experts
There are two unique arenas in which doctors at the community and public health level have been engaged in building concrete and consistent connections between slum housing conditions and health.
The first is the clinical environment of St. John’s, the medical partner of the Better Neighborhoods, Same Neighbors collaborative. A free community clinic, St. Johns’ doctors and staff work in the center of the cyclone of slum housing induced disease and have:
1) Extensive experience in collaborating with health promoters and tenant organizers; 2) Long-standing knowledge of the intersections between slum housing and disease; and 3) A strong commitment to the goal of eliminating this threat from their patients’ neighborhoods.
With tens of thousands of low-income children as their clients, the Clinic became a slum housing advocate by questioning the long term value of:
• Removing a cockroach from a child’s infected ear and returning the child home to cockroach infested slum housing;
• Establishing an asthma treatment plan that is then thwarted by the overwhelming presence of dust mites, cockroaches, and mold in the home;
• Addressing the psychological consequences of children who will not eat for the well-founded fear of finding cockroaches in their food; or,
• Addressing the needs of children who refuse to use the bathroom at home, for fear of another rat bite.
Linda Weekes, MD, is St. John’s Medical Director, and she has supervised the clinic-based case studies and protocols reported in this white paper. Dr. Weekes’ patients include 25,000 people who are primarily low-income children who live in the greater Figueroa Corridor area. Fifty-four percent of these children have elevated blood levels and 28% have chronic asthma. The asthma figure is two to three times greater than the average for Los Angeles as a whole.1 Dr. Weekes did her residency in Pediatrics at County USC Medical Center in the mid-1970s and served as the Chief of Pediatrics at Simi Valley Hospital. She has practiced medicine in the inner city communities of Los Angeles for over 30 years.
Aaron’s high blood lead level were reduced at St. John’s. He is now a healthy child.
9S h a m e o f t h e C i t y : S l u m H o u s i n g a n d t h e C r i t i c a l T h r e a t t o t h e H e a l t h o f L . A . C h i l d r e n a n d F a m i l i e s
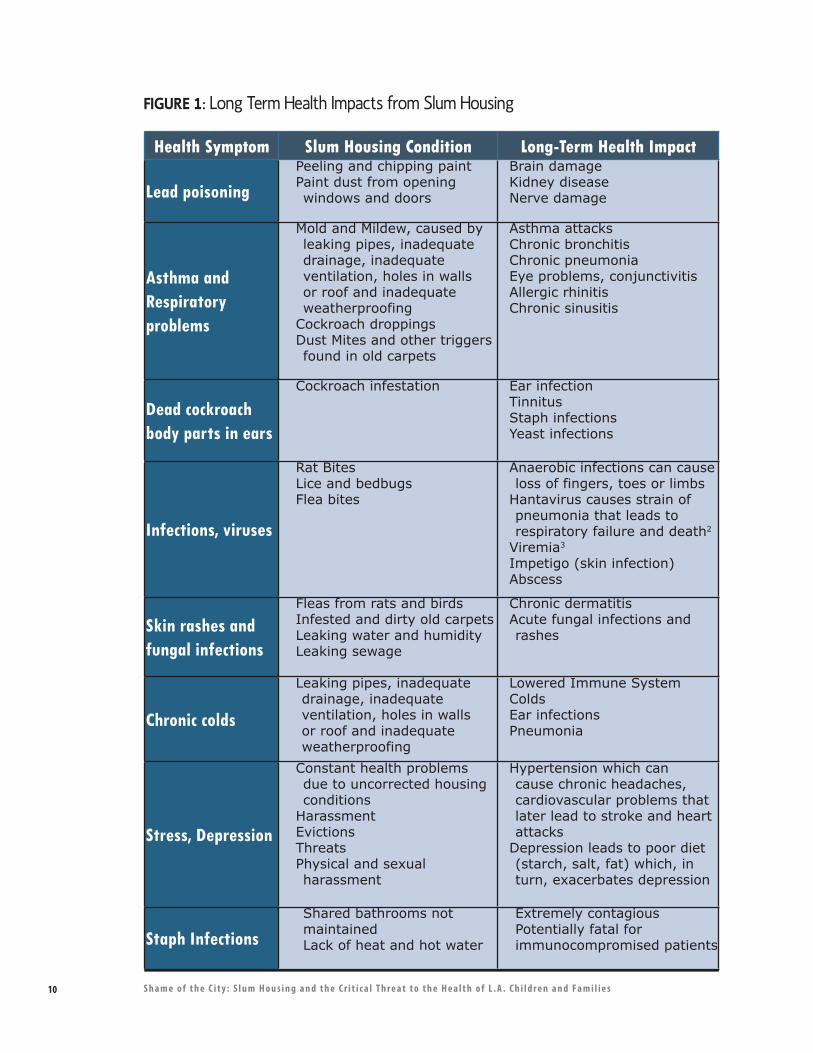
10 S h a m e o f t h e C i t y : S l u m H o u s i n g a n d t h e C r i t i c a l T h r e a t t o t h e H e a l t h o f L . A . C h i l d r e n a n d F a m i l i e s
Health Symptom Slum Housing Condition Long-Term Health Impact
Lead poisoningPeeling and chipping paintPaint dust from opening windows and doors
Brain damageKidney diseaseNerve damage
Asthma and Respiratory problems
Mold and Mildew, caused by leaking pipes, inadequate drainage, inadequate ventilation, holes in walls or roof and inadequate weatherproofing
Cockroach droppingsDust Mites and other triggers found in old carpets
Asthma attacksChronic bronchitisChronic pneumoniaEye problems, conjunctivitisAllergic rhinitisChronic sinusitis
Dead cockroach body parts in ears
Cockroach infestation Ear infectionTinnitusStaph infectionsYeast infections
Infections, viruses
Rat BitesLice and bedbugsFlea bites
Anaerobic infections can cause loss of fingers, toes or limbs
Hantavirus causes strain of pneumonia that leads to respiratory failure and death2
Viremia3
Impetigo (skin infection)Abscess
Skin rashes and fungal infections
Fleas from rats and birdsInfested and dirty old carpetsLeaking water and humidityLeaking sewage
Chronic dermatitisAcute fungal infections and rashes
Chronic colds
Leaking pipes, inadequate drainage, inadequate ventilation, holes in walls or roof and inadequate weatherproofing
Lowered Immune SystemColdsEar infectionsPneumonia
Stress, Depression
Constant health problems due to uncorrected housing conditions
HarassmentEvictionsThreatsPhysical and sexual harassment
Hypertension which can cause chronic headaches, cardiovascular problems that later lead to stroke and heart attacks
Depression leads to poor diet (starch, salt, fat) which, in turn, exacerbates depression
Staph InfectionsShared bathrooms not maintainedLack of heat and hot water
Extremely contagious Potentially fatal for immunocompromised patients
FIGURE 1: Long Term Health Impacts from Slum Housing
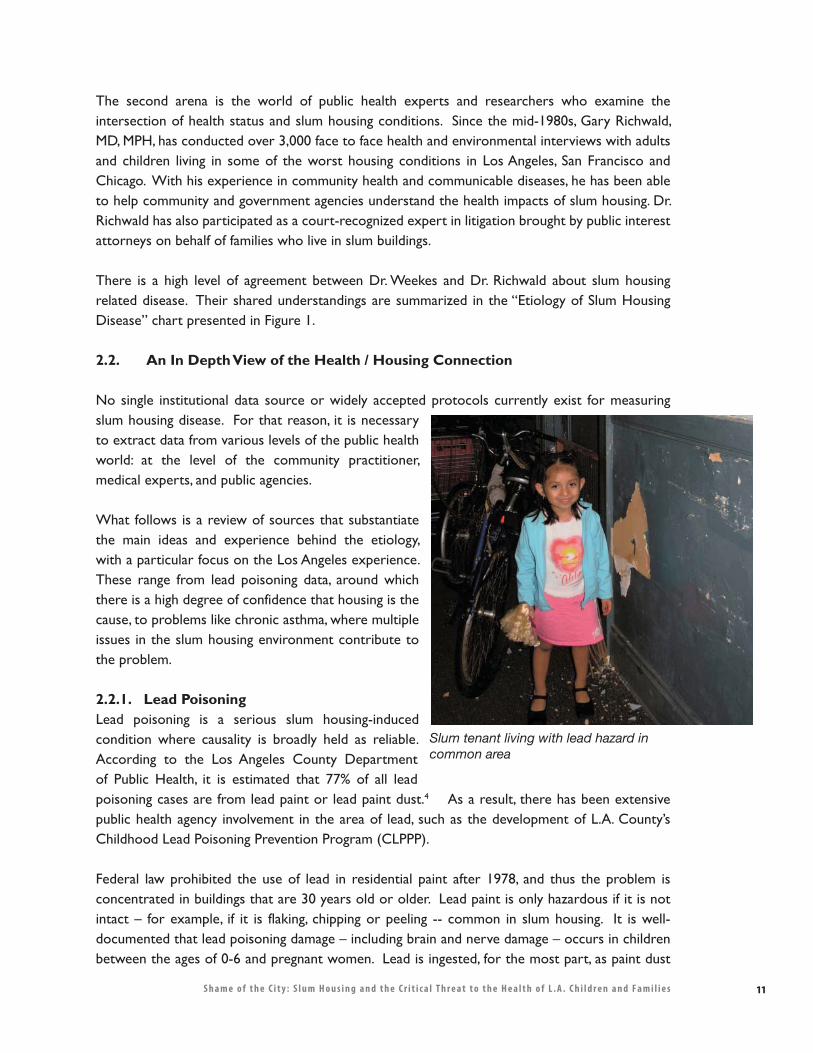
11S h a m e o f t h e C i t y : S l u m H o u s i n g a n d t h e C r i t i c a l T h r e a t t o t h e H e a l t h o f L . A . C h i l d r e n a n d F a m i l i e s
The second arena is the world of public health experts and researchers who examine the intersection of health status and slum housing conditions. Since the mid-1980s, Gary Richwald, MD, MPH, has conducted over 3,000 face to face health and environmental interviews with adults and children living in some of the worst housing conditions in Los Angeles, San Francisco and Chicago. With his experience in community health and communicable diseases, he has been able to help community and government agencies understand the health impacts of slum housing. Dr. Richwald has also participated as a court-recognized expert in litigation brought by public interest attorneys on behalf of families who live in slum buildings.
There is a high level of agreement between Dr. Weekes and Dr. Richwald about slum housing related disease. Their shared understandings are summarized in the “Etiology of Slum Housing Disease” chart presented in Figure 1.
2.2. An In Depth View of the Health / Housing Connection
No single institutional data source or widely accepted protocols currently exist for measuring slum housing disease. For that reason, it is necessary to extract data from various levels of the public health world: at the level of the community practitioner, medical experts, and public agencies.
What follows is a review of sources that substantiate the main ideas and experience behind the etiology, with a particular focus on the Los Angeles experience. These range from lead poisoning data, around which there is a high degree of confidence that housing is the cause, to problems like chronic asthma, where multiple issues in the slum housing environment contribute to the problem.
2.2.1. Lead PoisoningLead poisoning is a serious slum housing-induced condition where causality is broadly held as reliable. According to the Los Angeles County Department of Public Health, it is estimated that 77% of all lead poisoning cases are from lead paint or lead paint dust.4 As a result, there has been extensive public health agency involvement in the area of lead, such as the development of L.A. County’s Childhood Lead Poisoning Prevention Program (CLPPP).
Federal law prohibited the use of lead in residential paint after 1978, and thus the problem is concentrated in buildings that are 30 years old or older. Lead paint is only hazardous if it is not intact – for example, if it is flaking, chipping or peeling -- common in slum housing. It is well-documented that lead poisoning damage – including brain and nerve damage – occurs in children between the ages of 0-6 and pregnant women. Lead is ingested, for the most part, as paint dust
Slum tenant living with lead hazard in common area
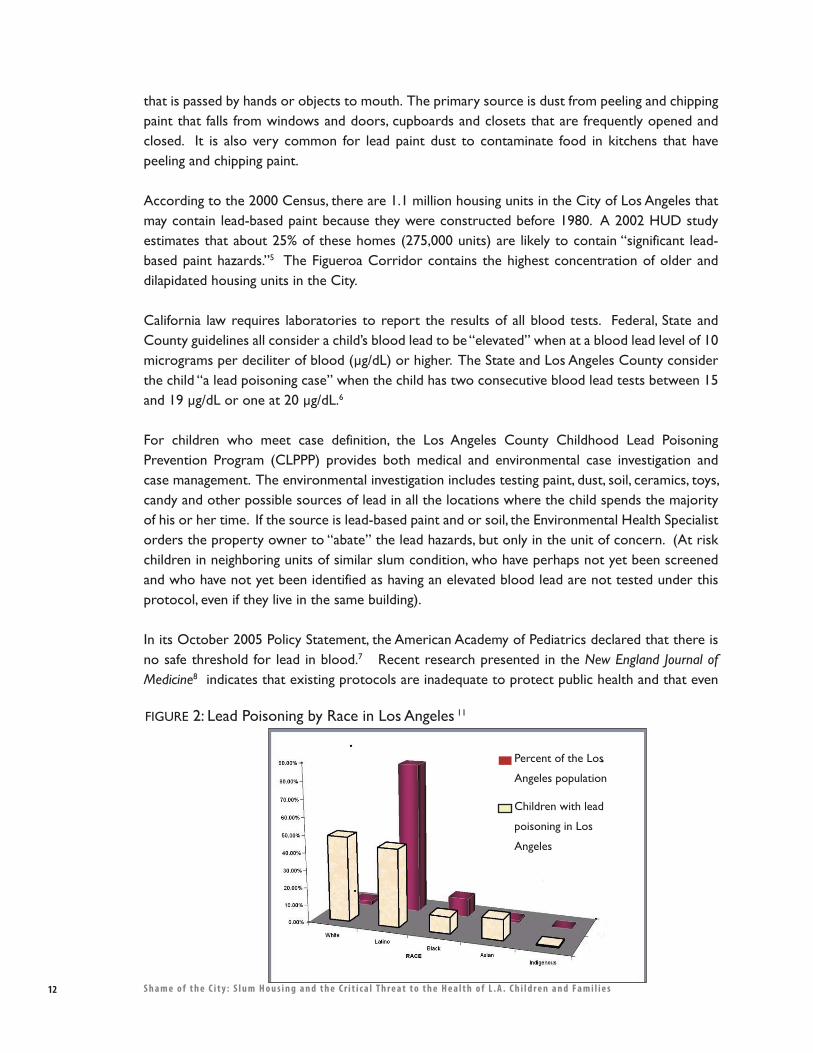
that is passed by hands or objects to mouth. The primary source is dust from peeling and chipping paint that falls from windows and doors, cupboards and closets that are frequently opened and closed. It is also very common for lead paint dust to contaminate food in kitchens that have peeling and chipping paint.
According to the 2000 Census, there are 1.1 million housing units in the City of Los Angeles that may contain lead-based paint because they were constructed before 1980. A 2002 HUD study estimates that about 25% of these homes (275,000 units) are likely to contain “significant lead-based paint hazards.”5 The Figueroa Corridor contains the highest concentration of older and dilapidated housing units in the City.
California law requires laboratories to report the results of all blood tests. Federal, State and County guidelines all consider a child’s blood lead to be “elevated” when at a blood lead level of 10 micrograms per deciliter of blood (�g/dL) or higher. The State and Los Angeles County consider the child “a lead poisoning case” when the child has two consecutive blood lead tests between 15 and 19 �g/dL or one at 20 �g/dL.6
For children who meet case definition, the Los Angeles County Childhood Lead Poisoning Prevention Program (CLPPP) provides both medical and environmental case investigation and case management. The environmental investigation includes testing paint, dust, soil, ceramics, toys, candy and other possible sources of lead in all the locations where the child spends the majority of his or her time. If the source is lead-based paint and or soil, the Environmental Health Specialist orders the property owner to “abate” the lead hazards, but only in the unit of concern. (At risk children in neighboring units of similar slum condition, who have perhaps not yet been screened and who have not yet been identified as having an elevated blood lead are not tested under this protocol, even if they live in the same building).
In its October 2005 Policy Statement, the American Academy of Pediatrics declared that there is no safe threshold for lead in blood.7 Recent research presented in the New England Journal of Medicine8 indicates that existing protocols are inadequate to protect public health and that even
FIGURE 2: Lead Poisoning by Race in Los Angeles 11
Percent of the Los
Angeles population
Children with lead
poisoning in Los
Angeles
12 S h a m e o f t h e C i t y : S l u m H o u s i n g a n d t h e C r i t i c a l T h r e a t t o t h e H e a l t h o f L . A . C h i l d r e n a n d F a m i l i e s
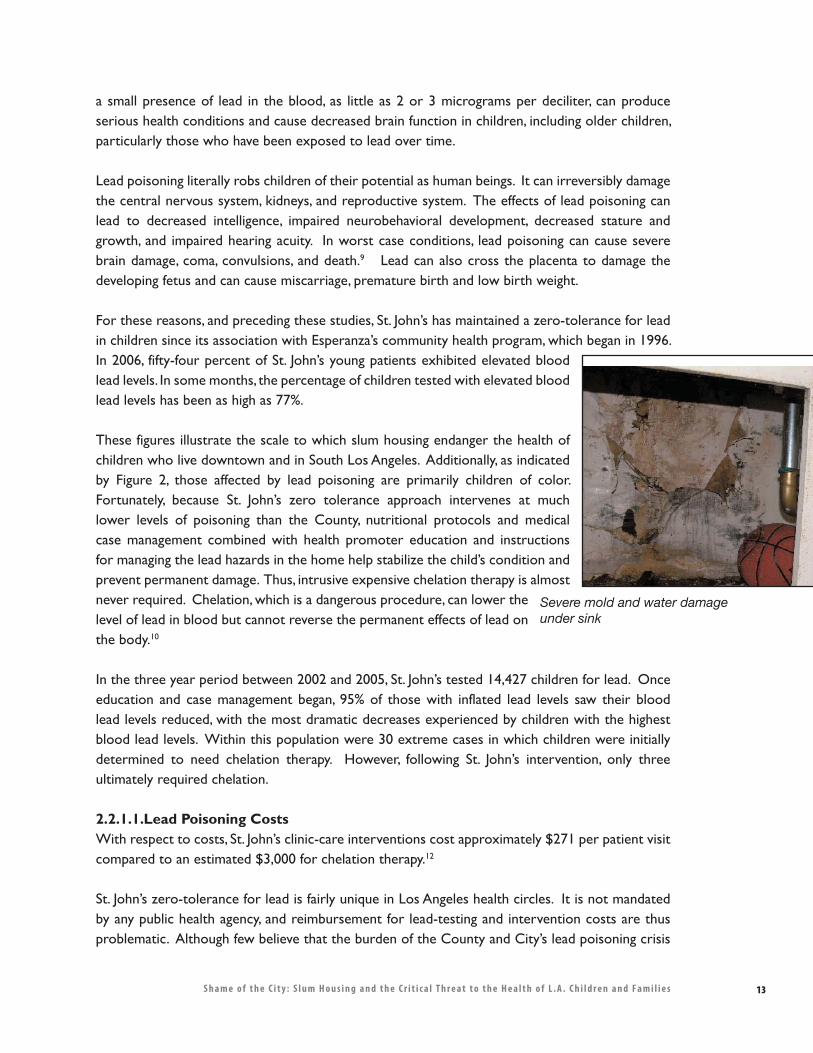
a small presence of lead in the blood, as little as 2 or 3 micrograms per deciliter, can produce serious health conditions and cause decreased brain function in children, including older children, particularly those who have been exposed to lead over time.
Lead poisoning literally robs children of their potential as human beings. It can irreversibly damage the central nervous system, kidneys, and reproductive system. The effects of lead poisoning can lead to decreased intelligence, impaired neurobehavioral development, decreased stature and growth, and impaired hearing acuity. In worst case conditions, lead poisoning can cause severe brain damage, coma, convulsions, and death.9 Lead can also cross the placenta to damage the developing fetus and can cause miscarriage, premature birth and low birth weight.
For these reasons, and preceding these studies, St. John’s has maintained a zero-tolerance for lead in children since its association with Esperanza’s community health program, which began in 1996. In 2006, fifty-four percent of St. John’s young patients exhibited elevated blood lead levels. In some months, the percentage of children tested with elevated blood lead levels has been as high as 77%.
These figures illustrate the scale to which slum housing endanger the health of children who live downtown and in South Los Angeles. Additionally, as indicated by Figure 2, those affected by lead poisoning are primarily children of color. Fortunately, because St. John’s zero tolerance approach intervenes at much lower levels of poisoning than the County, nutritional protocols and medical case management combined with health promoter education and instructions for managing the lead hazards in the home help stabilize the child’s condition and prevent permanent damage. Thus, intrusive expensive chelation therapy is almost never required. Chelation, which is a dangerous procedure, can lower the level of lead in blood but cannot reverse the permanent effects of lead on the body.10
In the three year period between 2002 and 2005, St. John’s tested 14,427 children for lead. Once education and case management began, 95% of those with inflated lead levels saw their blood lead levels reduced, with the most dramatic decreases experienced by children with the highest blood lead levels. Within this population were 30 extreme cases in which children were initially determined to need chelation therapy. However, following St. John’s intervention, only three ultimately required chelation.
2.2.1.1. Lead Poisoning CostsWith respect to costs, St. John’s clinic-care interventions cost approximately $271 per patient visit compared to an estimated $3,000 for chelation therapy.12
St. John’s zero-tolerance for lead is fairly unique in Los Angeles health circles. It is not mandated by any public health agency, and reimbursement for lead-testing and intervention costs are thus problematic. Although few believe that the burden of the County and City’s lead poisoning crisis
Severe mold and water damage under sink
13S h a m e o f t h e C i t y : S l u m H o u s i n g a n d t h e C r i t i c a l T h r e a t t o t h e H e a l t h o f L . A . C h i l d r e n a n d F a m i l i e s
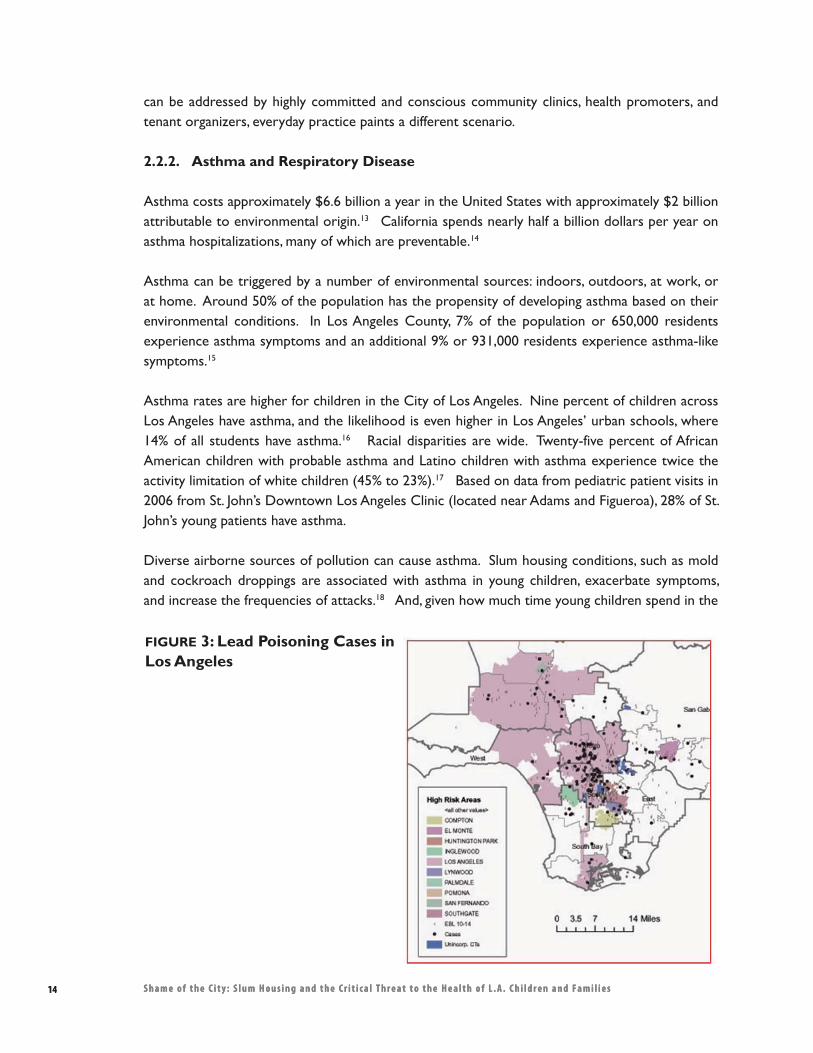
14 S h a m e o f t h e C i t y : S l u m H o u s i n g a n d t h e C r i t i c a l T h r e a t t o t h e H e a l t h o f L . A . C h i l d r e n a n d F a m i l i e s
can be addressed by highly committed and conscious community clinics, health promoters, and tenant organizers, everyday practice paints a different scenario.
2.2.2. Asthma and Respiratory Disease
Asthma costs approximately $6.6 billion a year in the United States with approximately $2 billion attributable to environmental origin.13 California spends nearly half a billion dollars per year on asthma hospitalizations, many of which are preventable.14
Asthma can be triggered by a number of environmental sources: indoors, outdoors, at work, or at home. Around 50% of the population has the propensity of developing asthma based on their environmental conditions. In Los Angeles County, 7% of the population or 650,000 residents experience asthma symptoms and an additional 9% or 931,000 residents experience asthma-like symptoms.15
Asthma rates are higher for children in the City of Los Angeles. Nine percent of children across Los Angeles have asthma, and the likelihood is even higher in Los Angeles’ urban schools, where 14% of all students have asthma.16 Racial disparities are wide. Twenty-five percent of African American children with probable asthma and Latino children with asthma experience twice the activity limitation of white children (45% to 23%).17 Based on data from pediatric patient visits in 2006 from St. John’s Downtown Los Angeles Clinic (located near Adams and Figueroa), 28% of St. John’s young patients have asthma.
Diverse airborne sources of pollution can cause asthma. Slum housing conditions, such as mold and cockroach droppings are associated with asthma in young children, exacerbate symptoms, and increase the frequencies of attacks.18 And, given how much time young children spend in the
FIGURE 3: Lead Poisoning Cases in Los Angeles
14 S h a m e o f t h e C i t y : S l u m H o u s i n g a n d t h e C r i t i c a l T h r e a t t o t h e H e a l t h o f L . A . C h i l d r e n a n d F a m i l i e s
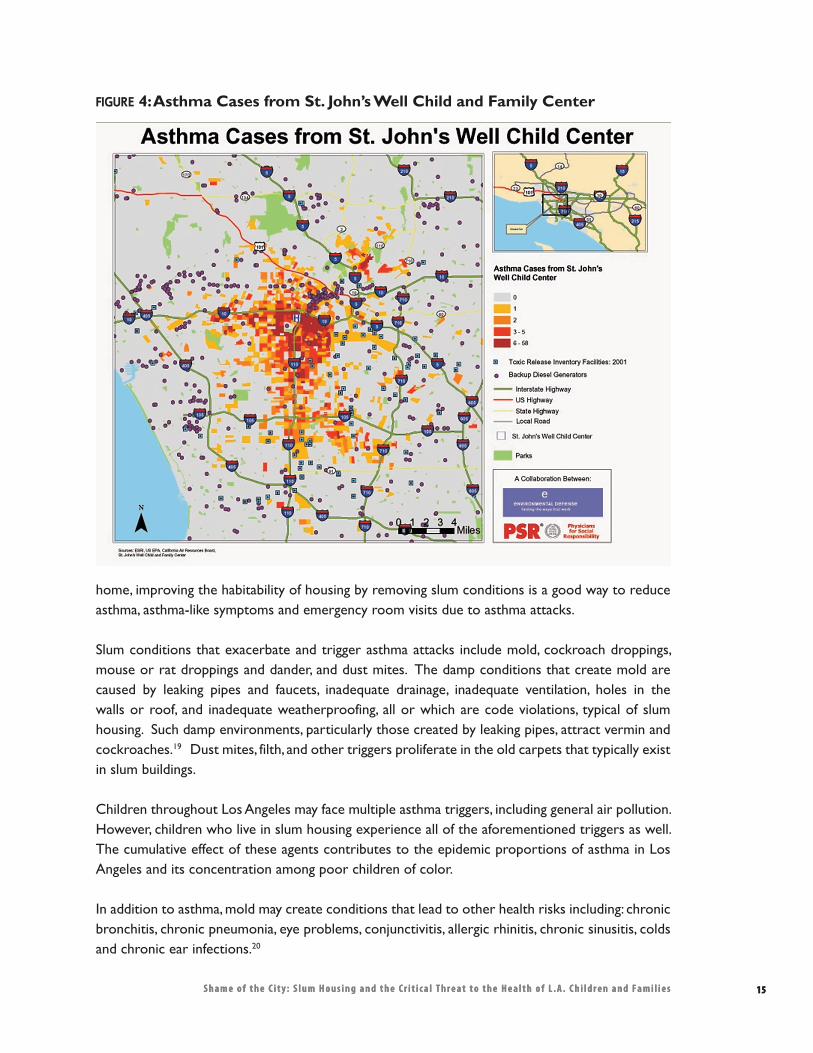
15S h a m e o f t h e C i t y : S l u m H o u s i n g a n d t h e C r i t i c a l T h r e a t t o t h e H e a l t h o f L . A . C h i l d r e n a n d F a m i l i e s
home, improving the habitability of housing by removing slum conditions is a good way to reduce asthma, asthma-like symptoms and emergency room visits due to asthma attacks.
Slum conditions that exacerbate and trigger asthma attacks include mold, cockroach droppings, mouse or rat droppings and dander, and dust mites. The damp conditions that create mold are caused by leaking pipes and faucets, inadequate drainage, inadequate ventilation, holes in the walls or roof, and inadequate weatherproofing, all or which are code violations, typical of slum housing. Such damp environments, particularly those created by leaking pipes, attract vermin and cockroaches.19 Dust mites, filth, and other triggers proliferate in the old carpets that typically exist in slum buildings.
Children throughout Los Angeles may face multiple asthma triggers, including general air pollution. However, children who live in slum housing experience all of the aforementioned triggers as well. The cumulative effect of these agents contributes to the epidemic proportions of asthma in Los Angeles and its concentration among poor children of color.
In addition to asthma, mold may create conditions that lead to other health risks including: chronic bronchitis, chronic pneumonia, eye problems, conjunctivitis, allergic rhinitis, chronic sinusitis, colds and chronic ear infections.20
FIGURE 4: Asthma Cases from St. John’s Well Child and Family Center
15S h a m e o f t h e C i t y : S l u m H o u s i n g a n d t h e C r i t i c a l T h r e a t t o t h e H e a l t h o f L . A . C h i l d r e n a n d F a m i l i e s
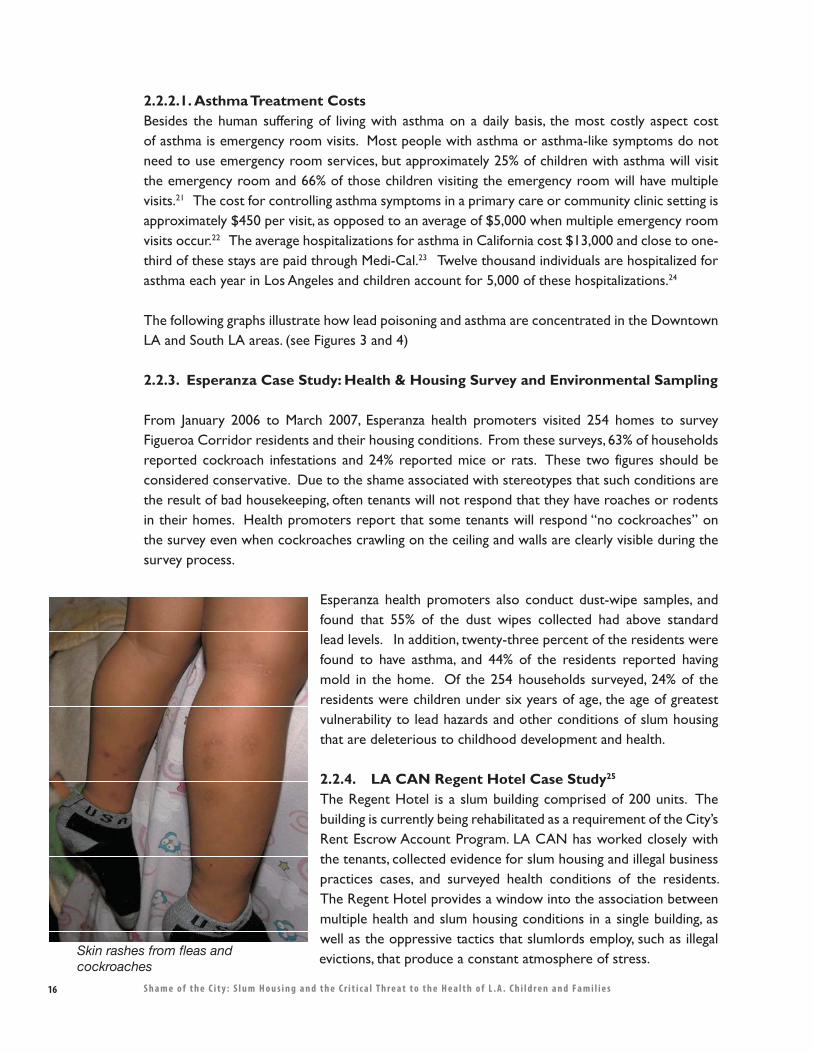
16 S h a m e o f t h e C i t y : S l u m H o u s i n g a n d t h e C r i t i c a l T h r e a t t o t h e H e a l t h o f L . A . C h i l d r e n a n d F a m i l i e s
2.2.2.1. Asthma Treatment CostsBesides the human suffering of living with asthma on a daily basis, the most costly aspect cost of asthma is emergency room visits. Most people with asthma or asthma-like symptoms do not need to use emergency room services, but approximately 25% of children with asthma will visit the emergency room and 66% of those children visiting the emergency room will have multiple visits.21 The cost for controlling asthma symptoms in a primary care or community clinic setting is approximately $450 per visit, as opposed to an average of $5,000 when multiple emergency room visits occur.22 The average hospitalizations for asthma in California cost $13,000 and close to one-third of these stays are paid through Medi-Cal.23 Twelve thousand individuals are hospitalized for asthma each year in Los Angeles and children account for 5,000 of these hospitalizations.24
The following graphs illustrate how lead poisoning and asthma are concentrated in the Downtown LA and South LA areas. (see Figures 3 and 4)
2.2.3. Esperanza Case Study: Health & Housing Survey and Environmental Sampling
From January 2006 to March 2007, Esperanza health promoters visited 254 homes to survey Figueroa Corridor residents and their housing conditions. From these surveys, 63% of households reported cockroach infestations and 24% reported mice or rats. These two figures should be considered conservative. Due to the shame associated with stereotypes that such conditions are the result of bad housekeeping, often tenants will not respond that they have roaches or rodents in their homes. Health promoters report that some tenants will respond “no cockroaches” on the survey even when cockroaches crawling on the ceiling and walls are clearly visible during the survey process.
Esperanza health promoters also conduct dust-wipe samples, and found that 55% of the dust wipes collected had above standard lead levels. In addition, twenty-three percent of the residents were found to have asthma, and 44% of the residents reported having mold in the home. Of the 254 households surveyed, 24% of the residents were children under six years of age, the age of greatest vulnerability to lead hazards and other conditions of slum housing that are deleterious to childhood development and health.
2.2.4. LA CAN Regent Hotel Case Study25 The Regent Hotel is a slum building comprised of 200 units. The building is currently being rehabilitated as a requirement of the City’s Rent Escrow Account Program. LA CAN has worked closely with the tenants, collected evidence for slum housing and illegal business practices cases, and surveyed health conditions of the residents. The Regent Hotel provides a window into the association between multiple health and slum housing conditions in a single building, as well as the oppressive tactics that slumlords employ, such as illegal evictions, that produce a constant atmosphere of stress.Skin rashes from fleas and
cockroaches
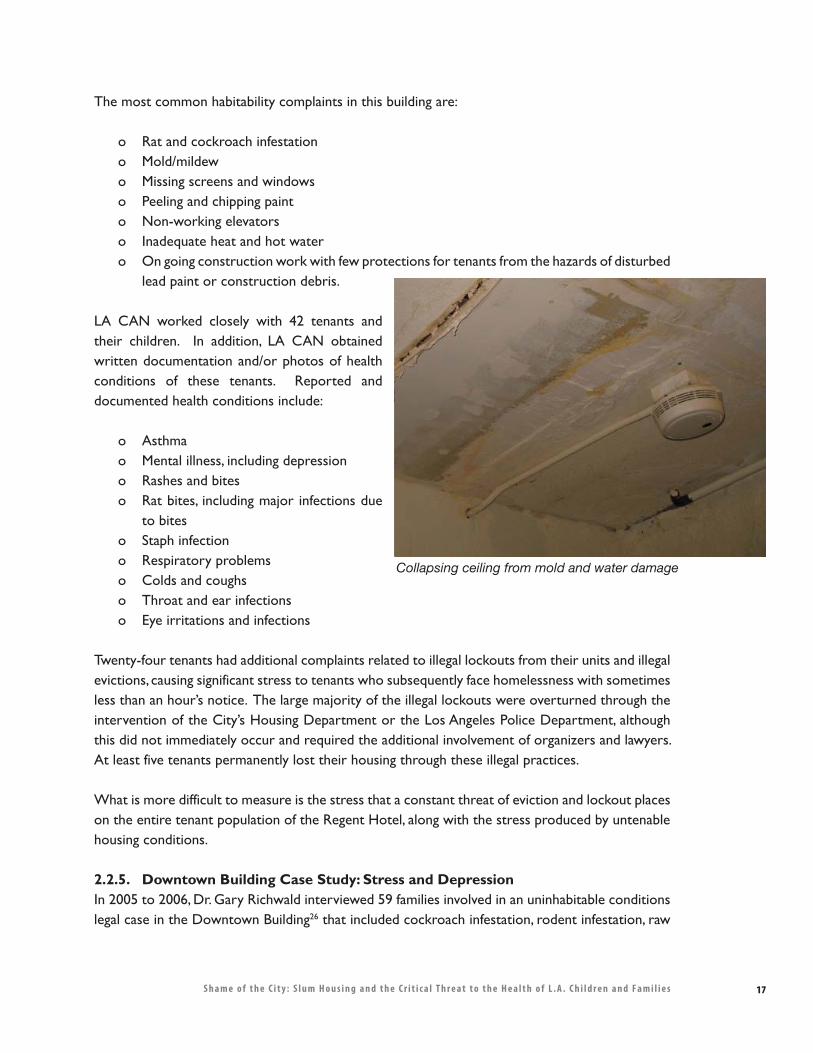
17S h a m e o f t h e C i t y : S l u m H o u s i n g a n d t h e C r i t i c a l T h r e a t t o t h e H e a l t h o f L . A . C h i l d r e n a n d F a m i l i e s
The most common habitability complaints in this building are:
o Rat and cockroach infestationo Mold/mildewo Missing screens and windowso Peeling and chipping painto Non-working elevatorso Inadequate heat and hot watero On going construction work with few protections for tenants from the hazards of disturbed
lead paint or construction debris.
LA CAN worked closely with 42 tenants and their children. In addition, LA CAN obtained written documentation and/or photos of health conditions of these tenants. Reported and documented health conditions include:
o Asthmao Mental illness, including depressiono Rashes and biteso Rat bites, including major infections due
to biteso Staph infectiono Respiratory problemso Colds and coughso Throat and ear infectionso Eye irritations and infections
Twenty-four tenants had additional complaints related to illegal lockouts from their units and illegal evictions, causing significant stress to tenants who subsequently face homelessness with sometimes less than an hour’s notice. The large majority of the illegal lockouts were overturned through the intervention of the City’s Housing Department or the Los Angeles Police Department, although this did not immediately occur and required the additional involvement of organizers and lawyers. At least five tenants permanently lost their housing through these illegal practices.
What is more difficult to measure is the stress that a constant threat of eviction and lockout places on the entire tenant population of the Regent Hotel, along with the stress produced by untenable housing conditions.
2.2.5. Downtown Building Case Study: Stress and Depression In 2005 to 2006, Dr. Gary Richwald interviewed 59 families involved in an uninhabitable conditions legal case in the Downtown Building26 that included cockroach infestation, rodent infestation, raw
Collapsing ceiling from mold and water damage
18 S h a m e o f t h e C i t y : S l u m H o u s i n g a n d t h e C r i t i c a l T h r e a t t o t h e H e a l t h o f L . A . C h i l d r e n a n d F a m i l i e s
Smith Hotel Case Study: Tale of Two TenantsJoe Miller,28 an African-American paraplegic man, lived in the Smith Hotel for eight years. During the course of his residency, he lost his left leg from an infection which he attributes to the unhealthy conditions of his building.
During the last three years of residency, his private bathroom was out of order despite his continued complaints and requests for repairs. In addition, the shared bathroom down the hall had a raised entryway, preventing wheelchair access, so that in order to “use the bathroom,” Mr. Miller either needed to crawl into the bathroom or use diapers and then clean himself afterwards. Without running water, Mr. Miller would wake up in the middle of the night to find cockroaches crawling and nibbling on his legs and groin area.
The elevator in the Smith Hotel was frequently out of order or intentionally shut-down by the building’s thug-style managers in retaliation for housing complaints. As a result Mr. Miller was literally trapped in his room for days at a time.
The Smith Hotel had every other slum housing condition that could possibly exacerbate an infection -- leaking pipes, mold, mildew, roaches, and vermin, not to mention chipping and peeling paint containing lead dust.
Mr. Miller’s neighbor, Maria Gonzalez and her two sons lived in the Smith Hotel for two years without heat or hot water. Twice, a broken sink on the floor above leaked raw sewage for several days, ruining their belongings.
“I would have to leave the apartment to eat somewhere else because of the stench,” said Gonzalez, a downtown garment worker. “And I had to sleep somewhere else because the carpeting stank.”
Her sons suffer from asthma, and all three of them had fungus growing on their feet and on their scalps.
With the help of SAJE, Esperanza, St. John’s and LACAN, along with City, private, and non-profit attorneys, the owners were convicted of 21 criminal counts and tenants who had not been illegally evicted, like Ms. Gonzalez and Mr. Miller, won monetary damages.
Ms. Gonzalez was able to use her settlement to start her own seamstress business and move into a better and safer apartment with her sons. For Mr. Miller, the cost of slum housing was the loss of his leg, the loss of his dignity, and, despite recovering for damages in the lawsuit settlement, ultimately, the loss of his home. He is currently homeless.
The owner of the building, while convicted as a criminal slumlord, never fixed Mr. Miller’s bathroom nor repaired the building and is still trying to earn millions of dollars by selling the property.
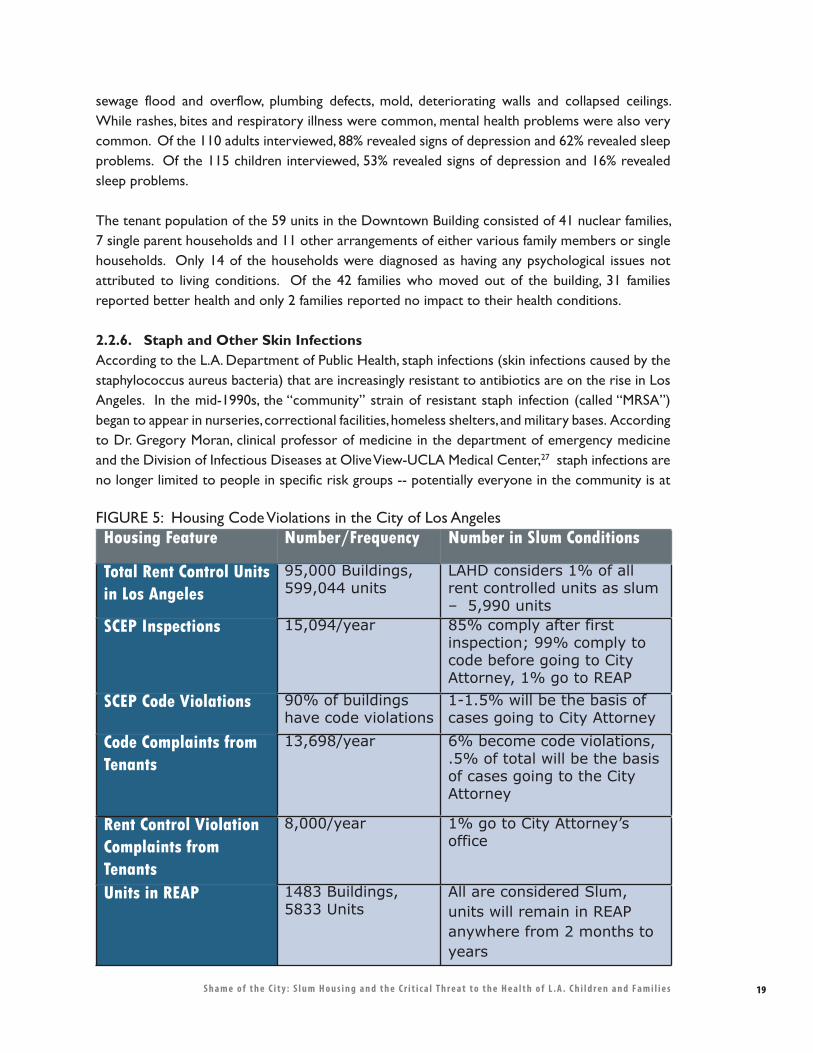
19S h a m e o f t h e C i t y : S l u m H o u s i n g a n d t h e C r i t i c a l T h r e a t t o t h e H e a l t h o f L . A . C h i l d r e n a n d F a m i l i e s
sewage flood and overflow, plumbing defects, mold, deteriorating walls and collapsed ceilings. While rashes, bites and respiratory illness were common, mental health problems were also very common. Of the 110 adults interviewed, 88% revealed signs of depression and 62% revealed sleep problems. Of the 115 children interviewed, 53% revealed signs of depression and 16% revealed sleep problems.
The tenant population of the 59 units in the Downtown Building consisted of 41 nuclear families, 7 single parent households and 11 other arrangements of either various family members or single households. Only 14 of the households were diagnosed as having any psychological issues not attributed to living conditions. Of the 42 families who moved out of the building, 31 families reported better health and only 2 families reported no impact to their health conditions.
2.2.6. Staph and Other Skin Infections According to the L.A. Department of Public Health, staph infections (skin infections caused by the staphylococcus aureus bacteria) that are increasingly resistant to antibiotics are on the rise in Los Angeles. In the mid-1990s, the “community” strain of resistant staph infection (called “MRSA”) began to appear in nurseries, correctional facilities, homeless shelters, and military bases. According to Dr. Gregory Moran, clinical professor of medicine in the department of emergency medicine and the Division of Infectious Diseases at Olive View-UCLA Medical Center,27 staph infections are no longer limited to people in specific risk groups -- potentially everyone in the community is at
Housing Feature Number/Frequency Number in Slum Conditions
Total Rent Control Units in Los Angeles
95,000 Buildings, 599,044 units
LAHD considers 1% of all rent controlled units as slum – 5,990 units
SCEP Inspections 15,094/year 85% comply after first inspection; 99% comply to code before going to City Attorney, 1% go to REAP
SCEP Code Violations 90% of buildings have code violations
1-1.5% will be the basis of cases going to City Attorney
Code Complaints from Tenants
13,698/year 6% become code violations, .5% of total will be the basis of cases going to the City Attorney
Rent Control Violation Complaints from Tenants
8,000/year 1% go to City Attorney’s office
Units in REAP 1483 Buildings, 5833 Units
All are considered Slum, units will remain in REAP anywhere from 2 months to years
FIGURE 5: Housing Code Violations in the City of Los Angeles
20 S h a m e o f t h e C i t y : S l u m H o u s i n g a n d t h e C r i t i c a l T h r e a t t o t h e H e a l t h o f L . A . C h i l d r e n a n d F a m i l i e s
risk. While the origins of staph infection are the continuing subject of public health research, there are basic facts about its propagation that are relevant to slum housing.
Staph infections are passed from skin to skin, but once a person has been exposed, good hygiene is crucial. According to Dr. Elizabeth Bancroft of the Los Angeles County Public Health Department, shared bathrooms and lack of hot water, typical in slum housing, often create barriers to necessary hygiene and accelerate the spread of existing staph infections. Staph infections are common complaints among slum housing tenants, and due to their highly contagious nature, cannot be confined to a building or unit.
3. The Scale and Scope of the Slum Housing Problem: Los Angeles Housing Department Data
According to the calculations below, there are between 5,833 and 11,980 slum housing units in the City of Los Angeles affecting approximately 40,000 people. Figure 5 provides a snapshot of slum housing figures based on data from the City of Los Angeles Housing Department, which maintains the Systematic Code Enforcement Program (SCEP) is charged with inspecting all rent stabilized29 buildings in Los Angeles every three years, in addition to responding to code violation complaints on a demand-responsive basis.
The Housing Department also manages the Rent Escrow Account Program (REAP) which is a special process by which extreme slum housing cases are managed by the City, and rent is reduced until the buildings have met compliance. REAP cases typically involve some form of tenant organization and are often the source of cases which are sent to the Interagency Housing Task Force, which is comprised of representatives from the Los Angeles Housing Department (LAHD), Los Angeles Fire Department (LAFD), Los Angeles County Health Department and the City Attorney’s Housing Enforcement Section. Task Force cases are a kind of “academy awards” of slum housing -- only the worst cases are referred here, and as a result, are the source of prosecutorial activity by the City Attorney’s office.
In addition, LAHD collects data on violations of the city’s rent stabilization (rent control) ordinance. These violations include items that contribute to public health issues as indicated in the Figure 1 etiology chart, which though difficult to measure, are relevant. Typical violations, which compose of 80% of all rent control violations, are illegal evictions and illegal rent increases, both of which can lead to stressful situations for tenants.
Los Angeles Housing Department data provides a conservative picture of the scale of the slum housing problem in the City of Los Angeles, which is approximately 6,000 units at any given time, impacting approximately 18,000 people.30 However, based on the experience of health promoters and tenant organizers, who have face to face contact with thousands of slum housing tenants on an annual basis, the total number is probably closer to 2% of all RSO units, which is close to 12,000 units and population of approximately 48,000 people, a population larger than Culver City.
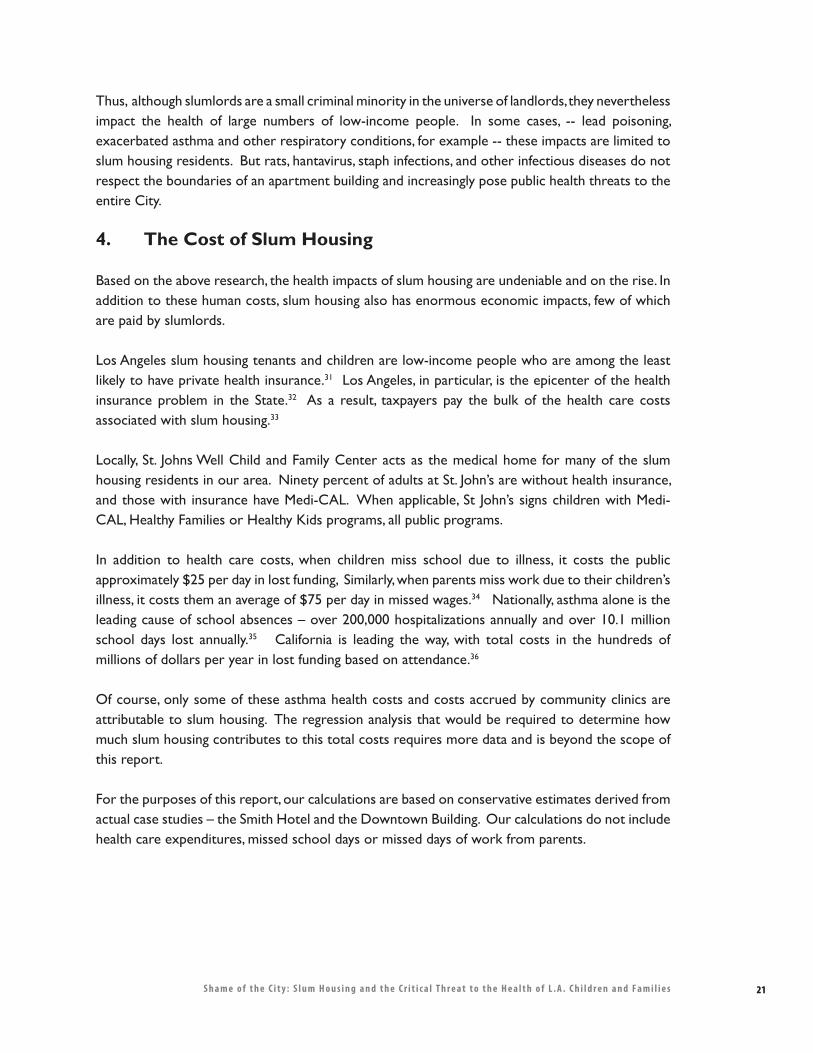
21S h a m e o f t h e C i t y : S l u m H o u s i n g a n d t h e C r i t i c a l T h r e a t t o t h e H e a l t h o f L . A . C h i l d r e n a n d F a m i l i e s
Thus, although slumlords are a small criminal minority in the universe of landlords, they nevertheless impact the health of large numbers of low-income people. In some cases, -- lead poisoning, exacerbated asthma and other respiratory conditions, for example -- these impacts are limited to slum housing residents. But rats, hantavirus, staph infections, and other infectious diseases do not respect the boundaries of an apartment building and increasingly pose public health threats to the entire City.
4. The Cost of Slum Housing
Based on the above research, the health impacts of slum housing are undeniable and on the rise. In addition to these human costs, slum housing also has enormous economic impacts, few of which are paid by slumlords.
Los Angeles slum housing tenants and children are low-income people who are among the least likely to have private health insurance.31 Los Angeles, in particular, is the epicenter of the health insurance problem in the State.32 As a result, taxpayers pay the bulk of the health care costs associated with slum housing.33
Locally, St. Johns Well Child and Family Center acts as the medical home for many of the slum housing residents in our area. Ninety percent of adults at St. John’s are without health insurance, and those with insurance have Medi-CAL. When applicable, St John’s signs children with Medi-CAL, Healthy Families or Healthy Kids programs, all public programs.
In addition to health care costs, when children miss school due to illness, it costs the public approximately $25 per day in lost funding, Similarly, when parents miss work due to their children’s illness, it costs them an average of $75 per day in missed wages.34 Nationally, asthma alone is the leading cause of school absences – over 200,000 hospitalizations annually and over 10.1 million school days lost annually.35 California is leading the way, with total costs in the hundreds of millions of dollars per year in lost funding based on attendance.36
Of course, only some of these asthma health costs and costs accrued by community clinics are attributable to slum housing. The regression analysis that would be required to determine how much slum housing contributes to this total costs requires more data and is beyond the scope of this report.
For the purposes of this report, our calculations are based on conservative estimates derived from actual case studies – the Smith Hotel and the Downtown Building. Our calculations do not include health care expenditures, missed school days or missed days of work from parents.
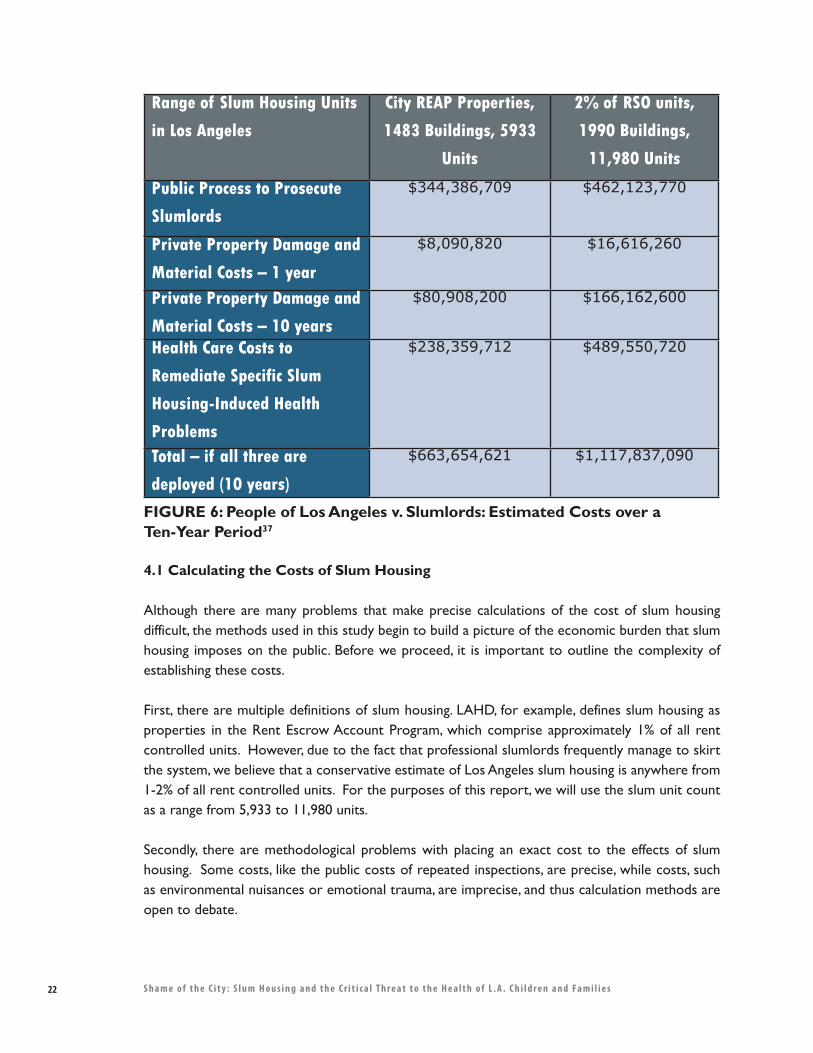
22 S h a m e o f t h e C i t y : S l u m H o u s i n g a n d t h e C r i t i c a l T h r e a t t o t h e H e a l t h o f L . A . C h i l d r e n a n d F a m i l i e s
4.1 Calculating the Costs of Slum Housing
Although there are many problems that make precise calculations of the cost of slum housing difficult, the methods used in this study begin to build a picture of the economic burden that slum housing imposes on the public. Before we proceed, it is important to outline the complexity of establishing these costs.
First, there are multiple definitions of slum housing. LAHD, for example, defines slum housing as properties in the Rent Escrow Account Program, which comprise approximately 1% of all rent controlled units. However, due to the fact that professional slumlords frequently manage to skirt the system, we believe that a conservative estimate of Los Angeles slum housing is anywhere from 1-2% of all rent controlled units. For the purposes of this report, we will use the slum unit count as a range from 5,933 to 11,980 units.
Secondly, there are methodological problems with placing an exact cost to the effects of slum housing. Some costs, like the public costs of repeated inspections, are precise, while costs, such as environmental nuisances or emotional trauma, are imprecise, and thus calculation methods are open to debate.
Range of Slum Housing Units
in Los Angeles
City REAP Properties,
1483 Buildings, 5933
Units
2% of RSO units,
1990 Buildings,
11,980 Units
Public Process to Prosecute
Slumlords
$344,386,709 $462,123,770
Private Property Damage and
Material Costs – 1 year
$8,090,820 $16,616,260
Private Property Damage and
Material Costs – 10 years
$80,908,200 $166,162,600
Health Care Costs to
Remediate Specific Slum
Housing-Induced Health
Problems
$238,359,712 $489,550,720
Total – if all three are
deployed (10 years)
$663,654,621 $1,117,837,090
FIGURE 6: People of Los Angeles v. Slumlords: Estimated Costs over a Ten-Year Period37
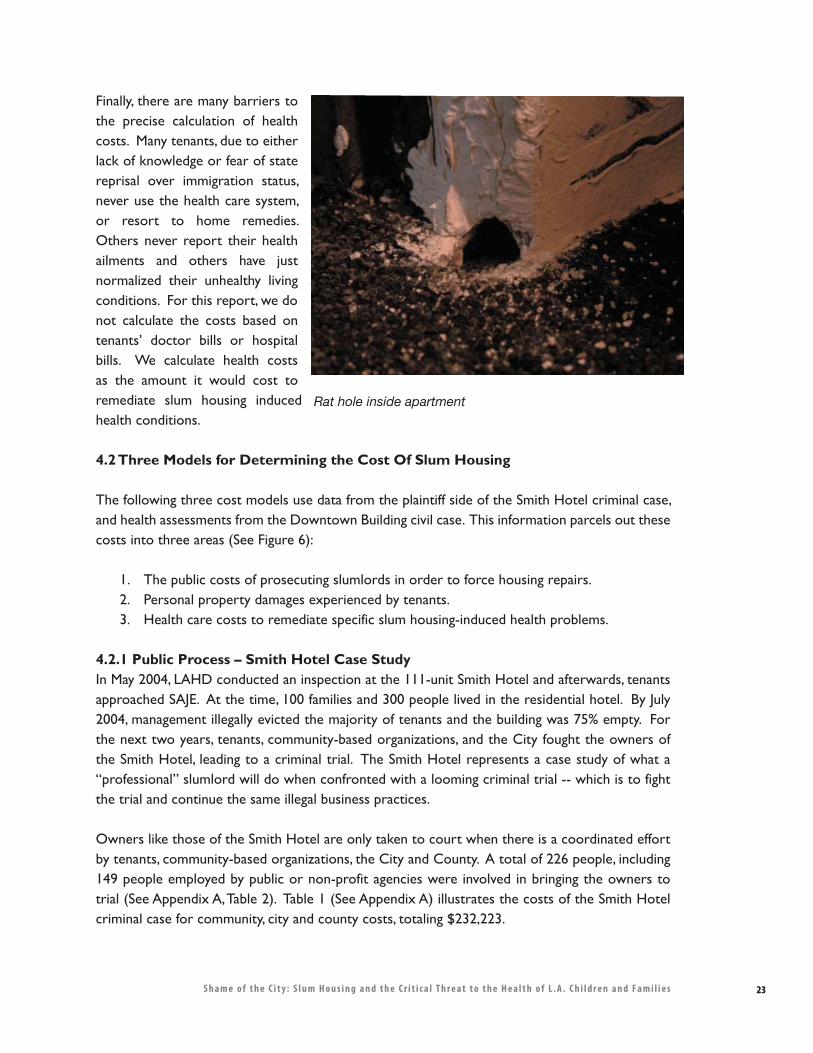
23S h a m e o f t h e C i t y : S l u m H o u s i n g a n d t h e C r i t i c a l T h r e a t t o t h e H e a l t h o f L . A . C h i l d r e n a n d F a m i l i e s
Finally, there are many barriers to the precise calculation of health costs. Many tenants, due to either lack of knowledge or fear of state reprisal over immigration status, never use the health care system, or resort to home remedies. Others never report their health ailments and others have just normalized their unhealthy living conditions. For this report, we do not calculate the costs based on tenants’ doctor bills or hospital bills. We calculate health costs as the amount it would cost to remediate slum housing induced health conditions.
4.2 Three Models for Determining the Cost Of Slum Housing
The following three cost models use data from the plaintiff side of the Smith Hotel criminal case, and health assessments from the Downtown Building civil case. This information parcels out these costs into three areas (See Figure 6):
1. The public costs of prosecuting slumlords in order to force housing repairs.2. Personal property damages experienced by tenants.3. Health care costs to remediate specific slum housing-induced health problems.
4.2.1 Public Process – Smith Hotel Case StudyIn May 2004, LAHD conducted an inspection at the 111-unit Smith Hotel and afterwards, tenants approached SAJE. At the time, 100 families and 300 people lived in the residential hotel. By July 2004, management illegally evicted the majority of tenants and the building was 75% empty. For the next two years, tenants, community-based organizations, and the City fought the owners of the Smith Hotel, leading to a criminal trial. The Smith Hotel represents a case study of what a “professional” slumlord will do when confronted with a looming criminal trial -- which is to fight the trial and continue the same illegal business practices.
Owners like those of the Smith Hotel are only taken to court when there is a coordinated effort by tenants, community-based organizations, the City and County. A total of 226 people, including 149 people employed by public or non-profit agencies were involved in bringing the owners to trial (See Appendix A, Table 2). Table 1 (See Appendix A) illustrates the costs of the Smith Hotel criminal case for community, city and county costs, totaling $232,223.
Rat hole inside apartment
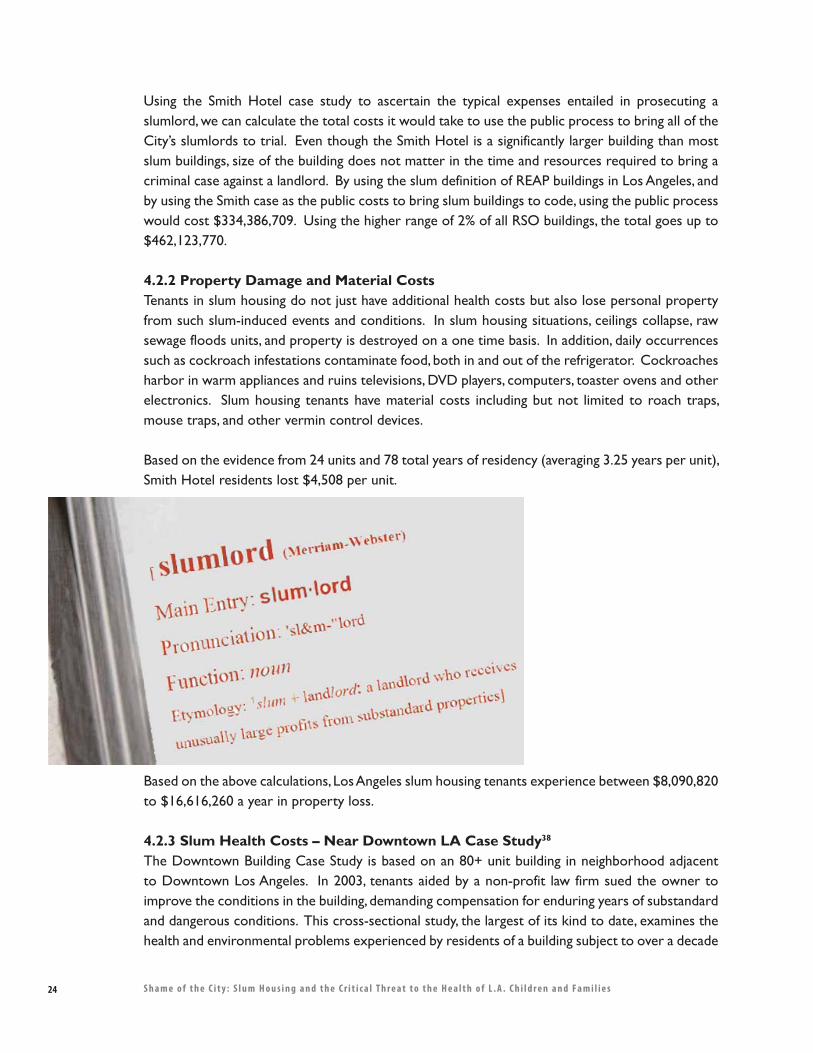
24 S h a m e o f t h e C i t y : S l u m H o u s i n g a n d t h e C r i t i c a l T h r e a t t o t h e H e a l t h o f L . A . C h i l d r e n a n d F a m i l i e s
Using the Smith Hotel case study to ascertain the typical expenses entailed in prosecuting a slumlord, we can calculate the total costs it would take to use the public process to bring all of the City’s slumlords to trial. Even though the Smith Hotel is a significantly larger building than most slum buildings, size of the building does not matter in the time and resources required to bring a criminal case against a landlord. By using the slum definition of REAP buildings in Los Angeles, and by using the Smith case as the public costs to bring slum buildings to code, using the public process would cost $334,386,709. Using the higher range of 2% of all RSO buildings, the total goes up to $462,123,770.
4.2.2 Property Damage and Material CostsTenants in slum housing do not just have additional health costs but also lose personal property from such slum-induced events and conditions. In slum housing situations, ceilings collapse, raw sewage floods units, and property is destroyed on a one time basis. In addition, daily occurrences such as cockroach infestations contaminate food, both in and out of the refrigerator. Cockroaches harbor in warm appliances and ruins televisions, DVD players, computers, toaster ovens and other electronics. Slum housing tenants have material costs including but not limited to roach traps, mouse traps, and other vermin control devices.
Based on the evidence from 24 units and 78 total years of residency (averaging 3.25 years per unit), Smith Hotel residents lost $4,508 per unit.
Based on the above calculations, Los Angeles slum housing tenants experience between $8,090,820 to $16,616,260 a year in property loss.
4.2.3 Slum Health Costs – Near Downtown LA Case Study38 The Downtown Building Case Study is based on an 80+ unit building in neighborhood adjacent to Downtown Los Angeles. In 2003, tenants aided by a non-profit law firm sued the owner to improve the conditions in the building, demanding compensation for enduring years of substandard and dangerous conditions. This cross-sectional study, the largest of its kind to date, examines the health and environmental problems experienced by residents of a building subject to over a decade
25S h a m e o f t h e C i t y : S l u m H o u s i n g a n d t h e C r i t i c a l T h r e a t t o t h e H e a l t h o f L . A . C h i l d r e n a n d F a m i l i e s
of complaints to City and County agencies. These complaints increased markedly in recent years when the building was sold to a new owner. Residents from the Downtown Building lived with cockroaches and rodent infestation, serious sewage problems that flooded multiple apartment units, poor plumbing, deteriorating walls due to mold, and collapsing ceilings.
Health care costs associated with slum housing have both direct and indirect medical costs. Direct costs are composed of health system costs (e.g. office visits, diagnostic tests, ER visits, hospitalization, health education) and pharmaceutical costs. These costs are measured with respect to the proportion attributable to slum housing, illness severity, service mix and utilization rates, and cost of services and drugs, among other factors. Indirect medical costs include productivity losses (adults), reduced educational achievements (children and young adults), loss of income, and reduction of quality of life. Indirect costs often present difficulties in quantification, but none the less represent significant costs to individuals or family members/friends who serve as caretakers or care receivers.
Data from the Downtown Building demonstrates that most health costs are attributable to slum housing rather than other sources. For example, the rates of reported cigarettes, alcohol and illicit drug use were very low and sources of non-slum-housing related stress were infrequently reported.
Table 4 (See Appendix B) presents data on direct medical costs associated with slum housing. Cost estimates were developed with the assistance of a health economist. For simplicity, adult and child direct medical costs were considered the same for similar conditions. Costs of treating chronic problems are projected over a ten year period, even though some conditions could generate costs over a lifetime. Acute problems (e.g. slip and fall injuries) are estimated for single occurrences and do not reflect the likelihood of additional acute events in the future. Medical costs are not adjusted for inflation. Since precise indirect medical costs are difficult to estimate, they are not included. As a result, the final total direct medical costs are a very conservative estimate of the total medical costs associated with slum housing.
Projecting this unit cost across the City, in order to pay for the health care costs to remediate specific slum housing induced health problems, Los Angeles slumlords are costing tenants and the public between $238 million and $490 million.39
Total CostsBased on the above research and calculations, we estimate that slumlords impose on Los Angeles tenants, public agencies, and community advocates, approximately $1.1 billion.
26 S h a m e o f t h e C i t y : S l u m H o u s i n g a n d t h e C r i t i c a l T h r e a t t o t h e H e a l t h o f L . A . C h i l d r e n a n d F a m i l i e s
5. Understanding Slumlords
5.1. Defining “Slumlord”
Before we proceed, it is important to provide a clear understanding of what our doctors, health promoters, researchers, and organizers mean when they use the term “slumlord.” This is a precise term that is not used loosely or lightly.
The term “slumlord” refers to a minority criminal class of property owner, conservatively estimated by the City’s Housing Department as perhaps 1% of the total landlord population in Los Angeles. These slumlords consistently, repeatedly, and intentionally violate housing and health laws in order to maximize profit. The slumlord’s business model requires non-compliance with housing laws and always exploits the economic position of low-income families who have limited or no choices in today’s housing market.
However, although the criminal slumlords only constitute 1-2% of the entire landlord population, they nevertheless can have a major impact. For example, one slumlord owns over 200 properties in Los Angeles which house over 1,700 families and 8,000 people.40
5.2. Slum Housing And The Current Historical Moment In Los Angeles
As you may imagine, as with most forms of crime, there have been slumlords in Los Angeles as long as there has been a city. And, as long as these criminal practices are profitable and permissible, there will always be slumlords.
However, the current crisis stems from the following unprecedented economic conditions, which are increasing opportunities for slumlords at the same time that they are decreasing opportunities for low-income tenants – thus escalating the threat to public health:
o Skyrocketing real estate values: While property values and rents have increased 100% over the past 12 years in Los Angeles41 as whole, in the Figueroa Corridor, where slum housing is ubiquitous, land values have increased 200%-250% over the past four years.42 This creates a tight housing market where low-income renters are simply trapped. With few housing choices, working-class people increasingly provide a “sheltered market” for slumlords.43 These conditions also mean that slum housing business practices are more profitable than they ever have been before. For example, the owner of the infamous Smith Hotel purchased the foreclosed property in 1997 for about one million dollars, with a $750,000 loan. Over the years, they let slum conditions get worse, until the building was placed in the City’s slum housing task force. Over the next two years, the owners used the building to borrow over six million dollars in equity loans. By the time the City Attorney had filed criminal charges against the owners, the building was on the market for eight million dollars.
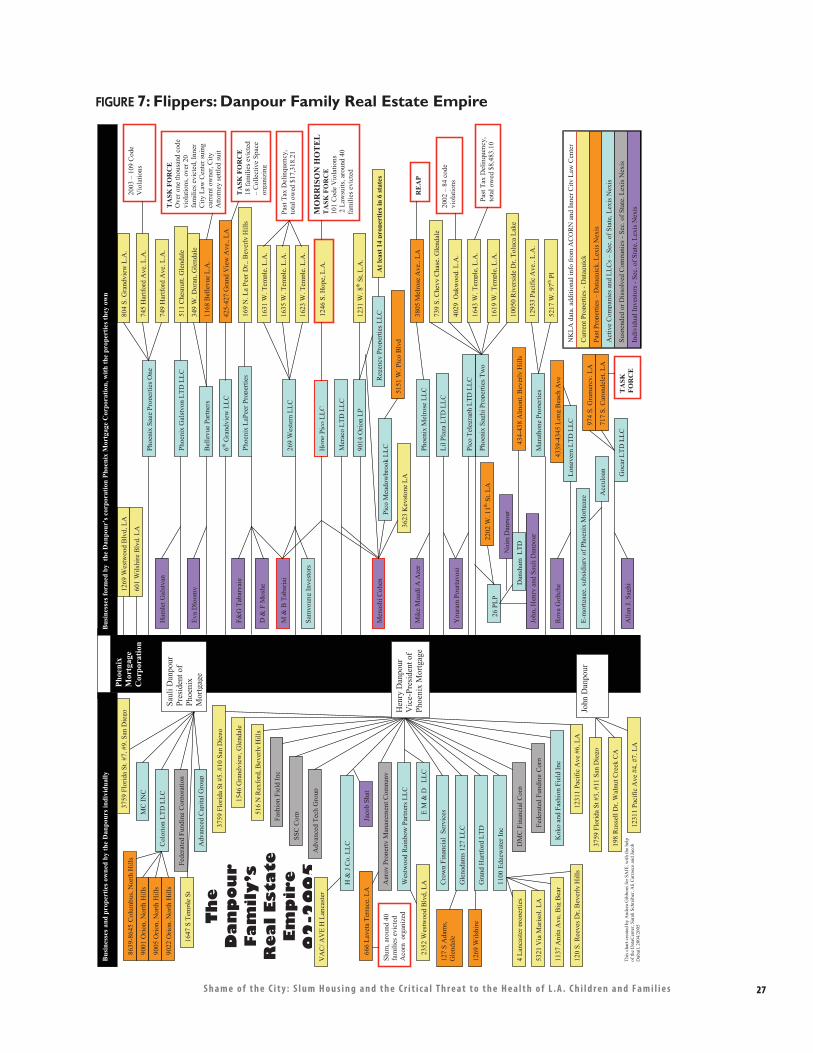
27S h a m e o f t h e C i t y : S l u m H o u s i n g a n d t h e C r i t i c a l T h r e a t t o t h e H e a l t h o f L . A . C h i l d r e n a n d F a m i l i e s
FIGURE 7: Flippers: Danpour Family Real Estate Empire
120
S. R
eeve
s D
r, B
ever
ly H
ills
D &
F M
oshe
Thi
s ch
art c
reat
ed b
y A
ndre
a G
ibbo
ns f
or S
AJE
, wit
h th
e he
lp
of th
e D
ataC
ente
r, S
arah
Sch
reib
er, A
li C
arra
sco
and
Jaco
b D
ubai
l, 20
04/2
005
Th
eD
an
po
ur
Fa
mil
y’s
Re
al
Est
ate
E
mp
ire
02
-20
05
9001
Ori
on, N
orth
Hill
s
1269
Wils
hire
127
S A
dam
s,
Gle
ndal
e 20
02 –
84
code
vi
olat
ions
Phoe
nix
Sagh
i Pro
pert
ies
Tw
o
1005
0 R
iver
side
Dr,
Tol
uca
Lak
e
1619
W. T
empl
e, L
.A.
1643
W. T
empl
e, L
.A.
4029
Oak
woo
d, L
.A.
739
S. C
hevy
Cha
se, G
lend
ale
Past
Tax
Del
inqu
ency
, to
tal o
wed
$8,
483.
10
Phoe
nix
Gal
styo
n L
TD
LL
C
511
Che
snut
t, G
lend
ale
Ham
let G
alst
yan
Pico
Tel
egra
ph L
TD
LL
C
Cur
rent
Pro
pert
ies
- D
ataq
uick
Act
ive
Com
pani
es a
nd L
LC
s –
Sec.
of
Stat
e, L
exis
Nex
is
Indi
vidu
al I
nves
tors
-Se
c. o
f St
ate,
Lex
is N
exis
Past
Pro
pert
ies
– D
ataq
uick
, Lex
is N
exis
Susp
ende
d or
Dis
solv
ed C
ompa
nies
-Se
c. o
f St
ate,
Lex
is N
exis
NK
LA
dat
a, a
dditi
onal
info
from
AC
OR
N a
nd I
nner
City
Law
Cen
ter
Lil
Plaz
a L
TD
LL
C
You
ram
Pou
rtav
osi
Mar
atho
ne P
rope
rtie
s12
933
Paci
fic
Ave
., L
.A.
5217
W. 9
7thPl
Acc
uloa
n
E-m
ortg
age,
sub
sidi
ary
of P
hoen
ix M
ortg
age
Phoe
nix
LaP
eer
Prop
ertie
s16
9 N
. La
Peer
Dr.
, Bev
erly
Hill
sF&
G T
abar
yaie
M&
B T
abar
iai
Mer
aco
LT
D L
LC
Phoe
nix
Sage
Pro
pert
ies
One
804
S. G
rand
view
L.A
.
745
Har
tfor
d A
ve. L
.A.
749
Har
tfor
d A
ve. L
.A.
2003
– 1
09 C
ode
V
iola
tions
Hop
ePi
co L
LC
1246
S. H
ope,
L.A
. M
OR
RIS
ON
HO
TE
L
TA
SK F
OR
CE
10
1 C
ode
Vio
latio
ns
2 L
awsu
its, a
roun
d 40
fa
mili
es e
vict
ed
Bel
levu
e Pa
rtne
rs
349
W. D
oran
, Gle
ndal
e
1168
Bel
levu
e L
.A.
Eva
Dlo
omy
TA
SK F
OR
CE
O
ver
one
thou
sand
cod
e vi
olat
ions
, ove
r 20
fa
mili
es e
vict
ed, I
nner
C
ity L
aw C
ente
r su
ing
curr
ent o
wne
r, C
ity
Atto
rney
set
tled
suit
269
Wes
tern
LL
C
1623
W. T
empl
e, L
.A.
1635
W. T
empl
e, L
.A.
1631
W. T
empl
e, L
.A.
Sam
youn
g In
vest
ors
Past
Tax
Del
inqu
ency
, to
tal o
wed
$17
,318
.21
Pico
Mea
dow
broo
k L
LC
Men
ashi
Coh
en
9014
Ori
on L
P12
31 W
. 8th
St,
L.A
.
Reg
ency
Pro
pert
ies
LL
C
At l
east
14
prop
ertie
s in
6 st
ates
3623
Key
ston
e L
A51
51 W
. Pic
o B
lvd
Dan
sham
LT
D
26 P
LP
John
, Hen
ry a
nd S
auli
Dan
pour
Nai
m D
anpo
ur
2202
W. 1
1thSt
, LA
434-
438
Alm
ont,
Bev
erly
Hill
s
Lon
gver
n L
TD
LL
C
Roy
a G
oltc
he43
39-4
345
Lon
g B
each
Ave
1269
Wes
twoo
d B
lvd,
LA
601
Wils
hire
Blv
d, L
A
Goc
ar L
TD
LL
CA
llan
J. S
aghi
974
S. G
ram
ercy
, LA
717
S. C
aron
dele
t, L
A
TA
SKFO
RC
E
6thG
rand
view
LL
C42
5-42
7 G
rand
Vie
w A
ve.,
LA
TA
SK F
OR
CE
18
fam
ilies
evi
cted
–
Col
lect
ive
Spac
e or
gani
zing
Phoe
nix
Mel
rose
LL
CM
ike
Mag
di A
Aze
r38
05 M
elro
se A
ve.,
LA
RE
AP
Agr
oy P
rope
rty
Man
agem
ent C
ompa
ny
Wes
twoo
d R
ainb
ow P
artn
ers
LL
C
Cro
wn
Fina
ncia
l Se
rvic
es
E M
& D
L
LC
Gle
nada
ms
127
LL
C
Gra
nd H
artf
ord
LT
D
H &
J C
o. L
LC
Jaco
b Sh
at
Adv
ance
d T
ech
Gro
up
SSC
Cor
p
Fash
ion
Fiel
d In
c
DM
C F
inan
cial
Cor
p
Fede
rate
d Fu
ndin
g C
orp
Kok
o an
d Fa
shio
n Fi
eld
Inc
VA
C/ A
VE
H L
anca
ster
1100
Edg
ewat
er I
nc
1137
Ani
ta A
ve, B
ig B
ear
5321
Via
Mar
isol
, LA
4 L
anca
ster
pro
pert
ies
2352
Wes
twoo
d B
lvd,
LA
516
N R
exfo
rd, B
ever
ly H
ills
1546
Gra
ndvi
ew, G
lend
ale
3759
Flo
rida
St #
5, #
10 S
an D
iego
1231
1 Pa
cifi
c A
ve #
6, L
A
666
Lav
eta
Ter
race
, LA
Slum
, aro
und
40
fam
ilies
evi
cted
A
corn
org
aniz
ed
Phoe
nix
Mor
tgag
eC
orpo
ratio
n
Bus
ines
ses a
nd p
rope
rtie
s ow
ned
by th
e D
anpo
urs i
ndiv
idua
lly
Bus
ines
ses f
orm
ed b
y th
e D
anpo
ur’s
cor
pora
tion
Phoe
nix
Mor
tgag
e C
orpo
ratio
n, w
ith th
e pr
oper
ties t
hey
own
MC
IN
C
Col
orio
n L
TD
LL
C
Fede
rate
d Fu
ndin
g C
orpo
ratio
n
Adv
ance
d C
apita
l Gro
up
3759
Flo
rida
St.
#7, #
9, S
an D
iego
1647
S T
empl
e St
Saul
i Dan
pour
Pr
esid
ent o
f Ph
oeni
xM
ort g
age
9005
Ori
on, N
orth
Hill
s
9022
Ori
on, N
orth
Hill
s
8639
-864
5C
olum
bus,
Nor
th H
ills
Hen
ry D
anpo
ur
Vic
e-Pr
esid
ent o
f Ph
oeni
x M
ortg
age
3759
Flo
rida
St #
3, #
11 S
an D
iego
198
Rus
sell
Dr,
Wal
nut C
reek
CA
1231
1 Pa
cifi
c A
ve #
4, #
7, L
A
John
Dan
pour
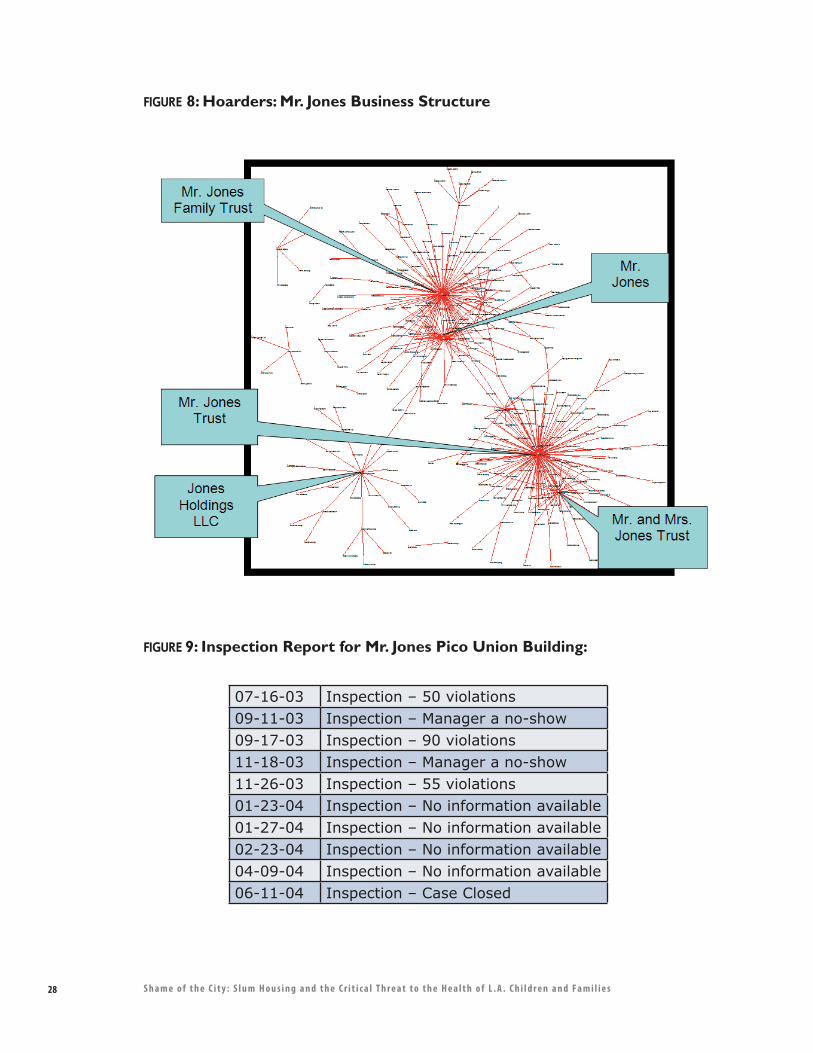
28 S h a m e o f t h e C i t y : S l u m H o u s i n g a n d t h e C r i t i c a l T h r e a t t o t h e H e a l t h o f L . A . C h i l d r e n a n d F a m i l i e s
FIGURE 8: Hoarders: Mr. Jones Business Structure
FIGURE 9: Inspection Report for Mr. Jones Pico Union Building:
07-16-03 Inspection – 50 violations09-11-03 Inspection – Manager a no-show09-17-03 Inspection – 90 violations11-18-03 Inspection – Manager a no-show11-26-03 Inspection – 55 violations01-23-04 Inspection – No information available01-27-04 Inspection – No information available02-23-04 Inspection – No information available04-09-04 Inspection – No information available06-11-04 Inspection – Case Closed
29S h a m e o f t h e C i t y : S l u m H o u s i n g a n d t h e C r i t i c a l T h r e a t t o t h e H e a l t h o f L . A . C h i l d r e n a n d F a m i l i e s
o Increased slum conditions: This unique real estate market has produced conditions that make slum housing conditions even worse. Slumlords provide even less repairs on buildings that they intend to sell to the highest bidder. And, as a criminal class, they have no scruples about using unhealthy conditions and other forms of harassment to get low-income tenants to leave so that buildings might be “delivered vacant” to new owners. The Bristol Hotel, a residential hotel located in Downtown Los Angeles, provides a prime example. In this case the hotel was purchased by a restaurant owner who wanted to convert the building to an upscale boutique hotel. When LA CAN organizers investigated how the building became completely vacant overnight, they found that management had given most tenants verbal notice and only a few days, or even hours, to vacate. Tenants were intimidated by the conduct of the owners and employees of the Bristol Hotel, one of whom wore a gun on his hip at all times, and was often both physically and verbally confrontational. Some tenants were able to find rooms in other residential hotels, others were forced to sleep on the streets or enter shelters. None of the tenants were given a legal reason for eviction, and none were given the due process required by law. No tenants received relocation money. Subsequent investigation showed that these illegal tactics were necessary because the escrow instructions specifically required that when the building was turned over to the new owner it be “delivered vacant.”
5.3. Understanding Slumlord Business Models
It is useful to have some familiarity with the business practices of slumlords. For the purposes of this paper, we have summarized the experience of the lawyers and organizers who confront them every day into three simple categories: Flippers, Hoarders, and Incompetents.
5.3.1. Flippers
Flippers are in the business of buying buildings, milking them for their equity, and then selling them at a profit. They are often careful to protect their holdings by setting up a separate limited liability company (LLC) for each building. There is nothing in these practices that is illegal. What is illegal, however, is the fact that these owners collect rents at the same time that they maintain their building in deplorable conditions, ignoring building and safety and public health laws and citations. The fact that these owners use multiple, often scores, of business names and sell their buildings frequently, makes it difficult for public agencies to see patterns, or even recognize that they are dealing with the same people.
The Smith case is a strong example. Figure 6 shows the owners’ large holdings and web of limited liability companies. Outlined in red are all of the times that the owners had been placed in the city’s slum housing task force, unbeknownst to city officials that they were repeatedly reacting to the same owners. These owners and other “flippers” would often sell the building before the issues were resolved. Everyone involved, including City officials, tenant organizers, attorneys and tenant leaders, learned a lot from this example and has since adjusted all of our strategies.
30 S h a m e o f t h e C i t y : S l u m H o u s i n g a n d t h e C r i t i c a l T h r e a t t o t h e H e a l t h o f L . A . C h i l d r e n a n d F a m i l i e s
5.3.2. Hoarders
A smaller group of slumlords do their business the old-fashioned way. They acquire a building, collect rents, defer maintenance and use the rents instead to make down- payments on additional buildings. They do not necessarily have a complex ownership structure. Figure 7 illustrates how, unlike their flipper counterpart, a hoarder owns a number of properties under a small handful of ownership entities. Their skill lies in evading the highest level of public scrutiny with superficial repairs and appearing to cooperate with city officials, by hiring tenants to do some work, and managing relationships in this manner.
Figure 8 shows a typical inspection record for a typical “hoarder” who has managed to wait out repeated inspections by simply not being present. A real and present danger is that given the current inflated market, these owners will begin to start “flipping” their buildings, earning exorbitant and undeserved profits, and displacing literally thousands of tenants without ever making a reasonable repair. 5.3.3 IncompetentsThere are people who simply should not be in the real estate business. They may have bought a building as an investment or inherited property, and then simply cannot do a professional job and refuse to hire professional managers. These property owners are frequently cited by the City and in general, eventually, comply. There are those, however, who simply refuse, and these are included in the slumlord class. Because they are not clever business people like the “flippers” and “hoarders,” they are the most likely to be brought to justice by the system.
For example, Mrs. Mendoza inherited a building from her husband who passed away and had previously conducted all the management and maintenance on the building. Mrs. Mendoza did not keep the building up to code, and when tenants began complaining she responded with harassment – refusal to make repairs, verbal and physical abuse -- and illegal evictions. When cited by the City, she refused to comply, and the City as well as the tenants took her to court. The building is currently being rehabilitated.
6. Strategies for Change: New Alignment, Policy, and Practice
6.1. Solutions Are Available And Achievable In The Near Term
Today’s slum housing problems are the result of a collision course between a hot real estate market and a thriving criminal class of property owner. The result, however, is a public health crisis that cannot be ignored because it will ultimately impact everyone in the City. Unlike other environmental health issues such as polluted air and water, the AIDS crisis, or global warming, the solutions to slum housing are attainable locally and in the near term. Although seeds of these solutions are already underway within several public agencies and community organizations, these are still disparate, lack coordination, and have divergent priorities.
31S h a m e o f t h e C i t y : S l u m H o u s i n g a n d t h e C r i t i c a l T h r e a t t o t h e H e a l t h o f L . A . C h i l d r e n a n d F a m i l i e s
With these facts in mind, our call for new alignment, policy and practice includes:
1. Improve health and housing.
a. There are thousands of people who live in Los Angeles who now have chronic diseases that were caused by slum housing and which are sustained by slum housing. L.A.’s children and families must be brought back to health through effective and coordinated health interventions by medical professionals, community-based organizations, and slum enforcement agencies.
b. Slum housing conditions must be corrected with the same urgency that health symptoms should be treated.
2. Prevent displacement.
a. It is absolutely imperative that Los Angeles improves housing and health conditions without displacing the people who have been suffering for all these years. There is no benefit to be gained if buildings are repaired, only to result in people’s lives and communities being destabilized.
3. Fix the broken system.
The only way to correct the public health crisis created by our current slum housing problem is to change the behavior of slumlords, which is completely controlled by a business model that maximizes profits at the expense of human health and human rights. To accomplish this, we must engage in:
a. Protecting and increasing the affordable housing stock in Los Angeles. At the risk of stating the obvious, if there were an adequate supply of affordable housing for all in Los Angeles, low income people would no longer provide a sheltered market for criminal slumlords.
b. Reimburse medical providers for environmental health services and treatment.
c. Unprecedented enforcement of health and housing laws and unprecedented levels of penalties for non-compliance, particularly in the case of criminal, repeat violators. It is essential that these property owners – the unrepentant, worst of the worst – finally pay the costs of the damage they inflict on our City. These penalties, in turn, can help pay for the stepped up enforcement program.
32 S h a m e o f t h e C i t y : S l u m H o u s i n g a n d t h e C r i t i c a l T h r e a t t o t h e H e a l t h o f L . A . C h i l d r e n a n d F a m i l i e s
d. Increased health testing by enforcing and ensuring compliance with California State regulations requiring that all children ages one and two are assessed for risk of lead poisoning, and given a blood lead test when risk is identified. Ensure that medical professionals inform families about environmental risks to their children’s health.
e. Unprecedented alignment of government health and housing agencies and community-based organizations. This has been improving over the years, beginning with collaboration at the grassroots level, such as the Better Neighborhoods, Same Neighbors collaborative, and increased collaboration with public officials. In light of the current crisis, this process of alignment must be accelerated across public and non-profit, health and housing, organizing and legal sectors, in order to have a meaningful impact on the problem.
f. A vigilant criminal justice strategy that attacks the criminals, not the victims. With so many people’s health at stake, we must abandon specious arguments that “tenants cause slum housing,” and that organizers and health promoters who are invited to people’s homes are “trespassers.” We need to look at the health evidence, the business practices, and the resulting slum conditions and dismiss the tired argument that slumlords who own scores of buildings which have been strip-mined of their equity cannot afford to make repairs. Los Angeles can no longer afford to house its current booming slumlord industry.
Within these areas there are clear roles for the different players, which, if aligned, can make a world of difference. Here are some examples.
County Department of Public Health and Department of Public Health Services can adopt and promote the use of medical evidence forms and collect data on obvious housing induced health problems. If this data were collected, analyzed and made available to the public, the issues framed in this paper will have that much more resonance.
City Attorneys could then access legitimate findings from the County’s on-going collection of medical evidence to help build their cases, and make the necessary links for housing induced health problems. Health promoters and tenant organizers would also be able to benefit from the County’s collaborative work and associate their knowledge with the knowledge of health experts at a higher level.
Community organizations can adopt the Better Neighborhoods, Same Neighbors approach by reaching out across sector barriers to form partnerships between health, housing, and community organizations who share the same client base. The model works, but it cannot solve the problem without scale – that requires a level of replication and supportive public policy that turns our protocols into norms rather than exceptions.

33S h a m e o f t h e C i t y : S l u m H o u s i n g a n d t h e C r i t i c a l T h r e a t t o t h e H e a l t h o f L . A . C h i l d r e n a n d F a m i l i e s
Doctors can become healthy homes advocates who educate their patients about slum housing induced illnesses and conditions. A letter from a doctor accompanying a housing complaint is one strategy that St. John’s Dr. Weekes has employed (see Appendix C). And all doctors can adopt the Better Neighborhoods zero-tolerance for lead in children’s blood.
Tenants can get to know their local tenants rights organizations – we can provide a list. They need to remember that almost all slumlords have attorneys, while almost all low-income tenants do not. The playing field is not equal by any stretch of the imagination. However, all of L.A.’s tenant organizations work with attorneys, and some, like ours, work with environmental health experts. Becoming connected to a community-based organization is the first step towards a healthier community.
It is time to reverse the trend. Slumlords, rather than low-income children, need to start paying for the cost of the problem. With shared alignment and renewed commitment, it is currently within our collective means and capacity to eliminate the slum housing threat to public health in Los Angeles and improve the lives and futures of thousands of families and children.
34 S h a m e o f t h e C i t y : S l u m H o u s i n g a n d t h e C r i t i c a l T h r e a t t o t h e H e a l t h o f L . A . C h i l d r e n a n d F a m i l i e s
Acknowledgements:
The Better Neighborhoods, Same Neighbors collaborative would like to thank the following foundations and organizations for their support of this project: The California Endowment, The California Wellness Foundation, Community Action to Fight Asthma, James Irvine Foundation, Liberty Hill Environmental Justice Fund, Marguerite Casey Foundation, and U.S. Department of Housing and Urban Development Healthy Homes Project Funding.
This report is an accumulation of many years of work among the four organizations in the Better Neighborhoods, Same Neighbors collaborative and assistance from many other organizations and individuals. We would like to acknowledge the many years of work from the staffs of St. John’s, Esperanza, SAJE and LA CAN. In addition to the work from the Executive Directors, Jim Mangia, Nancy Halpern Ibrahim, Gilda Haas, Pete White and Becky Dennison, this report would not be possible without the dedicated work of the health promoters, organizers, and researchers who perform the “on-the-ground” face-to-face work among tenants, City and County staffs, and community allies. We would like to thank Davin Corona, Roberto Bustillo, Gloria Serrano, Lidia Castelo, Thelmy Perez, Monic Uriarte, Gabriela Gonzalez, Cesar Anaya, Cindy Huerta, Maria Irene Vargas, Maria Lobos, Alexia Marjorie Aparicio, Consuelo Pernia, Aliria Cardenas, Steve Diaz, Deborah Burton, General Dogon, Linda Valverde, Veronica Doleman, LaVeeta Marbury, Sonya Muniz, Andrea Gibbons, Paige Cowett, Sarah Newman, David Robinson, Jose Esquivel, Gerry Villa and Albert Lowe. We also thank the physicians, medical providers, dentists, therapists, clinic managers, medical assistants, front desk and benefits staff and all the employees of St. John’s Well Child and Family Center for their devotion and service to the poorest residents of Los Angeles.
We would also like to specifically thank Dr. Linda Weekes and Dr. Gary Richwald for lending their knowledge from their many years in working at medical side of ground zero of Los Angeles’ slum housing health crisis. Thanks to Dr. Cheryl Grills, for providing evaluating tools and measures throughout this entire process.
Numerous others have also helped in the creation of this report from answering questions on the public process to providing data; from providing legal support to lending an eye for copy editing. We would like to acknowledge the support from the following organizations and people: Bet Tzedek, Inner City Law Center, Legal Aid Foundation of Los Angeles, Scott Abbott, Jean Armbruster, Elissa Barrett, Angela Beltran, Jim Boller, Manus Boonkokua, Cynthia Chan, Frank Cordova, Michael Duran, Wayne Durand, Everett Emerson, Tai Glenn, Susan Gosden, Andy Guiterrez, Barbara Hairston, Franklin Hall, Betsy Handler, Chris Hatzikian, Marilynn Hildebrandt, John Kaddis, Michelle Kezirian, Cole Landowski, An Le, Henry Marentes, Franklin Macintyre, Mike Mina, Calvin Morris, Hakha Mortezaie, Polo Munoz, Joe Nash, Karin Pally, Maurice Pantoja, Patricia Paterno, Mel Plummer, Linda Ramirez, Wortman Rodney, Linda Samels, Dr. Paul Simon, Barbara Schultz, Grant Sunoo, Brett Terrell, Bonnie Tinoco, Angie Toyota, Yolanda Vera, Valerie Warner, and Tom West.
And special thanks to all of the doctors, nurse practitioners, physician assistants, nurses, clinic managers and medical assistants who work in the poorest neighborhoods of Los Angeles to provide high quality medical care to the children and families of Los Angeles.
35S h a m e o f t h e C i t y : S l u m H o u s i n g a n d t h e C r i t i c a l T h r e a t t o t h e H e a l t h o f L . A . C h i l d r e n a n d F a m i l i e s
Endnotes:
1 Susan Babey, Ying-Ying Meng, E. Richard Brown, Theresa Hastert, “Nearly Six Million Californians Suffer from Asthma Symptoms or Asthma-like Breathing Problems,” (Los Angeles: UCLA Center for Health Policy Research, October 2006), 5. 2 There is a current rash of hantavirus in Los Angeles, possibly due to the increase in slum housing conditions. 3 “Viruses from rats are not easy to diagnose. Doctors must send samples to the CDC and the State. By then the patient may be quite ill -- on a respirator.” Interview with Dr. Linda Weekes. 4 Lead Safe 2010: Strategic Plan to End Childhood Lead Poisoning in Los Angeles County: http://lapublic health.org/lead/projects/CDCelimination, 6. 5 Jacobs, David E. et al., “The Prevalence of Lead-Based Paint Hazards in U.S. Housing,” Environmental Health Perspectives, October 2002, 110:10: A599-606. 6 Standards of care for screening can be found at www.dhs.ca.gov/child lead. 7 American Academy of Pediatrics, “Policy Statement: Lead Exposure in Children: Prevention, Detection, and Management,” Pediatrics, October 2005, 116:4:1036-1045. 8 Richard Canfield, et al, “Intellectual Impairment in Children with Blood Lead Concentrations Below 10 �g per Deciliter,” The New England Journal of Medicine, V. 348:16, April 17, 2003, 1517-1526 9 “Lead Safe 2010: Strategic Plan to End Childhood Lead Poisoning in Los Angeles County: http://lapublic health.org/lead/projects/CDCelimination_intro.pdf pp. 6, 9. 10 The American Medical Association advocates about 30 chelation therapy treatments to rid the body of lead poisoning. A single treatment lasts between two and three hours. Chelation therapy consists of administering, intravenously, ethylenediamine tetra acetic acid (EDTA), a synthetic amino acid. It is most often used in cases of “heavy metal” poisoning, such as lead or mercury. EDTA binds to heavy metals in the blood stream so that they can be excreted in urine. Chelation therapy is an extremely dangerous procedure. It can cause kidney failure (renal tubular necrosis), bone marrow depression (from binding to calcium in the process), shock, low blood pressure, convulsions, cardiac arrythmias (disturbances of regular heart rhythm), allergic type reactions, and respiratory arrest. 11 Los Angeles County Department of Public Health, found at http://lapublichealth.org/lead/reports/leaddata.htm 12 Jim Mangia, St. John’s Well Child and Family Center, 2004. 13 Landrigan, P.J., Schechter, C.B., Lipton, J.M., Fahs, M.C., Schwartz, J., “Environmental Pollutants and Disease in American Children: Estimates of Morbidity, Mortality, and Costs for Lead Poisoning, Asthma, Cancer and Developmental Disabilities,” Environmental Health Perspectives 2002; 110:721-728. 14 Fact sheet developed by California Children’s Asthma Management Program (AMP), 03-04 15 Susan Babey, Ying-Ying Meng, E. Richard Brown, Theresa Hastert, “Nearly Six Million Californians Suffer from Asthma Symptoms or Asthma-like Breathing Problems,” (Los Angeles: UCLA Center for Health Policy Research, October 2006), 5. 16 Controlling Asthma in Los Angeles County: A Call to Action http://lapublichealth.org/mch/CHI/Asthma%20Call%20to%20Action%20-%20Final.pdf 17 Controlling Asthma in Los Angeles County 18 CDC “Mold Prevention Strategies and Possible Health Effects in the Aftermath of Hurricanes and Major Floods,” MMWR 55(RR08), June 9, 2006. 19 Ibid. 20 Ibid. 21 Controlling Asthma in Los Angeles County, 6. 22 Controlling Asthma in Los Angeles County, 6. 23 http://www.ehib.org/papers/Hosp_Cht_Book_2003.pdf, 12 24 Controlling Asthma in Los Angeles County, 6.
36 S h a m e o f t h e C i t y : S l u m H o u s i n g a n d t h e C r i t i c a l T h r e a t t o t h e H e a l t h o f L . A . C h i l d r e n a n d F a m i l i e s
25 Due to ongoing litigation, this is the fictitious name of an actual slum hotel. 26 Near Downtown LA building is a pseudonym. 27 Christine Pelisek, “The Scourge of Skid Row,” L.A. Weekly, October 18, 2006. 28 Joe Miller is a pseudonym used to protect the privacy of the actual tenant. 29 All buildings in Los Angeles constructed before 1978 are subject to the rent stabilization ordinance, which, in addition to limiting rent increases to a specific standard once a year, provides basic protections to tenants including “just cause eviction.” Landlords who own these buildings must register with the city and pay an annual fee, which is partly passed on to the tenants. These fees pay for the SCEP inspection program. 30 Los Angeles averages 2.89 residents per unit, 2000 U.S. Census, found at http://www.census.gov/main/www/cen2000.html. 31 Most slum housing tenants, who are among the lowest income brackets, do not have health insurance. The lower the income, the more likely Californians will be uninsured. Thirty-two percent of adults in families earning the less than the federal poverty line were uninsured all year, as opposed to 4.6% of adults in families earning three times the federal poverty line. Almost 1.5 million California children are uninsured and the uninsured rates are highest in Los Angeles County. Carolyn A. Mendez, Steven P. Wallace, Hongjian Yu, Ying-Ying Meng, Jenny Chia, E. Richard Brown, “California’s New Assembly and Senate Districts: Geographic Disparities in health Insurance Coverage,” UCLA Center for Health Policy Research, May 2003. 32 “Los Angeles County is ‘ground zero’ in the nation’s uninsurance problem. Nearly 2.2 million residents – one in four non-elderly residents (ages 0-64) – lacked coverage during at least some of the year.” Los Angeles’ uninsured represent 36% of all uninsured in California. Los Angeles’ uninsured population included nearly 1.4 million residents who were uninsured all year round.” “The State of Health Insurance in California: Long-Term and Intermittent Lack of Health Insurance Coverage,” UCLA Center for Health Policy Research, pg. 24. 33 Also, in general, slum housing residents are likely to have higher than average direct medical costs for many reasons including higher proportion of tertiary care (including ER) than primary care services, and lack of access to and use of prevention services. 34 “Smoggy Schools, Poor Air Quality Costs Californians more than $521 Million a Year,” Environmental Working Group, http://www.ewg.org/reports/caschoolsozone/part4.php. 35 Landrigan, P.J., Schechter, C.B., Lipton, J.M., Fahs, M.C., Schwartz, J., “Environmental Pollutants and Disease in American Children: Estimates of Morbidity, Mortality, and Costs for Lead Poisoning, Asthma, Cancer and Developmental Disabilities,” Environmental Health Perspectives 2002;110:723. 36 “Children’s Asthma, A Crisis and a Solution for Medi-Cal,” Community Health Works, a partnership of San Francisco State University and City College of San Francisco, www.communityhealthworks.org. 37 Ten year period is used because health costs are in this section for the Near Downtown LA building are projected based on a ten-year treatment plan. 38 Due to on-going legal proceedings, real name of building is not used. 39 The direct medical costs for 19 conditions listed in Table 4 are $1,201,000 for adults and $1,210,000 for children. The total direct amount medical costs are $2,411,000 projected over a ten-year interval. The average amount for each apartment study is approximately $41,000. 40 Based on our contact with families in the Figueroa Corridor, families tend to have a little more than average of 2.89 residents per unit. For one, most units are occupied by families and two; there are very few single units. 41 source: Los Angeles Times, 4/6/07 42 source: Dataquick, 2006 43 One-third of renters in Los Angeles live in overcrowded conditions and 30% of Los Angeles families cannot afford rent on a two bedroom home. (source: Los Angeles Housing Department)
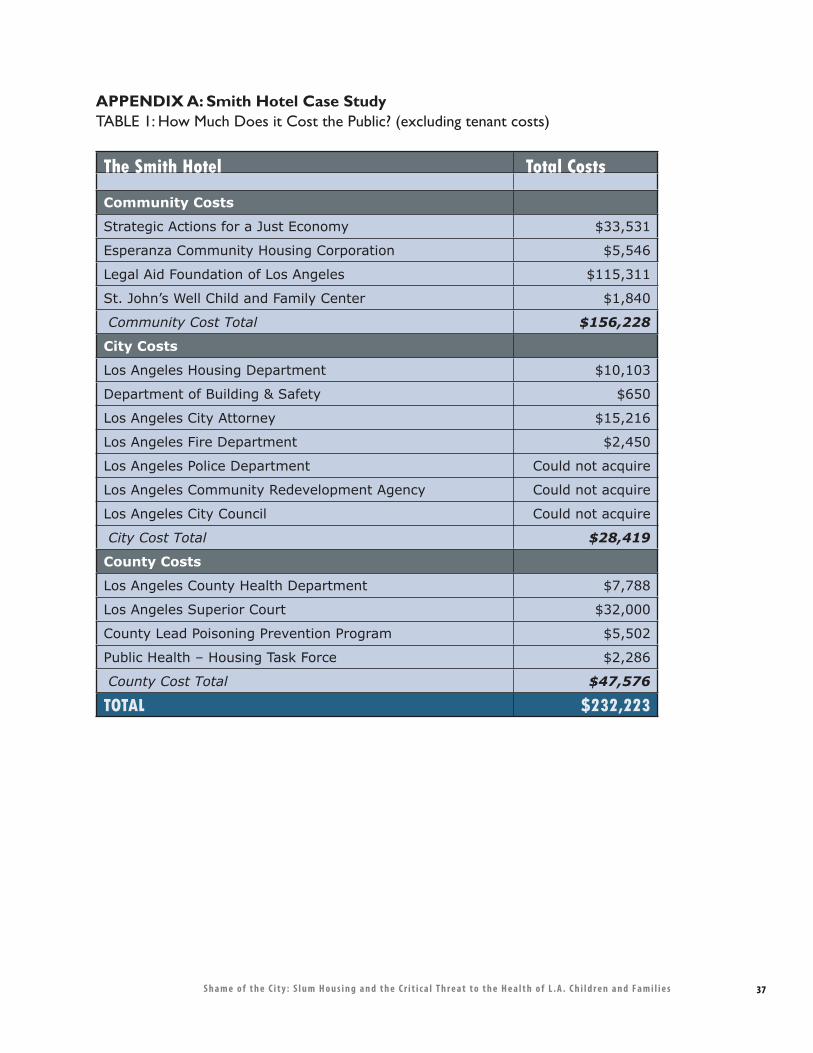
37S h a m e o f t h e C i t y : S l u m H o u s i n g a n d t h e C r i t i c a l T h r e a t t o t h e H e a l t h o f L . A . C h i l d r e n a n d F a m i l i e s
APPENDIX A: Smith Hotel Case StudyTABLE 1: How Much Does it Cost the Public? (excluding tenant costs)
The Smith Hotel Total Costs
Community Costs
Strategic Actions for a Just Economy $33,531
Esperanza Community Housing Corporation $5,546
Legal Aid Foundation of Los Angeles $115,311
St. John’s Well Child and Family Center $1,840
Community Cost Total $156,228
City Costs
Los Angeles Housing Department $10,103
Department of Building & Safety $650
Los Angeles City Attorney $15,216
Los Angeles Fire Department $2,450
Los Angeles Police Department Could not acquire
Los Angeles Community Redevelopment Agency Could not acquire
Los Angeles City Council Could not acquire
City Cost Total $28,419
County Costs
Los Angeles County Health Department $7,788
Los Angeles Superior Court $32,000
County Lead Poisoning Prevention Program $5,502
Public Health – Housing Task Force $2,286
County Cost Total $47,576
TOTAL $232,223
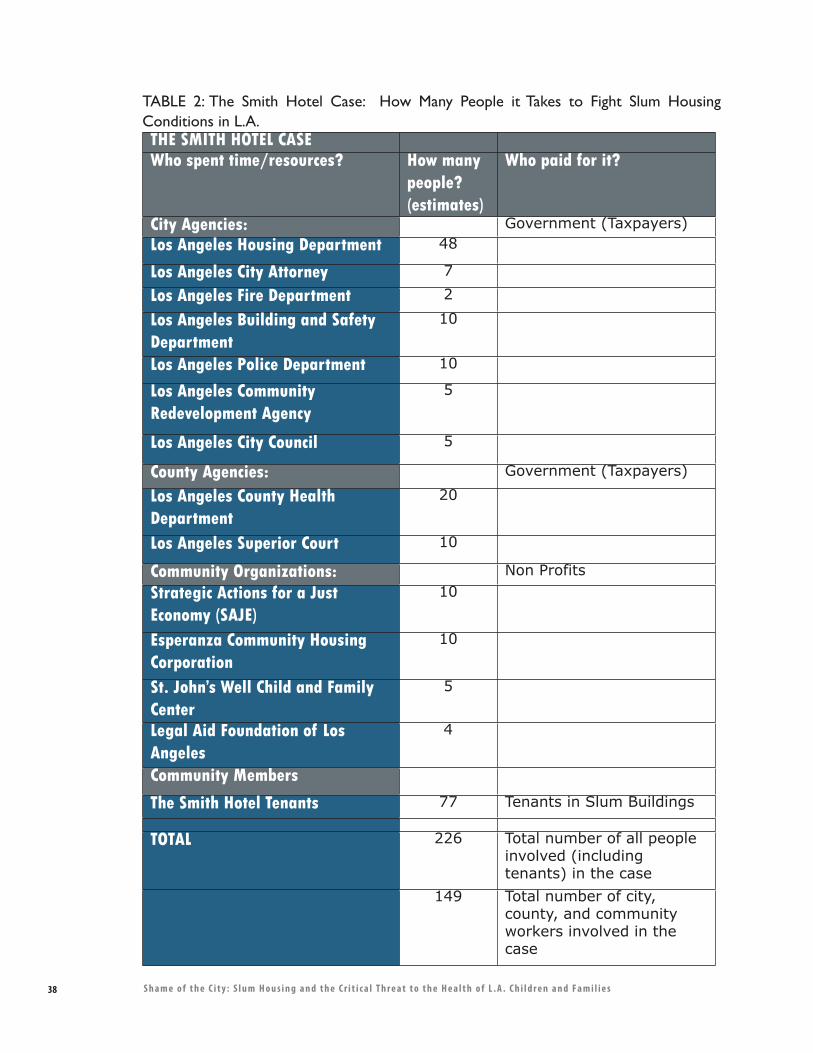
38 S h a m e o f t h e C i t y : S l u m H o u s i n g a n d t h e C r i t i c a l T h r e a t t o t h e H e a l t h o f L . A . C h i l d r e n a n d F a m i l i e s
TABLE 2: The Smith Hotel Case: How Many People it Takes to Fight Slum Housing Conditions in L.A.THE SMITH HOTEL CASEWho spent time/resources? How many
people? (estimates)
Who paid for it?
City Agencies: Government (Taxpayers)Los Angeles Housing Department 48
Los Angeles City Attorney 7
Los Angeles Fire Department 2
Los Angeles Building and Safety Department
10
Los Angeles Police Department 10
Los Angeles Community Redevelopment Agency
5
Los Angeles City Council 5
County Agencies: Government (Taxpayers)
Los Angeles County Health Department
20
Los Angeles Superior Court 10
Community Organizations: Non ProfitsStrategic Actions for a Just Economy (SAJE)
10
Esperanza Community Housing Corporation
10
St. John’s Well Child and Family Center
5
Legal Aid Foundation of Los Angeles
4
Community Members
The Smith Hotel Tenants 77 Tenants in Slum Buildings
TOTAL 226 Total number of all people involved (including tenants) in the case
149 Total number of city, county, and community workers involved in the case
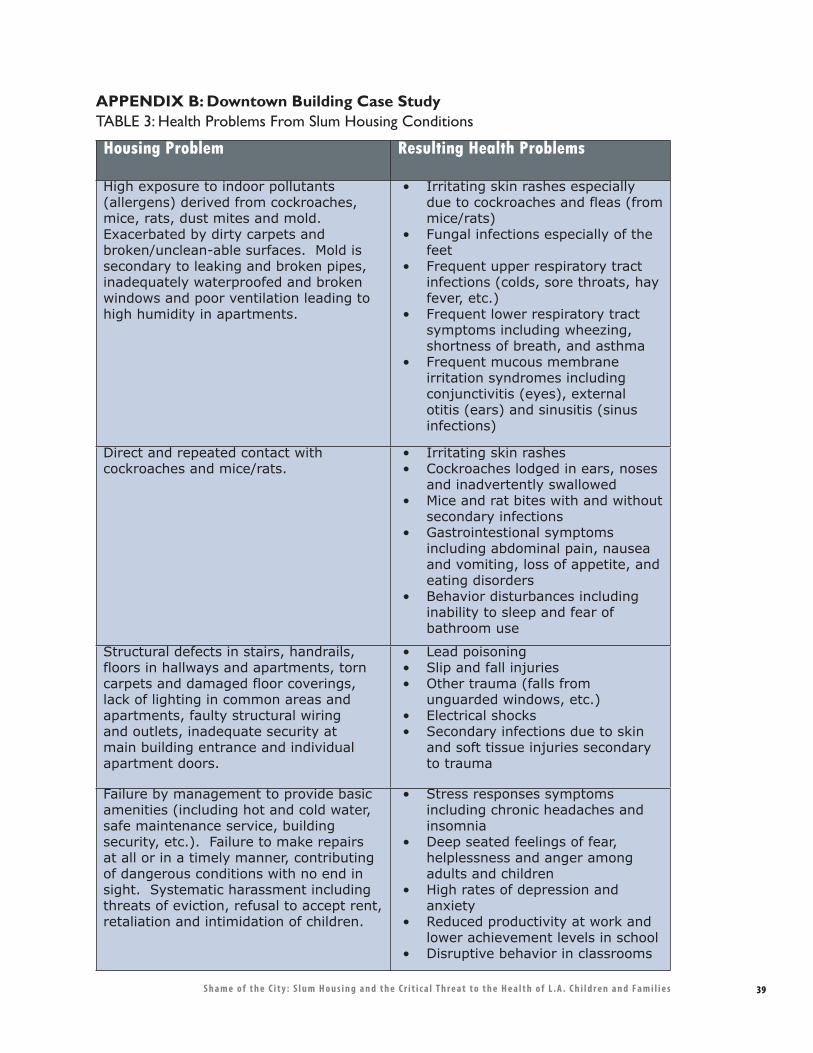
39S h a m e o f t h e C i t y : S l u m H o u s i n g a n d t h e C r i t i c a l T h r e a t t o t h e H e a l t h o f L . A . C h i l d r e n a n d F a m i l i e s
Housing Problem Resulting Health Problems
High exposure to indoor pollutants (allergens) derived from cockroaches, mice, rats, dust mites and mold. Exacerbated by dirty carpets and broken/unclean-able surfaces. Mold is secondary to leaking and broken pipes, inadequately waterproofed and broken windows and poor ventilation leading to high humidity in apartments.
• Irritating skin rashes especially due to cockroaches and fleas (from mice/rats)
• Fungal infections especially of the feet
• Frequent upper respiratory tract infections (colds, sore throats, hay fever, etc.)
• Frequent lower respiratory tract symptoms including wheezing, shortness of breath, and asthma
• Frequent mucous membrane irritation syndromes including conjunctivitis (eyes), external otitis (ears) and sinusitis (sinus infections)
Direct and repeated contact with cockroaches and mice/rats.
• Irritating skin rashes• Cockroaches lodged in ears, noses
and inadvertently swallowed• Mice and rat bites with and without
secondary infections• Gastrointestional symptoms
including abdominal pain, nausea and vomiting, loss of appetite, and eating disorders
• Behavior disturbances including inability to sleep and fear of bathroom use
Structural defects in stairs, handrails, floors in hallways and apartments, torn carpets and damaged floor coverings, lack of lighting in common areas and apartments, faulty structural wiring and outlets, inadequate security at main building entrance and individual apartment doors.
• Lead poisoning• Slip and fall injuries• Other trauma (falls from
unguarded windows, etc.)• Electrical shocks• Secondary infections due to skin
and soft tissue injuries secondary to trauma
Failure by management to provide basic amenities (including hot and cold water, safe maintenance service, building security, etc.). Failure to make repairs at all or in a timely manner, contributing of dangerous conditions with no end in sight. Systematic harassment including threats of eviction, refusal to accept rent, retaliation and intimidation of children.
• Stress responses symptoms including chronic headaches and insomnia
• Deep seated feelings of fear, helplessness and anger among adults and children
• High rates of depression and anxiety
• Reduced productivity at work and lower achievement levels in school
• Disruptive behavior in classrooms
APPENDIX B: Downtown Building Case StudyTABLE 3: Health Problems From Slum Housing Conditions
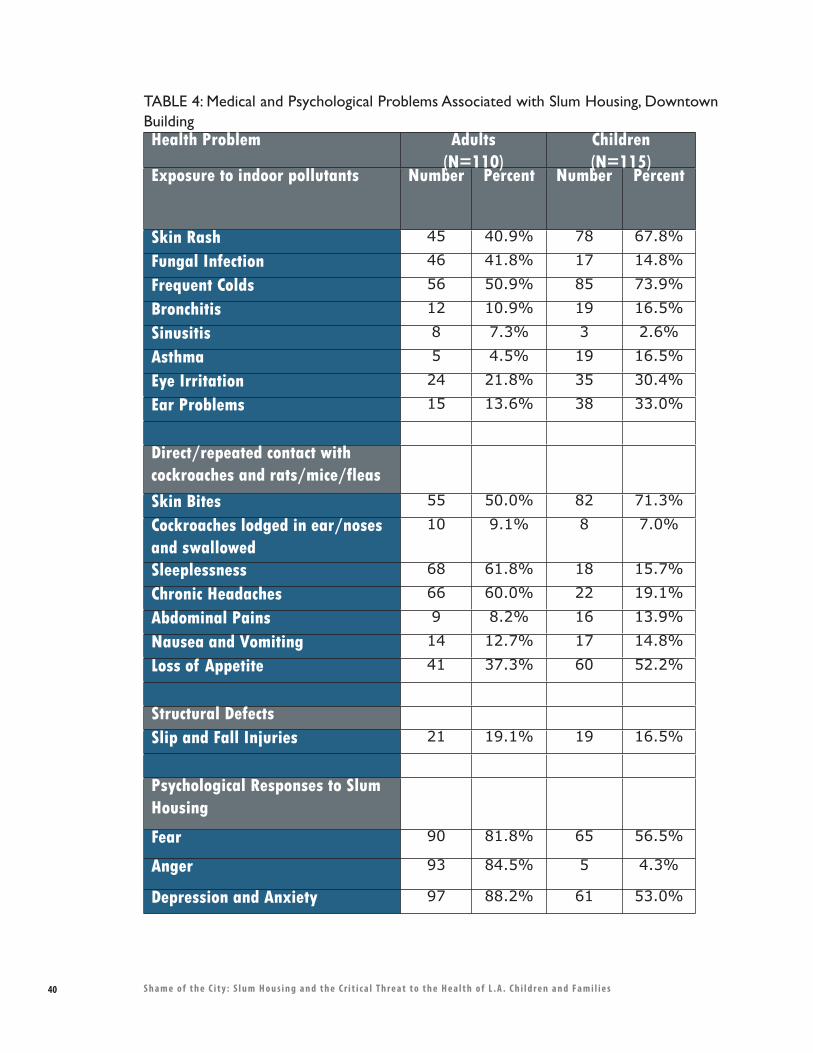
40 S h a m e o f t h e C i t y : S l u m H o u s i n g a n d t h e C r i t i c a l T h r e a t t o t h e H e a l t h o f L . A . C h i l d r e n a n d F a m i l i e s
TABLE 4: Medical and Psychological Problems Associated with Slum Housing, Downtown BuildingHealth Problem Adults
(N=110)Children(N=115)
Exposure to indoor pollutants Number Percent Number Percent
Skin Rash 45 40.9% 78 67.8%
Fungal Infection 46 41.8% 17 14.8%
Frequent Colds 56 50.9% 85 73.9%
Bronchitis 12 10.9% 19 16.5%
Sinusitis 8 7.3% 3 2.6%
Asthma 5 4.5% 19 16.5%
Eye Irritation 24 21.8% 35 30.4%
Ear Problems 15 13.6% 38 33.0%
Direct/repeated contact with cockroaches and rats/mice/fleas
Skin Bites 55 50.0% 82 71.3%
Cockroaches lodged in ear/noses and swallowed
10 9.1% 8 7.0%
Sleeplessness 68 61.8% 18 15.7%
Chronic Headaches 66 60.0% 22 19.1%
Abdominal Pains 9 8.2% 16 13.9%
Nausea and Vomiting 14 12.7% 17 14.8%
Loss of Appetite 41 37.3% 60 52.2%
Structural Defects
Slip and Fall Injuries 21 19.1% 19 16.5%
Psychological Responses to Slum Housing
Fear 90 81.8% 65 56.5%
Anger 93 84.5% 5 4.3%
Depression and Anxiety 97 88.2% 61 53.0%
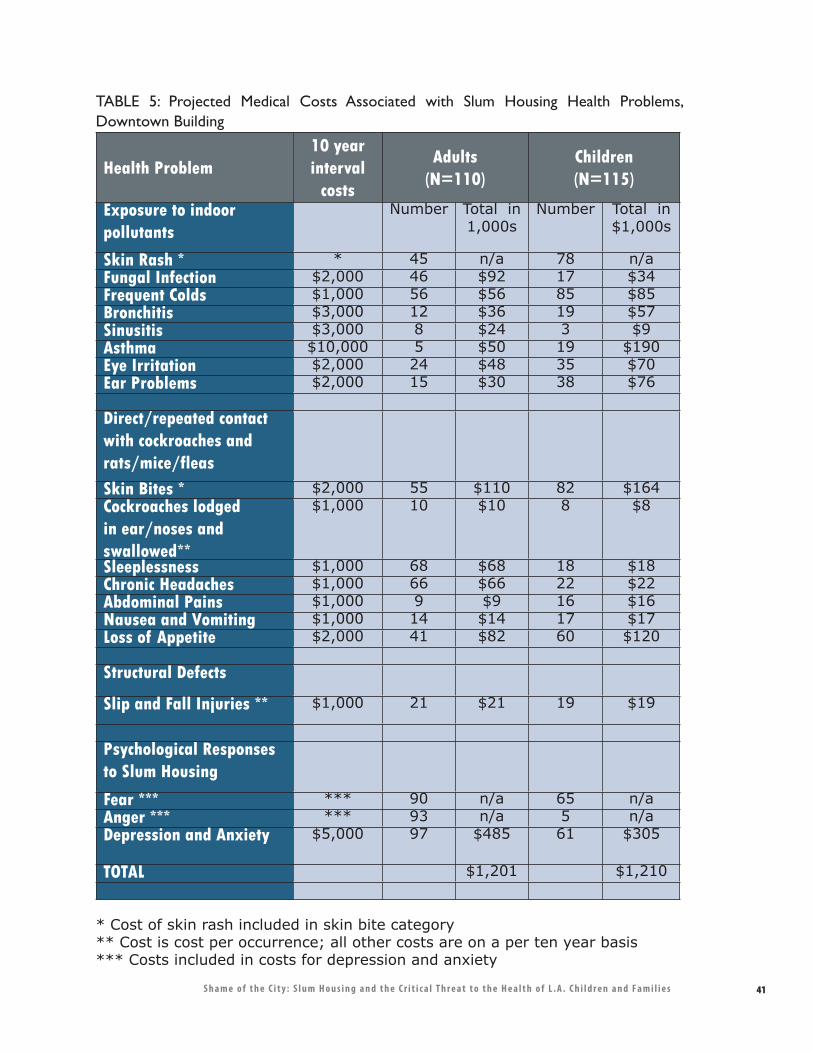
41S h a m e o f t h e C i t y : S l u m H o u s i n g a n d t h e C r i t i c a l T h r e a t t o t h e H e a l t h o f L . A . C h i l d r e n a n d F a m i l i e s
TABLE 5: Projected Medical Costs Associated with Slum Housing Health Problems, Downtown Building
Health Problem10 year interval
costs
Adults(N=110)
Children(N=115)
Exposure to indoor pollutants
Number Total in 1,000s
Number Total in $1,000s
Skin Rash * * 45 n/a 78 n/aFungal Infection $2,000 46 $92 17 $34 Frequent Colds $1,000 56 $56 85 $85 Bronchitis $3,000 12 $36 19 $57 Sinusitis $3,000 8 $24 3 $9 Asthma $10,000 5 $50 19 $190 Eye Irritation $2,000 24 $48 35 $70 Ear Problems $2,000 15 $30 38 $76
Direct/repeated contact with cockroaches and rats/mice/fleas
Skin Bites * $2,000 55 $110 82 $164 Cockroaches lodged in ear/noses and swallowed**
$1,000 10 $10 8 $8
Sleeplessness $1,000 68 $68 18 $18 Chronic Headaches $1,000 66 $66 22 $22 Abdominal Pains $1,000 9 $9 16 $16 Nausea and Vomiting $1,000 14 $14 17 $17 Loss of Appetite $2,000 41 $82 60 $120 Structural Defects
Slip and Fall Injuries ** $1,000 21 $21 19 $19
Psychological Responses to Slum Housing
Fear *** *** 90 n/a 65 n/aAnger *** *** 93 n/a 5 n/aDepression and Anxiety $5,000 97 $485 61 $305
TOTAL $1,201 $1,210
* Cost of skin rash included in skin bite category** Cost is cost per occurrence; all other costs are on a per ten year basis*** Costs included in costs for depression and anxiety

42 S h a m e o f t h e C i t y : S l u m H o u s i n g a n d t h e C r i t i c a l T h r e a t t o t h e H e a l t h o f L . A . C h i l d r e n a n d F a m i l i e s
APPENDIX C: St. John’s FormsSt. Johns Medical Evidence Form
Medical Evidence Form
Patient information: Date: Name: DOB: � Female �MaleChart #: Blood Lead Levels: Diagnosis: � Asthma � Hypertension � Skin Disease � Stress/Depression
Parent/Child Information: Does anyone in the home smoke? � Yes � No Is the child exposed to second hand smoke? � Yes � No
Environmental History: Do you live next to or near a freeway? � Yes � No
� Which freeway? Do you live near a construction site? � Yes � No
Is your home being repaired or new construction?
� Yes � No � Now � Recently
Which of the following do you have in your home?
� Air Conditioner � Wood Stove � Fireplace � Central Heating � Air Purifier � Humidifier � Gas Stove � Electric Stove � Kitchen � Hot Water
Is there a strong (bad) smell in your home? � Yes � No Are pesticides or herbicides used in your home, garden or on pets?
� Yes � No
Have you ever been bitten by or have in your home:
� Roaches � Yes � No � Rats or mice � Yes � No
Do you have pets? � Yes � No Type:Do you have mold in your home? � Yes � No Do you have leaking pipes? � Yes � No Does your home have a lot of dust? � Yes � No Do you have any rusting pipes? � Yes � No Do you have chipping or pealing paint? � Yes � No
Health:# of missed schools days due to asthma # # of doctor visits due to asthma attacks # # of emergency room visits due to asthma # Provider comments/remarks (including referrals made or action taken):
Provider Signature Date
43S h a m e o f t h e C i t y : S l u m H o u s i n g a n d t h e C r i t i c a l T h r e a t t o t h e H e a l t h o f L . A . C h i l d r e n a n d F a m i l i e s
515 West 27th Street Los Angeles, CA 90007 (213) 749-XXXX Fax (213) 749-XXXX
Dear Landlord,
A child’s environment has a major impact on their physical, mental, biological and social health. So it is very important that exposure to cockroaches, molds, nitrogen oxides, radon, asbestos, rodents carbon monoxide, lead, and dust mites be eliminated.
Prevention strategies include removing mold, controlling rodents and roaches, moisture control, fixing leaking pipes or faucets, fixing gas-fuel cooking stoves and space heaters and getting rid of leaded paint in older buildings.
The above pollutants are documented to cause Mental Retardation, Asthma, Anemia, Chronic Lung Disease, ear infections, skin infections, and in the case Carbon Monoxide and radon death.
So in advance, I am thanking you for correcting the environmental hazards in your housing units. These corrections will go a long ways to ensure that the children will grow up in a healthy environment and reduce their incidence of disease and death.
I sincerely thank you for your concern in this matter. The children will appreciate it.
Sincerely,
Linda Tigner-Weekes, M.D. Chief Medical Officer Pediatrician
APPENDIX C: St. John’s FormsLetter from Dr. Weekes to Slumlords

44 S h a m e o f t h e C i t y : S l u m H o u s i n g a n d t h e C r i t i c a l T h r e a t t o t h e H e a l t h o f L . A . C h i l d r e n a n d F a m i l i e s
������������� �
�������������� ������ ��������������� ���������������������������������� ������������������������������� ����������������������� ������� �������!!�"����!�������������������#��� ����
���� ������� ��������������� ��� ���� ���� ����������"����$�����������%$������#��"��"�����%��#�������������!!�"��&��&���#��������%
�� ����� ���
���&���#������������������������������!����&�&���������������'����������!�������'����������"���������&����(������������)&�����*� ���������������������+����������������,��)&�����"�������������!��"�����"��������������������������+!�!���������������,-������������������(����'���������������������"��������(������������&�����������������������!�������(����)&�����*�.��������������������������/��!�������)&�����-��#�(��-���������!����������/��!���������"�������&�����'�"�����������������'��������"��(�������&��������������&�������������������������������*
���&����"����-�!����#�������&���������)&��������������-�&��&���#����������)&�����"�
��"�������!��0���"���!�����������"/���"������������!������"�������(�"��
1���������-�'������&������2�����&�����������-�(����������"�����������'������&�"�������/��!�!!�"����&������&�����������������(���&����-��������2������!!�"����!�#�"���������/��#�*� ���-������)&����������������!���(�����&���������!�����������������!�������)&������*�����(�������#��"����"���������������"���"��������'����&�����������!��"����������������"�����'�������������/���"���(����������������������"����������������!��"�����"������������������&��&�����������!!�"��*����)��������#�"��������������������/��#�*
��� ������ ����
.����"����-������������"����"���!�������������������!�������#�������#�"������"������&���&���������-����&����"����������"����-�������&���-����������&�"����*�������"�&��'�������(������-�����!����������"��������"��������&��������!�#������-�'������������-�"������������-�����"���-&����"������������������3����������������*���������&���������������������"������#���#����&����'���(����'������!��#��'����"���������������������&��������(����'��-��������&���������������#�����������*������!���������������"�������������"��������"������������#������&����(����������(��������!��������*����'���"�&��������"��������������!�����������'���"��&���-����������'�����"���������'����"��(��+���!��#2�������,������!��"����-������-������&����"������*
�(����"���!�'���"������!��������������'�������!���
4�������������&�"�!�"�'���"�����&�����&����(�����5���"���(��������(����+5 6,5���"����'��&��������"����&����
�����7�������!��������������"������#����������"����&���������"���������'�����������������"����������������������+�84,-�&������-��������������-����������*�������������������!������������""��&�����*����������"�����&�����&���������(������-��)&�������������������"���������������������"
����������������������� ���������������!���������.�������(�����
6�����&����������������-��"��'���99�-�:;;<*��&33###*�&�*��(3;=������������3�!!�"��*���
������������ ����� ������ ������������������������������ ����������������� ��������������� �!�"#��������� � � �����������
$���% $�&%�&"$"�$"�#'��(
ATTACHMENT G
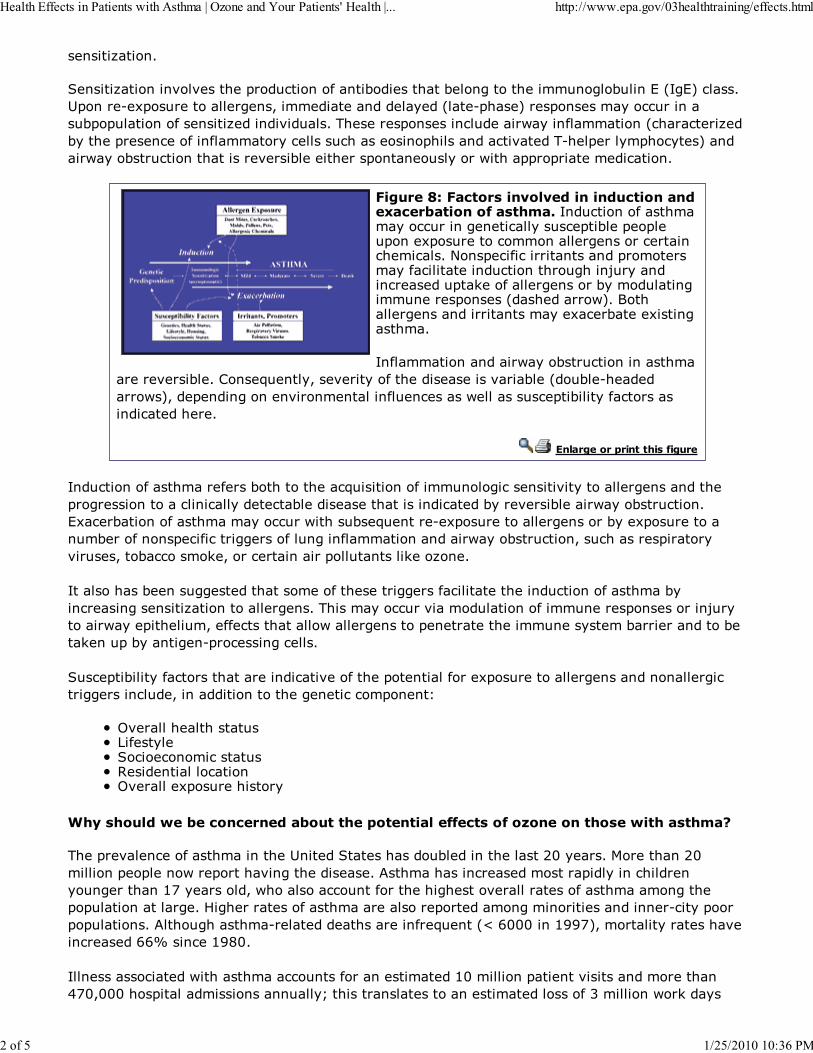
�������������*
����������������(��(������&����"������!�����'����������'���������������������'�������+���,�"����*>&�����2�)&������������������-�����������������������+����2&���,����&�����������""���������'&�&���������!����������������(������*���������&��������"��������#�����!����������+"���"�������'�����&�����"���!���!����������"�������"����������&���������"��(������2��&������&�"����,�������#����'����"��������������(����'����������&���������������#����&&��&����������"�����*
�!����"#� �� ��������������������� ��������$����%� ��������� ���&�����"������!�����������""������������"��������"�&��'���&��&���&����)&���������"�������������������"������"���"���*�?���&�"�!�"���������������&������������!�"������������"�������������7���������"��������&��/���!��������������'����������������������&������+����������#,*�5�������������������������������)�"��'�����)�����������*
��!�����������������#����'����"�������������������(����'��*�.����0������-���(�������!���������������(����'���+���'��2���������#�,-���&������������(�������������!����"������#����������"�&��'������!�"�����������"��������*
������!�����'��� � ������!���
����"������!���������!����'����������"0����������!�����������"��������(�����������������������&����������������"����"���������"��'����������������������"�����'����(����'������#����'����"����*�)�"��'�������!������������""���#�����'��0�������2�)&����������������������'���)&�������������'����!�����&�"�!�"�����������!��������!�����������������#����'����"����-���"�������&�������(������-���'�""�����/�-����"�����������&������������/�������*
�����������'������������������������!���������������!�"���������������"������!�������'���"����������������������������������*����������""���(���������������!�����������&�����������7���������#����&�������-��!!�"�����������#��������������&��������������������������'��������������'���/����&�'���������2&��"�������"����*
���"�&��'������!�"�����������������"���(���!����&���������!����)&���������������������������������"�����������"����-�������������������������"�"��&�����
�(�����������������6�!��������"���"�����"���������������������"������(�������)&������������
�������������%�������������%�� � ���'� �� ��������� �������������� ������� ���� ����
���&��(����"���!�������������>�������������������'���������������:;������*�4��������:;��������&��&�����#���&�����(��������������*� ����������"��������������&��������"������������������9<����������-�#��������""�����!�������������(�������������!���������������&�&����������������*��������������!������������������&��������������������������������2"����&���&�&��������*� �����������2��������������������!��0�����+@�A;;;����9BB<,-������������������(���"�������AAC����"��9BD;*
������������"������#����������""������!����������������9;���������&�������(������������������E<;-;;;���&������������������������F��������������������������������������!�=���������#��/�����
������������ ����� ������ ������������������������������ ����������������� ��������������� �!�"#��������� � � �����������
&���% $�&%�&"$"�$"�#'��(
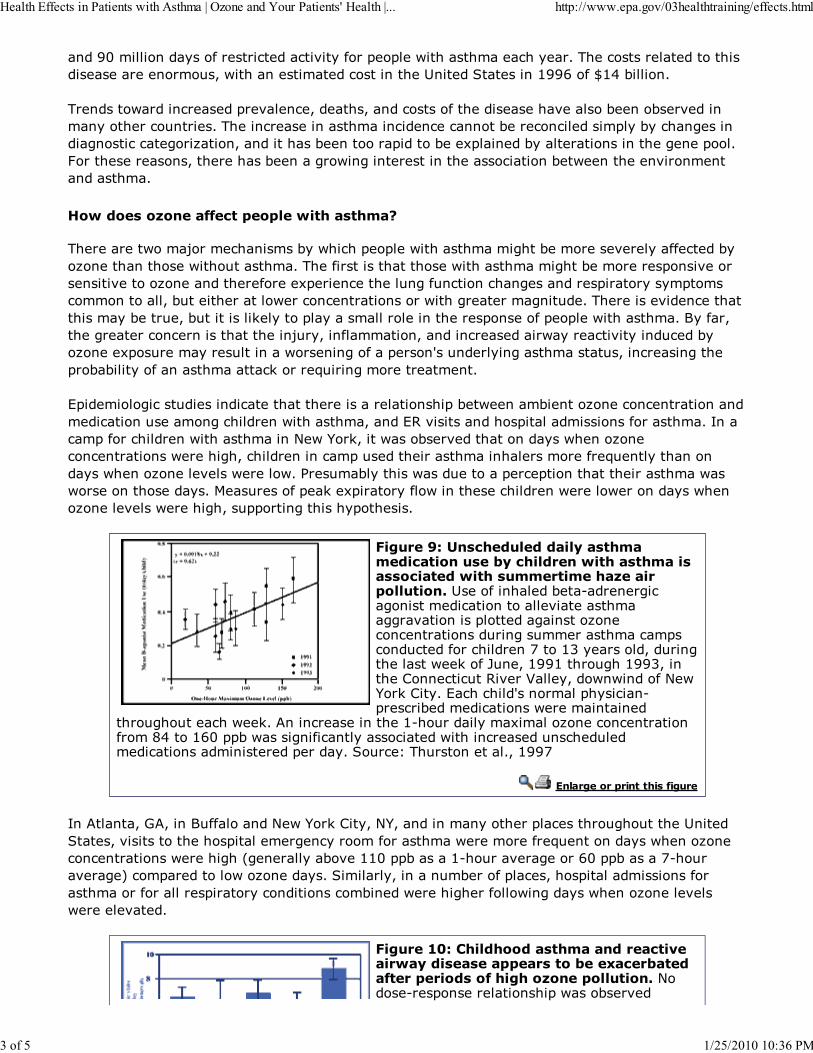
����B;���������������!�������"�����"��(����!���&��&���#�����������"�����*����"���������������������������������������-�#����������������"����������>����������������9BBA��!�G9E�'������*
���������#������"�������&��(����"�-������-�����"������!�������������(�������'�����'���(���������������"��������*������"�����������������"����"��"������'����"��"��������&���'��"�����������������"�"�������������-�����������'����������&������'���)&�������'�������������������������&���*1���������������-���������'���������#�����������������������"�������'��#���������(�����������������*
�������������������� �'��'����� ���� ����
����������#����7�����"�������'��#�"�&��&���#��������������'���������(�������!!�"����'����������������#�����������*����!�����������������#��������������'����������&����(�����������(�������������������!�����)&�����"����������!��"�����"�������������&�����������&����"������������-�'��������������#���"��"��������������#��������������������*����������(����"�������������'������-�'�����������/�������&��������������������������&������!�&��&���#��������*�5��!��-�����������"��"����������������7���-���!���������-�������"����������#������"��(��������"���'��������)&����������������������#����������!���&����� �������������������������-���"����������&��'�'�������!��������������"/������0���������������������*
�&����������"�������������"����������������������������&�'��#������'�����������"��"�����������������"����������������"�������#��������-��������(������������&����������������!��������*�����"��&�!���"�������#������������?�#����/-����#����'���(���������������#��������"��"�����������#������-�"����������"��&������������������������������!��0������������������#�����������(����#������#*��������'�������#������������&��"�&��������������������#��#�����������������*�4���������!�&��/��)&��������!��#���������"�������#������#�����������#����������(����#������-���&&������������&������*
�!����(#�)������������������ ��������� ��������%������������ ���� ������������� ����� �������� ������������'���� ���&�>����!��������'���2���������"������������"�������������(���������������(���������&��������������������"��"�������������������������������"��&�"����"����!���"�������<����9=����������-���������������#��/��!�H���-�9BB9�������9BB=-������.����"��"�����(���I�����-���#�#�����!�?�#���/�.���*���"�"��� ���������&���"���2&���"��'�������"�������#��������������
�����������"�#��/*� ����"������������92������������)�����������"��"���������!����DE����9A;�&&'�#��������!�"����������"������#�����"����������"����������"��������������������&������*�����"���������������*-�9BB<
������!�����'��� � ������!���
��� ������-�J -����5�!!��������?�#����/�.���-�?�-������������������&��"���������������>�����������-�(��������������&������������"�������!���������#���������!��0�������������#��������"��"�����������#�������+�����������'�(��99;�&&'������92�����(���������A;�&&'������<2����(�����,�"��&����������#�����������*����������-���������'����!�&��"��-���&����������������!�����������!����������&��������"����������"��'�����#���������!����#���������#�����������(���#�������(����*
�!����*+#�,����������� ������������ ������������������''����� ��%���$����%� ���� ���'������������!��������'���� ���&�?�����2���&���������������&�#����'���(��
������������ ����� ������ ������������������������������ ����������������� ��������������� �!�"#��������� � � �����������
#���% $�&%�&"$"�$"�#'��(
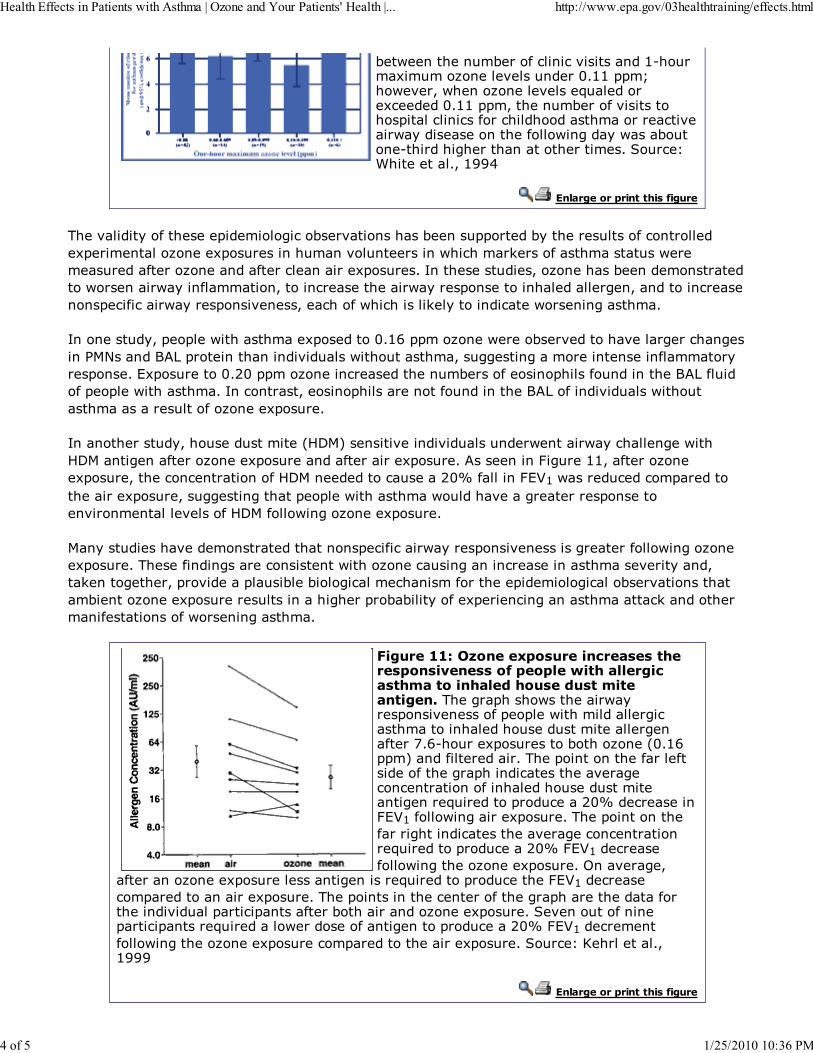
'��#����������'����!�"����"�(����������92�����)�������������(����������;*99�&&�F�#�(��-�#�����������(�����0���������)"������;*99�&&�-�������'����!�(����������&�����"����"��!���"�������������������"��(����#�����������������!����#��������#����'������2���������������������������*�����"�$���������*-�9BBE
������!�����'��� � ������!���
���(���������!�������&����������"��'���(����������'������&&������'��������������!�"����������)&�����������������)&���������������(�������������#�"����/�����!��������������#�������������!���������������!����"����������)&������*����������������-����������'�������������������#���������#�����!���������-������"������������#������&�����������������������-����������"���������&�"�!�"����#������&����(�����-���"��!�#�"������/�����������"����#��������������*
������������-�&��&���#����������)&��������;*9A�&&��������#�����'���(�������(���������"���������4?������5 6�&���������������(�������#�����������-�����������������������������!������������&����*��)&���������;*:;�&&����������"�������������'�����!�������&����!�����������5 6�!�����!�&��&���#��������*����"�������-�������&������������!�����������5 6��!�����(�������#������������������������!��������)&�����*
���������������-����������������+�84,��������(������(������������#�������#���"��������#���84����������!�����������)&�����������!���������)&�����*� ����������1������99-��!����������)&�����-����"��"�����������!��84�����������"�������:;C�!�������1�I9�#�������"���"��&���������������)&�����-����������������&��&���#���������#������(���������������&���������(�������������(�����!��84�!����#�����������)&�����*
4�������������(�����������������������&�"�!�"����#������&����(�����������������!����#����������)&�����*������!������������"����������#���������"������������"�����������������(���������-��/����������-�&��(������&�����'���'������"�����"������!�������&����������"����'���(������������'������������)&������������������������&��'�'�������!��)&�����"�����������������"/�������������!�����������!�#��������������*
�!����**#��������$'���������������� �����'��������������'��'����� �������!���� ���� ������������������� ��� ��� �!��&�������&���#��������#�����&����(�������!�&��&���#���������������"����������������������������������������!����<*A2�����)&����������'���������+;*9A&&�,�����!�����������*����&�����������!�����!�������!�������&�����"���������(�����"��"�����������!��������������������������������0���������&����"����:;C���"��������1�I9�!����#���������)&�����*����&����������!������������"���������(������"��"�����������0���������&����"����:;C�1�I9���"�����!����#��������������)&�����*�����(�����-
�!��������������)&������������������������0���������&����"�����1�I9���"�����"��&����������������)&�����*����&������������"�������!�������&�������������!���������(������&����"�&������!����'������������������)&�����*���(��������!�����&����"�&�������0����������#���������!������������&����"����:;C�1�I9���"������!����#��������������)&������"��&����������������)&�����*�����"��K���������*-9BBB
������!�����'��� � ������!���
������������ ����� ������ ������������������������������ ����������������� ��������������� �!�"#��������� � � �����������
)���% $�&%�&"$"�$"�#'��(

������������� ���
�
������������ ����� ������ ������������������������������ ����������������� ��������������� �!�"#��������� � � �����������
%���% $�&%�&"$"�$"�#'��(
CE Delft
Solutions for
environment
technolog
The Netherlands
tel: +31 15 2150 150
,
economy and
y
Oude Delft 180
2611 HH Delft
fax: +31 15 2150 151
e-mail: [email protected]
website: www.ce.nl
Report
Delft, August 2007
Authors: L.C. (Eelco) den Boer
A. (Arno) Schroten
Traffic noise reductionin Europe
Health effects, social costs and technical and policy options to
reduce road and rail traffic noise
KvK 27251086
CE DelftSolutions for
environment,
economy and
technology
Oude Delft 180
2611 HH Delft
The Netherlands
tel: +31 15 2 150 150
fax: +31 15 2 150 151
website: www.ce.nl
KvK 27251086
e-mail: [email protected]
ATTACHMENT H
Publication Data
Bibliographical data:
L.C. (Eelco) den Boer, A. (Arno) Schroten
Traffic noise reduction in Europe
CE Delft, March 2007
Traffic / Noise / Reduction / Health / Effects / Costs / Technology / Policy / Road /
Railways /
Publication code: 07.4451.27
CE Delft publications are available from www.ce.nl
Commissioned by: T&E Brussels
For further information on this study, contact Eelco den Boer at CE.
© copyright, CE, Delft
CE Delft is an independent research and consultancy organisation specialised in developing structural and
innovative solutions to environmental problems. CE Delfts solutions are characterised in being politically fea-
sible, technologically sound, economically prudent and socially equitable.
CE Delft Solutions for environment, economy and technology
This report is printed on 100% recycled paper.

Preface
Millions of people in Europe are affected by transport noise. Transport noise an-
noys people, causes stress and illness and may sometimes even have a fatal
impact. As a result, noise is very costly to society.
There are numerous cheap and relatively easy ways to reduce transport noise
significantly. First of all, noise should be taken as seriously as other forms of pol-
lution, as it is similarly damaging to human health. This year, 2007, is an impor-
tant one for the future of noise policy. The European Commission is presenting a
proposal for tightening car tyre noise emission limits, and in June 2007 the first
noise maps of large agglomerations, main roads and railways were to be submit-
ted to the Commission under the terms of the Environmental noise directive.
This reports describes the health effects of rail and road transport noise and pre-
sents a number of recommendations as to how to address them.
We would like to kindly thank the people who reviewed this report for their contri-
butions. The comments of Rokho Kim of the WHO and Tor Kihlman of the
Chalmers Institute of Technology were especially helpful in improving the overall
quality of the report. We also thank Nigel Harle for his careful editing of the Eng-
lish.
Eelco den Boer
Arno Schroten

Contents
Summary 1
1 Introduction 3
2 The health effects of traffic noise 5
2.1 WHO Community Noise Guidelines 5
2.2 The relation between noise and human health 6
2.3 Review of health effects 7
2.3.1 Annoyance 7
2.3.2 Sleep disturbance 8
2.3.3 Impaired cognitive functioning 9
2.3.4 Cardiovascular disease 10
2.3.5 Mental illness 11
2.4 Traffic noise especially harmful to vulnerable groups 11
2.5 Over 210 million in EU25 exposed to harmful traffic noise 12
2.6 Health of millions of Europeans affected by traffic noise 13
2.7 Effects on animals and ecosystems 19
3 The social costs of traffic noise 21
3.1 Valuing the health effects of traffic noise 21
3.2 Social cost of traffic noise in EU22 over € 40 billion a year 21
3.3 Passenger cars and lorries responsible for bulk of costs 23
3.4 Benefits of noise reduction 23
4 Noise reduction options 25
4.1 At-source versus end-of pipe measures 25
4.2 Transport noise regulation: the legal framework 28
4.3 Vehicle noise regulation failed 29
4.4 Tyre noise limits too high to be effective 32
4.5 Low-noise road pavements 35
4.6 Speed reduction and traffic management 36
4.7 Anti-propagation measures (noise barriers, insulation) 37
4.8 Rail transport noise 38
4.9 Two-wheeled vehicle noise 40
5 Recommendations for action 43
Literature 45
A Exposure to traffic noise 57
B Social costs for traffic noise 61
C Vehicle noise emission trends 63

Summary
The main conclusions of this report are as follows:
Health effects and social costs � Traffic noise has a variety of adverse impacts on human health. Community
noise, including traffic noise, is already recognised as a serious public health
problem by the World Health Organization, WHO.
� Of all the adverse effects of traffic noise the most widespread is simply an-
noyance.
� There is also substantial evidence for traffic noise disturbing sleep patterns,
affecting cognitive functioning (especially in children) and contributing to cer-
tain cardiovascular diseases. For raised blood pressure, the evidence is in-
creasing. For mental illness, however, the evidence is still only limited.
� The health effects of noise are not distributed uniformly across society, with
vulnerable groups like children, the elderly, the sick and the poor suffering
most.
� In 2000, more than 44% of the EU251 population (about 210 million people)
were regularly exposed to over 55 dB of road traffic noise, a level potentially
dangerous to health. In addition, 35 million people in the EU25 (about 7%)
are exposed to rail traffic noise above 55 dB. Millions of people indeed ex-
perience health effects due to traffic noise. For example, about 57 million
people are annoyed by road traffic noise, 42% of them seriously.
� A preliminary analysis shows that each year over 245,000 people in the EU25
are affected by cardiovascular diseases that can be traced to traffic noise.
About 20% of these people (almost 50,000) suffer a lethal heart attack,
thereby dying prematurely.
� The annual health loss due to traffic noise increased between 1980 and 2000
and is expected to increase up to 2020. In contrast, traffic safety has im-
proved, following implementation of a variety of policy measures.
� At a conservative estimate, the social costs of traffic noise in the EU222
amount to at least € 40 billion per year (0.4% of total GDP). The bulk of these
costs (about 90%) are caused by passenger cars and lorries.
Noise reduction options � If noise-related problems are to be alleviated, they must be the subject of
greater political focus. Vehicle noise emission limits have not been technol-
ogy-forcing since their introduction and were last tightened in 1995. This
means these limits have not been updated for twelve years, in stark contrast
to vehicle air pollution emission standards, which have been tightened three
times over the same period.
� Consequently, there has been no reduction in community exposure to noise.
This is due to the lax limits in the EU Motor vehicle sound emission directive
1 EU25 refers to EU27 except Cyprus and Malta.
2 EU22 refers to EU27 except Cyprus, Estonia, Latvia, Lithuania and Malta.
4.451.1/Traffic noise reduction in Europe
August 2007
1
and the Tyre/road directive, the fact that changes in test conditions have in
practice led to even weaker limits, and increased traffic volumes.
� There is plenty of scope for reducing ambient noise levels by at least 3-4
dB(A) in the short term using currently available technology. Beyond 2012,
year-on-year improvement targets (x dB(A) every y years) should be intro-
duced, outlined well in advance to give industry time to adapt.
� In the case of both road and rail traffic, there are already vehicles/rolling stock
available that are well within current noise standards. Besides the vehicles
themselves, examples of silent tyres/wheels and road pavements/tracks show
also room for noise reduction. At noise ‘hotspots’ additional, local measures
can be implemented.
� The most cost-effective measures are those addressing the noise at-source.
This includes noise from the engine, exhaust, mechanical systems and con-
tact between tyres and road, or wheels and track. The associated costs are
generally limited, for vehicles and tyres at least. There are signs that use of
composite brake blocks on rail wagons also comes at a modest cost.
� Although an optimal noise control regime will always be a mix of local and at-
source measures, the Commission should take responsibility for ensuring that
the noise emissions of cars, tyres and railways are reduced significantly.
These are the most cost-effective measures and their impact will be felt
across Europe.
� When it comes to tightening noise standards and improving test procedures,
prolonged discussions and political procedures are costing Europe dearly. If
the EU does not come up with better policies soon, local measures will need
to be taken, which are considerably more expensive than measures taken
across the EU.
4.451.1/Traffic noise reduction in Europe
August 2007
2
1 Introduction
Noise pollution consistently ranks high on the list of citizens’ concerns. It is esti-
mated that over half of Europe’s population is exposed to unacceptable noise lev-
els. Noise from road transport is the major source, followed by aircraft and rail-
way noise. In its 6th Environmental Action Programme (2002-2012) the EU has
set itself the objective of substantially reducing the number of people regularly
affected by long-term average levels of noise. The aim of reducing noise expo-
sure to acceptable levels has been repeated in the renewed Sustainable Devel-
opment Strategy as well as in the transport White paper and its mid-term review.
Despite all efforts in this direction, however, EU policy does not seem to recog-
nise that noise is first and foremost a major environmental health issue.
Vehicle noise regulation is important, especially in light of growing traffic volumes
and the proximity between transport infrastructure and residential and living ar-
eas. Every doubling of transport intensity increases noise levels by 3 dB(A). Ve-
hicle noise regulation goes back to the 1970s, with tyre/road noise regulation
added in 2001 and thereafter. In their present form, however, both sets of legisla-
tion are too liberal to have had any significant effect and the number of people
exposed to ambient noise has consequently increased rather than declined.
This report highlights the scale and scope of the traffic noise problem, which af-
fects a very substantial proportion of the European populace. It serves as a
background report to a T&E brochure and is based on a thorough literature re-
view. The report covers health effects and social costs, and reviews noise reduc-
tion policies and measures to reduce noise exposure. In conclusion, a number of
recommendations for action are given. The report focuses on road and rail trans-
port.
4.451.1/Traffic noise reduction in Europe
August 2007
3

4.451.1/Traffic noise reduction in Europe
August 2007
4
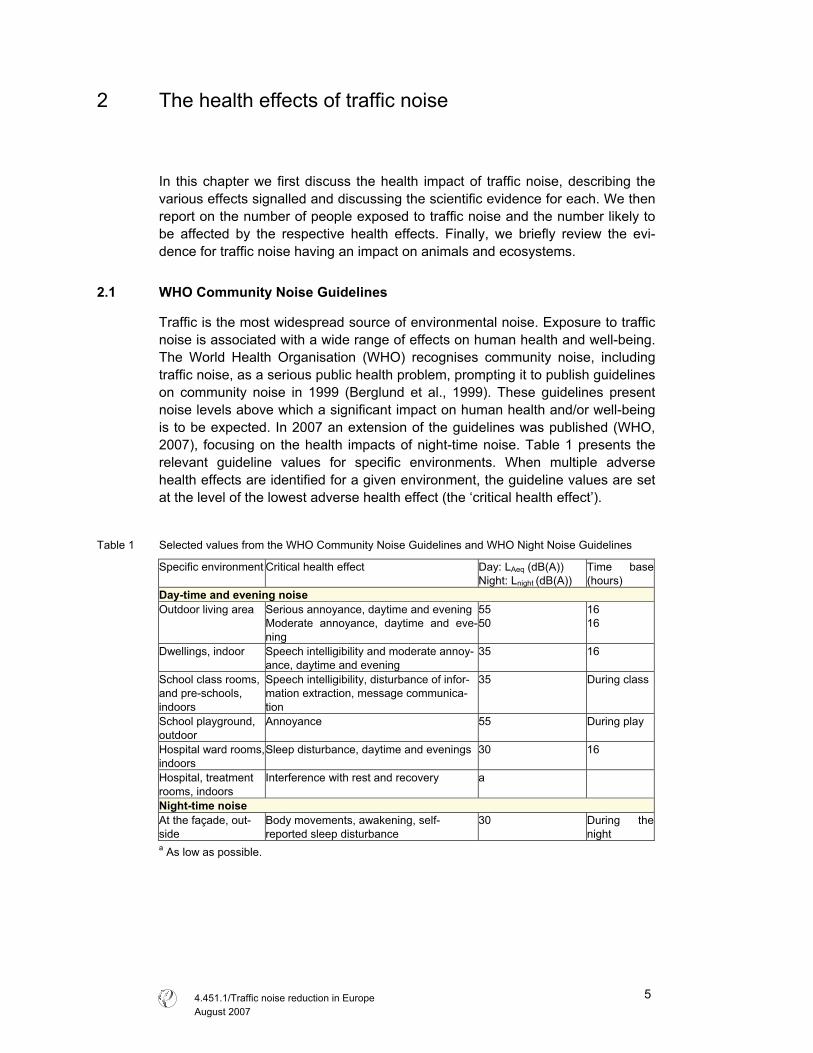
2 The health effects of traffic noise
In this chapter we first discuss the health impact of traffic noise, describing the
various effects signalled and discussing the scientific evidence for each. We then
report on the number of people exposed to traffic noise and the number likely to
be affected by the respective health effects. Finally, we briefly review the evi-
dence for traffic noise having an impact on animals and ecosystems.
2.1 WHO Community Noise Guidelines
Traffic is the most widespread source of environmental noise. Exposure to traffic
noise is associated with a wide range of effects on human health and well-being.
The World Health Organisation (WHO) recognises community noise, including
traffic noise, as a serious public health problem, prompting it to publish guidelines
on community noise in 1999 (Berglund et al., 1999). These guidelines present
noise levels above which a significant impact on human health and/or well-being
is to be expected. In 2007 an extension of the guidelines was published (WHO,
2007), focusing on the health impacts of night-time noise. Table 1 presents the
relevant guideline values for specific environments. When multiple adverse
health effects are identified for a given environment, the guideline values are set
at the level of the lowest adverse health effect (the ‘critical health effect’).
Table 1 Selected values from the WHO Community Noise Guidelines and WHO Night Noise Guidelines
Specific environment Critical health effect Day: LAeq (dB(A))
Night: Lnight (dB(A))
Time base
(hours)
Day-time and evening noise Outdoor living area Serious annoyance, daytime and evening
Moderate annoyance, daytime and eve-
ning
55
50
16
16
Dwellings, indoor Speech intelligibility and moderate annoy-
ance, daytime and evening
35 16
School class rooms,
and pre-schools,
indoors
Speech intelligibility, disturbance of infor-
mation extraction, message communica-
tion
35 During class
School playground,
outdoor
Annoyance 55 During play
Hospital ward rooms,
indoors
Sleep disturbance, daytime and evenings 30 16
Hospital, treatment
rooms, indoors
Interference with rest and recovery a
Night-time noiseAt the façade, out-
side
Body movements, awakening, self-
reported sleep disturbance
30 During the
night a As low as possible.
4.451.1/Traffic noise reduction in Europe
August 2007
5
2.2 The relation between noise and human health
Traffic noise frequently exceeds the guideline values published by the WHO and
those exposed to traffic noise consequently suffer an array of adverse health ef-
fects. These include socio-psychological responses like annoyance and sleep
disturbance, and physiological effects such as cardiovascular diseases (heart
and circulatory problems) and impacts on mental health (RIVM, 2004). In addi-
tion, traffic noise may also affect children’s learning progress. Finally, prolonged,
cumulative exposure to noise levels above 70 dB(A), common along major roads,
may lead to irreversible loss of hearing (Rosenhall et al., 1990).
Figure 1 summarises the potential mechanisms of noise-induced health effects
and their interactions. In the first place, noise exposure can lead to disturbance of
sleep and daily activities, to annoyance and to stress. This stress can in turn trig-
ger the production of certain hormones (e.g. cortisol, noradrenalin and adrena-
line), which may lead to a variety of intermediate effects, including increased
blood pressure. Over a prolonged period of exposure these effects may in their
turn increase the risk of cardiovascular disease and psychiatric disorders. The
degree to which noise leads to disturbance, annoyance and stress depends
partly on individual characteristics, in particular a person’s attitude and sensitivity
to noise. Finally, the relation between noise and personal health and well-being is
also influenced by external factors like physical and social environment and life-
style.
Figure 1 The mechanisms of noise-induced health effects
Source: HCN (Health Council of the Netherlands), 1999.
Exposure to sound
Other determi-nants of:
� Physical environment
� Social environment
� Lifestyle
Processing by the organism
Genetic and acquired characteristics (atti-
tude, sensitivity, cop-ing style, etc.)
Disturbance of sleep, activities, performance,
concentration.
Annoyance and stress
Biological risk factors (blood dynamics, hormones)
Cardiovascular diseases, psychiatric disorders
Appraisal as noise
Vegetative response
Environment Health effects
4.451.1/Traffic noise reduction in Europe
August 2007
6
2.3 Review of health effects
From Figure 1 and the discussion thus far we can identify the following potential
health effects due to exposure to traffic noise:
� Annoyance.
� Sleep disturbance.
� Disturbed cognitive functioning (learning and understanding).
� Cardiovascular disease.
� Adverse effects on mental health.
2.3.1 Annoyance
The most widespread problem created by noise is quite simply annoyance. An-
noyance can be defined as a general feeling of displeasure or adverse reaction
triggered by the noise. Among the ways it can express itself are fear, uncertainty
and mild anger (Stansfeld & Matheson, 2003; RIVM, 2005). In the human envi-
ronment (which also includes neighbours, industry, etc.) traffic is the single most
important source of noise annoyance (Niemann & Maschke, 2004; RIVM, 2004).
As Figure 2 shows, aircraft noise is perceived as more annoying than road and
rail traffic noise at the same volume. At a noise level of 55 dB(A), the guideline
limit set by the WHO, approximately 30% of those exposed are annoyed by air-
craft noise, about 20% by road traffic noise and about 10% by rail traffic noise.
Some people begin to experience annoyance at traffic noise from noise levels of
40 dB(A) upwards.
Figure 2 Percentage of people annoyed as a function of noise exposure of dwellings (Lden in dB(A))
Source: Miedema & Oudshoorn (2001).
The degree of annoyance triggered by traffic noise is determined first of all by the
noise level. The higher the level, the more people are annoyed and the greater
the severity of perceived annoyance (Ellebjerg Larsen et al., 2002; RIVM, 2005).
0
10
20
30
40
50
60
70
80
40 45 50 55 60 65 70 75
Lden
% a
nnoy
ed road
rail
aviation
WHO guideline
The degree of annoyance depends on other noise characteristics, too (London
4.451.1/Traffic noise reduction in Europe
August 2007
7
Health Commission, 2003). The higher the pitch of the noise, the greater the an-
noyance. Duration and intermittency also influence the degree of annoyance.
However, traffic noise-induced annoyance is governed by more than just acoustic
o some extent, people frequently exposed to traffic noise develop strategies of
2.3.2 Sleep disturbance
sleep disturbance (Niemann & Maschke, 2004).
noise can increase the arousal of the human
� gh the following day. The secondary
effects of sleep disturbance include reduced perceived sleep quality and in-
factors, with personal and situational factors also coming into play, as well as a
person’s relationship to the source of the noise. In a familiar illustration, a mos-
quito may not make much of a noise, but during the night it can cause consider-
able annoyance. Feelings of annoyance depend in the first place on an individ-
ual’s sensitivity to noise (Ouis, 2001; RIVM, 2004). The fact that noise is a form of
harm that can be avoided contributes to people’s perception of noise as annoy-
ance (London Health Commission, 2003). Another important determinant of per-
ceived annoyance is fear of the noise’s source (RIVM, 2004). People who feel
they have no control over the situation, or believe authorities are failing to control
it, are likely to experience a greater level of annoyance. Annoyance at noise de-
pends also on how the noise interferes with everyday life (London Health Com-
mission, 2003; Stansfeld & Matheson, 2003). People will be more annoyed when
noise affects activities that involve talking and listening, such as conversations,
listening to music, watching television and so on. Finally, noise in situations
where it is expected is less annoying than noise in circumstances anticipated to
be quiet. For this reason noise at night-time (the buzzing of a mosquito, as cited,
but also traffic noise) is more annoying than during the day.
T
adapting and coping with the problem (London Health Commission, 2003). The
problem still remains, however: subconscious physical reactions, such as raised
blood pressure, and levels of annoyance due to chronic noise will not diminish
over time unless the noise itself is abated.
Traffic noise is the main cause of
This effect of noise on sleep has important health effects, since uninterrupted
sleep is known to be a prerequisite for proper physiological and mental function-
ing in healthy people (WHO, 2007). Three types of effects of noise on sleep can
be distinguished: effects on sleeping behaviour (primary effects), effects on per-
formance and mood through the following day (secondary effects) and long-term
effects on well-being and health:
� Sleeping behaviour. Night-time
body, i.e. lead to activation of the nervous system, which may result in a per-
son awakening or prevent them from falling asleep (Ising et al., 2004; TNO In-
ro, 2002; WHO, 2007). However, this arousal response to noise is often more
subtle than mere awakening and may involve a change from a deeper to
lighter sleep, an increase in body movements, a temporary increase in heart
rate and changes in (stress) hormone levels (RVIM, 2003; HCN, 2004; WHO,
2007). Finally, there is also some evidence that blood pressure is affected by
traffic noise during sleep (WHO, 2007).
Effects on performance and mood throu
4.451.1/Traffic noise reduction in Europe
August 2007
8
creased drowsiness, tiredness and irritability (HCN, 2004). While there are al-
so indications of other effects such as depressed mood and decreased per-
formance (Ouis, 2001), the available evidence is still inconclusive (HCN,
2004; WHO, 2007).
Long-term effects on well-being. In the long-term, night-time noise can lead to
insomnia and increas
� ed medication use (HCN, 2004; WHO, 2007). It may
The turbance begin at fairly low vol-
mes and become more likely as the intensity of the noise increases. Changes
re is never com-
lete habituation, particularly with respect to heart-rate acceleration (Stansfeld &
2.3.3
air an adult’s cognitive functioning (information
eson, 2003). To have
luence of traffic noise on the
ognitive functioning of children. Although most of the studies are concerned with
et al., 2005; RIVM, 2005):
also result in chronic annoyance (Berglund et al., 1999; RIVM, 2004). Fur-
thermore, an increased risk of cardiovascular disease due to night-time noise
is plausible, although there is only limited evidence for this effect (TNO Inro,
2002; WHO, 2007). Finally, there are certain indications that night-time noise
can contribute to mental illness (WHO, 2007)
effects of night-time traffic noise on sleep dis
u
between sleep stages, increased body movements and heart-rate acceleration
start at noise levels around 32-42 dB(A) (WHO, 2007). In addition, reported sleep
quality is likely to be affected at noise levels above 40 dB(A) (RIVM, 2004; Ising
et al., 2004; WHO, 2007). Night-time awakenings also start at levels above 40
dB(A) (WHO, 2007). However, sleep disturbance is influenced by other noise
characteristics, too. People are far more sensitive to intermittent noise than con-
tinuous noise (Prasher, 2003). For example, an accelerating car will disturb a
person’s sleep more than a continuous traffic flow. In addition, the alarm function
of the sense of hearing may lead to awakening if the noise contains information
perceived to be of relevance, even if the noise level is low. This means that un-
familiar noises are far more likely to disturb sleep than familiar, regular patterns of
noise. Finally, personal characteristics like noise sensitivity influence the relation
between night-time noise and sleep disturbances (Ouis, 2001).
People are good at adapting to nocturnal noise. However, the
p
Matheson, 2003; WHO, 2007).
Impaired cognitive functioning
Exposure to traffic noise can imp
processing, understanding and learning) (Stansfeld & Math
this effect, though, noise levels must be high, or the task complex or cognitively
demanding (Prasher, 2003). Repetitive and simple tasks are unaffected by (traf-
fic) noise. The influence of noise on cognitive functioning depends on a person’s
perceived control of the noise and its predictability.
In the literature there is a prominent focus on the inf
c
the impact of aircraft noise in this respect, some of them consider road and rail
traffic noise, too. According to Bistrup et al. (2001), the adverse effects of road
traffic noise exceed those of rail traffic noise.
In general, the following effects have been found for children exposed to high
levels of traffic noise (Bistrup et al., 2001; Clark
4.451.1/Traffic noise reduction in Europe
August 2007
9
� Difficulty sustaining attention.
� Difficulty concentrating.
� Poorer discrimination between sounds and poorer perception of speech.
pecially complex issues.
t of chronic exposure to noise
n the cognitive development of children is that noise affects the intelligibility of
duction in this
ontext, there is evidence that reduced noise levels can relieve cognitive prob-
2.3.4
sociated with changes in blood pressure and in-
e.g. ischemic heart diseases, an-
the literature for the relation between traffic
oise and heart diseases like myocardial infarction and ischemic heart diseases
� Difficulty remembering, es
� Poorer reading ability and school performance.
A hypothesis frequently stated to explain the impac
o
speech communication (Bistrup et al., 2001; RIVM, 2005). Ambient noise leads to
a loss in the content of a teacher’s instruction, and consequently children may
have problems with speech perception and language acquisition. This, in turn,
can lead to impairment of children’s reading skills and vocabulary, and eventually
to difficulties with other, higher-level processes, such as long-term memory for
complex issues. Closely related to this process is the so-called ‘tuning out’ re-
sponse: to adapt to noise interferences during activities, children filter out the
unwanted noise stimuli (RIVM, 2005). However, researchers suggest that chil-
dren generalise this strategy to other situations where noise is not present, with
adverse effects on their understanding and learning performance.
Although there has been little research into the impact of noise re
c
lems within about a year (London Health Commission, 2003).
Cardiovascular disease
Exposure to traffic noise is as
creased risk of various types of heart disease (
gina pectoris, myocardial infraction). Noise-induced cardiovascular diseases are
considered to be the consequence of stress (Babisch, 2006; Ising et al., 2004;
Prasher, 2003; RIVM, 2004). Exposure to noise triggers the production of (stress)
hormones like cortisol, noradrenaline and adrenaline. It does so both directly and
indirectly, through disturbance of activities. These hormones may cause changes
in the values of a number of biological risk factors, such as hypertension (high
blood pressure), blood lipids (e.g. cholesterol) and blood glucose. These risk fac-
tors can increase the risk of cardiovascular disease (Babisch, 2006; Ising et al.,
2004). Persistent exposure to environmental noise could therefore result in per-
manent changes to the vascular system, with elevated blood pressure and heart
diseases as potential outcomes. The magnitude of these effects will be partly de-
termined by individual characteristics, lifestyle behaviours and environmental
conditions (Berglund et al., 1999).
Sufficient evidence can be found in
n
(Babisch, 2006; Babisch et al., 2005; Ising et al., 2004; Prasher, 2003). Higher
risks of heart disease are found for those living in streets with average noise lev-
els above 65-70 dB(A). For these people the risk of heart disease is approxi-
mately 20% higher than for those living in quieter areas (Babisch, 2006). This risk
increases with noise level. Again, the risk is also influenced by personal charac-
teristics. For example, Babisch et al. (2005) found that only men are at higher risk
4.451.1/Traffic noise reduction in Europe
August 2007
10
of heart attack due to traffic noise. This risk is also dependent on the number of
years of exposure to the traffic noise, moreover. The longer people are exposed
to a high level of traffic noise, the greater the likelihood of it having an impact and
increasing the risk of a heart attack.
There is a growing body of evidence for a higher risk of hypertension in people
xposed to high levels of traffic noise (Babisch, 2006). For example, a recent
earch into the impact of night-time noise exposure
n cardiovascular health outcomes (Babisch, 2006). One exception is UBA
ays
rough habituation (see paragraph 2.3.1), none of the cardiovascular diseases
2.3.5
tudies have presented limited evidence for a link between
ss (Prasher, 2003; Stansfeld & Matheson, 2003;
2.4 o vulnerable groups
t distributed uniformly
across society, with vulnerable groups like children, the elderly and the sick af-
particularly vulnerable to the health ef-
cts of noise. They have less cognitive capacity to understand and anticipate it
e
study by Bluhm et al. (2006) suggests the existence of a relation between resi-
dential exposure to road traffic noise and hypertension. However, earlier studies
(e.g. Babisch, 1998; RIVM, 2005) show less evidence for this relationship, and
according to Babisch (2006) these studies cannot be neglected in the overall
judgement process. Hence more research into the relation between traffic noise
and hypertension is needed.
There has been hardly any res
o
(2003), who showed that night-time noise exposure was more strongly associ-
ated with medical treatment for hypertension than day-time noise exposure.
In contrast to the subjective perception of noise, which adapts within a few d
th
show habituation to noise after prolonged exposure (WHO, 2007).
Mental illness
A small number of s
traffic noise and mental illne
WHO, 2007). The clear association between noise and annoyance does not nec-
essarily translate into a more serious relationship with mental health (London
Health Commission, 2003). However, noise may well accelerate and intensify the
development of latent mental disorder. Even so, people already suffering mental
problems are likely to be more sensitive to being annoyed or disturbed by traffic
noise than the general population.
Traffic noise especially harmful t
The health effects of road and rail traffic noise are no
fected most. In addition, poorer people are more likely to suffer the health effects
of transport noise than the better off. This might be explained by lower quality
housing with poor noise insulation and the proximity of housing for lower income
groups to noisy transport infrastructure.
Children are likely to be a group that is
fe
and lack well-developed coping strategies (Stansfeld & Matheson, 2003). As
children are still developing both physically and cognitively, moreover, in this
group there is a potential risk of chronic noise having irreversible negative con-
4.451.1/Traffic noise reduction in Europe
August 2007
11
sequences. The impact of traffic noise on children’s cognitive development has
already been briefly discussed. Noise may also possibly affect foetal develop-
ment, by way of (stress) effects on expectant mothers (EPA, 1978). However, a
more recent study questions this impact on foetal development, although such
effects are not completely ruled out (Bistrup et al., 2001). Additionally, children do
not appear to be at particular risk with respect to cardiovascular disease, espe-
cially through high blood pressure (Babisch, 2006). At the same time, though,
traffic noise exposure from an early age may have cumulative health effects in
later life, which once more include cardiovascular disease. This also holds for the
negative effects of sleep disturbance. In the short term, however, children are
less severely affected by sleep disturbance than adults (RIVM, 2004), as evi-
denced by fewer awakenings and changes between sleep stages. With respect
to annoyance due to traffic noise, finally, children do not differ from adults.
The elderly and the sick are two other groups that may be especially vulnerable
the effects of traffic noise. There has not been much research into this area,
that
f similar houses in quieter areas (Soguel, 1994; Theebe, 2004). Those living on
2.5
sed to noise levels below
5 dB are not reported on. As already discussed, though, noise below 55 dB may
to
however. One of the rare findings is that both the elderly and those already ill are
more affected by sleep disturbance - especially awakenings - than the general
population (HCN, 2004; Ouis, 2001). Also, those already suffering from sleep dis-
turbance are more severely affected by traffic noise. With regard to cardiovascu-
lar disease, Babisch (2006) shows that people with prevalent chronic diseases
have a slightly higher probability of contracting certain heart diseases as a result
of traffic noise than those without. For the elderly, there is no consistent evidence
that the effect of traffic noise on cardiovascular diseases is greater than for
younger people. Finally, traffic noise may aggravate the psychological problems
of people with existing health problems (London Health Commission, 2003).
The price of houses exposed to high levels of traffic noise will be lower than
o
lower household incomes are therefore more likely to be exposed to traffic noise
than those with higher incomes, and will hence have more noise-related health
problems. For the Dutch region ‘Rijnmond’ this relationship between household
income and exposure to noise was confirmed by RIVM (2004).
Over 210 million in EU25 exposed to harmful traffic noise
In the year 2000 about 44% of the population of the EU253 (over 210 million peo-
ple) were exposed to road traffic noise levels above 55 dB(A). This is the WHO
guideline value for outdoor noise levels and the threshold for ‘serious annoy-
ance’. More than 54 million people were exposed to road traffic noise levels over
65 dB(A), which is ten times louder than the WHO guideline value. Rail traffic
noise is a burden to fewer people. Nonetheless, 35 million people in the EU25
(about 7%) were exposed to rail traffic noise above 55 dB in 2000, with 7 million
of them exposed to noise over 65 dB from this source.
In most European countries the number of people expo
5
3 EU27 except Cyprus and Malta.
4.451.1/Traffic noise reduction in Europe
August 2007
12
still trigger adverse effects like annoyance, sleep disturbance and reduced cogni-
tive ability. The actual number of people exposed to levels of traffic noise that are
potentially dangerous to their health will thus be higher than the figures presented
in Figure 3.
The data in this figure are for the year 2000. Given traffic growth and the fact that
gislation and standards have hardly changed in the meantime, these exposure
Figure 3 0
le
figures probably underestimate the true extent of the problem.
umber of people exposed to road and rail traffic noise in 25 EU countries in 200N
0
40
80
120
160
200
55-65 dB 65-70 dB > 70 dB
mill
ions
of p
eopl
e ex
pose
d
road
rail
Note: This figure covers the EU27 except Cyprus and Malta.
Source: INFRAS/IWW (2004), OECD/INFRAS/Herry (2002), calculations by CE Delft (for
hese figures for the number of people exposed to traffic noise are based mainly
n data from INFRAS/IWW (2004) (West European countries) and
2.6
xperience health ef-
ations of
Estionia, Latvia, Lithuania).
T
o
OECD/INFRAS/Herry (2002) (East European countries). Link (2000) also pre-
sents estimates for the number of people exposed to traffic noise in certain West
European countries. Although in some cases the results for individual countries
(including the Netherlands) differ considerably between the first and last of these
studies, the aggregate numbers are comparable, with a difference of only about
3% between the two. Since INFRAS/IWW (2004) covers more countries and uses
more up-to-date data, we chose to present these figures here.
The reliability of these data sets is discussed in appendix A.
Health of millions of Europeans affected by traffic noise
Although not all people exposed to road or rail noise will e
fects (see also appendix A), a significant fraction will. Beyond investig
the absolute number of people suffering from various health effects due to traffic
noise, however, not much research has been undertaken in this area. In this sec-
tion, therefore, we cannot do much more than provide an estimate of the number
of people affected by cardiovascular disease. In addition, figures on the number
4.451.1/Traffic noise reduction in Europe
August 2007
13
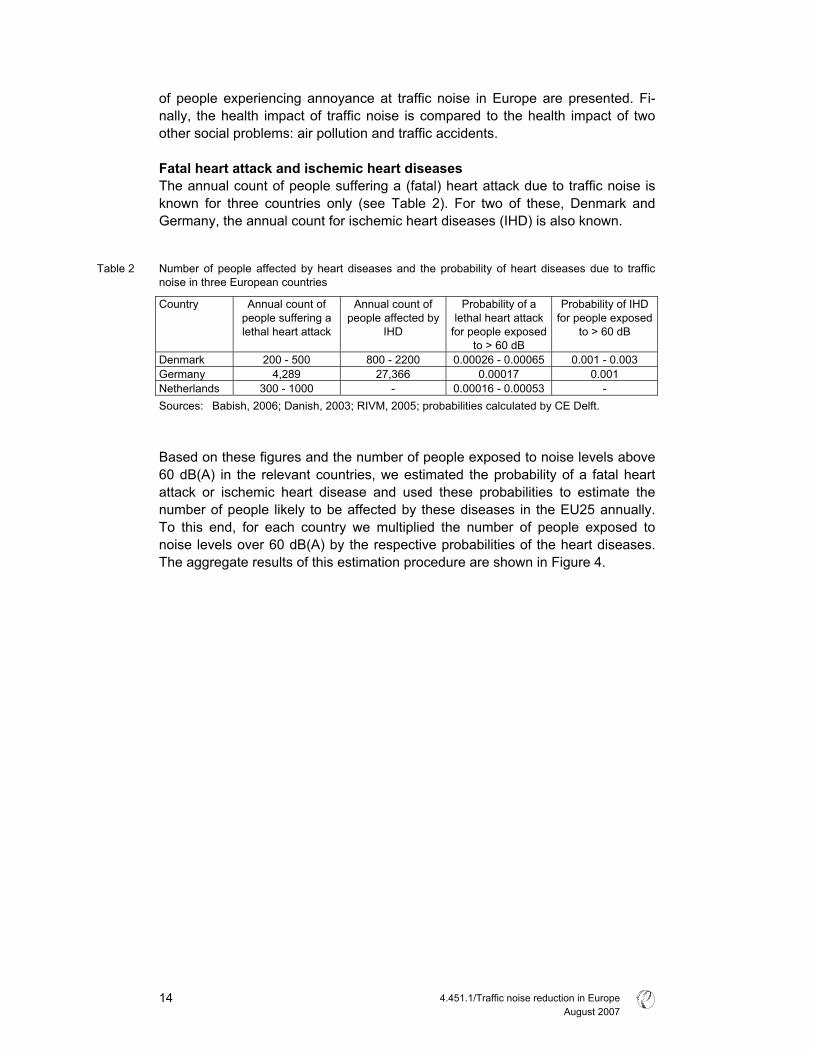
of people experiencing annoyance at traffic noise in Europe are presented. Fi-
nally, the health impact of traffic noise is compared to the health impact of two
other social problems: air pollution and traffic accidents.
Fatal heart attack and ischemic heart diseases The annual count of people suffering a (fatal) heart attack due to traffic noise is
r two of these, Denmark and
Table 2
oise in three European countries
lethal heart attack
people affected by lethal heart attack
fo
for people exposed
known for three countries only (see Table 2). Fo
Germany, the annual count for ischemic heart diseases (IHD) is also known.
umber of people affected by heart diseases and the probability of heart diseases due to trafficN
n
Country Annual count of
people suffering a
Annual count of Probability of a Probability of IHD
IHD r people exposed
to > 60 dB
to > 60 dB
Denmark 200 - 500 800 - 2200 0.00026 - 0.00065 0.001 - 0.003
Germany 4,289 2 7,366 0.00017
0.001
Netherlands 300 - 1000 - 0.00016 - 0.00053 -
Sources: Babish, 2006; Danish, 2003; RIV ; probabilitie ed by CE De
ased on these figures and the number of people exposed to noise levels above
0 dB(A) in the relevant countries, we estimated the probability of a fatal heart
M, 2005 s calculat lft.
B
6
attack or ischemic heart disease and used these probabilities to estimate the
number of people likely to be affected by these diseases in the EU25 annually.
To this end, for each country we multiplied the number of people exposed to
noise levels over 60 dB(A) by the respective probabilities of the heart diseases.
The aggregate results of this estimation procedure are shown in Figure 4.
4.451.1/Traffic noise reduction in Europe
August 2007
14
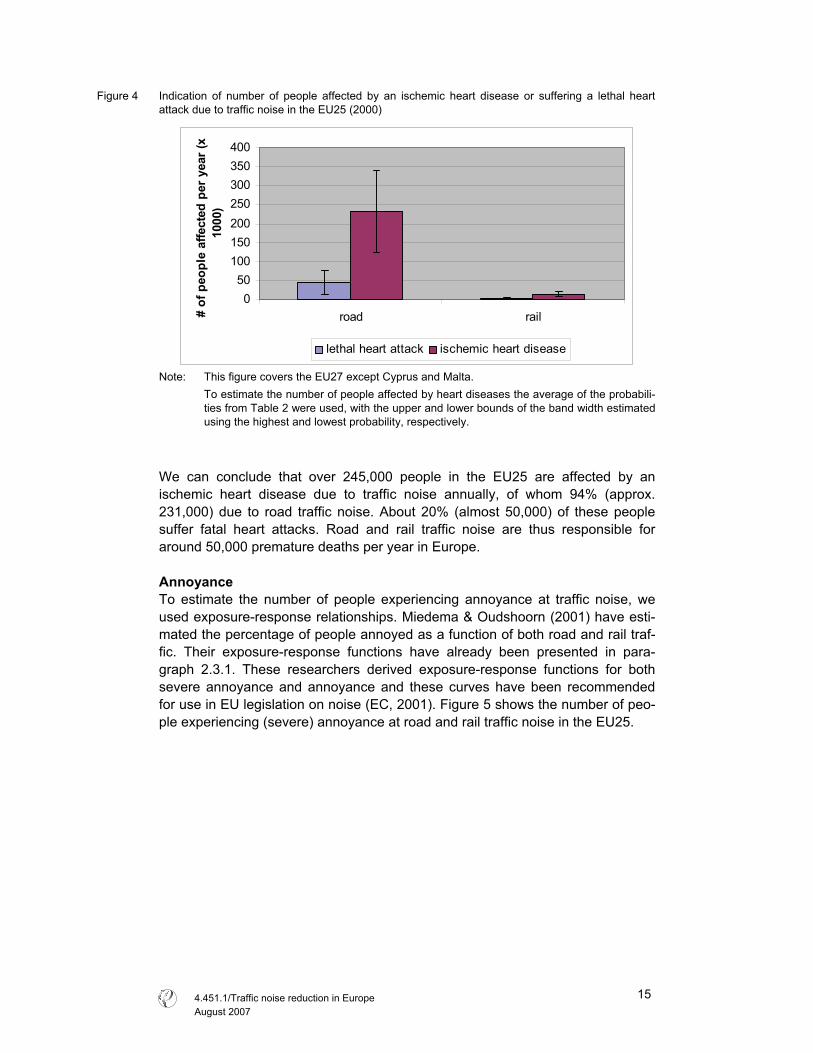
Figure 4 Indication of number of people affected by an ischemic heart disease or suffering a lethal heart
attack due to traffic noise in the EU25 (2000)
0
50
100
150
200
250
300
350
400
road rail# of
peo
ple
affe
cted
per
yea
r (x
1000
)
lethal heart attack ischemic heart disease
Note: This figure covers the EU27 except Cyprus and Malta.
To estimate the number of people affected by heart diseases the average of the probabili-
ties from Table 2 were used, with the upper and lower bounds of the band width estimated
using the highest and lowest probability, respectively.
We can conclude that over 245,000 people in the EU25 are affected by an
ischemic heart disease due to traffic noise annually, of whom 94% (approx.
231,000) due to road traffic noise. About 20% (almost 50,000) of these people
suffer fatal heart attacks. Road and rail traffic noise are thus responsible for
around 50,000 premature deaths per year in Europe.
Annoyance To estimate the number of people experiencing annoyance at traffic noise, we
used exposure-response relationships. Miedema & Oudshoorn (2001) have esti-
mated the percentage of people annoyed as a function of both road and rail traf-
fic. Their exposure-response functions have already been presented in para-
graph 2.3.1. These researchers derived exposure-response functions for both
severe annoyance and annoyance and these curves have been recommended
for use in EU legislation on noise (EC, 2001). Figure 5 shows the number of peo-
ple experiencing (severe) annoyance at road and rail traffic noise in the EU25.
4.451.1/Traffic noise reduction in Europe
August 2007
15
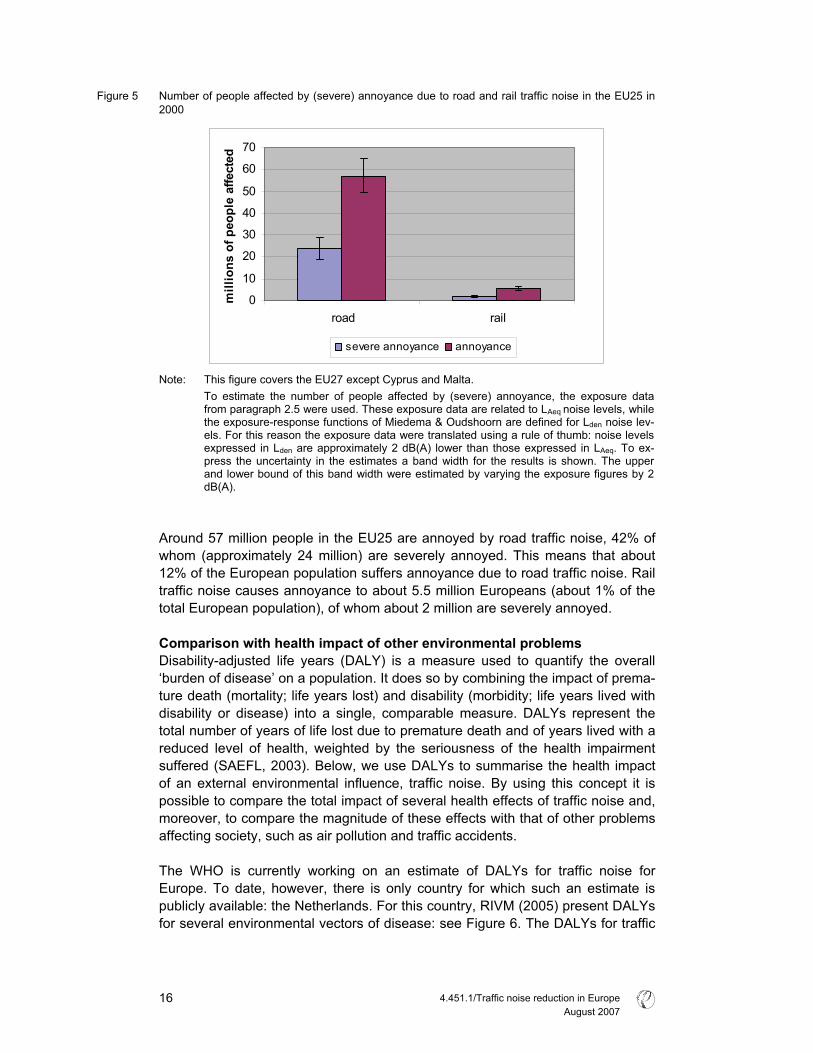
Figure 5 Number of people affected by (severe) annoyance due to road and rail traffic noise in the EU25 in
2000
0
10
20
30
40
50
60
70
road rail
mill
ions
of p
eopl
e af
fect
ed
severe annoyance annoyance
Note: This figure covers the EU27 except Cyprus and Malta.
To estimate the number of people affected by (severe) annoyance, the exposure data from paragraph 2.5 were used. These exposure data are related to LAeq
noise levels, while
the exposure-response functions of Miedema & Oudshoorn are defined for Lden noise lev-els. For this reason the exposure data were translated using a rule of thumb: noise levels expressed in Lden are approximately 2 dB(A) lower than those expressed in LAeq. To ex-press the uncertainty in the estimates a band width for the results is shown. The upper and lower bound of this band width were estimated by varying the exposure figures by 2 dB(A).
Around 57 million people in the EU25 are annoyed by road traffic noise, 42% of
whom (approximately 24 million) are severely annoyed. This means that about
12% of the European population suffers annoyance due to road traffic noise. Rail
traffic noise causes annoyance to about 5.5 million Europeans (about 1% of the
total European population), of whom about 2 million are severely annoyed.
Comparison with health impact of other environmental problems Disability-adjusted life years (DALY) is a measure used to quantify the overall
‘burden of disease’ on a population. It does so by combining the impact of prema-
ture death (mortality; life years lost) and disability (morbidity; life years lived with
disability or disease) into a single, comparable measure. DALYs represent the
total number of years of life lost due to premature death and of years lived with a
reduced level of health, weighted by the seriousness of the health impairment
suffered (SAEFL, 2003). Below, we use DALYs to summarise the health impact
of an external environmental influence, traffic noise. By using this concept it is
possible to compare the total impact of several health effects of traffic noise and,
moreover, to compare the magnitude of these effects with that of other problems
affecting society, such as air pollution and traffic accidents.
The WHO is currently working on an estimate of DALYs for traffic noise for
Europe. To date, however, there is only country for which such an estimate is
publicly available: the Netherlands. For this country, RIVM (2005) present DALYs
for several environmental vectors of disease: see Figure 6. The DALYs for traffic
4.451.1/Traffic noise reduction in Europe
August 2007
16
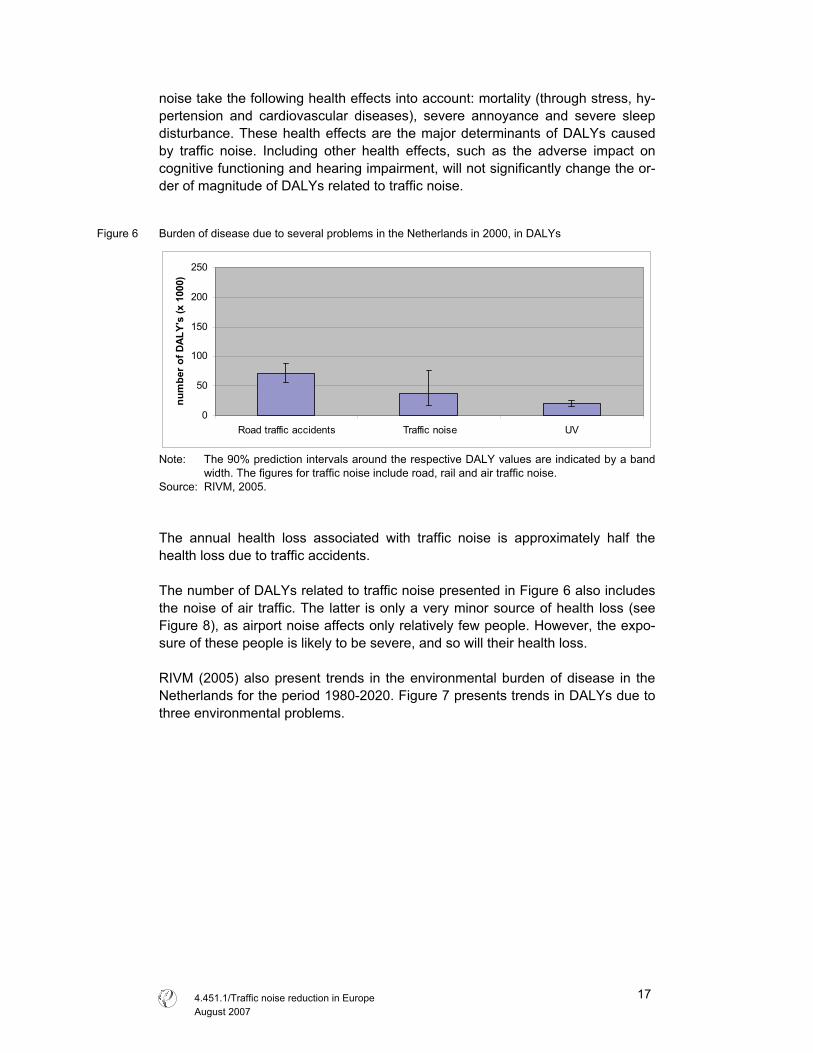
noise take the following health effects into account: mortality (through stress, hy-
pertension and cardiovascular diseases), severe annoyance and severe sleep
disturbance. These health effects are the major determinants of DALYs caused
by traffic noise. Including other health effects, such as the adverse impact on
cognitive functioning and hearing impairment, will not significantly change the or-
der of magnitude of DALYs related to traffic noise.
Figure 6 Burden of disease due to several problems in the Netherlands in 2000, in DALYs
0
50
100
150
200
250
Road traffic accidents Traffic noise UV
num
ber o
f DAL
Y's
(x 1
000)
Note: The 90% prediction intervals around the respective DALY values are indicated by a band
width. The figures for traffic noise include road, rail and air traffic noise.
Source: RIVM, 2005.
The annual health loss associated with traffic noise is approximately half the
health loss due to traffic accidents.
The number of DALYs related to traffic noise presented in Figure 6 also includes
the noise of air traffic. The latter is only a very minor source of health loss (see
Figure 8), as airport noise affects only relatively few people. However, the expo-
sure of these people is likely to be severe, and so will their health loss.
RIVM (2005) also present trends in the environmental burden of disease in the
Netherlands for the period 1980-2020. Figure 7 presents trends in DALYs due to
three environmental problems.
4.451.1/Traffic noise reduction in Europe
August 2007
17
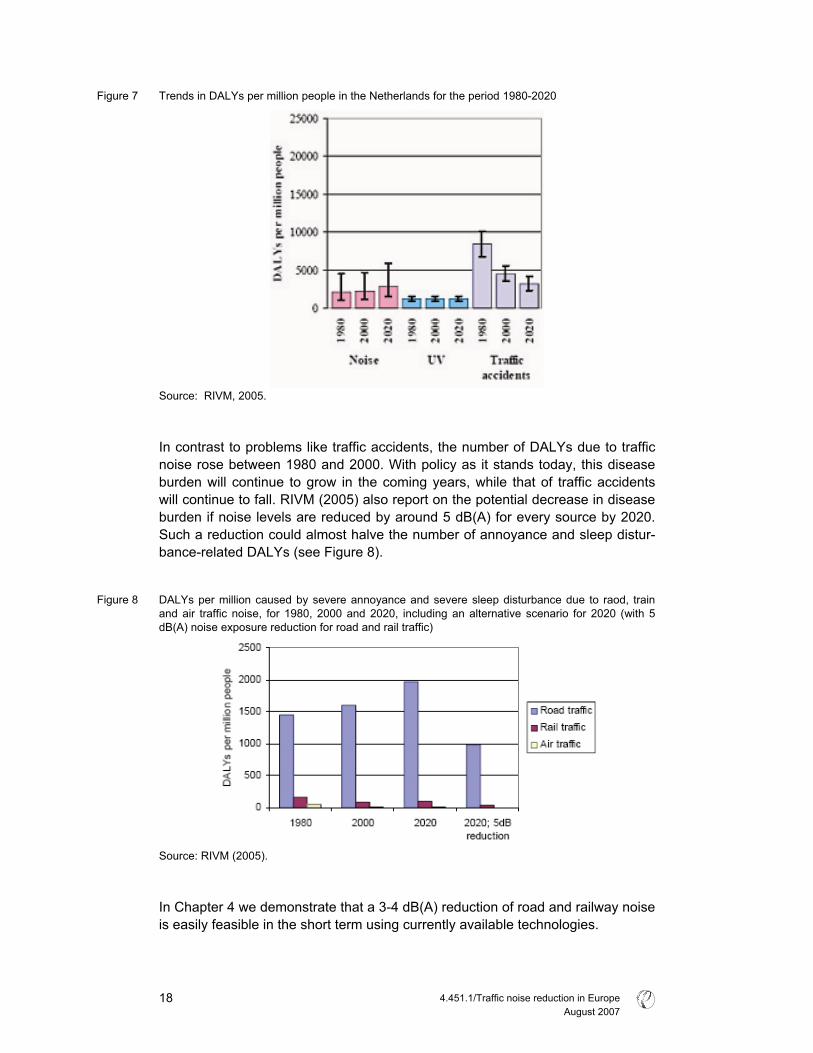
Figure 7 Trends in DALYs per million people in the Netherlands for the period 1980-2020
Source: RIVM, 2005.
In contrast to problems like traffic accidents, the number of DALYs due to traffic
noise rose between 1980 and 2000. With policy as it stands today, this disease
burden will continue to grow in the coming years, while that of traffic accidents
will continue to fall. RIVM (2005) also report on the potential decrease in disease
burden if noise levels are reduced by around 5 dB(A) for every source by 2020.
Such a reduction could almost halve the number of annoyance and sleep distur-
bance-related DALYs (see Figure 8).
Figure 8 DALYs per million caused by severe annoyance and severe sleep disturbance due to raod, train
and air traffic noise, for 1980, 2000 and 2020, including an alternative scenario for 2020 (with 5
dB(A) noise exposure reduction for road and rail traffic)
Source: RIVM (2005).
In Chapter 4 we demonstrate that a 3-4 dB(A) reduction of road and railway noise
is easily feasible in the short term using currently available technologies.
4.451.1/Traffic noise reduction in Europe
August 2007
18
2.7 Effects on animals and ecosystems
It is not only humans but also animals that are affected by traffic noise. When ex-
posed to man-made noise they may suffer both physiological and behavioural
effects (Kaseloo and Tyson, 2004). With regard to the former, an animal’s re-
sponse may range from mild annoyance to panic and escape behaviour. These
responses are manifestations of stress, which may harm an animal’s health,
growth and reproductive fitness. For example, energy losses due to escape and
panic responses could result in impaired growth and health. For some animals,
traffic noise also interferes with communication (Kaseloo, 2005). Bats, for exam-
ple, a species group totally reliant on echo location, are unable to find food if
noise levels are too high.
In terms of behaviour, animals may avoid places with high levels of traffic noise.
In the case of birds it has been found that sound levels above 40 - 45 dB(A) in-
fluence species distribution; as the noise level at a given spot increases, fewer
birds will visit the spot (Kaseloo, 2005; RIVM, 2002). For animals like the moun-
tain goat and white-tailed deer, too, evidence has been found for the avoidance
of noisy areas around busy roads (Kaseloo & Tyson, 2004).
The effects of traffic noise on animals vary markedly among as well as within
species, owing to a variety of factors (such as age, sex, prior exposure, etc.). It is
therefore hard to draw any general conclusions about the effects of traffic noise
on animals. Further research on this topic is certainly needed. Nevertheless, from
the evidence presented here it is reasonable to say that traffic noise interferes
with animals’ feeding, hunting and breeding behaviour and performance.
4.451.1/Traffic noise reduction in Europe
August 2007
19

4.451.1/Traffic noise reduction in Europe
August 2007
20
3 The social costs of traffic noise
3.1 Valuing the health effects of traffic noise
The loss of well-being due to exposure to traffic noise can be expressed in mone-
tary terms. The amount of money people are willing to pay to avoid traffic noise
provides a good estimate of the loss of well-being people experience. In some
instances the market will provide reliable estimates of people’s willingness to pay
(WTP). For example, the price of sleeping pills provides an estimate of the WTP
to fall asleep and avoid night-time awakenings.
For many of the health effects of noise, however, there are no such market
prices. To estimate the WTP to avoid these effects various methods are avail-
able. Generally speaking, there are two relevant valuation methods: hedonic pric-
ing and contingent valuation. The hedonic pricing method examines variations in
housing prices due to traffic noise. These differences can be seen as the WTP to
avoid the adverse effects (especially annoyance) of noise. The contingent valua-
tion method, on the other hand, involves asking people directly in a survey how
much they would be willing to pay to avoid certain health effects associated with
noise. Both methods are used for placing a value on the effects of traffic noise.
To value mortality due to traffic noise means assigning a monetary value to a
human life. In the field of environmental valuation this has always been a contro-
versial topic, for the WTP to avoid the loss of one’s life is infinite, is it not? None-
theless, in their everyday lives people make plenty of choices that influence their
risk of mortality. For example, we may choose to drive a motorcycle despite being
aware that this involves a greater risk of lethal accident than driving a car. With
the aid of this kind of information on risk behaviour a value can be determined for
a statistical human life.
Additional information on attributing a monetary value to traffic noise is provided
in appendix B.
3.2 Social cost of traffic noise in EU22 over € 40 billion a year
The social cost of road traffic noise in the EU224 is estimated to be at least €38
(30 - 46) billion per year, which is approximately 0.4% of total GDP in the EU22.
For rail, estimates of social costs due to noise are about € 2.4 (2.3 - 2.5) billion
per year (about 0.02% of total EU22 GDP). It should be noted that this takes into
account only effects related to noise levels above 55 dB(A), while people may
also be adversely affected by noise below this level. Hence, the social cost esti-
mates presented here probably underestimate the actual costs.
The social costs of road traffic noise in the EU22 are almost one-third of those
associated with road traffic accidents; see Figure 9. In the case of rail traffic,
4 EU27 except Cyprus, Estonia, Latvia, Lithuania and Malta.
4.451.1/Traffic noise reduction in Europe
August 2007
21
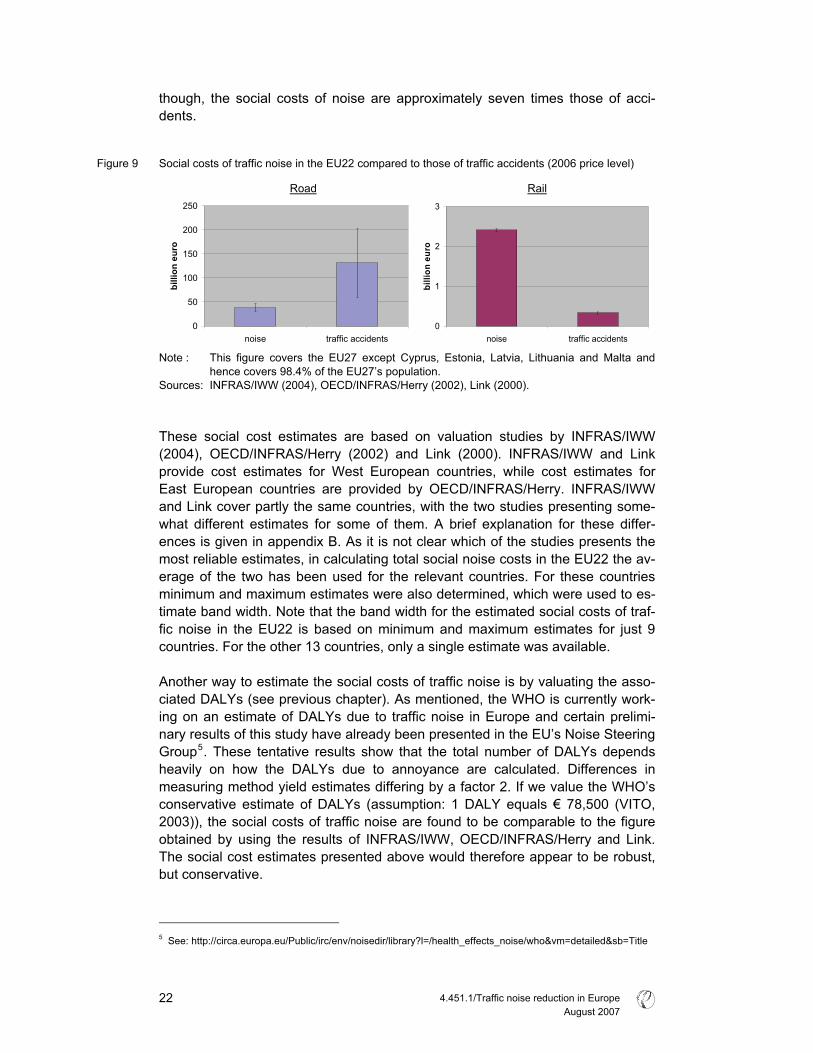
though, the social costs of noise are approximately seven times those of acci-
dents.
Figure 9 Social costs of traffic noise in the EU22 compared to those of traffic accidents (2006 price level)
Road Rail
0
50
100
150
200
250
noise traffic accidents
billi
on e
uro
0
1
2
3
noise traffic accidents
billi
on e
uro
Note : This figure covers the EU27 except Cyprus, Estonia, Latvia, Lithuania and Malta and
hence covers 98.4% of the EU27’s population.
Sources: INFRAS/IWW (2004), OECD/INFRAS/Herry (2002), Link (2000).
These social cost estimates are based on valuation studies by INFRAS/IWW
(2004), OECD/INFRAS/Herry (2002) and Link (2000). INFRAS/IWW and Link
provide cost estimates for West European countries, while cost estimates for
East European countries are provided by OECD/INFRAS/Herry. INFRAS/IWW
and Link cover partly the same countries, with the two studies presenting some-
what different estimates for some of them. A brief explanation for these differ-
ences is given in appendix B. As it is not clear which of the studies presents the
most reliable estimates, in calculating total social noise costs in the EU22 the av-
erage of the two has been used for the relevant countries. For these countries
minimum and maximum estimates were also determined, which were used to es-
timate band width. Note that the band width for the estimated social costs of traf-
fic noise in the EU22 is based on minimum and maximum estimates for just 9
countries. For the other 13 countries, only a single estimate was available.
Another way to estimate the social costs of traffic noise is by valuating the asso-
ciated DALYs (see previous chapter). As mentioned, the WHO is currently work-
ing on an estimate of DALYs due to traffic noise in Europe and certain prelimi-
nary results of this study have already been presented in the EU’s Noise Steering
Group5. These tentative results show that the total number of DALYs depends
heavily on how the DALYs due to annoyance are calculated. Differences in
measuring method yield estimates differing by a factor 2. If we value the WHO’s
conservative estimate of DALYs (assumption: 1 DALY equals € 78,500 (VITO,
2003)), the social costs of traffic noise are found to be comparable to the figure
obtained by using the results of INFRAS/IWW, OECD/INFRAS/Herry and Link.
The social cost estimates presented above would therefore appear to be robust,
but conservative.
5 See: http://circa.europa.eu/Public/irc/env/noisedir/library?l=/health_effects_noise/who&vm=detailed&sb=Title
4.451.1/Traffic noise reduction in Europe
August 2007
22
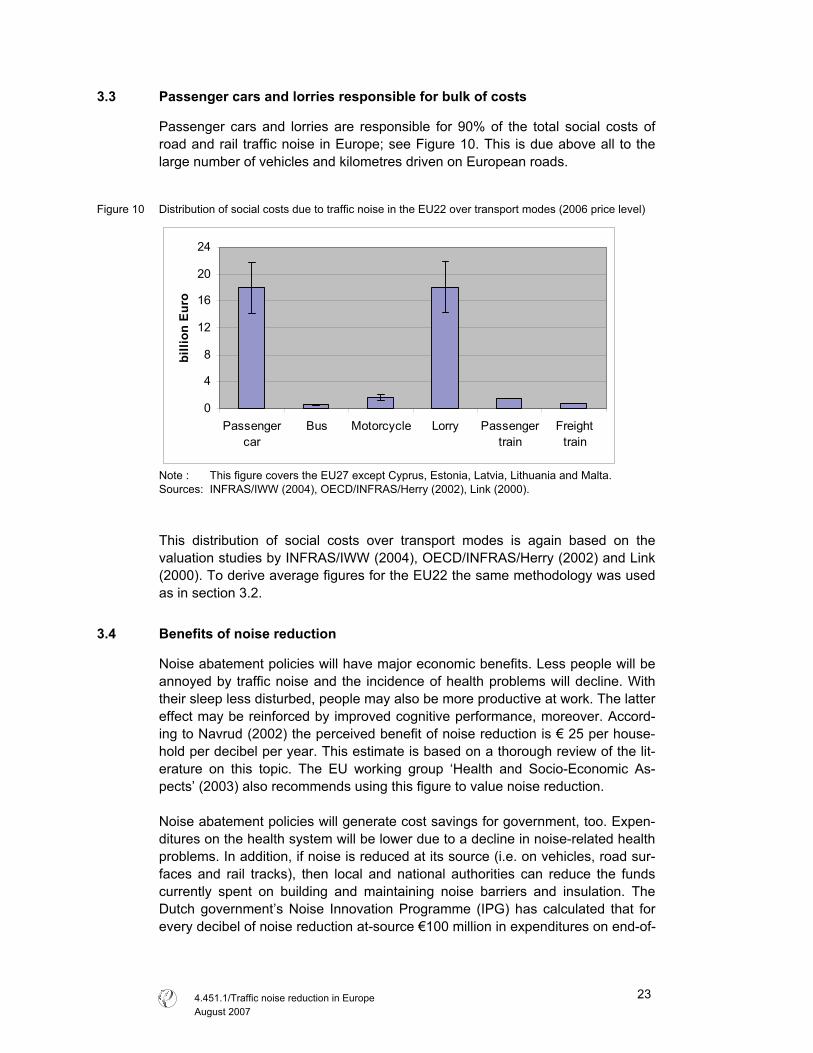
3.3 Passenger cars and lorries responsible for bulk of costs
Passenger cars and lorries are responsible for 90% of the total social costs of
road and rail traffic noise in Europe; see Figure 10. This is due above all to the
large number of vehicles and kilometres driven on European roads.
Figure 10 Distribution of social costs due to traffic noise in the EU22 over transport modes (2006 price level)
0
4
8
12
16
20
24
Passenger
car
Bus Motorcycle Lorry Passenger
train
Freight
train
billi
on E
uro
Note : This figure covers the EU27 except Cyprus, Estonia, Latvia, Lithuania and Malta.
Sources: INFRAS/IWW (2004), OECD/INFRAS/Herry (2002), Link (2000).
This distribution of social costs over transport modes is again based on the
valuation studies by INFRAS/IWW (2004), OECD/INFRAS/Herry (2002) and Link
(2000). To derive average figures for the EU22 the same methodology was used
as in section 3.2.
3.4 Benefits of noise reduction
Noise abatement policies will have major economic benefits. Less people will be
annoyed by traffic noise and the incidence of health problems will decline. With
their sleep less disturbed, people may also be more productive at work. The latter
effect may be reinforced by improved cognitive performance, moreover. Accord-
ing to Navrud (2002) the perceived benefit of noise reduction is € 25 per house-
hold per decibel per year. This estimate is based on a thorough review of the lit-
erature on this topic. The EU working group ‘Health and Socio-Economic As-
pects’ (2003) also recommends using this figure to value noise reduction.
Noise abatement policies will generate cost savings for government, too. Expen-
ditures on the health system will be lower due to a decline in noise-related health
problems. In addition, if noise is reduced at its source (i.e. on vehicles, road sur-
faces and rail tracks), then local and national authorities can reduce the funds
currently spent on building and maintaining noise barriers and insulation. The
Dutch government’s Noise Innovation Programme (IPG) has calculated that for
every decibel of noise reduction at-source €100 million in expenditures on end-of-
4.451.1/Traffic noise reduction in Europe
August 2007
23

pipe measures such as noise barriers and insulation will be saved (IPG, 2007).
This calculation only takes major interurban roads and railways into account. Ac-
tual savings will probably be even greater, because other regions and urban ar-
eas will also benefit from such noise reduction via at-source measures. From a
social perspective there is also a preference for at-source over end-of-pipe meas-
ures, the latter being considerably less cost-effective (see Chapter 4).
4.451.1/Traffic noise reduction in Europe
August 2007
24
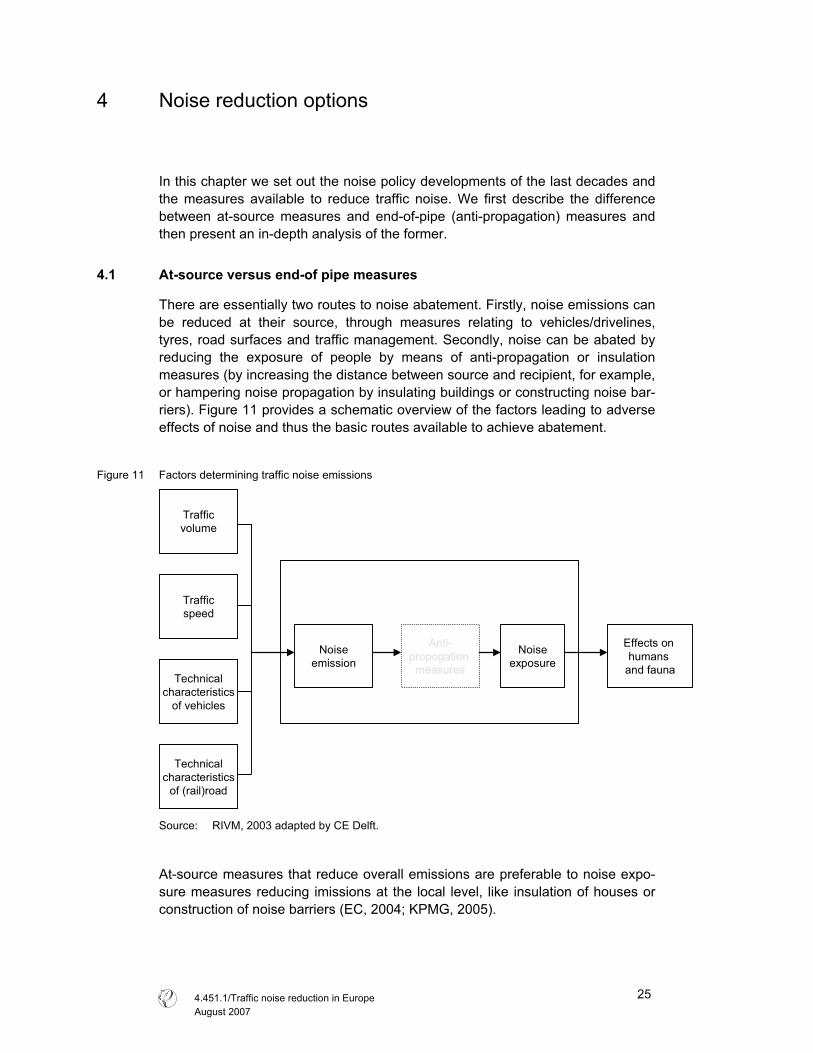
4 Noise reduction options
In this chapter we set out the noise policy developments of the last decades and
the measures available to reduce traffic noise. We first describe the difference
between at-source measures and end-of-pipe (anti-propagation) measures and
then present an in-depth analysis of the former.
4.1 At-source versus end-of pipe measures
There are essentially two routes to noise abatement. Firstly, noise emissions can
be reduced at their source, through measures relating to vehicles/drivelines,
tyres, road surfaces and traffic management. Secondly, noise can be abated by
reducing the exposure of people by means of anti-propagation or insulation
measures (by increasing the distance between source and recipient, for example,
or hampering noise propagation by insulating buildings or constructing noise bar-
riers). Figure 11 provides a schematic overview of the factors leading to adverse
effects of noise and thus the basic routes available to achieve abatement.
Figure 11 Factors determining traffic noise emissions
Noise
emission
Noise
exposure
Effects on
humans
and faunaTechnical
characteristics
of vehicles
Technical
characteristics
of (rail)road
Traffic
speed
Traffic
volume
Anti-
propogation
measures
Source: RIVM, 2003 adapted by CE Delft.
At-source measures that reduce overall emissions are preferable to noise expo-
sure measures reducing imissions at the local level, like insulation of houses or
construction of noise barriers (EC, 2004; KPMG, 2005).
4.451.1/Traffic noise reduction in Europe
August 2007
25
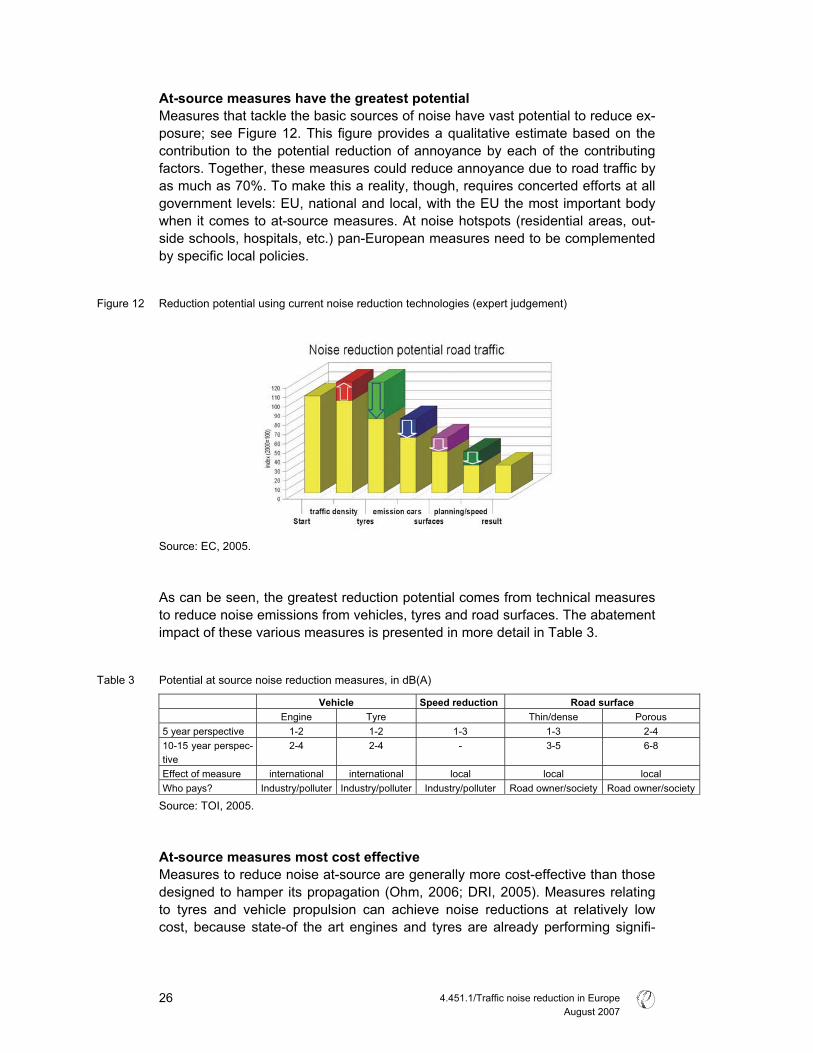
At-source measures have the greatest potential Measures that tackle the basic sources of noise have vast potential to reduce ex-
posure; see Figure 12. This figure provides a qualitative estimate based on the
contribution to the potential reduction of annoyance by each of the contributing
factors. Together, these measures could reduce annoyance due to road traffic by
as much as 70%. To make this a reality, though, requires concerted efforts at all
government levels: EU, national and local, with the EU the most important body
when it comes to at-source measures. At noise hotspots (residential areas, out-
side schools, hospitals, etc.) pan-European measures need to be complemented
by specific local policies.
Figure 12 Reduction potential using current noise reduction technologies (expert judgement)
Source: EC, 2005.
As can be seen, the greatest reduction potential comes from technical measures
to reduce noise emissions from vehicles, tyres and road surfaces. The abatement
impact of these various measures is presented in more detail in Table 3.
Table 3 Potential at source noise reduction measures, in dB(A)
Vehicle Speed reduction Road surface Engine Tyre Thin/dense Porous
5 year perspective 1-2 1-2 1-3 1-3 2-4
10-15 year perspec-
tive
2-4 2-4 - 3-5 6-8
Effect of measure international international local local local
Who pays? Industry/polluter Industry/polluter Industry/polluter Road owner/society Road owner/society
Source: TOI, 2005.
At-source measures most cost effective Measures to reduce noise at-source are generally more cost-effective than those
designed to hamper its propagation (Ohm, 2006; DRI, 2005). Measures relating
to tyres and vehicle propulsion can achieve noise reductions at relatively low
cost, because state-of the art engines and tyres are already performing signifi-
4.451.1/Traffic noise reduction in Europe
August 2007
26
cantly better than current limits. Tightening of the limits will therefore cause very
little additional cost to the automotive industry (KPMG, 2005).
The Danish national traffic noise strategy shows that measures aimed at reduc-
ing noise propagation (including noise barriers) are amongst the least cost–
effective solutions for 2020 (Danish, 2003). If these are applied on a large scale
in the absence of at-source measures, the costs will even outstrip the benefits.
One Danish case study clearly illustrates that porous asphalt is far more cost-
effective than anti-propagation measures like home insulation or noise barrier
construction, which are 3-10 times more expensive (DRI, 2005).
The Dutch Noise Innovation Programme (IPG) has calculated that every decibel
of noise reduction at-source will save € 100 million in national expenditure on
noise barriers and building insulation.
In general, the benefits of at-source noise abatement measures dramatically ex-
ceed their costs. This means that from a welfare point of view it is clearly advan-
tageous to implement noise measures at-source. RIVM (2003) estimates that the
benefits of noise reduction by way of quieter tyres, low-noise road pavements
and wheel/rail optimisation are on average 2-4 times higher than their cost.
Of these measures, the cost effectiveness of quieter tyres is greatest, as several
studies report that tyre/road noise reduction comes at zero cost (Sandberg, 2006;
RIVM, 2003). A study by FEHRL indicates that the cost effectiveness of a reduc-
tion of tyre/road noise is significantly better than the figure reported above.
FEHRL estimates the benefits at € 48-123 billion, while the costs are only € 1.2
billion. The main cost item for industry would be discontinuation of production of
the noisiest tyres. Research costs would be very limited, as quieter tyres have
already been developed and are already on sale on the European market
(FEHRL, 2006).
Another argument in favour of at-source measures is that the costs of noise re-
duction are borne directly by the car driver, with any research and development
costs being incorporated into prices. Furthermore, at-source measures - espe-
cially those at vehicle level - are in line with the polluter pays principle and Article
174 of the EC Treaty, which states action at-source to be a priority principle.
One disadvantage of at-source measures at the vehicle level, however, is that
penetration of the vehicle fleet takes several years for tyres and almost a decade
for motor vehicles. Local measures like speed reduction and low-noise road sur-
faces are therefore also needed. Given the very long life spans of railway rolling
stock, this is even truer of railway noise reduction measures. The optimal strategy
will need to comprise a mix of local and at-source measures, including noise bar-
riers at hotspots.
4.451.1/Traffic noise reduction in Europe
August 2007
27
4.2 Transport noise regulation: the legal framework
Road vehicle noise is covered by two European directives. Motor vehicle noise
emission has been covered by legislation since the 1970s (Directive 70/157) and
tyre-road noise since 2001 (Directive 2001/43).
The EU Driveline noise directive follows Regulation No. 51 of the United Nations
Economic Commission for Europe (UNECE), which harmonises measurements
of road vehicle sound emissions. Regulation 51 is defined at the international
level by the UNECE world forum for harmonisation of vehicle regulations.
Railway noise is addressed through directives on railway interoperability for high-
speed rail (Directive 96/48/EC) and conventional rail (Directive 2001/16/EC),
which provide a legislative framework for technical and operational harmonisation
of the rail network. Under this legislation, Technical Specifications for Interopera-
bility (TSIs) are established by the Commission, which include noise limits for roll-
ing stock.
Despite these efforts, the noise exposure of citizens has not diminished since the
1970s. In part this is due to ineffective legislation as well as increased traffic vol-
umes. Additionally, though, it was deemed necessary to focus noise policy on
actual noise reception. The 1996 Green Paper marked the start of this alternative
approach, leading to the Environmental Noise Directive (END) of 2002 (Directive
2002/49) as a second cornerstone of noise policy. Its main objectives are:
� To monitor environmental noise.
� To address local issues.
� To inform the public about noise issues.
� To oblige local authorities to draw up noise maps and action plans for reduc-
ing noise exposure in and around major cities, roads, railway lines and air-
ports (see Table 4).
At the same time, however, responsibility for setting noise exposure limits re-
mains the competence of national authorities. Formally speaking, the action
plans do not need to be attuned to these national exposure limits.
Table 4 Timetable for creation of noise maps and action plans
Area / Source to be mapped Strategic noise maps by Action plans by Agglomerations
> 250,000 inhabitants
> 100,000 inhabitants
30 June 2007
30 June 2012
18 July 2008
18 July 2008
Major roads
> 6,000,000 vehicles / year
> 3,000,000 vehicles / year
30 June 2007
30 June 2012
18 July 2008
18 July 2008
Major railways
> 60,000 train journeys / year
> 30,000 train journeys / year
30 June 2007
30 June 2012
18 July 2008
18 July 2008
Major airports
> 50,000 flights / year
30 June 2007
18 July 2008
4.451.1/Traffic noise reduction in Europe
August 2007
28
Traffic noise is also one of the impacts to be documented during the environ-
mental impact assessment (EIA) of transport infrastructure projects. Guidelines
for weighting noise as an environmental impact during the decision-making proc-
ess are set out in European directives 85/337/EEC and 97/11/EC.
Under the framework of the CARS 21 initiative to boost the competitiveness of
the EU car industry, the Commission has announced a ‘holistic’ view with regard
to the tackling of noise issues. Thus, all relevant stakeholders and systems (e.g.
traffic management, driver behaviour, vehicle and tyre technology, road surfaces)
should be involved in tackling noise issues so as to achieve a cost-effective pack-
age of reduction measures (EC, 2007).
In the past, noise has always been seen as more of a trade issue relating to har-
monisation of product standards than as an environmental health issue in the EU.
This is still the case today, to judge by the influence of UNECE working groups,
the handling of rail noise and the leading position of DG Enterprise and Industry
in determining EU noise standards for vehicles.
4.3 Vehicle noise regulation failed
Despite noise type approval limits being in force since 1970, since then there has
been no tangible reduction of noise emissions under real driving conditions for
passenger cars and only a 2-4 dB(A) reduction for heavy duty vehicles (HDVs)
(RIVM, 2003; Blokland, 2004). This is due to:
� Weak, ineffective noise emission limits.
� Driving conditions during product approval tests for vehicles and tyres that do
not reflect real traffic situations.
� Test conditions being changed several times, which implied a tightening of
the limits for HDVs but a weakening for passenger cars by several dB(A)
(M+P, 2000; see Figure 14).
� Tyres only being assessed separately since 2001, even though tyre/road con-
tact is already the dominant source of noise from passenger cars at any
speed over 30-50 km/h.
Although the exterior noise of vehicles has not diminished over the last decades,
interior noise has been reduced, through improved insulation methods, in re-
sponse to customer demand.
Directive 70/157/EEC, which has been updated several times, prescribes a test
method for vehicle driveline and tyre noise and lays down noise emission limits.
The test method basically comprises a noise measurement under full torque dur-
ing acceleration at low speed. The underlying reasoning is that if a vehicle
passes this extreme test it will also be quiet under normal circumstances. How-
ever, the test method has undergone several changes over the years, the most
important of which has been changes in gear and hence engine speed (rpm), the
most important determinant of driveline noise emissions.
4.451.1/Traffic noise reduction in Europe
August 2007
29
Vehicle driveline noise versus tyre noise The two main noise sources in road transport are the vehicle driveline and tyre/road contact. The
higher its speed, the more noise a vehicle produces. This graph shows the relationship between
speed and noise emission for both driveline and tyres. At lower speeds driveline noise predomi-
nates, with the noise of tyre-road contact becoming most important as speed increases. The jagged
line follows gear changes.
Figure 13 Correlation between speed and noise emission for a passenger car
Source: RIVM, 2002.
The change in test method meant a reduction in the tested engine speed of pas-
senger cars and an increase in that of heavy vehicles. Consequently, heavy ve-
hicles became significantly more silent, while passenger cars did not (Blokland,
2004). The road surface and tyre have also been redefined in the test method,
moreover, in a way beneficial to vehicle manufacturers. Figure 14, below, illus-
trates the liberal limits and the effect of the changes in the measurement proce-
dure.
All in all, the noise emissions of passenger cars have not been further restricted
by European or international noise emissions standards. This is illustrated by
(M+P, 2000). One would expect a 1998 vehicle to be far more silent than the
noise emission standard of 1970, but Figure 15 shows that this is not the case.
The figure shows that although noise emission limits have indeed been tightened
over time, these gains have been mainly on paper and not been translated to the
real world. As can be seen, vehicle noise emissions follow roughly the same pat-
tern as the tightening of limits. This means vehicles did not in fact become qui-
eter, but that changes in the test method caused reduced noise emissions. Ap-
pendix A elaborates further on the effect of the past tightening of limits and test
cycles on vehicle noise emissions.
4.451.1/Traffic noise reduction in Europe
August 2007
30
Figure 14 Measured noise emissions of two passenger cars over the years as a function of the type approval
test
Source: M+P, 2000.
Since 2000, lengthy discussions have been held within the UNECE working
group on vehicle noise about the update of the test method and new limit values.
There is a general consensus in the Working Party on Noise (GRB) that equiva-
lent values must be identified between the new and old test procedures before
any tightening of the limits can be discussed. A 2-year data collection period will
start in June 2007. Updating the Directive will therefore take around 5 years from
now before coming into force. Several experts consequently argue for a tighten-
ing of the type approval limits while still retaining the current test cycle.
As the new standards will apply only to new vehicles, it will be a decade before
quieter cars start reducing noise exposure. With a 2-year measurement period
after 2007 and around four years for new limit values to be negotiated and trans-
posed in the UNECE and EU, it will be another two years before the new limit
values come into force, so that quieter cars may not reach the market until about
2015. The average age of a car on the roads is around 6 years, and the overall
noise abatement impact of new legislation will only have effect once quieter vehi-
cles make up the bulk of the fleet. Tangible effects could therefore perhaps be
expected on Europe’s roads around 2020.
Recent drafts of the test procedure indicate that a more realistic driving pattern is
to be adopted. It is extremely important, however, that the vehicle test remains a
test of the power unit itself, where tyre/road noise is marginal.
Scope for immediate improvement of at least 3 dB(A) The conclusions of a review of the technical potential for reduction of vehicle
noise by TRL and RWTUV (TRL, 2003) can be summarised as follows:
4.451.1/Traffic noise reduction in Europe
August 2007
31
� Engine: the variance of today’s production engines for cars is around 7 dB(A)
over the whole range, with the upper half comprising engines that are still on
the market but not state-of-the-art. This means there is a reduction potential
of 3 dB(A) if all vehicles are equipped with these quieter, currently available
engines.
� Gas flow noise: a further reduction of intake and exhaust noise can in general
be achieved by using greater silencer volumes and double-walled silencers.
The problem is to reserve the necessary storage capacity for the silencers
and accommodate the increase in weight.
� Mechanical noise: For cars, the contribution of gearbox and drivetrain to
overall noise emission is insignificant. For heavy duty vehicles the situation is
different, especially since the requirements for robustness and durability are
much higher than for passenger cars. Possible reduction measures are ad-
vanced encapsulations and the de-coupling of the gearbox and engine (lower
rpm).
A study by EC (2004) indicates that the limits for heavy duty vehicles could be
lowered by 3-5 dB(A) in two steps within 10 years, based on a new measurement
method. For passenger cars and light duty vehicles, the limits could be tightened
by 3-6 dB(A) in two steps within the same timeframe.
For passenger cars the following proposal has been presented by M+P consul-
tancy (Blokland, 2004):
� Decrease limit value from current 74 to 71 dB(A) (several cars are already
available with 67 dB(A)).
� Remove the +1 dB(A) allowance for direct-injected diesel engines. Modern
diesel injection technology is not louder than petrol engines.
� Remove the unnecessary allowance of +2 dB(A) for vans: these are mainly
‘stripped down’ passenger car models.
In the case of passenger cars, acoustic design usually tends towards lower noise
volumes, especially for luxury models. However, loud acoustic design is a spe-
cific feature of a small minority of sports cars, which can thus nonetheless deter-
mine the overall sound level of a road. The industry is not that keen to reduce
noise limits, as it sets restrictions on producing cars with a ‘sporty’ sound.
4.4 Tyre noise limits too high to be effective
In 2001 Directive 2001/43/EC came into force, setting limit values for tyre/road
noise. This Directive was potentially an important contribution to noise policy, be-
cause above 30-50 km/h tyre/road noise becomes the most important source.
Almost all the tyres that have been in service since the regulations were intro-
duced are well below the current limits. The Directive is therefore essentially inef-
fective and no more than symbolic (see Figure 15). Even the lowering by 1-2
dB(A) foreseen by the directive for 2007-2009 is ineffective (Sandberg, 2003).
The most striking feature is that a 1dB(A) reduction and a round-down are ap-
plied before the measured test values are compared with the limit values. This
implies that a tyre measured at 77.9 dB(A) meets the limit value of 76 dB(A).
4.451.1/Traffic noise reduction in Europe
August 2007
32
In August 2004 the Directive and emissions limits were scheduled for revision.
Within the framework of the revision of the Road/tyre directive, the Commission
has commissioned FEHRL to carry out a study to assess the potential for reduc-
ing the limit values and the impacts of reductions on overall traffic noise, safety
and economy. Based on the FEHRL study, the Commission will come up with a
proposal for a Directive replacing and expanding on 2001/43/EC. This proposal
will include standards for safety (wet grip, aquaplaning) and rolling resistance as
well as noise. A consultation will be announced around May 2007, with a pro-
posal due for the autumn.
As part of the FEHRL study, a database of measurements on 300 tyres has been
created. Fifty per cent of the tyres measured produced noise levels over 3dB(A)
below the current limits. As a whole, the range is typically up to around 5 dB(A)
below the current limit value, while best available technology is even 8dB(A) be-
low that limit (FEHRL, 2006; EC, 2004).
Figure 15 Measurement data and proposed limit values for passenger car tyres
Source: FEHRL, 2006.
Proposals for tightening the Road/tyre directive FEHRL and the German Federal Environment Agency (UBA) have both provided
proposals for a tightening of the Road/tyre directive. Their limit values for pas-
senger cars are depicted in Figure 15. The FEHRL study recommends reductions
of 2.5-5.5 dB(A) for passenger car tyres and 5.5-6.5 dB(A) for commercial vehicle
tyres. The German Federal Agency (UBA) has proposed reductions versus the
current limit values of roughly the same order, but proposes dropping the differ-
entiation on the basis of tyre width. Table 5 shows the proposed limit values.
4.451.1/Traffic noise reduction in Europe
August 2007
33
Table 5 Type approval limits (dB(A)) proposed for passenger car tyres
2001/43/EG FEHRL UBA Tyre width R (mm)
Current Next phase 2008 2012 2008 2012 2016
R � 145 72 71
145 < R � 165 73 72
165 < R � 185 74 73
71.5 69.5
185 < R � 215 75 74
215 < R � 245 72.5 70.5
245 < R � 275 73.5 71.5
R > 275
76 75
75.5 73.5
71 70 69
Low-noise tyres do not conflict with low rolling resistance and safety standards;
see Figure 16. With respect to the former the FEHRL study (FEHRL, 2006) found
no conflict at all. As regards the latter, there are many examples in the database
of tyres that produce relatively low noise levels and yet perform well in terms of
safety. There are indeed indications that these two characteristics are even posi-
tively associated (Sandberg, 2006).
While there is no conflict between safety (wet weather conditions) and low noise
at current levels of technological development, it still needs to be monitored in the
future, as it cannot be guaranteed that there will be no conflict for future tyres, as
the FEHRL study concludes.
Figure 16 Correlation between low noise, safety and rolling resistance characteristics for passenger car tyres
Retreaded tyres are not covered by the Directive. This limits its effectiveness,
because, somewhat surprisingly, around half the tyres used in heavy goods
transport and a smaller fraction of passenger car tyres are reused.
The arguments for reducing tyre noise limits are sound not only because of the
technical potential, but also from a socio-economic perspective. Several studies
show that low-noise tyres are currently no more expensive than normal tyres
(Sandberg, 2006; RIVM, 2003). According to the tyre industry, the costs for low-
noise tyres amount to around € 2 billion per year, but in the view of FEHRL these
are significantly overestimated. The benefits are significant, totalling around € 48-
123 billion between 2010 and 2022, making low-noise tyres very cost-effective
(FEHRL, 2006). These savings accrue to local and national authorities and hence
4.451.1/Traffic noise reduction in Europe
August 2007
34
taxpayers, via savings on anti-propagation methods. Other benefits are lower
health care costs and improved well-being.
Incentives for quieter tyres To speed up the development of low-noise tyres, financial incentives may need to
be introduced. One means of doing so may be to levy a tax on tyres or introduce
some other type of financial incentive proportional to the assigned noise level.
Another option is a system based on introduction of a noise-differentiated annual
vehicle tax. To increase the use of low-noise tyres, the type approval rating
needs to be marked on the tyre sidewall. This is easy to realise and should be
part of the revision of Directive 2001/43/EC (Sandberg, 2006b).
Optimisation of tyres from a fuel-efficiency perspective is also presently under
discussion. The revision of the Tyre/road noise directive will include limits pertain-
ing to fuel efficiency, safety and noise. There is currently very little information
available to consumers on these tyre performance characteristics. There are
therefore also arguments for developing a consumer label for tyres that covers
safety, climate and noise together6.
4.5 Low-noise road pavements
Low-noise road surfaces, such as thin-layer, double-layer, porous and poro-
elastic pavements, offer considerable potential to cut road noise dramatically,
and are very complementary to technical measures to reduce engine, exhaust
and tyre noise from cars and trucks. Such surface measures have the advantage
of bringing immediate benefits, particularly for use in noise hotspots.
Tyre road noise explained Tyre/road noise is a complex addition of several mechanisms of noise generation and amplification,
depending on the properties of both tyres and road surface:
� Noise is generated partly by impacts and shocks on the tyre, caused by road surface irregulari-
ties or irregularities on the tyre tread. These shocks make the tyre vibrate and radiate noise.
Vibrations of the tyre tread spread to the sidewalls, which then radiate the noise further.
� Aerodynamic noise sources include so-called air pumping, consisting of the noisy pushing
away of air on the leading edge of the contact zone between tyre and road surface and the
noisy sucking in of air along the rear edge. The resonances occurring in the tyre cavity and
tread pattern canals can also be considered as aerodynamic noise sources.
� One ‘micro-movement’ effect is the stick/slip tread elements’ motion relative to the road sur-
face, causing the tread elements to vibrate tangentially.
� An adhesion effect is the stick/snap effect of the sudden loosening of the tyre tread from the
road surface, comparable to the sudden loosening of a suction cup.
� The horn effect is a noise amplification mechanism whereby noise generated near the edge of
the tyre/road surface contact area becomes amplified due to the geometry created by tyre and
road surface. This is the same phenomenon intended by the conical part of a trumpet or a
megaphone.
Source: EC, 2006.
6 There are indications that this labelling needs to be different in different climatic zones. This would be a
complication.
4.451.1/Traffic noise reduction in Europe
August 2007
35
The degrees of noise reduction achieved by low-noise pavements are shown in
Table 6.
Table 6 Noise reductions due to low-noise road pavements in urban and rural areas
Pavement Urban Rural 50 km/h 70 km/h 110 km/h
Two-layer asphalt 3 dB(A) 4 dB(A) 5 dB(A)
Thin layer asphalt 1.5 dB(A) 2 dB(A) 2 dB(A)
Source: Ohm, 2006.
Low-noise pavements are a cost-effective option to reduce traffic noise. KPMG
(2005) indicates that low-noise asphalt can reduce investments in noise abate-
ment measures by up to 80% compared to noise barriers. The cost reductions
are greatest for intra-urban roads, because it is here particularly that low-noise
pavements can reduce the need for expensive barriers.
The European Commission is planning to mandate CEN7 to develop a European
standard for low-noise asphalt. In certain Member States there are several
acoustical classification systems for road surfaces, but there are no international
standards on such classification nor are road surfaces checked for conformity.
With such a CEN standard in place, the introduction of acoustical performance in
public contracts for road surfacing might be facilitated, competition in tendering
increased, and the use of lower-noise road surfaces fostered as well.
Importantly, the SILVIA project found that there are no significant differences be-
tween porous asphalts and dense asphalts with respect to either safety, rolling
resistance or fuel consumption (Elvik, 2003).
4.6 Speed reduction and traffic management
The noise of a road can also be reduced by influencing the speed or flow of the
traffic it carries. Limiting traffic speed reduces its noise, especially between 50
and 80km/h. As Table 7 below shows, speed limit enforcement in urban areas
has a positive effect on transport noise. Traffic management often also has an
effect on the number of vehicles. The table shows the noise reduction caused by
a reduced traffic volume under assumption of no changes in either speed or per-
centage of heavy vehicles.
Although traffic management measures have relatively limited potential com-
pared to the long-term potential of other measures, they involve only limited in-
vestments and have a direct effect, because of their limited implementation time.
However, the costs associated with travel time losses may be significant.
Compliance with new speed limits is obviously important for achieving the de-
sired effects, as illustrated in the example in the textbox.
7 CEN is the European Standardisation Committee.
4.451.1/Traffic noise reduction in Europe
August 2007
36
Speed reduction positive for air quality and noise In the Netherlands, the speed limit on various motorway sections close to city dwellings was re-
duced in 2006 because of local non-compliance with EU air quality regulations. Compliance with
the new limit, 80 instead of 100 km/h, is enforced with speed cameras that calculate average
speed. This has had a positive effect on air quality, but noise emission has also been reduced by
up to 1.5 dB(A), depending on local circumstances. Another effect perceived by people living close
to the road sections in question is the absence of noise peaks by individual cars passing at high
speed during the night.
Source: Dutch Ministry of Transport, 2006.
Traffic management measures have a positive impact not only on noise reduction
but also on air quality and road safety. Reductions in traffic can be achieved by
promoting public transport, encouraging cycling and walking, parking manage-
ment, HGV bans, route designation and road bypasses. Other examples of traffic
management include measures that induce the traffic flow to become more flu-
ent, through smart tuning of traffic lights, for example, to avoid stop-and-go traffic
as far as possible. The effects of traffic management measures is shown in Table
7 and Table 8.
Table 7 Effects of speed limit changes on noise reduction
Speed reduction (10% heavy traffic) Traffic reduction
From 110 to 100 km/h 0.7 dB(A) 10 % 0.5 dB(A)
From 100 to 90 km/h 0.7 dB(A) 20 % 1.0 dB(A)
From 90 to 80 km/h 1.3 dB(A) 30 % 1.6 dB(A)
From 80 to 70 km/h 1.7 dB(A) 40 % 2.2 dB(A)
From 70 to 60 km/h 1.8 dB(A) 50 % 3.0 dB(A)
From 60 to 50 km/h 2.1 dB(A) 75 % 6.0 dB(A)
From 50 to 40 km/h 1.4 dB(A)
From 40 to 30 km/h 0 dB(A)
Source: DRI, 2004.
Table 8 Effects of traffic management measures on noise reduction
Traffic management measure Potential noise reduction (LAeq) Traffic calming / Environmentally adapted through-roads Up to 4 dB(A)
30 km/h zone Up to 2 dB(A)
Roundabouts Up to 4 dB(A)
Round-top/circle-top road humps Up to 2 dB(A)
Speed limits combined with signs about noise disturbance 1 - 4 dB(A)
Night time restrictions on heavy vehicles Up to 7 dB(A) at night time
Rumble strips of thermoplastic Up to 4 dB(A) noise increase
Rumble areas of paving stones Up to 3 dB(A) noise increase
Flat-top humps Up to 6 dB(A) increase
Narrow speed cushions Up to 1 dB(A) increase
Rumble wave devices 0 dB(A)
Source: Berndtsen, 2005.
4.7 Anti-propagation measures (noise barriers, insulation)
If the desired degree of noise reduction cannot be achieved by at-source meas-
ures, noise barriers and insulation of dwellings may be helpful in reducing propa-
gation of the noise. On average, noise barriers reduce noise levels by 3-6 dB(A),
depending on their design and height. Roadside noise barriers are only accept-
4.451.1/Traffic noise reduction in Europe
August 2007
37
able for motorways and other bypass roads where there is no need for pedestri-
ans to cross. On busy urban streets, which are crossed by pedestrians along
their entire length, noise barriers cannot be placed directly on the kerbside. It is
only in non-urban areas that they can provide a solution, therefore.
If no other measures can be adopted, or if other measures are inadequate,
soundproof windows and insulated walls are the only possibility remaining for fur-
ther protection against noise. To be effective, though, such windows must be
kept closed, and many people have trouble adjusting to this restriction on their
normal behaviour (opening windows, etc.), especially during the summer.
The average cost of a noise barrier is around € 300 per m2, depending on its
construction and the materials used (Witteveen+Bos, 2004). This is around € 2.4
million for a barrier 4 metres high and 1 kilometre along both sides of a road.
4.8 Rail transport noise
Noise is one of the most significant environmental impacts of rail traffic. Contrary
to road traffic, where European emission standards have existed since the early
1970s, such emissions standards for trains only came into force at the beginning
of the present century. Moreover, EU noise emission standards apply only to rail
vehicles operating in more than one Member State.
European legislation addresses railway noise at-source through directives on rail-
way interoperability for high-speed rail (Council Directive 96/48/EC) and conven-
tional rail (Directive 2001/16/EC), which provide a legislative framework for tech-
nical and operational harmonisation of the rail network. Under this legislation,
Technical Specifications for Interoperability (TSIs) are established by the Com-
mission, which include noise limits. Within the operability framework, emission
limits regarding the noise of high speed trains (2002) and conventional trains
(2005) have been set. These limits apply to new or upgraded rolling stock. A re-
duction of the limit values by 2-5 dB(A) is foreseen for 2016/18.
Wheel and rail roughness the cause of noise Noise from trains is basically caused mainly by the wheels rolling over the rails.
This problem obviously concerns the transport of both passengers and freight,
but it is far more acute in the latter case. It is the roughness of rails and wheels
that causes noise. Locally higher rail roughness, caused by intensive traffic and
wear and tear of wheels, may cause a rise in noise emissions of up to 5 dB(A)
(EC, 2003). One of the options to reduce such emissions is therefore regular pol-
ishing of the rails. One important source of wheel and rail roughness is vehicles
with tread-braked wheels. The brake pads can create a roughness on the wheel,
which in turn roughens the rail over time. Replacing cast iron brake blocks by
composite material blocks would therefore be beneficial for all the vehicles travel-
ling on the same track. Reports by the International Union of Railways (UIC) as
well as other studies have stated that a reduction of 8-10 dB(A) can be achieved
if all tread-braked freight wagons are retrofitted with composite brakes.
4.451.1/Traffic noise reduction in Europe
August 2007
38
There are two types of brake blocks that are made of composite materials rather
than iron: K-blocks and LL-blocks. K-blocks are approved by the official authori-
ties for international use and are most frequently applied at the moment. Al-
though LL-blocks are more similar to conventional brake systems and cheaper to
fit, they are not yet certified for international use, a procedure that may take about
2 years (from 2007). In the case of new vehicles, disc brakes can also be used.
Most recent information shows that use of K-blocks saves maintenance costs,
while LL-blocks can be applied cost-neutrally. LL-blocks are already applied in
the US, South Africa and Portugal for cost reasons. The aforementioned Dutch
IPG programme is running tests with both K- and LL-blocks, estimating the life
cycle costs of each, amongst other things.
Composite brake blocks most cost-effective Retrofitting all the 600,000 freight wagons in use in the EU would cost around
€ 2-3 billion (K-blocks) according to the UIC (UIC, 2006b), but these costs may
be an upper estimate, as indicated above. It is undisputed, however, that retrofit-
ting the freight wagon fleet with composite brake blocks is most cost-effective. It
is concluded by the UIC, among others, that use of such braking blocks is far
more cost-effective than merely installing noise barriers. The STAIRRS project
(Oertli, 2003) concludes that a combination of composite braking blocks, opti-
mised wheels, rail absorbers, acoustic grinding and noise barriers up to 2 m high
is the most effective option. Higher noise barriers should only be used if other
technologies fall short (Oertli, 2003; RIVM, 2003; UIC, 2006).
Without due action, half of all freight wagons currently on the rails in the EU will
still be in use in 2020 (Kunst, 2006; UIC, 2006b). The EU working group on
health and socio-economic aspects has therefore advised phasing out existing
rolling stock (EC, 2005). This phase-out can be achieved by introducing progres-
sively stringent emission standards.
Track charge differentiation is promising An important instrument for noise emission control is the rail access charge. This
is the fee the operator pays the infrastructure manager for using the railway sys-
tem. This charge could be differentiated on the basis of the noise emission of the
rolling stock. To increase its effectiveness, it could be differentiated according to
population density. Track charge differentiation would put market pressure on
operators to use low-noise rolling stock and on vehicle manufacturers to invest in
low-noise technology development. Subsidy programmes lack such incentives.
The costs of low-noise rolling stock are borne by the rail sector rather than the
taxpayer, furthermore, in line with the polluter pays principle.
4.451.1/Traffic noise reduction in Europe
August 2007
39
Rail noise reduction in Switzerland Since January 2002 a noise reduction bonus is encouraging infrastructure users to employ low-
noise rolling stock in Switzerland. To qualify for the bonus, advanced brake technology must be
used (composite blocks, disc brakes or comparable). In practice the bonus is about 5-8 per cent of
the total rail access charge. The noise reduction bonus is combined with a noise reduction pro-
gramme including subsidies for retrofitting all Swiss rolling stock with composite brakes (K-type).
Noise barriers have furthermore been constructed under a cost-benefit constraint. The whole pro-
gramme is being funded from tax increases in the road sector.
Source: UIC, 2006
In the subsidy programme outlined in the box, Swiss rolling stock benefited, while
foreign operators could not claim the subsidies for retrofitting. They were conse-
quently charged more for their use of Swiss track. The Swiss example shows that
in the single market national subsidies pose the risk of discriminatory treatment of
operators.
Future rail noise reduction As wheels become smoother, track grinding and other measures also become
more important. Quieter railways depend not only on rolling stock, but also on
track quality. Track-related measures are cost-effective. One way to enforce
grinding of major tracks would be to introduce tighter noise exposure limits at
night time. For the mid and long term, rolling stock needs to be developed with
noise reduction in mind.
4.9 Two-wheeled vehicle noise
Only in regions where motorcycles make up a significant fraction of the overall
vehicle fleet are they are a major contributor to ambient noise levels. Although it
is mainly in urban settings that this noise problem is noticed and reported, their
annoyance potential is also high elsewhere because of the high percentage of
illegal noise-increasing mufflers fitted and often aggressive driving behaviour. A
Swedish noise annoyance study identified motorcycle noise as by far the most
annoying form of vehicle-related noise. Consequently, measures to address the
use of such mufflers need to be given the highest priority. In addition, all the other
reduction measures cited for cars and heavy-duty vehicles, such as improvement
of the type approval measurement method and lowering of noise limits, should be
applied to motorcycles, too.
Directive 97/24/EC lays down limit values for two-wheeled road vehicles. These
European limits are not particularly stringent, nor is the noise test technically de-
manding, as is demonstrated by the fact that some motorcycles pass it by a sub-
stantial margin of 4-6 dB(A) margin below the limit value.
The problem of owners tampering with their vehicle, particularly by replacing the
original exhaust silencer by a less efficient one, seems to be equally serious all
over Europe. Overall, the penetration of illegal exhausts in the fleet is 35% for
motorcycles and 65% for mopeds.
4.451.1/Traffic noise reduction in Europe
August 2007
40
The purpose of the type approval required for each category of vehicle is to en-
sure that individual vehicles meet the safety and environment requirements es-
tablished by society. It is therefore patently absurd that in the case of two-
wheeled vehicles many if not most of those vehicles in reality acquire quite a dif-
ferent, noisier performance profile, whether immediately or soon. Measures to
prevent tampering should therefore be afforded the higher priority. Only after the
problem of illegal noise emissions has been resolved is further tightening of noise
emissions worthwhile. There is room enough for tightening of the limits, given the
current margins under the limit value as well as the emission levels already being
achieved in Japan.
The EffNoise study (EC, 2004) indicates that reduced use of illegal exhaust si-
lencers could reduce motorcycle noise emissions by 5-15 dB(A), while subse-
quent stepwise tightening of limit values could reduce them by a further 3-6 dB(A)
(EC, 2004).
4.451.1/Traffic noise reduction in Europe
August 2007
41

4.451.1/Traffic noise reduction in Europe
August 2007
42
5 Recommendations for action
Noise exposure is a widespread and serious health problem In the European Un-
ion and noise abatement measures should therefore be afforded greater priority
than at present in the EU policy process. To this end we make the following rec-
ommendations:
� To guarantee the European population a healthier living environment, noise
exposure standards should be set and enforced for several different environ-
ments (outdoor living area, dwelling interiors, schools, etc.), as is the case
with current EU air quality standards. In quantifying these standards, the
guidelines drawn up by the WHO could serve as a starting point. These ex-
posure standards could then serve as an appropriate basis for the action
plans prescribed in the EU Environmental noise directive.
� There needs to be greater political focus on noise policy. Traffic noise should
be viewed primarily as a public health issue, rather than merely a trading
standards topic. The lead at both the European and the international level
should therefore be taken by public health and environmental experts.
� The most cost-effective measures are those at the level of vehicles. It is
therefore these measures that should be afforded priority at the EU level.
� The instruments employed in noise policy have the potential to reduce noise
emissions significantly, but to do so the limits they rest on must be made con-
siderably more stringent. To date, though, lobbying by industry seems to have
been very successful, for the limits in force have been too liberal to have had
any effect. Priority should not be given merely to harmonisation, but tighten-
ing of the limits placed higher on the political agenda, to reduce the ever
growing noise exposure of the EU population.
� There is already scope for tightening the noise limits for vehicle drivelines by
at least 3-4 dB(A), as an initial step. After 2012 year-on-year improvement
targets (x dB(A) every y years) should be introduced, outlined well in advance
to give industry sufficient time to adapt.
� The current test cycle for road vehicles is sub-optimal in relation to real-world
vehicle noise performance. Revision of the test cycle is a lengthy process,
however, and the noise emission limits should therefore first be tightened
based on the current cycle, with the cycle itself being revised in time for the
next tightening of limits around 2012.
� The limits in the EU Tyre/road directive need to be tightened if new technol-
ogy is to be promoted. The UBA/FEHRL proposals are a good starting point.
To improve consumer information, all tyres should be labelled with their noise
approval rating and rolling resistance. Retreaded tyres should be included in
the directive, at least for heavy vehicles, since these account for a surpris-
ingly high share of about 50% of the market.
� An international standard for noise road surface classification systems should
be developed, laying down terms for including acoustic performance in public
contracts for road surfacing.
� As an initial step to reduce the noise emissions of rail transport, the use of
composite brakes on freight wagons should be promoted. The current track
4.451.1/Traffic noise reduction in Europe
August 2007
43

charge is a promising instrument for differentiating on the basis of noise
emission. The advantage of this measure over a subsidised retrofitting pro-
gramme is that retrofitted wagons will be used most frequently. Combining
track charge differentiation with a subsidy scheme may have adverse effects
on international competition.
� Type approval procedures for LL-blocks should also be hastened, as these
perform just as well as K-blocks and are regarded as more cost-effective.
Since LL-blocks can applied cost-neutrally, no subsidies are necessary.
4.451.1/Traffic noise reduction in Europe
August 2007
44
Literature
Babisch, 2006
W. Babish
Transportation Noise and Cardiovascular Risk : Review and Synthesis of Epide-
miological Studies, Dose Effect Curve and Risk Estimation
Berlin : UBA, 2006
Babisch et al., 2005
W. Babisch, B. Beule, M. Schust, N. Kersten, H. Ising,
Traffic noise and risk of myocardial infarction,
In : Epidemiology, 16(1): 33-40, 2005
Babisch, 1998
W. Babisch
Epidemiological studies of the cardiovascular effects of occupational noise – a
critical appraisal
In : Noise & Health, 1: 24-39, 1998
Berg, 2003
M. van den Berg, et al.
Valuation of noise : position paper
S.l. : Working group on Health and Socio-economic aspects, 2003
Berglund et al., 1999
B. Berglund, T. Lindvall, D.H. Schwela
Guidelines for Community Noise
London : WHO (World Health Organisation), 1999
Bistrup et al., 2001
M.L. Bistrup, S. Hygge, L. Keiding, W. Passchier-Vermeer
Health effects of noise on children and perception of the risk of noise
Copenhagen : National Institute of Public Health, 2001
Blokland, 2004
Gijsjan van Blokland
Type-approval as instrument for controlling road traffic noise
Aalsmeer/Vugt : M+P/Müller-BBM, 2004
Bluhm et al., 2006
G.L. Bluhm, N, Berglind, E. Nordling, M. Rosenlund
Road traffic noise and hypertension
In: Occupational and Environmental Medicine 2007;64:122-126
4.451.1/Traffic noise reduction in Europe
August 2007
45
Ellebjerg Larsen et al., 2002
L. Ellebjerg Larsen, H. Bendtsen, B. Mikkelsen
Traffic noise annoyance : A survey, in: Aarhus, Odense & Randers
Lyngby : Danish Transport Review Institute, 2002
Berndtsen, 2005
Traffic Management and Noise Reducing Pavements : Recommendations on
Additional Noise Reducing Measures
Silvia project deliverable, 2005
http://www.trl.co.uk/silvia/Silvia/pdf/Main_Outputs/SILVIA-DTF-DRI-008-11-WP5-
020205.pdf
CE, 2004
J.P.L Vermeulen, B.H. Boon, H.P. van Essen, L.C.den Boer, J.M.W. Dings, F.R.
Bruinsma, M.J. Koetse
De prijs van een reis
Delft ; Amsterdam : CE ; VU, 2004
Clark et al., 2005
C. Clark, R. Martinez, E. van Kempen, A. Tamuno, J. Head, W. Hugh, M. Davies,
M.M. Haines, I, Lopez Barrio, M. Matheson, S.A. Stansfeld
Exposure-Effect Relations between Aircraft and Road Traffic Noise Exposure at
School and Reading Comprehension
In : American Journal of Epidemiology 163(1), 27-37, 2005
Danish EPA, 2003
A. Ohm, M.P. Jensen
Strategi for begrænsning af vejtrafikstøj : Delrapport 3. Virkemidler og sam-
fundsøkonomiske beregninger (Strategy for limiting road traffic noise : Report 2.
Means of abatement and socio-economic assessment (in Danish))
Copenhagen : Danish Environmental Protection Agency, 2003
DRI, 2005
Lars Ellebjerg Larsen
Cost-benefit analysis on noise-reducing pavements
Copenhagen : Danish Road Institute, 2005
DRI, 2004
Traffic management and noise reducing pavements : Recommendations on addi-
tional noise reducing measures
Danish Road Institute
Copenhagen : Ministry of transport and energy, 2004
Dutch Ministry of Transport, 2006
Evaluatie 80 km zones (Evaluation of 80-km zones (in Dutch), letter from the Min-
ister of Transport to the Dutch parliament, DGP/WV/u.06.02308, 2006.
http://www.vananaarbeter.nl/Images/Evaluatie%2080%20km%20zone_tcm220-
171282.pdf
4.451.1/Traffic noise reduction in Europe
August 2007
46
EC, 2001
EU’s Future Noise Policy, WG2 – Dose/Effect
Position Paper On Dose Response Relationships BetweenTransportation Noise
And Annoyance : Revised
Brussels : European Commissieon, 2001
EC, 2007
A Competitive Automotive Regulatory Framework for the 21st Century : Commis-
sion's response to the CARS 21 High Level Group Final Report Impact Assess-
ment, Communication from the Commission to the European Parliament and the
CouncilCOM(2007) 22 final, 2007
Brussels : European Commission, 2007
EC, 2006
Noise classification of road pavements :Task 1: Technical background informa-
tion, Draft report
COWI
Brussels : European Commission - DG Environment, 2006
EC, 2005
Position paper on the effectiveness of noise measures
EU Working Group Health & Socio-Economic Aspects
Brussels : European Commission, 2005
EC, 2004
EffNoise : Service contract relating to the effectiveness of noise mitigation meas-
ures : final Report, Volume I
LÄRMKONTOR GmbH (contractor)
Brussels : European Commission - DG Environment, 2004
EC, 2003
Position Paper on the European strategies and priorities for railway noise abate-
ment
EU Working Group Railway Noise of the European Commission
Brussels : European Commission, 2003
EC, 2002
S. Navrud
The state-of-the-art on economic valuation of noise
Brussels : European Commission, DG Environment, 2002
Elvik, 2003
R. Elvik, P. Greibe
Safety Aspects Related to Low Noise Road Surfaces, Silvia project
Silvia project deliverable, 2003
http://www.trl.co.uk/silvia/Silvia/pdf/Main_Outputs/SILVIA-DTF-ATKINS-001-03-
WP3-091203.pdf
4.451.1/Traffic noise reduction in Europe
August 2007
47
EPA, 1978
Noise : A health problem
Washington D.C. : Environmental Protection Agency, Office of Noise Abatement
and Control, 1978
FEHRL, 2006
Tyre/road noise : final report
Brussels : TUV Nord, BAST, TRL, VTI, 2005
Health Council of the Netherlands, 2004
The influence of nighttime noise on sleep and health
The Hague : Health Council of the Netherlands, 2004
IPG, 2007
Innovatieprogramma Geluid (Noise Innovation Programme (in Dutch)), 2007
http://www.innovatieprogrammageluid.nl
INFRAS/IWW, 2004
External Costs of Transport, Update Study
Zürich/Karlsruhe : INFRAS/IWW, 2004
Ising et al., 2004
Exposure and effect indicators of environmental noise
H. Ising, W. Babisch, R. Guski, B. Kruppa, C. Maschke
Berlin : Berlin Zentrum Public Health, 2004
Kaseloo, 2005
P.A. Kaseloo
Synthesis of noise effects on wildlife populations
Center for Transportation and the Environment, North Carolina State University
In : Proceedings of the 2005 International Conference on Ecology
and Transportation / C.L. Irwin, P. Garrett, K.P. McDermott, (eds.)
p. 33-35, 2005
Kaseloo et al., 2004
P.A. Kaseloo, K.O. Tyson
Synthesis of noise effects on wildlife populations
S.l. : Virginia State University, 2004
Kunst, 2006
Heiko Kunst
European Transport and Rail Noise Policy, Railway noise in urban areas: possi-
ble source noise, reduction measures, presentation Pisa : S.n., 2006
KPMG, 2005
J. Klooster
Cost effectiveness of road traffic noise measures
The Hague : KPMG, 2005
4.451.1/Traffic noise reduction in Europe
August 2007
48
Link, 2000
H. Link, et al.
The Accounts Approach
UNITE (UNIfication of accounts and marginal costs for Transport Efficiency)
Leeds ; S.n., 2000
London Health Commission, 2003
Noise & Health : Making the link
London : London Health Commission, 2003
M+P, 2000
Noise of passenger cars 1974-1999 : The paradox of a 2 dB(A) increase in traffic
noise and a 8 dB(A) decrease in type approval limits
Vught, : M+P, 2000
Miedema, 2001
H.M.E. Miedema, C.G. Oudshoorn
Annoyance from transportation noise: relationships with exposure metrics DNL
and DENL and their confidence intervals, In: Environmental Health Perspectives,
109(4) : (2001) p. 409-416
Oertli, 2003
J. Oertli
The STAIRRS project, work package 1: a cost-effectiveness analysis of railway
noise reduction on a European scale,
In: Journal of Sound and Vibration, Volume 267, Issue 3, p. 431-437, 2003.
Niemann, 2004
H. , Niemann, C. Maschke
WHO LARES Final Report : Noise effects and morbidity
Berlin, : S.n., 2004
OECD/INFRAS/Herry, 2002
External costs of transport in Eastern Europe
Zürich/Vienna : S.n., 2003
Ohm, 2006
Anne Ohm
Acoustical classification and conformity checking of road surfaces : Costs, bene-
fits and cost-effectiveness of low-noise surfaces, COWI, Stakeholder Workshop,
2006.
Kongens Lyngby : COWI A/S, 2006
Ouis, 2002
D. Ouis
Annoyance caused by exposure to road traffic noise: an update
In : Noise Health, 4(15), 69-79, 2002
4.451.1/Traffic noise reduction in Europe
August 2007
49
Prasher, 2003
D. Prasher
NOPHER Noise Pollution Health Effects Reduction, Final report 2000-2003
London : University College London, 2003
RIVM, 2005
A.B. Knol, B.A.M. Staatsen
Trends in the environmental burden of disease in the Netherlands 1980 - 2020
Bilthoven, RIVM, 2005
RIVM, 2005
E.E.M.M. van Kempen van, B.A.M. Staatsen, I. van Kamp
Selection and evaluation of exposure-effectrelationships for health impact as-
sessment in the field of noise and health
Bilthoven : RIVM, 2005
RIVM, 2004
H. Kruize, A.A. Bouwman
Environmental (in)equity in the Netherlands : A case study on the distribution of
environmental quality in the Rijnmond region
Bilthoven : RIVM, 2004
RIVM, 2003
H.A. Nijland, E.E.M.M van Kempen van, G.P. van Wee, J. Jabben
Bilthoven
Costs and benefits of noise abatement measures
In :Transport policy 10, 131-140, 2003
RIVM., 2003
A.E.M. Franssen, J.M.I. Kwekkeboom,
Effecten van geluid door wegverkeer op de slaap (The impact of road traffic noise
on sleep (in Dutch)),
Bilthoven : RIVM (Dutch National Institute for Public Health and the Environ-
ment), 2003
RIVM, 2004
B.A.M. Staatsen, H.A. Nijland, E.E.M. van Kempen A.E.M. de Hollander A.E.M.
Franssen, A.E.M., I. van Kamp
Assessment of health impacts and policy options in relation to transport-related
noise exposures : Topic paper on noise
Bilthoven : RIVM, 2004
RIVM, 2002
H.A. Nijland, A.G.M. Dassen
Verkeerslawaai in Europa (Traffic noise in Europe (in Dutch))
Bilthoven : RIVM (RijksInstituut voor Volksgezondheid en Milieuhygiëne), 2002
4.451.1/Traffic noise reduction in Europe
August 2007
50
RIVM, 2001
E.E.M.M. van Kempen, C.A. Ameling, R.T. Hoogenveen, B.A.M. Staatsen,
A.E.M. de Hollander
De potentiële ziektelast toe te schrijven aan de geluidsbelasting in Nederland
(The potential health burden attributable to noise nuisance in the Netherlands (in
Dutch))
Bilthoven : RIVM, 2001
Rosenhall, 1990
U. Rosenhall, K. Pedersen, A. Svenborg
Presbycusis and Noise-induced hearing loss, In: Ear & Hearing, 11(4):257-263,
1990
SAEFL, 2003
Monetisation of the health impact due to traffic noise
Bern : SAEFL (Swiss Agency for the Environment, Forests and Landscape) 2003
Sandberg, 2002
Ulf Sandberg
Noise Emission from Powered Two-Wheeled Vehicles : Position Paper
Lingköping : VTI (Swedish National Road and Transport Research Institute),
2002
Stansfeld, 2003
S.A. Stansfeld, M.P. Matheson
Noise pollution: non-auditory effects on health
In: British Medical Bulletin, 68., p. 243-257, 2003
Soguel, 1994
N. Soguel
Évaluation Monétaire des Atteintes à l’Environnement: une Étude Hédoniste et
Contingente sur l’impact des Transports (Monetary evaluation of environmental
harm : a hedonic and contingent study of the impacts of transport (in French)),
Neuchâtel : University of Neuchâtel, 1994
Theebe, 2004
M.A.J. Theebe
Planes, trains and automobiles : The impact of traffic noise on house prices
In : The Journal of Real Estate Finance and Economics, Vol. 28, No. 2-3, 2004
TNO Inro, 2002
H.M.E. Miedema, W. Passchier-Vermeer, H. Vos
Elements for a position paper on night-time transportation noise and sleep distur-
bance,
Delft : TNO Inro, 2002
4.451.1/Traffic noise reduction in Europe
August 2007
51
TOI, 2005
Astrid H. Admundsen, Ronny Klaeboe
A Nordic perspective on noise reduction at the source Oslo : TOI (Institute of Transport Economics), 2005
TRL, 2003
P.A. Morgan, P.M. Nelson, H. Steven
Integrated assessment of noise reduction measures in the road transport sector
TRL limed : RWT V
Brussels : European Commission-DG Enterprise, 2003
http://ec.europa.eu/enterprise/automotive/projects/report_noise_reduction.pdf
UBA, 2005
Data on the environment : The state of the environment in Germany, edition 2005
Berlin ; UBA, 2005
UBA, 2003
C. Maschke, U. Wolf, T. Leitmann.
Epidemiologische Untersuchungen zum Einfluss von Lärmstress auf das Immun-
system und die Entstehung von Arteriosklerose (Epidemiological studies on the
influence of noise stress on the immune system and the development of arterio-
sclerosis (in German)), Anschlussbericht des Forschungsvorhabens
Berlin : UBA, 2003
UIC, 2006
Rail Freight Noise Abatement, a report on the state of the art
Paris : UIC & CER, 2006
UIC, 2006b
Status and options for the reduction of noise emission from the existing European
rail freight wagon fleet : including a third party assessment of the UIC/UIP/CER
action programme on noise
UIC, CER, UNIFE, UIP, UIRR, AEA Technology
Paris : UIC, 2006
Van Kempen, 2002
E.E.M.M. van Kempen, H. Kruize, H.C. Boshuizen, C.B, Ameling, B.A.M. Staat-
sen, A.E.M. de Hollander
The association between noise exposure and blood pressure and ischemic heart
disease, In :Environmental Health Perspectives, 110 (2002) p. 307-317
VITO, 2003
R. Torfs
Kwantificering van gezondheidsrisico’s aan de hand van DALYs en externe ge-
zondheidskosten (Quantification of health risks using DALYs and external health
costs (in Dutch))
Mol : VITO (Vlaamse instelling voor technologisch onderzoek), 2003
4.451.1/Traffic noise reduction in Europe
August 2007
52
VTI, 2006
Mikael Ögren
Noise emissions from railway traffic
Lingköping : VTI (Swedish National Road and Transport Research Institute),
2006
VTI, 2006
Ulf Sandberg
Financial Incentives to Encourage the Use of Low-Noise Tyres Lingköping : VTI
(Swedish National Road and Transport Research Institute ), 2006
WHO, 2007
Night Noise Guidelines for Europe
Bonn : WHO, regional Office for Europe, 2007
Witteveen+Bos, 2004
Project IPG4.3 Schermpositie - fase 1: verkenning oplossingsrichtingen, fase 2:
akoestische effecten en kosten (Barrier positioning - phase 1: possible solutions,
phase 2: acoustic effects and costs (in Dutch))
Deventer : Witteveen+Bos, 2004
4.451.1/Traffic noise reduction in Europe
August 2007
53

4.451.1/Traffic noise reduction in Europe
August 2007
54
CE Delft
Solutions for
environment,
economy and
technology
The Netherlands
tel: +31 15 2150 150
Oude Delft 180
2611 HH Delft
fax: +31 15 2150 151
e-mail: [email protected]
website: www.ce.nl
Report
Delft, August 2007
Authors: L.C. (Eelco) den Boer
A. (Arno) Schroten
Traffic noise reductionin Europe
Health effects, social costs and technical and policy options to
reduce road and rail traffic noise
Annexes
KvK 27251086
CE DelftSolutions for
environment,
economy and
technology
Oude Delft 180
2611 HH Delft
The Netherlands
tel: +31 15 2 150 150
fax: +31 15 2 150 151
website: www.ce.nl
KvK 27251086
e-mail: [email protected]
4.451.1/Traffic noise reduction in Europe
August 2007
55

4.451.1/Traffic noise reduction in Europe
August 2007
56
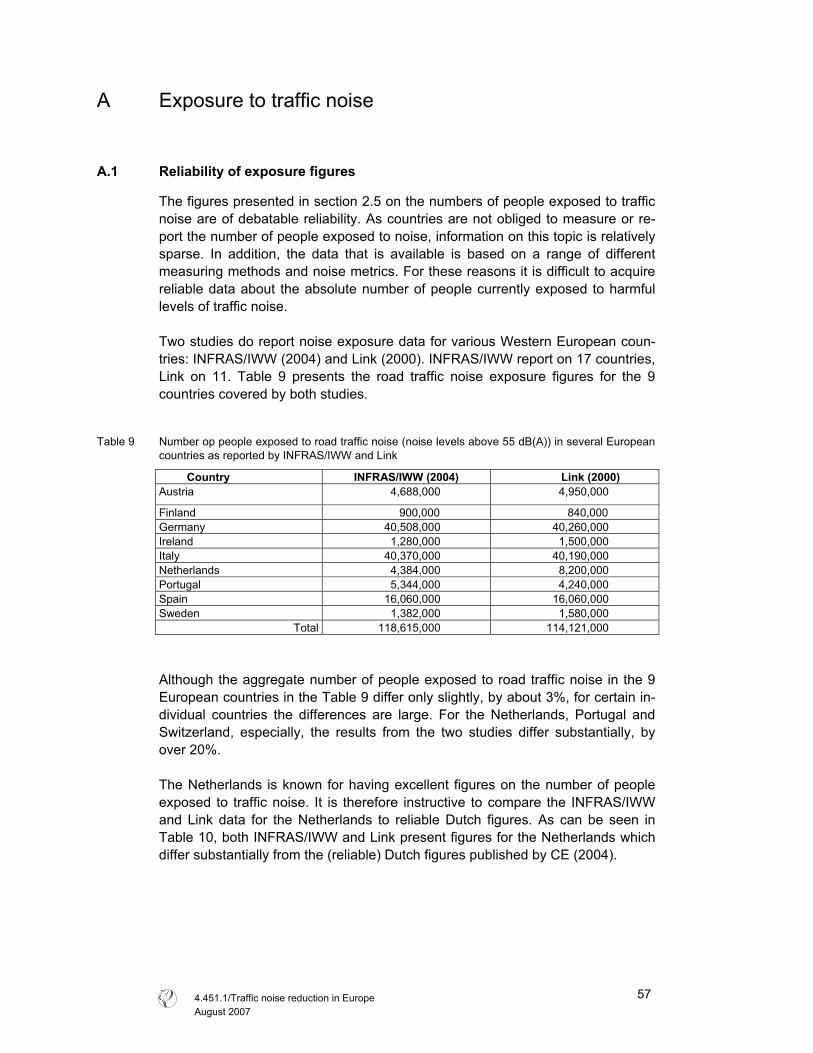
A Exposure to traffic noise
A.1 Reliability of exposure figures
The figures presented in section 2.5 on the numbers of people exposed to traffic
noise are of debatable reliability. As countries are not obliged to measure or re-
port the number of people exposed to noise, information on this topic is relatively
sparse. In addition, the data that is available is based on a range of different
measuring methods and noise metrics. For these reasons it is difficult to acquire
reliable data about the absolute number of people currently exposed to harmful
levels of traffic noise.
Two studies do report noise exposure data for various Western European coun-
tries: INFRAS/IWW (2004) and Link (2000). INFRAS/IWW report on 17 countries,
Link on 11. Table 9 presents the road traffic noise exposure figures for the 9
countries covered by both studies.
Table 9 Number op people exposed to road traffic noise (noise levels above 55 dB(A)) in several European
countries as reported by INFRAS/IWW and Link
Country INFRAS/IWW (2004) Link (2000) Austria 4,688,000 4,950,000
Finland 900,000 840,000
Germany 40,508,000 40,260,000
Ireland 1,280,000 1,500,000
Italy 40,370,000 40,190,000
Netherlands 4,384,000 8,200,000
Portugal 5,344,000 4,240,000
Spain 16,060,000 16,060,000
Sweden 1,382,000 1,580,000
Total 118,615,000 114,121,000
Although the aggregate number of people exposed to road traffic noise in the 9
European countries in the Table 9 differ only slightly, by about 3%, for certain in-
dividual countries the differences are large. For the Netherlands, Portugal and
Switzerland, especially, the results from the two studies differ substantially, by
over 20%.
The Netherlands is known for having excellent figures on the number of people
exposed to traffic noise. It is therefore instructive to compare the INFRAS/IWW
and Link data for the Netherlands to reliable Dutch figures. As can be seen in
Table 10, both INFRAS/IWW and Link present figures for the Netherlands which
differ substantially from the (reliable) Dutch figures published by CE (2004).
4.451.1/Traffic noise reduction in Europe
August 2007
57
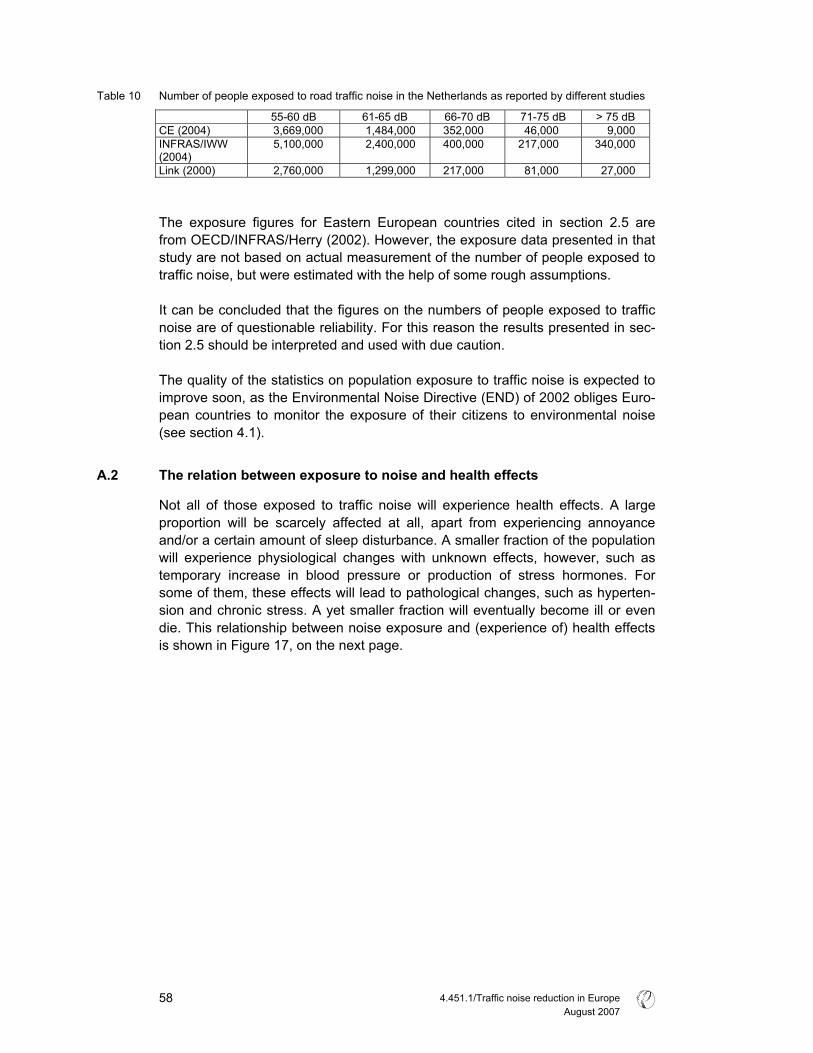
Table 10 Number of people exposed to road traffic noise in the Netherlands as reported by different studies
55-60 dB 61-65 dB 66-70 dB 71-75 dB > 75 dB
CE (2004) 3,669,000 1,484,000 352,000 46,000 9,000
INFRAS/IWW (2004)
5,100,000 2,400,000 400,000 217,000 340,000
Link (2000) 2,760,000 1,299,000 217,000 81,000 27,000
The exposure figures for Eastern European countries cited in section 2.5 are
from OECD/INFRAS/Herry (2002). However, the exposure data presented in that
study are not based on actual measurement of the number of people exposed to
traffic noise, but were estimated with the help of some rough assumptions.
It can be concluded that the figures on the numbers of people exposed to traffic
noise are of questionable reliability. For this reason the results presented in sec-
tion 2.5 should be interpreted and used with due caution.
The quality of the statistics on population exposure to traffic noise is expected to
improve soon, as the Environmental Noise Directive (END) of 2002 obliges Euro-
pean countries to monitor the exposure of their citizens to environmental noise
(see section 4.1).
A.2 The relation between exposure to noise and health effects
Not all of those exposed to traffic noise will experience health effects. A large
proportion will be scarcely affected at all, apart from experiencing annoyance
and/or a certain amount of sleep disturbance. A smaller fraction of the population
will experience physiological changes with unknown effects, however, such as
temporary increase in blood pressure or production of stress hormones. For
some of them, these effects will lead to pathological changes, such as hyperten-
sion and chronic stress. A yet smaller fraction will eventually become ill or even
die. This relationship between noise exposure and (experience of) health effects
is shown in Figure 17, on the next page.
4.451.1/Traffic noise reduction in Europe
August 2007
58
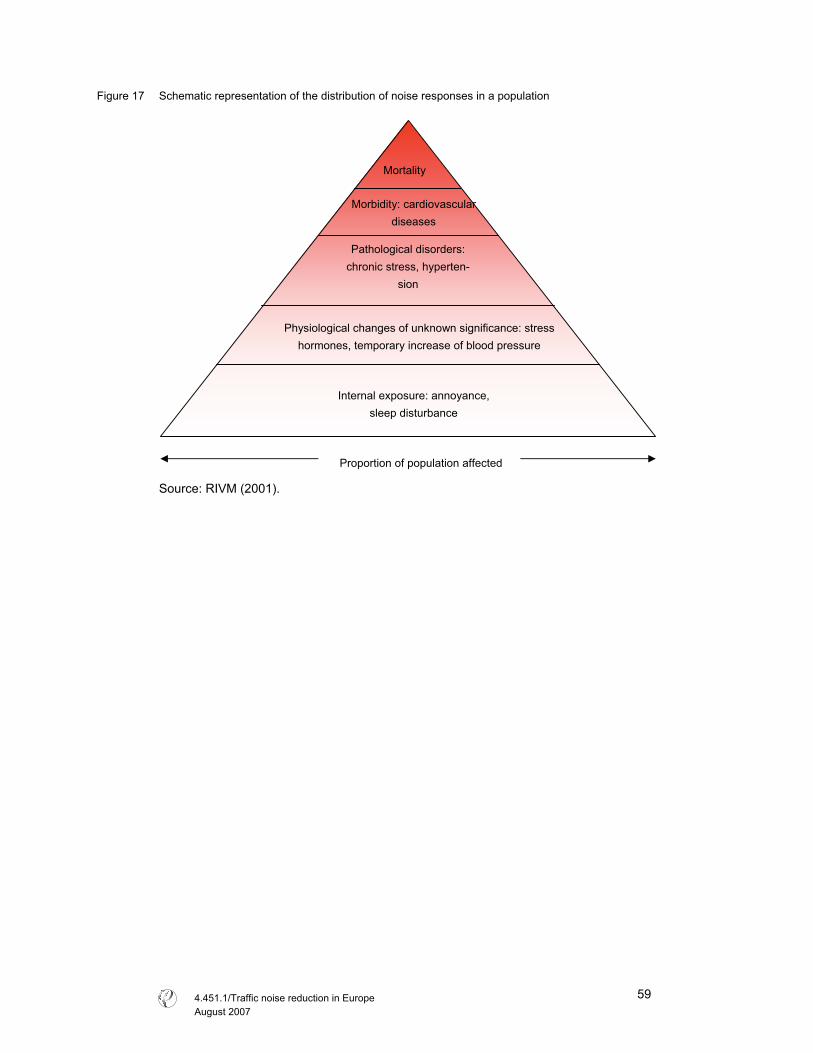
Figure 17 Schematic representation of the distribution of noise responses in a population
Source: RIVM (2001).
Mortality
Morbidity: cardiovascular
diseases
Pathological disorders:
chronic stress, hyperten-
sion
Physiological changes of unknown significance: stress
hormones, temporary increase of blood pressure
Internal exposure: annoyance,
sleep disturbance
Proportion of population affected
4.451.1/Traffic noise reduction in Europe
August 2007
59

4.451.1/Traffic noise reduction in Europe
August 2007
60
B Social costs for traffic noise
B.1 Comparing INFRAS/IWW and Link
Both INFRAS/IWW (2004) and Link (2000) have estimated the social costs of
noise due to road and rail traffic. However, their results vary rather widely. The
main reasons for these differences are:
� The number of people reported to be exposed to traffic noise differs between
the two studies because of the different data sources used. Since the total es-
timated costs are the sum of the costs for all individuals exposed to noise, the
estimated numbers of people exposed to traffic noise directly affects the cost
estimates reported.
� Both studies use comparable Willingess to Pay (WTP) figures derived from
hedonic pricing studies for noise reduction: about 0.1% of per capita income.
However, INFRAS/IWW use these figures to estimate the loss of well-being
due to annoyance and sleep disturbance, while Link uses the same figures to
estimate the loss of well-being due to annoyance only. In the latter report the
monetary value of sleep disturbance due to traffic noise is estimated sepa-
rately.
� An important difference between INFRAS/IWW and Link is the way fatalities
due to traffic noise are valued. INFRAS/IWW (2004) estimate the increased
mortality due to health risk and value each fatality using the so-called Risk
Value, based among other things on the value of a statistical life, the latter
from the literature on valuing the victims of traffic accidents. This method has
been criticised because victims of traffic accidents are much younger than
victims of heart attacks. For this reason, Link evaluates only the ‘years of life
lost’ (YOLL), using a ‘value of a life year lost’ (VLYL). This method, for its
part, can be criticised for ethical reasons, because it claims that the lives of
elderly people are ‘worth less’ than those of younger citizens.
� Medical costs are estimated in the two studies in entirely different ways.
INFRAS/IWW provides estimates for the medical costs of cardiovascular dis-
eases only, thereby assuming that 8% of all the economic costs associated
with cardiovascular disease are due to traffic noise. This figure of 8% repre-
sents the share of the costs of these diseases attributable to traffic noise of
65 dB(A) and upwards and it is consequently on the basis of the population
exposed to this noise level that medical costs are calculated. Link, on the
other hand, uses a series of exposure-response functions to estimate the
number of people suffering various health effects due to traffic noise. To
value the health effects in these people, Link uses monetary values from Ex-
ternE. The medical costs associated with sleep disturbance are estimated in
a similar way.
4.451.1/Traffic noise reduction in Europe
August 2007
61

4.451.1/Traffic noise reduction in Europe
August 2007
62
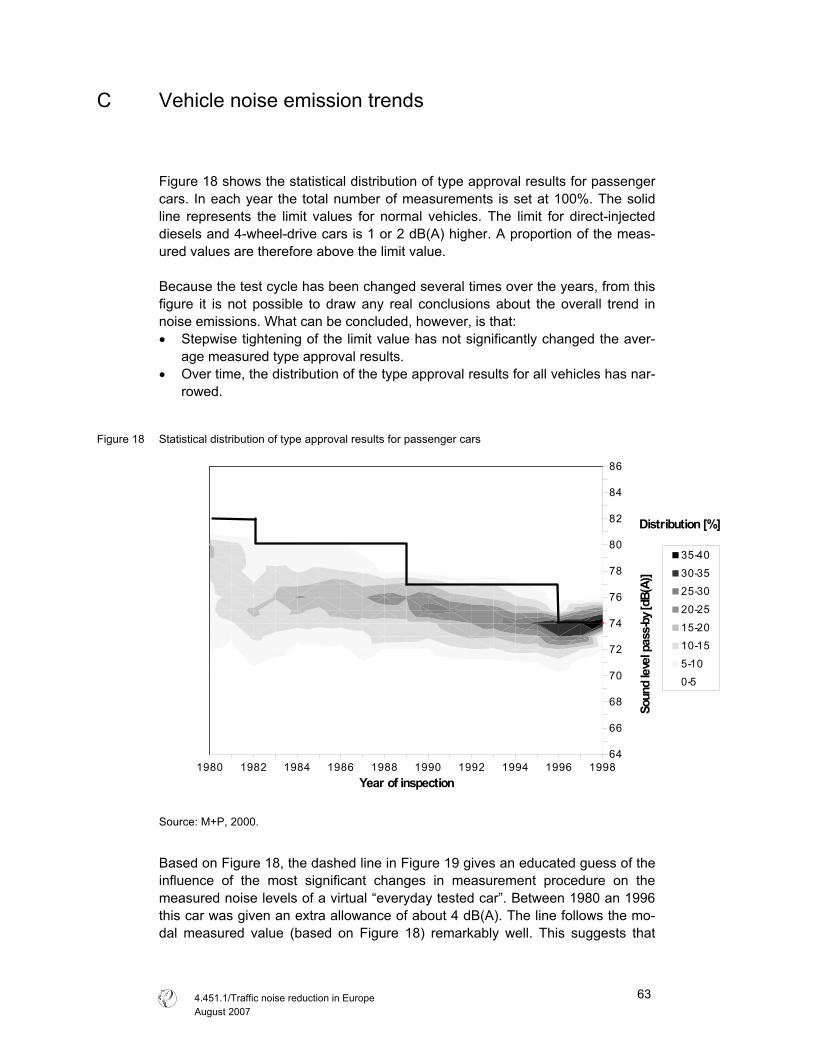
C Vehicle noise emission trends
Figure 18 shows the statistical distribution of type approval results for passenger
cars. In each year the total number of measurements is set at 100%. The solid
line represents the limit values for normal vehicles. The limit for direct-injected
diesels and 4-wheel-drive cars is 1 or 2 dB(A) higher. A proportion of the meas-
ured values are therefore above the limit value.
Because the test cycle has been changed several times over the years, from this
figure it is not possible to draw any real conclusions about the overall trend in
noise emissions. What can be concluded, however, is that:
� Stepwise tightening of the limit value has not significantly changed the aver-
age measured type approval results.
� Over time, the distribution of the type approval results for all vehicles has nar-
rowed.
Figure 18 Statistical distribution of type approval results for passenger cars
1980 1982 1984 1986 1988 1990 1992 1994 1996 1998
64
66
68
70
72
74
76
78
80
82
84
86
Distribution [%]
Year of inspection
Soun
d le
vel p
ass-b
y [dB
(A)]
35-40
30-35
25-30
20-25
15-20
10-15
5-10
0-5
Source: M+P, 2000.
Based on Figure 18, the dashed line in Figure 19 gives an educated guess of the
influence of the most significant changes in measurement procedure on the
measured noise levels of a virtual “everyday tested car”. Between 1980 an 1996
this car was given an extra allowance of about 4 dB(A). The line follows the mo-
dal measured value (based on Figure 18) remarkably well. This suggests that
4.451.1/Traffic noise reduction in Europe
August 2007
63
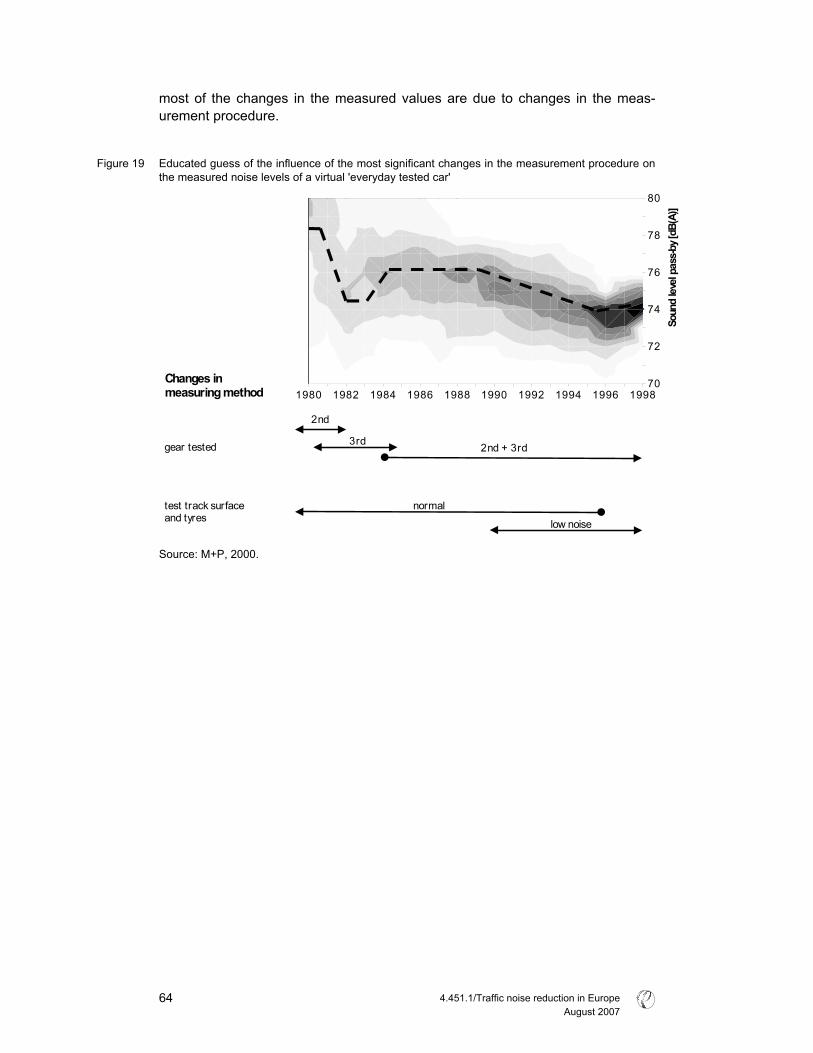
most of the changes in the measured values are due to changes in the meas-
urement procedure.
Figure 19 Educated guess of the influence of the most significant changes in the measurement procedure on
the measured noise levels of a virtual 'everyday tested car'
1980 1982 1984 1986 1988 1990 1992 1994 1996 199870
72
74
76
78
80
Soun
d lev
el pa
ss-b
y [dB
(A)]
2nd
3rd2nd + 3rd
low noise
normal
gear tested
test track surfaceand tyres
Changes inmeasuring method
Source: M+P, 2000.
4.451.1/Traffic noise reduction in Europe
August 2007
64