Embed Size (px)
Citation preview


Hazardous Waste Permit No. 50078Phillips 66 Company, Borger Refinery
Page 1 of 4
Application Deficiencies – Technical NOD #1
ID1
Ap
p.
Part App.
SectionLocation2 Citation Error Type3 Deficiency Description/Resolution
Phillips 66 Response
C1
For replaced pages in this modification (MOD) request, please update the facilityname from ConocoPhillips to Phillips 66 Company, ensure that the date is includedon each modified page, and provide a redline strikeout for all proposed changes.
Please note that pages without change should retain their current revision dates.
Submit an editable electronic copy of all revised Tables. Reminder: do not changetable formats.
A printed copy of redline strikeout version of application is provided;electronic copy of revised tables also provided. Other requested editscompleted.
T1 B Instructions Pages v and vi30 TAC305.69(d)(1)(A) &(D)
Incomplete
Include a description of the exact changes to be made to the permit conditions andsupporting documents referenced by the permit application and an explanation ofwhy the Class 3 modification is needed. Please reference Requirements for Class 3Modification to Hazardous and Industrial Waste Permits - may be found throughthe following link:https://www.tceq.texas.gov/permitting/waste_permits/ihw_permits/ihw_class_3.html
Phillips 66 has provided additional clarification/explanation of theproposed changes in the Class 3 permit modification in the NOD responsetransmittal letter.
T2 B I.D.6. (table) Page 4 40 FR 270.42Ambiguous/Incomplete
Please separate the proposed revisions to the Compliance Plan from the otherpermit sections. In order for the revisions to not be overlooked, they must be listedunder a Section XI reference.It is noted that changes to Permit Tables are requested. However, no redline strikeout, indicating changes, is provided. Please submit the redline strike out pages. Fortables not being revised in this application, please do not revise the page dates(reference C1 above).
Changes to the permit specified in Section I.D.6 have been separated intoPermit and Compliance Plan categories. A printed copy of redlinestrikeout version of application is provided. Other requested editscompleted.
1 Deficiency ID – Key: A#= Administrative deficiency (ex. A12); T#= Technical deficiency relating to Sections I- X and Sections XII- XIII of the Part B application (ex. T10); C#= Comment only (ex. C1); CP#= Technical deficiency relating to Section XI- Compliance Plan of the PartB application (ex. CP14); Number in parenthesis (n) = nth instance of same deficiency (ex. T1(2) is the second instance of deficiency T1 originally identified in previous NOD).
2 Location of deficiency in submittal/application. Items in square brackets [ ] refer to applicant’s supplemental information submitted as attachments to the application form.3 Possible Error Types: Ambiguous, Incomplete, Inconsistent, Incorrect, Omitted, Typo, or Format.

Hazardous Waste Permit No. 50078Phillips 66 Company, Borger Refinery
Page 2 of 4
ID1
Ap
p.
Part App.
SectionLocation2 Citation Error Type3 Deficiency Description/Resolution
Phillips 66 Response
T3 B IV
AttachmentB.IV.D. WasteAnalysis Plan
(WAP),Appendix 2
40 CFR 261,Appendix IX
Incomplete/Ambiguous
a. As part of the WAP, please include a copy of WRB Refining, LLC’s WastesExcluded from Non-Specific-Sources.
b. Please explain/confirm the Delisting Levels Maximum AllowableConcentrations (mg/L) listed in Appendix 2 – Annual LDR Analyte List for theorganic constituents.
c. For each constituent listed, please clarify whether it applies to wastewater,non- wastewater, etc.
d. Provide the EPA approval document for the organics listed.
a. The requested “Wastes Excluded from Non- Specific Sources” from 40CFR 21 Appendix IX has been added to Appendix 3 of the WAP.
b. The organic parameters are not currently listed in the “WastesExcluded from Non- Specific Sources” from 40 CFR 21 Appendix IX;however the organics were listed in the FR cited below in Item d.
c. Clarified the LDR Analyte List in Appendix 2 applies to non-wastewater samples of treated desorber solids tested for LeachableConcentrations (results in mg/l).
d. The Federal Register listing of the “Wastes Excluded from Non-Specific Sources” from 40 CFR 21 Appendix IX is from FR Vol 74 No146 Friday July 31, 2009, in Table 1 Paragraph 1, copied below.
T4 B IV WAP, page 2- 2 40 CFR 264.13 Incomplete
a. The agency received a redline strikeout for page 2- 2. This page wascorrected during Admin Review. Please submit a clean copy of page 2- 2 toreplace the corrected page in Phillips 66’s WAP.
b. Please clarify whether any changes were made to the WAP tables or otherparts of the WAP. If yes, please submit the redline strike outs for the pages(e.g., page 2- 5).
Clean copy of WAP page 2- 2 is provided.
No other changes were made to the WAP; however clarifications toAppendix 2 and addition of Appendix 3 were made as part of theTechnical NOD1 response.
T5 B VI
Application Tab– Section VITables,
Tables VI.B.3.c.
30 TAC 335.164 IncompleteOn page 122, please correct Hazardous Waste Impoundments to read HazardousWaste Surface Impoundments.
Correction made as requested; a similar change was also made to TableVI.B.3.b.

Hazardous Waste Permit No. 50078Phillips 66 Company, Borger Refinery
Page 3 of 4
ID1
Ap
p.
Part App.
SectionLocation2 Citation Error Type3 Deficiency Description/Resolution
Phillips 66 Response
T6 B VIIApplication Tab– ATT B.VII.A.3,pg. 1- 1
40 CFR270.22(e);264.310(a) & (b);& 264.14(b)(13)
Incorrect
Section 1.0
a. In the first paragraph, please clarify why Interim Standards underSubchapter E are referenced (30 TAC 335.118). Note: Delay of closure isfound under 264.113(d).
b. In the second paragraph, please clarify: Solid Waste Registration No. 30111;and Hazardous Waste Permit No. 50078. Also, please include the facility’sphysical address. Note: Notice of Registration Nos. (NORs) are assigned tounits.
c. Please include a copy of the referenced letter dated October 2001 or provideits location within the permit application.
Section 2.0
d. The agency does not issue permits on speculative information. Please pick aclosure path and provide the detailed plans and an engineering reportdescribing the final cover which will be applied to the North Holding Pond(NOR 036) at closure in accordance with §264.310(a), and a description ofhow the landfill will be maintained and monitored after closure inaccordance with §264.310(b). This information should be included in theclosure plan and the post- closure care plans submitted under§264.14(b)(13).
a. Corrections were made to the referenced regulatory citations torefer to 40 CFR §264 Subpart G and TCEQ 30 TAC §335.169requirements.
b. The SWR number was corrected and the site address was addedas requested.
c. A copy of the TCEQ approval of the Class 2 permit modificationassociated with partial closure and delay of closure of NHP is providedwith the Technical NOD 1 response documents. The reference in theClosure Plan to October 2004 appears to be incorrect; the approval letteris dated April 2004. The reference date has been updated in the ClosurePlan.
d. The Closure Plan has been revised to incorporate elementsdiscussed between TCEQ technical staff and Phillips 66 in a conferencecall on May 1, 2020.
T7 B VII
AttachmentB.VII.C.1,Table 1- UnitPost- ClosureCost Estimate
Permit ProvisionVII.A.9 Incorrect
a. Please reference P66’s April 25, 2018 Class 11 MOD that changed thefinancial assurance amount for year 2013 to $3,556,800. Please correct theapplicable tables and resubmit.
b. Please include Post- Closure Care Cost Estimates for units:
Surface Impoundment 301 (NOR 031);
New Evaporation Pond (NOR066);
Class I Landfill (NOR 065);and
Old Caustic Pond (NOR 008)For units currently under a compliance plan for groundwatermonitoring, include only the above- ground costs.[Reference Permit Table VII.G. – Post- Closure Period]
c. Please clarify if Hazardous Waste Landfill is the unit named Class I- HLandfill.
a. Corrected the 2013 Total Post- Closure Cost in Table 1 of thePost- Closure Care Plan to $3,556,800; this cost included CorrectiveAction Costs, which are now accounted for in the Compliance PlanFinancial Assurance Cost, per notes in item (b) below.
b. The post- closure cost for SI 301 was included with the cost forSI- 302 but the detail was missing; the detail for SI- 301 was copied fromPart B Table VII.D into Table 1 of the Post- Closure Plan. Post- closurecosts for the Class 1 Landfill, New Evaporation Pond, and Old CausticPond were previously included in the Compliance Plan FinancialAssurance costs. The above- ground Post- Closure costs for these unitshave been separated from the Compliance Plan and included in Table 1of the Post- Closure Plan.
c. Yes, the Hazardous Waste Landfill (NOR 024) is known as theClass I- H Landfill.
T8 B VII
Tab Section VIITables,Table VII.A. –Unit Closure,Pg. 123
40 CFR 270Incomplete/Incorrect
In the 1st column enter equipment used in closing the Waste Management Unit(trucks, dozers, shovels, etc.)
In the 2nd column list the possible methods of decontamination to clean theequipment listed in the 1st column.
In the 3rd column list how the residues from the 2nd column will be disposed.
Table VII.A. has been updated as requested.
T9 B VII
Tab Section VIITables, TableVII.D. – UnitPost- ClosureCost Estimate
Permit ProvisionVII.A.9
Incomplete
Please see T7 (b) above regarding inclusion of units currently also under thecompliance plan.
Correct remaining tables in this Section as applicable.
Above- ground Post- closure costs for the Class 1 Landfill, NewEvaporation Pond, and Old Caustic Pond have been separated from theCompliance Plan and included in Tables VII.D. and VII.E2 of the Part Bforms.

Hazardous Waste Permit No. 50078Phillips 66 Company, Borger Refinery
Page 4 of 4
ID1
Ap
p.
Part App.
SectionLocation2 Citation Error Type3 Deficiency Description/Resolution
Phillips 66 Response
C2 The following information needs to be updated/corrected on P66’s NOR and permittables:
For NOR 006 = Change TCEQ Unit No. 006 for Pitch Pits 12 & 14 to TCEQ Unit No.007.
For NOR 023 = Remove TCEQ Unit No. 007 and Post- Closure Care (SWMU is in aFOA, not in Post- closure care). Change name of unit by removing “12”. Shouldread Pitch Pit Annex.
Please make the changes to the NOR as suggested. The reference toPitch Pit 12 Annex in CP Table II has been corrected to Pitch Pit Annex.
CP1 B XI CP Table III, IIIA30TAC 335.166and 335.167
Format
CP Table III and CP Table IIIA:
For Columns B, C, and D, Applicant should list the GWPS footnote next to the GWPS.The footnote should not be listed in the header.
CP Tables III and IIIA have been corrected as requested.
CP2 B XI CP Table III30TAC 335.166and 335.167
IncorrectCP Table III:
Litharge Impoundment: Need to remove NAPL from the table. NAPL should beaddressed in CP Table VII.
“NAPL” has been removed from CP Table III as requested.
CP3 B XI CP Table IIIA30TAC 335.166and 335.167
IncorrectCP Table IIIA:
Litharge Impoundment: Need to remove NAPL from the table. NAPL should beaddressed in CP Table VII.
“NAPL” has been removed from CP Table IIIA as requested.
CP4 B XI.ETables XI.E.1-XI.E.3
30TAC
335.165 and335.166
Incorrect
Financial Assurance. Table XI.E.1
Please adjust cost to the year 2019.
Financial Assurance costs for Corrective Action were also updated to2019 values in CP Tables XI.E.1 through XI.E.3; Also, closure costs havebeen updated to 2019 values in Tables VII.B, VII.D, VII.E1, and VII.E2 ofthe Part B forms.

TCEQ Part B Application 4 Phillips 66, Borger RefineryTCEQ-00376 (Rev. 9-29-2017 M.L. Shannon) HW-50078, May 2020, Rev. 12
5. Is the facility within the Coastal Management Program boundary (for Class 3Modifications, Permit Renewals, and New Permit applications only)?
☐ Yes ☒ No
6. Provide a brief description of the portion of the facility covered by this application inthe table below, including the changes for which an amendment or modification isrequested: [Note: List all changes requested in the table below. Unlisted requestsrisk remaining unaddressed or possibly denied if brought to the permit applicationreviewer’s attention at a later time.]
Changes to Permit Sections are shown below:
Permit/CompliancePlan ApplicationSection
Brief Description of ProposedChange
Modificationor AmendmentType
SupportingRegulatoryCitation
Part B Section XII Permit application fee worksheet. Class 1 30 TAC305.69(k)(A)(1)
Part B, TablesRevised Table VII.B, VII.D, VII E.1,VII.E.2: Closure costs for NorthHolding Pond (NHP) were revised dueto a change in the closure plan. Costsfor other units were updated forinflation to 2019 dollars.
Revised Table VI.B.3.b. and TableVI.B.3.c. in response to TCEQcomments on the 2018 AnnualGroundwater Monitoring Report in aletter dated June 13, 2019.
Class 3 30 TAC305.69(K)(D)(2)
Part B. Waste AnalysisPlan
Section 2.2 was revised to clarify thatthe delisting petition was approved forTDU residue solids and not for sludgegenerated from the wastewatertreatment plant.
Class 11 30 TAC
305 .69(k)(A)(1)
Section VII, NHPClosure Plan
Revised the closure plan for the NorthHolding Pond (cap design change).
Class 3 30 TAC305.69(k)(D)(2)
Section VII, NHP PostClosure Plan
Revised the post closure plan for theNorth Holding Pond to reflect changesin cap design and updated Post Closurecosts.
Class 3 30 TAC305.69(k)(D)(2)

TCEQ Part B Application 5 Phillips 66, Borger RefineryTCEQ-00376 (Rev. 9-29-2017 M.L. Shannon) HW-50078, May 2020, Rev. 12
Changes to Compliance Plan Sections are shown in the table below:
Permit/CompliancePlan ApplicationSection
Brief Description of ProposedChange
Modificationor AmendmentType
SupportingRegulatoryCitation
Section XI, CompliancePlan and CP Tables
Updated CP Tables I through V based onsubmittal of the following RAPs:
Revised RAP Rev 2, Old Caustic PondArea, Submitted January, 2017;Conditional Approval OCP RevisedRAP Rev 2 with Request for a RAPAddendum Received February 2017,Additional Responses to ConditionalApproval OCP Revised RAP Rev 2with Request for a RAP AddendumSubmitted August 8, 2017, TCEQApproval Responses to ConditionalApproval OCP Revised RAP Rev 2with Request for a RAP AddendumReceived August 17, 2017, andAdditional Responses to ConditionalApproval OCP Revised RAP Rev 2with Request for a RAP AddendumSubmitted April 12, 2018; RevisedResponse Action Plan, Addendum 2,Old Caustic Pond, Submitted June2019
Revised Response Action Plan,Litharge Impoundment, SubmittedApril 4, 2015; Response ActionCompletion Report, LithargeImpoundment, Submitted July 20,2018
Revised Response Action Plan, HP-7/ South Cobles, Submitted April 30,2015; Addendum to the 2015 RevisedResponse Action Plan, HP-7/SouthCobles Site, February 1, 2016
Response Action Plan, New CausticPond, Submitted December 4, 2017;Revised Response Action Plan, NewCaustic Pond, Submitted June 6,2018
Revised Response Action Plan,Southeast Canyon, SubmittedDecember 18, 2018
Removed the word Philtex from the CPtables for consistency with currentnaming convention for the Class 1Landfill and New Evaporation Pond.
Updated CP Tables XI E.1, E.2, and E.3to reflect Correction Action costs for
Class 3 30 TAC305.69(k)(C)(8)(b)

TCEQ Part B Application 6 Phillips 66, Borger RefineryTCEQ-00376 (Rev. 9-29-2017 M.L. Shannon) HW-50078, May 2020, Rev. 12
Permit/CompliancePlan ApplicationSection
Brief Description of ProposedChange
Modificationor AmendmentType
SupportingRegulatoryCitation
New Caustic Pond, (NCP) Old CausticPond (OCP), HP-7/South Cobles,Litharge, and Southeast Canyon (SEC)sites in agreement with approved RAPs.Costs for other Corrective Action siteswere updated for inflation to 2019dollars.
PCLs were updated in CP Tables III,IIIA, IV, and IVA for changes made inTCEQ PCL tables, and updates to 2018Human Health RBELs and the 2017 Ecobenchmarks.
Updated the CP Attachment C Samplingand Analysis Plan (SAP): updated Tables1, 2, and 4 to match permit andcompliance plan; text edit in Section5.4.2 to clarify filtration requirements.
Updated CP Attachment B (Well Design)to incorporate well design usingalternate screen length.
7. Total acreage of the facility being permitted: The facility has 6,045 acres.____
8. Identify the name of the drainage basin and segment where the facility is located:____Canadian River Basin – Segment 0101__________________
TCEQ Part B Application 7 Phillips 66, Borger RefineryTCEQ-00376 (Rev. 9-29-2017 M.L. Shannon) HW-50078, May 2020, Rev. 12
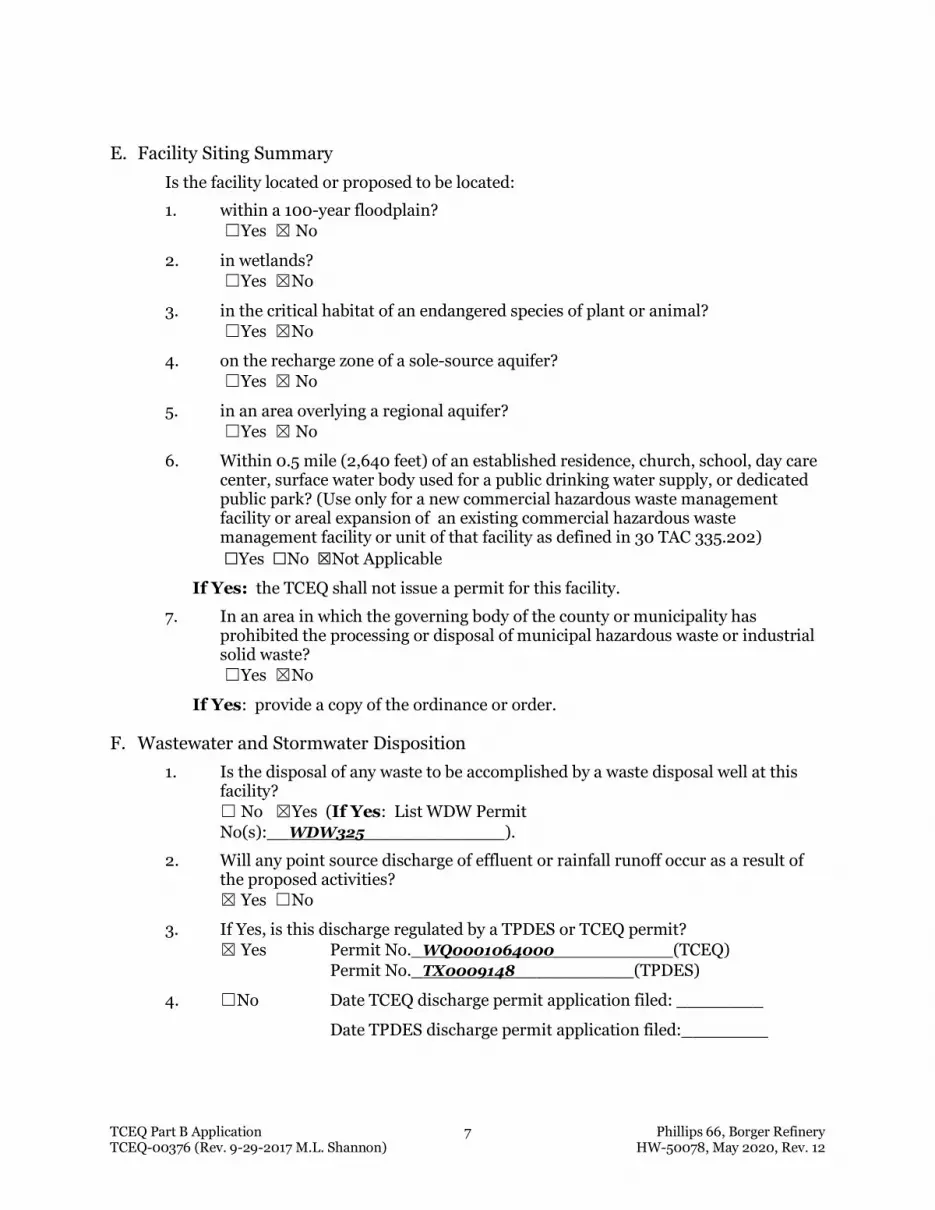
E. Facility Siting Summary
Is the facility located or proposed to be located:
1. within a 100-year floodplain?☐Yes ☒ No
2. in wetlands?☐Yes ☒No
3. in the critical habitat of an endangered species of plant or animal?☐Yes ☒No
4. on the recharge zone of a sole-source aquifer?☐Yes ☒ No
5. in an area overlying a regional aquifer?☐Yes ☒ No
6. Within 0.5 mile (2,640 feet) of an established residence, church, school, day carecenter, surface water body used for a public drinking water supply, or dedicatedpublic park? (Use only for a new commercial hazardous waste managementfacility or areal expansion of an existing commercial hazardous wastemanagement facility or unit of that facility as defined in 30 TAC 335.202)
☐Yes ☐No ☒Not Applicable
If Yes: the TCEQ shall not issue a permit for this facility.
7. In an area in which the governing body of the county or municipality hasprohibited the processing or disposal of municipal hazardous waste or industrialsolid waste?☐Yes ☒No
If Yes: provide a copy of the ordinance or order.
F. Wastewater and Stormwater Disposition
1. Is the disposal of any waste to be accomplished by a waste disposal well at thisfacility?☐ No ☒Yes (If Yes: List WDW PermitNo(s):__WDW325_____________).
2. Will any point source discharge of effluent or rainfall runoff occur as a result ofthe proposed activities?☒ Yes ☐No
3. If Yes, is this discharge regulated by a TPDES or TCEQ permit?☒ Yes Permit No._WQ0001064000___________(TCEQ)
Permit No._TX0009148___________(TPDES)
4. ☐No Date TCEQ discharge permit application filed: ________
Date TPDES discharge permit application filed:________

TCEQ Part B Application 8 Phillips 66, Borger RefineryTCEQ-00376 (Rev. 9-29-2017 M.L. Shannon) HW-50078, May 2020, Rev. 12
G. Information Required to Provide Notice
State Officials List
Provide the name and mailing address for the State Senator and State Representative inthe district in which the facility is or will be located. Either local district addresses orcapitol addresses are acceptable. This list should not be included in the AdjacentLandowners List required below. [30 TAC 39.103(b)]
State Senator State Representative
The Honorable Kel Seliger Representative Four PriceP.O. Box 12068 P.O. Box 2910Capitol Station Austin, TX 78768Austin, Texas 78711 (512) 463-0470(512) 463-0131Fax (512) 475-3733
Local Officials List
Provide the name and mailing address of the mayor and health authority of themunicipality in whose territorial limits or extraterritorial jurisdiction the facility is or willbe located. In addition, please provide the county judge and health authority of thecounty in which the facility is located. This list should not be included in the AdjacentLandowners List required below. [30 TAC 39.103(c)]
Mayor Marvin Dickson Judge Cindy Irwin Dr. Kimberly Wolboldt, MD, MPH600 North Main Street 515 S. Main St, Ste 214 (or current Medical Director)PO Box 5250 P.O. Box 790 (mail address) Department of State Health Services, PHR1Borger, TX Stinnett, Texas 6302 Iola Avenue79008-5250 79083 Lubbock, Texas(806) 273-0900 806-878-4000 79424Fax: 806-878-4048 Fax: 806-783-6435 [email protected] [email protected]
Adjacent Landowners List
Submit a map indicating the boundaries of all adjacent parcels of land, and a list (seesamples in the instructions) of the names and mailing addresses of all adjacentlandowners and other nearby landowners who might consider themselves affected by theactivities described by this application. Cross-reference this list to the map through theuse of appropriate keying techniques. The map should be a USGS map, a city or countyplat, or another map, sketch, or drawing with a scale adequate enough to show the cross-referenced affected landowners. The list should be updated prior to any required publicnotice. It is the applicant’s responsibility to ensure that the list is up-to-date for anyrequired public notice. For all applications (with the exception of Class 1 and Class 11
modifications) this mailing list should be submitted on:
1. a Compact Disk (CD) using software compatible with MS Word [30 TAC 39.5(b)];or
2. four sets of printed labels.
If the adjacent landowners list is submitted on a compact disk (CD), please label the diskwith the applicant’s name and permit number. Within the file stored on the disk, type
TCEQ Part B Application 9 Phillips 66, Borger RefineryTCEQ-00376 (Rev. 9-29-2017 M.L. Shannon) HW-50078, May 2020, Rev. 12
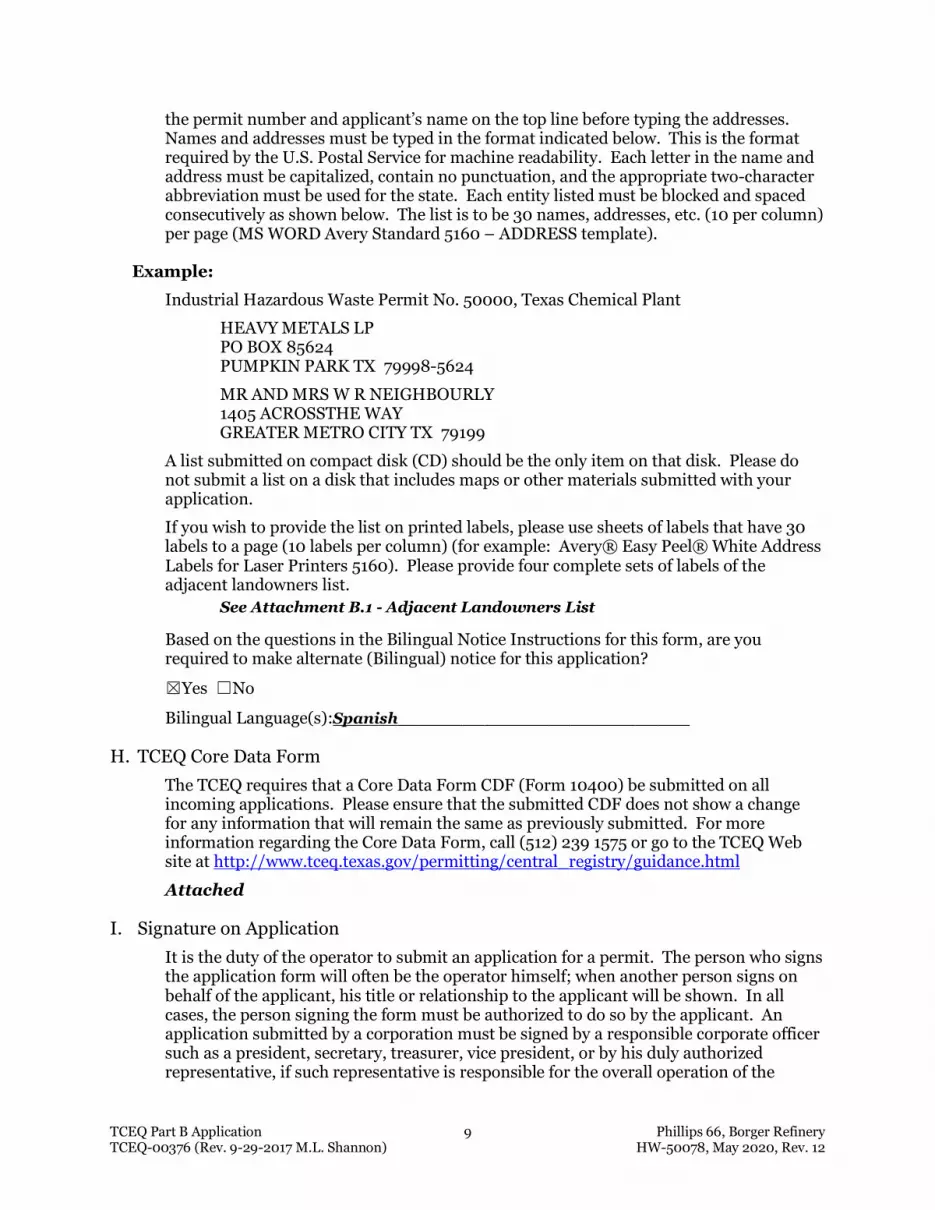
the permit number and applicant’s name on the top line before typing the addresses.Names and addresses must be typed in the format indicated below. This is the formatrequired by the U.S. Postal Service for machine readability. Each letter in the name andaddress must be capitalized, contain no punctuation, and the appropriate two-characterabbreviation must be used for the state. Each entity listed must be blocked and spacedconsecutively as shown below. The list is to be 30 names, addresses, etc. (10 per column)per page (MS WORD Avery Standard 5160 – ADDRESS template).
Example:
Industrial Hazardous Waste Permit No. 50000, Texas Chemical Plant
HEAVY METALS LPPO BOX 85624PUMPKIN PARK TX 79998-5624
MR AND MRS W R NEIGHBOURLY1405 ACROSSTHE WAYGREATER METRO CITY TX 79199
A list submitted on compact disk (CD) should be the only item on that disk. Please donot submit a list on a disk that includes maps or other materials submitted with yourapplication.
If you wish to provide the list on printed labels, please use sheets of labels that have 30labels to a page (10 labels per column) (for example: Avery® Easy Peel® White AddressLabels for Laser Printers 5160). Please provide four complete sets of labels of theadjacent landowners list.
See Attachment B.1 - Adjacent Landowners List
Based on the questions in the Bilingual Notice Instructions for this form, are yourequired to make alternate (Bilingual) notice for this application?
☒Yes ☐No
Bilingual Language(s):Spanish___________________________
H. TCEQ Core Data Form
The TCEQ requires that a Core Data Form CDF (Form 10400) be submitted on allincoming applications. Please ensure that the submitted CDF does not show a changefor any information that will remain the same as previously submitted. For moreinformation regarding the Core Data Form, call (512) 239 1575 or go to the TCEQ Website at http://www.tceq.texas.gov/permitting/central_registry/guidance.html
Attached
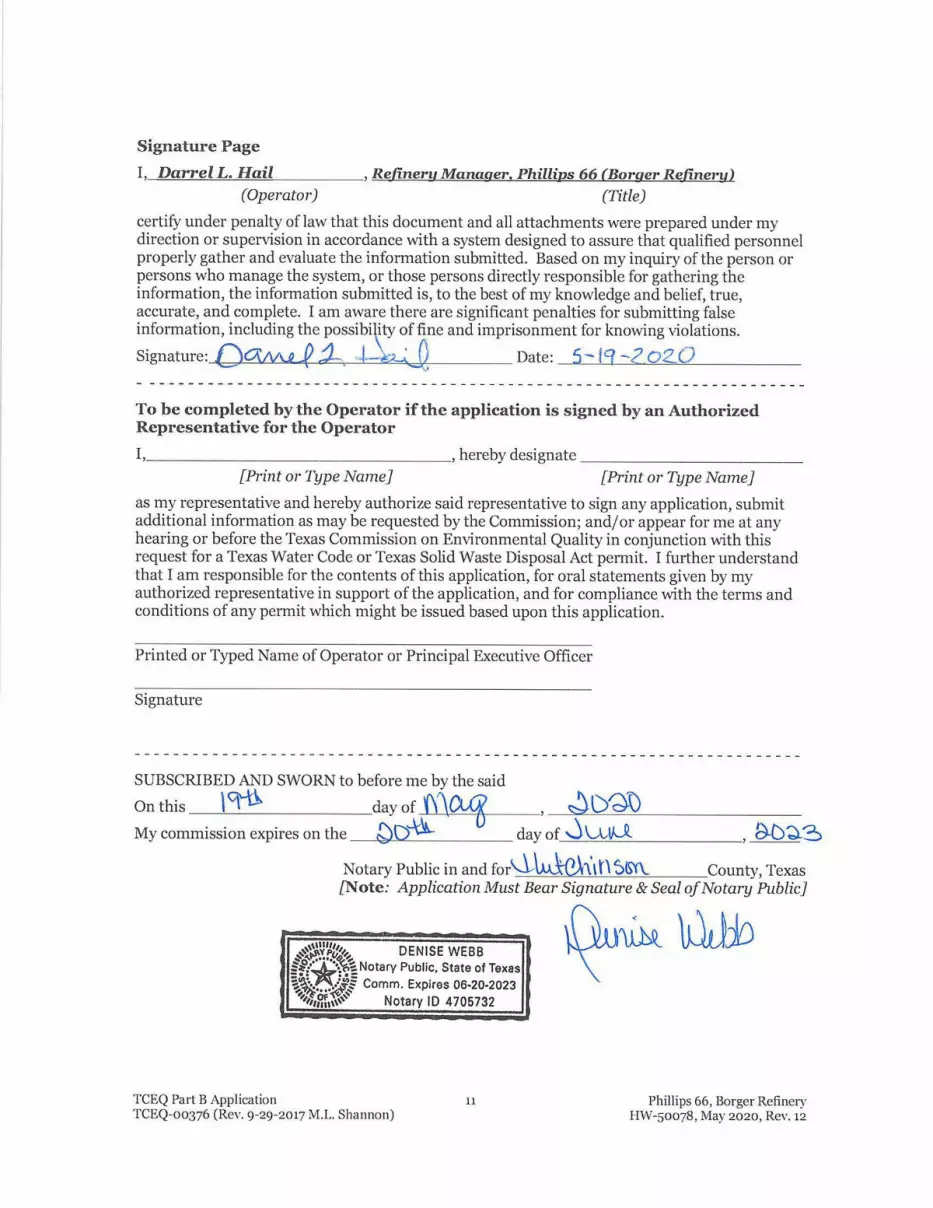
I. Signature on Application
It is the duty of the operator to submit an application for a permit. The person who signsthe application form will often be the operator himself; when another person signs onbehalf of the applicant, his title or relationship to the applicant will be shown. In allcases, the person signing the form must be authorized to do so by the applicant. Anapplication submitted by a corporation must be signed by a responsible corporate officersuch as a president, secretary, treasurer, vice president, or by his duly authorizedrepresentative, if such representative is responsible for the overall operation of the

TCEQ Part B Application 10 Phillips 66, Borger RefineryTCEQ-00376 (Rev. 9-29-2017 M.L. Shannon) HW-50078, May 2020, Rev. 12
facility from which the activity described in the form originates. In the case of apartnership or a sole proprietorship, the application must be signed by a general partneror the proprietor, respectively. In the case of a municipal, state, federal, or other publicfacility, the application must be signed by a principal executive officer, a ranking electedofficial, or another duly authorized employee. A person signing an application on behalfof an applicant must provide notarized proof of authorization.

Permit No. HW-50078 Rev. 12Phillips 66, Borger Refinery May 2020
Vol. II Attachment B.IV.D Waste Analysis Plan i
Attachment B.IV.DWaste Analysis Plan
Table of Contents
1.0 Introduction.............................................................................................................................. 1-1
1.1 Basis ........................................................................................................................... 1-1
1.2 Purpose and Approach ................................................................................................ 1-1
1.3 Waste Categories ........................................................................................................ 1-2
1.4 Existing Hazardous Waste Streams............................................................................. 1-2
1.5 Implementation............................................................................................................ 1-2
1.6 Waste Management Units............................................................................................ 1-3
2.0 Waste Properties and Rationale for Evaluation......................................................................... 2-1
2.1 Profiling Waste Streams .............................................................................................. 2-1
2.2 Waste Classification .................................................................................................... 2-2
2.3 Properties for Waste Management Units...................................................................... 2-2
2.4 Land Disposal Restrictions .......................................................................................... 2-2
2.5 Waste Tracking ........................................................................................................... 2-4
2.6 Frequency of Evaluation .............................................................................................. 2-4
3.0 Criteria for Waste Management Units....................................................................................... 3-1
3.1 Landfills....................................................................................................................... 3-1
3.2 Surface Impoundments................................................................................................ 3-2
3.3 Waste Disposed of Off-Site ......................................................................................... 3-2
4.0 Sampling Methodology............................................................................................................. 4-1
4.1 Sampling Procedures .................................................................................................. 4-1
4.2 Quality Assurance/Quality Control (QA/QC) Procedures .............................................. 4-2
5.0 Analytical Procedures .............................................................................................................. 5-1
5.1 Sample Preparation..................................................................................................... 5-1
5.2 Analytical Methods ...................................................................................................... 5-1
5.3 Laboratory Quality Control ........................................................................................... 5-1
Table 1 – Wastes Managed in Permitted Units
Table 2 – Sampling and Analytical Methods
Table 3 – Additional Sampling and Analytical Methods

Permit No. HW-50078 Rev. 12Phillips 66, Borger Refinery May 2020
Vol. II Attachment B.IV.D Waste Analysis Plan ii
Attachment B.IV.DWaste Analysis Plan
Table of Contents (Continued)
Figure 1 – Overview of Waste Management
Figure 2 – Overview of Hazardous Waste Evaluation Process
Figure 3 – Example of Internal Manifest
Figure 4 – Overview of LDR Sampling Process
Appendix 1 – Phillips 66 Analyte List (Modified Skinner List)
Appendix 2 – LDR Annual Analyte List
Appendix 3 – Wastes Excluded from Non-Specific Sources

Permit No. HW-50078 Rev. 12Phillips 66, Borger Refinery May 2020
Vol. II Attachment B.IV.D Waste Analysis Plan 2 - 2
2.2 Waste Classification
One of the most important facets of waste evaluation is making a determination of whether a particular
solid waste stream is a hazardous waste. In order to make this determination, the regulatory criteria
established in 40 CFR Part 261 and 30 TAC Chapter 335 must be evaluated (see Figure 2 for guidance).
As demonstrated by Figure 2, a determination of whether or not a particular solid waste is a hazardous
waste begins with an assessment of whether it is a listed hazardous waste. Since the listed hazardous
wastes (F, K, P, and U-list) have certain “generation conditions” that must be satisfied to classify them as
a listed hazardous waste, an evaluation of the production process is typically conducted as the first step
to determine if the solid waste is a listed hazardous waste.
If it is determined that a listing does not apply, then information will be gathered to determine applicability
of any of the RCRA hazardous characteristics. This determination will be based on either process
knowledge or analytical data. Applicable EPA waste codes and TCEQ classification and form codes are
then assigned to the waste at the point of generation.
The (thermal desorption unit TDU) residue solids generated by the facility have been delisted for the
Hazardous Waste Numbers: F037, F038, K048, K049, K050, and K051. This delisting petition was
posted in the Federal Register as EPA-RO6-RCRA-2008-0418; SW-FRL-8933-3. This exclusion applies
to 5,000 cubic yards per year of the TDU residual solids. Accordingly, this final rule excludes the waste
from the requirements of hazardous waste regulations under the RCRA when it is disposed in a Subtitle D
Landfill. A copy of the delisting requirements from 40 CFR 261 Appendix IX is included as Appendix 3.
2.3 Properties for Waste Management Units
Acceptable operating criteria vary according to the specific waste management units that will receive the
waste. To verify that a waste is within acceptable operating criteria for a particular waste management
unit, the following information will be evaluated:
Physical and chemical characteristics of the waste;
Volume of the waste;
Construction materials of the specific waste management unit; and
Specific permit conditions associated with a waste management unit.
2.4 Land Disposal Restrictions
The LDRs specify the level of treatment or specific treatment technology, on a waste code basis, that
must be achieved prior to placing hazardous wastes on or in the land. The treatment standards specified

Permit No. HW-50078 Rev. 12Phillips 66, Borger Refinery May 2020
Vol. II Attachment B.IV.D Waste Analysis Plan Appendices - 1
Appendices to Waste Analysis Plan
Appendix 1 – Phillips 66 Analyte List (Modified Skinner List)
Appendix 2 – LDR Annual Analyte List
Appendix 3 - Wastes Excluded From Non-Specific Sources
Permit No. HW-50078 Rev. 12Phillips 66, Borger Refinery May 2020
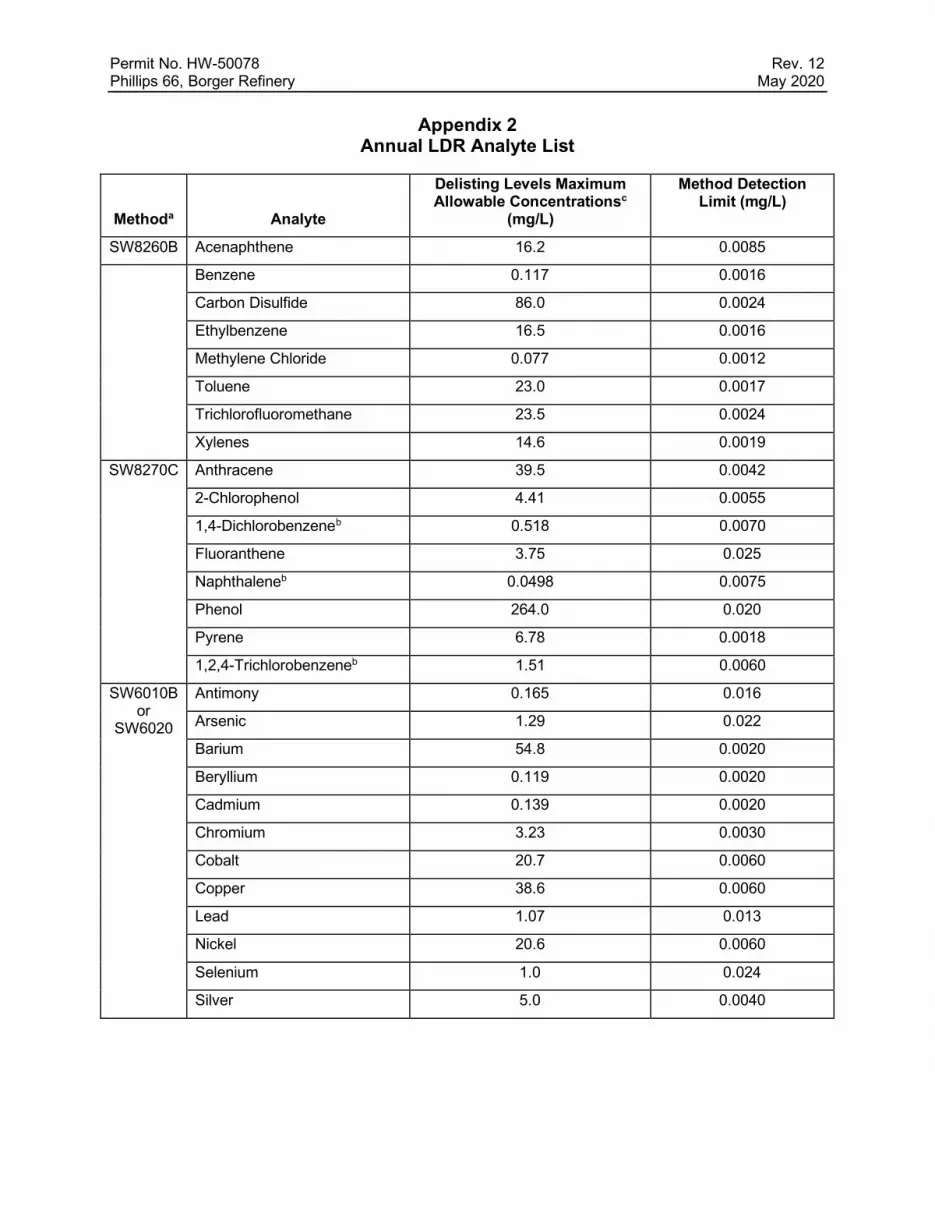
Appendix 2Annual LDR Analyte List
Methoda Analyte
Delisting Levels MaximumAllowable Concentrationsc
(mg/L)
Method DetectionLimit (mg/L)
SW8260B Acenaphthene 16.2 0.0085
Benzene 0.117 0.0016
Carbon Disulfide 86.0 0.0024
Ethylbenzene 16.5 0.0016
Methylene Chloride 0.077 0.0012
Toluene 23.0 0.0017
Trichlorofluoromethane 23.5 0.0024
Xylenes 14.6 0.0019
SW8270C Anthracene 39.5 0.0042
2-Chlorophenol 4.41 0.0055
1,4-Dichlorobenzeneb 0.518 0.0070
Fluoranthene 3.75 0.025
Naphthaleneb 0.0498 0.0075
Phenol 264.0 0.020
Pyrene 6.78 0.0018
1,2,4-Trichlorobenzeneb 1.51 0.0060
SW6010Bor
SW6020
Antimony 0.165 0.016
Arsenic 1.29 0.022
Barium 54.8 0.0020
Beryllium 0.119 0.0020
Cadmium 0.139 0.0020
Chromium 3.23 0.0030
Cobalt 20.7 0.0060
Copper 38.6 0.0060
Lead 1.07 0.013
Nickel 20.6 0.0060
Selenium 1.0 0.024
Silver 5.0 0.0040

Permit No. HW-50078 Rev. 12Phillips 66, Borger Refinery May 2020
Appendix 2Annual LDR Analyte List (Continued)
Methoda Analyte
Delisting Levels MaximumAllowable Concentraions
(mg/L)
Method Detection Limit(mg/L)
SW6010 orSW6020
(Continued)
Tin 3790.00 0.029
Vanadium 1.46 0.0060
Zinc 320.0 0.022
Mercury 0.104 0.000030
SW7196 Hexavalent Chromium 3.23 0.0040
SW9012 /SW9014
Cyanide 4.69 0.0020
aMethod is from SW-846, 3rd edition or most recent update.
bThis analyte may be analyzed by either SW-846 SW-8260 or SW-8270 as long as detection limits are
met.
c Delisting levels in the above table refer to samples of Thermal Desorber Residual Solids (non-
wastewater), tested for Leachable Concentrations (results in mg/l).

Permit No. HW-50078 Rev. 12Phillips 66, Borger Refinery May 2020
Appendix 3WASTES EXCLUDED FROM NON-SPECIFIC SOURCES
APPENDIX IX TO PART 261—WASTES EXCLUDED UNDER §§260.20 AND 260.22
Facility Address Waste description
WRB
Refining,
LLC
Borger,
TX
Thermal desorber residual solids (Hazardous Waste Nos. F037, F038, K048, K049,
K050, and K051) generated at a maximum annual rate of 5,000 cubic yards per
calendar year after September 29, 2009 and disposed in Subtitle D Landfill.
For the exclusion to be valid, WRB Refining LLC must implement a verification
testing program that meets the following Paragraphs:
(1) Delisting Levels: All concentrations for those constituents must not exceed the
maximum allowable concentrations in mg/l specified in this paragraph.
Thermal Desorber Residual Solid Leachable Concentrations (mg/l): Antimony—
0.165; Arsenic—1.29; Barium—54.8; Beryllium—0.119; Cadmium—0.139;
Chromium—3.23; Chromium, Hexavalent—3.23; Cobalt—20.7; Copper—38.6;
Cyanide—4.69; Lead—1.07; Mercury—0.104; Nickel—20.6; Selenium—1.0; Silver—
5.0; Tin—3790.00; Vanadium—1.46; Zinc—320.0.
(2) Waste Holding and Handling:
(A) Waste classification as non-hazardous can not begin until compliance with the
limits set in paragraph (1) for thermal desorber residual solids has occurred for two
consecutive quarterly sampling events.
(B) If constituent levels in any sample taken by WRB Refining LLC exceed any of the
delisting levels set in paragraph (1) for the thermal desorber residual solids, WRB
Refining LLC must do the following:
(i) Notify EPA in accordance with paragraph (6) and
(ii) Manage and dispose the thermal desorber residual solids as hazardous waste
generated under Subtitle C of RCRA.
(3) Testing Requirements:
Upon this exclusion becoming final, WRB Refining LLC may perform quarterly
analytical testing by sampling and analyzing the desorber residual solids as follows:
(A) Quarterly Testing:

Permit No. HW-50078 Rev. 12Phillips 66, Borger Refinery May 2020
(i) Collect two representative composite samples of the sludge at quarterly intervals
after EPA grants the final exclusion. The first composite samples may be taken at
any time after EPA grants the final approval. Sampling should be performed in
accordance with the sampling plan approved by EPA in support of the exclusion.
(ii) Analyze the samples for all constituents listed in paragraph (1). Any composite
sample taken that exceeds the delisting levels listed in paragraph (1) for the sludge
must be disposed as hazardous waste in accordance with the applicable hazardous
waste requirements.
(iii) Within thirty (30) days after taking its first quarterly sample, WRB Refining LLC
will report its first quarterly analytical test data to EPA. If levels of constituents
measured in the samples of the sludge do not exceed the levels set forth in
paragraph (1) of this exclusion for two consecutive quarters, WRB Refining LLC can
manage and dispose the non-hazardous thermal desorber residual solids according
to all applicable solid waste regulations.
(B) Annual Testing: (i) If WRB Refining LLC completes the quarterly testing specified
in paragraph (3) above and no sample contains a constituent at a level which
exceeds the limits set forth in paragraph (1), WRB Refining LLC may begin annual
testing as follows: WRB Refining LLC must test two representative composite
samples of the thermal desorber residual solids for all constituents listed in
paragraph (1) at least once per calendar year.
(ii) The samples for the annual testing shall be a representative composite sample
according to appropriate methods. As applicable to the method-defined parameters
of concern, analyses requiring the use of SW-846 methods incorporated by
reference in 40 CFR 260.11 must be used without substitution. As applicable, the
SW-846 methods might include Methods 0010, 0011, 0020, 0023A, 0030, 0031,
0040, 0050, 0051, 0060, 0061, 1010A, 1020B,1110A, 1310B, 1311, 1312, 1320,
1330A, 9010C, 9012B, 9040C, 9045D, 9060A, 9070A (uses EPA Method 1664, Rev.
A), 9071B, and 9095B. Methods must meet Performance Based Measurement
System Criteria in which the Data Quality Objectives are to demonstrate that
samples of the WRB Refining thermal desorber residual solids are representative for
all constituents listed in paragraph (1).
(iii) The samples for the annual testing taken for the second and subsequent annual
testing events shall be taken within the same calendar month as the first annual
sample taken.

Permit No. HW-50078 Rev. 12Phillips 66, Borger Refinery May 2020
(iv) The annual testing report should include the total amount of delisted waste in
cubic yards disposed as non-hazardous waste during the calendar year.
(4) Changes in Operating Conditions: If WRB Refining LLC significantly changes the
process described in its petition or starts any processes that generate(s) the waste
that may or could affect the composition or type of waste generated (by illustration,
but not limitation, changes in equipment or operating conditions of the treatment
process), it must notify EPA in writing and it may no longer handle the wastes
generated from the new process as non-hazardous until the wastes meet the
delisting levels set in paragraph (1) and it has received written approval to do so from
EPA.
WRB Refining LLC must submit a modification to the petition, complete with full
sampling and analysis, for circumstances where the waste volume changes and/or
additional waste codes are added to the waste stream, if it wishes to dispose of the
material as non-hazardous.
(5) Data Submittals:
WRB Refining LLC must submit the information described below. If WRB Refining
LLC fails to submit the required data within the specified time or maintain the
required records on-site for the specified time, EPA, at its discretion, will consider this
sufficient basis to reopen the exclusion as described in paragraph (6). WRB Refining
LLC must:
(A) Submit the data obtained through paragraph (3) to the Chief, Corrective Action
and Waste Minimization Section, Multimedia Planning and Permitting Division, U.S.
Environmental Protection Agency Region 6, 1445 Ross Ave., Dallas, Texas, 75202,
within the time specified. All supporting data can be submitted on CD-ROM or
comparable electronic media.
(B) Compile records of analytical data from paragraph (3), summarized, and
maintained on-site for a minimum of five years.
(C) Furnish these records and data when either EPA or the State of Texas requests
them for inspection.
(D) Send along with all data a signed copy of the following certification statement, to
attest to the truth and accuracy of the data submitted:
“Under civil and criminal penalty of law for the making or submission of false or
fraudulent statements or representations (pursuant to the applicable provisions of the

Permit No. HW-50078 Rev. 12Phillips 66, Borger Refinery May 2020
Federal Code, which include, but may not be limited to, 18 U.S.C. §1001 and 42
U.S.C. §6928), I certify that the information contained in or accompanying this
document is true, accurate and complete.
As to the (those) identified section(s) of this document for which I cannot personally
verify its (their) truth and accuracy, I certify as the company official having
supervisory responsibility for the persons who, acting under my direct instructions,
made the verification that this information is true, accurate and complete.
If any of this information is determined by EPA in its sole discretion to be false,
inaccurate or incomplete, and upon conveyance of this fact to the company, I
recognize and agree that this exclusion of waste will be void as if it never had effect
or to the extent directed by EPA and that the company will be liable for any actions
taken in contravention of the company's RCRA and CERCLA obligations premised
upon the company's reliance on the void exclusion.”
(6) Re-opener
(A) If, anytime after disposal of the delisted waste WRB Refining LLC possesses or is
otherwise made aware of any environmental data (including but not limited to
leachate data or ground water monitoring data) or any other data relevant to the
delisted waste indicating that any constituent identified for the delisting verification
testing is at level higher than the delisting level allowed by the Division Director in
granting the petition, then the facility must report the data, in writing, to the Division
Director within 10 days of first possessing or being made aware of that data.
(B) If either the quarterly or annual testing of the waste does not meet the delisting
requirements in paragraph 1, WRB Refining LLC must report the data, in writing, to
the Division Director within 10 days of first possessing or being made aware of that
data.
(C) If WRB Refining LLC fails to submit the information described in paragraphs (5),
(6)(A) or (6)(B) or if any other information is received from any source, the Division
Director will make a preliminary determination as to whether the reported information
requires EPA action to protect human health and/or the environment. Further action
may include suspending, or revoking the exclusion, or other appropriate response
necessary to protect human health and the environment.
(D) If the Division Director determines that the reported information requires action by
EPA, the Division Director will notify the facility in writing of the actions the Division

Permit No. HW-50078 Rev. 12Phillips 66, Borger Refinery May 2020
Director believes are necessary to protect human health and the environment. The
notice shall include a statement of the proposed action and a statement providing the
facility with an opportunity to present information as to why the proposed EPA action
is not necessary. The facility shall have 10 days from the date of the Division
Director's notice to present such information.
(E) Following the receipt of information from the facility described in paragraph (6)(D)
or (if no information is presented under paragraph (6)(D)) the initial receipt of
information described in paragraphs (5), (6)(A) or (6)(B), the Division Director will
issue a final written determination describing EPA actions that are necessary to
protect human health and/or the environment. Any required action described in the
Division Director's determination shall become effective immediately, unless the
Division Director provides otherwise.
(7) Notification Requirements
WRB Refining LLC must do the following before transporting the delisted waste.
Failure to provide this notification will result in a violation of the delisting petition and
a possible revocation of the decision.
(A) Provide a one-time written notification to any state Regulatory Agency to which or
through which it will transport the delisted waste described above for disposal, 60
days before beginning such activities.
(B) Update the one-time written notification if it ships the delisted waste into a
different disposal facility.
(C) Failure to provide this notification will result in a violation of the delisting variance
and a possible revocation of the decision.

TCEQ Part B Application 114 Phillips 66, Borger Refinery
TCEQ-00376 (Rev. 9-29-2017 M.L. Shannon) HW-50078, May 2020, Rev. 12
Table VI.B.3.b. – Unit Groundwater Detection Monitoring Systems
Waste Management Unit/Area Name1 Hazardous Waste Surface Impoundment (Surface Impoundments NORs 031 and 032, wells apply to thetwo impoundments)
Well Number(s):0582/HWI-
MW-010584/HWI-
02B0586/HWI-
MW-03B0587/HWI-
MW-040588/HWI-
MW-050589/HWI-
MW-06
Hydrogeologic Unit Monitored PermianWhitehorseFormation
PermianWhitehorseFormation
PermianWhitehorseFormation
PermianWhitehorseFormation
PermianWhitehorseFormation
PermianWhitehorseFormation
Type (e.g., point of compliance, background,observation, etc.)
BG POC POC POC POC POC
Up or Down Gradient UG DG DG DG DG DG
Casing Diameter and Material 2 in. PVC andTeflon
2 in. PVC andTeflon
2 in. PVC andTeflon
2 in. PVC andTeflon
2 in. PVC andTeflon
2 in. PVCand Teflon
Screen Diameter and Material 2 in. Teflon 2 in. Teflon 2 in. Teflon 2 in. Teflon 2 in. Teflon 2 in. Teflon
Screen Slot Size (in.) 0.010 0.010 0.010 0.010 0.010 0.010
Top of Casing Elevation (Ft, MLGL or MSL) 2911.17 2906.68 2913.11 2907.70 2907.37 2912.55
Grade or Surface Elevation (Ft, MLGL or MSL) 2908.48 2904.10 2910.43 2904.72 2904.56 2909.97
Well Depth (Ft, Below Grade Surface [BGS]) 35 127.5 145.1 127.5 127.5 127.5
Well Depth (Ft, Below Top of Casing [BTOC])
Screen IntervalFrom(Ft, MSL)
To(Ft, MSL)
2886.17-2876.17
2799.18-2779.1880
2788-27782800.2-2780.2
2799.87-2779.87
2805.05-2785.05
Screen IntervalFrom(Ft, BTOC)
To(Ft, BTOC)
Facility Coordinates (e.g., lat./long. orcompany coordinates)
N1216,E4801
N1734,E5113
N1372,E5431
N1522,E5031
N1426,E5265
N1136,E5224
1From Tables in Section V.MSL: Mean Sea Level; MLGL: Mean Low-tide Gulf Level; BGS: Below Grade Surface; BTOC: Below Top of Casing

TCEQ Part B Application 122 Phillips 66, Borger Refinery
TCEQ-00376 (Rev. 9-29-2017 M.L. Shannon) HW-50078, May 2020, Rev. 12
Table VI.B.3.c. –Groundwater Detection Monitoring Parameters
Unit/Waste Management Area: Hazardous Waste Surface Impoundments:
Well No(s): Wells 0582/HWI-MW-01, 0584/HWI-MW-02B, 0586/HWI-MW-03B, 0587/HWI-MW-04, 0588/HWI-MW-05, 0589/HWI-MW-06.
Parameter Sampling Frequency Analytical Method Method Detection Limit(MDL) or Method
Quantification Limit (MQL)Value, (units), MDL or MQL2
Concentration Limit1
Lead Semi-annual SW6010C / SW6020A 0.05 mg/L 0.075 mg/L
Chromium Semi-annual SW6010C / SW6020A 0.01 mg/L 0.0235 mg/L
Phenol Semi-annual SW8270D 0.05 mg/L 0.075 mg/L
Benzene Semi-annual SW8021B / SW8260B 0.001 mg/L 0.0015 mg/L
Toluene Semi-annual SW8021B / SW8260B 0.001 mg/L 0.0015 mg/L
1 The concentration limit is the basis for determining whether a release has occurred from the waste management unit/area.2 a. Enter the laboratory expected Method Detection Limit if determination of Statistically Significant Increase (SSI) occurrence is based on detection of the
presence of the constituent of concern in the sample.2 b. Enter the laboratory expected Method Quantification Limit if determination of SSI is based on statistical analysis of detection monitoring data or direct
comparison to a limit value.This should be based on the laboratory’s minimum expected level of performance. Please designate which type of limit has been entered for each constituent, with
its value and units.
TCEQ Part B Application 123 Phillips 66, Borger RefineryTCEQ-00376 (Rev. 9-29-2017 M.L. Shannon) HW-50078, May 2020, Rev 12
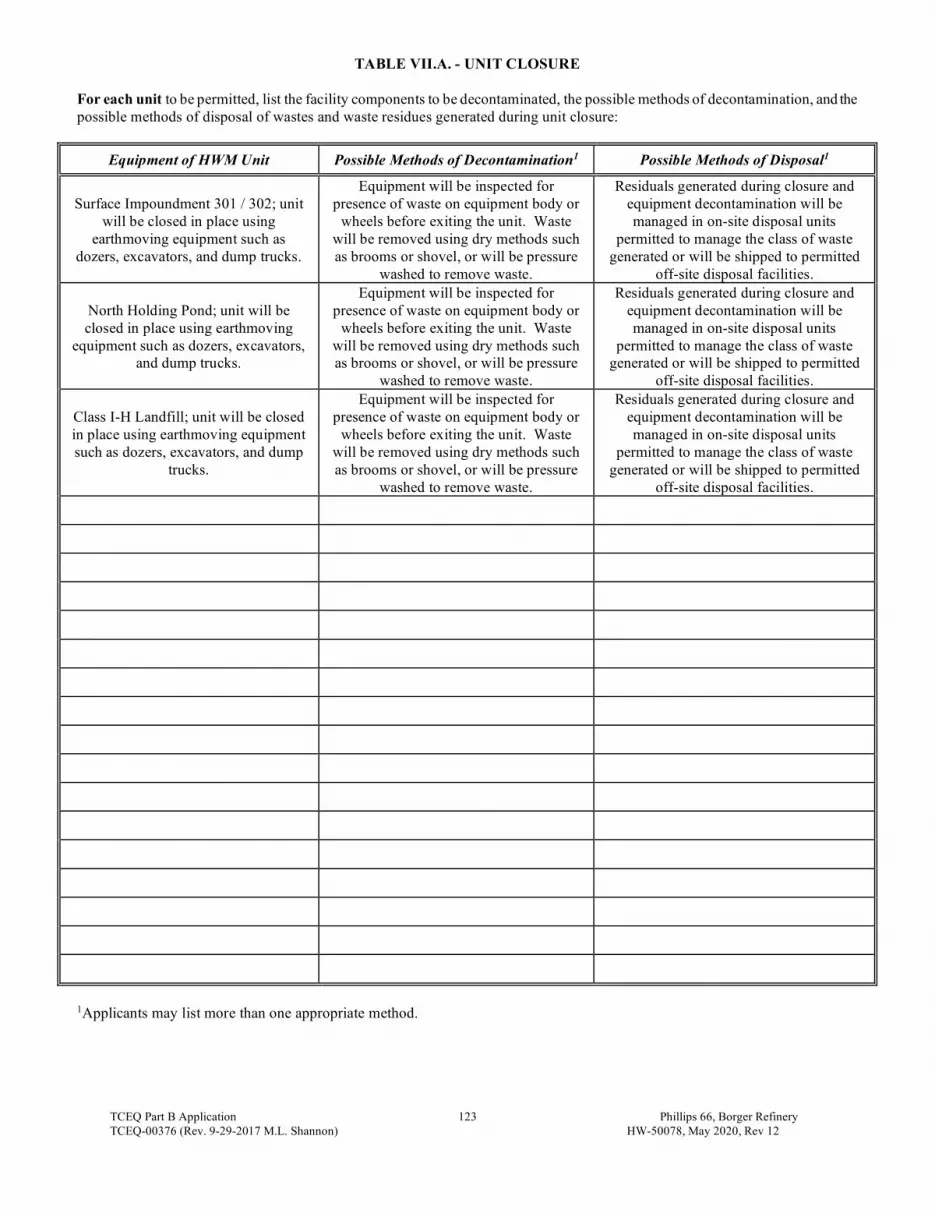
TABLE VII.A. - UNIT CLOSURE
For each unit to be permitted, list the facility components to be decontaminated, the possible methods of decontamination, and thepossible methods of disposal of wastes and waste residues generated during unit closure:
Equipment of HWM Unit Possible Methods of Decontamination1 Possible Methods of Disposal1
Surface Impoundment 301 / 302; unitwill be closed in place using
earthmoving equipment such asdozers, excavators, and dump trucks.
Equipment will be inspected forpresence of waste on equipment body or
wheels before exiting the unit. Wastewill be removed using dry methods suchas brooms or shovel, or will be pressure
washed to remove waste.
Residuals generated during closure andequipment decontamination will bemanaged in on-site disposal units
permitted to manage the class of wastegenerated or will be shipped to permitted
off-site disposal facilities.
North Holding Pond; unit will beclosed in place using earthmoving
equipment such as dozers, excavators,and dump trucks.
Equipment will be inspected forpresence of waste on equipment body or
wheels before exiting the unit. Wastewill be removed using dry methods suchas brooms or shovel, or will be pressure
washed to remove waste.
Residuals generated during closure andequipment decontamination will bemanaged in on-site disposal units
permitted to manage the class of wastegenerated or will be shipped to permitted
off-site disposal facilities.
Class I-H Landfill; unit will be closedin place using earthmoving equipmentsuch as dozers, excavators, and dump
trucks.
Equipment will be inspected forpresence of waste on equipment body or
wheels before exiting the unit. Wastewill be removed using dry methods suchas brooms or shovel, or will be pressure
washed to remove waste.
Residuals generated during closure andequipment decontamination will bemanaged in on-site disposal units
permitted to manage the class of wastegenerated or will be shipped to permitted
off-site disposal facilities.
1Applicants may list more than one appropriate method.
TCEQ Part B Application 124 Phillips 66, Borger RefineryTCEQ-00376 (Rev. 9-29-2017 M.L. Shannon) HW-50078, May 2020, Rev 12
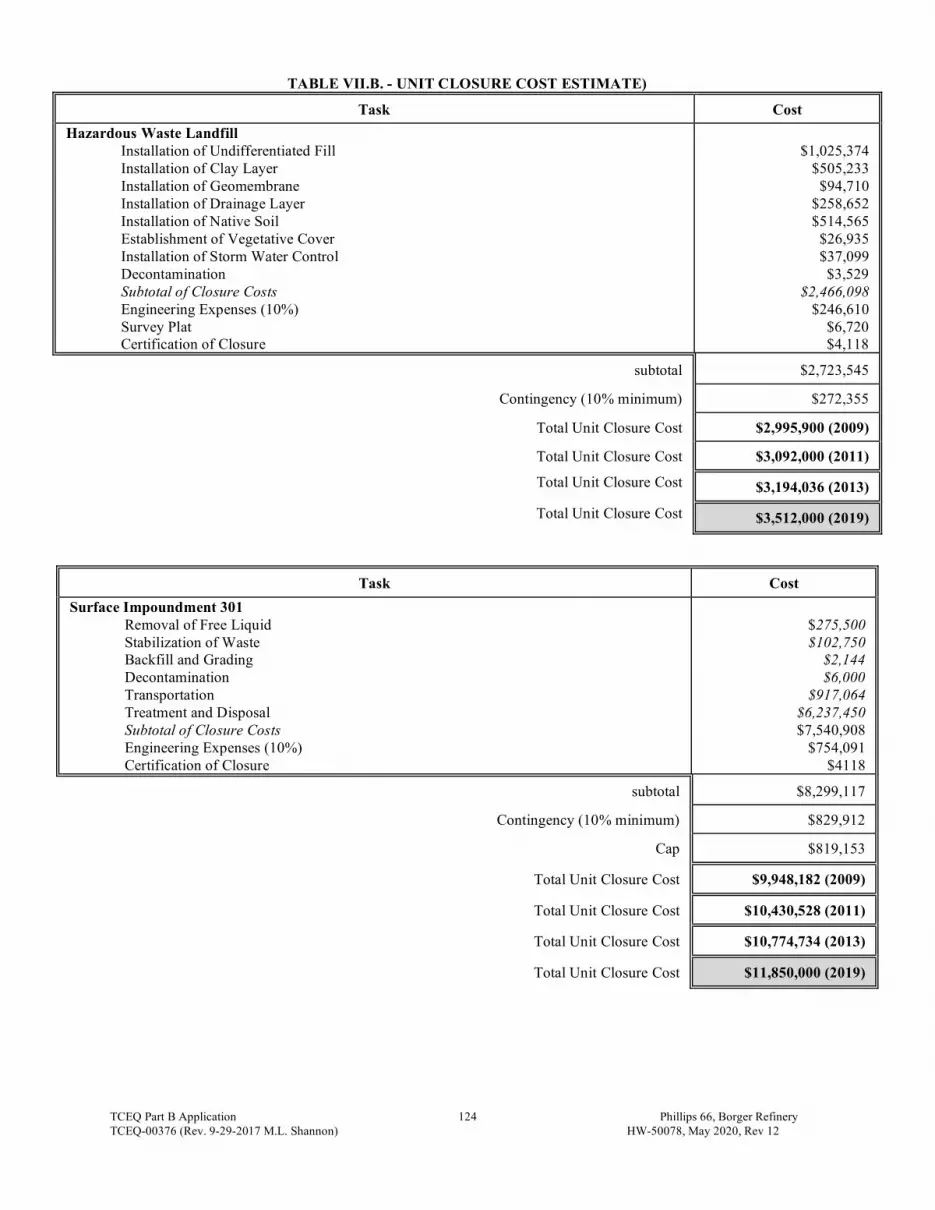
TABLE VII.B. - UNIT CLOSURE COST ESTIMATE)
Task Cost
Hazardous Waste LandfillInstallation of Undifferentiated FillInstallation of Clay LayerInstallation of GeomembraneInstallation of Drainage LayerInstallation of Native SoilEstablishment of Vegetative CoverInstallation of Storm Water ControlDecontaminationSubtotal of Closure CostsEngineering Expenses (10%)Survey PlatCertification of Closure
$1,025,374$505,233
$94,710$258,652$514,565
$26,935$37,099$3,529
$2,466,098$246,610
$6,720$4,118
subtotal $2,723,545
Contingency (10% minimum) $272,355
Total Unit Closure Cost $2,995,900 (2009)
Total Unit Closure Cost $3,092,000 (2011)
Total Unit Closure Cost $3,194,036 (2013)
Total Unit Closure Cost $3,512,000 (2019)
Task Cost
Surface Impoundment 301Removal of Free LiquidStabilization of WasteBackfill and GradingDecontaminationTransportationTreatment and DisposalSubtotal of Closure CostsEngineering Expenses (10%)Certification of Closure
$275,500$102,750
$2,144$6,000
$917,064$6,237,450$7,540,908
$754,091$4118
subtotal $8,299,117
Contingency (10% minimum) $829,912
Cap $819,153
Total Unit Closure Cost $9,948,182 (2009)
Total Unit Closure Cost $10,430,528 (2011)
Total Unit Closure Cost $10,774,734 (2013)
Total Unit Closure Cost $11,850,000 (2019)

TCEQ Part B Application 125 Phillips 66, Borger RefineryTCEQ-00376 (Rev. 9-29-2017 M.L. Shannon) HW-50078, May 2020, Rev 12
TABLE VII.B. - UNIT CLOSURE COST ESTIMATE (Continued)
Surface Impoundment 302Removal of Free LiquidStabilization of WasteBackfill and GradingDecontaminationTransportationTreatment and DisposalSubtotal of Closure CostsEngineering Expenses (10%)Certification of Closure
$358,478$133,680
$1,322$5,999
$1,192,860$8,117,694$9,810,033
$981,003$4,118
subtotal $10,795,135
Contingency (10% minimum) $1,079,515
Cover Installation $403,913
Total Unit Closure Cost $12,278,583 (2009)
Total Unit Closure Cost $12,672,000 (2011)
Total Unit Closure Cost $13,090,175 (2013)
Total Unit Closure Cost $14,396,000 (2019)
Task Cost
North Holding PondInstallation of Unclassified FillInstallation of Clay layerInstallation of Geosynthetic Clay LinerInstallation of Geomembrane w drainage layer, engineered turf, and sand ballastInstallation of Storm Water ControlDecontaminationSubtotal of Closure CostsEngineering Expenses (10%)Survey PlatCertification of Closure
$31,000$181,000$122,000$568,000
$29,000$4,000
$935,000$94,000$5,000
$10,000
subtotal $1,044,000
Contingency (10% minimum) $104,000
Total Unit Closure Cost $1,224,000 (2019)
TOTAL PERMITTED FACILITY CLOSURE COST (all unit costs combined) $26,753,031 (2009)
27,773,922 (2011)
$28,690,460 (2013)
$30,982,000 (2019)

TCEQ Part B Application 127 Phillips 66, Borger RefineryTCEQ-00376 (Rev. 9-29-2017 M.L. Shannon) HW-50078, May 2020, Rev 12
TABLE VII.D. - UNIT POST-CLOSURE COST ESTIMATE
Task Cost
Hazardous Waste LandfillMaintenance and InspectionGroundwater Monitoring (5 wells x 2 events)Subtotal of Post-closure CostsEngineering Expenses (10%)Deed NotationFinal Certification of Post-Closure Care
$930$11,597$12,526$1,253$6,800$4,960
subtotal $13,779
Contingency (10% minimum) $1,378
TOTAL UNIT POST-CLOSURE CARE COST x 30 yrs. (or other post-closure care period) $466,471 (2009)
481,398 (2011)
$497,414 (2013)
$547,000 (2019)
Surface Impoundments 301 and 302SI 301Maintenance and InspectionGroundwater MonitoringSubtotal of Post-closure CostsEngineering Expenses (10%)Subtotal of Annual Post-Closure CostsDeed NotationFinal Certification of Post-Closure Care
SI 302Maintenance and InspectionGroundwater Monitoring (7 wells x 2 events)Subtotal of Post-closure CostsEngineering Expenses (10%)Deed NotationFinal Certification of Post-Closure Care
$642$0a
$642$64
$706$6,800$4,960
$549$15,512$16,061$1,606$6,800$4,960
subtotal SI 301 and SI 302 18,373
Contingency (10% minimum) 1,837
TOTAL UNIT POST-CLOSURE CARE COST x 30 yrs. (or other post-closure care period) $629,820 (2009)
$625,702 (2011)
$646,519 (2013)
$711,000 (2019)
aGroundwater monitoring is priced in the SI 302 Closure Costs. The units are too close together to separate.

TCEQ Part B Application 128 Phillips 66, Borger RefineryTCEQ-00376 (Rev. 9-29-2017 M.L. Shannon) HW-50078, May 2020, Rev 12
TABLE VII.D. - UNIT POST-CLOSURE COST ESTIMATE (Continued)
North Holding Pond
Site Security (one-time only)Site Security (annual)Maintenance and InspectionGroundwater Monitoring (6 wells x 2 events)Non-destructive engineered turf testing (annual)Engineered turf replacement (one-time if needed)Subtotal of Annual Post-closure CostsEngineering Expenses (10%)Deed NotationFinal Certification of Post-Closure Care
$25,000$500
$1,000$13,000
$500$200,000
$15,000$1,500$7,000
$10,000
subtotal $16,500
Contingency (10% minimum) $1,650
TOTAL UNIT POST-CLOSURE CARE COST x 30 yrs. (or other post-closure care period) $952,000 (2019)
Task Cost
Pitch Pits 11, 12 &14Maintenance and InspectionGroundwater Monitoring (7 wells x 2 events)Subtotal of Annual Post-closure CostsEngineering Expenses (10%)Deed NotationFinal Certification of Post-Closure Care
$2,440$16,292$19,217$1,922$6,880$4,960
subtotal $21,139
Contingency (10% minimum) $2,114
$337,295 (2009)
$348,088(2011)
$359,669 (2013)
TOTAL UNIT POST-CLOSURE CARE COST x 14 yrs. (or other post-closure care period) $395,000 (2019)

TCEQ Part B Application 129 Phillips 66, Borger RefineryTCEQ-00376 (Rev. 9-29-2017 M.L. Shannon) HW-50078, May 2020, Rev 12
TABLE VII.D. - UNIT POST-CLOSURE COST ESTIMATE (Continued)
Filter Slurry PondMaintenance and InspectionGroundwater Monitoring (5 wells x 2 events)Subtotal of Post-closure CostsEngineering Expenses (10%)Deed NotationFinal Certification of Post-Closure Care
$2,627$17,326$20,476$2,048$6,880$4,960
subtotal $22,524
Contingency (10% minimum) $2,252
TOTAL UNIT POST-CLOSURE CARE COST x 13 yrs. (or other post-closure care period) $333,854 (2009)
$346,601 (2011)
$358,132 (2013)
$394,000 (2019)
New Caustic Pond (Post-closure groundwater and corrective action costs for NCP inCompliance Plan)
Maintenance and InspectionSubtotal of Post-closure CostsEngineering Expenses (10%)Deed NotationFinal Certification of Post-Closure Care
$1,363$1,363
$136$6,800
$10,000
subtotal $1,499
Contingency (10% minimum) $150
TOTAL UNIT POST-CLOSURE CARE COST x 30 yrs. (or other post-closure care period) $84,000 (2019)

TCEQ Part B Application 130 Phillips 66, Borger RefineryTCEQ-00376 (Rev. 9-29-2017 M.L. Shannon) HW-50078, May 2020, Rev 12
TABLE VII.D. - UNIT POST-CLOSURE COST ESTIMATE (Continued)
Task Cost
Surge PondMaintenance and InspectionGroundwater Monitoring (5 wells x 2 events)Subtotal of Post-closure CostsEngineering Expenses (10%)Deed NotationFinal Certification of Post-Closure Care
$1,908$14,838$17,105$1,710$6,880$4,960
subtotal $18,815
Contingency (10% minimum) $1,882
TOTAL UNIT POST-CLOSURE CARE COST x 19 yrs. (or other post-closure care period) $398,689 (2009)
$424,613 (2011)
$438,740 (2013)
$483,000 (2019)
Off-Test PondMaintenance and InspectionGroundwater Monitoring (5 wells x 2 events)Subtotal of Post-closure CostsEngineering Expenses (10%)Deed NotationFinal Certification of Post-Closure Care
$1,908$12,377$14,643$1,464$6,880$4,960
subtotal $16,107
Contingency (10% minimum) $1,611
TOTAL UNIT POST-CLOSURE CARE COST x 19 yrs. (or other post-closure care period) $348,400 (2009)
$359,549 (2011)
$371,511 (2013)
$408,000 (2019)

TCEQ Part B Application 131 Phillips 66, Borger RefineryTCEQ-00376 (Rev. 9-29-2017 M.L. Shannon) HW-50078, May 2020, Rev 12
Task Cost
Old Caustic Pond (Post-closure groundwater and correctiveaction costs for OCP in Compliance Plan)
Maintenance and Inspection
Subtotal of Post-closure Costs
Engineering Expenses (10%)
Deed Notation
Final Certification of Post-Closure Care
$1,363
$1,363
$136
$6,800
$10,000
subtotal $1,499
Contingency (10% minimum) $150
TOTAL UNIT POST-CLOSURE CARE COST x 30 yrs. (orother post-closure care period)
$84,000 (2019)
Task Cost
Class I Landfill (Post-closure groundwater costs for this unit inCompliance Plan)
Maintenance and Inspection
Subtotal of Post-closure Costs
Engineering Expenses (10%)
Subtotal of Annual Post-Closure Costs
Deed Notation
Final Certification of Post-Closure Care
$913
$913
$91
$1,004
$6,800
$4,960
subtotal $1,004
Contingency (10% minimum) $100
TOTAL UNIT POST-CLOSURE CARE COST x 9 yrs. (orother post-closure care period)
$29,000 (2019)

TCEQ Part B Application 132 Phillips 66, Borger RefineryTCEQ-00376 (Rev. 9-29-2017 M.L. Shannon) HW-50078, May 2020, Rev 12
Task Cost
New Evaporation Pond (Post-closure groundwater costs for thisunit in Compliance Plan)
Maintenance and Inspection
Subtotal of Post-closure Costs
Engineering Expenses (10%)
Subtotal of Annual Post-Closure Costs
Deed Notation
Final Certification of Post-Closure Care
$1,567
$1,567
$157
$1,723
$6,800
$4,960
subtotal $1,724
Contingency (10% minimum) $172
TOTAL UNIT POST-CLOSURE CARE COST x 10 yrs. (orother post-closure care period)
$40,000 (2019)
TOTAL PERMITTED FACILITY POST-CLOSURE COST (all unit costs combined) $3,167,830(2009)
TOTAL PERMITTED FACILITY POST-CLOSURE COST (all unit costs combined) $3,229,903 (2011)
TOTAL PERMITTED FACILITY POST-CLOSURE COST (all unit costs combined) $3,556,800 (2013)
TOTAL PERMITTED FACILITY POST-CLOSURE COST (all unit costs combined) $4,127,000 (2019)
One-time only costs such as Deed Notation and Fencing have not been multiplied by the number of years left in post-closurecare but added to the total cost.
TCEQ Part B Application 1 Phillips 66, Borger RefineryTCEQ-00376 (Rev. 9-29-2017 M.L. Shannon) HW-50078, May 2020, Rev 12
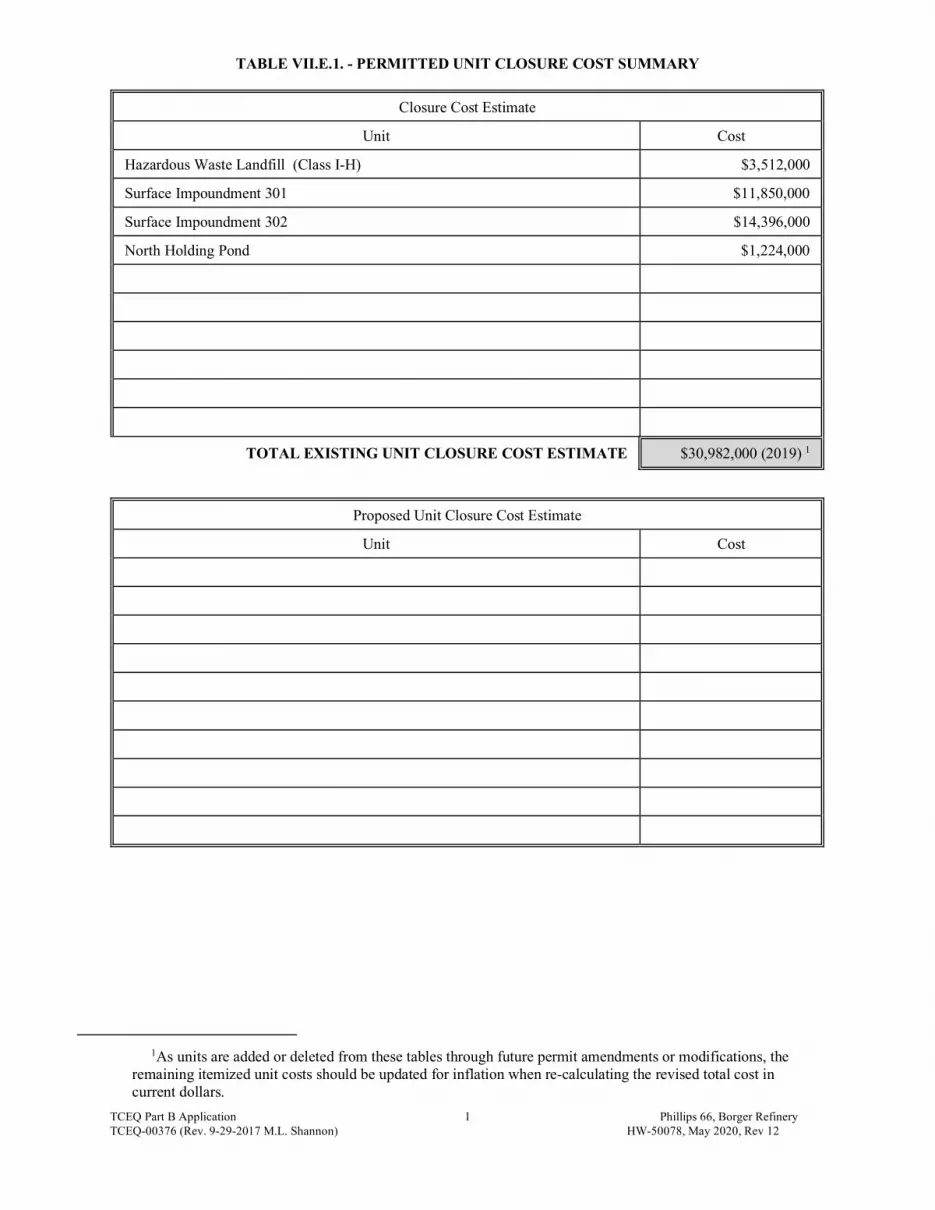
TABLE VII.E.1. - PERMITTED UNIT CLOSURE COST SUMMARY
Closure Cost Estimate
Unit Cost
Hazardous Waste Landfill (Class I-H) $3,512,000
Surface Impoundment 301 $11,850,000
Surface Impoundment 302 $14,396,000
North Holding Pond $1,224,000
TOTAL EXISTING UNIT CLOSURE COST ESTIMATE $30,982,000 (2019) 1
Proposed Unit Closure Cost Estimate
Unit Cost
1As units are added or deleted from these tables through future permit amendments or modifications, theremaining itemized unit costs should be updated for inflation when re-calculating the revised total cost incurrent dollars.

Permit No. 50078Permittee: Phillips 66 Company Page 1 of 1
TCEQ Part B Application 1 Phillips 66, Borger RefineryTCEQ-00376 (Rev. 9-29-2017 M.L. Shannon) HW-50078, May 2020, Rev 12
TABLE VII.E.2. - PERMITTED UNIT POST-CLOSURE COST SUMMARY
Existing Unit Post-Closure Cost Estimate
Unit Cost
Hazardous Waste Landfill $547,000
Surface Impoundment 301/302 $711,000
North Holding Pond $952,000
Pitch Pits 11, 12 & 14 $395,000
Filter Slurry Pond $394,000
Surge Pond $483,000
Off-Test Pond $408,000
New Caustic Pond $84,000
Class I Landfill $29,000
New Evaporation Pond $40,000
Old Caustic Pond $84,000
TOTAL EXISTING UNIT POST-CLOSURE COSTESTIMATE
4,127,000 (2019)
Proposed Unit Post-Closure Cost Estimate
Unit Cost
Note: Post-closure care inspection/maintenance costs for the New Caustic Pond ,Old Caustic Pond, Class I Landfill, and New Evaporation Pond are includedabove; corrective action costs for these units are included in the CompliancePlan.
Permit No. HW-50078-000 Revision 12Phillips 66 Company – Borger Refinery, Texas May 2020
TCEQ Part B Application 183TCEQ-00376 (Rev. 9-29-2017 M.L. Shannon)
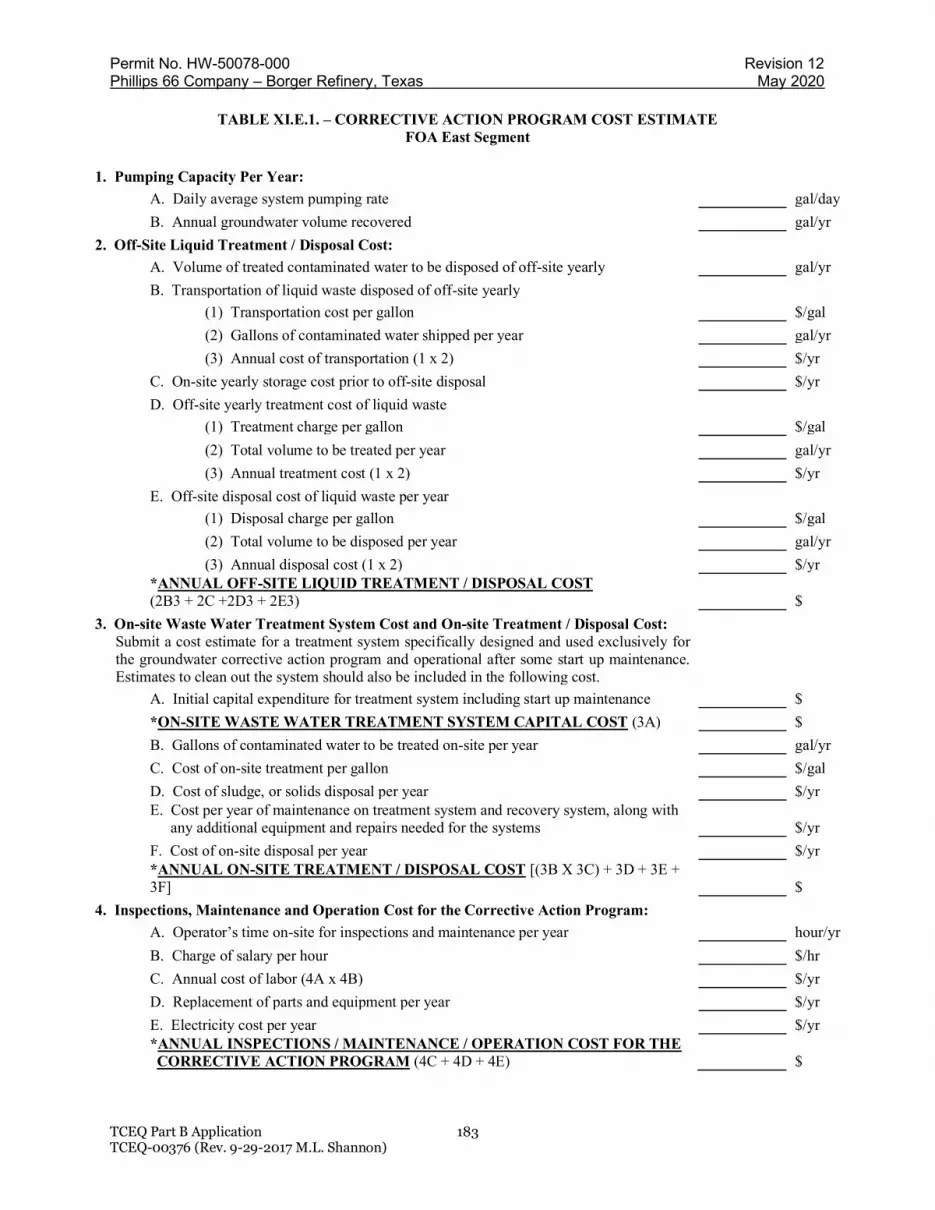
TABLE XI.E.1. – CORRECTIVE ACTION PROGRAM COST ESTIMATEFOA East Segment
1. Pumping Capacity Per Year:
A. Daily average system pumping rate gal/day
B. Annual groundwater volume recovered gal/yr
2. Off-Site Liquid Treatment / Disposal Cost:
A. Volume of treated contaminated water to be disposed of off-site yearly gal/yr
B. Transportation of liquid waste disposed of off-site yearly
(1) Transportation cost per gallon $/gal
(2) Gallons of contaminated water shipped per year gal/yr
(3) Annual cost of transportation (1 x 2) $/yr
C. On-site yearly storage cost prior to off-site disposal $/yr
D. Off-site yearly treatment cost of liquid waste
(1) Treatment charge per gallon $/gal
(2) Total volume to be treated per year gal/yr
(3) Annual treatment cost (1 x 2) $/yr
E. Off-site disposal cost of liquid waste per year
(1) Disposal charge per gallon $/gal
(2) Total volume to be disposed per year gal/yr
(3) Annual disposal cost (1 x 2) $/yr*ANNUAL OFF-SITE LIQUID TREATMENT / DISPOSAL COST(2B3 + 2C +2D3 + 2E3) $
3. On-site Waste Water Treatment System Cost and On-site Treatment / Disposal Cost:Submit a cost estimate for a treatment system specifically designed and used exclusively forthe groundwater corrective action program and operational after some start up maintenance.Estimates to clean out the system should also be included in the following cost.
A. Initial capital expenditure for treatment system including start up maintenance $
*ON-SITE WASTE WATER TREATMENT SYSTEM CAPITAL COST (3A) $
B. Gallons of contaminated water to be treated on-site per year gal/yr
C. Cost of on-site treatment per gallon $/gal
D. Cost of sludge, or solids disposal per year $/yrE. Cost per year of maintenance on treatment system and recovery system, along with
any additional equipment and repairs needed for the systems $/yr
F. Cost of on-site disposal per year $/yr*ANNUAL ON-SITE TREATMENT / DISPOSAL COST [(3B X 3C) + 3D + 3E +3F] $
4. Inspections, Maintenance and Operation Cost for the Corrective Action Program:
A. Operator’s time on-site for inspections and maintenance per year hour/yr
B. Charge of salary per hour $/hr
C. Annual cost of labor (4A x 4B) $/yr
D. Replacement of parts and equipment per year $/yr
E. Electricity cost per year $/yr*ANNUAL INSPECTIONS / MAINTENANCE / OPERATION COST FOR THECORRECTIVE ACTION PROGRAM (4C + 4D + 4E) $

Permit No. HW-50078-000 Revision 12Phillips 66 Company – Borger Refinery, Texas May 2020
TCEQ Part B Application 184TCEQ-00376 (Rev. 9-29-2017 M.L. Shannon)
TABLE XI.E.2. – GROUNDWATER MONITORING COST ESTIMATEFOA East Segment
1. Annual Sampling and Analysis Cost:
A. Background Wells
(1) Number of wells
(2) Sample analysis cost per well $/well
(3) Number of sampling events per year /yr
(4) Sampling cost (1 x 2 x 3) $
B. Point of Compliance Wells
(1) Number of wells 7
(2) Sample analysis cost per well 648.57 $/well
(3) Number of sampling events per year 2 /yr
(4) Sampling cost (1 x 2 x 3) 9,080.00 $
C. Recovery Wells
(1) Number of wells
(2) Sample analysis cost per well $/well
(3) Number of sampling events per year /yr
(4) Sampling cost (1 x 2 x 3) $
D. Corrective Action Observation Wells
(1) Number of wells
(2) Sample analysis cost per well $/well
(3) Number of sampling events per year /yr
(4) Sampling cost (1 x 2 x 3) $
E. Point of Exposure Wells
(1) Number of wells
(2) Sample analysis cost per well $/well
(3) Number of sampling events per year /yr
(4) Sampling cost (1 x 2 x 3) $
F. Supplemental Wells
(1) Number of wells
(2) Sample analysis cost per well $/well
(3) Number of sampling events per year /yr
(4) Sampling cost (1 x 2 x 3) $
G. Field Quality Control Sampling
(1) Number of wells
(2) Sample analysis cost per well $/well
(3) Number of sampling events per year /yr
(4) Sampling cost (1 x 2 x 3) $
H. Sediment Sampling
(1) Number of samples 2
(2) Sample analysis cost per sample 1,115.09 $/sample
(3) Number of sampling events per year 2 /yr

Permit No. HW-50078-000 Revision 12Phillips 66 Company – Borger Refinery, Texas May 2020
TCEQ Part B Application 185TCEQ-00376 (Rev. 9-29-2017 M.L. Shannon)
(4) Sampling cost (1 x 2 x 3) 4,460.36 $
I. Surface Water Sampling
(1) Number of samples 2
(2) Sample analysis cost per sample 1,083.44 $/sample
(3) Number of sampling events per year 2 /yr
(4) Sampling cost (1 x 2 x 3) 4,333.76 $
2. Sampling Labor Cost:
A. Hours of sampling per well 4 hrs/well
B. Number of sampling technicians per well 2
C. Charge per hour 104.36 $/hr
D. Total number of wells to be sampled annually Wells
E. Total number of wells sampled semi-annually 7 Wells
F. Total number of wells sampled quarterly Wells
G. Total number of wells sampled monthly WellsH. Total number of wells sampled per year(2D) + (2E x 2) + (2F x 4) + (2G x 12) 14
total wellssampled/yr
I. Sampling Labor Cost (2A x 2B x 2C x 2H) 11,688.32 $*ANNUAL GROUNDWATER/SURFACEWATER/SEDIMENT MONITORING COST 29,562.44 $
3. Well Installation (typical cost):
A. Monitor well installation cost per well $/well
B. Number of monitor wells to be installed Wells
C. Cost of monitor well system (A x B) $
D. Recovery well installation cost per well $/well
E. Number of Recovery Wells to be installed Wells
F. Cost of Recovery well system (D x E) $
*TOTAL WELL INSTALLATION COST (3C + 3F) $
4. Administrative Cost:
A. Annual cost for record-keeping and report preparation 50,000 $
*ANNUAL ADMINISTRATIVE COST (4A) 50,000 $5. Inspection and Maintenance Cost for the MonitoringProgram:
A. Operator’s time (hours) on-site for inspections andmaintenance per year hour/yr
B. Charge or salary per hour $/hr
C. Annual cost of labor (4A x 4B) $/yr
D. Replacement of parts and equipment per year $/yr*ANNUAL INSPECTIONS / MAINTENANCE COSTFOR THE GROUNDWATER MONITORINGPROGRAM (5C + 5D) $

Permit No. HW-50078-000 Revision 12Phillips 66 Company – Borger Refinery, Texas May 2020
TCEQ Part B Application 186TCEQ-00376 (Rev. 9-29-2017 M.L. Shannon)
TABLE XI.E.3. – FINANCIAL ASSURANCE SUMMARYFOA East Segment
ANNUAL OFF-SITE LIQUID TREATMENT / DISPOSAL COST $
ANNUAL ON-SITE TREATMENT / DISPOSAL COST $ANNUAL INSPECTION / MAINTENACE / OPERATION COST FOR THE
CORRECTIVE ACTION PROGRAM $ANNUAL GROUNDWATER/SURFACE WATER/SEDIMENTMONITORING COST $ 29,562.44
ANNUAL ADMINISTRATIVE COST $ 50,000ANNUAL INSPECTION AND MAINTENANCE COST FOR THE
GROUNDWATER MONITORING PROGRAM $
ANNUAL SUB TOTAL $ 79,562.44
TOTAL YEARS USED FOR CALCULATING FINANCIAL ASSURANCE 30 Yrs
REMEDIATION COST(Annual Sub Total x Total Years Used) $ 2,386,873
SOIL DELINEATION
1. Sample analysis
Number of samples
Cost per sample $
Total $
2. Sampling cost
3. Drilling cost
4. Decontamination cost
ON-SITE WASTE WATER TREATMENT SYSTEM CAPITAL COST $
TOTAL WELL COST $
10% Engineering expenses $ 238,687
Subtotal $ 2,625,560
10% Contingency $ 262,556
GRAND TOTAL COST (nearest $1000) 2007 $2,888,000
2013 $3,263,000
2019 $3,587,000

Permit No. HW-50078-000 Revision 12Phillips 66 Company – Borger Refinery, Texas May 2020
TCEQ Part B Application 187TCEQ-00376 (Rev. 9-29-2017 M.L. Shannon)
TABLE XI.E.1. – CORRECTIVE ACTION PROGRAM COST ESTIMATEFOA West Segment
1. Pumping Capacity Per Year:
A. Daily average system pumping rate gal/day
B. Annual groundwater volume recovered gal/yr
2. Off-Site Liquid Treatment / Disposal Cost:
A. Volume of treated contaminated water to be disposed of off-site yearly gal/yr
B. Transportation of liquid waste disposed of off-site yearly
(1) Transportation cost per gallon $/gal
(2) Gallons of contaminated water shipped per year gal/yr
(3) Annual cost of transportation (1 x 2) $/yr
C. On-site yearly storage cost prior to off-site disposal $/yr
D. Off-site yearly treatment cost of liquid waste
(1) Treatment charge per gallon $/gal
(2) Total volume to be treated per year gal/yr
(3) Annual treatment cost (1 x 2) $/yr
E. Off-site disposal cost of liquid waste per year
(1) Disposal charge per gallon $/gal
(2) Total volume to be disposed per year gal/yr
(3) Annual disposal cost (1 x 2) $/yr*ANNUAL OFF-SITE LIQUID TREATMENT / DISPOSAL COST(2B3 + 2C +2D3 + 2E3) $
3. On-site Waste Water Treatment System Cost and On-site Treatment / Disposal Cost:Submit a cost estimate for a treatment system specifically designed and used exclusively forthe groundwater corrective action program and operational after some start up maintenance.Estimates to clean out the system should also be included in the following cost.
A. Initial capital expenditure for treatment system including start up maintenance $
*ON-SITE WASTE WATER TREATMENT SYSTEM CAPITAL COST (3A) $
B. Gallons of contaminated water to be treated on-site per year gal/yr
C. Cost of on-site treatment per gallon $/gal
D. Cost of sludge, or solids disposal per year $/yrE. Cost per year of maintenance on treatment system and recovery system, along with
any additional equipment and repairs needed for the systems $/yr
F. Cost of on-site disposal per year $/yr*ANNUAL ON-SITE TREATMENT / DISPOSAL COST [(3B X 3C) + 3D + 3E +3F] $
4. Inspections, Maintenance and Operation Cost for the Corrective Action Program:
A. Operator’s time on-site for inspections and maintenance per year hour/yr
B. Charge of salary per hour $/hr
C. Annual cost of labor (4A x 4B) $/yr
D. Replacement of parts and equipment per year $/yr
E. Electricity cost per year $/yr*ANNUAL INSPECTIONS / MAINTENANCE / OPERATION COST FOR THECORRECTIVE ACTION PROGRAM (4C + 4D + 4E) $

Permit No. HW-50078-000 Revision 12Phillips 66 Company – Borger Refinery, Texas May 2020
TCEQ Part B Application 188TCEQ-00376 (Rev. 9-29-2017 M.L. Shannon)
TABLE XI.E.2. – GROUNDWATER MONITORING COST ESTIMATEFOA West Segment
1. Annual Sampling and Analysis Cost:
A. Background Wells
(1) Number of wells
(2) Sample analysis cost per well $/well
(3) Number of sampling events per year /yr
(4) Sampling cost (1 x 2 x 3) $
B. Point of Compliance Wells
(1) Number of wells 3
(2) Sample analysis cost per well 811.25 $/well
(3) Number of sampling events per year 2 /yr
(4) Sampling cost (1 x 2 x 3) 4,867.50 $
C. Recovery Wells
(1) Number of wells
(2) Sample analysis cost per well $/well
(3) Number of sampling events per year /yr
(4) Sampling cost (1 x 2 x 3) $
D. Corrective Action Observation Wells
(1) Number of wells
(2) Sample analysis cost per well $/well
(3) Number of sampling events per year /yr
(4) Sampling cost (1 x 2 x 3) $
E. Point of Exposure Wells
(1) Number of wells 1
(2) Sample analysis cost per well 811.25 $/well
(3) Number of sampling events per year 2 /yr
(4) Sampling cost (1 x 2 x 3) 1,622.50 $
F. Supplemental Wells
(1) Number of wells
(2) Sample analysis cost per well $/well
(3) Number of sampling events per year /yr
(4) Sampling cost (1 x 2 x 3) $
G. Field Quality Control Sampling
(1) Number of wells
(2) Sample analysis cost per well $/well
(3) Number of sampling events per year /yr
(4) Sampling cost (1 x 2 x 3) $
H. Sediment Sampling
(1) Number of samples 4
(2) Sample analysis cost per sample 791.34 $/sample
(3) Number of sampling events per year 2 /yr

Permit No. HW-50078-000 Revision 12Phillips 66 Company – Borger Refinery, Texas May 2020
TCEQ Part B Application 189TCEQ-00376 (Rev. 9-29-2017 M.L. Shannon)
(4) Sampling cost (1 x 2 x 3) 6,330.72 $
I. Surface Water Sampling
(1) Number of samples 4
(2) Sample analysis cost per sample 759.69 $/sample
(3) Number of sampling events per year 2 /yr
(4) Sampling cost (1 x 2 x 3) 6,077.52 $
2. Sampling Labor Cost:
A. Hours of sampling per well 4 hrs/well
B. Number of sampling technicians per well 2
C. Charge per hour 73.59 $/hr
D. Total number of wells to be sampled annually Wells
E. Total number of wells sampled semi-annually 4 Wells
F. Total number of wells sampled quarterly Wells
G. Total number of wells sampled monthly WellsH. Total number of wells sampled per year(2D) + (2E x 2) + (2F x 4) + (2G x 12) 8
total wellssampled/yr
I. Sampling Labor Cost (2A x 2B x 2C x 2H) 4,709.76 $*ANNUAL GROUNDWATER/SURFACEWATER/SEDIMENT MONITORING COST 23,608.00 $
3. Well Installation (typical cost):
A. Monitor well installation cost per well $/well
B. Number of monitor wells to be installed Wells
C. Cost of monitor well system (A x B) $
D. Recovery well installation cost per well $/well
E. Number of Recovery Wells to be installed Wells
F. Cost of Recovery well system (D x E) $
*TOTAL WELL INSTALLATION COST (3C + 3F) $
4. Administrative Cost:
A. Annual cost for record-keeping and report preparation $
*ANNUAL ADMINISTRATIVE COST (4A) $5. Inspection and Maintenance Cost for the MonitoringProgram:
A. Operator’s time (hours) on-site for inspections andmaintenance per year hour/yr
B. Charge or salary per hour $/hr
C. Annual cost of labor (4A x 4B) $/yr
D. Replacement of parts and equipment per year $/yr*ANNUAL INSPECTIONS / MAINTENANCE COSTFOR THE GROUNDWATER MONITORINGPROGRAM (5C + 5D) $

Permit No. HW-50078-000 Revision 12Phillips 66 Company – Borger Refinery, Texas May 2020
TCEQ Part B Application 190TCEQ-00376 (Rev. 9-29-2017 M.L. Shannon)
TABLE XI.E.3. – FINANCIAL ASSURANCE SUMMARYFOA West Segment
ANNUAL OFF-SITE LIQUID TREATMENT / DISPOSAL COST $
ANNUAL ON-SITE TREATMENT / DISPOSAL COST $ANNUAL INSPECTION / MAINTENACE / OPERATION COST FOR THE
CORRECTIVE ACTION PROGRAM $ANNUAL GROUNDWATER/SURFACE WATER/SEDIMENT MONITORINGCOST $ 23,608.00
ANNUAL ADMINISTRATIVE COST $
ANNUAL INSPECTION AND MAINTENANCE COST FOR THEGROUNDWATER MONITORING PROGRAM $
Included inengineeringestimate
ANNUAL SUB TOTAL $ 23,608.00
TOTAL YEARS USED FOR CALCULATING FINANCIAL ASSURANCE 30 Yrs
REMEDIATION COST(Annual Sub Total x Total Years Used) $ 708,240
SOIL DELINEATION
1. Sample analysis
Number of samples
Cost per sample $
Total $
2. Sampling cost
3. Drilling cost
4. Decontamination cost
ON-SITE WASTE WATER TREATMENT SYSTEM CAPITAL COST $
TOTAL WELL COST $
10% Engineering expenses $ 70,824
Subtotal $ 779,064
10% Contingency $ 77,906
GRAND TOTAL COST (nearest $1000) 2007 $ 857,000
2013 $ 968,000
2019 $ 1,064,000

Permit No. HW-50078-000 Revision 12Phillips 66 Company – Borger Refinery, Texas May 2020
TCEQ Part B Application 191TCEQ-00376 (Rev. 9-29-2017 M.L. Shannon)
TABLE XI.E.1. – CORRECTIVE ACTION PROGRAM COST ESTIMATEFOA Northwest Segment
1. Pumping Capacity Per Year:
A. Daily average system pumping rate gal/day
B. Annual groundwater volume recovered gal/yr
2. Off-Site Liquid Treatment / Disposal Cost:
A. Volume of treated contaminated water to be disposed of off-site yearly gal/yr
B. Transportation of liquid waste disposed of off-site yearly
(1) Transportation cost per gallon $/gal
(2) Gallons of contaminated water shipped per year gal/yr
(3) Annual cost of transportation (1 x 2) $/yr
C. On-site yearly storage cost prior to off-site disposal $/yr
D. Off-site yearly treatment cost of liquid waste
(1) Treatment charge per gallon $/gal
(2) Total volume to be treated per year gal/yr
(3) Annual treatment cost (1 x 2) $/yr
E. Off-site disposal cost of liquid waste per year
(1) Disposal charge per gallon $/gal
(2) Total volume to be disposed per year gal/yr
(3) Annual disposal cost (1 x 2) $/yr*ANNUAL OFF-SITE LIQUID TREATMENT / DISPOSAL COST(2B3 + 2C +2D3 + 2E3) $
3. On-site Waste Water Treatment System Cost and On-site Treatment / Disposal Cost:Submit a cost estimate for a treatment system specifically designed and used exclusively forthe groundwater corrective action program and operational after some start up maintenance.Estimates to clean out the system should also be included in the following cost.
A. Initial capital expenditure for treatment system including start up maintenance $
*ON-SITE WASTE WATER TREATMENT SYSTEM CAPITAL COST (3A) $
B. Gallons of contaminated water to be treated on-site per year gal/yr
C. Cost of on-site treatment per gallon $/gal
D. Cost of sludge, or solids disposal per year $/yrE. Cost per year of maintenance on treatment system and recovery system, along
with any additional equipment and repairs needed for the systems $/yr
F. Cost of on-site disposal per year $/yr*ANNUAL ON-SITE TREATMENT / DISPOSAL COST [(3B X 3C) + 3D + 3E+ 3F] $
4. Inspections, Maintenance and Operation Cost for the Corrective Action Program:
A. Operator’s time on-site for inspections and maintenance per year hour/yr
B. Charge of salary per hour $/hr
C. Annual cost of labor (4A x 4B) $/yr
D. Replacement of parts and equipment per year $/yr
E. Electricity cost per year $/yr*ANNUAL INSPECTIONS / MAINTENANCE / OPERATION COST FORTHE CORRECTIVE ACTION PROGRAM (4C + 4D + 4E) $

Permit No. HW-50078-000 Revision 12Phillips 66 Company – Borger Refinery, Texas May 2020
TCEQ Part B Application 192TCEQ-00376 (Rev. 9-29-2017 M.L. Shannon)
TABLE XI.E.2. – GROUNDWATER MONITORING COST ESTIMATEFOA Northwest Segment
1. Annual Sampling and Analysis Cost:
A. Background Wells
(1) Number of wells
(2) Sample analysis cost per well $/well
(3) Number of sampling events per year /yr
(4) Sampling cost (1 x 2 x 3) $
B. Point of Compliance Wells
(1) Number of wells
(2) Sample analysis cost per well $/well
(3) Number of sampling events per year /yr
(4) Sampling cost (1 x 2 x 3) $
C. Recovery Wells
(1) Number of wells
(2) Sample analysis cost per well $/well
(3) Number of sampling events per year /yr
(4) Sampling cost (1 x 2 x 3) $
D. Corrective Action Observation Wells
(1) Number of wells
(2) Sample analysis cost per well $/well
(3) Number of sampling events per year /yr
(4) Sampling cost (1 x 2 x 3) $
E. Point of Exposure Wells
(1) Number of wells 1
(2) Sample analysis cost per well 2,075 $/well
(3) Number of sampling events per year 2 /yr
(4) Sampling cost (1 x 2 x 3) 4,150 $
F. Supplemental Wells
(1) Number of wells
(2) Sample analysis cost per well $/well
(3) Number of sampling events per year /yr
(4) Sampling cost (1 x 2 x 3) $
G. Field Quality Control Sampling
(1) Number of wells
(2) Sample analysis cost per well $/well
(3) Number of sampling events per year /yr
(4) Sampling cost (1 x 2 x 3) $
H. Sediment Sampling
(1) Number of samples 5
(2) Sample analysis cost per sample 726.59 $/sample
(3) Number of sampling events per year 2 /yr

Permit No. HW-50078-000 Revision 12Phillips 66 Company – Borger Refinery, Texas May 2020
TCEQ Part B Application 193TCEQ-00376 (Rev. 9-29-2017 M.L. Shannon)
(4) Sampling cost (1 x 2 x 3) 7,265.90 $
I. Surface Water Sampling
(1) Number of samples 5
(2) Sample analysis cost per sample 694.94 $/sample
(3) Number of sampling events per year 2 /yr
(4) Sampling cost (1 x 2 x 3) 6,949.40 $
2. Sampling Labor Cost:
A. Hours of sampling per well 4 hrs/well
B. Number of sampling technicians per well 2
C. Charge per hour 73.58 $/hr
D. Total number of wells to be sampled annually Wells
E. Total number of wells sampled semi-annually 1 Wells
F. Total number of wells sampled quarterly Wells
G. Total number of wells sampled monthly WellsH. Total number of wells sampled per year(2D) + (2E x 2) + (2F x 4) + (2G x 12) 2
total wellssampled/yr
I. Sampling Labor Cost (2A x 2B x 2C x 2H) 1,177.28 $*ANNUAL GROUNDWATER/SURFACEWATER/SEDIMENT MONITORING COST 19,542.58 $
3. Well Installation (typical cost):
A. Monitor well installation cost per well $/well
B. Number of monitor wells to be installed Wells
C. Cost of monitor well system (A x B) $
D. Recovery well installation cost per well $/well
E. Number of Recovery Wells to be installed Wells
F. Cost of Recovery well system (D x E) $
*TOTAL WELL INSTALLATION COST (3C + 3F) $
4. Administrative Cost:
A. Annual cost for record-keeping and report preparation $
*ANNUAL ADMINISTRATIVE COST (4A) $5. Inspection and Maintenance Cost for the MonitoringProgram:
A. Operator’s time (hours) on-site for inspections andmaintenance per year hour/yr
B. Charge or salary per hour $/hr
C. Annual cost of labor (4A x 4B) $/yr
D. Replacement of parts and equipment per year $/yr*ANNUAL INSPECTIONS / MAINTENANCE COSTFOR THE GROUNDWATER MONITORINGPROGRAM (5C + 5D) $
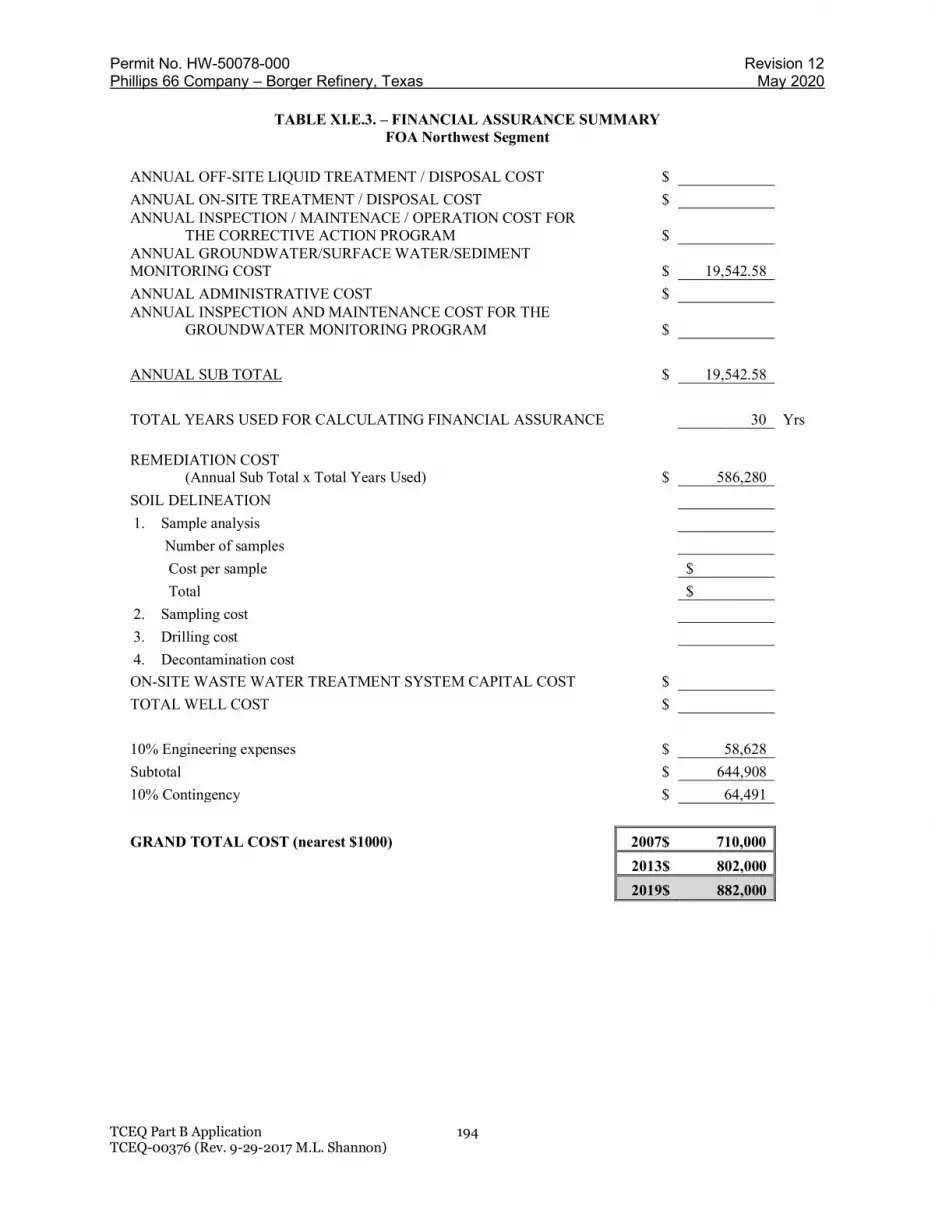
Permit No. HW-50078-000 Revision 12Phillips 66 Company – Borger Refinery, Texas May 2020
TCEQ Part B Application 194TCEQ-00376 (Rev. 9-29-2017 M.L. Shannon)
TABLE XI.E.3. – FINANCIAL ASSURANCE SUMMARYFOA Northwest Segment
ANNUAL OFF-SITE LIQUID TREATMENT / DISPOSAL COST $
ANNUAL ON-SITE TREATMENT / DISPOSAL COST $ANNUAL INSPECTION / MAINTENACE / OPERATION COST FOR
THE CORRECTIVE ACTION PROGRAM $ANNUAL GROUNDWATER/SURFACE WATER/SEDIMENTMONITORING COST $ 19,542.58
ANNUAL ADMINISTRATIVE COST $ANNUAL INSPECTION AND MAINTENANCE COST FOR THE
GROUNDWATER MONITORING PROGRAM $
ANNUAL SUB TOTAL $ 19,542.58
TOTAL YEARS USED FOR CALCULATING FINANCIAL ASSURANCE 30 Yrs
REMEDIATION COST(Annual Sub Total x Total Years Used) $ 586,280
SOIL DELINEATION
1. Sample analysis
Number of samples
Cost per sample $
Total $
2. Sampling cost
3. Drilling cost
4. Decontamination cost
ON-SITE WASTE WATER TREATMENT SYSTEM CAPITAL COST $
TOTAL WELL COST $
10% Engineering expenses $ 58,628
Subtotal $ 644,908
10% Contingency $ 64,491
GRAND TOTAL COST (nearest $1000) 2007$ 710,000
2013$ 802,000
2019$ 882,000

Permit No. HW-50078-000 Revision 12Phillips 66 Company – Borger Refinery, Texas May 2020
TCEQ Part B Application 195TCEQ-00376 (Rev. 9-29-2017 M.L. Shannon)
TABLE XI.E.1. – CORRECTIVE ACTION PROGRAM COST ESTIMATEFOA Northeast Segment
1. Pumping Capacity Per Year:
A. Daily average system pumping rate gal/day
B. Annual groundwater volume recovered gal/yr
2. Off-Site Liquid Treatment / Disposal Cost:
A. Volume of treated contaminated water to be disposed of off-site yearly gal/yr
B. Transportation of liquid waste disposed of off-site yearly
(1) Transportation cost per gallon $/gal
(2) Gallons of contaminated water shipped per year gal/yr
(3) Annual cost of transportation (1 x 2) $/yr
C. On-site yearly storage cost prior to off-site disposal $/yr
D. Off-site yearly treatment cost of liquid waste
(1) Treatment charge per gallon $/gal
(2) Total volume to be treated per year gal/yr
(3) Annual treatment cost (1 x 2) $/yr
E. Off-site disposal cost of liquid waste per year
(1) Disposal charge per gallon $/gal
(2) Total volume to be disposed per year gal/yr
(3) Annual disposal cost (1 x 2) $/yr*ANNUAL OFF-SITE LIQUID TREATMENT / DISPOSAL COST(2B3 + 2C +2D3 + 2E3) $
3. On-site Waste Water Treatment System Cost and On-site Treatment / Disposal Cost:Submit a cost estimate for a treatment system specifically designed and used exclusively forthe groundwater corrective action program and operational after some start up maintenance.Estimates to clean out the system should also be included in the following cost.
A. Initial capital expenditure for treatment system including start up maintenance $
*ON-SITE WASTE WATER TREATMENT SYSTEM CAPITAL COST (3A) $
B. Gallons of contaminated water to be treated on-site per year gal/yr
C. Cost of on-site treatment per gallon $/gal
D. Cost of sludge, or solids disposal per year $/yrE. Cost per year of maintenance on treatment system and recovery system, along
with any additional equipment and repairs needed for the systems $/yr
F. Cost of on-site disposal per year $/yr*ANNUAL ON-SITE TREATMENT / DISPOSAL COST [(3B X 3C) + 3D + 3E+ 3F] $
4. Inspections, Maintenance and Operation Cost for the Corrective Action Program:
A. Operator’s time on-site for inspections and maintenance per year hour/yr
B. Charge of salary per hour $/hr
C. Annual cost of labor (4A x 4B) $/yr
D. Replacement of parts and equipment per year $/yr
E. Electricity cost per year $/yr*ANNUAL INSPECTIONS / MAINTENANCE / OPERATION COST FORTHE CORRECTIVE ACTION PROGRAM (4C + 4D + 4E) $

Permit No. HW-50078-000 Revision 12Phillips 66 Company – Borger Refinery, Texas May 2020
TCEQ Part B Application 196TCEQ-00376 (Rev. 9-29-2017 M.L. Shannon)
TABLE XI.E.2. – GROUNDWATER MONITORING COST ESTIMATEFOA Northeast Segment
1. Annual Sampling and Analysis Cost:
A. Background Wells
(1) Number of wells
(2) Sample analysis cost per well $/well
(3) Number of sampling events per year /yr
(4) Sampling cost (1 x 2 x 3) $
B. Point of Compliance Wells
(1) Number of wells 4
(2) Sample analysis cost per well 713.75 $/well
(3) Number of sampling events per year 2 /yr
(4) Sampling cost (1 x 2 x 3) 5,710.00 $
C. Recovery Wells
(1) Number of wells
(2) Sample analysis cost per well $/well
(3) Number of sampling events per year /yr
(4) Sampling cost (1 x 2 x 3) $
D. Corrective Action Observation Wells
(1) Number of wells
(2) Sample analysis cost per well $/well
(3) Number of sampling events per year /yr
(4) Sampling cost (1 x 2 x 3) $
E. Point of Exposure Wells
(1) Number of wells
(2) Sample analysis cost per well $/well
(3) Number of sampling events per year /yr
(4) Sampling cost (1 x 2 x 3) $
F. Supplemental Wells
(1) Number of wells
(2) Sample analysis cost per well $/well
(3) Number of sampling events per year /yr
(4) Sampling cost (1 x 2 x 3) $
G. Field Quality Control Sampling
(1) Number of wells
(2) Sample analysis cost per well $/well
(3) Number of sampling events per year /yr
(4) Sampling cost (1 x 2 x 3) $
H. Sediment Sampling
(1) Number of samples 3
(2) Sample analysis cost per sample 899.26 $/sample
(3) Number of sampling events per year 2 /yr

Permit No. HW-50078-000 Revision 12Phillips 66 Company – Borger Refinery, Texas May 2020
TCEQ Part B Application 197TCEQ-00376 (Rev. 9-29-2017 M.L. Shannon)
(4) Sampling cost (1 x 2 x 3) 5,395.56 $
I. Surface Water Sampling
(1) Number of samples 3
(2) Sample analysis cost per sample 867.62 $/sample
(3) Number of sampling events per year 2 /yr
(4) Sampling cost (1 x 2 x 3) 5,205.70 $
2. Sampling Labor Cost:
A. Hours of sampling per well 4 hrs/well
B. Number of sampling technicians per well 2
C. Charge per hour 73.59 $/hr
D. Total number of wells to be sampled annually Wells
E. Total number of wells sampled semi-annually 4 Wells
F. Total number of wells sampled quarterly Wells
G. Total number of wells sampled monthly WellsH. Total number of wells sampled per year(2D) + (2E x 2) + (2F x 4) + (2G x 12) 8
total wellssampled/yr
I. Sampling Labor Cost (2A x 2B x 2C x 2H) 4,709.76 $*ANNUAL GROUNDWATER/SURFACEWATER/SEDIMENT MONITORING COST 21,021.02 $
3. Well Installation (typical cost):
A. Monitor well installation cost per well $/well
B. Number of monitor wells to be installed Wells
C. Cost of monitor well system (A x B) $
D. Recovery well installation cost per well $/well
E. Number of Recovery Wells to be installed Wells
F. Cost of Recovery well system (D x E) $
*TOTAL WELL INSTALLATION COST (3C + 3F) $
4. Administrative Cost:
A. Annual cost for record-keeping and report preparation $
*ANNUAL ADMINISTRATIVE COST (4A) $5. Inspection and Maintenance Cost for the MonitoringProgram:
A. Operator’s time (hours) on-site for inspections andmaintenance per year hour/yr
B. Charge or salary per hour $/hr
C. Annual cost of labor (4A x 4B) $/yr
D. Replacement of parts and equipment per year $/yr*ANNUAL INSPECTIONS / MAINTENANCE COSTFOR THE GROUNDWATER MONITORINGPROGRAM (5C + 5D) $

Permit No. HW-50078-000 Revision 12Phillips 66 Company – Borger Refinery, Texas May 2020
TCEQ Part B Application 198TCEQ-00376 (Rev. 9-29-2017 M.L. Shannon)
TABLE XI.E.3. – FINANCIAL ASSURANCE SUMMARYFOA Northeast Segment
OFF-SITE LIQUID TREATMENT / DISPOSAL COST $
ANNUAL ON-SITE TREATMENT / DISPOSAL COST $ANNUAL INSPECTION / MAINTENACE / OPERATION COST FOR THE
CORRECTIVE ACTION PROGRAM $ANNUAL GROUNDWATER/SURFACE WATER/SEDIMENT MONITORINGCOST $ 21,021
ANNUAL ADMINISTRATIVE COST $
ANNUAL INSPECTION AND MAINTENANCE COST FOR THEGROUNDWATER MONITORING PROGRAM $
Included inengineeringexpenses
ANNUAL SUB TOTAL $ 21,021
TOTAL YEARS USED FOR CALCULATING FINANCIAL ASSURANCE 30 Yrs
REMEDIATION COST(Annual Sub Total x Total Years Used) $ 630,630
SOIL DELINEATION
1. Sample analysis
Number of samples
Cost per sample $
Total $
2. Sampling cost
3. Drilling cost
4. Decontamination cost
ON-SITE WASTE WATER TREATMENT SYSTEM CAPITAL COST $
TOTAL WELL COST $
10% Engineering expenses $ 63,063
Subtotal $ 693,693
10% Contingency $ 69,369
GRAND TOTAL COST (nearest $1000) 2007 $ 763,000
2013 $ 862,000
2019 $ 948,000

Permit No. HW-50078-000 Revision 12Phillips 66 Company – Borger Refinery, Texas May 2020
TCEQ Part B Application 199TCEQ-00376 (Rev. 9-29-2017 M.L. Shannon)
TABLE XI.E.3. – FINANCIAL ASSURANCE SUMMARY
Grand Total
ANNUAL OFF-SITE LIQUID TREATMENT / DISPOSAL COST $
ANNUAL ON-SITE TREATMENT / DISPOSAL COST $ANNUAL INSPECTION / MAINTENACE / OPERATION COST FOR THE
CORRECTIVE ACTION PROGRAM $
ANNUAL GROUNDWATER MONITORING COST $ 93,734
ANNUAL ADMINISTRATIVE COST $ 50,000
ANNUAL INSPECTION AND MAINTENANCE COST FOR THEGROUNDWATER MONITORING PROGRAM $
Covered inengineeringcosts
ANNUAL SUB TOTAL $ 143,734
TOTAL YEARS USED FOR CALCULATING FINANCIAL ASSURANCE 30 Yrs
REMEDIATION COST(Annual Sub Total x Total Years Used) $ 4,312,020
ON-SITE WASTE WATER TREATMENT SYSTEM CAPITAL COST $
TOTAL WELL COST $
10% Engineering expenses $ 431,202
Subtotal $ 4,743,222
10% Contingency $ 474,322
Subtotal (Facilities Operation Area [FOA] Segments) (Adjusted for 2019 $) $ 6,481,000
Caustic Pits 1-4 $ 91,000
HP-7 South Cobles $ 8,034,000
Lead Pits North $ 3,392,000
Lead Pits South $ 3,400,000
NAPL Recovery $ 2,955,000
Litharge Impoundment $ 372,000
New Canyon Dam $ 202,000
New Caustic Pond $ 4,848,000
NGL Truck Loading Rack UST $ 53,000
Odens Dam $ 473,000
Old Canyon Dam $ 1,742,000
Old Caustic Pond $ 9,187,000
Pantex Reservoir $ 57,000
Phillips Camp Dump-WWTSLF $ 2,684,000
Philtex Drum Disposal Area $ 196,000
Pitch Pit 13 $ 1,510,000
Pitch Pit 15 $ 1,504,000

Permit No. HW-50078-000 Revision 12Phillips 66 Company – Borger Refinery, Texas May 2020
TCEQ Part B Application 200TCEQ-00376 (Rev. 9-29-2017 M.L. Shannon)
Pitch Pit 16 $ 1,835,000
Pitch Pit Annex $ 169,000
Pitch Pits 1-5 $ 2,216,000
Pitch Pits 8-10 $ 556,000
Rocky Station Lead Pits $ 2,127,000
Sandblast Yards $ 248,000
Sawtooth UST $ 959,000
Sludge Drying Pond –WWTSDS $ 1,453,000
Southeast Canyon $ 2,767,000
Taubman Yard $ 1,388,000
Transfer Box $ 44,000
ULSD $ 45,000
Area 2 (West FOA Segment) $ 636,000
Class 1 Landfill and New Evaporation Pond $ 327,000
Areas 1-5 O&M $ 5,832,000
TOTAL COST (excluding FOA Segments) (nearest $1000)(2019) $61,302,000
TOTAL COST (FOA Segments) (nearest $1000)
(2019) $6,481,000
TOTAL COST of Closure/O&M(2019) $67,783,000

Permit No. HW-50078-000 Revision 12Phillips 66 Company – Borger Refinery, Texas May 2020
TCEQ Part B Application 205TCEQ-00376 (Rev. 9-29-2017 M.L. Shannon)
CP Table II: Solid Waste Management Units and/or Areas of Concern for which Corrective Action appliespursuant to 30 TAC 335.167
UnitNumber1
Unit Name Notice ofRegistration
(NOR)Number, ifapplicable
SWMUor AOC
Media Affected2 Date Program Requirement andRemedy Standard Completed3
1 Surge Pond 037 SWMUProof of Deed Recordation Letter July27, 2000 a, RRS3
2 Off-Test Pond 039 SWMUProof of Deed Recordation Letter July27, 2000 a, RRS3
3 North Holding Pond 036 SWMU October 17, 2002 c
12 Class I/II Landfill 020 SWMUNo Further Action – November 17,2008 e
15 Pitch Pit Annex 023 SWMU August 1, 1984 f
16 West Sludge Drying Pond 018 SWMU November 15, 1994 g
17Rocky Station Tank Lead Pits – Tanks 5532 /8032
Z SWMU Soil / Groundwater
17South Refinery Tank Lead Pits – Tanks 5521,5554, 5555, 5556
Z SWMUNo Further Action – TCEQ Letter July24, 2001 b
22 Sunset Heights Class 1 Landfill 043 SWMUNo Further Action – TCEQ Letter July24, 2001 b
23 Asbestos Landfill 012 SWMUNo Further Action – TCEQ LetterApril 24, 2005 d
23 Landfill (Regional Asbestos Landfill) 034 SWMUNo Further Action – TCEQ LetterApril 24, 2005 d
27 Pitch Pit 15 054 SWMUNo Further Action – TCEQ July 24,2001 a
29 Area 2 (West FOA Segment North) AOCSediment /Groundwater /Surface Water

Permit No. HW-50078-000 Revision 12Phillips 66 Company – Borger Refinery, Texas May 2020
TCEQ Part B Application 206TCEQ-00376 (Rev. 9-29-2017 M.L. Shannon)
UnitNumber1
Unit Name Notice ofRegistration
(NOR)Number, ifapplicable
SWMUor AOC
Media Affected2 Date Program Requirement andRemedy Standard Completed3
29 Area 2 (West FOA Segment South) AOCSediment /Groundwater /Surface Water
34 AvGas Spill AOCSoil / Groundwater /Surface water
No Further Action (Groundwater)–TCEQ November 25, 2013 h
38 Philtex Canyon/Sawtooth (East FOA Segment) AOCGroundwater /Surface Water
Foot Notes:
SWMU ‘ Solid Waste Management UnitAOC ‘ Area of Concern
a Proof of Deed Recordation for Risk Reduction Standard No. 3 (RRS3) Off-Test Pond/Surge Pond. Letter from TNRCC to Phillips Petroleum dated July 27, 2000.b Response to TNRCC Request for Additional Information with Respect to Review of May 15, 2000 Phase II/III RCRA Facility Investigation Report, dated March
9, 2001 Letter from TNRCC to Phillips Petroleum dated July 24, 2001.c TCEQ Acknowledgment of Phillips 66 April 11, 2002 Response to TCEQ Letter dated April 11, 2002. North Holding Pond (RCRA Facility Investigation Unit K).
Letter from TCEQ to Phillips 66 dated October 17, 2002.d Approval of Closure – Request for Change in Status, dated May 16, 2005. Letter from TCEQ to Phillips 66 dated August 24, 2005.e RCRAInfo Comprehensive Corrective Action Report provided by TCEQ to Phillips 66, dated July 7, 2010f Notice of Registration, WRB Refining LLC (Owner), Phillips 66 Company (Operator), dated February 23, 2011g Response to RFI Phase II Report, December 1999. Response to TNRCC Comment I.B.3, Attachment 3. Closure Plan, Certification of Closure and Deed
Recordationh Approval of No Further Action for Groundwater with Comments and Request for Information, Response Action Completion Report dated October 25, 2013.
Letter from TCEQ to Phillips 66 dated November 25, 2013.i Potentially affected media based on current data
1 For sites with FOA Authorization, list SWMUs and/or AOCs that were not included in the FOA, and are subject to corrective action.2 Specify affected media groundwater, soils, etc.3 Specify the date of Commissions No Further Action approval letter for program requirement and remedy standard completed for all media of concern.

Permit No. HW-50078-000 Revision 12Phillips 66 Company – Borger Refinery, Texas May 2020
TCEQ Part B Application 207TCEQ-00376 (Rev. 9-29-2017 M.L. Shannon)
CP Table III: Corrective Action Program Table of Detected Hazardous and Solid Waste Constituents and theGroundwater Protection Standard
Unit Name COLUMN A: HazardousConstituents
COLUMN B
Groundwater Point ofExposure
(mg/l))
Industrial/Residential*
COLUMN C
Surface Water Point ofExposure
(mg/l)
1. Old Caustic Pond Fluoride (upper sand zone andlower gravel zone)
4.0E+00 GWGWIng /4.0E+00 GWGWIng
1.0E+01 SWSW
2,4-Dimethylphenol (lowergravel zone only)
1.5E+00 GWGWIng /
4.9E-01 GWGWIng
2-Methylphenol (o-Cresol,lower gravel zone only)
3.7E+00 GWGWIng /1.2E+00 GWGWIng
3-Methylphenol (m-Cresol,lower gravel zone only)
3.7E-01 GWGWIng /
1.2E-01 GWGWIng
4-Methylphenol (p-Cresol,lower gravel zone only)
3.7E-01 GWGWIng /
1.2E-01 GWGWIng
Sulfolane (upper sand zoneand lower gravel zone)
9.5E-01 GWGWIng /
3.2E-01 GWGWIng
2.5E+01 SWSW
GWGWIng – Protective Concentration Level, Commercial/Industrial Worker, April 27, 2018Table 3.Reference: Revised Response Action Plan, Old Caustic Pond Area, Submitted August 8, 2017; TCEQ Responses to Conditional Approval with Request for a Response
Action Plan Addendum, Old Caustic Pond, Received August 17, 2017; Addendum to Response Action Plan, Old Caustic Pond, Submitted March 2018;Revised Response Action Plan, Addendum 2, Old Caustic Pond, Submitted June 2019
* Off-site wells comply with residential PCLs.

Permit No. HW-50078-000 Revision 12Phillips 66 Company – Borger Refinery, Texas May 2020
TCEQ Part B Application 208TCEQ-00376 (Rev. 9-29-2017 M.L. Shannon)
Unit Name COLUMN A: HazardousConstituents
COLUMN B: FOABoundary of
Compliance (mg/l)
COLUMN C: FOAPoint of Exposure
(mg/l)
COLUMN D: FOAPoint of Exposure
(mg/kg)
2. FOA East Segment
3. FOA West Segment
4. FOA Northwest Segment
5. FOA Northeast Segment
Acetone (2-propanone) 1.0E+02 SWGW 1.0E+02 SWSW 1.5E+02 SEDSEDEco
Benzene 1.3E-01 SWGW 1.3E-01 SWSW 1.5E+00 SEDSEDEco
Benzyl alcohol 8.6E-03 SWGW 8.6E-03 SWSW NA
Bromomethane 1.1E-01 SWGW 1.1E-01 SWSW 2.7E-01 SEDSEDEco
Carbon disulfide 1.1E-01 SWGW 1.1E-01 SWSW 4.5E-01 SEDSEDEco
Chlorobenzene 6.4E-02 SWGW 6.4E-02 SWSW 1.9E+00 SEDSEDEco
Chloroform 1.8E+00 SWGW 1.8E+00 SWSW 3.8E+00 SEDSEDEco
Chloromethane 2.8E+01 SWGW 2.8E+01 SWSW 6.2E+01 SEDSEDEco
Dichlorobenzene, 1,4- 1.1E-01 SWGW 1.1E-01 SWSW 2.7E+00 SEDSEDEco
Dichloroethane, 1,1- 2.1E-01 SWGW 2.1E-01 SWSW 8.1E+00 SEDSEDEco
Dichloroethane, 1,2- 3.6E+00 SWGW 3.6E+00 SWSW 1.9E+01 SEDSEDEco
cis-1,2-Dichloroethene 1.4E+01 SWGW 1.4E+01 SWSW 4.8E+01 SEDSEDEco
Ethylbenzene 1.0E+00 SWGW 1.0E+00 SWSW 5.3E+00 SEDSEDEco
Ethyl ether 4.4E+03 SWGW 4.4E+03 SWSW NA
2-Butanone 4.2E+01 SWGW 4.2E+01 SWSW 9.0E+01 SEDSEDEco
Iodomethane 3.4E+01 SWGW 3.4E+01 SWSW NA
Methylene chloride 2.2E+01 SWGW 2.2E+01 SWSW 3.1E+01 SEDSEDEco
MTBE (methyl tert-butylether)
5.1E+01 SWGW 5.1E+01 SWSW 1.3E+02 SEDSEDEco
Styrene 1.3E+00 SWGW 1.3E+00 SWSW 3.6E+01 SEDSEDEco

Permit No. HW-50078-000 Revision 12Phillips 66 Company – Borger Refinery, Texas May 2020
TCEQ Part B Application 209TCEQ-00376 (Rev. 9-29-2017 M.L. Shannon)
Unit Name COLUMN A: HazardousConstituents
COLUMN B: FOABoundary of
Compliance (mg/l)
COLUMN C: FOAPoint of Exposure
(mg/l)
COLUMN D: FOAPoint of Exposure
(mg/kg)
Tetrachloroethene 1.3E+00 SWGW 1.3E+00 SWSW 5.5E+00 SEDSEDEco
Toluene 3.4E+00 SWGW 3.4E+00 SWSW 1.4E+01 SEDSEDEco
Trichloroethene 7.2E-01 SWGW 7.2E-01 SWSW 9.1E+00 SEDSEDEco
Trimethylbenzene, 1,2,4- 7.7E-02 SWGW 7.7E-02 SWSW 2.7E+00 SEDSEDEco
Trimethylbenzene, 1,3,5- 7.1E-02 SWGW 7.1E-02 SWSW 2.7E+00 SEDSEDEco
Vinyl chloride 1.6E-01 SWGW 1.6E-01 SWSW 6.9E+00 SEDSEDEco
Xylenes (total) 1.3E+00 SWGW 1.3E+00 SWSW 8.0E+00 SEDSEDEco
Acenaphthene 2.3E-02 SWGW * 2.3E-02 SWSW * Evaluate as TotalPAHs
Acenaphthylene 1.9E+01 SWGW * 1.9E+01 SWSW * Evaluate as TotalPAHs
Acetophenone 1.5E+04 SWGW 1.5E+04 SWSW NA
Anthracene 3.0E-04 SWGW * 3.0E-04 SWSW * Evaluate as TotalPAHs
Benzenethiol 2.1E-02 SWGW 2.1E-02 SWSW 1.6E-01 SEDSEDEco
Benzo(a)anthracene 2.5E-04 SWGW * 2.5E-04 SWSW * Evaluate as TotalPAHs
Benzo(a)pyrene 1.0E-04 MQL * 1.0E-04 MQL * Evaluate as TotalPAHs
Benzo(b)fluoranthene 1.8E-03 SWGW * 1.8E-03 SWSW * Evaluate as TotalPAHs
Benzo(g,h,i)perylene 8.4E-02 SWGW * 8.4E-02 SWSW * Evaluate as TotalPAHs
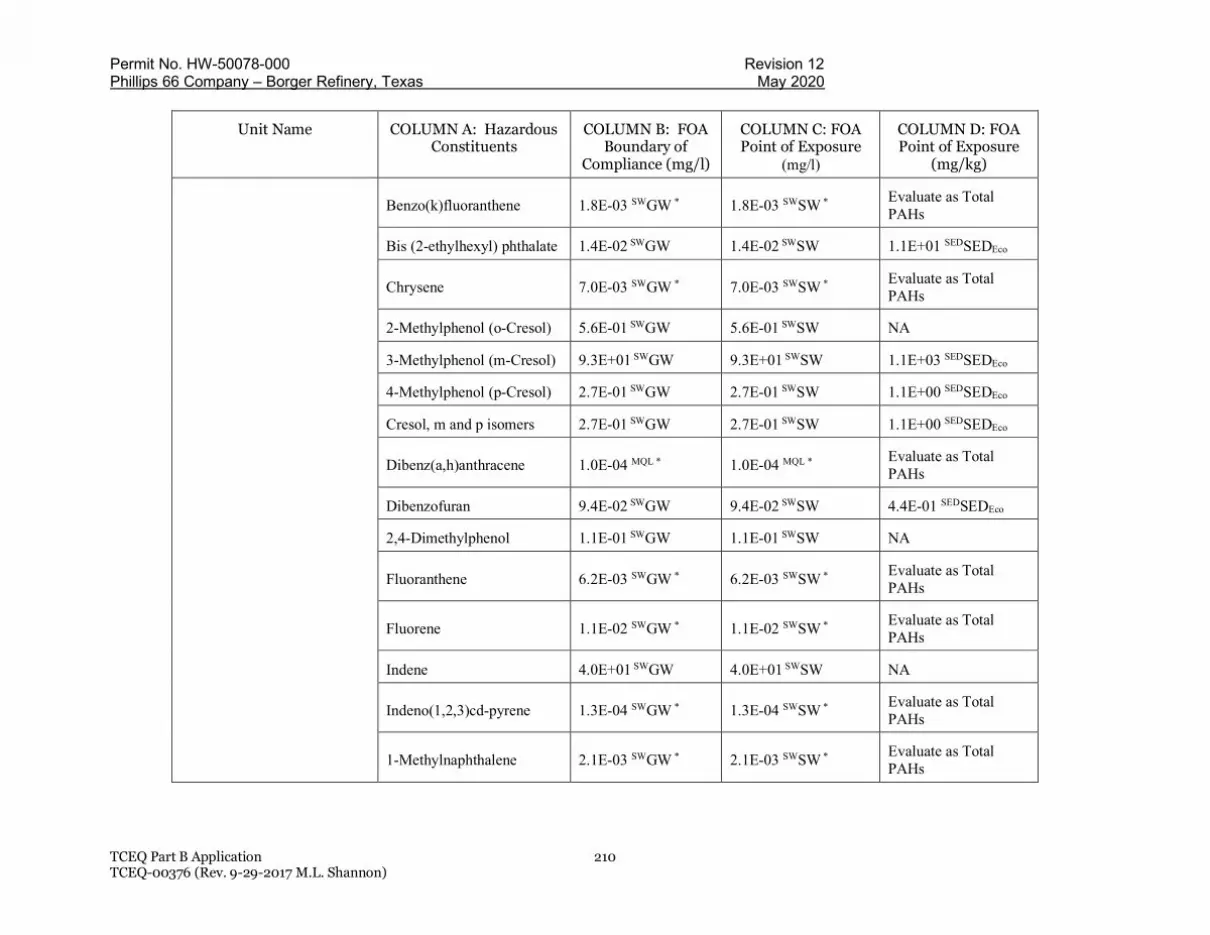
Permit No. HW-50078-000 Revision 12Phillips 66 Company – Borger Refinery, Texas May 2020
TCEQ Part B Application 210TCEQ-00376 (Rev. 9-29-2017 M.L. Shannon)
Unit Name COLUMN A: HazardousConstituents
COLUMN B: FOABoundary of
Compliance (mg/l)
COLUMN C: FOAPoint of Exposure
(mg/l)
COLUMN D: FOAPoint of Exposure
(mg/kg)
Benzo(k)fluoranthene 1.8E-03 SWGW * 1.8E-03 SWSW * Evaluate as TotalPAHs
Bis (2-ethylhexyl) phthalate 1.4E-02 SWGW 1.4E-02 SWSW 1.1E+01 SEDSEDEco
Chrysene 7.0E-03 SWGW * 7.0E-03 SWSW * Evaluate as TotalPAHs
2-Methylphenol (o-Cresol) 5.6E-01 SWGW 5.6E-01 SWSW NA
3-Methylphenol (m-Cresol) 9.3E+01 SWGW 9.3E+01 SWSW 1.1E+03 SEDSEDEco
4-Methylphenol (p-Cresol) 2.7E-01 SWGW 2.7E-01 SWSW 1.1E+00 SEDSEDEco
Cresol, m and p isomers 2.7E-01 SWGW 2.7E-01 SWSW 1.1E+00 SEDSEDEco
Dibenz(a,h)anthracene 1.0E-04 MQL * 1.0E-04 MQL * Evaluate as TotalPAHs
Dibenzofuran 9.4E-02 SWGW 9.4E-02 SWSW 4.4E-01 SEDSEDEco
2,4-Dimethylphenol 1.1E-01 SWGW 1.1E-01 SWSW NA
Fluoranthene 6.2E-03 SWGW * 6.2E-03 SWSW * Evaluate as TotalPAHs
Fluorene 1.1E-02 SWGW * 1.1E-02 SWSW * Evaluate as TotalPAHs
Indene 4.0E+01 SWGW 4.0E+01 SWSW NA
Indeno(1,2,3)cd-pyrene 1.3E-04 SWGW * 1.3E-04 SWSW * Evaluate as TotalPAHs
1-Methylnaphthalene 2.1E-03 SWGW * 2.1E-03 SWSW * Evaluate as TotalPAHs

Permit No. HW-50078-000 Revision 12Phillips 66 Company – Borger Refinery, Texas May 2020
TCEQ Part B Application 211TCEQ-00376 (Rev. 9-29-2017 M.L. Shannon)
Unit Name COLUMN A: HazardousConstituents
COLUMN B: FOABoundary of
Compliance (mg/l)
COLUMN C: FOAPoint of Exposure
(mg/l)
COLUMN D: FOAPoint of Exposure
(mg/kg)
2-Methylnaphthalene 6.3E-02 SWGW * 6.3E-02 SWSW * Evaluate as TotalPAHs
Naphthalene 2.5E-01 SWGW * 2.5E-01 SWSW * Evaluate as TotalPAHs
Phenanthrene 3.0E-02 SWGW * 3.0E-02 SWSW * Evaluate as TotalPAHs
Phenol 1.1E-01 SWGW 1.1E-01 SWSW NA
Pyrene 7.0E-03 SWGW * 7.0E-03 SWSW * Evaluate as TotalPAHs
Total PAHs 6.8E-02 SWGW *** 6.8E-02 SWSW *** 1.2E+01 SEDSEDEco
Antimony 2.2E+00 SWGW 2.2E+00 SWSW 6.2E+00 SEDSEDEco
Arsenic 1.0E-01 SWGW D 1.0E-01 SWSW D 2.1E+01 SEDSEDEco
Barium 2.6E+00 SWGW 2.6E+00 SWSW 3.4E+02 BKG ****
Beryllium 5.3E-03 SWGW 5.3E-03 SWSW 2.6E+02 SEDSEDEco
Cadmium 1.0E-03 MQL D** 1.0E-03 MQL D** 3.0E+00 SEDSEDEco
Chromium 3.2E-01 SWGW D** 3.2E-01 SWSW D** 7.7E+01 SEDSEDEco
Cobalt 1.5E+00 SWGW 1.5E+00 SWSW 5.0E+01 SEDSEDEco
Lead 1.6E-02 SWGW D** 1.6E-02 SWSW D** 8.2E+01 SEDSEDEco
Mercury 2.0E-04 MQL 2.0E-04 MQL 6.2E-01 SEDSEDEco
Nickel and compounds 2.3E-01 SWGW D** 2.3E-01 SWSW D** 3.6E+01 SEDSEDEco
Selenium 5.0E-03 SWGW 5.0E-03 SWSW 1.7E+00 BKG ****
Vanadium 2.0E-02 SWGW 2.0E-02 SWSW 2.2E+01 BKG ****

Permit No. HW-50078-000 Revision 12Phillips 66 Company – Borger Refinery, Texas May 2020
TCEQ Part B Application 212TCEQ-00376 (Rev. 9-29-2017 M.L. Shannon)
Notes:BKG Background as determined in accordance with 30 TAC 350.51(l).D – DissolvedNA – Not applicable* - For information only; PAHs will be evaluated as Total PAHs
Boundary of Compliance and Point of Exposure (Aqueous) lower of Incidental Fishery (TCEQ, 2018), Surface Water Benchmark (TCEQ, 2017), or Wildlife PCL(COP, 2007)Point of Exposure (Sediment) lower of Sediment Benchmark (TCEQ, 2017) or Wildlife PCL (COP, 2007)
MCL – Maximum Contaminant LevelMQL – Method Quantitation LimitSWGW, SWSW, and SEDSED PCLs obtained from Step 3 FOA Pre-Qualification Monitoring and Corrective Action Report Table 3.4-1 (August 2007) except asmodified below:
** - Conditional Approval of Phillips 66’ Request for Revision of Cadmium, Chromium, Lead, and Nickel Protective Concentration Levels in Surface Water, datedMarch 7, 2011, Letter from TCEQ dated May 17, 2011
*** - Approval of Request for Revision of Total Polycyclic Aromatic Hydrocarbon Protective Concentration Level in Surface Water and Groundwater, datedOctober 27, 2010, Letter from TCEQ dated January 24, 2011.
**** - Approval of Response to TCEQ Comments on Request for Revision of Barium, Selenium, and Vanadium Protective Concentration Levels in Sediment,Letter from TCEQ to Phillips 66 dated May 17, 2011
References: Step 3 FOA Pre-Qualification Monitoring and Corrective Action Program Report, dated July 21, 2006 and modified by Addendums dated August2, 2006, February 8, 2007, August 3, 2007, and December 1, 2007.Response to October 9, 2007 TCEQ Letter Containing TCEQ Comments to Phillips 66 Response dated August 3, 2007 to TCEQ CommentsLetter dated June 4, 2007 and to Additional TCEQ Comment Letter, dated June 25, 2007, dated December 1, 2007Conditional Approval of Phillips 66’ Response to October 9, 2007 TCEQ Letter Containing TCEQ Comments to Phillips 66 Response datedAugust 3, 2007 to TCEQ Comments Letter dated June 4, 2007 and to Additional TCEQ Comment Letter, dated June 25, 2007, dated December1, 2007, Letter from TCEQ, February 15, 2008.Texas Commission on Environmental Quality (TCEQ). 2017. Ecological Benchmarks. RG263B. January 31, 2017.Texas Commission on Environmental Quality (TCEQ). 2018. Human Health Risk Bisk Exposure Limit. March 1, 2018

Permit No. HW-50078-000 Revision 12Phillips 66 Company – Borger Refinery, Texas May 2020
TCEQ Part B Application 213TCEQ-00376 (Rev. 9-29-2017 M.L. Shannon)
Unit Name COLUMN A: HazardousConstituents
COLUMN B
Groundwater Point ofExposure
(mg/l)
COLUMN C
Surface Water Point ofExposure
(mg/l)
COLUMN D
Surface Water Pointof Exposure
(mg/l)
COLUMN E
Sediment Point ofExposure
(mg/kg)
6. SoutheastCanyon
Benzene 5.0E-03 GWGWIng 1.3E-01 SWGW 1.3E-01 SWSW NA
GWGWIng PCL – Protective Concentration Level, Commercial/Industrial Worker, April 27, 2018 Table 3.S – Retained due to soil exceedance; no groundwater exceedance
Reference: Response Action Plan (RAP) for Southeast Canyon Site, dated February 16, 2007; Approval of Response Action Plan, dated February 16, 2007Southeast Canyon Site. Letter from Eleanor Wehner dated April 20, 2007; Revised Response Action Plan, Southeast Canyon, Submitted December18, 2018.
Texas Commission on Environmental Quality (TCEQ). 2017. Ecological Benchmarks. RG263B. January 31, 2017.

Permit No. HW-50078-000 Revision 12Phillips 66 Company – Borger Refinery, Texas May 2020
TCEQ Part B Application 214TCEQ-00376 (Rev. 9-29-2017 M.L. Shannon)
Unit Name COLUMN A: HazardousConstituents
COLUMN B
Groundwater Point ofExposure
(mg/l)
COLUMN C
Surface Water Point ofExposure
(mg/l)
COLUMN D
Sediment Point ofExposure
(mg/kg)
7. HP-7/SouthCobles
Benzene 1.3E-01 SWGW 1.3E-01 SWSW 2.2E+01 SEDSEDEco
Ethylbenzene 1.1E+00 SWGW 1.1E+00 SWSW 1.0E+01 SEDSEDEco
Toluene 1.5E+00 SWGW 1.5E+00 SWSW 1.0E+01 SEDSEDEco
Xylenes (total) 1.3E+00 SWGW 1.3E+00 SWSW 8.0E+00 SEDSEDEco
Total PetroleumHydrocarbons
4.4E+00 SWGWNA NA
Reference: Response Action Plan for HP-7/South Cobles dated September 2010; Conditional Approval of HP-7/South Cobles Site CorrectiveMeasures Implementation Work plan / Response Action Plan, dated September 15, 2010, letter dated December 22, 2010 from EleanorWehner; Revised Response Action Plan, HP-7 / South Cobles, Submitted April 30, 2015; Addendum to the 2015 Revised ResponseAction Plan, HP-7/South Cobles Site, February 1, 2016.
Texas Commission on Environmental Quality (TCEQ). 2017. Ecological Benchmarks. RG263B. January 31, 2017.

Permit No. HW-50078-000 Revision 12Phillips 66 Company – Borger Refinery, Texas May 2020
TCEQ Part B Application 215TCEQ-00376 (Rev. 9-29-2017 M.L. Shannon)
Unit Name COLUMN A: HazardousConstituents
COLUMN B
Point of Exposure
(mg/l)
COLUMN C
Point of Exposure(mg/l)
8. LithargeImpoundment
Arsenic 1.0E-02 GWGWIng 1.0E+00 GWGWClass3
Benzene 5.0E-03 GWGWIng 5.0E-01 GWGWClass3
Notes:MCL – Maximum Contaminant LevelGWGWIng – Protective Concentration Level, Commercial/Industrial Worker, April 27, 2018, Table 3
Reference: Revised Response Action Plan, Litharge Impoundment, Submitted April 4, 2015; Response Action Completion Report, LithargeImpoundment, Submitted July 20, 2018

Permit No. HW-50078-000 Revision 12Phillips 66 Company – Borger Refinery, Texas May 2020
TCEQ Part B Application 216TCEQ-00376 (Rev. 9-29-2017 M.L. Shannon)
Unit Name COLUMN A: HazardousConstituents
COLUMN B
Point of Exposure
(mg/l)
9. New Caustic Pond Arsenic 1.0E-02 GWGWIng
Vanadium 1.3E-01 GWGWIng
Fluoride 4.0E+00 GWGWIng
2,4-Dimethylphenol 1.5E+00 GWGWIng
2-Methylphenol 3.7E+00 GWGWIng
3&4-Methylphenol 3.7E-01 GWGWIng
Phenol 2.2E+01 GWGWIng
Sulfolane 9.5E-01 GWGWIng
GWGWIng – Protective Concentration Level, Commercial/Industrial Worker, April 27, 2018, Table 3
Reference: Response Action Plan, New Caustic Pond, Submitted December 4, 2017; Revised Response Action Plan, New Caustic Pond,Submitted June 6, 2018
[Note: This Table should present the long list of hazardous constituents that are reasonably expected to be in or derived from waste placed in the units, and maynot necessarily be detected and that are to be monitored semi-annually. Also, instead of listing individual constituents of concern (COCs), Appendix IX can bereferenced in this table. If Appendix IX list and associated Practical Quantitation Limit (PQL) or Method Quantitation Limit (MQLs) are being required insteadof listing individual COCs, add this sentence: The Permittee may petition the Executive Director for deletion of specific parameters from Appendix IX analysis ifthe Permittee can demonstrate that the constituents were never used in the facility’s operation or were never disposed in the waste management area.]
[*Add COLUMN C if there is a GWPS assigned at a Point of Exposure (POE) (e.g. monitored natural attenuation and Plume Management Zone established inaccordance with 30 TAC 350, if applicable). Modify Table and footnotes as necessary.]
Foot Note:Use the following GWPS footnote designations if Risk Reduction Rules (RRR) or Texas Risk Reduction Program (TRRP) apply:* For RRR use the following GWPS designation:*

Permit No. HW-50078-000 Revision 12Phillips 66 Company – Borger Refinery, Texas May 2020
TCEQ Part B Application 217TCEQ-00376 (Rev. 9-29-2017 M.L. Shannon)
MSC ACL pursuant to 30 TAC §335.160(b) based upon the Groundwater Medium-Specific Concentration, Residential {...or Industrial...) Risk ReductionStandard No. 2 {...or No. 3}specified in 30 TAC §335 Subchapter S.
MCL ACL pursuant to 30 TAC §335.160(b) based upon the Groundwater Maximum Contaminant Level specified in 40 CFR Part 141, National PrimaryDrinking Water Regulations Subparts B and G.
SMCL ALC pursuant to 30 TAC §335.160(b) based upon the Groundwater Secondary Maximum Contaminant Level (MCL) specified in 40 CFR Part 143,National Secondary Drinking Water Regulations.
AL ACL pursuant to 30 TAC §335.160(b) based upon the Action Level specified in 40 CFR Part 141, National Primary Drinking Water Regulations Subpart I.BKG Background as determined in accordance with 30 TAC 350.4(a)(6).ND Non-detectable at PQL as determined by the analytical methods of the EPA SW-846 most recent edition, and as listed in the July 8, 1987 edition of the
Federal Register and later editions. PQL is indicated in parentheses. PQL is the lowest concentrations of analytes in groundwaters that can be reliablydetermined within specified limits of precision and accuracy by the indicated methods under routine laboratory operating condition.
* or Use the following GWPS designation if TRRP applies:*GWGWIng ACL pursuant to 30 TAC §335.160(b) based upon the PCL determined under RSA or RSB (Residential or Commercial /Industrial) for Class 1 or
Class 2 Groundwater ingestion PCL of 30 TAC Chapter 350. The PCL value, Column B, will change as updates to the rule are promulgated.Changes to the rule automatically change the concentration value established in Column B in this table.. In accordance with §350.72(b),GWGWIng, PCLs may need to be adjusted to lower concentrations to meet the cumulative carcinogenic risk level (less than or equal to 1x10⁻⁴)and hazard index criteria (less than or equal to 10) when there are more than 10 carcinogenic and/or more than 10 non-carcinogenic chemicals ofconcern within a source medium.
GWGWClass3 ACL pursuant to 30 TAC §335.160(b) based upon the PCL determined under RSA or RSB (Residential or Commercial /Industrial), Tier I forClass 3 Groundwater ingestion PCL of 30 TAC Chapter 350. The PCL value, Column B, will change as updates to the rule are promulgated.Changes to the rule automatically change the concentration value established in Column B in this table.
AirGWInh-V ACL pursuant to 30 TAC §335.160(b) based upon the PCL determined under RSA or RSB (Residential or Commercial /Industrial) for Class 1 orClass 2 Groundwater inhalation PCL of 30 TAC Chapter 350. The PCL value, Column B, will change as updates to the rule are promulgated.Changes to the rule automatically change the concentration value established in Column B in this table.
SWGW ACL pursuant to 30 TAC §335.160(b) based upon the Protective PCL determined under RSA or RSB for Groundwater- to-surface water PCL of 30 TACChapter 350. The PCL value, Column B, will change as updates to the rule are promulgated. Changes to the rule automatically change the concentrationvalue established in Column B in this table.
SEDGW ACL pursuant to 30 TAC §335.160(b) based upon the PCL determined under RSA or RSB for Groundwater- to-sediment PCL of 30 TAC Chapter 350. ThePCL value, Column B, will change as updates to the rule are promulgated. Changes to the rule automatically change the concentration value established inColumn B in this table.
ECOGW ACL pursuant to 30 TAC §335.160(b) based upon the PCL determined under RSA or RSB for Groundwater- based on ecological receptor(s) PCL of 30 TACChapter 350. The PCL value, Column B, will change as updates to the rule are promulgated. Changes to the rule automatically change the concentrationvalue established in Column B in this table.
AAL ACL derived pursuant to 30 TAC §335.160(b) based upon the Protective Concentration level (PCL) established as an Attenuation Action Level as definedin 30 TAC §350(a)(4).
BKG Background as determined in accordance with 30 TAC 350.4(a)(6).ND Non-detectable at MQL as determined by the analytical methods of the EPA SW-846 most recent edition, and as listed in the July 8, 1987 edition of the
Federal Register and later editions. MQL is indicated in parentheses. MQL is defined in 30 TAC §350.4 (54) as the lowest non-zero concentrationstandard in the laboratory’s initial calibration curve and is based on the final volume of extract (or sample) used by the laboratory.

Permit No. HW-50078-000 Revision 12Phillips 66 Company – Borger Refinery, Texas May 2020
TCEQ Part B Application 218TCEQ-00376 (Rev. 9-29-2017 M.L. Shannon)
CP Table IIIA: Corrective Action Program Table of Indicator Parameters and Groundwater Protection Standard
Unit Name COLUMN A: HazardousConstituents
COLUMN B
Groundwater Point of Exposure
(mg/l))
Industrial/Residential*
COLUMN C
Surface Water Point of Exposure
(mg/l)
1. Old Caustic Pond Fluoride (upper sand zone andlower gravel zone)
4.0E+00 GWGWIng /
4.0E+00 GWGWIng
1.0E+01 SWSW
2,4-Dimethylphenol (lower gravelzone only)
1.5E+00 GWGWIng /
4.9E-01 GWGWIng
2-Methylphenol (o-Cresol, lowergravel zone only)
3.7E+00 GWGWIng /
1.2E+00 GWGWIng
3-Methylphenol (m-Cresol, lowergravel zone only)
3.7E-01 GWGWIng /
1.2E-01 GWGWIng
4-Methylphenol (p-Cresol, lowergravel zone only)
3.7E-01 GWGWIng /
1.2E-01 GWGWIng
Sulfolane (upper sand zone andlower gravel zone)
9.5E-01 GWGWIng /
3.2E-01 GWGWIng
2.5E+01 SWSW
GWGWIng – Protective Concentration Level, Commercial/Industrial Worker, April 27, 2018 Table 3.Reference: Revised Response Action Plan, Old Caustic Pond Area, Submitted August 8, 2017; TCEQ Responses to Conditional Approval with Request for a Response
Action Plan Addendum, Old Caustic Pond, Received August 17, 2017; Addendum to Response Action Plan, Old Caustic Pond, Submitted March 2018;Revised Response Action Plan, Addendum 2, Old Caustic Pond, Submitted June 2019
* Off-site wells comply with residential PCLs.

Permit No. HW-50078-000 Revision 12Phillips 66 Company – Borger Refinery, Texas May 2020
TCEQ Part B Application 219TCEQ-00376 (Rev. 9-29-2017 M.L. Shannon)
Unit Name COLUMN A: HazardousConstituents
COLUMN B: FOABoundary of
Compliance (mg/l)
COLUMN C: FOAPoint of Exposure
(mg/l)
COLUMN D: FOAPoint of Exposure
(mg/kg)
2. FOA East Segment
3. FOA West Segment
4. FOA Northwest Segment
5. FOA Northeast Segment
Benzene 1.3E-01 SWGW 1.3E-01 SWSW 1.5E+00 SEDSEDeco
Ethylbenzene 1.0E+00 SWGW 1.0E+00 SWSW 5.3E+00 SEDSEDeco
Toluene 3.4E+00 SWGW 3.4E+00 SWSW 1.4E+01 SEDSEDeco
Acenaphthene 2.3E-02 SWGW * 2.3E-02 SWSW * Evaluate as TotalPAHs
Acenaphthylene 1.9E+01 SWGW * 1.9E+01 SWSW * Evaluate as TotalPAHs
Anthracene 3.0E-04 SWGW * 3.0E-04 SWSW * Evaluate as TotalPAHs
Fluorene 1.1E-02 SWGW * 1.1E-02 SWSW * Evaluate as TotalPAHs
1-Methylnaphthalene 2.1E-03 SWGW * 2.1E-03 SWSW * Evaluate as TotalPAHs
2-Methylnaphthalene 6.3E-02 SWGW * 6.3E-02 SWSW * Evaluate as TotalPAHs
Naphthalene 2.5E-01 SWGW * 2.5E-01 SWSW * Evaluate as TotalPAHs
Phenanthrene 3.0E-02 SWGW * 3.0E-02 SWSW * Evaluate as TotalPAHs
Total PAHs 6.8E-02 SWGW *** 6.8E-02 SWSW *** 1.2E+01 SEDSEDeco
Chromium 3.2E-01 SWGW / D** 3.2E-01 SWSW / D** 7.7E+01 SEDSEDeco
Lead 1.6E-02 SWGW / D** 1.6E-02 SWSW / D** 8.2E+01 SEDSEDeco

Permit No. HW-50078-000 Revision 12Phillips 66 Company – Borger Refinery, Texas May 2020
TCEQ Part B Application 220TCEQ-00376 (Rev. 9-29-2017 M.L. Shannon)
Unit Name COLUMN A: HazardousConstituents
COLUMN B: FOABoundary of
Compliance (mg/l)
COLUMN C: FOAPoint of Exposure
(mg/l)
COLUMN D: FOAPoint of Exposure
(mg/kg)
Selenium 5.0E-03 SWGW 5.0E-03 SWSW 1.7E+00 BKG****
* - For information only; PAHs will be evaluated as Total PAHsBoundary of Compliance and Point of Exposure (Aqueous) lower of Incidental Fishery (TCEQ, 2018), Surface Water Benchmark (TCEQ, 2017), or Wildlife PCL(COP, 2007)Point of Exposure (Sediment) lower of Sediment Benchmark (TCEQ, 2017) or Wildlife PCL (COP, 2007)
MCL – Maximum Contaminant LevelMQL – Method Quantitation LimitSWGW, SWSW, and SEDSED PCLs obtained from Step 3 FOA Pre-Qualification Monitoring and Corrective Action Report Table 3.4-1 (August 2007) except asmodified below:** - Conditional Approval of Phillips 66’ Request for Revision of Cadmium, Chromium, Lead, and Nickel Protective Concentration Levels in Surface Water, dated
March 7, 2011, Letter from TCEQ dated May 17, 2011*** - Approval of Request for Revision of Total Polycyclic Aromatic Hydrocarbon Protective Concentration Level in Surface Water and Groundwater, dated
October 27, 2010, Letter from TCEQ dated January 24, 2011.**** - Approval of Response to TCEQ Comments on Request for Revision of Barium, Selenium, and Vanadium Protective Concentration Levels in Sediment,
Letter from TCEQ to Phillips 66 dated May 17, 2011References: Step 3 FOA Pre-Qualification Monitoring and Corrective Action Program Report, dated July 21, 2006 and modified by Addendums dated August
2, 2006, February 8, 2007, August 3, 2007, and December 1, 2007.Response to October 9, 2007 TCEQ Letter Containing TCEQ Comments to Phillips 66 Response dated August 3, 2007 to TCEQ CommentsLetter dated June 4, 2007 and to Additional TCEQ Comment Letter, dated June 25, 2007, dated December 1, 2007Conditional Approval of Phillips 66’ Response to October 9, 2007 TCEQ Letter Containing TCEQ Comments to Phillips 66 Response datedAugust 3, 2007 to TCEQ Comments Letter dated June 4, 2007 and to Additional TCEQ Comment Letter, dated June 25, 2007, dated December1, 2007, Letter from TCEQ, February 15, 2008.Texas Commission on Environmental Quality (TCEQ). 2017. Ecological Benchmarks. RG263B. January 31, 2017.Texas Commission on Environmental Quality (TCEQ). 2018. Human Health Risk Bisk Exposure Limit. March 1, 2018

Permit No. HW-50078-000 Revision 12Phillips 66 Company – Borger Refinery, Texas May 2020
TCEQ Part B Application 221TCEQ-00376 (Rev. 9-29-2017 M.L. Shannon)
Unit Name COLUMN A: HazardousConstituents
COLUMN B
Groundwater Point ofExposure
(mg/l)
COLUMN C
Surface Water Pointof Exposure
(mg/l)
COLUMN D
Surface Water Pointof Exposure
(mg/l)
COLUMN E
Sediment Point ofExposure
(mg/kg)
6. SoutheastCanyon
Benzene 5.0E-03 GWGWIng 1.3E-01 SWGW 1.3E-01 SWSW NA
GWGWIng PCL – Protective Concentration Level, Commercial/Industrial Worker, April 27, 2018Table 3.S – Retained due to soil exceedance; no groundwater exceedance** - TotSEDComb PCL – Protective Concentration Level, March 31, 2006.
Reference: Response Action Plan (RAP) for Southeast Canyon Site, dated February 16, 2007; Approval of Response Action Plan, dated February 16, 2007Southeast Canyon Site. Letter from Eleanor Wehner dated April 20, 2007; Revised Response Action Plan, Southeast Canyon, Submitted December18, 2018.
Texas Commission on Environmental Quality (TCEQ). 2017. Ecological Benchmarks. RG263B. January 31, 2017.

Permit No. HW-50078-000 Revision 12Phillips 66 Company – Borger Refinery, Texas May 2020
TCEQ Part B Application 222TCEQ-00376 (Rev. 9-29-2017 M.L. Shannon)
Unit Name COLUMN A: HazardousConstituents
COLUMN B
Groundwater Point ofExposure
(mg/l)
COLUMN C
Surface Water Pointof Exposure
(mg/l)
COLUMN D
Sediment Point ofExposure
(mg/kg)
7. HP-7/SouthCobles
Benzene 1.3E-01 SWGW 1.3E-01 SWSW 2.2E+01 SEDSEDEco
Ethylbenzene 1.1E+00 SWGW 1.1E+00 SWSW 1.0E+01 SEDSEDEco
Toluene 1.5E+00 SWGW 1.5E+00 SWSW 1.0E+01 SEDSEDEco
Xylenes (total) 1.3E+00 SWGW 1.3E+00 SWSW 8.0E+00 SEDSEDEco
Total PetroleumHydrocarbons
4.4E+00 SWGWNA NA
Reference: Response Action Plan for HP-7/South Cobles dated September 2010; Conditional Approval of HP-7/South Cobles Site CorrectiveMeasures Implementation Work plan / Response Action Plan, dated September 15, 2010, letter dated December 22, 2010 from EleanorWehner; Revised Response Action Plan, HP-7 / South Cobles, Submitted April 30, 2015; Addendum to the 2015 Revised ResponseAction Plan, HP-7/South Cobles Site, February 1, 2016.
Texas Commission on Environmental Quality (TCEQ). 2017. Ecological Benchmarks. RG263B. January 31, 2017.

Permit No. HW-50078-000 Revision 12Phillips 66 Company – Borger Refinery, Texas May 2020
TCEQ Part B Application 223TCEQ-00376 (Rev. 9-29-2017 M.L. Shannon)
Unit Name COLUMN A: HazardousConstituents
COLUMN BPoint of Exposure
(mg/l)
COLUMN CPoint of Exposure
(mg/l)
8. LithargeImpoundment
Arsenic 1.0E-02 GWGWIng 1.0E+00 GWGWClass3
Benzene 5.0E-03 GWGWIng 5.0E-01 GWGWClass3
Notes:MCL – Maximum Contaminant LevelGWGWIng – Protective Concentration Level, Commercial/Industrial Worker, April 27, 2018, Table 3
Reference: Revised Response Action Plan, Litharge Impoundment, Submitted April 4, 2015; Response Action Completion Report, LithargeImpoundment, Submitted July 20, 2018

Permit No. HW-50078-000 Revision 12Phillips 66 Company – Borger Refinery, Texas May 2020
TCEQ Part B Application 224TCEQ-00376 (Rev. 9-29-2017 M.L. Shannon)
Unit NameCOLUMN A: HazardousConstituents
COLUMN BPoint of Exposure
(mg/l)
9. New Caustic Pond Arsenic 1.0E-02 GWGWIng
Vanadium 1.3E-01 GWGWIng
Fluoride 4.0E+00 GWGWIng
2,4-Dimethylphenol 1.5E+00 GWGWIng
2-Methylphenol (o-Cresol) 3.7E+00 GWGWIng
3&4-Methylphenol (m-Cresol) 3.7E-01 GWGWIng
Phenol 2.2E+01 GWGWIng
GWGWIng – Protective Concentration Level, Commercial/Industrial Worker, April 27, 2018, Table 3
Reference: Response Action Plan, New Caustic Pond, Submitted December 4, 2017; Revised Response Action Plan, New Caustic Pond,Submitted June 6, 2018
[Note: This Table should list the short list of constituents (i.e., indicator parameters) developed from CP Table III – Corrective Action Program Table of DetectedHazardous and Solid Waste Constituents and the Groundwater Protection Standard to be monitored semiannually during the Corrective Action Program to verifyGWPSs are met.]
[*Add COLUMN C if there is a GWPS assigned at a Point of Exposure (POE) (e.g. monitored natural attenuation and Plume Management Zone established inaccordance with 30 TAC 350, if applicable). Modify Table and footnotes as necessary.]
Foot Note:Use the following GWPS footnote designations if Risk Reduction Rules (RRR) or Texas Risk Reduction Program (TRRP) apply:* For RRR use the following GWPS designation:*MSC ACL pursuant to 30 TAC §335.160(b) based upon the Groundwater Medium-Specific Concentration, Residential {...or Industrial...) Risk Reduction
Standard No. 2 {...or No. 3}specified in 30 TAC §335 Subchapter S.MCL ACL pursuant to 30 TAC §335.160(b) based upon the Groundwater Maximum Contaminant Level specified in 40 CFR Part 141, National Primary
Drinking Water Regulations Subparts B and G.SMCL ALC pursuant to 30 TAC §335.160(b) based upon the Groundwater Secondary Maximum Contaminant Level (MCL) specified in 40 CFR Part 143,
National Secondary Drinking Water Regulations.AL ACL pursuant to 30 TAC §335.160(b) based upon the Action Level specified in 40 CFR Part 141, National Primary Drinking Water Regulations Subpart I.BKG Background as determined in accordance with 30 TAC 350.4(a)(6).

Permit No. HW-50078-000 Revision 12Phillips 66 Company – Borger Refinery, Texas May 2020
TCEQ Part B Application 225TCEQ-00376 (Rev. 9-29-2017 M.L. Shannon)
ND Non-detectable at PQL as determined by the analytical methods of the EPA SW-846 most recent edition, and as listed in the July 8, 1987 edition of theFederal Register and later editions. PQL is indicated in parentheses. PQL is the lowest concentrations of analytes in groundwaters that can be reliablydetermined within specified limits of precision and accuracy by the indicated methods under routine laboratory operating condition.
* or Use the following GWPS designation if TRRP applies:*GWGWIng ACL pursuant to 30 TAC §335.160(b) based upon the PCL determined under RSA or RSB (Residential or Commercial /Industrial) for Class 1 or
Class 2 Groundwater ingestion PCL of 30 TAC Chapter 350. The PCL value, Column B, will change as updates to the rule are promulgated. Changes to the ruleautomatically change the concentration value established in Column B in this table. In accordance with §350.72(b), GWGWIng, PCLs may need to be adjusted tolower concentrations to meet the cumulative carcinogenic risk level (less than or equal to 1x10⁻⁴) and hazard index criteria (less than or equal to 10) when thereare more than 10 carcinogenic and/or more than 10 non-carcinogenic chemicals of concern within a source medium.
GWGWClass3 ACL pursuant to 30 TAC §335.160(b) based upon the PCL determined under RSA or RSB (Residential or Commercial /Industrial), Tier I forClass 3 Groundwater ingestion PCL of 30 TAC Chapter 350. The PCL value, Column B, will change as updates to the rule are promulgated. Changes to the ruleautomatically change the concentration value established in Column B in this table.
AirGWInh-V ACL pursuant to 30 TAC §335.160(b) based upon the PCL determined under RSA or RSB (Residential or Commercial /Industrial) for Class 1 orClass 2 Groundwater inhalation PCL of 30 TAC Chapter 350. The PCL value, Column B, will change as updates to the rule are promulgated. Changes to the ruleautomatically change the concentration value established in Column B in this table.
SWGW ACL pursuant to 30 TAC §335.160(b) based upon the Protective PCL determined under RSA or RSB for Groundwater- to-surface water PCL of 30 TACChapter 350. The PCL value, Column B, will change as updates to the rule are promulgated. Changes to the rule automatically change the concentration valueestablished in Column B in this table.
SEDGW ACL pursuant to 30 TAC §335.160(b) based upon the PCL determined under RSA or RSB for Groundwater- to-sediment PCL of 30 TAC Chapter 350. ThePCL value, Column B, will change as updates to the rule are promulgated. Changes to the rule automatically change the concentration value established inColumn B in this table.
ECOGW ACL pursuant to 30 TAC §335.160(b) based upon the PCL determined under RSA or RSB for Groundwater- based on ecological receptor(s) PCL of 30 TACChapter 350. The PCL value, Column B, will change as updates to the rule are promulgated. Changes to the rule automatically change the concentration valueestablished in Column B in this table.
AAL ACL derived pursuant to 30 TAC §335.160(b) based upon the Protective Concentration level (PCL) established as an Attenuation Action Level as definedin 30 TAC §350(a)(4).
BKG Background as determined in accordance with 30 TAC 350.4(a)(6).ND Non-detectable at MQL as determined by the analytical methods of the EPA SW-846 most recent edition, and as listed in the July 8, 1987 edition of the
Federal Register and later editions. MQL is indicated in parentheses. MQL is defined in 30 TAC §350.4 (54) as the lowest non-zero concentration standard in thelaboratory’s initial calibration curve and is based on the final volume of extract (or sample) used by the laboratory.

Permit No. 50078Permittee: Phillips 66 Company Page l of 5 ( May 2020)
CP Attachment B: Well Design, Construction, Installation, Certification, Plugging and AbandonmentProcedures and Specifications
1. The Permittee shall use well drilling methods that minimize potential adverse effects on thequality of water samples withdrawn from the well, and that minimize or eliminate theintroduction of foreign fluids into the borehole.
2. All wells constructed to meet the terms of this Compliance Plan shall be constructed suchthat the wells can be routinely sampled with a pump, bailer, or alternate sampling device.Piping associated with recovery wells should be fitted with sample ports or an acceptablealternative sampling method to facilitate sampling of the recovered groundwater on a wellby well basis.
3. Above the saturated zone the well casing may be two (2)-inch diameter or largerschedule 4o or 8o polyvinyl chloride (PVC) rigid pipe or stainless steel orpolytetrafluoroethylene (PTFE or "teflon") or an approved alternate material. The PVCcasing must bear the National Sanitation Foundation logo for potable water applications(NSF-pw). Solvent cementing compounds shall not be used to bond joints and allconnections shall be flush-threaded. In and below the saturated zone, the well casing shall bestainless steel or PTFE.
The Permittee may use PVC or fiberglass reinforced resin as an alternate well casing materialin and below the saturated zone provided that it yields samples for groundwater qualityanalysis that are unaffected by the well casing material.
4. The Permittee shall replace any well that has deteriorated due to incompatibility of thecasing material with the groundwater contaminants or due to any other factors. Replacementof the damaged well shall be completed within ninety (90) days of the date of the inspectionthat identified the deterioration.
5. Well casings and screens shall be steam cleaned prior to installation to remove all oils,greases, and waxes. Well casings and screens made of fluorocarbon resins shall be cleanedby detergent washing.
6. For wells constructed after the date of issuance of this Compliance Plan, the screen lengthshall typically be ten (10) feet within a given transmissive zone unless location-specifichydrogeologic considerations support a screen length exceeding ten feet. Screen lengthsexceeding ten (10) feet may be installed in groundwater recovery or injection wells tooptimize the groundwater remediation process in accordance with standard engineeringpractice.
7. The Permittee shall design and construct the intake portion of a well so as to allowsufficient water flow into the well for sampling purposes and minimize the passage offormation materials into the well during pumping. The intake portion of a well shallconsist of commercially manufactured stainless steel or PTFE screen or approved alternatematerial. The annular space between the screen and the borehole shall be filled with cleansiliceous granular material (i.e., filter pack) that has a proper size gradation to providemechanical retention of the formation sand and silt. The well screen slot size shall becompatible with the filter pack size as recommended by well screen manufacturer. Thefilter pack should extend no more than three (3) feet above the well screen. A silt trap, nogreater than one (1) foot in length, may be added to the bottom of the well screen tocollect any silt that may enter the well. The bottom of the well casing shall be capped withPTFE or stainless steel or approved alternate material.

Permit No. 50078Permittee: Phillips 66 Company Page 2 of 5 ( May 2020)
Groundwater recovery and injection wells shall be designed in accordance with standardengineering practice to ensure adequate well production and accommodate ancillaryequipment. Silt traps exceeding one (1) foot may be utilized to accommodate ancillaryequipment. Well heads shall be fitted with mechanical well seals, or equivalent, to prevententry of surface water or debris.
8. A minimum of two (2) feet of pellet or granular bentonite shall immediately overlie thefilter pack in the annular space between the well casing and borehole. -Where the saturatedzone extends above the filter pack, pellet or granular bentonite shall be used to seal theannulus. The bentonite shall be allowed to settle and hydrate for a sufficient amount oftime prior to placement of grout in the annular space. Above the minimumtwo (2)-foot thick bentonite seal, the annular-space shall be sealed with acement/bentonite grout mixture. The grout shall be placed in the annular space by meansof a tremie pipe or pressure grouting methods equivalent to tremie gouting standards.
The cement/bentonite grout mixture or TCEQ approved alternative grout mixture shall fillthe annular space to within two (2) feet of the surface. A suitable amount of time shall beallowed for settling to occur. The annular space shall be sealed with concrete, blendinginto a cement apron at the surface that extends at least two (2) feet from the outer edge ofthe monitor well for above-ground completions. Alternative annular-space seal, materialmay be proposed with justification and must be approved by the Executive Director priorto installation.
In cases where flush-to-ground completions are unavoidable, a protective structure such as autility vault or meter box should be installed around the well casing and the concrete paddesign should prevent infiltration of water into the vault. In addition, the Permittee mustensure that 1) the well/cap juncture is watertight; 2) the bond between the cement surface sealand the protective structure is watertight; and 3) the protective structure with a steel lid ormanhole cover has a rubber seal or gasket.
9. Water added as a drilling fluid to a well shall contain no bacteriological or chemicalconstituents that could interfere with the formation or with the chemical constituentsbeing monitored. For groundwater recovery and injection wells, drilling fluids containingfreshwater and treatment agents may be utilized in accordance with standard engineeringpractice to facilitate proper well installation. In these cases, the water and agents addedshould be chemically analyzed to evaluate their potential impact on in-situ water qualityand to assess the potential for formation damage. All such additives shall be removed tothe extent practicable during well development.
10. Upon completion of installation of a well, the well must be developed to remove anyfluids used during well drilling and to remove fines from the formation to provide aparticulate-free discharge to the extent achievable by accepted completion methods and bycommercially available well screens. Development shall be accomplished by reversingflow direction, surging the well or by air lift procedures. No fluids other than formation watershall be added during development of a well unless the aquifer to be screened is alow-yieldingwater-bearing aquifer. In these eases, the water to be added should be chemically analyzed toevaluate its potential impact on in-situ water quality, and to assess the potential for formationdamage.
For recovery and injection wells, well development methods may be utilized in accordancewith standard engineering practice to remove fines and maximize well efficiency and specificcapacity. Addition of freshwater and treatment agents may be utilized during well

Permit No. 50078Permittee: Phillips 66 Company Page 3 of 5 (May 2020)
development or re-development to remove drilling fluids, inorganic scale or bacterialslime. In these cases, the water and agents added should be chemically analyzed toevaluate their potential impact on in-situ water quality-and to assess the potential forformation damage. All such additives shall be removed to the extent practicable duringwell development.
11. Each well shall be secured and/or designed to maintain the integrity of the well boreholeand groundwater.
12. The Permittee shall protect the above-ground portion of the well by bumper guards and/ormetal outer casing protection when wells are located in traffic areas or outside the securedplant area.
13. The attached Table Of Well Construction Details is to be completed or updated for eachwell installed and kept on site. Items in the table that require a yes or no answer indicatediagrams plans, or procedures that shall be kept on site and made available to inspection.The completed table and other records shall include all of the following information:
name/number of well (well designation); intended use of the well(sampling, recovery, etc.); date/time of construction; drilling method and drilling fluid used; well location (+ 0.5 ft.); bore hole diameter and well casing diameter; well depth (+ 0.1 ft.); drilling and lithologic logs; depth to first saturated zone; casing materials; screen materials and design; casing and screen joint type; screen slot size/length; filter pack material/size; filter pack volume (how many bags, buckets, etc.); filter pack placement method; sealant materials; sealant volume (how many bags, buckets, etc.); sealant placement method; surface seal design/construction; well development procedure; type of protective well cap; ground surface elevation (+ 0.01 ft. MSL); top of casing elevation (+ 0.01 ft. MSL); and, detailed drawing of well (include dimensions).
14. The Permittee shall clearly mark and maintain the well number on each well at the site.
15. The Permittee shall measure and keep a record of the elevation of the top of each wellcasing in feet above mean sea level to the nearest 0.01 foot and permanently mark themeasuring point on the well. The Permittee shall compare old and new elevationsfrom previously surveyed wells and determine a frequency of surveying not to exceedfive (5) year intervals.
16. A well's screened interval shall be appropriately designed and installed to meet thewell's specific objective (i.e., either DNAPL, LNAPL, both, or other objective

Permit No. 50078Permittee: Phillips 66 Company Page 4 of 5 ( May 2020)
of the well). All Wells designed to detect, monitor; or recover DNAPL must bedrilled to intercept the bottom confining layer of the aquifer. The screened interval todetect DNAPL should extend from the top of the lower confining layer to above theportion of the aquifer saturated with DNAPL. The screened interval for all wellsdesigned to detect, monitor, or recover LNAPL must extend high enough into thevadose zone to provide for fluctuations in the seasonal water table. In addition, thesandpacks for the recovery or monitoring well's screened interval shall be coarserthan surrounding media to ensure the movement of NAPL to the well.
Certification, Plugging and Abandonment Procedures
17. Prior to installation of a Point of Compliance (POC), FOA Boundary of Compliance (FBOC),Point of Exposure (POE), Alternate Point of Exposure (APOE) or Background replacement welllisted in CP Table V, the Permittee shall submit to the Executive Director for approval, thereplacement well specifications and an explanation of why the well is being replaced, For anysuch well to be considered as a replacement well and not as a new well, the well shall have nosubstantive design changes from the well being replaced as determined by the ExecutiveDirector. The well shall be drilled within fifteen (15) feet of the well being replaced unless analternate location is authorized by the Executive Director, The Permittee shall submit areplacement well certification to the Executive Director in accordance with CP Table VII and CPAttachment C, Provision 19.
18. Plugging and abandonment of a Corrective Action System Background, POC, FBOC, POE,and/or APOE wells in Provision XI.B.1 shall be subject to the Compliance Plan modificationprovisions in 30 TAC ' 305 Subchapter D. Plugging and abandonment of Corrective ActionObservation, Corrective Action System and/or Attenuation Monitoring Point wells in ProvisionXI.B.2, shall commence upon written approval of the Executive Director. The well shall beplugged and abandoned in accordance with requirements of this Attachment C. The Permitteeshall certify proper plugging and abandonment in accordance with .CP Table VII and CPAttachment C, Provision 19.
19. The Permittee shall complete construction or plugging and abandonment of each well inaccordance with the requirements of this Compliance Plan and 16 TAC Chapter 76 and shallcertify such proper construction or plugging and abandonment in the first report submittedpursuant to CP Table VII following installation or plugging and abandonment. Copies of theState of Texas Plugging Report filed with the Texas Department of Licensing and Regulationand completion logs for each newly installed or replaced well shall be included with the report.The certification shall be prepared by a qualified geologist or geotechnical engineer. Each wellcertification shall be accompanied by a certification report, including an accurate log of the soilboring, which thoroughly describes and depicts the location, elevations, material specifications,construction details, and soil conditions encountered in the boring for the well. A copy of thecertification and certification report shall be kept on-site, and a second copy shall be submittedto the Executive Director. Required certification shall be in the following format, edited asappropriate, and shall specify the Compliance Plan Number as indicated:
"This is to certify that installation (or plugging and abandonment) of the followingfacility components authorized or required by TCEQ Compliance Plan No. (Insert CPnumber) has been completed, and that construction (or plugging) of said componentshas been performed in accordance with and in compliance with the design andconstruction specifications of this Compliance Plan No, (Insert CP number):" (Add

Permit No. 50078Permittee: Phillips 66 Company Page 5 of 5 ( May 2020)
description of facility components with reference to applicable Compliance Planprovisions).
20. Wells may be replaced at any time the Permittee or Executive Director determines that the wellintegrity or materials of construction or well placement no longer enable the well to yieldsamples representative of groundwater quality.
21. The Permittee shall plug soil test borings and wells removed from service after issuance of theCompliance Plan with a cement/bentonite grout mixture so as to prevent the preferentialmigration of fluids in the area of the borehole. Certification of each plugging shall be reportedin accordance with Provision 19 of CP Attachment C of this Compliance Plan. The plugging ofwells shall be in accordance with 16 TAC Chapter 76 dealing with Well Drilling, Completion,Capping and Plugging.

Permit No. HW-50078-000 Revision 10
Phillips 66 Company – Borger Refinery, Texas January 2020
Volume IV • Compliance Plan Section XI – Attachment C Page 1
COMPLIANCE PLAN ATTACHMENT C
SAMPLING AND ANALYSIS PLAN
Phillips 66 Borger Refinery
ID NO.: SWR 30111
COMPLIANCE PLAN NO.: CP-50078
Submitted to:
Texas Commission on Environmental Quality
P.O. Box 13087
Austin, Texas 78711-3087
Submitted By:
Phillips 66 WRB Borger Refinery
Borger, Hutchinson County, Texas
January 2020

Permit No. HW-50078-000 Revision 10
Phillips 66 Company – Borger Refinery, Texas January 2020
Volume IV • Compliance Plan Section XI – Attachment C Page 2
TABLE OF CONTENTS
1.0 INTRODUCTION...................................................................................................................... 6
1.1 Site Description ............................................................................................................. 6
1.2 Project Description ........................................................................................................ 7
2.0 HEALTH AND SAFETY PLAN ................................................................................................. 8
3.0 SAMPLING LOCATION AND FREQUENCY ............................................................................ 9
4.0 ANALYTES AND CHEMICALS OF CONCERN...................................................................... 10
5.0 FIELD METHODS .................................................................................................................. 11
5.1 Well Inspection............................................................................................................ 11
5.2 Groundwater and NAPL Measurements ....................................................................... 11
5.3 Well Purging................................................................................................................ 12
5.3.1 Low Flow Approach................................................................................................. 12
5.3.2 Micro-Purge Approach............................................................................................. 13
5.4 Well Sampling ............................................................................................................. 13
5.4.1 Sampling Order ....................................................................................................... 14
5.4.2 Filtration.................................................................................................................. 14
5.5 Surface Water Sampling .............................................................................................. 15
5.5.1 First-Flush Storm Water Sampling............................................................................ 15
5.5.2 Direct Sampling....................................................................................................... 15
5.5.3 Dip Sampler ............................................................................................................ 15
5.5.4 Pump...................................................................................................................... 16
5.5.5 Kemmerer Bottle ..................................................................................................... 16
5.6 Sediment Sampling ..................................................................................................... 16
5.6.1 Trowel..................................................................................................................... 16
5.6.2 Bucket Auger........................................................................................................... 17
5.6.3 Hand Dredges......................................................................................................... 17
5.6.4 Push Core............................................................................................................... 17
5.6.5 Homogenization Procedure...................................................................................... 18
5.7 Decontamination Procedures ....................................................................................... 18
5.8 Sample Handling......................................................................................................... 18
Permit No. HW-50078-000 Revision 10
Phillips 66 Company – Borger Refinery, Texas January 2020
Volume IV • Compliance Plan Section XI – Attachment C Page 3
5.9 Management of Investigative-Derived Waste................................................................ 18
6.0 DOCUMENTATION AND RECORDKEEPING ........................................................................ 19
6.1 Sample Naming Convention......................................................................................... 19
6.2 Sample Documentation................................................................................................ 19
6.2.1 Field Data Sheets.................................................................................................... 19
6.2.2 Chain-of-Custody Forms.......................................................................................... 19
6.2.3 Sample Container Labels......................................................................................... 20
6.2.4 Custody Seal........................................................................................................... 21
6.2.5 Split Sample Acknowledgment/Receipt..................................................................... 21
6.3 Sample Shipment Documentation ................................................................................ 21
6.4 Sample Shipment ........................................................................................................ 21
7.0 QUALITY ASSURANCE/QUALITY CONTROL....................................................................... 22
7.1 Data Quality Objectives ............................................................................................... 22
7.2 Containers, Preservatives, and Holding Times.............................................................. 22
7.3 Sampling Handling and Custody .................................................................................. 22
7.4 QA/QC for Sampling Procedures.................................................................................. 23
7.4.1 Trip Blanks.............................................................................................................. 23
7.4.2 Equipment Blanks.................................................................................................... 23
7.4.3 Field Duplicates....................................................................................................... 23
7.4.4 Matrix Spike/Matrix Spike Duplicate.......................................................................... 24
7.5 QA/QC for Analytical Procedures ................................................................................. 24
7.5.1 Method Detection Limit, Method Quantitation Limit, and Sample Detection Limit ........ 24
7.5.2 Quality Control Measures......................................................................................... 25
7.6 Instrument/Equipment Testing, Inspection, and Maintenance ........................................ 25
7.6.1 Field Equipment ...................................................................................................... 25
7.6.2 Laboratory Equipment ............................................................................................. 25
7.7 Instrument Calibration and Frequency .......................................................................... 26
8.0 DATA MANAGEMENT........................................................................................................... 27
8.1 Laboratory Deliverables for Detection Monitoring .......................................................... 27
8.2 Laboratory Deliverables for Compliance and Corrective Action Monitoring..................... 27
8.2.1 Electronic Data Deliverables .................................................................................... 28

Permit No. HW-50078-000 Revision 10
Phillips 66 Company – Borger Refinery, Texas January 2020
Volume IV • Compliance Plan Section XI – Attachment C Page 4
8.3 Data Review................................................................................................................ 28
8.3.1 Laboratory Data Review .......................................................................................... 28
8.3.2 Data Verification for Detection Monitoring.................................................................. 29
8.3.3 Data Verification for Compliance and Corrective Action Monitoring ............................. 30
8.3.4 Data Reporting ........................................................................................................ 31
9.0 REFERENCES....................................................................................................................... 32
LIST OF TABLES
Table 1 Parameters List, Analytical Methods and Method Quantitation Limits (MQLs) for Detection
Monitoring
Table 2 Chemicals of Concern List, Analytical Methods and Method Quantitation Limits (MQLs) for
Compliance or Corrective Action Monitoring
Table 3 Sampling Frequency and Analytes
Table 4 Analytical Methods, Containers and Holding Times for Aqueous and Solid Samples
Table 5 Field Measurement Equipment Quality Control
Table 6 Quality Control Performance Criteria for Inorganic Methods
Table 7 Quality Control Performance Criteria for Gas Chromatographic Methods
Table 8 Quality Control Performance Criteria for Semivolatile Organic Compounds and Volatile Organic
Compounds
Table 9 LCS, MS/MSD and Surrogate Precision and Accuracy Acceptance Criteria for Data Review
LIST OF FIGURES
Figure 1 Example Field Sheet
Figure 2 Example Chain-of-Custody
Figure 3 Example Custody Seal (Left) and Sample Label (Right)

Permit No. HW-50078-000 Revision 10
Phillips 66 Company – Borger Refinery, Texas January 2020
Volume IV • Compliance Plan Section XI – Attachment C Page 5
REVISION LOG
Rev. Date Description
0 7/17/2011 Initial Issue
1 7/1/2017 Revision: update Tables 1 and 2 to match permit and compliance plan, to field
duplicate frequency, clarify metals filtration
2 January
2020
Revision: update Tables 1, 2, and 4 to match permit and compliance plan; text
edit in Section 5.4.2 to clarify filtration requirements

Permit No. HW-50078-000 Revision 9
Phillips 66 Company – Borger Refinery, Texas December 2017
Volume IV • Compliance Plan Section XI – Attachment C Page 6
1.0 Introduction
This Sampling and Analysis Plan (SAP) describes procedures to be implemented for the detection,
compliance, and corrective action monitoring programs at the Phillips 66 WRB Borger Refinery (Facility)
located in Borger, Hutchinson County, Texas. This SAP incorporates sampling and analysis
requirements to support the detection monitoring program for the permitted units and the compliance
monitoring or corrective action monitoring programs for the Facility Operations Area (FOA) and the units
outside the FOA. The detection monitoring program requirements are described in the RCRA Part B
Permit in Section VI and the compliance monitoring, corrective action monitoring, and Facility Operations
Area (FOA) monitoring programs are described in Section XI of the RCRA Part B Permit (Compliance
Plan). The SAP provides policies, project organization, objectives, functional activities, and quality
assurance/quality control (QA/QC) measures intended to achieve the project goals associated with the
Resource Conservation and Recovery Act (RCRA) Hazardous Waste Permit HW-50078 and Compliance
Plan CP-50078. This SAP is prepared to conform to the requirements of 30 Texas Administrative Code
(TAC) 335.165 and 40 Code of Federal Regulations (CFR) 270.30 and 270.31. This SAP was also
prepared to conform to the requirements of the Texas Commission on Environmental Quality (TCEQ)
Quality Assurance Project Plan for Environmental Monitoring and Measurement Activities Relating to the
Resource Conservation and Recovery Act (RCRA) and Underground Injection Control (UIC).
The objectives of the SAP are to ensure that:
< Field methods for detection monitoring are conducted consistent with the requirements of HW-
50078 and the TCEQ Quality Assurance Project Plan (QAPP);
< Field methods for compliance and corrective action monitoring are conducted consistent with the
TCEQ Texas Risk Reduction Program (TRRP) requirements;
< Consistent field methods are used for monitoring activities;
< Data generated during field monitoring are usable for their intended purpose; and
< Field activities are conducted safely and are compliant with both Facility and Remediation
Management (RM) Health and Safety procedures.
Activities covered under this SAP include monitoring well sampling, surface water sampling; and
sediment sampling.
1.1 Site Description
Phillips 66 Company (P66), Operator of the Borger Refinery in Borger, Texas, is permitted to manage,
store, handle, and dispose of industrial hazardous and non-hazardous waste under the conditions of the
RCRA Part B Permit HW-50078. The permit provisions include a Compliance Plan (CP-50078) for
compliance monitoring and corrective action monitoring at solid waste management units (SWMUs) and
areas of concern (AOCs). The Facility is located on approximately 6,400 acres along State Highway Spur
119, approximately 2 miles north of the City of Borger, Hutchinson County, Texas. Figures within the
RCRA Part B Permit and Compliance Plan show the location of the Facility, the hazardous waste
management units, SWMUs and AOCs.

Permit No. HW-50078-000 Revision 9
Phillips 66 Company – Borger Refinery, Texas December 2017
Volume IV • Compliance Plan Section XI – Attachment C Page 7
1.2 Project Description
Detection monitoring samples are collected semiannually from hazardous waste units listed in the RCRA
Part B Permit Tables VI.B.3.b. Samples are analyzed for the parameters in RCRA Part B Permit Table
VI.B.3.c. Sample Table 1 summarizes the parameters for the detection monitoring program.
Waste units and areas subject to compliance and corrective action monitoring are listed in Compliance
Plan Table 1 (Waste Management Units and Areas Subject to Groundwater Corrective Action and
Compliance Monitoring). Corrective action monitoring samples are collected from the locations specified
in Compliance Plan Table V (Designation of Wells by Function) and are analyzed for the chemicals of
concern (COCs) specified in Compliance Plan Tables III (Table of Detected Hazardous and Solid Waste
Constituents and the Groundwater Protection Standard) and IIIA (Table of Indicator Parameters and the
Groundwater Protection Standard). Compliance monitoring samples are collected from the locations
specified in Compliance Plan Table V (Designation of Wells by Function) and are analyzed for the COCs
specified in Compliance Plan Table IV (Compliance Monitoring Program Table of Hazardous and Solid
Waste Constituents and Quantitation Limits) and IVA (Compliance Monitoring Program Table of Detected
Hazardous Constituents and the Groundwater Protection Standard). SAP Table 2 summarizes the COCs
for the compliance and corrective action monitoring programs.

Permit No. HW-50078-000 Revision 9
Phillips 66 Company – Borger Refinery, Texas December 2017
Volume IV • Compliance Plan Section XI – Attachment C Page 8
2.0 Health and Safety Plan
The monitoring programs will be conducted in a manner consistent with Facility and RM health and safety
procedures and applicable Occupational Safety and Health Administration (OSHA) regulations found in
29 CFR Part 1910.120. A Facility-specific Health and Safety Plan (HASP) will be developed by the Field
Sampling Coordinator before starting field sampling activities. The HASP also serves as the Field
Emergency Contingency Plan.
Activities to be managed under the HASP include but are not limited to:
< Safety training and monitoring requirements (especially hazard identification, control, and
elimination;
< Clearing underground utilities;
< Obtaining necessary work permits from Facility personnel;
< Selecting personal protective equipment (PPE);
< Collecting groundwater samples from monitoring wells;
< Collecting surface water and sediment samples from streams;
< Installing monitoring wells;
< Collecting soil samples during monitoring well or boring installation;
< Decontaminating equipment; and
< Staging of investigation derived wastes (IDW); and
< Surveying field sampling locations.
Subcontractors working under the direction of the Field Sampling Coordinator will be required to abide by
the contents of the HASP.

Permit No. HW-50078-000 Revision 9
Phillips 66 Company – Borger Refinery, Texas December 2017
Volume IV • Compliance Plan Section XI – Attachment C Page 9
3.0 Sampling Location and Frequency
Pursuant to the provisions outlined in the RCRA Part B Permit and Compliance Plan, Point of Compliance
(POC) wells, FOA Boundary of Compliance (BOC) wells, Attenuation Monitoring Point (AMP) wells, and
Point of Exposure (POE) locations (including groundwater, surface water, and sediment locations) will be
sampled and analyzed at the frequency listed in Table 3 for the parameters identified in Table VI.B.3.c of
the RCRA Part B Permit and CP Tables III, IIIA, IV, and IVA. Specific sampling locations for the detection
monitoring program are denoted in RCRA Part B Permit Table VI.B.3.b and Figures B.V.A-5 through
B.V.A-7 of the RCRA Part B Permit. Specific sampling locations for the compliance and corrective action
monitoring programs are listed in Compliance Plan Table V.
The detection monitoring program includes POC wells and background wells. POC wells are placed at
the vertical surface located at the hydraulically downgradient limit of the waste management unit that
extends down into the uppermost aquifer. If a confirmed statistically significant increase (SSI) over
background for any parameter is determined in a detection monitoring POC well, then the waste
management unit is placed into compliance monitoring and possibly a corrective action program.
Background wells are located hydraulically upgradient of the waste management unit.
The compliance and corrective action monitoring program includes the following sample locations:
< POC Wells – These wells are placed at the vertical surface located at the hydraulically
downgradient limit of the waste management unit that extends down into the uppermost aquifer.
< FOA BOC Wells – These wells are placed at the FOA boundary and are used to monitor COC
concentrations in groundwater. COCs detected in the groundwater are compared to the FOA
BOC groundwater protection standards in Compliance Plan Table III or IIIA.
< AMP Wells – These wells are used within the FOA and within a Plume Management Zone
(PMZ). AMP wells are used as “early warning” monitoring points to detect the presence and
concentration of COCs in the groundwater upgradient of the FOA BOC wells. Within the PMZ,
AMP wells verify conformance with the PMZ response objective (exceedance of the critical PCL
at the PMZ POE). COCs detected in the groundwater are compared with the calculated
Attenuation Action Levels (AALs) to determine if additional response actions are needed.
< POE Locations – These are located at the nearest downgradient location associated with a
potential receptor. POE locations are used to verify that receptors are not exposed to COCs that
exceed risk-based exposure levels (RBELs). POE locations can also include surface water and
sediment locations. COCs detected in the groundwater, surface water or sediment are compared
with calculated RBELs to determine if response actions are needed; and
< Corrective Action Observation (CAO) Wells – These wells or piezometers are used to monitor
groundwater elevations, groundwater gradients, and, if necessary, NAPL thickness.
< First –flush Storm Water Samples – These locations are used to determine if any COCs present
in the soil above ephemeral drainages might enter the major drainage systems (Patton Creek or
Dixon Creek) at concentrations exceeding applicable water quality criteria during storm events.
Table 3 summarizes the sampling frequency for the various monitoring programs.

Permit No. HW-50078-000 Revision 9
Phillips 66 Company – Borger Refinery, Texas December 2017
Volume IV • Compliance Plan Section XI – Attachment C Page 10
4.0 Analytes and Chemicals of Concern
Parameters for detection monitoring locations are listed in Table VI.B.3.c of the RCRA Permit Part B.
Compliance and corrective action monitoring COCs are listed in Compliance Plan Tables III, IIIA, IV, and
IVA. Table 1 summarize the parameters and analytical methods for the detection monitoring program.
Table 2 summarizes the COCs and analytical methods for the compliance and corrective action
monitoring programs. The list of COCs was developed by reviewing the following:
< Current and historical Facility process operations;
< A list of standard chemicals associated with refinery operations; and
< Groundwater monitoring results from sampling associated with compliance monitoring, corrective
action monitoring, RCRA facility investigations, and FOA investigations.

Permit No. HW-50078-000 Revision 9
Phillips 66 Company – Borger Refinery, Texas December 2017
Volume IV • Compliance Plan Section XI – Attachment C Page 11
5.0 Field Methods
This section describes the field methods to be implemented during the monitoring programs. To reduce
the potential for cross-contamination, water level measurements, purging, and sampling begin at the well
location with the lowest historical concentrations and proceed systematically to the monitoring wells with
the highest historical concentrations. Standard operating procedures (SOPs) for field methods
implemented during the monitoring program are maintained at the Facility.
At a minimum, PPE worn during all purging and sampling activities will include a hard hat with goggle
attached, disposable powder-less vinyl or latex gloves and safety glasses. A new pair of gloves will be
worn at each well. The gloves will also be changed if they become cut, torn, or soiled. Refer to the
HASP for additional PPE to be worn during sampling procedures.
5.1 Well Inspection
Maintenance inspections are conducted during routine semiannual monitoring events and results are noted
on the field sampling forms. Maintenance or repair needs identified during the inspections are addressed
as soon as practicable. Maintenance inspections evaluate:
< legibility of well identification numbers;
< presence of visible damage to the well above ground (i.e., outer/inner casing stickup, concrete
surface seal, padlock, and guard posts);
< security of cap and monitoring well;
< damage to dedicated well pump components (i.e., tubing, screens, and impellers);
< silt accumulation in well screen based on total well depth measurements; and
< specified location on the top of the well casing to ensure consistent gauging and elevation data.
Any significant silt build-up (greater than 20% of the well screen) is removed by well redevelopment. Well
and pump maintenance activities are documented. Wells are resurveyed whenever evidence of heaving,
settling, damage or other disturbance that affects the elevation reference measurements is observed.
The reporting and, as appropriate, the repair or replacement of damaged wells is in accordance with
Compliance Plan Attachment B (Well Design and Construction Specifications).
5.2 Groundwater and NAPL Measurements
The static groundwater elevation, and if present, the thickness of any light non-aqueous phase liquids
(LNAPLs) at each monitoring well, is measured and recorded on the field sheets during every sampling
event prior to well purging/sample collection. Measurements are consistently recorded from the notch or
marked location on the well casing. Dense non-aqueous phase liquids (DNAPL) are not expected given
the chemical characteristics of the waste materials. The groundwater elevations and LNAPL thickness are
calculated by measuring the depth to LNAPL and the depth to groundwater from a permanently marked
and surveyed location on the top of the riser or inner well casing. Measurements are made to the same
surveyed reference point at each well for all sampling events. Meter readings are made to 0.01 foot
accuracy.

Permit No. HW-50078-000 Revision 9
Phillips 66 Company – Borger Refinery, Texas December 2017
Volume IV • Compliance Plan Section XI – Attachment C Page 12
Groundwater and NAPL elevations can be determined with dedicated drawdown meters, static sensing
probes, or phase interface probe. Non-dedicated, downhole measurement tools are decontaminated prior
to initial use, prior to use at each well location, and after completion of the daily gauging event.
Decontamination procedures are presented in Section 5.8.
5.3 Well Purging
Well purging is required to ensure that the water samples collected are representative of the in-situ water
present in the aquifer and not stagnant casing water within the well. Where practicable, purging and
sampling is accomplished using low-flow groundwater sampling techniques. This technique provides
better sample reproducibility over multiple sample events when groundwater conditions are stable through
time and can result in more representative sample concentrations.
Well purging utilizes dedicated pumps, including bladder or electrical submersible pumps or portable, non-
dedicated equipment such as electrical submersible or peristaltic pumps. The pump must be easily
adjustable and reliable at the low flow rates. Bailers and other types of grab samplers are not suitable for
low-flow sampling.
5.3.1 Low Flow Approach
Low-flow purging is conducted using a pump, tubing, and an in-line flow-through cell capable of
monitoring stabilization parameters in accordance with the following procedures:
1. The portable (non-dedicated) pumps and in-line flow-through cell is decontaminated prior to use
at each well;
2. If the well does not have a dedicated pump and tubing, then tubing is replaced prior to use at
each well. Dedicated tubing is marked or fixed in position adjacent to the top of casing to allow
for accurate placement over multiple sample events;
3. The inlet of the pump is carefully lowered to approximately at the mid-point of the screened
interval of each well. Care is taken to minimize re-suspension of solids at the bottom of the well;
4. The pump flow rate is adjusted to remove groundwater at a recommended pumping rate of 0.1 to
0.5 liter per rate, or at a sufficiently low rate to ensure that drawdown in the well is less than 0.1
meter (0.33 feet) relative to the static water level;
5. In-line flow-through cells and water quality meters are utilized to monitor, at a minimum, pH,
temperature, specific conductivity, temperature, dissolved oxygen (DO), turbidity, and oxidation-
reduction potential (ORP). Water quality measurements are taken every three to five minutes;
6. Purging is complete after parameters have stabilized for three successive readings. These three
successive readings should be within the following ranges:
a. 0.1 unit for pH;
b. 1°C for temperature; [alternative 3%]
c. 5% for specific conductivity;
d. 0.3 mg/L for DO; and
e. 10% for turbidity (with a goal of < 10 nephelometric turbidity units [NTUs]).

Permit No. HW-50078-000 Revision 9
Phillips 66 Company – Borger Refinery, Texas December 2017
Volume IV • Compliance Plan Section XI – Attachment C Page 13
7. If field parameters have not stabilized after three consecutive readings, measurements are
continued at three minute intervals up to a maximum of five successive readings. If, after five
successive readings, the parameters have not stabilized, an entry is made in the field logbook
indicating that the sampling will be conducted without stabilized parameters.
8. Stabilized readings indicate that stagnant water from the well has been removed and the sample
will be representative of groundwater in the aquifer. Values for the above parameters are
recorded on the Field Data Sheet (Figure 1).
9. Purge water is contained in labeled and sealed Department of Transportation (DOT)-approved
containers until proper disposal can be coordinated with the Facility.
5.3.2 Micro-Purge Approach
Micro-purge sampling may be employed for low yield wells. This approach requires removal of the
smallest possible purge volume prior to sampling, generally limited to the volume of the sampling system.
The sampling system volume is reduced by using very small diameter tubing and the smallest possible
pump chamber volume. After removing this combined volume, samples are taken from the subsequent
water pumped from the well. Since micro-purge sampling requires the minimum possible disturbance to
the water column and surrounding formation, dedicated sampling systems are required for this approach.
The pumping rates used for micro-purge sampling are lower than for low-flow purging, generally 100
ml/minute or less. Drawdown is expected, since it cannot be avoided. It is still advisable to pump at the
lowest possible rate to limit drawdown to the minimum possible. As with low-flow/low-stress techniques,
the water level in the well should not be lowered below the top of the screen if possible.
Monitoring indicator parameters for stability is not part of this approach, since the intention is not to purge
until stabilization of these measurements. However, pumping through a flow cell is still the best way to get
field measurements prior to sampling. Where the total volume of water in the well is very small, field
measurements can be accomplished with a very small volume flow cell.
5.4 Well Sampling
Groundwater samples are collected from each well for the analysis of parameters identified in the RCRA
Permit B Table VI.B.3.c and COCs identified in Compliance Plan Tables III, IIIA, IV or IVA. Sample
containers and applicable preservatives are supplied by the analytical laboratory and met the 40 CFR Part
136.3 Table II (Required Containers, Preservation Techniques, and Holding Times) requirements. Table 4
summarizes the applicable containers, preservatives, and holding times for the parameters and COCs in
the Facility monitoring programs.
Samples are collected immediately after purging. Immediately before samples are collected, the pump
tubing is disconnected from the in-line flow-through cell and the flow rate is adjusted to a range that is
optimal for sample collection but at or below that used for purging. The hose should not be placed inside
the containers or allowed to encounter the sample containers.
To minimize aeration, samples for volatile organic compounds (VOCs) should be collected at the lower
rates (i.e., less than 0.25 L/min). The pump should produce a thin, continuous stream of water, and the
water stream should be allowed to flow down the inner wall of the 40-mL volatile organic analysis (VOA)
vial to minimize air bubble formation. Each container should be filled to a positive meniscus and then
sealed with a Teflon-lined cap furnished by laboratory. Care should be taken during the capping of the
VOA vial to avoid trapping any headspace or air bubbles.

Permit No. HW-50078-000 Revision 10
Phillips 66 Company – Borger Refinery, Texas January 2020
Volume IV • Compliance Plan Section XI – Attachment C Page 14
5.4.1 Sampling Order
VOC samples are always the collected first during groundwater sampling events. Once VOC samples
have been collected, other constituents can be collected at a higher pumping rate, not to exceed the
pumping rate at field parameter stabilization, to reduce sampling time. The rate should be controlled to
keep drawdown in the well within the specified limits (i.e., <0.1 m or 0.33 ft.). The container filling order is
as follows:
1. VOCs;
2. Semivolatile organic compounds (SVOCs) including base/neutral acids, pesticides, total petroleum
hydrocarbons (TPH);
3. Metals, total;
4. Anions/cations (such as fluoride, cyanide, sulfide)
5. Nutrients (NH3, NO3, NO2, SO4);
6. General (pH, alkalinity, total suspended solids, total dissolved solids); and
7. Metals, dissolved (0.45-micron filtered samples).
5.4.2 Filtration
Filtration of aqueous samples is required for the determination of dissolved metals in surface water. Two
samples will be collected for surface water: total metals (unfiltered) and dissolved metals (0.45-micron
filter). Filtration is also required for groundwater samples collected from monitoring wells where the
concentration limit is based on an ecological PCL. Note that two samples will be collected from FOA POE,
BOC and POC wells for total metals (unfiltered) and dissolved metals (0.45-micron filter), where the
concentration limit is based on an ecological PCL.
Dissolved metals samples are collected last when collecting multiple sample jars for a sample location.
Filtration can be completed in the field or in the laboratory. Field filtration utilizes a single-use (disposable)
in-line filter cartridge attached directly to the pump discharge line. The filtrate is collected in a separate
nitric acid preserved container from the total metals sample. Note that this sample container must be
clearly labeled ‘dissolved metals’ to eliminate the possibility of misinterpreting the data. Samples for
laboratory filtration are collected in a separate unpreserved container. This sample container must be
clearly labeled for ‘laboratory filtration’ and the requirement for laboratory filtration noted on the chain-of-
custody (C-O-C):
Since the detection and compliance monitoring programs are not based on ecological PCLs, samples for
these programs are not filtered unless the turbidity is greater than 10 NTU. In this case the 10-micron filter
is used.
Generally, groundwater samples for total metals analyses should not be filtered. However, if the turbidity
of the groundwater sample exceeds 10 NTU, then filtering with a 10.0-micron filter may be appropriate to
prepare a soluble metals fraction. Filtration should be completed in the field. Field filtration utilizes a
single-use (disposable) in-line filter cartridge attached directly to the pump discharge line.
Field filtration for dissolved metals or soluble metals is recorded on the field sampling forms, including the
filter supplier, filter size, and batch number (if available).

Permit No. HW-50078-000 Revision 9
Phillips 66 Company – Borger Refinery, Texas December 2017
Volume IV • Compliance Plan Section XI – Attachment C Page 15
5.5 Surface Water Sampling
Surface water samples can be collected using one of four methods: direct sampling with container,
Kemmerer bottle, dip sampler or pump. The preferred collection technique for surface water samples at
the Facility is direct sampling with a container. This method will allow for the collection of representative
samples from a shallow water column. However, if site conditions change, an alternate method for
collecting the surface water samples in deeper water are a dip sampler, Kemmerer bottle or pump.
Sample collection order is the same as specified for the collection of groundwater samples. Surface
water samples for the analysis of dissolved metals will be either field filtered or laboratory filtered using a
0.45-micron filter. The sections below briefly describe the procedures for each technique.
Decontamination procedures are described in Section 5.7.
5.5.1 First-Flush Storm Water Sampling
The first-flush storm water sampling method is used to collect storm water samples from normally dry
(i.e., ephemeral) drainage features. One of two methods for collection of storm water samples may be
used. The preferred method is manual collection of storm water runoff samples (see Section 5.5.2 [Direct
Sampling]). The second method is the use of embedded sampling containers in the dry drainages that
allow for passive collection of the FOA monitoring samples. An example embedded sampling container
can be found at http://www.benmeadows.com/Nalgene-Stormwater-Samplers_31226903. This method is
not intended or expected to accurately measure VOOOC concentrations but is expected to meet project
objectives for SVOCs and metals.
The first-flush storm water samples using embedded sampling containers are collected directly into the
sample bottle contained within the reloadable sample container. The reloadable sample container is
permanently installed in the drainage, with the intake slots approximately 0.5-inches above the drainage
bed. Two samplers, an inorganic analytes sampler and an organic analytes sampler, are required at
each location. The sample containers are unpreserved because the sample collection bottles may
remain in a drainage channel for an extended period prior to a rainfall event, which is likely to cause
deterioration of the preservatives in the interim. As soon as possible after a rainfall event, the samplers
are checked, and if sufficient volume is available in the sample bottles for analyses, the bottles are
removed, preservative added, and the samples shipped to the analytical laboratory. The sample
container is reloaded with new sample bottles. If insufficient volume is available, the sample bottles are
removed, discarded, and the sample container is reloaded with new sample bottles.
5.5.2 Direct Sampling
The direct method may be utilized to collect water samples from the surface directly into a disposable
glass container or directly into the sample bottle (if the sample bottle does not contain preservative). This
method may not be used when contact with high concentrations of contaminants is a concern. Adequate
protective clothing and safe procedures to access the sampling station should be used. Pre-preserved
sample bottles must not be used because the collection method will dilute the concentration of
preservative necessary for proper sample preservation. Samples must be collected under the water
surface while pointing open end of the sample container upstream; also, the container must be located
upstream of the sample collector. Disturbing the sediment must be avoided. Water must then be
transferred to a pre-preserved sample container as applicable for the sample analyses. The sampling
container is replaced between each sample location.
5.5.3 Dip Sampler
The sampler is a wide-mouth container of glass or other inert material attached to an extension pole. The
technique is suitable for collecting surface water samples from a structure such as a berm, bridge or pier.

Permit No. HW-50078-000 Revision 9
Phillips 66 Company – Borger Refinery, Texas December 2017
Volume IV • Compliance Plan Section XI – Attachment C Page 16
A clean, disposable container is attached to the extension device and the sample is collected by dipping
the sampler into the substance. Do not use the pre-preserved sample bottles to collect the sample since
that may dilute the concentration of preservative necessary for proper sample preservation. Transfer the
water to a pre-preserved sample container as applicable for the sample analyses. The dip sampler
should be decontaminated between uses (Section 5.8), if a bottle is used with the dip sampler, it should
be replaced between each sample location.
5.5.4 Pump
A peristaltic pump may be used in most situations where site access is from a boat or samples from a
certain depth are required. In addition, a peristaltic pump is required for field filtration for dissolved
metals. The pump should produce a thin, continuous stream of water, and the water stream should be
allowed to flow down the inner wall containers to minimize turbulence and agitation. The hose should not
be placed inside the containers or allowed to encounter the sample containers. The pump should be
decontaminated (Section 5.8) and the tubing replaced between each sample location.
5.5.5 Kemmerer Bottle
A Kemmerer bottle may be used in most situations where site access is from a boat or structure such as
a bridge or pier, and where samples at depth are required. The sampling device is set so that water
passes through the device. The Kemmerer sampling device is lowered to a pre-determined depth and the
sampling device is closed at that depth to collect a sample. After retrieval, the first 10 to 20 mL of water is
discharged to clear potential contamination and the remaining water is transferred to suitable sample
containers. The Kemmerer bottle should be decontaminated between each use (Section 5.8).
5.6 Sediment Sampling
Sediment samples can be collected using four techniques: trowel, bucket auger, hand dredge or push
core. The preferred collection technique for sediment samples at the Facility is a trowel. This method will
allow for the collection of representative sediment samples under a shallow water column. However, if
site conditions change, other sample collection techniques, such as a push core, bucket auger, or dredge
device may be utilized. Sample collection order is the same as specified for the collection of groundwater
samples. The sections below describe the sampling procedures and the homogenization procedures for
non-VOC analyses. Decontamination procedures are described in Section 5.8.
5.6.1 Trowel
Tools such as spades, shovels, trowels, and scoops can be used to collect surface sediment below the
shallow aqueous layer. Although this method can be used to collect both consolidated and
unconsolidated sediment, it is limited somewhat by the depth and movement of the water layer. Deep
and rapidly flowing water render this method less accurate than other methods. However, representative
samples can be collected with this procedure in shallow sluggish water provided care is demonstrated by
the sampling team. A stainless steel or plastic sampling implement will suffice. Care should be exercised
to avoid the use of devices that have been painted or are plated with chrome or other materials; plating is
particularly common with garden trowels.
Non-dedicated sampling equipment is decontaminated prior to sample collection (Section 5.8). Sediment
is transferred directly from the sampling device to a labeled sample or homogenization container(s) of
appropriate size and construction for the analyses requested. Surface water should be decanted from the
sample or homogenization container; the fine sediment fraction must be retained during this procedure.
The homogenization procedure should not be used for volatile organics; in this case, sediment, or

Permit No. HW-50078-000 Revision 9
Phillips 66 Company – Borger Refinery, Texas December 2017
Volume IV • Compliance Plan Section XI – Attachment C Page 17
multiple grabs of sediment, should be transferred directly from the sample collection device or
homogenization container to the sample container.
5.6.2 Bucket Auger
A system consisting of a bucket auger or tube auger, a series of extensions, and a "T" handle can be
used to collect surface sediment from beneath a shallow aqueous layer. The use of additional extensions
in conjunction with a bucket auger can increase the depth of water from which sediment can be collected
from 24 inches to 10 feet or more, however, water clarity must be high enough to permit the sampler to
directly observe the sampling operation. Sample handling and manipulation increases in difficulty with
increasing depth of water and plasticity of sediment. For deep samples, the bucket auger is used to bore
a hole to the upper range of the desired sampling depth and then withdrawn. The tube auger is then
lowered down the borehole, and driven into the sediment to the lower range of the desired sampling
depth. Alternatively the tube auger may be used alone and the desired interval may be extracted from
the tube.
Non-dedicated sample equipment is decontaminated prior to sample collection (Section 5.8). Sediment is
transferred directly from the sampling device to a labeled sample or homogenization container(s) of
appropriate size and construction for the analyses requested. Samples for volatile organic analysis must
be collected directly from the bucket before homogenization to minimize volatilization of contaminants.
After collection of the VOC sample aliquot, the homogenization procedure should be used for the
remaining fractions.
5.6.3 Hand Dredges
A remotely activated device (dredge) and a deployment system can be used to collect the top layer of
sediment. This technique consists of lowering a sampling device (dredge) to the surface of the sediment
by use of a rope, cable, or extended handle. When the mechanism is activated the device entraps
sediment in spring-loaded or lever-operated jaws. An Ekman dredge is a lightweight sediment-sampling
device with spring activated jaws. It is used to collect moderately consolidated, fine textured sediment. A
Ponar dredge is a heavyweight sediment sampling device with weighted jaws that are lever or spring
activated. It is used to collect consolidated fine to coarse textured sediment.
Non-dedicated sample equipment is decontaminated prior to sample collection (Section 5.8). Sediment is
transferred directly from the sampling device to a labeled sample or homogenization container(s) of
appropriate size and construction for the analyses requested. VOC samples must be collected directly
from the dredge before homogenization to minimize volatilization of contaminants. After collection of the
VOC sample aliquot, the homogenization procedure should be used for the remaining fractions.
5.6.4 Push Core
A tube sampler, consisting of an acetate liner, eggshell check valve, nosecone, extensions, and "T"
handle, or drivehead can be used to collect a subsurface sediment from beneath a shallow aqueous
layer. The use of additional extensions can increase the depth of water from which sediment can be
collected from 24 inches to 10 feet or more. This sampler may be used with either a drive hammer for
firm sediment, or a "T" handle for soft sediment. However, sample handling and manipulation increases
in difficulty with increasing depth of water. A disadvantage of coring devices is that a relatively small
surface area and sample size is obtained often necessitating repetitive sampling in order to obtain the
required amount of sample. This method is advantageous in sampling sediments for trace organic
compounds or metals.

Permit No. HW-50078-000 Revision 9
Phillips 66 Company – Borger Refinery, Texas December 2017
Volume IV • Compliance Plan Section XI – Attachment C Page 18
Non-dedicated sampling equipment is decontaminated prior to sample collection (Section 5.8). Sediment
is transferred directly from the sampling device to a labeled sample or homogenization container(s) of
appropriate size and construction for the analyses requested. VOC samples must be collected directly
from the acetate liner before homogenization to minimize volatilization of contaminants. After collection of
the VOC sample aliquot, the homogenization procedure should be used for the remaining fractions.
5.6.5 Homogenization Procedure
After the VOC samples are collected directly from the sampling device, the remaining sediment is
homogenized to obtain a representative sediment sample. The sediment is transferred from the sample
device with a decontaminated stainless steel spoon or equivalent into a decontaminated stainless steel or
aluminum bowl. The sample is mixed and then aliquots are transferred with a stainless steel spoon or
equivalent in the appropriate sample containers.
5.7 Decontamination Procedures
Decontamination of all non-disposable sampling equipment is crucial to prevent potential cross-
contamination of both the samples as well as the sampling sites. Each piece of non-dedicated equipment
will be cleaned prior to initial use, at each sample location, and at the end of the day.
The usual procedure to be utilized for general equipment decontamination will include a non-ionic metal-
and phosphorus-free laboratory-grade detergent and water solution, thorough scrubbing interior and
exterior surfaces with a suitably sized brush followed by triple-rinsing with tap water and triple rinsing with
deionized water. Additional decontamination steps may be utilized as needed to minimize cross-
contamination at the low level (parts per billion or lower) reporting limits. When the equipment has been
dried completely, it will be stored in protective casing or aluminum foil, if it will not be used immediately.
Adequate decontamination is demonstrated by collecting equipment blanks from the sampling equipment.
5.8 Sample Handling
Sample labels must be checked for completeness and legibility. Containers must be clean and dry when
packed for shipping. Chemical preservation requirements are listed in Table 4 of the SAP. Sample
storage temperature should be maintained at <6o C from the time the sample is collected. Proper
temperature must be maintained in sample storage coolers both in the field, in storage and during
shipment to the analytical laboratory. This is best accomplished by ensuring that there is a sufficient
supply of ice during both sample collection and shipment. Ice requires the use of sealed plastic bags to
contain the melt water. After sample collection is completed, the samples should be securely packed in
the shipment coolers.
5.9 Management of Investigative-Derived Waste
Investigation derived waste (IDW) includes: personnel protective equipment (PPE) (e.g., gloves, respirator
canisters, or disposable coveralls, disposable sampling equipment (e.g., bailers, rope or twine, or plastic
sheeting), groundwater from well development or purging, and decontamination fluids. Liquid and solid
IDW is containerized and disposed of as required by the Refinery.

Permit No. HW-50078-000 Revision 9
Phillips 66 Company – Borger Refinery, Texas December 2017
Volume IV • Compliance Plan Section XI – Attachment C Page 19
6.0 Documentation and Recordkeeping
This section describes sample naming conventions and field documentation requirements. To minimize
bias in the laboratory, field QC samples are submitted to the laboratory as blind samples using the
identification codes described below.
6.1 Sample Naming Convention
Example sample IDs for use in this project are as follow:
Monitor Wells
1909/SDP-MW02-071711 Sample collected from monitor well 1909/SDP-MW02 on July 17, 2011.
Sediment Locations
WSeepD4-SW-071711 Surface water (SW) location WSeepD4 on July 17, 2011.
Surface Water Locations
WSeepD4-SD-071711 Sediment (SD) location WSeepD4 on July 17, 2011.
Trip Blanks
TB-071711-01 First (01) trip blank (TB) sample collected on July 17, 2011 (071711).
Equipment Rinse Blank
EB-071711 Equipment blank (EB) sample collected on July 17, 2011 (071711). If
needed, additional acronyms such as SW, MW, or SD can be added to
differentiate multiple equipment blanks.
Field Duplicate
1909/SDP-MW02D-071711 Field duplicate of monitor well sample collected on July 17, 2011.
6.2 Sample Documentation
The paperwork required for sampling documentation and informational purposes includes the field data
sheets, chain of custody (C-O-C) forms, sample labels, custody seals, and split sample
acknowledgment/receipt forms as described below.
6.2.1 Field Data Sheets
The field data sheets are both a reference source of essential sampling data as well as a written historical
record of pertinent field-generated data and information. The field data sheets are constructed and
organized in a standard format to assist field personnel. This serves to reduce the potential for the
omission of necessary documentation and performance of procedures. A typical field data sheet is shown
in Figure 1.
6.2.2 Chain-of-Custody Forms
Documentation of possession of analytical samples is required on the C-O-C form from the time of
sample collection through sample delivery and check-in at the analytical laboratory. The C-O-C records
will accompany each set of samples/coolers and will document each time samples change possession. A
typical C-O-C form is shown on Figure 2. The C-O-C will also provide the details included on the sample

Permit No. HW-50078-000 Revision 9
Phillips 66 Company – Borger Refinery, Texas December 2017
Volume IV • Compliance Plan Section XI – Attachment C Page 20
bottles and any additional laboratory analysis and reporting requirements. At a minimum the C-O-C will
contain:
Site identification
Sample identification (including sampling point);
Date and time of sample collection;
Sample type (e.g., groundwater, surface water, sediment);
Analyticalparameters;
Number of containers;
Preservatives;
Signature of sample collector(s);
Signature(s) of person(s) involved in chain of possession; and
Inclusive dates and time of possession.
6.2.3 Sample Container Labels
Sample containers will be supplied by the analytical laboratory and will be consistent with 40 CFR 136.3
Table 2 (Required Containers, Preservation Techniques, and Holding Times) for the selected analytical
methods. The sample container label is one of the first links in the paper chain that tracks the sample
through the sampling and analytical process. Because proper identification of sample containers is
necessary, legible, complete, and securely attached labels must be affixed to each sample container and
remain legible and intact if wet.
A typical sample container label is shown in Figure 3. At a minimum, the label information will contain:
< Sample identification;
< Name or initials of collection party;
< Date and time of collection;
< Site and project identification (if space permits);
< Preservation technique and/or filtration (if space permits); and
< Parameters required for analysis.

Permit No. HW-50078-000 Revision 9
Phillips 66 Company – Borger Refinery, Texas December 2017
Volume IV • Compliance Plan Section XI – Attachment C Page 21
6.2.4 Custody Seal
Custody seals are fastened to both the lid and side of the coolers to aid in detecting unauthorized opening
of the coolers prior to arrival at the analytical laboratory receiving/check-in department. The seals should
be positioned such that they must be broken when the sample shuttle is opened. The seals should include
the signature of the person placing the seal and the date and time that the seal was placed. Seals are not
required if the sample coolers are hand-delivered to the lab by the sampling team and the coolers do not
leave the sight of the sampling team. A typical custody seal is shown in Figure 3.
6.2.5 Split Sample Acknowledgment/Receipt
If split samples are collected by a regulatory agency, a receipt or acknowledgment of samples collected
should be completed and signed by both parties with each party retaining a copy. This receipt should
include the sampling details such as date, time, well number, and personnel involved. This can be written
and signed in the field data records of both sampling parties.
6.3 Sample Shipment Documentation
The bills of lading or air bills provided by the courier companies require general shipping information -
including the shipper's name, address, telephone number, account number, as well as the recipient's
name, address, and telephone number. Additional information includes the billing information and the
delivery details such as overnight service, Saturday delivery, and cooler weight.
6.4 Sample Shipment
Sample coolers generally require overnight shipment to the analytical laboratory. The courier dispatcher
should be made aware of the contents (liquids in glass containers) and also the potential thermal problems
with either high or low temperature extremes.
Special cooler handling measures must be undertaken if either extremely high or low temperatures will be
encountered during transit to the contact laboratory. High temperatures require that more ice packs be
included inside each cooler to avoid exceeding the maximum 6o C internal cooler temperature. Extremely
low temperatures necessitate more insulation being added to the cooler(s) as well as the incomplete
freezing of cold packs to keep samples from freezing and sample bottles from breaking. Weekend delivery
service requires that both laboratory and courier personnel are notified of Saturday delivery service in
advance. If ice is used, the ice will be double-bagged in zip-lock style bags.

Permit No. HW-50078-000 Revision 9
Phillips 66 Company – Borger Refinery, Texas December 2017
Volume IV • Compliance Plan Section XI – Attachment C Page 22
7.0 Quality Assurance/Quality Control
The detection monitoring and compliance monitoring/corrective action monitoring programs require data
of sufficient quality and quantity to define the extent of impacted groundwater, and make informed
decisions to manage the associated issues.
7.1 Data Quality Objectives
The data quality objective for groundwater, surface water, and sediment samples is to obtain definitive
data suitable for the assessment and evaluation of:
< Statistically significant data trends including, but not limited to statistically significant increases
(SSIs) in the detection monitoring program parameters;
< The presence and extent of contamination in the environmental media;
< Compliance with groundwater protection standards; and
< Evaluation of remedial alternatives.
To meet these objectives, SW-846 analytical methods and data review procedures in accordance with
USEPA and TCEQ protocols (30 TAC 350.54) are prescribed. Other approved and documented
analytical methods from the USEPA, the American Society for Testing and Materials, other organizations
nationally recognized as having scientifically valid methods by the TCEQ Executive Director, or a
laboratory method that is completely documented in an appropriate SOP approved by the Executive
Director may also be utilized.
This data is generated by a laboratory accredited by the State of Texas National Environmental
Laboratory Accreditation Program (NELAP) for the parameters listed in Tables 1 and 2.
7.2 Containers, Preservatives, and Holding Times
Table 4 lists containers, preservatives, and holding times applicable for aqueous and solid samples.
Dissolved metals samples should be preserved by the laboratory for 24-hours prior to acid digestion in
order to solubilize the metals constituents.
Sampling containers are purchased precleaned and treated according to USEPA specifications. Note
that sample containers should be filled to the preferred volume listed in Table 4. If sample volume is
insufficient to collect the preferred volume, at least the minimum volume listed in Table 4 must be
collected for the requested analysis. If only the minimum sample is collected, the lab may have
insufficient sample volume in cases where a dilution or reanalysis is required, which may require a
resampling event. The laboratory will supply coolers and bottles. The laboratory will supply preservatives
listed in Table 4 in sample bottles.
7.3 Sampling Handling and Custody
Samples will be handled and C-O-Cs will be maintained as described previous sections. Sample holding
time tracking begins with the collection of the sample and continues until analysis is complete. Holding
times are specified in Table 4.

Permit No. HW-50078-000 Revision 9
Phillips 66 Company – Borger Refinery, Texas December 2017
Volume IV • Compliance Plan Section XI – Attachment C Page 23
7.4 QA/QC for Sampling Procedures
The quality assurance (QA) objectives for measurement data include considerations of precision, bias,
accuracy, representativeness, comparability, and completeness. Precision, bias, and accuracy are
evaluated with duplicate and spiked samples. Representativeness is evaluated by blanks to identify trace
sources of artificially introduced contamination. Comparability is obtained by consistency in the
acquisition, handling, and analysis of samples. Details regarding sampling and analysis procedures are
provided earlier in the SAP. The evaluation of QA objectives requires the collection of field quality control
(QC) samples. During the course of monitoring activities, samples are collected in the field and analyzed
by the laboratory for QA/QC purposes. The following QA/QC samples will be collected:
Trip blanks;
Equipment blanks;
Field duplicates; and
Extra volume for matrix spike/matrix spike duplicate samples.
QC samples are handled, preserved, and documented in the same manner as the original field samples.
7.4.1 Trip Blanks
Trip blanks are prepared prior to the sampling event by the analytical laboratory in the actual sample
container using deionized water. Trip blanks are kept with the field samples throughout the sampling
event. They are then packaged for shipment with the field samples and sent for analysis. Sample
containers are not opened before they reach the laboratory. If multiple coolers of samples are required,
VOC samples are placed in one cooler to minimize sample costs and simplify data review. Trip blanks
are analyzed only for VOCs. Trip blanks are labeled as TB-date.
7.4.2 Equipment Blanks
Equipment blanks are defined as samples that are obtained by running deionized water over/through
non-disposable, reusable sample collection equipment after it has been cleaned (i.e., rinse water will be
poured from the bailer, pumped through the sample pump and tubing, or poured over the trowels).
Deionized water is obtained from the laboratory or an equivalent from a commercially available source.
These samples are used to determine if decontamination procedures were adequate. One equipment
blank is collected each day sampling activities occur. Equipment blanks are collected for each matrix
sampled. Equipment blanks are analyzed for metals, SVOC, and VOC analytes associated with the
sampling event. Equipment blanks are not collected for dedicated or disposable (one use only)
equipment. Equipment blanks are labeled as EB-date.
7.4.3 Field Duplicates
Field duplicate samples are two or more samples collected simultaneously or in immediate succession
from the same location under identical conditions. One duplicate sample is collected for each batch of 10
or fewer field samples. The duplicate sample provides a measure of precision, or reproducibility of the
sample collection process. Field duplicate samples are analyzed for metals, SVOC, and VOC analytes
associated with the sampling event. Field duplicates are labeled as described in Section 6.1.

Permit No. HW-50078-000 Revision 9
Phillips 66 Company – Borger Refinery, Texas December 2017
Volume IV • Compliance Plan Section XI – Attachment C Page 24
7.4.4 Matrix Spike/Matrix Spike Duplicate
Matrix spike/matrix spike duplicate (MS/MSD) samples are spiked and analyzed by the laboratory to
facilitate identification of effects of the particular matrix of interest on analytical results, particularly biasing
of results. Sufficient sample volume will be collected (triple the normal sample volume for aqueous
samples - one volume each for the regular sample plus the MS and MSD samples) for at least one
sample in each batch of 20 or fewer field samples so that MS/MSD samples can be prepared for analysis.
MS/MSD samples are analyzed for the same parameters as the parameter sample. These are not
labeled separately, but are denoted as “extra volume for MS/MSD” in the comments column.
7.5 QA/QC for Analytical Procedures
In addition to field samples collected for the evaluation of the QA/QC objectives, laboratory QA/QC
samples are analyzed. The procedures and samples described in the following sections are implemented
during analytical activities. Details regarding sampling and analysis procedures are provided earlier in the
SAP. The following QA/QC samples will be analyzed by the laboratory:
Trip blanks (supplied by laboratory);
Equipment blanks (supplied by Facility);
Field duplicates (supplied by Facility);
Laboratory preparation blanks;
Laboratory control samples (LCS) (and if applicable laboratory control sample duplicate
[LCSD];
MS/MSD samples (extra volume supplied by Facility); and
Detectability check standards.
In addition to QC samples, sample specific quality control is implemented for organic analyses by
evaluating surrogate recoveries and internal standard areas.
QC samples are prepared and documented in the same manner as field samples. Tables 6 through 9
summarize quality control requirements for each method used in the detection, compliance and corrective
action monitoring programs.
7.5.1 Method Detection Limit, Method Quantitation Limit, and Sample Detection
Limit
The method detection limit (MDL) is the defined in 40 CFR 136 as the minimum concentration of an
analyte the laboratory would measure and report with 99% confidence that the analyte concentration is
greater than zero. The MDL is determined for each analyte in a reagent matrix. The MDL can be
determined using the procedures specified in 40 CFR Part 136, Appendix B (as amended), using reagent
matrices that are both laboratory grade aqueous and solid materials. The MDL is verified through
quarterly analyses of detectability check standards.
The method quantitation limit (MQL) is the lowest non-zero standard concentration in the laboratory’s
initial calibration curve based on the laboratory’s standard operating procedures (SOPs) for initial sample
mass or volume and the final mass or volume after preparation. Therefore, the MQL is method specific.
Generally, the MQL is five to ten times higher than the MDL.

Permit No. HW-50078-000 Revision 9
Phillips 66 Company – Borger Refinery, Texas December 2017
Volume IV • Compliance Plan Section XI – Attachment C Page 25
The sample detection limit (SDL) is the MDL adjusted to reflect sample-specific actions, such as dilution
or change in aliquots for analysis and sample-specific characteristics, such as moisture content. Non-
detected results are reported as less than the numeric value of the SDL. Concentrations greater than the
SDL but less than the MQL are reported as estimated (“J”) by the laboratory.
7.5.2 Quality Control Measures
In addition to the QC samples discussed for sampling procedures, laboratory QC samples include LCS,
laboratory blanks, and MS/MSD samples. Surrogate recoveries and internal standard areas are used to
evaluate the method performance for individual samples. Table 9 lists surrogates for organic analyses.
LCS and MS/MSD will be spiked with all the COCs specified for the project.
Laboratories generate statistically-derived control limits in accordance with method or accreditation
requirements to determine internal acceptability for LCS, MS/MSD and surrogate recoveries and
LCS/LCSD and MS/MSD precision. These control limits are updated periodically and reflect the variety of
samples analyzed by the laboratory. Table 9 lists acceptance criteria for contractor data review and Data
Usability Summaries (DUS). These acceptance criteria are suitable for detection, compliance, and
corrective action monitoring.
7.6 Instrument/Equipment Testing, Inspection, and Maintenance
The purpose of this element is to specify procedures used to verify that instruments and equipment are
maintained in sound operating condition and are capable of acceptable performance. A proactive
preventative maintenance program minimizes downtime and improves analytical performance.
7.6.1 Field Equipment
Acceptable performance for field equipment is defined as meeting the instrument performance and
calibration requirements listed in Table 5. The field contractors shall have a preventative maintenance
program in place to minimize the downtime of crucial sampling equipment due to unexpected component
failure. Maintenance responsibilities are assigned to the Field Investigation Manager who shall establish
maintenance procedures and schedules for each major equipment item. The responsibility may be
delegated to field personnel, although the manager retains responsibility for ensuring adherence to the
protocols and procedures.
Manufacturers’ recommendations provide the primary basis for establishing maintenance schedules. In
addition to a schedule for maintenance activities, the field contractors shall maintain an adequate
inventory of spare parts that are subject to frequent failures, have a limited useful lifetime or cannot be
obtained in a timely manner should failure occur. Maintenance and repair of field equipment shall be
recorded in field notebooks. These records shall document the serial numbers of the equipment, the
person performing the maintenance or repairs, the date of the repair, and the procedures used during the
repair.
7.6.2 Laboratory Equipment
Acceptable performance for field equipment is defined as meeting the instrument performance and
calibration requirements listed in Tables 6 through 8 and laboratory SOPs. The laboratory contractors
shall have a preventative maintenance program in place to minimize the downtime of crucial analytical
equipment due to unexpected component failure. Maintenance responsibilities are assigned to the
Laboratory Manager who shall establish maintenance procedures and schedules for each major
equipment item. The responsibility may be delegated to laboratory personnel, although the manager
retains responsibility for ensuring adherence to the protocols and procedures.

Permit No. HW-50078-000 Revision 9
Phillips 66 Company – Borger Refinery, Texas December 2017
Volume IV • Compliance Plan Section XI – Attachment C Page 26
Manufacturers’ recommendations provide the primary basis for establishing maintenance schedules. In
addition to a schedule for maintenance activities, the laboratory contractors shall maintain an adequate
inventory of spare parts that are subject to frequent failures, have a limited useful lifetime or cannot be
obtained in a timely manner should failure occur. Maintenance and repair of laboratory equipment shall
be recorded in laboratory notebooks. These records shall document the serial numbers of the equipment,
the person performing the maintenance or repairs, the date of the repair, and the procedures used during
the repair.
7.7 Instrument Calibration and Frequency
The purpose of this element is to define calibration procedures that will be used to generate environmental
measurements. Calibration frequency is specified in the field and laboratory SOPs. Calibration
procedures utilize standards that are traceable to National Institute of Standards and Technology
materials (NIST). Field equipment will be calibrated according to manufacturer’s specifications prior to
use in the field. Laboratory equipment will be calibrated and standardized prior to sample analysis.
Specific requirements for calibration and standardization of analytical instruments are described in the field
and laboratory SOPs. Instrument/equipment calibration and frequency must be consistent with the
accreditation agency criteria.

Permit No. HW-50078-000 Revision 9
Phillips 66 Company – Borger Refinery, Texas December 2017
Volume IV • Compliance Plan Section XI – Attachment C Page 27
8.0 Data Management
This element describes the laboratory deliverables, electronic data deliverables, and data review
requirements.
8.1 Laboratory Deliverables for Detection Monitoring
The summary data package should be provided within the specified turnaround time. Each summary
data package should contain the current version of Table D1.2 (Laboratory Data QA/QC Report Checklist)
from the (TCEQ) Quality Assurance Project Plan for Environmental Monitoring and Measurement
Activities Relating to the Resource Conservation and Recovery Act (RCRA) and Underground Injection
Control (UIC). The data package should also contain the following items:
Completed C-O-C documentation;
Sample identificationcross-reference;
Test reports for samples;
Surrogate recoveries for organic parameters;
Test reports or summary forms for laboratory blank samples;
Test reports or summary forms for LCS (and LCSD, if applicable);
Test reports or summary forms for MS/MSD;
MQLs; and
Other problems and anomalies.
Instrument printouts, laboratory notebook records, calibration, instrument performance records and other
supporting data are not required as part of the summary data package. These supporting data are
archived by the laboratory for a minimum of 5 years and made available by the laboratory upon request by
TCEQ or the facility.
8.2 Laboratory Deliverables for Compliance and Corrective Action Monitoring
The summary data package should be provided within the specified turnaround time. Each summary
data package should contain Laboratory Review Checklist(s) (LRC), any associated exception reports
(ER), and the reportable data. LRCs and ERs should generally comply with the requirements of the
TCEQ guidance document RG-366/TRRP-13 (Review and Reporting of COC Concentration Data). The
data package should also contain the following items:
Completed C-O-C documentation;
Sample identificationcross-reference;
Test reports for samples;
Surrogate recoveries for organic parameters;
Test reports or summary forms for laboratory blank samples;

Permit No. HW-50078-000 Revision 9
Phillips 66 Company – Borger Refinery, Texas December 2017
Volume IV • Compliance Plan Section XI – Attachment C Page 28
Test reports or summary forms for LCS (and LCSD, if applicable)
Test reports or summary forms for MS/MSD
MQLs; and
Other problems and anomalies.
Instrument printouts, laboratory notebook records, calibration, instrument performance records and other
supporting data are not required as part of the summary data package. These supporting data are
archived by the laboratory for a minimum of 5 years and made available by the laboratory upon request by
TCEQ or the facility
8.2.1 Electronic Data Deliverables
Data is maintained for the project in an electronic database. The laboratory will submit electronic data
deliverables in a format suitable for input into the project database. The electronic deliverable format will
be specified by Phillips 66. Tables summarizing groundwater, surface water, and sediment data will be
prepared from the database to minimize transcription errors. Data for input into statistical programs will
also be derived from the database to minimize transcription errors.
8.3 Data Review
Data undergoes two reviews prior to submittal to the TCEQ in the monitoring reports. Data are initially
reviewed by the laboratory to determine if it meets their quality control criteria. Deviations from the quality
control criteria are documented by the laboratory in Table D1.2 for detection monitoring or in the
LRCs/ERs for compliance or corrective action monitoring. After submittal of the data to Phillips 66, data
are reviewed for usability and reporting in the specific project reports.
8.3.1 Laboratory Data Review
This element includes checking for data entry, transcription, calculation, reduction, and transformation
errors. The laboratory analyst is responsible for the reduction of raw data and shall clearly identify any
problems or anomalies that might affect the quality of the data. The analyst shall review 100 percent of
the data and shall verify that data reduction protocols are correct. At least 10% of the data shall be
reviewed independently by a senior analyst or by the supervisor of the laboratory analyst. Both the
analyst and independent review shall include:
< Calibrations and calibration verifications;
< Instrument and system performance checks;
< Instrument calibrations;
< Blanks;
< LCS recoveries and precision (if LCSD analyzed);
< MS/MSD recoveries and precision;

Permit No. HW-50078-000 Revision 9
Phillips 66 Company – Borger Refinery, Texas December 2017
Volume IV • Compliance Plan Section XI – Attachment C Page 29
< Duplicate sample precision (if applicable to the method);
< Compound identification and quantification;
< System monitoring or surrogate recoveries (if applicable to the method);
< Internal standard areas (if applicable to the method);
< Serial dilutions (if applicable to the method);
< Interference check sample results (if applicable to the method);
< Post-digestion spike recoveries (if applicable to the method); and
< Other problems and anomalies.
The laboratory QA section shall review the completed data packages and perform a reasonableness
check review on the completed data packages. The QA section shall ensure that all deliverables are
present, that qualifiers have been applied to the data, and that nonconformance and other issues have
been addressed in the case narrative, Table D1.2 (Laboratory Data QA/QC Report Checklist), or
laboratory review checklists (LRCs)/exception reports (ERs).
8.3.2 Data Verification for Detection Monitoring
The analytical data package is transmitted electronically to Phillips 66 or their contractor following
completion of the laboratory review process described above. One hundred percent of the definitive data
undergoes data verification. The specific measures evaluated during verification are specified below:
< Sample preservation and holding times;
< Instrument and system performance checks;
< Instrument calibrations;
< Blank contamination (laboratory method blanks and field-generated blanks);
< Accuracy (MS/MSD and LCS/LCSD recoveries);
< Precision (field and laboratory duplicate results; MS/MSD results; LCS/LCSD results; total and
dissolved metals results; dual column gas chromatographic results);
< System monitoring or surrogate recoveries (if applicable to method);
< C-O-C; and

Permit No. HW-50078-000 Revision 9
Phillips 66 Company – Borger Refinery, Texas December 2017
Volume IV • Compliance Plan Section XI – Attachment C Page 30
< Table D1.2. (Laboratory Data QA/QC Report Checklist).
The data verification process is designed to evaluate the QC measures where rejection of data would most
likely occur ensuring that the vast majority of cases resulting in data rejection would be identified. If the
data verification process indicates that data should be rejected, then the affected monitoring well is
resampled for the affected parameter(s).
8.3.3 Data Verification for Compliance and Corrective Action Monitoring
The analytical data package is transmitted electronically to Phillips 66 or their contractor following
completion of the laboratory review process described above. Data validation/verification is completed
following the requirements of the TCEQ guidance document Review and Reporting of COC Concentration
Data (RG-366/TRRP-13) (TCEQ, 2010). One hundred percent of the definitive data undergoes data
verification. The specific measures evaluated during verification are specified below:
< Sample preservation and holding times;
< Instrument and system performance checks;
< Instrument calibrations;
< Blank contamination (laboratory method blanks and field-generated blanks);
< Accuracy (MS/MSD and LCS/LCSD recoveries);
< Precision (field and laboratory duplicate results; MS/MSD results; LCS/LCSD results; total and
dissolved metals results; dual column gas chromatographic results);
< System monitoring or surrogate recoveries (if applicable to method);
< C-O-C; and,
< LRCs/ERs.
Raw data for the field and QC samples are not evaluated during the data verification process; however, the
data verification process is designed to evaluate the QC measures where rejection of data would most
likely occur.
Data qualifiers and the protocols for evaluation of data usability are described in the RG-366/TRRP-13
guidance document Review and Reporting of COC Concentration Data. All data received from the
laboratory is validated by means of a Data Usability Summary (DUS), which includes an examination of
the following:
< Reportable data;
< LRC and associated ERs for the reportable and supporting data;

Permit No. HW-50078-000 Revision 9
Phillips 66 Company – Borger Refinery, Texas December 2017
Volume IV • Compliance Plan Section XI – Attachment C Page 31
< Field notes and data associated with the sampling event(s); and
< Project objectives.
DUS are generated that includes a review of the deficiencies identified in the data, qualifiers identifying
biases and unreliable data, assessments of field and laboratory performance, overall precision and
accuracy, and representativeness and completeness of the data set. The DUS should provide the
following information:
< Samples and analytical parameters reviewed;
< Field data reviewed;
< QC parameters reviewed;
< Review criteria for each QC parameter;
< Specific samples and constituents that did not meet criteria and applied qualifiers;
< Usability of the data; and
< Appropriateness of laboratory’s demonstration that “available technology” was used to minimize
the sample quantitation limit (SQL), as discussed in 30 TAC 350.51(d) and 350.79.
The DUS will be included in the compliance and corrective action reports submitted to the TCEQ.
8.3.4 Data Reporting
Reports summarizing the sampling, analytical and evaluation results are prepared and submitted to the
TCEQ in accordance with the schedules listed in the RCRA Part B Permit and Compliance Plan. Data are
presented in summary tables, figures and data analyses. Appendices containing field sampling sheets,
laboratory reports, data usability summaries and statistical evaluations are also included in the reports.

Permit No. HW-50078-000 Revision 9
Phillips 66 Company – Borger Refinery, Texas December 2017
Volume IV • Compliance Plan Section XI – Attachment C Page 32
9.0 References
ConocoPhillips. 2007. Facility Operations Area Application. Step 3. December 2007.
Texas Commission on Environmental Quality (TCEQ). 2010. Review and Reporting of COC Concentration
Data. Regulatory Guidance RG-366/TRRP-13. Revised May 2010 (and subsequent updates).
Texas Commission on Environmental Quality (TCEQ). 2010. Quality Assurance Project Plan for
Environmental Monitoring and Measurement Activities Relating to the Resource Conservation and
Recovery Act (RCRA) and Underground Injection Control (UIC). Fiscal Year 2011 and subsequent
updates.
Texas Natural Resource Conservation Commission (TNRCC). 2001. Total Petroleum Hydrocarbons,
TNRCC Method 1005, Revision 03, July 1, 2001 (and subsequent updates).
U.S. Environmental Protection Agency (USEPA). 1983. Methods for the Chemical Analysis of Water and
Wastes (EPA 600/4-79-020, March 1983), listed in Federal Register on March 12, 2007 (Volume 72, No.
14, pg 11200) and subsequent updates.
U.S. Environmental Protection Agency (USEPA). 1986. EPA Test Methods for Evaluating Solid Waste -
Physical/Chemical Methods", EPA Publication SW-846, 3rd Edition, listed in the Federal Register on
January 3, 2008 (Volume 73, No. 2, pg 486) and subsequent updates.
U.S. Environmental Protection Agency (USEPA). 2009. Statistical Analysis of Groundwater Monitoring
Data at RCRA Facilities. Unified Guidance. Office of Resource Conservation and Recovery. EPA 530- 4-
09-007. March 2009.

Permit No. HW-50078-000 Revision 10
Phillips 66 Company – Borger Refinery, Texas January 2020
Volume IV • Compliance Plan Section XI – Attachment C Page 33
Table 1 Parameters List, Analytical Methods and Method Quantitation Limits (MQLs) for Detection
Monitoring
Parameter CAS RN1 Method2 Aqueous MQL (mg/L)
Chromium (tri) 7440-47-3 SW 6010C/6020A 0.010
Lead 7439-92-1 SW 6010C/6020A 0.005
2-Methylphenol (o-Cresol) 95-48-7 SW 8270D 0.010
4-Methylphenol (p-Cresol) 106-44-5 SW 8270D 0.010
Phenol 108-95-2 SW 8270D 0.010
Benzene 71-43-2 SW 8260B 0.001
Toluene 108-88-3 SW 8260B 0.001
Methanol 67-56-1 SW 8015C 1.0
1 Chemical Abstracts Service Registry Number2 SW: USEPA 1986; MCAWW: USEPA 1983; Method references are updated if USEPA modifies the list of promulgated
or approved methods.
MQL – Method Quantitation Limit.
NA – Not Available

Permit No. HW-50078-000 Revision 10
Phillips 66 Company – Borger Refinery, Texas January 2020
Volume IV • Compliance Plan Section XI – Attachment C Page 34
Table 2 Chemicals of Concern List, Analytical Methods and Method Quantitation Limits (MQLs) for
Compliance or Corrective Action Monitoring
Parameter CAS RN1 Method2 Aqueous
MQL (mg/L)
Solid MQL
(mg/Kg)
Antimony 7440-36-0 SW 6010C/6020A 0.005 0.5
Arsenic 7440-38-2 SW 6010C/6020A 0.005 5
Barium 7440-39-3 SW 6010C/6020A 0.005 20
Beryllium 7440-41-7 SW 6010C/6020A 0.001 5
Cadmium 7440-43-9 SW 6010C/6020A 0.001 0.5
Chromium (tri) 7440-47-3 SW 6010C/6020A 0.005 5
Cobalt 7440-48-4 SW 6010C/6020A 0.005 5
Lead 7439-92-1 SW 6010C/6020A 0.005 5
Mercury 7439-97-6 SW 7470A 0.0002 0.013
Nickel 7440-02-0 SW 6010C/6020A 0.005 5
Selenium 7782-49-2 SW 6010C/6020A 0.005 0.5
Silver 7440-22-4 SW 6010C/6020A 0.005 0.5
Vanadium 7440-62-2 SW 6010C/6020A 0.005 5
Zinc 7440-66-6 SW 6010C/6020A 0.005 5
Cyanide 57-12-5 SW 9010/9014 0.02 NA
Fluoride 7681-49-4* MCAWW 300.0 0.1 NA
Sulfide 7783-06-4** SW 9030/9034/9215 1 NA
Ethylene glycol 107-21-1 SW 8015M 25 NA
Methanol 67-56-1 SW 8015C 1.0 NA
Dieldrin 60-57-1 SW 8081B 0.00005 NA
Endosulfan I (alpha) 959-98-8 SW 8081B 0.00005 NA
Isodrin 465-73-6 SW 8081B 0.00001 NA
Acetone 67-64-1 SW 8260B 0.005 0.010
Benzene 71-43-2 SW 8260B 0.001 0.005
Bromomethane 74-83-9 SW 8260B 0.001 0.005
2-Butanone (Methyl ethyl ketone) 78-93-3 SW 8260B 0.002 0.010
Carbon disulfide 75-15-0 SW 8260B 0.001 0.005
Chlorobenzene 108-90-7 SW 8260B 0.001 0.005
Chloroform 67-66-3 SW 8260B 0.001 0.005
Chloromethane 74-87-3 SW 8260B 0.001 0.005
1,4-Dichlorobenzene 106-46-7 SW 8260B 0.001 0.005
1,1-Dichloroethane 75-34-3 SW 8260B 0.001 0.005
1,2-Dichloroethane 107-06-2 SW 8260B 0.001 0.005
cis-1,2-Dichloroethene 156-59-2 SW 8260B 0.001 0.005
Ethylbenzene 100-41-4 SW 8260B 0.001 0.005
Ethyl ether 60-29-7 SW 8260B 0.010 NA
Iodomethane (Methyl iodide) 74-88-4 SW 8260B 0.001 NA

Permit No. HW-50078-000 Revision 10
Phillips 66 Company – Borger Refinery, Texas January 2020
Volume IV • Compliance Plan Section XI – Attachment C Page 35
Table 2 Chemicals of Concern List, Analytical Methods and Method Quantitation Limits (MQLs) for
Compliance or Corrective Action Monitoring
Parameter CAS RN1 Method2Aqueous
MQL (mg/L)
Solid MQL
(mg/Kg)
Methyl tert-butyl ether 1634-04-4 SW 8260B 0.001 0.005
Methylene chloride 75-09-2 SW 8260B 0.001 0.005
Naphthalene 91-20-3 SW 8260B 0.001 0.005
2-Nitropropane 76-46-9 SW 8260B 0.040 NA
Styrene 100-42-5 SW 8260B 0.001 0.005
Tetrachloroethene 127-18-4 SW 8260B 0.001 0.005
Toluene 108-88-3 SW 8260B 0.001 0.005
Trichloroethene 79-01-6 SW 8260B 0.001 0.005
1,2,4-Trimethylbenzene 95-63-6 SW 8260B 0.001 0.005
1,3,5-Trimethylbenzene 108-67-8 SW 8260B 0.001 0.005
Vinyl chloride 75-01-4 SW 8260B 0.001 0.005
Xylenes, total 1330-20-7 SW 8260B 0.005 0.015
Acenaphthene *T 83-32-9 SW 8270D 0.005 0.33
Acenaphthylene *T 208-96-8 SW 8270D 0.005 0.33
Acetophenone 98-86-2 SW 8270D 0.010 0.33
Anthracene *T 120-12-7 SW 8270D 0.0001 0.33
Benzenethiol (thiophenol) 108-98-5 SW 8270D 0.020 0.33
Benzo(a)anthracene *T 56-55-3 SW 8270D 0.0001 0.33
Benzo(b)fluoranthene *T 205-99-2 SW 8270D 0.0001 0.33
Benzo(k)fluoranthene *T 207-08-9 SW 8270D 0.0001 0.33
Benzo(ghi)perylene *T 191-24-2 SW 8270D 0.005 0.33
Benzo(a)pyrene *T 50-32-8 SW 8270D 0.0001 0.33
Benzyl alcohol 100-51-6 SW 8270D 0.005 NA
bis(2-Ethylhexyl)phthalate 117-81-7 SW 8270D 0.005 0.33
Chrysene *T 218-01-9 SW 8270D 0.005 0.33
Dibenz(a,h)anthracene *T 53-70-3 SW 8270D 0.0001 0.33
Dibenzofuran 132-64-9 SW 8270D 0.005 0.33
7,12-Dimethylbenz(a)anthracene 57-97-6 SW 8270D 0.010 0.33
2,4-Dimethylphenol 105-67-9 SW 8270D 0.010 NA
Fluoranthene *T 206-44-0 SW 8270D 0.005 0.33
Fluorene *T 86-73-7 SW 8270D 0.005 0.33
Indene 95-13-6 SW 8270D 0.010 0.33
Indeno(1,2,3-cd)pyrene *T 193-39-5 SW 8270D 0.0001 0.33
6-Methylchrysene 1705-85-7 SW 8270D 0.010 NA
1-Methylnaphthalene *T 90-12-0 SW 8270D 0.001 0.33
2-Methylnaphthalene *T 91-57-6 SW 8270D 0.001 0.33
3-Methylphenol (m-Cresol) 108-39-4 SW 8270D 0.010 0.33
2-Methylphenol (o-Cresol) 95-48-7 SW 8270D 0.010 0.33
4-Methylphenol (p-Cresol) 106-44-5 SW 8270D 0.010 0.33

Permit No. HW-50078-000 Revision 10
Phillips 66 Company – Borger Refinery, Texas January 2020
Volume IV • Compliance Plan Section XI – Attachment C Page 36
Table 2 Chemicals of Concern List, Analytical Methods and Method Quantitation Limits (MQLs) for
Compliance or Corrective Action Monitoring
Parameter CAS RN1 Method2Aqueous
MQL (mg/L)
Solid MQL
(mg/Kg)
n-Methylpyrrolidone 872-50-4 SW 8270D 0.010 NA
Naphthalene *T 91-20-3 SW 8270D 0.001 0.33
Phenanthrene *T 85-01-8 SW 8270D 0.005 0.33
Phenol 108-95-2 SW 8270D 0.010 0.33
Pyrene *T 129-00-0 SW 8270D 0.005 0.33
Pyridine 110-86-1 SW 8270D 0.010 NA
Sulfolane 126-33-0 SW 8270D 0.010 NA
Total PAHs NA SW 8270D Calculated Calculated
TPH (C06-C12) NA TX1005 1.0 20
TPH (>C12-C28) NA TX1005 1.0 20
TPH (>C28-C35) NA TX1005 1.0 20
This is a comprehensive parameter list for the units in compliance or corrective action monitoring. Analytes for each
unit in corrective action monitoring are specified in Compliance Plan Tables III and IIIA. Analytes for each unit in
compliance monitoring are specified in Compliance Plan Tables IV and IVA.1 Chemical Abstracts Service Registry Number
2 SW: USEPA 1986 and subsequent updates; MCAWW: USEPA, 1983 and subsequent updates; TNRCC, 2001 and
subsequent updates. Method references are updated if USEPA modifies the list of promulgated or approved methods.
MQL – Method Quantitation Limit.
NA – Not Available
*T – Total PAHs
* CAS RN for sodium fluoride
** CAS RN for hydrogen sulfide

Permit No. HW-50078-000 Revision 10
Phillips 66 Company – Borger Refinery, Texas January 2020
Volume IV • Compliance Plan Section XI – Attachment C Page 37
Table 3 Sampling Frequency and Analytes
Sample Event Medium Locations Frequency Analyses
Detection Monitoring GroundwaterRCRA Part BPermit Table
B.VI.A.4
Semiannual RCRA Part B PermitTable VI.B.3.c
Compliance Monitoring GroundwaterCompliance Plan
Table V SemiannualCompliance Plan
Table IVA
Compliance Monitoring GroundwaterCompliance Plan
Table V AnnualCompliance Plan
Table IV
Corrective Action Monitoring(Litharge Impoundment, Old
Caustic Pond, New Caustic Pond)Groundwater
Compliance PlanTable V Semiannual
Compliance PlanTable IIIA (see
specific unit tables)
Corrective Action Monitoring (Area2/West FOA Segment,
Philtex/Sawtooth Canyon/East FOASegment, Southeast Canyon, HP-
7/South Cobles)
GroundwaterSurface Water
Sediment
Compliance PlanTable V
SemiannualCompliance PlanTable IIIA (see
specific unit tables)
Corrective Action Monitoring (West,Northwest, Northeast, East FOA
Segments)
GroundwaterSurface Water
Compliance PlanTable V
Semiannual Compliance PlanTable IIIA (FOA)
Corrective Action Monitoring (West,Northwest, Northeast, East FOA
Segments)
Sediment Compliance PlanTable V
Every Five Years Compliance PlanTable IIIA (FOA)
Corrective Action Monitoring (First-flush storm water)
SurfaceWater
FOA Step 3Application Figures
3-2 to 3-5
Quarterly FirstYear
Compliance PlanTable III (FOA)
Corrective Action Monitoring (First-flush storm water)
SurfaceWater
FOA Step 3Application Figures
3-2 to 3-5
Annually yearstwo through four
Compliance PlanTable IIIA (FOA)
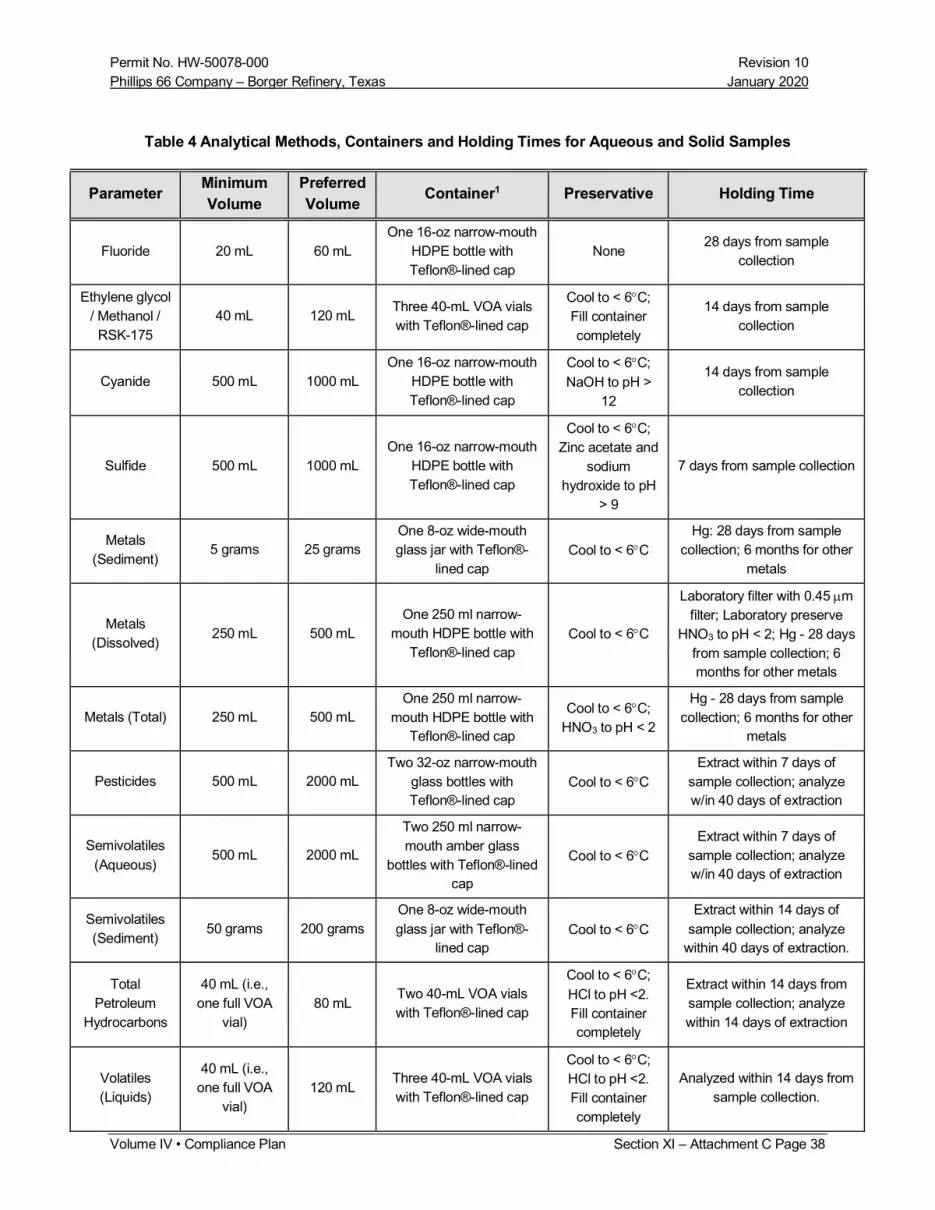
Permit No. HW-50078-000 Revision 10
Phillips 66 Company – Borger Refinery, Texas January 2020
Volume IV • Compliance Plan Section XI – Attachment C Page 38
Table 4 Analytical Methods, Containers and Holding Times for Aqueous and Solid Samples
ParameterMinimum
Volume
Preferred
VolumeContainer1 Preservative Holding Time
Fluoride 20 mL 60 mL
One 16-oz narrow-mouth
HDPE bottle with
Teflon®-lined cap
None28 days from sample
collection
Ethylene glycol
/ Methanol /
RSK-175
40 mL 120 mLThree 40-mL VOA vials
with Teflon®-lined cap
Cool to < 6C;
Fill container
completely
14 days from sample
collection
Cyanide 500 mL 1000 mL
One 16-oz narrow-mouth
HDPE bottle with
Teflon®-lined cap
Cool to < 6C;
NaOH to pH >
12
14 days from sample
collection
Sulfide 500 mL 1000 mL
One 16-oz narrow-mouth
HDPE bottle with
Teflon®-lined cap
Cool to < 6C;
Zinc acetate and
sodium
hydroxide to pH
> 9
7 days from sample collection
Metals
(Sediment)5 grams 25 grams
One 8-oz wide-mouth
glass jar with Teflon®-
lined cap
Cool to < 6C
Hg: 28 days from sample
collection; 6 months for other
metals
Metals
(Dissolved)250 mL 500 mL
One 250 ml narrow-
mouth HDPE bottle with
Teflon®-lined cap
Cool to < 6C
Laboratory filter with 0.45 m
filter; Laboratory preserve
HNO3 to pH < 2; Hg - 28 days
from sample collection; 6
months for other metals
Metals (Total) 250 mL 500 mL
One 250 ml narrow-
mouth HDPE bottle with
Teflon®-lined cap
Cool to < 6C;
HNO3 to pH < 2
Hg - 28 days from sample
collection; 6 months for other
metals
Pesticides 500 mL 2000 mL
Two 32-oz narrow-mouth
glass bottles with
Teflon®-lined cap
Cool to < 6C
Extract within 7 days of
sample collection; analyze
w/in 40 days of extraction
Semivolatiles
(Aqueous)500 mL 2000 mL
Two 250 ml narrow-
mouth amber glass
bottles with Teflon®-lined
cap
Cool to < 6C
Extract within 7 days of
sample collection; analyze
w/in 40 days of extraction
Semivolatiles
(Sediment)50 grams 200 grams
One 8-oz wide-mouth
glass jar with Teflon®-
lined cap
Cool to < 6C
Extract within 14 days of
sample collection; analyze
within 40 days of extraction.
Total
Petroleum
Hydrocarbons
40 mL (i.e.,
one full VOA
vial)
80 mLTwo 40-mL VOA vials
with Teflon®-lined cap
Cool to < 6C;
HCl to pH <2.
Fill container
completely
Extract within 14 days from
sample collection; analyze
within 14 days of extraction
Volatiles
(Liquids)
40 mL (i.e.,
one full VOA
vial)
120 mLThree 40-mL VOA vials
with Teflon®-lined cap
Cool to < 6C;
HCl to pH <2.
Fill container
completely
Analyzed within 14 days from
sample collection.

Permit No. HW-50078-000 Revision 10
Phillips 66 Company – Borger Refinery, Texas January 2020
Volume IV • Compliance Plan Section XI – Attachment C Page 39
Table 4 Analytical Methods, Containers and Holding Times for Aqueous and Solid Samples
ParameterMinimum
Volume
Preferred
VolumeContainer1 Preservative Holding Time
Volatiles
(Sediments)25 grams 25 grams
One 2-oz wide-mouth
glass jar with Teflon®-
lined cap; fill completely
Cool to < 6CAnalyze within 14 days from
sample collection.
Volatiles (Dry
sediments or
Soils)
3 x 5 grams 15 grams
Terracore Sample Kit:
2-oz soil jar, 40-ml VOA
vial methanol preserved,
and 2 40-ml unpreserved
VOA vials
Cool to < 6C
Freeze samples within 48
hours of sample collection;
analyze within 14 days of
sample collection.
Triple the sample volume will be required for aqueous samples and volatiles soils samples designated as matrix spike/matrix spike
duplicates
HDPE – High density polyethylene
VOA – Volatile Organic Analysis
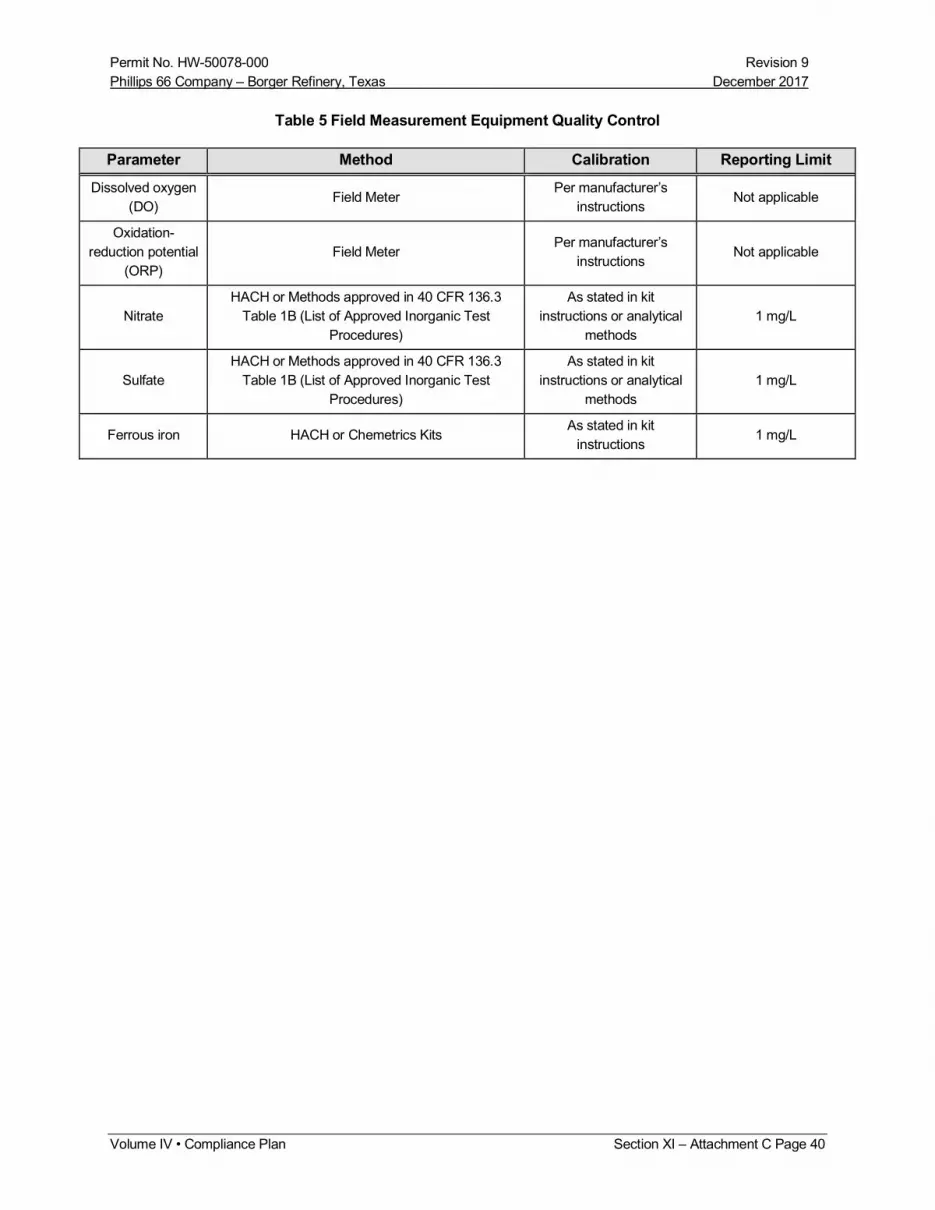
Permit No. HW-50078-000 Revision 9
Phillips 66 Company – Borger Refinery, Texas December 2017
Volume IV • Compliance Plan Section XI – Attachment C Page 40
Table 5 Field Measurement Equipment Quality Control
Parameter Method Calibration Reporting Limit
Dissolved oxygen
(DO)Field Meter
Per manufacturer’s
instructionsNot applicable
Oxidation-
reduction potential
(ORP)
Field MeterPer manufacturer’s
instructionsNot applicable
Nitrate
HACH or Methods approved in 40 CFR 136.3
Table 1B (List of Approved Inorganic Test
Procedures)
As stated in kit
instructions or analytical
methods
1 mg/L
Sulfate
HACH or Methods approved in 40 CFR 136.3
Table 1B (List of Approved Inorganic Test
Procedures)
As stated in kit
instructions or analytical
methods
1 mg/L
Ferrous iron HACH or Chemetrics KitsAs stated in kit
instructions1 mg/L

Permit No. HW-50078-000 Revision 9
Phillips 66 Company – Borger Refinery, Texas December 2017
Volume III • Compliance Plan Section XI – Attachment C Page 41
Table 6 Quality Control Performance Criteria for Inorganic Methods
Quality ControlParameter Metals (Total and Dissolved) Fluoride Cyanide Sulfide
Method SW 6010C / 6020A, 7470A / 7471B SW 9056A / MCAWW 300.0 SW 9010 / 9014 SW 9030 / 9034
MQL See Table 1 or Table 2 See Table 1 or 2 See Table 2 See Table 2
Holding Times See Table 4 See Table 4 See Table 4 See Table 4
Equipment BlankDaily per matrix and equipment type
<MQL
Daily per matrix and equipment
type
<MQL
Daily per matrix and equipment type
<MQL
Daily per matrix and equipment type
<MQL
Field Duplicate
1 every 10 samples
30 RPD (aqueous)
50 RPD (solid)
1 every 10 samples
30 RPD (aqueous)
1 every 10 samples
30 RPD (aqueous)
1 every 10 samples
30 RPD (aqueous)
Trip Blank NA NA NA NA
Preparation
(Laboratory) Blank
Daily per digestion batch (maximum
20 samples) per matrix
< MQL
Daily per analysis batch (maximum
20 samples) per matrix
< MQL
Daily per distillation batch
(maximum 20 samples) per matrix
<MQL
Daily per analysis batch (maximum
20 samples)
<MQL
Initial Calibration
and Calibration
Verification and
Interference Check
Sample
Analyze blank and three
concentrations for initial calibration
– correlation coefficient > 0.995;
analyze mid-level standard for
calibration verification after every 10
samples - % Recovery 90-110;
Interference check sample at
beginning of run - % Recovery 80 -
Analyze blank and three
concentrations for initial calibration
– correlation coefficient > 0.995;
analyze mid-level standard for
calibration verification after every
10 samples - % Recovery 90-110
Analyze blank and six
concentrations for initial calibration –
correlation coefficient > 0.995;
analyze mid-level distilled standard
for calibration verification after every
10 samples - % Recovery 90-110
Analyze blank and three
concentrations for initial calibration –
correlation coefficient > 0.995;
analyze mid-level standard for
calibration verification after every 10
samples - % Recovery 90-110
Initial Calibration
and Continuing
Calibration Blank
Analyze immediately after each ICV
and CCV
Analyze immediately after each
ICV and CCVNA NA
Surrogate NAEvery sample
% Recovery (Table 9)NA NA
Matrix SpikeOne per 20 samples per matrix
% Recovery / RPD (Table 9)
One per 20 samples per matrix
% Recovery / RPD (Table 9)
One per 20 samples per matrix
%Recovery (Table 9)
One per 20 samples per matrix
%Recovery (Table 9)

Permit No. HW-50078-000 Revision 9
Phillips 66 Company – Borger Refinery, Texas December 2017
Volume III • Compliance Plan Section XI – Attachment C Page 42
Table 6 Quality Control Performance Criteria for Inorganic Methods
Quality ControlParameter
Metals (Total and Dissolved) Fluoride Cyanide Sulfide
Matrix Spike
Duplicate
One per 20 samples per matrix
% Recovery / RPD (Table 9)
One per 20 samples per matrix
% Recovery / RPD (Table 9)
One per 20 samples per matrix
% Recovery / RPD (Table 9)
One per 20 samples per matrix
% Recovery / RPD (Table 9)
Internal Standard NA NA NA NA
Laboratory Control
Sample
Daily per digestion batch per matrix
%Recovery (Table 9)
Daily per analysis batch per matrix
%Recovery (Table 9)
Daily per distillation batch per matrix
%Recovery (Table 9)
Daily per analysis batch per matrix
%Recovery (Table 9)
Identification
CriteriaNA Retention time window S/N 2.5 NA NA
Confirmation
AnalysisNA NA NA NA
Method Detection
Limit Verification
Quarterly during sample analyses
No control limits
Quarterly during sample analyses
No control limits
Quarterly during sample analyses
No control limits
Quarterly during sample analyses
No control limits
Note: These are minimum requirements. Additional quality control measures may be necessary if alternative methods are chosen or methods are updated.
MQL – Method quantitation limit
NA – Not applicableRPD – Relative percent difference
S/N – Signal/noise

Permit No. HW-50078-000 Revision 9
Phillips 66 Company – Borger Refinery, Texas December 2017
Volume III • Compliance Plan Section XI – Attachment C Page 43
Table 7 Quality Control Performance Criteria for Gas Chromatographic Methods
Quality ControlParameter Total Petroleum Hydrocarbons
Ethylene Glycol or Methanol(Alcohols) Pesticides Aromatic Volatiles
Method TX1005 SW 8015C SW 8081B SW 8021B
MQL See Table 2 See Table 1 See Table 2 See Table 1
Holding Times See Table 4 See Table 4 See Table 4 See Table 4
Equipment Blank Daily per matrix and equipment type
<MQL
Daily per matrix and equipment type
<MQL
Daily per matrix and equipment type
<MQL
Daily per matrix and equipment type
<MQL
Field Duplicate 1 every 10 samples
30 RPD (aqueous)
1 every 10 samples
30 RPD (aqueous)
1 every 10 samples
30 RPD (aqueous)
1 every 10 samples
30 RPD (aqueous)
Trip BlankNA NA NA
One per volatiles sample cooler
<MQL
Preparation(Laboratory) Blank Daily per extraction batch (maximum
20 samples) per matrix < MQLDaily per digestion batch (maximum
20 samples) per matrix < MQL
Daily per extraction batch(maximum 20 samples) per matrix
<MQL
One per 12 hour shift (maximum 20samples)
<MQL
Initial Calibrationand Calibration
Verification
Minimum five concentrations: %RSD< 25 or COD > 0.99; Verify daily andevery 20 samples maximum %D
25
Minimum five concentrations: %RSD <20 or COD > 0.99; Verify daily and
every 20 samples maximum %D 20
Minimum five concentrations:%RSD < 20 or COD > 0.99; Verify
daily and every 10 samplesmaximum %D 20
Minimum five concentrations: %RSD< 20 or COD > 0.99; Verify daily andevery 20 samples maximum %D
20
Initial Calibrationand Continuing
Calibration BlankNA NA NA NA
Surrogate One per 20 samples per matrix
%Recovery (Table 9)
One per 20 samples per matrix
%Recovery (Table 9)
Every sample
% Recovery (Table 9)
Every sample
% Recovery (Table 9)
Matrix Spike One per 20 samples per matrix
% Recovery / RPD (Table 9)
One per 20 samples per matrix
% Recovery / RPD (Table 9)
One per 20 samples per matrix
%Recovery (Table 9)
One per 20 samples per matrix
%Recovery (Table 9)
Matrix SpikeDuplicate
One per 20 samples per matrix
% Recovery / RPD (Table 9)
One per 20 samples per matrix
% Recovery / RPD (Table 9)
One per 20 samples per matrix
% Recovery / RPD (Table 9)
One per 20 samples per matrix
% Recovery / RPD (Table 9)
Internal Standard NA NA Optional Optional
Laboratory ControlSample
Daily per extraction batch per matrix
%Recovery (Table 9)
Daily per analysis batch per matrix
%Recovery (Table 9)
Daily per extraction batch per matrix
%Recovery (Table 9)
Daily per analysis batch per matrix
%Recovery (Table 9)

Permit No. HW-50078-000 Revision 9
Phillips 66 Company – Borger Refinery, Texas December 2017
Volume III • Compliance Plan Section XI – Attachment C Page 44
Table 7 Quality Control Performance Criteria for Gas Chromatographic Methods
Quality ControlParameter
Total Petroleum HydrocarbonsEthylene Glycol or Methanol
(Alcohols)Pesticides Aromatic Volatiles
IdentificationCriteria Retention time window S/N 2.5 Retention time window S/N 2.5 Retention time window S/N 2.5 Retention time window S/N 2.5
ConfirmationAnalysis NA NA Second GC column or GC/MS NA
Method DetectionLimit Verification
Quarterly during sample analyses
No control limits
Quarterly during sample analyses
No control limits
Quarterly during sample analyses
No control limits
Quarterly during sample analyses
No control limitsNote: These are minimum requirements. Additional quality control measures may be necessary if alternative methods are chosen or methods are updated.
COD – Coefficient of determination
%D – percent difference
MQL – Method quantitation limit NA – Not applicable
RPD – Relative percent difference
RSD – Relative Standard deviation
S/N – signal/noise

Permit No. HW-50078-000 Revision 9
Phillips 66 Company – Borger Refinery, Texas December 2017
Volume III • Compliance Plan Section XI – Attachment C Page 45
Table 8 Quality Control Performance Criteria for Semivolatile Organic Compounds and Volatile Organic Compounds
Quality Control Parameter Semivolatiles Volatiles
Method SW 8270D SW 8260B
MQL See Table 1 or Table 2 See Table 1 or Table 2
Holding Times See Table 4 See Table 4
Equipment BlankDaily per matrix and equipment type
<MQL
Daily per matrix and equipment type
<MQL
Field Duplicate
1 every 10 samples
30 RPD (aqueous)
50 RPD (solid)
1 every 10 samples
30 RPD (aqueous)
50 RPD (solid)
Trip Blank NA One per volatiles sample cooler <MQL
Preparation (Laboratory) Blank
Daily per extraction batch (maximum 20 samples) permatrix
<MQL
One per 12 hour shift (maximum 20 samples)
<MQL
Initial Calibration and CalibrationVerification
Instrument performance check every 12 hours
Minimum five concentrations: %RSD < 20 or COD > 0.99for CCC; Verify every 12 hours maximum %D 20
Instrument performance check every 12 hours
Minimum five concentrations: %RSD < 20 or COD > 0.99for CCC; Verify every 12 hours maximum %D 20
Initial Calibration and ContinuingCalibration Blank NA NA
SurrogateEvery sample
% Recovery (Table 9)
Every sample
% Recovery (Table 9)
Matrix SpikeOne per 20 samples per matrix
%Recovery (Table 9)
One per 20 samples per matrix
%Recovery (Table 9)
Matrix Spike DuplicateOne per 20 samples per matrix
% Recovery / RPD (Table 9)
One per 20 samples per matrix
% Recovery / RPD (Table 9)
Internal Standard AreaEach sample 50-100% of amount in calibration standard;Retention time within ±30 seconds from last calibration
Each sample 50-100% of amount in calibration standard;Retention time within ±30 seconds from last calibration
Laboratory Control SampleDaily per extraction batch per matrix
%Recovery (Table 9)
Daily per analysis batch per matrix
%Recovery (Table 9)

Permit No. HW-50078-000 Revision 9
Phillips 66 Company – Borger Refinery, Texas December 2017
Volume III • Compliance Plan Section XI – Attachment C Page 46
Table 8 Quality Control Performance Criteria for Semivolatile Organic Compounds and Volatile Organic Compounds
Quality Control Parameter Semivolatiles Volatiles
Identification CriteriaIntensities of characteristic ions maximize in same scan or
within one scanIntensities of characteristic ions maximize in same scan or
within one scan
Method Detection Limit VerificationQuarterly during sample analyses
No control limits
Quarterly during sample analyses
No control limitsNote: These are minimum requirements. Additional quality control measures may be necessary if alternative methods are chosen or methods are updated.
CCC – Calibration Check Compound
COD – Coefficient of determination
%D – percent difference
MQL – Method quantitation limit
NA – Not applicable
RPD – Relative percent difference
RRT – Relative Retention Time
RSD – Relative Standard deviation
S/N – signal/noise

Permit No. HW-50078-000 Revision 9
Phillips 66 Company – Borger Refinery, Texas December 2017
Volume III • Compliance Plan Section XI – Attachment C Page 47
Table 9 – LCS, MS/MSD and Surrogate Precision and Accuracy Acceptance Criteria for Data
Review
AnalyteLCS
MS/MSD Surrogate
Aqueous Solid Aqueous Solid
%R %R RPD %R RPD %R %R
Pesticides
Decachlorobiphenyl NA NA NA NA NA 60-140 60-140
Tetrachloro-m-xylene NA NA NA NA NA 60-140 60-140
Dieldrin 60-140 60-140 30 60-140 40 NA NA
Pesticides not listed above 60-140 60-140 30 60-140 40 NA NA
Polycyclic Aromatic Hydrocarbons
Nitrobenzene-d5 NA NA NA NA NA 60-140 60-140
2-Fluorobiphenyl NA NA NA NA NA 60-140 60-140
Terphenyl-d14 NA NA NA NA NA 60-140 60-140
Acenaphthene 60-140 60-140 30 60-140 40 NA NA
Pyrene 60-140 60-140 30 60-140 40 NA NA
PAHs not listed above 60-140 60-140 30 60-140 40 NA NA
Semivolatile Organic Compounds
Nitrobenzene-d5 NA NA NA NA NA 60-140 60-140
2-Fluorobiphenyl NA NA NA NA NA 60-140 60-140
Terphenyl-d14 NA NA NA NA NA 60-140 60-140
Phenol-d5 NA NA NA NA NA 60-140 60-140
2-Fluorophenol NA NA NA NA NA 60-140 60-140
2,4,6-Tribomophenol NA NA NA NA NA 60-140 60-140
Acenaphthene 60-140 60-140 30 60-140 40 NA NA
Phenol 60-140 60-140 30 60-140 40 NA NA
Pyrene 60-140 60-140 30 60-140 40 NA NA
SVOCs not listed above 60-140 60-140 30 60-140 40 NA NA
Volatile Organic Compounds
1,2-Dichloroethane-d4 NA NA NA NA NA 60-140 60-140
Toluene-d8 NA NA NA NA NA 60-140 60-140
Bromofluorobenzene NA NA NA NA NA 60-140 60-140
Trichloroethene 60-140 60-140 30 60-140 40 NA NA
Benzene 60-140 60-140 30 60-140 40 NA NA
Toluene 60-140 60-140 30 60-140 40 NA NA
Chlorobenzene 60-140 60-140 30 60-140 40 NA NA
VOCs not listed above 60-140 60-140 30 60-140 40 NA NA
Cyanide, Fluoride, Metals

Permit No. HW-50078-000 Revision 9
Phillips 66 Company – Borger Refinery, Texas December 2017
Volume III • Compliance Plan Section XI – Attachment C Page 48
Table 9 – LCS, MS/MSD and Surrogate Precision and Accuracy Acceptance Criteria for Data
Review
AnalyteLCS
MS/MSD Surrogate
Aqueous Solid Aqueous Solid
%R %R RPD %R RPD %R %R
Cyanide 70-130 70-130 30 70-130 30 NA NA
Metals (including mercury) 70-130 70-130 30 70-130 30 NA NA
Methanol, Ethylene glycol, Total Petroleum Hydrocarbons
Methanol 60-140 60-140 30 60-140 40 NA NA
Ethylene glycol 60-140 60-140 30 60-140 40 NA NA
o-Terphenyl (TPH Surrogate) NA NA NA NA NA 60-140 60-140
Trifluoromethylbenzene (TPH
Surrogate)NA NA NA NA NA 60-140 60-140
TPH 60-140 60-140 30 60-140 40 NA NA

Permit No. HW-50078-000 Revision 9
Phillips 66 Company – Borger Refinery, Texas December 2017
Volume III • Compliance Plan Section XI – Attachment C Page 49
FIGURES
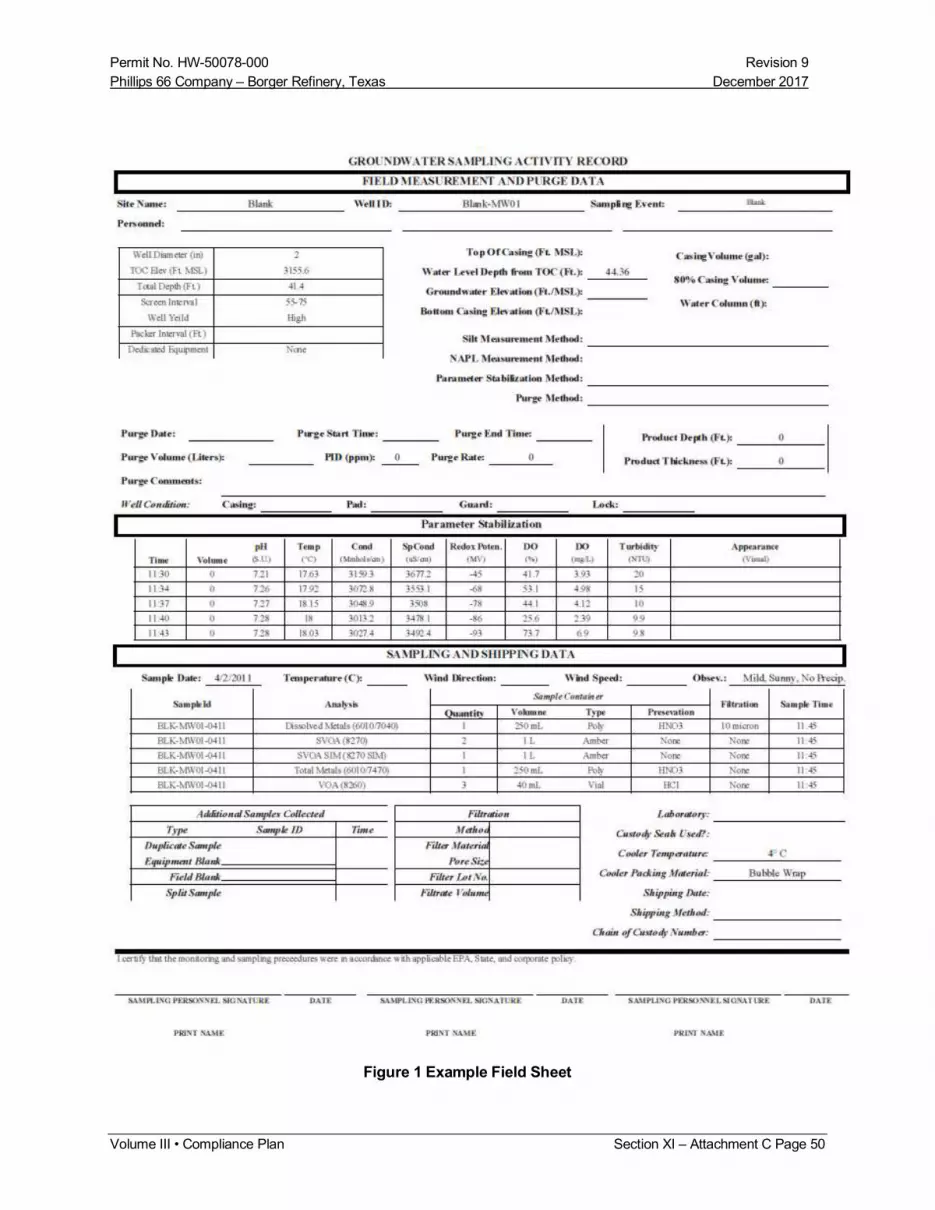
Permit No. HW-50078-000 Revision 9
Phillips 66 Company – Borger Refinery, Texas December 2017
Volume III • Compliance Plan Section XI – Attachment C Page 50
Figure 1 Example Field Sheet

Permit No. HW-50078-000 Revision 9
Phillips 66 Company – Borger Refinery, Texas December 2017
Volume III • Compliance Plan Section XI – Attachment C Page 51
Figure 2 Example Chain-of-Custody

Permit No. HW-50078-000 Revision 9
Phillips 66 Company – Borger Refinery, Texas December 2017
Volume III • Compliance Plan Section XI – Attachment C Page 52
Figure 3 Example Custody Seal (Left) and Sample Label (Right)

Permit No. HW-50078 Rev. 11Phillips 66 – Borger Refinery, Texas May 2020
Vol. II Attachment B.VII.A.3 North Holding Pond Closure Plan i
Attachment B.VII.A.3North Holding Pond Closure Plan
Table of Contents
1.0 Introduction.............................................................................................................................. 1-1
2.0 Closure Activities ..................................................................................................................... 2-1
3.0 Certification.............................................................................................................................. 3-1
4.0 Closure Schedule..................................................................................................................... 4-1
5.0 Closure Cost Estimates............................................................................................................ 5-1
Table 1 – Unit Closure Cost Estimate
Figure B.VII.A.3-1 – Final Cover Design
Figure B.VII.A.3-2 – Cross-Section
Figure B.VII.A.3-3 – Details
Appendix A – Engineering Design Report

Permit No. HW-50078 Rev. 11Phillips 66 – Borger Refinery, Texas May 2020
Vol. II Attachment B.VII.A.3 North Holding Pond Closure Plan 1 - 1
1.0 INTRODUCTION
This closure plan has been prepared to outline the steps that Phillips 66 (P66) will take to close the North
Holding Pond Notice of Registration No. 036 (NOR#036), Hazardous Waste Permit No. 50078. This closure
plan is prepared in accordance with federal (40 CFR §264 Subpart G, 264.310, and §264.113(d)) and state
(30 TAC §335.174) requirements.
Phillips 66 Company (Phillips 66, CN601491608) operates the Borger Refinery (RN102495884), which is
owned by a joint venture between Phillips 66 (P66) and Cenovus called WRB Refining LP (WRB,
CN603215997). The mailing address to the facility is P.O. Box 271, Borger, Texas 79008. The physical
address for the facility is State Highway Spur 119 North, Borger, Texas 79007. P66 has been assigned a
hazardous waste generator number by the U.S. Environmental Protection Agency (EPA) TXD980626774 and
a Texas Commission on Environmental Quality (TCEQ) Solid Waste Notice of Registration Number 30111.
Closure in accordance with this closure plan will begin within 180 days from receipt of the last known
shipment of wastes at the North Holding Pond. Amendments to the plan may be proposed as a result of
unexpected events that occur during closure and affect the ability of the closure plan to be implemented as
designed.
The North Holding Pond is a 3.4-acre double-lined surface impoundment. It is a below-grade unit, constructed
of 3 feet of compacted bentonite amended native soils with an overlying 100-mil HDPE liner. The North
Holding Pond is in partial closure in accordance with the 1998 closure plan. The free liquid has been removed
and the sludge has been stabilized. The impoundment is now being filled with non-hazardous waste. The
partial closure permit modification was approved by TCEQ on April 21, 2004.
Closure of the North Holding Pond will generally consist of final grading to establish positive surface drainage
and compaction followed by the installation of a clay and synthetic impermeable cover system to close the
landfill.

Permit No. HW-50078 Rev. 11Phillips 66 – Borger Refinery, Texas May 2020
Vol. II Attachment B.VII.A.3 North Holding Pond Closure Plan 3 - 1
2.0 CLOSURE ACTIVITIES
Closure certification for North Holding Pond (NOR #036) will be submitted to TCEQ upon completion of final
closure activities in accordance with federal (40 CFR §264.115) and state (30 TAC §335.155) requirements.
A detailed engineering design report for the final cover system is included as Appendix A. The final cover
system design is shown in Figure VII.A.3-1 and Figure VII.A.3-2 (previously presented in the 2001 permit
modification). Figure VII.A.3-3 shows additional design details and the previously permitted final cover
system. Closure activities are described below:
1. Waste will be covered with fill material as needed to achieve the desired grade and sloped appropriately.
The fill will be placed using ordinary compaction techniques and compacted to 95% of maximum dry
density and plus or minus three percent moisture content.
2. Final Cover System
a. The final cover system will be constructed in accordance with the CQA Plan (and Technical
Specifications) included in Appendix A. The final cover system consists of the following:
i. A compacted clay liner (CCL) with a thickness of 1 foot and a permeability that is less than or
equal to 1 x 10⁻⁷ centimeters per second (cm/sec) will be placed over the waste and/or fill
material. The clay will have a plasticity index of greater than or equal to 15. A geosynthetic clay
liner (GCL) with a permeability that is less than or equal to 5 x 10⁻⁹ cm/sec will be placed on top
of the CCL.
ii. A 50-mil high density polyethylene (HDPE) or linear low-density polyethylene (LLDPE)
geomembrane with an integrated drainage layer, will be placed over the GCL.
iii. A layer of engineered turf will be placed on top of the geomembrane’s integrated drainage layer.
The engineered turf will consist of synthetic blades of grass looped through two layers of 6-ounce
woven geotextiles.
iv. A 0.5” layer of sand ballast will be incorporated on the surface of the engineered turf.
3. Stormwater run-on to the final cover system will be eliminated by the elevation of the final cover system
over surrounding areas. Drainage patterns around the closure unit will be established to promote drainage
away from the unit, by grading of surrounding soils. The slope of the final cover system will be a
minimum of 2% and a maximum of 5%. The run-on control system will be capable of preventing flow
onto the final cover system during peak discharge from at least a 100-year storm. The run-off control

Permit No. HW-50078 Rev. 11Phillips 66 – Borger Refinery, Texas May 2020
Vol. II Attachment B.VII.A.3 North Holding Pond Closure Plan 3 - 2
system will be capable of collecting and controlling the water volume resulting from a 24-hour, 100-year
storm. Run-on and run-off collection and holding facilities will be managed after storms to maintain
design capacity of the system. Run-on and run-off will be managed to prevent eroding or otherwise
damaging the final cover. A detailed stormwater analysis is included in Appendix A.
4. Areas outside the final cover system that are regraded or otherwise disturbed during closure activities will
be seeded with native species.
5. Appropriate signs will be placed around the closed site.
6. Fencing will be maintained around the closed site.
7. Six brass benchmarks will be permanently mounted on concrete pads on the final cover system. The
benchmarks will be spaced across the surface of the final cover system. The location and elevations of the
benchmarks will be surveyed at the completion of construction activities, relative to the nearest existing
survey monument. The location and elevation of the benchmarks may be used to evaluate potential
settlement during the post-closure period.
8. Hazardous wastes are not expected to be contacted during construction due to previous removal and
stabilization measures, and subsequent placement of non-hazardous solid waste. In the event that
hazardous wastes are encountered during construction, equipment that contacts hazardous waste will be
decontaminated with high-pressure water. Wash water will be collected in the wash rack drainage system
and pumped to the refinery’s wastewater treatment system, or transported to a permitted off-site treatment
or disposal facility. This decontamination will be conducted prior to placing the equipment in service in
non-waste areas.
3.0 CERTIFICATION
A professional engineer licensed by the State of Texas, and a P66 representative, will certify that the North
Holding Pond is closed in accordance with the approved closure plan. After closure activities are completed at
the site, a report will be submitted to the TCEQ which includes the closure certification, a list of the maximum
waste inventory, a description of the maximum extent of the final cover system footprint, a summary of the
activities performed during closure, the results of tests or analyses performed, as-built drawings (including
benchmarks), and a description of anticipated future land use as well as area topography reflecting as-built
conditions.
A notation of the presence and location of waste disposed of in the NHP will be placed in the real property
records of Hutchinson County, Texas when the unit is certified closed, in accordance with 40 CFR §264.116
requirements.

Permit No. HW-50078 Rev. 11Phillips 66 – Borger Refinery, Texas May 2020
Vol. II Attachment B.VII.A.3 North Holding Pond Closure Plan 4 - 1
4.0 CLOSURE SCHEDULE
Provided that significant weather and/or contractor delays do not occur, closure activities for the North
Holding Pond will be completed according to the following schedule:
1. Place unclassified fill 8 weeks
2. Construct final cover system
Installation of CCL and GCL 6 weeks
Installation of geomembrane 4 weeks
Installation of engineered turf 2 weeks
Installation of sand ballast 1 week
3. Reshape Stormwater Run-on/Run-off Controls, Construct Fence 6 weeks
4. Set and Survey Benchmarks 4 weeks
5. Submittal of Closure Report and Certification 12 weeks
Total 43 weeks after the start of closure

Permit No. HW-50078 Rev. 11Phillips 66 – Borger Refinery, Texas May 2020
Vol. II Attachment B.VII.A.3 North Holding Pond Closure Plan 5 - 1
5.0 CLOSURE COST ESTIMATES
Closure costs for the North Holding Pond are provided in Table 1. These closure costs were developed
using a combination of EPA’s preferred software, Costpro 6.0 and using 2019 cost estimates from
material vendors and contractors . Estimates from Costpro are based upon 2007 unit costs; these costs
were updated using standard inflation factors to give 2019 costs.

Permit No. HW-50078 Rev. 11Phillips 66 – Borger Refinery, Texas May 2020
Vol. II Attachment B.VII.A.3 North Holding Pond Closure Plan Tables/Figures/Drawings - 1
Tables/Figures/Drawings for North Holding Pond Closure Plan
Tables
Table 1 – Unit Closure Cost Estimate
Figures
Figure B.VII.A.3-1 – Final Cover Design
Figure B.VII.A.3-2 – Cross-Section
Figure B.VII.A.3-3 - Details
Drawings
None

Permit No. HW-50078 Rev. 11Phillips 66 – Borger Refinery, Texas May 2020
Vol. II Attachment B.VII.A.3 North Holding Pond Closure Plan Tables/Figures/Drawings - 2
Table 1. Unit Closure Cost Estimate1
Task Cost
North Holding Pond
Installation of Unclassified Fill
Installation of Clay layer
Installation of Geosynthetic Clay Liner
Installation of Geomembrane w drainage layer, engineered turf, and sand ballast
Installation of Storm Water Control
Decontamination
Subtotal of Closure Costs
Engineering Expenses (10%)
Survey Plat
Certification of Closure
$31,000
$181,000
$122,000
$568,000
$29,000
$4,000
$935,000
$94,000
$5,000
$10,000
subtotal $1,044,000
Contingency (10% minimum) $104,000
Total Unit Closure Cost $1,224,000 (2019)
1The cost basis for line items in the above table are based on a mixture of 2007 and
2019 costs; these items were adjusted to a common 2019 cost basis in the total
closure cost.

' ' '
NO.
1
2
REVISION
ISSUE FDR APPROVAL
ISSUE FDR APPROVAL
REV. BY DATE REFERENCE DRAWINGS:
CHECKED APPVD. RJ 012212019 CT
ST, CT 5/18/20
CT
ISSUED FOR: APPROVAL
5/18/2020
DSN TH
DWN RJ
CHK CT APD
0 100'
WRB Refining LP NOTIF.#
NOTES:
1. CARE SHALL BE TAKEN DURING CONSTRUCTION NOT TO DISTURB ANY EXISTING MONITORING WELLS, SUMPS, AND FENCE.
CERTIFICATE OF ENGINEER
STATE OF TEXAS ) ) SS:
COUNTY OF HUTCHINSON )
I, CAMERON TWING, HEREBY STATE TO THE BEST OF MY KNOWLEDGE AND UNDERSTANDING THAT THIS DESIGN AND ACCOMPANYING DRAWINGS HAVE BEEN PREPARED BY ME OR UNDER MY DIRECT SUPERVISION IN ACCORDANCE WITH STANDARD AND GENERALLY ACCEPTED ENGINEERING PRACTICES AND PROCEDURES IN EFFECT AT THE TIME.
WO NO. WFA.#
FIGURE B.VII.A.3-1 FINAL COVER DESIGN CROSS REFERENCE:
(IN-PLACE CLOSURE)
NORTH HOLDING POND DOCUMENT #:
BORGER REFINERY BORGER.TX

� i
z 0 � GJ ....J w
�-:J' � (/) li � � <(
& t "',__.. � z If 0 � � � ?i ) ....J ffi w i � � � �
A PROPOSED COVER SYSTEM: EAST-WEST SECTION VIEW SCALE H: 1" = 60' V: 1" = 20'
0 60' .--HORIZONTAL
3000
2995
2990
2985
2980
2975
2970
2965
2960
2955
2950
2945
2940
0 20'
VERTICAL
2995-,----------------------- - - - - - - - - - --------------------------------------,--2995
2990 :::yd::::1:::::;:::1::::::::::::::::::::l:::t:::::::::'.:::.::::::i:::j:::::::: .. :·····:·····'· .. ::tT:·:L::{:::'.::::L:t ·:·:::::;:::::;:J::: .. '····'·· .. ·' .. ::i:::/········'·· ........ ::::::;::··'·····'···::::::::::::t::·:::::t}::::1:::J::··' .......... ; .... ::::::::::::··:::;:::::?:F:f J:}(]:::::!Uf ::i:::+::}:::::::: 2990 . . . . . ... . . . . .. .. . . . . . . . . . . . . . . . . . . . .. .. :·::: y: ·: �:::: :1:: :::=:::::: :: : · :-: : : :: : ::: : :�:::: �:::: :: : : ': �-::: :; : : . 2985 2985
2980
2975
2970
2965
2960
' . - -:- . . -.. ' ... :, .... : .... <· .... ; .... -:- . ... i •••. -�.'.
2955 ... : ... . ; .. . : ..... ;.�\·::·: .... : .. :::: ..... (DESiGNEi:f::FciR·i24 ..... : .. ·:jf?·�t.1 ... :��;,'. .. . · ;. --: .. · .. ,. '., �.. �ff .... : ..... ; ....... :: ..... ; .... /\ .... : .... ; .... 2955 ' · · "' ' · - ' DETENTION ·POND · · · .. 2 .;.. ... · · . , ·. · '·' ·- · 1· ,,._, -.- ,-� . '
2950 .... ! ..... : . . ; ..... \ .. ).\:.:j{f:L�pu�. ·: 1.�q ,�EA)
R g)F 1 i I .'<''I(,; ·· i L �) zsso _ . _. ; ·:::\ .. :: .. ?Tc:>R.M.:.l:V_E!J_T�_.:. --"'.'.::.: ::· . .-,:. . , . <q . 1 I . STOR MWATER . 3_2 ,
2945 .: ..... : .... i. .. ::::: .. :: ... :: .... ., .... r ....... :.::.::.:.::::.¥ .. : .. :::::::.:::::.1 .... : ..... : ..... 3 .. : ...... �����@j������������E������� ,/41 ... , . ...... .. : . ... : .... C HAN NEL, .. : ..... : .. ........ 2945 : · �x1?!1.N.9. GRouNp ?U�_F�c.�.· : .-.:: . ...
·:.: :.: : , : - : : _: ,, --"'. . . _,;,.,-_,"! _ ..,__ . . -. _ _ . ·? 3 ! .. .-:1 :5H:1V:\(DESIGNED.
2940 ·:----·: .. :·,::::::·:::: ... : ............ , ..... : .... : .. ::·::: .... E�IST.ING:. GR.�V.�l JA'(E� .. (� .. ,6 ) ..... _. ..... :--: .... , ..... : ... EXISTING,· BENTON IT[ . .. : ..... , . . ... -....................... ................................ : .. .. ,, ... : .. : .... : ..... , .......... FQR .. ·24., HOU�,·:1 Op.. 2940 1 EXISTING::2'.' :SAN D'.OVERLAI NiW ITH::100.::MIL HDPE [POND LINER '. :T:'.::AMENDED:!C1);{ LINER :(3'.): : .�}f'i:��)�J ·••:••• +:···· ::::,YEA.,R;:s,:OR M.:[EVEt-:JT,) .•
2935+- -- - -�- ----,-----,------.------....-------,------,--�-·---...--- ---.-- --- --.------,------,------,-----......... 2935 - 350 -300 -250 -200 -150 -1 OD -50 0 50 100 150 200 250 300 350
B PROPOSED COVER SYSTEM: NORTH-SOUTH SECTION VIEW SCALE H: 1" = 60' V: 1" =20'
0 60' ;;;;
HORIZONTAL
0 20'
VERTICAL
z 0 � ?i w
NOTES: 1. □RIG INA LL Y INST ALL ED FDR LEAK DETECTION
□F SURF ACE IM P□UND MEN T. HAS F UNCTIONED AS LEACHATE COL LECTION SYSTEM SIN CE PARTIAL CLOSURE IN 2005 AND CONVERSION T O A CL ASS 1 AND 2 NON-HAZ ARD OUS 'wASTE L AN D FIL L.
CERTIFICATE OF ENGINEER
STATE OF TEXAS ) ) SS:
COUNTY OF HUTCHINSON )
I, CAMERON TWING, HEREBY STATE TO THE BEST OF MY KNOWLEDGE AND UNDERSTANDING THAT THIS DESIGN AND ACCOMPANYING DRAWINGS HAVE BEEN PREPARED BY ME OR UNDER MY DIRECT SUPERVISION IN ACCORDANCE WITH STANDARD AND GENERALLY ACCEPTED ENGINEERINGPRACTICES AND PROCEDURES IN EFFECT AT THE TIME.
TRIHYDRO CORPORATION: TEXAS ENGINEERING FIRM F-131 _, ....... ,,, .--:1i� OF 1'!:. \\
/�:.'t···•·" ······�J,. "'*... . •,. 1, /•/ ·•.* I �·····························=·�·� -,_ Cameron John r-..v:ng :
�,·�:.:-·· .. 1"0";�·�·9······: ...... , t-11-., . o...::,:n .·�� t0.(',·• .. <tc- ,c,,-0 .·.::«.:,:'
C ••�s·•.:i:.-:1"-0·-:.•·i-s••
,, S.10,j.;•"··�:;>,....,..,
Dso SIZE 1.0' �1',,,:•..,..;.--- S°iB-2{)
1.5'
Dso SIZE i; __ 1.:..:.·.:::c.O_' 70"-'R�_, m�""- ,,,,� .... -���""
�""'
!ii,,..
l'i!b,. 1.5' z 0
� ?i ....J w
C
FINISHED COM PAC TED
GRADE
STABILIZATIO FABRIC
RIPRAP (D50 SIZE
XIST I NG GROUND
TYPICAL STORMWATER CHANNEL SECTION SCALE: N.T.S.
i1---�- - - - --- - ---------,---�---.--------- - - - - - ----,-
I-SS_U
_E
_D
_F
_O
_R
_·. ------,-------------------r,-N-,-:O=T=
IF--,,.#,-------,�w-=-o-;N---:--:0:--. ----.:-:-w=FA-:-.---;;-#--"""T"".'""'CM-:-OC"""'#..----------------1 _ R EV. BY DATE REFERENCE oRAw,Ncs:
WRB Ret·,n·ing LP � N O. R EVISION APPROVAL 3 CHECKED APPVD. �l------+- - - - -------------+"
"-'='-'--'='+-"
-"-'-"--"-'--1 5/18/2020 � l ISSUE FDR APPROVAL RJ 0122119
!:,z 1----+- -- ------------------+-c_T ______ --t
2 ISSUE FDR APPROVAL ST 5/18/20 D SN TH
_,,
0
i'i:" CT 5/18/20 DWN R J CHK CT
FIGURE B.VII.A.3-2 CROSS SECTIONS
(IN-PLACE CLOSURE)
NORTH HOLDING POND
BORGER REFINERY BORGER,TX
CROSS REFEREN CE:
DOCUMEN T #:
� �D '------'----------------------'------'-- -__J __ _ _ _ _ _ ___________ ___,__;__ ___________ __,_ _________________ _ _ _ _ _ _ ___. ______________ _ _ _ ____ ___,

� g 6 !/! �
i � i I
:,; � r;;
"' I
� §1
PREVIOUSL Y PERMITTED COVER SYSTEM
NATIVE VEGETATION
18" PROTECTIVE SOIL LAYER (UNCLASSIFIED NATIVE SOIL)
FINAL COVER SYSTEM
ENGINEERED TURF WITH 1 /2" SAND BALLAST
CERTIFICATE OF ENGINEER
STATE OF TEXAS ) ) SS:
COUNTY OF HUTCHINSON )
3" SAND AND GRAVEL OVERLAIN BY 8-0UNCE NON-WOVEN GEOTEXTILE
50-MIL LINEAR LOW-DENSITY POLYETHYLENE MICRODRAIN® LINER
I, CAMERON TWING, HEREBY STATE TO THE BEST OF MY KNOWLEDGE AND UNDERSTANDING THAT THIS DESIGN AND ACCOMPANYING DRAWINGS HAVE BEEN PREPARED BY ME OR UNDER MY DIRECT SUPERVISION IN ACCORDANCE WITH STANDARD AND GENERALLY ACCEPTED ENGINEERING PRACTICES AND PROCEDURES IN EFFECT AT THE TIME. 40-MIL HIGH DENSITY
POLYETHYLENE GEOMEMBRANE
I GEOSYNTHETIC CLAY LINER
I COMPACTED CLAY LINER
2' COMPA
UNCLASSIFIED� FILL (TO MEET DESIGN GRADES) TRIHYDRO CORPORATION:
TEXAS ENGINEERING FIRM F-131
'r ...f,\
�; / 9/2SS ,1 ANQ /2 1/jAS . "-
',,, �ON-HAZARDOUS; TOP /Ei_.f 2960.25') /
100-MIL HDPE POND LINER
' '
3' EXISTING BENTONITE AMENDED CLAY
EXISTING GRAVEL LAYER (3-6") EXISTING 2" SAND OVERLAIN WITH 100 MIL HOPE POND EXISTING SAND/GRAVEL LAYER (6")
A CLOSURE CAP: TYPICAL SECTION PREVIOUSLY PERMITTED AND FINAL COVER SYSTEM SCALE:NONE
EXTRUSION WELD 50-MIL LINEAR LOW-DENSITY POLYETHYLENE
AND EXTEND TO ANCHOR TRENCH
ENGINEERED TURF WITH 1 /2" SAND BALLAST
COMPACTED BACKFILL TO 95% MAXIMUM DRY DENSITY
ASTM D698
3%
� -- ---EXTRUSION WELD 50-MIL LINEAR LOW-DENSITY POLYETHYLENE TO 100-MIL HOPE LINER
50-MIL LOW-DENSITY POLYETHYLENE MICRODRAIN® LINER
GEO SYNTHETIC - CLAY LINER
2'
l-2·-l
C TYPICAL DITCH SECTION SCALE: NONE
VALVE STEM
s-1!·.tl)
FIELD WELD LINEAR LOW-DENSITY POLYETHYLENE
TO TOP OF VENT BASE
FIELD WELD LINEAR LOW-DENSITY POLYETHYLENE TO TOP OF VENT BASE
GAS FLOW
D
NOTES,
GAS FLOW
PASSIVE VENT SCALE: NONE
1. DRIGINALL Y INSTALLED FDR LEAK DETECTION OF SURFACE IMPDUNDMENT. HAS FUNCTIONED AS LEACHATE COLLECTION SYSTEM SINCE PARTIAL CLOSURE IN 2005 AND CONVERSION TD A CLASS 1 AND 2 NON-HAZARDOUS w'ASTE LANDFILL.
jt----,-----------------.__,_R-:,EV:-. ....:
-B:::.:.Y��-:,D
-A..:..:.T--=-E
----l
.---R-E -FE- R-E-N-C- E-D-R-A-W-IN_G_
S_:-------,-1-SS_U_E _D _ F_O_R _: ---------,-------------------..-N- O ___ T ___ IF-.#,,....--.--W-O _ N_O_.----r-W-F_A.....,,.#--�M-0-C#�-�
� No. REVISION CHECKED APPVD. APPROVAL WRB Refining LP �--------------------.=c:....:.=:..:.==-i--:....::....:......:....=..:.... 5/18/202D
l-l __ 1_s_su_E_F_□ _
R_A_P_ P_
R_□ _v_
AL ________ --4-�_; __ 4-s_1_1s_12_0
---120
::i DSN TH � s DWN ST g-------------------+-----+------1 � CHK CT
FIGURE B.VII.A.3-3 DETAILS
CIN-PLACE CLOSURE> NORTH HOLDING POND
CROSS REFERENCE:
DOCUMENT #:
� APD BORGER REFINERY BORGER.TX � -� ------------- ---'-------'-- -----'---------------------'-'--"----"- - - - - - - - ------L------------------____:_-_.1._ _ _ _ _ _ _ _ _ _ _________ _J

Permit No. HW-50078 Rev. 11Phillips 66 – Borger Refinery, Texas May 2020
Vol. II Attachment B.VII.A.3 North Holding Pond Closure Plan
Appendices to North Holding Pond Closure Plan
Appendix A – Engineering Design Report

1-0 M:\OtoR\Phillips66\Projects\BorgerRefinery\ProjectDocs\NorthHoldingPond\CapModifications&Design\Reports\202005_ClassIIIPermitMod\ClosurePlan\APP-A_DesignReport\202005_CP-ModificationDesign_RPT.docx
CLOSURE PLAN MODIFICATION – DESIGN REPORT
NORTH HOLDING POND (PERMIT NO. HW-50078)
BORGER REFINERY, BORGER, TEXAS
May 18, 2020
Project #: 42M-002-008
SUBMITTED BY: Trihydro Corporation
1252 Commerce Drive, Laramie, WY 82070

CERTIFICATE OF ENGINEER
I certify that the Closure Plan Modification, which includes the Design Report, for the North Holding Pond Notice of
Registration No. 036, Hazardous Waste Permit No. 50078 and associated structures was prepared by me or under my
direct supervision with federal (40 CFR §264 Subpart G, 264.310) and state (30 TAC §335.174) requirements, and to
the best of my knowledge is true and correct.
��-/_J-20 Cameron John Twing
Registered Professional Engineer No. 105389
Trihydro Corporation # 131
202005_ CP-ModificationDesign_R PT .docx

202005_CP-ModificationDesign_RPT.docx
Table of Contents
1.0 INTRODUCTION ................................................................................................................... 1-1
2.0 BACKGROUND..................................................................................................................... 2-1 2.1 Site Operating and Regulatory History ..................................................................... 2-1 2.2 Site Conditions .......................................................................................................... 2-2
3.0 FINAL COVER SYSTEM ....................................................................................................... 3-1 3.1 Previously Permitted Final Cover System................................................................. 3-1 3.2 Proposed Final Cover System .................................................................................. 3-1 3.3 Regulatory Requirements ......................................................................................... 3-2
4.0 FINAL COVER SYSTEM DESIGN ........................................................................................ 4-1 4.1 Final Cover System Performance and Equivalency Demonstration ......................... 4-1 4.2 Final Cover Erosion and Protection .......................................................................... 4-1 4.3 Final Cover System Stability ..................................................................................... 4-1 4.4 Final Cover System Maintenance ............................................................................. 4-2 4.5 Final Cover System Construction Quality Assurance ............................................... 4-3
5.0 REFERENCES ...................................................................................................................... 5-1
202005_CP-ModificationDesign_RPT.docx
List of Appendices
A. CONSTRUCTION QUALITY ASSURANCE PLAN
B. HELP MODELING MEMO
C. STORMWATER CALCULATIONS MEMO

202005_CP-ModificationDesign_RPT.docx 1-1
1.0 INTRODUCTION
Phillips 66 Company (Phillips 66, CN601491608) operates the Borger Refinery (RN102495884), which is owned by a
joint venture between Phillips 66 (P66) and Cenovus called WRB Refining LP (WRB, CN603215997). This
engineering design report has been prepared to support the proposed final cover system design included in the Closure
Plan, which outlines the steps that P66 will take to close the North Holding Pond (NHP), Notice of Registration
No. 036 (NOR#036), Hazardous Waste Permit No. 50078. This engineering design report is prepared in accordance
with federal (40 CFR §264 Subpart G, 264.310) and state (30 TAC §335.174) requirements.

202005_CP-ModificationDesign_RPT.docx 2-1
2.0 BACKGROUND
The following general information is provided to describe the facility.
2.1 SITE OPERATING AND REGULATORY HISTORY NHP was Registered in 1982 as Solid Waste Management Unit No. 36 under Texas Solid Waste Registration
No. 30111, Hazardous Waste Permit HW-50078, EPA ID TXD980626774. The July 8, 2011 permit HW-50078
application, revised; June 13, 2013, June 28, 2013, December 10, 2013, April 9, 2014, and September 4, 2014;
Modified (Class 1) revised on February 23, 2016, August 22, 2017, and October 11, 2017, and approved on October 25,
2017 [Tracking No. 21896851, RN102495884, CN604065912] authorizes the NHP Closure Plan (Section B.VII.A.3),
Post Closure Care Plan (Section B.VII.C.1), and Engineering Report (Attachment B.V.D.2).
The NHP was constructed in the early 1980’s as a 3.4-acre surface impoundment with a liner system consisting of
3-feet of bentonite amended clay, leak detection system, and 100-mil high-density polyethylene (HDPE) liner. The
NHP’s initial permitted waste capacity was 8.7 million gallons and was first put into service in 1982. The
impoundment received oily sewer water from the Borger Refinery Drop Out Basins, Tank 3003, and Natural Gas
Liquid (NGL) Wastewater System. These liquids were pumped to the Dixon Creek Surge Pond (now closed) prior to
treatment at Dixon Creek wastewater treatment plant (WWTP) and discharge via Outfall 001. A Texas Commission on
Environmental Quality (TCEQ) letter from 1992 acknowledged that P66 reported the NHP leak detection sumps were
receiving liquids, indicating the HDPE liner had been breached. However, P66 maintains that the primary liner (the
bentonite clay liner) has not been compromised, as indicated in approximately 25 years of groundwater monitoring.
The leak detection sumps now essentially function as a leachate collection system.
The NHP was taken out of service in 1994 and replaced by the North Holding Tanks (Tanks 9600 and 9601), which
receive the same oily sewer water. Between 1994 and 2004 the pond received no additional waste and the pond
sediments were stabilized in place with a 15% Portland cement mixture. Phillips 66 received permit authorization from
the TCEQ for a partial closure of the hazardous waste unit, allowing the available headspace remaining in the pond to
be used for non-hazardous remediation related waste materials (mainly hydrocarbon impacted soils). A Class 2 permit
modification application for Permit No. HW-50078 was submitted to the TCEQ on December 22, 2003 to seek
approval to convert the NHP to a Class 1 and 2 non-hazardous waste landfill. The Class 2 permit modification was
approved by the TCEQ on April 21, 2004 and the NHP was closed as a surface impoundment in accordance with
40 CFR 264.228(a)(1), 264.228(a)(2)(i), and 264.228(a)(2)(ii) and the approved Closure Plan in 2005. Following
partial closure, Class 1 and 2 non-hazardous landfill operations began.

2-2 202005_CP-ModificationDesign_RPT.docx
In November of 2016, P66 assessed potential design/construction issues relative to the closure of NHP. Alternative
closure strategies were identified and then incorporated into a letter to Mr. Martin Torres of the TCEQ, RE: Closure
Plan Alternatives, North Holding Pond, WRB Borger Refinery, Phillips 66, Borger, TX, SWR No. 30111: EPA ID
TXD980626774: CN603215997; RN 102495884; CP-50078, dated February 1, 2017 (Phillips 66 2017a). The purpose
of the letter was to provide an overview of the review findings and to provide a basis for discussion of possible
modifications to the approved closure plan. On February 23, 2017 P66 and TCEQ met to discuss the possible
modifications. The TCEQ responded in a letter to Mr. Ben Elliott on April 26, 2017 indicating that proposed
alternatives to the NHP Closure Plan would require completion of a Class 3 permit modification in accordance with
Texas Administrative Code (TAC) 335.69(k)J.3 (TCEQ 2017a).
A Class 1 permit modification was submitted to TCEQ on August 14, 2017 to meet requirements of the TAC for proposed maintenance activities that included (Phillips 66 2017b):
Raising the elevation of the leachate collection system sump access
Repairing tears on the exposed portion of the existing liner system at the banks of the NHP
Repairing erosional features surrounding the permitted NHP area
Removing out-of-service ancillary equipment associated with the historic NHP surface impoundment operations On October 25, 2017, P66 received permit authorization from TCEQ (via Class 1a Modification to HW-50078, Attachment B.V.D.2) to carry out the proposed maintenance activities (TCEQ 2017b). P66 began the maintenance activities in 2017 and completed them in 2019.
On January 31, 2020 P66 submitted a Class 3 permit modification, which included a revised NHP closure plan, revised
post closure plan, and supporting figures (Phillips 66 2020). On March 10, 2020 P66 received draft comments from
TCEQ, which included a request for more information on the NHP final cover system. P66 and TCEQ met via a
conference call on May 1, 2020 to discuss the requested information. The TCEQ formally submitted their comments to
P66 on May 4, 2020. This design report has been prepared in response to the TCEQ comments from May 4, 2020 and
the discussion held on May 1, 2020.
2.2 SITE CONDITIONS NHP is operating as a Class 1 and 2 non-hazardous landfill. There is an estimated 1,034 cubic yards of capacity
remaining in the unit until permitted waste grades are reached. P66 anticipates the landfill will reach capacity in 2022.

202005_CP-ModificationDesign_RPT.docx 3-1
3.0 FINAL COVER SYSTEM
The following information is provided to describe the previously permitted final cover system (FCS) design and the
proposed FCS design. The prepared FCS subgrade will be cleared of existing vegetation and soil stockpiles, remaining
waste disposal/storage pits will be backfilled to match surrounding grades, and the existing surface profile will be
compacted for acceptance of unclassified fill to reach design grades. The Closure Plan calls for placing unclassified fill
material up to the desired grade using ordinary compaction techniques and compacted to 95% of maximum dry density
and plus or minus three percent moisture content. The unclassified fill material will be graded to form a mound in the
center of the impoundment footprint, sloped at 2-5% toward the perimeter, and then covered with a FCS as shown in
Figure B.VII.A.3-2. Materials will be placed in accordance with the Construction Quality Assurance (CQA) plan and
Engineering Specifications (Appendix A).
3.1 PREVIOUSLY PERMITTED FINAL COVER SYSTEM The previously permitted FCS constitutes a traditional Resource Conservation Recovery Act (RCRA) Subtitle C
(Hazardous Waste) FCS, which is designed to provide a low permeability barrier to prevent water infiltration; promote
run-off; and, stabilize the surface. The previously permitted FCS includes the following as shown in
Figure B.VII.A.3-3 (from top to bottom):
1.5-ft topsoil layer
Non-woven geotextile
3-inch (in) sand or gravel layer (or geonet)
40-mil polyethylene membrane
2-foot (ft) compacted clay with a permeability of < 1x10⁻⁷ centimeters per second (cm/sec)
Prepared subgrade
3.2 PROPOSED FINAL COVER SYSTEM The proposed FCS was selected to improve constructability, short term effectiveness, and long-term reliability. The
proposed FCS was designed to improve surface water runoff and provide a lower permeability barrier to water
infiltration in comparison to the previously permitted FCS. Also, the proposed FCS will provide immediate
stabilization of the surface. The proposed FCS will be constructed over any routine or intermediate cover already in
place and include the following as shown in Figure B.VII.A.3-3 (from top to bottom):
Engineered synthetic turf woven into two 6-ounce woven geotextiles, with ½” sand ballast (ClosureTurf®)
MicroDrain® barrier layer (50-mil linear low-density polyethylene (LLDPE), with drainage studs on top side, and MicroSpike® on bottom side)

3-2 202005_CP-ModificationDesign_RPT.docx
Geosynthetic clay liner (GCL) with a permeability of < 1x10⁻⁹ cm/sec
1-ft compacted clay with a permeability of < 1x10⁻⁷ cm/sec
Prepared subgrade
The semi-arid climate and the FCS are expected to reduce the potential for infiltration of precipitation, degradation of
waste, and generation of leachate. In addition, the types of wastes in place in the unit will result in relatively low
landfill gas generation rates. As a protective measure, a minimum of four passive gas vents will be installed to collect
any gasses that accumulate below the geomembrane barrier layer. Based on the performance factors noted above,
degradation and settlement of waste is not expected to be significant and does not warrant additional stability design or
construction measures.
3.3 REGULATORY REQUIREMENTS The FCS must meet the requirements described in 40 CFR Part 264, Subpart K. Specifically, the FCS must meet the
requirements of 40 CFR 264.228(a)(2)(iii), also in 30 Texas Administrative Code (TAC) 335.169(a)(2) listed below.
(iii) Cover the surface impoundment with a final cover designed and constructed to:
(A) Provide long-term minimization of the migration of liquids through the closed
impoundment; 264.228(a)(2)(iii)(A)
(B) Function with minimum maintenance; 264.228(a)(2)(iii)(B)
(C) Promote drainage and minimize erosion or abrasion of the final cover;
264.228(a)(2)(iii)(C)
(D) Accommodate settling and subsidence so that the cover’s integrity is maintained;
and 264.228(a)(2)(iii)(D)
(E) Have a permeability less than or equal to the permeability of any bottom liner
system or natural subsoils present. 264.228(a)(2)(iii)(E)
The analysis considered to demonstrate the FCS is designed in a manner to meet the regulatory requirements listed
above is discussed in the following section.

202005_CP-ModificationDesign_RPT.docx 4-1
4.0 FINAL COVER SYSTEM DESIGN
The following sections provide comparisons between the previously permitted FCS and the proposed FCS and
demonstrate how the proposed FCS meets the regulatory requirements from Section 3.3.
4.1 FINAL COVER SYSTEM PERFORMANCE AND EQUIVALENCY DEMONSTRATION The previously permitted FCS and Proposed FCS were modeled using the Hydrologic Evaluation of Landfill
Performance (HELP) software, which is a standard analysis tool for landfill design. The HELP model demonstrates
that the proposed FCS performed superior to the previously permitted FCS with average annual percolation of
0.00000 inches versus 0.00006 inches through the barrier layer, respectively. The lower annual average percolation of
the proposed FCS demonstrates its performance will exceed or is equivalent to the previously permitted FCS. Detailed
model inputs and results are described in Appendix B.
4.2 FINAL COVER EROSION AND PROTECTION The FCS drainage component and conveyance channels were designed to provide adequate stormwater capacity for a
24 hour, 100-year storm. Most of the precipitation that falls on the site is expected to be managed as surface water run-
off. In 2018, P66 designed and installed a stormwater diversion channel around the east side of NHP to route surface
water run-on around the NHP to a stabilized discharge (Figures B.VII.A.3-1, B.VII.A.3-2). Additionally, the
stormwater channel has the capacity to convey surface water run-off from the NHP once the final cover system is in
place. The stormwater channel typical section is shown on Figure B.VII.A.3-2. Several ditch sections will be graded
around the west side of the NHP during final closure activities to convey the remaining run-on and run-off away from
the FCS (Figures B.VII.A.3-1, B.VII.A.3-2). A typical section is shown on Figure B.VII.A.3-3. Detailed design
calculations for the stormwater capacity are included in Appendix C.
4.3 FINAL COVER SYSTEM STABILITY During hazardous waste stabilization activities completed in 2005 waste materials were mixed with Portland Type I
cement, typically 25% by weight. Stabilized waste materials were required to have a minimum Unconfined
Compressive Strength (UCS) of not less than 20 pounds per square inch (psi) at 7 days, in accordance with
ASTM D2166 (Weston Solutions 2005). The stabilized hazardous waste is unlikely to be significantly further
compressed by placement of the FCS.
Since 2005, non-hazardous waste has periodically been placed and graded in NHP. Construction techniques associated
with placing waste materials in NHP was generally to compact soils to 80 to 90 percent of the maximum dry density.

4-2 202005_CP-ModificationDesign_RPT.docx
Placement and grading of additional waste and fill materials will add weight at the surface and further consolidate the
underlying soils. Additionally, storm events from 2005 to 2020 have periodically inundated the NHP. The saturation
of the surface and the ponding of water in the area resulted in consolidation of the soils in NHP.
Based on field observation and a review of historic soil testing data at the refinery and the soil index properties in the
greater Borger area, it is highly unlikely that soils with shrink/swell related movements would have been deposited in
NHP (Phillips 66 1994). Low to Medium plasticity clay, Plasticity Indices between 10 and 15 have been encountered
in the general area, but it is more likely that granular soils that are evident throughout the refinery were likely placed in
NHP which have very low potential for movement based on the deposition, waste placement techniques, and the fact
that granular soil density increases when fine soil particles are placed and then inundated with stormwater.
The previously permitted FCS thickness is approximately 3.75-feet, while the proposed FCS thickness is approximately
13-inches. The reduced proposed FCS profile and associated load will reduce settlement as a result of consolidation of
the waste mass. Settlement areas, if they occur, under the proposed FCS will be readily identifiable through visual
inspections and easily repaired. Identification of settlement issues associated with final cover systems similar to the
previously permitted FCS may not be as readily identifiable as the soil covered geomembrane will bridge areas
experiencing differential settlement.
4.4 FINAL COVER SYSTEM MAINTENANCE Many typical maintenance activities required for the previously permitted FCS would not be necessary for the proposed
FCS including mowing, erosion control, reseeding, fertilizing, and major storm repair. For the previously permitted
FCS, a soil loss rate of 0.24 ton/acre/year was calculated using the National Resource Conservation Service (NRCS)
Revised Universal Soil Loss Equation (RUSLE), Version 2.5.2.11 modeling software (RUSLE2) (Trihydro 2017). The
memorandum describing the RUSLE2 modeling results was included in the letter from P66 to Martin Torres dated
February 1, 2017 (P66 2017a). The proposed FCS would require sand ballast replacement at a rate of approximately
2% every 5 years according to Watershed Geo, manufacturer of ClosureTurf®. The reduction in activity and equipment
on the FCS necessary for soil replacement reduces the chances of equipment damaging the FCS.
The most critical component of ClosureTurf® relative to UV degradation appears to be the exposed HDPE grass blades
(Geosyntec 2015). Geosyntec demonstrated that a conservative half-life (synthetic turf grass blades lose 50% of their
manufactured tensile strength) of the HDPE grass blades will be on the order of 100 years (Geosyntec 2015). The half-
life has a factor of safety of about 2.8 to 4.0 when considering the tensile capacity performance requirements of the
HDPE grass blades (Geosyntec 2015). Annual sampling for tensile strength in accordance with ASTM D2256 of the

202005_CP-ModificationDesign_RPT.docx 4-3
HDPE grass blades was included in the Post-Closure Plan to verify integrity of the material throughout the post-closure
period. A one-time turf replacement cost was also added to the Post-Closure Plan and cost estimate in the event that
the synthetic turf loses 50% or more of its tensile strength through the post-closure period.
Wind tunnel testing was performed by Georgia Tech Research Institute (GTRI) to evaluate the required amount of sand
ballast for various environmental conditions. The geotextile turf layer of ClosureTurf® is designed to be installed on
top of the geomembrane and to remain in place without an anchoring system linking it to the geomembrane below
(GTRI 2010). Rather, it relies on the interface friction and sand ballast added on top of the turf to ensure that it remains
in place (GTRI 2010). The highest 2-minute wind speed recorded at the Hutchinson County Airport was 55.9 mph in
2013 according to available wind speed data from the National Oceanic and Atmospheric Administration (NOAA)
(NOAA 2020). The highest 5-second wind speed recorded at the Hutchinson County Airport was 94 mph in 2013
(NOAA 2020). Data were available for 1999 to 2019. The wind tunnel testing conducted by GTRI demonstrated that
the proposed FCS could sustain wind speeds up to 174 miles per hour, significantly higher than historical sustained and
peak wind speeds near the NHP.
4.5 FINAL COVER SYSTEM CONSTRUCTION QUALITY ASSURANCE The FCS is considered to be an engineered containment system as it includes a synthetic geomembrane barrier layer. A
CQA plan is provided in Appendix A, with specifications included within. Contract documents, general requirements,
and specifications will be prepared and compiled during the bidding phase of the project, prior to construction.

202005_CP-ModificationDesign_RPT.docx 5-1
5.0 REFERENCES
Georgia Tech Research Institute (GTRI). 2010. Letter to Michael Ayres, Closure Turf, LCC. Re: Aerodynamic
Evaluations of Closure Turf Ground Cover Materials. July 8, 2010.
Geosyntec. 2015. Letter to Jose Urrutia, Watershed Geosynthetics. Re: Literature Review and Assessment of
ClosureTurf® UV Longevity. May 15, 2015.
National Oceanic and Atmospheric Administration (NOAA). 2020. Climate Data Online. Available from:
https://www.ncdc.noaa.gov/cdo-web/search.
Phillips 66. 1994. Letter to Chris Peckham, Texas Commission on Environmental Quality. Re: Phillips 66 Co.
Borger Complex, ISWR No. 30111, North Holding Pond, TNRCC Facility No. 36. January 3, 1994.
Phillips 66. 2017a. Letter to Martin Torres, Texas Commission on Environmental Quality. Re: Closure Plan
Alternatives, North Holding Pond, WRB Borger Refinery, Phillips 66, Borger, TX, SWR No. 30111: EPA ID
TXD980626774: CN603215997; RN 102495884; CP-50078. February 1, 2017.
Phillips 66. 2017b. Letter to Martin Torres, Texas Commission on Environmental Quality. Re: Transmittal of Permit
Application Modification for RCRA Part B Permit and Notification of Maintenance Activities for North
Holding Pond (NHP) NOR Unit #36, Phillips 66, Borger Refinery, Hazardous Waste Permit/Compliance Plan
No. 50078, Industrial Solid Waste Registration No. 30111. August 14, 2017.
Phillips 66. 2020. Letter to Karen Scott, Texas Commission on Environmental Quality. Re: Transmittal of Class 3
Permit Modification Application Phillips 66, Borger Refinery, Hazardous Waste Permit No. 50078, EPA ID #
TXD980626774, Solid Waste Registration No. 30111. January 31, 2020.
Texas Commission on Environmental Quality (TCEQ). 2017a. Letter to Ben Elliott, Phillips 66 Company. Re: North
Holding Pond Closure Cost Alternatives, Phillips 66 - Borger, Hazardous Waste Permit/Compliance Plan No.
50078, Industrial Solid Waste Registration No. 30111, EPA Identification No. 21381125;
RN 102495884/CN603215997. April 26, 2017.

5-2 202005_CP-ModificationDesign_RPT.docx
TCEQ. 2017b. Letter to Justin Evans, Phillips 66. Re: Transmittal of Class 1 Permit and Compliance Plan
Modification, Phillips 66 Company, Borger Refinery – Borger, Hutchinson County, Texas, Hazardous Waste
Permit/Compliance Plan No. 50078, Industrial Solid Waste Registration No. 30111, EPA Identification No.
TXD980626774, Tracking No. 21896851; RN102495884/CN604065912. October 25, 2017.
Trihydro Corporation (Trihydro). 2017. Memorandum to Ken Schreuder, Soil Loss Analysis (RUSLE2), North
Holding Pond Closure, Phillips 66 Borger Refinery. Borger, Texas. January 27, 2017.
Weston Solutions. 2005. Stabilization Report, North Holding Pond, ConocoPhillips Borger Refinery. Borger, Texas.
January 2005.

APPENDIX A
CONSTRUCTION QUALITY ASSURANCE PLAN

202005_CQA-Plan_RPT.docx
CONSTRUCTION QUALITY ASSURANCE PLAN
PHILLIPS 66 NORTH HOLDING POND CLOSURE
BORGER, TEXAS
PERMIT NO. HW-50078
May 18, 2020
Project #: 42M-002-008
SUBMITTED BY: Trihydro Corporation
1252 Commerce Drive, Laramie, WY 82070

202005_CQA-Plan_RPT.docx
Table of Contents
1.0 INTRODUCTION ................................................................................................................... 1-1 1.1 Project Description .................................................................................................... 1-1 1.2 Purpose ..................................................................................................................... 1-1 1.3 Project Organization .................................................................................................. 1-2
1.3.1 Owner............................................................................................................ 1-2 1.3.2 Design Engineer ........................................................................................... 1-2 1.3.3 CQA Certifying Engineer .............................................................................. 1-2 1.3.4 CQA Organization ......................................................................................... 1-2 1.3.5 General Contractor ....................................................................................... 1-3
1.4 CQA Plan Format ...................................................................................................... 1-3
2.0 GENERAL REQUIREMENTS ............................................................................................... 2-1 2.1 Section Summary ...................................................................................................... 2-1 2.2 Product Quality Assurance Verification Testing ........................................................ 2-1 2.3 Construction Monitoring ............................................................................................ 2-2 2.4 Construction Verification Testing .............................................................................. 2-2 2.5 Project Meetings ........................................................................................................ 2-3 2.6 Submittal Review ....................................................................................................... 2-3 2.7 Documentation .......................................................................................................... 2-3
3.0 REFERENCES ...................................................................................................................... 3-1 3.1 Section Summary ...................................................................................................... 3-1 3.2 Project Reference Documents .................................................................................. 3-1 3.3 Industry Standards and Technical Reference Documents ....................................... 3-1 3.4 Soils Testing Standards and Methods ...................................................................... 3-1 3.5 Standard Operating Procedures for Soils Testing .................................................... 3-2 3.6 Geosynthetics Testing Standards and Methods ....................................................... 3-2
4.0 PROJECT MEETINGS .......................................................................................................... 4-1 4.1 Section Summary ...................................................................................................... 4-1 4.2 Preconstruction Meeting ........................................................................................... 4-1 4.3 Progress Meetings .................................................................................................... 4-2 4.4 Preparatory Meetings ................................................................................................ 4-3

202005_CQA-Plan_RPT.docx
Table of Contents (cont.)
5.0 SUBMITTALS ........................................................................................................................ 5-1 5.1 Section Summary ...................................................................................................... 5-1 5.2 Submittal Control Log ................................................................................................ 5-1 5.3 Submittal Review Procedures ................................................................................... 5-1
6.0 DOCUMENTATION ............................................................................................................... 6-1 6.1 Section Summary ...................................................................................................... 6-1 6.2 Daily Summary Reports ............................................................................................ 6-1 6.3 CQA Field Logs ......................................................................................................... 6-2 6.4 Construction and Testing Forms ............................................................................... 6-2 6.5 Testing Reports ......................................................................................................... 6-3 6.6 Corrective Action Determination and Verification Reports ....................................... 6-3 6.7 As-built Record Drawings .......................................................................................... 6-4 6.8 Photographic Documentation .................................................................................... 6-4 6.9 Documentation Control ............................................................................................. 6-5 6.10 Final Certification Report ........................................................................................... 6-6 6.11 Documentation Archive Storage ............................................................................... 6-7
7.0 UNCLASSIFIED FILL CQA................................................................................................... 7-1 7.1 General ...................................................................................................................... 7-1
7.1.1 Section Summary ......................................................................................... 7-1 7.2 Products .................................................................................................................... 7-1
7.2.1 Earthfill .......................................................................................................... 7-1 7.2.2 Product Quality Assurance Verification Testing ........................................... 7-1
7.3 Execution ................................................................................................................... 7-1 7.3.1 Construction and CQA Preparation .............................................................. 7-1 7.3.2 Unclassified Fill CQA Monitoring and Testing .............................................. 7-2 7.3.3 Final Surface Preparation CQA Monitoring .................................................. 7-2 7.3.4 Borrow Area CQA Monitoring ....................................................................... 7-3
8.0 LANDFILL SUBGRADE PREPARATION CQA ................................................................... 8-1 8.1 General ...................................................................................................................... 8-1
8.1.1 Section Summary ......................................................................................... 8-1

202005_CQA-Plan_RPT.docx
Table of Contents (cont.)
8.2 Products .................................................................................................................... 8-1 8.2.1 Product Quality Assurance Verification Testing ........................................... 8-1
8.3 Execution ................................................................................................................... 8-1 8.3.1 Construction and CQA Preparation .............................................................. 8-1 8.3.2 CQA Monitoring ............................................................................................ 8-2
9.0 SOIL LINER CQA .................................................................................................................. 9-1 9.1 General ...................................................................................................................... 9-1
9.1.1 Section Summary ......................................................................................... 9-1 9.1.2 Soils Investigation of Existing Clay Sources ................................................ 9-1 9.1.3 Soil Liner Test Pad Construction .................................................................. 9-1 9.1.4 Submittals ..................................................................................................... 9-1
9.2 Products .................................................................................................................... 9-2 9.2.1 Soil Liner Material Verification Testing ......................................................... 9-2
9.3 Execution ................................................................................................................... 9-2 9.3.1 Soil Liner Mixing............................................................................................ 9-2 9.3.2 Test Pad Construction CQA ......................................................................... 9-3 9.3.3 Soil Liner Construction and CQA Preparation .............................................. 9-4 9.3.4 Soil Liner Construction CQA ......................................................................... 9-5 9.3.5 Final Surface Preparation CQA .................................................................... 9-6 9.3.6 Maintenance and Repair CQA ...................................................................... 9-7
10.0 GEOSYNTHETIC CLAY LINER CQA................................................................................. 10-1 10.1 General .................................................................................................................... 10-1
10.1.1 Section Summary ....................................................................................... 10-1 10.1.2 Submittal Review and Approval .................................................................. 10-1 10.1.3 Delivery, Storage, and Handling ................................................................. 10-1
10.2 Products .................................................................................................................. 10-2 10.2.1 Product Quality Assurance Verification Testing ......................................... 10-2
10.3 Execution ................................................................................................................. 10-3 10.3.1 CQA Preparation......................................................................................... 10-3 10.3.2 Examination of GCL Subgrade ................................................................... 10-3

202005_CQA-Plan_RPT.docx
Table of Contents (cont.)
10.3.3 GCL Deployment CQA ............................................................................... 10-3 10.3.4 Repair CQA ................................................................................................. 10-4
11.0 GEOMEMBRANE CQA ....................................................................................................... 11-1 11.1 General .................................................................................................................... 11-1
11.1.1 Section Summary ....................................................................................... 11-1 11.1.2 Submittals ................................................................................................... 11-1 11.1.3 Delivery, Storage, and Handling ................................................................. 11-2
11.2 Products .................................................................................................................. 11-4 11.2.1 Product Quality Assurance Verification Testing ......................................... 11-4 11.2.2 Field Testing Equipment ............................................................................. 11-5
11.3 Execution ................................................................................................................. 11-5 11.3.1 General CQA Preparation........................................................................... 11-5 11.3.2 Examination of Geomembrane Subgrade .................................................. 11-5 11.3.3 CQA Installation Preparation ...................................................................... 11-5 11.3.4 Deployment CQA ........................................................................................ 11-6 11.3.5 Fusion Welding CQA .................................................................................. 11-7 11.3.6 Extrusion Welding CQA .............................................................................. 11-8 11.3.7 Repair CQA ................................................................................................. 11-9 11.3.8 Installer’s Quality Control .......................................................................... 11-10 11.3.9 Destructive Seam Sampling and Testing Procedures .............................. 11-11 11.3.10 Failed Seam Analysis Procedures ............................................................ 11-12 11.3.11 Wrinkles .................................................................................................... 11-12
12.0 CLOSURETURF® CQA ....................................................................................................... 12-1 12.1 General .................................................................................................................... 12-1
12.1.1 Section Summary ....................................................................................... 12-1 12.1.2 Submittal Review ........................................................................................ 12-1 12.1.3 Delivery, Storage, and Handling ................................................................. 12-1
12.2 Products .................................................................................................................. 12-3 12.2.1 Product Quality Assurance Verification Testing ......................................... 12-3

202005_CQA-Plan_RPT.docx
Table of Contents (cont.)
12.3 Execution ................................................................................................................. 12-3 12.3.1 CQA Preparation......................................................................................... 12-3 12.3.2 Closureturf® Installations CQA ................................................................... 12-4 12.3.3 Closureturf® Repair CQA ............................................................................ 12-5
13.0 SAND BALLAST CQA ........................................................................................................ 13-1 13.1 General .................................................................................................................... 13-1
13.1.1 Section Summary ....................................................................................... 13-1 13.2 Products .................................................................................................................. 13-1
13.2.1 Product Quality Assurance Verification Testing ......................................... 13-1 13.3 Execution ................................................................................................................. 13-1
13.3.1 Construction and CQA Preparation ............................................................ 13-1 13.3.2 Sand Ballast CQA Monitoring ..................................................................... 13-1

202005_CQA-Plan_RPT.docx
List of Tables
1. Soil Testing Standards
2. Geosynthetics Testing Standards
3. Earthworks Schedule of Testing Frequencies
4. Soil Liner Schedule of Testing Frequencies
5. GCL Schedule of Testing Frequencies
6. LLDPE Schedule of Testing Frequencies
7. Destructive Sampling Intervals
8. Closure Turf Schedule of Testing Frequencies
9. Sand Ballast Schedule of Testing Frequencies

202005_CQA-Plan_RPT.docx
List of Appendices
A. TECHNICAL SPECIFICATIONS

202005_CQA-Plan_RPT.docx 1-1
1.0 INTRODUCTION
1.1 PROJECT DESCRIPTION Phillips 66 Company (Phillips 66, CN601491608) operates the Borger Refinery (RN102495884), which is owned by a
joint venture between Phillips 66 (P66) and Cenovus called WRB Refining LP (WRB, CN603215997). The North
Holding Pond (NHP) is a 3.4-acre surface impoundment with a liner system consisting of 3-feet of bentonite amended
clay, leak detection system, and 100-mil high-density polyethylene (HDPE) liner. The NHP is in partial closure in
accordance with the 1998 closure plan. The free liquid has been removed and the sludge has been stabilized. The
impoundment is now being filled with non-hazardous waste. The partial closure permit modification was approved by
the Texas Commission of Environmental Quality (TCEQ) on April 21, 2004.
The NHP is nearing its permitted waste capacity, thus P66 is planning to close the NHP as required under TCEQ
Permit Number HW-50078.
Closure construction will consist of placing unclassified fill; preparing a subgrade for the final cover liner system;
construct a composite liner system consisting of 12 inches of compacted soil liner and a Geosynthetic Clay Liner
(GCL) for the barrier layer; a geomembrane barrier with an integrated drainage layer; and, a engineered synthetic turf
with sand ballast (ClosureTurf®).
1.2 PURPOSE The purpose of this Construction Quality Assurance (CQA) Plan is to provide a detailed guidance document for
systematic and thorough CQA verification procedures which will typically be implemented during construction of the
NHP final closure. This plan provides general and specific requirements of the overall CQA program to verify and
document that construction is in substantial compliance with the contract documents and the design intent.
Requirements of the CQA program include the following:
Review of product submittals to verify construction materials are in compliance with the technical specifications.
Product quality assurance verification testing to verify all construction materials are in compliance with the
technical specifications.
Construction monitoring and documentation to verify each unit of construction is in compliance with the technical
specifications and construction was executed correctly using industry standard construction methods and the proper
materials.

1-2 202005_CQA-Plan_RPT.docx
Construction verification testing to verify each installed or constructed unit of the closure system is in compliance
with the technical specifications.
CQA documentation consisting of daily summary reports, CQA field logs, testing forms and reports, installation
logs, document control binders, material control logs, photographic documentation, technical revisions, design
modifications, as-built record drawings, and corrective action determination and verification reports.
Preparation of the final certification report that documents the CQA program implemented during construction and
that landfill construction was completed in compliance with the contract documents and the design intent. The
final Soil Liner Evaluation Report (SLER) and Geomembrane Liner Evaluation Report (GLER) will be submitted
to the TCEQ at the completion of construction.
1.3 PROJECT ORGANIZATION
1.3.1 OWNER The owner is P66 and is responsible for communicating with the CQA Organization and the TCEQ. The owner will
request assistance from the CQA Organization and design engineer to resolve technical or regulatory issues during
construction. The Owner is responsible for complying with TCEQ regulatory requirements.
1.3.2 DESIGN ENGINEER The design engineer is responsible for landfill design and site engineering related to the design. Site engineering
includes; 1) review and approval of product and construction submittals required by the contract documents, 2)
technical issues related to construction, 3) interpretation of the technical specifications and the construction drawings,
and 4) design modifications and technical revisions to the contract documents.
1.3.3 CQA CERTIFYING ENGINEER The CQA Certifying Engineer is responsible for certifying to the Owner and the TCEQ that landfill construction is in
compliance with the contract documents and the design intent. Specific responsibilities of the certifying engineer
include; 1) providing a professional engineer registered in the State of Texas, 2) verification that all CQA procedures
are correctly and completely implemented, 3) review of all CQA documentation, and 4) preparation of the SLER and
GLER report.
1.3.4 CQA ORGANIZATION The CQA Organization is the firm responsible for the overall construction quality assurance of the project.

202005_CQA-Plan_RPT.docx 1-3
1.3.5 GENERAL CONTRACTOR The general contractor will be responsible for overall performance of the work in accordance with the contract
documents and as shown on the construction drawings.
1.4 CQA PLAN FORMAT This CQA Plan format organizes all necessary CQA verification procedures for each unit of construction, as defined by
the technical specifications, into individually complete sections. This plan is presented as follows:
Sections 1.0 through 6.0 presents general information about the construction project and the general requirements
of the CQA program.
Sections 7.0 through 13.0 includes written instructions and directions for the CQA Organization and provides
detailed and specific CQA procedures to be implemented for each unit of closure construction as it relates to site
work.

202005_CQA-Plan_RPT.docx 2-1
2.0 GENERAL REQUIREMENTS
2.1 SECTION SUMMARY General requirements of the CQA program include:
Product quality assurance verification testing
Construction monitoring
Construction verification testing
Project meetings
Submittal review
Documentation
2.2 PRODUCT QUALITY ASSURANCE VERIFICATION TESTING Products and material sources will be sampled and tested to verify compliance with the technical specifications.
Testing requirements, methods and sampling frequencies are specified for each work element described in this plan.
All material samples will be recorded into appropriate Testing Control Logs, assigned sample numbers, and processed
by the CQA Organization for either on-site or off-site testing.
Testing Control Logs document the following:
Sample numbers
Product or material types
Required testing
Sampling locations and dates
Testing completion dates
Brief summary of the testing results
Each material sampled and tested will be archived on site for a period of one year. Archived samples will be stored and
sealed in plastic containers tagged with:
Sample number
Product or material type

2-2 202005_CQA-Plan_RPT.docx
Project name and number
Date for discarding the sample
The following products or materials require quality assurance verification testing.
Earth fill for unclassified fill
Liner system subgrade
Low-permeability compacted soil liner
Geosynthetic clay liner (GCL)
Structured geomembrane barrier and drainage layer
ClosureTurf® synthetic turf
Sand ballast layer
A recommended schedule of testing frequencies is discussed in later sections of this plan.
2.3 CONSTRUCTION MONITORING The closure will be monitored and documented to verify compliance with the technical specifications and that
construction was executed correctly using industry standard construction methods and the proper materials.
Monitoring guidelines and procedures are specified for each work element section in this plan.
2.4 CONSTRUCTION VERIFICATION TESTING Construction verification testing will be performed on installed or constructed components of the final cover system to
verify compliance with the technical specifications. Construction verification testing will be performed by either the
Contractor or the CQA Organization, as required by this plan. Construction verification testing includes the following:
Permeability of fine-grained soils.
Nuclear density and moisture content of in-place unclassified fill and soil liner.
In-place density by the drive-cylinder method to verify nuclear density/moisture testing gauge (densometer) is
providing accurate results.
Geomembrane seam analysis.
Air pressure testing of fusion welded geomembrane seams.

202005_CQA-Plan_RPT.docx 2-3
Vacuum testing of extrusion welded geomembrane seams and repairs.
Sand ballast material classification and gradation.
A recommended schedule of testing frequencies is discussed later in this plan.
2.5 PROJECT MEETINGS Project meetings will be held in accordance with Section 4.0 of this CQA Plan.
2.6 SUBMITTAL REVIEW Submittal review will be completed in accordance with Section 5.0 of this CQA Plan.
2.7 DOCUMENTATION Documentation will be completed in accordance with Section 6.0 of this CQA Plan.

202005_CQA-Plan_RPT.docx 3-1
3.0 REFERENCES
3.1 SECTION SUMMARY Section 3.1 provides an overview of the following references:
Project reference documents
Industry standards and technical reference documents
Soils testing standards and methods
Standard Operating Procedures (SOP) for soils testing
Geosynthetics testing standards and methods
3.2 PROJECT REFERENCE DOCUMENTS The project manual and construction drawings provide background, design, and contractual information, and are used
in conjunction with this CQA Plan.
3.3 INDUSTRY STANDARDS AND TECHNICAL REFERENCE DOCUMENTS The following industry standards and technical reference documents were used in the preparation of this CQA Plan.
ASTM Standards and Other Specifications and Test Methods on the Quality Assurance of Landfill Liner Systems.
American Society for Testing and Materials. 1994.
EPA Technical Guidance Document, Quality Assurance and Quality Control for Waste Containment Facilities.
United States Environmental Protection Agency. 1993.
Standard Specifications for Transportation Materials and Methods of Sampling and Testing. American Association
of State Highway and Transportation Officials (AASHTO). 1987.
3.4 SOILS TESTING STANDARDS AND METHODS Soils testing standards and methods which apply as referenced in the technical specifications and this CQA Plan are
provided in Table 1.
3-2 202005_CQA-Plan_RPT.docx
3.5 STANDARD OPERATING PROCEDURES FOR SOILS TESTING The CQA Organization will perform soils testing on site during construction. The CQA Organization, or their
laboratory subconsultant’s, Standard Operating Procedures (SOP) for soils testing will be maintained on-site for
reference and written direction.
3.6 GEOSYNTHETICS TESTING STANDARDS AND METHODS Geosynthetics testing standards and methods listed in Table 2 apply as referenced in this CQA Plan.

202005_CQA-Plan_RPT.docx 4-1
4.0 PROJECT MEETINGS
4.1 SECTION SUMMARY Communication and coordination between the Owner, Design Engineer, Contractor, and CQA Organization are
important to achieve quality construction. To establish successful communications, coordination, and an overall
environment of teamwork, a series of project meetings will be held. The meetings will be administered by the Owner,
Design Engineer, or CQA Organization to 1) clearly define responsibility and authority of each organization involved
in the project, 2) resolve communication problems, misunderstandings, and misinterpretations, 3) find solutions to
unanticipated developments, and 4) to identify, prevent and correct problems and deficiencies that may occur during
the construction process. Project meetings include the following:
Pre-construction Meeting
Progress Meetings
Preparatory Meetings
4.2 PRECONSTRUCTION MEETING The Owner will schedule the pre-construction meeting after the construction contract is awarded and the major
subcontractors and material suppliers have been established. The CQA objectives of this meeting are to 1) clearly
define the roles, responsibility and authority of each organization and individual involved in the project, 2) review
details of the CQA program and expectations, and 3) establish a foundation of cooperation to achieve quality
construction. The CQA Organization will address the following agenda:
Distribution of this CQA Plan
Introduction, role, authority, and responsibilities of each organization and individual involved in the project
Establish lines of communications
Design review in coordination with the Design Engineer
Construction schedule
Contractor’s QC procedures and responsibilities
Submittal review and approval procedures
Non-conformance and corrective action procedures
Construction restrictions due to weather conditions
Weekly progress and preparatory meetings

4-2 202005_CQA-Plan_RPT.docx
Meeting minutes and items for resolution will be recorded by the Owner’s Representative and distributed to all parties
in attendance.
The following representatives from each organization are required to attend the pre-construction meeting.
Owner’s Project Manager
Design Engineer
Contractor’s Project Manager and on-site Superintendent
CQA Organization’s CQA Officer
Representatives from the local and state regulatory agencies are encouraged to attend the meeting
4.3 PROGRESS MEETINGS The Owner will schedule and administer weekly (or other period) progress meetings. The CQA objectives of these
meetings are to 1) maintain lines of communication, 2) review procedures and results of the CQA program, and
3) maintain and improve the established foundation of cooperation to achieve quality construction. The CQA
Organization will address the following agenda:
Review minutes relevant to CQA of previous progress meeting
Review work progress
Review and update construction schedule. Obtain projected schedule for the next 2 weeks from Contractor
CQA and QC related field observations, problems, decisions, and conflicts
Presentation of CQA verification testing results
Review and up-date Submittal Log in coordination with the Design Engineer and Contractor
Coordination of projected work progress
Maintenance of quality and work standards
Acknowledgments and recognition of quality construction practices and QC procedures
Meeting minutes and items for resolution will be recorded by the Owner and distributed to all parties in attendance.
The following representatives from each organization are required to attend the weekly progress meetings:

202005_CQA-Plan_RPT.docx 4-3
Owner’s Project Manager
Design Engineer
Contractor’s on-site Superintendent
CQA Organization’s CQA Manager
4.4 PREPARATORY MEETINGS In coordination with the Design Engineer, the CQA Organization will schedule and hold informal preparatory meetings
prior to the following units of construction:
Embankment operations
Landfill subgrade preparation
Low-perm soil liner construction and/or geosynthetic clay liner installation
Geomembrane installation
ClosureTurf® installation
Sand ballast installation
Perimeter stormwater control structure construction
Anchor trench construction
The CQA objective of these preparatory meetings is to establish a thorough understanding of the upcoming unit of
construction and of the CQA procedures and testing that will be implemented during construction. To achieve this
objective, the CQA Organization’s CQA Officer will address the following agenda:
Review materials needed for the work and the product section of the technical specifications
Review the construction requirements section of the technical specifications
Review construction staking and grade control staking needed to complete the work
Review test records and Contractor’s quality control test procedures
CQA test procedures
Review required submittals
Coordination, scheduling, and sequencing of the work
Equipment and manpower

4-4 202005_CQA-Plan_RPT.docx
Meeting minutes will be recorded by the CQA Organization and distributed to the Owner and all parties in attendance.
The following representatives from each organization are required to attend the preparatory meetings.
Contractor’s on-site Superintendent
Subcontractors as appropriate to the work
CQA Organization’s CQA Officer and CQA Monitor(s)

202005_CQA-Plan_RPT.docx 5-1
5.0 SUBMITTALS
5.1 SECTION SUMMARY This section describes methods and procedures required during the submittal review process for the following:
Submittal Control Log
Submittal review procedures
5.2 SUBMITTAL CONTROL LOG A Submittal Control Log will be prepared by the CQA Organization that will list all submittals required by the
technical specifications. The Submittal Control Log will be issued to the Contractor and will be maintained by the
CQA Organization in coordination with the Contractor and Design Engineer during construction. The control log
documents:
Submittal numbers
Referenced specification sections
Submittal descriptions
Received dates
Reviewer
Action taken determinations
Return dates
5.3 SUBMITTAL REVIEW PROCEDURES Two copies of each submittal listed in the Submittal Control Log or, if mutually approved, an electronic submittal will
be submitted by the Contractor in accordance with the technical specifications. The submittals will be forwarded to the
Design Engineer for review. The CQA Organization may perform a preliminary review of submittals for compliance
with the technical specifications and issue a verbal Approval for Use at the recommendation of the Design Engineer.
The CQA Organization will notify the Design Engineer that no corrective action determinations were required prior to
issuing a verbal Approval for Use. All submittals not in compliance with the technical specifications must be
immediately forwarded to the Design Engineer for review and corrective action determinations.

5-2 202005_CQA-Plan_RPT.docx
At the completion of the review process the Design Engineer will stamp both copies of each submittal with Action
Taken determinations. The Action Taken determinations and the return dates will be recorded on the Submittal Control
Log. One copy of the reviewed submittal will be returned to the Contractor, one copy will be archived in the submittal
documentation control binder.
The CQA Organization will review and up-date the Submittal Control Log in coordination with the Contractor and
Design Engineer at the weekly progress meetings.
The CQA Organization will inspect materials delivered to the site to verify these materials are the same as what was
approved in the submittal process. When material is delivered it will be placed in administrative hold until inspected
and approved for use by the CQA Organization. Material different than what was included in the submittal process will
subject to corrective action, as discussed in Section 6.6.
202005_CQA-Plan_RPT.docx 6-1
6.0 DOCUMENTATION
6.1 SECTION SUMMARY This section of the CQA Plan summarizes the following documentation required during the project:
Daily summary reports
CQA field logs
Construction and testing forms
Testing reports
Corrective action determination and verification reports
As-built record drawings
Photographic documentation
Documentation control
Final certification report
Documentation archive storage
6.2 DAILY SUMMARY REPORTS A computer generated summary report will be prepared daily by the CQA Organization. This report will summarize all
construction activities, CQA verification procedures, CQA testing, and QC testing completed during the day. The daily
summary report will contain the following information:
Title block containing; 1) project name, 2) project number, 3) project location, 4) Owner, 5) date, and 6) summary
report number.
Description of weather conditions including low and high temperature readings, cloud cover, and precipitation.
Summary of the day’s on-going construction activities for each unit of construction. This summary will also
include equipment, personnel, and subcontractors utilized for each unit of construction and identification of areas
in which the construction is taking place.
Summary of CQA verification procedures implemented during the day’s construction for each unit of construction.
This summary will include construction monitoring, construction verification testing, and quality control
procedures.

6-2 202005_CQA-Plan_RPT.docx
Summary of CQA product verification testing and presentation of testing results.
Summary of any project meetings or pertinent discussions including list of attendees, action items and resolutions.
Areas of non-conformance for substandard work and corrective action measures.
Summary of materials received and accompanying QC documentation provided by supplier.
If necessary, attachments of cross-referencing CQA field logs, construction and testing forms, testing reports, and
corrective action reports to substantiate any corrective action determinations or CQA decisions.
Record of site visitors.
Signature of CQA Officer.
Daily summary reports will be submitted to the Owner on a daily basis and to the Design Engineer on a weekly basis.
6.3 CQA FIELD LOGS CQA Monitors will maintain individual field logs issued by the CQA Officer. Each field log is assigned a unique
cross-referencing number and will contain daily entries of the CQA Monitor. The CQA Monitors will provide a
written chronological framework of construction activities, construction monitoring, construction testing, production
verification testing, and quality control procedures performed during the day in the area of the monitor’s responsibility.
CQA Monitor’s field log entries will be addressed by the CQA Officer in the daily summary report.
CQA field logs will be submitted to the CQA Officer on a daily basis for preparation of the daily summary report and
may be reviewed by the Design Engineer on a weekly basis.
6.4 CONSTRUCTION AND TESTING FORMS Construction activities, CQA procedures, laboratory testing, and construction testing will be recorded on appropriate
construction and testing forms. The following construction and testing forms typically are issued by the CQA Officer:
Soil Testing Forms
a. Soils Testing Control Log
b. Soils Test Request - Sample Custody Log
c. Sieve Analysis of Granular Soils
d. Nuclear Density/Moisture Tests
e. Moisture Content of Soils

202005_CQA-Plan_RPT.docx 6-3
Geosynthetics Forms
a. Geosynthetics Testing Control Log
b. Geosynthetics Delivery and Control Log
c. Geosynthetics Test Request – Sample Custody Log
d. Geomembrane Deployment/Seaming Log
e. Geomembrane Repair Log
Completed construction and testing forms will be submitted to the CQA Officer for review on a daily basis and will be
addressed by the CQA Officer in the daily summary report.
6.5 TESTING REPORTS Testing reports may be issued by independent testing laboratories contracted by the CQA Organization to perform
various product verification and construction testing.
Testing reports will be addressed within one day of receipt by the CQA Officer in the daily summary report.
6.6 CORRECTIVE ACTION DETERMINATION AND VERIFICATION REPORTS Corrective action determination and verification reports will be issued to the Contractor by either the Design Engineer
or the CQA Officer for construction or materials not in compliance with the technical specifications or for defective
workmanship or materials, even if there is compliance with the technical specifications. Corrective action
determination and verification reports will contain the following information:
Title block containing; 1) project name, 2) project number, 3) project location, 4) Owner, 5) date, and 6) Corrective
action determination and verification report number.
Location and description of the problem area or corrective action determination.
If necessary, attachments of cross-referencing CQA field logs, construction and testing forms, testing reports,
supporting sketches, and photographs to describe and substantiate the corrective action determination.
If necessary, additional testing required to determine the extent of corrective action measures.
Corrective measures necessary to correct the area of construction or material to compliance with the technical
specifications as determined by the Engineer or CQA Officer.

6-4 202005_CQA-Plan_RPT.docx
Corrective action measures implemented and verification of these measures. Additional verification testing
performed to verify compliance with the technical specifications.
If necessary, attachments of cross-referencing CQA field logs, construction and testing forms, testing reports,
supporting sketches, and photographs to describe and verify the corrective action measures taken.
Signature of the issuing Design Engineer or CQA Officer and follow-up signature verifying corrective measures
taken.
6.7 AS-BUILT RECORD DRAWINGS As-built record drawings will be maintained by the Contractor and will be reviewed and verified by the CQA
Organization. The record drawings will show actual as-built conditions of landfill construction and will adequately
reflect that construction is in substantial compliance with the design intent. Irrelevant deviations in actual construction
that do not substantially affect the design intent may not be incorporated into the record drawings, but they will be
addressed in the final certification report. Record drawings will be prepared during the construction process by making
modifications and red-line markups as they occur to a single set of construction drawings designated as the “Site As-
built Record Drawings.” At the completion of construction, the CQA Organization, in coordination with the Design
Engineer, will incorporate all as-built conditions into the “Final As-built Record Drawings.” The final record
drawings will contain revision numbers and dates, review signatures of the Design Engineer and CQA Officer.
The Owner is required by the technical specification to perform as-built surveys and provide record drawings for the
following units of construction:
Limits, contours, and grade breaks of landfill subgrade and final grades and establishment of 50-foot grid points for
soil liner thickness verification.
Limits, contours, and grade breaks of soil liner and final grades and layer thickness verification at 50-ft grid points.
Limits of geomembrane installation.
Contours and grade breaks of borrow area excavation and stockpiles at 100-foot stations (x,y,z) and angle points.
These additional survey records will be incorporated into the final set of record drawings.
6.8 PHOTOGRAPHIC DOCUMENTATION All construction activities will be continually photographed to clearly show and define construction methods and as-
built conditions of completed units of construction. Photographs will include:
202005_CQA-Plan_RPT.docx 6-5
Product or material sources and stockpiles
In progress construction methods for each unit of construction
Completed units of construction
Damaged, rejected, or substandard units of construction
In progress corrective action measures to rectify damaged, rejected, or substandard units of construction
Completed units of construction as the result of corrective action measures
Design modifications
Photographs will be identified by number, date, and time of the photograph. The CQA Organization will maintain a
cross-referencing photographic log documenting the subject matter of each photograph.
6.9 DOCUMENTATION CONTROL Complete documentation of construction and the CQA program will be controlled and secured in an electronic file
management system maintained at the site by the CQA Organization and shared with the Owner and Design Engineer.
This documentation control structure organizes and indexes all construction and CQA documents and is intended to
allow easy access to all documents for review and audit by the Owner, Design Engineer, or regulatory agencies. The
following is a preliminary list and contents of the CQA Documentation established by the CQA Organization.
Title: Project Administration Documentation.
Progress meeting minutes, preparatory meeting minutes, Owner correspondences, Design Engineer
correspondences, Contractor correspondences, CQA Organization correspondences, and miscellaneous
correspondences.
Title: CQA Daily Summary and Contractor Field Reports.
Daily summary reports prepared by the CQA Officer and CQA Monitors and field reports prepared by the
Contractor dated from the beginning of the project to the completion of the project.
Title: Submittals.
Submittal Control Log, submittal transmittal cover sheets, and all reviewed submittals required by the
technical specifications.

6-6 202005_CQA-Plan_RPT.docx
Title: Soils CQA.
Soils Testing Control Log, moisture content test results, moisture-density relations test results, permeability
test results, sieve analysis results, nuclear density test results, cylinder-drive density test results, Atterberg
Limits results, soil analysis results, summary of laboratory testing, and summary of nuclear density testing.
Title: Geosynthetics CQA.
Geosynthetics Testing Control Log, Installer daily field reports, geomembrane test reports, geotextile test
reports, geomembrane seam analysis results, panel layout drawings, geosynthetics delivery and control logs,
subgrade acceptance forms, geomembrane deployment/welding logs, and geomembrane repair logs.
Title: Project Manual and CQA Plan.
Project Manual and CQA Plans.
Title: Photograph Log.
Construction and CQA photographs and cross-referencing photographic log.
6.10 FINAL CERTIFICATION REPORT At the completion of the project, the Design Engineer and the CQA Organization will prepare the final SLER and
GLER. The reports will consist of information and data generated by the CQA program and will document that landfill
construction is in compliance with the contract documents and the design intent. At a minimum, the report will contain
the following information:
Summary of construction methods for each unit of construction completed.
Summary of the CQA program implemented during construction and specific CQA verification procedures for
each unit of construction completed.
Results of product quality assurance verification testing and construction testing.
Design modifications and technical revisions to the contract documents.
Final as-built record drawings.
Statement of compliance.
Signature and stamp of the Certifying Engineer.

202005_CQA-Plan_RPT.docx 6-7
6.11 DOCUMENTATION ARCHIVE STORAGE At the completion of the project and following submittal of the final certification report, all original documentation
generated by construction and by the CQA program will be archived at the on-site offices of the Owner with duplicate
copies stored at the home offices of the CQA Organization.

202005_CQA-Plan_RPT.docx 7-1
7.0 UNCLASSIFIED FILL CQA
7.1 GENERAL
7.1.1 SECTION SUMMARY CQA monitoring, verification procedures, and testing to verify unclassified fill materials and construction methods are
in compliance with the technical specifications.
7.2 PRODUCTS
7.2.1 EARTHFILL Unclassified fill material will be obtained from the on-site borrow area and will meet the following product
requirements:
Free of organic, saturated, oversized, or other unsuitable materials.
Free of frost, ice or snow.
Free of contaminants.
Maximum particle size of four (4) inches, unless otherwise approved by Design Engineer.
7.2.2 PRODUCT QUALITY ASSURANCE VERIFICATION TESTING Verify that unclassified fill materials are free of organic, saturated, frozen, deleterious, oversized, and other unsuitable
materials by performing frequent visual examinations of the material as the material is being excavated from the
borrow area.
Perform moisture-density relations (ASTM D 698) testing to determine the maximum dry density and optimum
moisture content for each material type used as unclassified fill at frequencies provided in Table 3.
7.3 EXECUTION
7.3.1 CONSTRUCTION AND CQA PREPARATION Prior to fill operations, perform the following CQA verification procedures.
Hold a preparatory meeting in accordance with Section 4.4 of this CQA Plan.
If necessary, verify erosion control measures are in place.

7-2 202005_CQA-Plan_RPT.docx
Verify measures are implemented to protect utilities, temporary benchmarks, and existing structures from damage.
Verify base survey is performed on site borrow area (stockpile) for computation of measurement and payment
quantities prior to and after embankment operations. Verify borrow area (stockpile) is graded with uniform lines
and grades to provide accurate measurement and payment survey.
Verify construction and grade control staking.
7.3.2 UNCLASSIFIED FILL CQA MONITORING AND TESTING To verify compliance of unclassified fill operations with the technical specifications, perform the following CQA
verification procedures:
Verify fills are placed to the limits, lines and grades as shown on the Drawings.
Verify excavated soils not intended or used as fill material are removed and stockpiled.
Verify fill material is keyed into subgrade as shown on the Drawings.
Verify fill materials are placed and compacted in loose lifts not exceeding 8 inches.
Verify the top of each lift is scarified prior to placing subsequent lifts. If a sheepsfoot or pad-foot compactor is
used for compaction, scarifying may not be required subject to Design Engineer approval.
Verify unclassified fill lift surfaces are maintained to prevent moisture loss and desiccation cracking. Verify repair
of desiccated areas prior to placement of subsequent lifts.
Perform nuclear density-moisture testing (ASTM D 6938) to verify fill materials are moisture conditioned and
compacted to the values specified in the technical specifications. Perform tests every 500 cubic yards of in-place
material. (Refer to Earthworks Schedule of Testing Frequencies presented in Table 3).
Perform one drive-cylinder density test (ASTM D 2937) for every 30 nuclear density-moisture tests to verify
nuclear density gauge is providing accurate results. (Refer to Earthworks Schedule of Testing Frequencies
presented in Table 3).
7.3.3 FINAL SURFACE PREPARATION CQA MONITORING In order to verify compliance of final surface preparation operations with the technical specifications, perform the
following CQA verification procedures:

202005_CQA-Plan_RPT.docx 7-3
Verify that all debris and protrusions greater than 1-inch are pressed into or removed from the final subgrade.
Verify final surface is graded to lines and grades shown on the construction drawings and are final graded to a
tolerance of ±0.10-foot of design grade at.
Verify the completed surface is finished with a pneumatic steel drum compactor. Verify removal of ridges gouges,
and ruts greater than 1-inch.
Verify moisture conditioning of completed surface as necessary.
7.3.4 BORROW AREA CQA MONITORING To verify compliance of borrow area excavation operations with the technical specifications, perform the following
CQA verification procedures:
Verify excavation of borrow area with sides slopes no steeper than 2H:1V.
Verify borrow area is maintained with positive drainage patterns directed away from borrow area.
Verify borrow area is watered as necessary for dust control.
Verify borrow area is graded with uniform lines and grades to provide accurate measurement and payment survey.
Verify final borrow area is restored and graded with grades directed to provide positive drainage patterns
surrounding the completed borrow area.
Verify final surface is track-walked with dozer cleat marks running perpendicular to the slope.

202005_CQA-Plan_RPT.docx 8-1
8.0 LANDFILL SUBGRADE PREPARATION CQA
8.1 GENERAL
8.1.1 SECTION SUMMARY CQA monitoring procedures to verify subgrade preparation operations are in compliance with the technical
specifications. Landfill subgrade preparation includes:
Grading landfill subgrade
Removal and disposal of excavated waste material
Final surface preparation
8.2 PRODUCTS
8.2.1 PRODUCT QUALITY ASSURANCE VERIFICATION TESTING
Perform moisture-density relations (ASTM D 698) testing on a 5-gallon sample to determine the maximum dry density
and optimum moisture content for each subgrade material as described in Table 3.
8.3 EXECUTION
8.3.1 CONSTRUCTION AND CQA PREPARATION Prior to landfill subgrade preparation operations, perform the following CQA verification procedures:
Hold a preparatory meeting in accordance with Section 4.4 of this CQA Plan.
If necessary, verify erosion control measures are in place.
Verify measures are implemented to protect utilities, temporary benchmarks, and existing structures from damage.
Verify construction and grade control staking.
Verify dust control operations are available.
Verify traffic control and barricades are coordinated with Owner.
Verify operations and haul routes are coordinated with landfill operations.
Verify subgrade underdrain pipes (if required) are placed along toe before placing subgrade unclassified fill.
Verify unclassified fill is placed in accordance with the technical specifications.
8-2 202005_CQA-Plan_RPT.docx
Verify as-built survey of completed landfill subgrade is performed and provided in accordance with the technical
specifications. As-built survey must be completed prior to geosynthetic installations.
8.3.2 CQA MONITORING To verify compliance of landfill subgrade preparation operations with the technical specifications, perform the
following CQA verification procedures:
Verify landfill subgrade is graded to provide smooth uniform surface.
If necessary, verify removal of excavated waste materials and disposal of in active landfill.
Verify removal of all debris, rocks greater than four (4) inches in diameter, and all protruding wood and metal from
the completed surface.
Verify dust control measures are implemented when necessary.
Verify final surface is graded to the lines and grades shown on the Drawings and to a tolerance of ± 0.10-foot of
design grade.
Verify the completed surface is finished with a pneumatic steel drum roller. Verify removal of ridges gouges, and
ruts greater than 2-inches.
Verify moisture conditioning of completed surface as necessary.

202005_CQA-Plan_RPT.docx 9-1
9.0 SOIL LINER CQA
9.1 GENERAL
9.1.1 SECTION SUMMARY This section summarizes the following CQA procedures:
CQA assistance, monitoring procedures, and testing during soil liner test pad construction.
CQA monitoring procedures and testing to verify soil liner materials and construction methods are in compliance
with the technical specifications.
9.1.2 SOILS INVESTIGATION OF EXISTING CLAY SOURCES The Owner will perform investigations and testing on soil liner material from the on-site borrow source to determine its
acceptability as a low-perm soil component of the composite liner system. In the event the source does not meet
product specifications for soil liner, the owner will conduct laboratory testing to determine the amount of bentonite
addition required to meet the specified hydraulic conductivity.
A “Zone of Acceptable Compaction” establishes a relationship of in-place dry density and moisture content that
achieves the specified permeability of the soil liner. The “Zone of Acceptable Compaction” is for guidance only,
passing criteria for the in-place soil liner is permeability.
9.1.3 SOIL LINER TEST PAD CONSTRUCTION The Contractor is required to construct a soil liner test pad prior to actual construction of the soil liner in the landfill
cell. The intent of the test pad is to simulate construction of the actual soil liner, including processing, moisture
conditioning, lift thickness, placement, grading, compaction efforts, and finishing operations. The intent of the test pad
is to also verify that requirements of the technical specifications can be met.
9.1.4 SUBMITTALS Review the following submittal that was due with the Contractor’s with bid.
List of proposed equipment and description of construction methods to excavate, moisture condition, haul, place,
compact, finish, maintain, and protect soil liner in accordance with the technical specifications.

9-2 202005_CQA-Plan_RPT.docx
Bentonite technical data including:
The type and origin of the bentonite (natural sodium, sodium enriched, or calcium bentonite)
The montmorillonite content
The content of materials other than montmorillonite
The presence or absence of polymers or additives
9.2 PRODUCTS
9.2.1 SOIL LINER MATERIAL VERIFICATION TESTING Perform the following product verification testing, and as summarized in Table 4, prior to and during test pad
construction and actual soil liner operations:
Moisture-density relation checkpoints to verify materials correspond with the established “Zone of Acceptable
Compaction” and to detect any changes in the consistency of the soil liner material. Perform checkpoints for each
material type and at a minimum of one test per each lift.
Particle size analysis and hydrometer to verify product gradation requirements of the technical specifications.
Perform size analysis and hydrometer for every 1,850 yd3 of material used to construct the soil liner.
Atterberg Limits to verify plasticity index. Perform Atterberg Limits for every 1,850 yd3 of material used to
construct the soil liner.
Continually examine soil liner materials to verify materials contain no organic, saturated, oversized, or other
unsuitable materials.
9.3 EXECUTION
9.3.1 SOIL LINER MIXING The soil liner material will be spread in a controlled manner to achieve uniform thickness in a pre-determined mixing
location. The bentonite will be applied at a rate equivalent to the percent of bentonite (by dry weight) determined as
part of project specific testing prior to liner construction. The bentonite spreader should be equipped with an
electronically variable mechanical or weight-controlled spreader allowing an application accuracy of 0.01 pounds per
square foot. The CQA Organization will monitor the bentonite deposited over a known area to verify the bentonite
application rate. A road reclaimer (CAT RM300 or Design Engineer approved equivalent) will be used to mix the
bentonite with the soil using the number of passes determined in the test pad. Controls should be established so the
mixing depth does not exceed the lift thickness to prevent mixing the underlying layers. The first three passes will be

202005_CQA-Plan_RPT.docx 9-3
conducted without adding water. Water may be added after the initial three passes. Once the soils are mixed with
bentonite, the soil-bentonite mixture will be hydrated to within 2% of the optimum moisture content and allowed to
hydrate for 24 hours prior to placement as liner. Water required to achieve the specified water content may be added to
the soil during liner placement and compaction.
Upon completion of mixing operations, the soil liner will be hauled to the test pad and the CQA organization will
conduct the CQA activities as described below.
9.3.2 TEST PAD CONSTRUCTION CQA Verify Contractor schedules test pad construction a minimum of 14 days prior to actual soil liner construction. The test
pad will be constructed utilizing the intended mixing, lacing and compaction machinery. The test pad will be designed
to provide the following information:
Suitability of the mixing method and mixture composition (does not apply to on-site soils which meet soil liner
requirements).
The ability of the specified soil-bentonite admixture to achieve the permeability requirement.
The suitability of the method of placement and compaction requirements to achieve the permeability requirements.
Recommendations for the operation and management of the chosen mixing and water addition techniques.
Recommendations for the compaction of the liner, including the thickness of each lift, the weight and type of
compaction equipment, and minimum number of passes required to achieve the compaction specification.
During test pad construction document the following:
Every equipment type and size utilized by the Contractor to haul, place, moisture condition, aerate, compact, grade,
and finish the soil liner.
Every equipment type and size utilized by the Contractor to place and incorporate bentonite.
Moisture conditioning and aeration procedures.
Lift thickness prior to and after compaction.
Lift bonding procedures.
Overall description and chronological framework of construction activities.

9-4 202005_CQA-Plan_RPT.docx
Test pad will consist of a minimum 2-foot thick fill of soil liner material. At a minimum, CQA verification of the test
pad should include:
Verify the test pad is constructed with a top deck of 25-feet wide by 50-foot long, and provides 4H:1V ramps onto
and off the pad along the width of the pad.
Verify soil liner materials are not contaminated with any other soil materials.
Verify test pad is constructed in accordance with the technical specifications. At a minimum, the final 2-foot thick
soil liner should have 4 separate compacted lifts but may require 8 or more to achieve the required hydraulic
conductivity.
Perform the product verification testing outlined in Section 9.2.1 of this CQA Plan and the following construction
testing. Work closely with the Contractor in providing accurate and timely testing data. The Contractor will rely
heavily on the data provided to adjust or modify the construction methods necessary to achieve the required
hydraulic conductivity.
Perform nuclear density and moisture content on each compacted lift will be conducted to verify the relative
compaction is within the established “Zone of Acceptable Compaction”. Perform oven-dried moisture content
testing at every nuclear test location to correct nuclear moisture content readings.
Conduct in-place density by the drive-cylinder method to verify the nuclear density gauge is working properly and
is providing reliable testing results.
Perform hydraulic conductivity on undisturbed samples obtained from each compacted lift to verify the hydraulic
conductivity of the in-place soil liner.
Provide Design Engineer with documentation of test pad construction equipment and methods, product verification
testing results, and construction testing results. The Design Engineer will review the results of test pad
construction and testing and may modify the construction requirements and testing criteria specified in the
technical specifications for actual construction of the soil liner.
9.3.3 SOIL LINER CONSTRUCTION AND CQA PREPARATION Prior to soil liner construction, perform the following CQA verification procedures:
Hold a preparatory meeting in accordance with Section 4.4 of this CQA Plan.
Review testing methods and frequencies included in Table 4.
If necessary, verify erosion control measures are in place.

202005_CQA-Plan_RPT.docx 9-5
Verify measures are implemented to protect utilities, temporary benchmarks, and existing structures from damage.
Verify construction staking and grade control stakes at 50-foot grid and grade breaks. GPS machine control will be
allowed in lieu of staking.
Verify landfill subgrade is complete and in accordance with the technical specifications. Verification includes
submission and acceptance of as-built survey of completed subgrade.
Verify Contractor provides full-time grade checker during soil liner placement to control grade, lift thickness, and
tolerances.
Verify Contractor utilizes the same equipment and construction methods used to construct the test pad (and achieve
the required hydraulic conductivity) to construct the actual soil liner in the landfill cell.
Verify Contractor schedules soil liner placement operations to facilitate CQA product verification and construction
testing. Placement of succeeding soil liner lifts will not be allowed until passing results for compaction, moisture
content, and permeability are achieved from each lift of the in-place soil liner.
9.3.4 SOIL LINER CONSTRUCTION CQA Perform the following CQA monitoring procedures and testing to verify soil liner materials and construction methods
are in compliance with the technical specifications (or as modified by results of soil liner test pad construction).
Verify soil liner is placed and graded to the limits, lines and grades as shown on the construction drawings.
Perform the product verification testing outlined in Section 9.2.1 of this CQA Plan.
Verify first lift of soil liner is placed in a loose lift not exceeding 8-inches and is compacted without penetrating the
underlying subgrade material. If subgrade material is penetrated, verify Contractor increases loose lift thickness to
prevent contamination of soil liner with subgrade materials.
Verify subsequent lifts of soil liner are placed in loose lifts not exceeding 6-inches. The final 1-foot thick soil liner
should have a minimum of 2 separate compacted lifts, but may require more to achieve the required hydraulic
conductivity.
Verify lifts are compacted with fully penetrating foot compactor (sheepsfoot roller) or kneading pad foot roller and
moisture content is adjusted to specified range.
Perform nuclear density and moisture content on each compacted lift to verify the relative compaction is within the
established “Zone of Acceptable Compaction”. Perform oven-dried moisture content testing at every nuclear test
location to correct nuclear moisture content readings. Perform five (5) nuclear density and moisture content tests
per every lift per acre of in-place material.

9-6 202005_CQA-Plan_RPT.docx
Perform in-place density by the drive-cylinder method to verify the nuclear density gauge is working properly and
is providing reliable testing results. At a minimum, perform one test per 20 nuclear density-moisture tests.
Perform hydraulic conductivity on undisturbed samples obtained from each compacted lift to verify the hydraulic
conductivity of the in-place soil liner. At a minimum, perform one hydraulic conductivity test every acre per
6-inch lift.
Verify lifts are scarified, blended, and compacted together to prevent smooth zones and provide bonding between
lifts.
Verify new soil liner lifts are scarified, blended, compacted, and keyed-into the existing soil liner.
Verify completed lifts are protected from damage, desiccation, and moisture loss. Verify complete repair of
damaged lifts prior to placing succeeding lifts.
The in-place soil liner must have permeability less than or equal to 1 x 10⁻⁷ cm/sec. If soil liner does not meet the
specified permeability, verify Contractor reworks areas, or removes and replaces materials to meet the specified
permeability.
9.3.5 FINAL SURFACE PREPARATION CQA Perform the following CQA monitoring procedures to verify the final surface of the soil liner is in compliance with the
technical specifications.
Verify all exposed rock protruding greater than 0.5-inch is removed from the completed soil liner surface. In no
case will sharp protrusions be allowed even if less than 0.5-inch.
Verify final surface is graded to the lines and grades shown on the construction drawings and within the tolerances
specified in the technical specifications. The absolute minimum thickness is 1-foot and maximum thickness is 1.1
feet.
Verify the completed surface is finished with a pneumatic steel drum roller. Verify the removal of abrupt edges,
ridges, gouges, tire tracks, desiccation cracks, and ruts greater than 0.5 inches.
Verify completed surface is moisture conditioned as necessary to prevent surface drying and desiccation.
Verify Owner performs and provides as-built surveys (thickness verification) of completed soil liner prior to
geomembrane installation.

202005_CQA-Plan_RPT.docx 9-7
9.3.6 MAINTENANCE AND REPAIR CQA
Verify all hubs, grade control stakes, and survey stakes are removed. Verify repair of all holes, including those
excavated or driven for nuclear density testing and permeability testing with approved moisture-conditioned soil
liner material or bentonite/soil admixture.
Verify soil liner moisture content and surface condition is maintained and protected within the specified moisture
content range until covered by geomembrane. Protective measures may include covering the soil liner with
temporary plastic sheeting or soil.
Verify completed surface is not allowed to desiccate. If desiccation cracks are greater than 0.2 feet deep or
0.5 inches wide, verify the full depth and length of the crack is excavated, and repaired with additional moisture-
conditioned soil liner material. If desiccation cracks are less than 0.2 feet deep or 0.5 inches wide, verify moisture
conditioning and compaction with steel-drum roller.
Verify the repair of all weather and erosion related damage to the soil liner not covered by GCL and geomembrane.
Verify the Contractor implements measures to not to allow water to run or collect under the GCL and
geomembrane installation. If water runs or collects under the GCL and geomembrane, causing erosion and/or
saturation of the soil liner, verify the removal of GCL and geomembrane to allow soil-liner to air dry and/or the
removal and replacement of soil liner material entirely, or moisture conditioning, re-compaction, and finishing of
soil liner to the requirements of the technical specifications.
Verify the repair of soil liner surfaces found to be out-of-grade-tolerance as follows:
Scarifying and moisture conditioning (water spray) surface.
Placement of additional moisture-conditioned soil liner material.
If surface is greater than 0.1 feet out-of-grade-tolerance, re-compact soil liner backfill with sheepsfoot or pad foot
roller. If surface is less than 0.1 feet out-of-grade-tolerance, re-compact soil liner backfill with steel drum roller.
Grading or trimming of repaired surface within tolerance. Steel-drum rolling the surface smooth.
Verify the repair of wheel ruts on soil liner surface caused by geomembrane deployment equipment.

202005_CQA-Plan_RPT.docx 10-1
10.0 GEOSYNTHETIC CLAY LINER CQA
10.1 GENERAL
10.1.1 SECTION SUMMARY CQA verification procedures to verify Geosynthetic Clay Liner (GCL) materials and installation methods are in
compliance with the technical specifications.
10.1.2 SUBMITTAL REVIEW AND APPROVAL The following GCL submittals are required before GCL is shipped to the site in accordance with the technical
specifications:
Two 1-foot by 1-foot samples representative of the GCL material meeting these specifications of the material that
will be shipped to the site
Product data sheet and complete description of GCL that meet or exceed the product requirements described in
Table 5 and the technical specifications
Manufacturer’s quality control testing reports for GCL rolls delivered to the site. At a minimum, GCL tests
specified in Table 5 must be included in the testing reports.
Collect two copies of each submittal listed above and initiate submittal review and approval process as outlined in
Section 5.0 of this CQA plan.
10.1.3 DELIVERY, STORAGE, AND HANDLING Prior to delivery and storage of the GCL rolls, observe and verify an elevated surface is prepared to store the rolls. This
storage area must be elevated off the ground, away from where water can accumulate and prepared in a manner that the
GCL rolls do not create a dam for ponding water. If the GCL rolls are to be stored for a long period of time,
recommend to the Owner that the rolls be stored in an enclosed facility or in the enclosed shipping trailers.
During delivery of the GCL rolls, perform the following verification procedures:
Obtain a copy of the packing list accompanying the GCL rolls.
Complete the Geosynthetics Delivery and Control Log for shipment of GCL. Attach a copy of the accompanying
packing list to the completed Geosynthetics Delivery and Control Log. This log documents and controls the
following:

10-2 202005_CQA-Plan_RPT.docx
Delivery dates.
GCL roll numbers.
GCL roll batch/lot numbers or production dates.
CQA personnel monitoring the delivery of the GCL rolls.
Total quantity of GCL delivered with each shipment and the accumulated total quantity of GCL delivered to
the site.
Receipt of manufacturer’s quality control test reports for each roll of GCL.
Completion of quality assurance verification testing.
Additional notes including rejection of materials, condition of delivered materials and other materials included
with the shipments.
Verify GCL rolls are unloaded, handled, and transported with nylon or other cloth straps that do not damage the
GCL rolls or protective covering.
Verify GCL rolls are stored and protected from damage and moisture intrusion. Verify protective coverings are
waterproof and damaged coverings are repaired, or removed and replaced completely.
Verify GCL rolls are stacked only three rolls high, are supported along the entire width of each roll and that a
3-foot wide access path is left between the stacked rows of GCL.
Identify and separate damaged or rejected GCL rolls.
If GCL rolls have been contacted by moisture during shipping, separate affected rolls for bentonite moisture
content testing. If the moisture content of the bentonite is greater than 50 percent, identify and mark the affected
roll as “DRY OUT DURING INSTALLATION”.
10.2 PRODUCTS
10.2.1 PRODUCT QUALITY ASSURANCE VERIFICATION TESTING The following quality assurance verification testing will be performed by the geosynthetics testing laboratory to verify
compliance with the product requirements of the technical specifications and as summarized in Table 5.
Bentonite Mass per Unit Area (ASTM D5993)
Bentonite Moisture Content (ASTM D2216)
GCL Tensile Strength (ASTM D6768)GCL Index Flux (ASTM D6496)

202005_CQA-Plan_RPT.docx 10-3
GCL Peel Strength (ASTM D6496)
GCL Hydraulic Conductivity (ASTM D5084)
Bentonite Free Swell Index (ASTM D5890)
Bentonite Fluid Loss (ASTM D5891)
10.3 EXECUTION
10.3.1 CQA PREPARATION Prior to GCL installation perform the following CQA verification procedures hold a preparatory meeting in accordance
with Section 4.4 of this CQA Plan.
10.3.2 EXAMINATION OF GCL SUBGRADE Prior to GCL installation, examine the GCL subgrade as follows:
Verify Geosynthetics Contractor’s daily acceptance of the compacted soil liner and document acceptance with the
site superintendent’s signature on the daily GCL Deployment/Seaming Log.
10.3.3 GCL DEPLOYMENT CQA To verify compliance of GCL deployment operations with the technical specifications perform the following CQA
verification procedures:
Record the following information on the GCL Deployment/Seaming Log:
Subgrade Acceptance (SA). Physical description and approximate area of subgrade accepted by the
Geosynthetics Contractor and approved by the CQA Organization for daily GCL installation.
Temperature (T). Ambient and GCL surface temperatures with a description of the current weather conditions.
Record every two hours and document dramatic changes in temperature and weather conditions.
Moisture Content (MC). Moisture content of GCL bentonite, roll or area sampled and time of sampling.
Panel (P). Assigned panel number, GCL roll number, panel dimensions, and area of panel.
Using a graph computation sheet, field sketch a panel layout drawing of the GCL panels deployed during the day.
Attach this field sketch to the completed GCL Deployment/Seaming Log. These daily field sketches will be
transposed to the master panel layout drawing.
In general, verify GCL is installed in accordance with manufacturer’s instructions.

10-4 202005_CQA-Plan_RPT.docx
Verify protective covering on the GCL rolls are not removed until the roll is transported into place of installation
and is immediately ready for deployment.
Verify GCL is installed with the machine direction (lengthwise) of the roll is oriented down and centered in the
drainage troughs.
Verify corrections or adjustments are made to panels that become askew to the center line of the trough.
Verify GCL is installed with sufficient tension to prevent excessive overlapping, insufficient overlapping, wrinkles,
and folds.
Verify panels are overlapped a minimum of 12-inches along the width (ends) of the panels.
Verify underlying soil liner is not damaged.
Verify damaged soil liner is completely repaired.
Verify the removal of materials that could damage the GCL or adversely affect the hydraulic conductivity of the
GCL.
Continually inspect the GCL panels and overlaps for damage, thin areas, excessively hydrated areas, and other
items that could damage the GCL or adversely affect the hydraulic conductivity of the GCL.
Verify damaged GCL is removed entirely or repaired in accordance with Section 16.3.4 of this CQA Plan.
Verify all deployed GCL is completely covered by the overlying geomembrane and secured in one day.
Verify small areas of the GCL not covered by the geomembrane, and protected by other temporary means (e.g.
plastic sheeting).
Verify deployed GCL is protected from becoming excessively hydrated (rain or snow).
Verify excessively hydrated GCL material with moisture content greater than 50 percent is dried-out or removed
and replaced entirely.
Verify GCL is adequately ballasted during placement operations and ballast is left in place until GCL is covered
with the overlying geomembrane.
Verify geomembrane is also adequately ballasted.
10.3.4 REPAIR CQA Verify damaged GCL is removed entirely or repaired in accordance with the following guidelines:
Verify repair (patching) material is the same material as the damaged GCL.

202005_CQA-Plan_RPT.docx 10-5
Verify patches extend a minimum of 12-inches in all directions beyond the damaged area and machine direction of
the patches aligns with the machine direction of the damaged GCL.

202005_CQA-Plan_RPT.docx 11-1
11.0 GEOMEMBRANE CQA
11.1 GENERAL
11.1.1 SECTION SUMMARY CQA monitoring procedures, guidelines, and testing for the following areas to verify geomembrane material and
installation methods are in compliance with the technical specifications:
Review and approval of submittals
Geomembrane quality assurance verification testing
Extrusion welding beads or rods quality assurance verification
Geomembrane seam analysis
Installation monitoring, verification, and documentation
Monitoring, verification, and documentation of Installer’s quality control procedures
11.1.2 SUBMITTALS The following geomembrane submittals are required from the manufacturer in accordance with the technical
specifications:
Product data sheets and complete description of geomembrane that meets or exceeds the product requirements of
the technical specifications. Submittal due with Bid.
Sample of geomembrane that is representative of roughness of texturing on both sides. This sample will be used as
a standard for manufacturing. A pointed depth micrometer may be used to compare relative roughness of
texturing. Submittal due with Bid.
Geomembrane resin certificate of compliance with product requirements as presented in the technical
specifications. Submittal due before geomembrane shipment to the site.
Geomembrane resin specific gravity quality control test reports. Submittal due before geomembrane shipment to
the site.
Certification listing percentages of processing aids, antioxidants, and additives other than carbon black added to the
geomembrane resin. Submittal due before geomembrane shipment to the site.

11-2 202005_CQA-Plan_RPT.docx
Manufacturer’s quality control testing reports for geomembrane rolls delivered to the site. At a minimum, tests
specified in the technical specifications or Table 6 must be included in the testing reports. Submittal due before
geomembrane shipment to the site.
Instructions for handling, storing, installing, and repairing geomembrane. Submittal due before geomembrane
shipment to the site.
Extrusion welding beads or rod certificate of compliance with product requirements of the technical specifications.
Submittal due before geomembrane shipment to the site.
Manufacturer’s warranty in compliance with the technical specifications. Submittal due after geomembrane
delivery.
The following geomembrane submittals are required from the installer in accordance with the technical specifications:
Installer’s Geomembrane Installation Quality Control Manual. Submittal due 14 days prior to geomembrane
installations.
Proposed geomembrane panel layout drawings. Submittal due 14 days prior to geomembrane installations.
Resume of geomembrane installation superintendent. Submittal due 14 days prior to geomembrane installations.
Resume of geomembrane master welder. Submittal due 14 days prior to geomembrane installations.
Resume of welding and quality control crew. Submittal due 14 days prior to geomembrane installations.
Installation warranty in compliance with the technical specifications. Submittal due at the completion of the
geomembrane installation.
Completed geomembrane panel layout drawings. Submittal due at the completion of the geomembrane
installation.
Collect two copies of each submittal listed above and initiate submittal review process as outlined in Section 5.0 of this
CQA Plan.
11.1.3 DELIVERY, STORAGE, AND HANDLING Prior to delivery and storage of the geomembrane rolls, observe and verify a bedding layer surface is prepared to store
the rolls.

202005_CQA-Plan_RPT.docx 11-3
During delivery of the geomembrane rolls, perform the following CQA verification procedures:
Obtain a copy of the packing list accompanying the geomembrane rolls.
Complete the Geomembrane Delivery and Control Log for each shipment of geomembrane rolls. Attach a copy of
the accompanying packing list to the completed Geomembrane Delivery and Control Log. This log documents and
controls the following:
Delivery dates.
Geomembrane roll numbers.
Geomembrane roll batch/lot numbers or production dates.
CQA personnel monitoring the delivery of the geomembrane rolls.
Total quantity of geomembrane delivered with each shipment and the accumulated total quantity of
geomembrane delivered to the site.
Receipt of manufacturer’s quality control test reports for each roll of geomembrane.
Completion of quality assurance verification testing.
Additional notes including rejection of materials, condition of delivered materials and other materials included
with the shipments.
Verify geomembrane rolls are unloaded, handled, and transported with nylon or other cloth straps that do not
damage the geomembrane rolls.
Verify geomembrane rolls are stacked only three rolls high and that a 3-foot wide access path is left between the
stacked rows of geomembrane.
Identify and separate damaged or rejected geomembrane rolls.
Determine which geomembrane rolls will be sampled for quality assurance verification testing by either individual
roll numbers, batch/lot numbers, or production dates. Select one geomembrane roll for sampling and testing for
every 100,000 square feet of material produced for the project. Conformance samples should be obtained and
tested by the CQA Organization and/or the CQA laboratory and test results reviewed by the CQA Manager and/or
certifying engineer prior to shipment to the site.
Sample the selected geomembrane rolls for quality assurance verification testing using the following sampling
procedure:

11-4 202005_CQA-Plan_RPT.docx
Cut and remove the first three feet of geomembrane material from across the entire width of the roll. Store this
first three feet of material near the stacked rolls of geomembrane for later use by the Installer.
Cut and remove the next 12 inches of material from across the entire width of the roll. This 12-inch section of
material is the quality assurance verification testing sample.
Assign a quality assurance verification test number to the sample and mark the following information directly
on the sample with an indelible marker:
Machine direction of the sample.
Manufacturer’s geomembrane roll number.
Quality assurance verification test number.
Complete the Geomembrane Test Request and Sample Custody Log and ship samples to the geosynthetics testing
laboratory via overnight delivery.
11.2 PRODUCTS
11.2.1 PRODUCT QUALITY ASSURANCE VERIFICATION TESTING The following quality assurance verification testing will be performed by the geosynthetics testing laboratory to verify
compliance with the product requirements of the technical specifications included in Table 6:
Density (ASTM D 792 or ASTM D 1505)
Tensile Properties (ASTM D 6693)
Carbon Black Content (ASTM D 1603)
Carbon Black Dispersion – core of sheet only (ASTM D 5596)
Sheet Thickness (ASTM D 5994)
Asperity Height for textured geomembrane (ASTM D 7466)
Puncture Resistance (ASTM D 4833)
Upon completion of the above quality assurance verification testing and receipt of the testing results, the CQA
Organization will review all test results for compliance with the technical specifications. The CQA Organization will
report any non-compliance of the test results to the Design Engineer.

202005_CQA-Plan_RPT.docx 11-5
Additional quality assurance verification testing or corrective action measures as the result of non-complying test
results will be determined by the Design Engineer.
11.2.2 FIELD TESTING EQUIPMENT Prior to geomembrane deployment, confirm the following with the Installer:
Verify Installer provides a field tensiometer capable of measuring seam strength for trial welds. Verify tensiometer
has been calibrated within the last year and is accurate within 2 pounds.
Verify Installer provides a 1-inch (width) by 6-inch (length) cutting die and cutting press for cutting seam
specimens from the trial welds.
11.3 EXECUTION
11.3.1 GENERAL CQA PREPARATION Prior to geomembrane installations, perform the following CQA verification procedures:
Hold preparatory meeting for geomembrane installation in accordance with Section 4.4 of this CQA Plan.
11.3.2 EXAMINATION OF GEOMEMBRANE SUBGRADE
Prior to geomembrane installations, perform the following CQA verification procedures:
Verify liner subgrade surface that the geomembrane will be installed on is complete and in compliance with the
technical specifications.
Verify Installer’s daily acceptance of the liner subgrade surface. Document acceptance with the site
superintendent’s signature on the daily Geomembrane Deployment/Welding Log.
11.3.3 CQA INSTALLATION PREPARATION Prior to welding operations verify trial welds are prepared for each welding machine that will be used during the day.
Verify the following procedures are used during preparation of the trial welds:
Trial welds are prepared for both fusion welding machines and extrusion guns.
At a minimum, trial welds are prepared at the beginning of the shift (am) and at mid-shift (pm).
Trial weld samples for fusion welding machines are a minimum of 6-feet in length with the trial weld centered
down the length of the sample.

11-6 202005_CQA-Plan_RPT.docx
Trial weld samples for extrusion guns are a minimum of 3-feet in length with the trial weld centered down the
length of the sample.
Verify trial weld is allowed to cool to ambient conditions. After cooling, verify excessive material is cut from the
beginning and the end of the trial weld sample (approximately 4-inches from each end).
Verify four 1-inch specimens are cut with the cutting die and are spaced evenly along the length of the trial weld.
Observe and verify field testing of two specimens for peel adhesion (peel) and two specimens for bonded seam strength
(shear) in accordance with the technical specifications. Each specimen must pass their respective peel or shear test.
Peel test specimens must meet the following criteria:
The break is a film-tearing bond (FTB) or exceeds 400% strain.
There is no more than 10 percent peel penetration into the weld.
The quantitative value for peel strength is 63 lb./in for fusion welds and 57 lb./in for extrusion welds.
Shear test specimens must meet the following criteria:
The quantitative value for elongation is a minimum of 50%.
The quantitative value for shear strength is 75 lb./in. for both fusion and extrusion welds.
If any test specimens fail either peel or shear testing, the entire trial weld is considered failing. Verify the above trial
weld procedure and field testing is repeated if any of the four specimens fail in either peel or shear. If the trial weld
repeats in failure, verify the failing welding machine or extrusion gun is not used until proper adjustments are made or
the machine or gun is repaired. Verify repeat trial weld failures pass two consecutive peel and shear tests. If the
welding machine or extrusion gun continually fails field testing, verify the machine or gun is tagged and completely
removed from service.
11.3.4 DEPLOYMENT CQA To verify compliance of geomembrane installation operations with the technical specifications, perform the following
CQA verification procedures:
Record the following information on the Geomembrane Deployment/Welding Log. Abbreviations in parenthesis
following each verification procedure are used on the Geomembrane Deployment/Welding Log:

202005_CQA-Plan_RPT.docx 11-7
Subgrade Acceptance (SA). Physical description and approximate area of subgrade accepted by the Installer
and approved by the CQA Organization for daily geomembrane installation.
Temperature (T). Ambient and geomembrane surface temperatures with a description of the current weather
conditions. Record every two hours and document dramatic changes in temperature and weather conditions.
Trial Welds (TW). Time of trial weld, type of welding equipment, welding equipment number, welding
operator, and results of field peel and shear testing.
Panel (P). Assigned panel number, geomembrane roll number, panel dimensions, and area of panel.
Field sketch a panel layout drawing of the geomembrane panels deployed during the day. Attach this field sketch
to the completed Geomembrane Deployment/Welding Log. These daily field sketches will be transferred to the
master panel layout drawing.
Verify panels are deployed parallel to the slope, with the panels running down the entire length of the slope.
Verify corrections or adjustments are made to panels that become askew to the parallel line of the slope.
Verify panels are overlapped to the proper length as required by the fusion welding machines. At a minimum the
panels should be overlapped 4-inches. Verify the alignment of the overlap is consistent and overlap indicator
points are marked approximately every 20-feet along the entire length of the panels.
Verify geomembrane is not damaged during handling, transport, or deployment operations. Verify damaged
geomembrane is repaired or removed entirely.
Verify underlying subgrade is not damaged during deployment. Verify any detected damaged subgrade is
completely repaired.
Verify excessive wrinkling of the geomembrane does not occur and compensation for stress bridging is added
during deployment operations. Verify excessive wrinkles and stress bridging are repaired or removed entirely.
Verify Installer only deploys the quantity of geomembrane that can be completely welded and secured in one day.
Verify, immediately after panels running through ditches are welded, sandbags are placed end-to-end along the
entire length of the flow line to prevent geomembrane stress bridging through the ditch lines.
11.3.5 FUSION WELDING CQA To verify compliance of geomembrane fusion welding operations with the technical specifications, perform the
following CQA verification procedures:
Record the following information on the Geomembrane Deployment/Welding Log.

11-8 202005_CQA-Plan_RPT.docx
Seam (S). Assigned seam number, welding equipment number that welded the seam, welding operator, and
length of the welded seam.
End of Seam Test. (EST). If the Installer’s quality control program requires that specimens be taken from the
end of each welded seam and tested for peel adhesion, record these results using the same criteria as trial
welds. If the Installer records these results, request a copy of the results and this verification procedure can be
omitted from the Geomembrane Deployment/Welding Log.
Destructive Sample (DS). Assigned sample number, seam number sample is located on, location of sample
within the seam, welding equipment number that welded the seam, welding operator, and results of field peel
adhesion test results.
Verify welding operations only take place when the ambient temperature is between 40°F and 110°F. Measure
ambient and in-place geomembrane temperatures and record readings every two hours on the Geomembrane
Deployment/Welding Log. Special weather welding plans must be submitted and approved by the Design
Engineer to weld outside this range.
Verify fusion welding machines complete trial weld procedures as specified in Section 11.3.3 of this CQA Plan
prior to welding operations.
Verify power source is capable of producing sufficient and constant voltage under the combined line load of
multiple welders and other equipment.
Verify welding surfaces are thoroughly cleaned prior to and during welding operations.
Verify seams are welded at the same speed, temperature, roller pressure, and gauge settings used to prepare the
trial weld. Verify operators record welding machine numbers, operators, machine settings, times, and dates on
each seam welded.
Closely observe each fusion welding machine to verify the machine is not adversely affecting or damaging the
parent geomembrane material outside the welding area.
11.3.6 EXTRUSION WELDING CQA To verify compliance of geomembrane extrusion welding operations with the technical specifications, perform the
following CQA verification procedures:
Verify extrusion welding is used for repair operations, where welding is inaccessible to fusion welding machines.
Verify extrusion guns complete trial weld procedures as specified in Section 11.3.3 of this CQA Plan prior to
welding operations.

202005_CQA-Plan_RPT.docx 11-9
Verify geomembrane is overlapped a minimum of 4-inches for extrusion welding.
Verify repair patches are cut square with rounded corners and are large enough to extend a minimum of 4-inches in
all directions over the repair area.
Verify geomembrane and repair patches are tack-welded in place to prevent movement during grinding and
extrusion welding operations.
Verify the outer edge of repair patches and the adjacent underlying geomembrane are disc-ground to remove
surface debris and oxidation. Verify grinding is not parallel to seam.
Verify nozzles of extrusion guns are purged to remove solidified extrudate.
Verify extrusion weld completely covers the entire width of the grind area and extrusion safety welds extend 4-
inches up the intersecting fusion weld (if applicable).
Verify extrusion weld repair (safety) patches are welded over all fusion welded seam intersections.
11.3.7 REPAIR CQA To verify geomembrane is completely repaired and tested, perform the following CQA verification procedures:
After geomembrane deployment, welding, seam analysis sampling, and QC procedures, inspect the geomembrane
installation to locate, mark, identify, number, and record defective areas for repair. Include all installation repairs
(e.g. safety patches, air pressure patches, destructive seam sample patches, and geomembrane boots). Record the
following information on the Geomembrane Repair Log.
Repair Number
Repair Description
Repair Location
After the repair is completed, verify and record the following QC information on the Geomembrane Repair Log:
Repair Date
Vacuum Test Date
Vacuum Test Result

11-10 202005_CQA-Plan_RPT.docx
11.3.8 INSTALLER’S QUALITY CONTROL The CQA program requires the verification of quality control procedures performed by the geomembrane Installer in
accordance with the technical specifications and the Installer’s own Geomembrane Installation Quality Control (QC)
Manual. At a minimum, verify Installer is performing the following QC procedures in accordance with the technical
specifications:
Maintaining a geomembrane panel layout drawing during the geomembrane installation. The drawing must
include; a) roll and panel numbers; b) seam numbers; c) geomembrane limits; and d) seam analysis sample
locations.
Performing all quality control procedures and testing in accordance with the Installer’s Geomembrane Installation
Quality Control Manual, except where amended or modified by the Design Engineer or in the technical
specifications.
Maintaining daily deployment logs and panel layout drawings as the deployment progresses. Logs must be
submitted to the CQA Organization daily and include; 1) panel and seam numbers, 2) panel dimensions, and
3) deployment quantities.
Maintaining daily welding logs. Logs must be submitted to the CQA Organization daily and include; 1) welding
machine numbers, 2) operators, 3) machine settings, and 4) times and dates for each seam welded.
Air pressure testing each fusion welded seam.
Vacuum testing each extrusion welded repair and length of seam.
Air pressure testing of fusion welded seams.
Verify each fusion welded seam is air pressure tested by the Installer and is in accordance with the following
procedures:
The air pump must be capable of generating and maintaining 40 psi of pressure and equipped with a regulator
and pressure gauge. Pressure feed needles must have pressure gauges accurate to 1 psi.
Both ends of the fusion welded seam are sealed with vise-grip plate clamps or extrusion weld. Heat may be
applied to the seam ends to aid in sealing the seam in conjunction with the clamps.
The air pressure needle is inserted into the fusion weld channel at one end of the seam.
The channel is pressurized to 30-35 psi and pressure is maintained for 5 minutes.
Air is released from the opposite end of the seam to verify that the entire length of the fusion weld channel was
pressurized. If channel does not maintain pressure with a maximum allowable pressure loss of 2 psi over the

202005_CQA-Plan_RPT.docx 11-11
5-minute test period or does not stabilize at all, verify that the defective area is located and isolated. Repeat air
pressure test procedures in both directions from the defective area.
Record the following air pressure testing information on the Geomembrane Deployment/Welding Log.
Abbreviations in parenthesis following each verification procedure are used on the Geomembrane
Deployment/Welding Log.
Air Pressure Test (AP). Seam number tested, start time of the air pressure test and initial air pressure (psi),
termination time of the air pressure test and ending air pressure (psi), and length of seam or portion of seam
successfully tested.
Vacuum testing of extrusion welded repairs.
Verify each extrusion welded seam and repair is vacuum tested by the Installer and is in accordance with the
following procedures:
Vacuum pump is capable of generating and maintaining 30 inches of mercury and is equipped with a regulator
and vacuum gauge. Vacuum boxes have clean view windows and vacuum gauges are accurate to 1 psi.
Extrusion welds are saturated with soap/water solution.
View-box is placed over the saturated weld, an airtight seal is created, and vacuum is applied to the weld.
Vacuum is maintained for 10 seconds and weld is examined for leaks. Leaks are detected by the presence of
excessive bubbles. Detected leaks are marked for follow up extrusion welding repair. Detected leaks are
re-vacuumed tested after repair operations to verify that the leaks were successfully repaired.
Record the following vacuum testing information on the Geomembrane Repair Log:
Assigned repair number, location and description of repair, vacuum test dates, and vacuum test results.
11.3.9 DESTRUCTIVE SEAM SAMPLING AND TESTING PROCEDURES Determine seam analysis sample locations by the stratified random sampling (SRS) method. The SRS method allows
random selection of a single sample location anywhere within the required sampling interval specified within the
technical specifications. In coordination with the Geosynthetics Contractor, perform the following seam analysis
sampling procedures.
Destructive seam samples will be a minimum of 12-inches wide by 36-inches long with the weld centered down
the length of the sample. Sample sizes may be increased at the request of the CQA Organization and/or the
Geosynthetics Contractor.
11-12 202005_CQA-Plan_RPT.docx
Divide the sample into equal sections. A minimum of one section for destructive testing and one section for
archival storage.
The Geosynthetics Contractor may obtain and test any seam sample at its option.
If there is a failing test, follow the procedures described in Section 11.3.10 of this CQA Plan.
Repair sample locations in accordance with Section 11.3.7 of this CQA Plan and vacuum test repair in accordance
with Section 11.3.8 of this CQA Plan.
Based on the destructive sampling method of attributes, the Design Engineer may increase or decrease the
sampling interval based on the information in Table 7.
11.3.10 FAILED SEAM ANALYSIS PROCEDURES In coordination with the Installer, perform the following CQA verification procedures in the event of a seam analysis
sample failure determined by either field testing or laboratory seam analysis:
Track the welded seam 10-feet in both directions away from the failed seam analysis sample location. Cut a small
8-inch wide by 8-inch long sample from each location. Cut two 1-inch specimens from each end of the sample,
and field test specimens for peel adhesion in accordance with Section 12.3.3 of this CQA Plan. If either of the
specimens fail the field peel test at either location, continue tracking the welded seam at 10-foot intervals until
specimens successfully pass the field peel tests. If specimens continually fail field peel tests at 10-foot intervals,
the entire seam or portion of the welded seam will be repaired at the discretion of the CQA Organization.
Verify the failed length of seam is repaired with an 18-inch wide extrusion welded cap strip. Tack and extrusion
welding the leading flap of the fusion welded seam is not permitted. Verify the extrusion welded cap strip is
vacuum tested in accordance with Section 11.3.8 of this CQA Plan.
If the re-test sample fails laboratory seam analysis, repeat the above procedures.
Sample extrusion welded cap strips exceeding 100-feet in length for seam analysis.
11.3.11 WRINKLES Temperature changes may cause wrinkles to develop in the geomembrane. Any wrinkles that can fold over will be
repaired either by cutting out excess material or, if possible, by allowing the geomembrane to contract by temperature
reduction. In no case will material be placed over the geomembrane that could result in the geomembrane folding. The
CQA Organization will monitor geomembrane for wrinkles and notify the Geosynthetics Installer if wrinkles are
forming. The CQA Organization is then responsible for documenting corrective action to remove the wrinkles on the
Daily Progress Report form.

202005_CQA-Plan_RPT.docx 12-1
12.0 CLOSURETURF® CQA
12.1 GENERAL
12.1.1 SECTION SUMMARY CQA procedures, guidelines, and testing to verify the turf component materials and installation methods are in
compliance with the technical specifications.
12.1.2 SUBMITTAL REVIEW The following geotextile submittals are required 14 days prior to ClosureTurf® installation in accordance with the
technical specifications:
Sample, product data sheet, and complete description of ClosureTurf® that meet or exceed the product
requirements of the technical specifications and Table 8.
Manufacturer’s quality control testing reports for ClosureTurf® rolls delivered to the site. At a minimum, tests
specified in the technical specifications must be included in the testing reports.
Instructions for storage, installation, and repair of ClosureTurf®.
Collect two copies of each submittal listed above and initiate submittal review process as outlined in Section 5.0 of
this CQA Plan.
12.1.3 DELIVERY, STORAGE, AND HANDLING Prior to delivery and storage of the ClosureTurf® rolls, observe and verify that an elevated surface is prepared to store
the rolls.
During delivery of the ClosureTurf® rolls, perform the following CQA verification procedures:
Obtain a copy of the packing list accompanying the ClosureTurf® rolls.
Complete the Geosynthetics Delivery and Control Log for each shipment of ClosureTurf®. Attach a copy of the
accompanying packing list to the completed Geosynthetics Delivery and Control Log. This log documents and
controls the following:
Delivery dates.
ClosureTurf® roll numbers.

12-2 202005_CQA-Plan_RPT.docx
ClosureTurf® roll batch/lot numbers or production dates.
CQA personnel monitoring the delivery of the ClosureTurf® rolls.
Total quantity of ClosureTurf® delivered with each shipment and the accumulated total quantity of
ClosureTurf® delivered to the site.
Receipt of manufacturer’s quality control test reports for each roll of ClosureTurf®.
Completion of quality assurance verification testing.
Additional notes including rejection of materials, condition of delivered materials and other materials included
with the shipments.
Verify ClosureTurf® rolls are delivered with opaque protective coverings.
Verify ClosureTurf® rolls are unloaded, handled, and transported with nylon or other cloth straps that do not
damage the ClosureTurf® rolls or the protective coverings.
Verify ClosureTurf® rolls are stored and protected from damage and damaged protective coverings are replaced.
Verify ClosureTurf® rolls are stacked only five rolls high and a 3-foot wide access path is left between the stacked
rows of ClosureTurf®.
Identify and separate damaged or rejected ClosureTurf® rolls.
Determine which ClosureTurf® rolls will be sampled for quality assurance verification testing by either individual
roll numbers, batch/lot numbers, or production dates. Select one ClosureTurf® roll for sampling and testing for
every 100,000 square feet of material delivered to the site. Identify selected rolls and separate the rolls so that the
rolls are stored on the top row of the five-roll stack.
Sample the selected ClosureTurf® rolls for quality assurance verification testing using the following sampling
procedure:
Cut and remove the first three feet of ClosureTurf® material from across the entire width of the roll. Store this
first three feet of material near the stacked rolls of ClosureTurf® for later use by the Installer.
Cut and remove the next 18 inches of material from across the entire width of the roll. This 18-inch section of
material is the quality assurance verification testing sample.
Assign a quality assurance verification test number to the sample and mark the following information directly
on the sample with a white paint marker.
Machine direction of the sample.

202005_CQA-Plan_RPT.docx 12-3
Manufacturer’s ClosureTurf® roll number.
Quality assurance verification test number.
Immediately re-wrap the sampled ClosureTurf® roll with its protective covering. Use additional impermeable
plastic sheeting if needed to completely cover the roll.
Complete the Geosynthetics Test Request and Sample Custody Log and ship samples to the geosynthetics testing
laboratory via overnight delivery.
12.2 PRODUCTS
12.2.1 PRODUCT QUALITY ASSURANCE VERIFICATION TESTING The following quality assurance verification testing will be performed by the geosynthetics testing laboratory to verify
compliance with the ClosureTurf® product requirements of the technical specifications which are provided in Table 8:
ClosureTurf®
Yarn Weight (ASTM D5261)
CBR Puncture (ASTM D6241)
Tensile Strength of Product (ASTM D4595)
Tensile Strength of Yarn (ASTM D2256)
Upon completion of the above quality assurance verification testing and receipt of the testing results, the CQA
Organization will review all test results for compliance with the technical specifications. The CQA Organization will
report non-compliance to the Design Engineer.
Additional quality assurance verification testing or correction action measures as the result of non-complying test
results will be determined by the Design Engineer.
12.3 EXECUTION
12.3.1 CQA PREPARATION Prior to ClosureTurf® installations, perform the following CQA verification procedures:
Hold preparatory meeting in accordance with Section 4.4 of this CQA Plan.
Verify geomembrane installation is complete and in accordance with the technical specifications.

12-4 202005_CQA-Plan_RPT.docx
The geomembrane surface is free of stones or debris that could damage the turf or geomembrane during the turf
installation process.
12.3.2 CLOSURETURF® INSTALLATIONS CQA
In general, verify ClosureTurf® is installed in accordance with manufacturer’s instructions.
Verify ClosureTurf® is deployed from the top of the slope in a manner where the leading edge of the roll stays at
the top of the slope with the grass filaments pointing up the slope.
Verify installation equipment or methods do not damage underlying geomembrane by handling, traffic, leakage of
hydrocarbons, or by other means. Verify small equipment such as generators are placed on rub sheets above
geosynthetics materials.
Verify ClosureTurf® is adequately ballasted during placement operations and that ballast is left in place until
geotextile is covered with the overlying cover sand layer.
Verify ClosureTurf® is installed with sufficient tension to prevent excessive overlapping, insufficient overlapping,
wrinkles, and folds.
Verify ClosureTurf® panels are overlapped with sufficient material to create a thermal bond or prayer fold for
sewing operations.
Verify the seaming operations use stitching or thermal bonding. Seaming must be performed using a 4-inch
overlap. Stitched seams shall be fastened with a heavy-duty textile stitching machine or equivalent means. A
prayer-type seam is constructed using a Nulong sewing machine or approved equivalent. Sewing shall use 207
polyester thread or equivalent.
Verify no horizontal seams are placed on side slopes greater than 10-percent, except when part of a patch.
Verify stitching operations do not expose woven geotextiles
Verify rocks, excessive dust, excessive moisture, or other materials that could hamper sewing operations are not
entrapped under the ClosureTurf® or within the overlap.
Verify in-place ClosureTurf® is not left exposed and uncovered beyond the time limitations recommended by the
Manufacturer.
Verify the ends of the ClosureTurf® panels are permanently anchored in the anchor trench and covered with a
minimum of 2-feet of soil after seaming operations are completed and sand ballast has been placed.

202005_CQA-Plan_RPT.docx 12-5
Verify the ClosureTurf® and underlying geosynthetics are not damaged or displaced during placement of the sand
ballast layer. Sand material shall be placed over the ClosureTurf® system with equipment ground pressure less
than five pounds per square foot (psi). No equipment shall be left running and unattended over the constructed
ClosureTurf® system.
12.3.3 CLOSURETURF® REPAIR CQA Verify damaged ClosureTurf® is removed entirely or repaired in accordance with the following guidelines:
Sand shall be removed from the area surrounding the repair to prevent migration of sand into the SGN drainage
layer. Sand removal shall be performed using a blower, vacuum, or other means that will not damage the
underlying geomembrane.
Holes or tears in the turf shall be repaired by placing a patch extending 2 feet beyond the edges of the hole or tear.
Where the hole or tear width across the roll is more than 50 percent of the roll width, the damaged area will be cut
out across the entire roll, and the two portions of the turf will be joined.
All artificial turf repairs will be completed using a heatbond seam, achieved with either a hand held Leister or a
Varimat V2 leistering machine.

202005_CQA-Plan_RPT.docx 13-1
13.0 SAND BALLAST CQA
13.1 GENERAL
13.1.1 SECTION SUMMARY CQA monitoring procedures to verify sand ballast materials and construction methods of the ClosureTurf® system are
in compliance with the technical specifications.
13.2 PRODUCTS The sand layer shall have a minimum thickness of ½ inch and a maximum thickness of ¾ inch. The sand shall be
worked into the turf layer as in-fill between the synthetic yarn blades. The physical characteristics of the sand layer
shall be evaluated through laboratory testing prior to construction and will be visually inspected during construction.
The sand shall be tan or light brown in color. Additional materials testing during construction will be at the discretion
of the CQA Consultant based on the variability of material observed by the CQA Consultant and/or if the sand source is
changed.
13.2.1 PRODUCT QUALITY ASSURANCE VERIFICATION TESTING Verify the sand ballast consists of a highly permeable sand with a Universal Soil Classification of SW or SP and meets
the graduation requirements presented in Table 9 prior to delivery of the ballast material.
13.3 EXECUTION
13.3.1 CONSTRUCTION AND CQA PREPARATION Prior to sand ballast placement, perform the following CQA verification procedures.
Hold a preparatory meeting in accordance with Section 4.4 of this CQA Plan.
Verify underlying geosynthetics and turf installation is complete and in accordance with the technical
specifications.
13.3.2 SAND BALLAST CQA MONITORING The Installer shall place the sand ballast in the geotextile artificial turf in accordance with the following:
The ½-inch to ¾-inch thick sand ballast layer shall be installed in two lifts of ¼inch to ½-inch thickness.

13-2 202005_CQA-Plan_RPT.docx
No equipment shall be allowed on slopes exceeding 15% until the sand ballast is in place. On flatter slopes, ATV
and vehicles will be allowed prior to sand ballast placement if the tire pressure is less than 15 psi.
Precautions must be taken to ensure that the geosynthetics are not displaced as the sand ballast is being placed.
Placement of the sand ballast shall not occur with snow or ice on the artificial turf and must occur during dry
weather conditions.
During construction, the CQA Organization will:
Verify that grade control is performed prior to work.
Verify that underlying geosynthetic installations are not damaged during placement operations. Identify and mark
damaged geosynthetics and verify that damage is repaired.
Verify that a minimum thickness of ½ inch and a maximum thickness of ¾ inches of sand is placed on the
synthetic turf. Frequency will be 10 measurements per acre of turf installed. Additional measurements shall be
taken if the CQA Organization visually identifies areas that appear to have insufficient sand ballast.
Examine 12-inch by 12-inch grids, and verify that a minimum of 90% of the HDPE grass blades protrude through
the ballast. The exposed blades shall be counted in a representative area and compared to the standard grass blade
count of uncovered material. The percentage of protruding blades shall be calculated, and sand shall be adjusted
accordingly. A minimum of 4 tests shall be conducted per acre, and any increased frequency shall be at the
discretion of the CQA Organization.
Verify the sand ballast is spread using blower equipment, ATVs with oscillating brushes, golf type equipment, or a
combination of these. Sand placement shall be monitored to verify that underlying geosynthetic installations are
not damaged during sand placement, and to verify that a sufficient thickness of sand is applied. Proper embedment
of the sand is essential to prevent migration of the sand during storm events. Special care shall be taken to ensure
proper sand embedment and HDPE blade protrusion through the sand ballast.

TABLES

TABLE 1. NORTH HOLDING PONDSOIL TESTING STANDARDS
Number Testing Standard Description
1 AASHTO T11 Standard Method of Test for Materials Finer than No. 200 Sieve in Mineral Aggregates by Washing
2 ASTM C 136 Standard Test Method for Sieve Analysis of Fine and Coarse Aggregates
3 ASTM D 698 Standard Test Method for Laboratory Compaction Characteristics of Soil Using Standard Effort
4 ASTM D 2216 Standard Test Method for Laboratory Determination of Water Moisture Content of Soil and Rock
5 ASTM D 2434 Standard Test Method for Permeability of Granular Soils
6 ASTM D 6938 Standard Test Methods for In-Place Density and Water Content of Soil and Soil-Aggregate by Nuclear Methods
7 ASTM D 2937 Standard Test Method for Density of Soil in Place by the Drive-Cylinder Method
8 ASTM D 4318 Standard Test Methods for Liquid Limit, Plastic Limit, and Plasticity Index of Soils
9 ASTM D 5084 Standard Test Methods for Measurement of Hydraulic Conductivity of Saturated Porous Materials Using a Flexible Wall Permeameter
202005_TestingFrequencies_TBL.xlsx
1 of 1
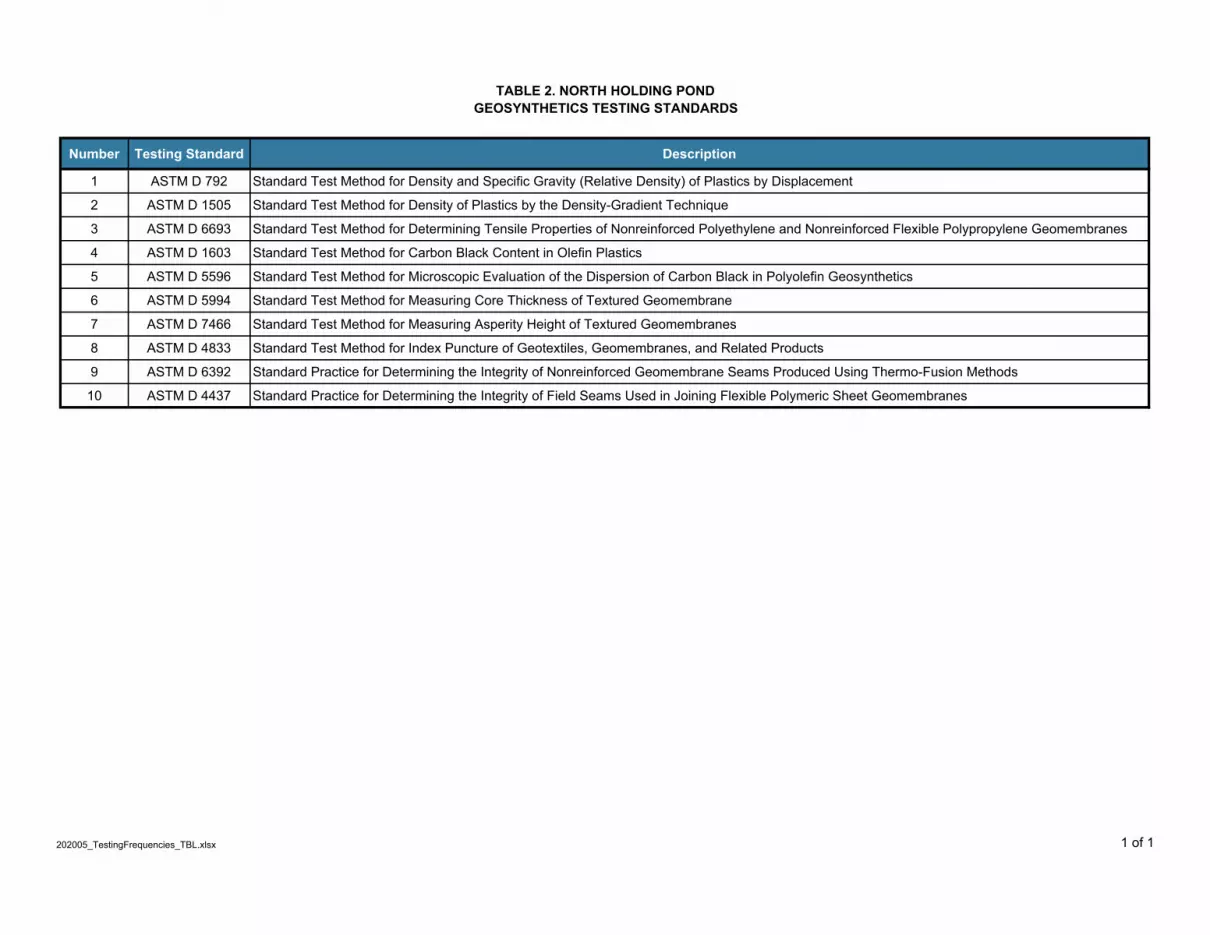
TABLE 2. NORTH HOLDING PONDGEOSYNTHETICS TESTING STANDARDS
Number Testing Standard Description
1 ASTM D 792 Standard Test Method for Density and Specific Gravity (Relative Density) of Plastics by Displacement
2 ASTM D 1505 Standard Test Method for Density of Plastics by the Density-Gradient Technique
3 ASTM D 6693 Standard Test Method for Determining Tensile Properties of Nonreinforced Polyethylene and Nonreinforced Flexible Polypropylene Geomembranes
4 ASTM D 1603 Standard Test Method for Carbon Black Content in Olefin Plastics
5 ASTM D 5596 Standard Test Method for Microscopic Evaluation of the Dispersion of Carbon Black in Polyolefin Geosynthetics
6 ASTM D 5994 Standard Test Method for Measuring Core Thickness of Textured Geomembrane
7 ASTM D 7466 Standard Test Method for Measuring Asperity Height of Textured Geomembranes
8 ASTM D 4833 Standard Test Method for Index Puncture of Geotextiles, Geomembranes, and Related Products
9 ASTM D 6392 Standard Practice for Determining the Integrity of Nonreinforced Geomembrane Seams Produced Using Thermo-Fusion Methods
10 ASTM D 4437 Standard Practice for Determining the Integrity of Field Seams Used in Joining Flexible Polymeric Sheet Geomembranes
202005_TestingFrequencies_TBL.xlsx 1 of 1

TABLE 3. NORTH HOLDING PONDEARTHWORKS SCHEDULE OF TESTING FREQUENCIES
MATERIAL REQUIRED TESTING MINIMUM SPECIFICATION TESTING FREQUENCY
1 test per material type
1 check point per 10,000 yd3
Visual Examination Continuous during excavation operationsNuclear Density-Moisture
ASTM D 6938 95% Max. Dry Density 1 test per 500 yd3 of in-place material, or one test per 500 lf in backfilled trenches
Drive-Cylinder Density ASTM D2937 +/- 3% Optimum Moisture 1 test per 30 Nuclear Density-Moisture tests
Moisture Density RelationsASTM D698 1 check point per 10,000 yd3
Visual Examination Continuous during excavation operationsNuclear Density-Moisture
ASTM D 6938 95% Max. Dry Density 1 test per 500 yd3 of in-place material
Drive-Cylinder Density ASTM D2937 +/- 3% Optimum Moisture 1 test per 30 Nuclear Density-Moisture tests
SUBGRADE - CONSTRUCTION TESTING
Subgrade Moisture Density RelationsASTM D698
95% Max. Dry Density+/- 3% Optimum Moisture 1 test per material type
UNCLASSIFIED FILL - PRE-CONSTRUCTION TESTING
Unclassified Fill
Moisture Density RelationsASTM D698
UNCLASSIFIED FILL - CONSTRUCTION TESTING
Unclassified Fill
202005_TestingFrequencies_TBL.xlsx 1 of 1

TABLE 4. NORTH HOLDING PONDSOIL LINER SCHEDULE OF TESTING FREQUENCIES
REQUIRED TESTING MINIMUM SPECIFICATION TESTING FREQUENCY
Visual Examination Continuous during excavation from borrow areaGrain Size DistributionASTM C136Atterberg Limits LL >= 30ASTM D 4318 PI > 15Hydraulic ConductivityASTM D 5084Moisture Density RelationsASTM D 698Oven Moisture ContentASTM D 2216
Grain Size DistributionASTM C 136Atterberg Limits LL > 30ASTM D 4318 PI > 15Hydraulic ConductivityASTM D 5084Moisture Density Relations(check point)ASTM D 698Drive CylinderASTM D 2937Oven Moisture ContentASTM D 2216Nuclear Density-MoistureASTM D 6938
1 test per source
1 test per source
One per Moisture Density Relations
1 test per material type
K < = 1x10⁻⁷ cm/s
PRE-CONSTRUCTION TESTING
> 30% Passing # 200100% Passing 1-inch
> 30% Passing # 200100% Passing 1-inch
K < = 1x10⁻⁷ cm/s
CONSTRUCTION TESTING
1 test per 6,500 yd3
1 per 20 nuclear tests
1 per nuclear density test until correlation is established (minimum 10)
6 tests per lift per acre
1 per nuclear density test until correlation is established (minimum 10)
1 test per 1,850 yd3
1 test per 1,850 yd3
1 per acre per 6-inch lift
202005_TestingFrequencies_TBL.xlsx 1 of 1

TABLE 5. NORTH HOLDING PONDGCL SCHEDULE OF TESTING FREQUENCIES
MATERIAL REQUIRED TESTING MINIMUM SPECIFICATION
MANUFACTURER OR SUPPLIER MQC TESTING FREQUENCY CONFORMANCE TESTING
FREQUENCY
Bentonite Mass Per Unit Area (ASTM D5993) 0.75 lb/ft2 1 per 40,000 ft2 1 per 100,000 ft2
Bentonite Moisture Content (ASTM D2216) <= 35% 1 per 40,000 ft2
Tensile Strength (ASTM D6768) 23 lb/in 1 per 200,000 ft2
Hydraulic Conductivity (ASTM 5084) 5x10⁻⁹ cm/sec 1 per week/production line 1 per 100,000 ft2
Peel Strength (D6496) 2.1 lb/in 1 per 5,000 yd2
Free Swell Index (ASTM D5890) 24 ml 1 per 50 tons 1 per 50 tonsFluid Loss (ASTM D5891) 18 ml 1 per 50 tons 1 per 50 tons
Mass/Unit Area (ASTM D5261) 3 oz/yd2 1 per 200,000 ft2
Grab Tensile Strength (ASTM D4632) 90 lb 1 per 200,000 ft2
GEOSYNTHETIC CLAY LINER (GRI - GCL3)
Bentonite
Geotextile
GCL
202005_TestingFrequencies_TBL.xlsx 1 of 1

TABLE 6. NORTH HOLDING PONDLLDPE SCHEDULE OF TESTING FREQUENCIES
MATERIAL REQUIRED TESTING MINIMUM SPECIFICATION TESTING FREQUENCY
Geomembrane Asperity Height (ASTM D 7466). 16 every 2nd rollGrab Tensile Strength (ASTM D4632) 0.939 g/cc 200,000 lbTensile Properties (ASTM D 6693)1. Break Strength 75 lb/in (min. avg)2. Break Elongation 250% (min. avg)2% Modulus (ASTM D5323) 3000 per formulationTear Resistance (ASTM D1004) 27 45,000 lbPuncture Resistance (ASTM D 4833) 55 (min. avg) 45,000 lbDrainage Stud Height 0.13 inches per rollCarbon Black Content (ASTM D 4218) 2%-3% 20,000 lbCarbon Black Dispersion (ASTM D 5596) See Note 1 45,000 lbOxidative Induction Time - Standard (ASTM D 3895) 100 hours 200,000 lbOxidative Induction Time - High Pressure (ASTM D 5885) 400 Min. 200,000 lbOven Aging @ 85°C (ASTM D 5721)a. Standard OIT (min. ave. - % retained after 90 days) (ASTM D 3895) 35%b. High Pressure OIT (min. ave. - % retained after 90 days) (ASTM D 5885) 60%UV Resistance (ASTM D7238)a. Standard OIT (min. ave.) (ASTM D 3895) Not Recommendedb. High Pressure OIT (min. ave. - % retained after 1600 hrs) (ASTM D 5885) 35%Density (ASTM D 1505 or ASTM D 792 Method B 0.932 g/cm3 1 per Resin batchMelt Index (ASTM D 1238 Condition E) < 1.0 g per 10 minutes 1 per Resin batchOxidative Induction Time 100 hr. 1 per formulationStandard OIT or High Pressure OIT (ASTM D 3895 or ASTM D 5885) 400 min. 1 per formulationDensity (ASTM D 1505 or ASTM D 792 Method B 0.939 g/cm3 1 per resin lot or batchCarbon Black Content (ASTM D 1603) 2-3%Melt Index (ASTM D 1238 Condition E) < 1.0 g per 10 minutes
20,000 lb
Per Each Formulation
Per Each Formulation
GEOMEMBRANE PROPERTIES (GRI GM-17) & MQC TESTING FREQUENCY
Resin
Extrudate or Bead
202005_TestingFrequencies_TBL.xlsx 1 of 2

TABLE 6. NORTH HOLDING PONDLLDPE SCHEDULE OF TESTING FREQUENCIES
MATERIAL REQUIRED TESTING MINIMUM SPECIFICATION TESTING FREQUENCY
Density (ASTM D 792 or 1505) 0.939 g/ccTensile Properties (ASTM D 6693)1. Break Strength 60 lb/in (min. avg)2. Break Elongation 100% (min. avg)Carbon Black Content (ASTM D 1603) 2%-3%Carbon Black Dispersion (ASTM D 5596) See Note 1Thickness (ASTM D 5994) 47.5 mil (min avg)Asperity Height (ASTM D 7466). 16Puncture Resistance (ASTM D 4833) 55 (min. avg)
Peel Peel Strength (ASTM D4437) Fusion 63 lb/inExtrusion 57 lb/in
Elongation min. 50%2
Shear Shear (ASTM D4437) 75 lb/in
Notes:1. Carbon black dispersion (only near spherical agglomerates) for 10 different views: * 9 in Categories 1 or 2 and 1 in Category 32. Elongation measurements should be omitted for field testing.
1 test per 100,000 ft2
1 test per 500 linear feet of welded seam to start, then method of
attributes
Seam Analysis (ASTM D 6392)
QUALITY ASSURANCE GEOMEMBRANE TESTING
Geomembrane
202005_TestingFrequencies_TBL.xlsx 2 of 2

TABLE 7. NORTH HOLDING PONDDESTRUCTIVE SAMPLING INTERVALS
Percent of Passing Seam Analysis Sampling Modifications*100 Decrease interval to 1000 LF
90-100 Decrease interval to 750 LF
60-90 Maintain interval at 500 LF
30-60 Increase interval to 250 LF*Note that sampling modifications will not be considered until 20 percent of testing is completed.
202005_TestingFrequencies_TBL.xlsx 1 of 1

TABLE 8. NORTH HOLDING PONDCLOSURE TURF SCHEDULE OF TESTING FREQUENCIES
REQUIRED TESTING MINIMUM SPECIFICATION MQC TESTING FREQUENCYCONFORMANCE
TESTING FREQUENCY
Yarn Weight (ASTM D5261) >= 20 oz/sq yard 1 test per 100,000 ft2 1 test per 50,000 ft2
Tensile Strength of Yarn (ASTM D2256) 15 lb min. 1 test per 100,000 ft2 1 test per 50,000 ft2
CBR Puncture (ASTM D6241) 1500 lb. (MARV) 1 test per 100,000 ft2 1 test per 50,000 ft2
Tensile Product (MD/XD) (ASTM D4595) 2100 MD/ 1600 XD lb/ft MARV 1 test per 100,000 ft2 1 test per 50,000 ft2
Interface Friction (ASTM D5321) 21(d) Peak 1 test per 100,000 ft2 NoneEngineered Turf Fiber UV Stability (ASTM G147) >60% retained @ 100 years 1 test per 100,000 ft2 NoneBacking System UV Stability (Exposed) (ASTM G154) 110 lb/ft retained at 6,500 hrs 1 test per 100,000 ft2 None
202005_TestingFrequencies_TBL.xlsx 1 of 1

TABLE 9. NORTH HOLDING PONDSAND BALLAST SCHEDULE OF TESTING FREQUENCIES
REQUIRED TESTING MINIMUM SPECIFICATION
PRE-CONSTRUCTION TESTING CONSTRUCTION TESTING
Visual Examination Continuous during placement operations
Void Content - Method A (ASTM C1252) >= 40% 1 test per source 1 test per 175 yd3
Relative Density (ASTM C128) >= 2.40 1 test per source 1 test per 175 yd3
Sieve Analysis - (ASTM C 136) See Specification 1 test per source 1 test per 175 yd3
CONFORMANCE TESTING
202005_TestingFrequencies_TBL.xlsx 1 of 1

APPENDIX A
TECHNICAL SPECIFICATIONS

Technical Specifications Surveying 42M-002-008 01050 - 1 May 18, 2020
SECTION 01050 SURVEYING
PART 1 GENERAL 1.01 SECTION SUMMARY
A. Surveying requirements. B. Submittals.
C. Surveying performed by OWNER. D. Construction staking performed by CONTRACTOR to layout the Work. E. Surveying performed by OWNER to determine measurement and payment quantities. F. Surveying performed by OWNER to prepare as-built record drawings. G. Surveying Accuracy and Tolerances.
1.02 SURVEYING REQUIREMENTS
A. Employ a Land Surveyor registered in the State of Texas and acceptable to OWNER, to
perform survey work described in this Section.
1.03 SUBMITTALS A. Submit with bid, name, address, and phone number of proposed Land Surveyor. B. Submit before starting survey work, certificate of Land Surveyor’s Errors and Omissions
current insurance coverage. C. Submit upon request, documentation verifying the accuracy of the survey work.
1.04 SURVEYS PERFORMED BY OWNER A. OWNER has reference control points and benchmark elevations in the vicinity of the
project. OWNER will provide drawing and/or coordinates of the reference control points prior to construction. All other necessary reference points to perform the Work will be established by CONTRACTOR. CONTRACTOR will replace any pins, hubs, benchmarks, or other survey markers destroyed or displaced by CONTRACTOR at CONTRACTOR’s expense.
B. OWNER will perform surveying for Certification Surveys and As-Built Record
Drawings. C. OWNER may use line and grade points and markers established by the CONTRACTOR
as part of the Work.

Technical Specifications Surveying 42M-002-008 01050 - 2 May 18, 2020
1.05 CONSTRUCTION STAKING TO LAYOUT AND PERFORM THE WORK A. CONTRACTOR will provide initial construction staking necessary to commence
construction. CONTRACTOR will provide grade staking as required to complete the work in accordance with the Drawings and Technical Specifications.
1.06 SURVEYING FOR AS-BUILT RECORD DRAWINGS
A. OWNER will perform the following as-built surveys and provide record drawings at
50-scale for the following items.
1. Limits, contours, and grade breaks of subgrade on 50-foot point-over-point grid (x,y,z).
2. Limits, contours, and grade breaks of soil liner on 50-foot point-over-point grid
(x,y,z) for layer thickness verification.
3. Limits of landfill geomembrane installation at 50-foot stations (x,y,z) and angle points.
4. Alignment and grade of stormwater ditches and stormwater culvert pipes at 50-
foot stations (x,y,z) and angle points.
5. Alignment, width and grade of all roadways at 50-foot stations (x,y,z) and angle points.
1.08 SURVEYING ACCURACY AND TOLERANCES
A. Perform control traverse field surveys and computations to an accuracy of 1:10,000. B. Tolerances for setting survey stakes are as follows.
Type of Point Horizontal Position Elevation Permanent reference points 1: 10,000 ±0.01 foot Earthwork 1: 2,000 ±0.10 foot
C. Tolerances for thickness and elevations of the granular drainage layer and cover soil layer
are as follows unless otherwise specified.
1. Soil Liner Layer Thickness - 0.0 / + 0.1 foot
2. Elevations ± 0.10 foot
3. Line ± 0.30 foot PART 2 PRODUCTS Not Used.

Technical Specifications Surveying 42M-002-008 01050 - 3 May 18, 2020
PART 3 EXECUTION Not Used.
END SECTION 01050

Technical Specifications Earthworks 42M-002-008 02220-1 May 18, 2020
SECTION 02220 EARTHWORK
PART 1 GENERAL The directives outlined in this document apply to the WORK performed by the CONTRACTOR unless otherwise noted. 1.01 SECTION SUMMARY
A. Excavation
1. Excavation of suitable earth fill materials to construct the unclassified fill and
compacted soil liner for the final cover system.
B. Unclassified Fill 1. Unclassified fill to achieve design grades in the landfill closure limits.
1.02 RELATED SECTIONS
A. Section 1050 – Surveying
B. Section 02250 – Soil Liner 1.03 REFERENCES
A. ASTM D698 Standard Test Methods for Laboratory Compaction Characteristics of
Soil Using Standard Effort. B. ASTM D6938 Standard Test Methods for In-Place Density and Water Content of Soil
and Soil-Aggregate by Nuclear Methods. C. ASTM D2937 Density of Soil in Place by the Drive-Cylinder Method.
1.04 QUALITY ASSURANCE VERIFICATION TESTING AND DESIGNATION OF MATERIAL TYPES A. CQA ORGANIZATION will perform the following quality assurance verification testing
prior to and during embankment operations.
1. Moisture-density relations (ASTM D698) to determine the maximum dry density and optimum moisture content for each different type of embankment material.
2. Nuclear density and moisture content (ASTM D 6938) to verify relative
compaction. 3. In-place density by the drive-cylinder method (ASTM D2937) to verify that the
nuclear density gauge is working properly and providing reliable test results

Technical Specifications Earthworks 42M-002-008 02220-2 May 18, 2020
4. Visual examination and sampling to verify that embankment materials contain no organic, saturated, oversized, or other unsuitable materials.
B. The CONTRACTOR shall cooperate with CQA ORGANIZATION in the performance of
quality assurance verification testing. PART 2 PRODUCTS 2.01 TOPSOIL
A. Removed from on-site unclassified fill and soil liner borrow sources.
B. Topsoil and organic soil contain organic material (grassy vegetation, roots, etc.).
2.02 UNCLASSIFIED FILL
A. Obtained from on-site borrow sources.
B. Free of organic, saturated, oversized, or other unsuitable materials. C. Maximum particle size of four (4) inches, unless otherwise approved by Engineer.
2.03 CONSTRUCTION WATER A. Obtain from OWNER provided source.
PART 3 EXECUTION 3.01 PREPARATION AND EXAMINATION
A. Locate, identify, and protect all utilities and existing structures from damage (including overhead and suspended utilities).
B. Coordinate with utility company and OWNER to locate utilities, if applicable. C. Provide dust control. Water haul roads several times each day and when requested by
OWNER. D. Coordinate traffic control and barricades with OWNER. E. Coordinate operations and haul routes with site operations. Maintain OWNER’s access
to and from operating facilities. F. CONTRACTOR will provide construction staking and grade control. Establish lines,
grade, contours and datum. Protect temporary benchmarks and offset construction staking.
G. OWNER will perform topographic surveys and mapping prior to starting any excavation
or fill for measurement and payment purposes. H. Perform and provide as-built surveys in accordance with Section 01050.
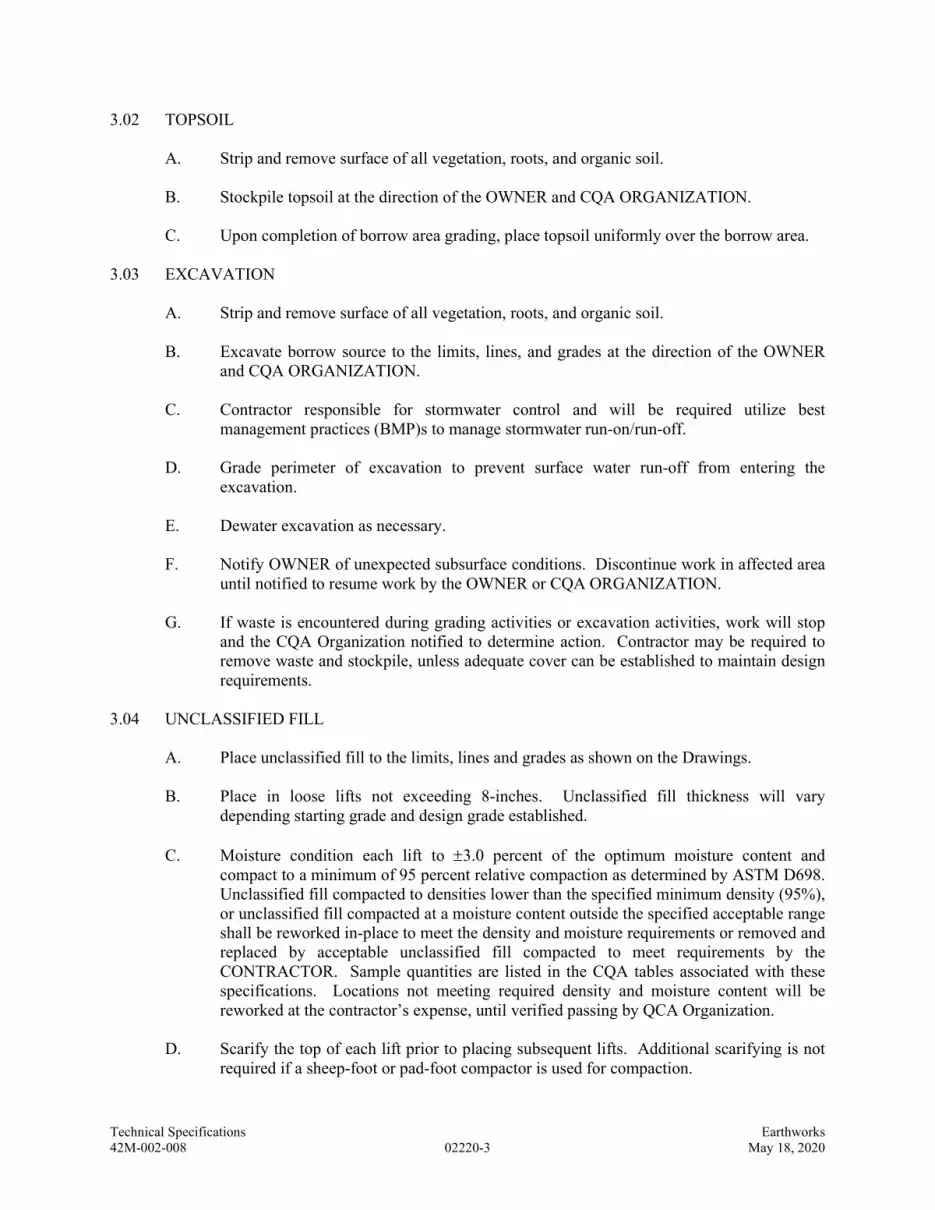
Technical Specifications Earthworks 42M-002-008 02220-3 May 18, 2020
3.02 TOPSOIL
A. Strip and remove surface of all vegetation, roots, and organic soil.
B. Stockpile topsoil at the direction of the OWNER and CQA ORGANIZATION.
C. Upon completion of borrow area grading, place topsoil uniformly over the borrow area. 3.03 EXCAVATION
A. Strip and remove surface of all vegetation, roots, and organic soil. B. Excavate borrow source to the limits, lines, and grades at the direction of the OWNER
and CQA ORGANIZATION. C. Contractor responsible for stormwater control and will be required utilize best
management practices (BMP)s to manage stormwater run-on/run-off.
D. Grade perimeter of excavation to prevent surface water run-off from entering the excavation.
E. Dewater excavation as necessary. F. Notify OWNER of unexpected subsurface conditions. Discontinue work in affected area
until notified to resume work by the OWNER or CQA ORGANIZATION. G. If waste is encountered during grading activities or excavation activities, work will stop
and the CQA Organization notified to determine action. Contractor may be required to remove waste and stockpile, unless adequate cover can be established to maintain design requirements.
3.04 UNCLASSIFIED FILL
A. Place unclassified fill to the limits, lines and grades as shown on the Drawings.
B. Place in loose lifts not exceeding 8-inches. Unclassified fill thickness will vary
depending starting grade and design grade established. C. Moisture condition each lift to ±3.0 percent of the optimum moisture content and
compact to a minimum of 95 percent relative compaction as determined by ASTM D698. Unclassified fill compacted to densities lower than the specified minimum density (95%), or unclassified fill compacted at a moisture content outside the specified acceptable range shall be reworked in-place to meet the density and moisture requirements or removed and replaced by acceptable unclassified fill compacted to meet requirements by the CONTRACTOR. Sample quantities are listed in the CQA tables associated with these specifications. Locations not meeting required density and moisture content will be reworked at the contractor’s expense, until verified passing by QCA Organization.
D. Scarify the top of each lift prior to placing subsequent lifts. Additional scarifying is not
required if a sheep-foot or pad-foot compactor is used for compaction.

Technical Specifications Earthworks 42M-002-008 02220-4 May 18, 2020
E. Maintain embankment lift surfaces to prevent moisture loss and desiccation cracking. Repair desiccated areas prior to placing subsequent lifts.
F. Do not place frozen unclassified fill material or place material over frost or snow
impacted base layer. 3.05 FINAL SUBGRADE PREPARATION
A. Grade final subgrade surface to the limits, lines, and grades as shown on the Drawings.
Fine grade to a tolerance of 0.0 to 0.10 feet below design grade. B. Maintain subgrades to prevent moisture loss and desiccation cracking. Repair desiccated
areas. C. Remove all debris and rocks greater than 1-inch in diameter from the completed surface. D. Roll the completed surface with a steel drum roller. For clay liner subgrade, remove
ridges, gouges and ruts greater than 1-inch. E. Moisture condition completed surface as necessary. F. OWNER will perform as-built survey of completed borrow source and unclassified fill in
accordance with Section 01050. As-built survey must be completed, submitted, and accepted prior to soil liner construction.
G. OWNER will perform and provide measurement and payment surveys in accordance
with Sections 01050.
END SECTION 02220

Technical Specifications Trenching and Backfilling 42M-002-008 02223-1 May 18, 2020
SECTION 02223 TRENCHING AND BACKFILLING
PART 1 GENERAL
The directives outlined in this document apply to the WORK performed by the CONTRACTOR unless otherwise noted. 1.01 SECTION SUMMARY
A. Trenching and backfilling.
1.02 RELATED SECTIONS
A. Section 01050 - Surveying B. Section 02220 - Earthworks
C. Section 02771-1 - LLDPE Geomembrane
PART 2 PRODUCTS 2.01 UNCLASSIFIED FILL
A. In accordance with Section 02220
PART 3 EXECUTION 3.01 PREPARATION
A. Provide alignment control staking at 50-foot stations for anchor trenches. B. Locate, identify, and protect utilities and existing structures from damage.
3.04 ANCHOR TRENCHES
A. Excavate at locations and to dimensions shown on the Drawings. B. Round inside edge of anchor trench or protect with 4-foot wide strip of geotextile cushion.
Remove materials from trench that may damage geomembrane. C. Backfill anchor trench with earthfill or material excavated from the trench (if material
meets specifications outlined by Section 02220 – Earthworks) to dimensions shown on the Drawings and only after engineered turf layer placement operations are complete.
D. Place earthfill in loose 12-inch lifts. E. Moisture condition and compact each lift with manual hand tampers or by wheel-rolling
with rubber tired equipment to a minimum 95 percent relative compaction as determined by ASTM D698.

Technical Specifications Trenching and Backfilling 42M-002-008 02223-2 May 18, 2020
F. Repair damaged geomembrane if damage occurs during trenching and backfill operations. The CONTRACTOR shall be responsible for repairs to the geomembrane at no additional cost to the OWNER.
G. Remove geomembrane and closure turf tails so that material is adequately covered in the
anchor trench and the terminal ends do not surface. H. Receive approval from QCA Organization prior to backfilling anchor trenches.
END SECTION 02223
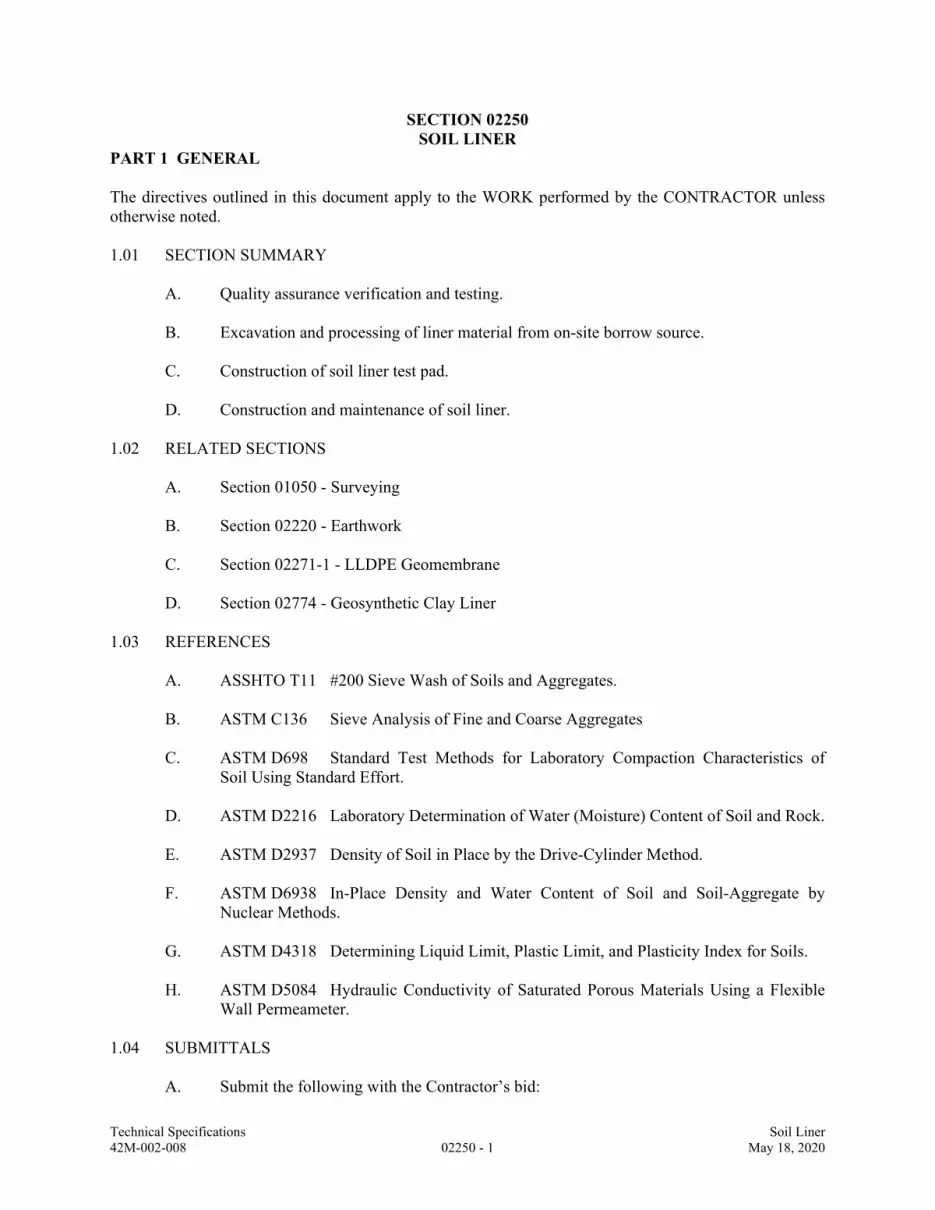
Technical Specifications Soil Liner 42M-002-008 02250 - 1 May 18, 2020
SECTION 02250 SOIL LINER
PART 1 GENERAL The directives outlined in this document apply to the WORK performed by the CONTRACTOR unless otherwise noted. 1.01 SECTION SUMMARY
A. Quality assurance verification and testing.
B. Excavation and processing of liner material from on-site borrow source.
C. Construction of soil liner test pad. D. Construction and maintenance of soil liner.
1.02 RELATED SECTIONS
A. Section 01050 - Surveying B. Section 02220 - Earthwork
C. Section 02271-1 - LLDPE Geomembrane D. Section 02774 - Geosynthetic Clay Liner
1.03 REFERENCES
A. ASSHTO T11 #200 Sieve Wash of Soils and Aggregates. B. ASTM C136 Sieve Analysis of Fine and Coarse Aggregates C. ASTM D698 Standard Test Methods for Laboratory Compaction Characteristics of
Soil Using Standard Effort. D. ASTM D2216 Laboratory Determination of Water (Moisture) Content of Soil and Rock. E. ASTM D2937 Density of Soil in Place by the Drive-Cylinder Method. F. ASTM D6938 In-Place Density and Water Content of Soil and Soil-Aggregate by
Nuclear Methods.
G. ASTM D4318 Determining Liquid Limit, Plastic Limit, and Plasticity Index for Soils. H. ASTM D5084 Hydraulic Conductivity of Saturated Porous Materials Using a Flexible
Wall Permeameter. 1.04 SUBMITTALS
A. Submit the following with the Contractor’s bid:
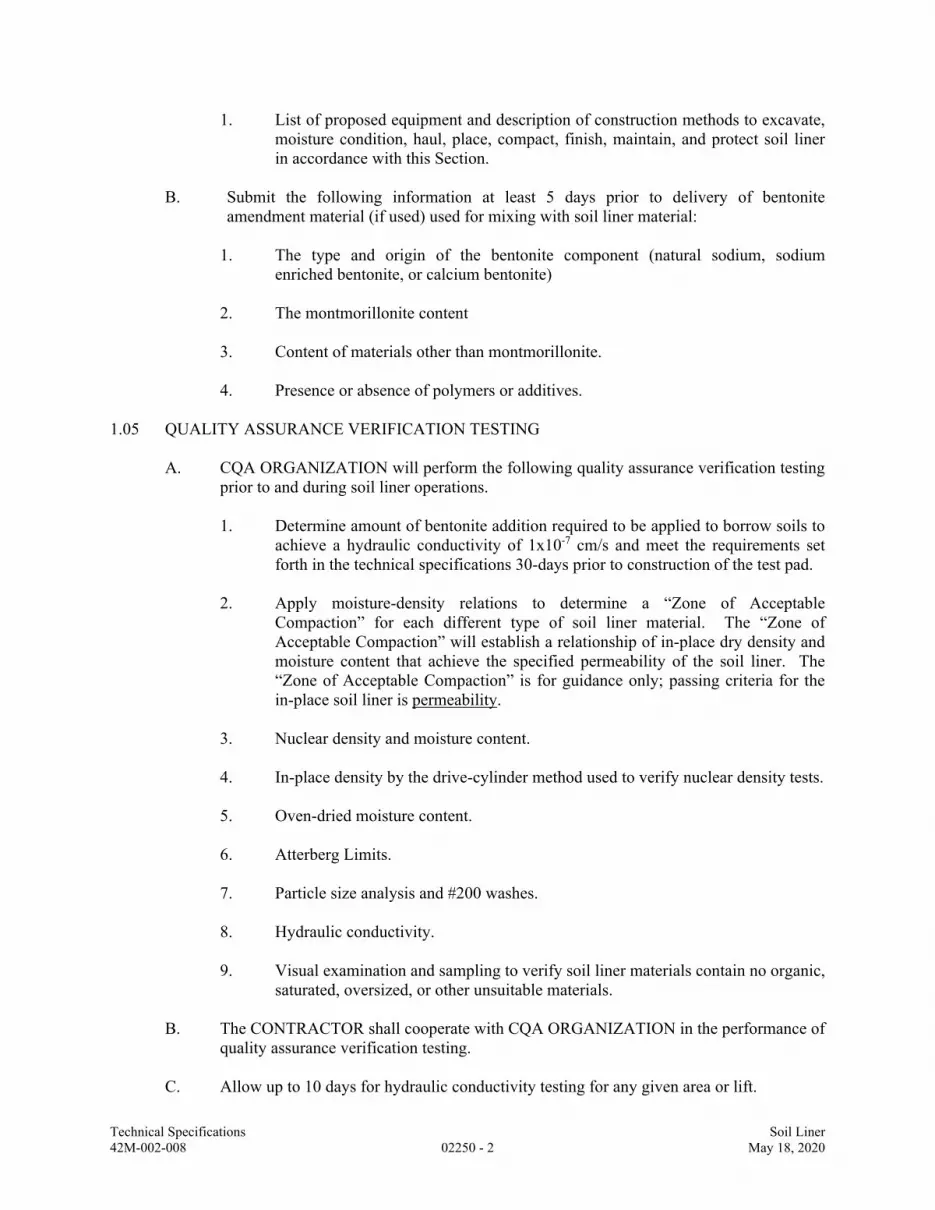
Technical Specifications Soil Liner 42M-002-008 02250 - 2 May 18, 2020
1. List of proposed equipment and description of construction methods to excavate, moisture condition, haul, place, compact, finish, maintain, and protect soil liner in accordance with this Section.
B. Submit the following information at least 5 days prior to delivery of bentonite amendment material (if used) used for mixing with soil liner material:
1. The type and origin of the bentonite component (natural sodium, sodium
enriched bentonite, or calcium bentonite) 2. The montmorillonite content 3. Content of materials other than montmorillonite. 4. Presence or absence of polymers or additives.
1.05 QUALITY ASSURANCE VERIFICATION TESTING
A. CQA ORGANIZATION will perform the following quality assurance verification testing
prior to and during soil liner operations.
1. Determine amount of bentonite addition required to be applied to borrow soils to achieve a hydraulic conductivity of 1x10⁻⁷ cm/s and meet the requirements set forth in the technical specifications 30-days prior to construction of the test pad.
2. Apply moisture-density relations to determine a “Zone of Acceptable Compaction” for each different type of soil liner material. The “Zone of Acceptable Compaction” will establish a relationship of in-place dry density and moisture content that achieve the specified permeability of the soil liner. The “Zone of Acceptable Compaction” is for guidance only; passing criteria for the in-place soil liner is permeability.
3. Nuclear density and moisture content. 4. In-place density by the drive-cylinder method used to verify nuclear density tests. 5. Oven-dried moisture content. 6. Atterberg Limits. 7. Particle size analysis and #200 washes. 8. Hydraulic conductivity. 9. Visual examination and sampling to verify soil liner materials contain no organic,
saturated, oversized, or other unsuitable materials. B. The CONTRACTOR shall cooperate with CQA ORGANIZATION in the performance of
quality assurance verification testing. C. Allow up to 10 days for hydraulic conductivity testing for any given area or lift.

Technical Specifications Soil Liner 42M-002-008 02250 - 3 May 18, 2020
PART 2 PRODUCTS 2.01 SOIL LINER
A. The CONTRACTOR shall obtain soil liner material from on-site borrow area. On-site
soils must meet the following requirements: 1. Percent passing (by weight), of fine material passing the No. 200 sieve greater
than 30 percent.
2. Percent passing (by weight), of fine material passing the one inch sieve equal to 100 percent.
3. Plasticity index (PI) greater than 15 percent.
4. Liquid Limit (LL) greater than or equal to 30.
5. Free of organic, saturated, oversized, or other unsuitable materials. 6. Hydraulic conductivity less than or equal to 1 x 10⁻⁷ when moisture conditioned,
placed, and compacted in accordance with this Section. B. Addition of bentonite amendment to on-site soils may be required to meet the
specifications outlined in Section 2.01.A. Bentonite used for amendment shall be in granular or pulverized form.
C. Off-site borrow materials may be used if the material meets the requirements of these
specifications without bentonite amendments. The proposed soil liner materials shall be approved by the OWNER and the DESIGN ENGINEER prior to use.
D. Required proportion of on-site soils and bentonite, and the suitability of the soil liner material shall be verified by the CQA ORGANIZATION by evaluation and testing conducted by the CQA ORGANIZATION prior to and as part of the test pad construction.
2.02 CONSTRUCTION WATER A. Obtain from OWNER furnished source. Contractor required to haul water to the project
location.
PART 3 EXECUTION 3.01 PREPARATION OF BENTONITE AMENDED SOIL LINER MATERIAL
A. If onsite soils require bentonite amendments to meet the specified soil liner requirements, the following procedures shall be implemented to prepare the bentonite amended soil liner material:
1. Use a soil liner material as determined by pre-construction testing and outlined in
2.01. The soil liner material shall be placed in measured loose lifts with a measured quantity of bentonite and blended using a rotary mixer (Caterpillar

Technical Specifications Soil Liner 42M-002-008 02250 - 4 May 18, 2020
RM300 or DESIGN ENGINEER approved equivalent). Care shall be taken to not incorporate subgrade soils into the bentonite/soil blend.
2. Do not apply water during the first three passes of the rotary mixer. Water may
be added after the initial three passes. 3. Water shall be added in a uniform manner either with the rotary mixer and the
materials moisture conditioned to within 2% of the optimum moisture content or slightly higher in extreme heat conditions to account for moisture loss due to evaporation. The material will be hydrated for a minimum of 24 hours prior to placement as liner. The remaining water required to reach the appropriate water content may be added to the soil in-place during liner placement and compaction.
B. Contractor shall blend the material in the mixing area prior to placement in the test pad.
Samples will be obtained for hydraulic conductivity testing and tested prior to placement by the CQA ORGANIZATION. Samples will be remolded at the testing laboratory within the range specified in this section. Pre-construction tests shall be performed for hydraulic conductivity by the CQA ORGANIZATION to verify the blended material meets the hydraulic conductivity specification of 1x10⁻⁷ cm/sec or lower.
3.02 TEST PAD CONSTRUCTION
The intent of the test pad is to simulate construction of the actual soil liner in the landfill cell including processing, moisture conditioning, bentonite addition, lift thickness, placement, grading, compaction efforts, and finishing operations. The intent of the test pad is to also verify that requirements of this specification can be met.
A. Construct test pad a minimum of 14 days prior to actual soil liner construction.
B. Use equipment and construction methods used proposed to construct the soil liner to
construct the test pad. C. Test pad shall consist of a minimum 2-foot thick fill of soil liner material. Construct test
pad with a top deck of 25-feet wide by 50-feet long. Provide 4H:1V ramps onto and off the pad along the width of the pad and a 2H:1V slope the length the pad. The DESIGN ENGINEER shall provide a drawing for the configuration of the test pad prior to construction.
D. Do not contaminate soil liner material with any other soil materials. E. Construct test pad in accordance with Parts 3.03 and 3.04 of this Section. F. CQA ORGANIZATION will document construction equipment and methods and
perform quality assurance verification testing outlined in Part 1.05 of this Section. The DESIGN ENGINEER will review the results of test pad construction and may modify the construction requirements and testing criteria specified in Part 3.03.
3.02 PREPARATION AND EXAMINATION OF LANDFILL CLOSURE SITE
A. CQA ORGANIZATION shall verify landfill closure subgrade is complete and in
accordance with Section 02220 Earthwork. Verification includes submission of as-built

Technical Specifications Soil Liner 42M-002-008 02250 - 5 May 18, 2020
survey of completed subgrade by the OWNER and acceptance of as-built survey by the CQA ORGANIZATION.
B. Locate, identify and protect all utilities and existing structures from damage (including
overhead and suspended utilities). C. Provide dust control. D. Coordinate traffic control and barricades with OWNER. E. Coordinate operations and haul routes with landfill operations. F. Provide construction staking and grade control stakes at 50-foot grid and grade breaks or
utilize construction equipment equipped with GPS grade control. G. Provide full-time grade checker during soil liner placement to control grade, lift
thickness, and tolerances or provide equipment with GPS grade control. H. Protect temporary benchmarks and construction staking from disturbance during
construction. 3.03 SOIL LINER CONSTRUCTION
A. Place soil liner to the limits, lines, and grades as shown on the Drawings. B. Process soil liner material to meet the project specifications in accordance with the
specified blend and procedures identified during construction of the test pad. C. Scarify liner subgrade areas to a depth of two inches to ensure adequate bonding. D. Place initial soil line lift at 8-inches in depth to prevent contamination of soil liner with
subgrade materials. E. Place subsequent lifts of soil liner in loose lifts not exceeding 6-inches in thickness. Lift
thickness may be adjusted (decreased) depending on permeability results. The final 1-foot thick soil liner shall consist of a minimum of 2 separate compacted lifts but may require 4 or more to achieve the required permeability. No loose lift shall be thicker than the pads of the compactor so complete bonding with the previous lift is achieved.
F. Compact the soil liner to at least 95% of the maximum dry density (ASTM D698) at a
moisture content that falls within the “Acceptable Zone of Compaction,” ` and as confirmed, or revised as applicable, based on final test results obtained from the soil liner test pad. The moisture content and density shall be uniform throughout the lift. The CONTRACTOR shall reduce the clod size of the soil liner to a size no greater than 1-inch or a size acceptable to the CQA ORGANIZATION, the method by which shall be approved by the CQA ORGANIZATION and OWNER prior to implementation.
G. Compact lifts with kneading pad-foot compactor and adjust moisture content to specified
range.

Technical Specifications Soil Liner 42M-002-008 02250 - 6 May 18, 2020
H. Scarify, blend, and compact lifts together to prevent smooth zones and provide bonding between lifts.
I. Protect completed lifts from damage, desiccation, and moisture loss. Repair damaged
lifts prior to placing succeeding lifts. J. Schedule soil liner placement operations to facilitate quality assurance verification
testing. Do not place succeeding lifts until passing results for compaction, moisture content, and permeability are achieved from the completed soil liner lift.
K. Ensure the in-place soil liner has a permeability less than or equal to 1 x 10⁻⁷ cm/sec as
determined by ASTM D5084 (Method D). If soil liner does not meet the specified permeability, the CONTRACTOR shall rework areas, or remove and replace materials to meet the specified permeability. Rework to areas of failed permeability shall be completed are at no additional cost to the OWNER, even if materials were placed and compacted within the “Zone of Acceptable Compaction”.
3.04 FINAL SURFACE PREPARATION
A. Remove all exposed rock protruding greater than 0.5-inch from the completed soil liner
surface. In no case will sharp protrusions be allowed even if less than 0.5-inch. B. Grade final surface to the lines and grades shown on the Drawings within the tolerances
specified in Section 01050, Part 1.08. The absolute minimum thickness is 2.0 feet and maximum thickness is 2.1 feet. Do not over build soil liner thickness.
C. Shall use a steel drum roller to complete the surface. Remove abrupt edges, ridges,
gouges, tire tracks, desiccation cracks, and ruts greater than 0.5 inches. D. Compact corners and other areas not accessible by driven compaction equipment utilizing
hand-operated 500-pound (minimum) vibratory plate or vibratory smooth-drum compaction equipment approved by CQA ORGANIZATION and OWNER.
E. Moisture condition completed surface as necessary to prevent desiccation. F. Perform as-built surveys (thickness verification) of completed soil liner prior to
geomembrane installation. As-built surveys shall be provided to the CQA ORGANIZATION.
3.05 MAINTENANCE AND REPAIR
A. Remove all hubs, grade control stakes, and survey stakes. Repair all holes with approved
moisture conditioned soil liner material or bentonite/soil admixture. Compact with suitable device (e.g. jumping jack) to achieve required material compaction.
B. Maintain and protect soil liner moisture content and surface condition within specified
moisture content range until covered by geomembrane. Protective measures may include covering the soil liner with temporary plastic sheeting.
C. Shall not allow completed surface to desiccate. If desiccation cracks are greater than 0.2
feet deep or 0.5 inches wide, excavate the full depth and along the full length of the

Technical Specifications Soil Liner 42M-002-008 02250 - 7 May 18, 2020
crack, and repair with additional soil liner material. If desiccation cracks are less than 0.2 feet deep or 0.5 inches wide, moisture condition and compact with steel drum roller.
D. Repair all weather and erosion related damage to the soil liner not covered by
geosynthetics at no additional cost to the OWNER. Do not allow water to run or collect under the geosynthetics installation. If water runs or collects under the geosynthetics, causing erosion and saturation, remove geosynthetics and then remove and replace soil liner material entirely. Depending on circumstances, the soil liner material may or moisture conditioned, re-compacted, and re-finished to the requirements of 3.03 and 3.04.
E. Repair soil liner surfaces found to be out-of-grade-tolerance as follows:
1. Scarify and moisture condition (water spray) surface. 2. Place additional moisture-conditioned soil liner material. 3. If surface is greater than 0.1 feet out-of-grade-tolerance, compact soil liner
backfill with pad-foot compactor. If surface is less than 0.1 feet out-of-grade-tolerance, compact soil liner backfill with steel drum roller.
4. Grade or trim repaired surface within tolerance. Steel drum roll surface smooth.
F. Repair wheel ruts on soil liner surface caused by geomembrane deployment equipment.
3.06 SURVEY CONTROL
A. Surveys of soil liner shall be conducted by the OWNER to verify quantities for payment purposes and verify thickness on a 50-foot point over point grid.
END SECTION 02250

Technical Specifications LLDPE Geomembrane 42M-002-008 02771-1 - 1 May 18, 2020
SECTION 02771-1 LINEAR LOW DENSITY POLYETHYLENE (LLDPE) GEOMEMBRANE
PART 1 GENERAL The directives outlined in this document apply to the WORK performed by the CONTRACTOR unless otherwise noted. 1.01 SECTION SUMMARY
A. Furnishing and installing primary geomembrane.
1.02 RELATED SECTIONS
A. Section 02774 – Geosynthetic Clay Liner.
1.03 REFERENCES A. ASTM D 792 - Standard Test Method for Density and Specific Gravity (Relative Density)
of Plastics by Displacement
B. ASTM D 1505 - Standard Test Method for Density of Plastics by the Density-Gradient Technique
C. ASTM D 6693 - Standard Test Method for Determining Tensile Properties of
Nonreinforced Polyethylene and Nonreinforced Flexible Polypropylene Geomembranes D. ASTM D 1603 - Standard Test Method for Carbon Black Content in Olefin Plastics E. ASTM D 5596 - Standard Test Method for Microscopic Evaluation of the Dispersion of
Carbon Black in Polyolefin Geosynthetics F. ASTM D 5994 - Standard Test Method for Measuring Core Thickness of Textured
Geomembrane G. ASTM D 7466 - Standard Test Method for Measuring Asperity Height of Textured
Geomembranes H. ASTM D 4833 - Standard Test Method for Index Puncture of Geotextiles, Geomembranes,
and Related Products I. ASTM D 6392 - Standard Practice for Determining the Integrity of Nonreinforced
Geomembrane Seams Produced Using Thermo-Fusion Methods J. ASTM D 4437 - Standard Practice for Determining the Integrity of Field Seams Used in
Joining Flexible Polymeric Sheet Geomembranes
K. GRI GM17 Standard Specification for Supply of LLDPE Geomembrane. L. GRI GM19 Seam Strength and Related Properties of Thermally Bonded Polyolefin
Geomembranes

Technical Specifications LLDPE Geomembrane 42M-002-008 02771-1 - 2 May 18, 2020
1.04 SUBMITTALS A. Submit the following 21 days before geomembrane is shipped to the site.
1. A 2-foot by 10-foot sample of geomembrane material meeting the specifications
outlined in Part 2.02 and containing a degree of texturization representative of the material that will be shipped to the site. Materials shipped to the site that do not contain a degree of texturization comparable to the samples will be rejected.
B. Submit the following 14 days prior geomembrane installations. 1. Geomembrane Resin.
a. Certificate of Compliance with product requirements of Part 2.01 of this
Section.
b. Specific Gravity quality control test reports.
c. Certification listing percentages of processing aids, antioxidants, and other additives other than carbon black added to the resin.
2. Geomembrane Rolls.
a. Samples, product data sheets, and complete description of geomembranes
that meet or exceed the product requirements of Part 2.02 of this Section.
b. Manufacturer’s quality control testing reports for geomembrane rolls delivered to the site. At a minimum, tests specified in Part 2.02 of this Section must be included in the testing reports.
c. Certification stating that all geomembrane rolls are furnished by one
supplier and that all rolls are manufactured from one resin type obtained from one resin supplier.
d. Instructions for handling, storing, installing, and repairing geomembrane.
e. Geomembrane Installation Quality Control Manual.
3. Extrusion Welding Beads and Rod.
a. Certificate of Compliance with product requirements of Part 2.03 of this
Section.
4. LLDPE Pipe Boots a. Shop drawings proposed pipe boot configuration and dimensions.

Technical Specifications LLDPE Geomembrane 42M-002-008 02771-1 - 3 May 18, 2020
5. Proposed Geomembrane Panel Layout Drawings. a. Drawings showing the proposed primary and secondary geomembrane
panel layouts and penetration details in compliance with Drawings and this Section.
6. Geomembrane INSTALLER Qualifications. a. Resumes must include number of lineal feet of seam welded.
b. Resume of geomembrane installation superintendent.
c. Resume of geomembrane master welder.
d. Resume of welding and quality control crew.
C. Submit at the completion of the geomembrane installation.
1. Manufacturer’s warranty in compliance with Part 1.05 of this Section.
2. Installation warranty in compliance with Part 1.05 of this Section.
3. Completed geomembrane panel layout drawings.
1.05 WARRANTIES
A. Twenty year prorata manufacturer warranty for the primary geomembranes against
deterioration due to exposure to the elements, either exposed or buried.
B. Two year nonprorata installation warranty for the primary geomembrane installations against defects.
1.06 DELIVERY, STORAGE, AND HANDLING
A. Notify CQA ORGANIZATION of geomembrane shipment deliveries. Provide CQA
ORGANIZATION with copy of packing list.
B. Unload, handle, transport geomembrane rolls with nylon or other cloth straps that do not damage the geomembrane rolls.
C. Prepare a bedding layer surface in an area indicated by CQA ORGANIZATION to store
the geomembrane rolls. D. Only stack the geomembrane rolls three high. E. Leave a 3-foot wide access path between the stacked geomembrane rolls. F. Separate damaged or rejected geomembrane rolls as directed by CQA ORGANIZATION.

Technical Specifications LLDPE Geomembrane 42M-002-008 02771-1 - 4 May 18, 2020
1.07 QUALITY ASSURANCE VERIFICATION TESTING A. CQA ORGANIZATION will sample geomembrane every 100,000 square feet of material
delivered to the site or produced at the manufacturing plant and perform the following quality assurance verification testing to verify compliance with the product requirements of this Section. 1. Tensile Properties
2. Density
3. Carbon Black Content
4. Carbon Black Dispersion
5. Sheet Thickness
6. Asperity Height
7. Puncture Resistance
B. OWNER’s acceptance of geomembrane will be based on results of quality assurance
verification testing. Allow 7 days to complete testing.
C. Assist CQA ORGANIZATION with sampling procedures by separating selected rolls during unloading operations.
D. CQA ORGANIZATION will perform laboratory seam analysis approximately every 500
lineal feet of welded geomembrane seam in accordance with Part 3.07 of this Section. OWNER’s acceptance of welded geomembrane seams will be based on results of the CQA ORGANIZATION’S seam analysis. Allow 2 days to complete seam analysis.
1. Based on the destructive sampling method of attributes, the DESIGN ENGINEER
may increase or decrease the sampling interval based on information in Table 7 of the CQA Plan.
E. Assist CQA ORGANIZATION with seam analysis sampling procedures by cutting
samples and repairing sample locations. PART 2 PRODUCTS 2.01 GEOMEMBRANE RESIN
A. Linear low density polyethylene (LLDPE) new, first quality, compounded, and manufactured specifically for producing LLDPE geomembrane.
B. No mixing of different resin types during manufacturing. C. No second run or recycled materials in manufacturing.

Technical Specifications LLDPE Geomembrane 42M-002-008 02771-1 - 5 May 18, 2020
D. Having a Specific Gravity (ASTM D 792) of 0.939 gm/cm3 measured after adding carbon black.
2.02 GEOMEMBRANE
A. Linear low density polyethylene (LLDPE).
B. Geomembrane shall have drainage studs on one side (up) and textured on the other (down). Texture cannot be sprayed on.
C. Non-textured edges along roll length. D. Do not exceed a combined maximum total of 1 percent by weight of additives other than
carbon black or pigment. Identify percentage of processing aids, antioxidants, and other additives other than carbon black.
E. Do not exceed 3.5 percent by weight of finished geomembrane for total combined
processing aids, antioxidants, carbon black, and other additives. F. All additives for UV protection, thermal stability, color, or processing agents must not
“bloom” to the surface over time or inhibit welding. G. Materials produced in the United States or Canada. H. Finished geomembrane rolls free from blemishes, holes, pin holes, bubbles, blisters,
excessive gels, undispersed resins, undispersed carbon black, contamination by foreign materials, and nicks or cuts.
I. Meeting the following minimum average roll values (MARV) specified in Table 02772-1A
for the proposed 50-mil textured LLDPE MicroDrain®.

Technical Specifications LLDPE Geomembrane 42M-002-008 02771-1 - 6 May 18, 2020
TABLE 02771-1A 50-MIL TEXTURED LLDPE MICRODRAIN® PROPERTIES
TEST MINIMUM AVERAGE
ROLL VALUE
MQC(1) TEST FREQUENCY
Sheet Thickness (ASTM D 5994) 47.5(2) per roll Asperity Height (ASTM D 7466) 16 mils (min avg) Every 2nd roll
Density with carbon black (ASTM D 792 or ASTM 1505) 0.939 gm/cm3 200,000 lbs
Drainage Stud Height 0.130 inches Per roll Tensile Properties
Break Stress 75 ppi (min avg) 20,000 lbs
Break Elongation 250% (min. avg)
Tear Resistance (ASTM D 1004) 27 lb. (min avg) 45,000 lbs Puncture Resistance (ASTM D 4833) 55 lb. (min avg) 45,000 lbs Carbon Black Content (ASTM D 1603) 2.0 to 3.0 % 45,000 lbs Carbon Black Dispersion (ASTM D 5596) Category 1 or 2 45,000 lbs Oxidation Induction Time (ASTM D 5885) 400 hours (min avg) 200,000 lbs
2% Modulus (ASTM D 5323) Stress Crack Resistance (ASTM D 5397) Axi-Symmetric Break Resistance Strain (ASTM D 5617)
3000 lbs/in (max) 300 hours 30% min
Per formulation Per GRI-GM10 Per formulation
(1) Manufacturing Quality Control. (2) The minimum average allowable thickness.
2.03 EXTRUSION WELDING BEADS OR ROD
A. Made from same resin as the geomembrane.
B. Thoroughly disperse additives throughout beads or rod. C. Containing 2 to 3 percent carbon black. D. Free of contamination by moisture or foreign materials.
2.04 FIELD TESTING EQUIPMENT
A. Field tensiometer capable of measuring seam strength for trial welds. Calibrated and accurate within 2 pounds.
B. One-inch (width) x six-inch (length) cutting die for cutting seam specimens for testing trial welds.

Technical Specifications LLDPE Geomembrane 42M-002-008 02771-1 - 7 May 18, 2020
PART 3 EXECUTION 3.01 EXAMINATION OF GEOMEMBRANE SURFACE
A. Complete and sign Subgrade Acceptance form provided by CQA ORGANIZATION verifying that the surface the geomembrane will be installed on is acceptable. CQA ORGANIZATION will also verify subgrade acceptance.
3.02 PREPARATION
A. Prepare adequate number of sandbags to ballast the geomembrane during deployment operations. Use free-draining sand or gravel material to fill the sandbags.
B. Do not rely on anchor trenches shown on the Drawings to secure the geomembrane during construction. INSTALLER is responsible for temporary anchorage during construction.
C. Prior to welding operations, prepare trial welds for each welding machine that will be used
during the day. Trial welds will be prepared for both fusion and extrusion welding machines. At a minimum, trial welds will be prepared the beginning of the shift and at mid-shift. Trial weld samples for fusion welding machines will be a minimum of 6-feet in length and samples for extrusion guns will be a minimum of 3-feet in length with the trial weld centered down the length of the sample.
D. Allow trial weld to cool to ambient conditions. After cooling, cut excessive material from
the beginning and the end of the trial weld sample (approximately 4-inches from each end). Using the cutting die, cut four 1-inch specimens, spaced evenly along the length of the trial weld.
E. Using the field tensiometer, test the specimens for peel adhesion (peel) and bonded seam
strength (shear). Alternate the specimens peel, shear, peel, shear. Peel test both sides of the weld for fusion welded samples. The rate of separation for both the peel and the shear test is 2-inch per minute. Test specimens only when the Engineer is present.
F. Each specimen must pass their respective test (peel or shear).
1. 50-mil LLDPE Geomembrane: Peel test specimens must meet all three of the following criteria: a. The break is a film tearing bond (FTB).
b. There is no more than 25 percent peel penetration into the weld.
c. The quantitative value for peel strength is a minimum of 57 ppi for
extrusion welded seams.
d. The quantitative value for peel strength is a minimum of 63 ppi for fusion welded seams

Technical Specifications LLDPE Geomembrane 42M-002-008 02771-1 - 8 May 18, 2020
2. Shear test specimens must meet both of the following criteria: a. The quantitative value for shear strength is a minimum of 75 ppi for
extrusion welded seams.
b. The quantitative value for shear strength is a minimum of 75 ppi for fusion welded seams.
G. If any of the four test specimens fail either peel or shear testing, the entire trial weld is
considered failing. Repeat the above trial weld procedure and field testing if any of the four specimens fail in either peel or shear. If the trial weld repeats in failure, do not use the failing welding machine until proper adjustments are made or the machine is repaired. Repeat trial weld failures must pass two peel and shear test consecutively. If the welding machine continually fails field-testing, tag and completely remove the machine from service.
H. Conduct additional trial welds at mid-day, and whenever adjustments are made to the welding machines.
3.03 DEPLOYMENT
A. Deploy panels parallel to the slope, running the panels down the entire length of the slope. Correct or make adjustments to panels that become askew to the parallel line of the slope.
B. Overlap panels a minimum of 4-inches. Keep the alignment of the overlap consistent by marking overlap indicator points.
C. Do not damage geomembrane during handling, transport, or deployment operations.
Remove or repair damaged geomembrane. Repairs to damaged geomembrane will be completed by the CONTRACTOR at no additional cost to the OWNER.
D. Do not damage the underlying soil layers or geotextile installation. Repair damaged soil
layers or geotextile. Repairs to damaged soil layers or geotextile will be completed by the CONTRACTOR at no additional cost to the OWNER.
E. Only deploy the quantity of geomembrane that can be completely welded and secured in
one day. Securely ballast (sandbag) the geomembrane at the end of the day. If wind conditions are high use geomembrane rolls as extra ballast. INSTALLER is responsible for temporary anchorage during construction.
F. Avoid excessive wrinkles and compensate for stress bridging during deployment
operations. Remove and repair excessive wrinkles and stress bridging. Excessive wrinkles and stress bridging will be removed and repaired even if these conditions occur during placement operations of the succeeding soil or geosynthetic layer.
G. Immediately after panels running through ditch flow lines or slope toes are welded, place
sandbags end-to-end along the entire length of the flow line to prevent geomembrane stress bridging through the ditch.

Technical Specifications LLDPE Geomembrane 42M-002-008 02771-1 - 9 May 18, 2020
H. When deploying textured geomembrane above a geotextile, or a GCL, always use a slip sheet to avoid snagging and weakening the geotextile fibers, or damaging the bentonite surface.
3.04 FUSION WELDING
A. Welding operations will only take place when the ambient temperature is between 40°F and 110°F. Measure ambient temperature 6-inches above the in-place geomembrane. Special weather seaming plans must be submitted and approved by Engineer to weld outside this range.
B. Fusion weld all seams. Extrusion welding will only be used for repair and patching operations.
C. Fusion welding machines must complete trial weld procedures and pass field testing as
specified in Part 3.02 of this Section prior to welding operations. D. Use power source capable of producing sufficient and constant voltage under the combined
line load of other welders and equipment. E. Thoroughly clean welding surface. F. Weld panels at the same speed, temperature, roller pressure, and gauge settings used to
prepare the trial weld. Adjust the above settings as temperature conditions indicate. Record welding machine number, operator, machine settings, time, and date on each seam welded.
3.05 EXTRUSION WELDING
A. Extrusion guns must complete trial weld procedures and pass field testing as specified in Part 3.02 of this Section prior to welding operations.
B. Overlap geomembrane a minimum of 4-inches. C. Cut square repair patches with rounded corners large enough to extend a minimum of 4-
inches in all directions over the repair area. D. Tack-weld geomembrane or repair patches in place to prevent movement during grinding
and extrusion welding operations. E. Disc-grind the outer edge of overlapped geomembrane or repair patches and the adjacent
underlying geomembrane to remove surface debris and oxidation. Do not grind parallel to seam.
F. Purge nozzle of extrusion gun to remove solidified extrudate. G. Completely cover the entire width of the grind area with extrusion weld. Extend extrusion
safety welds 4-inches up the intersecting fusion weld (if applicable). H. Extrusion weld repair (safety) patches at all fusion welded seam intersections.

Technical Specifications LLDPE Geomembrane 42M-002-008 02771-1 - 10 May 18, 2020
3.06 QUALITY CONTROL
A. General Quality Control 1. Perform all quality control procedures and testing in accordance with the
INSTALLER’s Geomembrane Installation Quality Control Manual, except where amended or modified by the DESIGN ENGINEER or this Section.
2. Maintain a geomembrane panel layout drawing during the geomembrane installation. Include in the drawing; 1) roll and panel numbers; 2) seam numbers; 3) geomembrane limits; 4) anchor trench locations; and 5) seam analysis sample locations.
B. Deployment Quality Control
1. Coordinate with CQA ORGANIZATION in assigning panel identification and
corresponding seam numbering system.
2. Maintain daily deployment logs and panel layout drawings as the deployment progresses. Record panel and seam numbers, panel dimensions, and deployment quantities. Submit daily deployment logs to Engineer.
C. Fusion Welding Quality Control
1. Maintain daily welding logs. Record welding machine number, operator, machine
settings, time, and date for each seam welded. Submit daily welding logs to CQA ORGANIZATION.
2. Air pressure test each fusion-welded seam. Provide air pump capable of generating and maintaining 40 psi of pressure equipped with a regulator and pressure gauge. Provide pressure feed needles with pressure gauges accurate to 1 psi. Perform the following air pressure test procedure.
a. Seal both ends of the fusion-welded seam with vise-grip plate clamps or
extrusion weld. Heat may be applied to the seam ends to aid in sealing the seam in conjunction with the clamps. Due to the potential hazard of igniting landfill gas, DO NOT use propane torches or any other flame-producing device.
b. At one end of the seam, insert air pressure needle into the fusion weld channel.
c. Pressurized channel to 30-35 psi. Maintain pressure for 5 minutes.
d. Release air from the opposite end of the seam to verified that the entire
length of the fusion weld channel was pressurized. If channel does not maintain pressure with a maximum allowable pressure loss of 2 psi over the 5 minute test period or does not stabilize at all, locate defective area, isolate, and repeat air pressure test procedures in both directions from the defective area.

Technical Specifications LLDPE Geomembrane 42M-002-008 02771-1 - 11 May 18, 2020
e. Maintain air pressure test logs. Record seam numbers, beginning and ending air pressures, beginning and ending test times, lengths of tested seam, and defective areas.
D. Extrusion Welding Quality Control
1. Maintain daily welding logs. Record welding machine number, operator, machine
settings, time, and date. Submit daily welding logs to CQA ORGANIZATION.
2. Vacuum test each extrusion welded repair and length of seam. Provide vacuum pump capable of generating and maintaining 30 inches of mercury equipped with a regulator and vacuum gauge. Provide vacuum box with a clean view window, and vacuum gauge accurate to 1 psi. Perform the following vacuum test procedure.
a. Saturate extrusion weld with soap/water solution. b. Place view box over the saturated weld, create an airtight seal, and apply
vacuum to the weld.
c. Maintain vacuum for 10 seconds and examine weld for leaks. Leaks are detected by the presence of excessive bubbles. Mark detected leaks for follow up extrusion weld repair. Re-vacuum test detected leaks after repair operations to verify that the leaks were successfully repaired.
d. Maintain repair logs. Assign and record repair numbers, vacuum test
dates, and vacuum test results.
E. Seam Analysis Sampling Procedures 1. CQA ORGANIZATION will determine seam analysis sample locations at
minimum intervals of 500 lineal feet of welded seam. CQA ORGANIZATION OR DESIGN ENGINEER may decrease or increase this frequency based on previous seam analysis results. INSTALLER will cut samples at its discretion.
2. Repair sample holes in accordance with Part 3.05 of this Section. Vacuum test repair in accordance with Part 3.06 of this Section.
3. Seam analysis samples will be 12-inches wide by 36-inches long with the weld
centered down the length of the sample. Samples sizes may be modified at the request of the INSTALLER or CQA ORGANIZATION. Cut one 1-inch specimen from each end of the sample, and field test specimens for peel adhesion in accordance with Part 3.02 of this Section. If these specimens pass the field peel test, submit sample for laboratory seam analysis. If either of the specimens fail the field peel test, perform Failed Seam Analysis Procedures in accordance with Part 3.08 of this Section.
4. Divide the remaining sample into equal two sections and submit to CQA
ORGANIZATION for quality assurance seam analysis and archive storage.
5. INSTALLER may take and test any sample at its option.

Technical Specifications LLDPE Geomembrane 42M-002-008 02771-1 - 12 May 18, 2020
3.07 LABORATORY SEAM ANALYSIS
A. CQA ORGANIZATION will perform seam analysis in accordance with the following procedures. 1. Seam analysis will be performed at qualified geosynthetics testing laboratory
independent of the geomembrane manufacturer and INSTALLER.
2. Seam analysis includes peel adhesion and bonded seam strength (ASTM D4437). Five specimens will be tested for each method.
3. All five of the specimens must meet the criteria specified in paragraph E, Part 3.02
of this Section.
4. Both sides of fusion-welded seams will be tested for peel adhesion. B. OWNER’s acceptance of the welded geomembrane seams will be based on the results of
laboratory seam analysis.
C. Allow 24 hours to complete seam analysis after submission of the samples.
3.08 FAILED SEAM ANALYSIS PROCEDURES
A. Perform the following procedures in the event of a seam analysis sample failure determined by field-testing or laboratory seam analysis.
1. Track the welded seam 10-feet in both directions away from the failed seam
analysis sample location. Cut a small 8-inch wide by 8-inch long sample from each location. Cut one 1-inch specimen from each end of the sample, and field test specimens for peel adhesion in accordance with Part 3.02 of this Section. If these specimens pass the field peel test, submit a 12-inch wide by 18-inch long re-test sample from both locations for laboratory seam analysis. If either of the specimens fail the field peel test at either location, continue tracking the welded seam at 10-foot intervals until specimens successfully pass the field peel tests and a sample can be submitted for laboratory seam analysis. If specimens continually fail field peel tests at 10-foot intervals, the entire seam or portion of the welded seam will be repaired at the discretion of the CQA ORGANIZATION.
2. Repair the failed length of seam determined by field peel testing with an 18-inch wide cap strip. Extrusion weld the cap strip in accordance with Part 3.04 of this Section. Tack and extrusion welding the leading flap of the fusion-welded seam is not permitted. Vacuum test extrusion welded cap strip in accordance with Part 3.05 of this Section.
3. If the re-test sample fails laboratory seam analysis, repeat the above procedures.
B. Seam analysis samples will be taken from extrusion welded cap strips exceeding 100-feet in length, at the CQA ORGANIZATION’S discretion.
Technical Specifications LLDPE Geomembrane 42M-002-008 02771-1 - 13 May 18, 2020
3.09 REPAIRS
A. Available repair procedures include:
1. Patching: Extrusion welding a patch of geomembrane over seam intersections and defects.
2. Spot welding: A bead of molten extrudate placed on a flaw up to ¼-inch wide.
3. Capping: A strip of geomembrane extrusion welded over a defective area.
4. Removal and replacement. B. All repairs must be thoroughly checked with a vacuum box.
END SECTION 02771-1

Technical Specifications ClosureTurf™ 42M-002-008 02771-2 - 1 May 18, 2020
SECTION 02771-2 CLOSURETURF®
PART 1 GENERAL 1.01 SECTION SUMMARY
A. Product specifications for ClosureTurf®
B. Furnishing and installing ClosureTurf® synthetic turf component.
1.02 RELATED SECTIONS
A. Section 02771-1 – Linear Low Density Polyethylene (LLDPE) Liner B. Section 02771-3 – Sand Infill
1.03 REFERENCES
A. ASTM D 5261 – Standard Test Method for Measuring Mass per Unit Area of Geotextiles
B. ASTM D 2256 – Standard Test Method for Tensile Properties of Yarns by the Single-
Strand Method C. ASTM D 6241 – Standard Test Method for Static Puncture Strength of Geotextiles and
Geotextile-Related Products Using a 50-mm Probe D. ASTM D 4595 – Standard Test Method for Tensile Properties of Geotextiles by the Wide-
Width Strip Method E. ASTM D 5321 – Standard Test Method for Determining the Coefficient of Soil and
Geosynthetic or Geosynthetic and Geosynthetic Friction by the Direct Shear Method F. ASTM G 147 – Standard Practice for Conditioning and Handling of Nonmetallic materials
for Natural and Artificial Weathering Tests G. ASTM G 154 – Standard Practice for Operating Fluorescent Ultraviolet (UV) Lamp
Apparatus for Exposure of Nonmetallic Materials H. Aerospace, Transportation and Advanced Systems Laboratory, Georgia Tech Research
Institute – Aerodynamic Evaluations of ClosureTurf™ Ground Cover. 2010. I. WatershedGeo – ClosureTurf® Design Guidelines Manual v05.19
1.04 SUBMITTALS A. Manufacturer
1. Provide the following Manufacturer’s Quality Control (MQC) testing data:

Technical Specifications ClosureTurf™ 42M-002-008 02771-2 - 2 May 18, 2020
a. Provide inspection records of the tufting procedures for every 100,000 square feet of engineered turf.
b. Inspection records that indicates the following properties as they relate to the product specifications described in Part 2.01 of this specification including:
(1) Tufting gauge
(2) Pile height
(3) Total product weight
(4) CBR Puncture (ASTM D6241)
(5) Tensile Strength Product (ASTM D4595)
(6) Tensile Strength of Yarn (ASTM D2256)
B. Submit the following 14 days prior geomembrane installations.
1. Engineered Turf
a. Certificate of Compliance with product requirements of Part 2.01 of this
Section.
2. Proposed Panel Layout Drawings. a. Drawings indicating the panel layout and field seams
3. INSTALLER Qualifications.
a. Documentation that the INSTALLER is an approved ClosureTurf®
INSTALLER.
b. ClosureTurf® Installation Schedule
c. Installation capabilities, including:
(1) Information on seaming, testing, and deployment equipment proposed for this project.
(2) Average daily production anticipated for this project; and,
(3) Construction Quality Control (CQC) procedures.
d. Resumes of:
(1) Project designated turf seaming supervisor
(2) CQA supervisor
Technical Specifications ClosureTurf™ 42M-002-008 02771-2 - 3 May 18, 2020
(3) All personnel who will perform seaming operations including:
(a) Date hired and duration of employment
(b) Installed at least 5,000,000 square feet of geomembrane materials
(c) Engineered turf fusion seamers shall be factory trained by DemTech
e. Geosynthetics INSTALLER personnel shall attend ClosureTurf®
orientation prior to the job beginning if this is their first ClosureTurf® installation.
C. Submit at the completion of the engineered turf installation.
1. Completed geomembrane panel layout drawings.
1.05 DELIVERY, STORAGE, AND HANDLING
A. Notify CQA ORGANIZATION of engineered turf shipment deliveries. Provide CQA
ORGANIZATION with copy of packing list which includes the manufacturer’s name, product identification, lot number, roll number, and roll dimensions.
B. Unload, handle, transport engineered turf rolls with nylon or other cloth straps that do not damage the geomembrane rolls and preserve the integrity of the protective covering
C. Store on a level surface graded to drain away from engineered turf rolls. D. Only stack the geomembrane rolls three high.
E. Leave a 3-foot wide access path between the stacked geomembrane rolls.
F. Separate damaged or rejected geomembrane rolls as directed by CQA ORGANIZTION.
1.06 QUALITY ASSURANCE VERIFICATION TESTING A. CQA ORGANIZATION will sample engineered turf every 50,000 square feet of material
delivered to the site or produced at the manufacturing plant and perform the following quality assurance verification testing to verify compliance with the product requirements of this Section. 1. Total Product Weight
2. CBR Puncture (ASTM D6241)
3. Tensile Strength of Product (ASTM D4595)
4. Tensile Strength of Yarn (ASTM D2256)

Technical Specifications ClosureTurf™ 42M-002-008 02771-2 - 4 May 18, 2020
B. Owner’s acceptance of geomembrane will be based on results of quality assurance verification testing. Allow 7 days to complete testing.
C. Assist CQA ORGANIZATION with sampling procedures by separating selected rolls during unloading operations.
PART 2 PRODUCTS
2.01 CLOSURETURF® ENGINEERED TURF COMPONENT
A. Engineered turf manufactured by Watershed Geo B. Meeting the following minimum average roll values (MARV) specified in Table 02772-2A
for the proposed engineered turf product.
TABLE 02771-2A CLOSURE TURF® ENGINEERED TURF PROPERTIES
TEST MINIMUM AVERAGE
ROLL VALUE
MQC(1) TEST FREQUENCY
CBR Puncture (ASMT D6241) 1500 lb. 100,000 ft2
Tensile Strength Product (MD/XD) (ASTM D4595) 2,100 MD/1,600 XD lb./ft. 100,000 ft2
Aerodynamic Evaluation (GTRI Wind Tunnel) 120 mph w/ max. uplift of 0.12 lb/ft2
Engineered Turf Fiber Stability (ASTM G147) >60% retained tensile strength at 100 yrs (projected)
Backing System UV Stability Index Test (ASTM G1545 Modified Cycle 1.UVA340)
110 lbs/ft retained tensile strength at 6500 hrs. (projected)
Internal Friction of Combined Components (ASTM D5321) 35°, min
Yarn Weight (Total Product Weight) (ASTM D5261) >= 20 oz/sq. yard 100,000 ft2 Tensile Strength of Yarn (ASTM D2256) 15 lbs. min. 100,000 ft2 (1) Manufacturing Quality Control.
2.02 SEWING THREAD
A. Sewing thread shall be 207 Polyester or equivalent.

Technical Specifications ClosureTurf™ 42M-002-008 02771-2 - 5 May 18, 2020
2.03 FIELD TESTING EQUIPMENT
A. Field tensiometer capable of measuring seam strength for trial welds. Calibrated and accurate within 2 pounds.
B. One-inch (width) x six-inch (length) cutting die for cutting seam specimens for testing trial welds.
PART 3 EXECUTION 3.01 EXAMINATION OF ENGINEERED TURF SURFACE
A. Complete and sign Subgrade Acceptance form provided by CQA ORGANIZATION verifying that the surface the engineered turf will be installed on is acceptable. CQA ORGANIZATION will also verify engineered turf acceptance.
3.02 PREPARATION
A. Prepare adequate number of sandbags to ballast the engineered turf during deployment operations. Use free-draining sand or gravel material to fill the sandbags.
B. Coordinate anchor trench excavation with Earthwork Contractor. Do not rely on anchor trenches shown on the Drawings to secure the engineered turf during construction. INSTALLER is responsible for temporary anchorage during construction.
C. Prior to welding operations, prepare trial welds for each welding machine that will be used
during the day. Trial welds will be prepared fusion welding machines. At a minimum, trial welds will be prepared the beginning of the shift, after any break, or any time after the machine is turned off for more than 30 minutes. The CQA Organization may request a trial weld seam if they believe the operator or fusion welding apparatus is not functioning properly. Trial weld samples for fusion welding machines will be a minimum of 3-feet in length and 12 inches in width with the trial weld centered down the length of the sample.
D. Allow trial weld to cool to ambient conditions before seam snapping or panel adjustments
are applied. E. A manual peal/pull test is performed and a passing seam is based on visual criteria. F. The criterial for a passing trial weld includes:
1. A passing trial weld is achieved when approximately 75% of the top turf panel tufts transfer to the bottom turf panel.
2. Two consecutive trial welds meet the visual passing criteria.
G. If any of the two test specimens fail, both trial welds are considered failing. Repeat the above trial weld procedure and field testing if any of the two specimens fail. If the trial weld repeats in failure, do not use the failing welding machine until proper adjustments are made or the machine is repaired. Repeat trial weld failures must pass two visual inspections consecutively. If the welding machine continually fails field-testing, tag and completely remove the machine from service.

Technical Specifications ClosureTurf™ 42M-002-008 02771-2 - 6 May 18, 2020
H. Conduct additional trial welds at mid-day, and whenever adjustments are made to the welding machines.
3.03 DEPLOYMENT
A. Deploy panels from the top of the slope in a way that the engineered turf filaments are pointing upslope after deployment is complete.
B. Overlap panels a minimum of 5-inches. Keep the alignment of the overlap consistent by marking overlap indicator points.
C. Do not damage engineered turf during handling, transport, or deployment operations.
Remove or repair damaged engineered turf. D. Do not damage the underlying geomembrane. Repair damaged geomembrane. E. Only deploy the quantity of engineered turf that can be completely welded and secured in
one day. Securely ballast (sandbag) the geomembrane at the end of the day. If wind conditions are high use engineered turf rolls as extra ballast. INSTALLER is responsible for temporary anchorage during construction.
F. Avoid excessive wrinkles and compensate for stress bridging during deployment
operations. Remove and repair excessive wrinkles and stress bridging. Excessive wrinkles and stress bridging will be removed and repaired even if these conditions occur during placement operations of the succeeding sand ballast layer.
3.04 SEWN SEAMS
A. Sew all longitudinal and transverse seams.
B. Deploy first panel with turf filaments facing up.
C. Deploy subsequent panels turf side down, on top of the previous panel.
D. After each panel is seamed, flip onto the geomembrane component with care to avoid pulling of tufts in the drainage studs.
E. Sewn seams shall consist of a prayer type seam installed with a Newlong sewing machine
or equivalent.
F. Sewing will occur between the first and second row of tufts on the both sides of panel. 3.05 FUSION WELDING (FOR REFERENCE ONLY)
A. Welding operations will only take place when the ambient temperature is between 40°F and 110°F. Measure ambient temperature 6-inches above the in-place geomembrane. Special weather seaming plans must be submitted and approved by CQA ORGANIZATION to weld outside this range.
B. Fusion welding machines must consist of a DemTech VM20/4/A fusion welder only.

Technical Specifications ClosureTurf™ 42M-002-008 02771-2 - 7 May 18, 2020
C. Use power source capable of producing sufficient and constant voltage under the combined line load of other welders and equipment.
D. Thoroughly clean welding surface. E. Fusion welded seams require a minimum of 5-inches of overlap. F. Frayed or loose geotextile strands will be cut off or removed. G. Prior to starting the production fusion seaming, trial seams must be performed as outlined
in Section 3.02. H. Demonstrate the preparation methods and equipment utilized for removal of the selvage
from the outside edge of the rolls of turf (i.e. trimming and cutting devices). I. Mechanical or hot knife trimming and cutting devices will be utilized for salvage trimming. J. Demonstrate and control the fraying of geotextile strands when performing the removal of
selvage. K. Any damage that occurs due to production seaming will be repaired as outlined in the WG
Installation guidance Documents. L. Any defects will be repaired as outlined in Section 3.06 M. Weld panels at the same speed, temperature, roller pressure, and gauge settings used to
prepare the trial weld. Adjust the above settings as temperature conditions indicate. Record welding machine number, operator, machine settings, time, and date on each seam welded.
3.06 EQUIPMENT ON THE TURF
A. During Construction
1. On slopes exceeding 15% no equipment will be allowed until sand infill is in place.
2. On Slopes less than 15% ATV type vehicles will be allowed prior to infill
placement if the tire/track ground contact pressure is less than 5 psi. B. Post Construction (full specified sand infill thickness)
1. On slopes exceeding 15%
a. Temporary or transient loads, allowable tire/track ground contact pressure
will be limited to 35 psi.
b. Regularly trafficked areas will be designed and approved by the DESIGN ENGINEER.
2. On Slopes less than 15%

Technical Specifications ClosureTurf™ 42M-002-008 02771-2 - 8 May 18, 2020
a. Temporary or transient loads, allowable tire/track ground contact pressure will be limited to 85 psi.
b. Regularly trafficked areas will be designed and approved by the DESIGN ENGINEER.
c. Allowable tire/track ground contact pressures may be increased with the
written approval of the DESIGN ENGINEER.
C. Any activity that may be identified during construction by the Owner, CQA Organization as being a possible danger to the integrity of the ClosureTurf® system will be prohibited regardless of any prior approval.
3.07 REPAIRS
A. When repairs to engineered turf occur, the CQA Organization must observe the following:
1. Repairs are completed by using a heat-bonded seam. 2. All tie-in seams along flatter slopes (i.e. less than 15%) with length greater than 25
feet will use an approved heat bonded seam so as consistent pressure is achieved throughout the seam.
3. A handheld heat gun with a pressure wheel will be used in small areas.
3.08 QUALITY CONTROL
A. General Quality Control 1. Perform all quality control procedures and testing in accordance with the
INSTALLER’s Installation Quality Control Manual, except where amended or modified by the Engineer or this Section.
2. Maintain a engineered turf panel layout drawing during the engineered turf installation. Include in the drawing; 1) roll and panel numbers; 2) seam numbers; 3) geomembrane limits; 4) anchor trench locations; and 5) seam analysis sample locations.
B. Deployment Quality Control
1. Coordinate with CQA ORGANIZATION in assigning panel identification and
corresponding seam numbering system.
2. Maintain daily deployment logs and panel layout drawings as the deployment progresses. Record panel and seam numbers, panel dimensions, and deployment quantities. Submit daily deployment logs to CQA ORGANIZATION.

Technical Specifications ClosureTurf™ 42M-002-008 02771-2 - 9 May 18, 2020
C. Sewn Seam Quality Control 1. Verify engineered turf tufts are not excessively pulled out by the installation
process.
D. Fusion Welding Quality Control 1. Maintain daily welding logs. Record welding machine number, operator, machine
settings, time, and date for each seam welded. Submit daily welding logs to CQA ORGANIZATION.
END SECTION 02771-2

Technical Specifications Sand Infill 42M-002-008 02771-3 - 1 May 18, 2020
SECTION 02771-3 SAND INFILL
PART 1 GENERAL 1.01 SECTION SUMMARY
The directives outlined in this document apply to the WORK performed by the CONTRACTOR unless otherwise noted. A. This section describes product requirements and installation requirements for the sand
infill component of the ClosureTurf® final cover system. 1.02 RELATED SECTIONS
A. Section 02771-1 – Linear Low Density Polyethylene (LLDPE) Liner
B. Section 02771-2 – ClosureTurf® 1.03 REFERENCES
A. ASTM C1252 Standard Test Methods for Uncompacted Void Content of Fine
Aggregate (as Influence by Particle Shape, Surface Texture, and Grading) Method A. B. ASTM C128 Standard Test Method for Relative Density (Specific Gravity) and
Absorption of Fine Aggregate. C. ASTM C136 Standard Test Method for Sieve Analysis of Fine and Coarse Aggregates.
1.05 SUBMITTALS
A. Submit the following 14 days before sand infill material is shipped to site: 1. Product data sheets and complete description of sand material that meet or
exceed the product requirements of Part 2.01 of this Section.
2. Suppliers quality control testing demonstrating the proposed material’s void content, relative density, and gradation meet the product requirements of Part 2.01 of this Section.
B. Submit written description of sand infill placement methods describing equipment and
application methods 14 days prior to sand infill installation. 1.04 QUALITY ASSURANCE VERIFICATION TESTING
A. CQA ORGANIZATION will perform the following quality assurance verification testing
prior to and during sand infill placement operations.
1. Uncompacted void content of sand infill (ASTM C1252)
2. Relative density of sand infill (ASTM C128)

Technical Specifications Sand Infill 42M-002-008 02771-3 - 2 May 18, 2020
3. Sieve analysis of sand infill (ASTM C136)
4. Visual examination and sampling to verify that sand materials contain no organic, saturated, oversized, or other unsuitable materials.
B. Cooperate with CQA ORGANIZATION in the performance of quality assurance
verification testing. PART 2 PRODUCTS 2.01 SAND INFILL
A. Uncompacted Void Content (ASTM C1242) >= 40%
B. Specific Gravity (ASTM C128) >= 2.40
C. Grain Size Distribution (ASTM C136)
TABLE 02771-3A
SAND INFILL GRAIN SIZE DISTRIBUTION 3/8" (9.5 mm) < 100%
90% < #4 (4.75 mm) < 100% 50% < #8 (2.36 mm) < 85% 25% < #16 (1.18 mm) < 65% 10% < #30 (0.60 mm) < 45% 0 < #50 (0.30 mm) < 30% 0 < #100 (0.15 mm) < 10% 0 < #200 (0.075 mm) < 5%

Technical Specifications Sand Infill 42M-002-008 02771-3 - 3 May 18, 2020
PART 3 EXECUTION 3.01 EQUIPMENT ON THE TURF
A. During Construction
1. On slopes exceeding 15% no equipment will be allowed until sand infill is in
place.
2. On Slopes less than 15% ATV type vehicles will be allowed prior to infill placement if the tire/track ground contact pressure is less than 5 psi.
B. Post Construction (full specified sand infill thickness)
1. On slopes exceeding 15%
a. Temporary or transient loads, allowable tire/track ground contact
pressure will be limited to 35 psi.
b. Regularly trafficked areas will be designed and approved by the DESIGN ENGINEER.
2. On Slopes less than 15%
a. Temporary or transient loads, allowable tire/track ground contact
pressure will be limited to 85 psi.
b. Regularly trafficked areas will be designed and approved by the DESIGN ENGINEER.
c. Allowable tire/track ground contact pressures may be increased with the
written approval of the DESIGN ENGINEER.
C. Any activity that may be identified during the course of construction by the Owner, CQA ORGANIZATION as being a possible danger to the integrity of the ClosureTurf® system will be prohibited regardless of any prior approval.
3.02 SAND BALLAST INFILL PLACEMENT
A. Sand infill that is placed between the tufts of the engineered turf component:
1. The sand infill layer will be placed to a ½ inch minimum thickness not to exceed ¾ inch thick.
2. Will consist wholly of sand meeting Part 2 of this specification.
3. The CQA ORGANIZATION shall check final thickness of sand infill at a rate of
approximately 20 times per acre.

Technical Specifications Sand Infill 42M-002-008 02771-3 - 4 May 18, 2020
B. ClosureTurf® Sand Infill Grain Size Parameters are shown in Section 2.01, Table 1.
1. The CQA ORGANIZATION shall observe that the following requirements regarding Sand Infill are met:
a. Installation of sand infill will only be performed by a Watershed
Geosynthetics’ licensed and approved installer. b. Areas that are to receive sand infill must be accepted by the CQA
Organization before placement of sand infill takes place. C. SAND INFILL INSTALLATION
1. Prior to installation, the Sand Infill Installer will explain with detail the method
of sand infill deployment to be used during the pre-construction meeting. The contactor shall take into account recent OSHA requirements for silica exposure for sand placement methods.
2. The sand infill is worked into the Engineered Turf between the synthetic yarn blades.
3. Conveyor systems and/or Express Blowers will be used to spread and place the
sand infill.
4. That sand infill placement does not occur with snow or ice on the Engineered Turf component.
5. That previously installed ClosureTurf® components are not displaced or damaged
as a result of the sand infill component installation.
D. CQA ORGANIZATION shall observe and/or verify:
1. The sand infill is worked into the Engineered Turf between the synthetic yarn blades with a brush.
2. Conveyor systems and/or Express Blowers will be used to spread and place the
sand infill. 3. The method for measuring the sand infill thickness will be performed utilizing a
digital caliper, or a DESIGN ENGINEER approved alternate measuring device.
D. OWNER will perform surveys in accordance with Section01050.
END SECTION 02221-3

Technical Specification Geosynthetic Clay Liner (GCL) 42M-002-008 02774 - 1 May 18, 2020
SECTION 02774 GEOSYNTHETIC CLAY LINER (GCL)
PART 1 GENERAL
The directives outlined in this document apply to the WORK performed by the CONTRACTOR unless otherwise noted.
1.01 SECTION SUMMARY
A. Furnishing and installing geosynthetic clay liner (GCL) at locations shown on the Drawings.
1.02 RELATED SECTIONS
A. Section 02250 – Soil Liner
B. Section 02771-1 – Linear Low Density Polyethylene (LLDPE) Geomembrane. 1.03 REFERENCES
A. ASTM D 4632 Standard Test Method for Breaking Load and Elongation of Geotextiles (Grab Method).
B. ASTM D 5084 Standard Test Method of Hydraulic Conductivity of Saturated Porous
Materials Using a Flexible Wall Permeameter. C. ASTM D 5261 Standard Test Method for Measuring Mass Per Unit Area of Geotextiles. D. ASTM D 5888 Standard Guide for Storage and Handling of GCLs. E. ASTM D 5890 Standard Test Method for Swell Index of Clay Mineral Component of
GCLs. F. ASTM D 5891 Standard Test Method for Fluid Loss of Clay Mineral Component of
GCLs. G. ASTM D 5993 Standard Test Method for Mass Per Unit Area of GCLs. H. ASTM D 6072 Standard Guide for Installation of GCLs. I. GRI GCL-3 Standard Test Method for “GCL Overlap Seam Permeability”.
1.04 SUBMITTALS
A. Submit the following before the GCL is shipped from the point of manufacture to the site:
1. Two 1-foot by 1-foot samples representative of the GCL material meeting these specifications of the material that will be shipped to the site.

Technical Specification Geosynthetic Clay Liner (GCL) 42M-002-008 02774 - 2 May 18, 2020
2. Product data sheet, and complete description of GCL that meet or exceed the product requirements of Part 2.03 of this Section.
3. Manufacturer’s quality control testing reports for GCL rolls delivered to the site. At a minimum, GCL tests specified in Table 02774-1 of this Section must be included in the testing reports.
B. DESIGN ENGNEER’s acceptance of GCL will be based on submittal documents
meeting the product requirements of this Section. 1.05 SHIPMENT, DELIVERY, STORAGE, AND HANDLING
A. Follow guidance from ASTM D 5888: Standard Guide for Storage and Handling of GCLs. B. Ship GCL rolls with waterproof opaque protective coverings on flatbed trailer. C. Notify CQA ORGANIZATION of GCL shipment deliveries and provide copy of packing
list. D. Unload, handle and transport rolls with nylon or other cloth straps that do not damage
the GCL or the protective coverings. E. Protect rolls from damage. Replace damaged protective coverings. F. Separate damaged GCL rolls.
1.06 QUALITY ASSURANCE VERIFICATION TESTING
A. Engineer will sample GCL every 100,000 square feet of material delivered to the site or produced at the manufacturing plant and perform the following quality assurance verification testing to verify compliance with the product requirements of this Section. 1. Bentonite Mass per Unit Area
2. Permeability
PART 2 PRODUCTS 2.01 GCL BASE BENTONITE
A. Greater than 80 percent sodium montmorillonite clay. B. Granular form. C. Meeting the product requirements specified in Table 02774-1.
2.02 TOP (CAP) GEOTEXTILE
A. Non-woven, continuous or staple-filament, needle punched, polypropylene or polyester fabric; yarn oriented into a stable network that maintains its structure during handling, placement, and long term service.

Technical Specification Geosynthetic Clay Liner (GCL) 42M-002-008 02774 - 3 May 18, 2020
B. Resistant to soil chemicals. C. No recycled materials. D. Meeting the minimum average roll values (MARV) specified in Table 02774-1.
2.03 BOTTOM (CARRIER) GEOTEXTILE
A. Woven monofilament polypropylene fabric.
B. Resistant to soil chemicals. C. No recycled materials. D. Meeting the minimum average roll values (MARV) specified in Table 02774-1.
2.04 GCL
A. Bentonite granules, containing no adhesives, supported by individual geotextiles on the upper and lower surfaces that are needle punched throughout or stitch-bonded to form a stable composite.
B. Needled surface to receive heat-bonding to resist fiber pullout. C. Rolls marked with continuous, water-proof laplines and matchlines offset 6 and 9 inches
from the edge of the rolls. D. Supplied on center-cores that can fully support the weight of the GCL without bending or
buckling. E. Meeting the minimum average roll values (MARV) specified in Table 02774-1.
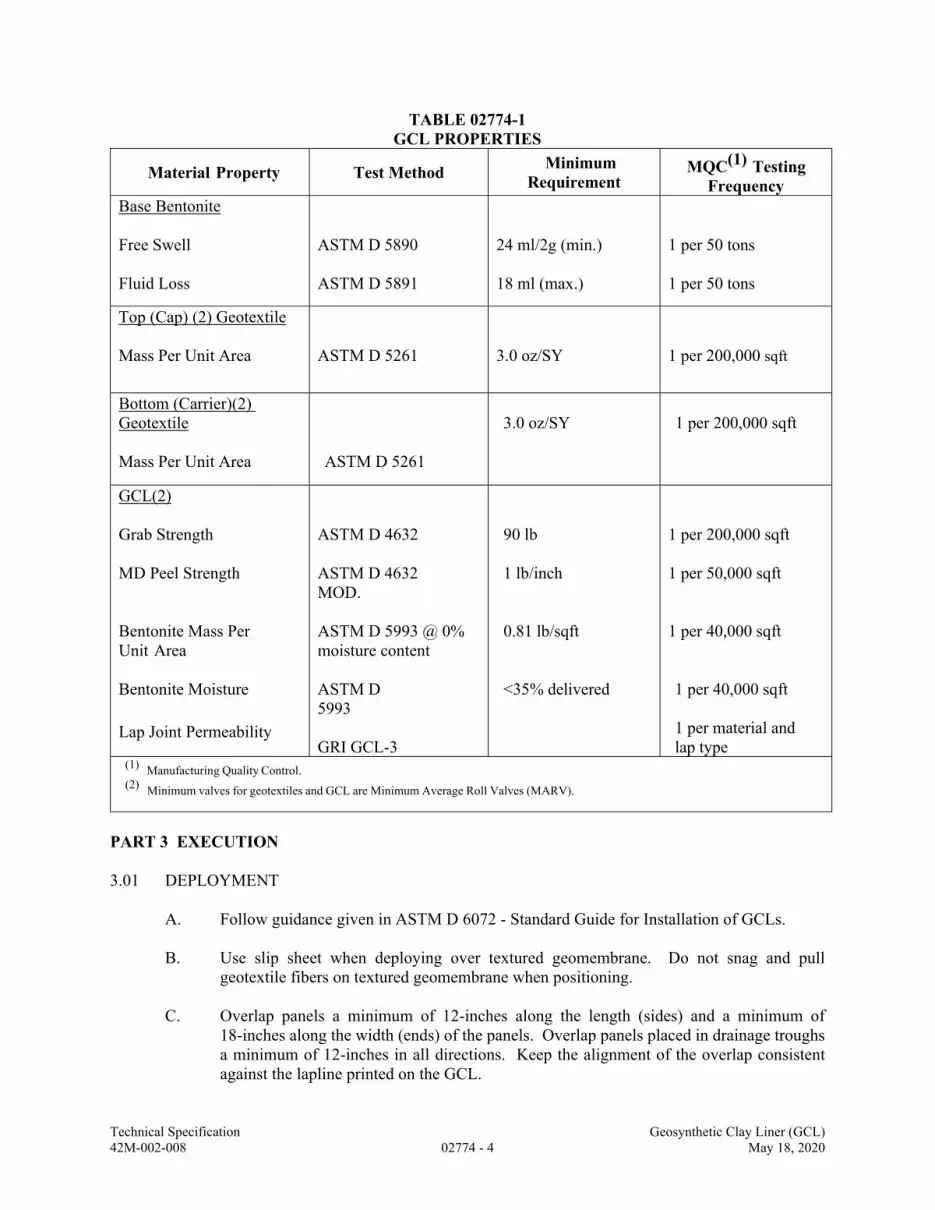
Technical Specification Geosynthetic Clay Liner (GCL) 42M-002-008 02774 - 4 May 18, 2020
TABLE 02774-1 GCL PROPERTIES
Material Property Test Method Minimum
Requirement MQC(1) Testing
Frequency Base Bentonite
Free Swell Fluid Loss
ASTM D 5890 ASTM D 5891
24 ml/2g (min.) 18 ml (max.)
1 per 50 tons 1 per 50 tons
Top (Cap) (2) Geotextile Mass Per Unit Area
ASTM D 5261
3.0 oz/SY
1 per 200,000 sqft
Bottom (Carrier)(2) Geotextile
Mass Per Unit Area
ASTM D 5261
3.0 oz/SY
1 per 200,000 sqft
GCL(2)
Grab Strength MD Peel Strength Bentonite Mass Per Unit Area Bentonite Moisture
Lap Joint Permeability
ASTM D 4632
ASTM D 4632 MOD.
ASTM D 5993 @ 0% moisture content ASTM D 5993
GRI GCL-3
90 lb
1 lb/inch
0.81 lb/sqft
<35% delivered
1 per 200,000 sqft 1 per 50,000 sqft 1 per 40,000 sqft 1 per 40,000 sqft
1 per material and lap type
(1) Manufacturing Quality Control. (2) Minimum valves for geotextiles and GCL are Minimum Average Roll Valves (MARV).
PART 3 EXECUTION 3.01 DEPLOYMENT
A. Follow guidance given in ASTM D 6072 - Standard Guide for Installation of GCLs. B. Use slip sheet when deploying over textured geomembrane. Do not snag and pull
geotextile fibers on textured geomembrane when positioning. C. Overlap panels a minimum of 12-inches along the length (sides) and a minimum of
18-inches along the width (ends) of the panels. Overlap panels placed in drainage troughs a minimum of 12-inches in all directions. Keep the alignment of the overlap consistent against the lapline printed on the GCL.

Technical Specification Geosynthetic Clay Liner (GCL) 42M-002-008 02774 - 5 May 18, 2020
D. Do not damage GCL during handling, transport, or deployment operations. Remove or repair damaged GCL.
E. Do not damage the underlying geosynthetic installations. Repair damaged geosynthetic
installations. F. Do not drive on GCL with any equipment. Driving on GCL with specialized equipment
for purposes of deploying geosynthetics can only be done with CQA ORGANIZATION’S and DESIGN ENGINEER’S approval.
G. Avoid wrinkles during deployment operations. Remove and repair wrinkles. Wrinkles
will be removed and repaired even if these conditions occur during placement operations of succeeding geosynthetic layers.
H. Protect GCL from becoming excessively hydrated (rain). GCL with moisture content
greater than 100 percent may be required to be removed at INSTALLER’s expense. I. Only deploy the quantity of GCL that can be completely covered by the overlying primary
geomembrane and secured in one day. Securely anchor the GCL and primary geomembrane at the end of the day. If wind conditions are high use geomembrane rolls as extra ballast during deployment. INSTALLER is responsible for temporary anchorage during construction.
J. Coordinate backfill and compaction of anchor trench with CONTRACTOR after
installation of GCL, primary geomembrane, and engineered turf. 3.02 SEAMING
A. All overlapped panels shall be augmented with seaming bentonite. B. Clean overlaps. C. Place seaming bentonite within the overlapped panel zone at a rate of 4 ounces per lineal
foot. 3.03 REPAIRS
A. Repair holes or tears by patching.
B. Extend patch 12-inches beyond the edges of the hole or tear.
C. Place seaming bentonite within the overlapped patch at a rate of 4 ounces per lineal foot. All overlapped patches must be augmented with seaming bentonite.
END SECTION 02774

APPENDIX B
HELP MODELING MEMO

memorandum To: Project File From: Ms. Melissa Hinman Date: May 18, 2020 Re: North Holding Pond – HELP Model Design Calculations
BACKGROUND Phillips 66 Company (Phillips 66, CN601491608) operates the Borger Refinery (RN102495884), which is owned by a joint venture between Phillips 66 (P66) and Cenovus called WRB Refining LP (WRB, CN603215997). This memo has been prepared to evaluate the proposed cover system design to close the North Holding Pond (NOR#036). The North Holding Pond (NHP) is a 3.4-acre surface impoundment with a liner system consisting of 3-feet of bentonite amended clay, leak detection system, and 100-mil high-density polyethylene (HDPE) liner. The North Holding Pond is in partial closure in accordance with the 1998 closure plan. The free liquid has been removed and the sludge has been stabilized. The impoundment is now being filled with non-hazardous waste. The partial closure permit modification was approved by the Texas Commission of Environmental Quality (TCEQ) on April 21, 2004.
OBJECTIVE The following calculations will demonstrate the performance of the proposed final cover system is superior or equivalent to the previously permitted cover system for the North Holding Pond during the 30-year post closure period. The calculations for the hydrologic evaluation of the cover systems presented below were modeled using the Hydrologic Evaluation of Landfill Performance (HELP) software, Version 3.07. The proposed cover system and previously permitted cover system elements are summarized in TABLE 1.
TABLE 1. COVER SYSTEM ELEMENTS Proposed Cover System Previously Permitted Cover System
Engineered Turf with ½” sand ballast 18” Vegetative Support and Protective Cover Layer Non-woven fabric
130-mil Linear Low-Density Polyethylene (LLDPE) MicroDrain® (integrated in to geomembrane) 3” Sand or gravel drainage layer
50-mil LLDPE Geomembrane 40-mil HDPE geomembrane liner layer 0.24” Geosynthetic Clay Liner and 12” Compacted Clay 24” Compacted clay
MODELING ASSUMPTIONS
Weather Data Precipitation and mean temperature data were synthetically generated utilizing average monthly values for Borger, Texas from the National Oceanic and Atmospheric Administration (NOAA) Climate Data Online, Data Tools 1981-2010 Normals. Solar radiation data were synthetically generated utilizing

Project File May 18, 2020 Page 2
coefficients for Amarillo, Texas modified to the site’s latitude of 35.71 degrees. The precipitation data for the 100-year, 24-hour rainfall event for Borger was 3.88 in. Relative humidity and evapotranspiration data used in the model reflect the default HELP data for Amarillo, Texas modified to the site’s latitude of 35.71 degrees. For the proposed cover the evaporative zone depth assumed was 0.63 in. (0.5 in. sand ballast and 0.13 in. studded drainage layer that is part of the LLDPE geomembrane). A leaf index of 0 was utilized as the synthetic turf is constructed of HDPE and will not transpire. For the previously permitted cover the evaporative zone depth assumed was 18 in. and a leaf index of 2 was utilized based on the assumption a fair stand of grass will be established on the final cover. 100% of the area will have runoff.
Initial Soil Moisture Content The initial soil moisture content for the soil layers and snow water were computed as nearly steady-state values by the HELP Model program.
Runoff Curve Number The runoff curve number (88.4) was computed by the HELP Model using soil texture #13 with a fair stand of grass, a surface slope of 3% and a slope length of 260 feet for the previously permitted cover. A runoff curve number of 92 was manually input based on data provided by WatershedGeo, the ClosureTurf® manufacturer.
Final Cover Section Input The final cover cross section for the proposed (TABLE 2) and previously permitted cover (TABLE 3) systems were modeled using the HELP Model and included layers described in the following tables.
TABLE 2. PROPOSED COVER SYSTEM
MATERIAL LAYER TYPE HELP MODEL
MATERIAL TEXTURE NO.
ASSUMPTIONS
Engineered Turf with ½” sand ballast
1-Vertical Percolation Layer 2
Default HELP values for hydraulic conductivity and porosity were
utilized.
130-mil LLDPE MicroDrain®
2-Lateral Drainage Layer 0
Hydraulic conductivity of 31.57 cm/s represent the long-
term hydraulic conductivities with a performance reduction factor of
2.4 applied.1

Project File May 18, 2020 Page 3
MATERIAL LAYER TYPE HELP MODEL
MATERIAL TEXTURE NO.
ASSUMPTIONS
50-mil LLDPE Geomembrane
4-Geomembrane Liner 36
Default HELP values for hydraulic conductivity and porosity were utilized. Assume 1 pinhole per acre and a “good” placement quality, which is conservative based on Construction Quality
Assurance (CQA) requirements.
0.24” Geosynthetic Clay Liner and 12” Compacted
Clay 3-Barrier Soil Liner 0
Hydraulic Conductivity of 3.435 x 10⁻⁸ cm/s is the calculated effective saturated hydraulic conductivity of the GCL and the compacted clay.2
Notes: 1 MicroDrain® hydraulic conductivity value and reduction factor from “Hydrologic Performance of Synthetic Turf Cover Systems and
Their Equivalency to Prescriptive Cover Systems” (Carlson et al. 2019) 2 The EPA’s user guide for the HELP model was followed to calculate the effective saturated hydraulic conductivity of the barrier soil
liner.
TABLE 3. PREVIOUSLY PERMITTED COVER SYSTEM
MATERIAL LAYER TYPE HELP MODEL
MATERIAL TEXTURE NO.
(1) ASSUMPTIONS
18” Vegetative Support and Protective Cover
Layer
1-Vertical Percolation Layer 13
Utilized soil type with a hydraulic conductivity (3.3 x 10⁻⁵ cm/s)
similar to site soils ( 1 x 10⁻⁸ to 5 x 10⁻⁵ cm/sec)
Non-woven fabric Not modeled Not modeled
3” Sand and gravel drainage layer
2-Lateral Drainage Layer 0
User input hydraulic conductivity of 3.3 x 10⁻² cm/sec selected as
3 orders of magnitude greater than topsoil as specified in permitted
closure plan.
40-mil high density polyethylene (HDPE) geomembrane liner
layer
4-Geomembrane Liner 35
Default HELP values for hydraulic conductivity and porosity were utilized. Assume 1 pinhole per acre and a “good” placement quality, which is conservative based on CQA requirements.
24” Compacted clay 3-Barrier Soil Liner 16
Utilized a soil type with a hydraulic conductivity matching the
permitted hydraulic conductivity for the compacted clay liner of
1 x 10⁻⁷ cm/sec. Note: (1) Total porosity, field capacity, and wilting point used in the model were the default values for the selected HELP material texture
number.
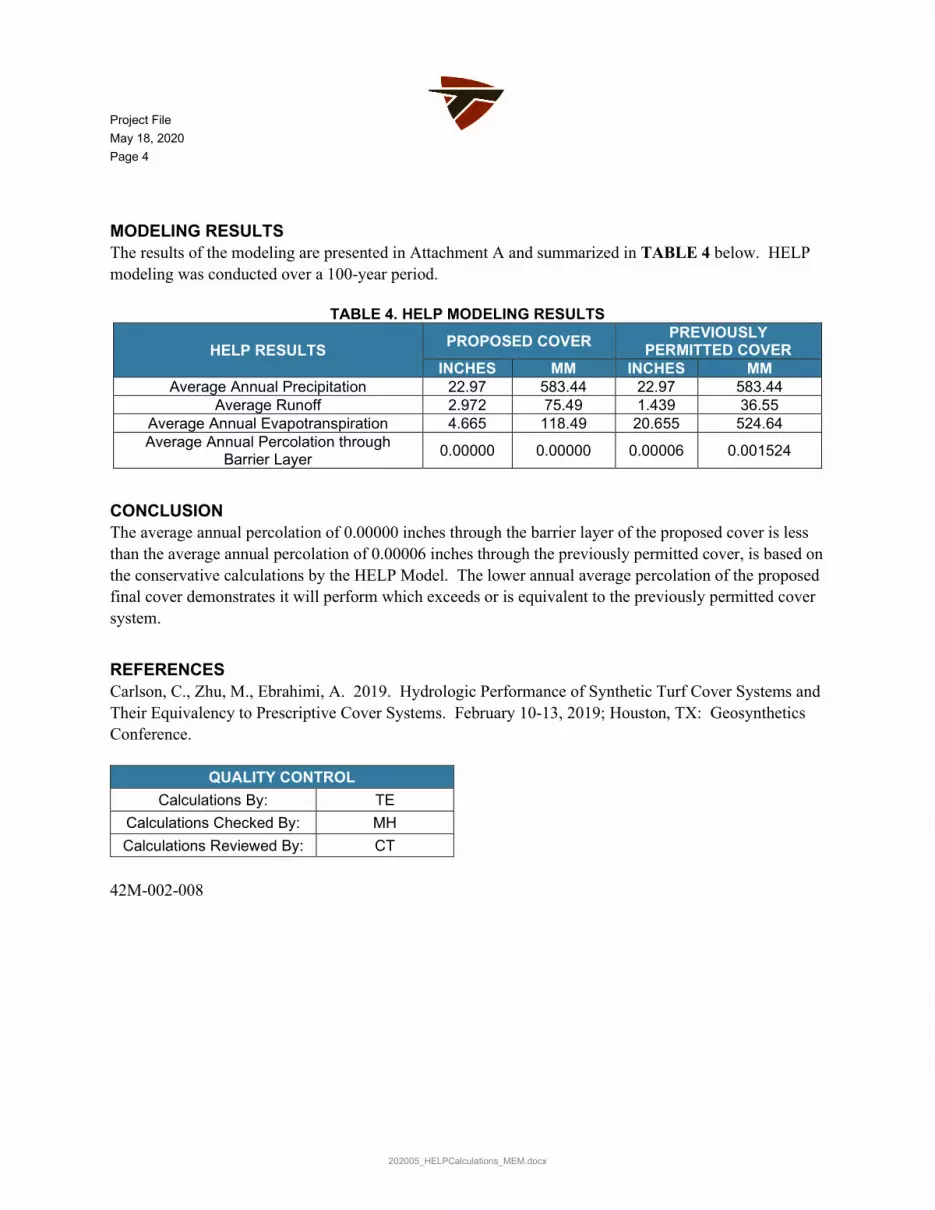
Project File May 18, 2020 Page 4
202005_HELPCalculations_MEM.docx
MODELING RESULTS The results of the modeling are presented in Attachment A and summarized in TABLE 4 below. HELP modeling was conducted over a 100-year period.
TABLE 4. HELP MODELING RESULTS
HELP RESULTS PROPOSED COVER PREVIOUSLY PERMITTED COVER
INCHES MM INCHES MM Average Annual Precipitation 22.97 583.44 22.97 583.44
Average Runoff 2.972 75.49 1.439 36.55 Average Annual Evapotranspiration 4.665 118.49 20.655 524.64 Average Annual Percolation through
Barrier Layer 0.00000 0.00000 0.00006 0.001524
CONCLUSION The average annual percolation of 0.00000 inches through the barrier layer of the proposed cover is less than the average annual percolation of 0.00006 inches through the previously permitted cover, is based on the conservative calculations by the HELP Model. The lower annual average percolation of the proposed final cover demonstrates it will perform which exceeds or is equivalent to the previously permitted cover system.
REFERENCES Carlson, C., Zhu, M., Ebrahimi, A. 2019. Hydrologic Performance of Synthetic Turf Cover Systems and Their Equivalency to Prescriptive Cover Systems. February 10-13, 2019; Houston, TX: Geosynthetics Conference.
QUALITY CONTROL Calculations By: TE
Calculations Checked By: MH Calculations Reviewed By: CT
42M-002-008

ATTACHMENT A
PROPOSED COVER HELP MODEL OUTPUT
****************************************************************************** ****************************************************************************** ** ** ** ** ** HYDROLOGIC EVALUATION OF LANDFILL PERFORMANCE ** ** HELP MODEL VERSION 3.07 (1 NOVEMBER 1997) ** ** DEVELOPED BY ENVIRONMENTAL LABORATORY ** ** USAE WATERWAYS EXPERIMENT STATION ** ** FOR USEPA RISK REDUCTION ENGINEERING LABORATORY ** ** ** ** ** ****************************************************************************** ******************************************************************************
PRECIPITATION DATA FILE: C:\NHP\DATA4.D4 TEMPERATURE DATA FILE: C:\NHP\DATA7.D7 SOLAR RADIATION DATA FILE: C:\NHP\DATA13.D13 EVAPOTRANSPIRATION DATA: C:\NHP\DATA11.D11 SOIL AND DESIGN DATA FILE: C:\NHP\opt2.D10 OUTPUT DATA FILE: C:\NHP\opt2.OUT
TIME: 16:32 DATE: 5/ 8/2020
******************************************************************************
TITLE: NORTH HOLDING POND - OPTION 2
******************************************************************************
NOTE: INITIAL MOISTURE CONTENT OF THE LAYERS AND SNOW WATER WERE COMPUTED AS NEARLY STEADY-STATE VALUES BY THE PROGRAM.
LAYER 1 --------
TYPE 1 - VERTICAL PERCOLATION LAYER MATERIAL TEXTURE NUMBER 0 THICKNESS = 0.50 INCHES

POROSITY = 0.4370 VOL/VOL FIELD CAPACITY = 0.0620 VOL/VOL WILTING POINT = 0.0240 VOL/VOL INITIAL SOIL WATER CONTENT = 0.0241 VOL/VOL EFFECTIVE SAT. HYD. COND. = 0.250000004000E-01 CM/SEC
LAYER 2 --------
TYPE 2 - LATERAL DRAINAGE LAYER MATERIAL TEXTURE NUMBER 0 THICKNESS = 0.13 INCHES POROSITY = 0.8500 VOL/VOL FIELD CAPACITY = 0.0100 VOL/VOL WILTING POINT = 0.0050 VOL/VOL INITIAL SOIL WATER CONTENT = 0.0061 VOL/VOL EFFECTIVE SAT. HYD. COND. = 31.5699997000 CM/SEC SLOPE = 3.00 PERCENT DRAINAGE LENGTH = 260.0 FEET
LAYER 3 --------
TYPE 4 - FLEXIBLE MEMBRANE LINER MATERIAL TEXTURE NUMBER 36 THICKNESS = 0.05 INCHES POROSITY = 0.0000 VOL/VOL FIELD CAPACITY = 0.0000 VOL/VOL WILTING POINT = 0.0000 VOL/VOL INITIAL SOIL WATER CONTENT = 0.0000 VOL/VOL EFFECTIVE SAT. HYD. COND. = 0.399999993000E-12 CM/SEC FML PINHOLE DENSITY = 1.00 HOLES/ACRE FML INSTALLATION DEFECTS = 1.00 HOLES/ACRE FML PLACEMENT QUALITY = 3 - GOOD
LAYER 4 --------
TYPE 3 - BARRIER SOIL LINER MATERIAL TEXTURE NUMBER 0 THICKNESS = 12.24 INCHES

POROSITY = 0.7500 VOL/VOL FIELD CAPACITY = 0.7470 VOL/VOL WILTING POINT = 0.4000 VOL/VOL INITIAL SOIL WATER CONTENT = 0.7500 VOL/VOL EFFECTIVE SAT. HYD. COND. = 0.343499984000E-07 CM/SEC
GENERAL DESIGN AND EVAPORATIVE ZONE DATA ----------------------------------------
NOTE: SCS RUNOFF CURVE NUMBER WAS USER-SPECIFIED.
SCS RUNOFF CURVE NUMBER = 92.00 FRACTION OF AREA ALLOWING RUNOFF = 100.0 PERCENT AREA PROJECTED ON HORIZONTAL PLANE = 1.000 ACRES EVAPORATIVE ZONE DEPTH = 0.6 INCHES INITIAL WATER IN EVAPORATIVE ZONE = 0.013 INCHES UPPER LIMIT OF EVAPORATIVE STORAGE = 0.304 INCHES LOWER LIMIT OF EVAPORATIVE STORAGE = 0.013 INCHES INITIAL SNOW WATER = 0.000 INCHES INITIAL WATER IN LAYER MATERIALS = 9.193 INCHES TOTAL INITIAL WATER = 9.193 INCHES TOTAL SUBSURFACE INFLOW = 0.00 INCHES/YEAR
EVAPOTRANSPIRATION AND WEATHER DATA -----------------------------------
NOTE: EVAPOTRANSPIRATION DATA WAS OBTAINED FROM AMARILLO TEXAS
STATION LATITUDE = 35.71 DEGREES MAXIMUM LEAF AREA INDEX = 0.00 START OF GROWING SEASON (JULIAN DATE) = 95 END OF GROWING SEASON (JULIAN DATE) = 303 EVAPORATIVE ZONE DEPTH = 0.6 INCHES AVERAGE ANNUAL WIND SPEED = 13.70 MPH AVERAGE 1ST QUARTER RELATIVE HUMIDITY = 55.00 % AVERAGE 2ND QUARTER RELATIVE HUMIDITY = 52.00 % AVERAGE 3RD QUARTER RELATIVE HUMIDITY = 57.00 % AVERAGE 4TH QUARTER RELATIVE HUMIDITY = 57.00 %
NOTE: PRECIPITATION DATA WAS SYNTHETICALLY GENERATED USING
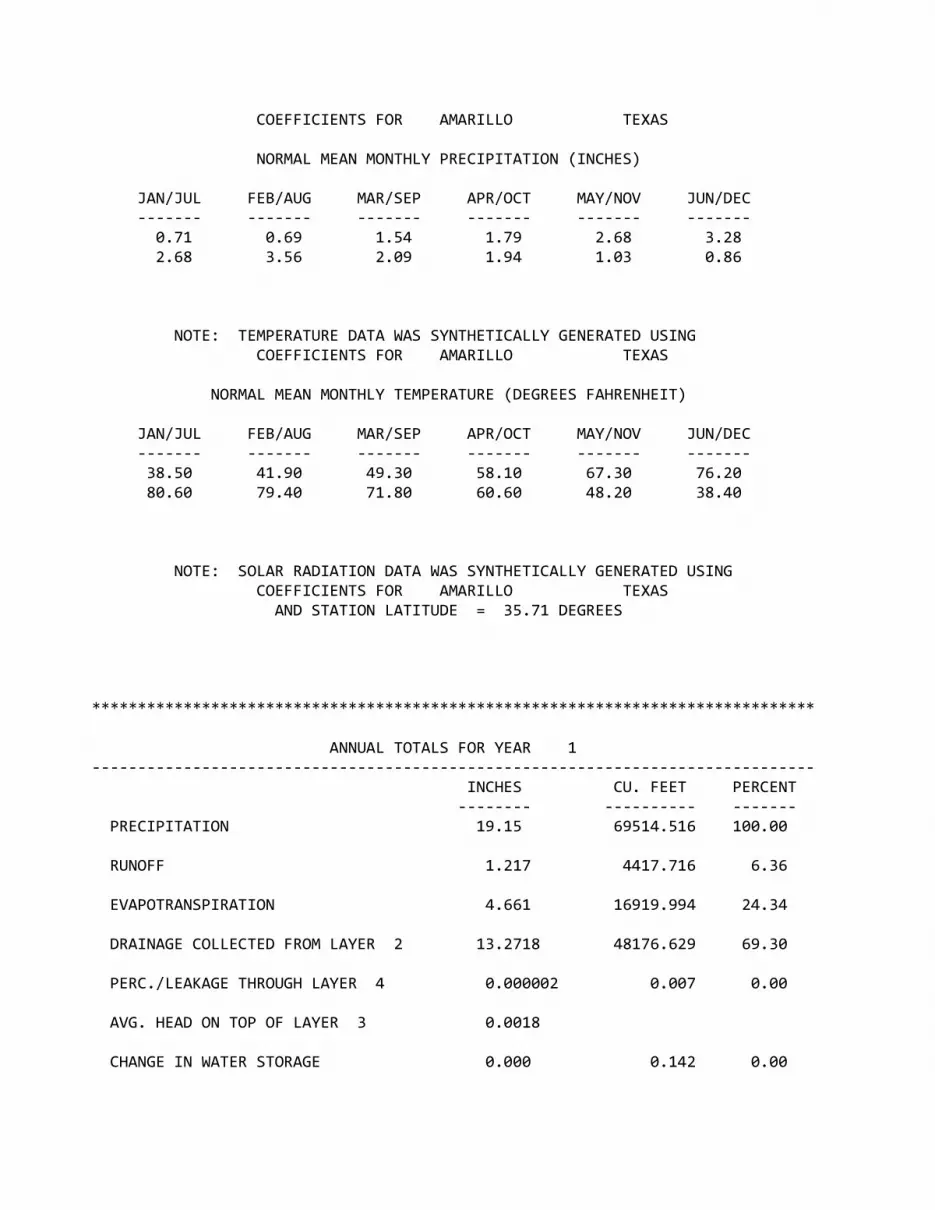
COEFFICIENTS FOR AMARILLO TEXAS
NORMAL MEAN MONTHLY PRECIPITATION (INCHES)
JAN/JUL FEB/AUG MAR/SEP APR/OCT MAY/NOV JUN/DEC ------- ------- ------- ------- ------- ------- 0.71 0.69 1.54 1.79 2.68 3.28 2.68 3.56 2.09 1.94 1.03 0.86
NOTE: TEMPERATURE DATA WAS SYNTHETICALLY GENERATED USING COEFFICIENTS FOR AMARILLO TEXAS
NORMAL MEAN MONTHLY TEMPERATURE (DEGREES FAHRENHEIT)
JAN/JUL FEB/AUG MAR/SEP APR/OCT MAY/NOV JUN/DEC ------- ------- ------- ------- ------- ------- 38.50 41.90 49.30 58.10 67.30 76.20 80.60 79.40 71.80 60.60 48.20 38.40
NOTE: SOLAR RADIATION DATA WAS SYNTHETICALLY GENERATED USING COEFFICIENTS FOR AMARILLO TEXAS AND STATION LATITUDE = 35.71 DEGREES
******************************************************************************* ANNUAL TOTALS FOR YEAR 1 ------------------------------------------------------------------------------- INCHES CU. FEET PERCENT -------- ---------- ------- PRECIPITATION 19.15 69514.516 100.00 RUNOFF 1.217 4417.716 6.36 EVAPOTRANSPIRATION 4.661 16919.994 24.34 DRAINAGE COLLECTED FROM LAYER 2 13.2718 48176.629 69.30 PERC./LEAKAGE THROUGH LAYER 4 0.000002 0.007 0.00 AVG. HEAD ON TOP OF LAYER 3 0.0018 CHANGE IN WATER STORAGE 0.000 0.142 0.00

SOIL WATER AT START OF YEAR 9.193 33370.086 SOIL WATER AT END OF YEAR 9.193 33370.230 SNOW WATER AT START OF YEAR 0.000 0.000 0.00 SNOW WATER AT END OF YEAR 0.000 0.000 0.00 ANNUAL WATER BUDGET BALANCE 0.0000 0.033 0.00 *******************************************************************************
******************************************************************************* ANNUAL TOTALS FOR YEAR 2 ------------------------------------------------------------------------------- INCHES CU. FEET PERCENT -------- ---------- ------- PRECIPITATION 27.94 101422.203 100.00 RUNOFF 3.968 14404.554 14.20 EVAPOTRANSPIRATION 5.072 18409.941 18.15 DRAINAGE COLLECTED FROM LAYER 2 18.9003 68608.070 67.65 PERC./LEAKAGE THROUGH LAYER 4 0.000002 0.007 0.00 AVG. HEAD ON TOP OF LAYER 3 0.0025 CHANGE IN WATER STORAGE 0.000 -0.370 0.00 SOIL WATER AT START OF YEAR 9.193 33370.230 SOIL WATER AT END OF YEAR 9.193 33369.859 SNOW WATER AT START OF YEAR 0.000 0.000 0.00 SNOW WATER AT END OF YEAR 0.000 0.000 0.00 ANNUAL WATER BUDGET BALANCE 0.0000 -0.001 0.00 *******************************************************************************

******************************************************************************* ANNUAL TOTALS FOR YEAR 3 ------------------------------------------------------------------------------- INCHES CU. FEET PERCENT -------- ---------- ------- PRECIPITATION 21.10 76593.000 100.00 RUNOFF 2.536 9205.100 12.02 EVAPOTRANSPIRATION 5.478 19886.479 25.96 DRAINAGE COLLECTED FROM LAYER 2 13.0858 47501.402 62.02 PERC./LEAKAGE THROUGH LAYER 4 0.000002 0.006 0.00 AVG. HEAD ON TOP OF LAYER 3 0.0017 CHANGE IN WATER STORAGE 0.000 0.000 0.00 SOIL WATER AT START OF YEAR 9.193 33369.859 SOIL WATER AT END OF YEAR 9.193 33369.859 SNOW WATER AT START OF YEAR 0.000 0.000 0.00 SNOW WATER AT END OF YEAR 0.000 0.000 0.00 ANNUAL WATER BUDGET BALANCE 0.0000 0.014 0.00 *******************************************************************************
******************************************************************************* ANNUAL TOTALS FOR YEAR 4 ------------------------------------------------------------------------------- INCHES CU. FEET PERCENT -------- ---------- ------- PRECIPITATION 21.58 78335.430 100.00 RUNOFF 2.059 7475.807 9.54 EVAPOTRANSPIRATION 3.682 13364.661 17.06 DRAINAGE COLLECTED FROM LAYER 2 15.8388 57494.937 73.40 PERC./LEAKAGE THROUGH LAYER 4 0.000002 0.007 0.00

AVG. HEAD ON TOP OF LAYER 3 0.0021 CHANGE IN WATER STORAGE 0.000 0.000 0.00 SOIL WATER AT START OF YEAR 9.193 33369.859 SOIL WATER AT END OF YEAR 9.193 33369.859 SNOW WATER AT START OF YEAR 0.000 0.000 0.00 SNOW WATER AT END OF YEAR 0.000 0.000 0.00 ANNUAL WATER BUDGET BALANCE 0.0000 0.014 0.00 *******************************************************************************
******************************************************************************* ANNUAL TOTALS FOR YEAR 5 ------------------------------------------------------------------------------- INCHES CU. FEET PERCENT -------- ---------- ------- PRECIPITATION 20.77 75395.094 100.00 RUNOFF 1.002 3635.646 4.82 EVAPOTRANSPIRATION 5.201 18879.016 25.04 DRAINAGE COLLECTED FROM LAYER 2 14.5676 52880.437 70.14 PERC./LEAKAGE THROUGH LAYER 4 0.000002 0.006 0.00 AVG. HEAD ON TOP OF LAYER 3 0.0019 CHANGE IN WATER STORAGE 0.000 0.000 0.00 SOIL WATER AT START OF YEAR 9.193 33369.859 SOIL WATER AT END OF YEAR 9.193 33369.859 SNOW WATER AT START OF YEAR 0.000 0.000 0.00 SNOW WATER AT END OF YEAR 0.000 0.000 0.00 ANNUAL WATER BUDGET BALANCE 0.0000 -0.012 0.00

*******************************************************************************
******************************************************************************* ANNUAL TOTALS FOR YEAR 6 ------------------------------------------------------------------------------- INCHES CU. FEET PERCENT -------- ---------- ------- PRECIPITATION 24.15 87664.516 100.00 RUNOFF 4.089 14842.455 16.93 EVAPOTRANSPIRATION 5.151 18698.168 21.33 DRAINAGE COLLECTED FROM LAYER 2 14.9102 54123.863 61.74 PERC./LEAKAGE THROUGH LAYER 4 0.000002 0.007 0.00 AVG. HEAD ON TOP OF LAYER 3 0.0020 CHANGE IN WATER STORAGE 0.000 0.000 0.00 SOIL WATER AT START OF YEAR 9.193 33369.859 SOIL WATER AT END OF YEAR 9.193 33369.859 SNOW WATER AT START OF YEAR 0.000 0.000 0.00 SNOW WATER AT END OF YEAR 0.000 0.000 0.00 ANNUAL WATER BUDGET BALANCE 0.0000 0.019 0.00 *******************************************************************************
******************************************************************************* ANNUAL TOTALS FOR YEAR 7 ------------------------------------------------------------------------------- INCHES CU. FEET PERCENT -------- ---------- ------- PRECIPITATION 20.44 74197.195 100.00 RUNOFF 1.911 6935.774 9.35

EVAPOTRANSPIRATION 4.058 14729.002 19.85 DRAINAGE COLLECTED FROM LAYER 2 14.3346 52034.535 70.13 PERC./LEAKAGE THROUGH LAYER 4 0.000002 0.007 0.00 AVG. HEAD ON TOP OF LAYER 3 0.0019 CHANGE IN WATER STORAGE 0.137 497.878 0.67 SOIL WATER AT START OF YEAR 9.193 33369.859 SOIL WATER AT END OF YEAR 9.330 33867.738 SNOW WATER AT START OF YEAR 0.000 0.000 0.00 SNOW WATER AT END OF YEAR 0.000 0.000 0.00 ANNUAL WATER BUDGET BALANCE 0.0000 0.000 0.00 *******************************************************************************
******************************************************************************* ANNUAL TOTALS FOR YEAR 8 ------------------------------------------------------------------------------- INCHES CU. FEET PERCENT -------- ---------- ------- PRECIPITATION 25.28 91766.406 100.00 RUNOFF 3.812 13836.615 15.08 EVAPOTRANSPIRATION 5.207 18899.994 20.60 DRAINAGE COLLECTED FROM LAYER 2 16.1120 58486.543 63.73 PERC./LEAKAGE THROUGH LAYER 4 0.000002 0.007 0.00 AVG. HEAD ON TOP OF LAYER 3 0.0021 CHANGE IN WATER STORAGE 0.150 543.245 0.59 SOIL WATER AT START OF YEAR 9.330 33867.738 SOIL WATER AT END OF YEAR 9.480 34410.984 SNOW WATER AT START OF YEAR 0.000 0.000 0.00

SNOW WATER AT END OF YEAR 0.000 0.000 0.00 ANNUAL WATER BUDGET BALANCE 0.0000 0.003 0.00 *******************************************************************************
******************************************************************************* ANNUAL TOTALS FOR YEAR 9 ------------------------------------------------------------------------------- INCHES CU. FEET PERCENT -------- ---------- ------- PRECIPITATION 19.33 70167.898 100.00 RUNOFF 2.624 9524.913 13.57 EVAPOTRANSPIRATION 2.831 10277.644 14.65 DRAINAGE COLLECTED FROM LAYER 2 14.1616 51406.465 73.26 PERC./LEAKAGE THROUGH LAYER 4 0.000002 0.006 0.00 AVG. HEAD ON TOP OF LAYER 3 0.0019 CHANGE IN WATER STORAGE -0.287 -1041.124 -1.48 SOIL WATER AT START OF YEAR 9.480 34410.984 SOIL WATER AT END OF YEAR 9.193 33369.859 SNOW WATER AT START OF YEAR 0.000 0.000 0.00 SNOW WATER AT END OF YEAR 0.000 0.000 0.00 ANNUAL WATER BUDGET BALANCE 0.0000 -0.003 0.00 *******************************************************************************
******************************************************************************* ANNUAL TOTALS FOR YEAR 10 ------------------------------------------------------------------------------- INCHES CU. FEET PERCENT

-------- ---------- ------- PRECIPITATION 22.40 81312.016 100.00 RUNOFF 2.052 7448.376 9.16 EVAPOTRANSPIRATION 4.368 15856.794 19.50 DRAINAGE COLLECTED FROM LAYER 2 15.8960 57702.598 70.96 PERC./LEAKAGE THROUGH LAYER 4 0.000002 0.007 0.00 AVG. HEAD ON TOP OF LAYER 3 0.0021 CHANGE IN WATER STORAGE 0.084 304.212 0.37 SOIL WATER AT START OF YEAR 9.193 33369.859 SOIL WATER AT END OF YEAR 9.277 33674.070 SNOW WATER AT START OF YEAR 0.000 0.000 0.00 SNOW WATER AT END OF YEAR 0.000 0.000 0.00 ANNUAL WATER BUDGET BALANCE 0.0000 0.033 0.00 *******************************************************************************
******************************************************************************* ANNUAL TOTALS FOR YEAR 11 ------------------------------------------------------------------------------- INCHES CU. FEET PERCENT -------- ---------- ------- PRECIPITATION 29.18 105923.406 100.00 RUNOFF 2.848 10339.919 9.76 EVAPOTRANSPIRATION 7.125 25865.432 24.42 DRAINAGE COLLECTED FROM LAYER 2 18.1735 65969.680 62.28 PERC./LEAKAGE THROUGH LAYER 4 0.000002 0.008 0.00 AVG. HEAD ON TOP OF LAYER 3 0.0024 CHANGE IN WATER STORAGE 1.033 3748.354 3.54

SOIL WATER AT START OF YEAR 9.277 33674.070 SOIL WATER AT END OF YEAR 9.248 33570.949 SNOW WATER AT START OF YEAR 0.000 0.000 0.00 SNOW WATER AT END OF YEAR 1.061 3851.475 3.64 ANNUAL WATER BUDGET BALANCE 0.0000 0.016 0.00 *******************************************************************************
******************************************************************************* ANNUAL TOTALS FOR YEAR 12 ------------------------------------------------------------------------------- INCHES CU. FEET PERCENT -------- ---------- ------- PRECIPITATION 19.82 71946.602 100.00 RUNOFF 2.283 8288.470 11.52 EVAPOTRANSPIRATION 3.951 14343.427 19.94 DRAINAGE COLLECTED FROM LAYER 2 14.7017 53367.262 74.18 PERC./LEAKAGE THROUGH LAYER 4 0.000002 0.006 0.00 AVG. HEAD ON TOP OF LAYER 3 0.0019 CHANGE IN WATER STORAGE -1.116 -4052.567 -5.63 SOIL WATER AT START OF YEAR 9.248 33570.949 SOIL WATER AT END OF YEAR 9.193 33369.859 SNOW WATER AT START OF YEAR 1.061 3851.475 5.35 SNOW WATER AT END OF YEAR 0.000 0.000 0.00 ANNUAL WATER BUDGET BALANCE 0.0000 0.002 0.00 *******************************************************************************

******************************************************************************* ANNUAL TOTALS FOR YEAR 13 ------------------------------------------------------------------------------- INCHES CU. FEET PERCENT -------- ---------- ------- PRECIPITATION 25.09 91076.711 100.00 RUNOFF 2.848 10338.269 11.35 EVAPOTRANSPIRATION 6.267 22751.021 24.98 DRAINAGE COLLECTED FROM LAYER 2 15.9745 57987.402 63.67 PERC./LEAKAGE THROUGH LAYER 4 0.000002 0.007 0.00 AVG. HEAD ON TOP OF LAYER 3 0.0021 CHANGE IN WATER STORAGE 0.000 0.000 0.00 SOIL WATER AT START OF YEAR 9.193 33369.859 SOIL WATER AT END OF YEAR 9.193 33369.859 SNOW WATER AT START OF YEAR 0.000 0.000 0.00 SNOW WATER AT END OF YEAR 0.000 0.000 0.00 ANNUAL WATER BUDGET BALANCE 0.0000 0.015 0.00 *******************************************************************************
******************************************************************************* ANNUAL TOTALS FOR YEAR 14 ------------------------------------------------------------------------------- INCHES CU. FEET PERCENT -------- ---------- ------- PRECIPITATION 15.15 54994.516 100.00 RUNOFF 1.631 5920.577 10.77 EVAPOTRANSPIRATION 3.094 11229.421 20.42 DRAINAGE COLLECTED FROM LAYER 2 10.4255 37844.504 68.82 PERC./LEAKAGE THROUGH LAYER 4 0.000002 0.006 0.00

AVG. HEAD ON TOP OF LAYER 3 0.0014 CHANGE IN WATER STORAGE 0.000 0.000 0.00 SOIL WATER AT START OF YEAR 9.193 33369.859 SOIL WATER AT END OF YEAR 9.193 33369.859 SNOW WATER AT START OF YEAR 0.000 0.000 0.00 SNOW WATER AT END OF YEAR 0.000 0.000 0.00 ANNUAL WATER BUDGET BALANCE 0.0000 0.009 0.00 *******************************************************************************
******************************************************************************* ANNUAL TOTALS FOR YEAR 15 ------------------------------------------------------------------------------- INCHES CU. FEET PERCENT -------- ---------- ------- PRECIPITATION 18.42 66864.609 100.00 RUNOFF 1.200 4356.324 6.52 EVAPOTRANSPIRATION 4.814 17474.369 26.13 DRAINAGE COLLECTED FROM LAYER 2 12.4060 45033.906 67.35 PERC./LEAKAGE THROUGH LAYER 4 0.000002 0.006 0.00 AVG. HEAD ON TOP OF LAYER 3 0.0017 CHANGE IN WATER STORAGE 0.000 0.000 0.00 SOIL WATER AT START OF YEAR 9.193 33369.859 SOIL WATER AT END OF YEAR 9.193 33369.859 SNOW WATER AT START OF YEAR 0.000 0.000 0.00 SNOW WATER AT END OF YEAR 0.000 0.000 0.00 ANNUAL WATER BUDGET BALANCE 0.0000 0.003 0.00

*******************************************************************************
******************************************************************************* ANNUAL TOTALS FOR YEAR 16 ------------------------------------------------------------------------------- INCHES CU. FEET PERCENT -------- ---------- ------- PRECIPITATION 22.01 79896.305 100.00 RUNOFF 3.641 13215.442 16.54 EVAPOTRANSPIRATION 3.931 14268.033 17.86 DRAINAGE COLLECTED FROM LAYER 2 14.4388 52412.820 65.60 PERC./LEAKAGE THROUGH LAYER 4 0.000001 0.005 0.00 AVG. HEAD ON TOP OF LAYER 3 0.0019 CHANGE IN WATER STORAGE 0.000 0.000 0.00 SOIL WATER AT START OF YEAR 9.193 33369.859 SOIL WATER AT END OF YEAR 9.193 33369.859 SNOW WATER AT START OF YEAR 0.000 0.000 0.00 SNOW WATER AT END OF YEAR 0.000 0.000 0.00 ANNUAL WATER BUDGET BALANCE 0.0000 0.000 0.00 *******************************************************************************
******************************************************************************* ANNUAL TOTALS FOR YEAR 17 ------------------------------------------------------------------------------- INCHES CU. FEET PERCENT -------- ---------- ------- PRECIPITATION 15.31 55575.305 100.00 RUNOFF 1.486 5393.886 9.71
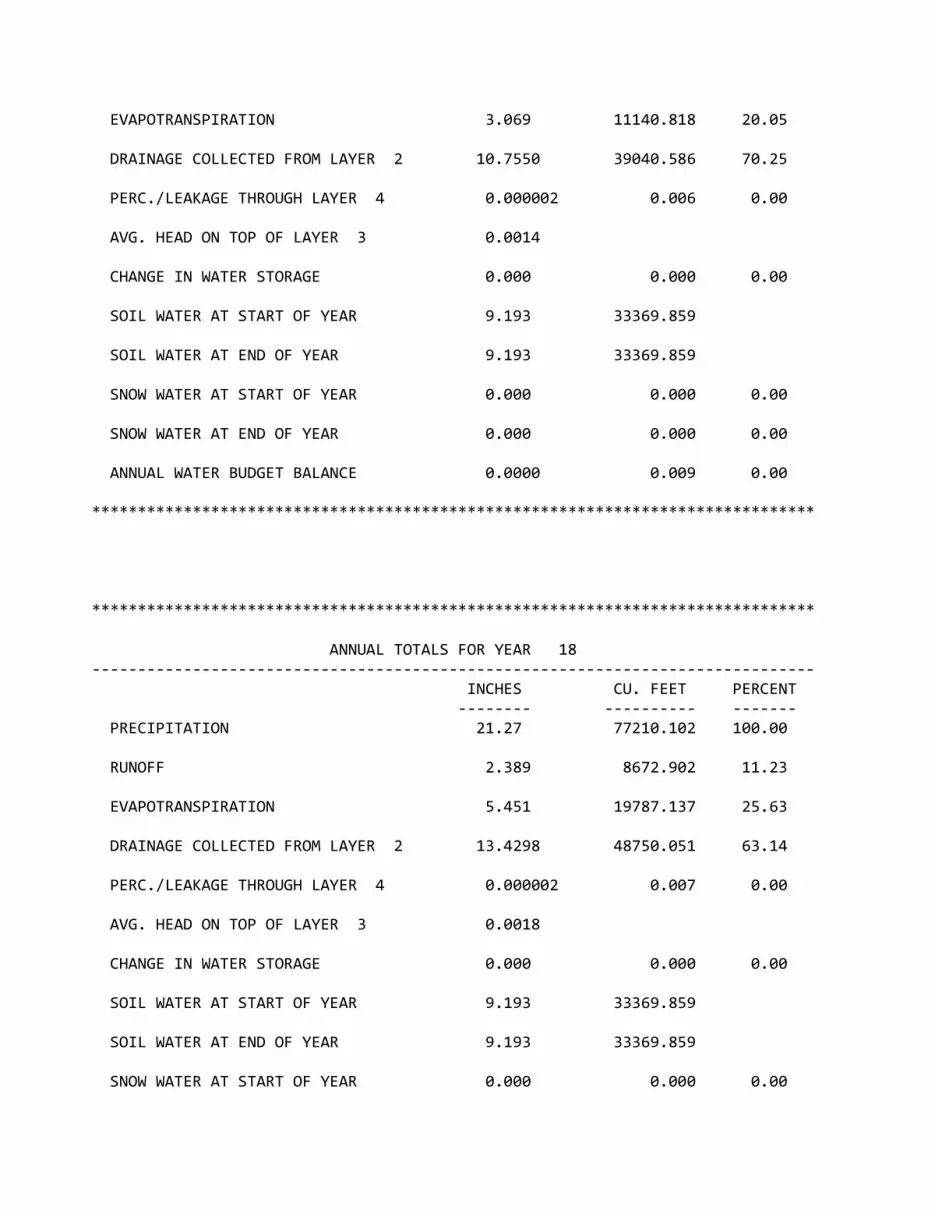
EVAPOTRANSPIRATION 3.069 11140.818 20.05 DRAINAGE COLLECTED FROM LAYER 2 10.7550 39040.586 70.25 PERC./LEAKAGE THROUGH LAYER 4 0.000002 0.006 0.00 AVG. HEAD ON TOP OF LAYER 3 0.0014 CHANGE IN WATER STORAGE 0.000 0.000 0.00 SOIL WATER AT START OF YEAR 9.193 33369.859 SOIL WATER AT END OF YEAR 9.193 33369.859 SNOW WATER AT START OF YEAR 0.000 0.000 0.00 SNOW WATER AT END OF YEAR 0.000 0.000 0.00 ANNUAL WATER BUDGET BALANCE 0.0000 0.009 0.00 *******************************************************************************
******************************************************************************* ANNUAL TOTALS FOR YEAR 18 ------------------------------------------------------------------------------- INCHES CU. FEET PERCENT -------- ---------- ------- PRECIPITATION 21.27 77210.102 100.00 RUNOFF 2.389 8672.902 11.23 EVAPOTRANSPIRATION 5.451 19787.137 25.63 DRAINAGE COLLECTED FROM LAYER 2 13.4298 48750.051 63.14 PERC./LEAKAGE THROUGH LAYER 4 0.000002 0.007 0.00 AVG. HEAD ON TOP OF LAYER 3 0.0018 CHANGE IN WATER STORAGE 0.000 0.000 0.00 SOIL WATER AT START OF YEAR 9.193 33369.859 SOIL WATER AT END OF YEAR 9.193 33369.859 SNOW WATER AT START OF YEAR 0.000 0.000 0.00

SNOW WATER AT END OF YEAR 0.000 0.000 0.00 ANNUAL WATER BUDGET BALANCE 0.0000 0.007 0.00 *******************************************************************************
******************************************************************************* ANNUAL TOTALS FOR YEAR 19 ------------------------------------------------------------------------------- INCHES CU. FEET PERCENT -------- ---------- ------- PRECIPITATION 27.00 98010.016 100.00 RUNOFF 5.556 20168.148 20.58 EVAPOTRANSPIRATION 3.918 14221.061 14.51 DRAINAGE COLLECTED FROM LAYER 2 17.5264 63620.781 64.91 PERC./LEAKAGE THROUGH LAYER 4 0.000002 0.006 0.00 AVG. HEAD ON TOP OF LAYER 3 0.0023 CHANGE IN WATER STORAGE 0.000 0.000 0.00 SOIL WATER AT START OF YEAR 9.193 33369.859 SOIL WATER AT END OF YEAR 9.193 33369.859 SNOW WATER AT START OF YEAR 0.000 0.000 0.00 SNOW WATER AT END OF YEAR 0.000 0.000 0.00 ANNUAL WATER BUDGET BALANCE 0.0000 0.015 0.00 *******************************************************************************
******************************************************************************* ANNUAL TOTALS FOR YEAR 20 ------------------------------------------------------------------------------- INCHES CU. FEET PERCENT

-------- ---------- ------- PRECIPITATION 15.09 54776.699 100.00 RUNOFF 1.264 4587.510 8.37 EVAPOTRANSPIRATION 3.109 11284.935 20.60 DRAINAGE COLLECTED FROM LAYER 2 10.7174 38904.258 71.02 PERC./LEAKAGE THROUGH LAYER 4 0.000002 0.006 0.00 AVG. HEAD ON TOP OF LAYER 3 0.0014 CHANGE IN WATER STORAGE 0.000 0.000 0.00 SOIL WATER AT START OF YEAR 9.193 33369.859 SOIL WATER AT END OF YEAR 9.193 33369.859 SNOW WATER AT START OF YEAR 0.000 0.000 0.00 SNOW WATER AT END OF YEAR 0.000 0.000 0.00 ANNUAL WATER BUDGET BALANCE 0.0000 -0.007 0.00 *******************************************************************************
******************************************************************************* ANNUAL TOTALS FOR YEAR 21 ------------------------------------------------------------------------------- INCHES CU. FEET PERCENT -------- ---------- ------- PRECIPITATION 18.54 67300.219 100.00 RUNOFF 3.345 12140.685 18.04 EVAPOTRANSPIRATION 2.861 10383.902 15.43 DRAINAGE COLLECTED FROM LAYER 2 12.3173 44711.848 66.44 PERC./LEAKAGE THROUGH LAYER 4 0.000002 0.006 0.00 AVG. HEAD ON TOP OF LAYER 3 0.0016 CHANGE IN WATER STORAGE 0.018 63.757 0.09

SOIL WATER AT START OF YEAR 9.193 33369.859 SOIL WATER AT END OF YEAR 9.210 33433.617 SNOW WATER AT START OF YEAR 0.000 0.000 0.00 SNOW WATER AT END OF YEAR 0.000 0.000 0.00 ANNUAL WATER BUDGET BALANCE 0.0000 0.020 0.00 *******************************************************************************
******************************************************************************* ANNUAL TOTALS FOR YEAR 22 ------------------------------------------------------------------------------- INCHES CU. FEET PERCENT -------- ---------- ------- PRECIPITATION 26.25 95287.508 100.00 RUNOFF 3.223 11698.722 12.28 EVAPOTRANSPIRATION 4.935 17915.662 18.80 DRAINAGE COLLECTED FROM LAYER 2 18.0980 65695.617 68.94 PERC./LEAKAGE THROUGH LAYER 4 0.000002 0.007 0.00 AVG. HEAD ON TOP OF LAYER 3 0.0024 CHANGE IN WATER STORAGE -0.006 -22.502 -0.02 SOIL WATER AT START OF YEAR 9.210 33433.617 SOIL WATER AT END OF YEAR 9.204 33411.113 SNOW WATER AT START OF YEAR 0.000 0.000 0.00 SNOW WATER AT END OF YEAR 0.000 0.000 0.00 ANNUAL WATER BUDGET BALANCE 0.0000 0.005 0.00 *******************************************************************************

******************************************************************************* ANNUAL TOTALS FOR YEAR 23 ------------------------------------------------------------------------------- INCHES CU. FEET PERCENT -------- ---------- ------- PRECIPITATION 20.73 75249.898 100.00 RUNOFF 2.908 10557.721 14.03 EVAPOTRANSPIRATION 3.593 13043.321 17.33 DRAINAGE COLLECTED FROM LAYER 2 14.2397 51690.117 68.69 PERC./LEAKAGE THROUGH LAYER 4 0.000002 0.006 0.00 AVG. HEAD ON TOP OF LAYER 3 0.0019 CHANGE IN WATER STORAGE -0.011 -41.255 -0.05 SOIL WATER AT START OF YEAR 9.204 33411.113 SOIL WATER AT END OF YEAR 9.193 33369.859 SNOW WATER AT START OF YEAR 0.000 0.000 0.00 SNOW WATER AT END OF YEAR 0.000 0.000 0.00 ANNUAL WATER BUDGET BALANCE 0.0000 -0.014 0.00 *******************************************************************************
******************************************************************************* ANNUAL TOTALS FOR YEAR 24 ------------------------------------------------------------------------------- INCHES CU. FEET PERCENT -------- ---------- ------- PRECIPITATION 22.92 83199.617 100.00 RUNOFF 2.271 8245.218 9.91 EVAPOTRANSPIRATION 4.068 14765.494 17.75 DRAINAGE COLLECTED FROM LAYER 2 16.4976 59886.422 71.98 PERC./LEAKAGE THROUGH LAYER 4 0.000002 0.006 0.00

AVG. HEAD ON TOP OF LAYER 3 0.0022 CHANGE IN WATER STORAGE 0.083 302.450 0.36 SOIL WATER AT START OF YEAR 9.193 33369.859 SOIL WATER AT END OF YEAR 9.276 33672.309 SNOW WATER AT START OF YEAR 0.000 0.000 0.00 SNOW WATER AT END OF YEAR 0.000 0.000 0.00 ANNUAL WATER BUDGET BALANCE 0.0000 0.023 0.00 *******************************************************************************
******************************************************************************* ANNUAL TOTALS FOR YEAR 25 ------------------------------------------------------------------------------- INCHES CU. FEET PERCENT -------- ---------- ------- PRECIPITATION 23.80 86394.008 100.00 RUNOFF 2.237 8119.025 9.40 EVAPOTRANSPIRATION 6.850 24866.164 28.78 DRAINAGE COLLECTED FROM LAYER 2 14.7965 53711.250 62.17 PERC./LEAKAGE THROUGH LAYER 4 0.000002 0.007 0.00 AVG. HEAD ON TOP OF LAYER 3 0.0020 CHANGE IN WATER STORAGE -0.083 -302.450 -0.35 SOIL WATER AT START OF YEAR 9.276 33672.309 SOIL WATER AT END OF YEAR 9.193 33369.859 SNOW WATER AT START OF YEAR 0.000 0.000 0.00 SNOW WATER AT END OF YEAR 0.000 0.000 0.00 ANNUAL WATER BUDGET BALANCE 0.0000 0.014 0.00

*******************************************************************************
******************************************************************************* ANNUAL TOTALS FOR YEAR 26 ------------------------------------------------------------------------------- INCHES CU. FEET PERCENT -------- ---------- ------- PRECIPITATION 19.41 70458.312 100.00 RUNOFF 1.780 6462.535 9.17 EVAPOTRANSPIRATION 4.776 17336.844 24.61 DRAINAGE COLLECTED FROM LAYER 2 12.8447 46626.211 66.18 PERC./LEAKAGE THROUGH LAYER 4 0.000002 0.006 0.00 AVG. HEAD ON TOP OF LAYER 3 0.0017 CHANGE IN WATER STORAGE 0.009 32.683 0.05 SOIL WATER AT START OF YEAR 9.193 33369.859 SOIL WATER AT END OF YEAR 9.202 33402.543 SNOW WATER AT START OF YEAR 0.000 0.000 0.00 SNOW WATER AT END OF YEAR 0.000 0.000 0.00 ANNUAL WATER BUDGET BALANCE 0.0000 0.034 0.00 *******************************************************************************
******************************************************************************* ANNUAL TOTALS FOR YEAR 27 ------------------------------------------------------------------------------- INCHES CU. FEET PERCENT -------- ---------- ------- PRECIPITATION 23.64 85813.219 100.00 RUNOFF 1.865 6768.195 7.89

EVAPOTRANSPIRATION 5.109 18546.631 21.61 DRAINAGE COLLECTED FROM LAYER 2 16.6752 60531.070 70.54 PERC./LEAKAGE THROUGH LAYER 4 0.000002 0.007 0.00 AVG. HEAD ON TOP OF LAYER 3 0.0022 CHANGE IN WATER STORAGE -0.009 -32.683 -0.04 SOIL WATER AT START OF YEAR 9.202 33402.543 SOIL WATER AT END OF YEAR 9.193 33369.859 SNOW WATER AT START OF YEAR 0.000 0.000 0.00 SNOW WATER AT END OF YEAR 0.000 0.000 0.00 ANNUAL WATER BUDGET BALANCE 0.0000 -0.003 0.00 *******************************************************************************
******************************************************************************* ANNUAL TOTALS FOR YEAR 28 ------------------------------------------------------------------------------- INCHES CU. FEET PERCENT -------- ---------- ------- PRECIPITATION 21.17 76847.117 100.00 RUNOFF 1.709 6202.729 8.07 EVAPOTRANSPIRATION 4.946 17952.709 23.36 DRAINAGE COLLECTED FROM LAYER 2 14.3411 52058.305 67.74 PERC./LEAKAGE THROUGH LAYER 4 0.000002 0.007 0.00 AVG. HEAD ON TOP OF LAYER 3 0.0019 CHANGE IN WATER STORAGE 0.174 633.357 0.82 SOIL WATER AT START OF YEAR 9.193 33369.859 SOIL WATER AT END OF YEAR 9.367 34003.215 SNOW WATER AT START OF YEAR 0.000 0.000 0.00

SNOW WATER AT END OF YEAR 0.000 0.000 0.00 ANNUAL WATER BUDGET BALANCE 0.0000 0.012 0.00 *******************************************************************************
******************************************************************************* ANNUAL TOTALS FOR YEAR 29 ------------------------------------------------------------------------------- INCHES CU. FEET PERCENT -------- ---------- ------- PRECIPITATION 26.90 97646.984 100.00 RUNOFF 4.052 14707.945 15.06 EVAPOTRANSPIRATION 4.803 17433.322 17.85 DRAINAGE COLLECTED FROM LAYER 2 18.2201 66139.086 67.73 PERC./LEAKAGE THROUGH LAYER 4 0.000002 0.007 0.00 AVG. HEAD ON TOP OF LAYER 3 0.0024 CHANGE IN WATER STORAGE -0.174 -633.357 -0.65 SOIL WATER AT START OF YEAR 9.367 34003.215 SOIL WATER AT END OF YEAR 9.193 33369.859 SNOW WATER AT START OF YEAR 0.000 0.000 0.00 SNOW WATER AT END OF YEAR 0.000 0.000 0.00 ANNUAL WATER BUDGET BALANCE 0.0000 -0.013 0.00 *******************************************************************************
******************************************************************************* ANNUAL TOTALS FOR YEAR 30 ------------------------------------------------------------------------------- INCHES CU. FEET PERCENT

-------- ---------- ------- PRECIPITATION 25.88 93944.398 100.00 RUNOFF 3.616 13125.238 13.97 EVAPOTRANSPIRATION 5.742 20842.186 22.19 DRAINAGE COLLECTED FROM LAYER 2 16.5224 59976.312 63.84 PERC./LEAKAGE THROUGH LAYER 4 0.000002 0.007 0.00 AVG. HEAD ON TOP OF LAYER 3 0.0022 CHANGE IN WATER STORAGE 0.000 0.661 0.00 SOIL WATER AT START OF YEAR 9.193 33369.859 SOIL WATER AT END OF YEAR 9.193 33370.520 SNOW WATER AT START OF YEAR 0.000 0.000 0.00 SNOW WATER AT END OF YEAR 0.000 0.000 0.00 ANNUAL WATER BUDGET BALANCE 0.0000 -0.006 0.00 *******************************************************************************
******************************************************************************* ANNUAL TOTALS FOR YEAR 31 ------------------------------------------------------------------------------- INCHES CU. FEET PERCENT -------- ---------- ------- PRECIPITATION 24.80 90024.008 100.00 RUNOFF 2.803 10174.625 11.30 EVAPOTRANSPIRATION 6.036 21911.082 24.34 DRAINAGE COLLECTED FROM LAYER 2 15.9611 57938.941 64.36 PERC./LEAKAGE THROUGH LAYER 4 0.000002 0.007 0.00 AVG. HEAD ON TOP OF LAYER 3 0.0021 CHANGE IN WATER STORAGE 0.000 -0.661 0.00

SOIL WATER AT START OF YEAR 9.193 33370.520 SOIL WATER AT END OF YEAR 9.193 33369.859 SNOW WATER AT START OF YEAR 0.000 0.000 0.00 SNOW WATER AT END OF YEAR 0.000 0.000 0.00 ANNUAL WATER BUDGET BALANCE 0.0000 0.017 0.00 *******************************************************************************
******************************************************************************* ANNUAL TOTALS FOR YEAR 32 ------------------------------------------------------------------------------- INCHES CU. FEET PERCENT -------- ---------- ------- PRECIPITATION 25.36 92056.812 100.00 RUNOFF 2.723 9883.026 10.74 EVAPOTRANSPIRATION 4.733 17182.592 18.67 DRAINAGE COLLECTED FROM LAYER 2 17.8425 64768.320 70.36 PERC./LEAKAGE THROUGH LAYER 4 0.000002 0.008 0.00 AVG. HEAD ON TOP OF LAYER 3 0.0024 CHANGE IN WATER STORAGE 0.061 222.856 0.24 SOIL WATER AT START OF YEAR 9.193 33369.859 SOIL WATER AT END OF YEAR 9.254 33592.715 SNOW WATER AT START OF YEAR 0.000 0.000 0.00 SNOW WATER AT END OF YEAR 0.000 0.000 0.00 ANNUAL WATER BUDGET BALANCE 0.0000 0.009 0.00 *******************************************************************************

******************************************************************************* ANNUAL TOTALS FOR YEAR 33 ------------------------------------------------------------------------------- INCHES CU. FEET PERCENT -------- ---------- ------- PRECIPITATION 17.27 62690.117 100.00 RUNOFF 0.719 2610.606 4.16 EVAPOTRANSPIRATION 4.696 17044.965 27.19 DRAINAGE COLLECTED FROM LAYER 2 11.8491 43012.168 68.61 PERC./LEAKAGE THROUGH LAYER 4 0.000002 0.007 0.00 AVG. HEAD ON TOP OF LAYER 3 0.0016 CHANGE IN WATER STORAGE 0.006 22.357 0.04 SOIL WATER AT START OF YEAR 9.254 33592.715 SOIL WATER AT END OF YEAR 9.260 33615.070 SNOW WATER AT START OF YEAR 0.000 0.000 0.00 SNOW WATER AT END OF YEAR 0.000 0.000 0.00 ANNUAL WATER BUDGET BALANCE 0.0000 0.015 0.00 *******************************************************************************
******************************************************************************* ANNUAL TOTALS FOR YEAR 34 ------------------------------------------------------------------------------- INCHES CU. FEET PERCENT -------- ---------- ------- PRECIPITATION 27.87 101168.094 100.00 RUNOFF 5.569 20216.410 19.98 EVAPOTRANSPIRATION 4.217 15306.130 15.13 DRAINAGE COLLECTED FROM LAYER 2 18.1517 65890.758 65.13 PERC./LEAKAGE THROUGH LAYER 4 0.000002 0.007 0.00

AVG. HEAD ON TOP OF LAYER 3 0.0024 CHANGE IN WATER STORAGE -0.068 -245.212 -0.24 SOIL WATER AT START OF YEAR 9.260 33615.070 SOIL WATER AT END OF YEAR 9.193 33369.859 SNOW WATER AT START OF YEAR 0.000 0.000 0.00 SNOW WATER AT END OF YEAR 0.000 0.000 0.00 ANNUAL WATER BUDGET BALANCE 0.0000 0.004 0.00 *******************************************************************************
******************************************************************************* ANNUAL TOTALS FOR YEAR 35 ------------------------------------------------------------------------------- INCHES CU. FEET PERCENT -------- ---------- ------- PRECIPITATION 19.38 70349.398 100.00 RUNOFF 0.724 2628.988 3.74 EVAPOTRANSPIRATION 5.414 19653.125 27.94 DRAINAGE COLLECTED FROM LAYER 2 13.2412 48065.699 68.32 PERC./LEAKAGE THROUGH LAYER 4 0.000002 0.007 0.00 AVG. HEAD ON TOP OF LAYER 3 0.0017 CHANGE IN WATER STORAGE 0.000 1.579 0.00 SOIL WATER AT START OF YEAR 9.193 33369.859 SOIL WATER AT END OF YEAR 9.193 33371.437 SNOW WATER AT START OF YEAR 0.000 0.000 0.00 SNOW WATER AT END OF YEAR 0.000 0.000 0.00 ANNUAL WATER BUDGET BALANCE 0.0000 -0.001 0.00

*******************************************************************************
******************************************************************************* ANNUAL TOTALS FOR YEAR 36 ------------------------------------------------------------------------------- INCHES CU. FEET PERCENT -------- ---------- ------- PRECIPITATION 20.52 74487.617 100.00 RUNOFF 3.230 11723.593 15.74 EVAPOTRANSPIRATION 3.273 11880.292 15.95 DRAINAGE COLLECTED FROM LAYER 2 13.9733 50723.223 68.10 PERC./LEAKAGE THROUGH LAYER 4 0.000002 0.006 0.00 AVG. HEAD ON TOP OF LAYER 3 0.0018 CHANGE IN WATER STORAGE 0.044 160.487 0.22 SOIL WATER AT START OF YEAR 9.193 33371.437 SOIL WATER AT END OF YEAR 9.237 33531.926 SNOW WATER AT START OF YEAR 0.000 0.000 0.00 SNOW WATER AT END OF YEAR 0.000 0.000 0.00 ANNUAL WATER BUDGET BALANCE 0.0000 0.018 0.00 *******************************************************************************
******************************************************************************* ANNUAL TOTALS FOR YEAR 37 ------------------------------------------------------------------------------- INCHES CU. FEET PERCENT -------- ---------- ------- PRECIPITATION 18.59 67481.711 100.00 RUNOFF 2.454 8909.412 13.20

EVAPOTRANSPIRATION 3.344 12140.296 17.99 DRAINAGE COLLECTED FROM LAYER 2 12.8358 46594.059 69.05 PERC./LEAKAGE THROUGH LAYER 4 0.000001 0.004 0.00 AVG. HEAD ON TOP OF LAYER 3 0.0017 CHANGE IN WATER STORAGE -0.045 -162.066 -0.24 SOIL WATER AT START OF YEAR 9.237 33531.926 SOIL WATER AT END OF YEAR 9.193 33369.859 SNOW WATER AT START OF YEAR 0.000 0.000 0.00 SNOW WATER AT END OF YEAR 0.000 0.000 0.00 ANNUAL WATER BUDGET BALANCE 0.0000 0.003 0.00 *******************************************************************************
******************************************************************************* ANNUAL TOTALS FOR YEAR 38 ------------------------------------------------------------------------------- INCHES CU. FEET PERCENT -------- ---------- ------- PRECIPITATION 17.07 61964.105 100.00 RUNOFF 0.859 3117.153 5.03 EVAPOTRANSPIRATION 3.736 13562.092 21.89 DRAINAGE COLLECTED FROM LAYER 2 12.4752 45284.824 73.08 PERC./LEAKAGE THROUGH LAYER 4 0.000002 0.006 0.00 AVG. HEAD ON TOP OF LAYER 3 0.0017 CHANGE IN WATER STORAGE 0.000 0.000 0.00 SOIL WATER AT START OF YEAR 9.193 33369.859 SOIL WATER AT END OF YEAR 9.193 33369.859 SNOW WATER AT START OF YEAR 0.000 0.000 0.00

SNOW WATER AT END OF YEAR 0.000 0.000 0.00 ANNUAL WATER BUDGET BALANCE 0.0000 0.033 0.00 *******************************************************************************
******************************************************************************* ANNUAL TOTALS FOR YEAR 39 ------------------------------------------------------------------------------- INCHES CU. FEET PERCENT -------- ---------- ------- PRECIPITATION 24.27 88100.109 100.00 RUNOFF 4.066 14758.231 16.75 EVAPOTRANSPIRATION 4.760 17279.980 19.61 DRAINAGE COLLECTED FROM LAYER 2 15.4440 56061.871 63.63 PERC./LEAKAGE THROUGH LAYER 4 0.000002 0.006 0.00 AVG. HEAD ON TOP OF LAYER 3 0.0020 CHANGE IN WATER STORAGE 0.000 0.000 0.00 SOIL WATER AT START OF YEAR 9.193 33369.859 SOIL WATER AT END OF YEAR 9.193 33369.859 SNOW WATER AT START OF YEAR 0.000 0.000 0.00 SNOW WATER AT END OF YEAR 0.000 0.000 0.00 ANNUAL WATER BUDGET BALANCE 0.0000 0.020 0.00 *******************************************************************************
******************************************************************************* ANNUAL TOTALS FOR YEAR 40 ------------------------------------------------------------------------------- INCHES CU. FEET PERCENT

-------- ---------- ------- PRECIPITATION 24.65 89479.516 100.00 RUNOFF 1.694 6150.279 6.87 EVAPOTRANSPIRATION 5.869 21305.996 23.81 DRAINAGE COLLECTED FROM LAYER 2 17.0762 61986.504 69.27 PERC./LEAKAGE THROUGH LAYER 4 0.000002 0.008 0.00 AVG. HEAD ON TOP OF LAYER 3 0.0023 CHANGE IN WATER STORAGE 0.010 36.727 0.04 SOIL WATER AT START OF YEAR 9.193 33369.859 SOIL WATER AT END OF YEAR 9.203 33406.586 SNOW WATER AT START OF YEAR 0.000 0.000 0.00 SNOW WATER AT END OF YEAR 0.000 0.000 0.00 ANNUAL WATER BUDGET BALANCE 0.0000 -0.001 0.00 *******************************************************************************
******************************************************************************* ANNUAL TOTALS FOR YEAR 41 ------------------------------------------------------------------------------- INCHES CU. FEET PERCENT -------- ---------- ------- PRECIPITATION 19.48 70712.414 100.00 RUNOFF 2.100 7622.201 10.78 EVAPOTRANSPIRATION 4.862 17647.461 24.96 DRAINAGE COLLECTED FROM LAYER 2 12.5288 45479.453 64.32 PERC./LEAKAGE THROUGH LAYER 4 0.000002 0.006 0.00 AVG. HEAD ON TOP OF LAYER 3 0.0016 CHANGE IN WATER STORAGE -0.010 -36.727 -0.05

SOIL WATER AT START OF YEAR 9.203 33406.586 SOIL WATER AT END OF YEAR 9.193 33369.859 SNOW WATER AT START OF YEAR 0.000 0.000 0.00 SNOW WATER AT END OF YEAR 0.000 0.000 0.00 ANNUAL WATER BUDGET BALANCE 0.0000 0.017 0.00 *******************************************************************************
******************************************************************************* ANNUAL TOTALS FOR YEAR 42 ------------------------------------------------------------------------------- INCHES CU. FEET PERCENT -------- ---------- ------- PRECIPITATION 25.16 91330.805 100.00 RUNOFF 2.277 8266.765 9.05 EVAPOTRANSPIRATION 4.680 16987.361 18.60 DRAINAGE COLLECTED FROM LAYER 2 18.2029 66076.672 72.35 PERC./LEAKAGE THROUGH LAYER 4 0.000002 0.008 0.00 AVG. HEAD ON TOP OF LAYER 3 0.0024 CHANGE IN WATER STORAGE 0.000 0.000 0.00 SOIL WATER AT START OF YEAR 9.193 33369.859 SOIL WATER AT END OF YEAR 9.193 33369.859 SNOW WATER AT START OF YEAR 0.000 0.000 0.00 SNOW WATER AT END OF YEAR 0.000 0.000 0.00 ANNUAL WATER BUDGET BALANCE 0.0000 0.001 0.00 *******************************************************************************

******************************************************************************* ANNUAL TOTALS FOR YEAR 43 ------------------------------------------------------------------------------- INCHES CU. FEET PERCENT -------- ---------- ------- PRECIPITATION 27.81 100950.336 100.00 RUNOFF 3.588 13023.431 12.90 EVAPOTRANSPIRATION 5.806 21075.201 20.88 DRAINAGE COLLECTED FROM LAYER 2 18.1671 65946.492 65.33 PERC./LEAKAGE THROUGH LAYER 4 0.000002 0.008 0.00 AVG. HEAD ON TOP OF LAYER 3 0.0024 CHANGE IN WATER STORAGE 0.249 905.135 0.90 SOIL WATER AT START OF YEAR 9.193 33369.859 SOIL WATER AT END OF YEAR 9.232 33512.770 SNOW WATER AT START OF YEAR 0.000 0.000 0.00 SNOW WATER AT END OF YEAR 0.210 762.223 0.76 ANNUAL WATER BUDGET BALANCE 0.0000 0.072 0.00 *******************************************************************************
******************************************************************************* ANNUAL TOTALS FOR YEAR 44 ------------------------------------------------------------------------------- INCHES CU. FEET PERCENT -------- ---------- ------- PRECIPITATION 24.59 89261.711 100.00 RUNOFF 3.716 13489.295 15.11 EVAPOTRANSPIRATION 5.246 19043.187 21.33 DRAINAGE COLLECTED FROM LAYER 2 15.8672 57597.828 64.53 PERC./LEAKAGE THROUGH LAYER 4 0.000002 0.006 0.00

AVG. HEAD ON TOP OF LAYER 3 0.0021 CHANGE IN WATER STORAGE -0.239 -868.613 -0.97 SOIL WATER AT START OF YEAR 9.232 33512.770 SOIL WATER AT END OF YEAR 9.203 33406.383 SNOW WATER AT START OF YEAR 0.210 762.223 0.85 SNOW WATER AT END OF YEAR 0.000 0.000 0.00 ANNUAL WATER BUDGET BALANCE 0.0000 0.010 0.00 *******************************************************************************
******************************************************************************* ANNUAL TOTALS FOR YEAR 45 ------------------------------------------------------------------------------- INCHES CU. FEET PERCENT -------- ---------- ------- PRECIPITATION 21.39 77645.703 100.00 RUNOFF 1.217 4417.427 5.69 EVAPOTRANSPIRATION 4.116 14942.576 19.24 DRAINAGE COLLECTED FROM LAYER 2 16.0597 58296.773 75.08 PERC./LEAKAGE THROUGH LAYER 4 0.000002 0.007 0.00 AVG. HEAD ON TOP OF LAYER 3 0.0021 CHANGE IN WATER STORAGE -0.003 -11.078 -0.01 SOIL WATER AT START OF YEAR 9.203 33406.383 SOIL WATER AT END OF YEAR 9.200 33395.305 SNOW WATER AT START OF YEAR 0.000 0.000 0.00 SNOW WATER AT END OF YEAR 0.000 0.000 0.00 ANNUAL WATER BUDGET BALANCE 0.0000 -0.001 0.00

*******************************************************************************
******************************************************************************* ANNUAL TOTALS FOR YEAR 46 ------------------------------------------------------------------------------- INCHES CU. FEET PERCENT -------- ---------- ------- PRECIPITATION 16.33 59277.906 100.00 RUNOFF 1.891 6863.788 11.58 EVAPOTRANSPIRATION 4.591 16663.893 28.11 DRAINAGE COLLECTED FROM LAYER 2 9.8556 35775.668 60.35 PERC./LEAKAGE THROUGH LAYER 4 0.000002 0.006 0.00 AVG. HEAD ON TOP OF LAYER 3 0.0013 CHANGE IN WATER STORAGE -0.007 -25.445 -0.04 SOIL WATER AT START OF YEAR 9.200 33395.305 SOIL WATER AT END OF YEAR 9.193 33369.859 SNOW WATER AT START OF YEAR 0.000 0.000 0.00 SNOW WATER AT END OF YEAR 0.000 0.000 0.00 ANNUAL WATER BUDGET BALANCE 0.0000 -0.001 0.00 *******************************************************************************
******************************************************************************* ANNUAL TOTALS FOR YEAR 47 ------------------------------------------------------------------------------- INCHES CU. FEET PERCENT -------- ---------- ------- PRECIPITATION 27.05 98191.508 100.00 RUNOFF 3.362 12205.005 12.43

EVAPOTRANSPIRATION 5.940 21563.570 21.96 DRAINAGE COLLECTED FROM LAYER 2 17.7474 64422.926 65.61 PERC./LEAKAGE THROUGH LAYER 4 0.000002 0.008 0.00 AVG. HEAD ON TOP OF LAYER 3 0.0023 CHANGE IN WATER STORAGE 0.000 0.000 0.00 SOIL WATER AT START OF YEAR 9.193 33369.859 SOIL WATER AT END OF YEAR 9.193 33369.859 SNOW WATER AT START OF YEAR 0.000 0.000 0.00 SNOW WATER AT END OF YEAR 0.000 0.000 0.00 ANNUAL WATER BUDGET BALANCE 0.0000 0.003 0.00 *******************************************************************************
******************************************************************************* ANNUAL TOTALS FOR YEAR 48 ------------------------------------------------------------------------------- INCHES CU. FEET PERCENT -------- ---------- ------- PRECIPITATION 21.27 77210.109 100.00 RUNOFF 2.665 9674.837 12.53 EVAPOTRANSPIRATION 4.857 17632.289 22.84 DRAINAGE COLLECTED FROM LAYER 2 13.7474 49902.957 64.63 PERC./LEAKAGE THROUGH LAYER 4 0.000002 0.006 0.00 AVG. HEAD ON TOP OF LAYER 3 0.0018 CHANGE IN WATER STORAGE 0.000 0.000 0.00 SOIL WATER AT START OF YEAR 9.193 33369.859 SOIL WATER AT END OF YEAR 9.193 33369.859 SNOW WATER AT START OF YEAR 0.000 0.000 0.00
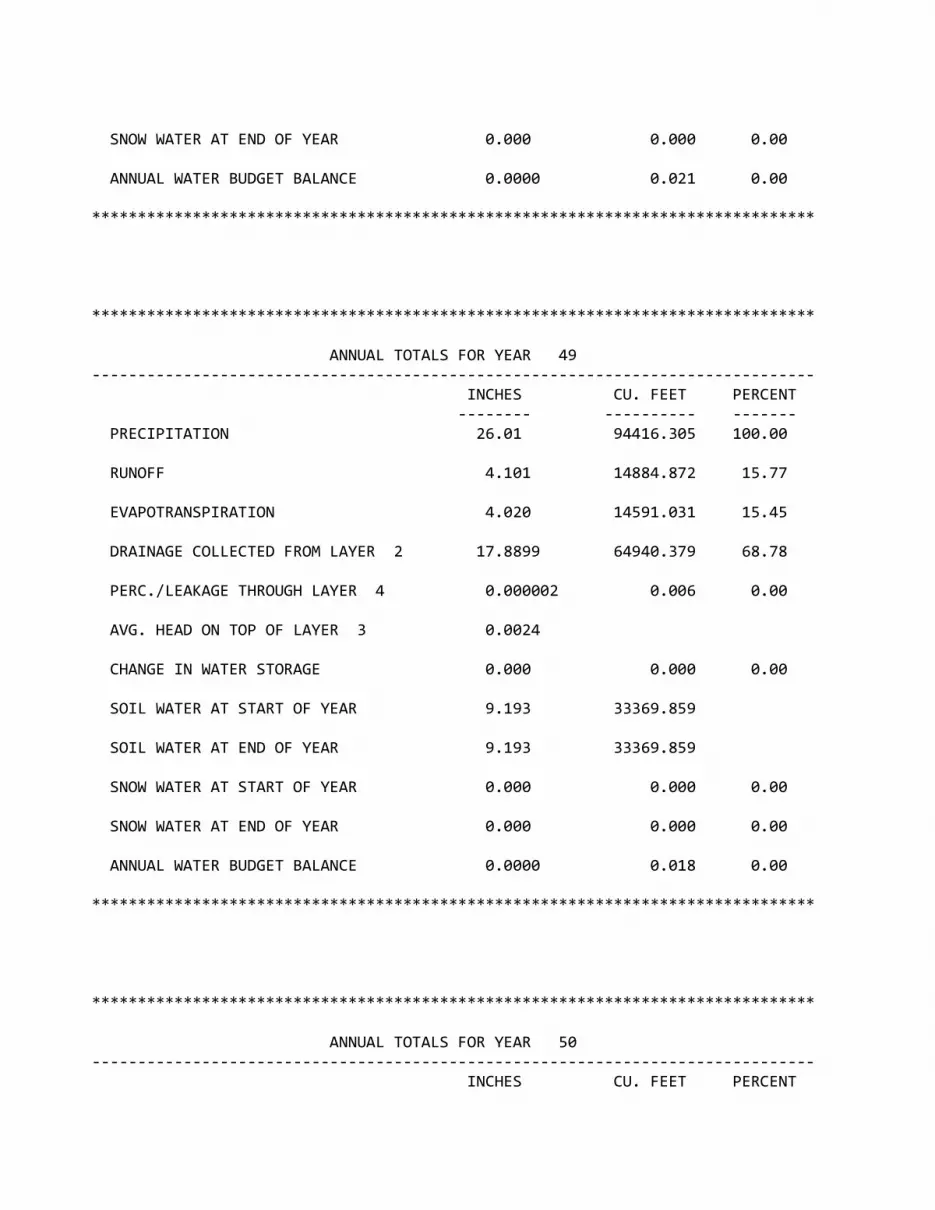
SNOW WATER AT END OF YEAR 0.000 0.000 0.00 ANNUAL WATER BUDGET BALANCE 0.0000 0.021 0.00 *******************************************************************************
******************************************************************************* ANNUAL TOTALS FOR YEAR 49 ------------------------------------------------------------------------------- INCHES CU. FEET PERCENT -------- ---------- ------- PRECIPITATION 26.01 94416.305 100.00 RUNOFF 4.101 14884.872 15.77 EVAPOTRANSPIRATION 4.020 14591.031 15.45 DRAINAGE COLLECTED FROM LAYER 2 17.8899 64940.379 68.78 PERC./LEAKAGE THROUGH LAYER 4 0.000002 0.006 0.00 AVG. HEAD ON TOP OF LAYER 3 0.0024 CHANGE IN WATER STORAGE 0.000 0.000 0.00 SOIL WATER AT START OF YEAR 9.193 33369.859 SOIL WATER AT END OF YEAR 9.193 33369.859 SNOW WATER AT START OF YEAR 0.000 0.000 0.00 SNOW WATER AT END OF YEAR 0.000 0.000 0.00 ANNUAL WATER BUDGET BALANCE 0.0000 0.018 0.00 *******************************************************************************
******************************************************************************* ANNUAL TOTALS FOR YEAR 50 ------------------------------------------------------------------------------- INCHES CU. FEET PERCENT
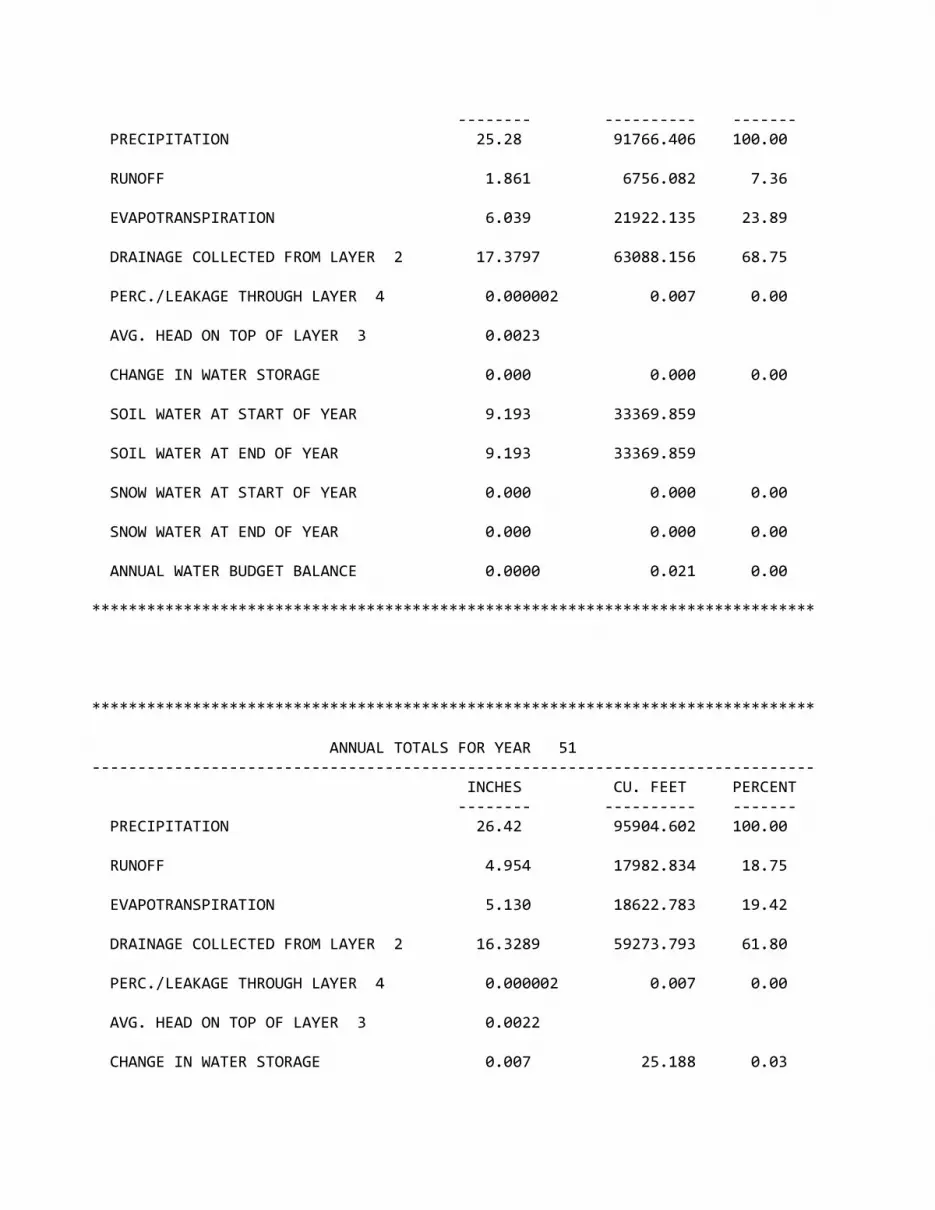
-------- ---------- ------- PRECIPITATION 25.28 91766.406 100.00 RUNOFF 1.861 6756.082 7.36 EVAPOTRANSPIRATION 6.039 21922.135 23.89 DRAINAGE COLLECTED FROM LAYER 2 17.3797 63088.156 68.75 PERC./LEAKAGE THROUGH LAYER 4 0.000002 0.007 0.00 AVG. HEAD ON TOP OF LAYER 3 0.0023 CHANGE IN WATER STORAGE 0.000 0.000 0.00 SOIL WATER AT START OF YEAR 9.193 33369.859 SOIL WATER AT END OF YEAR 9.193 33369.859 SNOW WATER AT START OF YEAR 0.000 0.000 0.00 SNOW WATER AT END OF YEAR 0.000 0.000 0.00 ANNUAL WATER BUDGET BALANCE 0.0000 0.021 0.00 *******************************************************************************
******************************************************************************* ANNUAL TOTALS FOR YEAR 51 ------------------------------------------------------------------------------- INCHES CU. FEET PERCENT -------- ---------- ------- PRECIPITATION 26.42 95904.602 100.00 RUNOFF 4.954 17982.834 18.75 EVAPOTRANSPIRATION 5.130 18622.783 19.42 DRAINAGE COLLECTED FROM LAYER 2 16.3289 59273.793 61.80 PERC./LEAKAGE THROUGH LAYER 4 0.000002 0.007 0.00 AVG. HEAD ON TOP OF LAYER 3 0.0022 CHANGE IN WATER STORAGE 0.007 25.188 0.03

SOIL WATER AT START OF YEAR 9.193 33369.859 SOIL WATER AT END OF YEAR 9.200 33395.047 SNOW WATER AT START OF YEAR 0.000 0.000 0.00 SNOW WATER AT END OF YEAR 0.000 0.000 0.00 ANNUAL WATER BUDGET BALANCE 0.0000 -0.007 0.00 *******************************************************************************
******************************************************************************* ANNUAL TOTALS FOR YEAR 52 ------------------------------------------------------------------------------- INCHES CU. FEET PERCENT -------- ---------- ------- PRECIPITATION 16.56 60112.805 100.00 RUNOFF 1.293 4694.248 7.81 EVAPOTRANSPIRATION 3.010 10927.794 18.18 DRAINAGE COLLECTED FROM LAYER 2 12.2633 44515.941 74.05 PERC./LEAKAGE THROUGH LAYER 4 0.000001 0.005 0.00 AVG. HEAD ON TOP OF LAYER 3 0.0016 CHANGE IN WATER STORAGE -0.007 -25.188 -0.04 SOIL WATER AT START OF YEAR 9.200 33395.047 SOIL WATER AT END OF YEAR 9.193 33369.859 SNOW WATER AT START OF YEAR 0.000 0.000 0.00 SNOW WATER AT END OF YEAR 0.000 0.000 0.00 ANNUAL WATER BUDGET BALANCE 0.0000 0.005 0.00 *******************************************************************************

******************************************************************************* ANNUAL TOTALS FOR YEAR 53 ------------------------------------------------------------------------------- INCHES CU. FEET PERCENT -------- ---------- ------- PRECIPITATION 23.78 86321.414 100.00 RUNOFF 3.760 13650.543 15.81 EVAPOTRANSPIRATION 4.256 15448.106 17.90 DRAINAGE COLLECTED FROM LAYER 2 14.9290 54192.090 62.78 PERC./LEAKAGE THROUGH LAYER 4 0.000002 0.006 0.00 AVG. HEAD ON TOP OF LAYER 3 0.0020 CHANGE IN WATER STORAGE 0.835 3030.652 3.51 SOIL WATER AT START OF YEAR 9.193 33369.859 SOIL WATER AT END OF YEAR 9.248 33571.020 SNOW WATER AT START OF YEAR 0.000 0.000 0.00 SNOW WATER AT END OF YEAR 0.779 2829.491 3.28 ANNUAL WATER BUDGET BALANCE 0.0000 0.019 0.00 *******************************************************************************
******************************************************************************* ANNUAL TOTALS FOR YEAR 54 ------------------------------------------------------------------------------- INCHES CU. FEET PERCENT -------- ---------- ------- PRECIPITATION 29.58 107375.430 100.00 RUNOFF 3.767 13675.795 12.74 EVAPOTRANSPIRATION 6.154 22340.418 20.81 DRAINAGE COLLECTED FROM LAYER 2 20.3529 73881.117 68.81 PERC./LEAKAGE THROUGH LAYER 4 0.000002 0.007 0.00

AVG. HEAD ON TOP OF LAYER 3 0.0027 CHANGE IN WATER STORAGE -0.695 -2521.941 -2.35 SOIL WATER AT START OF YEAR 9.248 33571.020 SOIL WATER AT END OF YEAR 9.232 33512.770 SNOW WATER AT START OF YEAR 0.779 2829.491 2.64 SNOW WATER AT END OF YEAR 0.101 365.800 0.34 ANNUAL WATER BUDGET BALANCE 0.0000 0.032 0.00 *******************************************************************************
******************************************************************************* ANNUAL TOTALS FOR YEAR 55 ------------------------------------------------------------------------------- INCHES CU. FEET PERCENT -------- ---------- ------- PRECIPITATION 18.93 68715.930 100.00 RUNOFF 2.804 10177.842 14.81 EVAPOTRANSPIRATION 3.796 13780.195 20.05 DRAINAGE COLLECTED FROM LAYER 2 12.4516 45199.152 65.78 PERC./LEAKAGE THROUGH LAYER 4 0.000002 0.006 0.00 AVG. HEAD ON TOP OF LAYER 3 0.0016 CHANGE IN WATER STORAGE -0.122 -441.295 -0.64 SOIL WATER AT START OF YEAR 9.232 33512.770 SOIL WATER AT END OF YEAR 9.211 33437.273 SNOW WATER AT START OF YEAR 0.101 365.800 0.53 SNOW WATER AT END OF YEAR 0.000 0.000 0.00 ANNUAL WATER BUDGET BALANCE 0.0000 0.028 0.00
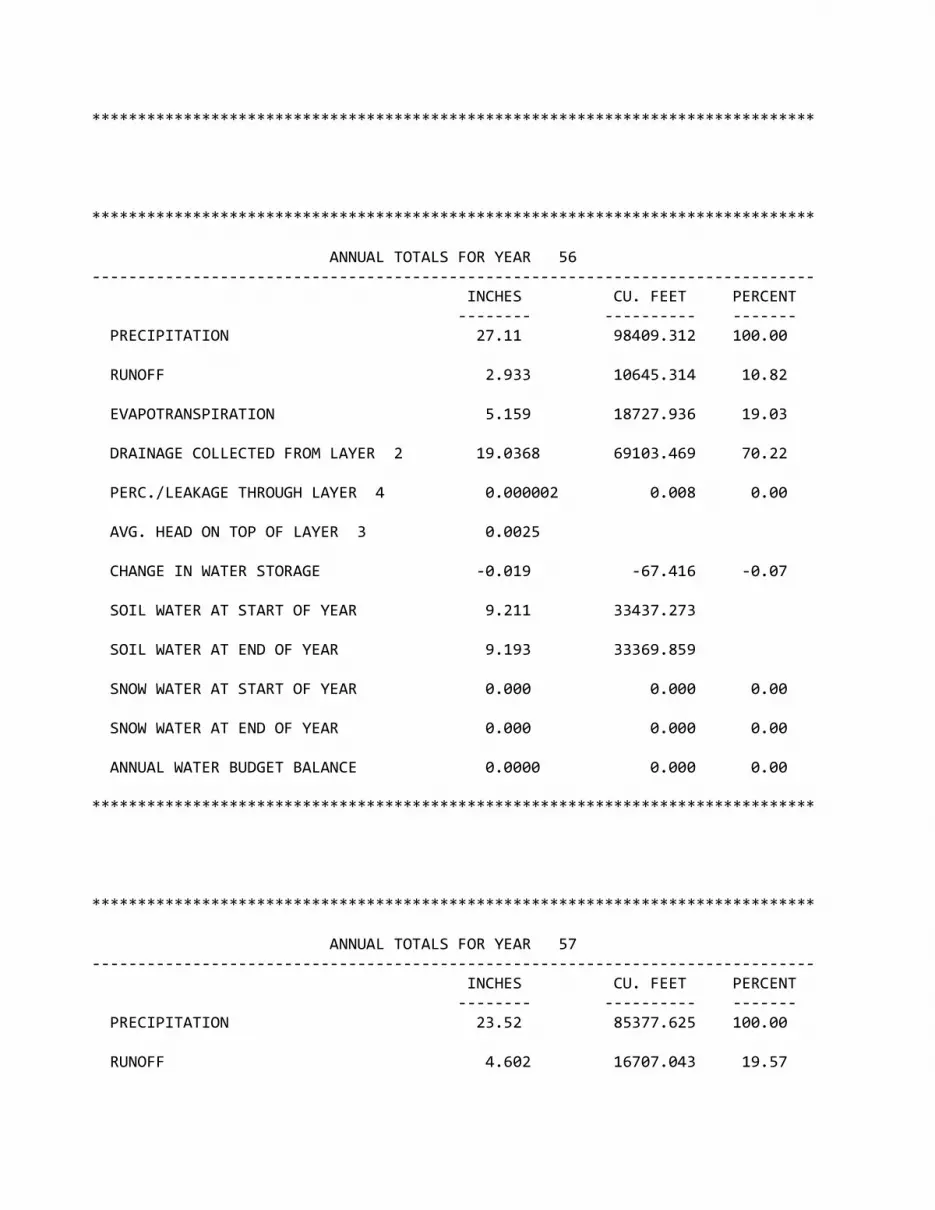
*******************************************************************************
******************************************************************************* ANNUAL TOTALS FOR YEAR 56 ------------------------------------------------------------------------------- INCHES CU. FEET PERCENT -------- ---------- ------- PRECIPITATION 27.11 98409.312 100.00 RUNOFF 2.933 10645.314 10.82 EVAPOTRANSPIRATION 5.159 18727.936 19.03 DRAINAGE COLLECTED FROM LAYER 2 19.0368 69103.469 70.22 PERC./LEAKAGE THROUGH LAYER 4 0.000002 0.008 0.00 AVG. HEAD ON TOP OF LAYER 3 0.0025 CHANGE IN WATER STORAGE -0.019 -67.416 -0.07 SOIL WATER AT START OF YEAR 9.211 33437.273 SOIL WATER AT END OF YEAR 9.193 33369.859 SNOW WATER AT START OF YEAR 0.000 0.000 0.00 SNOW WATER AT END OF YEAR 0.000 0.000 0.00 ANNUAL WATER BUDGET BALANCE 0.0000 0.000 0.00 *******************************************************************************
******************************************************************************* ANNUAL TOTALS FOR YEAR 57 ------------------------------------------------------------------------------- INCHES CU. FEET PERCENT -------- ---------- ------- PRECIPITATION 23.52 85377.625 100.00 RUNOFF 4.602 16707.043 19.57
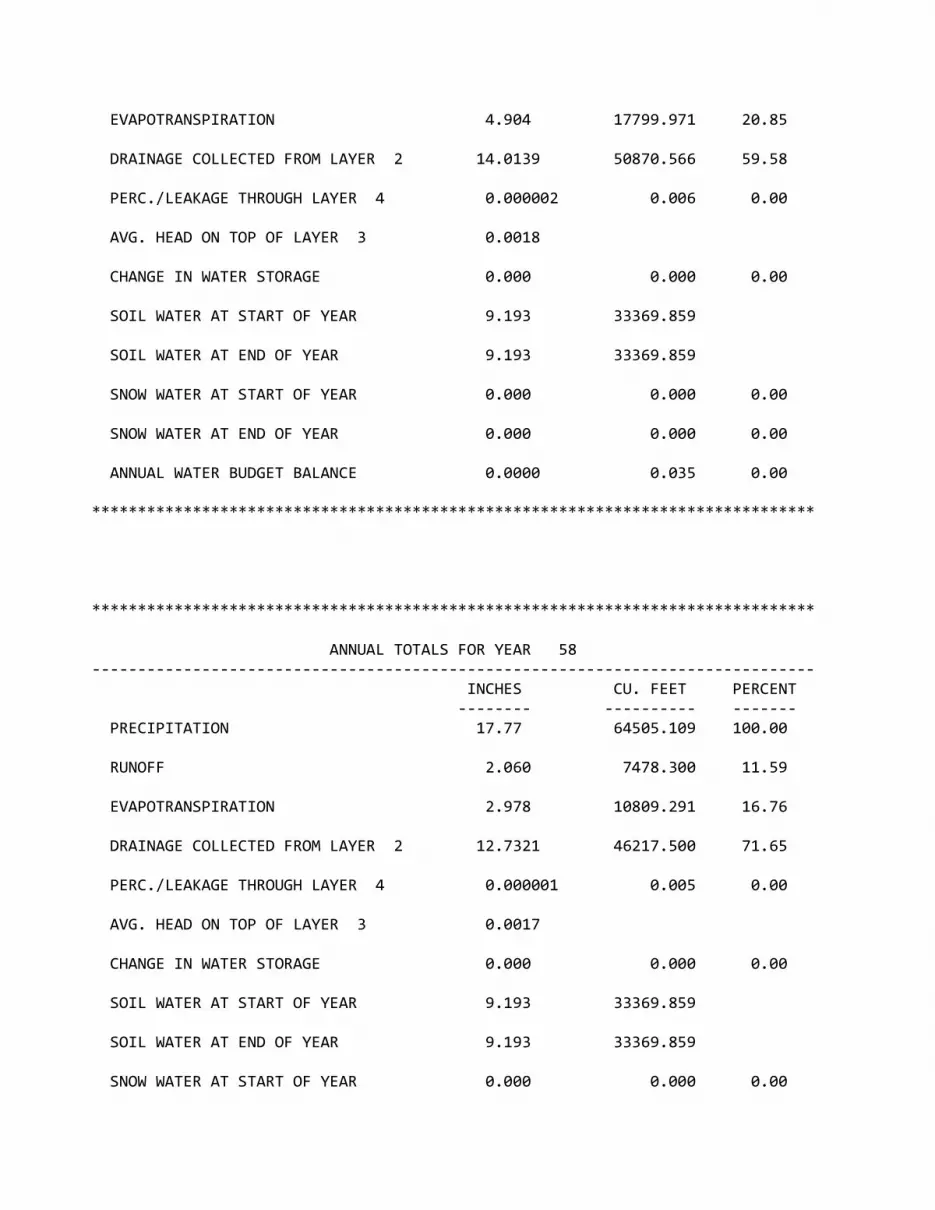
EVAPOTRANSPIRATION 4.904 17799.971 20.85 DRAINAGE COLLECTED FROM LAYER 2 14.0139 50870.566 59.58 PERC./LEAKAGE THROUGH LAYER 4 0.000002 0.006 0.00 AVG. HEAD ON TOP OF LAYER 3 0.0018 CHANGE IN WATER STORAGE 0.000 0.000 0.00 SOIL WATER AT START OF YEAR 9.193 33369.859 SOIL WATER AT END OF YEAR 9.193 33369.859 SNOW WATER AT START OF YEAR 0.000 0.000 0.00 SNOW WATER AT END OF YEAR 0.000 0.000 0.00 ANNUAL WATER BUDGET BALANCE 0.0000 0.035 0.00 *******************************************************************************
******************************************************************************* ANNUAL TOTALS FOR YEAR 58 ------------------------------------------------------------------------------- INCHES CU. FEET PERCENT -------- ---------- ------- PRECIPITATION 17.77 64505.109 100.00 RUNOFF 2.060 7478.300 11.59 EVAPOTRANSPIRATION 2.978 10809.291 16.76 DRAINAGE COLLECTED FROM LAYER 2 12.7321 46217.500 71.65 PERC./LEAKAGE THROUGH LAYER 4 0.000001 0.005 0.00 AVG. HEAD ON TOP OF LAYER 3 0.0017 CHANGE IN WATER STORAGE 0.000 0.000 0.00 SOIL WATER AT START OF YEAR 9.193 33369.859 SOIL WATER AT END OF YEAR 9.193 33369.859 SNOW WATER AT START OF YEAR 0.000 0.000 0.00

SNOW WATER AT END OF YEAR 0.000 0.000 0.00 ANNUAL WATER BUDGET BALANCE 0.0000 0.012 0.00 *******************************************************************************
******************************************************************************* ANNUAL TOTALS FOR YEAR 59 ------------------------------------------------------------------------------- INCHES CU. FEET PERCENT -------- ---------- ------- PRECIPITATION 17.77 64505.102 100.00 RUNOFF 2.524 9163.584 14.21 EVAPOTRANSPIRATION 3.610 13103.770 20.31 DRAINAGE COLLECTED FROM LAYER 2 11.4187 41449.902 64.26 PERC./LEAKAGE THROUGH LAYER 4 0.000002 0.006 0.00 AVG. HEAD ON TOP OF LAYER 3 0.0015 CHANGE IN WATER STORAGE 0.217 787.823 1.22 SOIL WATER AT START OF YEAR 9.193 33369.859 SOIL WATER AT END OF YEAR 9.248 33571.074 SNOW WATER AT START OF YEAR 0.000 0.000 0.00 SNOW WATER AT END OF YEAR 0.162 586.607 0.91 ANNUAL WATER BUDGET BALANCE 0.0000 0.016 0.00 *******************************************************************************
******************************************************************************* ANNUAL TOTALS FOR YEAR 60 ------------------------------------------------------------------------------- INCHES CU. FEET PERCENT

-------- ---------- ------- PRECIPITATION 30.41 110388.305 100.00 RUNOFF 4.356 15810.556 14.32 EVAPOTRANSPIRATION 5.182 18812.145 17.04 DRAINAGE COLLECTED FROM LAYER 2 20.4366 74185.016 67.20 PERC./LEAKAGE THROUGH LAYER 4 0.000002 0.008 0.00 AVG. HEAD ON TOP OF LAYER 3 0.0027 CHANGE IN WATER STORAGE 0.435 1580.564 1.43 SOIL WATER AT START OF YEAR 9.248 33571.074 SOIL WATER AT END OF YEAR 9.232 33512.770 SNOW WATER AT START OF YEAR 0.162 586.607 0.53 SNOW WATER AT END OF YEAR 0.613 2225.476 2.02 ANNUAL WATER BUDGET BALANCE 0.0000 0.018 0.00 *******************************************************************************
******************************************************************************* ANNUAL TOTALS FOR YEAR 61 ------------------------------------------------------------------------------- INCHES CU. FEET PERCENT -------- ---------- ------- PRECIPITATION 29.01 105306.320 100.00 RUNOFF 5.882 21351.617 20.28 EVAPOTRANSPIRATION 6.375 23140.701 21.97 DRAINAGE COLLECTED FROM LAYER 2 17.4056 63182.348 60.00 PERC./LEAKAGE THROUGH LAYER 4 0.000002 0.008 0.00 AVG. HEAD ON TOP OF LAYER 3 0.0023 CHANGE IN WATER STORAGE -0.652 -2368.387 -2.25

SOIL WATER AT START OF YEAR 9.232 33512.770 SOIL WATER AT END OF YEAR 9.193 33369.859 SNOW WATER AT START OF YEAR 0.613 2225.476 2.11 SNOW WATER AT END OF YEAR 0.000 0.000 0.00 ANNUAL WATER BUDGET BALANCE 0.0000 0.036 0.00 *******************************************************************************
******************************************************************************* ANNUAL TOTALS FOR YEAR 62 ------------------------------------------------------------------------------- INCHES CU. FEET PERCENT -------- ---------- ------- PRECIPITATION 18.48 67082.406 100.00 RUNOFF 1.504 5459.158 8.14 EVAPOTRANSPIRATION 3.119 11322.083 16.88 DRAINAGE COLLECTED FROM LAYER 2 13.8571 50301.148 74.98 PERC./LEAKAGE THROUGH LAYER 4 0.000002 0.006 0.00 AVG. HEAD ON TOP OF LAYER 3 0.0018 CHANGE IN WATER STORAGE 0.000 0.000 0.00 SOIL WATER AT START OF YEAR 9.193 33369.859 SOIL WATER AT END OF YEAR 9.193 33369.859 SNOW WATER AT START OF YEAR 0.000 0.000 0.00 SNOW WATER AT END OF YEAR 0.000 0.000 0.00 ANNUAL WATER BUDGET BALANCE 0.0000 0.011 0.00 *******************************************************************************

******************************************************************************* ANNUAL TOTALS FOR YEAR 63 ------------------------------------------------------------------------------- INCHES CU. FEET PERCENT -------- ---------- ------- PRECIPITATION 27.00 98010.008 100.00 RUNOFF 3.233 11734.974 11.97 EVAPOTRANSPIRATION 5.856 21256.482 21.69 DRAINAGE COLLECTED FROM LAYER 2 17.9055 64997.062 66.32 PERC./LEAKAGE THROUGH LAYER 4 0.000002 0.007 0.00 AVG. HEAD ON TOP OF LAYER 3 0.0024 CHANGE IN WATER STORAGE 0.006 21.477 0.02 SOIL WATER AT START OF YEAR 9.193 33369.859 SOIL WATER AT END OF YEAR 9.199 33391.336 SNOW WATER AT START OF YEAR 0.000 0.000 0.00 SNOW WATER AT END OF YEAR 0.000 0.000 0.00 ANNUAL WATER BUDGET BALANCE 0.0000 0.003 0.00 *******************************************************************************
******************************************************************************* ANNUAL TOTALS FOR YEAR 64 ------------------------------------------------------------------------------- INCHES CU. FEET PERCENT -------- ---------- ------- PRECIPITATION 23.90 86756.992 100.00 RUNOFF 3.462 12566.325 14.48 EVAPOTRANSPIRATION 4.524 16422.404 18.93 DRAINAGE COLLECTED FROM LAYER 2 15.8446 57516.023 66.30 PERC./LEAKAGE THROUGH LAYER 4 0.000002 0.006 0.00

AVG. HEAD ON TOP OF LAYER 3 0.0021 CHANGE IN WATER STORAGE 0.069 252.243 0.29 SOIL WATER AT START OF YEAR 9.199 33391.336 SOIL WATER AT END OF YEAR 9.268 33643.578 SNOW WATER AT START OF YEAR 0.000 0.000 0.00 SNOW WATER AT END OF YEAR 0.000 0.000 0.00 ANNUAL WATER BUDGET BALANCE 0.0000 -0.008 0.00 *******************************************************************************
******************************************************************************* ANNUAL TOTALS FOR YEAR 65 ------------------------------------------------------------------------------- INCHES CU. FEET PERCENT -------- ---------- ------- PRECIPITATION 22.89 83090.687 100.00 RUNOFF 3.755 13630.556 16.40 EVAPOTRANSPIRATION 4.219 15313.666 18.43 DRAINAGE COLLECTED FROM LAYER 2 14.9802 54378.168 65.44 PERC./LEAKAGE THROUGH LAYER 4 0.000002 0.007 0.00 AVG. HEAD ON TOP OF LAYER 3 0.0020 CHANGE IN WATER STORAGE -0.064 -231.697 -0.28 SOIL WATER AT START OF YEAR 9.268 33643.578 SOIL WATER AT END OF YEAR 9.204 33411.883 SNOW WATER AT START OF YEAR 0.000 0.000 0.00 SNOW WATER AT END OF YEAR 0.000 0.000 0.00 ANNUAL WATER BUDGET BALANCE 0.0000 -0.007 0.00
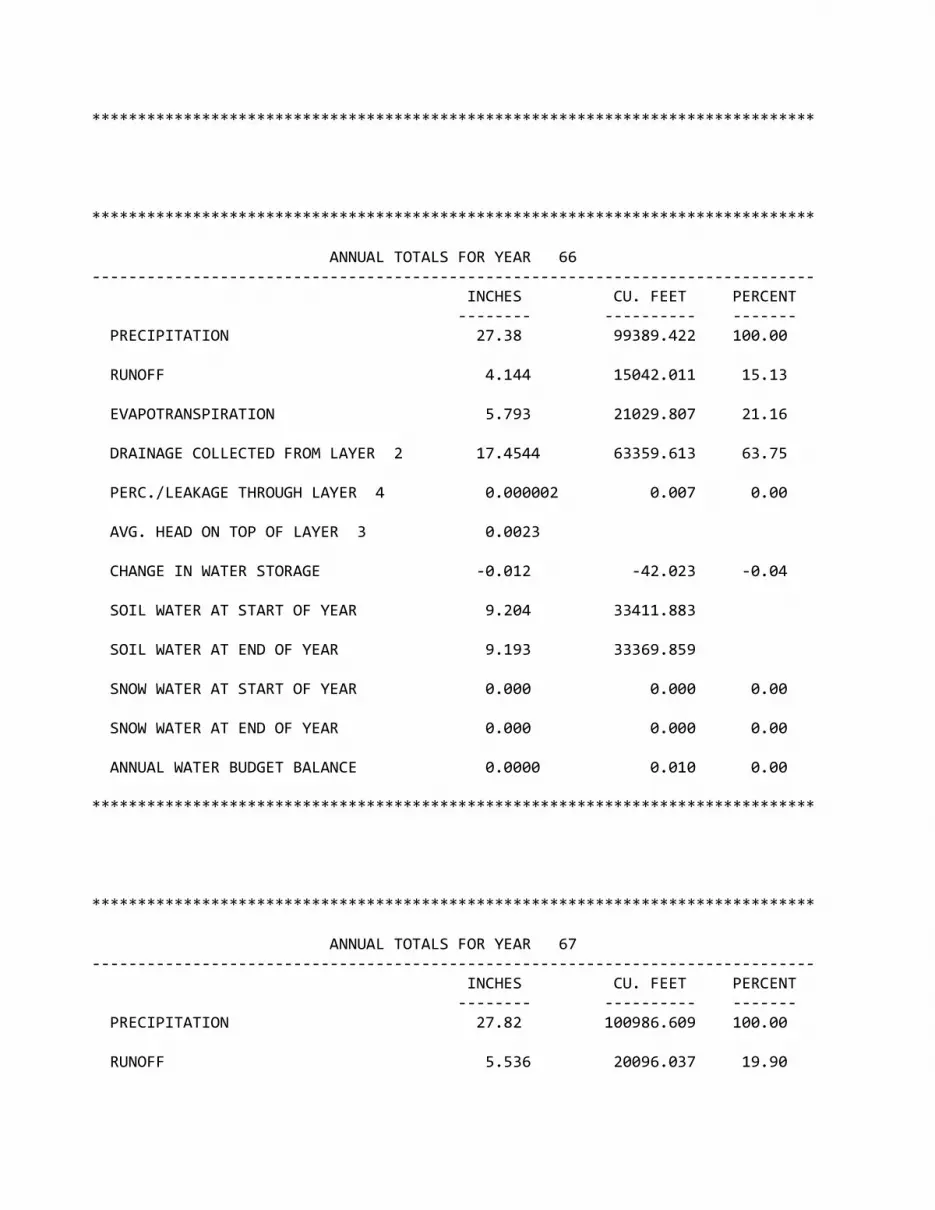
*******************************************************************************
******************************************************************************* ANNUAL TOTALS FOR YEAR 66 ------------------------------------------------------------------------------- INCHES CU. FEET PERCENT -------- ---------- ------- PRECIPITATION 27.38 99389.422 100.00 RUNOFF 4.144 15042.011 15.13 EVAPOTRANSPIRATION 5.793 21029.807 21.16 DRAINAGE COLLECTED FROM LAYER 2 17.4544 63359.613 63.75 PERC./LEAKAGE THROUGH LAYER 4 0.000002 0.007 0.00 AVG. HEAD ON TOP OF LAYER 3 0.0023 CHANGE IN WATER STORAGE -0.012 -42.023 -0.04 SOIL WATER AT START OF YEAR 9.204 33411.883 SOIL WATER AT END OF YEAR 9.193 33369.859 SNOW WATER AT START OF YEAR 0.000 0.000 0.00 SNOW WATER AT END OF YEAR 0.000 0.000 0.00 ANNUAL WATER BUDGET BALANCE 0.0000 0.010 0.00 *******************************************************************************
******************************************************************************* ANNUAL TOTALS FOR YEAR 67 ------------------------------------------------------------------------------- INCHES CU. FEET PERCENT -------- ---------- ------- PRECIPITATION 27.82 100986.609 100.00 RUNOFF 5.536 20096.037 19.90

EVAPOTRANSPIRATION 5.476 19876.941 19.68 DRAINAGE COLLECTED FROM LAYER 2 16.8082 61013.609 60.42 PERC./LEAKAGE THROUGH LAYER 4 0.000002 0.007 0.00 AVG. HEAD ON TOP OF LAYER 3 0.0022 CHANGE IN WATER STORAGE 0.000 0.000 0.00 SOIL WATER AT START OF YEAR 9.193 33369.859 SOIL WATER AT END OF YEAR 9.193 33369.859 SNOW WATER AT START OF YEAR 0.000 0.000 0.00 SNOW WATER AT END OF YEAR 0.000 0.000 0.00 ANNUAL WATER BUDGET BALANCE 0.0000 0.017 0.00 *******************************************************************************
******************************************************************************* ANNUAL TOTALS FOR YEAR 68 ------------------------------------------------------------------------------- INCHES CU. FEET PERCENT -------- ---------- ------- PRECIPITATION 32.45 117793.500 100.00 RUNOFF 6.685 24266.686 20.60 EVAPOTRANSPIRATION 6.785 24631.121 20.91 DRAINAGE COLLECTED FROM LAYER 2 18.8847 68551.500 58.20 PERC./LEAKAGE THROUGH LAYER 4 0.000002 0.007 0.00 AVG. HEAD ON TOP OF LAYER 3 0.0025 CHANGE IN WATER STORAGE 0.095 344.187 0.29 SOIL WATER AT START OF YEAR 9.193 33369.859 SOIL WATER AT END OF YEAR 9.248 33571.031 SNOW WATER AT START OF YEAR 0.000 0.000 0.00

SNOW WATER AT END OF YEAR 0.039 143.016 0.12 ANNUAL WATER BUDGET BALANCE 0.0000 0.005 0.00 *******************************************************************************
******************************************************************************* ANNUAL TOTALS FOR YEAR 69 ------------------------------------------------------------------------------- INCHES CU. FEET PERCENT -------- ---------- ------- PRECIPITATION 23.24 84361.203 100.00 RUNOFF 3.148 11428.249 13.55 EVAPOTRANSPIRATION 4.351 15793.733 18.72 DRAINAGE COLLECTED FROM LAYER 2 15.8356 57483.402 68.14 PERC./LEAKAGE THROUGH LAYER 4 0.000002 0.006 0.00 AVG. HEAD ON TOP OF LAYER 3 0.0021 CHANGE IN WATER STORAGE -0.095 -344.187 -0.41 SOIL WATER AT START OF YEAR 9.248 33571.031 SOIL WATER AT END OF YEAR 9.193 33369.859 SNOW WATER AT START OF YEAR 0.039 143.016 0.17 SNOW WATER AT END OF YEAR 0.000 0.000 0.00 ANNUAL WATER BUDGET BALANCE 0.0000 0.004 0.00 *******************************************************************************
******************************************************************************* ANNUAL TOTALS FOR YEAR 70 ------------------------------------------------------------------------------- INCHES CU. FEET PERCENT

-------- ---------- ------- PRECIPITATION 21.52 78117.602 100.00 RUNOFF 4.217 15309.391 19.60 EVAPOTRANSPIRATION 4.173 15149.753 19.39 DRAINAGE COLLECTED FROM LAYER 2 13.1291 47658.461 61.01 PERC./LEAKAGE THROUGH LAYER 4 0.000001 0.005 0.00 AVG. HEAD ON TOP OF LAYER 3 0.0017 CHANGE IN WATER STORAGE 0.000 0.000 0.00 SOIL WATER AT START OF YEAR 9.193 33369.859 SOIL WATER AT END OF YEAR 9.193 33369.859 SNOW WATER AT START OF YEAR 0.000 0.000 0.00 SNOW WATER AT END OF YEAR 0.000 0.000 0.00 ANNUAL WATER BUDGET BALANCE 0.0000 -0.010 0.00 *******************************************************************************
******************************************************************************* ANNUAL TOTALS FOR YEAR 71 ------------------------------------------------------------------------------- INCHES CU. FEET PERCENT -------- ---------- ------- PRECIPITATION 23.47 85196.102 100.00 RUNOFF 2.345 8514.038 9.99 EVAPOTRANSPIRATION 5.181 18807.637 22.08 DRAINAGE COLLECTED FROM LAYER 2 15.7159 57048.621 66.96 PERC./LEAKAGE THROUGH LAYER 4 0.000002 0.007 0.00 AVG. HEAD ON TOP OF LAYER 3 0.0021 CHANGE IN WATER STORAGE 0.227 825.795 0.97

SOIL WATER AT START OF YEAR 9.193 33369.859 SOIL WATER AT END OF YEAR 9.212 33441.316 SNOW WATER AT START OF YEAR 0.000 0.000 0.00 SNOW WATER AT END OF YEAR 0.208 754.339 0.89 ANNUAL WATER BUDGET BALANCE 0.0000 0.006 0.00 *******************************************************************************
******************************************************************************* ANNUAL TOTALS FOR YEAR 72 ------------------------------------------------------------------------------- INCHES CU. FEET PERCENT -------- ---------- ------- PRECIPITATION 20.65 74959.516 100.00 RUNOFF 1.576 5719.453 7.63 EVAPOTRANSPIRATION 4.017 14580.358 19.45 DRAINAGE COLLECTED FROM LAYER 2 15.2853 55485.465 74.02 PERC./LEAKAGE THROUGH LAYER 4 0.000002 0.007 0.00 AVG. HEAD ON TOP OF LAYER 3 0.0020 CHANGE IN WATER STORAGE -0.227 -825.795 -1.10 SOIL WATER AT START OF YEAR 9.212 33441.316 SOIL WATER AT END OF YEAR 9.193 33369.859 SNOW WATER AT START OF YEAR 0.208 754.339 1.01 SNOW WATER AT END OF YEAR 0.000 0.000 0.00 ANNUAL WATER BUDGET BALANCE 0.0000 0.025 0.00 *******************************************************************************

******************************************************************************* ANNUAL TOTALS FOR YEAR 73 ------------------------------------------------------------------------------- INCHES CU. FEET PERCENT -------- ---------- ------- PRECIPITATION 27.09 98336.711 100.00 RUNOFF 4.593 16673.887 16.96 EVAPOTRANSPIRATION 5.217 18937.145 19.26 DRAINAGE COLLECTED FROM LAYER 2 17.2798 62725.656 63.79 PERC./LEAKAGE THROUGH LAYER 4 0.000002 0.007 0.00 AVG. HEAD ON TOP OF LAYER 3 0.0023 CHANGE IN WATER STORAGE 0.000 0.000 0.00 SOIL WATER AT START OF YEAR 9.193 33369.859 SOIL WATER AT END OF YEAR 9.193 33369.859 SNOW WATER AT START OF YEAR 0.000 0.000 0.00 SNOW WATER AT END OF YEAR 0.000 0.000 0.00 ANNUAL WATER BUDGET BALANCE 0.0000 0.015 0.00 *******************************************************************************
******************************************************************************* ANNUAL TOTALS FOR YEAR 74 ------------------------------------------------------------------------------- INCHES CU. FEET PERCENT -------- ---------- ------- PRECIPITATION 29.84 108319.211 100.00 RUNOFF 3.470 12594.602 11.63 EVAPOTRANSPIRATION 6.420 23305.164 21.52 DRAINAGE COLLECTED FROM LAYER 2 19.9503 72419.422 66.86 PERC./LEAKAGE THROUGH LAYER 4 0.000002 0.008 0.00

AVG. HEAD ON TOP OF LAYER 3 0.0027 CHANGE IN WATER STORAGE 0.000 0.000 0.00 SOIL WATER AT START OF YEAR 9.193 33369.859 SOIL WATER AT END OF YEAR 9.193 33369.859 SNOW WATER AT START OF YEAR 0.000 0.000 0.00 SNOW WATER AT END OF YEAR 0.000 0.000 0.00 ANNUAL WATER BUDGET BALANCE 0.0000 0.017 0.00 *******************************************************************************
******************************************************************************* ANNUAL TOTALS FOR YEAR 75 ------------------------------------------------------------------------------- INCHES CU. FEET PERCENT -------- ---------- ------- PRECIPITATION 32.99 119753.703 100.00 RUNOFF 8.015 29095.840 24.30 EVAPOTRANSPIRATION 5.358 19447.785 16.24 DRAINAGE COLLECTED FROM LAYER 2 19.6171 71210.047 59.46 PERC./LEAKAGE THROUGH LAYER 4 0.000002 0.007 0.00 AVG. HEAD ON TOP OF LAYER 3 0.0026 CHANGE IN WATER STORAGE 0.000 0.000 0.00 SOIL WATER AT START OF YEAR 9.193 33369.859 SOIL WATER AT END OF YEAR 9.193 33369.859 SNOW WATER AT START OF YEAR 0.000 0.000 0.00 SNOW WATER AT END OF YEAR 0.000 0.000 0.00 ANNUAL WATER BUDGET BALANCE 0.0000 0.029 0.00

*******************************************************************************
******************************************************************************* ANNUAL TOTALS FOR YEAR 76 ------------------------------------------------------------------------------- INCHES CU. FEET PERCENT -------- ---------- ------- PRECIPITATION 29.32 106431.609 100.00 RUNOFF 5.712 20734.414 19.48 EVAPOTRANSPIRATION 4.524 16420.311 15.43 DRAINAGE COLLECTED FROM LAYER 2 18.9347 68733.078 64.58 PERC./LEAKAGE THROUGH LAYER 4 0.000002 0.008 0.00 AVG. HEAD ON TOP OF LAYER 3 0.0025 CHANGE IN WATER STORAGE 0.150 543.779 0.51 SOIL WATER AT START OF YEAR 9.193 33369.859 SOIL WATER AT END OF YEAR 9.343 33913.637 SNOW WATER AT START OF YEAR 0.000 0.000 0.00 SNOW WATER AT END OF YEAR 0.000 0.000 0.00 ANNUAL WATER BUDGET BALANCE 0.0000 0.024 0.00 *******************************************************************************
******************************************************************************* ANNUAL TOTALS FOR YEAR 77 ------------------------------------------------------------------------------- INCHES CU. FEET PERCENT -------- ---------- ------- PRECIPITATION 18.50 67155.008 100.00 RUNOFF 2.434 8834.682 13.16

EVAPOTRANSPIRATION 2.948 10700.844 15.93 DRAINAGE COLLECTED FROM LAYER 2 13.2681 48163.238 71.72 PERC./LEAKAGE THROUGH LAYER 4 0.000002 0.006 0.00 AVG. HEAD ON TOP OF LAYER 3 0.0018 CHANGE IN WATER STORAGE -0.150 -543.779 -0.81 SOIL WATER AT START OF YEAR 9.343 33913.637 SOIL WATER AT END OF YEAR 9.193 33369.859 SNOW WATER AT START OF YEAR 0.000 0.000 0.00 SNOW WATER AT END OF YEAR 0.000 0.000 0.00 ANNUAL WATER BUDGET BALANCE 0.0000 0.017 0.00 *******************************************************************************
******************************************************************************* ANNUAL TOTALS FOR YEAR 78 ------------------------------------------------------------------------------- INCHES CU. FEET PERCENT -------- ---------- ------- PRECIPITATION 24.92 90459.594 100.00 RUNOFF 3.997 14509.966 16.04 EVAPOTRANSPIRATION 5.027 18249.689 20.17 DRAINAGE COLLECTED FROM LAYER 2 15.8851 57662.992 63.74 PERC./LEAKAGE THROUGH LAYER 4 0.000002 0.007 0.00 AVG. HEAD ON TOP OF LAYER 3 0.0021 CHANGE IN WATER STORAGE 0.010 36.931 0.04 SOIL WATER AT START OF YEAR 9.193 33369.859 SOIL WATER AT END OF YEAR 9.203 33406.789 SNOW WATER AT START OF YEAR 0.000 0.000 0.00

SNOW WATER AT END OF YEAR 0.000 0.000 0.00 ANNUAL WATER BUDGET BALANCE 0.0000 0.007 0.00 *******************************************************************************
******************************************************************************* ANNUAL TOTALS FOR YEAR 79 ------------------------------------------------------------------------------- INCHES CU. FEET PERCENT -------- ---------- ------- PRECIPITATION 22.33 81057.906 100.00 RUNOFF 3.399 12338.158 15.22 EVAPOTRANSPIRATION 4.046 14687.855 18.12 DRAINAGE COLLECTED FROM LAYER 2 14.8950 54068.809 66.70 PERC./LEAKAGE THROUGH LAYER 4 0.000002 0.006 0.00 AVG. HEAD ON TOP OF LAYER 3 0.0020 CHANGE IN WATER STORAGE -0.010 -36.931 -0.05 SOIL WATER AT START OF YEAR 9.203 33406.789 SOIL WATER AT END OF YEAR 9.193 33369.859 SNOW WATER AT START OF YEAR 0.000 0.000 0.00 SNOW WATER AT END OF YEAR 0.000 0.000 0.00 ANNUAL WATER BUDGET BALANCE 0.0000 0.007 0.00 *******************************************************************************
******************************************************************************* ANNUAL TOTALS FOR YEAR 80 ------------------------------------------------------------------------------- INCHES CU. FEET PERCENT

-------- ---------- ------- PRECIPITATION 17.86 64831.801 100.00 RUNOFF 0.842 3055.621 4.71 EVAPOTRANSPIRATION 4.384 15915.661 24.55 DRAINAGE COLLECTED FROM LAYER 2 11.6668 42350.449 65.32 PERC./LEAKAGE THROUGH LAYER 4 0.000002 0.006 0.00 AVG. HEAD ON TOP OF LAYER 3 0.0015 CHANGE IN WATER STORAGE 0.967 3510.073 5.41 SOIL WATER AT START OF YEAR 9.193 33369.859 SOIL WATER AT END OF YEAR 9.248 33570.902 SNOW WATER AT START OF YEAR 0.000 0.000 0.00 SNOW WATER AT END OF YEAR 0.912 3309.030 5.10 ANNUAL WATER BUDGET BALANCE 0.0000 -0.006 0.00 *******************************************************************************
******************************************************************************* ANNUAL TOTALS FOR YEAR 81 ------------------------------------------------------------------------------- INCHES CU. FEET PERCENT -------- ---------- ------- PRECIPITATION 19.52 70857.617 100.00 RUNOFF 2.569 9324.905 13.16 EVAPOTRANSPIRATION 4.117 14946.244 21.09 DRAINAGE COLLECTED FROM LAYER 2 13.8007 50096.512 70.70 PERC./LEAKAGE THROUGH LAYER 4 0.000002 0.006 0.00 AVG. HEAD ON TOP OF LAYER 3 0.0018 CHANGE IN WATER STORAGE -0.967 -3510.073 -4.95

SOIL WATER AT START OF YEAR 9.248 33570.902 SOIL WATER AT END OF YEAR 9.193 33369.859 SNOW WATER AT START OF YEAR 0.912 3309.030 4.67 SNOW WATER AT END OF YEAR 0.000 0.000 0.00 ANNUAL WATER BUDGET BALANCE 0.0000 0.022 0.00 *******************************************************************************
******************************************************************************* ANNUAL TOTALS FOR YEAR 82 ------------------------------------------------------------------------------- INCHES CU. FEET PERCENT -------- ---------- ------- PRECIPITATION 24.45 88753.516 100.00 RUNOFF 2.469 8961.838 10.10 EVAPOTRANSPIRATION 6.352 23058.756 25.98 DRAINAGE COLLECTED FROM LAYER 2 15.6289 56732.902 63.92 PERC./LEAKAGE THROUGH LAYER 4 0.000002 0.007 0.00 AVG. HEAD ON TOP OF LAYER 3 0.0021 CHANGE IN WATER STORAGE 0.000 0.000 0.00 SOIL WATER AT START OF YEAR 9.193 33369.859 SOIL WATER AT END OF YEAR 9.193 33369.859 SNOW WATER AT START OF YEAR 0.000 0.000 0.00 SNOW WATER AT END OF YEAR 0.000 0.000 0.00 ANNUAL WATER BUDGET BALANCE 0.0000 0.014 0.00 *******************************************************************************

******************************************************************************* ANNUAL TOTALS FOR YEAR 83 ------------------------------------------------------------------------------- INCHES CU. FEET PERCENT -------- ---------- ------- PRECIPITATION 21.87 79388.102 100.00 RUNOFF 2.094 7601.854 9.58 EVAPOTRANSPIRATION 4.795 17405.955 21.93 DRAINAGE COLLECTED FROM LAYER 2 14.9808 54380.277 68.50 PERC./LEAKAGE THROUGH LAYER 4 0.000002 0.008 0.00 AVG. HEAD ON TOP OF LAYER 3 0.0020 CHANGE IN WATER STORAGE 0.000 0.000 0.00 SOIL WATER AT START OF YEAR 9.193 33369.859 SOIL WATER AT END OF YEAR 9.193 33369.859 SNOW WATER AT START OF YEAR 0.000 0.000 0.00 SNOW WATER AT END OF YEAR 0.000 0.000 0.00 ANNUAL WATER BUDGET BALANCE 0.0000 0.007 0.00 *******************************************************************************
******************************************************************************* ANNUAL TOTALS FOR YEAR 84 ------------------------------------------------------------------------------- INCHES CU. FEET PERCENT -------- ---------- ------- PRECIPITATION 19.64 71293.203 100.00 RUNOFF 2.731 9912.791 13.90 EVAPOTRANSPIRATION 4.499 16329.606 22.90 DRAINAGE COLLECTED FROM LAYER 2 12.4074 45038.918 63.17 PERC./LEAKAGE THROUGH LAYER 4 0.000002 0.006 0.00

AVG. HEAD ON TOP OF LAYER 3 0.0016 CHANGE IN WATER STORAGE 0.003 11.878 0.02 SOIL WATER AT START OF YEAR 9.193 33369.859 SOIL WATER AT END OF YEAR 9.196 33381.738 SNOW WATER AT START OF YEAR 0.000 0.000 0.00 SNOW WATER AT END OF YEAR 0.000 0.000 0.00 ANNUAL WATER BUDGET BALANCE 0.0000 0.006 0.00 *******************************************************************************
******************************************************************************* ANNUAL TOTALS FOR YEAR 85 ------------------------------------------------------------------------------- INCHES CU. FEET PERCENT -------- ---------- ------- PRECIPITATION 15.23 55284.906 100.00 RUNOFF 1.702 6178.006 11.17 EVAPOTRANSPIRATION 3.133 11371.894 20.57 DRAINAGE COLLECTED FROM LAYER 2 10.3657 37627.473 68.06 PERC./LEAKAGE THROUGH LAYER 4 0.000002 0.006 0.00 AVG. HEAD ON TOP OF LAYER 3 0.0014 CHANGE IN WATER STORAGE 0.030 107.528 0.19 SOIL WATER AT START OF YEAR 9.196 33381.738 SOIL WATER AT END OF YEAR 9.226 33489.266 SNOW WATER AT START OF YEAR 0.000 0.000 0.00 SNOW WATER AT END OF YEAR 0.000 0.000 0.00 ANNUAL WATER BUDGET BALANCE 0.0000 -0.002 0.00

*******************************************************************************
******************************************************************************* ANNUAL TOTALS FOR YEAR 86 ------------------------------------------------------------------------------- INCHES CU. FEET PERCENT -------- ---------- ------- PRECIPITATION 20.49 74378.703 100.00 RUNOFF 0.947 3437.951 4.62 EVAPOTRANSPIRATION 5.168 18761.303 25.22 DRAINAGE COLLECTED FROM LAYER 2 14.4074 52298.852 70.31 PERC./LEAKAGE THROUGH LAYER 4 0.000002 0.007 0.00 AVG. HEAD ON TOP OF LAYER 3 0.0019 CHANGE IN WATER STORAGE -0.033 -119.406 -0.16 SOIL WATER AT START OF YEAR 9.226 33489.266 SOIL WATER AT END OF YEAR 9.193 33369.859 SNOW WATER AT START OF YEAR 0.000 0.000 0.00 SNOW WATER AT END OF YEAR 0.000 0.000 0.00 ANNUAL WATER BUDGET BALANCE 0.0000 -0.002 0.00 *******************************************************************************
******************************************************************************* ANNUAL TOTALS FOR YEAR 87 ------------------------------------------------------------------------------- INCHES CU. FEET PERCENT -------- ---------- ------- PRECIPITATION 27.38 99389.414 100.00 RUNOFF 4.987 18103.678 18.21

EVAPOTRANSPIRATION 5.248 19051.357 19.17 DRAINAGE COLLECTED FROM LAYER 2 17.1445 62234.359 62.62 PERC./LEAKAGE THROUGH LAYER 4 0.000002 0.008 0.00 AVG. HEAD ON TOP OF LAYER 3 0.0023 CHANGE IN WATER STORAGE 0.000 0.000 0.00 SOIL WATER AT START OF YEAR 9.193 33369.859 SOIL WATER AT END OF YEAR 9.193 33369.859 SNOW WATER AT START OF YEAR 0.000 0.000 0.00 SNOW WATER AT END OF YEAR 0.000 0.000 0.00 ANNUAL WATER BUDGET BALANCE 0.0000 0.018 0.00 *******************************************************************************
******************************************************************************* ANNUAL TOTALS FOR YEAR 88 ------------------------------------------------------------------------------- INCHES CU. FEET PERCENT -------- ---------- ------- PRECIPITATION 16.19 58769.703 100.00 RUNOFF 0.821 2980.050 5.07 EVAPOTRANSPIRATION 3.899 14155.031 24.09 DRAINAGE COLLECTED FROM LAYER 2 11.4696 41634.613 70.84 PERC./LEAKAGE THROUGH LAYER 4 0.000001 0.005 0.00 AVG. HEAD ON TOP OF LAYER 3 0.0015 CHANGE IN WATER STORAGE 0.000 0.000 0.00 SOIL WATER AT START OF YEAR 9.193 33369.859 SOIL WATER AT END OF YEAR 9.193 33369.859 SNOW WATER AT START OF YEAR 0.000 0.000 0.00

SNOW WATER AT END OF YEAR 0.000 0.000 0.00 ANNUAL WATER BUDGET BALANCE 0.0000 0.003 0.00 *******************************************************************************
******************************************************************************* ANNUAL TOTALS FOR YEAR 89 ------------------------------------------------------------------------------- INCHES CU. FEET PERCENT -------- ---------- ------- PRECIPITATION 18.12 65775.602 100.00 RUNOFF 1.694 6148.832 9.35 EVAPOTRANSPIRATION 3.339 12121.479 18.43 DRAINAGE COLLECTED FROM LAYER 2 13.0869 47505.270 72.22 PERC./LEAKAGE THROUGH LAYER 4 0.000002 0.006 0.00 AVG. HEAD ON TOP OF LAYER 3 0.0017 CHANGE IN WATER STORAGE 0.000 0.000 0.00 SOIL WATER AT START OF YEAR 9.193 33369.859 SOIL WATER AT END OF YEAR 9.193 33369.859 SNOW WATER AT START OF YEAR 0.000 0.000 0.00 SNOW WATER AT END OF YEAR 0.000 0.000 0.00 ANNUAL WATER BUDGET BALANCE 0.0000 0.017 0.00 *******************************************************************************
******************************************************************************* ANNUAL TOTALS FOR YEAR 90 ------------------------------------------------------------------------------- INCHES CU. FEET PERCENT

-------- ---------- ------- PRECIPITATION 19.58 71075.406 100.00 RUNOFF 2.606 9460.654 13.31 EVAPOTRANSPIRATION 3.906 14177.209 19.95 DRAINAGE COLLECTED FROM LAYER 2 13.0682 47437.520 66.74 PERC./LEAKAGE THROUGH LAYER 4 0.000002 0.006 0.00 AVG. HEAD ON TOP OF LAYER 3 0.0017 CHANGE IN WATER STORAGE 0.000 0.000 0.00 SOIL WATER AT START OF YEAR 9.193 33369.859 SOIL WATER AT END OF YEAR 9.193 33369.859 SNOW WATER AT START OF YEAR 0.000 0.000 0.00 SNOW WATER AT END OF YEAR 0.000 0.000 0.00 ANNUAL WATER BUDGET BALANCE 0.0000 0.017 0.00 *******************************************************************************
******************************************************************************* ANNUAL TOTALS FOR YEAR 91 ------------------------------------------------------------------------------- INCHES CU. FEET PERCENT -------- ---------- ------- PRECIPITATION 31.14 113038.219 100.00 RUNOFF 5.132 18628.561 16.48 EVAPOTRANSPIRATION 6.577 23876.123 21.12 DRAINAGE COLLECTED FROM LAYER 2 19.4307 70533.508 62.40 PERC./LEAKAGE THROUGH LAYER 4 0.000002 0.008 0.00 AVG. HEAD ON TOP OF LAYER 3 0.0026 CHANGE IN WATER STORAGE 0.000 0.000 0.00
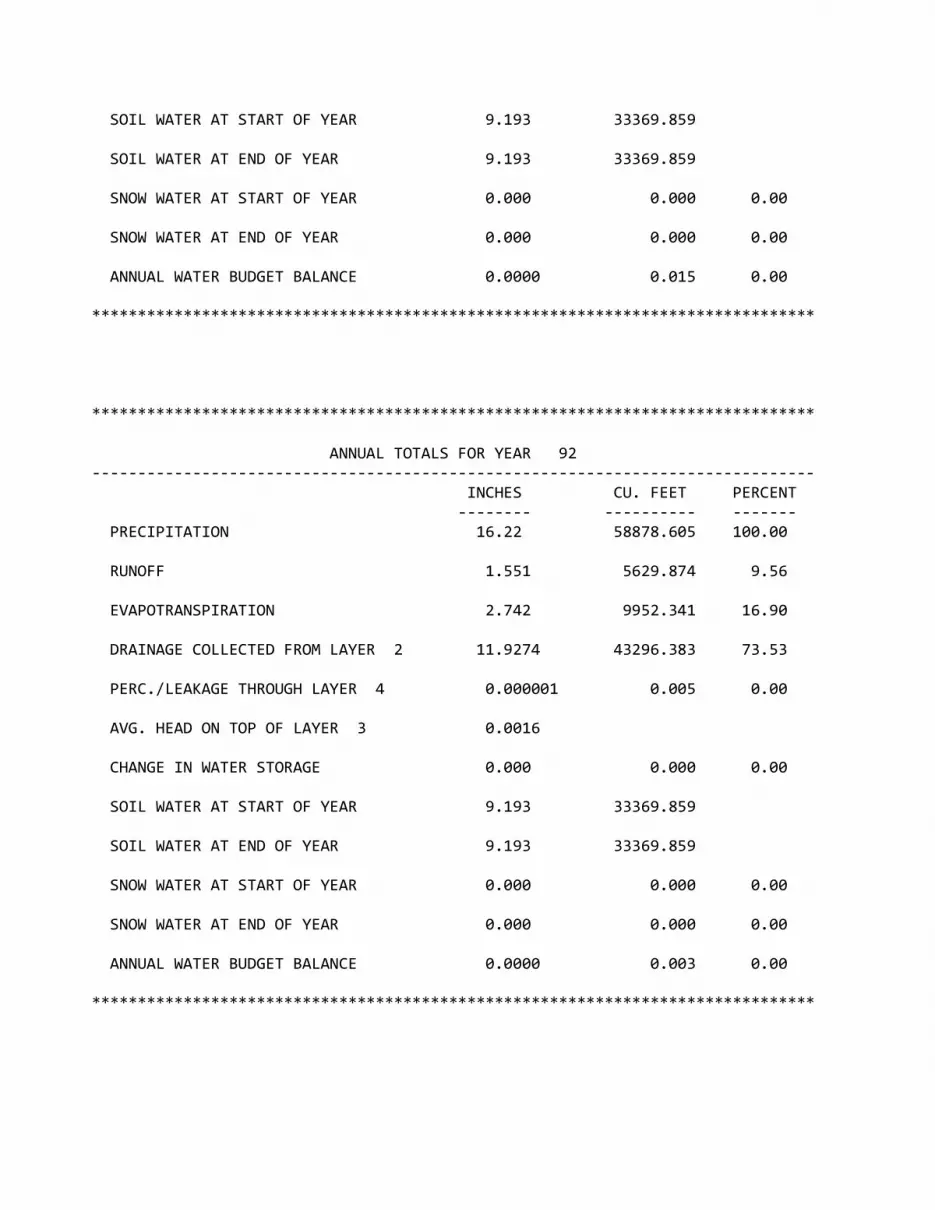
SOIL WATER AT START OF YEAR 9.193 33369.859 SOIL WATER AT END OF YEAR 9.193 33369.859 SNOW WATER AT START OF YEAR 0.000 0.000 0.00 SNOW WATER AT END OF YEAR 0.000 0.000 0.00 ANNUAL WATER BUDGET BALANCE 0.0000 0.015 0.00 *******************************************************************************
******************************************************************************* ANNUAL TOTALS FOR YEAR 92 ------------------------------------------------------------------------------- INCHES CU. FEET PERCENT -------- ---------- ------- PRECIPITATION 16.22 58878.605 100.00 RUNOFF 1.551 5629.874 9.56 EVAPOTRANSPIRATION 2.742 9952.341 16.90 DRAINAGE COLLECTED FROM LAYER 2 11.9274 43296.383 73.53 PERC./LEAKAGE THROUGH LAYER 4 0.000001 0.005 0.00 AVG. HEAD ON TOP OF LAYER 3 0.0016 CHANGE IN WATER STORAGE 0.000 0.000 0.00 SOIL WATER AT START OF YEAR 9.193 33369.859 SOIL WATER AT END OF YEAR 9.193 33369.859 SNOW WATER AT START OF YEAR 0.000 0.000 0.00 SNOW WATER AT END OF YEAR 0.000 0.000 0.00 ANNUAL WATER BUDGET BALANCE 0.0000 0.003 0.00 *******************************************************************************

******************************************************************************* ANNUAL TOTALS FOR YEAR 93 ------------------------------------------------------------------------------- INCHES CU. FEET PERCENT -------- ---------- ------- PRECIPITATION 27.88 101204.414 100.00 RUNOFF 4.277 15526.429 15.34 EVAPOTRANSPIRATION 5.011 18190.832 17.97 DRAINAGE COLLECTED FROM LAYER 2 18.5915 67487.125 66.68 PERC./LEAKAGE THROUGH LAYER 4 0.000002 0.007 0.00 AVG. HEAD ON TOP OF LAYER 3 0.0025 CHANGE IN WATER STORAGE 0.000 0.000 0.00 SOIL WATER AT START OF YEAR 9.193 33369.859 SOIL WATER AT END OF YEAR 9.193 33369.859 SNOW WATER AT START OF YEAR 0.000 0.000 0.00 SNOW WATER AT END OF YEAR 0.000 0.000 0.00 ANNUAL WATER BUDGET BALANCE 0.0000 0.014 0.00 *******************************************************************************
******************************************************************************* ANNUAL TOTALS FOR YEAR 94 ------------------------------------------------------------------------------- INCHES CU. FEET PERCENT -------- ---------- ------- PRECIPITATION 15.00 54450.000 100.00 RUNOFF 1.449 5258.681 9.66 EVAPOTRANSPIRATION 2.602 9443.602 17.34 DRAINAGE COLLECTED FROM LAYER 2 10.9498 39747.727 73.00 PERC./LEAKAGE THROUGH LAYER 4 0.000001 0.005 0.00

AVG. HEAD ON TOP OF LAYER 3 0.0014 CHANGE IN WATER STORAGE 0.000 0.000 0.00 SOIL WATER AT START OF YEAR 9.193 33369.859 SOIL WATER AT END OF YEAR 9.193 33369.859 SNOW WATER AT START OF YEAR 0.000 0.000 0.00 SNOW WATER AT END OF YEAR 0.000 0.000 0.00 ANNUAL WATER BUDGET BALANCE 0.0000 -0.015 0.00 *******************************************************************************
******************************************************************************* ANNUAL TOTALS FOR YEAR 95 ------------------------------------------------------------------------------- INCHES CU. FEET PERCENT -------- ---------- ------- PRECIPITATION 21.27 77210.125 100.00 RUNOFF 3.286 11927.324 15.45 EVAPOTRANSPIRATION 3.052 11077.056 14.35 DRAINAGE COLLECTED FROM LAYER 2 14.9327 54205.727 70.21 PERC./LEAKAGE THROUGH LAYER 4 0.000002 0.006 0.00 AVG. HEAD ON TOP OF LAYER 3 0.0020 CHANGE IN WATER STORAGE 0.000 0.000 0.00 SOIL WATER AT START OF YEAR 9.193 33369.859 SOIL WATER AT END OF YEAR 9.193 33369.859 SNOW WATER AT START OF YEAR 0.000 0.000 0.00 SNOW WATER AT END OF YEAR 0.000 0.000 0.00 ANNUAL WATER BUDGET BALANCE 0.0000 0.011 0.00

*******************************************************************************
******************************************************************************* ANNUAL TOTALS FOR YEAR 96 ------------------------------------------------------------------------------- INCHES CU. FEET PERCENT -------- ---------- ------- PRECIPITATION 29.96 108754.820 100.00 RUNOFF 2.874 10434.272 9.59 EVAPOTRANSPIRATION 7.128 25873.336 23.79 DRAINAGE COLLECTED FROM LAYER 2 19.9579 72447.172 66.62 PERC./LEAKAGE THROUGH LAYER 4 0.000002 0.008 0.00 AVG. HEAD ON TOP OF LAYER 3 0.0026 CHANGE IN WATER STORAGE 0.000 0.000 0.00 SOIL WATER AT START OF YEAR 9.193 33369.859 SOIL WATER AT END OF YEAR 9.193 33369.859 SNOW WATER AT START OF YEAR 0.000 0.000 0.00 SNOW WATER AT END OF YEAR 0.000 0.000 0.00 ANNUAL WATER BUDGET BALANCE 0.0000 0.027 0.00 *******************************************************************************
******************************************************************************* ANNUAL TOTALS FOR YEAR 97 ------------------------------------------------------------------------------- INCHES CU. FEET PERCENT -------- ---------- ------- PRECIPITATION 31.47 114236.102 100.00 RUNOFF 5.082 18446.670 16.15

EVAPOTRANSPIRATION 5.998 21772.734 19.06 DRAINAGE COLLECTED FROM LAYER 2 20.3903 74016.664 64.79 PERC./LEAKAGE THROUGH LAYER 4 0.000002 0.008 0.00 AVG. HEAD ON TOP OF LAYER 3 0.0027 CHANGE IN WATER STORAGE 0.000 0.000 0.00 SOIL WATER AT START OF YEAR 9.193 33369.859 SOIL WATER AT END OF YEAR 9.193 33369.859 SNOW WATER AT START OF YEAR 0.000 0.000 0.00 SNOW WATER AT END OF YEAR 0.000 0.000 0.00 ANNUAL WATER BUDGET BALANCE 0.0000 0.023 0.00 *******************************************************************************
******************************************************************************* ANNUAL TOTALS FOR YEAR 98 ------------------------------------------------------------------------------- INCHES CU. FEET PERCENT -------- ---------- ------- PRECIPITATION 20.32 73761.609 100.00 RUNOFF 1.646 5973.335 8.10 EVAPOTRANSPIRATION 3.649 13247.470 17.96 DRAINAGE COLLECTED FROM LAYER 2 15.0250 54540.785 73.94 PERC./LEAKAGE THROUGH LAYER 4 0.000002 0.007 0.00 AVG. HEAD ON TOP OF LAYER 3 0.0020 CHANGE IN WATER STORAGE 0.000 0.000 0.00 SOIL WATER AT START OF YEAR 9.193 33369.859 SOIL WATER AT END OF YEAR 9.193 33369.859 SNOW WATER AT START OF YEAR 0.000 0.000 0.00

SNOW WATER AT END OF YEAR 0.000 0.000 0.00 ANNUAL WATER BUDGET BALANCE 0.0000 0.008 0.00 *******************************************************************************
******************************************************************************* ANNUAL TOTALS FOR YEAR 99 ------------------------------------------------------------------------------- INCHES CU. FEET PERCENT -------- ---------- ------- PRECIPITATION 26.78 97211.430 100.00 RUNOFF 4.041 14667.964 15.09 EVAPOTRANSPIRATION 4.895 17767.855 18.28 DRAINAGE COLLECTED FROM LAYER 2 17.8445 64775.582 66.63 PERC./LEAKAGE THROUGH LAYER 4 0.000002 0.007 0.00 AVG. HEAD ON TOP OF LAYER 3 0.0024 CHANGE IN WATER STORAGE 0.000 0.000 0.00 SOIL WATER AT START OF YEAR 9.193 33369.859 SOIL WATER AT END OF YEAR 9.193 33369.859 SNOW WATER AT START OF YEAR 0.000 0.000 0.00 SNOW WATER AT END OF YEAR 0.000 0.000 0.00 ANNUAL WATER BUDGET BALANCE 0.0000 0.021 0.00 *******************************************************************************
******************************************************************************* ANNUAL TOTALS FOR YEAR 100 ------------------------------------------------------------------------------- INCHES CU. FEET PERCENT

-------- ---------- ------- PRECIPITATION 28.58 103745.414 100.00 RUNOFF 5.197 18866.279 18.19 EVAPOTRANSPIRATION 4.061 14742.487 14.21 DRAINAGE COLLECTED FROM LAYER 2 19.3213 70136.281 67.60 PERC./LEAKAGE THROUGH LAYER 4 0.000002 0.008 0.00 AVG. HEAD ON TOP OF LAYER 3 0.0026 CHANGE IN WATER STORAGE 0.000 0.343 0.00 SOIL WATER AT START OF YEAR 9.193 33369.859 SOIL WATER AT END OF YEAR 9.193 33370.203 SNOW WATER AT START OF YEAR 0.000 0.000 0.00 SNOW WATER AT END OF YEAR 0.000 0.000 0.00 ANNUAL WATER BUDGET BALANCE 0.0000 0.017 0.00 *******************************************************************************
******************************************************************************* AVERAGE MONTHLY VALUES IN INCHES FOR YEARS 1 THROUGH 100 ------------------------------------------------------------------------------- JAN/JUL FEB/AUG MAR/SEP APR/OCT MAY/NOV JUN/DEC ------- ------- ------- ------- ------- ------- PRECIPITATION ------------- TOTALS 0.69 0.72 1.51 1.73 2.79 3.15 2.67 3.49 2.08 2.23 1.05 0.85 STD. DEVIATIONS 0.60 0.54 1.09 1.30 1.53 1.54 1.36 2.16 1.39 1.91 1.07 0.84 RUNOFF ------ TOTALS 0.018 0.013 0.139 0.204 0.309 0.496
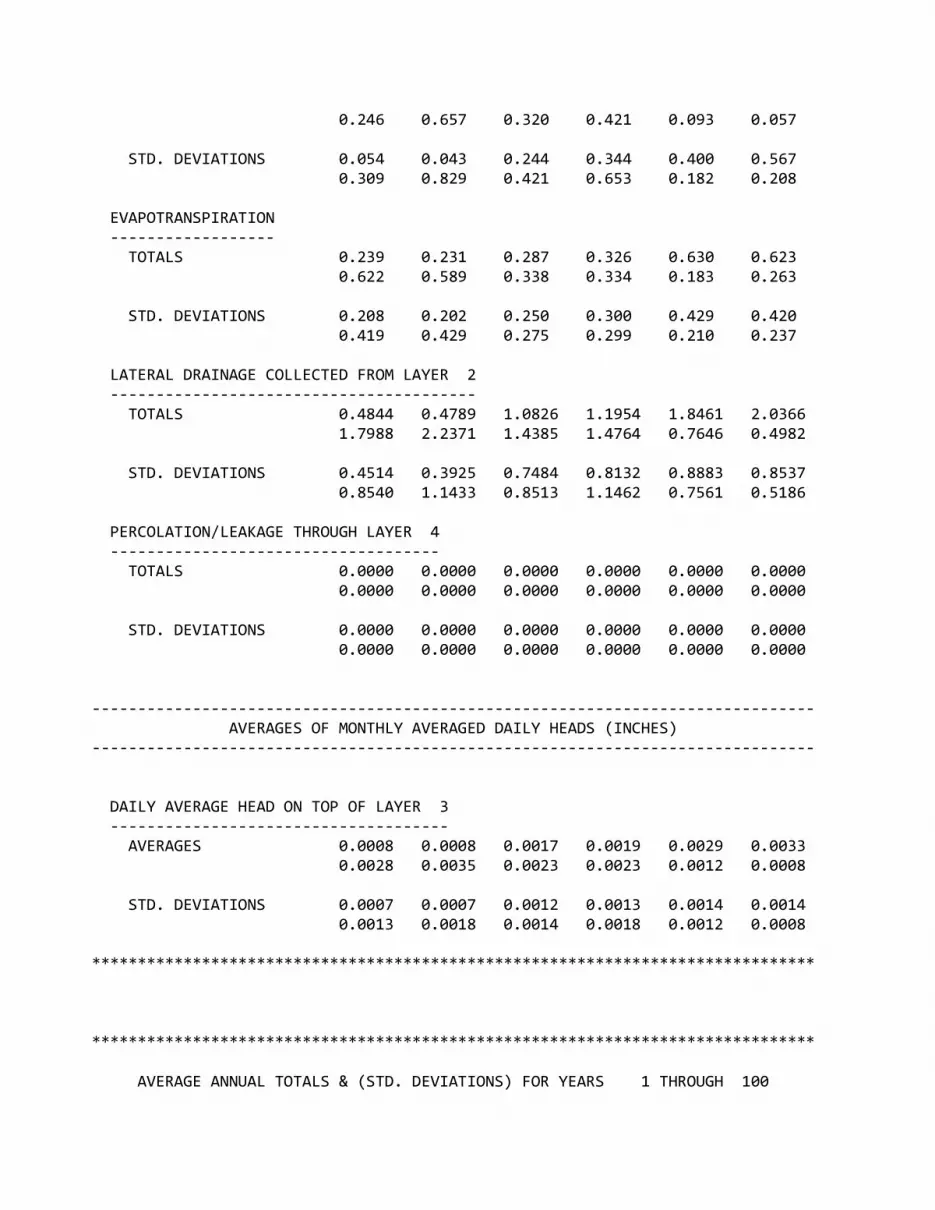
0.246 0.657 0.320 0.421 0.093 0.057 STD. DEVIATIONS 0.054 0.043 0.244 0.344 0.400 0.567 0.309 0.829 0.421 0.653 0.182 0.208 EVAPOTRANSPIRATION ------------------ TOTALS 0.239 0.231 0.287 0.326 0.630 0.623 0.622 0.589 0.338 0.334 0.183 0.263 STD. DEVIATIONS 0.208 0.202 0.250 0.300 0.429 0.420 0.419 0.429 0.275 0.299 0.210 0.237 LATERAL DRAINAGE COLLECTED FROM LAYER 2 ---------------------------------------- TOTALS 0.4844 0.4789 1.0826 1.1954 1.8461 2.0366 1.7988 2.2371 1.4385 1.4764 0.7646 0.4982 STD. DEVIATIONS 0.4514 0.3925 0.7484 0.8132 0.8883 0.8537 0.8540 1.1433 0.8513 1.1462 0.7561 0.5186 PERCOLATION/LEAKAGE THROUGH LAYER 4 ------------------------------------ TOTALS 0.0000 0.0000 0.0000 0.0000 0.0000 0.0000 0.0000 0.0000 0.0000 0.0000 0.0000 0.0000 STD. DEVIATIONS 0.0000 0.0000 0.0000 0.0000 0.0000 0.0000 0.0000 0.0000 0.0000 0.0000 0.0000 0.0000
------------------------------------------------------------------------------- AVERAGES OF MONTHLY AVERAGED DAILY HEADS (INCHES) -------------------------------------------------------------------------------
DAILY AVERAGE HEAD ON TOP OF LAYER 3 ------------------------------------- AVERAGES 0.0008 0.0008 0.0017 0.0019 0.0029 0.0033 0.0028 0.0035 0.0023 0.0023 0.0012 0.0008 STD. DEVIATIONS 0.0007 0.0007 0.0012 0.0013 0.0014 0.0014 0.0013 0.0018 0.0014 0.0018 0.0012 0.0008 *******************************************************************************
******************************************************************************* AVERAGE ANNUAL TOTALS & (STD. DEVIATIONS) FOR YEARS 1 THROUGH 100

------------------------------------------------------------------------------- INCHES CU. FEET PERCENT ------------------- ------------- --------- PRECIPITATION 22.97 ( 4.466) 83398.2 100.00 RUNOFF 2.972 ( 1.4395) 10788.24 12.936 EVAPOTRANSPIRATION 4.665 ( 1.0804) 16933.93 20.305 LATERAL DRAINAGE COLLECTED 15.33773 ( 2.64988) 55675.969 66.75923 FROM LAYER 2 PERCOLATION/LEAKAGE THROUGH 0.00000 ( 0.00000) 0.007 0.00001 LAYER 4 AVERAGE HEAD ON TOP 0.002 ( 0.000) OF LAYER 3 CHANGE IN WATER STORAGE 0.000 ( 0.2573) 0.00 0.000 *******************************************************************************
****************************************************************************** PEAK DAILY VALUES FOR YEARS 1 THROUGH 100 ------------------------------------------------------------------------ (INCHES) (CU. FT.) ---------- ------------- PRECIPITATION 3.88 14084.400 RUNOFF 2.466 8950.0703 DRAINAGE COLLECTED FROM LAYER 2 1.59852 5802.63867 PERCOLATION/LEAKAGE THROUGH LAYER 4 0.000000 0.00023 AVERAGE HEAD ON TOP OF LAYER 3 0.080 MAXIMUM HEAD ON TOP OF LAYER 3 0.153
LOCATION OF MAXIMUM HEAD IN LAYER 2 (DISTANCE FROM DRAIN) 2.6 FEET SNOW WATER 1.87 6789.2432
MAXIMUM VEG. SOIL WATER (VOL/VOL) 0.4989

MINIMUM VEG. SOIL WATER (VOL/VOL) 0.0208
*** Maximum heads are computed using McEnroe's equations. ***
Reference: Maximum Saturated Depth over Landfill Liner by Bruce M. McEnroe, University of Kansas ASCE Journal of Environmental Engineering Vol. 119, No. 2, March 1993, pp. 262-270.
******************************************************************************
****************************************************************************** FINAL WATER STORAGE AT END OF YEAR 100 ---------------------------------------------------------------------- LAYER (INCHES) (VOL/VOL) ----- -------- --------- 1 0.0121 0.0242
2 0.0008 0.0062
3 0.0000 0.0000
4 9.1800 0.7500
SNOW WATER 0.000 ****************************************************************************** ******************************************************************************

ATTACHMENT B
PREVIOUSLY PERMITTED COVER HELP MODEL OUTPUT

****************************************************************************** ****************************************************************************** ** ** ** ** ** HYDROLOGIC EVALUATION OF LANDFILL PERFORMANCE ** ** HELP MODEL VERSION 3.07 (1 NOVEMBER 1997) ** ** DEVELOPED BY ENVIRONMENTAL LABORATORY ** ** USAE WATERWAYS EXPERIMENT STATION ** ** FOR USEPA RISK REDUCTION ENGINEERING LABORATORY ** ** ** ** ** ****************************************************************************** ******************************************************************************
PRECIPITATION DATA FILE: C:\NHP\DATA4.D4 TEMPERATURE DATA FILE: C:\NHP\DATA7.D7 SOLAR RADIATION DATA FILE: C:\NHP\DATA13.D13 EVAPOTRANSPIRATION DATA: C:\NHP\DATA11.D11 SOIL AND DESIGN DATA FILE: C:\NHP\data10.D10 OUTPUT DATA FILE: C:\NHP\permitUD.OUT
TIME: 12:14 DATE: 5/ 7/2020
******************************************************************************
TITLE: North Holding Pond - Permitted Final Cover System
******************************************************************************
NOTE: INITIAL MOISTURE CONTENT OF THE LAYERS AND SNOW WATER WERE COMPUTED AS NEARLY STEADY-STATE VALUES BY THE PROGRAM.
LAYER 1 --------
TYPE 1 - VERTICAL PERCOLATION LAYER MATERIAL TEXTURE NUMBER 13 THICKNESS = 18.00 INCHES

POROSITY = 0.4300 VOL/VOL FIELD CAPACITY = 0.3210 VOL/VOL WILTING POINT = 0.2210 VOL/VOL INITIAL SOIL WATER CONTENT = 0.2725 VOL/VOL EFFECTIVE SAT. HYD. COND. = 0.330000003000E-04 CM/SEC NOTE: SATURATED HYDRAULIC CONDUCTIVITY IS MULTIPLIED BY 3.00 FOR ROOT CHANNELS IN TOP HALF OF EVAPORATIVE ZONE.
LAYER 2 --------
TYPE 2 - LATERAL DRAINAGE LAYER MATERIAL TEXTURE NUMBER 0 THICKNESS = 3.00 INCHES POROSITY = 0.3970 VOL/VOL FIELD CAPACITY = 0.0320 VOL/VOL WILTING POINT = 0.0130 VOL/VOL INITIAL SOIL WATER CONTENT = 0.0323 VOL/VOL EFFECTIVE SAT. HYD. COND. = 0.329999998000E-01 CM/SEC SLOPE = 3.00 PERCENT DRAINAGE LENGTH = 260.0 FEET
LAYER 3 --------
TYPE 4 - FLEXIBLE MEMBRANE LINER MATERIAL TEXTURE NUMBER 35 THICKNESS = 0.04 INCHES POROSITY = 0.0000 VOL/VOL FIELD CAPACITY = 0.0000 VOL/VOL WILTING POINT = 0.0000 VOL/VOL INITIAL SOIL WATER CONTENT = 0.0000 VOL/VOL EFFECTIVE SAT. HYD. COND. = 0.199999996000E-12 CM/SEC FML PINHOLE DENSITY = 1.00 HOLES/ACRE FML INSTALLATION DEFECTS = 1.00 HOLES/ACRE FML PLACEMENT QUALITY = 3 - GOOD
LAYER 4 --------
TYPE 3 - BARRIER SOIL LINER
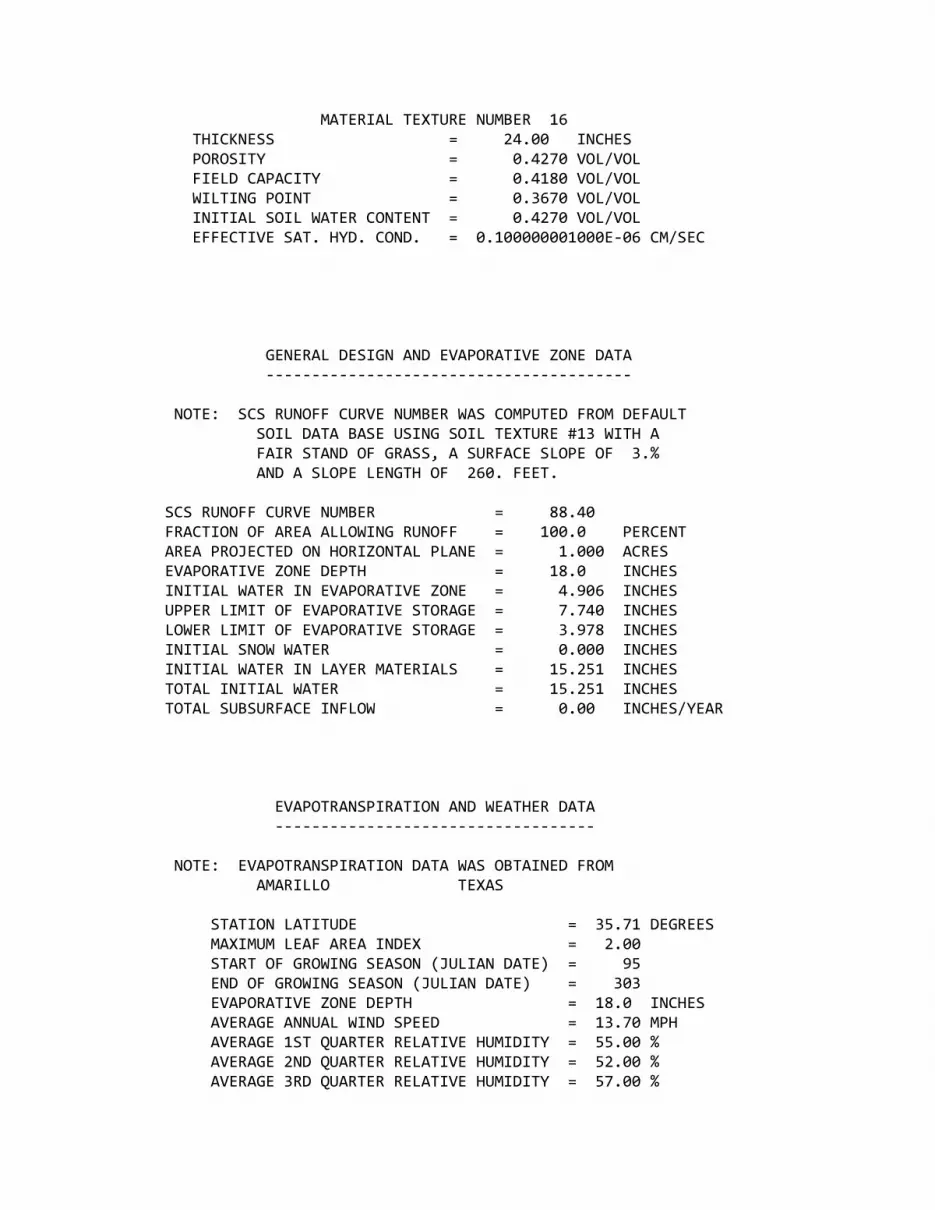
MATERIAL TEXTURE NUMBER 16 THICKNESS = 24.00 INCHES POROSITY = 0.4270 VOL/VOL FIELD CAPACITY = 0.4180 VOL/VOL WILTING POINT = 0.3670 VOL/VOL INITIAL SOIL WATER CONTENT = 0.4270 VOL/VOL EFFECTIVE SAT. HYD. COND. = 0.100000001000E-06 CM/SEC
GENERAL DESIGN AND EVAPORATIVE ZONE DATA ----------------------------------------
NOTE: SCS RUNOFF CURVE NUMBER WAS COMPUTED FROM DEFAULT SOIL DATA BASE USING SOIL TEXTURE #13 WITH A FAIR STAND OF GRASS, A SURFACE SLOPE OF 3.% AND A SLOPE LENGTH OF 260. FEET.
SCS RUNOFF CURVE NUMBER = 88.40 FRACTION OF AREA ALLOWING RUNOFF = 100.0 PERCENT AREA PROJECTED ON HORIZONTAL PLANE = 1.000 ACRES EVAPORATIVE ZONE DEPTH = 18.0 INCHES INITIAL WATER IN EVAPORATIVE ZONE = 4.906 INCHES UPPER LIMIT OF EVAPORATIVE STORAGE = 7.740 INCHES LOWER LIMIT OF EVAPORATIVE STORAGE = 3.978 INCHES INITIAL SNOW WATER = 0.000 INCHES INITIAL WATER IN LAYER MATERIALS = 15.251 INCHES TOTAL INITIAL WATER = 15.251 INCHES TOTAL SUBSURFACE INFLOW = 0.00 INCHES/YEAR
EVAPOTRANSPIRATION AND WEATHER DATA -----------------------------------
NOTE: EVAPOTRANSPIRATION DATA WAS OBTAINED FROM AMARILLO TEXAS
STATION LATITUDE = 35.71 DEGREES MAXIMUM LEAF AREA INDEX = 2.00 START OF GROWING SEASON (JULIAN DATE) = 95 END OF GROWING SEASON (JULIAN DATE) = 303 EVAPORATIVE ZONE DEPTH = 18.0 INCHES AVERAGE ANNUAL WIND SPEED = 13.70 MPH AVERAGE 1ST QUARTER RELATIVE HUMIDITY = 55.00 % AVERAGE 2ND QUARTER RELATIVE HUMIDITY = 52.00 % AVERAGE 3RD QUARTER RELATIVE HUMIDITY = 57.00 %

AVERAGE 4TH QUARTER RELATIVE HUMIDITY = 57.00 %
NOTE: PRECIPITATION DATA WAS SYNTHETICALLY GENERATED USING COEFFICIENTS FOR AMARILLO TEXAS
NORMAL MEAN MONTHLY PRECIPITATION (INCHES)
JAN/JUL FEB/AUG MAR/SEP APR/OCT MAY/NOV JUN/DEC ------- ------- ------- ------- ------- ------- 0.71 0.69 1.54 1.79 2.68 3.28 2.68 3.56 2.09 1.94 1.03 0.86
NOTE: TEMPERATURE DATA WAS SYNTHETICALLY GENERATED USING COEFFICIENTS FOR AMARILLO TEXAS
NORMAL MEAN MONTHLY TEMPERATURE (DEGREES FAHRENHEIT)
JAN/JUL FEB/AUG MAR/SEP APR/OCT MAY/NOV JUN/DEC ------- ------- ------- ------- ------- ------- 38.50 41.90 49.30 58.10 67.30 76.20 80.60 79.40 71.80 60.60 48.20 38.40
NOTE: SOLAR RADIATION DATA WAS SYNTHETICALLY GENERATED USING COEFFICIENTS FOR AMARILLO TEXAS AND STATION LATITUDE = 35.71 DEGREES
******************************************************************************* ANNUAL TOTALS FOR YEAR 1 ------------------------------------------------------------------------------- INCHES CU. FEET PERCENT -------- ---------- ------- PRECIPITATION 19.15 69514.516 100.00 RUNOFF 0.465 1686.935 2.43 EVAPOTRANSPIRATION 18.392 66761.250 96.04 DRAINAGE COLLECTED FROM LAYER 2 0.2355 854.972 1.23 PERC./LEAKAGE THROUGH LAYER 4 0.000016 0.058 0.00

AVG. HEAD ON TOP OF LAYER 3 0.0299 CHANGE IN WATER STORAGE 0.058 211.276 0.30 SOIL WATER AT START OF YEAR 15.251 55360.180 SOIL WATER AT END OF YEAR 15.309 55571.457 SNOW WATER AT START OF YEAR 0.000 0.000 0.00 SNOW WATER AT END OF YEAR 0.000 0.000 0.00 ANNUAL WATER BUDGET BALANCE 0.0000 0.028 0.00 *******************************************************************************
******************************************************************************* ANNUAL TOTALS FOR YEAR 2 ------------------------------------------------------------------------------- INCHES CU. FEET PERCENT -------- ---------- ------- PRECIPITATION 27.94 101422.203 100.00 RUNOFF 1.753 6361.691 6.27 EVAPOTRANSPIRATION 25.817 93716.367 92.40 DRAINAGE COLLECTED FROM LAYER 2 0.9151 3321.664 3.28 PERC./LEAKAGE THROUGH LAYER 4 0.000051 0.187 0.00 AVG. HEAD ON TOP OF LAYER 3 0.1159 CHANGE IN WATER STORAGE -0.545 -1977.720 -1.95 SOIL WATER AT START OF YEAR 15.309 55571.457 SOIL WATER AT END OF YEAR 14.764 53593.734 SNOW WATER AT START OF YEAR 0.000 0.000 0.00 SNOW WATER AT END OF YEAR 0.000 0.000 0.00 ANNUAL WATER BUDGET BALANCE 0.0000 0.014 0.00

*******************************************************************************
******************************************************************************* ANNUAL TOTALS FOR YEAR 3 ------------------------------------------------------------------------------- INCHES CU. FEET PERCENT -------- ---------- ------- PRECIPITATION 21.10 76593.000 100.00 RUNOFF 1.241 4504.747 5.88 EVAPOTRANSPIRATION 18.334 66551.187 86.89 DRAINAGE COLLECTED FROM LAYER 2 1.9563 7101.415 9.27 PERC./LEAKAGE THROUGH LAYER 4 0.000130 0.473 0.00 AVG. HEAD ON TOP OF LAYER 3 0.3467 CHANGE IN WATER STORAGE -0.431 -1564.813 -2.04 SOIL WATER AT START OF YEAR 14.764 53593.734 SOIL WATER AT END OF YEAR 14.333 52028.922 SNOW WATER AT START OF YEAR 0.000 0.000 0.00 SNOW WATER AT END OF YEAR 0.000 0.000 0.00 ANNUAL WATER BUDGET BALANCE 0.0000 -0.006 0.00 *******************************************************************************
******************************************************************************* ANNUAL TOTALS FOR YEAR 4 ------------------------------------------------------------------------------- INCHES CU. FEET PERCENT -------- ---------- ------- PRECIPITATION 21.58 78335.430 100.00 RUNOFF 0.754 2737.023 3.49

EVAPOTRANSPIRATION 19.529 70891.773 90.50 DRAINAGE COLLECTED FROM LAYER 2 0.5990 2174.518 2.78 PERC./LEAKAGE THROUGH LAYER 4 0.000036 0.130 0.00 AVG. HEAD ON TOP OF LAYER 3 0.0764 CHANGE IN WATER STORAGE 0.698 2531.926 3.23 SOIL WATER AT START OF YEAR 14.333 52028.922 SOIL WATER AT END OF YEAR 15.031 54560.848 SNOW WATER AT START OF YEAR 0.000 0.000 0.00 SNOW WATER AT END OF YEAR 0.000 0.000 0.00 ANNUAL WATER BUDGET BALANCE 0.0000 0.054 0.00 *******************************************************************************
******************************************************************************* ANNUAL TOTALS FOR YEAR 5 ------------------------------------------------------------------------------- INCHES CU. FEET PERCENT -------- ---------- ------- PRECIPITATION 20.77 75395.094 100.00 RUNOFF 0.300 1088.535 1.44 EVAPOTRANSPIRATION 20.678 75060.227 99.56 DRAINAGE COLLECTED FROM LAYER 2 0.0048 17.335 0.02 PERC./LEAKAGE THROUGH LAYER 4 0.000003 0.010 0.00 AVG. HEAD ON TOP OF LAYER 3 0.0006 CHANGE IN WATER STORAGE -0.212 -770.934 -1.02 SOIL WATER AT START OF YEAR 15.031 54560.848 SOIL WATER AT END OF YEAR 14.818 53789.914 SNOW WATER AT START OF YEAR 0.000 0.000 0.00

SNOW WATER AT END OF YEAR 0.000 0.000 0.00 ANNUAL WATER BUDGET BALANCE 0.0000 -0.076 0.00 *******************************************************************************
******************************************************************************* ANNUAL TOTALS FOR YEAR 6 ------------------------------------------------------------------------------- INCHES CU. FEET PERCENT -------- ---------- ------- PRECIPITATION 24.15 87664.516 100.00 RUNOFF 1.754 6366.597 7.26 EVAPOTRANSPIRATION 22.057 80065.641 91.33 DRAINAGE COLLECTED FROM LAYER 2 0.4740 1720.626 1.96 PERC./LEAKAGE THROUGH LAYER 4 0.000027 0.098 0.00 AVG. HEAD ON TOP OF LAYER 3 0.0598 CHANGE IN WATER STORAGE -0.135 -488.493 -0.56 SOIL WATER AT START OF YEAR 14.818 53789.914 SOIL WATER AT END OF YEAR 14.684 53301.422 SNOW WATER AT START OF YEAR 0.000 0.000 0.00 SNOW WATER AT END OF YEAR 0.000 0.000 0.00 ANNUAL WATER BUDGET BALANCE 0.0000 0.044 0.00 *******************************************************************************
******************************************************************************* ANNUAL TOTALS FOR YEAR 7 ------------------------------------------------------------------------------- INCHES CU. FEET PERCENT

-------- ---------- ------- PRECIPITATION 20.44 74197.195 100.00 RUNOFF 0.795 2887.581 3.89 EVAPOTRANSPIRATION 16.370 59422.160 80.09 DRAINAGE COLLECTED FROM LAYER 2 1.3027 4728.766 6.37 PERC./LEAKAGE THROUGH LAYER 4 0.000068 0.248 0.00 AVG. HEAD ON TOP OF LAYER 3 0.1648 CHANGE IN WATER STORAGE 1.972 7158.454 9.65 SOIL WATER AT START OF YEAR 14.684 53301.422 SOIL WATER AT END OF YEAR 16.656 60459.875 SNOW WATER AT START OF YEAR 0.000 0.000 0.00 SNOW WATER AT END OF YEAR 0.000 0.000 0.00 ANNUAL WATER BUDGET BALANCE 0.0000 -0.015 0.00 *******************************************************************************
******************************************************************************* ANNUAL TOTALS FOR YEAR 8 ------------------------------------------------------------------------------- INCHES CU. FEET PERCENT -------- ---------- ------- PRECIPITATION 25.28 91766.406 100.00 RUNOFF 1.821 6611.068 7.20 EVAPOTRANSPIRATION 23.378 84862.039 92.48 DRAINAGE COLLECTED FROM LAYER 2 0.4656 1690.212 1.84 PERC./LEAKAGE THROUGH LAYER 4 0.000028 0.100 0.00 AVG. HEAD ON TOP OF LAYER 3 0.0588 CHANGE IN WATER STORAGE -0.385 -1397.059 -1.52

SOIL WATER AT START OF YEAR 16.656 60459.875 SOIL WATER AT END OF YEAR 16.271 59062.816 SNOW WATER AT START OF YEAR 0.000 0.000 0.00 SNOW WATER AT END OF YEAR 0.000 0.000 0.00 ANNUAL WATER BUDGET BALANCE 0.0000 0.051 0.00 *******************************************************************************
******************************************************************************* ANNUAL TOTALS FOR YEAR 9 ------------------------------------------------------------------------------- INCHES CU. FEET PERCENT -------- ---------- ------- PRECIPITATION 19.33 70167.898 100.00 RUNOFF 1.424 5170.198 7.37 EVAPOTRANSPIRATION 18.812 68288.875 97.32 DRAINAGE COLLECTED FROM LAYER 2 0.5249 1905.512 2.72 PERC./LEAKAGE THROUGH LAYER 4 0.000032 0.115 0.00 AVG. HEAD ON TOP OF LAYER 3 0.0664 CHANGE IN WATER STORAGE -1.432 -5196.821 -7.41 SOIL WATER AT START OF YEAR 16.271 59062.816 SOIL WATER AT END OF YEAR 14.839 53865.996 SNOW WATER AT START OF YEAR 0.000 0.000 0.00 SNOW WATER AT END OF YEAR 0.000 0.000 0.00 ANNUAL WATER BUDGET BALANCE 0.0000 0.019 0.00 *******************************************************************************

******************************************************************************* ANNUAL TOTALS FOR YEAR 10 ------------------------------------------------------------------------------- INCHES CU. FEET PERCENT -------- ---------- ------- PRECIPITATION 22.40 81312.016 100.00 RUNOFF 0.841 3053.951 3.76 EVAPOTRANSPIRATION 19.529 70891.687 87.18 DRAINAGE COLLECTED FROM LAYER 2 0.2360 856.712 1.05 PERC./LEAKAGE THROUGH LAYER 4 0.000016 0.057 0.00 AVG. HEAD ON TOP OF LAYER 3 0.0301 CHANGE IN WATER STORAGE 1.793 6509.598 8.01 SOIL WATER AT START OF YEAR 14.839 53865.996 SOIL WATER AT END OF YEAR 16.632 60375.594 SNOW WATER AT START OF YEAR 0.000 0.000 0.00 SNOW WATER AT END OF YEAR 0.000 0.000 0.00 ANNUAL WATER BUDGET BALANCE 0.0000 0.014 0.00 *******************************************************************************
******************************************************************************* ANNUAL TOTALS FOR YEAR 11 ------------------------------------------------------------------------------- INCHES CU. FEET PERCENT -------- ---------- ------- PRECIPITATION 29.18 105923.406 100.00 RUNOFF 1.239 4499.068 4.25 EVAPOTRANSPIRATION 25.849 93831.141 88.58 DRAINAGE COLLECTED FROM LAYER 2 2.1398 7767.571 7.33 PERC./LEAKAGE THROUGH LAYER 4 0.000115 0.418 0.00

AVG. HEAD ON TOP OF LAYER 3 0.2723 CHANGE IN WATER STORAGE -0.048 -174.808 -0.17 SOIL WATER AT START OF YEAR 16.632 60375.594 SOIL WATER AT END OF YEAR 15.523 56349.309 SNOW WATER AT START OF YEAR 0.000 0.000 0.00 SNOW WATER AT END OF YEAR 1.061 3851.475 3.64 ANNUAL WATER BUDGET BALANCE 0.0000 0.019 0.00 *******************************************************************************
******************************************************************************* ANNUAL TOTALS FOR YEAR 12 ------------------------------------------------------------------------------- INCHES CU. FEET PERCENT -------- ---------- ------- PRECIPITATION 19.82 71946.602 100.00 RUNOFF 0.974 3535.443 4.91 EVAPOTRANSPIRATION 19.661 71370.586 99.20 DRAINAGE COLLECTED FROM LAYER 2 0.6937 2518.108 3.50 PERC./LEAKAGE THROUGH LAYER 4 0.000040 0.144 0.00 AVG. HEAD ON TOP OF LAYER 3 0.0875 CHANGE IN WATER STORAGE -1.509 -5477.653 -7.61 SOIL WATER AT START OF YEAR 15.523 56349.309 SOIL WATER AT END OF YEAR 15.075 54723.133 SNOW WATER AT START OF YEAR 1.061 3851.475 5.35 SNOW WATER AT END OF YEAR 0.000 0.000 0.00 ANNUAL WATER BUDGET BALANCE 0.0000 -0.027 0.00

*******************************************************************************
******************************************************************************* ANNUAL TOTALS FOR YEAR 13 ------------------------------------------------------------------------------- INCHES CU. FEET PERCENT -------- ---------- ------- PRECIPITATION 25.09 91076.711 100.00 RUNOFF 1.715 6223.742 6.83 EVAPOTRANSPIRATION 22.191 80552.312 88.44 DRAINAGE COLLECTED FROM LAYER 2 1.1575 4201.882 4.61 PERC./LEAKAGE THROUGH LAYER 4 0.000061 0.222 0.00 AVG. HEAD ON TOP OF LAYER 3 0.1473 CHANGE IN WATER STORAGE 0.027 98.493 0.11 SOIL WATER AT START OF YEAR 15.075 54723.133 SOIL WATER AT END OF YEAR 15.102 54821.625 SNOW WATER AT START OF YEAR 0.000 0.000 0.00 SNOW WATER AT END OF YEAR 0.000 0.000 0.00 ANNUAL WATER BUDGET BALANCE 0.0000 0.064 0.00 *******************************************************************************
******************************************************************************* ANNUAL TOTALS FOR YEAR 14 ------------------------------------------------------------------------------- INCHES CU. FEET PERCENT -------- ---------- ------- PRECIPITATION 15.15 54994.516 100.00 RUNOFF 0.686 2490.765 4.53

EVAPOTRANSPIRATION 14.679 53283.348 96.89 DRAINAGE COLLECTED FROM LAYER 2 0.1594 578.507 1.05 PERC./LEAKAGE THROUGH LAYER 4 0.000012 0.043 0.00 AVG. HEAD ON TOP OF LAYER 3 0.0203 CHANGE IN WATER STORAGE -0.374 -1358.152 -2.47 SOIL WATER AT START OF YEAR 15.102 54821.625 SOIL WATER AT END OF YEAR 14.728 53463.473 SNOW WATER AT START OF YEAR 0.000 0.000 0.00 SNOW WATER AT END OF YEAR 0.000 0.000 0.00 ANNUAL WATER BUDGET BALANCE 0.0000 0.006 0.00 *******************************************************************************
******************************************************************************* ANNUAL TOTALS FOR YEAR 15 ------------------------------------------------------------------------------- INCHES CU. FEET PERCENT -------- ---------- ------- PRECIPITATION 18.42 66864.609 100.00 RUNOFF 0.425 1544.556 2.31 EVAPOTRANSPIRATION 16.562 60121.258 89.91 DRAINAGE COLLECTED FROM LAYER 2 0.4000 1451.961 2.17 PERC./LEAKAGE THROUGH LAYER 4 0.000024 0.088 0.00 AVG. HEAD ON TOP OF LAYER 3 0.0504 CHANGE IN WATER STORAGE 1.032 3746.712 5.60 SOIL WATER AT START OF YEAR 14.728 53463.473 SOIL WATER AT END OF YEAR 15.760 57210.187 SNOW WATER AT START OF YEAR 0.000 0.000 0.00

SNOW WATER AT END OF YEAR 0.000 0.000 0.00 ANNUAL WATER BUDGET BALANCE 0.0000 0.031 0.00 *******************************************************************************
******************************************************************************* ANNUAL TOTALS FOR YEAR 16 ------------------------------------------------------------------------------- INCHES CU. FEET PERCENT -------- ---------- ------- PRECIPITATION 22.01 79896.305 100.00 RUNOFF 1.922 6976.539 8.73 EVAPOTRANSPIRATION 20.792 75474.398 94.47 DRAINAGE COLLECTED FROM LAYER 2 0.4789 1738.268 2.18 PERC./LEAKAGE THROUGH LAYER 4 0.000028 0.103 0.00 AVG. HEAD ON TOP OF LAYER 3 0.0611 CHANGE IN WATER STORAGE -1.183 -4293.004 -5.37 SOIL WATER AT START OF YEAR 15.760 57210.187 SOIL WATER AT END OF YEAR 14.578 52917.180 SNOW WATER AT START OF YEAR 0.000 0.000 0.00 SNOW WATER AT END OF YEAR 0.000 0.000 0.00 ANNUAL WATER BUDGET BALANCE 0.0000 -0.004 0.00 *******************************************************************************
******************************************************************************* ANNUAL TOTALS FOR YEAR 17 ------------------------------------------------------------------------------- INCHES CU. FEET PERCENT

-------- ---------- ------- PRECIPITATION 15.31 55575.305 100.00 RUNOFF 0.539 1956.215 3.52 EVAPOTRANSPIRATION 14.495 52617.676 94.68 DRAINAGE COLLECTED FROM LAYER 2 0.0385 139.768 0.25 PERC./LEAKAGE THROUGH LAYER 4 0.000005 0.018 0.00 AVG. HEAD ON TOP OF LAYER 3 0.0049 CHANGE IN WATER STORAGE 0.237 861.610 1.55 SOIL WATER AT START OF YEAR 14.578 52917.180 SOIL WATER AT END OF YEAR 14.815 53778.793 SNOW WATER AT START OF YEAR 0.000 0.000 0.00 SNOW WATER AT END OF YEAR 0.000 0.000 0.00 ANNUAL WATER BUDGET BALANCE 0.0000 0.017 0.00 *******************************************************************************
******************************************************************************* ANNUAL TOTALS FOR YEAR 18 ------------------------------------------------------------------------------- INCHES CU. FEET PERCENT -------- ---------- ------- PRECIPITATION 21.27 77210.102 100.00 RUNOFF 1.038 3766.968 4.88 EVAPOTRANSPIRATION 19.065 69206.937 89.63 DRAINAGE COLLECTED FROM LAYER 2 1.0045 3646.441 4.72 PERC./LEAKAGE THROUGH LAYER 4 0.000055 0.199 0.00 AVG. HEAD ON TOP OF LAYER 3 0.1266 CHANGE IN WATER STORAGE 0.162 589.544 0.76

SOIL WATER AT START OF YEAR 14.815 53778.793 SOIL WATER AT END OF YEAR 14.978 54368.336 SNOW WATER AT START OF YEAR 0.000 0.000 0.00 SNOW WATER AT END OF YEAR 0.000 0.000 0.00 ANNUAL WATER BUDGET BALANCE 0.0000 0.015 0.00 *******************************************************************************
******************************************************************************* ANNUAL TOTALS FOR YEAR 19 ------------------------------------------------------------------------------- INCHES CU. FEET PERCENT -------- ---------- ------- PRECIPITATION 27.00 98010.016 100.00 RUNOFF 3.320 12051.882 12.30 EVAPOTRANSPIRATION 22.686 82351.617 84.02 DRAINAGE COLLECTED FROM LAYER 2 0.8709 3161.365 3.23 PERC./LEAKAGE THROUGH LAYER 4 0.000051 0.185 0.00 AVG. HEAD ON TOP OF LAYER 3 0.1110 CHANGE IN WATER STORAGE 0.123 444.912 0.45 SOIL WATER AT START OF YEAR 14.978 54368.336 SOIL WATER AT END OF YEAR 15.100 54813.246 SNOW WATER AT START OF YEAR 0.000 0.000 0.00 SNOW WATER AT END OF YEAR 0.000 0.000 0.00 ANNUAL WATER BUDGET BALANCE 0.0000 0.054 0.00 *******************************************************************************

******************************************************************************* ANNUAL TOTALS FOR YEAR 20 ------------------------------------------------------------------------------- INCHES CU. FEET PERCENT -------- ---------- ------- PRECIPITATION 15.09 54776.699 100.00 RUNOFF 0.431 1562.987 2.85 EVAPOTRANSPIRATION 14.890 54050.605 98.67 DRAINAGE COLLECTED FROM LAYER 2 0.1121 406.878 0.74 PERC./LEAKAGE THROUGH LAYER 4 0.000009 0.033 0.00 AVG. HEAD ON TOP OF LAYER 3 0.0143 CHANGE IN WATER STORAGE -0.343 -1243.800 -2.27 SOIL WATER AT START OF YEAR 15.100 54813.246 SOIL WATER AT END OF YEAR 14.757 53569.445 SNOW WATER AT START OF YEAR 0.000 0.000 0.00 SNOW WATER AT END OF YEAR 0.000 0.000 0.00 ANNUAL WATER BUDGET BALANCE 0.0000 0.000 0.00 *******************************************************************************
******************************************************************************* ANNUAL TOTALS FOR YEAR 21 ------------------------------------------------------------------------------- INCHES CU. FEET PERCENT -------- ---------- ------- PRECIPITATION 18.54 67300.219 100.00 RUNOFF 2.266 8226.578 12.22 EVAPOTRANSPIRATION 15.241 55323.559 82.20 DRAINAGE COLLECTED FROM LAYER 2 0.5519 2003.248 2.98 PERC./LEAKAGE THROUGH LAYER 4 0.000032 0.117 0.00

AVG. HEAD ON TOP OF LAYER 3 0.0694 CHANGE IN WATER STORAGE 0.481 1746.684 2.60 SOIL WATER AT START OF YEAR 14.757 53569.445 SOIL WATER AT END OF YEAR 15.239 55316.133 SNOW WATER AT START OF YEAR 0.000 0.000 0.00 SNOW WATER AT END OF YEAR 0.000 0.000 0.00 ANNUAL WATER BUDGET BALANCE 0.0000 0.030 0.00 *******************************************************************************
******************************************************************************* ANNUAL TOTALS FOR YEAR 22 ------------------------------------------------------------------------------- INCHES CU. FEET PERCENT -------- ---------- ------- PRECIPITATION 26.25 95287.508 100.00 RUNOFF 2.255 8185.246 8.59 EVAPOTRANSPIRATION 20.259 73539.992 77.18 DRAINAGE COLLECTED FROM LAYER 2 3.8305 13904.696 14.59 PERC./LEAKAGE THROUGH LAYER 4 0.000378 1.373 0.00 AVG. HEAD ON TOP OF LAYER 3 1.0833 CHANGE IN WATER STORAGE -0.095 -343.833 -0.36 SOIL WATER AT START OF YEAR 15.239 55316.133 SOIL WATER AT END OF YEAR 15.144 54972.297 SNOW WATER AT START OF YEAR 0.000 0.000 0.00 SNOW WATER AT END OF YEAR 0.000 0.000 0.00 ANNUAL WATER BUDGET BALANCE 0.0000 0.031 0.00

*******************************************************************************
******************************************************************************* ANNUAL TOTALS FOR YEAR 23 ------------------------------------------------------------------------------- INCHES CU. FEET PERCENT -------- ---------- ------- PRECIPITATION 20.73 75249.898 100.00 RUNOFF 1.587 5762.624 7.66 EVAPOTRANSPIRATION 19.352 70249.406 93.35 DRAINAGE COLLECTED FROM LAYER 2 0.1514 549.427 0.73 PERC./LEAKAGE THROUGH LAYER 4 0.000011 0.041 0.00 AVG. HEAD ON TOP OF LAYER 3 0.0191 CHANGE IN WATER STORAGE -0.361 -1311.590 -1.74 SOIL WATER AT START OF YEAR 15.144 54972.297 SOIL WATER AT END OF YEAR 14.783 53660.707 SNOW WATER AT START OF YEAR 0.000 0.000 0.00 SNOW WATER AT END OF YEAR 0.000 0.000 0.00 ANNUAL WATER BUDGET BALANCE 0.0000 -0.009 0.00 *******************************************************************************
******************************************************************************* ANNUAL TOTALS FOR YEAR 24 ------------------------------------------------------------------------------- INCHES CU. FEET PERCENT -------- ---------- ------- PRECIPITATION 22.92 83199.617 100.00 RUNOFF 0.992 3602.497 4.33

EVAPOTRANSPIRATION 19.613 71194.609 85.57 DRAINAGE COLLECTED FROM LAYER 2 1.8919 6867.448 8.25 PERC./LEAKAGE THROUGH LAYER 4 0.000097 0.350 0.00 AVG. HEAD ON TOP OF LAYER 3 0.2394 CHANGE IN WATER STORAGE 0.423 1534.709 1.84 SOIL WATER AT START OF YEAR 14.783 53660.707 SOIL WATER AT END OF YEAR 15.205 55195.418 SNOW WATER AT START OF YEAR 0.000 0.000 0.00 SNOW WATER AT END OF YEAR 0.000 0.000 0.00 ANNUAL WATER BUDGET BALANCE 0.0000 -0.002 0.00 *******************************************************************************
******************************************************************************* ANNUAL TOTALS FOR YEAR 25 ------------------------------------------------------------------------------- INCHES CU. FEET PERCENT -------- ---------- ------- PRECIPITATION 23.80 86394.008 100.00 RUNOFF 0.749 2718.973 3.15 EVAPOTRANSPIRATION 21.928 79597.711 92.13 DRAINAGE COLLECTED FROM LAYER 2 0.5930 2152.558 2.49 PERC./LEAKAGE THROUGH LAYER 4 0.000035 0.128 0.00 AVG. HEAD ON TOP OF LAYER 3 0.0753 CHANGE IN WATER STORAGE 0.530 1924.626 2.23 SOIL WATER AT START OF YEAR 15.205 55195.418 SOIL WATER AT END OF YEAR 15.736 57120.043 SNOW WATER AT START OF YEAR 0.000 0.000 0.00

SNOW WATER AT END OF YEAR 0.000 0.000 0.00 ANNUAL WATER BUDGET BALANCE 0.0000 0.015 0.00 *******************************************************************************
******************************************************************************* ANNUAL TOTALS FOR YEAR 26 ------------------------------------------------------------------------------- INCHES CU. FEET PERCENT -------- ---------- ------- PRECIPITATION 19.41 70458.312 100.00 RUNOFF 0.518 1879.630 2.67 EVAPOTRANSPIRATION 19.609 71181.133 101.03 DRAINAGE COLLECTED FROM LAYER 2 0.1202 436.473 0.62 PERC./LEAKAGE THROUGH LAYER 4 0.000010 0.035 0.00 AVG. HEAD ON TOP OF LAYER 3 0.0153 CHANGE IN WATER STORAGE -0.837 -3038.971 -4.31 SOIL WATER AT START OF YEAR 15.736 57120.043 SOIL WATER AT END OF YEAR 14.898 54081.070 SNOW WATER AT START OF YEAR 0.000 0.000 0.00 SNOW WATER AT END OF YEAR 0.000 0.000 0.00 ANNUAL WATER BUDGET BALANCE 0.0000 0.014 0.00 *******************************************************************************
******************************************************************************* ANNUAL TOTALS FOR YEAR 27 ------------------------------------------------------------------------------- INCHES CU. FEET PERCENT

-------- ---------- ------- PRECIPITATION 23.64 85813.219 100.00 RUNOFF 0.705 2558.708 2.98 EVAPOTRANSPIRATION 22.899 83124.016 96.87 DRAINAGE COLLECTED FROM LAYER 2 0.5035 1827.730 2.13 PERC./LEAKAGE THROUGH LAYER 4 0.000031 0.112 0.00 AVG. HEAD ON TOP OF LAYER 3 0.0639 CHANGE IN WATER STORAGE -0.468 -1697.415 -1.98 SOIL WATER AT START OF YEAR 14.898 54081.070 SOIL WATER AT END OF YEAR 14.431 52383.656 SNOW WATER AT START OF YEAR 0.000 0.000 0.00 SNOW WATER AT END OF YEAR 0.000 0.000 0.00 ANNUAL WATER BUDGET BALANCE 0.0000 0.070 0.00 *******************************************************************************
******************************************************************************* ANNUAL TOTALS FOR YEAR 28 ------------------------------------------------------------------------------- INCHES CU. FEET PERCENT -------- ---------- ------- PRECIPITATION 21.17 76847.117 100.00 RUNOFF 0.686 2490.276 3.24 EVAPOTRANSPIRATION 19.458 70633.258 91.91 DRAINAGE COLLECTED FROM LAYER 2 0.0324 117.615 0.15 PERC./LEAKAGE THROUGH LAYER 4 0.000005 0.017 0.00 AVG. HEAD ON TOP OF LAYER 3 0.0041 CHANGE IN WATER STORAGE 0.993 3605.926 4.69

SOIL WATER AT START OF YEAR 14.431 52383.656 SOIL WATER AT END OF YEAR 15.424 55989.582 SNOW WATER AT START OF YEAR 0.000 0.000 0.00 SNOW WATER AT END OF YEAR 0.000 0.000 0.00 ANNUAL WATER BUDGET BALANCE 0.0000 0.027 0.00 *******************************************************************************
******************************************************************************* ANNUAL TOTALS FOR YEAR 29 ------------------------------------------------------------------------------- INCHES CU. FEET PERCENT -------- ---------- ------- PRECIPITATION 26.90 97646.984 100.00 RUNOFF 1.587 5760.464 5.90 EVAPOTRANSPIRATION 24.492 88907.719 91.05 DRAINAGE COLLECTED FROM LAYER 2 1.3152 4774.003 4.89 PERC./LEAKAGE THROUGH LAYER 4 0.000069 0.252 0.00 AVG. HEAD ON TOP OF LAYER 3 0.1672 CHANGE IN WATER STORAGE -0.495 -1795.461 -1.84 SOIL WATER AT START OF YEAR 15.424 55989.582 SOIL WATER AT END OF YEAR 14.930 54194.121 SNOW WATER AT START OF YEAR 0.000 0.000 0.00 SNOW WATER AT END OF YEAR 0.000 0.000 0.00 ANNUAL WATER BUDGET BALANCE 0.0000 0.006 0.00 *******************************************************************************

******************************************************************************* ANNUAL TOTALS FOR YEAR 30 ------------------------------------------------------------------------------- INCHES CU. FEET PERCENT -------- ---------- ------- PRECIPITATION 25.88 93944.398 100.00 RUNOFF 1.714 6223.134 6.62 EVAPOTRANSPIRATION 23.351 84764.484 90.23 DRAINAGE COLLECTED FROM LAYER 2 0.6987 2536.220 2.70 PERC./LEAKAGE THROUGH LAYER 4 0.000040 0.145 0.00 AVG. HEAD ON TOP OF LAYER 3 0.0892 CHANGE IN WATER STORAGE 0.116 420.378 0.45 SOIL WATER AT START OF YEAR 14.930 54194.121 SOIL WATER AT END OF YEAR 15.045 54614.500 SNOW WATER AT START OF YEAR 0.000 0.000 0.00 SNOW WATER AT END OF YEAR 0.000 0.000 0.00 ANNUAL WATER BUDGET BALANCE 0.0000 0.038 0.00 *******************************************************************************
******************************************************************************* ANNUAL TOTALS FOR YEAR 31 ------------------------------------------------------------------------------- INCHES CU. FEET PERCENT -------- ---------- ------- PRECIPITATION 24.80 90024.008 100.00 RUNOFF 1.248 4532.006 5.03 EVAPOTRANSPIRATION 23.581 85599.172 95.08 DRAINAGE COLLECTED FROM LAYER 2 0.5548 2013.919 2.24 PERC./LEAKAGE THROUGH LAYER 4 0.000032 0.118 0.00

AVG. HEAD ON TOP OF LAYER 3 0.0708 CHANGE IN WATER STORAGE -0.584 -2121.220 -2.36 SOIL WATER AT START OF YEAR 15.045 54614.500 SOIL WATER AT END OF YEAR 14.461 52493.277 SNOW WATER AT START OF YEAR 0.000 0.000 0.00 SNOW WATER AT END OF YEAR 0.000 0.000 0.00 ANNUAL WATER BUDGET BALANCE 0.0000 0.015 0.00 *******************************************************************************
******************************************************************************* ANNUAL TOTALS FOR YEAR 32 ------------------------------------------------------------------------------- INCHES CU. FEET PERCENT -------- ---------- ------- PRECIPITATION 25.36 92056.812 100.00 RUNOFF 1.365 4955.005 5.38 EVAPOTRANSPIRATION 22.217 80646.031 87.60 DRAINAGE COLLECTED FROM LAYER 2 0.7714 2800.296 3.04 PERC./LEAKAGE THROUGH LAYER 4 0.000045 0.163 0.00 AVG. HEAD ON TOP OF LAYER 3 0.0985 CHANGE IN WATER STORAGE 1.007 3655.296 3.97 SOIL WATER AT START OF YEAR 14.461 52493.277 SOIL WATER AT END OF YEAR 15.468 56148.574 SNOW WATER AT START OF YEAR 0.000 0.000 0.00 SNOW WATER AT END OF YEAR 0.000 0.000 0.00 ANNUAL WATER BUDGET BALANCE 0.0000 0.019 0.00

*******************************************************************************
******************************************************************************* ANNUAL TOTALS FOR YEAR 33 ------------------------------------------------------------------------------- INCHES CU. FEET PERCENT -------- ---------- ------- PRECIPITATION 17.27 62690.117 100.00 RUNOFF 0.123 447.823 0.71 EVAPOTRANSPIRATION 17.252 62623.336 99.89 DRAINAGE COLLECTED FROM LAYER 2 0.0233 84.477 0.13 PERC./LEAKAGE THROUGH LAYER 4 0.000004 0.015 0.00 AVG. HEAD ON TOP OF LAYER 3 0.0029 CHANGE IN WATER STORAGE -0.128 -465.544 -0.74 SOIL WATER AT START OF YEAR 15.468 56148.574 SOIL WATER AT END OF YEAR 15.340 55683.031 SNOW WATER AT START OF YEAR 0.000 0.000 0.00 SNOW WATER AT END OF YEAR 0.000 0.000 0.00 ANNUAL WATER BUDGET BALANCE 0.0000 0.008 0.00 *******************************************************************************
******************************************************************************* ANNUAL TOTALS FOR YEAR 34 ------------------------------------------------------------------------------- INCHES CU. FEET PERCENT -------- ---------- ------- PRECIPITATION 27.87 101168.094 100.00 RUNOFF 2.676 9715.480 9.60

EVAPOTRANSPIRATION 25.010 90784.484 89.74 DRAINAGE COLLECTED FROM LAYER 2 1.2011 4359.915 4.31 PERC./LEAKAGE THROUGH LAYER 4 0.000065 0.236 0.00 AVG. HEAD ON TOP OF LAYER 3 0.1521 CHANGE IN WATER STORAGE -1.017 -3692.043 -3.65 SOIL WATER AT START OF YEAR 15.340 55683.031 SOIL WATER AT END OF YEAR 14.323 51990.988 SNOW WATER AT START OF YEAR 0.000 0.000 0.00 SNOW WATER AT END OF YEAR 0.000 0.000 0.00 ANNUAL WATER BUDGET BALANCE 0.0000 0.021 0.00 *******************************************************************************
******************************************************************************* ANNUAL TOTALS FOR YEAR 35 ------------------------------------------------------------------------------- INCHES CU. FEET PERCENT -------- ---------- ------- PRECIPITATION 19.38 70349.398 100.00 RUNOFF 0.117 423.129 0.60 EVAPOTRANSPIRATION 18.751 68066.234 96.75 DRAINAGE COLLECTED FROM LAYER 2 0.1412 512.466 0.73 PERC./LEAKAGE THROUGH LAYER 4 0.000011 0.039 0.00 AVG. HEAD ON TOP OF LAYER 3 0.0178 CHANGE IN WATER STORAGE 0.371 1347.545 1.92 SOIL WATER AT START OF YEAR 14.323 51990.988 SOIL WATER AT END OF YEAR 14.694 53338.531 SNOW WATER AT START OF YEAR 0.000 0.000 0.00
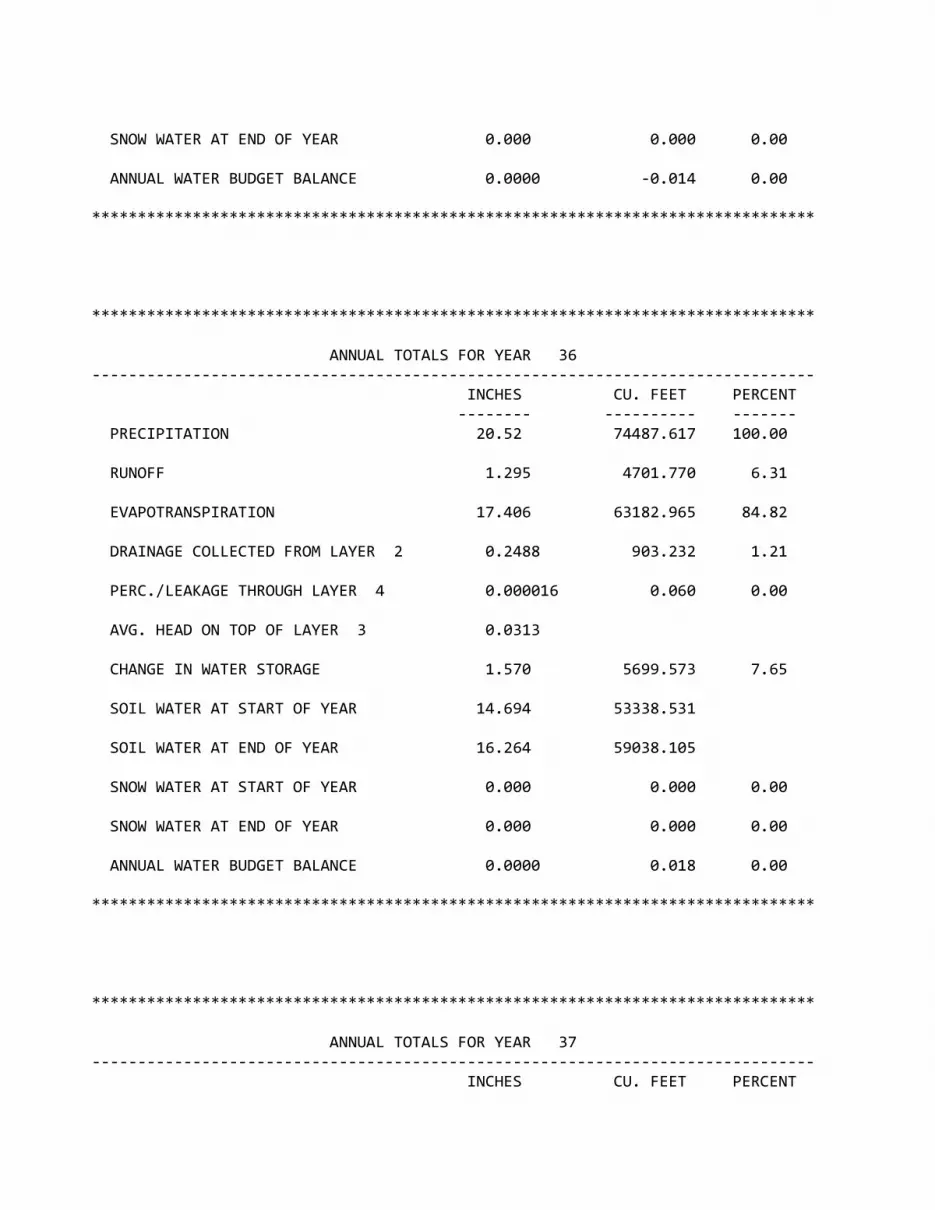
SNOW WATER AT END OF YEAR 0.000 0.000 0.00 ANNUAL WATER BUDGET BALANCE 0.0000 -0.014 0.00 *******************************************************************************
******************************************************************************* ANNUAL TOTALS FOR YEAR 36 ------------------------------------------------------------------------------- INCHES CU. FEET PERCENT -------- ---------- ------- PRECIPITATION 20.52 74487.617 100.00 RUNOFF 1.295 4701.770 6.31 EVAPOTRANSPIRATION 17.406 63182.965 84.82 DRAINAGE COLLECTED FROM LAYER 2 0.2488 903.232 1.21 PERC./LEAKAGE THROUGH LAYER 4 0.000016 0.060 0.00 AVG. HEAD ON TOP OF LAYER 3 0.0313 CHANGE IN WATER STORAGE 1.570 5699.573 7.65 SOIL WATER AT START OF YEAR 14.694 53338.531 SOIL WATER AT END OF YEAR 16.264 59038.105 SNOW WATER AT START OF YEAR 0.000 0.000 0.00 SNOW WATER AT END OF YEAR 0.000 0.000 0.00 ANNUAL WATER BUDGET BALANCE 0.0000 0.018 0.00 *******************************************************************************
******************************************************************************* ANNUAL TOTALS FOR YEAR 37 ------------------------------------------------------------------------------- INCHES CU. FEET PERCENT

-------- ---------- ------- PRECIPITATION 18.59 67481.711 100.00 RUNOFF 1.056 3834.298 5.68 EVAPOTRANSPIRATION 18.331 66543.234 98.61 DRAINAGE COLLECTED FROM LAYER 2 0.7021 2548.781 3.78 PERC./LEAKAGE THROUGH LAYER 4 0.000041 0.149 0.00 AVG. HEAD ON TOP OF LAYER 3 0.0905 CHANGE IN WATER STORAGE -1.500 -5444.785 -8.07 SOIL WATER AT START OF YEAR 16.264 59038.105 SOIL WATER AT END OF YEAR 14.764 53593.320 SNOW WATER AT START OF YEAR 0.000 0.000 0.00 SNOW WATER AT END OF YEAR 0.000 0.000 0.00 ANNUAL WATER BUDGET BALANCE 0.0000 0.034 0.00 *******************************************************************************
******************************************************************************* ANNUAL TOTALS FOR YEAR 38 ------------------------------------------------------------------------------- INCHES CU. FEET PERCENT -------- ---------- ------- PRECIPITATION 17.07 61964.105 100.00 RUNOFF 0.193 702.388 1.13 EVAPOTRANSPIRATION 16.551 60080.508 96.96 DRAINAGE COLLECTED FROM LAYER 2 0.3711 1347.214 2.17 PERC./LEAKAGE THROUGH LAYER 4 0.000024 0.085 0.00 AVG. HEAD ON TOP OF LAYER 3 0.0469 CHANGE IN WATER STORAGE -0.046 -166.113 -0.27

SOIL WATER AT START OF YEAR 14.764 53593.320 SOIL WATER AT END OF YEAR 14.718 53427.207 SNOW WATER AT START OF YEAR 0.000 0.000 0.00 SNOW WATER AT END OF YEAR 0.000 0.000 0.00 ANNUAL WATER BUDGET BALANCE 0.0000 0.025 0.00 *******************************************************************************
******************************************************************************* ANNUAL TOTALS FOR YEAR 39 ------------------------------------------------------------------------------- INCHES CU. FEET PERCENT -------- ---------- ------- PRECIPITATION 24.27 88100.109 100.00 RUNOFF 2.436 8843.934 10.04 EVAPOTRANSPIRATION 19.356 70260.562 79.75 DRAINAGE COLLECTED FROM LAYER 2 2.1466 7792.272 8.84 PERC./LEAKAGE THROUGH LAYER 4 0.000112 0.407 0.00 AVG. HEAD ON TOP OF LAYER 3 0.2707 CHANGE IN WATER STORAGE 0.331 1202.944 1.37 SOIL WATER AT START OF YEAR 14.718 53427.207 SOIL WATER AT END OF YEAR 15.050 54630.152 SNOW WATER AT START OF YEAR 0.000 0.000 0.00 SNOW WATER AT END OF YEAR 0.000 0.000 0.00 ANNUAL WATER BUDGET BALANCE 0.0000 -0.007 0.00 *******************************************************************************

******************************************************************************* ANNUAL TOTALS FOR YEAR 40 ------------------------------------------------------------------------------- INCHES CU. FEET PERCENT -------- ---------- ------- PRECIPITATION 24.65 89479.516 100.00 RUNOFF 0.606 2200.535 2.46 EVAPOTRANSPIRATION 24.058 87330.648 97.60 DRAINAGE COLLECTED FROM LAYER 2 0.0148 53.638 0.06 PERC./LEAKAGE THROUGH LAYER 4 0.000004 0.013 0.00 AVG. HEAD ON TOP OF LAYER 3 0.0019 CHANGE IN WATER STORAGE -0.029 -105.323 -0.12 SOIL WATER AT START OF YEAR 15.050 54630.152 SOIL WATER AT END OF YEAR 15.021 54524.828 SNOW WATER AT START OF YEAR 0.000 0.000 0.00 SNOW WATER AT END OF YEAR 0.000 0.000 0.00 ANNUAL WATER BUDGET BALANCE 0.0000 0.003 0.00 *******************************************************************************
******************************************************************************* ANNUAL TOTALS FOR YEAR 41 ------------------------------------------------------------------------------- INCHES CU. FEET PERCENT -------- ---------- ------- PRECIPITATION 19.48 70712.414 100.00 RUNOFF 0.926 3360.398 4.75 EVAPOTRANSPIRATION 18.133 65824.414 93.09 DRAINAGE COLLECTED FROM LAYER 2 0.8394 3046.924 4.31 PERC./LEAKAGE THROUGH LAYER 4 0.000046 0.166 0.00

AVG. HEAD ON TOP OF LAYER 3 0.1056 CHANGE IN WATER STORAGE -0.419 -1519.515 -2.15 SOIL WATER AT START OF YEAR 15.021 54524.828 SOIL WATER AT END OF YEAR 14.602 53005.312 SNOW WATER AT START OF YEAR 0.000 0.000 0.00 SNOW WATER AT END OF YEAR 0.000 0.000 0.00 ANNUAL WATER BUDGET BALANCE 0.0000 0.025 0.00 *******************************************************************************
******************************************************************************* ANNUAL TOTALS FOR YEAR 42 ------------------------------------------------------------------------------- INCHES CU. FEET PERCENT -------- ---------- ------- PRECIPITATION 25.16 91330.805 100.00 RUNOFF 0.711 2579.278 2.82 EVAPOTRANSPIRATION 22.599 82032.742 89.82 DRAINAGE COLLECTED FROM LAYER 2 0.1419 515.131 0.56 PERC./LEAKAGE THROUGH LAYER 4 0.000011 0.039 0.00 AVG. HEAD ON TOP OF LAYER 3 0.0178 CHANGE IN WATER STORAGE 1.709 6203.606 6.79 SOIL WATER AT START OF YEAR 14.602 53005.312 SOIL WATER AT END OF YEAR 16.311 59208.918 SNOW WATER AT START OF YEAR 0.000 0.000 0.00 SNOW WATER AT END OF YEAR 0.000 0.000 0.00 ANNUAL WATER BUDGET BALANCE 0.0000 0.014 0.00

*******************************************************************************
******************************************************************************* ANNUAL TOTALS FOR YEAR 43 ------------------------------------------------------------------------------- INCHES CU. FEET PERCENT -------- ---------- ------- PRECIPITATION 27.81 100950.336 100.00 RUNOFF 1.484 5387.473 5.34 EVAPOTRANSPIRATION 27.061 98232.898 97.31 DRAINAGE COLLECTED FROM LAYER 2 0.5614 2037.791 2.02 PERC./LEAKAGE THROUGH LAYER 4 0.000034 0.122 0.00 AVG. HEAD ON TOP OF LAYER 3 0.0712 CHANGE IN WATER STORAGE -1.297 -4707.993 -4.66 SOIL WATER AT START OF YEAR 16.311 59208.918 SOIL WATER AT END OF YEAR 14.804 53738.703 SNOW WATER AT START OF YEAR 0.000 0.000 0.00 SNOW WATER AT END OF YEAR 0.210 762.223 0.76 ANNUAL WATER BUDGET BALANCE 0.0000 0.045 0.00 *******************************************************************************
******************************************************************************* ANNUAL TOTALS FOR YEAR 44 ------------------------------------------------------------------------------- INCHES CU. FEET PERCENT -------- ---------- ------- PRECIPITATION 24.59 89261.711 100.00 RUNOFF 1.650 5988.414 6.71

EVAPOTRANSPIRATION 22.362 81175.570 90.94 DRAINAGE COLLECTED FROM LAYER 2 0.9305 3377.716 3.78 PERC./LEAKAGE THROUGH LAYER 4 0.000050 0.183 0.00 AVG. HEAD ON TOP OF LAYER 3 0.1187 CHANGE IN WATER STORAGE -0.353 -1280.156 -1.43 SOIL WATER AT START OF YEAR 14.804 53738.703 SOIL WATER AT END OF YEAR 14.661 53220.770 SNOW WATER AT START OF YEAR 0.210 762.223 0.85 SNOW WATER AT END OF YEAR 0.000 0.000 0.00 ANNUAL WATER BUDGET BALANCE 0.0000 -0.010 0.00 *******************************************************************************
******************************************************************************* ANNUAL TOTALS FOR YEAR 45 ------------------------------------------------------------------------------- INCHES CU. FEET PERCENT -------- ---------- ------- PRECIPITATION 21.39 77645.703 100.00 RUNOFF 0.331 1200.023 1.55 EVAPOTRANSPIRATION 20.735 75266.594 96.94 DRAINAGE COLLECTED FROM LAYER 2 0.0279 101.352 0.13 PERC./LEAKAGE THROUGH LAYER 4 0.000004 0.015 0.00 AVG. HEAD ON TOP OF LAYER 3 0.0035 CHANGE IN WATER STORAGE 0.297 1077.746 1.39 SOIL WATER AT START OF YEAR 14.661 53220.770 SOIL WATER AT END OF YEAR 14.958 54298.516 SNOW WATER AT START OF YEAR 0.000 0.000 0.00

SNOW WATER AT END OF YEAR 0.000 0.000 0.00 ANNUAL WATER BUDGET BALANCE 0.0000 -0.023 0.00 *******************************************************************************
******************************************************************************* ANNUAL TOTALS FOR YEAR 46 ------------------------------------------------------------------------------- INCHES CU. FEET PERCENT -------- ---------- ------- PRECIPITATION 16.33 59277.906 100.00 RUNOFF 0.845 3068.953 5.18 EVAPOTRANSPIRATION 15.780 57282.441 96.63 DRAINAGE COLLECTED FROM LAYER 2 0.3112 1129.682 1.91 PERC./LEAKAGE THROUGH LAYER 4 0.000019 0.070 0.00 AVG. HEAD ON TOP OF LAYER 3 0.0398 CHANGE IN WATER STORAGE -0.607 -2203.242 -3.72 SOIL WATER AT START OF YEAR 14.958 54298.516 SOIL WATER AT END OF YEAR 14.351 52095.273 SNOW WATER AT START OF YEAR 0.000 0.000 0.00 SNOW WATER AT END OF YEAR 0.000 0.000 0.00 ANNUAL WATER BUDGET BALANCE 0.0000 0.002 0.00 *******************************************************************************
******************************************************************************* ANNUAL TOTALS FOR YEAR 47 ------------------------------------------------------------------------------- INCHES CU. FEET PERCENT

-------- ---------- ------- PRECIPITATION 27.05 98191.508 100.00 RUNOFF 1.175 4266.221 4.34 EVAPOTRANSPIRATION 25.016 90806.672 92.48 DRAINAGE COLLECTED FROM LAYER 2 0.7386 2681.140 2.73 PERC./LEAKAGE THROUGH LAYER 4 0.000041 0.151 0.00 AVG. HEAD ON TOP OF LAYER 3 0.0943 CHANGE IN WATER STORAGE 0.120 437.303 0.45 SOIL WATER AT START OF YEAR 14.351 52095.273 SOIL WATER AT END OF YEAR 14.472 52532.578 SNOW WATER AT START OF YEAR 0.000 0.000 0.00 SNOW WATER AT END OF YEAR 0.000 0.000 0.00 ANNUAL WATER BUDGET BALANCE 0.0000 0.027 0.00 *******************************************************************************
******************************************************************************* ANNUAL TOTALS FOR YEAR 48 ------------------------------------------------------------------------------- INCHES CU. FEET PERCENT -------- ---------- ------- PRECIPITATION 21.27 77210.109 100.00 RUNOFF 1.124 4079.457 5.28 EVAPOTRANSPIRATION 19.272 69958.836 90.61 DRAINAGE COLLECTED FROM LAYER 2 1.0225 3711.501 4.81 PERC./LEAKAGE THROUGH LAYER 4 0.000056 0.202 0.00 AVG. HEAD ON TOP OF LAYER 3 0.1290 CHANGE IN WATER STORAGE -0.149 -539.894 -0.70

SOIL WATER AT START OF YEAR 14.472 52532.578 SOIL WATER AT END OF YEAR 14.323 51992.684 SNOW WATER AT START OF YEAR 0.000 0.000 0.00 SNOW WATER AT END OF YEAR 0.000 0.000 0.00 ANNUAL WATER BUDGET BALANCE 0.0000 0.004 0.00 *******************************************************************************
******************************************************************************* ANNUAL TOTALS FOR YEAR 49 ------------------------------------------------------------------------------- INCHES CU. FEET PERCENT -------- ---------- ------- PRECIPITATION 26.01 94416.305 100.00 RUNOFF 2.385 8658.673 9.17 EVAPOTRANSPIRATION 22.293 80922.594 85.71 DRAINAGE COLLECTED FROM LAYER 2 1.3314 4832.906 5.12 PERC./LEAKAGE THROUGH LAYER 4 0.000070 0.256 0.00 AVG. HEAD ON TOP OF LAYER 3 0.1682 CHANGE IN WATER STORAGE 0.001 1.876 0.00 SOIL WATER AT START OF YEAR 14.323 51992.684 SOIL WATER AT END OF YEAR 14.324 51994.559 SNOW WATER AT START OF YEAR 0.000 0.000 0.00 SNOW WATER AT END OF YEAR 0.000 0.000 0.00 ANNUAL WATER BUDGET BALANCE 0.0000 0.000 0.00 *******************************************************************************
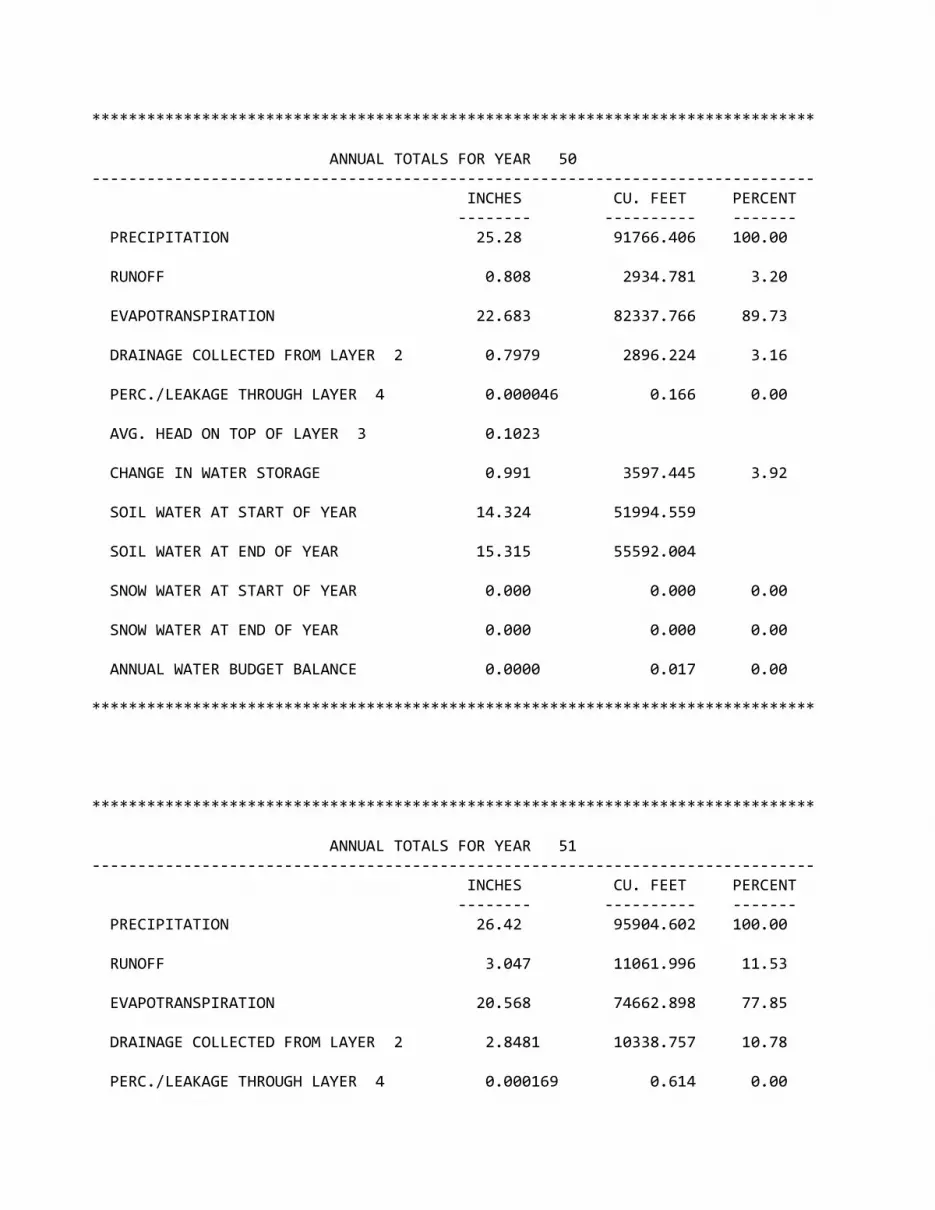
******************************************************************************* ANNUAL TOTALS FOR YEAR 50 ------------------------------------------------------------------------------- INCHES CU. FEET PERCENT -------- ---------- ------- PRECIPITATION 25.28 91766.406 100.00 RUNOFF 0.808 2934.781 3.20 EVAPOTRANSPIRATION 22.683 82337.766 89.73 DRAINAGE COLLECTED FROM LAYER 2 0.7979 2896.224 3.16 PERC./LEAKAGE THROUGH LAYER 4 0.000046 0.166 0.00 AVG. HEAD ON TOP OF LAYER 3 0.1023 CHANGE IN WATER STORAGE 0.991 3597.445 3.92 SOIL WATER AT START OF YEAR 14.324 51994.559 SOIL WATER AT END OF YEAR 15.315 55592.004 SNOW WATER AT START OF YEAR 0.000 0.000 0.00 SNOW WATER AT END OF YEAR 0.000 0.000 0.00 ANNUAL WATER BUDGET BALANCE 0.0000 0.017 0.00 *******************************************************************************
******************************************************************************* ANNUAL TOTALS FOR YEAR 51 ------------------------------------------------------------------------------- INCHES CU. FEET PERCENT -------- ---------- ------- PRECIPITATION 26.42 95904.602 100.00 RUNOFF 3.047 11061.996 11.53 EVAPOTRANSPIRATION 20.568 74662.898 77.85 DRAINAGE COLLECTED FROM LAYER 2 2.8481 10338.757 10.78 PERC./LEAKAGE THROUGH LAYER 4 0.000169 0.614 0.00

AVG. HEAD ON TOP OF LAYER 3 0.4550 CHANGE IN WATER STORAGE -0.044 -159.688 -0.17 SOIL WATER AT START OF YEAR 15.315 55592.004 SOIL WATER AT END OF YEAR 15.271 55432.316 SNOW WATER AT START OF YEAR 0.000 0.000 0.00 SNOW WATER AT END OF YEAR 0.000 0.000 0.00 ANNUAL WATER BUDGET BALANCE 0.0000 0.019 0.00 *******************************************************************************
******************************************************************************* ANNUAL TOTALS FOR YEAR 52 ------------------------------------------------------------------------------- INCHES CU. FEET PERCENT -------- ---------- ------- PRECIPITATION 16.56 60112.805 100.00 RUNOFF 0.598 2169.912 3.61 EVAPOTRANSPIRATION 15.920 57789.215 96.13 DRAINAGE COLLECTED FROM LAYER 2 0.1513 549.151 0.91 PERC./LEAKAGE THROUGH LAYER 4 0.000011 0.040 0.00 AVG. HEAD ON TOP OF LAYER 3 0.0190 CHANGE IN WATER STORAGE -0.109 -395.498 -0.66 SOIL WATER AT START OF YEAR 15.271 55432.316 SOIL WATER AT END OF YEAR 15.162 55036.820 SNOW WATER AT START OF YEAR 0.000 0.000 0.00 SNOW WATER AT END OF YEAR 0.000 0.000 0.00 ANNUAL WATER BUDGET BALANCE 0.0000 -0.016 0.00

*******************************************************************************
******************************************************************************* ANNUAL TOTALS FOR YEAR 53 ------------------------------------------------------------------------------- INCHES CU. FEET PERCENT -------- ---------- ------- PRECIPITATION 23.78 86321.414 100.00 RUNOFF 2.210 8021.332 9.29 EVAPOTRANSPIRATION 19.381 70353.023 81.50 DRAINAGE COLLECTED FROM LAYER 2 1.8903 6861.704 7.95 PERC./LEAKAGE THROUGH LAYER 4 0.000114 0.415 0.00 AVG. HEAD ON TOP OF LAYER 3 0.2987 CHANGE IN WATER STORAGE 0.299 1084.919 1.26 SOIL WATER AT START OF YEAR 15.162 55036.820 SOIL WATER AT END OF YEAR 14.681 53292.246 SNOW WATER AT START OF YEAR 0.000 0.000 0.00 SNOW WATER AT END OF YEAR 0.779 2829.491 3.28 ANNUAL WATER BUDGET BALANCE 0.0000 0.022 0.00 *******************************************************************************
******************************************************************************* ANNUAL TOTALS FOR YEAR 54 ------------------------------------------------------------------------------- INCHES CU. FEET PERCENT -------- ---------- ------- PRECIPITATION 29.58 107375.430 100.00 RUNOFF 1.764 6402.517 5.96

EVAPOTRANSPIRATION 27.125 98463.898 91.70 DRAINAGE COLLECTED FROM LAYER 2 1.2417 4507.262 4.20 PERC./LEAKAGE THROUGH LAYER 4 0.000065 0.235 0.00 AVG. HEAD ON TOP OF LAYER 3 0.1587 CHANGE IN WATER STORAGE -0.551 -1998.563 -1.86 SOIL WATER AT START OF YEAR 14.681 53292.246 SOIL WATER AT END OF YEAR 14.809 53757.375 SNOW WATER AT START OF YEAR 0.779 2829.491 2.64 SNOW WATER AT END OF YEAR 0.101 365.800 0.34 ANNUAL WATER BUDGET BALANCE 0.0000 0.082 0.00 *******************************************************************************
******************************************************************************* ANNUAL TOTALS FOR YEAR 55 ------------------------------------------------------------------------------- INCHES CU. FEET PERCENT -------- ---------- ------- PRECIPITATION 18.93 68715.930 100.00 RUNOFF 1.395 5063.564 7.37 EVAPOTRANSPIRATION 16.499 59890.977 87.16 DRAINAGE COLLECTED FROM LAYER 2 1.0963 3979.693 5.79 PERC./LEAKAGE THROUGH LAYER 4 0.000061 0.222 0.00 AVG. HEAD ON TOP OF LAYER 3 0.1419 CHANGE IN WATER STORAGE -0.060 -218.543 -0.32 SOIL WATER AT START OF YEAR 14.809 53757.375 SOIL WATER AT END OF YEAR 14.850 53904.633 SNOW WATER AT START OF YEAR 0.101 365.800 0.53

SNOW WATER AT END OF YEAR 0.000 0.000 0.00 ANNUAL WATER BUDGET BALANCE 0.0000 0.015 0.00 *******************************************************************************
******************************************************************************* ANNUAL TOTALS FOR YEAR 56 ------------------------------------------------------------------------------- INCHES CU. FEET PERCENT -------- ---------- ------- PRECIPITATION 27.11 98409.312 100.00 RUNOFF 1.110 4030.939 4.10 EVAPOTRANSPIRATION 23.885 86703.758 88.11 DRAINAGE COLLECTED FROM LAYER 2 1.7832 6473.026 6.58 PERC./LEAKAGE THROUGH LAYER 4 0.000095 0.345 0.00 AVG. HEAD ON TOP OF LAYER 3 0.2258 CHANGE IN WATER STORAGE 0.331 1201.234 1.22 SOIL WATER AT START OF YEAR 14.850 53904.633 SOIL WATER AT END OF YEAR 15.181 55105.867 SNOW WATER AT START OF YEAR 0.000 0.000 0.00 SNOW WATER AT END OF YEAR 0.000 0.000 0.00 ANNUAL WATER BUDGET BALANCE 0.0000 0.010 0.00 *******************************************************************************
******************************************************************************* ANNUAL TOTALS FOR YEAR 57 ------------------------------------------------------------------------------- INCHES CU. FEET PERCENT

-------- ---------- ------- PRECIPITATION 23.52 85377.625 100.00 RUNOFF 2.780 10090.044 11.82 EVAPOTRANSPIRATION 21.008 76257.641 89.32 DRAINAGE COLLECTED FROM LAYER 2 0.5454 1979.861 2.32 PERC./LEAKAGE THROUGH LAYER 4 0.000032 0.116 0.00 AVG. HEAD ON TOP OF LAYER 3 0.0699 CHANGE IN WATER STORAGE -0.813 -2950.095 -3.46 SOIL WATER AT START OF YEAR 15.181 55105.867 SOIL WATER AT END OF YEAR 14.368 52155.770 SNOW WATER AT START OF YEAR 0.000 0.000 0.00 SNOW WATER AT END OF YEAR 0.000 0.000 0.00 ANNUAL WATER BUDGET BALANCE 0.0000 0.058 0.00 *******************************************************************************
******************************************************************************* ANNUAL TOTALS FOR YEAR 58 ------------------------------------------------------------------------------- INCHES CU. FEET PERCENT -------- ---------- ------- PRECIPITATION 17.77 64505.109 100.00 RUNOFF 0.830 3014.282 4.67 EVAPOTRANSPIRATION 16.652 60447.566 93.71 DRAINAGE COLLECTED FROM LAYER 2 0.0080 29.209 0.05 PERC./LEAKAGE THROUGH LAYER 4 0.000003 0.011 0.00 AVG. HEAD ON TOP OF LAYER 3 0.0010 CHANGE IN WATER STORAGE 0.279 1014.021 1.57

SOIL WATER AT START OF YEAR 14.368 52155.770 SOIL WATER AT END OF YEAR 14.647 53169.793 SNOW WATER AT START OF YEAR 0.000 0.000 0.00 SNOW WATER AT END OF YEAR 0.000 0.000 0.00 ANNUAL WATER BUDGET BALANCE 0.0000 0.021 0.00 *******************************************************************************
******************************************************************************* ANNUAL TOTALS FOR YEAR 59 ------------------------------------------------------------------------------- INCHES CU. FEET PERCENT -------- ---------- ------- PRECIPITATION 17.77 64505.102 100.00 RUNOFF 1.469 5333.382 8.27 EVAPOTRANSPIRATION 15.630 56736.152 87.96 DRAINAGE COLLECTED FROM LAYER 2 0.4186 1519.433 2.36 PERC./LEAKAGE THROUGH LAYER 4 0.000024 0.089 0.00 AVG. HEAD ON TOP OF LAYER 3 0.0525 CHANGE IN WATER STORAGE 0.252 916.057 1.42 SOIL WATER AT START OF YEAR 14.647 53169.793 SOIL WATER AT END OF YEAR 14.738 53499.242 SNOW WATER AT START OF YEAR 0.000 0.000 0.00 SNOW WATER AT END OF YEAR 0.162 586.607 0.91 ANNUAL WATER BUDGET BALANCE 0.0000 -0.012 0.00 *******************************************************************************

******************************************************************************* ANNUAL TOTALS FOR YEAR 60 ------------------------------------------------------------------------------- INCHES CU. FEET PERCENT -------- ---------- ------- PRECIPITATION 30.41 110388.305 100.00 RUNOFF 2.321 8424.145 7.63 EVAPOTRANSPIRATION 25.324 91927.500 83.28 DRAINAGE COLLECTED FROM LAYER 2 1.9564 7101.659 6.43 PERC./LEAKAGE THROUGH LAYER 4 0.000102 0.371 0.00 AVG. HEAD ON TOP OF LAYER 3 0.2475 CHANGE IN WATER STORAGE 0.808 2934.614 2.66 SOIL WATER AT START OF YEAR 14.738 53499.242 SOIL WATER AT END OF YEAR 15.095 54794.984 SNOW WATER AT START OF YEAR 0.162 586.607 0.53 SNOW WATER AT END OF YEAR 0.613 2225.476 2.02 ANNUAL WATER BUDGET BALANCE 0.0000 0.016 0.00 *******************************************************************************
******************************************************************************* ANNUAL TOTALS FOR YEAR 61 ------------------------------------------------------------------------------- INCHES CU. FEET PERCENT -------- ---------- ------- PRECIPITATION 29.01 105306.320 100.00 RUNOFF 3.198 11608.200 11.02 EVAPOTRANSPIRATION 24.712 89702.773 85.18 DRAINAGE COLLECTED FROM LAYER 2 1.7777 6453.181 6.13 PERC./LEAKAGE THROUGH LAYER 4 0.000094 0.343 0.00

AVG. HEAD ON TOP OF LAYER 3 0.2259 CHANGE IN WATER STORAGE -0.677 -2458.229 -2.33 SOIL WATER AT START OF YEAR 15.095 54794.984 SOIL WATER AT END OF YEAR 15.031 54562.234 SNOW WATER AT START OF YEAR 0.613 2225.476 2.11 SNOW WATER AT END OF YEAR 0.000 0.000 0.00 ANNUAL WATER BUDGET BALANCE 0.0000 0.054 0.00 *******************************************************************************
******************************************************************************* ANNUAL TOTALS FOR YEAR 62 ------------------------------------------------------------------------------- INCHES CU. FEET PERCENT -------- ---------- ------- PRECIPITATION 18.48 67082.406 100.00 RUNOFF 0.637 2310.762 3.44 EVAPOTRANSPIRATION 17.647 64057.215 95.49 DRAINAGE COLLECTED FROM LAYER 2 0.0064 23.413 0.03 PERC./LEAKAGE THROUGH LAYER 4 0.000003 0.011 0.00 AVG. HEAD ON TOP OF LAYER 3 0.0008 CHANGE IN WATER STORAGE 0.190 691.004 1.03 SOIL WATER AT START OF YEAR 15.031 54562.234 SOIL WATER AT END OF YEAR 15.221 55253.238 SNOW WATER AT START OF YEAR 0.000 0.000 0.00 SNOW WATER AT END OF YEAR 0.000 0.000 0.00 ANNUAL WATER BUDGET BALANCE 0.0000 0.000 0.00
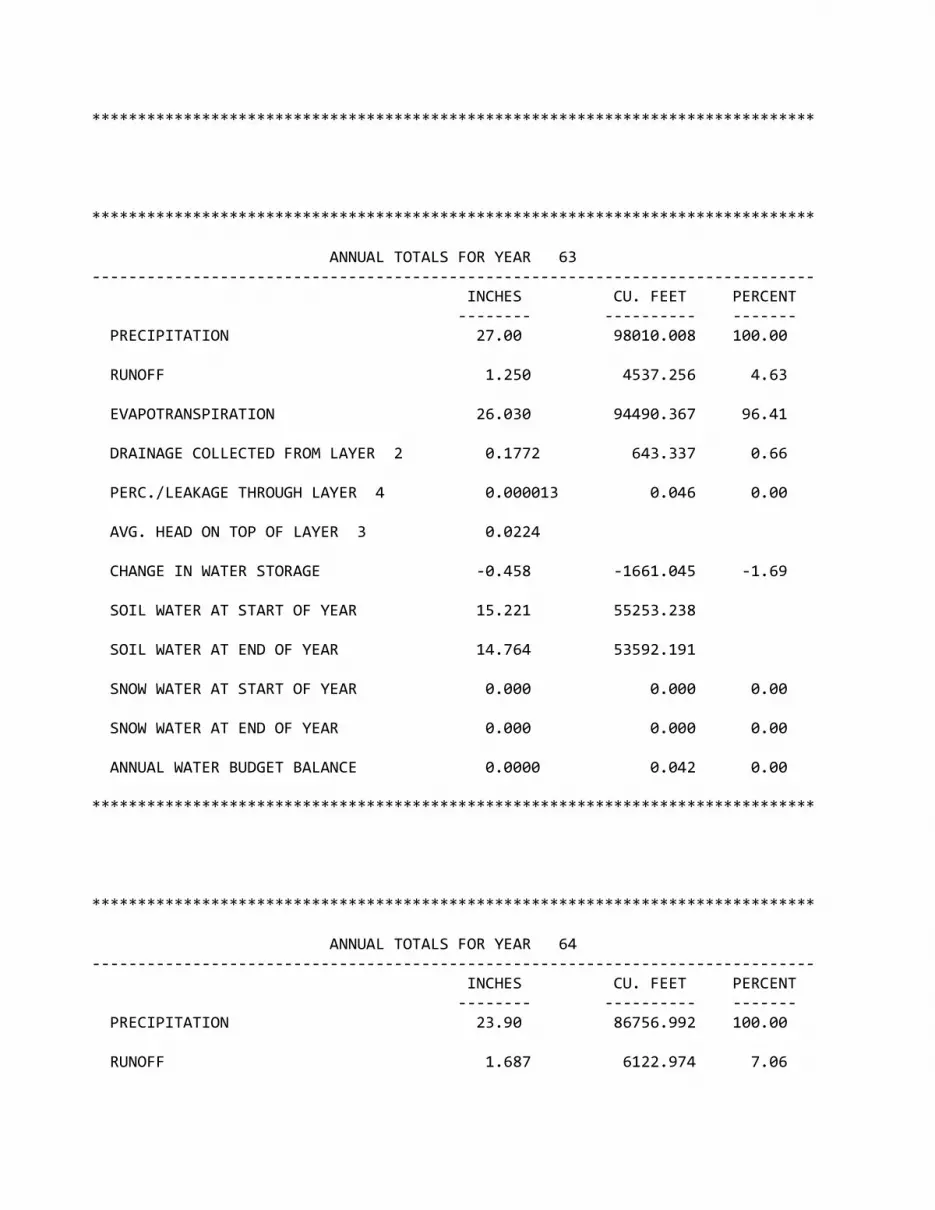
*******************************************************************************
******************************************************************************* ANNUAL TOTALS FOR YEAR 63 ------------------------------------------------------------------------------- INCHES CU. FEET PERCENT -------- ---------- ------- PRECIPITATION 27.00 98010.008 100.00 RUNOFF 1.250 4537.256 4.63 EVAPOTRANSPIRATION 26.030 94490.367 96.41 DRAINAGE COLLECTED FROM LAYER 2 0.1772 643.337 0.66 PERC./LEAKAGE THROUGH LAYER 4 0.000013 0.046 0.00 AVG. HEAD ON TOP OF LAYER 3 0.0224 CHANGE IN WATER STORAGE -0.458 -1661.045 -1.69 SOIL WATER AT START OF YEAR 15.221 55253.238 SOIL WATER AT END OF YEAR 14.764 53592.191 SNOW WATER AT START OF YEAR 0.000 0.000 0.00 SNOW WATER AT END OF YEAR 0.000 0.000 0.00 ANNUAL WATER BUDGET BALANCE 0.0000 0.042 0.00 *******************************************************************************
******************************************************************************* ANNUAL TOTALS FOR YEAR 64 ------------------------------------------------------------------------------- INCHES CU. FEET PERCENT -------- ---------- ------- PRECIPITATION 23.90 86756.992 100.00 RUNOFF 1.687 6122.974 7.06

EVAPOTRANSPIRATION 22.436 81441.398 93.87 DRAINAGE COLLECTED FROM LAYER 2 0.0275 99.673 0.11 PERC./LEAKAGE THROUGH LAYER 4 0.000004 0.016 0.00 AVG. HEAD ON TOP OF LAYER 3 0.0035 CHANGE IN WATER STORAGE -0.250 -907.088 -1.05 SOIL WATER AT START OF YEAR 14.764 53592.191 SOIL WATER AT END OF YEAR 14.514 52685.102 SNOW WATER AT START OF YEAR 0.000 0.000 0.00 SNOW WATER AT END OF YEAR 0.000 0.000 0.00 ANNUAL WATER BUDGET BALANCE 0.0000 0.022 0.00 *******************************************************************************
******************************************************************************* ANNUAL TOTALS FOR YEAR 65 ------------------------------------------------------------------------------- INCHES CU. FEET PERCENT -------- ---------- ------- PRECIPITATION 22.89 83090.687 100.00 RUNOFF 2.227 8084.180 9.73 EVAPOTRANSPIRATION 19.311 70098.625 84.36 DRAINAGE COLLECTED FROM LAYER 2 1.2950 4700.750 5.66 PERC./LEAKAGE THROUGH LAYER 4 0.000070 0.254 0.00 AVG. HEAD ON TOP OF LAYER 3 0.1636 CHANGE IN WATER STORAGE 0.057 206.872 0.25 SOIL WATER AT START OF YEAR 14.514 52685.102 SOIL WATER AT END OF YEAR 14.571 52891.977 SNOW WATER AT START OF YEAR 0.000 0.000 0.00

SNOW WATER AT END OF YEAR 0.000 0.000 0.00 ANNUAL WATER BUDGET BALANCE 0.0000 0.007 0.00 *******************************************************************************
******************************************************************************* ANNUAL TOTALS FOR YEAR 66 ------------------------------------------------------------------------------- INCHES CU. FEET PERCENT -------- ---------- ------- PRECIPITATION 27.38 99389.422 100.00 RUNOFF 2.094 7602.431 7.65 EVAPOTRANSPIRATION 24.416 88630.086 89.17 DRAINAGE COLLECTED FROM LAYER 2 0.9863 3580.199 3.60 PERC./LEAKAGE THROUGH LAYER 4 0.000056 0.202 0.00 AVG. HEAD ON TOP OF LAYER 3 0.1245 CHANGE IN WATER STORAGE -0.117 -423.545 -0.43 SOIL WATER AT START OF YEAR 14.571 52891.977 SOIL WATER AT END OF YEAR 14.454 52468.430 SNOW WATER AT START OF YEAR 0.000 0.000 0.00 SNOW WATER AT END OF YEAR 0.000 0.000 0.00 ANNUAL WATER BUDGET BALANCE 0.0000 0.050 0.00 *******************************************************************************
******************************************************************************* ANNUAL TOTALS FOR YEAR 67 ------------------------------------------------------------------------------- INCHES CU. FEET PERCENT

-------- ---------- ------- PRECIPITATION 27.82 100986.609 100.00 RUNOFF 3.430 12451.944 12.33 EVAPOTRANSPIRATION 21.333 77439.250 76.68 DRAINAGE COLLECTED FROM LAYER 2 2.6674 9682.739 9.59 PERC./LEAKAGE THROUGH LAYER 4 0.000138 0.499 0.00 AVG. HEAD ON TOP OF LAYER 3 0.3394 CHANGE IN WATER STORAGE 0.389 1412.139 1.40 SOIL WATER AT START OF YEAR 14.454 52468.430 SOIL WATER AT END OF YEAR 14.843 53880.570 SNOW WATER AT START OF YEAR 0.000 0.000 0.00 SNOW WATER AT END OF YEAR 0.000 0.000 0.00 ANNUAL WATER BUDGET BALANCE 0.0000 0.043 0.00 *******************************************************************************
******************************************************************************* ANNUAL TOTALS FOR YEAR 68 ------------------------------------------------------------------------------- INCHES CU. FEET PERCENT -------- ---------- ------- PRECIPITATION 32.45 117793.500 100.00 RUNOFF 3.462 12567.119 10.67 EVAPOTRANSPIRATION 27.840 101059.281 85.79 DRAINAGE COLLECTED FROM LAYER 2 0.6491 2356.292 2.00 PERC./LEAKAGE THROUGH LAYER 4 0.000038 0.136 0.00 AVG. HEAD ON TOP OF LAYER 3 0.0823 CHANGE IN WATER STORAGE 0.499 1810.680 1.54

SOIL WATER AT START OF YEAR 14.843 53880.570 SOIL WATER AT END OF YEAR 15.303 55548.234 SNOW WATER AT START OF YEAR 0.000 0.000 0.00 SNOW WATER AT END OF YEAR 0.039 143.016 0.12 ANNUAL WATER BUDGET BALANCE 0.0000 -0.009 0.00 *******************************************************************************
******************************************************************************* ANNUAL TOTALS FOR YEAR 69 ------------------------------------------------------------------------------- INCHES CU. FEET PERCENT -------- ---------- ------- PRECIPITATION 23.24 84361.203 100.00 RUNOFF 1.172 4254.585 5.04 EVAPOTRANSPIRATION 20.981 76160.156 90.28 DRAINAGE COLLECTED FROM LAYER 2 0.6299 2286.522 2.71 PERC./LEAKAGE THROUGH LAYER 4 0.000036 0.132 0.00 AVG. HEAD ON TOP OF LAYER 3 0.0800 CHANGE IN WATER STORAGE 0.457 1659.816 1.97 SOIL WATER AT START OF YEAR 15.303 55548.234 SOIL WATER AT END OF YEAR 15.799 57351.066 SNOW WATER AT START OF YEAR 0.039 143.016 0.17 SNOW WATER AT END OF YEAR 0.000 0.000 0.00 ANNUAL WATER BUDGET BALANCE 0.0000 -0.003 0.00 *******************************************************************************
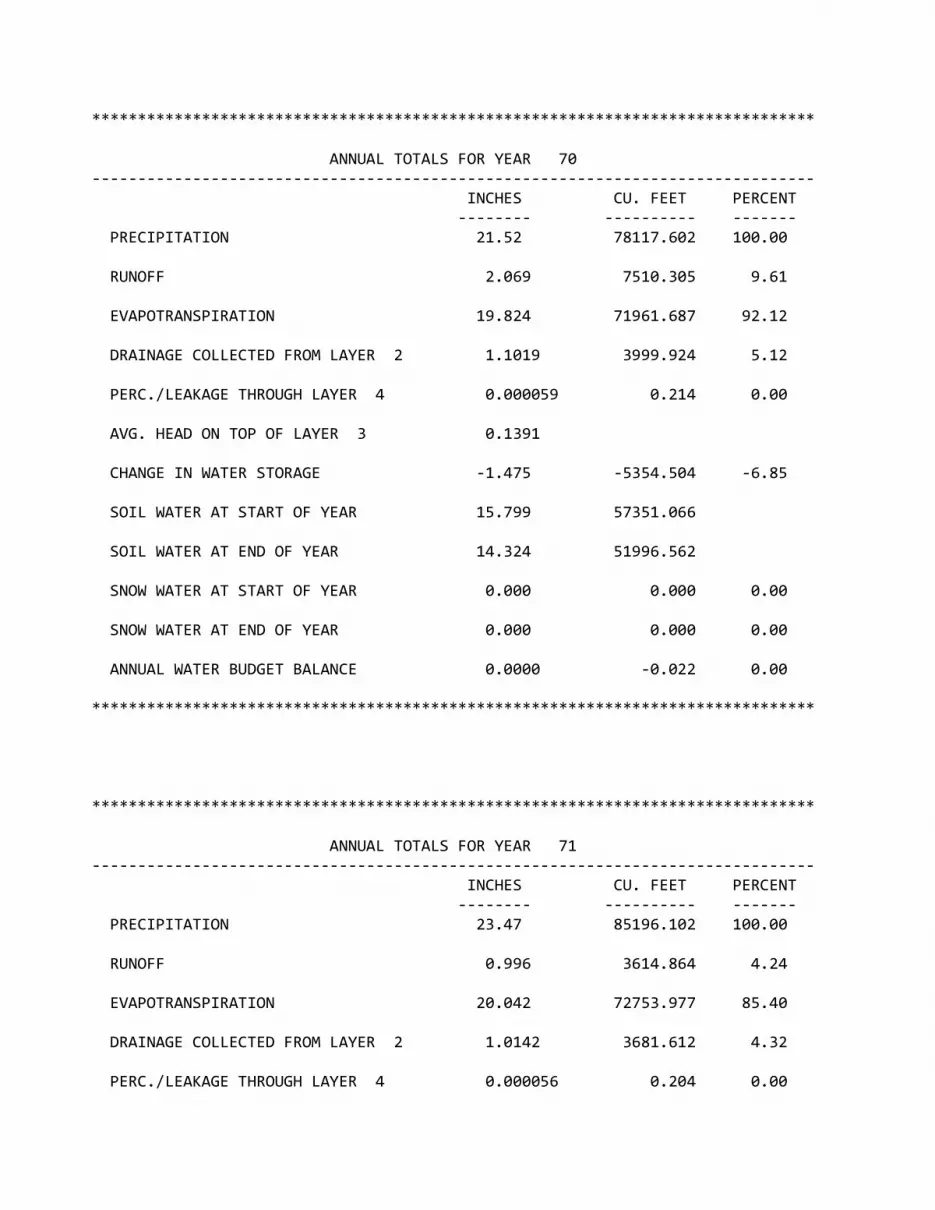
******************************************************************************* ANNUAL TOTALS FOR YEAR 70 ------------------------------------------------------------------------------- INCHES CU. FEET PERCENT -------- ---------- ------- PRECIPITATION 21.52 78117.602 100.00 RUNOFF 2.069 7510.305 9.61 EVAPOTRANSPIRATION 19.824 71961.687 92.12 DRAINAGE COLLECTED FROM LAYER 2 1.1019 3999.924 5.12 PERC./LEAKAGE THROUGH LAYER 4 0.000059 0.214 0.00 AVG. HEAD ON TOP OF LAYER 3 0.1391 CHANGE IN WATER STORAGE -1.475 -5354.504 -6.85 SOIL WATER AT START OF YEAR 15.799 57351.066 SOIL WATER AT END OF YEAR 14.324 51996.562 SNOW WATER AT START OF YEAR 0.000 0.000 0.00 SNOW WATER AT END OF YEAR 0.000 0.000 0.00 ANNUAL WATER BUDGET BALANCE 0.0000 -0.022 0.00 *******************************************************************************
******************************************************************************* ANNUAL TOTALS FOR YEAR 71 ------------------------------------------------------------------------------- INCHES CU. FEET PERCENT -------- ---------- ------- PRECIPITATION 23.47 85196.102 100.00 RUNOFF 0.996 3614.864 4.24 EVAPOTRANSPIRATION 20.042 72753.977 85.40 DRAINAGE COLLECTED FROM LAYER 2 1.0142 3681.612 4.32 PERC./LEAKAGE THROUGH LAYER 4 0.000056 0.204 0.00

AVG. HEAD ON TOP OF LAYER 3 0.1272 CHANGE IN WATER STORAGE 1.417 5145.418 6.04 SOIL WATER AT START OF YEAR 14.324 51996.562 SOIL WATER AT END OF YEAR 15.534 56387.641 SNOW WATER AT START OF YEAR 0.000 0.000 0.00 SNOW WATER AT END OF YEAR 0.208 754.339 0.89 ANNUAL WATER BUDGET BALANCE 0.0000 0.032 0.00 *******************************************************************************
******************************************************************************* ANNUAL TOTALS FOR YEAR 72 ------------------------------------------------------------------------------- INCHES CU. FEET PERCENT -------- ---------- ------- PRECIPITATION 20.65 74959.516 100.00 RUNOFF 0.596 2164.540 2.89 EVAPOTRANSPIRATION 20.225 73416.648 97.94 DRAINAGE COLLECTED FROM LAYER 2 0.5123 1859.728 2.48 PERC./LEAKAGE THROUGH LAYER 4 0.000031 0.113 0.00 AVG. HEAD ON TOP OF LAYER 3 0.0647 CHANGE IN WATER STORAGE -0.684 -2481.520 -3.31 SOIL WATER AT START OF YEAR 15.534 56387.641 SOIL WATER AT END OF YEAR 15.058 54660.457 SNOW WATER AT START OF YEAR 0.208 754.339 1.01 SNOW WATER AT END OF YEAR 0.000 0.000 0.00 ANNUAL WATER BUDGET BALANCE 0.0000 0.004 0.00

*******************************************************************************
******************************************************************************* ANNUAL TOTALS FOR YEAR 73 ------------------------------------------------------------------------------- INCHES CU. FEET PERCENT -------- ---------- ------- PRECIPITATION 27.09 98336.711 100.00 RUNOFF 2.354 8545.519 8.69 EVAPOTRANSPIRATION 23.552 85495.266 86.94 DRAINAGE COLLECTED FROM LAYER 2 1.1928 4330.027 4.40 PERC./LEAKAGE THROUGH LAYER 4 0.000063 0.228 0.00 AVG. HEAD ON TOP OF LAYER 3 0.1521 CHANGE IN WATER STORAGE -0.009 -34.362 -0.03 SOIL WATER AT START OF YEAR 15.058 54660.457 SOIL WATER AT END OF YEAR 15.049 54626.098 SNOW WATER AT START OF YEAR 0.000 0.000 0.00 SNOW WATER AT END OF YEAR 0.000 0.000 0.00 ANNUAL WATER BUDGET BALANCE 0.0000 0.033 0.00 *******************************************************************************
******************************************************************************* ANNUAL TOTALS FOR YEAR 74 ------------------------------------------------------------------------------- INCHES CU. FEET PERCENT -------- ---------- ------- PRECIPITATION 29.84 108319.211 100.00 RUNOFF 1.809 6565.681 6.06

EVAPOTRANSPIRATION 25.614 92979.398 85.84 DRAINAGE COLLECTED FROM LAYER 2 1.6583 6019.551 5.56 PERC./LEAKAGE THROUGH LAYER 4 0.000089 0.321 0.00 AVG. HEAD ON TOP OF LAYER 3 0.2102 CHANGE IN WATER STORAGE 0.759 2754.245 2.54 SOIL WATER AT START OF YEAR 15.049 54626.098 SOIL WATER AT END OF YEAR 15.807 57380.344 SNOW WATER AT START OF YEAR 0.000 0.000 0.00 SNOW WATER AT END OF YEAR 0.000 0.000 0.00 ANNUAL WATER BUDGET BALANCE 0.0000 0.020 0.00 *******************************************************************************
******************************************************************************* ANNUAL TOTALS FOR YEAR 75 ------------------------------------------------------------------------------- INCHES CU. FEET PERCENT -------- ---------- ------- PRECIPITATION 32.99 119753.703 100.00 RUNOFF 5.047 18320.113 15.30 EVAPOTRANSPIRATION 25.204 91492.180 76.40 DRAINAGE COLLECTED FROM LAYER 2 3.6528 13259.784 11.07 PERC./LEAKAGE THROUGH LAYER 4 0.000235 0.854 0.00 AVG. HEAD ON TOP OF LAYER 3 0.6251 CHANGE IN WATER STORAGE -0.914 -3319.286 -2.77 SOIL WATER AT START OF YEAR 15.807 57380.344 SOIL WATER AT END OF YEAR 14.893 54061.055 SNOW WATER AT START OF YEAR 0.000 0.000 0.00

SNOW WATER AT END OF YEAR 0.000 0.000 0.00 ANNUAL WATER BUDGET BALANCE 0.0000 0.057 0.00 *******************************************************************************
******************************************************************************* ANNUAL TOTALS FOR YEAR 76 ------------------------------------------------------------------------------- INCHES CU. FEET PERCENT -------- ---------- ------- PRECIPITATION 29.32 106431.609 100.00 RUNOFF 3.660 13285.941 12.48 EVAPOTRANSPIRATION 19.608 71178.242 66.88 DRAINAGE COLLECTED FROM LAYER 2 3.9499 14338.006 13.47 PERC./LEAKAGE THROUGH LAYER 4 0.000567 2.056 0.00 AVG. HEAD ON TOP OF LAYER 3 1.6738 CHANGE IN WATER STORAGE 2.101 7627.343 7.17 SOIL WATER AT START OF YEAR 14.893 54061.055 SOIL WATER AT END OF YEAR 16.994 61688.398 SNOW WATER AT START OF YEAR 0.000 0.000 0.00 SNOW WATER AT END OF YEAR 0.000 0.000 0.00 ANNUAL WATER BUDGET BALANCE 0.0000 0.022 0.00 *******************************************************************************
******************************************************************************* ANNUAL TOTALS FOR YEAR 77 ------------------------------------------------------------------------------- INCHES CU. FEET PERCENT

-------- ---------- ------- PRECIPITATION 18.50 67155.008 100.00 RUNOFF 1.029 3734.817 5.56 EVAPOTRANSPIRATION 19.288 70016.570 104.26 DRAINAGE COLLECTED FROM LAYER 2 0.8548 3102.942 4.62 PERC./LEAKAGE THROUGH LAYER 4 0.000047 0.170 0.00 AVG. HEAD ON TOP OF LAYER 3 0.1084 CHANGE IN WATER STORAGE -2.672 -9699.543 -14.44 SOIL WATER AT START OF YEAR 16.994 61688.398 SOIL WATER AT END OF YEAR 14.322 51988.855 SNOW WATER AT START OF YEAR 0.000 0.000 0.00 SNOW WATER AT END OF YEAR 0.000 0.000 0.00 ANNUAL WATER BUDGET BALANCE 0.0000 0.052 0.00 *******************************************************************************
******************************************************************************* ANNUAL TOTALS FOR YEAR 78 ------------------------------------------------------------------------------- INCHES CU. FEET PERCENT -------- ---------- ------- PRECIPITATION 24.92 90459.594 100.00 RUNOFF 1.893 6870.896 7.60 EVAPOTRANSPIRATION 21.475 77952.609 86.17 DRAINAGE COLLECTED FROM LAYER 2 1.3031 4730.374 5.23 PERC./LEAKAGE THROUGH LAYER 4 0.000068 0.245 0.00 AVG. HEAD ON TOP OF LAYER 3 0.1646 CHANGE IN WATER STORAGE 0.249 905.492 1.00

SOIL WATER AT START OF YEAR 14.322 51988.855 SOIL WATER AT END OF YEAR 14.571 52894.348 SNOW WATER AT START OF YEAR 0.000 0.000 0.00 SNOW WATER AT END OF YEAR 0.000 0.000 0.00 ANNUAL WATER BUDGET BALANCE 0.0000 -0.025 0.00 *******************************************************************************
******************************************************************************* ANNUAL TOTALS FOR YEAR 79 ------------------------------------------------------------------------------- INCHES CU. FEET PERCENT -------- ---------- ------- PRECIPITATION 22.33 81057.906 100.00 RUNOFF 1.771 6429.615 7.93 EVAPOTRANSPIRATION 20.500 74416.461 91.81 DRAINAGE COLLECTED FROM LAYER 2 0.0029 10.688 0.01 PERC./LEAKAGE THROUGH LAYER 4 0.000003 0.010 0.00 AVG. HEAD ON TOP OF LAYER 3 0.0004 CHANGE IN WATER STORAGE 0.055 201.095 0.25 SOIL WATER AT START OF YEAR 14.571 52894.348 SOIL WATER AT END OF YEAR 14.627 53095.441 SNOW WATER AT START OF YEAR 0.000 0.000 0.00 SNOW WATER AT END OF YEAR 0.000 0.000 0.00 ANNUAL WATER BUDGET BALANCE 0.0000 0.037 0.00 *******************************************************************************

******************************************************************************* ANNUAL TOTALS FOR YEAR 80 ------------------------------------------------------------------------------- INCHES CU. FEET PERCENT -------- ---------- ------- PRECIPITATION 17.86 64831.801 100.00 RUNOFF 0.237 860.922 1.33 EVAPOTRANSPIRATION 16.147 58613.531 90.41 DRAINAGE COLLECTED FROM LAYER 2 0.0098 35.556 0.05 PERC./LEAKAGE THROUGH LAYER 4 0.000003 0.012 0.00 AVG. HEAD ON TOP OF LAYER 3 0.0012 CHANGE IN WATER STORAGE 1.466 5321.801 8.21 SOIL WATER AT START OF YEAR 14.627 53095.441 SOIL WATER AT END OF YEAR 15.181 55108.215 SNOW WATER AT START OF YEAR 0.000 0.000 0.00 SNOW WATER AT END OF YEAR 0.912 3309.030 5.10 ANNUAL WATER BUDGET BALANCE 0.0000 -0.020 0.00 *******************************************************************************
******************************************************************************* ANNUAL TOTALS FOR YEAR 81 ------------------------------------------------------------------------------- INCHES CU. FEET PERCENT -------- ---------- ------- PRECIPITATION 19.52 70857.617 100.00 RUNOFF 1.262 4579.860 6.46 EVAPOTRANSPIRATION 18.159 65916.461 93.03 DRAINAGE COLLECTED FROM LAYER 2 1.3286 4822.966 6.81 PERC./LEAKAGE THROUGH LAYER 4 0.000070 0.253 0.00

AVG. HEAD ON TOP OF LAYER 3 0.1675 CHANGE IN WATER STORAGE -1.229 -4461.957 -6.30 SOIL WATER AT START OF YEAR 15.181 55108.215 SOIL WATER AT END OF YEAR 14.864 53955.285 SNOW WATER AT START OF YEAR 0.912 3309.030 4.67 SNOW WATER AT END OF YEAR 0.000 0.000 0.00 ANNUAL WATER BUDGET BALANCE 0.0000 0.034 0.00 *******************************************************************************
******************************************************************************* ANNUAL TOTALS FOR YEAR 82 ------------------------------------------------------------------------------- INCHES CU. FEET PERCENT -------- ---------- ------- PRECIPITATION 24.45 88753.516 100.00 RUNOFF 0.772 2800.682 3.16 EVAPOTRANSPIRATION 22.619 82108.516 92.51 DRAINAGE COLLECTED FROM LAYER 2 1.1941 4334.654 4.88 PERC./LEAKAGE THROUGH LAYER 4 0.000066 0.238 0.00 AVG. HEAD ON TOP OF LAYER 3 0.1510 CHANGE IN WATER STORAGE -0.135 -490.650 -0.55 SOIL WATER AT START OF YEAR 14.864 53955.285 SOIL WATER AT END OF YEAR 14.729 53464.637 SNOW WATER AT START OF YEAR 0.000 0.000 0.00 SNOW WATER AT END OF YEAR 0.000 0.000 0.00 ANNUAL WATER BUDGET BALANCE 0.0000 0.080 0.00

*******************************************************************************
******************************************************************************* ANNUAL TOTALS FOR YEAR 83 ------------------------------------------------------------------------------- INCHES CU. FEET PERCENT -------- ---------- ------- PRECIPITATION 21.87 79388.102 100.00 RUNOFF 0.800 2904.345 3.66 EVAPOTRANSPIRATION 21.361 77540.289 97.67 DRAINAGE COLLECTED FROM LAYER 2 0.1144 415.126 0.52 PERC./LEAKAGE THROUGH LAYER 4 0.000009 0.034 0.00 AVG. HEAD ON TOP OF LAYER 3 0.0146 CHANGE IN WATER STORAGE -0.405 -1471.717 -1.85 SOIL WATER AT START OF YEAR 14.729 53464.637 SOIL WATER AT END OF YEAR 14.323 51992.918 SNOW WATER AT START OF YEAR 0.000 0.000 0.00 SNOW WATER AT END OF YEAR 0.000 0.000 0.00 ANNUAL WATER BUDGET BALANCE 0.0000 0.022 0.00 *******************************************************************************
******************************************************************************* ANNUAL TOTALS FOR YEAR 84 ------------------------------------------------------------------------------- INCHES CU. FEET PERCENT -------- ---------- ------- PRECIPITATION 19.64 71293.203 100.00 RUNOFF 1.188 4311.919 6.05

EVAPOTRANSPIRATION 17.388 63119.785 88.54 DRAINAGE COLLECTED FROM LAYER 2 0.9180 3332.277 4.67 PERC./LEAKAGE THROUGH LAYER 4 0.000050 0.181 0.00 AVG. HEAD ON TOP OF LAYER 3 0.1172 CHANGE IN WATER STORAGE 0.146 529.031 0.74 SOIL WATER AT START OF YEAR 14.323 51992.918 SOIL WATER AT END OF YEAR 14.469 52521.949 SNOW WATER AT START OF YEAR 0.000 0.000 0.00 SNOW WATER AT END OF YEAR 0.000 0.000 0.00 ANNUAL WATER BUDGET BALANCE 0.0000 0.012 0.00 *******************************************************************************
******************************************************************************* ANNUAL TOTALS FOR YEAR 85 ------------------------------------------------------------------------------- INCHES CU. FEET PERCENT -------- ---------- ------- PRECIPITATION 15.23 55284.906 100.00 RUNOFF 1.036 3760.969 6.80 EVAPOTRANSPIRATION 14.049 50997.418 92.24 DRAINAGE COLLECTED FROM LAYER 2 0.1049 380.739 0.69 PERC./LEAKAGE THROUGH LAYER 4 0.000009 0.031 0.00 AVG. HEAD ON TOP OF LAYER 3 0.0132 CHANGE IN WATER STORAGE 0.040 145.743 0.26 SOIL WATER AT START OF YEAR 14.469 52521.949 SOIL WATER AT END OF YEAR 14.509 52667.695 SNOW WATER AT START OF YEAR 0.000 0.000 0.00

SNOW WATER AT END OF YEAR 0.000 0.000 0.00 ANNUAL WATER BUDGET BALANCE 0.0000 0.004 0.00 *******************************************************************************
******************************************************************************* ANNUAL TOTALS FOR YEAR 86 ------------------------------------------------------------------------------- INCHES CU. FEET PERCENT -------- ---------- ------- PRECIPITATION 20.49 74378.703 100.00 RUNOFF 0.196 710.755 0.96 EVAPOTRANSPIRATION 19.880 72163.039 97.02 DRAINAGE COLLECTED FROM LAYER 2 0.0011 4.014 0.01 PERC./LEAKAGE THROUGH LAYER 4 0.000002 0.008 0.00 AVG. HEAD ON TOP OF LAYER 3 0.0001 CHANGE IN WATER STORAGE 0.413 1500.852 2.02 SOIL WATER AT START OF YEAR 14.509 52667.695 SOIL WATER AT END OF YEAR 14.922 54168.547 SNOW WATER AT START OF YEAR 0.000 0.000 0.00 SNOW WATER AT END OF YEAR 0.000 0.000 0.00 ANNUAL WATER BUDGET BALANCE 0.0000 0.037 0.00 *******************************************************************************
******************************************************************************* ANNUAL TOTALS FOR YEAR 87 ------------------------------------------------------------------------------- INCHES CU. FEET PERCENT

-------- ---------- ------- PRECIPITATION 27.38 99389.414 100.00 RUNOFF 2.625 9529.044 9.59 EVAPOTRANSPIRATION 22.667 82282.477 82.79 DRAINAGE COLLECTED FROM LAYER 2 1.9784 7181.753 7.23 PERC./LEAKAGE THROUGH LAYER 4 0.000103 0.375 0.00 AVG. HEAD ON TOP OF LAYER 3 0.2518 CHANGE IN WATER STORAGE 0.109 395.743 0.40 SOIL WATER AT START OF YEAR 14.922 54168.547 SOIL WATER AT END OF YEAR 15.031 54564.289 SNOW WATER AT START OF YEAR 0.000 0.000 0.00 SNOW WATER AT END OF YEAR 0.000 0.000 0.00 ANNUAL WATER BUDGET BALANCE 0.0000 0.025 0.00 *******************************************************************************
******************************************************************************* ANNUAL TOTALS FOR YEAR 88 ------------------------------------------------------------------------------- INCHES CU. FEET PERCENT -------- ---------- ------- PRECIPITATION 16.19 58769.703 100.00 RUNOFF 0.205 745.279 1.27 EVAPOTRANSPIRATION 16.580 60187.008 102.41 DRAINAGE COLLECTED FROM LAYER 2 0.0729 264.643 0.45 PERC./LEAKAGE THROUGH LAYER 4 0.000007 0.025 0.00 AVG. HEAD ON TOP OF LAYER 3 0.0093 CHANGE IN WATER STORAGE -0.669 -2427.261 -4.13

SOIL WATER AT START OF YEAR 15.031 54564.289 SOIL WATER AT END OF YEAR 14.363 52137.027 SNOW WATER AT START OF YEAR 0.000 0.000 0.00 SNOW WATER AT END OF YEAR 0.000 0.000 0.00 ANNUAL WATER BUDGET BALANCE 0.0000 0.010 0.00 *******************************************************************************
******************************************************************************* ANNUAL TOTALS FOR YEAR 89 ------------------------------------------------------------------------------- INCHES CU. FEET PERCENT -------- ---------- ------- PRECIPITATION 18.12 65775.602 100.00 RUNOFF 0.527 1912.907 2.91 EVAPOTRANSPIRATION 16.800 60984.750 92.72 DRAINAGE COLLECTED FROM LAYER 2 0.2275 825.680 1.26 PERC./LEAKAGE THROUGH LAYER 4 0.000015 0.056 0.00 AVG. HEAD ON TOP OF LAYER 3 0.0284 CHANGE IN WATER STORAGE 0.565 2052.191 3.12 SOIL WATER AT START OF YEAR 14.363 52137.027 SOIL WATER AT END OF YEAR 14.928 54189.219 SNOW WATER AT START OF YEAR 0.000 0.000 0.00 SNOW WATER AT END OF YEAR 0.000 0.000 0.00 ANNUAL WATER BUDGET BALANCE 0.0000 0.018 0.00 *******************************************************************************

******************************************************************************* ANNUAL TOTALS FOR YEAR 90 ------------------------------------------------------------------------------- INCHES CU. FEET PERCENT -------- ---------- ------- PRECIPITATION 19.58 71075.406 100.00 RUNOFF 1.038 3767.526 5.30 EVAPOTRANSPIRATION 18.674 67788.148 95.37 DRAINAGE COLLECTED FROM LAYER 2 0.0870 315.850 0.44 PERC./LEAKAGE THROUGH LAYER 4 0.000008 0.029 0.00 AVG. HEAD ON TOP OF LAYER 3 0.0110 CHANGE IN WATER STORAGE -0.219 -796.174 -1.12 SOIL WATER AT START OF YEAR 14.928 54189.219 SOIL WATER AT END OF YEAR 14.709 53393.047 SNOW WATER AT START OF YEAR 0.000 0.000 0.00 SNOW WATER AT END OF YEAR 0.000 0.000 0.00 ANNUAL WATER BUDGET BALANCE 0.0000 0.027 0.00 *******************************************************************************
******************************************************************************* ANNUAL TOTALS FOR YEAR 91 ------------------------------------------------------------------------------- INCHES CU. FEET PERCENT -------- ---------- ------- PRECIPITATION 31.14 113038.219 100.00 RUNOFF 2.546 9240.598 8.17 EVAPOTRANSPIRATION 27.187 98688.820 87.31 DRAINAGE COLLECTED FROM LAYER 2 0.9277 3367.520 2.98 PERC./LEAKAGE THROUGH LAYER 4 0.000052 0.190 0.00

AVG. HEAD ON TOP OF LAYER 3 0.1175 CHANGE IN WATER STORAGE 0.480 1741.083 1.54 SOIL WATER AT START OF YEAR 14.709 53393.047 SOIL WATER AT END OF YEAR 15.188 55134.129 SNOW WATER AT START OF YEAR 0.000 0.000 0.00 SNOW WATER AT END OF YEAR 0.000 0.000 0.00 ANNUAL WATER BUDGET BALANCE 0.0000 0.010 0.00 *******************************************************************************
******************************************************************************* ANNUAL TOTALS FOR YEAR 92 ------------------------------------------------------------------------------- INCHES CU. FEET PERCENT -------- ---------- ------- PRECIPITATION 16.22 58878.605 100.00 RUNOFF 0.634 2300.995 3.91 EVAPOTRANSPIRATION 16.183 58743.496 99.77 DRAINAGE COLLECTED FROM LAYER 2 0.2698 979.341 1.66 PERC./LEAKAGE THROUGH LAYER 4 0.000018 0.064 0.00 AVG. HEAD ON TOP OF LAYER 3 0.0342 CHANGE IN WATER STORAGE -0.866 -3145.294 -5.34 SOIL WATER AT START OF YEAR 15.188 55134.129 SOIL WATER AT END OF YEAR 14.322 51988.836 SNOW WATER AT START OF YEAR 0.000 0.000 0.00 SNOW WATER AT END OF YEAR 0.000 0.000 0.00 ANNUAL WATER BUDGET BALANCE 0.0000 0.003 0.00

*******************************************************************************
******************************************************************************* ANNUAL TOTALS FOR YEAR 93 ------------------------------------------------------------------------------- INCHES CU. FEET PERCENT -------- ---------- ------- PRECIPITATION 27.88 101204.414 100.00 RUNOFF 1.946 7065.454 6.98 EVAPOTRANSPIRATION 24.623 89380.297 88.32 DRAINAGE COLLECTED FROM LAYER 2 0.7988 2899.590 2.87 PERC./LEAKAGE THROUGH LAYER 4 0.000046 0.168 0.00 AVG. HEAD ON TOP OF LAYER 3 0.1012 CHANGE IN WATER STORAGE 0.512 1858.865 1.84 SOIL WATER AT START OF YEAR 14.322 51988.836 SOIL WATER AT END OF YEAR 14.834 53847.699 SNOW WATER AT START OF YEAR 0.000 0.000 0.00 SNOW WATER AT END OF YEAR 0.000 0.000 0.00 ANNUAL WATER BUDGET BALANCE 0.0000 0.038 0.00 *******************************************************************************
******************************************************************************* ANNUAL TOTALS FOR YEAR 94 ------------------------------------------------------------------------------- INCHES CU. FEET PERCENT -------- ---------- ------- PRECIPITATION 15.00 54450.000 100.00 RUNOFF 0.673 2441.413 4.48
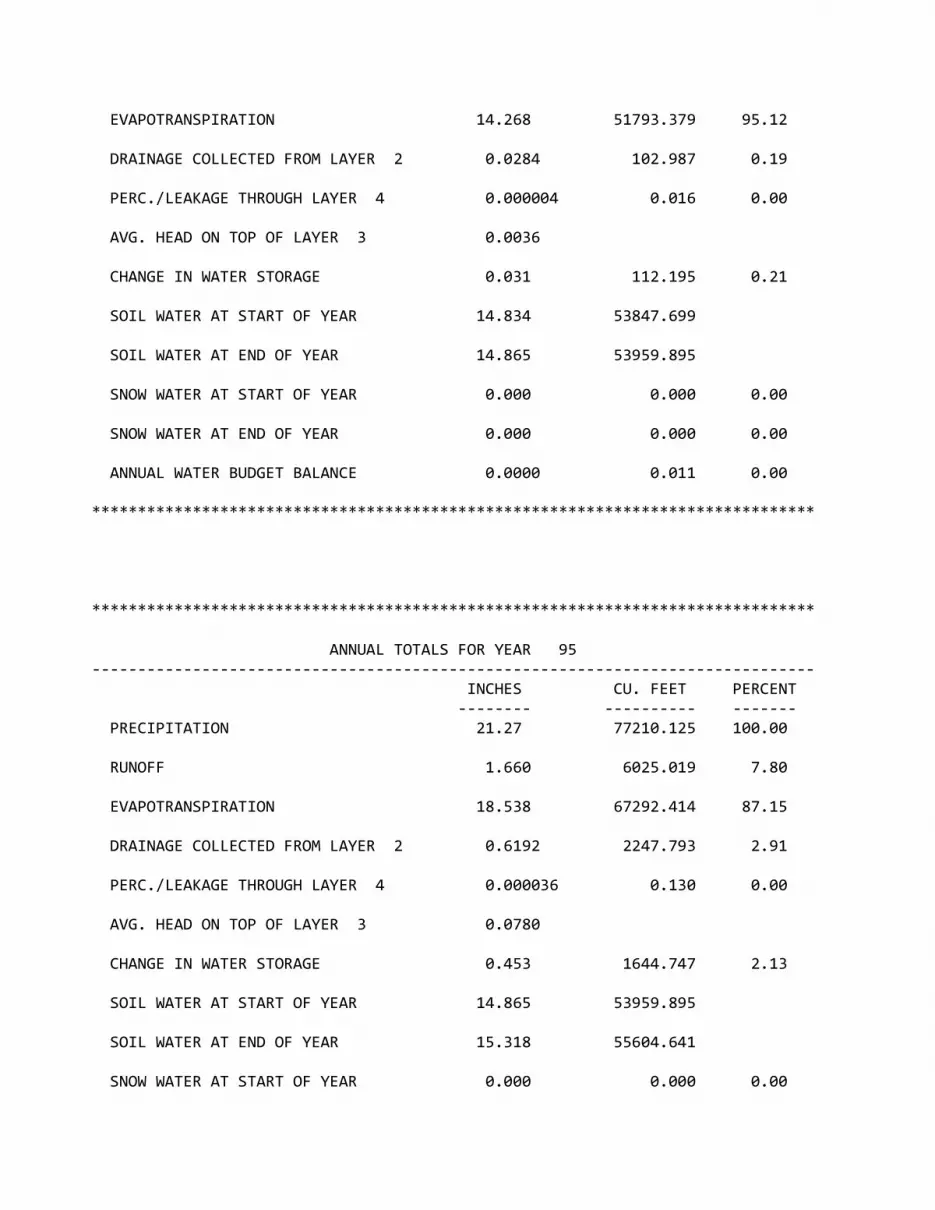
EVAPOTRANSPIRATION 14.268 51793.379 95.12 DRAINAGE COLLECTED FROM LAYER 2 0.0284 102.987 0.19 PERC./LEAKAGE THROUGH LAYER 4 0.000004 0.016 0.00 AVG. HEAD ON TOP OF LAYER 3 0.0036 CHANGE IN WATER STORAGE 0.031 112.195 0.21 SOIL WATER AT START OF YEAR 14.834 53847.699 SOIL WATER AT END OF YEAR 14.865 53959.895 SNOW WATER AT START OF YEAR 0.000 0.000 0.00 SNOW WATER AT END OF YEAR 0.000 0.000 0.00 ANNUAL WATER BUDGET BALANCE 0.0000 0.011 0.00 *******************************************************************************
******************************************************************************* ANNUAL TOTALS FOR YEAR 95 ------------------------------------------------------------------------------- INCHES CU. FEET PERCENT -------- ---------- ------- PRECIPITATION 21.27 77210.125 100.00 RUNOFF 1.660 6025.019 7.80 EVAPOTRANSPIRATION 18.538 67292.414 87.15 DRAINAGE COLLECTED FROM LAYER 2 0.6192 2247.793 2.91 PERC./LEAKAGE THROUGH LAYER 4 0.000036 0.130 0.00 AVG. HEAD ON TOP OF LAYER 3 0.0780 CHANGE IN WATER STORAGE 0.453 1644.747 2.13 SOIL WATER AT START OF YEAR 14.865 53959.895 SOIL WATER AT END OF YEAR 15.318 55604.641 SNOW WATER AT START OF YEAR 0.000 0.000 0.00

SNOW WATER AT END OF YEAR 0.000 0.000 0.00 ANNUAL WATER BUDGET BALANCE 0.0000 0.019 0.00 *******************************************************************************
******************************************************************************* ANNUAL TOTALS FOR YEAR 96 ------------------------------------------------------------------------------- INCHES CU. FEET PERCENT -------- ---------- ------- PRECIPITATION 29.96 108754.820 100.00 RUNOFF 1.433 5203.594 4.78 EVAPOTRANSPIRATION 25.468 92449.094 85.01 DRAINAGE COLLECTED FROM LAYER 2 2.8669 10406.967 9.57 PERC./LEAKAGE THROUGH LAYER 4 0.000204 0.741 0.00 AVG. HEAD ON TOP OF LAYER 3 0.5486 CHANGE IN WATER STORAGE 0.191 694.368 0.64 SOIL WATER AT START OF YEAR 15.318 55604.641 SOIL WATER AT END OF YEAR 15.509 56299.008 SNOW WATER AT START OF YEAR 0.000 0.000 0.00 SNOW WATER AT END OF YEAR 0.000 0.000 0.00 ANNUAL WATER BUDGET BALANCE 0.0000 0.056 0.00 *******************************************************************************
******************************************************************************* ANNUAL TOTALS FOR YEAR 97 ------------------------------------------------------------------------------- INCHES CU. FEET PERCENT

-------- ---------- ------- PRECIPITATION 31.47 114236.102 100.00 RUNOFF 2.619 9506.340 8.32 EVAPOTRANSPIRATION 27.422 99541.352 87.14 DRAINAGE COLLECTED FROM LAYER 2 1.6978 6163.127 5.40 PERC./LEAKAGE THROUGH LAYER 4 0.000092 0.334 0.00 AVG. HEAD ON TOP OF LAYER 3 0.2142 CHANGE IN WATER STORAGE -0.269 -975.065 -0.85 SOIL WATER AT START OF YEAR 15.509 56299.008 SOIL WATER AT END OF YEAR 15.241 55323.945 SNOW WATER AT START OF YEAR 0.000 0.000 0.00 SNOW WATER AT END OF YEAR 0.000 0.000 0.00 ANNUAL WATER BUDGET BALANCE 0.0000 0.017 0.00 *******************************************************************************
******************************************************************************* ANNUAL TOTALS FOR YEAR 98 ------------------------------------------------------------------------------- INCHES CU. FEET PERCENT -------- ---------- ------- PRECIPITATION 20.32 73761.609 100.00 RUNOFF 0.557 2023.709 2.74 EVAPOTRANSPIRATION 19.808 71901.711 97.48 DRAINAGE COLLECTED FROM LAYER 2 0.2077 753.896 1.02 PERC./LEAKAGE THROUGH LAYER 4 0.000015 0.053 0.00 AVG. HEAD ON TOP OF LAYER 3 0.0264 CHANGE IN WATER STORAGE -0.253 -917.750 -1.24

SOIL WATER AT START OF YEAR 15.241 55323.945 SOIL WATER AT END OF YEAR 14.988 54406.195 SNOW WATER AT START OF YEAR 0.000 0.000 0.00 SNOW WATER AT END OF YEAR 0.000 0.000 0.00 ANNUAL WATER BUDGET BALANCE 0.0000 -0.015 0.00 *******************************************************************************
******************************************************************************* ANNUAL TOTALS FOR YEAR 99 ------------------------------------------------------------------------------- INCHES CU. FEET PERCENT -------- ---------- ------- PRECIPITATION 26.78 97211.430 100.00 RUNOFF 1.820 6607.295 6.80 EVAPOTRANSPIRATION 24.792 89994.305 92.58 DRAINAGE COLLECTED FROM LAYER 2 0.4114 1493.321 1.54 PERC./LEAKAGE THROUGH LAYER 4 0.000026 0.093 0.00 AVG. HEAD ON TOP OF LAYER 3 0.0523 CHANGE IN WATER STORAGE -0.243 -883.620 -0.91 SOIL WATER AT START OF YEAR 14.988 54406.195 SOIL WATER AT END OF YEAR 14.745 53522.574 SNOW WATER AT START OF YEAR 0.000 0.000 0.00 SNOW WATER AT END OF YEAR 0.000 0.000 0.00 ANNUAL WATER BUDGET BALANCE 0.0000 0.040 0.00 *******************************************************************************

******************************************************************************* ANNUAL TOTALS FOR YEAR 100 ------------------------------------------------------------------------------- INCHES CU. FEET PERCENT -------- ---------- ------- PRECIPITATION 28.58 103745.414 100.00 RUNOFF 3.146 11418.242 11.01 EVAPOTRANSPIRATION 22.448 81486.633 78.54 DRAINAGE COLLECTED FROM LAYER 2 2.3334 8470.373 8.16 PERC./LEAKAGE THROUGH LAYER 4 0.000157 0.571 0.00 AVG. HEAD ON TOP OF LAYER 3 0.4188 CHANGE IN WATER STORAGE 0.653 2369.586 2.28 SOIL WATER AT START OF YEAR 14.745 53522.574 SOIL WATER AT END OF YEAR 15.397 55892.160 SNOW WATER AT START OF YEAR 0.000 0.000 0.00 SNOW WATER AT END OF YEAR 0.000 0.000 0.00 ANNUAL WATER BUDGET BALANCE 0.0000 0.008 0.00 *******************************************************************************
******************************************************************************* AVERAGE MONTHLY VALUES IN INCHES FOR YEARS 1 THROUGH 100 ------------------------------------------------------------------------------- JAN/JUL FEB/AUG MAR/SEP APR/OCT MAY/NOV JUN/DEC ------- ------- ------- ------- ------- ------- PRECIPITATION ------------- TOTALS 0.69 0.72 1.51 1.73 2.79 3.15 2.67 3.49 2.08 2.23 1.05 0.85 STD. DEVIATIONS 0.60 0.54 1.09 1.30 1.53 1.54

1.36 2.16 1.39 1.91 1.07 0.84 RUNOFF ------ TOTALS 0.004 0.003 0.063 0.105 0.138 0.244 0.090 0.332 0.145 0.240 0.048 0.026 STD. DEVIATIONS 0.019 0.016 0.137 0.242 0.245 0.367 0.149 0.518 0.246 0.469 0.123 0.119 EVAPOTRANSPIRATION ------------------ TOTALS 0.744 0.667 1.211 1.558 3.005 3.002 2.643 2.853 1.871 1.270 1.053 0.779 STD. DEVIATIONS 0.500 0.430 0.811 0.910 1.168 1.149 1.264 1.517 1.120 0.839 0.625 0.470 LATERAL DRAINAGE COLLECTED FROM LAYER 2 ---------------------------------------- TOTALS 0.0368 0.0141 0.0293 0.1073 0.1058 0.0655 0.0199 0.0373 0.0436 0.1144 0.2014 0.1041 STD. DEVIATIONS 0.0946 0.0429 0.0926 0.2336 0.1844 0.1300 0.0467 0.1157 0.1154 0.2480 0.3974 0.2590 PERCOLATION/LEAKAGE THROUGH LAYER 4 ------------------------------------ TOTALS 0.0000 0.0000 0.0000 0.0000 0.0000 0.0000 0.0000 0.0000 0.0000 0.0000 0.0000 0.0000 STD. DEVIATIONS 0.0000 0.0000 0.0000 0.0000 0.0000 0.0000 0.0000 0.0000 0.0000 0.0000 0.0000 0.0000
------------------------------------------------------------------------------- AVERAGES OF MONTHLY AVERAGED DAILY HEADS (INCHES) -------------------------------------------------------------------------------
DAILY AVERAGE HEAD ON TOP OF LAYER 3 ------------------------------------- AVERAGES 0.0550 0.0231 0.0540 0.1886 0.1582 0.1013 0.0298 0.0558 0.0674 0.2304 0.4784 0.1952 STD. DEVIATIONS 0.1415 0.0710 0.2009 0.4661 0.2758 0.2010 0.0698 0.1731 0.1783 0.6340 1.5689 0.6694 *******************************************************************************

******************************************************************************* AVERAGE ANNUAL TOTALS & (STD. DEVIATIONS) FOR YEARS 1 THROUGH 100 ------------------------------------------------------------------------------- INCHES CU. FEET PERCENT ------------------- ------------- --------- PRECIPITATION 22.97 ( 4.466) 83398.2 100.00 RUNOFF 1.439 ( 0.9255) 5222.75 6.262 EVAPOTRANSPIRATION 20.655 ( 3.4404) 74977.91 89.904 LATERAL DRAINAGE COLLECTED 0.87933 ( 0.86703) 3191.952 3.82736 FROM LAYER 2 PERCOLATION/LEAKAGE THROUGH 0.00006 ( 0.00008) 0.203 0.00024 LAYER 4 AVERAGE HEAD ON TOP 0.136 ( 0.217) OF LAYER 3 CHANGE IN WATER STORAGE 0.001 ( 0.7798) 5.32 0.006 *******************************************************************************
****************************************************************************** PEAK DAILY VALUES FOR YEARS 1 THROUGH 100 ------------------------------------------------------------------------ (INCHES) (CU. FT.) ---------- ------------- PRECIPITATION 3.88 14084.400 RUNOFF 2.066 7497.9219 DRAINAGE COLLECTED FROM LAYER 2 0.06526 236.87787 PERCOLATION/LEAKAGE THROUGH LAYER 4 0.000016 0.05776 AVERAGE HEAD ON TOP OF LAYER 3 17.637 MAXIMUM HEAD ON TOP OF LAYER 3 24.104
LOCATION OF MAXIMUM HEAD IN LAYER 2 (DISTANCE FROM DRAIN) 82.2 FEET
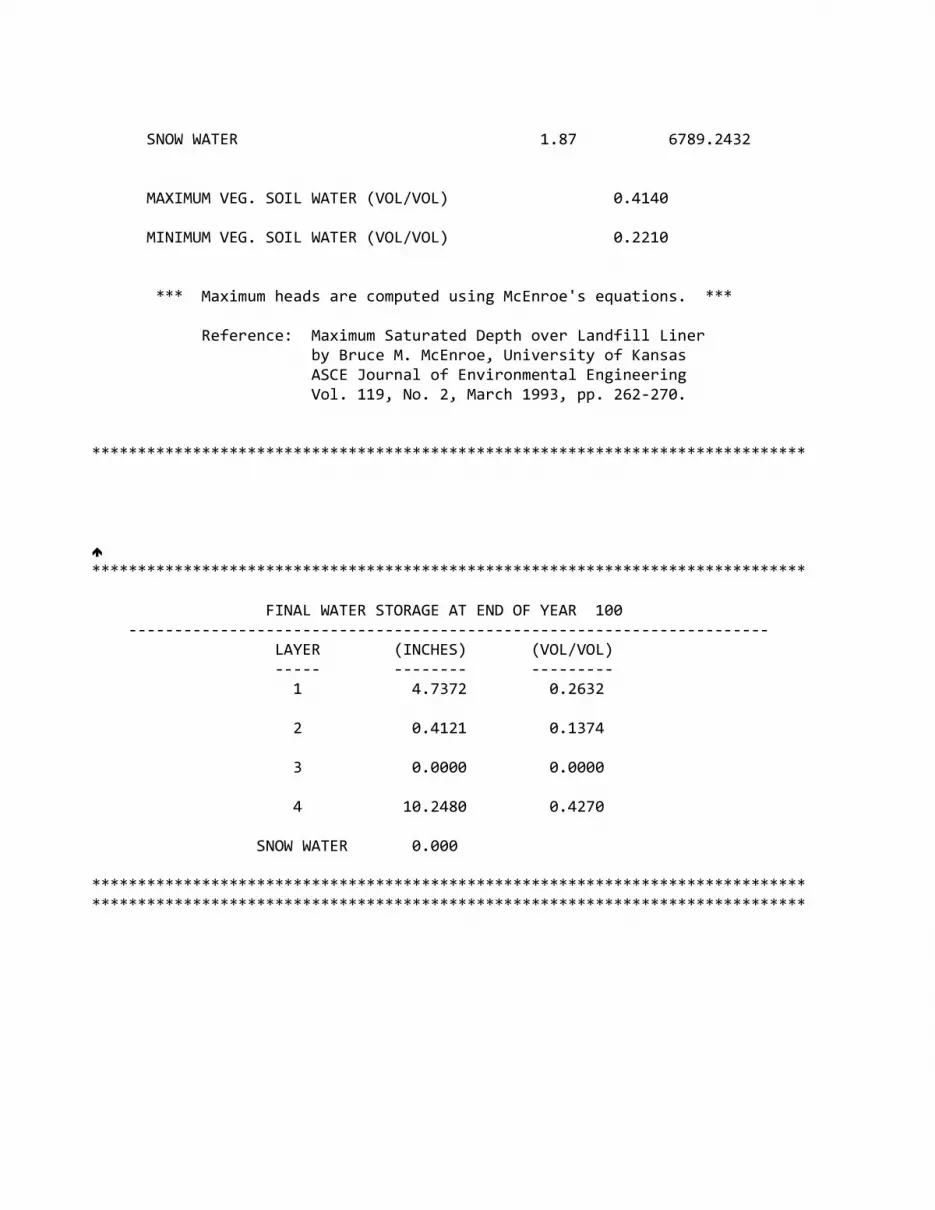
SNOW WATER 1.87 6789.2432
MAXIMUM VEG. SOIL WATER (VOL/VOL) 0.4140 MINIMUM VEG. SOIL WATER (VOL/VOL) 0.2210
*** Maximum heads are computed using McEnroe's equations. ***
Reference: Maximum Saturated Depth over Landfill Liner by Bruce M. McEnroe, University of Kansas ASCE Journal of Environmental Engineering Vol. 119, No. 2, March 1993, pp. 262-270.
******************************************************************************
****************************************************************************** FINAL WATER STORAGE AT END OF YEAR 100 ---------------------------------------------------------------------- LAYER (INCHES) (VOL/VOL) ----- -------- --------- 1 4.7372 0.2632
2 0.4121 0.1374
3 0.0000 0.0000
4 10.2480 0.4270
SNOW WATER 0.000 ****************************************************************************** ******************************************************************************

APPENDIX C
STORMWATER CALCULATIONS MEMO

memorandum To: Project File From: Mr. Nathan Ewert, P.E. Date: May 18, 2020 Re: North Holding Pond – Stormwater Channel Design Model Calculations
BACKGROUND Phillips 66 Company (Phillips 66, CN601491608) operates the Borger Refinery (RN102495884), which is owned by a joint venture between Phillips 66 (P66) and Cenovus called WRB Refining LP (WRB, CN603215997). This memo has been prepared to evaluate the proposed stormwater channel design to close the North Holding Pond (NOR#036). The North Holding Pond (NHP) is a 3.4-acre surface impoundment with a liner system consisting of 3-feet of bentonite amended clay, leak detection system, and 100-mil high-density polyethylene (HDPE) liner. The North Holding Pond is in partial closure in accordance with the 1998 closure plan. The free liquid has been removed and the sludge has been stabilized. The impoundment is now being filled with non-hazardous waste. The partial closure permit modification was approved by the Texas Commission of Environmental Quality (TCEQ) on April 21, 2004.
OBJECTIVE The following memorandum describes the evaluation and design of the proposed stormwater channels, existing detention pond, and outfall system which will capture and convey runoff from the North Holding Pond, once the final cap is in place, as shown on the attached Figure 1. The calculations for the evaluation of the channels, detention pond, and outlet system are presented below. Evaluation of the entire system was completed using the United States Army Corp Hydrologic Modeling System (HEC-HMS) software (Ver. 4.2.1) and Manning’s open channel and pipe flow equations.
HYDROLOGIC MODELING The North Holding Pond Cap (Cap) was subdivided into five sub-basins. The runoff from the sub-basins is collected and conveyed to the detention pond via the stormwater channels which run along the east and west side of the cap. The Soil Conservation Service (SCS) Curve Number method was used to calculate runoff from each sub-basin using the HEC-HMS software. Area weighted curve numbers for each sub-basin were calculated based on final cap surfacing conditions. Rainfall information from United States Geological Survey (USGS) Depth Duration Frequency of Precipitation for Texas were used to determine runoff amounts for the 10, 25, 50 and 100-year 24-hour events. Only the 100-year 24-hour event was used for sizing the channels and structures. Input parameters and peak runoff values for each sub-basin are summarized in Table 1.

Project File May 18, 2020 Page 2
HYDRAULIC MODELING Hydraulic modeling for the main components of the stormwater channels, detention pond and outlet system were completed using HEC-HMS modeling software. HEC-HMS was used to route the runoff hydrographs through the system. Peak flows through each of the components of the system were used to confirm channel and pipe sizes using Manning’s Equation for open channel and circular (pipe) flow.
East Stormwater Channel The east stormwater channel (east channel) was divided into five segments along the east side of the cap and collects runoff from sub-basins 1, 2, and 3 (See Figure 1). The divisions within the east channel were based on changes in slope of the channel. Capacity calculations for each segment were completed using the specific slope of that segment along with the peak flow from HEC-HMS. The typical section for the east channel generally consisted of a “v section” with depth ranging from 3 feet to 4 feet and sides slopes of 1.5 ft to 1 ft (horizontal to vertical). The east channel was lined with angular rock riprap or recycled concrete with a D50 of 6 inches and a manning’s n value of 0.036, which was used in the calculations. East channel capacity calculations are summarized in Table 2. The East Stormwater Channel discharges into the detention pond through a 30-inch corrugated metal pipe (CMP) culvert. Culvert capacity was analyzed using the Federal Highway Administration HY-8 culvert design software version 7.5. The CMP is approximately 83 feet long with a slope of 3.0 percent. At the peak flow for the east channel of 34 cubic feet per second (cfs) the culvert has a headwater elevation of 2,951.0 feet. The culvert overtopping elevation is 2,952 feet. Outlet velocity from the culvert is 8.7 feet per second (ft/s). The culvert outlet is protected by riprap with a D50 of 6 inches.
West Stormwater Channel The west stormwater channel (west channel) runs along the west side of the cap collecting runoff from sub-basins 4 and 5. The same capacity calculation method of dividing the channel into segments based on the varying slope and using the peak runoff values from HEC-HMS was used to confirm channel sizing. The typical section for the west channel consists of a two feet deep trapezoidal section with a two-foot bottom width and 2:1 side slopes. Due to minimal slopes and velocities, there is no riprap lining along these channels, so a Manning’s n value of 0.025 is used. West channel capacity calculations are summarized in Table 2.
Detention Pond The existing detention pond that the stormwater channels discharge into has a storage volume of 2.63-acre feet at a maximum elevation of 2,950 feet and bottom elevation of 2,941 feet. Storage within the pond was modeled in HEC-HMS using a stage storage curve developed from survey of the pond. The maximum storage within the pond during the 100-year event is 0.7 ac-ft corresponding to an elevation of

Project File May 18, 2020 Page 3
202005_StormwaterDesign_MEM.docx
2,946.6 feet. Peak inflow into the pond is approximately 100cfs, the peak discharge from the pond is approximately 45 cfs. Discharge from the pond is controlled by a two-foot diameter smooth polyethylene (PE 4710 DR11) outlet pipe which is projecting from fill at an invert elevation of 2,941 feet. The detention pond outlet pipe system hydraulics are further discussed in the Outfall Pipe section.
Outfall Pipe The outfall pipe conveys stormwater runoff from the detention pond to the new outfall location within an existing drainage channel. The outfall pipe consists of approximately 350 feet of 30-inch PE 4710 DR11 pipe broken into six segments with slopes ranging from 3.1 percent to 21 percent. The outfall pipe discharges to a 43 foot by 14 foot by 2.9-foot riprap and angular concrete pad with a D50 of 1.4 feet. Peak discharge through the outfall pipe is 45 cfs.
SUMMARY Calculations summarized within this memorandum were used for the design of the Refinery Stormwater Improvement Project dated 5/24/2018.
QUALITY CONTROL Calculations By: RJ/NE
Calculations Checked By: JY Calculations Reviewed By: CT
42M-002-008

TABLES

TABLE 1. SUB-BASIN SUMMARYBORGER REFINERY, HUTCHINSON COUNTY, TEXAS
Area100-Year Peak
Discharge(sq. mi.) (cfs)
Sub-Basin-1 0.00102 90 47 9Sub-Basin-2 0.00257 89 0 21Sub-Basin-3 0.00117 88 3 10Sub-Basin-4 0.00292 89 0 25Sub-Basin-5 0.00525 90 7 47
Notes:cfs - cubic feet per second sq. mi. - square miles
Basin ID Area Weighted Curve Number
Percent Impervious
202005_StormwaterDesign_TBL.xlsx 1 of 1

TABLE 2. CHANNEL DESIGN SUMMARYBORGER REFINERY, HUTCHINSON COUNTY, TEXAS
Channel Slope Length Velocity
100-Year NormalDepth
100-Year DesignCapacity
(ft/ft) (ft) (ft/s) (ft) (ft)East Channel Reach 1 V-Ditch 0.140 38 0.036 13.7 0.9 3.0East Channel Reach 1A V-Ditch 0.070 70 0.036 9.7 1.0 3.0East Channel Reach 2 V-Ditch 0.005 398 0.036 3.0 2.4 3.0East Channel Reach 3 V-Ditch 0.025 201 0.036 6.7 2.0 3.5East Channel Reach 3A V-Ditch 0.015 108 0.036 5.2 2.2 3.5West Channel Reach 4 Trapezoidal Channel 0.006 500 0.025 4.9 1.8 2.0West Channel Reach 5 Trapezoidal Channel 0.005 200 0.025 4.5 1.8 2.0
Notes:1 - V-Ditch section consist on varying depth and 1.5ft:1ft side slopes2 - Trapezoidal Channel consists of 2ft depth, 2ft bottom width and 2ft:1ft side slopes ft - feetft/s - feet per secondft/ft - foot per foot
Stormwater Channel Channel Section1,2 Manning's n
202005_StormwaterDesign_TBL.xlsx 1 of 1

FIGURE
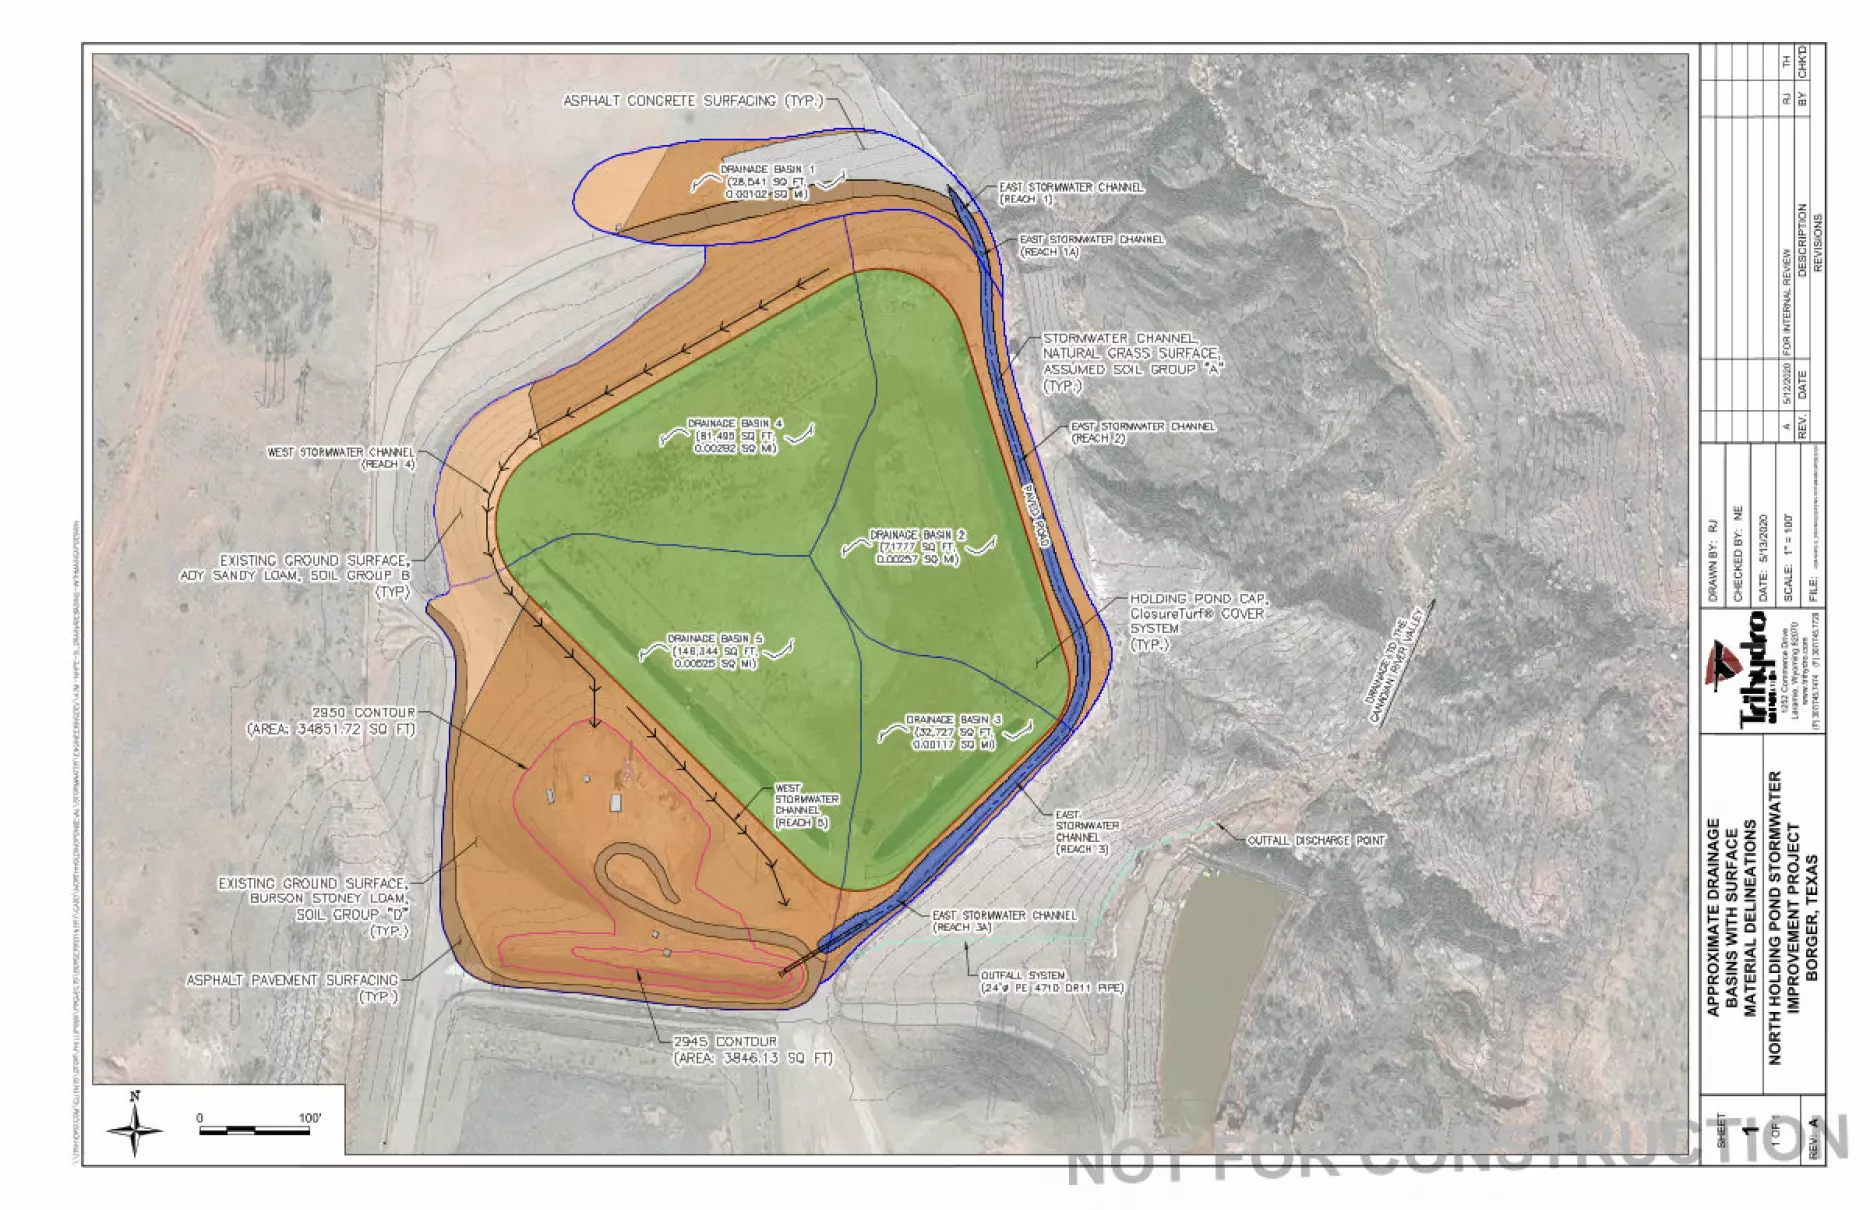
Image courtesy of ImagePatch.com © 2017 Microsoft Corporation
NOT FOR CONSTRUCTIO
N
0 100'
ww
w.trih
yd
ro
.co
m
12
52
C
om
me
rce
D
rive
La
ra
mie
, W
yo
min
g 8
20
70
(P
) 307/745.7474 (F
) 307/745.7729
AP
PR
OX
IM
AT
E D
RA
IN
AG
E
BA
SIN
S W
IT
H S
UR
FA
CE
MA
TE
RIA
L D
EL
IN
EA
TIO
NS
NO
RT
H H
OL
DIN
G P
ON
D S
TO
RM
WA
TE
R
IM
PR
OV
EM
EN
T P
RO
JE
CT
BO
RG
ER
, T
EX
AS
RE
V:
FIL
E:
CH
EC
KE
D B
Y:
SC
AL
E:
DR
AW
N B
Y:
DA
TE
RE
VIS
IO
NS
DE
SC
RIP
TIO
NC
HK
'D
BY
RE
V.
DA
TE
:
SH
EE
T
1
A
RJ
NE
5/1
3/2
02
0
1" =
1
00
'
42M
-N
HP
E-S
_D
RA
IN
AG
EB
AS
IN
S-W
IT
HM
AIN
CA
PD
ES
IG
N
A5
/1
2/2
02
0F
OR
IN
TE
RN
AL
R
EV
IE
WR
JT
H
1 O
F 1
®

Permit No. HW-50078 Rev. 2Phillips 66 – Borger Refinery, Texas May 2020
Vol. II Attachment B.VII.C.1 Post-Closure Care Plan i
Attachment B.VII.C.1Post-Closure Care Plan
Table of Contents
1.0 General Information ................................................................................................................. 1-1
2.0 Post-Closure Period................................................................................................................. 2-1
3.0 Post-Closure Monitoring........................................................................................................... 3-1
4.0 Post-Closure Inspections ......................................................................................................... 4-1
5.0 Post-Closure Maintenance ....................................................................................................... 5-1
6.0 Amendment of Plan.................................................................................................................. 6-1
7.0 Post-Closure Cost Estimates.................................................................................................... 7-1
8.0 Reporting ................................................................................................................................. 8-1
Table 1 – Unit Post-Closure Cost Estimate
Appendix A – Engineering Reports and Drawings for Closed Surface Impoundments and Landfills
Appendix B – Closure Notices and Deed Recordation

Permit No. HW-50078 Rev. 2Phillips 66– Borger Refinery, Texas May 2020
Vol. II Attachment B.VII.C.1 Post-Closure Care Plan 1 - 1
1.0 General Information
This post-closure care plan has been prepared to provide guidance to Phillips 66 (P66) for post-closure
care of the Hazardous Waste Landfill; Surface Impoundment 302; North Holding Pond (NHP); Pitch Pits
11, 12 & 14; Old Caustic Pond; Filter Slurry Pond; New Caustic Pond; Surge Pond; Off Test Pond; Class I
Landfill; and New Evaporation Pond for Hazardous Waste Permit No. 50078. This post-closure care plan
is prepared in accordance with Federal (40 CFR §264 Subpart G and 40 CFR §264.144) and State (30
TAC §335.169) requirements.
Phillips 66 Company (Phillips 66, CN601491608) operates the Borger Refinery (RN102495884), which is
owned by a joint venture between Phillips 66 (P66) and Cenovus called WRB Refining LP (WRB,
CN603215997).The mailing address to the facility is P.O. Box 271, Borger, Texas 79008. The physical
address for the facility is State Highway Spur 119 North, Borger, Texas 79007. P66 has been assigned a
hazardous waste generator number by the U.S. Environmental Protection Agency (EPA) TXD980626774
and a Texas Commission on Environmental Quality (TCEQ) Solid Waste Notice of Registration Number
30111. The units listed above were closed and will be maintained in the post-closure period in a manner
that minimizes the need for maintenance, and minimizes or eliminates the potential for hazardous waste
and hazardous constituents to contaminate the ground or surface waters or the atmosphere. The
hazardous waste units are deed recorded for commercial and industrial use only. No future changes in
land use are expected.
Surface Impoundment 301 has never received hazardous waste, will be closed as such, and so does not
require post-closure care.
Copies of engineering reports and figures for the surface impoundments closed as landfills and closed
landfills are presented in Appendix A.

Permit No. HW-50078 Rev. 1Phillips 66 – Borger Refinery, Texas May 2020
Vol. II Attachment B.VII.C.1 Post-Closure Care Plan 2 - 1
2.0 Post-Closure Period
The post-closure period for units will extend for at least 30 years after final closure as specified in the
permit, or as modified by the TCEQ. Closure dates are presented below. Closure letters and deed
recordation are presented in Appendix B.
Closure Dates and Schedules
Unit Name (NOR #) Date Closed Registration # Anticipated End ofPost-Closure Care
PeriodHazardous Waste Landfill N/A 536-589 -
Surface Impoundment301
N/A 564-967 -
Surface Impoundment302
N/A 564-967 -
North Holding Pond (36)a 3/15/1991(reopened)
585-875 -
Pitch Pit 11 (5) 7/05/1995 75220 7/2025Pitch Pits 12/14 (6) 7/05/1995 75220 7/2025
Old Caustic Pond (8) 1/17/1990 176-433 1/2020Filter Slurry Pond (10) 11/15/1994 72317 11/2024New Caustic Pond (11) 4/13/1993 642141 4/2023
Surge Pond (37) 12/03/1998 0290260/0296785 12/2030Off Test Pond (39) 12/03/1998 0290261/0296785 12/2030
Class I Landfill 4/09/1990 0291953 9/2020New Evaporation Pond 4/09/1990 0291955 9/2020
aAlthough the North Holding Pond stopped receiving hazardous waste in 1991, it is still open as a non-hazardous landfill.
A groundwater detection monitoring program is in place for the regulated units listed in the above table.
The Old Caustic Pond and New Caustic Pond are in Corrective Action; the Class I Landfill and New
Evaporation Pond are in Compliance Monitoring. Post-closure costs for the Class 1 Landfill, New
Evaporation Pond, Old Caustic Pond, and New Caustic Pond were previously included in the Compliance
Plan Financial Assurance costs. The costs for Post-Closure maintenance, inspection, closure
certification, etc. (i.e. above-ground post-closure items) for these units have now been separated from the
Compliance Plan and are included in Table 1 of the Post-Closure Plan. The corrective action and
groundwater monitoring post-closure costs for these units are included in the Compliance Plan.

Permit No. HW-50078 Rev. 1Phillips 66 – Borger Refinery, Texas May 2020
Vol. II Attachment B.VII.C.1 Post-Closure Care Plan 3 - 1
3.0 Post-Closure Monitoring
3.1 Groundwater Detection Monitoring Program
A groundwater detection monitoring program has been in place since the initial operation of the units.
Details of the program are presented in Section VI of the RCRA Permit Renewal Application, Geology
Section.
3.2 Leachate Collection and Leak Detection System
Leachate collection and/or leak detection systems exist for the Hazardous Waste Landfill, the surface
impoundments, the N H P, and the Filter Slurry Pond. The leachate collection and leak detection systems
are described below:
Surface Impoundments
The leak detection system of each impoundment consists of a geogrid, installed between the primary and
secondary liners, which drains to a perforated central drain pipe along the bottom of each pond. The
geogrid consists of a HDPE mesh material designed to drain moisture which penetrates the primary liner.
The central drain pipe is enclosed in a geotextile sleeve and embedded in coarse sand within a geotextile
envelope to prevent clogging of the perforations. The drain pipe accepts drainage from the geogrid and
conveys the liquid to a Driscopipe sump. Each sump was constructed in a mechanically stable and
watertight manner to enable the sump to retain any moisture which drains from the geogrid drainage
layer.
North Holding Pond
A three-foot thick soil/bentonite liner was constructed on the pond bottom and interior side wails, with a
pipe and gravel leak detection system constructed on top of the liner. Construction details are included in
Section V of the 1997 Part B permit application. Since the NHP no longer receives hazardous waste,
construction details have not been reproduced in this report.
Hazardous Waste Landfill
A leachate collection system was installed above the primary liner. The leachate collection system
consists of a network of 4-6 inch perforated Driscopipes packed in a 12-inch layer of coarse sand. The
piping directs leachate to a sump located at the east end of the landfill. The sump also receives run-off
from within the landfill. The pumping system has a capacity of 100 gallons per minute. A leak detection
system was installed between the primary and secondary liners.

Permit No. HW-50078 Rev. 1
Phillips 66 – Borger Refinery, Texas May 2020
Vol. II Attachment B.VII.C.1 Post-Closure Care Plan 3 - 2
Filter Slurry Pond
The Filter Slurry Pond was constructed with a primary liner of 45 mil reinforced Hypalon above a 3-foot
bentonite-stabilized clay secondary liner. A leak detection system of three, 3-inch perforated PVC pipes
within a 6-inch layer of granular material that separates the two liners. The PVC pipes drain by gravity
into three concrete leak detection drain boxes located at the toe of the eastern embankment.

Permit No. HW-50078 Rev. 2Phillips 66 – Borger Refinery, Texas May 2020
Vol. II Attachment B.VII.C.1 Post-Closure Care Plan 4 - 1
4.0 Post-Closure Inspections
The units will be inspected semi-annually during the post-closure care period. Post-closure inspections
will evaluate the condition of the system components. Post-closure inspections include the following
activities:
Clay-rich soil structures, including covers and caps, will be inspected to verify
that no cracks or deep erosions have developed, that deleterious settlement has
not occurred, and that deep-rooted vegetation or burrowing animals have not
penetrated the cap;
Synthetic covers and caps will be inspected to verify that no damage has
occurred, and that deleterious settlement has not occurred.
o Samples of engineered turf material will be collected annually at a rate of 1
sample per acre and tested for tensile strength in accordance with ASTM
D2256.
o Condition of sand ballast will be inspected to determine if appropriate cover
of turf remains in sufficient quantity to meet manufacturers specifications.
Signage (e.g., “TCEQ Permit Unit No.”, “Danger Hazardous Waste”), or other
markers will be observed to ensure they are intact and legible; and
Benchmark surveys will be conducted annually to evaluate cap subsidence
potential.

Permit No. HW-50078 Rev. 2Phillips 66 – Borger Refinery, Texas May 2020
Vol. II Attachment B.VII.C.1 Post-Closure Care Plan 5 - 1
5.0 Post-Closure Maintenance
Because of the design of the closure caps, only routine post-closure maintenance is usually required
(e.g., maintaining cover after storms, etc.). These and other less routine maintenance are evaluated as
part of the routine inspections. Based on the results of these inspections, the following maintenance
activities are performed as required:
Stormwater conveyances will be maintained in good functional condition to avoid
erosional features such as rills or other erosional damage to cover integrity;
If evidence of ponding, settling, subsidence or disruption of established drainage
patterns is observed, or discovered using the annual benchmark survey data,
additional cover materials or vegetation, if applicable, will be applied to maintain
proper slope and cover integrity;
If damage to a synthetic cover or cap is discovered, it will be repaired;
If annual test results indicate the engineered turf material has lost 50% or more in
tensile strength the engineered turf material and sand ballast will be replaced;
If subsidence or damage to a benchmark is observed during the annual
benchmark survey, repairs will be made and the benchmark will be returned to its
original elevation;
Missing or illegible signage will be replaced;
Animal burrows will be addressed by removal of the animal if possible and
backfilling the burrow to avoid animals from encountering waste material; and
Routine and other maintenance activities are performed as needed. If an
inspection reveals that a maintenance activity is required to correct a problem,
that action is implemented as soon as practicable.
Because the Borger, Texas area is semi-arid, minimal vegetative maintenance will be performed. The
units are initially seeded with native species; however, no routine watering or mowing will take place.

Permit No. HW-50078 Rev. 1Phillips 66 – Borger Refinery, Texas May 2020
Vol. II Attachment B.VII.C.1 Post-Closure Care Plan 6 - 1
6.0 Amendment of Plan
The post-closure plan will be maintained and updated as necessary by the Site Environmental Specialist.
The post-closure care contact is:
Site Environmental SpecialistPhillips 66, Borger RefineryP.O. Box 271Borger, Texas 79008-0271806-275-1815
Permit No. HW-50078 Rev. 11Phillips 66 – Borger Refinery, Texas May 2020
Vol. II Attachment B.VII.C.1 Post-Closure Care Plan 7 - 1
7.0 Post-Closure Cost Estimates
This information is provided for each hazardous waste land-based unit included in this plan. These
closure costs were developed using a combination of EPA’s preferred software, Costpro 6.0 and using
2019 cost estimates from material vendors and contractors. Estimates from Costpro are based upon
2007 unit costs; these costs were updated using standard inflation factors to give 2019 costs.
Detailed costs are presented in Tables VII.C.1-1 through VII.C.1-8. Post-closure costs for the Class 1
Landfill, New Evaporation Pond, Old Caustic Pond, and New Caustic Pond were previously included in
the Compliance Plan Financial Assurance costs. The costs for Post-Closure maintenance, inspection,
closure certification, etc. (i.e. above-ground post-closure items) for these units have now been separated
from the Compliance Plan and are included in Table 1 of the Post-Closure Plan. The corrective action
and groundwater monitoring post-closure costs for these units are included in the Compliance Plan.

Permit No. HW-50078 Rev. 1Phillips 66 – Borger Refinery, Texas May 2020
Vol. II Attachment B.VII.C.1 Post-Closure Care Plan 8 - 1
8.0 Reporting
Reports and documentation required by the Part B Permit will be provided to TCEQ as indicated in the
permit.
Additionally, post-closure care notices and certifications required by 40 CFR §264.119 through §264.120
will be performed. Within 60 days of completing the post-closure care period, P66 will provide the TCEQ
with a certification that the post-closure care period was performed and completed in accordance with the
specifications in the approved post-closure plan.

Permit No. HW-50078 Rev. 1Phillips 66 – Borger Refinery, Texas May 2020
Vol. II Attachment B.VII.C.1 Post-Closure Care Plan Tables/Figures/Drawings - 1
Tables/Figures/Drawings for Post-Closure Care Plan
Tables
Table 1 – Unit Post-Closure Cost Estimate
Figures
None
Drawings
None

Permit No. HW-50078 Rev. 11Phillips 66 – Borger Refinery, Texas May 2020
Vol. II Attachment B.VII.C.1 Post-Closure Care Plan Tables/Figures/Drawings - 3
Table 1. Unit Post-Closure Cost Estimate
Task Cost
Hazardous Waste Landfill
Maintenance and Inspection
Groundwater Monitoring (5 wells x 2 events)
Subtotal of Post-closure Costs
Engineering Expenses (10%)
Deed Notation
Final Certification of Post-Closure Care
$930
$11,597
$12,526
$1,253
$6,800
$4,960
subtotal $13,779
Contingency (10% minimum) $1,378
TOTAL UNIT POST-CLOSURE CARE COST x 30 yrs. (or otherpost-closure care period)
$466,471 (2009)
TOTAL UNIT POST-CLOSURE CARE COST x 30 yrs. (or otherpost-closure care period)
$481,398 (2011)
$497,414 (2013)
TOTAL UNIT POST-CLOSURE CARE COST x 30 yrs. (or otherpost-closure care period)
$547,000 (2019)

Permit No. HW-50078 Rev. 11Phillips 66 – Borger Refinery, Texas May 2020
Vol. II Attachment B.VII.C.1 Post-Closure Care Plan Tables/Figures/Drawings - 4
Table 1. Unit Post-Closure Cost Estimate (Continued)
Task Cost
Surface Impoundments 301 and 302
SI 301Maintenance and Inspection
Groundwater Monitoring
Subtotal of Post-closure Costs
Engineering Expenses (10%)
Subtotal of Annual Post-Closure Costs
Deed Notation
Final Certification of Post-Closure Care
SI 302Maintenance and Inspection
Groundwater Monitoring (7 wells x 2 events)
Subtotal of Post-closure Costs
Engineering Expenses (10%)
Deed Notation
Final Certification of Post-Closure Care
$642
$0a
$642
$64
$706
$6,800
$4,960
$549
$15,512
$16,061
$1,606
$6,800
$4,960
subtotal $18,373
Contingency (10% minimum) $1,837
TOTAL UNIT POST-CLOSURE CARE COST x 30 yrs. (or otherpost-closure care period)
$606,300 (2009)
TOTAL UNIT POST-CLOSURE CARE COST x 30 yrs. (or otherpost-closure care period)
$625,702 (2011)
$646,519 (2013)
TOTAL UNIT POST-CLOSURE CARE COST x 30 yrs. (or otherpost-closure care period)
$711,000 (2019)
aGroundwater monitoring is priced in the SI 302 Closure Costs. The units are too close together to separate.

Permit No. HW-50078 Rev. 11Phillips 66 – Borger Refinery, Texas May 2020
Vol. II Attachment B.VII.C.1 Post-Closure Care Plan Tables/Figures/Drawings - 5
Table 1. Unit Post-Closure Cost Estimate (Continued)
Task1 Cost
North Holding Pond
Site Security (one-time only)
Site Security (annual)
Maintenance and Inspection
Groundwater Monitoring (6 wells x 2 events)
Non-destructive engineered turf testing (annual)
Engineered turf replacement (one-time if needed)
Subtotal of Annual Post-closure Costs
Engineering Expenses (10%)
Deed Notation
Final Certification of Post-Closure Care
$25,000
$500
$1,000
$13,000
$500
$200,000
$15,000
$1,500
$7,000
$10,000
subtotal $16,500
Contingency (10% minimum) $1,650
TOTAL UNIT POST-CLOSURE CARE COST x 30 yrs. (or
other post-closure care period)$952,000 (2019)
1The cost basis for line items in the above table are based on a mixture of 2007 and 2019 costs; theseitems were adjusted to a common 2019 cost basis in the total post closure cost.
Task Cost
Pitch Pits 11, 12 &14
Maintenance and Inspection
Groundwater Monitoring (7 wells x 2 events)
Subtotal of Annual Post-closure Costs
Engineering Expenses (10%)
Deed Notation
Final Certification of Post-Closure Care
$2,440
$16,292
$19,217
$1,922
$6,880
$4,960
subtotal $21,139
Contingency (10% minimum) $2,114
TOTAL UNIT POST-CLOSURE CARE COST x 14 yrs. (orother post-closure care period)
$337,295 (2009)
TOTAL UNIT POST-CLOSURE CARE COST x 14 yrs. (orother post-closure care period)
$348,088 (2011)
$359,669 (2013)
TOTAL UNIT POST-CLOSURE CARE COST x 14 yrs. (orother post-closure care period)
$395,000 (2019)
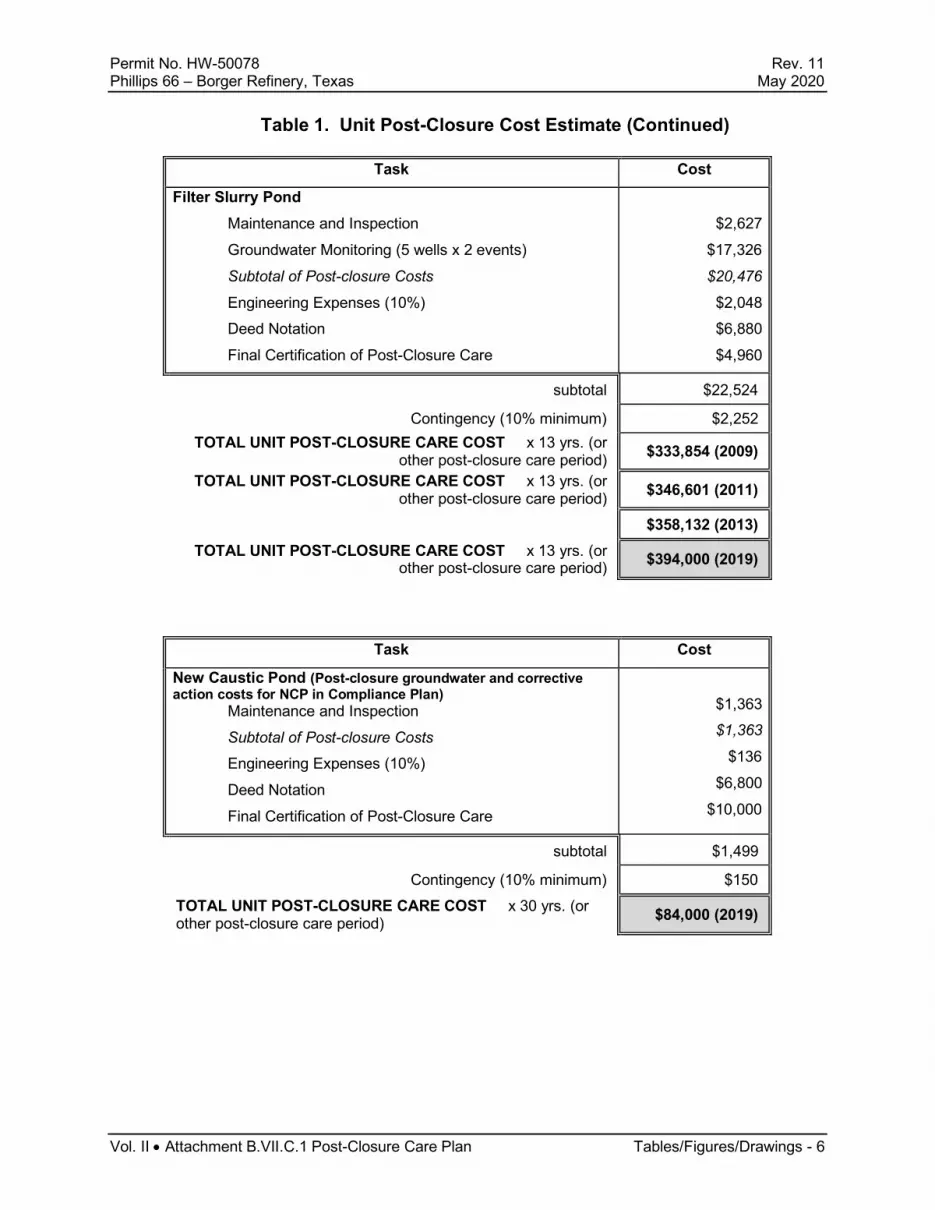
Permit No. HW-50078 Rev. 11Phillips 66 – Borger Refinery, Texas May 2020
Vol. II Attachment B.VII.C.1 Post-Closure Care Plan Tables/Figures/Drawings - 6
Table 1. Unit Post-Closure Cost Estimate (Continued)
Task Cost
Filter Slurry Pond
Maintenance and Inspection
Groundwater Monitoring (5 wells x 2 events)
Subtotal of Post-closure Costs
Engineering Expenses (10%)
Deed Notation
Final Certification of Post-Closure Care
$2,627
$17,326
$20,476
$2,048
$6,880
$4,960
subtotal $22,524
Contingency (10% minimum) $2,252
TOTAL UNIT POST-CLOSURE CARE COST x 13 yrs. (orother post-closure care period)
$333,854 (2009)
TOTAL UNIT POST-CLOSURE CARE COST x 13 yrs. (orother post-closure care period)
$346,601 (2011)
$358,132 (2013)
TOTAL UNIT POST-CLOSURE CARE COST x 13 yrs. (orother post-closure care period)
$394,000 (2019)
Task Cost
New Caustic Pond (Post-closure groundwater and correctiveaction costs for NCP in Compliance Plan)
Maintenance and Inspection
Subtotal of Post-closure Costs
Engineering Expenses (10%)
Deed Notation
Final Certification of Post-Closure Care
$1,363
$1,363
$136
$6,800
$10,000
subtotal $1,499
Contingency (10% minimum) $150
TOTAL UNIT POST-CLOSURE CARE COST x 30 yrs. (orother post-closure care period)
$84,000 (2019)

Permit No. HW-50078 Rev. 11Phillips 66 – Borger Refinery, Texas May 2020
Vol. II Attachment B.VII.C.1 Post-Closure Care Plan Tables/Figures/Drawings - 7
Table 1. Unit Post-Closure Cost Estimate (Continued)
Task Cost
Surge Pond
Maintenance and Inspection
Groundwater Monitoring (5 wells x 2 events)
Subtotal of Post-closure Costs
Engineering Expenses (10%)
Deed Notation
Final Certification of Post-Closure Care
$1,908
$14,838
$17,105
$1,710
$6,880
$4,960
subtotal $18,815
Contingency (10% minimum) $1,882
TOTAL UNIT POST-CLOSURE CARE COST x 19 yrs. (orother post-closure care period)
$398,689 (2009)
TOTAL UNIT POST-CLOSURE CARE COST x 19 yrs. (orother post-closure care period)
$424,613 (2011)
TOTAL UNIT POST-CLOSURE CARE COST x 19 yrs. (orother post-closure care period)
$438,740 (2013)
TOTAL UNIT POST-CLOSURE CARE COST x 19 yrs. (orother post-closure care period)
$483,000 (2019)
Task Cost
Off-Test Pond
Maintenance and Inspection
Groundwater Monitoring (5 wells x 2 events)
Subtotal of Post-closure Costs
Engineering Expenses (10%)
Deed Notation
Final Certification of Post-Closure Care
$1,908
$12,377
$14,643
$1,464
$6,880
$4,960
subtotal $16,107
Contingency (10% minimum) $1,611
TOTAL UNIT POST-CLOSURE CARE COST x 19 yrs. (orother post-closure care period)
$348,400 (2009)
TOTAL UNIT POST-CLOSURE CARE COST x 19 yrs. (orother post-closure care period)
$359,549 (2011)
$371,511 (2013)
TOTAL UNIT POST-CLOSURE CARE COST x 19 yrs. (orother post-closure care period)
$408,000 (2019)

Permit No. HW-50078 Rev. 11Phillips 66 – Borger Refinery, Texas May 2020
Vol. II Attachment B.VII.C.1 Post-Closure Care Plan Tables/Figures/Drawings - 8
Task Cost
Old Caustic Pond (Post-closure groundwater and correctiveaction costs for OCP in Compliance Plan)
Maintenance and Inspection
Subtotal of Post-closure Costs
Engineering Expenses (10%)
Deed Notation
Final Certification of Post-Closure Care
$1,363
$1,363
$136
$6,800
$10,000
subtotal $1,499
Contingency (10% minimum) $150
TOTAL UNIT POST-CLOSURE CARE COST x 30 yrs. (orother post-closure care period)
$84,000 (2019)
Task Cost
Class I Landfill (Post-closure groundwater costs for this unit inCompliance Plan)
Maintenance and Inspection
Subtotal of Post-closure Costs
Engineering Expenses (10%)
Subtotal of Annual Post-Closure Costs
Deed Notation
Final Certification of Post-Closure Care
$913
$913
$91
$1,004
$6,800
$4,960
subtotal $1,004
Contingency (10% minimum) $100
TOTAL UNIT POST-CLOSURE CARE COST x 9 yrs. (orother post-closure care period)
$29,000 (2019)

Permit No. HW-50078 Rev. 11Phillips 66 – Borger Refinery, Texas May 2020
Vol. II Attachment B.VII.C.1 Post-Closure Care Plan Tables/Figures/Drawings - 9
Task Cost
New Evaporation Pond (Post-closure groundwater costs for thisunit in Compliance Plan)
Maintenance and Inspection
Subtotal of Post-closure Costs
Engineering Expenses (10%)
Subtotal of Annual Post-Closure Costs
Deed Notation
Final Certification of Post-Closure Care
$1,567
$1,567
$157
$1,723
$6,800
$4,960
subtotal $1,724
Contingency (10% minimum) $172
TOTAL UNIT POST-CLOSURE CARE COST x 10 yrs. (orother post-closure care period)
$40,000 (2019)
TOTAL PERMITTED FACILITY POST-CLOSURE COST (allunit costs combined)
$3,344,299 (2009)
TOTAL PERMITTED FACILITY POST-CLOSURE COST (allunit costs combined)
$3,442,273 (2011)
TOTAL PERMITTED FACILITY POST-CLOSURE COST (allunit costs combined
$3,556,800 (2013)
TOTAL PERMITTED FACILITY POST-CLOSURE COST (allunit costs combined)
$4,127,000 (2019)
One-time only costs such as Deed Notation and Fencing have not been multiplied by the number of years
left in post-closure care but added to the total cost.

Permit No. HW-50078 Rev. 1Phillips 66– Borger Refinery, Texas May 2020
Vol. II Attachment B.VII.C.1 Post-Closure Care Plan Appendices - 1
Appendices to Post-Closure Care Plan
Appendix A – Engineering Reports and Drawings for Closed Surface Impoundments and Landfills
Appendix B – Closure Notices and Deed Recordation


