Embed Size (px)
Citation preview

QUANTITATIVE METHODS IN ECONOMICS Vol. XIV, No. 1, 2013, pp. 265 – 275
APPLICATION OF CLASSIFICATION TREES TO ANALYZE 1 INCOME DISTRIBUTION IN POLAND 2
Krzysztof Kompa, Dorota Witkowska 3 Department of Econometrics and Statistics 4
Warsaw University of Life Sciences – SGGW 5 e-mail: [email protected], [email protected] 6
Abstract: The aim of presented research is to identify factors that determine 7 wages in Poland and to find out if gender pay gap exists, applying 8 classification trees. For the grouping variable i.e. net income from the main 9 place of employment we construct clusters of respondents that are created 10 due to such features as: gender, education, employment contract, economic, 11 occupation, additional job, size of enterprise, measured by the number 12 of employees, age and job seniority in years. Investigation is provided 13 applying data from the Polish Labor Force Survey in the years 2003, 2006 14 and 2009. 15
Keywords: labor market, gender segregation, classification tree 16
INTRODUCTION 17
In modern economics income distribution has been concerned as the 18 distribution of income across individuals and households. Important theoretical and 19 policy concerns include the relationship between income inequality and economic 20 growth. The transformation of economies from centrally planned toward market-21 oriented that has been taking place in Central and Eastern Europe involved 22 significant changes in labor market institutions. Constraints on layoffs and 23 redundancies were significantly reduced but unemployment – the unknown in 24 communist era phenomenon - appeared. Situation on labor market in transitional 25 economies has been discussed by: Adamchik and Bedi (2003), Grajek (2001), Kot 26 (1999), Keane and Prasad (2006), Newell and Reilly (2001), Newell and Socha 27 (2005) and (2007), Witkowska (2012) among others. 28
There are many factors influencing wages that are widely discussed in 29 literature ([Kot 1999] may be an example). These features are either connected 30

266 Krzysztof Kompa, Dorota Witkowska
with the individual attributes of employees or describe the general situation at the 1 labor market and characterize the particular place (institution or enterprise) 2 of employment. The former may be the subject of potential wage disparities. 3 Inequalities at the labor market concern different aspects and social relations such 4 as [Cain 1986, p. 693]: gender, sexual orientation, age, race, disabilities, religion, 5 etc. Labor market discrimination by gender, race and ethnicity is the world-wide 6 problem and estimation of these types of discriminations has become routine 7 [Neuman and Oaxaca 2003]. 8
Gender discrimination at the labor market may appear in a variety of forms 9 such as: wage discrimination, discrimination in hiring, human capital 10 discrimination (educational gender segregation) and occupational segregation (see 11 [McConnell and Brue 1986, p. 289 –290], [Kot 1999, p. 225 – 226], [Livanos and 12 Pouliakas 2009]). To explain causes and mechanisms of gender discrimination is 13 very difficult however it seems to be easier to define it than to measure such 14 inequalities [Kot 1999, p. 225]. Literature offers variety of theories about how and 15 why women face discrimination in the labor market: Becker (1957), Madden 16 (1975), McConnell and Brue (1986), Thurow (1975), Arrow (1973) and Bergmann 17 (1971) among others. 18
The aim of our research1 is to analyze income distribution to detect factors 19 influencing wages and to answer the question if gender pay gap exists in Poland. 20 Our investigation is based on data from Polish Labour Force Survey in years 2003, 21 2006 and 2009, and is conducted applying classification trees. 22
CLASSIFICATION TREE 23
Classification trees are used to predict membership of cases or objects in the 24 classes of a categorical dependent variable from their measurements on one or 25 more predictor variables. Classification trees are a powerful alternative to the more 26 traditional statistical models. This model has the advantage of being able to detect 27 non-linear relationships and showing a good performance in presence of qualitative 28 information. Classification tree analysis is one of the main techniques used in so-29 called data mining. Description and examples of classification trees may be found 30 in Breiman et al. (1984), Gatnar and Walesiak (2004) among others. 31
The entire construction of a tree consists of 3 elements: (1) the selection 32 of the split; (2) the decisions when to declare a node terminal or to continue 33 splitting it; (3) the assignment of each terminal node to a class. In the tree 34 structures, leaves represent class labels and branches represent conjunction 35 of features that lead to those class labels. Since classification trees are used to 36 recognize homogenous groups, we apply them to find out major factors that create 37 these classes. 38
1 Research conducted under the National Science Centre Grant No. 2011/01/B/HS4/06346.
Application of classification trees … 267
In our research we use QUEST (Quick Unbiased Efficient Statistical Tree) 1 algorithm developed by Loh and Shih (1997) that employs a modification of 2 recursive quadratic discriminant analysis and includes a number of innovative 3 features for improving the reliability and efficiency of the classification trees that it 4 computes. QUEST is fast and unbiased. It's lack of bias in variable selection for 5 splits is also a distinct advantage when some predictor variable have few levels and 6 other predictor variables have many levels since predictors with many levels are 7 more likely to produce "fluke theories," which fit the data well but have low 8 predictive accuracy(see [Doyle 1973]). Finally, QUEST does not sacrifice 9 predictive accuracy for speed, (see [Lim, Loh, and Shih 1997]). 10
DATA DESCRIPTION 11
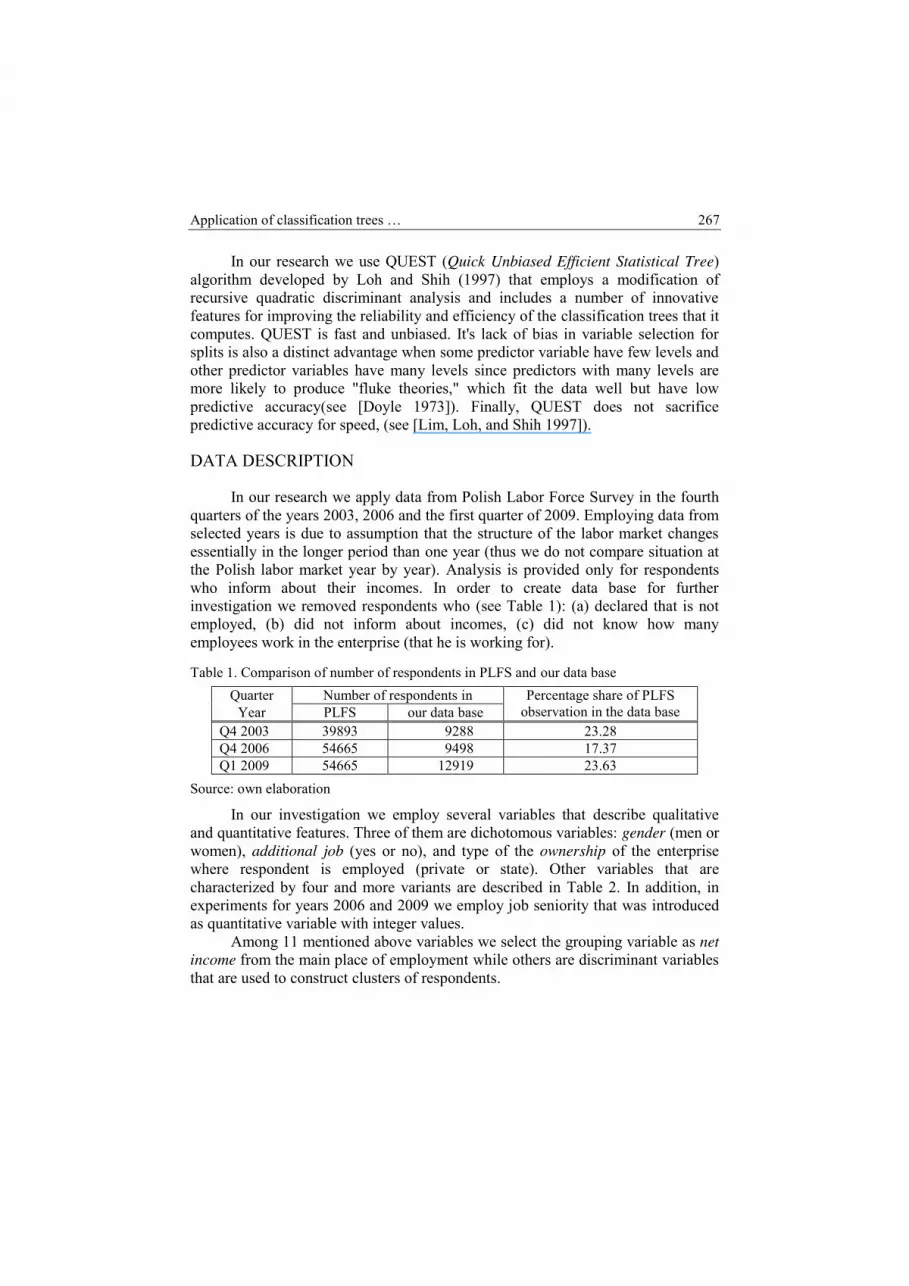
In our research we apply data from Polish Labor Force Survey in the fourth 12 quarters of the years 2003, 2006 and the first quarter of 2009. Employing data from 13 selected years is due to assumption that the structure of the labor market changes 14 essentially in the longer period than one year (thus we do not compare situation at 15 the Polish labor market year by year). Analysis is provided only for respondents 16 who inform about their incomes. In order to create data base for further 17 investigation we removed respondents who (see Table 1): (a) declared that is not 18 employed, (b) did not inform about incomes, (c) did not know how many 19 employees work in the enterprise (that he is working for). 20
Table 1. Comparison of number of respondents in PLFS and our data base 21 Quarter Number of respondents in Percentage share of PLFS
observation in the data base Year PLFS our data base Q4 2003 39893 9288 23.28 Q4 2006 54665 9498 17.37 Q1 2009 54665 12919 23.63
Source: own elaboration 22 In our investigation we employ several variables that describe qualitative 23
and quantitative features. Three of them are dichotomous variables: gender (men or 24 women), additional job (yes or no), and type of the ownership of the enterprise 25 where respondent is employed (private or state). Other variables that are 26 characterized by four and more variants are described in Table 2. In addition, in 27 experiments for years 2006 and 2009 we employ job seniority that was introduced 28 as quantitative variable with integer values. 29
Among 11 mentioned above variables we select the grouping variable as net 30 income from the main place of employment while others are discriminant variables 31 that are used to construct clusters of respondents. 32

268 Krzysztof Kompa, Dorota Witkowska
EMPIRICAL RESULTS 1
Searching for factors that influence wages has been provided for very long 2 time. Usually regression analysis or econometric modeling are employed in such 3 investigation. In the paper we present different approach using classification 4 method (see also Matuszewska-Janica, Witkowska, 2013). 5
Table 2. Description of variables 6 Variable Description
Education level tertiary
education post-secondary and vocational
secondary general
secondary basic vocational lower secondary and below that level
Economic sectors agricultural industrial services others
Occupation
army managerial professional technical
clerical sales & services farmers, fishers, etc. industry workers
skilled workers unskilled workers
Employment contract permanent job
temporary - training
temporary since cannot find permanent job
temporary since that form is suitable
Size of firm [number of employees] <10 11-19 20-49 50-99 >100
Age [years] <29 30 – 39 40 – 49 50 – 59 >60 Incomes [PLN] < 1000 1001 – 1400 1401 – 1800 1801 – 2200 > 2200
Source: own elaboration 7 In our experiments we construct classification trees for each year employing 8
the same rules such as minimal number of cases in superior node is 100, for 9 inferior node – 50, and maximal length from the starting node to the leaves is 5. In 10 all trees but one for 2003 the set of discriminant variables is the same. 11
The results are presented in tabular format. Table 3 contains counts of all 12 nodes and leaves (clusters) in each tree together with detailed description 13 of participation of each variable in splitting procedure. As one can see in the tree 14 constructed for the year 2003 job seniority is missing since data were not available. 15 Among distinguished variables only one, informing if the respondent had 16 additional job, does not create any classes. We may notice essential changes in 17 factors influencing wages in analyzed years. For instance economic sector seems to 18 be important factor only in the year 2006 while ownership of the firm, where 19 respondent is employed, together with age participate in splitting only in the year 20 2003. However the last mentioned variable is probably replaced by job seniority in 21 experiments provided for following years. We must also realize that “economic 22

Application of classification trees … 269
sector” is represent only by 4 variants of the variable and in such a case there is no 1 good representation of economic branches, and at least NACE classification 2 (Nomenclature statistique des Activité séconomiques dans la Communauté Euro-3 péenne) is recommended2. 4
Table 3.Participation of discriminant variables in the construction of classification trees 5 Years 2003 2006 2009
Count of: Count of all nodes and clusters in the entire tree
nodes clusters nodes clusters nodes clusters 27 14 43 22 49 25
Variables Number of nodes in the tree:
splitting terminal splitting terminal splitting terminal Education level 2 5 14, 22, 26 27, 28, 37,
38, 41, 42 17, 23 33, 34, 39, 40
Economic sectors 24 39, 40
Occupation 0, 1, 3, 16 23, 24
2, 4, 5, 8, 9, 15, 17,
20,
18, 29, 30, 31, 32, 35,
36
0, 1, 6, 7, 24 41, 42
Employment contract 12 25 4, 8, 11,
13, 27 9, 18, 21,
47, 48
Size of firm 8, 14 19, 20 10, 15, 16, 20,
19, 29, 30, 31, 32, 35,
36 Age 9 18
Job seniority × × 0, 1, 3, 7 16 2, 5, 12, 22, 37, 38
Gender 4, 6, 7, 15
10, 11, 12, 13, 21, 22
6, 10, 11, 19
13, 21, 23, 33, 34
3, 14, 25, 26
28, 43, 44, 45, 46
Additional job Ownership 17 25, 26
Source: own calculation 6 Synthetic description of all factors that take part in creation of groups of 7
respondents is presented in Table 4.Variables that create splitting the most often 8 are: occupation (24%), gender (23%), education level (14%), size of firm (13%) 9 and employment contract (10%). Taking into account percent of objects in terminal 10 nodes we see that 41% in 2003, 21% in 2006 and 28% in 2009 of them are created 11 for gender as discriminant variable. Therefore this factor influences wages the 12 most. Other important variables are: occupation although it seems to become less 13
2 As it was done in the paper [Matuszewska–Janica and Witkowska 2013].

270 Krzysztof Kompa, Dorota Witkowska
important in 2009 than before, size of firm in years 2003 and 2009, and education 1 in 2006. 2
Table 4. Participation of discriminant variables in the cluster construction 3
Count of all nodes Percentage share in terminal nodes
Count Percentage of splits Years 2003 2006 2009 2003 2006 2009 2003 - 2006 Education level 2 9 6 2.1 35.8 19.2 17 14.41 Economic sectors 3 6.7 3 2.54 Occupation 6 15 7 22.0 26.6 14.2 28 23.73 Employment contract 2 10 4.2 13.6 12 10.17 Size of firm 4 11 25.5 22.9 15 12.71 Age 2 1.2 2 1.69 Job seniority* × 5 6 × 6.0 2.2 11 12.09 Gender 10 9 9 41.3 20.5 27.6 27 22.88 Ownership 3 7.9 3 2.54 Sum 27 43 49 118 102.77
Source: own calculation. 4 * Percentage share for job seniority is calculated for 2 models only. 5
In Tables 5 ÷ 9 we present groups of respondents recognized by 6 classification trees as homogenous, separately for selected variables that participate 7 in terminal splits. In column “%” we present the percentage share of all 8 respondents that are classified to the particular leaf, i.e. 0.8 means that 0.8% of the 9 whole sample from the certain year creates the terminal node which number is 10 given in the second column (for instance, in Table 5, cluster generated by the node 11 11 in 2003 contains 0.8% of the sample i.e. 74 respondents). Structure of incomes 12 is represented by percentage share of respondents from each cluster who obtain 13 wages belonging to five groups of incomes from the main place of work 14 (see Table 2). 15
In Table 5 we describe income distribution in clusters selected by gender. As 16 one can see incomes are essentially lower in “woman nodes”. However one should 17 notice that gender structure in terminal nodes is not symmetric. In the year 2003, 18 there are 2636 women and 1200 men in terminal nodes, in 2006 and 2009 this 19 proportion is the opposite 513 to 1424, and 815 to 2751, respectively. Nevertheless 20 in 2003 in the highest income group there are only 1% of women from the nodes: 21 11, 13 and 21, while 11% of men from the nodes: 10, 12 and 22. In 2006 only 0.4% 22 of women from the node 34, but 17% of men belonging to nodes: 13, 21, 23 and 33 23 earn more than 2200PLN. The women situation seems to be better in 2009 since 24 9% of women from terminal nodes belong to the highest income class although this 25 share equals 27% for men. 26

Application of classification trees … 271
Table 5.Analysis of wages for respondents who created leaves according to: gender 1
Year Structure of sample Structure of incomes in the node
No. of node Count Gender % <1000 <1400 <1800 <2200 >2200
2003
11 74 women 0.8 32.4 35.1 14.9 13.5 4.1 13 1808 women 19.5 95.5 3.4 0.9 0.0 0.2 21 754 women 8.1 58.6 25.9 10.3 2.9 2.3 10 401 men 4.3 22.4 22.2 20.7 13.0 21.7 12 138 men 1.5 14.5 15.9 33.3 22.5 13.8 22 661 men 7.1 35.7 31.0 20.7 8.2 4.4
2006
34 513 women 5.4 81.9 12.3 4.9 0.6 0.4 13 357 men 3.8 7.6 8.4 23.2 20.7 40.1 21 126 men 1.3 4.8 11.9 18.3 19.8 45.2 23 425 men 4.5 72.7 13.6 8.0 2.8 2.8 33 519 men 5.5 50.9 26.0 14.1 4.2 4.8
2009
43 102 women 0.8 43.1 33.3 12.7 8.8 2.0 45 713 women 5.5 16.0 31.0 29.3 13.3 10.4 28 477 men 3.7 2.5 4.8 12.4 19.5 60.8 44 328 men 2.5 21.0 33.5 24.1 10.1 11.3 46 1946 men 15.1 6.2 21.7 31.1 20.1 21.0
Source: own calculation 2 In Table 6 we analyze wages considering employment contract. It is worth 3
mentioning that there are two nodes containing respondents with permanent job 4 which show completely different wage distribution. In the node 48 respondents 5 earn much better than employees classified to the node 18. 6
Table 6.Wages analysis for respondents created leaves according to: job contract 7
Year Structure of sample Structure of incomes in the node
No. of node Contract % <1000 <1400 <1800 <2200 >2200
2006 25 temporary: training or since one cannot find permanent job
4.2 65.8 20.1 8.2 2.7 3.2
2009
47 temporary: all situations 0.5 28.4 28.4 14.9 11.9 16.4 48 permanent 6.6 2.1 12.1 30.3 27.4 28.1 18 permanent 4.9 22.6 32.6 25.9 9.9 9.1 21 temporary: training 0.9 59.8 22.1 11.5 4.1 2.5 9 temporary: training 0.7 53.6 31.0 11.9 2.4 1.2
Source: own calculation 8

272 Krzysztof Kompa, Dorota Witkowska
Incomes of temporary employed because of training are identically distributed 1 while including all reasons for nonpermanent employment changes the distribution 2 of earnings toward higher wages. 3
Influence of education is analyzed in Table 7. It is visible that incomes 4 of employees with tertiary education were on the highest level in the year 2003, 5 while wages dramatically decreased in 2006. It may be connected with depreciation 6 of higher education since, due to demographic decline, every year higher 7 percentage of young people in age 19 – 24 study at universities. It causes that 8 university alumna are worse and worse educated and “overproduction” of people 9 with tertiary education in “soft disciplines” every year. Therefore they cannot find 10 better paid jobs. In 2003 2% of respondents were recognized as employees with 11 tertiary education in the node 5 while in 2006 there were 8% in the nodes: 27, 37 12 and 41. Among them in 2003 nearly 40% belong to the highest income class while 13 in 2006 there were only 13% of the ones from the terminal nodes. In 2009 there is 14 no cluster containing employees with tertiary only. It may be interpreted that level 15 of education became less important factor in wage determination. 16
Table 7. Wages analysis for respondents created leaves according to: level of education 17
Year No. of node Education % <1000 <1400 <1800 <2200 >2200
2003 5 tertiary 2.1 6.0 10.6 22.1 21.6 39.7
2006
27 tertiary 4.6 8.2 24.9 38.7 14.0 14.2 37 tertiary 2.2 11.6 28.5 35.7 14.5 9.7 41 tertiary 1.1 19.6 25.2 22.4 16.8 15.9
28 general, and post- secondary basic and secondary vocational
2.7 36.5 36.5 15.4 6.5 5.0
38 general, and post- secondary basic and secondary vocational
0.8 59.5 27.0 8.1 5.4 0.0
42 all variants except tertiary 24.4 34.0 31.7 20.0 9.3 5.0
2009
40 general secondary, basic vocational and below that level
5.1 23.2 30.6 27.1 11.2 7.8
34 general secondary, basic vocational and below that level
2.3 52.2 29.6 9.0 5.3 4.0
39 tertiary, post- and vocational secondary 10.9 8.6 22.0 27.9 17.5 23.9
33 tertiary, post- and vocational secondary 0.9 35.0 38.3 17.5 7.5 1.7
Source: own calculation 18

Application of classification trees … 273
One of the main factors influencing wages is occupation that is multi-variant 1 variable. Analysis of such variables is not precise because - due to assumed rules 2 of splitting in order to obtain the reasonable size of the tree – different variants are 3 “aggregated”. In Table 8 we can see that three groups of occupation: army, 4 managerial and professional earn the best and their wages has been increasing. 5
Table 8. Analysis of wages for respondents who created leaves according to: occupation 6
Year No. of node Occupation % <1000 <1400 <1800 <2200 >2200
2003 23 clerical and skilled workers 13.0 70.5 20.2 6.8 1.7 0.7
24 technical 9.0 56.5 22.6 12.8 4.8 3.2
2006
18 army, managerial 0.5 15.4 21.2 15.4 23.1 25.0
30 army, managerial, professional 1.4 41.0 33.6 11.2 7.5 6.7
29 all except army, managerial and professional
9.4 81.6 12.7 3.9 1.1 0.7
31 all except army, managerial, technical and professional
7.3 69.4 17.3 8.8 3.2 1.3
32 professional, technical 3.3 29.6 28.3 21.1 10.7 10.4
35 skilled workers 2.5 49.8 28.7 14.3 3.4 3.8 36 technical 2.2 26.7 22.4 22.9 19.0 9.0
2009 42 army, managerial,
professional 5.3 2.2 10.0 22.5 20.6 44.8
41 technical, industry and skilled workers 8.9 14.8 27.6 27.6 15.1 14.9
Source: own calculation 7
Table 9. Wages analysis for respondents created leaves according to: size of firm in 2009 8 No. of node Size of firm % <1000 <1400 <1800 <2200 >2200
36 <10 1.1 35.2 37.2 20.0 6.2 1.4 32 <10 5.2 57.5 33.0 8.0 1.3 0.1 35 11 - 49 2.7 16.8 39.6 32.4 6.6 4.6 30 1 - 100 4.0 65.5 28.8 5.2 0.4 0.2 31 >10 3.9 39.3 41.9 15.0 2.8 1.0 19 >50 4.4 12.0 31.5 29.6 15.4 11.5 29 >101 1.6 45.3 38.7 13.2 1.9 0.9
Source: own calculation 9 In Table 9 we look at incomes obtained in different sizes of firms. This factor 10
is essential only for 2009, and as one may see the highest wages are observed in 11

274 Krzysztof Kompa, Dorota Witkowska
institutions with more than 50 employees. Although in firms with more than 100 1 employees earnings are much smaller. 2
CONCLUSIONS 3
It is worth noticing that direct comparison of clusters does not give reliable 4 results unless the samples are not characterized by similar structure. Since splitting 5 was provided under constrains, that let us create reasonable size of the tree, it is 6 difficult to compare income distribution in the time span especially for 7 discriminant variables that are characterized by many variants (i.e. occupation, 8 education or employment contract) because leaves represent group of respondents 9 due to “aggregated feature”. 10
Application of classification trees let us distinguish the most important 11 variables that create homogenous classes of earnings. It also proves that during 12 transition period determinants of wages has been changed. However gender, 13 occupation and education seem to be the most important in the whole period 14 of analysis. While influence of employment contract and size of the institution 15 becomes more and more essential. 16
REFERENCES 17
Adamchik V.A., Bedi A.S. (2003) Gender Pay Differentials during the Transition in 18 Poland, Economics of Transition, Vol. 11(4) pp. 697 – 726. 19
Arrow K. J. (1973) The Theory of Discrimination in: Ashenfelter O. and Rees A. (ed.) 20 Discrimination in Labor Markets, Princeton, Princeton University Press. 21
Bergmann B. (1971) The Effect of White Incomes of Discrimination in Employment, 22 Journal of Political Economy Vol. 79, p. 294 – 313. 23
Breiman, L., Friedman, J., Olshen R. and Stone C. (1984) Classification and Regression 24 Trees. Wadsworth International Group, Belmont, CA. 25
Cain G. G. (1986) The Economic Analysis of labor Market Discrimination: A Survey, in: 26 Ashenfeler O., Layard R., (ed.) Handbook of Labour Economics, Vol. I, Elsevier 27 Science Publishers BV, pp. 693 – 785. 28
Doyle P. (1973) The use of Automatic Interaction Detector and Similar Search Procedures. 29 Operational Research Quarterly, Vol. 24, pp.465-467. 30
Gatnar E., Walesiak M. (2004) Metody statystycznej analizy wielowymiarowej 31 w badaniach marketingowych, Wydawnictwo AE im. O. Langego we Wrocławiu, 32 Wrocław. 33
Grajek M. (2001) Gender Pay Gap in Poland, Discussion Paper FS IV 01 – 13, Wissen-34 schaftszentrum Berlin. 35
Keane M. P. and Prasad E. (2006) Changes in the Structure of Earnings During the Polish 36 Transition, Journal of Development Economics Vol. 80, pp. 389 – 427. 37
Kot S. M. (ed.) (1999) Analiza ekonometryczna kształtowania się płac w Polsce w okresie 38 transformacji, Warszawa, Kraków, PWN. 39

Application of classification trees … 275
Lim T., Loh W., Shih Y. (2000) A Comparison of Prediction Accuracy, Complexity, and 1 Training Time of Thirty-three Old and New Classification Algorithms, Machine 2 Learning, Vol. 40, pp. 203 – 229. 3
Loh W., Shih Y. (1997) Split Selection Methods for Classification Trees, Statistica Sinica, 4 Vol. 7, pp. 815 – 840. 5
Livanos I., Pouliakas K. (2009) The Gender Wage Gap as a Function of Educational 6 Degree Choices in an Occupationally Segregated EU Country, IZA Discussion Paper 7 Series, Discussion Paper No. 4636, Bonn, Germany: Institute for the Study of Labor 8 (IZA)December 2009. 9
Madden, J. F. (1975) Discrimination - A Manifestation of Male Market Power? In: Lloyd, 10 C. B. (ed.) Sex, Discrimination, and the Division of Labor, New York: Columbia 11 University Press. 12
Matuszewska–Janica A., Witkowska D. (2013) Zróżnicowanie płac ze względu na płeć: 13 zastosowanie drzew klasyfikacyjnych, Taksonomia 21, Klasyfikacja i analiza danych. 14 teoria i zastosowania, Prace naukowe Uniwersytetu Ekonomicznego we Wrocławiu, 15 nr 279, Wydawnictwo Uniwersytetu Ekonomicznego we Wrocławiu, Wrocław, 16 pp. 58 – 66. 17
McConnell C. R., Brue S. L. (1986) Contemporary Labor Economics, New York, McGraw 18 Hill Book Co. 19
Milanovic, B. (1999) Explaining the increase in inequality during transition, Economics 20 of Transition, 7 (2) 299-341. 21
Newell, A., Reilly B. (2001) The gender wage gap in the transition from communism: some 22 empirical evidence, Economic Systems, 25, pp. 287-304. 23
Newell A., Socha M.W. (2005) The Distribution of Wages in Poland, 1992-2002, 24 IZA Discussion Paper 1485. 25
Newell A., Socha M.W. (2007) The Polish Wage Inequality Explosion, IZA Discussion 26 Paper No. 2644. 27
Neuman S., Oaxaca R. L. (2003) Estimating Labor Market Discrimination with Selectivity-28 Corrected Wage Equations: Methodological Considerations and An Illustration from 29 Israel, The Pinhas Sapir Center for Development Tel-Aviv University, Discussion Paper 30 No. 2-2003. 31
Thurow L. C. (1975) Generating Inequality, New York, Basic Books Inc. Publ. 32 Witkowska D. (2012) Wage Disparities in Poland: Econometric Models of Wages, Metody 33
Ilościowe w Badaniach Ekonomicznych, Vol. XIII No. 2, SGGW Warszawa, 34 pp. 115 – 124. 35


