Embed Size (px)
Citation preview

Materials Performance andCharacterization
N. K. Sharma,1 Ruchita Pal,2 D. K. Sehgal,3 and R. K. Pandey3
DOI: 10.1520/MPC20130069
Application of Elastic-Plastic FractureMechanics to Determinethe Locational Variationin Fracture Properties ofCortical Bone
VOL. 3 / NO. 3 / 2014

N. K. Sharma,1 Ruchita Pal,2 D. K. Sehgal,3 and R. K. Pandey3
Application of Elastic-Plastic FractureMechanics to Determine the LocationalVariation in Fracture Properties ofCortical Bone
Reference
Sharma, N. K., Pal, Ruchita, Sehgal, D. K., and Pandey, R. K., “Application of Elastic-Plastic
Fracture Mechanics to Determine the Locational Variation in Fracture Properties of Cortical
Bone,” Materials Performance and Characterization, Vol. 3, No. 3, 2014, pp. 429–447,
doi:10.1520/MPC20130069. ISSN 2165-39924
ABSTRACT
The complex nature of bone material results in a locational variation of fracture
and mechanical properties. The heterogeneity associated with bone material
and complex hierarchical assembly results in several toughening mechanisms,
such as plasticity, micro-cracking, viscoplasticity, etc. These toughening
mechanisms and presence of water in bone material makes the linear elastic
fracture mechanics (LEFM) inapplicable in such materials. The present work is
focused on the elastic-plastic fracture mechanics (EPFM) approach to estimate
the locational variation in fracture properties of buffalo cortical bone for
longitudinal, as well as transverse orientation of cracking. Samples from upper,
middle, and lower locations of bone diaphysis were tested using compact
tension and single-edge notch-bending testing methods for longitudinal and
transverse orientation of cracking, respectively. The crack-tip opening
displacement (CTOD) approach was applied to determine fracture properties,
such as CTOD toughness (dc), J integral (Jcd), and equivalent fracture
toughness (Kdc) at different locations of bone diaphysis. The effect of
orientation and location on mechanical properties of cortical bone, such as
elastic modulus (E) and yield strength (rys), was also analyzed with the help of
tensile testing. The equivalent fracture toughness values (Kdc) obtained in the
present work were found to be three times higher than the corresponding
Manuscript received October 7,
2013; accepted for publication
February 10, 2014; published
online June 7, 2014.
1
School of Technology, The Glocal
University, Mirzapur Pole,
Saharanpur, India (Corresponding
author),
e-mail: [email protected];
2
AIRF, Jawaharlal Nehru Univ., New
Delhi, India.
3
Dept. of Applied Mechanics, Indian
Institute of Technology Delhi, New
Delhi, India.
4
This paper is a contribution to a
Special Issue of Materials
Performance and Characterization
on “Fracture Toughness,” Guest
Editors, Bojan Podgornik and
Votjeh Leskovsek, Institute of
Metals and Technology, Ljubljana,
Slovenia.
Copyright VC 2014 by ASTM International, 100 Barr Harbor Drive, P.O. Box C700, West Conshohocken, PA 19428-2959 429
Materials Performance and Characterization
doi:10.1520/MPC20130069 / Vol. 3 / No. 3 / 2014 / available online at www.astm.org

values reported in the previous reports where the LEFM approach was applied
favoring the application of EPFM for bone materials. The mechanical
properties, as well as the fracture properties, were found to be maximum at
middle location and minimum at lower location of bone diaphysis. The
locational variation in fracture and mechanical properties observed in the
present work are considered to be because of locational distribution of
collagen fibrils, minerals, porosity, and density at different locations of bone
diaphysis.
Keywords
bone, fracture toughness, crack-tip-opening displacement, elastic-plastic fracture
mechanics, linear-elastic fracture mechanics
Introduction
Bone is a composite-like material consisting of minerals, carbonated hydroxyapatite
crystals, type I collagen, non-collagenous proteins, and water. Bone material is
treated as an anisotropic, heterogeneous material with hierarchical structure that
changes at different length scales. The complex nature of bone material results in a
wide range of fracture properties according to the orientation of crack, loading con-
dition, type of testing, and the location from where the specific sample is taken out.
Fracture mechanics of bone has been a very important field of study for researchers
to understand the risk of bone fracture because of age-related changes and several
diseases like osteoporosis, bone cancer, or osteogenesis imperfecta.
In different studies, longitudinal and transverse-direction fracture properties of
cortical bone have been obtained. To evaluate longitudinal fracture toughness, pre-
crack was oriented parallel to the long axis of the bone, whereas for transverse frac-
ture toughness the same was developed perpendicular to the long axis of the bone.
Both the single-edge notch-bend testing [1–3] and compact tension (CT) specimen
testing were used [4–14] to find the longitudinal and transverse fracture toughness
of cortical bone. A few researchers have also applied chevron–notched-beam testing
method to determine fracture toughness [15,16]. Nalla et al. [17] used the double-
notched test to determine toughness mechanism in bone. Feng et al. [18] determined
the fracture toughness of bone under different modes. It is noted that in all the above
tests of cortical bone the fracture toughness was evaluated in terms of critical-stress-
intensity factor (Kc) and the critical-strain energy-release rate (Gc) based on linear
elastic fracture mechanics (LEFM). Apart from these, in some studies [6,10–14] it
was suggested that the fracture toughness of bone increases with crack length and,
therefore, fracture resistance of bone materials cannot be described by a single pa-
rameter. These studies highlight the rising crack-growth-resistance behavior of corti-
cal bone and indicate that the increment of fracture toughness may be because of
micro-cracking, osteon pullout, fiber bridging, and crack deflection. Some research-
ers also tried to find out the effect of bone composition, mineral density, porosity,
crack orientation, loading condition, and storage media on fracture toughness of
cortical bone [3,7,9,18].
SHARMA ET AL. ON ELASTIC-PLASTIC FRACTURE MECHANICS 430
Materials Performance and Characterization

Over the last few years, Yang et al. [19,20] have shown that in case of cortical
bone fracture, the LEFM analysis is not sufficient to characterize fracture toughness.
They suggested a non-linear fracture model to accurately predict the fracture prop-
erties of cortical bone. This non-linear behavior of bone material during deforma-
tion may be considered because of involvement of several toughening mechanisms
like plasticity, micro-cracking, visco-plasticity, etc. The water content in bone mate-
rial may also be responsible for this non-linearity as cortical bone becomes brittle
and has reduced toughness after the removal of water in a vacuum oven at increased
temperature. This influence of water removal on toughness of cortical bone was
shown by Nyman et al. [21]. Yan et al. [22] in their studies applied elastic-plastic
fracture mechanics (EPFM) using the J-integral approach to study the fracture
toughness of cortical bone. In one of our recent studies [23], EPFM was applied
using a crack-tip opening displacement (CTOD) approach to find out the CTOD
toughness (dc), the equivalent fracture toughness (Kdc), and J toughness values for
buffalo tibia cortical bone.
From the above review, it is noted that the analysis of fracture in cortical bone
using EPFM approach has been conducted only to a very limited extent. Further lit-
tle work has been carried out to find out the locational variation in fracture proper-
ties of cortical bone. Taking these aspects into consideration, the EPFM approach is
applied in the present investigation to estimate the locational variation in fracture
properties such as crack-tip opening displacement (CTOD), equivalent critical-
stress-intensity factor and J integral for longitudinal as well as transverse orientation
of cracking in the case of a buffalo femoral cortical bone. The fracture micro-
mechanism of such bones is also investigated using scanning electron microscopy
(SEM).
Materials and Methods
The present work is performed on the femoral cortical bones obtained from two
young buffalos about 24 months of age. These bones were obtained under institu-
tional permission from the farm raised just after an animal’s natural death and with-
out causing any harm to the animal. After removal of bone tissue from the body, the
surrounding soft tissue was removed and bone tissue was wrapped in gauze, soaked
in normal saline, wrapped with plastic wrap, and placed in sealed, airtight plastic
bags. These plastic bags were placed in a freezer and stored at �20�C within 1 h after
the bone tissues had been harvested. The bones were kept hydrated in saline upon
removal from the freezer and during all stages of tissue preparation.
The material orientations for femoral cortical bone were defined using a cylin-
drical coordinate system with longitudinal (1), circumferential (2), and radial (3)
axis. The whole bone diaphysis was divided into three equal segments, namely,
upper, middle, and lower bone diaphysis. The material orientations and different
locations of the bone diaphysis are shown in Fig. 1. Further, different anatomic quad-
rants (A¼ anterior, M¼medial, P¼ posterior, and L¼ lateral) of bone diaphysis
were identified and marked accordingly on each one-third segment of the diaphysis.
Each segment of the diaphysis was then subsequently sectioned into a number of
specimens according to different anatomic quadrants. The preparation of specimens
from different anatomic locations of the bone diaphysis is shown in Fig. 2. The
SHARMA ET AL. ON ELASTIC-PLASTIC FRACTURE MECHANICS 431
Materials Performance and Characterization

specimen obtained from a particular length segment and anatomic quadrant was
suitably labeled (e.g., UA¼ specimen from upper length segment and anterior quad-
rant) and arranged in different groups according to their labels. The number of
specimens obtained from different anatomic locations of the bone diaphysis is listed
in Table 1. As per Table 1, number six from the quadrant represents four specimens
for fracture testing and two specimens for tensile testing, whereas number four rep-
resents two specimens for fracture and two for tensile testing. Comparatively, more
specimens were prepared from the medial quadrant because of limited availability of
bone material from other quadrants.
The fracture properties of cortical bone were evaluated with the help of a crack-
tip opening displacement (CTOD) method using compact tension (CT) and single-
edge notch-bend (SENB) specimens. This method is an alternative approach of
elastic-plastic fracture mechanics apart from the J-integral approach. CTOD is con-
sidered as a fracture property of the material and is a measure of the crack opening
at the vicinity of the crack tip. The CTOD value can be determined with the help of
a crack mouth opening displacement (CMOD). The values of CMOD can be
FIG. 2
Schematic diagram showing
sectioning of cortical bone
diaphysis for preparation of
mechanical and fracture tests
specimens from different
anatomic locations of the bone
diaphysis. (a) The flattened
cortical bone diaphysis was
sectioned into three equal
length (L/3) segments. (b)
Each segment of the diaphysis
was subsequently sectioned
into four parts according to
different anatomic quadrants
(A¼anterior, M¼medial,
P¼posterior, and L¼ lateral)
for further preparation of
different samples.
FIG. 1
Diagram showing different
locations of the femoral
diaphysis from where the
specimens were cut for SENB
and CT testing.
SHARMA ET AL. ON ELASTIC-PLASTIC FRACTURE MECHANICS 432
Materials Performance and Characterization

measured easily with the help of a clip gauge attached to the crack mouth of the
SENB and CT specimens. The CTOD toughness obtained from the CMOD values
can be further converted into equivalent J toughness and K toughness with the help
of different correlations [24].
In the present investigation, CT and SENB specimens were prepared to undergo
longitudinal (crack advances parallel to the long axis of bone) and transverse (crack
advances perpendicular to the long axis of bone) fracture, respectively. All of the
specimens for CTOD testing were prepared following BS 7448 [24]. In all, 30 speci-
mens were cut from upper, middle, and lower locations of the femoral bone diaphy-
sis out of which 15 specimens with dimensions 3mm (thickness)� 15mm
(width)� 60mm (length) were obtained for SENB testing and the other 15 speci-
mens with dimensions 3mm (thickness)� 20mm (width)� 19mm (length) for CT
testing. A very fine slit of appropriate length as per the British standard simulating
the fine crack is induced in the sample using a diamond wheel (Isomet 4000). Differ-
ent locations and orientations of the CTOD specimens prepared from the femoral
bone are shown in Fig. 1. To avoid buckling/twisting of the SENB specimen, metallic
(Al) strips were attached on both sides at the two ends of the specimen with the help
of screws as shown in Fig. 3.
The uniaxial tensile properties at three different locations of the bone diaphysis
were evaluated using dumbbell-shaped strip-type specimens. In all, 24 specimens
were obtained from upper, middle, and lower portions of the bone diaphysis out of
which 12 specimens with thickness 2.5mm, gauge length 25mm, gauge width 4mm,
and total length 80mm were prepared for conducting the tensile test in the longitu-
dinal direction (load being applied along the long axis of femur), whereas the other
FIG. 3
Schematic diagram showing
attachment of metallic strips to
the SENB specimen of cortical
bone.
TABLE 1
Breakdown of specimens according to different anatomic locations of bone diaphysis.
Lower Diaphysis Middle Diaphysis Upper Diaphysis
L M A P L M A P L M A P
4 6 4 4 4 6 4 4 4 6 4 4
Note: L, lateral; M, medial; A, anterior; P, posterior.
SHARMA ET AL. ON ELASTIC-PLASTIC FRACTURE MECHANICS 433
Materials Performance and Characterization

12 specimens with thickness 2.5mm, gauge length 8mm, gauge width 4mm, and
total length 22mm for the transverse tensile test (load being applied perpendicular
to the long axis of femur).
All different specimens were stored at room temperature in a solution of 50 %
saline and 50 % ethanol at all time until testing. To keep the specimens wet and to
avoid heating during cutting and polishing, a constant spray of water was supplied.
The SENB and compact tension tests were performed on an MTS 858 table-top
machine. The crack-mouth opening displacement (CMOD) was measured with the
help of a clip gauge during the test. The load-CMOD (P-CMOD) diagrams were
recorded and analyzed for the evaluation of CTOD. A uniaxial tensile test was per-
formed on a Zwick 7250 universal testing machine. The stress–strain curves in the
case of a uniaxial tensile test for longitudinal as well as transverse specimens
obtained from different locations of the bone diaphysis are shown in Figs. 4 and 5,
respectively. The yield strength values were obtained corresponding to 0.2 % perma-
nent set.
FIG. 5
Stress–strain curves in the case
of transverse tensile testing for
specimens obtained from
different locations of the
buffalo cortical bone diaphysis.
FIG. 4
Stress–strain curve in the case
of longitudinal tensile testing
for specimens obtained from
different locations of the
buffalo cortical bone diaphysis.
SHARMA ET AL. ON ELASTIC-PLASTIC FRACTURE MECHANICS 434
Materials Performance and Characterization

Typical load (P-CMOD) diagrams for longitudinal and transverse orientation of
cracking at three different locations of bone diaphysis are shown in Figs. 6 and 7,
respectively. The first load maxima/pop-in point has been taken as the critical point
in P-CMOD diagram [24]. In the present case, no pop-in was noticed on P-CMOD
diagram and the CMOD value is found to increase steadily with load in the elastic-
plastic situation. Hence, the CMOD corresponding to the maximum load point was
employed for the evaluation of CTOD.
For the computation of CTOD from the CMOD value, the total CMOD corre-
sponding to maximum load point was divided in to two parts: the CMOD corre-
sponding to the elastic part (ve) and the one corresponding to the plastic part (vp) of
FIG. 6
Load-CMOD curves for
longitudinal fractured
specimens obtained from
different locations of the
buffalo femoral bone diaphysis.
FIG. 7
Load-CMOD curves for
transverse fractured specimens
obtained from different
locations of the buffalo femoral
bone diaphysis.
SHARMA ET AL. ON ELASTIC-PLASTIC FRACTURE MECHANICS 435
Materials Performance and Characterization

the crack-mouth opening. Figure 8 shows the elastic and plastic parts of CMOD on
the P-CMOD curve.
The elastic (de) and plastic (dp) parts of CTOD were calculated using Eq 1,
whereas Eqs 2a and 2b were used to determine the plastic part of CTOD for the
SENB and CT specimens, respectively [24],
de ¼K2I ð1� t2Þ2Erys
(1)
where:
KI¼ the stress-intensity factor corresponding to the critical load,
E¼ the elastic modulus,
rys¼ the yield strength, and
t¼ the Poisson’s ratio.
dp ¼vp
arðW � aÞ þ 1
(2a)
dp ¼vp
aþ C �WrðW � aÞ þ 1
(2b)
where:
vp¼ the plastic component of CMOD corresponding to the critical load,
a¼ the original crack length,
W¼ the width of the specimen,
C¼ the total height of the CT specimen, and
r¼ the rotation factor, which may be taken as 0.4 and 0.46, respectively, for
SENB and CT specimens as per the standard [24].
Total CTOD (dc) was calculated using Eq 3 as given below:
dc ¼ de þ dp(3)
FIG. 8
Analysis of the load-CMOD
diagram for the evaluation of
CTOD toughness.
SHARMA ET AL. ON ELASTIC-PLASTIC FRACTURE MECHANICS 436
Materials Performance and Characterization
Stress-intensity factors in the case of SENB and CT tests were calculated using Eqs 4
and 5, respectively [24].
KI ¼PS
BW3=2f1(4)
KI ¼P
BW1=2f2(5)
where:
P is the maximum load,
S is the span length, and
B is the thickness of the specimen.
The f1 and f2 are the function of a¼ (a/W) and given by Eqs 6 and 7 for the
SENB and CT geometry, respectively,
f1 ¼3a0:5 1:99� a 1� að Þ½ � 2:15� 3:93aþ 2:7a2½ �
2 1þ 2að Þ 1� að Þ1:5(6)
f2 ¼ 29:6a0:5 � 185:5a1:5 þ 655:7a2:5 � 1017a3:5 þ 639a4:5(7)
Specimens from the middle location of bone diaphysis have been selected for
scanning electron microscopic (SEM) analysis as higher values of fracture properties
are obtained at this location. The samples for SEM analysis were prepared with
cross-section 3mm� 8mm from one of the bisected fractured specimen. These
samples were cleaned in acetone and dried slowly at 60�C in a vacuum oven. Fur-
ther, these samples were placed in a vacuum for about 4 h with silicate gel to remove
the remaining moisture and then coated with gold for the SEM examination. The
SEM examination was conducted on a ZEISS-EV040 instrument at appropriate
magnifications.
Results and Discussion
The fracture toughness values for all the three selected locations of the femoral bone
diaphysis were calculated as described above for both longitudinal and transverse
orientation of fracture. The values of elastic modulus (E) and yield strength (rys) as
obtained from the experiments for different locations of the femoral bone diaphysis
in case of longitudinal and transverse testing are reported in Tables 2 and 3, respec-
tively. The elastic part of CTOD (de), plastic part of CTOD (dp), and total CTOD
(dc) values computed for different locations of the bone diaphysis in case of longitu-
dinal and transverse orientations of fracture are presented in Tables 4 and 5,
respectively.
TABLE 2
Elastic modulus (E1) and yield strength (rysl ) for longitudinal specimens of buffalo femoral cortical bone obtained
from different locations of the bone diaphysis.
Lower Diaphysis (n¼ 4) Middle Diaphysis (n¼ 4) Upper Diaphysis (n¼ 4)
E1 (GPa) 17.26 2.39 27.36 1.75 24.76 1.43
rysl (MPa) 77.46 7.57 114.36 2.53 102.76 5.41
SHARMA ET AL. ON ELASTIC-PLASTIC FRACTURE MECHANICS 437
Materials Performance and Characterization

The equivalent fracture toughness in terms of critical-stress-intensity factor
(Kdc) and J-toughness (Jcd) values were calculated employing the corresponding dc
values using Eqs 8 and 9, respectively [24],
Kdc ¼ffiffiffiffiffiffiffiffiffiffiffiffiffiffiffi2dcErys
q(8)
Jdc ¼ 2rys � dc(9)
and the corresponding Kdc and Jcd values are also reported in Tables 4 and 5.
Based on the CTOD and J approaches, to determine whether the specimen
thickness (B) and length of the uncracked ligament (W-a) were sufficient to meet
the requirement of plane-strain condition, Eqs 10 and 11 were used, respectively
[24],
B; ðW � aÞ � 25ðdcÞ(10)
B; ðW � aÞ � 25 JC=rys� �
(11)
Note that the minimum thickness requirement for plane strain in the present
case is about 1.1mm (based on CTOD approach) and 2.3mm (based on the J
approach), whereas the actual specimen thickness is 3.0mm. The lengths of the
uncracked ligament for the present investigation are 7.5mm (for SENB specimen)
and 8mm (for CT specimen). Therefore, all of the specimens are meeting the plane-
strain condition and reported dc and Jc values are the plane-strain values. The values
of Poisson’s ratio for all calculations are taken in between 0.32 to 0.47 based on a
separate study.
TABLE 3
Elastic modulus (E2), yield strength (ryst ) for transverse specimens of buffalo femoral cortical bone obtained from
different locations of the bone diaphysis.
Lower Diaphysis (n¼ 4) Middle Diaphysis (n¼ 4) Upper Diaphysis (n¼ 4)
E2 (GPa) 12.46 1.35 17.16 1.46 14.66 1.16
ryst (MPa) 45.46 3.78 80.66 3.24 68.476 3.93
Note: The results reported in Tables 2 and 3 are the average of four values and n gives the number of samples tested. Standard deviationsare also given.
TABLE 4
The elastic CTOD (de), plastic CTOD (dp), and the total CTOD (dc) along with the equivalent fracture toughness
(Kdc) and J-toughness (Jcd) values for longitudinal fractured specimens obtained from different locations of the
femoral bone diaphysis.
Lower Diaphysis (n¼ 5) Middle Diaphysis (n¼ 5) Upper Diaphysis (n¼ 5)
de (mm) 0.00096 0.0002 0.00136 0.0001 0.00116 0.0002
dp (mm) 0.0136 0.0019 0.0236 0.0021 0.0136 0.0028
dc (mm) 0.0146 0.0021 0.0256 0.0022 0.0146 0.0029
Kdc (MPa � m1/2) 3.936 0.29 8.256 0.37 5.366 0.56
Jcd (kJ/m2) 1.256 0.19 3.996 0.35 1.996 0.40
SHARMA ET AL. ON ELASTIC-PLASTIC FRACTURE MECHANICS 438
Materials Performance and Characterization

JUSTIFICATION FOR USING ELASTIC-PLASTIC FRACTURE MECHANICS
(EPFM) FOR CHARACTERIZATION OF BONE TOUGHNESS
The results obtained in the present study for different locations of bone diaphysis
and orientation of cracking show that in all cases the plastic part of CTOD (dp) is
higher as compared to the elastic part of CTOD (de). As per Tables 4 and 5, the plas-
tic part of CTOD (dp) is 11.8 to 14.4 times higher for longitudinal orientation and
2 to 9 times higher for transverse orientation of cracking as compared to the elastic
part of CTOD (de). This shows a considerable amount of plasticity associated with
bone material. The significant amount of non-linearity preceding instability/cracking
is also visible in the P-CMOD diagrams obtained in this study. Based on the analysis
of the P-CMOD diagram, it is noticed that the diagram does not meet other require-
ments for validity, i.e., the non-linearity at 0.8 PQ� 0.25 of the non-linearity at PQand Pmax/PQ� 1.1, where PQ is the load at which the 5 % secant line intersects the
P-CMOD diagram. In other words, non-linearity is large enough to make the K
approach inapplicable in the bone samples. This non-linearity may be the result of
several toughening mechanisms like plasticity, micro-cracking, and viscoelasticity,
and presence of water in bone material as observed in our previous study [23].
The average equivalent fracture toughness (Kdc) values for longitudinal and trans-
verse orientation of fracture at mid-diaphysis location are 8.25MPa � m1/2 and
14.97MPa � m1/2, respectively, as reported in Tables 4 and 5, whereas the average Kc
values reported in the previous studies for the same location of bone diaphysis are
2.6MPa � m1/2 and 5.1MPa � m1/2, respectively [18,25]. The comparison of these val-
ues show that the Kdc values obtained in the present study are about three times
higher than the corresponding values reported in the literature where the linear-
elastic fracture mechanics (LEFM) approach was applied. This difference in K-
toughness values is because of non-linearity associated with bone material that
causes the K approach inapplicable for such materials and any attempt to determine
K toughness with the LEFM approach will result in an unrealistically low value.
These observations favor the application of EPFM for the determination of fracture
properties of bone material.
EFFECT OF ORIENTATION AND LOCATION ONMECHANICAL PROPERTIES
OF CORTICAL BONE
The mechanical properties of cortical bone at different locations and for different
directions of loading are mentioned in Tables 2 and 3, respectively. It may be noted
from reported values that the maximum values of elastic modulus and yield strength
TABLE 5
The elastic CTOD (de), plastic CTOD (dp), and the total CTOD (dc) along with the equivalent fracture toughness(Kdc) for transverse fractured specimens obtained from different locations of the femoral bone diaphysis.
Lower Diaphysis (n¼ 5) Middle Diaphysis (n¼ 5) Upper Diaphysis (n¼ 5)
de (mm) 0.0036 0.0008 0.0116 0.0025 0.0106 0.0014
dp (mm) 0.0276 0.0056 0.0266 0.0067 0.0206 0.0066
dc (mm) 0.0306 0.0063 0.0376 0.0088 0.0306 0.0076
Kdc (MPa � m1/2) 8.966 0.90 14.976 1.88 12.226 1.55
Jcd (kJ/m2) 4.726 0.97 8.346 2.01 6.146 1.56
Note: The results reported in Tables 4 and 5 are the average of five values. Standard deviations are also given.
SHARMA ET AL. ON ELASTIC-PLASTIC FRACTURE MECHANICS 439
Materials Performance and Characterization

are obtained at the middle location and minimum values at the lower location of
bone diaphysis for both orientations of loading. The upper diaphysis gives the inter-
mediate values of these properties. The maximum and minimum values of elastic
modulus for longitudinal orientation of loading are 27.3 GPa and 17.2GPa, respec-
tively, as per Table 2, and for transverse orientation of loading are 17.1GPa and
12.4GPa, respectively, as per Table 3. Similarly, for yield strength, the maximum and
minimum values for longitudinal orientation of loading are found to be 114.3MPa
and 77.4MPa, respectively, and for transverse orientation of loading are 80.6MPa
and 45.4MPa, respectively. It may also be noticed from the above tables that the av-
erage values of elastic modulus and yield strength in longitudinal orientation are,
respectively, 1.4 to 1.7 times higher as compared to the corresponding values in
transverse orientation. The maximum ratio of elastic modulus for longitudinal to
transverse orientation (E1/E2) is found to be 1.7 for the upper location and mini-
mum, i.e., 1.4 for the lower location of the bone diaphysis. For the case of yield
strength, the maximum ratio (rysl /rys
t ) was found to be 1.7 for the lower location and
minimum, i.e., 1.4 for the middle location of the bone diaphysis. It is interesting to
note that the ratio of elastic modulus (E1/E2) for human cortical bone obtained in
various studies ranges from 1.5 to 1.7 [26–30]. Yan et al. [22], in their study,
obtained the ratio of elastic modulus (E1/E2) to be 1.4 for bovine femoral bone.
These values show a close resemblance with the results obtained in the present
investigation for buffalo femoral bone.
The variation in mechanical properties of cortical bone for different loading ori-
entations and locations of bone specimens is because of anisotropic and heterogene-
ous nature of bone material. The main cause of anisotropic nature of bone material
is considered to be the non-longitudinal axial distribution of orientation of bone
minerals [31]. The heterogeneity associated with bone material is because of orienta-
tion of collagen fibrils, distribution of minerals, porosity, and density at different
locations of bone diaphysis. This is evident from various studies that factors such as
variation in porosity, density, and distribution of collagen fibrils, mineral contents,
etc. may lead to variation in mechanical properties of cortical bone [32–40].
EFFECT OF ORIENTATION AND LOCATION ON FRACTURE PROPERTIES
OF CORTICAL BONE
The fracture properties of buffalo femoral cortical bone as obtained by the CTOD
approach for different locations of bone diaphysis and orientations of cracking are
listed in Tables 4 and 5, respectively. The fracture properties are found to be better
for transverse orientation as compared to the longitudinal orientation of cracking.
The CTOD toughness (dc) values are observed to be 1.5 to 2.1 times higher in trans-
verse orientation as compared to the longitudinal orientation of cracking. Similarly,
equivalent fracture toughness (Kdc) and J-toughness (Jcd) values are reported to be,
respectively, 1.8 to 2.3 times and 2.1 to 3.8 times higher in transverse orientation as
compared to the longitudinal orientation of cracking. The better values of fracture
properties for transverse orientation of cracking may be because of the orientation
of bone lamellae and arrangement of vascular networks in between these lamellae
and the arrangement of collagen fibrils.
The maximum values of CTOD toughness (dc), equivalent fracture toughness
(Kdc), and J toughness (Jcd) for longitudinal orientation of cracking as reported in
SHARMA ET AL. ON ELASTIC-PLASTIC FRACTURE MECHANICS 440
Materials Performance and Characterization

Table 4 are 0.025 mm, 8.25MPa � m1/2, and 3.99 kJ/m2, respectively, and for trans-
verse orientation of cracking as per Table 5 are 0.037 mm, 14.97MPa � m1/2, and
8.34 kJ/m2, respectively. The maximum values of fracture properties are obtained at
middle location of the bone diaphysis for both the cases. The minimum values of
fracture properties (dc, Kdc, and Jcd) as listed in Tables 4 and 5 are 0.014mm,
3.93MPa � m1/2, and 1.25 kJ/m2, respectively, for longitudinal orientation of cracking
and 0.030mm, 8.96MPa � m1/2, and 4.72 kJ/m2, respectively, for transverse orienta-
tion of cracking. These values are obtained at the lower location of bone diaphysis
for both cases. The results shown in Tables 4 and 5 reflect that the values of CTOD
toughness (dc) are 1.8 and 1.2 times higher as compared to the corresponding values
measured, respectively, at the lower and upper locations of the bone diaphysis. The
equivalent fracture toughness (Kdc) values at upper and lower diaphysis are found to
be decreased by a factor of 1.5 and 2.1, respectively, for longitudinal orientation of
cracking and by 1.2 and 1.7 times, respectively, for the transverse orientation of
cracking whereas the J-toughness values at these locations are reported to be
decreased by a factor of 2.0 and 3.2, respectively, for longitudinal orientation of
cracking and by factors of 1.3 and 1.9, respectively, for transverse orientation of
cracking as compared to the values measured at the middle location of bone
diaphysis.
The arrangement of collagen fibrils and mineral particles at different locations
of bone diaphysis and the amount of mineralization and crystallinity may result in
locational variation of fracture properties along the bone diaphysis. Nalla et al. [41]
observed that fracture occurs more readily when the crack is oriented parallel to the
direction of fibers in dentin. Goldman et al. [38] observed that an increase in the ho-
mogeneity of collagen fiber orientation may decrease the toughness of bone as crack
will move a greater distance before hitting a perpendicular fiber. As per the study of
Currey [40], the range of mineralization results in an even greater range of mechani-
cal properties and very high values of mineralization may result in low values of
work to fracture.
The other factors that may be responsible for this variation in fracture proper-
ties are apparent density and porosity. Orias et al. [42] in their study have shown the
locational distribution of apparent density along the entire length of human cortical
bone and found that the distribution of apparent density was at a maximum near
the mid-location of femoral bone diaphysis. Yeni et al. [9], from their study, sug-
gested that fracture properties increase with increasing apparent density in human
cortical bone. These two observations reflect that because of higher density at the
mid-diaphysis location fracture toughness values may be higher. The porosity in
bone material because of plexiform vascular spaces, blood vessels, etc. at different
locations of bone diaphysis may be different and also result in local variation of frac-
ture properties. Some researchers have observed the effect of porosity on mechanical
and fracture properties of bone [43–46]. Yeni et al. [43] observed that the fracture
toughness of human cortical bone in mode I and mode II conditions significantly
decreases with increasing porosity. In a recent study, Tang and Vashishth [46]
observed the effect of porosity on bone fragility and reported that the propagation
toughness (R-curve slope) of bone reduces with increasing porosity. The above
observations show that the combined effect of all these factors may be responsible
for the locational variation in fracture properties of cortical bone.
SHARMA ET AL. ON ELASTIC-PLASTIC FRACTURE MECHANICS 441
Materials Performance and Characterization

SEM ANALYSIS OF FRACTURE SURFACE IN TWOORIENTATIONS
OF CRACKING
The SEM images of fracture surfaces from longitudinal and transverse fractured
specimens at different magnifications are shown in Figs. 9 and 10, respectively. The
microstructure of these specimens is mainly plexiform type, which is found predom-
inantly in large and rapidly growing animals. The bone lamellae and vascular plex-
uses are clearly visible on the fracture surfaces of these specimens. The SEM images
show that the fracture surface of a longitudinally fractured specimen is much
smoother than that of the transverse fractured specimen. This is because the bone
lamellae and plane of vascular networks are mainly oriented along the long axis of
bone; therefore, in the case of longitudinal fracture, a crack can easily propagate
along the interfaces between lamella and in the plane of vascular networks produc-
ing a smooth fracture surface. This leads to a less amount of energy consumption in
this case. In the case of transverse fracture, the fracture surface is found to be
FIG. 9 SEM images of longitudinal fractured specimen obtained from mid-diaphysis of the cortical femoral bone at different
magnifications. White arrow in image (a) indicates the direction of crack propagation. In image (b) and (c), white arrows
indicate the vascular networks and blood vessels. Black arrows in image (b) indicate the micro-cracks, and in image (c)
different bone lamellae.
SHARMA ET AL. ON ELASTIC-PLASTIC FRACTURE MECHANICS 442
Materials Performance and Characterization
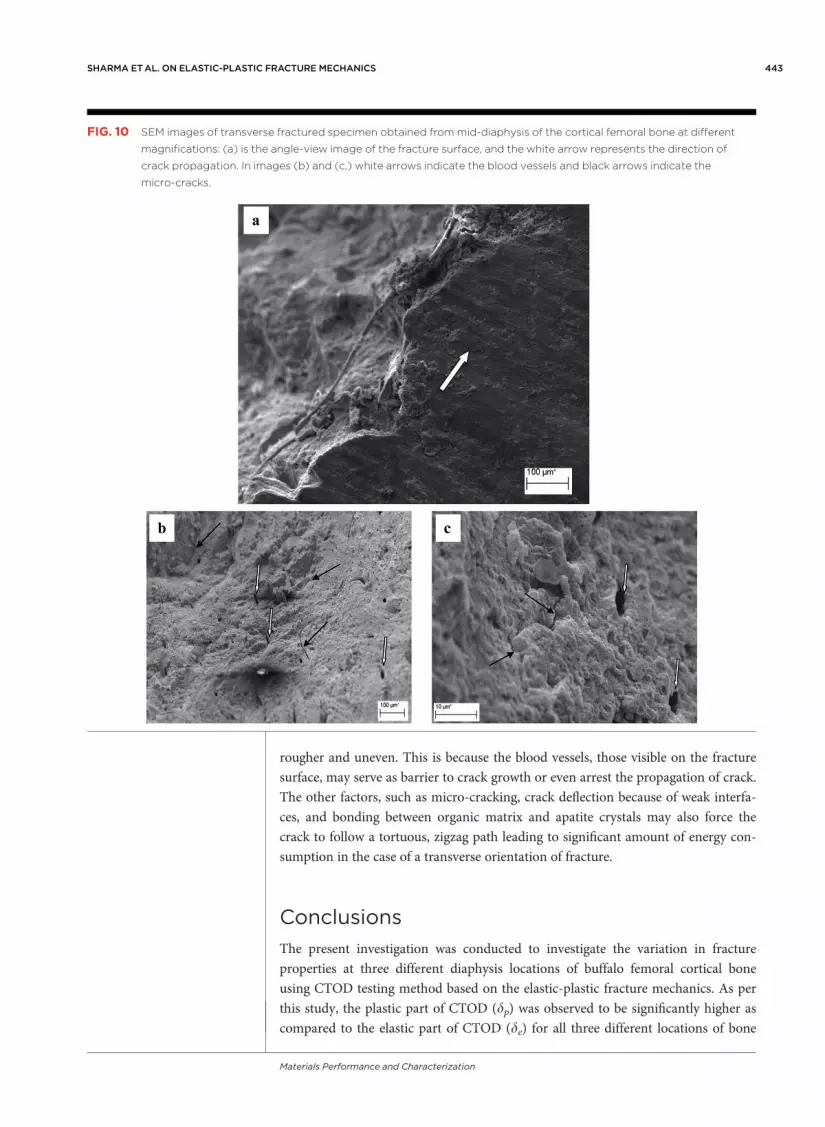
rougher and uneven. This is because the blood vessels, those visible on the fracture
surface, may serve as barrier to crack growth or even arrest the propagation of crack.
The other factors, such as micro-cracking, crack deflection because of weak interfa-
ces, and bonding between organic matrix and apatite crystals may also force the
crack to follow a tortuous, zigzag path leading to significant amount of energy con-
sumption in the case of a transverse orientation of fracture.
Conclusions
The present investigation was conducted to investigate the variation in fracture
properties at three different diaphysis locations of buffalo femoral cortical bone
using CTOD testing method based on the elastic-plastic fracture mechanics. As per
this study, the plastic part of CTOD (dp) was observed to be significantly higher as
compared to the elastic part of CTOD (de) for all three different locations of bone
FIG. 10 SEM images of transverse fractured specimen obtained from mid-diaphysis of the cortical femoral bone at different
magnifications: (a) is the angle-view image of the fracture surface, and the white arrow represents the direction of
crack propagation. In images (b) and (c,) white arrows indicate the blood vessels and black arrows indicate the
micro-cracks.
SHARMA ET AL. ON ELASTIC-PLASTIC FRACTURE MECHANICS 443
Materials Performance and Characterization

diaphysis. The minimum and maximum values of fracture properties such as CTOD
toughness (dc), equivalent fracture toughness (Kdc), and J toughness (Jcd) were found
at the lower and middle locations of bone diaphysis, respectively, for both the orien-
tations of fracture. The bone lamellae and plane of vascular networks were found
mainly along the long axis of bone producing a smooth fracture surface in case of
longitudinal orientation of cracking. The fracture surface of transversely fractured
specimen was found to be rough and uneven as compared to the longitudinally frac-
tured specimen. This was because the orientation of blood vessels, combined effect
of other factors such as micro-cracking, crack deflection because of weak interfaces
and bonding between organic matrix and apatite crystals. These factors may serve as
barrier to the crack growth in case of transverse orientation of cracking. The overall
results show that elastic-plastic fracture mechanics approach is a better technique to
determine the fracture properties of bone material as compared to linear elastic frac-
ture mechanics.
ACKNOWLEDGMENTS
The writers extend their thanks to the anonymous reviewers and the editorial board
members for their valuable comments and suggestions for the improvement of the
paper.
References
[1] Zioupos, P. and Currey, J. D., “Changes in Stiffness, Strength and Toughness of
Human Cortical Bone with Age,” Bone, Vol. 22, No. 1, 1998, pp. 57–66.
[2] Wang, X., Shen, X., Li, X., and Agrawal, C. M., “Age Related Changes in Colla-
gen Network and Toughness of Bone,” Bone, Vol. 31, No. 1, 2002, pp. 1–7.
[3] Lucksanasombool, P., Higgs, W. A. J., Higgs, R. J. E. D., and Swain, M. V.,
“Fracture Toughness of Bovine Bone: Influence of Orientation and Storage
Media,” Biomaterials, Vol. 22, No. 23, 2001, pp. 3127–3132.
[4] Behiri, J. C. and Bonfield, W., “Fracture Mechanics of Bone—The Effect of
Density, Specimen Thickness and Crack Velocity on Longitudinal Fracture,”
J. Biomech., Vol. 17, No. 1, 1984, pp. 25–34.
[5] Norman, T. L., Vashishth, D., and Burr, D. B., “Effect of Groove on Bone Frac-
ture Toughness,” J. Biomech., Vol. 25, No. 12, 1992, pp. 1489–1492.
[6] Vashishth, D., Behiri, J. C., and Bonfield, W., “Crack Growth Resistance in
Cortical Bone: Concept of Microcrack Toughening,” J. Biomech., Vol. 30, No. 8,
1997, pp. 763–769.
[7] Wang, X. D., Masilamani, N. S., Mabery, J. D., Alder, M. E., and Agrawal, C. M.,
“Changes in Fracture Toughness of Bone May Not Be Reflected in Its Mineral
Density, Porosity, and Tensile Properties,” Bone, Vol. 23, No. 1, 1998, pp. 67–72.
[8] Norman, T. L., Vashishth, D., and Burr, D. B., “Fracture Toughness of Human
Bone under Tension,” J. Biomech., Vol. 28, No. 3, 1995, pp. 309–320.
[9] Yeni, Y. N., Brown, C. U., and Norman, T. L., “Influence of Bone Composition
and Apparent Density on Fracture Toughness of Human Femur and Tibia,”
Bone, Vol. 22, No. 1, 1998, pp. 79–84.
SHARMA ET AL. ON ELASTIC-PLASTIC FRACTURE MECHANICS 444
Materials Performance and Characterization

[10] Nalla, R. K., Kruzic, J. J., and Ritchie, R. O., “On the Origin of the Toughness of
Mineralized Tissue: Microcracking or Crack Bridging?” Bone, Vol. 34, No. 5,
2004, pp. 790–798.
[11] Malik, C. L., Stover, S. M., Martin, R. B., and Gibeling, J. C., “Equine Cortical
Bone Exhibits Rising R-Curve Fracture Mechanics,” J. Biomech., Vol. 36, No. 2,
2003, pp. 191–198.
[12] Nalla, R. K., Kruzic, J. J., Kinney, J. H., and Ritchie, R. O., “Effect of Aging on
Toughness of Human Cortical Bone: Evaluation by R-Curves,” Bone, Vol. 35,
No. 6, 2004, pp. 1240–1246.
[13] Nalla, R. K., Kruzic, J. J., Kinney, J. H., and Ritchie, R. O., “Mechanistic Aspects
of Fracture and R-Curve Behavior in Human Cortical Bone,” Biomaterials, Vol.
26, No. 2, 2005, pp. 217–231.
[14] Vashishth, D., “Rising Crack-Growth-Resistance Behavior in Cortical Bone: Implica-
tions for Toughness Measurements,” J. Biomech., Vol. 37, No. 6, 2004, pp. 943–946.
[15] Santis, R. D., Anderson, P., Tanner, K. E., Ambrosio, L., Nicolasis, L., Bonfield,
W., and Davis, G. R., “Bone Fracture Analysis on Short Rod Chevron-Notch
Specimens Using the X-Ray Computer Micro-Tomography,” J. Mater. Sci.:
Mater. Med., Vol. 11, 2000, pp. 629–636.
[16] Yan, J., Clifton, K. B., Mecholsky, J. J., Jr., and Reep, R. L., “Fracture Toughness
of Manatee Rib and Bovine Femur Using a Chevron Notched Beam Test,”
J. Biomech., Vol. 39, No. 6, 2006, pp. 1066–1074.
[17] Nalla, R. K., Stolken, J. S., Kinney, J. H., and Ritchie, R. O., “Fracture in Human
Cortical Bone: Local Fracture Criteria and Toughening Mechanisms,” J. Bio-
mech., Vol. 38, No. 7, 2005, pp. 1517–1525.
[18] Feng, Z., Rho, J., Han, S., and Ziv, I., “Orientation and Loading Condition De-
pendence of Fracture Toughness in Cortical Bone,” Mater. Sci. Eng. C, Vol. 11,
No. 1, 2000, pp. 41–46.
[19] Yang, Q. D., Cox, B. N., Nalla, R. K., and Ritchie, R. O., “Fracture Length Scales
in Human Cortical Bone: The Necessity of Non Linear Fracture Model,” Bio-
materials, Vol. 27, No. 9, 2006, pp. 2095–2113.
[20] Yang, Q. D., Cox, B. N., Nalla, R. K., and Ritchie, R. O., “Re-Evaluating the
Toughness of Human Cortical Bone,” Bone, Vol. 38, No. 6, 2006, pp. 878–887.
[21] Nyman, J. S., Roy, A., Shen, X., Acuna, R. L., Tyler, J. H., and Wang, X., “The
Influence of Water Removal on the Strength and Toughness of Cortical Bone,”
J. Biomech., Vol. 39, No. 5, 2006, pp. 931–938.
[22] Yan, J., Mecholsky, J. J., Jr., and Clifton, K. B., “How Tough Is Bone? Applica-
tion of Elastic-Plastic Fracture Mechanics to Bone,” Bone, Vol. 40, No. 2, 2007,
pp. 479–484.
[23] Sharma, N. K., Sehgal, D. K., and Pandey, R. K., “Orientation Dependence of
Elastic-Plastic Fracture Toughness and Micro-Fracture Mechanism in Cortical
Bone,” Eng. Lett., Vol. 19, 2011, pp. 304–309.
[24] BS 7448, 1991, “Method for Determination of KIC Critical CTOD and Critical J
Values of Metallic Materials,” British Standards Institution, London,
[25] Bonfield, W., Grynpas, M. D., and Young, R. J., “Crack Velocity and the Frac-
ture of Bone,” J. Biomech., Vol. 11, Nos. 10–12, 1978, pp. 473–479.
[26] Taylor, W. R., Roland, E., Ploeg, H., Hertig, D., Klabunde, R.,Warner, M. D.,
Hobatho, M. C., Rakotomanana, L., and Clift, S. E., “Determination of
SHARMA ET AL. ON ELASTIC-PLASTIC FRACTURE MECHANICS 445
Materials Performance and Characterization

Orthotropic Bone Elastic Constants Using FEA and Modal Analysis,” J. Bio-
mech., Vol. 35, No. 6, 2002, pp. 767–773.
[27] Dong, X. N. and Guo, X. E., “The Dependence of Transversely Isotropic Elastic-
ity of Human Femoral Cortical Bone on Porosity,” J. Biomech., Vol. 37, No. 8,
2004, pp. 1281–1287.
[28] Reilly, D. T., Burstein, A. H., and Frankel, V. H., “The Elastic Modulus of
Bone,” J. Biomech., Vol. 7, No. 3, 1974, pp. 271–275.
[29] Katz, J. L. and Meunier, A., “The Elastic Anisotropy of Bone,” J. Biomech., Vol.
20, Nos. 11–12, 1987, pp. 1063–1070.
[30] Ashman, R. B., Cowin, S. C., Van Buskirk, W. C., and Rice, J. C., “A Continu-
ous Wave Technique for the Measurement of the Elastic Properties of Cortical
Bone,” J. Biomech., Vol. 17, No. 5, 1984, pp. 349–361.
[31] Sasaki, N., Matsushima, N., Ikawa, T., Yamamura, H., and Fukuda, A.,
“Orientation of Bone Minerals and Its Role in Anisotropic Mechanical Properties
of Bone-Transverse Anisotropy,” J. Biomech., Vol. 22, No. 2, 1989, pp. 157–164.
[32] Martin, R. B. and Ishida, J., “The Relative Effects of Collagen Fibers Orienta-
tion, Porosity, Density and Mineralization on Bone Strength,” J. Biomech., Vol.
22, No. 5, 1989, pp. 419–426.
[33] Nyman, J. S., Reyes, M., and Wang, X., “Effect of Ultrastructural Changes on
Toughness of Bone,” J. Micron, Vol. 36, Nos. 7–8, 2005, pp. 566–582.
[34] Chang, Y. T., Chen, C. M., Tu, M. Y., Chem, H. L., Chang, S. Y., Tsai, T. C.,
Wang, Y. T., and Hasiao, H. L., “Effect of Osteoporosis and Nutrition Supple-
ments on Stiffness and Nano-Mechanical Properties of Bone Tissue,” J. Mech.
Behav. Biomech. Mater., Vol. 4, No. 7, 2011, pp. 1412–1420.
[35] Ramasamy, J. G. and Akkus, O., “Local Variation in the Micromechanical
Properties of Mouse Femur: The Involvement of Collagen Fiber Orientation
and Mineralization,” J. Biomech., Vol. 40, No. 4, 2007, pp. 910–918.
[36] Martin, R. B., Lau, S. T., Mathews, P. V., Gibson, V. A., and Stover, S. M.,
“Collagen Fiber Organization Is Related to Mechanical Properties and Remod-
eling in Equine Bone: A Comparison of Two Methods,” J. Biomech., Vol. 29,
No. 12, 1996, pp. 1515–1521.
[37] Riggs, C. M., Vaughan, L. C., Evans, G. P., Lanyon, L. E., and Boyde, A.,
“Mechanical Implications of Collagen Fiber Orientation in Cortical Bone of the
Equine Radius,” Anat. Embryol., Vol. 187, 1993, pp. 239–248.
[38] Goldman, H. M., Bromage, T. G., Thomas, C. D., and Clement, J. G., “Preferred
Collagen Fiber Orientation in Human Mid-Shaft Femur,” Anat. Rec. A Discov.
Mol. Cell Evol. Biol., Vol. 272A, No. 1, 2003, pp. 434–445.
[39] Akkus, O., Adar, F., and Schaffler, M. B., “Age Related Changes in Physico-
chemical Properties of Mineral Crystals Are Related to Impaired Mechanical
Function of Cortical Bone,” Bone, Vol. 34, No. 3, 2004, pp. 443–453.
[40] Currey, J. D., “Effects of Differences in Mineralization on the Mechanical Prop-
erties of Bone,” Philos. Trans. R. Soc. Lond. B Biol. Sci., Vol. 304, No. 1121,
1984, pp. 509–518.
[41] Nalla, R. K., Kinney, J. H., and Ritchie, R. O., “Effect of Orientation on the
in vitro Fracture Toughness of Dentine: The Role of Toughening Mechanisms,”
Biomaterials, Vol. 24, No. 22, 2003, pp. 3955–3968.
SHARMA ET AL. ON ELASTIC-PLASTIC FRACTURE MECHANICS 446
Materials Performance and Characterization

[42] Orias, A. A. E., Deuerling, J. M., Landrigan, M. D., Renaud, J. E., and Roeder,
R. K., “Anatomic Variation in Elastic Anisotropy of Cortical Bone Tissue in
Human Femur,” J. Mech. Behav. Biomed. Mater., Vol. 2, No. 3, 2009, pp.
255–263.
[43] Yeni, Y. N., Brown, C. U., Wang, Z., and Norman, T. L., “The Influence of
Bone Morphology on Fracture Toughness of Human Femur and Tibia,” Bone,
Vol. 21, No. 5, 1997, pp. 453–459.
[44] Bell, K. L., Loveridge, N., Power, J., Garrahan, N., Meggitt, B. F., and Reeve, J.,
“Regional Differences in Cortical Porosity in the Fractured Femoral Neck,”
Bone, Vol. 24, No. 1, 1999, pp. 57–64.
[45] Schaffler, M. B. and Burr, D. B., “Stiffness of Cortical Bone: Effect of Porosity
and Density,” J. Biomech., Vol. 21, No. 1, 1998, pp. 13–16.
[46] Tang, S. Y. and Vashishth, D., “The Relative Contribution of Non-Enzymatic
Glycation and Cortical Porosity on the Fracture Toughness of Aging Bone,” J.
Biomech., Vol. 44, No. 2, 2011, pp. 330–336.
SHARMA ET AL. ON ELASTIC-PLASTIC FRACTURE MECHANICS 447
Materials Performance and Characterization
Copyright by ASTM Int’l (all rights reserved); Mon Sep 8 7:33:7 EDT 2014Downloaded/printed byNitin Kumar Sharma (The Glocal University, School of Technology, Saharanpur, India)Pursuant to License Agreement. No further reproduction authorized.


