Embed Size (px)
Citation preview

JOURNAL OF APPLIED PHYSICS VOLUME 95, NUMBER 4 15 FEBRUARY 2004
Application of real-time, stroboscopic x-ray diffraction with dynamicalmechanical analysis to characterize the motion of ferroelastic domain walls
Richard J. Harrison,a) Simon A. T. Redfern, Andrew Buckley, and Ekhard K. H. SaljeDepartment of Earth Sciences, University of Cambridge, Downing Street, Cambridge,CB2 3EQ, United Kingdom
~Received 10 July 2003; accepted 19 November 2003!
The dynamic response of ferroelastic twins to an alternating stress has been studiedin situ at hightemperature using a stroboscopic x-ray diffractometer and combined dynamical mechanical analyzer~XRD-DMA !. The XRD-DMA is designed to allow x-ray rocking curves to be collected while thesample is undergoing simultaneous dynamical mechanical analysis in three-point-bend geometry.The detection of diffracted x-rays is synchronized with the applied load, so that rocking curvescorresponding to different parts of the dynamic load cycle can be obtained separately. The techniqueis applied to single-crystal LaAlO3 , which undergoes a cubic to rhombohedral phase transition at550 °C, leading to the generation of characteristic ‘‘chevron’’ twins. The rocking-curve topology iscalculated as a function of crystal orientation for each chevron type. Systematic changes in therocking curves during heating and cooling under dynamic load demonstrate a clear preference forchevrons containing$100%pc walls perpendicular to the sample surface and$110%pc walls oriented at45° to the sample surface. These domain walls are oriented favorably with respect to the appliedstress~i.e., they separate domains with contrasting components of spontaneous strain parallel to thesample length!. Below 200 °C, the superelastic strain is accommodated by rapid advancement/retraction of vertical$100%pc needle domains, with little effect on the dynamic rocking curves.Above 200 °C, a dynamic shift in peak position between rocking curves measured at the maximumand minimum applied loads is detected. The onset of a dynamic response correlates with the loss ofthe $100%pc needle domains and the transformation of the microstructure to 45°$110%pc walls.Superelastic strain is then accommodated by domain wall displacement/rotation, causing the wall tosweep back and forth across the x-ray beam and diffraction to occur from alternate domains at themaximum and minimum points of the stress cycle. A second sample, oriented so that domain wallsin all possible chevrons are unfavorably oriented with respect to the applied stress, shows verydifferent behavior. The rocking curves consist of several well-separated peaks at the minimum loadand a single broad diffraction signal at the maximum load. This is caused by the creation of a veryhigh density of twin walls across the sample above a critical applied stress, leading to corrugationof the sample surface. ©2004 American Institute of Physics.@DOI: 10.1063/1.1639949#
ide
ybitos.ns
r
r—m
ngal-
f ain
sisr-the
lla-ye-du-
e-
cive
n
I. INTRODUCTION
The dynamic response of transformation-induced twstructures to an external force~either a mechanically appliestress in the case of ferroelastic materials, or an electric fiin the case of ferroelectric materials! is of fundamental im-portance in a wide range of fields spanning solid state phics, materials science, and geology. The interaction of moferroelectric domain walls with lattice defects is a key facin determining the lifetime of ferroelectric memory device1
The creation and displacement of domain walls in martetic alloys leads to the shape memory effect.2 More perti-nently, movements of domain walls are the origin of feroelastic hysteresis and thus define ferroelasticity.3 Recently,ferroelastic twinning in LaAlO3 and (Ca,Sr)TiO3 perovs-kites, analogs of the (Mg,Fe)SiO3 perovskite thought to be amajor component of the Earth’s lower mantle, has been pposed as a possible source of anelasticity in the Earthphenomenon responsible for the attenuation of seis
a!Electronic mail: [email protected]
1700021-8979/2004/95(4)/1706/12/$22.00
n
ld
s-ler
i-
-
o-a
ic
waves.4,5 In this context there is great interest in determinithe dynamic response of ferroelastic domain walls to anternating stimulus mimicking the typical characteristics oseismic wave~i.e., frequencies of the order 1 Hz and straamplitudes of the order 1026). This regime is amenable tostudy via the technique of dynamical mechanical analy~DMA !.6 Various geometries may be employed, with a tosional pendulum apparatus commonly used to measureshear modulus under dynamic conditions of forced oscition ~e.g., the work on KCN, RbBr, KBr solid solutions bRef. 7!. Alternatively, parallel-plate or three-point bend gometry may be used to calculate the dynamic Young’s molus ~see Fig. 1 for details!.
The mechanical properties of single-crystal LaAlO3 haverecently been studied in some detail using DMA in threpoint bend geometry.4 LaAlO3 has the cubic perovskitestructure at high temperatures and undergoes a displaphase transition to a rhombohedral phase below 550 °C.8–13
Measurements of the storage modulus~i.e., the real part ofthe dynamic Young’s modulus! and tand ~i.e., the energydissipated per cycle! as a function of temperature are show
6 © 2004 American Institute of Physics

1707J. Appl. Phys., Vol. 95, No. 4, 15 February 2004 Harrison et al.
FIG. 1. ~a! Schematic illustration of DMA operation in three-point bend geometry.~b! Applied force consists of a static component (FS) and dynamiccomponent (FD) with angular frequencyv. The mechanical response is characterized by static and dynamic componentsuS anduD , and the phase lagd.
linbre(
tryeth
th
fotoesebt
us
meeesblece.
trin-re-
aseical
s ofe oftimein-nla-dle-
sticcon-ple
mi-d ofrter
on.imestro-pid
ol-thsbo-
ls toal-
enorsenton
inga-nd
in Fig. 2. The large decrease in storage modulus on coobelow 550 °C and the corresponding increase on coolinglow 170 °C occur at the boundaries between differentgimes of mechanical behavior. The paraelastic regimeT.Tc) corresponds to the stability field of the high-symmeparaelastic phase. In this regime the material is untwinntand is small, and the storage modulus corresponds tointrinsic Young’s modulus of the cubic phase. The start ofsuperelastic regime (T,Tc) coincides with the cubic torhombohedral phase transition and the formation of transmation twins. In this regime, thermal energy is sufficientallow domain walls to move in response to an applied strand the modulus rapidly decreases to its ‘‘relaxed’’ valumore than an order of magnitude lower than that of the cuphase. Energy is dissipated by the internal friction duewall–wall, wall–defect, and wall–surface interactions, ca
FIG. 2. Normalized storage modulus~closed symbols, left axis! and tand~open symbols, right axis! as a function of temperature for sample 1. Mesurements were obtained using a static:dynamic force of 100:90 mN afrequency of 1 Hz.
ge--
d,e
e
r-
s,ico-
ing tand to rise. The domain-freezing regime sets in at sotemperature belowTc , and is seen by the point at which thmodulus increases on cooling. Domain-wall motion becomincreasingly sluggish at low temperature, as walls are unato unpin themselves on the time scale of the dynamic forThe storage modulus increases to its low-temperature insic value, corresponding to a change from relaxed to unlaxed behavior, in the language of anelasticity. The increin modulus is accompanied by a maximum in the mechanloss, seen as a Debye-like resonance peak in tand.
The first stage in understanding these three regimemechanical behavior is to determine how the domain statthe sample changes as a function of temperature andduring prolonged annealing under dynamic stress. Suchformation can be easily obtained from x-ray diffractio~XRD! rocking curves, which characterize the angular retionships and volumetric proportions of differently orientetwin domains intersecting the surface of a ferroelastic singcrystal ~see Fig. 3 for details!. The rocking-curve techniquehas been applied for many years to the study of ferroeladomain structures. These studies have been all beenducted as static experiments: the applied load on the samis usually zero, or is a fixed static stress.14,15 In the case of adynamic stress, we need to observe the response of thecrostructure on a time scale much smaller than the periothe alternating load. The time scales are also much shothan those for standard x-ray rocking curve data collectiHowever, the dynamic response may be studied at tscales less than the period of the alternating stress usingboscopic methods. The advent of fast detectors and raswitching electronics now make it technically feasible to clect diffraction signals from samples on time scales of tenof milliseconds, and hence makes it possible to use stroscopic methods to study the varying response of materiaapplied stresses as a function of phase angle during theternating cycle of a dynamically applied load. This has beachieved by combining a DMA with a multichannel detectand a fast-switching data-grabbing system. Here we prediffraction measurements of the effects of dynamic stressdomain state in a ferroelastic perovskite single crystal, usa novel stroboscopic XRD-DMA diffractometer.a

t latticele
time. Aular
s ofindi
1708 J. Appl. Phys., Vol. 95, No. 4, 15 February 2004 Harrison et al.
FIG. 3. ~a! and~b! The general principle of an XRD rocking curve. In a twinned crystal the reciprocal lattice vectors representing a set of equivalenplanes in different twin domains will not be parallel~in this case we are dealing with diffraction from the 001pc planes in domains II and III, as defined in TabI!. A suitably oriented crystal is placed close to the diffraction condition, with both reciprocal lattice vectors lying within the scattering plane. The sample isrotated by an anglev about an axis perpendicular to the scattering plane in order to bring it into the diffracting condition for one set of twins at arocking curve, which is a plot of integrated intensity as a function ofv, will show individual peaks corresponding to each of the twin domains. The angdifference between the peak positions in the rocking curves~dv! corresponds to the angular difference between the reciprocal lattice vectors~projected intothe scattering plane!. ~c! Starting material for the XRD-DMA experiments is a single crystal of LaAlO3 , with surface parallel to (001)pc and length parallel
to @110#pc . The microstructure consists of lamellar (110) twins. ~d! Stroboscopic XRD rocking curves at room temperature with static:dynamic force200:180 mN and frequency 1 Hz. The four components of the rocking curve, collected at different parts of the dynamic stress cycle, are coincident,catingthat the domain walls of this orientation are not responding to the stress at this temperature.
-ta
ics
tese-
c
ea-
imec
sog-
loss
-on
al-Theee allented
a-
tedust
theelf.ed
ro-, al-ile
II. STROBOSCOPIC XRD-DMA
The general principal of DMA in three-point bend geometry is illustrated in Fig. 1. The sample is a single crysbeam with lengthl, width w, and thicknesst, suspended ontwo knife-edges. A force is applied using a electromechanforce motor with a force resolution of 1 mN. This impingeupon the sample from above via a third knife-edge locahalfway along the sample length. The applied force hastatic component (FS), which ensures that the sample rmains in contact with the knife-edges at all times, anddynamic component (FD) with frequency ~f ! the range0.01–50 Hz. The amplitude~u! and phase lag~d! of themechanical response are measured via electromagnetiductive coupling with a resolution ofDu;10 nm andDd;0.1°, respectively. The amplitude of displacement isfunction of both the Young’s~Y! and shear~G! moduli, but inthree-point bend geometry the contribution from the shmodulus vanishes forl @t.19 Under these conditions, the dynamic Young’s modulus parallel to the sample length is sply related to the dynamic force and the amplitude of defltion (uD) via
Y5l 3
4t3w
FD
uDexp~ id!.
This expression is derived for an isotropic solid. In an anitropic material the measured modulus is an effective Younmodulus transformed parallel tol, and hence is a combina
l
al
da
a
in-
a
r
--
-’s
tion of individual tensor components. The real (Y85uYucosd) and imaginary (Y95uYusind) components of thedynamic modulus are referred to as the storage andmoduli, respectively. The ratioY9/Y85tand is the attenua-tion ~energy dissipated per cycle!.
The elements of the stroboscopic XRD-DMA diffractometer are shown in Fig. 4. The DMA component is baseda standard Perkin-Elmer DMA-7e, modified in-house tolow access of x rays to the bottom surface of the sample.DMA is configured in a vertical orientation at the top of thinstrument. The sample and flexure head components arenclosed in a thermally stable furnace with x-ray-transparwindows. The diffractometer comprises an INEL curvposition-sensitive detector, covering 120°2u, and a sealed-tube x-ray source with monochromator optics and collimtion system (CuKa1 radiation!. A 100 mm diameter beamimpinges on the lower surface of the sample and is diffracin reflection geometry to the detector. Since the sample mremain static within the DMA apparatus~neglecting thesmall strains imposed by the mechanical analyzer!, rockingcurves are obtained by changing the angle of incidence ofincoming x rays, rather than by rotating the sample itsThe x-ray source is mounted on a rigid vertically orientoptic table, centered on the sample. The source can betated about an axis perpendicular to the scattering planelowing rocking curves to be measured from the sample whit is under dynamic stress.

chicaa
rn
teinl-fre
oon
ohc
ri
,nuli
an
hro-de-
ingre-
nral
entg ofur-the
ans-ith
ta-a-of
hean-
ofen
onre-
der
ich
thatirsthe
toasnalls
nin-
ndionsis-
aEoe
1709J. Appl. Phys., Vol. 95, No. 4, 15 February 2004 Harrison et al.
Central to this new instrument is the manner in whidata from the x-ray detector and data from the mechananalyzer are collected in a combined manner. A timing chtakes information from the DMA and passes it throughlogic translator to trigger collection of the diffraction patteat four points in the applied stress cycle~corresponding tothe maximum force, the minimum force, the maximum raof increasing force, and the maximum rate of decreasforce!. The diffraction information, extracted from the mutichannel analyzer of the curved PSD at four times thequency of the sample oscillation, is then stored into onefour cumulating data files, corresponding to the diffractipattern of the sample under each of the four conditionsapplied stress at that frequency. By altering the phase sbetween the applied stress reference signal and the datalection trigger, the sample can be probed at any conditionapplied stress by diffraction. By employing a rocking expement, the diffraction~from specific domain wall orientations!can be observed at each state of applied stress. If desiredcollection of diffraction data can be synchronized to the sisoidal response curve of the sample, rather than the appforce. This is useful for materials where there is a large phlag between the force and response curves. All data prese
FIG. 4. ~a! Design of the XRD-DMA. Central vertical column consists ofstandard Perkin-Elmer DMA-7e. Cu x-ray tube, monochromator, and IN120° position-sensitive detector are mounted on a rotatable verticallyented optic table. A 700 °C, 1 atm furnace surrounds the three-point-bsample assembly, shown in detail in~b!.
alin
g
-f
fiftol-
of-
the-edseted
here were obtained using stress, rather than strain, syncnization. A telescopic lens attached to a charge coupledvice camera is mounted directly below the sample, allowthe dynamic response of the twin walls to be viewed inflected light and recorded digitally.
III. PHASE TRANSITIONS AND TWINNING IN LaAlO 3
A. Symmetry and spontaneous strain
The high-temperature phase of LaAlO3 has the cubicperovskite structure with space groupPm3m and lattice pa-rameteracubic;3.79 Å. Below about 550 °C it undergoes aimproper ferroelastic phase transition to the rhombohedsubgroupR3c, driven by rotation of the AlO6 octahedraabout one of the cubic threefold symmetry axes. Adjacoctahedra rotate in opposite senses, leading to a doublinthe unit cell along the octahedral rotation axis. For the ppose of defining the spontaneous strain associated withphase transition, however, we can ignore the change in trlational symmetry and define a pseudocubic unit cell wrhombohedral shape (apc5bpc5cpc;3.79 Å and apc5bpc
5gpcÞ90°) that is directly comparable in size and oriention to the high-temperature cubic unit cell. The lattice prameters have been determined as a functiontemperature.9,11,12The symmetry-breaking straine4 is nega-tive (apc.90°), which corresponds to compression of tunit cell parallel to the octahedral rotation axis and expsion perpendicular to this axis. The temperature evolutionthe twin angle and its structural significance has bemeasured.10,13The thermodynamic character of the transitiis, within experimental resolution, second order, and thefore e4 varies linearly with temperature~the symmetry-breaking strain couples to the square of the driving orparameter for an improper ferroelastic transition!.
B. Twin domains and chevron tiling
Transformation twins form on cooling belowTc due tothe degeneracy of four equivalent triad axes about whoctahedral rotation can occur~Table I!. Given the four puredomain states, there are six possible pairs of domainscan meet to form a domain wall. For each of the six pathere are two possible orientations of domain wall, one ofform $100%pc and one of the form$110%pc. An optical micro-graph of the twin microstructure of a typical LaAlO3 crystalis shown in Fig. 5. The surface of the sample is parallel(001)pc. The characteristic microstructure, referred to‘‘chevron tiling,’’ contains each of the four pure domaistates, separated by three mutually compatible domain w~two walls parallel to$110%pc and one parallel to$100%pc)intersecting along a common^100&pc direction. There are sixdistinguishable chevron orientations.16 The chevron in Fig. 5is of type 1~Table II!. The three domain walls within a givechevron are mutually compatible, allowing a stress-freetergrowth of the four pure domain states.8 However, the sixchevrons are not mutually compatible with each other, athere are high lattice strains at the boundary between regcontaining different chevron orientations. An exampleshown in Fig. 6~a!, which contains regions of chevron orien
Lri-nd

1710 J. Appl. Phys., Vol. 95, No. 4, 15 February 2004 Harrison et al.
TABLE I. Twin domain and twin wall orientations in LaAlO3 @after Buebleet al. ~Ref. 8!#.
Domain I II III IV
Axis of rotation @111# @111# @ 111# @111#Spontaneousstrain tensor S0 e e
e 0 e
e e 0D S0 e e
e 0 e
e e 0D S0 e e
e 0 e
e e 0D S0 e e
e 0 e
e e 0D
Domain Pair I, II I, III I, IV II, III II, IV III, IV
Orientation oftwin wall
~010!~101!
~100!~011!
~001!~110!
~001!
(110)
~100!
(011)
~010!
(101)
tdletynle
ali-st
Its
eain
as
n
insachn-allyinger-ipstra-
-
ndong)the
rityI.
ta-n.-
eaksthe
ng
essio
v-l
tations 1~right! and 2~left!. On annealing, the high strain athe boundary is partially relieved by the formation of neetwins at the points where$100%pc domain walls intersec@Fig. 6~b!#. In addition, lateral migration of the high-energchevron nodes can lead to the destruction of chevron baand the gradual transition from chevron tiling to simplamellar twinning.4
IV. SAMPLE CHARACTERISTICS
A. Sample
Two differently oriented samples of single-crystLaAlO3 ~Crystal GmbH, Berlin! were used in these experments. The samples were cut from high-quality single-cryslabs, normally used as substrates for high-Tc superconduct-ors. Sample 1 was 6 mm long, 1.96 mm wide, and 0.52 mthick. Its surface was parallel to (001)pc and its length par-allel to @110#pc ~corresponding tof545° in Fig. 7!. Sample2 was 6 mm long, 1.85 mm wide, and 0.25 mm thick.surface was parallel to (001)pc and its length parallel to@100#pc ~corresponding tof50° in Fig. 7!. The orientationof sample 1 was chosen so that the effective force on at lone domain wall in each chevron would be maximum
FIG. 5. Optical micrograph of the ‘‘as-received’’ starting material showithe chevron microstructure of mutually intersecting$100%pc and$110%pc do-main walls. Labels I, II, III, and IV refer to the pure twin domain statlisted in Table I. Ellipses show the orientations of the axes of compres~minor axis! and extension~major axis! in each domain~projected into theplane of the diagram!.
ds
al
m
st
three-point bend geometry. The orientation of sample 2 wchosen so that~to a first approximation! the effective forceon all domain walls would be zero in all chevroorientations.5
B. Rocking curves as a function of chevronorientation
Our use of x-ray rocking curves in detecting strainssingle crystal LaAlO3 follows the earlier pioneering studiedescribed in Refs. 10 and 13. The six chevron types, econtaining four domain states, yield 24 physically distiguishable domain orientations, each of which can potentiproduce a peak in the rocking curve. This can lead to rockcurves with complex topologies, requiring careful considation of the inter- and intra-chevron angular relationshbetween diffracting planes when assigning peaks. The inchevron angular relationships between (001)pc diffractingplanes are well defined~neglecting any effect of surface relaxation! ~Fig. 7!. Figures 7~a! and 7~b! show the arrange-ment of domains and domain walls for chevron types 1 a2. In both these cases, the domain walls intersect al@001#pc and are approximately perpendicular to the (001pc
surface of the sample. The dashed lines in Fig. 7 showoutline of the pseudocubic unit cell~the magnitude of thespontaneous strain has been greatly exaggerated for cla!.Domains are labeled according to the definitions in TableFigure 7~c! is a schematic stereogram indicating the orientions of the (001)pc* reciprocal lattice vectors in each domaiThe angle between (001)pc* for domains separated by a domain wall of type$100%pc is 0.18°.8 The corresponding anglefor domains separated by a domain wall of type$110%pc is0.25°. To calculate the corresponding distance between pin a rocking curve, these angles have to be projected into
n
TABLE II. Six possible triplets of domain walls forming strain-free cherons, and their common direction of intersection@after Bueble and Schma~Ref. 16!#.
Chevron label 1 2 3 4 5 6
$100%-type domainwall orientation
~010! ~100! ~100! ~001! ~010! ~001!
$110%-type domainwall orientations
~110! ~110! ~101! ~101! ~011! ~011!
(110) (110) (101) (101) (011) (011)Intersection @001# @001# @010# @010# @100# @100#
iated
1711J. Appl. Phys., Vol. 95, No. 4, 15 February 2004 Harrison et al.
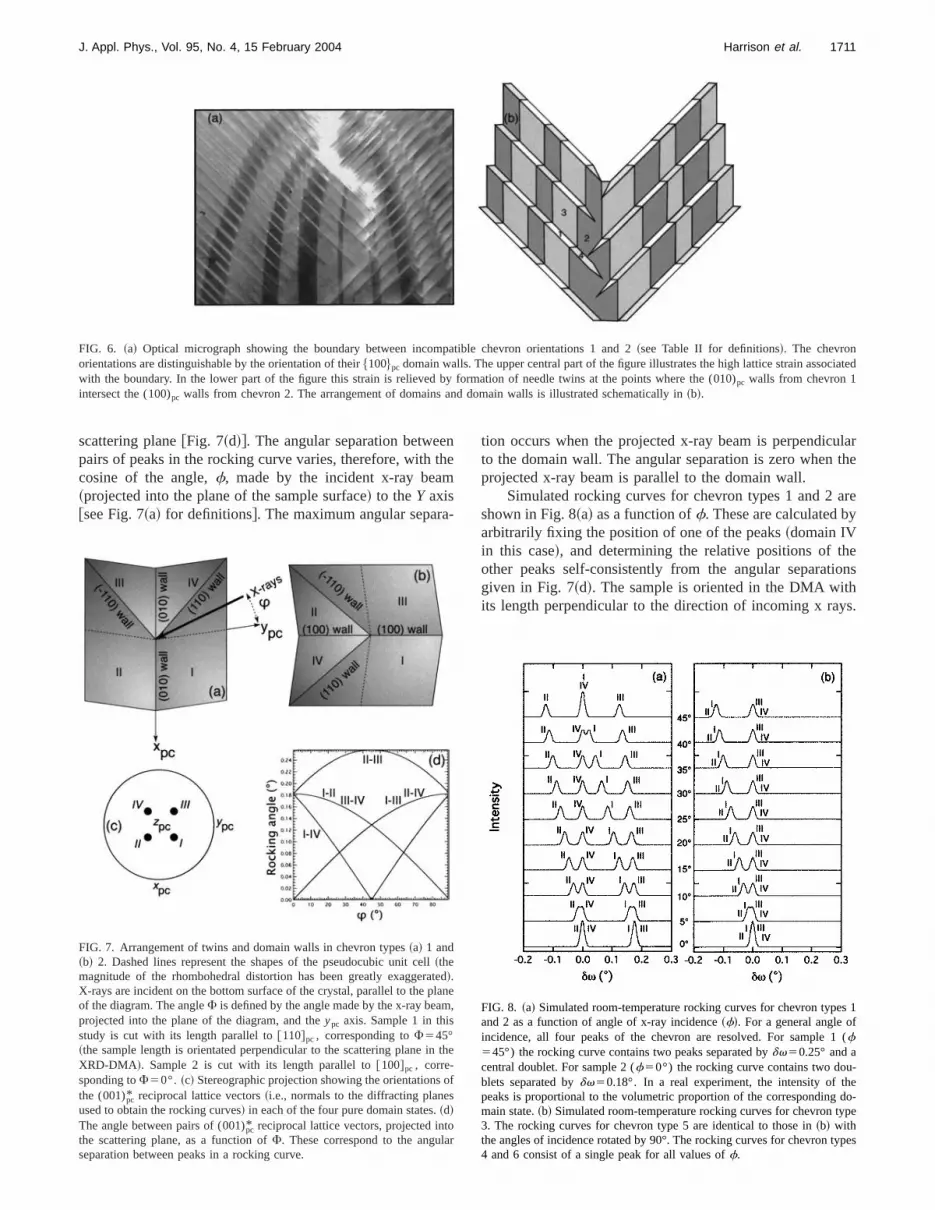
FIG. 6. ~a! Optical micrograph showing the boundary between incompatible chevron orientations 1 and 2~see Table II for definitions!. The chevronorientations are distinguishable by the orientation of their$100%pc domain walls. The upper central part of the figure illustrates the high lattice strain assocwith the boundary. In the lower part of the figure this strain is relieved by formation of needle twins at the points where the (010)pc walls from chevron 1intersect the (100)pc walls from chevron 2. The arrangement of domains and domain walls is illustrated schematically in~b!.
nth
-
ularthe
arey
eions
s.
ltelanm
n t
ofs
oar
s 1
(
-edo-pe
pes
scattering plane@Fig. 7~d!#. The angular separation betweepairs of peaks in the rocking curve varies, therefore, withcosine of the angle,f, made by the incident x-ray beam~projected into the plane of the sample surface! to theY axis@see Fig. 7~a! for definitions#. The maximum angular separa
FIG. 7. Arrangement of twins and domain walls in chevron types~a! 1 and~b! 2. Dashed lines represent the shapes of the pseudocubic unit cel~themagnitude of the rhombohedral distortion has been greatly exaggera!.X-rays are incident on the bottom surface of the crystal, parallel to the pof the diagram. The angleF is defined by the angle made by the x-ray beaprojected into the plane of the diagram, and theypc axis. Sample 1 in thisstudy is cut with its length parallel to@110#pc , corresponding toF545°~the sample length is orientated perpendicular to the scattering plane iXRD-DMA !. Sample 2 is cut with its length parallel to@100#pc , corre-sponding toF50°. ~c! Stereographic projection showing the orientationsthe (001)pc* reciprocal lattice vectors~i.e., normals to the diffracting planeused to obtain the rocking curves! in each of the four pure domain states.~d!The angle between pairs of (001)pc* reciprocal lattice vectors, projected intthe scattering plane, as a function ofF. These correspond to the angulseparation between peaks in a rocking curve.
etion occurs when the projected x-ray beam is perpendicto the domain wall. The angular separation is zero whenprojected x-ray beam is parallel to the domain wall.
Simulated rocking curves for chevron types 1 and 2shown in Fig. 8~a! as a function off. These are calculated barbitrarily fixing the position of one of the peaks~domain IVin this case!, and determining the relative positions of thother peaks self-consistently from the angular separatgiven in Fig. 7~d!. The sample is oriented in the DMA withits length perpendicular to the direction of incoming x ray
de
,
he
FIG. 8. ~a! Simulated room-temperature rocking curves for chevron typeand 2 as a function of angle of x-ray incidence~f!. For a general angle ofincidence, all four peaks of the chevron are resolved. For sample 1f545°) the rocking curve contains two peaks separated bydv50.25° and acentral doublet. For sample 2 (f50°) the rocking curve contains two doublets separated bydv50.18°. In a real experiment, the intensity of thpeaks is proportional to the volumetric proportion of the correspondingmain state.~b! Simulated room-temperature rocking curves for chevron ty3. The rocking curves for chevron type 5 are identical to those in~b! withthe angles of incidence rotated by 90°. The rocking curves for chevron ty4 and 6 consist of a single peak for all values off.

th
anb
nd.2thetTh-d
u
eural
r-ed
r-
n-
, iovthfyarvo
eltic
lluro
taed
i1
re45e
o-th
t
dif-perk-c-astionsity
sthe
g
ing
iso-andmedad.ad
re-forock-pe-ob-ingajorg or
isic
edof
icalcur-ce-ton
of
ng
II
mentIII
-)
ofrero-
1712 J. Appl. Phys., Vol. 95, No. 4, 15 February 2004 Harrison et al.
Hence a value off50 corresponds to sample 2, with lengcut parallel to 100&pc, and a value off545° corresponds tosample 1, with length cut parallel to110&pc. In the f50case, peaks II and IV and peaks I and III are coincident,the rocking curve consists of two doublets separated0.18°. In thef545° case, peaks I and IV are coincident, athe rocking curve consists of two singlets separated by 0surrounding a central doublet. Small misalignment ofsample on the knife-edges leads to splitting of the doublso that all four peaks in the chevron can be resolved.peak separations in Figs. 7~d! and 8 are based on the roomtemperature value of the spontaneous strain. The straincreases linearly with increasing temperature (e4}T2Tc),and the peak separations decrease correspondingly.10,13
A similar analysis can be performed for the other fochevron orientations. For chevrons 3 and 5 the$100%pc-typedomain wall is perpendicular to the sample surface, wherthe $110%pc-type domain walls are at 45° to the sample sface. The rocking curves consist of two doublets for all vues off @Fig. 8~b!# because the (001)pc diffracting planes indomains I and II and in domains III and IV are exactly paallel to each other~this is true for any two domains separatby $110%pc walls oriented at 45° to the surface!. For chevrontypes 4 and 6, the$100%pc domain wall is parallel to thesurface and the$110%pc domain walls are at 45° to the suface. In this case, the (001)pc diffracting planes are exactlyparallel in all four domains and the rocking curves will cosist of a single peak for all values off.
When assigning peaks it should be borne in mind thataddition to the geometrical considerations described abthe number of peaks in the rocking curves will depend onvolumetric proportions of each of the four components ogiven chevron. Some peaks expected to be present masmall, poorly resolved, or simply absent. Ambiguities in peassignment must be resolved by direct microscopic obsetion. The effect of surface relaxations on the trajectoriesdomain walls and resulting surface topography is also likto play a significant role in determining the characterisx-ray rocking curves.
The interchevron angular relationships are not wedefined, due to the variable amounts of lattice strain encotered at the boundaries between differently oriented chevregions ~Fig. 6!. Peaks assigned to the same domain swithin different chevron regions will be close to each othbut not necessarily coincident, leading to splitting or broaening of peaks.
V. EXPERIMENTAL PROCEDURES
All measurements were performed using a dynamforce with frequencyf 51 Hz. Measurements on samplewere performed using a static force componentFs
5200 mN and a dynamic force componentFD5180 mN~abbreviated 200:180 mN!. Measurements on sample 2 weperformed with a range of dynamic loads varying from 50:to 200:180 mN. Measurements were also made with zdynamic load~probe tip of the DMA just resting on thesample surface!. Rocking curves were collected during isthermal annealing under dynamic stress. The angle of
dy
5°es,e
e-
r
as--
ne,eabe
ka-fy
-n-n
ter-
c
ro
e
x-ray source to the horizontal~v! was set to a value juslower than the Bragg angle~u! for the (001)pc reflection. Thesource position was then rotated in steps of 0.005° andfracted intensity was collected stroboscopically for 30 sstep~effectively 30/4 s for each of the four component rocing curves!. At each step, the diffracted intensity as a funtion of 2u recorded by the position-sensitive detector wintegrated using an automated peak-finding and integraroutine. Rocking curves are presented as integrated intenas a function ofv. There are four individual rocking curvefor each measurement, corresponding to the four parts ofdynamic stress cycle: solid line5minimum force (FS
2FD), dotted line5maximum force (FS1FD), mediumdashed line5maximum rate of increasing force, and londashed line5maximum rate of decreasing force.
High-temperature rocking curves were collected durheating from room-temperature to aboveTc and back again.Diffraction measurements were made during a series ofthermal annealing steps under dynamic load. Heatingcooling of the sample between measurements was perforat a rate of approximately 10 °C per min under dynamic loThe sample remained in the DMA under dynamic lothroughout the measurement of each series. It was thenmoved for microscopic analysis and replaced in the DMAmeasurement of the next series. At some temperatures, ring curves were measured at infrequent intervals over ariod of days to weeks. No changes in the curves wereserved as a function of time during isothermal annealunder dynamic load at a given temperature. However, mchanges in the rocking curves were observed on heatincooling. It appears, therefore, that the bulk microstructurehighly sensitive to changing temperature under dynamload, but is highly stable with respect to time at any fixtemperature. This is presumably due to the generationthermal stresses during heating and cooling.
Separate experiments were performed under identconditions to observe optically the domain processes ocring during dynamical mechanical analysis. Careful plament of the illumination allowed one set of twins at a timebe imaged. Movement of the illumination during acquisitiowas required to image all twins’ orientations. Modificationthe instrument to permitin situ observations in transmittedlight under crossed polars is planned.
VI. RESULTS
A. Sample 1 „length parallel to †110‡pc , fÄ45°…
An optical micrograph and room-temperature rockicurve of the starting material are shown in Figs. 3~c! and3~d!. The central portion of the sample contains domainsand III separated by (110)pc walls. The rocking curve con-tains two sharp peaks separated by 0.25°, in good agreewith the expected rocking angle between domains II andfor f545° @Figs. 7~d! and 8~a!#. It is assumed that the microstructure corresponds to chevron type 1 with the (010pc
domain walls~and hence domains I and IV! absent.The rocking curve was collected under dynamic load
200:180 mN. All four components of the rocking curve aidentical and coincident, indicating that no change in mic

sgr
akth
ckwonapoureth
roh
nh
s
he
ine ofex-
ntoture
e-
ed.1ul-ont to
ainaks°C,la-g1,
gle-
fof to
edt
us
e 1
re-
s isnta-
1713J. Appl. Phys., Vol. 95, No. 4, 15 February 2004 Harrison et al.
structure occurs in response to the dynamic load. A serierocking curves collected in isothermal steps during heatinshown in Fig. 9. Little change in the rocking curves occuon heating from room temperature to 151 °C. Two new peappear at 192 °C, which can be attributed to a region ofcrystal containing a second chevron orientation~type 2!. Attemperatures up to 234 °C, all four components of the roing curve are identical and coincident. Above 234 °C, hoever, two significant changes occur. First, the diffractipeaks attributed to domain II in both chevron regions dispear, leaving only those due to domain III. Second, the fcomponents of the rocking curve become shifted withspect to each other, with the curve corresponding tomaximum applied force~dotted line! shifting to the rightwith increasing temperature. This indicates that the micstructure is now responding to the applied dynamic load. Tphysical origin of the peak shift is discussed below.
After heating aboveTc , the sample was cooled to roomtemperature under dynamic load. An optical micrograph arocking curve of the cooled sample are shown in Fig. 10. Tpeaks in the rocking curve can be assigned to two region
FIG. 9. Stroboscopic XRD rocking curves as a function of temperaturesample 1, recorded at 1 Hz and 200:180 mN. The four components orocking curve correspond to different parts of the dynamic stress cycle: sline5minimum force~20 mN!, dotted line5maximum force~380 mN!, me-dium dashed line5maximum rate of increasing force, and long dashline5maximum rate of decreasing force. Loss of intensity on heating553 °C is due to thermal expansion of the sample assembly, which cathe x-ray beam to miss the sample at high temperatures.
ofissse
--
-r-e
-e
deof
the crystal containing chevron-types 1 and 2@Fig. 10~a!#.The peak positions indicate a slight misalignment of tsample, corresponding to a value off540° @Fig. 8~a!#. Dif-fraction peaks from domain I in chevron 1 and domain IVchevron 2 are poorly resolved or absent. The presencchevron orientations 1 and 2 was confirmed by opticalamination@Fig. 10~b!#.
After optical examination, the sample was reinserted ithe diffractometer and another series of high-temperarocking curves was acquired under identical conditions~Fig.11!. The initial rocking curves are similar to those seen bfore removal of the sample@Fig. 10~a!#, although the peaksfrom chevron orientations 1 and 2 are less clearly resolvAt 194 °C, the contribution from domain II in chevronincreases relative to that of domain II in chevron 2. Simtaneously, the position of the peak from domain II in chevr1 begins to respond to the dynamic load, causing a shifhigher angles when maximum force is applied~dotted line!.No changes are observed in the contributions from domIII in chevrons 1 and 2, however, and neither of these peresponds to the dynamic load at this temperature. At 237the contribution from domain III in chevron 2 increases retive to that of domain III in chevron 1. By 280 °C the rockincurves consist of a single peak from domain II in chevronwhich responds strongly to the dynamic load, and a sinpeak from domain III in chevron 2, which shows little re
rhelid
oes
FIG. 10. ~a! Stroboscopic room-temperature rocking curves of samplafter heating aboveTc and cooling under dynamic load~Fig. 9!. Splitting ofpeaks indicates the presence of chevron orientations 1 and 2~see Table II fordefinitions!. ~b! Optical micrograph of sample 1 after heating aboveTc andcooling under dynamic load. The domain walls most clearly visible corspond to the$100%pc walls, which are at;90° to each other in the twochevron orientations. A high strain boundary between the two chevronindicated. In other regions the interpenetration of the two chevron orietions is mediated by the formation of needle twins, as shown in Fig. 6~b!.

anm
tui
throo
re
en
le)rto°
itk-i
ginat
t to
1.r tole 1eak
fo
ling
tionle in
1714 J. Appl. Phys., Vol. 95, No. 4, 15 February 2004 Harrison et al.
sponse to the dynamic load. This situation continues up370 °C, at which point both peaks respond in a similar mner to the dynamic load. At 462 °C, only domain II frochevron 1 is observable.
After the sample had been heated aboveTc in the secondheating run, it was once again cooled to room temperaunder dynamic load. The corresponding rocking curveshown at the top of Fig. 11 and an optical micrograph ofcooled sample is shown in Fig. 12. The nature of the micstructure has changed significantly, with the generationchevron orientations of types 3–6, characterized by the pence of$110%pc domain walls at 45° to the (001)pc samplesurface. These domain walls are visible by the birefringfringes created when viewed under crossed polars.
B. Sample 2 „length parallel to †100‡pc , fÄ0°…
An optical micrograph of the starting material for samp2 is shown in Fig. 13. The sample contains lamellar (010pc
domain walls parallel to its length, with a single set of vetical $110%pc domain walls in the center, correspondingchevron type 1. A series of rocking curves acquired at 84under varying dynamic loads is shown in Fig. 14~a!. Thelower curve was acquired with no applied force~probe tipresting on the sample surface!. The rocking curve containsjust two peaks, as expected for chevrons of this type wf50° @Fig. 8~a!#. When a dynamic load is applied, the rocing curve corresponding to the maximum in the dynam
FIG. 11. Stroboscopic XRD rocking curves as a function of temperaturesample 1, recorded at 1 Hz and 200:180 mN.
to-
rese-fs-
t
-
C
h
c
load cycle~dotted line! shifts to lower angles with increasinforce. In addition to the shift, there is a noticeable increasethe width of the peaks compared to the widths observedthe minimum of the dynamic load cycle~solid line!, espe-cially at high loads@top of Fig. 14~a!#. The nature of the shiftin peak position with applied force appears to be differenthat observed in sample 1@Figs. 9 and 11#. First, the direc-tion of shift is opposite to that observed in Figs. 9 and 1More importantly, however, the peak shifts do not appeabe thermally activated. The peak shifts observed for sampappear only in the superelastic regime. In contrast, the p
r
FIG. 12. Optical micrograph of sample 1 after a second heating and coocycle under dynamic load. The central fringes correspond to$110%pc domainwalls oriented at 45° to the surface, corresponding to a chevron orientaof types 3–6. Regions containing chevron orientations 1 and 2 are visibthe upper right and lower left corners.
FIG. 13. Optical micrograph of sample 2, with length parallel to@100#pc .The microstructure consists predominantly of (010)pc domain walls parallelto the length of the sample, with a single set of$110%pc domain walls in thecenter, corresponding to chevron type 1~inset!. In this orientation, there isno force on the domain walls due to application of the external load.

1715J. Appl. Phys., Vol. 95, No. 4, 15 February 2004 Harrison et al.
FIG. 14. Stroboscopic rocking curves for sample 2 recorded at 1 Hz and a range of dynamic forces at a temperature of~a! 84 °C and~b! 298 °C.
fth
thb
lie
eCt-F
reb
ndax
inay
sererth
er
omlu
farraoallehe
ar--to-sthe
e-
-thes
omi-nce-
re-
for a
rain
shifts in sample 2 occur even at room temperature andforces as low as 50 mN. This indicates that changes indiffraction pattern do not represent a dynamic responsethe microstructure to the applied load. The magnitude ofpeak shifts may be explained by the curvature inducedelastic bending of the sample in response to the appforce.
The behavior observed up to a temperature of 169 °Cidentical to that depicted in Fig. 14~a!. Significant force-dependent changes occur in the rocking curves at temptures of 212 °C and above@representative behavior at 298 °is shown in Fig. 14~b!#. First, a third peak appears, attribuable to the presence of a second chevron orientation.forces up to 100:90~static:dynamic! mN, the behavior issimilar to that seen at lower temperatures, with all thpeaks shifting to lower angles by an amount determinedthe applied dynamic force. At forces of 150:135 mN aabove, however, the nature of the rocking curves at the mmum in the dynamic force cycle~dotted line! changes com-pletely. Rather than three well-defined peaks, the rockcurve becomes smeared out into a broad signal encomping an equivalent angular range. At the minimum of the dnamic stress cycle~solid line!, the three well-defined peakare reformed. The force required to see this effect is tempture dependent, with larger forces required at lower tempture. Both the temperatures and forces required indicatethe effect is related to domain-wall motion within the supelastic regime.
The mechanical properties of sample 2 as a functiontemperature are shown in Fig. 15, recorded using a dynaload of 100:90 mN. Measurements of storage modu~circles! and tand ~squares! made during heating~closedsymbols! and cooling~open symbols! at a constant rate o10 °C/min are shown. Measurements of storage modulustand made during the acquisition of the rocking curves ashown as closed and open triangles, respectively. The stomodulus decreases by around a factor of 2 on cooling frthe paraelastic to the superelastic regime, a much smdecrease than the factor of 10 drop observed in samp~Fig. 1!. Most of this drop in modulus can be attributed to t
ore
ofeyd
is
ra-
or
ey
i-
gss--
a-a-at-
fics
ndege
mler1
elastic softening due to order-parameter strain coupling.17,18
The dashed line shows schematically the effect of linequadratic order parameter-strain coupling for a closesecond-order transition.19 The softening observed in excesof this is due to domain wall processes, as is revealed byprogressive immobilization of domain walls on cooling blow 170 °C.
C. In situ optical observations
In situ optical observation of the microstructural response to a dynamic load provides a basis for interpretingresults of the XRD-DMA experiments. Two distinct modeof anelastic response were observed in sample 1. The dnant mechanism at low temperatures is the rapid adva
FIG. 15. Storage modulus~circles! and tand ~squares! as a function oftemperature for sample 2, made during heating~closed symbols! and cooling~open symbols! at a constant rate of 10 °C/min. Triangles show measuments made during acquisition of rocking curves~Fig. 14!. The dashed lineshows schematically the form of the elastic constant variation expectedclose-to-second-order improper ferroelastic phase transition~see Ref. 19!.This variation is the intrinsic elastic softening due to order parameter-stcoupling ~see Ref. 18!.

f tow
ai
etreintiithal-d
-
ean
t-e-
aheio
onano
s)ds
i-inrtrellI
on-r
eived
ri-ll
r
ofallel
deee-om-trac-sticof
bye
offact
oflied
tress.strainitive
ces,the
innsion
ead-mceD-
1716 J. Appl. Phys., Vol. 95, No. 4, 15 February 2004 Harrison et al.
ment and retraction of combs of narrow, vertical$100%pc
needle domains. These combs originate at the sides osample and advance horizontally across its width. At ltemperatures and small loads, continuous advancementretraction of individual needle tips over small distancesobserved in response to the dynamic stress. At high temptures and large loads, discontinuous advancement and retion of the needle tips across the entire width of the samplobserved, with rapid movement of the needle tips occurrbetween discrete pinning points. The ratio of mobile to staneedle tips within a comb is a function of temperature, wthe ratio decreasing steadily on cooling through the domfreezing regime (T,200 °C). At higher temperatures the aternative mode of anelastic response involves the lateralplacement and rotation of a single 45°$110%pc wall ~such asthat shown in Fig. 12!. Large-amplitude lateral displacements of these walls~of the order of 0.5–1 mm! are facili-tated at high temperatures either by the disappearanc$100%pc needles, or by their cooperative advancementretraction.
Sample 2 shows a similar behavior to sample 1 aT,200 °C and forces,150:135 mN, with the anelastic response accommodated by the formation/advancemretraction of small numbers of$100%pc needle domains parallel or perpendicular to the sample length. AtT.200 °Cand forces>150:135 mN there is rapid advancement ofhigh density of needle twins across the entire sample wthe force is at its maximum, and almost complete retractwhen the force is at its minimum.
VII. DISCUSSION
A. Preferred chevron orientation
Our experiments on sample 1 show that there is a strpreference for certain chevron orientations when heatingcooling under dynamic load. Whereas the microstructurethe starting material is dominated by chevron orientationand 2, with all domain walls perpendicular to the (001pc
surface ~Figs. 5 and 6!, the microstructure after repeateheating and cooling is dominated by chevron orientationand 5, characterized by vertical$100%pc walls and 45°$110%pc walls ~Fig. 12!. The gradual change in chevron orentation with increasing temperature is seen in the rockcurves as the disappearance of peaks associated with ve$100%pc and$110%pc walls, leaving a single doublet peak foeach chevron~Figs. 9 and 11!. This observation can easily bexplained in terms of the effective force on the domain wawithin the different chevrons due to the applied stress.chevrons 1, 2, 4, and 6, the effective force on at leastdomain wall in the chevron is zero~these walls separate domains with an equal component of spontaneous strain palel to the length of the sample!. Such walls are likely tohinder the dynamic response of the microstructure. In chrons 3 and 5, all walls experience the maximum effectforce, and will be able to respond directly to the applistress.
Another contributing factor to the preferred chevron oentation is illustrated in Fig. 16, which shows schematicathe effect of a bending stress on a chevron of type 3 o
he
ndsra-ac-isgc
in
is-
ofd
nt/
nn
gdf1
3
gical
sne
al-
v-e
y5.
Twin domains shaded white and gray have componentsspontaneous contraction and expansion, respectively, parto the length of the sample. Vertical$100%pc walls formcombs of needle twins@Fig. 16~a!#. The presence of a banof 45° $110%pc walls causes the ‘‘sign’’ of the needles to breversed in the top and bottom halves of the crystal. In thrpoint-bend geometry, the top surface is placed under cpression whereas the bottom surface is under tension. Retion of the needles creates exactly the required anelaresponse~contraction of the upper surface and expansionthe lower surface!, leaving a single 45°$110%pc wall @Fig.16~b!#. Further deformation can then be accommodatedrotation of this wall@Fig. 16~c!#. On releasing the stress, thwall returns to its stress-free trajectory@Fig. 16~d!#. This mayor may not be accompanied by readvancement of the$100%pc
needles.
B. Microstructural response to dynamic force
A significant observation is that no dynamic responsethe rocking curves is observed below 200 °C, despite thethat domains are mobile at this temperature~Fig. 1!. Thisdiscrepancy is easily explained by the change in modeanelastic response on heating. Below 200 °C, and for app
FIG. 16. Schematic response of chevron types 3 and 5 to a bending sDomains shaded white have a negative component of spontaneousparallel to the length of the sample. Domains shaded gray have a poscomponent.~a! Closely spaced vertical$100%pc walls form needle twins~forsimplicity the needle tips are shown forming at the top and bottom surfaand advancing/retracting vertically. In reality, the needle tips form atsides of the sample and advance/retract horizontally!. The presence of aband of 45°$110%pc walls causes the sign of the needle twins to reversethe top and bottom halves of the crystal.~b! Retraction of the needles casimultaneously accommodate contraction of the top surface and expanof the bottom surface. Full retraction leaves a single$110%pc wall. ~c! Fur-ther deformation can be accommodated by rotation of the$110%pc wall. ~d!Removal of stress allows the wall to relax to its stress-free trajectory. Rvancement of the$100%pc needles may also occur. Note the deviation frothe 45°$110%pc wall trajectory at the top and bottom surfaces. This surfarelaxation is responsible for the dynamic peak-shift observed using XRDMA, as the domain wall sweeps past the x-ray beam.

o
thllbeot
asauinalthth-
a
3
e
s
enenin
s
°ou
exia
y
onnda
ou
heig
onseaddif-en
tivees
do-fur-ous
Weeby
R/ndA
ls
pl.
and
ens.
ns.
ys.:
ral.
J.
r
1717J. Appl. Phys., Vol. 95, No. 4, 15 February 2004 Harrison et al.
forces<200:180 mN, the anelastic response is accommdated by continuous advancement and retraction of$100%pc
needle tips@Fig. 16~a!#. The positions of individual peaks inthe rocking curve are unaffected by the movement ofneedle tips. If diffraction is occurring from a region weaway from the tips, then the intensities of the peaks willsimilarly unaffected. Above 200 °C the anelastic responsincreasingly accommodated by lateral translation and rtion of $110%pc domain walls@Fig. 16~c!#. The trace of asingle$110%pc domain wall on the surface of the crystal wobserved to move by a distance of around 0.5–1 mm, cing it to track back and forth across the x-ray beam durthe dynamic force cycle. Hence diffraction occurs fromternate domains at the maximum and minimum points offorce cycle. The shift in peak position is a measure ofangle between (001)pc diffracting planes in adjacent domains. In the bulk, this angle is expected to be zero~Fig. 7!.At the surface, however, the trajectory of the domain wrelaxes, producing a small splitting of the peaks.20 An esti-mate of 0.06° was obtained for the splitting angle using aelastic model based on empirical pair potentials~W. Lee,personal communication!. Although the pair potentials wernot specifically optimized for LaAlO3 , the splitting angle isthe same order-of-magnitude as the peak shift observed uXRD-DMA ~values up to 0.045° were observed!.
The orientation of sample 2 is such that the componof spontaneous strain parallel to the length of the samplequal in all domains. Ideally, therefore, there should benet force on any domain wall and no superelastic soften~neglecting any ferrobielastic contribution!. Although thesoftening is reduced, there is clearly a significant superelacontribution to the mechanical behavior of sample 2~Fig.15!. Major changes in the rocking curves occur above 200and 150:135 mN, indicating a first-order transformationthe surface topography between the maximum and minimpoints of the dynamic force cycle@Fig. 14~b!#. Thesechanges correlate with the massive increase in twin-wall dsity observed optically. The broad rocking curve at mamum force indicates that the distance between domain wapproaches the wall width~;50 Å10!, leading to a smoothlycorrugated surface. The generation of such a high densitdomain walls may be explained if@100#pc is not exactly par-allel to the length of the sample. A small angular deviatileads to a small contrast between the component of sponeous strain parallel to the sample length in adjacentmains. For a given superelastic strain, the density of domwalls is inversely proportional to the contrast in spontanestrain.4 Hence as the contrast tends to zero, the densitydomain walls becomes infinite. Balancing this effect is textra energy required to create the domain walls. This dcate balance leads to a critical force, above which a hdensity of domain walls is energetically favored.
-
e
eisa-
s-g-ee
ll
D
ing
tisog
tic
Cfm
n--lls
of
ta-o-ins
ofeli-h
VIII. OUTLOOK
These experiments have demonstrated that the respof ferroelastic domain walls to a dynamically applied locan be resolved successfully using stroboscopic x-rayfraction techniques. The nature of the interaction betweferroelastic domain walls and surfaces is an area of acresearch.21,22Much work has been done using Lennard-Jontype potentials to simulate the structure of ferroelasticmain walls at the surface of a crystal.20 The precise nature othe changes in domain wall structure, orientation, and sface topography that occur in response to the inhomogenestress resulting from three-point bending are unknown.have now established an experimental technique whersuch changes can be probedin situ as a function of varyingtemperature, force, and frequency.
ACKNOWLEDGMENTS
This study was supported by EPSRC Grant No. GM49816. The authors would like to thank A. R. Abraham aJ. Summerfield for their help in constructing the XRD-DMand W. Lee for useful discussions.
1J. F. Scott, Integr. Ferroelectr.38, 769 ~2001!.2J. A. Krumhansl, J. Phys. IV5, 3 ~1995!.3E. K. H. Salje,Phase Transitions in Ferroelastic and Co-Elastic Crysta~Cambridge University Press, Cambridge, England, 1993!.
4R. J. Harrison and S. A. T. Redfern, Phys. Earth Planet. Inter.134, 253~2002!.
5R. J. Harrison, S. A. T. Redfern, and J. Street, Am. Mineral.88, 574~2003!.
6W. Schranz, Phase Transitions64, 103 ~1997!.7A. Binder, K. Knorr, and F. Luty, Phys. Rev. B56, 2991~1997!.8S. Bueble, K. Knorr, E. Brecht, and W. Schmahl, Surf. Sci.400, 345~1998!.
9B. C. Chakoumakos, D. G. Schlom, M. Urbanik, and J. Luiane, J. ApPhys.83, 1979~1998!.
10J. Chrosch and E. K. H. Salje, J. Appl. Phys.85, 722 ~1999!.11H. Lehnert, H. Boysen, J. Schneider, F. Frey, D. Hohlwein, P. Radelli,
H. Ehrenberg, Z. Kristallogr.215, 536 ~2000!.12C. J. Howard, B. J. Kennedy, and B. C. Chakoumakos, J. Phys.: Cond
Matter 12, 349 ~2000!.13S. A. Hayward, S. A. T. Redfern, and E. K. H. Salje, J. Phys.: Conde
Matter 14, 10131~2002!.14M. C. Gallardo, J. Jimenez, J. delCerro, and E. K. H. Salje, J. Ph
Condens. Matter8, 83 ~1996!.15J. Chrosch and E. K. H. Salje, J. Phys.: Condens. Matter10, 2817~1998!.16S. Bueble and W. W. Schmahl, Mater. Struct.6, 140 ~1999!.17M. A. Carpenter, E. K. H. Salje, and A. Graeme-Barber, Eur. J. Mine
10, 621 ~1998!.18M. A. Carpenter and E. K. H. Salje, Eur. J. Mineral.10, 693 ~1998!.19A. V. Kityk, W. Schranz, P. Sondergeld, D. Havlik, E. K. H. Salje, and
F. Scott, Phys. Rev. B61, 946 ~2000!.20J. Novak and E. K. H. Salje, J. Phys.: Condens. Matter10, L359 ~1998!.21J. Novak and E. K. H. Salje, Eur. Phys. J. B4, 279 ~1998!.22I. Tsatskis, E. K. H. Salje, and V. Heine, J. Phys.: Condens. Matte6,
11027~1994!.


