Embed Size (px)
Citation preview
46Jecn 2015,21(2):46-77
AbstrActs presented At the 2nd brAInn congress brAzIlIAn InstItute of neuroscIence And neuro-technology (cepId–fApesp) - AprIl 13th to 15th 2015
Applied clinical neuroscience
Abstracts
is it possible to identify patients with refractory epilepsy using a plasma-based test?
b.p.s. lima1, s.h. Avansini1, r. secolin1, M. l. santos1, A.c. coan2, A.s. Vieira1, b.s.carvalho1, M.K.M, Alvim2, f.r. torres1, l.r. silva2, f. rogério3, f. cendes2, I. lopes-cendes1
departments of 1 Medical genetics, 2neurology and 3Anatomical pathology, school of Medical sciences, university of campinas-unIcAMp; and brazilian Institute of neuroscience and neurotechnology (brAInn); campinas, sp, brazil.
introduction: Refractory or intractable epilepsy occurs when a patient fails to become, and stay, seizure free with adequate trials of at least two antiepileptic drugs (AEDs). About 30% of all patients with epi-lepsy do not have seizure remission despite appropriate therapy with AEDs. Major causes of pharmacoresistant are focal cortical dysplasia (FCD), malformation of the cerebral cortex, and mesial temporal epi-lepsy (MTLE). In some of these cases, surgical resection of the abnormal tissue can be performed in order to achieve better seizure control. Nev-ertheless, surgery indication may be delayed due to a long investigation. Therefore, the identification of biomarkers for seizure control could potentially speed-up the diagnosis of medically refractory seizures, which in turn would lead to earlier indication of an effective treatment, such as epilepsy surgery. One potential candidate for biomarkers is circulating microRNAs (miRNAs); these are small noncoding RNAs present in extracellular human body fluids including plasma or serum. It is well known that induced changes of miRNAs levels are stable in plasma, can be strongly associated with specific disease states and it is noninvasively and easily quantifiable. In this context the first objective of this project is to determine if changes in expression of three candidate miRNAs, previously associated with mechanisms underlying epilepsy and FCDs, as demonstrated by others and our own work: hsa-miR-23a, hsa-miR-31and hsa-miR-134 are present in plasma of patients with FCD and MTLE presenting with refractory seizures. In addition, we aim to verify if plasma levels of these miRNAs may be associated with response to AEDs. Materials and Methods: We determined plasma levels of these three miRNAs by quantitative PCR assays in plasma samples. This study is divided into two stages: an initial discovery phase, followed by a vali-dation study. In the first trial, miRNAs were extracted from 18 patients with FCD, 14 patients with MTLE and 16 control subjects. To further verify the discriminating power of these miRNAs, plasma levels of these same miRNAs have been assessed on an independent cohort study comparing patients with MTLE who are responsive to AED treatment (n=30), patients with MTLE who are non-responsive to AED treatment (n=40) and controls without epilepsy (n=80). The expression levels of miRNAs were normalized to hsa-miR-191and hsa-miR-451. All donors provided written informed consent prior to enter the study. Differential miRNA expression among groups was analyzed using Wilcoxon test with a significance at p<0.05, corrected by Bonferroni test. Receiver Operating Characteristic (ROC) curve was used to identify sensitivity and specificity of possible biomarkers. Results: Our preliminary results indicate that hsa-miR-31 is up-regulated in patients with FCD and
refractory epilepsy (p=0.021), as well as in patients with MTLE and refractory seizures (p= 0.035), when compared to controls. In addition, hsa-miR-31 plasma levels could be used to distinguish patients with and without epilepsy, with an area under the curve (AUC) of 0.785. The validation study is still under way. discussion/Conclusions: Although our data is still preliminary, with only the results of the discovery phase finalized, we were able to show, for the first time that miRNAs can be used as non-invasive biomarker for epilepsy. These findings could have a significant impact in the treatment of patients with refractory seizures in the future, leading to an early indication of epilepsy surgery and a better chance for patients to become seizure free.
Study of the effects of transcranial direct current stimulation (tdCS) using the time varying graph approach (tVG)
c.s.f. barreto1, c.s.A. cosmo2, r.s.rosário1, e.p. sena2, p. Montoya2, J.g.V. Miranda1.1Instituto de física, 2Instituto de ciências da saúde, ufbA.
introduction: The attention-deficit/hyperactivity disorder, also known as ADHD, is a disorder whose diagnosis is made by symptoms such as inattention, difficulty in concentrating, impulsive behavior, among others. A dysfunction in executive function processes (located in prefrontal striatal circuits) has long been considered an important neuropsychological correlate of ADHD. This study aims to analyze the patterns of connectivity between brain regions of ADHD groups before and after transcranial direct current stimulation (TDCS) in the prefrontal region. Materials and Methods: Electroencephalogram (EEG) activity of 60 individuals with ADHD divided in two groups, active and sham, was recorded. Both groups were stimulated with TDCS in the frontal region of cortex during 20 min, however, one group was truly and the other was falsely stimulated. By applying the motifs synchronization correlation method on these data, functional brain networks (FBNs) were built so that nodes corresponded to the electrodes and the correlation between them were the edges. In order to analyze dynamical properties of the FBN, a sliding time window of 20 points (100ms) was taken over the whole EEG signal and a single FBN was built for each window. All these FBNs were summed togeth-er resulting in a unique network, which is called Aggregated Static Network (ASN). Results: The ASN local parameters (node degree, node weighted degree, clustering coefficient) and global parameters (average node degree, average node weighted degree, average cluster-ing coefficient and network size) were computed for the pre and post stimulation data. Statistical analyses were performed by applying the Wilcoxon paired test with α = 0.05, and only the weighted degree showed significant difference between pre and post values. discus-sion: The weighted degree showed significant difference between pre and post stimulation for the active group. Results were found for the electrodes of occipital, frontal left, temporal left and right and parietal center (O1, O2, O3, FT7, FC3, T5, TP8, CPz, CP4, Pz, P4, C3 e C4).
Auditorium of Instituto de pesquisas eldorado (Ipe)Av. Alan turing, 275, cidade universitária – barão geraldo - campinas/sp – cep 13083-898
47Jecn 2015,21(2):46-77
These results imply that an increase in the connectivity happened as a result of the stimulation. Furthermore, this shows that the TDCS effect is a diffusive phenomenon, since it appeared not only in the stimulated region but in many others. Conclusion: The ASN built from EEG data by using the motifs synchronization and time varying graphs seems to be an interesting approach to study the connectivity between brain regions, since it was capable of verifying the TDCS effects in this parameter.
tnF-α serum in Mild Cognitive impairment elderly - ApOE epsilon 4 carriers versus non carriers
c.V.l. teixeira1, t.n.c. Magalhães1, J.e. Vicentini1, M. weiler1, r.secolin2, I. lopes-cendes2, A.s. Moraes3, l.M.b. santos3, f. cendes1, M.l.f balthazar1
1neuroImage laboratory, lnI, 2departments of Medical genetics, 3neuroimmunology unit, department of genetics, evolution and bioagents, school of Medical sciences, university of campinas-unIcAMp, campinas, sp, brazil.
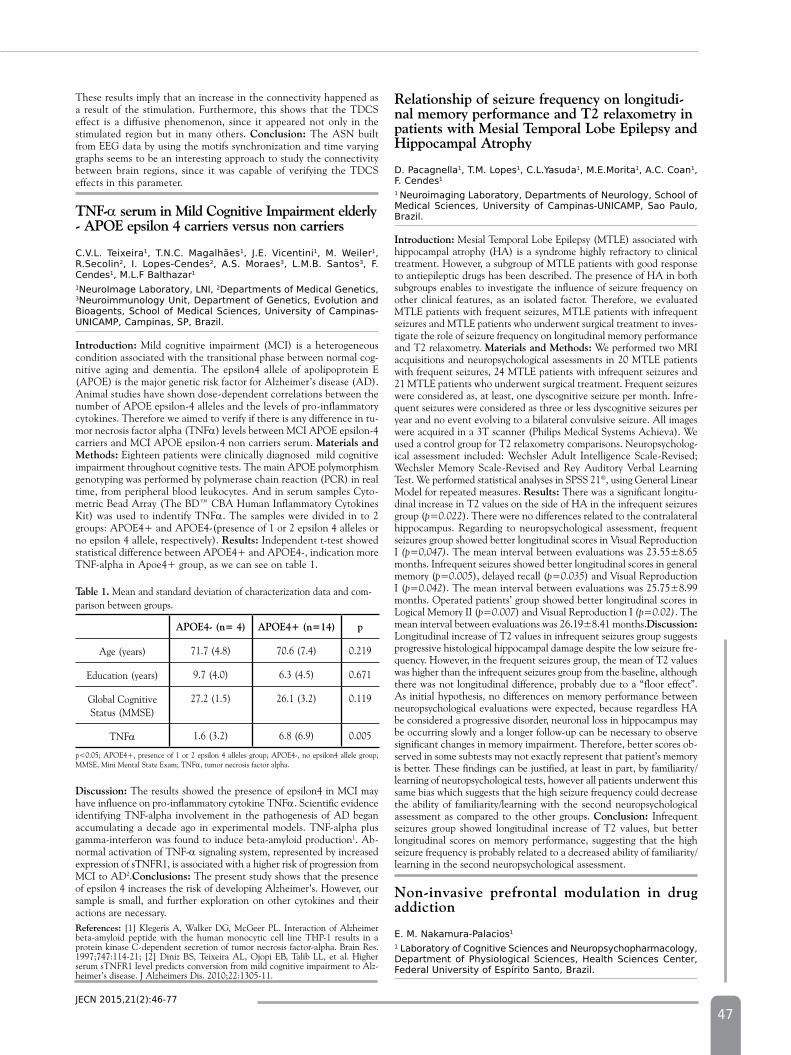
introduction: Mild cognitive impairment (MCI) is a heterogeneous condition associated with the transitional phase between normal cog-nitive aging and dementia. The epsilon4 allele of apolipoprotein E (APOE) is the major genetic risk factor for Alzheimer’s disease (AD). Animal studies have shown dose-dependent correlations between the number of APOE epsilon-4 alleles and the levels of pro-inflammatory cytokines. Therefore we aimed to verify if there is any difference in tu-mor necrosis factor alpha (TNFα) levels between MCI APOE epsilon-4 carriers and MCI APOE epsilon-4 non carriers serum. Materials and Methods: Eighteen patients were clinically diagnosed mild cognitive impairment throughout cognitive tests. The main APOE polymorphism genotyping was performed by polymerase chain reaction (PCR) in real time, from peripheral blood leukocytes. And in serum samples Cyto-metric Bead Array (The BD™ CBA Human Inflammatory Cytokines Kit) was used to indentify TNFα. The samples were divided in to 2 groups: APOE4+ and APOE4-(presence of 1 or 2 epsilon 4 alleles or no epsilon 4 allele, respectively). Results: Independent t-test showed statistical difference between APOE4+ and APOE4-, indication more TNF-alpha in Apoe4+ group, as we can see on table 1.
table 1. Mean and standard deviation of characterization data and com-parison between groups.
ApOE4- (n= 4) ApOE4+ (n=14) p
Age (years) 71.7 (4.8) 70.6 (7.4) 0.219
Education (years) 9.7 (4.0) 6.3 (4.5) 0.671
Global Cognitive Status (MMSE)
27.2 (1.5) 26.1 (3.2) 0.119
TNFα 1.6 (3.2) 6.8 (6.9) 0.005
p<0.05; APOE4+, presence of 1 or 2 epsilon 4 alleles group; APOE4-, no epsilon4 allele group; MMSE, Mini Mental State Exam; TNFα, tumor necrosis factor alpha.
discussion: The results showed the presence of epsilon4 in MCI may have influence on pro-inflammatory cytokine TNFα. Scientific evidence identifying TNF-alpha involvement in the pathogenesis of AD began accumulating a decade ago in experimental models. TNF-alpha plus gamma-interferon was found to induce beta-amyloid production1. Ab-normal activation of TNF-α signaling system, represented by increased expression of sTNFR1, is associated with a higher risk of progression from MCI to AD2.Conclusions: The present study shows that the presence of epsilon 4 increases the risk of developing Alzheimer’s. However, our sample is small, and further exploration on other cytokines and their actions are necessary. References: [1] Klegeris A, Walker DG, McGeer PL. Interaction of Alzheimer beta-amyloid peptide with the human monocytic cell line THP-1 results in a protein kinase C-dependent secretion of tumor necrosis factor-alpha. Brain Res. 1997;747:114-21; [2] Diniz BS, Teixeira AL, Ojopi EB, Talib LL, et al. Higher serum sTNFR1 level predicts conversion from mild cognitive impairment to Alz-heimer’s disease. J Alzheimers Dis. 2010;22:1305-11.
Relationship of seizure frequency on longitudi-nal memory performance and t2 relaxometry in patients with Mesial temporal Lobe Epilepsy and Hippocampal Atrophy
d. pacagnella1, t.M. lopes1, c.l.yasuda1, M.e.Morita1, A.c. coan1, f. cendes1 1 neuroimaging laboratory, departments of neurology, school of Medical sciences, university of campinas-unIcAMp, sao paulo, brazil.
introduction: Mesial Temporal Lobe Epilepsy (MTLE) associated with hippocampal atrophy (HA) is a syndrome highly refractory to clinical treatment. However, a subgroup of MTLE patients with good response to antiepileptic drugs has been described. The presence of HA in both subgroups enables to investigate the influence of seizure frequency on other clinical features, as an isolated factor. Therefore, we evaluated MTLE patients with frequent seizures, MTLE patients with infrequent seizures and MTLE patients who underwent surgical treatment to inves-tigate the role of seizure frequency on longitudinal memory performance and T2 relaxometry. Materials and Methods: We performed two MRI acquisitions and neuropsychological assessments in 20 MTLE patients with frequent seizures, 24 MTLE patients with infrequent seizures and 21 MTLE patients who underwent surgical treatment. Frequent seizures were considered as, at least, one dyscognitive seizure per month. Infre-quent seizures were considered as three or less dyscognitive seizures per year and no event evolving to a bilateral convulsive seizure. All images were acquired in a 3T scanner (Philips Medical Systems Achieva). We used a control group for T2 relaxometry comparisons. Neuropsycholog-ical assessment included: Wechsler Adult Intelligence Scale-Revised; Wechsler Memory Scale-Revised and Rey Auditory Verbal Learning Test. We performed statistical analyses in SPSS 21®, using General Linear Model for repeated measures. Results: There was a significant longitu-dinal increase in T2 values on the side of HA in the infrequent seizures group (p=0.022). There were no differences related to the contralateral hippocampus. Regarding to neuropsychological assessment, frequent seizures group showed better longitudinal scores in Visual Reproduction I (p=0,047). The mean interval between evaluations was 23.55±8.65 months. Infrequent seizures showed better longitudinal scores in general memory (p=0.005), delayed recall (p=0.035) and Visual Reproduction I (p=0.042). The mean interval between evaluations was 25.75±8.99 months. Operated patients’ group showed better longitudinal scores in Logical Memory II (p=0.007) and Visual Reproduction I (p=0.02). The mean interval between evaluations was 26.19±8.41 months.discussion: Longitudinal increase of T2 values in infrequent seizures group suggests progressive histological hippocampal damage despite the low seizure fre-quency. However, in the frequent seizures group, the mean of T2 values was higher than the infrequent seizures group from the baseline, although there was not longitudinal difference, probably due to a “floor effect”. As initial hypothesis, no differences on memory performance between neuropsychological evaluations were expected, because regardless HA be considered a progressive disorder, neuronal loss in hippocampus may be occurring slowly and a longer follow-up can be necessary to observe significant changes in memory impairment. Therefore, better scores ob-served in some subtests may not exactly represent that patient’s memory is better. These findings can be justified, at least in part, by familiarity/learning of neuropsychological tests, however all patients underwent this same bias which suggests that the high seizure frequency could decrease the ability of familiarity/learning with the second neuropsychological assessment as compared to the other groups. Conclusion: Infrequent seizures group showed longitudinal increase of T2 values, but better longitudinal scores on memory performance, suggesting that the high seizure frequency is probably related to a decreased ability of familiarity/learning in the second neuropsychological assessment.
non-invasive prefrontal modulation in drug addiction
e. M. nakamura-palacios1 1 laboratory of cognitive sciences and neuropsychopharmacology, department of physiological sciences, health sciences center, federal university of espírito santo, brazil.
48Jecn 2015,21(2):46-77
introduction: Prefrontal modulation induced by non-invasive brain stim-ulation, such as transcranial Direct Current Stimulation (tDCS), has been increasingly shown to benefit many neurobehavioral disorders.1-4 We have investigated the effects of the tDCS over the dorsolateral prefrontal cortex (dlPFC) on relapsing and craving to alcohol or crack-cocaine use in drug addicts. Materials and Methods: Subjects were recruited from public outpatients for treatment of alcoholism or mental health. Those who met inclusion and exclusion criteria underwent to clinical and cognitive assessments, and also to Event Related Potentials (ERPs) under random presentation of neutral or drug-related visual cues, and to Diffusion Tensor Imaging study, before and after repetitive tDCS over the dlPFC (2 mA, 35 cm2, for 20 min or in two applications of 13 min with an interval of 20 min, which seems to increase the aftereffects) or placebo treatment (sham-tDCS). Approvals were granted by the Ethics Committee of the Federal University of Espírito Santo no. 017/09 and 296/10 records, and they were published in clinicaltrial.gov under registers nos. NCT01330394 and NCT01337297. Results: We first observed that a single anodal tDCS over the left dlPFC slightly improved the frontal function (p<0.04) and increased the auditory P3 component in a sample of 49 alcoholics (p< 0.0001)5, but when repetitively applied it increased the probability of re-lapsing to the drug use (sham-tDCS: n=7; tDCS: n=6)6. By changing the polarity of the tDCS to cathodal over the left dlPFC and placing the anodal over the right dlPFC, relapses to the use of alcohol was reduced in alcoholics (sham-tDCS: n = 17, tDCS: n=16; p=0.02)7 and craving to the use of crack-cocaine was diminished (p=0.02) in crack-cocaine addicts after repetitive bilateral tDCS (n=15) when compared to sham-tDCS (n=15) and when compared to the baseline (p=0.01). By LORETA (Low Resolution Eletromagnetic Tomography) analysis in alcoholics, the ventral medial prefrontal cortex (vmPFC) showed to be the region with the largest change (p<0.001) in activation under drug-related cues in the P3 compo-nent (300–500 ms) in those subjects that kept abstinence (n=8) during and after tDCS treatment. Completely different brain regions showed larger changes under the exposition to the drug-related cues in relapsed subjects (n=8) and under placebo (sham-tDCS) condition (14 alcoholics). In 7 crack-cocaine addicts, we have also found increased DTI parameters in the right and left connections between vmPFC and nucleus accumbens (NAcc), which were significantly greater for the number of voxels (p < 0.01) after repetitive bilateral tDCS treatment when compared to 7 control (sham-tDCS) subjects. discussion/Conclusion: The vmPFC might relate to the control of drug-seeking, possibly by extinguishing this behavior. The bilateral dlPFC tDCS reduced relapses to the drug use and induced great changes on vmPFC activation under drug cues, which may be of a great importance in the control of drug use in drug addiction. The better understanding of the cognitive control over relapsing and compulsive behavior involving prefrontal areas, notably the vmPFC and its functional connectivity, needs to be developed, and the maintenance of this cogni-tive control over the lifetime may require an additional investigation on advanced neuromodulatory methods. References: [1] Nitsche MA, Boggio PS, Fregni F, Pascual-Leone A.Treatment of depression with transcranial direct current stimulation (tDCS): a review. Exp Neurol. 2009; 219:14-9; [2] Brunoni AR, et al. Sertraline vs. ELectrical Current Therapy for Treating Depression Clinical Trial--SELECT TDCS: design, rationale and objectives. Contemp Clin Trials. 2011;32:90-8; [3] Faber M, Vanneste S, Fregni F, De Ridder D. Top down prefrontal affective modulation of tinnitus with multiple sessions of tDCS of dorsolateral prefrontal cortex. Brain Stimul. 2012;5:492-8; [4] Brunoni AR, et al. Clinical research with transcranial direct current stimulation (tDCS): challenges and future directions. Brain Stimul. 2012;5:175-95; [5] Nakamura-Palacios EM, et al. Auditory event-related potentials (P3) and cognitive changes induced by frontal direct current stimulation in alcoholics according to Lesch alcoholism typology. Int J Neuropsychopharmacol. 2012;15:601-16; [6] da Silva MC, et al. Behavioral effects of transcranial direct current stimulation (tDCS) induced dorsolateral prefrontal cortex plasticity in alcohol dependence. J Physiol Paris. 2013;107:493-502; [7] Klauss J, et al. A randomized controlled trial of targeted prefrontal cortex modulation with tDCS in patients with alcohol dependence. Int J Neuropsychopharmacol. 2014;17:1793-803.
Brain activity in different levels of workplace or-ganization applying 5S: an fMRi study using a se-arch-based task paradigm
g.s. spagnol1, b.M. campos2, f. bressan3, l.M. li4 1faculty of Medical sciences, unIcAMp, 2unIcAMp, 3pontifícia universidade católica de campinas, 4faculty of Medical sciences, university of campinas-unIcAMp, sao paulo, brazil.
introduction: In response to the increasing number of medical errors and expenditures, healthcare improvement initiatives have implemented tools
old of p<0.01. discussion: Previous findings in Cognitive Neuroscience describe right hemisphere dominance for visuospatial attention3, as shown in Table 1. Also, a higher activation in the inferior frontal gyrus and in the middle temporal gyrus is described when observing a meaningful action.4
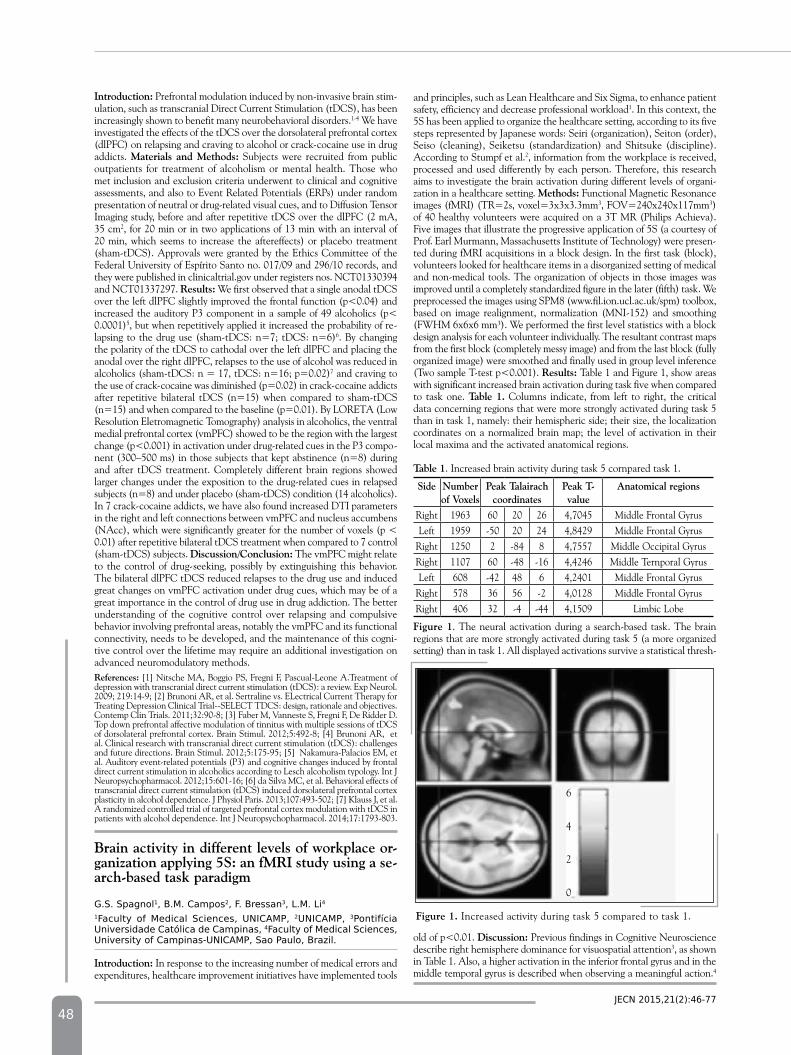
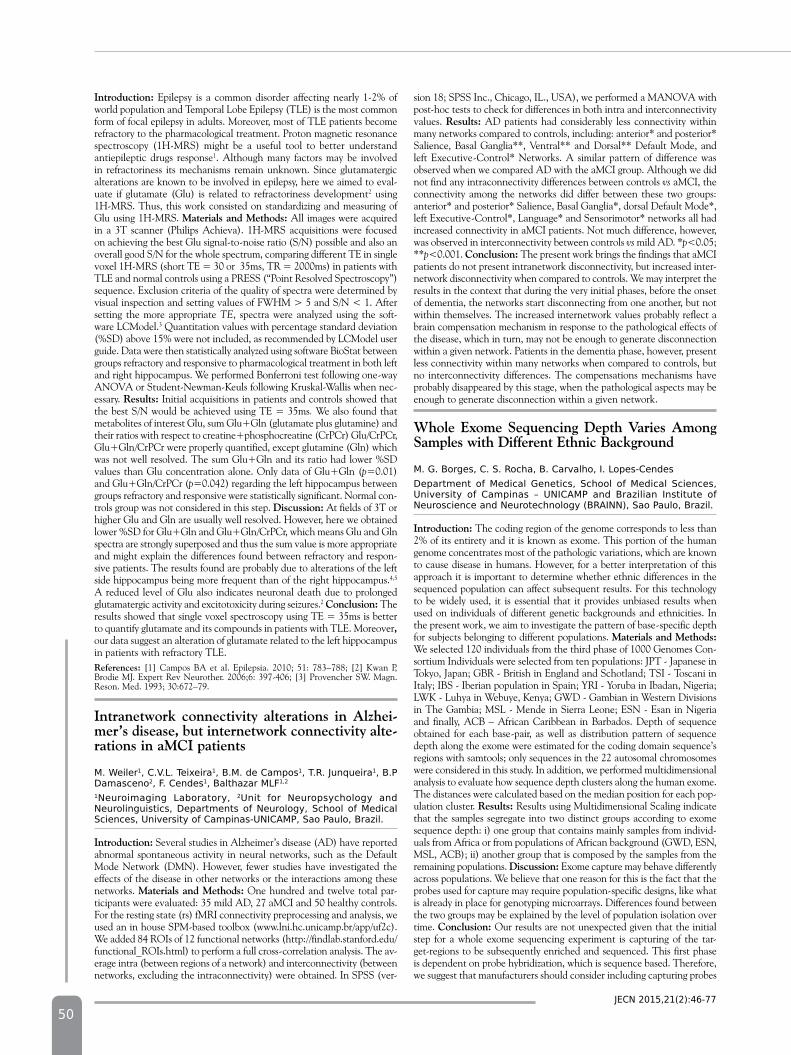
and principles, such as Lean Healthcare and Six Sigma, to enhance patient safety, efficiency and decrease professional workload1. In this context, the 5S has been applied to organize the healthcare setting, according to its five steps represented by Japanese words: Seiri (organization), Seiton (order), Seiso (cleaning), Seiketsu (standardization) and Shitsuke (discipline). According to Stumpf et al.2, information from the workplace is received, processed and used differently by each person. Therefore, this research aims to investigate the brain activation during different levels of organi-zation in a healthcare setting. Methods: Functional Magnetic Resonance images (fMRI) (TR=2s, voxel=3x3x3.3mm3, FOV=240x240x117mm3) of 40 healthy volunteers were acquired on a 3T MR (Philips Achieva). Five images that illustrate the progressive application of 5S (a courtesy of Prof. Earl Murmann, Massachusetts Institute of Technology) were presen-ted during fMRI acquisitions in a block design. In the first task (block), volunteers looked for healthcare items in a disorganized setting of medical and non-medical tools. The organization of objects in those images was improved until a completely standardized figure in the later (fifth) task. We preprocessed the images using SPM8 (www.fil.ion.ucl.ac.uk/spm) toolbox, based on image realignment, normalization (MNI-152) and smoothing (FWHM 6x6x6 mm³). We performed the first level statistics with a block design analysis for each volunteer individually. The resultant contrast maps from the first block (completely messy image) and from the last block (fully organized image) were smoothed and finally used in group level inference (Two sample T-test p<0.001). Results: Table 1 and Figure 1, show areas with significant increased brain activation during task five when compared to task one. table 1. Columns indicate, from left to right, the critical data concerning regions that were more strongly activated during task 5 than in task 1, namely: their hemispheric side; their size, the localization coordinates on a normalized brain map; the level of activation in their local maxima and the activated anatomical regions.
table 1. Increased brain activity during task 5 cornpared task 1.
Side numberof Voxels
peak talairachcoordinates
peak t- value
Anatomical regions
Right 1963 60 20 26 4,7045 Middle Frontal GyrusLeft 1959 -50 20 24 4,8429 Middle Frontal Gyrus
Right 1250 2 -84 8 4,7557 Middle Occipital GyrusRight 1107 60 -48 -16 4,4246 Middle Ternporal GyrusLeft 608 -42 48 6 4,2401 Middle Frontal Gyrus
Right 578 36 56 -2 4,0128 Middle Frontal GyrusRight 406 32 -4 -44 4,1509 Limbic Lobe
Figure 1. The neural activation during a search-based task. The brain regions that are more strongly activated during task 5 (a more organized setting) than in task 1. All displayed activations survive a statistical thresh-
Figure 1. Increased activity during task 5 compared to task 1.
6
4
2
0
49Jecn 2015,21(2):46-77
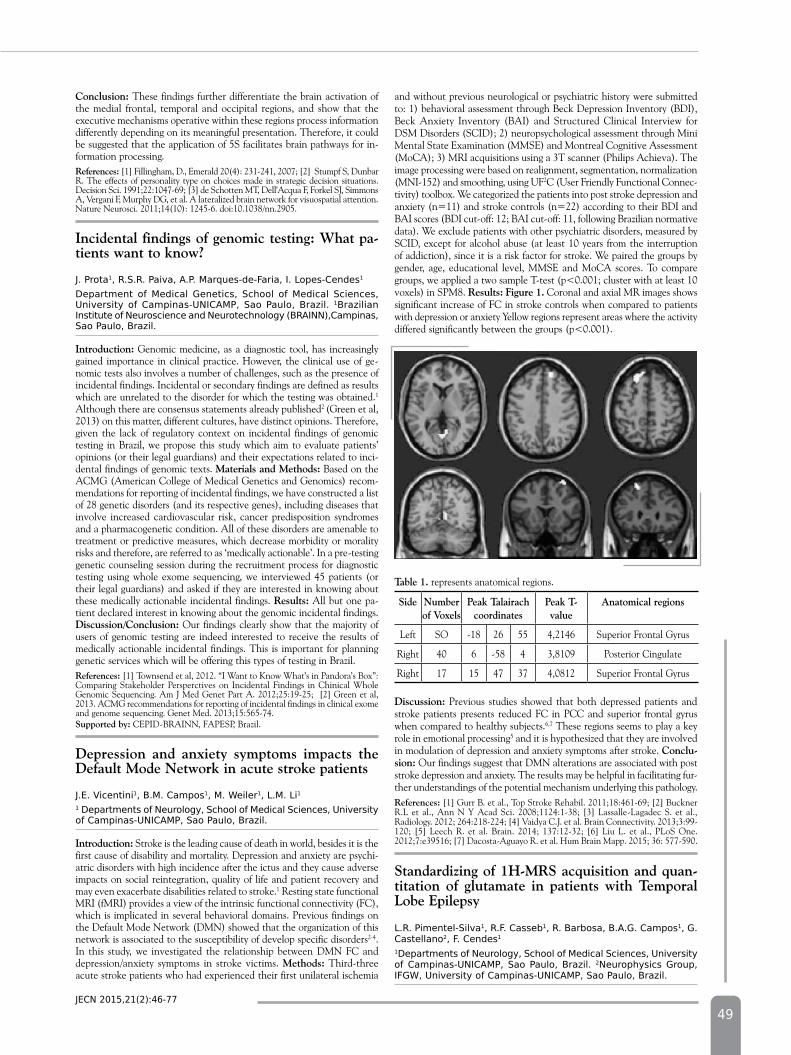
and without previous neurological or psychiatric history were submitted to: 1) behavioral assessment through Beck Depression Inventory (BDI), Beck Anxiety Inventory (BAI) and Structured Clinical Interview for DSM Disorders (SCID); 2) neuropsychological assessment through Mini Mental State Examination (MMSE) and Montreal Cognitive Assessment (MoCA); 3) MRI acquisitions using a 3T scanner (Philips Achieva). The image processing were based on realignment, segmentation, normalization (MNI-152) and smoothing, using UF2C (User Friendly Functional Connec-tivity) toolbox. We categorized the patients into post stroke depression and anxiety (n=11) and stroke controls (n=22) according to their BDI and BAI scores (BDI cut-off: 12; BAI cut-off: 11, following Brazilian normative data). We exclude patients with other psychiatric disorders, measured by SCID, except for alcohol abuse (at least 10 years from the interruption of addiction), since it is a risk factor for stroke. We paired the groups by gender, age, educational level, MMSE and MoCA scores. To compare groups, we applied a two sample T-test (p<0.001; cluster with at least 10 voxels) in SPM8. Results: Figure 1. Coronal and axial MR images shows significant increase of FC in stroke controls when compared to patients with depression or anxiety Yellow regions represent areas where the activity differed significantly between the groups (p<0.001).
table 1. represents anatomical regions.
Side numberof Voxels
peak talairachcoordinates
peak t- value
Anatomical regions
Left SO -18 26 55 4,2146 Superior Frontal Gyrus
Right 40 6 -58 4 3,8109 Posterior Cingulate
Right 17 15 47 37 4,0812 Superior Frontal Gyrus
discussion: Previous studies showed that both depressed patients and stroke patients presents reduced FC in PCC and superior frontal gyrus when compared to healthy subjects.6,7 These regions seems to play a key role in emotional processing5 and it is hypothesized that they are involved in modulation of depression and anxiety symptoms after stroke. Conclu-sion: Our findings suggest that DMN alterations are associated with post stroke depression and anxiety. The results may be helpful in facilitating fur-ther understandings of the potential mechanism underlying this pathology.References: [1] Gurr B. et al., Top Stroke Rehabil. 2011;18:461-69; [2] Buckner R.L et al., Ann N Y Acad Sci. 2008;1124:1-38; [3] Lassalle-Lagadec S. et al., Radiology. 2012; 264:218-224; [4] Vaidya C.J. et al. Brain Connectivity. 2013;3:99-120; [5] Leech R. et al. Brain. 2014; 137:12-32; [6] Liu L. et al., PLoS One. 2012;7:e39516; [7] Dacosta-Aguayo R. et al. Hum Brain Mapp. 2015; 36: 577-590.
Standardizing of 1H-MRS acquisition and quan-titation of glutamate in patients with temporal Lobe Epilepsy
l.r. pimentel-silva1, r.f. casseb1, r. barbosa, b.A.g. campos1, g. castellano2, f. cendes1 1departments of neurology, school of Medical sciences, university of campinas-unIcAMp, sao paulo, brazil. 2neurophysics group, Ifgw, university of campinas-unIcAMp, sao paulo, brazil.
Conclusion: These findings further differentiate the brain activation of the medial frontal, temporal and occipital regions, and show that the executive mechanisms operative within these regions process information differently depending on its meaningful presentation. Therefore, it could be suggested that the application of 5S facilitates brain pathways for in-formation processing. References: [1] Fillingham, D., Emerald 20(4): 231-241, 2007; [2] Stumpf S, Dunbar R. The effects of personality type on choices made in strategic decision situations. Decision Sci. 1991;22:1047-69; [3] de Schotten MT, Dell'Acqua F, Forkel SJ, Simmons A, Vergani F, Murphy DG, et al. A lateralized brain network for visuospatial attention. Nature Neurosci. 2011;14(10): 1245-6. doi:10.1038/nn.2905.
incidental findings of genomic testing: What pa-tients want to know?
J. prota1, r.s.r. paiva, A.p. Marques-de-faria, I. lopes-cendes1
department of Medical genetics, school of Medical sciences, university of campinas-unIcAMp, sao paulo, brazil. 1brazilian Institute of neuroscience and neurotechnology (brAInn),campinas, sao paulo, brazil.
introduction: Genomic medicine, as a diagnostic tool, has increasingly gained importance in clinical practice. However, the clinical use of ge-nomic tests also involves a number of challenges, such as the presence of incidental findings. Incidental or secondary findings are defined as results which are unrelated to the disorder for which the testing was obtained.1 Although there are consensus statements already published2 (Green et al, 2013) on this matter, different cultures, have distinct opinions. Therefore, given the lack of regulatory context on incidental findings of genomic testing in Brazil, we propose this study which aim to evaluate patients’ opinions (or their legal guardians) and their expectations related to inci-dental findings of genomic texts. Materials and Methods: Based on the ACMG (American College of Medical Genetics and Genomics) recom-mendations for reporting of incidental findings, we have constructed a list of 28 genetic disorders (and its respective genes), including diseases that involve increased cardiovascular risk, cancer predisposition syndromes and a pharmacogenetic condition. All of these disorders are amenable to treatment or predictive measures, which decrease morbidity or morality risks and therefore, are referred to as ‘medically actionable’. In a pre-testing genetic counseling session during the recruitment process for diagnostic testing using whole exome sequencing, we interviewed 45 patients (or their legal guardians) and asked if they are interested in knowing about these medically actionable incidental findings. Results: All but one pa-tient declared interest in knowing about the genomic incidental findings. discussion/Conclusion: Our findings clearly show that the majority of users of genomic testing are indeed interested to receive the results of medically actionable incidental findings. This is important for planning genetic services which will be offering this types of testing in Brazil.References: [1] Townsend et al, 2012. “I Want to Know What’s in Pandora’s Box”: Comparing Stakeholder Persperctives on Incidental Findings in Chinical Whole Genomic Sequencing. Am J Med Genet Part A. 2012;25:19-25; [2] Green et al, 2013. ACMG recommendations for reporting of incidental findings in clinical exome and genome sequencing. Genet Med. 2013;15:565-74.Supported by: CEPID-BRAINN, FAPESP, Brazil.
depression and anxiety symptoms impacts the default Mode network in acute stroke patients
J.e. Vicentini1, b.M. campos1, M. weiler1, l.M. li11 departments of neurology, school of Medical sciences, university of campinas-unIcAMp, sao paulo, brazil.
introduction: Stroke is the leading cause of death in world, besides it is the first cause of disability and mortality. Depression and anxiety are psychi-atric disorders with high incidence after the ictus and they cause adverse impacts on social reintegration, quality of life and patient recovery and may even exacerbate disabilities related to stroke.1 Resting state functional MRI (fMRI) provides a view of the intrinsic functional connectivity (FC), which is implicated in several behavioral domains. Previous findings on the Default Mode Network (DMN) showed that the organization of this network is associated to the susceptibility of develop specific disorders2-4. In this study, we investigated the relationship between DMN FC and depression/anxiety symptoms in stroke victims. Methods: Third-three acute stroke patients who had experienced their first unilateral ischemia
50Jecn 2015,21(2):46-77
introduction: Epilepsy is a common disorder affecting nearly 1-2% of world population and Temporal Lobe Epilepsy (TLE) is the most common form of focal epilepsy in adults. Moreover, most of TLE patients become refractory to the pharmacological treatment. Proton magnetic resonance spectroscopy (1H-MRS) might be a useful tool to better understand antiepileptic drugs response1. Although many factors may be involved in refractoriness its mechanisms remain unknown. Since glutamatergic alterations are known to be involved in epilepsy, here we aimed to eval-uate if glutamate (Glu) is related to refractoriness development2 using 1H-MRS. Thus, this work consisted on standardizing and measuring of Glu using 1H-MRS. Materials and Methods: All images were acquired in a 3T scanner (Philips Achieva). 1H-MRS acquisitions were focused on achieving the best Glu signal-to-noise ratio (S/N) possible and also an overall good S/N for the whole spectrum, comparing different TE in single voxel 1H-MRS (short TE = 30 or 35ms, TR = 2000ms) in patients with TLE and normal controls using a PRESS (“Point Resolved Spectroscopy”) sequence. Exclusion criteria of the quality of spectra were determined by visual inspection and setting values of FWHM > 5 and S/N < 1. After setting the more appropriate TE, spectra were analyzed using the soft-ware LCModel.3 Quantitation values with percentage standard deviation (%SD) above 15% were not included, as recommended by LCModel user guide. Data were then statistically analyzed using software BioStat between groups refractory and responsive to pharmacological treatment in both left and right hippocampus. We performed Bonferroni test following one-way ANOVA or Student-Newman-Keuls following Kruskal-Wallis when nec-essary. Results: Initial acquisitions in patients and controls showed that the best S/N would be achieved using TE = 35ms. We also found that metabolites of interest Glu, sum Glu+Gln (glutamate plus glutamine) and their ratios with respect to creatine+phosphocreatine (CrPCr) Glu/CrPCr, Glu+Gln/CrPCr were properly quantified, except glutamine (Gln) which was not well resolved. The sum Glu+Gln and its ratio had lower %SD values than Glu concentration alone. Only data of Glu+Gln (p=0.01) and Glu+Gln/CrPCr (p=0.042) regarding the left hippocampus between groups refractory and responsive were statistically significant. Normal con-trols group was not considered in this step. discussion: At fields of 3T or higher Glu and Gln are usually well resolved. However, here we obtained lower %SD for Glu+Gln and Glu+Gln/CrPCr, which means Glu and Gln spectra are strongly superposed and thus the sum value is more appropriate and might explain the differences found between refractory and respon-sive patients. The results found are probably due to alterations of the left side hippocampus being more frequent than of the right hippocampus.4,5 A reduced level of Glu also indicates neuronal death due to prolonged glutamatergic activity and excitotoxicity during seizures.2 Conclusion: The results showed that single voxel spectroscopy using TE = 35ms is better to quantify glutamate and its compounds in patients with TLE. Moreover, our data suggest an alteration of glutamate related to the left hippocampus in patients with refractory TLE.References: [1] Campos BA et al. Epilepsia. 2010; 51: 783–788; [2] Kwan P, Brodie MJ. Expert Rev Neurother. 2006;6: 397-406; [3] Provencher SW. Magn. Reson. Med. 1993; 30:672–79.
intranetwork connectivity alterations in Alzhei-mer’s disease, but internetwork connectivity alte-rations in aMCi patients
M. weiler1, c.V.l. teixeira1, b.M. de campos1, t.r. Junqueira1, b.p damasceno2, f. cendes1, balthazar Mlf1,2
1neuroimaging laboratory, 2unit for neuropsychology and neurolinguistics, departments of neurology, school of Medical sciences, university of campinas-unIcAMp, sao paulo, brazil.
introduction: Several studies in Alzheimer’s disease (AD) have reported abnormal spontaneous activity in neural networks, such as the Default Mode Network (DMN). However, fewer studies have investigated the effects of the disease in other networks or the interactions among these networks. Materials and Methods: One hundred and twelve total par-ticipants were evaluated: 35 mild AD, 27 aMCI and 50 healthy controls. For the resting state (rs) fMRI connectivity preprocessing and analysis, we used an in house SPM-based toolbox (www.lni.hc.unicamp.br/app/uf2c). We added 84 ROIs of 12 functional networks (http://findlab.stanford.edu/functional_ROIs.html) to perform a full cross-correlation analysis. The av-erage intra (between regions of a network) and interconnectivity (between networks, excluding the intraconnectivity) were obtained. In SPSS (ver-
sion 18; SPSS Inc., Chicago, IL., USA), we performed a MANOVA with post-hoc tests to check for differences in both intra and interconnectivity values. Results: AD patients had considerably less connectivity within many networks compared to controls, including: anterior* and posterior* Salience, Basal Ganglia**, Ventral** and Dorsal** Default Mode, and left Executive-Control* Networks. A similar pattern of difference was observed when we compared AD with the aMCI group. Although we did not find any intraconnectivity differences between controls vs aMCI, the connectivity among the networks did differ between these two groups: anterior* and posterior* Salience, Basal Ganglia*, dorsal Default Mode*, left Executive-Control*, Language* and Sensorimotor* networks all had increased connectivity in aMCI patients. Not much difference, however, was observed in interconnectivity between controls vs mild AD. *p<0.05; **p<0.001. Conclusion: The present work brings the findings that aMCI patients do not present intranetwork disconnectivity, but increased inter-network disconnectivity when compared to controls. We may interpret the results in the context that during the very initial phases, before the onset of dementia, the networks start disconnecting from one another, but not within themselves. The increased internetwork values probably reflect a brain compensation mechanism in response to the pathological effects of the disease, which in turn, may not be enough to generate disconnection within a given network. Patients in the dementia phase, however, present less connectivity within many networks when compared to controls, but no interconnectivity differences. The compensations mechanisms have probably disappeared by this stage, when the pathological aspects may be enough to generate disconnection within a given network.
Whole Exome Sequencing depth Varies Among Samples with different Ethnic Background
M. g. borges, c. s. rocha, b. carvalho, I. lopes-cendesdepartment of Medical genetics, school of Medical sciences, university of campinas – unIcAMp and brazilian Institute of neuroscience and neurotechnology (brAInn), sao paulo, brazil.
introduction: The coding region of the genome corresponds to less than 2% of its entirety and it is known as exome. This portion of the human genome concentrates most of the pathologic variations, which are known to cause disease in humans. However, for a better interpretation of this approach it is important to determine whether ethnic differences in the sequenced population can affect subsequent results. For this technology to be widely used, it is essential that it provides unbiased results when used on individuals of different genetic backgrounds and ethnicities. In the present work, we aim to investigate the pattern of base-specific depth for subjects belonging to different populations. Materials and Methods: We selected 120 individuals from the third phase of 1000 Genomes Con-sortium Individuals were selected from ten populations: JPT - Japanese in Tokyo, Japan; GBR - British in England and Schotland; TSI - Toscani in Italy; IBS - Iberian population in Spain; YRI - Yoruba in Ibadan, Nigeria; LWK - Luhya in Webuye, Kenya; GWD - Gambian in Western Divisions in The Gambia; MSL - Mende in Sierra Leone; ESN - Esan in Nigeria and finally, ACB – African Caribbean in Barbados. Depth of sequence obtained for each base-pair, as well as distribution pattern of sequence depth along the exome were estimated for the coding domain sequence’s regions with samtools; only sequences in the 22 autosomal chromosomes were considered in this study. In addition, we performed multidimensional analysis to evaluate how sequence depth clusters along the human exome. The distances were calculated based on the median position for each pop-ulation cluster. Results: Results using Multidimensional Scaling indicate that the samples segregate into two distinct groups according to exome sequence depth: i) one group that contains mainly samples from individ-uals from Africa or from populations of African background (GWD, ESN, MSL, ACB); ii) another group that is composed by the samples from the remaining populations. discussion: Exome capture may behave differently across populations. We believe that one reason for this is the fact that the probes used for capture may require population-specific designs, like what is already in place for genotyping microarrays. Differences found between the two groups may be explained by the level of population isolation over time. Conclusion: Our results are not unexpected given that the initial step for a whole exome sequencing experiment is capturing of the tar-get-regions to be subsequently enriched and sequenced. This first phase is dependent on probe hybridization, which is sequence based. Therefore, we suggest that manufacturers should consider including capturing probes
51Jecn 2015,21(2):46-77
that take into account the ethnic background of the sequenced sample. This is of particular relevance for populations of mixed ethnic background, such as the Brazilian population.
Molecular Studies of mtOR and tau pathways in Focal Cortical dysplasia
Mazutti, M.g.1, torres, f.r.1, ribeiro p.A.o.1, Avansini s.h.1, secolin, r.1, carvalho, b.1, borges M.g.1, rogério f.2, queiroz l.s.2, coan, A.c.3, tedeschi, h.3, oliveira, e.p.l.3, cendes, f.3, lopes-cendes, I.1
1department of Medical genetics, 2department of pathology, 3department of neurology; school of Medical sciences, university of campinas – unIcAMp and brazilian Institute of neuroscience and neurotechnology (brAInn), campinas, sao paulo, brazil.
introduction: Focal cortical dysplasia (FCD) is a sub-type of malformation of the cerebral cortex which is a frequent cause of intractable focal seizures, requiring surgical treatment. FCD presents cortical architecture abnor-malities also observed in tuberous sclerosis (TS) and hemimegalencephaly (HME). In addition, FCD, TS and HME show aberrant expression of genes belonging to the mTOR signaling pathway. Potential involvement of Tau pathway was also reported in FCD. Therefore, the similarity in histological features as well as abnormal gene expression pattern suggests that patho-genic mechanisms could be common to these three disorders. Recently, somatic mosaic mutations have been indentified in patients with TS and HME. In addition, genomic structural variants known as Copy Number Variations (CNV) have been associated with several neurological disorders ranging from psychiatric disorders to malformations of cerebral cortex. Therefore, the objective of this work is to investigate whether somatic mosaic mutations in genes belonging to the mTOR and Tau pathways are present in the central nervous system of patients with FCD. In addition, we aim to determine if there are specific CNVs which are present exclusively in the dysplastic tissue. Materials and Methods: NGS was performed in genomic DNA extracted from brain tissue resected by surgery (BTRS) and peripheral blood of patients with FCD. We performed exome capture with Nextera® Expanded Kit (Illumina®) and NGS on a Hiseq 2500 bench top sequencing machine. A bioinformatics pipeline was applied, using filters to variants present only in brain tissue. The CNV screening was performed with the SNP-array CytoScan HD (Affymetrix). Analyses of CNVs were performed with Chromosome Suite (Affymetrix) software (Affymetrix), and also, by means of databases: Database of Genomic Variants (DGV) and The International Standards for Cytogenomic Arrays Consortium (ISCA). Results: To date, BTRS and blood samples of four patients with FCD were sequenced and a total of 749 and 91 variants were identified in genes belonging to the mTOR and Tau pathways, respectively. Among these variants we found 107 and 12 mutations in a mosaic state (present only in the BTRS samples), respectively; including 77 variants not described in databases of human mutations. Genes disrupted by mutations code for proteins involved in regulation of cell growth and cellular processes such as proliferation, differentiation and development, as well as genes already implicated in other cerebral cortical malformations. Furthermore, the CNVs were investigated in BTRS and blood samples of six patients. We identified a total of 92 CNVs, 53 gain and 39 loss, with a range of 100-1.237kbp. These, 12 CNVs are not described in DGV and some of these are present only in brain tissue. discussion and conclusion: Our preliminary results confirm the presence of mosaic mutations in mTOR and Tau pathways in FCD. However, all these data have yet to be con-firmed by a high-deep NGS. In addition, the identification of novel CNVs, which are unique of brain dysplastic tissue may suggest new mechanisms underlying the pathogenesis of FCD. Supported by: CEPID-FAPESP.
Family psychiatric history and psychiatric disor-ders in patients with MtLE
M. h. nogueira1, c.l. yasuda1, f. cendes1
1laboratory of neuroimaging, departments of neurology, school of Medical sciences, university of campinas-unIcAMp, sao paulo, brazil.
introduction: Patients with mesial temporal lobe epilepsy (MTLE) have a high propensity of developing psychiatric disorders (PD) due to the role of the limbic system in controlling of emotional response.1,2 The purpose of this
study was to evaluate if MTLE patients with a first degree of family psychi-atric history (FPH) have more PD and symptoms than patients without this family condition. Materials and Methods: We evaluated 191 patients with MTLE. We excluded 24 patients whom did not fill in all inclusion criteria, five patients with only a current diagnosis of interictal dysphoric disorder (IDD), and three patients who had a diagnosis of psychotic disorders. Our final sample consisted of 159 MTLE patients (59 men and 100 women) with a mean [± standard deviation] age of 45.6411.23 years, divided into five groups: (group 1) Psychiatric asymptomatic symptoms, (group 2) Current subsyndromic forms of depressive and anxiety episodes (SSDAEs), (group 3) Patients with a general current DSM-IV Axis I diagnoses from SCID-I, (group 4) Current Mood (MD) or Anxiety disorder (AD) according DSM-IV Axis I diagnosis, and (group 5) Current mixed MD/AD. The following psychological tests were applied: Structured Clinical Interview for DSM-IV (SCID-I), Beck Depression Inventory (BDI), Beck Anxiety Inventory (BAI), Neurological Disorders Depression Inventory for Epilepsy (NDDI-E) and Interictal Disphoric Disorder Inventory (IDDI). IBM SPSS20 software was used for statistical analysis. Results: FPH was found in 42 (26.4%) patients. We observed significant differences considering the FPH when we compared group 1 with group 3 (p<0.01) and group 5 (p<0.01). The sig-nificant differences which were found considering the FPH were in relation to gender (p=0.04), refractoriness (p=0.02), antidepressants use (p<0.01), alcohol use (p=0.01), past history of PD (p<0.01), family history of epi-lepsy (p<0.01), and psychological and/or psychiatric treatment (p<0.01). When we compared patients with FPH with patients without a FPH we observed significant differences on the BDI score (p<0.01), BAI (p<0.01) and NDDI-E (p<0.01). We also observed these differences considering the categorization on BDI positive with scores >12 (p=0.02), BDI positive with scores >19 (p<0.01), BAI positive with scores >9 (p=0.01) and NDDI-E positive with scores >=15 (p<0.01). discussion: The FPH is one of psy-chosocial predictors which are related to the occurrence of PD in patients with MTLE. This subjective experience can be accompanied by social vulnerability and dependency, unemployment, and a lack of interpersonal relationships.3 Conclusion: MTLE patients with a FPH have more PD and more intense psychiatric symptoms than patients without a FPH. A FPH is related to refractoriness, antidepressants and alcohol use, past history of psychiatric disorders, family history of epilepsy, and the occurrence of a psychological and/or psychiatric treatment. The female gender can be a vulnerability factor considering the FPH in patients with epilepsy. For this reason it is necessary that epilepsy treatment recognize the occurrence of PD and its implications, in addition considering the FPH influences, to provide a more specific and appropriate treatment when necessary.References: [1] Gaitatzis A, Trimble MR, Sander JW. Acta Neurol Scand. 2004; 110:207-20; [2] Kanner AM, Barry JJ, Gilliam F, Hermann B, Meador KJ. Epi-lepsia. 2010;51:1152-8; [3] Schmitz EB, Robertson MM, Trimble MR. Epilepsy Res.1999;35:59-68.
people with epilepsy must practice more leisure physical activity to maintain their Quality of Life and Cardiopulmonary function equivalent to the general population
n. Volpato1, J. Kobashigawa1, p. fernandes1, c.l. yasuda1, f. cendes1
1departments of neurology, school of Medical sciences, university of campinas-unIcAMp, sao paulo, brazil.
introduction: People with epilepsy have poor quality of life (QOL) and higher incidence of comorbidities, such as diabetes, hypertension and obe-sity, compared to the general population. Studies have demonstrated the benefits of physical activity (PA) to QOL as well as the prevention of the treatment of comorbidities. Nevertheless, older studies show that people with epilepsy have been discouraged to practice PA. The better compre-hension of the benefits of PA habits, of physical capacity and level of QOL for people with epilepsy will help leverage the practice of physical exercise (PE) programs as a complementary treatment. Therefore, the purpose of the present study was to compare the QOL and PA habits of people with temporal lobe epilepsy and people without epilepsy. Materials and Methods: Forty volunteers were divided in two groups, 20 people with temporal lobe epilepsy (E), and 20 people without epilepsy (C). Both groups were from the same sociocultural environment. The groups answered the questionnaires, WHOQOL-Bref, which evaluates the QOL, and the IPAQ, which evaluates the level of PA. The groups were submitted to maximal effort cardiopulmonary test in treadmill through the incremental protocol,
52Jecn 2015,21(2):46-77
and had the corporal composition measured through the body mass index (BMI). The results were compared between groups using the Wilcoxon test for non-parametric data. Results and discussion: We observed that both groups (E=95%; C=80%) had regular or poor cardiopulmonary capacity and none of them had good capacity. Therefore, people with and without epilepsy need more information about the importance of PE. There were no differences in the QOL, level of PA, cardiopulmonary capacity and the BMI between groups. Although, we observed that people with epilepsy who practice leisure PA (LPA) have better QOL and cardiopulmonary capacity than people with epilepsy who do not practice LPA. This difference was not found in controls. We concluded that people with epilepsy have grater needs to practice LPA or PE to maintain their QOL and cardiopulmonary capacity rates close to the general population’s.
Evaluation of cerebellar gray matter damage in Hun-tington’s disease: a voxel based morphometry study
p.c. Azevedo1, r.p. guimaraes2, c.c. piccinin², l.g. piovesana¹, b.M. campos², M.c.A. santos², l.n.n. Vilany², l.s. campos¹, M.c. frança¹, A.c. Amato filho³, f. cendes¹, Í.lopes-cendes4, A. d’Abreu¹ ¹ departments of neurology, ²neuroimaging laboratory, ³department of radiology, 4department of genetics, school of Medical sciences, university of campinas-unIcAMp, sao paulo, brazil.
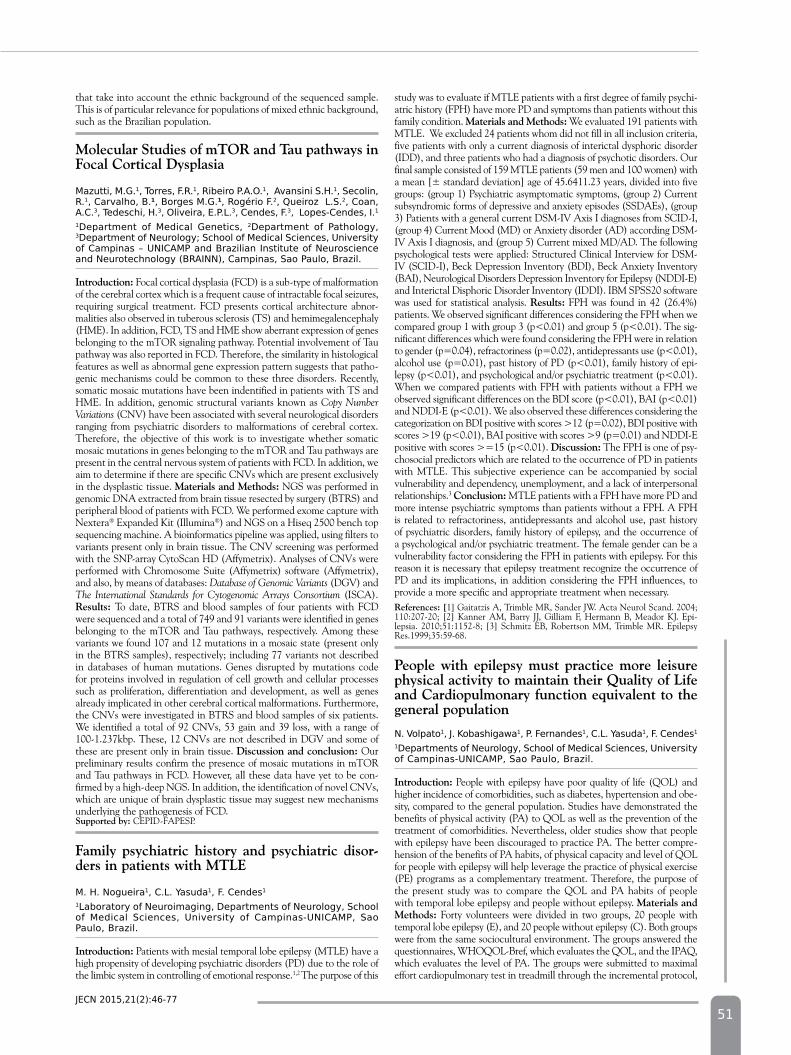
introduction: Huntington’s disease (HD) is a neurodegenerative disease, autosomal dominant. Its main symptoms are manifestations motor, cogni-tive and psychiatric in nature. The diagnosis of HD is through molecular genetic confirmation when the CAG-repeats exceed 35 repetitions. It usually begins in the fourth decade of one’s life.1 The objective of this present study is to evaluate the existing brain changes in Huntington’s disease through the use of the tool “spatially unbiased template atlas” (SUIT) for Voxel based morphometry (VBM)2 by magnetic resonance imaging (MRI). Materials and Methods: Twenty-six patients (26) with molecularly confirmed HD diagnosis were selected. Those individuals un-derwent neurological and psychiatric evaluations and MRI. We acquired T1 weighted scans at a 3T scanner and compared the paired groups using VBM in SPM8. We used the SUIT tool (Spatial Unbiased Infratentorial Template) for a specific and detailed evaluation of the cerebellar gray matter (GM). Statistics were done applying p=.005, FWEcorrected and extentthreshold≥50voxels.Results: The SUIT analysis revealed an increase of the GM in the regions I-IV of both anterior cerebellar lobes (Table 1 and Figure 1) of the evaluated patients.
table 1. Increased GM areas in the cerebellum.
CLUStER SiZE in VOxELS
AREA LOBULE
378 Right Cerebellar Hemisphere I-IV357 Left Cerebellar Hemisphere I-IV
dynamic causal modeling shows no decline in de-fault Mode network parameters in patients with mild cognitive impairment
r.f. casseb1, e.l. da silva2, g. castellano1, c.V.l. teixeira3, M.l.f. balthazar3, M.c. frança Jr.3
1neurophysics group, Ifgw, 2Institute of physics, ufMt, 3school of Medical sciences, university of campinas-unIcAMp, sao paulo, brazil.
introduction: Dynamic Causal Modeling (DCM)1 is a technique used in the analysis of functional brain images. DCM models two phenome-na: (I) neuronal activity and (II) its consequent hemodynamic changes (which relies upon the Balloon Model).2 Mild cognitive impairment (MCI) is a condition in which subjects show a loss of memory greater than the expected for their age, but they do not meet criteria for prob-able Alzheimer’s Disease.3 Materials and Methods: In this pilot study, DCM was employed in the analysis of the functional magnetic resonance images (fMRI) acquired from 18 MCIAlzheimer’s Disease patients and 21 healthy control subjects. Acquisition followed a basic resting state protocol, i.e., no physical or mental task was performed during scanning. We used SPM8, which runs inside Matlab, to conduct preprocessing steps (realignment, coregistration, segmentation, normalization and smoothing) and also for processing steps (specification of the model and estimation of parameters). Our goal was to analyze the connectivity be-tween regions (nodes) of a robust brain network known as Default Mode Network (DMN) using a rationale recently presented in.4 We wanted to verify if there were differences in effective connectivity between these regions among the groups. Nodes were defined as spheres with radius of 8 mm around a center stablished in MNI coordinates: left and right hippocampus (LH (-24, -13, -20), red in the figure below, and RH (24, -13, -20), yellow), left and right inferior parietal lobules (LIPL (-50, -63, 32), green, and RIPL (48, -69, 35), ciano), Posterior Cingulate Cortex (PCC (0, -52, 26), magenta) and Medial Prefrontal Cortex (MPFC (3, 54, -2), blue). Important to note that we did not filtered, any frequencies from the original signal. The specified model hypothesized bidirectional connectivity from each node to all the other nodes, and every connec-tivity value was estimated and tested for differences between groups. For this purpose, a two sample t test was used and significance level
discussion: The lobules I-IV are responsible mainly for the motor control of upper extremities, gait, speech, tongue and orofacial movements,3 which are altered in HD. This can probably justify the fact that these are the areas most affected by chorea in these patients. Conclusion: We believe that these findings will contribute to a better understanding of the neuro-pathological process of this disease. The present work confirmed that there is more cerebellar involvement in the pathophysiology of Huntington’s disease than we knew about it. References: [1] Roos A.C.R. Huntington’s disease: a clinical review. Orphanet Journal of Rare Diseases, 2010;5:40; [2] Diedrichsen J. Neuroimage. A spatially unbiased atlas template of the human cerebellum. 2006;33:127-38; [3] Stoodley CJ, Schmahmann JD. Evidence for topographic organization in the cerebellum of motor control versus cognitive and affective processing. Cortex. 2010;46:831-44.
was established as 95%. The Bonferroni correction accounted for the multiple comparisons problem. Results: DCM analysis yielded values of connectivity between every pair of nodes, in the two possible directions. We found no significant differences between groups for those values. Conclusion: DCM analysis showed that the model used is not able to distinguish connectivity values between DMN nodes of healthy subjects and MCI patients. Nonetheless, DCM technique is still potentially im-portant, because it can further evaluate the most appropriate model of connectivity between those regions besides the one we used. Moreover, other networks can also be proved, and is this case, those that are related to memory processes may be even more appropriate. DCM technique was shown to be sensitive to medication withdrawal of Parkinson’s patient5 and thus could be employed in a different rationale to investigate not only MCI but also Alzheimer’s Disease.References: [1] Friston KJ, Harrison L, Penny W. Dynamic causal modelling. Neuroimage. 2003;19:1273-302; [2] Buxton RB, Wong EC, Frank LR. Dynamics of blood flow and oxygenation changes during brain activation: the balloon mod-el. Magn Reson Med.1998;39:855-64; [3] Petersen RC et al. Current concepts in mild cognitive impairment. Arch Neurol. 2001;58:1985-92; [4] Adeel Razi, Joshua Kahan, Geraint Rees, Karl J. Friston..Construct validation of a DCM for resting state fMRI. NeuroImage. 2015; 106:1-14; [5] Rowe JB1, Hughes LE, Barker RA, Owen AM. Dynamic causal modelling of effective connectivity from fMRI: are results reproducible and sensitive to Parkinson’s disease and its treatment?. Neuroimage. 2010;52:1015-26.
Figure 1. Red areas showing increased GM in coronal slices of the cerebellum.
-53 -51 -49 -47
53Jecn 2015,21(2):46-77
Cortical thickness and functional analyses in parkinson’s disease
r.p. guimarães1,2, A. dagher2, l. piovesana1, l. campos1, K. larcher2, p.c. Azevedo1, y. zeighami2, A.c.f. d’Abreu1, f. cendes1
1department of neurology, school of Medical sciences, university of campinas-unIcAMp, sao paulo, brazil, 2Montreal neurological Institute - Mcconnel brain Imaging center, Mcgill university.
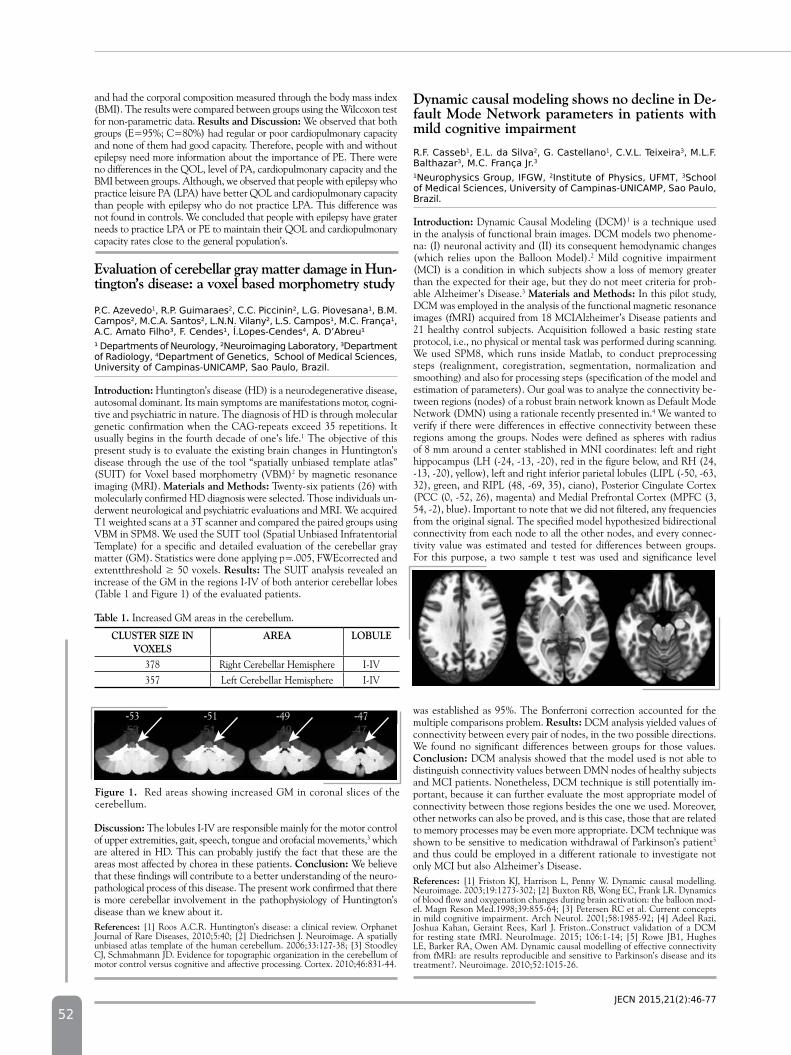
introduction: Parkinson’s Disease (PD) is the second most common neu-rodegenerative disease worldwide. Cortical Thickness (CT) measurement and resting state functional MRI (rs-fMRI) are well defined MRI tech-niques that assess the brain’s structure and functionality. Most studies use a Regions of Interest (ROI)-based analysis, however ROI identification is based on a priori hypothesis, and this approach is, to some degree, prone to user-introduced bias.1,2 We employed a data driven approach focusing on structural and functional abnormalities. Materials and Methods: 58 PD patients (mean age 60.3±9.0) meeting the UK Parkinson’s Disease Society Brain Bank criteria were compared with 33 healthy controls (HC) (mean age 57.8±10.0). T1-weighted MRI and EPI images were obtained on a 3T scanner. All fMRI analyses were implemented with the NIAK software (Neuroimaging Analysis Kit, release 0.7 [3]), and CT data was processed with the CIVET pipeline (v. 1.1.10, MNI, McGill University, Montreal, Quebec, Canada). Results: Areas showing lower functional connectivity (FC) in PD when compared to controls were (Figure 1): cerebellum (A), occipital lobe (B), basal ganglia, postcentral (C) and precentral gyrus, supplementary motor area (SMA) and substantia nigra. These areas had lower FC with several others areas, as shown in Figure 1. For the CT analysis we stratified patients into 3 subgroups: early PD (EPD), moderate PD (MPD) and severe PD (SPD). The comparison between EPD and HC revealed decreased CT in left superior temporal gyrus, left gyrus rectus and left olfactory cortex (p<0.05); in the MPD group, the areas with lower CT were right postcentral gyrus, right SMA and right inferior frontal gyrus
(p<0.05). SPD patients had significant lower CT in left inferior frontal gyrus, left precentral and postcentral gyrus, left SMA, left inferior frontal gyrus, left gyrus rectus, right temporal pole, right fusiform gyrus, right mid-dle temporal gyrus, and right occipital gyrus (p<0.05). There were no areas of increased CT. discussion: We found more pronounced cortical thick-ness abnormalities in the SPD group, although functional abnormalities were seen in the whole group, suggesting that functional alterations may precede the structural ones. Conclusion: The structural and functional abnormalities found in corresponding areas demonstrate that PD involves a great number of neuronal circuits, including areas responsible for visual processing. A better understanding of the involved areas may further refine our comprehension of the disease and its clinical subtypes.References: [1] Yang H, Zhou XJ, Zhang MM, Zheng XN, Zhao YL, Wang J. Changes in spontaneous brain activity in early Parkinson’s disease. Neurosci Lett. 2013; 549:24-8; [2] Pereira JB et al. Assessment of cortical degeneration in pa-tients with Parkinson’s disease by voxel-based morphometry, cortical folding, and cortical thickness.Hum Brain Mapp. 2012; 33: 2521-34; [3] Bellec P, Rosa-Neto P, Lyttelton OC, Benali H, Evans AC. Multi-level bootstrap analysis of stable clusters in resting-state fMRI. Neuroimage. 2010;51:1126-39.
preliminary neuropsychological memory investiga-tion between refractory and mild epileptic patientst.A. zanão1, t. lopes, f. cendes1
1neuroimaging laboratory, departments of neurology, school of Medical sciences, university of campinas-unIcAMp, sao paulo, brazil.
introduction: This work consisted on a neuropsychological (IQ estimat-ed, visual memory and general memory) preliminary data investigation between a temporal medial epileptic refractory group (n=20) and a tem-poral medial mild epileptic group (n=20). Structures involved in the consolidation of memory, as the hippocampus,1 are normally damaged on the temporal medial epileptic patients and the present work evaluated the performance of these two groups to check if the presence of crises2
(refractory group) might interfere on the results of the memory compo-nents in a neuropsychological test. Materials and Methods: All the tests were realized by psychologists of the Laboratory of Neuroimage (LNI), UNICAMP, in a private room at the LNI, in the absence of noise or other disturbances. We used subitens of the Wechsler Memory Scale-revised manual (WMS-R) and Rey Auditory Verbal Learning Tests to estimate IQ and also visual memory and general memory. For the statistical analysis it was used the unpaired t-test. Results: For the IQ estimated, the unpaired t-test shown a mean of 77,75 for the mild group and a mean of 72.2 for the refractory group (SD=10.4 and SD=8.81, respectively), but the P was not significant (P=0.07). The visual memory mean was -1.879 for the mild group and -1.928 for the refractory group, with P=0.9 and the general memory mean was -2.3 and -2.5 for the mild and refractory group, respec-tively (P=0.5). discussion: We expected that the refractory group would have a worse performance3 in the neuropsychological test because the crises itselfs and the use of antiepileptic drugs are known to lead to injuries in the memory consolidation.4 Although, it is a preliminary result because the study is still in progress. We will include more patients and evaluate other neuropsychological components, as educational level, Edinburgh Inventory, delayed recall, logical memory and visual reproduction. Other clinical components as duration and frequency of the crises, educational level and age of onset will be analyzed. Conclusion: Our findings suggest so far that there is not a significant neuropsychological memory difference between the refractory and mild epileptic patients. References: [1] Alessio A, Kobayashi E, Damasceno BP, Lopes-Cendes I, Cendes F. Evidence of memory impairment in asymptomatic individuals with hippocampal atrophy. Epilepsy Behav. 2004;5:981-7; [2] Alessio A, Kobayashi E, Damasceno BP, Lopes-Cendes I, Cendes F. Evidence of memory impairment in asymptomatic individuals with hippocampal atrophy. Epilepsy Behav. 2004;5:981-7; [3] Laxer KD, et al. The consequences of refractory epilepsy and its treatment. Epilepsy Behav. 2014;37:59-70;[4] Dodrill CB. A neuropsychological battery for epilepsy. Epilepsia. 1978 Dec;19:611-23.
Language fMRi activation depends on the cognitive effort
t.M. lopes1, b.M. campos1, M. balthazar1, J. binder2, f. cendes1
1neuroimaging laboratory, departments of neurology, school of Medical sciences, university of campinas-unIcAMp, sao paulo, brazil.2 language Imaging laboratory, Mcw.
A
B
C
d
E
54Jecn 2015,21(2):46-77
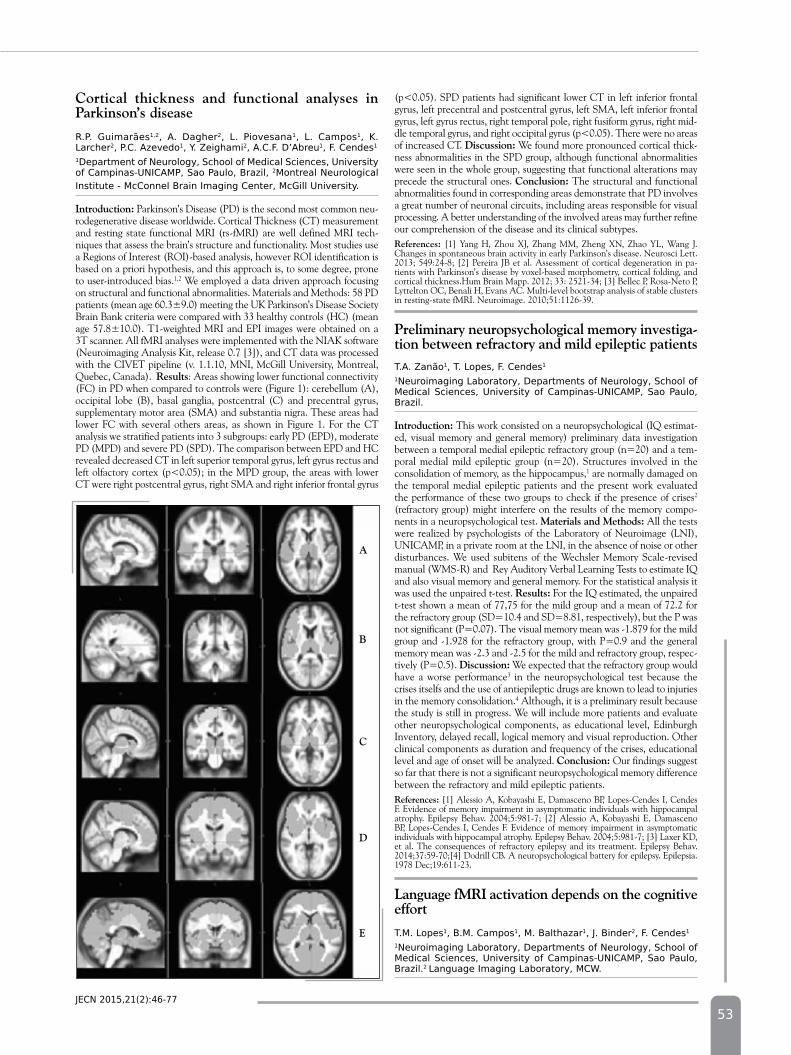
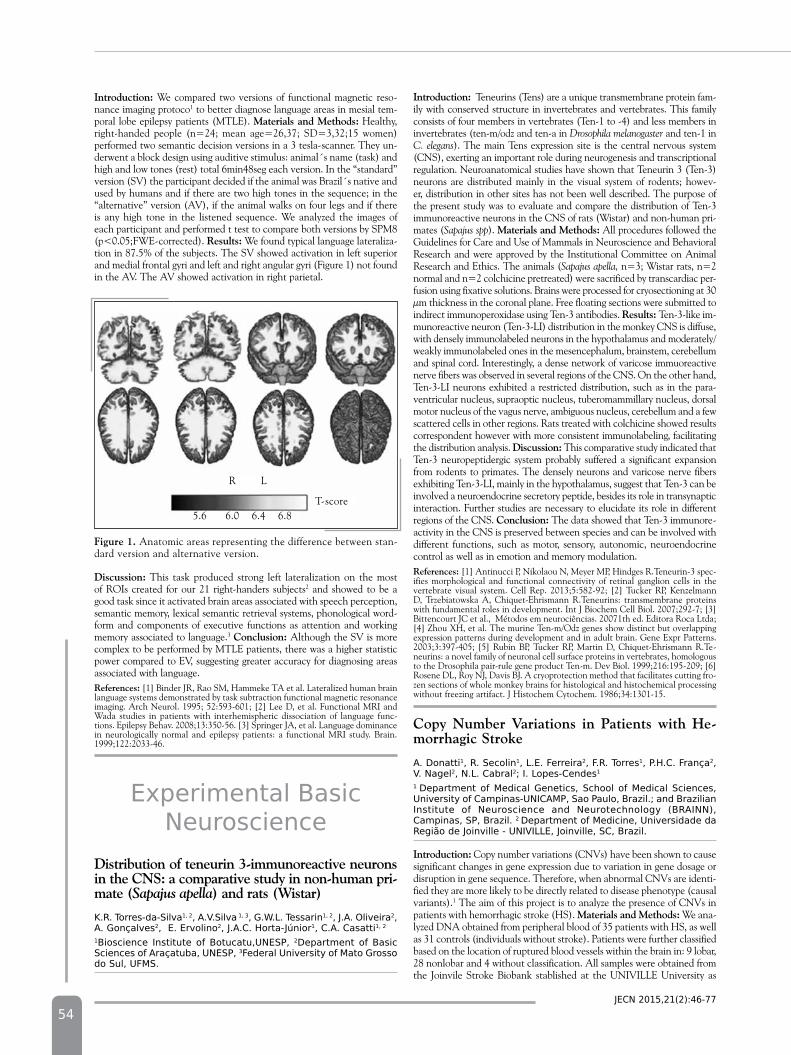
introduction: We compared two versions of functional magnetic reso-nance imaging protoco1 to better diagnose language areas in mesial tem-poral lobe epilepsy patients (MTLE). Materials and Methods: Healthy, right-handed people (n=24; mean age=26,37; SD=3,32;15 women) performed two semantic decision versions in a 3 tesla-scanner. They un-derwent a block design using auditive stimulus: animal´s name (task) and high and low tones (rest) total 6min48seg each version. In the “standard” version (SV) the participant decided if the animal was Brazil´s native and used by humans and if there are two high tones in the sequence; in the “alternative” version (AV), if the animal walks on four legs and if there is any high tone in the listened sequence. We analyzed the images of each participant and performed t test to compare both versions by SPM8 (p<0.05;FWE-corrected). Results: We found typical language lateraliza-tion in 87.5% of the subjects. The SV showed activation in left superior and medial frontal gyri and left and right angular gyri (Figure 1) not found in the AV. The AV showed activation in right parietal.
introduction: Teneurins (Tens) are a unique transmembrane protein fam-ily with conserved structure in invertebrates and vertebrates. This family consists of four members in vertebrates (Ten-1 to -4) and less members in invertebrates (ten-m/odz and ten-a in Drosophila melanogaster and ten-1 in C. elegans). The main Tens expression site is the central nervous system (CNS), exerting an important role during neurogenesis and transcriptional regulation. Neuroanatomical studies have shown that Teneurin 3 (Ten-3) neurons are distributed mainly in the visual system of rodents; howev-er, distribution in other sites has not been well described. The purpose of the present study was to evaluate and compare the distribution of Ten-3 immunoreactive neurons in the CNS of rats (Wistar) and non-human pri-mates (Sapajus spp). Materials and Methods: All procedures followed the Guidelines for Care and Use of Mammals in Neuroscience and Behavioral Research and were approved by the Institutional Committee on Animal Research and Ethics. The animals (Sapajus apella, n=3; Wistar rats, n=2 normal and n=2 colchicine pretreated) were sacrificed by transcardiac per-fusion using fixative solutions. Brains were processed for cryosectioning at 30 µm thickness in the coronal plane. Free floating sections were submitted to indirect immunoperoxidase using Ten-3 antibodies. Results: Ten-3-like im-munoreactive neuron (Ten-3-LI) distribution in the monkey CNS is diffuse, with densely immunolabeled neurons in the hypothalamus and moderately/weakly immunolabeled ones in the mesencephalum, brainstem, cerebellum and spinal cord. Interestingly, a dense network of varicose immuoreactive nerve fibers was observed in several regions of the CNS. On the other hand, Ten-3-LI neurons exhibited a restricted distribution, such as in the para-ventricular nucleus, supraoptic nucleus, tuberomammillary nucleus, dorsal motor nucleus of the vagus nerve, ambiguous nucleus, cerebellum and a few scattered cells in other regions. Rats treated with colchicine showed results correspondent however with more consistent immunolabeling, facilitating the distribution analysis. discussion: This comparative study indicated that Ten-3 neuropeptidergic system probably suffered a significant expansion from rodents to primates. The densely neurons and varicose nerve fibers exhibiting Ten-3-LI, mainly in the hypothalamus, suggest that Ten-3 can be involved a neuroendocrine secretory peptide, besides its role in transynaptic interaction. Further studies are necessary to elucidate its role in different regions of the CNS. Conclusion: The data showed that Ten-3 immunore-activity in the CNS is preserved between species and can be involved with different functions, such as motor, sensory, autonomic, neuroendocrine control as well as in emotion and memory modulation.References: [1] Antinucci P, Nikolaou N, Meyer MP, Hindges R.Teneurin-3 spec-ifies morphological and functional connectivity of retinal ganglion cells in the vertebrate visual system. Cell Rep. 2013;5:582-92; [2] Tucker RP, Kenzelmann D, Trzebiatowska A, Chiquet-Ehrismann R.Teneurins: transmembrane proteins with fundamental roles in development. Int J Biochem Cell Biol. 2007;292-7; [3] Bittencourt JC et al., Métodos em neurociências. 20071th ed. Editora Roca Ltda; [4] Zhou XH, et al. The murine Ten-m/Odz genes show distinct but overlapping expression patterns during development and in adult brain. Gene Expr Patterns. 2003;3:397-405; [5] Rubin BP, Tucker RP, Martin D, Chiquet-Ehrismann R.Te-neurins: a novel family of neuronal cell surface proteins in vertebrates, homologous to the Drosophila pair-rule gene product Ten-m. Dev Biol. 1999;216:195-209; [6] Rosene DL, Roy NJ, Davis BJ. A cryoprotection method that facilitates cutting fro-zen sections of whole monkey brains for histological and histochemical processing without freezing artifact. J Histochem Cytochem. 1986;34:1301-15.
Copy number Variations in patients with He-morrhagic Stroke
A. donatti1, r. secolin1, l.e. ferreira2, f.r. torres1, p.h.c. frança2, V. nagel2, n.l. cabral2; I. lopes-cendes1
1 department of Medical genetics, school of Medical sciences, university of campinas-unIcAMp, sao paulo, brazil.; and brazilian Institute of neuroscience and neurotechnology (brAInn), campinas, sp, brazil. 2 department of Medicine, universidade da região de Joinville - unIVIlle, Joinville, sc, brazil.
introduction: Copy number variations (CNVs) have been shown to cause significant changes in gene expression due to variation in gene dosage or disruption in gene sequence. Therefore, when abnormal CNVs are identi-fied they are more likely to be directly related to disease phenotype (causal variants).1 The aim of this project is to analyze the presence of CNVs in patients with hemorrhagic stroke (HS). Materials and Methods: We ana-lyzed DNA obtained from peripheral blood of 35 patients with HS, as well as 31 controls (individuals without stroke). Patients were further classified based on the location of ruptured blood vessels within the brain in: 9 lobar, 28 nonlobar and 4 without classification. All samples were obtained from the Joinvile Stroke Biobank stablished at the UNIVILLE University as
discussion: This task produced strong left lateralization on the most of ROIs created for our 21 right-handers subjects2 and showed to be a good task since it activated brain areas associated with speech perception, semantic memory, lexical semantic retrieval systems, phonological word-form and components of executive functions as attention and working memory associated to language.3 Conclusion: Although the SV is more complex to be performed by MTLE patients, there was a higher statistic power compared to EV, suggesting greater accuracy for diagnosing areas associated with language.References: [1] Binder JR, Rao SM, Hammeke TA et al. Lateralized human brain language systems demonstrated by task subtraction functional magnetic resonance imaging. Arch Neurol. 1995; 52:593-601; [2] Lee D, et al. Functional MRI and Wada studies in patients with interhemispheric dissociation of language func-tions. Epilepsy Behav. 2008;13:350-56. [3] Springer JA, et al. Language dominance in neurologically normal and epilepsy patients: a functional MRI study. Brain. 1999;122:2033-46.
experimental basic neuroscience
distribution of teneurin 3-immunoreactive neurons in the CnS: a comparative study in non-human pri-mate (Sapajus apella) and rats (Wistar)
K.r. torres-da-silva1, 2, A.V.silva 1, 3, g.w.l. tessarin1, 2, J.A. oliveira2, A. gonçalves2, e. ervolino2, J.A.c. horta-Júnior1, c.A. casatti1, 2
1bioscience Institute of botucatu,unesp, 2department of basic sciences of Araçatuba, unesp, 3federal university of Mato grosso do sul, ufMs.
Figure 1. Anatomic areas representing the difference between stan-dard version and alternative version.
5.6 6.0 6.4 6.8 T-score
R L
55Jecn 2015,21(2):46-77
part of a population-based epidemiologic study. CNVs were analyzed using the Genome-Wide Human SNP 6.0 DNA chips (Affymetrix Inc.), which exams CNVs present in the entire human genome. CNV data was estimat-ed by Bayesian Robust Linear Model using Mahalanobis (BRLMM) and Canary algorithms in the Genotype Console® Software (Affymetrix Inc.). In addition, a principal component analysis (PCA) was performed using the R software in order to evaluate population stratification. To evaluate possible interactions among genes found to contain CNVs, a gene net-work was built using METACORE TM software. Results and discussion: PCA analysis showed that the total sample did not present population stratification, which allows for unbiased comparisons between patients and controls. We identified a total of 162 CNVs among patients with HS, which were not present in the control individuals, including 105 losses and 143 gains. Thirty of these CNVs have never been reported previously. According to gene network analysis, we found CNVs present in several genes functionally related to blood pressure regulation, as DEFB103B, DEFB4B and PRODH. Conclusion: Our study identified CNVs which overlap genes involved in blood pressure regulation in patients with HS. Supported by: CNPq and BRAINN-CEPID/FAPESP, Brazil.References: [1] Mefford HC. CNVs in Epilepsy. Curr Genet Med Rep. 2014;2:162-167.
investigating molecular mechanisms predisposing to epilepsy in genetic animal model
A.h.b. Matos1, A.s. Matos1, V.d.b. pascoal1,4, c.s. rocha1, M.f.d. Moraes2, c.V. Maurer-Morelli1, A.s. Martins2, A.l.b godard3, I. lopes-cendes1
1department of Medical genetics, school of Medical sciences, university of campinas-unIcAMp, sao paulo, brazil, and brazilian Institute of neuroscience and neurotechnology (brAInn) campinas, sp, brazil, 2department of physiology and biophysics, Institute of biological sciences, federal university of Minas gerais – ufMg, belo horizonte, Mg, brAzIl, 3department of biology, Institute of biological sciences, federal university of Minas gerais – ufMg, belo horizonte, Mg, brazil, 4department of basics sciences, fluminense federal university - uff, nova friburgo, rJ, brazil
introduction: Wistar audiogenic rat (WAR) is a genetic animal model genetically susceptible to audiogenic seizures. When exposed to high in-tensity auditory stimulus (110 dB) rats from this strain develop tonic clonic generalized seizures followed by clonic spasms. Brain structures thought to be involved in these acute audiogenic seizures are the inferior and superior colliculus, substantia nigra, reticular formation and periaquedutal grey matter. The aim of this study was to determine molecular pathways involved in the susceptibility to seizures in these model using gene expression analysis. Meth-ods: We obtained total RNA from five susceptible WAR [hippocampus and corpora quadrigemina (IC and SC)], five control Wistar and five WAR-naive (WAR prior to auditory stimulus). Gene expression analysis was performed using microarray technology, and analyzed in R environment using the Affy and RankProd packages from Bioconductor, as well as the MetaCore® platform to identify molecular networks, gene ontology categories and gene interactions. Genes with differential expression and a possible biological role in epileptogenesis were validated by qRT-PCR. Results: In WAR, expression profile showed a total of 1624 differentially expressed transcripts in the corpora quadrigemina and 1351 differentially expressed in the hippocampus compared with controls, with 616 upregulated and 1008 downregulated in corpora quadrigemina and 660 upregulated and 691 downregulated in the hippocampus. Enriched gene ontology categories identified were involved in oxidative phosphorylation and neurophysiological process GABA-A receptor life cycle. Genes validated by qRT-PCR were Grin1, Nedd8, Il18 and Slc1a3. Subsequently, we compared expression of gene validated by qRT-PCR among the three groups of animals, WAR, WAR-naive, and Wistar, and observed that overall these genes were downregulated in WAR-naive. discussion: These observations indicate the possibility that an abnormal energy metab-olism in the central nervous system of these animals may be an underlying factor responsible or contributing to the susceptibility of seizures. An altered metabolic function would impair GABA and glutamate homeostasis, reflect-ing in the abnormal expression of genes involved in these neurotransmitter systems as seen in our results. Conclusion: Our results show that auditory stimulus was able to modify basal expression of several genes analyzed, thus activating specific gene pathways such as oxidative phosphorylation and neurophysiological process GABA-A receptor life cycle, which are likely to be involved in the susceptibility to seizures in WAR. Supported by CEpid-BRAinn, FApESp, Brazil.
proteomic analysis of dorsal and ventral dentate gyrus from epileptic rats induced by perforant pa-thway stimulation
A.M. canto1, A.h.b. Matos1, A.s. Vieira1, r. gilioli2, I.lopes-cendes1
1brazilian Institute of neuroscience and neurotechnology (brAInn), university of campinas-unIcAMp, campinas, sp, brazil. 2Multidisciplinary center for biological Investigation of laboratory Animals (ceMIb), campinas, sp, brazil
introduction: Proteomic analysis is a promising tool for the identification of key biological processes leading to epilepsy. However, the power of such “omic” approach is dependent on the preparation of homogeneous cell populations. In this context, laser-capture microdissection presents the ability to select specific cell populations that would give the most informative data in proteomic studies. The aim of this study is to identify differentially expressed proteins in the dorsal and ventral Dentate Gyrus (dDG and vDG) from epileptic rats. Epilepsy was induced by a perforant pathway stimulation protocol that leads to classical hippocampal sclerosis. Materials and Methods: Rats were induced as described by Norwood et al., 2010. Frozen sections were prepared and the dDG and vDG were laser microdissected (Zeiss PALM). Total proteins were obtained from using 8M urea and analyzed by LC-MS/MS using an LQT-Orbitrap (Waters). Results: We identified a total of 1271 proteins in samples of dDG and vDG combined. Of these, 42 proteins were found to be differentially expressed in dDG and 50 in vDG. Although there was some overlap between proteins that were differently expressed in dDG and vDG, we found that 76% of proteins differently expressed in dDG and 80% in vDG were unique to these sub-fields. discussion: The difference between the dDG and dDV is consistent with the data published by Fanselow and Dong (2010), which says that they are different in a functional and molecular level. Most of the differentially expressed proteins are involved in neuronal pathways such as GABA-receptor recycling and cytoskeleton remodeling, as indicated by gene ontology analysis employing the Metacore® software (Thomson Reuters). Conclusion: The identified proteins can indicate new pathways involved in epileptogenesis. Furthermore, we found that additional infor-mation molecular complexities could be observed as hippocampal subfields were analyzed separately. We believe that the further integration of the proteomic data with other “omics” approaches could generate even more informative data about those neuronal processes.References: [1] Fanselow MS, Dong HW. Are the dorsal and ventral hippocampus functionally distinct structures? Neuron. 2010;65:7-19.
RnA and protein extraction from rat hippocampus obtained through laser capture microdissection and a comparative proteomic analyses between two different mass spectrometers
A.M canto1, A.h.b. Matos1, A.s. Vieira1, r. gilioli2, I. lopes-cendes1
1brazilian Institute of neuroscience and neurotechnology (brAInn), university of campinas-unIcAMp, campinas, sp, brazil. 2Multidisciplinary center for biological Investigation of laboratory Animals (ceMIb), campinas, sp, brazil.
introduction: The use of animal models to investigate the mechanisms underlying human temporal lobe epilepsy has led to great advances in the better understanding of this disease. However the development of models that can present epileptogenesis similar to that observed in humans is still a challenge.1 In this context, transcriptome and proteomics studies are promising tools for the identification of key biological processes leading to epilepsy. The power of such “omics” approaches is dependent on the preparation of homogeneous cell populations, especially in heterogeneous tissues such as the Nervous System.2 Laser-capture microdissection (LCM) presents the ability to select a specific cell population that would give the most informative data. Therefore, the aim of the present study is to optimize simultaneous RNA and protein extraction and compare the efficacy of two different MS methods. Materials and Methods: The rat’s brain was quickly removed and frozen by immersion in n-hexane at -60º. Frozen sections were produced in a cryostat (Leica) and mounted in PEN covered glass slides (Zeiss). Slides were Nissl stained, and the Dentate Gyrus (DG), or the whole hippocampus was laser microdissected using Zeiss PALM LCM. RNA was extracted from microdissected DG samples using RNAeasy microkit (Qiagen). RNA quality was assessed employing
56Jecn 2015,21(2):46-77
Bioanalyzer Agilent RNA 6000 Pico. Total proteins were obtained from the collected hippocampus using TRizol reagent according to manufacturer instructions. Proteins were ressuspended in 8M urea and quantified by Qubit. Proteins from the same sample were analyzed using a Q-TOF mass spectrometer and a LTQ-Orbitrap Velos, to see the efficacy of both equip-ment. Results: For the production of frozen tissue slices, best results were obtained with 40µm of thickness. RNA extraction employing RNAeasy microkit (Qiagen) produced high quality isolated RNA. discussion: We obtained simultaneous isolation of RNA and protein employing the TRizol method, resulting in an average concentration of 1.1µg RNA and 10.6µg protein. The total number of identified proteins using the Q-TOF mass spectrometer was 125 and using the LTQ-Orbitrap MS was 432. These data suggests that the LTQ-Orbitrap MS was more efficiently when com-pared with the Q-TOF MS, and that the simultaneous extraction of RNA and Proteins are possible and efficient. Conclusion: The use of the TRizol method resulted in the simultaneous extraction of RNA and total proteins from the same sample. The difference between the identified proteins obtained from the two mass spectrometers was significant, leading us to choose the LTQ-Orbitrap Velos mass spectrometer as the more accurate equipment for proteomics analysis. References: [1] Avanzini G, Vergnes M, Spreafico R, Marescaux C. Calcium-de-pendent regulation of genetically determined spike and waves by the reticular thalamic nucleus of rats. Epilepsia. 1993;34(1):1-7, [2] Lothman EW, Rempe DA, Mangan PS. Changes in excitatory neurotransmission inthe CA1 region and dentate gyrus in a chronic model of temporal lobe epilepsy. J Neurophysiol. 1995;74(2):841-8; [3] Krapfenbauer K, Fountoulakis M, Lubec G. A rat brain protein expression map including cytosolic and enriched mitochondrial and mi-crosomal fractions. Electrophoresis. 2003;24(11):1847-70. [4] Krapfenbauer K, Engidawork E, Cairns N, Fountoulakis M, Lubec G. Aberrant expression of perox-iredoxin subtypes in neurodegenerative disorders. Brain Res.2003;967(1-2):152-60.
transcriptome profile of dorsal and ventral dentate gyrus of a rat epilepsy model induced by a single “cryptic” episode of focal hippocampal excitation
A.s. Vieira1, A.h. berenguer1, A.M. canto1, c.s. rocha1, b. carvalho1, V. pascoal1, r. glioli2, I. lopes-cendes1
1 department of Medical genetics, school of Medical sciences, university of campinas-unIcAMp, sao paulo, brazil and the brazilian Institute of neuroscience and neurotechnology (brAInn), 2 laboratory of Animal quality control (ceMIb), university of campinas – unIcAMp, campinas, sp, brazil.
introduction: A recently developed animal model based on a long period of electrical stimulation of the perforant pathway (pp) in rats is capable of inducing hippocampal damage that more closely resemble that found in patients with mesial temporal lobe epilepsy. Furthermore, these animals develop spontaneous seizures after a latent period. Although this model has been well characterized, the molecular mechanisms involved in the in-duction of epileptogenesis remain unknown. RNAseq-based transcriptome analyzes offers the possibility of accurate profiling of global gene expression. Therefore, the present study explores the molecular mechanisms responsible for epileptogenesis in this animal model using RNAseq-based transcriptome analyzes. Materials and Methods: Electrodes were implanted bilaterally in the dentate girus (DG) and in PP of control (n=4) and experimental rats (n=4). Experimental rats were stimulated as described previously (Nor-wood et al. 2010).1 Fifteen days following stimulation rats were euthanized and the brains processed for laser microdissected using Zeiss PALM LCM. Dorsal (dDG) and Ventral DG (vDG) were collected from each rat, total RNA was extracted, and libraries for RNAseq in Illumina Hiseq platform were prepared. Sequences were aligned and quantified with the TopHat/DESeq2 pipeline. Gene Onthologies were analyzed with the Metacore® software. Results: A total of 2,367 genes were found to be differentially expressed (p<0,05) when comparing the control dDG with the stimulated dDG, 1,331 genes were up-regulated and 1,036 were down-regulated in the stimulated condition. In the vDG, 1,889 genes were differentially ex-pressed, 1,085 genes were up-regulated and 804 were down-regulated in the stimulated condition. Gene onthology analysis indicated a predominance of inflammation related genes up-regulated in both dDG and vDG. Exclu-sively in the vDG there was a significant enrichment of axonal guidence and calcium signaling gene onthologies. discussion: The most prevalent gene pathways and biological processes which were differentially expressed in both the dDG and vDG were those related to the immune response. The present data indicates a strong increase in the expression of genes typically found in cells from the immune system specialized in phagocytosis,
indicating cell death even in the relatively preserved DG. It is noteworthy the presence of various differentially regulated genes involved in axonal guidance, synaptic function, neural electrical activity and neuropeptides. Moreover, different members of these families of molecules are exclusively differentially regulated in the dDG and vDG. Conclusion: The transcrip-tome data explored in this study suggest many possible components of the molecular mechanisms responsible for epileptogenesis in an animal mod-el that displays hippocampus sclerosis. Furthermore, even though similar mechanisms may be found in different DG sub-regions, the components involved in such processes seem to be region specific. References: [1] Norwood BA, et al. Classic hippocampal sclerosis and hippocam-pal-onset epilepsy produced by a single “cryptic” episode of focal hippocampal excitation in awake rats. J Comp Neurol. 2010;518:3381-407.
dorsal raphe nucleus and noradrenergic area A5 projection to elementary circuitry of acoustic start-le reflex
A.V. silva 1, 2, K.r. torres-da-silva2, n.o barioni2, d.e. lópez3,4, J.A.c. horta-Júnior2
1federal university of Mato grosso do sul, ufMs (cptl-ufMs), 2bioscience Institute of botucatu, unesp; 3Institute of neuroscience of castilla y león (Incyl), university of salamanca, spain; 4Institute of biomedical Investigation of salamanca (IbsAl), spain.
introduction: The acoustic startle reflex (ASR) is a rapid motor reaction elicited by a sudden intense acoustic stimulus. This an acoustic-motor reflex of brainstem conserved across mammals species including man and rodents. Moreover the ASR is a defensive behavior in front of real or unreal danger so it is useful to alert and probably protects the organism from injury. The contraction of facial, neck and skeletal muscles are evoked during ASR as well as autonomic nervous system with elevation of blood pressure and acceleration of the heart rate during reflex. The ASR shows various modulations such as habituation, sensitization, prepulse inhibition and fear potentiation. The modifications of the ASR and its modulations are im-portant in clinical diagnostics of psychiatric and neurodegenerative illnesses such as schizophrenia and Parkinson’s disease. In the rat the ASR consists of eye-lid-closure and rapid and phasic contractions of members, neck, length reduction of the animal, moreover identical stimulus parameters can generate equal response patterns in rats and humans. The fundamental neural circuit of ASR is mediated by ganglion cells of the organ of Corti, the cochlear root neurons (CRN), the pontine reticular nucleus (PnC) and motoneurons of the spinal cord with possible modulation of each element by some neuroactive systems. Our study aims to describe the possible afferents from the dorsal raphe nucleus (DR) and noradrenergic area A5 (A5) to PnC in female Wistar rats, using tract tracing and immunohistochemical methods. Materials and Methods: All experimental protocols are accord-ing Ethical Committee for Animal (Biosciences Institute of Sao Paulo State University, protocol: 17/08). After injections of retrograde tracer Fluo-ro-Gold (FG) (n=3) into the PnC, it was possible to identify retrogradely labeled neurons located in the DR and A5. To confirm these connections, the anterograde tracer BDA was injected at the DR (n=6), A5 (n=6), and PnC (n=3). The tissue was processed to visualize the tracer and basic neurochemistry of A5 and DR (noradrenalin and serotonin). Results: The projections of DR and A5 in the PnC were spread and present in fibers with varicosities and terminal-like in ventro-lateral part of this nucleus closed in its soma. The BDA terminals of A5 and DR correspond, respectively, with some terminals of noradrenaline and serotonin. PnC BDA labeling was identified in all extension of A5 and some divisions of DR. discussion: The literature shows that noradrenergic terminals are in contact with RAS elementary circuit as CRN and PnC. Moreover serotonin terminals are distributed in the cochlear nuclei and inferior coliculus. Our results show the existence of two possible origins for these terminals indicating the A5 as noradrenergic and serotonergic DR.Conclusion: This data suggest that DR and A5 could be afferents to PnC and contribute for connections with key area for the RAS. Moreover, PnC establishes communication with both areas and contributes to understand the neurocircuitry involved in the acoustic startle modulation.References: [1] Lee Y, López DE, Meloni EG, Davis M. A primary acoustic startle pathway: obligatory role of cochlear root neurons and the nucleus reticularis pontis caudalis. J Neurosci. 1996 Jun 1;16:3775-89; [2] López DE, Saldaña E, Nodal FR, Merchán MA, Warr WB. Projections of cochlear root neurons, sentinels of the rat auditory pathway. JComp Neurol. 1999;415:160-74; [3] Merchan MA Collia F, Lopez DE, Saldaña E. Morphology of cochlear root neurons in the rat. J Neurocytol. 1988;17:711-25.
57Jecn 2015,21(2):46-77
Role of SCN1A gene in childhood epileptic encephalopathiesc.V. soler¹, M.f. terra¹, M.M. guerreiro², M.A. Montenegro², I. lopes-cendes¹.¹department of Medical genetics, ² departments of neurology, school of Medical sciences, university of campinas-unIcAMp, sao paulo, brazil and brazilian Institute of neuroscience and neurotechnology (brAInn).
introduction: Childhood epileptic encephalopathies (CEE) are severe brain disorders in which abnormal electrical discharges may contribute to progressive psychomotor dysfunction. It is believed that the epileptic brain electrical activity during maturation is a major cause of regression or progressive deterioration in cognitive and neuropsychological develop-ment in children and may lead to early death.1 One of the most relevant genes in the etiology of some forms of epilepsy is SCN1A, encoding the alpha1- subunit of the neuronal voltage-dependent sodium channel. Mutations in this gene were identified in patients with the spectrum of generalized epilepsy with febrile seizures plus (GEFs+), especially in the more severe phenotype of the spectrum, Dravet syndrome.2 Previous studies conducted by our group identified mutations in SCN1A in 81% of patients with Dravet syndrome. Recently, mutations in this gene have been also found in other epileptic encencephalopathies.3 Materials and Methods: Forty-three consecutive patients with CEE were identified in our childhood epilepsy clinic. All patients were examined by the same group of child neurologists who established the clinical diagnosis of CEE based on current criteria. We performed extraction of genomic DNA from peripheral blood of all 43 patients with CEE. Subsequently, we screened for mutations in SCN1A by amplifying the 26 exons of the gene, as well as its exon-intron boundaries using the polymerase chain reaction (PCR). Amplified fragments were subjected to Sanger sequencing using the genetic analyzer (ABI 3500xL). Sequences obtained from patients were compared to genetic database in Ensembl, using the DNABaser program, in order to identify possible deleterious changes. All sequence variants found were subjected to computer analysis to estimate the possi-ble impact of nucleotide changes on protein function using the prediction software SNP& Go and Polyphen. Results: We enrolled 43 patients with different types of CEE. Overall we found 11 single bas- pair changes and one insertion in SCN1A in patients with CEE. However, only three of the single base-pair changes were predicted to be deleterious, all mis-sense mutations, two unpublished changes. The insertion of two base pairs has also never been described. This insertion causes a change of 58 amino acids after the base 1693 and generates a premature stop codon in the protein between domains 1 and 2. This change is also predicted to have a deleterious effect on protein function. discussion/Conclusion: We found putative deleterious changes in SCN1A in 9% (4/43) of the patients with CEE examined. Most importantly, of the four patients with deleterious changes, three did not show clinical feature of Dravet syndrome. Our findings indicate the importance of studying SCN1A in patients with CEEs even in the absence of typical clinical features of Dravet syndrome. Supported by: CEPID-BRAINN, FAPESP, Brazil.References: [1] Panayiotopoulos CP. The Epilepsies: Seizures, Syndromes and Management. Oxfordshire (UK): Bladon Medical Publishing; 2005. Chapter 7: Epileptic Encephalopathies in Infancy and Early Childhood in Which the Epileptiform Abnormalities May Contribute to Progressive Dysfunction; [2] Marini C, et al. Idiopathic epilepsies with seizures precipitated by fever and SCN1A abnormalities. Epilepsia. 2007;48:1678-85; [3] Claes L, Del-Favero J, Ceulemans B, Lagae L, Van Broeckhoven C, De Jonghe P. De novo mutations in the sodium-channel gene SCN1A cause severe myoclonic epilepsy of infancy. Am J Hum Genet. Jun;68:1327-32.
Global versus local networks, unveiling patterns on aMCi’s and Alzheimer’s braine.o. lopes1, M. weiler1, c.V.l. teixeira 1, f.cendes1, M.l.f. balthazar1,2
1neuroimaging laboratory, departments of neurology, school of Medical sciences, university of campinas-unIcAMp, sao paulo, brazil, 2unit for neuropsychology and neurolinguistics, department of neurology, university of campinas - unIcAMp, sp, brazil.
introduction: Studies in theoretical graph analysis of Alzheimer’s disease (AD) have reported changes in neural networks, such as the Default Mode Network (DMN). Our goal is to find patterns based on graph theo-
retical analysis over DMN that can best separate groups and estimate the maximum gain of information of this analysis. Materials and Methods: One hundred and twelve total participants were evaluated: 35 mild AD1, 27 amnestic Mild Cognitive Impairment (aMCI)2 and 50 healthy controls. For the resting state fMRI connectivity preprocessing and anal-ysis, we used an in house SPM-based toolbox (www.lni.hc.unicamp.br/app/uf2c). We added 16 ROIs of the DMN (based on the Automated Anatomical Labeling – AAL – template over the MNI space) to perform a full cross-correlation analysis. The graph analyses were based on ROIs with absolute correlation greater than 0.2. Our analysis involved several local (average neighbor degree, Katz centrality, eigenvector centrality, betweenness centrality, communicability centrality, pagerank, cluster-ing) and global (average clustering, average node connectivity, average shortest path length, Estrada index, node connectivity, diameter, density) metrics based on graph analysis. Results: ROC analysis of the data showed Area Under the Curve (AUC) of 0.6622 to differentiate aMCI and Control groups using global metrics, with classification accuracy (CA) of 0.7013. Global metrics differentiated aMCI and DA groups (AUC 0.6422 and CA 0.5968). Local metrics differentiated well only DA and Control groups, with AUC of 0.6509 and CA 0.6471. Con-clusion: Our work showed relatively well group separation using only fMRI information. This may lead to new discoveries on brain function of aMCI’s and Alzheimer’s brain and new ways of clinically distinguish them, helping the diagnosis. The findings suggest that aMCI patients may be characterized by global functional alterations of the DMN structure better than local alterations. This is probably because aMCI patients do not present enough brain structural damage to affect specific regions. AD patients, however, can be better characterized by local alterations of the selected ROIs of the DMN, possibly due to the extended brain damage, which is enough to generate local alterations.References: [1] Albert MS, et al. The diagnosis of mild cognitive impairment due to Alzheimer’s disease: recommendations from the National Institute on Ag-ing-Alzheimer’s Association workgroups on diagnostic guidelines for Alzheimer’s disease. Alzheimers Dement. 2011;7:270-9; [2] McKhann GM. Changing concepts of Alzheimer disease. JAMA. 2011;305:2458-9.
Abnormal copy number variations identified in pa-tients with malformations of cerebral cortex
f.r. torres1, d.A. de souza2, M.g. Mazutti1, M.M. guerreiro2, M.A. Montenegro2, A.c. dos santos3, V.c. terra3, A.s. sakamoto3, f. cendes2, I. lopes-cendes2
1department of Medical genetics, 2department of neurology, school of Medical sciences, university of campinas-unIcAMp, sao paulo, brazil, 3department of neuroscience, university of sao paulo-usp, brazil.
introduction: Patients with malformations of cerebral cortex (MCC) often suffer from seizures refractory to antiepileptic drugs. Advances in molecular biology have led to a better understanding of MCC etiology. However, the genetic cause still remains unidentified in the majority of patients. Recent studies have implicated large, rare copy number variations (CNVs) in a range of neurodevelopmental disorders. The aim of this study was search for deleterious CNVs in patients with MCC. Materials and Methods: We used a high resolution SNP array platform (CytoScan® HD) to investigate CNVs in a cohort of 52 patients with MCC, including liss-encephaly spectrum, nodular periventricular heterotopia, polymicrogyria and schizencephaly. To assess the clinical significance of the insertions/deletions found, we checked CNVs in the Database of Genomic Variants (DGV) and The International Standards For Cytogenomic Arrays Consor-tium (ISCA). Genes located within the rare CNVs were subjected for specific Gene Ontology Terms (Go). Results: We detected 31 rare CNVs, including 19 potentially pathogenic variants. Average size of CNVs was 245kb, ranging from 113kb to 600kb. Each CNVcontains approximately two genes. Potentially pathogenic CNVs, according to DGV and ISCA databases, contain genes involved in cell division (NCAPG2, HAUS7), vesicle mediated transport (TSNARE1), actin cytoskeleton organization (DAAM1, ACTR6) and axon guidance or neuronal migration (PLXNA1, KIRREL3, ARX, DCX). discussion: Several genes that reside in regions spanned by rare and potentially pathogenic CNVs described here are related to molecular pathways involved with MCC. Deleterious mutations in genes controlling mitosis, vesicle mediated transport, cytoskeleton or-ganization and neuronal migration, such as WDR62, AFGRF2, FLN1 and LIS1 have been reported in patients with MCC. Conclusion: SNP arrays
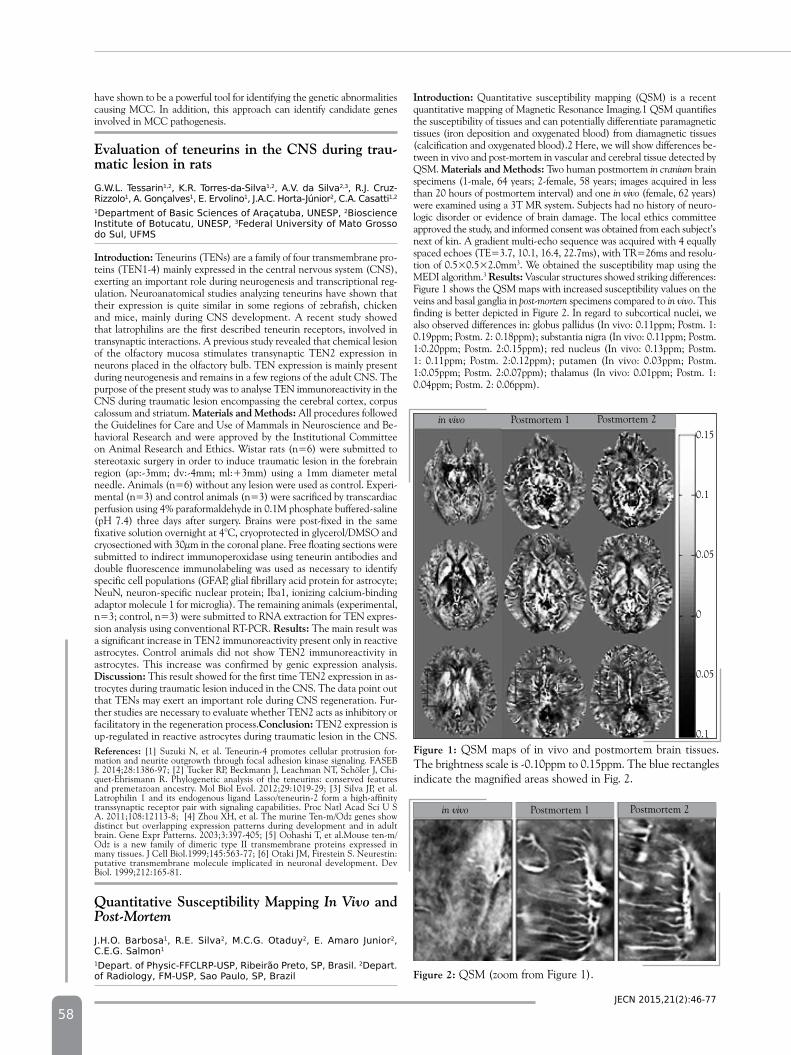
58Jecn 2015,21(2):46-77
have shown to be a powerful tool for identifying the genetic abnormalities causing MCC. In addition, this approach can identify candidate genes involved in MCC pathogenesis.
Evaluation of teneurins in the CnS during trau-matic lesion in rats
g.w.l. tessarin1,2, K.r. torres-da-silva1,2, A.V. da silva2,3, r.J. cruz-rizzolo1, A. gonçalves1, e. ervolino1, J.A.c. horta-Júnior2, c.A. casatti1,2
1department of basic sciences of Araçatuba, unesp, 2bioscience Institute of botucatu, unesp, 3federal university of Mato grosso do sul, ufMs
introduction: Teneurins (TENs) are a family of four transmembrane pro-teins (TEN1-4) mainly expressed in the central nervous system (CNS), exerting an important role during neurogenesis and transcriptional reg-ulation. Neuroanatomical studies analyzing teneurins have shown that their expression is quite similar in some regions of zebrafish, chicken and mice, mainly during CNS development. A recent study showed that latrophilins are the first described teneurin receptors, involved in transynaptic interactions. A previous study revealed that chemical lesion of the olfactory mucosa stimulates transynaptic TEN2 expression in neurons placed in the olfactory bulb. TEN expression is mainly present during neurogenesis and remains in a few regions of the adult CNS. The purpose of the present study was to analyse TEN immunoreactivity in the CNS during traumatic lesion encompassing the cerebral cortex, corpus calossum and striatum. Materials and Methods: All procedures followed the Guidelines for Care and Use of Mammals in Neuroscience and Be-havioral Research and were approved by the Institutional Committee on Animal Research and Ethics. Wistar rats (n=6) were submitted to stereotaxic surgery in order to induce traumatic lesion in the forebrain region (ap:-3mm; dv:-4mm; ml:+3mm) using a 1mm diameter metal needle. Animals (n=6) without any lesion were used as control. Experi-mental (n=3) and control animals (n=3) were sacrificed by transcardiac perfusion using 4% paraformaldehyde in 0.1M phosphate buffered-saline (pH 7.4) three days after surgery. Brains were post-fixed in the same fixative solution overnight at 4°C, cryoprotected in glycerol/DMSO and cryosectioned with 30µm in the coronal plane. Free floating sections were submitted to indirect immunoperoxidase using teneurin antibodies and double fluorescence immunolabeling was used as necessary to identify specific cell populations (GFAP, glial fibrillary acid protein for astrocyte; NeuN, neuron-specific nuclear protein; Iba1, ionizing calcium-binding adaptor molecule 1 for microglia). The remaining animals (experimental, n=3; control, n=3) were submitted to RNA extraction for TEN expres-sion analysis using conventional RT-PCR. Results: The main result was a significant increase in TEN2 immunoreactivity present only in reactive astrocytes. Control animals did not show TEN2 immunoreactivity in astrocytes. This increase was confirmed by genic expression analysis. discussion: This result showed for the first time TEN2 expression in as-trocytes during traumatic lesion induced in the CNS. The data point out that TENs may exert an important role during CNS regeneration. Fur-ther studies are necessary to evaluate whether TEN2 acts as inhibitory or facilitatory in the regeneration process.Conclusion: TEN2 expression is up-regulated in reactive astrocytes during traumatic lesion in the CNS.References: [1] Suzuki N, et al. Teneurin-4 promotes cellular protrusion for-mation and neurite outgrowth through focal adhesion kinase signaling. FASEB J. 2014;28:1386-97; [2] Tucker RP, Beckmann J, Leachman NT, Schöler J, Chi-quet-Ehrismann R. Phylogenetic analysis of the teneurins: conserved features and premetazoan ancestry. Mol Biol Evol. 2012;29:1019-29; [3] Silva JP, et al. Latrophilin 1 and its endogenous ligand Lasso/teneurin-2 form a high-affinity transsynaptic receptor pair with signaling capabilities. Proc Natl Acad Sci U S A. 2011;108:12113-8; [4] Zhou XH, et al. The murine Ten-m/Odz genes show distinct but overlapping expression patterns during development and in adult brain. Gene Expr Patterns. 2003;3:397-405; [5] Oohashi T, et al.Mouse ten-m/Odz is a new family of dimeric type II transmembrane proteins expressed in many tissues. J Cell Biol.1999;145:563-77; [6] Otaki JM, Firestein S. Neurestin: putative transmembrane molecule implicated in neuronal development. Dev Biol. 1999;212:165-81.
Quantitative Susceptibility Mapping In Vivo and Post-Mortem
J.h.o. barbosa1, r.e. silva2, M.c.g. otaduy2, e. Amaro Junior2, c.e.g. salmon1
1depart. of physic-ffclrp-usp, ribeirão preto, sp, brasil. 2depart. of radiology, fM-usp, sao paulo, sp, brazil
introduction: Quantitative susceptibility mapping (QSM) is a recent quantitative mapping of Magnetic Resonance Imaging.1 QSM quantifies the susceptibility of tissues and can potentially differentiate paramagnetic tissues (iron deposition and oxygenated blood) from diamagnetic tissues (calcification and oxygenated blood).2 Here, we will show differences be-tween in vivo and post-mortem in vascular and cerebral tissue detected by QSM. Materials and Methods: Two human postmortem in cranium brain specimens (1-male, 64 years; 2-female, 58 years; images acquired in less than 20 hours of postmortem interval) and one in vivo (female, 62 years) were examined using a 3T MR system. Subjects had no history of neuro-logic disorder or evidence of brain damage. The local ethics committee approved the study, and informed consent was obtained from each subject’s next of kin. A gradient multi-echo sequence was acquired with 4 equally spaced echoes (TE=3.7, 10.1, 16.4, 22.7ms), with TR=26ms and resolu-tion of 0.5×0.5×2.0mm3. We obtained the susceptibility map using the MEDI algorithm.3 Results: Vascular structures showed striking differences: Figure 1 shows the QSM maps with increased susceptibility values on the veins and basal ganglia in post-mortem specimens compared to in vivo. This finding is better depicted in Figure 2. In regard to subcortical nuclei, we also observed differences in: globus pallidus (In vivo: 0.11ppm; Postm. 1: 0.19ppm; Postm. 2: 0.18ppm); substantia nigra (In vivo: 0.11ppm; Postm. 1:0.20ppm; Postm. 2:0.15ppm); red nucleus (In vivo: 0.13ppm; Postm. 1: 0.11ppm; Postm. 2:0.12ppm); putamen (In vivo: 0.03ppm; Postm. 1:0.05ppm; Postm. 2:0.07ppm); thalamus (In vivo: 0.01ppm; Postm. 1: 0.04ppm; Postm. 2: 0.06ppm).
Figure 1: QSM maps of in vivo and postmortem brain tissues. The brightness scale is -0.10ppm to 0.15ppm. The blue rectangles indicate the magnified areas showed in Fig. 2.
Postmortem 1 Postmortem 2in vivo0.15
0.1
0.05
0
0.05
0.1
Figure 2: QSM (zoom from Figure 1).
Postmortem 1 Postmortem 2in vivo
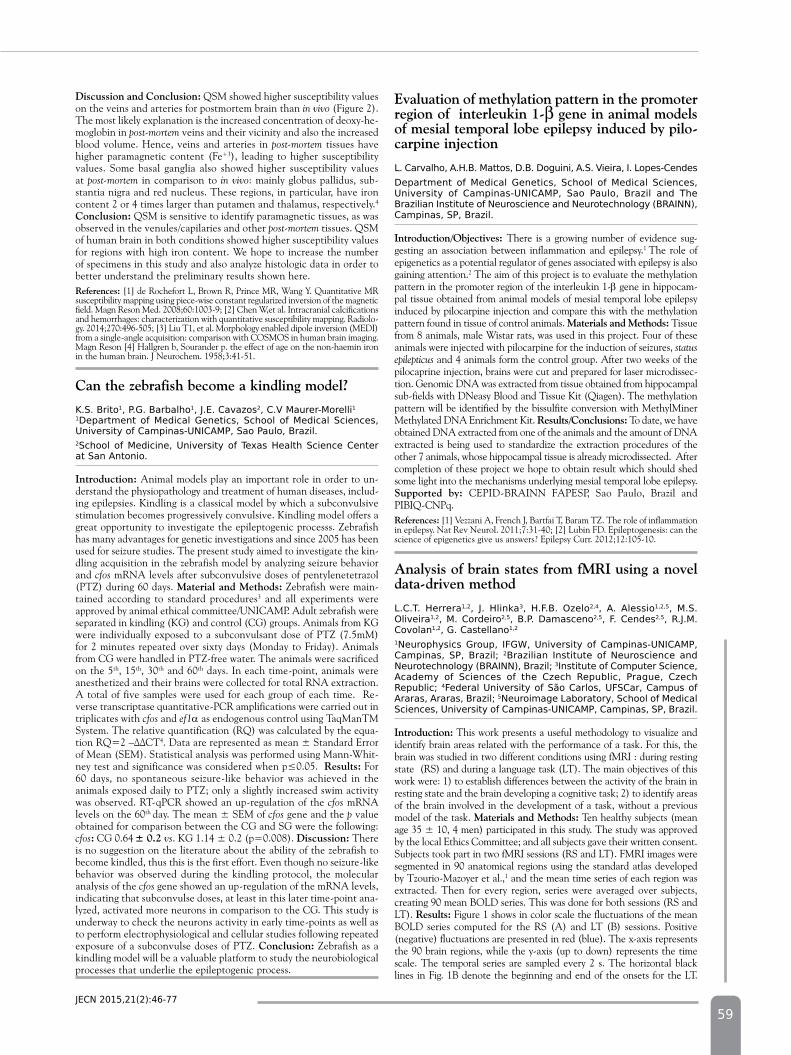
59Jecn 2015,21(2):46-77
discussion and Conclusion: QSM showed higher susceptibility values on the veins and arteries for postmortem brain than in vivo (Figure 2). The most likely explanation is the increased concentration of deoxy-he-moglobin in post-mortem veins and their vicinity and also the increased blood volume. Hence, veins and arteries in post-mortem tissues have higher paramagnetic content (Fe+3), leading to higher susceptibility values. Some basal ganglia also showed higher susceptibility values at post-mortem in comparison to in vivo: mainly globus pallidus, sub-stantia nigra and red nucleus. These regions, in particular, have iron content 2 or 4 times larger than putamen and thalamus, respectively.4 Conclusion: QSM is sensitive to identify paramagnetic tissues, as was observed in the venules/capilaries and other post-mortem tissues. QSM of human brain in both conditions showed higher susceptibility values for regions with high iron content. We hope to increase the number of specimens in this study and also analyze histologic data in order to better understand the preliminary results shown here. References: [1] de Rochefort L, Brown R, Prince MR, Wang Y. Quantitative MR susceptibility mapping using piece-wise constant regularized inversion of the magnetic field. Magn Reson Med. 2008;60:1003-9; [2] Chen W,et al. Intracranial calcifications and hemorrhages: characterization with quantitative susceptibility mapping. Radiolo-gy. 2014;270:496-505; [3] Liu T1, et al. Morphology enabled dipole inversion (MEDI) from a single-angle acquisition: comparison with COSMOS in human brain imaging. Magn Reson [4] Hallgren b, Sourander p. the effect of age on the non-haemin iron in the human brain. J Neurochem. 1958;3:41-51.
Can the zebrafish become a kindling model?
K.s. brito1, p.g. barbalho1, J.e. cavazos2, c.V Maurer-Morelli11department of Medical genetics, school of Medical sciences, university of campinas-unIcAMp, sao paulo, brazil.2school of Medicine, university of texas health science center at san Antonio.
introduction: Animal models play an important role in order to un-derstand the physiopathology and treatment of human diseases, includ-ing epilepsies. Kindling is a classical model by which a subconvulsive stimulation becomes progressively convulsive. Kindling model offers a great opportunity to investigate the epileptogenic processs. Zebrafish has many advantages for genetic investigations and since 2005 has been used for seizure studies. The present study aimed to investigate the kin-dling acquisition in the zebrafish model by analyzing seizure behavior and cfos mRNA levels after subconvulsive doses of pentylenetetrazol (PTZ) during 60 days. Material and Methods: Zebrafish were main-tained according to standard procedures3 and all experiments were approved by animal ethical committee/UNICAMP. Adult zebrafish were separated in kindling (KG) and control (CG) groups. Animals from KG were individually exposed to a subconvulsant dose of PTZ (7.5mM) for 2 minutes repeated over sixty days (Monday to Friday). Animals from CG were handled in PTZ-free water. The animals were sacrificed on the 5th, 15th, 30th and 60th days. In each time-point, animals were anesthetized and their brains were collected for total RNA extraction. A total of five samples were used for each group of each time. Re-verse transcriptase quantitative-PCR amplifications were carried out in triplicates with cfos and ef1α as endogenous control using TaqManTM System. The relative quantification (RQ) was calculated by the equa-tionRQ=2–ΔΔCT4. Data are represented as mean ± Standard Error of Mean (SEM). Statistical analysis was performed using Mann-Whit-neytestandsignificancewasconsideredwhenp≤0.05.Results: For 60 days, no spontaneous seizure-like behavior was achieved in the animals exposed daily to PTZ; only a slightly increased swim activity was observed. RT-qPCR showed an up-regulation of the cfos mRNA levels on the 60th day. The mean ± SEM of cfos gene and the p value obtained for comparison between the CG and SG were the following: cfos: CG 0.64 ± 0.2 vs. KG 1.14 ± 0.2 (p=0.008). discussion: There is no suggestion on the literature about the ability of the zebrafish to become kindled, thus this is the first effort. Even though no seizure-like behavior was observed during the kindling protocol, the molecular analysis of the cfos gene showed an up-regulation of the mRNA levels, indicating that subconvulse doses, at least in this later time-point ana-lyzed, activated more neurons in comparison to the CG. This study is underway to check the neurons activity in early time-points as well as to perform electrophysiological and cellular studies following repeated exposure of a subconvulse doses of PTZ. Conclusion: Zebrafish as a kindling model will be a valuable platform to study the neurobiological processes that underlie the epileptogenic process.
Evaluation of methylation pattern in the promoter region of interleukin 1-β gene in animal models of mesial temporal lobe epilepsy induced by pilo-carpine injection
l. carvalho, A.h.b. Mattos, d.b. doguini, A.s. Vieira, I. lopes-cendesdepartment of Medical genetics, school of Medical sciences, university of campinas-unIcAMp, sao paulo, brazil and the brazilian Institute of neuroscience and neurotechnology (brAInn), campinas, sp, brazil.
introduction/Objectives: There is a growing number of evidence sug-gesting an association between inflammation and epilepsy.1 The role of epigenetics as a potential regulator of genes associated with epilepsy is also gaining attention.2 The aim of this project is to evaluate the methylation pattern in the promoter region of the interleukin 1-β gene in hippocam-pal tissue obtained from animal models of mesial temporal lobe epilepsy induced by pilocarpine injection and compare this with the methylation pattern found in tissue of control animals. Materials and Methods: Tissue from 8 animals, male Wistar rats, was used in this project. Four of these animals were injected with pilocarpine for the induction of seizures, status epilepticus and 4 animals form the control group. After two weeks of the pilocaprine injection, brains were cut and prepared for laser microdissec-tion. Genomic DNA was extracted from tissue obtained from hippocampal sub-fields with DNeasy Blood and Tissue Kit (Qiagen). The methylation pattern will be identified by the bissulfite conversion with MethylMiner Methylated DNA Enrichment Kit. Results/Conclusions: To date, we have obtained DNA extracted from one of the animals and the amount of DNA extracted is being used to standardize the extraction procedures of the other 7 animals, whose hippocampal tissue is already microdissected. After completion of these project we hope to obtain result which should shed some light into the mechanisms underlying mesial temporal lobe epilepsy. Supported by: CEPID-BRAINN FAPESP, Sao Paulo, Brazil and PIBIQ-CNPq.References: [1] Vezzani A, French J, Bartfai T, Baram TZ. The role of inflammation in epilepsy. Nat Rev Neurol. 2011;7:31-40; [2] Lubin FD. Epileptogenesis: can the science of epigenetics give us answers? Epilepsy Curr. 2012;12:105-10.
Analysis of brain states from fMRi using a novel data-driven method
l.c.t. herrera1,2, J. hlinka3, h.f.b. ozelo2,4, A. Alessio1,2,5, M.s. oliveira1,2, M. cordeiro2,5, b.p. damasceno2,5, f. cendes2,5, r.J.M. covolan1,2, g. castellano1,2 1neurophysics group, Ifgw, university of campinas-unIcAMp, campinas, sp, brazil; 2brazilian Institute of neuroscience and neurotechnology (brAInn), brazil; 3Institute of computer science, Academy of sciences of the czech republic, prague, czech republic; 4federal university of são carlos, ufscar, campus of Araras, Araras, brazil; 5neuroimage laboratory, school of Medical sciences, university of campinas-unIcAMp, campinas, sp, brazil.
introduction: This work presents a useful methodology to visualize and identify brain areas related with the performance of a task. For this, the brain was studied in two different conditions using fMRI : during resting state (RS) and during a language task (LT). The main objectives of this work were: 1) to establish differences between the activity of the brain in resting state and the brain developing a cognitive task; 2) to identify areas of the brain involved in the development of a task, without a previous model of the task. Materials and Methods: Ten healthy subjects (mean age 35 ± 10, 4 men) participated in this study. The study was approved by the local Ethics Committee; and all subjects gave their written consent. Subjects took part in two fMRI sessions (RS and LT). FMRI images were segmented in 90 anatomical regions using the standard atlas developed by Tzourio-Mazoyer et al.,1 and the mean time series of each region was extracted. Then for every region, series were averaged over subjects, creating 90 mean BOLD series. This was done for both sessions (RS and LT). Results: Figure 1 shows in color scale the fluctuations of the mean BOLD series computed for the RS (A) and LT (B) sessions. Positive (negative) fluctuations are presented in red (blue). The x-axis represents the 90 brain regions, while the y-axis (up to down) represents the time scale. The temporal series are sampled every 2 s. The horizontal black lines in Fig. 1B denote the beginning and end of the onsets for the LT.
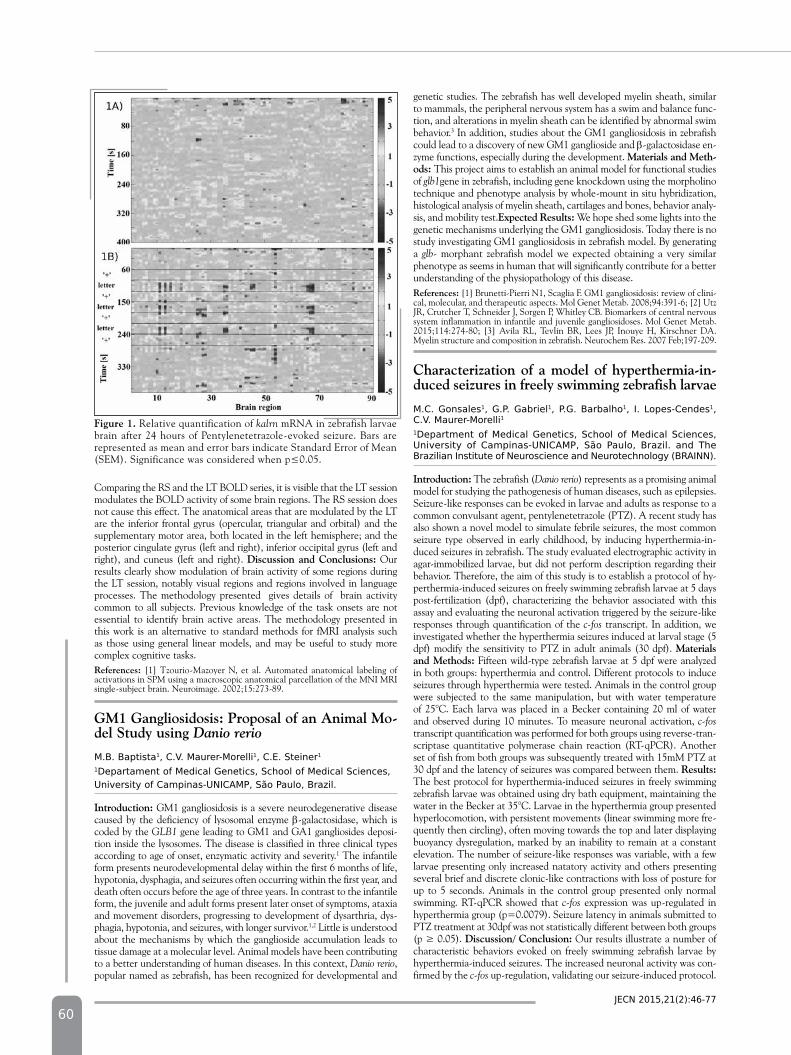
60Jecn 2015,21(2):46-77
genetic studies. The zebrafish has well developed myelin sheath, similar to mammals, the peripheral nervous system has a swim and balance func-tion, and alterations in myelin sheath can be identified by abnormal swim behavior.3 In addition, studies about the GM1 gangliosidosis in zebrafish could lead to a discovery of new GM1 ganglioside and β-galactosidase en-zyme functions, especially during the development. Materials and Meth-ods: This project aims to establish an animal model for functional studies of glb1gene in zebrafish, including gene knockdown using the morpholino technique and phenotype analysis by whole-mount in situ hybridization, histological analysis of myelin sheath, cartilages and bones, behavior analy-sis, and mobility test.Expected Results: We hope shed some lights into the genetic mechanisms underlying the GM1 gangliosidosis. Today there is no study investigating GM1 gangliosidosis in zebrafish model. By generating a glb- morphant zebrafish model we expected obtaining a very similar phenotype as seems in human that will significantly contribute for a better understanding of the physiopathology of this disease.References: [1] Brunetti-Pierri N1, Scaglia F. GM1 gangliosidosis: review of clini-cal, molecular, and therapeutic aspects. Mol Genet Metab. 2008;94:391-6; [2] Utz JR, Crutcher T, Schneider J, Sorgen P, Whitley CB. Biomarkers of central nervous system inflammation in infantile and juvenile gangliosidoses. Mol Genet Metab. 2015;114:274-80; [3] Avila RL, Tevlin BR, Lees JP, Inouye H, Kirschner DA. Myelin structure and composition in zebrafish. Neurochem Res. 2007 Feb;197-209.
Characterization of a model of hyperthermia-in-duced seizures in freely swimming zebrafish larvae
M.c. gonsales1, g.p. gabriel1, p.g. barbalho1, I. lopes-cendes1, c.V. Maurer-Morelli11department of Medical genetics, school of Medical sciences, university of campinas-unIcAMp, são paulo, brazil. and the brazilian Institute of neuroscience and neurotechnology (brAInn).
introduction: The zebrafish (Danio rerio) represents as a promising animal model for studying the pathogenesis of human diseases, such as epilepsies. Seizure-like responses can be evoked in larvae and adults as response to a common convulsant agent, pentylenetetrazole (PTZ). A recent study has also shown a novel model to simulate febrile seizures, the most common seizure type observed in early childhood, by inducing hyperthermia-in-duced seizures in zebrafish. The study evaluated electrographic activity in agar-immobilized larvae, but did not perform description regarding their behavior. Therefore, the aim of this study is to establish a protocol of hy-perthermia-induced seizures on freely swimming zebrafish larvae at 5 days post-fertilization (dpf), characterizing the behavior associated with this assay and evaluating the neuronal activation triggered by the seizure-like responses through quantification of the c-fos transcript. In addition, we investigated whether the hyperthermia seizures induced at larval stage (5 dpf) modify the sensitivity to PTZ in adult animals (30 dpf). Materials and Methods: Fifteen wild-type zebrafish larvae at 5 dpf were analyzed in both groups: hyperthermia and control. Different protocols to induce seizures through hyperthermia were tested. Animals in the control group were subjected to the same manipulation, but with water temperature of 25°C. Each larva was placed in a Becker containing 20 ml of water and observed during 10 minutes. To measure neuronal activation, c-fos transcript quantification was performed for both groups using reverse-tran-scriptase quantitative polymerase chain reaction (RT-qPCR). Another set of fish from both groups was subsequently treated with 15mM PTZ at 30 dpf and the latency of seizures was compared between them. Results: The best protocol for hyperthermia-induced seizures in freely swimming zebrafish larvae was obtained using dry bath equipment, maintaining the water in the Becker at 35°C. Larvae in the hyperthermia group presented hyperlocomotion, with persistent movements (linear swimming more fre-quently then circling), often moving towards the top and later displaying buoyancy dysregulation, marked by an inability to remain at a constant elevation. The number of seizure-like responses was variable, with a few larvae presenting only increased natatory activity and others presenting several brief and discrete clonic-like contractions with loss of posture for up to 5 seconds. Animals in the control group presented only normal swimming. RT-qPCR showed that c-fos expression was up-regulated in hyperthermia group (p=0.0079). Seizure latency in animals submitted to PTZ treatment at 30dpf was not statistically different between both groups (p≥0.05).discussion/ Conclusion: Our results illustrate a number of characteristic behaviors evoked on freely swimming zebrafish larvae by hyperthermia-induced seizures. The increased neuronal activity was con-firmed by the c-fos up-regulation, validating our seizure-induced protocol.
Comparing the RS and the LT BOLD series, it is visible that the LT session modulates the BOLD activity of some brain regions. The RS session does not cause this effect. The anatomical areas that are modulated by the LT are the inferior frontal gyrus (opercular, triangular and orbital) and the supplementary motor area, both located in the left hemisphere; and the posterior cingulate gyrus (left and right), inferior occipital gyrus (left and right), and cuneus (left and right). discussion and Conclusions: Our results clearly show modulation of brain activity of some regions during the LT session, notably visual regions and regions involved in language processes. The methodology presented gives details of brain activity common to all subjects. Previous knowledge of the task onsets are not essential to identify brain active areas. The methodology presented in this work is an alternative to standard methods for fMRI analysis such as those using general linear models, and may be useful to study more complex cognitive tasks. References: [1] Tzourio-Mazoyer N, et al. Automated anatomical labeling of activations in SPM using a macroscopic anatomical parcellation of the MNI MRI single-subject brain. Neuroimage. 2002;15:273-89.
GM1 Gangliosidosis: proposal of an Animal Mo-del Study using Danio rerio
M.b. baptista1, c.V. Maurer-Morelli1, c.e. steiner1
1departament of Medical genetics, school of Medical sciences, university of campinas-unIcAMp, são paulo, brazil.
introduction: GM1 gangliosidosis is a severe neurodegenerative disease caused by the deficiency of lysosomal enzyme β-galactosidase, which is coded by the GLB1 gene leading to GM1 and GA1 gangliosides deposi-tion inside the lysosomes. The disease is classified in three clinical types according to age of onset, enzymatic activity and severity.1 The infantile form presents neurodevelopmental delay within the first 6 months of life, hypotonia, dysphagia, and seizures often occurring within the first year, and death often occurs before the age of three years. In contrast to the infantile form, the juvenile and adult forms present later onset of symptoms, ataxia and movement disorders, progressing to development of dysarthria, dys-phagia, hypotonia, and seizures, with longer survivor.1,2 Little is understood about the mechanisms by which the ganglioside accumulation leads to tissue damage at a molecular level. Animal models have been contributing to a better understanding of human diseases. In this context, Danio rerio, popular named as zebrafish, has been recognized for developmental and
Figure 1. Relative quantification of kalrn mRNA in zebrafish larvae brain after 24 hours of Pentylenetetrazole-evoked seizure. Bars are represented as mean and error bars indicate Standard Error of Mean (SEM).Significancewasconsideredwhenp≤0.05.
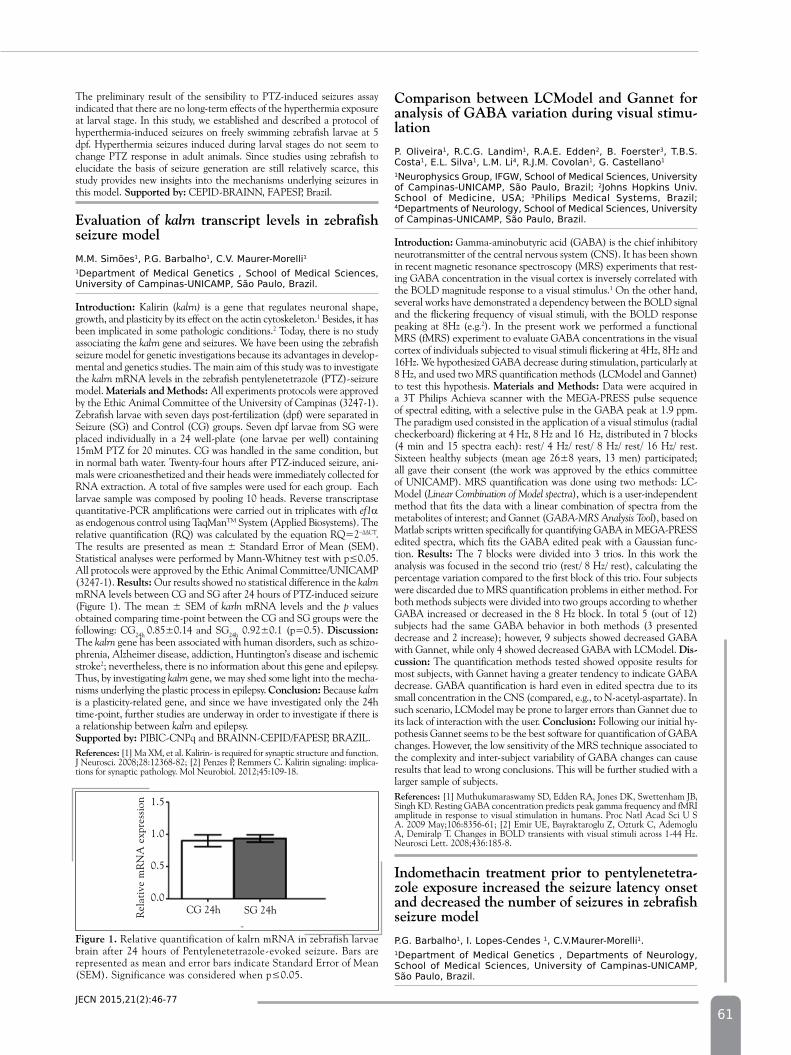
61
The preliminary result of the sensibility to PTZ-induced seizures assay indicated that there are no long-term effects of the hyperthermia exposure at larval stage. In this study, we established and described a protocol of hyperthermia-induced seizures on freely swimming zebrafish larvae at 5 dpf. Hyperthermia seizures induced during larval stages do not seem to change PTZ response in adult animals. Since studies using zebrafish to elucidate the basis of seizure generation are still relatively scarce, this study provides new insights into the mechanisms underlying seizures in this model. Supported by: CEPID-BRAINN, FAPESP, Brazil.
Evaluation of kalrn transcript levels in zebrafish seizure model
M.M. simões1, p.g. barbalho1, c.V. Maurer-Morelli11department of Medical genetics , school of Medical sciences, university of campinas-unIcAMp, são paulo, brazil.
introduction: Kalirin (kalrn) is a gene that regulates neuronal shape, growth, and plasticity by its effect on the actin cytoskeleton.1 Besides, it has been implicated in some pathologic conditions.2 Today, there is no study associating the kalrn gene and seizures. We have been using the zebrafish seizure model for genetic investigations because its advantages in develop-mental and genetics studies. The main aim of this study was to investigate the kalrn mRNA levels in the zebrafish pentylenetetrazole (PTZ)-seizure model. Materials and Methods: All experiments protocols were approved by the Ethic Animal Committee of the University of Campinas (3247-1). Zebrafish larvae with seven days post-fertilization (dpf) were separated in Seizure (SG) and Control (CG) groups. Seven dpf larvae from SG were placed individually in a 24 well-plate (one larvae per well) containing 15mM PTZ for 20 minutes. CG was handled in the same condition, but in normal bath water. Twenty-four hours after PTZ-induced seizure, ani-mals were crioanesthetized and their heads were immediately collected for RNA extraction. A total of five samples were used for each group. Each larvae sample was composed by pooling 10 heads. Reverse transcriptase quantitative-PCR amplifications were carried out in triplicates with ef1α as endogenous control using TaqManTM System (Applied Biosystems). The relative quantification (RQ) was calculated by the equation RQ=2–ΔΔCT. The results are presented as mean ± Standard Error of Mean (SEM). StatisticalanalyseswereperformedbyMann-Whitneytestwithp≤0.05.All protocols were approved by the Ethic Animal Committee/UNICAMP (3247-1). Results: Our results showed no statistical difference in the kalrn mRNA levels between CG and SG after 24 hours of PTZ-induced seizure (Figure 1). The mean ± SEM of karln mRNA levels and the p values obtained comparing time-point between the CG and SG groups were the following: CG24h 0.85±0.14 and SG24h 0.92±0.1 (p=0.5). discussion: The kalrn gene has been associated with human disorders, such as schizo-phrenia, Alzheimer disease, addiction, Huntington’s disease and ischemic stroke2; nevertheless, there is no information about this gene and epilepsy. Thus, by investigating kalrn gene, we may shed some light into the mecha-nisms underlying the plastic process in epilepsy. Conclusion: Because kalrn is a plasticity-related gene, and since we have investigated only the 24h time-point, further studies are underway in order to investigate if there is a relationship between kalrn and epilepsy. Supported by: PIBIC-CNPq and BRAINN-CEPID/FAPESP, BRAZIL.References: [1] Ma XM, et al. Kalirin- is required for synaptic structure and function. J Neurosci. 2008;28:12368-82; [2] Penzes P, Remmers C. Kalirin signaling: implica-tions for synaptic pathology. Mol Neurobiol. 2012;45:109-18.
Comparison between LCModel and Gannet for analysis of GABA variation during visual stimu-lation
p. oliveira1, r.c.g. landim1, r.A.e. edden2, b. foerster3, t.b.s. costa1, e.l. silva1, l.M. li4, r.J.M. covolan1, g. castellano1
1neurophysics group, Ifgw, school of Medical sciences, university of campinas-unIcAMp, são paulo, brazil; 2Johns hopkins univ. school of Medicine, usA; 3philips Medical systems, brazil; 4departments of neurology, school of Medical sciences, university of campinas-unIcAMp, são paulo, brazil.
introduction: Gamma-aminobutyric acid (GABA) is the chief inhibitory neurotransmitter of the central nervous system (CNS). It has been shown in recent magnetic resonance spectroscopy (MRS) experiments that rest-ing GABA concentration in the visual cortex is inversely correlated with the BOLD magnitude response to a visual stimulus.1 On the other hand, several works have demonstrated a dependency between the BOLD signal and the flickering frequency of visual stimuli, with the BOLD response peaking at 8Hz (e.g.2). In the present work we performed a functional MRS (fMRS) experiment to evaluate GABA concentrations in the visual cortex of individuals subjected to visual stimuli flickering at 4Hz, 8Hz and 16Hz. We hypothesized GABA decrease during stimulation, particularly at 8 Hz, and used two MRS quantification methods (LCModel and Gannet) to test this hypothesis. Materials and Methods: Data were acquired in a 3T Philips Achieva scanner with the MEGA-PRESS pulse sequence of spectral editing, with a selective pulse in the GABA peak at 1.9 ppm. The paradigm used consisted in the application of a visual stimulus (radial checkerboard) flickering at 4 Hz, 8 Hz and 16 Hz, distributed in 7 blocks (4 min and 15 spectra each): rest/ 4 Hz/ rest/ 8 Hz/ rest/ 16 Hz/ rest. Sixteen healthy subjects (mean age 26±8 years, 13 men) participated; all gave their consent (the work was approved by the ethics committee of UNICAMP). MRS quantification was done using two methods: LC-Model (Linear Combination of Model spectra), which is a user-independent method that fits the data with a linear combination of spectra from the metabolites of interest; and Gannet (GABA-MRS Analysis Tool), based on Matlab scripts written specifically for quantifying GABA in MEGA-PRESS edited spectra, which fits the GABA edited peak with a Gaussian func-tion. Results: The 7 blocks were divided into 3 trios. In this work the analysis was focused in the second trio (rest/ 8 Hz/ rest), calculating the percentage variation compared to the first block of this trio. Four subjects were discarded due to MRS quantification problems in either method. For both methods subjects were divided into two groups according to whether GABA increased or decreased in the 8 Hz block. In total 5 (out of 12) subjects had the same GABA behavior in both methods (3 presented decrease and 2 increase); however, 9 subjects showed decreased GABA with Gannet, while only 4 showed decreased GABA with LCModel. dis-cussion: The quantification methods tested showed opposite results for most subjects, with Gannet having a greater tendency to indicate GABA decrease. GABA quantification is hard even in edited spectra due to its small concentration in the CNS (compared, e.g., to N-acetyl-aspartate). In such scenario, LCModel may be prone to larger errors than Gannet due to its lack of interaction with the user. Conclusion: Following our initial hy-pothesis Gannet seems to be the best software for quantification of GABA changes. However, the low sensitivity of the MRS technique associated to the complexity and inter-subject variability of GABA changes can cause results that lead to wrong conclusions. This will be further studied with a larger sample of subjects.References: [1] Muthukumaraswamy SD, Edden RA, Jones DK, Swettenham JB, Singh KD. Resting GABA concentration predicts peak gamma frequency and fMRI amplitude in response to visual stimulation in humans. Proc Natl Acad Sci U S A. 2009 May;106:8356-61; [2] Emir UE, Bayraktaroglu Z, Ozturk C, Ademoglu A, Demiralp T. Changes in BOLD transients with visual stimuli across 1-44 Hz. Neurosci Lett. 2008;436:185-8.
indomethacin treatment prior to pentylenetetra-zole exposure increased the seizure latency onset and decreased the number of seizures in zebrafish seizure model
p.g. barbalho1, I. lopes-cendes 1, c.V.Maurer-Morelli1.1department of Medical genetics , departments of neurology, school of Medical sciences, university of campinas-unIcAMp, são paulo, brazil.
Jecn 2015,21(2):46-77
Figure 1. Relative quantification of kalrn mRNA in zebrafish larvae brain after 24 hours of Pentylenetetrazole-evoked seizure. Bars are represented as mean and error bars indicate Standard Error of Mean (SEM).Significancewasconsideredwhenp≤0.05.
Rel
ativ
e m
RN
A e
xpre
ssio
n 1.5
1.0
0.5
0.0CG 24h SG 24h
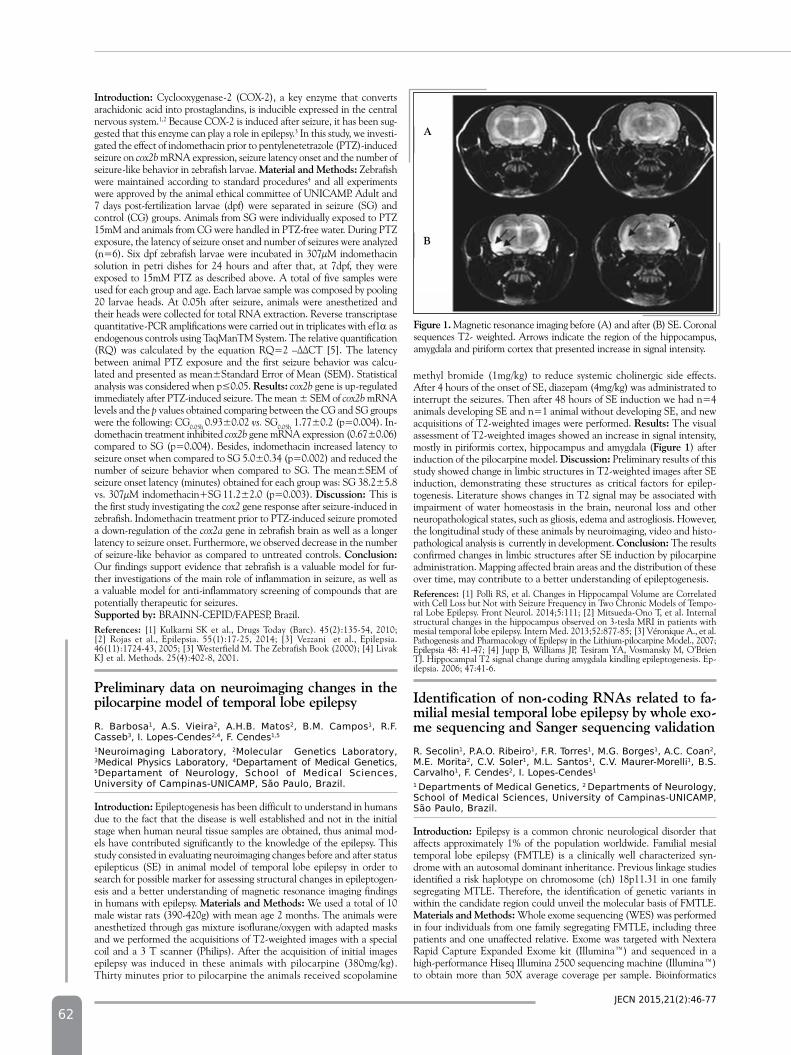
62
introduction: Cyclooxygenase-2 (COX-2), a key enzyme that converts arachidonic acid into prostaglandins, is inducible expressed in the central nervous system.1,2 Because COX-2 is induced after seizure, it has been sug-gested that this enzyme can play a role in epilepsy.3 In this study, we investi-gated the effect of indomethacin prior to pentylenetetrazole (PTZ)-induced seizure on cox2b mRNA expression, seizure latency onset and the number of seizure-like behavior in zebrafish larvae. Material and Methods: Zebrafish were maintained according to standard procedures4 and all experiments were approved by the animal ethical committee of UNICAMP. Adult and 7 days post-fertilization larvae (dpf) were separated in seizure (SG) and control (CG) groups. Animals from SG were individually exposed to PTZ 15mM and animals from CG were handled in PTZ-free water. During PTZ exposure, the latency of seizure onset and number of seizures were analyzed (n=6). Six dpf zebrafish larvae were incubated in 307µM indomethacin solution in petri dishes for 24 hours and after that, at 7dpf, they were exposed to 15mM PTZ as described above. A total of five samples were used for each group and age. Each larvae sample was composed by pooling 20 larvae heads. At 0.05h after seizure, animals were anesthetized and their heads were collected for total RNA extraction. Reverse transcriptase quantitative-PCR amplifications were carried out in triplicates with ef1α as endogenous controls using TaqManTM System. The relative quantification (RQ)was calculatedby theequationRQ=2–ΔΔCT[5].The latencybetween animal PTZ exposure and the first seizure behavior was calcu-lated and presented as mean±Standard Error of Mean (SEM). Statistical analysiswasconsideredwhenp≤0.05.Results: cox2b gene is up-regulated immediately after PTZ-induced seizure. The mean ± SEM of cox2b mRNA levels and the p values obtained comparing between the CG and SG groups were the following: CG0.05h 0.93±0.02 vs. SG0.05h 1.77±0.2 (p=0.004). In-domethacin treatment inhibited cox2b gene mRNA expression (0.67±0.06) compared to SG (p=0.004). Besides, indomethacin increased latency to seizure onset when compared to SG 5.0±0.34 (p=0.002) and reduced the number of seizure behavior when compared to SG. The mean±SEM of seizure onset latency (minutes) obtained for each group was: SG 38.2±5.8 vs. 307µM indomethacin+SG 11.2±2.0 (p=0.003). discussion: This is the first study investigating the cox2 gene response after seizure-induced in zebrafish. Indomethacin treatment prior to PTZ-induced seizure promoted a down-regulation of the cox2a gene in zebrafish brain as well as a longer latency to seizure onset. Furthermore, we observed decrease in the number of seizure-like behavior as compared to untreated controls. Conclusion: Our findings support evidence that zebrafish is a valuable model for fur-ther investigations of the main role of inflammation in seizure, as well as a valuable model for anti-inflammatory screening of compounds that are potentially therapeutic for seizures. Supported by: BRAINN-CEPID/FAPESP, Brazil.References: [1] Kulkarni SK et al., Drugs Today (Barc). 45(2):135-54, 2010; [2] Rojas et al., Epilepsia. 55(1):17-25, 2014; [3] Vezzani et al., Epilepsia. 46(11):1724-43, 2005; [3] Westerfield M. The Zebrafish Book (2000); [4] Livak KJ et al. Methods. 25(4):402-8, 2001.
preliminary data on neuroimaging changes in the pilocarpine model of temporal lobe epilepsy
r. barbosa1, A.s. Vieira2, A.h.b. Matos2, b.M. campos1, r.f. casseb3, I. lopes-cendes2,4, f. cendes1,5
1neuroimaging laboratory, 2Molecular genetics laboratory, 3Medical physics laboratory, 4departament of Medical genetics, 5departament of neurology, school of Medical sciences, university of campinas-unIcAMp, são paulo, brazil.
introduction: Epileptogenesis has been difficult to understand in humans due to the fact that the disease is well established and not in the initial stage when human neural tissue samples are obtained, thus animal mod-els have contributed significantly to the knowledge of the epilepsy. This study consisted in evaluating neuroimaging changes before and after status epilepticus (SE) in animal model of temporal lobe epilepsy in order to search for possible marker for assessing structural changes in epileptogen-esis and a better understanding of magnetic resonance imaging findings in humans with epilepsy. Materials and Methods: We used a total of 10 male wistar rats (390-420g) with mean age 2 months. The animals were anesthetized through gas mixture isoflurane/oxygen with adapted masks and we performed the acquisitions of T2-weighted images with a special coil and a 3 T scanner (Philips). After the acquisition of initial images epilepsy was induced in these animals with pilocarpine (380mg/kg). Thirty minutes prior to pilocarpine the animals received scopolamine
methyl bromide (1mg/kg) to reduce systemic cholinergic side effects. After 4 hours of the onset of SE, diazepam (4mg/kg) was administrated to interrupt the seizures. Then after 48 hours of SE induction we had n=4 animals developing SE and n=1 animal without developing SE, and new acquisitions of T2-weighted images were performed. Results: The visual assessment of T2-weighted images showed an increase in signal intensity, mostly in piriformis cortex, hippocampus and amygdala (Figure 1) after induction of the pilocarpine model. discussion: Preliminary results of this study showed change in limbic structures in T2-weighted images after SE induction, demonstrating these structures as critical factors for epilep-togenesis. Literature shows changes in T2 signal may be associated with impairment of water homeostasis in the brain, neuronal loss and other neuropathological states, such as gliosis, edema and astrogliosis. However, the longitudinal study of these animals by neuroimaging, video and histo-pathological analysis is currently in development. Conclusion: The results confirmed changes in limbic structures after SE induction by pilocarpine administration. Mapping affected brain areas and the distribution of these over time, may contribute to a better understanding of epileptogenesis. References: [1] Polli RS, et al. Changes in Hippocampal Volume are Correlated with Cell Loss but Not with Seizure Frequency in Two Chronic Models of Tempo-ral Lobe Epilepsy. Front Neurol. 2014;5:111; [2] Mitsueda-Ono T, et al. Internal structural changes in the hippocampus observed on 3-tesla MRI in patients with mesial temporal lobe epilepsy. Intern Med. 2013;52:877-85; [3] Véronique A., et al. Pathogenesis and Pharmacology of Epilepsy in the Lithium-pilocarpine Model., 2007; Epilepsia 48: 41-47; [4] Jupp B, Williams JP, Tesiram YA, Vosmansky M, O’Brien TJ. Hippocampal T2 signal change during amygdala kindling epileptogenesis. Ep-ilepsia. 2006; 47:41-6.
identification of non-coding RnAs related to fa-milial mesial temporal lobe epilepsy by whole exo-me sequencing and Sanger sequencing validation
r. secolin1, p.A.o. ribeiro1, f.r. torres1, M.g. borges1, A.c. coan2, M.e. Morita2, c.V. soler1, M.l. santos1, c.V. Maurer-Morelli1, b.s. carvalho1, f. cendes2, I. lopes-cendes1
1 departments of Medical genetics, 2 departments of neurology, school of Medical sciences, university of campinas-unIcAMp, são paulo, brazil.
introduction: Epilepsy is a common chronic neurological disorder that affects approximately 1% of the population worldwide. Familial mesial temporal lobe epilepsy (FMTLE) is a clinically well characterized syn-drome with an autosomal dominant inheritance. Previous linkage studies identified a risk haplotype on chromosome (ch) 18p11.31 in one family segregating MTLE. Therefore, the identification of genetic variants in within the candidate region could unveil the molecular basis of FMTLE. Materials and Methods: Whole exome sequencing (WES) was performed in four individuals from one family segregating FMTLE, including three patients and one unaffected relative. Exome was targeted with Nextera Rapid Capture Expanded Exome kit (Illumina™) and sequenced in a high-performance Hiseq Illumina 2500 sequencing machine (Illumina™) to obtain more than 50X average coverage per sample. Bioinformatics
Jecn 2015,21(2):46-77
Figure 1. Magnetic resonance imaging before (A) and after (B) SE. Coronal sequences T2- weighted. Arrows indicate the region of the hippocampus, amygdala and piriform cortex that presented increase in signal intensity.
A
B
63
analysis was performed using the GATK software package. Sequences were aligned using BWA algorithm. Variant calling and functional pre-diction was performed using VariantAnnotator and Variant Effect Pre-diction (VEP) tools. Genetic variant analyses were prioritized within the candidate region on ch 18p31.11. Variants found were validated by Sanger sequencing in additional 21 family members, including 14 patients sharing the affected haplotype on ch 18p31.11. Results: WES revealed a total of 272956 variants. Among them, six variants were found within ch 18p31.11 region (rs75897598, rs11363931, rs79570056, rs76231122, rs34214240 and rs3833206). Further Sanger sequencing validation showed that all 14 haplotype-positive individuals share the rs75897598 and rs76231122 variants. In addition, all four individuals previously sequenced by WES presented the same genotype by Sanger sequencing. discussion: Among ch 18p haplotype-positive individuals, eight have the diagnoses of FMTLE, two have had only a single seizure, two have the diagnoses of generalized epilepsy and two are asymptomatic relatives. However, all of them pre-sented hippocampal abnormalities, including hippocampal atrophy and/or abnormal shape or axis identified on MRI. The two validate variants are located in two long intergenic non-protein coding RNA (LINC00526 and LINC00667, respectively). Conclusion: lncRNAs were recently found to be related to several neurological diseases. Therefore, these two lncRNAs could be involved in the etiology of FMTLE.
neuroeducationUnderstanding differences in learning process: the mental model proposition
f. bressan1, g.s. spagnol2, l.M. li3 1economics and Management center, 2puc campinas, sp, brazil, 3departments of neurology, school of Medical sciences, university of campinas-unIcAMp, são paulo, brazil.
introduction: This work consisted in verifying the mental model influ-ences on students’ learning process and classroom preferences and its theoretical relationship to neuroeducation. Students have different levels of motivation, and different responses to specific classroom environments. Information and cues from classroom environment are perceived, pro-cessed and used differently, according his or her mental model. Mental model is the usual working mind pattern of one person, derived from the combination of one’s perception pattern with data organization / ar-rangement and preferred decision making models. Why some students are comfortable with theories and abstractions and others feel much more at home with facts and observable phenomena? The authors conclude that the student’s mental model – operational or strategic – may explain their learning process and preferences. Materials and Methods: To do this assessment, the questionnaire “Questionário de Inclinações Pessoais” was used. The questionnaire, developed Maria de Lourdes Ramos da Silva (SILVA, 1992), drawing on The Keirsey Temperament Sorter (KEIRSEY & BATES, 1978) The respondents for this exploratory study included ad-ministrators, engineers, physicians, advertising and publicity, physicists, and others professionals, all interested in mastering in business administration. The questionnaire was completed by all 197 professionals – 101 (51.3%) male and 96 (48,7%) female. Results: We found that the most frequent mental model among MBA professionals assessed in this exploratory study is the operational mental model (74.6%). This means that these profession-al will prefer a practical and realistic data collection process, focused on “here-and-now” demonstrating high level of confidence in objective facts, proven data, previous experiences and in the provide by senses information that they enjoy to organize and structure. They learn in step-by-step way and have a preference for an organized class pattern; they value a learning environment that has a fair number of rules and standard ways in doing things, where policies are previously definite and are accomplished by the school. They let past experiences guide then in solving practical problems. They are problem solvers rather than problem finders. discussion/Con-clusion: The results found are probably due to the differences on mental models. By analyzing the mental model proposition, it may be said that operational mental model looks like as the Piaget concrete operational stage, the stage when people can only to solve problems that apply to concrete events or objects. In this stage, abstract, hypothetical thinking,
a characteristic of strategic mental model, is not completely developed. This consideration appoint to the need and the possibility for developing the strategic mental model in order to help people to develop the com-petence for thinking abstractly and hypothetically. Results indicate the relative low frequency of the thinking preferred model. The most frequent mental model found among these professionals is a thinking model that is characterized by focusing here-and-now issues and by trusting facts, proven data, and previous experience, and the information their five senses brings. This appointed low frequency of a strategic mental model may be correlated to and explains why some students are comfortable with theories and abstractions and others feel much more at home with facts and observable phenomena. References: [1] Feuerstein R. et al. Teachers College. 2010. p.157; [2] Jung CG. Atlas, SP, 1991; [3] Keirsey D.; Bates M. Prometheus. 1978. p. 216; [4] Keller T, Weibler J. Behind managers´ Ambidexterity. Schmalenbach Business Rev. 2014;66:309-33; [5] Loureiro-Martínez, D. et al. Understanding the exploration–exploitation dilema. Strategic Management J. 36(3):2015;319-38; [6] Silva MLR. Personalidade e Escolha Profissional: subsídios de Keirsey e Bates para Orientação Vocacional. 1ª. ed. São Paulo: EPU.1992. v.2000.129 p.
Building an interactive Webdocumentary for Lear-ning and Raising Awareness about Epilepsy
f.n. Akhras1,2, p.s.c. ferreira1, M.t. dutra1, f.s. gutiyama2, J.e. Vicentini3,4, l.l. Min3,4, g.s. spagnol3,4, I.s.A.M. Assumpção3,4
1ctI renato Archer, 2IA, university of campinas-unIcAMp, são paulo, brazil, 3school of Medical sciences, university of campinas-unIcAMp, são paulo, brazil., 4Aspe.
introduction: In this work we discuss some examples of webdocumentaries developed to deliver medical information, and present an approach to the development of an interactive webdocumentary to raise awareness about epilepsy. The aim of the project is to increase knowledge about epilepsy in the Brazilian population,1 in order to promote social inclusion of people with epilepsy. A webdocumentary is a system of audiovisual content that uses the interactivity and non-linearity of the web to provide new forms of learning experience. A fundamental aspect of a webdocumentary is the creation of ways of structuring and organizing the audiovisual content on the web, so that it allows new forms of interaction with the content that can increase the involvement of the user, thus facilitating the assimilation of the content. Instead of a passive receiver, the user becomes an active participant of the process of making sense of the audiovisual material, exploring the material in ways that are productive to promote learning. Webdocumentaries about Medical Situations: In order to illustrate these and other characteristics of webdocumentaries, with a focus on webdocu-mentaries built to deliver medical information, in this poster we discuss two of these webdocumentaries: The Big Issue2, which addresses the problem of obesity, and Insomnia3, which offers a collective report on insomnia. Content of the Webdocumentary about Epilepsy: As webdocumentaries about medical situations tend to give voice to the people affected by the diseases, a webdocumentary about epilepsy can be able to give voice to the people with epilepsy and to those that live with them, to talk about the reality of living with the disease and what are its consequences. It can also be able to inform what can be done to ameliorate the effects of the disease, the types of epilepsy that exist, and other factors that can collab-orate to reduce the prejudice and demystify the disease. However, due to the stigma associated with epilepsy, we believe that to give voice to these people so that they can report their own cases directly in video would not be appropriate because of the exposition that this will cause. The alterna-tive is to develop a webdocumentary based on animations. This will also allow to take a lighter approach to the subject, demystifying the disease. Collecting Information: In order to create the animations we needed a way of having access to the experience of people with epilepsy in all its aspects. This is being done through a work that is being carried out by part of our team, which is focused on extracting information from people with epilepsy who participate in a meeting that occurs weekly in the Out-Patient Clinics at the Hospital de Clínicas of UNICAMP. In these meetings, people talk about their experience with the disease, allowing the researchers to make their profile in terms of quality of life, stigma, depression and anxiety symptoms, as well as the burden of their caregivers.4 The data collection approach taken in these meetings follows the concept of Narrative Med-icine, which support that a medical practice centered on the sick person should include the competence of interpreting “stories of illness” in order to better deal with the personal experience of the illness. The stories will be audio recorded and will address topics like: pregnant women with epilepsy,
Jecn 2015,21(2):46-77
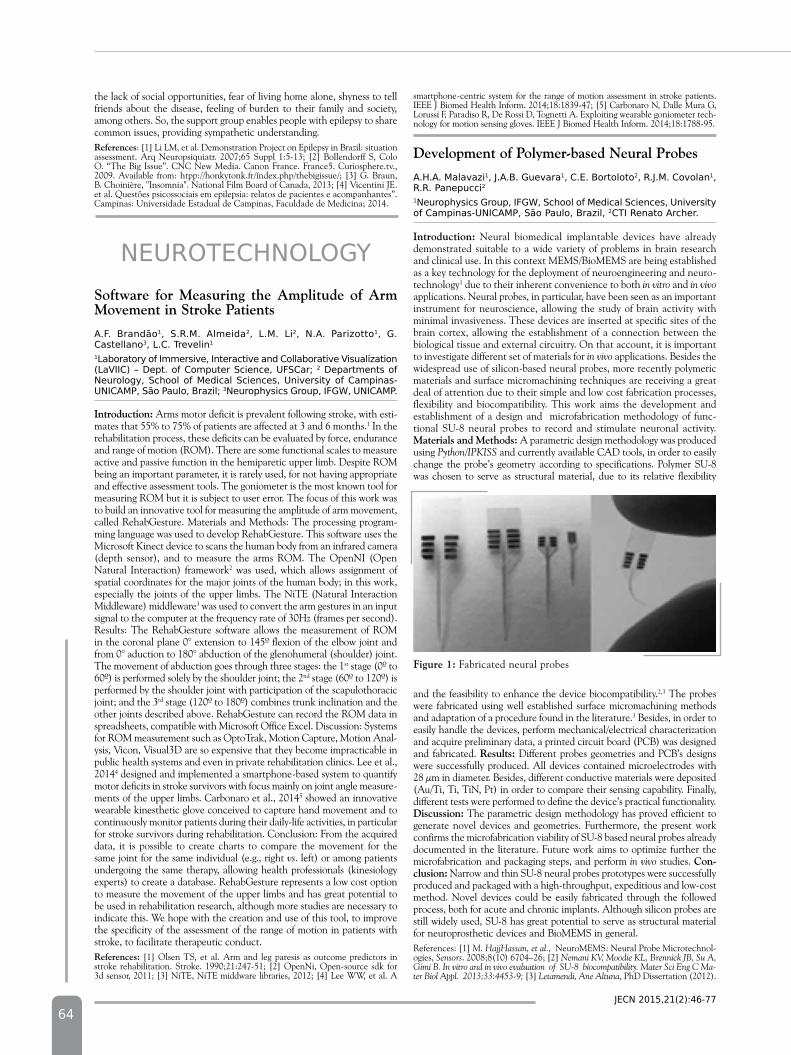
64
the lack of social opportunities, fear of living home alone, shyness to tell friends about the disease, feeling of burden to their family and society, among others. So, the support group enables people with epilepsy to share common issues, providing sympathetic understanding.References: [1] Li LM, et al. Demonstration Project on Epilepsy in Brazil: situation assessment. Arq Neuropsiquiatr. 2007;65 Suppl 1:5-13; [2] Bollendorff S, Colo O. “The Big Issue”. CNC New Media. Canon France. France5. Curiosphere.tv., 2009. Available from: htpp://honkytonk.fr/índex.php/thebigissue/; [3] G. Braun, B. Choinière, "Insomnia". National Film Board of Canada, 2013; [4] Vicentini JE. et al. Questões psicossociais em epilepsia: relatos de pacientes e acompanhantes”. Campinas: Universidade Estadual de Campinas, Faculdade de Medicina; 2014.
neurotechnologySoftware for Measuring the Amplitude of Arm Movement in Stroke patients
A.f. brandão1, s.r.M. Almeida2, l.M. li2, n.A. parizotto1, g. castellano3, l.c. trevelin1
1laboratory of Immersive, Interactive and collaborative Visualization (laVIIc) – dept. of computer science, ufscar; 2 departments of neurology, school of Medical sciences, university of campinas-unIcAMp, são paulo, brazil; 3neurophysics group, Ifgw, unIcAMp.
introduction: Arms motor deficit is prevalent following stroke, with esti-mates that 55% to 75% of patients are affected at 3 and 6 months.1 In the rehabilitation process, these deficits can be evaluated by force, endurance and range of motion (ROM). There are some functional scales to measure active and passive function in the hemiparetic upper limb. Despite ROM being an important parameter, it is rarely used, for not having appropriate and effective assessment tools. The goniometer is the most known tool for measuring ROM but it is subject to user error. The focus of this work was to build an innovative tool for measuring the amplitude of arm movement, called RehabGesture. Materials and Methods: The processing program-ming language was used to develop RehabGesture. This software uses the Microsoft Kinect device to scans the human body from an infrared camera (depth sensor), and to measure the arms ROM. The OpenNI (Open Natural Interaction) framework2 was used, which allows assignment of spatial coordinates for the major joints of the human body; in this work, especially the joints of the upper limbs. The NiTE (Natural Interaction Middleware) middleware3 was used to convert the arm gestures in an input signal to the computer at the frequency rate of 30Hz (frames per second). Results: The RehabGesture software allows the measurement of ROM in the coronal plane 0° extension to 145º flexion of the elbow joint and from 0° aduction to 180° abduction of the glenohumeral (shoulder) joint. The movement of abduction goes through three stages: the 1st stage (0º to 60º) is performed solely by the shoulder joint; the 2nd stage (60º to 120º) is performed by the shoulder joint with participation of the scapulothoracic joint; and the 3rd stage (120º to 180º) combines trunk inclination and the other joints described above. RehabGesture can record the ROM data in spreadsheets, compatible with Microsoft Office Excel. Discussion: Systems for ROM measurement such as OptoTrak, Motion Capture, Motion Anal-ysis, Vicon, Visual3D are so expensive that they become impracticable in public health systems and even in private rehabilitation clinics. Lee et al., 20144 designed and implemented a smartphone-based system to quantify motor deficits in stroke survivors with focus mainly on joint angle measure-ments of the upper limbs. Carbonaro et al., 20145 showed an innovative wearable kinesthetic glove conceived to capture hand movement and to continuously monitor patients during their daily-life activities, in particular for stroke survivors during rehabilitation. Conclusion: From the acquired data, it is possible to create charts to compare the movement for the same joint for the same individual (e.g., right vs. left) or among patients undergoing the same therapy, allowing health professionals (kinesiology experts) to create a database. RehabGesture represents a low cost option to measure the movement of the upper limbs and has great potential to be used in rehabilitation research, although more studies are necessary to indicate this. We hope with the creation and use of this tool, to improve the specificity of the assessment of the range of motion in patients with stroke, to facilitate therapeutic conduct.References: [1] Olsen TS, et al. Arm and leg paresis as outcome predictors in stroke rehabilitation. Stroke. 1990;21:247-51; [2] OpenNi, Open-source sdk for 3d sensor, 2011; [3] NiTE, NiTE middware libraries, 2012; [4] Lee WW, et al. A
smartphone-centric system for the range of motion assessment in stroke patients. IEEE J Biomed Health Inform. 2014;18:1839-47; [5] Carbonaro N, Dalle Mura G, Lorussi F, Paradiso R, De Rossi D, Tognetti A. Exploiting wearable goniometer tech-nology for motion sensing gloves. IEEE J Biomed Health Inform. 2014;18:1788-95.
development of polymer-based neural probes
A.h.A. Malavazi1, J.A.b. guevara1, c.e. bortoloto2, r.J.M. covolan1, r.r. panepucci21neurophysics group, Ifgw, school of Medical sciences, university of campinas-unIcAMp, são paulo, brazil, 2ctI renato Archer.
introduction: Neural biomedical implantable devices have already demonstrated suitable to a wide variety of problems in brain research and clinical use. In this context MEMS/BioMEMS are being established as a key technology for the deployment of neuroengineering and neuro-technology1 due to their inherent convenience to both in vitro and in vivo applications. Neural probes, in particular, have been seen as an important instrument for neuroscience, allowing the study of brain activity with minimal invasiveness. These devices are inserted at specific sites of the brain cortex, allowing the establishment of a connection between the biological tissue and external circuitry. On that account, it is important to investigate different set of materials for in vivo applications. Besides the widespread use of silicon-based neural probes, more recently polymeric materials and surface micromachining techniques are receiving a great deal of attention due to their simple and low cost fabrication processes, flexibility and biocompatibility. This work aims the development and establishment of a design and microfabrication methodology of func-tional SU-8 neural probes to record and stimulate neuronal activity. Materials and Methods: A parametric design methodology was produced using Python/IPKISS and currently available CAD tools, in order to easily change the probe’s geometry according to specifications. Polymer SU-8 was chosen to serve as structural material, due to its relative flexibility
Jecn 2015,21(2):46-77
and the feasibility to enhance the device biocompatibility.2,3 The probes were fabricated using well established surface micromachining methods and adaptation of a procedure found in the literature.3 Besides, in order to easily handle the devices, perform mechanical/electrical characterization and acquire preliminary data, a printed circuit board (PCB) was designed and fabricated. Results: Different probes geometries and PCB’s designs were successfully produced. All devices contained microelectrodes with 28 µm in diameter. Besides, different conductive materials were deposited (Au/Ti, Ti, TiN, Pt) in order to compare their sensing capability. Finally, different tests were performed to define the device’s practical functionality. discussion: The parametric design methodology has proved efficient to generate novel devices and geometries. Furthermore, the present work confirms the microfabrication viability of SU-8 based neural probes already documented in the literature. Future work aims to optimize further the microfabrication and packaging steps, and perform in vivo studies. Con-clusion: Narrow and thin SU-8 neural probes prototypes were successfully produced and packaged with a high-throughput, expeditious and low-cost method. Novel devices could be easily fabricated through the followed process, both for acute and chronic implants. Although silicon probes are still widely used, SU-8 has great potential to serve as structural material for neuroprosthetic devices and BioMEMS in general.References: [1] M. HajjHassan, et al., NeuroMEMS: Neural Probe Microtechnol-ogies, Sensors. 2008;8(10) 6704–26; [2] Nemani KV, Moodie KL, Brennick JB, Su A, Gimi B. In vitro and in vivo evaluation of SU-8 biocompatibility. Mater Sci Eng C Ma-ter Biol Appl. 2013;33:4453-9; [3] Letamendi, Ane Altuna, PhD Dissertation (2012).
Figure 1: Fabricated neural probes
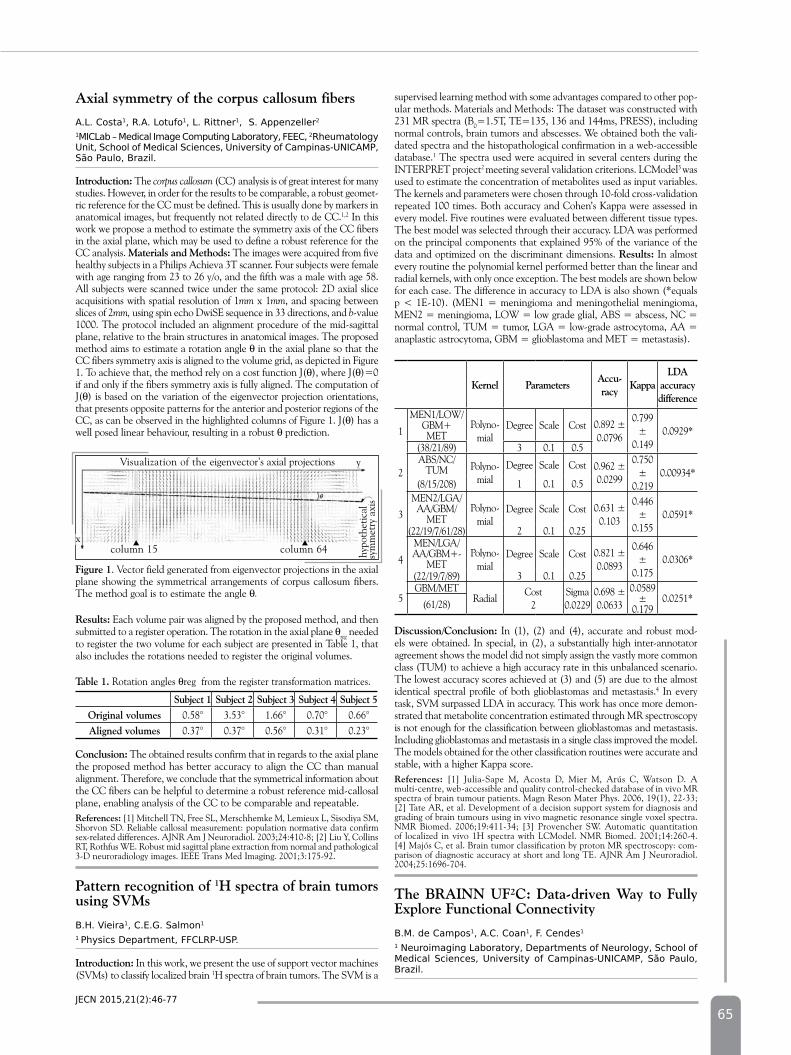
65
Axial symmetry of the corpus callosum fibers
A.l. costa1, r.A. lotufo1, l. rittner1, s. Appenzeller2
1MIclab – Medical Image computing laboratory, feec, 2rheumatology unit, school of Medical sciences, university of campinas-unIcAMp, são paulo, brazil.
introduction: The corpus callosum (CC) analysis is of great interest for many studies. However, in order for the results to be comparable, a robust geomet-ric reference for the CC must be defined. This is usually done by markers in anatomical images, but frequently not related directly to de CC.1,2 In this work we propose a method to estimate the symmetry axis of the CC fibers in the axial plane, which may be used to define a robust reference for the CC analysis. Materials and Methods: The images were acquired from five healthy subjects in a Philips Achieva 3T scanner. Four subjects were female with age ranging from 23 to 26 y/o, and the fifth was a male with age 58. All subjects were scanned twice under the same protocol: 2D axial slice acquisitions with spatial resolution of 1mm x 1mm, and spacing between slices of 2mm, using spin echo DwiSE sequence in 33 directions, and b-value 1000. The protocol included an alignment procedure of the mid-sagittal plane, relative to the brain structures in anatomical images. The proposed method aims to estimate a rotation angle θ in the axial plane so that the CC fibers symmetry axis is aligned to the volume grid, as depicted in Figure 1. To achieve that, the method rely on a cost function J(θ), where J(θ)=0 if and only if the fibers symmetry axis is fully aligned. The computation of J(θ) is based on the variation of the eigenvector projection orientations, that presents opposite patterns for the anterior and posterior regions of the CC, as can be observed in the highlighted columns of Figure 1. J(θ) has a well posed linear behaviour, resulting in a robust θ prediction.
supervised learning method with some advantages compared to other pop-ular methods. Materials and Methods: The dataset was constructed with 231 MR spectra (B0=1.5T, TE=135, 136 and 144ms, PRESS), including normal controls, brain tumors and abscesses. We obtained both the vali-dated spectra and the histopathological confirmation in a web-accessible database.1 The spectra used were acquired in several centers during the INTERPRET project2 meeting several validation criterions. LCModel3 was used to estimate the concentration of metabolites used as input variables. The kernels and parameters were chosen through 10-fold cross-validation repeated 100 times. Both accuracy and Cohen’s Kappa were assessed in every model. Five routines were evaluated between different tissue types. The best model was selected through their accuracy. LDA was performed on the principal components that explained 95% of the variance of the data and optimized on the discriminant dimensions. Results: In almost every routine the polynomial kernel performed better than the linear and radial kernels, with only once exception. The best models are shown below for each case. The difference in accuracy to LDA is also shown (*equals p < 1E-10). (MEN1 = meningioma and meningothelial meningioma, MEN2 = meningioma, LOW = low grade glial, ABS = abscess, NC = normal control, TUM = tumor, LGA = low-grade astrocytoma, AA = anaplastic astrocytoma, GBM = glioblastoma and MET = metastasis).
Kernel parametersAccu-racy
KappaLdA
accuracy difference
1
MEN1/LOW/GBM+MET
Polyno-mial
Degree Scale Cost 0.892 ± 0.0796
0.799 ±
0.1490.0929*
(38/21/89) 3 0.1 0.5
2ABS/NC/
TUM Polyno-mial
Degree Scale Cost 0.962 ± 0.0299
0.750 ±
0.2190.00934*
(8/15/208) 1 0.1 0.5
3
MEN2/LGA/AA/GBM/
METPolyno-
mialDegree Scale Cost 0.631 ±
0.103
0.446 ±
0.1550.0591*
(22/19/7/61/28) 2 0.1 0.25
4
MEN/LGA/AA/GBM+-
METPolyno-
mialDegree Scale Cost 0.821 ±
0.0893
0.646 ±
0.1750.0306*
(22/19/7/89) 3 0.1 0.25
5GBM/MET
RadialCost
2Sigma0.0229
0.698 ± 0.0633
0.0589 ±
0.1790.0251*(61/28)
discussion/Conclusion: In (1), (2) and (4), accurate and robust mod-els were obtained. In special, in (2), a substantially high inter-annotator agreement shows the model did not simply assign the vastly more common class (TUM) to achieve a high accuracy rate in this unbalanced scenario. The lowest accuracy scores achieved at (3) and (5) are due to the almost identical spectral profile of both glioblastomas and metastasis.4 In every task, SVM surpassed LDA in accuracy. This work has once more demon-strated that metabolite concentration estimated through MR spectroscopy is not enough for the classification between glioblastomas and metastasis. Including glioblastomas and metastasis in a single class improved the model. The models obtained for the other classification routines were accurate and stable, with a higher Kappa score.References: [1] Julia-Sape M, Acosta D, Mier M, Arús C, Watson D. A multi-centre, web-accessible and quality control-checked database of in vivo MR spectra of brain tumour patients. Magn Reson Mater Phys. 2006, 19(1), 22-33; [2] Tate AR, et al. Development of a decision support system for diagnosis and grading of brain tumours using in vivo magnetic resonance single voxel spectra.NMR Biomed. 2006;19:411-34; [3] Provencher SW. Automatic quantitation of localized in vivo 1H spectra with LCModel. NMR Biomed. 2001;14:260-4. [4] Majós C, et al. Brain tumor classification by proton MR spectroscopy: com-parison of diagnostic accuracy at short and long TE. AJNR Am J Neuroradiol. 2004;25:1696-704.
the BRAinn UF²C: data-driven Way to Fully Explore Functional Connectivity
b.M. de campos1, A.c. coan1, f. cendes1
1 neuroimaging laboratory, departments of neurology, school of Medical sciences, university of campinas-unIcAMp, são paulo, brazil.
Jecn 2015,21(2):46-77
Results: Each volume pair was aligned by the proposed method, and then submitted to a register operation. The rotation in the axial plane θreg needed to register the two volume for each subject are presented in Table 1, that also includes the rotations needed to register the original volumes.
table 1. Rotation angles θreg from the register transformation matrices.
Subject 1 Subject 2 Subject 3 Subject 4 Subject 5Original volumes 0.58° 3.53° 1.66° 0.70° 0.66°Aligned volumes 0.37° 0.37° 0.56° 0.31° 0.23°
Conclusion: The obtained results confirm that in regards to the axial plane the proposed method has better accuracy to align the CC than manual alignment. Therefore, we conclude that the symmetrical information about the CC fibers can be helpful to determine a robust reference mid-callosal plane, enabling analysis of the CC to be comparable and repeatable.References: [1] Mitchell TN, Free SL, Merschhemke M, Lemieux L, Sisodiya SM, Shorvon SD. Reliable callosal measurement: population normative data confirm sex-related differences. AJNR Am J Neuroradiol. 2003;24:410-8; [2] Liu Y, Collins RT, Rothfus WE. Robust mid sagittal plane extraction from normal and pathological 3-D neuroradiology images. IEEE Trans Med Imaging. 2001;3:175-92.
pattern recognition of 1H spectra of brain tumors using SVMs
b.h. Vieira1, c.e.g. salmon1
1 physics department, ffclrp-usp.
introduction: In this work, we present the use of support vector machines (SVMs) to classify localized brain 1H spectra of brain tumors. The SVM is a
Figure 1. Vector field generated from eigenvector projections in the axial plane showing the symmetrical arrangements of corpus callosum fibers. The method goal is to estimate the angle θ.
Visualization of the eigenvector's axial projections
column 15x
y
column 64
sym
met
ry a
xis
hypo
thet
ical
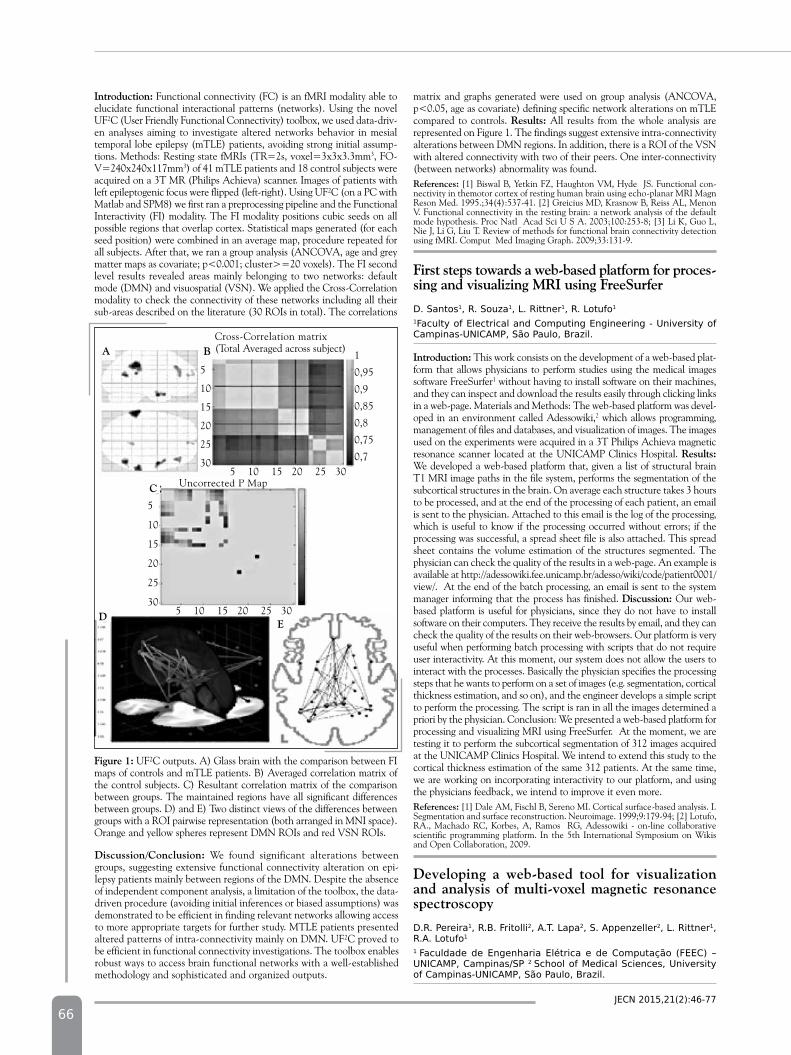
66
introduction: Functional connectivity (FC) is an fMRI modality able to elucidate functional interactional patterns (networks). Using the novel UF²C (User Friendly Functional Connectivity) toolbox, we used data-driv-en analyses aiming to investigate altered networks behavior in mesial temporal lobe epilepsy (mTLE) patients, avoiding strong initial assump-tions. Methods: Resting state fMRIs (TR=2s, voxel=3x3x3.3mm3, FO-V=240x240x117mm3) of 41 mTLE patients and 18 control subjects were acquired on a 3T MR (Philips Achieva) scanner. Images of patients with left epileptogenic focus were flipped (left-right). Using UF²C (on a PC with Matlab and SPM8) we first ran a preprocessing pipeline and the Functional Interactivity (FI) modality. The FI modality positions cubic seeds on all possible regions that overlap cortex. Statistical maps generated (for each seed position) were combined in an average map, procedure repeated for all subjects. After that, we ran a group analysis (ANCOVA, age and grey matter maps as covariate; p<0.001; cluster>=20 voxels). The FI second level results revealed areas mainly belonging to two networks: default mode (DMN) and visuospatial (VSN). We applied the Cross-Correlation modality to check the connectivity of these networks including all their sub-areas described on the literature (30 ROIs in total). The correlations
matrix and graphs generated were used on group analysis (ANCOVA, p<0.05, age as covariate) defining specific network alterations on mTLE compared to controls. Results: All results from the whole analysis are represented on Figure 1. The findings suggest extensive intra-connectivity alterations between DMN regions. In addition, there is a ROI of the VSN with altered connectivity with two of their peers. One inter-connectivity (between networks) abnormality was found. References: [1] Biswal B, Yetkin FZ, Haughton VM, Hyde JS. Functional con-nectivity in themotor cortex of resting human brain using echo-planar MRI Magn Reson Med. 1995.;34(4):537-41. [2] Greicius MD, Krasnow B, Reiss AL, Menon V. Functional connectivity in the resting brain: a network analysis of the default mode hypothesis. Proc Natl Acad Sci U S A. 2003;100:253-8; [3] Li K, Guo L, Nie J, Li G, Liu T. Review of methods for functional brain connectivity detection using fMRI. Comput Med Imaging Graph. 2009;33:131-9.
First steps towards a web-based platform for proces-sing and visualizing MRi using FreeSurfer
d. santos1, r. souza1, l. rittner1, r. lotufo1
1faculty of electrical and computing engineering - university of campinas-unIcAMp, são paulo, brazil.
introduction: This work consists on the development of a web-based plat-form that allows physicians to perform studies using the medical images software FreeSurfer1 without having to install software on their machines, and they can inspect and download the results easily through clicking links in a web-page. Materials and Methods: The web-based platform was devel-oped in an environment called Adessowiki,2 which allows programming, management of files and databases, and visualization of images. The images used on the experiments were acquired in a 3T Philips Achieva magnetic resonance scanner located at the UNICAMP Clinics Hospital. Results: We developed a web-based platform that, given a list of structural brain T1 MRI image paths in the file system, performs the segmentation of the subcortical structures in the brain. On average each structure takes 3 hours to be processed, and at the end of the processing of each patient, an email is sent to the physician. Attached to this email is the log of the processing, which is useful to know if the processing occurred without errors; if the processing was successful, a spread sheet file is also attached. This spread sheet contains the volume estimation of the structures segmented. The physician can check the quality of the results in a web-page. An example is available at http://adessowiki.fee.unicamp.br/adesso/wiki/code/patient0001/view/. At the end of the batch processing, an email is sent to the system manager informing that the process has finished. discussion: Our web-based platform is useful for physicians, since they do not have to install software on their computers. They receive the results by email, and they can check the quality of the results on their web-browsers. Our platform is very useful when performing batch processing with scripts that do not require user interactivity. At this moment, our system does not allow the users to interact with the processes. Basically the physician specifies the processing steps that he wants to perform on a set of images (e.g. segmentation, cortical thickness estimation, and so on), and the engineer develops a simple script to perform the processing. The script is ran in all the images determined a priori by the physician. Conclusion: We presented a web-based platform for processing and visualizing MRI using FreeSurfer. At the moment, we are testing it to perform the subcortical segmentation of 312 images acquired at the UNICAMP Clinics Hospital. We intend to extend this study to the cortical thickness estimation of the same 312 patients. At the same time, we are working on incorporating interactivity to our platform, and using the physicians feedback, we intend to improve it even more.References: [1] Dale AM, Fischl B, Sereno MI. Cortical surface-based analysis. I. Segmentation and surface reconstruction. Neuroimage. 1999;9:179-94; [2] Lotufo, RA., Machado RC, Korbes, A, Ramos RG, Adessowiki - on-line collaborative scientific programming platform. In the 5th International Symposium on Wikis and Open Collaboration, 2009.
developing a web-based tool for visualization and analysis of multi-voxel magnetic resonance spectroscopy
d.r. pereira1, r.b. fritolli2, A.t. lapa2, s. Appenzeller2, l. rittner1, r.A. lotufo1
1 faculdade de engenharia elétrica e de computação (feec) – unIcAMp, campinas/sp 2 school of Medical sciences, university of campinas-unIcAMp, são paulo, brazil.
Jecn 2015,21(2):46-77
discussion/Conclusion: We found significant alterations between groups, suggesting extensive functional connectivity alteration on epi-lepsy patients mainly between regions of the DMN. Despite the absence of independent component analysis, a limitation of the toolbox, the data-driven procedure (avoiding initial inferences or biased assumptions) was demonstrated to be efficient in finding relevant networks allowing access to more appropriate targets for further study. MTLE patients presented altered patterns of intra-connectivity mainly on DMN. UF²C proved to be efficient in functional connectivity investigations. The toolbox enables robust ways to access brain functional networks with a well-established methodology and sophisticated and organized outputs.
Figure 1: UF²C outputs. A) Glass brain with the comparison between FI maps of controls and mTLE patients. B) Averaged correlation matrix of the control subjects. C) Resultant correlation matrix of the comparison between groups. The maintained regions have all significant differences between groups. D) and E) Two distinct views of the differences between groups with a ROI pairwise representation (both arranged in MNI space). Orange and yellow spheres represent DMN ROIs and red VSN ROIs.
A
C
d
BCross-Correlation matrix (Total Averaged across subject)
Uncorrected P Map
5
10
15
20
25
30
1
0,95
0,9
0,85
0,8
0,75
0,7
5
10
15
20
25
30
5 10 15 20 25 30
E5 10 15 20 25 30
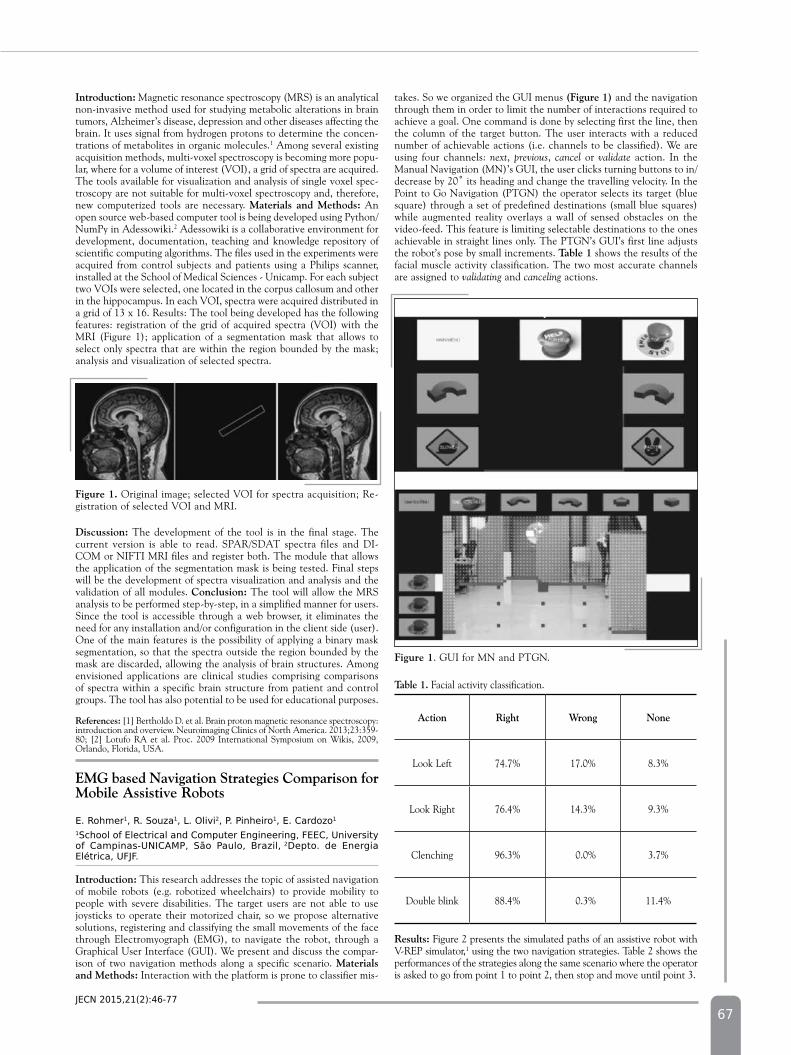
67
introduction: Magnetic resonance spectroscopy (MRS) is an analytical non-invasive method used for studying metabolic alterations in brain tumors, Alzheimer’s disease, depression and other diseases affecting the brain. It uses signal from hydrogen protons to determine the concen-trations of metabolites in organic molecules.1 Among several existing acquisition methods, multi-voxel spectroscopy is becoming more popu-lar, where for a volume of interest (VOI), a grid of spectra are acquired. The tools available for visualization and analysis of single voxel spec-troscopy are not suitable for multi-voxel spectroscopy and, therefore, new computerized tools are necessary. Materials and Methods: An open source web-based computer tool is being developed using Python/NumPy in Adessowiki.2 Adessowiki is a collaborative environment for development, documentation, teaching and knowledge repository of scientific computing algorithms. The files used in the experiments were acquired from control subjects and patients using a Philips scanner, installed at the School of Medical Sciences - Unicamp. For each subject two VOIs were selected, one located in the corpus callosum and other in the hippocampus. In each VOI, spectra were acquired distributed in a grid of 13 x 16. Results: The tool being developed has the following features: registration of the grid of acquired spectra (VOI) with the MRI (Figure 1); application of a segmentation mask that allows to select only spectra that are within the region bounded by the mask; analysis and visualization of selected spectra.
takes. So we organized the GUI menus (Figure 1) and the navigation through them in order to limit the number of interactions required to achieve a goal. One command is done by selecting first the line, then the column of the target button. The user interacts with a reduced number of achievable actions (i.e. channels to be classified). We are using four channels: next, previous, cancel or validate action. In the Manual Navigation (MN)’s GUI, the user clicks turning buttons to in/decrease by 20˚ its heading and change the travelling velocity. In the Point to Go Navigation (PTGN) the operator selects its target (blue square) through a set of predefined destinations (small blue squares) while augmented reality overlays a wall of sensed obstacles on the video-feed. This feature is limiting selectable destinations to the ones achievable in straight lines only. The PTGN’s GUI’s first line adjusts the robot’s pose by small increments. table 1 shows the results of the facial muscle activity classification. The two most accurate channels are assigned to validating and canceling actions.
Jecn 2015,21(2):46-77
discussion: The development of the tool is in the final stage. The current version is able to read. SPAR/SDAT spectra files and DI-COM or NIFTI MRI files and register both. The module that allows the application of the segmentation mask is being tested. Final steps will be the development of spectra visualization and analysis and the validation of all modules. Conclusion: The tool will allow the MRS analysis to be performed step-by-step, in a simplified manner for users. Since the tool is accessible through a web browser, it eliminates the need for any installation and/or configuration in the client side (user). One of the main features is the possibility of applying a binary mask segmentation, so that the spectra outside the region bounded by the mask are discarded, allowing the analysis of brain structures. Among envisioned applications are clinical studies comprising comparisons of spectra within a specific brain structure from patient and control groups. The tool has also potential to be used for educational purposes.
References: [1] Bertholdo D. et al. Brain proton magnetic resonance spectroscopy: introduction and overview. Neuroimaging Clinics of North America. 2013;23:359-80; [2] Lotufo RA et al. Proc. 2009 International Symposium on Wikis, 2009, Orlando, Florida, USA.
EMG based navigation Strategies Comparison for Mobile Assistive Robots
e. rohmer1, r. souza1, l. olivi2, p. pinheiro1, e. cardozo1 1school of electrical and computer engineering, feec, university of campinas-unIcAMp, são paulo, brazil, 2depto. de energia elétrica, ufJf.
introduction: This research addresses the topic of assisted navigation of mobile robots (e.g. robotized wheelchairs) to provide mobility to people with severe disabilities. The target users are not able to use joysticks to operate their motorized chair, so we propose alternative solutions, registering and classifying the small movements of the face through Electromyograph (EMG), to navigate the robot, through a Graphical User Interface (GUI). We present and discuss the compar-ison of two navigation methods along a specific scenario. Materials and Methods: Interaction with the platform is prone to classifier mis-
table 1. Facial activity classification.
Action Right Wrong none
Look Left 74.7% 17.0% 8.3%
Look Right 76.4% 14.3% 9.3%
Clenching 96.3% 0.0% 3.7%
Double blink 88.4% 0.3% 11.4%
Results: Figure 2 presents the simulated paths of an assistive robot with V-REP simulator,1 using the two navigation strategies. Table 2 shows the performances of the strategies along the same scenario where the operator is asked to go from point 1 to point 2, then stop and move until point 3.
Figure 1. Original image; selected VOI for spectra acquisition; Re-gistration of selected VOI and MRI.
Figure 1. GUI for MN and PTGN.
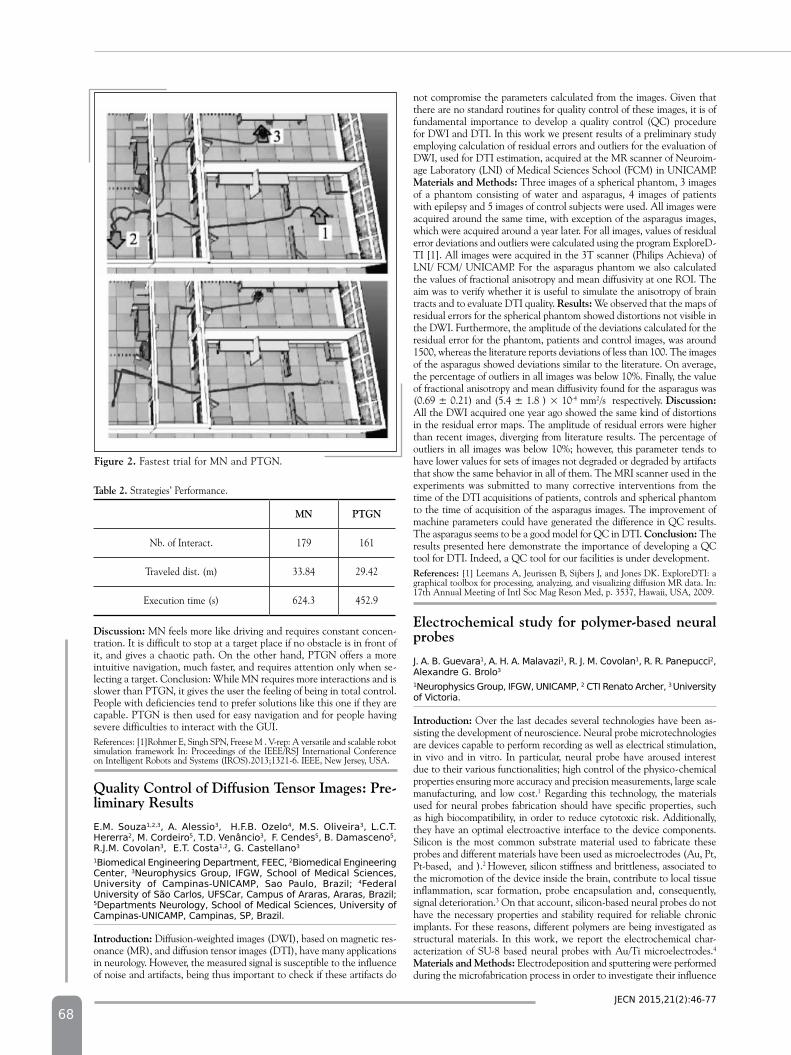
68
table 2. Strategies’ Performance.
Mn ptGn
Nb. of Interact. 179 161
Traveled dist. (m) 33.84 29.42
Execution time (s) 624.3 452.9
discussion: MN feels more like driving and requires constant concen-tration. It is difficult to stop at a target place if no obstacle is in front of it, and gives a chaotic path. On the other hand, PTGN offers a more intuitive navigation, much faster, and requires attention only when se-lecting a target. Conclusion: While MN requires more interactions and is slower than PTGN, it gives the user the feeling of being in total control. People with deficiencies tend to prefer solutions like this one if they are capable. PTGN is then used for easy navigation and for people having severe difficulties to interact with the GUI.References: [1]Rohmer E, Singh SPN, Freese M . V-rep: A versatile and scalable robot simulation framework In: Proceedings of the IEEE/RSJ International Conference on Intelligent Robots and Systems (IROS).2013;1321-6. IEEE, New Jersey, USA.
Quality Control of diffusion tensor images: pre-liminary Results
e.M. souza1,2,3, A. Alessio3, h.f.b. ozelo4, M.s. oliveira3, l.c.t. hererra2, M. cordeiro5, t.d. Venâncio3, f. cendes5, b. damasceno5, r.J.M. covolan3, e.t. costa1,2, g. castellano3
1biomedical engineering department, feec, 2biomedical engineering center, 3neurophysics group, Ifgw, school of Medical sciences, university of campinas-unIcAMp, sao paulo, brazil; 4federal university of são carlos, ufscar, campus of Araras, Araras, brazil; 5departments neurology, school of Medical sciences, university of campinas-unIcAMp, campinas, sp, brazil.
introduction: Diffusion-weighted images (DWI), based on magnetic res-onance (MR), and diffusion tensor images (DTI), have many applications in neurology. However, the measured signal is susceptible to the influence of noise and artifacts, being thus important to check if these artifacts do
not compromise the parameters calculated from the images. Given that there are no standard routines for quality control of these images, it is of fundamental importance to develop a quality control (QC) procedure for DWI and DTI. In this work we present results of a preliminary study employing calculation of residual errors and outliers for the evaluation of DWI, used for DTI estimation, acquired at the MR scanner of Neuroim-age Laboratory (LNI) of Medical Sciences School (FCM) in UNICAMP. Materials and Methods: Three images of a spherical phantom, 3 images of a phantom consisting of water and asparagus, 4 images of patients with epilepsy and 5 images of control subjects were used. All images were acquired around the same time, with exception of the asparagus images, which were acquired around a year later. For all images, values of residual error deviations and outliers were calculated using the program ExploreD-TI [1]. All images were acquired in the 3T scanner (Philips Achieva) of LNI/ FCM/ UNICAMP. For the asparagus phantom we also calculated the values of fractional anisotropy and mean diffusivity at one ROI. The aim was to verify whether it is useful to simulate the anisotropy of brain tracts and to evaluate DTI quality. Results: We observed that the maps of residual errors for the spherical phantom showed distortions not visible in the DWI. Furthermore, the amplitude of the deviations calculated for the residual error for the phantom, patients and control images, was around 1500, whereas the literature reports deviations of less than 100. The images of the asparagus showed deviations similar to the literature. On average, the percentage of outliers in all images was below 10%. Finally, the value of fractional anisotropy and mean diffusivity found for the asparagus was (0.69 ± 0.21) and (5.4 ± 1.8 ) × 10-4 mm2/s respectively. discussion: All the DWI acquired one year ago showed the same kind of distortions in the residual error maps. The amplitude of residual errors were higher than recent images, diverging from literature results. The percentage of outliers in all images was below 10%; however, this parameter tends to have lower values for sets of images not degraded or degraded by artifacts that show the same behavior in all of them. The MRI scanner used in the experiments was submitted to many corrective interventions from the time of the DTI acquisitions of patients, controls and spherical phantom to the time of acquisition of the asparagus images. The improvement of machine parameters could have generated the difference in QC results. The asparagus seems to be a good model for QC in DTI. Conclusion: The results presented here demonstrate the importance of developing a QC tool for DTI. Indeed, a QC tool for our facilities is under development.References: [1] Leemans A, Jeurissen B, Sijbers J, and Jones DK. ExploreDTI: a graphical toolbox for processing, analyzing, and visualizing diffusion MR data. In: 17th Annual Meeting of Intl Soc Mag Reson Med, p. 3537, Hawaii, USA, 2009.
Electrochemical study for polymer-based neural probes
J. A. b. guevara1, A. h. A. Malavazi1, r. J. M. covolan1, r. r. panepucci2, Alexandre g. brolo3
1neurophysics group, Ifgw, unIcAMp, 2 ctI renato Archer, 3 university of Victoria.
introduction: Over the last decades several technologies have been as-sisting the development of neuroscience. Neural probe microtechnologies are devices capable to perform recording as well as electrical stimulation, in vivo and in vitro. In particular, neural probe have aroused interest due to their various functionalities; high control of the physico-chemical properties ensuring more accuracy and precision measurements, large scale manufacturing, and low cost.1 Regarding this technology, the materials used for neural probes fabrication should have specific properties, such as high biocompatibility, in order to reduce cytotoxic risk. Additionally, they have an optimal electroactive interface to the device components. Silicon is the most common substrate material used to fabricate these probes and different materials have been used as microelectrodes (Au, Pt, Pt-based, and ).2 However, silicon stiffness and brittleness, associated to the micromotion of the device inside the brain, contribute to local tissue inflammation, scar formation, probe encapsulation and, consequently, signal deterioration.3 On that account, silicon-based neural probes do not have the necessary properties and stability required for reliable chronic implants. For these reasons, different polymers are being investigated as structural materials. In this work, we report the electrochemical char-acterization of SU-8 based neural probes with Au/Ti microelectrodes.4
Materials and Methods: Electrodeposition and sputtering were performed during the microfabrication process in order to investigate their influence
Jecn 2015,21(2):46-77
Figure 2. Fastest trial for MN and PTGN.
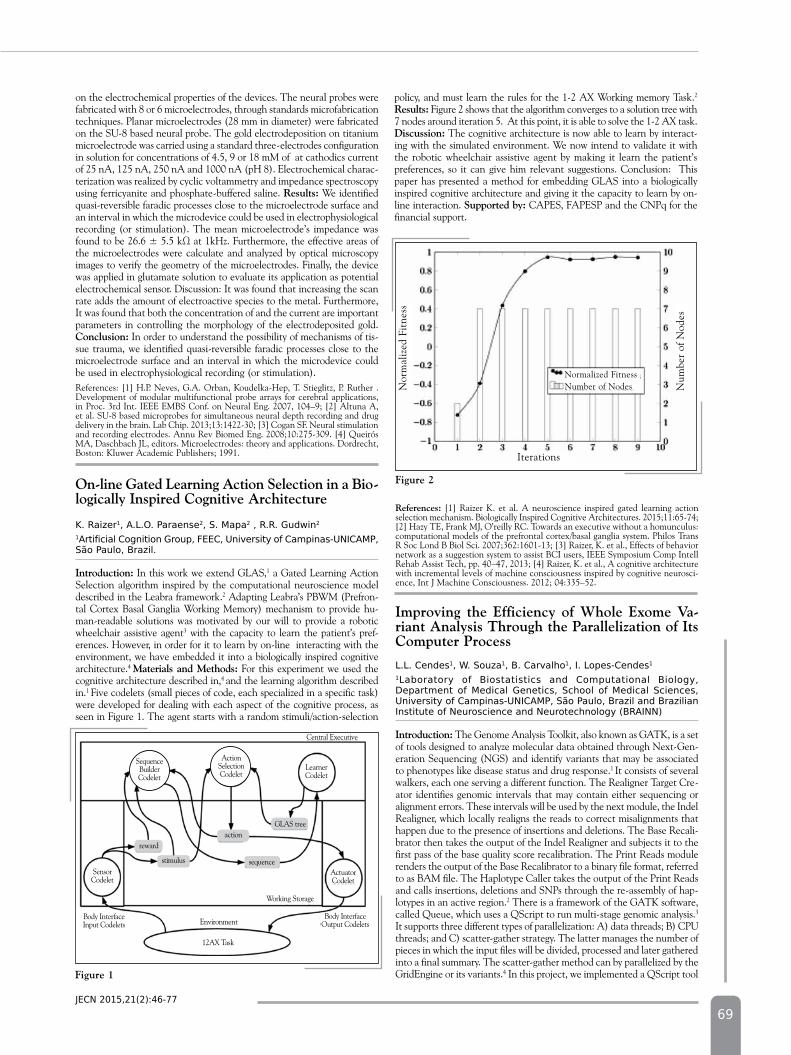
69
on the electrochemical properties of the devices. The neural probes were fabricated with 8 or 6 microelectrodes, through standards microfabrication techniques. Planar microelectrodes (28 mm in diameter) were fabricated on the SU-8 based neural probe. The gold electrodeposition on titanium microelectrode was carried using a standard three-electrodes configuration in solution for concentrations of 4.5, 9 or 18 mM of at cathodics current of 25 nA, 125 nA, 250 nA and 1000 nA (pH 8). Electrochemical charac-terization was realized by cyclic voltammetry and impedance spectroscopy using ferricyanite and phosphate-buffered saline. Results: We identified quasi-reversible faradic processes close to the microelectrode surface and an interval in which the microdevice could be used in electrophysiological recording (or stimulation). The mean microelectrode’s impedance was foundtobe26.6±5.5kΩat1kHz.Furthermore,theeffectiveareasofthe microelectrodes were calculate and analyzed by optical microscopy images to verify the geometry of the microelectrodes. Finally, the device was applied in glutamate solution to evaluate its application as potential electrochemical sensor. Discussion: It was found that increasing the scan rate adds the amount of electroactive species to the metal. Furthermore, It was found that both the concentration of and the current are important parameters in controlling the morphology of the electrodeposited gold. Conclusion: In order to understand the possibility of mechanisms of tis-sue trauma, we identified quasi-reversible faradic processes close to the microelectrode surface and an interval in which the microdevice could be used in electrophysiological recording (or stimulation).References: [1] H.P. Neves, G.A. Orban, Koudelka-Hep, T. Stieglitz, P. Ruther . Development of modular multifunctional probe arrays for cerebral applications, in Proc. 3rd Int. IEEE EMBS Conf. on Neural Eng. 2007, 104–9; [2] Altuna A, et al. SU-8 based microprobes for simultaneous neural depth recording and drug delivery in the brain. Lab Chip. 2013;13:1422-30; [3] Cogan SF. Neural stimulation and recording electrodes. Annu Rev Biomed Eng. 2008;10:275-309. [4] Queirós MA, Daschbach JL, editors. Microelectrodes: theory and applications. Dordrecht, Boston: Kluwer Academic Publishers; 1991.
On-line Gated Learning Action Selection in a Bio-logically inspired Cognitive Architecture
K. raizer1, A.l.o. paraense2, s. Mapa2 , r.r. gudwin2
1Artificial cognition group, feec, university of campinas-unIcAMp, são paulo, brazil.
introduction: In this work we extend GLAS,1 a Gated Learning Action Selection algorithm inspired by the computational neuroscience model described in the Leabra framework.2 Adapting Leabra’s PBWM (Prefron-tal Cortex Basal Ganglia Working Memory) mechanism to provide hu-man-readable solutions was motivated by our will to provide a robotic wheelchair assistive agent3 with the capacity to learn the patient’s pref-erences. However, in order for it to learn by on-line interacting with the environment, we have embedded it into a biologically inspired cognitive architecture.4 Materials and Methods: For this experiment we used the cognitive architecture described in,4 and the learning algorithm described in.1 Five codelets (small pieces of code, each specialized in a specific task) were developed for dealing with each aspect of the cognitive process, as seen in Figure 1. The agent starts with a random stimuli/action-selection
policy, and must learn the rules for the 1-2 AX Working memory Task.2 Results: Figure 2 shows that the algorithm converges to a solution tree with 7 nodes around iteration 5. At this point, it is able to solve the 1-2 AX task.discussion: The cognitive architecture is now able to learn by interact-ing with the simulated environment. We now intend to validate it with the robotic wheelchair assistive agent by making it learn the patient’s preferences, so it can give him relevant suggestions. Conclusion: This paper has presented a method for embedding GLAS into a biologically inspired cognitive architecture and giving it the capacity to learn by on-line interaction. Supported by: CAPES, FAPESP and the CNPq for the financial support.
Jecn 2015,21(2):46-77
References: [1] Raizer K. et al. A neuroscience inspired gated learning action selection mechanism. Biologically Inspired Cognitive Architectures. 2015;11:65-74; [2] Hazy TE, Frank MJ, O’reilly RC. Towards an executive without a homunculus: computational models of the prefrontal cortex/basal ganglia system. Philos Trans R Soc Lond B Biol Sci. 2007;362:1601-13; [3] Raizer, K. et al., Effects of behavior network as a suggestion system to assist BCI users, IEEE Symposium Comp Intell Rehab Assist Tech, pp. 40–47, 2013; [4] Raizer, K. et al., A cognitive architecture with incremental levels of machine consciousness inspired by cognitive neurosci-ence, Int J Machine Consciousness. 2012; 04:335–52.
improving the Efficiency of Whole Exome Va-riant Analysis through the parallelization of its Computer process
l.l. cendes1, w. souza1, b. carvalho1, I. lopes-cendes1
1laboratory of biostatistics and computational biology, department of Medical genetics, school of Medical sciences, university of campinas-unIcAMp, são paulo, brazil and brazilian Institute of neuroscience and neurotechnology (brAInn)
introduction: The Genome Analysis Toolkit, also known as GATK, is a set of tools designed to analyze molecular data obtained through Next-Gen-eration Sequencing (NGS) and identify variants that may be associated to phenotypes like disease status and drug response.1 It consists of several walkers, each one serving a different function. The Realigner Target Cre-ator identifies genomic intervals that may contain either sequencing or alignment errors. These intervals will be used by the next module, the Indel Realigner, which locally realigns the reads to correct misalignments that happen due to the presence of insertions and deletions. The Base Recali-brator then takes the output of the Indel Realigner and subjects it to the first pass of the base quality score recalibration. The Print Reads module renders the output of the Base Recalibrator to a binary file format, referred to as BAM file. The Haplotype Caller takes the output of the Print Reads and calls insertions, deletions and SNPs through the re-assembly of hap-lotypes in an active region.2 There is a framework of the GATK software, called Queue, which uses a QScript to run multi-stage genomic analysis.3
It supports three different types of parallelization: A) data threads; B) CPU threads; and C) scatter-gather strategy. The latter manages the number of pieces in which the input files will be divided, processed and later gathered into a final summary. The scatter-gather method can by parallelized by the GridEngine or its variants.4 In this project, we implemented a QScript tool Figure 1
Figure 2
Num
ber
of N
odes
Iterations
Nor
mal
ized
Fit
ness
Normalized FitnessNumber of Nodes
Sensor Codelet
Environment
12AX Task
Working Storage
Body InterfaceInput Codelets
Body InterfaceOutput Codelets
Actuator Codelet
Learner Codelet
Central Executive
reward
GLAS treeaction
sequencestimulus
SequenceBuilderCodelet
ActionSelectionCodelet
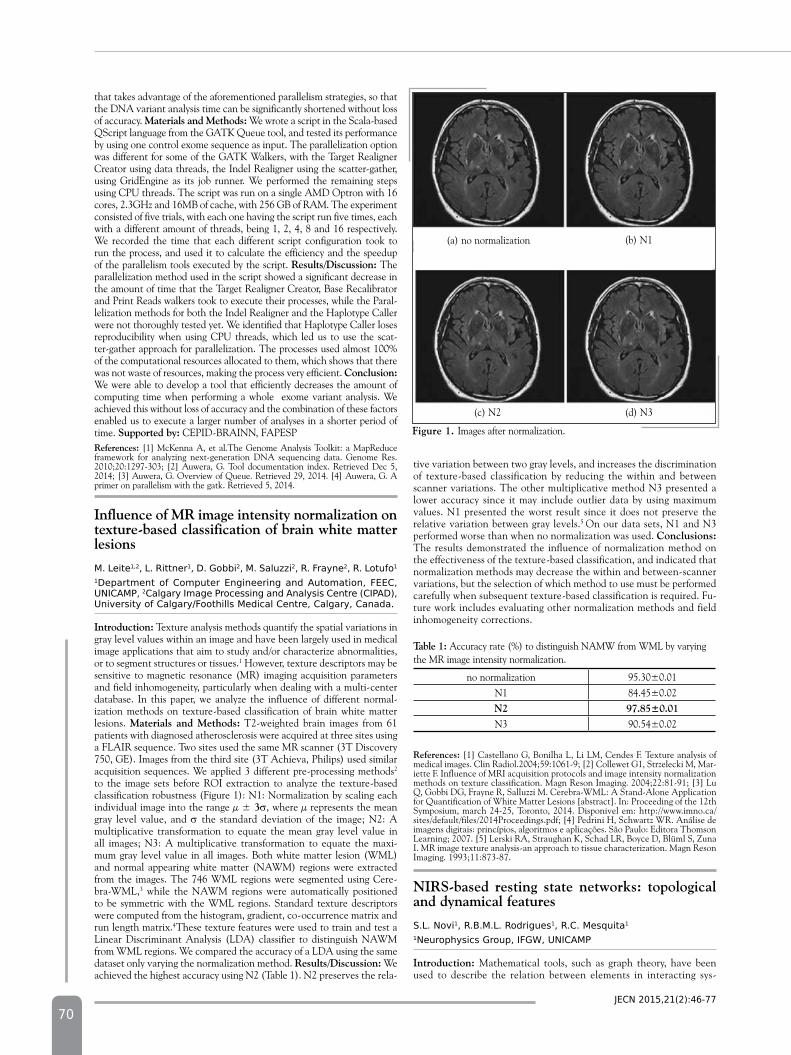
70
that takes advantage of the aforementioned parallelism strategies, so that the DNA variant analysis time can be significantly shortened without loss of accuracy. Materials and Methods: We wrote a script in the Scala-based QScript language from the GATK Queue tool, and tested its performance by using one control exome sequence as input. The parallelization option was different for some of the GATK Walkers, with the Target Realigner Creator using data threads, the Indel Realigner using the scatter-gather, using GridEngine as its job runner. We performed the remaining steps using CPU threads. The script was run on a single AMD Optron with 16 cores, 2.3GHz and 16MB of cache, with 256 GB of RAM. The experiment consisted of five trials, with each one having the script run five times, each with a different amount of threads, being 1, 2, 4, 8 and 16 respectively. We recorded the time that each different script configuration took to run the process, and used it to calculate the efficiency and the speedup of the parallelism tools executed by the script. Results/discussion: The parallelization method used in the script showed a significant decrease in the amount of time that the Target Realigner Creator, Base Recalibrator and Print Reads walkers took to execute their processes, while the Paral-lelization methods for both the Indel Realigner and the Haplotype Caller were not thoroughly tested yet. We identified that Haplotype Caller loses reproducibility when using CPU threads, which led us to use the scat-ter-gather approach for parallelization. The processes used almost 100% of the computational resources allocated to them, which shows that there was not waste of resources, making the process very efficient. Conclusion: We were able to develop a tool that efficiently decreases the amount of computing time when performing a whole exome variant analysis. We achieved this without loss of accuracy and the combination of these factors enabled us to execute a larger number of analyses in a shorter period of time. Supported by: CEPID-BRAINN, FAPESPReferences: [1] McKenna A, et al.The Genome Analysis Toolkit: a MapReduce framework for analyzing next-generation DNA sequencing data. Genome Res. 2010;20:1297-303; [2] Auwera, G. Tool documentation index. Retrieved Dec 5, 2014; [3] Auwera, G. Overview of Queue. Retrieved 29, 2014. [4] Auwera, G. A primer on parallelism with the gatk. Retrieved 5, 2014.
influence of MR image intensity normalization on texture-based classification of brain white matter lesions
M. leite1,2, l. rittner1, d. gobbi2, M. saluzzi2, r. frayne2, r. lotufo1
1department of computer engineering and Automation, feec, unIcAMp, 2calgary Image processing and Analysis centre (cIpAd), university of calgary/foothills Medical centre, calgary, canada.
introduction: Texture analysis methods quantify the spatial variations in gray level values within an image and have been largely used in medical image applications that aim to study and/or characterize abnormalities, or to segment structures or tissues.1 However, texture descriptors may be sensitive to magnetic resonance (MR) imaging acquisition parameters and field inhomogeneity, particularly when dealing with a multi-center database. In this paper, we analyze the influence of different normal-ization methods on texture-based classification of brain white matter lesions. Materials and Methods: T2-weighted brain images from 61 patients with diagnosed atherosclerosis were acquired at three sites using a FLAIR sequence. Two sites used the same MR scanner (3T Discovery 750, GE). Images from the third site (3T Achieva, Philips) used similar acquisition sequences. We applied 3 different pre-processing methods2 to the image sets before ROI extraction to analyze the texture-based classification robustness (Figure 1): N1: Normalization by scaling each individual image into the range µ ± 3σ, where µ represents the mean gray level value, and σ the standard deviation of the image; N2: A multiplicative transformation to equate the mean gray level value in all images; N3: A multiplicative transformation to equate the maxi-mum gray level value in all images. Both white matter lesion (WML) and normal appearing white matter (NAWM) regions were extracted from the images. The 746 WML regions were segmented using Cere-bra-WML,3 while the NAWM regions were automatically positioned to be symmetric with the WML regions. Standard texture descriptors were computed from the histogram, gradient, co-occurrence matrix and run length matrix.4These texture features were used to train and test a Linear Discriminant Analysis (LDA) classifier to distinguish NAWM from WML regions. We compared the accuracy of a LDA using the same dataset only varying the normalization method. Results/discussion: We achieved the highest accuracy using N2 (Table 1). N2 preserves the rela-
tive variation between two gray levels, and increases the discrimination of texture-based classification by reducing the within and between scanner variations. The other multiplicative method N3 presented a lower accuracy since it may include outlier data by using maximum values. N1 presented the worst result since it does not preserve the relative variation between gray levels.5 On our data sets, N1 and N3 performed worse than when no normalization was used. Conclusions: The results demonstrated the influence of normalization method on the effectiveness of the texture-based classification, and indicated that normalization methods may decrease the within and between-scanner variations, but the selection of which method to use must be performed carefully when subsequent texture-based classification is required. Fu-ture work includes evaluating other normalization methods and field inhomogeneity corrections.
table 1: Accuracy rate (%) to distinguish NAMW from WML by varying the MR image intensity normalization.
no normalization 95.30±0.01 N1 84.45±0.02 n2 97.85±0.01N3 90.54±0.02
References: [1] Castellano G, Bonilha L, Li LM, Cendes F. Texture analysis of medical images. Clin Radiol.2004;59:1061-9; [2] Collewet G1, Strzelecki M, Mar-iette F. Influence of MRI acquisition protocols and image intensity normalization methods on texture classification. Magn Reson Imaging. 2004;22:81-91; [3] Lu Q, Gobbi DG, Frayne R, Salluzzi M. Cerebra-WML: A Stand-Alone Application for Quantification of White Matter Lesions [abstract]. In: Proceeding of the 12th Symposium, march 24-25, Toronto, 2014. Disponivel em: http://www.imno.ca/sites/default/files/2014Proceedings.pdf; [4] Pedrini H, Schwartz WR. Análise de imagens digitais: princípios, algoritmos e aplicações. São Paulo: Editora Thomson Learning; 2007. [5] Lerski RA, Straughan K, Schad LR, Boyce D, Blüml S, Zuna I. MR image texture analysis-an approach to tissue characterization. Magn Reson Imaging. 1993;11:873-87.
niRS-based resting state networks: topological and dynamical features
s.l. novi1, r.b.M.l. rodrigues1, r.c. Mesquita1
1neurophysics group, Ifgw, unIcAMp
introduction: Mathematical tools, such as graph theory, have been used to describe the relation between elements in interacting sys-
Jecn 2015,21(2):46-77
Figure 1. Images after normalization.
(c) N2 (d) N3
(a) no normalization (b) N1
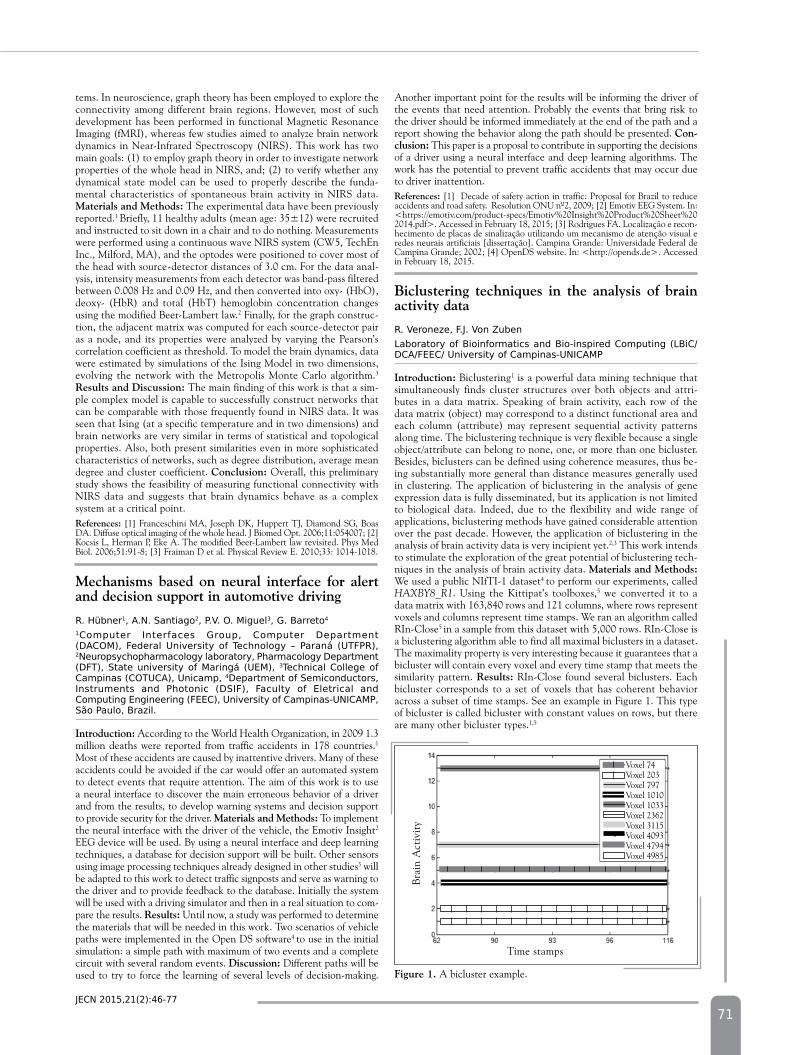
71
tems. In neuroscience, graph theory has been employed to explore the connectivity among different brain regions. However, most of such development has been performed in functional Magnetic Resonance Imaging (fMRI), whereas few studies aimed to analyze brain network dynamics in Near-Infrared Spectroscopy (NIRS). This work has two main goals: (1) to employ graph theory in order to investigate network properties of the whole head in NIRS, and; (2) to verify whether any dynamical state model can be used to properly describe the funda-mental characteristics of spontaneous brain activity in NIRS data. Materials and Methods: The experimental data have been previously reported.1 Briefly, 11 healthy adults (mean age: 35±12) were recruited and instructed to sit down in a chair and to do nothing. Measurements were performed using a continuous wave NIRS system (CW5, TechEn Inc., Milford, MA), and the optodes were positioned to cover most of the head with source-detector distances of 3.0 cm. For the data anal-ysis, intensity measurements from each detector was band-pass filtered between 0.008 Hz and 0.09 Hz, and then converted into oxy- (HbO), deoxy- (HbR) and total (HbT) hemoglobin concentration changes using the modified Beer-Lambert law.2 Finally, for the graph construc-tion, the adjacent matrix was computed for each source-detector pair as a node, and its properties were analyzed by varying the Pearson’s correlation coefficient as threshold. To model the brain dynamics, data were estimated by simulations of the Ising Model in two dimensions, evolving the network with the Metropolis Monte Carlo algorithm.3 Results and discussion: The main finding of this work is that a sim-ple complex model is capable to successfully construct networks that can be comparable with those frequently found in NIRS data. It was seen that Ising (at a specific temperature and in two dimensions) and brain networks are very similar in terms of statistical and topological properties. Also, both present similarities even in more sophisticated characteristics of networks, such as degree distribution, average mean degree and cluster coefficient. Conclusion: Overall, this preliminary study shows the feasibility of measuring functional connectivity with NIRS data and suggests that brain dynamics behave as a complex system at a critical point.References: [1] Franceschini MA, Joseph DK, Huppert TJ, Diamond SG, Boas DA. Diffuse optical imaging of the whole head. J Biomed Opt. 2006;11:054007; [2] Kocsis L, Herman P, Eke A. The modified Beer-Lambert law revisited. Phys Med Biol. 2006;51:91-8; [3] Fraiman D et al. Physical Review E. 2010;33: 1014-1018.
Mechanisms based on neural interface for alert and decision support in automotive driving
r. hübner1, A.n. santiago2, p.V. o. Miguel3, g. barreto4
1computer Interfaces group, computer department (dAcoM), federal university of technology – paraná (utfpr), 2neuropsychopharmacology laboratory, pharmacology department (dft), state university of Maringá (ueM), 3technical college of campinas (cotucA), unicamp, 4department of semiconductors, Instruments and photonic (dsIf), faculty of eletrical and computing engineering (feec), university of campinas-unIcAMp, são paulo, brazil.
introduction: According to the World Health Organization, in 2009 1.3 million deaths were reported from traffic accidents in 178 countries.1
Most of these accidents are caused by inattentive drivers. Many of these accidents could be avoided if the car would offer an automated system to detect events that require attention. The aim of this work is to use a neural interface to discover the main erroneous behavior of a driver and from the results, to develop warning systems and decision support to provide security for the driver. Materials and Methods: To implement the neural interface with the driver of the vehicle, the Emotiv Insight2 EEG device will be used. By using a neural interface and deep learning techniques, a database for decision support will be built. Other sensors using image processing techniques already designed in other studies3 will be adapted to this work to detect traffic signposts and serve as warning to the driver and to provide feedback to the database. Initially the system will be used with a driving simulator and then in a real situation to com-pare the results. Results: Until now, a study was performed to determine the materials that will be needed in this work. Two scenarios of vehicle paths were implemented in the Open DS software4 to use in the initial simulation: a simple path with maximum of two events and a complete circuit with several random events. discussion: Different paths will be used to try to force the learning of several levels of decision-making.
Another important point for the results will be informing the driver of the events that need attention. Probably the events that bring risk to the driver should be informed immediately at the end of the path and a report showing the behavior along the path should be presented. Con-clusion: This paper is a proposal to contribute in supporting the decisions of a driver using a neural interface and deep learning algorithms. The work has the potential to prevent traffic accidents that may occur due to driver inattention.References: [1] Decade of safety action in traffic: Proposal for Brazil to reduce accidents and road safety. Resolution ONU nº2, 2009; [2] Emotiv EEG System. In: <https://emotiv.com/product-specs/Emotiv%20Insight%20Product%20Sheet%202014.pdf>. Accessed in February 18, 2015; [3] Rodrigues FA. Localização e recon-hecimento de placas de sinalização utilizando um mecanismo de atenção visual e redes neurais artificiais [dissertação]. Campina Grande: Universidade Federal de Campina Grande; 2002; [4] OpenDS website. In: <http://opends.de>. Accessed in February 18, 2015.
Biclustering techniques in the analysis of brain activity data
r. Veroneze, f.J. Von zubenlaboratory of bioinformatics and bio-inspired computing (lbic/dcA/feec/ university of campinas-unIcAMp
introduction: Biclustering1 is a powerful data mining technique that simultaneously finds cluster structures over both objects and attri-butes in a data matrix. Speaking of brain activity, each row of the data matrix (object) may correspond to a distinct functional area and each column (attribute) may represent sequential activity patterns along time. The biclustering technique is very flexible because a single object/attribute can belong to none, one, or more than one bicluster. Besides, biclusters can be defined using coherence measures, thus be-ing substantially more general than distance measures generally used in clustering. The application of biclustering in the analysis of gene expression data is fully disseminated, but its application is not limited to biological data. Indeed, due to the flexibility and wide range of applications, biclustering methods have gained considerable attention over the past decade. However, the application of biclustering in the analysis of brain activity data is very incipient yet.2,3 This work intends to stimulate the exploration of the great potential of biclustering tech-niques in the analysis of brain activity data. Materials and Methods: We used a public NIfTI-1 dataset4 to perform our experiments, called HAXBY8_R1. Using the Kittipat’s toolboxes,5 we converted it to a data matrix with 163,840 rows and 121 columns, where rows represent voxels and columns represent time stamps. We ran an algorithm called RIn-Close5 in a sample from this dataset with 5,000 rows. RIn-Close is a biclustering algorithm able to find all maximal biclusters in a dataset. The maximality property is very interesting because it guarantees that a bicluster will contain every voxel and every time stamp that meets the similarity pattern. Results: RIn-Close found several biclusters. Each bicluster corresponds to a set of voxels that has coherent behavior across a subset of time stamps. See an example in Figure 1. This type of bicluster is called bicluster with constant values on rows, but there are many other bicluster types.1,5
Jecn 2015,21(2):46-77
Figure 1. A bicluster example.
Bra
in A
ctiv
ity
Time stamps
Voxel 74Voxel 203Voxel 797Voxel 1010Voxel 1033Voxel 2362Voxel 3115Voxel 4093Voxel 4794Voxel 4985
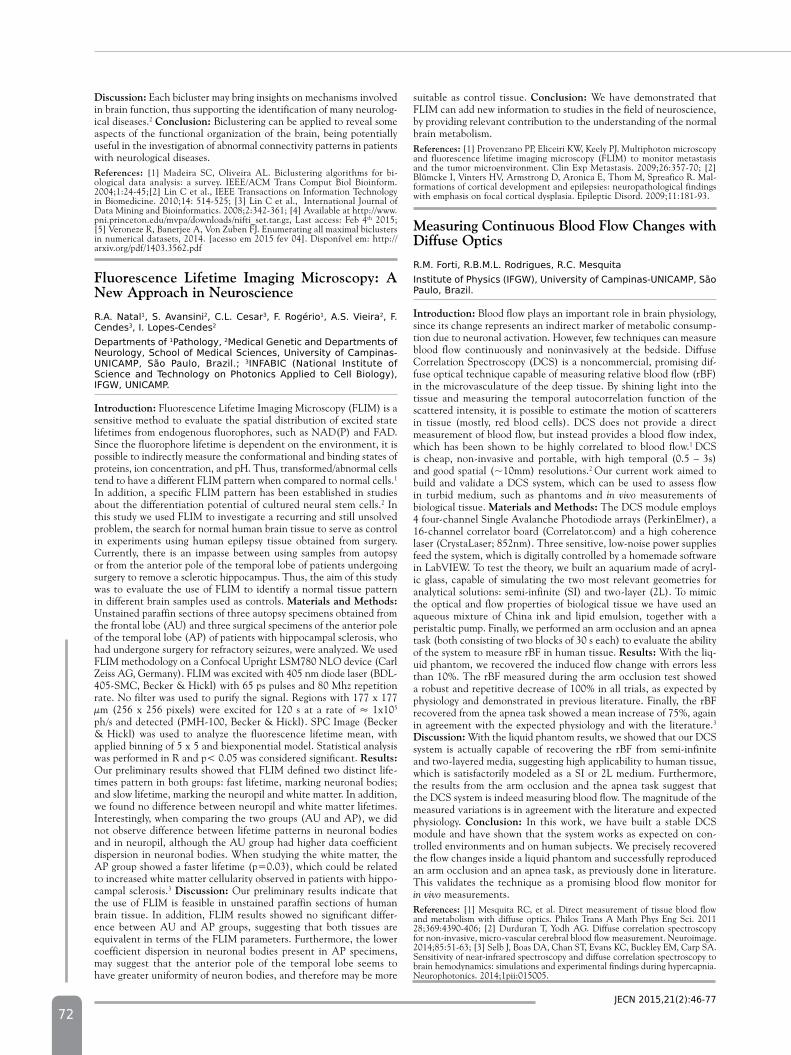
72
discussion: Each bicluster may bring insights on mechanisms involved in brain function, thus supporting the identification of many neurolog-ical diseases.2 Conclusion: Biclustering can be applied to reveal some aspects of the functional organization of the brain, being potentially useful in the investigation of abnormal connectivity patterns in patients with neurological diseases.References: [1] Madeira SC, Oliveira AL. Biclustering algorithms for bi-ological data analysis: a survey. IEEE/ACM Trans Comput Biol Bioinform. 2004;1:24-45;[2] Lin C et al., IEEE Transactions on Information Technology in Biomedicine. 2010;14: 514-525; [3] Lin C et al., International Journal of Data Mining and Bioinformatics. 2008;2:342-361; [4] Available at http://www.pni.princeton.edu/mvpa/downloads/nifti_set.tar.gz, Last access: Feb 4th 2015; [5] Veroneze R, Banerjee A, Von Zuben FJ. Enumerating all maximal biclusters in numerical datasets, 2014. [acesso em 2015 fev 04]. Disponível em: http://arxiv.org/pdf/1403.3562.pdf
Fluorescence Lifetime imaging Microscopy: A new Approach in neuroscience r.A. natal1, s. Avansini2, c.l. cesar3, f. rogério1, A.s. Vieira2, f. cendes3, I. lopes-cendes2
departments of 1pathology, 2Medical genetic and departments of neurology, school of Medical sciences, university of campinas-unIcAMp, são paulo, brazil.; 3InfAbIc (national Institute of science and technology on photonics Applied to cell biology), Ifgw, unIcAMp.
introduction: Fluorescence Lifetime Imaging Microscopy (FLIM) is a sensitive method to evaluate the spatial distribution of excited state lifetimes from endogenous fluorophores, such as NAD(P) and FAD. Since the fluorophore lifetime is dependent on the environment, it is possible to indirectly measure the conformational and binding states of proteins, ion concentration, and pH. Thus, transformed/abnormal cells tend to have a different FLIM pattern when compared to normal cells.1 In addition, a specific FLIM pattern has been established in studies about the differentiation potential of cultured neural stem cells.2 In this study we used FLIM to investigate a recurring and still unsolved problem, the search for normal human brain tissue to serve as control in experiments using human epilepsy tissue obtained from surgery. Currently, there is an impasse between using samples from autopsy or from the anterior pole of the temporal lobe of patients undergoing surgery to remove a sclerotic hippocampus. Thus, the aim of this study was to evaluate the use of FLIM to identify a normal tissue pattern in different brain samples used as controls. Materials and Methods: Unstained paraffin sections of three autopsy specimens obtained from the frontal lobe (AU) and three surgical specimens of the anterior pole of the temporal lobe (AP) of patients with hippocampal sclerosis, who had undergone surgery for refractory seizures, were analyzed. We used FLIM methodology on a Confocal Upright LSM780 NLO device (Carl Zeiss AG, Germany). FLIM was excited with 405 nm diode laser (BDL-405-SMC, Becker & Hickl) with 65 ps pulses and 80 Mhz repetition rate. No filter was used to purify the signal. Regions with 177 x 177 µm (256 x 256pixels)were excited for 120 s at a rate of≈1x10⁵ ph/s and detected (PMH-100, Becker & Hickl). SPC Image (Becker & Hickl) was used to analyze the fluorescence lifetime mean, with applied binning of 5 x 5 and biexponential model. Statistical analysis was performed in R and p< 0.05 was considered significant. Results: Our preliminary results showed that FLIM defined two distinct life-times pattern in both groups: fast lifetime, marking neuronal bodies; and slow lifetime, marking the neuropil and white matter. In addition, we found no difference between neuropil and white matter lifetimes. Interestingly, when comparing the two groups (AU and AP), we did not observe difference between lifetime patterns in neuronal bodies and in neuropil, although the AU group had higher data coefficient dispersion in neuronal bodies. When studying the white matter, the AP group showed a faster lifetime (p=0.03), which could be related to increased white matter cellularity observed in patients with hippo-campal sclerosis.3 discussion: Our preliminary results indicate that the use of FLIM is feasible in unstained paraffin sections of human brain tissue. In addition, FLIM results showed no significant differ-ence between AU and AP groups, suggesting that both tissues are equivalent in terms of the FLIM parameters. Furthermore, the lower coefficient dispersion in neuronal bodies present in AP specimens, may suggest that the anterior pole of the temporal lobe seems to have greater uniformity of neuron bodies, and therefore may be more
suitable as control tissue. Conclusion: We have demonstrated that FLIM can add new information to studies in the field of neuroscience, by providing relevant contribution to the understanding of the normal brain metabolism. References: [1] Provenzano PP, Eliceiri KW, Keely PJ. Multiphoton microscopy and fluorescence lifetime imaging microscopy (FLIM) to monitor metastasis and the tumor microenvironment. Clin Exp Metastasis. 2009;26:357-70; [2] Blümcke I, Vinters HV, Armstrong D, Aronica E, Thom M, Spreafico R. Mal-formations of cortical development and epilepsies: neuropathological findings with emphasis on focal cortical dysplasia. Epileptic Disord. 2009;11:181-93.
Measuring Continuous Blood Flow Changes with diffuse Optics
r.M. forti, r.b.M.l. rodrigues, r.c. MesquitaInstitute of physics (Ifgw), university of campinas-unIcAMp, são paulo, brazil.
introduction: Blood flow plays an important role in brain physiology, since its change represents an indirect marker of metabolic consump-tion due to neuronal activation. However, few techniques can measure blood flow continuously and noninvasively at the bedside. Diffuse Correlation Spectroscopy (DCS) is a noncommercial, promising dif-fuse optical technique capable of measuring relative blood flow (rBF) in the microvasculature of the deep tissue. By shining light into the tissue and measuring the temporal autocorrelation function of the scattered intensity, it is possible to estimate the motion of scatterers in tissue (mostly, red blood cells). DCS does not provide a direct measurement of blood flow, but instead provides a blood flow index, which has been shown to be highly correlated to blood flow.1 DCS is cheap, non-invasive and portable, with high temporal (0.5 – 3s) and good spatial (~10mm) resolutions.2 Our current work aimed to build and validate a DCS system, which can be used to assess flow in turbid medium, such as phantoms and in vivo measurements of biological tissue. Materials and Methods: The DCS module employs 4 four-channel Single Avalanche Photodiode arrays (PerkinElmer), a 16-channel correlator board (Correlator.com) and a high coherence laser (CrystaLaser; 852nm). Three sensitive, low-noise power supplies feed the system, which is digitally controlled by a homemade software in LabVIEW. To test the theory, we built an aquarium made of acryl-ic glass, capable of simulating the two most relevant geometries for analytical solutions: semi-infinite (SI) and two-layer (2L). To mimic the optical and flow properties of biological tissue we have used an aqueous mixture of China ink and lipid emulsion, together with a peristaltic pump. Finally, we performed an arm occlusion and an apnea task (both consisting of two blocks of 30 s each) to evaluate the ability of the system to measure rBF in human tissue. Results: With the liq-uid phantom, we recovered the induced flow change with errors less than 10%. The rBF measured during the arm occlusion test showed a robust and repetitive decrease of 100% in all trials, as expected by physiology and demonstrated in previous literature. Finally, the rBF recovered from the apnea task showed a mean increase of 75%, again in agreement with the expected physiology and with the literature.3 discussion: With the liquid phantom results, we showed that our DCS system is actually capable of recovering the rBF from semi-infinite and two-layered media, suggesting high applicability to human tissue, which is satisfactorily modeled as a SI or 2L medium. Furthermore, the results from the arm occlusion and the apnea task suggest that the DCS system is indeed measuring blood flow. The magnitude of the measured variations is in agreement with the literature and expected physiology. Conclusion: In this work, we have built a stable DCS module and have shown that the system works as expected on con-trolled environments and on human subjects. We precisely recovered the flow changes inside a liquid phantom and successfully reproduced an arm occlusion and an apnea task, as previously done in literature. This validates the technique as a promising blood flow monitor for in vivo measurements.References: [1] Mesquita RC, et al. Direct measurement of tissue blood flow and metabolism with diffuse optics. Philos Trans A Math Phys Eng Sci. 2011 28;369:4390-406; [2] Durduran T, Yodh AG. Diffuse correlation spectroscopy for non-invasive, micro-vascular cerebral blood flow measurement. Neuroimage. 2014;85:51-63; [3] Selb J, Boas DA, Chan ST, Evans KC, Buckley EM, Carp SA. Sensitivity of near-infrared spectroscopy and diffuse correlation spectroscopy to brain hemodynamics: simulations and experimental findings during hypercapnia. Neurophotonics. 2014;1pii:015005.
Jecn 2015,21(2):46-77
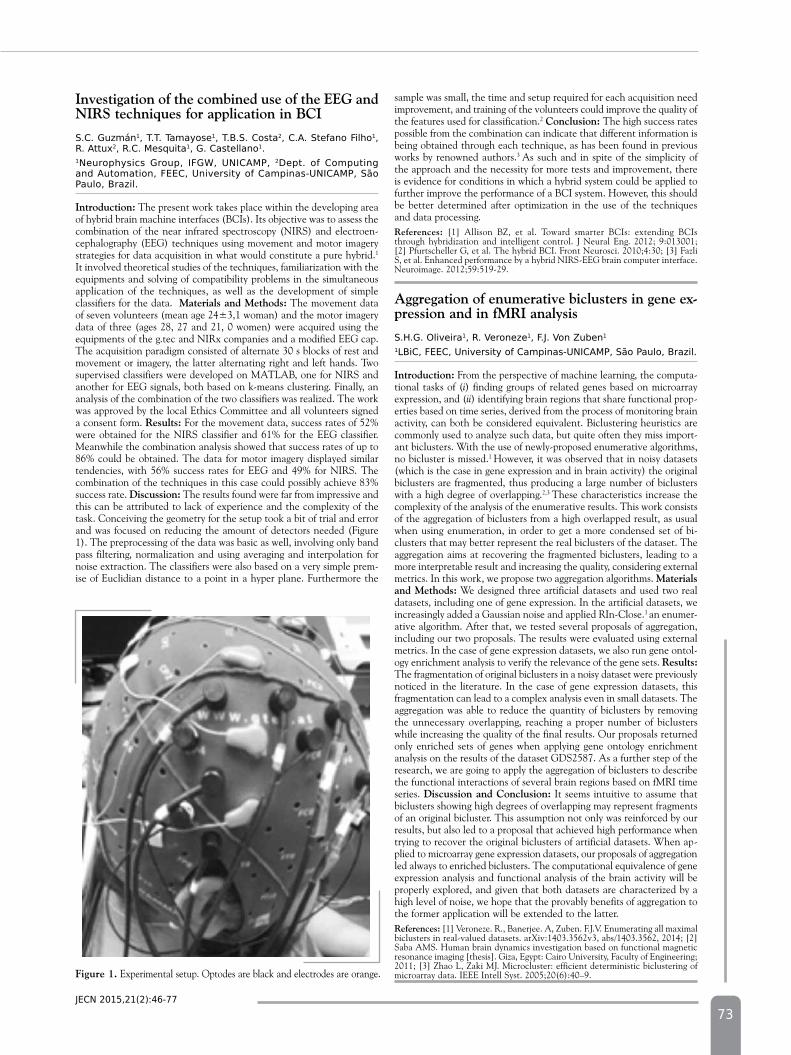
73Jecn 2015,21(2):46-77
investigation of the combined use of the EEG and niRS techniques for application in BCi
s.c. guzmán1, t.t. tamayose1, t.b.s. costa2, c.A. stefano filho1, r. Attux2, r.c. Mesquita1, g. castellano1.1neurophysics group, Ifgw, unIcAMp, 2dept. of computing and Automation, feec, university of campinas-unIcAMp, são paulo, brazil.
introduction: The present work takes place within the developing area of hybrid brain machine interfaces (BCIs). Its objective was to assess the combination of the near infrared spectroscopy (NIRS) and electroen-cephalography (EEG) techniques using movement and motor imagery strategies for data acquisition in what would constitute a pure hybrid.1
It involved theoretical studies of the techniques, familiarization with the equipments and solving of compatibility problems in the simultaneous application of the techniques, as well as the development of simple classifiers for the data. Materials and Methods: The movement data of seven volunteers (mean age 24±3,1 woman) and the motor imagery data of three (ages 28, 27 and 21, 0 women) were acquired using the equipments of the g.tec and NIRx companies and a modified EEG cap. The acquisition paradigm consisted of alternate 30 s blocks of rest and movement or imagery, the latter alternating right and left hands. Two supervised classifiers were developed on MATLAB, one for NIRS and another for EEG signals, both based on k-means clustering. Finally, an analysis of the combination of the two classifiers was realized. The work was approved by the local Ethics Committee and all volunteers signed a consent form. Results: For the movement data, success rates of 52% were obtained for the NIRS classifier and 61% for the EEG classifier. Meanwhile the combination analysis showed that success rates of up to 86% could be obtained. The data for motor imagery displayed similar tendencies, with 56% success rates for EEG and 49% for NIRS. The combination of the techniques in this case could possibly achieve 83% success rate. discussion: The results found were far from impressive and this can be attributed to lack of experience and the complexity of the task. Conceiving the geometry for the setup took a bit of trial and error and was focused on reducing the amount of detectors needed (Figure 1). The preprocessing of the data was basic as well, involving only band pass filtering, normalization and using averaging and interpolation for noise extraction. The classifiers were also based on a very simple prem-ise of Euclidian distance to a point in a hyper plane. Furthermore the
sample was small, the time and setup required for each acquisition need improvement, and training of the volunteers could improve the quality of the features used for classification.2 Conclusion: The high success rates possible from the combination can indicate that different information is being obtained through each technique, as has been found in previous works by renowned authors.3 As such and in spite of the simplicity of the approach and the necessity for more tests and improvement, there is evidence for conditions in which a hybrid system could be applied to further improve the performance of a BCI system. However, this should be better determined after optimization in the use of the techniques and data processing. References: [1] Allison BZ, et al. Toward smarter BCIs: extending BCIs through hybridization and intelligent control. J Neural Eng. 2012; 9:013001; [2] Pfurtscheller G, et al. The hybrid BCI. Front Neurosci. 2010;4:30; [3] Fazli S, et al. Enhanced performance by a hybrid NIRS-EEG brain computer interface. Neuroimage. 2012;59:519-29.
Aggregation of enumerative biclusters in gene ex-pression and in fMRi analysis
s.h.g. oliveira1, r. Veroneze1, f.J. Von zuben1
1lbic, feec, university of campinas-unIcAMp, são paulo, brazil.
introduction: From the perspective of machine learning, the computa-tional tasks of (i) finding groups of related genes based on microarray expression, and (ii) identifying brain regions that share functional prop-erties based on time series, derived from the process of monitoring brain activity, can both be considered equivalent. Biclustering heuristics are commonly used to analyze such data, but quite often they miss import-ant biclusters. With the use of newly-proposed enumerative algorithms, no bicluster is missed.1 However, it was observed that in noisy datasets (which is the case in gene expression and in brain activity) the original biclusters are fragmented, thus producing a large number of biclusters with a high degree of overlapping.2,3 These characteristics increase the complexity of the analysis of the enumerative results. This work consists of the aggregation of biclusters from a high overlapped result, as usual when using enumeration, in order to get a more condensed set of bi-clusters that may better represent the real biclusters of the dataset. The aggregation aims at recovering the fragmented biclusters, leading to a more interpretable result and increasing the quality, considering external metrics. In this work, we propose two aggregation algorithms. Materials and Methods: We designed three artificial datasets and used two real datasets, including one of gene expression. In the artificial datasets, we increasingly added a Gaussian noise and applied RIn-Close.1 an enumer-ative algorithm. After that, we tested several proposals of aggregation, including our two proposals. The results were evaluated using external metrics. In the case of gene expression datasets, we also run gene ontol-ogy enrichment analysis to verify the relevance of the gene sets. Results: The fragmentation of original biclusters in a noisy dataset were previously noticed in the literature. In the case of gene expression datasets, this fragmentation can lead to a complex analysis even in small datasets. The aggregation was able to reduce the quantity of biclusters by removing the unnecessary overlapping, reaching a proper number of biclusters while increasing the quality of the final results. Our proposals returned only enriched sets of genes when applying gene ontology enrichment analysis on the results of the dataset GDS2587. As a further step of the research, we are going to apply the aggregation of biclusters to describe the functional interactions of several brain regions based on fMRI time series. discussion and Conclusion: It seems intuitive to assume that biclusters showing high degrees of overlapping may represent fragments of an original bicluster. This assumption not only was reinforced by our results, but also led to a proposal that achieved high performance when trying to recover the original biclusters of artificial datasets. When ap-plied to microarray gene expression datasets, our proposals of aggregation led always to enriched biclusters. The computational equivalence of gene expression analysis and functional analysis of the brain activity will be properly explored, and given that both datasets are characterized by a high level of noise, we hope that the provably benefits of aggregation to the former application will be extended to the latter.References: [1] Veroneze. R., Banerjee. A, Zuben. F.J.V. Enumerating all maximal biclusters in real-valued datasets. arXiv:1403.3562v3, abs/1403.3562, 2014; [2] Saba AMS. Human brain dynamics investigation based on functional magnetic resonance imaging [thesis]. Giza, Egypt: Cairo University, Faculty of Engineering; 2011; [3] Zhao L, Zaki MJ. Microcluster: efficient deterministic biclustering of microarray data. IEEE Intell Syst. 2005;20(6):40–9.Figure 1. Experimental setup. Optodes are black and electrodes are orange.
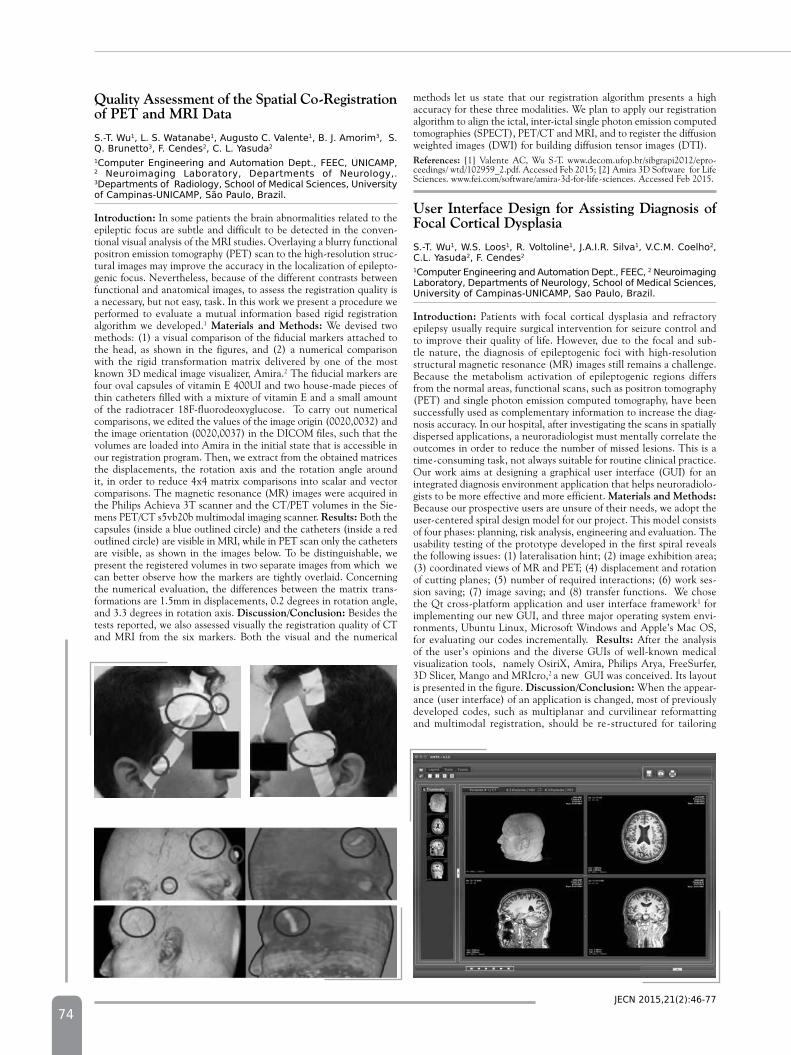
74
Quality Assessment of the Spatial Co-Registration of pEt and MRi data
s.-t. wu1, l. s. watanabe1, Augusto c. Valente1, b. J. Amorim3, s. q. brunetto3, f. cendes2, c. l. yasuda2
1computer engineering and Automation dept., feec, unIcAMp, 2 neuroimaging laboratory, departments of neurology,. 3departments of radiology, school of Medical sciences, university of campinas-unIcAMp, são paulo, brazil.
introduction: In some patients the brain abnormalities related to the epileptic focus are subtle and difficult to be detected in the conven-tional visual analysis of the MRI studies. Overlaying a blurry functional positron emission tomography (PET) scan to the high-resolution struc-tural images may improve the accuracy in the localization of epilepto-genic focus. Nevertheless, because of the different contrasts between functional and anatomical images, to assess the registration quality is a necessary, but not easy, task. In this work we present a procedure we performed to evaluate a mutual information based rigid registration algorithm we developed.1 Materials and Methods: We devised two methods: (1) a visual comparison of the fiducial markers attached to the head, as shown in the figures, and (2) a numerical comparison with the rigid transformation matrix delivered by one of the most known 3D medical image visualizer, Amira.2 The fiducial markers are four oval capsules of vitamin E 400UI and two house-made pieces of thin catheters filled with a mixture of vitamin E and a small amount of the radiotracer 18F-fluorodeoxyglucose. To carry out numerical comparisons, we edited the values of the image origin (0020,0032) and the image orientation (0020,0037) in the DICOM files, such that the volumes are loaded into Amira in the initial state that is accessible in our registration program. Then, we extract from the obtained matrices the displacements, the rotation axis and the rotation angle around it, in order to reduce 4x4 matrix comparisons into scalar and vector comparisons. The magnetic resonance (MR) images were acquired in the Philips Achieva 3T scanner and the CT/PET volumes in the Sie-mens PET/CT s5vb20b multimodal imaging scanner. Results: Both the capsules (inside a blue outlined circle) and the catheters (inside a red outlined circle) are visible in MRI, while in PET scan only the catheters are visible, as shown in the images below. To be distinguishable, we present the registered volumes in two separate images from which we can better observe how the markers are tightly overlaid. Concerning the numerical evaluation, the differences between the matrix trans-formations are 1.5mm in displacements, 0.2 degrees in rotation angle, and 3.3 degrees in rotation axis. discussion/Conclusion: Besides the tests reported, we also assessed visually the registration quality of CT and MRI from the six markers. Both the visual and the numerical
methods let us state that our registration algorithm presents a high accuracy for these three modalities. We plan to apply our registration algorithm to align the ictal, inter-ictal single photon emission computed tomographies (SPECT), PET/CT and MRI, and to register the diffusion weighted images (DWI) for building diffusion tensor images (DTI). References: [1] Valente AC, Wu S-T. www.decom.ufop.br/sibgrapi2012/epro-ceedings/ wtd/102959_2.pdf. Accessed Feb 2015; [2] Amira 3D Software for Life Sciences. www.fei.com/software/amira-3d-for-life-sciences. Accessed Feb 2015.
User interface design for Assisting diagnosis of Focal Cortical dysplasia
s.-t. wu1, w.s. loos1, r. Voltoline1, J.A.I.r. silva1, V.c.M. coelho2, c.l. yasuda2, f. cendes2 1computer engineering and Automation dept., feec, 2 neuroimaging laboratory, departments of neurology, school of Medical sciences, university of campinas-unIcAMp, sao paulo, brazil.
introduction: Patients with focal cortical dysplasia and refractory epilepsy usually require surgical intervention for seizure control and to improve their quality of life. However, due to the focal and sub-tle nature, the diagnosis of epileptogenic foci with high-resolution structural magnetic resonance (MR) images still remains a challenge. Because the metabolism activation of epileptogenic regions differs from the normal areas, functional scans, such as positron tomography (PET) and single photon emission computed tomography, have been successfully used as complementary information to increase the diag-nosis accuracy. In our hospital, after investigating the scans in spatially dispersed applications, a neuroradiologist must mentally correlate the outcomes in order to reduce the number of missed lesions. This is a time-consuming task, not always suitable for routine clinical practice. Our work aims at designing a graphical user interface (GUI) for an integrated diagnosis environment application that helps neuroradiolo-gists to be more effective and more efficient. Materials and Methods: Because our prospective users are unsure of their needs, we adopt the user-centered spiral design model for our project. This model consists of four phases: planning, risk analysis, engineering and evaluation. The usability testing of the prototype developed in the first spiral reveals the following issues: (1) lateralisation hint; (2) image exhibition area; (3) coordinated views of MR and PET; (4) displacement and rotation of cutting planes; (5) number of required interactions; (6) work ses-sion saving; (7) image saving; and (8) transfer functions. We chose the Qt cross-platform application and user interface framework1 for implementing our new GUI, and three major operating system envi-ronments, Ubuntu Linux, Microsoft Windows and Apple’s Mac OS, for evaluating our codes incrementally. Results: After the analysis of the user’s opinions and the diverse GUIs of well-known medical visualization tools, namely OsiriX, Amira, Philips Arya, FreeSurfer, 3D Slicer, Mango and MRIcro,2 a new GUI was conceived. Its layout is presented in the figure. discussion/Conclusion: When the appear-ance (user interface) of an application is changed, most of previously developed codes, such as multiplanar and curvilinear reformatting and multimodal registration, should be re-structured for tailoring
Jecn 2015,21(2):46-77
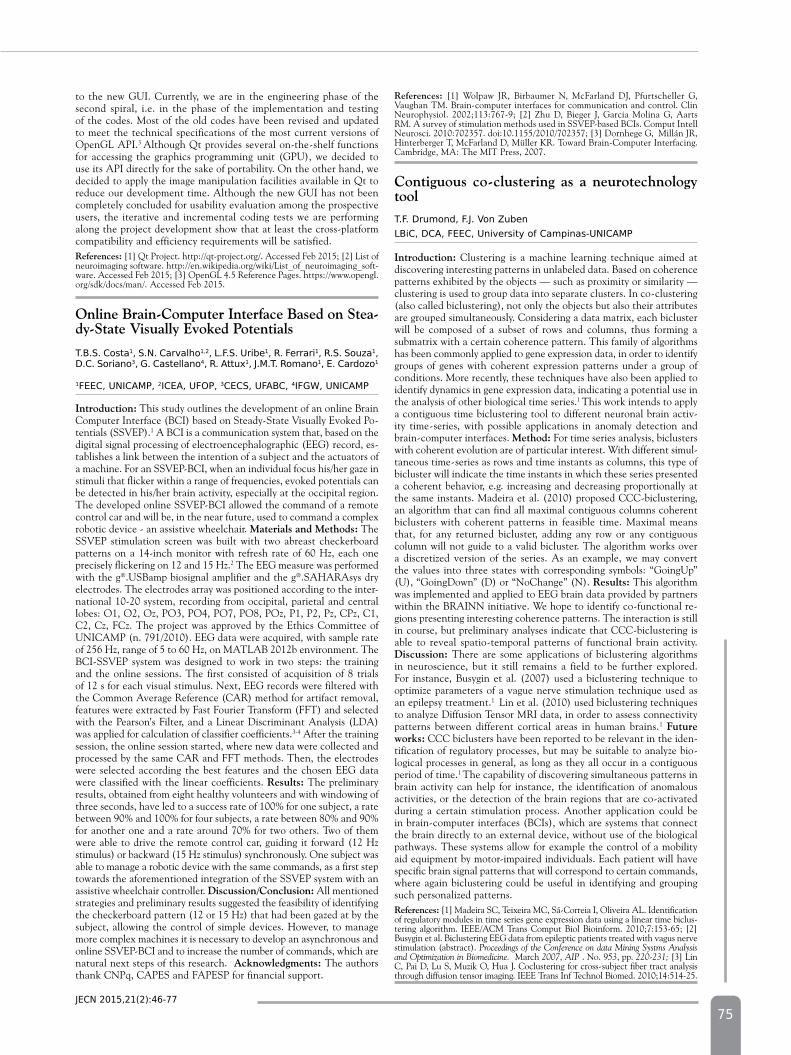
75
to the new GUI. Currently, we are in the engineering phase of the second spiral, i.e. in the phase of the implementation and testing of the codes. Most of the old codes have been revised and updated to meet the technical specifications of the most current versions of OpenGL API.3 Although Qt provides several on-the-shelf functions for accessing the graphics programming unit (GPU), we decided to use its API directly for the sake of portability. On the other hand, we decided to apply the image manipulation facilities available in Qt to reduce our development time. Although the new GUI has not been completely concluded for usability evaluation among the prospective users, the iterative and incremental coding tests we are performing along the project development show that at least the cross-platform compatibility and efficiency requirements will be satisfied. References: [1] Qt Project. http://qt-project.org/. Accessed Feb 2015; [2] List of neuroimaging software. http://en.wikipedia.org/wiki/List_of_neuroimaging_soft-ware. Accessed Feb 2015; [3] OpenGL 4.5 Reference Pages. https://www.opengl.org/sdk/docs/man/. Accessed Feb 2015.
Online Brain-Computer interface Based on Stea-dy-State Visually Evoked potentials
t.b.s. costa1, s.n. carvalho1,2, l.f.s. uribe1, r. ferrari1, r.s. souza1, d.c. soriano3, g. castellano4, r. Attux1, J.M.t. romano1, e. cardozo1
1feec, unIcAMp, 2IceA, ufop, 3cecs, ufAbc, 4Ifgw, unIcAMp
introduction: This study outlines the development of an online Brain Computer Interface (BCI) based on Steady-State Visually Evoked Po-tentials (SSVEP).1 A BCI is a communication system that, based on the digital signal processing of electroencephalographic (EEG) record, es-tablishes a link between the intention of a subject and the actuators of a machine. For an SSVEP-BCI, when an individual focus his/her gaze in stimuli that flicker within a range of frequencies, evoked potentials can be detected in his/her brain activity, especially at the occipital region. The developed online SSVEP-BCI allowed the command of a remote control car and will be, in the near future, used to command a complex robotic device - an assistive wheelchair. Materials and Methods: The SSVEP stimulation screen was built with two abreast checkerboard patterns on a 14-inch monitor with refresh rate of 60 Hz, each one precisely flickering on 12 and 15 Hz.2 The EEG measure was performed with the g®.USBamp biosignal amplifier and the g®.SAHARAsys dry electrodes. The electrodes array was positioned according to the inter-national 10-20 system, recording from occipital, parietal and central lobes: O1, O2, Oz, PO3, PO4, PO7, PO8, POz, P1, P2, Pz, CPz, C1, C2, Cz, FCz. The project was approved by the Ethics Committee of UNICAMP (n. 791/2010). EEG data were acquired, with sample rate of 256 Hz, range of 5 to 60 Hz, on MATLAB 2012b environment. The BCI-SSVEP system was designed to work in two steps: the training and the online sessions. The first consisted of acquisition of 8 trials of 12 s for each visual stimulus. Next, EEG records were filtered with the Common Average Reference (CAR) method for artifact removal, features were extracted by Fast Fourier Transform (FFT) and selected with the Pearson’s Filter, and a Linear Discriminant Analysis (LDA) was applied for calculation of classifier coefficients.3-4 After the training session, the online session started, where new data were collected and processed by the same CAR and FFT methods. Then, the electrodes were selected according the best features and the chosen EEG data were classified with the linear coefficients. Results: The preliminary results, obtained from eight healthy volunteers and with windowing of three seconds, have led to a success rate of 100% for one subject, a rate between 90% and 100% for four subjects, a rate between 80% and 90% for another one and a rate around 70% for two others. Two of them were able to drive the remote control car, guiding it forward (12 Hz stimulus) or backward (15 Hz stimulus) synchronously. One subject was able to manage a robotic device with the same commands, as a first step towards the aforementioned integration of the SSVEP system with an assistive wheelchair controller. discussion/Conclusion: All mentioned strategies and preliminary results suggested the feasibility of identifying the checkerboard pattern (12 or 15 Hz) that had been gazed at by the subject, allowing the control of simple devices. However, to manage more complex machines it is necessary to develop an asynchronous and online SSVEP-BCI and to increase the number of commands, which are natural next steps of this research. Acknowledgments: The authors thank CNPq, CAPES and FAPESP for financial support.
References: [1] Wolpaw JR, Birbaumer N, McFarland DJ, Pfurtscheller G, Vaughan TM. Brain-computer interfaces for communication and control. Clin Neurophysiol. 2002;113:767-9; [2] Zhu D, Bieger J, Garcia Molina G, Aarts RM. A survey of stimulation methods used in SSVEP-based BCIs. Comput Intell Neurosci. 2010:702357. doi:10.1155/2010/702357; [3] Dornhege G, Millán JR, Hinterberger T, McFarland D, Müller KR. Toward Brain-Computer Interfacing. Cambridge, MA: The MIT Press, 2007.
Contiguous co-clustering as a neurotechnology toolt.f. drumond, f.J. Von zubenlbic, dcA, feec, university of campinas-unIcAMp
introduction: Clustering is a machine learning technique aimed at discovering interesting patterns in unlabeled data. Based on coherence patterns exhibited by the objects — such as proximity or similarity — clustering is used to group data into separate clusters. In co-clustering (also called biclustering), not only the objects but also their attributes are grouped simultaneously. Considering a data matrix, each bicluster will be composed of a subset of rows and columns, thus forming a submatrix with a certain coherence pattern. This family of algorithms has been commonly applied to gene expression data, in order to identify groups of genes with coherent expression patterns under a group of conditions. More recently, these techniques have also been applied to identify dynamics in gene expression data, indicating a potential use in the analysis of other biological time series.1 This work intends to apply a contiguous time biclustering tool to different neuronal brain activ-ity time-series, with possible applications in anomaly detection and brain-computer interfaces. Method: For time series analysis, biclusters with coherent evolution are of particular interest. With different simul-taneous time-series as rows and time instants as columns, this type of bicluster will indicate the time instants in which these series presented a coherent behavior, e.g. increasing and decreasing proportionally at the same instants. Madeira et al. (2010) proposed CCC-biclustering, an algorithm that can find all maximal contiguous columns coherent biclusters with coherent patterns in feasible time. Maximal means that, for any returned bicluster, adding any row or any contiguous column will not guide to a valid bicluster. The algorithm works over a discretized version of the series. As an example, we may convert the values into three states with corresponding symbols: “GoingUp” (U), “GoingDown” (D) or “NoChange” (N). Results: This algorithm was implemented and applied to EEG brain data provided by partners within the BRAINN initiative. We hope to identify co-functional re-gions presenting interesting coherence patterns. The interaction is still in course, but preliminary analyses indicate that CCC-biclustering is able to reveal spatio-temporal patterns of functional brain activity. discussion: There are some applications of biclustering algorithms in neuroscience, but it still remains a field to be further explored. For instance, Busygin et al. (2007) used a biclustering technique to optimize parameters of a vague nerve stimulation technique used as an epilepsy treatment.1 Lin et al. (2010) used biclustering techniques to analyze Diffusion Tensor MRI data, in order to assess connectivity patterns between different cortical areas in human brains.1 Future works: CCC biclusters have been reported to be relevant in the iden-tification of regulatory processes, but may be suitable to analyze bio-logical processes in general, as long as they all occur in a contiguous period of time.1 The capability of discovering simultaneous patterns in brain activity can help for instance, the identification of anomalous activities, or the detection of the brain regions that are co-activated during a certain stimulation process. Another application could be in brain-computer interfaces (BCIs), which are systems that connect the brain directly to an external device, without use of the biological pathways. These systems allow for example the control of a mobility aid equipment by motor-impaired individuals. Each patient will have specific brain signal patterns that will correspond to certain commands, where again biclustering could be useful in identifying and grouping such personalized patterns.References: [1] Madeira SC, Teixeira MC, Sá-Correia I, Oliveira AL. Identification of regulatory modules in time series gene expression data using a linear time biclus-tering algorithm. IEEE/ACM Trans Comput Biol Bioinform. 2010;7:153-65; [2] Busygin et al. Biclustering EEG data from epileptic patients treated with vagus nerve stimulation (abstract). Proceedings of the Conference on data Mining Systms Analysis and Optimization in Biomedicine. March 2007, AIP . No. 953, pp. 220-231; [3] Lin C, Pai D, Lu S, Muzik O, Hua J. Coclustering for cross-subject fiber tract analysis through diffusion tensor imaging. IEEE Trans Inf Technol Biomed. 2010;14:514-25.
Jecn 2015,21(2):46-77
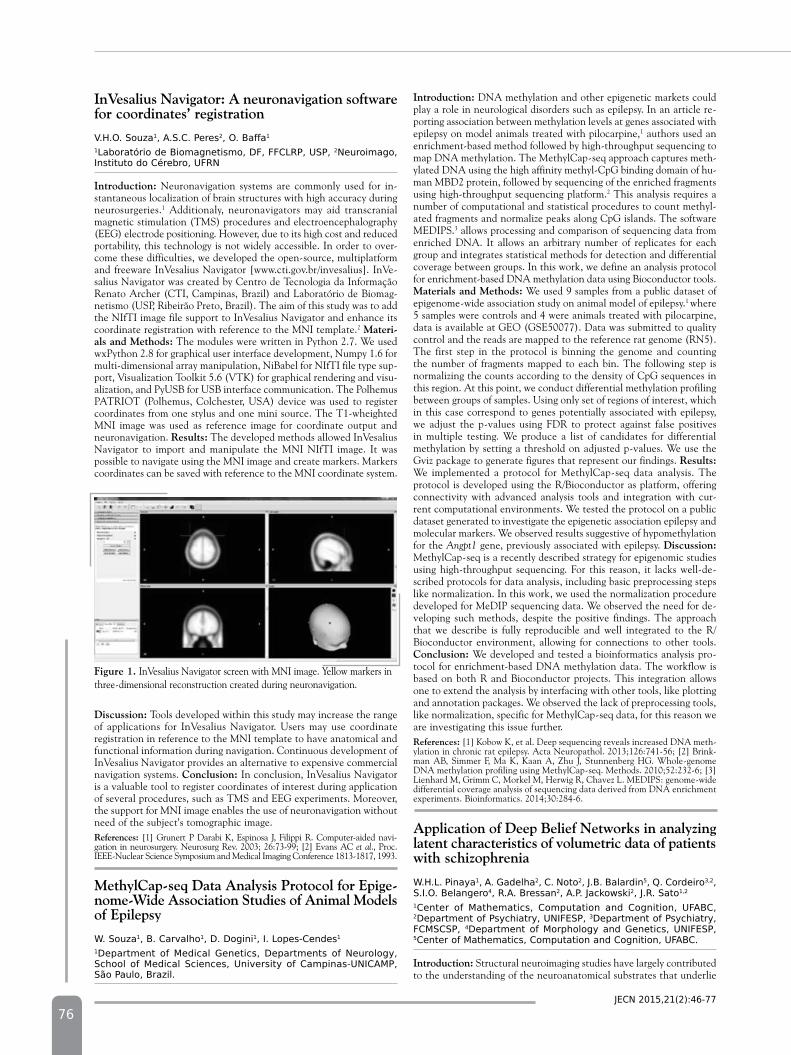
76
inVesalius navigator: A neuronavigation software for coordinates’ registration
V.h.o. souza1, A.s.c. peres2, o. baffa1
1laboratório de biomagnetismo, df, ffclrp, usp, 2neuroimago, Instituto do cérebro, ufrn
introduction: Neuronavigation systems are commonly used for in-stantaneous localization of brain structures with high accuracy during neurosurgeries.1 Additionaly, neuronavigators may aid transcranial magnetic stimulation (TMS) procedures and electroencephalography (EEG) electrode positioning. However, due to its high cost and reduced portability, this technology is not widely accessible. In order to over-come these difficulties, we developed the open-source, multiplatform and freeware InVesalius Navigator [www.cti.gov.br/invesalius]. InVe-salius Navigator was created by Centro de Tecnologia da Informação Renato Archer (CTI, Campinas, Brazil) and Laboratório de Biomag-netismo (USP, Ribeirão Preto, Brazil). The aim of this study was to add the NIfTI image file support to InVesalius Navigator and enhance its coordinate registration with reference to the MNI template.2 Materi-als and Methods: The modules were written in Python 2.7. We used wxPython 2.8 for graphical user interface development, Numpy 1.6 for multi-dimensional array manipulation, NiBabel for NIfTI file type sup-port, Visualization Toolkit 5.6 (VTK) for graphical rendering and visu-alization, and PyUSB for USB interface communication. The Polhemus PATRIOT (Polhemus, Colchester, USA) device was used to register coordinates from one stylus and one mini source. The T1-wheighted MNI image was used as reference image for coordinate output and neuronavigation. Results: The developed methods allowed InVesalius Navigator to import and manipulate the MNI NIfTI image. It was possible to navigate using the MNI image and create markers. Markers coordinates can be saved with reference to the MNI coordinate system.
introduction: DNA methylation and other epigenetic markets could play a role in neurological disorders such as epilepsy. In an article re-porting association between methylation levels at genes associated with epilepsy on model animals treated with pilocarpine,1 authors used an enrichment-based method followed by high-throughput sequencing to map DNA methylation. The MethylCap-seq approach captures meth-ylated DNA using the high affinity methyl-CpG binding domain of hu-man MBD2 protein, followed by sequencing of the enriched fragments using high-throughput sequencing platform.2 This analysis requires a number of computational and statistical procedures to count methyl-ated fragments and normalize peaks along CpG islands. The software MEDIPS.3 allows processing and comparison of sequencing data from enriched DNA. It allows an arbitrary number of replicates for each group and integrates statistical methods for detection and differential coverage between groups. In this work, we define an analysis protocol for enrichment-based DNA methylation data using Bioconductor tools. Materials and Methods: We used 9 samples from a public dataset of epigenome-wide association study on animal model of epilepsy.1 where 5 samples were controls and 4 were animals treated with pilocarpine, data is available at GEO (GSE50077). Data was submitted to quality control and the reads are mapped to the reference rat genome (RN5). The first step in the protocol is binning the genome and counting the number of fragments mapped to each bin. The following step is normalizing the counts according to the density of CpG sequences in this region. At this point, we conduct differential methylation profiling between groups of samples. Using only set of regions of interest, which in this case correspond to genes potentially associated with epilepsy, we adjust the p-values using FDR to protect against false positives in multiple testing. We produce a list of candidates for differential methylation by setting a threshold on adjusted p-values. We use the Gviz package to generate figures that represent our findings. Results: We implemented a protocol for MethylCap-seq data analysis. The protocol is developed using the R/Bioconductor as platform, offering connectivity with advanced analysis tools and integration with cur-rent computational environments. We tested the protocol on a public dataset generated to investigate the epigenetic association epilepsy and molecular markers. We observed results suggestive of hypomethylation for the Angpt1 gene, previously associated with epilepsy. discussion: MethylCap-seq is a recently described strategy for epigenomic studies using high-throughput sequencing. For this reason, it lacks well-de-scribed protocols for data analysis, including basic preprocessing steps like normalization. In this work, we used the normalization procedure developed for MeDIP sequencing data. We observed the need for de-veloping such methods, despite the positive findings. The approach that we describe is fully reproducible and well integrated to the R/Bioconductor environment, allowing for connections to other tools. Conclusion: We developed and tested a bioinformatics analysis pro-tocol for enrichment-based DNA methylation data. The workflow is based on both R and Bioconductor projects. This integration allows one to extend the analysis by interfacing with other tools, like plotting and annotation packages. We observed the lack of preprocessing tools, like normalization, specific for MethylCap-seq data, for this reason we are investigating this issue further.References: [1] Kobow K, et al. Deep sequencing reveals increased DNA meth-ylation in chronic rat epilepsy. Acta Neuropathol. 2013;126:741-56; [2] Brink-man AB, Simmer F, Ma K, Kaan A, Zhu J, Stunnenberg HG. Whole-genome DNA methylation profiling using MethylCap-seq. Methods. 2010;52:232-6; [3] Lienhard M, Grimm C, Morkel M, Herwig R, Chavez L. MEDIPS: genome-wide differential coverage analysis of sequencing data derived from DNA enrichment experiments. Bioinformatics. 2014;30:284-6.
Application of deep Belief networks in analyzing latent characteristics of volumetric data of patients with schizophrenia
w.h.l. pinaya1, A. gadelha2, c. noto2, J.b. balardin5, q. cordeiro3,2, s.I.o. belangero4, r.A. bressan2, A.p. Jackowski2, J.r. sato1,2
1center of Mathematics, computation and cognition, ufAbc, 2department of psychiatry, unIfesp, 3department of psychiatry, fcMscsp, 4department of Morphology and genetics, unIfesp, 5center of Mathematics, computation and cognition, ufAbc.
introduction: Structural neuroimaging studies have largely contributed to the understanding of the neuroanatomical substrates that underlie
discussion: Tools developed within this study may increase the range of applications for InVesalius Navigator. Users may use coordinate registration in reference to the MNI template to have anatomical and functional information during navigation. Continuous development of InVesalius Navigator provides an alternative to expensive commercial navigation systems. Conclusion: In conclusion, InVesalius Navigator is a valuable tool to register coordinates of interest during application of several procedures, such as TMS and EEG experiments. Moreover, the support for MNI image enables the use of neuronavigation without need of the subject’s tomographic image.References: [1] Grunert P Darabi K, Espinosa J, Filippi R. Computer-aided navi-gation in neurosurgery. Neurosurg Rev. 2003; 26:73-99; [2] Evans AC et al., Proc. IEEE-Nuclear Science Symposium and Medical Imaging Conference 1813-1817, 1993.
MethylCap-seq data Analysis protocol for Epige-nome-Wide Association Studies of Animal Models of Epilepsy
w. souza1, b. carvalho1, d. dogini1, I. lopes-cendes1
1department of Medical genetics, departments of neurology, school of Medical sciences, university of campinas-unIcAMp, são paulo, brazil.
Figure 1. InVesalius Navigator screen with MNI image. Yellow markers in three-dimensional reconstruction created during neuronavigation.
Jecn 2015,21(2):46-77
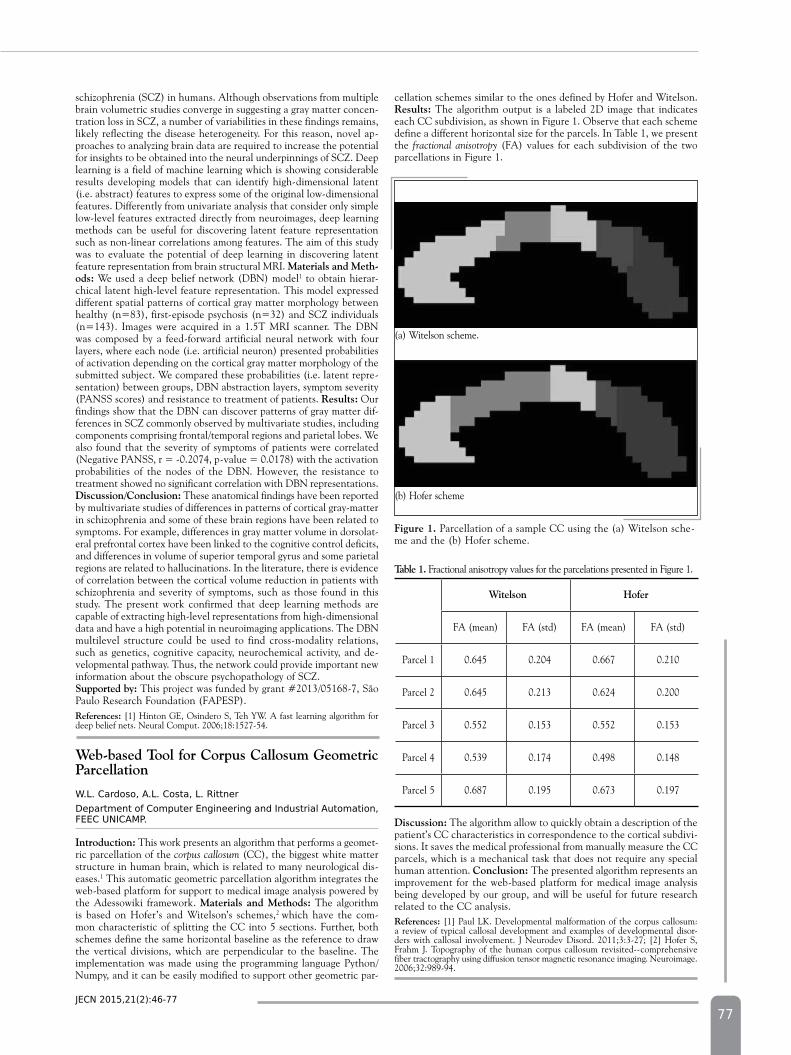
77
schizophrenia (SCZ) in humans. Although observations from multiple brain volumetric studies converge in suggesting a gray matter concen-tration loss in SCZ, a number of variabilities in these findings remains, likely reflecting the disease heterogeneity. For this reason, novel ap-proaches to analyzing brain data are required to increase the potential for insights to be obtained into the neural underpinnings of SCZ. Deep learning is a field of machine learning which is showing considerable results developing models that can identify high-dimensional latent (i.e. abstract) features to express some of the original low-dimensional features. Differently from univariate analysis that consider only simple low-level features extracted directly from neuroimages, deep learning methods can be useful for discovering latent feature representation such as non-linear correlations among features. The aim of this study was to evaluate the potential of deep learning in discovering latent feature representation from brain structural MRI. Materials and Meth-ods: We used a deep belief network (DBN) model1 to obtain hierar-chical latent high-level feature representation. This model expressed different spatial patterns of cortical gray matter morphology between healthy (n=83), first-episode psychosis (n=32) and SCZ individuals (n=143). Images were acquired in a 1.5T MRI scanner. The DBN was composed by a feed-forward artificial neural network with four layers, where each node (i.e. artificial neuron) presented probabilities of activation depending on the cortical gray matter morphology of the submitted subject. We compared these probabilities (i.e. latent repre-sentation) between groups, DBN abstraction layers, symptom severity (PANSS scores) and resistance to treatment of patients. Results: Our findings show that the DBN can discover patterns of gray matter dif-ferences in SCZ commonly observed by multivariate studies, including components comprising frontal/temporal regions and parietal lobes. We also found that the severity of symptoms of patients were correlated (Negative PANSS, r = -0.2074, p-value = 0.0178) with the activation probabilities of the nodes of the DBN. However, the resistance to treatment showed no significant correlation with DBN representations. discussion/Conclusion: These anatomical findings have been reported by multivariate studies of differences in patterns of cortical gray-matter in schizophrenia and some of these brain regions have been related to symptoms. For example, differences in gray matter volume in dorsolat-eral prefrontal cortex have been linked to the cognitive control deficits, and differences in volume of superior temporal gyrus and some parietal regions are related to hallucinations. In the literature, there is evidence of correlation between the cortical volume reduction in patients with schizophrenia and severity of symptoms, such as those found in this study. The present work confirmed that deep learning methods are capable of extracting high-level representations from high-dimensional data and have a high potential in neuroimaging applications. The DBN multilevel structure could be used to find cross-modality relations, such as genetics, cognitive capacity, neurochemical activity, and de-velopmental pathway. Thus, the network could provide important new information about the obscure psychopathology of SCZ. Supported by: This project was funded by grant #2013/05168-7, São Paulo Research Foundation (FAPESP).References: [1] Hinton GE, Osindero S, Teh YW. A fast learning algorithm for deep belief nets. Neural Comput. 2006;18:1527-54.
Web-based tool for Corpus Callosum Geometric parcellation
w.l. cardoso, A.l. costa, l. rittnerdepartment of computer engineering and Industrial Automation, feec unIcAMp.
introduction: This work presents an algorithm that performs a geomet-ric parcellation of the corpus callosum (CC), the biggest white matter structure in human brain, which is related to many neurological dis-eases.1 This automatic geometric parcellation algorithm integrates the web-based platform for support to medical image analysis powered by the Adessowiki framework. Materials and Methods: The algorithm is based on Hofer’s and Witelson’s schemes,2 which have the com-mon characteristic of splitting the CC into 5 sections. Further, both schemes define the same horizontal baseline as the reference to draw the vertical divisions, which are perpendicular to the baseline. The implementation was made using the programming language Python/Numpy, and it can be easily modified to support other geometric par-
cellation schemes similar to the ones defined by Hofer and Witelson. Results: The algorithm output is a labeled 2D image that indicates each CC subdivision, as shown in Figure 1. Observe that each scheme define a different horizontal size for the parcels. In Table 1, we present the fractional anisotropy (FA) values for each subdivision of the two parcellations in Figure 1.
table 1. Fractional anisotropy values for the parcelations presented in Figure 1.
Witelson Hofer
FA (mean) FA (std) FA (mean) FA (std)
Parcel 1 0.645 0.204 0.667 0.210
Parcel 2 0.645 0.213 0.624 0.200
Parcel 3 0.552 0.153 0.552 0.153
Parcel 4 0.539 0.174 0.498 0.148
Parcel 5 0.687 0.195 0.673 0.197
discussion: The algorithm allow to quickly obtain a description of the patient’s CC characteristics in correspondence to the cortical subdivi-sions. It saves the medical professional from manually measure the CC parcels, which is a mechanical task that does not require any special human attention. Conclusion: The presented algorithm represents an improvement for the web-based platform for medical image analysis being developed by our group, and will be useful for future research related to the CC analysis.References: [1] Paul LK. Developmental malformation of the corpus callosum: a review of typical callosal development and examples of developmental disor-ders with callosal involvement. J Neurodev Disord. 2011;3:3-27; [2] Hofer S, Frahm J. Topography of the human corpus callosum revisited--comprehensive fiber tractography using diffusion tensor magnetic resonance imaging. Neuroimage. 2006;32:989-94.
Figure 1. Parcellation of a sample CC using the (a) Witelson sche-me and the (b) Hofer scheme.
(b) Hofer scheme
(a) Witelson scheme.
Jecn 2015,21(2):46-77


