Embed Size (px)
Citation preview

1 FEBRUARY 2003 445D O N G A N D M A C E
q 2003 American Meteorological Society
Arctic Stratus Cloud Properties and Radiative Forcing Derived from Ground-BasedData Collected at Barrow, Alaska
XIQUAN DONG* AND GERALD G. MACE
University of Utah, Salt Lake City, Utah
(Manuscript received 21 June 2001, in final form 13 August 2002)
ABSTRACT
A record of single-layer and overcast low-level Arctic stratus cloud properties has been generated using datacollected from May to September 2000 at the Atmospheric Radiation Measurement (ARM) North Slope ofAlaska (NSA) (71.38N, 156.68W) site near Barrow, Alaska. The record includes liquid-phase and liquid dominantmixed-phase Arctic stratus macrophysical, microphysical, and radiative properties, as well as surface radiationbudget and cloud radiative forcing. The macrophysical properties consist of cloud fractions, cloud-base/topheights and temperatures, and cloud thickness derived from a ground-based radar and lidar pair, and rawinsondesounding. The microphysical properties include cloud liquid water path and content, and cloud-droplet effectiveradius and number concentration obtained from microwave radiometer brightness temperature measurements,and the new cloud parameterization. The radiative properties contain cloud optical depth, effective solar trans-mission, and surface/cloud/top-of-atmosphere albedos derived from the new cloud parameterization and standardEpply precision spectral pyranometers. The shortwave, longwave, and net cloud radiative forcings at the surfaceare inferred from measurements by standard Epply precision spectral pyranometers and pyrgeometers. Thereare approximately 300 h and more than 3600 samples (5-min resolution) of single-layer and overcast low-levelstratus during the study period. The 10-day averaged total and low-level cloud (Ztop , 3 km) fractions are 0.87and 0.55, and low-level cloud-base and -top heights are around 0.4 and 0.8 km. The cloud-droplet effectiveradii and number concentrations in the spring are similar to midlatitude continental stratus cloud microphysicalproperties, and in the summer they are similar to midlatitude marine stratus clouds. The total cloud fractions inthis study show good agreement with the satellite and surface results compiled from data collected during theFirst International Satellite Cloud Climatology Project (ISCCP) Regional Experiment (FIRE) Arctic Cloud Ex-periment (ACE) and the Surface Heat Budget of the Arctic Ocean (SHEBA) (;778N, 1658W) field experimentsin 1998. The cloud microphysics derived from this study are similar, in general, to those collected in past fieldprograms, although these comparisons are based on data collected at different locations and years. At the ARMNSA site, the summer cooling period is much longer (2–3 months vs 1–2 weeks), and the summer coolingmagnitude is much larger (2100 W m22 vs 25 W m22) than at the SHEBA ship under the conditions of allskies at the SHEBA and overcast low-level stratus clouds at the NSA site.
1. Introduction
Clouds are the dominant modulators of radiation in theArctic both at the surface and top of atmosphere. Theirimpact on the radiation fluxes depends on cloud particlesize and shape, and the amount and phase of condensedwater and its vertical and horizontal distributions (Curryet al. 2000; Randall et al. 1998). The cloud–radiativeinteractions in the Arctic are very complex due to lowtemperatures and absolute humidity, large solar zenithangles, the presence of the highly reflective and inho-
*Current affiliation: Department of Atmospheric Sciences, Uni-versity of North Dakota, Grand Forks, North Dakota.
Corresponding author address: Dr. Xiquan Dong, Department ofAtmospheric Sciences, University of North Dakota, Box 9006, GrandForks, ND 58202-9006.E-mail: [email protected]
mogeneous snow/ice surfaces and multiple cloud layers,and persistent temperature inversions (Curry et al. 1996;Stamnes et al. 1999). The importance of cloud–radiativeinteractions to global climate has been highlighted bymany investigators (e.g., Wetherald and Manabe 1988;Mitchell and Ingram 1992) and recent climate modelingresults have revealed that the largest disagreement be-tween coupled climate model simulations of present-dayclimate is found in the Arctic region (Gates 1992; Taoet al. 1996). These results reflect the weakness of ourcurrent understanding of the sensitivity of the simulatedArctic climate to different formulations of various phys-ical processes in global models (Randall et al. 1998). Anaspect of Arctic clouds that makes them difficult to treatin climate models is that they are often optically thin, sothat their emissivities are often less than one and a func-tion of particle size (Garrett et al. 2002; Curry and Ebert1992). The albedo of snow has a strong spectral variationand is a function of the ratio of direct-to-diffuse radiation,

446 VOLUME 16J O U R N A L O F C L I M A T E
both of which are affected by cloud optical depth, whichfurther complicates the treatment of radiative transfer inthe cloudy Arctic (Curry et al. 2001).
To provide a much-needed source of high-latitudedata concerning the physical state of the Arctic atmo-sphere, several extensive field programs have been con-ducted in the past several years. The Department ofEnergy Atmospheric Radiation Measurement (ARM)program (Stokes and Schwartz 1994) established theARM North Slope of Alaska (NSA) site (71.38N,156.68W) at Barrow, Alaska, in 1998 (Stamnes et al.1999). The general approach adopted by the ARM pro-gram is to use long records of surface observations todevelop, test, and improve cloud parameterizations inthe context of single GCM grid columns and then totransfer the resulting parameterizations into full three-dimensional GCMs (Randall et al. 1996). As a precursorto the establishment of the site at Barrow, the ARMprogram operated concurrently with the First Interna-tional Satellite Cloud Climatology Project (ISCCP) Re-gional Experiment (FIRE) Arctic Cloud Experiment(ACE; Curry et al. 2000) and the Surface Heat Budgetof the Arctic Ocean (SHEBA) project (Perovich et al.1999). In addition to observations collected at Barrow,ARM surface-based instruments were also installed onor near the SHEBA ship that served as a floating sciencestation in the Beaufort Sea and drifted from 75.38N,142.78W to 80.58N, 1668W during October 1997–Oc-tober 1998. FIRE ACE made aircraft observations andsatellite retrievals over the SHEBA ship (at ;778N,1658W) and Barrow from April to July 1998 (Curry etal. 2000). ARM, FIRE, and SHEBA share scientific ob-jectives that focus on collecting and evaluating data sothat the physical processes that drive the large-scaleatmosphere in the Arctic are more faithfully represented(Randall et al. 1998). In particular, ARM has a long-term program (;10 yr) of surface-based observationsand modeling of clouds and radiation at Barrow, FIREACE provided in situ aircraft measurements during the4-month period to improve satellite retrievals of cloudand surface characteristics in the Arctic, while SHEBAwas a 1-yr program to observe the surface energy bal-ance and the sea ice mass balance of the Arctic Ocean(Curry et al. 2000; Randall et al. 1998).
To begin the process of evaluating cloud parameter-izations and validating satellite retrievals using data col-lected at Barrow, we have compiled a 5-month recordof single-layer and overcast low-level stratus cloud ma-crophysical, microphysical, and radiative properties, aswell as surface radiation budget and cloud radiativeforcing using data collected at the ARM NSA site nearBarrow, Alaska, from May to September 2000 (referredto collectively as the summer 2000 results). During thisperiod, the liquid-phase and liquid dominant mixed-phase low-level Arctic stratus clouds occurred frequent-ly, which makes it possible to retrieve their micro-physical and radiative properties using the new cloudparameterization (see the appendix). The record of cloud
properties provides a unique source of information forstudying the seasonal variation of Arctic stratus cloudproperties and their impact on the surface radiation bud-get. In order to establish the representativeness of thedatasets collected at Barrow during summer 2000, thecloud properties are compared with aircraft in situ mea-surements in similar conditions (Lawson et al. 2001;Hobbs et al. 2001; Dong et al. 2001), surface obser-vations (Intrieri et al. 2002a,b; Curry et al. 2001), andsatellite data (Minnis et al. 2001; Maslanik et al. 2001)during the FIRE ACE and SHEBA field experiments.We also compare the summer 2000 results with the air-craft in situ measurements collected over the BeaufortSea during the Arctic Stratus Clouds (ASC) experimentin June 1980 (Herman and Curry 1984; Tsay and Jay-aweera 1984) and the Beaufort and Arctic Storms Ex-periment (BASE) in autumn 1994 (Pinto et al. 2001),as well as from Hobbs and Rangno’s study in June 1995(Hobbs and Rangno 1998). Although these comparisonsare based on data collected at different locations anddifferent years, this allows us to pose the following twoquestions:
1) What is the seasonal variation of Arctic stratus cloudmacrophysical, microphysical, and radiative prop-erties at Barrow, Alaska, from spring to autumn?How and when does this seasonal variation of cloudproperties influence the surface radiation budget?
2) How well do the summer 2000 results, generated ata single point over one summer, represent the westernArctic summer climatology? For example, what arethe differences in the cloud properties and associatedradiative forcing between Barrow and the SHEBAship? Does the cooling effect of clouds vary in du-ration and strength at the two sites?
2. Data
The datasets in this study are collected from directsurface measurements or derived from surface mea-surements, as well as calculated from a new parame-terization developed from an existing cloud propertyretrieval algorithm (see the appendix). The surface ob-servations at the ARM NSA site in this study are listedin Table 1. The millimeter wavelength cloud radar(MMCR; Moran et al. 1998) is the centerpiece of thisinstrument array. The MMCR operates at a wavelengthof 8 mm in a vertically pointing mode, and providescontinuous profiles of radar reflectivity from hydrom-eters advecting through the radar field of view allowingus to identify clear and cloudy conditions. The cloud-top height (Ztop) is derived from the MMCR reflectivityprofile, and the cloud-base height (Zbase) is derived fromlaser ceilometer measurements. Since the laser ceil-ometer is sensitive to the second moment of the particledistribution instead of the sixth moment like the MMCR,the ceilometer provides a more faithful estimate of cloudbase. The temporal and vertical resolutions and maxi-

1 FEBRUARY 2003 447D O N G A N D M A C E
TABLE 1. Summary of surface instruments at the ARM NSA site.
InstrumentTemporal
resolution (s)Vertical
resolution (m) Range (km) Observed/derived cloud parameters
Cloud radar 10 45 Up to 20 Cloud heights, profiles of radar reflectivity, Doppler ve-locity and spectral width
Ceilometer 30 7.6 Up to 7.5 Cloud-base heightRawinsonde 1 day21 5 Up to 25 Profiles of pressure, temperature, and relative humidityMicrowave radiometer 300 N/A N/A Column-integrated liquid water and water vaporPSP pyranometer 60 N/A N/A Downward/upward broadband SW fluxPIR pyrgeometer 60 N/A N/A Downward/upward broadband LW flux
mum detected heights of the MMCR and ceilometer arealso listed in Table 1. The total and low-level cloudfractions are averaged over 10-day intervals from thecombined measurements of the MMCR and ceilometeras the fraction of time that the upward-looking narrowfield-of-view radar and ceilometer detected clouds. Thetotal cloud fraction is the fraction of time cloud detectedanywhere in the vertical column, and the low-level cloudfraction is the fraction of time low cloud (Ztop , 3 km)detected during a 10-day period. The cloud fraction dis-cussed here should not be confused with an instanta-neous hemispheric cloud fraction used in radiative cal-culations and reported in surface observations. Aver-aged over a long time period, the two definitions tendto converge, however. Values of cloud base and toptemperatures (Tbase and Ttop) are found from ARM NSArawinsonde soundings (launched once per day at aroundlocal noon) using Zbase and Ztop derived from the ceil-ometer and radar data.
The cloud liquid water path (LWP) is derived frommicrowave radiometer brightness temperatures mea-sured at 23.8 and 31.4 GHz using a statistical retrievalmethod (Liljegren et al. 2001). The root-mean-square(rms) accuracies of the retrievals are about 20 g m22
and 10% for cloud LWP below and above 200 g m22,respectively (Dong et al. 2000, hereafter D00; Liljegrenet al. 2001). This retrieval method (Liljegren et al. 2001)may overestimate the LWP of supercooled clouds (Wes-twater et al. 2001) due to poorly known absorption co-efficients and an incorrect treatment of the cloud liquiddielectric model. However, the overestimation of LWP(;10–20 g m22) is within the expected accuracy of theretrievals (J. Liljegren 2001, personal communication),and its influence on the retrieved effective radius is alsowithin the uncertainty of the retrieved effective radius(Dong et al. 1997, 1998; hereafter D97, D98). Therefore,the low limit of LWP is set to 20 g m22 in this study.
The up- and down-looking standard Eppley precisionspectral pyranometers (PSPs) and precision infrared ra-diometers (PIRs) (pyrgeometer) provide measurementsof downward and upward broadband shortwave (0.3–3mm) and longwave (4–50 mm) fluxes at the surface,respectively. The absolute accuracies of the PSP andPIR measurements are approximately 10 W m22 (Longand Ackerman 2000). The surface albedo (Rsfc) is de-rived from the ratio of upward to downward shortwave
flux measurements. The effective solar transmission (g)is the ratio of the measured cloudy downward shortwaveflux at the surface to the inferred clear-sky downwardshortwave flux that would be recorded by the broadbandpyranometer if there were no clouds. Long and Ack-erman (2000) first fit the downward shortwave flux mea-surements on the clear-sky days that are closest in timeto the cloudy days, and then interpolate the empiricalcurve-fitting values to cloudy days to estimate clear-skydownward shortwave fluxes that would be observed un-der the assumption of constant aerosol optical depthduring this time period. The aerosol optical depth canvary by a factor of 4 over a short period of time duringArctic haze events (which are common in spring) whenthe aerosol optical depth can be as high as 0.5 (e.g.,Stone 1997). These variations may have a significantimpact on the inferred clear-sky shortwave flux and thusaffect the retrievals of cloud properties. Strictly speak-ing, the inferred clear-sky downward shortwave fluxeson the cloudy days are not measurements; nonetheless,they are derived from the measurements and should bemore appropriate than model calculations in estimationof g because the estimated clear-sky values automati-cally incorporate any biases between measured andmodeled surface downward shortwave fluxes (Kato etal. 1997). The g increases with increased Rsfc becausethe PSP-measured cloudy downward solar flux at thesurface includes the multiple reflections of solar radi-ation between the cloud layer and the highly reflectivesurface (see Fig. A1 of the appendix).
The cloud-droplet effective radius (re), number con-centration (N), broadband shortwave optical depth (t),and bulk albedos at the top of cloud and atmosphere(Rcldy, RTOA) with the underlying reflecting surface arecalculated by the new cloud parameterization. The newcloud parameterization is the same as that described byD98 except the impact of surface albedo is included.More details about the retrieval method and old/newcloud parameterizations are discussed in the appendix.The uncertainties in t, Rcldy, and RTOA are generally lessthan 5%, while in re and N they are about 10 and 30%,respectively (D97; D98).
3. ResultsWe have established five criteria for choosing the
clouds under which cloud properties can be estimated

448 VOLUME 16J O U R N A L O F C L I M A T E
FIG. 1. The 10-day means (std devs) are simply the averages ofall samples (5-min resolution) for (a) total and low cloud fractions,and the selected samples using the five criteria for (b) cloud-base and-top heights, (c) temperatures, and (d) cloud thickness in km withina 10-day period. The cloud-base and -top heights are derived fromthe radar and ceilometer measurements, respectively, and cloud-baseand -top temperatures from the ARM NSA rawinsonde soundings(;local noon) using the ceilometer and radar-derived cloud-base and-top heights.
using the new cloud parameterization. These criteria are(i) only single-layer and overcast low-level stratusclouds are present as determined from cloud radar ob-servations, (ii) the cosine of solar zenith angle (m0) islarger than 0.2, (iii) the range of g is between 0.1 and0.8, (iv) LWP is between 20 and 600 g m22, and (v)Ztop is less than 3 km. The physical reasons for usingthese five criteria were discussed in D00. We identifiedapproximately 300 h of the stratus clouds (more than3600 samples at 5-min resolution) that satisfied thesefive criteria during the study period, which include theretrieved cloud parameters from the new cloud param-eterization and the measured or derived cloud quantitiesfrom surface observations. The retrievals consist ofcloud-droplet effective radius (re) and number concen-tration (N), broadband shortwave optical depth (t), andbulk albedos at the top of cloud and atmosphere (Rcldy,RTOA) with the underlying reflecting surface. The mea-sured or derived cloud quantities include cloud-base/topheights (Zbase/Ztop) and temperatures (Tbase/Ttop), cloud-layer geometric thickness (DZ), cloud LWP and liquidwater content (LWC), effective solar transmission (g),surface albedo (Rsfc) with a cloud above, and cloudy netshortwave (SW) and longwave (LW) fluxes. Other cloudelements, including total and low-level cloud fractions(Ctot, Clow) and clear-sky net SW and LW fluxes, arecompiled irrespective of the five conditions listed above.
As shown in Fig. 1, clouds were dominant at the NSAsite during the study period, thus there were only limitedLW and SW flux measurements for clear-sky conditions
during any 10-day period. The averaged clear-sky LWflux may provide a representative value of the 10-dayclear-sky LW flux because LW flux does not change toomuch for the daytime. However, SW flux is stronglydependent on solar zenith angle so that the averagedclear-sky SW flux from the limited samples during a10-day period cannot represent real clear-sky informa-tion. Therefore, we use the empirical curve-fitting tech-nique to infer clear-sky downward SW flux, and thenuse it with all-sky (clear and cloudy) measured Rsfc toinfer clear-sky upward SW flux. We note that all-skyRsfc is slightly different from clear-sky Rsfc, but this ap-pears to be the most reasonable approach to inferringthe clear-sky SW fluxes for conditions that are predom-inantly cloudy. The clear-sky net LW and SW fluxes arededuced from the difference between downward andupward fluxes for m0 . 0.2 during the 10-day periodto be consistent with the cloudy net fluxes. The clear-sky values are then used to derive LW and SW cloudradiative forcings.
a. Macrophysical properties
The 10-day means and standard deviations of cloudmacrophysical properties from May to September 2000at the ARM NSA site are shown in Fig. 1, and thecorresponding frequency distributions during the 5-month period are shown in Fig. 2. These means (stan-dard deviations) are simply the averages of all samples(5-min temporal resolution) within a 10-day period. Theaveraged Ctot during the 5-month study period is 0.87with a maximum of 0.96 in September and a minimumof 0.77 in June, and the averaged Clow is 0.55 with amaximum of 0.69 in May and a minimum of 0.47 inJune. From high values of total and low-level cloudfractions, we can draw a conclusion that the ARM NSAsite is an ideal location to study clouds, especially low-level stratus clouds. The 10-day averaged Zbase and Ztop
altitudes are, in general, around 0.4 and 0.8 km, leadingto a DZ of 0.4 km. From the frequency distributions,most Zbase values are less than 1 km with a mean valueof 0.47 km and a standard deviation of 0.56 km, andmost Ztop values are less than 1.5 km and have a broadfrequency of occurrence histogram. Most Tbase and Ttop
values are above 08C from late June to early September,whereas others range from 2108 to 08C with liquid dom-inant mixed-phase stratus clouds.
b. Microphysical properties
The 10-day means and standard deviations of cloudmicrophysical properties are shown in Fig. 3, and thecorresponding frequency distributions are also shown inFig. 2. Most 10-day averaged cloud LWPs range from50 to 150 g m22, and more than 85% of the cloud LWPsare less than 150 g m22 with a mean and standard de-viation of 91 and 67 g m22, respectively. Cloud LWCis the ratio of cloud LWP to DZ. The 10-day means of

1 FEBRUARY 2003 449D O N G A N D M A C E
FIG. 2. Frequency distributions of the selected cloud macrophysical and microphysical properties usingthe five criteria during May–Sep 2000 at the ARM NSA site.
FIG. 3. Ten-day averages and standard deviations of cloud param-eters based on the 5-min-averaged samples selected using the fivecriteria described in the text. (a) Cloud LWC derived from the ratioof LWP to DZ, (b) cloud-droplet effective radius, and (c) numberconcentration calculated from the new cloud parameterization. (d)Cloud LWP retrieved from microwave radiometer measured bright-ness temperature.
cloud LWC increase from early May (0.2 g m23) to thesummer (0.35 g m23), then decrease to 0.2 g m23 inlate September. Thus, cloud LWC during the summer2000 at the NSA site increases with increased cloudmean temperature. This positive correlation (0.31) be-tween LWC and cloud mean temperature is not found
using data collected at the ARM Southern Great Plains(SGP) site (36.68N, 97.58W) (D00). We find no corre-lation between cloud LWP and cloud temperature in thisstudy nor is this correlation found at the ARM SGP site(Table 2 in D00). These findings are based on 10-daymeans in this study and monthly means at the ARMSGP site and therefore should be viewed with caution.The only difference between these two quantities (LWPand LWC) is the cloud geometric thickness. This sug-gests that warmer cloud layers are thinner but containhigher LWC than colder layers at the ARM NSA site,not at the ARM SGP site. The difference in the rela-tionships between cloud thickness and temperature atthe NSA and SGP sites may reveal that the formation,maintenance, and dissipation processes of stratus cloudsin the midlatitudes and Arctic are different. Preliminarycalculations suggest these correlations are lower at high-er temporal resolution and additional study is ongoingto explain these findings.
The 10-day means and standard deviations of re andN are illustrated in Fig. 3, and their frequency distri-butions are also shown in Fig. 2. The means of re mono-tonically increase from early May to mid June, thenbegin to decrease in August. Overall, re is larger duringthe summer than in the spring and autumn. As Fig. 2demonstrates, most effective radii range from 4 to 16mm with a bimodal distribution. The small and largemodes appear to peak at 6–7 mm and 11–14 mm, re-spectively. The smaller particle mode mainly consistsof clouds that were observed during the spring and au-tumn, while the larger particle mode is mostly from theclouds observed during the summer. The variation of N

450 VOLUME 16J O U R N A L O F C L I M A T E
TABLE 2. Monthly averaged values of cloud properties at the ARM NSA site.
May Jun Jul Aug Sep
Ctot
Clow
Zbase, kmZtop, kmTbase, KTtop, KLWP, g m22
LWC, g m23
re, mmN, cm23
0.830.690.3890.830
265.1263.294.10.2377.77
222.4
0.770.470.4310.736
274.1273.989.60.308
11.03121
0.860.500.2970.591
278.3276.174.80.291
13.3953.9
0.890.480.3930.762
274.9272.994.60.263
12.656.2
0.960.591.0591.608
271.3264.0107.4
0.23711.4581.4
tgRcldy
RTOA
Rsfc
SWclear
SWcloud
LWclear
LWcloud
CRFSW
CRFLW
CRFNET
17.70.6880.8520.7030.860
70.042.4
251.7212.1227.6
39.612.0
12.50.5760.7390.6110.589
263.1110.8
270.5219.0
2152.351.5
2100.8
8.60.5440.5530.4570.172
370.3203.7
2101.8232.4
2166.669.4
297.2
10.90.4480.6230.5140.157
319.2145.3
2102.9226.7
2173.976.2
297.7
13.80.4650.7290.6020.432
161.374.6
294.1226.2286.7
67.9218.8
FIG. 4. 10-day averages and standard deviations derived from the5-min-averaged samples selected using the five criteria. (a) Cloudoptical depth, (c) cloud and TOA albedos calculated from the newcloud parameterization, and (b) effective solar transmission, and (d)surface albedo derived from the PSP measurements.
is always complementary to that of re with much smallervalues during the summer than in the spring and autumn(Fig. 3). More than 70% of the N values are less than150 cm23 with a mean and standard deviation of 117and 113 cm23, respectively. During the summer, themeans of re and N are around 13 mm and 60 cm23,which are the same as midlatitude marine stratus cloudmicrophysical properties (D97). While during the springand autumn seasons, the means of re vary from 7 to 10mm, and the N values are around 200 cm23—similar to
midlatitude continental stratus clouds (D97; D98; D00;Mace and Sassen 2000; Dong et al. 2002).
We note that the variations of re and N, as discussedabove, are similar to that reported in D00 using datacollected at the ARM SGP site. This suggests that sim-ilar seasonally varying factors may be influencing thecloud microphysical properties at the two sites. Thesefactors include the increased levels of absolute humidityin the warmer temperatures, more vigorous boundarylayer dynamics due to solar heating, and/or a decreasein the strength of the inversion near cloud top. Aerosoleffects may be another factor for the variation of cloudmicrophysics at the NSA site as we discussed in section2. Factors that may lead to the seasonal variation ofcloud microphysics are discussed in the next section.We now demonstrate how this seasonal cycle in cloudmicrophysics influences the seasonal variation of cloudradiative properties.
c. Radiative properties
The calculated broadband cloud optical thickness (t),and bulk albedos at the top of cloud and atmosphere(Rcldy, RTOA), as well as the PSP-derived effective solartransmission (g) and surface albedo (Rsfc) are illustratedin Fig. 4, and their frequency distributions are shownin Fig. 5. The Rsfc values in May are more than 0.8, thendecrease significantly from the beginning to the end ofJune, and keep nearly a constant value of 0.16 for thewhole summer, and finally increase from early to lateSeptember (0.8). The large standard deviation of Rsfc inmid June suggests that snow melted quickly in that timeperiod, while the first snow of the coming winter oc-curred in the middle of September. With a snow-covered

1 FEBRUARY 2003 451D O N G A N D M A C E
FIG. 5. Frequency distributions of the selected cloud radiative prop-erties (;300 h and 3600 samples in 5-min resolution) using the fivecriteria between May and Sep 2000 at the ARM NSA site.
FIG. 6. The 10-day means of (a) SW and (b) LW fluxes; the clear-sky net LW and SW fluxes are calculated from pyrgeometer mea-surements and inferred SW flux, respectively, for the daytime (m0 .0.2) during the 10-day period. The 10-day means of cloudy net SWand LW fluxes are the averages of the selected samples using the fivecriteria. (c) The 10-day SW (LW) CRF is the difference betweencloudy and clear-sky net SW (LW) 10-day means, and (d) the 10-day net CRF is the summation of SW and LW CRFs (the values ofnet CRF are negative for cooling and positive for warming of thesurface).
surface, the cloudy-sky surface albedo is approximately5% higher than the clear-sky surface albedo becausesnow reflects diffuse solar radiation better than directsolar radiation and clouds attenuate near-IR radiationmore efficiently than visible radiation.
The variations of the 10-day means of Rcldy and RTOA
basically follow the trend of Rsfc. These results confirmthat Rcldy and RTOA depend on both t and Rsfc. Duringsummer both Rcldy and RTOA are mainly determined byt, and do not depend on Rsfc because Rsfc is low andconstant. As Fig. A1 (in the appendix) demonstrates,the dependence of Rcldy on t becomes smaller with in-creased Rsfc for nonabsorbing cloud. This argument hasbeen confirmed by the Rcldy values in mid- and late Sep-tember periods where t is smaller and both Rcldy and Rsfc
are larger in late September than in mid September. Thevariation in the 10-day means of t follows the variationof LWP, and most of the t values are between 5 and 20with a mean value of 12.9 (Fig. 5). Only 6% of the tvalues are less than 5, which are mainly due to theselection criteria (iii) and (iv) listed in the beginning ofthis section. Here g is negatively correlated to t for lowRsfc, but this correlation is significantly modified undera snow-covered surface. For instance, the t (;15) inearly June is almost double the value (;8) in mid June,whereas the g values in these two periods are nearlythe same. This is mainly due to the Rsfc difference wherethe former Rsfc (0.74) is about 50% higher than the latterRsfc (0.49). The higher Rsfc results in more multiple re-flections of solar radiation between the cloud layer andthe highly reflecting surface, which ultimately results inhigher g.
The importance of re and Rsfc to Rcldy is demonstratedin the appendix (Fig. A2). For fixed LWP, Rcldy has asignificant dependence on both re and Rsfc. The seasonalvariation of cloud microphysics, small (large) re(N) dur-ing the spring and large (small) re(N) during the summer
in this study, strongly supports the seasonal variationof Rcldy (high in spring and low in summer). It appearsthat Rcldy is significantly affected by the cloud propertiesduring the summer when Rsfc is relatively small, but notduring the spring because Rcldy is insensitive to cloudoptical depth when Rsfc is large (Figs. A1 and A2).
d. Surface cloud radiative forcing
The change in the surface radiation balance due toclouds is termed cloud radiative forcing (CRF). TheCRF is classified into shortwave (CRFSW) and longwave(CRFLW) and defined as (Ramanathan et al. 1989; Curryet al. 1996)
CRF 5 Q 2 Q , CRF 5 F 2 F . (1)SW 1 0 LW 1 0
The CRF is the difference between the flux when skiesare overcast (Q1 and F1, cloud fraction 5 1) and whenthey are clear (Q0 and F0, cloud fraction 5 0), and Qand F are the net (downward minus upward) SW andLW fluxes. The net CRF, CRFNET, is the sum of CRFSW
and CRFLW at the surface. The values of CRF are pos-itive for warming of the surface and negative for coolingof the surface.
The cloudy and clear-sky net SW and LW fluxes, andthe SW/LW/net CRFs are shown in Fig. 6, where thefilled circles represent the averaged cloudy net SW andLW fluxes in a 10-day period, and open circles representthe averaged clear-sky net SW and LW fluxes in thatperiod in the two upper panels of Fig. 6. As Fig. 6

452 VOLUME 16J O U R N A L O F C L I M A T E
demonstrates, both cloudy and clear-sky net SW fluxesare relatively small (;50 W m22), and the clear-sky netSW flux is only slightly larger than the cloudy net SWflux when Rsfc is large. However, during the summerwhen Rsfc is small, both cloudy (;100–200 W m22) andclear-sky (;300–400 W m22) net SW fluxes are largewith a peak during late June–early July. During this timeperiod, the clear-sky net SW flux is much larger thanthe cloudy net SW flux showing that the SW coolingeffect of Arctic stratus is obvious and dominant at Bar-row. The cloudy net LW flux is nearly constant andaround 220 W m22 while the clear-sky net LW fluxdecreases approximately from 250 W m22 in May to2100 W m22 in July due to the significant increase insurface temperature that results in increasing upwardLW flux. The surface temperature is nearly equal to thecloud-base temperature because the surface is in thethermal equilibrium with the clouds. This is particularlytrue for the overcast, optically thick cloud conditionsused in this study. The surface does warm when cloudsare not present because of solar heating.
Compared to the SW CRFs, the LW CRFs maintainrelatively small positive values and vary slightly duringthe 5-month period. The LW CRFs range from around40 W m22 in May to 70 W m22 during July–August,while the SW CRFs vary from 230 W m22 in May to2170 W m22 during July–August, and then return to230 W m22 in September. The net CRFs drop from asmall positive value (;10 W m22) in May to a largenegative value (2100 W m22) in the summer, and thenreturn to near the springtime values in September. Thevariation of net CRFs is mainly determined by the SWCRFs and the trend of net CRF variation is nearly thesame as that of Rsfc except during the middle of July.During the summer, Rsfc is low and the net CRF valuesare large but negative—a strong cooling effect that issimilar to low and middle latitude stratus clouds (Ra-manathan et al. 1989; Harrison et al. 1990; Hartmannet al. 1992). During the spring and autumn seasons, theSW CRFs are small and the LW CRFs are the dominantfactor in the net CRFs. The positive net CRFs duringthe spring and autumn seasons suggest that Arctic stra-tus clouds have a warming effect on the surface relativeto a cloudless atmosphere. The warming effect of cloudsin spring will tend to enhance snow melting and in fallit may slow the solidification of the permafrost.
Understanding the impact of cloud properties on thesurface energy balance is not always straightforward,however. For example, all net CRFs (Fig. 6) during thesummer are around 2100 W m22 except the middle ofJuly. During the summer, all t values are more than oraround 10 except during the period of mid July (;6)when optically thinner layers allow some direct solarflux to penetrate to the surface. Therefore, the SW CRFhas a small negative value that results in a small negativenet CRF during that period. The reason leading to thebump of net CRF in mid July is mainly due to ourselection criterion (iii) where the range of g is between
0.1 and 0.8 in this study. In all previous studies, themaximum of g was set to 0.7 ensuring that only diffusesolar radiation was recorded by the ground-based solarradiometers. The maximum of 0.8 in this study is rea-sonable to account for the multiple reflections of solarradiation between the cloud layer and the highly re-flective snow/ice surface, in which the diffuse solartransmission is still dominant. However, for lower Rsfc
during summer, the maximum of 0.8 results in the in-clusion of some situations where direct solar flux con-tributes to the ground-based PSP observations. The ap-parent anomaly in the middle of July includes a signif-icant number of such cases. If we set the maximum ofg to 0.7, the new net CRF will be 296 W m22 for thatperiod, which is much more negative than the originalvalue (252 W m22) and also much closer to the netCRFs of nearby time periods. This new set (gmax 5 0.7)significantly affects the net CRF calculation in the pe-riod of mid July but not for other time periods becausethe percentage of g . 0.7 is more than 35% for thatperiod, while it is less than 5% for other 10-day periodsduring the summer. However, many cloud samples dur-ing the spring and autumn periods would be missed ifthe maximum of g were set to 0.7. Therefore, we stilluse gmax 5 0.8 in this study.
The bump of net CRF in mid July also suggests thatthere are other factors affecting the net CRF except Rsfc,and this motivates us to calculate the correlation coef-ficients between net CRF and cloud parameters. Thecorrelation coefficients between net CRF and Rsfc, g,and t from the averages of 15 10-day periods in thisstudy are 0.79, 0.53, and 20.24, respectively. It isstraightforward to understand the positive correlationbetween net CRF and Rsfc because the net CRF valuesare small positive for high Rsfc and large negative forlow Rsfc. The positive (negative) correlation between netCRF and g(t) also appears reasonable because a low(large) solar transmission (optical depth) will result ina small cloudy net SW flux and a large negative net SWCRF, and therefore a large negative net CRF. A morecomplete understanding of the quantitative correlationsbetween the SW/LW/net CRFs and the cloud parametersshould be determined from higher temporal resolutiondata, such as hourly or daily, rather than 10-day averagesand by examining the meteorological situations that con-tribute to the formation and maintenance of cloud fieldsin this region.
e. Summary
The single-layer and overcast low-level Arctic stratusmacrophysical, microphysical, and radiative properties,as well as surface radiation budget and cloud radiativeforcing at the ARM NSA site are summarized as a func-tion of month in Table 2. Both Clow and Ctot have aminimum in June and their maxima are in May andSeptember, respectively. Most values of Zbase are around0.4 km and Ztop are 0.8 km except in September where

1 FEBRUARY 2003 453D O N G A N D M A C E
both Zbase and Ztop values are more than 1 km. Both Tbase
and Ttop increase more than 10 K from the spring to thesummer where the Arctic stratus has changed from liq-uid-dominant mixed phase to liquid phase only. The re
and N values in the spring are similar to midlatitudecontinental stratus cloud microphysical properties(D00), and in the summer they are similar to midlatitudemarine stratus clouds (D97). Here Rcldy and g dependon both t and Rsfc when Rsfc is high. If we define thesignificant time periods at the ARM NSA site based onthis study, from May to mid June is the transition periodof spring melting, from late June to early September issummer, while the transition period to autumn freezingstarted in mid September during the year 2000. Duringthe summer, Arctic stratus clouds have a strong coolingeffect on the surface while during the spring and autumnperiods, they have a slight warming effect at the ARMNSA site.
4. Discussion and comparisons with other datasets
To determine how well the data collected at Barrowand analyzed in this study represent cloud properties inthe western Arctic region, it is necessary to comparewith other field observations. Therefore, we comparethe summer 2000 results with aircraft in situ measure-ments (Lawson et al. 2001; Hobbs et al. 2001; Dong etal. 2001), surface observations (Intrieri et al. 2002a,b,Curry et al. 2001), and satellite retrievals (Minnis et al.2001; Maslanik et al. 2001) during the FIRE ACE andSHEBA experiments. We also compare with aircraft insitu measurements collected over the Beaufort Sea dur-ing the ASC experiment in June 1980 (Herman andCurry 1984; Tsay and Jayaweera 1984) and the BASEexperiment in autumn 1994 (Pinto et al. 2001), as wellas from Hobbs and Rangno’s study in June 1995 (Hobbsand Rangno 1998). Although these comparisons arebased on data collected at different locations and years,it is instructive to consider the similarities and differ-ences between the ARM NSA results and data collectedin other field campaigns.
a. Cloud formation, maintenance, and dissipationprocesses
Paluch and Lenschow (1991), based on aircraft in situmeasurements, developed a conceptual model of the lifecycle of a marine stratus layer in the midlatitudes. Itstarts initially as a thin, homogenous layer, then growsand becomes patchy with time and produces precipi-tation. This stage is followed by the formation of smallcumuli below and eventually disintegrates, leaving afield of cumuli behind. The summer stratus clouds atthe ARM SGP site (36.68N, 97.58W), based on the 25-month datasets in the D00 study, normally form in themorning and dissipate in the afternoon due to strongsolar heating at the surface, and the lifting of entirecloud layer from morning to afternoon. The life cycle
of a stratus cloud event at the ARM SGP site is similarto the conceptual model generated by Paluch and Len-schow (1991) except that the end result is normallydissipation without precipitation.
By contrast, a summer Arctic stratus event at theARM NSA site tends to last at least a few days, andeven more than 10 days as we found in this study. It isapparent that the formation, maintenance, and dissipa-tion processes of Arctic stratus clouds are significantlydifferent from what typically occurs at the SGP site orwas hypothesized in the conceptual models. Arctic stra-tus clouds are formed very near the sea-ice surface ifwarm moist air advects over the cold Arctic Ocean, orby a convective-type process if cold polar air flows overa warmer sea-ice surface (Tsay and Jayaweera 1984).As Herman and Goody (1976) pointed out, once Arcticstratus clouds form, they persist. This is the significantdifference between the Arctic and midlatitude stratusclouds. In the Arctic the dissipative mechanisms foundin the midlatitudes such as precipitation, convectiveheating from the surface, absorption of solar radiation,and destruction by synoptic activity are either nonex-istent or relatively weak. The persistence of the cloudfield occurs in a steady-state situation where dissipativeprocesses are balanced by advection of air masses intoa region where the synoptic regimes are suitable forcloud formation and maintenance. Certainly furtherstudy is required to more fully understand these feed-backs and eventually parameterize these physical pro-cesses in large-scale models.
b. Cloud fraction
Cloud fraction for the surface observer is the per-centage of the sky dome covered by clouds, while forthe satellite imager, it is the ratio of the number of pixelsclassified as cloudy to the total number of pixels withinsome defined earth surface area. Cloud fraction derivedfrom lidar and/or radar measurements is simply the per-centage of returns that are cloudy within a specifiedsampling time period. If all three measurements are tak-en at the same time with some time allowance for build-ing a set of returns for lidar/radar estimate, it is unlikelythat they will agree completely for a given observationunless there are extensive overcast or clear skies. Eachviewing perspective provides an estimate for a uniquearea that may contain a different fractional cloudiness.However, if it is assumed that the cloud cover, whenaveraged over a sufficient time interval, is essentiallyinvariant over a relatively large area (e.g., 100-km wide)then the mean values from all three sensors should agreeif each provides an accurate representation of the meancloud fraction.
The monthly averaged total cloud fractions derivedin this study and during the FIRE ACE and SHEBAexperiments are listed in Table 3. The monthly averagedcloud fractions from the surface observers are based on6-hourly visual observations (Minnis et al. 2001; Mas-
454 VOLUME 16J O U R N A L O F C L I M A T E
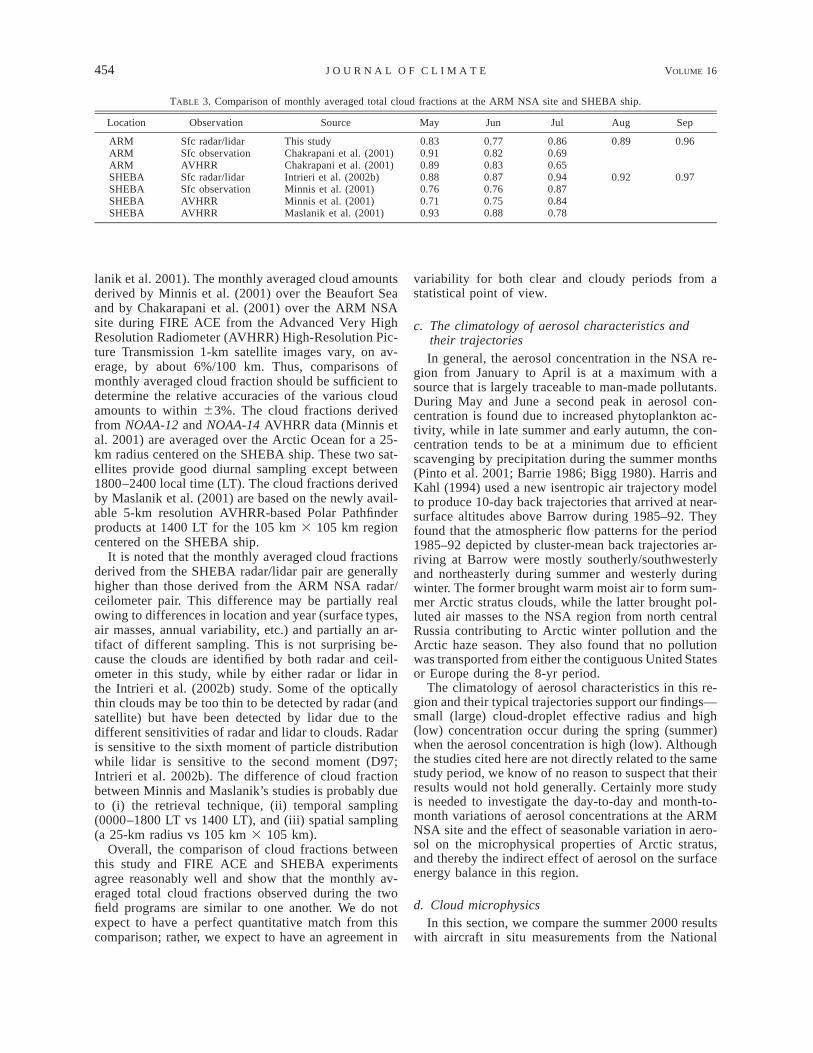
TABLE 3. Comparison of monthly averaged total cloud fractions at the ARM NSA site and SHEBA ship.
Location Observation Source May Jun Jul Aug Sep
ARM Sfc radar/lidar This study 0.83 0.77 0.86 0.89 0.96ARM Sfc observation Chakrapani et al. (2001) 0.91 0.82 0.69ARM AVHRR Chakrapani et al. (2001) 0.89 0.83 0.65SHEBA Sfc radar/lidar Intrieri et al. (2002b) 0.88 0.87 0.94 0.92 0.97SHEBA Sfc observation Minnis et al. (2001) 0.76 0.76 0.87SHEBA AVHRR Minnis et al. (2001) 0.71 0.75 0.84SHEBA AVHRR Maslanik et al. (2001) 0.93 0.88 0.78
lanik et al. 2001). The monthly averaged cloud amountsderived by Minnis et al. (2001) over the Beaufort Seaand by Chakarapani et al. (2001) over the ARM NSAsite during FIRE ACE from the Advanced Very HighResolution Radiometer (AVHRR) High-Resolution Pic-ture Transmission 1-km satellite images vary, on av-erage, by about 6%/100 km. Thus, comparisons ofmonthly averaged cloud fraction should be sufficient todetermine the relative accuracies of the various cloudamounts to within 63%. The cloud fractions derivedfrom NOAA-12 and NOAA-14 AVHRR data (Minnis etal. 2001) are averaged over the Arctic Ocean for a 25-km radius centered on the SHEBA ship. These two sat-ellites provide good diurnal sampling except between1800–2400 local time (LT). The cloud fractions derivedby Maslanik et al. (2001) are based on the newly avail-able 5-km resolution AVHRR-based Polar Pathfinderproducts at 1400 LT for the 105 km 3 105 km regioncentered on the SHEBA ship.
It is noted that the monthly averaged cloud fractionsderived from the SHEBA radar/lidar pair are generallyhigher than those derived from the ARM NSA radar/ceilometer pair. This difference may be partially realowing to differences in location and year (surface types,air masses, annual variability, etc.) and partially an ar-tifact of different sampling. This is not surprising be-cause the clouds are identified by both radar and ceil-ometer in this study, while by either radar or lidar inthe Intrieri et al. (2002b) study. Some of the opticallythin clouds may be too thin to be detected by radar (andsatellite) but have been detected by lidar due to thedifferent sensitivities of radar and lidar to clouds. Radaris sensitive to the sixth moment of particle distributionwhile lidar is sensitive to the second moment (D97;Intrieri et al. 2002b). The difference of cloud fractionbetween Minnis and Maslanik’s studies is probably dueto (i) the retrieval technique, (ii) temporal sampling(0000–1800 LT vs 1400 LT), and (iii) spatial sampling(a 25-km radius vs 105 km 3 105 km).
Overall, the comparison of cloud fractions betweenthis study and FIRE ACE and SHEBA experimentsagree reasonably well and show that the monthly av-eraged total cloud fractions observed during the twofield programs are similar to one another. We do notexpect to have a perfect quantitative match from thiscomparison; rather, we expect to have an agreement in
variability for both clear and cloudy periods from astatistical point of view.
c. The climatology of aerosol characteristics andtheir trajectoriesIn general, the aerosol concentration in the NSA re-
gion from January to April is at a maximum with asource that is largely traceable to man-made pollutants.During May and June a second peak in aerosol con-centration is found due to increased phytoplankton ac-tivity, while in late summer and early autumn, the con-centration tends to be at a minimum due to efficientscavenging by precipitation during the summer months(Pinto et al. 2001; Barrie 1986; Bigg 1980). Harris andKahl (1994) used a new isentropic air trajectory modelto produce 10-day back trajectories that arrived at near-surface altitudes above Barrow during 1985–92. Theyfound that the atmospheric flow patterns for the period1985–92 depicted by cluster-mean back trajectories ar-riving at Barrow were mostly southerly/southwesterlyand northeasterly during summer and westerly duringwinter. The former brought warm moist air to form sum-mer Arctic stratus clouds, while the latter brought pol-luted air masses to the NSA region from north centralRussia contributing to Arctic winter pollution and theArctic haze season. They also found that no pollutionwas transported from either the contiguous United Statesor Europe during the 8-yr period.
The climatology of aerosol characteristics in this re-gion and their typical trajectories support our findings—small (large) cloud-droplet effective radius and high(low) concentration occur during the spring (summer)when the aerosol concentration is high (low). Althoughthe studies cited here are not directly related to the samestudy period, we know of no reason to suspect that theirresults would not hold generally. Certainly more studyis needed to investigate the day-to-day and month-to-month variations of aerosol concentrations at the ARMNSA site and the effect of seasonable variation in aero-sol on the microphysical properties of Arctic stratus,and thereby the indirect effect of aerosol on the surfaceenergy balance in this region.
d. Cloud microphysicsIn this section, we compare the summer 2000 results
with aircraft in situ measurements from the National

1 FEBRUARY 2003 455D O N G A N D M A C E
TABLE 4. Summary of aircraft in situ measurements collected over the western Arctic region during other field experiments.
ObservationDate
(MM-DD-YY)Time
(UTC 5 LT 1 10)Latitude
(8N)Longitude
(8W)re
(mm)N
(cm23)LWC
(g m23)
NCAR C-130a
NCAR C-130a
NCAR C-130b
NCAR C-130a
UW Convair-580UW Convair-580UW C-131AUW C-131ANCAR ElectraNCAR ElectraNCAR C-130b
NCAR C-130b
NCAR C-130c
NCAR C-130c
5-04-985-15-985-18-985-27-985-29-986-03-986-06-956-14-956-20-806-28-807-21-987-29-989-21-94
10-12-94
23:15–24:1521:50–24:0022:08–22:1122:35–24:2022:11–22:4221:28–21:29N/AN/AN/AN/A22:53–23:2422:36–23:0520:4621:30–23:56
76.076.376.076.676.776.870.573.072.0–73.877.1–78.078.378.573.0–73.170.3–72.1
165.4165.3165.2168.0168.1167.6145.0147.0157.3–159.3154.3–155.1165.7163.2134.9134.8–137.0
7.98.7N/A9.17.3–15.35.5–7.75.3–8.47.4–11.76.5–7.96.2–7.1N/AN/A8.59.0–10.5
2065950–150437–50
65–7020–22563–102
178–244220–36530–600–80
5962–96
0.320.160.1–0.20.090.01–0.090.03–0.060.19–0.300.16–0.490.15–0.200.15–0.350.05–0.200–0.30N/AN/A
aData from Dong et al. (2001).bData from Lawson et al. (2001).cData from Pinto et al. (2001).
Center for Atmospheric Research (NCAR) C-130 (Donget al. 2001; Lawson et al. 2001) and the University ofWashington (UW) Convair-580 (Hobbs et al. 2001) overthe SHEBA ship during the FIRE Arctic Clouds Ex-periment. We also compare with the in situ measure-ments collected over the Beaufort Sea by the UW Con-vair C-131A research aircraft in June 1995 (Hobbs andRangno 1998) and by the NCAR Electra aircraft duringthe ASC experiment in June 1980 (Herman and Curry1984). Finally, the cloud microphysics observed by theNCAR C-130 aircraft during the BASE experiment fromlate September to early October 1994 (Pinto et al. 2001)is also listed in Table 4.
The aircraft results in Dong et al. (2001) were av-eraged from 1 or 2 h of Forward Scattering SpectrometerProbe (FSSP-100) measurements when the aircraft waswithin a radius of 10 km of the SHEBA ship. InLawson’s study, LWC was measured by a King hot-wireLWC device and N by an FSSP-100. In Hobbs et al.(2001) and Hobbs and Rangno (1998), the re and Nvalues were measured by the same probe, FSSP-100,while the LWC values were observed by the GerberScientific Particle Volume Monitor-100 (PVM-100) andthe King probe, respectively. The cloud microphysicalproperties in Herman and Curry (1984) and Pinto et al.(2001) were measured by the Knollenberg FSSP andFSSP-100, respectively.
Comparing Table 4 with Table 2, we find that in allcomparisons, one or two parameters of the surface-de-rived cloud microphysics, such as re, N, and LWC, agreewith the in situ data but not all at the same time. Whileit is possible that the discrepancies may be due to in-strumental or algorithmic uncertainties, they can alsoarise from the effects of ice crystals in liquid-dominantclouds, cloud vertical structure that is not totally sam-pled by the aircraft measurements, and different loca-tions and years. Although these comparisons using thesurface and aircraft data are limited, it appears that the
surface-retrieved cloud microphysical properties are inreasonable agreement with the aircraft in situ measure-ments. While it is not possible to validate the surface-retrieved cloud microphysics using the aircraft obser-vations shown in Table 4, the surface retrieval algorithmhas been partially validated elsewhere (Dong et al. 1998,2001). The question we attempt to address with thecomparison between Tables 4 and 2 is whether the sum-mer 2000 results fit within the general context of otherdata collected in the Arctic region.
e. Radiative properties
Using a simple radiation model, Leontyeva and Stam-nes (1994) estimated cloud optical depths from ground-based measurements of incoming solar irradiance atBarrow during April–October 1988. The estimations ofcloud optical depth were performed for all overcastcloudy conditions based on hourly mean values of in-coming and reflected solar irradiances at the surfacemeasured by the pyranometers with the assumptions ofplane-parallel and homogeneous cloud layers and fixedre (57 mm). The monthly averaged t values duringMay–August 1988 were 11, 12, 10, and 20, respectively.The averaged values during June and July are nearlythe same as those in this study (Table 2), while the meanvalue in May is smaller. In August, t derived by Leon-tyeva and Stamnes is much higher than the values ofother months in their study and the same month in thisstudy.
The monthly averaged surface albedos during May–September 1988, derived from the reflected and incidentsolar irradiances in Leontyeva and Stamnes’s study, arealmost the same as those in this study (Table 2). Curryet al. (2001) also presented the Rsfc values derived fromthe surface-based PSP measurements during the FIREACE and SHEBA field experiments and showed thatsurface albedos in May and late September are the same

456 VOLUME 16J O U R N A L O F C L I M A T E
TABLE 5. Monthly averaged CRFs (W m22) for all-cloudconditions at the ARM NSA site.
Month SWcloud LWcloud CRFSW CRFLW CRFNET
MayJunJulAugSep
55.1190.8182.2143.795.8
223.0227.8233.0230.4234.6
215.0272.3
2188.12175.5265.5
28.742.768.872.560.0
13.7229.6
2119.32103.0
26.5
TABLE 6. Monthly averaged CRFs (W m22) for Rsfc 5 0.5 (both clear and cloudy sky) in August at the ARM NSA site and SHEBA ship.
Location SWclear SWcloud LWclear LWcloud CRFSW CRFLW CRFNET
NSASHEBA
189.667.2
87.036.2
2102.6265.3
226.7211.5
2102.6230.3
76.255.1
226.424.8
as those in this study and during the summer (July andearly August) they are around 0.5. During summer, thedifference of Rsfc in these two sites is mainly due to thedifference in surrounding surface types where the NSAsite was covered by low-albedo tundra surrounded byopen water (Leontyeva and Stamnes 1994), while theSHEBA ship was covered by a mosaic of low-albedomelt ponds interspersed with much higher albedo re-gions of ice (Curry et al. 2001).
f. Cloud radiative forcing
Intrieri et al. (2002a) studied an annual cycle of Arcticsurface cloud radiative forcing from data obtained dur-ing the SHEBA experiment with the same instrumentsas in this study. The CRF reported in the Intrieri et al.study used the measured fluxes under all-sky conditions,that is, including clear sky, clouds at all levels and frac-tional amounts. The CRF used in this study is analogousto the maximum CRF defined in the Intrieri et al. study(cloud fraction 5 1 for overcast low-level stratus clouds,and cloud fraction 5 0 for clear sky). The clear-sky LWand SW fluxes in the Intrieri et al. study were calculatedusing the Santa Barbara discrete ordinate radiative trans-fer atmospheric radiative transfer computer code withthe inputs of rawinsonde soundings. Since the clear-skyand cloudy fluxes are different between the SHEBAexperiment and this study, the comparison of CRF forthese two sites should be viewed with caution. The LWCRFs between the ARM NSA site and SHEBA ship arenearly the same, but the values of negative SW CRF atthe ARM NSA are much larger than at the SHEBA ship.At the ARM NSA site, the summer cooling period ismuch longer (2–3 months vs 1–2 weeks), and the sum-mer cooling magnitude is much larger (2100 W m22
vs 25 W m22) than at the SHEBA ship.To study the difference of CRFs between all clouds
and low-level stratus clouds, we calculated five monthsof all-cloud CRFs at the ARM NSA site and listed themin Table 5. Comparing to the low-cloud downward LWflux (DLWF), the single-layer cirrus DLWF is lowerwhile the cumulus DLWF is nearly the same. Therefore,
the all-cloud net LW fluxes are slightly more negativethan those of the low clouds during the 5-month period,which results in smaller LW CRFs for all clouds whenthe same clear-sky LW flux is used. When cirrus cloudsoccur over low clouds, the DLWF does not change toomuch, but the downward SW flux (DSWF) is decreasedbut not much since most low clouds are already opticallythick in this study. Comparing to the low-cloud DSWF,the single-layer cirrus DSWF increases considerably,especially for broken cirrus clouds, while the cumulusDSWF decreases significantly. Therefore the all-cloudSW CRFs are nearly the same as the low-cloud valueswhen the effects of cirrus and cumulus are balanced,and sometimes they do not agree when one of these twoclouds dominates.
To further study the impact of surface albedo on thesurface radiation budget, we calculate the CRFs of low-level stratus clouds in August at the ARM NSA sitewith fixed Rsfc (50.5) for both clear and cloudy periods,and compare these results with the SHEBA AugustCRFs (Intrieri et al. 2002a) as shown in Table 6. Com-paring to the original August CRFs at the NSA site, thenewly calculated LW CRFs (with fixed Rsfc 5 0.5) arethe same but the SW CRFs are significantly decreased,which results in a small negative net CRF. Comparingto the SHEBA results, the newly calculated LW and SWfluxes and CRFs are much larger (in absolute sense)than those at the SHEBA ship owing to lower solarzenith angle and warmer atmosphere at the NSA site.
g. Summary
The formation, maintenance, and dissipation pro-cesses of Arctic stratus clouds are significantly differentfrom midlatitude stratus clouds. In the Arctic the dis-sipative processes that destroy stratus clouds in the mid-latitudes, such as precipitation, convective heating fromthe surface, and absorption of solar radiation, are ofteneither nonexistent and/or are relatively weak. The com-parison of cloud fractions between this study and theFIRE ACE and SHEBA experiments agree reasonablywell. For the cloud microphysics, one or two parametersof the surface-derived cloud microphysics (i.e., re, N,LWC) in this study agree with the in situ data but notall at the same time. Although these comparisons usingthe surface and aircraft data are limited, the surface-retrieved cloud microphysical properties in this studyagree reasonably well within the range found by aircraftin situ measurements over the western Arctic Oceanduring other field experiments. The climatology of Arc-tic aerosol characteristics and their trajectories shows a

1 FEBRUARY 2003 457D O N G A N D M A C E
maximum concentration in winter and a minimum insummer. This is consistent with the seasonal variationof cloud microphysics found in this study. The surfacealbedos at the SHEBA ship and the ARM NSA site aresimilar in May and late September because both sitesare snow-covered. Comparing the net CRFs at the ARMNSA site with those at the SHEBA ship, the summercooling period at the ARM NSA site is much longer(2–3 months vs 1–2 weeks), and the summer coolingmagnitude is much larger (2100 vs 25 W m22) thanat the SHEBA ship owing to much higher surface albedoand larger solar zenith angle at the SHEBA ship thanat the ARM NSA site.
5. Conclusions
A 5-month record of low-level stratus cloud prop-erties (May–September 2000) has been generated to de-termine the seasonal variation of Arctic stratus cloudmacrophysical, microphysical, and radiative propertiesat the ARM NSA site, and also to examine the impactof stratus cloud properties on the Arctic surface radia-tion budget. We have also compared the summer 2000results with datasets collected elsewhere in this region.From the summer 2000 results and comparisons withother datasets, we have found the following:
1) The monthly averaged cloud properties, summarizedin Table 2, show that the averaged total and low-level cloud fractions during the study period are 0.87and 0.55, with minima in June and maxima in Mayand September, respectively. Almost all low-cloudbase heights are around 0.4 km and top heights are0.8 km, except in September where both Zbase andZtop values are above 1 km. Both cloud-base and-top temperatures increase more than 10 K from thespring to the summer. The means of cloud-dropleteffective radius and number concentration are closeto 8 mm and 220 cm23 during the spring, and 13 mmand 60 cm23 during the summer, respectively. Thenet cloud radiative forcing cools the surface duringthe summer and warms the surface during the springand autumn periods, confirming that Arctic stratusclouds enhance the springtime melting and slowdown the autumn freezing of the ice pack comparedto having no clouds.
2) The total cloud fractions in this study show goodagreement with the satellite and surface results com-piled from data collected during the FIRE ACE andSHEBA field experiments in 1998. The cloud mi-crophysics derived from this study, in general, aresimilar to those collected in past field programs al-though these comparisons are based on data collectedat different locations and years. No attempt has beenmade to validate the surface-derived cloud propertiesin this study using aircraft and satellite data. Ourgoal is to show that the summer 2000 results at theARM NSA site fit within the general context of other
data collected in this region. The surface albedos(;0.8) at both SHEBA and the NSA site are thesame in May and late September. In summer thesurface albedo at the ARM NSA site is around 0.2,which is significantly lower than at the SHEBA ship(;0.5) owing to the different surface types. Thesummer cooling period at the ARM NSA is muchlonger and significantly stronger than that at theSHEBA ship. The ARM NSA site seems to representreasonably well Arctic land areas and adjacent open-ocean regions that transition to low surface albedoand a net negative CRF in summertime, while theSHEBA ship data record represents sea-ice-coveredlatitudes with larger surface albedo and weaker solarradiation where the net CRF remains weakly positiveor neutral during the summer.
The above conclusions are based only on data com-plied from May to September 2000 at the ARM NSAsite, and on comparisons with limited surface, aircraft,and satellite results at different locations and years. Noattempt has been made to give an exhaustive climatol-ogy of Arctic stratus clouds; rather, our emphasis is toprovide fundamental statistical information about Arcticstratus clouds that are useful for improving and/or de-veloping Arctic stratus cloud parameterizations for pro-cess models. In order to improve the representation ofcloud microphysics and the associated heating and otherfeedbacks in these models, the actual physical processesthat lead to cloud formation and maintenance must bephysically understood and parameterized so that themodeled hydrological cycle can faithfully representwhat is found in nature. Ultimately, improved param-eterizations can only result from a combined effort thatbuilds on the synergy of long-term observations, col-located aircraft data, and satellite data coupled withcloud-resolving models (Krueger 1988), single columnmodels (Randall et al. 1996), and full GCMs.
Acknowledgments. Data were obtained from the At-mospheric Radiation Measurement Program sponsoredby the U.S. Department of Energy Office of EnergyResearch, Office of Health and Environmental Research,Environmental Sciences Division. Special thanks to Ms.J. Intrieri for providing SHEBA CRFs, to Ms. S. Bensonfor processing the data, and to Drs. Minnis and Coakleyand three anonymous reviewers for providing insightfulcomments and suggestions. During this study, authorswere supported by the ARM program under Grant DE-A102-97ER62341, Dr. Dong was also supported byNASA CERES project under Contract NAG-1-2250,and Dr. Mace was also supported by NASA EOS val-idation project under Contract NAG-5-6458.
APPENDIX
New Cloud Parameterization
To retrieve the microphysical and radiative properties

458 VOLUME 16J O U R N A L O F C L I M A T E
FIG. A1. (a) Cloud albedo and (b) transmission are calculated bya two-stream discrete-ordinate method to study the impact of surfacealbedo on cloud albedo and transmission. (c) The effective solartransmission (g) is the total downward solar flux at the surface.
of single-layer and overcast low-level stratus clouds,D97 used a delta–2-stream radiative transfer model inconjunction with ground-based measurements. The re-trieval scheme is based on an iterative approach thatvaries re in the radiative transfer calculations until themodel-calculated solar transmission matches the mea-sured value. The retrieved cloud properties include thelayer-mean cloud-droplet effective radius (re) and num-ber concentration (N), broadband shortwave opticaldepth (t), and albedos at the top of cloud and atmosphere(Rcldy, RTOA) with the derived Rsfc. D98 parameterizedthe retrieved re and radiative properties as a function ofthe cloud LWP, the effective solar transmission (g), andcosine of the solar zenith angle (m0). The retrieved andparameterized cloud microphysical properties have beenvalidated by aircraft in situ measurements in the mid-latitudes (Dong et al. 1998, 2002) and in the Arcticregion (Dong et al. 2001).
The method to develop the new parameterization isthe same as that in D98; at first we retrieve re using theD97 technique with the inputs of surface measurements,such as cloud LWP, DZ, g, and Rsfc, and then we pa-rameterize re as a polynomial function of cloud LWP,g, m0, and Rsfc. The D98 parameterization is primarilydeveloped for low Rsfc where single-layer, liquid-phase,and daytime cloud conditions exist. The new parame-terization, reported here for the first time, is the sameas that described by D98 except the impact of Rsfc isincluded. To demonstrate the impact of Rsfc on cloudalbedo and transmission, Fig. A1 is plotted using a two-stream discrete-ordinate method (Liou 1974). The cloudalbedo and transmission only depend on t for Rsfc 5 0,but they monotonically increase with increased Rsfc. Thedependence of cloud albedo and transmission on t be-comes smaller with increased Rsfc. Therefore, cloud al-bedo and transmission depend on both t and Rsfc forconservative scattering, as shown in Fig. A1. However,if clouds absorb appreciably, the influence of Rsfc oncloud albedo would depend on the amount of cloudabsorption and t. The effective solar transmission (g),which relies on the measured total downward solar fluxat the surface, also increases with increased Rsfc due tothe multiple reflections of solar radiation between thecloud layer and the highly reflective surface.
To develop the new parameterization, we use 13 cases(;91 h of data) with the range of Rsfc from 0.1 to 0.9selected from the present study period at the ARM NSAsite. The retrieved values of re from the D97 methodare parameterized as a polynomial function of cloudLWP, g, m0, and Rsfc as follows:
3r 5 2.49LWP 1 10.25(1 2 R )g 2 0.25me sfc 0
31 20.28LWPg(1 2 R ) 2 3.14LWPm , (A1)sfc 0
where the units of LWP and re are 100 g m22 and mm,respectively. Equation (A1) is similar to (9) of D98except that Rsfc is included. Once re is known, N and tcan be estimated

1 FEBRUARY 2003 459D O N G A N D M A C E
FIG. A2. The lines represent the calculated cloud-top albedo from (A6) and effective radius from (A1) withfixed m0 and Rsfc (or re and g), and the circles represent the data (;91 h). The calculated cloud effective radiusand albedo (parameterization) are also compared with the retrieved cloud properties (retrieval) in the rightcolumn.
3LWP2N 5 exp(3s ), and (A2)x34pr r DZw e
3LWPt 5 . (A3)
2r re w
The logarithmic width sx is set to 0.38 (Miles et al.2000), and DZ is cloud thickness derived from the dif-ference of cloud-top and -base heights. Fixing sx in thescheme does not lead to significant errors in the retrievalvalues of re, while N changes by 15%–30% as sx variesfrom 0.2 to 0.5 (D97).
The D98 cloud albedo (RD98) and transmission (TD98)were calculated with the inputs of retrieved re and N,along with the measured cloud-base and -top heightsusing the same radiative transfer model as in the re-trieval of re and N but with Rsfc 5 0. The resulting valuesfor RD98 and TD98 are then fit with polynomial functionof LWP, re, and m0:
R 5 20.089 2 0.089r 2 0.19m 1 0.405 ln(LWP)D98 e 0
2 22 0.033 ln (LWP) 1 0.00045re
1 0.011 ln(LWP)r , (A4)e
T 5 1.087 1 0.096r 1 0.153m 2 0.418 ln(LWP)D98 e 0
2 21 0.034 ln (LWP) 2 0.0004re
2 0.012 ln(LWP)r , (A5)e
where the units of LWP and re are g m22 and mm,
respectively. The RD98 and TD98 are nearly the same asthe bulk cloud-top albedo Rcldy and measured g overland and ocean for low Rsfc, but not for high Rsfc. TheRcldy, a result found during the retrieval of re, has thefollowing relationship with RD98, TD98, and Rsfc based ona total of 91 h of measurements and retrievals:
R 5 R 1 R T .cldy D98 sfc D98 (A6)The Rcldy in (A6) will equal RD98 if Rsfc 5 0. The bulkTOA albedo (RTOA), on average, is 82.6% of the Rcldy
with only a 2% variation around the average value dur-ing the 91-h period. The rms errors in the parameteri-zations of re and Rcldy relative to the retrieved valuesare similar to those reported in D98, around 11% and4% (Fig. A2), respectively.
To illustrate the importance of re and Rsfc to Rcldy, Fig.A2 is produced from (A6) for a variety of cloud LWP,re and Rsfc with a specified m0. As Fig. A2 demonstrates,for fixed LWP, Rcldy has a significant dependence on bothre and Rsfc. The quantitative dependence of re on cloudLWP, g, and Rsfc is also illustrated in Fig. A2 where re
exhibits a strong positive correlation with g for a givenRsfc and a negative correlation with Rsfc for a fixed g.Most of data points (circles) fall within the lower andupper limits of calculations (lines) from the new param-eterizations (A1, A6) as shown in Fig. A2.
REFERENCES
Barrie, L. A., 1986: Arctic air pollution: An overview of currentknowledge. Atmos. Environ., 20, 643–663.

460 VOLUME 16J O U R N A L O F C L I M A T E
Bigg, E. K., 1980: Comparison of aerosol at four baseline atmosphericmonitoring stations. J. Appl. Meteor., 19, 521–533.
Chakrapani, V., D. A. Spangenberg, D. R. Doelling, P. Minnis, Q. Z.Trepte, and R. F. Arduini, 2001: Improvements in AVHRR day-time cloud detection over the ARM NSA site. Proc. 11th ARMScience Team Meeting, Atlanta, GA, Dept. of Energy. [Availableonline at http://www.arm.gov/docs/documents/technical/confp0103/author.html.]
Curry, J. A., and E. E. Ebert, 1992: Annual cycle of radiation fluxesover the Arctic Ocean: Sensitivity to cloud optical properties. J.Climate, 5, 1276–1280.
——, W. B. Rossow, D. Randall, and J. L. Schramm, 1996: Overviewof Arctic cloud and radiation characteristics. J. Climate, 9, 1731–1764.
——, and Coauthors, 2000: FIRE Arctic Clouds Experiment. Bull.Amer. Meteor. Soc., 81, 5–29.
——, J. L. Schramm, D. K. Perovich, and J. O. Pinto, 2001: Appli-cations of SHEBA/FIRE data to evaluation of snow/ice albedoparameterizations. J. Geophys. Res., 106, 15 345–15 355.
Dong, X., T. P. Ackerman, E. E. Clothiaux, P. Pilewskie, and Y. Han,1997: Microphysical and radiative properties of stratiform cloudsdeduced from ground-based measurements. J. Geophys. Res.,102, 23 829–23 843.
——, ——, and ——, 1998: Parameterizations of microphysical andshortwave radiative properties of boundary layer stratus fromground-based measurements. J. Geophys. Res., 103, 31 681–31 693.
——, P. Minnis, T. P. Ackerman, E. E. Clothiaux, G. G. Mace, C. N.Long, and J. C. Liljegren, 2000: A 25-month database of stratuscloud properties generated from ground-based measurements atthe ARM SGP site. J. Geophys. Res., 105, 4529–4538.
——, G. G. Mace, P. Minnis, and D. F. Young, 2001: Arctic stratuscloud properties and their effect on the surface radiation budget:Selected cases from FIRE ACE. J. Geophys. Res., 106, 15 297–15 312.
——, P. Minnis, G. G. Mace, W. L. Smith Jr., M. Poellot, R. T.Marchand, and R. P. Rapp, 2002: Comparison of stratus cloudproperties deduced from surface, GOES, and aircraft data duringthe March 2000 ARM cloud IOP. J. Atmos. Sci., 59, 3265–3284.
Garrett, T. J., L. F. Radke, and P. V. Hobbs, 2002: Aerosol effects oncloud emissivity and surface longwave heating in the Arctic. J.Atmos. Sci., 59, 769–778.
Gates, W. L., 1992: AMIP: The Atmospheric Model IntercomparisonProject. Bull. Amer. Meteor. Soc., 73, 1962–1970.
Harris, J. M., and J. D. W. Kahl, 1994: Analysis of 10-day isentropicflow patterns for Barrow, Alaska: 1985–1992. J. Geophys. Res.,99, 25 845–25 855.
Harrison, E. F., P. Minnis, B. R. Barkstrom, V. Ramanathan, R. D.Cess, and G. G. Gibson, 1990: Seasonal variation of cloud ra-diative forcing derived from the Earth Radiation Budget Ex-periment. J. Geophys. Res., 95, 18 687–18 703.
Hartmann, D. L., M. E. Ockert-Bell, and M. L. Michelsen, 1992: Theeffect of cloud type on earth’s energy balance: Global analysis.J. Climate, 5, 1281–1304.
Herman, G. F., and R. Goody, 1976: Formation and persistence ofsummertime Arctic stratus clouds. J. Atmos. Sci., 33, 1537–1553.
——, and J. A. Curry, 1984: Observational and theoretical studiesof solar radiation in Arctic stratus clouds. J. Climate Appl. Me-teor., 23, 5–24.
Hobbs, P. V., and A. L. Rangno, 1998: Microstructures of low andmiddle-level clouds over the Beaufort Sea. Quart. J. Roy. Me-teor. Soc., 124, 2035–2071.
——, ——, M. D. Shupe, and T. Uttal, 2001: Airborne studies ofcloud structures over the Arctic Ocean and comparisons withretrievals from ship-based remote sensing instruments. J. Geo-phys. Res., 106, 15 029–15 044.
Intrieri, J. M., C. W. Fairall, M. D. Shupe, P. O. G. Persson, E. L.Andreas, P. S. Guest, and R. E. Moritz, 2002a: An annual cycleof Arctic surface cloud forcing at SHEBA. J. Geophys. Res.,107 (C10), 8039, doi:10.1029/2000JC000439.
——, M. D. Shupe, T. Uttal, and B. J. McCarty, 2002b: An annual
cycle of Arctic cloud characteristics observed by radar and lidarat SHEBA. J. Geophys. Res., 107 (C10), 8030, doi:10.1029/2000JC000423.
Kato, S., T. P. Ackerman, E. E. Clothiaux, J. H. Mather, G. G. Mace,M. L. Wesely, F. Murcray, and J. Michalsky, 1997: Uncertaintiesin modeled and measured clear-sky surface shortwave irradiance.J. Geophys. Res., 102, 25 881–25 898.
Krueger, S. K., 1988: Numerical simulation of tropical cumulusclouds and their interaction with the subcloud layer. J. Atmos.Sci., 45, 2221–2250.
Lawson, R. P., B. A. Baker, C. G. Schmitt, and T. L. Jensen, 2001:An overview of microphysical properties and Arctic clouds ob-served in May and July 1998 during FIRE ACE. J. Geophys.Res., 106, 14 989–15 014.
Leontyeva, E., and K. Stamnes, 1994: Estimates of cloud opticalthickness from ground-based measurements of incoming solarradiation in the Arctic. J. Climate, 7, 566–578.
Liljegren, J. C., E. E. Clothiaux, G. G. Mace, S. Kato, and X. Dong,2001: A new retrieval for cloud liquid water path using a ground-based microwave radiometer and measurements of cloud tem-perature. J. Geophys. Res., 106, 14 485–14 500.
Liou, K. N., 1974: Analytic two-stream and four-stream solutions forradiative transfer. J. Atmos. Sci., 31, 1473–1475.
Long, C. N., and T. P. Ackerman, 2000: Identification of clear skiesfrom broadband pyranometer measurements and calculation ofdownwelling shortwave cloud effects. J. Geophys. Res., 105,15 609–15 626.
Mace, G. G., and K. Sassen, 2000: A constrained algorithm for re-trieval of stratocumulus cloud properties using solar radiation,microwave radiometer, and millimeter cloud radar data. J. Geo-phys. Res., 105, 29 099–29 108.
Maslanik, J. A., J. Key, C. W. Fowler, T. Nguyen, and X. Wang, 2001:Spatial and temporal variability of satellite-derived cloud andsurface characteristics during FIRE-ACE. J. Geophys. Res., 106,15 223–15 249.
Miles, N. L., J. Verlinde, and E. E. Clothiaux, 2000: Cloud-dropletsize distributions in low-level stratiform clouds. J. Atmos. Sci.,57, 295–311.
Minnis, P., and Coauthors, 2001: Cloud coverage and height duringFIRE ACE derived from AVHRR data. J. Geophys. Res., 106,15 215–15 232.
Mitchell, J. F. B., and W. J. Ingram, 1992: Carbon dioxide and climate:Mechanisms of changes in cloud. J. Climate, 5, 5–21.
Moran, K. P., B. E. Martner, M. J. Post, R. A. Kropfli, D. C. Welsh,and K. B. Widener, 1998: An unattended cloud-profiling radarfor use in climate research. Bull. Amer. Meteor. Soc., 79, 443–455.
Paluch, I. R., and D. H. Lenschow, 1991: Stratiform cloud formationin the marine boundary layer. J. Atmos. Sci., 48, 2141–2158.
Perovich, D. K., and Coauthors, 1999: Year on ice gives climateinsights. Eos, Trans. Amer. Geophys. Union, 80, 481–486.
Pinto, J. O., J. A. Curry, and J. M. Intrieri, 2001: Cloud–aerosolinteractions during the autumn over Beaufort Sea. J. Geophys.Res., 106, 15 077–15 097.
Ramanathan, V., R. D. Cess, E. F. Harrison, P. Minnis, B. R. Bark-strom, E. Ahmad, and D. Hartmann, 1989: Cloud-radiative forc-ing and climate: Results from the Earth Radiation Budget Ex-periment. Science, 243, 57–63.
Randall, D., K.-M. Xu, R. J. C. Somerville, and S. Iacobellis, 1996:Single-column models and cloud ensemble models as links betweenobservations and climate models. J. Climate, 9, 1683–1697.
——, and Coauthors, 1998: Status of and outlook for large-scalemodeling of atmospheric–ice–ocean interactions in the Arctic.Bull. Amer. Meteor. Soc., 78, 197–219.
Stamnes, K., R. G. Ellingson, J. A. Curry, J. E. Walsh, and B. D.Zak, 1999: Review of science issues, deployment strategy, andstatus for the ARM North Slope of Alaska–Adjacent ArcticOcean climate research site. J. Climate, 12, 46–63.
Stokes, G. M., and S. E. Schwartz, 1994: The Atmospheric RadiationMeasurement (ARM) program: Programmatic background and

1 FEBRUARY 2003 461D O N G A N D M A C E
design of the cloud and radiation testbed. Bull. Amer. Meteor.Soc., 8, 1251–1256.
Stone, R. S., 1997: Variations in western arctic temperature in re-sponse to cloud radiative and synoptic-scale influence. J. Geo-phys. Res., 102, 21 769–21 776.
Tao, X., J. E. Walsh, and W. L. Chapman, 1996: An assessment ofglobal climate simulations of Arctic air temperatures. J. Climate,9, 1060–1076.
Tsay, S.-C., and K. Jayaweera, 1984: Physical characteristics of Arcticstratus clouds. J. Climate Appl. Meteor., 23, 584–596.
Westwater, E. R., Y. Han, M. D. Shupe, and S. Y. Matrosov, 2001:Analysis of integrated cloud liquid and precipitable water vaporretrievals from microwave radiometers during SHEBA. J. Geo-phys. Res., 106, 32 019–32 030.
Wetherald, R. T., and S. Manabe, 1988: Cloud feedback processes ingeneral circulation model. J. Atmos. Sci., 45, 1397–1415.


