Embed Size (px)
Citation preview
Areas of endemism of Mexican mammals: reanalysisapplying the optimality criterion
TANIA ESCALANTE1, CLAUDIA SZUMIK2 and JUAN J. MORRONE1*
1Museo de Zoología ‘Alfonso L. Herrera’, Departamento de Biología Evolutiva, Facultad de Ciencias,Universidad Nacional Autónoma de México (UNAM), Apdo. Postal 70-399, 04510 Mexico, D.F.,Mexico2Instituto Superior de Entomología, Consejo Nacional de Investigaciones Científicas y Técnicas,Miguel Lillo 205, 4000 San Miguel de Tucumán, Argentina
Received 11 March 2009; accepted for publication 27 April 2009bij_1293 468..478
In order to test Mexican areas of endemism of mammals identified by previous parsimony analyses of endemicity(PAEs), we applied the optimality criterion to three data matrices (based on point records, potential distributionalmodels and the fill option in software NDM). We modelled the ecological niches of 429 terrestrial mammal speciesusing the genetic algorithm for rule-set prediction (GARP) and models were projected as potential distributionalareas. We overlapped the point occurrence data and the individual maps of potential distributions to a grid of 1°latitude–longitude. Three matrices of 247 grid cells (areas) and 429 species were built: (1) a binary matrix with ‘0’for absence and ‘1’ for presence of at least one record of the species inside the grid-cell; (2) a three-state matrixsimilar to (1) but assigning the state ‘2’ to the assumed presence in the model of potential distribution; and (3) athree-state matrix similar to (2), but applying the fill option of software NDM instead of using a model. Theoptimality criterion was performed in NDM version 2.7 and results were examined with VNDM version 2.7. Thefirst and second matrices showed 13 areas of endemism and the third identified 16 areas of endemism. NDMprovided a better resolution than PAE, allowing us to identify several new areas of endemism, previouslyundetected. Ecological niche models, projected as potential distributional areas, and the optimality criterion arevery useful to identify areas of endemism, although they should be used with caution because they may overpredictpotential distributional areas. PAE seems to underestimate the areas of endemism identified. © 2009 TheLinnean Society of London, Biological Journal of the Linnean Society, 2009, 98, 468–478.
ADDITIONAL KEYWORDS: ecological niche models – endemicity – Mexico – NDM software – parsimonyanalysis of endemicity.
INTRODUCTION
Areas of endemism are basic units of analysis inevolutionary biogeography (Morrone, 2008). There aremany methods to identify areas of endemism basedon different approaches (Rosen, 1988; Rosen & Smith,1988; Harold & Mooi, 1994; Morrone, 1994; Crispet al., 2001; Linder, 2001; Hausdorf, 2002; Szumiket al., 2002; Hausdorf & Hennig, 2003; Mast &Nyffeler, 2003; Szumik & Goloboff, 2004; Deo &DeSalle, 2006; Giokas & Sfenthourakis, 2007; Dos
Santos et al., 2008). Parsimony analysis of endemicity(PAE) (Rosen, 1988; Morrone, 1994) uses a parsimonyalgorithm to obtain an area cladogram, based on thetaxa inhabiting the study areas, where the clades aretreated as areas of endemism. It has been widelyused to identify areas of endemism for different taxain several regions (see Morrone & Escalante, 2002;Escalante & Morrone, 2003; Nihei, 2006; Morrone,2008). In Mexico, areas of endemism have beenidentified for mammals, birds, helminths, insects andplants (e.g. Aguilar-Aguilar, Contreras-Medina &Salgado-Maldonado, 2003; Espadas-Manrique, Durán& Argáez, 2003; Rojas-Soto, Alcántara-Ayala &Navarro, 2003; García-Trejo & Navarro, 2004;*Corresponding author. E-mail: [email protected]
Biological Journal of the Linnean Society, 2009, 98, 468–478. With 4 figures
© 2009 The Linnean Society of London, Biological Journal of the Linnean Society, 2009, 98, 468–478468
Méndez-Larios et al., 2005; Corona, Toledo &Morrone, 2007; Vargas, Guzmán & Breedy, 2008).
Mexico is situated between the Nearctic and Neo-tropical regions and most of the country has beencharacterized as a transition zone (Escalante,Rodríguez & Morrone, 2004; Morrone, 2005). It har-bours 11% of the mammal species of the world, withmore than 160 species restricted to the country(Ceballos & Oliva, 2005). In a recent biogeographicregionalization, Morrone (2005) recognized 14 biogeo-graphic provinces; however, some of them do notcoincide with those obtained for mammals (see Escal-ante, Morrone & Rodríguez, 2007a). Escalante, Espi-nosa & Morrone (2003) found five areas of endemism,namely the Mexican Plateau, the Baja California Pen-insula (with a nested area within it), Chiapas, theIsthmus of Tehuantepec and the Yucatan Peninsula.Escalante et al. (2007c) added the Mexican PacificCoast and the Sierra Madre Occidental and a nestedarea within Chiapas. The areas of endemism in theformer study were supported by 24 species of Roden-tia (66%), seven species of Chiroptera (19%), threespecies of Lagomorpha (8%) and two species of Sori-comorpha (6%). In the second analysis, there were 58species of Rodentia (70%), 14 of Chiroptera (18%), fiveof Soricomorpha (6%), three of Lagomorpha (4%) andone of Xenarthra, Carnivora and Cetartiodactyla(1% each one). Rodentia and Chiroptera are the mostdiverse mammal orders in Mexico and their specieshave relatively small distributional areas. Species ofCarnivora and Primates have wider areas of distri-bution and are not particularly useful for identifyingareas of endemism at the level of biogeographic prov-inces, but they may help identify patterns at otherlevels in the biogeographic hierarchy (dominions,regions, etc.).
Ecological niche models projected as potential dis-tribution areas have been used to improve identifica-tion of areas of endemism (Espadas-Manrique et al.,2003; Rojas-Soto et al., 2003; Escalante et al., 2007c).Many algorithms to model ecological niches have beendevised (Guisan & Zimmermann, 2000; Guisan &Thuiller, 2005) and some papers comparing theirperformance have been published (Elith et al., 2005;Hernández et al., 2006; Stockman, Beamer & Bond,2006; Sergio et al., 2007; Tsoar et al., 2007). Althoughthere is no agreement over the superiority of analgorithm over others when modelling ecologicalniches, the genetic algorithm for rule-set prediction(GARP) has been predominantly used in parsimonyanalyses of endemicity and has proven to be appro-priate for predicting mammal species distributions(Illoldi-Rangel, Sánchez-Cordero & Peterson, 2004;Sánchez-Cordero et al., 2005a, b).
Szumik et al. (2002) and Szumik & Goloboff (2004)formalized a method for identifying areas of ende-
mism that takes into account the general concept ofareas of endemism, where species are scored accord-ing to how well their distribution matches a givenarea (sets of grid cells) and the areas with higherscores are retained (Szumik & Goloboff, 2004; Szumik& Roig-Juñent, 2005). This optimality criterion isimplemented in the computer program NDM and itsviewer VNDM (Goloboff, 2005; available at http://www.zmuc.dk/public/phylogeny).
Our objectives are twofold: to undertake a newanalysis of the Mexican terrestrial mammals by usingthe optimality criterion devised, using both crudedata points and models of potential distribution; andto compare the areas of endemism obtained hereinwith those previous ones identified with PAE.
MATERIAL AND METHODS
Altogether, 19 058 specimen records of 429 terrestrialmammal species occurring in Mexico were used(Escalante et al., 2007c). English vernacular namesfollow Wilson & Reeder (2005). We modelled the eco-logical niche for each species using GARP (Stockwell& Peters, 1999) and the models were projected aspotential distribution areas (for details, see Escalanteet al., 2007c).
We overlapped the point occurrence data and theindividual maps of potential distributions to a grid of1° latitude–longitude nationwide. Three matrices of247 grid cells (areas) and 429 species were built: (1) abinary matrix with ‘0’ for absence and ‘1’ for presenceof at least one record of the species inside the gridcell; (2) a three-state matrix similar to (1) but assign-ing the state ‘2’ to the assumed presence in the modelof potential distribution; and (3) a three-state matrixsimilar to (2), but applying the fill option of theprogram NDM instead of using a model. The states ‘1’and ‘2’ are the results of the fill option of the programVNDM (fill = 20 and assumed = 40); where fill 20 indi-cates to the program that if a species record is closeto the edge of a cell (20% of its ratio) this species ispresent for the adjacent cell; the option ‘assumed’indicates to the program that this species is probablypresent in the neighbouring cell (see program docu-mentation). The optimality criterion was performed inNDM version 2.7 for the three matrices (Goloboff,2005; http://www.zmuk.dk/public/phylogeny), usingdefault parameters: save sets of areas with two ormore endemic species, save sets with score above2.000 and retain suboptimal sets of 0.90 worst fit andusing edge proportion option (see program documen-tation). Optimal sets were chosen when having above50% of different endemic species to the highest score.Consensus areas were obtained using 30% of similar-ity in species, against any of the other areas in theconsensus.
AREAS OF ENDEMISM OF MEXICAN MAMMALS 469
© 2009 The Linnean Society of London, Biological Journal of the Linnean Society, 2009, 98, 468–478
Results were examined with VNDM version2.7 (Goloboff, 2005; http://www.zmuk.dk/public/phylogeny). Endemic species and areas of endemismwere identified and mapped with Arc View 3.2 (ESRI,1999). Areas of endemism were compared with previ-ous analyses (Escalante et al., 2003, 2007c) and withMorrone’s (2005) regionalization.
RESULTS
The analysis of the binary matrix (only records) led tothe identification of 72 areas and 15 consensus areaswith 92 endemic species. The consensus areas repre-sent 13 areas of endemism: (1) Baja California Pen-insula; (2) Central Mexican Pacific Coast; (3) Chiapas;(4) Chiapas–Yucatan Peninsula; (5) Isthmus of Tehua-ntepec; (6) Neotropical; (7) North Baja California; (8)Northern Mexican Pacific Coast; (9) North-easternMexican Plateau; (10) Southern Mexican PacificCoast; (11) Transitional–Neotropical; (12) TropicalMesoamerican; and (13) Yucatan Peninsula (see Sup-porting Information).
The analysis of the three-state matrix (models) led tothe identification of 77 areas, summarized in 22 con-sensus areas with 101 endemic species. The consensusareas represent 13 areas of endemism: (1) Baja Cali-fornia Peninsula; (2) Central Mexican Pacific Coast; (3)Chiapas; (4) Isthmus of Tehuantepec; (5) MexicanTransition Zone; (6) Mountain Mesoamerican; (7) Neo-tropical; (8) North Baja California; (9) NorthernMexican Pacific Coast; (10) Southern Mexican PacificCoast; (11) Trans-Mexican Volcanic Belt, Eastern dis-trict; (12) Tropical Mesoamerican; and (13) YucatanPeninsula (see Supporting Information).
The analysis of the fill matrix (three-state matrixusing fill option) led to the identification of 49 possibleareas, summarized in 24 consensus areas, with 119endemic species. Sixteen areas of endemism wereidentified from the consensus areas: (1) Baja CaliforniaPeninsula; (2) California; (3) Central Mexican PacificCoast; (4) Chiapas; (5) Isthmus of Tehuantepec; (6)Neotropical; (7) Northern Baja California; (8) NorthernMexican Pacific Coast; (9) North-eastern Mexican
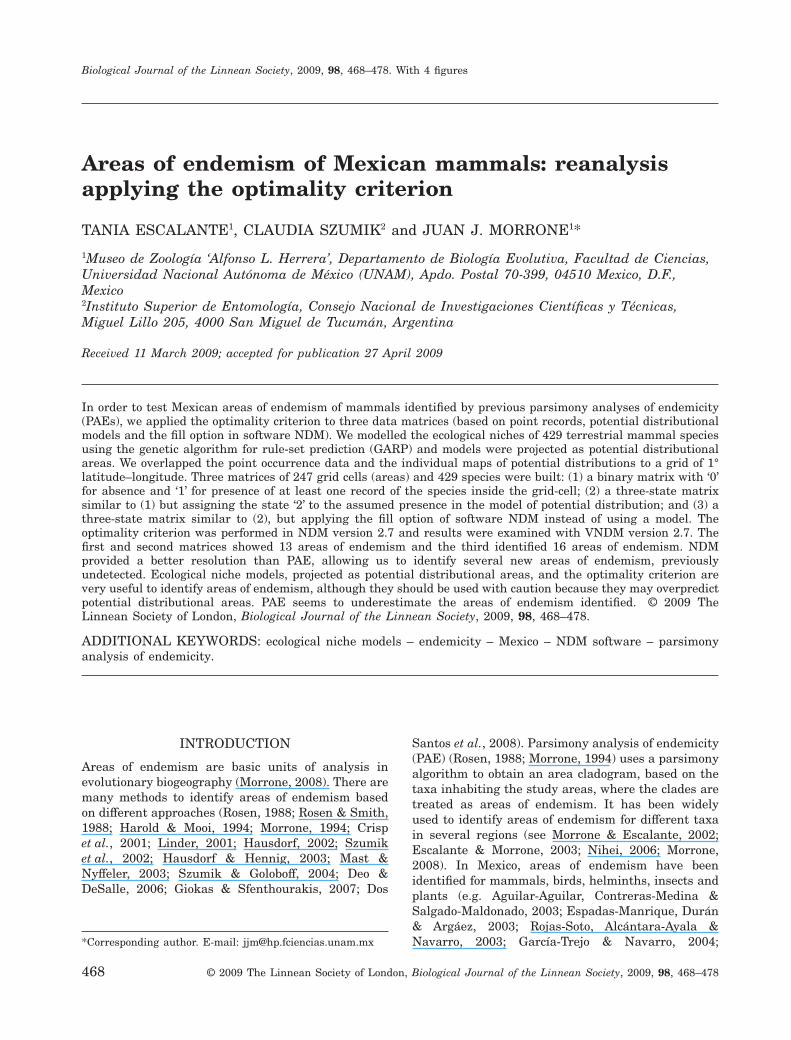
Plateau; (10) Transitional–Neotropical; (11) Sierra theMadre Oriental; (12) Southern Mexican Plateau; (13)Trans-Mexican Volcanic Belt, Eastern district; (14)Trans-Mexican Volcanic Belt, Western district; (15)Tropical Mesoamerican; and (16) Yucatan Peninsula(see Supporting Information; Figs 1–4).
DISCUSSION
Escalante et al. (2007c) found seven areas of ende-mism defined by two or more geographic synapo-morphies and autapomorphies by using potential dis-tribution models with GARP and PAE. The number ofareas of endemism and their endemic species areshown in Table 1, where they are compared with theresults of the present analysis.
Baja California Peninsula: recovered in our threeanalyses. In the binary matrix, only three specieshave a score: two of them are rodents [Dipodomyssimulans (Dulzura kangaroo rat) and Neotoma lepida(desert woodrat)], and they have already been iden-tified for this area (Escalante et al., 2003, 2007c); andSylvilagus bachmani (brush rabbit), which is alsoendemic to this area. In the three-state and fill matri-ces, another two species were added: Ammospermo-philus leucurus (white-tailed antelope squirrel) andMyotis evotis (long-eared myotis), identified in previ-ous analyses; whereas Tamias obscurus (Californiachipmunk) and Spermophilus atripicallus (Baja Cali-fornia rock squirrel) are new additions to this area.
The Baja California Peninsula showed a nestedarea of endemism; within it, the Northern Baja Cali-fornia Peninsula (NBCP) and California, similar toBCP2 and BCP3 from Escalante et al. (2003). Califor-nia was recovered only in the third matrix, identifiedby six species, some of them nested within NBCP.California corresponds only to the northern part ofthe peninsula above 28° latitude and NBCP includesalmost the whole peninsula except El Cabo (around24° latitude). NBCP was found in all matrices, but inthe matrix with the fill option it had few species.
Central Mexican Pacific Coast: corresponds to theMexican Pacific Coast of Escalante et al. (2007c), with
Table 1. Comparison of areas of endemism and endemic species from parsimony analysis of endemicity (PAE) (*Escalanteet al., 2003, **Escalante et al., 2007c) and NDM (this paper)
ComparisonPAE – datapoints*
PAE – models ofpotential distribution(k = 0)**
NDM – binarymatrix
NDM – three-states matrix
NDM – binarymatrix and fill
Number of areas ofendemism
5 7 13 13 16
Number of endemicspecies
9 35 (+17 possiblesynapomorphies)
92 101 119
470 T. ESCALANTE ET AL.
© 2009 The Linnean Society of London, Biological Journal of the Linnean Society, 2009, 98, 468–478
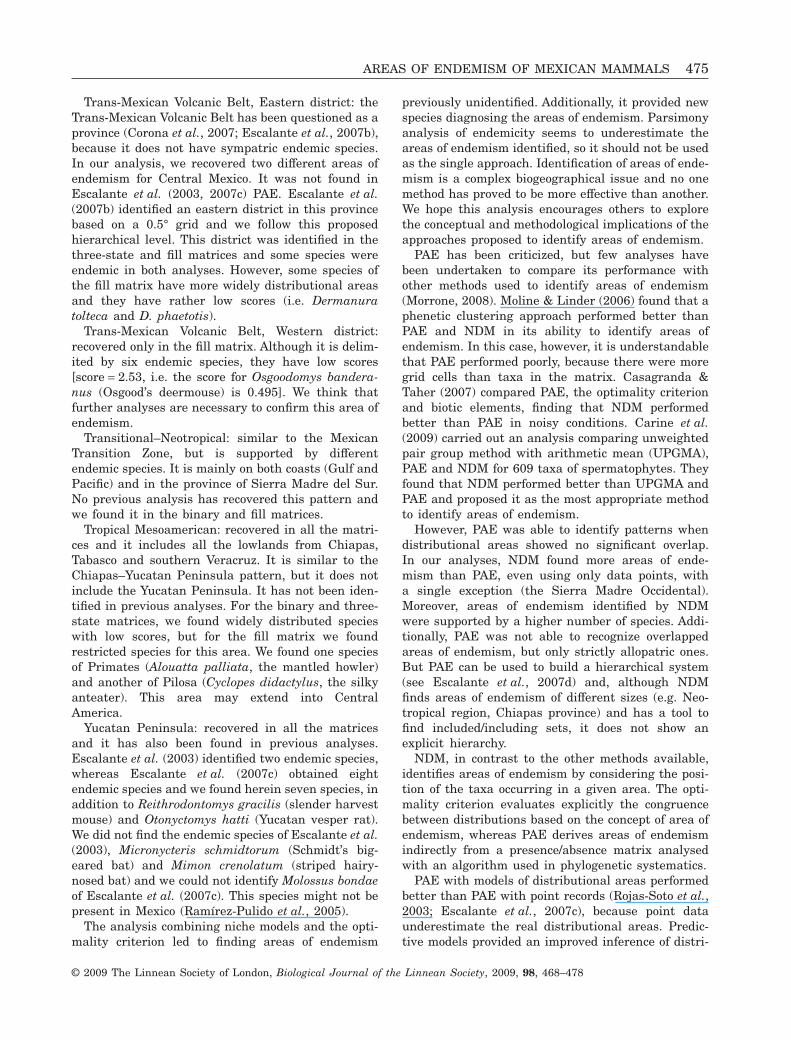
Cratogeomys fumosus (smoky pocket gopher) andXenomys nelsoni (Magdalena woodrat) as endemicspecies. We recovered this area of endemism in ourthree analyses; however, the endemic species are notthe same, although C. fumosus and X. nelsoni wereidentified for the matrix with the fill option. We foundanother two species, Pappogeomys alcorni (Rodentia,Alcorn’s pocket gopher) and Rhoogessa mira (Chi-roptera, least yellow bat), for this area, but somespecies extend their distributional area north or southof this area (i.e. Rhogeessa alleni, the Allen’s yellowbat, extends to Guerrero and Oaxaca, with a very lowscore in the three-state matrix: 0.364). Thus, we onlyconsidered the species of the fill matrix as endemic.
Chiapas: Escalante et al. (2007c) identified thisarea of endemism, with a nested area of endemismwithin it in the south and another one in the north.Here, we found an area of endemism in Chiapas forall the matrices, which have the same species, except
for the third matrix, where Microtus guatemalensis(Guatemalan vole), Scalopus aquaticus (eastern mole)and Tylomys bullaris (Chiapan climbing rat) areadded. Cabassous centralis (northern naked-tailedarmadillo) and Saccopteryx leptura (lesser sac-wingedbat) were identified for Chiapas by Escalante et al.(2007c). Microtus guatemalensis, Peromyscus zarhyn-chus (Chiapan deermouse) and T. bullaris weredefined for the Northern Chiapas area of endemismand Sciurus variegatoides (variegated squirrel) forthe Southern Chiapas area of Escalante et al. (2007c).We did not recover that nested area, but someendemic species are distributed only in the highlandsand others occupy only the lowlands (they were over-lapped with a digital elevation model (DEM). Thisfinding should be confirmed with other methods.
Chiapas–Yucatan Peninsula: this pattern was re-covered only in the first matrix, with point records.Three species were distributed in the Yucatan Penin-
Figure 1. Areas of endemism for Mexican mammals obtained from the binary matrix using fill options. A, Baja CaliforniaPeninsula. B, Central Mexican Pacific Coast. C, Chiapas. D, Northern Mexican Pacific Coast. E, North-eastern MexicanPlateau. F, Southern Mexican Plateau. G, Trans-Mexican Volcanic Belt, Eastern district. H, Yucatán Peninsula.
AREAS OF ENDEMISM OF MEXICAN MAMMALS 471
© 2009 The Linnean Society of London, Biological Journal of the Linnean Society, 2009, 98, 468–478
sula and Tabasco, southern Veracruz and the lowlandsof Chiapas, but there are possible allopatric areasbetween Campeche and Veracruz, in the state ofTabasco. This area was not recovered with GARP andthe fill option matrices, probably because of the under-representation of the collection data. Mimon benetti[(southern golden bat), also named M. cozumelae, seeCeballos & Oliva, 2005; Ramírez-Pulido, Arroyo-Cabrales & Castro-Campillo, 2005] is distributed inTabasco, but Dasyprocta punctata (Central Americanagouti) may not be present therein (Ceballos & Oliva,2005). It will be necessary to use other strategies toinfer areas of distribution because in this case GARPdid not help us identify this pattern.
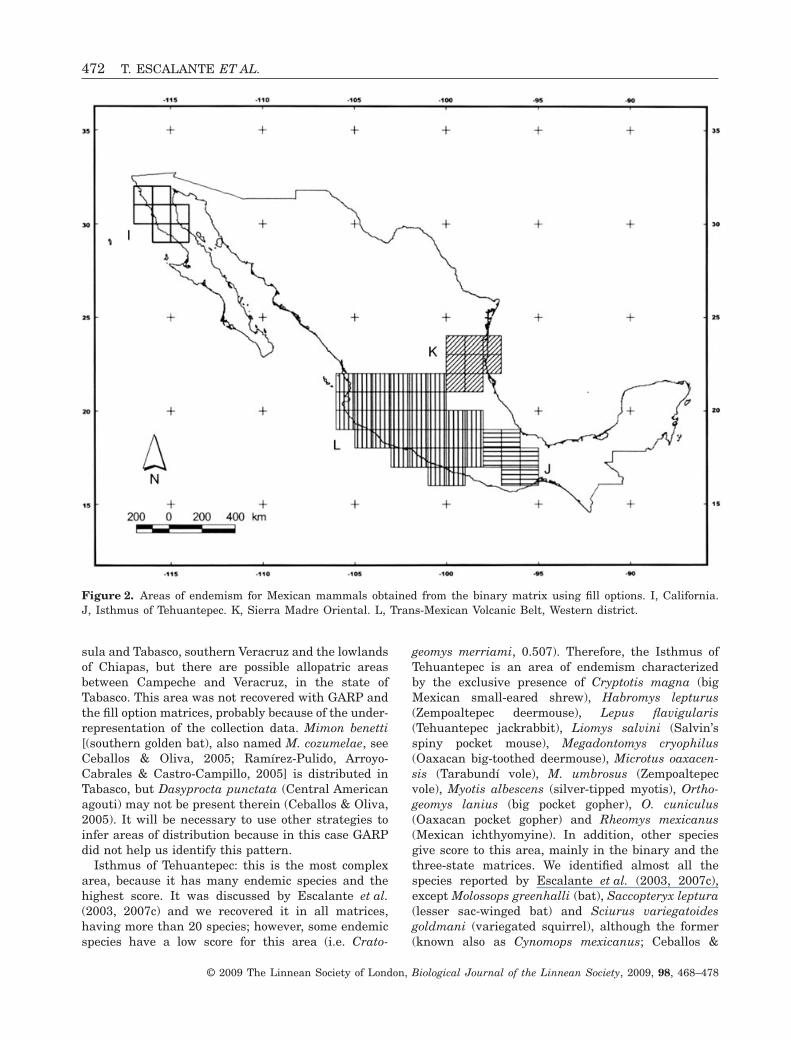
Isthmus of Tehuantepec: this is the most complexarea, because it has many endemic species and thehighest score. It was discussed by Escalante et al.(2003, 2007c) and we recovered it in all matrices,having more than 20 species; however, some endemicspecies have a low score for this area (i.e. Crato-
geomys merriami, 0.507). Therefore, the Isthmus ofTehuantepec is an area of endemism characterizedby the exclusive presence of Cryptotis magna (bigMexican small-eared shrew), Habromys lepturus(Zempoaltepec deermouse), Lepus flavigularis(Tehuantepec jackrabbit), Liomys salvini (Salvin’sspiny pocket mouse), Megadontomys cryophilus(Oaxacan big-toothed deermouse), Microtus oaxacen-sis (Tarabundí vole), M. umbrosus (Zempoaltepecvole), Myotis albescens (silver-tipped myotis), Ortho-geomys lanius (big pocket gopher), O. cuniculus(Oaxacan pocket gopher) and Rheomys mexicanus(Mexican ichthyomyine). In addition, other speciesgive score to this area, mainly in the binary and thethree-state matrices. We identified almost all thespecies reported by Escalante et al. (2003, 2007c),except Molossops greenhalli (bat), Saccopteryx leptura(lesser sac-winged bat) and Sciurus variegatoidesgoldmani (variegated squirrel), although the former(known also as Cynomops mexicanus; Ceballos &
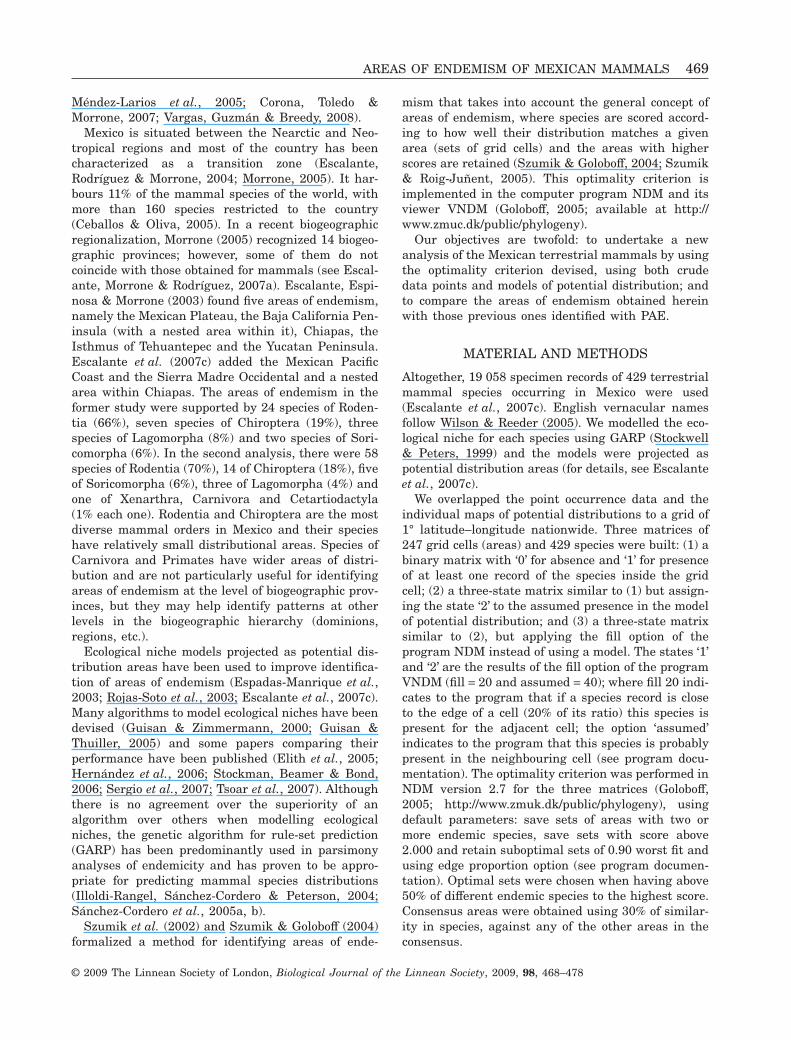
Figure 2. Areas of endemism for Mexican mammals obtained from the binary matrix using fill options. I, California.J, Isthmus of Tehuantepec. K, Sierra Madre Oriental. L, Trans-Mexican Volcanic Belt, Western district.
472 T. ESCALANTE ET AL.
© 2009 The Linnean Society of London, Biological Journal of the Linnean Society, 2009, 98, 468–478
Oliva, 2005) is present along all the southern Pacificcoast and the two latter are distributed in Chiapas(Ceballos & Oliva, 2005). The boundaries of this areashould be analysed with detailed information aboutits species and environmental characteristics.
Mexican Transition Zone: identified only in thethree-state matrix. It is defined by four species; all ofthem are distributed in the six provinces reported asthe Mexican Transition Zone by Escalante et al.(2004): Chiapas, the Balsas Basin, the Sierra MadreOriental, the Sierra Madre Occidental, the SierraMadre del Sur and the Trans-Mexican Volcanic Belt.Although all of them are distributed in the highlands,they are also present on the coasts. This might be asa result of a mixed pattern with Neotropical andNearctic elements, with predominance of the former.Three species are bats, which are found mainlybetween 500 and 2000 m, although they can be foundup to 3000 m, and some of them continue their dis-tribution to southern Mexico although they are notdistributed in the Yucatan Peninsula.
Mountain Mesoamerican: identified only in thethree-state matrix. This pattern is very similar tothat of the Mexican Transition Zone, but delimited bydifferent species. It includes mainly the Chiapas,Sierra Madre del Sur, Sierra Madre Occidental andeastern Trans-Mexican Volcanic Belt provinces fromthe Mexican Transition Zone and some lowlands fromsouthern Mexico. There are two species of Soricomor-pha in this area [Sorex ventralis (chestnut-belliedshrew) and S. veraepacis (Verapaz shrew)], both onlyfrom high altitudes (Ceballos & Oliva, 2005).
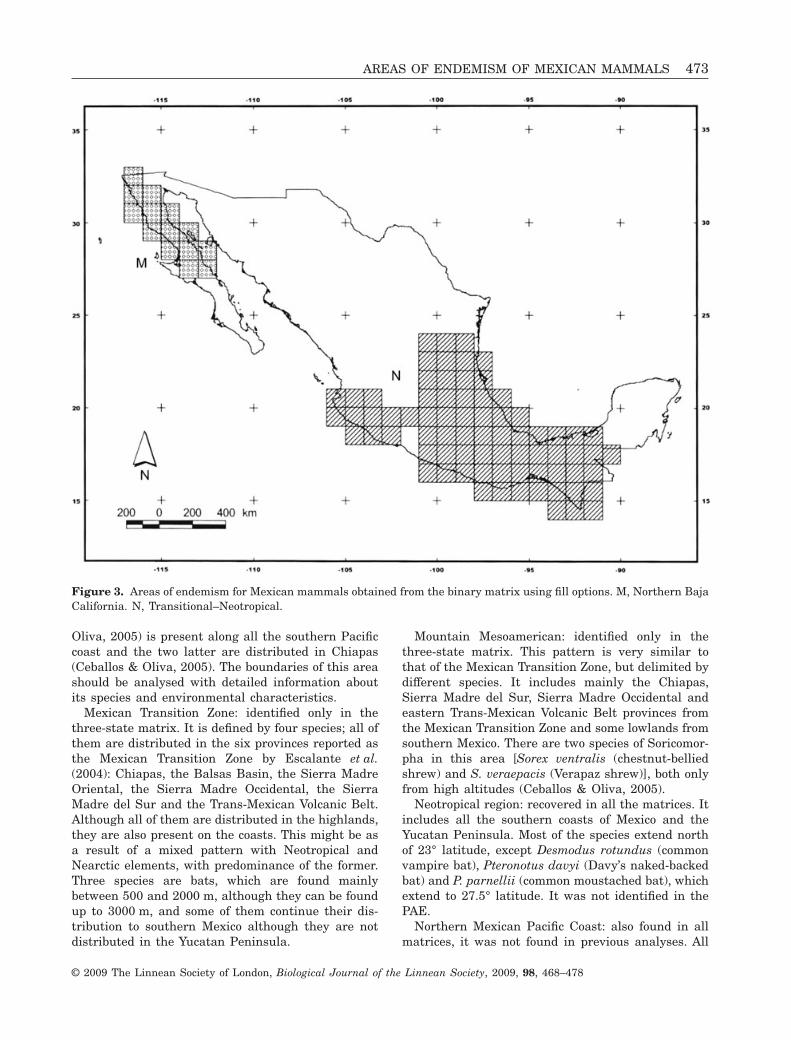
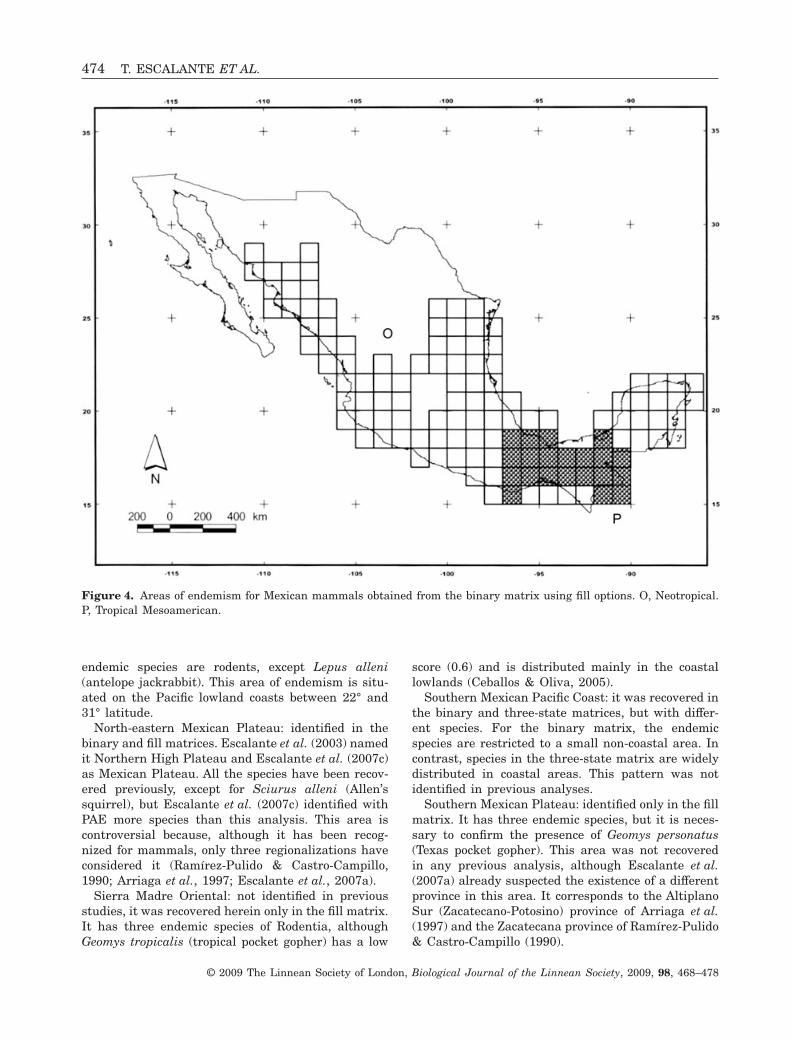
Neotropical region: recovered in all the matrices. Itincludes all the southern coasts of Mexico and theYucatan Peninsula. Most of the species extend northof 23° latitude, except Desmodus rotundus (commonvampire bat), Pteronotus davyi (Davy’s naked-backedbat) and P. parnellii (common moustached bat), whichextend to 27.5° latitude. It was not identified in thePAE.
Northern Mexican Pacific Coast: also found in allmatrices, it was not found in previous analyses. All
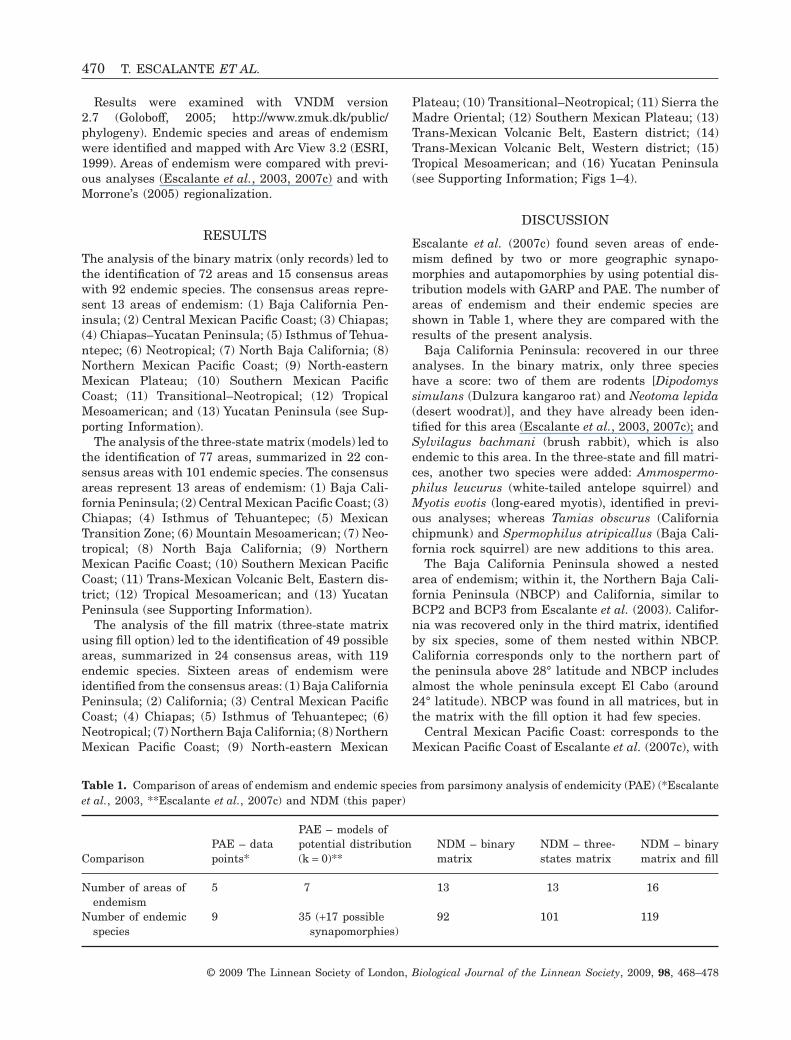
Figure 3. Areas of endemism for Mexican mammals obtained from the binary matrix using fill options. M, Northern BajaCalifornia. N, Transitional–Neotropical.
AREAS OF ENDEMISM OF MEXICAN MAMMALS 473
© 2009 The Linnean Society of London, Biological Journal of the Linnean Society, 2009, 98, 468–478
endemic species are rodents, except Lepus alleni(antelope jackrabbit). This area of endemism is situ-ated on the Pacific lowland coasts between 22° and31° latitude.
North-eastern Mexican Plateau: identified in thebinary and fill matrices. Escalante et al. (2003) namedit Northern High Plateau and Escalante et al. (2007c)as Mexican Plateau. All the species have been recov-ered previously, except for Sciurus alleni (Allen’ssquirrel), but Escalante et al. (2007c) identified withPAE more species than this analysis. This area iscontroversial because, although it has been recog-nized for mammals, only three regionalizations haveconsidered it (Ramírez-Pulido & Castro-Campillo,1990; Arriaga et al., 1997; Escalante et al., 2007a).
Sierra Madre Oriental: not identified in previousstudies, it was recovered herein only in the fill matrix.It has three endemic species of Rodentia, althoughGeomys tropicalis (tropical pocket gopher) has a low
score (0.6) and is distributed mainly in the coastallowlands (Ceballos & Oliva, 2005).
Southern Mexican Pacific Coast: it was recovered inthe binary and three-state matrices, but with differ-ent species. For the binary matrix, the endemicspecies are restricted to a small non-coastal area. Incontrast, species in the three-state matrix are widelydistributed in coastal areas. This pattern was notidentified in previous analyses.
Southern Mexican Plateau: identified only in the fillmatrix. It has three endemic species, but it is neces-sary to confirm the presence of Geomys personatus(Texas pocket gopher). This area was not recoveredin any previous analysis, although Escalante et al.(2007a) already suspected the existence of a differentprovince in this area. It corresponds to the AltiplanoSur (Zacatecano-Potosino) province of Arriaga et al.(1997) and the Zacatecana province of Ramírez-Pulido& Castro-Campillo (1990).
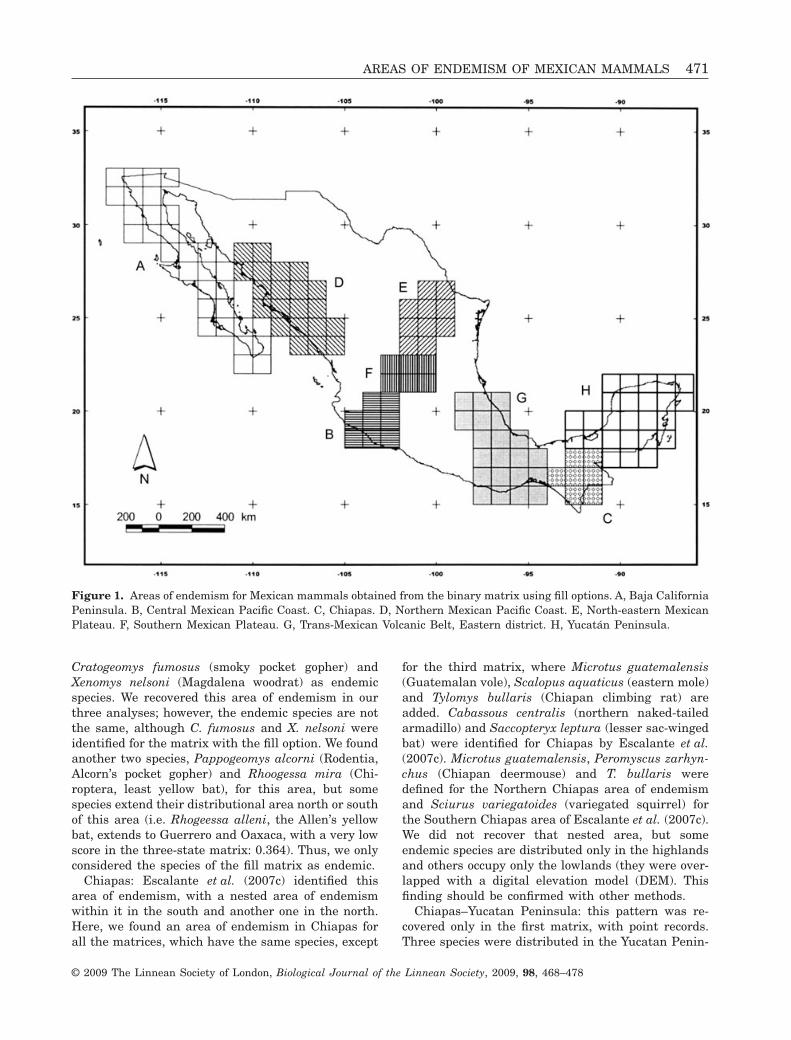
Figure 4. Areas of endemism for Mexican mammals obtained from the binary matrix using fill options. O, Neotropical.P, Tropical Mesoamerican.
474 T. ESCALANTE ET AL.
© 2009 The Linnean Society of London, Biological Journal of the Linnean Society, 2009, 98, 468–478
Trans-Mexican Volcanic Belt, Eastern district: theTrans-Mexican Volcanic Belt has been questioned as aprovince (Corona et al., 2007; Escalante et al., 2007b),because it does not have sympatric endemic species.In our analysis, we recovered two different areas ofendemism for Central Mexico. It was not found inEscalante et al. (2003, 2007c) PAE. Escalante et al.(2007b) identified an eastern district in this provincebased on a 0.5° grid and we follow this proposedhierarchical level. This district was identified in thethree-state and fill matrices and some species wereendemic in both analyses. However, some species ofthe fill matrix have more widely distributional areasand they have rather low scores (i.e. Dermanuratolteca and D. phaetotis).
Trans-Mexican Volcanic Belt, Western district:recovered only in the fill matrix. Although it is delim-ited by six endemic species, they have low scores[score = 2.53, i.e. the score for Osgoodomys bandera-nus (Osgood’s deermouse) is 0.495]. We think thatfurther analyses are necessary to confirm this area ofendemism.
Transitional–Neotropical: similar to the MexicanTransition Zone, but is supported by differentendemic species. It is mainly on both coasts (Gulf andPacific) and in the province of Sierra Madre del Sur.No previous analysis has recovered this pattern andwe found it in the binary and fill matrices.
Tropical Mesoamerican: recovered in all the matri-ces and it includes all the lowlands from Chiapas,Tabasco and southern Veracruz. It is similar to theChiapas–Yucatan Peninsula pattern, but it does notinclude the Yucatan Peninsula. It has not been iden-tified in previous analyses. For the binary and three-state matrices, we found widely distributed specieswith low scores, but for the fill matrix we foundrestricted species for this area. We found one speciesof Primates (Alouatta palliata, the mantled howler)and another of Pilosa (Cyclopes didactylus, the silkyanteater). This area may extend into CentralAmerica.
Yucatan Peninsula: recovered in all the matricesand it has also been found in previous analyses.Escalante et al. (2003) identified two endemic species,whereas Escalante et al. (2007c) obtained eightendemic species and we found herein seven species, inaddition to Reithrodontomys gracilis (slender harvestmouse) and Otonyctomys hatti (Yucatan vesper rat).We did not find the endemic species of Escalante et al.(2003), Micronycteris schmidtorum (Schmidt’s big-eared bat) and Mimon crenolatum (striped hairy-nosed bat) and we could not identify Molossus bondaeof Escalante et al. (2007c). This species might not bepresent in Mexico (Ramírez-Pulido et al., 2005).
The analysis combining niche models and the opti-mality criterion led to finding areas of endemism
previously unidentified. Additionally, it provided newspecies diagnosing the areas of endemism. Parsimonyanalysis of endemicity seems to underestimate theareas of endemism identified, so it should not be usedas the single approach. Identification of areas of ende-mism is a complex biogeographical issue and no onemethod has proved to be more effective than another.We hope this analysis encourages others to explorethe conceptual and methodological implications of theapproaches proposed to identify areas of endemism.
PAE has been criticized, but few analyses havebeen undertaken to compare its performance withother methods used to identify areas of endemism(Morrone, 2008). Moline & Linder (2006) found that aphenetic clustering approach performed better thanPAE and NDM in its ability to identify areas ofendemism. In this case, however, it is understandablethat PAE performed poorly, because there were moregrid cells than taxa in the matrix. Casagranda &Taher (2007) compared PAE, the optimality criterionand biotic elements, finding that NDM performedbetter than PAE in noisy conditions. Carine et al.(2009) carried out an analysis comparing unweightedpair group method with arithmetic mean (UPGMA),PAE and NDM for 609 taxa of spermatophytes. Theyfound that NDM performed better than UPGMA andPAE and proposed it as the most appropriate methodto identify areas of endemism.
However, PAE was able to identify patterns whendistributional areas showed no significant overlap.In our analyses, NDM found more areas of ende-mism than PAE, even using only data points, witha single exception (the Sierra Madre Occidental).Moreover, areas of endemism identified by NDMwere supported by a higher number of species. Addi-tionally, PAE was not able to recognize overlappedareas of endemism, but only strictly allopatric ones.But PAE can be used to build a hierarchical system(see Escalante et al., 2007d) and, although NDMfinds areas of endemism of different sizes (e.g. Neo-tropical region, Chiapas province) and has a tool tofind included/including sets, it does not show anexplicit hierarchy.
NDM, in contrast to the other methods available,identifies areas of endemism by considering the posi-tion of the taxa occurring in a given area. The opti-mality criterion evaluates explicitly the congruencebetween distributions based on the concept of area ofendemism, whereas PAE derives areas of endemismindirectly from a presence/absence matrix analysedwith an algorithm used in phylogenetic systematics.
PAE with models of distributional areas performedbetter than PAE with point records (Rojas-Soto et al.,2003; Escalante et al., 2007c), because point dataunderestimate the real distributional areas. Predic-tive models provided an improved inference of distri-
AREAS OF ENDEMISM OF MEXICAN MAMMALS 475
© 2009 The Linnean Society of London, Biological Journal of the Linnean Society, 2009, 98, 468–478
butional areas. NDM using the matrix with GARPpredictions allowed us to identify more areas of ende-mism than with the binary matrix, but less than withthe matrix with the fill option. This may be as a resultof over prediction in GARP models, because ecologicalniche models predict areas in terms of ecologicaldistance and not because of their shortest geographi-cal distance. In contrast, the fill option of NDMresolved the problem regarding artificial disjunctionsby geographic proximity; however, we should be cau-tious when choosing the percentage to be used in thefill and assumed options.
ACKNOWLEDGEMENTS
Malte Ebach, Rob Whittaker and two anonymousreviewers provided useful comments on the manu-script. Tania Escalante thanks DGAPA-UNAM fortwo postdoctoral scholarships (PROFIP 2004–06,2006–07) and Claudia Szumik thanks CONICET andFONCYT. Gerardo Rodríguez and Miguel Linajehelped us with SIG and GARP modelling. A prelimi-nary version of this paper was presented at the VIIReunión Argentina de Cladística y Biogeografía, SanIsidro, Argentina, 15 November 2007.
REFERENCES
Aguilar-Aguilar R, Contreras-Medina R, Salgado-Maldonado G. 2003. Parsimony analysis of endemicity(PAE) of Mexican hydrological basins based on helminthparasites of freshwater fishes. Journal of Biogeography 30:1861–1872.
Arriaga L, Aguilar C, Espinosa D, Jiménez R. 1997.Regionalización ecológica y biogeográfica de México. Mexico,DF: Conabio.
Carine MA, Humphries CJ, Guma IR, Reyes-BetancortJA, Santos Guerra A. 2009. Areas and algorithms: evalu-ating numerical approaches for the delimitation of areas ofendemism in the Canary Islands archipelago. Journal ofBiogeography 36: 593–611.
Casagranda D, Taher L. 2007. Elementos bióticos, ende-mismo y parsimonia: estudio de casos de distribucioneshipotéticas. Darwiniana 45: 37–38.
Ceballos G, Oliva G. 2005. Los mamíferos silvestres deMéxico. Mexico, DF: Fondo de Cultura Económica andConabio.
Corona AM, Toledo VH, Morrone JJ. 2007. Does theTransmexican Volcanic Belt represent a natural biogeo-graphical unit? An analysis of the distributional patterns ofColeoptera. Journal of Biogeography 34: 1008–1015.
Crisp MD, Laffan S, Linder HP, Monro A. 2001. Ende-mism in the Australian flora. Journal of Biogeography 28:183–198.
Deo AJ, DeSalle R. 2006. Nested areas of endemism analy-sis. Journal of Biogeography 33: 1511–1526.
Dos Santos DA, Fernández HR, Cuezzo MG, DomínguezE. 2008. Sympatry inference and network analysis in bio-geography. Systematic Biology 57: 432–448.
Elith J, Ferrier S, Huettmann F, Leathwick J. 2005. Theevaluation strip: a new and robust method for plottingpredicted responses from species distribution models.Ecological Modelling 186: 280–289.
Escalante T, Espinosa D, Morrone JJ. 2003. Using parsi-mony analysis of endemism to analyze the distribution ofMexican land mammals. Southwestern Naturalist 48: 563–578.
Escalante T, Morrone JJ. 2003. ¿Para qué sirve el análi-sis de parsimonia de endemismos? In: Morrone J, LlorenteJ, ed. Una perspectiva latinoamericana de la biogeografía.Mexico, D.F.: Las Prensas de Ciencias, UNAM, 167–172.
Escalante T, Morrone JJ, Rodríguez G. 2007a. La dis-tribución de los mamíferos terrestres y la regionalizaciónbiogeográfica natural de México. In: Sánchez-Rojas G,Rojas-Martínez AE, Tópicos en Sistemática, Biogeografía,Ecología y Conservación de Mamíferos. Pachuca: Univer-sidad Autónoma del Estado de Hidalgo, 9–17.
Escalante T, Rodríguez G, Gámez N, León L, Barrera O,Sánchez-Cordero V. 2007b. Biogeografía y conservaciónde los mamíferos. In: Luna I, Morrone JJ, Espinosa D, eds.Biodiversidad de la Faja Volcánica Transmexicana. Mexico,D.F.: UNAM-Conabio, 485–502
Escalante T, Sánchez-Cordero V, Morrone JJ, Linaje M.2007c. Areas of endemism of Mexican terrestrial mammals:a case study using species’ ecological niche modeling, Par-simony analysis of endemicity and Goloboff fit. Interciencia32: 151–159.
Escalante T, Sánchez-Cordero V, Morrone JJ, Linaje M.2007d. Deforestation affects biogeographical regionaliza-tion: a case study contrasting potential and extant distri-butions of Mexican terrestrial mammals. Journal of NaturalHistory 41: 965–984.
Escalante T, Rodríguez G, Morrone JJ. 2004. The diver-sification of Nearctic mammals in the Mexican TransitionZone. Biological Journal of the Linnean Society 83: 327–339.
Espadas-Manrique C, Durán R, Argáez J. 2003. Phyto-geographyc analysis of taxa endemic to the Yucatan Penin-sula using geographic information systems, the domainheuristic method and parsimony analysis of endemicity.Diversity and Distributions 9: 313–330.
ESRI. 1999. Arc View GIS 3.2. Redland, CA: EnvironmentalSystems Research Institute Press.
García-Trejo EA, Navarro AG. 2004. Patrones biogeográfi-cos de la riqueza de especies y el endemismo de la avifaunadel oeste de México. Acta Zoológica Mexicana (nueva serie)20: 167–185.
Giokas S, Sfenthourakis S. 2007. An improved method forthe identification of areas of endemism using speciesco-ocurrences. Journal of Biogeography 35: 892–902.
Goloboff P. 2005. NDM/VNDM, programs for identificationof areas of endemism. Program and documentation, Avail-able at www.zmuc.dk/public/phylogeny/endemism.
476 T. ESCALANTE ET AL.
© 2009 The Linnean Society of London, Biological Journal of the Linnean Society, 2009, 98, 468–478
Guisan A, Thuiller W. 2005. Predicting species distribution:offering more than simple habitat models. Ecology Letters 8:993–1009.
Guisan A, Zimmermann NE. 2000. Predictive habitat dis-tribution models in ecology. Ecological Modelling 135: 147–186.
Harold AS, Mooi RD. 1994. Areas of endemism: definitionand recognition criteria. Systematic Biology 43: 261–266.
Hausdorf B. 2002. Units in biogeography. Systematic Biology51: 648–652.
Hausdorf B, Hennig C. 2003. Biotic element analysis inbiogeography. Systematic Biology 52: 717–723.
Hernández PA, Graham CH, Master LL, Albert DL. 2006.The effect of sample size and species characteristics onperformance of different species distribution modelingmethods. Ecography 29: 773–785.
Illoldi-Rangel P, Sánchez-Cordero V, Peterson AT.2004. Predicting distributions of Mexican mammals usingecological niche modeling. Journal of Mammalogy 85: 658–662.
Linder HP. 2001. On areas of endemism, with an examplefrom the African Restionaceae. Systematic Biology 50: 892–912.
Mast AR, Nyffeler R. 2003. Using a null model to recognizesignificant co-occurrence prior to identifying candidateareas of endemism. Systematic Biology 52: 271–280.
Méndez-Larios I, Villaseñor JL, Lira R, Morrone JJ,Dávila P, Ortiz E. 2005. Toward the identification of a corezone in the Tehuacán–Cuicatlán biosphere reserve, Mexico,based on parsimony analysis of endemicity of floweringplant species. Interciencia 30: 267–274.
Moline PM, Linder HP. 2006. Input data, analyticalmethods and biogeography of Elegia (Restionaceae).Journal of Biogeography 33: 47–62.
Morrone JJ. 1994. On the identification of areas of ende-mism. Systematic Biology 43: 438–441.
Morrone JJ. 2005. Hacia una síntesis biogeográfica deMéxico. Revista Mexicana de Biodiversidad 76: 207–252.
Morrone JJ. 2008. Evolutionary biogeography: an integrativeapproach with case studies. New York: Columbia UniversityPress.
Morrone JJ, Escalante T. 2002. Parsimony analysis ofendemicity (PAE) of Mexican terrestrial mammals at differ-ent area units: when size matters. Journal of Biogeography29: 1095–1104.
Nihei SS. 2006. Misconceptions about parsimony analysis ofendemicity. Journal of Biogeography 33: 2099–2106.
Ramírez-Pulido J, Arroyo-Cabrales J, Castro-CampilloA. 2005. Estado actual y relación nomenclatural de losmamíferos terrestres de México. Acta Zoológica Mexicana(nueva serie) 21: 21–82.
Ramírez-Pulido J, Castro-Campillo A. 1990. Regionaliza-ción mastofaunística. Mapa IV.8.8.A. Atlas Nacional deMéxico, Vol. III. Mexico, DF: Instituto de Geografía, Univer-sidad Nacional Autónoma de México.
Rojas-Soto OR, Alcántara-Ayala O, Navarro AG. 2003.Regionalization of the avifauna of the Baja California Pen-insula, México: a parsimony analysis of endemicity and
distributional modeling approach. Journal of Biogeography30: 449–461.
Rosen BR. 1988. From fossils to earth history: applied his-torical biogeography. In: Myers AA, Giller P, eds. Analyticalbiogeography: an integrated approach to the study of animaland plant distributions. London: Chapman and Hall, 437–481.
Rosen BR, Smith AB. 1988. Tectonics from fossils? Analy-sis of reef-coral and sea-urchin distributions from lateCretaceous to Recent, using a new method. In: Audley-Charles MG, Hallam A, eds. Gondwana and Tethys.London: Special Publication of the Geological Society ofLondon 37, 275–306.
Sánchez-Cordero V, Cirelli V, Munguía M, Sarkar S.2005a. Place prioritization for biodiversity representationusing species’ ecological niche modeling. Biodiversity Infor-matics 2: 211–223.
Sánchez-Cordero V, Illoldi-Rangel P, Linaje M, SarkarS, Peterson AT. 2005b. Deforestation and extant distribu-tions of Mexican endemic mammals. Biological Conserva-tion 126: 465–473.
Sergio C, Figueira R, Draper D, Menezes R, Sousa AJ.2007. Modelling bryophyte distribution based on ecologicalinformation for extent of occurrence assessment. BiologicalConservation 135: 341–351.
Stockman AK, Beamer DA, Bond JE. 2006. Predicting thedistribution of non-vagile taxa: a response to McNyset andBlackburn (2006) and re-evaluation of Stockman et al.(2006). Diversity and Distributions 12: 787–792.
Stockwell DBR, Peters D. 1999. The GARP modelingsystem: problems and solutions to automated spatial pre-diction. International Journal of Geographical InformationScience 13: 143–158.
Szumik CA, Cuezzo F, Goloboff PA, Chalup AE. 2002.An optimality criterion to determine areas of endemism.Systematic Biology 51: 806–816.
Szumik CA, Goloboff P. 2004. Areas of endemism: animproved optimality criterion. Systematic Biology 53: 968–977.
Szumik CA, Roig-Juñent S. 2005. Criterio de optimaciónpara áreas de endemismo: El caso de América de Suraustral. In: Llorente J, Morrone JJ, eds. Regionalizaciónbiogeográfica en Iberoamérica y tópicos afines: primerasJornadas Biogeográficas de la Red Iberoamericana de Bio-geografía y Entomología Sistemática (RIBES XII.I-CYTED).Mexico, D.F.: CYTED-UNAM-Conabio, 495–508.
Tsoar A, Allouche O, Steinitz O, Rotem D, Kadmon R.2007. A comparative evaluation of presence-only methodsfor modeling species distribution. Diversity and Distribu-tions 13: 397–405.
Vargas S, Guzmán HM, Breedy O. 2008. Distributionpatterns of the genus Pacifigorgia (Octocorallia: Gorgoni-idae): track compatibility analysis and parsimonyanalysis of endemicity. Journal of Biogeography 35: 241–247.
Wilson DE, Reeder DAM. 2005. Mammal species of theworld. A taxonomic and geographic reference, 3rd edn.Baltimore, MD: Johns Hopkins University Press.
AREAS OF ENDEMISM OF MEXICAN MAMMALS 477
© 2009 The Linnean Society of London, Biological Journal of the Linnean Society, 2009, 98, 468–478

SUPPORTING INFORMATION
Additional Supporting Information may be found in the online version of this article:
Appendix S1. Description of areas of endemism of Mexican mammal and their endemic species identified withthe optimality criterion.
Please note: Wiley-Blackwell are not responsible for the content or functionality of any supporting materialssupplied by the authors. Any queries (other than missing material) should be directed to the correspondingauthor for the article.
478 T. ESCALANTE ET AL.
© 2009 The Linnean Society of London, Biological Journal of the Linnean Society, 2009, 98, 468–478


