Embed Size (px)
Citation preview

ASSOCIATION OF RESEARCH LIBRARIES
WASHINGTON, D.C. 2007
ARL ACADEMIC LAW LIBRARY STATISTICS
2005-06
Compiled and Edited by
MARK YOUNG
MARTHA KYRILLIDOU

ARL Academic Law Library Statistics is published annually by
Association of Research Libraries 21 Dupont Circle, NW, Suite 800
Washington, D.C. 20036 Telephone: (202) 296-2296
FAX: (202) 872-0884 email: [email protected]
The ARL Academic Law Library Statistics datafiles, with accompanying documentation, are available at
http://www.arl.org/stats/annualsurveys/law/index.shtml
The tables presented in this publication are not indicative of performance and outcomes and should not be used as measures of library quality. In comparing any individual library to ARL medians or to other ARL members, one must be careful to make such comparisons within the context of differing institutional and local goals and characteristics.
ISBN 1-59407-781-9 EAN 9781594077814
© Copyright Notice
The compilation is copyrighted by the Association of Research Libraries. Blanket permission is granted to reproduce and distribute copies of this work for nonprofit, educational, or library purposes, provided that the author, source, and copyright notice are included on each copy. This permission is in addition to rights of reproduction granted under Sections 107, 108, and other provisions of the U.S. Copyright Act.
The paper used in this publication meets the minimum requirements of the American National Standard for Information Science and National Information Standards Organization standard—Permanence of Paper for Publications and Documents in Libraries and Archives, ANSI/NISO Z39.48-1992(R1997).
Printed in the United States of America
3
TABLE OF CONTENTS Highlights: ARL Academic Law Library Statistics, 2005-06.......................................5 ARL Law Library Data Tables, 2005-06 .........................................................................7
Collections..............................................................................................................8
Expenditures........................................................................................................12
Expenditures for Electronic Resources ............................................................16 Personnel and Public Services...........................................................................20
Rank Order Table 1: Volumes in Library ........................................................24
Rank Order Table 2: Volumes Added (Gross)................................................25
Rank Order Table 3: Current Serials ................................................................26
Rank Order Table 4: Total Expenditures .........................................................27
Rank Order Table 5: Total Staff.........................................................................28
Rank Order Table 6: Total Electronic Materials..............................................29
ARL Academic Law Library Statistics Questionnaire and Instructions, 2005-06 .....................................................................31 Footnotes to the ARL Academic Law Library Statistics, 2005-06 ............................45 Appendix: ARL Member Libraries as of June 1, 2007................................................50


5
HIGHLIGHTS
ARL ACADEMIC LAW LIBRARY STATISTICS, 2005-06
• Out of 113 ARL university libraries, 75 responded to this survey.1
• Law libraries reported median values of 322,284 volumes held and 7,446 gross volumes added. Also, these libraries employed the full-time equivalent of 2,238 staff members in the fiscal year 2004-05.
• Responding libraries reported total expenditures of $206,514,082.2 As seen in
the graph below, materials expenditures made up the largest portion of the total, with 46.74% of aggregated expenses falling under a materials-related category.
• Law libraries reported a total of $14,893,320 on electronic materials, or a
median of 15.27% of their total materials budgets. This includes a total of $13,167,729 on electronic serials.
Expenditures in ARL Law Libraries, 2005-06
Contract Binding0.74%
Total Library Materials46.74%
Total Salaries &Wages44.67%
Other Operating Expend.7.86%
1 79 ARL university libraries included data for a Law library in the 2005-06 ARL Statistics; among them, Alberta, British Columbia, Laval, Manitoba, and Wayne State did not complete this survey. Alberta completed this survey in the past, but chose not to complete this survey in 2005-06. Colorado completed this survey but did not include a Law library on the ARL Statistics. Rutgers has two administratively independent Law libraries, which respond separately to this survey; they are aggregated together in the ARL Statistics. 2 This figure includes Canadian universities, whose expenditures were converted to U.S. dollars at the rate of 1.16289 Can$ = 1 US$, the average monthly noon exchange rate published in the Bank of Canada Review for the period July 2005-June 2006.


ARL LAW LIBRARY DATA TABLES 2005-06

+ - See Footnotes G - Government documents not included in serials count UA/NA – Unavailable or Not Applicable B - Includes branch campuses
8
ARL LAW LIBRARY DATA TABLES 2005-06
COLLECTIONS Volumes Volumes Volumes Mono- Current Current Current in Library Added Added graphs Serials Serials Serials (Gross) (Net) Purchased Purchased Received Total (Survey Question #) (1) (1.b.i) (1.b) (2) (4.a) (4.b) (4) INSTITUTION Notes ALABAMA BG+ 322,565 12,240 9,501 5,000 3,200 215 3,415 ARIZONA BG 261,351 7,849 2,006 1,279 4,444 0 4,444 ARIZONA STATE G 269,205 4,702 425 1,123 2,908 1,106 4,014 BOSTON G 327,940 6,148 -26,402 1,895 UA/NA UA/NA 4,740 BOSTON COLLEGE G+ 238,162 5,139 3,670 2,727 2,954 167 3,121 BRIGHAM YOUNG BG+ 334,735 8,027 6,354 2,111 3,293 698 3,991 CALIFORNIA, BERKELEY 676,100 11,068 2,467 UA/NA 7,801 0 7,801 CALIFORNIA, DAVIS G+ 290,743 6,248 2,775 2,912 UA/NA UA/NA 5,087 CALIFORNIA, LOS ANGELES 548,120 10,784 -843 2,749 8,354 0 8,354 CASE WESTERN RESERVE G 304,162 4,831 2,503 1,060 3,923 1,320 5,243 CHICAGO G+ 586,085 13,178 -64,316 4,078 UA/NA UA/NA 8,424 CINCINNATI G 284,179 5,443 5,024 1,408 6,585 40 6,625 COLORADO G+ 322,002 33,921 32,508 24,133 UA/NA UA/NA 5,317 COLUMBIA BG+ 870,578 14,465 13,468 4,143 5,215 1,628 6,843 CONNECTICUT G+ 340,102 6,549 4,481 1,136 5,704 980 6,684 CORNELL G+ 548,518 8,390 8,362 1,085 7,744 472 8,216 DUKE B 442,049 10,597 8,808 3,318 7,039 146 7,185 EMORY + 218,331 5,593 2,275 1,526 9,066 72 9,138 FLORIDA G+ 321,188 4,499 1,233 1,681 7,430 0 7,430 FLORIDA STATE B+ 266,653 25,138 22,929 701 3,866 934 4,800 GEORGE WASHINGTON BG+ 350,273 8,227 6,518 8,227 3,971 0 3,971 GEORGETOWN BG 543,613 16,209 2,987 4,970 9,612 123 9,735 GEORGIA 381,213 7,588 6,110 1,074 6,086 113 6,199 HARVARD G+ 1,744,077 23,943 20,432 UA/NA UA/NA UA/NA 15,499 HAWAII G+ 130,012 3,835 3,338 633 4,195 391 4,586 HOUSTON BG+ 260,684 49,558 40,045 14,001 3,590 230 3,820 HOWARD BG+ 208,884 1,535 1,231 722 1,088 10 1,098 ILLINOIS, URBANA G 616,737 3,840 2,990 UA/NA UA/NA UA/NA UA/NA INDIANA G 439,385 8,552 -9,259 2,029 8,866 82 8,948 IOWA G+ 779,501 19,075 16,615 16,400 10,233 0 10,233 KANSAS + 314,247 11,858 11,827 1,207 4,623 20 4,643 KENTUCKY G 259,601 5,554 4,145 2,209 3,908 0 3,908 LOUISIANA STATE G+ 442,210 6,048 4,712 1,035 12,887 228 13,115 LOUISVILLE 236,688 3,891 3,891 3,891 5,410 0 5,410 MCGILL G 181,165 5,939 4,801 UA/NA 2,045 592 2,637 MIAMI G+ 432,913 18,983 9,163 2,988 6,544 335 6,879 MICHIGAN + 690,082 17,488 -9,066 UA/NA UA/NA UA/NA 9,603 MICHIGAN STATE BG+ 129,055 7,356 5,266 1,536 4,088 0 4,088 MINNESOTA BG 714,192 12,386 11,364 1,727 9,348 1,262 10,610 MISSOURI BG 278,163 7,084 6,332 5,845 2,570 235 2,805 MONTREAL G+ 179,935 4,733 2,581 1,263 2,815 84 2,899 NEBRASKA G+ 238,727 4,153 3,325 UA/NA 2,461 188 2,649

UA/NA – Unavailable or Not Applicable
9
ARL LAW LIBRARY DATA TABLES 2005‐06
COLLECTIONS
Microform Government Computer Archives Carto- Graphic Audio Video and Units Documents Files and graphic Materials Materials Film
Manus. Materials
(6) (7) (8) (9) (10) (11) (12) (13) (Survey Question #) INSTITUTION
769,041 420,716 600 1,219 0 0 643 1,337 ALABAMA 682,516 0 436 0 9 0 306 222 ARIZONA 720,094 146,459 1,297 0 230,700 0 126 427 ARIZONA STATE
1,651,189 0 52 0 0 0 33 62 BOSTON 1,483,604 8,991 505 263 UA/NA UA/NA 50 394 BOSTON COLLEGE
813,402 UA/NA UA/NA UA/NA UA/NA UA/NA 1,380 UA/NA BRIGHAM YOUNG 917,661 0 241 296 1 2,500 2 172 CALIFORNIA, BERKELEY 743,034 40,900 374 47 20 0 800 139 CALIFORNIA, DAVIS 415,532 0 841 6 2 0 797 1,266 CALIFORNIA, LOS ANGELES 522,089 2,097 242 107 0 0 163 2,299 CASE WESTERN RESERVE 327,868 UA/NA 403 UA/NA 0 0 462 125 CHICAGO 734,604 0 238 434 0 0 933 351 CINCINNATI 905,041 0 501 0 2 0 431 1,047 COLORADO 875,708 0 1,110 2,890 32 1 143 283 COLUMBIA
1,104,297 0 405 117 0 0 779 301 CONNECTICUT 941,309 UA/NA 39 0 0 0 359 224 CORNELL
1,024,374 0 199 86 0 0 277 300 DUKE 600,049 56,904 159 0 8 0 72 1,087 EMORY
1,621,835 322,497 UA/NA UA/NA UA/NA UA/NA 142 1,076 FLORIDA 1,030,319 0 447 0 0 242 1,391 3,277 FLORIDA STATE 1,374,783 0 110 115 0 0 235 280 GEORGE WASHINGTON 2,598,608 9,385 1,204 3,289 85 501 5,697 958 GEORGETOWN
604,678 937,014 1,327 147 1,499 0 384 323 GEORGIA 2,037,869 UA/NA UA/NA UA/NA UA/NA UA/NA UA/NA UA/NA HARVARD 1,187,019 0 372 0 0 0 161 345 HAWAII 1,553,977 0 UA/NA UA/NA 0 0 2 25 HOUSTON
417,848 2,145 27 800 0 0 199 575 HOWARD 889 0 838 288 0 0 0 31 ILLINOIS, URBANA
1,622,070 0 662 584 0 0 917 1,255 INDIANA 1,703,518 0 1,300 0 3,505 0 869 407 IOWA
520,176 8,522 172 10 2 0 49 155 KANSAS 1,192,593 0 185 0 0 0 0 480 KENTUCKY 2,214,081 UA/NA 1,445 18 752 12 3,031 1,301 LOUISIANA STATE UA/NA UA/NA UA/NA UA/NA UA/NA UA/NA UA/NA UA/NA LOUISVILLE
50,111 118,063 46 UA/NA 0 0 29 18 MCGILL 892,437 0 1,278 0 0 0 1,163 770 MIAMI
1,597,199 0 57 0 0 0 101 128 MICHIGAN 902,106 0 0 UA/NA 0 0 263 621 MICHIGAN STATE
1,985,546 0 260 106 3 9 251 464 MINNESOTA 604,140 UA/NA 0 0 0 0 UA/NA 861 MISSOURI 66,422 0 192 0 0 5 492 110 MONTREAL
1,025,328 UA/NA UA/NA UA/NA 0 0 508 412 NEBRASKA

+ - See Footnotes G - Government documents not included in serials count UA/NA – Unavailable or Not Applicable B - Includes branch campuses
10
ARL LAW LIBRARY DATA TABLES 2005‐06
COLLECTIONS
Volumes Volumes Volumes Mono- Current Current Current in Added Added graphs Serials Serials Serials Library (Gross) (Net) Purchased Purchased Received Total (Survey Question #) (1) (1.b.i) (1.b) (2) (4.a) (4.b) (4) INSTITUTION Notes NEW MEXICO B 235,592 1,665 1,622 1,613 3,281 0 3,281 NEW YORK B 786,155 12,500 10,500 2,700 5,975 800 6,775 NORTH CAROLINA G 326,077 7,213 1,804 1,507 5,536 1,381 6,917 NORTHWESTERN G 572,980 11,767 10,379 1,576 UA/NA UA/NA 5,566 NOTRE DAME G 332,939 11,438 -1,218 UA/NA UA/NA UA/NA 7,217 OHIO STATE G+ 569,160 9,667 8,191 3,157 5,453 1,171 6,624 OKLAHOMA G 207,475 4,008 3,363 1,160 5,121 0 5,121 OREGON G+ 191,077 4,567 -2,552 22,880 2,577 116 2,693 PENNSYLVANIA 594,375 14,339 8,427 UA/NA 11,890 0 11,890 PENNSYLVANIA STATE G 272,700 5,708 4,645 4,603 4,553 2,276 6,829 PITTSBURGH G 219,192 5,874 4,853 UA/NA 2,442 177 2,619 QUEEN'S B+ 214,013 7,535 5,820 926 UA/NA UA/NA UA/NA RUTGERS – Camden BG+ 315,529 4,919 2,303 831 4,639 0 4,639 RUTGERS – Newark G+ 334,045 5,306 4,727 557 1,290 1,840 3,130 SASKATCHEWAN G+ 165,879 3,819 480 767 706 806 1,512 SOUTH CAROLINA 281,070 3,322 1,993 458 3,349 281 3,630 SOUTHERN CALIFORNIA BG 307,259 4,813 4,394 961 3,341 2,735 6,076 SOUTHERN ILLINOIS G 211,073 5,697 3,581 876 3,621 145 3,766 SUNY-BUFFALO G 295,588 7,545 4,397 2,800 4,609 3,103 7,712 SYRACUSE G+ 213,740 4,825 3,263 1,519 3,354 0 3,354 TEMPLE G+ 403,956 8,177 8,177 2,811 2,787 523 3,310 TENNESSEE 332,610 9,658 8,169 820 6,733 0 6,733 TEXAS 776,087 10,265 6,031 9,416 4,943 2,547 7,490 TEXAS TECH G+ 199,248 10,078 8,599 2,780 3,126 31 3,157 TORONTO G 207,121 3,218 2,679 857 2,150 31 2,181 TULANE BG+ 379,252 5,470 4,561 524 UA/NA UA/NA 4,954 UTAH G 233,612 6,233 3,186 UA/NA UA/NA UA/NA 4,864 VANDERBILT + 477,857 3,978 2,053 1,862 6,862 0 6,862 VIRGINIA G 631,072 10,754 8,474 2,560 9,208 2,085 11,293 WASHINGTON G 421,941 11,400 9,914 UA/NA UA/NA UA/NA 5,581 WASHINGTON U.-ST. LOUIS G+ 411,701 10,939 9,178 1,283 6,071 0 6,071 WESTERN ONTARIO G+ 183,620 5,866 3,870 1,049 1,078 330 1,408 WISCONSIN G 398,767 7,925 3,133 1,518 3,139 2,983 6,122 YALE BG+ 874,393 17,585 17,040 10,333 11,267 312 11,579
SUMMARY DATA High 1,744,077 49,558 40,045 24,133 12,887 3,103 15,499 Mean 393,438 9,352 4,771 3,362 5,126 768 5,881 Median 322,284 7,446 4,439 1,613 4,553 333 5,364 Low 129,055 1,535 -64,316 458 706 10 1,098 Totals 29,901,280 710,717 362,612 218,526 322,967 35,344 435,163 Number of Libraries 76 76 76 65 63 46 74

UA/NA – Unavailable or Not Applicable
11
ARL LAW LIBRARY DATA TABLES 2005‐06
COLLECTIONS Microform Government Computer Archives Carto- Graphic Audio Video and
Units Documents Files and graphic Materials Materials Film Manus. Materials
(6) (7) (8) (9) (10) (11) (12) (13) (Survey Question #) INSTITUTION
908,386 0 198 0 0 0 0 0 NEW MEXICO 1,001,695 17,152 1,050 UA/NA UA/NA UA/NA 2,758 690 NEW YORK
968,330 0 1,195 0 0 6 1,276 734 NORTH CAROLINA 980,001 0 578 0 0 0 12 105 NORTHWESTERN
1,693,280 0 749 0 0 0 607 1,057 NOTRE DAME 1,340,652 988 1,300 1 0 0 1,987 775 OHIO STATE
852,972 0 0 0 0 0 175 305 OKLAHOMA 952,137 2,716 208 0 0 0 1,030 336 OREGON
1,079,066 UA/NA 191 2,254 UA/NA UA/NA 2,546 1,604 PENNSYLVANIA 1,350,087 0 1,448 637 450 251 173 1,569 PENNSYLVANIA STATE 1,300,315 0 252 0 0 1,753 719 319 PITTSBURGH
111,218 UA/NA UA/NA UA/NA UA/NA UA/NA UA/NA UA/NA QUEEN'S 708,411 0 0 0 UA/NA UA/NA UA/NA UA/NA RUTGERS – Camden 695,920 120,162 1,243 1,166 UA/NA UA/NA UA/NA UA/NA RUTGERS – Newark 19,375 0 661 0 6 400 328 89 SASKATCHEWAN
1,363,665 0 738 0 0 0 891 750 SOUTH CAROLINA 582,911 0 609 0 60 28 552 526 SOUTHERN CALIFORNIA 943,635 0 723 0 0 0 1,820 1,191 SOUTHERN ILLINOIS
1,183,360 UA/NA 1,217 100 0 400 5,426 1,719 SUNY-BUFFALO 1,333,533 0 372 0 0 0 2,008 1,299 SYRACUSE
854,568 410 754 16 UA/NA UA/NA 111 662 TEMPLE 1,361,849 UA/NA UA/NA UA/NA 0 0 653 145 TENNESSEE 1,213,720 0 695 2,703 0 0 3,516 2,614 TEXAS
625,819 0 911 0 0 0 923 1,055 TEXAS TECH 57,510 0 244 0 0 34 105 68 TORONTO
1,237,337 144,533 586 1,206 0 558 501 431 TULANE 606,598 0 762 0 0 0 809 306 UTAH 661,049 0 0 0 0 0 172 85 VANDERBILT
1,326,754 35,012 154 2,813 528 2,303 50 817 VIRGINIA 1,000,944 0 915 0 0 0 159 380 WASHINGTON 1,418,607 0 839 0 0 0 489 650 WASHINGTON U.-ST. LOUIS
58,798 0 UA/NA 0 0 0 0 0 WESTERN ONTARIO 894,223 0 626 16 0 0 401 598 WISCONSIN
1,673,501 0 518 0 0 0 0 534 YALE
SUMMARY DATA 2,598,608 937,014 1,448 3,289 230,700 2,500 5,697 3,277 High
991,936 126,035 602 749 13,204 563 828 666 Mean 943,635 35,012 548 263 26 247 462 448 Median
889 410 27 1 1 1 2 18 Low 74,395,190 2,394,666 37,300 21,734 237,664 9,003 53,837 45,321 Sum
75 19 62 29 18 16 65 68 Number of Libraries

+ - See Footnotes G - Government documents not included in serials count UA/NA – Unavailable or Not Applicable B - Includes branch campuses
12
ARL LAW LIBRARY DATA TABLES 2005‐06
EXPENDITURES
Monographs Current Other Misc. Total Contract Serials Library Materials Library Binding Materials Materials (Survey Question #) (15a) (15b) (15c) (15d) (15) (16) INSTITUTION Notes ALABAMA BG+ 190,470 1,057,036 96,541 0 1,344,047 15,252 ARIZONA BG 51,784 689,025 274,188 12,970 1,027,967 12,993 ARIZONA STATE G 48,444 892,121 5,365 4,000 949,930 9,125 BOSTON G 147,486 1,327,849 0 0 1,475,335 21,697 BOSTON COLLEGE G+ 81,889 879,712 183,196 18,378 1,163,175 8,612 BRIGHAM YOUNG BG+ 49,000 896,370 15,431 0 960,801 9,715 CALIFORNIA, BERKELEY 534,408 1,533,519 259,587 0 2,327,514 54,972 CALIFORNIA, DAVIS G+ 205,401 783,540 UA/NA 0 988,941 27,196 CALIFORNIA, LOS ANGELES 269,939 1,586,456 24,856 UA/NA 1,881,251 37,494 CASE WESTERN RESERVE G 51,155 1,119,003 0 218,240 1,388,398 23,086 CHICAGO G+ 310,974 1,146,498 293,461 UA/NA 1,750,933 58,129 CINCINNATI G 150,018 638,820 13,097 90,180 892,115 6,239 COLORADO G+ 112,832 1,100,778 94,566 0 1,308,176 13,034 COLUMBIA BG+ 391,981 1,686,431 65,262 0 2,143,674 49,370 CONNECTICUT G+ 102,381 1,163,638 UA/NA 118,943 1,384,962 25,039 CORNELL G+ 887,291 529,382 185 35,503 1,452,361 22,596 DUKE B 206,450 1,270,336 62,129 82,312 1,621,227 19,177 EMORY + 80,525 747,052 6,086 224,758 1,058,421 9,318 FLORIDA G+ 401,733 473,993 UA/NA UA/NA 875,726 20,919 FLORIDA STATE B+ 72,493 612,611 183,077 82,691 950,872 7,195 GEORGE WASHINGTON BG+ 1,423,859 1,309,616 0 0 2,733,475 49,222 GEORGETOWN BG 364,793 2,248,993 91,693 79,359 2,784,838 64,219 GEORGIA 83,499 726,989 181,066 1,769 993,323 19,901 HARVARD G+ 589,097 2,337,527 441,060 785 3,368,469 171,525 HAWAII G+ 32,063 733,157 0 0 765,220 9,087 HOUSTON BG+ 125,578 1,027,931 247,050 0 1,400,559 14,726 HOWARD BG+ 59,164 601,732 0 0 660,896 4,192 ILLINOIS, URBANA G 45,327 848,712 161,653 0 1,055,692 UA/NA INDIANA G 99,642 1,143,425 224,455 2,440 1,469,962 17,066 IOWA G+ 612,084 1,705,920 143,377 35,500 2,496,881 30,369 KANSAS + 47,621 492,658 0 58,873 599,152 6,629 KENTUCKY G 17,940 1,044,304 0 7,577 1,069,821 7,680 LOUISIANA STATE G+ 75,156 748,178 213,362 0 1,036,696 10,689 LOUISVILLE 254,522 1,164,874 45,173 0 1,464,569 12,128 MCGILL G 338,984 431,694 9,489 0 780,168 8,930 MIAMI G+ 167,433 1,820,492 0 357,023 2,344,948 23,671 MICHIGAN + 205,883 2,210,795 101,159 56,571 2,574,408 35,258 MICHIGAN STATE BG+ 114,708 485,335 326,264 2,601 928,908 11,024 MINNESOTA BG 118,707 1,189,361 260,303 35,486 1,603,857 17,273 MISSOURI BG 82,063 464,047 0 0 546,110 8,082 MONTREAL G+ 113,067 563,168 0 0 676,235 13,916 NEBRASKA G+ 14,972 500,600 10,110 4,788 530,470 6,331

UA/NA – Unavailable or Not Applicable
13
ARL LAW LIBRARY DATA TABLES 2005‐06
EXPENDITURES Salaries Salaries Salaries Total Other Total
& Wages: & Wages: & Wages: Salaries Operating Library Professional Support Student Asst. & Wages Expenditures Expenditures
(17a) (17b) (17c) (17) (19) (20) (Survey Question #)
INSTITUTION
555,151 232,652 69,745 857,548 116,592 2,333,439 ALABAMA 587,334 241,799 26,523 855,656 60,700 1,957,316 ARIZONA 484,146 349,310 23,306 856,762 80,383 1,896,200 ARIZONA STATE 764,415 447,775 72,128 1,284,318 320,919 3,102,269 BOSTON
1,055,817 329,507 54,630 1,439,954 183,389 2,795,130 BOSTON COLLEGE 587,074 82,534 215,568 885,176 102,615 1,958,307 BRIGHAM YOUNG
1,235,310 1,182,915 337,997 2,756,222 417,941 5,556,649 CALIFORNIA, BERKELEY 606,972 357,438 14,935 979,345 105,351 2,100,833 CALIFORNIA, DAVIS
1,110,026 473,176 93,497 1,676,699 511,029 4,106,473 CALIFORNIA, LOS ANGELES 914,497 608,074 149,144 1,671,715 735,249 3,818,448 CASE WESTERN RESERVE 834,094 539,732 136,004 1,509,830 100,954 3,419,846 CHICAGO 565,768 247,573 33,158 846,499 220,041 1,964,894 CINCINNATI 619,858 343,857 42,644 1,006,359 65,322 2,392,891 COLORADO
1,327,219 829,740 117,859 2,274,818 399,838 4,867,700 COLUMBIA 760,332 530,359 52,061 1,342,752 80,841 2,833,594 CONNECTICUT 646,361 431,802 28,226 1,106,389 66,839 2,648,185 CORNELL 854,140 376,959 23,302 1,254,401 91,914 2,986,719 DUKE 643,879 224,772 71,118 939,769 333,109 2,340,617 EMORY 776,424 550,640 65,075 1,392,139 120,316 2,409,100 FLORIDA 562,584 199,633 79,414 841,631 74,184 1,873,882 FLORIDA STATE
1,435,639 677,288 159,733 2,272,660 189,032 5,244,389 GEORGE WASHINGTON 1,689,293 1,583,391 261,061 3,533,745 542,090 6,924,892 GEORGETOWN
489,190 242,686 58,159 790,035 171,025 1,974,284 GEORGIA 3,300,118 2,146,781 78,608 5,525,507 861,265 9,926,766 HARVARD
382,105 108,527 126,233 616,865 229,352 1,620,524 HAWAII 633,520 249,581 99,742 982,843 320,250 2,718,378 HOUSTON 490,459 215,482 77,559 783,500 92,622 1,541,210 HOWARD 593,478 206,745 29,446 829,669 UA/NA 1,885,361 ILLINOIS, URBANA 737,560 234,108 71,672 1,043,340 28,339 2,558,707 INDIANA 976,664 593,027 106,990 1,676,681 236,734 4,440,665 IOWA 394,978 221,089 34,133 650,200 68,800 1,324,781 KANSAS 317,352 171,534 45,090 533,976 82,125 1,693,602 KENTUCKY 621,204 266,812 91,681 979,697 173,994 2,201,076 LOUISIANA STATE 380,234 221,596 38,147 639,977 258,563 2,375,237 LOUISVILLE 330,760 280,931 19,763 631,454 30,968 1,451,520 MCGILL 628,617 383,763 107,814 1,120,194 248,092 3,736,905 MIAMI
UA/NA UA/NA 258,775 2,146,477 378,887 5,135,030 MICHIGAN 576,698 128,117 145,506 850,321 58,815 1,849,068 MICHIGAN STATE
1,129,264 547,793 162,792 1,839,849 397,230 3,858,209 MINNESOTA 381,110 212,872 54,814 648,796 UA/NA 1,202,988 MISSOURI 337,807 343,171 0 680,978 9,893 1,381,022 MONTREAL 333,660 149,000 48,312 530,972 20,366 1,088,139 NEBRASKA

+ - See Footnotes G - Government documents not included in serials count UA/NA – Unavailable or Not Applicable B - Includes branch campuses
14
ARL LAW LIBRARY DATA TABLES 2005‐06
EXPENDITURES
Monographs Current Other Misc. Total Contract Serials Library Materials Library Binding Materials Materials (Survey Question #) (15a) (15b) (15c) (15d) (15) (16) INSTITUTION Notes NEW MEXICO B 69,874 333,580 1,112 0 404,566 4,015 NEW YORK B 189,765 2,080,275 UA/NA UA/NA 2,270,040 36,000 NORTH CAROLINA G 123,031 1,268,539 31,663 0 1,423,233 11,239 NORTHWESTERN G 119,865 891,755 40,598 335,975 1,388,193 28,891 NOTRE DAME G 393,951 858,601 UA/NA 529,993 1,782,545 17,386 OHIO STATE G+ 226,820 970,974 50,370 304,193 1,552,357 25,372 OKLAHOMA G 67,966 433,890 263,321 0 765,177 7,306 OREGON G+ 67,778 428,202 UA/NA 303,280 799,260 7,637 PENNSYLVANIA 217,349 1,631,578 10,401 UA/NA 1,859,328 51,419 PENNSYLVANIA STATE G 88,810 642,298 28,041 UA/NA 759,149 16,189 PITTSBURGH G 71,869 663,554 48,839 0 784,262 10,769 QUEEN'S B+ 72,103 453,202 UA/NA UA/NA 525,305 3,761 RUTGERS – Camden BG+ 57,582 586,501 116,394 40,094 800,571 6,323 RUTGERS – Newark G+ 38,579 446,832 0 109,098 594,509 9,592 SASKATCHEWAN G+ 93,734 623,630 UA/NA UA/NA 717,364 5,817 SOUTH CAROLINA 24,040 846,293 3,625 0 873,958 7,918 SOUTHERN CALIFORNIA BG 70,822 709,725 68,742 0 849,289 19,987 SOUTHERN ILLINOIS G 78,491 769,223 3,676 0 851,390 7,959 SUNY-BUFFALO G 50,607 885,353 15,660 84,607 1,036,227 17,351 SYRACUSE G+ 87,536 849,156 216,897 34,004 1,187,593 9,582 TEMPLE G+ 294,605 919,742 39,844 2,243 1,256,434 23,872 TENNESSEE 33,228 493,652 348,160 657 875,697 13,397 TEXAS 215,388 919,516 348,036 0 1,482,940 18,300 TEXAS TECH G+ 161,031 472,263 85,658 339,018 1,057,970 7,921 TORONTO G 77,910 647,764 14,832 0 740,506 11,136 TULANE BG+ 14,624 806,540 441 0 821,605 6,000 UTAH G 70,487 752,820 0 105,772 929,079 6,431 VANDERBILT + 57,114 954,823 57,113 0 1,069,050 13,617 VIRGINIA G 148,820 1,088,282 148,289 22,732 1,408,123 15,497 WASHINGTON G 94,168 1,006,983 UA/NA 141,687 1,242,838 25,456 WASHINGTON U.-ST. LOUIS G+ 129,422 788,301 359,557 0 1,277,280 10,737 WESTERN ONTARIO G+ 88,330 579,432 UA/NA UA/NA 667,762 12,303 WISCONSIN G 83,179 915,623 30,181 8,838 1,037,821 7,953 YALE BG+ 761,073 1,513,803 276,619 44,746 2,596,241 54,013
SUMMARY DATA High 1,423,859 2,337,527 441,060 529,993 3,368,469 171,525 Mean 181,221 949,558 122,987 103,623 1,269,976 20,323 Median 96,905 853,879 77,200 50,659 1,058,196 13,397 Low 14,624 333,580 185 657 404,566 3,761 Totals 13,772,766 72,166,384 6,641,310 3,937,684 96,518,144 1,524,223 Number of Libraries 76 76 54 38 76 75

UA/NA – Unavailable or Not Applicable
15
ARL LAW LIBRARY DATA TABLES 2005‐06
EXPENDITURES Salaries Salaries Salaries Total Other Total
& Wages: & Wages: & Wages: Salaries Operating Library Professional Support Student Asst. & Wages Expenditures Expenditures
(17a) (17b) (17c) (17) (19) (20) (Survey Question #)
INSTITUTION
457,978 318,160 49,402 825,540 715,095 1,949,216 NEW MEXICO 1,416,062 991,018 100,556 2,507,636 368,000 5,181,676 NEW YORK
869,953 274,330 58,525 1,202,808 139,816 2,777,096 NORTH CAROLINA 805,908 635,342 24,690 1,465,940 160,788 3,043,812 NORTHWESTERN 796,794 402,015 84,766 1,283,575 494,610 3,578,116 NOTRE DAME 587,030 353,480 69,819 1,010,329 84,869 2,672,927 OHIO STATE 413,421 148,497 34,239 596,157 120,391 1,489,031 OKLAHOMA 362,082 152,943 47,595 562,620 53,120 1,422,637 OREGON
1,037,785 668,402 42,628 1,748,815 202,368 3,861,930 PENNSYLVANIA 396,000 251,789 61,021 708,810 111,731 1,595,879 PENNSYLVANIA STATE 464,751 211,662 31,072 707,485 239,908 1,742,424 PITTSBURGH 143,253 246,330 37,323 426,907 26,507 982,481 QUEEN'S 560,616 465,394 11,089 1,037,099 44,419 1,888,412 RUTGERS - Camden 523,972 535,465 56,207 1,115,644 104,282 1,824,027 RUTGERS - Newark 179,351 154,065 23,565 356,982 UA/NA 1,080,163 SASKATCHEWAN 595,605 437,794 28,843 1,062,242 360,801 2,304,919 SOUTH CAROLINA 765,474 359,472 90,372 1,215,318 265,719 2,350,313 SOUTHERN CALIFORNIA 482,090 292,471 25,094 799,655 109,138 1,768,142 SOUTHERN ILLINOIS 831,944 210,592 109,211 1,151,747 320,571 2,525,896 SUNY-BUFFALO 580,284 211,980 56,107 848,371 118,931 2,164,477 SYRACUSE 656,536 202,541 121,687 980,764 400,098 2,661,168 TEMPLE 607,972 438,961 81,534 1,128,467 178,797 2,196,358 TENNESSEE 886,090 672,787 74,501 1,633,378 394,354 3,528,972 TEXAS 421,566 570,005 47,308 1,038,879 548,477 2,653,247 TEXAS TECH 460,293 338,158 55,059 853,509 133,333 1,738,484 TORONTO 453,165 243,912 38,525 735,602 118,403 1,681,610 TULANE 522,899 265,714 42,116 830,729 79,100 1,845,339 UTAH 341,133 318,350 37,438 696,921 519,312 2,298,900 VANDERBILT
1,056,761 597,496 156,382 1,810,639 118,814 3,353,073 VIRGINIA 1,097,289 513,462 71,205 1,681,956 198,019 3,148,269 WASHINGTON
680,899 227,954 63,510 972,363 337,281 2,597,661 WASHINGTON U.-ST. LOUIS 175,777 95,988 29,192 300,956 18,304 999,325 WESTERN ONTARIO 827,473 293,019 121,291 1,241,783 136,886 2,424,443 WISCONSIN
1,479,121 1,076,384 62,578 2,618,083 420,077 5,688,414 YALE
SUMMARY DATA 3,300,118 2,146,781 337,997 5,525,507 861,265 9,926,766 High
714,513 412,540 77,691 1,213,729 222,305 2,717,291 Mean 606,972 318,350 61,021 994,601 160,788 2,345,465 Median 143,253 82,534 11,089 300,956 9,893 982,481 Low
53,588,439 30,940,473 5,826,814 92,243,427 16,228,287 206,514,082 Sum 75 75 75 76 73 76 Number of Libraries

+ - See Footnotes G - Government documents not included in serials count UA/NA – Unavailable or Not Applicable B - Includes branch campuses
16
ARL LAW LIBRARY DATA TABLES, 2005‐06
EXPENDITURES FOR ELECTRONIC RESOURCES
Computer Electronic Total Total E-Materials As % Files Serials E-Materials Materials Of Lib. Materials (Survey Question #) (21) (22) (21 + 22) (15)
INSTITUTION Notes ALABAMA BG+ 0 96,541 96,541 1,344,047 7.18 ARIZONA BG UA/NA UA/NA UA/NA 1,027,967 UA/NA ARIZONA STATE G 0 249,524 249,524 949,930 26.27 BOSTON G 0 241,942 241,942 1,475,335 16.40 BOSTON COLLEGE G+ 84,006 149,989 233,995 1,163,175 20.12 BRIGHAM YOUNG BG+ UA/NA 144,909 144,908 960,801 15.08 CALIFORNIA, BERKELEY UA/NA UA/NA UA/NA 2,327,514 UA/NA CALIFORNIA, DAVIS G+ 0 106,754 106,754 988,941 10.79 CALIFORNIA, LOS ANGELES UA/NA UA/NA UA/NA 1,881,251 UA/NA CASE WESTERN RESERVE G 0 209,142 209,142 1,388,398 15.06 CHICAGO G+ 94,000 181,433 275,433 1,750,933 15.73 CINCINNATI G 0 90,181 90,181 892,115 10.11 COLORADO G+ 0 272,245 272,245 1,308,176 20.81 COLUMBIA BG+ 54,250 198,648 252,898 2,143,674 11.80 CONNECTICUT G+ 30,500 150,518 181,018 1,384,962 13.07 CORNELL G+ 0 115,796 115,796 1,452,361 7.97 DUKE B UA/NA 140,167 140,166 1,621,227 8.65 EMORY + 0 210,558 210,558 1,058,421 19.89 FLORIDA G+ UA/NA 247,535 247,534 875,726 28.27 FLORIDA STATE B+ 182,500 194,597 377,097 950,872 39.66 GEORGE WASHINGTON BG+ 180,000 487,757 667,757 2,733,475 24.43 GEORGETOWN BG 86,089 326,426 412,515 2,784,838 14.81 GEORGIA 21,825 80,167 101,992 993,323 10.27 HARVARD G+ 294,021 UA/NA 294,020 3,368,469 8.73 HAWAII G+ 0 79,648 79,648 765,220 10.41 HOUSTON BG+ 0 356,887 356,887 1,400,559 25.48 HOWARD BG+ 0 90,861 90,861 660,896 13.75 ILLINOIS, URBANA G 0 161,653 161,653 1,055,692 15.31 INDIANA G UA/NA 224,455 224,454 1,469,962 15.27 IOWA G+ UA/NA 143,377 143,376 2,496,881 5.74 KANSAS + 0 91,478 91,478 599,152 15.27 KENTUCKY G 0 99,356 99,356 1,069,821 9.29 LOUISIANA STATE G+ 75,000 78,527 153,527 1,036,696 14.81 LOUISVILLE UA/NA 180,646 180,645 1,464,569 12.33 MCGILL G 27,449 80,901 108,350 780,168 13.89 MIAMI G+ 0 0 UA/NA 2,344,948 UA/NA MICHIGAN + 36,099 205,954 242,053 2,574,408 9.40 MICHIGAN STATE BG+ 24,500 277,731 302,231 928,908 32.54 MINNESOTA BG 0 224,720 224,720 1,603,857 14.01 MISSOURI BG UA/NA 338,715 338,714 546,110 62.02 MONTREAL G+ UA/NA 98,500 98,499 676,235 14.57 NEBRASKA G+ 0 169,776 169,776 530,470 32.00

UA/NA – Unavailable or Not Applicable
17
ARL LAW LIBRARY DATA TABLES, 2005‐06
EXPENDITURES FOR ELECTRONIC RESOURCES
Bibl. Utilities, Networks, and Consortia Hardware Document Delivery/ Library External And Software Interlibrary Loan
(23a) (23b) (24) (25) (Survey Question #)
INSTITUTION
45,160 UA/NA 18,489 435 ALABAMA UA/NA UA/NA 23,074 116 ARIZONA
8,490 0 8,122 1,012 ARIZONA STATE 23,662 0 106,176 3,980 BOSTON 18,050 UA/NA 25,595 70 BOSTON COLLEGE 0 UA/NA 1,686 UA/NA BRIGHAM YOUNG
UA/NA UA/NA UA/NA UA/NA CALIFORNIA, BERKELEY 17,429 0 54,374 120 CALIFORNIA, DAVIS
UA/NA UA/NA UA/NA UA/NA CALIFORNIA, LOS ANGELES 8,992 0 76,912 106 CASE WESTERN RESERVE 33,008 0 50,391 3,185 CHICAGO 7,933 0 102,320 984 CINCINNATI 0 72,924 3,052 2,198 COLORADO
35,458 0 134,281 22,159 COLUMBIA 28,000 UA/NA 64,611 11,295 CONNECTICUT 0 0 10,789 5,340 CORNELL
18,320 0 21,669 739 DUKE 0 14,200 1,245 2,044 EMORY
5,390 UA/NA UA/NA 88 FLORIDA 0 47,731 2,903 1,020 FLORIDA STATE 0 52,000 85,635 54,019 GEORGE WASHINGTON
43,133 UA/NA 81,508 14,092 GEORGETOWN 22,730 0 46,455 256 GEORGIA 19,886 UA/NA 196,607 8,391 HARVARD 31,349 0 0 0 HAWAII 68,382 0 31,372 1,273 HOUSTON 34,378 0 5,079 50 HOWARD
UA/NA UA/NA UA/NA UA/NA ILLINOIS, URBANA 10,190 0 0 0 INDIANA 28,202 UA/NA 90,629 8,392 IOWA 8,400 0 17,352 97 KANSAS 5,000 0 87 264 KENTUCKY 28,898 20,216 0 1,585 LOUISIANA STATE 0 6,000 22,971 35 LOUISVILLE
UA/NA UA/NA 415 UA/NA MCGILL 20,000 0 52,946 847 MIAMI 58,050 0 74,666 10,871 MICHIGAN 14,840 0 0 1,130 MICHIGAN STATE 12,131 0 18,790 5,059 MINNESOTA 14,000 UA/NA 9,364 UA/NA MISSOURI
UA/NA UA/NA UA/NA UA/NA MONTREAL 0 24,469 26,175 0 NEBRASKA
+ - See Footnotes G - Government documents not included in serials count UA/NA – Unavailable or Not Applicable B - Includes branch campuses
18
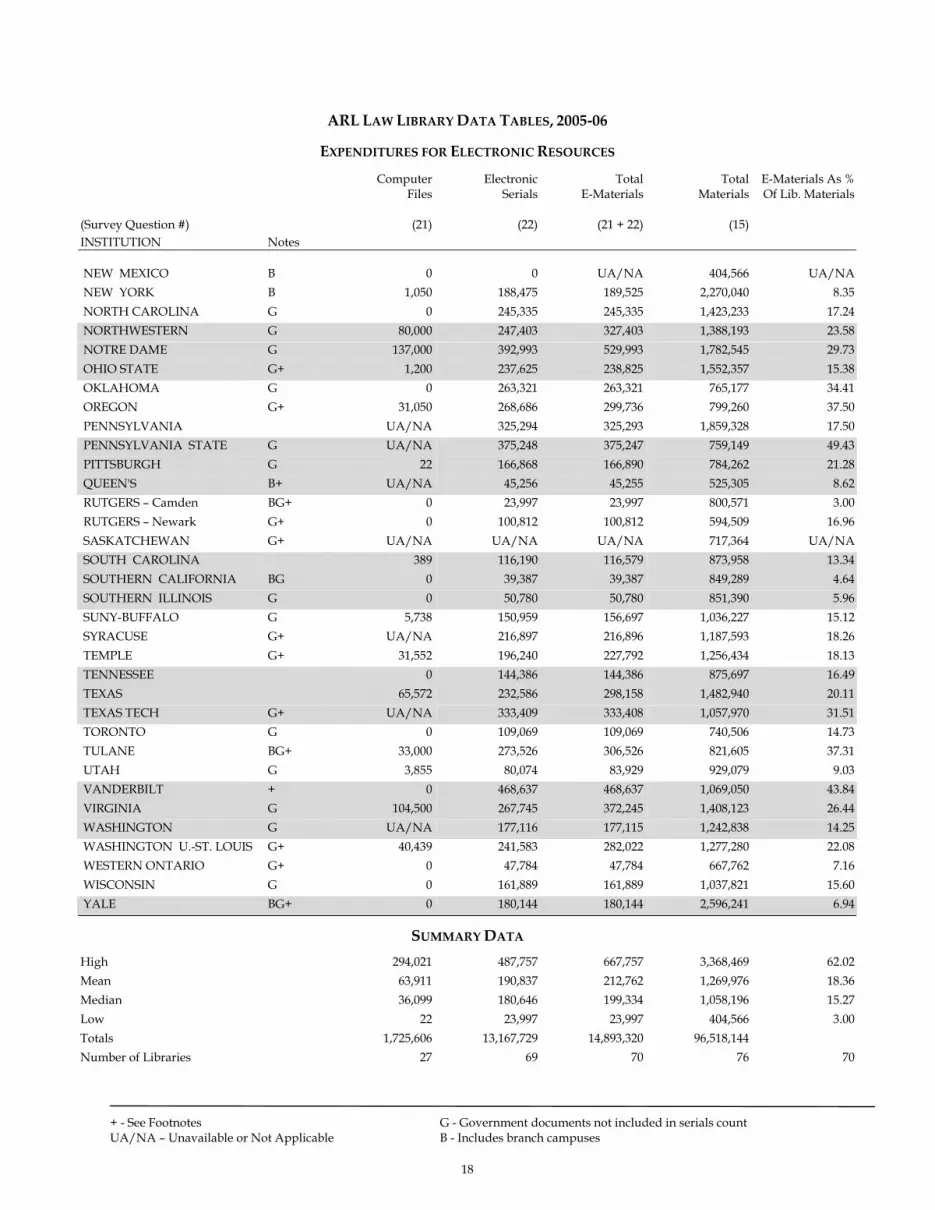
ARL LAW LIBRARY DATA TABLES, 2005‐06
EXPENDITURES FOR ELECTRONIC RESOURCES
Computer Electronic Total Total E-Materials As % Files Serials E-Materials Materials Of Lib. Materials (Survey Question #) (21) (22) (21 + 22) (15) INSTITUTION Notes NEW MEXICO B 0 0 UA/NA 404,566 UA/NA NEW YORK B 1,050 188,475 189,525 2,270,040 8.35 NORTH CAROLINA G 0 245,335 245,335 1,423,233 17.24 NORTHWESTERN G 80,000 247,403 327,403 1,388,193 23.58 NOTRE DAME G 137,000 392,993 529,993 1,782,545 29.73 OHIO STATE G+ 1,200 237,625 238,825 1,552,357 15.38 OKLAHOMA G 0 263,321 263,321 765,177 34.41 OREGON G+ 31,050 268,686 299,736 799,260 37.50 PENNSYLVANIA UA/NA 325,294 325,293 1,859,328 17.50 PENNSYLVANIA STATE G UA/NA 375,248 375,247 759,149 49.43 PITTSBURGH G 22 166,868 166,890 784,262 21.28 QUEEN'S B+ UA/NA 45,256 45,255 525,305 8.62 RUTGERS – Camden BG+ 0 23,997 23,997 800,571 3.00 RUTGERS – Newark G+ 0 100,812 100,812 594,509 16.96 SASKATCHEWAN G+ UA/NA UA/NA UA/NA 717,364 UA/NA SOUTH CAROLINA 389 116,190 116,579 873,958 13.34 SOUTHERN CALIFORNIA BG 0 39,387 39,387 849,289 4.64 SOUTHERN ILLINOIS G 0 50,780 50,780 851,390 5.96 SUNY-BUFFALO G 5,738 150,959 156,697 1,036,227 15.12 SYRACUSE G+ UA/NA 216,897 216,896 1,187,593 18.26 TEMPLE G+ 31,552 196,240 227,792 1,256,434 18.13 TENNESSEE 0 144,386 144,386 875,697 16.49 TEXAS 65,572 232,586 298,158 1,482,940 20.11 TEXAS TECH G+ UA/NA 333,409 333,408 1,057,970 31.51 TORONTO G 0 109,069 109,069 740,506 14.73 TULANE BG+ 33,000 273,526 306,526 821,605 37.31 UTAH G 3,855 80,074 83,929 929,079 9.03 VANDERBILT + 0 468,637 468,637 1,069,050 43.84 VIRGINIA G 104,500 267,745 372,245 1,408,123 26.44 WASHINGTON G UA/NA 177,116 177,115 1,242,838 14.25 WASHINGTON U.-ST. LOUIS G+ 40,439 241,583 282,022 1,277,280 22.08 WESTERN ONTARIO G+ 0 47,784 47,784 667,762 7.16 WISCONSIN G 0 161,889 161,889 1,037,821 15.60 YALE BG+ 0 180,144 180,144 2,596,241 6.94
SUMMARY DATA High 294,021 487,757 667,757 3,368,469 62.02 Mean 63,911 190,837 212,762 1,269,976 18.36 Median 36,099 180,646 199,334 1,058,196 15.27 Low 22 23,997 23,997 404,566 3.00 Totals 1,725,606 13,167,729 14,893,320 96,518,144 Number of Libraries 27 69 70 76 70

UA/NA – Unavailable or Not Applicable
19
ARL LAW LIBRARY DATA TABLES, 2005‐06
EXPENDITURES FOR ELECTRONIC RESOURCES
Bibl. Utilities, Networks, and Consortia Hardware Document Delivery/ Library External And Software Interlibrary Loan
(23a) (23b) (24) (25) (Survey Question #)
INSTITUTION
0 0 0 0 NEW MEXICO 39,000 UA/NA 82,000 UA/NA NEW YORK 1,210 10,000 35,771 159 NORTH CAROLINA 14,641 0 29,755 8,572 NORTHWESTERN 0 29,980 42,574 3,222 NOTRE DAME
47,057 UA/NA 13,328 306 OHIO STATE 10,074 592 8,918 0 OKLAHOMA 3,582 0 14,754 25 OREGON
UA/NA UA/NA 90,998 UA/NA PENNSYLVANIA UA/NA 9,101 33,647 544 PENNSYLVANIA STATE
0 6,848 9,104 400 PITTSBURGH UA/NA UA/NA UA/NA UA/NA QUEEN'S
5,886 UA/NA 7,939 2,500 RUTGERS – Camden 14,363 UA/NA 26,404 1,040 RUTGERS – Newark
UA/NA UA/NA UA/NA UA/NA SASKATCHEWAN 0 5,000 62,743 1,244 SOUTH CAROLINA
5,000 0 1,736 2,437 SOUTHERN CALIFORNIA 2,065 0 33,037 0 SOUTHERN ILLINOIS
UA/NA UA/NA UA/NA UA/NA SUNY-BUFFALO 30,726 0 7,013 1,809 SYRACUSE 2,243 0 115,666 3,088 TEMPLE 0 14,192 73,819 405 TENNESSEE
13,447 0 120,604 0 TEXAS 11,634 0 357,658 1,064 TEXAS TECH
UA/NA UA/NA 77,631 UA/NA TORONTO 3,710 0 28,876 950 TULANE 21,729 3,000 11,345 468 UTAH 0 0 4,526 4,250 VANDERBILT 0 2,017 33,226 22,853 VIRGINIA
22,992 UA/NA 50,733 1,161 WASHINGTON 30,364 0 30,365 5,291 WASHINGTON U.-ST. LOUIS
UA/NA 0 UA/NA 0 WESTERN ONTARIO 14,000 UA/NA 19,514 1,252 WISCONSIN 270,000 0 60,000 11,000 YALE
SUMMARY DATA
270,000 72,924 357,658 54,019 High 25,691 19,892 47,571 4,278 Mean 17,740 12,096 30,060 1,161 Median
1,210 592 87 25 Low 1,233,184 318,270 2,949,424 235,292 Sum
48 16 62 55 Number of Libraries

+ - See Footnotes G - Government documents not included in serials count UA/NA – Unavailable or Not Applicable B - Includes branch campuses
20
ARL LAW LIBRARY DATA TABLES, 2005‐06
PERSONNEL AND PUBLIC SERVICES
Professional Support Student Total Staffed Service Hours Staff (FTE) Staff (FTE) Assistants (FTE) Staff (FTE) Service Points Per Week (Survey Question #) (26a) (26b) (26c) (26) (27) (28) INSTITUTION Notes ALABAMA BG+ 9 7 6 22 4 110 ARIZONA BG 11 8 1 20 2 99 ARIZONA STATE G 7 13 2 22 2 110 BOSTON G 10 14 8 32 3 102 BOSTON COLLEGE G+ 14 10 5 29 2 105 BRIGHAM YOUNG BG+ 11 4 13 28 3 105 CALIFORNIA, BERKELEY 17 25 14 56 0 0 CALIFORNIA, DAVIS G+ 7 11 2 20 2 78 CALIFORNIA, LOS ANGELES 15 15 5 35 1 94 CASE WESTERN RESERVE G 14 17 8 39 2 108 CHICAGO G+ 10 19 5 34 2 90 CINCINNATI G 9 7 2 18 3 95 COLORADO G+ 8 10 2 20 2 104 COLUMBIA BG+ 21 24 7 52 2 102 CONNECTICUT G+ 12 12 3 27 3 87 CORNELL G+ 10 11 4 25 2 80 DUKE B 10 12 5 27 2 104 EMORY + 10 8 4 22 2 110 FLORIDA G+ 11 19 8 38 2 94 FLORIDA STATE B+ 10 7 5 22 5 UA/NA GEORGE WASHINGTON BG+ 20 21 7 48 3 110 GEORGETOWN BG 26 45 18 89 6 107 GEORGIA 8 12 0 20 3 110 HARVARD G+ 46 72 5 123 UA/NA UA/NA HAWAII G+ 5 4 8 17 2 94 HOUSTON BG+ 13 9 7 29 2 107 HOWARD BG+ 10 10 10 30 2 115 ILLINOIS, URBANA G 12 6 4 22 2 102 INDIANA G 11 9 5 25 4 115 IOWA G+ 16 17 5 38 3 106 KANSAS + 7 7 9 23 2 103 KENTUCKY G 7 7 3 17 2 100 LOUISIANA STATE G+ 10 10 11 31 4 101 LOUISVILLE 5 9 3 17 1 89 MCGILL G 4 7 1 12 2 83 MIAMI G+ 14 15 7 36 2 111 MICHIGAN + 11 29 12 52 2 112 MICHIGAN STATE BG+ 10 4 7 21 2 109 MINNESOTA BG 14 11 9 34 3 81 MISSOURI BG 8 9 4 21 5 73 MONTREAL G+ 6 11 0 17 3 89 NEBRASKA G+ 5 8 4 17 2 109

UA/NA – Unavailable or Not Applicable * Figures in italics are derived from a sampling method rather than an actual annual count.
21
ARL LAW LIBRARY DATA TABLES, 2005‐06
PERSONNEL AND PUBLIC SERVICES
Presentations Reference Initial Total ILL/DD Groups* Participants* Transactions* Circulation Circulation Loaned Borrowed
(29) (30) (31) (32) (33) (34) (35) (Survey Question #)
INSTITUTION
50 0 2,670 0 6,362 185 161 ALABAMA246 958 5,030 4,021 6,545 361 167 ARIZONA40 1,671 16,220 4,823 29,995 705 510 ARIZONA STATE279 3,719 7,802 7,084 26,954 197 557 BOSTON358 7,697 1,623 6,736 10,312 583 505 BOSTON COLLEGE354 7,320 5,604 9,082 13,317 333 45 BRIGHAM YOUNG0 0 0 15,735 36,288 70 129 CALIFORNIA, BERKELEY71 1,285 14,880 11,164 14,987 228 534 CALIFORNIA, DAVIS68 1,343 4,965 11,782 50,053 UA/NA UA/NA CALIFORNIA, LOS ANGELES99 1,346 5,254 4,898 8,666 223 414 CASE WESTERN RESERVE155 1,719 7,227 26,051 33,038 68 555 CHICAGO40 369 13,182 7,102 10,864 107 104 CINCINNATI103 2,178 3,110 5,007 13,203 721 647 COLORADO374 3,889 16,380 17,488 26,501 6,147 1,160 COLUMBIA107 890 4,689 6,089 9,857 594 1,381 CONNECTICUT273 1,314 8,415 13,970 20,326 1,757 1,254 CORNELL104 545 3,800 22,940 33,157 873 797 DUKE51 695 5,254 4,932 6,776 426 856 EMORY
UA/NA UA/NA UA/NA 16,505 22,224 305 106 FLORIDA113 1,690 5,647 9,739 11,246 367 310 FLORIDA STATE47 810 UA/NA 6,348 9,584 603 1,087 GEORGE WASHINGTON116 2,064 10,165 16,457 39,417 3,692 3,396 GEORGETOWN29 672 4,226 4,123 7,897 673 87 GEORGIA
UA/NA UA/NA UA/NA UA/NA 62,441 1,285 1,279 HARVARD21 691 3,174 2,500 3,801 18 34 HAWAII63 1,400 4,318 3,038 4,882 345 981 HOUSTON100 1,200 1,780 949 1,587 1,158 1,097 HOWARD
UA/NA UA/NA 2,779 4,317 7,518 UA/NA UA/NA ILLINOIS, URBANA160 2,953 53,040 17,933 36,768 1,107 670 INDIANA162 1,989 8,008 20,572 24,542 1,070 701 IOWA52 520 7,032 10,750 15,750 887 313 KANSAS8 42 3,424 6,098 9,132 220 167 KENTUCKY41 1,657 5,633 2,761 3,670 220 149 LOUISIANA STATE
UA/NA UA/NA UA/NA UA/NA UA/NA UA/NA UA/NA LOUISVILLE21 274 5,811 24,824 38,594 769 0 MCGILL355 7,118 32,139 8,646 17,658 424 450 MIAMI87 1,978 4,284 24,674 46,611 443 1,064 MICHIGAN70 1,659 5,015 4,986 11,026 307 312 MICHIGAN STATE190 1,210 9,432 23,099 29,855 2,611 343 MINNESOTA175 1,750 UA/NA 3,407 4,377 1,321 623 MISSOURI72 1,669 13,439 25,076 41,107 450 659 MONTREAL17 258 4,790 11,459 15,593 706 258 NEBRASKA

+ - See Footnotes G - Government documents not included in serials count UA/NA – Unavailable or Not Applicable B - Includes branch campuses
22
ARL LAW LIBRARY DATA TABLES, 2005‐06
PERSONNEL AND PUBLIC SERVICES
Professional Support Student Total Staffed Service Hours Staff (FTE) Staff (FTE) Assistants (FTE) Staff (FTE) Service Points Per Week (Survey Question #) (26a) (26b) (26c) (26) (27) (28) INSTITUTION Notes NEW MEXICO B 7 9 11 27 2 90 NEW YORK B 13 30 29 72 6 91 NORTH CAROLINA G 13 9 4 26 2 109 NORTHWESTERN G 11 18 2 31 4 105 NOTRE DAME G 10 13 9 32 2 95 OHIO STATE G+ 8 10 5 23 2 105 OKLAHOMA G 7 7 7 21 2 96 OREGON G+ 6 5 3 14 2 107 PENNSYLVANIA 16 18 2 36 2 111 PENNSYLVANIA STATE G 7 8 4 19 1 86 PITTSBURGH G 8 10 4 22 2 101 QUEENʹS B+ 3 7 2 12 2 95 RUTGERS – Camden BG+ 7 12 2 21 2 103 RUTGERS – Newark G+ 9 10 1 20 3 95 SASKATCHEWAN G+ 3 5 1 9 2 85 SOUTH CAROLINA 8 7 5 20 2 107 SOUTHERN CALIFORNIA BG 8 10 7 25 3 100 SOUTHERN ILLINOIS G 6 10 1 17 3 78 SUNY‐BUFFALO G 12 6 7 25 3 103 SYRACUSE G+ 12 9 4 25 2 104 TEMPLE G+ 11 7 7 25 2 96 TENNESSEE 10 14 7 31 2 112 TEXAS 15 21 4 40 5 99 TEXAS TECH G+ 7 19 4 30 3 106 TORONTO G 5 9 4 18 10 88 TULANE BG+ 8 9 6 23 3 114 UTAH G 8 11 5 24 4 100 VANDERBILT + 7 10 2 19 2 111 VIRGINIA G 13 20 3 36 7 112 WASHINGTON G 14 13 5 32 3 89 WASHINGTON U.‐ST. LOUIS G+ 9 11 5 25 2 120 WESTERN ONTARIO G+ 4 3 2 9 1 78 WISCONSIN G 12 11 8 31 3 104 YALE BG+ 29 27 15 71 5 86
SUMMARY DATA High 46 72 29 123 10 120Mean 11 13 6 29 3 100Median 10 10 5 25 2 102Low 3 3 1 9 1 73Totals 820 983 435 2,238 204Number of Libraries 76 76 74 76 74 73

UA/NA – Unavailable or Not Applicable * - Figures in italics are derived from a sampling method rather than an actual annual count.
23
ARL LAW LIBRARY DATA TABLES, 2005‐06
PERSONNEL AND PUBLIC SERVICES
Presentations Reference Initial Total ILL/DD Groups* Participants* Transactions* Circulation Circulation Loaned Borrowed
(29) (30) (31) (32) (33) (34) (35) (Survey Question #)
INSTITUTION
139 1,890 3,975 4,206 9,999 377 268 NEW MEXICO80 1,250 18,000 16,500 58,000 900 1,821 NEW YORK151 2,372 5,672 3,872 7,663 636 253 NORTH CAROLINA113 1,461 5,780 10,202 19,923 1,892 2,359 NORTHWESTERN
UA/NA UA/NA UA/NA 14,851 21,186 881 925 NOTRE DAME148 579 5,523 14,181 39,023 366 426 OHIO STATE363 1,060 1,600 2,969 3,744 108 222 OKLAHOMA70 987 2,126 3,794 5,272 UA/NA UA/NA OREGON251 4,311 UA/NA 20,440 UA/NA 394 1,340 PENNSYLVANIA521 835 9,257 8,074 9,957 567 480 PENNSYLVANIA STATE94 1,600 3,133 3,289 4,964 412 179 PITTSBURGH25 1,140 2,251 6,726 7,580 UA/NA UA/NA QUEENʹS6 150 4,308 5,607 6,120 90 357 RUTGERS – Camden 25 307 13,385 5,160 10,457 84 267 RUTGERS – Newark23 964 3,131 7,964 11,623 347 33 SASKATCHEWAN350 8,400 5,250 7,148 7,148 150 450 SOUTH CAROLINA317 425 3,100 6,251 10,159 91 493 SOUTHERN CALIFORNIA194 355 1,741 2,058 2,884 739 87 SOUTHERN ILLINOIS100 1,200 14,000 23,858 27,117 1,023 741 SUNY‐BUFFALO89 1,558 9,974 4,391 7,339 263 389 SYRACUSE99 1,325 24,067 5,659 6,650 29 42 TEMPLE
UA/NA UA/NA UA/NA UA/NA UA/NA UA/NA UA/NA TENNESSEE12 217 6,630 19,228 39,268 1,122 477 TEXAS74 1,328 3,820 9,325 13,743 268 360 TEXAS TECH151 1,520 36,147 12,374 19,450 863 373 TORONTO56 1,160 4,124 4,402 4,831 101 471 TULANE196 1,328 8,181 10,081 19,029 776 491 UTAH116 246 9,500 5,865 10,319 453 500 VANDERBILT18 380 16,740 34,279 49,550 1,426 634 VIRGINIA152 2,800 UA/NA UA/NA 20,157 1,320 1,585 WASHINGTON261 1,151 UA/NA 8,658 14,958 725 1,649 WASHINGTON U.‐ST. LOUIS121 564 2,171 15,504 17,366 341 0 WESTERN ONTARIO53 842 UA/NA 10,053 15,775 367 738 WISCONSIN138 1,690 6,435 27,763 55,324 1,001 1,614 YALE
SUMMARY DATA
521 8,400 53,040 34,279 62,441 6,147 3,396 High 133 1,676 8,442 10,731 18,891 724 645 Mean 100 1,300 5,564 8,074 13,317 447 486 Median 6 42 1,600 949 1,587 18 33 Low
9,177 113,937 540,262 761,897 1,379,059 50,671 43,886 Sum 69 68 64 71 73 70 68 Number of Libraries

24
RANK ORDER TABLE 1 – VOLUMES IN LIBRARY
INSTITUTION LAW LIBRARY VOLUMES
TOTAL VOLUMES
LAW % OF TOTAL INSTITUTION LAW LIBRARY
VOLUMES TOTAL
VOLUMES LAW %
OF TOTAL 1 HARVARD 1,744,077 15,826,570 11.02 39 COLORADO 322,002 * * 2 YALE 874,393 12,368,757 7.07 40 FLORIDA 321,188 4,178,355 7.69 3 COLUMBIA 870,578 9,455,312 9.21 41 RUTGERS - Camden 315,529 4,203,237 7.51 4 NEW YORK 786,155 5,144,879 15.28 42 KANSAS 314,247 4,194,283 7.49 5 IOWA 779,501 4,592,560 16.97 43 SOUTHERN CALIFORNIA 307,259 3,968,814 7.74 6 TEXAS 776,087 9,022,363 8.60 44 CASE WESTERN RESERVE 304,162 2,495,769 12.19 7 MINNESOTA 714,192 6,713,629 10.64 45 SUNY-BUFFALO 295,588 3,423,148 8.63 8 MICHIGAN 690,082 8,273,050 8.34 46 CALIFORNIA, DAVIS 290,743 3,549,004 8.19 9 CALIFORNIA, BERKELEY 676,100 10,094,417 6.70 47 CINCINNATI 284,179 3,209,337 8.85 10 VIRGINIA 631,072 5,102,954 12.37 48 SOUTH CAROLINA 281,070 3,532,538 7.96 11 ILLINOIS, URBANA 616,737 10,524,935 5.86 49 MISSOURI 278,163 3,295,378 8.44 12 PENNSYLVANIA 594,375 5,880,460 10.11 50 PENNSYLVANIA STATE 272,700 5,069,854 5.38 13 CHICAGO 586,085 * * 51 ARIZONA STATE 269,205 4,254,719 6.33 14 NORTHWESTERN 572,980 4,687,828 12.22 52 FLORIDA STATE 266,653 2,947,702 9.05 15 OHIO STATE 569,160 6,180,744 9.21 53 ARIZONA 261,351 5,533,482 4.72 16 CORNELL 548,518 7,785,263 7.05 54 HOUSTON 260,684 2,231,199 11.68 17 CALIFORNIA, LOS ANGELES 548,120 8,157,182 6.72 55 KENTUCKY 259,601 3,406,377 7.62 18 GEORGETOWN 543,613 2,489,528 21.84 56 NEBRASKA 238,727 3,113,473 7.67 19 VANDERBILT 477,857 3,264,231 14.64 57 BOSTON COLLEGE 238,162 2,407,253 9.89 20 LOUISIANA STATE 442,210 3,499,137 12.64 58 LOUISVILLE 236,688 2,081,825 11.37 21 DUKE 442,049 5,665,241 7.80 59 NEW MEXICO 235,592 2,675,082 8.81 22 INDIANA 439,385 7,374,784 5.96 60 UTAH 233,612 3,254,709 7.18 23 MIAMI 432,913 3,013,867 14.36 61 PITTSBURGH 219,192 4,909,264 4.46 24 WASHINGTON 421,941 7,111,065 5.93 62 EMORY 218,331 3,184,754 6.86 25 WASHINGTON U.-ST. LOUIS 411,701 3,947,725 10.43 63 QUEEN'S 214,013 2,477,137 8.64 26 TEMPLE 403,956 3,071,624 13.15 64 SYRACUSE 213,740 3,180,427 6.72 27 WISCONSIN 398,767 8,015,081 4.98 65 SOUTHERN ILLINOIS 211,073 3,026,125 6.98 28 GEORGIA 381,213 4,345,939 8.77 66 HOWARD 208,884 2,435,163 8.58 29 TULANE 379,252 3,076,954 12.33 67 OKLAHOMA 207,475 4,918,351 4.22 30 GEORGE WASHINGTON 350,273 2,197,950 15.94 68 TORONTO 207,121 10,536,868 1.97 31 CONNECTICUT 340,102 3,629,755 9.37 69 TEXAS TECH 199,248 2,525,957 7.89 32 BRIGHAM YOUNG 334,735 3,738,847 8.95 70 OREGON 191,077 2,787,476 6.85 33 RUTGERS - Newark 334,045 4,203,237 7.95 71 WESTERN ONTARIO 183,620 3,388,376 5.42 34 NOTRE DAME 332,939 3,246,968 10.25 72 MCGILL 181,165 3,631,326 4.99 35 TENNESSEE 332,610 3,183,529 10.45 73 MONTREAL 179,935 3,090,289 5.82 36 BOSTON 327,940 2,449,521 13.39 74 SASKATCHEWAN 165,879 1,996,901 8.31 37 NORTH CAROLINA 326,077 5,816,677 5.61 75 HAWAII 130,012 3,407,167 3.82 38 ALABAMA 322,565 2,566,978 12.57 76 MICHIGAN STATE 129,055 4,864,603 2.65
* Did not include a Law Library in the ARL Statistics 2005-06

25
RANK ORDER TABLE 2 – VOLUMES ADDED (GROSS)
INSTITUTION LAW LIBRARY VOLUMES
TOTAL VOLUMES
LAW % OF TOTAL INSTITUTION LAW LIBRARY
VOLUMES TOTAL
VOLUMES LAW %
OF TOTAL 1 HOUSTON 49,558 80,780 61.35 39 MICHIGAN STATE 7,356 80,572 9.13 2 COLORADO 33,921 * * 40 NORTH CAROLINA 7,213 118,374 6.09 3 FLORIDA STATE 25,138 64,265 39.12 41 MISSOURI 7,084 51,329 13.80 4 HARVARD 23,943 292,658 8.18 42 CONNECTICUT 6,549 38,920 16.83 5 IOWA 19,075 107,046 17.82 43 CALIFORNIA, DAVIS 6,248 68,375 9.14 6 MIAMI 18,983 76,138 24.93 44 UTAH 6,233 76,048 8.20 7 YALE 17,585 249,613 7.04 45 BOSTON 6,148 63,186 9.73 8 MICHIGAN 17,488 176,998 9.88 46 LOUISIANA STATE 6,048 57,772 10.47 9 GEORGETOWN 16,209 74,321 21.81 47 MCGILL 5,939 75,737 7.84 10 COLUMBIA 14,465 189,507 7.63 48 PITTSBURGH 5,874 129,443 4.54 11 PENNSYLVANIA 14,339 108,678 13.19 49 WESTERN ONTARIO 5,866 52,337 11.21 12 CHICAGO 13,178 * * 50 PENNSYLVANIA STATE 5,708 80,745 7.07 13 NEW YORK 12,500 137,629 9.08 51 SOUTHERN ILLINOIS 5,697 36,947 15.42 14 MINNESOTA 12,386 132,628 9.34 52 EMORY 5,593 86,754 6.45 15 ALABAMA 12,240 52,804 23.18 53 KENTUCKY 5,554 83,729 6.63 16 KANSAS 11,858 74,974 15.82 54 TULANE 5,470 35,843 15.26 17 NORTHWESTERN 11,767 102,557 11.47 55 CINCINNATI 5,443 87,840 6.20 18 NOTRE DAME 11,438 76,470 14.96 56 RUTGERS - Newark 5,306 72,957 7.27 19 WASHINGTON 11,400 120,950 9.43 57 BOSTON COLLEGE 5,139 46,782 10.98 20 CALIFORNIA, BERKELEY 11,068 186,987 5.92 58 RUTGERS - Camden 4,919 72,957 6.74 21 WASHINGTON U.-ST. LOUIS 10,939 60,029 18.22 59 CASE WESTERN RESERVE 4,831 28,365 17.03 22 CALIFORNIA, LOS ANGELES 10,784 106,767 10.10 60 SYRACUSE 4,825 32,087 15.04 23 VIRGINIA 10,754 76,325 14.09 61 SOUTHERN CALIFORNIA 4,813 53,232 9.04 24 DUKE 10,597 101,563 10.43 62 MONTREAL 4,733 64,371 7.35 25 TEXAS 10,265 127,845 8.03 63 ARIZONA STATE 4,702 89,216 5.27 26 TEXAS TECH 10,078 63,179 15.95 64 OREGON 4,567 40,872 11.17 27 OHIO STATE 9,667 123,424 7.83 65 FLORIDA 4,499 51,388 8.75 28 TENNESSEE 9,658 57,953 16.67 66 NEBRASKA 4,153 52,880 7.85 29 INDIANA 8,552 155,895 5.49 67 OKLAHOMA 4,008 84,137 4.76 30 CORNELL 8,390 127,998 6.55 68 VANDERBILT 3,978 55,283 7.20 31 GEORGE WASHINGTON 8,227 46,613 17.65 69 LOUISVILLE 3,891 67,393 5.77 32 TEMPLE 8,177 55,830 14.65 70 ILLINOIS, URBANA 3,840 158,914 2.42 33 BRIGHAM YOUNG 8,027 120,649 6.65 71 HAWAII 3,835 58,083 6.60 34 WISCONSIN 7,925 121,148 6.54 72 SASKATCHEWAN 3,819 35,466 10.77 35 ARIZONA 7,849 87,095 9.01 73 SOUTH CAROLINA 3,322 56,298 5.90 36 GEORGIA 7,588 75,195 10.09 74 TORONTO 3,218 216,531 1.49 37 SUNY-BUFFALO 7,545 41,442 18.21 75 NEW MEXICO 1,665 47,699 3.49 38 QUEEN'S 7,535 45,541 16.55 76 HOWARD 1,535 34,150 4.49
* Did not include a Law Library in the ARL Statistics 2005-06

26
RANK ORDER TABLE 3 – CURRENT SERIALS (TOTAL)
INSTITUTION LAW LIBRARY SERIALS
TOTAL SERIALS
LAW % OF TOTAL INSTITUTION LAW LIBRARY
SERIALS TOTAL
SERIALS LAW %
OF TOTAL 1 HARVARD 15,499 98,988 15.66 39 CASE WESTERN RESERVE 5,243 18,422 28.46 2 LOUISIANA STATE 13,115 60,889 21.54 40 OKLAHOMA 5,121 63,431 8.07 3 PENNSYLVANIA 11,890 47,787 24.88 41 CALIFORNIA, DAVIS 5,087 47,008 10.82 4 YALE 11,579 73,953 15.66 42 TULANE 4,954 19,716 25.13 5 VIRGINIA 11,293 71,832 15.72 43 UTAH 4,864 40,607 11.98 6 MINNESOTA 10,610 72,573 14.62 44 FLORIDA STATE 4,800 51,896 9.25 7 IOWA 10,233 51,374 19.92 45 BOSTON 4,740 40,757 11.63 8 GEORGETOWN 9,735 31,196 31.21 46 KANSAS 4,643 48,037 9.67 9 MICHIGAN 9,603 118,654 8.09 47 RUTGERS - Camden 4,639 53,302 8.70 10 EMORY 9,138 37,779 24.19 48 HAWAII 4,586 33,291 13.78 11 INDIANA 8,948 79,427 11.27 49 ARIZONA 4,444 33,899 13.11 12 CHICAGO 8,424 * * 50 MICHIGAN STATE 4,088 40,082 10.20 13 CALIFORNIA, LOS ANGELES 8,354 77,509 10.78 51 ARIZONA STATE 4,014 33,200 12.09 14 CORNELL 8,216 77,392 10.62 52 BRIGHAM YOUNG 3,991 30,895 12.92 15 CALIFORNIA, BERKELEY 7,801 114,860 6.79 53 GEORGE WASHINGTON 3,971 25,153 15.79 16 SUNY-BUFFALO 7,712 37,288 20.68 54 KENTUCKY 3,908 31,897 12.25 17 TEXAS 7,490 46,880 15.98 55 HOUSTON 3,820 22,193 17.21 18 FLORIDA 7,430 85,169 8.72 56 SOUTHERN ILLINOIS 3,766 40,490 9.30 19 NOTRE DAME 7,217 21,622 33.38 57 SOUTH CAROLINA 3,630 58,855 6.17 20 DUKE 7,185 58,282 12.33 58 ALABAMA 3,415 34,461 9.91 21 NORTH CAROLINA 6,917 54,591 12.67 59 SYRACUSE 3,354 22,865 14.67 22 MIAMI 6,879 51,349 13.40 60 TEMPLE 3,310 29,608 11.18 23 VANDERBILT 6,862 36,184 18.96 61 NEW MEXICO 3,281 24,323 13.49 24 COLUMBIA 6,843 117,264 5.84 62 TEXAS TECH 3,157 60,348 5.23 25 PENNSYLVANIA STATE 6,829 71,230 9.59 63 RUTGERS - Newark 3,130 53,302 5.87 26 NEW YORK 6,775 62,537 10.83 64 BOSTON COLLEGE 3,121 53,926 5.79 27 TENNESSEE 6,733 33,184 20.29 65 MONTREAL 2,899 62,374 4.65 28 CONNECTICUT 6,684 57,270 11.67 66 MISSOURI 2,805 36,244 7.74 29 CINCINNATI 6,625 42,265 15.67 67 OREGON 2,693 23,186 11.61 30 OHIO STATE 6,624 36,813 17.99 68 NEBRASKA 2,649 53,466 4.95 31 GEORGIA 6,199 39,226 15.80 69 MCGILL 2,637 81,772 3.22 32 WISCONSIN 6,122 68,560 8.93 70 PITTSBURGH 2,619 50,232 5.21 33 SOUTHERN CALIFORNIA 6,076 60,718 10.01 71 TORONTO 2,181 68,790 3.17 34 WASHINGTON U.-ST. LOUIS 6,071 41,339 14.69 72 SASKATCHEWAN 1,512 37,208 4.06 35 WASHINGTON 5,581 62,429 8.94 73 WESTERN ONTARIO 1,408 46,851 3.01 36 NORTHWESTERN 5,566 45,259 12.30 74 HOWARD 1,098 11,333 9.69 37 LOUISVILLE 5,410 37,931 14.26 75 ILLINOIS, URBANA UA/NA 63,413 UA/NA 38 COLORADO 5,317 * * 76 QUEEN'S UA/NA 45,363 UA/NA
* Did not include a Law Library in the ARL Statistics 2005-06

27
RANK ORDER TABLE 4 – TOTAL LIBRARY EXPENDITURES
INSTITUTION LAW LIBRARY EXP.
TOTAL EXP.
LAW % OF TOTAL INSTITUTION LAW LIBRARY
EXP. TOTAL
EXP. LAW %
OF TOTAL 1 HARVARD 9,926,766 105,809,085 9.38 39 EMORY 2,340,617 30,765,589 7.61 2 GEORGETOWN 6,924,892 23,754,207 29.15 40 ALABAMA 2,333,439 14,868,525 15.69 3 YALE 5,688,414 74,938,119 7.59 41 SOUTH CAROLINA 2,304,919 20,422,352 11.29 4 CALIFORNIA, BERKELEY 5,556,649 56,186,972 9.89 42 VANDERBILT 2,298,900 23,007,106 9.99 5 GEORGE WASHINGTON 5,244,389 21,727,764 24.14 43 LOUISIANA STATE 2,201,076 12,864,995 17.11 6 NEW YORK 5,181,676 41,003,612 12.64 44 TENNESSEE 2,196,358 22,871,489 9.60 7 MICHIGAN 5,135,030 49,053,402 10.47 45 SYRACUSE 2,164,477 15,836,698 13.67 8 COLUMBIA 4,867,700 56,938,255 8.55 46 CALIFORNIA, DAVIS 2,100,833 20,609,936 10.19 9 IOWA 4,440,665 25,655,780 17.31 47 GEORGIA 1,974,284 23,014,039 8.58 10 CALIFORNIA, LOS ANGELES 4,106,473 50,919,689 8.06 48 CINCINNATI 1,964,894 22,960,596 8.56 11 PENNSYLVANIA 3,861,930 33,897,604 11.39 49 BRIGHAM YOUNG 1,958,307 23,942,505 8.18 12 MINNESOTA 3,858,209 38,321,667 10.07 50 ARIZONA 1,957,316 28,333,910 6.91 13 CASE WESTERN RESERVE 3,818,448 14,861,753 25.69 51 NEW MEXICO 1,949,216 19,398,044 10.05 14 MIAMI 3,736,905 23,328,442 16.02 52 ARIZONA STATE 1,896,200 25,677,775 7.38 15 NOTRE DAME 3,578,116 21,694,210 16.49 53 RUTGERS - Camden 1,888,412 31,253,603 6.04 16 TEXAS 3,528,972 41,585,820 8.49 54 ILLINOIS, URBANA 1,885,361 36,102,613 5.22 17 CHICAGO 3,419,846 * * 55 FLORIDA STATE 1,873,882 15,083,949 12.42 18 VIRGINIA 3,353,073 34,775,087 9.64 56 MICHIGAN STATE 1,849,068 24,109,074 7.67 19 WASHINGTON 3,148,269 38,841,830 8.11 57 UTAH 1,845,339 23,288,732 7.92 20 BOSTON 3,102,269 19,484,243 15.92 58 RUTGERS - Newark 1,824,027 31,253,603 5.84 21 NORTHWESTERN 3,043,812 26,335,228 11.56 59 SOUTHERN ILLINOIS 1,768,142 14,619,649 12.09 22 DUKE 2,986,719 33,531,731 8.91 60 PITTSBURGH 1,742,424 28,927,212 6.02 23 CONNECTICUT 2,833,594 23,960,782 11.83 61 TORONTO 1,738,484 57,610,752 3.02 24 BOSTON COLLEGE 2,795,130 17,481,965 15.99 62 KENTUCKY 1,693,602 19,569,146 8.65 25 NORTH CAROLINA 2,777,096 34,488,601 8.05 63 TULANE 1,681,610 14,261,505 11.79 26 HOUSTON 2,718,378 17,000,792 15.99 64 HAWAII 1,620,524 17,306,904 9.36 27 OHIO STATE 2,672,927 32,966,111 8.11 65 PENNSYLVANIA STATE 1,595,879 48,580,052 3.29 28 TEMPLE 2,661,168 17,873,359 14.89 66 HOWARD 1,541,210 9,854,124 15.64 29 TEXAS TECH 2,653,247 21,324,759 12.44 67 OKLAHOMA 1,489,031 19,856,352 7.50 30 CORNELL 2,648,185 42,156,480 6.28 68 MCGILL 1,451,520 25,882,656 5.61 31 WASHINGTON U.-ST. LOUIS 2,597,661 31,466,476 8.26 69 OREGON 1,422,637 13,739,169 10.35 32 INDIANA 2,558,707 32,143,391 7.96 70 MONTREAL 1,381,022 28,288,912 4.88 33 SUNY-BUFFALO 2,525,896 19,453,788 12.98 71 KANSAS 1,324,781 20,832,470 6.36 34 WISCONSIN 2,424,443 40,800,267 5.94 72 MISSOURI 1,202,988 14,555,302 8.26 35 FLORIDA 2,409,100 27,435,482 8.78 73 NEBRASKA 1,088,139 16,138,697 6.74 36 COLORADO 2,392,891 * * 74 SASKATCHEWAN 1,080,163 14,829,710 7.28 37 LOUISVILLE 2,375,237 18,493,616 12.84 75 WESTERN ONTARIO 999,325 17,007,710 5.88 38 SOUTHERN CALIFORNIA 2,350,313 31,893,689 7.37 76 QUEEN'S 982,481 16,259,032 6.04
* Did not include a Law Library in the ARL Statistics 2005-06
28
RANK ORDER TABLE 5 – TOTAL STAFF
INSTITUTION LAW LIBRARY STAFF
TOTAL STAFF
LAW % OF TOTAL INSTITUTION LAW LIBRARY
STAFF TOTAL STAFF
LAW % OF TOTAL
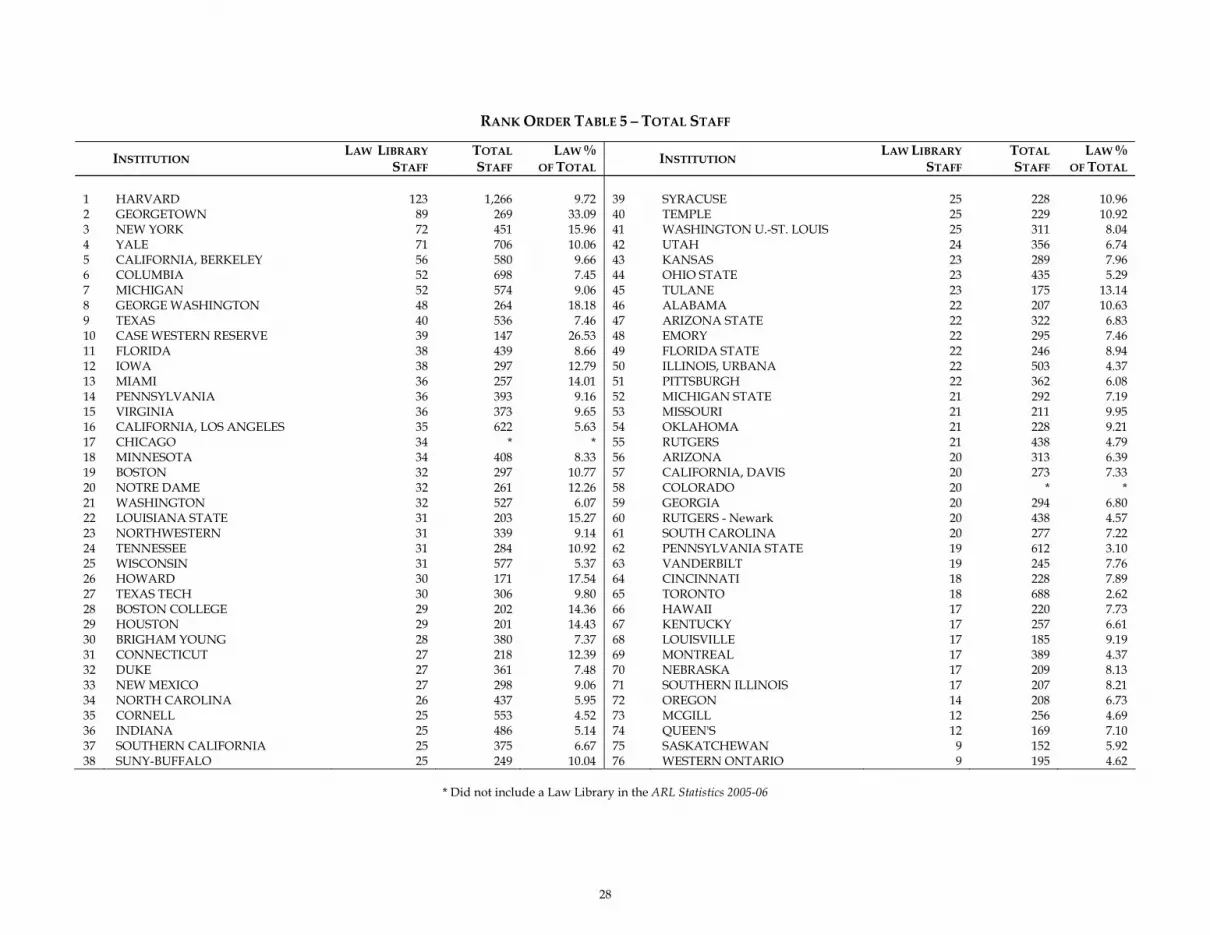
1 HARVARD 123 1,266 9.72 39 SYRACUSE 25 228 10.96 2 GEORGETOWN 89 269 33.09 40 TEMPLE 25 229 10.92 3 NEW YORK 72 451 15.96 41 WASHINGTON U.-ST. LOUIS 25 311 8.04 4 YALE 71 706 10.06 42 UTAH 24 356 6.74 5 CALIFORNIA, BERKELEY 56 580 9.66 43 KANSAS 23 289 7.96 6 COLUMBIA 52 698 7.45 44 OHIO STATE 23 435 5.29 7 MICHIGAN 52 574 9.06 45 TULANE 23 175 13.14 8 GEORGE WASHINGTON 48 264 18.18 46 ALABAMA 22 207 10.63 9 TEXAS 40 536 7.46 47 ARIZONA STATE 22 322 6.83 10 CASE WESTERN RESERVE 39 147 26.53 48 EMORY 22 295 7.46 11 FLORIDA 38 439 8.66 49 FLORIDA STATE 22 246 8.94 12 IOWA 38 297 12.79 50 ILLINOIS, URBANA 22 503 4.37 13 MIAMI 36 257 14.01 51 PITTSBURGH 22 362 6.08 14 PENNSYLVANIA 36 393 9.16 52 MICHIGAN STATE 21 292 7.19 15 VIRGINIA 36 373 9.65 53 MISSOURI 21 211 9.95 16 CALIFORNIA, LOS ANGELES 35 622 5.63 54 OKLAHOMA 21 228 9.21 17 CHICAGO 34 * * 55 RUTGERS 21 438 4.79 18 MINNESOTA 34 408 8.33 56 ARIZONA 20 313 6.39 19 BOSTON 32 297 10.77 57 CALIFORNIA, DAVIS 20 273 7.33 20 NOTRE DAME 32 261 12.26 58 COLORADO 20 * * 21 WASHINGTON 32 527 6.07 59 GEORGIA 20 294 6.80 22 LOUISIANA STATE 31 203 15.27 60 RUTGERS - Newark 20 438 4.57 23 NORTHWESTERN 31 339 9.14 61 SOUTH CAROLINA 20 277 7.22 24 TENNESSEE 31 284 10.92 62 PENNSYLVANIA STATE 19 612 3.10 25 WISCONSIN 31 577 5.37 63 VANDERBILT 19 245 7.76 26 HOWARD 30 171 17.54 64 CINCINNATI 18 228 7.89 27 TEXAS TECH 30 306 9.80 65 TORONTO 18 688 2.62 28 BOSTON COLLEGE 29 202 14.36 66 HAWAII 17 220 7.73 29 HOUSTON 29 201 14.43 67 KENTUCKY 17 257 6.61 30 BRIGHAM YOUNG 28 380 7.37 68 LOUISVILLE 17 185 9.19 31 CONNECTICUT 27 218 12.39 69 MONTREAL 17 389 4.37 32 DUKE 27 361 7.48 70 NEBRASKA 17 209 8.13 33 NEW MEXICO 27 298 9.06 71 SOUTHERN ILLINOIS 17 207 8.21 34 NORTH CAROLINA 26 437 5.95 72 OREGON 14 208 6.73 35 CORNELL 25 553 4.52 73 MCGILL 12 256 4.69 36 INDIANA 25 486 5.14 74 QUEEN'S 12 169 7.10 37 SOUTHERN CALIFORNIA 25 375 6.67 75 SASKATCHEWAN 9 152 5.92 38 SUNY-BUFFALO 25 249 10.04 76 WESTERN ONTARIO 9 195 4.62
* Did not include a Law Library in the ARL Statistics 2005-06

29
RANK ORDER TABLE 6 – TOTAL ELECTRONIC MATERIALS
INSTITUTION LAW LIBRARY E-MATERIAL
TOTAL E-MATERIAL
LAW % OF TOTAL INSTITUTION LAW LIBRARY
E-MATERIAL TOTAL E-
MATERIAL LAW %
OF TOTAL
1 GEORGE WASHINGTON 667,757 2,894,930 23.07 39 YALE 180,144 4,689,354 3.84 2 NOTRE DAME 529,993 4,214,924 12.57 40 WASHINGTON 177,115 4,022,052 4.40 3 VANDERBILT 468,637 4,728,525 9.91 41 NEBRASKA 169,776 2,115,486 8.03 4 GEORGETOWN 412,515 3,114,752 13.24 42 PITTSBURGH 166,890 5,891,621 2.83 5 FLORIDA STATE 377,097 3,880,840 9.72 43 WISCONSIN 161,889 3,606,560 4.49 6 PENNSYLVANIA STATE 375,247 9,823,592 3.82 44 ILLINOIS, URBANA 161,653 3,247,049 4.98 7 VIRGINIA 372,245 4,157,333 8.95 45 SUNY‐BUFFALO 156,697 4,677,244 3.35 8 HOUSTON 356,887 2,378,095 15.01 46 LOUISIANA STATE 153,527 1,470,331 10.44 9 MISSOURI 338,714 2,787,967 12.15 47 BRIGHAM YOUNG 144,908 1,981,220 7.31 10 TEXAS TECH 333,408 2,015,136 16.55 48 TENNESSEE 144,386 2,355,919 6.13 11 NORTHWESTERN 327,403 5,844,331 5.60 49 IOWA 143,376 5,421,137 2.64 12 PENNSYLVANIA 325,293 5,231,082 6.22 50 DUKE 140,166 4,463,339 3.14 13 TULANE 306,526 3,572,303 8.58 51 SOUTH CAROLINA 116,579 3,679,957 3.17 14 MICHIGAN STATE 302,231 4,899,965 6.17 52 CORNELL 115,796 5,366,442 2.16 15 OREGON 299,736 1,763,019 17.00 53 TORONTO 109,069 3,930,250 2.78 16 TEXAS 298,158 6,038,544 4.94 54 MCGILL 108,350 6,016,847 1.80 17 HARVARD 294,020 5,417,996 5.43 55 CALIFORNIA, DAVIS 106,754 3,792,873 2.81 18 WASHINGTON U.‐ST. LOUIS 282,022 5,273,151 5.35 56 GEORGIA 101,992 5,478,944 1.86 19 CHICAGO 275,433 * * 57 RUTGERS ‐ Newark 100,812 3,733,667 2.70 20 COLORADO 272,245 * * 58 KENTUCKY 99,356 3,491,559 2.85 21 OKLAHOMA 263,321 2,912,861 9.04 59 MONTREAL 98,499 5,030,158 1.96 22 COLUMBIA 252,898 7,704,688 3.28 60 ALABAMA 96,541 3,578,275 2.70 23 ARIZONA STATE 249,524 5,010,330 4.98 61 KANSAS 91,478 2,434,356 3.76 24 FLORIDA 247,534 5,355,636 4.62 62 HOWARD 90,861 1,070,931 8.48 25 NORTH CAROLINA 245,335 3,804,794 6.45 63 CINCINNATI 90,181 7,239,964 1.25 26 MICHIGAN 242,053 UA/NA UA/NA 64 UTAH 83,929 1,193,845 7.03 27 BOSTON 241,942 1,716,862 14.09 65 HAWAII 79,648 2,471,454 3.22 28 OHIO STATE 238,825 5,174,694 4.62 66 SOUTHERN ILLINOIS 50,780 2,921,467 1.74 29 BOSTON COLLEGE 233,995 1,700,151 13.76 67 WESTERN ONTARIO 47,784 5,493,986 0.87 30 TEMPLE 227,792 5,121,982 4.45 68 QUEENʹS 45,255 4,478,343 1.01 31 MINNESOTA 224,720 5,414,827 4.15 69 SOUTHERN CALIFORNIA 39,387 3,359,071 1.17 32 INDIANA 224,454 4,135,103 5.43 70 RUTGERS 23,997 3,733,667 0.64 33 SYRACUSE 216,896 2,899,414 7.48 71 MIAMI 0 3,844,486 UA/NA 34 EMORY 210,558 2,935,205 7.17 72 NEW MEXICO 0 2,205,594 UA/NA 35 CASE WESTERN RESERVE 209,142 2,866,823 7.30 73 ARIZONA UA/NA 5,560,913 UA/NA 36 NEW YORK 189,525 6,688,267 2.83 74 CALIFORNIA, BERKELEY UA/NA UA/NA UA/NA 37 CONNECTICUT 181,018 3,504,528 5.17 75 CALIFORNIA, LOS ANGELES UA/NA 3,287,538 UA/NA 38 LOUISVILLE 180,645 2,703,346 6.68 76 SASKATCHEWAN UA/NA 3,943,918 UA/NA
* Did not include a Law Library in the ARL Statistics 2005-06


31
ARL STATISTICS 2005-06 LAW LIBRARY WORKSHEET
This worksheet is designed to help you plan your submission for the 2005-06 ARL Statistics. Include here ONLY those libraries which would appear in the ARL Academic Law Library Statistics publication. Please respond to all questions. If an exact figure is unavailable, use “NA/UA”. If the appropriate answer is zero or none, use “0.” Reporting Institution_______________________________________________ Date Returned to ARL ________________
Report Prepared by (name)______________________________________________________________________________
Title _______________________________________________________________________________________________
Email address ____________________________________________________ Phone number ______________________
Contact person (if different) _____________________________________________________________________________
Title _______________________________________________________________________________________________
Email address ____________________________________________________ Phone number ______________________
PAGE ONE – VOLUMES
1. Volumes held June 30, 2006
1a. Volumes held June 30, 2005 (1.a) ___________________
1b. Volumes added during the year
(i) Volumes added – Gross 1.b.i) __________________
(ii) Volumes withdrawn during year (1.b.ii) __________________ (Net Volumes Added: 1.b.i – 1.b.ii) (1.b) ___________________ (Volumes held June 30, 2006: 1.a + 1.b) (1) ___________________
2. Number of monographic volumes purchased (2) ___________________
3. Basis of volume count is: (3) _____ Physical _____ Bibliographic

32
PAGE TWO – OTHER COLLECTIONS SERIALS
4. Total number of current serials received, including periodicals
4a. Number of current serials purchased (4a) _____________
4b. Number of current serials received but not purchased (4b) _____________ (Exchanges, gifts, deposits, etc. See instructions.)
(Total serials received: 4.a + 4.b) (4) ___________________
5. Government documents are included in count of Current Serials? (5) _____ Yes _____ No OTHER LIBRARY MATERIALS
6. Microform units (6) ___________________
7. Government documents not counted elsewhere (7) ___________________
8. Computer files (8) ___________________
9. Manuscripts and archives (linear ft.) (9) ___________________ AUDIOVISUAL MATERIALS
10. Cartographic (10) ___________________ 11. Graphic (11) ___________________
12. Audio (12) ___________________ 13. Film and Video (13) ___________________

33
PAGE THREE – EXPENDITURES
14. Are the below figures reported in Canadian dollars? (14) ______Yes ______No
15. Total Library Materials Expenditures
15a. Monographs (15a) ___________________
15b. Current serials, including periodicals (15b) ___________________
15c. Other Library Materials (15c) ___________________ 15d. Miscellaneous (15d) ___________________
(Total library materials: 15.a + 15.b + 15.c + 15.d) (15) ___________________
16. Contract binding (16) ___________________
17. Total Salaries and Wages
17a. Professional staff (17a) ___________________
17b. Support staff (17b) ___________________
17c. Student assistants (17c) ___________________
(Total salaries and wages: 17.a + 17.b + 17.c) (17) ___________________
18. Fringe benefits are included in expenditures for salaries and wages? (18) _____ Yes _____ No
19. Other operating expenditures (19) ___________________
20. Total library expenditures ( 15 + 16 + 17 + 19) (20) ___________________
ELECTRONIC MATERIALS EXPENDITURES
21. Computer files (One-time/monographic purchases.) (21) ___________________
22. Electronic serials (22) ___________________
23. Bibliograhpic Utilities, Networks, and Consortia
23a. From internal library sources (23a) ___________________
23b. From external sources (23b) ___________________
24. Computer hardware and software (24) ___________________ 25. Document Delivery/Interlibrary Loan (25) ___________________

34
PAGE FOUR – PERSONNEL AND PUBLIC SERVICES PERSONNEL (Round figures to nearest whole number.)
26. Total Staff FTE
26a. Professional staff (26a) _____________
26b. Support staff (26b) _____________
26c. Student assistants (26c) _____________
(Total staff FTE: 26.a + 26.b + 26.c) (26) ___________________ STAFFED SERVICE POINTS AND HOURS
27. Number of staffed library service points (27) ___________________ 28. Number of weekly public service hours (28) ___________________
INSTRUCTION
29. Number of library presentations to groups (29) ___________________ 29a. Figure based on sampling? (29a) ______Yes ______No
30. Number of total participants in group presentations reported in line 29 (30) ___________________
30a. Figure based on sampling? (30a) ______Yes ______No REFERENCE
31. Number of reference transactions (31) ___________________ 31a. Figure based on sampling? (31a) ______Yes ______No
35
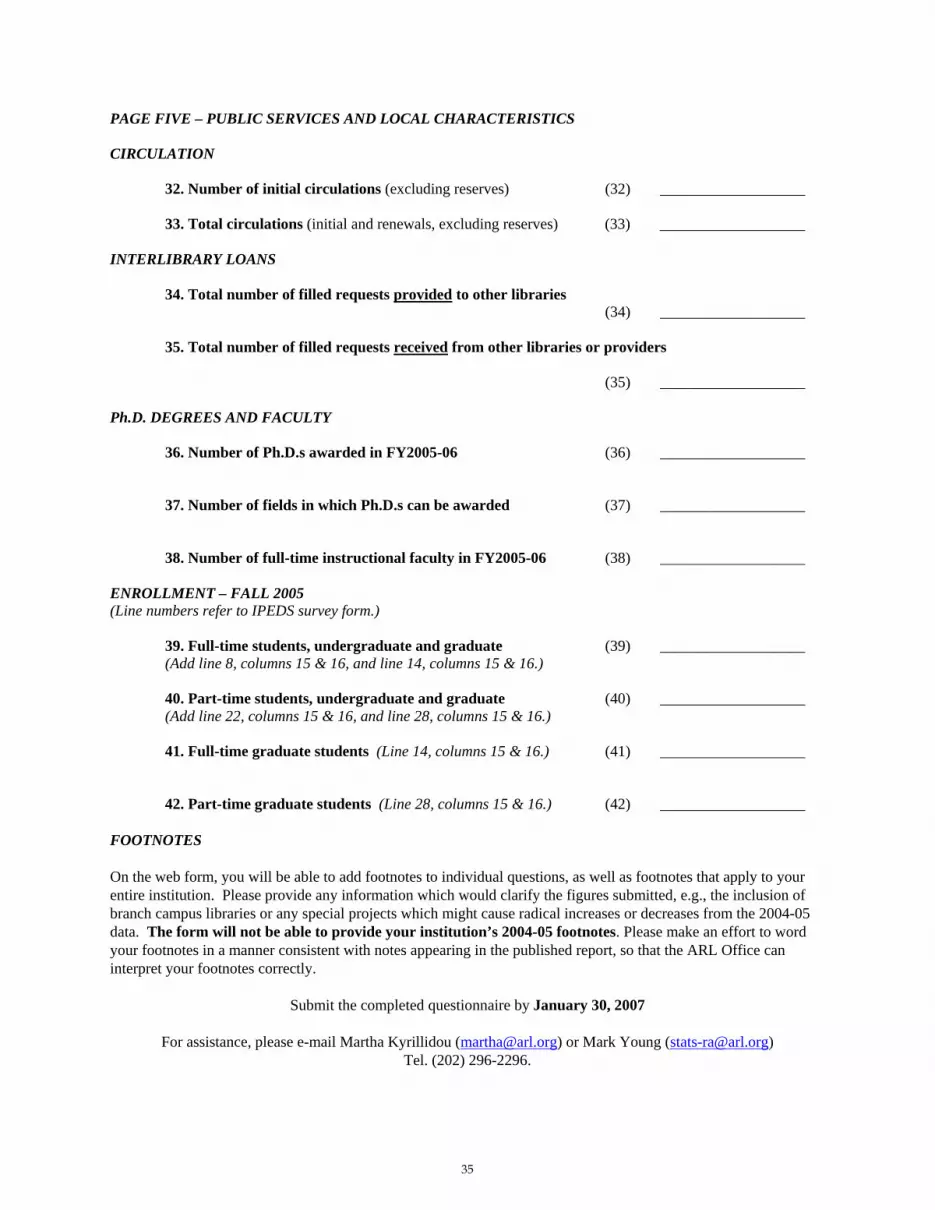
PAGE FIVE – PUBLIC SERVICES AND LOCAL CHARACTERISTICS CIRCULATION
32. Number of initial circulations (excluding reserves) (32) ___________________
33. Total circulations (initial and renewals, excluding reserves) (33) ___________________ INTERLIBRARY LOANS
34. Total number of filled requests provided to other libraries (34) ___________________
35. Total number of filled requests received from other libraries or providers
(35) ___________________ Ph.D. DEGREES AND FACULTY
36. Number of Ph.D.s awarded in FY2005-06 (36) ___________________
37. Number of fields in which Ph.D.s can be awarded (37) ___________________ 38. Number of full-time instructional faculty in FY2005-06 (38) ___________________ ENROLLMENT – FALL 2005 (Line numbers refer to IPEDS survey form.)
39. Full-time students, undergraduate and graduate (39) ___________________ (Add line 8, columns 15 & 16, and line 14, columns 15 & 16.)
40. Part-time students, undergraduate and graduate (40) ___________________ (Add line 22, columns 15 & 16, and line 28, columns 15 & 16.)
41. Full-time graduate students (Line 14, columns 15 & 16.) (41) ___________________
42. Part-time graduate students (Line 28, columns 15 & 16.) (42) ___________________ FOOTNOTES On the web form, you will be able to add footnotes to individual questions, as well as footnotes that apply to your entire institution. Please provide any information which would clarify the figures submitted, e.g., the inclusion of branch campus libraries or any special projects which might cause radical increases or decreases from the 2004-05 data. The form will not be able to provide your institution’s 2004-05 footnotes. Please make an effort to word your footnotes in a manner consistent with notes appearing in the published report, so that the ARL Office can interpret your footnotes correctly.
Submit the completed questionnaire by January 30, 2007
For assistance, please e-mail Martha Kyrillidou ([email protected]) or Mark Young ([email protected])
Tel. (202) 296-2296.


37
ARL STATISTICS QUESTIONNAIRE, 2005-06 INSTRUCTIONS FOR COMPLETING THE QUESTIONNAIRE
General Instructions Definitions of statistical categories can be found in NISO Z39.7-2004, Information Services and Use: Metrics & statistics for libraries and information providers--Data Dictionary (http://www.niso.org/emetrics/current/index.html). ARL has been modifying the interpretation of the standard definitions to address questions posed by by the library staff at various member institutions that complete the survey and with feedback from the ARL Statistics and Assessment Committee (http://www.arl.org/stats/program/meeting.html). Please do not use decimals. All figures should be rounded to the nearest whole number.
Please respond to every question. If an exact figure cannot be provided, use NA/UA to indicate that the figure is
either unavailable or not applicable. If the appropriate answer is zero or none, use 0. Although the form allows for data to be entered from both main and branch campuses, an effort should be made to
report figures for the main campus only. (The U.S. National Center for Education Statistics, Integrated Postsecondary Education Data System (IPEDS) defines a branch institution as “a campus or site of an educational institution that is not temporary, is located in a community beyond a reasonable commuting distance from its parent institution, and offers organized programs of study, not just courses.”) If figures for libraries located at branch campuses are reported, please specify which branch libraries are included and which ones are excluded in the notes below.
A branch library is defined as an auxiliary library service outlet with quarters separate from the central library of an institution, which has a basic collection of books and other materials, a regular staffing level, and an established schedule. A branch library is administered either by the central library or (as in the case of some law and medical libraries) through the administrative structure of other units within the university. Departmental study/reading rooms are not included. The questionnaire assumes a fiscal year ending June 30, 2006. If your fiscal year is different, please indicate this in the notes below by adjusting the reporting period.
Footnotes. Explanatory footnotes will be included with the published statistics. Provide any notes you may have in the footnotes area at the end of the survey. Reporting libraries are urged to record there any information that would clarify the figures submitted in that line, e.g., the inclusion and exclusion of branch campus libraries. Please make an effort to word your footnotes in a manner consistent with notes appearing in the published report, so that the ARL Office can interpret your footnotes correctly. Specific Instructions
Question 1. Volumes in Library. Use the ANSI/NISO Z39.7-2004 definition for volume as follows:
a single physical unit of any printed, typewritten, handwritten, mimeographed, or processed work, distinguished from other units by a separate binding, encasement, portfolio, or other clear distinction, which has been cataloged, classified, and made ready for use, and which is typically the unit used to charge circulation transactions. Either a serial volume is bound, or it comprises the serial issues that would be bound together if the library bound all serials.
Include duplicates and bound volumes of periodicals. For purposes of this questionnaire, unclassified bound serials
arranged in alphabetical order are considered classified. Exclude microforms, maps, nonprint materials, and uncataloged items. If any of these items cannot be excluded, please provide an explanatory footnote

38
Include government document volumes that are accessible through the library’s catalogs regardless of whether they
are separately shelved. “Classified” includes documents arranged by Superintendent of Documents, CODOC, or similar numbers. “Cataloged” includes documents for which records are provided by the library or downloaded from other sources into the library’s card or online catalogs. Documents should, to the extent possible, be counted as they would if they were in bound volumes (e.g., 12 issues of an annual serial would be one or two volumes). Title and piece counts should not be considered the same as volume counts. If a volume count has not been kept, it may be estimated through sampling a representative group of title records and determining the corresponding number of volumes, then extrapolating to the rest of the collection. As an alternative, an estimate may be made using the following formulae:
52 documents pieces per foot 10 “traditional” volumes per foot 5.2 documents pieces per volume
Include e-book units, as long as these e-books have been purchased and are owned by your library. If you have access to netLibrary titles as a result of participating in various consortia, do not report these e-books as your library's property unless the e-books actually belong to your library. If the books were purchased by a consortium, they may belong to the consortium itself and not to the participating libraries. Report only the number of e-books that belong to your library and are cataloged, classified and made ready for use. Provide a footnote explaining how many e-books you are reporting, preferably by specifying the products and the number of titles in a note.
For information on how to count items housed in remote storage, see the Interim Guidelines for Counting Materials Housed in Library Storage Centers, at http://www.arl.org/stats/arlstat/storage.html .
If either formulas or sampling are used for deriving your count, please indicate in a footnote. Question 1b. Volumes Added. Include only volumes cataloged, classified, and made ready for use. Include
government documents if they have been included in the count of volumes on line 1a. Do not include as part of Volumes Added Gross any government documents or other collections (such as large gift collections or e-book packages) that were added to the collection as the result of a one time download or addition to the OPAC. Include these items in Volumes Held of the previous year (Line 1a) and provide a footnote explaining the revision of Line 1a.
Include e-book units, as long as these e-books have been purchased and are owned by your library. If you have access to netLibrary titles as a result of participating in various consortia, do not report these e-books as your library's property unless the e-books actually belong to your library. If the books were purchased by a consortium, they may belong to the consortium itself and not to the participating libraries. Report only the number of e-books that belong to your library and are cataloged, classified and made ready for use. Provide a footnote explaining how many e-books you are reporting, preferably by specifying the products and the number of titles in a note.
Question 2. Monographic Volumes Purchased. Report number of volumes purchased; do not include volumes
received or cataloged. Include all volumes for which an expenditure was made during 2005-06, including volumes paid for in advance but not received during the fiscal year. Include monographs in series and continuations. Include e-books that fit the netLibrary model, i.e., electronic manifestations of physical entities and/or units; provide a footnote explaining how many e-books you are reporting, preferably by specifying the products and the number of titles. If only number of titles purchased can be reported, please report the data and provide an explanatory footnote.
Question 3: Basis of Volume Count. A physical count is a piece count; a bibliographic count is a catalog record
count. Questions 4-5. Serials. Report the total number of subscriptions, not titles. Include duplicate subscriptions and, to
the extent possible, all government document serials even if housed in a separate documents collection. Verify the inclusion or exclusion of document serials in Question 5. Exclude unnumbered monographic and publishers’ series.

39
Electronic serials acquired as part of an aggregated package (e.g., Project MUSE, BioOne, ScienceDirect) should be counted by title. A serial is
a publication in any medium issued in successive parts bearing numerical or chronological designations and intended to be continued indefinitely. This definition includes periodicals, newspapers, and annuals (reports, yearbooks, etc.); the journals, memoirs, proceedings, transactions, etc. of societies; and numbered monographic series.
In the case of consortial agreements, count under Q4a only those subscriptions to titles for which the library pays directly from its budgeted expenditures reported under Q15b (expenditures for serials). Count under Q4a only those titles and subscriptions for which your library pays. Report other subscriptions that your library receives and does not pay for directly under Q4b (serials received and not purchased). If a purchased subscription includes electronic access to the title, count that subscription twice: once for the print version and once for the electronic version. If serials have been purchased through a consortium whose budget is centrally funded and independent from the library's budget, these serials should be reported under Q4b. Do not include the full-text serials from such indexing/abstracting products as Wilson Social Sciences Abstracts Full Text, Lexis-Nexis, ABI/INFORM, and other indexes with access to the full text of articles. These full-text titles are counted in in the ARL Supplementary Statistics. Question 4b. Serials: Not Purchased. Record those serials whose subscriptions were received without purchase for whatever reason. If separate counts of nonpurchased and purchased serials are not available, report only the total number of current serials received on line 4, and report U/A for lines 4a and 4b.
Question 6. Microforms. Report the total number of physical units: reels of microfilm, microcards, and
microprint and microfiche sheets. Include all government documents in microform; provide a footnote if documents are excluded.
Question 7. Government documents. Report the total number of physical units (pieces) of government
documents in paper format that have not been counted elsewhere. Include local, state, national, and international documents; include documents purchased from a commercial source if shelved with separate documents collections and not counted above. Include serials and monographs. To estimate pieces from a measurement of linear feet, use the formula 1 foot = 52 pieces and indicate in a footnote that the count is based on this estimate. Exclude microforms and nonprint formats such as maps or CD-ROMs. Adjust line 1a, i.e., last year’s Volumes Held, and provide a footnote if you are adding records to the OPAC for government documents previously held but not counted as part of Volumes Held (line 1a).
Question 8. Computer files. Include the number of pieces of computer-readable disks, tapes, CD-ROMs, and
similar machine-readable files comprising data or programs that are locally held as part of the library’s collections available to library clients. Examples are U.S. Census data tapes, sample research software, locally-mounted databases, and reference tools on CD-ROM, tape or disk. Exclude bibliographic records used to manage the collection (i.e., the library’s own catalog in machine-readable form), library system software, and microcomputer software used only by the library staff.
Question 9. Manuscripts and archives. Include both manuscripts and archives measured in linear feet. Question 10. Cartographic materials. Include the numbers of pieces of two- and three-dimensional maps and
globes. Include satellite and aerial photographs and images. Question 11. Graphic materials. Include the number of pieces of prints, pictures, photographs, postcards, slides,
transparencies, film strips, and the like. Question 12. Audio materials. Include the number of pieces of audiocassettes, phonodiscs, audio compact discs,
reel-to-reel tapes, and other sound recordings.

40
Question 13. Film and video materials. Include the number of pieces of motion pictures, videocassettes, video laser discs, and similar visual materials.
Questions 14-20. Expenditures. Report all expenditures of funds that come to the library from the regular
institutional budget, and from sources such as research grants, special projects, gifts and endowments, and fees for service. (For question 17, include non-library funds; see instruction Q17.) Do not report encumbrances of funds that have not yet been expended. Canadian libraries should report expenditures in Canadian dollars. (For your information, if interested in determining figures in U.S. dollars, divide Canadian dollar amounts by 1.16289, the average monthly noon exchange rate published in the Bank of Canada Review for the period July 2005-June 2006.) Please round figures to the nearest dollar.
Question 15a. Monographs. Report expenditures for volumes counted on line 2. Question 15b. Current Serials. Report expenditures for serials counted on line 4a. Exclude unnumbered
monographic and publishers’ series, and encumbrances. Question 15c. Other library materials. Include expenditures for all materials not reported in Questions 15a and
15b, e.g., backfiles of serials, charts and maps, audiovisual materials, manuscripts, etc. If expenditures for these materials are included in lines 15a and/or 15b and cannot be disaggregated, please report U/A and provide a footnote. Do not include encumbrances.
Question 15d. Miscellaneous expenditures. Include any other materials funds expenditures not included in
questions 15a-c, e.g., expenditures for bibliographic utilities, literature searching, security devices, memberships for the purposes of publications, etc. Please list categories, with amounts, in a footnote. Note: If your library does not use materials funds for non-materials expenditures—i.e., such expenditures are included in “Other Operating Expenditures”— report 0, not U/A, on line 15d.
Question 16. Contract Binding. Include only contract expenditures for binding done outside the library. If all
binding is done in-house, state this fact and give in-house expenditures in a footnote; do not include personnel expenditures. (This figure should also be reported in the 2005-06 ARL Preservation Survey, question 7b.)
Questions 17. Salaries and wages. Exclude fringe benefits. If professional and support staff salaries cannot be
separated, enter U/A, on lines 17a and 17b and enter total staff on line 17. Question 17c. Salaries and wages: Student Assistants. Report 100% of student wages regardless of budgetary
source of funds. Include federal and local funds for work study students. Question 19. Other operating expenditures. Exclude expenditures for buildings, maintenance, and fringe
benefits. Questions 21-25. Electronic materials expenditures. These items are intended to indicate what portion of your institution’s total library expenditures are dedicated to electronic resources and services. Please use the Footnotes to indicate any electronic materials expenditures you believe not to be covered by these questions. Many expenditures recorded in these questions should have been included in Question 20, total library expenditures. Question 21. Computer files. Report expenditures that are not current serials (i.e. are non-subscription, one-time, or monographic in nature) for software and machine-readable materials considered part of the collections. Examples include periodical backfiles, literature collections, one-time costs for JSTOR membership, etc. Expenditures reported here may be derived from any of the following categories: Monographs (Q15a), Other Library Materials (Q15c), Miscellaneous (Q15d), or Other Operating Expenditures (Q19). Question 22. Electronic Serials. Report subscription expenditures (or those which are expected to be ongoing commitments) for serial publications whose primary format is electronic and for online searches of remote databases such as OCLC FirstSearch, DIALOG, Lexis-Nexis, etc. Examples include paid subscriptions for electronic journals and indexes/abstracts available via the Internet, CD-ROM serials, and annual access fees for resources purchased on a “one-time” basis, such as literature collections, JSTOR membership, etc. Not all items whose expenditures are counted here will be included in Total Current Serials (Question 4) or Current Serial Expenditures (Question 15b).

41
Q23. Bibliographic Utilities, Networks, and Consortia. Because it is increasingly common for ARL Libraries to enter into consortial arrangements to purchase access to electronic resources, both “Library” and “External” expenditure blanks and instructions are provided. Please use afootnote to describe expenditures that you believe are not covered by the question, or situations that do not seem to fit the instructions. Q23a. From internal library sources. Report expenditures paid by the Library for services provided by national, regional, and local bibliographic utilities, networks, and consortia, such as OCLC and RLG, unless for user database access and subscriptions, which should be reported in Questions 21 or 22. Include only expenditures that are part of Other Operating Expenditures (Q19). Q23b. From external sources. If your library receives access to computer files, electronic serials or search services through one or more centrally-funded system or consortial arrangements for which it does not pay fully and/or directly (for example, funding is provided by the state on behalf of all members), enter the amount paid by external bodies on its behalf. If the specific dollar amount is not known, but the total student FTE for the consortium and amount spent for the academic members are known, divide the overall amount spent by your institution’s share of the total student FTE. Q24. Computer hardware and software. Report expenditures from the library budget for computer hardware and software used to support library operations, whether purchased or leased, mainframe or microcomputer, and whether for staff or public use. Include expenditures for: maintenance; equipment used to run information service products when those expenditures can be separated from the price of the product; telecommunications infrastructure costs, such as wiring, hubs, routers, etc. Include only expenditures that are part of Other Operating Expenditures (Q19). Q25. Document Delivery/Interlibrary Loan. Report expenditures for document delivery and interlibrary loan services (both borrowing and lending). Include fees paid for photocopies, costs of telefacsimile transmission, royalties and access fees paid to provide document delivery or interlibrary loan. Include fees paid to bibliographic utilities if the portion paid for interlibrary loan can be separately counted. Include only expenditures that are part of Miscellaneous Materials Expenditures (Q15d) or Other Operating Expenditures (Q19), and only for those ILL/DD programs with data recorded in Questions 34-35.
Questions 26. Personnel. Report the number of staff in filled positions, or positions that are only temporarily vacant. ARL defines temporarily vacant positions as positions that were vacated during the fiscal year for which ARL data were submitted, for which there is a firm intent to refill, and for which there are expenditures for salaries reported on line 17.
Include cost recovery positions and staff hired for special projects and grants, but provide an explanatory footnote
indicating the number of such staff. If such staff cannot be included, provide a footnote. To compute full-time equivalents of part-time employees and student assistants, take the total number of hours per week (or year) worked by part-time employees in each category and divide it by the number of hours considered by the reporting library to be a full-time work week (or year). Round figures to the nearest whole numbers.
Question 26a. Professional Staff. Since the criteria for determining professional status vary among libraries, there
is no attempt to define the term “professional.” Each library should report those staff members it considers professional, including, when appropriate, staff who are not librarians in the strict sense of the term, for example computer experts, systems analysts, or budget officers.
Question 26c. Student Assistants. Report the total FTE (see instruction Q26) of student assistants employed on an
hourly basis whose wages are paid from funds under library control or from a budget other than the library’s, including federal work-study programs. Exclude maintenance and custodial staff.
Question 27. Number of staffed library service points. Count the number of staffed public service points in the main library and in all branch libraries reported in this inventory, including reference desks, information desks, circulation, current periodicals, reserve rooms, reprographic services (if staffed as a public facility), etc. Report the number of designated locations, not the number of staff.

42
Question 28. Number of weekly public service hours. Report an unduplicated count of the total public service hours per typical full-service week (i.e., no holidays or other special accommodations) across both main library and branches using the following method (corresponds to IPEDS): If a library is open from 9:00 a.m. to 5:00 p.m. Monday through Friday, it should report 40 hours per week. If several of its branches are also open during these hours, the figure remains 40 hours per week. Should Branch A also be open one evening from 7:00 p.m. to 9:00 p.m., the total hours during which users can find service somewhere within the system becomes 42 hours per week. If Branch B is open the same hours on the same evening, the count is still 42, but if Branch B is open two hours on another evening, or remains open two hours later, the total is then 44 hours per week. Exclude 24-hour unstaffed reserve or similar reading rooms. The maximum total is 168 (i.e., a staffed reading room open 7 days per week, 24 hours per day).
Questions 29-30. Instruction. Sampling based on a typical week may be used to extrapolate TO A FULL YEAR
for Questions 29 and 30. Please indicate if responses are based on sampling. Question 29. Presentations to Groups. Report the total number of sessions during the year of presentations made
as part of formal bibliographic instruction programs and through other planned class presentations, orientation sessions, and tours. If the library sponsors multi-session or credit courses that meet several times over the course of a semester, each session should be counted. Presentations to groups may be for either bibliographic instruction, cultural, recreational, or educational purposes. Presentations both on and off the premises should be included as long as they are sponsored by the library. Do not include meetings sponsored by other groups using library meeting rooms. Do not include training for library staff; the purpose of this question is to capture information about the services the library provides for its clientele. Please indicate if the figure is based on sampling.
Question 30. Participants in Group Presentations. Report the total number of participants in the presentations
reported on line 29. For multi-session classes with a constant enrollment, count each person only once. Personal, one-to-one instruction in the use of sources should be counted as reference transactions on line 31. Please indicate if the figure is based on sampling. Use a footnote to describe any special situations.
Question 31. Reference Transactions. Report the total number of reference transactions. A reference
transaction is
an information contact that involves the knowledge, use, recommendations, interpretation, or instruction in the use of one or more information sources by a member of the library staff. The term includes information and referral service. Information sources include (a) printed and nonprinted material; (b) machine-readable databases (including computer-assisted instruction); (c) the library’s own catalogs and other holdings records; (d) other libraries and institutions through communication or referral; and (e) persons both inside and outside the library. When a staff member uses information gained from previous use of information sources to answer a question, the transaction is reported as a reference transaction even if the source is not consulted again.
If a contact includes both reference and directional services, it should be reported as one reference transaction.
Duration should not be an element in determining whether a transaction is a reference transaction. Sampling based on a typical week may be used to extrapolate TO A FULL YEAR for Question 31. Please indicate if the figure is based on sampling.
EXCLUDE SIMPLE DIRECTIONAL QUESTIONS. A directional transaction is an information contact that
facilitates the logistical use of the library and that does not involve the knowledge, use, recommendations, interpretation, or instruction in the use of any information sources other than those that describe the library, such as schedules, floor plans, and handbooks.
Questions 32-33. Circulation. For Question 32, count the number of initial circulations during the fiscal year from
the general collection for use usually (although not always) outside the library. Do not count renewals. Include circulations to and from remote storage facilities for library users (i.e., do not include transactions reflecting transfers or stages of technical processing). Count the total number of items lent, not the number of borrowers. For
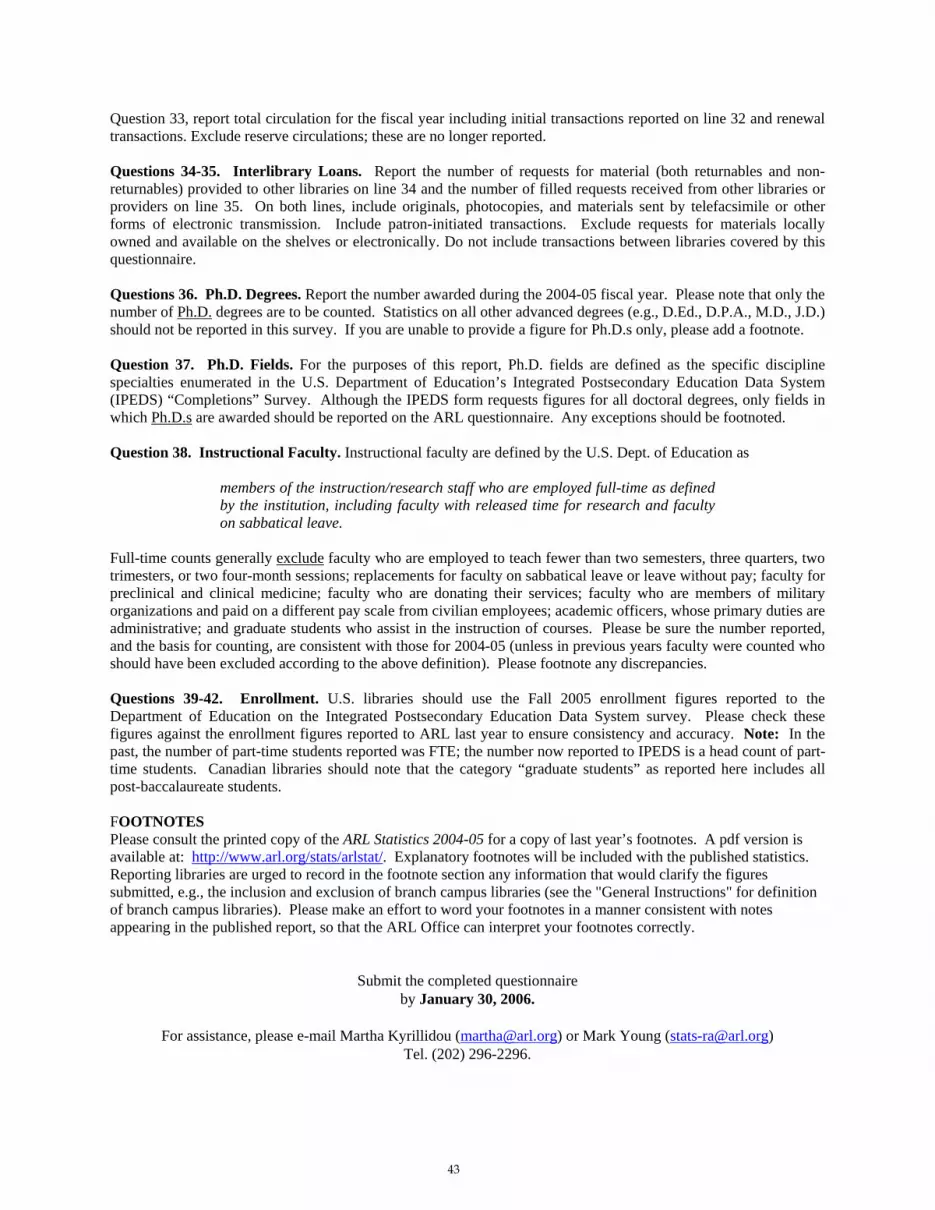
43
Question 33, report total circulation for the fiscal year including initial transactions reported on line 32 and renewal transactions. Exclude reserve circulations; these are no longer reported.
Questions 34-35. Interlibrary Loans. Report the number of requests for material (both returnables and non-
returnables) provided to other libraries on line 34 and the number of filled requests received from other libraries or providers on line 35. On both lines, include originals, photocopies, and materials sent by telefacsimile or other forms of electronic transmission. Include patron-initiated transactions. Exclude requests for materials locally owned and available on the shelves or electronically. Do not include transactions between libraries covered by this questionnaire.
Questions 36. Ph.D. Degrees. Report the number awarded during the 2004-05 fiscal year. Please note that only the
number of Ph.D. degrees are to be counted. Statistics on all other advanced degrees (e.g., D.Ed., D.P.A., M.D., J.D.) should not be reported in this survey. If you are unable to provide a figure for Ph.D.s only, please add a footnote.
Question 37. Ph.D. Fields. For the purposes of this report, Ph.D. fields are defined as the specific discipline
specialties enumerated in the U.S. Department of Education’s Integrated Postsecondary Education Data System (IPEDS) “Completions” Survey. Although the IPEDS form requests figures for all doctoral degrees, only fields in which Ph.D.s are awarded should be reported on the ARL questionnaire. Any exceptions should be footnoted.
Question 38. Instructional Faculty. Instructional faculty are defined by the U.S. Dept. of Education as
members of the instruction/research staff who are employed full-time as defined by the institution, including faculty with released time for research and faculty on sabbatical leave.
Full-time counts generally exclude faculty who are employed to teach fewer than two semesters, three quarters, two
trimesters, or two four-month sessions; replacements for faculty on sabbatical leave or leave without pay; faculty for preclinical and clinical medicine; faculty who are donating their services; faculty who are members of military organizations and paid on a different pay scale from civilian employees; academic officers, whose primary duties are administrative; and graduate students who assist in the instruction of courses. Please be sure the number reported, and the basis for counting, are consistent with those for 2004-05 (unless in previous years faculty were counted who should have been excluded according to the above definition). Please footnote any discrepancies.
Questions 39-42. Enrollment. U.S. libraries should use the Fall 2005 enrollment figures reported to the
Department of Education on the Integrated Postsecondary Education Data System survey. Please check these figures against the enrollment figures reported to ARL last year to ensure consistency and accuracy. Note: In the past, the number of part-time students reported was FTE; the number now reported to IPEDS is a head count of part-time students. Canadian libraries should note that the category “graduate students” as reported here includes all post-baccalaureate students.
FOOTNOTES Please consult the printed copy of the ARL Statistics 2004-05 for a copy of last year’s footnotes. A pdf version is available at: http://www.arl.org/stats/arlstat/. Explanatory footnotes will be included with the published statistics. Reporting libraries are urged to record in the footnote section any information that would clarify the figures submitted, e.g., the inclusion and exclusion of branch campus libraries (see the "General Instructions" for definition of branch campus libraries). Please make an effort to word your footnotes in a manner consistent with notes appearing in the published report, so that the ARL Office can interpret your footnotes correctly.
Submit the completed questionnaire
by January 30, 2006.
For assistance, please e-mail Martha Kyrillidou ([email protected]) or Mark Young ([email protected]) Tel. (202) 296-2296.


45
FOOTNOTES TO THE ARL ACADEMIC LAW LIBRARY STATISTICS, 2005-06 Footnotes may also include errata and corrections to data not previously reported from prior years. Numbers in parentheses refer to columns in Library Data Tables and to Questionnaire numbers.
QUESTION NUMBER FOOTNOTE
ALABAMA
19 Includes bibliographic utilities, memberships, and literature searching.
BOSTON COLLEGE
15.d Includes NELLCO Legal scholarship Repository e‐mail notification service for items newly deposited in scholarly
repository ($296), MARC records purchased for MOML ($15,000), and membership fees for LOCKSS and Portico ($3,082).
22 2004‐05 figure was erroneous, inadvertently double‐counting resource expenditures. Current figure reflects actual
expenditures in this category.
BRIGHAM YOUNG
All figures are for the calendar year ending December 31, 2005.
12 This figure includes both audio and film/video items and cannot be separated.
39 All Law enrollment numbers are embedded in the Main Library figures.
CALIFORNIA, DAVIS
1.b Figure reflects additional volumes purchased; volumes withdrawn decreased due to less weeding of the collection.
2 Cancellation of added copies, little used sets last year allowed increased purchase of new titles.
4 Figure reflects additional volumes purchased; volumes withdrawn decreased due to less weeding of the collection.
15.a Figure reflects funds from cancelled titles allocated to monographs.
17.c Figure reflects fewer vacancies and less temporary help needed.
22 Figure reflects increased electronic resources purchased.
24 Figure reflects a new server for online catalog.
25 Figure reflects greater use of intercampus free delivery services, Tricor.
34 Figure reflects more items requested this reporting period.
35 Figure reflects fewer items borrowed from others for this reporting period.
CHICAGO
1.b Withdrew 77,494 volumes that were duplicative or available in electronic form and in the university library.
2, 15a Committed more money in 2005‐06 than 2004‐05, but did not receive the books before June 30 because the project
work delayed book selection and orders.
12 Claimed outstanding orders.
17.c Figure reflects expenses related to Project, to select and process books for storage and to withdraw duplicative and
out‐of‐scope volumes.
23.a Increase is the result of the Law Libraryʹs ability to now accurately reflect its expenditures.
24 Increase is the result of an overall upgrade in hardware.
26.b Figure reflects personnel related to Project to select and process books for storage and to withdraw duplicative and
out‐of‐scope volumes.
26.c Figures reflect personnel related to Project to select and process books for storage and to withdraw duplicative and

46
QUESTION NUMBER FOOTNOTE
out‐of‐scope volumes.
34, 35 Figures represent items, not requests.
COLORADO
Volumes held June 30, 2004‐05 revised to 289,494.
COLUMBIA
34 Includes 5,372 requests from fee‐based service.
CONNECTICUT
Volumes held June 30, 2005 revised to 335,621 to include 21,700 from Making of Modern Law purchase.
CORNELL
Volumes held June 30, 2005 revised to 540,156 to reflect additional e‐book counts (Making of Modern Law; and items in earlier years from LLMC Digital and Manas Media).
1.b.i Includes a small number of e‐books (LLMC Digital and Manas Media).
17.a Includes professional staff and exempt staff.
17.b Excludes exempt staff. Includes hourly staff and non‐student staff.
26.a Includes professional staff and exempt staff.
EMORY
Volumes held June 30, 2005 revised to 216,056.
15.d Includes: Legal research and other online resources ($210,558), and bibliographic utilities ($14,200).
19 Includes: Fringe benefits ($226,579), contract staff ($74,422), and miscellaneous ($32,108).
FLORIDA
Volumes held June 30, 2005 revised to 319,955.
FLORIDA STATE
28 Figure is included in the main library data.
GEORGE WASHINGTON
15.b Increase due to year‐end funds used to pay for some 2006‐07 subscriptions at the end of the 2005‐06 fiscal year.
Also, inflation was a factor.
15.c Decrease due to a one‐time purchase of some large microform sets in 2004‐05, which were included here.
21 In 2005‐06, the Law Library made one‐time purchases of two large databases (Making of Modern Law, and
Supreme Court Records) for $180,000.
HARVARD UNIVERSITY
Volumes held June 30, 2005 revised to 1,723,645.
35 Decrease is a result of access to digital resources.
HAWAII
Volumes held June 30, 2005 revised to 126,674 to reflect gift volumes inadvertently omitted in 2003‐04.
HOUSTON
When compiling statistics for this report, law library staff noted a discrepancy between the current volume count and figures reported previously. After extensive study, they determined that a mistake had been made several years ago. That error is corrected; volumes held June 30, 2005 has been revised to 220,639 because of different

47
QUESTION NUMBER FOOTNOTE
reporting requirements for the American Bar Association statistics.
2 Both UH Law Library and the Main Library had a significant increase in number of monographic volumes
purchased.
6 The increase in the number of microform units held by the UH Libraries is due to a change in the way the Law Library reported its statistics. Previously, Law had used the definition required for the American Bar Association (fiche = number of units divided by 6, microfilm = number of reels x 5). The number reported this year reflects the definition used by ARL and was calculated by reverse‐engineering the figures reported to ABA.
HOWARD
Volumes held June 30, 2005 revised to 207,653.
24 Figure reflects fewer computer hardware purchases.
IOWA
2 Figure is estimated; titles are not separated by monograph/serials, only by dollar amount.
17.a Does not include salary of Associate Dean for Research.
17.c Law library does not include 2 RAs and 5 LOF students paid by law school Deanʹs account.
19 Law Library includes postage, phones, supplies, equipment.
31 Law Library bases on two weekly surveys taken each year and then multiplied.
KANSAS
1.b.i Library monograph expenditures were significantly cut in 2005‐06.
4.a Includes the number of serials received in PDF format from Hein Online.
15.a Library monograph expenditures were significantly cut in 2005‐06.
LOUISIANA STATE
10 Change due to maps being recounted in 2006.
MIAMI
Volumes held June 30, 2005 revised to 423,750 to include 21,811 e‐books not included in prior years.
17.a Excludes law library directorʹs salary.
MICHIGAN
Volumes held June 30, 2005 revised to 699,148 to include 21,811 e‐books.
1.b.i Includes 2,684 e‐books.
15.d Includes: ILL ($480) and Preservation ($56,091)
32, 33 Includes reserves.
MICHIGAN STATE
12 Counts based on item (or copy), not on number of units within each copy.
MONTREAL
Volumes held May 31, 2005 revised to 177,354 in order to correct past miscalculations.
NEBRASKA
7‐9 Figures unavailable for Law Library.
OHIO STATE
Volumes held June 30, 2005 revised to 560,969.

48
QUESTION NUMBER FOOTNOTE
23.b OhioLINK funds are provided for the entire university and are not broken down by individual library.
OREGON
Volumes held June 30, 2005 revised to 193,629 to include 21,811 titles from MOML.
2 Includes 21,811 titles loaded from MOML.
21 Figure reflects the 1st of 4 payments for MOML.
25 Most ILL expenses for Law are not separate from the Main Library.
34, 35 Cannot be separated from the main library figure.
QUEENʹS
All statistics unless otherwise stated are as of April 30, 2006.
26a, 26b Figures are as of November 2005.
RUTGERS, CAMDEN
10‐13 Audiovisual Materials figures cannot be disaggregated. Total audiovisual is 122.
RUTGERS, NEWARK
10‐13 Audiovisual Materials figures cannot be disaggregated. Total audiovisual is 1,164.
17a, 26a Reduction of 2 professionals due to Law School reorganization.
17b, 26b Reduction of 6 support staff from 2004‐05, as those data were incorrectly reported; 2004‐05 figure revised to 15. 3
positions removed due to Law School reorganization, and 2 hourly support staff removed.
17c, 26c Reduced by 4 student employees due to lack of funds.
SASKATCHEWAN
4a‐b Figures were not provided in previous years.
SYRACUSE
12 Previously reported in bibliographic units.
TEMPLE
1.b.i Higher number of volumes reflects increase in library funding.
4.b Increase reflects inclusion of government documents.
15a, 15b Increases are a result of an increase in funding.
15.c Includes a one‐time purchase of a backfile and audio visual materials due to an increase in funding from the
University Library.
15.d Reflects spending on bibliographic utilities in 2005‐06 upon a closer reading of the instructions.
19 Reflects an increase in funding from the Law School and from the University Library system.
21 Figure reflects a one‐time purchase.
TEXAS TECH
All figures are as of August 31, 2006.
TULANE
Volumes held June 30, 2005 revised to 374,691, reflecting the first accurate count since Hurricane Katrina.
VANDERBILT
Volumes held June 30, 2005 revised to 475,804 to include 9,111 volumes from 18th Century Collections Online.

49
QUESTION NUMBER FOOTNOTE
15.c Some expenditures included here were previously reported as Miscellaneous (15d).
24 The Law School provides much not reported here.
WASHINGTON U.‐ST. LOUIS
1.a Does not include e‐books.
4.b Cannot distinguish between serials purchased and received.
31 Law Library does not track reference transactions.
WESTERN ONTARIO
Volumes held June 30, 2005 revised to 179,750 due to an automated count from the system which does not include unlinked items previously counted as part of the manual count. These items will be linked over time.
8, 12, 13 Law Library is no longer counting computer files separately from the Main Library.
35 Requests for materials from other libraries are handled centrally.
YALE
Volumes held June 30, 2005 revised to 857,353.
33 Includes 6,252 from ELI Express.

S: U.S. public univ.; P: U.S. private univ.; C: Canadian univ.; N: U.S. non-univ.; X: Canadian non-univ.
50
APPENDIX –ARL MEMBER LIBRARIES AS OF JUNE 1, 2007
Institution Category Full Name of Institution Location Alabama S University of Alabama Tuscaloosa, Alabama Alberta C University of Alberta Edmonton, Alberta Arizona S University of Arizona Tucson, Arizona Arizona State S Arizona State University Tempe, Arizona Auburn S Auburn University Auburn, Alabama Boston P Boston University Boston, Massachusetts Boston College P Boston College Boston, Massachusetts Brigham Young P Brigham Young University Provo, Utah British Columbia C University of British Columbia Vancouver, British Columbia Brown P Brown University Providence, Rhode Island Berkeley, California S University of California, Berkeley California, Berkeley California, Davis S University of California, Davis Davis, California California, Irvine S University of California, Irvine Irvine, California California, Los Angeles S University of California, Los Angeles Los Angeles, California California, Riverside S University of California, Riverside Riverside, California California, San Diego S University of California, San Diego La Jolla, California California, Santa Barbara S University of California, Santa Barbara Santa Barbara, California Case Western Reserve P Case Western Reserve University Cleveland, Ohio Chicago P University of Chicago Chicago, Illinois Cincinnati S University of Cincinnati Cincinnati, Ohio Colorado S University of Colorado Boulder, Colorado Colorado State S Colorado State University Fort Collins, Colorado Columbia P Columbia University New York, New York Connecticut S University of Connecticut Storrs, Connecticut Cornell P Cornell University Ithaca, New York Dartmouth P Dartmouth College Hanover, New Hampshire Delaware S University of Delaware Newark, Delaware Duke P Duke University Durham, North Carolina Emory P Emory University Atlanta, Georgia Florida S University of Florida Gainesville, Florida Florida State S Florida State University Tallahassee, Florida George Washington P George Washington University Washington, D.C. Georgetown P Georgetown University Washington, D.C. Georgia S University of Georgia Athens, Georgia Georgia Tech S Georgia Institute of Technology Atlanta, Georgia Guelph C University of Guelph Guelph, Ontario Harvard P Harvard University Cambridge, Massachusetts Hawaii S University of Hawaii Honolulu, Hawaii Houston S University of Houston Houston, Texas Howard P Howard University Washington, D.C. Illinois, Chicago S University of Illinois at Chicago Chicago, Illinois Illinois, Urbana S University of Illinois at Urbana Urbana, Illinois Indiana S Indiana University Bloomington, Indiana Iowa S University of Iowa Iowa City, Iowa Iowa State S Iowa State University Ames, Iowa Johns Hopkins P Johns Hopkins University Baltimore, Maryland Kansas S University of Kansas Lawrence, Kansas Kent State S Kent State University Kent, Ohio Kentucky S University of Kentucky Lexington, Kentucky Laval C Laval University Quebec, Quebec Louisiana State S Louisiana State University Baton Rouge, Louisiana Louisville S University of Louisville Louisville, Kentucky McGill C McGill University Montreal, Quebec McMaster C McMaster University Hamilton, Ontario Manitoba C University of Manitoba Winnipeg, Manitoba Maryland S University of Maryland College Park, Maryland Massachusetts S University of Massachusetts Amherst, Massachusetts MIT P Massachusetts Institute of Technology Cambridge, Massachusetts Miami P University of Miami Coral Gables, Florida Michigan S University of Michigan Ann Arbor, Michigan Michigan State S Michigan State University East Lansing, Michigan Minnesota S University of Minnesota Minneapolis, Minnesota

S: U.S. public univ.; P: U.S. private univ.; C: Canadian univ.; N: U.S. non-univ.; X: Canadian non-univ.
51
Institution Category Full Name of Institution Location Missouri S University of Missouri Columbia, Missouri Montreal C University of Montreal Montreal, Quebec Nebraska S University of Nebraska-Lincoln Lincoln, Nebraska New Mexico S University of New Mexico Albuquerque, New Mexico New York P New York University New York, New York North Carolina S University of North Carolina Chapel Hill, North Carolina North Carolina State S North Carolina State University Raleigh, North Carolina Northwestern P Northwestern University Evanston, Illinois Notre Dame P University of Notre Dame Notre Dame, Indiana Ohio S Ohio University Athens, Ohio Ohio State S Ohio State University Columbus, Ohio Oklahoma S University of Oklahoma Norman, Oklahoma Oklahoma State S Oklahoma State University Stillwater, Oklahoma Oregon S University of Oregon Eugene, Oregon Pennsylvania P University of Pennsylvania Philadelphia, Pennsylvania Pennsylvania State S Pennsylvania State University University Park, Pennsylvania Pittsburgh S University of Pittsburgh Pittsburgh, Pennsylvania Princeton P Princeton University Princeton, New Jersey Purdue S Purdue University West Lafayette, Indiana Queen’s C Queen's University Kingston, Ontario Rice P Rice University Houston, Texas Rochester P University of Rochester Rochester, New York Rutgers S Rutgers University New Brunswick, New Jersey Saskatchewan C University of Saskatchewan Saskatoon, Saskatchewan South Carolina S University of South Carolina Columbia, South Carolina Southern California P University of Southern California Los Angeles, California Southern Illinois S Southern Illinois University Carbondale, Illinois SUNY-Albany S University at Albany, State Univ. of New York Albany, New York SUNY-Buffalo S University at Buffalo, State Univ. of New York Buffalo, New York SUNY-Stony Brook S State University of New York at Stony Brook Stony Brook, New York Syracuse P Syracuse University Syracuse, New York Temple S Temple University Philadelphia, Pennsylvania Tennessee S University of Tennessee Knoxville, Tennessee Texas S University of Texas Austin, Texas Texas A&M S Texas A&M University College Station, Texas Texas Tech S Texas Tech University Lubbock, Texas Toronto C University of Toronto Toronto, Ontario Tulane P Tulane University New Orleans, Louisiana Utah S University of Utah Salt Lake City, Utah Vanderbilt P Vanderbilt University Nashville, Tennessee Virginia S University of Virginia Charlottesville, Virginia Virginia Tech S Virginia Polytechnic Institute & State University Blacksburg, Virginia Washington S University of Washington Seattle, Washington Washington State S Washington State University Pullman, Washington Washington U.-St. Louis P Washington University St. Louis, Missouri Waterloo C University of Waterloo Waterloo, Ontario Wayne State S Wayne State University Detroit, Michigan Western Ontario C University of Western Ontario London, Ontario Wisconsin S University of Wisconsin Madison, Wisconsin Yale P Yale University New Haven, Connecticut York C York University North York, Ontario Boston Public Library N Boston Public Library Boston, Massachusetts CISTI X Canada Inst. for Scientific & Technical Info. Ottawa, Ontario Ctr. for Research Libs. N Center for Research Libraries Chicago, Illinois Library of Congress N Library of Congress Washington, D.C. Natl. Agricultural Lib. N National Agricultural Library Beltsville, Maryland Natl. Library of Canada X National Library of Canada Ottawa, Ontario Natl. Library of Medicine N National Library of Medicine Bethesda, Maryland New York Public Library N New York Public Library New York, New York New York State Library N New York State Library Albany, New York Smithsonian Institution N Smithsonian Institution Washington, D.C.


