Embed Size (px)
Citation preview
ICES Journal of Marine Science, 53: 173–180. 1996
II. Classification and identification
Artificial neural networks as a tool for species identification offish schools
J. Haralabous and S. Georgakarakos
Haralabous, J. and Georgakarakos, S. 1996. Artificial neural networks as a tool forspecies identification of fish schools. – ICES Journal of Marine Science, 53: 173–180.
Fish schools of sardine, anchovy, and horse mackerel can be discriminated from eachother, under given conditions, using a set of parameters extracted from echo-integration data. Trawl sampling and hydroacoustic data were collected in 1992 and1993 in the Thermaikos Gulf by using a towed dual-beam 120 kHz transducer. Theparameters extracted from the available schools were used to train multi-layeredfeed-forward artificial neural networks. Various applied networks easily generatedassociations between school descriptors and species identity, providing a powerful toolfor classification. The expertise of the trained network was tested with data fromidentified schools not used in training. The use of neural networks cannot replaceclassical statistical procedures, but offers an alternative when there are significantoverlaps in the school characteristics and the parametric assumptions are not satisfied.
? 1996 International Council for the Exploration of the Sea
Key words: backpropagation, classification, echogram, feed-forward, fish school,hydroacoustics, identification, neural networks, pelagic fish, supervised learning.
J. Haralabous, and S. Georgakarakos: Institute of Marine Biology of Crete (IMBC) –Hydroacoustics, PO Box 2214 GR-71003 Heraklion, Crete, Greece. Correspondence toHaralabous [tel: 030 81 243368, fax: 030 81 241882].
IntroductionThe development of fish-species identification techniquesbased on hydroacoustic data is one of the keys for thereduction of error in biomass estimation. Echogramscrutinizing methods, combined with concurrent trawl-ing data and human experience are time-consuming andsubjective. Most of the recent improvements attempt toextract from the backscattered echo signals a set ofquantitative parameters that could sufficiently describethe structure of particular fish aggregations (Diner et al.,1989; Georgakarakos and Paterakis, 1993) or acousticpopulations (Gerlotto and Fréon, 1988) and support thespecies identification procedures.The selection of the best descriptors, and the accuracy
of classification, are the two main associated problems.Classical statistical methods, such as PCA (principalcomponents analysis) and DFA (discriminant functionanalysis), are the most commonly performed techniquesin this area (Scalabrin et al., 1992). However, the strictconstraints limit the reliable use of the above proceduresin some cases.Feed-forward artificial neural networks (ANN) do not
demand any assumptions concerning the distributions.They are now widely used for regression, classification,
and discrimination, though their use is rather new in fishschool identification and classification problems. Theaim of the present study is to discuss features of neuralnetworks which could serve as a tool for classification,and to present neural network applications for thespecies identification of small pelagic fish schools.
Materials and methodsData acquisition and extraction of descriptors
School data were obtained from hydroacoustic surveyswith the RV ‘‘Philia’’ in the Thermaikos Gulf in1992 and 1993. Data were collected using BioSonicsdual-beam equipment operated at 120 kHz. The pulseduration was 0.5 ms and integration was carried outover 1 m intervals through the water column. Thedata have been analysed by using ‘‘School’’ software,developed in IMBC (Georgakarakos and Paterakis,1993), for school identification and extraction of therequired parameters. The software includes thefollowing routines.‘‘SCROLL’’: The formation of the echogram is based
on a set of elements (pixels) with a resolution equal to1 m on the vertical axis and to 1 ping interval on the
1054–3139/96/020173+08 $18.00/0 ? 1996 International Council for the Exploration of the Sea
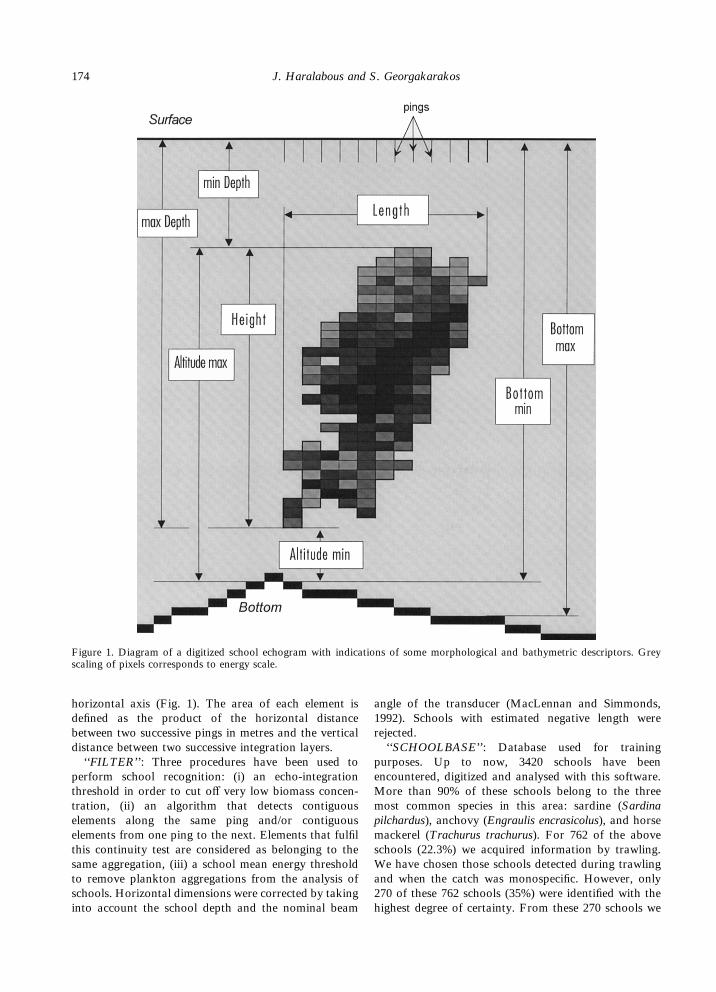
horizontal axis (Fig. 1). The area of each element isdefined as the product of the horizontal distancebetween two successive pings in metres and the verticaldistance between two successive integration layers.‘‘FILTER’’: Three procedures have been used to
perform school recognition: (i) an echo-integrationthreshold in order to cut off very low biomass concen-tration, (ii) an algorithm that detects contiguouselements along the same ping and/or contiguouselements from one ping to the next. Elements that fulfilthis continuity test are considered as belonging to thesame aggregation, (iii) a school mean energy thresholdto remove plankton aggregations from the analysis ofschools. Horizontal dimensions were corrected by takinginto account the school depth and the nominal beam
angle of the transducer (MacLennan and Simmonds,1992). Schools with estimated negative length wererejected.‘‘SCHOOLBASE’’: Database used for training
purposes. Up to now, 3420 schools have beenencountered, digitized and analysed with this software.More than 90% of these schools belong to the threemost common species in this area: sardine (Sardinapilchardus), anchovy (Engraulis encrasicolus), and horsemackerel (Trachurus trachurus). For 762 of the aboveschools (22.3%) we acquired information by trawling.We have chosen those schools detected during trawlingand when the catch was monospecific. However, only270 of these 762 schools (35%) were identified with thehighest degree of certainty. From these 270 schools we
Figure 1. Diagram of a digitized school echogram with indications of some morphological and bathymetric descriptors. Greyscaling of pixels corresponds to energy scale.
174 J. Haralabous and S. Georgakarakos
used a subset of 140 that were sampled under similarenvironmental conditions (same surveyed area, time ofday, season of year, distance from land, etc.) to avoidvariability in data, due to factors that have not beenused in the analysis. More than 25 parameters could becalculated by ‘‘School’’ software classified into threemain groups: morphological, energetic, and bathymetric(Table 1).
Neural network application
An artificial neural network (ANN) uses a highly inter-connected group of simulated neurons (units, elements,or nodes) that process information in parallel. Its mainconcept is to approximate functions with raw sampledata, i.e. to approximate input–output responses learn-ing from experience. A review of the current develop-ment of ANNs and their applications can be found inRumelhart et al. (1986), Kosko (1992), Hecht-Nielsen(1991), Lawrence (1993), and Ripley (1993).From the broad range of ANNs, we are involved here
with pattern classifiers that use supervised learning algo-rithms. The patterns (in our case the values of the schooldescriptors) are presented to the network, which issupposed to categorize them according to the predefinedclasses (in our case the three species IDs: anchovy,sardine, or horse mackerel). A supervisor presents sev-eral patterns together with their correct classification.After having been trained, the network should be able to
correctly classify patterns different from those usedduring the training phase. The output of the networkcan be seen as a mapping from the input vector space tothe output vector space (Ripley, 1993). Learning is takenhere as the means by which such mapping can beconstructed.In the present study we used the most common
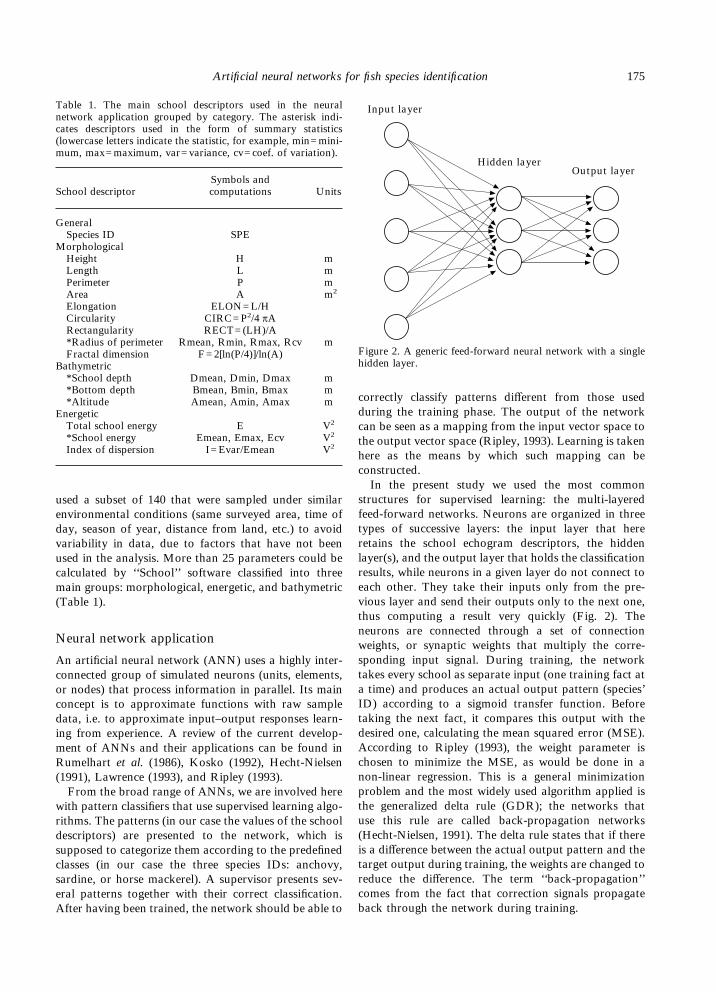
structures for supervised learning: the multi-layeredfeed-forward networks. Neurons are organized in threetypes of successive layers: the input layer that hereretains the school echogram descriptors, the hiddenlayer(s), and the output layer that holds the classificationresults, while neurons in a given layer do not connect toeach other. They take their inputs only from the pre-vious layer and send their outputs only to the next one,thus computing a result very quickly (Fig. 2). Theneurons are connected through a set of connectionweights, or synaptic weights that multiply the corre-sponding input signal. During training, the networktakes every school as separate input (one training fact ata time) and produces an actual output pattern (species’ID) according to a sigmoid transfer function. Beforetaking the next fact, it compares this output with thedesired one, calculating the mean squared error (MSE).According to Ripley (1993), the weight parameter ischosen to minimize the MSE, as would be done in anon-linear regression. This is a general minimizationproblem and the most widely used algorithm applied isthe generalized delta rule (GDR); the networks thatuse this rule are called back-propagation networks(Hecht-Nielsen, 1991). The delta rule states that if thereis a difference between the actual output pattern and thetarget output during training, the weights are changed toreduce the difference. The term ‘‘back-propagation’’comes from the fact that correction signals propagateback through the network during training.
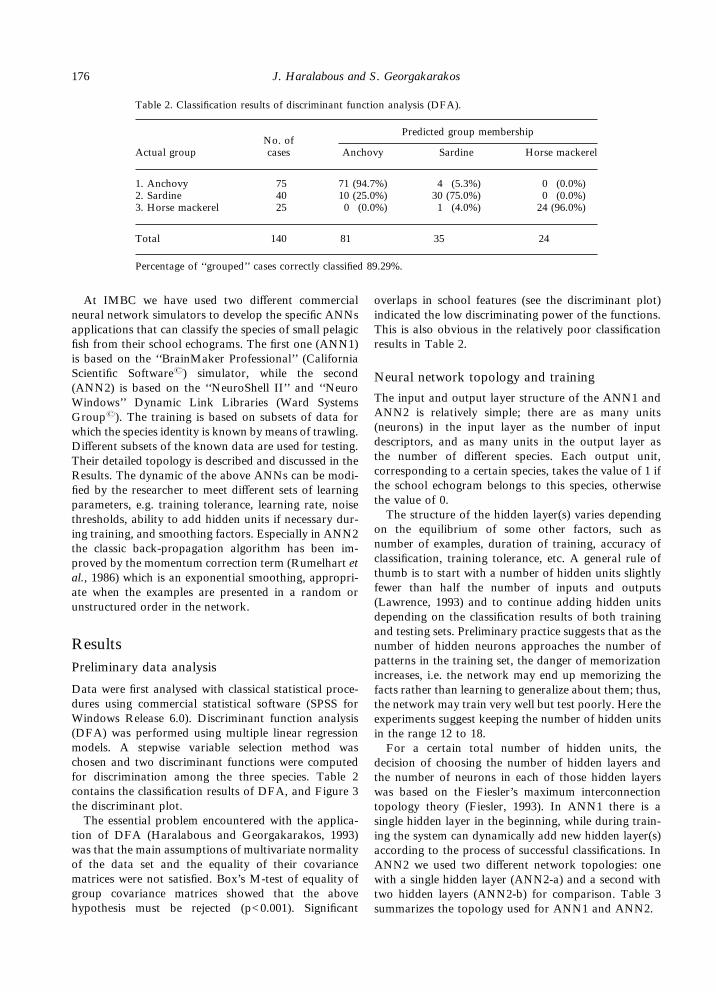
Table 1. The main school descriptors used in the neuralnetwork application grouped by category. The asterisk indi-cates descriptors used in the form of summary statistics(lowercase letters indicate the statistic, for example, min=mini-mum, max=maximum, var=variance, cv=coef. of variation).
School descriptorSymbols andcomputations Units
GeneralSpecies ID SPE
MorphologicalHeight H mLength L mPerimeter P mArea A m2
Elongation ELON=L/HCircularity CIRC=P2/4 ðARectangularity RECT=(LH)/A*Radius of perimeter Rmean, Rmin, Rmax, Rcv mFractal dimension F=2[ln(P/4)]/ln(A)
Bathymetric*School depth Dmean, Dmin, Dmax m*Bottom depth Bmean, Bmin, Bmax m*Altitude Amean, Amin, Amax m
EnergeticTotal school energy E V2
*School energy Emean, Emax, Ecv V2
Index of dispersion I=Evar/Emean V2
Input layer
Hidden layerOutput layer
Figure 2. A generic feed-forward neural network with a singlehidden layer.
175Artificial neural networks for fish species identification
At IMBC we have used two different commercialneural network simulators to develop the specific ANNsapplications that can classify the species of small pelagicfish from their school echograms. The first one (ANN1)is based on the ‘‘BrainMaker Professional’’ (CaliforniaScientific Software?) simulator, while the second(ANN2) is based on the ‘‘NeuroShell II’’ and ‘‘NeuroWindows’’ Dynamic Link Libraries (Ward SystemsGroup?). The training is based on subsets of data forwhich the species identity is known by means of trawling.Different subsets of the known data are used for testing.Their detailed topology is described and discussed in theResults. The dynamic of the above ANNs can be modi-fied by the researcher to meet different sets of learningparameters, e.g. training tolerance, learning rate, noisethresholds, ability to add hidden units if necessary dur-ing training, and smoothing factors. Especially in ANN2the classic back-propagation algorithm has been im-proved by the momentum correction term (Rumelhart etal., 1986) which is an exponential smoothing, appropri-ate when the examples are presented in a random orunstructured order in the network.
ResultsPreliminary data analysis
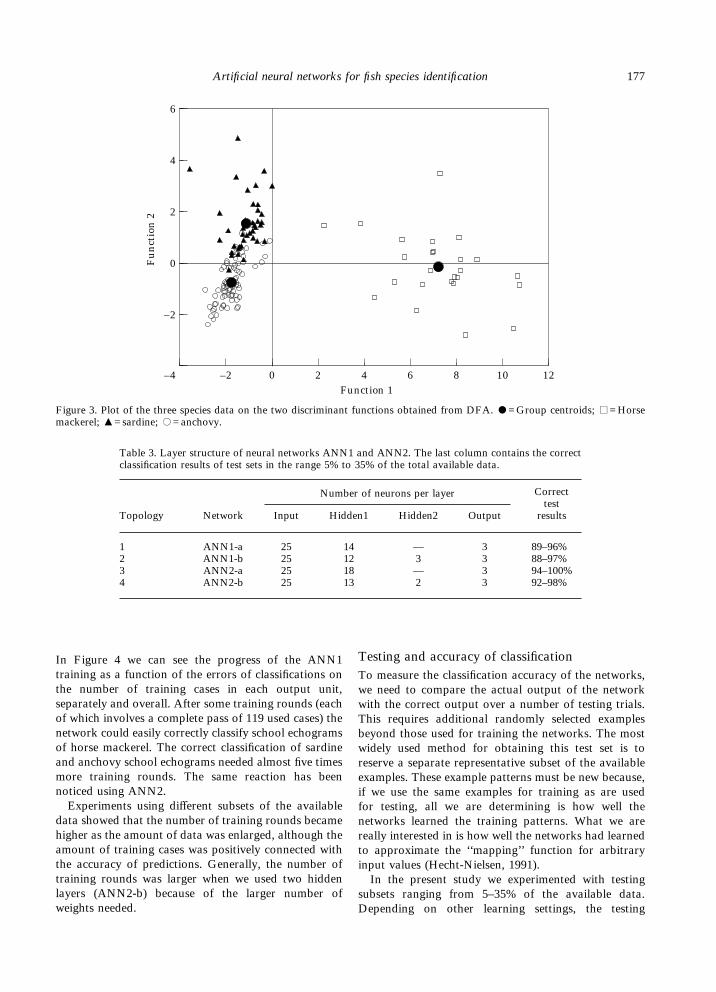
Data were first analysed with classical statistical proce-dures using commercial statistical software (SPSS forWindows Release 6.0). Discriminant function analysis(DFA) was performed using multiple linear regressionmodels. A stepwise variable selection method waschosen and two discriminant functions were computedfor discrimination among the three species. Table 2contains the classification results of DFA, and Figure 3the discriminant plot.The essential problem encountered with the applica-
tion of DFA (Haralabous and Georgakarakos, 1993)was that the main assumptions of multivariate normalityof the data set and the equality of their covariancematrices were not satisfied. Box’s M-test of equality ofgroup covariance matrices showed that the abovehypothesis must be rejected (p<0.001). Significant
overlaps in school features (see the discriminant plot)indicated the low discriminating power of the functions.This is also obvious in the relatively poor classificationresults in Table 2.
Neural network topology and training
The input and output layer structure of the ANN1 andANN2 is relatively simple; there are as many units(neurons) in the input layer as the number of inputdescriptors, and as many units in the output layer asthe number of different species. Each output unit,corresponding to a certain species, takes the value of 1 ifthe school echogram belongs to this species, otherwisethe value of 0.The structure of the hidden layer(s) varies depending
on the equilibrium of some other factors, such asnumber of examples, duration of training, accuracy ofclassification, training tolerance, etc. A general rule ofthumb is to start with a number of hidden units slightlyfewer than half the number of inputs and outputs(Lawrence, 1993) and to continue adding hidden unitsdepending on the classification results of both trainingand testing sets. Preliminary practice suggests that as thenumber of hidden neurons approaches the number ofpatterns in the training set, the danger of memorizationincreases, i.e. the network may end up memorizing thefacts rather than learning to generalize about them; thus,the network may train very well but test poorly. Here theexperiments suggest keeping the number of hidden unitsin the range 12 to 18.For a certain total number of hidden units, the
decision of choosing the number of hidden layers andthe number of neurons in each of those hidden layerswas based on the Fiesler’s maximum interconnectiontopology theory (Fiesler, 1993). In ANN1 there is asingle hidden layer in the beginning, while during train-ing the system can dynamically add new hidden layer(s)according to the process of successful classifications. InANN2 we used two different network topologies: onewith a single hidden layer (ANN2-a) and a second withtwo hidden layers (ANN2-b) for comparison. Table 3summarizes the topology used for ANN1 and ANN2.
Table 2. Classification results of discriminant function analysis (DFA).
Actual groupNo. ofcases
Predicted group membership
Anchovy Sardine Horse mackerel
1. Anchovy 75 71 (94.7%) 4 (5.3%) 0 (0.0%)2. Sardine 40 10 (25.0%) 30 (75.0%) 0 (0.0%)3. Horse mackerel 25 0 (0.0%) 1 (4.0%) 24 (96.0%)
Total 140 81 35 24
Percentage of ‘‘grouped’’ cases correctly classified 89.29%.
176 J. Haralabous and S. Georgakarakos
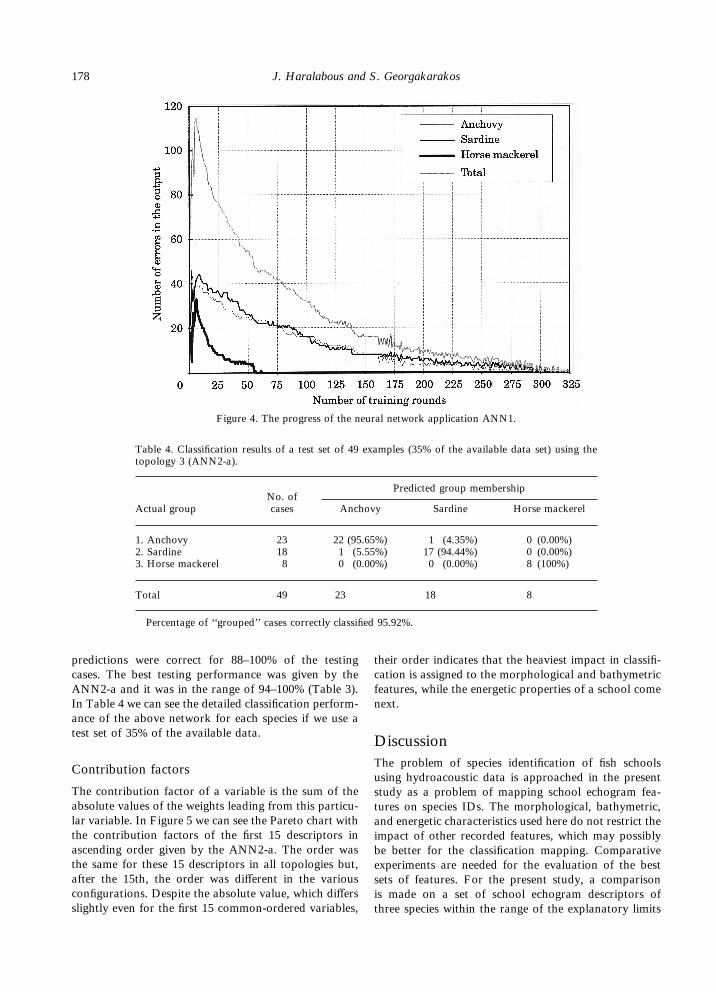
In Figure 4 we can see the progress of the ANN1training as a function of the errors of classifications onthe number of training cases in each output unit,separately and overall. After some training rounds (eachof which involves a complete pass of 119 used cases) thenetwork could easily correctly classify school echogramsof horse mackerel. The correct classification of sardineand anchovy school echograms needed almost five timesmore training rounds. The same reaction has beennoticed using ANN2.Experiments using different subsets of the available
data showed that the number of training rounds becamehigher as the amount of data was enlarged, although theamount of training cases was positively connected withthe accuracy of predictions. Generally, the number oftraining rounds was larger when we used two hiddenlayers (ANN2-b) because of the larger number ofweights needed.
Testing and accuracy of classificationTo measure the classification accuracy of the networks,we need to compare the actual output of the networkwith the correct output over a number of testing trials.This requires additional randomly selected examplesbeyond those used for training the networks. The mostwidely used method for obtaining this test set is toreserve a separate representative subset of the availableexamples. These example patterns must be new because,if we use the same examples for training as are usedfor testing, all we are determining is how well thenetworks learned the training patterns. What we arereally interested in is how well the networks had learnedto approximate the ‘‘mapping’’ function for arbitraryinput values (Hecht-Nielsen, 1991).In the present study we experimented with testing
subsets ranging from 5–35% of the available data.Depending on other learning settings, the testing
12
6
Function 1
Fu
nct
ion
2
6
4
2
0
–2
–2 0 2 4 8 10–4
Figure 3. Plot of the three species data on the two discriminant functions obtained from DFA. -=Group centroids; .=Horsemackerel; 4=sardine; ,=anchovy.
Table 3. Layer structure of neural networks ANN1 and ANN2. The last column contains the correctclassification results of test sets in the range 5% to 35% of the total available data.
Topology Network
Number of neurons per layer CorrecttestresultsInput Hidden1 Hidden2 Output
1 ANN1-a 25 14 — 3 89–96%2 ANN1-b 25 12 3 3 88–97%3 ANN2-a 25 18 — 3 94–100%4 ANN2-b 25 13 2 3 92–98%
177Artificial neural networks for fish species identification
predictions were correct for 88–100% of the testingcases. The best testing performance was given by theANN2-a and it was in the range of 94–100% (Table 3).In Table 4 we can see the detailed classification perform-ance of the above network for each species if we use atest set of 35% of the available data.
Contribution factors
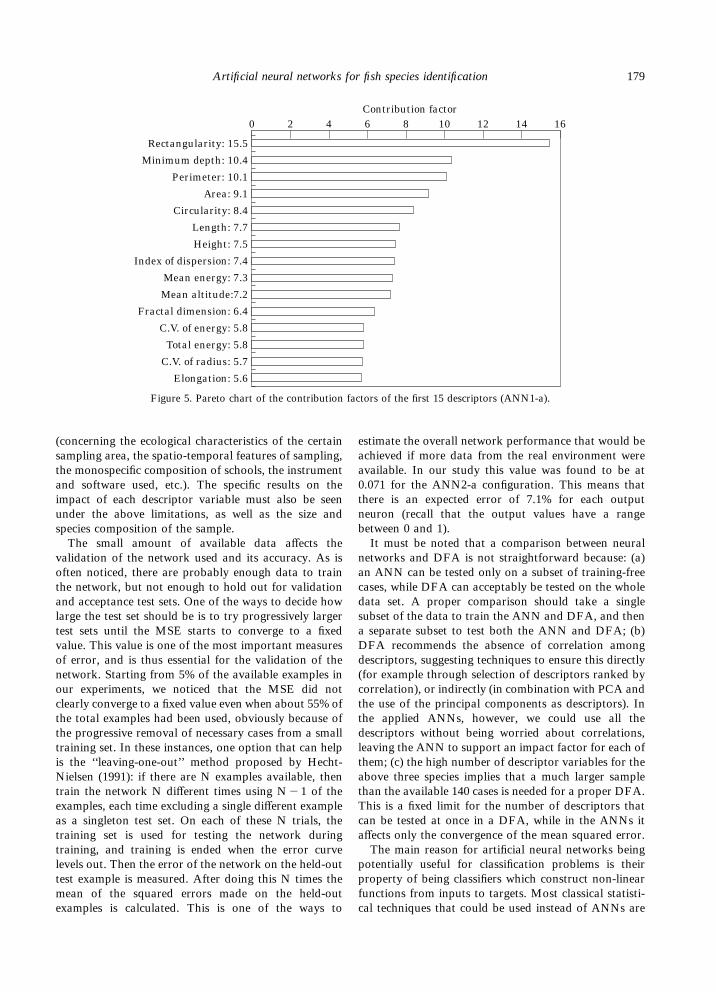
The contribution factor of a variable is the sum of theabsolute values of the weights leading from this particu-lar variable. In Figure 5 we can see the Pareto chart withthe contribution factors of the first 15 descriptors inascending order given by the ANN2-a. The order wasthe same for these 15 descriptors in all topologies but,after the 15th, the order was different in the variousconfigurations. Despite the absolute value, which differsslightly even for the first 15 common-ordered variables,
their order indicates that the heaviest impact in classifi-cation is assigned to the morphological and bathymetricfeatures, while the energetic properties of a school comenext.
DiscussionThe problem of species identification of fish schoolsusing hydroacoustic data is approached in the presentstudy as a problem of mapping school echogram fea-tures on species IDs. The morphological, bathymetric,and energetic characteristics used here do not restrict theimpact of other recorded features, which may possiblybe better for the classification mapping. Comparativeexperiments are needed for the evaluation of the bestsets of features. For the present study, a comparisonis made on a set of school echogram descriptors ofthree species within the range of the explanatory limits
Figure 4. The progress of the neural network application ANN1.
Table 4. Classification results of a test set of 49 examples (35% of the available data set) using thetopology 3 (ANN2-a).
Actual groupNo. ofcases
Predicted group membership
Anchovy Sardine Horse mackerel
1. Anchovy 23 22 (95.65%) 1 (4.35%) 0 (0.00%)2. Sardine 18 1 (5.55%) 17 (94.44%) 0 (0.00%)3. Horse mackerel 8 0 (0.00%) 0 (0.00%) 8 (100%)
Total 49 23 18 8
Percentage of ‘‘grouped’’ cases correctly classified 95.92%.
178 J. Haralabous and S. Georgakarakos
(concerning the ecological characteristics of the certainsampling area, the spatio-temporal features of sampling,the monospecific composition of schools, the instrumentand software used, etc.). The specific results on theimpact of each descriptor variable must also be seenunder the above limitations, as well as the size andspecies composition of the sample.The small amount of available data affects the
validation of the network used and its accuracy. As isoften noticed, there are probably enough data to trainthe network, but not enough to hold out for validationand acceptance test sets. One of the ways to decide howlarge the test set should be is to try progressively largertest sets until the MSE starts to converge to a fixedvalue. This value is one of the most important measuresof error, and is thus essential for the validation of thenetwork. Starting from 5% of the available examples inour experiments, we noticed that the MSE did notclearly converge to a fixed value even when about 55% ofthe total examples had been used, obviously because ofthe progressive removal of necessary cases from a smalltraining set. In these instances, one option that can helpis the ‘‘leaving-one-out’’ method proposed by Hecht-Nielsen (1991): if there are N examples available, thentrain the network N different times using N"1 of theexamples, each time excluding a single different exampleas a singleton test set. On each of these N trials, thetraining set is used for testing the network duringtraining, and training is ended when the error curvelevels out. Then the error of the network on the held-outtest example is measured. After doing this N times themean of the squared errors made on the held-outexamples is calculated. This is one of the ways to
estimate the overall network performance that would beachieved if more data from the real environment wereavailable. In our study this value was found to be at0.071 for the ANN2-a configuration. This means thatthere is an expected error of 7.1% for each outputneuron (recall that the output values have a rangebetween 0 and 1).It must be noted that a comparison between neural
networks and DFA is not straightforward because: (a)an ANN can be tested only on a subset of training-freecases, while DFA can acceptably be tested on the wholedata set. A proper comparison should take a singlesubset of the data to train the ANN and DFA, and thena separate subset to test both the ANN and DFA; (b)DFA recommends the absence of correlation amongdescriptors, suggesting techniques to ensure this directly(for example through selection of descriptors ranked bycorrelation), or indirectly (in combination with PCA andthe use of the principal components as descriptors). Inthe applied ANNs, however, we could use all thedescriptors without being worried about correlations,leaving the ANN to support an impact factor for each ofthem; (c) the high number of descriptor variables for theabove three species implies that a much larger samplethan the available 140 cases is needed for a proper DFA.This is a fixed limit for the number of descriptors thatcan be tested at once in a DFA, while in the ANNs itaffects only the convergence of the mean squared error.The main reason for artificial neural networks being
potentially useful for classification problems is theirproperty of being classifiers which construct non-linearfunctions from inputs to targets. Most classical statisti-cal techniques that could be used instead of ANNs are
16
Rectangularity: 15.5
Contribution factor
Total energy: 5.8
C.V. of radius: 5.7
Elongation: 5.6
2 4 6 80
C.V. of energy: 5.8
10 12 14
Fractal dimension: 6.4
Mean altitude:7.2
Mean energy: 7.3
Index of dispersion: 7.4
Height: 7.5
Length: 7.7
Circularity: 8.4
Area: 9.1
Perimeter: 10.1
Minimum depth: 10.4
Figure 5. Pareto chart of the contribution factors of the first 15 descriptors (ANN1-a).
179Artificial neural networks for fish species identification
severely constrained if linear regression models have tobe used. During the 1980s, the proliferation of computerpower removed the constraints of linearity and anumber of non-linear approaches have been developedfor regression and discrimination, often referred to assemi-parametric methods. According to Ripley (1993)‘‘both feed-forward neural networks and semi-parametric statistics are ‘black-box’ approaches; theyprovide a prediction for any input, but no readilyinterpretable explanation for that prediction. As suchthey lose some of the power of linear statistical modelsin statistical inference’’. However, many approachesare now being combined to explain the basis for thepredictions made by neural networks.
Acknowledgements
This study was partially financed by the Commissionof the European Union within the framework ofthe project ‘‘Biomass’’. The authors thank their partnersfor the excellent collaboration, especially E. J.Simmonds for encouragment throughout the ANNimplementation.
ReferencesDiner, N., Weill, A., Coail, J. Y., and Coudevill, J. M. 1989.‘‘Ines-movies’’: a new acoustic data acquisition andprocessing system. ICES CM 1989/B: 45.
Fiesler, E. 1993. Connectivity maximisation of layered neuralnetworks for supervised learning. In Proceedings of theInternational Conference on Artificial Neural Networks.Ed. by S. Gielen and B. Kappen. Springer-Verlag, London.514 pp.
Gerlotto, F. and Fréon, P. 1988. School structure observed insome clupeid species. ICES/FAST Work Group, Ostend,Belgium, 19–22 April 1988.
Georgakarakos, S. and Paterakis, G. 1993. ‘‘School’’: Asoftware for fish-school identification. ICES CM 1993/B: 8.
Haralabous, J. and Georgakarakos, S. 1993. Fish-schoolspecies identification using a neural network. ICES CM1993/B: 9.
Hecht-Nielsen, R. 1991. Neurocomputing. Addison-WesleyPublishing Company, USA. 433 pp.
Kosko, B. 1992. Neural networks for signal processing.Prentice-Hall, New Jersey. 399 pp.
Lawrence, J. 1993. Introduction to neural networks. Design,theory and applications. California Scientific Software,Nevada City. 324 pp.
MacLennan, D. N. and Simmonds, E. J. 1992. Fisheriesacoustics. Chapman and Hall, London. 325 pp.
Ripley, B. D. 1993. Statistical aspects of neural networks. InChaos and networks – statistical and probabilistic aspects,pp. 40–123. Ed. by O. E. Barndoff-Nielsen, D. R. Cox, J. L.Jensen, and W. S. Kendall. Chapman and Hall, London.
Rumelhart, D. E., McClelland, J. L., and the PDP ResearchGroup 1986. Parallel distributed processing: explorations inthe microstructure of cognition. MIT Press, Cambridge,Massachusetts.
Scalabrin, C., Weill, A., and Diner, N. 1992. The structure ofmultidimensional data from acoustic detection of fishschools. In European Conference on Underwater Acoustics,pp. 141–146. Ed. by M. Weydert. Elsevier Applied Science,London.
180 J. Haralabous and S. Georgakarakos


