Embed Size (px)
Citation preview
Asia Pac Campos Survey Results February 2012
1
Methodology From January 4 to 17, 2012, we conducted a Web-based survey using a
panel of IT decision-makers from the Pacific Rim. 302 panel participants were selected from:
• Large companies with at least US$500M annual revenues or 500+ employees (2,000+ employees for Singapore).
• Three locations: Sydney, Australia (N=101), Hong Kong SAR (N=101) and Singapore (N=100).
Participants must be IT/MIS/IS, Finance, or Real Estate Executives or Management.
• Participants must be responsible for managing a data centre, contract execution for or implementing a new data centre or expanding existing data centres. Internal data centre customers are also eligible.
All reported differences are significant at the .10 level or better. Confidence intervals are shown in the Appendix.
2
Overall Summary Data Centre Profile Most (74%) of the companies have 3 or fewer data centres, but one in
ten (10%) has 6 or more. Nearly two thirds (64%) of companies have built a new data centre in
the past 24 months. Nearly two thirds (64%) of participants report average raised floor space
of more than 10,000 square feet. • The largest companies (US$20B+) tend to report larger data centres: 24%
have 25,000+ square feet. The average power capacity is 5.0 kW per rack and over two thirds
(68%) use 6 kW or less per rack. Over two thirds (70%) meter power use. The average reported PUE is
2.52.
3
Overall Summary Expansion Plans Three in four (76%) say they plan to expand their data centres in 2012.
• One in five (20%) say they definitely plan to expand in 2012 and another 56% say they will probably expand.
• One in five (21%) say they will definitely expand in 2013. • One in six (17%) are unlikely to expand in either 2012 or 2013.
Larger companies (US$20B+) are more likely to definitely expand (41%) in 2012.
Among those with any plans to expand (definitely or probably in 2012): • Half (48%) say they plan to expand in more than one location. • Security is the most important reason for expansion.
4
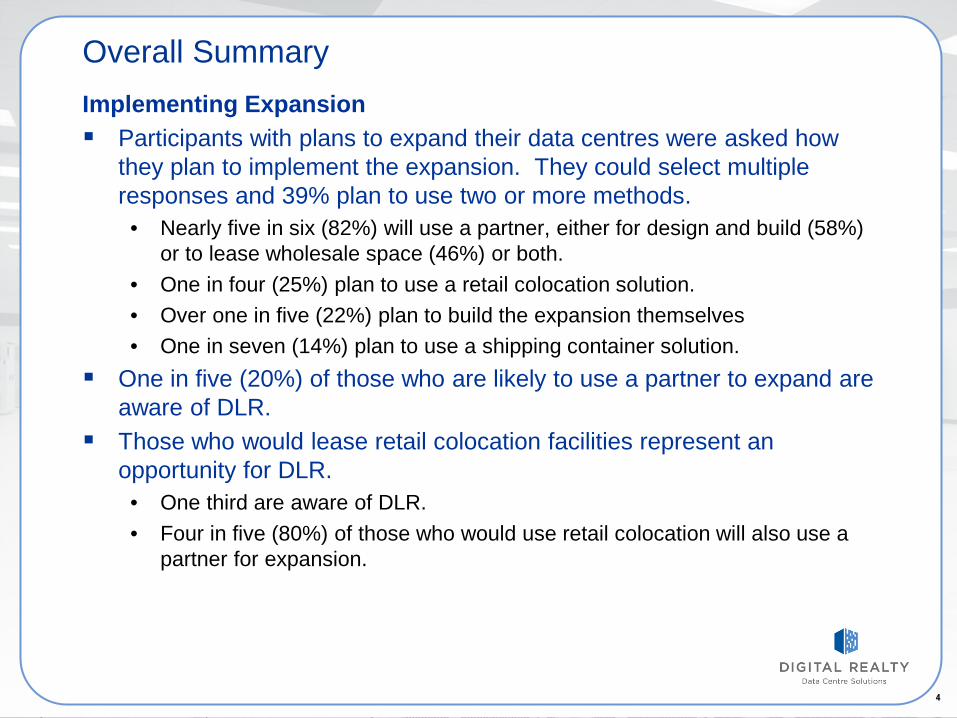
Overall Summary Implementing Expansion Participants with plans to expand their data centres were asked how
they plan to implement the expansion. They could select multiple responses and 39% plan to use two or more methods.
• Nearly five in six (82%) will use a partner, either for design and build (58%) or to lease wholesale space (46%) or both.
• One in four (25%) plan to use a retail colocation solution. • Over one in five (22%) plan to build the expansion themselves • One in seven (14%) plan to use a shipping container solution.
One in five (20%) of those who are likely to use a partner to expand are aware of DLR.
Those who would lease retail colocation facilities represent an opportunity for DLR.
• One third are aware of DLR. • Four in five (80%) of those who would use retail colocation will also use a
partner for expansion.
5
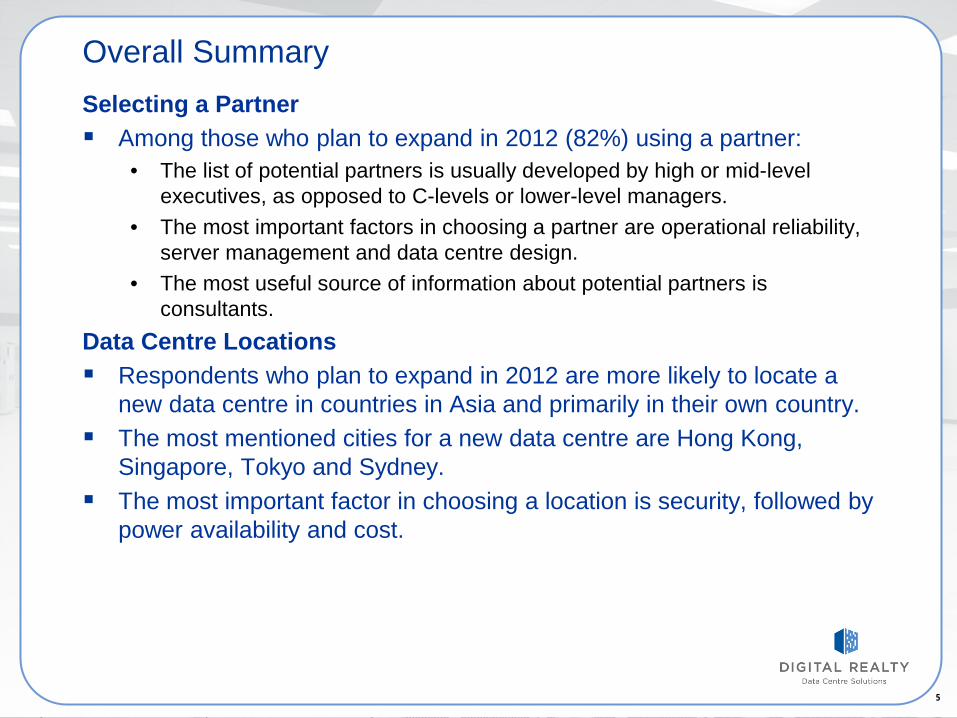
Overall Summary Selecting a Partner Among those who plan to expand in 2012 (82%) using a partner:
• The list of potential partners is usually developed by high or mid-level executives, as opposed to C-levels or lower-level managers.
• The most important factors in choosing a partner are operational reliability, server management and data centre design.
• The most useful source of information about potential partners is consultants.
Data Centre Locations Respondents who plan to expand in 2012 are more likely to locate a
new data centre in countries in Asia and primarily in their own country. The most mentioned cities for a new data centre are Hong Kong,
Singapore, Tokyo and Sydney. The most important factor in choosing a location is security, followed by
power availability and cost.
6 6
DATA CENTER PROFILE Asia Pacific Campos Survey 2012
7
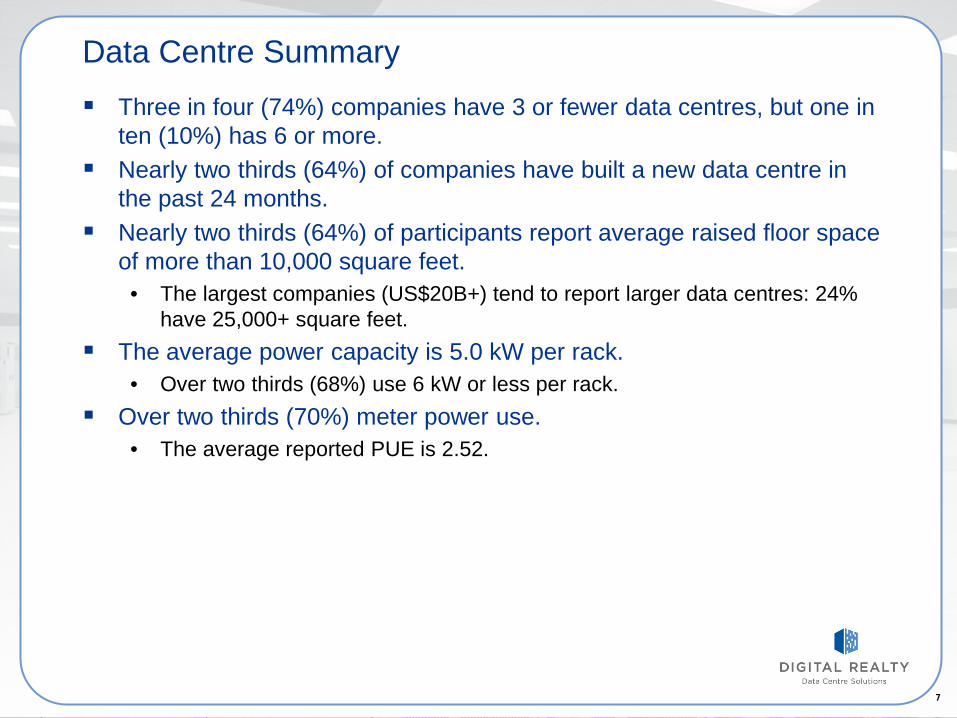
Data Centre Summary Three in four (74%) companies have 3 or fewer data centres, but one in
ten (10%) has 6 or more. Nearly two thirds (64%) of companies have built a new data centre in
the past 24 months. Nearly two thirds (64%) of participants report average raised floor space
of more than 10,000 square feet. • The largest companies (US$20B+) tend to report larger data centres: 24%
have 25,000+ square feet. The average power capacity is 5.0 kW per rack.
• Over two thirds (68%) use 6 kW or less per rack. Over two thirds (70%) meter power use.
• The average reported PUE is 2.52.
8 8
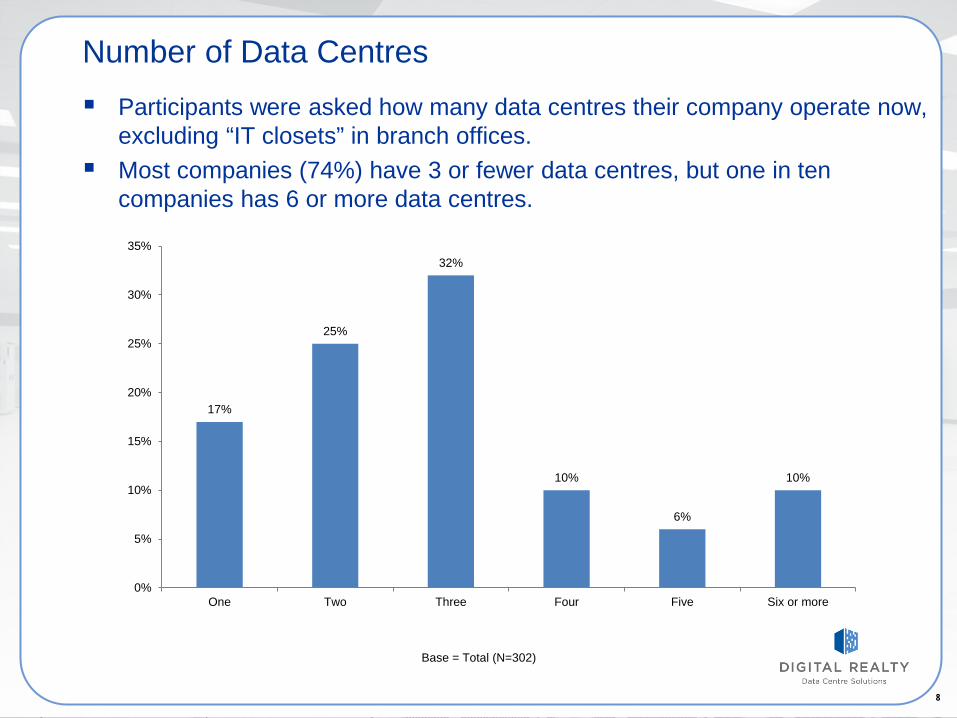
Number of Data Centres Participants were asked how many data centres their company operate now,
excluding “IT closets” in branch offices. Most companies (74%) have 3 or fewer data centres, but one in ten
companies has 6 or more data centres.
17%
25%
32%
10%
6%
10%
0%
5%
10%
15%
20%
25%
30%
35%
One Two Three Four Five Six or more
Base = Total (N=302)
9 9
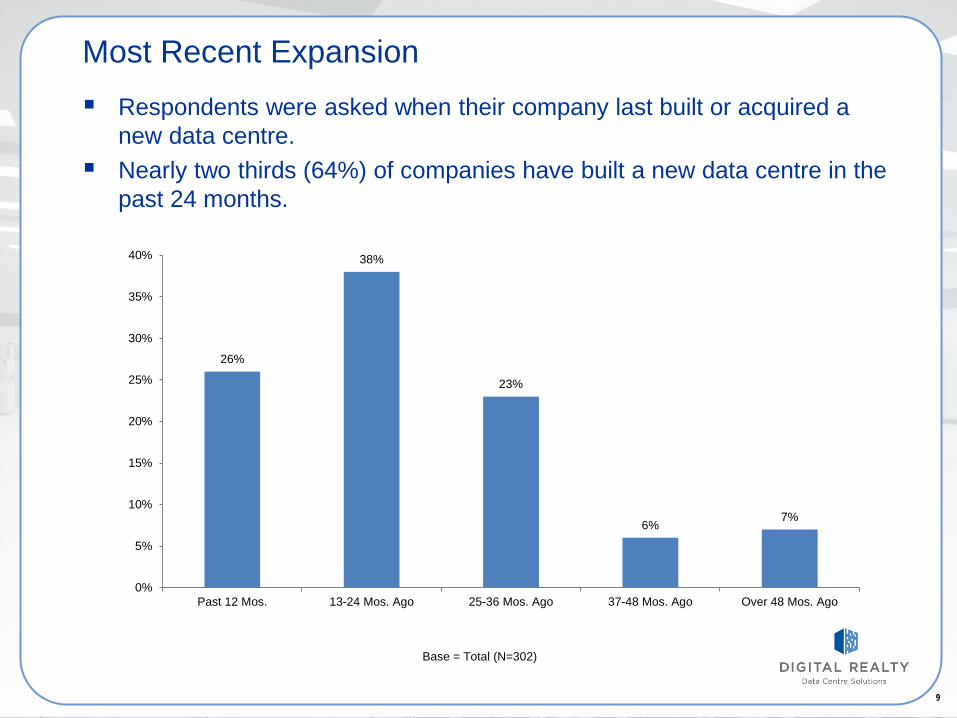
Most Recent Expansion Respondents were asked when their company last built or acquired a
new data centre. Nearly two thirds (64%) of companies have built a new data centre in the
past 24 months.
26%
38%
23%
6% 7%
0%
5%
10%
15%
20%
25%
30%
35%
40%
Past 12 Mos. 13-24 Mos. Ago 25-36 Mos. Ago 37-48 Mos. Ago Over 48 Mos. Ago
Base = Total (N=302)
10 10
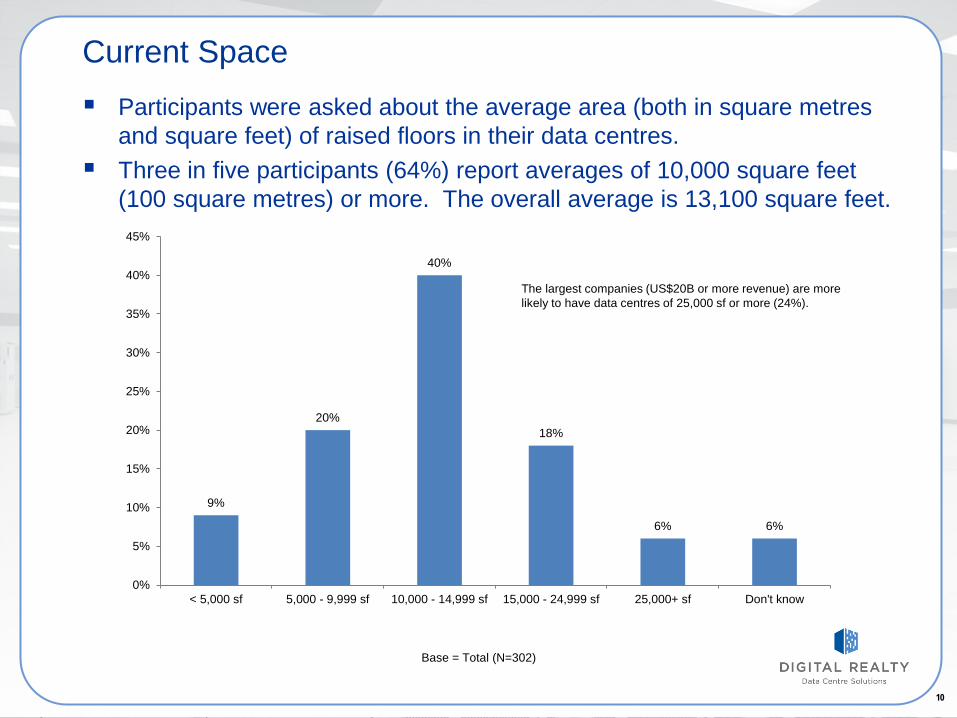
Current Space Participants were asked about the average area (both in square metres
and square feet) of raised floors in their data centres. Three in five participants (64%) report averages of 10,000 square feet
(100 square metres) or more. The overall average is 13,100 square feet.
9%
20%
40%
18%
6% 6%
0%
5%
10%
15%
20%
25%
30%
35%
40%
45%
< 5,000 sf 5,000 - 9,999 sf 10,000 - 14,999 sf 15,000 - 24,999 sf 25,000+ sf Don't know
The largest companies (US$20B or more revenue) are more likely to have data centres of 25,000 sf or more (24%).
Base = Total (N=302)
11 11
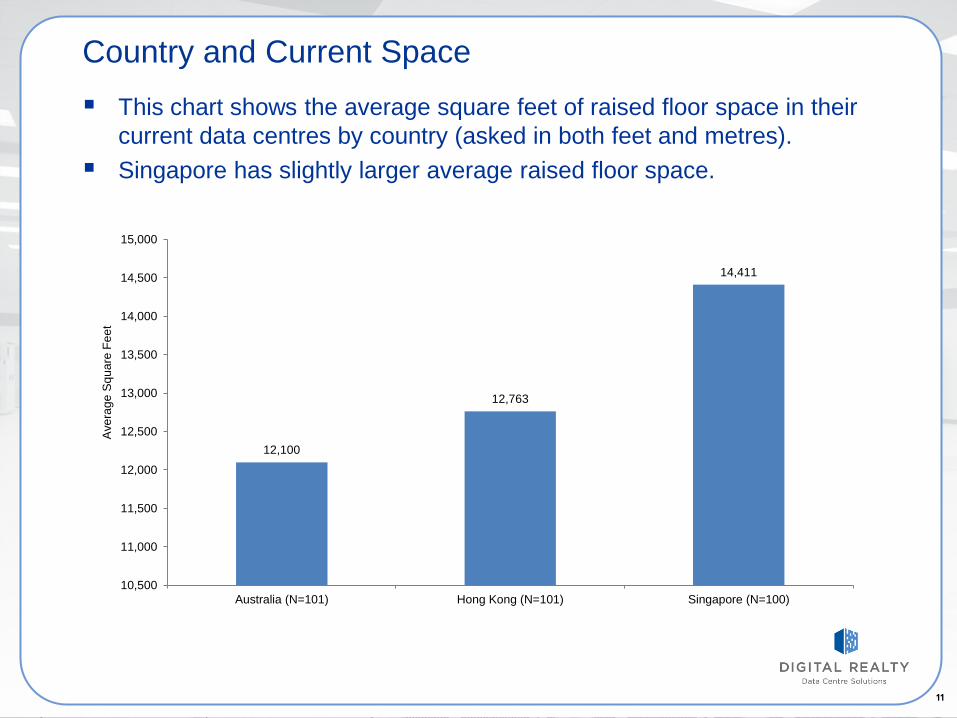
Country and Current Space This chart shows the average square feet of raised floor space in their
current data centres by country (asked in both feet and metres). Singapore has slightly larger average raised floor space.
12,100
12,763
14,411
10,500
11,000
11,500
12,000
12,500
13,000
13,500
14,000
14,500
15,000
Australia (N=101) Hong Kong (N=101) Singapore (N=100)
Ave
rage
Squ
are
Feet
12 12
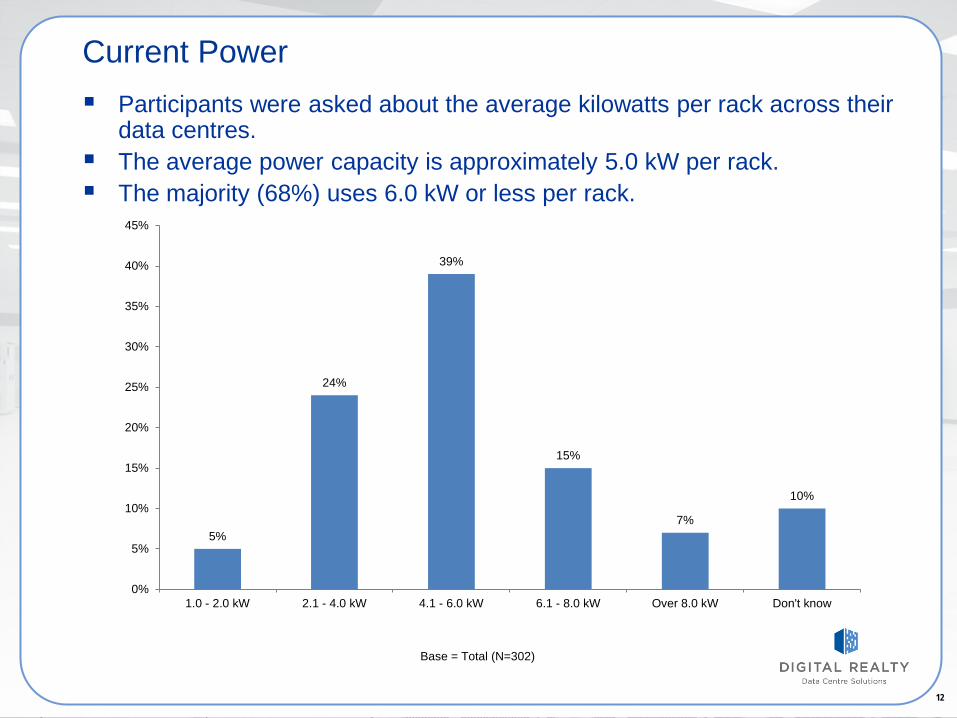
Current Power Participants were asked about the average kilowatts per rack across their
data centres. The average power capacity is approximately 5.0 kW per rack. The majority (68%) uses 6.0 kW or less per rack.
5%
24%
39%
15%
7%
10%
0%
5%
10%
15%
20%
25%
30%
35%
40%
45%
1.0 - 2.0 kW 2.1 - 4.0 kW 4.1 - 6.0 kW 6.1 - 8.0 kW Over 8.0 kW Don't know
Base = Total (N=302)
13 13
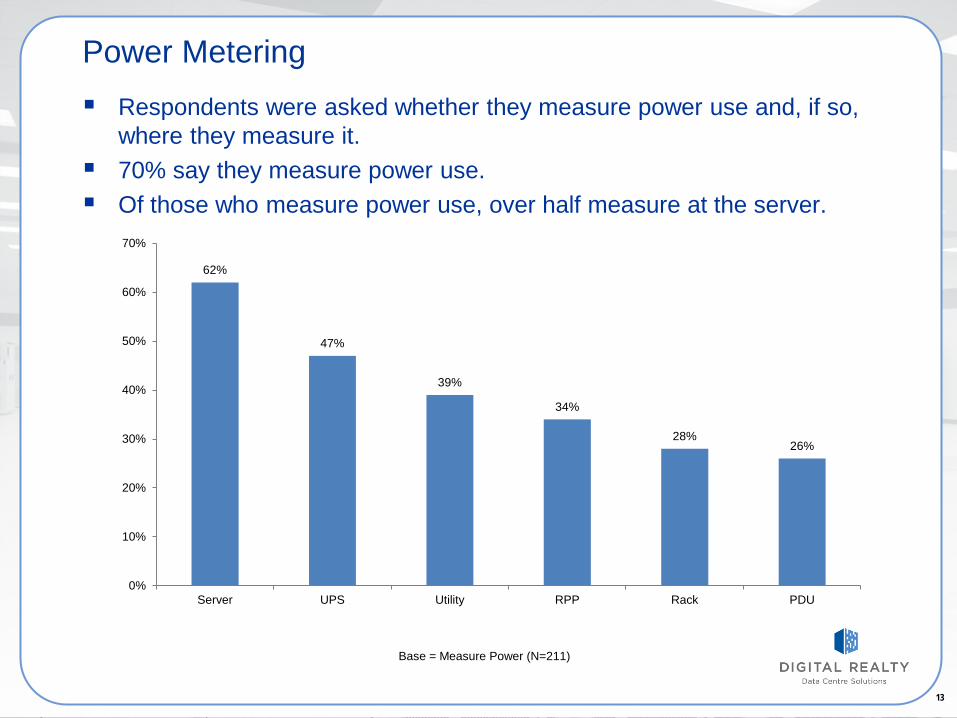
Power Metering Respondents were asked whether they measure power use and, if so,
where they measure it. 70% say they measure power use. Of those who measure power use, over half measure at the server.
62%
47%
39%
34%
28% 26%
0%
10%
20%
30%
40%
50%
60%
70%
Server UPS Utility RPP Rack PDU
Base = Measure Power (N=211)
14 14
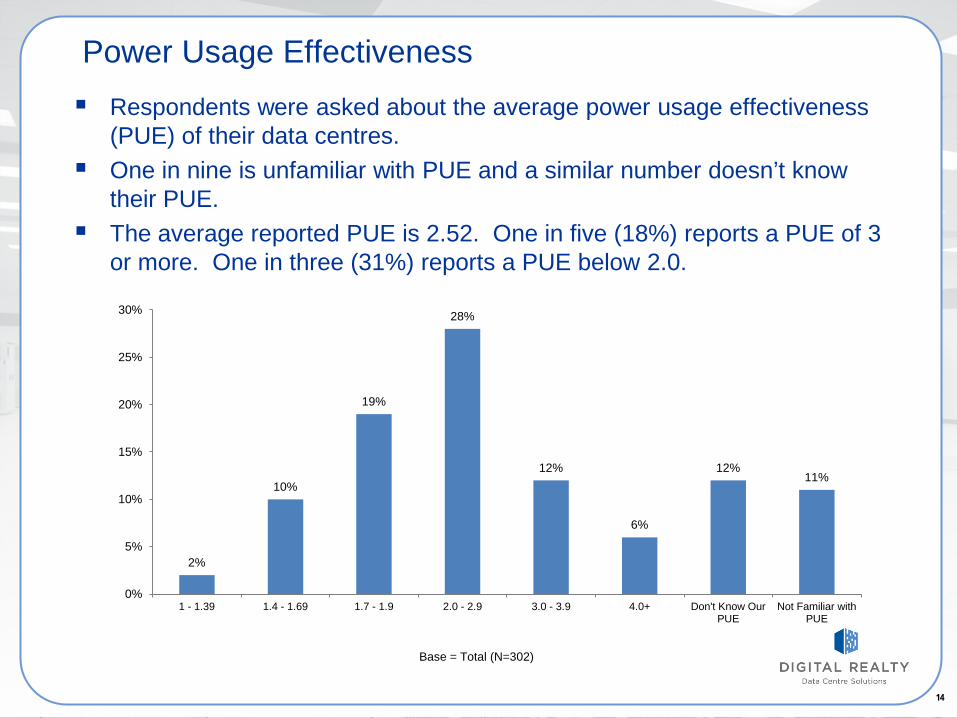
Power Usage Effectiveness Respondents were asked about the average power usage effectiveness
(PUE) of their data centres. One in nine is unfamiliar with PUE and a similar number doesn’t know
their PUE. The average reported PUE is 2.52. One in five (18%) reports a PUE of 3
or more. One in three (31%) reports a PUE below 2.0.
2%
10%
19%
28%
12%
6%
12% 11%
0%
5%
10%
15%
20%
25%
30%
1 - 1.39 1.4 - 1.69 1.7 - 1.9 2.0 - 2.9 3.0 - 3.9 4.0+ Don't Know OurPUE
Not Familiar withPUE
Base = Total (N=302)
15 15
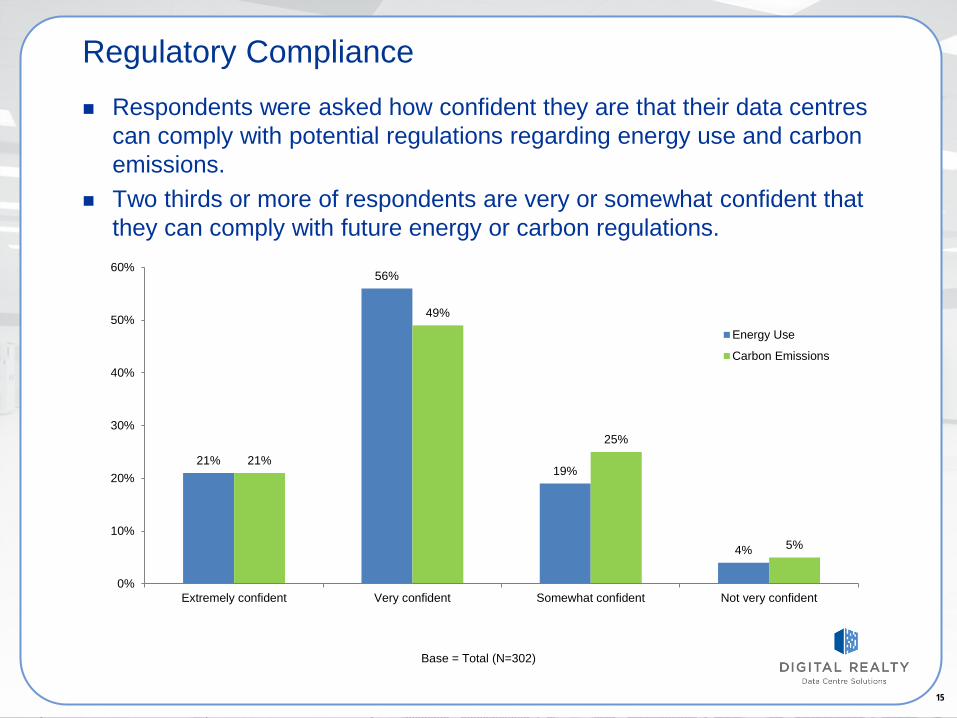
Regulatory Compliance
21%
56%
19%
4%
21%
49%
25%
5%
0%
10%
20%
30%
40%
50%
60%
Extremely confident Very confident Somewhat confident Not very confident
Energy Use
Carbon Emissions
Respondents were asked how confident they are that their data centres can comply with potential regulations regarding energy use and carbon emissions.
Two thirds or more of respondents are very or somewhat confident that they can comply with future energy or carbon regulations.
Base = Total (N=302)
16 16
EXPANSION PLANS Asia Pacific Campos Survey 2012
17
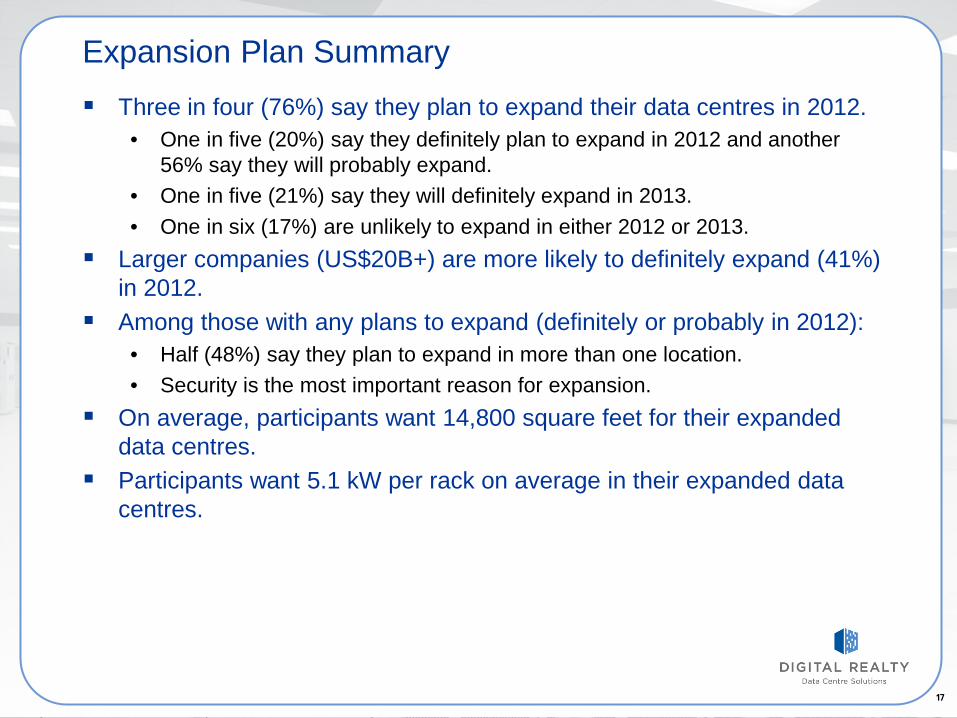
Expansion Plan Summary Three in four (76%) say they plan to expand their data centres in 2012.
• One in five (20%) say they definitely plan to expand in 2012 and another 56% say they will probably expand.
• One in five (21%) say they will definitely expand in 2013. • One in six (17%) are unlikely to expand in either 2012 or 2013.
Larger companies (US$20B+) are more likely to definitely expand (41%) in 2012.
Among those with any plans to expand (definitely or probably in 2012): • Half (48%) say they plan to expand in more than one location. • Security is the most important reason for expansion.
On average, participants want 14,800 square feet for their expanded data centres.
Participants want 5.1 kW per rack on average in their expanded data centres.
18 18
Definitely, 20%
Probably, 56%
Probably Not, 22%
Definitely Not, 2%
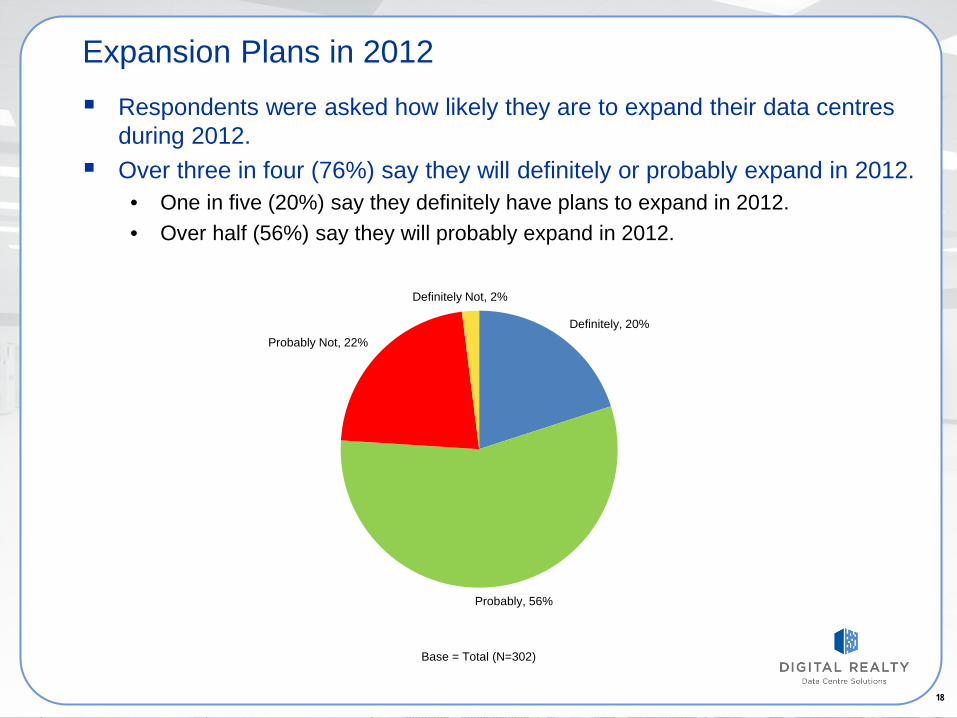
Expansion Plans in 2012 Respondents were asked how likely they are to expand their data centres
during 2012. Over three in four (76%) say they will definitely or probably expand in 2012.
• One in five (20%) say they definitely have plans to expand in 2012. • Over half (56%) say they will probably expand in 2012.
Base = Total (N=302)
19 19
Definitely 21%
Probably 54%
Probably Not 23%
Definitely Not 2%
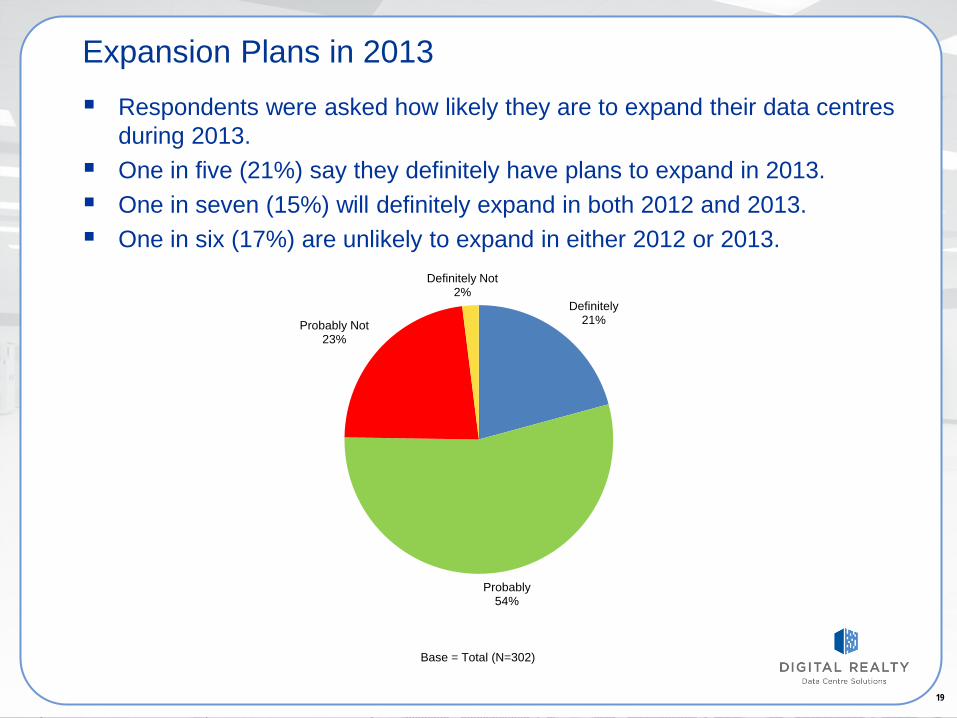
Expansion Plans in 2013 Respondents were asked how likely they are to expand their data centres
during 2013. One in five (21%) say they definitely have plans to expand in 2013. One in seven (15%) will definitely expand in both 2012 and 2013. One in six (17%) are unlikely to expand in either 2012 or 2013.
Base = Total (N=302)
20 20
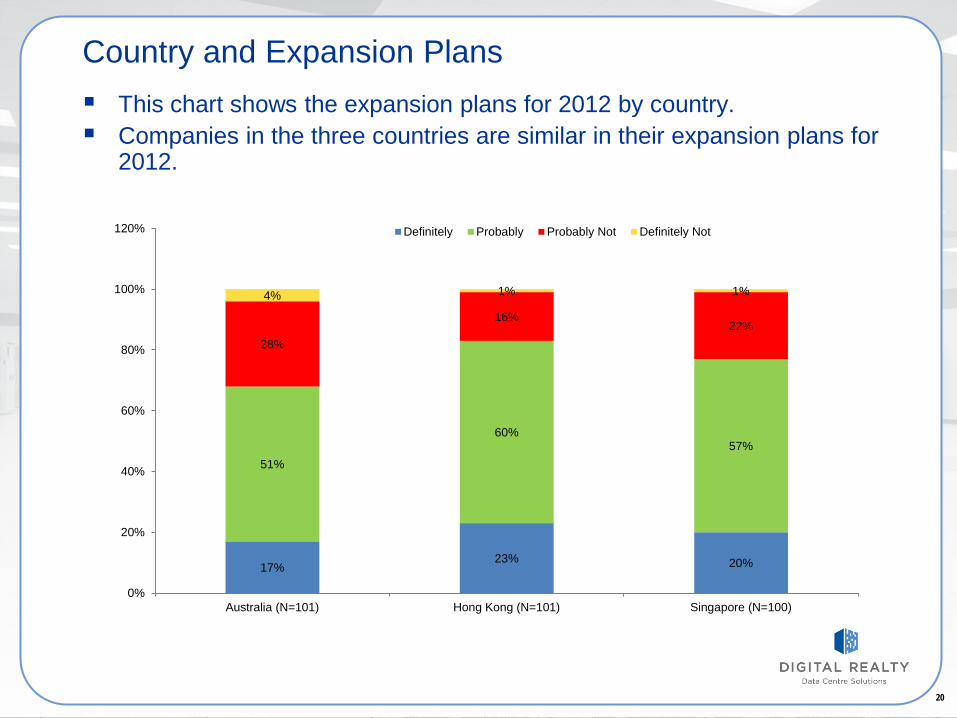
Country and Expansion Plans This chart shows the expansion plans for 2012 by country. Companies in the three countries are similar in their expansion plans for
2012.
17% 23% 20%
51%
60% 57%
28%
16% 22%
4% 1% 1%
0%
20%
40%
60%
80%
100%
120%
Australia (N=101) Hong Kong (N=101) Singapore (N=100)
Definitely Probably Probably Not Definitely Not
21 21
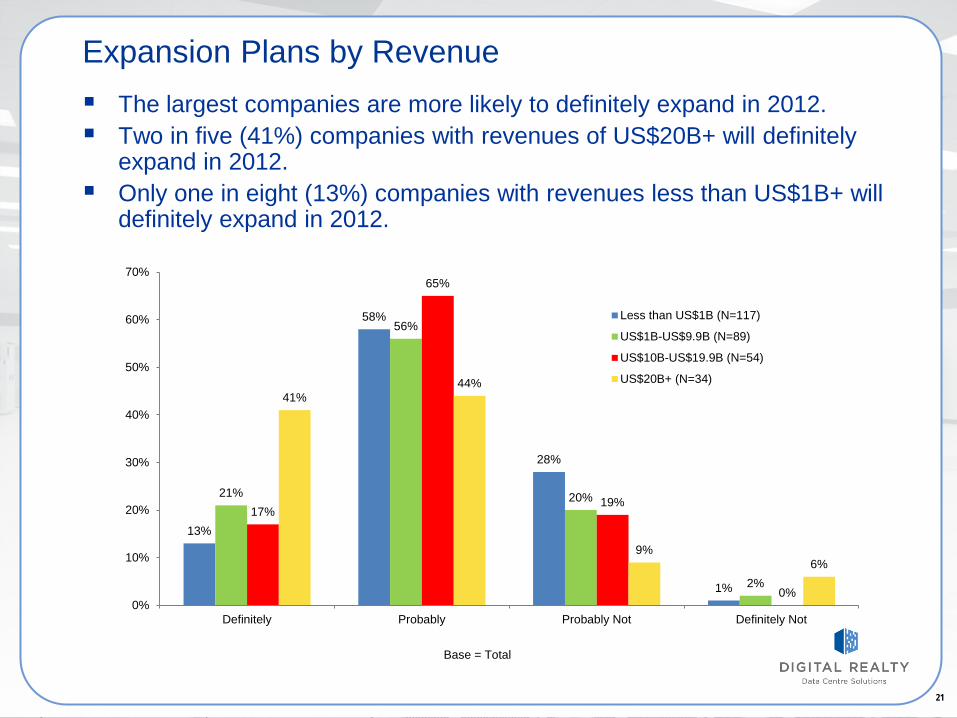
Expansion Plans by Revenue The largest companies are more likely to definitely expand in 2012. Two in five (41%) companies with revenues of US$20B+ will definitely
expand in 2012. Only one in eight (13%) companies with revenues less than US$1B+ will
definitely expand in 2012.
13%
58%
28%
1%
21%
56%
20%
2%
17%
65%
19%
0%
41% 44%
9% 6%
0%
10%
20%
30%
40%
50%
60%
70%
Definitely Probably Probably Not Definitely Not
Less than US$1B (N=117)
US$1B-US$9.9B (N=89)
US$10B-US$19.9B (N=54)
US$20B+ (N=34)
Base = Total
22 22
One, 40%
Two, 34%
Three, 11%
Four or more, 3%
No decision, 12%
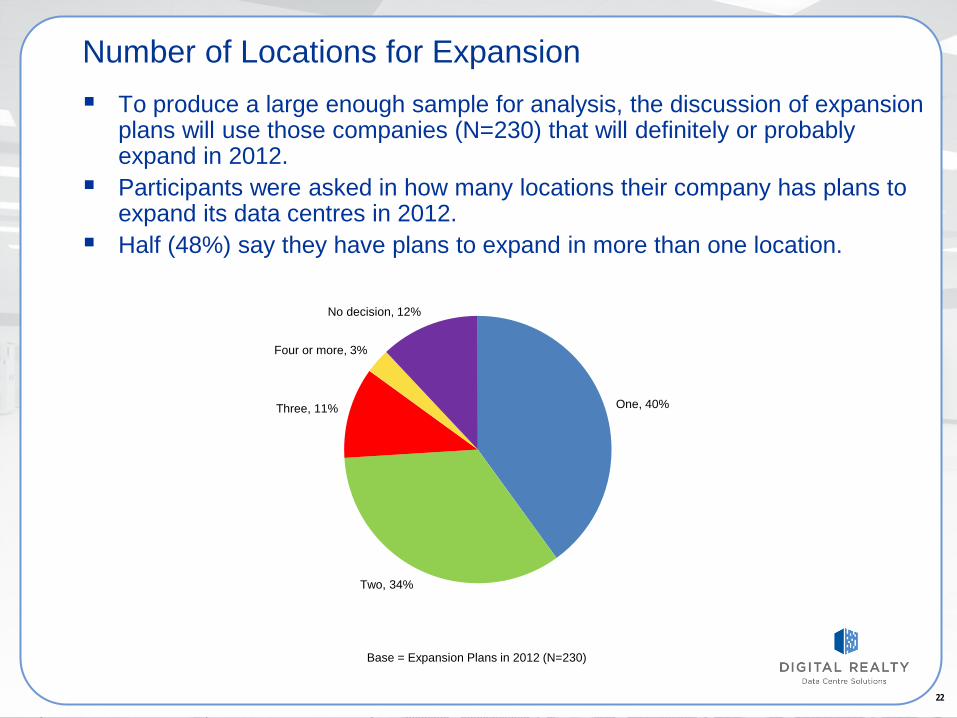
Number of Locations for Expansion To produce a large enough sample for analysis, the discussion of expansion
plans will use those companies (N=230) that will definitely or probably expand in 2012.
Participants were asked in how many locations their company has plans to expand its data centres in 2012.
Half (48%) say they have plans to expand in more than one location.
Base = Expansion Plans in 2012 (N=230)
23 23
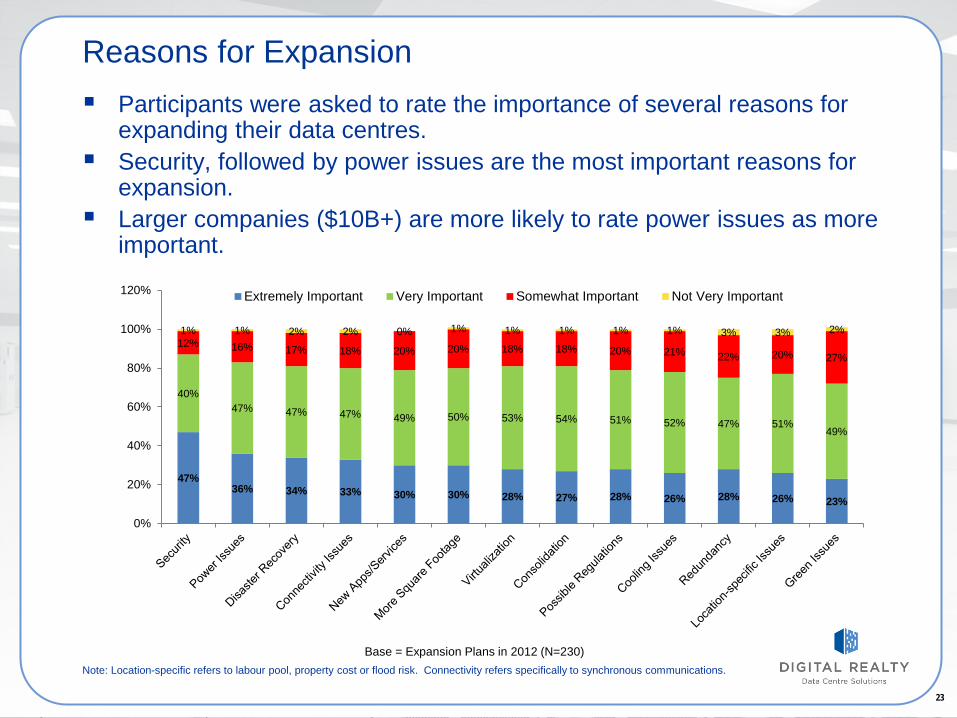
Reasons for Expansion Participants were asked to rate the importance of several reasons for
expanding their data centres. Security, followed by power issues are the most important reasons for
expansion. Larger companies ($10B+) are more likely to rate power issues as more
important.
47% 36% 34% 33% 30% 30% 28% 27% 28% 26% 28% 26% 23%
40% 47% 47% 47% 49% 50% 53% 54% 51% 52% 47% 51%
49%
12% 16% 17% 18% 20% 20% 18% 18% 20% 21% 22% 20% 27%
1% 1% 2% 2% 0% 1% 1% 1% 1% 1% 3% 3% 2%
0%
20%
40%
60%
80%
100%
120% Extremely Important Very Important Somewhat Important Not Very Important
Base = Expansion Plans in 2012 (N=230) Note: Location-specific refers to labour pool, property cost or flood risk. Connectivity refers specifically to synchronous communications.
24 24
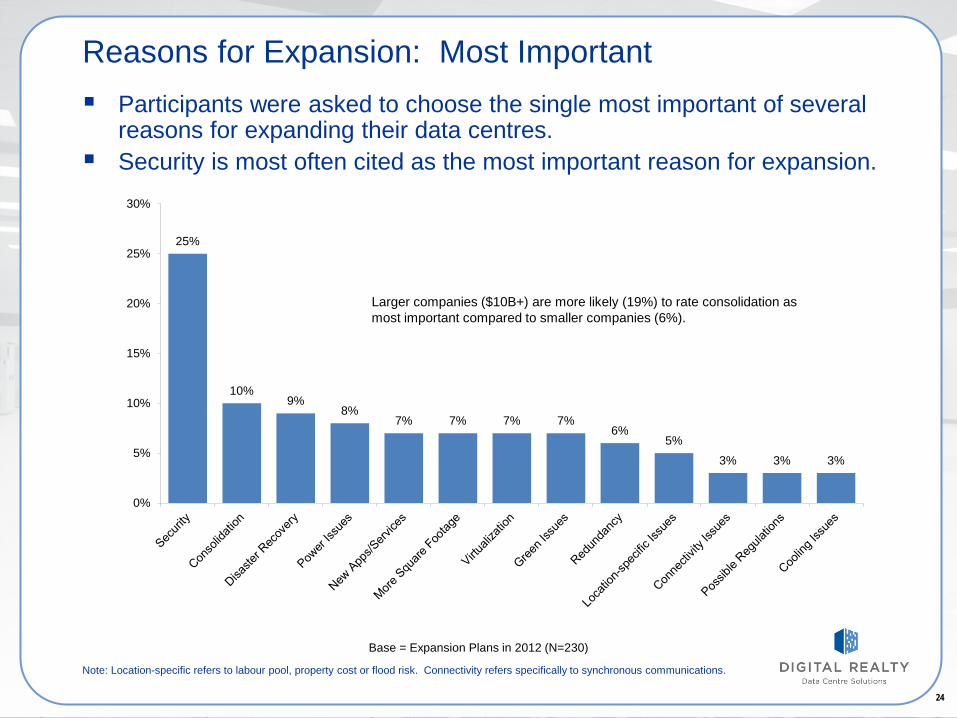
Reasons for Expansion: Most Important Participants were asked to choose the single most important of several
reasons for expanding their data centres. Security is most often cited as the most important reason for expansion.
25%
10% 9%
8% 7% 7% 7% 7%
6% 5%
3% 3% 3%
0%
5%
10%
15%
20%
25%
30%
Larger companies ($10B+) are more likely (19%) to rate consolidation as most important compared to smaller companies (6%).
Base = Expansion Plans in 2012 (N=230)
Note: Location-specific refers to labour pool, property cost or flood risk. Connectivity refers specifically to synchronous communications.
25 25
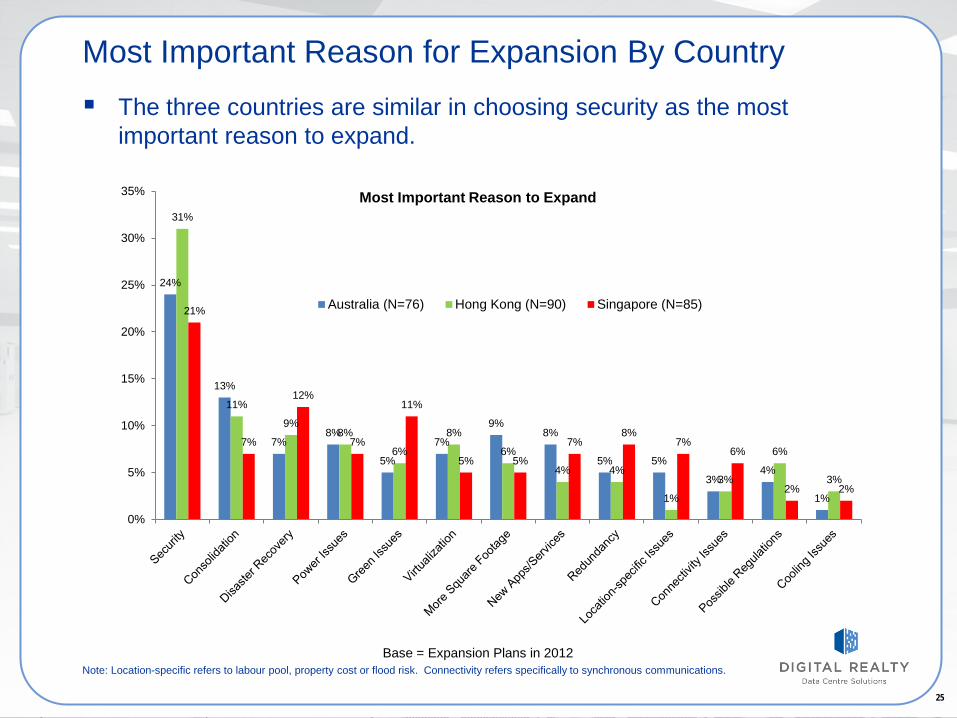
Most Important Reason for Expansion By Country The three countries are similar in choosing security as the most
important reason to expand.
24%
13%
7% 8%
5%
7%
9% 8%
5% 5%
3% 4%
1%
31%
11%
9% 8%
6%
8%
6%
4% 4%
1%
3%
6%
3%
21%
7%
12%
7%
11%
5% 5%
7% 8%
7% 6%
2% 2%
0%
5%
10%
15%
20%
25%
30%
35%
Australia (N=76) Hong Kong (N=90) Singapore (N=85)
Base = Expansion Plans in 2012 Note: Location-specific refers to labour pool, property cost or flood risk. Connectivity refers specifically to synchronous communications.
Most Important Reason to Expand
26 26
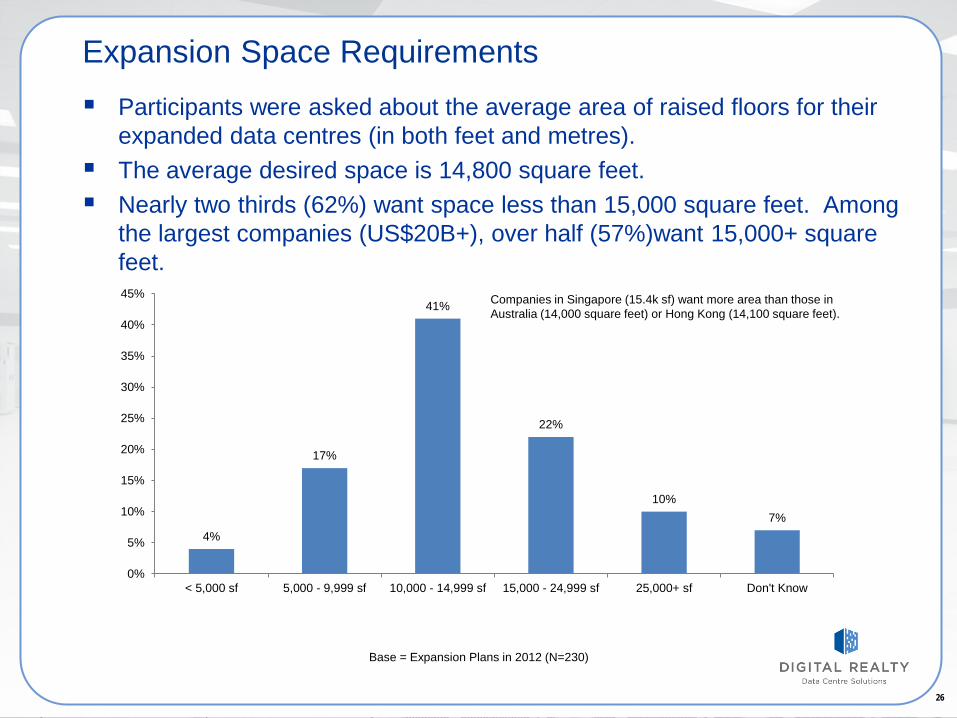
Expansion Space Requirements Participants were asked about the average area of raised floors for their
expanded data centres (in both feet and metres). The average desired space is 14,800 square feet. Nearly two thirds (62%) want space less than 15,000 square feet. Among
the largest companies (US$20B+), over half (57%)want 15,000+ square feet.
4%
17%
41%
22%
10% 7%
0%
5%
10%
15%
20%
25%
30%
35%
40%
45%
< 5,000 sf 5,000 - 9,999 sf 10,000 - 14,999 sf 15,000 - 24,999 sf 25,000+ sf Don't Know
Companies in Singapore (15.4k sf) want more area than those in Australia (14,000 square feet) or Hong Kong (14,100 square feet).
Base = Expansion Plans in 2012 (N=230)
27 27
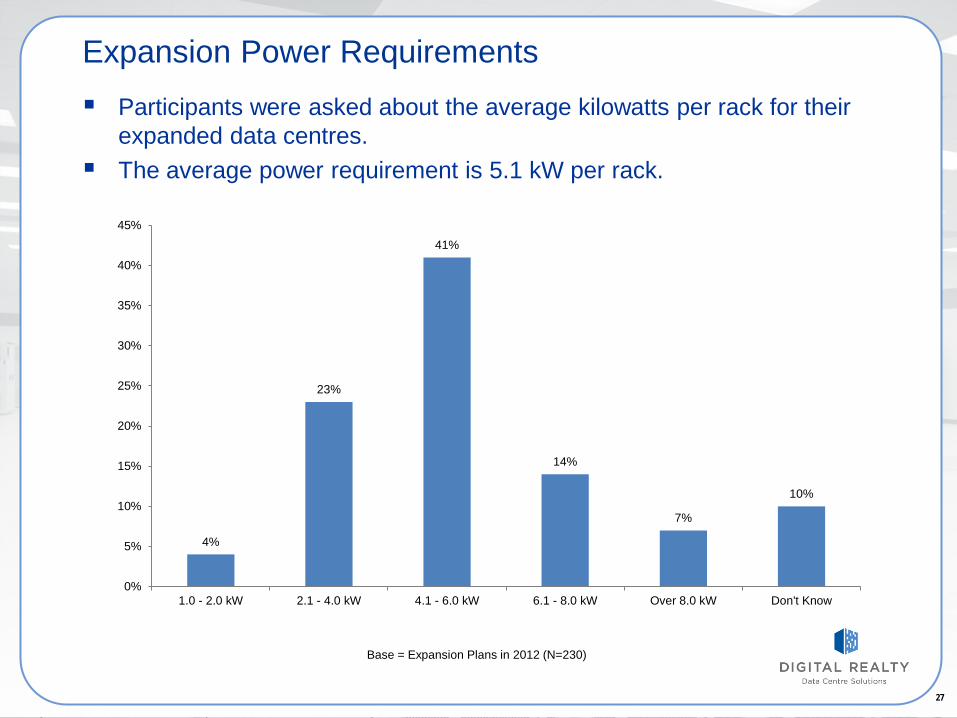
Expansion Power Requirements Participants were asked about the average kilowatts per rack for their
expanded data centres. The average power requirement is 5.1 kW per rack.
4%
23%
41%
14%
7%
10%
0%
5%
10%
15%
20%
25%
30%
35%
40%
45%
1.0 - 2.0 kW 2.1 - 4.0 kW 4.1 - 6.0 kW 6.1 - 8.0 kW Over 8.0 kW Don't Know
Base = Expansion Plans in 2012 (N=230)

28 28
IMPLEMENTING EXPANSION Asia Pacific Campos Survey 2012
29
Expansion Strategies Respondents who have plans to expand their data centres in 2012 were
asked to select among the alternatives below how they planned to implement the expansion:
• Build with or use a data centre design and construction partner. • Lease space from a wholesale data centre provider. • Use a container solution. • Build themselves. • Use a retail colocation solution. • Have not decided yet.
Respondents could choose one or more of these alternatives.
30 30
58%
46%
25% 22%
14%
7%
0%
10%
20%
30%
40%
50%
60%
70%
Design/Build Partner Lease Space Use Colo Build Themselves Container Solution No Decision Yet
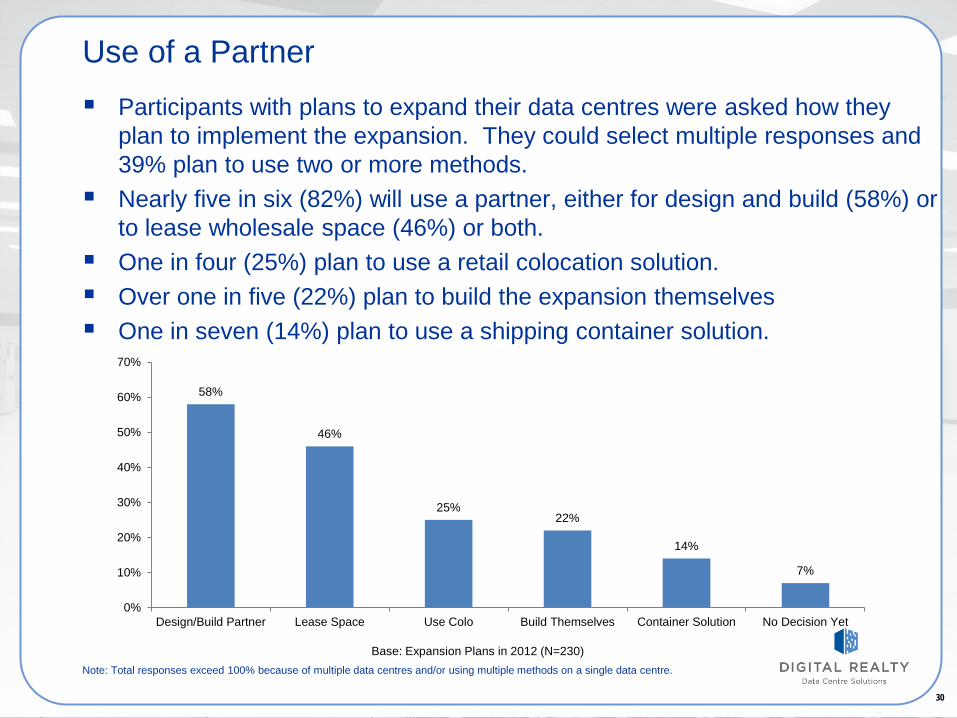
Use of a Partner Participants with plans to expand their data centres were asked how they
plan to implement the expansion. They could select multiple responses and 39% plan to use two or more methods.
Nearly five in six (82%) will use a partner, either for design and build (58%) or to lease wholesale space (46%) or both.
One in four (25%) plan to use a retail colocation solution. Over one in five (22%) plan to build the expansion themselves One in seven (14%) plan to use a shipping container solution.
Base: Expansion Plans in 2012 (N=230) Note: Total responses exceed 100% because of multiple data centres and/or using multiple methods on a single data centre.
31
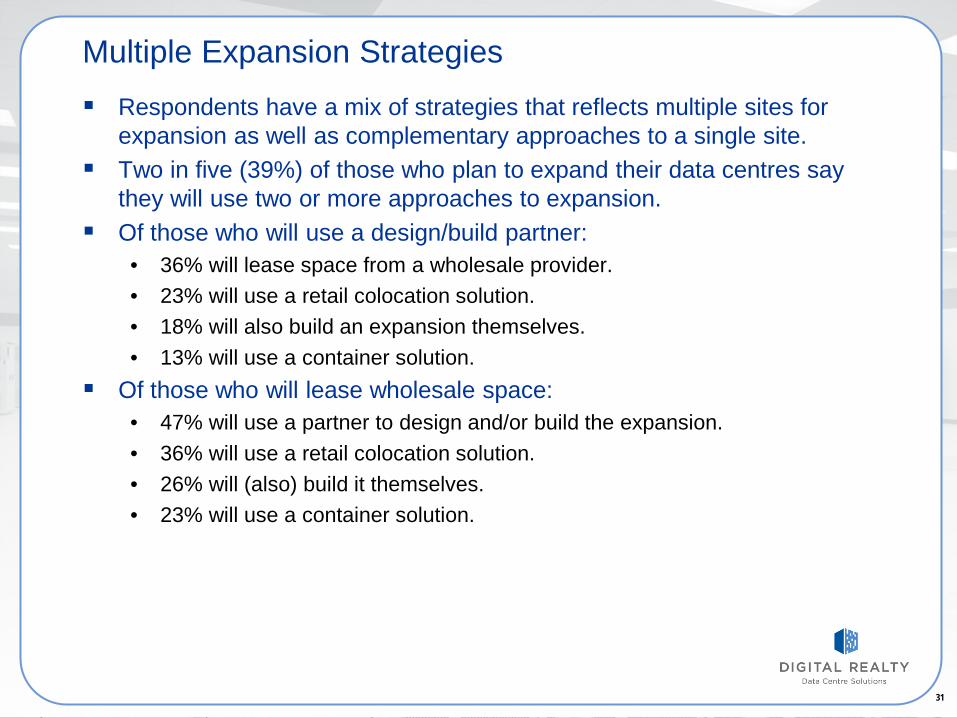
Multiple Expansion Strategies Respondents have a mix of strategies that reflects multiple sites for
expansion as well as complementary approaches to a single site. Two in five (39%) of those who plan to expand their data centres say
they will use two or more approaches to expansion. Of those who will use a design/build partner:
• 36% will lease space from a wholesale provider. • 23% will use a retail colocation solution. • 18% will also build an expansion themselves. • 13% will use a container solution.
Of those who will lease wholesale space: • 47% will use a partner to design and/or build the expansion. • 36% will use a retail colocation solution. • 26% will (also) build it themselves. • 23% will use a container solution.
32 32
55%
28%
12%
18%
5%
14%
58%
52%
34%
22% 17%
2%
58%
51%
24% 20% 18%
8%
0%
10%
20%
30%
40%
50%
60%
70%
Build with/use adatacentre designand construction
partner
Lease space from awholesale datacentre
provider
Use colo Build themselves Use a containersolution
Have not decided yet
Australia (N=76) Hong Kong (N=90) Singapore (N=85)
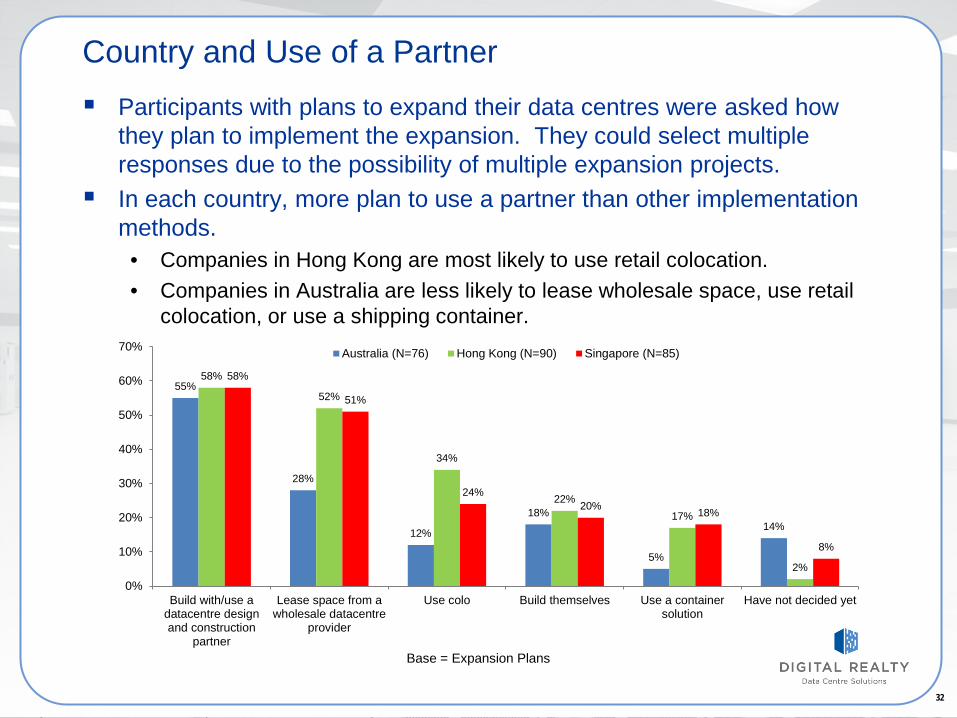
Country and Use of a Partner Participants with plans to expand their data centres were asked how
they plan to implement the expansion. They could select multiple responses due to the possibility of multiple expansion projects.
In each country, more plan to use a partner than other implementation methods.
• Companies in Hong Kong are most likely to use retail colocation. • Companies in Australia are less likely to lease wholesale space, use retail
colocation, or use a shipping container.
Base = Expansion Plans
33
15%
55%
42%
9%
15%
9%
23%
59%
38%
10%
30%
7%
22%
60%
51%
24%
33%
9%
27%
53%
60%
23% 23%
3%
0%
10%
20%
30%
40%
50%
60%
70%
Build themselves Build with/use adatacentre design andconstruction partner
Lease space from awholesale datacentre
provider
Use a container solution Use retail colo Have not decided yet
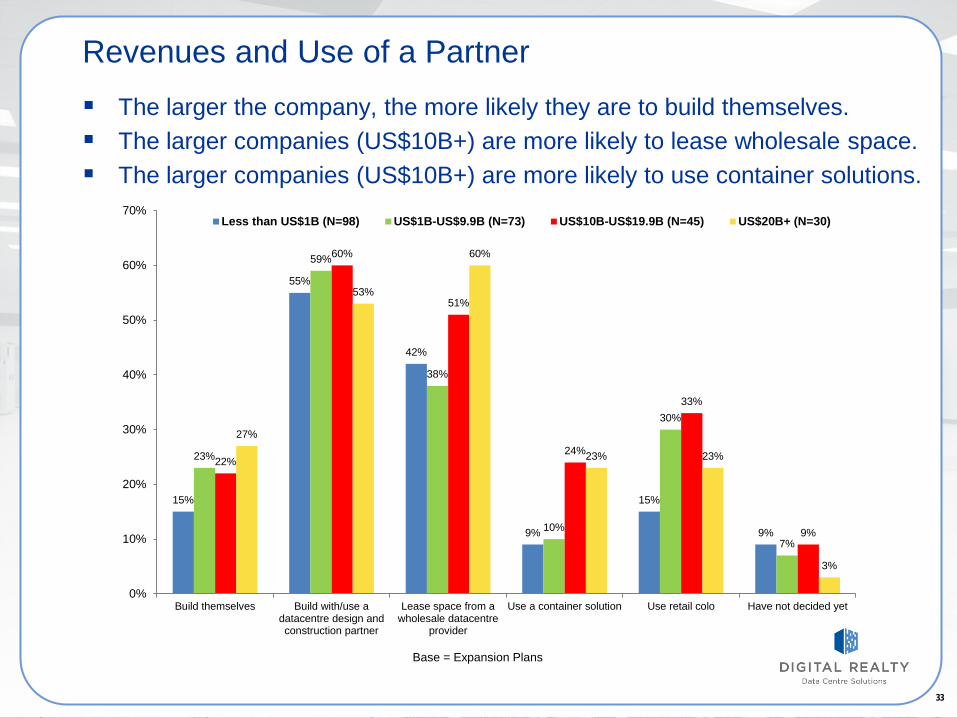
Less than US$1B (N=98) US$1B-US$9.9B (N=73) US$10B-US$19.9B (N=45) US$20B+ (N=30)
Revenues and Use of a Partner The larger the company, the more likely they are to build themselves. The larger companies (US$10B+) are more likely to lease wholesale space. The larger companies (US$10B+) are more likely to use container solutions.
Base = Expansion Plans
34 34
SELECTING A PARTNER Asia Pacific Campos Survey 2012
35
Partner Summary Of those who plan to expand in 2012, nearly five in six (82%) will use a
partner, either for design and build (58%) or to lease wholesale space (46%) or both.
The list of potential partners is usually developed by high or mid-level executives, as opposed to C-levels or lower-level managers.
The most important factors in choosing a partner are operational reliability, server management and data centre design.
The most useful source of information about potential partners is consultants.
36
Partner Summary (cont’d) The most valuable information from providers is case studies, followed
by educational seminars and the provider’s website. The information sources that respondents most often used for the last
data centre they built or leased are educational seminars, case studies and providers’ websites.
• Participants prefer email from the provider as a notification about new white papers or seminars.
IT and C-level executives, followed by Finance, are most likely to participate in selecting a partner for expansion.
IT and C-level executives tend to have to most influence on the final decision.
37 37
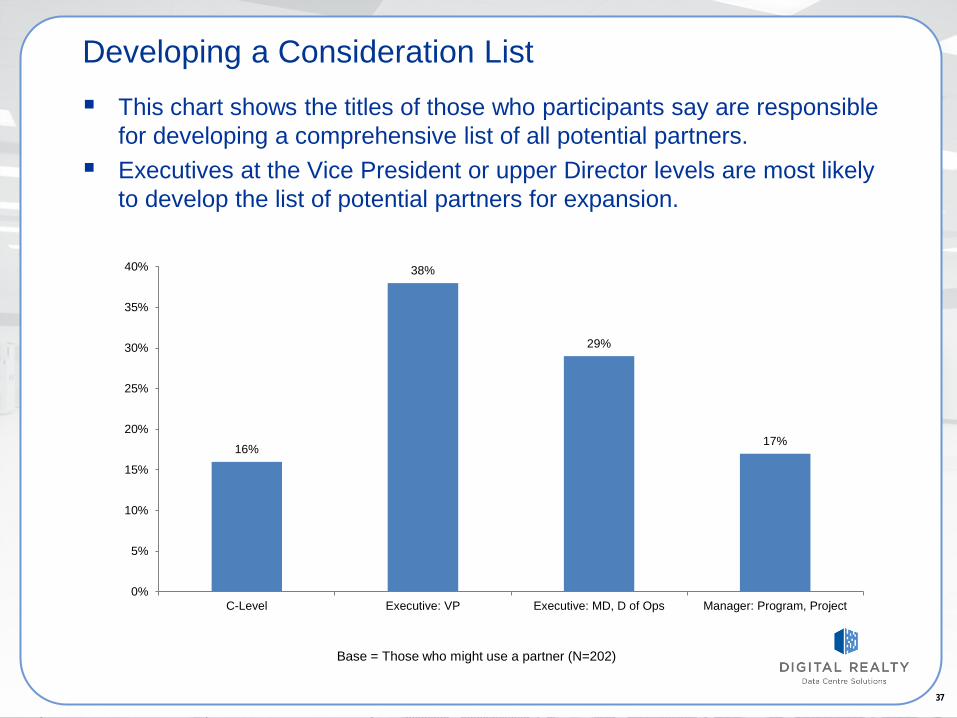
Developing a Consideration List
16%
38%
29%
17%
0%
5%
10%
15%
20%
25%
30%
35%
40%
C-Level Executive: VP Executive: MD, D of Ops Manager: Program, Project
This chart shows the titles of those who participants say are responsible for developing a comprehensive list of all potential partners.
Executives at the Vice President or upper Director levels are most likely to develop the list of potential partners for expansion.
Base = Those who might use a partner (N=202)
38 38
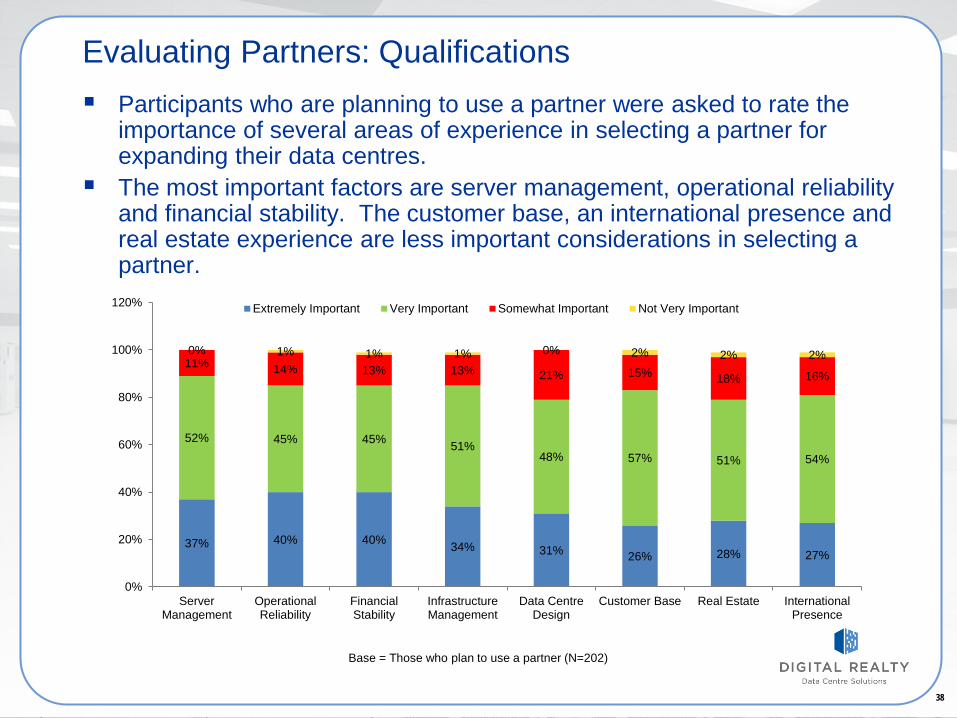
Evaluating Partners: Qualifications
37% 40% 40% 34% 31% 26% 28% 27%
52% 45% 45% 51% 48% 57% 51% 54%
11% 14% 13% 13% 21% 15% 18% 16%
0% 1% 1% 1% 0% 2% 2% 2%
0%
20%
40%
60%
80%
100%
120%
ServerManagement
OperationalReliability
FinancialStability
InfrastructureManagement
Data CentreDesign
Customer Base Real Estate InternationalPresence
Extremely Important Very Important Somewhat Important Not Very Important
Participants who are planning to use a partner were asked to rate the importance of several areas of experience in selecting a partner for expanding their data centres.
The most important factors are server management, operational reliability and financial stability. The customer base, an international presence and real estate experience are less important considerations in selecting a partner.
Base = Those who plan to use a partner (N=202)
39 39
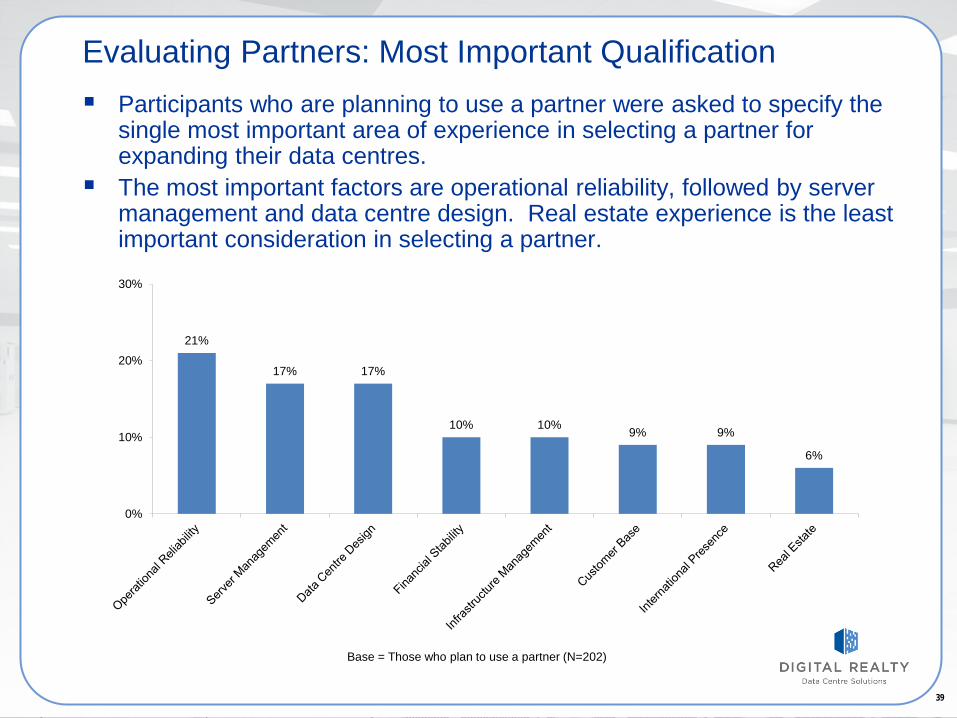
Evaluating Partners: Most Important Qualification Participants who are planning to use a partner were asked to specify the
single most important area of experience in selecting a partner for expanding their data centres.
The most important factors are operational reliability, followed by server management and data centre design. Real estate experience is the least important consideration in selecting a partner.
21%
17% 17%
10% 10% 9% 9%
6%
0%
10%
20%
30%
Base = Those who plan to use a partner (N=202)
40 40
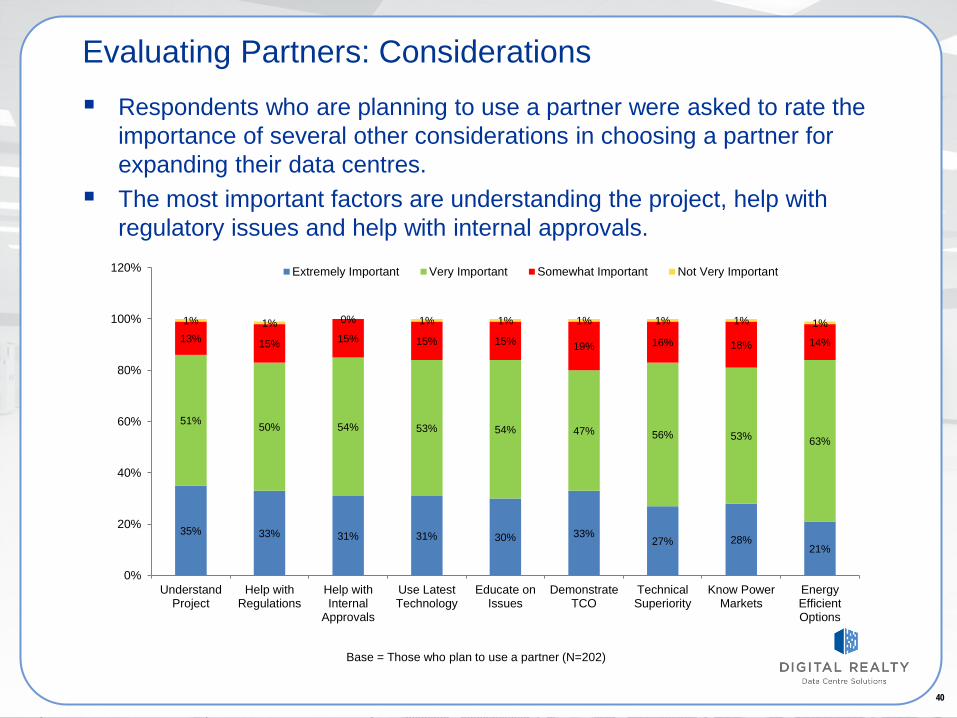
Evaluating Partners: Considerations
35% 33% 31% 31% 30% 33% 27% 28%
21%
51% 50% 54% 53% 54% 47% 56% 53% 63%
13% 15% 15% 15% 15% 19% 16% 18% 14%
1% 1% 0% 1% 1% 1% 1% 1% 1%
0%
20%
40%
60%
80%
100%
120%
UnderstandProject
Help withRegulations
Help withInternal
Approvals
Use LatestTechnology
Educate onIssues
DemonstrateTCO
TechnicalSuperiority
Know PowerMarkets
EnergyEfficientOptions
Extremely Important Very Important Somewhat Important Not Very Important
Respondents who are planning to use a partner were asked to rate the importance of several other considerations in choosing a partner for expanding their data centres.
The most important factors are understanding the project, help with regulatory issues and help with internal approvals.
Base = Those who plan to use a partner (N=202)
41 41
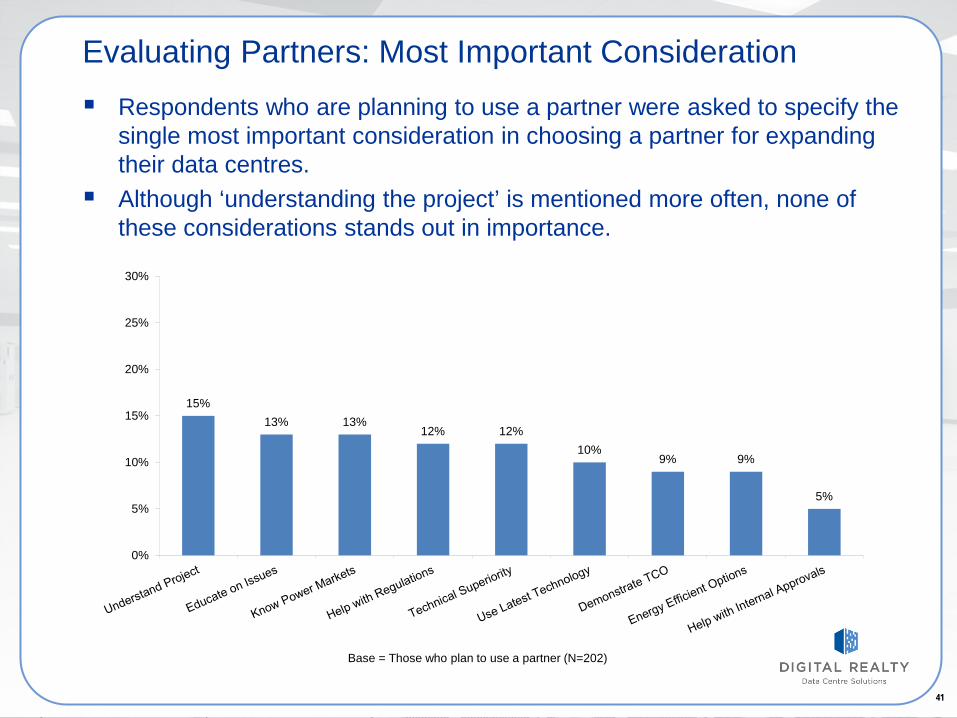
Evaluating Partners: Most Important Consideration Respondents who are planning to use a partner were asked to specify the
single most important consideration in choosing a partner for expanding their data centres.
Although ‘understanding the project’ is mentioned more often, none of these considerations stands out in importance.
15% 13% 13%
12% 12% 10%
9% 9%
5%
0%
5%
10%
15%
20%
25%
30%
Base = Those who plan to use a partner (N=202)
42 42
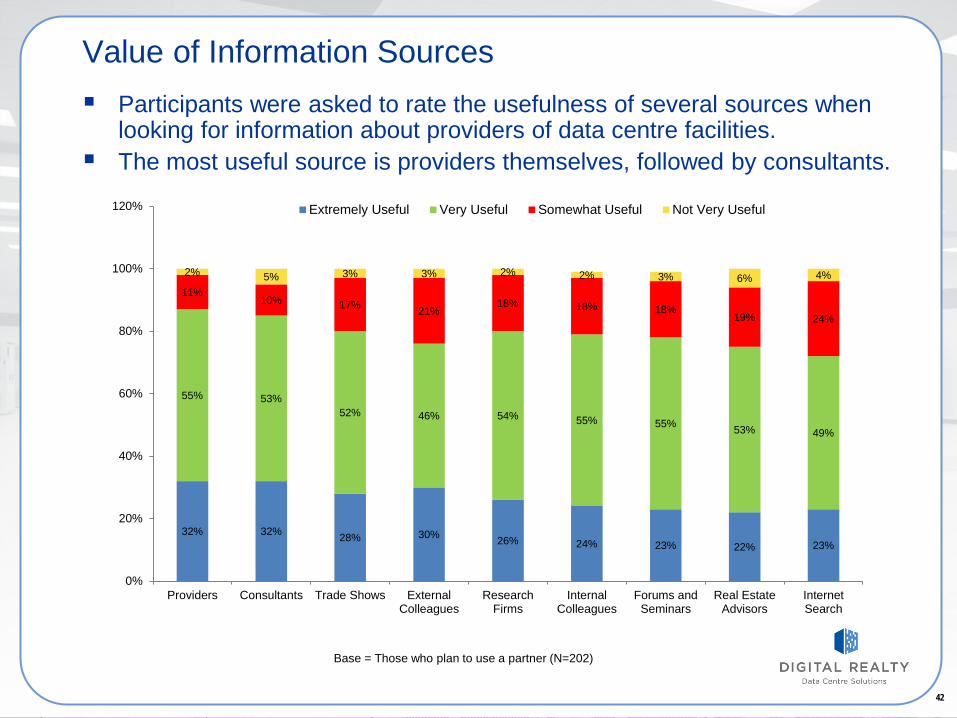
Value of Information Sources
32% 32% 28% 30% 26% 24% 23% 22% 23%
55% 53% 52% 46% 54% 55% 55% 53% 49%
11% 10% 17% 21%
18% 18% 18% 19% 24%
2% 5% 3% 3% 2% 2% 3% 6% 4%
0%
20%
40%
60%
80%
100%
120%
Providers Consultants Trade Shows ExternalColleagues
ResearchFirms
InternalColleagues
Forums andSeminars
Real EstateAdvisors
InternetSearch
Extremely Useful Very Useful Somewhat Useful Not Very Useful
Participants were asked to rate the usefulness of several sources when looking for information about providers of data centre facilities.
The most useful source is providers themselves, followed by consultants.
Base = Those who plan to use a partner (N=202)
43 43
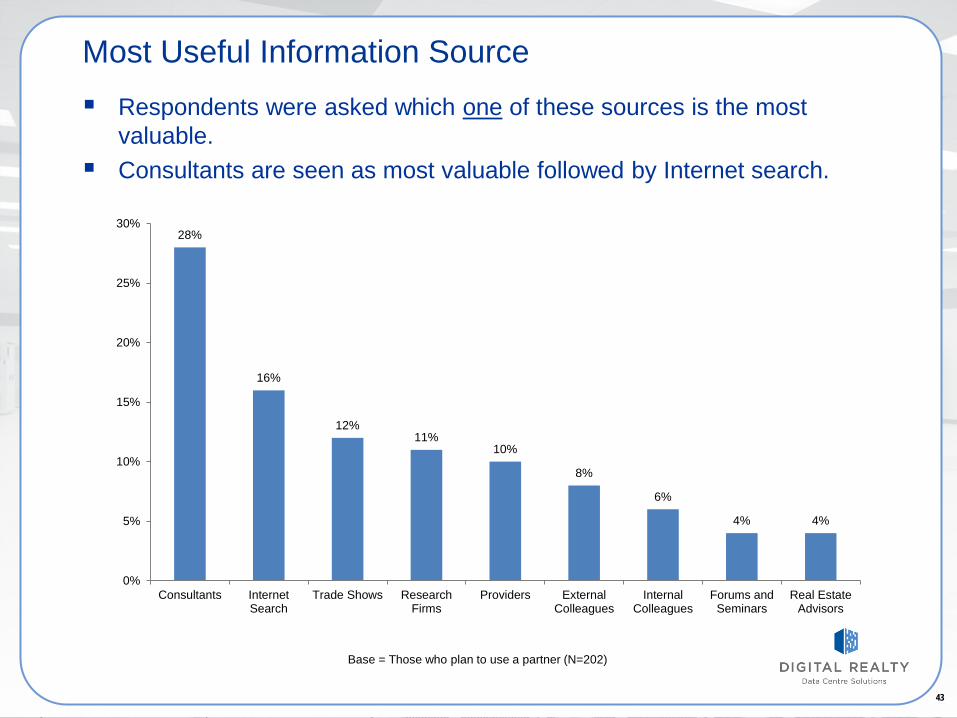
Most Useful Information Source Respondents were asked which one of these sources is the most
valuable. Consultants are seen as most valuable followed by Internet search.
28%
16%
12% 11%
10%
8%
6%
4% 4%
0%
5%
10%
15%
20%
25%
30%
Consultants InternetSearch
Trade Shows ResearchFirms
Providers ExternalColleagues
InternalColleagues
Forums andSeminars
Real EstateAdvisors
Base = Those who plan to use a partner (N=202)
44 44
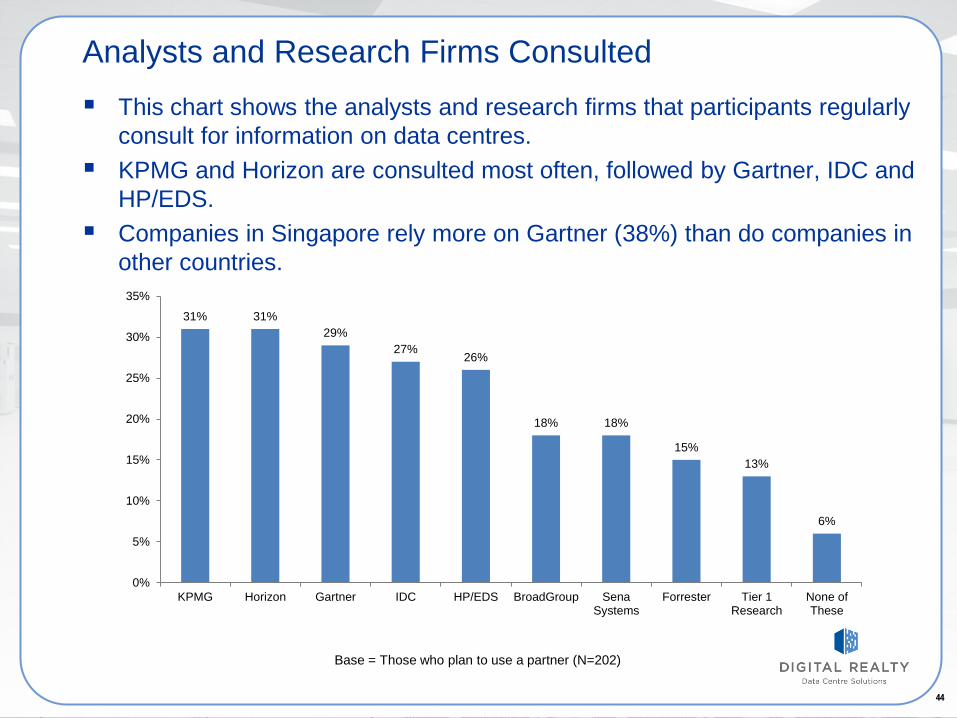
Analysts and Research Firms Consulted This chart shows the analysts and research firms that participants regularly
consult for information on data centres. KPMG and Horizon are consulted most often, followed by Gartner, IDC and
HP/EDS. Companies in Singapore rely more on Gartner (38%) than do companies in
other countries.
31% 31% 29%
27% 26%
18% 18%
15% 13%
6%
0%
5%
10%
15%
20%
25%
30%
35%
KPMG Horizon Gartner IDC HP/EDS BroadGroup SenaSystems
Forrester Tier 1Research
None ofThese
Base = Those who plan to use a partner (N=202)
45 45
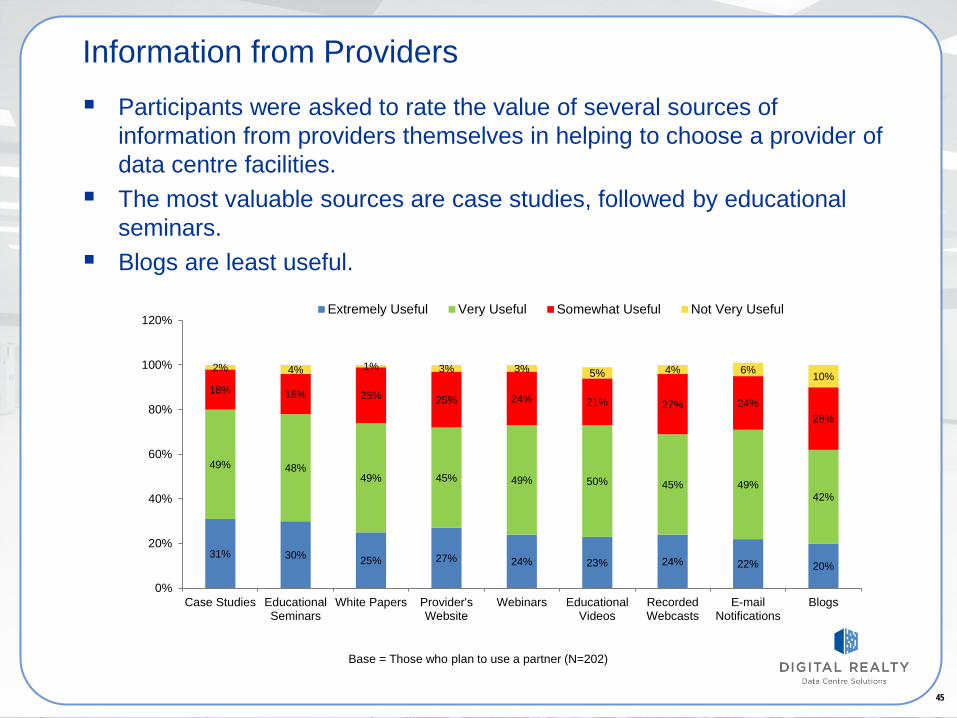
Information from Providers Participants were asked to rate the value of several sources of
information from providers themselves in helping to choose a provider of data centre facilities.
The most valuable sources are case studies, followed by educational seminars.
Blogs are least useful.
31% 30% 25% 27% 24% 23% 24% 22% 20%
49% 48% 49% 45% 49% 50% 45% 49%
42%
18% 18% 25% 25% 24% 21% 27% 24% 28%
2% 4% 1% 3% 3% 5% 4% 6% 10%
0%
20%
40%
60%
80%
100%
120%
Case Studies EducationalSeminars
White Papers Provider'sWebsite
Webinars EducationalVideos
RecordedWebcasts
E-mailNotifications
Blogs
Extremely Useful Very Useful Somewhat Useful Not Very Useful
Base = Those who plan to use a partner (N=202)
46 46
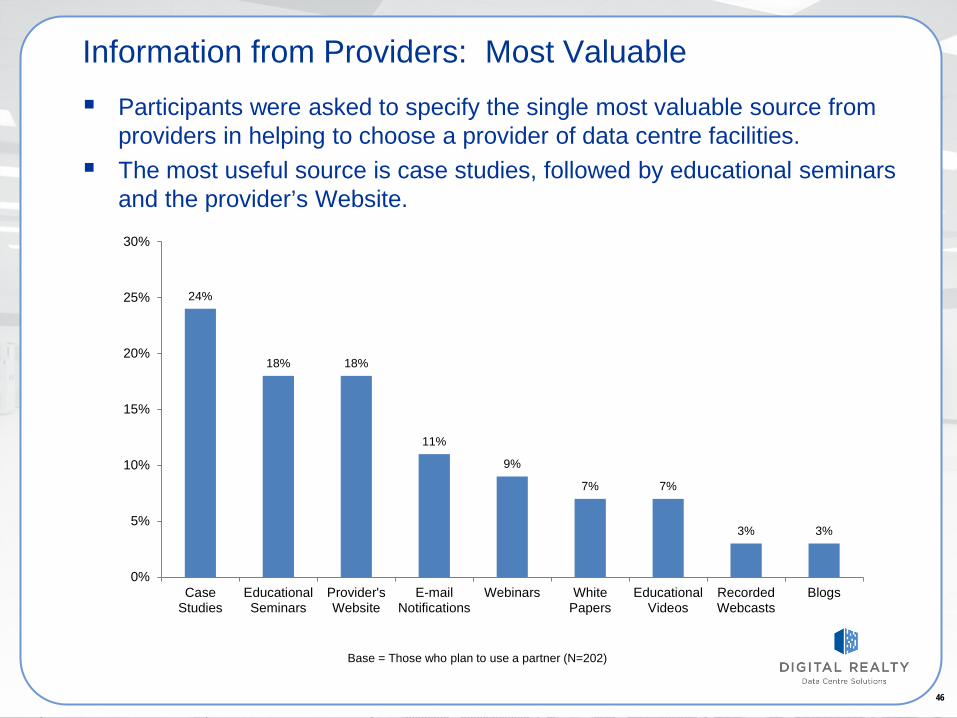
Information from Providers: Most Valuable Participants were asked to specify the single most valuable source from
providers in helping to choose a provider of data centre facilities. The most useful source is case studies, followed by educational seminars
and the provider’s Website.
24%
18% 18%
11%
9%
7% 7%
3% 3%
0%
5%
10%
15%
20%
25%
30%
CaseStudies
EducationalSeminars
Provider'sWebsite
E-mailNotifications
Webinars WhitePapers
EducationalVideos
RecordedWebcasts
Blogs
Base = Those who plan to use a partner (N=202)
47 47
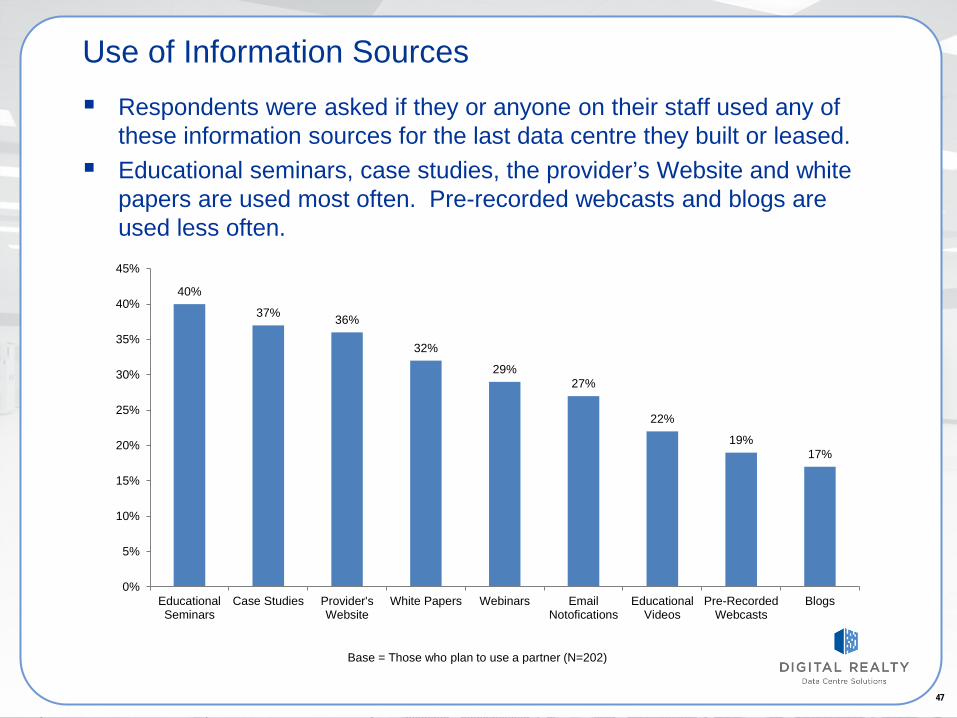
Use of Information Sources Respondents were asked if they or anyone on their staff used any of
these information sources for the last data centre they built or leased. Educational seminars, case studies, the provider’s Website and white
papers are used most often. Pre-recorded webcasts and blogs are used less often.
40%
37% 36%
32%
29% 27%
22%
19% 17%
0%
5%
10%
15%
20%
25%
30%
35%
40%
45%
EducationalSeminars
Case Studies Provider'sWebsite
White Papers Webinars EmailNotofications
EducationalVideos
Pre-RecordedWebcasts
Blogs
Base = Those who plan to use a partner (N=202)
48 48
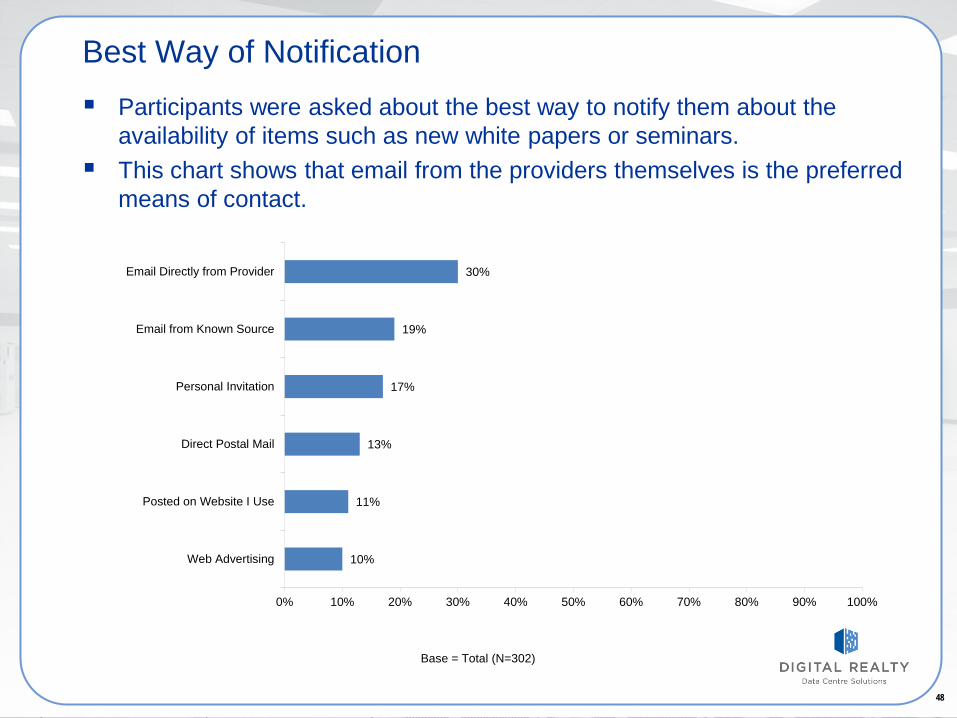
Best Way of Notification Participants were asked about the best way to notify them about the
availability of items such as new white papers or seminars. This chart shows that email from the providers themselves is the preferred
means of contact.
10%
11%
13%
17%
19%
30%
0% 10% 20% 30% 40% 50% 60% 70% 80% 90% 100%
Web Advertising
Posted on Website I Use
Direct Postal Mail
Personal Invitation
Email from Known Source
Email Directly from Provider
Base = Total (N=302)
49 49
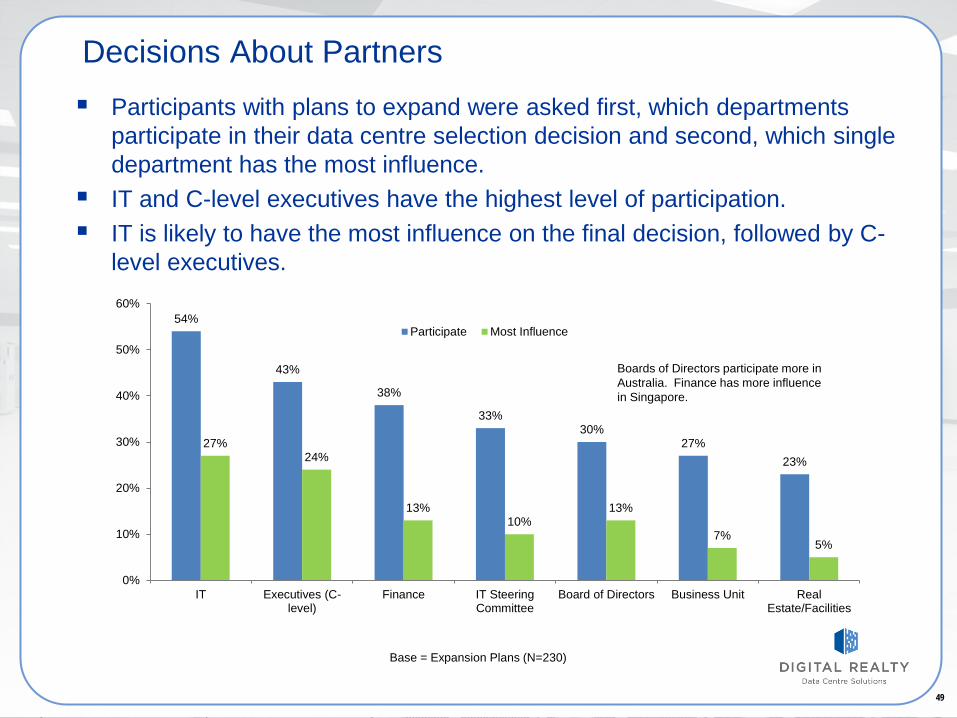
Decisions About Partners Participants with plans to expand were asked first, which departments
participate in their data centre selection decision and second, which single department has the most influence.
IT and C-level executives have the highest level of participation. IT is likely to have the most influence on the final decision, followed by C-
level executives.
54%
43%
38%
33% 30%
27% 23%
27% 24%
13% 10%
13%
7% 5%
0%
10%
20%
30%
40%
50%
60%
IT Executives (C-level)
Finance IT SteeringCommittee
Board of Directors Business Unit RealEstate/Facilities
Participate Most Influence
Base = Expansion Plans (N=230)
Boards of Directors participate more in Australia. Finance has more influence in Singapore.
50 50
DATA CENTRE LOCATIONS
Asia Pacific Campos Survey 2012
51
Location Summary Respondents who plan to expand in 2012 are more likely to locate a
new data centre in countries in Asia and primarily in their own country. The most mentioned cities for a new data centre are Hong Kong,
Singapore, Tokyo and Sydney. The most important factor in choosing a location is security, followed by
power availability and cost.
52 52
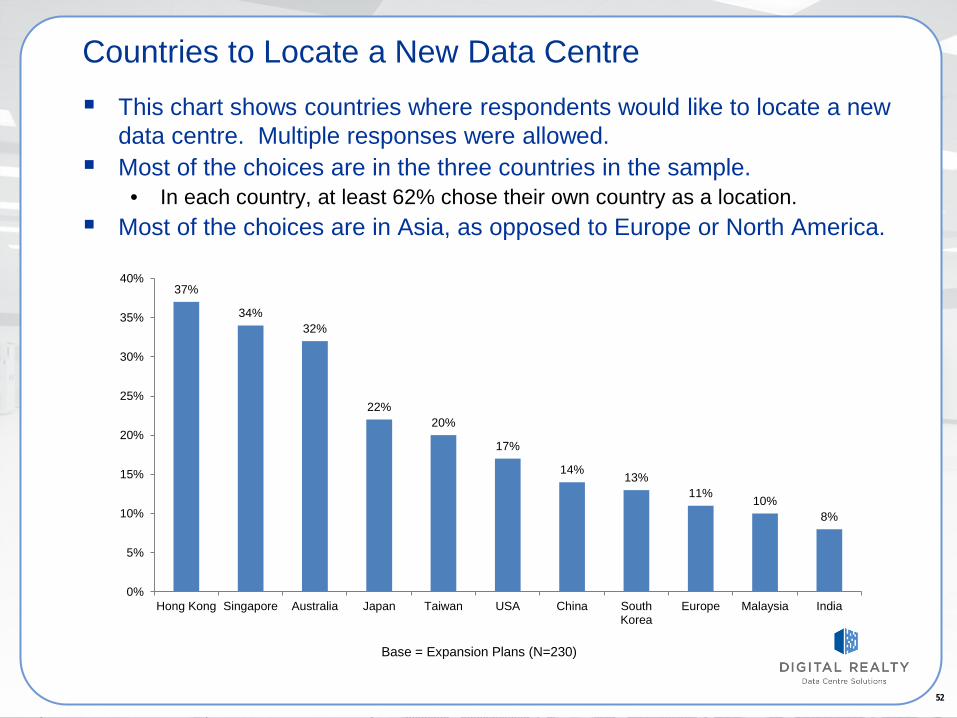
Countries to Locate a New Data Centre This chart shows countries where respondents would like to locate a new
data centre. Multiple responses were allowed. Most of the choices are in the three countries in the sample.
• In each country, at least 62% chose their own country as a location. Most of the choices are in Asia, as opposed to Europe or North America.
37%
34% 32%
22% 20%
17%
14% 13% 11% 10%
8%
0%
5%
10%
15%
20%
25%
30%
35%
40%
Hong Kong Singapore Australia Japan Taiwan USA China SouthKorea
Europe Malaysia India
Base = Expansion Plans (N=230)
53 53
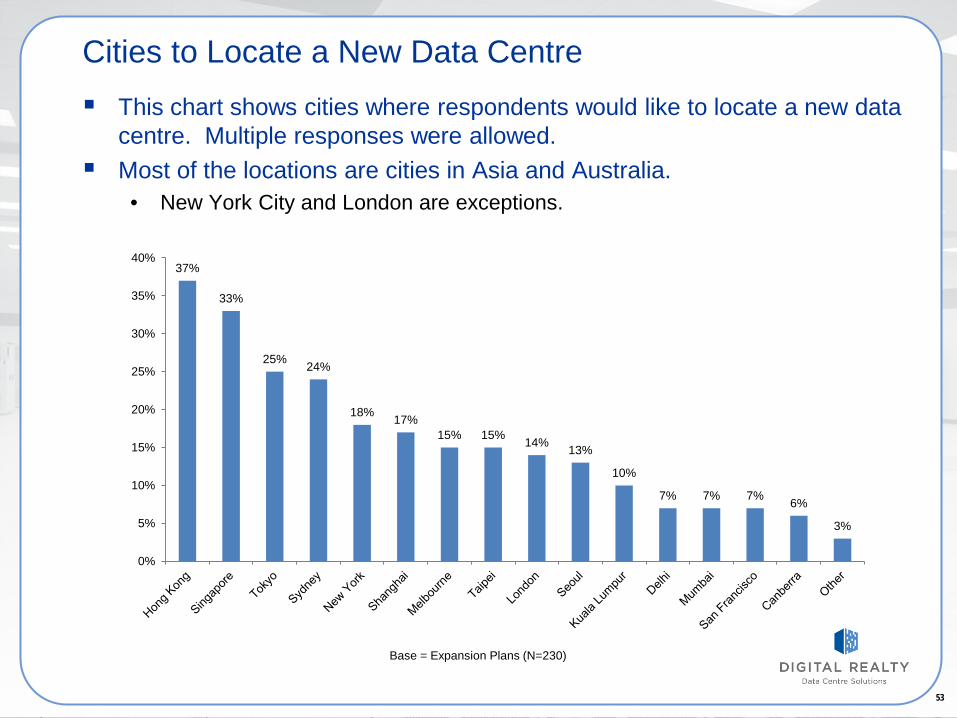
Cities to Locate a New Data Centre This chart shows cities where respondents would like to locate a new data
centre. Multiple responses were allowed. Most of the locations are cities in Asia and Australia.
• New York City and London are exceptions.
37%
33%
25% 24%
18% 17% 15% 15% 14% 13%
10%
7% 7% 7% 6%
3%
0%
5%
10%
15%
20%
25%
30%
35%
40%
Base = Expansion Plans (N=230)
54 54
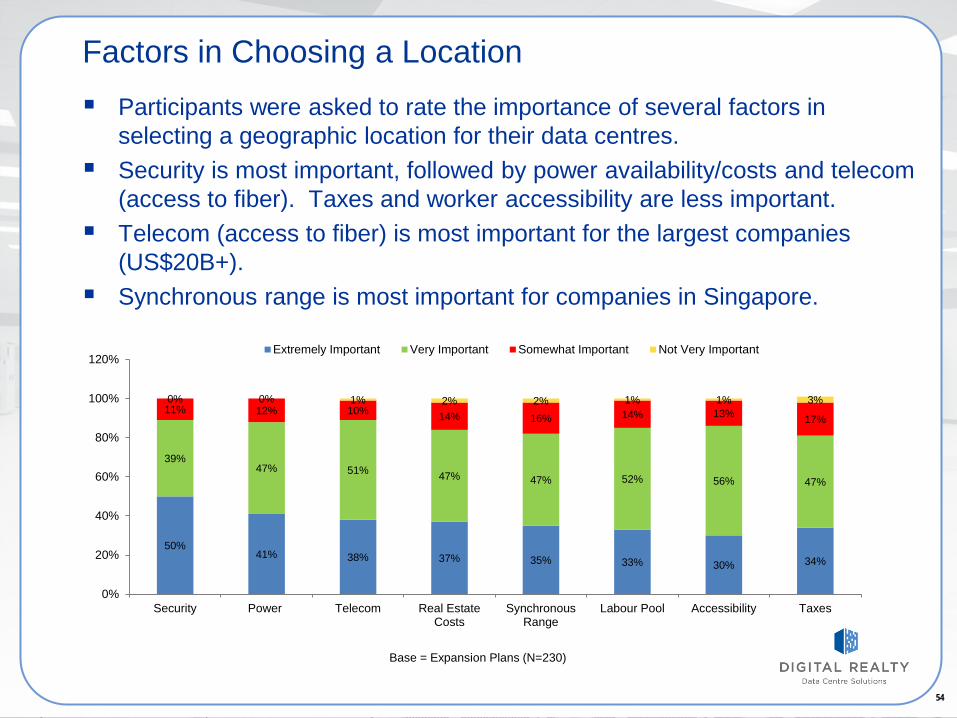
Factors in Choosing a Location Participants were asked to rate the importance of several factors in
selecting a geographic location for their data centres. Security is most important, followed by power availability/costs and telecom
(access to fiber). Taxes and worker accessibility are less important. Telecom (access to fiber) is most important for the largest companies
(US$20B+). Synchronous range is most important for companies in Singapore.
50% 41% 38% 37% 35% 33% 30% 34%
39% 47% 51% 47% 47% 52% 56% 47%
11% 12% 10% 14% 16% 14% 13% 17%
0% 0% 1% 2% 2% 1% 1% 3%
0%
20%
40%
60%
80%
100%
120%
Security Power Telecom Real EstateCosts
SynchronousRange
Labour Pool Accessibility Taxes
Extremely Important Very Important Somewhat Important Not Very Important
Base = Expansion Plans (N=230)
55 55
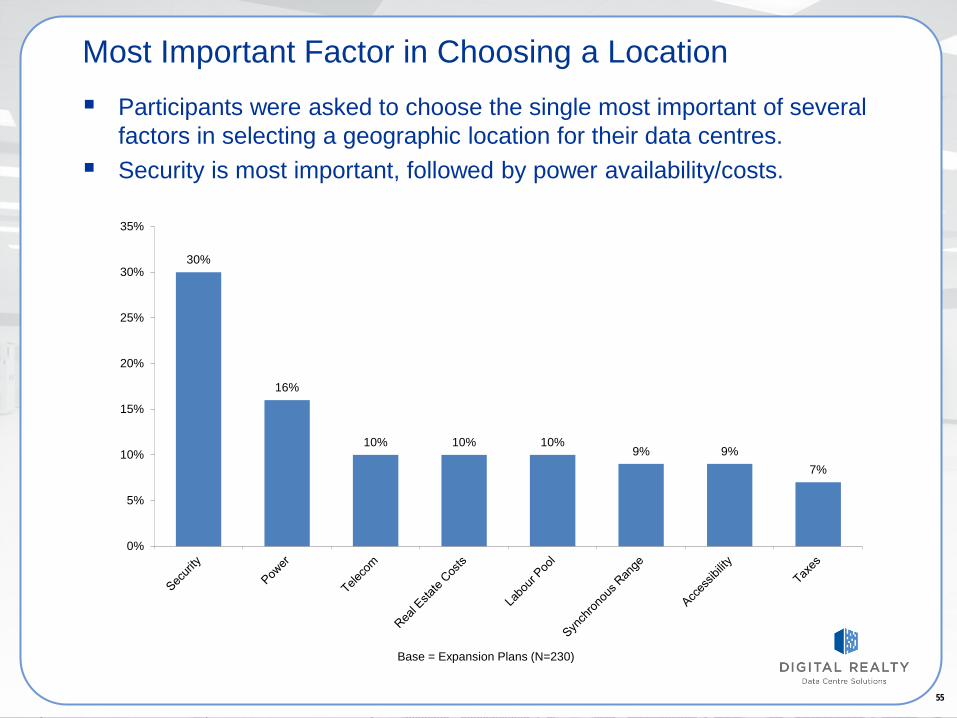
Most Important Factor in Choosing a Location Participants were asked to choose the single most important of several
factors in selecting a geographic location for their data centres. Security is most important, followed by power availability/costs.
30%
16%
10% 10% 10% 9% 9%
7%
0%
5%
10%
15%
20%
25%
30%
35%
Base = Expansion Plans (N=230)
56 56
APPENDIX
Asia Pacific Campos Survey 2012
57 57
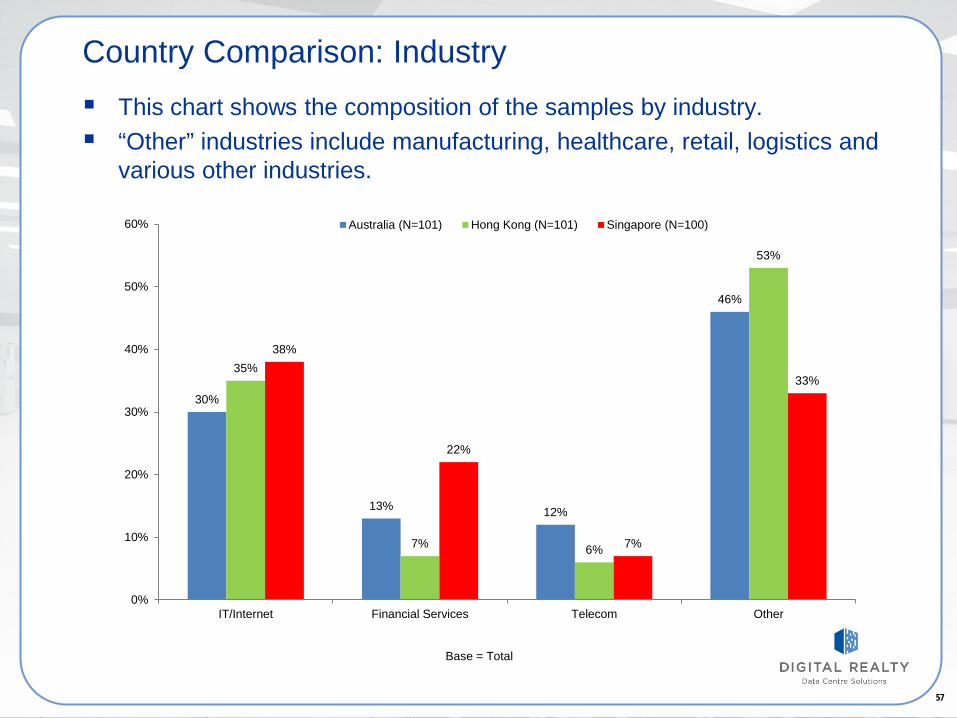
Country Comparison: Industry This chart shows the composition of the samples by industry. “Other” industries include manufacturing, healthcare, retail, logistics and
various other industries.
30%
13% 12%
46%
35%
7% 6%
53%
38%
22%
7%
33%
0%
10%
20%
30%
40%
50%
60%
IT/Internet Financial Services Telecom Other
Australia (N=101) Hong Kong (N=101) Singapore (N=100)
Base = Total
58 58
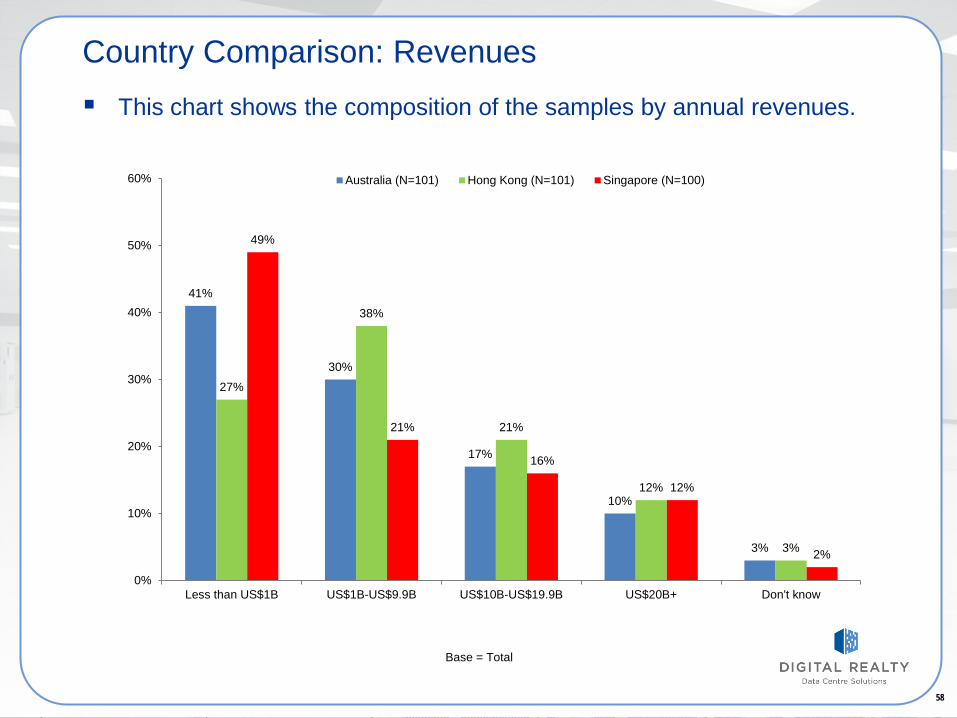
Country Comparison: Revenues This chart shows the composition of the samples by annual revenues.
41%
30%
17%
10%
3%
27%
38%
21%
12%
3%
49%
21%
16%
12%
2%
0%
10%
20%
30%
40%
50%
60%
Less than US$1B US$1B-US$9.9B US$10B-US$19.9B US$20B+ Don't know
Australia (N=101) Hong Kong (N=101) Singapore (N=100)
Base = Total
59 59
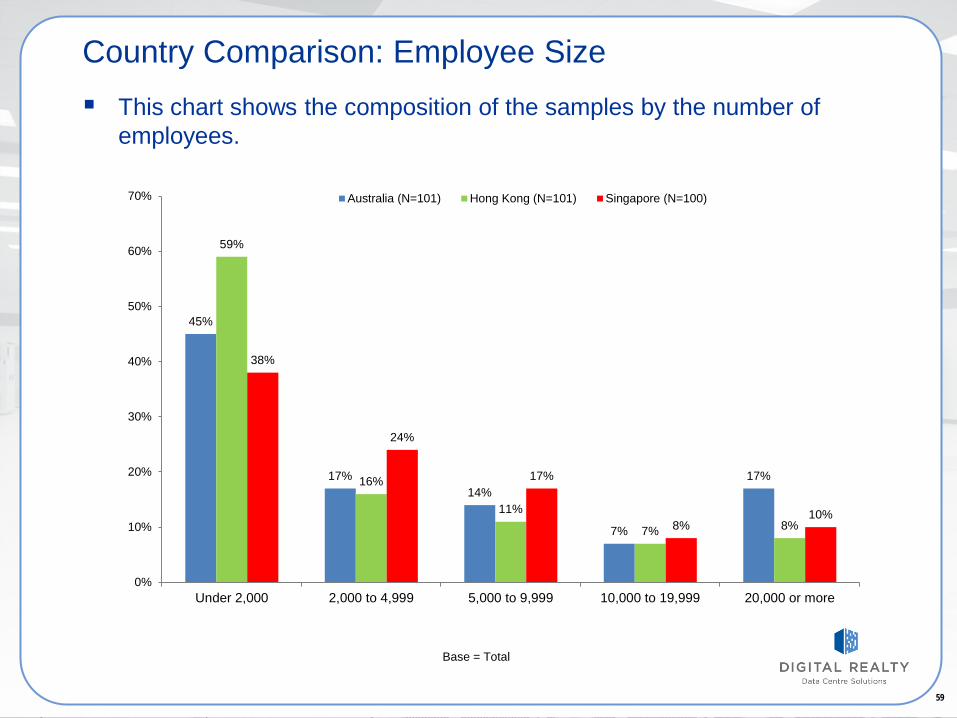
Country Comparison: Employee Size This chart shows the composition of the samples by the number of
employees.
45%
17% 14%
7%
17%
59%
16%
11%
7% 8%
38%
24%
17%
8% 10%
0%
10%
20%
30%
40%
50%
60%
70%
Under 2,000 2,000 to 4,999 5,000 to 9,999 10,000 to 19,999 20,000 or more
Australia (N=101) Hong Kong (N=101) Singapore (N=100)
Base = Total
60 60
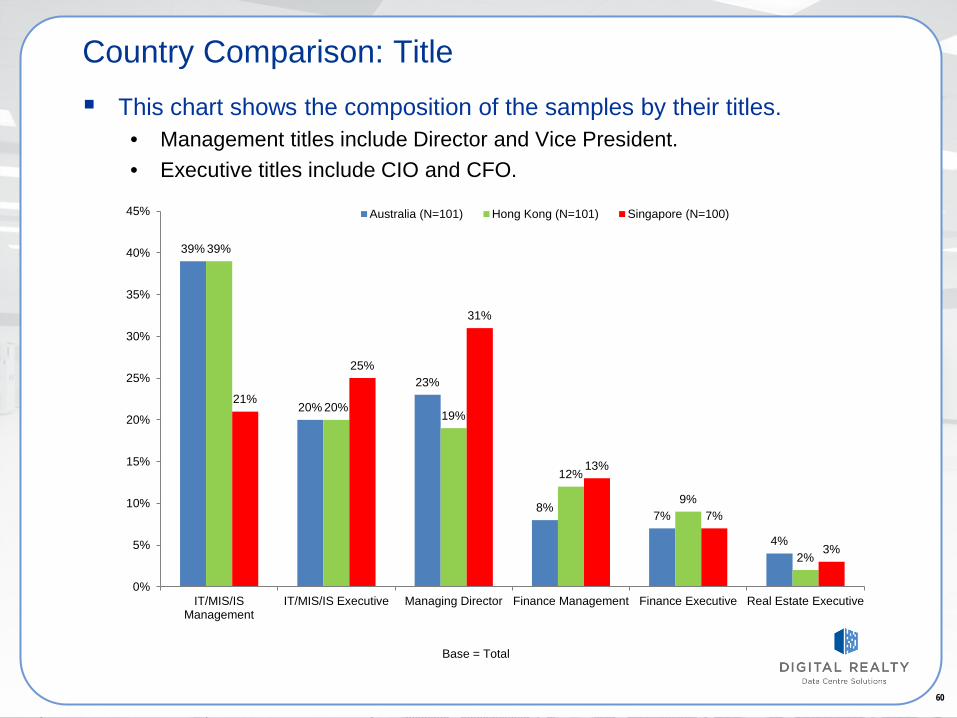
Country Comparison: Title This chart shows the composition of the samples by their titles.
• Management titles include Director and Vice President. • Executive titles include CIO and CFO.
39%
20%
23%
8% 7%
4%
39%
20% 19%
12%
9%
2%
21%
25%
31%
13%
7%
3%
0%
5%
10%
15%
20%
25%
30%
35%
40%
45%
IT/MIS/ISManagement
IT/MIS/IS Executive Managing Director Finance Management Finance Executive Real Estate Executive
Australia (N=101) Hong Kong (N=101) Singapore (N=100)
Base = Total
61 61
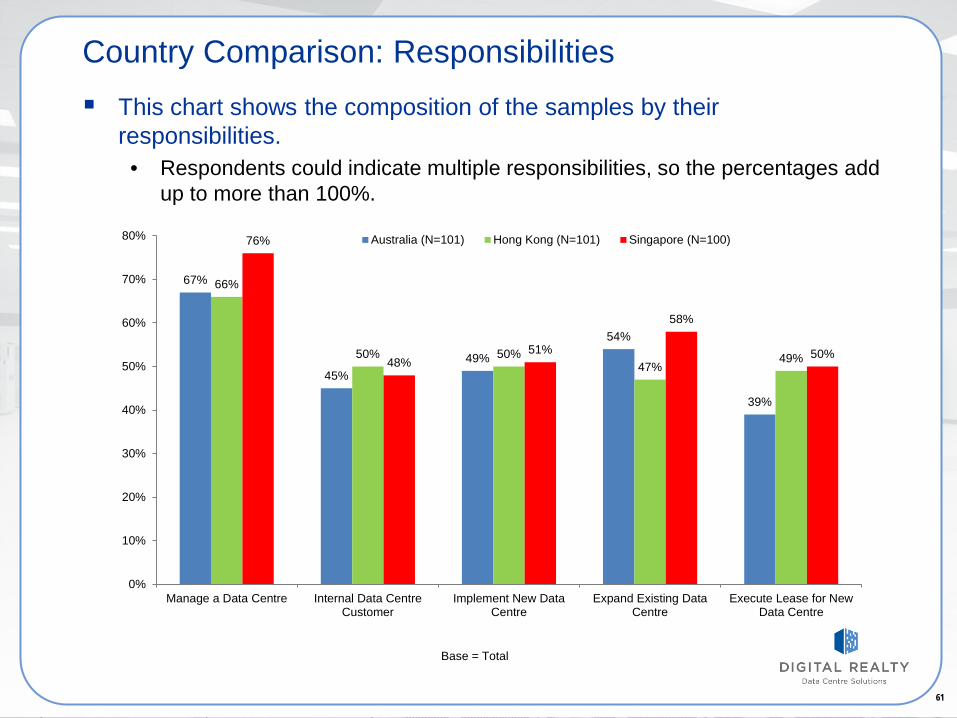
Country Comparison: Responsibilities This chart shows the composition of the samples by their
responsibilities. • Respondents could indicate multiple responsibilities, so the percentages add
up to more than 100%.
67%
45% 49%
54%
39%
66%
50% 50% 47%
49%
76%
48% 51%
58%
50%
0%
10%
20%
30%
40%
50%
60%
70%
80%
Manage a Data Centre Internal Data CentreCustomer
Implement New DataCentre
Expand Existing DataCentre
Execute Lease for NewData Centre
Australia (N=101) Hong Kong (N=101) Singapore (N=100)
Base = Total
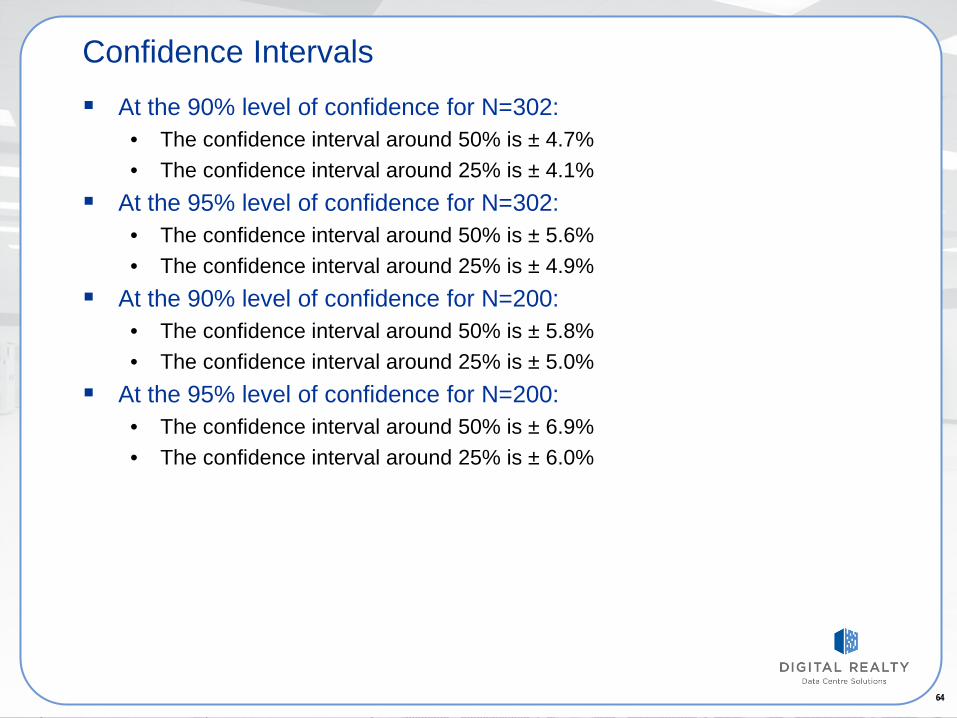
64
Confidence Intervals At the 90% level of confidence for N=302:
• The confidence interval around 50% is ± 4.7% • The confidence interval around 25% is ± 4.1%
At the 95% level of confidence for N=302: • The confidence interval around 50% is ± 5.6% • The confidence interval around 25% is ± 4.9%
At the 90% level of confidence for N=200: • The confidence interval around 50% is ± 5.8% • The confidence interval around 25% is ± 5.0%
At the 95% level of confidence for N=200: • The confidence interval around 50% is ± 6.9% • The confidence interval around 25% is ± 6.0%


