Embed Size (px)
Citation preview
ASOTIN COUNTY WATERSHED
ASSESSMENT:
TECHNICAL DOCUMENT & APPENDICES
Prepared for:
Asotin County Conservation District 720 6th Street, Suite B, Clarkston, WA 99403
Prepared by:
Stephen Bennett123, Reid Camp13, Joe Wheaton23, Nick Bouwes123, Gary O’Brien12, Andrew Hill13, Ben Floyd4 and Tracy Drury4
1 Eco Logical Research Inc., PO Box 706, Providence, Utah 84332 2Fluvial Habitats Center, 5210 Old Main Hill, Utah State University, Logan, Utah 84321
3Anabranch Solutions, PO Box 579, Newton, Utah 8432 4Anchor QEA, 8033 W. Grandridge Avenue, Suite A, Kennewick, WA 99336
April 30, 2018
ASOTIN COUNTY WATERSHED ASSESSMENT
iii
Recommended Citation:
Bennett, S., Camp, R., Wheaton, J., Bouwes, N., O’Brien, G., Hill, A., Floyd, B., and Drury, T. Asotin County
Watershed Assessment: Technical Document and Appendices. Prepared for Asotin County Conservation District.
Providence, UT. 220 Pages.
Thanks very much to Chalese Haffen, Micael Albonico, and Matt Meier who made many of the maps and to Doris
Bennett and Adrea Wheaton for proof reading and formatting the report.
This work is licensed under a Creative Commons Attribution 4.0 International License.
Asotin Working Group
This document was completed by the consulting team with significant input, guidance, and review by the Asotin
Working Group. The Working Group includes the following people and agencies:
Megan Stewart, Asotin County Conservation District
Kris Fischer, Confederated Tribes of the Umatilla Indian Reservation
Heidi McRoberts, Nez Perce Tribe
Dave Karl, Washington Department of Fish and Wildlife
Ethan Crawford, Washington Department of Fish and Wildlife
Joe Bumgarner, Washington Department of Fish and Wildlife
Tom Schirm, Washington Department of Fish and Wildlife
John Foltz, Snake River Salmon Recovery Board
Kay Caromile, Washington State Recreation and Conservation Office
Andre L’Heureux, Bonneville Power Administration
ASOTIN COUNTY WATERSHED ASSESSMENT
iv
KEY FINDINGS & RECOMMENDED RESTORATION STRATEGIES
Background
We present a watershed assessment of four watersheds in the Asotin County Assessment Area (hereafter the
study area): Alpowa Creek, Asotin Creek, Couse Creek, and Tenmile Creek. The Salmon Recovery Funding Board
funded the assessment and the Asotin County Conservation District administered the contract. The goals of the
assessment were to determine the:
characteristics that control the creation and maintenance of fish habitat,
geomorphic, riparian, and floodplain conditions of the study area ,
factors that are most likely limiting the productivity and survival of key fish species, and
restoration strategies that will address the limiting factors.
We used the findings from this assessment to develop a Conceptual Restoration Plan that prioritizes restoration
actions across 83 project areas based on the geomorphic conditions, potential benefits to fish, cost effectiveness,
landowner and agency support, and compatibility with regional and local recovery goals and objectives. The
Conceptual Restoration Plan is presented in a separate report.
This assessment was developed with a focus on Endangered Species Act listed summer steelhead (Oncorhynchus
mykiss), Chinook salmon (O. tshawytscha), bull trout (Salvelinus confluentus), and Washington state species of
concern, the Pacific lamprey (Entosphenus tridentatus). We focused our assessment on the geomorphic, riparian,
and floodplain condition of fish bearing streams in the study area, but supplemented these assessments by
evaluating the condition of the entire stream network (perennial, intermittent, and ephemeral streams) and using
a series of GIS tools to assess beaver dam capacity, floodplain fragmentation, stream temperature, and fish
barriers.
Setting and Past Limiting Factors
The study area has several distinguishing features that have a large influence on river character and the potential
to restore fish habitat. First, the region is dominated by long, hot summers and annual precipitation is low (< 20”)
in all but the highest elevations (<40“) in the Blue Mountains. Watersheds are short and steep, with streams that
generally have narrow valleys and discontinuous or patchy floodplain areas. In streams with headwaters in the
Blue Mountains (e.g., Asotin Creek and portions of George Creek), the hydrologic regime is snow-rain dominated
and the flows are more consistent. In watersheds that do not have headwaters in the Blue Mountains (e.g.,
Alpowa, Couse, Tenmile Creeks), the hydrologic regime is groundwater dominated, and flows are often very low or
intermittent during the summer months (i.e., sections of stream regularly go dry).
Southeast Washington has some of the most erosion prone soils in the country and soil erosion was a significant
problem prior to the 1990s. Intensive agriculture on loess soils with a high erosion potential led to an over-supply
of fine sediment into streams that severely degraded spawning habitat. Intensive logging in the headwaters,
grazing throughout the watershed, removal of mature riparian forests, and numerous diversion dams for irrigation
also led to degradation of fish habitat and rapid decline or complete extirpation of fish populations. Several large
floods that happened every 10-20 years in the last century exacerbated the impact on channel, riparian, and
floodplain conditions. In 1995, a community led Model Watershed Plan was developed and in the subsequent 20
years restoration projects were implemented to improve upland and stream conditions. Prior to the current
ASOTIN COUNTY WATERSHED ASSESSMENT
v
assessment effort, channel stability, sediment supply, flow, habitat diversity, temperature, and key habitat
quantity were considered the most significant limiting factors on fish productivity.
Assessment Results
Valley Confinement, Reach Types, and Geomorphic Units The study area is dominated by reach types that are naturally confined or partly confined by the valley walls, and
streams often run along steep bedrock cliffs. Valley widths rarely exceed 300’ for large streams and 100’ on small
to medium sized streams. The most common reach types in these valley settings are characterized by a single
channel, low sinuosity, moderate to high gradient, and long planar features (e.g., runs and rapids). Floodplains are
patchy or discontinuous and pools are often forced by bars or large woody debris (LWD). Multiple channels can
exist but they are usually forced by wood also. Wandering gravel bed reaches that commonly have multiple
channels and wider floodplains make up only 12% (22 miles) of the study area.
Geomorphic, Riparian, and Floodplain Conditions
There are 182 miles of perennial stream in the study area and we found that 76% of the length had moderate to
high geomorphic function (i.e., the expected frequency and type of geomorphic units in a reach type were often
observed). Past conservation actions appear to have stabilized many limiting factors, and in general, the
geomorphic function was stable or improving in most reaches. Reaches with limited geomorphic function were
often due to low habitat diversity, lack of LWD, simplified channel planforms, and infrequent overbank flow.
Riparian conditions have recovered well from historic disturbances and we found that along the mainstems of the
study streams 44.5% of the riparian areas had moderate function and 43.5% had high to near full function.
Riparian areas with limited function were often due to reduced extent of riparian habitat, young riparian canopy,
monoculture of species, invasive species, upland encroachment, and conversion to agriculture or development.
We identified 498 acres (22%) of disconnected floodplain out of 2,237 acres of potential floodplain we assessed.
Disconnected habitat was mainly caused by levees and rip-rap in the lower sections of streams for protection of
infrastructure (i.e., houses and roads).
Other Assessments
Direct measurements and models of stream temperature suggests that during cool years (i.e., high flow and/or low
air temperature) streams rarely exceed mean maximum weekly temperatures of 64.4 °F, but during warm years
(low flow and/or high average air temperatures), the lower reaches of streams can exceed 64 °F for almost 50% of
the summer weeks (June to September). However, streams rarely exceed 72 °F even during warm years. An
assessment of the capacity to support dam building beaver suggests that there is a high capacity in many areas of
the mid to upper elevation reaches and the potential for damage to infrastructure is generally low in these areas.
Two partial barriers were identified at the mouth of Tenmile and Couse Creeks. These potential barriers occur
when the elevation of the Snake River is low and stream flow across the alluvial fans at the mouth of Couse and
Tenmile Creek is low or goes subsurface.
Current Limiting Factors
Based on our assessment, it appears that channel stability (defined as the channel being too unstable) is not an
issue in most areas. The flooding, loss of LWD, straightening of many channels, and re-establishment of dense
riparian areas dominated by alder has had the opposite effect – channels are “locked” in place and are very
efficient at transporting sediment and wood. This situation leads to low habitat diversity and a lack of well sorted
gravel and cobble bars. We found no evidence of an over-supply of fine sediment, which is likely due to the
extensive investment in erosion control measures on the loess uplands in the past 20 years. Low flows continue to
ASOTIN COUNTY WATERSHED ASSESSMENT
vi
be observed especially in Couse, Tenmile, and George Creeks and their tributaries. However, these watersheds
have groundwater dominated hydrologic regimes and are naturally prone to low flows. We suspect that past
disturbances have exacerbated the flow conditions, but is unknown by how much. High stream temperatures also
continue to be observed in the groundwater dominated streams but, like flow, it is likely that these streams
frequently had high stream temperatures due to low flow, high air temperatures, and low precipitation (e.g., flow
< 5 cfs, air temperatures > 100 °F, and < 20” precipitation annually). We found that a lack of habitat diversity and
key habitats (i.e., LWD and pool frequency, cover, gravel bars, undercut banks, off-channel habitat) continue to be
a significant limiting factor. There are two general situations where this occurs: 1) areas where floodplain has been
physically disconnected by way of levees or rip-rap and 2) areas where there are no levees or rip-rap, but the
stream rarely has overbank flow because of a lack of structural elements in the channel and because the
surrounding riparian habitat is not contributing LWD. We characterize this state as a “legacy” effect of past
disturbances. The major stressors have been removed (e.g., sediment supply, removal of LWD and loss of riparian
areas), the stream is recovering, but it may take several more decades to see improvements without active
restoration.
Restoration Strategies
We present a set of restoration strategies to address the limiting factors we identified. We mapped these
restoration strategies on 44 restoration reaches across the study area. The restoration strategies are adapted from
Roni et al. (2002) which suggest the following prioritization of restoration strategies: 1) protect and maintain
natural processes, 2) remove barriers and reconnect disconnected habitats, 3) restore long-term processes (e.g.,
sediment routing, riparian function, nutrient cycling), and 4) restore short-term processes. We follow this basic
prioritization framework but adapt it for the specific limiting factors we identified in the study area.
1) Protect and maintain natural processes
a) Protect fragile soils, maintain soil conservation practices, and protect and enhance riparian areas - Our
assessment suggests that measures to minimize erosion in loess dominated watersheds should continue to be a
top priority. Numerous conservation programs are promoted by ACCD and NRCS in the county, and landowners
have adopted many best management practices to reduce erosion. These efforts should be continued and
enhanced where erosion concerns still exist. Riparian protection and enhancement should also be a priority
throughout the study area. Riparian habitat has shown great recovery in many areas, but these habitats can be
easily damaged, and many riparian areas have been reduced which also makes them vulnerable to disturbance.
2) Remove barriers and reconnect disconnected habitats
a) Barrier removal - is paramount to recovering fish populations and should be a top priority for active restoration
actions. In Asotin County, it appears most of the fish barriers have been removed (e.g., Headgate Dam was
removed completely in 2016). However, there are potential flow barriers at the mouth of Tenmile and Couse
Creeks. Addressing these barriers will involve a multi-stakeholder and agency participation.
b) Reconnect habitats - Disconnected habitats are generally restricted to the lower mainstem reaches where
infrastructure density is highest. The disconnection of floodplain reduces the extent of riparian vegetation which
can lead to increased water temperatures and reduced input of wood to streams. The confining features increase
the velocity of high flows because the water is contained within the channel. These confined channels transport
wood more effectively which reduces cover for adult and juvenile fish. Fish are especially susceptible when the
flows are high because there is limited velocity refugia in these sections.
ASOTIN COUNTY WATERSHED ASSESSMENT
vii
c) Promote overbank flow - We suggest another process that needs addressing is increasing the frequency and
duration of overbank flow. This is a similar strategy to “reconnecting habitats” but has some important differences.
Unlike reconnecting habitats, promoting overbank flow is appropriate where there are no readily identifiable
confining features. This situation is very common in the study area. Successive floods over the last 200 years,
removal of riparian areas, straightening of the channel, and removal of LWD have created very efficient “bowling
alleys” out of many of the streams. In order to “reconnect” these streams to their floodplains, restoration
strategies are needed that promote overbank flow. Strategies that either cause avulsions, deposition, and the
slowing of flows would all help to achieve greater overbank flow. The IMW has recently installed almost 700 wood
structures in Charley, North Fork, and South Fork Asotin Creeks and demonstrated that overbank flow can be
achieved in these systems. Once overbank flow is more common, riparian areas will have the ability to expand (i.e.,
more water on floodplain), more refuge habitat will be available for fish during high flows, wood recruitment will
increase, and groundwater recharge will increase. These responses can lead to improved riparian function, less
solar input to streams (less heating), and better sediment sorting and storing (i.e., more gravel bars created for
spawning, more sediment trapped on floodplain).
3) Long-term processes
a) Riparian management - Many of the mainstems of the study creeks have some form of riparian protection and
as a result riparian function is moderate to high in the majority of the study area. However, significant areas are
still in need of riparian protection. A variety of riparian management strategies will be required depending on the
specific conditions and needs of landowners. In many areas, invasive weeds and/or upland encroachment are
impairing the function of riparian areas. Active weed management and planting may be required in these areas. In
other areas, grazing pressure is damaging riparian plants or preventing recruitment. Fencing and off-site water
developments have been proven to help manage grazing pressure in these situations and have been successfully
implemented by ACCD and their partners in the study area.
4) Long-term processes
a) Improve Instream Habitat - A common impairment of fish habitat in Asotin County is low habitat diversity. The
limited riparian function, limited floodplain connection, and past floods have all led to low volumes of LWD in the
streams. Large wood is a main driver of habitat complexity and its importance in stream processes is no longer in
dispute (Roni et al. 2015). There are several alternatives to adding large wood to create habitat complexity. In
areas of confinement and high densities of infrastructure (i.e., near towns and bridges), restoration strategies will
require engineered approaches to reduce the potential that structures will fail or cause unintended consequences.
However, in large portions of the study area where infrastructure is minimal, it may be appropriate to use non-
engineered LWD restoration approaches such as post-assisted log structures or whole trees (Wheaton et al. 2012,
Carah et al. 2014).
Alternative Strategies
There are a variety of other management strategies that could be beneficial to overall restoration objectives which
include:
Fuel reduction is a necessity across the west. Using a coordinated thinning program could be very
effective at meeting fuel reduction, wildlife management, and stream restoration objectives. Snags,
Legacy Trees, Openings, Patches, Piles, Shrubs, and Logs (SLLOPPS) is a forest fuels reduction approach
that can be used to provide LWD small woody debris material for the benefit of forest wildlife and
creating fish habitat (Strong et al. 2016).
ASOTIN COUNTY WATERSHED ASSESSMENT
viii
Traditional riparian management actions (i.e., fencing/exclusion) could be substituted in selected areas
with controlled grazing that focuses on managing the timing, duration, frequency, and intensity of the
grazing. Managed grazing in riparian areas can increase vigor and function and provide landowners with
increased cattle production and alternative grazing areas (Swanson et al. 2015, Kozlowski et al. 2016).
Recognition and use of beavers as nature’s engineers is not new, but the increase in beaver management
as a part of stream restoration has become very popular in recent years (Pollock et al. 2015, Bouwes et al.
2016b). There is an enormous potential in the study area to achieve multiple objectives at low cost by
having beavers do the work. We suspect that many of the perennial streams were home to beaver
populations prior to Euro-American settlement. Evidence of beaver activity is still common, and dams
have been documented on the mainstem of Charley, North Fork, and South Fork Asotin Creeks. It is
speculated that high densities of cougars and poor habitat conditions (long stretches of shallow habitat)
are preventing beaver from recolonizing the study area. We propose developing a beaver management
plan in conjunction with WDFW and local landowners prior to attempting a reintroduction.
Nutrient enhancement (e.g., adding fish carcasses or analogs) has the potential to increase the
effectiveness of stream restoration actions and this strategy could be implemented as a trial in the study
area. There was a much more diverse fish assemblage in the study area historically and much higher
densities of returning adults which would have provided substantial marine derived nutrients to the
system. The reduced diversity and abundance of anadromous fish could be limiting the current carrying
capacity and this could be tested with a trial. Nutrient enhancement has been moderately successful in
some areas, but it is not widely used, and it is not clear how effective it is (Harvey and Wilzbach 2010,
Childress et al. 2014, Bellmore et al. 2017).
Conceptual Restoration Plan
We used the results from this assessment to develop a Conceptual Restoration Plan in a separate report. The
Conceptual Restoration Plan identifies and prioritizes restoration actions in 83 unique project areas within Asotin
County. We developed the Conceptual Restoration Plan with input from the Nez Perce tribe, landowners, state and
local agencies, Salmon Recovery Funding Board, Bonneville Power Administration, and oversight from Asotin
County Conservation District, and the Snake River Salmon Recovery Board.
ASOTIN COUNTY WATERSHED ASSESSMENT
ix
CONTENTS
Key Findings & Recommended Restoration Strategies ................................................................................................ iv
Contents ....................................................................................................................................................................... ix
List of Abbreviations ................................................................................................................................................... xiv
Key Definitions ............................................................................................................................................................. xv
List of Figures ............................................................................................................................................................... xv
List of Tables .............................................................................................................................................................. xvii
List of Appendices ....................................................................................................................................................... xix
Appendix A – Maps and Data Summaries .............................................................................................................. xix
Appendix B – Tables ............................................................................................................................................... xxi
Appendix C – Figures ............................................................................................................................................. xxii
Appendix D – Network Tools Background Information ........................................................................................ xxiii
Appendix E. Summary of Assessment REsults and Recommendations for Restoration Strategies. .................... xxiii
Appendix F. Summary of Assessment Results and Recommendations for Restoration Strategies ..................... xxiii
1. Introduction ............................................................................................................................................................... 1
1.1. Background ................................................................................................................................................. 1
1.2. Goals & Objectives ...................................................................................................................................... 1
1.3. Assessment Framework .............................................................................................................................. 3
1.4. Restoration Framework .............................................................................................................................. 6
1.5. Report Organization ................................................................................................................................... 7
2. Study Area ................................................................................................................................................................. 7
3. History and Land Use ................................................................................................................................................. 9
3.1 Native American History and Land Use ........................................................................................................... 9
3.2 Euro-American History and Land Use............................................................................................................ 11
3.2.1. Lewis and Clark .................................................................................................................................... 11
3.2.2. Fur Trade/Pre-settlement .................................................................................................................... 12
3.2.3. Euro-American Settlement .................................................................................................................. 12
3.2.4. Current Land Use and Conservation .................................................................................................... 13
4. Geologic and Watershed Setting ............................................................................................................................. 14
4.1 Geologic Setting ............................................................................................................................................ 14
4.2 Landscape Units ............................................................................................................................................ 14
ASOTIN COUNTY WATERSHED ASSESSMENT
x
4.3 Hydrology ...................................................................................................................................................... 16
4.3.1. Hydrologic Regimes and Climate Change ............................................................................................ 16
4.3.2. Stream Flow Monitoring and Annual Statistics.................................................................................... 16
4.3.3. Floods and Return Intervals ................................................................................................................. 20
4.3.4. HydroGeology ...................................................................................................................................... 20
4.4 Sediment Sources and Routing ..................................................................................................................... 21
4.4.1. General Sediment Sources and Characteristics ................................................................................... 21
4.4.2. Sediment Budget Analysis ................................................................................................................... 22
5. Fish Resources ......................................................................................................................................................... 24
5.1 Historic Fish Abundance and Recovery Goals ............................................................................................... 24
5.2 Fish Presence, Status, and Distribution ......................................................................................................... 25
5.2.1. Steelhead ............................................................................................................................................. 26
Population Status .......................................................................................................................................... 26
Distribution and Timing ................................................................................................................................. 27
Abundance and Age Structure ...................................................................................................................... 27
5.2.2. Chinook salmon ................................................................................................................................... 27
5.2.3. Bull trout .............................................................................................................................................. 28
5.2.4. Lamprey ............................................................................................................................................... 28
5.3 Linking Fish Habitat Requirements to Geomorphic Function ....................................................................... 31
5.4 Limiting Factors ............................................................................................................................................. 31
6. Watershed Assessment and Restoration Prioritization Methods ........................................................................... 33
6.1 Geomorphic Assessment - Reach Classification ............................................................................................ 34
6.1.1. Stacked Long Profiles and Sediment Transport Zones ......................................................................... 35
6.2 Geomorphic Assessment - Reach Conditon (River Styles Stage 2) ................................................................ 35
6.2.1. Capacity for Reaches to Adjust and River Evolution ............................................................................ 36
6.2.2. Determining Geomorphic Condition Categories.................................................................................. 37
6.3 Geomorphic Assessment - Recovery Potential (River Styles Stage 3) ........................................................... 37
6.4 Supporting Network Analyses and Landscape Assessment .......................................................................... 39
6.4.1. Riparian Condition and Floodplain Fragmentation Assessment .......................................................... 40
High Resolution Valley Fragmentation Analysis ............................................................................................ 40
6.4.2. Water Quality....................................................................................................................................... 40
Pollutants 40
ASOTIN COUNTY WATERSHED ASSESSMENT
xi
Stream Temperature Assessment ................................................................................................................. 40
6.4.3. Beaver Restoration Assessment Tool (BRAT)....................................................................................... 41
6.4.4. Fish Passage ......................................................................................................................................... 41
7. Watershed Assesssment Results ............................................................................................................................. 42
7.1 Geomorphic Assessment Results .................................................................................................................. 42
7.1.1. Reach Types (Stage 1) .......................................................................................................................... 42
Reach type Description - Confined Valley Setting ......................................................................................... 42
Reach Types - Partly Confined Valley Setting ................................................................................................ 43
Reach Types - Laterally Unconfined Valley Setting ....................................................................................... 44
Long Profiles Results...................................................................................................................................... 44
7.1.2. Reach Type Summary .......................................................................................................................... 47
7.1.3. Geomorphic Condition Assessment Results (River Styles Stage 2) ...................................................... 47
7.1.4. Geomorphic Condition Summary ........................................................................................................ 51
7.1.5. Recovery Potential Results (River Styles Stage 3) ................................................................................ 51
7.2 Riparian Condition and Floodplain Fragmentation Results ........................................................................... 51
7.2.1. Riparian Vegetation Departure (RVD) .................................................................................................. 52
7.2.2. Riparian Vegetation Conversion Type (RVCT) ...................................................................................... 52
7.2.3. Riparian Condition Assessment (RCA) ................................................................................................. 52
7.2.4. High Resolution Floodplain Connection Analysis ................................................................................. 53
7.2.5. Riparian Condition Summary ............................................................................................................... 53
7.3 Water Quality Results .................................................................................................................................... 53
7.3.1. Pollutants ............................................................................................................................................. 53
7.3.2. Temperature Assessment Results ........................................................................................................ 53
7.3.3. Water Quality Summary ...................................................................................................................... 54
7.4 Beaver Restoration Assessment Results ....................................................................................................... 54
7.4.1. Beaver Restoration Assessment Summary .......................................................................................... 55
7.5 Fish Barriers ................................................................................................................................................... 55
8. Assessment Summary and Goals for Restoration .................................................................................................... 55
8.1 Assessment Summary ................................................................................................................................... 55
8.2 Restoration Goals .......................................................................................................................................... 56
9. Restoration Strategies ............................................................................................................................................. 56
9.1 Protect and maintain natural processes ....................................................................................................... 57
ASOTIN COUNTY WATERSHED ASSESSMENT
xii
9.1.1. Protect fragile soils, maintain soil conservation practices, and protect and enhance riparian areas . 57
9.2 Remove barriers and reconnect disconnected habitats ............................................................................... 57
9.2.1. Barrier removal .................................................................................................................................... 57
9.2.2. Reconnect habitats .............................................................................................................................. 57
9.2.3. Promote overbank flow ....................................................................................................................... 57
9.3 Long-term processes ..................................................................................................................................... 58
9.3.1. Riparian management ......................................................................................................................... 58
9.4 Short-term processes .................................................................................................................................... 58
9.5 Alternative Strategies .................................................................................................................................... 58
10. Restoration Reach Summaries ............................................................................................................................... 61
10.1 Alpowa Creek ............................................................................................................................................ 61
10.1.1. Reach: AP_01 – RM 0.0 to 0.6 ......................................................................................................... 62
10.1.2. Reach: AP_02 – RM 0.6 to 13.9 ....................................................................................................... 63
10.1.3. Reach: AP_03 – RM 13.9 to 19.6 ..................................................................................................... 65
10.1.4. Pow Wah Kee Gulch ........................................................................................................................ 67
Reach PW_01 – RM 0.0 - 3.0 ......................................................................................................................... 67
10.2 Asotin Creek ............................................................................................................................................. 69
10.2.1. Reach: AC_01 – RM 0.0 to 0.4 ......................................................................................................... 69
10.2.2. Reach: AC_02 – RM 0.4 to 7.3 ......................................................................................................... 71
10.2.3. Reach: AC_03 – RM 7.3 to 8.3 ......................................................................................................... 73
10.2.4. Reach: AC_04 – RM 8.3 to 15.4 ....................................................................................................... 74
10.3 Charley Creek ............................................................................................................................................ 77
10.3.1. Reach: CC_01 – RM 0.0 to 2.0 ......................................................................................................... 77
10.3.2. Reach: CC_02 – RM 2.0 to 7.9 ......................................................................................................... 80
10.3.3. Reach: CC_03 – RM 7.9 to 13.0 ....................................................................................................... 82
10.4 North Fork Asotin Creek ........................................................................................................................... 83
10.4.1. Reach: NF_01 – RM 0.0 to 0.8 ......................................................................................................... 83
10.4.2. Reach: NF_02 – RM 0.8 to 10.1 ....................................................................................................... 85
10.4.3. Reach: NF_03 – RM 0.0 to 2.3 (South Fork of North Fork) ............................................................. 86
10.4.4. Reach: NF_04 – RM 0.0 to 3.8 (Middle Fork of North Fork)............................................................ 87
10.4.5. Reach: NF_05 – RM 10.1 to 17.4 (North Fork of North Fork) ......................................................... 88
10.5 Lick Creek .................................................................................................................................................. 89
ASOTIN COUNTY WATERSHED ASSESSMENT
xiii
10.5.1. Reach: LC_01 – RM 0.0 to 0.2 ......................................................................................................... 89
10.5.2. Reach: LC_02 and LC_03 – RM 0.2 to 6.4 ........................................................................................ 90
10.6 South Fork Asotin Creek ........................................................................................................................... 91
10.6.1. Reach SF_01 – RM 0.0 to 10.9 ......................................................................................................... 91
10.7 George Creek ............................................................................................................................................ 94
10.7.1. Reach: GC_01 – RM 0.0 to 9.2......................................................................................................... 94
10.7.2. Reach: GC_02 – RM 9 to 10.3.......................................................................................................... 97
10.7.3. Reach: GC_03 to GC_06 – RM 10.3 to 20.1 ..................................................................................... 98
10.8 Pintler Creek ............................................................................................................................................. 99
10.8.1. Reach: PC_01 – RM 0.0 to 3.6 ......................................................................................................... 99
10.8.2. Reach: PC_02 – RM 3.6 to 8.7 ....................................................................................................... 101
10.8.3. Reach: PC_03 – RM 8.7 to 11.2 ..................................................................................................... 102
10.8.4. Reach: PC_04 to 05 ....................................................................................................................... 104
10.9 Tenmile Creek ......................................................................................................................................... 105
10.9.1. Reach: TM_01 – RM 0.0 to 4.5 ...................................................................................................... 106
10.9.2. Reach: TM_02 – RM 4.5 to 10.7 .................................................................................................... 108
10.9.3. Reach: TM_03 – RM 10.7 to 14.8 .................................................................................................. 110
10.9.4. Reach: TM_04 and TM_05 (unnamed tributaries) ....................................................................... 111
10.10 Mill Creek ................................................................................................................................................ 112
10.10.1. Reach: MC_01 – RM 0.0 – 4.7 ....................................................................................................... 112
10.11 Couse Creek ............................................................................................................................................ 114
10.11.1. Reach: C0_01 – RM 0.0 to 3.2 ....................................................................................................... 114
10.11.2. Reach: CO_02 – RM 3.2 to 7.4 ...................................................................................................... 116
10.11.3. Reach: CO_03 and CO_04 – RM 3.2 to 6.9 .................................................................................... 117
References ................................................................................................................................................................. 119
Appendix A – Maps and Data Summaries.................................................................................................................. 127
Appendix B – Tables................................................................................................................................................... 156
Appendix C – Figures ................................................................................................................................................. 175
Appendix D – Network Tools Background Information ............................................................................................. 191
Appendix E – Maps with valley extent and confining featrues for each river mile for the extent of 1 m LIDAR. ..... 195
Appendix F. Summary of Assessment FIndings and Recommendations for Restoration Strategies ......................... 196
ASOTIN COUNTY WATERSHED ASSESSMENT
xiv
LIST OF ABBREVIATIONS
ACCD - Asotin County Conservation District
AQEA - Anchor QEA
BDA - Beaver Dam Analog
BRAT - Beaver Restoration Assessment Tool
DEM - Digital elevation model
DoD - DEM of difference
DOE - Washington State Department of Ecology
ELR - Eco Logical Research Inc.
ELJ - Engineered log jam
ESA - Endangered Species Act
ESU - Evolutionary Significant Unit
FSA - Farm Services Agency
GCD - Geomorphic change detection
IMW - Intensively Monitored Watershed
LIDAR - Light detection and ranging
LWD - Large woody debris
NHD - National Hydrography Dataset
NREI - Net rate of energy intake
NOAA - National Oceanic and Atmospheric Administration
NRCS - USDA Natural Resources Conservation Service
PALS - Post-assisted log structure (i.e., the proposed LWD restoration method)
PCSRF - Pacific Coast Salmon Recovery Fund
PTAGIS - PIT Tag Information System
RCAT - Riparian Condition Assessment Tool
RM - River mile
RCO - Washington State Recreation and Conservation Office
RTT - Regional Technical Team
RVD - Riparian Vegetation Departure
RVCT - Riparian Vegetation Conversion Type
SRSRB - Snake River Salmon Recovery Board
ASOTIN COUNTY WATERSHED ASSESSMENT
xv
USFS - United States Forest Service
USGS - United States Geological Survey
WDFW - Washington Department of Fish and Wildlife
KEY DEFINITIONS
Engineered structural elements: discrete objects in the valley bottom that are designed and built to remain static and intact following a predicted discharge (e.g., ELJs, levees, rip-rap, culverts).
Geomorphic unit: landforms with a distinct form to process association. Based on morphology, substrate,
orientation, and forcing mechanism (building blocks of rivers).
Hydraulic units: spatially separated patches of homogenous substrate and surface hydraulics (synonymous with
facies; building blocks of geomorphic units).
Non-engineered structural elements: discrete objects in the valley bottom with a typical design life of 5-10 years.
Structural elements: discrete objects in the valley bottom that directly influence hydraulics (e.g., LWD, bedrock,
beaver dams).
LIST OF FIGURES
Figure 1. Asotin County and the watersheds included in the geomorphic and conceptual restoration planning
process: Alpowa, Asotin, George, Tenmile, and Couse Creeks. Black lines are watershed boundaries, and the thick
borders are the boundaries of Asotin and Garfield Counties. The stream layer is a modified perennial network
based on the known distribution of steelhead and bull trout (Streamnet.org). ........................................................... 2
Figure 2. Landscape setting and land management activities that control the physical, chemical, and biological
processes that lead to formation, sustainability, and spatial and temporal distribution of fish habitat. The
availability of habitat in turn has direct influence on the fitness (e.g., growth, survival, reproductive success),
abundance, and ultimately production of fish populations. Figure adapted Spence et al. (1996). .............................. 4
Figure 3. Reach prioritization and project area restoration framework used in the Asotin Watershed Assessment.
Adapted from Roni et al. (2002). Red arrows indicate that sometimes short-term processes need to be
implemented in order to promote recovery of long-term processes (e.g., adding large woody debris to promote
overbank flow and channel avulsions, which can increase floodplain connection and promote riparian recovery).
See Bennett et al. (2018) for details on the Conceptual Restoration Plan. ................................................................... 7
Figure 4. Development (bars) and population change (line) in the Columbia River Basin. Wide dark bars = peak
development; wide light bars = continued effects (modified from Rieman et al. 2015, Penaluna et al. 2016). ......... 11
Figure 5. Average monthly discharge (cfs) in Asotin Creek measured at USGS gauge 13335050 at the mouth and
North Fork Asotin Creek as determined by subtracting South Fork Asotin Creek discharge from USGS gauge
1334450 just downstream from the confluence of North Fork and South Fork Asotin Creek. ................................... 17
Figure 6. Estimated peak discharge by year at the mouth of Asotin Creek from 1929-2017. Data compiled from
USGS gauges 13334500, 13334700, and 1335050). Data were extrapolated from gauges upstream of George Creek
ASOTIN COUNTY WATERSHED ASSESSMENT
xvi
by regressing data from years when there was overlap with gauges from upstream and downstream of George
Creek. ........................................................................................................................................................................... 18
Figure 7. View looking upstream on mainstem Asotin Creek at Asotin City Park near the mouth: January 1, 1997. . 18
Figure 8. Average monthly discharge (cfs) in Alpowa, Charley Creek, and South Fork Asotin Creek. Charley and
South Fork Asotin Creek discharge was determined by monitoring conducted for the Asotin IMW (Bennett et al.
2015) and Alpowa discharge was determined from DOE gauge 35K050. ................................................................... 19
Figure 9. Timing of fish presence by life stage and month for key species in Asotin Creek. Data based on historic
and ongoing WDFW surveys. Timing of fish presence is expected to be similar for Alpowa, George, Couse, and
Tenmile Creeks if the species is present (see Table 10). ............................................................................................. 29
Figure 10. Presence and approximate distribution of Chinook, steelhead, and bull trout starting at the mouth of the
target watersheds. ....................................................................................................................................................... 30
Figure 11. Factors affecting viability of Asotin Creek Steelhead (SRSFB 2011). .......................................................... 32
Figure 12. Factors affecting viability of Asotin Creek Spring/Summer Chinook (SRSRB 2011). ................................... 32
Figure 13. Summary of our modified River Styles framework as described in Brierley and Fryirs (2005) and O’Brien
et al. (2017). ................................................................................................................................................................. 34
Figure 14. Trajectory of change example for four reach types in target watersheds. Colors represent condition and
arrows represent direction of change (up = improving, across = stable or changing to new type of reach, and down
= degrading). Current conditions are on the left and potential conditions (change) are on the right. ....................... 38
Figure 15. Flow chart showing factors influencing recovery potential of reach types. ............................................... 39
Figure 16. Decision tree for determining trajectory of change for individual reaches. ............................................... 39
Figure 17. Restoration strategies and reach breaks for Alpowa Creek. Reach breaks are labeled by stream and reach
number: AP_01 = Alpowa Creek restoration reach 1. Restoration strategies are defined in Section 9. .................... 61
Figure 18. View of the channel under relatively dense canopy cover in reach AP_01. ............................................... 62
Figure 19. View of reach AP_03. .................................................................................................................................. 65
Figure 20. Restoration strategies and reach breaks for Asotin Creek. Reach breaks are labeled by stream and reach
number: AC_01 = Asotin Creek restoration reach 1. Restoration strategies are defined in Section 9. ...................... 69
Figure 21. Reach AC_01 on the mainstem of Asotin Creek looking upstream from the Highway 129 bridge during a
high flow event. The channel is confined on both sides by rip-rap, restricting floodplain access. ............................. 70
Figure 22. Asotin Creek mainstem at approximately RM 10. Stream has good shade from alder dominated riparian
area. Habitat complexity is moderate with some pools and LWD, but side-channels are rare, banks are relatively
high, and floodplain access is limited. ......................................................................................................................... 75
Figure 23. Riparian enhancement area along Charley Creek above Asotin Creek road. Note road is above the valley
bottom. ........................................................................................................................................................................ 78
Figure 24. Typical condition of Charley Creek with recovering riparian habitat and low instream diversity .............. 80
Figure 25. Typical low diversity section in the lower North Fork Asotin Creek with large alder dominating the
riparian. Note the boulders on river left are remains of old restoration structure. .................................................... 84
Figure 26. Lick Creek ford just upstream of confluence with North Fork Asotin Creek during spring high flow......... 89
ASOTIN COUNTY WATERSHED ASSESSMENT
xvii
Figure 27. South Fork Asotin Creek with typical recovering riparian and low diversity habitat. ................................ 92
Figure 28. Restoration strategies and reach breaks for George Creek. Reach breaks are labeled by stream and reach
number: GC_01 = George Creek restoration reach 1. Restoration strategies are defined in Section 9. .................... 94
Figure 29. Lower George Creek at site of a created meander reach. .......................................................................... 95
Figure 30. Lower Pintler Creek just above the confluence with George Creek. Flows in this section go dry each year.
................................................................................................................................................................................... 100
Figure 31. Restoration strategies and reach breaks for Couse and Tenmile Creeks. Reach breaks are labeled by
stream and reach number: TM_01 = Tenmile Creek restoration 1. Restoration strategies are defined in Section 9.
................................................................................................................................................................................... 105
Figure 32. Alluvial fan at the bottom of reach TM_01 as Tenmile Creek enters the Snake River. ............................ 106
Figure 33. Reach TM_01 upstream of Beckman Gulch depicting the riparian canopy dominated by young alder.
LWD in the channel is typically small and rare. ......................................................................................................... 106
Figure 34. Restoration strategies and reach breaks for Couse and Tenmile Creeks. Reach breaks are labeled by
stream and reach number: CO_01 = Couse Creek restoration 1. Restoration strategies are defined in Section 9. . 114
Figure 35. Lower Couse Creek just upstream of confluence with the Snake River. Flows in this section go subsurface
each year. .................................................................................................................................................................. 115
LIST OF TABLES
Table 1. Framework for assessing the condition and restoration potential of fish habitat in the Asotin County
Watershed Assessment area (Figure 1) and spatial scale at which assessments were conducted. Geomorphic units
are the smallest scale assessed and are the building blocks of reach types, streams, and ultimately fish habitat
(Wheaton et al. 2015). ................................................................................................................................................... 5
Table 2. Basin characteristics for the Asotin Creek, four Asotin Creek tributaries (George, Charley, North Fork, and
South Fork Creeks), and Alpowa, Tenmile, and Couse Creek. ....................................................................................... 9
Table 3. Distinguishing characteristics of landscape units in the Asotin Creek drainage. ........................................... 15
Table 4. Discharge records available with the target watersheds and estimates of mean annual and peak flows (cfs)
for the period of each gauge station. Estimates are modeled from stage height relationships and estimates from
Asotin Creek, Charley Creek, and North and South Fork Asotin Creeks were derived from filling in data gaps with
correlations with other nearby gauges. ....................................................................................................................... 17
Table 5. Predicted discharge (cfs) based on gauge data and basin characteristics for the main basins within Asotin
Creek watershed based on regional regressions using USGS Stream Stats tool. ........................................................ 20
Table 6. Mean substrate distribution based on standard Wollman pebble counts (Wolman 1954) from Asotin Creek
Intensively Monitored Watershed project: 2011-2016. .............................................................................................. 22
Table 7. Relative proportions of fine sediment delivery estimated by ACCD (1995) from streams in the Asotin Creek
watershed to the Snake River. Table reproduced from Model Watershed sediment budget. ................................... 23
ASOTIN COUNTY WATERSHED ASSESSMENT
xviii
Table 8. Estimates of historic fish abundance based on run reconstruction from habitat availability and spawning
densities (Pess et al. in review). Abundance estimates presented are one third of full capacity. .............................. 25
Table 9. Estimate of viable abundance estimates, and sustainable and ecological escapement objectives for
Chinook and steelhead in Asotin, Tucannon, and Lolo Creek. Lolo Creek is a tributary to the Clearwater River and
was included because it is similar in size to Asotin Creek (SRSRB 2011, NPT 2013). .................................................. 25
Table 10. Estimates of naturally reproduced adult steelhead and juvenile outmigrants in Asotin, George, Alpowa,
and Tenmile Creeks based on adult weir and rotary screw trap data (Crawford and Herr 2017). ............................. 27
Table 11. Capacity for adjustment by reach type and valley setting. Capacity for adjustment represents the range of
morphological adjustments caused by natural changes in biological/physical processes that do not result in a
change in the reach type. ............................................................................................................................................ 36
Table 12. Example of geoindicators used to measure the geomorphic function of reach types in confined valley
settings in the Asotin Creek watershed. See Appendix B for examples of other reach types. .................................... 37
Table 13. Characteristics and attributes of valley settings and reach types in the Asotin Watershed Assessment
Area. ............................................................................................................................................................................ 45
Table 14. Geomorphic conditions generally associated with high, moderate, and limited geomorphic function for a)
confined with occasional floodplain, b) partly confined wandering gravel bed with discontinuous floodplain, and c)
partly confined with discontinuous floodplain. ........................................................................................................... 48
Table 15. Summary of habitat factors and associated objectives for Asotin Assessment Study Area Major Spawning
Areas (MaSA). Reproduced from SRSRB (2011)........................................................................................................... 56
Table 16. Steelhead and spring Chinook salmon limiting factors addressed by proposed restoration strategies. Dots
indicate restoration actions that may reduce or eliminate the influence of limiting factors...................................... 60
Table 17. Restoration recommendations for Alpowa Creek reach AP_01. ................................................................. 63
Table 18. Restoration recommendations for Alpowa Creek reach AP_02. ................................................................. 65
Table 19. Restoration recommendations for Alpowa Creek reach AP_03. ................................................................. 66
Table 20. Restoration recommendations for Pow Wah Kee Gulch reach PW_01. ...................................................... 68
Table 21. Restoration recommendations for Asotin Creek mainstem reach AC_01. .................................................. 71
Table 22. Restoration recommendations for Asotin Creek mainstem reach AC_02. .................................................. 73
Table 23. Restoration recommendations for Asotin Creek mainstem reach AC_03. .................................................. 74
Table 24. Restoration recommendations for Asotin Creek mainstem reach AC_04. .................................................. 77
Table 25. Restoration recommendations for Charley Creek reach CC_01. ................................................................. 80
Table 26. Restoration recommendations for Charley Creek reach CC_02 .................................................................. 82
Table 27. Restoration recommendations for Charley Creek reach CC_03. ................................................................. 83
Table 28. Restoration recommendations for North Fork Asotin Creek reach NF_01. ................................................. 85
Table 29. Restoration recommendations for North Fork Asotin Creek reach NF_02. ................................................. 86
Table 30. Restoration recommendations for South Fork of North Fork reach NF_03. ............................................... 87
Table 31. Restoration recommendations for Middle Fork of North Fork reach NF_04. .............................................. 88
ASOTIN COUNTY WATERSHED ASSESSMENT
xix
Table 32. Restoration recommendations for North Fork of North Fork reach NF_05. ............................................... 89
Table 33. Restoration recommendations for Lick Creek reach LC_01. ........................................................................ 90
Table 34. Restoration recommendations for Lick Creek reach LC_02. ........................................................................ 91
Table 35. Restoration recommendations for South Fork Asotin Creek reach SF_01. ................................................. 93
Table 36. Restoration recommendations for George Creek reach GC_01. ................................................................. 97
Table 37. Restoration recommendations for George Creek reach GC_02. ................................................................. 98
Table 38. Restoration recommendations for George Creek reach GC_03 to GC_06. ................................................. 99
Table 39. Restoration recommendations for Pintler Creek reach PC_01. ................................................................. 101
Table 40. Restoration recommendations for Pintler Creek reach PC_02. ................................................................. 102
Table 41. Restoration recommendations for Pintler Creek reach PC_03. ................................................................. 103
Table 42. Restoration recommendations for Pintler Creek reach PC_04 to PC_05. ................................................. 105
Table 43. Restoration recommendations for Tenmile Creek reach TM_01. ............................................................. 108
Table 44. Restoration recommendations for Tenmile Creek reach TM_02. ............................................................. 110
Table 45. Restoration recommendations for Tenmile Creek reach TM_03. ............................................................. 111
Table 46. Restoration recommendations for Tenmile Creek reach TM_04 to 05 (unnamed tributaries of Tenmile).
................................................................................................................................................................................... 112
Table 47. Restoration recommendations for Mill Creek reach MC_01. .................................................................... 113
Table 48. Restoration recommendations for Couse Creek reach CO_01. ................................................................. 116
Table 49. Restoration recommendations for Couse Creek reach CO_02. ................................................................. 117
Table 50. Restoration recommendations for Couse Creek reach CO_03 and CO_04................................................ 118
LIST OF APPENDICES
APPENDIX A – MAPS AND DATA SUMMARIES
Appendix A. 1. Mean annual precipatation across Asotin County (PRISM 2016). ..................................................... 127
Appendix A. 2. Landownership by watershed for the Asotin Creek Assessment study area (USDA 2016). .............. 128
Appendix A. 3. Land cover classifications for the Asotin Assessment study area (USEPA 2013). ............................. 129
Appendix A. 4. Land use classification for Asotin Assessment study area (DOE 2010). ............................................ 130
Appendix A. 5. Hydrogeomorphic classification of Washington state rivers based on analysis by Liermann et al.
(2012). Current hydrologic regime classified as groundwater, snow-rain, or snowmelt dominated. ....................... 131
Appendix A. 6. Hydrogeomorphic classification of Washington state rivers based on analysis by Liermann et al.
(2012). Predicted under a common climate change scenario where the climate hydrologic regime classified as
groundwater, snow-rain, or snowmelt dominated. .................................................................................................. 132
ASOTIN COUNTY WATERSHED ASSESSMENT
xx
Appendix A. 7. Landscape units that represent areas with unique geologic, soil, elevation, topography, climate, and
vegetation characteristics. Mapping based on EPA Ecoregion mapping (Omernik and Griffith 2014) and geologic
mapping (Schuster 1993). .......................................................................................................................................... 133
Appendix A. 8. Distribution of steelhead and bull trout including known migration, rearing, and spawning extents
(Streamnet.org). Spring Chinook salmon do migrate, rear, and/or spawn in the mainstem Asotin Creek, upper
Asotin Creek tributaries, and Alpowa Creek, but in very low numbers. .................................................................... 134
Appendix A. 9. Location of geomorphic and riparian assessment validation sites, Asotin Creek Intensively
Monitored temperature probes, fish, and habitat monitoring sites (2008-2017), and General Land Survey township
and range transect survey notes at selected stream crossings (BLM 2018).............................................................. 135
Appendix A. 10. Valley confinement (pie charts) and reach types (colored stream segments) for the perennial
network of the Alpowa, Asotin, Tenmile, and Couse Creek (O’Brien et al. 2014, 2017). .......................................... 136
Appendix A. 11. Valley confinement and reach types for the entire NHD stream network by target watershed
(O’Brien et al. 2014, 2017). ........................................................................................................................................ 137
Appendix A. 12. Geomorphic function of the perennial stream network by target watershed. Note - we did not
identify any reaches in the full function category (O’Brien et al. 2014, 2017). ......................................................... 138
Appendix A. 13. Geomorphic function of the entire NHD stream network by target watershed. Note - we did not
identify any reaches in the full function category (O’Brien et al. 2014, 2017). ......................................................... 139
Appendix A. 14. Recovery Potential Assessment (O’Brien et al. 2014, 2017). .......................................................... 140
Appendix A. 15. Riparian Vegetation Departure Assessment (RVD). Vegetation departure was estimated from the
difference between the current riparian extent and the historic riparian extent using LANDFIRE vegetation data
(Macfarlane et al. 2016). ........................................................................................................................................... 141
Appendix A. 16. Riparian vegetation conversion type assessment (RVCT). Vegetation conversion type was
estimated from the difference between the current riparian composition and the historic riparian composition
using LANDFIRE vegetation data (e.g., historic willow dominated riparian converted to alfalfa cover would be
labeled as “Conversion to Agriculture”; Macfarlane et al. 2016). ............................................................................. 142
Appendix A. 17. Riparian Condition Assessment (RCA) on the perennial network. Resolution of data required
classifying small streams in narrow valley settings (i.e., confined) as either impacted or unimpacted based on
presence of development (e.g., roads or infrastructure). All other streams were classified based on estimated
riparian function (Macfarlane et al. 2016)................................................................................................................. 143
Appendix A. 18. Riparian Condition Assessment (RCA) on NHD network. Resolution of data required classifying
small streams in narrow valley settings (i.e., confined) as either impacted or unimpacted based on presence of
development (e.g., roads or infrastructure). All other streams were classified based on estimated riparian function
(Macfarlane et al. 2016). ........................................................................................................................................... 144
Appendix A. 19. Floodplain Connectivity Assessment. The amount of floodplain (valley bottom) disconnected due
to development activities (roads and infrastructure) was estimated by the Riparian Assessment Tools (Appendix A.
7-9). We refined the estimate of disconnected floodplain by using existing hand digitized levees and rip-rap
locations using 1 m digital elevation data to delineate a new valley bottom layer. The percent disconnected
floodplain was estimated by dividing the new valley bottom layer by the original valley bottom extent x 100. ..... 145
ASOTIN COUNTY WATERSHED ASSESSMENT
xxi
Appendix A. 20. Stream Temperature Model results for July 2011. Line segment colors represent the number of
weeks a reach exceeds 64.4 °F (18 °C) during the summer (June – September – 15 weeks). Pie charts represent the
percent of RMs that exceed 64.4 °F (McNyset et al. 2015). ...................................................................................... 146
Appendix A. 21. Stream Temperature Model results for summer 2015 (June – September). Line segment colors
represent the number of weeks a reach exceeds 64.4 °F (18 °C). Pie charts represent the percent of RMs that
exceed 64.4 °F (McNyset et al. 2015). ....................................................................................................................... 147
Appendix A. 22. Stream Temperature Model results for summer 2011 (June – September). Line segment colors
represent the number of weeks a reach exceeds 68 °F (20 °C). Pie charts represent the percent of RMs that exceed
68 °F (McNyset et al. 2015). ...................................................................................................................................... 148
Appendix A. 23. Stream Temperature Model results for summer 2015 (June – September). Line segment colors
represent the number of weeks a reach exceeds 68 °F (20 °C). Pie charts represent the percent of RMs that exceed
68 °F (McNyset et al. 2015). ...................................................................................................................................... 149
Appendix A. 24. Current capacity to support dam building beaver based on results of the Beaver Restoration
Assessment Tool (Macfarlane et al. 2015)................................................................................................................. 150
Appendix A. 25. Historic capacity to support dam building beaver based on results of the Beaver Restoration
Assessment Tool (Macfarlane et al. 2015)................................................................................................................. 151
Appendix A. 26. Beaver conflict potential based on the results of the Beaver Restoration Assessment Tool
(Macfarlane et al. 2015). ........................................................................................................................................... 152
Appendix A. 27. Beaver management zones based on the results of the Beaver Restoration Assessment Tool
(Macfarlane et al. 2015). ........................................................................................................................................... 153
Appendix A. 28. Fish passage assessment conducted by Walla Walla Community College for the Snake River Salmon
Recovery Board in 2008-2009 (WWCC 2009). Potential barriers are low flow or subsurface flow identified at the
mouth of Couse and Tenmile Creeks. ........................................................................................................................ 154
Appendix A. 29. Conservation and enhancement reaches for maintenance of natural processes and potential trial
beaver reintroduction locations. ............................................................................................................................... 155
APPENDIX B – TABLES
Appendix B. 1. Basic habitat requirements and limiting factors of steelhead, Chinook, and bull trout and links to
how geomorphic and riparian functions affect these factors. .................................................................................. 156
Appendix B. 2. Summary and key findings of numerous assessments, monitoring, and planning projects completed
in Asotin County since 1995. ..................................................................................................................................... 157
Appendix B. 3. Indigenous and introduced fish species present in Asotin Creek Watershed and their approximate
distribution (ACCD 2004). .......................................................................................................................................... 159
Appendix B. 4. Geoindicators used to measure the geomorphic function of river styles in partly confined valley
settings in the Asotin Creek watershed. .................................................................................................................... 160
Appendix B. 5. Geoindicators used to measure the geomorphic function of river styles in laterally unconfined valley
settings in the Asotin Creek watershed. .................................................................................................................... 161
ASOTIN COUNTY WATERSHED ASSESSMENT
xxii
Appendix B. 6. Criteria and measures used to assess geomorphic function of variants of the Planform controlled
discontinuous floodplain reach type in partly confined valley settings (adapted from Brierley and Fryirs 2005). ... 162
Appendix B. 7. Criteria and measures used to assess geomorphic function of variants of the Wandering gravel bed
with discontinuous floodplain reach type in partly confined valley settings (Brierley and Fryirs 2005). See Table
Appendix for other reach types. ................................................................................................................................ 163
Appendix B. 8. Criteria and measures used to assess geomorphic function of variants of the Fan controlled with
discontinuous floodplain reach type in partly confined valley settings (Brierley and Fryirs 2005). .......................... 165
Appendix B. 9. Criteria and measures used to assess geomorphic function of variants of the Wandering gravel bed
with discontinuous floodplain reach type in partly confined valley settings (Brierley and Fryirs 2005). .................. 166
Appendix B. 10. Criteria and measures used to assess geomorphic function of variants of the Bedrock canyon reach
type in confined valley settings (Brierley and Fryirs 2005). ....................................................................................... 167
Appendix B. 11. Criteria and measures used to assess geomorphic function of variants of the Steep ephemeral
hillslope reach type in confined valley settings (Brierley and Fryirs 2005). .............................................................. 169
Appendix B. 12. Criteria and measures used to assess geomorphic function of variants of the Steep perennial
headwater reach type in confined valley settings (Brierley and Fryirs 2005). .......................................................... 170
Appendix B. 13. Criteria and measures used to assess geomorphic function of variants of the Confined occasional
floodplain pockets reach type in confined valley settings (Brierley and Fryirs 2005). .............................................. 170
Appendix B. 14. Criteria and measures used to assess geomorphic function of variants of the Upland swale reach
type in laterally unconfined valley settings (Brierley and Fryirs 2005). ..................................................................... 172
Appendix B. 15. Temperature requirements for cold water salmon, trout and char (DOE 2002). ........................... 173
Appendix B. 16. Summary of water temperature data collected across the study area from 2009-2016 (data
sources are DOE stream gauges and IMW temperature monitoring). ...................................................................... 174
APPENDIX C – FIGURES
Appendix C. 1. River evolution sequences for partly confined a) fan controlled, b) planform controlled, and c)
wandering gravel bed reach types. These reach types encompass the majority of the steelhead distribution in the
target watersheds. Evolution sequences allow us to look back to how reach form and function was prior to
development and land use impacts. .......................................................................................................................... 175
Appendix C. 2. Flowchart showing the workflow of the a) Riparian Vegetation Departure index and b) Riparian
Vegetation Conversion Type Classification (MacFarlane et al. 2017)........................................................................ 178
Appendix C. 3. Proportion and length (RMs) of valley setting and reach types by watershed for the perennial
network. .................................................................................................................................................................... 179
Appendix C. 4. Proportion and length (RMs) of the perennial stream network by geomorphic function type and
target watershed. ...................................................................................................................................................... 180
Appendix C. 5. Reach type decision tree describing the character of each reach type and how it is differentiated
from other reach types within three valley setting: a) confined, b) partly confined, and c) laterally unconfined.... 183
Appendix C. 6. Proportion and length (RMs) of the perennial stream network by riparian function and target
watershed. ................................................................................................................................................................. 184
ASOTIN COUNTY WATERSHED ASSESSMENT
xxiii
Appendix C. 7. Long profiles of a) Alpowa Creek, b) Asotin Creek (including North Fork Asotin Creek), c) Couse
Creek, and d) Tenmile Creek...................................................................................................................................... 185
Appendix C. 8. Average mean, minimum, and maximum stream temperature from May 1 to October 30 for
Alpowa, George, and Tenmile Creeks: 2011-2016. Date represent the lower river mile (RM) of each stream. All data
are from DOE stream gauges. See Table 4 for site names......................................................................................... 189
Appendix C. 9. Average mean, minimum, and maximum stream temperature from May 1 to October 30: 2013-
2016. Asotin Creek mainstem just above George Creek at river mile (RM) 3.2, Asotin Creek below the confluence
of South Fork and Asotin Creeks (RM 14), and North Fork Asotin Creek (RM 22*). North Fork RM 22* represents
the distance from the mouth of Asotin Creek to 6.8 miles upstream on North Fork Creek. Data are from the DOE
stream gauge above George Creek and IMW temperature surveys. ........................................................................ 190
APPENDIX D – NETWORK TOOLS BACKGROUND INFORMATION
Appendix D. 1 Description of the riparian vegetation departure tool (RVD) and source of GIS code (Macfarlane et al.
2016, Macfarlane et al. 2018). ................................................................................................................................... 192
Appendix D. 2 Description of the riparian vegetation condition assessment tool (RCA) and source of GIS code
(Macfarlane et al. 2016, Macfarlane et al. 2018). ..................................................................................................... 193
Appendix D. 3. Description of the beaver restoration assessment tool (BRAT) and source of GIS code (Macfarlane et
al. 2016, Macfarlane et al. 2018). .............................................................................................................................. 194
APPENDIX E. SUMMARY OF ASSESSMENT RESULTS AND RECOMMENDATIONS FOR
RESTORATION STRATEGIES.
Appendix E. 1. See separate attachment (100 + maps) ............................................................................................ 195
APPENDIX F. SUMMARY OF ASSESSMENT RESULTS AND RECOMMENDATIONS FOR
RESTORATION STRATEGIES
Appendix F. 1. Summary of the Asotin County Assessment results by restoration reach and recommended
restoration strategies for Alpowa and Asotin Creeks and their tributaries. Map number refers to the stream and
section number of Appendix E of the complete assessment report. Appendix E provides 1 m LIDAR imagery, and
delineation of valley extent and anthropogenic confining features by river mile (RM) for the mainstem of each
study creek. See figures and appendix in the report for definitions of the color codes. .......................................... 197
Appendix F. 2. Summary of the Asotin County Assessment results by restoration reach and recommended
restoration strategies for George, Couse, Tenmile Creeks, and their tributaries. Map number refers to the stream
and section number of Appendix E of the complete assessment report. Appendix E provides 1 m LIDAR imagery,
and delineation of valley extent and anthropogenic confining features by river mile (RM) for the mainstem of each
study creek. See figures and appendix in the report for definitions of the color codes. .......................................... 198
1. INTRODUCTION
1.1. BACKGROUND
The Asotin County Conservation District (ACCD) contracted with Eco Logical Research, Inc. (ELR) to conduct a
geomorphic focused Watershed Assessment and develop a Conceptual Restoration Plan for Alpowa, Asotin, Couse,
and Tenmile Creeks (hereafter referred to as the study area; Figure 1). We divided the Asotin Creek watershed into
the Asotin Creek mainstem and George Creek for much of the assessment because George Creek makes up over
40% of the area of the Asotin Creek watershed, and the two creeks have distinct geomorphic characteristics. The
watershed assessment and conceptual restoration plan are part of an overall effort within the Snake River Salmon
Recovery Region to develop watershed-based strategic management plans that prioritize restoration projects that
will most benefit the recovery of Endangered Species Act (ESA) listed salmon and steelhead and other species of
management concern (e.g., AQEA 2011, GeoEngineers 2011). Eco Logical Research, Inc., in partnership with Anchor
QEA (AQEA), used existing assessments as a template for conducting a geomorphic focused watershed assessment
(hereafter “assessment”) of the study area. We used the results from the assessment to develop a Conceptual
Restoration Plan we provided in a stand-alone report. The approach we used will provide continuity with regional
goals and objectives for stream restoration and species recovery. The ultimate goal of the assessment and
conceptual restoration plan is to promote implementation of restoration projects that will improve habitat for
steelhead (Oncorhynchus mykiss), Chinook salmon (O. tshawytscha), bull trout (Salvelinus confluentus), Pacific
Lamprey (Entosphenus tridentatus), and other fish species while maintaining viability of local communities and
agricultural producers.
1.2. GOALS & OBJECTIVES
We recognize that regardless of the rigor of the assessments and planning, the success of the project will
ultimately hinge on stakeholder support. Therefore, communication and information sharing with local
communities, landowners, and land management agencies is critical. We recognize there is a long history of public
involvement in watershed restoration in the study area (e.g., ACCD 1995). The ACCD coordinated meetings, input,
and review from both the public and Working Group to facilitate collaboration in the development of the
assessment and conceptual restoration plan.
The goals of the Asotin County watershed assessment are to:
1) provide a summary and background of historic conditions, limiting factors, and status of fish distribution
and habitat requirements,
2) conduct a comprehensive watershed assessment to evaluate the ecological function and geomorphic
condition of the study area,
3) identify current impacts to fish and their habitats, and
4) outline potential restoration actions to mitigate current impacts.
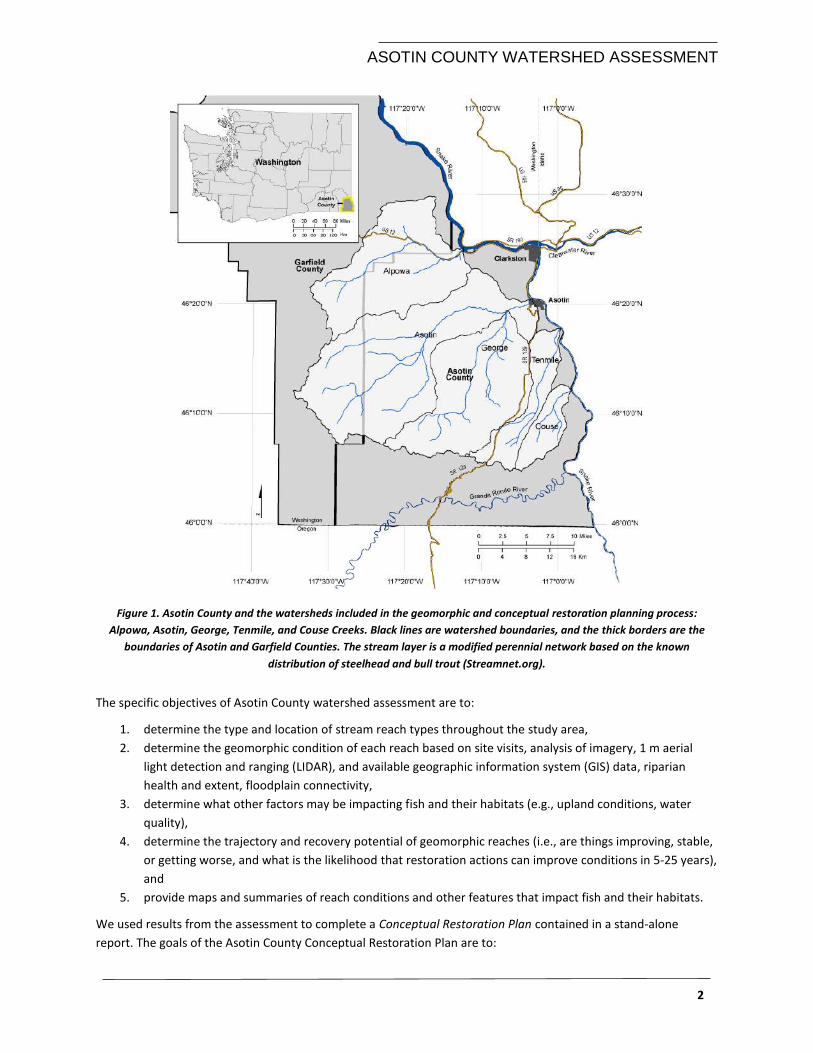
ASOTIN COUNTY WATERSHED ASSESSMENT
2
Figure 1. Asotin County and the watersheds included in the geomorphic and conceptual restoration planning process:
Alpowa, Asotin, George, Tenmile, and Couse Creeks. Black lines are watershed boundaries, and the thick borders are the
boundaries of Asotin and Garfield Counties. The stream layer is a modified perennial network based on the known
distribution of steelhead and bull trout (Streamnet.org).
The specific objectives of Asotin County watershed assessment are to:
1. determine the type and location of stream reach types throughout the study area,
2. determine the geomorphic condition of each reach based on site visits, analysis of imagery, 1 m aerial
light detection and ranging (LIDAR), and available geographic information system (GIS) data, riparian
health and extent, floodplain connectivity,
3. determine what other factors may be impacting fish and their habitats (e.g., upland conditions, water
quality),
4. determine the trajectory and recovery potential of geomorphic reaches (i.e., are things improving, stable,
or getting worse, and what is the likelihood that restoration actions can improve conditions in 5-25 years),
and
5. provide maps and summaries of reach conditions and other features that impact fish and their habitats.
We used results from the assessment to complete a Conceptual Restoration Plan contained in a stand-alone
report. The goals of the Asotin County Conceptual Restoration Plan are to:
ASOTIN COUNTY WATERSHED ASSESSMENT
3
1. use the assessment results, meetings, and workshops with the public and the Asotin Working Group to
develop a conceptual restoration plan, and
2. prioritize the locations for potential restoration projects that will lead to substantial improvement of
instream habitat and riparian conditions for key life stages and a diversity of life history strategies of ESA
listed salmon and steelhead, and other species of concern.
The specific objectives of the Asotin County Conceptual Restoration Plan are to:
1. prioritize each reach for restoration based on benefits to ESA listed fish, geomorphic condition, recovery
potential (i.e., likelihood for success), economic, social, and other factors (landowner willingness,
potential negative consequences, etc.), and
2. identify a series of high priority restoration projects that have a high likelihood of meeting current funding
criteria.
1.3. ASSESSMENT FRAMEWORK
We based the assessment on the River Styles Framework developed by Brierley and Fryirs (2005) which distills an
assessment into understanding “… why rivers are the way they are, how they have changed, and how they are
likely to look and behave in the future.” Many stream classification and assessment frameworks exist, but the River
Styles framework provides the most exhaustive explanation of geomorphic and river context, making it ideal for
restoration planning (Kasprak et al. 2016). We conducted our assessment to answer these questions and to better
understand what restoration actions are appropriate and possible, and where best to apply them. We conducted a
variety of assessments at different spatial scales to determine the condition of fish habitats across the stream
network (i.e., Assessment Framework; Table 1). We enhanced the River Styles approach (Stage 1-4) for assessing
the watershed condition using a set of network scale GIS models and mapping to understand other factors not
directly related to geomorphology (e.g., riparian areas, floodplain fragmentation, stream temperature).
The first step (Stage 1) in our assessment was to describe the landscape setting and range of reach types present.
The landscape setting (i.e., geology, climate, topography, vegetation) dominates the range of stream and habitat
types available to fish and the productive potential of a watershed (Figure 2). Chemical, physical, and biological
processes vary spatially and temporally across landscapes which in turn create a mosaic of habitat types (Spence et
al. 1996, Beechie and Bolton 1999) and reach types based on landscape setting, valley setting, channel planform,
floodplain and in-stream geomorphic units, and the caliber of bed material (Brierley and Fryirs 2005).The range
and inherent productivity of habitat types directly relates to the fitness, abundance, and ultimately productivity of
fish populations (Figure 2). Individual stocks of salmonids have adapted to the range of habitat conditions
produced by particular landscape settings (Waples et al. 2009).
The remaining steps in our assessment focused on two stages: determining the geomorphic condition of individual
reaches and conducting assessments of other key factors that influence fish habitat (GIS models and mapping;
Stage 2), and recovery potential of each reach (Stage 3). In Stage 4, we prioritize restoration reaches and develop a
conceptual restoration plan. The conceptual restoration plan is provided in a separate report.
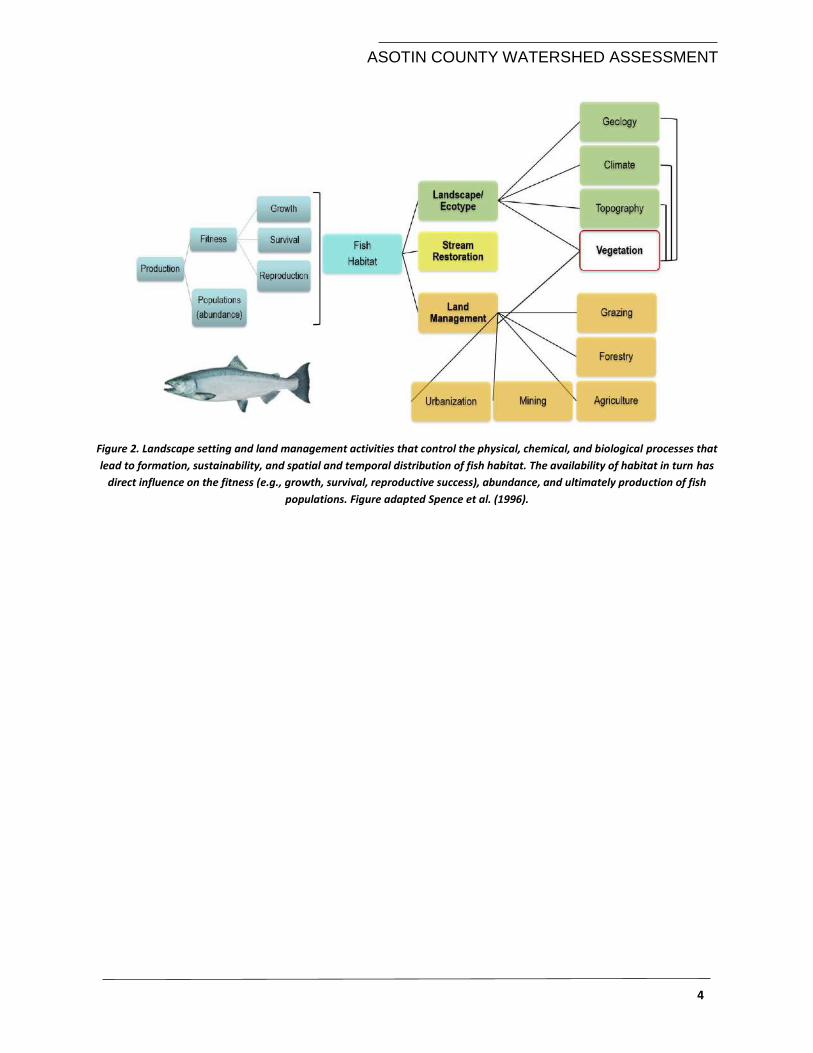
ASOTIN COUNTY WATERSHED ASSESSMENT
4
Figure 2. Landscape setting and land management activities that control the physical, chemical, and biological processes that
lead to formation, sustainability, and spatial and temporal distribution of fish habitat. The availability of habitat in turn has
direct influence on the fitness (e.g., growth, survival, reproductive success), abundance, and ultimately production of fish
populations. Figure adapted Spence et al. (1996).
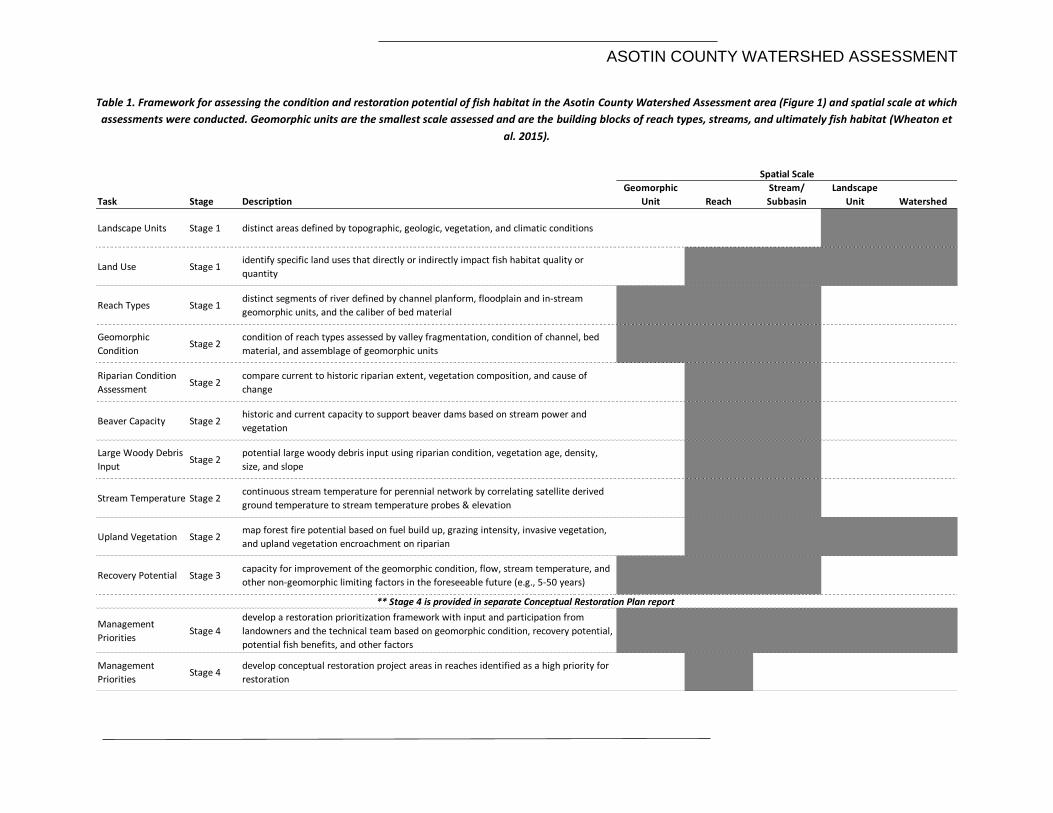
ASOTIN COUNTY WATERSHED ASSESSMENT
Table 1. Framework for assessing the condition and restoration potential of fish habitat in the Asotin County Watershed Assessment area (Figure 1) and spatial scale at which
assessments were conducted. Geomorphic units are the smallest scale assessed and are the building blocks of reach types, streams, and ultimately fish habitat (Wheaton et
al. 2015).
Task Stage Description
Geomorphic
Unit Reach
Stream/
Subbasin
Landscape
Unit Watershed
Landscape Units Stage 1 distinct areas defined by topographic, geologic, vegetation, and climatic conditions
Land Use Stage 1identify specific land uses that directly or indirectly impact fish habitat quality or
quantity
Reach Types Stage 1distinct segments of river defined by channel planform, floodplain and in-stream
geomorphic units, and the caliber of bed material
Geomorphic
ConditionStage 2
condition of reach types assessed by valley fragmentation, condition of channel, bed
material, and assemblage of geomorphic units
Riparian Condition
AssessmentStage 2
compare current to historic riparian extent, vegetation composition, and cause of
change
Beaver Capacity Stage 2historic and current capacity to support beaver dams based on stream power and
vegetation
Large Woody Debris
Input Stage 2
potential large woody debris input using riparian condition, vegetation age, density,
size, and slope
Stream Temperature Stage 2continuous stream temperature for perennial network by correlating satellite derived
ground temperature to stream temperature probes & elevation
Upland Vegetation Stage 2map forest fire potential based on fuel build up, grazing intensity, invasive vegetation,
and upland vegetation encroachment on riparian
Recovery Potential Stage 3capacity for improvement of the geomorphic condition, flow, stream temperature, and
other non-geomorphic limiting factors in the foreseeable future (e.g., 5-50 years)
Management
PrioritiesStage 4
develop a restoration prioritization framework with input and participation from
landowners and the technical team based on geomorphic condition, recovery potential,
potential fish benefits, and other factors
Management
PrioritiesStage 4
develop conceptual restoration project areas in reaches identified as a high priority for
restoration
Spatial Scale
** Stage 4 is provided in separate Conceptual Restoration Plan report
ASOTIN COUNTY WATERSHED ASSESSMENT
6
1.4. RESTORATION FRAMEWORK
Acknowledgement of the importance of landscape level processes in creating and sustaining fish habitat has led to
a change in how stream restoration is planned and implemented. Historically, landscape level processes were
ignored, and design and planning of stream restoration focused on conditions at the reach-scale (Thompson 2005,
Doyle and Douglas Shields 2012, Rieman et al. 2015). Reach-scale approaches to restoration often failed to address
which processes that create fish habitat are impaired. This led to reconstructed reaches and habitats that were not
compatible with the natural potential of the stream, or tried to enforce static habitats that failed to recognize
dynamic nature of stream habitats (Kondolf 2000, Kondolf et al. 2007). Actions that are more process-based are
now commonly used in stream restoration. The goals of process-based restoration are to: address the root causes
of degradation, (2) be consistent with the physical and biological potential of the site, (3) be at a scale
commensurate with environmental problems, and (4) clearly articulate expected outcomes for ecosystem
dynamics (Beechie et al. 2010).
We used a similar reach prioritization and restoration framework as described by Roni et al. (2002) and used in the
Tucannon River Geomorphic Assessment (AQEA 2011) to develop a conceptual restoration plan and identify high
priority project areas. The prioritization and restoration frameworks are described in detail in the conceptual
restoration plan, but we briefly describe the frameworks here because the frameworks helped focus our
assessment. We determined reach prioritization on geomorphic and riparian function, location of a reach within
the stream network, potential for geomorphic and riparian recovery, ability to increase fish capacity, and input
from landowners and the Working Group (Figure 3). We used the restoration framework to provide a simple
hierarchical strategy for implementing restoration actions in specific project areas. In general, protection of high
quality habitats and maintenance of natural processes should be the first restoration priority. The second
restoration priority is the removal of barriers and reconnection of disconnected habitats because these actions can
often provide large benefits by opening access to miles of previously inaccessible habitat (Roni et al. 2008).
Restoration of long-term processes is fundamental to achieving lasting and sustainable restoration of stream
habitat (Spence et al. 1996). A common example of restoring long-term processes is the removal or realignment of
confining features (e.g., roads and levees) to allow the stream access to disconnected floodplain. Removing
confining features leads to more interaction between the floodplain and the stream channel which can promote
sediment sorting, recharging of the water table, improved riparian conditions, and greater recruitment of nutrients
and large wood (Beechie et al. 2008, Bellmore et al. 2013). Restoration of short-term processes are typically the
lowest priority in the restoration framework. However, because of the time required to restore long-term
processes (e.g., recovery of riparian function can take decades), short-term restoration actions like adding large
wood to the stream can be necessary. Addition of wood into the active channel can also enhance floodplain
connectivity by promoting channel avulsions, slowing velocities and activating side-channels, and trapping
sediment which raises the channel elevation (Wohl 2013, Roni et al. 2015). See the conceptual restoration plan for
complete details on how these general frameworks were used to identify priority restoration projects in the study
area.
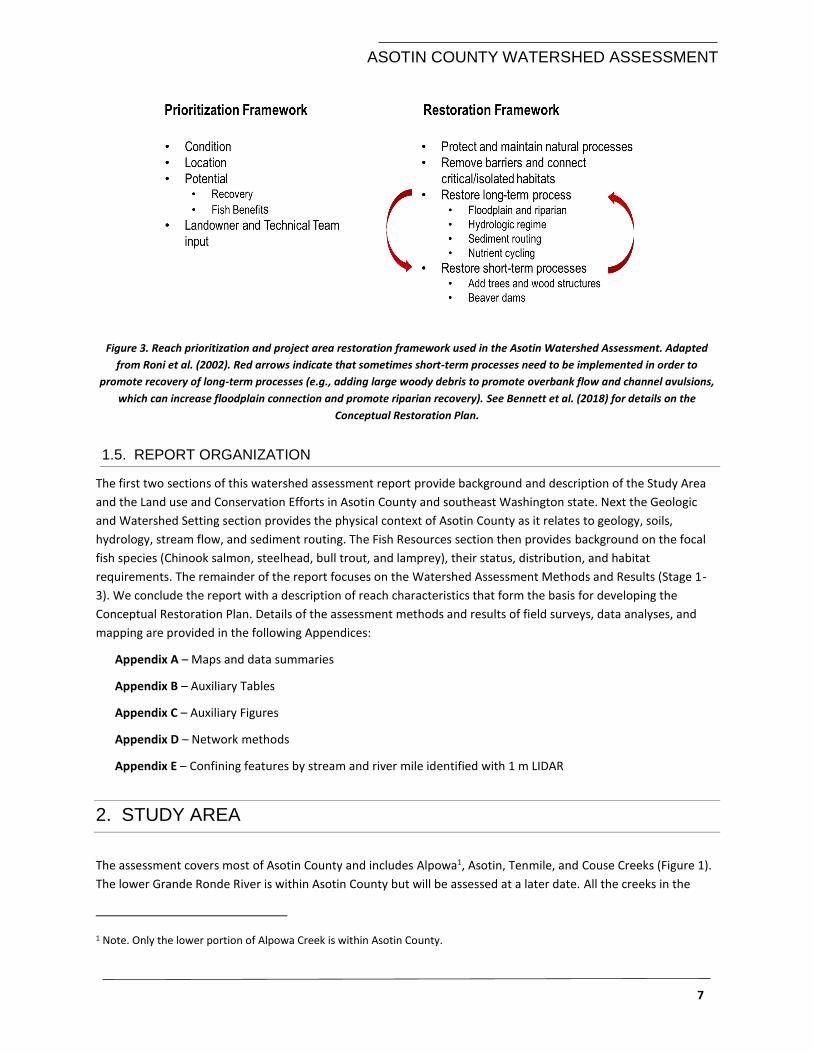
ASOTIN COUNTY WATERSHED ASSESSMENT
7
Figure 3. Reach prioritization and project area restoration framework used in the Asotin Watershed Assessment. Adapted
from Roni et al. (2002). Red arrows indicate that sometimes short-term processes need to be implemented in order to
promote recovery of long-term processes (e.g., adding large woody debris to promote overbank flow and channel avulsions,
which can increase floodplain connection and promote riparian recovery). See Bennett et al. (2018) for details on the
Conceptual Restoration Plan.
1.5. REPORT ORGANIZATION
The first two sections of this watershed assessment report provide background and description of the Study Area
and the Land use and Conservation Efforts in Asotin County and southeast Washington state. Next the Geologic
and Watershed Setting section provides the physical context of Asotin County as it relates to geology, soils,
hydrology, stream flow, and sediment routing. The Fish Resources section then provides background on the focal
fish species (Chinook salmon, steelhead, bull trout, and lamprey), their status, distribution, and habitat
requirements. The remainder of the report focuses on the Watershed Assessment Methods and Results (Stage 1-
3). We conclude the report with a description of reach characteristics that form the basis for developing the
Conceptual Restoration Plan. Details of the assessment methods and results of field surveys, data analyses, and
mapping are provided in the following Appendices:
Appendix A – Maps and data summaries
Appendix B – Auxiliary Tables
Appendix C – Auxiliary Figures
Appendix D – Network methods
Appendix E – Confining features by stream and river mile identified with 1 m LIDAR
2. STUDY AREA
The assessment covers most of Asotin County and includes Alpowa1, Asotin, Tenmile, and Couse Creeks (Figure 1).
The lower Grande Ronde River is within Asotin County but will be assessed at a later date. All the creeks in the
1 Note. Only the lower portion of Alpowa Creek is within Asotin County.
ASOTIN COUNTY WATERSHED ASSESSMENT
8
study area flow directly into the Snake River: Asotin, Couse, and Tenmile Creeks enter the Snake upstream of the
town of Clarkston, Washington and the confluence of the Snake River and the Clearwater River. Alpowa enters the
Snake River downstream of Clarkston (Figure 1). Alpowa Creek is 453 mi, Asotin 470 mi, Tenmile 475 mi, and Couse
482 mi from the ocean. There are eight mainstem dams downstream of the study area: four Snake River dams
(Lower Granite, Little Goose, Lower Monumental, and Ice Harbor), and four Columbia River dams (McNary, John
Day, The Dalles, and Bonneville).
The study area is within the Columbia Plateau and Blue Mountains level III ecoregion (Omernik 1987, Clarke 1995,
Omernik 1995). The area is dominated by deep narrow canyons cut into underlying basalt lithology and
surrounded by semi-arid sagebrush steppe and grasslands at lower elevations and open conifer dominated forests
at higher elevations. The area is semi-arid, receiving less than 12 in of precipitation at lower elevations (Appendix
A. 1). However, the headwaters of Asotin Creek drain from the Blue Mountains and can receive over 45 inches of
precipitation. The area is prone to large floods associated with either highly localized, high intensity summer
thunderstorms, or winter rain-on-snow or rain-on-frozen ground that causes rapid runoff. Temperatures vary
greatly between seasons, with highs in the summer sometimes reaching > 100° F, and winter highs < 32 ° F. The
wettest period is from March to June (3-4”/month) and the driest period is during the summer from July to
September (1.5”/month).
All of the watersheds in the study area are relatively short (~ < 25 miles long), moderate to high gradient along the
mainstems (2-3%), with narrow valley bottoms, and surrounded by steep side hills. The main difference between
the watersheds is maximum elevation, land ownership, land cover, land use, and their hydrologic regimes (Table 2,
Appendix A.2-6). Asotin Creek and parts of George Creek have a greater proportion of their watershed above 5,000
feet elevation (i.e., headwaters flow from the Blue Mountains), have more public land, less agriculture, and have
hydrologic regimes dominated by snow-rain. Couse Creek, Tenmile, and Pintler Creek (a tributary to George Creek)
do not exceed 5000 feet elevation, are almost entirely privately owned, the land use is predominately agriculture,
and they all have hydrologic regimes dominated by groundwater. In all the watersheds, the proportion of
perennial stream miles to intermittent and ephemeral stream miles is very low (~ 0.01%). These differences and
the general dry-low flow environment of the area have a profound effect on the geomorphic condition and habitat
available for fish. Large portions of Couse, Tenmile, Pintler, and the lower elevations of George Creek regularly go
dry and these watersheds tend to be flashy (i.e., short-duration but intense runoff events).
The fish bearing extents of the streams are also influenced by the character of the watersheds. In Asotin Creek and
George Creek, steelhead and bull trout distribution extends from the base elevation at the Snake River almost to
the top of the watershed (Appendix A. 8). In Couse, Tenmile, and Pintler, the extent of steelhead is restricted to
lower elevations because of the hydrologic regime and character of the watersheds. The streams in the study area
are generally small to medium sized with most fish bearing reaches being stream order 2-4. The creeks in the study
area range in size from 30-40 bankfull width and 1.0-1.5 % gradient (e.g., Asotin Creek, North Fork Creek) to 1-5
feet bankfull width and 5-10% gradient (e.g., upper North Fork, Upper George Creek, and Cougar Creek).
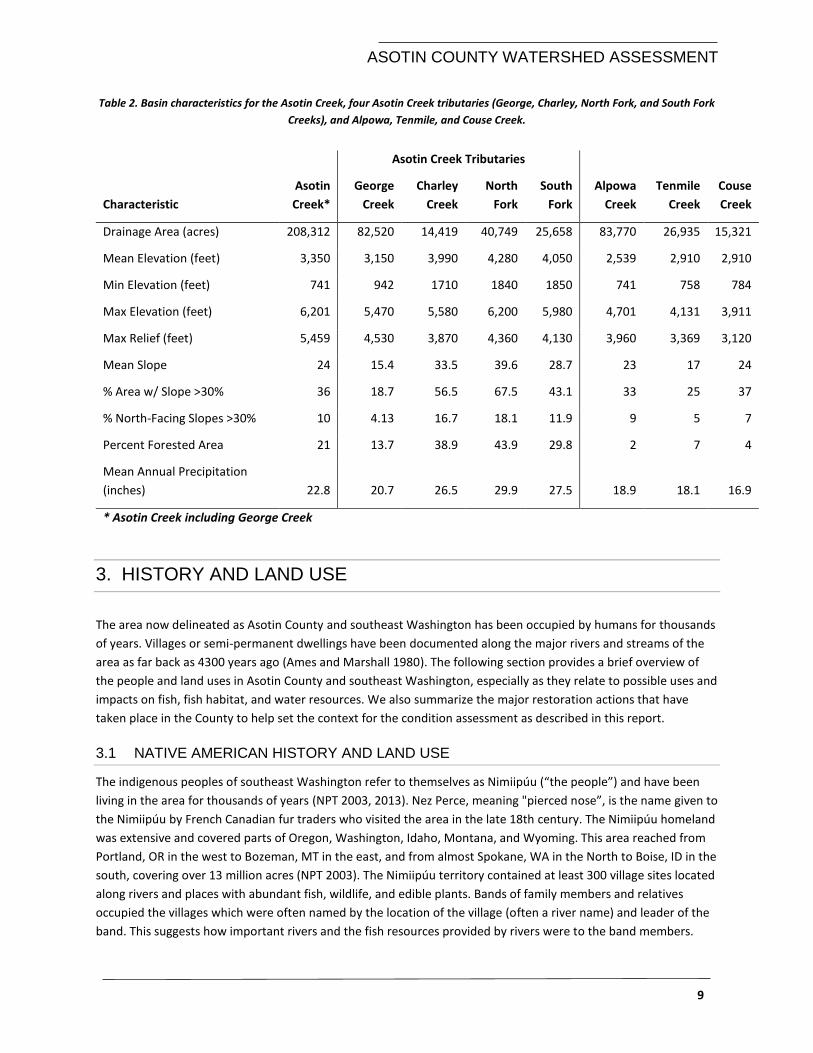
ASOTIN COUNTY WATERSHED ASSESSMENT
9
Table 2. Basin characteristics for the Asotin Creek, four Asotin Creek tributaries (George, Charley, North Fork, and South Fork
Creeks), and Alpowa, Tenmile, and Couse Creek.
Asotin Creek Tributaries
Characteristic
Asotin
Creek*
George
Creek
Charley
Creek
North
Fork
South
Fork
Alpowa
Creek
Tenmile
Creek
Couse
Creek
Drainage Area (acres) 208,312 82,520 14,419 40,749 25,658 83,770 26,935 15,321
Mean Elevation (feet) 3,350 3,150 3,990 4,280 4,050 2,539 2,910 2,910
Min Elevation (feet) 741 942 1710 1840 1850 741 758 784
Max Elevation (feet) 6,201 5,470 5,580 6,200 5,980 4,701 4,131 3,911
Max Relief (feet) 5,459 4,530 3,870 4,360 4,130 3,960 3,369 3,120
Mean Slope 24 15.4 33.5 39.6 28.7 23 17 24
% Area w/ Slope >30% 36 18.7 56.5 67.5 43.1 33 25 37
% North-Facing Slopes >30% 10 4.13 16.7 18.1 11.9 9 5 7
Percent Forested Area 21 13.7 38.9 43.9 29.8 2 7 4
Mean Annual Precipitation
(inches) 22.8 20.7 26.5 29.9 27.5 18.9 18.1 16.9
* Asotin Creek including George Creek
3. HISTORY AND LAND USE
The area now delineated as Asotin County and southeast Washington has been occupied by humans for thousands
of years. Villages or semi-permanent dwellings have been documented along the major rivers and streams of the
area as far back as 4300 years ago (Ames and Marshall 1980). The following section provides a brief overview of
the people and land uses in Asotin County and southeast Washington, especially as they relate to possible uses and
impacts on fish, fish habitat, and water resources. We also summarize the major restoration actions that have
taken place in the County to help set the context for the condition assessment as described in this report.
3.1 NATIVE AMERICAN HISTORY AND LAND USE
The indigenous peoples of southeast Washington refer to themselves as Nimiipúu (“the people”) and have been
living in the area for thousands of years (NPT 2003, 2013). Nez Perce, meaning "pierced nose”, is the name given to
the Nimiipúu by French Canadian fur traders who visited the area in the late 18th century. The Nimiipúu homeland
was extensive and covered parts of Oregon, Washington, Idaho, Montana, and Wyoming. This area reached from
Portland, OR in the west to Bozeman, MT in the east, and from almost Spokane, WA in the North to Boise, ID in the
south, covering over 13 million acres (NPT 2003). The Nimiipúu territory contained at least 300 village sites located
along rivers and places with abundant fish, wildlife, and edible plants. Bands of family members and relatives
occupied the villages which were often named by the location of the village (often a river name) and leader of the
band. This suggests how important rivers and the fish resources provided by rivers were to the band members.
ASOTIN COUNTY WATERSHED ASSESSMENT
10
Trade with neighboring tribes such as the Palouse, Cayuse, Umatilla, and others was common. The Nez Perce
acquired horses sometime around 1730 through trade with other tribes and soon became skilled horsemen
(Beckham 1995). The vast and productive grasslands within the Nimiipúu territory allowed them to keep large
herds of horses and these were used to expand trade and travel. Interaction with fur traders, settlers, and miners
increased through the 1800’s starting with the Lewis and Clark expedition in 1805 and 1806. Tensions between
Nimiipúu and Euro-Americans increased as more settlers and miners entered the Nimiipúu territory and began to
claim land. The Nimiipúu first entered into a treaty agreement with the federal government in 1855 when it was
clear that they needed to preserve their historic rights to fish, hunt, pasture animals, and practice their customs
and religion. The 1855 treaty reduced the Nimiipúu territory to 7.5 million acres, but importantly maintained the
rights of Nimiipúu to fish, hunt, collect roots and berries, pasture animals, and erect temporary buildings at all
“usual and accustomed places” upon open and unclaimed land (NPT 2003). By the 1860’s more settlers and an
influx of miners and settlements to support gold mining again created conflict, and the Nimiipúu territory was
reduced to 750,000 acres in 1863. The Dawes Allotment Act of 1887 further reduced the territory to 250,000 acres.
Despite the loss of their original territory (>98%), the Nimiipúu have never given up their rights to fish, hunt, and
gather, and these rights have been upheld in several court decisions (NPT 2003).
The area currently delineated as Asotin County features prominently in the historical use by the Nez Perce. A
village was based at the mouth of Asotin Creek and Alpowa Creeks, and numerous trails were used in Asotin
County to travel within the area and to other places such as the Tucannon, Snake, and Columbia River for fishing,
hunting, gathering other food, and trading. There were also trails up the Clearwater and over Lolo Pass into
Montana, where Nimiipúu would hunt buffalo, gather bitterroot, and trade with plains tribes (NPT 2003).
Especially important were annual trips to the Celilo Falls along the Columbia River. Well documented
congregations of numerous tribes took place at Celilo Falls every summer to capture migrating steelhead, salmon,
and lamprey and trade for other items (Landeen and Pinkham 1999). This harvest area and gathering place is
thought to be one of the longest permanently used areas by humans in North America.
Nimiipúu traveled extensively within their homeland and throughout the study area. They typically lived along the
rivers in the fall and winter, and seasonally traveled to areas based on availability of game, various plants, and
migration of salmon, steelhead, Pacific lamprey, and other fishes (Pinkham 2004, NPT 2013). Many of the streams
in the assessment area derive from Nimiipúu names. For example, Asotin Creek is the English way of saying
“hesuutin” which translates to “with eels”. Harvest of salmon, steelhead, lamprey, and suckers within the target
watersheds were and continue to be a critical food and cultural resource for the Nimiipúu. It has been estimated
that each tribal member consumed almost 600 pounds of fresh, dried and/or smoked salmon per year (Walker
1967, Marshall 1977, NPT 2013). They harvested primarily salmon and steelhead species, but lamprey, trout,
whitefish, suckers, sturgeon, pike minnow, and other non-game fish were consumed (NPT 2013). Oral traditions
play a central role in Nez Perce culture and stories about fish, and the importance of fish to the Nez Perce play a
central role in their oral history (NPT 2003). Band members would camp at fishing areas prior to arrival of
migrating fish – stories of fish that were so abundant they could be heard migrating upriver hint at the abundance
that has been lost.
The goal of the Nez Perce Tribe and the role of the Department of Fisheries Resources Management (DFRM) is to
“restore a balance with nature, bring fish populations and their habitats to healthy conditions, and provide harvest
opportunities for tribal members (NPT 2013).” The Nez Perce work with local, state, and federal agencies to
promote and conduct fisheries restoration projects, reintroductions, and operate hatcheries in hopes that
populations will recover, and harvest rates can be increased for tribal members and residents of the county (NPT
2013).
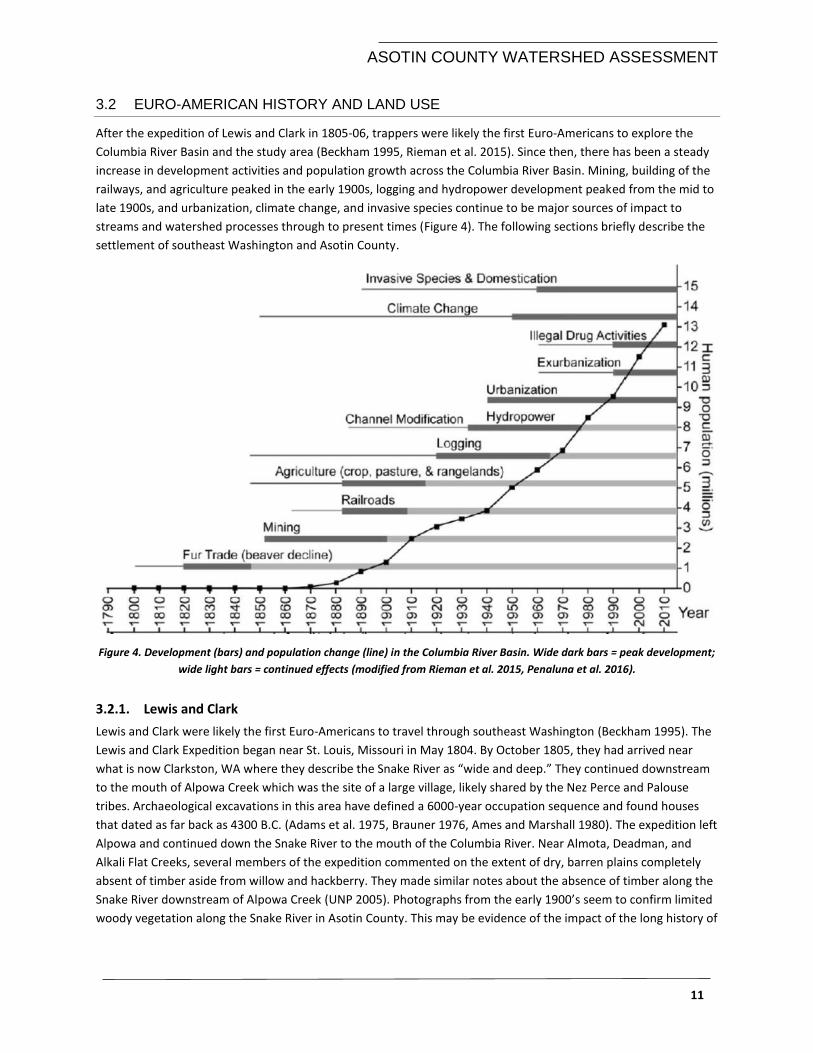
ASOTIN COUNTY WATERSHED ASSESSMENT
11
3.2 EURO-AMERICAN HISTORY AND LAND USE
After the expedition of Lewis and Clark in 1805-06, trappers were likely the first Euro-Americans to explore the
Columbia River Basin and the study area (Beckham 1995, Rieman et al. 2015). Since then, there has been a steady
increase in development activities and population growth across the Columbia River Basin. Mining, building of the
railways, and agriculture peaked in the early 1900s, logging and hydropower development peaked from the mid to
late 1900s, and urbanization, climate change, and invasive species continue to be major sources of impact to
streams and watershed processes through to present times (Figure 4). The following sections briefly describe the
settlement of southeast Washington and Asotin County.
Figure 4. Development (bars) and population change (line) in the Columbia River Basin. Wide dark bars = peak development;
wide light bars = continued effects (modified from Rieman et al. 2015, Penaluna et al. 2016).
3.2.1. Lewis and Clark
Lewis and Clark were likely the first Euro-Americans to travel through southeast Washington (Beckham 1995). The
Lewis and Clark Expedition began near St. Louis, Missouri in May 1804. By October 1805, they had arrived near
what is now Clarkston, WA where they describe the Snake River as “wide and deep.” They continued downstream
to the mouth of Alpowa Creek which was the site of a large village, likely shared by the Nez Perce and Palouse
tribes. Archaeological excavations in this area have defined a 6000-year occupation sequence and found houses
that dated as far back as 4300 B.C. (Adams et al. 1975, Brauner 1976, Ames and Marshall 1980). The expedition left
Alpowa and continued down the Snake River to the mouth of the Columbia River. Near Almota, Deadman, and
Alkali Flat Creeks, several members of the expedition commented on the extent of dry, barren plains completely
absent of timber aside from willow and hackberry. They made similar notes about the absence of timber along the
Snake River downstream of Alpowa Creek (UNP 2005). Photographs from the early 1900’s seem to confirm limited
woody vegetation along the Snake River in Asotin County. This may be evidence of the impact of the long history of
ASOTIN COUNTY WATERSHED ASSESSMENT
12
Native Americans camping along the Snake River and/or the dry, steep banks of the Snake River in this area that
have limited floodplain
When Lewis and Clark returned to the area in May 1806, they took an overland route rather than retracing their
steps upstream on the Snake River. They traveled up the Walla Walla River from the Columbia River, and then
crossed the Tucannon River and Pataha Creek to cross over Alpowa Summit. They likely accessed the Alpowa
Watershed by following Stember Creek down to the mouth of Alpowa Creek to revisit the villages they left nearly
five months earlier. Lewis, Clark, and several of their Captains described the high plains between the Snake and
Clearwater River confluence as being extremely fertile and well covered in ponderosa pine with some western
larch and grand fir.
3.2.2. Fur Trade/Pre-settlement
Trappers seeking beaver and otter pelts began to travel through southeast Washington soon after the Lewis and
Clark expedition and trapping likely occurred in Asotin, Garfield, and Columbia Counties (Tucker 1940, Ott 1997). In
1818, Britain and the United States signed a joint occupation agreement of the area known as the Columbia
District which included present day Washington, Oregon, and parts of Idaho, and Montana. Britain, via the Hudson
Bay Company, attempted to discourage Americans from claiming land along the Snake River, which was a key
route into the Columbia territory for settlers. The Hudson Bay Company implemented a policy to create a “fur
desert” (Ott 1997). From 1824-25 and 1829-30 six expeditions were launched with the explicit intent to trap
beaver to near extinction, thereby de-incentivizing American trappers from using the area, and ultimately slowing
the rate of American settlers moving to the area (Ott 1997). It is unclear how successful these trapping efforts
were, but notes from Peter Ogden, the leader of the expeditions, suggest that they were at least partly successful.
Between 1823-1841, 35,000 beavers were trapped out of the Snake River region and the annual trapping rates
decreased from highs of 4,500 beaver/year in 1923-24 to 600 beaver/year in 1831-32. Nez Perce were not involved
in trapping nearly as much as other tribes in the Columbia Plateau because they identified more with raising horses
and cattle, and hunting big game on the plains (NPT 2003). The fur trade dwindled by the 1850’s as fur hats in
Europe fell out of fashion.
In the 1840-50’s, the Nez Perce continued to expand their herds of horses and began to raise cattle more, which
allowed them to travel and trade more. Nez Perce were known to drive cattle to Salt Lake City to take advantage of
large influxes of setters to Utah (Ott 1997). At the same time, the number of Euro-American settlers coming into
southeast Washington was increasing rapidly. These settlers put pressure on the United States government to
grant them lands and laws started to be enacted to form official territories (e.g., Oregon Territory was formed in
1848). Discovery of gold in the Clearwater River in 1860 brought miners, settlers, and the development of Euro-
American settlements. Development of farms, orchards, towns, and transportation infrastructure increased rapidly
from 1860 onward. The Homestead Act of 1862 increased the number of setters that began farming and gave
settlers a “base of operation” on which they could build a home, winter cattle and take advantage of the abundant
federal lands to graze large herds in the summer (Beckham 1995).
3.2.3. Euro-American Settlement
The first permanent settlement in Asotin County appears to be around 1860. The town of Asotin was established in
1868 and Asotin county was established in 1883 (VSP 2017). Sheep and cattle grazing expanded rapidly with sheep
generally grazing the uplands and cattle grazing along streams and rivers (Johnson 1995). Herds of horses were
also common and kept by both the Nez Perce and Euro-Americans. Almost 700,000 horses were present in 91
counties east of the Cascade Mountains in the Columbia River basin by 1910 (Beckham 1995). Sheep ranching
peaked in this area in 1910 at 6.5 million head, while cattle ranching outpaced sheep in the 1950s, peaking at 4.3
million head in 1987 (Beckham 1995). In Asotin County by 1910, there 555 farms averaging 342.3 acres, with a
total of 5,000 horses, 5,000 cattle, and 50,000 sheep (USBC 1913).
ASOTIN COUNTY WATERSHED ASSESSMENT
13
We conducted a review of General Land Office Survey (GLOS) notes to assess selected stream crossings that the
original surveyors made in Asotin County between 1876 and 1877. We used archived GLOS survey PLATS from the
Bureau of Land Management (BLM 2018). We used methods outlined in Dilts et al. (2012) and White et al. (2017).
The Public Land Survey System of townships and ranges was established in 1812. Public lands were divided into 6 x
6 mile townships and each township was divided into 36 sections. GLOS crews would map all the section lines and
record the distance along the section line of stream crossings, soil quality, vegetation types, and other survey data.
Because the townships and section lines were surveyed, the information along the section lines can be spatially
referenced in GIS. We reviewed 42 stream crossing surveys and summarized the results by RM along each of the
major study creeks (Appendix A. 9). Although these records are often difficult to interpret, the results of our
analysis suggest that riparian vegetation along the major creeks in the study area was already converted to pasture
(recorded as grass cover) or degraded to gravel and cobble floodplains as of 1877. This may be evidence of the
rapid use of a relatively small supply of wood along the lower reaches of the study creeks by settlers moving into
the area and building homes and businesses and intensive grazing by horses, sheep, and cattle.
Development of roads, irrigation infrastructure, dry land farming, and logging also increased to support the
growing population. The mid elevation productive bunch grass prairie of Asotin County (especially in Couse,
Tenmile, and George Creek) began to be developed for wheat production in the 1870’s (ACWG 2017).
Development was rapid and by the 1930’s there were extensive orchards in Alpowa, Asotin, and Clarkston which
used water from both the Snake River and the local creeks via diversions and flumes. These activities likely had a
dramatic impact on fish and habitat. McIntosh et al. (1994) document that there were at least 13 water diversions
in Asotin Creek from 1935-1936, with two of the diversions removing all the water during summer low flows.
These diversions dewatered the lower eight miles of Asotin Creek, and a fish salvage operation recovered 250,000
juvenile steelhead and 28 adult Chinook (thought to be the entire run that year).
Logging in the 1930s through to the 1950s was also extensive and reports suggest that almost the entire accessible
timber was harvested three times (selective, seed tree, and eventually clearcutting). All these development
activities led to extensive erosion problems throughout the study area. In Asotin Creek and forested areas, erosion
was mainly due to road development, whereas in the low and mid elevation agricultural lands, erosion was mainly
due to farming practices that left many acres prone to sheet and rill erosion (SCS 1980). Fine sediment became a
principal threat to fish and fish habitat.
3.2.4. Current Land Use and Conservation
Agriculture is the dominant land use in the Asotin County and the study area and the two most common
agricultural activities are cattle grazing (162,462 acres) and dryland farming (84,330 acres; ACWG 2017). As of the
2012 census, there are 185 farms averaging 1,423 acres in size (USDA Census 2012). Cattle grazing occurs on
private land and on grazing allotments on USFS land, generally from the spring through the fall. Most cattle are
kept along the mainstems of the major creeks during the winter. Logging operations are still continuing in the
headwaters of the study area but at much reduced rates and there is some private woodland (14,412 acres).
Restoration initiatives began in the 1980s and increased dramatically after 1995. In 1995, a Model Watershed Plan
was developed by local landowners and agencies to reduce soil erosion, improve water quality, and improve
instream conditions (ACCD 1995). After the plan was developed, there were many upland conservation practices
implemented through programs funded by Washington Salmon Recovery Funding Board (SRFB), Washington
Conservation Commission, Washington Fish and Wildlife, Bonneville Power Fish and Wildlife Mitigation Program,
and USDA NRCS and Farm Services Agency (FSA). The NRCS and FSA programs alone have invested over $38.6
million in Asotin County conservation programs since 1995-2015 (conservation.ewg.org). The NRCS and FSA mange
a number of programs that are designed to protect water quality, reduce soil erosion, and enhance soil quality,
such as managing nutrients and pesticides to reduce runoff and reduced- or no-till practices. The most common
ASOTIN COUNTY WATERSHED ASSESSMENT
14
programs are the Environmental Quality Incentives Program (EQIP), Conservation Reserve Program (CRP), Wildlife
Habitats Incentive Program (WHIP), and the Conservation Stewardship Program (CSP). The CRP program is the
largest program and has had over 22,000 acres of agricultural land enrolled in mainly native grass, introduced
grass, and riparian buffers. Other programs since 1995 have been responsible for fencing at least 87 miles of
riparian fencing, 6 miles of terraces and 30 sediment ponds (to reduce sediment reaching streams), 31 off-site
watering locations for cattle (to reduce grazing in riparian areas), planting of over 200,000 trees and shrubs (mainly
along streams), 40 miles of road decommissioned, and numerous instream projects and other improvements to
farm practices (Johnson 2000, Ullman and Barber 2009).
These programs have been very successful in reducing erosion and stabilizing/enhancing riparian areas throughout
the region which has led to direct benefits for fish and water quality. We were unable to get monitoring data that
is consistent across years to fully understand the trends in habitat conditions, but it is generally appears that 1)
erosion issues have been largely mitigated and 2) instream habitat and riparian areas are generally stable and most
of the mid to upper elevation areas are improving slowly. However, there are still many legacy effects of
development activities (much of which occurred pre-1950) and many stream miles are still in a degraded state
(Scott et al. 2011).
4. GEOLOGIC AND WATERSHED SETTING
4.1 GEOLOGIC SETTING
The geologic setting of the study area typifies many of the tributaries to the Snake River in southeast Washington
and northeast Oregon in terms of its basic physiographic setting. Three broad geologic attributes set the character
of the study area: 1) the underlying igneous bedrock sourced from lava flows which are part of the Columbia River
Basalt Group that forms the broad plateau surfaces and uplands; 2) the Snake River Gorge, which sets the base-
level control for the target watersheds, 3) the steep canyons that dissect the lava flows with a network of streams
draining to the Snake River. Valley bottoms in the larger tributaries have formed discontinuous deposits of shallow
alluvium. The Columbia River Basalt Group is a thick sequence of flood basalts that spread throughout northern
Oregon, eastern Washington and western Idaho during the Miocene between 6 and 17 million years ago. During
the Pliocene (5.4 to 2.4 million years ago) these basalt flows were uplifted, allowing the antecedent streams to
form steep-sided canyon walls and hillslopes and formation of high plateaus (Gentry 1991). Many of these high
plateaus are mantled by loess (wind-blown sediment) deposits. The Snake River Canyon, at the mouth of target
watersheds, was subjected to the cataclysmic Bonneville flood 14,000 to 15,000 years ago. Deposits from the
Bonneville flood are overlain by additional flood deposits associated with drainage of Glacial Lake Missoula.
4.2 LANDSCAPE UNITS
We grouped large areas within the study area into distinct landscape units that can be defined as areas with a
similar combination of geologic, soil, elevation, topographic, climatic, and vegetation properties. By grouping areas
into landscape units, we can predict how streams will function and what basic properties they may have (e.g.,
transport zones, areas where large woody debris is an important driver of geomorphic diversity in channels, etc.).
We described four landscape units in the Asotin Creek drainage (Table 3, Appendix A. 7). The landscape units are
largely based on 1:250,000 scale Level IV EPA ecoregions (Omernik and Griffith 2014). We refined some of the
landscape unit boundaries based on geologic unit mapping at a finer 1:100,000 scale (Schuster 1993) because
geology exerts the greatest control on river character and behavior, the key drivers of geomorphic reach types.
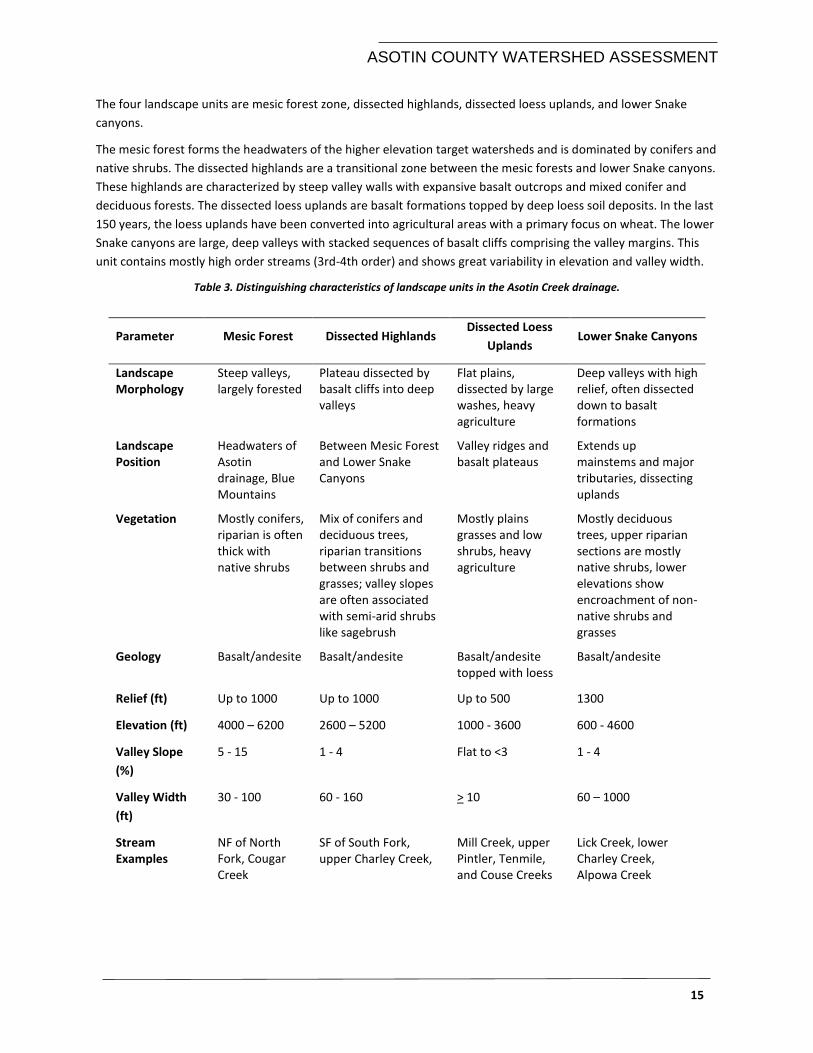
ASOTIN COUNTY WATERSHED ASSESSMENT
15
The four landscape units are mesic forest zone, dissected highlands, dissected loess uplands, and lower Snake
canyons.
The mesic forest forms the headwaters of the higher elevation target watersheds and is dominated by conifers and
native shrubs. The dissected highlands are a transitional zone between the mesic forests and lower Snake canyons.
These highlands are characterized by steep valley walls with expansive basalt outcrops and mixed conifer and
deciduous forests. The dissected loess uplands are basalt formations topped by deep loess soil deposits. In the last
150 years, the loess uplands have been converted into agricultural areas with a primary focus on wheat. The lower
Snake canyons are large, deep valleys with stacked sequences of basalt cliffs comprising the valley margins. This
unit contains mostly high order streams (3rd-4th order) and shows great variability in elevation and valley width.
Table 3. Distinguishing characteristics of landscape units in the Asotin Creek drainage.
Parameter Mesic Forest Dissected Highlands Dissected Loess
Uplands Lower Snake Canyons
Landscape Morphology
Steep valleys, largely forested
Plateau dissected by basalt cliffs into deep valleys
Flat plains, dissected by large washes, heavy agriculture
Deep valleys with high relief, often dissected down to basalt formations
Landscape Position
Headwaters of Asotin drainage, Blue Mountains
Between Mesic Forest and Lower Snake Canyons
Valley ridges and basalt plateaus
Extends up mainstems and major tributaries, dissecting uplands
Vegetation Mostly conifers, riparian is often thick with native shrubs
Mix of conifers and deciduous trees, riparian transitions between shrubs and grasses; valley slopes are often associated with semi-arid shrubs like sagebrush
Mostly plains grasses and low shrubs, heavy agriculture
Mostly deciduous trees, upper riparian sections are mostly native shrubs, lower elevations show encroachment of non-native shrubs and grasses
Geology Basalt/andesite Basalt/andesite Basalt/andesite topped with loess
Basalt/andesite
Relief (ft) Up to 1000 Up to 1000 Up to 500 1300
Elevation (ft) 4000 – 6200 2600 – 5200 1000 - 3600 600 - 4600
Valley Slope
(%)
5 - 15 1 - 4 Flat to <3 1 - 4
Valley Width
(ft)
30 - 100 60 - 160 > 10 60 – 1000
Stream Examples
NF of North Fork, Cougar Creek
SF of South Fork, upper Charley Creek,
Mill Creek, upper Pintler, Tenmile, and Couse Creeks
Lick Creek, lower Charley Creek, Alpowa Creek
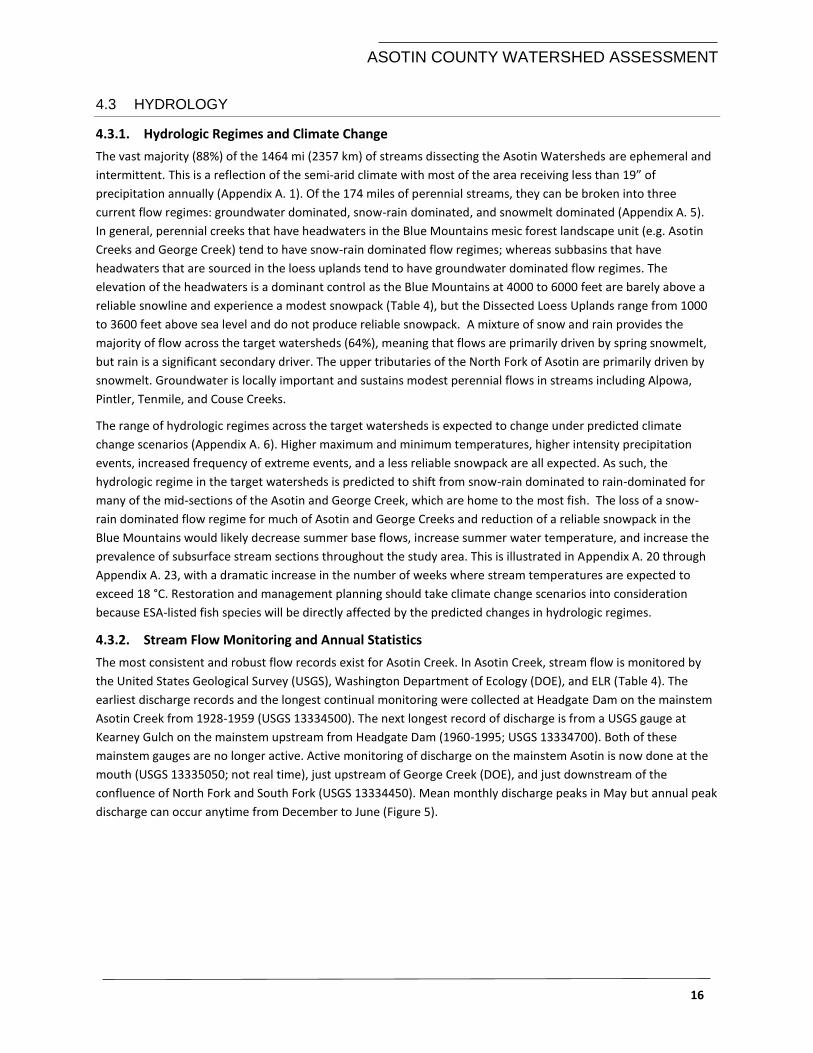
ASOTIN COUNTY WATERSHED ASSESSMENT
16
4.3 HYDROLOGY
4.3.1. Hydrologic Regimes and Climate Change
The vast majority (88%) of the 1464 mi (2357 km) of streams dissecting the Asotin Watersheds are ephemeral and
intermittent. This is a reflection of the semi-arid climate with most of the area receiving less than 19” of
precipitation annually (Appendix A. 1). Of the 174 miles of perennial streams, they can be broken into three
current flow regimes: groundwater dominated, snow-rain dominated, and snowmelt dominated (Appendix A. 5).
In general, perennial creeks that have headwaters in the Blue Mountains mesic forest landscape unit (e.g. Asotin
Creeks and George Creek) tend to have snow-rain dominated flow regimes; whereas subbasins that have
headwaters that are sourced in the loess uplands tend to have groundwater dominated flow regimes. The
elevation of the headwaters is a dominant control as the Blue Mountains at 4000 to 6000 feet are barely above a
reliable snowline and experience a modest snowpack (Table 4), but the Dissected Loess Uplands range from 1000
to 3600 feet above sea level and do not produce reliable snowpack. A mixture of snow and rain provides the
majority of flow across the target watersheds (64%), meaning that flows are primarily driven by spring snowmelt,
but rain is a significant secondary driver. The upper tributaries of the North Fork of Asotin are primarily driven by
snowmelt. Groundwater is locally important and sustains modest perennial flows in streams including Alpowa,
Pintler, Tenmile, and Couse Creeks.
The range of hydrologic regimes across the target watersheds is expected to change under predicted climate
change scenarios (Appendix A. 6). Higher maximum and minimum temperatures, higher intensity precipitation
events, increased frequency of extreme events, and a less reliable snowpack are all expected. As such, the
hydrologic regime in the target watersheds is predicted to shift from snow-rain dominated to rain-dominated for
many of the mid-sections of the Asotin and George Creek, which are home to the most fish. The loss of a snow-
rain dominated flow regime for much of Asotin and George Creeks and reduction of a reliable snowpack in the
Blue Mountains would likely decrease summer base flows, increase summer water temperature, and increase the
prevalence of subsurface stream sections throughout the study area. This is illustrated in Appendix A. 20 through
Appendix A. 23, with a dramatic increase in the number of weeks where stream temperatures are expected to
exceed 18 °C. Restoration and management planning should take climate change scenarios into consideration
because ESA-listed fish species will be directly affected by the predicted changes in hydrologic regimes.
4.3.2. Stream Flow Monitoring and Annual Statistics
The most consistent and robust flow records exist for Asotin Creek. In Asotin Creek, stream flow is monitored by
the United States Geological Survey (USGS), Washington Department of Ecology (DOE), and ELR (Table 4). The
earliest discharge records and the longest continual monitoring were collected at Headgate Dam on the mainstem
Asotin Creek from 1928-1959 (USGS 13334500). The next longest record of discharge is from a USGS gauge at
Kearney Gulch on the mainstem upstream from Headgate Dam (1960-1995; USGS 13334700). Both of these
mainstem gauges are no longer active. Active monitoring of discharge on the mainstem Asotin is now done at the
mouth (USGS 13335050; not real time), just upstream of George Creek (DOE), and just downstream of the
confluence of North Fork and South Fork (USGS 13334450). Mean monthly discharge peaks in May but annual peak
discharge can occur anytime from December to June (Figure 5).
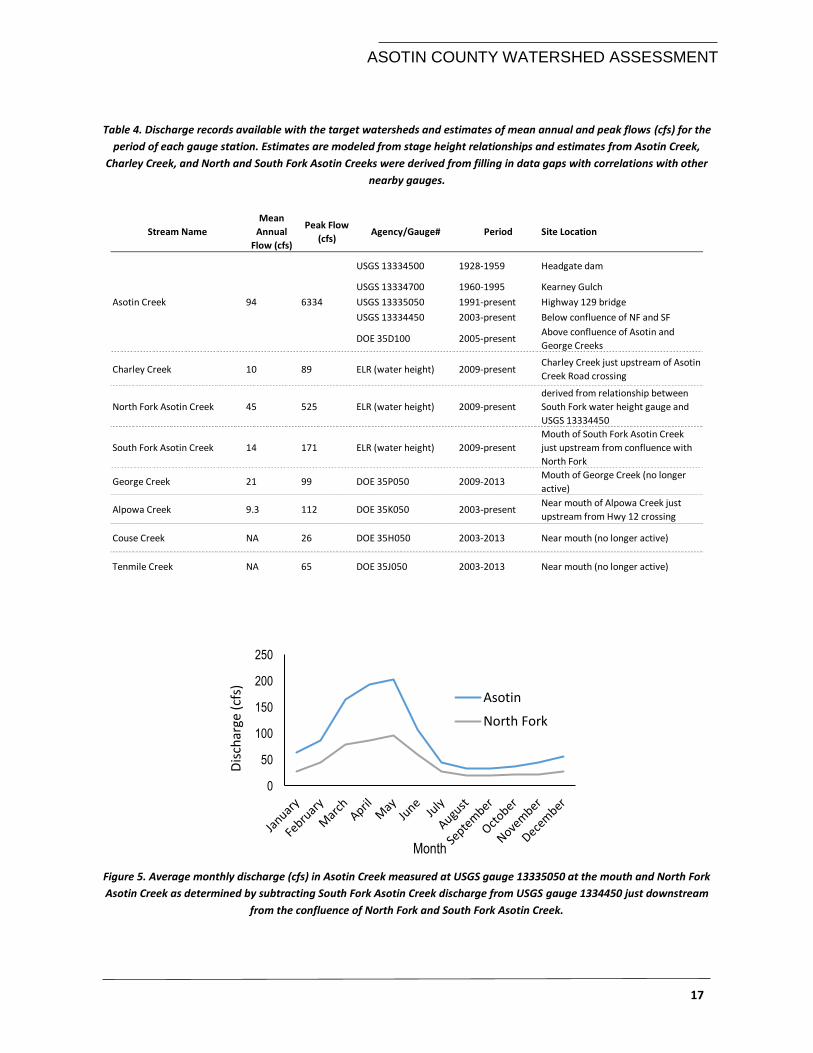
ASOTIN COUNTY WATERSHED ASSESSMENT
17
Table 4. Discharge records available with the target watersheds and estimates of mean annual and peak flows (cfs) for the
period of each gauge station. Estimates are modeled from stage height relationships and estimates from Asotin Creek,
Charley Creek, and North and South Fork Asotin Creeks were derived from filling in data gaps with correlations with other
nearby gauges.
Figure 5. Average monthly discharge (cfs) in Asotin Creek measured at USGS gauge 13335050 at the mouth and North Fork
Asotin Creek as determined by subtracting South Fork Asotin Creek discharge from USGS gauge 1334450 just downstream
from the confluence of North Fork and South Fork Asotin Creek.
Stream Name
Mean
Annual
Flow (cfs)
Peak Flow
(cfs)Agency/Gauge# Period Site Location
USGS 13334500 1928-1959 Headgate dam
USGS 13334700 1960-1995 Kearney Gulch
USGS 13335050 1991-present Highway 129 bridge
USGS 13334450 2003-present Below confluence of NF and SF
DOE 35D100 2005-presentAbove confluence of Asotin and
George Creeks
Charley Creek 10 89 ELR (water height) 2009-presentCharley Creek just upstream of Asotin
Creek Road crossing
North Fork Asotin Creek 45 525 ELR (water height) 2009-present
derived from relationship between
South Fork water height gauge and
USGS 13334450
South Fork Asotin Creek 14 171 ELR (water height) 2009-present
Mouth of South Fork Asotin Creek
just upstream from confluence with
North Fork
George Creek 21 99 DOE 35P050 2009-2013Mouth of George Creek (no longer
active)
Alpowa Creek 9.3 112 DOE 35K050 2003-presentNear mouth of Alpowa Creek just
upstream from Hwy 12 crossing
Couse Creek NA 26 DOE 35H050 2003-2013 Near mouth (no longer active)
Tenmile Creek NA 65 DOE 35J050 2003-2013 Near mouth (no longer active)
Asotin Creek 94 6334
0
50
100
150
200
250
Dis
char
ge (
cfs)
Month
Asotin
North Fork
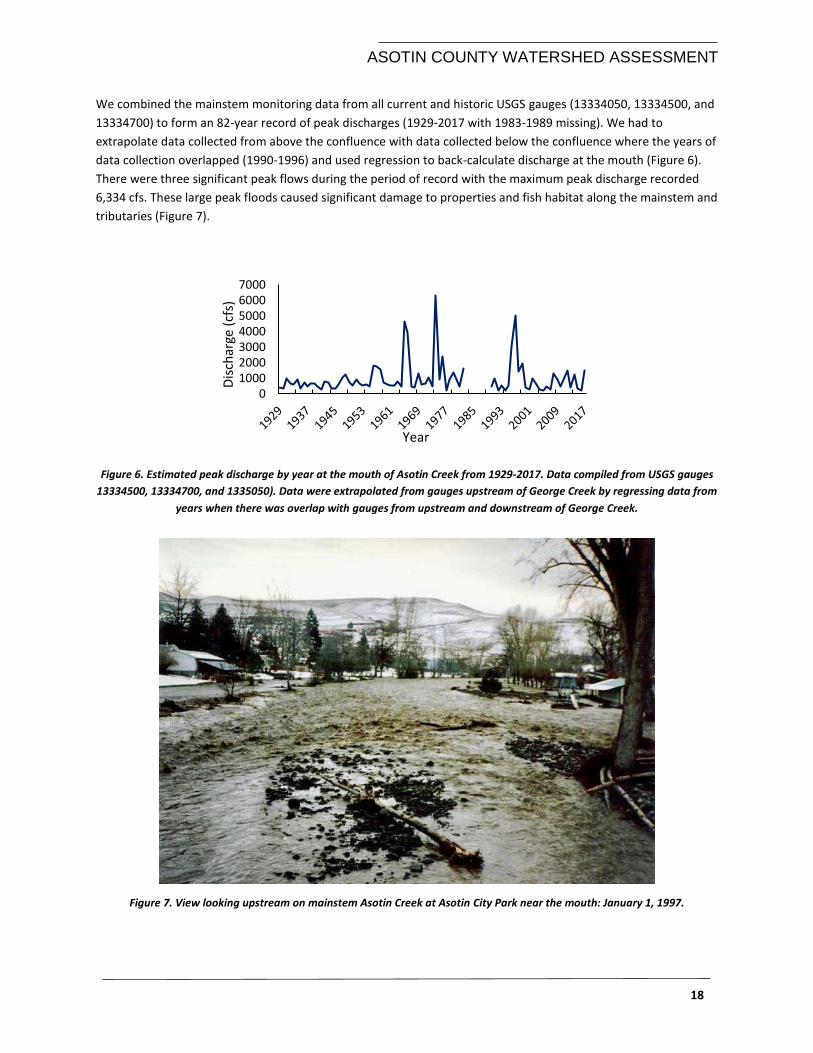
ASOTIN COUNTY WATERSHED ASSESSMENT
18
We combined the mainstem monitoring data from all current and historic USGS gauges (13334050, 13334500, and
13334700) to form an 82-year record of peak discharges (1929-2017 with 1983-1989 missing). We had to
extrapolate data collected from above the confluence with data collected below the confluence where the years of
data collection overlapped (1990-1996) and used regression to back-calculate discharge at the mouth (Figure 6).
There were three significant peak flows during the period of record with the maximum peak discharge recorded
6,334 cfs. These large peak floods caused significant damage to properties and fish habitat along the mainstem and
tributaries (Figure 7).
Figure 6. Estimated peak discharge by year at the mouth of Asotin Creek from 1929-2017. Data compiled from USGS gauges
13334500, 13334700, and 1335050). Data were extrapolated from gauges upstream of George Creek by regressing data from
years when there was overlap with gauges from upstream and downstream of George Creek.
Figure 7. View looking upstream on mainstem Asotin Creek at Asotin City Park near the mouth: January 1, 1997.
01000200030004000500060007000
Dis
char
ge (
cfs)
Year
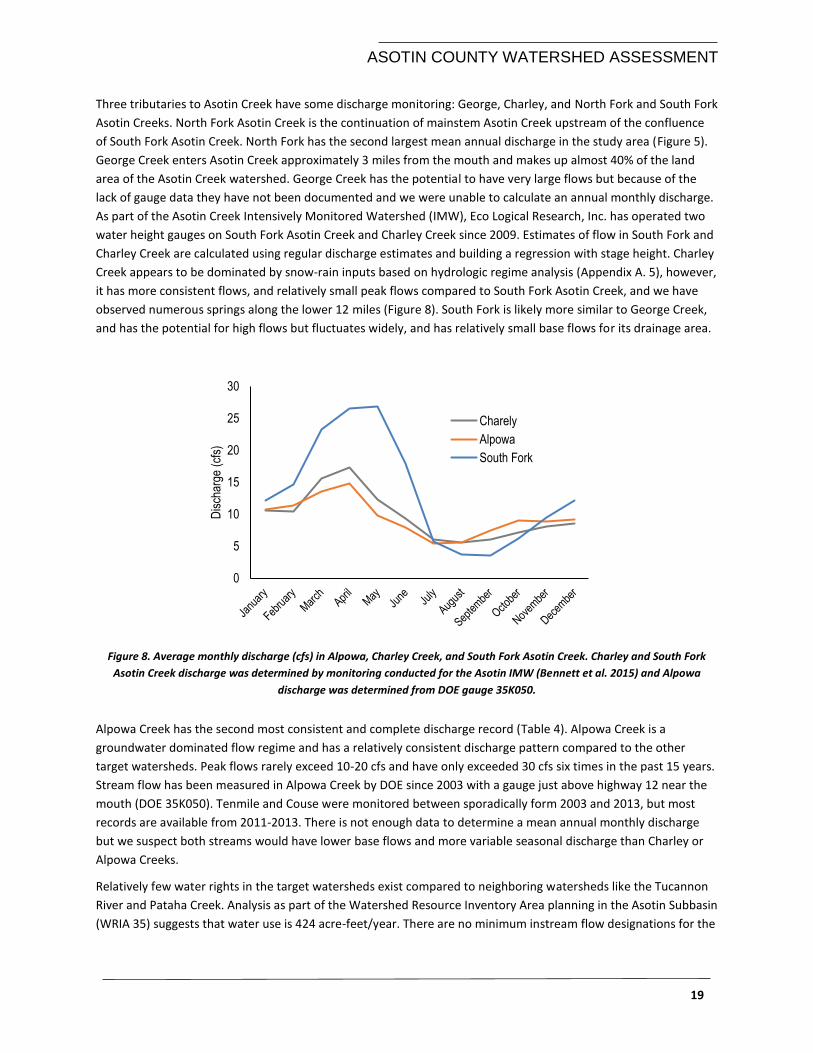
ASOTIN COUNTY WATERSHED ASSESSMENT
19
Three tributaries to Asotin Creek have some discharge monitoring: George, Charley, and North Fork and South Fork
Asotin Creeks. North Fork Asotin Creek is the continuation of mainstem Asotin Creek upstream of the confluence
of South Fork Asotin Creek. North Fork has the second largest mean annual discharge in the study area (Figure 5).
George Creek enters Asotin Creek approximately 3 miles from the mouth and makes up almost 40% of the land
area of the Asotin Creek watershed. George Creek has the potential to have very large flows but because of the
lack of gauge data they have not been documented and we were unable to calculate an annual monthly discharge.
As part of the Asotin Creek Intensively Monitored Watershed (IMW), Eco Logical Research, Inc. has operated two
water height gauges on South Fork Asotin Creek and Charley Creek since 2009. Estimates of flow in South Fork and
Charley Creek are calculated using regular discharge estimates and building a regression with stage height. Charley
Creek appears to be dominated by snow-rain inputs based on hydrologic regime analysis (Appendix A. 5), however,
it has more consistent flows, and relatively small peak flows compared to South Fork Asotin Creek, and we have
observed numerous springs along the lower 12 miles (Figure 8). South Fork is likely more similar to George Creek,
and has the potential for high flows but fluctuates widely, and has relatively small base flows for its drainage area.
Figure 8. Average monthly discharge (cfs) in Alpowa, Charley Creek, and South Fork Asotin Creek. Charley and South Fork
Asotin Creek discharge was determined by monitoring conducted for the Asotin IMW (Bennett et al. 2015) and Alpowa
discharge was determined from DOE gauge 35K050.
Alpowa Creek has the second most consistent and complete discharge record (Table 4). Alpowa Creek is a
groundwater dominated flow regime and has a relatively consistent discharge pattern compared to the other
target watersheds. Peak flows rarely exceed 10-20 cfs and have only exceeded 30 cfs six times in the past 15 years.
Stream flow has been measured in Alpowa Creek by DOE since 2003 with a gauge just above highway 12 near the
mouth (DOE 35K050). Tenmile and Couse were monitored between sporadically form 2003 and 2013, but most
records are available from 2011-2013. There is not enough data to determine a mean annual monthly discharge
but we suspect both streams would have lower base flows and more variable seasonal discharge than Charley or
Alpowa Creeks.
Relatively few water rights in the target watersheds exist compared to neighboring watersheds like the Tucannon
River and Pataha Creek. Analysis as part of the Watershed Resource Inventory Area planning in the Asotin Subbasin
(WRIA 35) suggests that water use is 424 acre-feet/year. There are no minimum instream flow designations for the
0
5
10
15
20
25
30
Dis
char
ge (
cfs)
Charely
Alpowa
South Fork
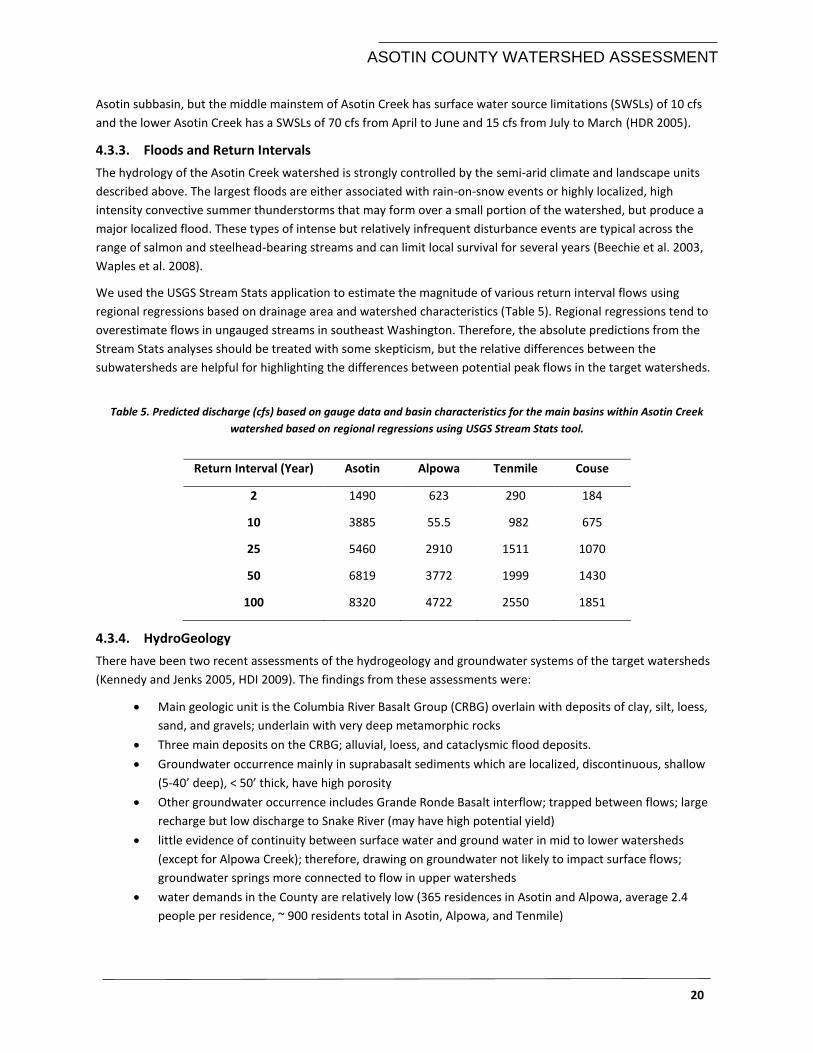
ASOTIN COUNTY WATERSHED ASSESSMENT
20
Asotin subbasin, but the middle mainstem of Asotin Creek has surface water source limitations (SWSLs) of 10 cfs
and the lower Asotin Creek has a SWSLs of 70 cfs from April to June and 15 cfs from July to March (HDR 2005).
4.3.3. Floods and Return Intervals
The hydrology of the Asotin Creek watershed is strongly controlled by the semi-arid climate and landscape units
described above. The largest floods are either associated with rain-on-snow events or highly localized, high
intensity convective summer thunderstorms that may form over a small portion of the watershed, but produce a
major localized flood. These types of intense but relatively infrequent disturbance events are typical across the
range of salmon and steelhead-bearing streams and can limit local survival for several years (Beechie et al. 2003,
Waples et al. 2008).
We used the USGS Stream Stats application to estimate the magnitude of various return interval flows using
regional regressions based on drainage area and watershed characteristics (Table 5). Regional regressions tend to
overestimate flows in ungauged streams in southeast Washington. Therefore, the absolute predictions from the
Stream Stats analyses should be treated with some skepticism, but the relative differences between the
subwatersheds are helpful for highlighting the differences between potential peak flows in the target watersheds.
Table 5. Predicted discharge (cfs) based on gauge data and basin characteristics for the main basins within Asotin Creek
watershed based on regional regressions using USGS Stream Stats tool.
Return Interval (Year) Asotin Alpowa Tenmile Couse
2 1490 623 290 184
10 3885 55.5 982 675
25 5460 2910 1511 1070
50 6819 3772 1999 1430
100 8320 4722 2550 1851
4.3.4. HydroGeology
There have been two recent assessments of the hydrogeology and groundwater systems of the target watersheds
(Kennedy and Jenks 2005, HDI 2009). The findings from these assessments were:
Main geologic unit is the Columbia River Basalt Group (CRBG) overlain with deposits of clay, silt, loess,
sand, and gravels; underlain with very deep metamorphic rocks
Three main deposits on the CRBG; alluvial, loess, and cataclysmic flood deposits.
Groundwater occurrence mainly in suprabasalt sediments which are localized, discontinuous, shallow
(5-40’ deep), < 50’ thick, have high porosity
Other groundwater occurrence includes Grande Ronde Basalt interflow; trapped between flows; large
recharge but low discharge to Snake River (may have high potential yield)
little evidence of continuity between surface water and ground water in mid to lower watersheds
(except for Alpowa Creek); therefore, drawing on groundwater not likely to impact surface flows;
groundwater springs more connected to flow in upper watersheds
water demands in the County are relatively low (365 residences in Asotin and Alpowa, average 2.4
people per residence, ~ 900 residents total in Asotin, Alpowa, and Tenmile)
ASOTIN COUNTY WATERSHED ASSESSMENT
21
4.4 SEDIMENT SOURCES AND ROUTING
4.4.1. General Sediment Sources and Characteristics
From a sediment supply perspective, the Asotin is characterized by two dichotomous sources of sediment and two
somewhat contradictory sediment ‘problems’. The two primary sources of sediment are from weathering of
bedrock (primarily basalts from the CRBG) producing relatively coarse boulders, cobbles and gravels, and the much
more recent (c. 13,000 to 15,000 years ago from Missoula Floods) cap of fine-grained loess (wind blown silts),
which blanketed and mantled the basalt plateaus. Spatially, these two ‘sources’ are easily visualized as the
landscape units of Appendix A. 7, with the ‘canyons’ exposing the basalt bedrock and ‘dissected loess uplands’
evacuating some of the easily erodible silts. The relief provided by the Blue Mountains versus the base level
imposed by the Snake River, set up roughly 4000 feet of elevation for these streams to pass through in less than 20
miles (from Blue Mountain to Snake). That produces relatively steep stream slopes with high enough stream power
when floods pass through to move sediment along. All of the 176 miles of perennial, streams are incised into this
bedrock. In general, the further downstream the deeper the basalt canyons, the wider the valleys become (around
500 to 600 feet wide near mouth of Asotin). The valley bottoms of these streams have partially filled with a mix of
both sources of sediment providing a third and much more important local source of sediment for contemporary
fluvial reworking within and along the modern channels. Within the active stream channel, the ‘contradictory’
sediment ‘problems’ are i) a system overwhelmed by fines (i.e. the loess), versus ii) a system so armored with
coarse materials that it has difficulty mobilizing much of that sediment in typical, annual floods. We will briefly
describe the role these two supplies played.
Where floodplain connectivity is adequate, the valley bottoms are important sinks for some of the fine fraction of
sediment yielded from the loess plateau uplands. Some of this fine fraction can become embedded within the
coarse cobble bed. The loess soil combined with poor farming practices historically produced excess fine sediment
supplies carried as suspended load and historically caused degradation of spawning areas (SCS 1984). Moreover,
these were the primary motivation of the Model Watershed (see §3.1.4). However, with implementation of the
Model Watershed Plan, farming practices such as no-till have so dramatically improved, that excessive erosion of
loess and its delivery downstream is no longer a problem. There is little evidence that there is an over supply of
fine sediment in the study creeks currently. Most of the study streams are channelized (i.e., high banks and
straight), low sinuosity channels, with very limited structural elements (i.e., wood) which is very efficient at
transporting fine sediment out to the Snake River. Better trap efficiency on these fines on floodplains could occur
with increased floodplain connectivity
Today, the composition of the streambed for the vast majority of the fish-bearing streams is a very coarse and
armored bed comprised of cobble, boulders and gravel. To illustrate this, we summarized simple grain size
statistics from CHaMP (Columbia Habitat Monitoring Program) surveys (Table 6). These are confirmed by previous
assessments, landscape unit mapping, field validation studies, Intensively Monitored Watershed monitoring sites
in George Creek, North Fork and South Asotin Creeks, and Charley Creek (Bennett et al. 2015), and the recent
sediment analysis (ESA 2016). These coarse gravels and cobbles are mobile under some larger floods, but not
always mobile under typical floods these creeks experience annually. Especially within the simplified and
channelized reaches, mobility of local bed sediments is limited. Within the Asotin IMW, we experimented with
whether or not diversifying hydraulic conditions with structural additions (i.e. wood), can increase mobility of the
bed and increase opportunities for deposition and temporary storage of sediment in active bars. We have found
that we can very effectively make these smaller floods more competent and effective at creating diverse habitats
and a much more diversified substrate surface composition.
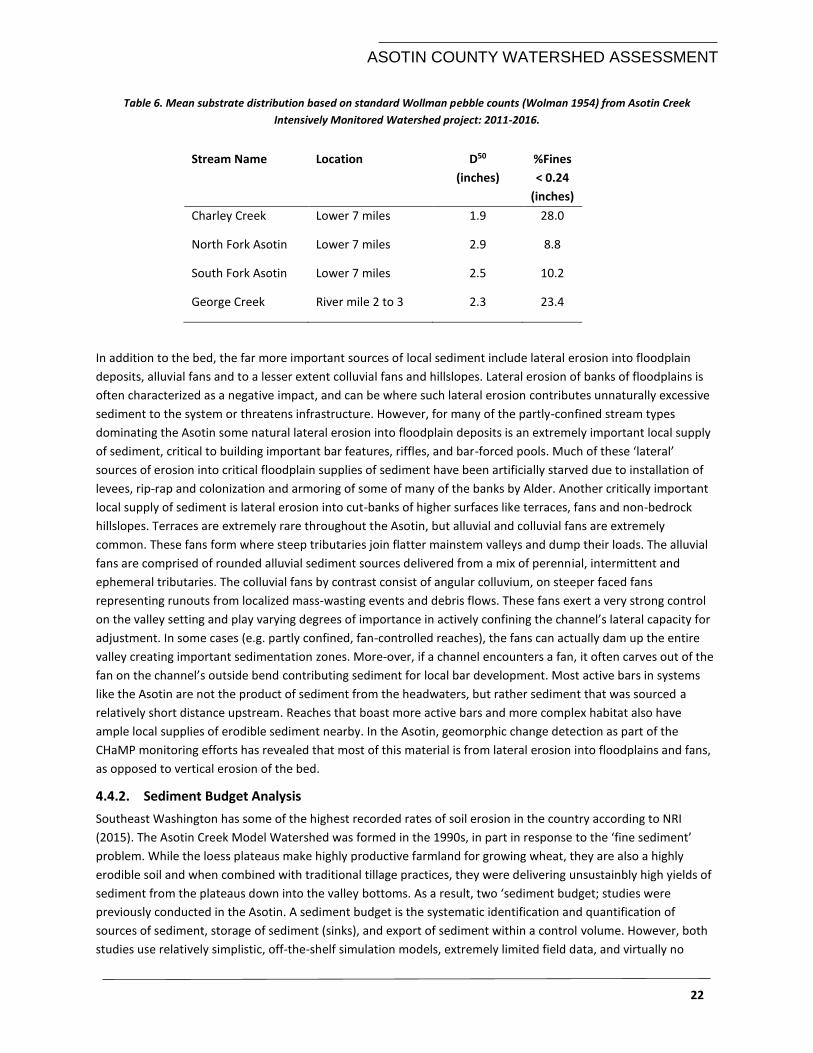
ASOTIN COUNTY WATERSHED ASSESSMENT
22
Table 6. Mean substrate distribution based on standard Wollman pebble counts (Wolman 1954) from Asotin Creek
Intensively Monitored Watershed project: 2011-2016.
Stream Name Location D50
(inches)
%Fines
< 0.24
(inches)
Charley Creek Lower 7 miles 1.9 28.0
North Fork Asotin Lower 7 miles 2.9 8.8
South Fork Asotin Lower 7 miles 2.5 10.2
George Creek River mile 2 to 3 2.3 23.4
In addition to the bed, the far more important sources of local sediment include lateral erosion into floodplain
deposits, alluvial fans and to a lesser extent colluvial fans and hillslopes. Lateral erosion of banks of floodplains is
often characterized as a negative impact, and can be where such lateral erosion contributes unnaturally excessive
sediment to the system or threatens infrastructure. However, for many of the partly-confined stream types
dominating the Asotin some natural lateral erosion into floodplain deposits is an extremely important local supply
of sediment, critical to building important bar features, riffles, and bar-forced pools. Much of these ‘lateral’
sources of erosion into critical floodplain supplies of sediment have been artificially starved due to installation of
levees, rip-rap and colonization and armoring of some of many of the banks by Alder. Another critically important
local supply of sediment is lateral erosion into cut-banks of higher surfaces like terraces, fans and non-bedrock
hillslopes. Terraces are extremely rare throughout the Asotin, but alluvial and colluvial fans are extremely
common. These fans form where steep tributaries join flatter mainstem valleys and dump their loads. The alluvial
fans are comprised of rounded alluvial sediment sources delivered from a mix of perennial, intermittent and
ephemeral tributaries. The colluvial fans by contrast consist of angular colluvium, on steeper faced fans
representing runouts from localized mass-wasting events and debris flows. These fans exert a very strong control
on the valley setting and play varying degrees of importance in actively confining the channel’s lateral capacity for
adjustment. In some cases (e.g. partly confined, fan-controlled reaches), the fans can actually dam up the entire
valley creating important sedimentation zones. More-over, if a channel encounters a fan, it often carves out of the
fan on the channel’s outside bend contributing sediment for local bar development. Most active bars in systems
like the Asotin are not the product of sediment from the headwaters, but rather sediment that was sourced a
relatively short distance upstream. Reaches that boast more active bars and more complex habitat also have
ample local supplies of erodible sediment nearby. In the Asotin, geomorphic change detection as part of the
CHaMP monitoring efforts has revealed that most of this material is from lateral erosion into floodplains and fans,
as opposed to vertical erosion of the bed.
4.4.2. Sediment Budget Analysis
Southeast Washington has some of the highest recorded rates of soil erosion in the country according to NRI
(2015). The Asotin Creek Model Watershed was formed in the 1990s, in part in response to the ‘fine sediment’
problem. While the loess plateaus make highly productive farmland for growing wheat, they are also a highly
erodible soil and when combined with traditional tillage practices, they were delivering unsustainbly high yields of
sediment from the plateaus down into the valley bottoms. As a result, two ‘sediment budget; studies were
previously conducted in the Asotin. A sediment budget is the systematic identification and quantification of
sources of sediment, storage of sediment (sinks), and export of sediment within a control volume. However, both
studies use relatively simplistic, off-the-shelf simulation models, extremely limited field data, and virtually no
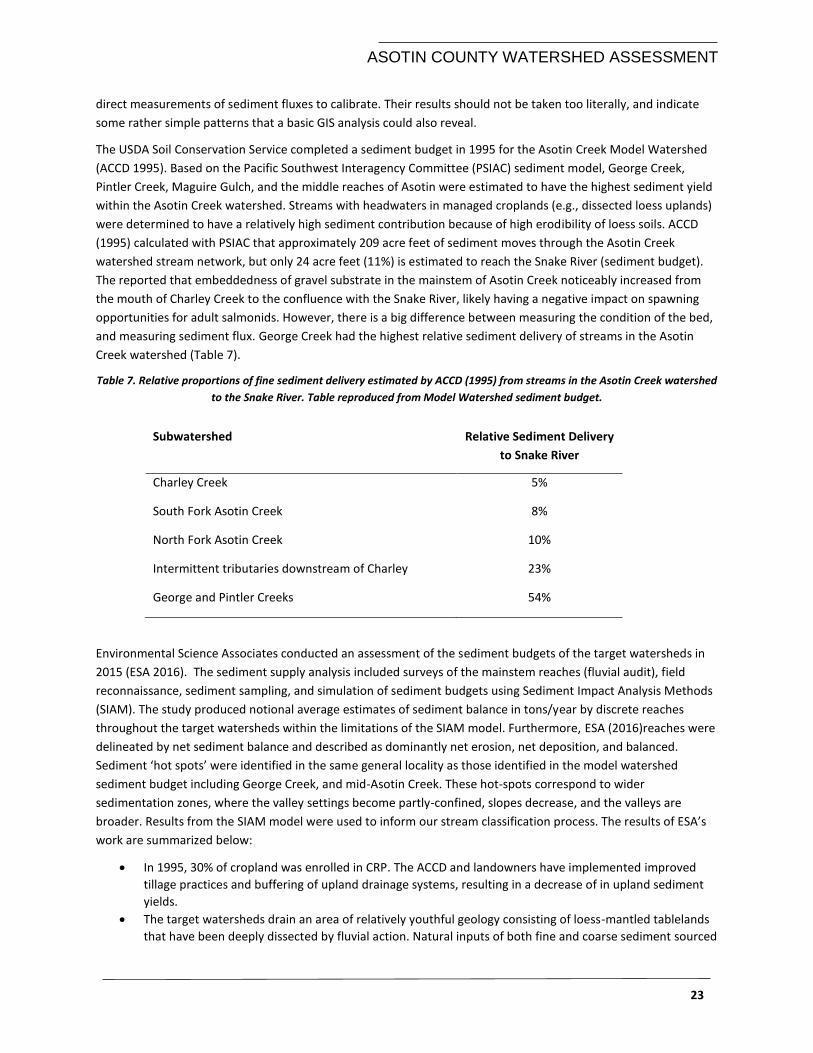
ASOTIN COUNTY WATERSHED ASSESSMENT
23
direct measurements of sediment fluxes to calibrate. Their results should not be taken too literally, and indicate
some rather simple patterns that a basic GIS analysis could also reveal.
The USDA Soil Conservation Service completed a sediment budget in 1995 for the Asotin Creek Model Watershed
(ACCD 1995). Based on the Pacific Southwest Interagency Committee (PSIAC) sediment model, George Creek,
Pintler Creek, Maguire Gulch, and the middle reaches of Asotin were estimated to have the highest sediment yield
within the Asotin Creek watershed. Streams with headwaters in managed croplands (e.g., dissected loess uplands)
were determined to have a relatively high sediment contribution because of high erodibility of loess soils. ACCD
(1995) calculated with PSIAC that approximately 209 acre feet of sediment moves through the Asotin Creek
watershed stream network, but only 24 acre feet (11%) is estimated to reach the Snake River (sediment budget).
The reported that embeddedness of gravel substrate in the mainstem of Asotin Creek noticeably increased from
the mouth of Charley Creek to the confluence with the Snake River, likely having a negative impact on spawning
opportunities for adult salmonids. However, there is a big difference between measuring the condition of the bed,
and measuring sediment flux. George Creek had the highest relative sediment delivery of streams in the Asotin
Creek watershed (Table 7).
Table 7. Relative proportions of fine sediment delivery estimated by ACCD (1995) from streams in the Asotin Creek watershed
to the Snake River. Table reproduced from Model Watershed sediment budget.
Subwatershed Relative Sediment Delivery
to Snake River
Charley Creek 5%
South Fork Asotin Creek 8%
North Fork Asotin Creek 10%
Intermittent tributaries downstream of Charley 23%
George and Pintler Creeks 54%
Environmental Science Associates conducted an assessment of the sediment budgets of the target watersheds in
2015 (ESA 2016). The sediment supply analysis included surveys of the mainstem reaches (fluvial audit), field
reconnaissance, sediment sampling, and simulation of sediment budgets using Sediment Impact Analysis Methods
(SIAM). The study produced notional average estimates of sediment balance in tons/year by discrete reaches
throughout the target watersheds within the limitations of the SIAM model. Furthermore, ESA (2016)reaches were
delineated by net sediment balance and described as dominantly net erosion, net deposition, and balanced.
Sediment ‘hot spots’ were identified in the same general locality as those identified in the model watershed
sediment budget including George Creek, and mid-Asotin Creek. These hot-spots correspond to wider
sedimentation zones, where the valley settings become partly-confined, slopes decrease, and the valleys are
broader. Results from the SIAM model were used to inform our stream classification process. The results of ESA’s
work are summarized below:
In 1995, 30% of cropland was enrolled in CRP. The ACCD and landowners have implemented improved
tillage practices and buffering of upland drainage systems, resulting in a decrease of in upland sediment
yields.
The target watersheds drain an area of relatively youthful geology consisting of loess-mantled tablelands
that have been deeply dissected by fluvial action. Natural inputs of both fine and coarse sediment sourced
ASOTIN COUNTY WATERSHED ASSESSMENT
24
from the high, steep valley sides and colluvial (sediment produced by hill slope processes) and alluvial
(sediment produced by stream processes) valley-fill deposits remain high.
Steep hillslopes are, in many places, directly connected to the active channel and drainage network,
making delivery of colluvial sediment into the drainage system highly efficient.
Typically low levels of precipitation and runoff, interspersed with infrequent but heavy rainfall and
occasional rain-on-snow events, result in low background sediment loads punctuated by episodic
transport of large volumes of sediment.
Restoration actions implemented in the target watersheds should work synergistically with each other
and be implemented at over a large spatial scale to have a system-wide impact on sediment yields.
Projects should be planned with knowledge of the cumulative or downstream effects of projects
previously implemented.
The reality is that sediment budgets are very difficult and costly to implement properly, and can require many
years of study to do well. Neither of the ‘sediment budgets’ previously commissioned represent true and full
sediment budgets, but instead practical simulation attempts to quantify some of the terms that go into a sediment
budget within the constraints of available data and time. Without comparison to a baseline, or some analysis of
how current conditions depart from some expectation, a sediment budget by itself provides no context to judge
whether or not the results are ‘good’, ‘bad’, ‘desirable’ or ‘undesirable’. There is a tendency in such studies to
overemphasize the importance of ‘equilibrium’ reaches where sediment inputs are balanced by sediment outputs,
as if they are somehow better. However, many reach types are naturally in dis-equilibrium. For example, active
alluvial fans are typically (at least episodically) characterized by net aggradation, and this is perfectly natural. By
contrast, many inactive alluvial fans, which still have streams flowing across them, are actively net degradational
and an important source of sediment to mainstems. We think it is more important to characterize current
geomorphic conditions in the context of what processes and forms are expected naturally and what are the
practical constraints today. Given the episodic nature of sediment fluxes within the Asotin with its flashy flow
regime, it is critically important to identify where and how we can work with these geomorphic processes of
erosion, transport, deposition and temporary storage of sediment to bring about desired changes and
improvement to fish habitat.
5. FISH RESOURCES
The focus of the assessment and restoration plan is to improve conditions for ESA listed salmon, steelhead, bull
trout, and Pacific lamprey. In this section, we briefly review historic abundance, recovery goals, status, distribution,
habitat requirements, and past limiting factors. This summary was primarily derived from the Asotin Model
Watershed (ACCD 1995), USFS stream surveys (USFS 2001, 2014a, b), baseline surveys from WDFW (Mendel et al.
2004, Mendel et al. 2008), Limiting Factors Analysis (Kuttel 2002), Subbasin Plan (ACCD 2004), Ecosystem Diagnosis
and Treatment analysis (SRSRB 2011), and Nez Perce Fisheries Management (NPT 2013).
5.1 HISTORIC FISH ABUNDANCE AND RECOVERY GOALS
It is important to put the current distribution and abundance of salmon and steelhead into an historic context.
Although there were no records of salmon and steelhead abundance prior to Euro-American development, it is
possible to estimate what the abundances might have been (i.e., run reconstruction) using habitat data and
estimates of spawning densities from other watersheds prior to dam construction and significant commercial
fishing pressure. Pess et al. (In review) conducted such a run reconstruction and estimated that Asotin Creek may
have supported over 15,000 adult steelhead and Chinook. These numbers are similar to the recovery goals of the
Nez Perce which consider full recovery to be > 10,000 for steelhead (Table 8; NPT).
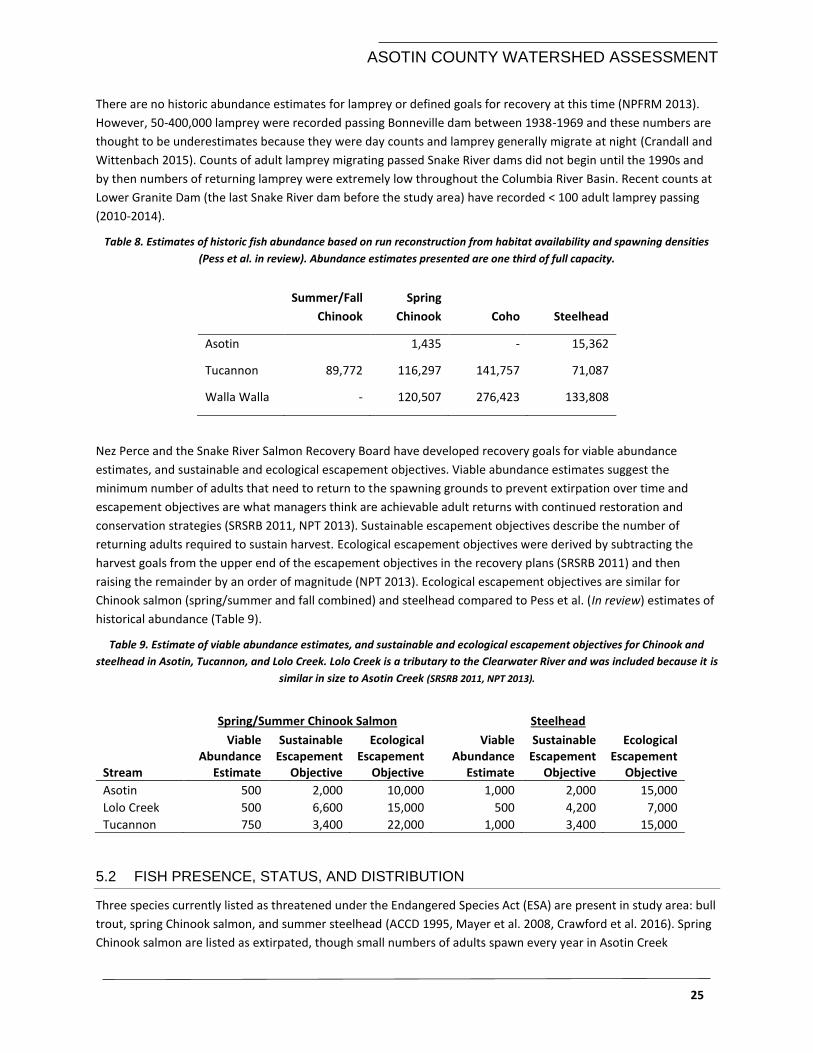
ASOTIN COUNTY WATERSHED ASSESSMENT
25
There are no historic abundance estimates for lamprey or defined goals for recovery at this time (NPFRM 2013).
However, 50-400,000 lamprey were recorded passing Bonneville dam between 1938-1969 and these numbers are
thought to be underestimates because they were day counts and lamprey generally migrate at night (Crandall and
Wittenbach 2015). Counts of adult lamprey migrating passed Snake River dams did not begin until the 1990s and
by then numbers of returning lamprey were extremely low throughout the Columbia River Basin. Recent counts at
Lower Granite Dam (the last Snake River dam before the study area) have recorded < 100 adult lamprey passing
(2010-2014).
Table 8. Estimates of historic fish abundance based on run reconstruction from habitat availability and spawning densities
(Pess et al. in review). Abundance estimates presented are one third of full capacity.
Summer/Fall
Chinook
Spring
Chinook Coho Steelhead
Asotin
1,435 - 15,362
Tucannon 89,772 116,297 141,757 71,087
Walla Walla - 120,507 276,423 133,808
Nez Perce and the Snake River Salmon Recovery Board have developed recovery goals for viable abundance
estimates, and sustainable and ecological escapement objectives. Viable abundance estimates suggest the
minimum number of adults that need to return to the spawning grounds to prevent extirpation over time and
escapement objectives are what managers think are achievable adult returns with continued restoration and
conservation strategies (SRSRB 2011, NPT 2013). Sustainable escapement objectives describe the number of
returning adults required to sustain harvest. Ecological escapement objectives were derived by subtracting the
harvest goals from the upper end of the escapement objectives in the recovery plans (SRSRB 2011) and then
raising the remainder by an order of magnitude (NPT 2013). Ecological escapement objectives are similar for
Chinook salmon (spring/summer and fall combined) and steelhead compared to Pess et al. (In review) estimates of
historical abundance (Table 9).
Table 9. Estimate of viable abundance estimates, and sustainable and ecological escapement objectives for Chinook and
steelhead in Asotin, Tucannon, and Lolo Creek. Lolo Creek is a tributary to the Clearwater River and was included because it is
similar in size to Asotin Creek (SRSRB 2011, NPT 2013).
Spring/Summer Chinook Salmon Steelhead
Stream
Viable Abundance
Estimate
Sustainable Escapement
Objective
Ecological Escapement
Objective
Viable Abundance
Estimate
Sustainable Escapement
Objective
Ecological Escapement
Objective
Asotin 500 2,000 10,000 1,000 2,000 15,000
Lolo Creek 500 6,600 15,000 500 4,200 7,000
Tucannon 750 3,400 22,000 1,000 3,400 15,000
5.2 FISH PRESENCE, STATUS, AND DISTRIBUTION
Three species currently listed as threatened under the Endangered Species Act (ESA) are present in study area: bull
trout, spring Chinook salmon, and summer steelhead (ACCD 1995, Mayer et al. 2008, Crawford et al. 2016). Spring
Chinook salmon are listed as extirpated, though small numbers of adults spawn every year in Asotin Creek
ASOTIN COUNTY WATERSHED ASSESSMENT
26
(Crawford et al. 2016). Lamprey are a species of concern in Washington and current efforts are underway to
reintroduce them to Asotin Creek (Schlosser and Peery 2010). There are 12 species of fish thought to occur within
the target watersheds (ACCD 2004). Most of these species occur in the lower portion of the Asotin Creek
watershed and 25% are non-native species (Appendix B. 3).
Distribution of some fish species has likely changed in the last 150 years. Lamprey and sucker distributions have
likely been reduced due to historic dams, barriers, and irrigation diversions. McIntosh et al. (1989) summarized
Bureau of Fisheries stream habitat surveys in Asotin Creek mainstem in March 1935 and June 1936 and
documented three permanent and 11 temporary barriers (dams and irrigation diversions) and noted that the lower
dam at ~RM 0.4 was built for the explicit purpose of stopping suckers from entering Asotin Creek. Headgate Dam
at ~ RM 8.1 would divert all the water from Asotin Creek during times of low flow, causing the lower river to go
dry. The irrigation diversions and permanent dams likely restricted Chinook salmon, bull trout, and lamprey from
migrating upstream because they migrate during low flow periods (summer and fall). The distribution of steelhead
was less influenced by fish passage barriers. Adult steelhead migrate during spring high flows when water
demands are low and they are able to ascend barriers that are otherwise impassable to other fish (e.g., lamprey,
suckers, and whitefish).
We used a combination of GIS data on the fish distribution layers that are available on the Pacific States Marine
Fisheries Commission (PSMFC) www.streamnet.org , and redd surveys and juvenile abundance estimates from
WDFW, USFS, and our own surveys to determine the current distribution and status of target fish species (Bennett
et al. 2015 and unpublished data).
5.2.1. Steelhead
Population Status
Steelhead are the dominant ESA listed species in the target watersheds and have the most extensive distribution (>
90-95% of all salmonids; Appendix A. 8). The steelhead present in the target watersheds are summer “A” run fish
that generally migrate up the Columbia River and past Bonneville Dam before August 25 (ACCD 2004). The
steelhead are part of the Snake River Evolutionary Significant Unit (ESU) based on genetic characteristics that
distinguish the Snake River steelhead from other Columbia River Basin steelhead (ACCD 2004, SRSRB 2006). The
steelhead are further grouped into the Lower Snake Mainstem Tributaries Major Population Grouping (MPG),
which includes the Tucannon River and nine small tributaries that flow directly into the Lower Snake River (SRSRB
2006). Asotin Creek and the following six tributaries are considered a subpopulation of the Lower Snake River
MPG: Almota, Alpowa, Couse, Steptoe, Tenmile, and Wawawai Creeks. The Asotin Creek steelhead subpopulation
is further divided into major spawning aggregations (MSA) and minor spawning aggregations (mSA). The Asotin
Creek Watershed and Alpowa are considered MSAs because they are thought to have been able to support at least
500 spawners historically. All other tributaries within the Asotin Creek subpopulation of steelhead are considered
mSAs, which indicates they historically supported between 50-500 spawners.
There is a large amount of data available on both the historic abundance and current abundance of steelhead in
the target watersheds, especially Asotin Creek (Bumgarner et al. 2003, Mendel et al. 2008, Crawford and Herr
2017). A detailed long-term monitoring study by WDFW of the Asotin Creek steelhead run began in 2004. The
survey effort focuses on Asotin Creek but has attempted to collect data on George Creek, Alpowa, Couse, and
Tenmile when conditions and support staff/funding are available (see Crawford et al. 2017 for more detail). The
study consists of a 5 m rotary screw trap (smolt trap) that is operated in the spring and fall to assess juvenile
outmigration and an adult weir that is operated from January to June to enumerate returning spawners. There are
also four passive integrated transponder tag (PIT tag) interrogation sites located on the mainstem and tributaries
of Asotin Creek that allow detection of PIT tagged fish (Bennett et al. 2015). Three interrogation sites were
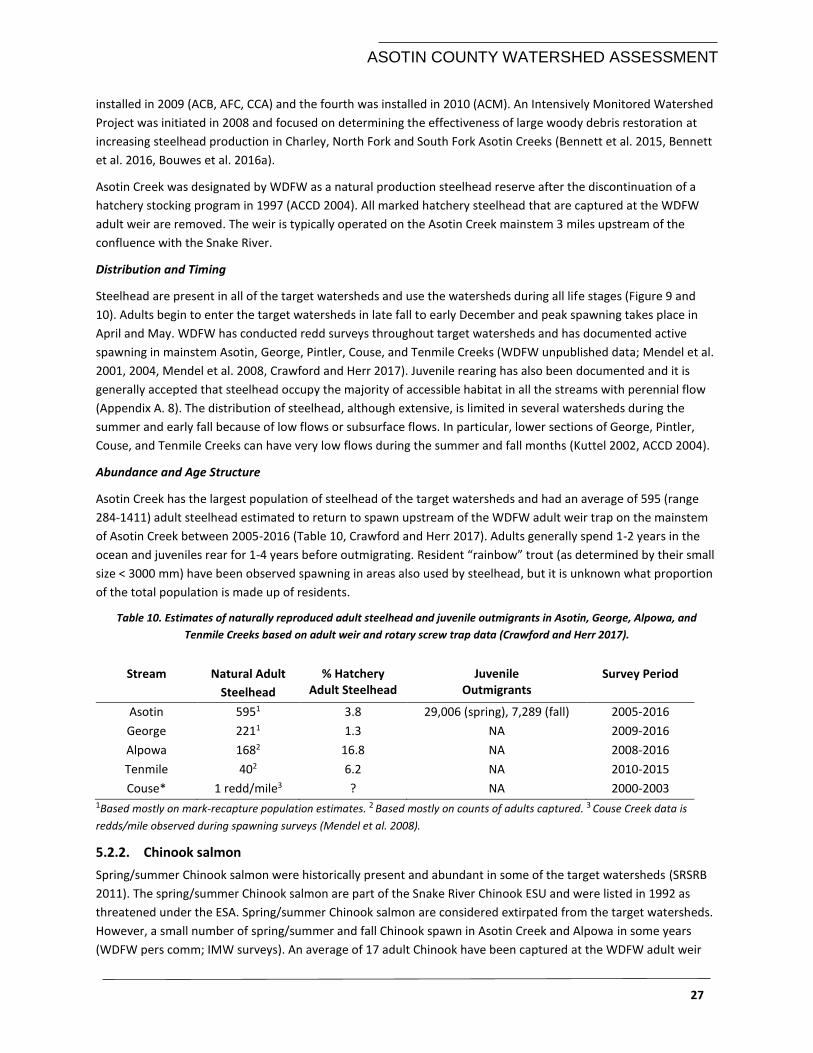
ASOTIN COUNTY WATERSHED ASSESSMENT
27
installed in 2009 (ACB, AFC, CCA) and the fourth was installed in 2010 (ACM). An Intensively Monitored Watershed
Project was initiated in 2008 and focused on determining the effectiveness of large woody debris restoration at
increasing steelhead production in Charley, North Fork and South Fork Asotin Creeks (Bennett et al. 2015, Bennett
et al. 2016, Bouwes et al. 2016a).
Asotin Creek was designated by WDFW as a natural production steelhead reserve after the discontinuation of a
hatchery stocking program in 1997 (ACCD 2004). All marked hatchery steelhead that are captured at the WDFW
adult weir are removed. The weir is typically operated on the Asotin Creek mainstem 3 miles upstream of the
confluence with the Snake River.
Distribution and Timing
Steelhead are present in all of the target watersheds and use the watersheds during all life stages (Figure 9 and
10). Adults begin to enter the target watersheds in late fall to early December and peak spawning takes place in
April and May. WDFW has conducted redd surveys throughout target watersheds and has documented active
spawning in mainstem Asotin, George, Pintler, Couse, and Tenmile Creeks (WDFW unpublished data; Mendel et al.
2001, 2004, Mendel et al. 2008, Crawford and Herr 2017). Juvenile rearing has also been documented and it is
generally accepted that steelhead occupy the majority of accessible habitat in all the streams with perennial flow
(Appendix A. 8). The distribution of steelhead, although extensive, is limited in several watersheds during the
summer and early fall because of low flows or subsurface flows. In particular, lower sections of George, Pintler,
Couse, and Tenmile Creeks can have very low flows during the summer and fall months (Kuttel 2002, ACCD 2004).
Abundance and Age Structure
Asotin Creek has the largest population of steelhead of the target watersheds and had an average of 595 (range
284-1411) adult steelhead estimated to return to spawn upstream of the WDFW adult weir trap on the mainstem
of Asotin Creek between 2005-2016 (Table 10, Crawford and Herr 2017). Adults generally spend 1-2 years in the
ocean and juveniles rear for 1-4 years before outmigrating. Resident “rainbow” trout (as determined by their small
size < 3000 mm) have been observed spawning in areas also used by steelhead, but it is unknown what proportion
of the total population is made up of residents.
Table 10. Estimates of naturally reproduced adult steelhead and juvenile outmigrants in Asotin, George, Alpowa, and
Tenmile Creeks based on adult weir and rotary screw trap data (Crawford and Herr 2017).
Stream Natural Adult
Steelhead
% Hatchery Adult Steelhead
Juvenile Outmigrants
Survey Period
Asotin 5951 3.8 29,006 (spring), 7,289 (fall) 2005-2016
George 2211 1.3 NA 2009-2016
Alpowa 1682 16.8 NA 2008-2016
Tenmile 402 6.2 NA 2010-2015
Couse* 1 redd/mile3 ? NA 2000-2003 1Based mostly on mark-recapture population estimates. 2 Based mostly on counts of adults captured. 3 Couse Creek data is
redds/mile observed during spawning surveys (Mendel et al. 2008).
5.2.2. Chinook salmon
Spring/summer Chinook salmon were historically present and abundant in some of the target watersheds (SRSRB
2011). The spring/summer Chinook salmon are part of the Snake River Chinook ESU and were listed in 1992 as
threatened under the ESA. Spring/summer Chinook salmon are considered extirpated from the target watersheds.
However, a small number of spring/summer and fall Chinook spawn in Asotin Creek and Alpowa in some years
(WDFW pers comm; IMW surveys). An average of 17 adult Chinook have been captured at the WDFW adult weir
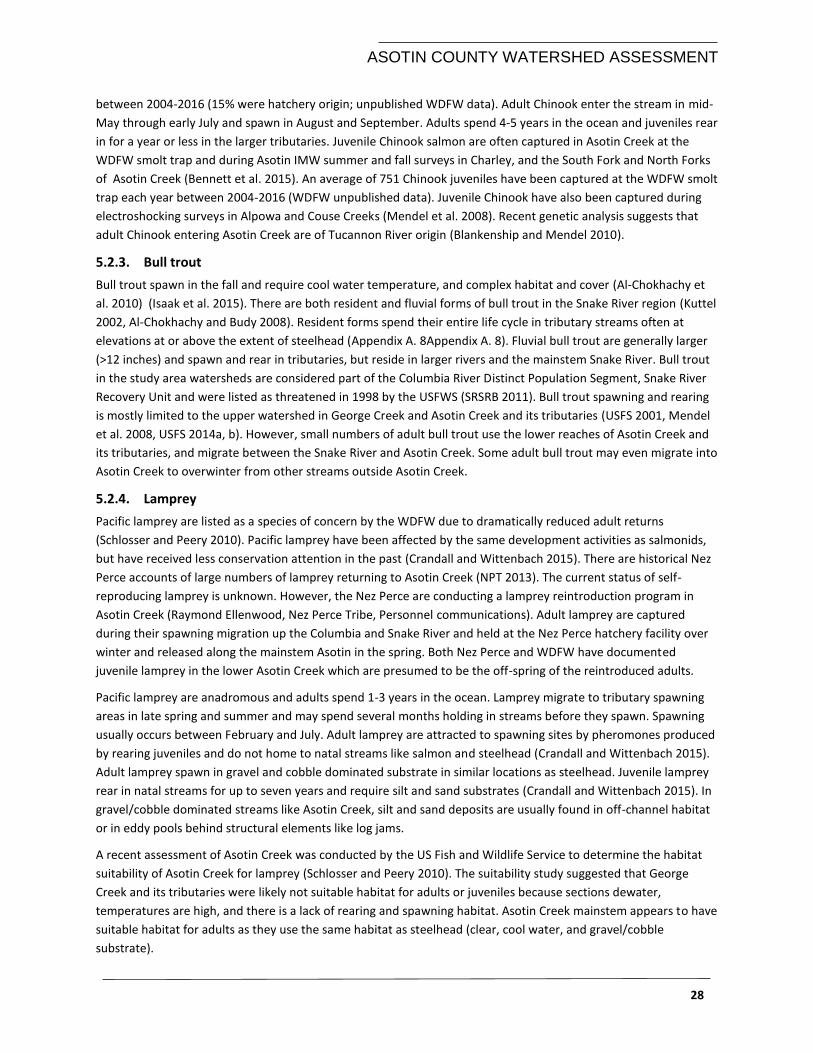
ASOTIN COUNTY WATERSHED ASSESSMENT
28
between 2004-2016 (15% were hatchery origin; unpublished WDFW data). Adult Chinook enter the stream in mid-
May through early July and spawn in August and September. Adults spend 4-5 years in the ocean and juveniles rear
in for a year or less in the larger tributaries. Juvenile Chinook salmon are often captured in Asotin Creek at the
WDFW smolt trap and during Asotin IMW summer and fall surveys in Charley, and the South Fork and North Forks
of Asotin Creek (Bennett et al. 2015). An average of 751 Chinook juveniles have been captured at the WDFW smolt
trap each year between 2004-2016 (WDFW unpublished data). Juvenile Chinook have also been captured during
electroshocking surveys in Alpowa and Couse Creeks (Mendel et al. 2008). Recent genetic analysis suggests that
adult Chinook entering Asotin Creek are of Tucannon River origin (Blankenship and Mendel 2010).
5.2.3. Bull trout
Bull trout spawn in the fall and require cool water temperature, and complex habitat and cover (Al-Chokhachy et
al. 2010) (Isaak et al. 2015). There are both resident and fluvial forms of bull trout in the Snake River region (Kuttel
2002, Al-Chokhachy and Budy 2008). Resident forms spend their entire life cycle in tributary streams often at
elevations at or above the extent of steelhead (Appendix A. 8Appendix A. 8). Fluvial bull trout are generally larger
(>12 inches) and spawn and rear in tributaries, but reside in larger rivers and the mainstem Snake River. Bull trout
in the study area watersheds are considered part of the Columbia River Distinct Population Segment, Snake River
Recovery Unit and were listed as threatened in 1998 by the USFWS (SRSRB 2011). Bull trout spawning and rearing
is mostly limited to the upper watershed in George Creek and Asotin Creek and its tributaries (USFS 2001, Mendel
et al. 2008, USFS 2014a, b). However, small numbers of adult bull trout use the lower reaches of Asotin Creek and
its tributaries, and migrate between the Snake River and Asotin Creek. Some adult bull trout may even migrate into
Asotin Creek to overwinter from other streams outside Asotin Creek.
5.2.4. Lamprey
Pacific lamprey are listed as a species of concern by the WDFW due to dramatically reduced adult returns
(Schlosser and Peery 2010). Pacific lamprey have been affected by the same development activities as salmonids,
but have received less conservation attention in the past (Crandall and Wittenbach 2015). There are historical Nez
Perce accounts of large numbers of lamprey returning to Asotin Creek (NPT 2013). The current status of self-
reproducing lamprey is unknown. However, the Nez Perce are conducting a lamprey reintroduction program in
Asotin Creek (Raymond Ellenwood, Nez Perce Tribe, Personnel communications). Adult lamprey are captured
during their spawning migration up the Columbia and Snake River and held at the Nez Perce hatchery facility over
winter and released along the mainstem Asotin in the spring. Both Nez Perce and WDFW have documented
juvenile lamprey in the lower Asotin Creek which are presumed to be the off-spring of the reintroduced adults.
Pacific lamprey are anadromous and adults spend 1-3 years in the ocean. Lamprey migrate to tributary spawning
areas in late spring and summer and may spend several months holding in streams before they spawn. Spawning
usually occurs between February and July. Adult lamprey are attracted to spawning sites by pheromones produced
by rearing juveniles and do not home to natal streams like salmon and steelhead (Crandall and Wittenbach 2015).
Adult lamprey spawn in gravel and cobble dominated substrate in similar locations as steelhead. Juvenile lamprey
rear in natal streams for up to seven years and require silt and sand substrates (Crandall and Wittenbach 2015). In
gravel/cobble dominated streams like Asotin Creek, silt and sand deposits are usually found in off-channel habitat
or in eddy pools behind structural elements like log jams.
A recent assessment of Asotin Creek was conducted by the US Fish and Wildlife Service to determine the habitat
suitability of Asotin Creek for lamprey (Schlosser and Peery 2010). The suitability study suggested that George
Creek and its tributaries were likely not suitable habitat for adults or juveniles because sections dewater,
temperatures are high, and there is a lack of rearing and spawning habitat. Asotin Creek mainstem appears to have
suitable habitat for adults as they use the same habitat as steelhead (clear, cool water, and gravel/cobble
substrate).
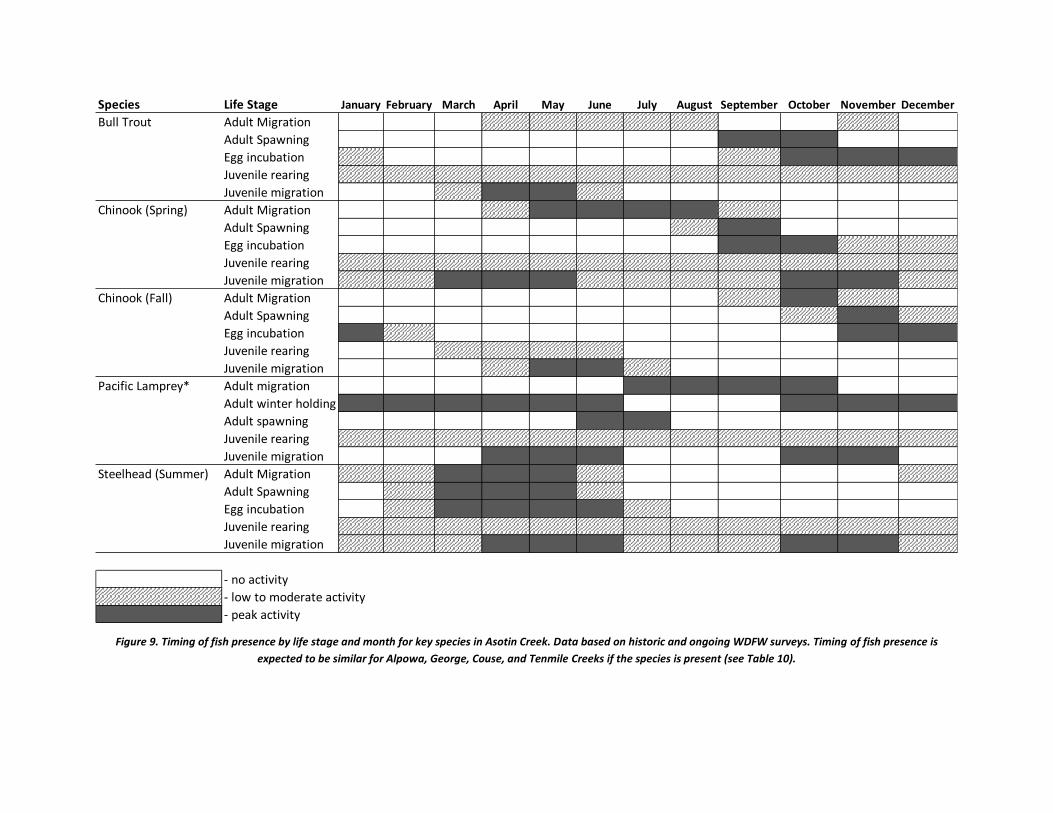
Figure 9. Timing of fish presence by life stage and month for key species in Asotin Creek. Data based on historic and ongoing WDFW surveys. Timing of fish presence is
expected to be similar for Alpowa, George, Couse, and Tenmile Creeks if the species is present (see Table 10).
Species Life Stage January February March April May June July August September October November December
Bull Trout Adult Migration
Adult Spawning
Egg incubation
Juvenile rearing
Juvenile migration
Chinook (Spring) Adult Migration
Adult Spawning
Egg incubation
Juvenile rearing
Juvenile migration
Chinook (Fall) Adult Migration
Adult Spawning
Egg incubation
Juvenile rearing
Juvenile migration
Pacific Lamprey* Adult migration
Adult winter holding
Adult spawning
Juvenile rearing
Juvenile migration
Steelhead (Summer) Adult Migration
Adult Spawning
Egg incubation
Juvenile rearing
Juvenile migration
- no activity
- low to moderate activity
- peak activity
ASOTIN COUNTY WATERSHED ASSESSMENT
Figure 10. Presence and approximate distribution of Chinook, steelhead, and bull trout starting at the mouth of the target watersheds.
StreamGeographic
Area
RM
Start
RM
EndDescription of Geographic Area Migration Spawning
Juvenile
Rearing
Adult
holdingMigration Spawning
Juvenile
Rearing
Adult
holdingMigration Spawning
Juvenile
Rearing
Adult
holdingMigration Spawning
Juvenile
Rearing
Adult
holding
Lower 0.0 3.2 mouth to George Creek confluence
Mid 3.2 8.0 George Creek to Headgate
Upper 8.0 15.4 Headgate to Forks
Lower 0.0 3.2 mouth of Pintler confluence
Mid 3.2 10.9 Pintler confluence to first river right tributary
Upper 10.9 ~25 tributary junction to headwaters
Lower 0.0 0.4 mouth to end of private property (Koch)
Mid 0.4 7.1 Koch property to end of WDFW property
Upper 7.1 13.0 USFS boundary to headwaters
Lower 0.0 1.0 mouth to Lick Creek
Mid 1.0 4.9 Lick Creek to USFS boundary
Upper 4.9 ~20 USFS Boundary to Headwaters
Lower 0 3.6 mouth to Warner Gulch
Mid 3.6 8.3 Warner Gulch to USFS Boudary
Upper 8.3 10 USFS Boundary to Headwaters
Lower 0 3 mouth to confluence with Pow Wah Kee
Mid 3 6.7 Pow Wah Kee to confluence with Stember
Upper 6.7 20 Stember to Headwaters
Lower 0 3.2 mouth to first bridge crossing
Mid 3.2 5.2 bridge to end of fish distribution
Upper NA NA no fish
Lower 0 1.1 mouth to first bridge crossing
Mid 1.1 10.7 first bridge to Mill Creek
Upper 10.7 15 Mill Creek to headwaters
- no activity
- low to moderate activity
- peak activity
North
Fork
South
Fork
Alpowa
Creek
Couse
Creek
Tenmile
Creek
Charley
Creek
Asotin
Creek
George
Creek
Chinook (spring) Bull troutChinook (fall) Steelhead
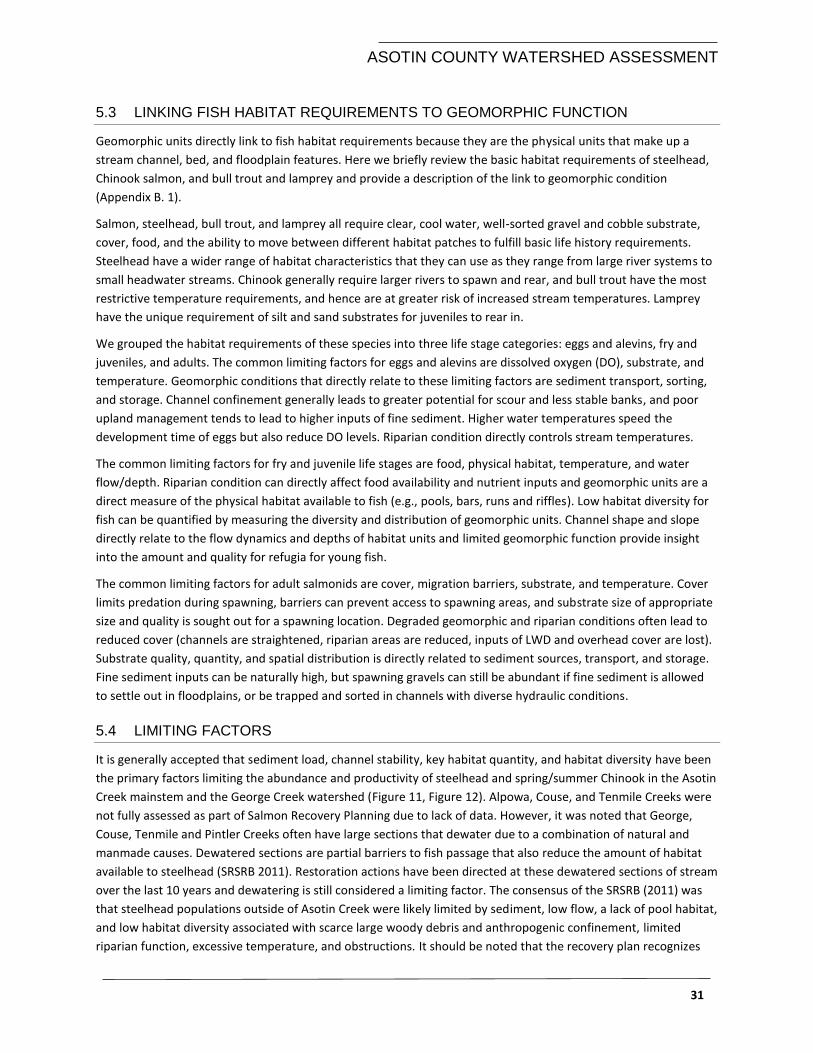
ASOTIN COUNTY WATERSHED ASSESSMENT
31
5.3 LINKING FISH HABITAT REQUIREMENTS TO GEOMORPHIC FUNCTION
Geomorphic units directly link to fish habitat requirements because they are the physical units that make up a
stream channel, bed, and floodplain features. Here we briefly review the basic habitat requirements of steelhead,
Chinook salmon, and bull trout and lamprey and provide a description of the link to geomorphic condition
(Appendix B. 1).
Salmon, steelhead, bull trout, and lamprey all require clear, cool water, well-sorted gravel and cobble substrate,
cover, food, and the ability to move between different habitat patches to fulfill basic life history requirements.
Steelhead have a wider range of habitat characteristics that they can use as they range from large river systems to
small headwater streams. Chinook generally require larger rivers to spawn and rear, and bull trout have the most
restrictive temperature requirements, and hence are at greater risk of increased stream temperatures. Lamprey
have the unique requirement of silt and sand substrates for juveniles to rear in.
We grouped the habitat requirements of these species into three life stage categories: eggs and alevins, fry and
juveniles, and adults. The common limiting factors for eggs and alevins are dissolved oxygen (DO), substrate, and
temperature. Geomorphic conditions that directly relate to these limiting factors are sediment transport, sorting,
and storage. Channel confinement generally leads to greater potential for scour and less stable banks, and poor
upland management tends to lead to higher inputs of fine sediment. Higher water temperatures speed the
development time of eggs but also reduce DO levels. Riparian condition directly controls stream temperatures.
The common limiting factors for fry and juvenile life stages are food, physical habitat, temperature, and water
flow/depth. Riparian condition can directly affect food availability and nutrient inputs and geomorphic units are a
direct measure of the physical habitat available to fish (e.g., pools, bars, runs and riffles). Low habitat diversity for
fish can be quantified by measuring the diversity and distribution of geomorphic units. Channel shape and slope
directly relate to the flow dynamics and depths of habitat units and limited geomorphic function provide insight
into the amount and quality for refugia for young fish.
The common limiting factors for adult salmonids are cover, migration barriers, substrate, and temperature. Cover
limits predation during spawning, barriers can prevent access to spawning areas, and substrate size of appropriate
size and quality is sought out for a spawning location. Degraded geomorphic and riparian conditions often lead to
reduced cover (channels are straightened, riparian areas are reduced, inputs of LWD and overhead cover are lost).
Substrate quality, quantity, and spatial distribution is directly related to sediment sources, transport, and storage.
Fine sediment inputs can be naturally high, but spawning gravels can still be abundant if fine sediment is allowed
to settle out in floodplains, or be trapped and sorted in channels with diverse hydraulic conditions.
5.4 LIMITING FACTORS
It is generally accepted that sediment load, channel stability, key habitat quantity, and habitat diversity have been
the primary factors limiting the abundance and productivity of steelhead and spring/summer Chinook in the Asotin
Creek mainstem and the George Creek watershed (Figure 11, Figure 12). Alpowa, Couse, and Tenmile Creeks were
not fully assessed as part of Salmon Recovery Planning due to lack of data. However, it was noted that George,
Couse, Tenmile and Pintler Creeks often have large sections that dewater due to a combination of natural and
manmade causes. Dewatered sections are partial barriers to fish passage that also reduce the amount of habitat
available to steelhead (SRSRB 2011). Restoration actions have been directed at these dewatered sections of stream
over the last 10 years and dewatering is still considered a limiting factor. The consensus of the SRSRB (2011) was
that steelhead populations outside of Asotin Creek were likely limited by sediment, low flow, a lack of pool habitat,
and low habitat diversity associated with scarce large woody debris and anthropogenic confinement, limited
riparian function, excessive temperature, and obstructions. It should be noted that the recovery plan recognizes
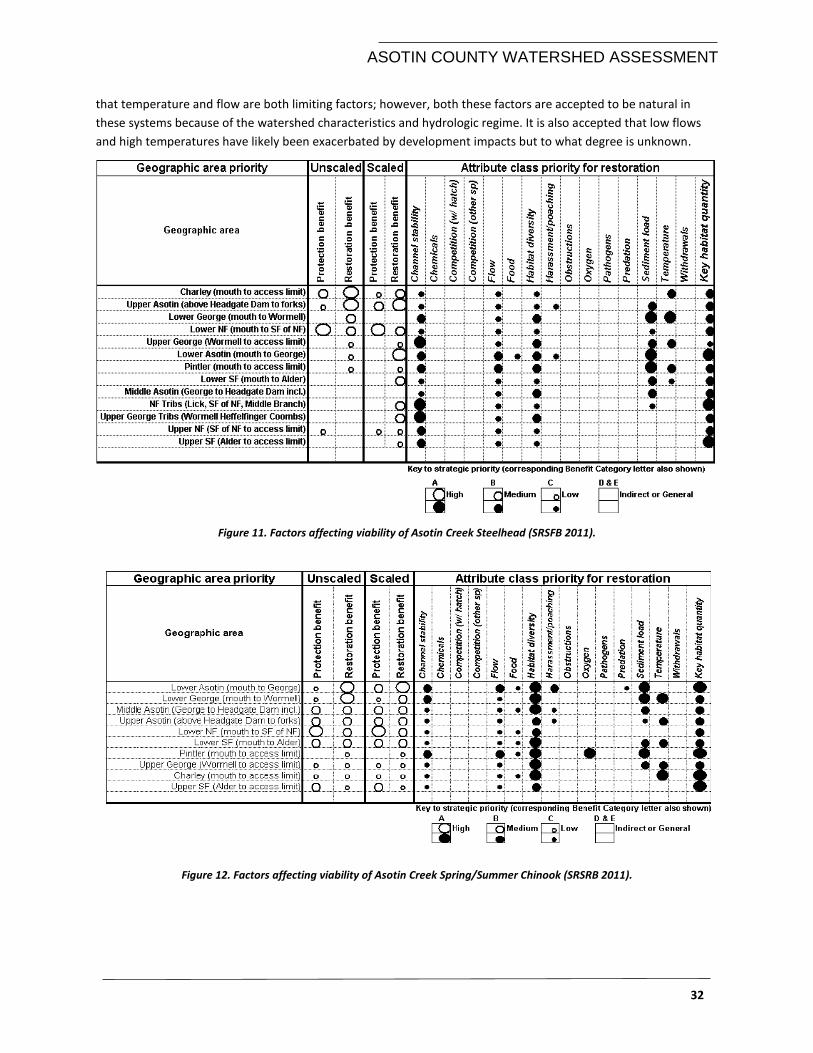
ASOTIN COUNTY WATERSHED ASSESSMENT
32
that temperature and flow are both limiting factors; however, both these factors are accepted to be natural in
these systems because of the watershed characteristics and hydrologic regime. It is also accepted that low flows
and high temperatures have likely been exacerbated by development impacts but to what degree is unknown.
Figure 11. Factors affecting viability of Asotin Creek Steelhead (SRSFB 2011).
Figure 12. Factors affecting viability of Asotin Creek Spring/Summer Chinook (SRSRB 2011).
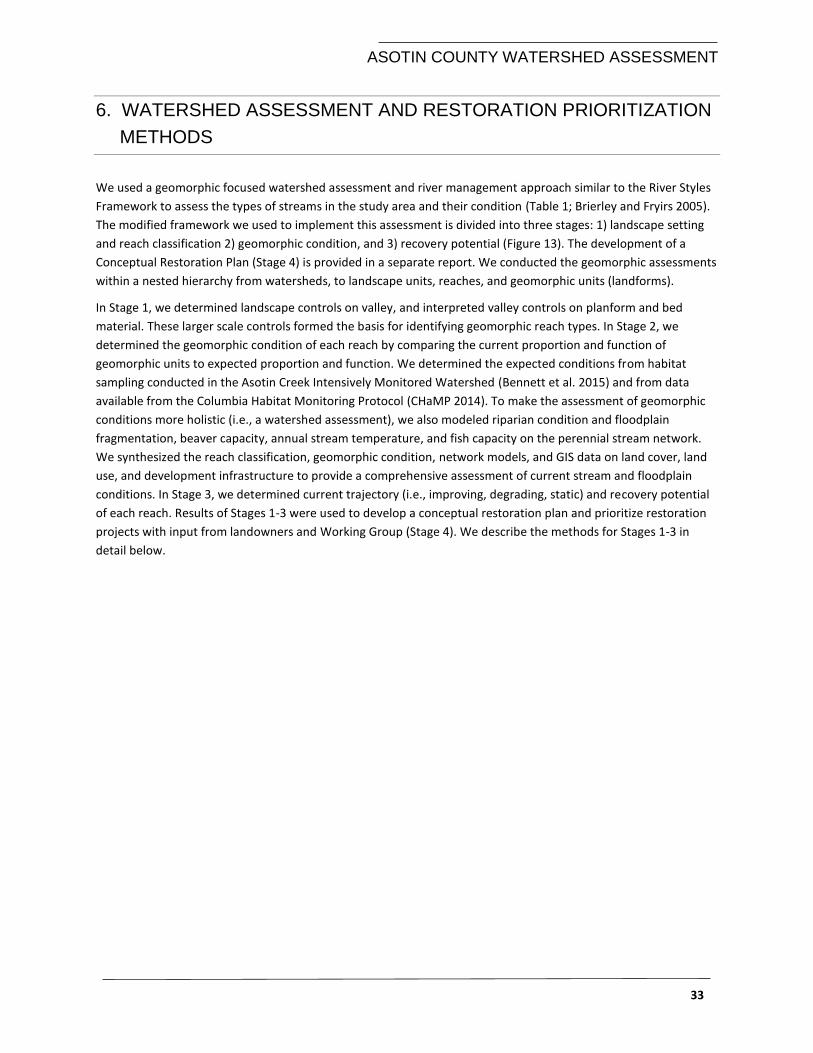
ASOTIN COUNTY WATERSHED ASSESSMENT
33
6. WATERSHED ASSESSMENT AND RESTORATION PRIORITIZATION
METHODS
We used a geomorphic focused watershed assessment and river management approach similar to the River Styles
Framework to assess the types of streams in the study area and their condition (Table 1; Brierley and Fryirs 2005).
The modified framework we used to implement this assessment is divided into three stages: 1) landscape setting
and reach classification 2) geomorphic condition, and 3) recovery potential (Figure 13). The development of a
Conceptual Restoration Plan (Stage 4) is provided in a separate report. We conducted the geomorphic assessments
within a nested hierarchy from watersheds, to landscape units, reaches, and geomorphic units (landforms).
In Stage 1, we determined landscape controls on valley, and interpreted valley controls on planform and bed
material. These larger scale controls formed the basis for identifying geomorphic reach types. In Stage 2, we
determined the geomorphic condition of each reach by comparing the current proportion and function of
geomorphic units to expected proportion and function. We determined the expected conditions from habitat
sampling conducted in the Asotin Creek Intensively Monitored Watershed (Bennett et al. 2015) and from data
available from the Columbia Habitat Monitoring Protocol (CHaMP 2014). To make the assessment of geomorphic
conditions more holistic (i.e., a watershed assessment), we also modeled riparian condition and floodplain
fragmentation, beaver capacity, annual stream temperature, and fish capacity on the perennial stream network.
We synthesized the reach classification, geomorphic condition, network models, and GIS data on land cover, land
use, and development infrastructure to provide a comprehensive assessment of current stream and floodplain
conditions. In Stage 3, we determined current trajectory (i.e., improving, degrading, static) and recovery potential
of each reach. Results of Stages 1-3 were used to develop a conceptual restoration plan and prioritize restoration
projects with input from landowners and Working Group (Stage 4). We describe the methods for Stages 1-3 in
detail below.
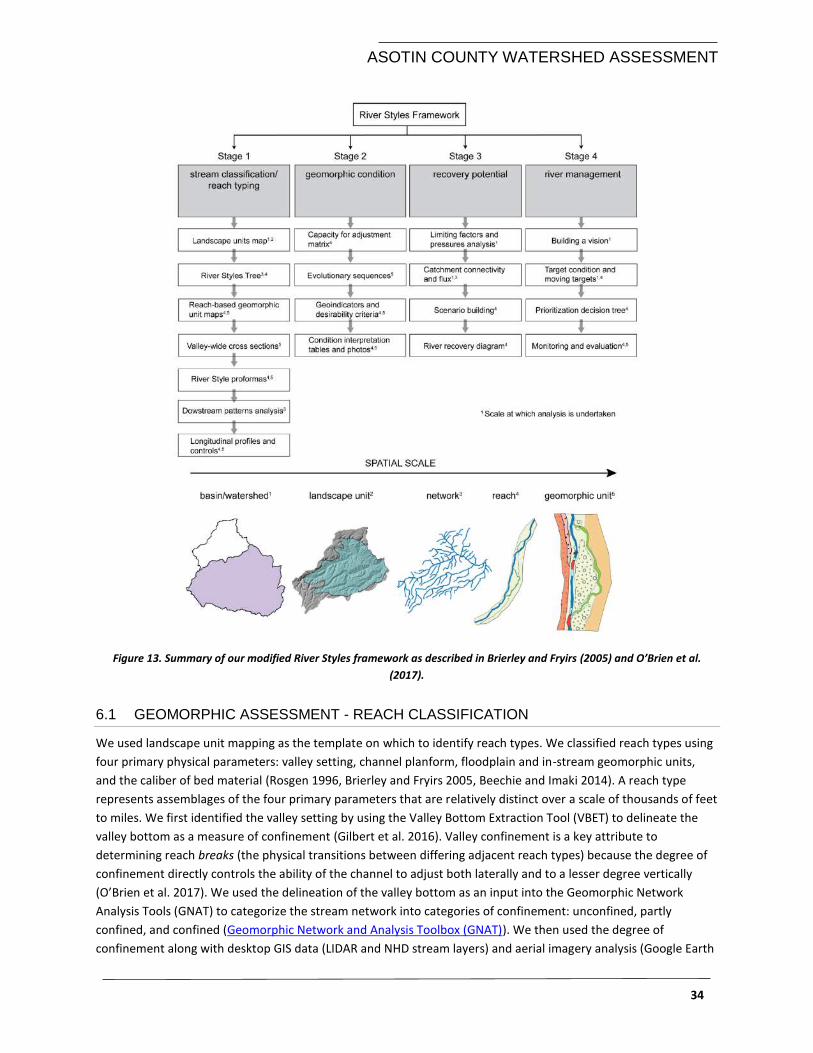
ASOTIN COUNTY WATERSHED ASSESSMENT
34
Figure 13. Summary of our modified River Styles framework as described in Brierley and Fryirs (2005) and O’Brien et al.
(2017).
6.1 GEOMORPHIC ASSESSMENT - REACH CLASSIFICATION
We used landscape unit mapping as the template on which to identify reach types. We classified reach types using
four primary physical parameters: valley setting, channel planform, floodplain and in-stream geomorphic units,
and the caliber of bed material (Rosgen 1996, Brierley and Fryirs 2005, Beechie and Imaki 2014). A reach type
represents assemblages of the four primary parameters that are relatively distinct over a scale of thousands of feet
to miles. We first identified the valley setting by using the Valley Bottom Extraction Tool (VBET) to delineate the
valley bottom as a measure of confinement (Gilbert et al. 2016). Valley confinement is a key attribute to
determining reach breaks (the physical transitions between differing adjacent reach types) because the degree of
confinement directly controls the ability of the channel to adjust both laterally and to a lesser degree vertically
(O’Brien et al. 2017). We used the delineation of the valley bottom as an input into the Geomorphic Network
Analysis Tools (GNAT) to categorize the stream network into categories of confinement: unconfined, partly
confined, and confined (Geomorphic Network and Analysis Toolbox (GNAT)). We then used the degree of
confinement along with desktop GIS data (LIDAR and NHD stream layers) and aerial imagery analysis (Google Earth
ASOTIN COUNTY WATERSHED ASSESSMENT
35
and recently acquired imagery) to determine preliminary reach breaks. We also used our experience from
determining reach break as part of our Asotin Creek Intensively Monitored Watershed project for the entire Asotin
Creek watershed to inform reach breaks in the other target watersheds (Bennett et al. 2015, Camp 2015) and
previous work in the Columbia River basin (O'Brien and Wheaton 2014, O’Brien et al. 2017). Reach types were then
validated by visiting a subset of reach types and filling out field forms to confirm reach types.
6.1.1. Stacked Long Profiles and Sediment Transport Zones
We created stacked longitudinal profile plots of selected streams to visualize and interpret the controls governing
character and behavior of three streams that represent the range of reach types occupied by steelhead (O’Brien
and Wheaton 2014). We plotted elevation, upstream catchment area, slope, and stream power, along each profile.
The shape of profiles indicates variability in the physical character of the bedrock (lithology) and rates of channel
incision versus lateral expansion in valley widths. We inferred process zones and transport regimes primarily from
valley setting. Erosion and coarse sediment production are dominant processes in confined valley settings. A
balance between sediment storage and throughflow are typical of partly confined valleys, and laterally unconfined
valleys generally reflect broad zones of sediment accumulation. Stream power drives changes in channel gradient
and discharge, which relates to upstream drainage area.
We constructed each plot using the National Hydrography Dataset plus Version 2 (NHDPlusV2) drainage network
(McKay et al. 2012). NHDPlusV2 is a geospatial, hydrologic digital vector dataset that incorporates features of the
National Hydrography Dataset (NHD), the National Elevation Dataset (NED), and the Watershed Boundary Dataset
(WBD). Unlike NHD, which is a cartographic-based digital dataset, the NHDPlusV2 dataset derives from a 10 meter
DEM, allowing many embedded attributes to be utilized. For this exercise, we used the NHD streamlines and WBD
layers. We derived upstream catchment area from an available flow accumulation raster. For extracting
longitudinal profiles, we segmented the streamlines in increments of 100 m to ensure high-resolution calculations
of upstream catchment area and slope. For this operation, and to derive catchment area from the flow
accumulation raster at the same intervals, we used the Geospatial Modeling Environment (GME) tool (Beyer 2012).
We calculated stream power at each 100 m segment of stream as a measure of the capability of a river to do work
on the bed and banks of the river (Bagnold 1960), where:
Ω = ρgQS
ρ is the density of water, g is acceleration due to gravity, Q is a characteristic discharge, S is the channel slope, and
Ω is stream power in watts. We used a two-year recurrence interval flow for discharge (Q2), given the
effectiveness of frequent bankfull flows in modifying and maintaining channel form relative to larger magnitude,
and infrequent floodstage flows (Wolman and Miller 1960). We used a regional regression equation obtained from
the United States Geological Survey (USGS) National Streamflow Statistics Website (URL:
http://water.usgs.gov/osw/programs/nss/pubs.html) to estimate Q.
6.2 GEOMORPHIC ASSESSMENT - REACH CONDITON (RIVER STYLES STAGE 2)
We define a watershed/geomorphic condition assessment as a measure of deviation from the “natural or expected
state” of any given landscape or stream reach. Our assessments focused on determining the current condition of
the reach types as identified in Stage 1. We also conducted the condition assessment with an emphasis on the
limiting factors in the Snake River Salmon Recovery Plan (SRSRB 2011) and our understanding of how land use
affects stream flow, vegetation (especially riparian vegetation), sediment routing, and how channel form and
behavior affect the creation and maintenance of natural/productive salmonid habitat. The geomorphic condition
assessment was first conducted using GIS data and aerial imagery. Individual reach types were further divided into
ASOTIN COUNTY WATERSHED ASSESSMENT
36
segments based on geomorphic condition. Then a subset of reach types and condition categories were visited to
perform validation surveys (Appendix A. 9).
6.2.1. Capacity for Reaches to Adjust and River Evolution
The capacity for adjustment of a reach is defined as morphological adjustments caused by natural changes in
biological and physical processes that do not result in a wholesale change in the reach type (Brierley and Fryirs,
2005). The capacity for adjustment represents the physical ability for a stream to adjust laterally (and to a lesser
extent, vertically) within its confining margins. We used a series of GIS assessments and field visits to several
representative sites of a specific reach type to determine a reach’s natural capacity for adjustment (Table 11). We
then developed a set of geoindicators for three specific components of reach condition: channel and floodplain
attributes, channel planform, and bed character (Table 11-12). Geoindicators directly relate to fish habitat
characteristics by describing the channel attributes (size, shape, bank, instream vegetation, structural elements),
planform (number of channels, sinuosity, lateral stability, geomorphic unit assemblage [i.e., bars, pools, runs,
cascades, etc.], riparian vegetation), and bed character (grain size and sorting, bed stability, and sediment regime).
Not all geoindicators were assessed for each reach. For example, the number of channels for steep perennial
headwaters was not expected to be more than one. We used geoindicators to directly compare current reaches to
their expected or reference equivalent. Reference reaches are the best available example of a reach type in a
watershed, and are determined using the same geoindicators. However, reference conditions rarely exist, making
meaningful comparisons and establishing specific targets for recovering reaches problematic. When a reference
reach could not be found, we developed river evolution sequences and used landscapes at various stages of
development to infer evolution and approximate a suitable representation of a reference reach type (Appendix C.
1). Evolution sequences are a way to look back at what a reach may have looked like before development and land
use pressures altered its form and function.
Table 11. Capacity for adjustment by reach type and valley setting. Capacity for adjustment represents the range of
morphological adjustments caused by natural changes in biological/physical processes that do not result in a change in the
reach type.
Valley Setting/ Reach Type Channel
Attributes Channel Planform
Bed Character
Capacity for
Adjustment
Confined Valley settings
Steep Ephemeral Hillslope Low
Steep Perennial Headwater Low
Bedrock Canyon Low
Occasional Floodplain Low
Partly Confined Valley Settings
Fan Controlled (DF) Moderate
Planform Controlled (DF) High
Wandering Gravel Bed (DF) High
Unconfined Valley Settings
Upland Swale Low
Alluvial Fan High
Minimal or no adjustment potential
Localized adjustment potential
Significant adjustment potential
ASOTIN COUNTY WATERSHED ASSESSMENT
37
Table 12. Example of geoindicators used to measure the geomorphic function of reach types in confined valley settings in the
Asotin Creek watershed. See Appendix B for examples of other reach types.
Geoindicator/River Style
Steep
perennial
headwater
Bedrock
canyon
Confined
occasional
floodplain
pockets
Steep
ephemeral
hillslope
Channel Attributes
Size No Yes Yes No
Shape No No Yes No
Bank No Yes Yes No
Instream vegetation structure No No Yes No
Structural elements (e.g.
woody debris loading) Yes Yes Yes Yes
Channel Planform
Number of channels No Yes No No
Sinuosity of channels No No No No
Lateral stability No No Yes No
Geomorphic unit assemblage Yes Yes Yes Yes
Riparian vegetation No Yes Yes No
Bed Character
Grain size and sorting Yes No Yes Yes
Bed stability No Yes No No
Sediment regime Yes Yes Yes Yes
6.2.2. Determining Geomorphic Condition Categories
We used a series of questions related to channel attributes, channel planform, and bed character to make the final
determination of geomorphic condition (Appendix B.6-14). We define geomorphic condition as the degree to
which the reach is functioning relative to fully functioning or reference conditions. Presence of relevant
geoindicators are used to categorize each reach as having full, high, moderate, or limited geomorphic function. If
the criteria for degree of freedom is met, a check mark [√] is placed in the matrix, if the criteria is not met, a cross
[x]. A reach was classified as having full geomorphic function with four checks, high with three checks, moderate
with one or two checks, and limited with no checks. See Appendix B. 6-14 for a complete list of questions we used
to assess geomorphic function.
6.3 GEOMORPHIC ASSESSMENT - RECOVERY POTENTIAL (RIVER STYLES STAGE 3)
In Stage 3, we determined the recovery potential of each reach by leveraging the information obtained in Stages 1-
2 (reach classification and geomorphic condition assessments) in two steps. We define the geomorphic recovery
potential as the capacity for natural improvement of the geomorphic condition, including attributes critical to ESA
listed fish of a reach (e.g., flow, stream temperature, and other non-geomorphic limiting factors) in the foreseeable
future (e.g., 5-25 years). We determined the recovery potential in two steps. First, the trajectory of river change
was determined by projecting the recovery trajectory of each reach into a pathway between fully and degraded
(i.e., limited) geomorphic function (Figure 14). Trajectory diagrams for reaches provide insight into the condition a
reach will be in with and without restoration. Secondly, river recovery potential was determined by assessing
ASOTIN COUNTY WATERSHED ASSESSMENT
38
limiting factors in the watershed along with the location of a reach within the stream network and proximity to
intrinsic pressures (Figure 15). For example, a naturally unconfined reach that is currently confined by a road or
levee would be categorized as having a “low” recovery potential if there was little chance of being able to remove
the current confinement.
Figure 14. Trajectory of change example for four reach types in target watersheds. Colors represent condition and arrows
represent direction of change (up = improving, across = stable or changing to new type of reach, and down = degrading).
Current conditions are on the left and potential conditions (change) are on the right.
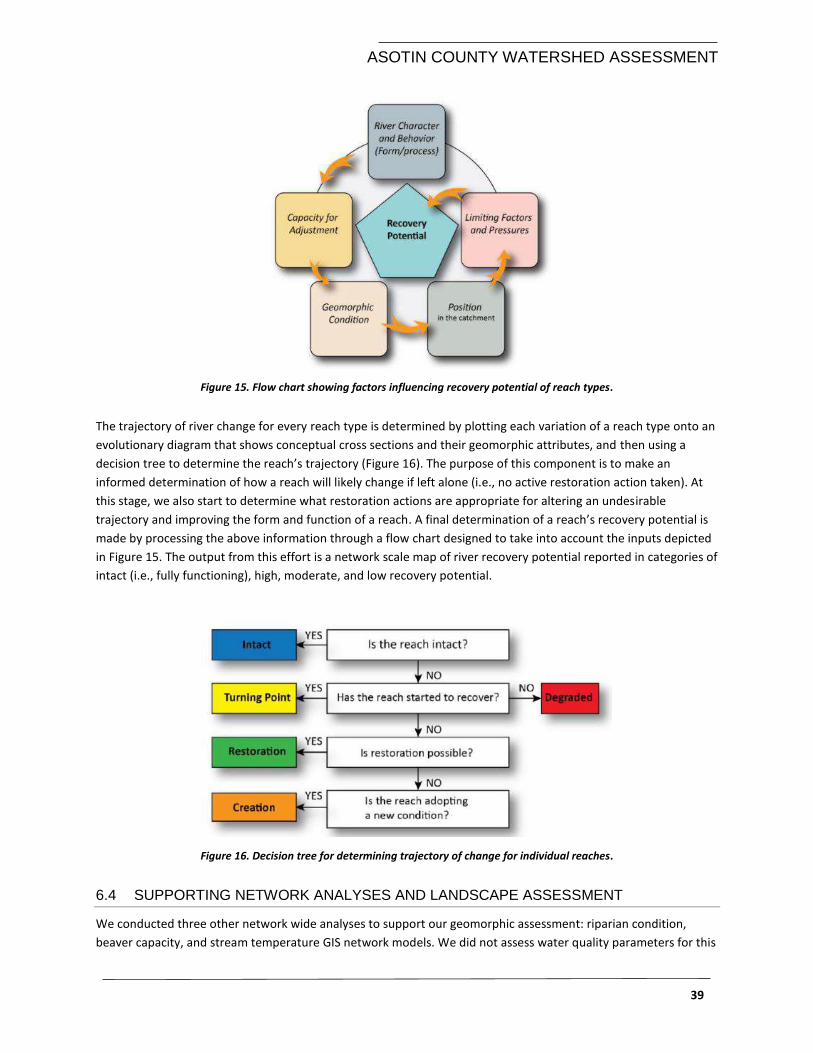
ASOTIN COUNTY WATERSHED ASSESSMENT
39
Figure 15. Flow chart showing factors influencing recovery potential of reach types.
The trajectory of river change for every reach type is determined by plotting each variation of a reach type onto an
evolutionary diagram that shows conceptual cross sections and their geomorphic attributes, and then using a
decision tree to determine the reach’s trajectory (Figure 16). The purpose of this component is to make an
informed determination of how a reach will likely change if left alone (i.e., no active restoration action taken). At
this stage, we also start to determine what restoration actions are appropriate for altering an undesirable
trajectory and improving the form and function of a reach. A final determination of a reach’s recovery potential is
made by processing the above information through a flow chart designed to take into account the inputs depicted
in Figure 15. The output from this effort is a network scale map of river recovery potential reported in categories of
intact (i.e., fully functioning), high, moderate, and low recovery potential.
Figure 16. Decision tree for determining trajectory of change for individual reaches.
6.4 SUPPORTING NETWORK ANALYSES AND LANDSCAPE ASSESSMENT
We conducted three other network wide analyses to support our geomorphic assessment: riparian condition,
beaver capacity, and stream temperature GIS network models. We did not assess water quality parameters for this
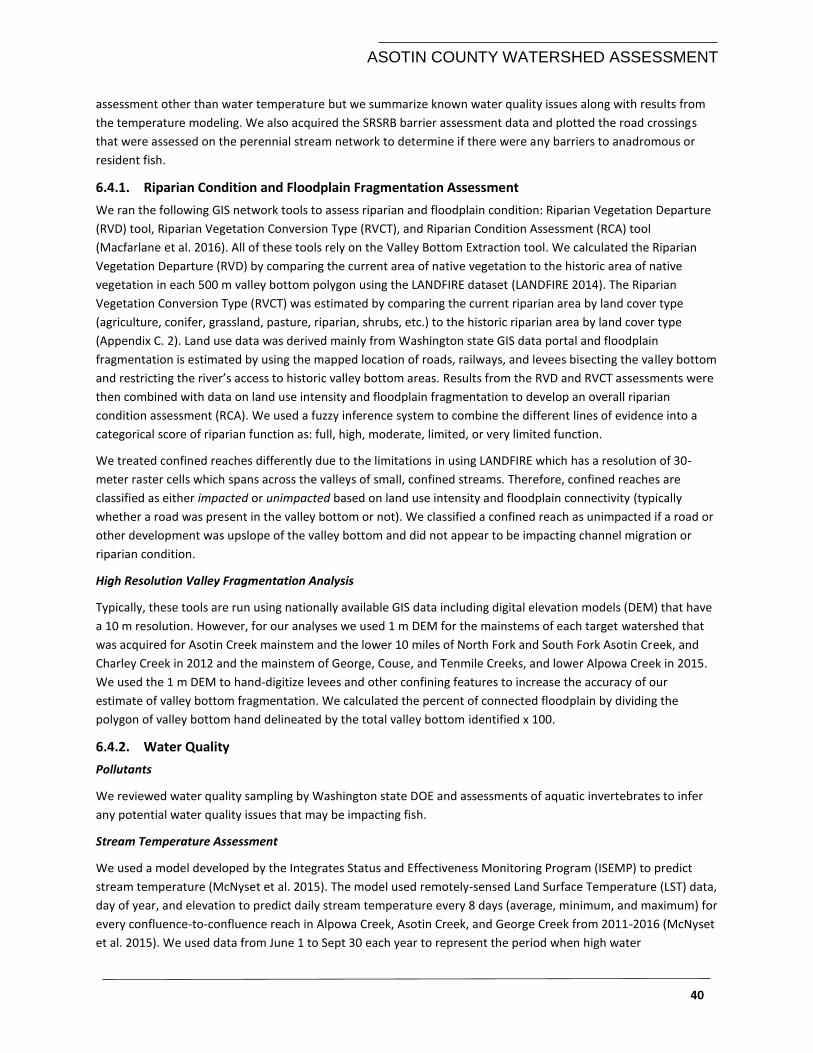
ASOTIN COUNTY WATERSHED ASSESSMENT
40
assessment other than water temperature but we summarize known water quality issues along with results from
the temperature modeling. We also acquired the SRSRB barrier assessment data and plotted the road crossings
that were assessed on the perennial stream network to determine if there were any barriers to anadromous or
resident fish.
6.4.1. Riparian Condition and Floodplain Fragmentation Assessment
We ran the following GIS network tools to assess riparian and floodplain condition: Riparian Vegetation Departure
(RVD) tool, Riparian Vegetation Conversion Type (RVCT), and Riparian Condition Assessment (RCA) tool
(Macfarlane et al. 2016). All of these tools rely on the Valley Bottom Extraction tool. We calculated the Riparian
Vegetation Departure (RVD) by comparing the current area of native vegetation to the historic area of native
vegetation in each 500 m valley bottom polygon using the LANDFIRE dataset (LANDFIRE 2014). The Riparian
Vegetation Conversion Type (RVCT) was estimated by comparing the current riparian area by land cover type
(agriculture, conifer, grassland, pasture, riparian, shrubs, etc.) to the historic riparian area by land cover type
(Appendix C. 2). Land use data was derived mainly from Washington state GIS data portal and floodplain
fragmentation is estimated by using the mapped location of roads, railways, and levees bisecting the valley bottom
and restricting the river’s access to historic valley bottom areas. Results from the RVD and RVCT assessments were
then combined with data on land use intensity and floodplain fragmentation to develop an overall riparian
condition assessment (RCA). We used a fuzzy inference system to combine the different lines of evidence into a
categorical score of riparian function as: full, high, moderate, limited, or very limited function.
We treated confined reaches differently due to the limitations in using LANDFIRE which has a resolution of 30-
meter raster cells which spans across the valleys of small, confined streams. Therefore, confined reaches are
classified as either impacted or unimpacted based on land use intensity and floodplain connectivity (typically
whether a road was present in the valley bottom or not). We classified a confined reach as unimpacted if a road or
other development was upslope of the valley bottom and did not appear to be impacting channel migration or
riparian condition.
High Resolution Valley Fragmentation Analysis
Typically, these tools are run using nationally available GIS data including digital elevation models (DEM) that have
a 10 m resolution. However, for our analyses we used 1 m DEM for the mainstems of each target watershed that
was acquired for Asotin Creek mainstem and the lower 10 miles of North Fork and South Fork Asotin Creek, and
Charley Creek in 2012 and the mainstem of George, Couse, and Tenmile Creeks, and lower Alpowa Creek in 2015.
We used the 1 m DEM to hand-digitize levees and other confining features to increase the accuracy of our
estimate of valley bottom fragmentation. We calculated the percent of connected floodplain by dividing the
polygon of valley bottom hand delineated by the total valley bottom identified x 100.
6.4.2. Water Quality
Pollutants
We reviewed water quality sampling by Washington state DOE and assessments of aquatic invertebrates to infer
any potential water quality issues that may be impacting fish.
Stream Temperature Assessment
We used a model developed by the Integrates Status and Effectiveness Monitoring Program (ISEMP) to predict
stream temperature (McNyset et al. 2015). The model used remotely-sensed Land Surface Temperature (LST) data,
day of year, and elevation to predict daily stream temperature every 8 days (average, minimum, and maximum) for
every confluence-to-confluence reach in Alpowa Creek, Asotin Creek, and George Creek from 2011-2016 (McNyset
et al. 2015). We used data from June 1 to Sept 30 each year to represent the period when high water
ASOTIN COUNTY WATERSHED ASSESSMENT
41
temperatures were most likely to occur. This period represents 15 unique temperature samples spanning an 8 day
period. We summarized the data by calculating the length of stream and number of weeks that the maximum
temperature exceeded either 64.4 or 68 °F. Stream temperature data from sites within the Asotin Creek IMW
(Bennett et al. 2015) were used to cross-validate the model predictions. With this model we were able to predict
how often the stream temperature was likely to exceed critical biological (i.e., lethal temperatures for salmonids)
or management temperature criteria (DOE 2002).
We compared 2011 and 2015 summer temperatures models because these two years represent a generally cool
year (2011) and hot year (2015) in Asotin Creek. In 2011 the peak and average annual discharge in Asotin Creek
were both 56% higher than in 2015, and the summer average and 7-day maximum temperature was 20% lower in
2011.
We also reviewed numerous temperature data sets from within the study area covering the period 2009-2016, and
compared them with previous temperature assessments (Bumgarner et al. 2003) to determine if there were any
obvious trends in summer temperatures.
6.4.3. Beaver Restoration Assessment Tool (BRAT)
We conducted an assessment of the target watersheds to support dam building beaver using the Beaver
Restoration Assessment Tool (Macfarlane et al. 2014). The BRAT tool is used to assess the existing and potential
(i.e., historic) capacity of riverscapes to support beaver dam building activities as measured in dams/mile. Capacity
is evaluated in GIS using readily available spatial datasets that provide the following lines of evidence (Macfarlane
and Wheaton 2013):
1. Evidence of a perennial water source,
2. Evidence of riparian vegetation to support dam building activity (acquired from Riparian Condition
Assessment (see above),
3. Evidence of adjacent vegetation (on riparian/upland fringe) that could support expansion and
establishment of larger colonies (acquired from Riparian Condition Assessment),
4. Evidence that a beaver dam could physically be built across the channel during low flows, and
5. Evidence that a beaver dam is likely to withstand typical floods.
Factors that can potentially limit beaver from realizing the full capacity such as land use activities (e.g., roads or
farming) and potential human conflicts (e.g., irrigation diversions, settlements) were also incorporated into the
assessment by including available GIS layers on land ownership, roads, and infrastructure. Rules in BRAT assume
that the closer the stream is to roads and infrastructure the higher the probability of conflict. The final output from
the BRAT model is Beaver Management, Conservation, and Restoration Zone Model (hereafter Management
Model). The Management Model incorporates the potential and existing capacity model and the conflict model
and categorizes the watershed based on seven specific conservation and restoration objectives: 1) currently
inhabited by beaver or in good shape but under-occupied (Low Hanging Fruit), 2) lack riparian vegetation but can
recover quickly if management is changed (Quick Return), 3) low current use but potential sites (Long-term
Possibility), 4) Unsuitable: Naturally limiting, 5) Unsuitable: Anthropogenically Limiting, 6) High potential to support
beavers but potential conflicts (Living with beaver high source), and 7) Low potential to support beavers but
potential conflicts (Living with beaver low source).
6.4.4. Fish Passage
We assessed potential fish passage problems by reviewing a barrier assessment that was conducted for the
majority of road crossings within the anadromous fish bearing reaches in southeast Washington (WWCC 2009). We
ASOTIN COUNTY WATERSHED ASSESSMENT
42
also assessed the condition of the mouth of Couse Creek and Tenmile Creek because they had previously been
identified as potential barriers (G. Mendel, Personal Communications).
In this section we present the results of assessments and network GIS analyses conducted based on the watershed
assessment framework (Table 1). We restrict our presentation of results of reach-based assessments to the
perennial stream network because the focus of the plan is fish habitat. However, we present results based on
assessments of the entire 1:24,000 NHD stream layer (i.e., perennial, intermittent, and ephemeral streams) and at
the watershed scale (i.e., land use and vegetation management) where they have direct or indirect potential to
impact fish habitat.
7. WATERSHED ASSESSSMENT RESULTS
In this section we present the results of assessments and network GIS analyses conducted based on the watershed
assessment framework (Table 1). We restrict our presentation of most of our results to the perennial stream
network because the focus of the plan is fish habitat.
7.1 GEOMORPHIC ASSESSMENT RESULTS
7.1.1. Reach Types (Stage 1)
We identified 182 miles of perennial stream in the study area (Appendix A. 10). The perennial stream layer is
composed of seven reach types in three valley settings: confined, partly confined, and unconfined (Table 13). The
most common valley settings for perennial streams across the study area are partly confined (47%) and confined
(51%). Confined valley settings are the most common in each target watershed (range 54-75%) except Asotin
Creek, which is dominated by the partly confined valley setting (79%). The confined valley with occasional
floodplain pockets reach type is the most common perennial reach type (61-75%) in each target watershed except
Asotin Creek. The most common reach type in Asotin Creek was the partly confined planform controlled reach
type. The full NHD stream network is 1,465 miles and contains two ephemeral reach types not present in the
perennial stream layer: unconfined upland swales and confined steep ephemeral hillslopes (Appendix A. 10 and
Appendix A. 11). Together, confined steep ephemeral hillslope reaches (41%) and unconfined reaches (19%) make
up 60% of the full NHD stream network. See Appendix C.5 for reach type decision tree that describes differences
between the reaches.
Reach type Description - Confined Valley Setting
Steep perennial headwater reach types are present only in the upper reaches of the watersheds extending from
the Blue Mountains. Although most reaches are perennial, their hydrology is highly dependent on snowmelt;
however, flows may spike in individual subbasins due to high intensity, localized summer storms. Peak flows in
these reaches are short because the upstream drainage area is relatively small. These reaches are very steep
(>10% gradient) with regular, localized inputs of colluvium from the surrounding hillslopes. This results in the
development of long rapids broken up by brief cascades and forced pools. Most of the reaches are in the mesic
forest landscape unit with high LWD loading, which forces most pools and traps sediment. Although there may be
occasional pockets of floodplain present, these areas are only accessed in extreme floods. The bed is comprised
primarily of boulders and cobble with sands and fines commonly deposited in the wake of in-channel structural
elements.
The Bedrock Canyon reach type occurs infrequently in the drainage, primarily because one of its defining
characteristics is the complete lack of a floodplain. The channel is mostly bordered by bedrock, although the bed
ASOTIN COUNTY WATERSHED ASSESSMENT
43
usually contains a mixed load of boulder, cobble, and gravel. The gradient is steep (5-10%) and the planform is
restricted by exposed basalt outcroppings, forcing the river to align to the valley margin. These reaches are found
in some minor tributaries and on some sections of the mainstem of Asotin Creek. Small bedrock canyons can be
the source of large amounts of sediment during intense, local storm events because of the high valley constriction
and proximity to loess sediment sources. For example, the Bedrock Canyon section on Warner Gulch (an
ephemeral tributary to the South Fork of Asotin Creek) has experienced multiple documented localized storms
which brought in large amounts of sediment deposits to the South Fork of Asotin Creek.
The Confined occasional floodplain pockets reach type is the most common reach type in confined valley settings
of the project area. It occurs throughout the drainage where confined valleys have developed small areas where
the floodplain is accessible, often downstream of tributaries and fan-forced knick points, but is dominant in George
Creek and its tributaries. Access to the floodplain may occur infrequently and in small pockets, but may be well
developed and store fine grained sediment. The most common geomorphic units are rapids, runs, and forced
pools. The streambed is comprised of coarse, often angular substrate, and is stable during bankfull floods. Bedrock
is the primary control in these reaches, forcing most of the pools at knick points or brief lengths of high
confinement in the channel.
The Steep ephemeral hillslope reach type represents 41% of the total stream length in the project area. However,
these are not fish-bearing reaches and many rarely have surface flow. These channels are completely confined by
the adjacent hillslopes and basalt outcrops and are aligned to the valley. Many reaches begin as Upland swales
along the tops of the dissected loess uplands and dissected highlands, and then rapidly increase in slope and
confinement as they dissect the basalt layers to reach the higher order tributaries. The instream geomorphic units
are step-pool sequences and cascades, with occasional plunge pools. The bed material texture is coarse and
angular, consisting primarily of colluvium from the adjacent hillslopes. Even though these reach types are
ephemeral, they may contribute large amounts of sediment to perennial reaches and can be affected by upland
land use.
Reach Types - Partly Confined Valley Setting
The Planform controlled with discontinuous floodplain reach type occurs where the valley widens slightly but is still
partly confined. These rivers abut the valley margin 10-50% of the time, and have a low to moderate sinuosity.
Multiple high-stage flood channels are common, indicating periodic overbank flow that rework the valley floor.
Large floods often force the active channel to shift in areas where it is not pinned against bedrock. These reaches
store local slugs of sediment that are mobilized during high flow events, giving rise to shifting channel topography.
The floodplain is discontinuous, but well developed with fine grains and a healthy riparian zone. Large woody
debris is the primary forcing mechanism for pool and bar development. Cutbanks are common where the channel
is migrating laterally and provide an important source of sediment and woody debris.
The Wandering gravel bed with discontinuous floodplain reach type is only present on the North Fork and
mainstem of Asotin Creek and lower George Creek. The valley in these reaches is slightly sinuous, and the channel
can be moderately sinuous with many side channels and anabranches. This reach type is very dynamic, and the
main channel shifts often during floods, sometimes reoccupying paleochannels in the floodplain during flood
events. The majority of the floodplain is fine grained and typically has a wide riparian zone. These rivers have the
sediment load and hydraulic capacity to rework the channel frequently leading to the development of complex
bars and habitats, and deposit large gravel and cobble sheets. Beaver dams and ponds occur in this reach,
increasing the density of side channels and stored fine sediment in some areas.
The Fan controlled with discontinuous floodplain reach type is most common on Charley Creek and Couse Creek
where large fans from ephemeral tributaries commonly force the channel to one side of the valley. Most of the
ASOTIN COUNTY WATERSHED ASSESSMENT
44
debris fans occur on south facing slopes, forcing the channel to the south valley wall, and the river does not have
the competence to erode their deposits in typical floods. With debris fans on one side of the valley emanating
from tributary sources and bedrock outcrops on the other, these reaches are confined 50-90% of the time.
However, they may exhibit localized sinuosity when given the lateral freedom, or in some cases, transition into a
planform controlled river style. The planform of these channels is highly stable; however, LWD, roots, and bedrock
lead to complex instream geomorphology. The imposition of fans also forces the river into the opposite channel
margin leading to occasional 5-8-meter-high cutbanks into terraces or other fans.
Reach Types - Laterally Unconfined Valley Setting
The Upland swale reach type is the second-most predominant reach type within a project area. The channel is
discontinuous with intermittent ponds and wetlands, and the valley is filled with fine sediment. The Upland swale
is found among smooth-sided rolling hills in the dissected loess uplands. Long, shallow swales converge to create
larger, smooth-sided depressions in the landscape to form this reach. In the Asotin Creek watershed, most of these
reaches are within areas of high agricultural use, and some of the naturally occurring wetlands have been
converted into sediment retention ponds.
The Alluvial fan reach type is specific to the mouths of rivers where the main channel is flowing over its own fan.
The stream’s own alluvial deposits accumulate at the mouth of streams in reaction to the mainstem’s base level. At
the mouth, the river may appear as a single channel, or develop multiple distributaries and flood runners as it
attempts to rework deposits. Depending on the primary sediment size in the upstream sections of river, large fan-
shaped or arcuate sheet deposits act as remnants of past floods (e.g. sand or gravel sheets). Pools are usually
forced by LWD, roots, and riparian vegetation, but can be rare. Long, deep runs are common and usually
associated with low gradient sections of the fan and channel spanning LWD. These reaches are battling between
reaching a base level at its confluence with the trunk stream, and eroding through massive sediment deposits from
large historic floods.
Long Profiles Results
We created long profiles of the main stems of Alpowa, Asotin (including North Fork Asotin Creek), Tenmile, and
Couse Creeks to illustrate how landscape units, valley setting, sediment dynamics, and stream power change along
mainstems of target watersheds (Appendix C. 7). These profiles will be used for informing the conceptual
restoration plan and prioritizing project locations.
ASOTIN COUNTY WATERSHED ASSESSMENT
Table 13. Characteristics and attributes of valley settings and reach types in the Asotin Watershed Assessment Area.
River Character
Confinement
Setting -
Reach Type
Landscape Unit Channel
Planform Geomorphic Units
Bed Material
Texture River Behavior
Confined -
Bedrock
Canyon
Lower Snake
canyons
Single
channel,
aligned to
valley, highly
stable
Little or no
floodplain.
Sequence of
cascades and
rapids
Bedrock-
boulder-
colluvium at
higher
elevations
Very steep, incised channel mostly confined by basalt cliffs on both
sides. The floodplain is almost entirely absent and there is no
opportunity for lateral adjustment. May be present in low order
ephemeral and intermittent streams, but is also common in the lower
Snake canyons.
Confined -
Steep
Perennial
Headwater
Mesic
forest/dissected
highlands
Single
channel,
aligned to
valley, highly
stable
Discontinuous
floodplain,
cascades, rapids,
step-pools
Bedrock-
boulder-
large cobble
Very steep channel, often groundwater dominated, but flow variability
is reliant on snowmelt so most of these rivers are intermittent. Limited
ability for lateral adjustment. Flushes colluvial deposits from high
elevations of the Blue Mountains. Only the large floods extend out of
the channel and into the floodplain.
Confined -
Occasional
Floodplain
Pockets
Dissected
highlands/lower
Snake canyons
Single
channel, low
sinuosity,
highly stable
Discontinuous
pockets of
floodplain,
bedrock outcrops,
pool-riffle, rapids,
bars
Bedrock-
boulder-
cobble
Steep channel, often intermittent at high elevations, with alternating
assemblage of bedrock forced pools and pool-riffle-rapid sequences.
Floodplain is accessed during bankfull floods, but little work is done to
the channel. Found in narrow valleys, largely confined by basalt cliffs
and often scoured vertically to bedrock.
Confined -
Steep
Ephemeral
Hillslope
All, but primarily
dissected highlands,
lower Snake canyons
Single
channel,
aligned to
valley, highly
stable
Step-pool, cascade Bedrock-
boulder-
cobble-
gravel-sand
Ephemeral, bedrock-controlled channel, aligned to the valley, and
confined by adjoining hillslopes. Coarse bed material texture with
highly angular colluvium eroded and transported downstream
from adjacent hillslopes. Dominated by step-pool sequences,
cascades, and occasional plunge pools.
ASOTIN COUNTY WATERSHED ASSESSMENT
Partly Confined -
Wandering Gravel
Bed with
Discontinuous
Floodplain
Lower Snake
canyons
One to many
channels,
jump channel
changes,
moderately
stable
Discontinuous
floodplain, pool-
riffle, rapids, bars,
frequent paleo
channels
Cobble-
gravel-
boulder
Mostly straight valley. The main channel will suddenly change at
greater than bankfull floods, but is otherwise stable. A mostly cobble-
gravel bed is reworked often, creating multiple bar formations. Flood
channels are very common across the floodplain and are commonly
inundated during bankfull floods. Bar forced pool-riffle sequence are
common between short sections of rapids.
Partly Confined -
Planform
Controlled with
Discontinuous
Floodplain
Mostly lower
Snake Canyons
1-3 channels,
moderate
sinuosity,
jump channel
changes,
moderately
stable
Discontinuous
floodplain, pool-
riffle, runs, rapids,
complex bars
Bedrock-
cobble-
gravel
Channel exhibits low-moderate sinuosity, but can be restricted on
occasion by bedrock. Found in wider but still partly confining valleys.
Multiple channels may develop in some areas, but one channel will
always contain most flow. Larger than bankfull floods will often force
sudden alterations to the primary channel. Floodplain is well
developed, although discontinuous. Sediment cycles between
transport and storage zones, creating complex bars in some areas.
Partly Confined -
Fan Controlled with
Discontinuous
Floodplain
Lower Snake
canyons
Single channel,
straight, highly
stable
Discontinuous
floodplain, rapids,
step-pool,
occasional
cascades or large
steps in channel
Boulder-
cobble
Found in valleys with frequent large fan deposits that ultimately impose the
channel into its current position. The erodibility of the lower Snake canyons
has resulted in long sections of river where these fans are abundant and may
even force the channel up against the basalt cliffs on the opposite valley
margin. They may exhibit localized sinuosity, but are more often straight and
are highly stable due to the coarse sediment in the debris fans. The
constriction points from these fans create sections of high channel slope.
Unconfined -
Upland Swale
Dissected
loess uplands,
dissected
highlands
Continuous
channel,
moderately
stable
Continuous
floodplain,
cascades, step
pools, rapids
Loess soils-
sand-gravel
Channel is discontinuous with intermittent ponds and wetlands. Valleys are
unconfined, shallow, and exhibit a rolling hill topography. Flushes loess soils
and agriculture land, but fine sediment can be stored as fill in the ponds and
wetlands.
Unconfined -
Alluvial Fan
Lower Snake
canyons
1 to multiple
channels,
wide valley,
avulsive, low
stability
Continuous
floodplain, forced
pools, runs, side
channels, dammed
pools
Sand-
gravel-
cobble
Found at the mouths of some rivers where the main channel is flowing over its
own fan. These rivers are at the base of a confined or partly confined valley
that acted mostly as a transport zone. When the river enters a wide-open
valley at its mouth, the bed material is dumped, and the river is forced to
frequently rework the material to reach its base level. LWD from upper river
sections tend to stack up here, leading to forced pools, dammed pools, and
long deep runs. The bed material is highly dependent on the dominant
material from upstream reaches.
ASOTIN COUNTY WATERSHED ASSESSMENT
47
7.1.2. Reach Type Summary
Perennial stream network is much smaller (12%) than entire network
Most of perennial stream reaches are in confined or partly confined valley settings
Floodplain areas are mostly discontinuous (i.e., on one side of the valley or other) and in small pockets; so
there is limited floodplain habitat in general
Places that are unconfined tend to be either upland swales that are ephemeral (common reaches) or
multi-threaded alluvial valleys that tend to be large sediment deposition zones that frequently dewater
(rare reaches)
Steelhead abundance and distribution is generally restricted to confined with occasional floodplain (43%),
partly confined planform controlled with discontinuous floodplain (34%), and partly confined wandering
gravel bed with discontinuous floodplain (12%)
7.1.3. Geomorphic Condition Assessment Results (River Styles Stage 2)
Overall, 75% of the perennial stream network has moderate (42%) to high (33%) geomorphic function (Appendix A.
12). We did not identify any full function reaches in the study area. The high function reaches tend to be located in
the upper elevation areas of the perennial network (e.g., upper North Fork Asotin Creek and upper George Creek).
Moderate condition reach types were generally on a positive trajectory (i.e., improving conditions) because of past
restoration actions, especially riparian enhancement and/or fencing. Each reach type tended to have predictable
attributes that resulted in being designated as high, moderate, or limited geomorphic function. Limited to
moderate geomorphic function confined reach types (e.g., confined with occasional floodplain) tended to have
over-widened or incised (trenched) channels, floodplains fragmented by development, bed material that was
armored and poorly sorted (Table 14). Limited to moderate geomorphic function partly confined reach types
tended to be disconnected from the floodplain, entrenched or over-widened, poorly sorted substrate, and low
geomorphic and hydraulic complexity. Limited to moderate geomorphic function unconfined reach types tended
to be anthropogenically confined, hydrologically disconnected from downstream reaches by impoundments, or
exposed to excessive sediment loads. See Appendix A. 14 for geomorphic condition results on the entire NHD
network.
ASOTIN COUNTY WATERSHED ASSESSMENT
Table 14. Geomorphic conditions generally associated with high, moderate, and limited geomorphic function for a) confined with occasional floodplain, b) partly confined
wandering gravel bed with discontinuous floodplain, and c) partly confined with discontinuous floodplain.
ASOTIN COUNTY WATERSHED ASSESSMENT
ASOTIN COUNTY WATERSHED ASSESSMENT
ASOTIN COUNTY WATERSHED ASSESSMENT
51
7.1.4. Geomorphic Condition Summary
Watershed Conditions
76% of the study area has moderate to high geomorphic function
Reach Type Conditions
Confined Reaches
o Generally have high geomorphic function because they have a relatively low capacity for
adjustment and land use impacts are limited in these reaches.
Partly Confined Reaches
o Generally are have limited to moderate geomorphic function because they have a moderate to
high capacity for adjustment, the floodplain may be fragmented reducing discontinuous and
occasional floodplain areas, or impairing function and/or maintenance. Large woody debris tends
to be well below reference conditions and dominated by small and fast decomposing alder (e.g.,
Charley, lower North Fork and South Asotin Creeks, portions of Alpowa, Couse, upper George,
and Tenmile). These are the key reaches for fish abundance and distribution.
Unconfined Reaches
o Generally in limited to moderate geomorphic function because they have a relatively high
capacity for adjustment and typically occur in agricultural areas (Upland Swales) or near
residential development (Alluvial fans).
Common Causes of Impairment
low diversity of geomorphic units (i.e.., more runs and fewer pools, bars, side-channels), low frequency of
structural elements (primarily LWD), channelization, limited connection to floodplain, low riparian
function (limited extent, young age, low species diversity), low thalweg variability
7.1.5. Recovery Potential Results (River Styles Stage 3)
Among the priority reaches in the target watersheds, 74.2% have a high recovery potential, 20.4% have a
moderate recovery potential, and 5.4% have a low recovery potential (Appendix A. 14). The bulk of reaches with
low recovery potential are located in lower George and Asotin Creeks. Many of the reaches in the study area are
recovering due to past conservation practices and changes in land management. Recovery potential is particularly
high for upper reaches in most streams in the study area. Stream reaches that have a particularly low recovery
potential are the reaches that run dry most summers on lower George, Pintler, Couse, and Tenmile Creeks. These
reaches have had large natural disturbances in the past, are geomorphically active areas, and have naturally low
summer flows. There has been some attempt to alter the reach type by creating a new condition in these areas –
but it remains to be seen how successful these strategies will be.
7.2 RIPARIAN CONDITION AND FLOODPLAIN FRAGMENTATION RESULTS
Our riparian and floodplain assessment provided estimates of riparian vegetation departure (RVD), riparian
vegetation conversion type (RVCT), overall Riparian Condition (RCA), and an estimate of valley bottom
fragmentation due to development (e.g., roads, levees, rip-rap, and infrastructure). These estimates were
developed for both the perennial stream network and the entire NHD stream network (except the valley
fragmentation estimate using 1 m DEM which was only conducted on the mainstem perennial network where 1 m
data was available).
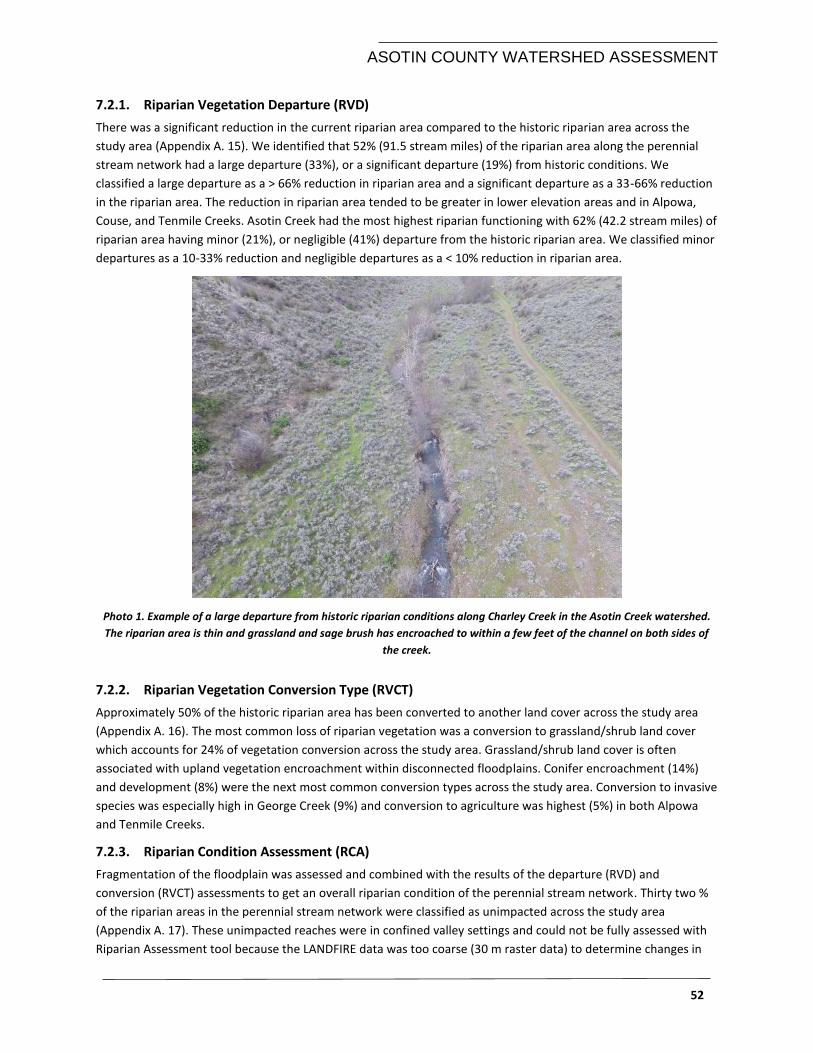
ASOTIN COUNTY WATERSHED ASSESSMENT
52
7.2.1. Riparian Vegetation Departure (RVD)
There was a significant reduction in the current riparian area compared to the historic riparian area across the
study area (Appendix A. 15). We identified that 52% (91.5 stream miles) of the riparian area along the perennial
stream network had a large departure (33%), or a significant departure (19%) from historic conditions. We
classified a large departure as a > 66% reduction in riparian area and a significant departure as a 33-66% reduction
in the riparian area. The reduction in riparian area tended to be greater in lower elevation areas and in Alpowa,
Couse, and Tenmile Creeks. Asotin Creek had the most highest riparian functioning with 62% (42.2 stream miles) of
riparian area having minor (21%), or negligible (41%) departure from the historic riparian area. We classified minor
departures as a 10-33% reduction and negligible departures as a < 10% reduction in riparian area.
Photo 1. Example of a large departure from historic riparian conditions along Charley Creek in the Asotin Creek watershed.
The riparian area is thin and grassland and sage brush has encroached to within a few feet of the channel on both sides of
the creek.
7.2.2. Riparian Vegetation Conversion Type (RVCT)
Approximately 50% of the historic riparian area has been converted to another land cover across the study area
(Appendix A. 16). The most common loss of riparian vegetation was a conversion to grassland/shrub land cover
which accounts for 24% of vegetation conversion across the study area. Grassland/shrub land cover is often
associated with upland vegetation encroachment within disconnected floodplains. Conifer encroachment (14%)
and development (8%) were the next most common conversion types across the study area. Conversion to invasive
species was especially high in George Creek (9%) and conversion to agriculture was highest (5%) in both Alpowa
and Tenmile Creeks.
7.2.3. Riparian Condition Assessment (RCA)
Fragmentation of the floodplain was assessed and combined with the results of the departure (RVD) and
conversion (RVCT) assessments to get an overall riparian condition of the perennial stream network. Thirty two %
of the riparian areas in the perennial stream network were classified as unimpacted across the study area
(Appendix A. 17). These unimpacted reaches were in confined valley settings and could not be fully assessed with
Riparian Assessment tool because the LANDFIRE data was too coarse (30 m raster data) to determine changes in
ASOTIN COUNTY WATERSHED ASSESSMENT
53
riparian vegetation. Confined reaches that were classified as impacted made up 14% of the study area. Fully
functioning riparian areas accounted for 13% across the study area with Asotin Creek having the highest amount of
fully functioning riparian (24%) and Alpowa having the least (4%). See Appendix A. 18 for riparian condition results
for the entire NHD network.
7.2.4. High Resolution Floodplain Connection Analysis
We had 1 m resolution DEM data for 76 miles (43%) of the perennial stream network which we used to digitize
levees and other features confining streams and limiting floodplain connection. The 76 miles of floodplain
accounted for a maximum extent of 1,739 acres of potential floodplain habitat (Appendix A. 19). We estimated
that 22% (498 acres) of the historic floodplain (i.e., valley extent) were disconnected across the study area. George
Creek, Couse Creek, and Tenmile Creeks had relatively low amounts of disconnected floodplain (< 10%) whereas
Asotin and Alpowa Creeks had relatively high amounts of disconnected floodplain (25-47%). Only the lower Alpowa
Creek was assessed for fragmentation because of the extent of the 1 m DEM data available which inflates the
amount of disconnected floodplain relative to the extent of the perennial stream network. Disconnected
floodplain was more common in the lower reaches near development and along the mainstem Asotin Creek.
7.2.5. Riparian Condition Summary
Valley bottom along mainstem sections of target watersheds generally < 100-300 feet
Valley fragmentation is present in some sections of wandering gravel bed mainstem sections but recovery
potential is low due to housing and cattle operations using these areas;
RCA analyses suggests Alpowa and Asotin Creek riparian function is moderate to high; George, Tenmile,
and Couse have limited to moderate riparian function; land conversion to grassland/shrubs, development,
and conifer encroachment appears to be the main reason for decreased riparian function
However, a significant amount of riparian degradation may be due to the poor channel conditions which
currently promote rapid runoff with little or no overbank flow. This leads to a narrow band of riparian
along the reach, which further exacerbates the problem because the channel cannot adjust laterally,
which leads to increased channelization. As the stream bed becomes more entrenched, the water table
lowers, allowing upland vegetation to encroach into areas formerly dominated by riparian species
7.3 WATER QUALITY RESULTS
7.3.1. Pollutants
The lower portion of Asotin Creek and much of Alpowa Creek exceed Washington state fecal coliform standards for
water quality (HDR 2006, WADOE 2015). Failing sewage systems and livestock feeding and grazing operations are
the sources of contamination. We are unaware of any negative effects of current fecal coliform levels on fish
populations. Water quality appears to be generally good in the upper reaches of most of the study area based on
some limited samples of aquatic invertebrates collected at IMW sites (S. Bennett, unpublished data) and by the
USFS (Dowdy 2002) that had abundant mayflies and stoneflies.
7.3.2. Temperature Assessment Results
We used results from a temperature model based on remotely-sensed Land Surface Temperature (LST) data, day
of year, elevation, and data from a set of stream temperature probes used by the Asotin IMW (Bennett et al. 2015)
to predict daily stream temperature every 8 days (average, minimum, and maximum) for every confluence-to-
confluence reach in the study area (McNyset et al. 2015). We used the mean maximum 8-day stream temperature
predictions for the summer (June-September) in the perennial stream network for Alpowa and Asotin Creek. We
selected a year that had high stream flows and lower air temperatures (2011) to compare to a year with low
stream flows and higher air temperatures (2015). In 2011 (cool year), 28% of Alpowa Creek, 23% Asotin Creek, and
ASOTIN COUNTY WATERSHED ASSESSMENT
54
19% of George Creek exceeded 64.4 °F at least once in three or more weeks2 (Appendix A. 20). However, only 12%
of Alpowa Creek and 0% of Asotin and George Creeks exceeded 68 °F in 2011 (Appendix A. 21). In 2015 (a warm
year), 69% Alpowa Creek, 62% Asotin Creek, and 59% of George Creek exceeded 64.4 °F in three or more weeks
(Appendix A. 22) and 59% of Alpowa Creek, 19% of Asotin Creek, and 24% of George Creeks exceeded 68 °F for
three or more weeks (Appendix A. 23).
We also summarized numerous temperature data sets available in the watershed from DOE stream gauge sites
and IMW survey sites. Asotin Creek exceeded the average 7-day maximum water temperature of 72 °F on average
7.6 days/year based on six years of summer temperature data (Appendix B. 16). Asotin Creek above George Creek,
Alpowa Creek near the mouth, and South Fork Asotin Creek near the mouth all exceeded 72 °F approximately 2-3
days/year. No other streams in the study areas exceeded average 7-day maximum temperatures of 72 °F.
Stream temperature data from various gauges in the study area were reviewed (Appendix C.8 and Appendix C.9).
These data confirmed that water temperatures are relatively warm in the lower river. Average maximum stream
temperatures did exceed 72 °F in lower Tenmile and Alpowa Creeks, but not Asotin Creek or George Creek during
the period of 2011-2013 (Tenmile) and 2011-2016 (Alpowa, George, and Asotin). Average stream temperatures for
all data reviewed did not exceed 70 °F.
7.3.3. Water Quality Summary
Water temperatures continue to exceed optimal ranges for salmon and trout during rearing in the lower
reaches of Alpowa, Asotin, George, Couse, and Tenmile Creeks in some years (i.e., low flow)
However, optimal temperatures are generally exceeded for short periods and overall mean temperatures
for most stream reaches are at or near optimal conditions
Lethal stream temperatures are rare except for areas that dewater
Steelhead in the study area are adapted to low flow conditions with higher average stream temperatures
than populations west of the Cascade Mountains; however, when the geomorphic conditions are
degraded, warm temperature may be more of a limiting factor
7.4 BEAVER RESTORATION ASSESSMENT RESULTS
The current capacity for dam building beaver is relatively high across all watersheds (Appendix A. 24). Asotin Creek
has the greatest current capacity to support beaver with 61% of the stream miles (109 miles) able to support
frequent (6%) to pervasive (45%) beaver dam densities. Couse Creek has the lowest capacity to support frequent
(17%) and pervasive (2%) beaver dam densities. In general, the lower elevations of each watershed had low to rare
capacities. Historic capacities were higher and there was a shift to larger proportions of the watersheds being able
to support the highest densities of beaver (18%; Appendix A. 25). The conflict potential results indicate almost 40%
of the study area has a 25 to > 75% conflict potential (Appendix A. 26). High areas of conflict potential occur in the
lower Alpowa, Pintler, George, Charley, and Asotin Creeks, and upper Couse Creek, Mill Creek, and Charley Creek.
The conflict potential analysis is a first pass of the potential issues. If beaver restoration was to be implemented, a
review of these results would be advised. For example, much of Charley Creek has a road along it, which is why it is
being flagged as having a high potential conflict. However, the road is typically outside the valley bottom and
WDFW now owns much of lower Charley Creek which would reduce the potential conflict. The beaver
management zone assessment suggests that there are numerous potential reaches that could be sites for beaver
reintroduction or simulation of beaver dams with beaver dam analogs (Appendix A. 27). The management zone
2 A week in this analysis represents an 8 day period where an average, minimum, and maximum temperature was predicted for
each segment of stream. There were 15 unique 8 day periods from June 2 to September 30 each year.
ASOTIN COUNTY WATERSHED ASSESSMENT
55
also flags several areas that would likely not be suitable for beaver reintroduction including lower Pintler and
George Creek because these sites have characteristics that naturally limit beaver occupation (e.g., intermittent
flows).
7.4.1. Beaver Restoration Assessment Summary
Current and historic beaver capacity appears to be relatively similar, suggesting that past riparian
restoration actions have improved the vegetation cover in riparian areas
There is moderate to high conflict potential in portions of the watershed that have houses or roads
However, at least 37% of the study area appears to have high potential to support more beavers with a
low probability of conflict
7.5 FISH BARRIERS
One potential fish barrier was identified along the perennial stream network during the 2008-2009 SRSRB
sponsored survey of road crossings throughout the target watersheds (Appendix A. 28). In addition, the alluvial fan
at the mouth of Couse and Tenmile Creek is a potential barrier for juvenile steelhead during low flows and may be
a significant threat during fall migration periods when water levels are only slightly elevated. Assessing restoration
options at these sites is recommended.
8. ASSESSMENT SUMMARY AND GOALS FOR RESTORATION
8.1 ASSESSMENT SUMMARY
The study area has several distinguishing features that have a large influence on our findings and the potential to
restore fish habitat. First, the region is dominated by long, hot summers, and low annual precipitation. Watersheds
are short and steep, with streams that generally have narrow valleys and discontinuous, or patchy floodplain
areas. In streams headwatered in the Blue Mountains (Asotin Creek), stream flows are snow-rain dominated. In
watersheds not headwatered in the Blue Mountains, flows are dominated by groundwater, and have very low or
intermittent flows during the summer months.
We assessed over 182 miles of perennial stream in the study area and found that 76% of the length had moderate
to high geomorphic function. Past conservation actions appear to have stabilized many limiting factors and in
general, geomorphic conditions are stable or improving in most reaches. Reaches with limited geomorphic
function were often due to low habitat diversity, lack of LWD, simplified channel planforms, and limited access to
the floodplain. We found that in general, riparian areas were recovering with 67% of the perennial stream network
having moderate to near fully functioning riparian habitat. Reaches with limited riparian function were often due
to reduced extent of riparian habitat, young riparian canopy, monoculture of species, invasive species, upland
encroachment, and conversion to agriculture or development. The moderate to high function of the riparian areas
provides a large proportion of the watershed that could support beavers with limited conflict potential. However,
we identified 498 acres (22%) of disconnected floodplain across the study area out of 2,237 acres of potential
floodplain, and stream temperatures are still less than optimal in many lower elevation reaches. Below, we
describe restoration strategies to improve degraded habitat conditions for the benefit of fish populations and to
meet restoration goals specific to the study area (SRSRB 2011). More detailed restoration actions will be presented
in the Conceptual Restoration Plan.
ASOTIN COUNTY WATERSHED ASSESSMENT
56
8.2 RESTORATION GOALS
The recovery goals of the SRSRB (2011) are to “… to have all extant populations at either viable (low risk) or highly
viable status, with representation of all the major life history strategies present historically, and with the
abundance, productivity, spatial structure and diversity attributes required for long-term persistence”. The
restoration strategies we are proposing to meet these goals are consistent with the strategic guidelines for
restoration adopted by SRSRB (2011), and include actions that have a long “life span”, distribute benefits across a
range of environments, and blend immediate actions (not necessarily process-based) with long-term actions that
deal with root causes of habitat impairment. The Snake River Salmon Recovery Board developed a set of general
restoration objectives for the major spawning areas (MaSA) in the Asotin Creek study area (Table 15). We propose
that these objectives be reviewed based on the results of our assessment and that revised objectives be used in
the Conceptual Restoration Plan.
Table 15. Summary of habitat factors and associated objectives for Asotin Assessment Study Area Major Spawning Areas
(MaSA). Reproduced from SRSRB (2011).
MaSA Priority Habitat Factor and Objective
Alpowa Creek I.
II.
III.
IV.
Riparian > 80% of maximum
Embeddedness < 10%
Temperature < 4 days > 72 °F
Large Woody Debris > 1 piece per channel width
Asotin I.
II.
III.
IV.
Large Woody Debris > 1 piece per channel width
Embeddedness < 10%
Bed scour reduce to < 10 cm
Riparian > 75-90% of maximum
George I.
II.
III.
IV.
Embeddedness < 10%
Large Woody Debris > 1 piece per channel width
Riparian > 75% of maximum
Temperature < 4 days > 72 °F
9. RESTORATION STRATEGIES
We present a set of restoration strategies to address the limiting factors we identified. We also provide a summary
of what limiting factors potential restoration strategies and actions may address (Table 16). We mapped these
restoration strategies on 44 restoration reaches across the study area. The restoration strategies are adapted from
Roni et al. (2002) which suggest the following prioritization of restoration strategies (Figure 3): 1) protect and
maintain natural processes, 2) remove barriers and reconnect disconnected habitats, 3) restore long-term
processes (e.g., sediment routing, riparian function, nutrient cycling), and 4) restore short-term processes. We
follow this basic prioritization framework but adapt it for the specific limiting factors we identified in the study
ASOTIN COUNTY WATERSHED ASSESSMENT
57
area. Below we describe these restoration strategies, how they fit into our framework and how the strategies will
address current SRSRB (2011) restoration goals and other potential goals that may be considered in the Conceptual
Restoration Plan.
9.1 PROTECT AND MAINTAIN NATURAL PROCESSES
9.1.1. Protect fragile soils, maintain soil conservation practices, and protect and enhance riparian
areas
Our assessment suggests that measures to minimize erosion in loess dominated watersheds should continue to be
a top priority. Numerous conservation programs are promoted by ACCD and NRCS in the county, and landowners
have adopted many best management practices to reduce erosion. These efforts should be continued and
enhanced where erosion concerns still exist. Riparian protection and enhancement should also be a priority
throughout the study area. Riparian habitat has shown great recovery in many areas, but these habitats can be
easily damaged and many riparian areas have been reduced which also makes them vulnerable to disturbance. We
identified protection reaches based on the assessment results and the location of the reach within the watershed
(Appendix A. 29). We also suggest the protection reaches are potential places to implement a trial beaver
reintroduction (see alternative restoration strategies below).
9.2 REMOVE BARRIERS AND RECONNECT DISCONNECTED HABITATS
9.2.1. Barrier removal
Barrier removal is paramount to recovering fish populations and should be a top priority for active restoration
actions. In Asotin County, it appears most of the fish barriers have been removed (e.g., Headgate Dam was
removed completely in 2016). However, there are potential flow barriers at the mouth of Tenmile and Couse
Creeks. Addressing these barriers will involve a multi-stakeholder and agency participation.
9.2.2. Reconnect habitats
Disconnected habitats are generally restricted to the lower mainstem reaches where infrastructure density is
highest. The disconnection of floodplain reduces the extent of riparian vegetation which can lead to increased
water temperatures and reduced input of wood to streams. The confining features increase the velocity of high
flows because the water is contained within the channel. These confined channels transport wood more effectively
which reduces cover for adult and juvenile fish. Fish are especially susceptible when the flows are high because
there is limited velocity refugia in these sections.
9.2.3. Promote overbank flow
We suggest another process that needs addressing is increasing the frequency and duration of overbank flow. This
is a similar strategy to “reconnecting habitats” but has some important differences. Unlike reconnecting habitats,
promoting overbank flow is appropriate where there is no readily identifiable confining features. This situation is
very common in the study area. Successive floods over the last 200 years, removal of riparian areas, straightening
of the channel, and removal of LWD have created very efficient “bowling alleys” out of many of the streams. In
order to “reconnect” these streams to their floodplains, restoration strategies are needed that promote overbank
flow. Strategies that either cause avulsions, deposition, and the slowing of flows would all help to achieve greater
overbank flow. The IMW has recently installed almost 700 wood structures in Charley, North Fork, and South Fork
Asotin Creeks and demonstrated that overbank flow can be achieved in these systems. Once overbank flow is
more common, riparian areas will have the ability to expand (i.e., more water on floodplain), more refuge habitat
will be available for fish during high flows, wood recruitment will increase, and groundwater recharge will increase.
ASOTIN COUNTY WATERSHED ASSESSMENT
58
These responses can lead to improved riparian function, less solar input to streams (less heating), and better
sediment sorting and storing (i.e., more gravel bars created for spawning, more sediment trapped on floodplain).
9.3 LONG-TERM PROCESSES
9.3.1. Riparian management
Many of the mainstems of the study creeks have some form of riparian protection and as a result riparian areas
have moderate to high function in the majority of the study area. However, significant areas are still in need of
riparian protection. A variety of riparian management strategies will be required depending on the specific
conditions and needs of landowners. In many areas, invasive weeds and/or upland encroachment are impairing
the function of riparian areas. Active weed management and planting may be required in these areas. In other
areas, grazing pressure is damaging riparian plants or preventing recruitment. Fencing and off-site water
developments have been proven to help manage grazing pressure in these situations and have been successfully
implemented by ACCD and their partners in the study area.
9.4 SHORT-TERM PROCESSES
a) Improve Instream Habitat - A common impairment of fish habitat in Asotin County is low habitat diversity.
Limited riparian function, limited floodplain connection, and past floods have all led to low volumes of LWD in the
streams. Large wood is a main driver of habitat complexity and its importance in stream processes is no longer in
dispute (Roni et al. 2015). There are several alternatives to adding large wood to create habitat complexity. In
areas of confinement and high densities of infrastructure (i.e., near towns and bridges), restoration strategies will
require engineered approaches to reduce the potential that structures will fail or cause unintended consequences.
However, in large portions of the study area where infrastructure is minimal, it may be appropriate to use non-
engineered LWD restoration approaches such as post-assisted log structures or whole trees (Wheaton et al. 2012,
Carah et al. 2014).
9.5 ALTERNATIVE STRATEGIES
There are a variety of other management strategies that could be beneficial to overall restoration objectives which
include:
Fuel reduction is a necessity across the west. Using a coordinated thinning program could be very
effective at meeting fuel reduction, wildlife management, and stream restoration objectives. Snags,
Legacy Trees, Openings, Patches, Piles, Shrubs, and Logs (SLLOPPS) is a forest fuels reduction approach
that can be used to provide LWD small woody debris material for the benefit of forest wildlife and
creating fish habitat (Strong et al. 2016).
Traditional riparian management actions (i.e., fencing/exclusion) could be substituted in selected areas
with controlled grazing that focuses on managing the timing, duration, frequency, and intensity of the
grazing. Managed grazing in riparian areas can increase vigor and function and provide landowners with
increased cattle production and alternative grazing areas (Swanson et al. 2015, Kozlowski et al. 2016).
Recognition and use of beavers as nature’s engineers is not new, but the increase in beaver management
as a part of stream restoration has become very popular in recent years (Pollock et al. 2015, Bouwes et al.
2016b). There is an enormous potential in the study area to achieve multiple objectives at low cost by
having beavers do the work. We suspect that many of the perennial streams were home to beaver
populations prior to Euro-American settlement. Evidence of beaver activity is still common and dams have
been documented on the mainstem of Charley, North Fork, and South Fork Asotin Creeks. It is speculated
that high densities of cougars and poor habitat conditions (long stretches of shallow habitat) are
ASOTIN COUNTY WATERSHED ASSESSMENT
59
preventing beaver from recolonizing the study area. We propose developing a beaver management plan
in conjunction with WDFW and local landowners prior to attempting a reintroduction.
Nutrient enhancement (e.g., adding fish carcasses or analogs) has the potential to increase the effectiveness of stream restoration actions and this strategy could be implemented as a trial in the study area. There was a much more diverse fish assemblage in the study area historically and much higher densities of returning adults which would have provided substantial marine derived nutrients to the system. The reduced diversity and abundance of anadromous fish could be limiting the current carrying capacity and this could be tested with a trial. Nutrient enhancement has been moderately successful in some areas, but it is not widely used, and it is not clear how effective it is (Harvey and Wilzbach 2010, Childress et al. 2014, Bellmore et al. 2017).
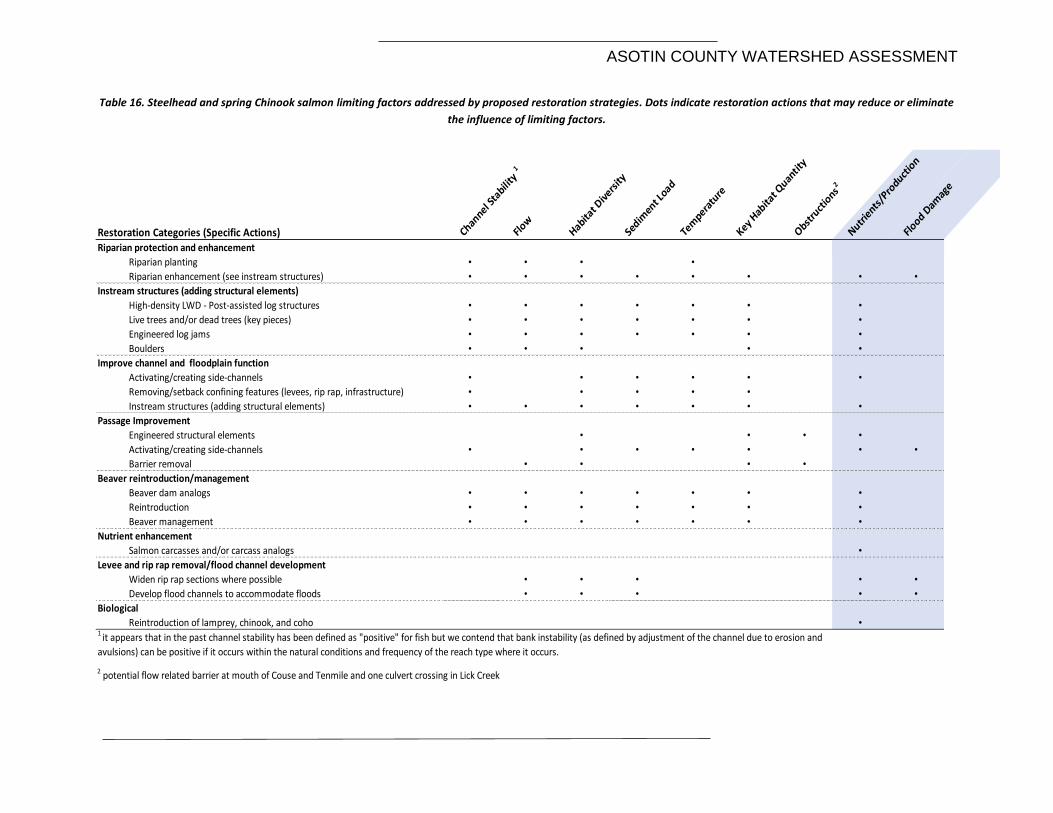
ASOTIN COUNTY WATERSHED ASSESSMENT
Table 16. Steelhead and spring Chinook salmon limiting factors addressed by proposed restoration strategies. Dots indicate restoration actions that may reduce or eliminate
the influence of limiting factors.
Restoration Categories (Specific Actions) Channel S
tabili
ty 1
Flow
Habitat D
ivers
ity
Sedim
ent L
oad
Tem
peratu
re
Key Hab
itat Q
uantit
y
Obst
ruct
ions
2
Nutrie
nts/P
roduct
ion
Flood D
amag
e
Riparian protection and enhancement
Riparian planting • • • •
Riparian enhancement (see instream structures) • • • • • • • •
Instream structures (adding structural elements)
High-density LWD - Post-assisted log structures • • • • • • •
Live trees and/or dead trees (key pieces) • • • • • • •
Engineered log jams • • • • • • •
Boulders • • • • •
Improve channel and floodplain function
Activating/creating side-channels • • • • • •
Removing/setback confining features (levees, rip rap, infrastructure) • • • • •
Instream structures (adding structural elements) • • • • • • •
Passage Improvement
Engineered structural elements • • • •
Activating/creating side-channels • • • • • • •
Barrier removal • • • •
Beaver reintroduction/management
Beaver dam analogs • • • • • • •
Reintroduction • • • • • • •
Beaver management • • • • • • •
Nutrient enhancement
Salmon carcasses and/or carcass analogs •
Levee and rip rap removal/flood channel development
Widen rip rap sections where possible • • • • •
Develop flood channels to accommodate floods • • • • •
Biological
Reintroduction of lamprey, chinook, and coho •1 it appears that in the past channel stability has been defined as "positive" for fish but we contend that bank instability (as defined by adjustment of the channel due to erosion and
avulsions) can be positive if it occurs within the natural conditions and frequency of the reach type where it occurs.
2 potential flow related barrier at mouth of Couse and Tenmile and one culvert crossing in Lick Creek
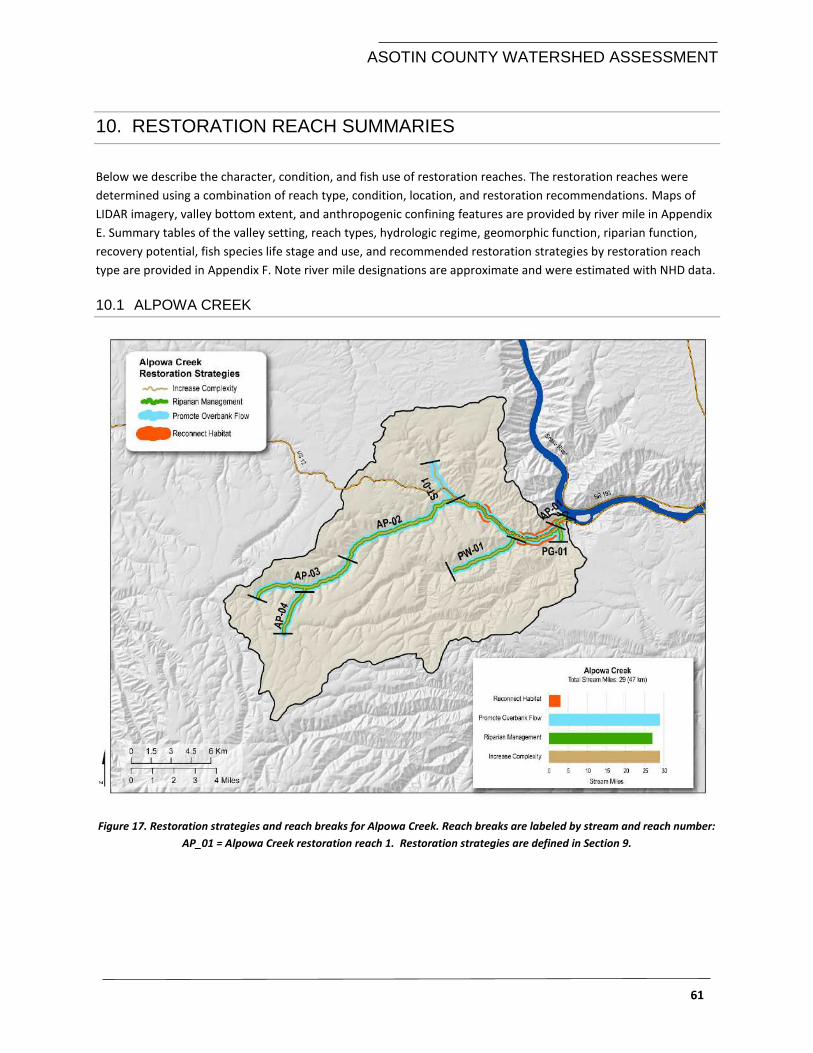
ASOTIN COUNTY WATERSHED ASSESSMENT
61
10. RESTORATION REACH SUMMARIES
Below we describe the character, condition, and fish use of restoration reaches. The restoration reaches were
determined using a combination of reach type, condition, location, and restoration recommendations. Maps of
LIDAR imagery, valley bottom extent, and anthropogenic confining features are provided by river mile in Appendix
E. Summary tables of the valley setting, reach types, hydrologic regime, geomorphic function, riparian function,
recovery potential, fish species life stage and use, and recommended restoration strategies by restoration reach
type are provided in Appendix F. Note river mile designations are approximate and were estimated with NHD data.
10.1 ALPOWA CREEK
Figure 17. Restoration strategies and reach breaks for Alpowa Creek. Reach breaks are labeled by stream and reach number:
AP_01 = Alpowa Creek restoration reach 1. Restoration strategies are defined in Section 9.
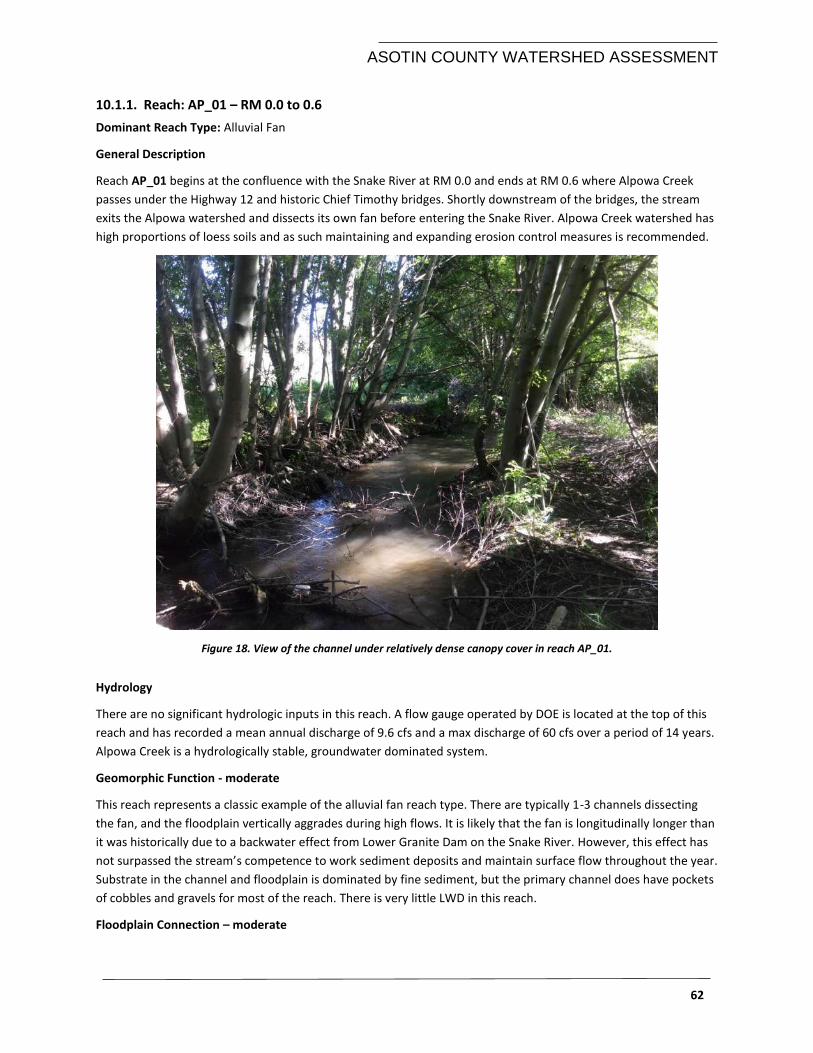
ASOTIN COUNTY WATERSHED ASSESSMENT
62
10.1.1. Reach: AP_01 – RM 0.0 to 0.6
Dominant Reach Type: Alluvial Fan
General Description
Reach AP_01 begins at the confluence with the Snake River at RM 0.0 and ends at RM 0.6 where Alpowa Creek
passes under the Highway 12 and historic Chief Timothy bridges. Shortly downstream of the bridges, the stream
exits the Alpowa watershed and dissects its own fan before entering the Snake River. Alpowa Creek watershed has
high proportions of loess soils and as such maintaining and expanding erosion control measures is recommended.
Figure 18. View of the channel under relatively dense canopy cover in reach AP_01.
Hydrology
There are no significant hydrologic inputs in this reach. A flow gauge operated by DOE is located at the top of this
reach and has recorded a mean annual discharge of 9.6 cfs and a max discharge of 60 cfs over a period of 14 years.
Alpowa Creek is a hydrologically stable, groundwater dominated system.
Geomorphic Function - moderate
This reach represents a classic example of the alluvial fan reach type. There are typically 1-3 channels dissecting
the fan, and the floodplain vertically aggrades during high flows. It is likely that the fan is longitudinally longer than
it was historically due to a backwater effect from Lower Granite Dam on the Snake River. However, this effect has
not surpassed the stream’s competence to work sediment deposits and maintain surface flow throughout the year.
Substrate in the channel and floodplain is dominated by fine sediment, but the primary channel does have pockets
of cobbles and gravels for most of the reach. There is very little LWD in this reach.
Floodplain Connection – moderate
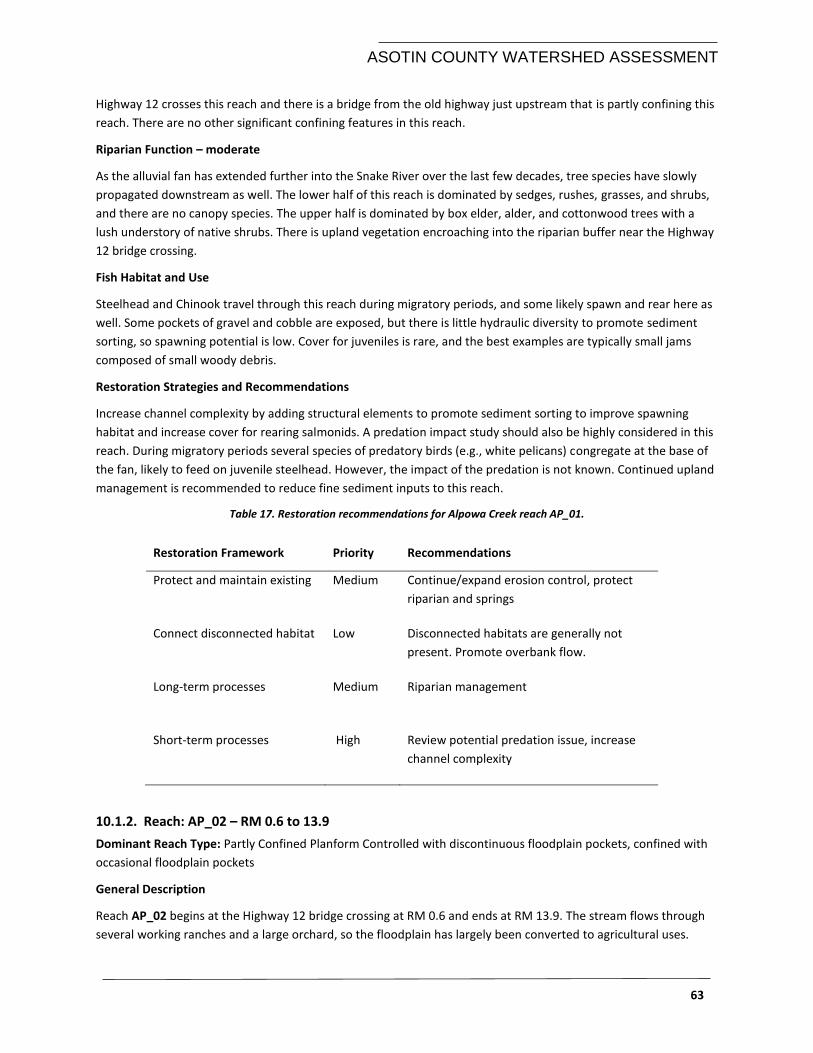
ASOTIN COUNTY WATERSHED ASSESSMENT
63
Highway 12 crosses this reach and there is a bridge from the old highway just upstream that is partly confining this
reach. There are no other significant confining features in this reach.
Riparian Function – moderate
As the alluvial fan has extended further into the Snake River over the last few decades, tree species have slowly
propagated downstream as well. The lower half of this reach is dominated by sedges, rushes, grasses, and shrubs,
and there are no canopy species. The upper half is dominated by box elder, alder, and cottonwood trees with a
lush understory of native shrubs. There is upland vegetation encroaching into the riparian buffer near the Highway
12 bridge crossing.
Fish Habitat and Use
Steelhead and Chinook travel through this reach during migratory periods, and some likely spawn and rear here as
well. Some pockets of gravel and cobble are exposed, but there is little hydraulic diversity to promote sediment
sorting, so spawning potential is low. Cover for juveniles is rare, and the best examples are typically small jams
composed of small woody debris.
Restoration Strategies and Recommendations
Increase channel complexity by adding structural elements to promote sediment sorting to improve spawning
habitat and increase cover for rearing salmonids. A predation impact study should also be highly considered in this
reach. During migratory periods several species of predatory birds (e.g., white pelicans) congregate at the base of
the fan, likely to feed on juvenile steelhead. However, the impact of the predation is not known. Continued upland
management is recommended to reduce fine sediment inputs to this reach.
Table 17. Restoration recommendations for Alpowa Creek reach AP_01.
Restoration Framework Priority Recommendations
Protect and maintain existing Medium Continue/expand erosion control, protect
riparian and springs
Connect disconnected habitat Low Disconnected habitats are generally not
present. Promote overbank flow.
Long-term processes Medium Riparian management
Short-term processes High Review potential predation issue, increase
channel complexity
10.1.2. Reach: AP_02 – RM 0.6 to 13.9
Dominant Reach Type: Partly Confined Planform Controlled with discontinuous floodplain pockets, confined with
occasional floodplain pockets
General Description
Reach AP_02 begins at the Highway 12 bridge crossing at RM 0.6 and ends at RM 13.9. The stream flows through
several working ranches and a large orchard, so the floodplain has largely been converted to agricultural uses.
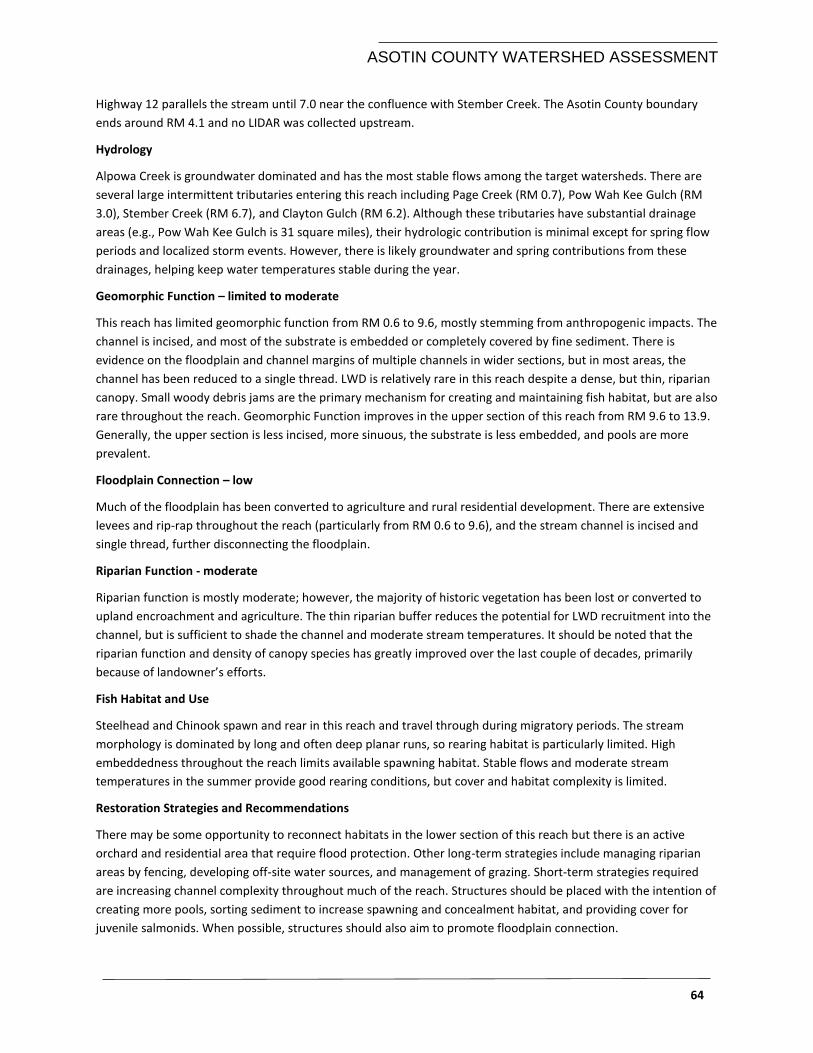
ASOTIN COUNTY WATERSHED ASSESSMENT
64
Highway 12 parallels the stream until 7.0 near the confluence with Stember Creek. The Asotin County boundary
ends around RM 4.1 and no LIDAR was collected upstream.
Hydrology
Alpowa Creek is groundwater dominated and has the most stable flows among the target watersheds. There are
several large intermittent tributaries entering this reach including Page Creek (RM 0.7), Pow Wah Kee Gulch (RM
3.0), Stember Creek (RM 6.7), and Clayton Gulch (RM 6.2). Although these tributaries have substantial drainage
areas (e.g., Pow Wah Kee Gulch is 31 square miles), their hydrologic contribution is minimal except for spring flow
periods and localized storm events. However, there is likely groundwater and spring contributions from these
drainages, helping keep water temperatures stable during the year.
Geomorphic Function – limited to moderate
This reach has limited geomorphic function from RM 0.6 to 9.6, mostly stemming from anthropogenic impacts. The
channel is incised, and most of the substrate is embedded or completely covered by fine sediment. There is
evidence on the floodplain and channel margins of multiple channels in wider sections, but in most areas, the
channel has been reduced to a single thread. LWD is relatively rare in this reach despite a dense, but thin, riparian
canopy. Small woody debris jams are the primary mechanism for creating and maintaining fish habitat, but are also
rare throughout the reach. Geomorphic Function improves in the upper section of this reach from RM 9.6 to 13.9.
Generally, the upper section is less incised, more sinuous, the substrate is less embedded, and pools are more
prevalent.
Floodplain Connection – low
Much of the floodplain has been converted to agriculture and rural residential development. There are extensive
levees and rip-rap throughout the reach (particularly from RM 0.6 to 9.6), and the stream channel is incised and
single thread, further disconnecting the floodplain.
Riparian Function - moderate
Riparian function is mostly moderate; however, the majority of historic vegetation has been lost or converted to
upland encroachment and agriculture. The thin riparian buffer reduces the potential for LWD recruitment into the
channel, but is sufficient to shade the channel and moderate stream temperatures. It should be noted that the
riparian function and density of canopy species has greatly improved over the last couple of decades, primarily
because of landowner’s efforts.
Fish Habitat and Use
Steelhead and Chinook spawn and rear in this reach and travel through during migratory periods. The stream
morphology is dominated by long and often deep planar runs, so rearing habitat is particularly limited. High
embeddedness throughout the reach limits available spawning habitat. Stable flows and moderate stream
temperatures in the summer provide good rearing conditions, but cover and habitat complexity is limited.
Restoration Strategies and Recommendations
There may be some opportunity to reconnect habitats in the lower section of this reach but there is an active
orchard and residential area that require flood protection. Other long-term strategies include managing riparian
areas by fencing, developing off-site water sources, and management of grazing. Short-term strategies required
are increasing channel complexity throughout much of the reach. Structures should be placed with the intention of
creating more pools, sorting sediment to increase spawning and concealment habitat, and providing cover for
juvenile salmonids. When possible, structures should also aim to promote floodplain connection.
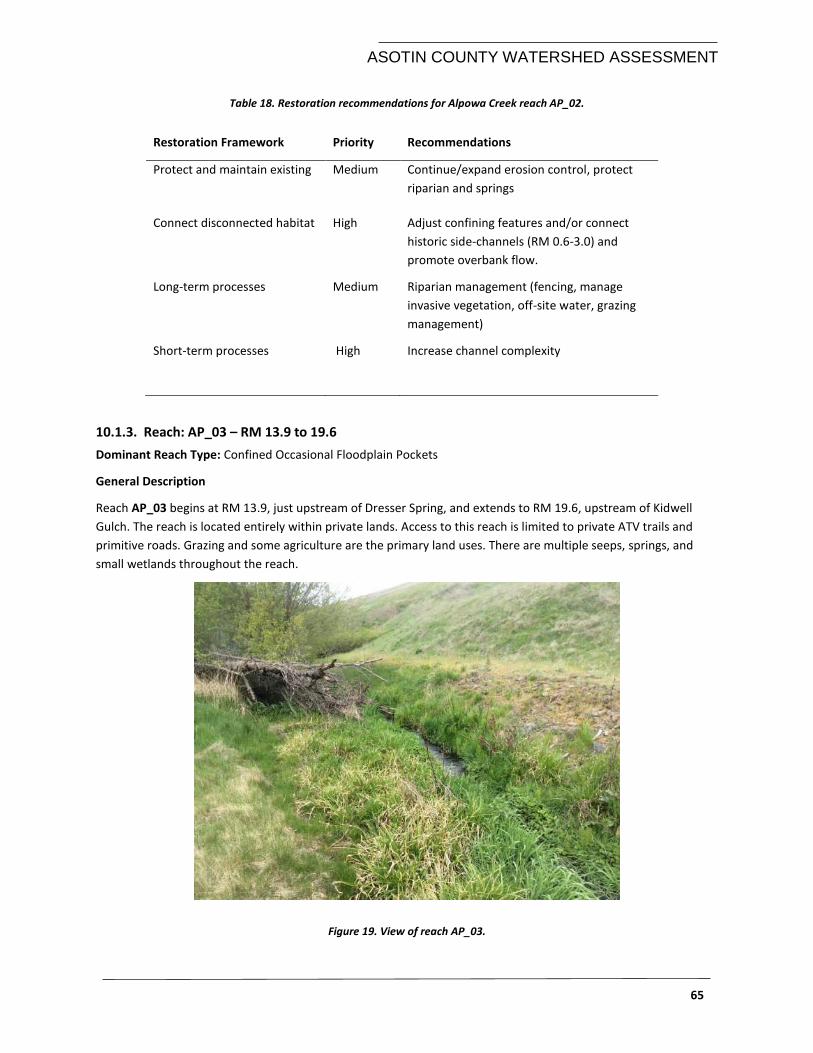
ASOTIN COUNTY WATERSHED ASSESSMENT
65
Table 18. Restoration recommendations for Alpowa Creek reach AP_02.
Restoration Framework Priority Recommendations
Protect and maintain existing Medium Continue/expand erosion control, protect
riparian and springs
Connect disconnected habitat High Adjust confining features and/or connect
historic side-channels (RM 0.6-3.0) and
promote overbank flow.
Long-term processes Medium Riparian management (fencing, manage
invasive vegetation, off-site water, grazing
management)
Short-term processes High Increase channel complexity
10.1.3. Reach: AP_03 – RM 13.9 to 19.6
Dominant Reach Type: Confined Occasional Floodplain Pockets
General Description
Reach AP_03 begins at RM 13.9, just upstream of Dresser Spring, and extends to RM 19.6, upstream of Kidwell
Gulch. The reach is located entirely within private lands. Access to this reach is limited to private ATV trails and
primitive roads. Grazing and some agriculture are the primary land uses. There are multiple seeps, springs, and
small wetlands throughout the reach.
Figure 19. View of reach AP_03.
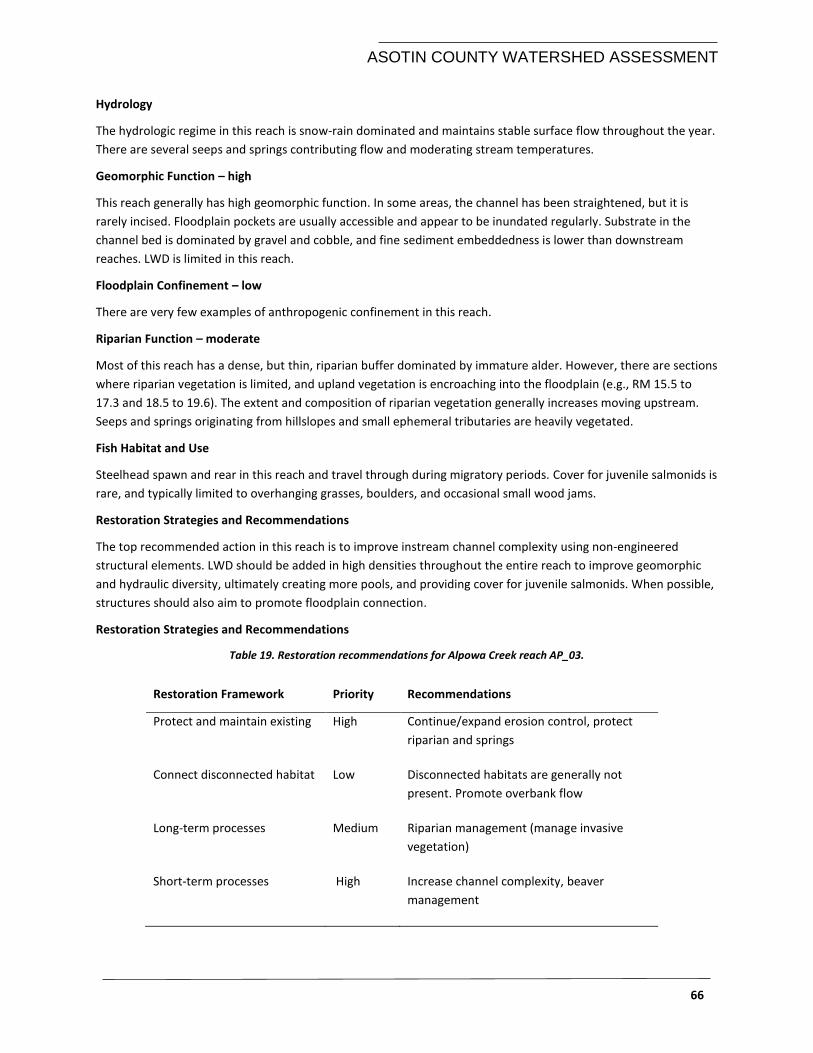
ASOTIN COUNTY WATERSHED ASSESSMENT
66
Hydrology
The hydrologic regime in this reach is snow-rain dominated and maintains stable surface flow throughout the year.
There are several seeps and springs contributing flow and moderating stream temperatures.
Geomorphic Function – high
This reach generally has high geomorphic function. In some areas, the channel has been straightened, but it is
rarely incised. Floodplain pockets are usually accessible and appear to be inundated regularly. Substrate in the
channel bed is dominated by gravel and cobble, and fine sediment embeddedness is lower than downstream
reaches. LWD is limited in this reach.
Floodplain Confinement – low
There are very few examples of anthropogenic confinement in this reach.
Riparian Function – moderate
Most of this reach has a dense, but thin, riparian buffer dominated by immature alder. However, there are sections
where riparian vegetation is limited, and upland vegetation is encroaching into the floodplain (e.g., RM 15.5 to
17.3 and 18.5 to 19.6). The extent and composition of riparian vegetation generally increases moving upstream.
Seeps and springs originating from hillslopes and small ephemeral tributaries are heavily vegetated.
Fish Habitat and Use
Steelhead spawn and rear in this reach and travel through during migratory periods. Cover for juvenile salmonids is
rare, and typically limited to overhanging grasses, boulders, and occasional small wood jams.
Restoration Strategies and Recommendations
The top recommended action in this reach is to improve instream channel complexity using non-engineered
structural elements. LWD should be added in high densities throughout the entire reach to improve geomorphic
and hydraulic diversity, ultimately creating more pools, and providing cover for juvenile salmonids. When possible,
structures should also aim to promote floodplain connection.
Restoration Strategies and Recommendations
Table 19. Restoration recommendations for Alpowa Creek reach AP_03.
Restoration Framework Priority Recommendations
Protect and maintain existing High Continue/expand erosion control, protect
riparian and springs
Connect disconnected habitat Low Disconnected habitats are generally not
present. Promote overbank flow
Long-term processes Medium Riparian management (manage invasive
vegetation)
Short-term processes High Increase channel complexity, beaver
management
ASOTIN COUNTY WATERSHED ASSESSMENT
67
10.1.4. Pow Wah Kee Gulch
Reach PW_01 – RM 0.0 - 3.0
Dominant Reach Type: Partly Confined Planform Controlled with Discontinuous Floodplain
General Description
Reach PW_01 enters Alpowa Creek on the right bank at RM 3.0. Pow Wah Kee Gulch is a long watershed that
parallels Alpowa Creek to the south and has intermittent flows. There is a large spring near the top of the reach at
RM 3.0. The reach is located entirely within private lands and grazing is the primary land use in this reach. Access
to this reach is limited by a primitive road that parallels the stream.
Hydrology
The hydrologic regime in this reach is dominated by groundwater, but sections typically go subsurface in early
summer. A large spring at the top of the reach helps to maintain surface flow for approximately 1.5 RM.
Geomorphic Function – limited to moderate
Geomorphic function is limited, primarily by a lack of LWD, low floodplain connection, and poor sediment sorting
and bed characteristics. Geomorphic function slightly improves near the spring, with a small increase in LWD
frequency and hydraulic diversity.
Floodplain Confinement – moderate
Not fully assessed – no LIDAR
Riparian Function – limited to moderate
Riparian function varies throughout the reach, and is typically in better condition near springs and seeps. Riparian
vegetation is mostly limited to the channel margin, and upland vegetation is encroaching into the floodplain in
most areas.
Fish Habitat and Use
Likely provides some refuge habitat for juveniles during high flows. The capacity for year-round fish use is likely
low due to sections with subsurface flow and very limited structural cover. Fish extent is limited to lower 1-1.5
miles based on Streamnet.org.
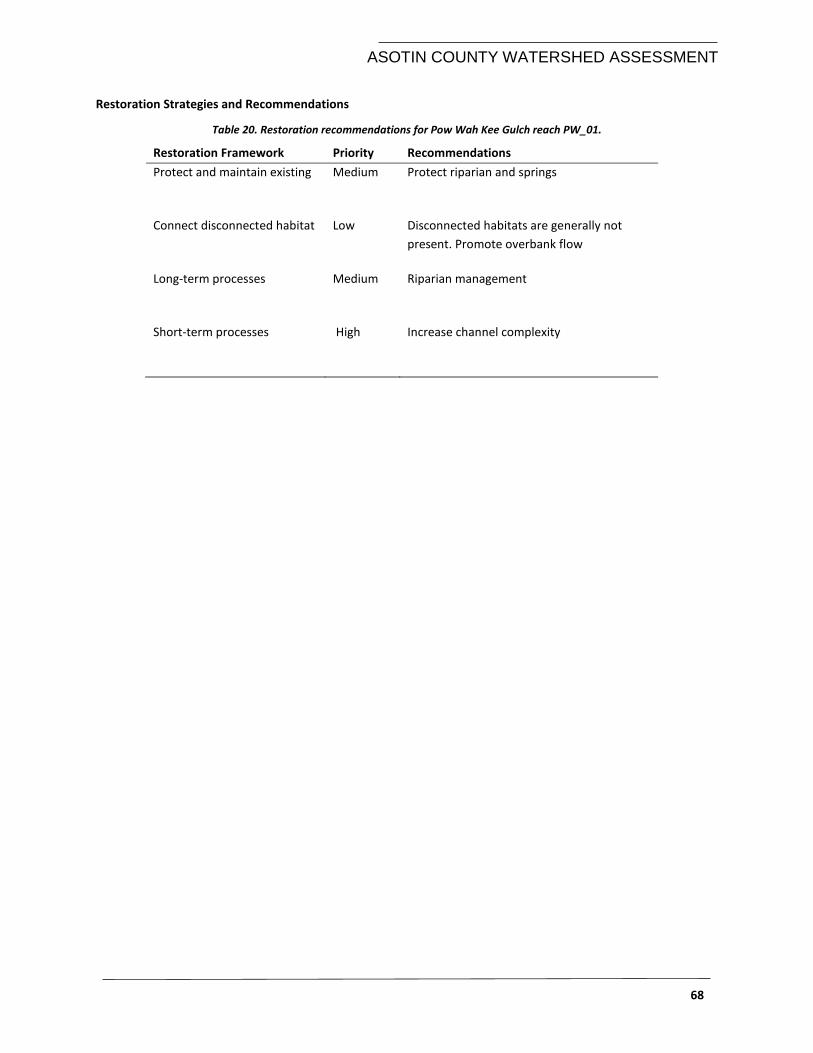
ASOTIN COUNTY WATERSHED ASSESSMENT
68
Restoration Strategies and Recommendations
Table 20. Restoration recommendations for Pow Wah Kee Gulch reach PW_01.
Restoration Framework Priority Recommendations
Protect and maintain existing Medium Protect riparian and springs
Connect disconnected habitat Low Disconnected habitats are generally not
present. Promote overbank flow
Long-term processes Medium Riparian management
Short-term processes High Increase channel complexity
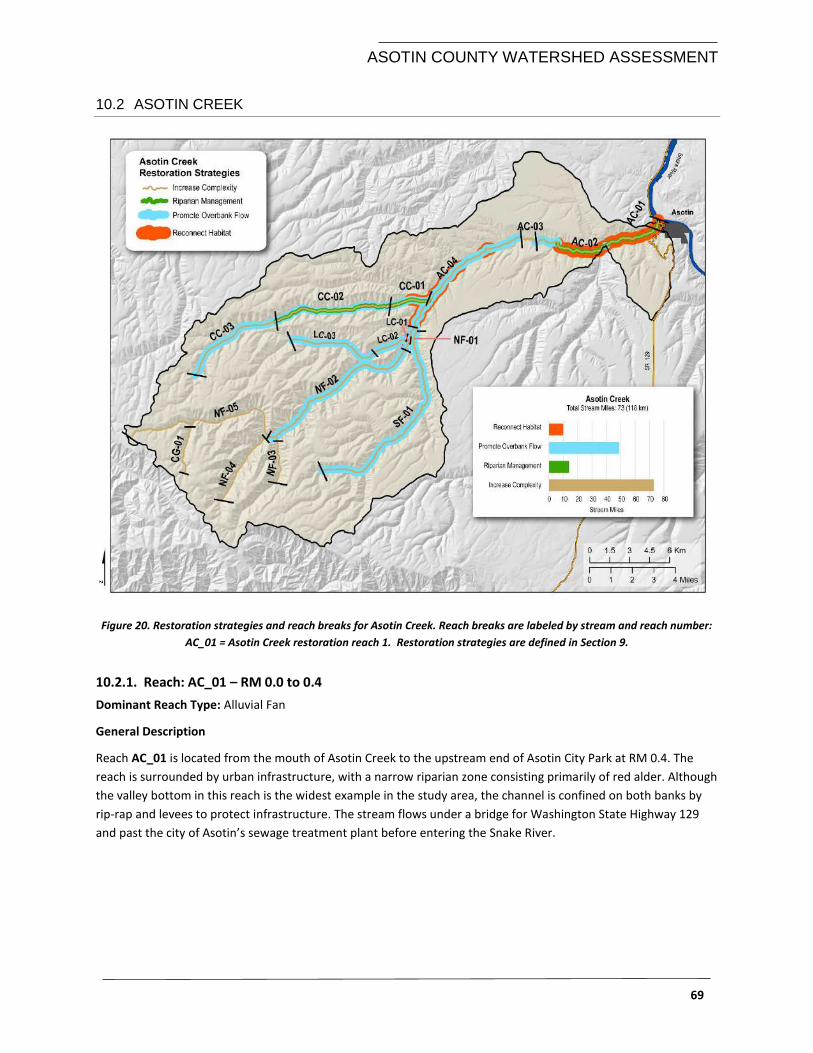
ASOTIN COUNTY WATERSHED ASSESSMENT
69
10.2 ASOTIN CREEK
Figure 20. Restoration strategies and reach breaks for Asotin Creek. Reach breaks are labeled by stream and reach number:
AC_01 = Asotin Creek restoration reach 1. Restoration strategies are defined in Section 9.
10.2.1. Reach: AC_01 – RM 0.0 to 0.4
Dominant Reach Type: Alluvial Fan
General Description
Reach AC_01 is located from the mouth of Asotin Creek to the upstream end of Asotin City Park at RM 0.4. The
reach is surrounded by urban infrastructure, with a narrow riparian zone consisting primarily of red alder. Although
the valley bottom in this reach is the widest example in the study area, the channel is confined on both banks by
rip-rap and levees to protect infrastructure. The stream flows under a bridge for Washington State Highway 129
and past the city of Asotin’s sewage treatment plant before entering the Snake River.
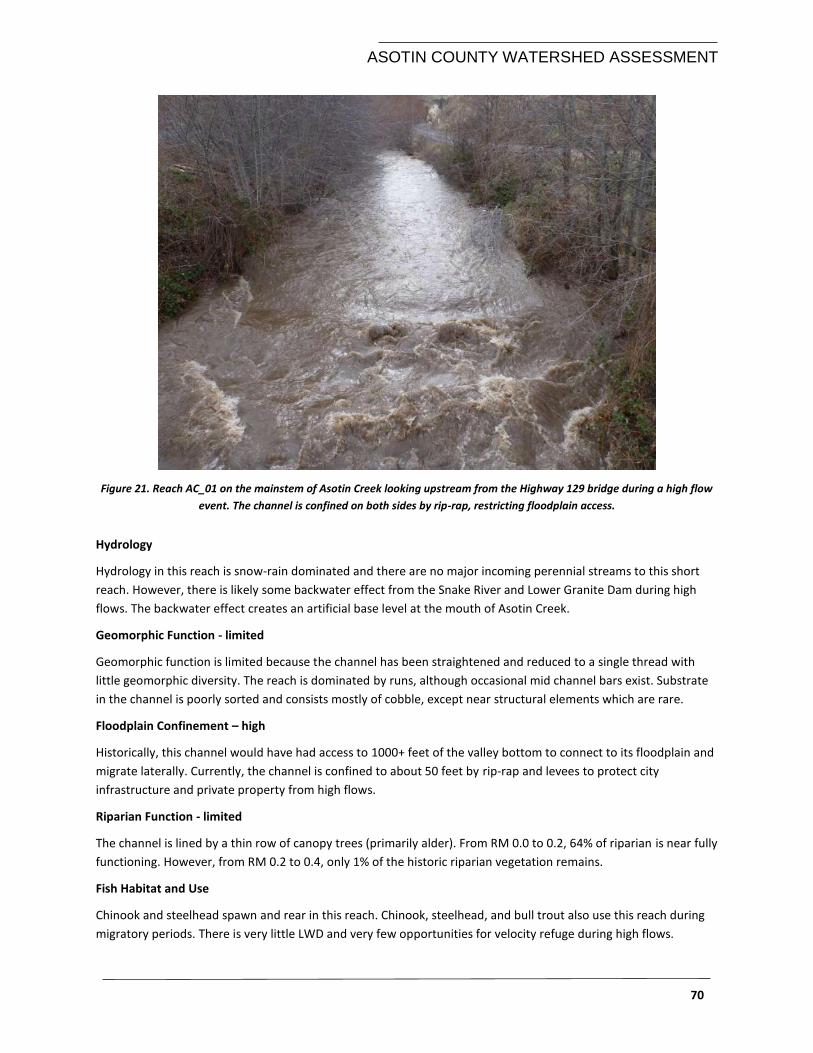
ASOTIN COUNTY WATERSHED ASSESSMENT
70
Figure 21. Reach AC_01 on the mainstem of Asotin Creek looking upstream from the Highway 129 bridge during a high flow
event. The channel is confined on both sides by rip-rap, restricting floodplain access.
Hydrology
Hydrology in this reach is snow-rain dominated and there are no major incoming perennial streams to this short
reach. However, there is likely some backwater effect from the Snake River and Lower Granite Dam during high
flows. The backwater effect creates an artificial base level at the mouth of Asotin Creek.
Geomorphic Function - limited
Geomorphic function is limited because the channel has been straightened and reduced to a single thread with
little geomorphic diversity. The reach is dominated by runs, although occasional mid channel bars exist. Substrate
in the channel is poorly sorted and consists mostly of cobble, except near structural elements which are rare.
Floodplain Confinement – high
Historically, this channel would have had access to 1000+ feet of the valley bottom to connect to its floodplain and
migrate laterally. Currently, the channel is confined to about 50 feet by rip-rap and levees to protect city
infrastructure and private property from high flows.
Riparian Function - limited
The channel is lined by a thin row of canopy trees (primarily alder). From RM 0.0 to 0.2, 64% of riparian is near fully
functioning. However, from RM 0.2 to 0.4, only 1% of the historic riparian vegetation remains.
Fish Habitat and Use
Chinook and steelhead spawn and rear in this reach. Chinook, steelhead, and bull trout also use this reach during
migratory periods. There is very little LWD and very few opportunities for velocity refuge during high flows.
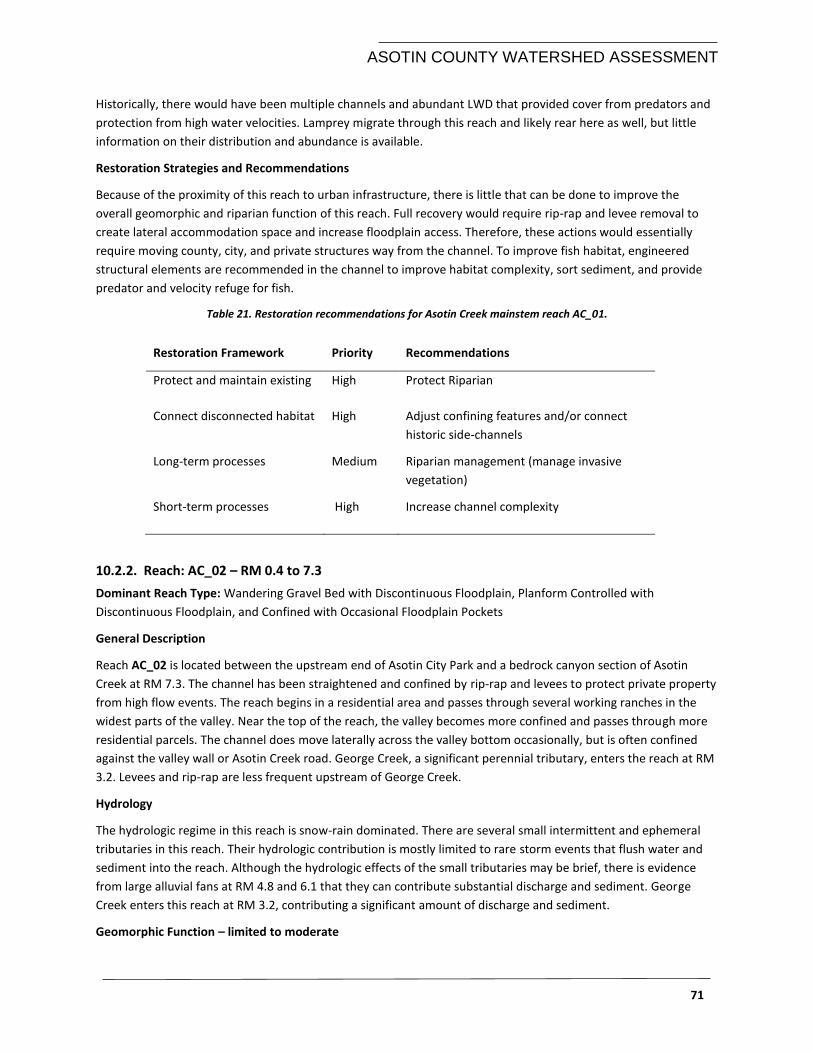
ASOTIN COUNTY WATERSHED ASSESSMENT
71
Historically, there would have been multiple channels and abundant LWD that provided cover from predators and
protection from high water velocities. Lamprey migrate through this reach and likely rear here as well, but little
information on their distribution and abundance is available.
Restoration Strategies and Recommendations
Because of the proximity of this reach to urban infrastructure, there is little that can be done to improve the
overall geomorphic and riparian function of this reach. Full recovery would require rip-rap and levee removal to
create lateral accommodation space and increase floodplain access. Therefore, these actions would essentially
require moving county, city, and private structures way from the channel. To improve fish habitat, engineered
structural elements are recommended in the channel to improve habitat complexity, sort sediment, and provide
predator and velocity refuge for fish.
Table 21. Restoration recommendations for Asotin Creek mainstem reach AC_01.
Restoration Framework Priority Recommendations
Protect and maintain existing High Protect Riparian
Connect disconnected habitat High Adjust confining features and/or connect
historic side-channels
Long-term processes Medium Riparian management (manage invasive
vegetation)
Short-term processes High Increase channel complexity
10.2.2. Reach: AC_02 – RM 0.4 to 7.3
Dominant Reach Type: Wandering Gravel Bed with Discontinuous Floodplain, Planform Controlled with
Discontinuous Floodplain, and Confined with Occasional Floodplain Pockets
General Description
Reach AC_02 is located between the upstream end of Asotin City Park and a bedrock canyon section of Asotin
Creek at RM 7.3. The channel has been straightened and confined by rip-rap and levees to protect private property
from high flow events. The reach begins in a residential area and passes through several working ranches in the
widest parts of the valley. Near the top of the reach, the valley becomes more confined and passes through more
residential parcels. The channel does move laterally across the valley bottom occasionally, but is often confined
against the valley wall or Asotin Creek road. George Creek, a significant perennial tributary, enters the reach at RM
3.2. Levees and rip-rap are less frequent upstream of George Creek.
Hydrology
The hydrologic regime in this reach is snow-rain dominated. There are several small intermittent and ephemeral
tributaries in this reach. Their hydrologic contribution is mostly limited to rare storm events that flush water and
sediment into the reach. Although the hydrologic effects of the small tributaries may be brief, there is evidence
from large alluvial fans at RM 4.8 and 6.1 that they can contribute substantial discharge and sediment. George
Creek enters this reach at RM 3.2, contributing a significant amount of discharge and sediment.
Geomorphic Function – limited to moderate
ASOTIN COUNTY WATERSHED ASSESSMENT
72
The channel has been reduced to single thread and straightened in most of the reach. Geomorphic and hydraulic
diversity is low and there are very few structural elements aside from occasional LWD and a few engineered
boulder structures. Geomorphic function in this reach varies from limited to moderate.
RM 3.2 to 5.9 is a planform controlled with discontinuous floodplain reach type with limited function primarily due
to the lack of floodplain connectivity and geomorphic diversity. Because much of the channel has been pinned
against the southern valley border, it has been reduced to a straight, single threaded channel with little access to
the floodplain during regular high flow events. There is very little LWD or other structural elements present.
From RM 5.9 to 7.3, the reach is in moderate condition. There is very little LWD present in the channel, except for
occasional large jams. Colluvial inputs from the steep ephemeral hillslopes on the north side of the valley have
been completely cut off due to the presence of Asotin Creek Road. In confined reaches, colluvium provides an
important source of structural elements that maintain hydraulic and geomorphic diversity in the channel.
Floodplain Confinement - high
Aside from the mouth of Asotin Creek, this reach includes the widest valley bottom and historic floodplain among
the target watersheds from the beginning of the reach to the George Creek confluence at RM 3.2. However, the
channel has been effectively cut off from the floodplain for most of the reach. From RM 0.4 to 5.9 the river has
levees and rip-rap along both banks, severely limiting access to the floodplain. There are a few opportunities for
floodplain connection that appear to have been inundated recently. From RM 5.9 to 7.3, the valley bottom is less
wide, and the natural width constriction is the primary control for this confined with occasional floodplain pocket
reach type. Because of the more constricted valley, there are inherently fewer opportunities for floodplain
connection unlike the wider portion of the reach downstream. However, the current floodplain pockets that exist
are only accessed during large flood events because the channel is entrenched.
Riparian Function – moderate to full
The extent of riparian vegetation in this reach is variable, ranging from 36-100% of full function. There are some
examples in the middle and upper end of the reach where the riparian function is still > 80% or more full (e.g., RM
1.8 – 2.4, 3.5 – 4.4, 5.2 – 5.5, and 6.0 – 7.3). However, there are several long sections where riparian vegetation is
limited to a thin extent along the channel margin. Alder and cottonwood are the dominant canopy species in this
reach and likely provide adequate shade to the stream channel.
Fish Habitat and Use
Chinook and steelhead spawn and rear in this reach. Chinook, steelhead, and bull trout also use this reach during
migratory periods. There is very little LWD and hydraulic diversity, limiting opportunities for suitable rearing
habitat. Pools are rare and typically created along the lateral edge of the channel near bedrock walls at the valley
margin. Lamprey migrate through this reach and likely rear here as well, but little information on their distribution
and abundance is available.
Restoration Strategies and Recommendations
Because of the proximity to urban infrastructure and working ranches, there is little that can be done to improve
the Geomorphic Function of this reach from river 0.4 to 3.2. However, if interested landowners can be identified,
there may be opportunities for rip-rap removal and levee setbacks to create pockets of improved condition and
fish habitat. Widening the channel and improving floodplain access is highly recommended. If such projects are not
feasible, improving instream habitat through engineered structural elements to increase cover, pool habitat, and
improve sediment sorting is recommended.
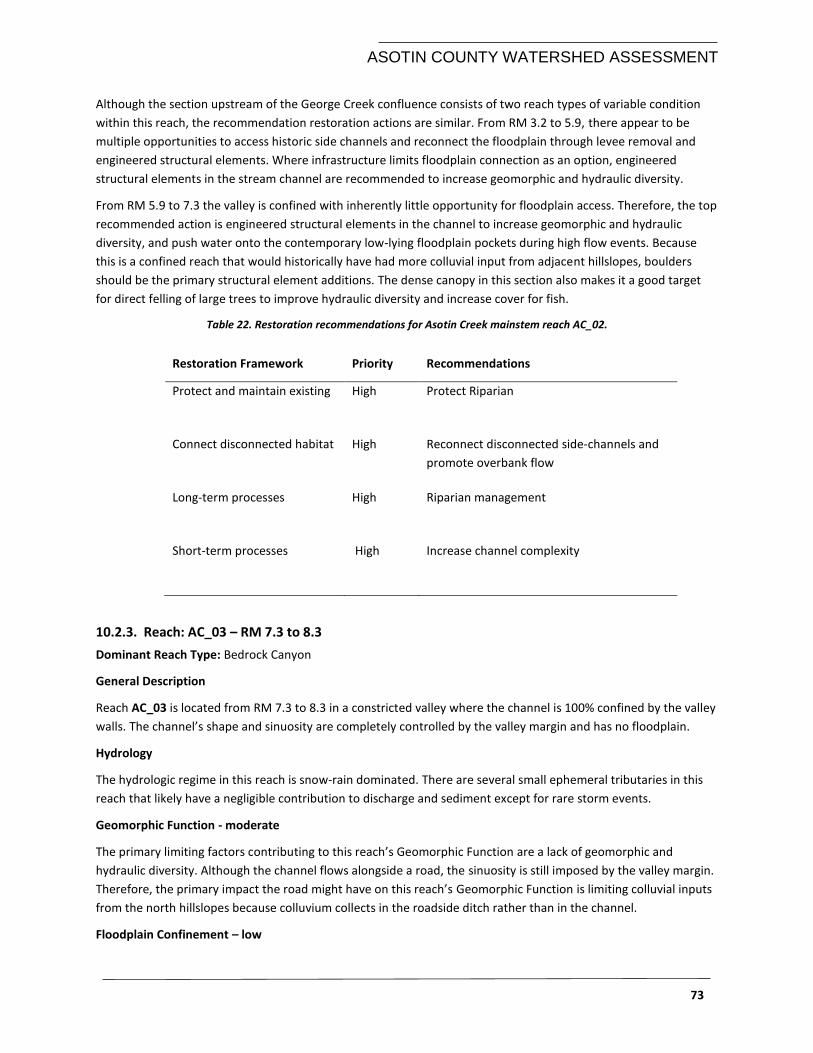
ASOTIN COUNTY WATERSHED ASSESSMENT
73
Although the section upstream of the George Creek confluence consists of two reach types of variable condition
within this reach, the recommendation restoration actions are similar. From RM 3.2 to 5.9, there appear to be
multiple opportunities to access historic side channels and reconnect the floodplain through levee removal and
engineered structural elements. Where infrastructure limits floodplain connection as an option, engineered
structural elements in the stream channel are recommended to increase geomorphic and hydraulic diversity.
From RM 5.9 to 7.3 the valley is confined with inherently little opportunity for floodplain access. Therefore, the top
recommended action is engineered structural elements in the channel to increase geomorphic and hydraulic
diversity, and push water onto the contemporary low-lying floodplain pockets during high flow events. Because
this is a confined reach that would historically have had more colluvial input from adjacent hillslopes, boulders
should be the primary structural element additions. The dense canopy in this section also makes it a good target
for direct felling of large trees to improve hydraulic diversity and increase cover for fish.
Table 22. Restoration recommendations for Asotin Creek mainstem reach AC_02.
Restoration Framework Priority Recommendations
Protect and maintain existing High Protect Riparian
Connect disconnected habitat High Reconnect disconnected side-channels and
promote overbank flow
Long-term processes High Riparian management
Short-term processes High Increase channel complexity
10.2.3. Reach: AC_03 – RM 7.3 to 8.3
Dominant Reach Type: Bedrock Canyon
General Description
Reach AC_03 is located from RM 7.3 to 8.3 in a constricted valley where the channel is 100% confined by the valley
walls. The channel’s shape and sinuosity are completely controlled by the valley margin and has no floodplain.
Hydrology
The hydrologic regime in this reach is snow-rain dominated. There are several small ephemeral tributaries in this
reach that likely have a negligible contribution to discharge and sediment except for rare storm events.
Geomorphic Function - moderate
The primary limiting factors contributing to this reach’s Geomorphic Function are a lack of geomorphic and
hydraulic diversity. Although the channel flows alongside a road, the sinuosity is still imposed by the valley margin.
Therefore, the primary impact the road might have on this reach’s Geomorphic Function is limiting colluvial inputs
from the north hillslopes because colluvium collects in the roadside ditch rather than in the channel.
Floodplain Confinement – low
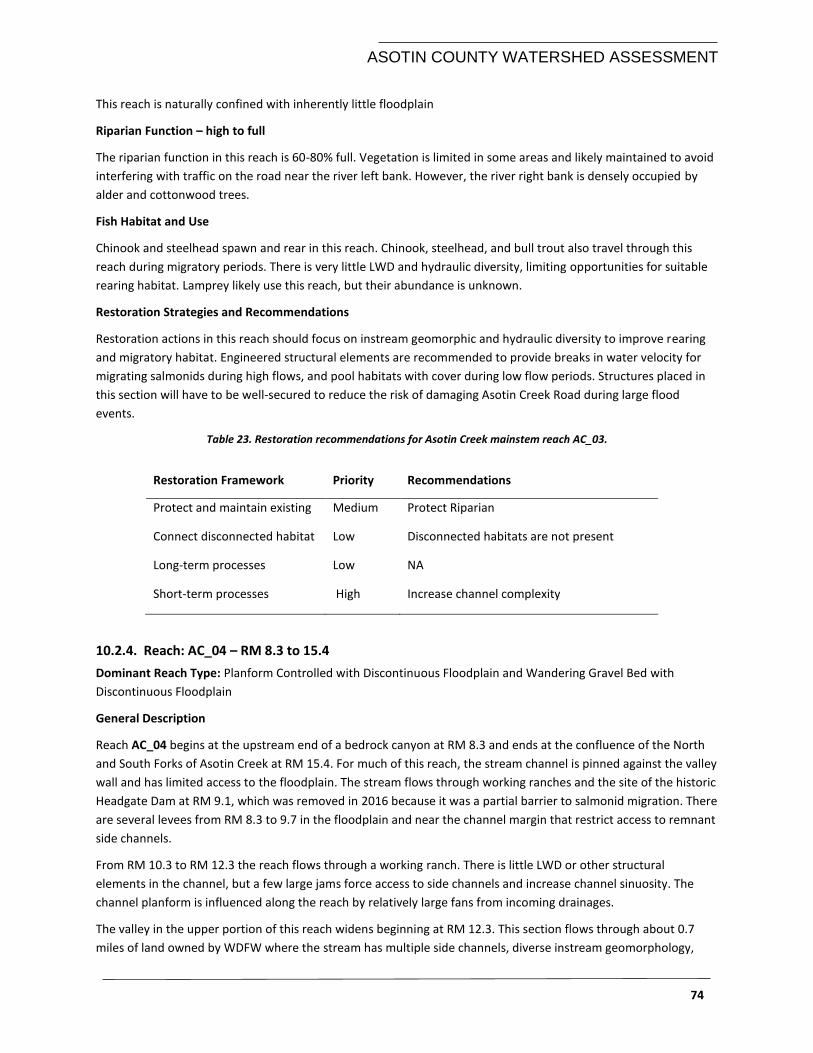
ASOTIN COUNTY WATERSHED ASSESSMENT
74
This reach is naturally confined with inherently little floodplain
Riparian Function – high to full
The riparian function in this reach is 60-80% full. Vegetation is limited in some areas and likely maintained to avoid
interfering with traffic on the road near the river left bank. However, the river right bank is densely occupied by
alder and cottonwood trees.
Fish Habitat and Use
Chinook and steelhead spawn and rear in this reach. Chinook, steelhead, and bull trout also travel through this
reach during migratory periods. There is very little LWD and hydraulic diversity, limiting opportunities for suitable
rearing habitat. Lamprey likely use this reach, but their abundance is unknown.
Restoration Strategies and Recommendations
Restoration actions in this reach should focus on instream geomorphic and hydraulic diversity to improve rearing
and migratory habitat. Engineered structural elements are recommended to provide breaks in water velocity for
migrating salmonids during high flows, and pool habitats with cover during low flow periods. Structures placed in
this section will have to be well-secured to reduce the risk of damaging Asotin Creek Road during large flood
events.
Table 23. Restoration recommendations for Asotin Creek mainstem reach AC_03.
Restoration Framework Priority Recommendations
Protect and maintain existing Medium Protect Riparian
Connect disconnected habitat Low Disconnected habitats are not present
Long-term processes Low NA
Short-term processes High Increase channel complexity
10.2.4. Reach: AC_04 – RM 8.3 to 15.4
Dominant Reach Type: Planform Controlled with Discontinuous Floodplain and Wandering Gravel Bed with
Discontinuous Floodplain
General Description
Reach AC_04 begins at the upstream end of a bedrock canyon at RM 8.3 and ends at the confluence of the North
and South Forks of Asotin Creek at RM 15.4. For much of this reach, the stream channel is pinned against the valley
wall and has limited access to the floodplain. The stream flows through working ranches and the site of the historic
Headgate Dam at RM 9.1, which was removed in 2016 because it was a partial barrier to salmonid migration. There
are several levees from RM 8.3 to 9.7 in the floodplain and near the channel margin that restrict access to remnant
side channels.
From RM 10.3 to RM 12.3 the reach flows through a working ranch. There is little LWD or other structural
elements in the channel, but a few large jams force access to side channels and increase channel sinuosity. The
channel planform is influenced along the reach by relatively large fans from incoming drainages.
The valley in the upper portion of this reach widens beginning at RM 12.3. This section flows through about 0.7
miles of land owned by WDFW where the stream has multiple side channels, diverse instream geomorphology,
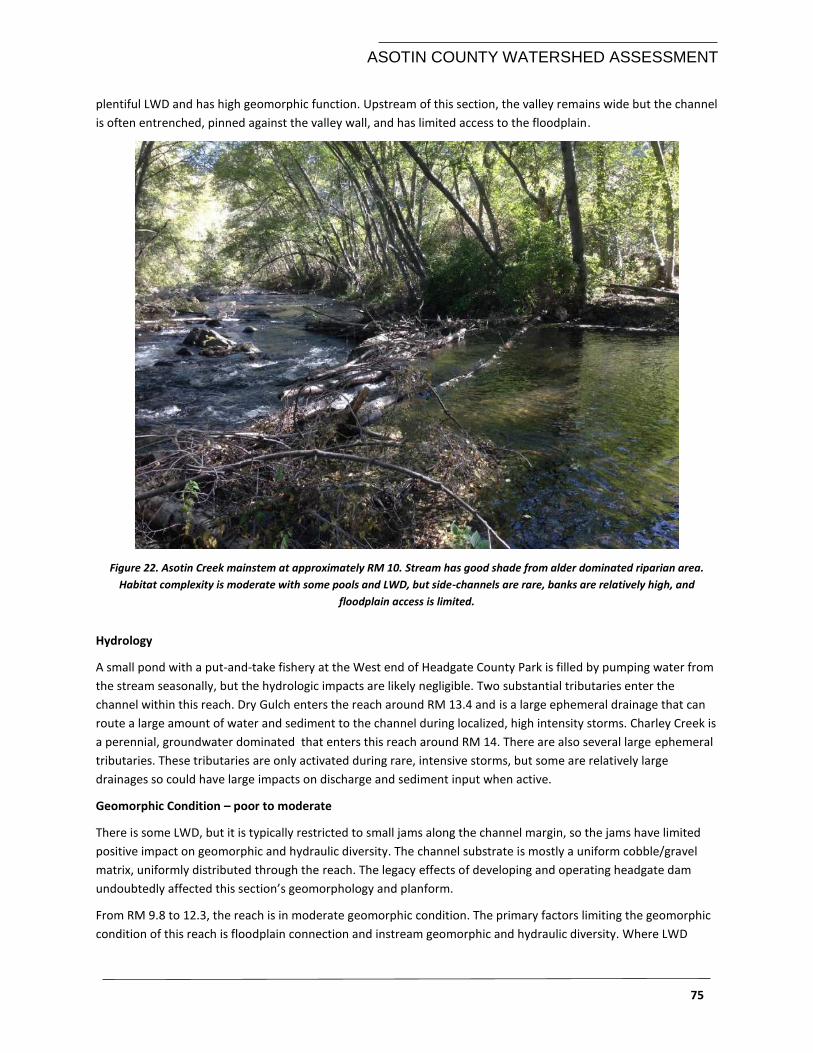
ASOTIN COUNTY WATERSHED ASSESSMENT
75
plentiful LWD and has high geomorphic function. Upstream of this section, the valley remains wide but the channel
is often entrenched, pinned against the valley wall, and has limited access to the floodplain.
Figure 22. Asotin Creek mainstem at approximately RM 10. Stream has good shade from alder dominated riparian area.
Habitat complexity is moderate with some pools and LWD, but side-channels are rare, banks are relatively high, and
floodplain access is limited.
Hydrology
A small pond with a put-and-take fishery at the West end of Headgate County Park is filled by pumping water from
the stream seasonally, but the hydrologic impacts are likely negligible. Two substantial tributaries enter the
channel within this reach. Dry Gulch enters the reach around RM 13.4 and is a large ephemeral drainage that can
route a large amount of water and sediment to the channel during localized, high intensity storms. Charley Creek is
a perennial, groundwater dominated that enters this reach around RM 14. There are also several large ephemeral
tributaries. These tributaries are only activated during rare, intensive storms, but some are relatively large
drainages so could have large impacts on discharge and sediment input when active.
Geomorphic Condition – poor to moderate
There is some LWD, but it is typically restricted to small jams along the channel margin, so the jams have limited
positive impact on geomorphic and hydraulic diversity. The channel substrate is mostly a uniform cobble/gravel
matrix, uniformly distributed through the reach. The legacy effects of developing and operating headgate dam
undoubtedly affected this section’s geomorphology and planform.
From RM 9.8 to 12.3, the reach is in moderate geomorphic condition. The primary factors limiting the geomorphic
condition of this reach is floodplain connection and instream geomorphic and hydraulic diversity. Where LWD
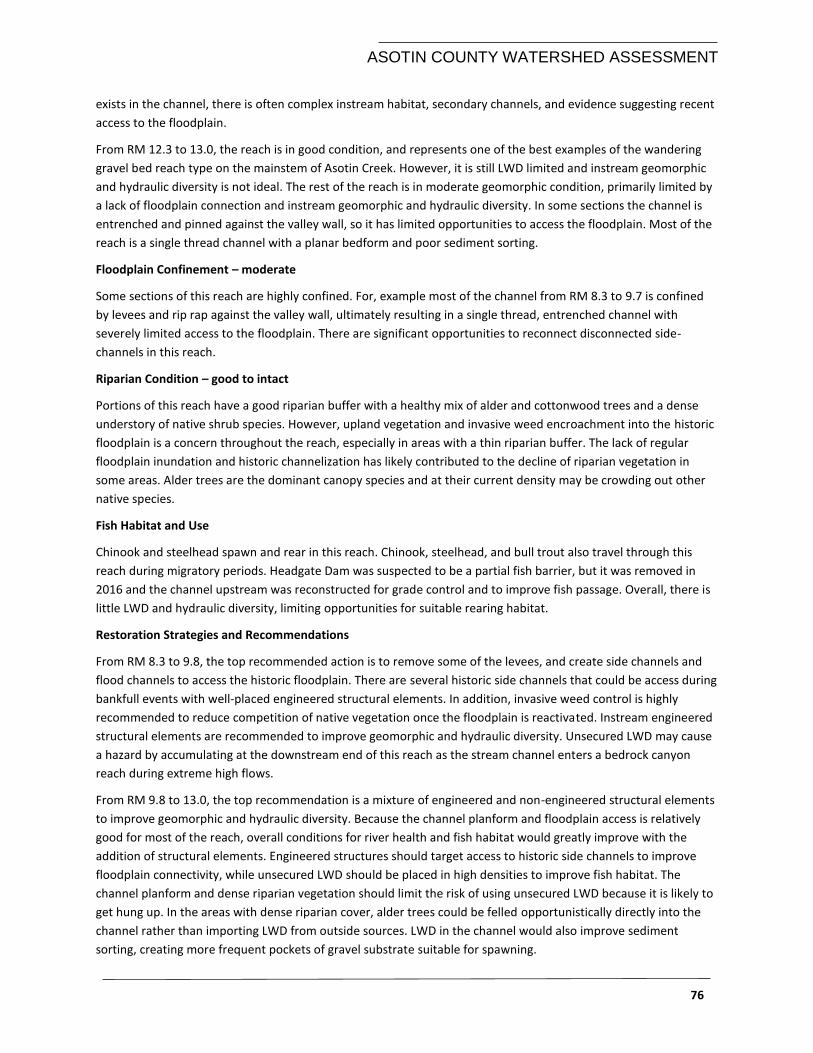
ASOTIN COUNTY WATERSHED ASSESSMENT
76
exists in the channel, there is often complex instream habitat, secondary channels, and evidence suggesting recent
access to the floodplain.
From RM 12.3 to 13.0, the reach is in good condition, and represents one of the best examples of the wandering
gravel bed reach type on the mainstem of Asotin Creek. However, it is still LWD limited and instream geomorphic
and hydraulic diversity is not ideal. The rest of the reach is in moderate geomorphic condition, primarily limited by
a lack of floodplain connection and instream geomorphic and hydraulic diversity. In some sections the channel is
entrenched and pinned against the valley wall, so it has limited opportunities to access the floodplain. Most of the
reach is a single thread channel with a planar bedform and poor sediment sorting.
Floodplain Confinement – moderate
Some sections of this reach are highly confined. For, example most of the channel from RM 8.3 to 9.7 is confined
by levees and rip rap against the valley wall, ultimately resulting in a single thread, entrenched channel with
severely limited access to the floodplain. There are significant opportunities to reconnect disconnected side-
channels in this reach.
Riparian Condition – good to intact
Portions of this reach have a good riparian buffer with a healthy mix of alder and cottonwood trees and a dense
understory of native shrub species. However, upland vegetation and invasive weed encroachment into the historic
floodplain is a concern throughout the reach, especially in areas with a thin riparian buffer. The lack of regular
floodplain inundation and historic channelization has likely contributed to the decline of riparian vegetation in
some areas. Alder trees are the dominant canopy species and at their current density may be crowding out other
native species.
Fish Habitat and Use
Chinook and steelhead spawn and rear in this reach. Chinook, steelhead, and bull trout also travel through this
reach during migratory periods. Headgate Dam was suspected to be a partial fish barrier, but it was removed in
2016 and the channel upstream was reconstructed for grade control and to improve fish passage. Overall, there is
little LWD and hydraulic diversity, limiting opportunities for suitable rearing habitat.
Restoration Strategies and Recommendations
From RM 8.3 to 9.8, the top recommended action is to remove some of the levees, and create side channels and
flood channels to access the historic floodplain. There are several historic side channels that could be access during
bankfull events with well-placed engineered structural elements. In addition, invasive weed control is highly
recommended to reduce competition of native vegetation once the floodplain is reactivated. Instream engineered
structural elements are recommended to improve geomorphic and hydraulic diversity. Unsecured LWD may cause
a hazard by accumulating at the downstream end of this reach as the stream channel enters a bedrock canyon
reach during extreme high flows.
From RM 9.8 to 13.0, the top recommendation is a mixture of engineered and non-engineered structural elements
to improve geomorphic and hydraulic diversity. Because the channel planform and floodplain access is relatively
good for most of the reach, overall conditions for river health and fish habitat would greatly improve with the
addition of structural elements. Engineered structures should target access to historic side channels to improve
floodplain connectivity, while unsecured LWD should be placed in high densities to improve fish habitat. The
channel planform and dense riparian vegetation should limit the risk of using unsecured LWD because it is likely to
get hung up. In the areas with dense riparian cover, alder trees could be felled opportunistically directly into the
channel rather than importing LWD from outside sources. LWD in the channel would also improve sediment
sorting, creating more frequent pockets of gravel substrate suitable for spawning.
ASOTIN COUNTY WATERSHED ASSESSMENT
77
From RM 13.0 to 15.4, the top recommended action is to enhance the floodplain by improving connectivity and
managing vegetation. There are many historic side channels in the valley bottom that could be engineered to be
accessed during regular bankfull flow events (2 year recurrence interval). In addition, there are low-lying areas in
the floodplain that appear to be historic wetlands (particularly around the Charley Creek confluence) and should
be reactivated. Invasive weed and upland vegetation control should be a priority, especially as the floodplain is
reconnected with the channel to decrease competition with native trees and shrubs. Engineered structural
elements are recommended to improve geomorphic and hydraulic diversity, and can be placed to target historic
side and flood channels to improve floodplain access as well. In areas with a dense riparian buffer, selective felling
of trees into the channel should be considered to increase LWD loading.
Table 24. Restoration recommendations for Asotin Creek mainstem reach AC_04.
Restoration Framework Priority Recommendations
Protect and maintain existing Medium Protect Riparian
Connect disconnected habitat High Reconnect disconnected side-channels and
promote overbank flow
Long-term processes High Manage non-native riparian vegetation
Short-term processes High Increase channel complexity
10.3 CHARLEY CREEK
10.3.1. Reach: CC_01 – RM 0.0 to 2.0
Dominant Reach Type: Laterally Unconfined Alluvial Fan and Partly Confined Planform Controlled with
Discontinuous Floodplain
General Description
Reach CC-01 begins at the mouth of Charley Creek where it enters the mainstem of Asotin Creek at approximately
RM 14 on the mainstem. The first 0.2 miles of the reach is an alluvial fan that enters the main Asotin Creek valley
below Asotin Creek Road. The fan has multiple channels as it crosses the mainstem valley and enters Asotin Creek.
One of the channels has been armored with rip-rap and is a restoration site implemented as part of the Model
Watershed. The stream flows through a large stand of mature alder trees and there are numerous small wetlands
bordering the fan. Upstream and downstream of the fan are ranches with large pastures that border the fan. The
stream flows through a concrete open top culvert with a cattle guard to pass under Asotin Creek Road.
From RM 0.2 to 2.0 upstream of the Asotin Creek Road, the stream enters a narrow valley with steep side hills. A
house with out-buildings, cattle loading ramp, and small corrals border the right bank of Charley Creek upstream of
the road crossing for < 0.1 mile. The remainder of the reach is now owned by WDFW. The stream flows mostly
against a steep bedrock cliff on the right bank. Riparian fencing borders both sides of the stream and is in a CREP
contract. The Asotin IMW has a PIT tag interrogation site above the road used to detect adult and juvenile PIT
ASOTIN COUNTY WATERSHED ASSESSMENT
78
tagged fish entering and leaving the stream. Inside the riparian fencing is a dense stand of shrubs and trees with
some patches of blackberry. There is a rough single lane gravel road that runs along the left side of the valley for
over 10 miles. The road generally stays above the valley bottom but does encroach into the valley bottom in a few
locations. Access is restricted by a locked gate at the entrance at Asotin Creek Road and controlled by WDFW and
USFS. Local ranchers use the road seasonally to move cattle to grazing allotments. The lower reaches of Charley
Creek were used to winter cattle and horses until WDFW purchased the property. Sections of stream that were not
fenced in the past have been overgrazed, and now these areas have been invaded by weeds. ACCD and USFS have
implemented intensive weed control and planting programs in these areas.
Figure 23. Riparian enhancement area along Charley Creek above Asotin Creek road. Note road is above the valley bottom.
Hydrology
The hydrologic regime in this reach is snow-rain dominated. However, Charley Creek is heavily influenced by
groundwater inputs as evidenced by numerous springs, cool stream temperatures (cooler than other Asotin
tributaries in the summer and warmer in the winter), and relatively consistent flows. The Asotin Creek IMW project
installed a water height gauge near the Asotin Creek Road crossing in 2009 and has developed a rating curve for
the gauge. The average stream flow is 10 cfs and often Charley Creek has higher base flows than South Fork Asotin
Creek despite the South Fork watershed being almost twice the area and reaching a higher elevation. No perennial
tributaries enter this reach.
Geomorphic Function - moderate
Geomorphic function is moderate because the alluvial fan is only partially constricted below Asotin Creek Road.
Abundant gravel in the fan suggests that high flows in Charley Creek are transported through the fan and likely
migrate into the mainstem Asotin. Upstream of the fan in the planform reach type, the geomorphic function
degrades to limited due to low hydraulic and geomorphic diversity, limited LWD, poor substrate sorting, and
limited floodplain connection. The bridge crossing at RM 0.2 is a major confining feature in this reach.
Floodplain confinement - high
ASOTIN COUNTY WATERSHED ASSESSMENT
79
Anthropogenic floodplain confinement is limited to RM 0.0 to 0.4, and is caused by levees protecting Asotin Creek
Road, and residential infrastructure at the mouth of Charley Creek. Floodplain connection is low throughout the
rest of the reach due to relatively deep channel incision and a lack of LWD to promote overbank flow.
Riparian Function - limited
Riparian function is moderate due to the age of the riparian vegetation and some encroachment by adjacent
pastures. The fan is dominated by young small diameter (6-12”) alder with a low diversity understory. There are
some wetlands adjacent to the fan with cattails and other aquatic vegetation. The planform reach from RM 0.4 to
2.0 has limited to moderate function due to large patches of non-native blackberry in the understory, immature
canopy, and encroachment by grass and upland shrubs. Young alder and some large cottonwood dominate the
canopy and in general the floodplain is narrow and has little evidence of frequent connection to the channel (i.e,
lack of fine sediment deposits). However, existing vegetation is dense and provides good shade and cover for the
stream.
Fish Habitat and Use
Charley Creek supports a relatively large number of spawning steelhead despite its small size. Spawning surveys by
WDFW and PIT tag detections at the interrogation site have found that almost 10% of the adult steelhead entering
Asotin Creek (not including George Creek) use Charley Creek. Since 2010, a minimum average of 45 adult steelhead
have migrated into Charley Creek. Spawning surveys suggests the entire reach is used for spawning and juvenile
steelhead have been captured throughout the reach. Bull trout and Chinook juveniles have been captured in the
lower reach of Charley Creek, but are rare.
Restoration Strategies and Recommendations
SRSRB reviewed the road crossing in this reach and noted that it could be a partial barrier. However, a road
realignment would be necessary to replace the culvert with a bridge or bottomless arch culvert. At this time, fish
appear to be able to freely navigate the crossing, but we recommend that it be reviewed periodically. The alluvial
fan is actively transporting gravel and functioning fairly well. The planform section of this reach upstream of the
road crossing is between the Charley Creek Road on the left bank and private property on the right bank, limiting
recovery potential for 50-100 yards. Relocation of the road out of the valley bottom or widening of the channel
onto private property would be required to improve the geomorphic condition of this small area. Upstream to the
end of the reach there is more opportunity to increase habitat complexity and reduce floodplain confinement on
the left bank because the road is mostly above the valley bottom.
We recommend no restoration actions from RM 0.0-0.2. Charley Creek is currently being used as part of the Asotin
Creek IMW to test the effectiveness of additions of LWD to improve instream habitat and increase steelhead
production. At this time, we recommend that no further restoration actions be taken in this reach until the IMW is
completed. Once the IMW is completed, from RM 0.2-0.3, we recommend moving the road out of the valley
bottom on the left bank or accessing some of the private property on the right bank to provide more space for the
stream. From RM 0.3- 2.0 we recommend a combination of instream habitat improvement and floodplain
enhancement. Instream wood additions should be designed to increase habitat complexity, increase sinuosity, and
activate historic side-channels and reconnect to floodplain areas. Riparian planting should occur in conjunction
with instream work, and target areas that are inundated/reconnected.
ASOTIN COUNTY WATERSHED ASSESSMENT
80
Table 25. Restoration recommendations for Charley Creek reach CC_01.
Restoration Framework Priority Recommendations
Protect and maintain existing Medium Protect Riparian and springs
Connect disconnected habitat Low Disconnected habitats are generally not
present
Long-term processes Medium Riparian management (manage invasive
vegetation and enhance native vegetation)
Short-term processes High Increase channel complexity
10.3.2. Reach: CC_02 – RM 2.0 to 7.9
Dominant Reach Type: Partly Confined Fan Controlled with Discontinuous Floodplain
General Description
Reach CC_02 begins at RM 2.0 and ends at RM 7.9. The assessment area from RM 2.0 to 7.0 is within state-owned
property, and from RM 7.0 to 7.9 is within USFS property. There are numerous fans in the valley from intermittent
and ephemeral tributaries throughout the reach. The creek generally lacks the competence to move material from
the toe of the fans, so the planform of the channel is heavily influenced. Remnant excessive sediment in the valley
bottom still exists from historic dams at RM 3.6 and 5.2. Charley Creek road follows the creek for the entire reach,
but is decommissioned starting at RM 7.4, and is behind state-operated gates, so vehicle access is by permission
only. The road is mostly located outside of the valley bottom and has little impact on the stream. A LWD
restoration project related to the Asotin Creek IMW was implemented within this reach in 2014, and there has
been documented improvements to fluvial processes and fish habitat as a result.
Figure 24. Typical condition of Charley Creek with recovering riparian habitat and low instream diversity
ASOTIN COUNTY WATERSHED ASSESSMENT
81
Hydrology
The hydrologic regime is snow-rain dominated; however, Charley Creek is heavily influenced by groundwater as
evident by numerous springs and stable annual flows. There are no perennial tributaries in this reach, but there
are numerous ephemeral tributaries.
Geomorphic Function – limited to moderate
Geomorphic condition is generally moderate throughout this reach. In many areas, hydraulic and geomorphic
diversity is low, the channel is incised, LWD is limited, substrate is embedded by fine sediment, and floodplain
interaction is limited. Locations near remnant feed lots and corrals typically have limited geomorphic function with
deeper incision, less LWD, and simple channel morphology. The channel upstream of the remnant dams is still
working through legacy sediment deposits, but this has created some unique and complex habitats with high
hydraulic and geomorphic diversity. Geomorphic condition generally improves moving upstream through this
reach.
Floodplain Confinement – low
There is little anthropogenic confinement restricting floodplain connection in this reach. The remnant dams are
still mostly intact and impose local confinement in the valley bottom. In areas where Charley Creek road is directly
against the channel, the valley bottom is naturally narrow with little inherent floodplain connection. Other areas
where floodplain connection is low, is due to deep channel incision and low abundance of LWD.
Riparian Function – moderate
Riparian function throughout this reach is generally moderate, and areas with limited riparian function are typically
near old feed lots and corrals where grazing activity was high. Immature alder are the dominant canopy species,
but cottonwood groves are present in small patches. Conifers are typically present where the hillslope and fans are
adjacent to the channel margin, but their prevalence greatly increases upstream of RM 5.2. Many riparian planting
projects have been implemented within this reach over the last two decades, so riparian function is expected to
continue improving over time. Upland and invasive vegetation is encroaching into the floodplain in several areas,
particularly near the old feed lots and corrals.
Fish Habitat and Use
Steelhead spawn and rear in this reach. Stable flows and cold water temperatures help maintain good rearing
conditions for juvenile steelhead; however hydraulic diversity is low in many areas. Opportunities for cover and
deep pool habitats are rare. Fish habitat in this IMW restoration section has improved after the addition of LWD,
with increased pool and cover density. Bull trout and Chinook juveniles have been observed in this reach, but are
rare.
Restoration Strategies and Recommendations
The top recommendation for this reach is to add LWD to increase channel complexity and promote overbank flow.
Because floodplain connection is primarily a result of channel incision, LWD additions are recommended to
increase sediment aggradation in the channel and push water onto the floodplain during high flow events. Riparian
management, including invasive vegetation treatments, should also be highly considered. The remnant dams in the
reach should be assessed to determine the feasibility of removal, as they artificially increase confinement and limit
floodplain connection. The riparian zone should be protected because its condition will improve naturally, and
canopy species will eventually begin contributing LWD to the channel. The upper section of this reach would be a
good candidate for beaver management as a restoration tool.
ASOTIN COUNTY WATERSHED ASSESSMENT
82
Table 26. Restoration recommendations for Charley Creek reach CC_02
Restoration Framework Priority Recommendations
Protect and maintain existing Medium Protect Riparian and springs
Connect disconnected habitat Medium Assess old dams for complete removal
Long-term processes High Riparian management (manage invasive
vegetation and enhance native vegetation)
Short-term processes High Increase channel complexity, beaver
management
10.3.3. Reach: CC_03 – RM 7.9 to 13.0
Dominant Reach Type: Confined with Occasional Floodplain Pockets, Partly Confined Planform Controlled with
Discontinuous Floodplain
General Description
Reach CC_03 is located from RM 7.9 to 13.0, and is entirely within USFS property. The decommissioned USFS road
060 follows the creek. The reach begins in a partly confined valley, but confinement increases near RM 9.6,
causing a wholesale change in reach type. USFS road 060 ends at RM 10.7 where it joins USFS road 4206, which is
not decommissioned, and follows the creek until RM 12.4.
Hydrology
The hydrologic regime in this reach is snow-rain dominated, but Charley Creek is heavily influenced by
groundwater inputs. There are several ephemeral tributaries throughout the reach. Starting near RM 9.6, small
perennial headwater tributaries become common until the top of the reach.
Geomorphic Function – high
This reach has high geomorphic function and near full function in sections. Geomorphic and hydraulic diversity is
relatively high. Areas where the remnant USFS road is within the valley bottom or adjacent to the channel are
generally less complex, but are rare instances throughout the reach. LWD frequency is lower than expected based
on this reach’s position in the basin and abundance of canopy species in the riparian zone.
Floodplain Confinement – low
Floodplain confinement was not fully assessed due to the lack of LIDAR in this reach. However, floodplain
connectivity is adequate and there is ample evidence of recent floodplain inundation throughout the reach.
Riparian Function – unimpacted
Logging has the potential to affect this reach; however, there are riparian buffers present, so there is likely
negligible impact to the stream. Conifers are the dominant canopy species.
ASOTIN COUNTY WATERSHED ASSESSMENT
83
Fish Habitat and Use
Steelhead rear throughout this reach, but spawning significantly decreases moving upstream. However, adult
steelhead have been observed as far up as RM 11.0. Pools and cover for juveniles is limited to areas with LWD jams
which are relatively infrequent from RM 7.9 to 12.4.
Restoration Strategies and Recommendations
Table 27. Restoration recommendations for Charley Creek reach CC_03.
Restoration Framework Priority Recommendations
Protect and maintain existing Medium Protect Riparian and springs
Connect disconnected habitat Low Disconnected habitats are generally not
present
Long-term processes Low Protect processes
Short-term processes High Increase channel complexity, beaver
management
10.4 NORTH FORK ASOTIN CREEK
10.4.1. Reach: NF_01 – RM 0.0 to 0.8
Dominant Reach Type: Partly Confined Wandering Gravel Bed with Discontinuous Floodplain
General Description
Reach NF_01 begins at the confluence with the South Fork Asotin Creek and extends to RM 0.8. A large storage
shed and wheat field maintained by WDFW is located near the mouth of the creek. Along the stream, between the
channel and the wheat field, from RM 0.0 to 0.1 is a WDFW operated firing range. Asotin Creek Road continues
past the confluence and follows the entire reach. The reach is entirely within state-owned lands.
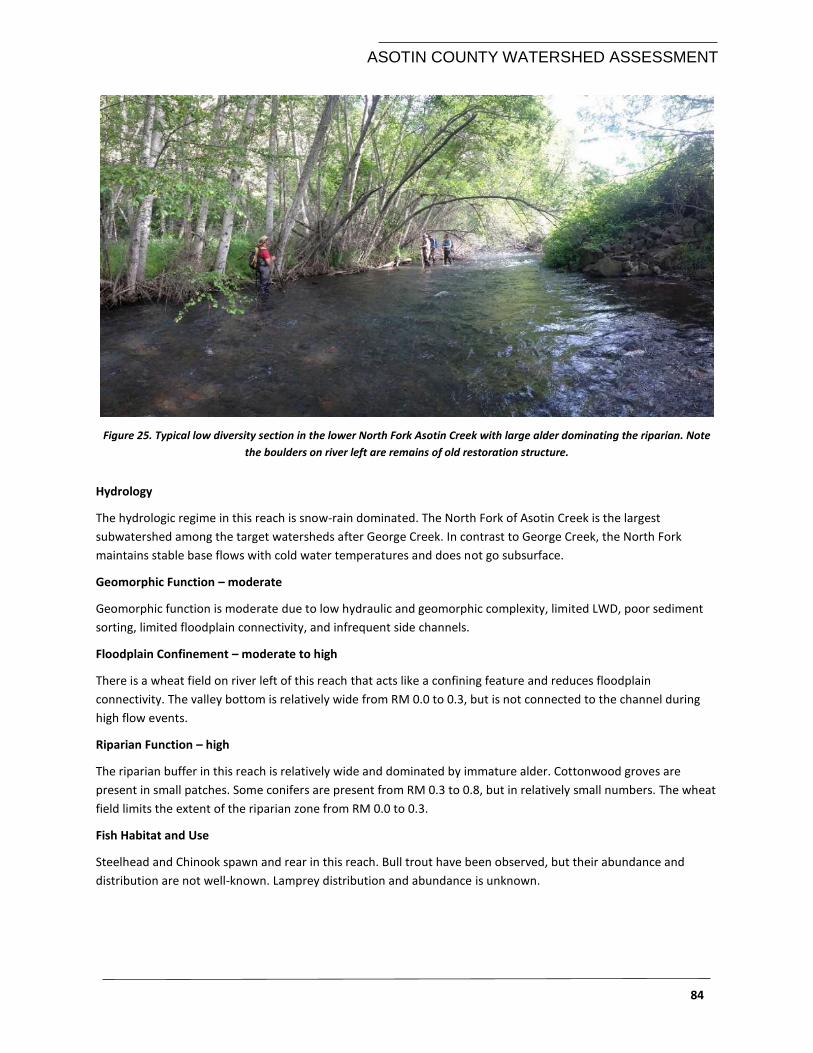
ASOTIN COUNTY WATERSHED ASSESSMENT
84
Figure 25. Typical low diversity section in the lower North Fork Asotin Creek with large alder dominating the riparian. Note
the boulders on river left are remains of old restoration structure.
Hydrology
The hydrologic regime in this reach is snow-rain dominated. The North Fork of Asotin Creek is the largest
subwatershed among the target watersheds after George Creek. In contrast to George Creek, the North Fork
maintains stable base flows with cold water temperatures and does not go subsurface.
Geomorphic Function – moderate
Geomorphic function is moderate due to low hydraulic and geomorphic complexity, limited LWD, poor sediment
sorting, limited floodplain connectivity, and infrequent side channels.
Floodplain Confinement – moderate to high
There is a wheat field on river left of this reach that acts like a confining feature and reduces floodplain
connectivity. The valley bottom is relatively wide from RM 0.0 to 0.3, but is not connected to the channel during
high flow events.
Riparian Function – high
The riparian buffer in this reach is relatively wide and dominated by immature alder. Cottonwood groves are
present in small patches. Some conifers are present from RM 0.3 to 0.8, but in relatively small numbers. The wheat
field limits the extent of the riparian zone from RM 0.0 to 0.3.
Fish Habitat and Use
Steelhead and Chinook spawn and rear in this reach. Bull trout have been observed, but their abundance and
distribution are not well-known. Lamprey distribution and abundance is unknown.
ASOTIN COUNTY WATERSHED ASSESSMENT
85
Restoration Strategies and Recommendations
The top recommendation for this reach is to reconnect the channel to the floodplain where the wheat field is
located. LWD additions are also recommended to increase channel complexity and promote overbank flow.
Table 28. Restoration recommendations for North Fork Asotin Creek reach NF_01.
Restoration Framework Priority Recommendations
Protect and maintain existing Medium Protect Riparian
Connect disconnected habitat High Reconnect disconnected side-channels and
remove rip-rap. Promote overbank flow
Long-term processes Medium Riparian management
Short-term processes High Increase channel complexity
10.4.2. Reach: NF_02 – RM 0.8 to 10.1
Dominant Reach Type: Partly Confined Wandering Gravel Bed with Discontinuous Floodplain
General Description
Reach NF_02 begins at the confluence with Lick Creek at RM 0.8 and extends to RM 10.1 at the confluence of the
North and Middle Forks of the North Fork of Asotin Creek. The North Fork Asotin Creek trail follows the creek for
the entire reach and is a popular recreation area. A parking lot is located at RM 0.9 and is the starting location for
the North Fork Trail.
Hydrology
The hydrologic regime in this reach is snow-rain dominated.
Geomorphic Function – moderate to high
The geomorphic function in this reach varies from moderate to high, with some areas near full function. The
variability of geomorphic function within this reach is indicative of natural recovery taking place. Geomorphic
processes related to hydraulic interactions with structural elements such as LWD are the primary limiting factor.
The stream in this reach has the competence to recover quickly, but there is very little structure within the channel
to increase hydraulic and geomorphic diversity.
Floodplain Confinement – low
Other than the parking lot at the bottom of this reach, there are no examples of anthropogenic confinement.
Riparian Function – high to full
Riparian function in this reach is high and is dominated by immature alder with many cottonwood groves. As
elevation increases towards the top of this reach, conifers become much more prevalent.
Fish Habitat and Use
Steelhead, Chinook, and bull trout spawn and rear in this reach. Water conditions are suitable for rearing, but
limited LWD results in infrequent pools and low amounts of cover for rearing juveniles. LWD and pool frequency
increase moving upstream to the top of the reach. Bull trout abundance increases upstream.
ASOTIN COUNTY WATERSHED ASSESSMENT
86
Restoration Strategies and Recommendations
The top recommendation for this reach is to increase channel complexity through LWD additions. Increasing LWD
density will improve hydraulic and geomorphic complexity, ultimately creating more diverse habitats for salmonids
of all life stages. Secondly, the riparian area should be protected because the riparian area in this reach represents
one of the best examples in the target watersheds. This reach may provide an opportunity to use beavers as a
restoration tool to increase channel complexity and floodplain interaction.
Table 29. Restoration recommendations for North Fork Asotin Creek reach NF_02.
Restoration Framework Priority Recommendations
Protect and maintain existing Medium Protect Riparian and springs
Connect disconnected habitat Low Disconnected habitats are generally not
present
Long-term processes Low Recovering
Short-term processes High Increase channel complexity, beaver
management
10.4.3. Reach: NF_03 – RM 0.0 to 2.3 (South Fork of North Fork)
Dominant Reach Type: Partly Confined Planform Controlled with Discontinuous Floodplain
General Description
Reach NF_03 is the lower 2.3 RM of the South Fork of the North Fork of Asotin Creek. The reach is entirely located
within USFS property and access is extremely limited.
Hydrology
The hydrologic regime in this reach is snow-rain dominated.
Geomorphic Function – high
This reach has high geomorphic function. The floodplain is inundated regularly, side channels are regularly present,
created, and maintained, and hydraulic and geomorphic diversity is relatively high. LWD is higher than many areas
in the target watersheds, but still below reference conditions.
Floodplain Confinement – low
There are no anthropogenic features restricting access to the floodplain.
Riparian Function – unimpacted
The riparian zone is mostly unimpacted and dominated by a mix of conifers, alder, and cottonwood.
Fish Habitat and Use
Steelhead and bull trout spawn and rear in this reach.
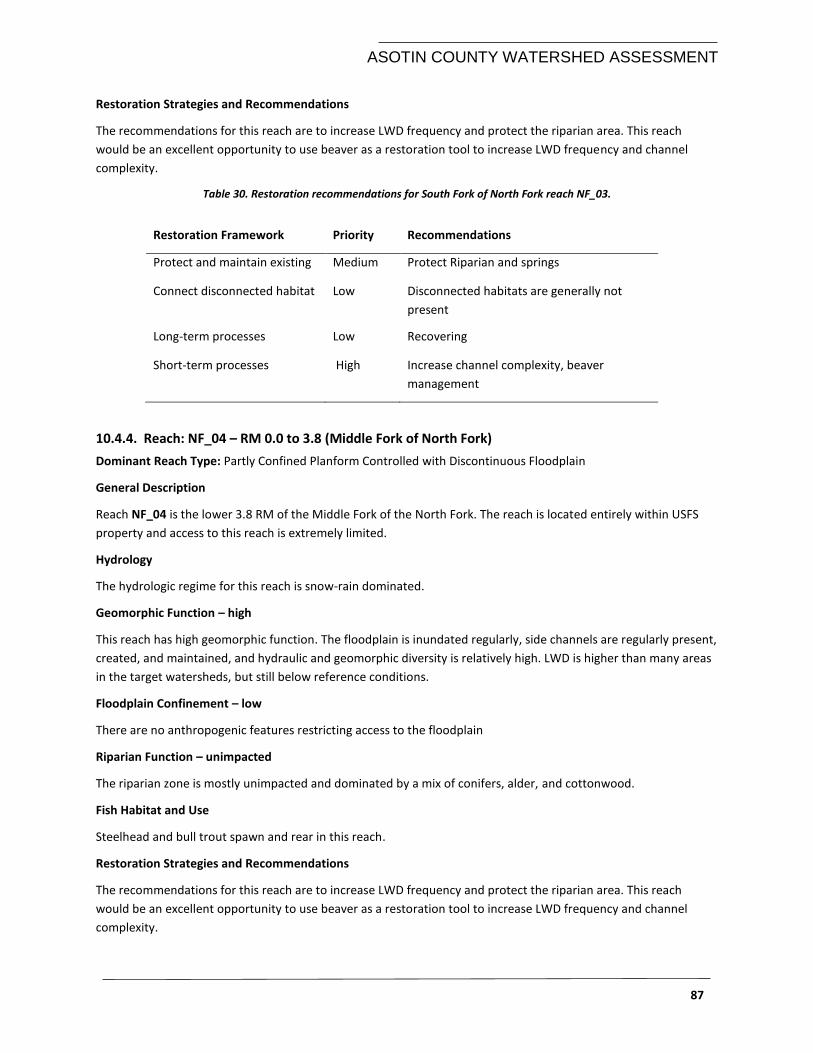
ASOTIN COUNTY WATERSHED ASSESSMENT
87
Restoration Strategies and Recommendations
The recommendations for this reach are to increase LWD frequency and protect the riparian area. This reach
would be an excellent opportunity to use beaver as a restoration tool to increase LWD frequency and channel
complexity.
Table 30. Restoration recommendations for South Fork of North Fork reach NF_03.
Restoration Framework Priority Recommendations
Protect and maintain existing Medium Protect Riparian and springs
Connect disconnected habitat Low Disconnected habitats are generally not
present
Long-term processes Low Recovering
Short-term processes High Increase channel complexity, beaver
management
10.4.4. Reach: NF_04 – RM 0.0 to 3.8 (Middle Fork of North Fork)
Dominant Reach Type: Partly Confined Planform Controlled with Discontinuous Floodplain
General Description
Reach NF_04 is the lower 3.8 RM of the Middle Fork of the North Fork. The reach is located entirely within USFS
property and access to this reach is extremely limited.
Hydrology
The hydrologic regime for this reach is snow-rain dominated.
Geomorphic Function – high
This reach has high geomorphic function. The floodplain is inundated regularly, side channels are regularly present,
created, and maintained, and hydraulic and geomorphic diversity is relatively high. LWD is higher than many areas
in the target watersheds, but still below reference conditions.
Floodplain Confinement – low
There are no anthropogenic features restricting access to the floodplain
Riparian Function – unimpacted
The riparian zone is mostly unimpacted and dominated by a mix of conifers, alder, and cottonwood.
Fish Habitat and Use
Steelhead and bull trout spawn and rear in this reach.
Restoration Strategies and Recommendations
The recommendations for this reach are to increase LWD frequency and protect the riparian area. This reach
would be an excellent opportunity to use beaver as a restoration tool to increase LWD frequency and channel
complexity.
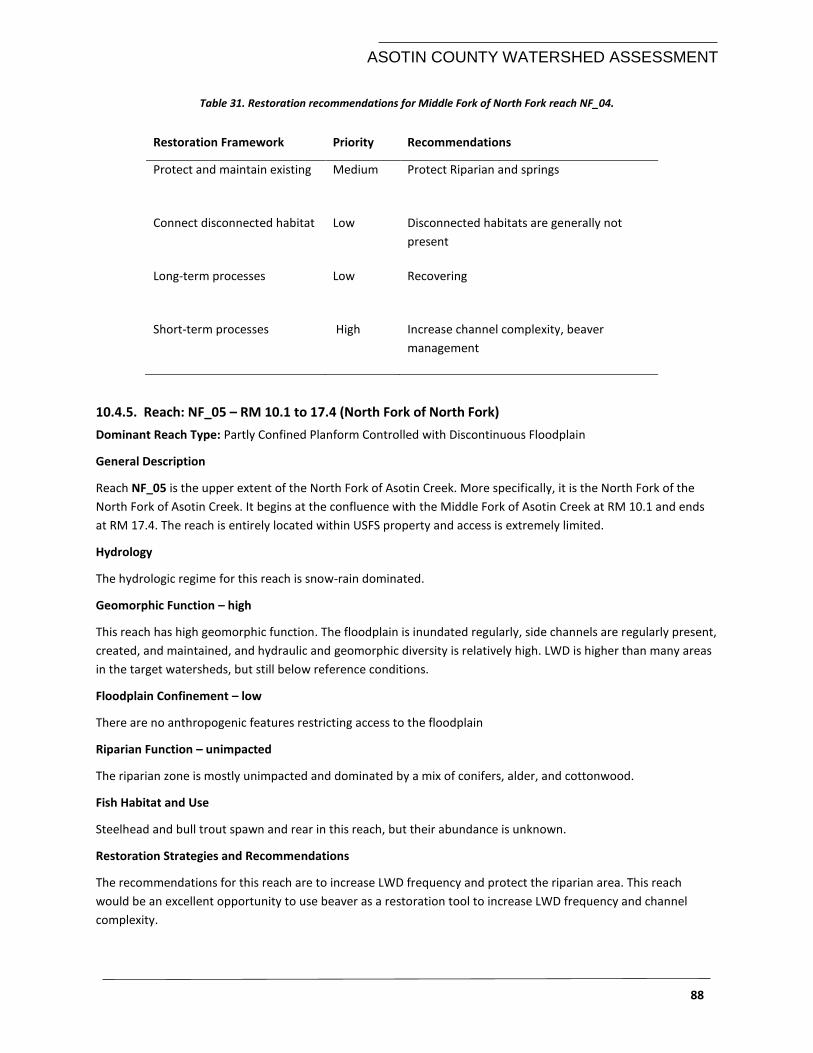
ASOTIN COUNTY WATERSHED ASSESSMENT
88
Table 31. Restoration recommendations for Middle Fork of North Fork reach NF_04.
Restoration Framework Priority Recommendations
Protect and maintain existing Medium Protect Riparian and springs
Connect disconnected habitat Low Disconnected habitats are generally not
present
Long-term processes Low Recovering
Short-term processes High Increase channel complexity, beaver
management
10.4.5. Reach: NF_05 – RM 10.1 to 17.4 (North Fork of North Fork)
Dominant Reach Type: Partly Confined Planform Controlled with Discontinuous Floodplain
General Description
Reach NF_05 is the upper extent of the North Fork of Asotin Creek. More specifically, it is the North Fork of the
North Fork of Asotin Creek. It begins at the confluence with the Middle Fork of Asotin Creek at RM 10.1 and ends
at RM 17.4. The reach is entirely located within USFS property and access is extremely limited.
Hydrology
The hydrologic regime for this reach is snow-rain dominated.
Geomorphic Function – high
This reach has high geomorphic function. The floodplain is inundated regularly, side channels are regularly present,
created, and maintained, and hydraulic and geomorphic diversity is relatively high. LWD is higher than many areas
in the target watersheds, but still below reference conditions.
Floodplain Confinement – low
There are no anthropogenic features restricting access to the floodplain
Riparian Function – unimpacted
The riparian zone is mostly unimpacted and dominated by a mix of conifers, alder, and cottonwood.
Fish Habitat and Use
Steelhead and bull trout spawn and rear in this reach, but their abundance is unknown.
Restoration Strategies and Recommendations
The recommendations for this reach are to increase LWD frequency and protect the riparian area. This reach
would be an excellent opportunity to use beaver as a restoration tool to increase LWD frequency and channel
complexity.
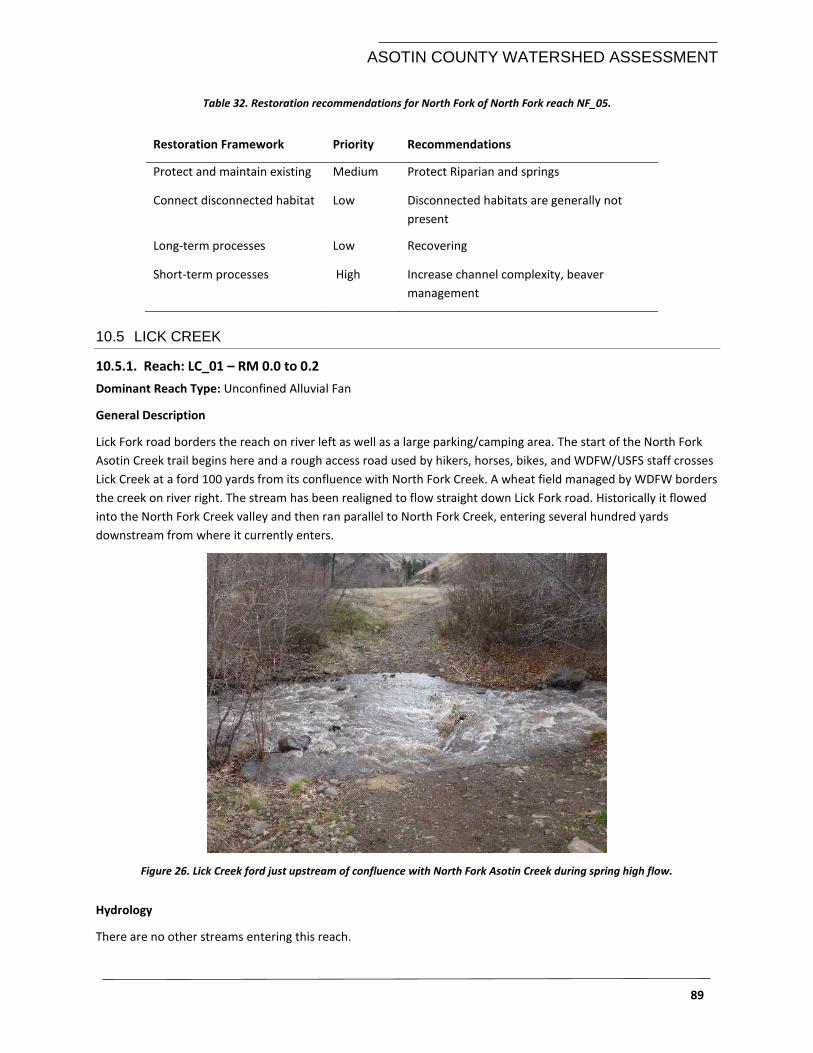
ASOTIN COUNTY WATERSHED ASSESSMENT
89
Table 32. Restoration recommendations for North Fork of North Fork reach NF_05.
Restoration Framework Priority Recommendations
Protect and maintain existing Medium Protect Riparian and springs
Connect disconnected habitat Low Disconnected habitats are generally not
present
Long-term processes Low Recovering
Short-term processes High Increase channel complexity, beaver
management
10.5 LICK CREEK
10.5.1. Reach: LC_01 – RM 0.0 to 0.2
Dominant Reach Type: Unconfined Alluvial Fan
General Description
Lick Fork road borders the reach on river left as well as a large parking/camping area. The start of the North Fork
Asotin Creek trail begins here and a rough access road used by hikers, horses, bikes, and WDFW/USFS staff crosses
Lick Creek at a ford 100 yards from its confluence with North Fork Creek. A wheat field managed by WDFW borders
the creek on river right. The stream has been realigned to flow straight down Lick Fork road. Historically it flowed
into the North Fork Creek valley and then ran parallel to North Fork Creek, entering several hundred yards
downstream from where it currently enters.
Figure 26. Lick Creek ford just upstream of confluence with North Fork Asotin Creek during spring high flow.
Hydrology
There are no other streams entering this reach.
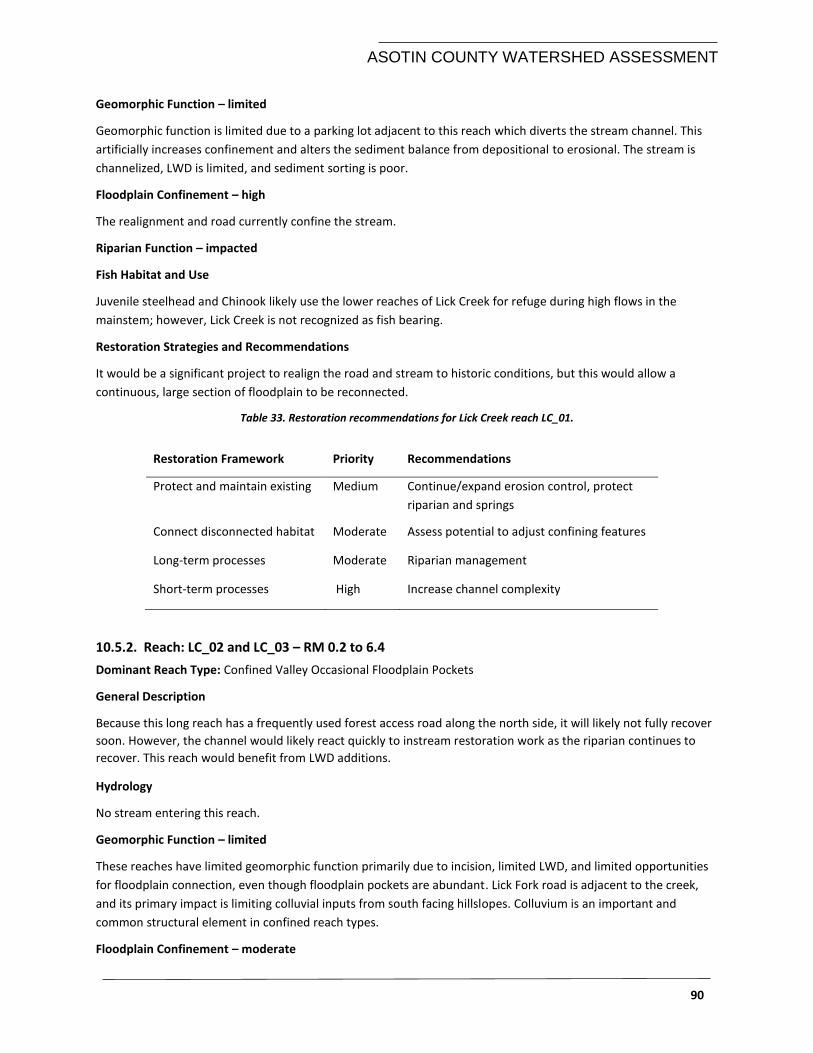
ASOTIN COUNTY WATERSHED ASSESSMENT
90
Geomorphic Function – limited
Geomorphic function is limited due to a parking lot adjacent to this reach which diverts the stream channel. This
artificially increases confinement and alters the sediment balance from depositional to erosional. The stream is
channelized, LWD is limited, and sediment sorting is poor.
Floodplain Confinement – high
The realignment and road currently confine the stream.
Riparian Function – impacted
Fish Habitat and Use
Juvenile steelhead and Chinook likely use the lower reaches of Lick Creek for refuge during high flows in the
mainstem; however, Lick Creek is not recognized as fish bearing.
Restoration Strategies and Recommendations
It would be a significant project to realign the road and stream to historic conditions, but this would allow a
continuous, large section of floodplain to be reconnected.
Table 33. Restoration recommendations for Lick Creek reach LC_01.
Restoration Framework Priority Recommendations
Protect and maintain existing Medium Continue/expand erosion control, protect
riparian and springs
Connect disconnected habitat Moderate Assess potential to adjust confining features
Long-term processes Moderate Riparian management
Short-term processes High Increase channel complexity
10.5.2. Reach: LC_02 and LC_03 – RM 0.2 to 6.4
Dominant Reach Type: Confined Valley Occasional Floodplain Pockets
General Description
Because this long reach has a frequently used forest access road along the north side, it will likely not fully recover
soon. However, the channel would likely react quickly to instream restoration work as the riparian continues to
recover. This reach would benefit from LWD additions.
Hydrology
No stream entering this reach.
Geomorphic Function – limited
These reaches have limited geomorphic function primarily due to incision, limited LWD, and limited opportunities
for floodplain connection, even though floodplain pockets are abundant. Lick Fork road is adjacent to the creek,
and its primary impact is limiting colluvial inputs from south facing hillslopes. Colluvium is an important and
common structural element in confined reach types.
Floodplain Confinement – moderate
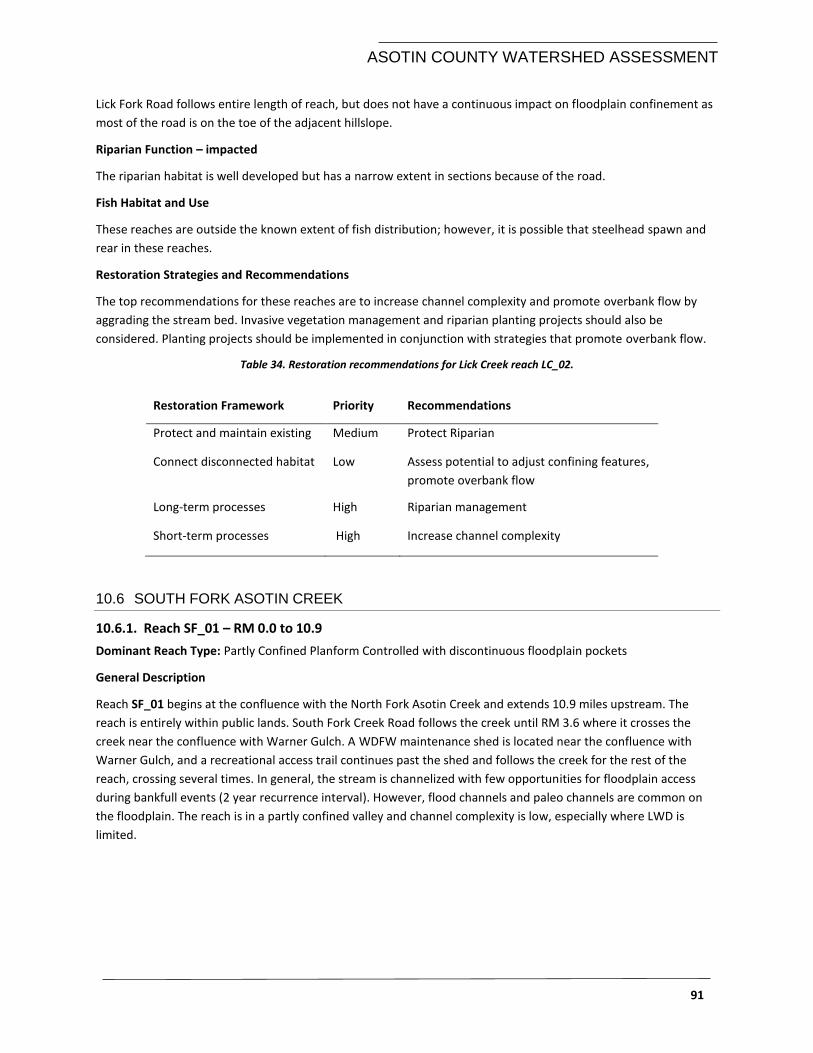
ASOTIN COUNTY WATERSHED ASSESSMENT
91
Lick Fork Road follows entire length of reach, but does not have a continuous impact on floodplain confinement as
most of the road is on the toe of the adjacent hillslope.
Riparian Function – impacted
The riparian habitat is well developed but has a narrow extent in sections because of the road.
Fish Habitat and Use
These reaches are outside the known extent of fish distribution; however, it is possible that steelhead spawn and
rear in these reaches.
Restoration Strategies and Recommendations
The top recommendations for these reaches are to increase channel complexity and promote overbank flow by
aggrading the stream bed. Invasive vegetation management and riparian planting projects should also be
considered. Planting projects should be implemented in conjunction with strategies that promote overbank flow.
Table 34. Restoration recommendations for Lick Creek reach LC_02.
Restoration Framework Priority Recommendations
Protect and maintain existing Medium Protect Riparian
Connect disconnected habitat Low Assess potential to adjust confining features,
promote overbank flow
Long-term processes High Riparian management
Short-term processes High Increase channel complexity
10.6 SOUTH FORK ASOTIN CREEK
10.6.1. Reach SF_01 – RM 0.0 to 10.9
Dominant Reach Type: Partly Confined Planform Controlled with discontinuous floodplain pockets
General Description
Reach SF_01 begins at the confluence with the North Fork Asotin Creek and extends 10.9 miles upstream. The
reach is entirely within public lands. South Fork Creek Road follows the creek until RM 3.6 where it crosses the
creek near the confluence with Warner Gulch. A WDFW maintenance shed is located near the confluence with
Warner Gulch, and a recreational access trail continues past the shed and follows the creek for the rest of the
reach, crossing several times. In general, the stream is channelized with few opportunities for floodplain access
during bankfull events (2 year recurrence interval). However, flood channels and paleo channels are common on
the floodplain. The reach is in a partly confined valley and channel complexity is low, especially where LWD is
limited.
ASOTIN COUNTY WATERSHED ASSESSMENT
92
Figure 27. South Fork Asotin Creek with typical recovering riparian and low diversity habitat.
Hydrology
Headwaters for SF_01 begin in the Blue Mountains and the hydrologic regime is snow-rain dominated. Surface
flows are maintained throughout the year, but base flows in the summer can fall to below one cfs. Warner Gulch is
an ephemeral tributary that enters the reach at RM 3.6. Warner Gulch has recently experienced several high-
intensity rain storms that caused brief floods that contributed large amounts of sediment to the South Fork of
Asotin Creek. A large unnamed intermittent tributary enters the reach at RM 4.4 and typically retains surface flow
until early summer.
Geomorphic Function – limited to high
SF_01 is in moderate geomorphic function until RM 9.1, primarily due to a lack of hydraulic and geomorphic
complexity, poor sediment sorting, limited floodplain connection, and low LWD density, but has limited
geomorphic function from RM 3.6 to 4.6. The fan from Warner Gulch, and the South Fork Creek Road bridge
crossing, create a brief pinch point that has likely contributed to a back-log of sediment upstream. The reach has
high geomorphic function from RM 9.1 to 10.9, and is primarily limited by LWD density.
Floodplain Connection – moderate
There are few areas where anthropogenic confinement is limiting floodplain connection in this reach. However,
the stream is often channelized, reducing interaction with the floodplain. When LWD is present in high densities,
floodplain connection improves. In many areas, soil on the floodplain is shallow and cobble sheets are exposed.
Riparian Function – moderate to high
ASOTIN COUNTY WATERSHED ASSESSMENT
93
Riparian function is generally in moderate condition until RM 3.8, just upstream of the confluence with Warner
Gulch. Although the riparian zone is typically dense, it is dominated by immature alder. Upstream of RM 3.8, the
riparian function is high, and a greater diversity of canopy species are present.
Fish Habitat and Use
Steelhead use this reach for migration, spawning, and rearing. Chinook likely spawn here in low numbers, and
juveniles have been observed through IMW survey efforts in low numbers. Bull trout migrate through the lower
portions of this reach, but are known to spawn and rear in the upper portions of the reach. Lamprey use is
unknown.
Restoration Strategies and Recommendations
The top recommended action from RM 0.0 to 9.1 is to add LWD to increase hydraulic and geomorphic diversity,
improve sediment sorting, and increase interaction with the floodplain. It would still be appropriate to add LWD
from RM 9.1 to 10.9; however, the potential for natural LWD recruitment and current LWD densities are higher
than in lower sections. Protecting current riparian vegetation is recommended throughout the reach to allow time
for alders to mature and the next successional species take hold (e.g., cottonwood and conifers). Over time, the
alders will be a source of natural LWD recruitment. Management for invasive vegetation is recommended for
several areas where upland vegetation is encroaching into the floodplain.
Table 35. Restoration recommendations for South Fork Asotin Creek reach SF_01.
Restoration Framework Priority Recommendations
Protect and maintain existing High Protect Riparian
Connect disconnected habitat Moderate Disconnected habitats are generally not
present. Promote overbank flow
Long-term processes High Riparian management
Short-term processes High Increase channel complexity, beaver
management
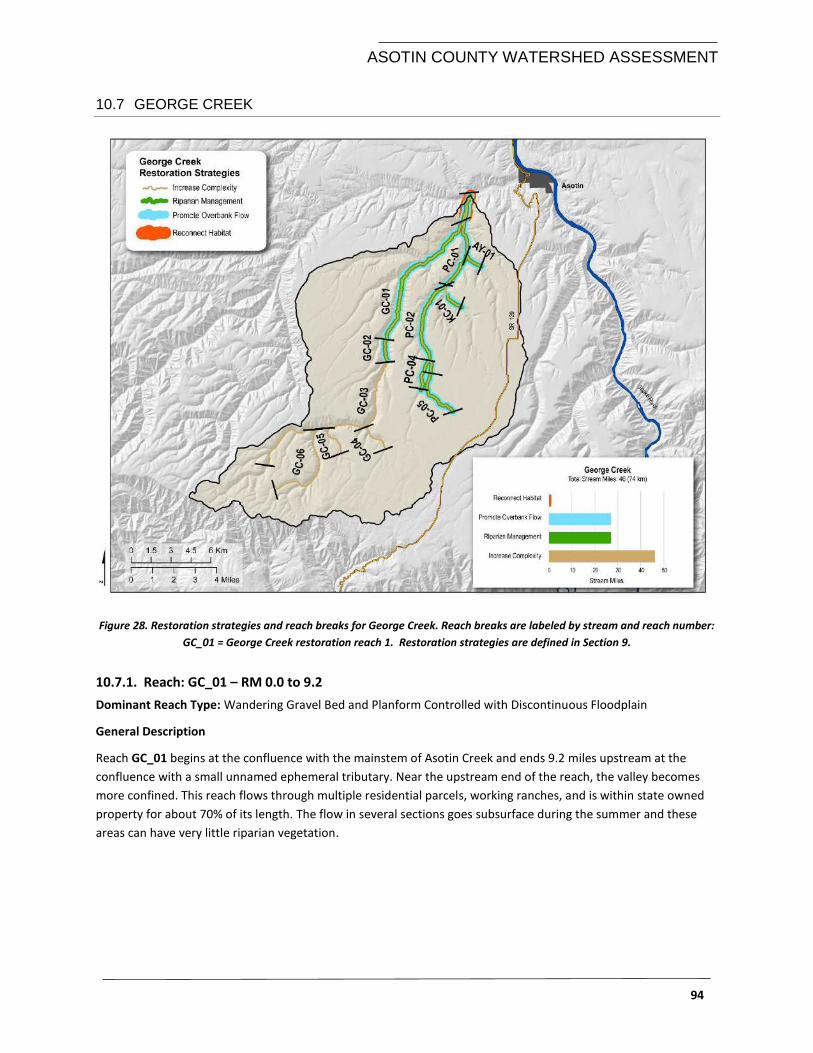
ASOTIN COUNTY WATERSHED ASSESSMENT
94
10.7 GEORGE CREEK
Figure 28. Restoration strategies and reach breaks for George Creek. Reach breaks are labeled by stream and reach number:
GC_01 = George Creek restoration reach 1. Restoration strategies are defined in Section 9.
10.7.1. Reach: GC_01 – RM 0.0 to 9.2
Dominant Reach Type: Wandering Gravel Bed and Planform Controlled with Discontinuous Floodplain
General Description
Reach GC_01 begins at the confluence with the mainstem of Asotin Creek and ends 9.2 miles upstream at the
confluence with a small unnamed ephemeral tributary. Near the upstream end of the reach, the valley becomes
more confined. This reach flows through multiple residential parcels, working ranches, and is within state owned
property for about 70% of its length. The flow in several sections goes subsurface during the summer and these
areas can have very little riparian vegetation.
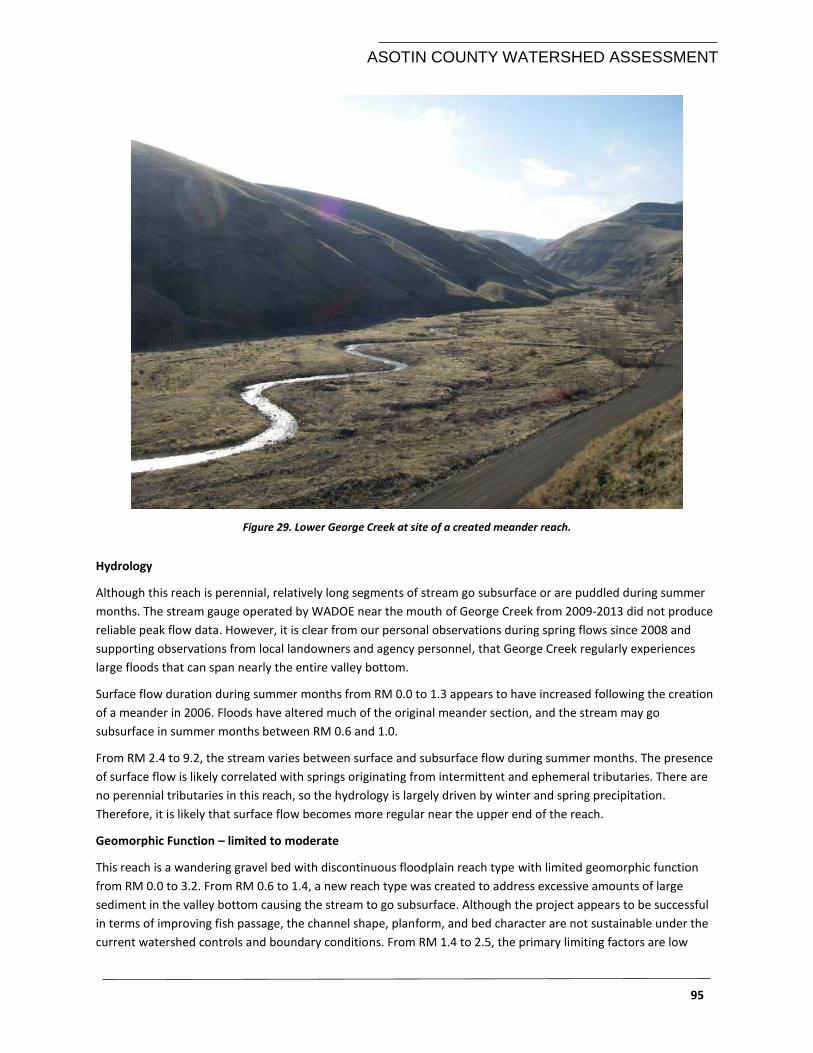
ASOTIN COUNTY WATERSHED ASSESSMENT
95
Figure 29. Lower George Creek at site of a created meander reach.
Hydrology
Although this reach is perennial, relatively long segments of stream go subsurface or are puddled during summer
months. The stream gauge operated by WADOE near the mouth of George Creek from 2009-2013 did not produce
reliable peak flow data. However, it is clear from our personal observations during spring flows since 2008 and
supporting observations from local landowners and agency personnel, that George Creek regularly experiences
large floods that can span nearly the entire valley bottom.
Surface flow duration during summer months from RM 0.0 to 1.3 appears to have increased following the creation
of a meander in 2006. Floods have altered much of the original meander section, and the stream may go
subsurface in summer months between RM 0.6 and 1.0.
From RM 2.4 to 9.2, the stream varies between surface and subsurface flow during summer months. The presence
of surface flow is likely correlated with springs originating from intermittent and ephemeral tributaries. There are
no perennial tributaries in this reach, so the hydrology is largely driven by winter and spring precipitation.
Therefore, it is likely that surface flow becomes more regular near the upper end of the reach.
Geomorphic Function – limited to moderate
This reach is a wandering gravel bed with discontinuous floodplain reach type with limited geomorphic function
from RM 0.0 to 3.2. From RM 0.6 to 1.4, a new reach type was created to address excessive amounts of large
sediment in the valley bottom causing the stream to go subsurface. Although the project appears to be successful
in terms of improving fish passage, the channel shape, planform, and bed character are not sustainable under the
current watershed controls and boundary conditions. From RM 1.4 to 2.5, the primary limiting factors are low
ASOTIN COUNTY WATERSHED ASSESSMENT
96
geomorphic and hydraulic complexity, mostly associated from a lack of structural elements. Anthropogenic
pressures are also impacting this section, reducing planform complexity and limiting access to the floodplain. From
RM 2.5 to 3.2, the reach has limited geomorphic function, primarily due to a lack of structural elements, limited
planform complexity, low geomorphic and hydraulic complexity. Many LWD structures were added to this section
recently, so the condition may improve given adequate high flow events.
From RM 3.2 to 9.2, the stream is a planform controlled with discontinuous floodplain reach type in moderate
condition. The primary limiting factors are lack of geomorphic and hydraulic diversity, most likely attributed to a
lack of structural elements. The channel planform is appropriate for most of the reach, but there are missed
opportunities for side channel and floodplain access due to low amounts of LWD. This section is dominated by
planar geomorphic units such as runs and glides, and the few pools are typically forced by LWD or small boulder
ribs. LWD density is especially low from RM 6.0 to 9.2.
Floodplain Confinement – low to high
The primary limiting factors from RM 0.0 to 0.6 are high artificial confinement, lack of floodplain connection, low
geomorphic and hydraulic diversity, and a lack of structural elements. There are several localized confining
features just upstream of the confluence with Pintler Creek around private property.
Riparian Function – limited to moderate
Riparian function in this reach highly variable. There are several segments (some 1 mile long) where as little as 21%
of the historic riparian vegetation currently exists (e.g., RM 2.4 – 3.4 and 7.4 – 8.3). Interestingly, the RCA model
predicts that the seemingly barren section from RM 0.6 to 1.3 has departed very little from its historic extent.
Currently, the only true riparian vegetation from RM 0.6 to 1.3 are willows planted during the meander creation.
Riparian vegetation in the rest of the reach upstream of RM 1.3 is dominated by alder and cottonwood. The most
common cause for riparian departure throughout the reach is a conversion to invasive vegetation.
Fish Habitat and Use
Steelhead spawn and rear in this reach, and juveniles likely migrate through, either to upper sections that maintain
surface flow, or to the mainstem of Asotin Creek to rear. Bull trout are present in the upper reaches (GC_03 to 06)
and likely migrate through this reach. It is unlikely that bull trout rear within this reach due to high water
temperatures during summer months.
Restoration Strategies and Recommendations
The stream channel is artificially confined from RM 0.0 to 0.6; however, there are several residential parcels that
need to be protected from high flows, so reconnecting the floodplain is not a feasible option. A meandering reach
was created in 2006 from RM 0.6 to 1.3. The lower portion of this meander is filling with gravel and flow is starting
to leave the created channel during high flows. The best strategy in this reach would be to allow the stream to
function naturally (i.e., form multiple channels), rather than trying to create an unnatural single meander.
From RM 1.3 to 3.2, the channel has low diversity and the floodplain is poorly connected. There is also a residence
that confines the floodplain. A WDFW restoration project was completed in 2013 from RM 2.4 to 3.2. Numerous
large trees and wood structures were added to the channel and floodplain. This restoration treatment is more
compatible with natural river behavior and this entire section could be monitored to see how well it performs. The
channel has low diversity, low LWD, and recovering riparian from RM 3.2 to the top of the reach at RM 9.2. The
recommended restoration strategy would be to promote overbank flow and increase habitat diversity.
ASOTIN COUNTY WATERSHED ASSESSMENT
97
Table 36. Restoration recommendations for George Creek reach GC_01.
Restoration Framework Priority Recommendations
Protect and maintain existing Medium Continue/expand erosion control, protect
riparian and springs
Connect disconnected habitat Low Assess confining features in the lower 0.5
miles and at confluence with Pintler Creek.
Remainder of the reach has no significant
confining features. Promote overbank flow
Long-term processes Medium Riparian management (fencing, manage
invasive vegetation, off-site water, grazing
management)
Short-term processes High Increase channel complexity
10.7.2. Reach: GC_02 – RM 9 to 10.3
Dominant Reach Type: Partly Confined Planform Controlled with Discontinuous Floodplain
General Description
Rockpile Creek enters this reach at RM 9.2. Rockpile Creek is a substantial tributary that brings in a lot of sediment
(potentially flow during spring melt) and marks the bottom of GC_02.
Hydrology
There are numerous ephemeral and intermittent tributaries in this reach.
Geomorphic Function – moderate
The lower end of this reach is adjusting to the active sediment inputs from Rockpile Creek. Accumulated sediment
from the fan creates a pinch point in the valley bottom, which forces sediment accumulation upstream. There is
limited LWD in the channel and floodplain which reduces the stream’s ability to sort these sediment inputs.
Floodplain Confinement – low
There are very few confining features in this reach.
Riparian Function – moderate
Canopy vegetation density is variable, but covers most of the stream in this reach. The canopy is dominated by
immature alder with occasional cottonwood groves. Vegetation density is lowest in the middle of the reach and
highest near the top and bottom near large tributary confluences.
Fish Habitat and Use
Steelhead spawn and rear in this reach and bull trout likely migrate through this reach.
ASOTIN COUNTY WATERSHED ASSESSMENT
98
Restoration Strategies and Recommendations
The top recommendation for this reach is to increase channel complexity through LWD additions. Adding LWD will
increase hydraulic and geomorphic complexity in the short term, and increase local stream competence to
transport larger substrate in the long term.
Table 37. Restoration recommendations for George Creek reach GC_02.
Restoration Framework Priority Recommendations
Protect and maintain existing Medium Continue/expand erosion control, protect
riparian and springs
Connect disconnected habitat Low There are very few confining features in this
reach. Promote overbank flow
Long-term processes Medium Riparian management (fencing, manage
invasive vegetation, off-site water, grazing
management)
Short-term processes High Increase channel complexity
10.7.3. Reach: GC_03 to GC_06 – RM 10.3 to 20.1
Dominant Reach Type: Confined Valley Occasional Floodplain Pockets, Confined Steep Headwater
General Description
Reach GC_03 to GC_06 are small tributaries that make up the headwaters of George Creek. Access is limited to
private roads for GC_04 and GC_05. The upper portions of GC_03 and GC_06 begin in USFS property.
Hydrology
The hydrologic regime in these reaches is snow-rain dominated.
Geomorphic Function – high
These reaches are have high geomorphic function.
Floodplain Confinement – low
There are no anthropogenic features confining the floodplain.
Riparian Function – unimpacted
The riparian zone in these reaches is mostly unimpacted. Logging has likely occurred in the past, but appropriate
riparian buffers exist, so impact to stream processes is minimal.
Fish Habitat and Use
Steelhead spawn and rear in these reaches, and juveniles likely migrate through to upper sections that maintain
surface flow, or to the mainstem of Asotin Creek to rear. WDFW and USFS have documented bull trout in these
reaches
ASOTIN COUNTY WATERSHED ASSESSMENT
99
Restoration Strategies and Recommendations
The top recommendation for this reach is to increase channel complexity through LWD additions. These reaches
may also be opportunities for using beaver management as a tool to increase channel complexity and increase
water retention which may improve summer base flows for downstream reaches.
Table 38. Restoration recommendations for George Creek reach GC_03 to GC_06.
Restoration Framework Priority Recommendations
Protect and maintain existing Medium Continue/expand erosion control, protect
riparian and springs
Connect disconnected habitat Low There are very few confining features in this
reach. Promote overbank flow
Long-term processes Low Riparian management (fencing, manage
invasive vegetation, off-site water, grazing
management)
Short-term processes High Increase channel complexity, beaver
management
10.8 PINTLER CREEK
10.8.1. Reach: PC_01 – RM 0.0 to 3.6
Dominant Reach Type: Confined with Occasional Floodplain Pockets
General Description
Reach PC_01 begins at the confluence with George Creek. From RM 0.0 to 0.6, the reach is a Wandering gravel bed
with discontinuous floodplain reach type, where there is one dominant channel with several side channels, but
only 1-3 may be active at a time. The stream regularly goes subsurface from RM 0.0 to 0.6 after spring flows
recede in the summer. A natural pinch point in the valley near RM 0.6 marks the beginning of a confined valley
setting, changing the reach type to Confined with occasional floodplain pockets. Most of the reach is within WDFW
property.
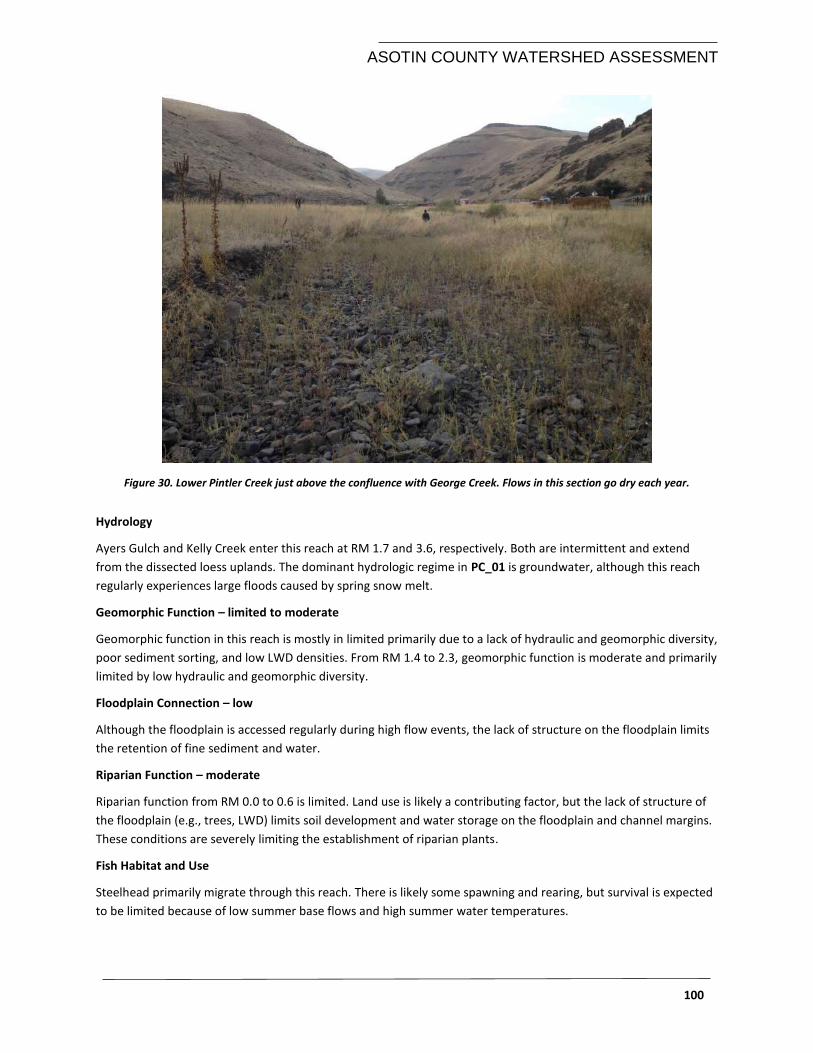
ASOTIN COUNTY WATERSHED ASSESSMENT
100
Figure 30. Lower Pintler Creek just above the confluence with George Creek. Flows in this section go dry each year.
Hydrology
Ayers Gulch and Kelly Creek enter this reach at RM 1.7 and 3.6, respectively. Both are intermittent and extend
from the dissected loess uplands. The dominant hydrologic regime in PC_01 is groundwater, although this reach
regularly experiences large floods caused by spring snow melt.
Geomorphic Function – limited to moderate
Geomorphic function in this reach is mostly in limited primarily due to a lack of hydraulic and geomorphic diversity,
poor sediment sorting, and low LWD densities. From RM 1.4 to 2.3, geomorphic function is moderate and primarily
limited by low hydraulic and geomorphic diversity.
Floodplain Connection – low
Although the floodplain is accessed regularly during high flow events, the lack of structure on the floodplain limits
the retention of fine sediment and water.
Riparian Function – moderate
Riparian function from RM 0.0 to 0.6 is limited. Land use is likely a contributing factor, but the lack of structure of
the floodplain (e.g., trees, LWD) limits soil development and water storage on the floodplain and channel margins.
These conditions are severely limiting the establishment of riparian plants.
Fish Habitat and Use
Steelhead primarily migrate through this reach. There is likely some spawning and rearing, but survival is expected
to be limited because of low summer base flows and high summer water temperatures.
ASOTIN COUNTY WATERSHED ASSESSMENT
101
Restoration Strategies and Recommendations
The top recommended action for PC_01 is to add LWD to increase channel and floodplain complexity from RM 0.6
to 3.6. Adding LWD to the channel will slow water transport times, improve habitat complexity for juveniles, and
improve sediment sorting, creating more spawning opportunities for adult salmonids. LWD additions are also
recommended for the floodplain, as the increased structure will increase the retention of water and fine sediment
and improve riparian function over time.
Table 39. Restoration recommendations for Pintler Creek reach PC_01.
Restoration Framework Priority Recommendations
Protect and maintain existing Low Continue/expand erosion control, protect
riparian and springs
Connect disconnected habitat Low There are very few confining features in this
reach. Promote overbank flow
Long-term processes High Riparian management (fencing, manage
invasive vegetation, off-site water, grazing
management)
Short-term processes High Increase channel complexity
10.8.2. Reach: PC_02 – RM 3.6 to 8.7
Dominant Reach Type: Confined with Occasional Floodplain Pockets
General Description
Reach PC_02 begins at the confluence with Kelly Creek and extends upstream to RM 8.7. The valley setting is
confined, and the channel is almost always single thread. The valley widens for brief sections, creating floodplain
pockets that are regularly accessed during high flow events. The entire reach is within private lands with very
limited access and grazing is the primary land use.
Hydrology
The hydrologic regime in reach PC_02 is dominated by groundwater; however, spring flows typically result in
floods over bankfull. A large intermittent tributary enters the reach near RM 7.9 and there are several ephemeral
tributaries throughout the reach. Summer base flows are typically less than 1 cfs, and sections of this reach may go
subsurface or become puddled.
Geomorphic Function – moderate
The geomorphic function in this reach is moderate and primarily limited by low LWD density, instream hydraulic
and geomorphic diversity, and poor sediment sorting.
Floodplain Connection – moderate
The floodplain in this reach is in moderate condition. There are naturally limited opportunities for floodplain
connection because of high valley confinement. The primary factor limiting floodplain condition is the lack of
structural elements on the floodplain, which reduces the retention of water and fine sediments stored.
ASOTIN COUNTY WATERSHED ASSESSMENT
102
Riparian Function – moderate to high
Riparian function in this reach is mostly moderate, but there are several examples of sections with high function.
Immature alder trees dominate the canopy and natural recruitment is low. Upland vegetation is encroaching up to
the channel margin in some areas.
Fish Habitat and Use
Steelhead migrate through this reach. They also spawn and rear throughout the reach. Juvenile survival may be
low due to the lack of cover and inadequate summer base flows. Spawning opportunities are limited due to poor
sediment sorting.
Restoration Strategies and Recommendations
The top recommended action for reach PC_02 is to increase channel complexity by adding LWD. Adding LWD will
promote local scour and deposition to improve critical pool and spawning habitats, and slow water transport times
to extend summer base flows downstream. LWD is particularly recommended near floodplain pockets to improve
floodplain connection. This reach may also have opportunities for beaver management.
Table 40. Restoration recommendations for Pintler Creek reach PC_02.
Restoration Framework Priority Recommendations
Protect and maintain existing Moderate Continue/expand erosion control, protect
riparian and springs
Connect disconnected habitat Low There are very few confining features in this
reach. Promote overbank flow
Long-term processes Moderate Riparian management (fencing, manage
invasive vegetation, off-site water, grazing
management)
Short-term processes High Increase channel complexity, beaver
management
10.8.3. Reach: PC_03 – RM 8.7 to 11.2
Dominant Reach Type: Confined with Occasional Floodplain Pockets
General Description
Reach PC_03 begins at RM 8.7 and ends at the upstream extent of known steelhead distribution at RM 11.2. The
entire reach is located within private lands and access is limited. There is a private access road to residences in the
middle of the reach.
Hydrology
The hydrologic regime is dominated by groundwater and the channel typically maintains surface flow. There are no
major tributaries to this reach; however, the mainstem of Pintler Creek extends further upstream into the
dissected loess uplands.
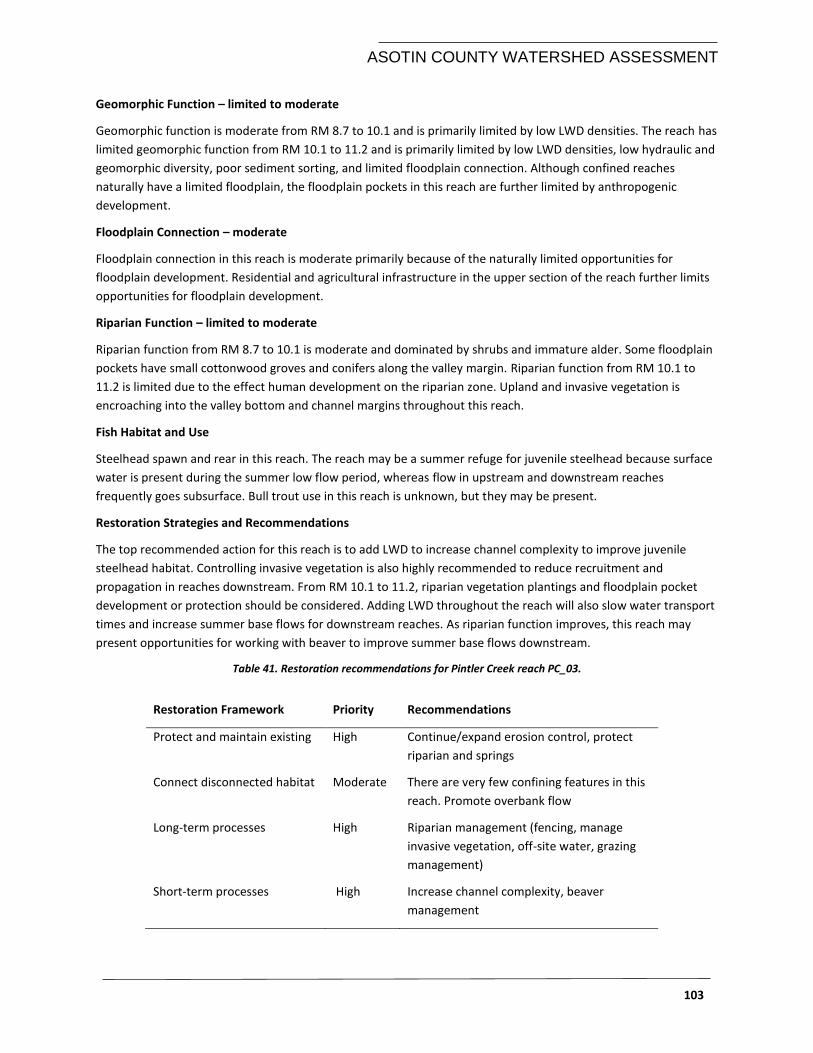
ASOTIN COUNTY WATERSHED ASSESSMENT
103
Geomorphic Function – limited to moderate
Geomorphic function is moderate from RM 8.7 to 10.1 and is primarily limited by low LWD densities. The reach has
limited geomorphic function from RM 10.1 to 11.2 and is primarily limited by low LWD densities, low hydraulic and
geomorphic diversity, poor sediment sorting, and limited floodplain connection. Although confined reaches
naturally have a limited floodplain, the floodplain pockets in this reach are further limited by anthropogenic
development.
Floodplain Connection – moderate
Floodplain connection in this reach is moderate primarily because of the naturally limited opportunities for
floodplain development. Residential and agricultural infrastructure in the upper section of the reach further limits
opportunities for floodplain development.
Riparian Function – limited to moderate
Riparian function from RM 8.7 to 10.1 is moderate and dominated by shrubs and immature alder. Some floodplain
pockets have small cottonwood groves and conifers along the valley margin. Riparian function from RM 10.1 to
11.2 is limited due to the effect human development on the riparian zone. Upland and invasive vegetation is
encroaching into the valley bottom and channel margins throughout this reach.
Fish Habitat and Use
Steelhead spawn and rear in this reach. The reach may be a summer refuge for juvenile steelhead because surface
water is present during the summer low flow period, whereas flow in upstream and downstream reaches
frequently goes subsurface. Bull trout use in this reach is unknown, but they may be present.
Restoration Strategies and Recommendations
The top recommended action for this reach is to add LWD to increase channel complexity to improve juvenile
steelhead habitat. Controlling invasive vegetation is also highly recommended to reduce recruitment and
propagation in reaches downstream. From RM 10.1 to 11.2, riparian vegetation plantings and floodplain pocket
development or protection should be considered. Adding LWD throughout the reach will also slow water transport
times and increase summer base flows for downstream reaches. As riparian function improves, this reach may
present opportunities for working with beaver to improve summer base flows downstream.
Table 41. Restoration recommendations for Pintler Creek reach PC_03.
Restoration Framework Priority Recommendations
Protect and maintain existing High Continue/expand erosion control, protect
riparian and springs
Connect disconnected habitat Moderate There are very few confining features in this
reach. Promote overbank flow
Long-term processes High Riparian management (fencing, manage
invasive vegetation, off-site water, grazing
management)
Short-term processes High Increase channel complexity, beaver
management
ASOTIN COUNTY WATERSHED ASSESSMENT
104
10.8.4. Reach: PC_04 to 05
Dominant Reach Type: Confined with Occasional Floodplain Pockets
General Description
PC_04 is an unnamed tributary to Pintler Creek at RM 8.7. PC_05 is an extension of Pintler Creek starting at RM
11.2 and going to RM 12.8.
Hydrology
The hydrologic regime is dominated by groundwater and the channel typically maintains surface flow. There are no
major tributaries to this reach; however, the mainstem of Pintler Creek extends further upstream into the
dissected loess uplands.
Geomorphic Function – limited to moderate
Geomorphic function is moderate from RM 8.7 to 10.1 and is primarily limited by low LWD densities. The reach has
limited geomorphic function from RM 10.1 to 11.2, primarily due to low LWD, hydraulic and geomorphic diversity,
and poor floodplain connection and sediment sorting. Although confined reaches naturally have a limited
floodplain, the floodplain pockets in this reach are further limited by anthropogenic development.
Floodplain Connection – moderate
The floodplain in this reach is in moderate condition primarily because of the naturally limited opportunities for
floodplain development. Residential and agricultural infrastructure in the upper section of the reach further limits
opportunities for floodplain development.
Riparian Function – limited to moderate
Riparian function from RM 8.7 to 10.1 is moderate and dominated by shrubs and immature alder. Some floodplain
pockets have small cottonwood groves and conifers along the valley margin. Riparian function from RM 10.1 to
11.2 is limited, due to human development limiting the extent of the riparian zone. Upland and invasive vegetation
is encroaching into the valley bottom and channel margins throughout this reach.
Fish Habitat and Use
Steelhead spawn and rear in this reach. Because the hydrology in this reach is relatively stable, it may be a summer
refuge for juvenile steelhead migrating from lower reaches that go subsurface or become puddled. Bull trout use in
this reach is unknown, but they may be present.
Restoration Strategies and Recommendations
The top recommended action for this reach is to add LWD to increase channel complexity to improve juvenile
steelhead habitat. Controlling invasive vegetation is also highly recommended to reduce recruitment and
propagation in reaches downstream. From RM 10.1 to 11.2, riparian vegetation plantings and floodplain pocket
development or protection should be considered. Adding LWD throughout the reach will also slow water transport
times and increase summer base flows for downstream reaches. As riparian function improves, this reach may
present opportunities for working with beaver to improve summer base flows downstream.
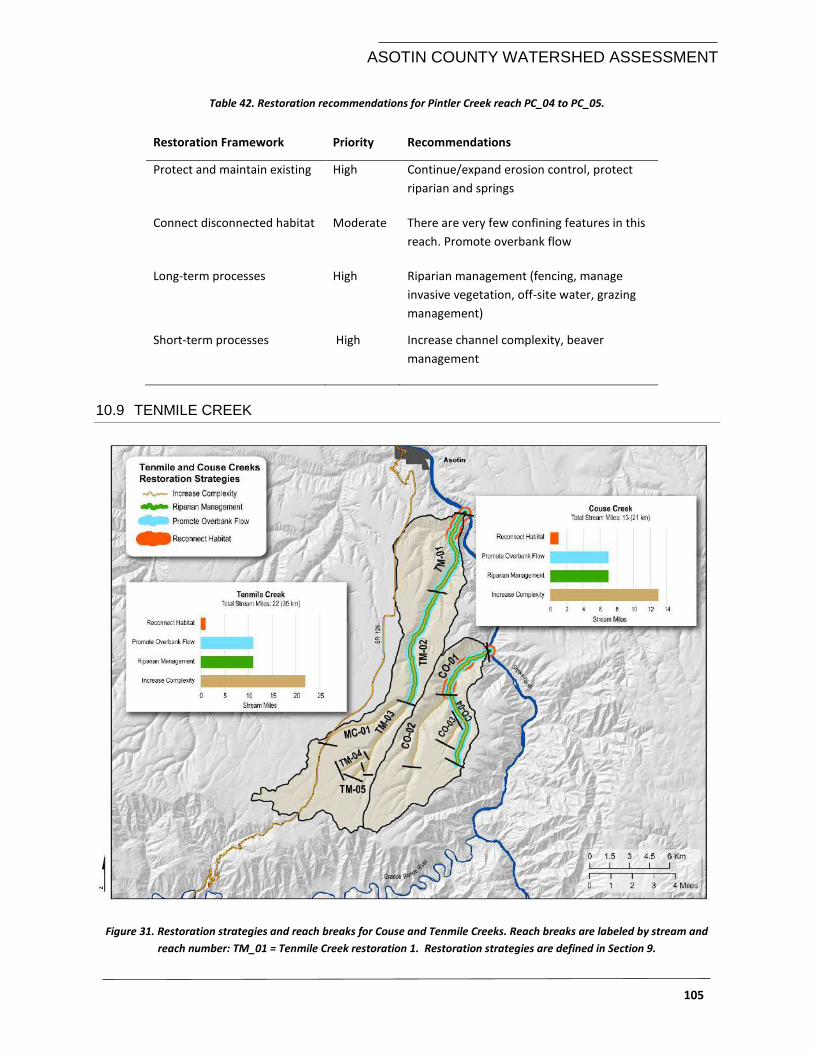
ASOTIN COUNTY WATERSHED ASSESSMENT
105
Table 42. Restoration recommendations for Pintler Creek reach PC_04 to PC_05.
Restoration Framework Priority Recommendations
Protect and maintain existing High Continue/expand erosion control, protect
riparian and springs
Connect disconnected habitat Moderate There are very few confining features in this
reach. Promote overbank flow
Long-term processes High Riparian management (fencing, manage
invasive vegetation, off-site water, grazing
management)
Short-term processes High Increase channel complexity, beaver
management
10.9 TENMILE CREEK
Figure 31. Restoration strategies and reach breaks for Couse and Tenmile Creeks. Reach breaks are labeled by stream and
reach number: TM_01 = Tenmile Creek restoration 1. Restoration strategies are defined in Section 9.
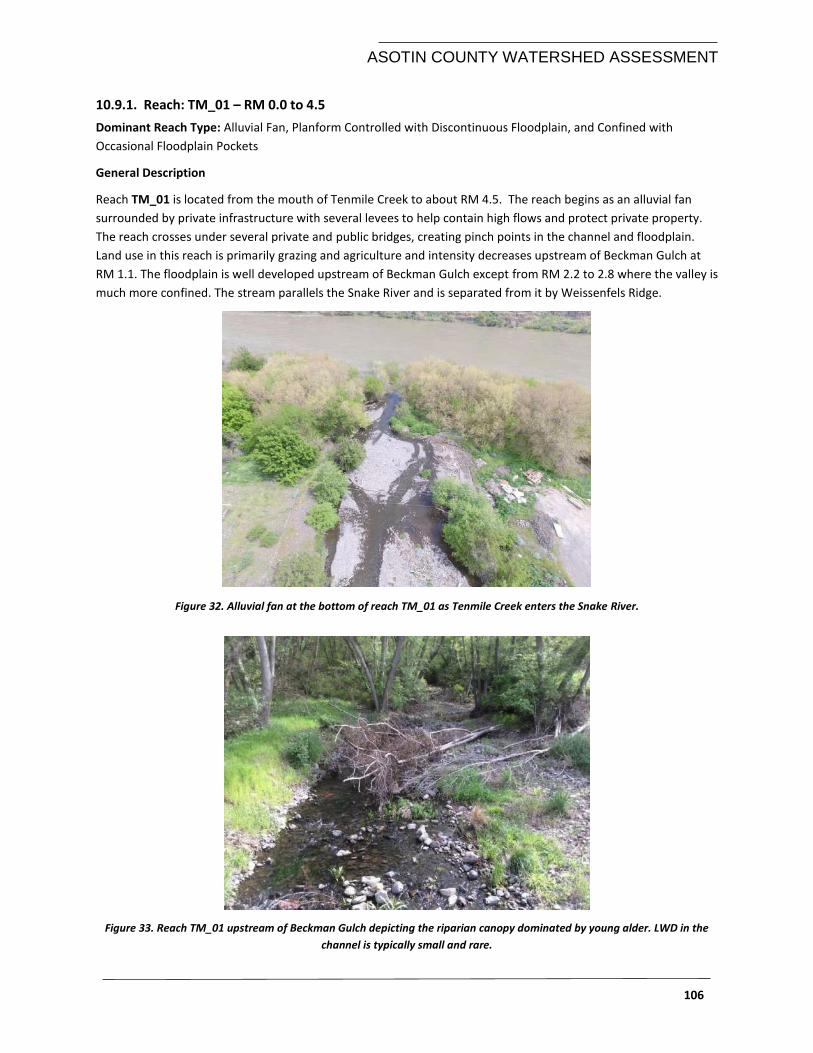
ASOTIN COUNTY WATERSHED ASSESSMENT
106
10.9.1. Reach: TM_01 – RM 0.0 to 4.5
Dominant Reach Type: Alluvial Fan, Planform Controlled with Discontinuous Floodplain, and Confined with
Occasional Floodplain Pockets
General Description
Reach TM_01 is located from the mouth of Tenmile Creek to about RM 4.5. The reach begins as an alluvial fan
surrounded by private infrastructure with several levees to help contain high flows and protect private property.
The reach crosses under several private and public bridges, creating pinch points in the channel and floodplain.
Land use in this reach is primarily grazing and agriculture and intensity decreases upstream of Beckman Gulch at
RM 1.1. The floodplain is well developed upstream of Beckman Gulch except from RM 2.2 to 2.8 where the valley is
much more confined. The stream parallels the Snake River and is separated from it by Weissenfels Ridge.
Figure 32. Alluvial fan at the bottom of reach TM_01 as Tenmile Creek enters the Snake River.
Figure 33. Reach TM_01 upstream of Beckman Gulch depicting the riparian canopy dominated by young alder. LWD in the
channel is typically small and rare.
ASOTIN COUNTY WATERSHED ASSESSMENT
107
Hydrology
There are no perennial tributaries in this reach. Beckman Gulch enters at RM 1.0 and is a large intermittent
tributary that drains a relatively substantial portion of the loess uplands. Portions of this reach upstream of
Beckman Gulch typically go dry or become puddled during late summer months. Several small ephemeral
tributaries enter this reach, some extending into the dissected loess uplands.
Geomorphic Function – limited to moderate
There is very little LWD present in this reach; however small woody debris accumulates in small jams on bar
surfaces and channel margins. Tenmile Creek transports a relatively large amount of sediment for its size, and
much of the sediment is deposited at the confluence with the Snake River. The regulated flow regime of the Snake
River may have reduced its competence to erode the toes of alluvial fans of incoming tributaries such as this one
on Tenmile Creek. Therefore, if the sediment accumulating at the mouth of this reach is not removed naturally, the
fan sets an artificial base level, causing sediment to accumulate upstream from the proximal end of the fan.
The channel is mostly entrenched from RM 0.2 to 1.7, limiting access to the floodplain during bankfull flood events
(2 year recurrence interval). The most disconnected section is from RM 0.2 to Beckman Gulch at RM 1.0. Upstream
of Beckman Gulch, the channel is still entrenched but has frequent access to low-lying floodplain pockets. LWD is
common on the floodplain but very little is in the channel, resulting in uniform sediment distribution and low
hydraulic diversity. Pools are rare and typically occur on the outside of meander bends, often at the base of tree
roots. The channel is dominated by planar units with poor complexity.
From RM 1.7 to 2.1, the channel is wide and braided as it tries to rework large sediment deposits and has very little
riparian vegetation. The valley upstream of this section is confined and acts a sediment transport zone. During high
flow events, sediment is deposited rapidly as the valley transitions from confined to unconfined beginning at RM
1.7. This section has limited function because it is almost completely devoid of structural elements, is laterally
unstable, has low hydraulic diversity, and an unstable channel bed. From RM 2.1 to 4.5, geomorphic function is
moderate because the valley width varies, causing short areas of sediment deposits similar to the lower section.
LWD is prevalent in the floodplain, but limited in the channel.
Floodplain Confinement – high
From RM 0.0 to 1.5, this reach would have historically had a much wider lateral extent to distribute flow and
sediment during flood events. Currently, the channel is confined by levees on both sides. Weissenfels Ridge Road
parallels the stream along the valley margin, but does not appear to have a substantial impact on channel
confinement.
Riparian Function - moderate
Riparian function in this reach is relatively high, but over 70% of riparian vegetation has been lost or converted to
agriculture. The canopy is dominated by cottonwood and alder, and willows are common. Much of this reach is
currently protected through CREP, and several planting projects have been completed or are underway.
From RM 0.2 to RM 1.2, over 70% of the historic riparian vegetation has been lost. However, this section is
currently protected through CREP and several planting projects are underway. Most of the loss in riparian
vegetation is in the floodplain as the channel is well-shaded by a thin alder-dominated canopy. Riparian vegetation
covers most of the valley bottom from RM 1.2 to RM 1.7 and is still dominated by young alder trees. In the blown-
out section from RM 1.7 to 2.1, there is very little riparian vegetation shading the channel, but there have been
substantial planting efforts on the floodplain to increase canopy cover. Riparian function varies moving upstream
from high to limited, typically coinciding with changes in the valley width.
ASOTIN COUNTY WATERSHED ASSESSMENT
108
Fish Habitat and Use
Steelhead may spawn and rear in this reach and certainly migrate through to reach upstream portions of Tenmile
Creek and Mill Creek. The large amount of deposition at the mouth of this reach may be a barrier to migrating
juveniles during low flows, particularly during fall migration. The lack of structural elements such as LWD in the
channel contributes to low geomorphic and hydraulic diversity. There are very few pools, and cover is often limited
to occasional undercut banks.
Restoration Strategies and Recommendations
Tenmile Creek is prone to short-duration, intense floods, which is typical of parallel, elongate watersheds;
therefore, removing the levees in this reach would likely put private property at risk. The primary concern at the
mouth of Tenmile Creek is the possibility of a migratory barrier caused by sediment accumulation near the Snake
River confluence. Dredging was a frequent practice in this reach to keep a clear fishway for migrating salmonids,
but this has not occurred for roughly 20 years. There is little that can be done to improve the overall condition of
the alluvial fan portion of this reach, but it is highly recommended that a barrier assessment be conducted. If the
fan is a barrier to migration, dredging could be considered as an option to improve fish passage.
The top recommended strategy in this reach is to reconnect habitats if possible and/or promote overbank flow and
increase structural complexity. Adding LWD from RM 1.7 to 2.2 could trap pockets of fine sediment and improve
conditions for reestablishing riparian vegetation. Overall, increasing the density of structural elements would
reduce sediment transport time, allowing the blown-out sections to recover more quickly. LWD structure
placement should focus on improving instream habitat and reconnecting the floodplain. Increasing the density of
structural elements would also slow surface water transport time and promote more hyporheic and groundwater
exchange, likely prolonging summer base flows and reducing water temperature during summer months.
Table 43. Restoration recommendations for Tenmile Creek reach TM_01.
Restoration Framework Priority Recommendations
Protect and maintain existing Medium Continue/expand erosion control, protect
riparian and springs
Connect disconnected habitat Low Assess potential barrier at the mouth, adjust
confining features and/or connect historic
side-channels (RM 0.0-1.5). Promote
overbank flow
Long-term processes Medium Riparian management (fencing, manage
invasive vegetation, off-site water, grazing
management)
Short-term processes High Increase channel complexity
10.9.2. Reach: TM_02 – RM 4.5 to 10.7
Dominant Reach Type: Partly Confined Planform Controlled with Discontinuous Floodplain
General Description
Reach TM_02 begins at RM 4.5 at a large alluvial fan from a river right tributary and ends at RM 10.7 at the
confluence with Mill Creek. Rangeland is the primary land use in this reach. There are multiple private primitive
ASOTIN COUNTY WATERSHED ASSESSMENT
109
roads to and paralleling this reach, making access to this remote reach difficult. Fans from steep ephemeral
hillslopes regularly push the channel from either side of the valley margin, but the stream appears to have the
competence to move the material, creating large cut banks at the toe of the fans.
Hydrology
There are no perennial tributaries in this reach, but there are several small ephemeral drainages extending from
the dissected loess uplands. Sections of this reach are puddled or dry during late summer months.
Geomorphic Function - moderate
The channel varies from entrenched to braided through this reach as the stream attempts to rework large pockets
of sediment deposition. Large sections of this reach are likely recovering from historic flood events and land use
disturbance and typically appear braided with very few structural elements in the channel. Typically, these sections
also have puddled or no surface flow during late summer months. Channel substrate is uniformly distributed and
poorly sorted, primarily composed of unembedded cobbles. Boulders act as the primary instream structural
element, but rarely occur in clusters or ribs, so their morphological impact is minimal.
Floodplain Confinement – low
There are very few confining features in this reach.
Riparian Function - moderate
Up to 100% of the riparian vegetation in sections of this reach have been lost. Where the stream goes subsurface,
upland vegetation encroachment is a concern due in part to a lack of regular floodplain inundation. Riparian
vegetation from RM 5.6 to 7.1 is nearly 100% fully functioning; however, patches of healthy riparian like this are
rare in the reach. Alder are the dominant canopy species in this reach, but there are several cottonwood groves
and patches of willow.
Fish Habitat and Use
Steelhead may spawn and rear in this reach and certainly migrate through to reach upstream portions of Tenmile
Creek and Mill Creek. Capacity in this reach is likely limited due to long sections going dry during late summer.
Instream habitat is limited by the lack of structural elements to create and maintain pools and provide cover for
rearing salmonids. Stream temperature may be an issue during summer and fall months in areas with limited
riparian cover.
Restoration Strategies and Recommendations
The top restoration strategy in this reach is to improve water retention to extend summer base flows through this
reach and downstream. Although this reach should be a high priority in the Tenmile Creek watershed, positive
effects of restoration may take several years to decades to achieve. Increasing structural elements in the channel
aimed at increasing hyporheic and groundwater exchange and reconnecting the floodplain are the top
recommended actions. Beaver translocation in sections identified as suitable by the BRAT model should also be
considered.
ASOTIN COUNTY WATERSHED ASSESSMENT
110
Table 44. Restoration recommendations for Tenmile Creek reach TM_02.
Restoration Framework Priority Recommendations
Protect and maintain existing Medium Continue/expand erosion control, protect
riparian and springs
Connect disconnected habitat Low Disconnected habitats are generally not
present. Promote overbank flow
Long-term processes Medium Riparian management (fencing, manage
invasive vegetation, off-site water, grazing
management)
Short-term processes High Increase channel complexity, beaver
management
10.9.3. Reach: TM_03 – RM 10.7 to 14.8
Dominant Reach Type: Confined with Occasional Floodplain Pockets
General Description
Reach TM_03 begins at the confluence with Mill Creek at RM 10.7 and ends at RM 14.8. The valley becomes
confined upstream of the confluence with Mill Creek. The valley is straight, but the stream channel maintains low
sinuosity and has access to relatively small pockets of floodplain. Rangeland is the dominant land use.
Hydrology
This reach ends near the headwaters of Tenmile Creek and several small intermittent tributaries enter this reach
near its upstream extent. The headwaters begin mostly in the dissected loess uplands, but are near the higher
elevations of the dissected highlands. Hydrology is primarily driven by winter snow and rains retained as shallow
groundwater. Inputs are still fairly low, which is typical of the dissected highlands and dissected loess uplands.
Geomorphic Function - high
This reach has high geomorphic function; however, there is very little LWD in the channel and floodplain. Like most
reaches on Tenmile Creek, even where the riparian vegetation is dense, the riparian composition is dominated by
young (<20 year old) alder. Therefore, there is little opportunity for local LWD recruitment.
Floodplain Confinement – low
There are very few confining features in this reach.
Riparian Function - unimpacted
Riparian function appears unimpacted; however, the canopy composition is dominated by young alder which will
need time to grow before making significant LWD contributions to the reach.
Fish Habitat and Use
Salmonid use in this reach is unknown; however, it is likely that steelhead do spawn and rear this far up Tenmile
Creek considering there are records of their presence in Mill Creek. There is perennial flow here, so it may act as an
over-summer refuge for juveniles waiting for fall or spring floods to migrate downstream.
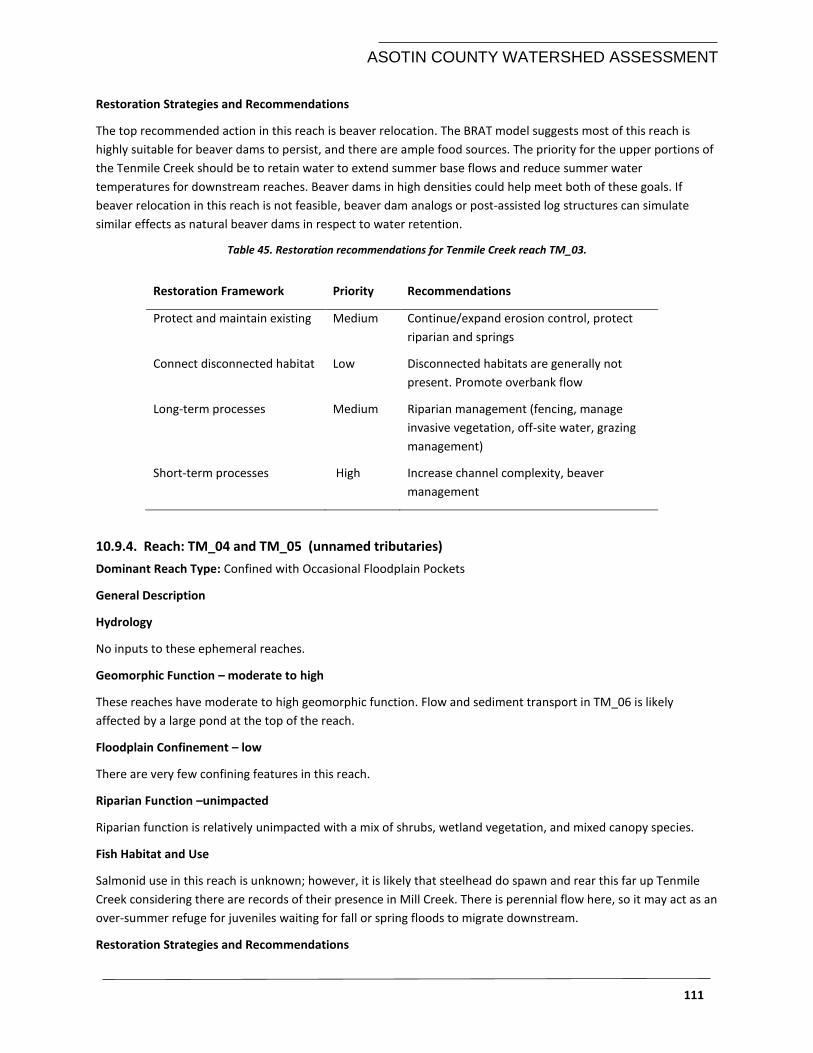
ASOTIN COUNTY WATERSHED ASSESSMENT
111
Restoration Strategies and Recommendations
The top recommended action in this reach is beaver relocation. The BRAT model suggests most of this reach is
highly suitable for beaver dams to persist, and there are ample food sources. The priority for the upper portions of
the Tenmile Creek should be to retain water to extend summer base flows and reduce summer water
temperatures for downstream reaches. Beaver dams in high densities could help meet both of these goals. If
beaver relocation in this reach is not feasible, beaver dam analogs or post-assisted log structures can simulate
similar effects as natural beaver dams in respect to water retention.
Table 45. Restoration recommendations for Tenmile Creek reach TM_03.
Restoration Framework Priority Recommendations
Protect and maintain existing Medium Continue/expand erosion control, protect
riparian and springs
Connect disconnected habitat Low Disconnected habitats are generally not
present. Promote overbank flow
Long-term processes Medium Riparian management (fencing, manage
invasive vegetation, off-site water, grazing
management)
Short-term processes High Increase channel complexity, beaver
management
10.9.4. Reach: TM_04 and TM_05 (unnamed tributaries)
Dominant Reach Type: Confined with Occasional Floodplain Pockets
General Description
Hydrology
No inputs to these ephemeral reaches.
Geomorphic Function – moderate to high
These reaches have moderate to high geomorphic function. Flow and sediment transport in TM_06 is likely
affected by a large pond at the top of the reach.
Floodplain Confinement – low
There are very few confining features in this reach.
Riparian Function –unimpacted
Riparian function is relatively unimpacted with a mix of shrubs, wetland vegetation, and mixed canopy species.
Fish Habitat and Use
Salmonid use in this reach is unknown; however, it is likely that steelhead do spawn and rear this far up Tenmile
Creek considering there are records of their presence in Mill Creek. There is perennial flow here, so it may act as an
over-summer refuge for juveniles waiting for fall or spring floods to migrate downstream.
Restoration Strategies and Recommendations
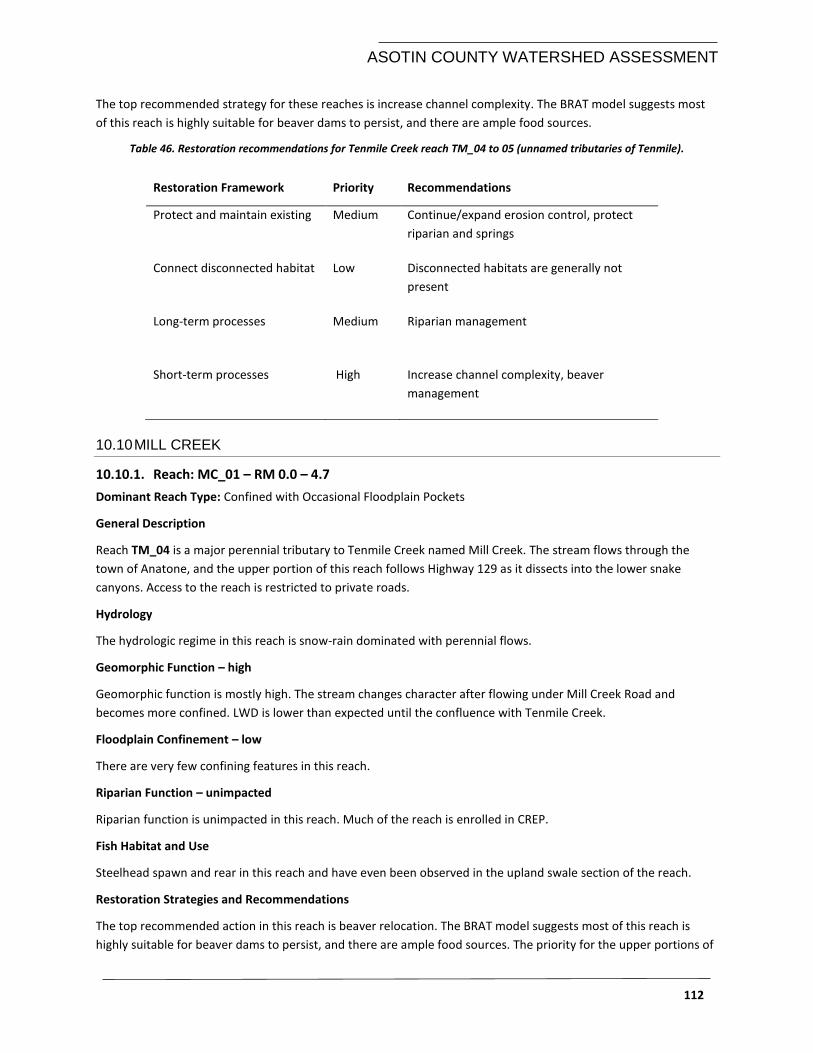
ASOTIN COUNTY WATERSHED ASSESSMENT
112
The top recommended strategy for these reaches is increase channel complexity. The BRAT model suggests most
of this reach is highly suitable for beaver dams to persist, and there are ample food sources.
Table 46. Restoration recommendations for Tenmile Creek reach TM_04 to 05 (unnamed tributaries of Tenmile).
Restoration Framework Priority Recommendations
Protect and maintain existing Medium Continue/expand erosion control, protect
riparian and springs
Connect disconnected habitat Low Disconnected habitats are generally not
present
Long-term processes Medium Riparian management
Short-term processes High Increase channel complexity, beaver
management
10.10 MILL CREEK
10.10.1. Reach: MC_01 – RM 0.0 – 4.7
Dominant Reach Type: Confined with Occasional Floodplain Pockets
General Description
Reach TM_04 is a major perennial tributary to Tenmile Creek named Mill Creek. The stream flows through the
town of Anatone, and the upper portion of this reach follows Highway 129 as it dissects into the lower snake
canyons. Access to the reach is restricted to private roads.
Hydrology
The hydrologic regime in this reach is snow-rain dominated with perennial flows.
Geomorphic Function – high
Geomorphic function is mostly high. The stream changes character after flowing under Mill Creek Road and
becomes more confined. LWD is lower than expected until the confluence with Tenmile Creek.
Floodplain Confinement – low
There are very few confining features in this reach.
Riparian Function – unimpacted
Riparian function is unimpacted in this reach. Much of the reach is enrolled in CREP.
Fish Habitat and Use
Steelhead spawn and rear in this reach and have even been observed in the upland swale section of the reach.
Restoration Strategies and Recommendations
The top recommended action in this reach is beaver relocation. The BRAT model suggests most of this reach is
highly suitable for beaver dams to persist, and there are ample food sources. The priority for the upper portions of
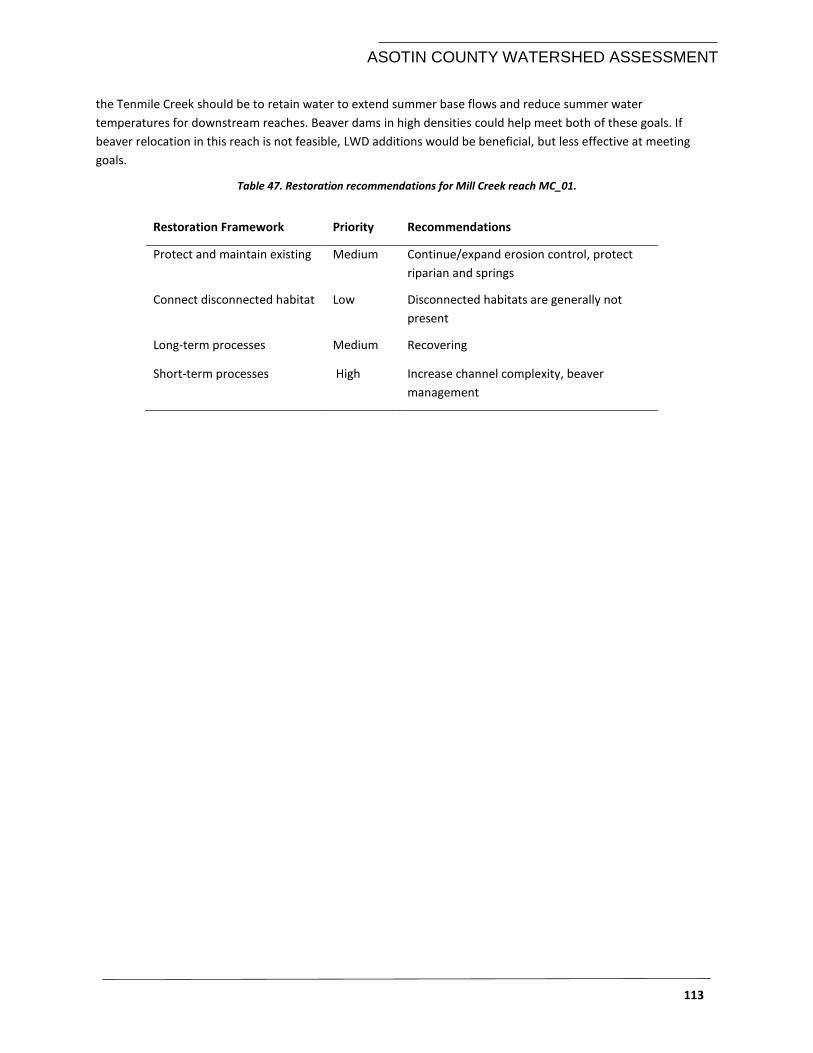
ASOTIN COUNTY WATERSHED ASSESSMENT
113
the Tenmile Creek should be to retain water to extend summer base flows and reduce summer water
temperatures for downstream reaches. Beaver dams in high densities could help meet both of these goals. If
beaver relocation in this reach is not feasible, LWD additions would be beneficial, but less effective at meeting
goals.
Table 47. Restoration recommendations for Mill Creek reach MC_01.
Restoration Framework Priority Recommendations
Protect and maintain existing Medium Continue/expand erosion control, protect
riparian and springs
Connect disconnected habitat Low Disconnected habitats are generally not
present
Long-term processes Medium Recovering
Short-term processes High Increase channel complexity, beaver
management
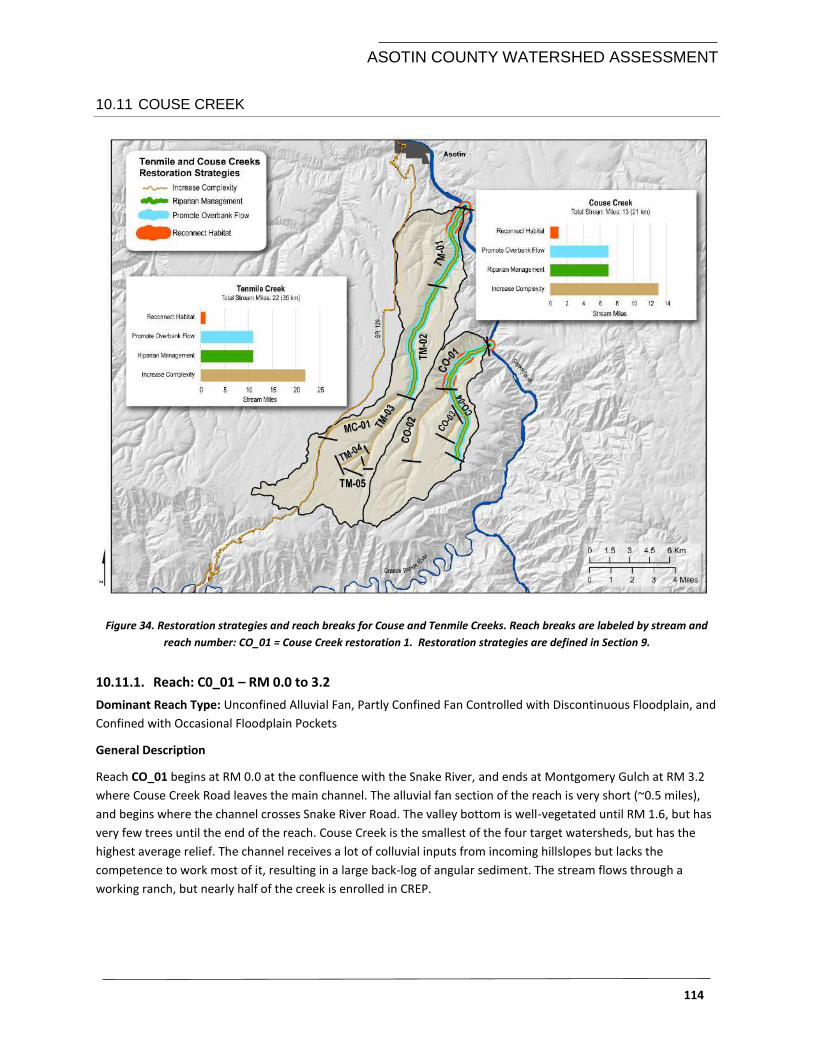
ASOTIN COUNTY WATERSHED ASSESSMENT
114
10.11 COUSE CREEK
Figure 34. Restoration strategies and reach breaks for Couse and Tenmile Creeks. Reach breaks are labeled by stream and
reach number: CO_01 = Couse Creek restoration 1. Restoration strategies are defined in Section 9.
10.11.1. Reach: C0_01 – RM 0.0 to 3.2
Dominant Reach Type: Unconfined Alluvial Fan, Partly Confined Fan Controlled with Discontinuous Floodplain, and
Confined with Occasional Floodplain Pockets
General Description
Reach CO_01 begins at RM 0.0 at the confluence with the Snake River, and ends at Montgomery Gulch at RM 3.2
where Couse Creek Road leaves the main channel. The alluvial fan section of the reach is very short (~0.5 miles),
and begins where the channel crosses Snake River Road. The valley bottom is well-vegetated until RM 1.6, but has
very few trees until the end of the reach. Couse Creek is the smallest of the four target watersheds, but has the
highest average relief. The channel receives a lot of colluvial inputs from incoming hillslopes but lacks the
competence to work most of it, resulting in a large back-log of angular sediment. The stream flows through a
working ranch, but nearly half of the creek is enrolled in CREP.
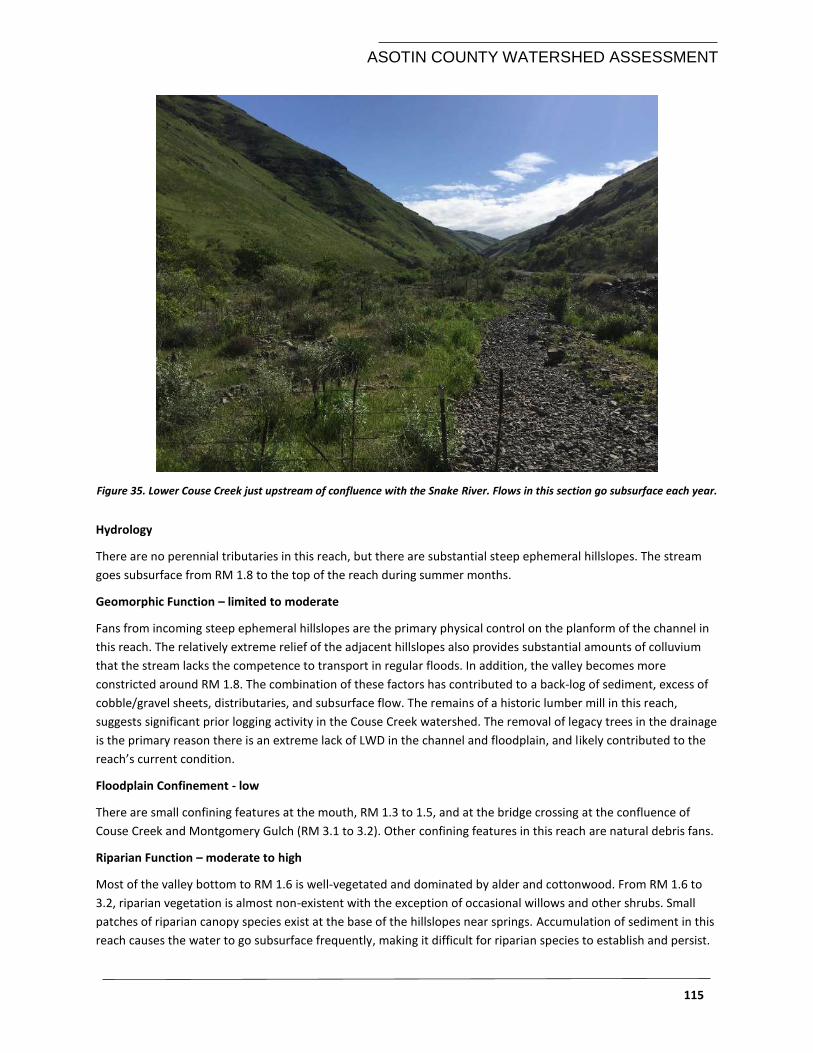
ASOTIN COUNTY WATERSHED ASSESSMENT
115
Figure 35. Lower Couse Creek just upstream of confluence with the Snake River. Flows in this section go subsurface each year.
Hydrology
There are no perennial tributaries in this reach, but there are substantial steep ephemeral hillslopes. The stream
goes subsurface from RM 1.8 to the top of the reach during summer months.
Geomorphic Function – limited to moderate
Fans from incoming steep ephemeral hillslopes are the primary physical control on the planform of the channel in
this reach. The relatively extreme relief of the adjacent hillslopes also provides substantial amounts of colluvium
that the stream lacks the competence to transport in regular floods. In addition, the valley becomes more
constricted around RM 1.8. The combination of these factors has contributed to a back-log of sediment, excess of
cobble/gravel sheets, distributaries, and subsurface flow. The remains of a historic lumber mill in this reach,
suggests significant prior logging activity in the Couse Creek watershed. The removal of legacy trees in the drainage
is the primary reason there is an extreme lack of LWD in the channel and floodplain, and likely contributed to the
reach’s current condition.
Floodplain Confinement - low
There are small confining features at the mouth, RM 1.3 to 1.5, and at the bridge crossing at the confluence of
Couse Creek and Montgomery Gulch (RM 3.1 to 3.2). Other confining features in this reach are natural debris fans.
Riparian Function – moderate to high
Most of the valley bottom to RM 1.6 is well-vegetated and dominated by alder and cottonwood. From RM 1.6 to
3.2, riparian vegetation is almost non-existent with the exception of occasional willows and other shrubs. Small
patches of riparian canopy species exist at the base of the hillslopes near springs. Accumulation of sediment in this
reach causes the water to go subsurface frequently, making it difficult for riparian species to establish and persist.
ASOTIN COUNTY WATERSHED ASSESSMENT
116
Fish Habitat and Use
Steelhead spawn and rear in this reach, and likely migrate through to get to the upper reaches. An adult steelhead
was observed in one of the isolated pools during a site visit in July when the stream had already gone subsurface.
Juvenile survival is likely low because surface flow is limited for most of this reach after spring flows.
Restoration Strategies and Recommendations
A barrier assessment should be completed at the mouth of Couse Creek because it is a potential barrier to adult
and juvenile migration (upstream and downstream), particularly during fall migration or sub-normal spring flows.
Confining features could be removed or setback to reconnect small pockets of floodplain. The top restoration
strategy should be to increase channel complexity and promote overbank flow as this reach often runs dry.
Addition of structural elements could help to restore riparian areas and trap sediment.
Table 48. Restoration recommendations for Couse Creek reach CO_01.
Restoration Framework Priority Recommendations
Protect and maintain existing Medium Continue/expand erosion control, protect
riparian and springs
Connect disconnected habitat Moderate Assess potential barrier at the mouth, adjust
confining features and/or connect historic
side-channels (RM 0.6-3.0). Promote
overbank flow
Long-term processes High Riparian management (fencing, manage
invasive vegetation, off-site water, grazing
management)
Short-term processes High Increase channel complexity
10.11.2. Reach: CO_02 – RM 3.2 to 7.4
Dominant Reach Type: Confined with Occasional Floodplain Pockets
General Description
Reach CO_02 begins at the confluence with Montgomery Gulch at river 3.2 and ends at RM 7.4. The reach is only
accessible from the mouth by walking up the basin, although there is a small private double-track trail entering the
reach around RM 5.5. The reach extends nearly to the headwaters of Couse Creek in the dissected loess uplands.
Hydrology
The lower ~0.2 miles of this reach typically go subsurface during summer months, but the rest of the reach is
typically perennial. There are no perennial tributaries in this reach, but a substantial intermittent tributary enters
at RM 5.5. This reach is largely groundwater dominated.
Geomorphic Function - high
Geomorphic function is mostly high; however, like the rest of Couse Creek, there is limited LWD. The lack of
structural elements has reduced the channel’s ability to access the floodplain pockets during bankfull floods (2
year recurrence interval).
ASOTIN COUNTY WATERSHED ASSESSMENT
117
Floodplain Confinement – low
There are very few confining features in this reach.
Riparian Function - moderate
Most of the valley bottom throughout this reach is covered in riparian vegetation, but there are pockets with
substantial upland vegetation encroachment. Typically, these are floodplain pockets that are not frequently
inundated.
Fish Habitat and Use
Steelhead use this reach for spawning and rearing and Chinook juveniles have even been captured (Mendel et al.
2008). Because this reach maintains flow throughout the summer, it may provide refuge for juveniles from the dry
and puddled reach downstream.
Restoration Strategies and Recommendations
The top recommended restoration strategy is increasing habitat complexity and promotion of overbank flow.
Promotion of water retention should be the priority for the upper reaches of Couse Creek to extend base flows and
lower water temperatures during the summer. The BRAT model suggests this reach is suitable to support beaver
dams, and in high enough densities could provide benefits to surface flow downstream.
Table 49. Restoration recommendations for Couse Creek reach CO_02.
Restoration Framework Priority Recommendations
Protect and maintain existing Medium Continue/expand erosion control, protect
riparian and springs
Connect disconnected habitat Low Disconnected habitats are generally not
present. Promote overbank flow
Long-term processes Low Protect processes
Short-term processes High Increase channel complexity, beaver
management
10.11.3. Reach: CO_03 and CO_04 – RM 3.2 to 6.9
Dominant Reach Type: Confined with Occasional Floodplain Pockets
General Description
These two reaches are intermittent to ephemeral and are dominated by shrubs and upland vegetation. However,
there is evidence of a channel and cobble gravel substrate.
Hydrology
There are no significant inputs in these reaches.
Geomorphic Function – moderate
A road follows both reaches for most of their length. There is a residence at in the upper end of CO_03 and the
road along reach CO_04 continues up steep switchbacks to the plateau uplands. Neither road is directly impacting
the valley bottom of these reaches.
ASOTIN COUNTY WATERSHED ASSESSMENT
118
Floodplain Confinement – low
There are very few confining features in this reach.
Riparian Function - impacted
The riparian assessment suggests that these reaches supported more riparian vegetation historically.
Fish Habitat and Use
No fish in these reaches
Restoration Strategies and Recommendations
Table 50. Restoration recommendations for Couse Creek reach CO_03 and CO_04.
Restoration Framework Priority Recommendations
Protect and maintain existing Medium Continue/expand erosion control, protect
riparian and springs
Connect disconnected habitat Low Disconnected habitats are generally not
present. Promote over bank flow
Long-term processes Low Protect processes
Short-term processes Moderate Increase channel complexity
ASOTIN COUNTY WATERSHED ASSESSMENT
119
REFERENCES
ACCD. 1995. Asotin Creek model watershed plan. Prepared by the Landowner Steering Committee. Prepared for the Asotin County Conservation District.
ACCD. 2004. Asotin subbasin plan. Prepared by the Asotin County Conservation District. Prepared for the Northwest Power and Conservation Council. Appendix B: Asotin subbasin plan aquatic assessment.
ACWG. 2017. DRAFT Asotin Voluntary Stewadship Plan. Prepared for the Asotin County VSP Working Group (ACWG). Prepared by Anchor QEA, Asotin County Conservation District, and Eco Logical Research Inc.
Adams, W. H., L. P. Gaw, and F. C. Leonhardy. 1975. Archaeological excavations at Silcott, Washington: The Data Inventory. Reports of Investigations no. 53. Laboratory of Anthropology, Washington State University. Pullman, WA.
Al-Chokhachy, R., and P. Budy. 2008. Demographic Characteristics, Population Structure, and Vital Rates of a Fluvial Population of Bull Trout in Oregon. Transactions of the American Fisheries Society 137:1709-1722.
Al-Chokhachy, R., B. Roper, T. Bowerman, and P. Budy. 2010. A Review of bull trout habitat associations and exploratory analyses of patterns across the Interior Columbia River Basin. North American Journal of Fisheries Management 30:464-480.
Ames, K. M., and A. G. Marshall. 1980. Villages, demography, and subsistence intensification on the sourthern Columbia Plateau. North American Archaeologist 2:25-52.
AQEA. 2011. Tucannon River geomorphic assessment and habitat restoration study. Prepared for Columbia Conservation District, Dayton, WA. Prepared by Anchor QEA, LLC, Bellingham, WA. April 2011.
Bagnold, R. 1960. Sediment discharge and stream power. USGS Circular 421. Washington.
Beckham, S. 1995. An Interior Empire: Historical overview of the Columbia Basin. Submitted to the Eastside Ecosystem Management Project. Walla Walla, WA.
Beechie, T., and H. Imaki. 2014. Predicting natural channel patterns based on landscape and geomorphic controls in the Columbia River basin, USA. Water Resources Research 50:39-57.
Beechie, T., G. Pess, P. Roni, and G. Giannico. 2008. Setting river restoration priorities: a review of approaches and a general protocol for identifying and prioritizing actions. North American Journal of Fisheries Management 28:891-905.
Beechie, T., D. A. Sear, J. D. Olden, G. R. Pess, J. M. Buffington, H. Moir, P. Roni, and M. M. Pollock. 2010. Process-based principles for river restoration. Bioscience 60:209-222.
Beechie, T. J., and S. Bolton. 1999. An approach to restoring salmonid habitat-forming processes in Pacific Northwest watersheds. Fisheries 24:6-15.
Beechie, T. J., E. A. Steel, P. Roni, and E. Quimby (editors). 2003. Ecosystem recovery planning for listed salmon: an integrated assessment approach for salmon habitat. U.S. Dept. Commer., NOAA Technical Memo NMFS-NWFSC-58, 183 p.
ASOTIN COUNTY WATERSHED ASSESSMENT
120
Bellmore, J. R., C. V. Baxter, K. Martens, and P. J. Connolly. 2013. The floodplain food web mosaic: a study of its importance to salmon and steelhead with implications for their recovery. Ecological Applications 23:189–207.
Bellmore, J. R., J. R. Benjamin, M. Newsom, J. A. Bountry, and D. Dombroski. 2017. Incorporating food web dynamics into ecological restoration: a modeling approach for river ecosystems. Ecol Appl 27:814-832.
Bennett, S., R. Camp, J. M. Wheaton, N. Bouwes, G. O'Brien, B. Floyd, and T. Drury. 2018. Asotin County Conceptual Restoration Plan: Technical Document and Appendices. Prepared for Asotin County Conservation District, Clarkston, Washington.
Bennett, S., G. Pess, N. Bouwes, P. Roni, R. E. Bilby, S. Gallagher, J. Ruzycki, T. Buehrens, K. Krueger, W. Ehinger, J. Anderson, C. Jordan, B. Bowersox, and C. Greene. 2016. Progress and Challenges of Testing the Effectiveness of Stream Restoration in the Pacific Northwest Using Intensively Monitored Watersheds. Fisheries 41:92-103.
Bennett, S. N., N. Bouwes, and R. Camp. 2015. Asotin Creek Intensively Monitored Watershed: updated study plan. Prepared for the Snake River Salmon Recovery Board, Dayton, WA. Prepared by Eco Logical Research INc. Providence, UT.
Beyer, H. L. 2012. Geospatial Modelling Environment (Version 0.7.2.1)(software).
Blankenship, S., and G. Mendel. 2010. Genetic Characterization of Adult Chinook Trapped in Lower Asotin Creek. Washington Department of Fish and Wildlife. http://wdfw.wa.gov/publications/01137.
BLM. 2018. Land Status & Cadastral Survey Records. US Department of Interior, Bureau of Land Management. https://www.blm.gov/or/landrecords/survey/ySrvy1.php.
Bouwes, N., S. Bennett, and J. Wheaton. 2016a. Adapting Adaptive Management for Testing the Effectiveness of Stream Restoration: An Intensively Monitored Watershed Example. Fisheries 41:84-91.
Bouwes, N., N. Weber, C. E. Jordan, W. C. Saunders, I. A. Tattam, C. Volk, J. M. Wheaton, and M. M. Pollock. 2016b. Ecosystem experiment reveals benefits of natural and simulated beaver dams to a threatened population of steelhead (Oncorhynchus mykiss). Sci Rep 6:28581.
Brauner, D. 1976. Alpowai: The Culture History of the Alpowa Locality. Unpublished Doctoral Dissertation. Department of Anthropology, Washington State University, Pullman.
Brierley, G., and K. Fryirs 2005. Geomorphology and River Management: Applications of the River Styles Framework. Blackwell Publishing. Book.
Bumgarner, J., L. Ross, and J. Jording. 2003. Asotin Creek 2003 snorkel surveys and water temperature monitoring. Washington Department of Fish and Wildlife, Snake River Lab, Dayton, WA.
Camp, R. J. 2015. Short-term effectiveness of high density large woody debris, a cheap and cheerful restoration action, in Asotin Creek. Master's thesis. Utah State University, Logan, Utah.
Carah, J. K., C. C. Blencowe, D. W. Wright, and L. A. Bolton. 2014. Low-Cost Restoration Techniques for Rapidly Increasing Wood Cover in Coastal Coho Salmon Streams. North American Journal of Fisheries Management 34:1003-1013.
ASOTIN COUNTY WATERSHED ASSESSMENT
121
CHaMP. 2014. Scientific protocol for salmonid habitat surveys within the Columbia Habitat Monitoring Program. Prepared by the Integrated Status and Effectiveness Monitoring Program and published by Terraqua, Inc., Wauconda, WA.
Childress, E. S., J. D. Allan, and P. B. McIntyre. 2014. Nutrient Subsidies from Iteroparous Fish Migrations Can Enhance Stream Productivity. Ecosystems 17:522-534.
Clarke, S. 1995. Hierarchical subdivisions of the Columbia Plateau and Blue Mountains Ecoregion, Oregon and Washington. USFS, General Technical Report, PNW-GTR-395.
Crandall, J. D., and E. Wittenbach. 2015. Pacific Lamprey Habitat Restoration Guide. Methow Salmon Recovery Foundation, Twisp, Washington. First edition 54p.
Crawford, E., and M. Herr. 2017. Washington Department of Fish and Widlife. Asotin Creek Steelhead Assessment, 3/1/2016 – 2/28/2017 Annual Report, 2002-053-00.
Crawford, E., M. Herr, and J. Bumgarner. 2016. Asotin Creek Steelhead Assessment, 3/1/2015 – 2/29/2016 Annual Report, 2002-053-00. WDFW, Clarkston, WA.
Dilts, T. E., P. J. Weisberg, J. Yang, T. J. Olson, P. L. Turner, and L. E. Condon. 2012. Using Historical General Land Office Survey Notes to Quantify the Effects of Irrigated Agriculture on Land Cover Change in an Arid Lands Watershed. Annals of the Association of American Geographers 102:531-548.
DOE. 2010. Land Use. Department of Ecology, State of Washington. https://ecology.wa.gov/Research-Data/Data-resources/Geographic-Information-Systems-GIS/GIS-data. .
DOE, W. 2002. Evaluating Standards for Protecting Aquatic Life in Washington's Surface Water Quality Standards Temperature Criteria Draft Discussion Paper and Literature Summary. Water Quality Program
Washington State Department of Ecology Watershed Management Section Olympia, Washington.
Dowdy, W. 2002. Asotin Creek Watershed: 2002-2004 macroinvertebrate report. U.S. Forest Service, Pomeroy Ranger District, Umatilla National Forest.
Doyle, M. W., and F. Douglas Shields. 2012. Compensatory Mitigation for Streams Under the Clean Water Act: Reassessing Science and Redirecting Policy. Journal of the American Water Resources Association 48:494-509.
ESA. 2016. Environmental Science Associates. Final report on sediment budgets for Snake River tributaries. Prepared for the Asotin County Conservation District, Clarkston, WA.
Gentry, H. R. 1991. Soil survey of Asotin County Area, Washington, parts of Asotin and Garfield Counties. USDA, Soil Conservation Service.
GeoEngineers. 2011. Geomorphic assessment: Touchet River upstream of Dayton, Washington. Prepared for the City of Dayton.
Gilbert, J. T., W. W. Macfarlane, and J. M. Wheaton. 2016. The Valley Bottom Extraction Tool (V-BET): A GIS tool for delineating valley bottoms across entire drainage networks. Computers & Geosciences 97:1-14.
Harvey, B. C., and M. A. Wilzbach. 2010. Carcass Addition Does Not Enhance Juvenile Salmonid Biomass, Growth, or Retention in Six Northwestern California Streams. North American Journal of Fisheries Management 30:1445-1451.
ASOTIN COUNTY WATERSHED ASSESSMENT
122
HDR. 2005. Water storage availability and needs assessment. WRIA 35 Planning Unit. Technical Memorandum. HDR Engineering.
HDR. 2006. Middle Snake River watershed plan: planning unit draft. Pasco, WA.
Isaak, D. J., M. K. Young, D. E. Nagel, D. L. Horan, and M. C. Groce. 2015. The cold-water climate shield: delineating refugia for preserving salmonid fishes through the 21st century. Glob Chang Biol.
Johnson, B. 2000. Habitat Projects Completed within the Asotin Creek Watershed. Project No. 1998-04600, BPA Report DOE/BP-11197-1.
Johnson, J. K. 1995. Farm, range, forest, and salmon: the Tucannon watershed of the Columbia River Basin, 1850-1995. Dissertation, Washington Stae Univeristy. University Microfilms International. Ph.D. dissertation,.
Kasprak, A., N. Hough-Snee, T. Beechie, N. Bouwes, G. Brierley, R. Camp, K. Fryirs, H. Imaki, M. Jensen, G. O'Brien, D. Rosgen, and J. Wheaton. 2016. The Blurred Line between Form and Process: A Comparison of Stream Channel Classification Frameworks. Plos One 11:e0150293.
Kondolf, G. M. 2000. Some suggested guidelines for geomorphic aspects of anadromous salmonid habitat restoration proposals. Restoration Ecology 8:48-56.
Kondolf, G. M., S. Anderson, R. Lave, L. Pagano, A. Merenlender, and E. S. Bernhardt. 2007. Two decades of river restoration in California: what can we learn? Restoration Ecology 15:516-523.
Kozlowski, D. F., R. K. Hall, S. R. Swanson, and D. T. Heggem. 2016. Linking Management and Riparian Physical Functions to Water Quality and Aquatic Habitat. Journal of Water Resource and Protection 08:797-815.
Kuttel, M. J. 2002. Salmonid habitat limiting factors, Water Resource Inventory Areas 33 (Lower) and 35 (Middle) Snake Watersheds and Lower Six Miles of the Palouse River. Washington State Conservation Commission, Olympia, Washington.
Landeen, D., and A. Pinkham. 1999. Salmon and his people: fish and fishing in Nez Perce culture. Confluence Press, Lewiston, Idaho.
LANDFIRE. 2014. Landscape Fire and Resource Management Planning Tools. Department of Agriculture, Forest Service; U.S. Department of Interior. Available: http://www.landfire.gov/index.php.
Macfarlane, W., J. Gilbert, W. C. Saunders, N. Hough-Snee, C. Haffen, J. Wheaton, and S. Bennett. 2018. What are the conditions of riparian ecosystems? Identifying impaired floodplain ecosystems across the western U.S. using the Riparian Condition Assessment (RCA) tool. Environmental Management In press.
Macfarlane, W. W., J. T. Gilbert, M. L. Jensen, J. D. Gilbert, N. Hough-Snee, P. A. McHugh, J. M. Wheaton, and S. N. Bennett. 2016. Riparian vegetation as an indicator of riparian condition: Detecting departures from historic condition across the North American West. Journal of Environmental Management 202:447-460.
Macfarlane, W. W., and J. M. Wheaton. 2013. Modeling the Capacity of Riverscapes to Support Dam-Building Beaver-Case Study: Escalante River Watershed. Ecogeomorphology and Topographic Analysis Lab, Utah State University, Prepared for Walton Family Foundation, Logan, Utah, 78 pp.
Macfarlane, W. W., J. M. Wheaton, N. Bouwes, M. L. Jensen, J. T. Gilbert, N. Hough-Snee, and J. A. Shivik. 2015. Modeling the capacity of riverscapes to support beaver dams. Geomorphology.
ASOTIN COUNTY WATERSHED ASSESSMENT
123
Macfarlane, W. W., J. M. Wheaton, and M. L. Jensen. 2014. The Beaver Restoration Assessment Tool: A Decision Support & Planning Tool for Utah. Ecogeomorphology and Topographic Analysis Lab, Utah State University, Prepared for Utah Division of Wildlife Resources, Logan, Utah, 142 pp.
Marshall, A. G. 1977. Nez Perce Social Groups: An Ecological Interpretation: Ph.D. Dissertation in Anthropology, Washington State University, Pullman.
Mayer, K., M. Schuck, and D. Hathaway. 2008. Assess salmonids in the Asotin Creek Watershed. Prepared by Washington Department of Fish and Wildlifem Hatchery/Wild Interactions Unit, Asotin Creek Project Office, Clarkston, WA. Prepared for US Department of Energy, Bonneville Power Administration, Environment, Fish, and Wildlife, Portland, OR.
McIntosh, B. A., S. E. Clarke, and J. R. Sedell. 1989. Summary report for Bureau of Fisheries stream habitat surveys - Umatilla, Tucannon, Asotin, and Grande Ronde River basins: 1934-1942.
McIntosh, B. A., J. R. Sedell, J. E. Smith, R. C. Wissmar, S. E. Clarke, G. H. Reeves, and L. A. Brown. 1994. Management History of Eastside in Fish Habitat over 50 years 1935-1992. USDA Forest Service General Technical Report.
McKay, L., T. Bondeild, T. Dewald, A. Rea, C. Johnston, and R. Moore. 2012. National Hydrologic Data. NHDPlus Version 2: User Guide: U.S. Environmental Protection Agency.
McNyset, K., C. Volk, and C. Jordan. 2015. Developing an Effective Model for Predicting Spatially and Temporally Continuous Stream Temperatures from Remotely Sensed Land Surface Temperatures. Water 7:6827-6846.
Mendel, G., J. Trump, C. Fulton, and M. Gembala. 2001. Brief assessments of salmonids and their habitats in George, Tenmile, Couse Creeks in Asotin County, 2000. For Asotin Conservation District, Clarkston, Washington.
Mendel, G., J. Trump, C. Fulton, and M. Gembala. 2004. Brief assessments of salmonids and stream habitat conditions in Snake River tributaries of Asotin, Whitman, and Garfield Counties in Washington: March 2001-June 2003. Final Report. For Salmon Recovery Funding Board, Olympia, WA.
Mendel, G., J. Trump, M. Gembala, and C. Fulton. 2008. Baseline Assessment of Salmonids in Tributaries of the Snake and Grande Ronde Rivers in Southeast Washington 2006-2007 Final Report. For Asotin County Conservation District, US Fish and Wildlife Service, and Washington Department of Fish and Wildlife.
NPT. 2003. Nez Perce Tribe. Treaties: Nez Perce Perspectives. Environmental Restoration and Waste Management Program in association with the United States Department of Energy and Confluence Press.
NPT. 2013. Nez Perce Tribe. Fisheriers Resources Management, Nez Perce Tribe Department of Fisheires Resources Management: Management Plan 2013-2028.
O'Brien, G. R., and J. M. Wheaton. 2014. Synthesis & recommendations from Middle Fork John Day River Styles.
O’Brien, G. R., J. Wheaton, K. Fryirs, P. McHugh, N. Bouwes, G. Brierley, and C. Jordan. 2017. A geomorphic assessment to inform strategic stream restoration planning in the Middle Fork John Day Watershed, Oregon, USA. Journal of Maps 13:369-381.
Omernik, J. M. 1987. Ecoregions of the conterminous United States. Map (scale 1:7,500,000). Annals of the Association of American Geographers 77:118-125.
ASOTIN COUNTY WATERSHED ASSESSMENT
124
Omernik, J. M. 1995. Ecoregions: A Spatial Framework for Environmental Management. In Biological Assessment and Criteria: Tools for Water Resource Planning and Decision Making, W. S. Davis and T. P. Simon, eds., Lewis Publishers, Boca Raton, FL, 49-62.
Omernik, J. M., and G. E. Griffith. 2014. Ecoregions of the conterminous United States: evolution of a hierarchical spatial framework. Environmental Management 54:1249–1266.
Ott, J. S. 1997. Clearing the country: A history of the Hudson's Bay Company's fur desert policy. Dissertations, Professional Papers. Paper 1809. The University of Montana.
Penaluna, B. E., A. Abadía-Cardoso, J. B. Dunham, F. J. García-Dé León, R. E. Gresswell, A. R. Luna, E. B. Taylor, B. B. Shepard, R. Al-Chokhachy, C. C. Muhlfeld, K. R. Bestgen, K. Rogers, M. A. Escalante, E. R. Keeley, G. M. Temple, J. E. Williams, K. R. Matthews, R. Pierce, R. L. Mayden, R. P. Kovach, J. C. Garza, and K. D. Fausch. 2016. Conservation of Native Pacific Trout Diversity in Western North America. Fisheries 41:286-300.
Pess, G., B. McMillan, T. J. Beechie, and H. Imakic. In review. Historical potential spawning abundance estimates for Columbia River Basin salmon and steelhead in areas above Bonneville Dam. North American Journal of Fisheries Management In review.
Pinkham, J. 2004. Nez Perce use of the Southeast Washington Sub-basin Draft Report prepared under contract for Nez Perce Tribe Department of Fisheries Resource Management Watershed Division.
Pollock, K. H., G. Lewallen, K. Woodruff, C. E. Jordan, and J. M. Castro. 2015. The Beaver Restoration Guidebook Working with Beaver to Restore Streams, Wetlands, and Floodplains. Version 1.0. United States Fish and Wildlife Service, Portland, Oregon. 189 pp. Online at:
http://www.fws.gov/oregonfwo/ToolsForLandowners/RiverScience/Beaver.asp.
PRISM. 2016. PRISM Climate Group, Oregon State Univeristy, http://prism.oregonstate.edu Map created October 2017.
Rieman, B. E., C. L. Smith, R. J. Naiman, G. T. Ruggerone, C. C. Wood, N. Huntly, E. N. Merrill, J. R. Alldredge, P. A. Bisson, J. Congleton, K. D. Fausch, C. Levings, W. Pearcy, D. Scarnecchia, and P. Smouse. 2015. A comprehensive approach for habitat restoration in the Columbia Basin. Fisheries 40:124-135.
Roni, P., T. Beechie, G. Pess, K. Hanson, and B. Jonsson. 2015. Wood placement in river restoration: fact, fiction, and future direction. Canadian Journal of Fisheries and Aquatic Sciences 72:466-478.
Roni, P., T. J. Beechie, R. E. Bilby, F. E. Leonetti, M. M. Pollock, and G. R. Pess. 2002. A review of stream restoration techniques and a hierarchical strategy for prioritizing restoration in Pacific Northwest watersheds. North American Journal of Fisheries Management 22:1-20.
Roni, P., K. Hanson, and T. Beechie. 2008. Global review of physical and biological effectiveness of stream habitat rehabilitation techniques. North American Journal of Fisheries Management 28:856-890.
Rosgen, D. L. 1996. A classification of natural rivers: reply to the comments of J.R. Miller and J.B. Ritter. Catena 27:301-307.
Schlosser, W. E., and C. A. Peery. 2010. Anadromous Fisheries Habitat Analysis of Asotin Creek for Pacific Lamprey; Asotin Creek Located in Asotin & Garfield Counties, Washington. Requested by the US Fish & Wildlife Service, Order Number 10181AM296, Requisition / Reference No. 1433003079. Pullman, WA. p. 50.
ASOTIN COUNTY WATERSHED ASSESSMENT
125
Schuster, J. E. 1993. Geologic map of the CLarkston 1: 100,000 quadrangle, Washington - Idaho, and the Washington portion of the Orofino 1: 100,00 quadrangle. Washington State Department of Natural Resources, Division of Geology and Earth Resources Open file report 93-4.
Scott, T., J. Kohr, D. Lowry, A. Weiss, A. Bosworth, J. Cummins, D. Gombert, P. Riviere, P. Liller, and B. Miurphy. 2011. Columbia River Instream Atlas Project - Final Report Appendix C – WRIA 35 Middle Snake.
SCS. 1984. USDA Soil Conservation Service. Southeast Washington cooperative river basin study. Forest Service, Economic Research Service.
Spence, B. C., G. A. Lomnicky, R. M. Hughes, and R. P. Novitzki. 1996. An Ecosystem Approach to Salmonid Conservation. TR-4501-96-6057. ManTech Environmental Research Services Corp., Corvallis, OR.
SRSRB. 2011. Snake River salmon recovery plan for SE Washington: 2011 version. Prepared by Snake River Salmon Recovery Board for the Washington Governor’s Salmon Recovery Office.
Strong, N., K. Bevis, and G. Brader. 2016. Wildlife friendly feuls reduction in dry forests of the Pacific Northwest. Western Forestry and Conservation Association, Portland, OR.
Swanson, S., S. Wyman, and C. Evans. 2015. Practical grazing management to maintain or restore riparian functions and values on rangelands. Journal of Rangeland Applications 2:1-28.
Thompson, D. M. 2005. The history of the use and effectiveness on instream structures in the United States. In Ehlen, J. Haneberg, W.C., and R.A. Larson. Eds. Humans as Geologic Agents, Boulder, CO. Geological Society of America Reviews in Engineering Geology XVI:35-50.
Tucker, G. J. 1940. History of the Northern Blue Mountains, Garfield County and Asotin County, Washington. United States Department of Agriculture, Forest Service, Umatilla National Forest Silviculture, Pomeroy, WA.
Ullman, J., and M. C. Barber. 2009. Middle Snake Watershed Instream Habitat Assessment. WRIA 35. Summitted to the Middle Snake Planning Unit.
UNP. 2005. University of Nebraska Press. University of Nebraska-Lincoln Libraries-Electronic Text Center. The Journals of the Lewis and Clark Expedition. Retrieved October 1-31, 2017, from http://lewisandclarkjournals.unl.edu/.
USBC. 1913. Untied States Bureau of the Census. Thirteenth Census of the United States Taken in the year 1910. Washington, DC.
USDA. 2016. Geospatial data gateway. United States Department of Agriculture, Natural Resources Conservation Service. https://datagateway.nrcs.usda.gov/GDGOrder.aspxData. Downloaded October 2016.
USEPA. 2013. Level III and IV Ecoregions of the Continental United States. https://www.epa.gov/eco-research/level-iii-and-iv-ecoregions-continental-united-states.
USFS. 2001. Level II stream survey report: George Creek. USDA Forest Service, Umatilla National Forest, Pomeroy, WA.
USFS. 2014a. Cougar Creek stream survey. USDA Forest Service, Umatilla National Forest, Pomeroy, WA.
USFS. 2014b. Middle Branch North Frok stream survey. USDA Forest Service, Umatilla National Forest, Pomeroy, WA.
ASOTIN COUNTY WATERSHED ASSESSMENT
126
VSP. 2017. Asotin County Voluntary Stewardship Program: Draft Work Plan. Prepared for the Asotin County VSP Work Group . Prepared by Anchor QEA, Asotin County Conservation District, and Eco Logical Research. Clarkston, WA.
WADOE. 2015. Washington Department of Ecology. Asotin Creek water quality fecal coliform bacteria study.
Walker. 1967. Mutual Cross-Utilization of Economic Resources in the Plateau: An example from Aboriginal Nez Perce Fishing Practices. Pullman, Washington: Washington State University Laboratory of Anthropology. No. 41.
Waples, R. S., T. Beechie, and G. R. Pess. 2009. Evolutionary history, habitat disturbance regimes, and anthropogenic changes: what do these mean for resilience of Pacific salmon populations? Ecology and Society 14.
Waples, R. S., G. R. Pess, and T. Beechie. 2008. Evolutionary history of Pacific salmon in dynamic environments. Evolutionary Applications 1:189-206.
Wheaton, J., S. Bennett, B. Bouwes, and R. Camp. 2012. Asotin Creek Intensively Monitored Watershed: Restoration plan for Charley Creek, North Fork Asotin, and South Fork Asotin Creeks. DRAFT: April 7, 2012. Prepared for the State of Washington Recreation and Conservation Office, Olympia, WA. Prepared by Eco Logical Research Ltd.
Wheaton, J. M., K. A. Fryirs, G. Brierley, S. G. Bangen, N. Bouwes, and G. O'Brien. 2015. Geomorphic mapping and taxonomy of fluvial landforms. Geomorphology 248:273-295.
White, S. M., C. Justice, D. A. Kelsey, D. A. McCullough, and T. Smith. 2017. Legacies of stream channel modification revealed using General Land Office surveys, with implications for water temperature and aquatic life. Elementa.
Wohl, E. 2013. Floodplains and wood. Earth-Science Reviews 123:194-212.
Wolman, M. G. 1954. A method of sampling coarse river-bed material. Transactions, American Geophysical Union 35:951-956.
Wolman, M. G., and J. P. Miller. 1960. Magnitude and frequency of forces in geomorphic processes. Journal of Geology 68:54-74.
Workman, G. W., and W. F. Sigler. 1965. Net-Plankton of the Bear Lake littoral zone, Utah-Idaho. Proceedings of the Utah Academy of Arts and Sciences 42:74-84.
WWCC. 2009. Snake River Salmon Recovery Region: fish barrier assesment. Prepared by Walla Walla Community College. Prepared for Snake River Salmon Recovery Region, Dayton, WA.
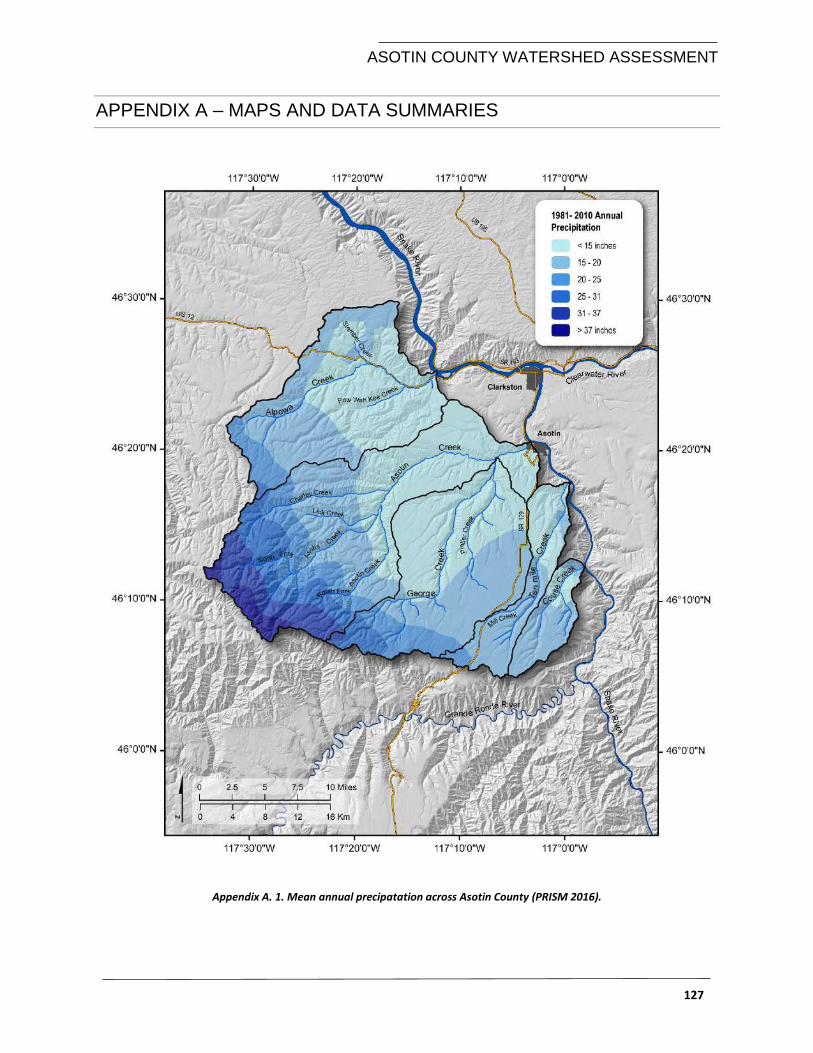
ASOTIN COUNTY WATERSHED ASSESSMENT
127
APPENDIX A – MAPS AND DATA SUMMARIES
Appendix A. 1. Mean annual precipatation across Asotin County (PRISM 2016).
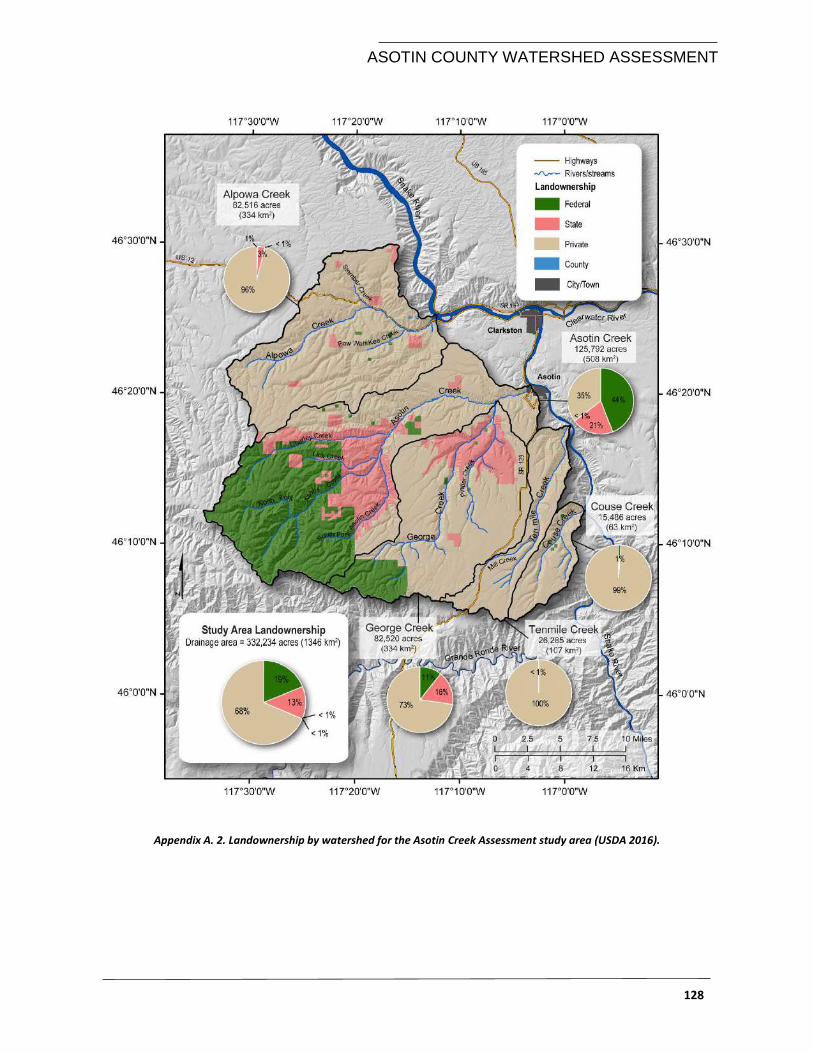
ASOTIN COUNTY WATERSHED ASSESSMENT
128
Appendix A. 2. Landownership by watershed for the Asotin Creek Assessment study area (USDA 2016).
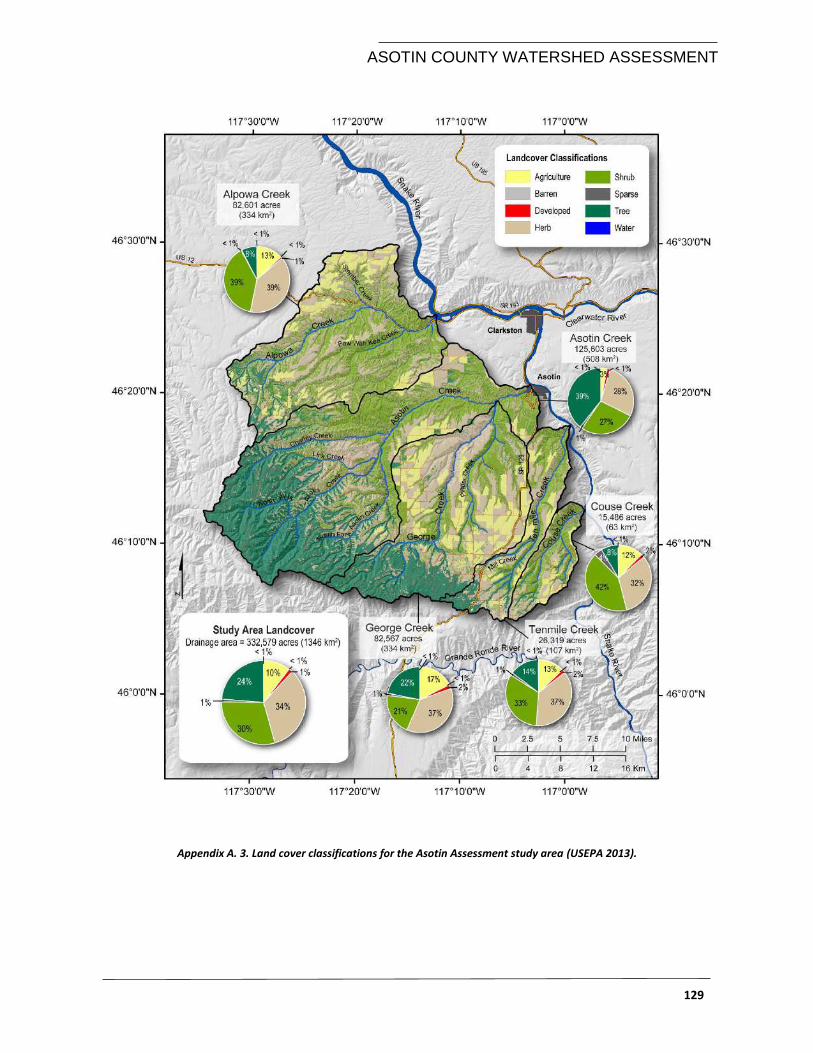
ASOTIN COUNTY WATERSHED ASSESSMENT
129
Appendix A. 3. Land cover classifications for the Asotin Assessment study area (USEPA 2013).
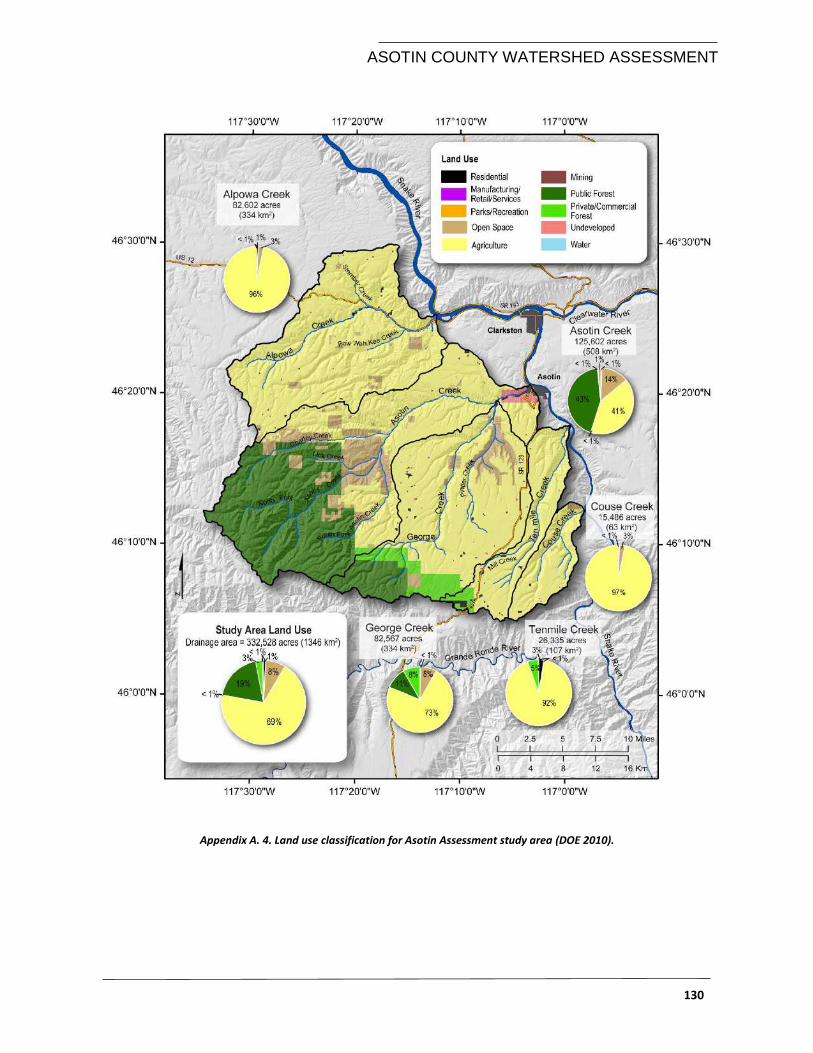
ASOTIN COUNTY WATERSHED ASSESSMENT
130
Appendix A. 4. Land use classification for Asotin Assessment study area (DOE 2010).
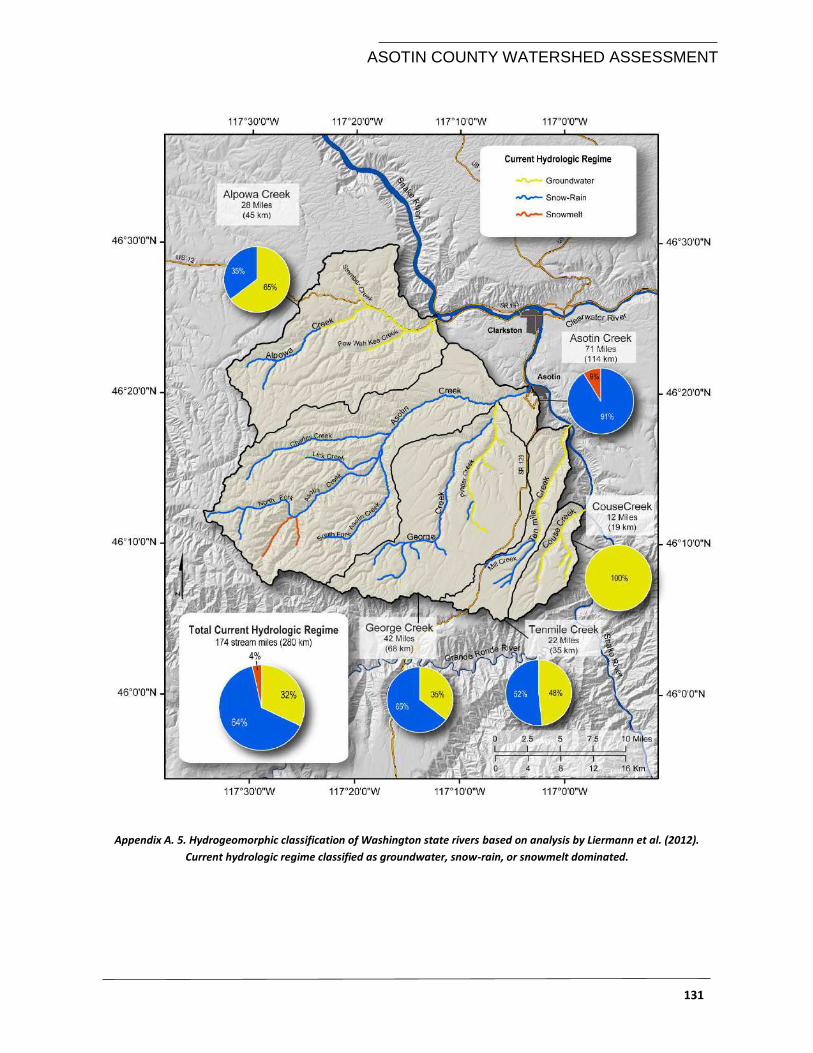
ASOTIN COUNTY WATERSHED ASSESSMENT
131
Appendix A. 5. Hydrogeomorphic classification of Washington state rivers based on analysis by Liermann et al. (2012).
Current hydrologic regime classified as groundwater, snow-rain, or snowmelt dominated.
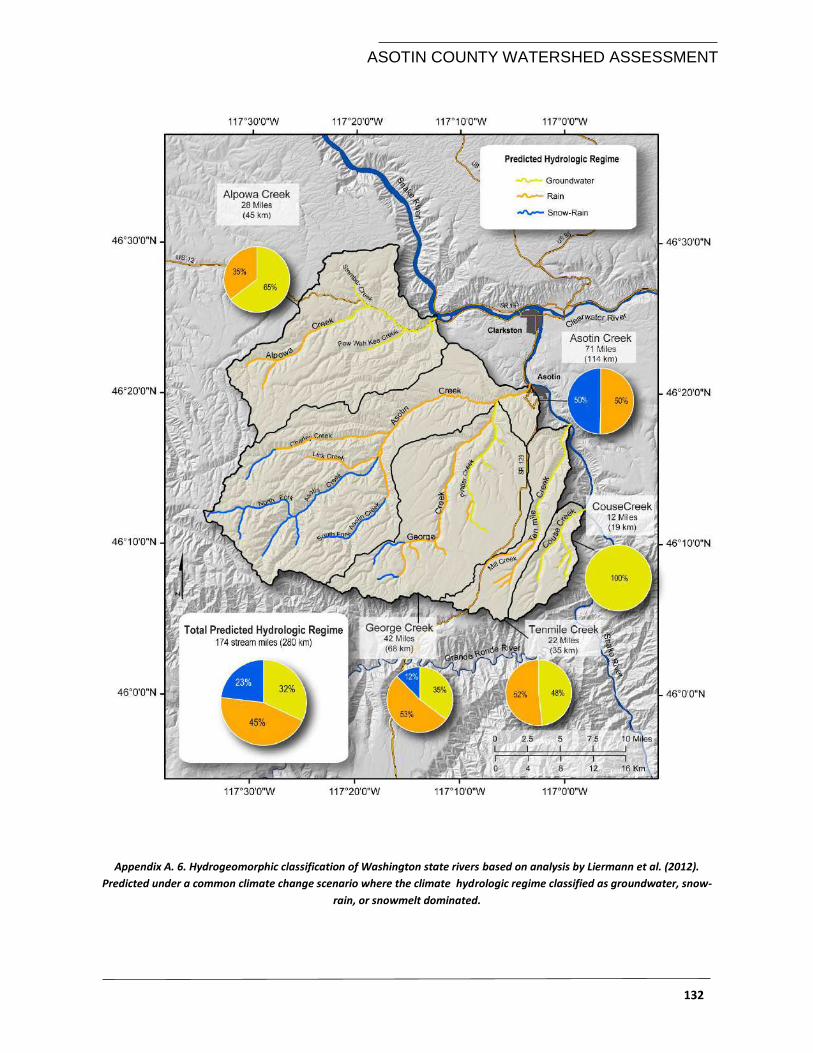
ASOTIN COUNTY WATERSHED ASSESSMENT
132
Appendix A. 6. Hydrogeomorphic classification of Washington state rivers based on analysis by Liermann et al. (2012).
Predicted under a common climate change scenario where the climate hydrologic regime classified as groundwater, snow-
rain, or snowmelt dominated.
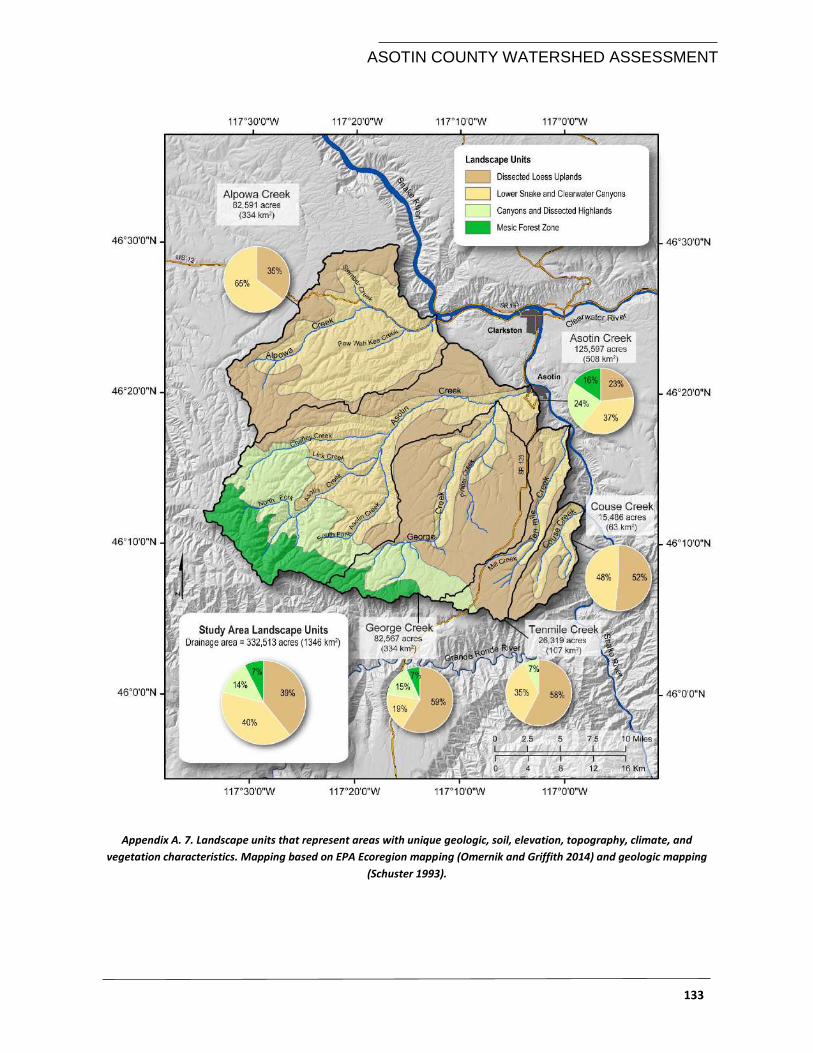
ASOTIN COUNTY WATERSHED ASSESSMENT
133
Appendix A. 7. Landscape units that represent areas with unique geologic, soil, elevation, topography, climate, and
vegetation characteristics. Mapping based on EPA Ecoregion mapping (Omernik and Griffith 2014) and geologic mapping
(Schuster 1993).
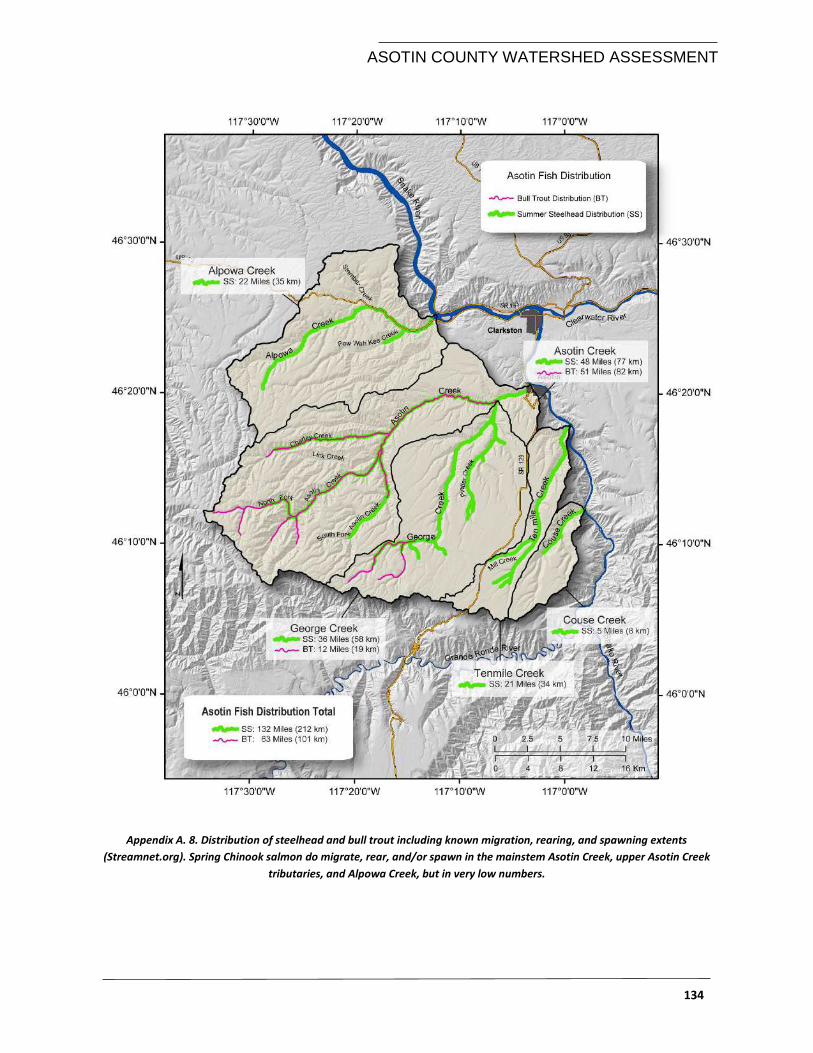
ASOTIN COUNTY WATERSHED ASSESSMENT
134
Appendix A. 8. Distribution of steelhead and bull trout including known migration, rearing, and spawning extents
(Streamnet.org). Spring Chinook salmon do migrate, rear, and/or spawn in the mainstem Asotin Creek, upper Asotin Creek
tributaries, and Alpowa Creek, but in very low numbers.
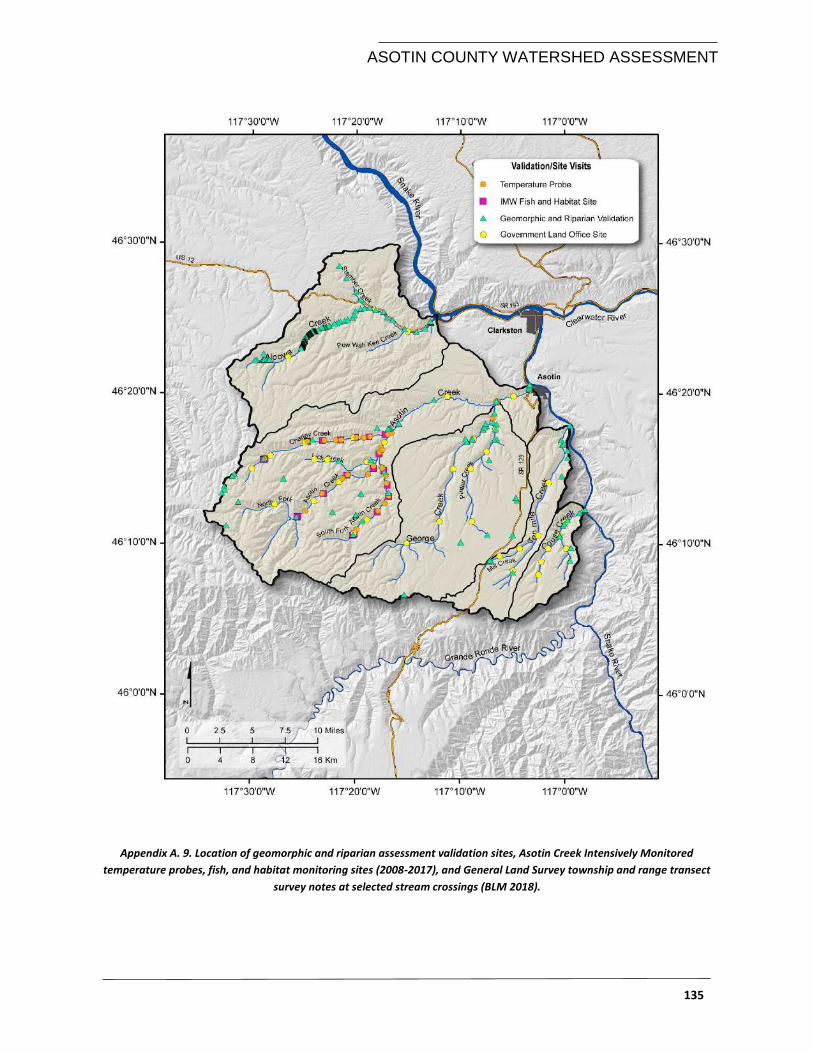
ASOTIN COUNTY WATERSHED ASSESSMENT
135
Appendix A. 9. Location of geomorphic and riparian assessment validation sites, Asotin Creek Intensively Monitored
temperature probes, fish, and habitat monitoring sites (2008-2017), and General Land Survey township and range transect
survey notes at selected stream crossings (BLM 2018).
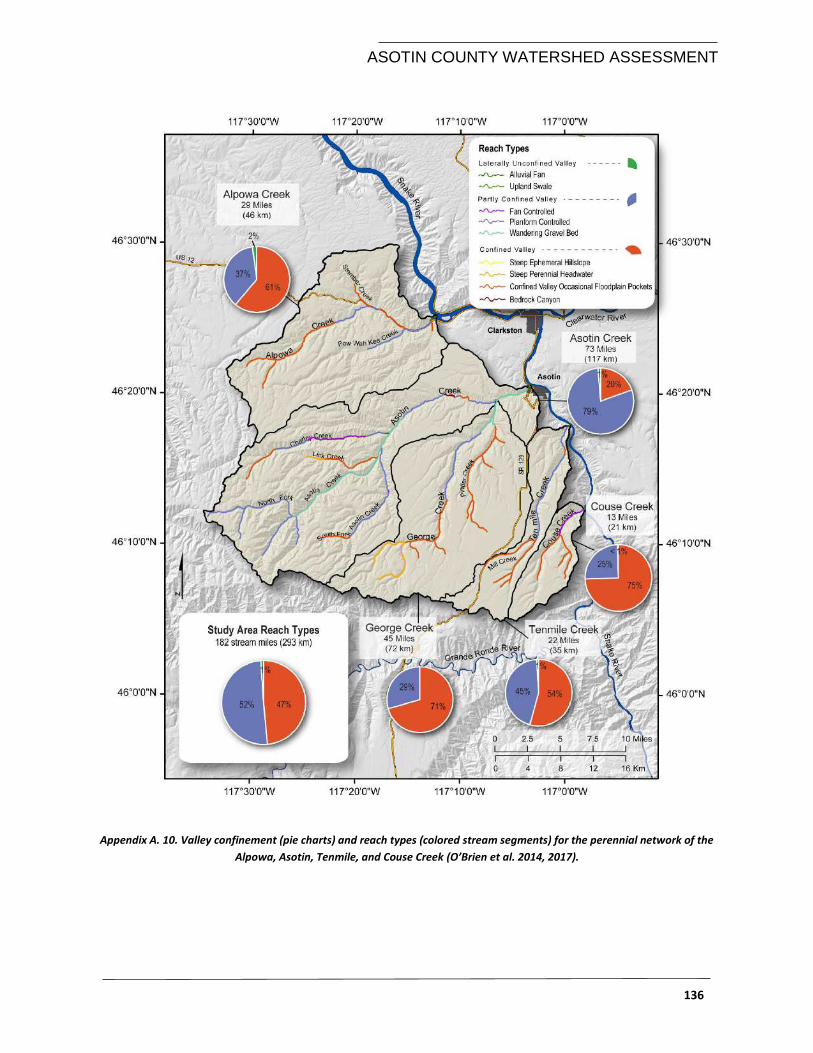
ASOTIN COUNTY WATERSHED ASSESSMENT
136
Appendix A. 10. Valley confinement (pie charts) and reach types (colored stream segments) for the perennial network of the
Alpowa, Asotin, Tenmile, and Couse Creek (O’Brien et al. 2014, 2017).
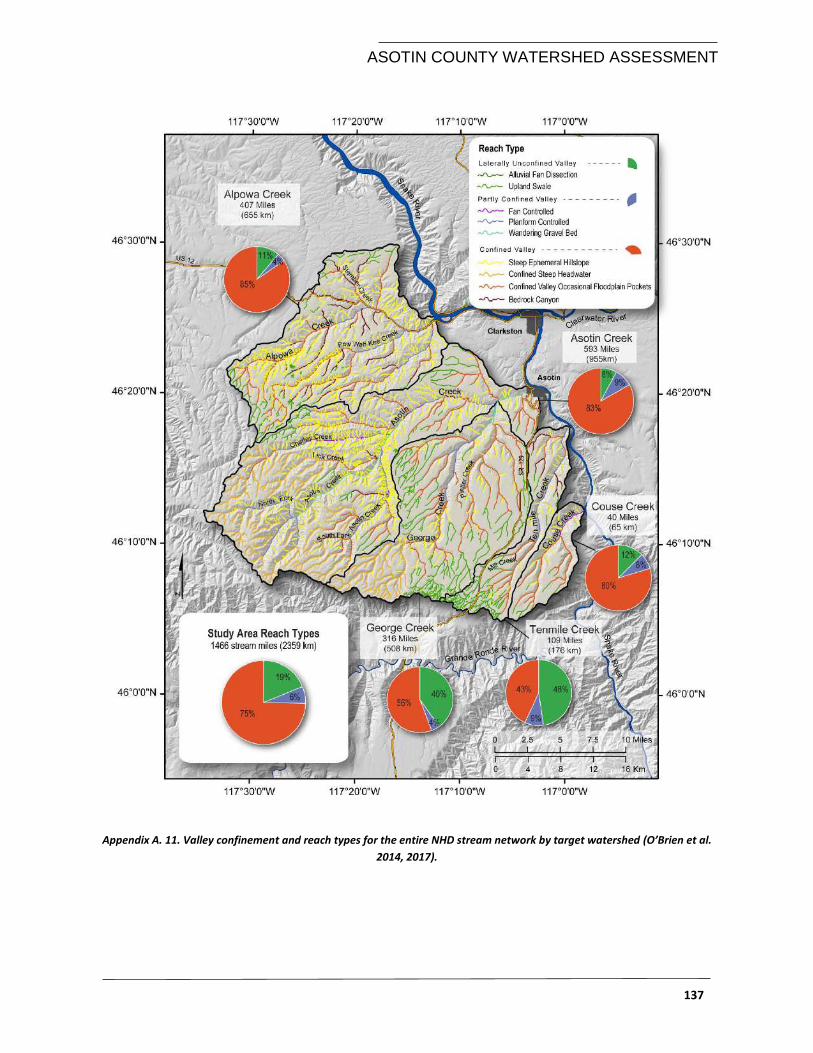
ASOTIN COUNTY WATERSHED ASSESSMENT
137
Appendix A. 11. Valley confinement and reach types for the entire NHD stream network by target watershed (O’Brien et al.
2014, 2017).
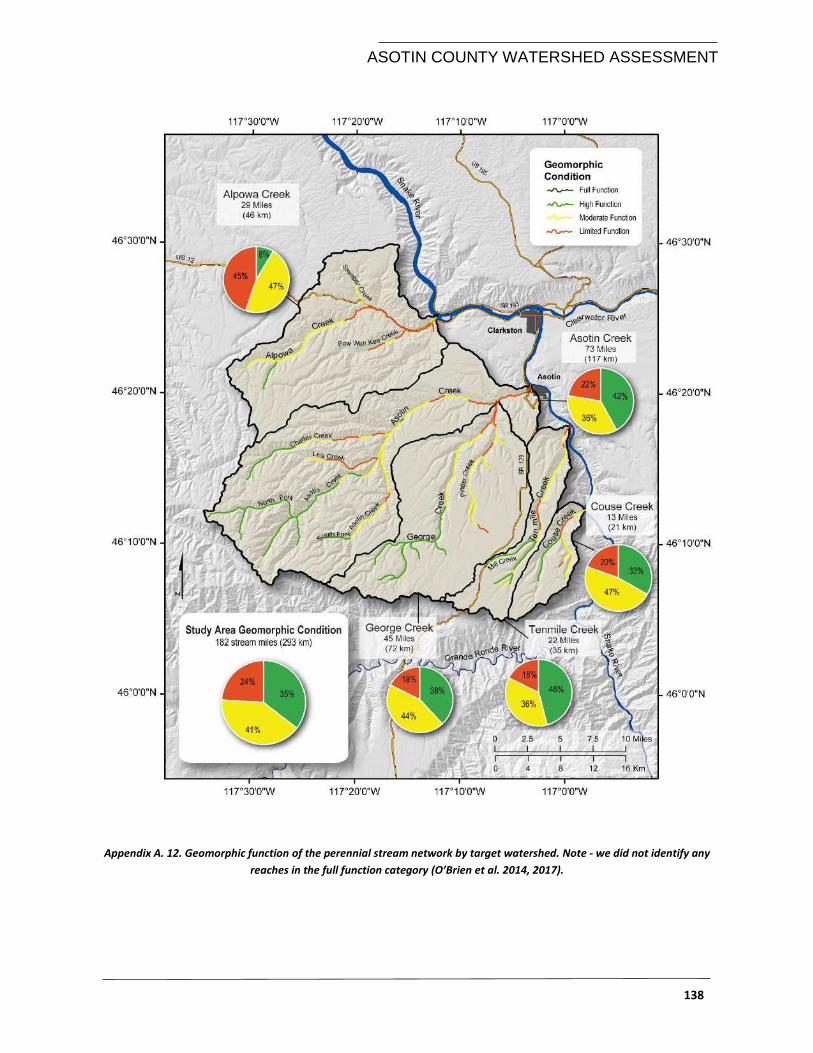
ASOTIN COUNTY WATERSHED ASSESSMENT
138
Appendix A. 12. Geomorphic function of the perennial stream network by target watershed. Note - we did not identify any
reaches in the full function category (O’Brien et al. 2014, 2017).
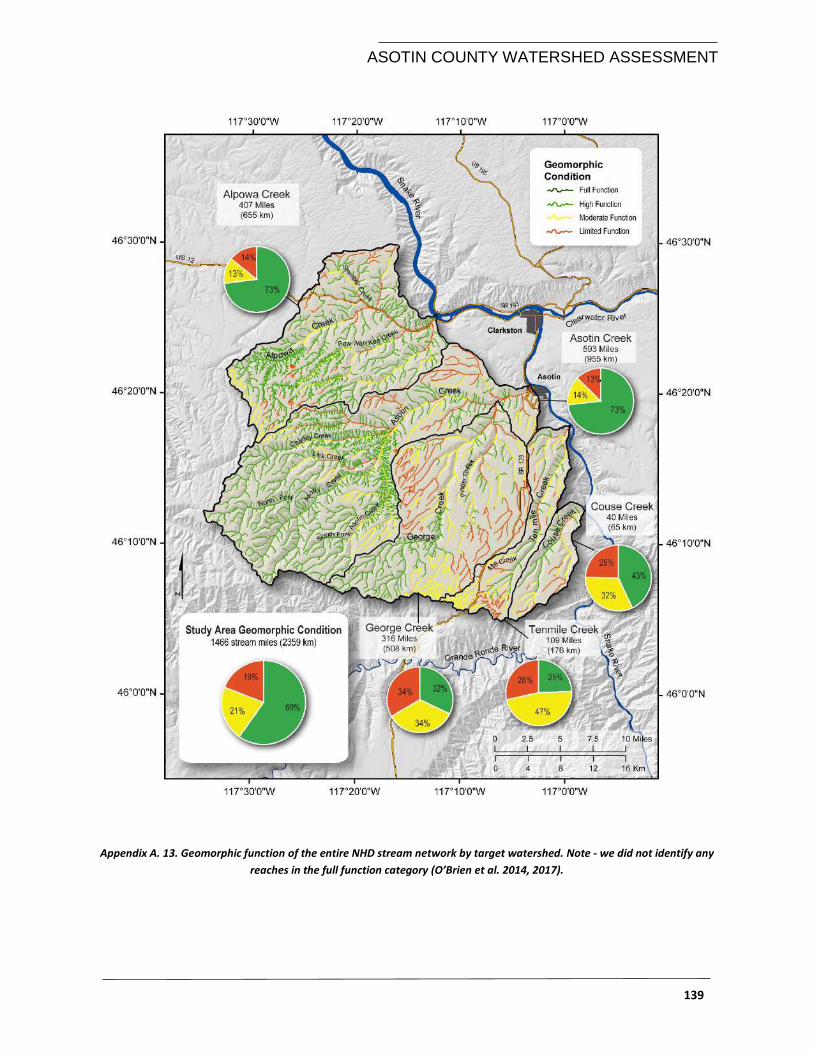
ASOTIN COUNTY WATERSHED ASSESSMENT
139
Appendix A. 13. Geomorphic function of the entire NHD stream network by target watershed. Note - we did not identify any
reaches in the full function category (O’Brien et al. 2014, 2017).
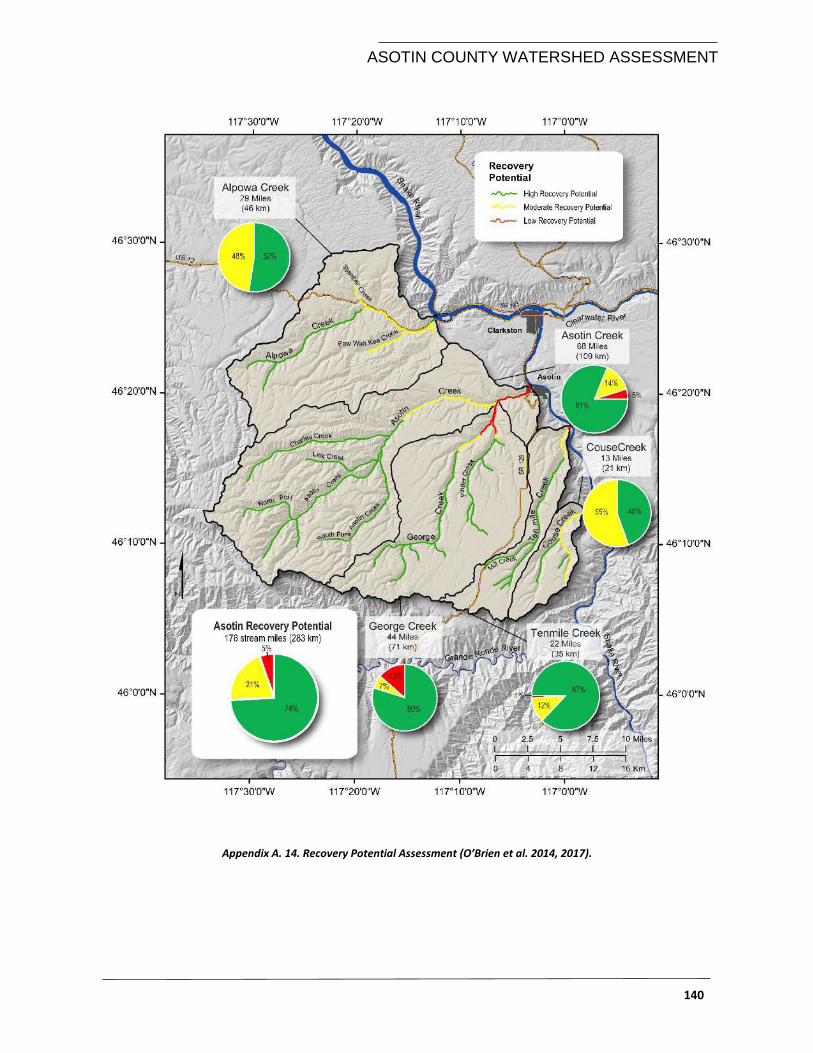
ASOTIN COUNTY WATERSHED ASSESSMENT
140
Appendix A. 14. Recovery Potential Assessment (O’Brien et al. 2014, 2017).
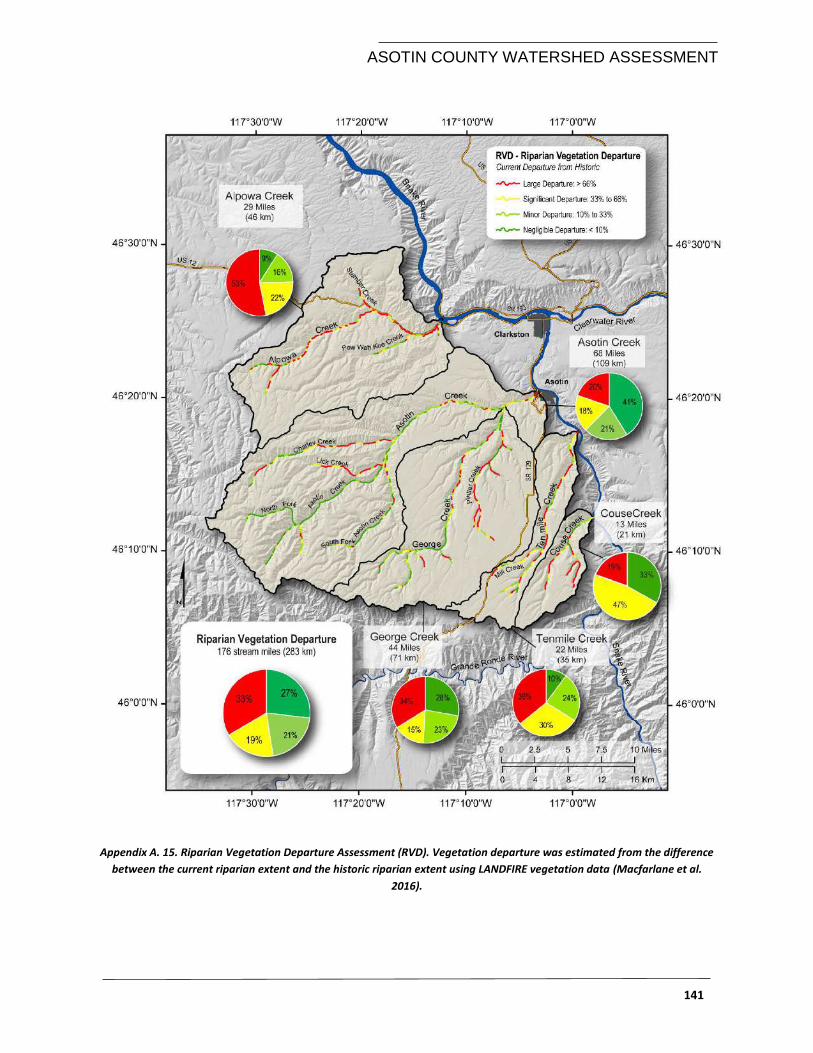
ASOTIN COUNTY WATERSHED ASSESSMENT
141
Appendix A. 15. Riparian Vegetation Departure Assessment (RVD). Vegetation departure was estimated from the difference
between the current riparian extent and the historic riparian extent using LANDFIRE vegetation data (Macfarlane et al.
2016).
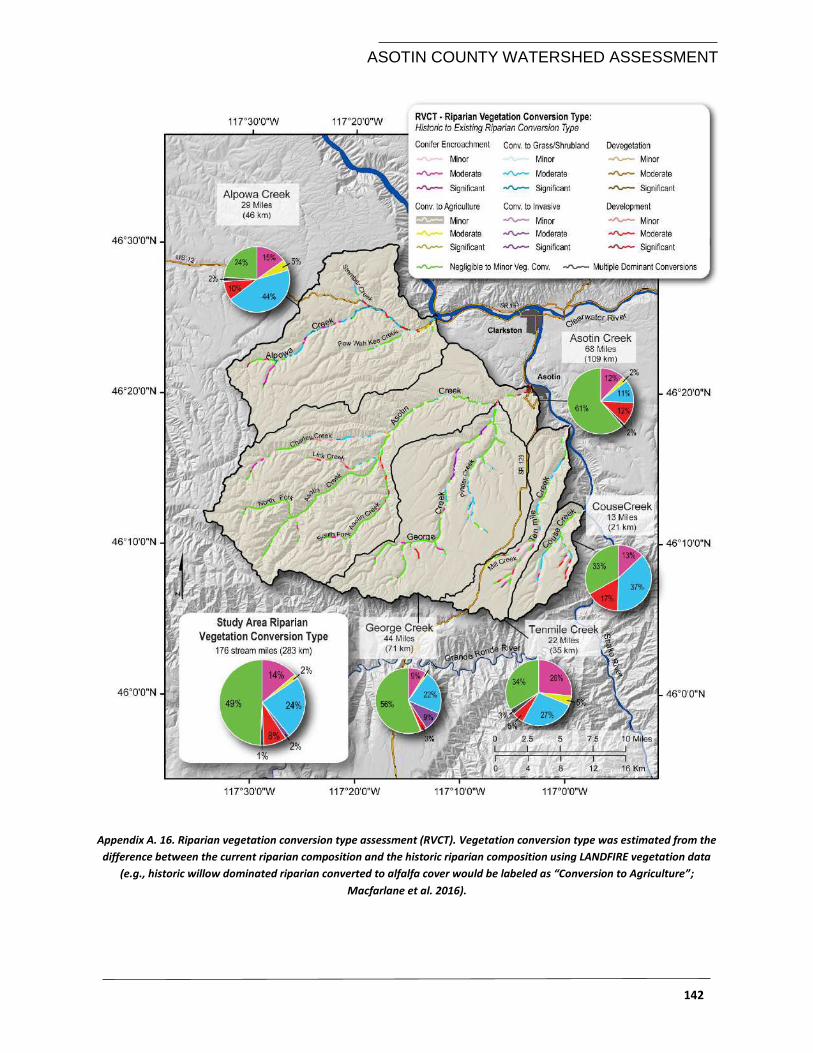
ASOTIN COUNTY WATERSHED ASSESSMENT
142
Appendix A. 16. Riparian vegetation conversion type assessment (RVCT). Vegetation conversion type was estimated from the
difference between the current riparian composition and the historic riparian composition using LANDFIRE vegetation data
(e.g., historic willow dominated riparian converted to alfalfa cover would be labeled as “Conversion to Agriculture”;
Macfarlane et al. 2016).
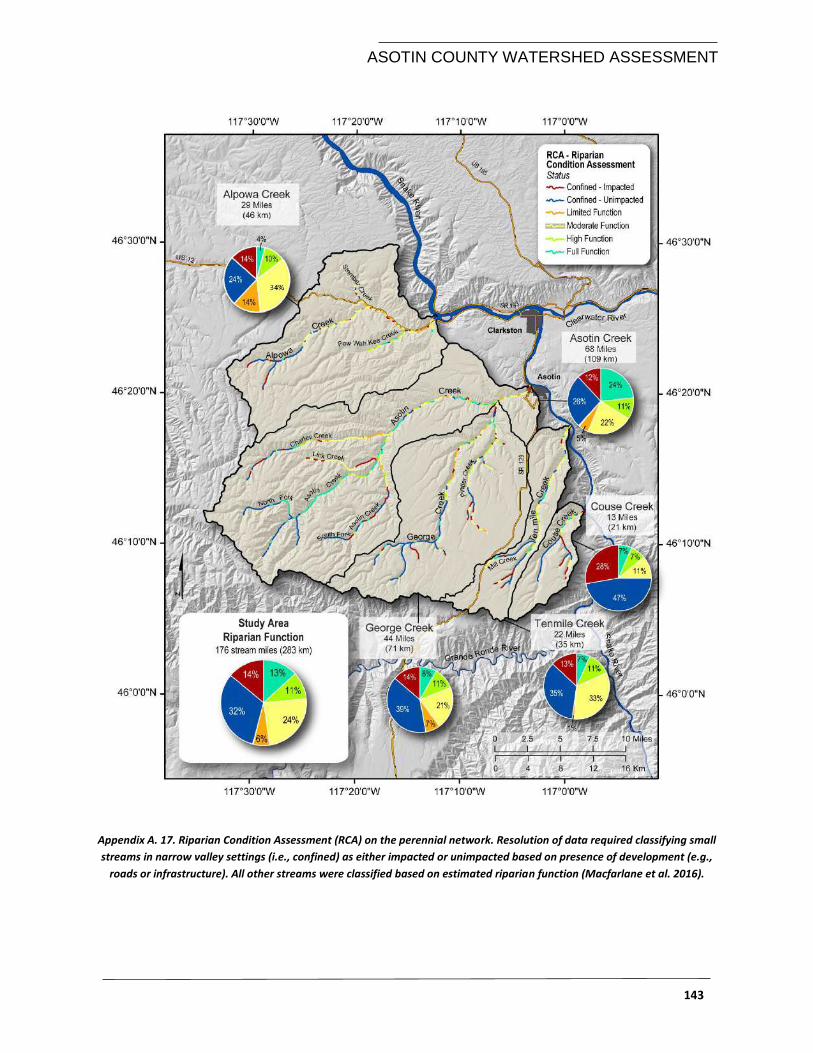
ASOTIN COUNTY WATERSHED ASSESSMENT
143
Appendix A. 17. Riparian Condition Assessment (RCA) on the perennial network. Resolution of data required classifying small
streams in narrow valley settings (i.e., confined) as either impacted or unimpacted based on presence of development (e.g.,
roads or infrastructure). All other streams were classified based on estimated riparian function (Macfarlane et al. 2016).
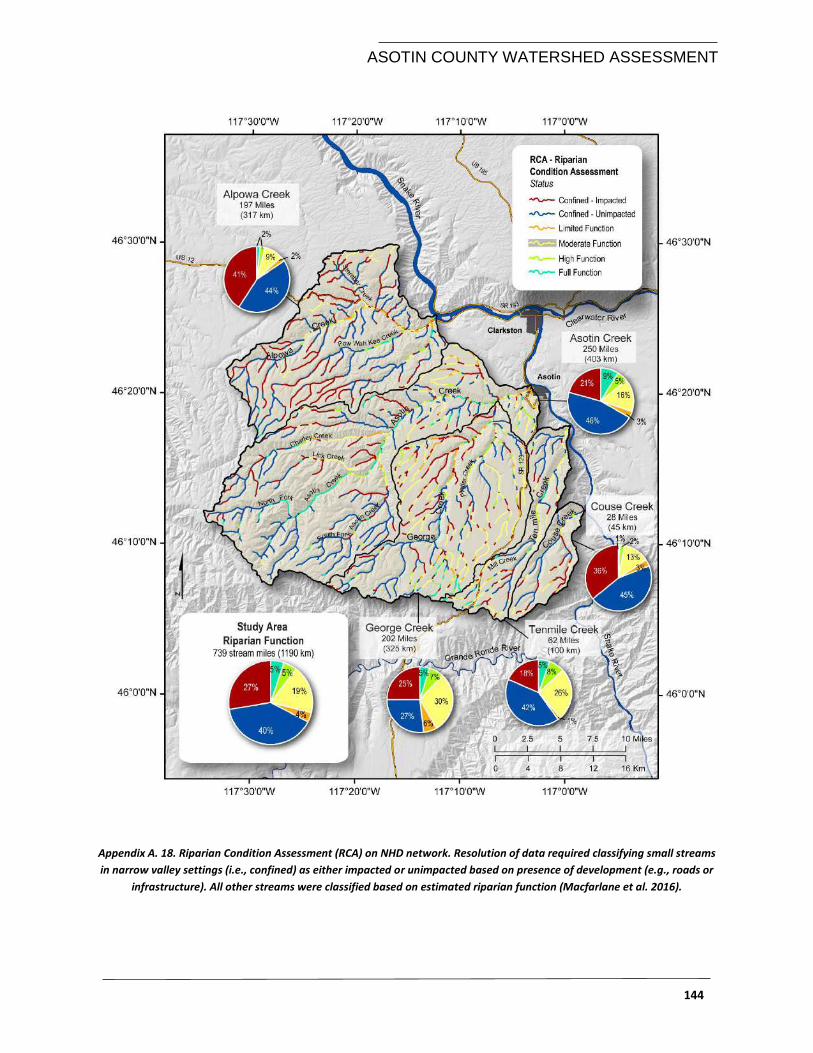
ASOTIN COUNTY WATERSHED ASSESSMENT
144
Appendix A. 18. Riparian Condition Assessment (RCA) on NHD network. Resolution of data required classifying small streams
in narrow valley settings (i.e., confined) as either impacted or unimpacted based on presence of development (e.g., roads or
infrastructure). All other streams were classified based on estimated riparian function (Macfarlane et al. 2016).
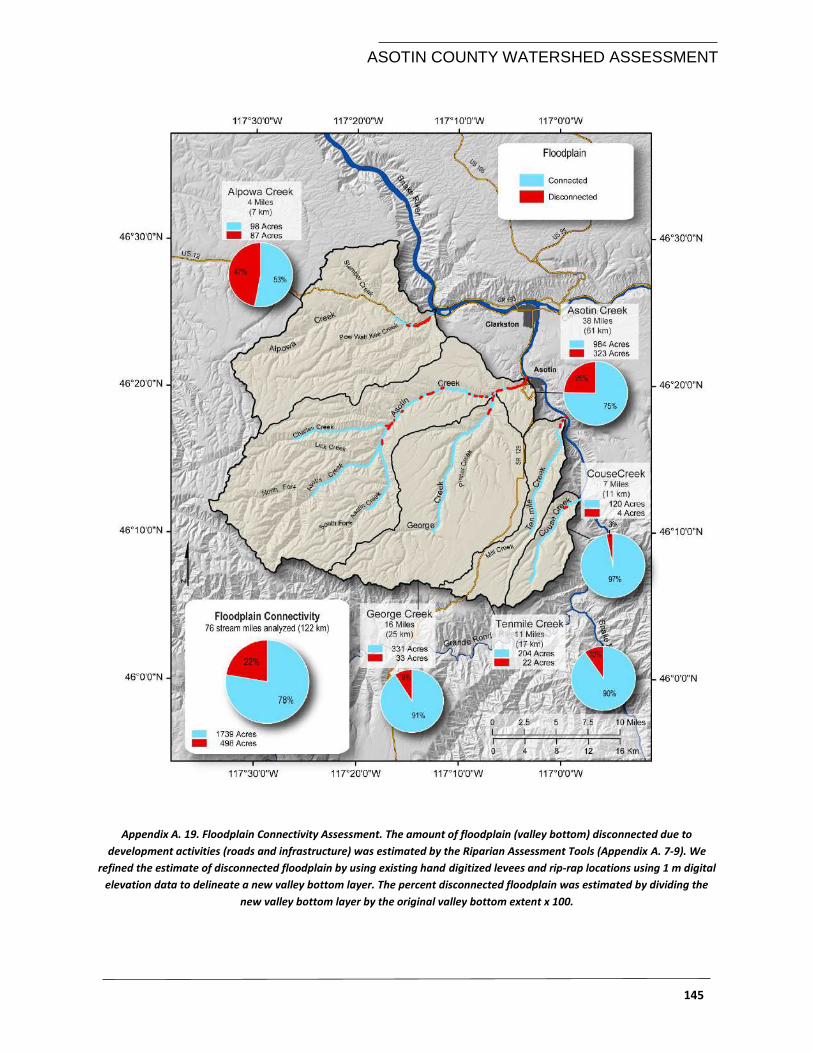
ASOTIN COUNTY WATERSHED ASSESSMENT
145
Appendix A. 19. Floodplain Connectivity Assessment. The amount of floodplain (valley bottom) disconnected due to
development activities (roads and infrastructure) was estimated by the Riparian Assessment Tools (Appendix A. 7-9). We
refined the estimate of disconnected floodplain by using existing hand digitized levees and rip-rap locations using 1 m digital
elevation data to delineate a new valley bottom layer. The percent disconnected floodplain was estimated by dividing the
new valley bottom layer by the original valley bottom extent x 100.
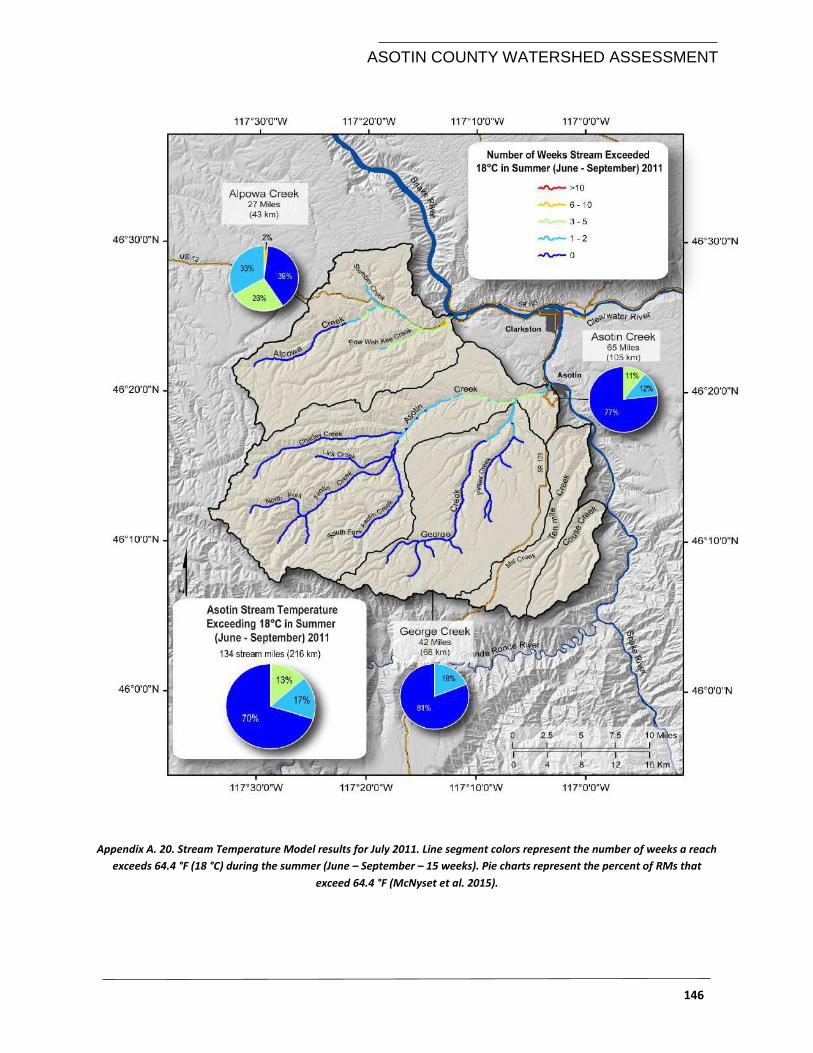
ASOTIN COUNTY WATERSHED ASSESSMENT
146
Appendix A. 20. Stream Temperature Model results for July 2011. Line segment colors represent the number of weeks a reach
exceeds 64.4 °F (18 °C) during the summer (June – September – 15 weeks). Pie charts represent the percent of RMs that
exceed 64.4 °F (McNyset et al. 2015).
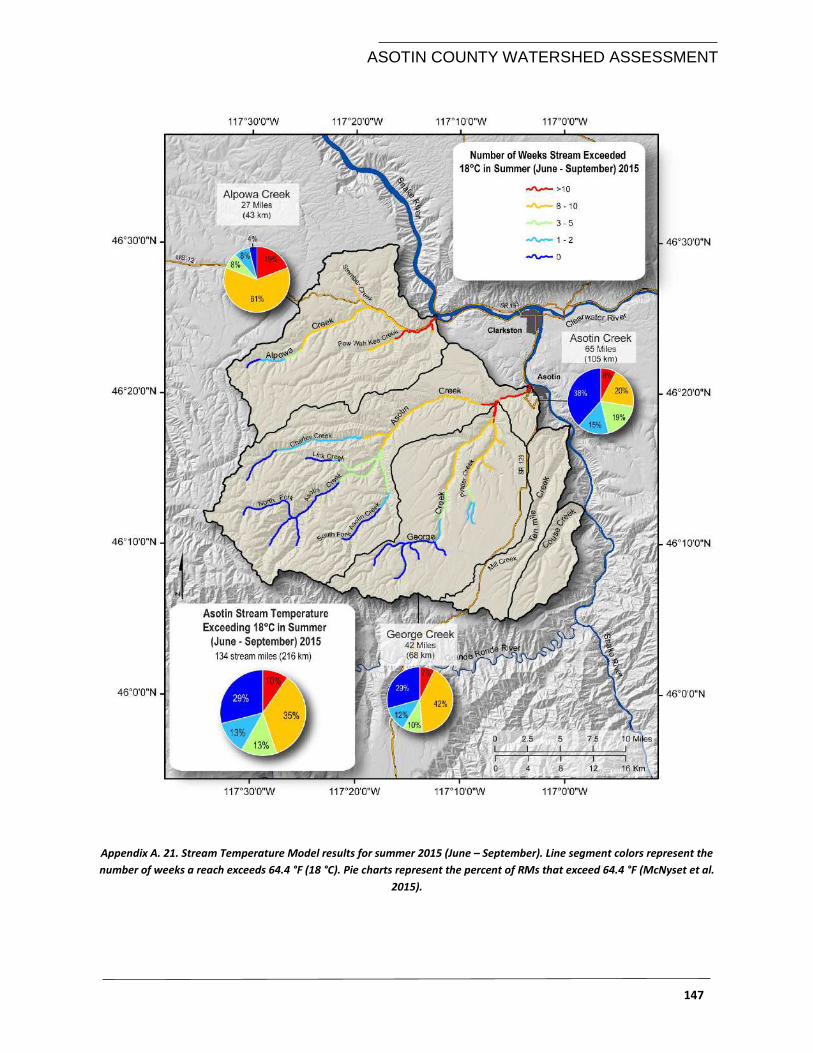
ASOTIN COUNTY WATERSHED ASSESSMENT
147
Appendix A. 21. Stream Temperature Model results for summer 2015 (June – September). Line segment colors represent the
number of weeks a reach exceeds 64.4 °F (18 °C). Pie charts represent the percent of RMs that exceed 64.4 °F (McNyset et al.
2015).
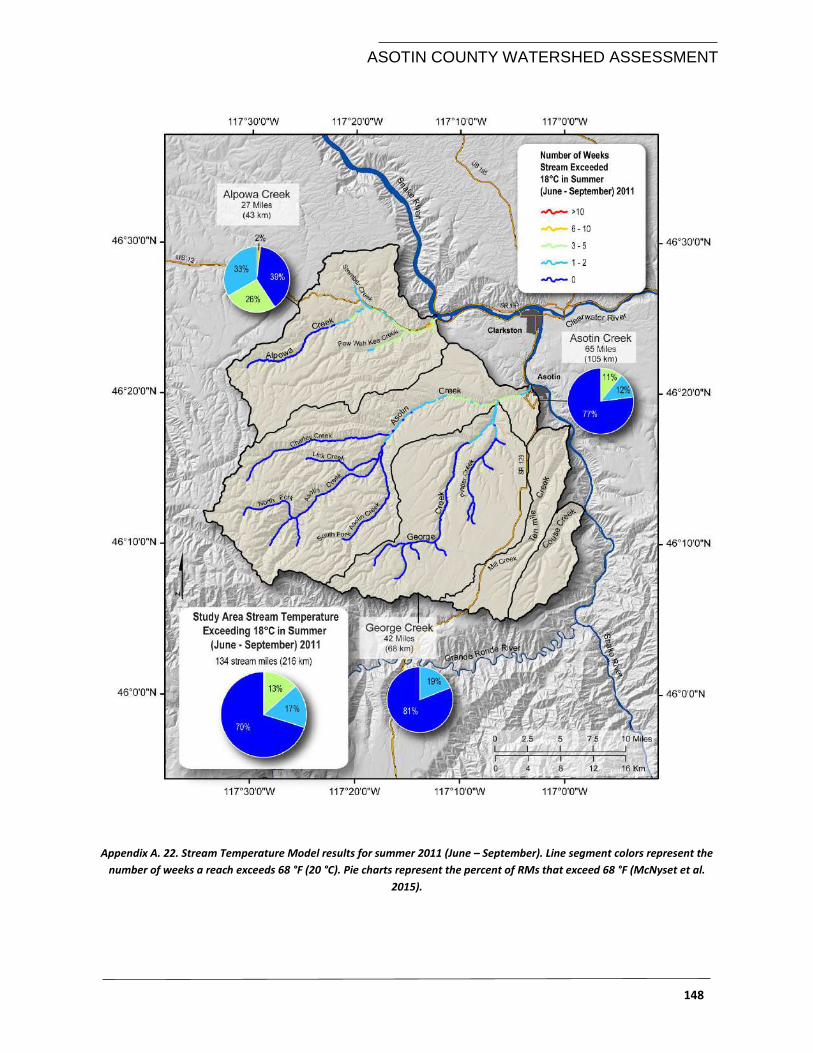
ASOTIN COUNTY WATERSHED ASSESSMENT
148
Appendix A. 22. Stream Temperature Model results for summer 2011 (June – September). Line segment colors represent the
number of weeks a reach exceeds 68 °F (20 °C). Pie charts represent the percent of RMs that exceed 68 °F (McNyset et al.
2015).
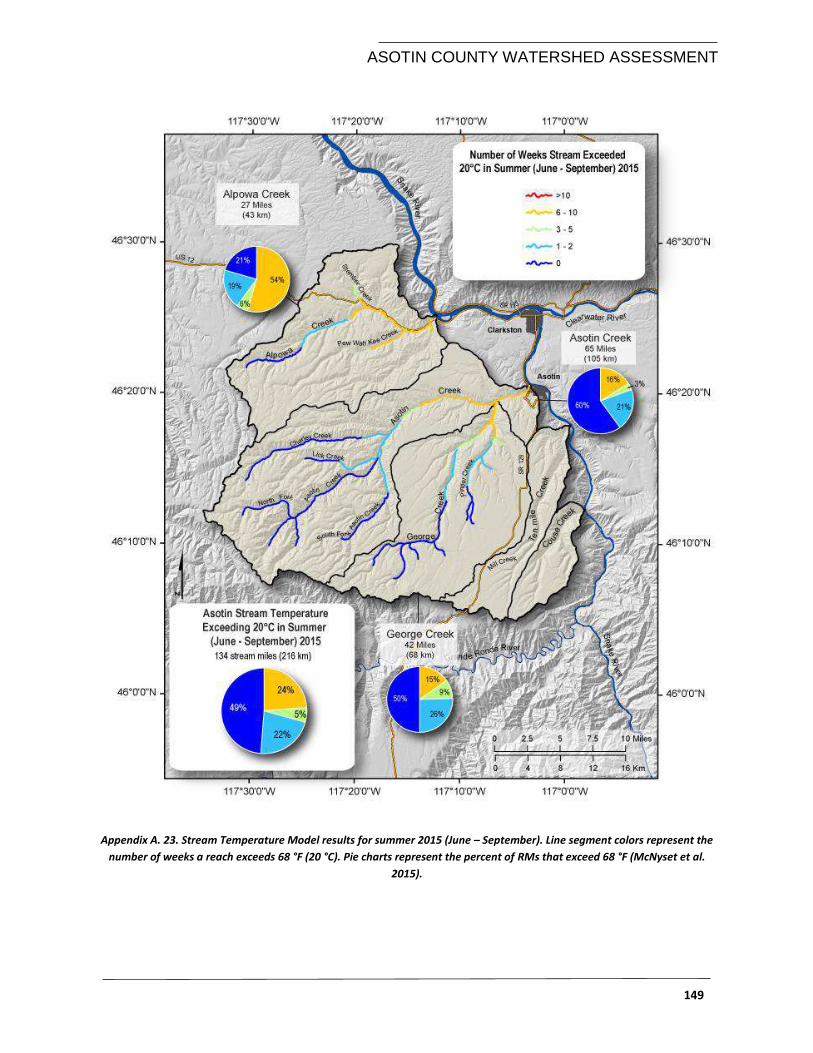
ASOTIN COUNTY WATERSHED ASSESSMENT
149
Appendix A. 23. Stream Temperature Model results for summer 2015 (June – September). Line segment colors represent the
number of weeks a reach exceeds 68 °F (20 °C). Pie charts represent the percent of RMs that exceed 68 °F (McNyset et al.
2015).
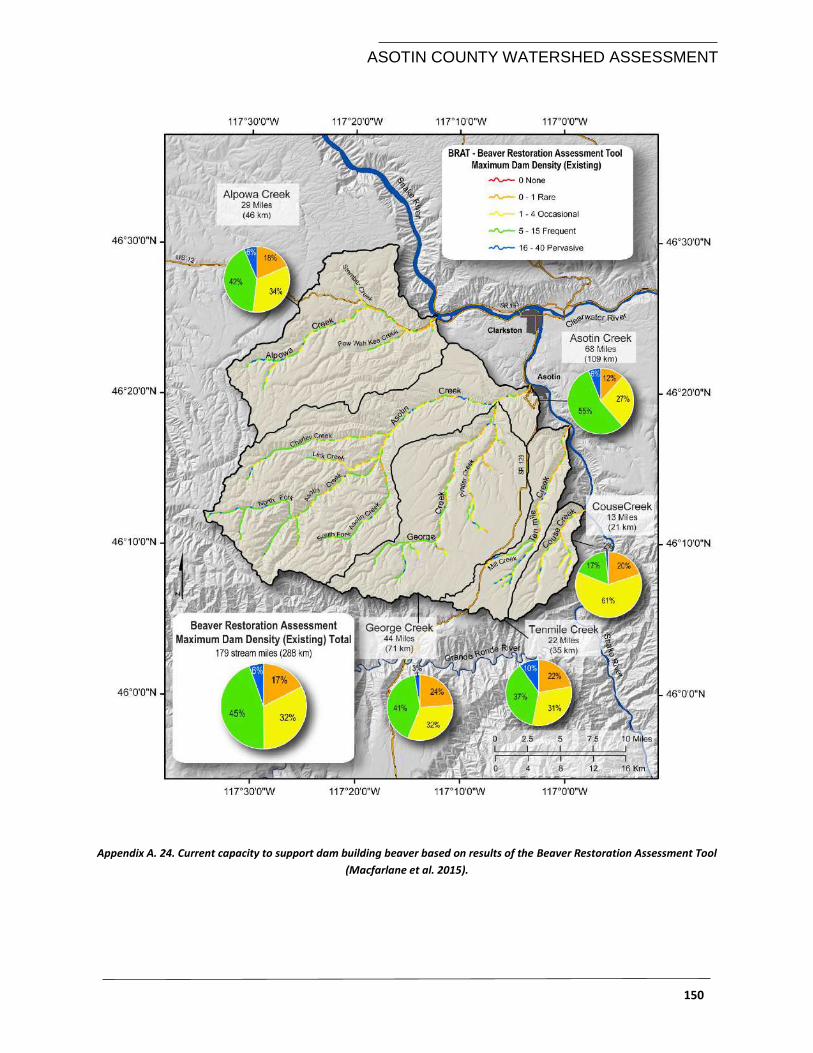
ASOTIN COUNTY WATERSHED ASSESSMENT
150
Appendix A. 24. Current capacity to support dam building beaver based on results of the Beaver Restoration Assessment Tool
(Macfarlane et al. 2015).
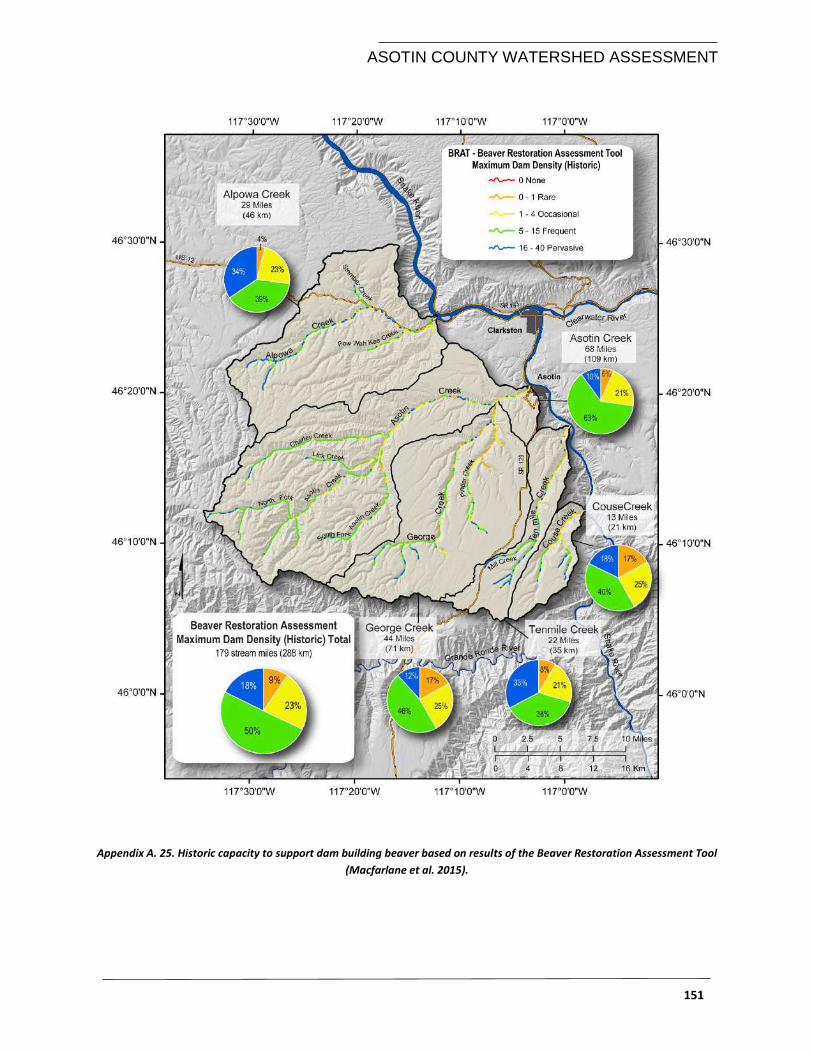
ASOTIN COUNTY WATERSHED ASSESSMENT
151
Appendix A. 25. Historic capacity to support dam building beaver based on results of the Beaver Restoration Assessment Tool
(Macfarlane et al. 2015).
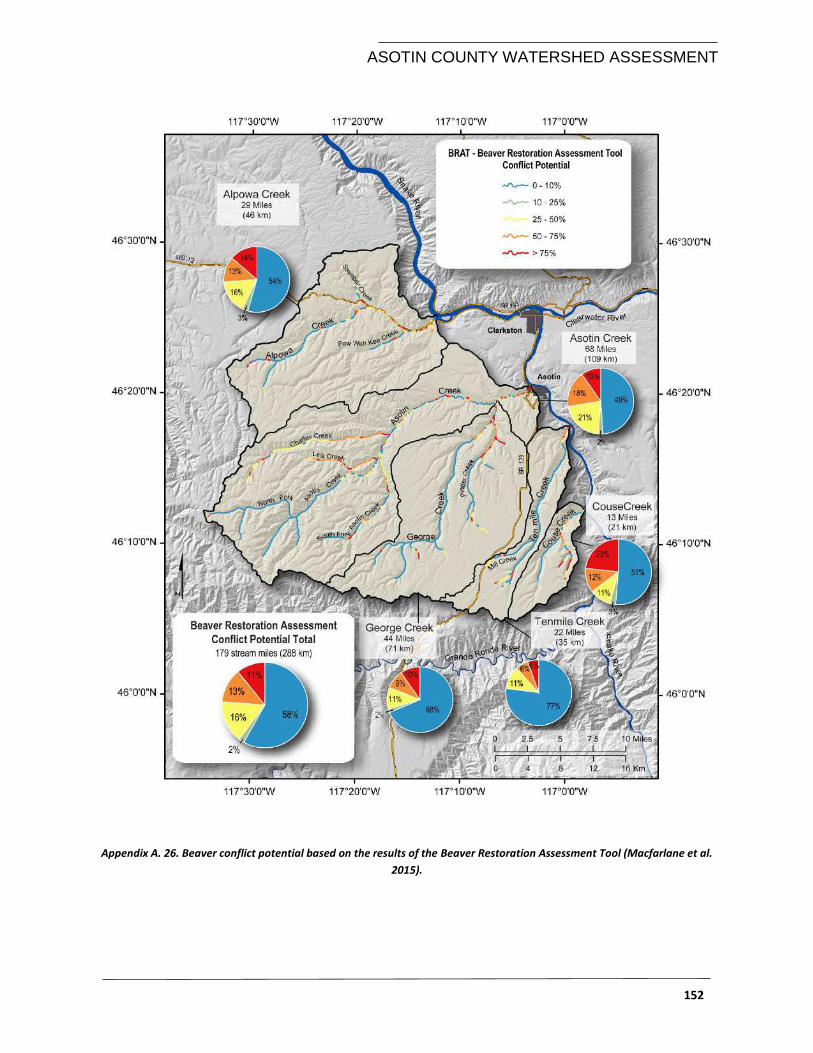
ASOTIN COUNTY WATERSHED ASSESSMENT
152
Appendix A. 26. Beaver conflict potential based on the results of the Beaver Restoration Assessment Tool (Macfarlane et al.
2015).
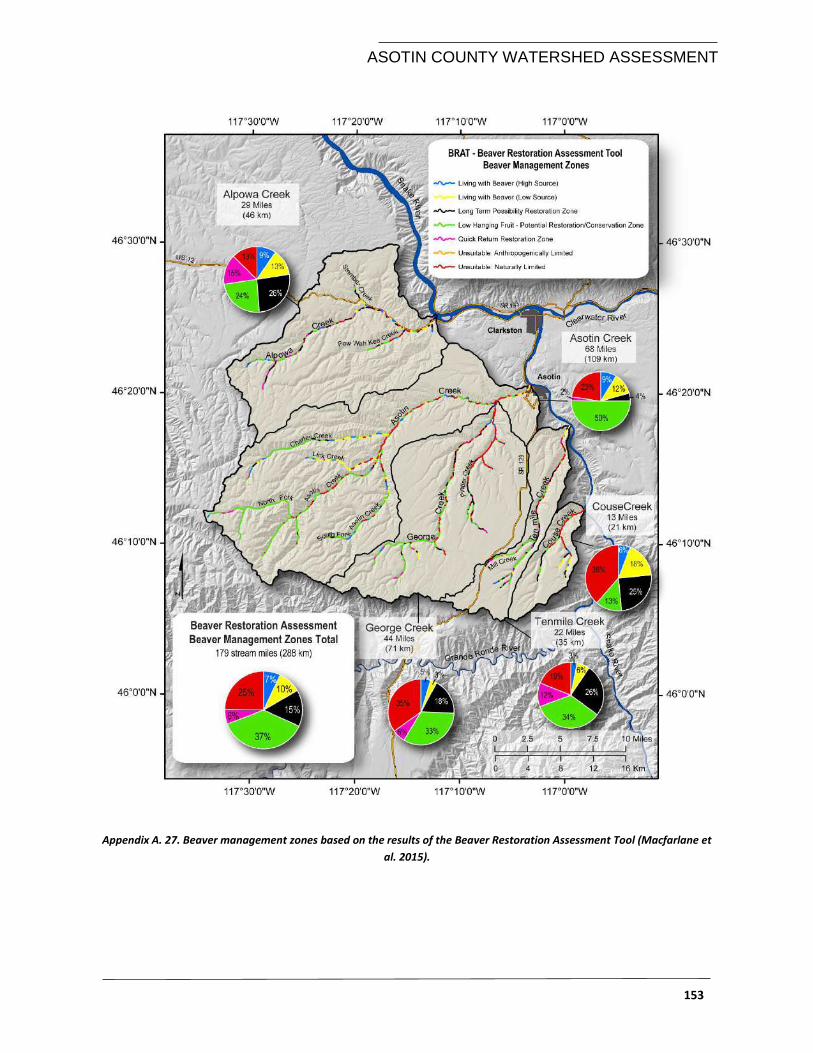
ASOTIN COUNTY WATERSHED ASSESSMENT
153
Appendix A. 27. Beaver management zones based on the results of the Beaver Restoration Assessment Tool (Macfarlane et
al. 2015).
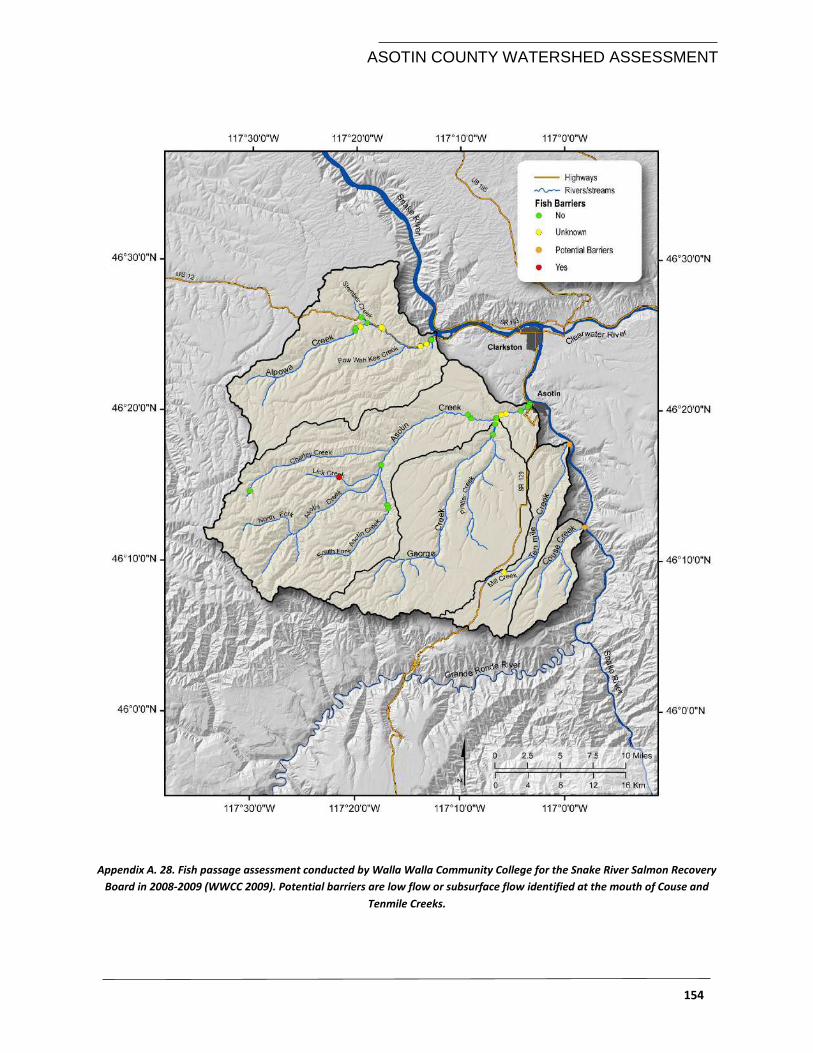
ASOTIN COUNTY WATERSHED ASSESSMENT
154
Appendix A. 28. Fish passage assessment conducted by Walla Walla Community College for the Snake River Salmon Recovery
Board in 2008-2009 (WWCC 2009). Potential barriers are low flow or subsurface flow identified at the mouth of Couse and
Tenmile Creeks.
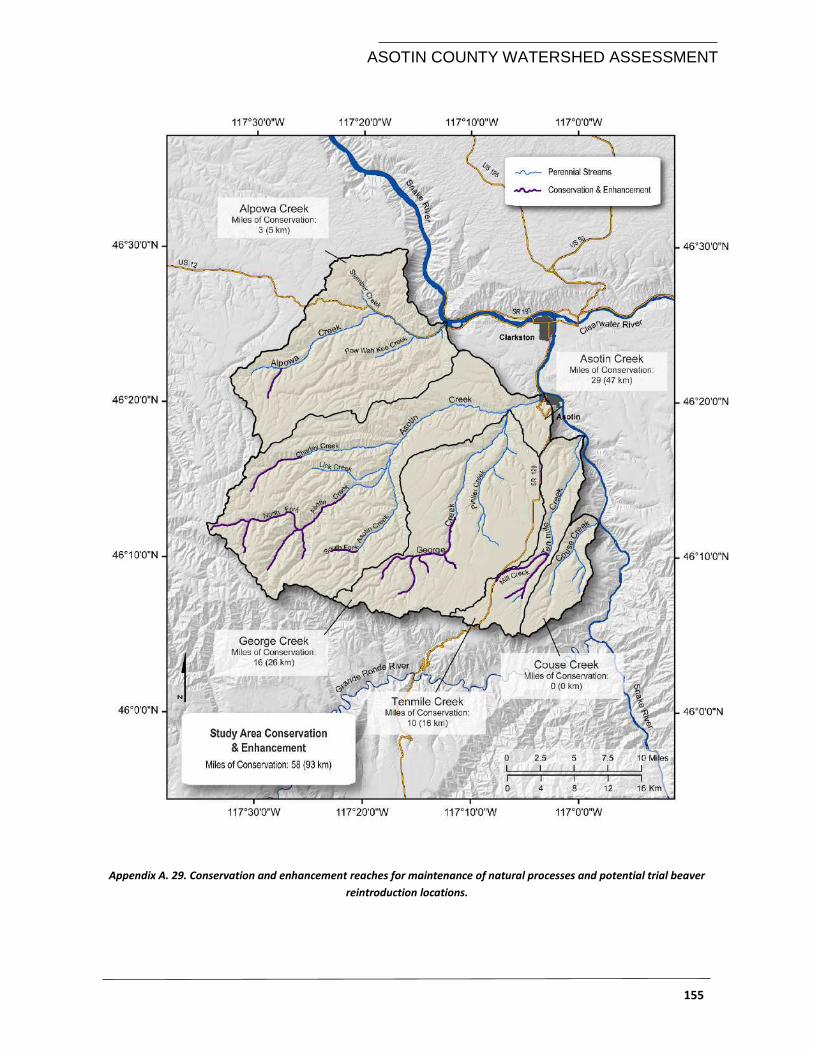
ASOTIN COUNTY WATERSHED ASSESSMENT
155
Appendix A. 29. Conservation and enhancement reaches for maintenance of natural processes and potential trial beaver
reintroduction locations.
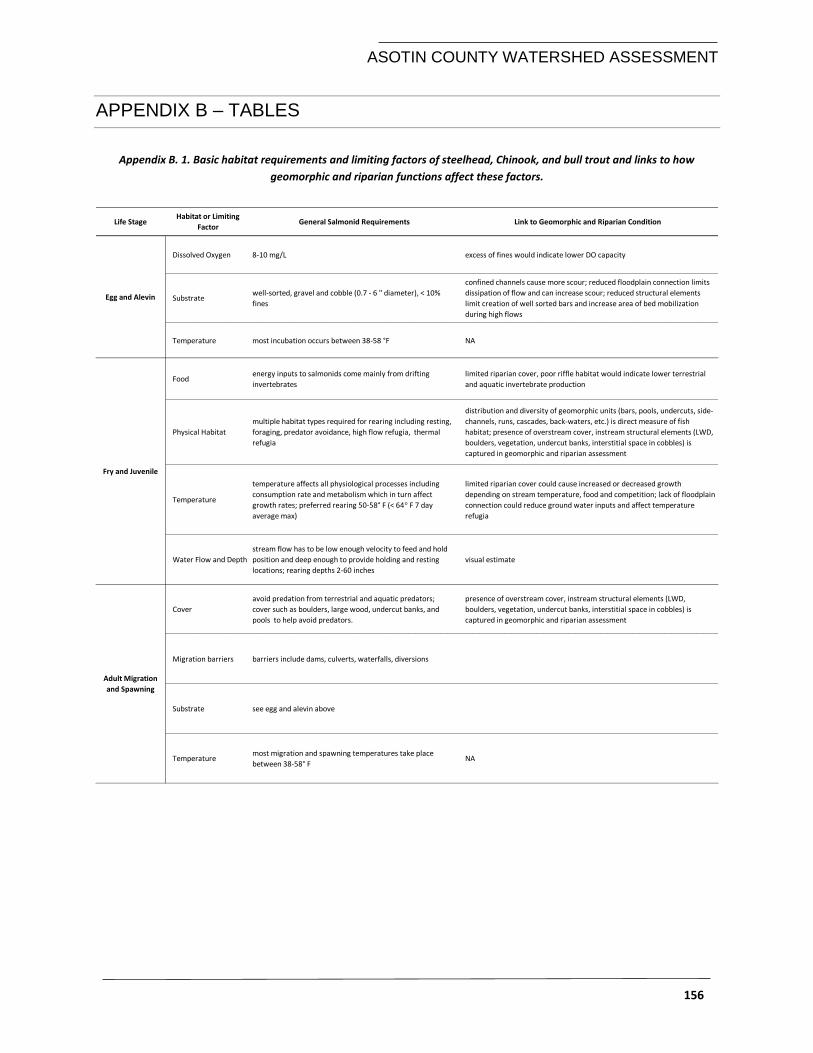
ASOTIN COUNTY WATERSHED ASSESSMENT
156
APPENDIX B – TABLES
Appendix B. 1. Basic habitat requirements and limiting factors of steelhead, Chinook, and bull trout and links to how
geomorphic and riparian functions affect these factors.
Life StageHabitat or Limiting
FactorGeneral Salmonid Requirements Link to Geomorphic and Riparian Condition
Dissolved Oxygen 8-10 mg/L excess of fines would indicate lower DO capacity
Substratewell-sorted, gravel and cobble (0.7 - 6 " diameter), < 10%
fines
confined channels cause more scour; reduced floodplain connection limits
dissipation of flow and can increase scour; reduced structural elements
limit creation of well sorted bars and increase area of bed mobilization
during high flows
Temperature most incubation occurs between 38-58 °F NA
Foodenergy inputs to salmonids come mainly from drifting
invertebrates
limited riparian cover, poor riffle habitat would indicate lower terrestrial
and aquatic invertebrate production
Physical Habitat
multiple habitat types required for rearing including resting,
foraging, predator avoidance, high flow refugia, thermal
refugia
distribution and diversity of geomorphic units (bars, pools, undercuts, side-
channels, runs, cascades, back-waters, etc.) is direct measure of fish
habitat; presence of overstream cover, instream structural elements (LWD,
boulders, vegetation, undercut banks, interstitial space in cobbles) is
captured in geomorphic and riparian assessment
Temperature
temperature affects all physiological processes including
consumption rate and metabolism which in turn affect
growth rates; preferred rearing 50-58° F (< 64° F 7 day
average max)
limited riparian cover could cause increased or decreased growth
depending on stream temperature, food and competition; lack of floodplain
connection could reduce ground water inputs and affect temperature
refugia
Water Flow and Depth
stream flow has to be low enough velocity to feed and hold
position and deep enough to provide holding and resting
locations; rearing depths 2-60 inches
visual estimate
Cover
avoid predation from terrestrial and aquatic predators;
cover such as boulders, large wood, undercut banks, and
pools to help avoid predators.
presence of overstream cover, instream structural elements (LWD,
boulders, vegetation, undercut banks, interstitial space in cobbles) is
captured in geomorphic and riparian assessment
Migration barriers barriers include dams, culverts, waterfalls, diversions
Substrate see egg and alevin above
Temperaturemost migration and spawning temperatures take place
between 38-58° FNA
Adult Migration
and Spawning
Egg and Alevin
Fry and Juvenile
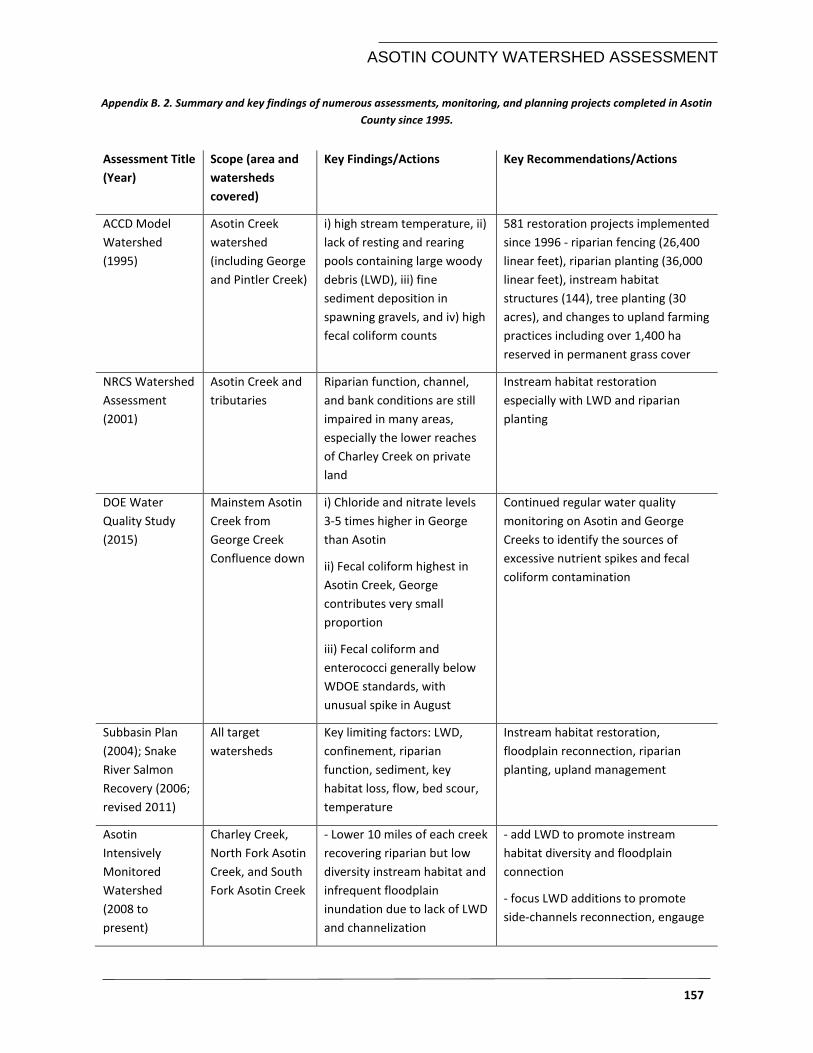
ASOTIN COUNTY WATERSHED ASSESSMENT
157
Appendix B. 2. Summary and key findings of numerous assessments, monitoring, and planning projects completed in Asotin
County since 1995.
Assessment Title
(Year)
Scope (area and
watersheds
covered)
Key Findings/Actions Key Recommendations/Actions
ACCD Model
Watershed
(1995)
Asotin Creek
watershed
(including George
and Pintler Creek)
i) high stream temperature, ii)
lack of resting and rearing
pools containing large woody
debris (LWD), iii) fine
sediment deposition in
spawning gravels, and iv) high
fecal coliform counts
581 restoration projects implemented
since 1996 - riparian fencing (26,400
linear feet), riparian planting (36,000
linear feet), instream habitat
structures (144), tree planting (30
acres), and changes to upland farming
practices including over 1,400 ha
reserved in permanent grass cover
NRCS Watershed
Assessment
(2001)
Asotin Creek and
tributaries
Riparian function, channel,
and bank conditions are still
impaired in many areas,
especially the lower reaches
of Charley Creek on private
land
Instream habitat restoration
especially with LWD and riparian
planting
DOE Water
Quality Study
(2015)
Mainstem Asotin
Creek from
George Creek
Confluence down
i) Chloride and nitrate levels
3-5 times higher in George
than Asotin
ii) Fecal coliform highest in
Asotin Creek, George
contributes very small
proportion
iii) Fecal coliform and
enterococci generally below
WDOE standards, with
unusual spike in August
Continued regular water quality
monitoring on Asotin and George
Creeks to identify the sources of
excessive nutrient spikes and fecal
coliform contamination
Subbasin Plan
(2004); Snake
River Salmon
Recovery (2006;
revised 2011)
All target
watersheds
Key limiting factors: LWD,
confinement, riparian
function, sediment, key
habitat loss, flow, bed scour,
temperature
Instream habitat restoration,
floodplain reconnection, riparian
planting, upland management
Asotin
Intensively
Monitored
Watershed
(2008 to
present)
Charley Creek,
North Fork Asotin
Creek, and South
Fork Asotin Creek
- Lower 10 miles of each creek
recovering riparian but low
diversity instream habitat and
infrequent floodplain
inundation due to lack of LWD
and channelization
- add LWD to promote instream
habitat diversity and floodplain
connection
- focus LWD additions to promote
side-channels reconnection, engauge
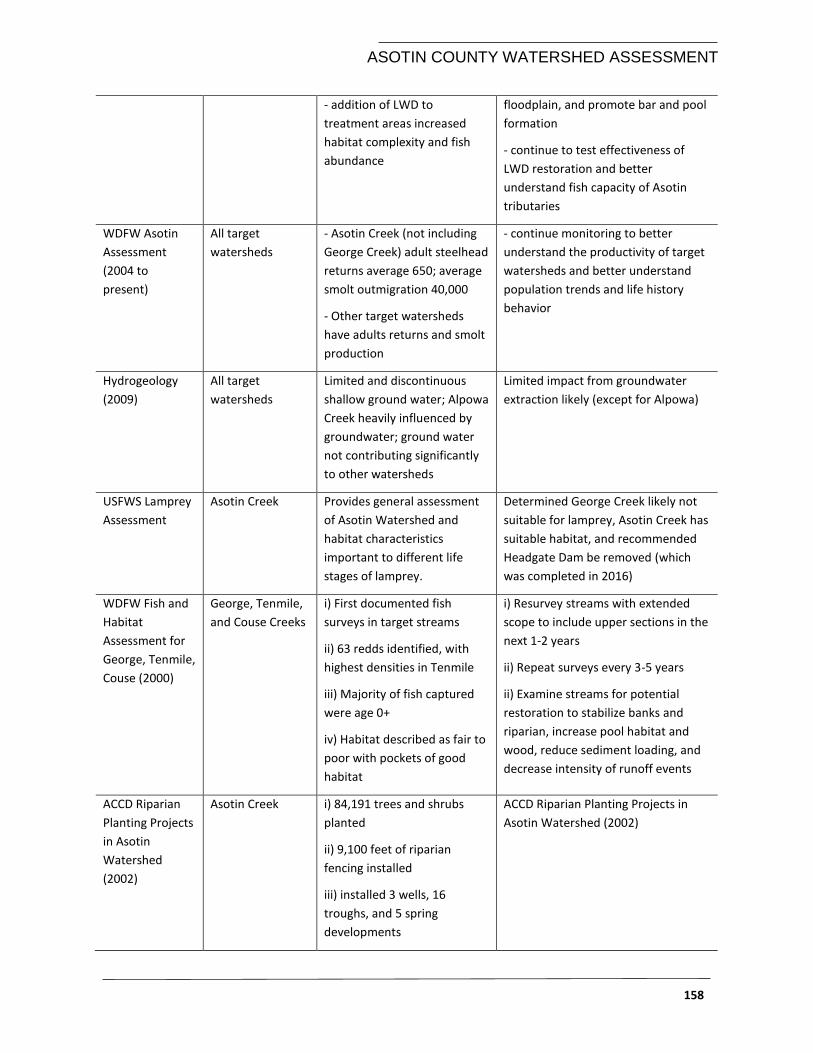
ASOTIN COUNTY WATERSHED ASSESSMENT
158
- addition of LWD to
treatment areas increased
habitat complexity and fish
abundance
floodplain, and promote bar and pool
formation
- continue to test effectiveness of
LWD restoration and better
understand fish capacity of Asotin
tributaries
WDFW Asotin
Assessment
(2004 to
present)
All target
watersheds
- Asotin Creek (not including
George Creek) adult steelhead
returns average 650; average
smolt outmigration 40,000
- Other target watersheds
have adults returns and smolt
production
- continue monitoring to better
understand the productivity of target
watersheds and better understand
population trends and life history
behavior
Hydrogeology
(2009)
All target
watersheds
Limited and discontinuous
shallow ground water; Alpowa
Creek heavily influenced by
groundwater; ground water
not contributing significantly
to other watersheds
Limited impact from groundwater
extraction likely (except for Alpowa)
USFWS Lamprey
Assessment
Asotin Creek Provides general assessment
of Asotin Watershed and
habitat characteristics
important to different life
stages of lamprey.
Determined George Creek likely not
suitable for lamprey, Asotin Creek has
suitable habitat, and recommended
Headgate Dam be removed (which
was completed in 2016)
WDFW Fish and
Habitat
Assessment for
George, Tenmile,
Couse (2000)
George, Tenmile,
and Couse Creeks
i) First documented fish
surveys in target streams
ii) 63 redds identified, with
highest densities in Tenmile
iii) Majority of fish captured
were age 0+
iv) Habitat described as fair to
poor with pockets of good
habitat
i) Resurvey streams with extended
scope to include upper sections in the
next 1-2 years
ii) Repeat surveys every 3-5 years
ii) Examine streams for potential
restoration to stabilize banks and
riparian, increase pool habitat and
wood, reduce sediment loading, and
decrease intensity of runoff events
ACCD Riparian
Planting Projects
in Asotin
Watershed
(2002)
Asotin Creek i) 84,191 trees and shrubs
planted
ii) 9,100 feet of riparian
fencing installed
iii) installed 3 wells, 16
troughs, and 5 spring
developments
ACCD Riparian Planting Projects in
Asotin Watershed (2002)
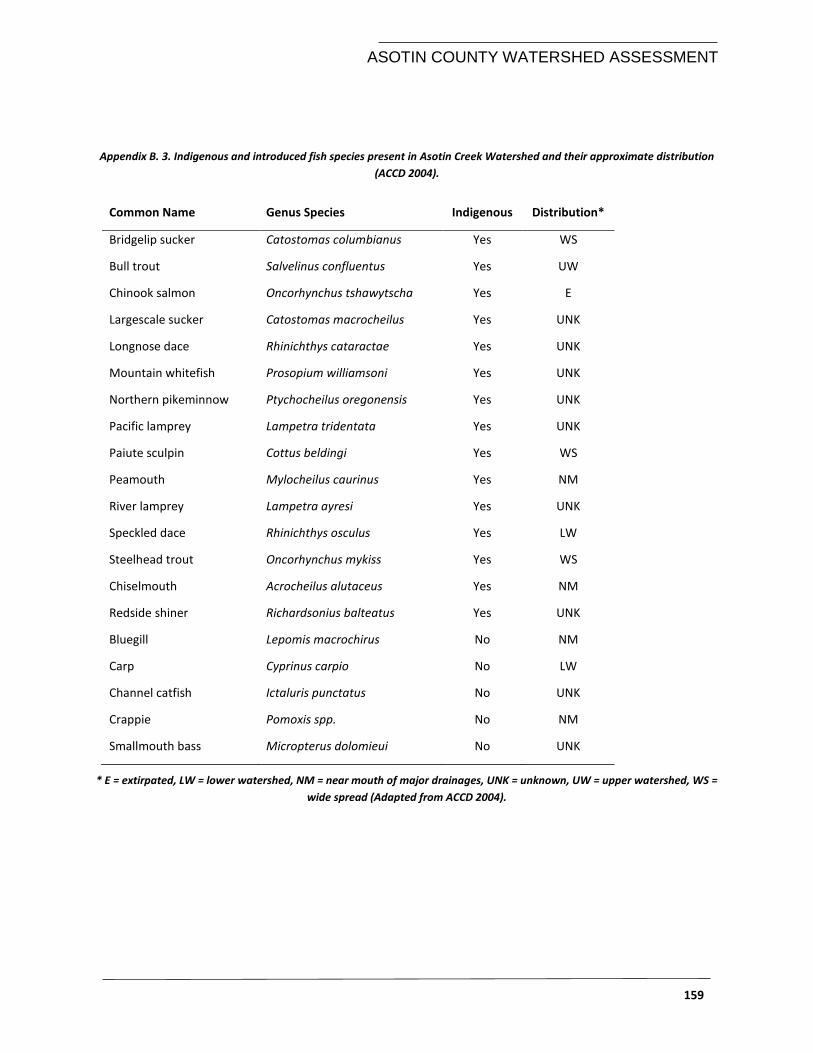
ASOTIN COUNTY WATERSHED ASSESSMENT
159
Appendix B. 3. Indigenous and introduced fish species present in Asotin Creek Watershed and their approximate distribution
(ACCD 2004).
Common Name Genus Species Indigenous Distribution*
Bridgelip sucker Catostomas columbianus Yes WS
Bull trout Salvelinus confluentus Yes UW
Chinook salmon Oncorhynchus tshawytscha Yes E
Largescale sucker Catostomas macrocheilus Yes UNK
Longnose dace Rhinichthys cataractae Yes UNK
Mountain whitefish Prosopium williamsoni Yes UNK
Northern pikeminnow Ptychocheilus oregonensis Yes UNK
Pacific lamprey Lampetra tridentata Yes UNK
Paiute sculpin Cottus beldingi Yes WS
Peamouth Mylocheilus caurinus Yes NM
River lamprey Lampetra ayresi Yes UNK
Speckled dace Rhinichthys osculus Yes LW
Steelhead trout Oncorhynchus mykiss Yes WS
Chiselmouth Acrocheilus alutaceus Yes NM
Redside shiner Richardsonius balteatus Yes UNK
Bluegill Lepomis macrochirus No NM
Carp Cyprinus carpio No LW
Channel catfish Ictaluris punctatus No UNK
Crappie Pomoxis spp. No NM
Smallmouth bass Micropterus dolomieui No UNK
* E = extirpated, LW = lower watershed, NM = near mouth of major drainages, UNK = unknown, UW = upper watershed, WS =
wide spread (Adapted from ACCD 2004).
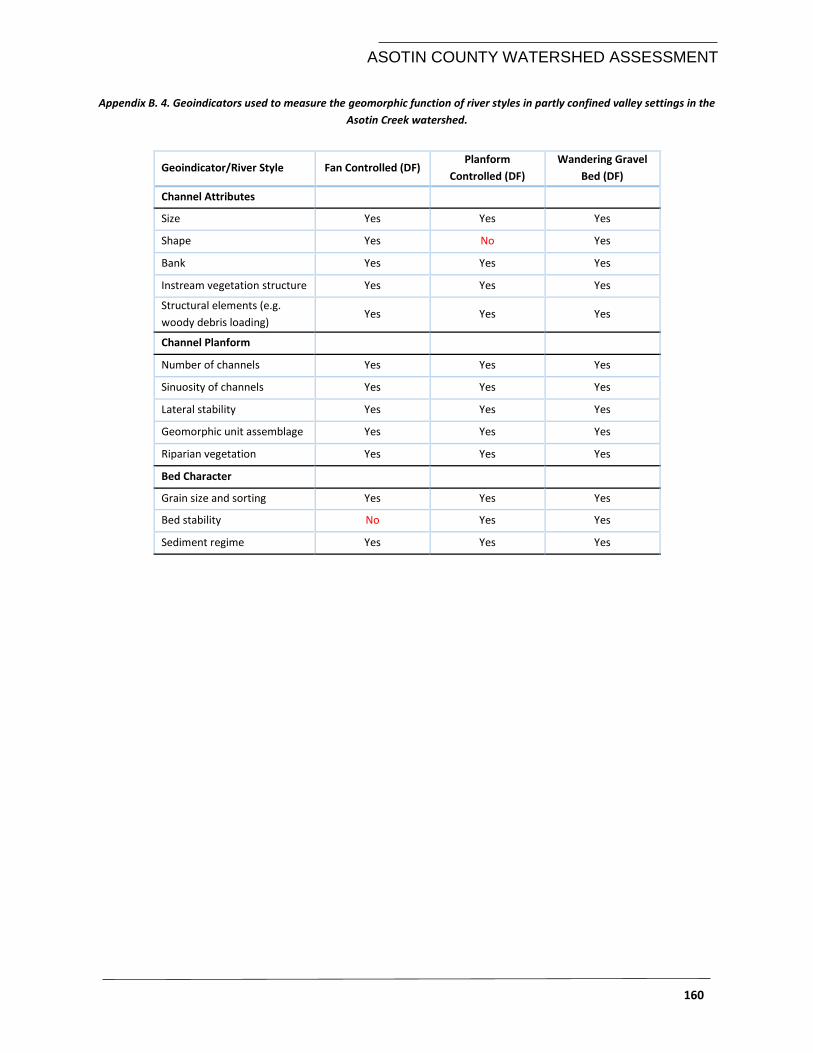
ASOTIN COUNTY WATERSHED ASSESSMENT
160
Appendix B. 4. Geoindicators used to measure the geomorphic function of river styles in partly confined valley settings in the
Asotin Creek watershed.
Geoindicator/River Style Fan Controlled (DF) Planform
Controlled (DF)
Wandering Gravel
Bed (DF)
Channel Attributes
Size Yes Yes Yes
Shape Yes No Yes
Bank Yes Yes Yes
Instream vegetation structure Yes Yes Yes
Structural elements (e.g.
woody debris loading) Yes Yes Yes
Channel Planform
Number of channels Yes Yes Yes
Sinuosity of channels Yes Yes Yes
Lateral stability Yes Yes Yes
Geomorphic unit assemblage Yes Yes Yes
Riparian vegetation Yes Yes Yes
Bed Character
Grain size and sorting Yes Yes Yes
Bed stability No Yes Yes
Sediment regime Yes Yes Yes
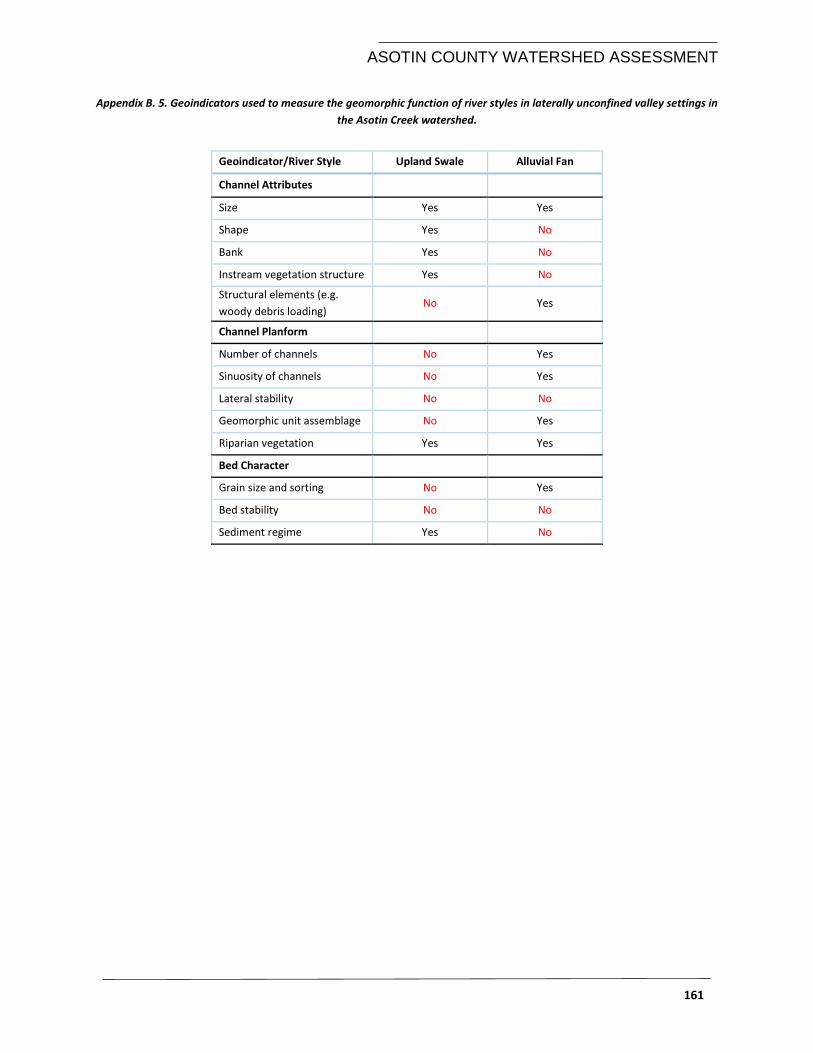
ASOTIN COUNTY WATERSHED ASSESSMENT
161
Appendix B. 5. Geoindicators used to measure the geomorphic function of river styles in laterally unconfined valley settings in
the Asotin Creek watershed.
Geoindicator/River Style Upland Swale Alluvial Fan
Channel Attributes
Size Yes Yes
Shape Yes No
Bank Yes No
Instream vegetation structure Yes No
Structural elements (e.g.
woody debris loading) No Yes
Channel Planform
Number of channels No Yes
Sinuosity of channels No Yes
Lateral stability No No
Geomorphic unit assemblage No Yes
Riparian vegetation Yes Yes
Bed Character
Grain size and sorting No Yes
Bed stability No No
Sediment regime Yes No
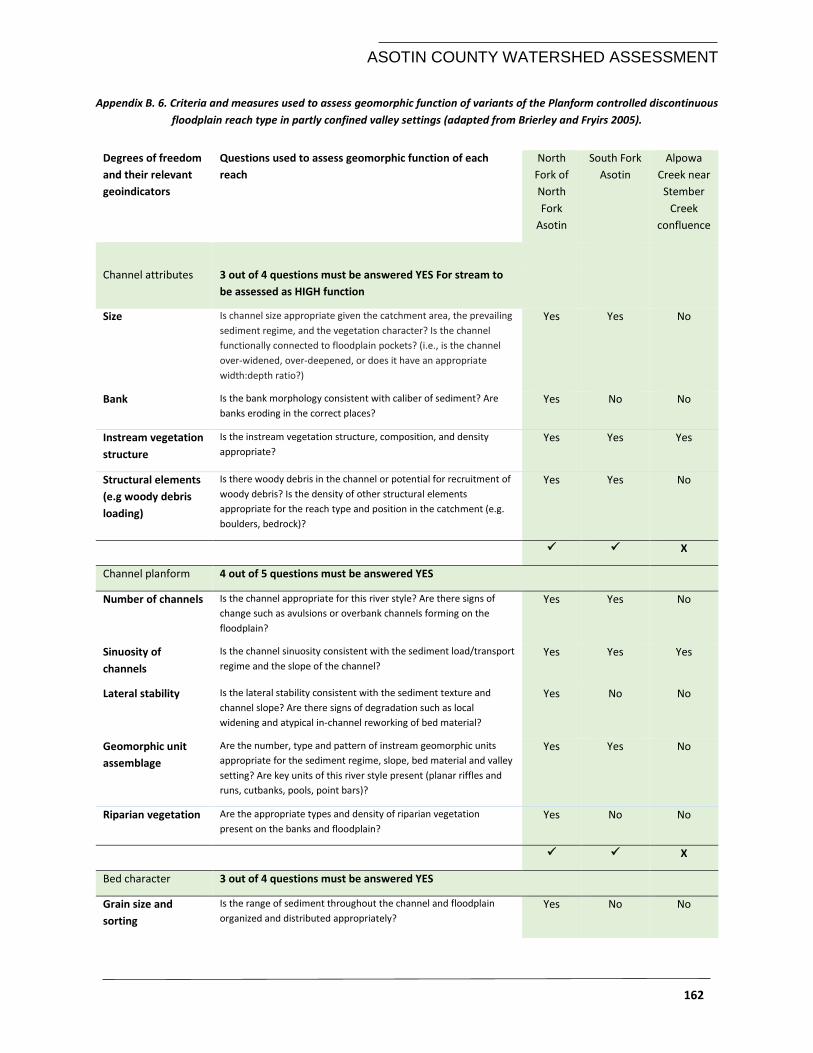
ASOTIN COUNTY WATERSHED ASSESSMENT
162
Appendix B. 6. Criteria and measures used to assess geomorphic function of variants of the Planform controlled discontinuous
floodplain reach type in partly confined valley settings (adapted from Brierley and Fryirs 2005).
Degrees of freedom
and their relevant
geoindicators
Questions used to assess geomorphic function of each
reach
North
Fork of
North
Fork
Asotin
South Fork
Asotin
Alpowa
Creek near
Stember
Creek
confluence
Channel attributes 3 out of 4 questions must be answered YES For stream to
be assessed as HIGH function
Size Is channel size appropriate given the catchment area, the prevailing
sediment regime, and the vegetation character? Is the channel
functionally connected to floodplain pockets? (i.e., is the channel
over-widened, over-deepened, or does it have an appropriate
width:depth ratio?)
Yes Yes No
Bank Is the bank morphology consistent with caliber of sediment? Are
banks eroding in the correct places?
Yes No No
Instream vegetation
structure
Is the instream vegetation structure, composition, and density
appropriate?
Yes Yes Yes
Structural elements
(e.g woody debris
loading)
Is there woody debris in the channel or potential for recruitment of
woody debris? Is the density of other structural elements
appropriate for the reach type and position in the catchment (e.g.
boulders, bedrock)?
Yes Yes No
X
Channel planform 4 out of 5 questions must be answered YES
Number of channels Is the channel appropriate for this river style? Are there signs of
change such as avulsions or overbank channels forming on the
floodplain?
Yes Yes No
Sinuosity of
channels
Is the channel sinuosity consistent with the sediment load/transport
regime and the slope of the channel?
Yes Yes Yes
Lateral stability Is the lateral stability consistent with the sediment texture and
channel slope? Are there signs of degradation such as local
widening and atypical in-channel reworking of bed material?
Yes No No
Geomorphic unit
assemblage
Are the number, type and pattern of instream geomorphic units
appropriate for the sediment regime, slope, bed material and valley
setting? Are key units of this river style present (planar riffles and
runs, cutbanks, pools, point bars)?
Yes Yes No
Riparian vegetation Are the appropriate types and density of riparian vegetation
present on the banks and floodplain?
Yes No No
X
Bed character 3 out of 4 questions must be answered YES
Grain size and
sorting
Is the range of sediment throughout the channel and floodplain
organized and distributed appropriately?
Yes No No
ASOTIN COUNTY WATERSHED ASSESSMENT
163
Bed stability Is the bed vertically stable such that it is not incising or aggrading
inappropriately for the channel slope, sediment caliber, and
sinuosity?
Yes Yes Yes
Sediment regime Is the sediment storage and transport function of the reach
appropriate for the catchment position (i.e., is it a sediment transfer
or accumulation zone?)?
Yes Yes No
Hydraulic diversity Are roughness characteristics and the pattern of hydraulic diversity
appropriate for the catchment position?
Yes No No
X X
Total checks and crosses are added for each stream reach 3 1 0
Geomorphic
function
High Moderate Limited
Appendix B. 7. Criteria and measures used to assess geomorphic function of variants of the Wandering gravel bed with
discontinuous floodplain reach type in partly confined valley settings (Brierley and Fryirs 2005). See Table Appendix for other
reach types.
Degrees of freedom
and their relevant
geoindicators
Questions used to assess geomorphic function of
each reach
North
Fork
Asotin
Creek
~RM 7
Asotin
Creek
below
Charley
Creek
Asotin
Creek
near
mouth
George
Creek
near
mouth
Channel attributes 4 out of 5 questions must be answered YES For
stream to be assessed as HIGH function
Size Is channel size appropriate given the catchment
area, the prevailing sediment regime, and the
vegetation character? Is the channel functionally
connected to floodplain? (i.e., is the channel over-
widened, over-deepened, or does it have an
appropriate width:depth ratio?)
Yes No Yes Yes
Shape Is the channel shape consistent with partly
confined valley features (typically asymmetrical)?
Yes Yes Yes No
Bank Is the bank morphology consistent with caliber of
sediment? Are banks eroding in the correct places?
Yes No No No
Instream vegetation
structure
Is the instream vegetation structure, composition,
and density appropriate?
Yes Yes Yes No
Structural elements
(e.g. woody debris
loading)
Is there woody debris in the channel or potential
for recruitment of woody debris? Is the density of
other structural elements appropriate for the
reach type and position in the catchment (e.g.
boulders, bedrock)?
Yes Yes No No
X X X
Channel planform 4 out of 5 questions must be answered YES
ASOTIN COUNTY WATERSHED ASSESSMENT
164
Number of channels Is the channel appropriate for this river style? Are
there secondary channels or accessible flood
channels?
Yes No No No
Sinuosity of
channels
Is the channel sinuosity consistent with the
sediment load/transport regime and the slope of
the channel?
Yes Yes Yes No
Lateral stability Is lateral stability consistent with sediment texture
and channel slope? Is there minimal degradation
(e.g., local widening/atypical in-channel reworking
of bed material?
Yes No No No
Geomorphic unit
assemblage
Are the number, type and pattern of instream
geomorphic units appropriate for the sediment
regime, slope, bed material and valley setting? Are
key units of this river style present (secondary
channels, pool-riffle, forced pools, gravel sheets)?
Yes Yes No No
Riparian vegetation Are the appropriate types and density of riparian
vegetation present on the banks and floodplain?
Yes No No No
X X X
Bed character 3 out of 4 questions must be answered YES
Grain size and
sorting
Is the range of sediment throughout the channel
and floodplain organized and distributed
appropriately?
Yes Yes No No
Bed stability Is the bed vertically stable such that it is not
incising or aggrading inappropriately for the
channel slope, sediment caliber, and sinuosity?
Yes Yes Yes No
Sediment regime Is the sediment storage and transport function of
the reach appropriate for the catchment position
(i.e., is it a sediment transfer or accumulation
zone?)?
Yes Yes Yes No
Hydraulic diversity Are roughness characteristics and pattern of
hydraulic diversity appropriate for the catchment
position?
Yes Yes No No
X X
Total checks are added for each stream reach 3 1 0 0
Geomorphic function High Moderate Limited Limited
ASOTIN COUNTY WATERSHED ASSESSMENT
165
Appendix B. 8. Criteria and measures used to assess geomorphic function of variants of the Fan controlled with discontinuous
floodplain reach type in partly confined valley settings (Brierley and Fryirs 2005).
Degrees of freedom
and their relevant
geoindicators
Questions used to assess geomorphic function of each reach Couse
Creek
near
mouth
Charley
Creek
~RKM 8
Charley
Creek
~RKM 6
Channel attributes 4 out of 5 questions must be answered YES For stream to
be assessed as HIGH function
Size Is channel size appropriate given the catchment area, the prevailing
sediment regime, and the vegetation character? Is the channel
functionally connected to floodplain pockets? (i.e., is the channel
over-widened, over-deepened, or does it have an appropriate
width:depth ratio?)
Yes Yes Yes
Shape Is the channel shape consistent with partly confined valley features
(typically asymmetrical)?
Yes Yes Yes
Bank Is the bank morphology consistent with caliber of sediment? Are
banks eroding in the correct places?
Yes Yes No
Instream
vegetation
structure
Is the instream vegetation structure, composition, and density
appropriate?
Yes Yes Yes
Structural elements
(e.g woody debris
loading)
Is there woody debris in the channel or potential for recruitment of
woody debris? Is the density of other structural elements
appropriate for the reach type and position in the catchment (e.g.
boulders, bedrock)?
No Yes No
X
Channel planform 4 out of 5 questions must be answered YES
Number of
channels
Is the channel appropriate for this river style? Is the channel mostly
single thread?
Yes Yes Yes
Sinuosity of
channels
Is the channel sinuosity consistent with the sediment load/transport
regime and the slope of the channel?
Yes Yes No
Lateral stability Is the lateral stability consistent with the sediment texture and
channel slope? Is there a low amount of degradation such as local
widening and atypical in-channel reworking of bed material?
No No No
Geomorphic unit
assemblage
Are the number, type and pattern of instream geomorphic units
appropriate for the sediment regime, slope, bed material and valley
setting? Are key units of this river style present (runs, rapids, forced
pools, forced bars)?
No Yes No
Riparian vegetation Are the appropriate types and density of riparian vegetation present
on the banks and floodplain?
Yes Yes No
X X
Bed character 3 out of 4 questions must be answered YES
Grain size and
sorting
Is the range of sediment throughout the channel and floodplain
organized and distributed appropriately?
No No No
ASOTIN COUNTY WATERSHED ASSESSMENT
166
Bed stability Is the bed vertically stable such that it is not incising or aggrading
inappropriately for the channel slope, sediment caliber, and
sinuosity?
Yes Yes Yes
Sediment regime Is the sediment storage and transport function of the reach
appropriate for the catchment position (i.e., is it a sediment transfer
or accumulation zone?)?
Yes Yes No
Hydraulic diversity Are roughness characteristics and the pattern of hydraulic diversity
appropriate for the catchment position?
Yes No No
X X
Total checks and crosses are added for each stream reach 2 2 0
Geomorphic
function
Moderate Moderate Limited
Appendix B. 9. Criteria and measures used to assess geomorphic function of variants of the Wandering gravel bed with
discontinuous floodplain reach type in partly confined valley settings (Brierley and Fryirs 2005).
Degrees of freedom
and their relevant
geoindicators
Questions used to assess geomorphic function of
each reach
North
Fork
Asotin
Creek
~RKM 12
Asotin
Creek
below
Charley
Creek
Asotin
Creek
near
mouth
George
Creek
near
mouth
Channel attributes 4 out of 5 questions must be answered YES For
stream to be assessed as HIGH function
Size Is channel size appropriate given the catchment area,
the prevailing sediment regime, and the vegetation
character? Is the channel functionally connected to
floodplain pockets? (i.e., is the channel over-widened,
over-deepened, or does it have an appropriate
width:depth ratio?)
Yes No Yes Yes
Shape Is the channel shape consistent with partly confined
valley features (typically asymmetrical)?
Yes Yes Yes No
Bank Is the bank morphology consistent with caliber of
sediment? Are banks eroding in the correct places?
Yes No No No
Instream vegetation
structure
Is the instream vegetation structure, composition, and
density appropriate?
Yes Yes Yes No
Structural elements
(e.g woody debris
loading)
Is there woody debris in the channel or potential for
recruitment of woody debris? Is the density of other
structural elements appropriate for the reach type and
position in the catchment (e.g. boulders, bedrock)?
Yes Yes No No
X X X
Channel planform 4 out of 5 questions must be answered YES
Number of channels Is the channel appropriate for this river style? Are there
secondary channels or accessible flood channels?
Yes No No No
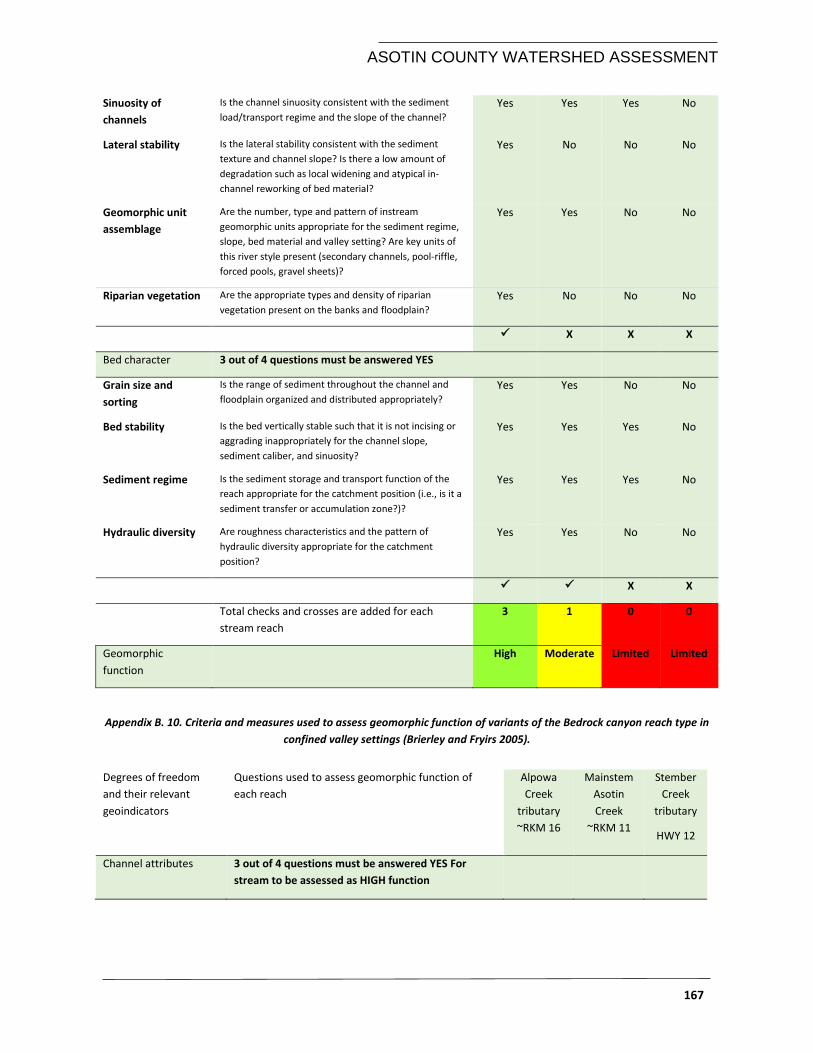
ASOTIN COUNTY WATERSHED ASSESSMENT
167
Sinuosity of
channels
Is the channel sinuosity consistent with the sediment
load/transport regime and the slope of the channel?
Yes Yes Yes No
Lateral stability Is the lateral stability consistent with the sediment
texture and channel slope? Is there a low amount of
degradation such as local widening and atypical in-
channel reworking of bed material?
Yes No No No
Geomorphic unit
assemblage
Are the number, type and pattern of instream
geomorphic units appropriate for the sediment regime,
slope, bed material and valley setting? Are key units of
this river style present (secondary channels, pool-riffle,
forced pools, gravel sheets)?
Yes Yes No No
Riparian vegetation Are the appropriate types and density of riparian
vegetation present on the banks and floodplain?
Yes No No No
X X X
Bed character 3 out of 4 questions must be answered YES
Grain size and
sorting
Is the range of sediment throughout the channel and
floodplain organized and distributed appropriately?
Yes Yes No No
Bed stability Is the bed vertically stable such that it is not incising or
aggrading inappropriately for the channel slope,
sediment caliber, and sinuosity?
Yes Yes Yes No
Sediment regime Is the sediment storage and transport function of the
reach appropriate for the catchment position (i.e., is it a
sediment transfer or accumulation zone?)?
Yes Yes Yes No
Hydraulic diversity Are roughness characteristics and the pattern of
hydraulic diversity appropriate for the catchment
position?
Yes Yes No No
X X
Total checks and crosses are added for each
stream reach
3 1 0 0
Geomorphic
function
High Moderate Limited Limited
Appendix B. 10. Criteria and measures used to assess geomorphic function of variants of the Bedrock canyon reach type in
confined valley settings (Brierley and Fryirs 2005).
Degrees of freedom
and their relevant
geoindicators
Questions used to assess geomorphic function of
each reach
Alpowa
Creek
tributary
~RKM 16
Mainstem
Asotin
Creek
~RKM 11
Stember
Creek
tributary
HWY 12
Channel attributes 3 out of 4 questions must be answered YES For
stream to be assessed as HIGH function
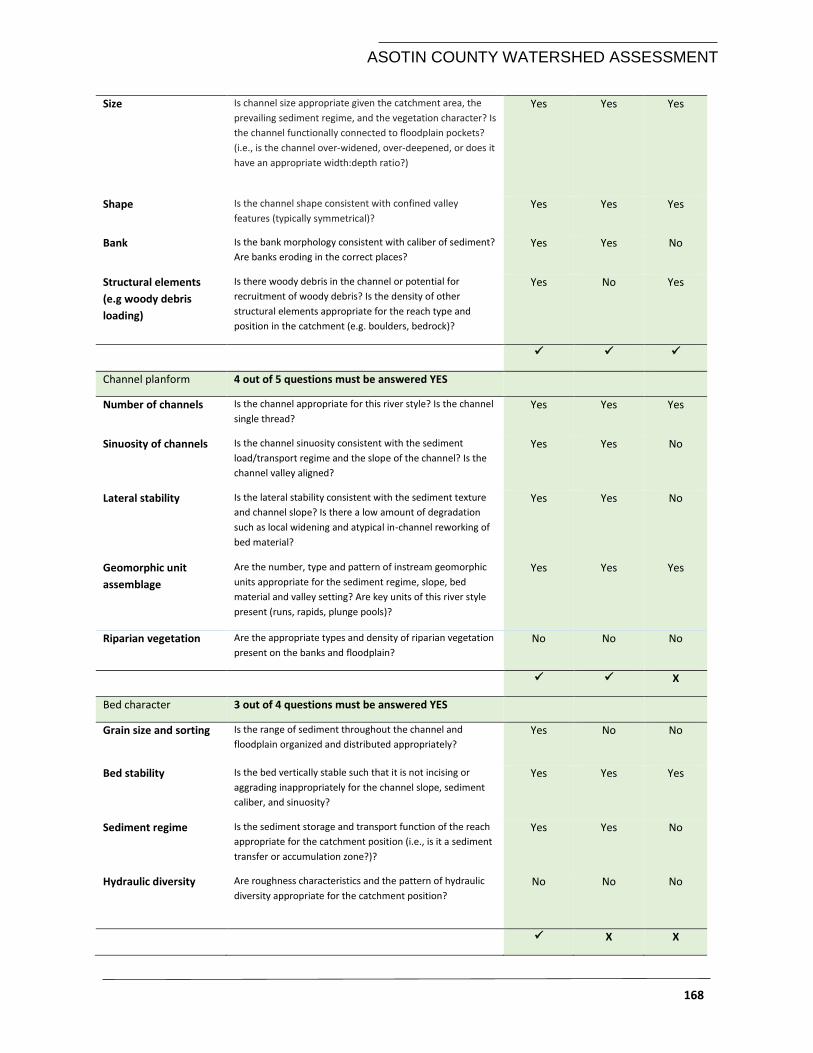
ASOTIN COUNTY WATERSHED ASSESSMENT
168
Size Is channel size appropriate given the catchment area, the
prevailing sediment regime, and the vegetation character? Is
the channel functionally connected to floodplain pockets?
(i.e., is the channel over-widened, over-deepened, or does it
have an appropriate width:depth ratio?)
Yes Yes Yes
Shape Is the channel shape consistent with confined valley
features (typically symmetrical)?
Yes Yes Yes
Bank Is the bank morphology consistent with caliber of sediment?
Are banks eroding in the correct places?
Yes Yes No
Structural elements
(e.g woody debris
loading)
Is there woody debris in the channel or potential for
recruitment of woody debris? Is the density of other
structural elements appropriate for the reach type and
position in the catchment (e.g. boulders, bedrock)?
Yes No Yes
Channel planform 4 out of 5 questions must be answered YES
Number of channels Is the channel appropriate for this river style? Is the channel
single thread?
Yes Yes Yes
Sinuosity of channels Is the channel sinuosity consistent with the sediment
load/transport regime and the slope of the channel? Is the
channel valley aligned?
Yes Yes No
Lateral stability Is the lateral stability consistent with the sediment texture
and channel slope? Is there a low amount of degradation
such as local widening and atypical in-channel reworking of
bed material?
Yes Yes No
Geomorphic unit
assemblage
Are the number, type and pattern of instream geomorphic
units appropriate for the sediment regime, slope, bed
material and valley setting? Are key units of this river style
present (runs, rapids, plunge pools)?
Yes Yes Yes
Riparian vegetation Are the appropriate types and density of riparian vegetation
present on the banks and floodplain?
No No No
X
Bed character 3 out of 4 questions must be answered YES
Grain size and sorting Is the range of sediment throughout the channel and
floodplain organized and distributed appropriately?
Yes No No
Bed stability Is the bed vertically stable such that it is not incising or
aggrading inappropriately for the channel slope, sediment
caliber, and sinuosity?
Yes Yes Yes
Sediment regime Is the sediment storage and transport function of the reach
appropriate for the catchment position (i.e., is it a sediment
transfer or accumulation zone?)?
Yes Yes No
Hydraulic diversity Are roughness characteristics and the pattern of hydraulic
diversity appropriate for the catchment position?
No No No
X X
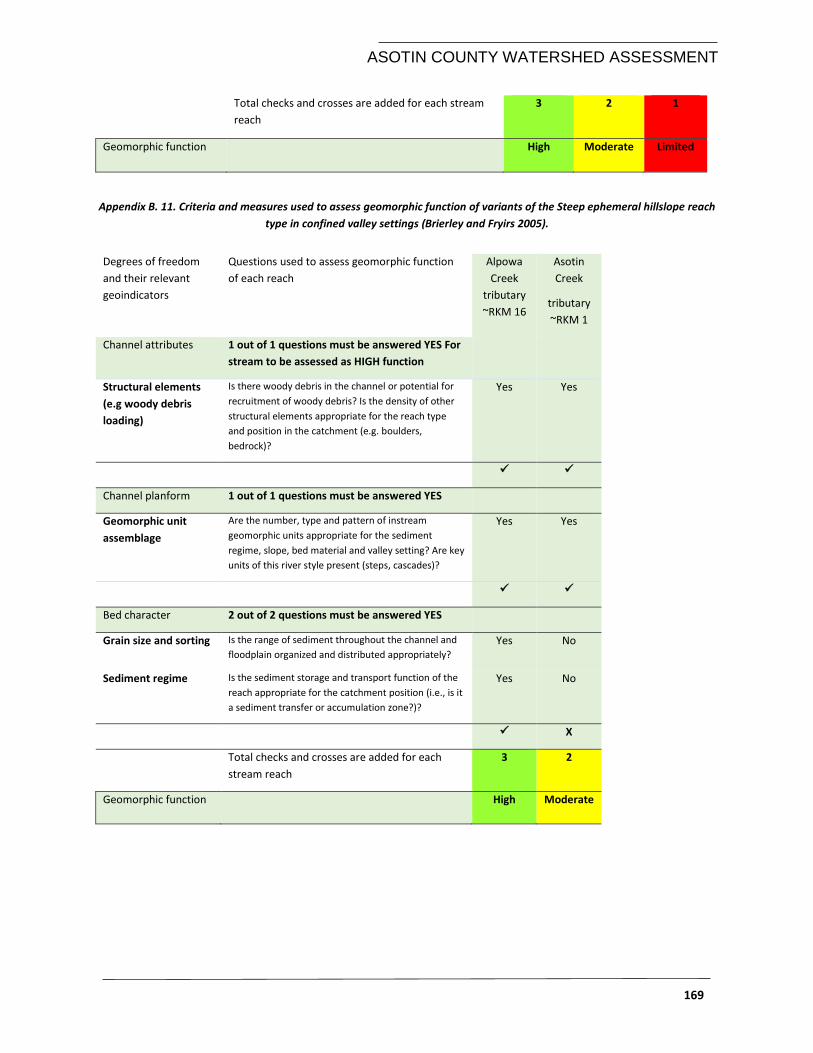
ASOTIN COUNTY WATERSHED ASSESSMENT
169
Total checks and crosses are added for each stream
reach
3 2 1
Geomorphic function High Moderate Limited
Appendix B. 11. Criteria and measures used to assess geomorphic function of variants of the Steep ephemeral hillslope reach
type in confined valley settings (Brierley and Fryirs 2005).
Degrees of freedom
and their relevant
geoindicators
Questions used to assess geomorphic function
of each reach
Alpowa
Creek
tributary
~RKM 16
Asotin
Creek
tributary
~RKM 1
Channel attributes 1 out of 1 questions must be answered YES For
stream to be assessed as HIGH function
Structural elements
(e.g woody debris
loading)
Is there woody debris in the channel or potential for
recruitment of woody debris? Is the density of other
structural elements appropriate for the reach type
and position in the catchment (e.g. boulders,
bedrock)?
Yes Yes
Channel planform 1 out of 1 questions must be answered YES
Geomorphic unit
assemblage
Are the number, type and pattern of instream
geomorphic units appropriate for the sediment
regime, slope, bed material and valley setting? Are key
units of this river style present (steps, cascades)?
Yes Yes
Bed character 2 out of 2 questions must be answered YES
Grain size and sorting Is the range of sediment throughout the channel and
floodplain organized and distributed appropriately?
Yes No
Sediment regime Is the sediment storage and transport function of the
reach appropriate for the catchment position (i.e., is it
a sediment transfer or accumulation zone?)?
Yes No
X
Total checks and crosses are added for each
stream reach
3 2
Geomorphic function High Moderate
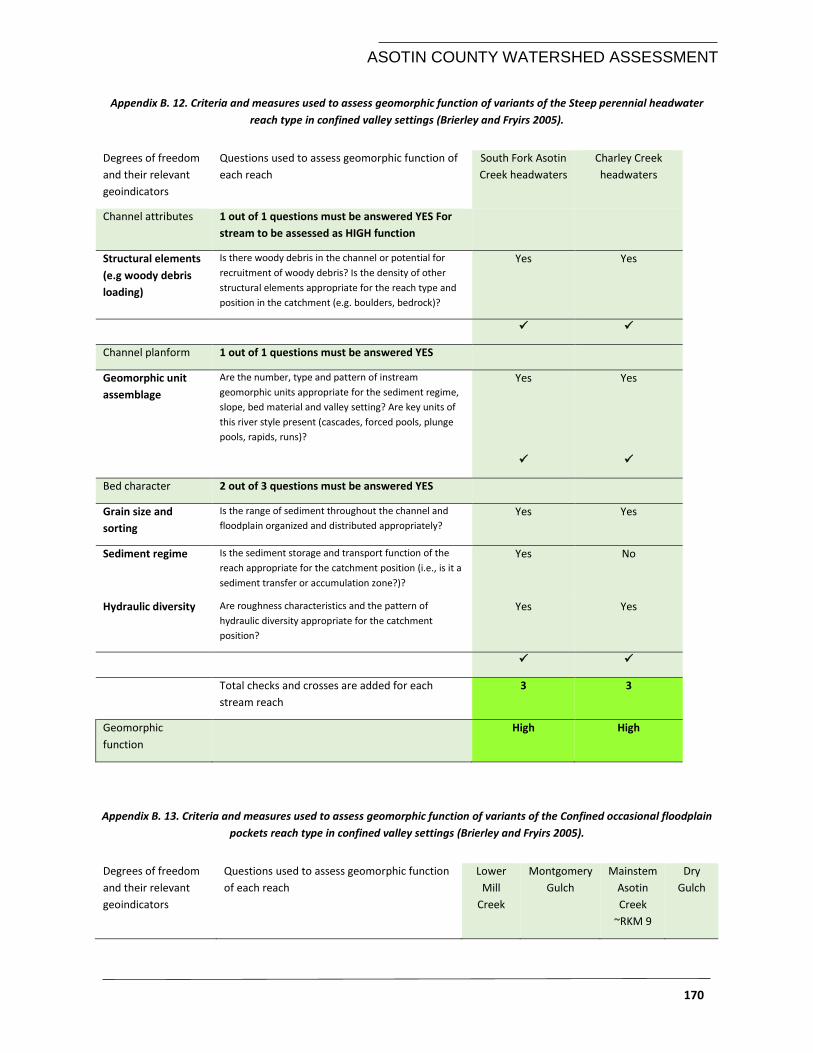
ASOTIN COUNTY WATERSHED ASSESSMENT
170
Appendix B. 12. Criteria and measures used to assess geomorphic function of variants of the Steep perennial headwater
reach type in confined valley settings (Brierley and Fryirs 2005).
Degrees of freedom
and their relevant
geoindicators
Questions used to assess geomorphic function of
each reach
South Fork Asotin
Creek headwaters
Charley Creek
headwaters
Channel attributes 1 out of 1 questions must be answered YES For
stream to be assessed as HIGH function
Structural elements
(e.g woody debris
loading)
Is there woody debris in the channel or potential for
recruitment of woody debris? Is the density of other
structural elements appropriate for the reach type and
position in the catchment (e.g. boulders, bedrock)?
Yes Yes
Channel planform 1 out of 1 questions must be answered YES
Geomorphic unit
assemblage
Are the number, type and pattern of instream
geomorphic units appropriate for the sediment regime,
slope, bed material and valley setting? Are key units of
this river style present (cascades, forced pools, plunge
pools, rapids, runs)?
Yes Yes
Bed character 2 out of 3 questions must be answered YES
Grain size and
sorting
Is the range of sediment throughout the channel and
floodplain organized and distributed appropriately?
Yes Yes
Sediment regime Is the sediment storage and transport function of the
reach appropriate for the catchment position (i.e., is it a
sediment transfer or accumulation zone?)?
Yes No
Hydraulic diversity Are roughness characteristics and the pattern of
hydraulic diversity appropriate for the catchment
position?
Yes Yes
Total checks and crosses are added for each
stream reach
3 3
Geomorphic
function
High High
Appendix B. 13. Criteria and measures used to assess geomorphic function of variants of the Confined occasional floodplain
pockets reach type in confined valley settings (Brierley and Fryirs 2005).
Degrees of freedom
and their relevant
geoindicators
Questions used to assess geomorphic function
of each reach
Lower
Mill
Creek
Montgomery
Gulch
Mainstem
Asotin
Creek
~RKM 9
Dry
Gulch
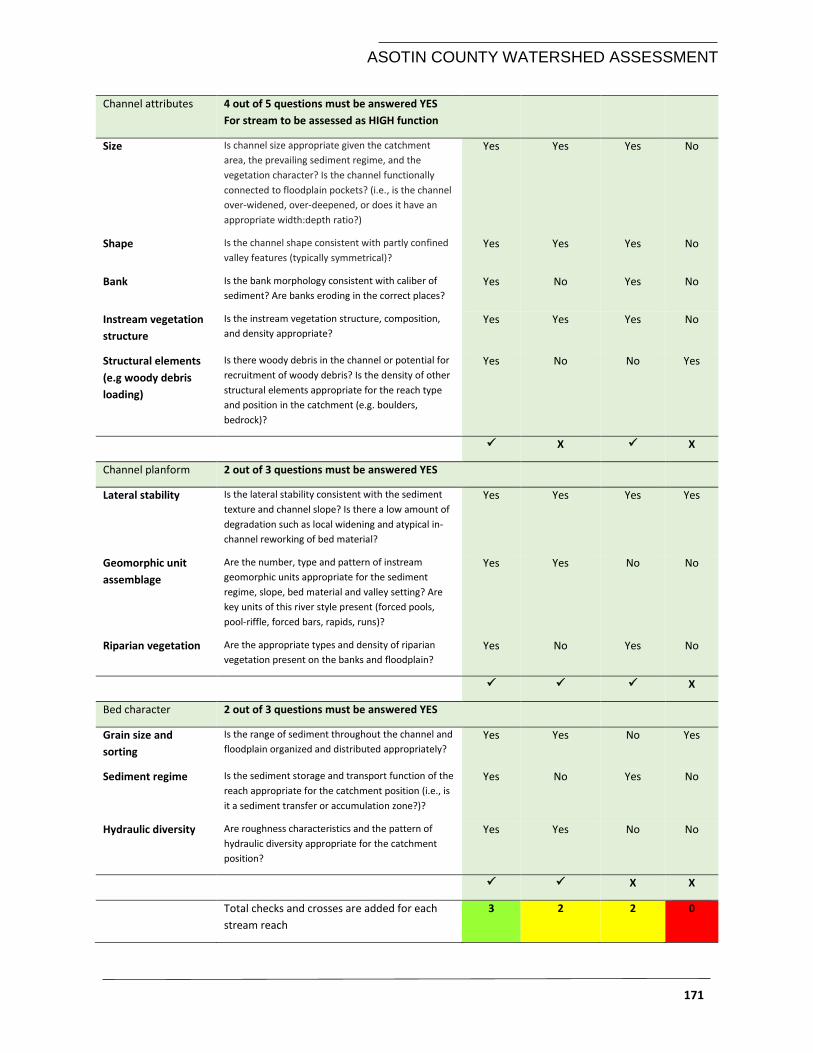
ASOTIN COUNTY WATERSHED ASSESSMENT
171
Channel attributes 4 out of 5 questions must be answered YES
For stream to be assessed as HIGH function
Size Is channel size appropriate given the catchment
area, the prevailing sediment regime, and the
vegetation character? Is the channel functionally
connected to floodplain pockets? (i.e., is the channel
over-widened, over-deepened, or does it have an
appropriate width:depth ratio?)
Yes Yes Yes No
Shape Is the channel shape consistent with partly confined
valley features (typically symmetrical)?
Yes Yes Yes No
Bank Is the bank morphology consistent with caliber of
sediment? Are banks eroding in the correct places?
Yes No Yes No
Instream vegetation
structure
Is the instream vegetation structure, composition,
and density appropriate?
Yes Yes Yes No
Structural elements
(e.g woody debris
loading)
Is there woody debris in the channel or potential for
recruitment of woody debris? Is the density of other
structural elements appropriate for the reach type
and position in the catchment (e.g. boulders,
bedrock)?
Yes No No Yes
X X
Channel planform 2 out of 3 questions must be answered YES
Lateral stability Is the lateral stability consistent with the sediment
texture and channel slope? Is there a low amount of
degradation such as local widening and atypical in-
channel reworking of bed material?
Yes Yes Yes Yes
Geomorphic unit
assemblage
Are the number, type and pattern of instream
geomorphic units appropriate for the sediment
regime, slope, bed material and valley setting? Are
key units of this river style present (forced pools,
pool-riffle, forced bars, rapids, runs)?
Yes Yes No No
Riparian vegetation Are the appropriate types and density of riparian
vegetation present on the banks and floodplain?
Yes No Yes No
X
Bed character 2 out of 3 questions must be answered YES
Grain size and
sorting
Is the range of sediment throughout the channel and
floodplain organized and distributed appropriately?
Yes Yes No Yes
Sediment regime Is the sediment storage and transport function of the
reach appropriate for the catchment position (i.e., is
it a sediment transfer or accumulation zone?)?
Yes No Yes No
Hydraulic diversity Are roughness characteristics and the pattern of
hydraulic diversity appropriate for the catchment
position?
Yes Yes No No
X X
Total checks and crosses are added for each
stream reach
3 2 2 0
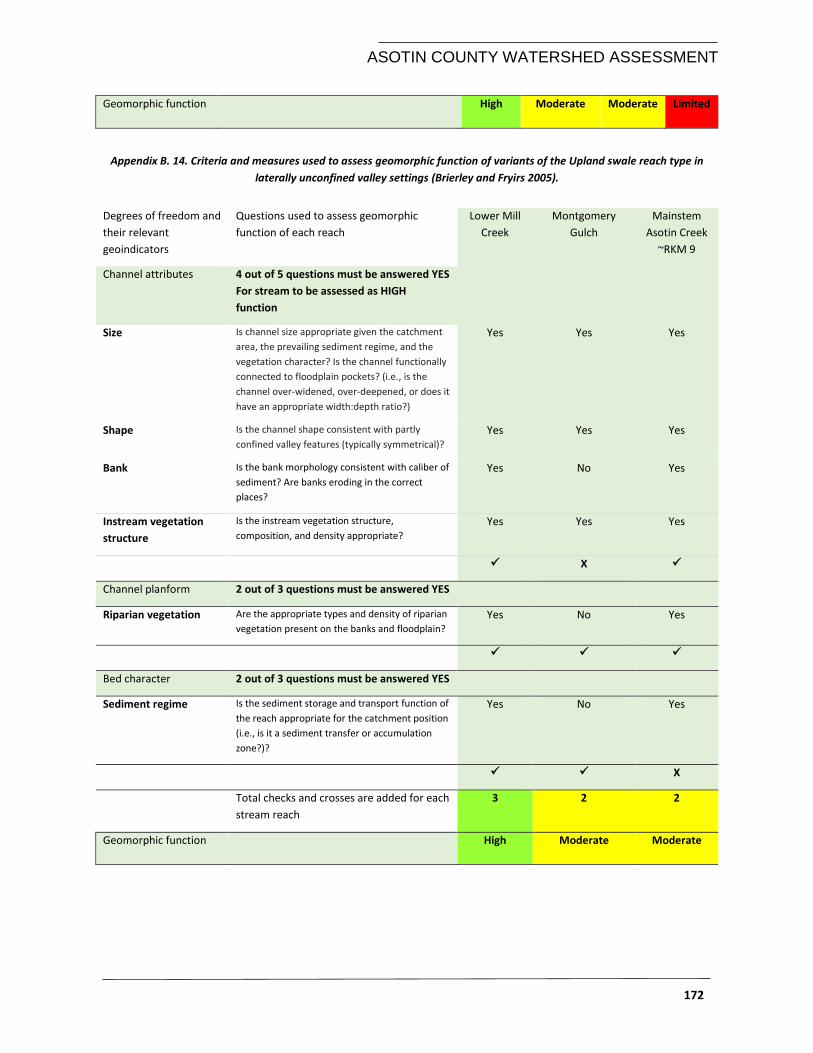
ASOTIN COUNTY WATERSHED ASSESSMENT
172
Geomorphic function High Moderate Moderate Limited
Appendix B. 14. Criteria and measures used to assess geomorphic function of variants of the Upland swale reach type in
laterally unconfined valley settings (Brierley and Fryirs 2005).
Degrees of freedom and
their relevant
geoindicators
Questions used to assess geomorphic
function of each reach
Lower Mill
Creek
Montgomery
Gulch
Mainstem
Asotin Creek
~RKM 9
Channel attributes 4 out of 5 questions must be answered YES
For stream to be assessed as HIGH
function
Size Is channel size appropriate given the catchment
area, the prevailing sediment regime, and the
vegetation character? Is the channel functionally
connected to floodplain pockets? (i.e., is the
channel over-widened, over-deepened, or does it
have an appropriate width:depth ratio?)
Yes Yes Yes
Shape Is the channel shape consistent with partly
confined valley features (typically symmetrical)?
Yes Yes Yes
Bank Is the bank morphology consistent with caliber of
sediment? Are banks eroding in the correct
places?
Yes No Yes
Instream vegetation
structure
Is the instream vegetation structure,
composition, and density appropriate?
Yes Yes Yes
X
Channel planform 2 out of 3 questions must be answered YES
Riparian vegetation Are the appropriate types and density of riparian
vegetation present on the banks and floodplain?
Yes No Yes
Bed character 2 out of 3 questions must be answered YES
Sediment regime Is the sediment storage and transport function of
the reach appropriate for the catchment position
(i.e., is it a sediment transfer or accumulation
zone?)?
Yes No Yes
X
Total checks and crosses are added for each
stream reach
3 2 2
Geomorphic function High Moderate Moderate
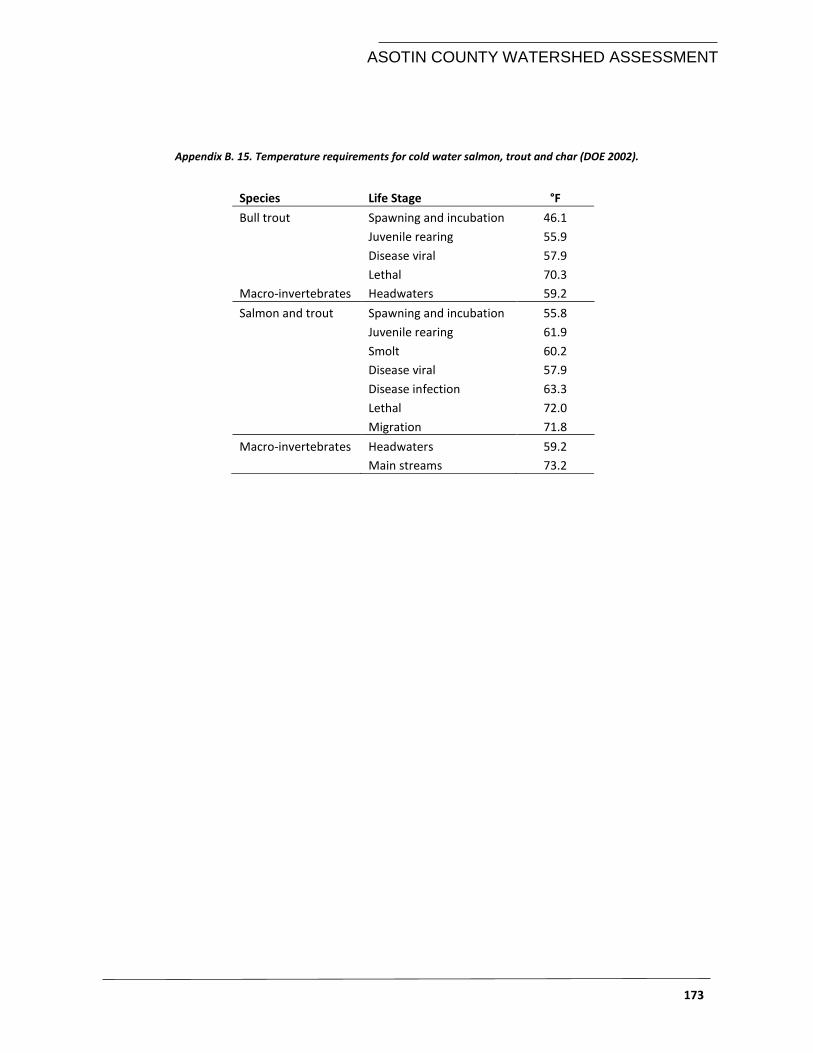
ASOTIN COUNTY WATERSHED ASSESSMENT
173
Appendix B. 15. Temperature requirements for cold water salmon, trout and char (DOE 2002).
Species Life Stage °F
Bull trout Spawning and incubation 46.1
Juvenile rearing 55.9
Disease viral 57.9
Lethal 70.3
Macro-invertebrates Headwaters 59.2
Salmon and trout Spawning and incubation 55.8
Juvenile rearing 61.9
Smolt 60.2
Disease viral 57.9
Disease infection 63.3
Lethal 72.0
Migration 71.8
Macro-invertebrates Headwaters 59.2
Main streams 73.2
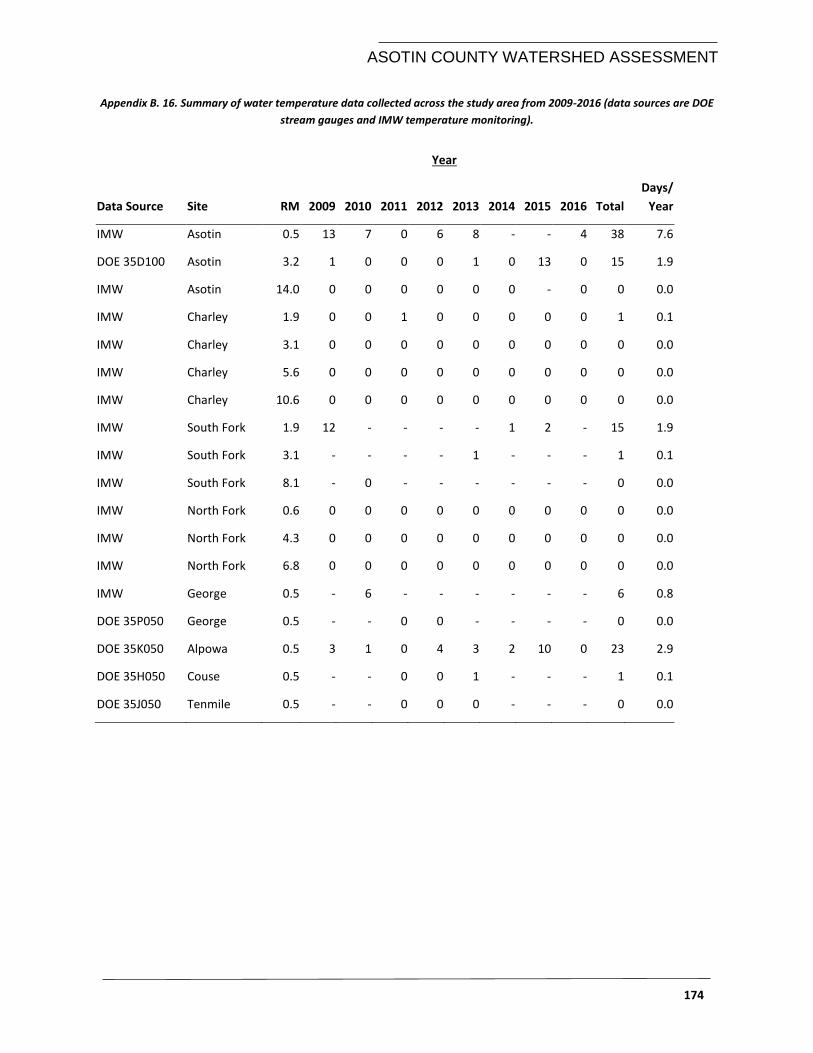
ASOTIN COUNTY WATERSHED ASSESSMENT
174
Appendix B. 16. Summary of water temperature data collected across the study area from 2009-2016 (data sources are DOE
stream gauges and IMW temperature monitoring).
Year
Data Source Site RM 2009 2010 2011 2012 2013 2014 2015 2016 Total
Days/
Year
IMW Asotin 0.5 13 7 0 6 8 - - 4 38 7.6
DOE 35D100 Asotin 3.2 1 0 0 0 1 0 13 0 15 1.9
IMW Asotin 14.0 0 0 0 0 0 0 - 0 0 0.0
IMW Charley 1.9 0 0 1 0 0 0 0 0 1 0.1
IMW Charley 3.1 0 0 0 0 0 0 0 0 0 0.0
IMW Charley 5.6 0 0 0 0 0 0 0 0 0 0.0
IMW Charley 10.6 0 0 0 0 0 0 0 0 0 0.0
IMW South Fork 1.9 12 - - - - 1 2 - 15 1.9
IMW South Fork 3.1 - - - - 1 - - - 1 0.1
IMW South Fork 8.1 - 0 - - - - - - 0 0.0
IMW North Fork 0.6 0 0 0 0 0 0 0 0 0 0.0
IMW North Fork 4.3 0 0 0 0 0 0 0 0 0 0.0
IMW North Fork 6.8 0 0 0 0 0 0 0 0 0 0.0
IMW George 0.5 - 6 - - - - - - 6 0.8
DOE 35P050 George 0.5 - - 0 0 - - - - 0 0.0
DOE 35K050 Alpowa 0.5 3 1 0 4 3 2 10 0 23 2.9
DOE 35H050 Couse 0.5 - - 0 0 1 - - - 1 0.1
DOE 35J050 Tenmile 0.5 - - 0 0 0 - - - 0 0.0
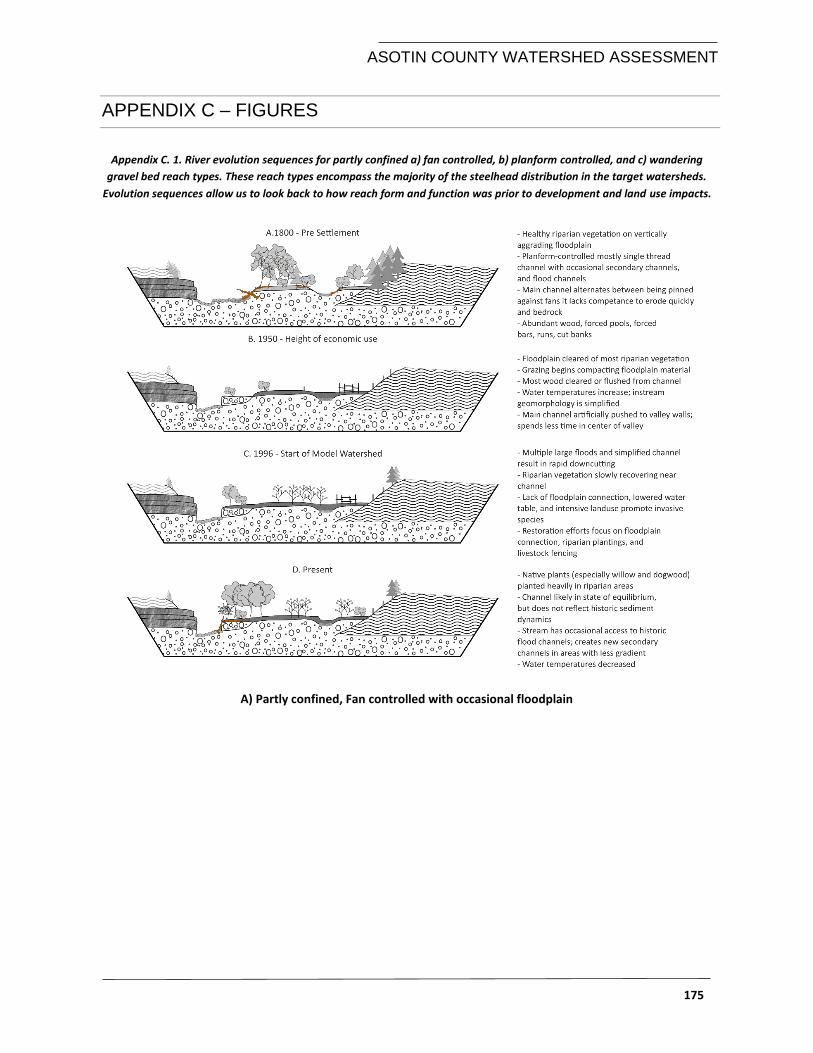
ASOTIN COUNTY WATERSHED ASSESSMENT
175
APPENDIX C – FIGURES
Appendix C. 1. River evolution sequences for partly confined a) fan controlled, b) planform controlled, and c) wandering
gravel bed reach types. These reach types encompass the majority of the steelhead distribution in the target watersheds.
Evolution sequences allow us to look back to how reach form and function was prior to development and land use impacts.
A) Partly confined, Fan controlled with occasional floodplain
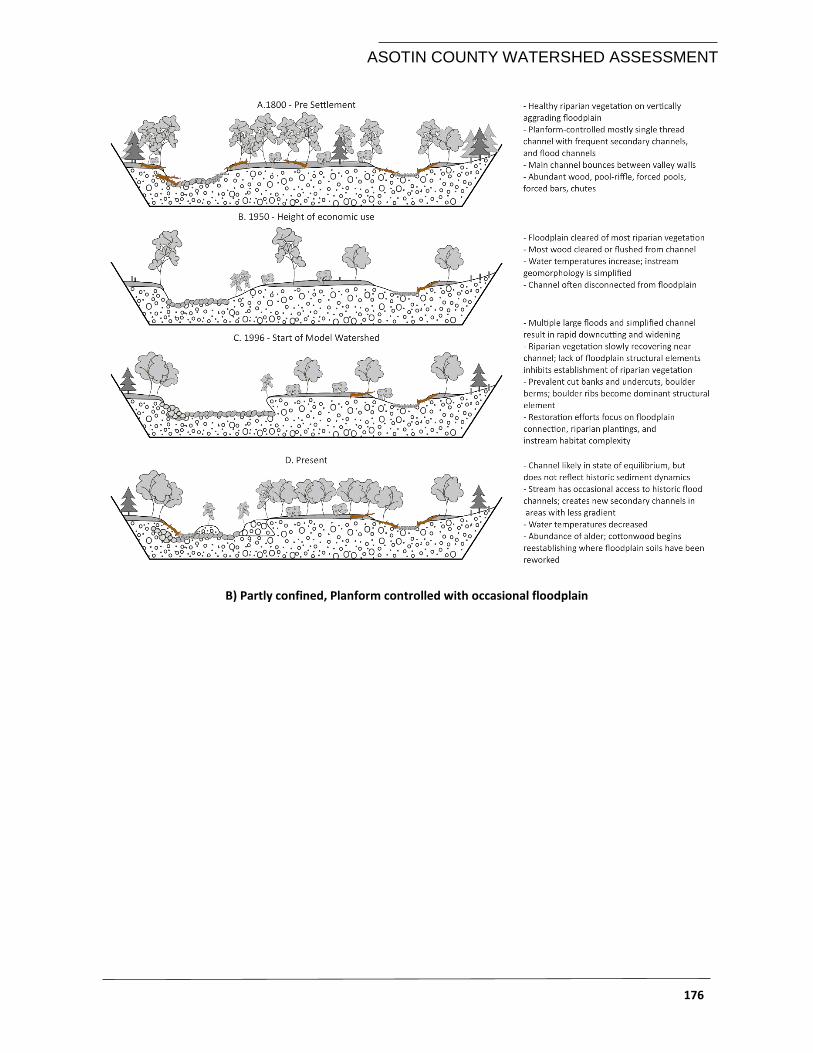
ASOTIN COUNTY WATERSHED ASSESSMENT
176
B) Partly confined, Planform controlled with occasional floodplain
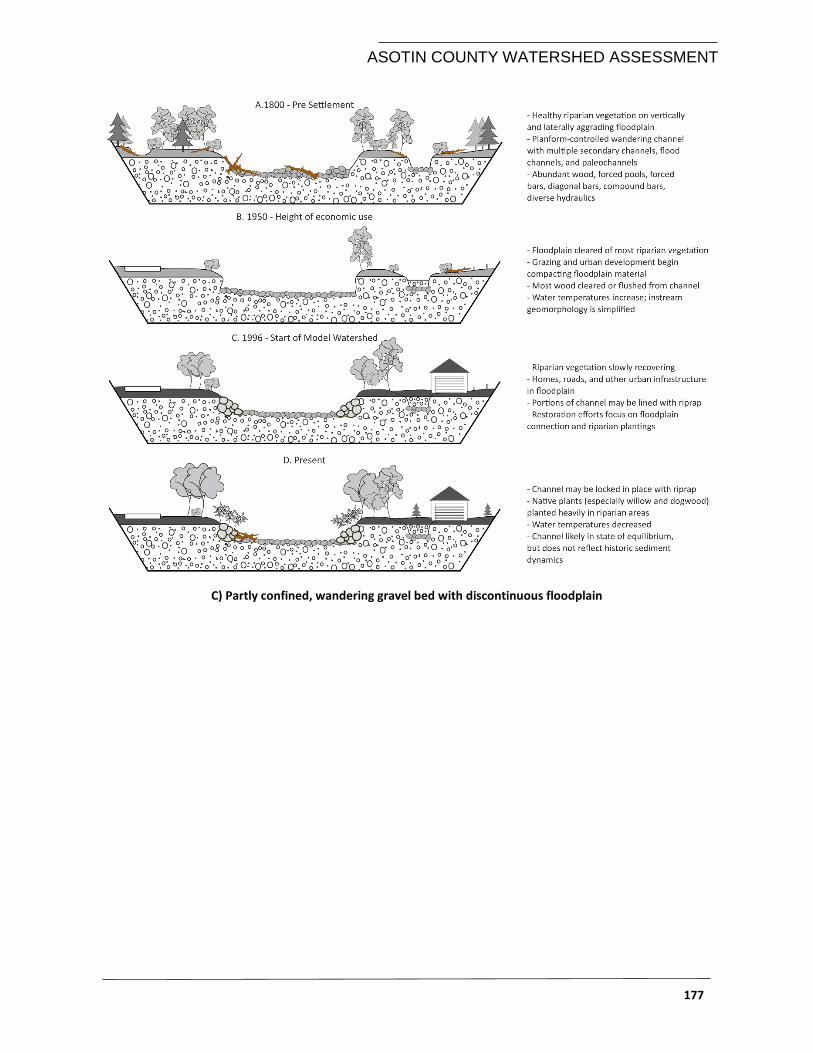
ASOTIN COUNTY WATERSHED ASSESSMENT
177
C) Partly confined, wandering gravel bed with discontinuous floodplain
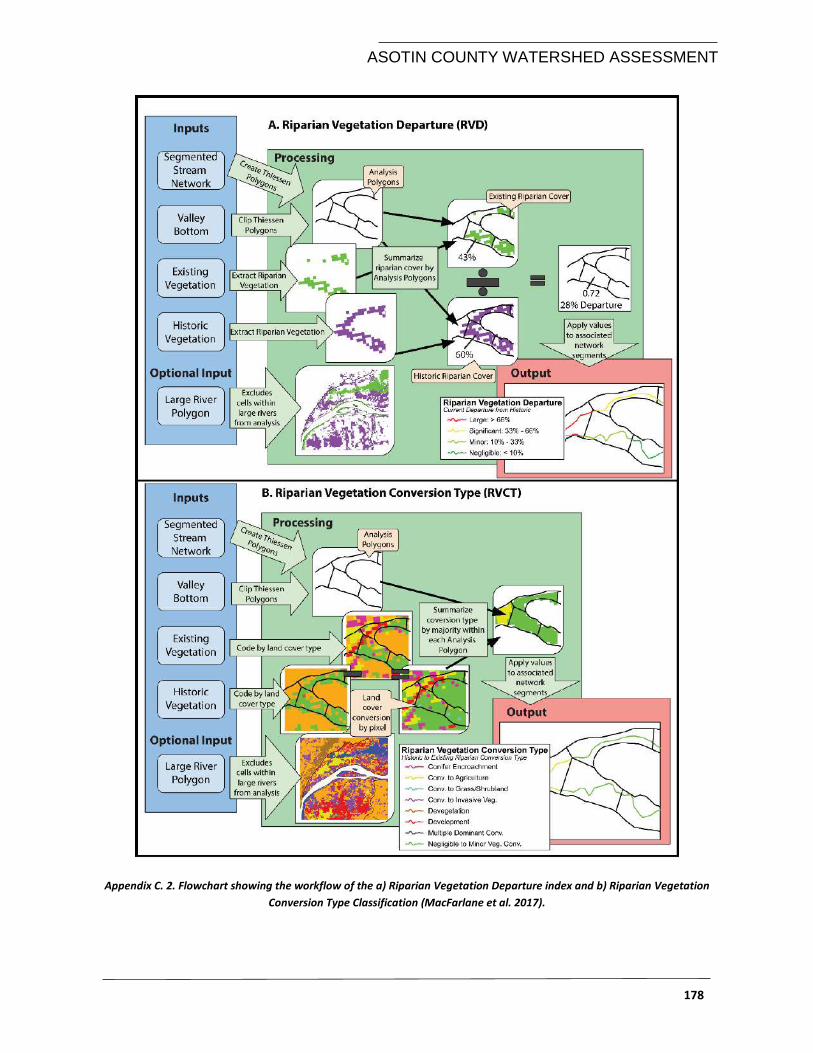
ASOTIN COUNTY WATERSHED ASSESSMENT
178
Appendix C. 2. Flowchart showing the workflow of the a) Riparian Vegetation Departure index and b) Riparian Vegetation
Conversion Type Classification (MacFarlane et al. 2017).
ASOTIN COUNTY WATERSHED ASSESSMENT
179
Appendix C. 3. Proportion and length (RMs) of valley setting and reach types by watershed for the perennial network.
ASOTIN COUNTY WATERSHED ASSESSMENT
180
Appendix C. 4. Proportion and length (RMs) of the perennial stream network by geomorphic function type and target
watershed.
ASOTIN COUNTY WATERSHED ASSESSMENT
a)
ASOTIN COUNTY WATERSHED ASSESSMENT
b)
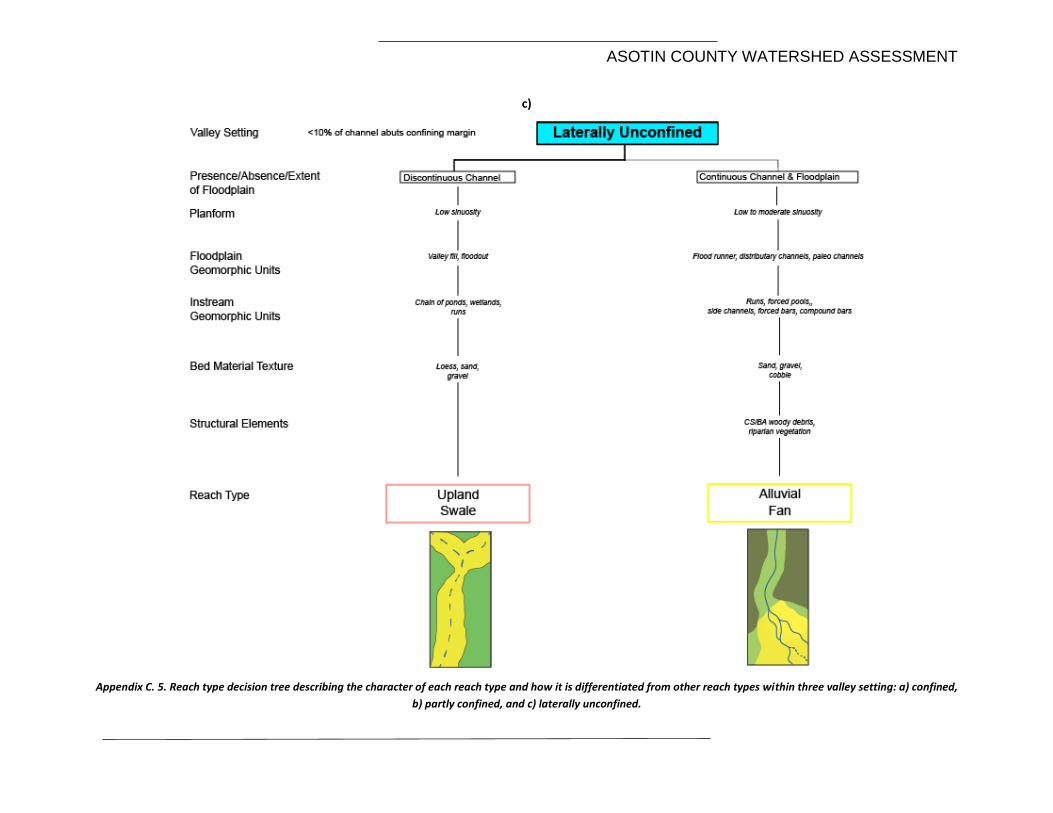
ASOTIN COUNTY WATERSHED ASSESSMENT
c)
Appendix C. 5. Reach type decision tree describing the character of each reach type and how it is differentiated from other reach types within three valley setting: a) confined,
b) partly confined, and c) laterally unconfined.
ASOTIN COUNTY WATERSHED ASSESSMENT
184
Appendix C. 6. Proportion and length (RMs) of the perennial stream network by riparian function and target watershed.
ASOTIN COUNTY WATERSHED ASSESSMENT
185
Appendix C. 7. Long profiles of a) Alpowa Creek, b) Asotin Creek (including North Fork Asotin Creek), c) Couse Creek, and d)
Tenmile Creek.
a) Alpowa Creek begins in an unconfined valley in the dissected loess uplands. After passing over the first exposed
basalt layer (Grande Ronde member), stream gradient increases, and valley confinement increases. The stream
quickly dissects the through the basalt, entering the lower snake canyons and works through its own alluvium,
primarily consisting of fines, sands, and some small gravels. The valley becomes partly confined and begins
transporting a mixed sediment load as drainage are and stream power increase. Pulses in stream power are caused
by pinch points in the valley bottom and result in an alternative net positive and net negative sediment flux. Bed
load contribution to the sediment regime is low until near the confluence with Pow Wah Kee Gulch.
ASOTIN COUNTY WATERSHED ASSESSMENT
186
b) Asotin Creek begins as confined steep headwaters in the mesic forest of the Blue Mountains. The three forks of
the North Fork all merge within 0.2 miles of each other, increasing drainage area, bed load sediment, and valley
width. After entering the lower Snake Canyons, stream gradient decreases as the stream works the alluvial valley
and transports a relatively even mix of bed load and suspended load. Bed load contributions to the sediment
regime increase at the confluence with the South Fork of Asotin Creek, while Charley Creek contributes higher
proportions of suspended load. Valley confinement increases slightly after the confluence with Charley Creek and
the stream dissects older basalt flow members. The Wanapum basalt member is exposed in the bedrock canyon,
creating a high valley constriction and greatly increasing stream power for a short section. Bed load transport and
accumulation increases after the confluence with George Creek.
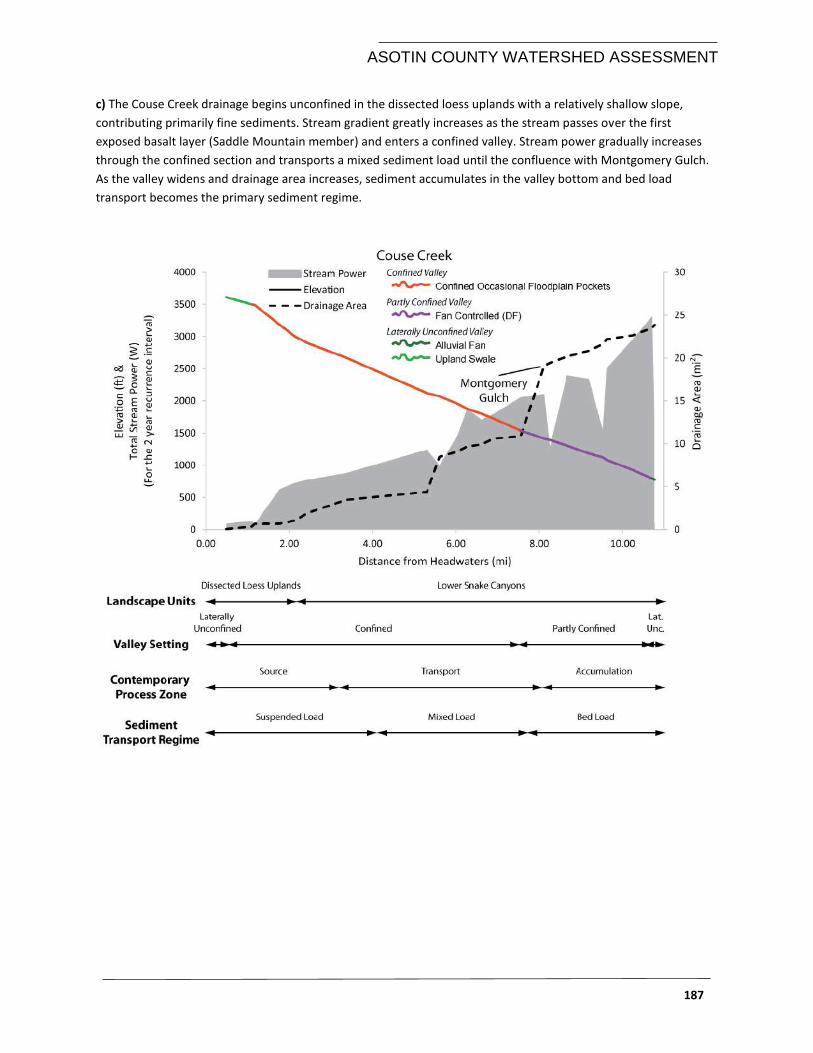
ASOTIN COUNTY WATERSHED ASSESSMENT
187
c) The Couse Creek drainage begins unconfined in the dissected loess uplands with a relatively shallow slope,
contributing primarily fine sediments. Stream gradient greatly increases as the stream passes over the first
exposed basalt layer (Saddle Mountain member) and enters a confined valley. Stream power gradually increases
through the confined section and transports a mixed sediment load until the confluence with Montgomery Gulch.
As the valley widens and drainage area increases, sediment accumulates in the valley bottom and bed load
transport becomes the primary sediment regime.
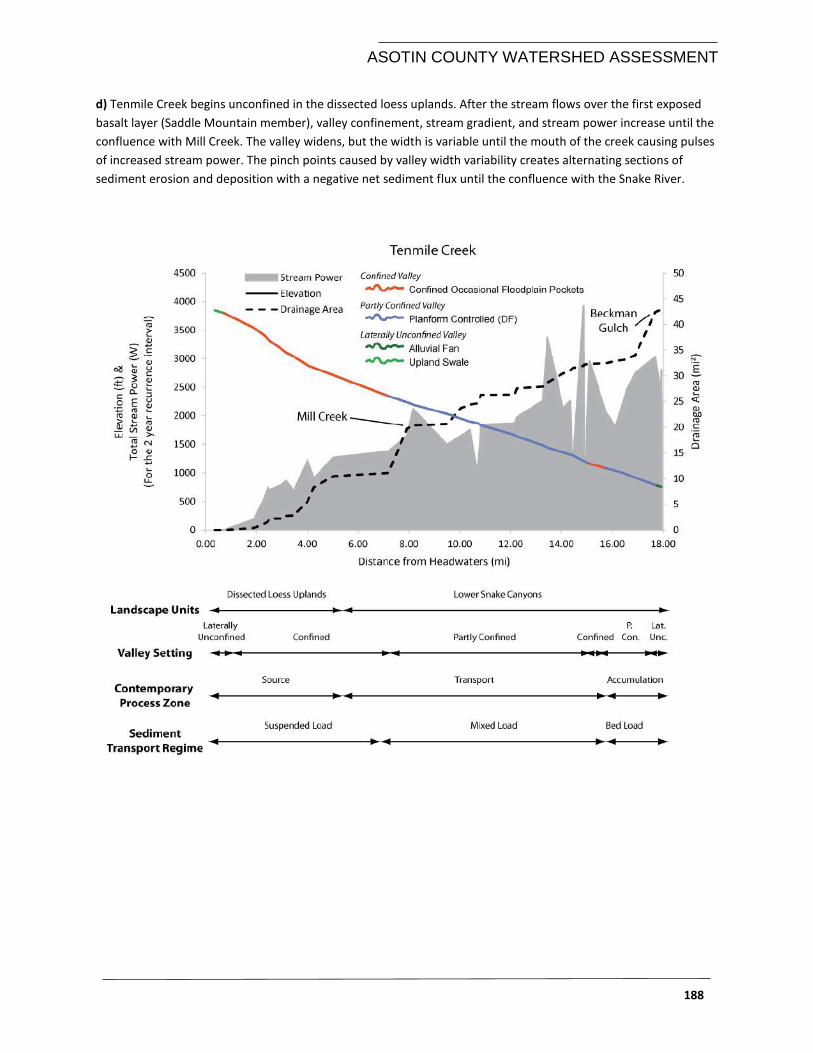
ASOTIN COUNTY WATERSHED ASSESSMENT
188
d) Tenmile Creek begins unconfined in the dissected loess uplands. After the stream flows over the first exposed
basalt layer (Saddle Mountain member), valley confinement, stream gradient, and stream power increase until the
confluence with Mill Creek. The valley widens, but the width is variable until the mouth of the creek causing pulses
of increased stream power. The pinch points caused by valley width variability creates alternating sections of
sediment erosion and deposition with a negative net sediment flux until the confluence with the Snake River.
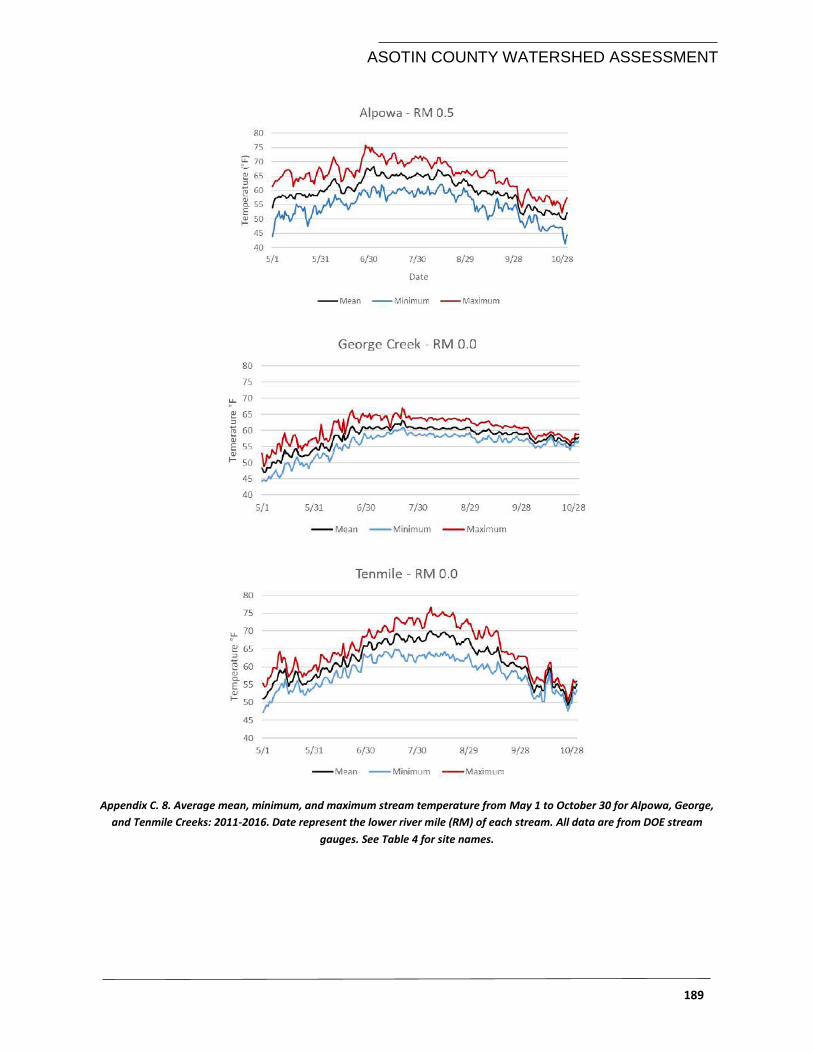
ASOTIN COUNTY WATERSHED ASSESSMENT
189
Appendix C. 8. Average mean, minimum, and maximum stream temperature from May 1 to October 30 for Alpowa, George,
and Tenmile Creeks: 2011-2016. Date represent the lower river mile (RM) of each stream. All data are from DOE stream
gauges. See Table 4 for site names.
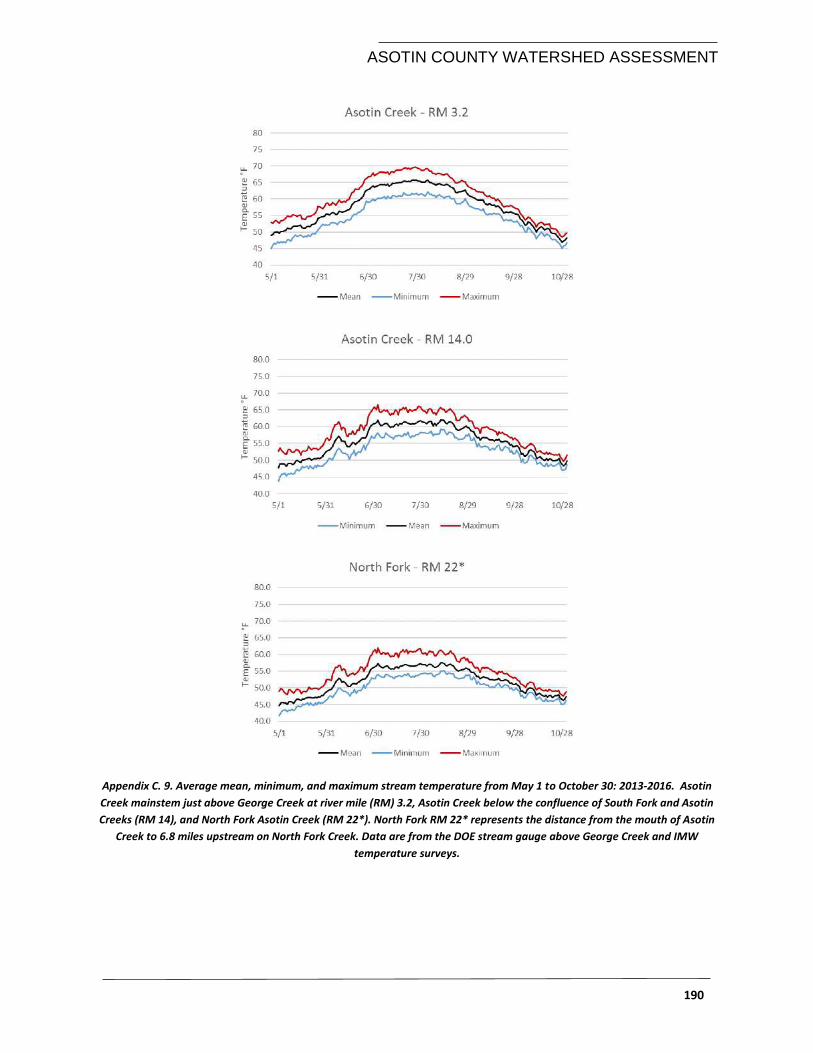
ASOTIN COUNTY WATERSHED ASSESSMENT
190
Appendix C. 9. Average mean, minimum, and maximum stream temperature from May 1 to October 30: 2013-2016. Asotin
Creek mainstem just above George Creek at river mile (RM) 3.2, Asotin Creek below the confluence of South Fork and Asotin
Creeks (RM 14), and North Fork Asotin Creek (RM 22*). North Fork RM 22* represents the distance from the mouth of Asotin
Creek to 6.8 miles upstream on North Fork Creek. Data are from the DOE stream gauge above George Creek and IMW
temperature surveys.

ASOTIN COUNTY WATERSHED ASSESSMENT
191
APPENDIX D – NETWORK TOOLS BACKGROUND INFORMATION
We used a variety of network analysis tools to support the geomorphic assessment and better describe the
watershed condition as it relates to fish habitat and stream function. The following provide more detail on how the
network tools were used and where to access free GIS code and tool kits.
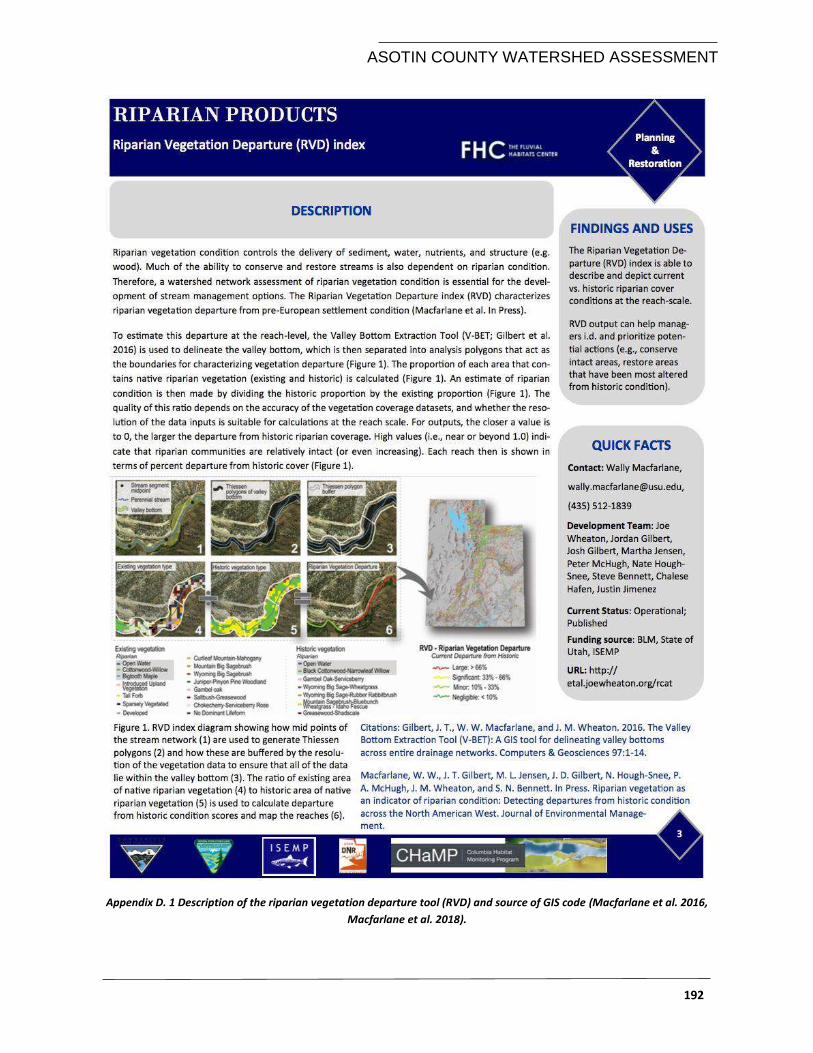
ASOTIN COUNTY WATERSHED ASSESSMENT
192
Appendix D. 1 Description of the riparian vegetation departure tool (RVD) and source of GIS code (Macfarlane et al. 2016,
Macfarlane et al. 2018).
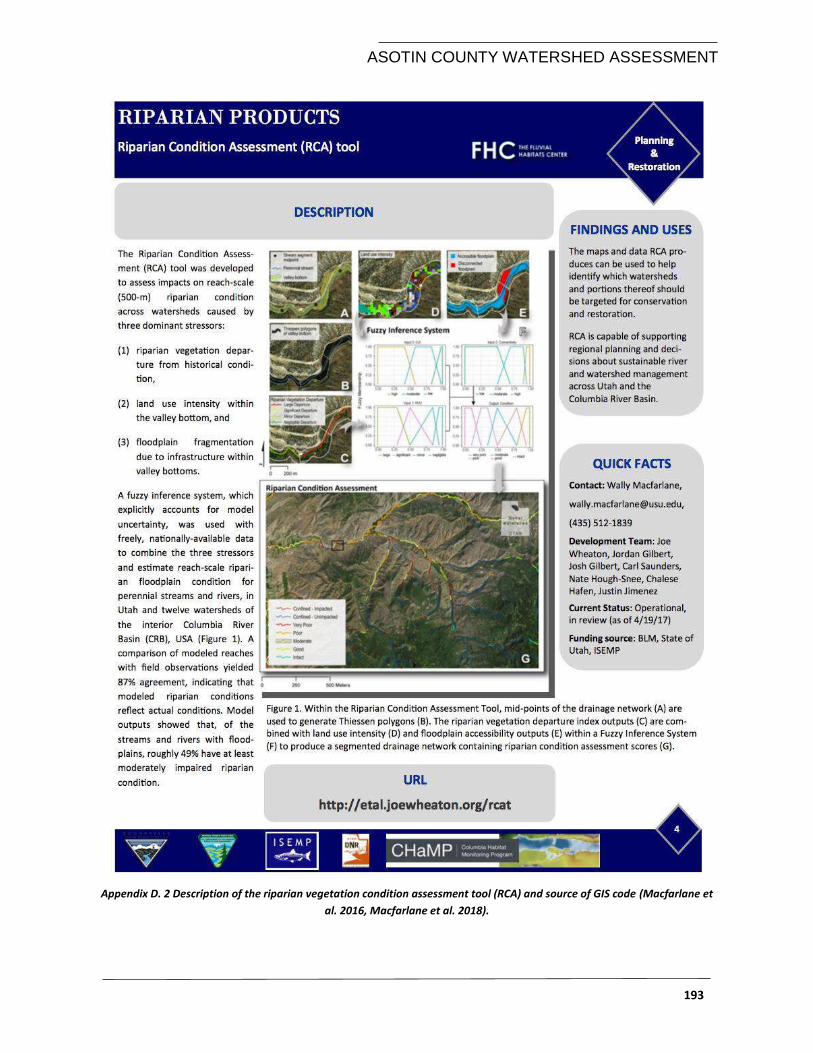
ASOTIN COUNTY WATERSHED ASSESSMENT
193
Appendix D. 2 Description of the riparian vegetation condition assessment tool (RCA) and source of GIS code (Macfarlane et
al. 2016, Macfarlane et al. 2018).
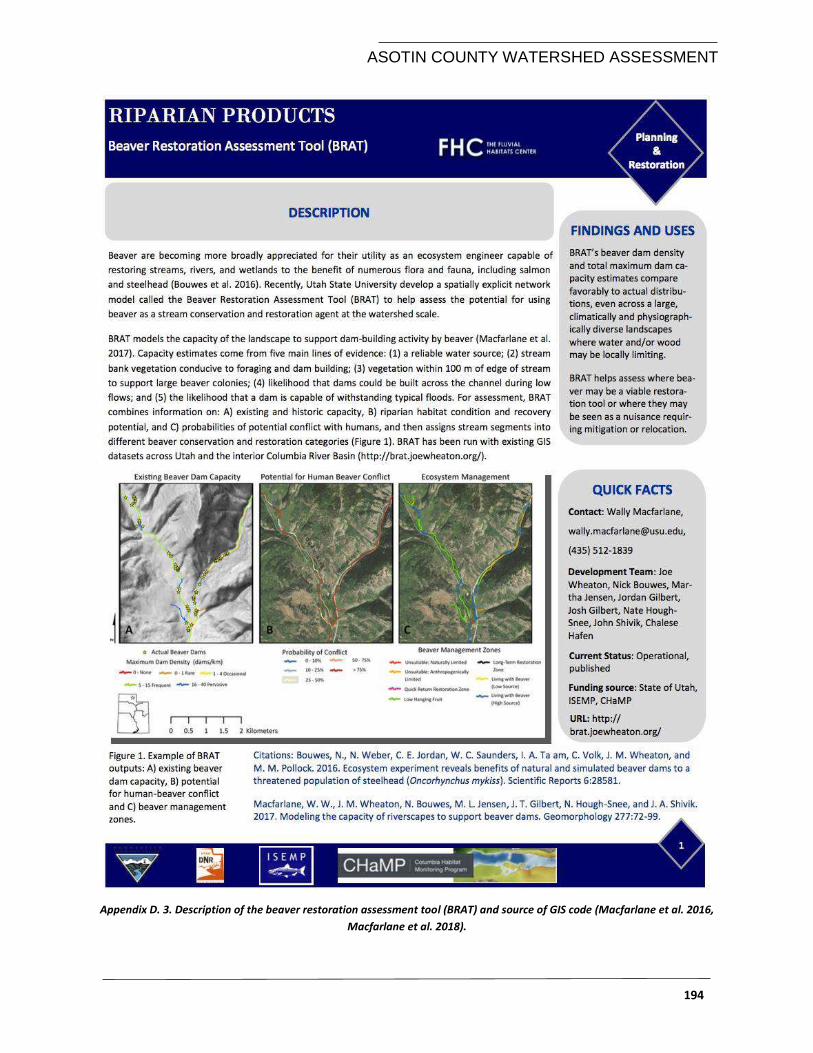
ASOTIN COUNTY WATERSHED ASSESSMENT
194
Appendix D. 3. Description of the beaver restoration assessment tool (BRAT) and source of GIS code (Macfarlane et al. 2016,
Macfarlane et al. 2018).
ASOTIN COUNTY WATERSHED ASSESSMENT
APPENDIX E – MAPS WITH VALLEY EXTENT AND CONFINING FEATRUES FOR EACH RIVER
MILE FOR THE EXTENT OF 1 M LIDAR.
Appendix E. 1. See separate attachment (100 + maps)
ASOTIN COUNTY WATERSHED ASSESSMENT
APPENDIX F. SUMMARY OF ASSESSMENT FINDINGS AND RECOMMENDATIONS FOR RESTORATION STRATEGIES
ASOTIN COUNTY WATERSHED ASSESSMENT
Appendix F. 1. Summary of the Asotin County Assessment results by restoration reach and recommended restoration strategies for Alpowa and Asotin Creeks and their tributaries. Map number refers to the stream and section number of Appendix E of
the complete assessment report. Appendix E provides 1 m LIDAR imagery, and delineation of valley extent and anthropogenic confining features by river mile (RM) for the mainstem of each study creek. See figures and appendix in the report for
definitions of the color codes.
Unconfin
ed
Partly C
onfined
Confined
Alluvia
l Fan
Canyon
Confined
Fan C
ontrolle
d
Headwate
r
Planfo
rm
Wanderin
g
Groundw
ater
Snow-ra
in
Snowm
elt
Limite
d
Modera
te
High
Low
High
Impact
ed
Unimpact
ed
Limite
d
Modera
te
High
Full
Low
Modera
te
High
Steelh
ead
Chinook
Lam
prey
Bull Tro
ut
Spawnin
g
Rearing
Mig
ratio
n
Map Watershed Subwatershed Tributary
Reach
ID
RM
Start
RM
End
Reach
Length
Geomorphic
Recovery
Potential Dominant Species Fish UseRecommendation
Appendix A.10 Appendix A.10 Appendix A.5Appendix A.12-
13Appendix E Appendix A.15-18
Valley Setting Dominant Reach Type
Hydrologic
Regime
Geomorphic
Function
Disconnected
Floodplain Riparian Function
Appendix A.14 Appendix A.8 Figure 9-10
E.1. Alpowa mainstem - AP_01 0.0 0.6 0.6 assess predation, riparian mgt, increase complexity
E.1. Alpowa mainstem - AP_02 0.6 13.9 13.3reconnect habitats, promote overbank flow, habitats, riparian mgt,
increase complexity
n/a Alpowa mainstem - AP_03 13.9 19.6 5.7promote overbank flow, habitats, riparian mgt, increase complexity,
beaver mgt
n/a Alpowa Pow Wah Kee - PW_01 0.0 3.9 3.9reconnect habitats floodplain, riparian mgt, increase complexity, beaver
mgt
E.2.1 Asotin mainstem - AC_01 0.0 0.4 0.4reconnect habitats, promote overbank flow, riparian mgt, increase
complexity
E.2.1 Asotin mainstem - AC_02 0.4 7.3 6.9reconnect habitats, promote overbank flow, riparian mgt, increase
complexity
E.2.1 Asotin mainstem - AC_03 7.3 8.3 1.0 increase complexity
E.2.1 Asotin mainstem - AC_04 8.3 15.4 7.1 reconnect habitats, promote overbank flow, increase complexity
E.2.2 Asotin Charley - CC_01 0.0 2.0 2.0reconnect habitats, promote overbank flow, riparian mgt, increase
complexity
E.2.2 Asotin Charley - CC_02 2.0 7.9 5.9assess old dams, promote overbank flow, riparian mgt, increase
complexity, beaver mgt
E.2.2 Asotin Charley - CC_03 7.9 13.0 5.1 increase complexity, beaver mgt
E.2.3 Asotin North Fork - NF_01 0.0 0.8 0.8 reconnect habitats, promote overbank flow, increase complexity
E.2.3 Asotin North Fork - NF_02 0.8 10.1 9.3 increase complexity, beaver mgt
n/a Asotin North Fork South Fork NF_03 0.0 2.3 2.3 increase complexity, beaver mgt
n/a Asotin North ForkMiddle
ForkNF_04 0.0 3.8 3.8 increase complexity, beaver mgt
n/a Asotin North Fork North Fork NF_05 10.1 17.4 7.3 increase complexity, beaver mgt
n/a Asotin North ForkCougar
CreekCG-01 0.0 3.2 3.2 increase complexity, beaver mgt
n/a Asotin North Fork Lick LC_01 0.0 0.2 0.2 reconnect habitats, promote overbank flow, increase complexity
n/a Asotin North Fork Lick LC_02 0.2 2.0 1.8 - - - promote overbank flow, increase complexity, beaver mgt
n/a Asotin North Fork Lick LC_03 2.0 6.4 4.4 - - - promote overbank flow, increase complexity, beaver mgt
E.2.4 Asotin South Fork - SF_01 0.0 10.9 10.9 increase complexity, beaver mgt
outside fish
distribution
ASOTIN COUNTY WATERSHED ASSESSMENT
Appendix F. 2. Summary of the Asotin County Assessment results by restoration reach and recommended restoration strategies for George, Couse, Tenmile Creeks, and their tributaries. Map number refers to the stream and section number of Appendix
E of the complete assessment report. Appendix E provides 1 m LIDAR imagery, and delineation of valley extent and anthropogenic confining features by river mile (RM) for the mainstem of each study creek. See figures and appendix in the report for
definitions of the color codes.
Unconfin
ed
Partly C
onfined
Confined
Alluvia
l Fan
Canyon
Confined
Fan C
ontrolle
d
Headwate
r
Planfo
rm
Wanderin
g
Groundw
ater
Snow-ra
in
Snowm
elt
Limite
d
Modera
te
High
Low
High
Impact
ed
Unimpact
ed
Limite
d
Modera
te
High
Full
Low
Modera
te
High
Steelh
ead
Chinook
Lam
prey
Bull Tro
ut
Spawnin
g
Rearing
Mig
ratio
n
Map Watershed Subwatershed Tributary
Reach
ID
RM
Start
RM
End
Reach
Length
E.3.1 George mainstem - GC_01 0.0 9.2 9.2reconnect habitats, promote overbank flow, riparian mgt, increase
complexity,
E.3.1 George mainstem - GC_02 9.2 10.3 1.1 promote overbank flow, riparian mgt, increase complexity, beaver mgt
E.3.1 George mainstem - GC_03 10.3 20.1 9.8 increase complexity, beaver mgt
n/a George - - GC_04 0.0 1.6 1.6 increase complexity, beaver mgt
n/a George - - GC_05 0.0 1.6 1.6 increase complexity, beaver mgt
n/a George - - GC_06 0.0 4.7 4.7 increase complexity, beaver mgt
n/a George Pintler - PC_01 0.0 3.6 3.6 promote overbank flow, riparian mgt, increase complexity, beaver mgt
n/a George Pintler - PC_02 3.6 8.7 5.1 promote overbank flow, riparian mgt, increase complexity, beaver mgt
n/a George Pintler - PC_03 8.7 11.2 2.5 promote overbank flow, riparian mgt, increase complexity, beaver mgt
n/a George Pintler Ayers AY_01 0.0 0.9 0.9 promote overbank flow, riparian mgt, increase complexity
n/a George Pintler Kelly KC_01 0.0 1.4 1.4 promote overbank flow, riparian mgt, increase complexity
n/a George Pintler unnamed PC_04 0.0 1.6 1.6 promote overbank flow, riparian mgt, increase complexity
n/a George Pintler - PC_05 0.0 1.6 1.6 - - - increase complexity, beaver mgt
E.4 Couse Couse - CO_01 0.0 3.2 3.2reconnect habitats (assess barrier), promote overbank flow, riparian mgt,
increase complexity
E.4 Couse Couse - CO_02 3.2 7.4 4.2 increase complexity, beaver mgt
n/a Couse Couse - CO_03 0.0 1.5 1.5 - - - increase complexity
n/a Couse Couse - CO_04 3.2 6.9 3.7 - - - increase complexity
E.5 Tenmile Tenmile - TM_01 0.0 4.5 4.5reconnect habitats (assess barrier), promote overbank flow, riparian mgt,
increase complexity
E.5 Tenmile Tenmile - TM_02 4.5 10.7 6.2 promote overbank flow, increase complexity, beaver mgt
E.5 Tenmile Tenmile - TM_03 10.7 14.8 4.1 increase complexity, beaver mgt
n/a Tenmile Unnamed - TM_04 0.0 1.7 1.7 increase complexity, beaver mgt
n/a Tenmile Unnamed - TM_05 0.0 1.0 1.0 increase complexity, beaver mgt
n/a Tenmile Mill - MC-01 0.0 4.7 4.7 increase complexity, beaver mgt
Fish Use
Figure 9-10
Recommendation
outside fish
distribution
Valley Setting Dominant Reach Type
Hydrologic
Regime
Geomorphic
Function Riparian Function
Appendix A.10 Appendix A.10 Appendix A.5Appendix A.12-
13Appendix A.15-18
Geomorphic
Recovery
Potential
Disconnected
Floodplain
Appendix E
outside fish
distribution
outside fish
distribution
Dominant Species
Appendix A.14 Appendix A.8


