Embed Size (px)
Citation preview

K E N Y A
E T H I O P I A
ERITREA
S U D A N
SOMALIA
T A N Z A N I A
UGANDA
BURUNDI
RWANDA
DJIBOUTI Gulf of Aden
Red Sea
I N D I A
O C E A
THE INTERNATIONAL RESEARCH INSTITUTE FOR CLIMATE PREDICTIONL I N K I N G S C I E N C E T O S O C I E T Y
COLUMBIA EARTH INSTITUTEC O L U M B I A U N I V E R S I T Y I N T H E C I T Y O F N E W Y O R K
Assessing the value of climate forecast information for pastoralists:
Evidence from southern Ethiopia and northern Kenya
IRI TECHNICAL REPORT NO. 02-03

The International Research Institute for Climate Prediction (IRI) was established as a cooperative agreement between U.S. NOAA Office of Global Programs and Columbia University. IRI is a unit of the Columbia Earth Institute located at Lamont-Doherty Earth Observatory. This report is one in a series on the use of climate forecasts in the Greater Horn of Africa. Financial support for the research component reported here was provided by the Office of Foreign Disaster Assistance of the U.S. Agency for International Development, under the project “Capacity Building in Regional Climate Prediction and Applications in the Greater Horn of Africa” (AID AOTG 009001 17900). This project is a joint effort between the IRI, the Drought Monitoring Center Nairobi, and the World Meteorological Organization, WMO.
Published by the International Research Institute for Climate Prediction (IRI) Lamont-Doherty Earth Observatory of Columbia University
Palisades, New York, 10964, USA IRI Technical Report 02-03
© 2002 International Research Institute for Climate Prediction. All rights reserved.
Assessing the value of climate forecast information for pastoralists: Evidence from southern Ethiopia and northern Kenya
Winnie K. Lusenoa, John G. McPeaka,b, Christopher B. Barrett*a, Peter D. Littlec and Getachew Gebrub,d
Final project report to the International Research Institute for Climate Prediction, Columbia University, USA, and to the Department of Range Management, University of Nairobi, Kenya.
May 2002
a Cornell University, Ithaca, NY b International Livestock Research Institute, Addis Ababa, Ethiopia, and Nairobi, Kenya c University of Kentucky, Lexington, KY d Utah State University, Logan, UT * Corresponding author: 315 Warren Hall, Department of Applied Economics and Management,
Cornell University, Ithaca, NY 14853-7801 USA, tel: 607-255-4489, fax: 607-255-9984, email: [email protected]
Luseno, McPeak and Barrett share seniority of authorship. We thank the governments of Ethiopia and Kenya for research clearance, the International Livestock Research Institute for hospitality, and Abdillahi Aboud, Layne Coppock, Tag Demment, Solomon Desta, Cheryl Doss, Simeon Ehui, Calum McLean, Robinson Ngugi, Sharon Osterloh, Jen Phillips, Amare Teklu and a seminar audience at Columbia University for helpful discussions and information and Ingrid Rhinehart for help with Figure 1. This work took place within the broader Pastoral Risk Management Project of the Global Livestock Collaborative Research Support Program, funded by the Office of Agriculture and Food Security, Global Bureau, United States Agency for International Development, under grants DAN-1328-G-00-0046-00 and PCE-G-98-00036-00. The opinions expressed do not necessarily reflect the views of the U.S. Agency for International Development.

1
Assessing the value of climate forecast information for pastoralists: Evidence from southern Ethiopia and northern Kenya
Abstract: Climatic variability exerts tremendous influence on the livelihoods and well-being of pastoralists who inhabit the arid and semi-arid lands of the Horn of Africa. Recent advances in climate forecasting technologies have raised the intriguing prospect of reasonably accurate forecasts of coming seasons’ rainfall patterns. Several donors and governments in the region are keenly interested in these technologies and in developing forecast delivery channels on the assumption that this information will prove valuable to the vulnerable populations it is meant to help not only indirectly, as an input into top-down early warning systems, but also directly, as a basis for improving choice under uncertainty. We explore the value of such external climate forecast information to pastoralists in a large study area spanning southern Ethiopia and northern Kenya using original data collected using both open-ended qualitative methods to identify and understand indigenous climate forecasting methods and quantitative data collected using survey instruments fielded in two rounds, one before and one after the long rains of 2001. The data show that pastoralists rely heavily on indigenous forecasting methods – in terms of having both access to and confidence in these methods – while external forecasts are less commonly received or believed. We elicited pastoralists’ subjective, probabilistic expectations of the coming season’s rainfall and find that neither use of nor belief in external forecasts causes any appreciable change in respondents’ seasonal rainfall expectations. Moreover, relatively few pastoralists act on their own climate expectations, no matter how formed. In sum, climate forecast information does not seem a limiting factor at present in pastoralist communities in the Horn of Africa, not least of which because of the existence of a vibrant and still-relevant tradition of indigenous forecasting.

2
Table of Contents
Sections
I. Introduction.................................................................................................................................. 4 II. The Basics of Information Theory ............................................................................................. 7 III. Data ......................................................................................................................................... 11 IV. The Value of Climate Forecast Information to Pastoralists in the HA................................... 13
(i) Pastoralists’ comprehension of probabilistic forecasts ........................................................ 14 (ii)Pastoralists’ use of indigenous climate forecasting methods ............................................... 19 (iii) Awareness of and access to external or meteorology-based climate forecasts.................. 27 (iv) If aware of external forecasts, do pastoralists have confidence in them? .......................... 31 (v) Do external forecasts differ from indigenous forecasts?..................................................... 34 (vi) Do pastoralists update their prior beliefs based on external climate information? ............ 37 (vii) Do pastoralists adjust behavior in response to changes in climate expectations? ............ 39
V. Concluding Remarks ................................................................................................................ 46 VI. References............................................................................................................................... 50
Appendices Appendix A: First Round Survey Instrument (fielded March 2001)............................................ 54 Appendix B: Second Round Survey Instrument (fielded June-July 2001) ................................... 64 Appendix C: Open-Ended Interview Guidelines (fielded February-April 2001) ........................ 67 Appendix D: Open-Ended Interview Findings on Indigenous Climate Forecasting Methods in Southern Ethiopia.......................................................................................................................... 68 Appendix E: Open-Ended Interview Findings on Indigenous Climate Forecasting Methods in Northern Kenya............................................................................................................................. 77
Illustrations Figure .........................................................................................................................................Page 1. Map of Study Sites in southern Ethiopia and northern Kenya ................................................... 6 2. January 1999 - May 2001 Rainfall in Kenya Study Sites ........................................................ 13 3. Use of Different Traditional Methods in Kenya ...................................................................... 21 4. Confidence Level in Various Traditional Climate Forecasting Methods, Kenya .................... 25 5. Rainfall Expectations (deviation from DMC forecast), all households ................................... 37 6. Rainfall Expectations (deviation from DMC forecast), households who express greater confidence in external climate forecasts ....................................................................................... 38 8. Percent Change in Rainfall vs. Percent Change in Median Herd Size ..................................... 44
Tables Table...........................................................................................................................................Page 1. Mean probabilistic expectations of rainfall volume for the 2001 long rains season ................ 18 2. Pastoralists' opinions on the realized rainfall volume of the long rains 2001 .......................... 18 3. Respondents' opinions on the realized timing of the long rains 2001 ...................................... 18 4. Receipt of climate forecasts for 2001 long rains, by content, source and location (reported after the conclusion of the rains) .......................................................................................................... 22 5. Distribution of level of confidence in climate forecasts by type ............................................. 23

3
6. Perceived accuracy of 2001 long rains forecasts, conditional on hearing a forecast ............... 26 7. Pastoralists' receipt of forecasts, by forecast content and source (reported prior to the onset of the rains) ....................................................................................................................................... 27 8. Percent who never learned about forecasts from the listed sources over the past ten years either because they did not know they annoucne forecasts or because they have not had access to the source ............................................................................................................................................ 28 9. Pastoralists' rank of the usefulness of different types of forecasts............................................ 29 10. Mean weeks in advance of the season that a forecast needs to be received in order to be useful ............................................................................................................................................ 30 11. Confidence level conditional on hearing a forecast by type .................................................. 31 12. Results for probit model of access to and confidence in external climate forecasts .............. 33 13. Difference in mean long rains 2001 rainfall predictions between users of traditional forecasts only and DMC forecasts .............................................................................................................. 36 14. If your received this forecast for long rains 2001, how helpful do you think it was? ........... 41 15. Percent who received a climate forecast who changed any behaviors .................................. 42

4
I. Introduction
Agricultural ecosystems in general are quite responsive to climate fluctuations, which
create tremendous potential for skillful climate forecasts to improve resource management and
the welfare of rural populations. Because climate shocks can have especially devastating effects
among poor populations in rural areas of the developing world, special attention is being given to
understanding what potential, if any, exists for using climate forecasting to mitigate downside
risk and to create new opportunities for reducing poverty and vulnerability, and much effort is
currently being directed toward improving the skill, spatial resolution and dissemination of
climate forecasts (Hammer et al. 2001, Phillips et al.2001, Roncoli et al. 2001, Phillips
forthcoming, Roncoli et al. forthcoming a, b).1
Climatic variability is especially pronounced and crucial in drylands and among rural
populations heavily dependent on the functioning of agroecosystems. Roughly two-thirds of the
African continent is drylands, an area home to roughly 50 million or so Africans, a population
typically far poorer than those in higher rainfall areas (Galvin et al. 2001). Most poverty in
Africa remains rural and most Africans are employed in crop or livestock agriculture. Because
optimal management regimes in agriculture depend fundamentally on rainfall, there would seem
to be tremendous opportunities for improved climate forecasting to enhance opportunities and
reduce risk in rural Africa, perhaps especially among the pastoralists who inhabit the drylands
and depend on extensive (i.e., semi-nomadic) livestock grazing systems that respond directly to
climate- induced spatial and temporal variability in forage and water availability and in disease
patterns.

5
This paper contributes to the emerging literature on climate forecasting and to the
longstanding literature on pastoral peoples by reporting on research undertaken over the course
of 2001 to understand pastoralists’ access to, confidence in and use of external and indigenous
climate forecasts2 in a large study region in the arid and semi-arid lands (ASAL) of southern
Ethiopia and northern Kenya (Figure 1). Average rainfall in the region is only 200-750mm/year
with coefficients of variation ranging from 44% to 65%; in the last decade alone the region
experienced three significant droughts, in 1992/1993, 1996/1997, and 1999/2000, and serious
flooding in 1997/1998 (Little et al. 2001a, McPeak and Barrett 2001). These climate shocks
often lead to great suffering and unexpected wealth losses due to massive herd die-offs among
some of the world’s poorest populations. Opportunities for remunerative diversification out of
extensive grazing are limited (Little et al. 2001b), as rainfall is insufficient in most locations to
support crop agriculture most years, while basic physical infrastructure (e.g., all-season roads,
electricity, telephone) to support commerce and manufacturing is largely absent. As a
consequence, pastoralists’ livelihoods and behavior are especially responsive to climate
fluctuations (Sandford 1983, Ellis and Swift 1988, Behnke et al. 1991, Washington and Downing
1999). Herders employ elaborate livestock management strategies based on regular,
opportunistic migration in search of sufficient forage and water, herd splitting, rapid destocking,
complex gift and loan systems, and raiding of other clans’ and ethnic groups’ herds. This
responsiveness to climate fluctuations would, on the surface, seem to create tremendous
opportunities for humanitarian use of climate forecasting technologies among pastoralists.
1 As used in this paper, climate forecasts, also sometimes called seasonal forecasts , relate to periods of one month or more issued in advance of the relevant season. These are distinct, therefore, from short-term weather forecasts of meteorological conditions for the coming few days to two weeks. 2 By “external” or “science-based” or “modern” forecasts we mean those generated by meteorological services using modern scientific methods and disseminated into pastoralist communities. By “indigenous” or “traditional” forecasts we mean those generated within the communities through any of a variety of means, some of which are traditional, others of which appear to evolve and emerge in response to changing circumstances.

6
Figure 1: Map of Study Sites in southern Ethiopia and northern Kenya
Survey Sites in Southern Ethiopia and Northern Kenya
$Z
$Z
$Z
$Z
$Z
$Z
$Z
$Z
$Z
$Z
$Z
#Y
#Y
#Y
#Y
#Y#Y
#Y
#Y
#Y
#Y
Negelle
Hagere Mariam
Yabello
Mega
Moyale
Marsabit
Marigat
Maralal
Isiolo
Dillo
Kargi
Ngambo
Qorate
Wachille
Finchawa
Logologo
Dida Hara
North Horr
Dirib Gumbo
Suguta Marmar
Major Roads$Z Survey Sites#Y Major Towns
100 0 100 200 300 Kilometers
N
EthiopiaSudan
Kenya
CentralAfrican
Republ ic
Ta nzania
Ugan daCongoSomalia
Rwan da
Burundi
Map prepared by Ingrid Rhinehart

7
The past decade’s droughts and floods that buffeted pastoralists have indeed sparked
intense interest in improving and extending early warning systems in the Horn of Africa (HA) as
donors operating in the region look to break the “relief trap” cycle of spending on emergency
relief distribution in response to the last shock that crowds out development investments that
might help pastoralists reduce their vulnerability to the next shock (Barrett and Carter 2001,
McPeak and Barrett 2001). Improved climate forecasting is a central part of many discussions
about improved early warning systems. Considerable effort has been directed toward building
up climate forecasting and dissemination capacity in the region, with the Drought Monitoring
Centre (DMC) in Nairobi at the hub of most such efforts (Curry 2001). Yet questions abound as
to the value of climate forecast information and there has been no work on this topic among
pastoralists, perhaps the population of greatest humanitarian interest for this emergent
technology. The research on which we report here aimed to fill that important void.
The plan of this paper is as follows. Section II presents some basic principles of
information theory. Section III briefly describes the data collection objectives, methods and
timing. Section IV then uses these data to address the key principles identified in section II.
Section V concludes with a brief summary of our findings and implications for future research
and for the policy community interested in HA pastoralists.
II. The Basics of Information Theory 4
Information is valuable in helping people cope with uncertainty. To be somewhat more
precise, if an individual must make resource allocation (e.g., consumption, employment) choices
at time t in the face of an uncertain future events or states of nature, et+1, that affects the relative
4 A much richer, more technical treatment can be found in Hirshleifer and Riley (1992).

8
productivity of different alternatives available to her, then information, It, in the form of a
message or signal has non-negative value. People commonly confuse the estimated losses
associated with adverse climate shocks — a bad draw on et – with the value of climate forecast
information, It. This can lead to serious overestimation of the value of information. The exact
value of the exogenous information5 depends on whether
(i) It and et are correlated (i.e., the signal indeed carries information), with a more
informative signal necessarily worth at least as much as a less informative
signal (hence the importance of forecast skill);
(ii) It changes her subjective probability distribution on et, following Bayes’
theorem, with a signal that causes a greater change worth at least as much as
information that causes less change (underscoring the importance of
confidence in forecast information received);
(iii) her preferences and constraints are such that her optimal decisions will vary
depending on her subjective probability distribution on et, with the value of
information equal to the change in expected discounted welfare stream
resulting from optimal decisions made with the new information in hand. Note
that what matters is whether decisions subject to uncertainty change, not
whether outcomes are different, since the latter depend on the ex post
realization of the state of nature.
5 We focus on the case of exogenous information (so-called “passive learning”), which is not affected by recipients’ behavior. Where individuals’ behavior affects the production of information (i.e., when information flow is endogenous, or so-called “active learning”), then agents must choose an optimal experimental design, introducing a bit more complexity that we eschew here since it is irrelevant to the present setting 7 Rainfall data come from local meteorological stations, missions, police stations, and other sources. Most are in the sites, while the most distant are for Logologo, for which we use data from Laisamis, about 25 kilometers away, and Dirib Gumbo, for which we use data from the Marsabit meteorological station, less than 10 kilometers away.

9
These foundational principles of information theory identify several crucial questions one
needs to address to assess the value of climate forecast information for any population of intended
beneficiaries, HA pastoralists included.
• First, what is the skill of climate forecasts? This question lies outside the scope
of the present work. We can, however, offer some insight on pastoralists’
capacity to understand probabilistic forecasts of the sort generated and
disseminated by the climate community, which offers a clear indication as to
their ability to comprehend the concept of imperfect information (i.e., It that is
imperfectly correlated with et).
• Second, what sort of prior beliefs do prospective users hold with respect to
climate patterns? In the present context, the issue is the availability of and
confidence in indigenous climate forecasts. If individuals have a base level of
information already and place great confidence in their resulting priors,
updating in the wake of new information is necessarily less likely, all else held
constant.
• Third, who receives external forecasts? Information necessarily has no value
to those who do not receive it.
• Fourth, what level of confidence do recipients have in external forecasts? If
forecast recipients have no confidence in the new information, they will not
update their prior beliefs in response to this information, which therefore has no
value.

10
• Fifth, is the external forecast different from the pre-existing, indigenous
forecast? Recipients will update their beliefs only in so far as the new
information differs from the prior subjective distribution.
• Sixth, how does receipt of and confidence in external forecasts affect users’
subjective probability distributions over climate? If forecast recipients are
slow to update their prior beliefs in response to forecast information in which
they express confidence, it takes many forecasts to change beliefs and thus,
potentially, behavior. As a consequence, information has little value.
• Seventh, how do pastoralists’ posterior beliefs over uncertain climate affect
their decisions and with what consequences for their welfare? This depends
fundamentally on pastoralists’ material and nonmaterial preferences (e.g., with
respect to risk, the timing of consumption, and conformity to or deviation from
community norms), incentives (e.g., prices, range productivity, risk of livestock
loss to raiders, predators, injury or disease) and constraints on their choices
(e.g., ex ante herd size, available cash, agroecological potential of soils and
water, and accessibility to nonpastoral livelihood options).
Section IV is structured to explore these seven core questions in turn. But before turning
to the data and analysis, let us sum up the core point to take away from information theory: the
value of information depends on its novelty, recipients’ confidence in it, and their ability and
willingness to act on it.
Several key points will come out in the evidence and analysis that follows. We find that
pastoralists offer their own probabilistic forecasts, underscoring the fact that they acknowledge
and accept forecasts of less-than-perfect skill. They make extensive use of a wide range of

11
indigenous climate forecasting methods and have considerable confidence in some such
methods. Relatively few pastoralists presently receive external forecasts – and almost
exclusively via radio – but those who receive them have at least some confidence in
meteorology-based forecasts. The external forecasts do differ significantly from the comparable
forecasts one observes within the subsample who do not receive external forecasts, which we
infer as an indication that the external forecasts indeed provide new information, not just
repeating recipients’ priors. Nonetheless, receipt of and confidence in external forecasts has no
discernible impact on pastoralists’ posterior distributions over rainfall. Furthermore, pastoralists
rarely act on their own climate beliefs, limiting even the value of imperfect forecasts universally
received with great confidence. Although climate fluctuations clearly have a pronounced effect
on pastoralist livelihoods in the ASAL, climate forecast information does not appear to be a
limiting factor at present, so the value of climate forecast information seems quite low and will
likely remain thus for some time.
III. Data
The data were collected by USAID’s Global Livestock Collaborative Research Support
Program (GL CRSP) Pastoral Risk Management (PARIMA) project on a subcontract from the
“Regional Climate Prediction and Applications for the Greater Horn of Africa” project
undertaken by the International Research Institute for Climate Prediction at Columbia University
in collaboration with the University of Nairobi’s Department of Range Management. The
objectives of the data collection effort were to establish (i) the extent to which pastoralists in
northern Kenya and southern Ethiopia are aware of, make use of, and have confidence in
externally generated forecasts of the sort disseminated by the DMC in Nairobi in collaboration
12
with Ethiopia and Kenya’s national meteorological services, (ii) the media through which
pastoralists obtain such external forecasts, (iii) competing sources of climate forecast information
in these communities, particularly traditional climate forecasting methods, (iv) the types of
forecasts to which pastoralists pay attention and respond, (v) forecast information content and
timing most desired by pastoralists, (vi) how pastoralist households respond to different climate
expectations, (vii) the relationship between pastoralists’ price and climate expectations, (viii)
how pastoralists’ expectations of climate compare to DMC forecasts, (ix) their perception of the
accuracy of external forecasts, and (x) the range of traditional climate forecasting methods in use
in the study region.
A two-stage survey was designed to bracket either side of the long rains of April-May
2001. The initial survey instrument was fielded from early March 2001 to early April 2001 and
the follow-up module was implemented between early June 2001 and early July 2001. Both
modules are attached as appendices A and B, respectively. An open-ended questionnaire was
also fielded to establish prevailing indigenous climate forecasting methods and a copy of the
interview guidelines is included as appendix C.
The surveys were fielded among 323 households participating in PARIMA’s multi-year
study sample. There are approximately 30 households in each of 11 different sites, six in
northern Kenya (Dirib Gumbo, Kargi, Logologo, Ngambo, North Horr and Suguta Marmar) and
five in southern Ethiopia (Dida Hara, Dillo, Finchawa, Qorate and Wachile), spread over an area
of approximately 124,000 km2 (Figure 1). The sample spans several ethnic groups, including the
Ariaal, Boran, Chamus, Gabra, Guji, Rendille, and Samburu. These households are surveyed
quarterly on a variety of demographic, economic, agricultural and attitudinal topics. In the case
of this climate forecasting research, logistical difficulties due to insecurity unfortunately

13
disrupted our efforts in the Qorate site. The analysis reported here therefore relies on data from
just the other ten sites, six in northern Kenya, four in southern Ethiopia.
Our survey was conducted following one of the worst droughts in the Horn of Africa in
many years. Over the two years prior to the long rains of 2001, less than 100 millimeters of rain
had fallen in one of our Kenyan sites (Logologo), and only 120 millimeters in another (Kargi),
with the others all well below average as Figure 2 demonstrates for our Kenya sites.7’8 Having
just suffered through a severe drought, pastoralists were perhaps especially sensitive to the
upcoming season’s, making this an opportune time for a survey such as ours.
Figure 2: January 1999 – May 2001 Rainfall in Kenya Study Sites
IV. The Value of Climate Forecast Information to Pastoralists in the HA
The focus of this report is climate information, and, in particular, its use by pastoralists in
northern Kenya and southern Ethiopia. A distinction is made between indigenous or “traditional”
8 Because the 1999 rainfall data for Kargi were missing, we use data from the Laisamis meteorological station.
0
50
100
150
200
250
Jan-99
Mar-99
May-99
Jul-99
Sep-9
9Nov
-99
Jan-0
0
Mar-00
May-00
Jul-00
Sep-0
0Nov
-00Ja
n-01
Mar-01
May-01
rain
fall
in m
m
Dirib Gumbo Kargi LogologoNgambo North Horr Suguta Marmar

14
and externally generated or “modern” climate information. The former derive from indigenous
forecast methods, which are based on reading of clouds, stars, the moon, intestines, livestock and
wildlife behavior, or other phenomena, while the latter are primarily based on modern climate
science, particularly coupled global ocean-atmospheric models. We are particularly interested in
the issues enumerated in section II, notably pastoralists’ awareness and/or use of external,
meteorology-based climate forecasts, the channel(s) through which they receive this information,
the confidence they have in it, whether receipt of external climate forecast information in which
they express confidence has any discernible effect on pastoralists’ climate expectations, and
whether pastoralists change their behaviors in response to different climate expectations.
Our analysis proceeds from the following basic behavioral and informational
assumptions. Pastoralist households form prior beliefs about the upcoming season’s climate
based on past experiences and indigenous climate forecasts.9 These beliefs are then subject to
revision following reception of new forecast information from external sources. Pastoralists act
on their posterior beliefs as to seasonal climate patterns. Actions based only on indigenous
climate information are treated and labeled as “unsupplemented” relative to those based on an
information set supplemented with external forecast information.
(i) Pastoralists’ comprehension of probabilistic forecasts
Few people care directly about weather patterns for their own sake, so there is little
intrinsic value in the forecasts. Rather, climate forecasts may be instrumentally valuable because
people use them, implicitly or explicitly, to make forecasts of impact variables that matter to
them. East African pastoralists worry primarily about variables heavily influenced by climate
9 As we will show, almost all pastoralists receive indigenous climate forecast information and the vast majority express confidence in these indigenous forecasts .

15
patterns, such as forage and water availability, livestock prices, and animal and human disease
(Smith et al. 2001). There would therefore seem to be much opportunity for climate forecasting
to prove useful.
Several prospective obstacles stand in the way, however. In arid and semi-arid regions,
microvariability in climate often dominates, weakening the broad-scale teleconnections on which
most contemporary climate forecasting rests. Forecast skill may therefore not be as great in
higher potential areas nearby. The spatial resolution of the forecasts remains fairly coarse, but
semi-nomadic pastoralism depends heavily on spatial information. Finally, forecast skill with
respect to seasonal climate patterns is generally weak but the ability to forecast impacts on
variables of direct interest to decision makers is weaker still (Barrett 1998). Although these
issues merit attention, they are technical challenges well beyond our expertise and thus receive
no further mention in this paper. Our concern is rather with end-user behavior and how this
affects the value of climate forecast information among east African pastoralists.
There is widespread perception that despite its skill limitations, climate forecasting
technology has nonetheless advanced faster than have forecast delivery mechanisms that reach
and are trusted by targeted users (IRI 2001). One concern in this regard stems from the issuance
of probabilistic forecasts. Do end-users understand the uncertainty conveyed in a probabilistic
forecast? If not, one might reasonably worry that decision makers can react to forecast
information in ways that are ex ante optimal but ex post inappropriate and consequently lose
confidence in forecasts. If one can establish that people express uncertainty over climate
outcomes, especially if they can express them in a quasi-probabilistic fashion, one might
reasonably believe that they indeed understand the concept of forecast uncertainty and would

16
therefore be less likely to conflate the randomness of the climate realization with forecast
accuracy.
In order to get at this question, just prior to the onset of the long rains of 2001 we tried to
elicit pastoralists’ probabilistic assessment of the upcoming seasonal rainfall volume in a fashion
that would make their replies directly comparable to the external forecasts released by the DMC-
Nairobi.10 We gave each respondent twelve stones and asked them to allocate them across three
different piles on the ground, one for “above normal”, one for “normal”, and one for “below
normal”, according to their expectations regarding the rainfall for the upcoming season. 11 This
trinomial distribution is directly comparable to the equivalent trinomial forecast that had been
issued a few weeks earlier by the DMC, enabling us to compare individuals’ climate
expectations against the official forecast released by the region’s meteorology experts.
One striking result of this exercise is that pastoralists, the vast majority of whom have not
completed primary school – in Ethiopia, the vast majority have never attended any school and
are illiterate – clearly comprehend and themselves employ the concept of a probabilistic forecast,
even if they would not employ such terminology. Only 10.2 percent of respondents put all
twelve stones into any one category. Almost half of our respondents did not even put a majority
of the twelve stones in any one category. The mean probabilistic rainfall volume forecast by site
is reported in Table 1. This shows considerable variation in expectations across sites that are
reasonably proximate in climate forecasting terms. For example, the DMC issued a single
forecast for an area encompassing all the Kenya sites and a different, single forecast for an area
10 The DMC forecasts are generated from a climate forum that convenes scientists using different modeling methods, some based on statistical relationships between historical sea-surface temperature and terrestrial precipitation data, other derived from numerical models based on physical oceanic-atmospheric relationships. 11 The exact phrasing of the exercise is at the end of the survey instrument in Appendix A.

17
to the north that encompassed all the Ethiopia sites.12 It is also interesting to note that, on
average, our Kenyan respondents were considerably more optimistic about seasonal rainfall than
was the DMC forecast, while our Ethiopian respondents were somewhat more pessimistic about
the rainfall prospects of the upcoming season, as compared to the DMC consensus forecast.
As it turned out, when we revisited these same households after the rains had finished, a
large majority believed that rainfall had been below normal for their location during the forecast
period (Table 2), due mainly to the rains ending early (Table 3).13 In actuality, recorded rainfall
seems to have exceeded the annual means in our sites, although we haven’t all the final 2001
data yet to corroborate this guesstimate off of partial year data (which in some sites already
exceeded long-term annual means).
While perceptions about total annual rainfall are not the focus of this paper, our data
points to important inconsistencies between subjective and objective assessments of local rainfall
experience, and it is not entirely clear what one should make of these discrepanc ies. One
possible explanation of these inconsistencies is that pastoralists’ definitions of adequate rainfall
(including drought occurrences) may relate closely to range and livestock condition, which are
not solely affected by precipitation. In one of our research sites (Ngambo, Baringo), Little
(1992) previously found that definitions of insufficient rainfall or drought correlated closely with
years when the area was heavily stocked, pasture was in short supply, and animals were stressed,
even though rainfall may have only been slightly below normal.14
12 These forecasts were released following the Seventh Climate Outlook Forum held 14-16 February 2001, in Morogoro, Tanzania, and organized by the Drought Monitoring Centre Nairobi. 13 Interestingly, they also believed that rainfall volumes had been about normal elsewhere in the rangelands. Whether this reflects microvariability or respondent bias (“the grass is greener on the other side” syndrome) we cannot tell. 14 Another reason for the discrepancy between subjective interpretations and actual amounts of rainfall may relate to our reliance on monthly aggregates of rainfall amounts. A herder might label rainfall as ‘below normal’ if it is poorly distributed and heavily concentrated in a limited number of days, with large stretches (weeks) of little or no

18
Table 1: Mean probabilistic expectations of rainfall volume for the 2001 long rains season15 Above Normal Normal Below Normal
All Sites 36% 42% 22% All Kenya sites 42% 37% 21% DG 25% 39% 36% KA 35% 35% 30% LL 15% 61% 24% NG 52% 34% 14% NH 63% 25% 12% SM 62% 28% 10% All Ethiopia sites 27% 48% 25% DH 28% 50% 22% DI 15% 29% 56% FI 21% 73% 6% WA 45% 44% 11% DMC Forecast: Ethiopia sites (Region V)
35% 40% 25%
DMC Forecast: Kenya sites (Region IV)
25% 40% 35%
Table 2: Pastoralists’ opinions on the realized rainfall volume of the long rains 2001: In your area In other areas Above Normal 11% 23% Normal 18% 50% Below Normal 69% 25%
Table 3: Respondents’ opinions on the realized timing of the long rains 2001: Started Ended
Early 29% 56% Late 15% 8% On time 56% 34%
The finding that pastoralists form and communicate their own probabilistic forecasts
should help assuage concerns that the climate community’s probabilistic forecasts inherently
pose an obstacle to dissemination of retention among poor target populations. We will return to
these data in section 4(v) when we consider how receipt of and confidence in external forecasts
precipitation. This outcome takes place even in months when aggregate rainfall volume is normal or above normal (Little 1992).

19
changes pastoralists’ beliefs about climate. We first need to examine the primary source of
climate forecast information used to inform these beliefs: indigenous climate forecasting
methods.
(ii)Pastoralists’ use of indigenous climate forecasting methods
Pastoralists have, since time immemorial, used traditional, indigenous forecasting
methods to predict impending seasonal events. Climate forecasting is most certainly not new to
these peoples. However, many traditional forecasting methods are perceived as becoming less
reliable with increasing climate variability, raising the question of whether external,
meteorology-based climate forecasts might better help pastoralists conserve livestock wealth and
contribute to sustainable use of natural resources (Roncoli et al. forthcoming a). In some
quarters, it is therefore assumed that there exists considerable latent demand for science-based,
external forecasts. As this subsection demonstrates, it is not at all clear that such inferences are
well- founded in the case of the pastoralists we study.
Pastoralists employ an extraordinary variety of indigenous climate forecasting methods in
our eleven sites. As reported in detail in Appendices D (on Ethiopia) and E (on Kenya), a wide
array of methods are used, with a corresponding diversity of personnel making these forecasts.
Some use observations of clouds, wind or lightning that likely have their origins in traditional
understandings of what contemporary researchers might recognize as atmospheric science.
Others watch the behavior of livestock, wildlife or local flora. Still others slaughter animals to
read their intestines, watch the stars or the moon, or interpret dreams. Many of these methods
generate long-lead, seasonal forecasts that roughly match the time scale of external, model-based
15 The codes used for sites in this and subsequent tables are as follows. Ethiopia sites: DH = Dida Hara, DI = Dillo, FI = Finchawa, WA=Wachille. Kenya sites: DG= Dirib Gumbo, KA = Kargi, LL= Logologo, NG=Ngambo, NH =

20
forecasts. Figure 3 presents a histogram of frequency of use of different traditional forecasting
methods in our Kenya sites. This underscores the considerable diversity of methods employed
by pastoralists, from reading slaughtered animal intestines or cloud formations to interpreting
wildlife behavior or the patterns in which pairs of shoes repeatedly thrown fall.
As has been emphasized elsewhere in the developing world, traditional climate
forecasting methods may been have poorly understood, but may nonetheless be based on
intrinsically scientific foundations that account for moderate observed forecast skill (Orlove et al.
2000, The Economist 2001, Roncoli et al. forthcoming). As the chemist-philosopher Michael
Polanyi emphasized in his articulation of the concept of “tacit knowledge”, people – he was
speaking of scientists – often arrive at the correct answer, if sometimes by inappropriate,
imprecise or even incorrect means because they know and can implement knowledge and skills
that cannot be readily explained (Polanyi 1966). Based on the extensive information provided by
our sample communities, there seems to be much room for exploration of the scientific
foundations of ethno-meteorology among east African pastoralists.
Such tacit understanding of climate patterns appears widespread among east African
pastoralists. Before the onset of the 2001 long rains, 71%, 52%, 30% and 24% of pastoralists
only heard some sort of indigenous forecast about the onset of the rain, the amount of rainfall
expected locally, the amount of rainfall expected in other areas, and the duration of the rains,
respectively. While the number who heard only meteorology-based forecasts is negligible, 9-
15% heard both types forecasts (Table 4).
North Horr, SM= Suguta Marmar.

21
Figure 3: Use of Different Traditional Methods in Kenya16
Percent Using Different Traditional Methods
0%2%4%6%8%
10%12%14%16%18%
Intestin
eClou
dsBir
ds
Lives
tock B
ehav
ior Stars
Trees
Wind
Night S
ky Moon
Shoe
sPla
nts
Dreams
Year T
ype Seer
Lighte
ning
Frogs
Butte
rfly
Climate
Month
The forecast of greatest interest, and thus the one most could recollect hearing, concerned when
the long rains would commence. Forecasts of the amount of rainfall expected to fall over the
course of the season in their location likewise were widely heard. Forecasts of the duration of
rainfall, as reflected in forecast end date for the rains, were less widely heard. The volume of
rainfall in other areas, to which pastoralists might be able to migrate, were still less widely
received. These patterns were stable across the preceding two rainy seasons, for which we also
collected basic data on forecast receipt (not reported here). There is, however,
16 Each household could identify up to ten distinct methods from which it used forecasts. This graphic represents the percent of total indigenous forecast use data points (776 in the case Kenya) accounted for by different methods.

22
Table 4: Receipt of climate forecasts for 2001 long rains, by content, source and location17 (reported after the conclusion of the rains) Start date Amt in own area Amt in other areas End date Trad.
only Ext. only
Both Neither Trad. only
Ext. only
Both Neither Trad. only
Ext. only
Both Neither Trad. only
Ext. only
Both Neither
All 71% 1% 15% 12% 52% 0% 13% 20% 30% 0% 12% 54% 24% 0% 9% 64% DG 32% 4% 8% 61% 19% 0% 8% 73% 0% 0% 4% 96% 0% 0% 0% 100% KA 87% 4% 9% 0% 43% 4% 9% 43% 17% 0% 0% 83% 30% 0% 4% 65% LL 32% 0% 55% 5% 36% 0% 36% 18% 36% 9% 36% 18% 32% 4% 32% 23% NG 93% 0% 7% 0% 82% 0% 11% 7% 0% 0% 21% 78% 21% 0% 0% 79% NH 89% 0% 11% 0% 93% 0% 7% 0% 48% 0% 4% 48% 0% 7% 0% 93% SM 50% 0% 32% 14% 45% 0% 23% 32% 36% 0% 23% 41% 41% 0% 23% 36% DH 87% 0% 0% 13% 87% 0% 0% 13% 70% 0% 0% 30% 70% 0% 0% 30% DI 97% 0% 0% 3% 93% 0% 0% 7% 7% 0% 0% 93% 3% 0% 0% 97% FI 64% 0% 12% 20% 80% 0% 8% 8% 80% 0% 4% 16% 68% 0% 12% 16% WA 70% 0% 30% 0% 67% 0% 30% 3% 44% 0% 30% 22% 0% 0% 19% 78%
17 lro1 is long rains of 2001, sr00 is short rains of 2000, and lr00 is long rains of 2001. govt. exten. is government extension agents; ngo exten. is non-government extension agents; local elders includes religious leaders; friends here is friends or neighbors living in this area; friends away is friends or neighbors living outside area.

considerable spatial variation in the sources and use of climate forecasts, although all sites show
widespread use of traditional forecasting methods and considering greater use of these than of
external forecasts.
The hierarchy of forecast access reflects both supply and demand considerations.
Traditional forecasting methods tend to focus on predicting the onset of the rains and the rainfall
volume, which are also the variables of greatest interest to pastoralists, as we will demonstrate in
the next section. External climate forecasts in this area are offered exclusively for rainfall
volumes. The fact that ten percent of our respondents reported hearing external forecasts of start
or end dates for rains signals that in spite of our efforts to clearly restrict the questioning to
longer- lead climate forecasting, as distinct from near-term weather forecasting, these two are
sometimes conflated in the minds of respondents (and enumerators and researchers).
Table 5: Distribution of level of confidence in climate forecasts by type Start date End date Amt in own area Amt in other areas
Traditional External Traditional External Traditional External Traditional External Never Heard
2% 52% 26% 58% 9% 52% 21% 55%
None 4% 10% 16% 12% 6% 12% 17% 9% Some 60% 26% 43% 20% 46% 24% 39% 20% High 34% 6% 14% 3% 38% 5% 20% 8% In spite of widespread claims in the scientific and donor communities that indigenous
forecasting methods’ skill is declining in the face of increased climate variability, pastoralists
continue to express considerable confidence in traditional methods (Table 5). While less than
one-third of respondents express confidence in any type of climate forecast, 94% express at least
some confidence in traditional forecasts of rains’ start date, 84% have at least some confidence in
indigenous forecasts of rainfall volume, and a majority have at least some confidence in forecasts
of both rains’ end dates and rainfall amounts in other areas.
24
We asked pastoralists why they had confidence in whichever method they preferred. A
wide range of open-ended responses emerged. One of the most common responses as to why
pastoralists retain confidence in indigenous forecasts was their familiarity and accessibility, both
in terms of having the forecasters personally present forecasts in the community and in terms of
the language used. Another common response was historical performance, along the lines of
“my great grandfather used these methods successfully and we have all used them since.” The
wider range of indigenous forecasts, many of which are targeted toward particular features of the
upcoming season – e.g., when the rains will start, where they will fall, when they will end, etc. –
also generate greater detail and spatial, temporal and subject specificity, all of which are
appreciated and induce confidence, especially when coupled with past success in prediction.
The results in Table 5 mask significant heterogeneity across particular indigenous
methods. As Figure 4 shows, using just data from our Kenya sites, confidence levels are not
uniform across all traditional methods. Perhaps this reflects changing performance records,
shifting skill sets among the traditional forecasters, or the effects of increasing education among
pastoralists, at least in our Kenya sites. More than half of the Kenyan pastoralists in our sample
express at least some confidence in the reading of clouds, stars and animal intestines. But most
methods enjoy the confidence of a minority of pastoralists. It is therefore not so much that there
is a single indigenous forecasting method that is perceived as especially skillful, but rather that
the suite of traditional methods seem to offer sufficient complementarity as to elicit confidence
from the overwhelming majority of the region’s pastoralists. It appears that while there may be
some perception of poor skill or decline in one or another fo recasting method within a
community, the broader suite of indigenous climate forecasting methods retains considerable

25
confidence within pastoralist cultures. The challenge for external forecasting is to demonstrate
that it can contribute new, valuable information to these peoples.
Figure 4: Confidence Level in Various Traditional Climate Forecasting Methods, Kenya
Pastoralists’ perceptions of the accuracy of forecasts they heard for the 2001 long rains
reinforces their declarations of confidence in indigenous methods (Table 6). For the two key
forecasts – rains’ start date and the amount expected to fall in their area – 97-98 percent of
respondents felt that traditional forecasts were at least somewhat accurate and half or more
deemed them very accurate. This strikes us as an extraordinarily high rate of perceived skill,
whether or not it is objectively verifiable.
Rainfall data collected in each of the sites show that, except for Finchawa and Kargi,
each of the other nine locations in our survey received rainfall below the median for the
traditional long rains period (March-May). The historical figures also show that rainfall amounts
received during the long rains of 2001 in Dillo, Dirib Gumbo, Suguta Marmar and Wachille were
19 The careful reader will note that there are very modest differences between the percentages shown in this Table, which is based on information collected in our pre -rains round (March 2001) and those shown in Table 4, which is based on data from our post-rains round (June-July 2001).
Confidence Level in Traditional Methods
0%10%20%30%40%50%60%70%80%90%
100%
Clouds
Intestin
eMoo
n
Dream
sStar
s
Livest
ock Be
havio
r Birds
Wind
Trees
Plants
Night S
ky
Year T
ype
Shoe
s
HighSomeLow

26
even below amounts usually received in two out of every three seasons. It would therefore
appear that for that one season at least, the DMC forecasts, which were biased towards below
normal rains in Kenya, were more accurate than the traditional forecasts reflected in our Kenyan
respondents’ relatively optimistic ex ante view of the season. The DMC forecast seems to have
been somewhat less accurate ex post in Ethiopia, where it was weighted toward above average
rainfall and where respondents’ own assessments were slightly more pessimistic ex ante than the
DMC forecast.
Table 6: Perceived accuracy of 2001 long rains forecasts, conditional on hearing a forecast Start date End date Amt in own area Amt in your area
Traditional External Traditional External Traditional External Traditional External Not at all 2% 22% 3% 21% 9% 9% Somewhat 48% 39% 36% 83% 26% 32% 36% 43% Very 50% 61% 42% 17% 71% 47% 55% 48%
A key issue here concerns the spatial resolution of different types of climate forecasts.
Averaged over the tens of thousands of square kilometers in the relevant DMC forecast regions,
the external forecasts appear to have been reasonably accurate. But while low resolution,
accurate information might be of use to to policy makers thinking of northern Kenya or southern
Ethiopia or the Horn of Africa as a whole (e.g., how much food aid to request in a new appeal to
donors), herders in specific places need forecasts at higher spatial resolutions relevant to the
decisions they make. Until model-based technologies permit accurate forecasting at a spatial
scale related to pastoralists’ choices, there is little reason to believe it will have direct value for
them. Indigenous forecasting methods offer relevant information (e.g., rainfall volume and start
dates) at the appropriate spatial scale, hence their far greater popularity among pastoralists.
Given the wide range of indigenous climate forecasting methods offering predictions on a
range of variables of interest to pastoral peoples, pastoralists’ perception that these indeed evince

27
some skill in predicting future climate patterns and their resulting confidence in them, it is not at
all apparent that there exists much latent demand for further climate forecasting information
among these peoples. We therefore turn now to studying external, science-based climate
forecasts directly, first exploring who is aware of these forecasts and how much confidence
pastoralists hold in them before turning to consider the extent to which external forecasts provide
truly new information and induce the updating of pastoralists’ prior beliefs, or the degree to
which pastoralist behavior varies in response to variation in their expectations of upcoming
climate patterns.
(iii) Awareness of and access to external or meteorology-based climate forecasts
A sharp minority of respondents obtains meteorology-based forecasts. Indeed, only about
one-fifth of our sample had heard a forecast about the onset and duration of the rains, and the
amount of rain expected to fall in their local area and in other areas from any of the modern
sources (radio, television, newspapers, other printed materials, and government or NGO
extension agents). Radio is by far the most common medium through which pastoralists receive
external climate forecasts (Table 7). No other external forecast source reaches more than three
percent of the pastoralist population.
Table 7: Pastoralists’ receipt of forecasts, by forecast content and source 19 (reported prior to the onset of the rains) Heard
forecast radio tv Newspaper other
print govt. exten.
ngo exten.
traditional forecast
local elders
friends here
friends away
Onset date Lr01 89% 16% 1% 1% 0% 1% 3% 80% 51% 24% 4% sr00 78% 13% 1% 1% 0% 2% 1% 72% 44% 21% 3% End date Lr01 38% 10% 1% 1% 0% 0% 1% 33% 22% 9% 1% sr00 42% 7% 1% 1% 0% 0% 0% 38% 30% 12% 3% Rainfall volume, their location Lr01 80% 12% 1% 1% 0% 1% 2% 71% 44% 21% 4% sr00 70% 9% 1% 0% 0% 1% 0% 65% 41% 19% 4%

28
In assessing the reach of external forecasts, it is important to bear in mind the material
deprivation of most pastoralists.20 .In our sample, only 5% of the Ethiopians owned a radio and
only 23% of the Kenyans did.21 The implication is that the proportion of respondents reporting
that they had heard an external forecast for the long rains of 2001 exactly equals the overall
proportion of the sample that owns a radio. This suggests that there exists a basic material
constraint on receipt of external climate forecasts.
Table 8: Percent who never learned about forecasts from the listed sources over the past ten years either because they did not know they announce forecasts or because they have not had access to the source. radio newspaper Other
print tv govt.
exten. ngo exten.
traditional forecas t
local elders
friends here
friends away
All 60% 81% 81% 79% 73% 72% 3% 16% 23% 35% DG 65% 92% 85% 81% 27% 73% 4% 15% 19% 19% KA 72% 88% 96% 92% 80% 56% 0% 0% 8% 28% LL 37% 78% 81% 74% 70% 63% 0% 15% 26% 30% NG 50% 97% 97% 93% 97% 83% 0% 0% 3% 47% NH 85% 100% 100% 100% 100% 100% 0% 63% 56% 56% SM 16% 46% 42% 42% 37% 25% 0% 0% 0% 0% DH 96% 96% 96% 96% 96% 96% 0% 0% 32% 48% DI 93% 100% 100% 100% 100% 100% 0% 0% 0% 0% FI 11% 4% 0% 0% 8% 8% 0% 0% 0% 0% WA 69% 100% 100% 100% 100% 100% 28% 62% 83% 97% Table 8 reinforces this point. We asked whether respondents were aware of the availability of
external climate forecasts through various media and found that in seven of ten sites, a majority
either were not aware that forecasts were available on radio or they had no access to a radio. The
other media for external forecast delivery – television, newspapers, other printed periodicals,
government or NGO extension agents – were even less accessible than radio, perhaps explaining
the extraordinarily low reported rates of access to external climate forecasts from those sources.
20 In spite of this statement, we caution against inferring from the modest material endowments of pastoralists that pastoralism is not a viable livelihood. Abundant evidence shows that the resource deprivations most closely associated with human suffering are often quite different among east African pastoralists than standard asset, expenditure or income accounting approaches to poverty measurement would suggest (Anderson and Broch-Due 1999, Little et al. 2001).

29
By contrast, absolutely every respondent in eight of our ten sites learned about traditional climate
forecasts over the same period. Accessibility plainly matters.
One needs to be cautious, however, about attributing the relatively low rate of external
forecast use wholly to accessibility. There are at least two other significant issues: content and
timeliness of forecasts. In an effort to identify the climate fo recast content pastoralists most
desire, we asked them to rank order different types of forecast content by usefulness if each type
could be reliably provided with some skill. As mentioned previously and shown in Table 9, the
survey data show that pastoralists are mainly interested in climate information pertaining to the
onset date of the rains. This was the first choice of more than 70 percent of our respondents,
with 94% putting it either first or second. Such forecasts are available from indigenous providers
but are not presently produced and disseminated by the meteorological agencies in the Horn of
Africa. Since the forecast information pastoralists most desire is available only through
indigenous providers, is it any wonder that they rely far more on traditional sources than on
external ones? This reinforces our earlier point that the potential for external climate forecasting
lies in complementing, rather than replacing, existing indigenous systems.
Table 9: Pastoralists’ rank of the usefulness of different types of forecasts Rank Start
dateEnd date
Amount here
Amount away
1 71.3% 2.3% 24.7% 1.7% 2 22.5% 17.0% 51.3% 9.2% 3 4.4% 51.5% 20.7% 17.5% 4 0.0% 13.0% 1.6% 49.5% not useful 1.8% 16.2% 1.8% 22.1%
21 Such poverty is by no means exclusive to pastoralists in these countries. Rather it typifies residents of less favored areas no matter the livelihood most commonly practiced.

30
The total amount of rain expected to fall within the vicinity of residence is of much, but
decidedly secondary, interest. Less than one-quarter of respondents placed highest priority on
this forecast variable, one of the two available from meteorological agencies, although more than
half ranked it second. Much less interest was expressed in forecast information concerning
when the rains will end, and consequently of the duration of the rains, with 16 percent of
respondents deeming the information not useful and less than 20 percent ranking it first or
second. The forecast variable of least interest to pastoralists was clearly the rainfall volume
expected in areas outside respondents’ vicinity, i.e., in areas to which they might migrate in
search of water and pasture if the rains in their area were to prove insufficient. This likely
reflects the fact that pastoralists do not move on the basis of forecasts; they move only after
having sent advance scouts to establish where they might find and be able to secure access to
sufficient forage and water to maintain their herds in a reasonably secure area. .
The other factor affecting demand for forecast information has to do with their timeliness.
In order to incorporate new information and make adjustments to herd or farm management (or
other) behaviors, pastoralists need sufficient advance notice. The 2001 climate forum organized
by the Drought Monitoring Centre Nairobi was held in mid-February, about one month prior to
the usual onset of the long rains in this region. Release and dissemination of the consensus
climate forecast from that meeting by the national meteorological services therefore gave
pastoralists less than one month’s notice.
Based on pastoralists’ declaration to us as to how many weeks in advance of the season
they need to receive a forecast in order for it to be useful, the 2001 long rains forecasts appear to
have arrived too late. Although there is significant spatial variation in the lead times demanded,

31
the mean was 4.6 weeks for forecasts of rainfall volume in respondents’ location (Table 10).22
This finding is consistent with similar results among farmers in Burkina Faso, where Roncoli et
al. (forthcoming b) found that farmers sought forecasts one to two full months prior to the onset
of the rainy season. One clear implication is that future climate outlook fora should be scheduled
for late January or early February if they are to prove useful to the pastoralist community.
Table 10: Mean weeks in advance of the season that a forecast needs to be received in order to be useful Start date end date amount here amount away
overall 4.4 4.1 4.6 3.7 DG 3.3 4.9 3.5 3.6 KA 3.1 2.0 3.1 2.3 LL 2.9 2.6 3.4 3.1 NG 8.1 6.6 9.6 4.0 NH 5.3 4.5 5.5 5.3 SM 2.8 6.3 4.1 4.0 DH 3.2 2.7 2.9 2.6 DI 4.5 4.7 4.5 3.1 FI 4.2 5.2 4.2 4.0 WA 5.0 4.1 4.3 5.0
(iv) If aware of external forecasts, do pastoralists have confidence in them?
In order for external climate forecasts to have value among pastoralists, herders must not
only receive the forecasts, they must also have some confidence in them. Even controlling for
access to forecast, pastoralists express less confidence in external forecasts than in traditional
ones (Table 11). For each type of forecast, a larger proportion of respondents have no
22 The one notable outlier in these data is Ngambo, where dependence on dryland and irrigated agriculture is higher than in other sites . Because Ngambo agropastoralists must have their fields ready to plant as soon as the rains start and because they have strong competing demands for labor in the late dry season due to herding, it is critical that they begin (manual and mechanized) field preparation more than one month before the rains start. Little (1992) found that one of the most important determinants of a successful harvest both on dryland and irrigated plots was the time of planting after the rains started, which is a reflection of field preparation.

32
confidence in external forecasts than in indigenous ones and a smaller share have high
confidence.
Table 11:Confidence Level Conditional on Hearing Forecast, By Type Start date End date Amt in own area Amt in your area
Traditional External Traditional External Traditional External Traditional External
None 4.1% 23.8% 21.9% 34.3% 6.7% 29.3% 22.4% 24.3% At Least Some 95.9% 76.2% 78.1% 65.7% 93.3% 70.7% 77.6% 75.7% High 34.7% 14.3% 19.2% 8.6% 42.2% 12.2% 26.3% 21.6%
The good news for the meteorological community, however, is that 70-76 percent of
respondents expressed at least some confidence in the external forecasts they heard as to the
amount of rainfall expected to fall during the upcoming long rains in 2001. Looking back to
Table 6, this confidence is associated with the perception that external forecasts exhibit
reasonable skill. Almost half of all respondents who heard external forecasts of 2001 seasonal
rainfall amounts thought ex post that they had been very accurate. When we asked open-ended
questions as to the reasons for their confidence in modern forecasts, the replies almost always
revolved around the use of modern equipment (“machines”) and the educational attainment and
training of the meteorological staff who generate the forecasts.
So there appears to be a nontrivial cohort of pastoralists who indeed are interested in
hearing the external forecasts because they have access to and confidence in them. Who are
these pastoralists? We explore this question via a simple probit model of a binary variable taking
value one if the household head had access to and confidence in external climate forecasts, zero
otherwise, regressed on the age of the household head, the square of the household head’s age,
the years of education completed by the household head, and a set of dummy variables taking the
value one if the household (i) resides in Kenya, (ii) lives near a town or major highway, (iii)

33
owns a radio, (iv) participated in an adult education program, or (v) owns property, either a shop
or a house or both, in a nearby town.
Table 12: Results for probit model of access to and confidence in external climate forecasts (N = 247)
Marginal Effects (Std. errors) Coefficients (Std. Errors) Constant Location dummies
Kenya Near town/major road
Male Formal education Adult education Age Age2 Own a radio Own property in town
N/A 0.100* (0.051) 0.113** (0.050)
- 0.068 (0.059)
0.019* (0.011) 0.218* (0.141)
- 0.007 (0.010) 0.000 (0.000) 0.114* (0.077)
- 0.065 (0.073)
-0.848 (1.11)
0.436* (0.237) 0.494** (0.235)
-0.269 (0.222) 0.079* (0.045) 0.703* (0.386)
-0.028 (0.043) 0.000 (0.000) 0.419* (0.253)
-0.306 (0.399)
** (*) denotes statistical significance at the 5% (10%)level.
The estimation results, reported in Table 12, clearly reveal spatial heterogeneity in the
probability of access to and confidence in external forecasts. Respondents in Kenya are more
likely to have access to and confidence in external forecasts, as are those who reside near a town
or major highway, i.e., respondents in Dirib Gumbo, Finchawa, Logologo, Ngambo, Samburu
and Wachile. Location of residence or work plainly matters to who receives information about
meteorology-based climate forecasts, with more-favored areas getting better information.
Respondents in Logologo, Ngambo and Samburu also often have family members employed as
wage laborers in nearby towns such as Isiolo, Marigat, Meru, Nakuru, Naivasha, Gilgil or
Nyahururu. This likely helps foster information flow back to rural communities, increasing
awareness of external climate forecasts. Also as expected, respondents who own a radio are more
likely to have access to and confidence in meteorology-based climate forecasts. Indeed, owning

34
a radio has a strong marginal effect on the probability of receiving and having confidence in
external climate forecasts.
Not surprisingly, educational attainment appears to play a significant role as well, which
perhaps helps explain the frequency with which respondents cited the education of
meteorological forecasters as the primary reason for their confidence in these products.
However, since greater educational attainment is associated with higher and more stable cash
incomes among these pastoralists, this also implies the same sort of wealth bias that one
commonly finds in other technology adoption studies. Climate forecasts based on
meteorological science appear to be reaching primarily a relative elite within the pastoral areas of
northern Kenya and southern Ethiopia, although it is impossible to establish clearly whether
these forecasts are actually used by the elites or if they serve just as a mark of modernity .
(v) Do external forecasts differ from indigenous forecasts?
Even if pastoralists receive and have confidence in external climate forecasts, there will
not be value in these forecasts unless they change respondents’ prior beliefs. This obviously
requires that the external forecast contain new information, that it differs somehow from
indigenous forecasts already available. This difference can be with respect to the forecast
variables, a point made previously in discussing the sort of climate information pastoralists most
want. The difference can also come in the form of variation in forecast values of the same
variables (e.g., rainfall volume). We focus now on this latter point.
Since indigenous climate forecasting methods have evolved over long periods of time to
fit site-specific patterns, it is perhaps not surprising that most pastoralists perceive these methods
to be reasonably accurate. In that case, accurate meteorology-based forecasts might not differ

35
much from the traditional forecasts if both offer unbiased estimates of upcoming climate
patterns. Hammer et al. (2001) and Phillips et al. (2001) report that in both 1997-98 and 1998-
99, Zimbabwean farmers’ seasonal climate forecasts elicited in advance of the release of official
climate forecasts corresponded almost exactly with the official meteorological service forecasts.
This likely partly reflects the tacit scientific knowledge – based on readings of clouds, winds,
flora and fauna behavior – that intersects with the explicitly scientific methods used in the
climate modeling community. External forecasts that merely reinforce prior beliefs necessarily
do not change behaviors and are thus of limited value.
Given the multitude of indigenous forecasts available in the sample communities, there
would not be a clear way to establish what “the” indigenous forecast was for the long rains of
2001, especially since it would likely be incomparable to the DMC’s trinomial probabilistic
seasonal forecast of rainfall volumes. However, because we elicited pastoralists’ own subjective
beliefs over rainfall we can compare the beliefs of those who used – and could therefore have
been influenced by – traditional forecasts with the DMC forecasts to see if the two differ. Table
13 presents site-specific mean differences between the forecasts reported by households that used
only traditional forecasts and the DMC forecasts released through the national meteorological
services. In Dirib Gumbo, the site close to Marsabit town, the mean forecast is quite close to the
DMC forecast. In the other nine sites, however, there seem to be significant differences – at least
ten percent in one of the forecast categories – between the DMC forecast and the prior beliefs of
pastoralists based on their own experience and traditional forecast information.

36
Table 13: Difference in mean long rains 2001 rainfall predictions between users of traditional forecasts only and DMC forecasts Above Normal Normal Below Normal DMC Forecast: Ethiopia sites (Region V)
35% 40% 25%
All 37% 41% 22% All Kenya 19% -3% -16% DG 1% -2% 1% KA 10% -7% -4% LL -10% 20% -11% NG 27% -6% -21% NH 38% -15% -23% SM 37% -10% -27% All Ethiopia -7% 7% 0% DH -7% 10% -3% DI -20% -11% 31% FI -15% 34% -19% WA 12% 2% -14% Note: Computed as mean traditional forecast probability less DMC forecast probability, by site.
This pattern is evident as well in Figure 5, which plots deviations of household forecasts
from the DMC forecast for the household’s area. The vertical axis captures the difference
between the household’s expressed probability of above average rainfall less the DMC forecast
of the same outcome. The horizontal axis captures the difference between the household and
DMC probabilities of a below average rainfall season. Since the trinomial distribution must sum
to one, this two-dimensional depiction captures the full variation in forecasts. If the forecasts
were identical, all the observations would fall on the origin. So dispersion away from the origin
is a measure of the “newness” of the information in the DMC forecast. If the DMC forecast
merely repeated what pastoralists already believed, its redundancy would sharply limit its
potential value. As is apparent, there is considerable deviation from the DMC forecast.

37
Figure 5: Rainfall expectations (deviation from DMC forecast), all households
(vi) Do pastoralists update their prior beliefs based on external climate information?
Having established that the DMC forecast indeed seems to have offered original
information to most of the pastoralists in our sample, the next question is whether receipt of such
information actually causes pastoralists to update their prior beliefs. If external climate
forecasts are to have value, pastoralists must update their beliefs on the basis of this information.
We should therefore observe a discernible difference between the forecasts of those who receive
and express more confidence in modern forecasts than in traditional forecasts and the rest of the
population, with the former group’s own beliefs moving in the direction of the DMC forecasts.
Figure 6 presents a plot of the deviation of household from DMC forecasts among only
households who received external climate forecasts and expressed more confidence in them than
in indigenous forecasts. As is apparent in comparing Figures 5 and 6, these pastoralists’
forecasts are not discernibly closer to the DMC forecasts than the broader sample’s forecasts.
Not only did extraordinarily few households offer a probability forecast that matched the DMC
Scatter plot of difference between individual households and DMC prediction: Above versus below normal.
All Households
-0.6
-0.4
-0.2
0
0.2
0.4
0.6
0.8
1
-0.4 -0.2 0 0.2 0.4 0.6
HH below normal - DMC below normal
HH
ab
ove
no
rmal
- D
MC
ab
ove
no
rmal
38
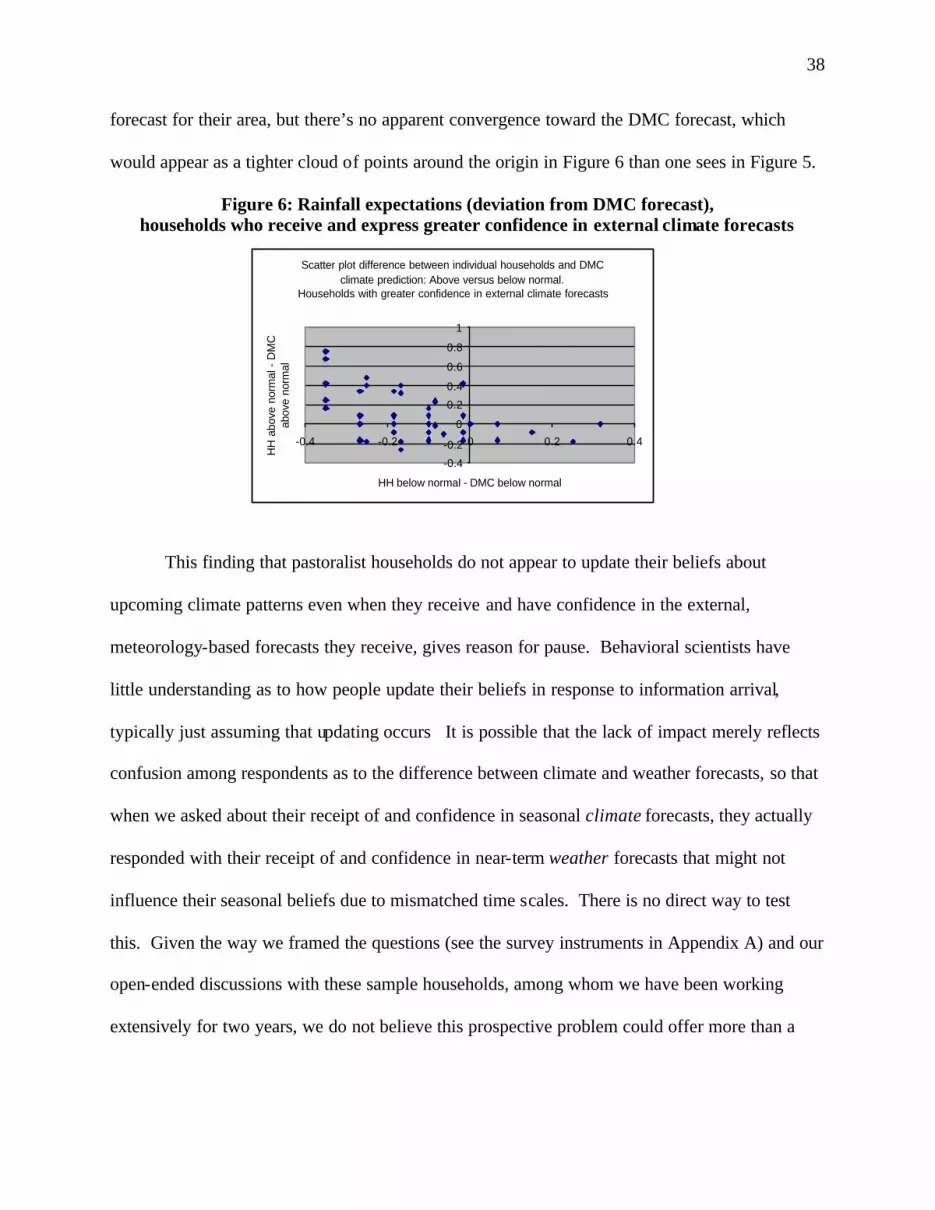
forecast for their area, but there’s no apparent convergence toward the DMC forecast, which
would appear as a tighter cloud of points around the origin in Figure 6 than one sees in Figure 5.
Figure 6: Rainfall expectations (deviation from DMC forecast), households who receive and express greater confidence in external climate forecasts
This finding that pastoralist households do not appear to update their beliefs about
upcoming climate patterns even when they receive and have confidence in the external,
meteorology-based forecasts they receive, gives reason for pause. Behavioral scientists have
little understanding as to how people update their beliefs in response to information arrival,
typically just assuming that updating occurs It is possible that the lack of impact merely reflects
confusion among respondents as to the difference between climate and weather forecasts, so that
when we asked about their receipt of and confidence in seasonal climate forecasts, they actually
responded with their receipt of and confidence in near-term weather forecasts that might not
influence their seasonal beliefs due to mismatched time scales. There is no direct way to test
this. Given the way we framed the questions (see the survey instruments in Appendix A) and our
open-ended discussions with these sample households, among whom we have been working
extensively for two years, we do not believe this prospective problem could offer more than a
Scatter plot difference between individual households and DMC climate prediction: Above versus below normal.
Households with greater confidence in external climate forecasts
-0.4
-0.2
0
0.2
0.4
0.6
0.8
1
-0.4 -0.2 0 0.2 0.4
HH below normal - DMC below normal
HH
abo
ve n
orm
al -
DM
C
abov
e no
rmal

39
minor, partial explanation for this important result of non-updating of beliefs in response to
information in which respondents declare confidence.
A more convincing explanation would focus again on the difference between the spatial
resolution of modern climate forecasts and the scale relevant to respondents. Pastoralists might
indeed have confidence in the DMC forecast for the whole of northern Kenya or southern
Ethiopia yet hold different climate expectations that are much more local and based primarily on
indigenous forecasts specific to their locality. The lack of apparent updating may reflect, in
other words, an implicit assessment that model-based forecasts, although accurate at the spatial
resolution at which they are offered, are not particularly useful to the choices pastoralists must
make.
(vii) Do pastoralists adjust behavior in response to changes in climate expectations?
The final key piece of the climate forecast information valuation puzzle has to do with
behavioral response. If pastoralists receive external forecasts, have confidence in them, and
update their beliefs in response to this new information, do they then adjust their behaviors to
take advantage of their revised climate expectations? If people either cannot or will not change
behavior in response to information they receive, then the information has no management value.
Information may nonetheless have some (limited) direct consumption value, akin to when
westerners pay for tarot card or palm reading to satisfy some curiosity about the future. But it
would not have the value of interest to the climate and development community: the instrumental
value associated with information’s utility as a management tool.
People need more than information to be able to respond to a predictable, impending
(positive or negative) shock. They must have access to resources necessary to give them

40
strategic alternatives among which they can choose, and they must have the will to make such
strategic choices. Low income populations, such as the pastoralists we study, often lack the
means to adjust behaviors to suit emerging conditions. Loss of spatial refugia in the rangelands
to town growth, violence, gazetting of parks, and encroachment of dryland cultivation all limit
grazing management options and few desirable non-pastoral opportunities exist, especially for
those who lack secondary education or funds sufficient to start a business. The critical issue for
herders is the onset/timing of rainfall since animals’ mobility depends on water and forage
availability, which steadily deplete in a location until recharged by new rainfall. Herders rarely
stay put on the basis of as-yet-unfulfilled expectations of rainfall. We do, however, know of
several exceptions to this rule, cases in our study area where herders waited too long to move
their cattle, which then became so weak that many died in route to drought refuge pastures and
water.
The obstacles to adaptive management in response to climate forecast information can be
cognitive as well as material. Status quo bias may lead to routinization of behaviors that
impedes optimal ex ante adaptation. Moreover, in some cultures forecast information may be
understood differently than is implied in conventional information theory, more as early notice of
an outcome than as an input to assist human agency, as users in industrial and post- industrial
societies more commonly view forecasts. In the case of either insufficient means or insufficient
will to respond, the potential value of skillful climate forecasting goes unrealized.
Other studies have suggested that poor farmers’ response to climate forecast information
might be limited. Roncoli et al. (forthcoming b) report that Burkinabe farmers’ capacity to
respond adequately to climate forecasts is hindered by their poor access to necessary inputs and
by risk aversion. Phillips et al. (2001) similarly report that Zimbabwean farmers generally did

41
not act on climate forecast information signaling drier than normal conditions. In both cases,
limited response appears to have been due primarily to limited capacity to act, for example due
to unavailability of appropriate seed.
A large majority of the pastoralists who heard a forecast felt ex post that the forecast
information was not only accurate (see Table 6), but also helpful (Table 14). Not surprisingly,
given the rest of the data reported already, respondents generally rated traditional forecasts more
helpful than external forecasts when queried after the long rains had passed.
Table 14: If you received this forecast for long rains 2001, how helpful do you think it was? Start date End date Amt in own area Amt in your area
Traditional External Traditional External Traditional External Traditional External Not at all 5% -- 32% -- 6% 22% 13% 5% Somewhat 38% 40% 23% 60% 30% 33% 42% 57% Very 57% 60% 45% 40% 64% 44% 45% 38%
One has to wonder what made these forecasts “helpful”, however, because very few
pastoralists in our sample did anything differently based on the climate forecast information they
received. As Table 15 indicates, only about one quarter of our respondents changed their
behavior on the basis of the forecast start dates for the long rains. Less than ten percent of those
who received external forecasts of rainfall volumes in their own areas adjusted behavior in
response. The combination of pastoralists’ relatively high confidence in both traditional and
external climate forecasts and their accuracy, combined with the negligible updating of their
prior beliefs and lack of behavioral response suggest that these pastoralists may treat climate
forecasts more as information to be consumed to satisfy curiosity than as a management tool.
This inference is consistent with the use of messages from dreams and, especially, by the
tendency of traditional forecast methods to generate predictions about the outcome of seasons in
addition to the upcoming environmental conditions. This would be consistent with the

42
hypothesis that forecast information is treated more as early notice of what is to befall recipients
rather than to equip them to take control of their circumstances and to manage their resources so
as to attain the best possible outcome.
Table 15: Percent who received a climate forecast who changed any behaviors Start date End date Amt in own area Amt in other areas Traditional 26% 3% 15% 2% External 24% 0 % 9% 13%
Those who did alter their management practices did so on the strength of traditional
information about the onset date and expected volume of rain in their area. Further, most
responses were with respect to cultivation practices rather than herd management strategies.
Almost all the responses we got to open-ended questions asking what people did differently
during the long rains of 2001 on the basis of climate forecast information referred to decisions as
to whether or not to plant, when to sow, seed choice, etc.
In the first (pre-rains) round, we had asked people to recall what actions, if any, they took
the last time they had expected above normal or below normal rains. A similar pattern emerged,
wherein those who cultivate crops indicated that they had adjusted cultivation choices in
response to climate forecasts, but the incidence of behavioral change in herd or household
finance management. The primary reported response to expectations of above- or below-average
came in the form of prayers and other ceremonial activities.
These results may seem puzzling since pastoralists’ livelihoods depend so heavily on
climatic patterns. We believe the absence of a strong behavioral response to climate forecast
information may be best explained by the methods pastoralists have developed over many years
to guide key decisions. For example, choices over when and where to move the herd are perhaps
the key management decisions a pastoralist makes (Dyson-Hudson 1972, McCabe 1984 and

43
1994, Little et al. 2001, McPeak and Barrett 2001). But they don’t move on the basis of
forecasts; rather, they usually send scouts to establish range conditions and safety before making
the trek. Marketing behavior likewise is unlikely to be directly affected by climate forecast
information because rainfall shocks have countervailing effects on pastoralists’ incentives to sell
(or purchase) animals. As McPeak (2002) shows, rainfall shocks affect both the flow of income
pastoralists enjoy – primarily from milk – and the stock of assets they own, with the former
(latter) effect encouraging (discouraging) sales when rainfall is low. As a consequence, on
average, observed pastoralist marketing behavior appears invariant with respect to rainfall
patterns, although there are plenty of anecdotal examples of exceptions to this central tendency
(Lybbert et al. 2001, McPeak and Barrett 2001, McPeak 2002). In short, there is this built in
flexibility in nomadic pastoralism that does not exist to the same degree in crop cultivation.
Pastoralists react, but not ex ante because they can react ex post, although this sometimes entails
mistakes, particularly in the form of waiting too long to move the herd.
Perhaps most fundamentally, the linkage between rainfall and risk is less strong among
pastoralists than one might be led to believe by conventional wisdom. Or, stated differently,
“drought” and rainfall deficit may not be the same thing. Pastoralists’ declared risk assessment
with respect to drought is, if anything, inversely correlated with mean rainfall as it is not semi-
nomadic pastoralists who worry about drought so much as sedentarized agropastoralists clustered
around towns because the former employ a livelihood strategy defined by its flexibility to
respond to climatic perturbations (Smith et al. 2001). As a consequence, asset risk appears to be
largely household specific rather than highly covariate based on community- level experiences
such as rainfall. Statistical analysis of detailed herd histories over 17 years in our study area

44
reveal that covariate stocking rate and rainfall shocks explain relatively little household-level
herd mortality experience; most asset risk is idiosyncratic (Lybbert et al. 2001).23
Figure 7: Percent Change in Rainfall vs. Percent Change in Median Herd Size
The weaker-than-expected relationship between rainfall and pastoral risk appears at
community level as well. Figure 7 plots the percent change in rainfall between July 1999-
December 2000, relative to seasonal averages in each of our sites, against percent change in
median household herd size over the period March-December 2000, the tail end of the recent,
severe drought that struck the Horn of Africa. There’s an obvious, positive correlation between
the two variables, as reflected in the positive univariate regression coefficient estimate (8.835),
but with considerable variation around the central tendency (the regression r2=0.005). Even in a
severe drought, median herd sizes grew in three of our sites, including two (Kargi and Qorate)
that suffered sharp falls in rainfall relative to seasonal averages. By contrast, sharp drops in
median herd size were suffered in sites that suffered only modest reductions in seasonal rainfall
(Ngambo) or that even enjoyed increased rainfall (Suguta Marmar).
23 This analysis is based on data collected by Desta (1999).
DGDI
FI
DH
SM
NH
LL
KAQO
NG
y = 8.8353x - 31.493
-100
-80
-60
-40
-20
0
20
40
-90% -60% -30% 0% 30% 60%
Percent change in rainfall from seasonal average (Jul 99 - Dec 00)
Per
cen
t ch
ang
e in
her
d s
ize
(Mar
00
- D
ec 0
0)

45
The upshot of these findings is that traditional pastoralists seem to make very little
instrumental use of climate forecasting information even when they have confidence in it. Most
likely, this is because they have adopted a livelihood strategy built around flexibility in
production, primarily through migration in response to spatio-temporal variation in range
conditions. Those who choose highly flexible production systems have less need for long- lead
information; they adapt to the gradual resolution of temporal uncertainty (Chavas et al. 1991,
Fafchamps 1993). Moreover, climate realization and livestock loss and productivity, the
variables of concern to pastoralists, may be only weakly related. Certainly a one season
realization has little to do with herd size change or even productivity.
By contrast, crop and low- or zero-grazing livestock production systems do not build in
the same sort of adjustment mechanisms found in pastoralism. Agropastoral cultivators and
those practice sedentarized livestock production have to choose crop and herd management
strategies carefully based on expected climatic conditions. Variation in environmental
conditions has an enormous effect on productivity with very little opportunity for ex post
corrective adjustments in these systems (Sherlund et al. forthcoming). Since crop cultivation is
growing rapidly among stockless and displaced pastoralists who have become sedentarized
around towns where cropping is ecologically feasible (Little et al. 2001a, Smith et al. 2001),
climate forecasting may be of greatest potential benefit to these poorest subpopulations in those
limited areas of the rangelands where cropping is ecologically feasible. However, since access to
and confidence in external climate forecasts strongly depends on educational attainment, which
is commonly lacking among displaced pastoralists, this potential does not seem to be realized yet
in our survey region.

46
In the longer term, it may be that the emergence of reliable and accessible seasonal
forecasts at appropriate spatial scale may help foster some shift from more flexible pastoralist
production systems to potentially higher expected return sedentarized production systems in
semi-arid areas where sufficient water can be tapped to support such strategies. But in the arid
areas and in the near term, there really do not exist viable alternatives to the highly flexible
system of semi-nomadic grazing on which contemporary pastoralists still depend, and in which
the value of climate forecast information appears quite low.
V. Concluding Remarks
Improved climate forecasting as an instrument for assisting poor pastoralist populations
routinely buffeted by climate shocks holds obvious appeal. Consequently, several research
teams and development agencies are presently engaged in major efforts to develop and
disseminate climate forecasting products for these peoples. The wisdom of these investments in
the face of alternative uses depends fundamentally on the value of external climate forecast
information to pastoralists. This question remains severely under-researched. The value of this
information depends fundamentally on (i) people’s access to the forecast, (ii) their confidence in
the information presented, (iii) the extent to which the forecast provides information different
from that they already possessed, (iv) the degree to which they update their beliefs on the basis
of such information, and (v) the behavioral adjustments they make in response to changes in their
beliefs. This report offers an initial, in-depth look at these issues among an ethnically
heterogeneous sample of pastoralists across a relatively large area of southern Ethiopia and
northern Kenya.

47
The evidence presented here offers several hopeful points for those championing
improved climate forecasting as an instrument to assist vulnerable pastoralists. First, we find
that pastoralists readily understand and can themselves communicate probabilistic seasonal
climate forecasts. In a risky environment, pastoralists can be expected to have a reasonably
sophisticated understanding of the concept of uncertainty. Therefore worries as to the
comprehensibility of such forecasts seem misplaced.
Second, those who hear external forecasts are roughly the same proportion of the
population as those who own radios and access to and confidence in external forecasts is
associated with market access and education. Therefore, as market access, education and wealth
increase and communications technologies increasingly infiltrate pastoral communities, one
might reasonably expect steady growth in access to and use of scientific climate forecasts.
Third, the overwhelming majority of those who report receiving modern forecasts find
them at least somewhat useful and have at least some confidence in them. This suggests that
building confidence in forecasting – whether through further investments in improving forecast
skill or in developing new communication packages using existing media – is less a priority right
now than is promoting the economic advancement that will both endogenously stimulate demand
for meteorology-based forecasts and empower pastoralists to respond to forecast through ex ante
optimal adjustments in resource allocation.
Rather, the pressing issues are the sorts of information provided by modern climate
forecasting, pastoralists’ updating of information, and their capacity and willingness to act on
beliefs about climate. The data indicate that pastoralists are most interested in the onset date and
the total amount of rainfall expected in the area of residence. Minimal interest is shown in the
duration of the rains or in the total amount of rain expected in other areas. DMC produces and

48
distributes a variety of forecast products, which include seasonal bulletins issued twice a year in
February before the March-April-May rainfall and August before the September-October-
November-December rainfall (Curry 2001a, Hammer et. al 2001). These forecasts are, however,
not likely to be what the pastoralist receives via radio and television broadcasts, or by reading
newspapers. Rather what the pastoralist is most likely to receive are daily weather reports
produced by the Kenya Meteorological Department (KMD) and the National Meteorological
Services Agency (NMSA) in Ethiopia. These reports have limited value to the pastoralists with
regards to seasonal predictions.
Where a seasonal forecast is disseminated, the information contained therein is oriented
more towards crop cultivation than to pastoral production systems. These usually include crop
weather reviews for coffee, maize, sugar, tea, horticulture, tobacco, wheat, and pertinent
agricultural information such as onset date of rains in the highland areas and recommended
planting dates. Forecast information for dairy and ranching production systems and for tourism
are also produced (Curry 2001a, Hammer et. al 2001). These reports are likewise of little value
to the pastoralist.
Ultimately, our results reinforce the conclusions offered by others (Glantz 1996, Broad
2000, Mahmoud and Little 2000) that those who are interested in helping mitigate climate-
related risk among vulnerable populations, such as the Ethiopian and Kenyan pastoralists we
study, must be careful not to focus excessively on improving forecast skill or dissemination.
These do not seem to be binding constraints at present, even if external forecasts are accessed by
only a sharp minority of pastoralist respondents. Rather, greater attention needs to be given to
the process by which pastoralists form their beliefs regarding climate – a process that as yet
seems largely unaffected by modern forecasts, even among those who receive and express

49
confidence in them – and what infrastructural and institutional advances are necessary to
facilitate the use of climate forecast information within the livelihood strategies prevailing in
these fragile systems.
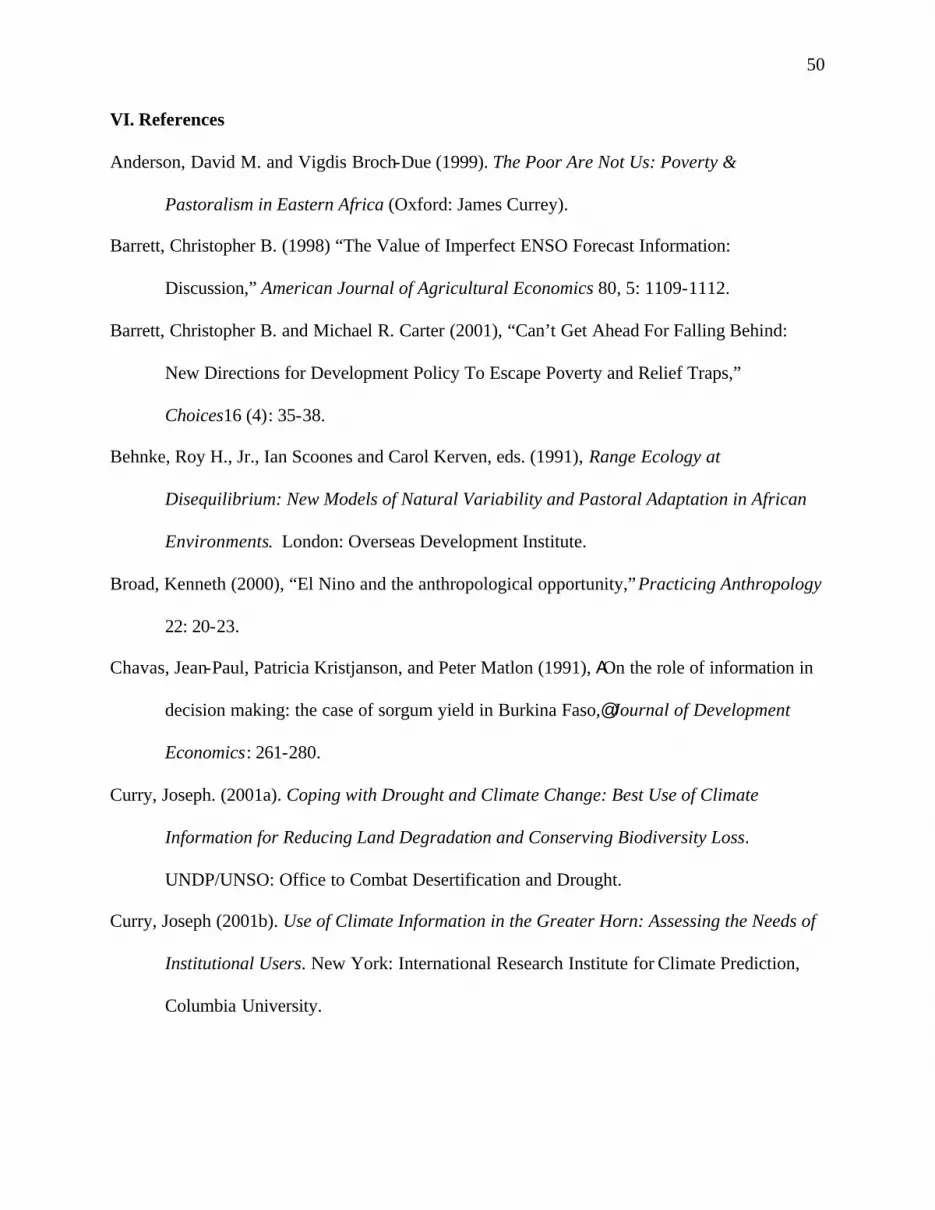
50
VI. References
Anderson, David M. and Vigdis Broch-Due (1999). The Poor Are Not Us: Poverty &
Pastoralism in Eastern Africa (Oxford: James Currey).
Barrett, Christopher B. (1998) “The Value of Imperfect ENSO Forecast Information:
Discussion,” American Journal of Agricultural Economics 80, 5: 1109-1112.
Barrett, Christopher B. and Michael R. Carter (2001), “Can’t Get Ahead For Falling Behind:
New Directions for Development Policy To Escape Poverty and Relief Traps,”
Choices16 (4): 35-38.
Behnke, Roy H., Jr., Ian Scoones and Carol Kerven, eds. (1991), Range Ecology at
Disequilibrium: New Models of Natural Variability and Pastoral Adaptation in African
Environments. London: Overseas Development Institute.
Broad, Kenneth (2000), “El Nino and the anthropological opportunity,” Practicing Anthropology
22: 20-23.
Chavas, Jean-Paul, Patricia Kristjanson, and Peter Matlon (1991), AOn the role of information in
decision making: the case of sorgum yield in Burkina Faso,@ Journal of Development
Economics: 261-280.
Curry, Joseph. (2001a). Coping with Drought and Climate Change: Best Use of Climate
Information for Reducing Land Degradation and Conserving Biodiversity Loss.
UNDP/UNSO: Office to Combat Desertification and Drought.
Curry, Joseph (2001b). Use of Climate Information in the Greater Horn: Assessing the Needs of
Institutional Users. New York: International Research Institute for Climate Prediction,
Columbia University.

51
Ellis, James E. and David M. Swift (1988), “Stability of African Pastoral Ecosystems: Alternate
Paradigms and Implications for Development,” Journal of Range Management 41: 450-
459.
Fafchamps, Marcel (1993) ASequential labor decisions under uncertainty: an estimable household
model of West African farmers,@ Econometrica: 1173-1197.
Galvin, Kathleen A., Randall B. Boone, Nicole M. Smith and Stacy J. Lynn (2001), “Impacts of
climate variability on East African pastoralists: linking social science and remote
sensing,” Climate Research 19, 1: 161-172.
Glantz, M.H. (1996), Currents of Change: El Nino’s Impact on Climate and Society.
Cambridge: Cambridge University Press.
Hammer, G. L., J. W. Hansen, J. G. Phillips, J. W. Mjelde, H. Hill, A. Love, and A. Potgieter.
(2001). Advances in application of climate prediction in agriculture, Agricultural
Systems, 70, 515-553.
Hirshleifer, Jack and John G. Riley. (1992). The analytics of uncertainty and information.
Cambridge: Cambridge University Press.
International Research Institute for Climate Prediction (IRI) (2001). Communication of Climate
Forecast Information Workshop Proceedings. Palisades, NY.
Little, Peter D (1992). The Elusive Granary: Herder, Farmer, and State in Northern Kenya.
Cambridge: Cambridge University Press.
Little, Peter D., Kevin Smith, Barbara A. Cellarius, D. Layne Coppock and Christopher B.
Barrett (2001a), “Avoiding Disaster: Diversification and Risk Management Among East
African Herders,” Development and Change 32, 3: 401-433.

52
Little, Peter D., Hussein Mahmoud, and D. Layne Coppock ( 2001b), “When Deserts Flood: Risk
Management and Climatic Processes Among East African Pastoralists,” Climate
Research 19, 1: 149-159.
Lybbert, Travis J., Christopher B. Barrett, Solomon Desta, and D. Layne Coppock (2001),
“Pastoral Risk and Wealth-Differentiated Herd Accumulation Patterns in Southern
Ethiopia,” unpublished Cornell University manuscript.
Mahmoud, Hussein and Peter D. Little (2000), “Climatic shocks and pastoral risk management in
northern Kenya,” Practicing Anthropology 22: 11-14.
McPeak, John G. (2002), “Contrasting Income Shocks With Asset Shocks: Livestock Sales in
Northern Kenya,” unpublished Cornell University manuscript.
McPeak, John G. and Christopher B. Barrett (2001). “Differential Risk Exposure and Stochastic
Poverty Traps Among East African Pastoralists,” American Journal of Agricultural
Economics, 83 (3): 674-679.
Orlove, B.S., J.H. Chiang and M.A. Cane (2000), “Forecasting Andean rainfall and crop yield
from the influence of El Nino on Pleiades visibility,” Nature 403: 68-71.
Phillips, J.G., E. Makaudze, and L. Unganai (2001), “Current and Potential Use of Climate
Forecasts for Resource-Poor Farmers in Zimbabwe,” in Impact of El Nino and Climate
Variability on Agriculture, ASA Special Publication number 63. Madison: American
Society of Agronomy, Crop Science Society of America and Soil Science Society of
America.
Polanyi, Michael (1966), The Tacit Dimension. New York: Doubleday and Company.
Roncoli, Carla, Keith Ingram, and Paul Kirshen (forthcoming a). “Reading the Rains: Local
Knowledge and Rainfall Forecasting in Burkina Faso”, Society and Natural Resources.
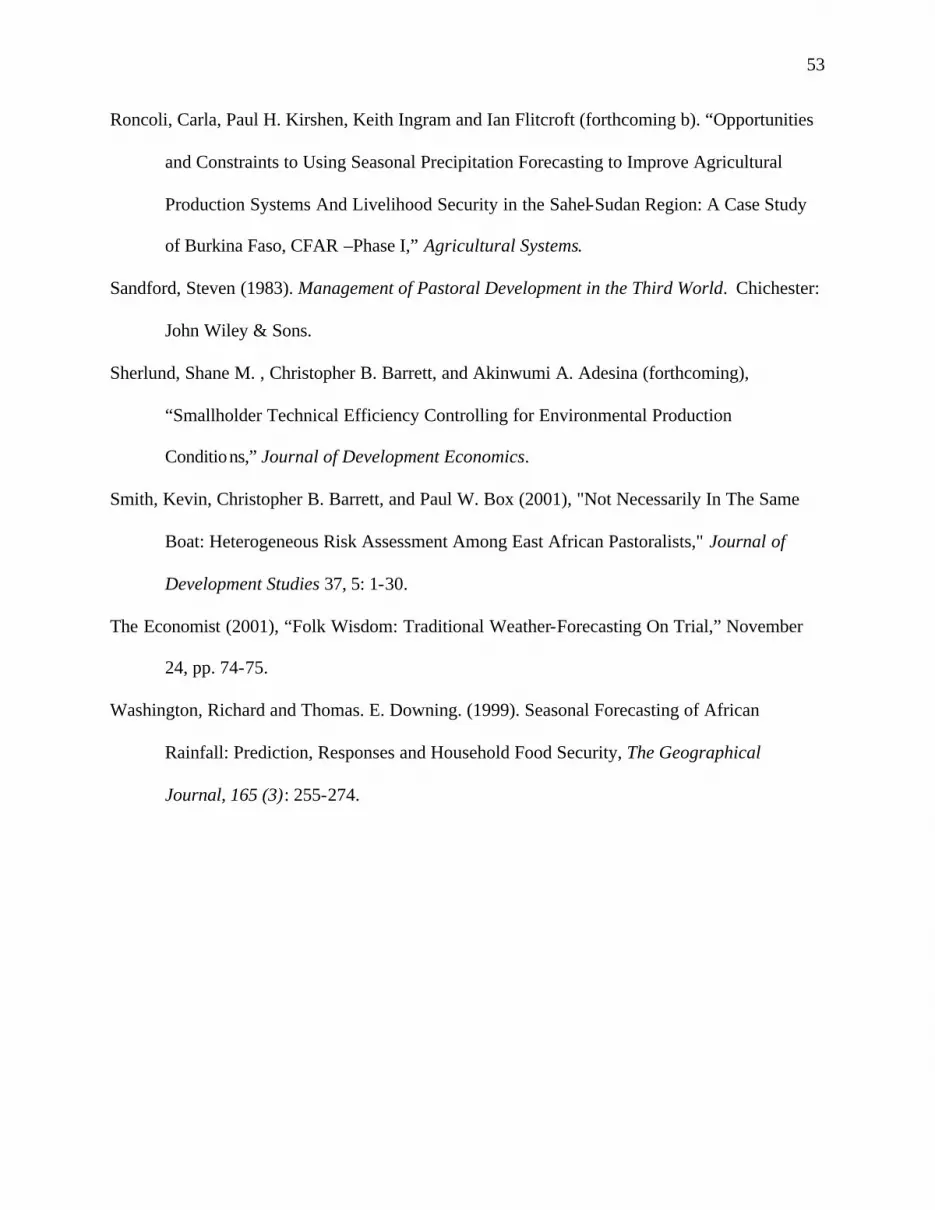
53
Roncoli, Carla, Paul H. Kirshen, Keith Ingram and Ian Flitcroft (forthcoming b). “Opportunities
and Constraints to Using Seasonal Precipitation Forecasting to Improve Agricultural
Production Systems And Livelihood Security in the Sahel-Sudan Region: A Case Study
of Burkina Faso, CFAR –Phase I,” Agricultural Systems.
Sandford, Steven (1983). Management of Pastoral Development in the Third World. Chichester:
John Wiley & Sons.
Sherlund, Shane M. , Christopher B. Barrett, and Akinwumi A. Adesina (forthcoming),
“Smallholder Technical Efficiency Controlling for Environmental Production
Conditions,” Journal of Development Economics.
Smith, Kevin, Christopher B. Barrett, and Paul W. Box (2001), "Not Necessarily In The Same
Boat: Heterogeneous Risk Assessment Among East African Pastoralists," Journal of
Development Studies 37, 5: 1-30.
The Economist (2001), “Folk Wisdom: Traditional Weather-Forecasting On Trial,” November
24, pp. 74-75.
Washington, Richard and Thomas. E. Downing. (1999). Seasonal Forecasting of African
Rainfall: Prediction, Responses and Household Food Security, The Geographical
Journal, 165 (3): 255-274.

54
Appendix A: First Round Survey Instrument (fielded March 2001)
Climate Expectations and Forecast Information Module
Respondent Name:__________________________ Interview Date:________________ Survey ID: area _______household # _________ Interviewer:___________________ Data entry completed (date) _______by_____ The disruption to the lives of people in this area caused by dramatic climate variability is a cause of concern to us. We have seen that recent events, such as el nino and the dry period we just came through, led to herd loss, crop failure, and damage to things like roads and water supplies. These two events caused a great deal of human suffering. We are trying to find out if the impact of such events in the future on people in this area can be reduced by improving the means by which you get forecasts of coming rainy seasons, so that you are better able to prepare in advance of a coming rainy season. To do this, we would first like to ask you questions about where you have gotten rainfall forecasts in the past. We are also going to ask you what kind of forecast information is most useful to you. Then we would like to know what you have done to prepare for different kinds of rainy seasons in the past. Finally, we would like to find out about your prediction for the coming rainy season, and whether this prediction has influenced your preparations for this season. As always, the information you give will be strictly confidential. Your identity will not be revealed to anyone outside our project. If you would rather not answer any questions, please just say so. Your cooperation is greatly appreciated, as it will help us to understand the life and customs of pastoralists in this area. Before we begin, it is important to make clear a distinction between reports and forecasts. Reports tell us what has already happened. For example, a newspaper story that says 20 millimeters of rain fell yesterday is a report. By contrast, a forecast offers a prediction of what will happen in the future, as when you hear someone say the rains will begin in a week’s time. In the questions that follow, we are interested in forecasts, not reports.

55
1. There are many different ways to learn about forecasts of a coming rainy season. Did you hear anyone make forecasts about any of the following for the coming long rains of 2001 (LR01), the short rains of 2000 (SR00), or the long rains of last year (LR00)? Enumerator: tick in the box below the season for which the respondent says he or she heard a forecast
A forecast of when rains are expected to start falling in your area
A forecast of when the rains are expected to end in your area
A forecast of whether the amount of rain falling will be above average, normal, or below average in your area
Forecasts of whether the amount of rain falling will be above average, normal, or below average in other areas
SEASON LR01 SR00 LR00 LR01 SR00 LR00 LR01 SR00 LR00 LR01 SR00 LR00
If you did hear a forecast, what was the source (or sources) of the forecast
Enumerator: tick as many as apply in each column SEASON LR01 SR00 LR00 LR01 SR00 LR00 LR01 SR00 LR00 LR01 SR00 LR00
Radio
Television
Newspapers
Other printed materials
Government extension agents
NGO extension agents
Traditional forecasters
Local elders or religious leaders
Friends /neighbors living in this area
Friends /neighbors living outside area
Other: Describe
(Your area is the area you graze your animals or grow your crops in a normal year. Other areas are outside this area)

56
2. How do you describe your use of the following sources to learn about forecasts of coming rainy seasons over the past ten years?
a) Never learned about forecasts from this source because I did not know they announce forecasts
b) Never learned about forecasts from this source because I have not had access to this source
c) Never learned about forecasts from this source because I think their forecasts are not useful
d) Sometimes learned about forecasts from this source e) Always learned about forecasts from this source
Forecast Source Describe Use What forecasts have you heard about a coming rainy season from this source
(circle as many as apply) Radio a b c d e Start date End Date Overall amount in your area Overall amount
in other areas
Newspapers a b c d e Start date End date Overall amount in your area Overall amount in other areas
Other printed materials
a b c d e Start date End date Overall amount in your area Overall amount in other areas
Television a b c d e Start date End date Overall amount in your area Overall amount in other areas
Government extension agents
a b c d e Start date End date Overall amount in your area Overall amount in other areas
NGO extension agents
a b c d e Start date End date Overall amount in your area Overall amount in other areas
Traditional forecasters
a b c d e Start date End date Overall amount in your area Overall amount in other areas
Local elders or religious leaders
a b c d e Start date End date Overall amount in your area Overall amount in other areas
Friends and neighbors living in this area
a b c d e Start date End date Overall amount in your area Overall amount in other areas
Friends and neighbors living outside this area
a b c d e Start date End date Overall amount in your area Overall amount in other areas
Other: Describe
a b c d e Start date End date Overall amount in your area Overall amount in other areas

57
3. In the past ten years, have you relied on any of the following traditional methods to forecast a coming rainy season? If yes, how confident are you of their reliability?
Traditional method Used? Confidence level
Y N Low confidence Some confidence High
confidence
Y N Low confidence Some confidence High
confidence
Y N Low confidence Some confidence High
confidence
Y N Low confidence Some confidence High
confidence
Y N Low confidence Some confidence High
confidence
Y N Low confidence Some confidence High
confidence
Y N Low confidence Some confidence High
confidence
Y N Low confidence Some confidence High
confidence
Y N Low confidence Some confidence High
confidence
4. What level of confidence do you have in climate forecasts provided by traditional sources
such as elders, religious leaders, or traditional forecast methods (circle never heard one if the respondent have never heard such a forecast from this source, rank the respondents confidence if they have heard such a forecast from this source)?
Forecasts about when rains are expected to start falling in your area
Forecasts about when the rains are expected to end in your area
Forecasts about whether the amount of rain falling will be above average, normal, or below average in your area
Forecasts of whether the amount of rain falling will be above average, normal, or below average in other areas

58
Level of confidence
Never Heard One None Some
High
Never Heard One None Some
High
Never Heard One None Some
High
Never Heard One None Some High
5. What level of confidence do you have in climate forecasts provided by external sources such as extension agents or modern media (circle never heard one if the respondent have never heard such a forecast from this source, rank the respondents confidence if they have heard such a forecast from this source)?
Forecasts about when rains are expected to start falling in your area
Forecasts about when the rains are expected to end in your area
Forecasts about whether the amount of rain falling will be above average, normal, or below average in your area
Forecasts of whether the amount of rain falling will be above average, normal, or below average in other areas
Level of confidence
Never Heard One None Some
High
Never Heard One None Some
High
Never Heard One None Some
High
Never Heard One None Some High
6. Do you have more overall confidence in forecasts provided by traditional sources or external
sources?
(circle one) Traditional External
Please explain why.
7. If forecasts about a coming rainy season could be provided reliably, what type of forecast
information would be most useful to you? (Enumerator: rank these from 1= most useful to 4=least useful. If any are not useful, write NU)
_____Forecasts about when rains are expected to start falling in your area _____ Forecasts about when the rains are expected to end in your area _____ Forecasts about whether the amount of rain falling will be above average, normal, or below average in your area _____Forecasts of whether the amount of rain falling will be above average, normal, or below average in other areas 8. How many weeks or months in advance of the season for which a forecast is made would
you need to receive this information in order for it to be useful to you?

59
(Enumerator: fill in the answer in terms of weeks or months for any noted as useful in question 6
)
__________Forecasts about when rains are expected to start falling in your area __________ Forecasts about when the rains are expected to end in your area __________Forecasts about whether the amount of rain falling will be above average, normal, or below average in your area __________Forecasts of whether the amount of rain falling will be above average, normal, or below average in other areas
9. When was the last time you expected a rainy season to be below normal when compared to
other years?
(write in season and year) _______________________________ 10. What information did you use to make this prediction that the season would be below
normal? 11. Did you do anything different to prepare your household before this season began based on
your prediction that the season would be below normal with regard to: Herd management - Y N (breeding of animals, where animals are sent to graze, purchase of supplemental feed or veterinary inputs,…) if yes, please describe your preparations and whether you think they helped or hurt you Cultivation practices- Y N (what crops or varieties to plant, when to prepare and plant, what fields to plant,…) if yes, please describe your preparations and whether you think they helped or hurt you Household finances and management- Y N (whether to take or repay credit, purchase of food stocks to store, whether to make other purchases,…) if yes, please describe your preparations and whether you think they helped or hurt you

60
Meetings with others to discuss plans- Y N (meeting with elders to plan herd movements, meeting with other tribes to discuss water point use, …) if yes, please describe your preparations and whether you think they helped or hurt you Prayers and Ceremonies- Y N (appealing to God for help and blessings,…) if yes, please describe your preparations and whether you think they helped or hurt you Other - Y N if yes, please describe your preparations and whether you think they helped or hurt you

61
12. When was the last time you expected a rainy season to be above normal when compared to other years?
(write in season and year) _______________________________
13. What information did you use to make this prediction that the season would be above normal
when compared to other years? 14. Did you do anything different to prepare your household before this season began based on
your prediction that the season would be above normal with regard to: Herd management- Y N (breeding of animals, where animals are sent to graze, purchase of supplemental feed or veterinary inputs,…) if yes, please describe your preparations and whether you think they helped or hurt you Cultivation practices- Y N (what crops or varieties to plant, when to prepare and plant, what fields to plant,…) if yes, please describe your preparations and whether you think they helped or hurt you Household finances and management- Y N (whether to take or repay credit, purchase of food stocks to store, whether to make other purchases,…) if yes, please describe your preparations and whether you think they helped or hurt you Meetings with others to discuss plans- Y N (meeting with elders to plan herd movements, meeting with other tribes to discuss water point use, …) if yes, please describe your preparations and whether you think they helped or hurt you

62
Prayers and Ceremonies- Y N (appealing to God for help and blessings,…) if yes, please describe your preparations and whether you think they helped or hurt you Other - Y N if yes, please describe your preparations and whether you think they helped or hurt you 15. Compared to right now, do you think that it is more likely that livestock prices will:
(enumerator: circle response) a) Increase in the coming three months b) Remain at the current level in the coming three months c) Decrease in the coming three months
How confident are you in making this prediction? Not very Somewhat Very What information are you using to make this prediction?
Has your prediction about future prices caused you to make any preparations for the coming three months? Y N
If yes, please describe.
16. What are your current expectations about the total amount of rain that will fall in this area during the coming rainy season?
I think it is most likely that rainfall will be: (enumerator: circle response) a) above normal b) normal c) below normal How confident are you in making this prediction? Not very Somewhat Very What information are you using to make this prediction? Has your prediction about the total amount of rain that will fall caused you to make any
preparations for the coming three months? Y N If yes, please describe.

63
17. If I give you these twelve stones and ask you to give the most stones to the prediction you
think is most likely, the next most stones to the prediction you think is next most likely, and the least stones to the least likely prediction, how do you rate the chances that the coming rainy season will be: (enumerator: write # of stones in blank. If they think it is not possible that a particular type of season will occur, allow them to place no stones in a category and write zero)
a) above normal ___________ b) normal__________ c) below normal ___________
Thank you very much for your cooperation

Appendix B: Second Round Survey Instrument (fielded June-July 2001)
Respondent Name:__________________________ Interview Date:_______________________ Survey ID: area__________ household #________ Interviewer:__________________________ 1) Previously, we asked you questions about forecasts you heard before the past rainy season started. Today, we would like to ask a few follow up questions now that the rainy season is over. A forecast of when rains are
expected to start falling in your
area
A forecast of when the rains
are expected to end in your
area
A forecast of whether the amount of
rain falling will be above average,
normal, or below average in your area
Forecasts of whether the amount of
rain falling will be above average,
normal, or below average in other areas
Type of forecast Traditional External Traditional External Traditional External Traditional External Did you tell us
before you heard a forecast for the long
rains of 2001 from
this source?
Y N Y N Y N Y N Y N Y N Y N Y N
If yes, how accurate
do you think this forecast was?
Not at all
Somewhat Very
Not at all
Somewhat Very
Not at all
Somewhat Very
Not at all
Somewhat Very
Not at all
Somewhat Very
Not at all
Somewhat Very
Not at all
Somewhat Very
Not at all Somewhat Very
If yes, how helpful do you think this
forecast was?
Not at all Somewhat
Very
Not at all Somewhat
Very
Not at all Somewhat
Very
Not at all Somewhat
Very
Not at all Somewhat
Very
Not at all Somewhat
Very
Not at all Somewhat
Very
Not at all Somewhat Very
If you answered
“not at all” or
“somewhat”, can you think of
anything that would
make it more helpful?
Did you do anything differently
because of this
forecast?
Y N Y N
Y N Y N
Y N Y N
Y N Y N

65
If yes, tell me what you did differently.

2) In your opinion, the rainy season that just passed started: (circle one) a) early b) late c) on time
Did this affect you in any way? Y N (if yes, describe) 3) In your opinion, the rainy season that just passed ended: (circle one)
a) early b) late c) on time
Did this affect you in any way? Y N (if yes, describe) 4) In your opinion, the total amount of rain that fell in your area during the rainy season that just passed was: (circle one)
a) above normal b) below normal c) normal
Did this affect you in any way? Y N (if yes, describe) 5) In your opinion, the total amount of rain that fell in other areas during the rainy season that just passed was: (circle one)
a) above normal b) below normal c) normal
Did this affect you in any way? Y N (if yes, describe) 6) In your opinion, the price for livestock during the rainy season that just passed was: (circle one)
a) above normal b) below normal c) normal
Did this affect you in any way? Y N (if yes, describe)

67
Appendix C: Open-Ended Interview Guidelines (fielded February-April 2001)
With a small group (about 5) of women, and a similar size group of men, please ask the following questions. First, what are the traditional methods people in your area use to forecast rainfall in terms of when it will start, where it will fall, whether it will be better than normal / normal / worst than normal, and how long it will last. These can be things like reading intestines, looking for stars, cloud formations, bird or animal behavior, tree or plants doing certain things, the day of the week that starts the year, … whatever. Second, describe what each method they mention is meant to predict. Third, describe how it is done and provide some details on how the different signs are interpreted. Fourth, describe for each method how far in advance of the predicted event it is usually known. Finally, find out whether your informants think each method is: Very reliable Sometimes reliable Not very reliable Used to be reliable, but is no longer (if this one, ask them what they think has changed to make it less reliable). For example, in the US, we have a thing we call groundhog day. (responds to the first question) Groundhog day is meant to predict how long winter will last. (responds to the second question) The groundhog is a little animal that lives in a hole in the ground. On February second, there is a place in the US (Pauxatawnee Pennsylvania if you really want to know) where the official groundhog comes out of his hole. On that day, if when he comes out at dawn he sees his shadow, winter will last less than six more weeks. If he does not see his shadow winter will last more than six weeks. (responds to the third question, and also says “six weeks” in response to the fourth question) People think it is mostly fun, but does seem to have some ability to predict, so it is sometimes reliable. (responds to the last question). Second example, for the Gabra, the day a year starts on tells you something about what you can expect. The day of the year is meant to predict whether a year will be good, average, or bad in terms of drought. Each type of year has a character. Roughly speaking, Saturday years have droughts, as do years that start on Sunday. Monday years are very wet, while years starting on a Tuesday have sufficient rains. Wednesday years are dry, as are most Thursday years. Friday years tend to be average or above average. This can be used to predict rainfall long in advance. People think it used to be reliable, but something has happened and it is not any more. Some say it is because the Gabra have left their customs.

68
Appendix D: Open-Ended Interview Findings on Indigenous Climate Forecasting Methods
in Southern Ethiopia
Reading the stars Known locally as aganhi, the culture of forecasting events based on the orientation and assortment of stars observable in the night sky is widespread among the Borana, Guji and Gabra communities in southern Ethiopia. The forecast ‘experts’, known locally as ayantu, use the stars to forecast about important events in pastoral life, including rainfall, drought and security. Forecast knowledge of the ayantus is passed on from fathers to sons. Forecasts can be told to any one who asks for it but the skill of the task is always kept secret to the lineage of the experts’ heirs (sons). Educating the sons of the ayantus starts early in their childhood. Reading is done once in the early night sky and again in the midnight. The resulting forecast is reported to the one who asked for it in the following morning. For obvious reasons, the forecast is best done best on a clear night free from clouds. If a forecast is requested but it is cloudy, the experts pray earnestly to God to set the sky free. By custom, experts are to avoid sexual contact on the eve of the forecast. The ayantus observe the sky from a favorable sitting position, with good attention on the sky searching for stars meaningful to the particular forecast requested. Some stars are read in conjunction with the position of the moon, while others are not. Names of Stars for climate forecasting example of interpretation 1. ‘Koromi Mado’ § These stars are four in number two sets of two each § They are distinct, large and dazzling twinkle. § They run across the southern hemisphere from east to west and are believed to have been
in the sea § is referred to for climate/weather forecast only in case other very important stars failed to
appear in the sky and are not known to have any relation with the movement of the moon. Example of interpretation: § If the first pair of these stars has descended below the western horizon around dawn and
that the other pair is also touching that horizon almost descending it is believed that the rains shall fall in a matter of less than a week if clouds were prevailing.
§ Brightness of the stars indicates heavy rains, while dullness indicate vice versa § This stars are used for forecasting both long and short rains
2. ‘Torban’ § These stars are seven in number § They are placed in separate set of 2, 2 and 3, respectively. § They traverse the northern hemisphere from east to west. § These set of stars are also used for predicting both long and short rains.

69
Example of interpretation: § If during downtime the first pair of this stars descends below the western horizon it is
believed that the rains are near: 7-14 days. § When the second set of the pair follows and descends at dawn time it is believed that the
rains can fall in a matter of day or two.
3. ‘Busan’ § These stars exist as seven and make a small cluster in the sky. § They traverse from east to west in the middle hemisphere. Example of interpretation: § At dusk time, seated on his or her heels, if the milkman /woman observes these stars from
under the cow belly it implies that the long rains shall be very good and shall fall in less than 2 weeks.
The following stars cannot be independently used to predict weather forecast but instead they are used to make forecast in conjunction with the movement of the moon. As each night passes, these stars are drawn closer to the moon and based on the sequence of the stars in relation to the moon predictions are made. Each star is associated with a specific prediction. These stars are namely Lami, Arb Gadu, Walla and Bassa in order of descending fast to the last. All the four stars named above are used to forecast both long rains and short rains, as well as other unexpected sporadic rain locally known as ‘Furmata’ 4A. ‘LAMI’ § These stars consists of two § They are shortly set apart moving together parallel. § They are sighted once in the evening and again in the late night. § To collect a good forecast of the weather these stars should be sighted in the sky together
with the moon and clouds. § If cloud is missing the rainfall expectation is said to be low. Example of interpretation: § If the moon draws and passes in between the gulf of the two stars which are moving
together in parallel and plenty of clouds are accompanying, Rains are predicted to fall in less than 3 weeks.
§ If the amount of clouds, while the star and the moon are as described, is sparse or none the rain is forecasted to rain in more than months time:
4B. ‘Arb Gadu’ § These stars consist of seven. § It is one of the stars among the series that is sighted and read in conjunction with the
movement of the moon and presence of the clouds. § These stars are second to the stars (Lami) in order of placement in the sky as they are
traversing. § These stars give additional information on predictions received from the preceding stars. Example of interpretation: In the midnight if the moon is observed overlapping these stars and,

70
I) in the afternoon of the following day clouds are sighted it is believed that the rains shall fall within that month.
II) if little clouds are sighted the rains are believed to be poor the starting date might fall
back. 4C. ‘Walla’ § These stars consist of two and are observed in conjunction with the movement of the
moon and presence of cloud the following morning. Example of interpretation:
§ In the event the moon overlap these stars and that in the following morning clouds are spotted on the mountain tops it is believed that the rainy season shall be good and that rains shall fall in a day or two.
§ If hazy weather develops in that morning the chances of having rain that season is skeptical
4D. ‘Bassa’ § This is the last star in the series. This star one, large and distinctly bright. If the moon
overlaps this star it is believed that there shall be rain although the starting date of rain for that season is delayed.
5. ‘Bakalch Bari’ (Morning star) § One in number, large in size, doesn’t twinkle. Its appearance coincides with the timing of
Cockrel crow. It can be sighted either during the long or short season and is used to make weather forecast independently of the moon’s position and movement.
§ This star is considered reliable and is named as the ‘hearer of the household’, ‘God’s messenger’.
Example of interpretation: § If this star is sighted on the eastern horizon in the morning and this continues on for 5-6
months both the long and short rains are believed to be satisfactory in terms of the amount of rain falling.
§ If it descends in the western horizon and reappears in the eastern in, I) Less than 30 days = the season ahead shall be good. II) 70 days = the season ahead is poor, probably no rain at all
§ If this star descends while rain is falling, then the disappearance of the star has no effect in terms of the amount of rain falling
§ If this star descends while the prevailing weather was dry, dusty & windy it is believed that the following rainy season shall be drought.
6. ‘Bakulch Eja Bul’ This star is used for counting Borana traditional calendar. Although calendar counting has no direct explanation for weather forecast, it provides date during which certain stars are observed and thus assist in making predictions. Intestine reading

71
This method of traditional forecasting is used to make predictions of events to happen either of far or near future, concerning either individual matters or the community at large. Intestine reading likewise has its experts, known locally as uchu. This skill is inherited by sons from their fathers but can also be passed to any other person who spends considerable time with the experts. Before one is recognized as a full status uchu, he should have made several attempts with perfect prediction reports. Traditionally when an uchu is called upon to make a prediction, he does not hesitate and also does not ask for a payment. However, the host serves him fried liver after the prediction is made. A long time ago, before the Gada system was started, there were four brothers by the names Jida Ali, Tone Ali, Boro Ali and Warda Ali. Jida was the eldest of all followed by Tone, Boro and Warda. The first and the second became Somali; however, the other two (i.e, Warda and Boro) became Borana tribes. Tradition holds that reading intestines came in with the Boro becoming Boran. Animals slaughtered for the purpose of reading intestines are goats, sheep, cattle and kolisa (a rat- like animal). Kolisa are used primarily to predict war. Male goats, male cattle, fitiko (male calf not more than seven days old), old female cattle (locally called dulacha), or old female sheep (gara bala) are most often used for intestine reading and the resulting predictions are considerable more reliable than from other sources. Sometimes wild ruminants, such as gazelle or antelope (any age) are slaughtered for intestine reading. Animals which died naturally are not used for this purpose, only for consumption. Animals slaughtered for forecasts undergo a process known as areracha. With the edge of the knife, from the top of the animals neck the butcher makes height touches with the edge of the knife down the spinal cord to the last caudal bone between each touches making blessing vows till the last touch. If an animal has not undergone this process the intestines are invalid for weather/climate forecasting. The small intestine is removed carefully to avoid rupture. The coiled intestine is placed on a flat surface available for reading. In some cases the intestine is placed on an instrument locally called mano. The reading is then made by one or more uchu. In special cases, group of uchus may be required to make the reading. Special cases include prediction on prolonged drought. The uchu takes his time to meticulously observe the intestine along its length. If there is more than one ‘Uchu’ the task is done between themselves fastidiously. Reading begins after the starting point or abawora has been sighted. Clouds, stream of veins, blood spots, folds, and other sets of white or black spot are the indicators used for climate and weather forecasting. Disproportion, displacement, pattern, size, length, direction of the mentioned agents are the things observed by the uchu to assist him make forecasts. Intestine reading predictions are made about rainfall, pasture, security, diseases, and change in family status that may come through livestock owning, deaths in the family, migration possibilities and other anticipated good or bad omen Example of interpretation:

72
1. If in the event of observing the intestine too much mad (need to explain what is mad?) is found trapped inside it is believed that particular rainy season will be very good; i.e. good amount, timely beginning and favorable ending.
2. Red vein denotes war 3. Black vein denotes good pasture free from diseases. 4. A white spot denotes war. 5. If a black vein, which denotes pasture, runs into a contraction the pasture is said to be
insufficient. § Events can be predicted a head of time from a day onwards as long as years. It’s
not specifically and tactfully with signs explained to the interviewer how time factor is denoted with certain indications on the int estine.
§ This method of prediction is said to be reliable yet sometimes their predictions fail to be decisive.
§ As compared to other traditional methods intestine reading is second in performance to the aganhi (reading stars).
Traditional Elders The gada is traditional form of elected rule consisting of two four years terms of office . So a particular person’s guda, or regime, runs eight years. During this gada, certain careful characterizations are made on rainfall, pasture, diseases, war and animal welfare. Such considerations bring about the belief that a particular head of gada, through his fate, brings about good or bad circumstances during his leadership tenure. As the turnover of power to the succeeding gada proceeds, the traditional elders who have been carefully observing events in last gada begin to make forecast on weather, war, diseases etc. Example of Interpretaion: The present gada, Liban Jaldesa, ’s term of tenure has been predicted by traditional elders to be:
1. Plenty of rain both in the long & short rain 2. Insecurity problem
Reliability using these phenomena is said to be nearly perfect. Forecast is done once for the eight years by traditional elders. These traditional elders are high ranking people in the traditional Borana administrative structure. Other traditional methods of climate and weather forecasting depend on observation of the behavior of animals and insects. These include the following. Cattle 1. Mating indicates two things:

73
• Good rainy season ahead • Good animal health
2. If cattle develops tendency of urinating in the pen while they were asleep (sitting position)
– it is believed that serious drought is ahead. Exact timing not indicated. Note: Certain ayantus are able to predict the future welfare of livestock by observing the cattle
pen. How cattle sleep together, march out for grazing and how they march in after grazing seem to indicate the occurrence of events in the pastoral life.
Also, if the herdsman observes within a particular period that livestock develop the habit of grazing in one direction while avoiding certain other directions, it is believed that: 1. In that direction avoided by the livestock, there is little or no hope of good pasture ahead. 2. Also in that direction avoided there is fear of enemy, diseases etc. Ants If ants are observed all over, building their hills on hot afternoons while the sun is overhead, it is believed that livestock are not at risk. Observation is done by breaking the anthill at the top and looking through the hole. If hills stay dormant when the sun is hot and overhead the forecast is that livestock are at risk. Grand Squirrel (Tuqa). If this squirrel is spotted digging holes and sprouting up soil when the sun is very hot and overhead, then it is predicted that the rains are about to fall. Spider webs If spider webs are spread all over the land, then rains are predicted to be sufficient in the coming season. Birds singing A bird by the name chdude makes a sound like that of a starting maize (milling?) engine. If they are heard commonly within the area, it is predicted that the rains shall fall in 2 weeks time at most. Bees § If bees are seen migrating from south to north direction rains are believed to fall in less
than a month’s time. This applies to both long and short rains. § Also presence of bees all over the area is a sign of good year plenty of rain pasture etc.
Children Parents also make forecasts by observing the behavior of their children with time. For example, times when children crave food (ghuton) are associated with a prediction that the season ahead shall be drought and vice versa.
Plants.

74
‘Halo’ – its flowering is indicative of rain soon ‘Hamesa’ – When this tree shades leaves drought is soon to begin.
Wind Dry hot fast wind = Drought Still air with hot sun-rains shall fall soon.
Observing the Moon 1. Goban is the 15th night of the moon.
If on the occasion of this day the orange colored moon appearing on the eastern horizon is encountered with eclipse, the forecast is either war or fall of a head of a certain state shall take place soon. The Borana community claims that they have experienced such a situation in the year 1991 (fall of Ethiopia’s Derg regime). The goban prediction is considered reliable.
2. Bati or observation of the moon’s crescent If the crescent inclines, it is forecast that the direction towards which it is inclining is not met with calamities like war. Yet if the crescent hangs equally balanced, it is not good for the people since it’s believed that the crescent refuses to forecast bad things.
Dream interpreters Certain people in the community are regarded with high esteem. These people dream almost every night and reputed to have the talent to interpret their dreams. Whenever they get certain dreams which concern the community at large they often talk it out. We identified a few further indigenous forecasting traditions among the Gabra community. These are as follows. Looking at the stars
Elders look at the following stars, each of which traverses from east to west 1. Torbn – seven stars 2. Bakalcha ( morning star) 1 star 3. Busan these stars make a small luster.
Examples of interpretation:
1. If five stars among the seven of Torbn descend in the western horizon late at night, it is believed that the long rains shall fail in a week’s time.
2. If bakalacha descends in the eastern horizon and appears on the western after 70
days, the short rains are predicted to fall in a week’s time. 3. If all the stars in the galaxy appear shiny and vividly clear, then the rains are expected
after two weeks.

75
Reading the stars is said by the Gabra to be somewhat reliable but not as good as following the traditional calendar system. This is most commonly done with the approach of a change of seasons.
Reading Intestines The Gabra likewise have uchu who read the intestines of cattle and goats. This method is less popular and considered less reliable among the Gabra, who more commonly follow Islamic teaching which prohibits this practice. Slaughtering is done in the Islamic tradition, with the intestine removed and kept on a flat surface for reading. The animal’s glands, veins, white spots etc. are used to derive climate and weather forecasts. The forecasting begins by locating the starting point on the intestine called abawora. Example of interpretation:
1. If a gland is seen at the door way or starting point, the forecast has drawn back home and will only avail information about the household. This condition generates optimistic forecasts about health, income and livestock states.
2. If blood spot is seen on the edge of the intestines the forecast is that war shall break out very soon.
3. If clouds gray spots are seen on the intestine tract its believed that rain shall fall soon in less than a months time. This applies to both the long and short rains.
Traditional Elders & Calendar cycle system Forecasting using this method is done by observing calendar cycle on the traditional calendar. In the Gabra community a year consists of 360 days with 12 months in a year. Each week has seven days, named as follows:
1. Gumata 2. Sept 3. Ahad 4. Alasnin 5. Talada 6. Arbaa 7. Kamsa
Each of these days has a year named after it and hence, after every seven years it is believed that life has made one cycle. As each cycles ends and another begins, careful characterization of events including weather is made for the coming cycle. For example, if the year Gumata happens to be a year of drought, in the following cycle it is presumed that this event will repeat itself after eight years. This task of relating weather forecast with calendar cycle is done by elderly people. Traditional elders and 100 Days Gabra people have four seasons in a year namely Gana (long rains), ‘Adolesa’ (dry season following the long rains), Hagaya (short rains) and Bona (dry season following the short rains). After the dry season of the short rains ends after about 90 days, the Gabra community allows room for extra 10 days for the long rains to fall according to the weather forecast. If rain

76
does not fall within the 100 days, extra 30 is added as a waiting period before a second prediction. Rains are expected to fall within the 30 day period.
Animal behavior Camels
1. When camels develop the habit of looking for bones on the ground and start chewing as they are grazing, it is believed that heavy rains are about to fall, in less than a week’s time.
2. Prolonged voluntary exposure of the camel to the hot afternoon sun is said to predict a heavy rain coming in 9 weeks.
3. If camel interlocks its hind leg to urinate, it said that rains will fall soon. 4. In the evening camels sometimes refuses to enter into pen. They all gather at the
entrance to the corral and refuse entry despite the herdsman’s effort. This is indicative of heavy rain soon. If the camel knew the rains are falling soon they imagine the coral will be very muddy thus very uncomfortable for them.
Birds Singing If the Lakama and Rapacho birds keep singing at any one time they are said to predict rainfall. The prediction made by these birds are said to be somewhat reliable. Plants The Rukesa tree is known to grow very well during drought period, as are Bur and Amaji. It is believed that the rain falls after the abrasa tree flowers, although this is not considered an especially reliable source of rain forecast.
Winds: Once a gentle cold wind blows from west to east, it is said to indicate rain will soon arrive. Bees: Migration from the northwest to the southeast indicates imminent rain.

77
Appendix E: Open-Ended Interview Findings on Indigenous Climate Forecasting Methods
in Northern Kenya
DIRIB GUMBO (BORAN)
WHAT ARE THE TRADITIONAL METHODS USED BY BORANA COMMUNITES TO FORECAST THE COMING OF RAIN ? 1. Looking at stars
There is normally a special group of stars that are used to predict the coming of rain. An example of this is a group of stars called Orion (torban). They are normally seven in number. Apart from forecasting rain, these stars can also predict war or drought. How it is done?
This method is normally used only by a few people who are specialists in studying the stars and interpreting different signs. Usually these people study the stars at the night and know which group of stars predict different events How different signs are interpreted ? Normally these people follow some signs that enable them to interpret information. Examples of such signs are as follows: Example and their interpretation
(a) when signs which look like a water surface surround certain group of stars,
the signs predict the fall of rain. Also, when this water surface seems to be large, it predicts rain will be heavy.
(b) when signs which look like the presence of dust surround certain group of stars, the signs predict a drought season. This is because dust is normally associated with the drought season.
How far in advance of the event can a prediction be made? Normally these groups of stars only appear (the one which predict rain) when the rain is near. After their appearance, it is believed rain will fall after a month.

78
Is the method reliable?
It is said that the method is very reliable because most of the time the event predicted became true. 2 .Reading the intestines (husa) Apart from forecasting rain, intestines are read to predict events such as outbreak of diseases, war or drought. How it is done?
Normally there are special people who know how to read intestines and interpret them. These people study the intestine after certain animals are slaughtered. Usually their interpretations are based on the veins of intestine. Signs used and their interpretation:
(a) When the clotting of blood is noted in the veins of intestine, then the outbreak of war is predicted.
(b) When something that looks like mud is noted in the veins (if the veins of intestine are a black color) then the fall of rain is predicted since a muddy surface is associated with the rainy season. Also, if this muddy substance is noted in many veins of intestines it predicts heavy rain.
(c) Sometimes the veins of intestine are noted to be wide in diameter. This sign is believed to predict heavy rain, since the wide veins are associated with floods.
(d) Sometimes when shape of the veins in various parts of the intestine is similar to the claws of vulture (alati), severe drought is predicted since vultures appear during droughts to feed on dead animals.
3. Birds singing:
There are many birds that predict the coming rain. These birds normally produce different sounds when rain is coming. This method is used mostly to predict whether rain will fall or not. One example of such a bird is a small brown bird with a long neck called lo laase The frequency of sound produced by this bird predicts whether rain will fall after a short period of time or not. When this bird makes is sound only once or twice it predicts the coming of the rain in a short time. When it makes a prolonged call it predicts that the rain may not fall as God had refused to hear its cry.
Is the method reliable? It is believed to be reliable sometimes.
4. Cloud formations
The formation of dark clouds signifies the presence of rain. It is sometimes reliable.

79
5. Trees
Trees are also believed to predict coming of rains in that there are some changes that occur to some of the trees. An example is that trees start flowering and produce a certain smell if rain is near. It is believed to be sometimes reliable.
6. Animal Behavior Sheep shake their bodies when the rains are near. This is viewed as sometimes reliable (and a bit funny). Also, the refusal of the cattle to either go out for grazing or to return back to the boma is used to predict rain, as it is assumed they are doing so because they smell rain.
KARGI (RENDILE)
Traditional methods of forecasting rainfall in terms of
When it will start
(i) Cloud formations (ii) Looking at the moon and stars (iii) Reading intestine (iv) Prediction of experts in throwing shoes (v) Animal behavior
- Black birds (yool) appearing - Camels facing down toward the ground - Sheep shaking
(vi) Trees changing to green eg acacia (vii) Blowing wind
Where it will fall - Short rains, Marsabit - Long rains, northern side - Furmat places like chorr , kabotallo, Alat chorr and generally west (bahai)
Whether it will be better than normal or normal. Better than normal long rains (guu) start with thunderstorm.
Whether it will be worse than normal
A worse than normal short rains (yer) starts with a thunderstorm. How long will as season last?

80
Short rain - ends with very hot sun Long rains – ends with cold weather and windy conditions
What is each method meant to predict? 1. Cloud formations predict when it will rain 2. Looking at the moon and stars predicts when it will rain 3. Reading intestines predicts when it will rain 4. Shoe experts predict where and when it will rain 5. Animal behavior (birds and camels) predicts where and when it will rain. 6. Trees becoming green predict where and when 7. Blowing wind predicts where rain will fall
Describe how it is done and provide some details on how the different signs are interpreted (i) Cloud formation – herdsmen look at white heavy clouds (baal) appearing
from the north. This baal is said to predict heavy rain, especially for the long rains, and therefore animals are taken towards areas the long rains commonly fall.
(ii) Looking for stars and at the moon –a clan called galoro are moon specialists. They look at the 14th(hogder) and 15th (gooban) day of moon light . The other specialists are bakale who look for stars. All herdsmen (Rendille) entirely depend on these two classes of people to be honest and tell everybody who asks them
(iii) Reading intestines – specialist look at the intestines of slaughtered goats or sheep. Intestine are read when its fresh - directly from the animals. Reading of intestines predicts rain when some vein- like tissues or dots appear on an internal part of intestines.
(iv) Shoe experts –shoe experts throw a pair of shoes for several times. They interpret the signs depending on how the shoes appear on the ground after repeated throwings.
(v) Animal behavior – If the white or black yool is seen around, rains are expected soon. The more reliable is the black yool and these birds always fly towards certain directions in a group. A bird called chiiba produces a song that is used to predict rain. If it sings continuously, it predicts heavy rain. Camels predict rain by looking down as if drinking surface water. Sheep shaking during the daytime is also seen as a sign that rain is coming.
(vi) Trees turn green – acacia trees predict rains by turning green / growing leaves.
(vii) Blowing wind –A few people use this to predict weather. It is said that God is removing particles from dams so that they will fill with water soon
Describe for each method how far in advance of the predicted event it is usually known:
(i) Cloud formation -not far in advance (ii) Looking at stars and moon – far in advance (iii) Reading intestines – far and not far in advance (iv) Shoes experts – far in advance

81
(v) Animals behavior - not far in advance (vi) Trees turning green –not far in advance (vii) Blowing wind- far in advance
Find out whether your information think each methods/degree which the method is reliable
(i) Cloud formations (white heavy clouds from north), very reliable (ii) Looking at the stars and moon, not very reliable (iii) Reading intestines, sometimes reliable (iv) Animal behavior
1. black yool, very reliable 2. white yool, not reliable 3. chiiba is very reliable
(v) Trees (acacia) becoming green – very reliable (vi) Blowing wind - not very reliable
LOGOLOGO (ARIAL) TRADITIONAL METHODS USED TO FORECAST RAINFALL IN THIS AREA
1. Change of weather (wind, temperature, building up of rain clouds)
These particular methods apply to prediction of the long rains in March-April (nger ngerina). When the long rains are approaching, weather change occurs especially with the winds blowing from east to west. The temperature goes as far down as 25 at daytime and at the same time, heavy rain clouds are formed on the western side. This is about 2 weeks before the rains begin.
2. Greening of specific pasture/ trees / shrubs. These particular methods apply to prediction of the short rains in October-November rains (ltumuren). When the short rains are approaching, sudden change seen with specific pasture, trees and shrubs. Acacia melifera, coniphora africana and cordia sinensis start becoming green by gaining leaves shortly before the rains. These signs are seen about 2-3 weeks before the rainy season starts. At the same time, heavy rain clouds are formed in the Ethiopia highlands. These clouds are called loparo lolnyirigil, and are seen 2-3 weeks before rain.
3. Migration of birds/vultures in to the area. When birds and vultures migrate into the area, this predicts the commencement of a rainy season. The birds and vultures are known to have migrated from swamps and lakes. These movements occur 1-2 weeks before the rainy season begins.
4. Livestock behavior Livestock behavior is also used to predict rainy seasons. The following signs are observed during watering of animals: throat noises of animals are heard and animals tend to move away from the

82
watering point. When they move away they stand at a distance and move their heads down as if it is raining. These signs are seen 2 weeks before the rains Reliability of the methods
Methods 1 and 2 are sometime reliable, while 3 and 4 are not very reliable. However there is a general feeling that rainy seasons are not falling at the right time these days as before. Some people say it is due to human pressure and environmental destruction while others say only God knows why the change has occurred. Other methods, like reading of intestines and looking at stars, are only practiced by those who live on the mountains and laibons (for example, there is a star reader who lives at Mt. Nyiro). Some said the metrological people have better knowledge of weather than anyone else these days, but others argued even they don’t know because they could not even predict the El Nino disaster. NORTH HORR (GABRA)
TRADITONAL METHODS OF WEATHER OBSERVATION
Reading intestines a) both cattle and small stock intestines are read. Cattle peritoneum is the most reliable and only a few experts exist who are referred to as uchu. This is supposed to predict whether the rains will fall and not specify when. As previously mentioned, cattle intestine peritoneum is the most reliable.
Cloud formations There are three things about the clouds: 1. Two giant clouds, one in the N/E corner and another in the S/E corner, referred to selam idado.
2. A thin line of white clouds in the west early in the morning 3. A cloud over korm madho, a dark shadow in the milky way which looks like a camel.
This are supposed (as in other methods) to predict whether the rain will come without specifying when. Cloud observations are considered very reliable.
Bird observation Birds from Lake Turkana migrate east. There are two types of birds, black and snow white. There are also 2 birds that sing only to signify the approach of rains. These are called
chopabula and bararato

83
These also signify whether the rains will come without telling us when. Bararato birds from Lake Turkana are extremely reliable and signify the abundance of rain.
Animal behavior Small stock shaking their bodies Camels yawning and producing a sound or behaving like it is drinking water from the ground These signify the approach of the rains. These methods are very reliable Plant behavior Dadacha (acacia) trees suddenly sprouting green leaves during the dry season This also predicts the approach of the rain without specifying when. This method is sometimes reliable. Dreams and Seers Other people have dreams. This is sometimes reliable. yub are seers who make predictions. Nobody knows the details of what these people observe
SUGATA MAR MAR (Samburu) TRADITIONAL METHODS USED TO FORECAST RAINFALL BY WOMEN:
(i) When it will start-: Sometimes in the early morning the sky is orange and this tells rainfall is near and will start in a month’s time.
(ii) The wells where they draw water become lower as water is less and less. This to women predicts rainfall is near.
(iii) The winds blow heavily and a particular straight pile is formed as the action of wind becomes gentle (naworturot). The area where the wind blows is believed to be where rain will fall.
(iv) Specific trees flower namely sagumai,rangau, suchai, and ltepes . These tell rainfall will be better than normal and will last long. If these trees don’t flower, then people think rainfall will be worse than normal.
(v) Reading intestines. When a goat is slaughtered, the veins or blood vessels will look straight and blood is seen inside them. This is likened with streams and rivers flowing, so rainfall is expected to be normal.
(vi) Looking at stars. Particular stars will be seen in the night and once they exchange their direction from east to west, then rainfall is expected to fall and assumed to be long rains normal.
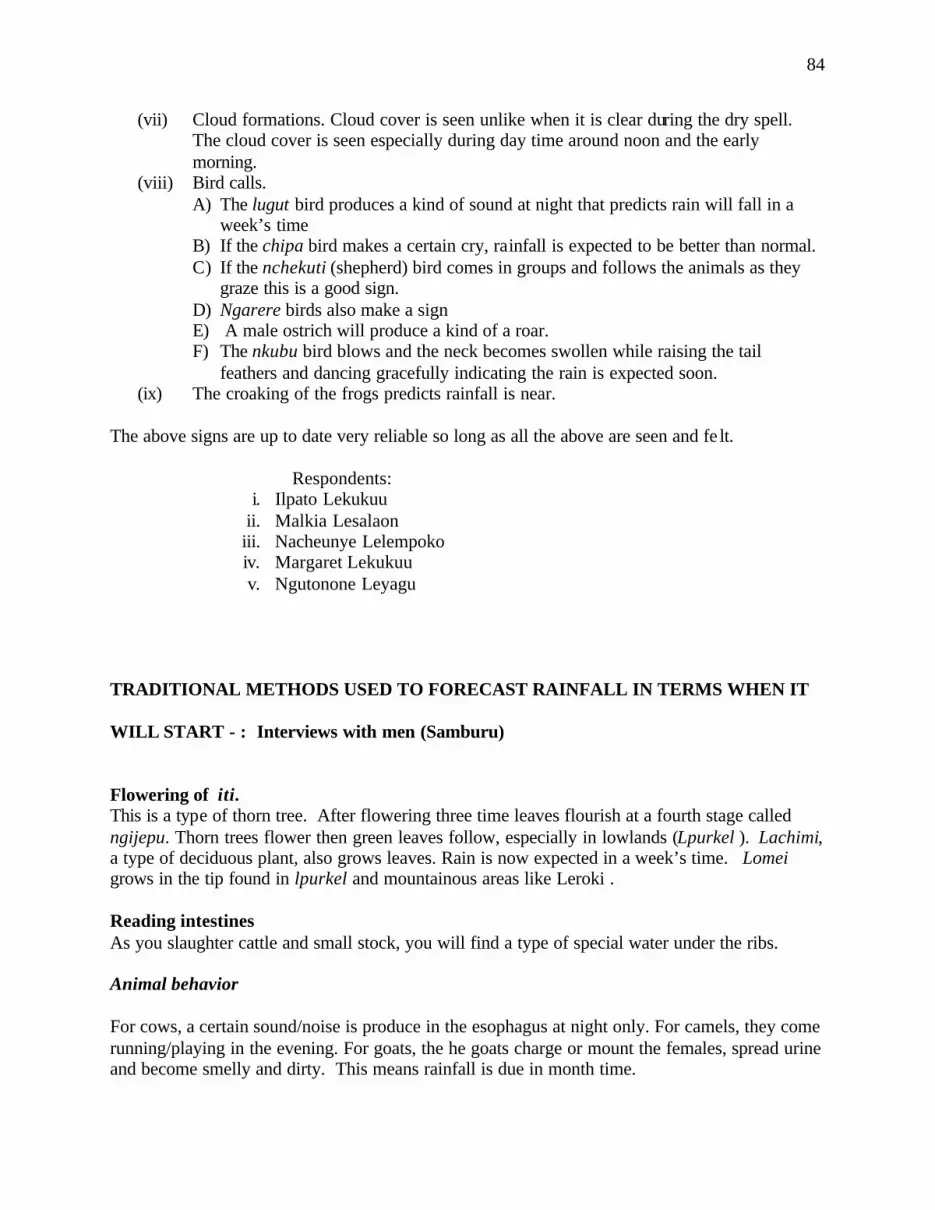
84
(vii) Cloud formations. Cloud cover is seen unlike when it is clear during the dry spell. The cloud cover is seen especially during day time around noon and the early morning.
(viii) Bird calls. A) The lugut bird produces a kind of sound at night that predicts rain will fall in a
week’s time B) If the chipa bird makes a certain cry, rainfall is expected to be better than normal. C) If the nchekuti (shepherd) bird comes in groups and follows the animals as they
graze this is a good sign. D) Ngarere birds also make a sign E) A male ostrich will produce a kind of a roar. F) The nkubu bird blows and the neck becomes swollen while raising the tail
feathers and dancing gracefully indicating the rain is expected soon. (ix) The croaking of the frogs predicts rainfall is near.
The above signs are up to date very reliable so long as all the above are seen and fe lt.
Respondents:
i. Ilpato Lekukuu ii. Malkia Lesalaon iii. Nacheunye Lelempoko iv. Margaret Lekukuu v. Ngutonone Leyagu
TRADITIONAL METHODS USED TO FORECAST RAINFALL IN TERMS WHEN IT
WILL START - : Interviews with men (Samburu)
Flowering of iti. This is a type of thorn tree. After flowering three time leaves flourish at a fourth stage called ngijepu. Thorn trees flower then green leaves follow, especially in lowlands (Lpurkel ). Lachimi, a type of deciduous plant, also grows leaves. Rain is now expected in a week’s time. Lomei grows in the tip found in lpurkel and mountainous areas like Leroki . Reading intestines As you slaughter cattle and small stock, you will find a type of special water under the ribs. Animal behavior
For cows, a certain sound/noise is produce in the esophagus at night only. For camels, they come running/playing in the evening. For goats, the he goats charge or mount the females, spread urine and become smelly and dirty. This means rainfall is due in month time.

85
Looking at stars Certain stars, called lookir aiy and lakikira dorop, approach each other in opposite directions. No rain is expected until they exchange directions and lookir aiye has to by pass in the right direction. Normal rain is expected. Loisapa, a group of seven stars, will always be seen during the night at exactly 9.00pm. This predicts long rains (Lngerngerwa).
Lunar eclipse This is believed to predict that rain will be normal and it is going to fall normally. A crescent is believed to be foretelling bad luck for animals.
The seven stars
The ngakua group of stars moves across the sky. When they arise, this predicts rainfall. When they seem static on the sky, this predicts worse than normal.
Sun During sunrise it becomes clear. This predicts normal rain. Late in the evening will be orange and very beautiful. This predicts rainfall is near. Fog
Kulunchu fog covers the ground that is warm. This predicts rainfall.
Cloud formation merelle fog / mist in the early morning is everywhere and seems dark. This predicts rainfall is near. Also, a cloud comes from east / Mt. Kenya is meant to predict rain.
Birds Nchekuti, a type of bird referred to as shepherds, change their feathers. They are brownish in the dry season and when rain is near, they become green in color. Marabou storks migrate in large numbers. This predicts normal rainfall. Nkaireere, a kind of bird, will fly touching the ground when rainfall is near.
Elephant migration When they migrate from the forest going towards the lowlands then rainfall is due.
Grevy zebra These animals produce a certain sound at night. Respondents think that the above methods used to be reliable, but are no longer reliable. They don’t seem to understand why. They say new influences / destruction of the environment could be a reason. One suggested it was due to a recent discovered machine in N.E province
Respondents - : Mzee Lentirangoi

86
Mzee Lenapoori Mzee Leparleen Mzee Lesalaon Mzee Leparkeri
TRADITIONAL METHODS USED TO FORECAST RAINFALL IN TERMS WHEN IT
WILL START - : Interviews with 5 women (Samburu): In terms of when it will start
Question, when will rain start:
1. sometimes early morning the sky is orange and this tells the rainfall is near, and will start in a
month’s time
2. The wells where they draw water simply become unusual, wtare is less and less. This to women predicts that rainfall is near. Again water level in the wells rises and now this is used to predict rainfall is near. 3. the winds blow heavily and a particular straight pile is formed as the action of the wind becomes gentle (naworturot). The area where wind blows is believed to be where rain will fall. 4. Specific trees flower namely—‘sagumai’, ‘rangu’, suchai’, and ltepes. This tells rainfall will be better than normal and will last long. If these trees don’t flower then people think the rainfall will be worse than normal. 5. Reading intenstines: when a goat is slaughtered the veins or blood vessels will look straight and blood is seen inside them. This is likened with streams and rivers flowing and rainfall will be expected to be normal. 6. Looking for stars: particular stars will be seen in the night and once they change their direction form east to west, then rainfall is expected to fall and assumed to be long rains and normal. 7. Cloud formations: cloud cover is seen unlike when it is clear during dry spell. The cloud cover is seen especially day time during time around noon and early morning. Il Chamus (Ngambo) Elders in our community are the experts of looking for cloud formation, there are cluds which they can observe and they will know that the rainfall is about to start. Especially nigus clouds which they are founding the middle of the sky or side ways when it is about to rain. Despite the cloud formation, there is frequent lightening which may occur once a year. Before the starting months of the rains, elders say when lightening takes place at night or around 4:00 AM at northern part of our community mostly there will be long rains throughout the year,

87
but for the normal lightening there is no rain. Likewise to the movement of clouds in the sky there will be two optional views either a lot of rain to be received or worse-- this method is sometimes reliable especially during last El Nino which most experts proved to be true. Wind flowing is another factor most Njemps in general believe that when there is a lot of flowing of wind there will be a lot of rainfall, to be received as described by the waves of winds. This method of prediction is very reliable in our community. Birds behavior is sometimes reliable at this community because of the reduction of birds at this place. Although there are few, e.g., flamingoes which are found on Lake Bogoria, people believe that when they move from Lake Bogoria to other lakes there will be normal rainfall as they predict it to be good. Breeding at the lakes which they have shifted and look at behavior of movement when flamingoes move is another method. Even people believe that when they will be seen around buffaloes and elephants it shows that there will be a lot of rain more than normal. This method is no longer around because there are no buffaloes and elephants around so it less reliable. Reading intestines also is part of rainfall forecast. This method can be used to tell when the rainfall will start to fall and when it will end. Traditionally it is not everybody who can be an expert at reading intestines but specific people (clan) and by looking at on this, there are some veins which have flowing blood and his veins represents rivers with water. When the veins have a lot of blood in them, it means there will be a lot of rainfall to be received or vice versa (little blood, little rain). This method is very reliable and still exists and many people of this community beliefs that it is true because when the experts tell it used to be true (rains). On looking at the method of stars elders are the experts of it. They look at sky when it is clear and the position of stars is moderate. By this there are two stars to be observed an evening star and morning star, they said when the evening star appears at eastern side and morning star at western part of sky it shows that there is a lot of rain to be experienced in our community and more so it will not take two weeks to start falling. This methods is sometimes reliable. To add on it, when these stars appears at wrong side of sky or change color to be red it shows likely that there will be danger, ie most animals will die, sickness in people and animals. In addition to this, there are some birds when they start to make strange sounds at night, this bird describes a lot of rainfall to be received in the area and many people believes this to be very reliable as they will not be seen day time or night but only sound to be heard. When eagles make a lot of sounds around the lake shows the people that there will be normal rainfall and it will start earlier than normal. In regard to trees, there are some trees which when they get flowers, especia lly acacia meelifera, acacia nubica, and acacia elatiar, people believe that when dropping their flowers it shows that when they complete the cycle of dropping the rainfall will start to fall. Also in certain plants, like acacia tortillas, balanites aegyptica, and savadora persica, when they bear fruits it can stay for some periods and when they complete the cycle the rainfall starts to fall and this is very reliable for the community. They says that there will be a lot of rainfall to fall. Also there are some shrubs which long time people in our community use to believe that when they grow along the lake basin or at wet grazing fields there will be better than normal rainfall and it will last a long time. This method is no longer reliable (existing) because the shrubs are no where to be seen because of erratic droughts and famines.

88
At the side of animal movement or behavior, there are some animals which people believes that when they will be seen around, eg., buffaloes and elephants, that shows there will be a lot of rainfall. This method no longer exists because animals have disappeared. Reading Intestines (Il Chamus): This is a major method of rainfall forecast. This method can tell whether rain will fall or not before two to three months. This method can tell a rainfall which will rain in a area where those animals can do grazing. In other words, it can be used to tell rain which will fall in a base camp or satellite camp. This method also will tell the amount of rainfall in an area. In intestines there are some veins which contain blood. Those veins represent rivers and bloods represent water. Then when veins are full of blood it mans that the rivers are full of water. Likewise, when veins contain little blood then it mans rivers contain little water. Therefore, the amount of water in the river is proportional to th amount of rainfall of that time. This method of studying intestines is a recommended method which has been used by the ancestors. This means that it is being inherited from one generation to the another. Before and currently the method is still reliable because it cannot fail in prediction. This method is not only used to tell rainfall forecasts but also used to forecast their future events like war (calamities and fortunes). Looking at stars: This is another complicated method of rainfall forecast. This is well done by observing the positions of stars and their behaviors. Therefore, their positions can clearly tell when the rain will come. For example, when a certain big shining star locates itself in the eastern portion of sky and at the same time a certain small shining star locates in the western portion, then the leading rain must come. These two stars are normally seen at 7PM. It was used that when the two located themselves in these positions then reliable methods like intestine reading, observation of stars can be used to tell apart from rainfall forexast. For example, when a small star changed to be red in color then it means danger like animal sickness or death of animals due to drought. Cloud formation: This is a method of telling rainfall. But this method depends on all other methods of rainfall forecasts. It means it is the final method of rainfall forecast. This method proves that the method like reading intestines is true. Rain can not come without forming of clouds, when an intestine specialist forecasted rainfall, when clouds will form first then it finally to conclude that it will rain. Clouds are a minor method of forecast. Birds or animals behavior: This is interesting method of rainfall forecast. In this method, there is certain bird, called lkweeny lenkai. This bird is used to tell rainfall when it goes singling along then flies toward a direction which water flows from and back again signing down to the lake means that it is likely to rain in two weeks. The movement of the bord along the river means that when it goes against the direction of the flow of the river and comes back in water will follow it soon. In other words near the time of rainfall and rivers will have water flowing. The amount of rain is being interpreted by difference initiating whether the bird is signing with happiness or not. When the bird sings with as well and smooth, it means that the bird is happy because a lot of rain will come and vice versa.

89
Trees: Trees are used to forecast rainfall in this area but not all tress. When a certain tree bear fruits and the fruits are finished, then a healthy rain will fall. It cannot be known if this rain will be normal, better or worse than normal. They will also know that immediately after fruits are diminished, the rain will come. That rain will not fall in that area only. This method can’t be used to know the period it will take raining in that connection in this area. There are certain months which rains are expected to come. The months, i.e. between March and April, otherwise when rains fail in these months then there are signs of delay of rainfall.


